Report of the Workshop of National Age Readings ... - Archimer
Upload
khangminh22Category
view
0download
0

NATIONAL E-WORKSHOP
ON
Current Scenario of Post Graduation Research
in Agriculture Sector
(September 9-11, 2020)
EXTENDED SUMMARIES AND ABSTRACTS
Organized under the Aegis of
World Bank-ICAR Funded National Agricultural Higher
Education Project
Swami Keshwanand Rajasthan Agricultural University,
Bikaner-334006

© 2020, NAHEP, SKRAU, Bikaner
Citation:
Sharma, N.K., Rathore, R.S., Kumawat, A., Yadav, A.L., Yogi V, Jhajharia A.K., Kachhawa M and Gautam A (Eds.) Extended Summaries and Abstracts, National e-workshop on Post Graduation Research in Agriculture Sector, September 9-11, 2020 NAHEP, SKRAU, Bikaner (Rajasthan), 309p.
Editors
���� N. K. Sharma
���� Rajendra Singh Rathore
���� Amit Kumawat
���� Arjun Lal Yadav
���� Vikram Yogi
���� A.K. Jhajharia
���� Mayur Kachhawa
���� Abhinav Gautam
Note: Responsibility for information in the publication rests with the individual
authors
Published by
World Bank-ICAR Funded National Agricultural Higher
Education Project
Swami Keshwanand Rajasthan Agricultural University,
Bikaner-334006

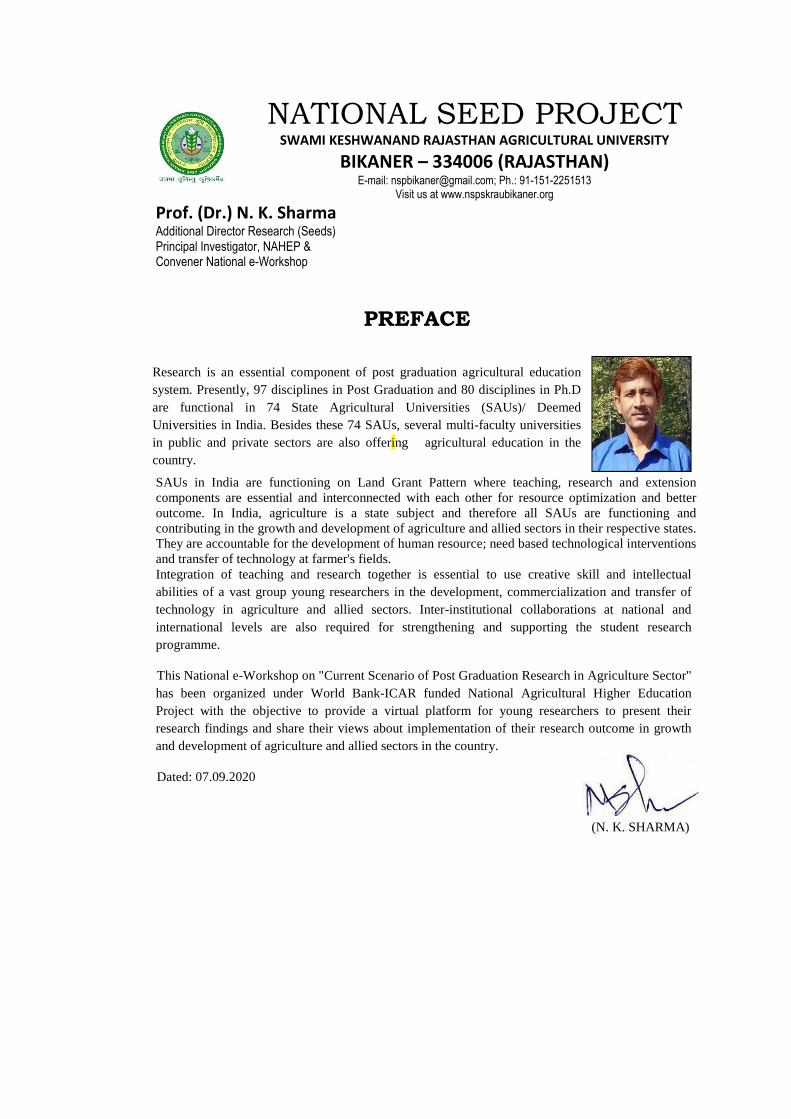
NATIONAL SEED PROJECT SWAMI KESHWANAND RAJASTHAN AGRICULTURAL UNIVERSITY
BIKANER – 334006 (RAJASTHAN) E-mail: [email protected]; Ph.: 91-151-2251513
Visit us at www.nspskraubikaner.org Prof. (Dr.) N. K. Sharma Additional Director Research (Seeds) Principal Investigator, NAHEP & Convener National e-Workshop
PREFACE
SAUs in India are functioning on Land Grant Pattern where teaching, research and extension components are essential and interconnected with each other for resource optimization and better outcome. In India, agriculture is a state subject and therefore all SAUs are functioning and contributing in the growth and development of agriculture and allied sectors in their respective states. They are accountable for the development of human resource; need based technological interventions and transfer of technology at farmer's fields. Integration of teaching and research together is essential to use creative skill and intellectual abilities of a vast group young researchers in the development, commercialization and transfer of technology in agriculture and allied sectors. Inter-institutional collaborations at national and international levels are also required for strengthening and supporting the student research programme.
This National e-Workshop on "Current Scenario of Post Graduation Research in Agriculture Sector" has been organized under World Bank-ICAR funded National Agricultural Higher Education Project with the objective to provide a virtual platform for young researchers to present their research findings and share their views about implementation of their research outcome in growth and development of agriculture and allied sectors in the country.
Dated: 07.09.2020
(N. K. SHARMA)
Research is an essential component of post graduation agricultural education system. Presently, 97 disciplines in Post Graduation and 80 disciplines in Ph.D are functional in 74 State Agricultural Universities (SAUs)/ Deemed Universities in India. Besides these 74 SAUs, several multi-faculty universities in public and private sectors are also offering agricultural education in the country.

Content
S.
No.
Title Author Page
No.
Crop Improvement
1 Study of genetic variability parameters for seed yield and its component traits in mungbean germplasm under arid environment
Anil Kumar, NK Sharma, R Kumar, SK Sanadya, S. Sahoo & MKYadav
2
2 Identification of effective restores against cms lines in temperate rice (Oryza sativa L.)
Asma Majid, GA Parray, NR Sofi, AB Shikari, SA Waza and ZA Dar
6
3 Estimation of stability parameters and genetic analysis for grain yield and its related characters in durum wheat under different environments
Bhagwati Barandaand AK Sharma
8
4 Heterosis and combining ability effect on yield and yield attributes of bitter gourd (Momordica charantia L.)
Daleep Kumar and Mamta Pathak
11
5 Studies on genetic diversity and variability for yield and yield attributes in garlic (Allium sativum L.) Under Dhampur condition
Deepak Kumar, SL Pal, Ravi & Soraj Singh
12
6 Introduction and Evaluation of sweet orange varieties in arid region of western Rajasthan
JS Gora and R. Kumar
17
7 Genetic architecture of pearl millet [Pennisetum glaucum (L.) R. Br.] Under varying moisture conditions
Kana Ram Kumawat, NK Sharma, AK Sharma and PC Gupta
18
8 Studies on character association analysis for seed yield in clusterbean {Cyamopsis tetragonoloba (L.) Taub.}
Kapil Bishnoi & Vijay Prakash
22
9 Targeting induced local lesions in genomes (tilling) in crop improvement
Komal Shekhawat, Swarnlata Kumawat, Anil Kumar & Kumari Rekha
25
10 Effect of plant growth regulator for in vitro shoot bud induction in guggul [Commiphora wightii (Arnott)]
Shekhawat, K. Kumar, R., Kumawat, S., Choudhary, R. & Jakhar ML
34
11 Study on mean performance of indian mustard (Brassica juncea L. Czern & coss) for seed yield and component traits under different environments for drought tolerance
Mahendra Singh Bhinda, SS Shekhawat, US Shekhawat & AK Sharma
42
12 Variability and interrelation analysis in cowpea [Vign aunguiculata (L.) Walp.] Genotypes
Navreet Kaur Rai & AK Sharma 45
13 Performance of different varieties of china aster under Nagpur conditions and their response to pinching
Neha Chopde, AR Palekar, Harsha Mendhe & VP Satar
50
14 Character association analysis for seed yield and related agro-morphological traits in mothbean
Sangeeta Pal & NK Sharma
54
15 Response of tuberose genotypes to gibberellic acid as foliar spray
Seema Thakre, DM Panchbhai, Harsha Mendhe & RP Gajbhiye
57
16 Study of heterosis analysis in f1 population of bread wheat (Triticum aestivum L. Em. Thell.) Over environments
Sohan Lal Kajla & AK Sharma
64
17 Effect of different fruit bunch covering materials on date palm (Phoenix dactylifera L.) Fruits
Tulsi Ram & RS Rathore
66
18 Crop improvement through domain of unknown function genes (duf 40)
Pushpikka Udawat 69
19 Effect of herbal treatments on Different vigour parameters of okra [Abelmoschuse sculentus (L.) Moench]
Indrajit Singh P. Girase and Prashant Kumar Rai
71
20 Genetic diversity and population structure analysis among the European and Asiatic carrot type of Indian collection
Chaitra C. Kulakarni and Sarvamangala S. Cholin
75
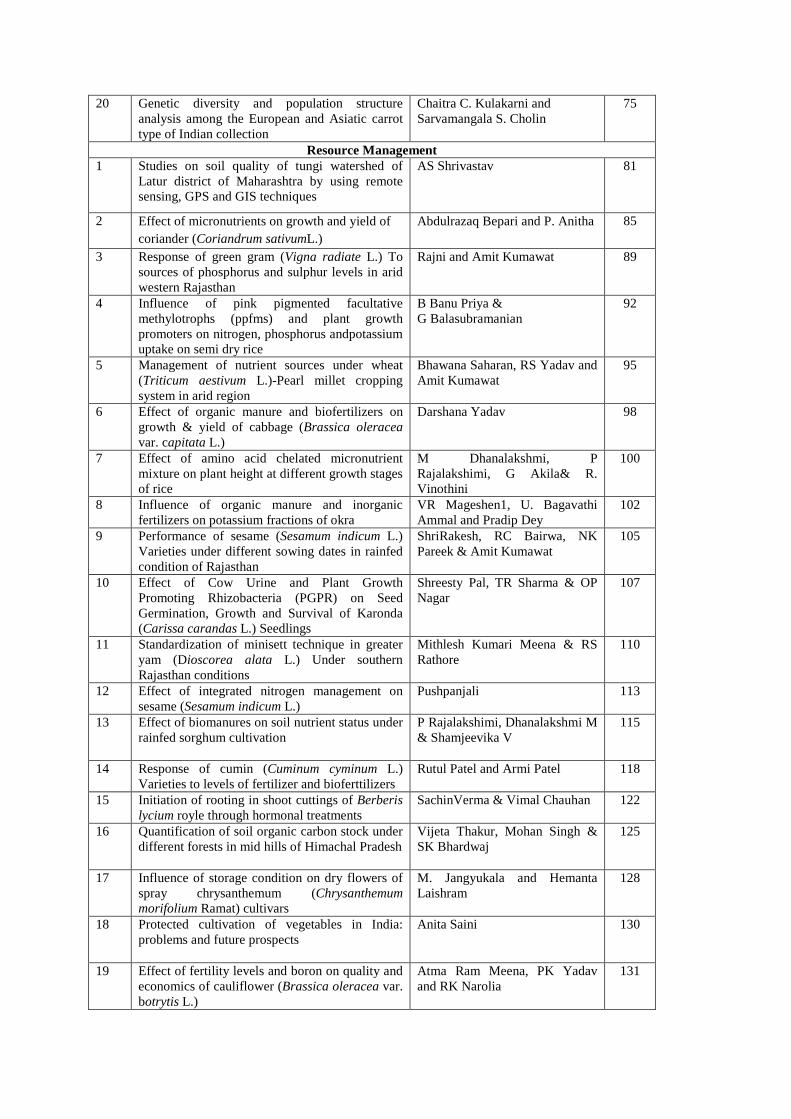
Resource Management 1 Studies on soil quality of tungi watershed of
Latur district of Maharashtra by using remote sensing, GPS and GIS techniques
AS Shrivastav 81
2 Effect of micronutrients on growth and yield of coriander (Coriandrum sativumL.)
Abdulrazaq Bepari and P. Anitha 85
3 Response of green gram (Vigna radiate L.) To sources of phosphorus and sulphur levels in arid western Rajasthan
Rajni and Amit Kumawat
89
4 Influence of pink pigmented facultative methylotrophs (ppfms) and plant growth promoters on nitrogen, phosphorus andpotassium uptake on semi dry rice
B Banu Priya & G Balasubramanian
92
5 Management of nutrient sources under wheat (Triticum aestivum L.)-Pearl millet cropping system in arid region
Bhawana Saharan, RS Yadav and Amit Kumawat
95
6 Effect of organic manure and biofertilizers on growth & yield of cabbage (Brassica oleracea var. capitata L.)
Darshana Yadav
98
7 Effect of amino acid chelated micronutrient mixture on plant height at different growth stages of rice
M Dhanalakshmi, P Rajalakshimi, G Akila& R. Vinothini
100
8 Influence of organic manure and inorganic fertilizers on potassium fractions of okra
VR Mageshen1, U. Bagavathi Ammal and Pradip Dey
102
9 Performance of sesame (Sesamum indicum L.) Varieties under different sowing dates in rainfed condition of Rajasthan
ShriRakesh, RC Bairwa, NK Pareek & Amit Kumawat
105
10 Effect of Cow Urine and Plant Growth Promoting Rhizobacteria (PGPR) on Seed Germination, Growth and Survival of Karonda (Carissa carandas L.) Seedlings
Shreesty Pal, TR Sharma & OP Nagar
107
11 Standardization of minisett technique in greater yam (Dioscorea alata L.) Under southern Rajasthan conditions
Mithlesh Kumari Meena & RS Rathore
110
12 Effect of integrated nitrogen management on sesame (Sesamum indicum L.)
Pushpanjali
113
13 Effect of biomanures on soil nutrient status under rainfed sorghum cultivation
P Rajalakshimi, Dhanalakshmi M & Shamjeevika V
115
14 Response of cumin (Cuminum cyminum L.) Varieties to levels of fertilizer and bioferttilizers
Rutul Patel and Armi Patel
118
15 Initiation of rooting in shoot cuttings of Berberis lycium royle through hormonal treatments
SachinVerma & Vimal Chauhan
122
16 Quantification of soil organic carbon stock under different forests in mid hills of Himachal Pradesh
Vijeta Thakur, Mohan Singh & SK Bhardwaj
125
17 Influence of storage condition on dry flowers of spray chrysanthemum (Chrysanthemum morifolium Ramat) cultivars
M. Jangyukala and Hemanta Laishram
128
18 Protected cultivation of vegetables in India: problems and future prospects
Anita Saini
130
19 Effect of fertility levels and boron on quality and economics of cauliflower (Brassica oleracea var. botrytis L.)
Atma Ram Meena, PK Yadav and RK Narolia
131
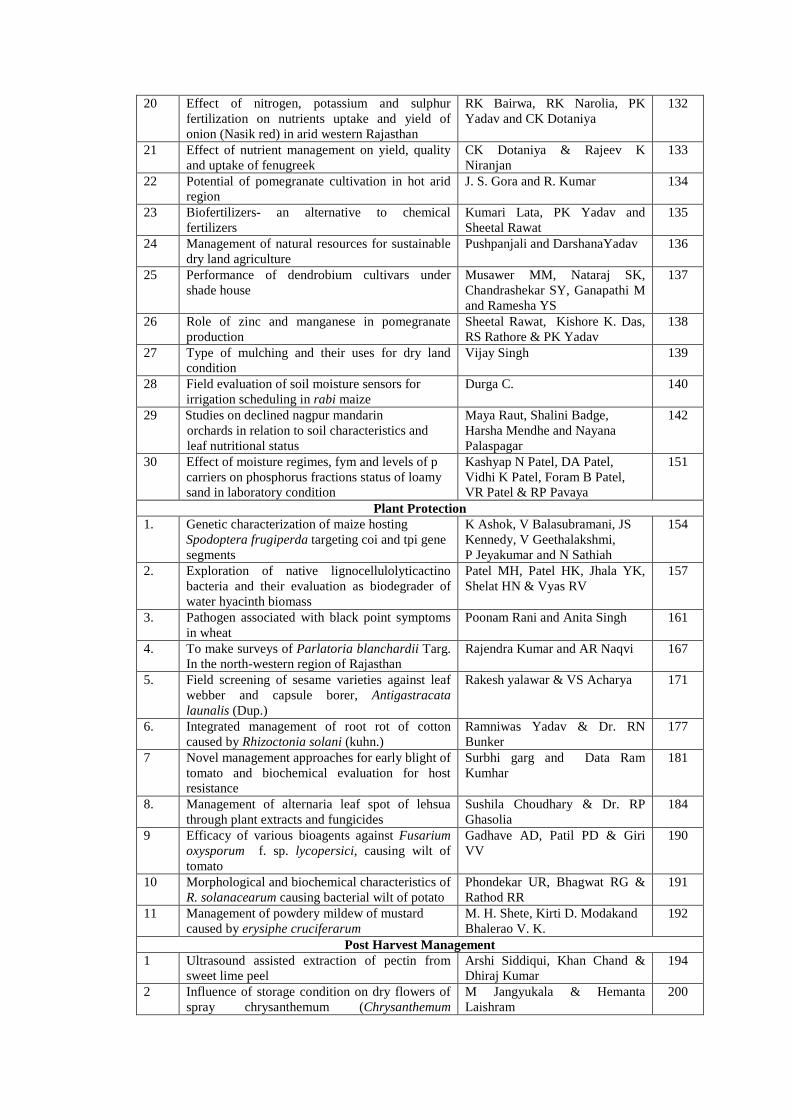
20 Effect of nitrogen, potassium and sulphur fertilization on nutrients uptake and yield of onion (Nasik red) in arid western Rajasthan
RK Bairwa, RK Narolia, PK Yadav and CK Dotaniya
132
21 Effect of nutrient management on yield, quality and uptake of fenugreek
CK Dotaniya & Rajeev K Niranjan
133
22 Potential of pomegranate cultivation in hot arid region
J. S. Gora and R. Kumar 134
23 Biofertilizers- an alternative to chemical fertilizers
Kumari Lata, PK Yadav and Sheetal Rawat
135
24 Management of natural resources for sustainable dry land agriculture
Pushpanjali and DarshanaYadav
136
25 Performance of dendrobium cultivars under shade house
Musawer MM, Nataraj SK, Chandrashekar SY, Ganapathi M and Ramesha YS
137
26 Role of zinc and manganese in pomegranate production
Sheetal Rawat, Kishore K. Das, RS Rathore & PK Yadav
138
27 Type of mulching and their uses for dry land condition
Vijay Singh
139
28 Field evaluation of soil moisture sensors for irrigation scheduling in rabi maize
Durga C.
140
29 Studies on declined nagpur mandarin orchards in relation to soil characteristics and leaf nutritional status
Maya Raut, Shalini Badge, Harsha Mendhe and Nayana Palaspagar
142
30 Effect of moisture regimes, fym and levels of p carriers on phosphorus fractions status of loamy sand in laboratory condition
Kashyap N Patel, DA Patel, Vidhi K Patel, Foram B Patel, VR Patel & RP Pavaya
151
Plant Protection 1. Genetic characterization of maize hosting
Spodoptera frugiperda targeting coi and tpi gene segments
K Ashok, V Balasubramani, JS Kennedy, V Geethalakshmi, P Jeyakumar and N Sathiah
154
2. Exploration of native lignocellulolyticactino bacteria and their evaluation as biodegrader of water hyacinth biomass
Patel MH, Patel HK, Jhala YK, Shelat HN & Vyas RV
157
3. Pathogen associated with black point symptoms in wheat
Poonam Rani and Anita Singh 161
4. To make surveys of Parlatoria blanchardii Targ. In the north-western region of Rajasthan
Rajendra Kumar and AR Naqvi 167
5. Field screening of sesame varieties against leaf webber and capsule borer, Antigastracata launalis (Dup.)
Rakesh yalawar & VS Acharya 171
6. Integrated management of root rot of cotton caused by Rhizoctonia solani (kuhn.)
Ramniwas Yadav & Dr. RN Bunker
177
7 Novel management approaches for early blight of tomato and biochemical evaluation for host resistance
Surbhi garg and Data Ram Kumhar
181
8. Management of alternaria leaf spot of lehsua through plant extracts and fungicides
Sushila Choudhary & Dr. RP Ghasolia
184
9 Efficacy of various bioagents against Fusarium oxysporum f. sp. lycopersici, causing wilt of tomato
Gadhave AD, Patil PD & Giri VV
190
10 Morphological and biochemical characteristics of R. solanacearum causing bacterial wilt of potato
Phondekar UR, Bhagwat RG & Rathod RR
191
11 Management of powdery mildew of mustard caused by erysiphe cruciferarum
M. H. Shete, Kirti D. Modakand Bhalerao V. K.
192
Post Harvest Management 1 Ultrasound assisted extraction of pectin from
sweet lime peel Arshi Siddiqui, Khan Chand & Dhiraj Kumar
194
2 Influence of storage condition on dry flowers of spray chrysanthemum (Chrysanthemum
M Jangyukala & Hemanta Laishram
200

morifolium Ramat) cultivars 3 Development of germinated wheat (Triticum
aestivum) flour cookies fortified with pumpkin (Cucurbita spp.) Seed and beet green (beta vulgaris L.) Powder and its organoleptic evaluation
Princy Gautam and Vinita Singh
202
4 Study the effect of temperature and packaging materials on shelf life of gladiouls cv. Punjab dawn
Priyanka Kumawat
205
5 Development and performance evaluation of quinoa (Chenopodium quinoa wild.) Polisher
Sagar M Chavan 210
6 New approach to microwave drying of sprouted green gram
Sejal R Sedani, Ishvar L Pardeshi & Anil K. Kamble
214
7 Physical characteristics of microencapsulated red-fleshed dragon fruit powder
Vinod BR, Ramachandra Naik K, Kiran kumar Gorabal, Deepa Terdal and Patil SN
224
8 To study the effectiveness of different edible coatings on shelf life and quality of fresh - cut red pumpkin
Survase SS and VK Garande
227
9 Nutritional sustainability with value addition Priyanka Kumawat, Kumari Lata and Manju Verma
229
10 Post harvest technology, losses & treatment Darshana Yadav and Pushpanjali 230 11 Value added products from Indian jujube Deepak S Rathore and Saket
Mishra 231
12 Effect of biodegradable nano formulation on post harvest losses in Tomato (Solanum lycopersicum L.)
Mahendra Meena, K.K. Meena, O.P. Garhwal, Shalini Pilania
234
13 Changes in physical and qualitative characters of date palm under freeze storage condition
Priyanka Kumawat, R.S. Rathore, P.K. Yadav, Sheetal Rawat and Kumari Lata
237
Social Science 1 The comparative economics of chickpea
production in Rajasthan with reference to gangour variety (GNG 1581)
Keshav Kumar & Dr. Vikram Yogi
243
2 Uses of services of agricultural technology information centre (ATIC) by the farmers of central (UP)
Priya vashishtha and vinita singh 245
3 Aloe vera (Ghritkumari) cultivation in Rajasthan- need of sustainable value chain model to increase income of the farmers
Rakesh Rathore & Aditi Mathur 246
4 Role of weather forecasting services in farm management and socio-economic development in Rajasthan
Rahul singh
250
5 Nutrient intake through mid-day meal of school going children aged 7-9 years residing in bikaner district (Rajasthan)
Rita Mishra and Vimla Dunkwal
254
6 Trade competitiveness and export performance of shrimps in India with special reference to Andhra Pradesh
KJVK Sirisha, DV Subba Rao, Y Radha, V Srinivasa Rao, & P Rambabu
257
7 Perception of farmers towards soil health card scheme in Rayalaseema region of Andhra Pradesh
S LokeshBabu, T Lakshmi, SV Prasad, S Hemalatha& B Ravindra Reddy
260
8 Problems faced by input dealers during daesi (diploma in agricultural extension services for input dealers) programme in Rajasthan
Priti Singh, Madhuri Joshi &Kiran Gaur
264
9 Impact of drip irrigation on costs and returns of banana growers in middle Gujarat
Rachana Kumari Bansal, KS Jadav and AS Shaikh
271

10 Preschooler anthropometric measurements: a representative survey in aurban areas of Bikaner city
Surbhi Shekhawat 275
11 Overall job perception and job performance of agriculture supervisors of Jaipur division of Rajasthan
Nisha Meena, Madhuri Joshi, JK Meena, Divya Rajpurohit, Sarita Meena & Renuka
278
12 Valuation of alder based farming system in Nagaland
Limasunep Ozukum, SM Feroze & ZohmingmawiiSailo
283
13 Opinion, reasons and benefits of joining self help groups in tribal sub plan region of Rajasthan-an evaluative study
SS Meena & Hanuman Prasad 287
14 Market opportunities of plant protection chemicals for grape cultivation in Nasik district of Maharashtra
GamdhaVivek Jaysukhbhai
296
15 Awareness and adaptation strategies of climate smart agriculture
Harsha S Mendhe, SS Sadaphal, Neha K Chopde & Seema Thakre
299
16 Knowledge level of farmers regarding recommended soybean cultivation practices Surendra Kumar and NK Sharma
300
17 Cost effective management of post-harvest anthracnose of mango by pre and post-harvest treatments
V. K. Bhalerao, Shete M. H. and Garande V. K.
302
18 Farmers perception towards the extension service of krishi vigyan kendra
S. D. Sarnaik PP Bhople & D.M. Mankar VS Tekale
303
19 A study on the extent of accessibility and utilization of mass media among school going children in bikaner district
Varsha Kumari and Prasanlata Arya
308
National E-Workshop onCurrent Scenario of Post Graduation Research in Agriculture Sector Sept 09-11, 2020
1
CROP IMPROVEMENT

National E-Workshop onCurrent Scenario of Post Graduation Research in Agriculture Sector Sept 09-11, 2020
2
STUDY OF GENETIC VARIABILITY PARAMETERS FOR SEED YIELD AND ITS COMPONENT TRAITS IN MUNGBEAN
GERMPLASM UNDER ARID ENVIRONMENT
Anil Kumar1, N.K. Sharma2, R. Kumar1, S.K. Sanadya1, S. Sahoo1, M. K. Yadav1 1Department of Genetics & Plant Breeding, College of Agriculture, SKRAU, Bikaner
2Additional Director Research (Seeds), NSP, SKRAU, Bikaner- 334006, India. Email: [email protected]
Introduction Pulses compliment the daily human diet of Indians along with cereals. They are a rich source of proteins with a satisfactory proportion of carbohydrates. Mungbean [Vigna radiata (L.) Wilczek], also known as green gram is an ancient pulse crop widely cultivated in India. High protein, easy digestibility and low flatulence production made this crop more acceptable by the people world over. Mungbean is a short day, warm-season crop, grown mainly in arid and semi-arid regions. It is tolerant to moisture stress and heat as well; and has the ability to grow under low input conditions (Sharma, 2016). Because of short duration, wide adaptation, low water requirement and photo insensitiveness, it can be grown in various crop rotation practices (Singh et al., 2015).
Being highly self-pollinated crop, natural variability for yield and yield related traits is very narrow in mungbean making selection ineffective. However, proper evaluation of the extent of genetic variation available for yield components, their heritability values and genetic advance could be of great significance for the breeders in order to choose best genotypes for improvement (Degafa et al., 2014). Estimates of genetic parameters provide an indication of the relative importance of the various types of gene effects affecting the total variation of a plant character. Therefore, the present study was conducted to assess genetic variability, heritability and genetic advance in mungbean germplasm under the arid environment of Rajasthan. So that promising genotypes could be identified for a breeding programme to develop high yielding varieties of mungbean for the arid zone. Methodology The present investigation was carried out during Kharif, 2017 at experimental farm, College of Agriculture, Swami Keshwanand Rajasthan Agricultural University, Bikaner. Sowing was done on July 6, 2017. The experimental material consisted of 79 genotypes was evaluated in randomized block design with three replications accommodating 3 meters long two rows per replication at 30 cm spacing under sprinkler irrigated situation. Observations recorded for 11 characters viz., days to 50 percent flowering, days to maturity, plant height, number of branches per plant, number of pods per plant, number of seeds per pod, pod length, 100-seed weight, biological yield per plant, seed yield per plant and harvest index were subjected to genetic variability analysis using standard procedures. Findings The analysis of variance (Table 1) showed significant differences among genotypes for all 11characters indicating that the material has adequate genetic variability to support the breeding programme for improving the seed yield of mungbean. A wide

National E-Workshop onCurrent Scenario of Post Graduation Research in Agriculture Sector Sept 09-11, 2020
3
range of variability in mungbean germplasm was displayed by different characters namely; days to 50 per cent flowering (34-60), days to maturity (64-84), plant height (40.47-126.13 cm), number of branches per plant (1.5-3.03), number of pods per plant (1.53-55.60), number of seeds per pod (8.00-11.67), pod length (2.46-10.22 cm), 100-seed weight (2.45-5.41 g), biological yield per plant (12.20-104.33 g), seed yield per plant (0.47-26.07 g) and harvest index (1.10-38.41). Genetic variability parameters estimated for different characters of mungbean are given in Table 2. The highest GCV and PCV in mungbean germplasm were observed for seed yield per plant followed by number of pods per plant, harvest index, biological yield per plant and plant height, respectively; thereby, suggesting a good scope of improvement, creating variability through hybridization followed by selection. The occurrence of moderate GCV and PCV was recorded for number of branches per plant, days to 50 per cent flowering, pod length and 100-seed weight which suggests that improvement in these characters might be gained to a reasonable extent. Similar findings were reported by Makeen et al. (2007), Bisht et al. (2014), Hemavathy et al. (2015), Bhatia et al. (2016) and Shiv et al. (2017). The response of selection depends upon the magnitude of heritable variation present in the population. A character with high GCV and high heritability will be more valuable in a selection programme. In the present investigation, high heritability estimates have been observed for days to 50 per cent flowering followed by seed yield per plant, number of pods per plant, biological yield per plant, 100-seed weight, harvest index, number of branches per plant, days to maturity, plant height, pod length and number of seeds per pod. According to Panse and Sukhatme (1985), such characters are predominantly governed by additive gene action and could be improved through individual plant selection owing to their high heritability values. Similar findings were reported by Makeen et al. (2007), Gadakh et al. (2013), Tiwari et al. (2014), Bhutia et al. (2016) and Shiv et al. (2017). The genetic advance as per cent of mean provides an idea of the amount of progress that can be achieved by selection for the concerned trait. High genetic advance as percentage of mean was estimated for seed yield per plant, number of pods per plant, harvest index, biological yield per plant, plant height, days to 50 per cent flowering, number of branches per plant, 100-seed weight and pod length; however, moderate values were observed for days to maturity and number of seeds per pod. The heritability values coupled with genetic advance would be more reliable and useful in predicting the gain under selection than the heritability estimates alone. The high estimate of heritability coupled with high genetic advance as percent of mean was recorded for seed yield per plant, number of pods per plant, harvest index, biological yield per plant, plant height, days to 50 per cent flowering, number of branches per plant, 100-seed weight and pod length. These traits are governed by additive gene effects and therefore, may be improved through direct selection. Similar findings were reported by Gadakh et al. (2013), Tiwari et al. (2014), Choudhary et al. (2017) and Shiv et al. (2017). Genotypes/ varieties exhibited higher seed yield along with other desirable traits were Ganga-1, MUM-2, COGG-912, Keshwanand Mung-1, RMG-268, GM-4, SML-668, RMG-492, Samrat, MH 2-15, MH-421, ML-683, IPM 205-7, GAM-5, SML-832, RMG-344, IPM 99-125, IC-39409, Keshwanand Mung-2, Ganga-8, RMG-62, IPM 02-14 and IC-39288. Besides quantitative traits, all these genotypes were also found early in flowering and maturity, which are considered as the most desirable traits for crop cultivation in the arid zone. Mungbean is a self-pollinated crop, therefore; all above mentioned varieties/genotypes could directly be used for cultivation under
National E-Workshop onCurrent Scenario of Post Graduation Research in Agriculture Sector Sept 09-11, 2020
4
irrigated normal soil and water situation of the arid zone as well as in future breeding programme to develop superior varieties. References Bhutia GM, Lal andN Thomas (2016). Studies on genetic variability, correlation and path analysis in
green gram germplasm. International Journal of Agriculture Science8(51): 2267-2272. Bisht N, Singh DP and Khulbe RK (2014).Genetic variability and correlation studies in advance inter-
specific and inter-varietal lines and cultivars of mungbean. Journal of Food Legume27(2): 155-157.
Choudhary P, Payasiand SK and PatleNK (2017). Genetic study and selection indices for grain yield of mungbean. Legume Research40(5): 836-841.
Degefa I, Petros Y and Andargie M (2014).Genetic variability, heritability and genetic advance in mungbean accessions.Plant Science Today1(2): 94-98.
Gadakh SS, Dethe AM and Kathale MN (2013). Genetic variability, correlations and path analysis studies on yield and its components in mungbean.Bioinfolet 10(2a): 441-447.
Hemavathy AT, ShunmugavalliN and Anand N (2015). Genetic variability, correlation and path coefficient studies on yield and its components in mungbean. Legume Research 38(4): 442-446.
Makeen K, Abrahim G, Jan A and Singh AK (2007). Genetic variability and correlation studies on yield and its component in mungbean. Journal of Agronomy 6(1): 216-218.
Panse VG and Sukhatme PV (1985). Statistical Methods for Agricultural Workers, I.C.A.R., New Delhi: 357 p.
Sharma NK (2016). Mungbean production strategy. Swami Keshwanand Rajasthan Agricultural University, Bikaner. DOR/SKRAU/NFSM Publication-2: 19 p.
Shiv A, Ramtekey V, Vadodariya GD, Modha KG and Patel RK (2017).Genetic variability, heritability and genetic advance in F3 progenies of mungbean.Intl. J. of Current Microbiology and Applied Sci.6(12): 3086-3094.
Singh C, Singh P and Singh R (2015).Modern Techniques of Raising Field Crops.Oxford & IBH Publishing Co. Pvt. Ltd., New Delhi: 386 p.
Tiwari A, Mishra SP and Nag SK (2014).Genetic variability, heritability and genetic advance studies for yield and its components in mungbean.Trends in Biosciences 7(1): 58-60.

National E-Workshop onCurrent Scenario of Post Graduation Research in Agriculture Sector Sept 09-11, 2020
5
Table1. Analysis of variance for different characters of mungbean
Table 2. Estimates of genetic variability parameters for different characters of mungbean S. No Characters Range Mean GCV PCV Heritability (%) Genetic
Advance GA as % of
mean 1 Days to 50% flowering 34 - 60 47.23 19.35 19.38 99.8 18.81 39.83 2 Days to maturity 64–84 74.70 9.71 9.88 96.7 14.70 19.68 3 Plant height (cm) 40.47-126.13 77.43 24.11 24.53 96.6 37.79 48.81 4 No. of branches/plant 1.50 -3.03 2.34 19.54 19.82 97.1 0.93 39.66 5 Number of pods/plant 1.53-55.60 21.89 63.00 63.33 99.0 28.26 129.11
6 Number of seeds/pod 8-11.67 10.17 9.20 10.22 81.2 1.74 17.09 7 Pod length (cm) 2.46-10.22 7.41 12.92 14.02 84.9 1.82 24.51 8 100-seed weight (g) 2.45-5.41 3.63 12.09 12.20 98.2 0.89 24.68 9 Biological yield/plant (g) 12.20-104.33 44.04 46.26 46.64 98.4 41.62 94.52 10 Harvest Index (%) 1.10- 38.41 19.16 53.31 54.09 97.1 20.74 108.25 11 Seed yield per plant (g) 0.47-26.07 9.07 80.95 81.22 99.3 15.07 166.17
Source of variation
D.F. Days to 50%
flowering
Days to maturity
Plant height (cm)
No. of branches per plant
No. of pods per
plant
No. of seeds
per pod
Pod length (cm)
100-seed weight
(g)
Biol. yield per plant
(g)
Harvest index (%)
Seed yield per plant
(g) Replications 2 0.34 4.81 27.06 0.362** 0.76 0.46 0.48 0.001 2.04 0.98 0.63 Genotypes 78 250.90** 159.74** 1057.98** 0.635** 572.79** 2.84** 2.91** 0.580** 1252.01** 316.13** 162.12**
Error 156
0.18
1.79 12.36 0.006 1.99 0.20 0.16 0.003 6.87 3.07 0.37

National E-Workshop onCurrent Scenario of Post Graduation Research in Agriculture Sector Sept 09-11, 2020
6
IDENTIFICATION OF EFFECTIVE RESTORES AGAINST CMS LINES IN TEMPERATE RICE (ORYZA SATIVA L.)
Asma Majid,G.A. Parray, N.R. Sofi, A.B. Shikari, S.A. Waza and Z.A Dar
Division of Genetics and Plant Breeding, SKUAST-K, J&K, India Email: [email protected]
Introduction Rice being staple crop of Kashmir valley, the focus is on enhancement of yield and quality in order to meet the needs of ever growing population. Although the number of CMS lines have been developed so far which suit the mountainous areas of Kashmir, the availability of promising restorer lines remains to be the major limitation. Exploitation of heterosis in the form of hybrid rice technology can serve as the major approach to increase the productivity in this crop. Identification of potential restorers is the main limiting factor for hybrid rice development in Kashmir valley. Marker based screening for Rf3 and Rf4 fertility restoration can be employed to enhance the selection of restorer lines. Methodology In the present study, 34 breeding lines screened with the help of molecular markers linked to Rf3 and Rf4 genes were crossed with 4 CMS lines in line × tester fashion. The molecular marker RM6100 linked to Rf4 gene on chromosome 10 and the markers DRRM-RF3-10, RM1 and RM3148 linked to Rf3 gene on chromosome 1 were used for identifying restorer lines. Under field conditions four cytoplasmic male sterile lines (A lines) along with their maintainers (B lines) and 34 male parents were grown on raised bed nursery in a staggered manner at three dates (10 days apart) to facilitate the synchronization of flowering. The 25 days old seedlings were transplanted in main field at the standard spacing of 20 × 15 cm in 5 m rows. Crosses were made between four CMS lines and 34 pollen parents to generate a set of 136 hybrids in line × tester manner. Data on agro-morphological traits was recorded for pollen parents, maintainer lines and checks. The hybrid seed from each of the crosses was collected separately, sun dried and stored at a proper place for sowing in the next season. The male genotypes and CMS lines along with their maintainer lines were maintained and harvested separately. Fertility restoration ability of parents was recorded through the estimates of pollen and spikelet fertility and confirmed using molecular markers. Next year the seed of 136 hybrids which were generated during previous season were sown in pots first. After 25 days the seedlings were than transplanted in main field at the standard spacing of 20 × 15 cm in 5 m rows in Randomized Complete Block Design with three replications. Pollen fertility (flowering stage) and spikelet fertility (maturity stage) of F1 hybrids was estimated at appropriate growth stage of the crop. The data on various agro-morphological traits was recorded on F1 crosses along with parents. All the crosses were harvested separately and stored in proper conditions. Findings Out of 136 hybrids, 16 cross combinations recorded complete fertility in the test cross nursery, as well as revealed the presence of both Rf3 and Rf4 genes through molecular screening. These lines may serve as potential restorers for obtaining heterotic rice hybrids.Molecular markers have the potential to enhance the selection efficiency for

National E-Workshop onCurrent Scenario of Post Graduation Research in Agriculture Sector Sept 09-11, 2020
7
identification of promising restorers for hybrid rice breeding as revealed in the present study. Their use for Rf loci and other related genes for restoration ability could facilitate in screening of entire germplasm base to identify the better line to be used as parent for hybrid rice breeding. Out of 136 cross combinations, 43 were found to show more than 80 percent and 75 percent pollen fertility and spikelet fertility, respectively. The pollen parents of these hybrids were classified as stable fertility restorers for the respective CMS lines.Genotypes showing restorer behaviour may be utilized as parents for development of successful three-line temperate rice hybrids. The introduction of rice hybrids need to be backed up with robust and durable hybrid seed production system, which is possible only at the availability of effective restorer genes among parental lines. The highly heterotic hybrids so developed can be a way out to break the yield ceiling of rice to ensure food security and better remuneration of farm produce.The estimates of combining ability effects aid in selecting desirable parents and crosses, as well as the suitable breeding procedures for further improvement of different traits. Therefore, in order to exploit the maximum heterosis using cytoplasmic male sterile (CMS) system in the hybrid breeding programmes, we must know the combining ability effects of different male sterile and restorer lines for various traits. Among female parents, SKUA-7A showed desirable GCA effects for most of the traits while among male parents RL-1, RL-2, RL-11, SKUA-497, SKUA-494, SKUA-496 and SKUA-420 showed desirable GCA effect for most of the traits. For grain yield, cross combination SKUA-7A × RL-3 and SKUA-11A × RL-5 registered the highest positive value of heterobeltiosis and mid parent heterosis respectively. However, the highest desirable value of standard heterosis over both the checks was recorded by SKUA-7A × RL-3. Cross combinations SKUA-7A × RL-3 and SKUA-11A × RL-5 showed desirable heterosis for most of the traits viz., grain yield, number of effective tillers per plant, panicle length and number of spikelets per panicle as well as desirable SCA effect. The hybrid, SKUA-7A × RL-3 was top performer for grain yield, number of effective tillers per plant, panicle length and number of spikelets per panicle.

National E-Workshop onCurrent Scenario of Post Graduation Research in Agriculture Sector Sept 09-11, 2020
8
ESTIMATION OF STABILITY PARAMETERS AND GENETIC ANALYSIS FOR GRAIN YIELD AND ITS RELATED CHARACTERS
IN DURUM WHEAT UNDER DIFFERENT ENVIRONMENTS
BhagwatiBarandaand A. K. Sharma Department of Genetics and Plant Breeding, College of Agriculture
Swami Keshwanand Rajasthan Agricultural University, Bikaner (Rajasthan)-334006 Email: [email protected]
Introduction Wheat is a prehistoric primary food grain crop consumed as primary food by human beings since the dawn of civilization. Durum wheat (Triticum durumDesf., 2n=4x=28, AABB) is a tetraploid cereal crop. Durum wheat is most important crop in the Mediterranean basin [1] mainly in the Central and West Asia and North Africa (CWANA) region. However, durum wheat is an economically essential crop because of its unique rheological characteristics and the varieties of industrial end-products that can be derived from it [2]. Plant breeder select parents with maximum capacity of transmitting desirable genes to the progenies and evolution of good combiner parental line towards the identify the best specific crosses for yield and various quality parameters.The heterotic effect is more pronounced generally in cross-pollinated crops than in self-pollinated crops [3]. Heterosis in wheat was first reported [4]. In breeding programmes, genotype-environment interaction it is also important to screen and identify phenotypically stable genotype. Keeping in view the above points, the present investigation of half diallel analysis is employed to estimate the general and specific combining ability variance, effects, gene action, heterosis and phenotypic stability for seed yield and its contributing characters in durum wheat. Methodology The present experimental material consisted of 10 parents, which were crossed in diallel fashion (excluding reciprocals) to develop forty five crosses during Rabi 2017-18. Three sets of the experiment material were sown at three different dates of sowing as E1 (early), E2 (normal) and E3 (late) of ten parents. The experiment was laid out in randomized block design (RBD) with three replications in each environment during Rabi 2018-19. Observations were recorded for characters like days to 50% heading, days to maturity, plant height (cm), flag leaf length (cm), flag leaf area (cm2), tillers plant-1, spike length (cm), grain filling period, number of grains spike-1, grain weight spike-1(g), biological yield plant-1(g), harvest index (%), test weight (g), protein content (%) and grain yield plant-1(g). The mean data were subjected to statistical analysis for analysis of variance [5] and combining ability and effects [6] using Model-1 and Method-2.Heterosis[7] heterobeltiosis[8] and G x E interactions and stability parameters by model [9].
Findings The pooled analysis of variance (ANOVA) for combining ability over the environments indicates the role of both additive and non-additive gene effects for all

National E-Workshop onCurrent Scenario of Post Graduation Research in Agriculture Sector Sept 09-11, 2020
9
the characters [10]. Component of gene action showed that SCA variance was significant for all the character, showed the preponderance of non-additive (H) gene effects. On the basis of GCA effects and per se performance it could be concluded that parents namely HI-8663 was most promising for GY plant-1 and its contributing characters like tillers, SL, GW and TW and HI-8498 for SL, grains spike-1, GW, TW and GY plant-1. Some other parental lines namely parent PDW-233 for number of grains spike-1, harvest index and GY plant-1; WH-896 for protein content. However, GCA effects in negative direction is desirable for RAJ-1555 for days to maturity and for dwarf plant height was PDW-314, PDW-233 [10 & 11], which is due to existence of gene attributed to additive and additive × additive gene interaction effects. Therefore, these parents could be used in hybridization programme for accumulation of favorable alleles in a single genetic background. The promising crosses HI-8498 × RAJ-1555 for tillers plant-1, spike length, grains spike-1, grain weight spike-1, test weight and GY plant-1; HI-8498 × HI-8737 for GY plant-1; HI-8663 × PDW-314 for days to maturity; WH-896 × PDW-274 for GY plant-1; WH-896 × HI-8737 for grains spike-1, grain weight spike-1, harvest index and test weight; RAJ-1555 × PDW-233 for days to maturity and protein content and PDW-314 × NIDW-295 for number of grains spike-1 and test weight[11]. Thus, these crosses may be used in a multiple crossing programme. The aim of heterosis study in this crop is to spot out heterotic hybrids which might throw desired segregants in the succeeding generations showing consistently significant heterosis and heterobeltiosis for GY plant-1 and its related characters were f namely PDW-291 × HI-8737, HI-8498 × HI-8663, HI-8663 × PDW-274 and PDW-274 × PDW-233. It could be frequently advanced to obtain high frequency of transgressivesergregants using simple pedigree method. The pooled analysis of variance for phenotypic stability revealed mean sum of squares due to environment and environment (linear) were found to be highly significant for all the studied characters, showing differential effect of environments on the genotypes [13].Joint consideration of mean performance and stability parameters revealed that parent NIDW-295 and three crosses namely PDW-291 × RAJ-1555, WH-896 × NIDW-295 and HI-8663 × PDW-274 were stable over varied environmental conditions for GY plant-1. While, HI-8498, PDW-314, HI-8498 × PDW-233, HI-8498 × HI-8663 for 50% heading; PDW-291, WH-896, RAJ-1555, PDW-291 × HI-8737, PDW-291 × HI-8663, for maturity; HI-8663 × RAJ-1555 BY plant-1, grain filling period and tillers plant-1; HI-8498 × NIDW-295 for grain weight spike-1 and test weight were stable under varied environmental conditions. However, RAJ-1555 × HI-8737 and HI-8663 × HI-8737 were stable in favourable environments registered higher mean than general mean with regression coefficient greater than unity and least deviation of S2di. While PDW-274 × PDW-233, HI-8498 × RAJ-1555 and HI-8498 × PDW-274 were suitable in unfavourable environments for grain yield plant-1. Inference From the foregoing discussion, it is concluded that parents namely HI-8498, HI-8663 and PDW-233 were used as good general combiners for grain yield and its contributing characters; HI-8737 for days to maturity. On over all bases, out of 45 crosses 20 crosses selected based on high per se performance, SCA effects, heterotic effects and their stability behavior performance. Amongst them,parent NIDW-295 and crosses HI-8663 × PDW-274 and PDW-291 × RAJ-1555 were stable across the

National E-Workshop onCurrent Scenario of Post Graduation Research in Agriculture Sector Sept 09-11, 2020
10
environments. Thus, studies of gene effects and genetic variance helps to understanding genetic potential of breeding material and stability is imparted by its component traits should be given weightage to formulating breeding programme aiming to develop high yielding and stable hybrids in durum wheat.
References Elias, E. M. and Manthey, F. A. (2005). End products: present and future uses. In: Royo,C., Nachit, M. M., DiFonzo, N., Araus, J. L., Pfeiffer, W.H., Slafer, G.A. (Eds.), Durum Wheat Breeding Current Approaches and Future Strategies. Food Products Press, New York, pp. 63–86. Gonzalez-Segura, E., Magana-Barajas, E., Torres-Chavez, P. I., Manthey, F. and Ramirez- Wong, B. (2014). Characterization of the dynamic viscoelastic behavior of semolina dough obtained from mexican durum wheat cultivars, vol. 3. A C.E.R., pp. 58–63. Gallais, A. (1988). Heterosis: its genetic basis and its utilisation in plant breeding. Euphytica, 39:95-104. Freeman, G. F. (1919). Heredity of quantitative characters in wheat.Genetics. 4: Tokyo.,18:167-175. Panse, V. G. and Sukhatme, P. V. (1967).Statistical method for agricultural Research worker 3rd edition, ICAR, New Delhi. Griffing, B. (1956). Concepts of general and specific combining ability in relation to diallel crossing system.Australian J. Biol. Sci., 9:463-493. Shull, G. H. (1908). What is heterosis.Genetics, 33:439-446. Fonseca, S. and Patterson F. L. (1968). Hybrid vigor in a seven parent diallel crosses in common winter wheat. Crop Science, 8:85–88. Eberhart, S. A. and Russell, W. A. (1966).Stability parameters for comparing varieties.Crop Science, 6:36-40. Patel, H. N. (2018).Identification of heterotic combinations for grain yield and quality taits in bread Wheat (TriticumaestivumL.).Int. J. Pure App. Biosci., 6(4):107-115. Deshmukh, S. G., Potdukhe, N. R., Deshmukh, H. S. andNandanwar, R. S. (2017). Combining ability analysis for yield and its component traits in wheat (TriticumaestivumL.).Trends in Biosciences, 10(43). Singh, A. G., Saini, L., Saini, H. and Sharma, A. K. (2017).Estimation of stability parameters for seed yield and its components in triticale and wheat genotypes under potimim and stress environments. International, J. Chemical Studies,5(4):708-7012. Singh, S. V., Yadav, R. K. and Ram, D. N. (2013).Stability analysis for comparing wheat genotypes.BharatiyaKrishiAnusandhanPatrika, 28:65-70.

National E-Workshop onCurrent Scenario of Post Graduation Research in Agriculture Sector Sept 09-11, 2020
11
HETEROSIS AND COMBINING ABILITY EFFECT ON YIELD AND YIELD ATTRIBUTES OF BITTER GOURD (MOMORDICA
CHARANTIA L.)
Daleep Kumar and Mamta Pathak Department of Vegetable Science, Punjab agricultural university, Luthiana-141001
Email: [email protected] The present study was conducted to estimate the effects of combining ability and heterobeltiosis in bitter gourd at Vegetable research farm, Department of Vegetable Science, PAU, Ludhiana during 2013. The six lines and seven testers which were mated in a line x tester manner to produce 42 hybrids. The hybrids and parents were evaluated with local check (Punjab-14 and commercial check (Prachi). The study on combining ability and heterosis revealed predominance of non-additive gene action for all the characters except days to anthesis of male flower and vine length. The lines PAUBG-1, WBBG-28, DBG-35 and DBG-45 and tester PBIG-56 and Pusa Vishesh were found to be good combiner for number of fruits, total and marketable yield. The hybrids PAUBG-1 x PBIG-56, WBBG-28 x PBIG-56, DBG-35 x Pusa Vishesh and DBG-45 x PBIG-56 were found to be the promising ones for number of fruits per plant, total and marketable yield. Maximum heterosis over better parent for marketable yield per plant was recorded for cross combination of PAUBG-1 x PBIG-56 (136.6%). However, cross DBG-45 x PBIG-56 showed 113.8% and 178.4% heterosis over local and commercial check, respectively. The cross combinations of DBG-45 x PBIG-56, PAUBG-1 x PBIG-56, DBG-35 x PBIG-56, WBBG-28 x PBIG-56 and WBBG-28 x Pusa Vishesh seemed to be high yielding with the yield potentialities of 1441.0, 1224.7, 1207.0, 1173.7 and 994.7 g/plant of marketable yield.

National E-Workshop onCurrent Scenario of Post Graduation Research in Agriculture Sector Sept 09-11, 2020
12
STUDIES ON GENETIC DIVERSITY AND VARIABILITY FOR YIELD AND YIELD ATTRIBUTES IN GARLIC (ALLIUM SATIVU M
L.) UNDER DHAMPUR CONDITION
Deepak Kumar, Dr. S.L. Pal, Dr. Ravi, Dr Soraj Singh
Horticulture Research Farm, Dhampur, Bijnor Email: [email protected]
Introduction Garlic (Allium sativum L.) belongs to the family Alliaceae (Allen, 2009). It is an apomyctic diploid species (2n=2x=16). The origin of garlic is thought to be in central Asia (India, Afghanistan, West China, Russia) and spread to other parts of the world through trade and colonization (Tindal, 1986). Garlic has been used in china and India for more than 500 years, and Egypt since 2000 BC (Kamenetsky and Rabinowitch, 2001). Garlic is the most important Allium crops and ranks second next to onion in the world (Voigt, 2004). With respect to its production and economic value, garlic is one of the main Allium vegetable crops in the world and used as a seasoning in many food throughout the globe. Garlic has also medicinal value which is well recognized in the control and treatment of hypertension , worms, germ, bacterial and fungal diseases diabetes, cancer, ulcer, rheumatism etc. (Kilgori et al., 2007(b) Samavatean et al., 2011, Kamenetsky et al. 2006) Many people perceived and appreciated garlic for its many medicinal attributes (Rabinowitch and Currah, 2002). Methodology The field experiment was conducted horticulture research centre (HRC) at R.S.M (PG) College Dhampur, Bijnor, Uttar Pradesh India. Geographically it is situated between 290 15’ 27.5328”latitude in the north and 78o 30’ 0.2196” longitudes in the eastern elevation of about 235 m above mean sea level. Geographically, it falls in the north east genetic alluvial plains of eastern U.P. region. The Experimental field had sandy loam soil, low in organic carbon, nitrogen, medium in phosphorous, potash and slightly alkaline (pH-8.0) in nature. The mechanical mixture of soil was 30.7 (%) Coarse sand, 35.5 (%) Fine sand,20.6 % silt and 13.2 % clay. The experimental material of garlic used in the present studywere, the collections from different places of India. The experiment was laid out in (RBD) Randomize block design. These 21 genotypes were evaluated and studied for their growth, yield and quality performance based on morphological and agronomical measurements. The following observations were recorded during the course of experimentation on following characters- Plant height (cm), Number of leaves per plant, Length of leaf (cm), Width of leaf (cm), Plant pseudo stem height(cm), Plant pseudo stem diameter (mm), Equatorial Diameter of bulbs (mm), Polar diameter of bulbs (mm), Weight of fresh bulbs (gm), Weight of dry bulbs (gm), Number of cloves per bulb, Yield q/ha, Total soluble solids (%). Protein %, Sulphur contain (%). The observations were recorded on five randomly selected plants of each row. Average of data from the sampled plant of each treatment was used for statistical analyses in order to draw valid conclusions. The statistical parameters like mean, range were calculated as per the standard methods of analysis.

National E-Workshop onCurrent Scenario of Post Graduation Research in Agriculture Sector Sept 09-11, 2020
13
Findings The analysis of variance for the design of experiment indicated that the mean squares due to genotypes were highly significant for most of the characters indicating a wide genetic variability among the genotypes Table 1. The variation due to checks were also highly significant for are the characters like plant height (58.91 cm), Plant pseudostem height (3.87 cm), number of leaves per plant (1.06), length of leaf (15.68 cm), width of leaf (6.72 mm), Plant pseudostem diameter (3.97 mm), Equatorial diameter of bulbs (25.71 mm), Polar diameter of bulbs (20.07 mm), number of cloves per bulb (22.96), weight of fresh bulbs (152.72 g), weight of dry bulbs (122.57 g), Yield quantal/ha (1573.66), total soluble solids (9.25%), Sulphur contain (0.0005 %), Protein (0.30 %). Mean performance serves as an important criterion in eliminating the undesirable types in a selection progrmme. Tesega K and Tiwari (2016)10. The phenotypic and genotypic correlation coefficients were worked out to measure the association among the fiften characters under study. The estimates of these correlation coefficients are presented in table-2. And table-3. In general the estimates of genotypic correlation coefficients between different characters showed close parallelism in direction with their corresponding phenotypic correlation coefficients presented in table.2 and table.3. Similar results were reported by, Tiwari et al (2014)9, Tsegas & kasshum (2011)11, Yadav JS & Singh (2007)13, Yadav NK & Singh KP (2012)14, pense et al. (2014)5 and Peryin et al. (2014)6. References Allen J. (2009). Garlic production. Factsheet, Garlic production, order number 97-007. www.omafra.gov.on.ca/english/crops/facts/09- 011w.htm Kamenetsky, R. and Rabinowitch, H.D. (2001). Floral development in bolting Garlic.Sex.Plant Report.13: 235-241 Kamenetsky R, Rabinowitch H.D (2006). The genus Allium: A developmental and horticultural analysis. Horticultural Reviw, 32, 329- 368 Kilgori, M., Magaji, M. and Yakubu, A. (2007). Effect of plant spacing and date of planting on yield of two garlic (Allium sativum L.) cultivars in Sokoto,Nigeria. American-Eurasian J. Agril.& Environmental Sci. 2(2): 153-157 Panse, Raju Jain, Gupta PK, Avneesh, Sasode DS.Morphological variability and character association in diverse collection of garlic germplasm. African J Agri. Res. 2013; 8(23):2861‐2869. Pervin, M. Kamrul, HM, Hassan, K and Hoque, AKMA 2014.Genetic variation of indigenous, improved and exotic garlic (Allium sativum L) germplasm. Advances in Plant and Agriculture Research, 1: 48-49 Rabinowitch, H.D. and Currah, L. (2002).Allium Crop Science: Recent Advances. CABI Publication, London. p. 346 Samavatean, N., Rafice. S., Mobli, H. and Mohammadi A. (2011).An analysis of energy use and relation between energy inputs and yield costs and income of garlic production in Iran. Renewable Energy 36: 1808-1813 Tiwari AK, Verma SK, Mishra DP, Pandey VP. Genetic variability, correlation and path coefficient studies in garlic (Allium sativum L.) 2nd U.P Agric. Sci. Congress, U.P Council of Agricultural Research, Lucknow, 2014. Tsega K, Tiwari A, Kebede W. Genetic variability, correlation and path coefficients among bulb yield and yield traits in Ethiopian garlic germplasm. Indian J. Hort., 2010; 67(4):489-499. Tsega, Kassahun, Tiwari, Akhilesh, Woldetsadik, Kebede. Genetic variability among bulb yield and yield related traits in Ethiopian garlic (Allium sativum L.) germ plasm. Pantnagar Journal of Research. 2011; 9(1):61-66. Voigt C.( 2004) . Glorious garlic herb of the year 2004. Journal of International Herb, Pp. 1-6. Association Horticulture Committee, Virginia State University. Yadav JR, Singh SP, Ramadhar, Gaurav, Mishra, Yadav JK. Path coefficient analysis in garlic (Allium sativum L.).Pro. Agri. 2007; 7(1, 2):185-186.

National E-Workshop onCurrent Scenario of Post Graduation Research in Agriculture Sector Sept 09-11, 2020
14
Yadav NK, Singh KP, Naidu AK, Nair B. Estimation of genetic variability for yield and its components in garlic (Allium sativum L.). Pro. Agri. 2012; 12(1):26
Table 1. Mean sum squares genotypes
Source of variation
d.f. Plant
Height
Plant seudostem
hieght
Number of leaf
Leaf length
Leaf Width (mm)
Plant Seudostem diameter
Equatarial Diameter of bulbs
Polar Diameter
Replication 2 2.22 1.14 0.32 8.20 0.02 1.57 5.70 0.74
Treatment 20 58.91** 3.87** 1.06** 15.68** 6.72** 3.97** 25.71** 20.07**
Error 40 6.28 0.87 0.15 4.34 2.08 0.46 3.81 2.20
Source of variation
D.F.
Number of cloves per bulb
Weight of fresh bulbs
Weight of Dry bulbs
Yield quintal/ha
Total soluble solids
%
Sulphur content
%
Protein %
Replication 2 4.06 35.27 42.67 232.21 4.55 0.0000 0.11
Treatment 20 22.96** 152.72** 122.15** 1573.66** 9.25** 0.0005** 0.30**
Error 40 2.17 22.71 16.96 298.23 2.65 0.0001 0.16
National E-Workshop onCurrent Scenario of Post Graduation Research in Agriculture Sector Sept 09-11, 2020
15
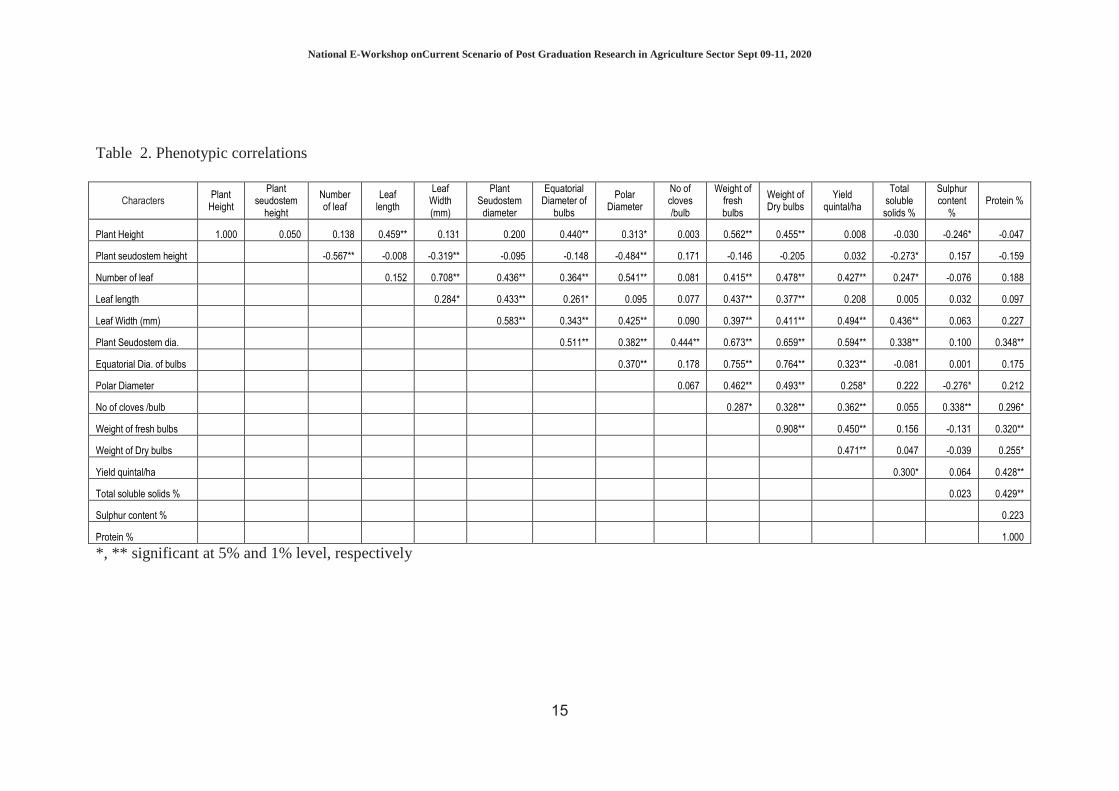
Table 2. Phenotypic correlations
*, ** significant at 5% and 1% level, respectively
Characters Plant
Height
Plant seudostem
height
Number of leaf
Leaf length
Leaf Width (mm)
Plant Seudostem
diameter
Equatorial Diameter of
bulbs
Polar Diameter
No of cloves /bulb
Weight of fresh bulbs
Weight of Dry bulbs
Yield quintal/ha
Total soluble solids %
Sulphur content
% Protein %
Plant Height 1.000 0.050 0.138 0.459** 0.131 0.200 0.440** 0.313* 0.003 0.562** 0.455** 0.008 -0.030 -0.246* -0.047
Plant seudostem height -0.567** -0.008 -0.319** -0.095 -0.148 -0.484** 0.171 -0.146 -0.205 0.032 -0.273* 0.157 -0.159
Number of leaf 0.152 0.708** 0.436** 0.364** 0.541** 0.081 0.415** 0.478** 0.427** 0.247* -0.076 0.188
Leaf length 0.284* 0.433** 0.261* 0.095 0.077 0.437** 0.377** 0.208 0.005 0.032 0.097
Leaf Width (mm) 0.583** 0.343** 0.425** 0.090 0.397** 0.411** 0.494** 0.436** 0.063 0.227
Plant Seudostem dia. 0.511** 0.382** 0.444** 0.673** 0.659** 0.594** 0.338** 0.100 0.348**
Equatorial Dia. of bulbs 0.370** 0.178 0.755** 0.764** 0.323** -0.081 0.001 0.175
Polar Diameter 0.067 0.462** 0.493** 0.258* 0.222 -0.276* 0.212
No of cloves /bulb 0.287* 0.328** 0.362** 0.055 0.338** 0.296*
Weight of fresh bulbs 0.908** 0.450** 0.156 -0.131 0.320**
Weight of Dry bulbs 0.471** 0.047 -0.039 0.255*
Yield quintal/ha 0.300* 0.064 0.428**
Total soluble solids % 0.023 0.429**
Sulphur content % 0.223
Protein % 1.000

National E-Workshop onCurrent Scenario of Post Graduation Research in Agriculture Sector Sept 09-11, 2020
16
Table 3. Genotypic correlations
*, ** significant at 5% and 1% level, respectively
Characters Plant
Height
Plant seudostem
height
Number of leaf
Leaf length
Leaf Width (mm)
Plant Seudostem
diameter
Equatarial Diameter of bulbs
Polar Diameter
No of cloves /bulb
Weight of fresh bulbs
Weight of Dry bulbs
Yield quintal/ha
Total soluble solids %
Sulphur content %
Protein %
Plant Height 1.000 -0.074 0.077 0.504** -0.001 0.205 0.608** 0.421** -0.045 0.663** 0.595** -0.079 -0.305* -0.406** -0.259*
Plant seudostem hieght -0.889** -0.044 -0.922** -0.232 -0.215 -0.708** 0.347** -0.305* -0.354** -0.170 -0.439** 0.326** -0.481**
Number of leaf 0.153 1.031** 0.512** 0.348** 0.757** 0.030 0.437** 0.564** 0.526** 0.306* -0.232 0.362**
Leaf length 0.201 0.582** 0.530** 0.258* 0.160 0.756** 0.744** 0.261* -0.134 0.037 -0.008
Leaf Width (mm) 0.874** 0.524** 0.771** 0.282* 0.693** 0.846** 0.832** 0.463** -0.065 0.585**
Plant Seudostem dia. 0.649** 0.484** 0.576** 0.823** 0.825** 0.833** 0.398** 0.119 0.694**
Equatarial Dia. of bulbs 0.483** 0.226 0.931** 0.947** 0.507** -0.341** -0.133 0.409**
Polar Diameter 0.087 0.585** 0.651** 0.467** 0.300* -0.436** 0.530**
No of cloves /bulb 0.368** 0.470** 0.606** 0.092 0.490** 0.716**
Weight of fresh bulbs 0.961** 0.628** 0.045 -0.187 0.557**
Weight of Dry bulbs 0.694** -0.087 -0.069 0.559**
Yield quantal/ha 0.534** 0.024 0.759**
Total soluble solids % -0.100 0.819**
Sulphur content % 0.399**
Protein % 1.000
National E-Workshop onCurrent Scenario of Post Graduation Research in Agriculture Sector Sept 09-11, 2020
17
INTRODUCTION AND EVALUATION OF SWEET ORANGE VARIETIES IN ARID REGION OF WESTERN RAJASTHAN
J. S. Gora and R. Kumar1
College of Agriculture, Swami Keshwanand Rajasthan Agricultural University, Bikaner
1ICAR-Central Institute for Arid Horticulture, Bikaner, Rajasthan, India Email:[email protected]
In hot arid region, citrus cultivation is found highly suitable under irrigated agriculture. With this view, nine varieties of sweet orange were introduced and evaluated. The grafted plants of sweet orange varieties namely Washington navel, Blood Red, Newhall Navel, Jaffa, Satgudi, Hamlin, Mosambi, Pineapple and Valencia Olinda on rough lemon rootstock were planted at 6x6 m distance and uniform intercultural operations were followed. The plant height (262.12 cm), canopy spread N-S (286.83 cm) and E-W (287.84 cm), canopy diameter (287.34 cm), canopy volume (15.78 m3), scion diameter (83.17 mm) and rootstocks diameter (91.27 mm) were found maximum in Satgudi followed by Hamlin and Jaffa. Whereas, the plant height, canopy diameter and canopy volume were recorded minimum in Valencia Olinda, Mosambi and Pineapple. The S:R ratio (0.96) was found highest in Newhall Navel however, it was recorded lowest in Washington navel, blood Red and pineapple. During third year, maximum average number of fruits per plant was recorded (12.25) in Satgudi followed by Mosambi (10.20) as compared to lowest (5.20) in Jaffa while no fruiting was observed in Washington variety. Fruit weight was ranged from maximum 235.40 g in Satgudi to minimum 175.68 g in Newhall Navel. Highest acidity was recorded in Satgudi (12.45 °Brix) followed Hamlin (11.90 °Brix) and Pineapple (11.80 °Brix). Acidity was found minimum in 0.42 % in Satgudi and maximum 0.68 in Hamlin. Ascorbic acid content varied from 31.05 to 45.26 mg/100 g among different varieties. In conclusion, the Satgudi was found significantly superior performer cultivar as compared to other cultivars of sweet orange varieties under arid region climatic conditions.

National E-Workshop onCurrent Scenario of Post Graduation Research in Agriculture Sector Sept 09-11, 2020
18
GENETIC ARCHITECTURE OF PEARL MILLET [PENNISETUM GLAUCUM (L.) R. BR.] UNDER VARYING MOISTURE
CONDITIONS
K.R. Kumawat, N.K. Sharma, A.K. Sharma and P.C. Gupta
Swami Keshwanand Rajasthan Agricultural University, Bikaner, Rajasthan-334006 Email: [email protected]
Introduction Among the cultivated food grains, pearl millet is considered as most drought tolerant crop and widely cultivated across arid and semi-arid tropics of Africa and Asia. It is highly cross pollinated crop due to protogynous nature with the advantages of huge genetic variability and availability of efficient cytoplasmic-genetic male sterile lines which offers great possibilities of crop improvement. The Rajasthan occupies largest area and production in the country. However, its productivity is very low due to unavailability of the high yielding genotypes for moisture stress condition. Such unfavourable situations required development of such genotypes which can give higher grain as well as fodder yield under moisture stress conditions. The basic aim of any plant breeding programme is to develop promising and desirable cultivars having high yield potential over the environments. To achieve this goal, basic information on nature and extent of genetic variation, combining ability, standard heterosis, genotypic x environment interaction (phenotypic stability) and stress indices is required to design effective breeding programme. With these perspectives, the present investigation was undertaken to assess the combining ability variances, effects and gene action for grain yield and its attributes, standard heterosis and to identify phenotypically stable hybrids suitable for moisture stress affected areas in pearl millet. Methodology Five male sterilelines (RMS 7A from Rajasthan Agricultural Research Institute, Jaipur, Rajasthan and ICMA 843-22, ICMA 88004, ICMA 93333 and ICMA 97111 from ICRISAT, Patancheru, Hyderabad) were crossed with ten restorer lines(BIB-343, BIB-359, BIB-383, BIB-391, BIB-399, BIB-407, BIB-415, BIB-423, BIB-439 and BIB-451 from AICRP on Pearl Millet, Bikaner, Rajasthan) in line x tester mating design at ICRISAT, Patancheru, Hyderabad, during Summer 2018 to develop 50 F1 hybrids. These 50 F1 hybrids (crosses) along with three standard check (HHB 67 Improved, RHB-177 and MPMH-17) hybrids were evaluated in randomized block design with three replications under three environments created by differentiating number of irrigations during Kharif, 2018 at Agricultural Research Station (E1) and College of Agriculture (E2 and E3), Bikaner. The environment E1, E2 and E3 were provided three, two and one irrigations, respectively with recommended doses of NPK fertilizers. Observations were recorded on twelve different characters viz., days to 50% flowering, days to maturity, plant height, total number of tillers per plant, number of effective tillers per plant, flag leaf area, ear head length, ear head diameter, test weight, dry stover yield per plant, harvest index and grain yield per plant.
Statistical analysis: The mean values of data recorded on various characters were subjected to statistical analyses as per the standard procedures i.e. ANOVA as described by Panse and Sukhatme (1985), Combining ability analysis as proposed by

National E-Workshop onCurrent Scenario of Post Graduation Research in Agriculture Sector Sept 09-11, 2020
19
Kempthorne (1957), Standard heterosis as per formula
[Standard heterosis (%) = F�1- SC����
SC����x100 ], stability parameters using the model proposed
by Eberhart and RusselI (1966) and stress indices as per the formulae proposed by different workers i.e. Stress tolerance (TOL) as per Rosielle and Hamblin (1981), Stress susceptibility index (SSI) as per Fischer and Maurer (1978) and Stress tolerance index (STI) as per Fernandez (1992). Findings Analysis of variance The analysis of variance for individual environments as well as in pooled analysis indicated significant differences among hybrids for all the traits indicating the sufficient variability for the traits studied. Significant differences among the environments were also observed which indicated influence of environments on the character expression. The crosses x environment interaction were also significant for all the characters, indicating existence of differential responses of hybrids to the varying environments.
Combining ability analysis The significant variance due to GCA and SCA indicated the importance of additive as well as non-additive components in the inheritance of different characters. The ratio of GCA/SCA variances was less than unity indicating the preponderance of non-additive components for all the characters over the environments. From the results of present investigation, it was evident that the additive as well as non-additive gene action was responsible in governing the many characters. Therefore, mass or recurrent selection with concurrent random mating may also be adopted for population improvement to exploit additive gene action in present material and heterosis breeding may be adopted to exploit non-additive gene action.
GCA and SCA effects From the results of GCA effects, it was revealed that a number of parents viz., ICMA 843-22, RMS 7A (female parents), BIB-423, BIB-343 and BIB-451 (male parents) were found to be better general combiner for grain yield and most of its component characters. Therefore, these can be utilized in multiple crossing programmes to synthesize a dynamic population with accumulation of the most of the favourable genes. In case of SCA effects, the hybrids viz., RMS 7A x BIB-407, ICMA 843-22 x BIB-343, ICMA 843-22 x BIB-451, ICMA 88004 x BIB-423 and ICMA 93333 x BIB-439 were identified as superior for grain yield and related traits. Therefore, these hybrids can be utilized for development of promising hybrids as well as in population improvement. The hybrids with high SCA effects involving good x good general combiners were ICMA 843-22 x BIB-343, ICMA 843-22 x BIB-451 and ICMA 843-22 x BIB-423 for grain yield and related traits therefore, it was expected that these hybrids may offer desirable transgressive segregants in the later generations.
Standard heterosis The hybrids viz., ICMA 843-22 x BIB-343, ICMA 843-22 x BIB-451, RMS 7A x BIB-407, ICMA 843-22 x BIB-423 and ICMA 88004 x BIB-423 showed high and significant standard heterosis for grain yield and its contributing characters over the environments. These hybrids were considered promising for their use in yield improvement because of having high heterotic effect for yield as well as some other component characters. The highest and desirable standard heterosis was recorded for

National E-Workshop onCurrent Scenario of Post Graduation Research in Agriculture Sector Sept 09-11, 2020
20
number of effective tillers per plant (107.46%) followed by grain yield per plant (97.04%), dry stover yield per plant (72.47%) and total number of tillers per plant (57.11%). This suggested potentiality of heterosis breeding for different characters in pearl millet.
Phenotypic stability analysis (G x E interaction) In the present investigation, the g x e interaction was found significant for majority of characters which indicated the influence of environment on the expression of genotypes. The mean sum of squares due to g x e (linear) were significantly higher than the mean sum of squares due to pooled deviations for all the characters which indicated that prediction across the environments was possible for all characters. Joint consideration of mean performance and stability parameters revealed that the hybrids viz., RMS 7A x BIB-407, RMS 7A x BIB-451, ICMA 843-22 x BIB-343, ICMA 843-22 x BIB-383, ICMA 843-22 x BIB-415 and ICMA 88004 x BIB-423 were found stable and depicted predictable genotype x environment interaction for eight or more characters over the environments. Therefore, these hybrids can offer a good opportunity for future pearl millet improvement programmes in wide range of environments in terms of stability of grain yield and its contributing characters.
Moisture stress indices On the basis of different moisture stress tolerance indices, the hybrids viz., ICMA 843-22 x BIB-343, ICMA 843-22 x BIB-423, RMS 7A x BIB-407, ICMA 843-22 x BIB-451 and ICMA 88004 x BIB-423 were identified as most tolerant for moisture stress conditions. Therefore, these hybrids may be adopted for higher yield in drought affected areas and may be used as parent in hybridization programmes for moisture stress tolerance breeding as well as developing moisture stress tolerant populations.
The hybrids which were found comparatively superior in all the parameters are presented in Table 1 with all the respective parameters.
Table 1: Promising crosses with high per se performance for grain yield per plant and
their performance in related parameters (and their comparison with best check)
Name of Cross Yield* Standard Heterosis
SCA Effect
GCA Effect
GCA Effect Stability$ Rank#
P1 P2 ICMA 843-22 x
BIB-343 24.89 97.04** 6.924** 3.828** 2.854** 8 1st
ICMA 843-22 x BIB-451
22.64 79.26** 6.016** 3.828** 1.515** 7 4th
RMS 7A x BIB-407
22.10 74.98** 8.771** 1.580** 0.469 9 3rd
ICMA 843-22 x BIB-423
21.56 70.68** 3.477** 3.828** 2.972** 7 2nd
ICMA 88004 x BIB-423
19.30 52.84** 5.878** -0.826** 2.972** 8 5th
RHB-177 (Best check)
12.63 - - - - 9 17th
* Mean grain yield per plant over the environments (g) $ Average stability exhibited for number of characters over the environments # Rank decided on the basis of different moisture stress tolerance indices

National E-Workshop onCurrent Scenario of Post Graduation Research in Agriculture Sector Sept 09-11, 2020
21
Inference Among the 50 crosses or hybrids the five crosses viz., ICMA 843-22 x BIB-343, ICMA 843-22 x BIB-451, RMS 7A x BIB-407, ICMA 843-22 x BIB-423 and ICMA 88004 x BIB-423 had high per se performance, high standard heterosis, high significant SCA effects, high stability for different characters and found tolerant for moisture stress conditions on the basis of stress indices. Thus, these crosses could be included in multi-locational testing programme to identify the suitability as commercial hybrid in arid and semi-arid regions of Rajasthan for high yield and its attributes.

National E-Workshop onCurrent Scenario of Post Graduation Research in Agriculture Sector Sept 09-11, 2020
22
STUDIES ON CHARACTER ASSOCIATION ANALYSIS FOR SEED YIELD IN CLUSTERBEAN {CYAMOPSIS TETRAGONOLOBA
(L.)TAUB.}
Kapil Bishnoi1, Vijay Prakash2
1 Department of Genetics & Plant Breeding, College of Agriculture, SKRAU, Bikaner 2 SKRAU-Agricultural Research Station, Sriganganagar
Email: [email protected] Introduction Clusterbean [Cyamopsis tetragonoloba (L.)Taub.] 2n=2x=14 is a drought tolerant, self-pollinated, leguminous crop belongs to family Fabaceae, commonly known as guar.India is a geographic center of variability for guar (Vavilov, 1951) while Gillet (1958) suggested that tropical Africa as its probable center of origin. It is an arid legume crop, mostly cultivated in the arid and semi-arid areas. Being a short duration crop, it holds immense potential to generate better economic returns to the growers from marginal land holdings with a huge production.Guar is mainly cultivated for food as vegetables, feed, fodder and guar gum. Its tender & young pods are used as vegetables, which also known for cheap source of energy (16 Kcal), protein (3.2 g), carbohydrate (10.8 g), fat (1.4 g), vitamin A (65.3 IU), vitamin C (49 mg), calcium (57 mg) and iron (4.5 mg) for every 100 g of edible portion (Kumar and Singh, 2002).The knowledge of association between yield and its component characters is of immense value for breeder, because it forms a basis for selection. Therefore, present study was conducted to assess correlation to identify component traits for developing high yielding varieties of clusterbean. Methodology The present investigation was undertaken during Kharif, 2019 at research farm, College of Agriculture, Swami Keshwanand Rajasthan Agricultural University, Bikaner. The experimental material comprised of 40 genotypes was evaluated in randomized block design with three replications accommodating 4 meters long two rows per replication at 45 cm spacing. The observations were recorded on the basis of five randomly selected plants from each replication for ten character viz., plant height, number of branches per plant, number of clusters per plant, number of pods per plant, number of seeds per pod, pod length, 100-seed weight, biological yield per plant, harvest index and seed yield/plant while days to 50% flowering and days to maturity were recorded on plot basis. Phenotypic and genotypic correlation coefficient was computed from the phenotypic and genotypic components of variances according to Singh and Choudhary (1985). Findings Grain yield is a complex polygenic character and largely influenced by its various component characters as well as by the environment, so direct selection for its improvement generally difficult.Hence, it becomes necessary to estimate association of seed yield with component characters and among themselves. Characters namely number of branches/plant, number of clusters/plant, number of pods/plant, 100-seed weight (genotypic correlation only) and biological yield/plant revealed highly positive and significant association with seed yield (Table 1). Therefore, these characters may
National E-Workshop onCurrent Scenario of Post Graduation Research in Agriculture Sector Sept 09-11, 2020
23
be emphasized for clusterbean breeding programme. While days to 50% flowering, plant height, days to maturity and harvest index showed only positive however, non significant association with seed yield. The characters like number of seeds/pod and pod length depicted non-significant and negative correlation with seed yield at genotypic. These findings were in close agreement with the observation of Mahla and Kumar (2006), Buttar et al. (2008), Pathak et al. (2011), Girish et al. (2012), Manivannan and Anandakumar (2013), Preeti and Prasad (2018), Reddy et al. (2018) and Choyal et al. (2018). Inference Seed yield/plant had significant and positive association with number of branches/plant, number of clusters/plant, number of pods/plant and biological yield/plant. Therefore, major emphasis should be put on these characters while selecting germplasm for yield improvement in clusterbean. References Buttar G. S., Brar K. S. and Singh S. (2008). Genetic architecture of seed yield and its attributing traits
in clusterbean (Cyamopsis tetragonoloba) grown under semi-arid region of Punjab. Indian J. Agril. Sci.,78(9): 795-797.
Choyal P.,Dewangan R., Ramesh N.D., Omprakesh, Choudhary S.K. and Yadav S.L. (2018). Correlation and path coefficient analysis studies in cluster bean [Cyamopsis tetragonoloba (L.) Taub.].The Pharma Innovation Journal, 7(7): 724-727.
Gillet J.B. (1958). Indigofera (microcharis) in tropical Africa with related genera Cyamopsis and Rhyncotropsis.Kew Bull. Add. Ser., 1: 1-166.
Girish M.H., Gasti V.D., Mastiholi A. B., Thammaiah N., Shantappa T., Mulge R. and Kerutagi M.G. (2012). Correlation and path analysis for growth, pod yield, seed yield and quality characters in cluster bean (Cyamopsis tetragonoloba (L.) Taub.).Karnataka J. Agric. Sci., 25 (4): 498-502.
Kumar D. and Singh N. B. (2002).Guar in India.Scientific publishers (India) Jodhpur.1-5. Mahla H.R. and Kumar D. (2006).Genetic variability, correlation and path analysis in clusterbean
[Cyamopsis tetragonoloba (L.)Taub].J. Arid Legumes,3(1): 75-78. Manivannan A. and Anandakumar C.R. (2013).Genetic variability, character association and path
analysis in clusterbean (Cyamopsis tetragonoloba (L.)Taub).J. Food Legumes,26 (3 and 4): 34-37.
Pathak R., Singh M. and Henry A. (2011). Stability, correlation and path analysis for seed yield and yield-attributing traits in clusterbean (Cyamopsis tetragonoloba). Indian J. Agric. Sci., 81(4): 309-313.
Preeti and Prasad V.M. (2018). Correlation coefficient analysis for yield and Its component traits in cluster bean [Cyamopsis tetragonoloba (L.) Taub.]for vegetable pod yield and seed yield parameters. Int. J. Curr. Microbiol. App. Sci., 7 (4): 980-985.
Reddy D.R., Saidaiah P., Reddy K.R., Pandravada S.R. and Geetha A. (2018).Correlation and path analysis in clusterbean (Cyamopsis tetragonoloba (L.)Taub).J. Pharmacogn. Phytochem.,7(5): 1233-1239.
Singh R.K. and Choudhary B.D. (1985).Biometrical methods in quantitative genetics analysis.Kalyani Publisher, Ludhiana.
Vavilov N.I. (1951). The origin, variation, immunity and breeding of cultivated plants.Chronica Botanica, 13.

National E-Workshop onCurrent Scenario of Post Graduation Research in Agriculture Sector Sept 09-11, 2020
24
Table1. Estimation of Phenotypic (P) and Genotypic (G) Correlation Coefficient for Twelve Quantitative Characters in Clusterbean
Characters Day to 50%
Flowering
Plant height
(cm)
Number of
branches/
Plant
Number of
clusters/
plant
Number of
pods/ plant
Number of
seeds/ pod
Pod length
(cm)
Day to
maturity
100-seed
weight
(g)
Biological
yield/plant (g)
Harvest
Index
(%)
Seed yield/
plant
(g)
Day to 50%
Flowering P 1.00 0.19 0.14 0.04 0.04 -0.12 -0.16 0.50** 0.18 0.11 -0.19 0.03
G 1.00 0.29 0.17 0.07 0.06 -0.21 -0.38* 0.60** 0.29 0.09 -0.18 0.04
Plant height (cm) P 1.00 0.15 0.06 -0.02 0.15 0.16 0.19 0.16 0.12 -0.08 0.11
G 1.00 0.17 0.05 -0.06 0.12 0.25 0.26 0.18 0.15 -0.24 0.11
Number of
branches/plant P 1.00 0.59** 0.53** 0.18 -0.03 0.38* 0.07 0.52** 0.10 0.57**
G 1.00 0.57** 0.51** 0.06 0.42** 0.43** 0.09 0.54** 0.15 0.54**
Number of
clusters/plant P 1.00 0.68** 0.21 0.13 0.30 0.25 0.71** 0.10 0.76**
G 1.00 0.65** -0.10 -0.36* 0.35* 0.32* 0.75** 0.08 0.73**
Number of pods/plant P 1.00 0.14 0.18 0.19 0.25 0.81** 0.22 0.91**
G 1.00 -0.20 -0.23 0.22 0.32* 0.89** 0.31* 0.91**
Number of seeds/pod P 1.00 0.63** 0.19 0.08 0.20 0.03 0.23
G 1.00 -0.03 0.36* 0.16 0.06 -0.49** -0.04
Pod length (cm) P 1.00 0.09 0.04 0.18 0.10 0.24
G 1.00 0.17 0.03 -0.10 -0.27 -0.12
Day to maturity P 1.00 0.08 0.26 -0.12 0.21
G 1.00 0.17 0.34* -0.39* 0.24
100-seed weight (g) P 1.00 0.21 0.22 0.31
G 1.00 0.30 0.50** 0.40*
Biological yield/plant
(g) P 1.00 -0.24 0.90**
G 1.00 0.08 0.98**
Harvest Index (%) P 1.00 0.19
G 1.00 0.27
Seed yield/plant (g) P 1.00
G 1.00

National E-Workshop onCurrent Scenario of Post Graduation Research in Agriculture Sector Sept 09-11, 2020
25
TARGETING INDUCED LOCAL LESIONS IN GENOMES (TILLING) INCROP IMPROVEMENT
Komal Shekhawat1, Swarnlata Kumawat1, Anil Kumar1, Kumari Rekha2
1Department of Genetics and Plant Breeding, SKRAU, Bikaner -334 006 2Dept. of PBG, Bihar Agricultural University, Sabour, Bhagalpur-813 210
Email: [email protected]
Introduction Recent advances in large-scale genome sequencing projects have opened up new possibilities for the application of mutation techniques in basic studies and in the improvement of crops. The reverse genetics strategy (“from gene sequence to phenotype”) has widely replaced the forward approach in studies involved in detecting gene function. This strategy is based on the alteration of a gene structure or its activity, followed by an analysis of the associated change in plant phenotype. Several reverse genetics technologies, such as insertional mutagenesis with T-DNA, transposon/retrotransposon tagging or gene silencing using RNA interference, have been proposed for plant functional genomics (for reviews, see: Alonso and Ecker 2006; Small 2007; Boutros and Ahringer 2008; Hirochika 2010; Bolle et al. 2011; Upadhyaya et al. 2011). TILLING (Targeting Induced Local Lesions In Genomes) was developed a decade ago as an alternative to insertion mutagenesis in Arabidopsis thaliana (McCallum et al. 2000).TILLING is a general reverse molecular genetic technique for mutation generation and discovery that combines chemical mutagenesis with PCR based screening to identify point mutations in regions of interest (McCallum et.al, 2000). It is a powerful technology that employed heteroduplex analysis to detect which organism in a population carry single nucleotide mutation in specific genes. It can also be used to detect naturally occurring SNP in genes among the accession, variety or cultivar. To study the gene function, or to detect genetic marker in population. TILLING has since been used as a reverse genetics method in other organisms such as zebrafish, corn, wheat, rice, soybean, tomato and lettuce.
Discovery of TILLING TILLING first began in the late 1990’s by McCallum who worked on characterizing the function of two chromomethylase gene in Arabidopsis. Claire McCallum utilized reverse genetic approaches such as T-DNA lines and antisense RNA, but was unable to successfully apply these approaches to characterize CMT2. The approach that was successful turned out to be what is now known as TILLING. Chemical use in TILLING: Mainly two chemicals are used in TILLING 1. Ethyl Methyl Sulphonate (EMS) Ethyl Methyl Sulphonate is a Alkylating agent. It’s Mode of action – By transfering their alkyl group at 6-oxygen and 7- nitrogen to the DNA base and the phosphate group. • Produces transition mutations (G/C:A/T) because it alkylates G residues. • Also the Ethylnitrosourea (ENU) used for induction of mutation.

National E-Workshop onCurrent Scenario of Post Graduation Research in Agriculture Sector Sept 09-11, 2020
26
2. CELL I Endonucleases CEL I, isolated from celery. S1 nuclease family of single strand-specific nucleases. Specifically recognizes mismatches in the heteroduplex. Cleaves DNA on the 3’ side of the mismatch (SNP). The TILLING Methodology: There are three important components necessary for the optimal TILLING order: 1) a good gene model (intron/exon positions), 2) a good protein sequence homology model, and 3) a good PCR primer pair. Development of mutagenized population. EMS mutagenesis. Development of M2 population. DNA preparation and pooling of individuals. Mutation Discovery PCR amplification of a region of interest Mismatched cleavage Detection of Heteroduplexes as extra peak or band (HPLC or Acrylamide gel) Identification of the mutant individual Sequencing of Mutant PCR product Basic TILLING method allows for high-throughput identification of single-base-pair (bp) allelic variations.The first step starts with mutagenized seeds obtained fromtreatment with EMS, done by soaking seeds in an EMS solution (14-18 h in a 30-100 mM (0.3%-1%) EMS solution.) Planting the seeds in field Mutagenized population (M1generation) is grown to maturity allowed to self-fertilize to produce M2 seeds. M2 seeds can be maintained as lines or bulked if the M2 seed is bulked then lines need to be established using M3 seed. In either case, when sampling M2 plants to establish population. The DNA samples are pooled, arrayed on micro titer plates and subjected to gene-specific PCR. Amplification productsare incubated with an endonuclease such as CELI, a member of the S1 nuclease family of single strand-specific nucleases. CELI cleaves the 3’ side of mismatched DNA where the heteroduplex between the wild-type and the mutant strands of DNA loops out, homoduplexes are left intact. Cleavage products are electrophoresed using an automated sequencing gel apparatus, and gel images are analyzed by examining the gel readout with the aid of a standard commercial image-processing program. Differential double endlabeling of amplification products allows for rapid visual confirmation because mutations are detected on complementary strands and can be
National E-Workshop onCurrent Scenario of Post Graduation Research in Agriculture Sector Sept 09-11, 2020
27
easily distinguished from amplification artifacts. Upon detection of a mutation in a pool, the individual DNA samples are similarly screened to identify the plant carrying the mutation. This rapid screening procedure determines the location of a mutation to within ±10 bp for PCR products that are 1-kb in size. For mismatch-specific cleavage, several enzymes, including S1 nuclease and T4 endonuclease VII have been used. CELI, a plant-specific extracellular glycoprotein, has been shown to be suitable for genotyping applications because it preferentially cleaves mismatches of all type and has been used to detect heterozygous polymorphisms in DNA pools.Further research showed that comparison of CELI with other single-strand specific nucleases revealed the endonuclease activity does not differ between these enzymes under optimized conditions. Also, plant extracts performed as well as the highly purified preparations. These results suggest that something in the crude sample either enhances the endonuclease activity of these enzymes at heteroduplex sites or inhibits their activity at the amplicon ends. In brief, screening is performed on DNAs that have been arrayed in 96-well microtiter plates and pooled eightfold to maximize screening efficiency. Gene specific, fluorescentlytagged primers areused to amplify pooled DNA (Figure 1). The amplification products are denatured and allowed to reanneal, generally by heating and cooling. As a result, a mutant strand will often reanneal with a wild-type strand, creating Heteroduplexes at the site of the mutation or polymorphism. The resultant double-stranded products are digested with CELI, which cleaves one of the two strands at the heteroduplex mismatches. Cleaved products, which are detected on polyacrylamide denaturing gels, identify individuals that have a mutation in the gene of interest. The size of the fragments carrying the 5’ and 3’ fluorescent tags can be used to estimate the position of the mutation within the amplicon. PCR forward and reverse primers are designed to amplify 1,500 bp or less of genomic DNA from a locus of interest. The forward and reverse primers are differentially 5’ end labeled with IRD700 and IRD800 dye labels for fluorescent detection at ~700 nm and ~800 nm, respectively.

National E-Workshop onCurrent Scenario of Post Graduation Research in Agriculture Sector Sept 09-11, 2020
28

National E-Workshop onCurrent Scenario of Post Graduation Research in Agriculture Sector Sept 09-11, 2020
29
Figure 1. Schematic diagram of TILLING method is redrawn with permission from the Annual Review of Plant Biology,(Volume 54 (c)2003 by Annual Reviews, www.annualreviews.org) from Henikoff and Comai, 2003 [14]. In each of 96 wellsof a plate, the DNA from eight plants are pooled. During the amplification of pooled DNA fluorescently tagged gene-specificprimers are used. The amplified products are denatured by heating and cooling slowly for randomly re-annealing andforming homo- and Heteroduplexes. Before denaturation is performed, the resultant double-stranded products are digested byCELI endonuclease. EMS treatment of seeds results alkylation of guanine bases and leads to mispairing such as G pairs withT instead of C. CELI cuts mismatched sites resulting shorter strands detectable differentially on a polyacrylamide gel,asymmetricly labeling with infrared dyes from 5’ and 3’ sites. Importance
• Tool for functional genomics that can help decipher the functions of the thousands of newly identified genes.
• To identify SNPs and/or INS/DELS in a gene of interest from population. • Genetic mutation is a powerful tool that establishes a direct link between the
biochemical function of a gene product and its role in vivo.
• Non transgenic method for reverse genetics • TILLING can provide the sub-lethal phenotypes we want. • TILLING can provide an allelic series that may help you better ascertain the
function of y gene. Advantages
• Its applicability to virtually any organism.
• Its facility for high-throughput and its independence of genome size, reproductive system or generation time.
• Since it uses Chemical mutagenesis virtually all genes can be targeted by screening few individuals.
• High degree of mutational saturation can be achieve without excessive collateral DNA damage.
• Identifying Rare haplotype • Identifying polymorphisms
TILLING takes advantage of classical mutagenesis, sequence availability and high-throughput screening for nucleotide polymorphisms in a targeted sequence. It combines the high frequency of mutations induced by traditional mutagenesis with sensitive techniques for discovering single nucleotide mutations. The main advantage of TILLING as a reverse genetics strategy is that it can be applied to any plant species, regardless of its genome size, ploidy level or method of propagation. Chemical mutagens, which are usually used in TILLING protocols, provide a high frequency of point mutations distributed randomly in the genome. An analysis of mutations induced by ethyl methanesulphonate (EMS) in 192 Arabidopsis genes revealed about ten mutations per gene among the 3,000 M2 plants examined (Greene et al. 2003). It was estimated that each M2 plant carried, on average, 720 mutations (Till et al. 2003), while only 1.5 T-DNA insertions per mutant line were

National E-Workshop onCurrent Scenario of Post Graduation Research in Agriculture Sector Sept 09-11, 2020
30
detected in the Arabidopsis insertion populations (Alonso et al. 2003). Thus, much smaller populations are required to reach saturation mutagenesis using TILLING—ca. 5,000 M1 plants in Arabidopsis (stergaard and Yanofsky 2004) as compared to 360,000 lines in T-DNA mutagenesis (Alonso and Ecker 2006). The application of TILLING makes the functional analysis of large genomes as well as small genes, which are difficult targets for insertional mutagenesis, possible. Another great advantage of TILLING technology relies on the ability of chemical mutagens to create a spectrum of mutations, including missense changes, truncation and mutations in splice junction sequences. In contrast to insertion mutagenesis that generates mostly gene knock-outs, using TILLING, it is possible to induce a series of alleles in a targeted locus. In addition to loss-of-function alleles, chemical mutagens generate gain-of-function and hypomorphic alleles that can provide a range of phenotypes (Alonso and Ecker 2006). The mutations are stable, which is not always the case for alternative methods of reverse genetics utilizing RNAi silencing or transposon, e.g. Ac/Ds tagging. In addition, RNAi technology and insertional mutagenesis through T-DNA or transposon tagging relies on genetic transformation. TILLING does not require transformation and, thus, is the only reverse genetics strategy applicable for species that are not transformable or recalcitrant. It is recommended as non-GMO technology, so when using TILLING, GMO procedures and controversies are avoided. Moreover, TILLING is not technically demanding and can be performed at a relatively low cost. The TILLING strategy was initially developed as a discovery platform for functional genomics, but it soon became a valuable tool in crop breeding as an alternative to the transgenic approach. The feasibility of TILLING has already been demonstrated for a large number of agronomically important crops, including rice, barley, wheat, maize, sorghum, soybean, rapeseed and tomato plants (Table 1). Large-scale TILLING services have also been created for model animal organisms such as Drosophila melanogaster, Caenorhabditis elegans, Danio rerio and Rattus norvegicus (Winkler et al. 2005; Gilchrist et al. 2006a; Wienholds et al. 2003; Smits et al. 2004, respectively).
TILLING IN PLANTS Arabidopsis thaliana In 2003, Greene et al. reported that the Arabidopsis TILLING Project (ATP), which was set up and introduced as a public service for the Arabidopsis community, had detected 1,890 mutations in 192 target gene fragments. The mutations in Arabidopsis thaliana that have been identified via TILLING have provided an allelic series of phenotypes and genotypes to elucidate gene and protein function throughout the genome for Arabidopsis researchers. Lotus japonicus - TILLING was used to investigate induced mutations occurring in the protein kinase domain of the SYMRK gene, which is necessary for root symbiosis. Nitrogen fixation and the functional role of sucrose synthase was the target of another Lotus japonicus TILLING study. Six isoforms of sucrose synthase were identified.Ecotilling can be used not only to determine the extent of variation but also to assay the level of heterozygosity within a gene. EcoTILLING is similar to TILLING, except that its objective is to identify natural genetic variation as opposed to induced mutations. • Many species are not

National E-Workshop onCurrent Scenario of Post Graduation Research in Agriculture Sector Sept 09-11, 2020
31
amenable to chemical mutagenesis; therefore, EcoTILLING can aid in the discovery of natural variants and their putative gene function. This approach allows one to rapidly screen through many samples with a gene of interest to identify naturally occurring SNPs and / or small INs/DELS. Eco- TILLING is useful for association mapping study and linkage disequilibrium analysis. Uses of Ecotilling 1. Screen many individuals at one locus 2. Not good for few individuals at many loci 3. Discover rare haplotypes 4. Good in heterozygous populations
Achievements 1. We demonstrate that high throughput TILLING is applicable to maize, an
important crop plant with a large genome but with limited reverse genetic resources currently available.
2. We screen the pools of DNA sample for mutation in 1-kb segment from 11 different gens, obtaining 17 independent induced mutations from a population of 750 pollen mutagenized maize plants.
3. One of the gene targeted was the DMT102 chromomethylase gene, for which we obtained an allelic series of three missense mutation that are predicted be strongly deleterious.
4. Slade et al. (2005) created a TILLING library in both bread and durum wheat to determine its utility in a complex genome like wheat. Using locus-specific PCR primers, they were able to identify 246 alleles of the waxy genes by TILLING. This made available novel genetic diversity at waxy loci and provided a way for allele mining in important germplasm of wheat. Using TILLING, Arcadia Biosciences has generated 220 induced mutations in 19 tomato genes.
5. It has been used in many species including Arabidopsis thaliana (Colbert et al. 2001), Lotus japonica (Perry et al. 2003), maize (Till et al. 2004a), wheat (Uauy et al. 2009; Dong et al. 2009), tomato (Minoia et al. 2010), rice (Till et al. 2007), zebrafish (Wienholds et al. 2003; Sood et al. 2006) and fruit fly (Winkler et al. 2005). • due to the complexity of the methodology, TILLING has not been used routinely in most laboratories for the detection of SNPs or InDels.
TILLING Centers • Several TILLING centers exist over the world that focus on agriculturally
important species: • Rice – UC Davis (USA)
• Maize – Purdue University (USA) • Brassica napus – University of British Columbia (CA)
• Brassica rapa – John Innes Centre (UK) • Arabidopsis – Fred Hutchinson Cancer Research • Soybean – Southern Illinois University (USA)
• Lotus and Medicago – John Innes Centre (UK)

National E-Workshop onCurrent Scenario of Post Graduation Research in Agriculture Sector Sept 09-11, 2020
32
• Wheat – UC Davis (USA) • Pea, Tomato - INRA (France)
• Tomato - RTGR, University of Hyderabad (India)
References Ashburner M. 1990. Drosophila: A LaboratoryHandbook. Cold Spring Harbor Laboratory Press, ColdSpring Harbor, NY.Lightner J, Caspar T. 1998. In J Martinez-Zapater, JSalinas, eds, Methods on Molecular Biology, Vol 82.Humana Press, Totowa, NJ, pp 91-104. Colbert T, Till BJ, Tompa R, Reynolds S, Steine MN,Yeung AT, McCallum CM, Comai L, Henikoff S.2001. High-throughput screening for induced pointmutations. Plant Physiology. 126:480-484. Comai L, Young K, Reynolds SH, Codomo C, Enns L,Johnson J, Burtner C, Henikoff JG, Greene EA, TillBJ, Henikoff S. 2004. Efficient discovery of nucleotidepolymorphisms in populations by ecotilling.PlantJournal. 37:778-786. Gilchrist EJ and Haughn GW. 2005. TILLING withouta plough: a new method with applications for reversegenetics. Current Opinion in Plant Biology. 8:211–215. Gilchrist EJ, Haughn GW, Ying CC, Otto SP, ZhuangJ, Cheung D, Hamberger B, Aboutorabi F, Kalynyak T,Johnson L, Bohlmann J, Ellis BE, Douglas CJ, CronkQCB. 2006. Use of Ecotilling as an efficient SNPdiscovery tool to survey genetic variation in wildpopulations of Populus trichocarpa. MolecularEcology. 15:1367-1378. Greene EA, Codomo CA, Taylor NE, Henikoff JG, TillBJ, Reynolds SH, Enns LC, Burtner C, Johnson JE,Odden AR, et al. 2003. Spectrum of chemicallyinduced mutations from a large-scale reverse-geneticscreen in Arabidopsis.Genetics. 164:731-740. Haughn G and Somerville CR. 1987. Selection forherbicide resistance at the whole-plant level, pp.98-107in Applications of Biotechnology to AgriculturalChemistry, edited by H.M. Lebaron, R.O. Mumma,R.C. Honeycutt and J.H. Duesing. American Chemical Society, Easton, PA. Henikoff S and Comai L. 2003.Single-nucleotidemutations for plant functional genomics.AnnualReviews of Plant Biology. 54:375-401. Henikoff S, Till BJ, Comai L. 2004. TILLING.Traditional mutagenesis meets functional genomics.Plant Physiology. 135:630-636. Howard, JT, Ward, J, Watson, JN and Roux, KH. 1999.Heteroduplex cleavage analysis using S1 nuclease.Biotechniques, 27, 18-19. Kulinski, J, Besack, D, Oleykowski, CA, Godwin, AKand Yeung, AT. 2000. CEL I enymatic mutationdetection assay. Biotechniques. 29:44-46. McCallum CM, Comai L, Greene EA, Henikoff S.2000. Targeted screening for induced mutations.Nature Biotechnology. 18:455-457. Muller HJ. 1930. Types of visible variations inducedby X-rays in Drosophila. Journal of Genetics. 22: 299-334. Ng PC and Henikoff S. 2003. SIFT: predicting aminoacid changes that affect protein function. Nucleic AcidsResearch. 31:3812-3814. nucleases. Nucleic Acids Research. 32:2632-2641. Oleykowski CA, Mullins CRB, Godwin AK, YeungAT. 1998. Mutation detection using a novel plantendonuclease. Nucleic Acids Research. 26:4597-4602. Perry JA, Wang TL, Welham TJ, Gardner S, Pike JM,Yoshida S, Parniske M. 2003. A TILLING reversegenetics tool and a webaccessible collection of mutantsof the legume Lotus japonica. Plant Physiology.131:866-871. Slade AJ and Knauf VC. 2005. TILLING movesbeyond functional genomics into crop improvement.Transgenic Research. 14:109–115. Slade AJ, Fuerstenberg SI, Loeffler D, Steine MN,Facciotti D. 2005. A reverse genetic, nontransgenicapproach to wheat crop improvement by TILLING.Nature Biotechnology.23:75 81. Smits BMG, Mudde J, Plasterk RHA, and Cuppen E2004.Target-selected mutagenesis of the rat.Genomics. 83:332–334.

National E-Workshop onCurrent Scenario of Post Graduation Research in Agriculture Sector Sept 09-11, 2020
33
Sood R, English MA, Jones M, Mullikin J, Wang D,Anderson M, Wu D, Chandrasekharappa SC, Yu J,Zhang J and Liu PP. 2006. Methods for reversegenetic screening in zebrafish by resequencing andTILLING.Methods. 39:220-227. Stadler LJ. 1932. On the genetic nature of inducedmutations in plants. Proceedings of the VI Congress ofGenetics. 1:274-294. Talamè V, Salvi S, Sanguineti MC, Tuberosa R. 2005.Development of a TILLING Reverse GeneticsResource in Barley. Proceedings of the Plant & AnimalGenomes XIII Conference. 81. Taylor NE and Grene EA. 2003. PARSESNP: a toolfor the analysis of nucleotide polymorphisms. NucleicAcids Research. 31: 3808–3811. Till BJ, Burtner C, Comai L, Henikoff S. 2004.Mismatch cleavage by single- strand specific Till BJ, Reynolds SH, Greene EA, Codomo CA, EnnsLC, Johnson JE, Burtner C, Odden AR, Young K,Taylor NE et al. 2003. Large-scale discovery ofinduced point mutations with high-throughputTILLING.Genome Research. 13:524-530. Till BJ, Reynolds SH, Weil C, Springer N, Burtner C,Young K, Bowers E, Codomo CA, Enns LC, OddenAR et al. 2004. Discovery of induced point mutationsin maize genes by TILLING. BioMedCentral PlantBiology. 4:12. Wienholds E, Van Eeden F, Kosters M, Mudde J,Plasterk RH, Cuppen E. 2003. Efficient target-selectedmutagenesis in zebrafish.Genome Research. 13:2700-2707. Youil, R, Kemper, B, and Cotton, RGH. 1996.Detection of 81 of 81 known mouse b-globin promotermutations with T4 endonuclease VII - The EMCmethod. Genomics 32:431-435.

National E-Workshop onCurrent Scenario of Post Graduation Research in Agriculture Sector Sept 09-11, 2020
34
EFFECT OF PLANT GROWTH REGULATOR FOR IN VITRO SHOOT BUD INDUCTION IN GUGGUL
[COMMIPHORAWIGHTII(ARNOTT)]
K.Shekhawat, R. Kumar, S. Kumawat, R. Choudharyand M L Jakhar
Department of Plant Breeding and Genetics, SKN Agriculture University, Jobner Email: [email protected]
Introduction India has a treasure of well recorded and traditionally well practiced knowledge on medicinal plants [1]. More than 6000 plants are used in our traditional, folk and herbal system of medicine [2]. India is endowed with a rich genetic resource of medicinal plants and is rightly called the “Emporium of Medicinal Plants” [3].Commiphorawightii(Arnott) is a medicinally important plant which is now considered as critically endangered species of the family Burseraceae and having the chromosome number 2n = 26 (Sobti and Singh, 1961) [4]. It is an important medicinal plant of herbal heritage of India [5]. It is known by various names like guggul in Hindi, gukkulu and maishakshi in Tamil, guggulu in Sanskrit and Indian bdellium in English [6]. The genus Commiphorais widely distributed in tropical regions of Africa, Madagascar, Asia, Australia and the Pacific Islands (Good, 1974) [7]. In India, it is found in arid, rocky tracts of Rajasthan and Gujarat Maharashtra and Karnataka (Kumar and Shankar, 1982) [8]. In Rajasthan it is found in districts namely Jaisalmer, Barmer, Jodhpur, Jalore, Sirohi, Ajmer, Sikar, Churu, Jhunjhunu, Pali, Udaipur, Alwar (Sariska Tiger Reserve), Jaipur (Ramgarh, Jhalana area), Bhilwara and Rajsamand [9].Guggul is a woody shrub with knotty, crooked, sping brown bracties, leaves 1-3 foliate leaf lets, sessile with serrated margin [10]. Fruit is drops red, ovate with two celled stone [11]. Flowers are small, brown, pink flowers unisexual small, brownish red, the fascicles polygamous sexual distribution bisexual, female and male flowers [12]. Their 3-4.5 mm long, usually red white pinkish, on the flowers individually or in groups appears in the 2 or 3 Fruits are red drupe, elliptical, tapered-shaped, 2-cell-type store, rarely four your valve voice, when ripe will be red and divides into two [13]. The ash coloured bark comes off in flakes exposing the under bark which also peels off in thin papery tolls [14]. The shrub defoliates in winter and reserves for guggul gum extraction are high during April-May [15].This prominent species of the arid tracts of Rajasthan and Gujarat states (northwest India), Commiphorawightiiis now on the verge of extinction over much of its Indian range and is listed as endangered (IUCN 2010) [16]. The predominant reasons for its fast diminishing populations are over-exploitation (tapping of woody shoots for its oleo-gum-resin), poor natural germination rate and slow growth rate [17]. The resin extracted from stem is considered by some to have tremendous value as cholesterol reducing agent and hence a favorite of the ayurvedic medicine industry [18]. This has resulted in widespread indiscriminate tapping for the resin [19]. The magnitude of the

National E-Workshop onCurrent Scenario of Post Graduation Research in Agriculture Sector Sept 09-11, 2020
35
conservation problem facing C. wightiithrough this exploitation is greatly exacerbated by the fact that a plant after being tapped through deep cuttings, usually dies within two to six months of a single tapping episode (Bhatt et al.,1989, Paliwal, 2010) [20]. It is not yet clear as to why plants die after tapping [21]. Seeds of guggul is the major propagation source in nature. In Rajasthan and nearby arid regions flowers and seeds are constantly produced by C. wightii except in winter season. However, the germination of seeds are poor thus large scale plantation is not possible through this natural method. Therefore, considerable efforts are still required to find out efficient in vitro methods for the regeneration of this critically endangered medicinal plant. The in vitro propagation method can be used for clonal propagation of selected germplasm, genetic improvement, production of active compound in cell culture. In vitro propagation in C. wightiihas been attempted through organogenesis and somatic embryogenesis methods by various researchers.
Methodology The present research work was conducted on Commiphorawightii(Arnott). Shoot apex and nodal segment were used as explant and obtained from healthy trees grown at Department of plant Breeding and Genetics, S.K.N. College of Agriculture, Jobner. Explant was sterilized by using different surface sterilization agents. Explant was washed thoroughly in running tap water for 20 minutes, these were again washed with liquid detergent (RanKleen) for ten minutes with vigorous shaking. After washing with detergent, explant was again washed with running tap water to remove any trace of detergent for 5 minutes. Finally explants were surface sterilized with 0.1 per cent HgCl2 in a laminar air flow cabinet for 3-4 minutes.
Shoot bud induction Shoot apex and nodal segments explants were placed on MS medium supplemented with different concentration of cytokinins (BAP/Kn: 0.5,1.0, 1.5, 2.0, 2.5, 3.0, 3.5, 4.0 and 4.5 mg/l) and auxins (NAA/IAA :0.5, 1.0, 1.5, 2.0, 2.5, 3.0, 3.5, 4.0 and 4.5 mg/l ) alone and BAP (1.0 and 4.5 mg/I) + IAA/NAA (1.0 and 4.5 ml/I) andKn (1.0 ml/l and 4.5 ml/l) + IAA/NAA (1.0 and 4.5 ml/l)in combination for shoot bud induction.
Findings Shoot bud induction The shoot apex were started to break bud within 16 – 19 days of inoculation at all the levels of BAP (0.5 – 4.5 mg/l). Maximum number of shoot bud (1.41) induction was observed at 3.5 mg/l BAP with 90 per cent frequency (Table 1 and Fig.1). Whereas, the minimum number of shoot buds (1.02) were observed at 4.5 mg/l BAP with 50 per cent frequency. Increasing concentration of BAP up to 3.5 mg/l promoted shoot bud induction. However, increasing concentration of BAP (> 3.5 mg/l) reduced the shoot bud induction progressively. All the level of BAP induced callus at the base of shoot apex explants except lower and higher levels of BAP. Medium callusing were observed at 2.5 - 3.0 mg/l BAP with 60 per cent frequency and other levels induced only low callus.

National E-Workshop onCurrent Scenario of Post Graduation Research in Agriculture Sector Sept 09-11, 2020
36
When nodal segment explants were inoculated on MS medium at different levels of BAP (0.5 – 4.5 mg/l), induction of shoot bud was observed within 2 - 3 weeks of incubation at all the levels. Maximum number of shoot bud induction (1.42) was observed at 3.0 mg/l BAP with 90 per cent frequency (Table 1 and Fig. 2). Increasing level of BAP increased shoot bud induction up to 3.0 mg/l. However, higher level of BAP showed inhibitory effect on shoot bud induction. As like shoot apex, nodal segment also induced medium callus at 2.5 mg/l BAP. Both lower (0.5 – 1.0 mg/l) and higher (4.0 - 4.5 mg/l) levels of BAP were insufficient to induced callus in nodal segment explants. Frequency of callus induction was 30-60 per cent at different level of BAP in nodal segment explant. Shoot apex explants responded to combined Kn (1.0 and 4.5 mg/l) and IAA (1.0 and 4.5 mg/l) treatments through shoot bud induction within 18 – 20 days of inoculation with 60-80 per cent frequency. Highest shoot bud induction (1.30) was observed at 4.5 mg/l Kn + 1.0 mg/l IAA. Minimum shoot bud induction (1.10) was observed at 1.0 mg/l Kn + 1.0 mg/l IAA and 1.0 mg/l Kn + 4.5 mg/l IAA (Table 2 and Fig 3). BAP (1.0 and 4.5 mg/l) in combination with IAA (1.0 and 4.5 mg/l) induced only shoot buds in nodal segment explants within 18 – 20 days of inoculation with 60-80 per cent frequency at all the levels of combinations. Highest shoot bud (1.30) was observed at 4.5 mg/l BAP + 1.0 mg/l IAA and 4.5 BAP + 4.5 mg/l IAA. Minimum shoot bud (1.10) was observed at 1.0 mg/l BAP + 4.5 mg/l IAA. Replacement of NAA with IAA also responded similarly by inducing more shoot bud break at lower levels of IAA (1.0 mg/l) with both levels of BAP (1.0 and 4.5 mg/l) in shoot apex and nodal segment explants (Table 2 and Fig 4).
Inference Cytokinins are able to stimulate cell division and induce shoot bud formation in tissue culture. The usually act as antagonists to auxins. Cytokinins inhibits embryogenesis and root induction [22]. The medium devoid of growth regulators failed to initiate callus or bud break from any of the explant. Similarly in Peganumharmala(Saini and Jaiwal, 2000) and Crataevanurvala(Waliaet al., 2003), no shoot buds developed on MS basal medium [23]. In case of nodal explant, cytokinins were reported to promote early bud initiation [24]. Of the two cytokinins (BAP and Kn) tested, BAP was more effective than Kn as bud inducer [25]. The most striking influence on bud break and shoot multiplication has been found with cytokinins (Normanlyet al., 1995) [26]. BAP and Kn are the most commomnly used cytokinins for micropropagation [27]. In the current investigation both the cytokinins, when incorporated singly in the basal medium, induced shoot buds at all levels, however, high shoot buds were observed when nodal stem segments were inoculated on basal medium containing 3.0 mg/l BAP [28]. This result was in accordance with results obtained by Kumari (2012) with respect to plant growth regulator (BAP) [29]. She observed maximum rate of shoot multiplication at 5.0 mg/l BAP in Bauhinia variegate[30]. However, in the present study maximum shoot proliferation was observed at 3.0 mg/l BAP[31]. This variation might be due genera differences[32].Role of BAP for shoot inductionwasalso observedby Borthakuret al.

National E-Workshop onCurrent Scenario of Post Graduation Research in Agriculture Sector Sept 09-11, 2020
37
(2012) in Albizziachinensis, Ismail et al.(2012) in Acacia auriculiformisand Kumar and Singh (2010) in Prosopis cineraria[33].Similar observations have been observed in many plants like Momordicacharantia(Agrawal and Kamal, 2004) and Chlorophytumborivillianum(Sharma and Mohan, 2006) [34].Establishment of cultures through young explants has also been reported by Veltcheva and Svetleva(2005) [35]. Low IAA and high BAP was favorable for shoot regeneration while high IAA and low BAP favored rooting[36]. Superiority of BAP in shoot regeneration has been widely reported (Akbaset al.2011,Dohlinget al.2012,Faisalet al.2012) [37]. Effectiveness of IAA + BAP in shoot regeneration has been recorded in other medicinal plants including Zehneriascabra (Anand and Jeyachandran, 2004),Ocimumgratissimum (Gopiet al., 2006),Withaniasomnifera(Sharadaet al.,2007.Purohit et al,(1995) and Pandeet al.(2002) have recorded superiority of IAA + Kn in Ammimajus and Lepidiumsativum, respectively [38]. These results are contrary to our results because of difference in genera.
Reference Sobti, S. N. and Singh S. D. 1961.A chromosomal survey of medicinal plants.Ind. Acadamic Sci.54(3):
138-144. Good, R. 1974. The geography of the flowering plants. 4th edition, London: Longman, pp. 557. Kumar, S. and Shankar, V. 1982. Medicinal plants of the Indian deserts: Comiphorawightii(Arnott)
Bhandari. J. of Arid Enviroment, 5: 1-11. IUCN, 2010.IUCN Red list of threatened species. IUCN, 2015. IUCN Red list of threatened species. Agarwal, M. and Kamal, R. 2004.In vitro clonal propagation of Momordicacharantia.Ind. J. of Biotech,
3: 426-430. Akbas, F., Isikalan, C., Namli, S., Karakus, P. and Basaran, D. 2015. Direct plant regeneration from in
vitro derived leaf explants of Hypericumspectabile, a medicinal plant. Journal of Medicinal Plants Res., 5(11): 2175- 2181.
Anand, S. P. and Jeyachandran, R. 2004.In vitro multiple shoot regeneration from nodal explants of Zehneriascabra (L.f.) Sonder-an important medicinal climber. PlantTissue Culture, 14(2): 101-106.
Borthakur, A., Das, C. S., Kalita, C. M. and Sen, P. 2012. An in vitro regeneration system for conservation of the leguminous tree Albizzachinesis (Osbeck) Merr.Advances in Applied Science Research, 3(3): 1727-1732.
Ismail, H., Noraini, A. N., Yusoff, M. A., Hassan, N. H., Zainudin, F., Abdulla, N. and Rahman, S. S. A. 2012.In vitro shoot induction of Acacia auriculiformisfrom juvenile and mature sources.Journal of Biotechnology and Pharmaceutical Research, 3(5): 88-93.
Faisal, M., Singh, P. P. and Irchhaiya, R. 2012. Review of Albizizlebbeck a potent herbal drug. International Research Journal of Pharmacy, 3 (1): 63–68.
Dohling S., Kumaria S., Tandon P., 2012. Multiple shoot induction from axillary bud cultures of the medicinal orchid, Dendrobiumlongicornu. AoB Plants, pp32.
Gopi, C., Sekhar, N. Y. and Ponmurugan, P. 2006. In vitro multiplication of Ocimumgratissimum L. through direct regeneration.African Journal of Biotechnology, 5(9): 723-726.
Kumar, S. and Singh, N. 2010.Micropropagation of Prosopis cineraria (L.) Druce: A multipurpose desert tree. Report and Opinion, 2(8): 44-47.
Kumari, M. 2012. Evaluation of ethanolic extracts of in vitro grown Bauhinia variegateL. for antibacterial activities. International Journal of Pharma and Bio Sciences, 3(4): 43-50.
Murashige,T. and Skoog, F. 1962. A revised medium for rapid growth and bioassays with tobacco tissue cultures.PhysiologiaPlantarum, 15: 431- 497.
Normanly, J.,Slovin, J. P. and Cohen, J. D. 1995. Re-thinking auxin biosynthesis and metabolism.Plant Physiology, 107: 323-329.
Pandey, H., Chandra, B., Nadeem, M., Kumar, A., Nandi, S. K. and Palni, L. M. S. 2002 In vitro propagation of some alpine medicinal herbs of the Himalayan region. pp 297–323.

National E-Workshop onCurrent Scenario of Post Graduation Research in Agriculture Sector Sept 09-11, 2020
38
Purohit, S. D., Tak, K., and Kukda, G. 1995. In vitro propagation of BoswelliaserrataRoxb.Biologia Plantarum, 37: 335–340.
Saini, R. and Jaiwal, P. K. 2000.In vitro multiplication of Peganumharmala - an important medicinal plant. Indian Journal Experimental Biology, 38: 499-503.
Sharada, M., Ahuja, A., Suri, K. A., Vij, S. P., Khajuria, R. K. and Verma, V. 2007. Withanolide production by in vitro cultures of Withaniasomniferaand its association with differentiation.Biologia Plantarum, 51: 161–164.
Sharma, U. and Mohan, J. S. 2006. Reduction of vitrificationin vitro raised shoots of Chlorophytumborivilianum- A rare potent medicinal herb. Indian Jouranal of Experimental Biology, 44(6): 499-505.
Veltcheva, M. R. and Svetleva, D. L. 2005. In vitro regeneration of Phaseolus vulgaris L. via organogenesis from petiole explants. Journal Central European Agriculture, 6: 53-58.
Walia N., Sinha S. and Babbar SB 2003.Micropropagation of Crataevanurvala. Biologia Plantarum46: 181–185.

National E-Workshop onCurrent Scenario of Post Graduation Research in Agriculture Sector Sept 09-11, 2020
39
(++)= Medium callus,(+)= Low callus,(-)= No response and (#)= Transformed value
Fig.1: Shoot bud induction in shoot apex explant on MS medium supplemented with 3.5 mg/l BAP.
Fig.2: Shoot bud inductionin nodal segment explant on MS medium supplemented with 3.0 mg/l BAP.
Fig.3: Shoot bud induction in shoot apex explant on MS medium supplemented with 4.5 mg/l Kn and 1.0 mg/l IAA.
Fig. 4: Shoot bud induction in nodal segment explant on MS medium supplemented with 4.5 mg/l BAP and 1.0 mg/l IAA.

National E-Workshop onCurrent Scenario of Post Graduation Research in Agriculture Sector Sept 09-11, 2020
40
Table 1:Morphogenetic effect of various concentration of cytokinin (BAP) supplemented singly in the MS medium on different explants of Guggul. Concentration
(mg/l) Shoot apex explants Nodal segment explant
Mean No. of days taken for shoot bud
break
No. of shoot buds/explant
Resp onse (%)
Callus induction
Mean No. of days taken for shoot bud
break
No. of shoot buds /explant
Response (%)
Callus induction
Appearance Freq. (%) Appearance Frequency(%) 0.5 16.30 1.10#±0.18 60 - - 17.60 1.02#±0.16 50 - - 1.0 17.80 1.10± 0.15 60 + 10 15.70 1.11±0.16 60 - - 1.5 18.10 1.12± 0.13 70 + 10 16.40 1.12±0.15 70 + 30 2.0 18.60 1.12± 0.12 70 + 20 16.90 1.30±0.13 80 + 40
2.5 18.80 1.30± 0.18 80 ++ 60 17.70 1.32±0.10 80 ++ 60 3.0 18.80 1.32± 0.17 80 ++ 50 17.30 1.42±0.13 90 - - 3.5 18.50 1.41± 0.10 90 + 40 17.10 1.12±0.12 70 + 40 4.0 18.40 1.12± 0.12 60 + 10 17.50 1.13±0.10 60 - -
4.5 18.50 1.02±0.14 50 - - 18.40 1.02±0.17 50 - -

National E-Workshop onCurrent Scenario of Post Graduation Research in Agriculture Sector Sept 09-11, 2020
41
Table 2: Morphogenetic effect of various concentration of cytokinin(BAP/Kn) and auxin (NAA/IAA) added in combination in the MS medium on different explants viz., nodal segment and shoot apex. Concentration
(mg/l) Nodal segment Shoot apex
Mean number of days taken for shoot bud break Number of shoot buds /explants
Response (%)
Mean number of days taken for shoot bud break Number of shoot buds /explant Response (%)
BAP NAA (1.0 mg/l) 1.0 20.10 1.10#±0.15 60 18.90 1.12#±0.14 70 4.5 19.90 1.12±0.16 70 19.80 1.30±0.15 80
BAP NAA (4.5 mg/l) 1.0 19.00 1.02±0.14 50 19.60 1.10±0.16 60 4.5 18.60 1.10±0.12 60 20.00 1.12±0.14 70 Kn NAA (1.0 mg/l) 1.0 19.90 1.12± 0.13 70 19.40 1.02±0.14 50 4.5 18.70 1.30±0.15 80 19.80 1.12±0.16 70 Kn NAA (4.5 mg/l) 1.0 19.60 1.10±0.15 60 18.50 1.02±0.15 50 4.5 19.70 1.30±0.16 80 19.20 1.12±0.13 70
BAP IAA (1.0 mg/l) 1.0 19.70 1.12±0.17 70 19.80 1.10±0.14 60 4.5 19.70 1.30±0.14 80 19.70 1.12±0.13 70
BAP IAA (4.5 mg/l) 1.0 18.50 1.10±0.15 60 18.50 1.02±0.15 50 4.5 19.00 1.30±0.13 80 18.70 1.10±0.14 60 Kn IAA (1.0 mg/l) 1.0 19.40 1.10±0.16 60 19.60 1.10±0.15 60 4.5 19.80 1.12±0.15 70 19.10 1.30±0.16 80 Kn IAA (4.5 mg/l) 1.0 18.50 1.02±0.14 50 18.60 1.10±0.14 60 4.5 18.40 1.10±0.13 60 19.40 1.12±0.13 70

National E-Workshop onCurrent Scenario of Post Graduation Research in Agriculture Sector Sept 09-11, 2020
42
STUDY ON MEAN PERFORMANCE OF INDIAN MUSTARD (BRASSICA JUNCEA L. CZERN & COSS) FOR SEED YIELD AND
COMPONENT TRAITS UNDER DIFFERENT ENVIRONMENTS FOR DROUGHT TOLERANCE
Mahendar Singh Bhinda1*, SS Shekhawat2, US Shekhawat3 and AK Sharma4
1ICAR-Vivekananda Parvatiya Krishi Anusandhan Sansthan, Almora (Uttarakhand) 2 & 4 Department of Genetics and Plant Breeding, SKRAU, Bikaner
3 SKRAU-Agricultural Research Station, Sriganganagar Email :[email protected]
Introduction Oilseeds occupy a place of prime importance in Indian economy next to food grain which is evident through the impact generated by yellow revolution in 1980’s. India is the third largest producer of oilseeds in the world. In India, B. juncea is the predominant Brassica species plays a crucial role in edible oil economy of India and occupies more than 80% of the total rapeseed mustard cultivated area followed by B. rapa and B. napus (Thakur et al., 2017). The largest cultivation of Brassica crops is done for edible vegetable oil production. The oil content in mustard seed ranges from 38-43 percent, which is yellow fragment and is considered to be the healthiest and nutritious cooking medium. It’s leaves and tender stem of young plant are used as green vegetablesas they supply enough sulphur, minerals, protein, vitamin A and C. Due to the presence of sulphur compound mustard oil has peculiar pungency thus making it suitable to be used as condiment in the preparation of pickles and for flavoring curries and vegetables. Moisture stress is foremost limiting factor for looming productivity of rapeseed-mustard. Majority of the Brassica cultivation is still based on rainfall and residual soil moisture received from monsoon rains. Crop inevitably suffers from drought stress during the reproductive period of growth after depletion of stored water (Kumar, 2001). Despite its immense potential for supplementing the world’s edible oil resources, mustard is often grown on marginal lands under moisture stress condition and under poor management resulting in low yield. There is a wide gap between supply and demand has resulted in dependency on imports to meet the additional requirement. In fact, according to figures available, the production of oilseeds grew marginally by close to 2% annually from 2003-04 to 2012-13 as against compounded annual growth rate of 4.6% in demand. Therefore, the gap in demand and supply is being bridged by importing about 9 mmt of edible oil at a cost of about Rs. 65000 crores (Kumar, 2014). To cope up with the increasing population and demand of oilseeds various strategies have been evolved to enhance the yield levels in the country that are far beneath the world average. Hence it has become necessary to enhance the production through developing superior varieties of mustard by means of reshuffling the genes via hybridization from suitable parents. For this, concerted efforts are required to breed varieties which are not only superior in their yield potential and oil
National E-Workshop onCurrent Scenario of Post Graduation Research in Agriculture Sector Sept 09-11, 2020
43
content under irrigated conditions but should sustain their superiority under varying degree of moisture stress during crop growth which is imperative to boost the production.
Methodology The experimental material consisted of 15 lines, 5 testers and their 75 cross combinations..The crosses were made in line x tester fashion at ARS, Sri Ganganagar during 2016-17 Rabi season. The parental material was selected on the basis of their adaptability and diversity. Ninety five genotypes of Indian mustard were sown in randomized block design with three replications at Bikaner and Sri Ganganagar during 2017-18 Rabi season under two sets of environments created by withholding irrigation facilities at two locations. Two soil moisture regimes, first one normal irrigated environment (i.e. Pre sowing irrigation + two irrigation, first irrigation at 35 days after sowing and second at 80 days after sowing) and second one moisture stress environment (i.e. pre sowing irrigation + one irrigation at 50 days after sowing) were applied. Each genotype was sown as single row plot in 3 m length. Row to row and plant to plant spacing were kept at 45 cm and 15 cm, respectively at both the location.
Findings For effective selection of superior genotypes from breeding material, the knowledge regarding nature and magnitude of variation present in the base material is very crucial because it widens the scope for selection. The analysis of variance for experimental revealed that the environments selected for the study represented distinctly different climatic conditions as the significant mean squares due to environments for all the characters. Likewise, significant differences for various characters under study also hinting towards the presence of variability amongst the genotypes which was revealed through highly significant mean square value due to parents as well as hybrids. The interaction of genotypes, parents, lines, testers, crosses with the environments were reported significant mean square values for all the characters which suggested their differential performances under different environments. Similar results in case of genotype and environmental interaction were observed by Dhillon et al. (2001) and Brar et al. (2007) for various yield attributes. In general, the mean of the F1’s exceeded the parental mean values for yield and yield components traits except for days to 50 % flowering in E1, E2 and E3; plant height in E2 and E4; number of secondary branches per plants in E1; days to maturity and oil content in all the environments indicating existence of heterosis for these characters. Similarly, general mean value of F1’s exceeded the general mean value of parents with regards to all the traits except days to 50% flowering, days to maturity, plant height and oil content. The mean performance and range of various genotypes (for both parents as well as crosses) were comparatively high under normal irrigated condition at both the locations for days to 50% flowering, maturity period, plant height, number of primary branches per plant, number of secondary branches per plant, number of siliqua per plant, number of seeds per siliqua, siliqua length, 1000-seed weight, Biological yield per plant, seed yield per plant and oil content except harvest index for which range of crosses were comparatively high under moisture stress condition at both the

National E-Workshop onCurrent Scenario of Post Graduation Research in Agriculture Sector Sept 09-11, 2020
44
locations. Drought appeared to cause reduction in the mean performance of these traits at both the locations for both parents as well as crosses. The mean performance of different genotypes were relatively high under normal irrigated condition at Sri Ganganagar as compared to normal irrigated condition at Bikaner.The reason for lower mean performance of genotypes under moisture stress conditions might be due to decreased translocation of assimilates/growth substances and loss of turgidity as described by Kumawat et al. (1997) in Indian mustard.
National E-Workshop onCurrent Scenario of Post Graduation Research in Agriculture Sector Sept 09-11, 2020
45
VARIABILITY AND INTERRELATION ANALYSIS IN COWPEA [VIGNA UNGUICULATA (L.)WALP.] GENOTYPES
Navreet Kaur Rai and A.K. Sharma
Department of Genetics and Plant Breeding, College of Agriculture, SKRAU, Bikaner Email: [email protected]
Introduction Cowpea remains an essential part of subsistence and sustainable production system due to its capacity to restore soil fertility. In India, this crop has a lot of scope for creating considerable diversity by identifying genotypes which are superior among the existing germplasm and this can be a good strategy to initiate any breeding programme and also for amplifying the productivity and production of cowpea (Singh etal., 2018). Thus, to bridge the existing gaps in cowpea breeding an experiment was conducted at the agriculture research farm of College of Agriculture, Bikaner during kharif season-2019 to rule out the variability, correlation and path coefficient in thirty genotypes of cowpea. Methodology The experimental material for the present investigation consisted of 30 genotypes of cowpea. These genotypes were evaluated in a randomized block design (RBD) with three replications during kharif 2019 at Agriculture Research Farm, College of Agriculture, Bikaner. The row to row distance and plant to plant distance were kept at 30 cm and 10 cm, respectively. The coefficient of variation (Burton, 1952), correlation (Searle, 1961) and path coefficient analysis (Wright, 1921) were estimated according to the established statistical procedures. Findings Analysis of variance revealed wide range of variation and significant differences among all genotypes studied for all the traits, which indicated that the material used had considerable genetic variability. Similar finding were reported byAnimasaum et al. (2015), Surpura et al. (2017)and Gupta et al. (2019). Highest PCV and GCV estimates were reported for number of pods per plant (50.76%, 50.05%), harvest index (43.05%, 42.54%), seed yield per plant (41.13%, 40.40%) and plant height (34.35%, 34.30%) indicating the scope of exploiting variability for further improvement of such characters. Similar results were shown by Surpura et al. (2017) for high PCV and GCV of number of pods per plant, plant height and seed yield per plant and Nguyen et al. (2019) for number of pods per plant, plant height, seed yield per plant and harvest index. Days to 50 per cent flowering along with days to maturity had low values of GCV and PCV suggesting narrow range of variation for these characters. Findings were in similar trend with Ramesh et al. (2014) for days to 50 per cent flowering and Sable et al. (2018) for days to maturity. The characters like plant height (99.80%), biological yield per plant (99.10%), harvest index (97.60%), number of pods per plant (97.20%), seed yield per plant (96.50%), 100-seed weight (92.80%) and pod length (89.60%) depicted high estimates of heritability. These characters can be easily transferred from parent to offsprings. These findings were in conformity with the results of Suganthi and Murugan (2008) for seed yield per plant, pod length and 100-seed weight;Sarath and Reshma (2017)
National E-Workshop onCurrent Scenario of Post Graduation Research in Agriculture Sector Sept 09-11, 2020
46
for plant height, seed yield per plant and pod length; Surpura et al. (2017) for number of pods per plant, biological yield per plant, seed yield per plant, 100-seed weight and plant height; Sable et al. (2018) for plant height, seed yield per plant, 100-seed weight, number of pods per plant and harvest index and Gupta et al. (2019) for plant height and number of pods per plant. The number of pods per plant (101.66%) followed by harvest index (86.59%), seed yield per plant (81.74%) and plant height (70.58%) had high result values of genetic advance as per cent of mean. Similar outcomes were obtained by Kumar et al. (2018) for number of pods per plant; Khan et al. (2015) and Surpura et al. (2017) for number of pods per plant, plant height and seed yield per plant and Sable et al. (2018) for seed yield per plant, number of pods per plant, harvest index and plant height. Whereas, moderate estimate of genetic advance as per cent of mean were reported for biological yield per plant (51.03%), 100-seed weight (42.35%), number of branches per plant (36.81%), number of seeds per pod (31.41%) and pod length (30.12%). High heritability and high to moderate genetic advance expressed as per cent of mean were found in plant height, number of pods per plant, harvest index, seed yield per plant, biological yield per plant and 100-seed weight which might be attributed to additive gene effect regulating their expression and phenotypic selection for their amelioration can be brought by simple selection for their genetic improvement over a short span of time. Similar findings were observed by Khan et al. (2015) for plant height, seed yield per plant, 100-seed weight and number of pods per plant; Sughanthi and Muragan (2008) for seed yield per plant and Surpura et al. (2017) for plant height, number of pods per plant, seed yield per plant, biological yield per plant and 100-seed weight. The magnitude of genotypic correlation coefficients were higher than phenotypic correlation coefficients for every attribute under the study that indicated inherent interrelation between different characters (Table 1). Thorat and Gadewar (2013), Chattopadhyay et al. (2014), Adetiloye et al. (2017) and Walle et al. (2018) reported the similar results. Significant and positive phenotypic correlation of seed yield was perceived with harvest index (0.838**), number of pods per plant (0.710**), number of seeds per pod (0.415**), plant height (0.302**) and protein content (0.218*) hinting that these attributes are the primary yield determinant in cowpea. These findings were in accordance with the results of Srinivas et al. (2017) and Walle et al. (2018). The phenotypic correlation coefficient of pod length (-0.212*), days to 50 per cent flowering (-0.328**) and days to maturity (-0.259*) was recorded significantly negative with seed yield per plant. The negative correlation of days to 50 per cent flowering and days to maturity with seed yield also suggested that selection for these characters will be of help to the breeders in selecting cultivar for earliness. Similar results were found by Thorat and Gadewar (2013)and Srinivas et al. (2017). At phenotypic level, the positive direct effect on seed yield per plant was majorly by harvest index (0.9094), biological yield per plant (0.3906), number of pods per plant (0.2089), plant height (0.0604), 100-seed weight (0.0080), number of branches per plant (0.0058), number of seeds per pod (0.0047), protein content (0.0023) and pod length (0.0003) indicating the direct selection for these traits in order to improve seed yield of cowpea whereas, highest negative direct effect were reported for days to 50 per cent flowering (-0.0204) and days to maturity (-0.0094). Direct positive effect over seed yield through number of branches per plant, 100-seed weight, number of seeds per pod along with number of pods per plant was earlier reported by Meena et al. (2015). Cokkizgin et al. (2013) reported positive direct effect by 100-seed weight

National E-Workshop onCurrent Scenario of Post Graduation Research in Agriculture Sector Sept 09-11, 2020
47
and number of branches per plant. Direct positive effect over seed yield per plant via plant height was earlier reported by Jogdhande et al. (2017), Manisha et al. (2018) and Walle et al. (2018). Residual effect resulted in path analysis was found to be very low 0.1697 at genotypic level and 0.1820 at phenotypic level representing that there was maximum and sufficient effect of the characters evaluated on seed yield in cowpea. Therefore, path analysis gave an idea that the characters viz., harvest index, plant height, number of pods per plant and number of seeds per pod possessed high direct positive effect over seed yield with significant and positive relationship and were the major determinants of seed yield. Thus, these traits should be given more emphasis during selection for yield improvement in cowpea. Inference Analysis of variance showed significant genetic variability among the cowpea genotypes for all 12 traits. Phenotypic and genotypic coefficient of variation along with heritability and genetic advance as percent of mean were reported high for traits like number of pods per plant, harvest index, seed yield per plant and plant height. Plant height, number of pods per plant, harvest index and number of seeds per pod were significantly and positively associated with seed yield and also contributed directly towards seed yield. References Adetiloye, I.S., Ariyo, O.J. and Awoyomi, O.L. (2017).Study of Genotypic and Phenotypic Correlation among 20
Accessions of Nigerian Cowpea.J. Agriculture and Veterinary Science , 10, 36-39. Animasaun DA, Oyedeji S, Azeez YK, Mustapha OT and Azeez MA (2015).Genetic variability study among ten
cultivars of cowpea using morpho-agronomic traits and nutritional composition.The J. Agril. Sci., 10(2): 119-130.
Burton, G.W. (1952). Quantitative inheritance in grasses. Proc. Sixth Int. Grassland Cong.: 277-285. Chattopadhyay, A., Rana, N. P., Seth, T., Das, S., Chatterjee, S. and Dutta, S. (2014). Identification of selection
indices and choosing of parents for vegetable cowpea breeding programme.Legume Res., 37(1):19-25. Cokkizgin, A., Colkesen, M., Idikut, L., Ozsisli, B. and Girgel, U. (2013).Determination of relationship between
yield components in bean by using path coefficient analysis.Greener J. Agri. Sci., 3(2):85-89. Gupta, R.P., Arya, M., Kumar, A. and Kumari, P. (2019). Study on genetic variability in cowpea .Curr. J. App.
Sci. and Tech., 33(2): 1-8. Jogdhande Srinivas, Vijay S. Kale and Nagre, P.K. (2017). Correlation and Path Analysis Study in Cowpea
Genotypes. Int. J. Curr. Microbiol. App. Sci. 6(6): 3305-3313. Khan, H., Viswanatha, K.P. and Sowmya, H.C. (2015). Study of genetic variability parameters in cowpea
germplasm lines. National Environmentalists Asso., Jharkhand, India. 10 (2): 747-750. Kouam, E.B., Ngompe-Deffo, T., Anoumaa, M. and Pasquet, R.M. (2018).Preliminary study on character
associations, phenotypic and genotypic divergence for yield and related quanitative traits among cowpea landraces from the Western Highland Region of Cameroon.Open Agriculture, 3: 84-97.
Kumar, S., Patel, P.S. and Kumar, P. (2018).Genetic variability, heritability and genetic advance in cowpea.Plant Archives, 18(2): 1268-1270.
Manisha, R.P., Vijay, S.K., Madhavi, B.B. and Jadhav, R.D. (2018).Correlation and Path Analysis Study in F5 Generation of Cowpea.Int. J. Cur. Microbio. App. Sci., 6: 1529-1537.
Meena, H.K., Ram Krishna, K. and Singh, B. (2015).Character associations between seed yield and its components traits in cowpea [Vignaunguiculata (L.)Walp.].Indian J. Agriculture Res., 49 (6): 567-570.
Nguyen, N.V., Arya, R.K. and Panchta Ravish. (2019). Studies on genetic parameters, correlation and path coefficient analysis in cowpea.Range Mng. and Agroforestry, 40(1): 49-58.
Ramesh, P., Nautiyal, M.K., Singh, Y.V. and Sharma, C.L. (2014).Evaluation of genetic variability for some of quantitative traits in grain cowpea.Int. J. Basic and Applied Agri. Res., 12(2): 188-192.
Sable, G.R., Bhave, S.G., Desai, S.S, Dalvi, M.B. and Pawar, P.R. (2018). Variability and genetic advance studies in F2 generation of cowpea. Int. J. Curr. Microbiol. App. Sci. 7(9): 3314-3320.
Sarath PS & Reshma T. (2017). Genetic variability studies in cowpea. Int. J. Agril Sci. and Res., 7(3): 129-132. Searle, S.R. (1961). Phenotypic, genotypic and environmental correlations.Biometrics 17: 474-480. Singh OV, Shekhawat, N., Singh, K. and Gowthami, R. (2018). Genetic divergence studies in cowpea germplasm
using Mahalanobis D2 analysis. Int. J. Curr. Microbiol.and App. Sci., 7 (3): 2616-2624. Srinivas, J., Kale, V.S. and Nagre, P.K. (2017). Correlation and path analysis study in cowpea genotypes. Int. J.
Curr. Microbiol. App. Sci., 6 (6): 3305-3313.
National E-Workshop onCurrent Scenario of Post Graduation Research in Agriculture Sector Sept 09-11, 2020
48
Suganthi, S. and Murugan, S. (2008).Association analysis in cowpea.Legume Res., 31(2):130-132. Surpura, M.H. and Sharma, S.C. (2017).Genetic variability for yield and physiological traits in cowpea.The
Allahabad Farmer, 19(3): 401-475. Thorat, A. and Gadewar, R. D. (2013).Variability and correlation studies in cowpea.International J. Environmental
Rehabilitation and Conservation, 4(1): 44-49. Walle, T., Mekbib, F., Amsalu, B. and Gedil, M. (2018).Correlation and path coefficient analyses of cowpea
landraces in Ethiopia.American J. Pl. Sci., 9: 2794-2812. Wright, S. (1921). Correlation and causation.J.AgriculturalRes., 20: 257-287.
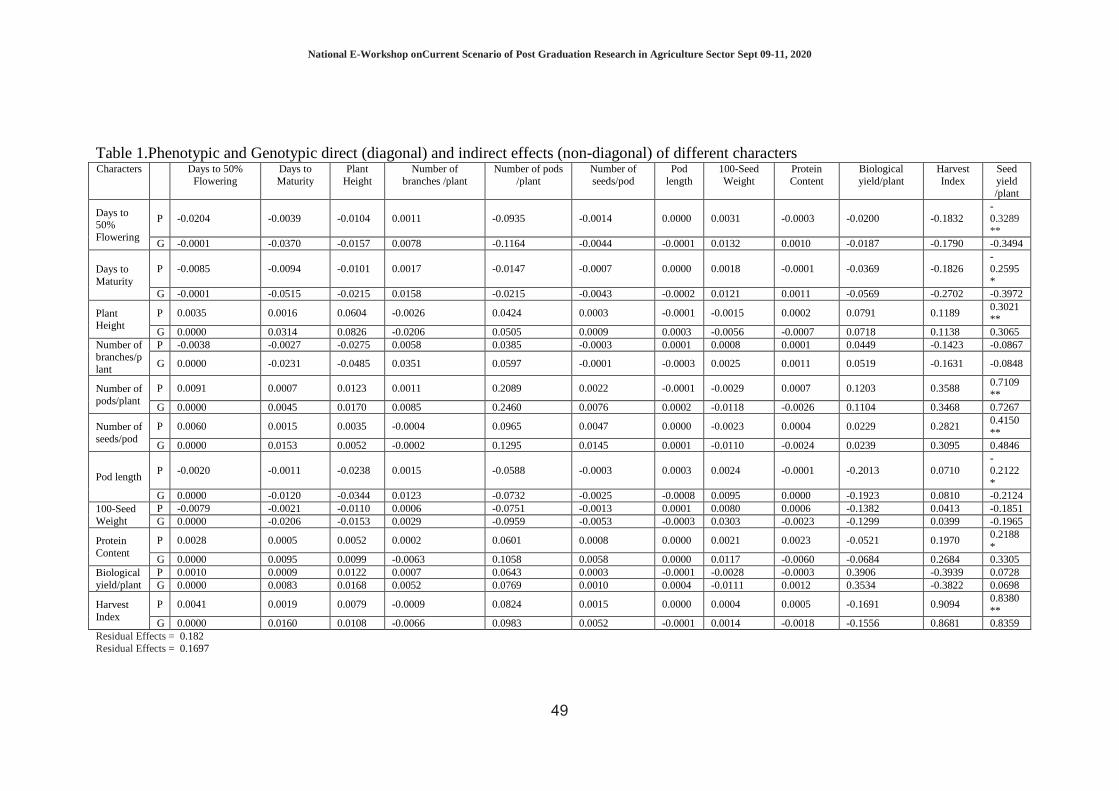
National E-Workshop onCurrent Scenario of Post Graduation Research in Agriculture Sector Sept 09-11, 2020
49
Table 1.Phenotypic and Genotypic direct (diagonal) and indirect effects (non-diagonal) of different characters Characters Days to 50%
Flowering Days to Maturity
Plant Height
Number of branches /plant
Number of pods /plant
Number of seeds/pod
Pod length
100-Seed Weight
Protein Content
Biological yield/plant
Harvest Index
Seed yield /plant
Days to 50% Flowering
P -0.0204 -0.0039 -0.0104 0.0011 -0.0935 -0.0014 0.0000 0.0031 -0.0003 -0.0200 -0.1832 -0.3289**
G -0.0001 -0.0370 -0.0157 0.0078 -0.1164 -0.0044 -0.0001 0.0132 0.0010 -0.0187 -0.1790 -0.3494
Days to Maturity
P -0.0085 -0.0094 -0.0101 0.0017 -0.0147 -0.0007 0.0000 0.0018 -0.0001 -0.0369 -0.1826 -0.2595*
G -0.0001 -0.0515 -0.0215 0.0158 -0.0215 -0.0043 -0.0002 0.0121 0.0011 -0.0569 -0.2702 -0.3972
Plant Height
P 0.0035 0.0016 0.0604 -0.0026 0.0424 0.0003 -0.0001 -0.0015 0.0002 0.0791 0.1189 0.3021**
G 0.0000 0.0314 0.0826 -0.0206 0.0505 0.0009 0.0003 -0.0056 -0.0007 0.0718 0.1138 0.3065 Number of branches/plant
P -0.0038 -0.0027 -0.0275 0.0058 0.0385 -0.0003 0.0001 0.0008 0.0001 0.0449 -0.1423 -0.0867
G 0.0000 -0.0231 -0.0485 0.0351 0.0597 -0.0001 -0.0003 0.0025 0.0011 0.0519 -0.1631 -0.0848
Number of pods/plant
P 0.0091 0.0007 0.0123 0.0011 0.2089 0.0022 -0.0001 -0.0029 0.0007 0.1203 0.3588 0.7109**
G 0.0000 0.0045 0.0170 0.0085 0.2460 0.0076 0.0002 -0.0118 -0.0026 0.1104 0.3468 0.7267
Number of seeds/pod
P 0.0060 0.0015 0.0035 -0.0004 0.0965 0.0047 0.0000 -0.0023 0.0004 0.0229 0.2821 0.4150**
G 0.0000 0.0153 0.0052 -0.0002 0.1295 0.0145 0.0001 -0.0110 -0.0024 0.0239 0.3095 0.4846
Pod length P -0.0020 -0.0011 -0.0238 0.0015 -0.0588 -0.0003 0.0003 0.0024 -0.0001 -0.2013 0.0710
-0.2122*
G 0.0000 -0.0120 -0.0344 0.0123 -0.0732 -0.0025 -0.0008 0.0095 0.0000 -0.1923 0.0810 -0.2124 100-Seed Weight
P -0.0079 -0.0021 -0.0110 0.0006 -0.0751 -0.0013 0.0001 0.0080 0.0006 -0.1382 0.0413 -0.1851 G 0.0000 -0.0206 -0.0153 0.0029 -0.0959 -0.0053 -0.0003 0.0303 -0.0023 -0.1299 0.0399 -0.1965
Protein Content
P 0.0028 0.0005 0.0052 0.0002 0.0601 0.0008 0.0000 0.0021 0.0023 -0.0521 0.1970 0.2188*
G 0.0000 0.0095 0.0099 -0.0063 0.1058 0.0058 0.0000 0.0117 -0.0060 -0.0684 0.2684 0.3305 Biological yield/plant
P 0.0010 0.0009 0.0122 0.0007 0.0643 0.0003 -0.0001 -0.0028 -0.0003 0.3906 -0.3939 0.0728 G 0.0000 0.0083 0.0168 0.0052 0.0769 0.0010 0.0004 -0.0111 0.0012 0.3534 -0.3822 0.0698
Harvest Index
P 0.0041 0.0019 0.0079 -0.0009 0.0824 0.0015 0.0000 0.0004 0.0005 -0.1691 0.9094 0.8380**
G 0.0000 0.0160 0.0108 -0.0066 0.0983 0.0052 -0.0001 0.0014 -0.0018 -0.1556 0.8681 0.8359 Residual Effects = 0.182 Residual Effects = 0.1697

National E-Workshop onCurrent Scenario of Post Graduation Research in Agriculture Sector Sept 09-11, 2020
50
PERFORMANCE OF DIFFERENT VARIETIES OF CHINA ASTER UNDER NAGPUR CONDITIONS AND THEIR RESPONSE TO
PINCHING
NehaChopde, A. R. Palekar, HarshaMendhe and V. P. Satar College of Agriculture, Gadchiroli, Nagpur
Introduction China aster (CallistephuschinensisNees.) belonging to the family Asteraceae is a free blooming annual grown all over the world for its cut and loose flowers. The species consists of diverse forms, types and wide spectrum of colour ranges. The flowers have long vase life and are used for the preparation of garlands, in bouquets as fillers, flower arrangements, in flower shows and exhibitions. The demand for flowers of China aster is increasing day by day in Vidharbha region of Maharashtra state, but flower yield of this crop is not satisfactory in this region. Successful cultivation of China aster depends upon proper selection of varieties. In recent years, several new cultivars of aster with wide range of colours have entered the market but all the cultivars cannot be grown everywhere successfully. Hence, it is necessary to identify the suitable cultivar for commercial cultivation in the region. In most of the flower crops, flower yield is mainly dependent on number of flower bearing branches which could be manipulated by arresting vertical growth of plants and encouraging side shoot by means of apical bud pinching. Considering the importance of commercial flower crop of China aster performance of China aster varieties under Nagpur conditions and their response to pinching was conducted to increase the flower yield in Vidharbha region.
Methodology A field experiment was carried out at Horticulture section, College of Agriculture, Nagpur during the year 2017-18 in Factorial Randomized Block Design to find out the most suitable variety and pinching method for increasing growth and flower yield of China aster with twelve treatment combinations and three replications. The treatments comprised of four varieties of aster viz., ArkaKamini, ArkaArchana, ArkaShashank and ArkaAdhya and three pinching treatments viz., No pinching (control), single pinching and double pinching. The experimental plot was brought to fine tilth by ploughing, clod crushing and harrowing. At the time of land preparation, well-rotted FYM @ 15 t ha-1 was mixed uniformly in the soil before last harrowing. The field was then laid out with flat beds of the dimension 1.50 m x 2.40 m. As per the treatment, uniform and healthy seedlings of four varieties of aster were transplanted in the prepared plots at the spacing of 30 cm x30 cm. Treatment wise half the dose of 100 kg nitrogen was applied in the form of urea before transplanting of seedlings and the remaining half dose of nitrogen was top dressed after 30 days of transplanting. However, the full dose of 50 kg phosphorus and 50 kg potassium ha-1 were applied in the form of single super phosphate and muriate of potash, respectively

National E-Workshop onCurrent Scenario of Post Graduation Research in Agriculture Sector Sept 09-11, 2020
51
at the time of transplanting. Single pinching was carried out on 30th day and double pinching on 30th and 45th day after transplanting. All the cultural operations viz., weeding, irrigation, pest control etc. were carried out as and when required. Various observations on growth, flowering, yield and quality parameters were recorded at proper stages and the data was statistically analyzed by the method suggested by Panse and Sukhatme (1995).
Findings The data presented in Table 1 revealed that, different varieties of China aster had significant effect on all growth, flowering, yield and quality parameters except diameter of flower. However, the effect of pinching on all the characters studied in China aster was found statistically significant. Table 1: Performance of China aster varieties and their response to pinching Treatments Plant
spread (cm)
Stem diameter (cm)
Days for commencement of flowering (days)
Days for 50 per cent flowering (days)
Flower yield plant-1 (g)
Flower diameter (cm)
Weight of flower (g)
Bloom ing period (days)
Main factor- Varieties
V1- ArkaKamini 25.52 1.30 59.06 94.59 110.92 5.51 2.66 38.35
V2- ArkaArchana 31.09 1.22 54.69 90.73 91.07 5.35 2.48 33.57
V3- ArkaShashank 27.57 1.19+ 59.37 95.54 78.86 4.92 2.28 36.40
V4- ArkaAdhya 30.03 1.32 56.79 93.21 74.54 5.06 2.35 33.75
F test Sig. Sig. Sig. Sig. Sig. NS Sig. Sig.
SE(m)± 0.69 0.04 0.81 0.80 3.42 0.19 0.08 0.68
CD 5% 2.03 0.11 2.39 2.35 10.04 - 0.25 2.01
Sub factor- Pinching
P1- No pinching 22.86 0.96 48.55 84.21 60.86 6.07 3.28 29.54
P2- Single pinching 29.27 1.38 57.06 94.12 93.52 5.08 2.35 35.78
P3- Double pinching 33.52 1.43 66.82 102.23 112.18 4.49 1.70 41.23
F test Sig. Sig. Sig. Sig. Sig. Sig. Sig. Sig.
SE(m)± 0.60 0.03 0.7 0.69 2.96 0.17 0.07 0.59
CD 5% 1.76 0.09 2.07 2.03 8.70 0.50 0.21 1.73
Interaction effect
F test NS NS NS NS NS NS NS NS
SE(m)± 1.20 0.06 1.41 1.38 5.93 0.34 0.14 1.18
CD 5% - - - - - - - -
Effect of varieties Significantly maximum plant spread (31.09 cm) and the earliest commencement of flowering (54.69 days) and 50 per cent flowering (90.73 days) were registered with the aster variety ArkaArchana and it was found statistically at par with the varieties ArkaAdhya (30.03 cm, 56.79 days and 93.21 days, respectively), whereas, stem diameter was found maximum (1.32 cm) with ArkaAdhya. However, significantly the highest flower yield plant-1 (110.92 g), weight of flower (2.66 g) and blooming period (38.35 days) were noticed with the variety ArkaKamini which was found at par with ArkaArchana in respect to weight of flower (2.48 g) and ArkaShashank in respect to vase life of flower (36.40 days). The significant differences in the plant growth, yield and quality of China aster varieties might be attributed due to the differential genetical makeup and varied growth rate among the varieties of China aster. Similar variations in plant growth, yield and quality attributes among the
National E-Workshop onCurrent Scenario of Post Graduation Research in Agriculture Sector Sept 09-11, 2020
52
varieties in China aster were also observed by Shailaja and Panchbhai (2014) and Shailajaet al. (2014). Effect of pinching Significantly the earliest commencement of flowering (48.55 days) and 50 per cent flowering (84.21 days), highest flower diameter (6.07 cm) and weight of flower (3.28 g) were noted with no pinching treatment, whereas, significantly maximum plant spread (33.52 cm), stem diameter (1.43 cm), flower yield plant-1 (112.18 g) and blooming period (41.23 days) were recorded with the treatment of double pinching. An increase in the plant spread and stem diameter in pinched plant was mainly due to the removal of apical meristematic tissue which inhibited the apical dominance and diverted plant metabolites from vertical growth to horizontal growth due to which branches plant-1 might have increased and as a result plant spread and stem diameter also increased. The flower yield plant-1was increased as a result of double pinching which might be due to the reason that extra energy diverted into the production of more reproductive parts instead of vegetative parts. Similar decrease in vertical growth and increase in horizontal growth with increase in flower yield and quality traits due to pinching was reported by Maharnoret al. (2011) and Meenaet al. (2015) in African marigold. The blooming period of aster was enhanced due to pinching treatment. This might be due to the fact that by removing apical position, the plant enters vegetative phase and new shoots took longer time to be physiologically mature and thus, resulted in extended flowering span due to pinching. This result was in line with findings of Jindal et al. (2018) in chrysanthemum. Interaction effect An interaction effect of China aster varieties and pinching treatments on various growth, flower yield and quality parameters studied was found to be non-significant. Similar non-significant effect of China aster varieties and pinching treatments on various growth, yield and quality parameters was found by Shailaja and Panchbhai (2014) and Shailajaet al. (2014).
Inference Maximum plant spread and earliest flowering were recorded with variety ArkaArchana, whereas, stem diameter was noted maximum with ArkaAdhya. However, flower yield plant-1, weight of flower and blooming period were recorded highest with the variety ArkaKamini. In respect of pinching methods, plant spread, stem diameter, flower yield plant-1 and blooming period were noticed significantly maximum with double pinching, whereas, diameter and weight of flower were noted maximum and days for commencement of flowering and 50 per cent flowering were minimum with no pinching treatment.
References Jindal Manisha, B V Thumar and Hallur Virupakshi (2018). Effect of planting time and pinching on flowering and flower quality of chrysanthemum cv. Ratlam Selection. J. Pharmacognosy &Phytochem.; 7(4):390-393. Maharnor SI, Chopde Neha, Thakre Seema and PD Raut (2011). Effect of nitrogen and pinching

National E-Workshop onCurrent Scenario of Post Graduation Research in Agriculture Sector Sept 09-11, 2020
53
on growth and yield of African marigold. Asian J. Hort.; 6(1):43-45. Meena Y, H S Sirohi, B S Tomar and S Kumar (2015). Effect of planting time, spacing and pinching on growth and seed yield traits in African marigold (Tageteserecta L.) cv. Pusa Narangi Gainda. Indian J. Agril. Sci.; 85(6):797-801. Panse VG and P V Sukhatme (1995).Statistical Methods for Agricultural Workers. New Delhi, Publication and Information Division, ICAR. Shailaja SM and D M Panchbhai(2014). Effect of pinching on growth and quality characters of China aster varieties.The Asian J. Hort.; 9(1):36-39. Shailaja SM, D M Panchbhai, K. Suneetha andN Vijay Kumar (2014). Effect of pinching on flowering and yield characters of China aster varieties. The Asian J. Hort.; 9(1):210- 212.
National E-Workshop onCurrent Scenario of Post Graduation Research in Agriculture Sector Sept 09-11, 2020
54
CHARACTER ASSOCIATION ANALYSISFOR SEED YIELD AND RELATED AGRO-MORPHOLOGICAL TRAITS IN MOTHBEAN
Sangeeta Pal1, N.K. Sharma2
1 Department of Genetics & Plant Breeding, College of Agriculture, SKRAU, Bikaner 2 Additional Director Research (Seeds), NSP-SKRAU, Bikaner - 334006, India.
Email: [email protected]
Introduction Mothbean [Vigna aconitifolia (jacq) Marechal] also known as Turkish gram (Yaqoob et al., 2015), mat or dewbean. It is a diploid species with chromosome number (2n=2x=22) belongs to the family Leguminaceae (Fabaceae), sub-family Papilionaceae(Verdcort, 1970).It is the principal ingredient of a famous spicy snack BikaneriBhujiya. It is also consumed in the preparation of other food products like Papad, Namkeen, Mangori, Dal vada etc. About 80 percent of mothbean production of Rajasthan is consumed in agri-industriesatBikaner. (Sharma,2016).The knowledge of association between yield and its component characters is of immense value for breeder, because it forms a basis for selection. Therefore, present study was conducted to assess correlation to identify component traits for developing high yielding varieties of mothbean for arid zone. Materials and Methods The present investigation was carried out during Kharif, 2019 at research farm atCollege of Agriculture, Swami Keshwanand Rajasthan Agricultural University, Bikaner. The experimental material consisted of 49 genotypes was evaluated in randomized block design with three replications accommodating 3 meters long two rows per replication at 30 cm spacing. Observations were recorded for 10 characters viz., days to 50 percent flowering, days to maturity, plant height, number of pods per plant, seeds per pod, pod length, 100 seed weight, biological yield, harvest index, seed yield.The correlation coefficients were computed according to Singh and Choudhary (1985). Results and Discussion Yield, a complex polygenic trait has a large number of other contributing component traits. In present investigation some yield related agro-morphological characters were studied(Table-1). At phenotypic level seed yield per plant had significant and positive correlation with harvest index followed by number of pods per plant, number of seeds per pod and hundred seed weight. At genotypic level seed yield per plant had significant and positive correlation with number of pods per plant followed by harvest index, number of seeds per pod and hundred seed weight. Therefore, these characters may be emphasized for mothbean breeding programme. Seed yield per plant exhibited negative correlation with days to fifty percent flowering and days to maturity at both genotypic and phenotypic level hence, suggesting the importance of short duration genotypes for cultivation in arid zone (Table 1). Similar results were reported by Garg etal. (2003), Sihag etal.(2005), Patil etal.(2007), Garg etal.(2017), Kohakade etal. (2017) and Sahooetal. (2019). Hence, presently study reveals that harvest index, number of pods per plant, number of seeds per pod and 100 seed weight are important agronomic traits as they have

National E-Workshop onCurrent Scenario of Post Graduation Research in Agriculture Sector Sept 09-11, 2020
55
significantly positively correlated with seed yield; Therefore, this information helps breeders to improve the yield through improving yield contributing traits. Inference Harvest index, number of pods per plant, number of seeds per pod and hundred seed weight had significant positive correlation with seed yield. Therefore, selection based on these component traits would results improvement in seed yield of mothbean. References Dewey, D.R. and Lu, H.K. (1959).A correlation and path coefficient analysis of components of crested
wheat grass and seed production. Agron J, 51(6): 5515-5518. Garg, D.K., Kakani, R.K., Sharma, R.C. and Gupta, P.C. (2003).Genetic variability and character
association in mothbean under hyper arid region.Adv.in Arid Legum. Res.: 93-97. Garg, G.K., Verma, P.K. and Harikesh.(2017). Genetic variability, correlation and path analysis in
mungbean [Vigna radiata (L.)Wilczek].Int. J. Curr.Microbiol. App. Sci., 6(11): 2166-2173. Kohakade, S.N., Bhavsar, V.V. and Pawar, V.Y. (2017).Correlation and path analysis for different
characteristics in germplasm of mothbean [Vigna aconitifolia (Jacq.)Marechal].Int.J.Curr.Microbiol. App.Sci.,6(11): 2181-2186.
Patil, S. C., Patil, V.P., Patil,H.E. and PawarS.V. (2007). Correlation and path coefficient studies in mothbean (Vigna aconitifolia).Int. J. Plant Sci., 2(2): 141-144.
Sahoo, S., Sharma, A.K., Sanadya, S.K. and Kumar, K. (2018).Character association and path coefficient analysis in mothbean germplasms.Int. J. Curr. Microbiol. App. Sci., 7(8): 833-839.
Sharma, N. K. (2016). Mothbean production strategy. Swami Keshwanand Rajasthan Agricultural University, Bikaner DOR/SKRAU /Bikaner /2016/ NFSM Publication-1: 18p.
Sihag, S.K., Khatri, R.S., Singh, J.V. (2005). Correlation and path analysis for grain yield in mothbean [Vigna aconitifolia (Jacq.) Marechal.J. Arid Legumes, 2: 306-308.
Singh, R.K. and Choudhary, B.D. (1985).Variance and covariance analysis."Biometrical methods in quantitative genetic analysis".Kalyani publication, New Delhi, 39-68.
Verdcourt, B. (1970). Studies in the leguminosae and papilionideae for flora of tropical east Africa ll.KewBull.24: 235-307.
Wright, S. (1921). Correlation and causation.J. Agric. Res. 20:557-587. Yaqoob, M., Khan, N. and Khaliq, P. (2007).Genetic divergence in some mothbean [Vigna aconitifolia (Jacq) Marechal] genotypes.Pak J Bot, 39: 2367–2372.
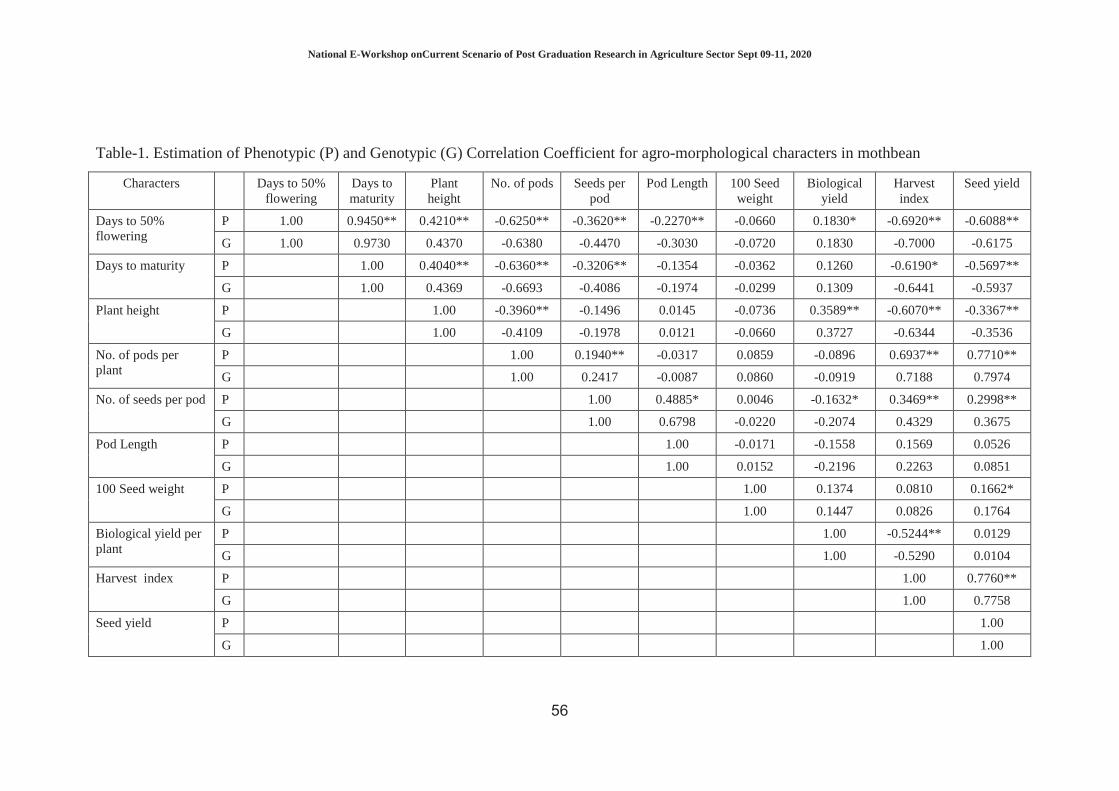
National E-Workshop onCurrent Scenario of Post Graduation Research in Agriculture Sector Sept 09-11, 2020
56
Table-1. Estimation of Phenotypic (P) and Genotypic (G) Correlation Coefficient for agro-morphological characters in mothbean
Characters Days to 50% flowering
Days to maturity
Plant height
No. of pods Seeds per pod
Pod Length 100 Seed weight
Biological yield
Harvest index
Seed yield
Days to 50% flowering
P 1.00 0.9450** 0.4210** -0.6250** -0.3620** -0.2270** -0.0660 0.1830* -0.6920** -0.6088**
G 1.00 0.9730 0.4370 -0.6380 -0.4470 -0.3030 -0.0720 0.1830 -0.7000 -0.6175
Days to maturity P 1.00 0.4040** -0.6360** -0.3206** -0.1354 -0.0362 0.1260 -0.6190* -0.5697**
G 1.00 0.4369 -0.6693 -0.4086 -0.1974 -0.0299 0.1309 -0.6441 -0.5937
Plant height P 1.00 -0.3960** -0.1496 0.0145 -0.0736 0.3589** -0.6070** -0.3367**
G 1.00 -0.4109 -0.1978 0.0121 -0.0660 0.3727 -0.6344 -0.3536
No. of pods per plant
P 1.00 0.1940** -0.0317 0.0859 -0.0896 0.6937** 0.7710**
G 1.00 0.2417 -0.0087 0.0860 -0.0919 0.7188 0.7974
No. of seeds per pod P 1.00 0.4885* 0.0046 -0.1632* 0.3469** 0.2998**
G 1.00 0.6798 -0.0220 -0.2074 0.4329 0.3675
Pod Length P 1.00 -0.0171 -0.1558 0.1569 0.0526
G 1.00 0.0152 -0.2196 0.2263 0.0851
100 Seed weight P 1.00 0.1374 0.0810 0.1662*
G 1.00 0.1447 0.0826 0.1764
Biological yield per plant
P 1.00 -0.5244** 0.0129
G 1.00 -0.5290 0.0104
Harvest index P 1.00 0.7760**
G 1.00 0.7758
Seed yield P 1.00
G 1.00

National E-Workshop onCurrent Scenario of Post Graduation Research in Agriculture Sector Sept 09-11, 2020
57
RESPONSE OF TUBEROSE GENOTYPES TO GIBBERELLIC ACID AS FOLIAR SPRAY
Seema Thakre, D. M. Panchbhai, Harsha Mendhe and R. P.Gajbhiye
Horticulture Farm, College of Agriculture, Nagpur Email: [email protected]
Introduction The tuberose occupies a very selective and prime position amongst the ornamental bulbous plants for its beauty, elegance and sweet pleasant fragrance. It has a great economic potential for cut-flower trade and essential oil industry. India had exported one metric tons of tuberose concrete worth of Rs. 44.5 million during 2000-2001 (Mathew, 2004). Due to their great demand, it is currently cultivated in most of the tropical and sub-tropical countries of the world. Due to lack of scientific information and non-adoption of technological advances day by day reduced the yield of tuberose spikes and bulb production tremendously. The growth and development of plants are governed by internal factors namely hormonal and nutritional balance. The balance development of plants is governed by the growth regulators, which are being increasingly used to manipulate the growth and flowering of ornamental plants. Keeping this in view, the present study was undertaken to find out the suitable genotype and concentration of gibberellic acid for the better growth, flowering and bulb production of tuberose
Methodology The investigation was carried out at Horticulture Farm, College of Agriculture, Nagpur, during the years 2015-16 and 2016-17. The experiment was laid out in split plot design with three replications and twenty treatment combinations. The main factor comprised of five tuberose genotypes viz. Prajwal (G1), Shringar (G2), NT-01 (G3), NT-06 (G4) and NT-09 (G5) and sub factor comprised of four foliar applications of gibberellic acid viz. P1 – Control (water spray), P2- GA3 50 ppm, P3 - GA3 100 ppm, P4 – GA3 150 ppm. Healthy and uniform bulbs of 1.5-2.0 cm in diameter size having 25-30 g weighed bulb were used as planting material in this experiment. The bulbs were planted on raised bed with 5 cm depth at 30 cm x 30 cm spacing.Solution of gibberellic acid was sprayed as per the treatment along with control (water spray) at 30th and 60th day after planting. All the intercultural operations were followed as and when required. Five plants were selected at random in each plot for recording the observations on various growth, flowering and bulb characters. Two years data was pooled together and statistically analyzed as per the methods suggested by Panse and Sukhatme (1967).
National E-Workshop onCurrent Scenario of Post Graduation Research in Agriculture Sector Sept 09-11, 2020
58
Findings Results obtained are summarized in Table 1 & 2; analysis of variance revealed that, tuberose genotypes and foliar application gibberellic acid had significant effect on growth, flowering, yield and quality parameters of tuberose spikes, bulb and bulbils for both the years of experimentation and pooled result, too. Growth Response of genotypes During both the years of experimentation and pooled result different genotypes had exhibited the significant difference in respect of plant height. After 210 days of planting significantly maximum height of tuberose plant and leaf area were recorded with the genotype Prajwal (77.95 cm and 147.19 cm2, respectively) and it was found to be at par with the genotype NT-09 in plant height and followed by in leaf area of tuberose plant. However, the genotype NT-01 had recorded significantly minimum plant height and leaf area (62.83 cm and 123.20 cm2, respectively). The significant differences in plant height and leaf area due to the different genetic makeup and heredity of the genotypes as well as prevailing climatic condition. Variations have also been observed in plant height and leaf area. Similar results in respect of height of plant in tuberose genotypes are quoted previously by Rao and Sushma (2015) Dimri et al. (2017) and Lalthawmliana et al. (2017) in tuberose. Effect of foliar application of Gibberellic acid Significantly maximum plant heightand leaf area (75.05 cm and 136.66 cm2, respectively) was observed under the treatment GA3 100 ppm and it was found to be at par with the treatment GA3 150 ppm (73.77 cm and 131.27 cm2, respectively) Whereas, significantly minimum plant height and leaf area (67.60 cm and 128.43 cm2, respectively) was recorded by control treatment. GA3 might have extended the plant height by increasing the internodal length which can be attributed to the cell elongation and cell division, Thus, GA3 might have promoted the vegetative growth, resulted in taller plants with greater leaf area. These results are in close conformity with the Patidar (2014) in tuberose. Flowering Response of genotypes Significant differences in respect of days to emergence first spike from planting, yield of spikes plant-1, Significantly early first spike emergence (84.57 days) and maximum number of spikes plant-1 (4.81) was registered with the Prajwal genotype whereas, significantly late first spike emergence (102.44 days) was recorded in genotypes NT-01, However, genotypes NT-06 was recorded minimum number of spike plant-1
(3.30). Similar variation in first spike emergence and spikes plant-1 was reported by the earlier workers viz. Ranchana et al. (2013), Krishnamoorthy (2014), Gaidhani et al. (2016), Singh and Dakho (2017) and Dimri et al. (2017) in tuberose. Effect of foliar application of gibberellic acid Among the different plant growth regulator treatments, spraying with GA3 100 ppm had registered minimum days to emergence of first spike (92.19, days) and maximum spikes plant-1 (4.16). However, significantly the maximum days to emergence of first

National E-Workshop onCurrent Scenario of Post Graduation Research in Agriculture Sector Sept 09-11, 2020
59
spike (96.01, days) and minimum number of spikes plant-1 (3.53) were recorded in control treatment. This might be due to the fact that GA3 application increased the leaf area and enhanced the translocation of food for the development of floral primordia, which lead to early flowering and have resulted into increased production of tuberose spikes. These results are in close conformity with the findings of Rani et al.(2015) in tuberose. Tuberose Spike and Bulb Quality Response of genotypes In respect of quality parameters of tuberose spike and bulb, the genotype Prajwal had recorded significantly the maximum spike length (93.63 cm), rachis length (32.31 cm), diameter of spike (1.46 cm), florets spike-1(49.65), diameter of bulb (6.40 cm) and weight of bulb(150.85, g). Whereas, minimum spike length (73.06 cm), diameter of spike (1.00 cm) and weight of bulb (131.61, g) were recorded in Shringar genotype. However genotype NT-06 was recorded minimum number of florets spike-1 (30.80) and length of rachis (25.76 cm) and diameter of bulb (4.57 cm) was recorded in genotype NT-01. The variation in flower yield and quality parameters might be due to difference in genetic composition of varieties that responded differently to the environment. Akand et al. (2016) in tuberose who recorded increased yield of better quality spikes with the treatment of gibberellic acid. Superiority of some of the genotypes over the others in respect of flowering parameters was also earlier reported by Rani and Singh (2013) in tuberose. Effect of foliar application of gibberellic acid Among the different plant growth regulator treatments, spraying with GA3 100 ppm were recorded maximum length of spike (83.84 cm) and length of rachis (30.96 cm), diameter of spike (1.14 cm), florets spike-1(42.24), diameter of bulb (5.40 cm) and weight of bulb plant-1 (145.26 g) and it was found to be at par with the foliar treatment of GA3 150 ppm. However, significantly the minimum length of spike and rachis, florets spike-1 diameter of bulb and weight of bulb plant-1 were recorded due to the control treatment. This might be due to the enhanced growth rate of vegetative plant parts due to the enhanced physiological activities as influenced by GA3 which also increases the photosynthetic and metabolic activities of the plant causing more transportation and utilization of photosynthetic products. This might have resulted into increased production of the better quality spikes, results are in close conformity with the findings of Patidar (2014) and Rani et al.(2015) in tuberose. Bulb Yield Response of genotypes The tuberose genotype Prajwal had recorded significantly the maximum bulb plant-1
(4.30) and bulbils plant-1 (15.87).However, minimum bulb plant-1 and bulbils plant-1
were recorded with the genotype NT-01. The differential behaviour of the tuberose genotypes as regards the bulb production might be due to the genetic differences in the varieties used. Similar variations in bulb characters due to different genotypes are also reported previously by Mahawer et al. (2013), Rao and Sushma (2015) in tuberose. Effect of foliar application of gibberellic acid

National E-Workshop onCurrent Scenario of Post Graduation Research in Agriculture Sector Sept 09-11, 2020
60
Significantly the maximum number of bulb plant-1, and number of bulbils plant-1 (3.70 and 14.47, respectively) were noted with the foliar application of 100 ppm GA3 and which were found to be at par with the treatment of GA3 150 ppm. However, the control treatment had produced significantly minimum number of bulbs plant-1 and number of bulbils plant-1 (3.05 and 13.09, respectively). Gibberellic acid is known to induce cell elongation, thus leading to increase plant height and number of leaves which might have controlled overall improved rate of photosynthesis and nutrient and water uptake. As a result of this increased availability of metabolites to developing bulbs, there might have been improvement in number and weight of tuberose bulb and bulbils. These results are in agreement with the results of Palanisamy and Parthiban (2014), Khatun (2015) in tuberose. Interaction effect An interaction effect due to the genotypes and foliar application gibberellic acid on height at 210 days after planting, days to emergence of spike, length and diameter of spike, bulbs clump-1 and weight of bulb plant-1 was found to be significant, treatment combination of the genotype Prajwal sprayed with GA3 100 ppm was recorded minimum days to emergence of spike and maximum plant height at 210 days after planting, length and diameter of spike, bulbs clump-1 and weight of bulb plant-1.
Inference The tuberose genotype Prajwal and foliar application of GA3 100 ppm were found to be effective for earlier flowering and getting maximum yield of better quality spikes as well as maximum bulb and bulbils production of tuberose.
References Akand, Muhammad Shafiqul Hoq, Nizamul Haque Patwary, Zuairia Sultana, Mst. Mahbuba Khatun and Ruhal
Amin, 2016.Effect of growth regulators on growth and flowering of tuberose cv. Single. Int. J. Applied Res. 2(3): 103-107.
Dimri, Sarita, Parul Punetha, Mamta Bohra and Tanuja, 2017.Screening of suitable germplasm of tuberose (Polianthes tuberosa L.) for Mid Hill Conditions of Garhwal Himalayas. International J. Agri. Sci. and Res. 7 (2): 499-506.
Gaidhani, A., S. Badge, S. Lokhande and M. Meshram, 2016.Response of tuberose genotypes to yield and quality Parameters. J. Soil and Crops. 26 (2):355-358.
Khatun, Z., 2015. Influence of growth regulators on growth flowering and bulb production of tuberose. M.Sc. (Agri.) Thesis (Unpub.) submitted to Sher-E-Bangla Agricultural University, Dhaka.
Krishnamoorthy, V. 2014.Assessment of tuberose (Polianthes tuberosa L.) varieties for growth and yield characters.Asian J. Hort. 9 (2): 515- 517.
Lalthawmliana, A., K. Rokolhu, Y. Buchem Angngoi and Bagang Lokam, 2017. Evaluation of tuberose cultivars under the foothill conditions of Nagaland. J. Ornamental Hort. 20 (1-2): 69-74.
Mahawer, L. N., H. L. Bairwa, and A. K. Shukla, 2013.Field performance of tuberose cultivars for growth, floral and economic characters under sub-humid southern plains and Aravalli hills of Rajasthan.Indian J. Hort. 70 (3): 411-416.
Mathew, A.G. 2004. Future of spice and floral extract.Indian Perfumer. 48 (1): 35-40. Palanisamy, A. and S. Parthiban, 2014.Studies on effect of spacing, bulb size and plant growth regulators on
growth, flowering and flower yield of tuberose (Polianthestuberosa L.) cv. ‘Prajwal’.Trends in Biosci. 7 (13): 1544-1548.
Panse, V.G. and P.V. Sukhatme, 1967.Statistical Methods for Agricultural Workers. New Delhi, Publication and Information Division, ICAR
Patidar (2014) Patidar, N. 2014.Effect of foliar application of growth regulators on growth and flowering of tuberose (Polianthes tuberosa L.) M.Sc. (Agri.) Thesis (Unpub.), submitted to R. V. S. K. V. V., Gwalior.
National E-Workshop onCurrent Scenario of Post Graduation Research in Agriculture Sector Sept 09-11, 2020
61
Rani, P. and P. Singh, 2013.Impact of gibberellic acid pre-treatment on growth and flowering of tuberose (Polianthes tuberosa L.) cv. Prajwal. J. Trop. Plant Physiol. 5: 33-41.
Rani, Pooja, Kuldeep Yadav, Nisha Kataria and Narender Singh, 2015. Assessment of growth, floral and yield attributes of gladiolus in response to gibberellic acid treatment. Bot. Res. Int. 8 (1): 01-06.
Ranchana, P., M. Kannan and M. Jawaharlal, 2013.The Assessment of genetic parameters yield, quality traits and performance of single genotypes, of tuberose (Polianthes tuberosa L.). Adv. Crop Sci. Tech. 1:3
Rao, K. Dhanumjaya and K. Sushma, 2015.Evaluation of certain tuberose (Polianthes tuberosa L.)Double genotypes for assessing the yield and quality traits under agro Climatic conditions of Telangana. J. Res. PJTSAU. 43 (1&2): 51- 56.
Singh and Dakho (2017) Singh, A. K. and J. Dakho, 2017. Evaluation on performance and superiority of tuberose (Polianthes tuberosa L.) cultivars for growth and flowering under North Indian plain, Environment and Ecology 35 (1A):341-345.

National E-Workshop onCurrent Scenario of Post Graduation Research in Agriculture Sector Sept 09-11, 2020
62
Table 1. Growth, flowering, and yield of spikes as influenced by genotypes and foliar application of gibberellic acid (pooled means) Treatments Height of plant (cm) at 210
DAP Leaf area
(cm2) Days to emergence of spike
(Days) Spikes plant-1
Bulbs clump-1 Bulbils clump-1
Main factor – Genotypes (G) G1 – Prajwal 77.95 147.19 84.57 4.81 4.30 15.87 G2 – Shringar 71.14 127.50 96.76 3.67 3.59 12.83 G3 – NT-01 62.83 123.20 102.44 3.47 2.75 11.82 G4 –NT-06 67.48 125.23 96.29 3.30 3.36 12.67 G5– NT-09 76.52 130.28 91.00 4.08 3.30 14.90 ‘F’ test Sig. Sig. Sig. Sig. Sig. Sig. SE (m)+ 0.58 2.00 1.53 0.13 0.24 0.26 CD at 5% 1.74 5.99 4.56 0.35 0.71 0.75 Sub factor – Foliar application of GA3 (P) P1–Control 67.60 128.43 96.01 3.53 3.05 13.09 P2–GA350 ppm 68.32 129.87 95.43 3.73 3.55 13.37 P3–GA3100 ppm 75.05 136.66 92.19 4.16 3.70 14.47 P4 – GA3 150 ppm 73.77 131.27 93.22 4.05 3.60 13.54 ‘F’ test Sig. Sig. Sig. Sig. Sig. Sig. SE (m)+ 0.54 1.90 0.63 0.16 0.14 0.23 CD at 5% 1.57 5.56 1.80 0.45 0.41 0.67
Interaction effect (G X P) ‘F’ test Sig. N.S. Sig. N.S. Sig. N.S. SE (m)+ 1.21 1.30 1.40 0.32 0.34 0.52 CD at 5% 3.51 - 4.04 - 0.99 -

National E-Workshop onCurrent Scenario of Post Graduation Research in Agriculture Sector Sept 09-11, 2020
63
Table 2. Quality of tuberose spikes and bulbs as influenced by genotypes and foliar application of gibberellic acid (pooled means) Treatments Length of spike (cm) Diameter of spike
(cm) Length of rachis
(cm) Florets spike-1 Diameter of bulb
(cm) Weight of bulb plant-1 (g)
Main factor – Genotypes (G) G1 – Prajwal 93.63 1.46 32.31 49.65 6.40 150.85 G2 – Shringar 73.06 1.00 26.99 35.05 4.67 131.61 G3 – NT-01 78.68 1.02 31.66 38.24 4.57 141.93 G4 –NT-06 77.60 1.02 25.76 30.80 5.04 142.18 G5– NT-09 80.80 1.01 29.10 42.61 5.39 145.27 ‘F’ test Sig. Sig. Sig. Sig. Sig. Sig. SE (m)+ 1.03 0.01 0.41 1.96 0.13 2.59 CD at 5% 3.05 0.02 1.42 3.92 0.41 7.46 Sub factor – Foliar application of GA3 (P) P1–Control 78.00 1.05 27.96 35.97 5.13 138.99 P2–GA3 50 ppm 78.48 1.08 28.85 36.96 5.15 141.21 P3–GA3100 ppm 83.84 1.14 30.96 42.24 5.40 145.26 P4 – GA3 150 ppm 82.68 1.13 28.88 41.86 5.22 144.01 ‘F’ test Sig. Sig. Sig. Sig. Sig. Sig. SE (m)+ 0.75 0.01 0.47 1.35 0.07 1.35 CD at 5% 2.17 0.02 1.35 3.91 0.20 3.89
Interaction effect (G X P) ‘F’ test Sig. Sig. N.S. N.S. N.S. Sig. SE (m)+ 1.68 0.01 0.98 3.03 0.16 3.01 CD at 5% 4.86 0.02 - - - 8.69

National E-Workshop onCurrent Scenario of Post Graduation Research in Agriculture Sector Sept 09-11, 2020
64
STUDY OF HETEROSIS ANALYSIS IN F1 POPULATION OF BREAD WHEAT (TRITICUM AESTIVUM L. EM. THELL.) OVER ENVIRONMENTS
Sohan Lal Kajla and A. K. Sharma
Department of Genetics and Plant Breeding, College of Agriculture, Swami Keshwanand Rajasthan Agricultural University, Bikaner
Email:[email protected] Introduction Bread wheat is considered as a staple food source for a large population of the world and also provides a range of diversified baked food products. Hence, wheat and its production are the chief food sources for human diet (Kumar et al., 2013). Heterosis has been estimated in a range of cultivated crops and has been the purpose of considerable importance to study as mean of increasing productivity of crop plant. It is now well established that heterosis does occur with proper combination of parents. Formerly, utilization of heterotic effects for grain yield was mainly ascribed to cross-pollinated crops. However, later it was reported in wheat as being predominantly self-pollinated for the first time by Freeman (1919), who well-versed the supremacies of F1 crosses over their parents (Özgen, 1989). Briggle (1963) described existence of heterosis in substantial quantity for grain yield components in different F1 wheat crosses. Keeping in view the above facts, the current research was designed to estimate heterotic effects in forty five crosses of wheat. Methodology The present investigation aimed to gather information’s on the genetic basis of yield and its contributing traits in ten diverse genotypes of bread wheat (Triticum aestivum L. em. Thell.). The resultant 45 F1s and all the ten parents were evaluated in randomized block design with three replications under three different environments created by three dates of sowing. Observations were recorded on ten randomly selected competitive plants of each parent and 45 F1’s. The heterosis (H%) and heterobeltiosis (HB%) values were estimated as the deviation of the F1 value from the mid-parent and the better-parent values as suggested by Matzinger et al. (1962) and Fonseca and Patterson (1968), respectively. Findings In present investigation, heterosis over mid parent and better parent has been estimated in order to explore the possibility of using in the production of hybrids. The expression of heterosis and heterobeltiosis, in general, was variable for different traits under all the environments. Heterotic expression was fairly high and desirable for grain yield per plant (82.72 per cent in E2), number of effective tillers per plant (67.50 per cent in E1), biological yield per plant (49.64 per cent in E3), harvest index (44.82 per cent in E3), number of grains per spike (37.89 in E3), grain filling period (36.36 per cent in E2), spike length (35.72 per cent in E3), flag leaf area (35.16 per cent in E3) and 1000-seed weight (25.03 per cent in E3). Similarly, magnitude of heterobeltiosis was fairly high and desirable for grain yield per plant (76.59 per cent in E2), number of effective tillers per plant (58.77 per cent in E1), biological yield per plant (42.24 per cent in E3), grain filling period (35.01 per cent in E2), number of grains per spike (32.46 per cent in E3), flag leaf area (32.24 per cent in E1), harvest index (32.22 per cent in E3), spike length (30.07 per cent in E3) and 1000-seed weight (22.46 per cent in E3). The results are in agreement with those of others obtained in varying
National E-Workshop onCurrent Scenario of Post Graduation Research in Agriculture Sector Sept 09-11, 2020
65
environments for different characters Kumar et al. (2014) andSaren (2018) also reported maximum heterosis for grain yield per plant.In current study, the highest range of heterosis has been estimated for all the attributes. The range of heterosis over mid-parent for grain yield per plant from -46.28 per cent to 60.86 per cent in E1, -47.42 per cent to 82.72 per cent in E2 and -41.22 per cent to 81.05 per cent in E3. The results in varying environments for different characters are in conformity with the findings of Lal et al. (2013) and Gaur et al. (2014). The superiority of hybrids particularly over better parent (heterobeltiosis) is more important and useful in determining the feasibility of commercial exploitation of heterosis and also indicating the parental combinations capable of producing the highest level of transgressive segregants.The crosses WH 1021 x PBW 550 in all three environments, Raj 3765 x Raj 3077 in E1 and E2 and Raj 4238 x WH 1021 in E1 and E3 emerged as good heterotic as well as heterobeltiotic crosses for grain yield per plant. Among top three crosses for grain yield per plant in all the environments, the crosses WH 1021 x PBW 550 and Raj 4238 x WH 1021 showed desirable heterosis and heterobeltiosis for one or more characters in all the environments. Hence, these crosses may be considered as promising type for tangible advancement of bread wheat yield under normal sown and thermal stress condition. The parents, who showed desirable heterosis and heterobeltiosis for grain yield per plant, also exhibited desirable heterosis and heterobeltiosis at least for one or more yield attributing traits. Such as, heterosis for grain yield per plant was mainly contributed by number of grains per spike and number of effective tillers per plant while heterobeltiosis by number of grains per spike and number of effective tillers per plant in all the three environments. Findings of this investigation supported the contentions of Grafius (1959), who suggested that there could be no separate gene system for yield per se as yield is an end product of the multiplicative interactions among its various contributing attributes. Thus, heterobeltiosis for various yield contributing characters might be result in the expression of heterobeltiosis for grain yield. However, the crosses showing heterotic expression for grain yield per plant were not heterotic for all the characters. It was also noted that the expression of heterosis and heterobeltiosis was influenced by the environments for almost all the characters. This was because of significant G x E interaction. The results are in harmony with Kumar and Maloo (2011), Lal et al. (2013) and Baloch et al. (2016). References Baloch, M., Baloch, A.W., Siyal, N.A., Baloch, S.N., Soomro, A.A., Baloch, S.K. and Gandahi, N. (2016).
Heterosis Analysis in F1Hybrids of Bread Wheat.SindhUniv. Res. Jour. (Sci. Ser.) 48 (2): 261-264. Briggle, L.W. (1963) Heterosis in wheat. Areview Crop Science, Vol. (3): 407-412. Fonseca S, Patterson FL (1968) Hybrid vigour in seven parent diallel cross in common wheat. Crop Sci. 8, 85-88 Freeman, G.F., (1919) Heredity of quantitative characters in wheat. Genetics, Vol. (4): 1-93. Gaur, S.C., Singh, S.N., Tiwari, L.P. and Gaur, L.B. (2014).Heterosis and inbreeding depression in the inheritance
of grain yield and its components in wheat.Current Advances inAgril. Sci.,6(2): 186-189. Grafius, J.E. 1959. Heterosis in barley.Agron.J., 51 : 551-554. Kumar, A., Kumar, V., Kerkhi, S.A., Kumar, S., Chand, P., Kumar, N., Kumar, D. and Kumar, M. (2014).
Evaluation of heterosis for yield and yield related traits in bread Wheat .Prog.Agric.14(1): 151-159. Kumar, A., V. K. Mishra, R. P. Vyas, V. Singh, (2013) Heterosis and combining ability analysis in bread wheat
(Triticum aestivum L.).Journal of Plant Breeding and Crop Science, Vol. (3): Issue 10: 209-217. Kumar, V. and Maloo, S.R. (2011). Heterosis and combining ability studies for yield components and grain protein
content in bread wheat. Indian J. Genet., 71 (4): 363-366. Lal, C., Kumar, V. and Maloo, S.R. (2013).Heterosis and inbreeding depression for some quantitative and heat
tolerance characters in bread wheat (Triticum aestivum L.).Journal of Wheat Research, 5(2): 52-55. Matzinger DF, Mannand TJ, Cockerham CC (1962) Diallel cross in Nicotiana tabacum. Crop Science 2, 238-286. Ozgen, M., (1989) Kışlık Ekmeklik Buğdayda MelezGücü.Turkish J.of Agriculture Forestry13(3): 1190-1201. Saren, D., Mandal, A. B. and Soren, C. (2018).Heterosis studies in bread wheat (Triticum aestivum L.)Journal of
Agriculture and Veterinary Science 11(9) Ver. I, PP 80-84.

National E-Workshop onCurrent Scenario of Post Graduation Research in Agriculture Sector Sept 09-11, 2020
66
EFFECT OF DIFFERENT FRUIT BUNCH COVERING MATERIALS ON DATE PALM (PHOENIX DACTYLIFERA L.) FRUITS
Tulsi Ram and R. S. Rathore
Department of Horticulture, College of Agriculture, S. K Rajasthan Agricultural University, Bikaner 334006
Email: [email protected]
Introduction One of the world’s first cultivated fruit trees, the date palm (Phoenix dactylifera L.) was domesticated in Mesopotamia. It has long been one of the most important plants of arid desert areas of northern Africa, the Middle East and Southern Asia, appropriately called “the tree of life”. In India, it is believed that date palm has been introduced by the soldiers of Alexander in the 4th century B.C. in Indus valley. A large number of seedling date palm groves exist in the western part of the India and Kachchh region of Gujarat state (Johnson et al. 2013). It has provided food, ornamentals, material for shelter, fiber, and fuel. It has even been used for religious purposes in a harsh environment where relatively few other plants can grow (Zaid, 2002; Hodel and Johnson, 2007). The date palm is the most widely grown fruit in Saudi Arabia. Date palm bunch covers offer several advantages and are commonly used in the date palm culture areas in order to protect fruits from high humidity, rain, bird attacks, blemishes caused by wind-blown dust and also from damage caused by insects. Al-Baker (1972) reported bagging spathes for 30 days after pollination with date fibers, as used in El-Ahsa, Saudi Arabia from old times. Also, Nixon and Carpenter (1978) reported that no damage has been observed from using bags. Bagging bunches of date palm cvs during fruit setting periods showed a beneficial effect on fruit set and yield, as well as accelerated ripening and improved fruit quality. Such treatment exhibited the highest fruit weight, total soluble solids, total sugars percentage and lowest tannins percentage (Kassem et al., 1994; El-Salhy, 2000, Rabah and Kassam, 2003 and Moustafa, 2007). In generally, palm fibers, as well as insect proof net bagging with removing at later growth stages, caused a significantly early fruit ripening and improved the yield and fruit quality and also decreased the percentage of tip cracked fruits at harvest time comparing with unbagged (control). Methodology The present experiment was performed during 2019 6-years old Halaway date palms, grown in a date palm orchard located at SKRAU, Bikaner. 63 palms were selected for Halawy cultivar. All cultural practices were carried out according to the applied schedule for experimental palms. Pollination was achieved by using pollen grains from the same parent in growing seasons. The experiment was arranged in a randomized block design and each treatment was replicated 3 times. For each treatment, one bunches per tree were used. The treatments were as follows: seven bagging materials, bagging by iron wire gauge, non-woven, agro shed net (green, 75 %), insect proof net, cloth bag, fertilizer bag (empty and porous) and unbagged as control. The bags were removed from bunches when the fruit started coloring. At the doka stages 50 fruits per bunch were randomly collected and immediately transported to the fruit laboratory of the, horticulture laboratory, College of Agriculture, Bikaner for fruit physical properties:, stone weight, pulp weight, length of fruit, diameter of fruit, volume of fruit.

National E-Workshop onCurrent Scenario of Post Graduation Research in Agriculture Sector Sept 09-11, 2020
67
Findings It is clear from Table 1 that all the treatments of bagging material significantly increased the average of ‘Halawy’ dates as compared to that of control treatment on grown 2019 except in number of days taken in maturity. Treatment 4 (bagging with insect proof net) recorded the highest number of strain (41.05), weight of fruit(7.18 gm), length of fruit (5.42 cm), diameter of fruit (2.80 cm), volume of fruit(7.25 cm3), pulp weight (5.44 gm), stone weight (1.38 gm), yield of fruit per bunch(5.89 kg), yield of fruit per palm (30.58 kg) and non-significantly increased the percentage of fruit per strain (93.63 %) during current season of study, respectively. Treatment 2 (bagging with non-woven) showed the non-significantly highest bunch length (54.37). On the other hand, control fruits had lowest values in all obvious parameters except number of days taken in maturity (after fruit set). Concerning the effects of different bagging material treatments on other physical parameters of ‘Halawy’ fruit, Table 1 shows that the lowest values of fruit weight, fruit volume, fruit length and diameter were found in ‘Halawy’ fruit of treatment 1 (control) in growing current seasons as compared with other treatments. The differences among different bagging material were not significant in length of bunch, number of days taken in maturity and percentage of fruit per strain at fruit harvest during 2019 seasons, respectively Inference Concerning the response of ‘Halawy’ fruit quality properties to the different treatments of bagging goes in line with those reported that different bagging application improved some fruit quality increment in bunch, fruit and fruit weight positively correlated with the type of bagging material in date fruits. From the foregoing results, it could be concluded that fruit bagging of ‘Halawy’ date palm under Date palm research centre, Bikaner conditions generally increased bunch yield. The early ripening 2 weeks before harvest of control fruits, which occurred by bagging may be due to accumulated higher heat units. Comparing the different bagging materials effect on ‘Halawy’ fruit, the average bunch weight, physical (fruit weight, diameter, fruit volume) treatment 4 (bagging with insect proof net) followed by treatment 2 (bagging with non-woven) in the current seasons. Reference Al-Baker, A. 1972.The date palm. AL-Ani Press, Baghdad Iraq (in Arabic). El-Salhy, A.M. 2000.Effect of bagging the spathes on Zaghloul date productive under Assiut
conditions.Journal of Agricultural Science. 31(3):123-134 Hodel, D.R. and Johnson, D.V. 2007. Dates imported and American varieties of dates in the United States.
University of California, Agriculture and Natural Resources: publication, 3498 Kassem, A.A., M.R.M. Rabeh and H.A. Kassem, 1994. The effect of bagging the spathes after pollination on
yield and quality of Zaghloul and Samany dates. Zagazig Journal of Agricultural Research. 21(3B): 935-944.
Moustafa, A.A. 2007. Effect of bagging period of spathes after pollination on fruit set, yield and fruit quality of ‘Seewy’ dates under Fayoum Governorate condations. Proceedings of the first Symposium on the date palm in Saudi Arabia, Al-Hassa. p.123
Nixon, R.W. and Carpenter, J.B. 1978. Growing dates in the United States. US Dept. Washington DC. Agric. Bull. 207. g com. 6th edition
Rabeh, M.R.M. and Kassem, H.A. 2003. The effect of bagging the spathes after pollination on yield and quality of Zaghloul and Samany dates. Zagazig Journal of Agricultural Research 21(3B):935-944
Zaid, A. (ed.). 2000. Date palm cultivation. Rome: United Nations FAO. Plant production and Protection Paper 156, Rve.1.

National E-Workshop onCurrent Scenario of Post Graduation Research in Agriculture Sector Sept 09-11, 2020
68
Table 1: Effect of different fruit bunch covering materials on date palm (Phoenix dactylifera l.) fruits. Treatment Number of
strain Weight of fruit (gm)
Length of fruit (cm)
Diameter of fruit (cm)
Volume of fruit (cm3)
Pulp weight (gm)
Stone weight (gm)
Yield of fruit per bunch (kg)
Yield of fruit per palm (kg)
Bunch length (cm
Number of days taken in maturity
Percentage of fruit per strain
Iron wire gauge
33.56 6.58 4.66 1.95 6.01 5.11 1.15 4.70 28.26 52.98 114.29 85.93
Non-woven 38.13 6.92 5.11 2.49 6.58 5.30 1.28 5.23 30.27 54.37 112.58 89.49
Agro-shed net 32.71 6.49 4.31 1.71 5.71 4.96 1.08 4.55 26.24 51.55 115.61 83.46
Insect proof net
41.05 7.18 5.42 2.80 7.25 5.44 1.38 5.89 30.58 53.70 110.56 93.63
Cloth bag 36.33 6.71 4.96 2.24 6.30 5.24 1.22 5.34 30.04 53.65 113.10 87.96
Fertilizer bag 39.57 7.03 5.25 2.71 7.09 5.37 1.33 5.65 30.46 54.01 111.71 91.38
Control 31.87 5.13 3.82 1.52 5.38 4.53 1.01 4.20 21.68 50.92 116.97 79.62
S Em± 1.74 0.38 0.33 0.16 0.37 0.18 0.05 0.29 1.87 2.62 5.86 4.62
C. D. at 5% 5.36 1.17 1.01 0.50 1.15 0.56 0.15 0.90 5.77 8.08 18.04 14.24

National E-Workshop onCurrent Scenario of Post Graduation Research in Agriculture Sector Sept 09-11, 2020
69
CROP IMPROVEMENT THROUGH DOMAIN OF UNKNOWN FUNCTION GENES (DUF 40)
Pushpikka Udawat 1, 2*
1Assistant Professor, Biotechnology, School of Agriculture Sciences, Dabok 2Janardan Rai Nagar Rajasthan Vidyapeeth, Udaipur - 313001, Rajasthan, India
Introduction Plants being sessile in nature have to countenance numerous abiotic stresses, viz salt, drought, extreme temperature (high heat or low chilling), light (high or low) and UV radiation in their native environment. Abiotic stresses along with population flareup and food dearth create grave trouble to mankind on the globe and cause losses worth hundreds of million dollars every year. As a sequel to this, halophytes have developed cascade of genes in order to achieve tolerance, which include ion compartmentalization, osmotic adjustment (osmolytes), succulence (ion sequestration in vacuoles), selective uptake and ion transport (transporter; SOS1, NHX1, HKT2, CLC), enzymatic (SOD, APX, GST, GR) and non-enzymatic antioxidant (proline, glycine betaine, ascorbate, tocopherol, polyols, polyamines) response, maintenance of redox/energetic status, salt inclusion/excretion and genetic control (TFs; DREB, NAC, MyB). There is a dire need to generate crops with enhanced abiotic stress tolerance for sustainable agriculture through genetic engineering, classical biotechnology approaches and various “omics” platforms. Based on plants performance under saline circumstances, they are classified as “glycophytes” (susceptible) or “halophytes” (tolerant). Halophytes have acquired well adapted and modified molecular, biochemical, morphological, anatomical and physiological distinctiveness, which authorize them to muddle through high salinity.
Methodology The present study reports “Cloning and characterization of novel salt responsive genes SbSR2 from Salicornia brachiata”. The EST database of Salicornia brachiata stress responsive genes category include 4.8% ESTs, while 29% ESTs showed no homology with recognized functional genes and thus classified as novel/unknown/hypothetical genes. Differential expression analyses of 25 ESTs (already deposited in the NCBI EST database) was studied under salinity stress (500 mM NaCl given for 24 hr) using qRT PCR. Out of twenty-five gene sequences screened for differential expression analyses, nine showed upregulation, whereas remaining sixteen were downregulated in response to salt stress. The ESTs of Sal-D-40 (SbSR2) showed high transcript accumulation by 6.4 fold (500 mM NaCl, 24 hr) compared to other genes, thus were chosen for functional validation. The partial EST fragment of SbSR2 (486 bp, EB484762) were retrieved in fasta format.

National E-Workshop onCurrent Scenario of Post Graduation Research in Agriculture Sector Sept 09-11, 2020
70
Findings The full length SbSR2 cDNA sequence was 849 bp. The gene contained a 5� untranslated leader sequence (5� UTR; 1-155 bp), an open reading frame (459 bp ORF), 3� UTR (235 bp; 614-849) and poly A tail of 16 base pairs. The 459 bp ORF had an in-frame ATG at nucleotide position 156, a TAA stop codon at nucleotide position 459 and encoded for a peptide 159 amino acids in length. The SbSR2 protein (153 amino acids) encoded by the ORF (459 bases), contained OMS28porin sequence sites, GPCRclan sequence, Cachannel motif and other motifs like CLAUDIN14, CDATpase, PROHIBIN and INTERLEUKIN11 as deduced by FingerPRINTScan. The conserved domain database (CDD) categorized the deduced protein with the Domain of Unknown Function581 superfamily (DUF581). The SbSR2 protein functional module detected by STRING revealed that it belongs to family of uncharacterized/predicted protein domain and has conserved neighbors like Arabidopsis lyrata (fgenesh2_kg_22094_AT1G78020.1) hypothetical protein, Arabidopsis thaliana (AT1G78020) uncharacterized protein. Phylogenetic analyses revealed that SbSR2 is in close proximity to hypothetical/predicted protein of Amborella trichopoda (LOC18421995) uncharacterized protein, Arabidopsis lyrata subsp. lyrata (AraLyDRAFT_476964) hypothetical protein, Arabis alpine (AAlp_AA1G241200) hypothetical protein. SbSR2 protein was categorized in DUF581 superfamily having ZFL domain thus named SbZFL gene. To elucidate the function and regulation of novel/unknown salt responsive genes, transcript profiling of SbSR2 was studied under salt (0.05, 100, 250, 500, 1000 M), desiccation, heat (45°C) and chilling (4°C) stresses using qRT PCR.
Inference The SbSR2 transcript was abundantly accumulated with escalating salt stress and reached maximum to 5.19 fold at 1 M NaCl. Under 250 mM salt stress exponential increase in SbSR2 transcript was observed at 12 hr (7.9 fold). Whereas, under desiccation stress, SbSR2 transcript accumulated in the course of increasing water stress and reached maximum by 8 fold up to 24 hr. The SbSR2 transcript showed inimitable blueprint under elevated temperature stress given at 45°C (4.6 fold). Under chilling stress (4°C), SbSR2 transcript was down regulated by ~2 fold. The transient expression of RFP and SbSR2:RFP vector in onion epidermal cells revealed that SbSR2 is expressed mainly in nucleus and plasma membrane in comparison to uniform expression of RFP vector (as control) throughout cells. Homologs of SbSR2 in the genome of Salicornia brachiata was studied by Southern blot analyses, it was observed that SbSR2 is present as single copy. The SbSR2 genes were overexpressed in wild type Nicotiana tabacum L. cv. Petit Havana or characterization and functional validation.
National E-Workshop onCurrent Scenario of Post Graduation Research in Agriculture Sector Sept 09-11, 2020
71
EFFECT OF HERBAL TREATMENTS ON DIFFERENT VIGOUR PARAMETERS OF OKRA [Abelmoschus
esculentus (L.)Moench]
Indrajitsingh P. Girase and Prashant Kumar Rai Department of Genetics and Plant Beeding, Sam Higginbottom University of
Agriculture, Technology and Sciences, Prayagraj, 211007 U. P., Ind
Introduction Okra [Abelmoschus esculentus (L.)], commonly known as Ladyfinger and it is one of the most widely known and utilized species of the family Malvaceae (Naveed et al., 2009). Okra plant was previously included in the genus Hibiscus. Later, it was designated to Abelmoschus, which is distinguished from the genus Hibiscus (Aladele et al., 2008). This crop is suitable for cultivation as a garden crop as well as on large commercial farms. In India, its ranks number one in its consumption with area of 528 thousand hectares and with the production of 6146 thousand metric tonne, but its original home is Ethiopia and Sudan, the north-eastern African countries. The seeds of okra best germinate at temperature range of 25-35°C (Chauhan, 1972). In contrast, when these okra seeds are sown in early spring season, they show poor germination due to low temperature. Another major problem in germination of okra seeds is hard seed coat which restricts the water imbibition and uniform growth and development of embryo (Mereddy et al., 2000). The seed hardness interferes with seed germination (Mahmoudi et al., 2012). The leaf extract such as Arjun, Bael,Hared, Baheda, Reetha, Neem, Amla, Tulsi,Prosopis contains proteins, carbohydrates, fatty acids, crude fibers active compounds. alkaloids, flavonoids,glycosides,lactones,phenolic,glucosides,azardichtin etc. act as antifungal, antibacterial,antimicrobial,antioxidant,antiproliferative agents and promotes physiological activity also helps to growth of seeds. Due to environmental concerns, there is an urgent need to reduce the use of chemical fertilizers and pesticides in agriculture and horticulture and alternative to chemicals are being sought to improve crop establishment and health. Keeping in view the above facts, the present investigation entitled “Effect of Herbal treatment on different vigour parameters of Okra (Abelmoschus esculentus L.)” has been conducted with following Objectives :- • To evaluate the effect of different Herbal Treatments on Vigour Parameters of Okra.
• To find out the suitable treatment for minimizing the use of chemicals. Methodology
• Lab experiment details Treatments : 12 (11+1) Replication : 4 Design : Completely Randomized Design Germination method : Between Paper Method (BP) and sand method Number of seeds /replication : 100 First count : 4 Final count : 21
National E-Workshop onCurrent Scenario of Post Graduation Research in Agriculture Sector Sept 09-11, 2020
72
• Treatment Details 1. T0 Control 2. T1 Terminalia arjuna Leaf Extract@ 3% (12hours) 3. T2 Aegle marmelos Leaf Extract@ 3% (12hours) 4. T3 Terminalia chebula Leaf Extract@ 3% (12hours) 5. T4 Terminalia bellirica Leaf Extract@ 3% (12hours) 6. T5 Albizia amara Leaf Extract@ 3% (12hours) 7. T6 Azadirachta indica Leaf Extract@ 3% (12hours) 8. T7 Sapindus mukorossi Leaf Extract@ 3% (12hours) 9. T8 Phyllanthus emblica Leaf Extract@ 3% (12hours) 10. T9 Ocimum tenuiflorum Leaf Extract@ 3% (12hours) 11. T10 Prosops juliflora Leaf Extract@ 3% (12hours) 12. T11 Cow Urine@ 3% (12hours)
• Procedure of Preparation of Arjuna Leaf Extracts: Leaf extract was prepared using cold extraction method. Make the powdered of separately shade dried leaves using electric grinder. Take three gram Powder and dissolved in 100 ml of distilled water to make 3 per cent leaf extract solution. These solutions were kept at room temperature for 48 hours. After 48 hours the leaf extracts were filtered by two layer of muslin cloth to remove unwanted material and leaf debris. Seeds were soaked independently in different leaf extracts at room temperature for twelve hours. After soaking seeds were air dried and use for Different tests. The seeds primed with 2% and 4% solution of leaf extract showed better results than 1%, therefore we used 3% leaf extract for further experiment (Prabha et al., 2016). Then the same procedure was followed for Bael, Harad, Baheda, Arrapu, Neem, Reetha, Amla, Tulsi and Prosopis Extract Preparation.
• Procedure for preparation of Cow urine: Locally available cow urine is used for organic seed priming which acts as growth promoter by preventing plant disease. 3ml of cow urine were added separately in 100 ml water to get 3% of solution which were used for seed treatment. Findings The results of the present investigation entitled “Effect of Herbal Treatments On Different Vigour Parameters Of Okra (Abelmoschus esculentus L.)” recorded during the experimental period have been analyzed statistically and the results were summarized below under following headings. • Priming with Albizia amara Leaf Extract at (3%) for 12hrs increased the
germination (%) and seed vigour in Okra. • Albizia amara Herbal priming is best to obtain healthy seedlings in okra.
References Aladele, S.E., Ariyo, O.J. and Lapena, R.de. (2008). Genetic relationships among West African okra (Abelmoschus caillei) and Asian genotypes (Abelmoschus esculentus) using RAPD. Indian Journal of Biotechnology. 7(10):1426-1431 Chauhan, D.V.S. (1972). Vegetable Production in India.3rd ed. Ram Prasad and Sons. Agra. Mereddy R, Wu L, Hallgren S W, Wu Y and Conway K E. (2000).Solid matrix priming Improves seedling vigour of okra seeds.Oklahoma Academy of Science.80: 33-37. Naveed, A., Khan, A.A., & Khan, I.A. (2009). Generation mean analysis of water stress tolerance in okra (Abelmoschus esculentus L.). Pak. J. Bot. 41: 195-205. Prabha Deepti, Swati N., Poonam K., Negi Y.K., J. S. Chauhan (2015). Effect of Seed Priming with Some Plant Leaf Extract on Seedling Growth Characteristics and Root Rot Disease in Tomato, International Journal of Agriculture System.4(1):46-51.
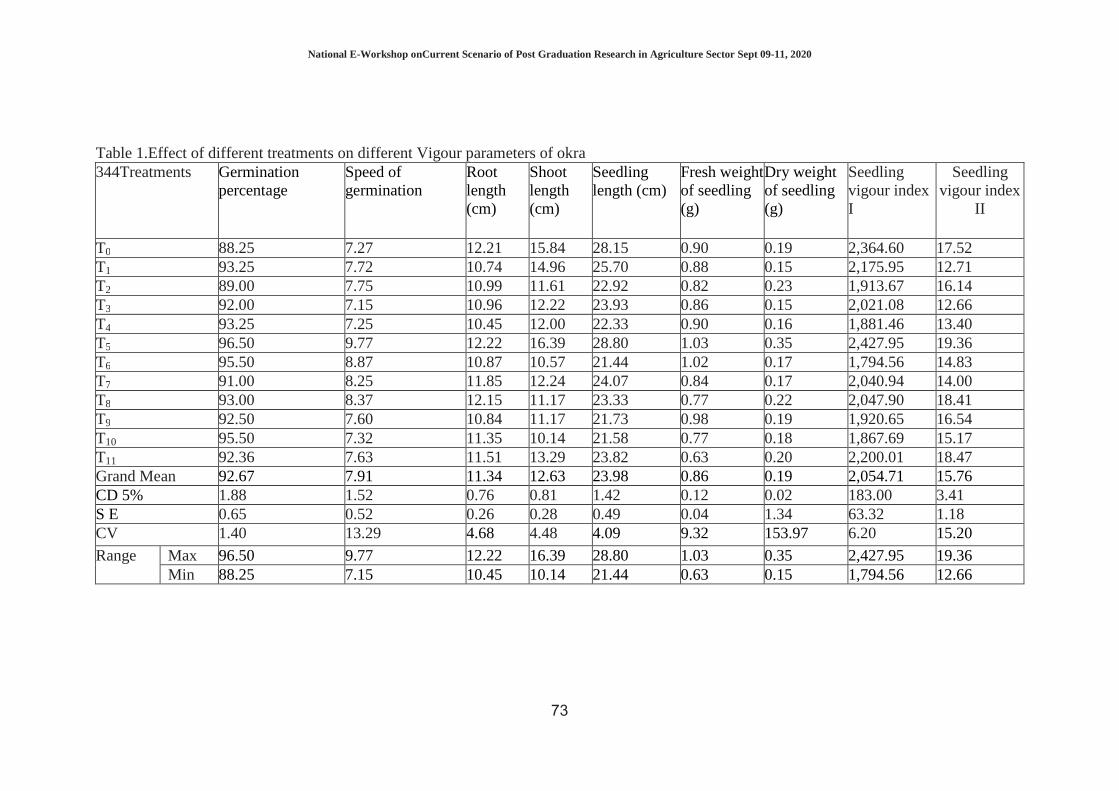
National E-Workshop onCurrent Scenario of Post Graduation Research in Agriculture Sector Sept 09-11, 2020
73
Table 1.Effect of different treatments on different Vigour parameters of okra 344Treatments Germination
percentage Speed of germination
Root length (cm)
Shoot length (cm)
Seedling length (cm)
Fresh weight of seedling (g)
Dry weight of seedling (g)
Seedling vigour index I
Seedling vigour index
II
T0 88.25 7.27 12.21 15.84 28.15 0.90 0.19 2,364.60 17.52 T1 93.25 7.72 10.74 14.96 25.70 0.88 0.15 2,175.95 12.71 T2 89.00 7.75 10.99 11.61 22.92 0.82 0.23 1,913.67 16.14 T3 92.00 7.15 10.96 12.22 23.93 0.86 0.15 2,021.08 12.66 T4 93.25 7.25 10.45 12.00 22.33 0.90 0.16 1,881.46 13.40 T5 96.50 9.77 12.22 16.39 28.80 1.03 0.35 2,427.95 19.36 T6 95.50 8.87 10.87 10.57 21.44 1.02 0.17 1,794.56 14.83 T7 91.00 8.25 11.85 12.24 24.07 0.84 0.17 2,040.94 14.00 T8 93.00 8.37 12.15 11.17 23.33 0.77 0.22 2,047.90 18.41 T9 92.50 7.60 10.84 11.17 21.73 0.98 0.19 1,920.65 16.54 T10 95.50 7.32 11.35 10.14 21.58 0.77 0.18 1,867.69 15.17 T11 92.36 7.63 11.51 13.29 23.82 0.63 0.20 2,200.01 18.47 Grand Mean 92.67 7.91 11.34 12.63 23.98 0.86 0.19 2,054.71 15.76 CD 5% 1.88 1.52 0.76 0.81 1.42 0.12 0.02 183.00 3.41 S E 0.65 0.52 0.26 0.28 0.49 0.04 1.34 63.32 1.18 CV 1.40 13.29 4.68 4.48 4.09 9.32 153.97 6.20 15.20
Range Max 96.50 9.77 12.22 16.39 28.80 1.03 0.35 2,427.95 19.36 Min 88.25 7.15 10.45 10.14 21.44 0.63 0.15 1,794.56 12.66

National E-Workshop onCurrent Scenario of Post Graduation Research in Agriculture Sector Sept 09-11, 2020
74
GENETIC DIVERSITY AND POPULATION STRUCTURE ANALYSIS AMONG THE EUROPEAN AND ASIATIC CARROT
(DAUCUS CAROTA l.)TYPE OF INDIAN COLLECTION
Chaitra C. Kulakarni and Sarvamangala S. Cholin*
Plant Molecular Biology Lab (DBT-BIOCARe), Dept. of Biotechnology & Crop Improvement, College of Horticulture, University of Horticultural Sciences, Bagalkot-587103, Karnataka, India Introduction Carrot (Daucus carota L.), an ancient cool season root vegetable, is a member of the family Apiaceae (Peirce, 1987). It is a diploid species having chromosome number of 2n =18, with a relatively small genome of 480 Mb (Iorizzo et al., 2016). It is considered to be native of Afghanistan (Banga, 1976). Roots are used for making soups, stews, curries, pies, pickles and for salad purposes. Carotenoid composition determines the white, yellow, orange or red root colour in the carrot (Nicolle et al., 2004; Surles et al., 2004). Majority of the carrot breeding work has been concentrated to temperate regions in carrot preferably only on European types (Temperate types) due to its suitability as a cool season vegetable. The information on Asiatic carrots (tropical type) in India and probably abroad is very scanty because tropical types has not received ample attention for its genetic improvement. Few numbers of varieties suitable to tropical regions are also developed by private and public sectors in India, but due its vernalization requirement and a biennial nature make the breeding effort more complex and laborious. Moreover, least efforts are made to explore the available germplasm lines suitable to tropical conditions although greater diversity is present within the germplasm pool with respect to adaptability, less vernalization requirement etc. Hence, it is most important to screen the large number of germplasm lines for the nutritional quality, root morphological traits, productivity traits for crop improvement of carrot. Characterization of carrot varieties or genotypes using morphological markers requires collection of extensive field data. Using morphological markers, it is easier to characterize the germplasm at the species level, but identification of genotypes within a species based on morphological markers alone is relatively difficult.
In the present investigation, a concerted effort was made to collect a large number of diverse colored carrot accessions from different parts of India for their detailed characterization by exploring the eighty publicly available DNA markers of carrot. The objective of the present study was to understand the composition and structure of the population of consisting of 144 carrot accessions. Methodology Outline of Experimental Work Plant material: A set of carrot germplasm consisting of 144 accessions comprised of Ttemperate region (Western types) and Tropical region (Asiatic types) belonging to five different root colors, viz., light orange, dark orange, yellow, red, and black/purple anthocyanin types collected from various agro-climatic regions of India. They were collected from local farmers, public, private organizations, and gene banks viz., National Bureau of Plant Genetic Resources, New Delhi and Indian Institute of Vegetable Research, Varanasi, India.
National E-Workshop onCurrent Scenario of Post Graduation Research in Agriculture Sector Sept 09-11, 2020
75
DNA isolation and quantification: Total genomic DNA was isolated from an individual plant selected from each accession using a standard CTAB method (Briard et al. 2000) and Quantification with a nanospectrophotometer (Nano Drop 2000, Thermo Scientific). Phenotyping for plant and root morphological characters: One hundred and forty four genotypes representing tropical/temperate carrot genotypes were sown in augmented block design with three replications at the experimental farm of College of Horticulture, Bagalkot during August-December, 2016. A total of 33 characters including qualitative and quantitative parameters were used to understand the genetic variability among the economic traits of carrot root with the help of augumented design comprising of 3 checks in 6 blocks. Genotyping:
Publicly available 140 carrot DNA markers wereused for genotyping of diverse collections. The markers consisted of genomic SSR (Cavagnaro et al.2011 ; Rong et al. 2010 and Niemann2001), genic microsatellites (Iorizzo et al. 2011), sequencecharacterized amplified region (SCAR) (Cavagnaro et al.2009), EST-based gene-specific markers (Cavagnaro et al.2009; Kawahara et al. 1992), and indels (Iorizzo et al. 2016). 80 polymorphic markers out of 140 were used statistical analysis, only the markers showing >80% amplification were selected. Statistical analysis: Analysis of molecular variance (AMOVA) and genetic diversity indices: To understand Genetic differentiation of the subpopulations AMOVA was carried out using the software package GenAlex 6.5. Genetic diversity parameters, viz., number of alleles (Na), number of effective alleles (Ne), gene diversity (He), observed heterozygosity (Ho), major allele frequency (MAF), polymorphic information content (PIC), Wright’s inbreeding coefficient (F), and Shannon’s information index (I), were estimated for 3 subpopulations obtained from the population structure. Cluster analysis: Cluster analyses was performed based un-weighted neighbor joining (NJ) tree using the software DARWIN version 6.0 (Perrier andJacquemoud-Collet 2006) with10,000 bootstrap values. Population structure assessment: To understand the composition/structure and gene flow within the AP across 80 polymorphic DNA markers, population structure analysis was carried out by using the STRUCTURE v 2.3.4 software package (Pritchard et al. 2000) with the use of Bayesian model of clustering. Findings Genetic variability in carrot (Daucus carota L.) for economic root traits among diverse germplasm grown under tropical region (Phenotypic data)
Analysis of variance (ANOVA) explained significant variation for most of the quantitative traits and the frequency distribution for qualitative traits showed diverse groups among the accessions. Traits like petiole colour, root colour (internal and external), shape, position in soil, texture showed 3 or more groups and exhibited greater variation. Quantitative traits which have strong positive correlation with productivity, such as root length (10.38-59.34 cm), root width (15.56-31.64cm) root weight (16.0-97.60 gms), total soluble solids (TSS-4.75-10.30 0Brix) showed greater variation which is also supported by higher genotypic and phenotypic coefficient of variation of >20.0%. Presence of moderate to high heritability among these traits indicates the necessity of reliable selection indices for improvement of these traits due to GxE interaction in their phenotypic expression which is also supported by relatively low to moderate genetic advance.

National E-Workshop onCurrent Scenario of Post Graduation Research in Agriculture Sector Sept 09-11, 2020
76
Correlation analysis revealed the importance of some of the traits related to vegetative parts like petiole length (0.488) and plant height (0.637) and a root parts such as root length (0.255), xylem width (0.726) and root width (0.675) had a significant positive association with root yield. As these genetic resources are excellent sources of variability for both root and umbel characters and hence, they were further subjected to molecular marker profiling to understand genomic level variations among diverse accessions (Unpublished). Analysis of Molecular Variance:
AMOVA revealed a significant genetic variation (p>0.001) among the sub-populations (13.00%), among individuals within the subpopulations (69.0 %) and also among the individuals of the total population (19.0%) (Figure 1).
Figure 1: Analysis of molecular variance (AMOVA explaining the percent molecular
variance for the sub-populations, accessions within the sub and total population based on 144AP
Molecular Diversity
Figure 2: Allelic patterns distribution as depicted by various genetic diversity parameters across eighty molecular markers among Indian carrot accession panel consisting of 144 accessions
A total of 305 alleles were extracted from 80 marker loci with an average of 3.81± 0.20 alleles
per locus, whereas, the average number of effective alleles (Ne) was 2.17 ± 0.10, Polymorphic information content (PIC) value was 0.513± 0.38. The gene diversity (He) value range from 0.01 to 0.79 with an average of 0.46 ±0.02, and the average Shannon index (I) was 0.84± 0.04 with a maximum of 1.68 and minimum of 0.03. The average F value was 0.72 ± 0.03 with a range of -0.04 to as high as 1.0 (Figure 2).
Among
Pops
13%
Among
Indiv
69%
Within
Indiv
18%
Percentages of Molecular Variance
0.000
0.200
0.400
0.600
0.800
1.000
1.200
0.000
1.000
2.000
3.000
4.000
5.000
He
tero
zyg
osi
ty
Me
an
Populations
Na
Na Freq. >= 5%
Ne
I
No. Private Alleles
He

National E-Workshop onCurrent Scenario of Post Graduation Research in Agriculture Sector Sept 09-11, 2020
77
Fig 2: Cluster Diagram showing 3 sub-populations obtained by unweighted neighbor-joining tree (NJ) drawn in Darwin 6.0 based on 80 polymorphic markers. The numbers in blue color within the tree branches (are thebootstrap values
Cluster analysis:
The details of molecular diversity analyzed for three subpopulations obtained from the 144 accession panel is presented in (Table 1).
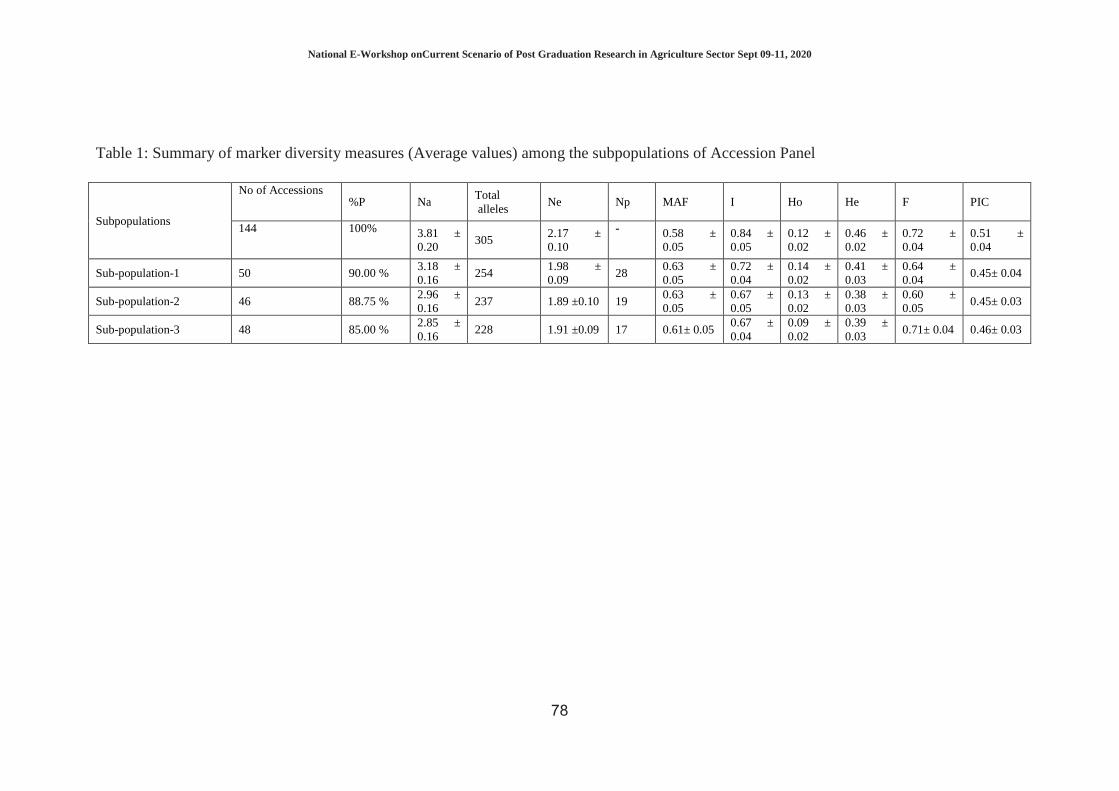
National E-Workshop onCurrent Scenario of Post Graduation Research in Agriculture Sector Sept 09-11, 2020
78
Table 1: Summary of marker diversity measures (Average values) among the subpopulations of Accession Panel
Subpopulations
No of Accessions %P Na
Total alleles
Ne Np MAF I Ho He F PIC
144 100% 3.81 ± 0.20
305 2.17 ± 0.10
- 0.58 ± 0.05
0.84 ± 0.05
0.12 ± 0.02
0.46 ± 0.02
0.72 ± 0.04
0.51 ± 0.04
Sub-population-1 50 90.00 % 3.18 ± 0.16
254 1.98 ± 0.09
28 0.63 ± 0.05
0.72 ± 0.04
0.14 ± 0.02
0.41 ± 0.03
0.64 ± 0.04
0.45± 0.04
Sub-population-2 46 88.75 % 2.96 ± 0.16
237 1.89 ±0.10 19 0.63 ± 0.05
0.67 ± 0.05
0.13 ± 0.02
0.38 ± 0.03
0.60 ± 0.05
0.45± 0.03
Sub-population-3 48 85.00 % 2.85 ± 0.16
228 1.91 ±0.09 17 0.61± 0.05 0.67 ± 0.04
0.09 ± 0.02
0.39 ± 0.03
0.71± 0.04 0.46± 0.03
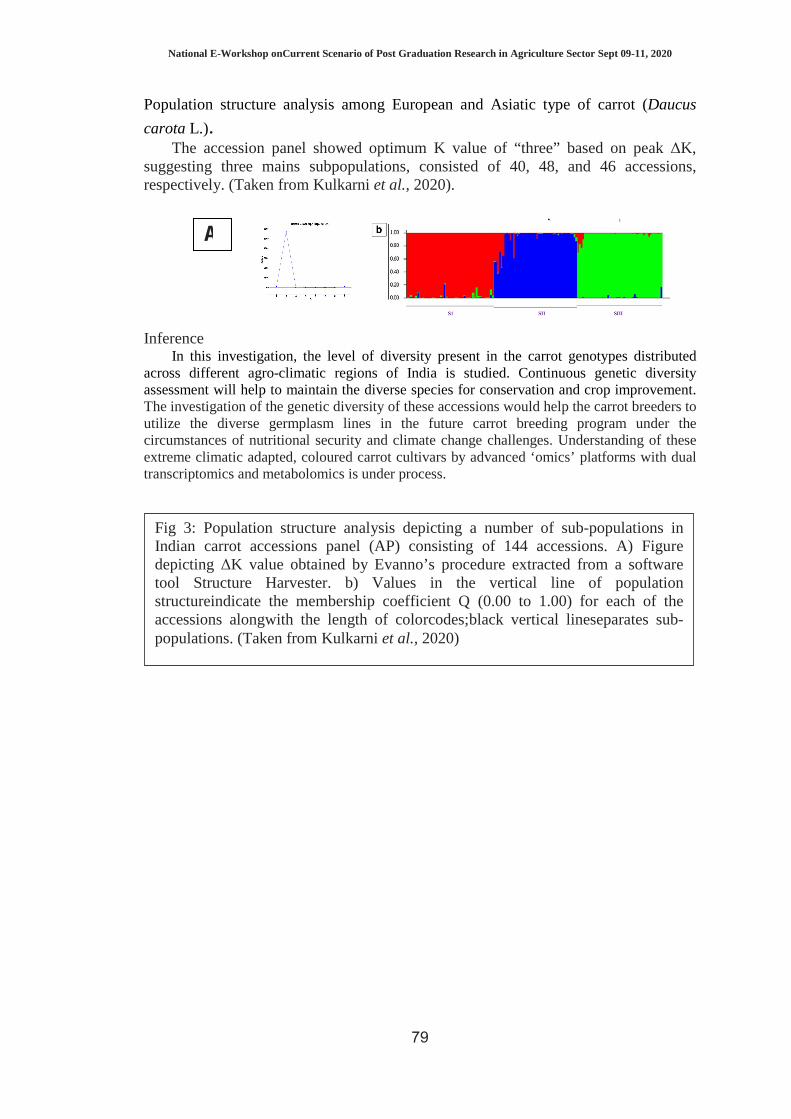
National E-Workshop onCurrent Scenario of Post Graduation Research in Agriculture Sector Sept 09-11, 2020
79
Fig 3: Population structure analysis depicting a number of sub-populations in Indian carrot accessions panel (AP) consisting of 144 accessions. A) Figure depicting ∆K value obtained by Evanno’s procedure extracted from a software tool Structure Harvester. b) Values in the vertical line of population structureindicate the membership coefficient Q (0.00 to 1.00) for each of the accessions alongwith the length of colorcodes;black vertical lineseparates sub-populations. (Taken from Kulkarni et al., 2020)
Population structure analysis among European and Asiatic type of carrot (Daucus
carota L.). The accession panel showed optimum K value of “three” based on peak ∆K,
suggesting three mains subpopulations, consisted of 40, 48, and 46 accessions, respectively. (Taken from Kulkarni et al., 2020).
Inference
In this investigation, the level of diversity present in the carrot genotypes distributed across different agro-climatic regions of India is studied. Continuous genetic diversity assessment will help to maintain the diverse species for conservation and crop improvement. The investigation of the genetic diversity of these accessions would help the carrot breeders to utilize the diverse germplasm lines in the future carrot breeding program under the circumstances of nutritional security and climate change challenges. Understanding of these extreme climatic adapted, coloured carrot cultivars by advanced ‘omics’ platforms with dual transcriptomics and metabolomics is under process.
A

National E-Workshop onCurrent Scenario of Post Graduation Research in Agriculture Sector Sept 09-11, 2020
80
RESOURCE MANAGEMENT

National E-Workshop onCurrent Scenario of Post Graduation Research in Agriculture Sector Sept 09-11, 2020
81
STUDIES ON SOIL QUALITY OF TUNGI WATERSHED OF LATUR DISTRICT OF MAHARASHTRA BY USING REMOTE SENSING,
GPS AND GIS TECHNIQUES
AS Shrivastav Department of Soil Science and Agricultural Chemisty, College of Agriculture, Latur,
Parbhani, Maharashtra Email: [email protected]
Introduction Soil quality is broad concept that encompasses biological, chemical and physical properties that sustain productivity, environmental quality, and support healthy organisms (Doren et al. 1996). Soil survey provides an accurate and scientific inventory of different soils, their kind and nature, and extent of distribution so that one can make prediction about their characters and potentialities. A wide range of agricultural soils represents diversely managed arable lands while the main goal to improve soil quality, crop yield, and reduce the ecological foot print. Tungi watershed in Ausa tehsil of Latur district selected for this research because it comprises a wide array of soils, crop yield potential and soil site suitability is differing from place to place (Sayambar, 2015). Watershed management indicates the wise use of natural resources within given geographical area so as to enable sustainable production with minimum hazards. Methodology Total geographical area is 24777.91 ha which is located in between latitudes N 18°14’31’’ to 18°01’57’’ and longitudes E 76°24’28’’ to 76°37’02’’ in Ausa tehsil of Latur district, Maharashtra. Hundred (100) surface soil samples (0-30cm) were collected from adjoining area of soil profiles studied by Sayambar, (2015) by free survey using toposheet, satellite imageries, GPS and evaluated for physical, chemical and biological property for soil health index, Parkers fertility index in order to study the quality of soils. Geo-reference based soil fertility map and soil health card generated. The bulk density and CaCO3 were determined by clod coating and rapid titration method, respectively (Piper, 1966). The particle density was estimated by pycnometer method (Das and Agrawal, 1997) and porosity, soil pH, EC, OC, available P and K determined as per standard procedure (Jackson, 1973). Available N estimated by alkaline permanganate method (Subbiah and Asija, 1956). Ex. Ca and Mg determined by Versenate (EDTA) titration method (Richards, 1954) and available S estimated by using turbidimetry method using spectrophotometer (William and Steinberg, 1969). Available boron as per by Berger and Trang, 1939 and DTPA micronutrient estimated by AAS (Lindsay and Norvell, 1978). Soil microbial count was estimated using serial dilution methods (Pramer and Schmidt, 1964). Chemical properties (soil pH, SOC), primary macronutrient and available S, DTPA extractable micronutrient categorized as per six tyre system given by Parker, 1991 and Katlar and Patil, 2010. Soil health index determined as score(0 to 1 by employing linear scoring functions, Andrews et al. 2002) were given to soil parameters to transform it into single value irrespective of units and formulated ratio of sum of score of each parameter to total number of parameter. Parkers fertility index calculated as per six tyre system and georeference based soil fertility map generated by QGIS.

National E-Workshop onCurrent Scenario of Post Graduation Research in Agriculture Sector Sept 09-11, 2020
82
Findings The bulk density of soils of tungi watershed ranged from 1.13 to 1.93 Mg m-3. The bulk density of Typic Ustorthents soil varied from 1.27 to 1.87 Mg m-3, Typic Haplustepts soil varied from 1.13 to 1.92 Mg m-3 and Typic Haplusterts soil varied from 1.3 to 1.93 Mg m-3. High value in Typic Haplusterts may be attributed to the smectite clay and the severe compaction stress. The particle density of Typic Ustorthents soil varied from 2.48 to 2.94 Mg m-3, Typic Haplustepts soil varied from 2.49 to 2.94 Mg m-3 and Typic Haplusterts soil varied from 2.48 to 2.88 Mg m-3. This may be ranges as per composition of chemical and mineralogical components. The lowest average porosity value (38 percent) was observed in soils of Typic Haplusterts, showed increasing soil bulk density results in diminishing soil porosity. The soils of tungi watershed were slightly alkaline to alkaline in reaction with pH ranged from 7.05 to 8.96. The pH of Typic Ustorthents soil varied from 7.05 to 8.91, Typic Haplustepts soil varied from 7.18 to 8.81 and Typic Haplusterts soil varied from 7.22 to 8.96. The soil pH variability could be due to the nature of the parent material, geomorphic location, fertilizer application, and management practices. The electrical conductivity of studied soil was < 1.0 dSm-1(0.14 to 0.58 dSm-1). This is well within the electrical conductivity range safe limit. The organic carbon content in soils of tungi watershed were very low to very high and which is varies from 0.15 to 1.05 percent. The organic carbon of Typic Ustorthents soil varied from 0.15 to 1.05 percent, Typic Haplustepts soil varied from 0.19 to 1.05 percent and Typic Haplusterts soil varied from 0.39 to 1.03 percent. The highest average organic carbon content (0.68 percent) was observed in soils of Typic Haplusterts as compared to Typic Ustorthents and Typic Haplustepts. This indicates that Vertisols surface (0-30 cm) have a large share of organic carbon in the soil. The calcium carbonate content in soils of tungi watershed was low to highly calcareous in nature and varied from 0.6 to 22.2 per cent. The calcium carbonateof Typic Ustorthents soil varied from 0.6 to 15.6 percent, Typic Haplustepts soil varied from 0.8 to 22.2 percent and Typic Haplusterts soil varied from 0.8 to 20 percent. These soils include low to high level of CaCO3 and can be due to the leaching of (HCO3)
2 and get precipitated down to the slope as well as at the lower horizon. The fertility status of soils of tungi watershed was low to high. The available nitrogen content of these soils ranged from 53.31 to 250.88 kg ha-1 indication that soils was low in available nitrogen, low to moderately high in available phosphorus (12.51 to 27.49 kg ha-1) and low to very high in available potassium (142.3 to 958.8 kg ha-1). The exchangeable calcium and magnesium content in soils of tungi watershed ranged from 14.60 to 42.40 cmol(p+) kg-1 and 5.40 to 21.60 cmol(p+) kg-1, respectively indicating soils were high in cations. The calcium is dominant cation followed by magnesium. The available sulphur content in soils ranged from 4.37 to 66.65 mg kg-1 indicating soils were low to high in available sulphur. In the soils of tungi watershed, DTPA extractable Fe ranged from 4.24 to 16.38 mg kg-1 indicating soils were low to moderately high in DTPA-Fe. DTPA extractable Mn ranged from 4.76 to 25.84 mg kg-1 indicating soils were high to very high in DTPA-Mn. DTPA extractable Zn ranged from 0.5 to 6.56 mg kg-1 indicating soils were low to very high in DTPA-Zn. DTPA extractable Cu ranged from 0.72 to 15.56 mg kg-1 indicating soils were low to very high in DTPA-Cu. The available boron content in soils ranged from 0.1 to 3.56 mg kg-1 indicating soils were low to high in available boron. In the soils of tungi watershed, the microbial population of fungi was observed in the range of 5.6 x 10⁴ to 12.8 x 10⁴ CFU g-1 with an average 9.30 x 10⁴ CFU g-1. The microbial population of actinomycetes were observed in the range of 10.02 x 10⁵ to 22.46 x 10⁵ CFU g-1, with

National E-Workshop onCurrent Scenario of Post Graduation Research in Agriculture Sector Sept 09-11, 2020
83
an average 18.24 x 10⁵ CFU g-1 of soil. The microbial population of bacteria were observed in the range of 31.68 x 10⁷ to 60.39 x 10⁷ CFU g-1, with an average 43.96 x 10⁷ CFU g-1. The population of bacteria predominated over the fungi and actinomycetes. It also indicated microbial populations vary with soil type. Soil health index of tungi watershed shown 45 samples belongs ‘good’ category of soil health index value while 55 samples belongs ‘very good’ category of soil health index value. The average soil health index values of Typic Ustorthents, Typic Haplustepts and Typic Haplusterts were 0.77, 0.79 and 0.87 respectively shows that Typic Haplusterts are healthy soil type as compare to Typic Ustorthents and Typic Haplustepts. Soil fertility index of tungi watershed, the available nitrogen, phosphorus and zinc with the NIV value 0.81, 1.64 and 0.98, respectively categorized into ‘low fertility status’. Organic carbon and available iron with the NIV value 1.82 and 1.71 categorized into ‘medium fertility status’. Available potassium, manganese and copper with the NIV value 2.78, 2.58 and 2.97 categorized into ‘high fertility status’. The soil fertility maps of relevant soil properties generated, which are useful for better interpretation, highlight the nutrient requirements and improve location-specific crop production technologies. The s-oil health card for tungi watershed soils found that the soil's nutrient status in Typic Ustorthents, Typic Haplustepts and Typic Haplusterts is almost related except for physical properties and microbial population that vary from soil to soil that adversely affects sustainable yield. Yield data for widely grown soybean, sorghum and pigeon pea under Typic Ustorthents (13.5, 13.20 and 15.60 q ha-1), Typic Haplustepts (17.2, 16.45 and 20.65 q ha-1) and Typic Haplusterts (22.35, 25.45 and 24.10 q ha-1), respectively found 46, 47.2 and 44.29 percent yield decrease over the optimums yield of studied area in Typic Ustorthents, 31.2, 34.8 and 27.25 percent yield decrease in Typic Haplustepts, 10.6, 6.2 and 13.93 percent yield decrease in Typic Haplusterts. It shows that the soil type and soil quality parameter viz. soil texture, soil structure, coarse fragments, PAWC should include in the soil health card parameter, in addition to indicating the suitability of the soil site for site-specific crops to support soil use and double farm profits. From the above results, however, it was recommended that the Typic Ustorthents (shallow soil) soil were suitable for short duration and shallow rooted crops, while Typic Haplustepts and Typic Haplusterts (moderately deep to very deep) soil recommended for both shallow and deep-rooted crops to obtain maximum returns under suggested site-specific soil management practices . Inference
• The bulk density of soils of tungi watershed ranged from 1.13 to 1.93 Mg m-3. High value may be attributed to the smectite clay and the severe compaction stress. Increasing soil bulk density results in diminishing soil porosity.
• Soils of study area were slightly alkaline to alkaline in reaction, salt concentration in safe limit, low to highly calcareous in nature.
• Variations were seen in the organic carbon content of Typic Ustorthents, Typic Haplustepts but Typic Haplusterts surface have a large share of organic carbon in the soil.
• The soils showed variation in fertility status. All soil sample categorized low in available nitrogen, low to moderately high in available phosphorus and low to very high rich in available potassium.
National E-Workshop onCurrent Scenario of Post Graduation Research in Agriculture Sector Sept 09-11, 2020
84
• The soils were rich in exchangeable calcium, exchangeable magnesium and available sulphur.
• Most of the soil samples (99%) were sufficient i.e. ranged above critical limit in DTPA extractable micronutrient (Fe, Mn, Zn and Cu) and low to high in available boron.
• The population of bacteria predominated over the fungi and actinomycetes. It also indicated microbial populations vary with soil type.
• Soil health index of tungi watershed shown that all the soils of Typic Haplusterts categorized ‘very good’ which indicates healthy soil as compare to Typic Ustorthents and Typic Haplustepts.
• Parkars fertility index of tungi watershed categorized the available nitrogen, phosphorus and zinc into ‘low’, organic carbon and available iron into ‘medium’ and available potassium, manganese and copper into ‘high’ fertility status.
• Georeference based soil fertility maps can be useful for managing soil fertilizer input for overall balanced nutrition and sustainable crop production.
• Study on soil health card indicated that the soil type, soil texture, soil structure, coarse fragment,PAWC and soil site suitability should inculcate in existing twelve parameter of soil health card parameter to support soil use and double farm profits. For study area Typic Ustorthents (shallow) soil were suitable for short duration and shallow rooted crops, while Typic Haplustepts and Typic Haplusterts (moderately deep to very deep) soil recommended for both shallow and deep-rooted crops to obtain maximum returns.

National E-Workshop onCurrent Scenario of Post Graduation Research in Agriculture Sector Sept 09-11, 2020
85
EFFECT OF MICRONUTRIENTS ON GROWTH AND YIELD OF CORIANDER (CORIANDRUM SATIVUM L.)
Abdulrazaq Bepari and P. Anitha Department of Plantation, Spices, Medicinal and Aromatic Crops,Rajmata Vijayaraje
Scindia Krishi Vishwavidyalaya,College of Horticulture, Mandsau, MP Email :[email protected]
Introduction Coriander is the dried fruit of Coriandrum sativum L., an aromatic spice crop belong to family Umbelliferae or Apiaceae. It is a native of Mediterranean region. It is a cross pollinated, possesses 2n = 22 chromosomes number. It is very old flavouring substance and its usage both for its leaves, stems as well as fruits has been mentioned in Egyptian. The plant is a smooth, erect annual herb, 30-90 cm high, with conspicuously enlarged nodes and hollow internodes. The fruit is a schizocarp, globular, yellow in colour with brown ribs. The size of the seed is about 3mm in diameter and ripe seeds are aromatic. At dehiscence, the 2 carpels called mericarps separate, each containing a single seed with a copious endosperm and a minute embryo (Farooqi et al., 2004). Recently sulphur deficiency has been aggravated in soils due to continuous crop removal under intensive cropping system and use of sulphur free high analysis NPK fertilizers. Sulphur which has now emerged as the third most important plant nutrient for crop plays a multiple role in nutrition. It helps in chlorophyll formation and also a constituent of amino acids like cysteine, cysteine and methionine. Sulphur is also responsible for synthesis of certain vitamins (biotin and thiamine), proteins, fats and metabolism of carbohydrates (Tondon, 1991). Sulphur is essential for production of protein, fats and oils, promotes enzyme activity and helps in chlorophyll formation, improves root growth and grain filling resulting in vigorous plant growth and resistance to cold. Its deficiency causes interveinal chlorosis with a very distinct reddish color of the veins and petioles (Shanyn and Lucy, 1999). Zinc is most deficient among all the micronutrients in Indian soils condition. In many parts of India, zinc as a plant nutrient now stands third in importance next to nitrogen and phosphorus (Takkar and Randhawa, 1980). It plays an important role as a constituent of alcohol dehydrogenase and carbonic anhydrase in both microorganisms an higher plants. It helps the utilization of phosphorus and nitrogen in plants (Singh et al., 2002).Thus looking to the situation, there is an urgent need to augment supplies of customised fertilisers supplying secondary and micronutrients to sufficiently support, the integrated need of nutrient in coriander production. Considering the above facts, the studies on effect of different levels of sulphur and zinc on growth, yield and quality of coriander was undertaken.
Methodology The experiment was laid out at the “Research Field of the Department of Plantation, Spices, Medicinal and Aromatic Crops”, College of Horticulture, RVSKVV, Mandsaur (M.P.) during Rabi season of 2017-18. Mandsaur is situated in Malwa
National E-Workshop onCurrent Scenario of Post Graduation Research in Agriculture Sector Sept 09-11, 2020
86
Plateau in western part of Madhya Pradesh at North latitude of 23.45º to 24.13º and 74.44º to 75.18º East longitudes and an altitude of 435.02 meters above mean sea level. The soil of the experimental field was light black loamy in texture with low nitrogen (192 kg/ha), low phosphorus (7.6 kg/ha), medium potassium (145.0 kg/ha) soil having (pH 8.36) and EC (0.18 dS/m). The field experiment comprising 16 treatment combinations with three replication was laid out in factorial randomized block design with two factors. The experiment consisted of four levels of sulphur (0, 15, 30 and 45 kg S/ha) and four levels of zinc (0, 2, 4 and 6 kg Zn/ha). The crop variety RCr-436 were sown in spacing 30x10 cm with seed rate of 15 kg/ha. Uniform dose of nitrogen (40 kg/ha) through urea and phosphorus (30 kg/ha), potassium (20 kg/ha) as per treatments through MOP, DAP and soil application of zinc and sulphur. Data were recorded for various morphological phenological and yield parameters and statistically analyzed using the method of analysis of variance as described by Panse and Sukhatme (1985).
Findings Interaction of Sulphur and Zinc The data revealed that in (Table.1) combined effect of both nutrients S3Z3 were significantly influenced higher plant height (53.83 and 111.07 cm), Number of branches plant-1(7.06 and 8.98),fresh weight of plant(78.45 and 84.22 g)and dry weight of plant(17.80 and 21.19 g) at all stages of growth attributes compared to control S0Z0. Combined effect of sulphur and zinc levels showed significantly influenced on yield attributes of Coriander (Table 1). However non- significantly influenced on harvest index (42.10%). Due to sulphur and zinc levels in combination significantly influenced maximum umbellets umbel-1 (7.03) and seed yield (19.59 qha-
1) was recorded under treatment combination S3Z3 compared to control S0Z0. The improvement in the coriander yield with interactive effects might be due to additive influence of improvement in growth; yield attributes and yield due the application of sulphur and zinc. The application of sulphur as secondary nutrient and zinc as micro nutrient in an integrated manner might have exhibited the positive effects in plant growth, development and yield. (Manure et al., 2000) also reported that yield attributes, seed and oil yield and oil content were all enhanced by the application of N, S and Zn fertilizers. (Aishwath et al., 2011)
Inference On the basis of one year research, It could be concluded that application of sulphur and zinc influence the growth and yield of Coriander can be increased by application of S3Z3 (45 Kg S/ha + 6 Kg Zn/ha) should be advocated for coriander seed production.
References Aishwath, O. P., Khurana, H. S. and Anwer, M. M. (2011). A review on the effect of integrated nutrient management on yield and quality of major seed spice crops in India. Better Crops South Asia. 19-21. Farooqi, A. A.; Sreeramu B. S. and Srinivaspa, K. N.(2004). Cultivation of spices crops.Universities press, pp-129-130.
National E-Workshop onCurrent Scenario of Post Graduation Research in Agriculture Sector Sept 09-11, 2020
87
Manure, G.R., Shivraj, B. Farooqii and Surendra, H.S. (2000).Spices and aromatic crops. In: Proceedings of Centennial Conference on Spices and Aromatic Plants, Calict, Kerala, India, September 20-23, 139-144. Pansey, V.G. and Sukhatme, P.V. (1985).Statistical Methods, for Agricultural Workers.Forth Enlarged Edition.ICAR Publication, New Delhi.Shanyn, H. and Lucy, B. (1999). Guide to symptoms of plant nutrient deficiencies. University of Arizona Cooperative Extension.Publication AZ1106 5/99, extension.arizona.edu/pubs/az 1106.pd. Singh.; Satpal.; Jat, N.L. and Singh, S. (2002). Effect of zinc fertilizer on growth and yield of coriander.Ann of Agri. Res. 23(4): 734-736. Takkar, P.N. and Randhawa, N.S. (1980). Zinc deficiency in Indian soils and plants. Seminar on zinc wastes and their utilization, 15-18, Oct. organized by Indian lead zinc information center and the fertilizer Association of India, New Delhi. Tondon, H.L.S. (1991). Sulphur research and agricultural production in India. pp. 4775.

National E-Workshop onCurrent Scenario of Post Graduation Research in Agriculture Sector Sept 09-11, 2020
88
(Table.1) Effect of micronutrients on growth and yield of Coriander Treatment
s Plant height
(cm) Number of branches per
plant Fresh weight of
plant(g) Dry weight of
plant(g) Harvest index
(%) Umbellets per
umbel Seed yield
q/ha Interaction 60
DAS 90
DAS 60 DAS 90
DAS 60 DAS 90
DAS 60 DAS 90
DAS
S0Z0 38.37 97.00 4.87 5.40 48.35 57.98 6.79 8.23 39.52 4.96 12.28
S0Z1 41.54 100.52 5.56 6.20 54.68 60.37 8.01 9.87 40.11 5.63 14.50
S0Z2 41.85 102.33 5.75 7.04 58.07 64.32 9.00 10.93 40.25 5.87 14.63
S0Z3 42.26 103.13 6.12 7.40 62.67 67.50 10.54 12.57 40.39 6.05 15.37
S1Z0 41.50 102.37 5.40 6.31 55.50 62.80 8.48 10.34 40.18 5.83 13.23
S1Z1 43.09 104.07 6.13 7.85 58.00 68.65 10.66 12.76 40.54 5.97 15.32
S1Z2 44.81 105.17 6.31 8.07 61.67 69.64 11.72 13.90 40.61 6.06 15.74
S1Z3 46.56 106.00 6.35 8.18 64.67 71.91 13.06 15.28 40.82 6.16 15.97
S2Z0 41.29 102.57 5.67 7.60 58.67 66.67 10.27 12.23 40.58 5.91 14.79
S2Z1 44.17 105.23 6.19 8.17 67.33 74.03 12.36 14.78 40.62 6.11 15.07
S2Z2 46.47 107.29 6.40 8.21 70.00 76.87 14.02 16.52 40.81 6.25 16.54
S2Z3 49.67 109.40 6.85 8.63 73.67 78.83 15.51 18.88 40.94 6.41 17.84
S3Z0 42.98 104.47 6.16 7.87 64.67 70.00 11.83 13.89 41.10 6.10 14.96
S3Z1 46.67 106.33 6.33 8.13 74.70 77.15 14.62 17.80 41.32 6.28 16.12
S3Z2 51.45 108.00 6.56 8.78 76.10 81.75 16.24 20.05 41.56 6.63 17.05
S3Z3 53.83 111.07 7.06 8.98 78.45 84.22 17.80 21.91 42.10 7.03 19.59
SEm± 0.92 0.46 0.09 0.19 0.58 0.58 0.25 0.50 0.26 0.10 0.38
CD5% 2.67 1.32 0.26 0.55 1.68 1.66 0.73 1.43 NS 0.28 1.10
National E-Workshop onCurrent Scenario of Post Graduation Research in Agriculture Sector Sept 09-11, 2020
89
RESPONSE OF GREEN GRAM (VIGNA RADIATE L.) TO SOURCES OF PHOSPHORUS AND SULPHUR LEVELS IN ARID WESTERN
RAJASTHAN
Rajni and Amit Kumawat College of Agriculture, SKRAU, Bikaner, Rajasthan 334 006, India
Email: [email protected] Introduction Mungbean or green gram [Vigna radiata (L.)Wilczek] is one of the most important edible pulse crops of our countryand belongs to family papilionaceae. It is drought tolerant crop and can be successfully grown on well drained sandy loam to loamy soil in the areas of receiving erratic rainfall. This crop is primarily grown in rainyseason but with the development of early maturing varieties, it has proved an ideal crop of spring and summer seasons. Being an efficient N- fixer, mungbean improve the soil fertility status and can thereby serve as a useful component in any viable cropping system in the country. Phosphorus plays a key role in energy metabolism of all plant cells particularly nitrogen fixation in leguminous crops. Phosphorus needed to promote the development of extensive root systems and vigorous seedlings. Encouraging vigorous root growth is an important step in promoting good nodule development.Phosphorous Rich Organic Manure (PROM) is an organic alternative indigenous source of phosphatic fertilizer. This substance is more efficient way of adding phosphorous to soil as compared to chemical fertilizers like, DAP, MAP, SSP etc. Besides, PROM also supplies the phosphorus to the succeeding crops as efficiently as it nourishes the crop to which it has been applied. Sulphur is mostly applied to oilseed and pulse crops found to benefit more than one crop in a sequence due to its significant residual response (Singh et al., 2005). Sulphur and phosphorus have systematic and antagonistic effect with each other on their varying levels of application as well as level of availability in the soil. Methodology A field experiment was conducted during Kharif 2019 at Instructional Farm, College of Agriculture, Swami Keshwanand Rajasthan Agricultural University, Bikaner. The experiment comprised of five levels of phosphorus sources (Control, 16 kg P2O5 ha-1 through DAP, 16 kg P2O5 ha-1 through PROM, 32 kg P2O5 ha-1 through DAP and 32 kg P2O5 ha-1 through PROM) and three levels of sulphur (Control, 15 and 30 kg ha-1) making 15 treatment combinations replicated three times in factorial randomized block design.Phosphorus was applied through DAP and PROM fertilizer as per treatments as basal application in furrows. PROM contains 0.4% N, 10.4% P, 7.9% OC. The weighed quantity of DAP and PROM was broadcasted uniformly in earmarked plots and thoroughly mixed in soil before sowing.Greengram variety ‘IPM 2-3’ seed @ 16 kg ha-1 was sown on 23 July, 2019 by “kera method” in rows spaced at 30 cm apart and 5 cm depth. Findings Application of phosphorus at 32 kg P2O5 ha-1 through PROM significantly increased the pods per plant, test weight, seed, straw and biological yield (Table 1) over 16 kg P2O5 ha-1 through DAP, 16 kg P2O5 ha-1 through PROM and 32 kg P2O5 ha-1 through DAP. However, 16 kg P2O5 ha-1 through DAP and 16 kg P2O5 ha-1 through PROM

National E-Workshop onCurrent Scenario of Post Graduation Research in Agriculture Sector Sept 09-11, 2020
90
found at par with each other. Lower dose of PROM application was probably not able to release adequate quantity of phosphorus in soil for crop growth as reported by Bairwa et al. (2019). Phosphorus has been recognized as essential nutrient for all living organisms and it plays a very important role in conservation as well as transfer of energy in metabolic reactions of all living cells including biological energy transformation. Phosphorus also plays a very important role in the root development and also proliferation as it improve root nodule and biological nitrogen fixation by supplying assimilates to roots. Phosphorus is the main constituent of various co-enzymes, ATP and ADP which serves as energy currency in plants. Phosphorus influences photosynthesis, phospholipids, synthesis of nucleic acids, membrane transport, cytoplasmic streaming and biosynthesis of proteins. Increased availability of phosphorus in the soil which was poor in content improved the status of available nutrient resulting into a greater uptake. The uptake of available nutrients might have improved the carbohydrate and photosynthetic synthesis and then translocations to the different parts for promoting the meristematic development in apical buds and inter calary meristems, ultimately increased the root and shoot development. This increase in yield and yield attributes by PROM may be due to an organic source of nutrition which contains organic matter and several essential nutrients with phosphorus and provide food for beneficial microorganism in field. The PROM application to soil might have increased the availability of nutrients due to increase in number of micro fauna which bring out transformation of nutrients. Beneficial effect of PROM is also related to improvement in the soil physical properties as well as soil health. The ample availability of nutrients due to application of PROM might have increased yield attributes because nutrient supply favorably influenced the synthesis of chlorophyll and thus increased the carbohydrate metabolism. The overall improvement in seed yield due to the application of PROM may be attributed to cumulative effect of growth parameters as well as yield attributes such as number of pods plant-1, number of seeds pod-1 and test weight. These results are in the conformity with findings of Singh et al. (2015), Aechra et al. (2017) and Yadav et al. (2017). References Aechra, S., Yadav, B.L., Ghosalya, B.D. and Bamboriya, J.S. (2017).Effect of soil salinity, phosphorus and biofertilizers on physical properties of soil, yield attributes and yield of cowpea [Vigna unguiculata (L.)Wilczek].J. Pharmacogn.& Phytochem,6(4): 1691-1695. Bairwa, P.C., Sammauria, R. and Gupta, K.C. (2019). Direct and Residual Effect of PROM on Productivity, Nutrient Uptake, Soil Properties and Economics under cluster bean - wheat cropping system. Journal of Soil Salinity and Water Quality, 11(1): 84-89. Singh, K., Manohar, R.S., Choudhary, R., Yadav A.K. and Sangwan, A. (2015).Response of different sources and levels of phosphorus on yield, nutrient uptake and net returns on mung bean under rainfed condition.Agric. Sci. Digest-A Res. J.,35 (4): 263-268. Yadav, K.R., Manohar, R.S., Kumawat, S.R. and Yadav, V.K. (2017).Effect of Phosphorus Sources and Phosphorus Solubilizing Microorganism on Growth and Yield of Mungbean [Vigna Radiata (L.) wilczek]. Chem. Sci. Rev. Lett.,6(22): 1152-1155.

National E-Workshop onCurrent Scenario of Post Graduation Research in Agriculture Sector Sept 09-11, 2020
91
Table 1 Effect of sources of phosphorus and levels of sulphur on yield attributed of green gram
Treatments No. of Pods/plant
Test weight
(g)
Yield (q/ha)
Seed Straw Biological
Sources of phosphorus (kg ha-1)
Control 28.1 26.16 7.63 17.03 24.66
16 kg P through DAP 30.3 28.11 8.51 18.89 27.40
16 kg P through PROM 31.2 28.94 9.34 20.28 29.62
32 kg P through DAP 34.3 30.32 10.01 21.98 31.99
32 kg P through PROM 36.1 31.64 11.17 23.86 35.02
SEm± 0.55 0.45 0.19 0.45 0.51
CD (P= 0.05) 1.59 1.29 0.54 1.32 1.46
Levels of sulphur (kg ha-1)
Control 27.4 27.45 8.26 18.36 26.62
15 32.9 29.17 9.45 20.57 30.03
30 35.8 30.48 10.29 22.28 32.57
SEm± 0.42 0.35 0.14 0.35 0.39
CD (P= 0.05) 1.23 1.00 0.42 1.02 1.13

National E-Workshop onCurrent Scenario of Post Graduation Research in Agriculture Sector Sept 09-11, 2020
92
INFLUENCE OF PINK PIGMENTED FACULTATIVE METHYLOTROPHS (PPFMS) AND PLANT GROWTH PROMOTERS
ON NITROGEN, PHOSPHORUS ANDPOTASSIUM UPTAKE ON SEMI DRY RICE
B. Banu Priya* and G. Balasubramanian**
*Department of Soils and Environment AC&RI, Madurai - 625 104, India **Department of Environmental Sciences, TNAU, Coimbatore – 641 003, India
Email: [email protected]
Introduction Abiotic stress has been estimated that more than half of the yield potential of major crops is mainly affected due to unfavourable growing environments such as drought (Cortina and Culianez-Macia, 2005). The problem of drought is increasing day by day with reduction in production of crops (Qayyum and Malik, 1988). Drought stress disturbs water relations, causing a reduction in water-use efficiency. Drought stress affects various physiological and metabolic processes in rice (Oryza sativa L.) plant. Non-availability of high-yielding varieties suitable for cultivation under drought condition lead to sharp decline in rice yield. The current study was aimed to carry out to assess the impact of PPFM and plant growth promoters on mitigating drought stress effects in semi dry rice.
Methodology The field experiments were conducted in sandy clay loam soil of farmers' field, Therkutheru, Melur Block, Madurai during 2017-18 with the short duration variety ADT 45. The experiment was conducted on the basis of factorial randomized block design with three replications. The experiment was conducted with the following treatments viz., Factor 1: Soil Application S1: 100% Recommended Dose of Fertilizer (75:25:37.5 kg ha-1 N,P and K), S2: 100 % RDF + Azospirillum(soil application @ 2 kg ha-1), S3: 100 % RDF+Azophos(soil application @ 2 kg ha-1) and S4: 100 % RDF+ Azotobacter (soil application @ 2 kg ha-1), Factor 2: Foliar application F1: PPFM (Foliar application 500 ml ha-1), F2: Brassinolide (1 ppm),F3:Salicylic acid (100 ppm) and F4: Control. Findings Nitrogen uptake: Among the various treatments,the highest nitrogen uptake was recorded in soil application of was observed in (S3) application of RDF + Azophos @2 kg ha-1 through soil as 18.3, 65.3, 23.9 and 42.4 at 30 DAS, 60 DAS, grain and straw, respectively.The data analysed revealed that the maximum nitrogen uptake was recorded in of foliar application of PPFM @ 500 ml ha-1 was recorded in control (F1) as 18.0, 62.6, 22.3 and 41.3 kg ha-1 30 DAS, 60 DAS, grain and straw, respectively The maximum nitrogen uptake was registered in the treatment, application of RDF + Azophos @ 2 kg ha-1 through soilalong with foliar spraying of PPFM@ 500 ml ha-1 (S3F1) as 24.2, 78.7, 30.4 and 49.4 kg ha-1 at 30 DAS, 60 DAS, grain and straw, correspondingly and followed by 30.4, 49.4 and 28.6, 47.6 kg ha-1 were though consolidating the application of RDF + Azophos @ 2 kg ha-1 through soil along with foliar application of Brassinolide @ 1 ppm was recorded in control plot (S3F2) at active

National E-Workshop onCurrent Scenario of Post Graduation Research in Agriculture Sector Sept 09-11, 2020
93
tillering, panicle initiation and grain and straw, correspondingly whereas nutrient uptake of (8.25, 33.9 , 9.26 and 24.2 kg ha-1) was recorded in control (S4F1) at 30 DAS, 60 DAS, grain and straw, correspondingly(Fig.1). The availability of soil available nitrogen in the soil through enhanced atmospheric nitrogen fixation and increased solubility and mobility due to improved microbial activity through the addition of biofertilizers might have enhanced the uptake of nitrogen by plants (Jeyajothi and Pazhanivelan, 2017). Phosphorus uptake: Among the various treatments, maximum phosphorus uptake was recorded in soil application of RDF + Azophos @ 2 kg ha-1 (S3) in 7.71, 18.5, 5.96 and 12.8 kg ha-1 at 30 DAS, 60 DAS, grain and straw, respectively.The data analysed that PPFM and growth promoters application extended from 4.66 to 8.01, 9.20 to 20.3, 4.0 to 6.12 and 7.07 to 13.3 kg ha-1 at 30 DAS, 60 DAS in grain and straw respectively whereas, the maximum phosphorus uptake was recorded in foliar application of PPFM @ 500 ml ha-1 (F1) in 8.01, 20.3, 6.12 and 13.3 kg per hectare at 30 DAS, 60 DAS, grain and straw, correspondingly. The least P uptake was observed in control.The conjoint application of soil and foliar application were critical at all development stages. The maximum phosphorus uptake was registered in the treatment application of RDF + Azophos @ 2 kg ha-1 through soil along with foliar application of PPFM @ 500 ml ha-1 (S3F1) in 9.15, 23.2, 6.78 and 15.5 kg ha-1 30 DAS, 60 DAS, grain and straw, respectively. This was followed by 8.58, 20.7, 6.60 and 14.6 kg ha-1 were though combining soil application of RDF + Azophos @ 2 kg ha-1 along with foliar application of Brassinolide @ 1ppm (S3F2) at 30 DAS, 60 DAS and grain and straw, correspondingly (Fig.2). Application of biofertilizers and growth promoters not only stimulated vegetative growth and capacity of the root, and also encouraged the adsorption and translocation of more nutrients which have led to increased uptake of these nutrients (Veerana S., 2003). Potassium uptake: Regarding uptake of potassium sources of biofertilizers, PPFM and plant growth promoters impacts a noticeable variation in all the growth stages. Among the various treatments, maximum K uptake was recorded in soil application of RDF + Azophos @ 2 kg ha-1 (S3)as 26.6, 56.6, 17.3 and 41.4 kg per hectare at active tillering, panicle initiation, grain and straw, respectively.The foliar application of PPFM and plant growth promoters application also significantly increased the maximum potassium uptake. Among the different treatments, foliar application of PPFM @ 500 ml ha-1 (F1) recorded the maximum potassium uptake in 27.3, 57.3, 19.5 and 49.3 kg ha-1 at 30 DAS, 60 DAS, grain and straw, respectively. The least potassium uptake was observed in control. The maximum potassium uptake was registered in the treatment application of RDF + Azophos @ 2 kg ha-1 through soil along with foliar application of PPFM @ 500 ml ha-1 (S3F1) in 31.3, 65.8, 21.6 and 57.7 kg ha-1 30 DAS,60 DAS, grain and straw, respectively and followed by consolidating soil application of RDF + Azophos @ 2 kg ha-1 along with foliar application of Brassinolide @ 1 ppm (S3F2) at 30 DAS, 60 DAS and grain and straw, correspondingly. The lowest potassium uptake was recorded in control(Fig.3). Use of stress ameliorators such as PPFM and Brassinolide supplementation could mitigate theill-effects of moisture stress with better absorption of nutrients. Plant growth regulators produced growth hormones which might have enhanced better root growth and canopy development that resulted in better nutrient (N, P and K) uptake. Similar finding as reported by Senthil et al. (2003).

National E-Workshop onCurrent Scenario of Post Graduation Research in Agriculture Sector Sept 09-11, 2020
94
References Cortina, C. and Culianez-Macia, F.A. 2005. Tomato abiotic stress enhanced tolerance by trehalose biosynthesis. Plant Sci. 169(1): 75-82. Qayyum, M.A., and M.D. Malik (1988). Farm production losses in salt affected soils. pp 356-364. In Proc. Managing Soil Resources. 1st Nat. Cong. Soil Sci. Lahore, Oct. 6-8. Jeyajothi, R., and S. Pazhanivelan. 2017. "Dry matter, nutrient uptake and yield of short duration pigeon pea (Cajanus cajan L.) varieties under drip fertigation system." Int. J. Curr. Microbiol. App. Sci 6 (11):3958-3965. Senthil, A., G. Pathmanaban, and P. Srinivasan. 2003. "Effect of bioregulators on some physiological and biochemical parameters of soybean (Glycine max L.)." Legume Research-An International Journal 26 (1):54-56. Veerana S., a.B.T.S. 2003. " Growth of florets of sunflower (Helianthus annuus L.) in relation to their position in the capitulum, shading and nitrogen supply. ." Field Crops Research 34:83-100.
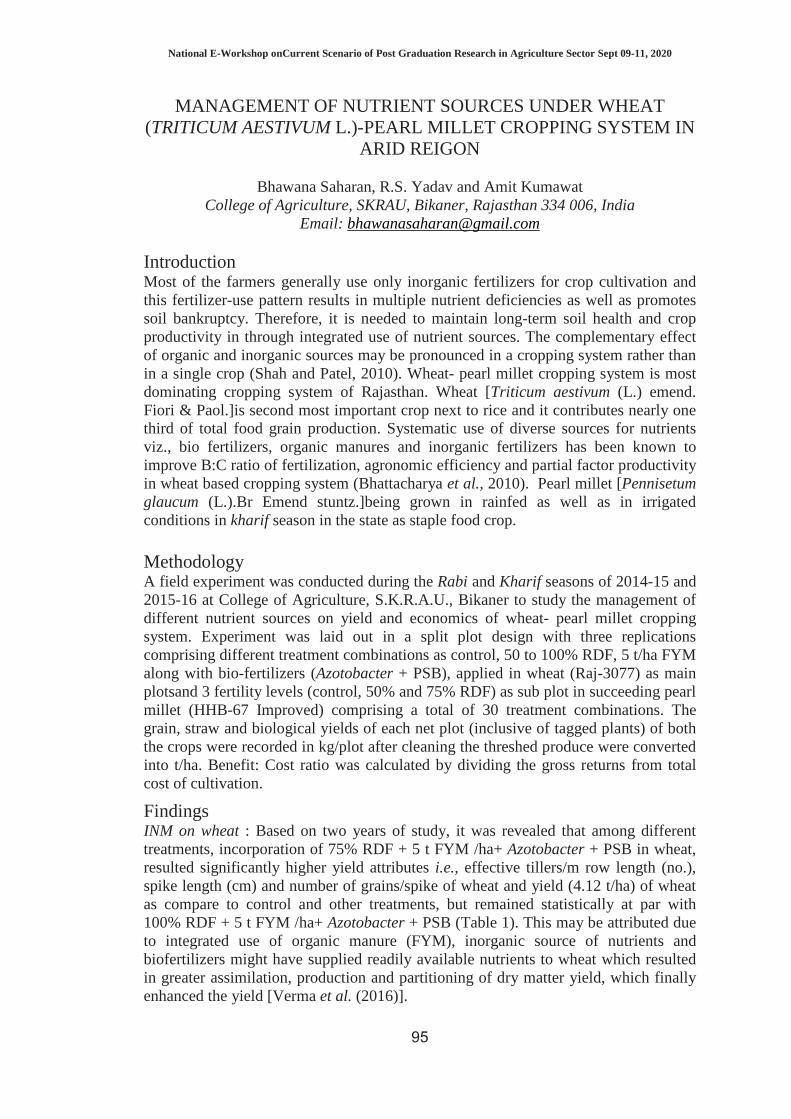
National E-Workshop onCurrent Scenario of Post Graduation Research in Agriculture Sector Sept 09-11, 2020
95
MANAGEMENT OF NUTRIENT SOURCES UNDER WHEAT (TRITICUM AESTIVUM L.)-PEARL MILLET CROPPING SYSTEM IN
ARID REIGON
Bhawana Saharan, R.S. Yadav and Amit Kumawat College of Agriculture, SKRAU, Bikaner, Rajasthan 334 006, India
Email: [email protected]
Introduction Most of the farmers generally use only inorganic fertilizers for crop cultivation and this fertilizer-use pattern results in multiple nutrient deficiencies as well as promotes soil bankruptcy. Therefore, it is needed to maintain long-term soil health and crop productivity in through integrated use of nutrient sources. The complementary effect of organic and inorganic sources may be pronounced in a cropping system rather than in a single crop (Shah and Patel, 2010). Wheat- pearl millet cropping system is most dominating cropping system of Rajasthan. Wheat [Triticum aestivum (L.) emend. Fiori & Paol.]is second most important crop next to rice and it contributes nearly one third of total food grain production. Systematic use of diverse sources for nutrients viz., bio fertilizers, organic manures and inorganic fertilizers has been known to improve B:C ratio of fertilization, agronomic efficiency and partial factor productivity in wheat based cropping system (Bhattacharya et al., 2010). Pearl millet [Pennisetum glaucum (L.).Br Emend stuntz.]being grown in rainfed as well as in irrigated conditions in kharif season in the state as staple food crop. Methodology A field experiment was conducted during the Rabi and Kharif seasons of 2014-15 and 2015-16 at College of Agriculture, S.K.R.A.U., Bikaner to study the management of different nutrient sources on yield and economics of wheat- pearl millet cropping system. Experiment was laid out in a split plot design with three replications comprising different treatment combinations as control, 50 to 100% RDF, 5 t/ha FYM along with bio-fertilizers (Azotobacter + PSB), applied in wheat (Raj-3077) as main plotsand 3 fertility levels (control, 50% and 75% RDF) as sub plot in succeeding pearl millet (HHB-67 Improved) comprising a total of 30 treatment combinations. The grain, straw and biological yields of each net plot (inclusive of tagged plants) of both the crops were recorded in kg/plot after cleaning the threshed produce were converted into t/ha. Benefit: Cost ratio was calculated by dividing the gross returns from total cost of cultivation.
Findings INM on wheat : Based on two years of study, it was revealed that among different treatments, incorporation of 75% RDF + 5 t FYM /ha+ Azotobacter + PSB in wheat, resulted significantly higher yield attributes i.e., effective tillers/m row length (no.), spike length (cm) and number of grains/spike of wheat and yield (4.12 t/ha) of wheat as compare to control and other treatments, but remained statistically at par with 100% RDF + 5 t FYM /ha+ Azotobacter + PSB (Table 1). This may be attributed due to integrated use of organic manure (FYM), inorganic source of nutrients and biofertilizers might have supplied readily available nutrients to wheat which resulted in greater assimilation, production and partitioning of dry matter yield, which finally enhanced the yield [Verma et al. (2016)].

National E-Workshop onCurrent Scenario of Post Graduation Research in Agriculture Sector Sept 09-11, 2020
96
Residual & direct effect of nutrient sources on succeeding pearl millet: Application of INM treatments to the preceding wheat recorded significantly higher yield attributes, grain (1.38 t/ha) and stover yield of pearl millet over control and other treatments (Table 1). Jat et al. (2015) indicated that organic manures supplemented nutrients, increased their availability in the soil brought about increase in succeeding crop yield in plots applied with FYM during preceding crop. Humic acid in FYM might have enhanced the availability of both native and added nutrients in soil as a result of improved growth, yield attributes and yield of the succeeding crop [Yadav et al. (2003)]. Significant increase in grain yield i.e. 1.43 t/ha (Table 1) of pearl millet with increasing levels of fertilizer (75% RDF) due to improvement in yield attributing characters, Supply of nitrogen and phosphorus to soil might have accelerated various physiological processes in plants favoring increased yield in pearl millet [Kumawat, et al. (2018)]. Economics: The highest significant pooled mean net returns (` 62672 ha-1) with B:C ratio (2.12) was obtained by the application of 75% RDF + 5 t FYM + Azotobacter + PSB in wheat closely followed by 100% RDF + 5 t FYM + Azotobacter + PSB (Table 1). In succeeding pearl millet crop the highest significant pooled mean net returns (`52551 ha-1) and B:C ratio (1.96) was recorded with 75% RDF (Table 1). Inference 75% RDF + 5 t/ha FYM + Azotobacter + PSB in wheat (as saving of 25% of nutrients) and75 % RDF in succeeding pearl millet should be applied for better nutrient management&for obtaining higher yields and net returns in wheat-pearl millet cropping system. References Bhattacharya, R., Pandey, S.L., Chandra, S., Kundu, S., Saha, S., Mina, B.L., Srivastav, A.K. and Gupta, H.S. 2010. Fertilizer effect on yield sustainability and soil properties under irrigated wheat soybean rotation on an Indian Himalayan upper Valley. Nutrients cycling in agro ecosystem86 (2): 255-268. Jat, A.L., Srivastava, V.K. and Singh, R.K. 2015.Effect of crop-establishment methods and integrated nitrogen management on productivity of hybrid rice-wheat.Indian Journal of Agronomy 60(3): 341-346. Shah, K.A. and Patel, R.H. 2010.Recycling effect of wheat straw incorporation and inorganic fertilizer on growth, yield and quality of wheat and their residual effect on yield of succeeding Kharif pearl millet, Advance Research Journal of Crop Improvment 1(2): 126-129. Verma, R.K., Shivay, Y.S., Kumar, D. and Ghasal, P.C. 2016.Productivity and profitability of wheat as influenced by different cropping systems and nutrient sources.Indian Journal of Agronomy61(4): 429-435. Yadav, R.S., Yadav, P.C. and Dahama, A.K. 2003.Integraed nutrient management in wheat-mungbean cropping sequence in arid region.Indian Journal of Agronomy 48(1): 23-26. Kumawat, A., Yadav, R.S. and Pareek, N.K. 2018.Residual effect of FYM and fertilizers on soil fertility, productivity and economics of pearl millet.Journal of Soil and Water Conservation 17(1): 102-106.
National E-Workshop onCurrent Scenario of Post Graduation Research in Agriculture Sector Sept 09-11, 2020
97
Table 1: Effect of different nutrient treatments on yield (t/ha) and system economics (�ha-1) of wheat- pearl millet cropping system(Pooled data of two years)
Treatments Wheat Pearl millet Net Return
B:C
Grain yield
Straw yield
Grain yield
Stover yield
(� ha-1) Ratio
INM in wheat Control 2.25 3.64 1.20 2.37 30342 1.67 50% RDF 2.99 4.70 1.25 2.43 43105 1.87 75% RDF 3.35 5.16 1.27 2.47 49216 1.95 100% RDF 3.63 5.49 1.29 2.50 53217 1.98 50% RDF + FYM 5 t/ha 3.37 5.02 1.29 2.51 47621 1.89 75% RDF + FYM 5 t/ha 3.65 5.55 1.35 2.61 52959 1.95 100% RDF + FYM 5 t/ha 3.98 5.86 1.35 2.63 57667 1.99 50% RDF + FYM 5 t/ha + Azotobacter + PSB
3.57 5.21 1.30 2.52 51550 1.96
75% RDF + FYM 5 t/ha + Azotobacter + PSB
4.12 5.89 1.38 2.66 62672 2.12
100% RDF + FYM 5 t/ha + Azotobacter + PSB
4.18 6.03 1.39 2.68 62109 2.07
SEm± 0.10 0.08 0.02 0.03 1778 - CD (P=0.05) 0.29 0.22 0.05 0.09 5099 - Fertilizers in pearl millet Control - - 1.15 2.33 49279 1.93 50% RDF - - 1.34 2.55 51307 1.95 75% RDF - - 1.43 2.73 52551 1.96 SEm± - - 0.02 0.02 293 - CD (P=0.05) - - 0.05 0.06 825 -
National E-Workshop onCurrent Scenario of Post Graduation Research in Agriculture Sector Sept 09-11, 2020
98
EFFECT OF ORGANIC MANURE AND BIOFERTILIZERS ON GROWTH & YIELD OF CABBAGE (BRASSICA OLERACEA VAR.
CAPITATA L.)
Darshana Yadav MJRP College of Agriculture and Research, Achrol, Jaipur (Raj.)
Email: [email protected] Introduction Cabbage (Brassica oleracea var. Capitata L.) is one of the most important member of the genus Brassica grown in the world. It is the native of Cyprus and Mediterranean coast. (Katyal and Chadha, 1985).India is the second largest producer of cabbage in the world, next to China. The current focus on use of organic manures and biofertilizers is a strategy for maintaining soil fertility for a long period. The FYM is commonly used organic manure which is rich source of organic matter and able to replenised most of the macronutrients being taken up by the crop (Abdel-Nasser and Hussein, 2001). Organic manures are considered helpful in improving the physical and nutritional status of the soil and also enhance the activity of soil micro flora.The information on use of organic manures along with bio-fertilizers on vegetables is very meager for the soil of Rajasthan.
Methodology A field experiment was conducted during Rabi season of 2017-18 at the Research Farm, MJRP College of Agriculture and Research, Achrol, Jaipur. The experiment comprised of with nine treatments namely FYM @ 25 t ha-1 + RDF (120: 80: 80 /ha NPK), FYM @ 25 t ha-1, RDF (120: 80: 80 /ha NPK), FYM @ 30 t ha-1 + Azotobacter, Vermicompost @ 10 t ha-1, Vermicompost @ 10 t ha-1 + Azotobacter, FYM @ 15 t ha-1 + Vermicompost @ 5 t ha-1 + Azotobacter, 75 % RDF + 25 % N byFYM + Azotobacter and 50 % RDF + 50 % N byFYM + Azotobacterin Randomized Block Design with three replications. Findings The data presented in Table 1 revealed that head weight per plant was significantly affected by different sources of nutrients and their combination. The treatment T8 (75% RDF of NPK + 25 % N byFYM + Azotobacter) produced maximum head weight as compared to treatment T2, T4, T5, T6, and T7 but remained at par with treatment FYM @ 25t ha-1 + RDF of NPK (T1), RDF of NPK (T3) and 50 % RDF of NPK + 50 % N byFYM + Azotobacter (T9). While lowestvalue of these parameters was recorded with application of FYM 25 t ha-1 (T2). Inference On the basis of present investigation, it may be concluded that all the treatments showed significant differences for most of the traits under study, except for number of days taken to head maturity. Application of 75% RDF of NPK + 25 % N byFYM + Azotobacter (T8) was rated as the best treatment for all parameters like as plant height, plant spread, number of leaves per plant, biological yield, diameter of head, weight of head, head yield ha-1 and net returns of cabbage. While the quality
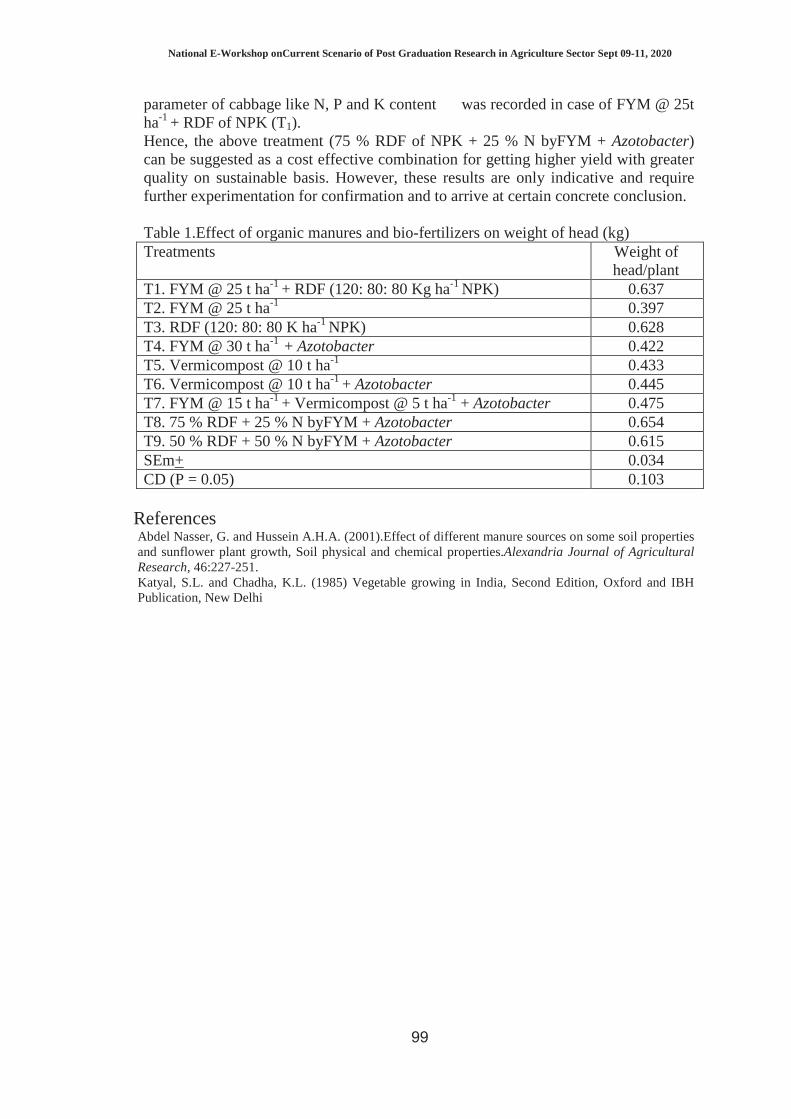
National E-Workshop onCurrent Scenario of Post Graduation Research in Agriculture Sector Sept 09-11, 2020
99
parameter of cabbage like N, P and K content was recorded in case of FYM @ 25t ha-1 + RDF of NPK (T1). Hence, the above treatment (75 % RDF of NPK + 25 % N byFYM + Azotobacter) can be suggested as a cost effective combination for getting higher yield with greater quality on sustainable basis. However, these results are only indicative and require further experimentation for confirmation and to arrive at certain concrete conclusion. Table 1.Effect of organic manures and bio-fertilizers on weight of head (kg) Treatments Weight of
head/plant T1. FYM @ 25 t ha-1 + RDF (120: 80: 80 Kg ha-1 NPK) 0.637 T2. FYM @ 25 t ha-1 0.397 T3. RDF (120: 80: 80 K ha-1 NPK) 0.628 T4. FYM @ 30 t ha-1 + Azotobacter 0.422 T5. Vermicompost @ 10 t ha-1 0.433 T6. Vermicompost @ 10 t ha-1 + Azotobacter 0.445 T7. FYM @ 15 t ha-1 + Vermicompost @ 5 t ha-1 + Azotobacter 0.475 T8. 75 % RDF + 25 % N byFYM + Azotobacter 0.654 T9. 50 % RDF + 50 % N byFYM + Azotobacter 0.615 SEm+ 0.034 CD (P = 0.05) 0.103
References Abdel Nasser, G. and Hussein A.H.A. (2001).Effect of different manure sources on some soil properties and sunflower plant growth, Soil physical and chemical properties.Alexandria Journal of Agricultural Research, 46:227-251. Katyal, S.L. and Chadha, K.L. (1985) Vegetable growing in India, Second Edition, Oxford and IBH Publication, New Delhi
National E-Workshop onCurrent Scenario of Post Graduation Research in Agriculture Sector Sept 09-11, 2020
100
EFFECT OF AMINOACID CHELATED MICRONUTRIENT MIXTURE ON PLANT HEIGHT AT DIFFERENT GROWTH STAGES
OF RICE
M Dhanalakshmi, P Rajalakshimi, G Akila, R. Vinothini
Department of Soil Science and Agricultural Chemistry, TNAU, Coimbatore Email: [email protected]
Introduction Rice (Oryza sativa L.) is cultivated world-wide over an area about 156.68 m ha with an annual production of about 650.19 million tons (Anonymous, 2013). Among the Indian states, Tamil Nadu is the one of the leading rice growing states which contributes 8 per cent of national rice production with 5.34 mt from an area of 1.97 mha, with an average productivity of 3.19 t ha-1. Producing micronutrient enriched cereals via bio-fortification, either agronomically or genetically, and improving Fe and Zn bioavailability are considered promising and cost effective approaches for diminishing malnutrition (Distelfeld et al., 2007).Zinc is main limited micronutrient of flooded rice; about 80-90 % of soil applied zinc is unavailable to plant due to its various harmful reactions. So chelated form of zinc may be an alternative source of Zn in crop production (Basal and Nayyar 1989; Karak et al., 2002). Sodic, upland and calcareous coarse-textured soils with low organic matter content suffer from Fe deficiency. Organic sources have improved the content of Fe by supplying chelating agents, which helps in maintaining the solubility of micro-nutrients including Fe. EDTA being a carcinogenic agent, the use of amino acid chelated metals may be a right choice for correcting deficiencies and availability of particular metals. In India Zn deficiency and Fe availability is the most widespread problem under the area of high yielding crop varieties particularly in low land rice. Therefore it was worthwhile to study the effect of chelated Fe and Zn on plant height in rice. Methodology The present investigation was conducted as field experiment during Nov 2018 – Jan 2019 at Lalapuram village, kallikudi block of Madurai district with the rice cultivar TKM 13 as a test crop which is a semi dwarf, with 135 days maturity. The experiment was laid out with 14 treatments and replicated five times. The treatmental details were Control with no RDF (T1), RDF @ 150:50:50 kg ha-1 (T2), RDF + ZnSO4 @ 25 kg ha-1 (T3) , RDF + FeSO4 @ 50 kg ha-1 (T4), RDF + Chelated Zn @ 2.5 kg ha-1 (T5), RDF + Chelated Zn @ 3.75 kg ha-1 (T6), RDF + Chelated Zn @ 5 kg ha-1 (T7) , RDF + Chelated Fe @ 5 kg ha-1 (T8) , RDF + Chelated Fe @ 7.5 kg ha-1 (T9) , RDF + Chelated Fe @ 10 kg ha-1 (T10) , Chelated micronutrient mixture @ 7.5 kg ha-1 (T11), Chelated micronutrient mixture @ 10 kg ha-1 (T12) , Chelated micronutrient mixture (Iron methionate and Zinc lysinate) @ 12.5 kg ha-1 (T13), TNAU micronutrient mixture @ 12.5 kg ha-1 (T14). Observations on plant height were recorded. All replicated data were analyzed statistically using AGRES software.

National E-Workshop onCurrent Scenario of Post Graduation Research in Agriculture Sector Sept 09-11, 2020
101
Findings At active tillering stage, plant height was significantly influenced by the application of chelated micronutrient mixture. The plant height ranged from 39.2 to 50.3 cm at active tillering stage whereas at panicle initiation and harvest it ranged from 70.0 to 92.2 and 73.5 to 95.4 cm respectively (Fig 1). The best treatment was recorded by the application of 12.5 kg ha-1 of chelated micronutrient mixture along with RDF which has shown the height of 50.3, 92.2 and 95.4 cm and mainly due to genetic characters. Fe and Zn might have played a key role in chlorophyll structure formation and transformation of energy within the plants reported by Rawashdeh and Sala (2014). Zinc mainly plays a role in accelerating the enzymatic activity (Naik and Das, 2018). The lowest plant height was recorded with absolute control where no fertilizers were applied and the height was 39.2, 70.0 and 73.5 cm at active tillering, panicle initiation and at harvest stages respectively.
Inference Based on the results of this experiment, it is concluded that the application of iron and zinc fertilizes either as salts or chelated form as a soil application in single or in mixture in rice contributed marked increase in plant height compared to other treatments because of availability of micronutrients. Application of micronutrients in association with NPK showed better performance as micronutrients have immense economic importance since an adequate supply of micronutrients can help to ensure better yields. Therefore application of chelated micronutrient mixture @ 12.5 kg ha-1 along with RDF (150:50:50) could be the promising combination for maximizing the plant height and correspondingly its yield. Reference Anonymous.Agriculture Research Data Book, Ministry of Agric., Govt. of India, 1996. Basal RL, Nayyar VK. IRRI News letter.1989; 14:24. Distelfeld A, Cakmak I, Peleg Z, Ozturk L, Yazici MA, Budak H, Saranga Y, Fahima T.Multiple QTL-effects of wheat Gpc-B1 locus on grain protein and micronutrient concentrations. Physiol Plant. 2007; 129:635-643. Karak OT, Das DK, Karmakar SK. In proc. 17th World congress of Soil Science, held on 14-21 August 2002 at Bangkok Thailand. 2002; Paper no. 64. Naik SK, Das DK. Relative performance of chelated zinc and zinc sulphate for lowland rice (Oryza sativa L.) Nutrcycle Agrocwsyst. 2008; 21:219-227 Rawashdeh, HM, and Florin Sala. 2014. "Influence of iron foliar fertilization on some growth and physiological parameters of wheat at two growth stages." Romania Scientific papers. Series A. Agron 57:306-309.
National E-Workshop onCurrent Scenario of Post Graduation Research in Agriculture Sector Sept 09-11, 2020
102
INFLUENCE OF ORGANIC MANURE AND INORGANIC FERTILIZERS ON POTASSIUM FRACTIONS OF OKRA
VR. Mageshen1, U. Bagavathi Ammal2 and Pradip Dey3
1Department of Soil Science and Agricultural Chemistry, TNAU, Coimbatore, 2Department of Soil Science and Agricultural Chemistry, PAJANCOA, Karaikal,
3Project Coordinator, AICRP (STCR), ISSS, Bhopal, Madhya Pradesh, India Email: [email protected]
Introduction
Potassium is one of the most important primary nutrients which is required by plants in large quantities and has several physiological functions within the plant. There are four forms of K in the soils: solution K, exchangeable K, fixed K or non exchangeable K and mineral K. The kinetic and equilibrium reactions between the four forms of soil K affect the level of K in soil solution and readily available forms for plant uptake at any particular time. Soil solution K is the form readily available for microbial and plant uptake. The exchangeable K is readily available to plants, exchangeable with other cations present in clay minerals and humic substances.Potassium in wedge, edge, cracks and step positions is regarded as fixed K.The amount of each K fraction varies, depending on cropping history, as well as chemical fertilizer or organic manure application. In some soils, non-exchangeable K becomes available as the exchangeable and solution K are removed by cropping or lost by leaching. In other soils, release from non-exchangeable K is slow to meet crop requirement. When there is surplus K in the soil solution (by the addition of fertilizer), the element is transferred to the exchangeable and non-exchangeable fractions through exchange and fixation process. Potassium being a mobile element in plants, behaves differently in soil and rarely a dynamic equilibrium is observed in soil. There is also very little information is available on the K management involving organic and inorganic sources. Keeping all these things in mind, present study was emphasised on potassium fractions.
Methodology The field experiment was taken up on a inceptisol soil belongs to Bahour soil series of puducherry, classified as fine, mixed isohyperthermic, Typic Ustropept using bhendi as a test crop.The treatments allocated were T1-Control, T2 - FYM [email protected] t ha-1,T3- blanket recommendation, T4 - farmer’s practice , T5- STCR-NPK alone @ 160 q ha-1 yield target, T6 - STCR- NPK alone @ 170 q ha-1 yield target, T7 - STCR-NPK alone @ 180 q ha-1 yield target, T8 STCR-IPNS @ 160 q ha-1 yield target, T9 – STCR-IPNS @ 170 q ha-1yield target,T10 – STCR- IPNS @ 180 q ha-1 yield target. The treatments were replicated three times in Randomized Block Design (RBD). The soil used for experiment was neutral in pH and low insalt content. The soil was low in organic carbon. The available N,P and K status were low, medium and medium respectively. The post harvest soil sample was collected after 19th picking and subjected to potassium fractionation viz.,water soluble K, exchangeable K and non exchangeable K. Findings Data on the effects of STCR based organic and inorganic source on potassium fractions of post harvest soil sample is presented in Table 1. In the present

National E-Workshop onCurrent Scenario of Post Graduation Research in Agriculture Sector Sept 09-11, 2020
103
investigation, the highest water soluble K was recorded in STCR+IPNS treatments and blanket recommendation.This might be due to the release of K from the added K and from the added organic manure and also due to balanced application of nutrients through STCR. Application of organic manure along with either STCR or blanket recommendation had registered higher values of exchangeable K than other treatments. This might be due to the increased adsorption sites i.e., CEC of soil due to the addition of organic manure which can hold more exchangeable K and also due to the release of organic acids during decomposition of organic manure, which dissolves the K present in mineral form (or) in the non- exchangeable form.The increase in water soluble K and exchangeable K by the application of FYM could be ascribed to the reduction in fixation of K by organic manures. The lowest non exchangeable K was recorded in STCR-IPNS treatments and the highest value was at control treatment. The decrease in the non-exchangeable K in the treatments receiving either the organic manures or the STCR+IPNS practices could be due to the formation of organo metallo complexes of higher solubility. The corresponding increase in easily available forms of K appears to have resulted from their translocation from non-exchangeable to easily soluble forms. This could be clearly visible with a significant decrease in the non-exchangeable K and a corresponding increase in water soluble and exchangeable K in these treatments. The greater depletion of non exchangeable K in the presence of organic matter might be due to the shift in CEC sites towards divalent selectivity which would decrease percentage K saturation of CEC resulting in the shift of equilibrium of non exchangeable K to exchangeable K. The potassium fractions also increased with increasing doses of K at higher yield target level. It was also indirectly proved by the highest soil available K status recorded under STCR-IPNS treatments at harvest stage. Inference The application of STCR+IPNS treatment increased the content of water soluble K and exchangeable K fractions and decrease the non exchangeable K content. The organic acids released as a result of decomposition of organic manures help in the conversion of the non-exchangeable forms of K to available forms of K. However, organic manures alone cannot meet the nutrient requirements as they contain small amounts of essential nutrients and get released slowly during decomposition, thus nutrients requirement of the crop when needed is not fulfilled. Hence a blend of organic manures and inorganic fertilizers ensures the immediate supply of the nutrients from inorganic fertilizers in the initial stages and from the decomposition of organic manures to cater to the nutrient needs at the later stages of crop growth.
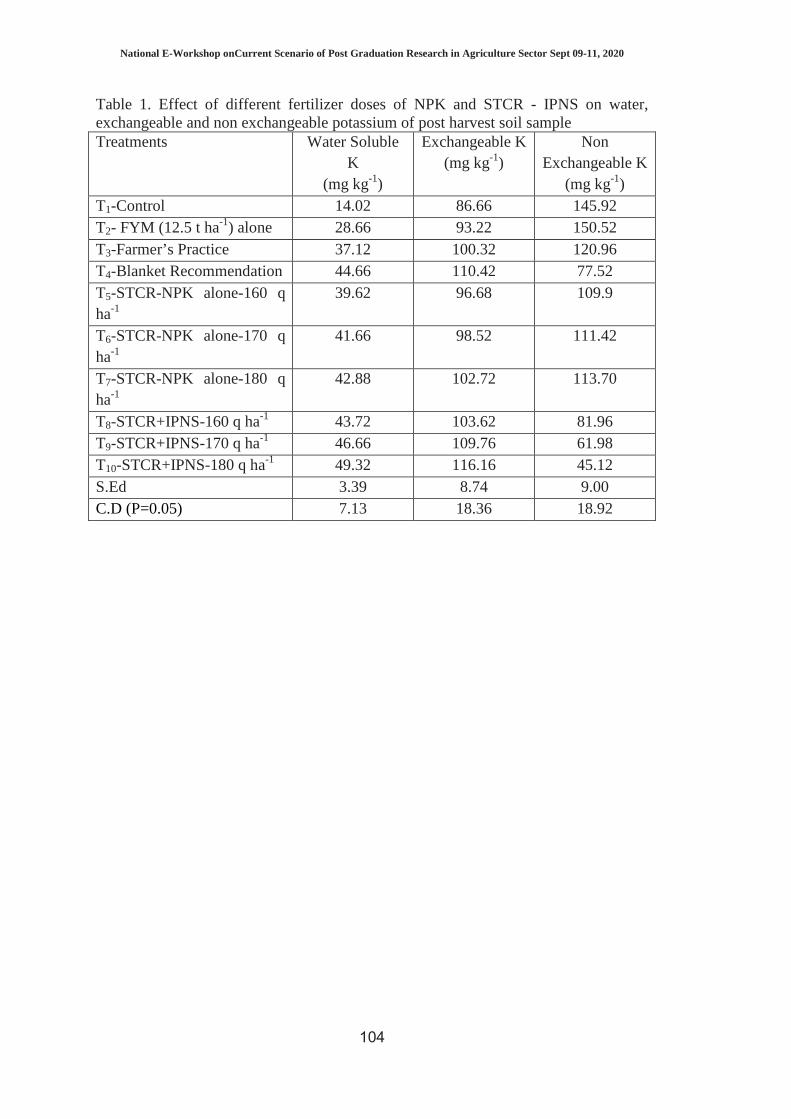
National E-Workshop onCurrent Scenario of Post Graduation Research in Agriculture Sector Sept 09-11, 2020
104
Table 1. Effect of different fertilizer doses of NPK and STCR - IPNS on water, exchangeable and non exchangeable potassium of post harvest soil sample Treatments Water Soluble
K (mg kg-1)
Exchangeable K (mg kg-1)
Non Exchangeable K
(mg kg-1) T1-Control 14.02 86.66 145.92 T2- FYM (12.5 t ha-1) alone 28.66 93.22 150.52 T3-Farmer’s Practice 37.12 100.32 120.96 T4-Blanket Recommendation 44.66 110.42 77.52 T5-STCR-NPK alone-160 q ha-1
39.62 96.68 109.9
T6-STCR-NPK alone-170 q ha-1
41.66 98.52 111.42
T7-STCR-NPK alone-180 q ha-1
42.88 102.72 113.70
T8-STCR+IPNS-160 q ha-1 43.72 103.62 81.96 T9-STCR+IPNS-170 q ha-1 46.66 109.76 61.98 T10-STCR+IPNS-180 q ha-1 49.32 116.16 45.12 S.Ed 3.39 8.74 9.00 C.D (P=0.05) 7.13 18.36 18.92

National E-Workshop onCurrent Scenario of Post Graduation Research in Agriculture Sector Sept 09-11, 2020
105
PERFORMANCE OF SESAME (SESAMUM INDICUM L.) VARIETIES UNDER DIFFERENT SOWING DATES IN RAINFED
CONDITION OF RAJASTHAN
Shri Rakesh1, R. C. Bairwa2, N. K.Pareek1 and Amit Kumawat1 Department of Agronomy, College of Agriculture,
2Agriculture Research Station Swami Keshwanand Rajasthan Agricultural University, Bikaner-334 006 (Raj.), India
Email: [email protected] Introduction Sesame (Sesamum indicum L.) is one of the oldest important oilseed crops. Today, India has achieved self-sufficiency in cereal food production but still vegetable oil needs to reach at the stage of self-sufficiency. Globally sesame is cultivated in more than 7 million hectare with an annual production 4 million tonnes and productivity 535 kg/ha. India is the largest producer and acreage holder (26%) of sesame in the world. It is cultivated in 20 lakh hectares with an annual production of 8.66 lakh tonnes and productivity 405 kg/ha(GOI, 2016). Sesame is cultivated on a large area in states of Maharashtra, Uttar Pradesh, Rajasthan, Orissa, Andhra Pradesh, Tamil Nadu, West Bengal, Gujarat and Karnataka. In Rajasthan, the crop occupied 2.66 lakh hectares and produced 0.92 lakh tonnes with the productivity 347 kg/hain 2016-17 (GOR 2017). Pali, Tonk, Sawai Madhopur, Jodhpur, Bhilwara, Karoli and Jalore are important sesame growing districts of Rajasthan. The seeds of sesame contains 40 to 63% oil which is rich in antioxidants and has a significant amount of oleic and linoleic acids (Abate and Mekbib, 2015). Sesame seed is consumed as a source of calcium, potassium, tryptophan and methionine. It is also used in pharmaceutical as well as cosmetic industries (Pornparn et al., 2009).Sesame seeds are rich source of food, nutrients, edible oil (50 %), and biomedicine as well as 6355 Kcal/kg energy (Kumar and Goel, 1994). Along with the seeds are also rich in protein i.e. 20.28 %, sugar 14-16 % and minerals 5-7 % (Dhinosa and Gupta, 1973). Sesame oil has excellent nutritional, medicinal, cosmetic and cooking qualities, for which it is known as “Queen of oilseed crops”. Among the available higher production technology selection of appropriate sowing time according to specific location and region is imperative phenomena to fully exploit the genetic potentiality of a variety as it synchronizes the optimum environmental conditions such as temperature, light, humidity, rainfall etc. with the different growth phases of the crop and results in boosting production of sesame. It is fact that particular genotypes do not exhibit the same phenotypic characteristics in all environmental circumstances. The responses of qualities, yield attributes and yield potential as well of genotype varies for a specific or different date of sowing (Dinda et al., 2015). Methodology The field experiment was conducted at Agronomy Farm, College of Agriculture, Swami Keshwanand Rajasthan Agricultural University, Bikaner, Rajasthan, India (28o 01’N latitude and 73o 22’E longitude at an altitude of 234.70 meters above mean sea level) during kharif season of 2017. Study was carried out to determine the Response of different sowing dates on growth, yield attributes and yields and quality of different sesame varieties. The soil of experimental field was loamy-sand, alkaline in reaction (pH 8.5) having 118 kg/haavailable N (Alkaline permanganate method, low level of

National E-Workshop onCurrent Scenario of Post Graduation Research in Agriculture Sector Sept 09-11, 2020
106
available phosphorus (15.1 kg/ha, Olsen’s method and medium in available potassium (173.7 kg/ha, Flame photometric method in 0-15 cm soil depth at the start of the experiment. Seed rate of 3.0 kg ha-1 of sesame seed was used for experimentation. The experiment was laid out in a split plot design with three replications. The different dates of sowing (4) were allocated in main plots and four varieties in sub plots. The four sowing Dates used were D1: 10 July, D2: 20 July and D3: 30 July, D4: 09 August and four varieties were V1: RT-125, V2: RT- 46, V3: RT- 127 and V4: RT- 346. The sowing of sesame varieties on scheduled dates of sowing and maintained crop geometry 30 ×10 cm. the size of individual plot was kept 3.0 × 4.0 m. the rainfall received during growing period (July to November) was 168.3mm in 09 rainy days. The mean weekly minimum and maximum temperature during the crop season fluctuated from 15.4 to 47.10c with the average relative humidity from 16.7 to 85.9 %. Experimental crop was raised as per recommended package of practices. Findings The results revealed that crop sown on 10 July recorded significantly higher growth attributing characters viz. plant height (15.38 & 138 cm at 25 DAS & harvest), dry matter accumulation (0.41, 3.73, 14.57 g/plant at 25, 75 DAS & harvest), crop growth rate (0.540, 4.438, 7.326 g/m2/day at 0 - 25, 25 - 50 DAS & 50 DAS -harvest), relative growth rate (0.581&1.143 mg/g/day at 25 - 50 DAS & 50 DAS –harvest), number of branches/plant(3.82), days to flowering (44.50), days to maturity (84) and yield attributing characters viz. number of capsules/plant (41.23), number of seeds/capsule (33.04), test weight (2.83g), seed yield (810 kg/ha), straw yield (2444 kg/ha), biological yield (3242 kg/ha) and harvest index (25.12 %) nitrogen (17.20 kg/ha), phosphorus (3.91 kg/ha) uptake, oil content (46.11%) and oil yield (399 kg/ha) as compared to 20 July 30 July and 09 August. Sowing on 09 August recorded significantly higher nitrogen (2.45 %), phosphorus (0.53 %) and crude protein (15.32%) content in seed as compared to 10 July, 20 July and 30 July. In case of varieties, variety RT- 127 recorded higher RGR (0.484 &0.892 mg/g/day at 25 - 50 DAS & 50 DAS –harvest) and seed yield (616 kg/ha) and harvest index (23.96 %) by RT- 125. The nitrogen, phosphorus uptake and oil yield also influenced significantly. Variety RT-125 have significantly higher nitrogen (13.66 kg/ha), phosphorus (3.0 kg/ha) uptake and oil yield (299 kg/ha) as compared to variety RT-46, RT-127 & RT-346. The crop sown on 10 July overall better than other dates of sowing it was recorded significantly higher plant height, dry matter accumulation, crop growth rate, relative growth rate, number of branches/plant, days to 50 % flowering and days to maturity, seed, straw yield, biological yield and harvest index of all tested varieties of sesame. The maximum seed yield was recorded by variety RT- 125 and relative growth rate was obtained by RT - 127. The variety RT- 346 recorded higher straw and biological yield as compared to RT- 125, RT-46 and RT- 127.
References Abate, M. and Mekbib, F. 2015 Assessment of genetic variability and character association in Ethiopian low altitude sesame (Sesamum indicum L.) genotypes. Journal of Advanced Studies in Agricultural, Biological and Environmental Sciences. 2 (3): 55-66. Dhinosa, K. S. and Gupta, S. K. 1973.Variability in chemical composition of sesamum (sesamum indicum L.). Haryana Agric. Univ. J. Res. 3(4): 197-201. Dinda, N. K., Ray, M. and Sarkar, P. 2015. Effect of sowing date visa- vis variety of rapeseed and mustard on growth, yield and aphid infestation in gangetic plains of West Bengal. The Ecoscan. 9(1&2): 21-24. GOI 2016. Pocket Book of Agricultural Statistics, Ministry of agriculture & Farmers Welfare Department of agriculture, cooperation & Farmers Welfare Directorate of Economics & Statistics New Delhi- 110001. pp 46.GOR 2017.Directorate of agriculture, Pant krishi Bhawan, Jaipur, Rajasthan – 302005.Kumar, S. and Goel, P. D. 1994.A great ancient oilseed Sesamum.Farmer and Parliament. 12: 6-7

National E-Workshop onCurrent Scenario of Post Graduation Research in Agriculture Sector Sept 09-11, 2020
107
Effect of Cow Urine and Plant Growth Promoting Rhizobacteria (PGPR) on Seed Germination, Growth and Survival of Karonda (Carissa
carandas L.) Seedlings Shreesty Pal, T.R. Sharmaand and O. P. Nagar
Department of Horticulture, College of Agriculture JNKVV, Jabalpur - 482004, (MP), India
Email: [email protected] Introduction Carissa carandas is native plant of India while 30 species of genus Carissa have been reported by Singh et al., (1967). It is cultivated throughout India in tropical and subtropical areas. Karonda fruit is a rich source of iron (3.91°per on dry weight basis) and contains a fair amount of Vitamin C. Therefore, it is very useful for cure of anaemia and has antiscorbutic properties. Vitamin A content of fruit is 1619 IU 100 g-1 of edible portion as well as 87-90% pulp, 13-14% total soluble solids and 4-6% acidity. Under the changing world trade scenario, it can be exploited on a commercial scale as a fruit for the processing industries. Karonda is commonly propagated by seed and fresh seeds are sown for raising seedlings in the month of August and September. Seeds of most species dehydrate at ripening and prior to dissemination, when moisture content drop to 30% or less. The seed dries further during harvest, usually to about 4-6% for storage. Germination cannot take place at this level of dryness which is important basis for maintaining viability and controllinggermination. In certain species, seed must not dry below which 30-50% or they will lose their ability to germinate (Chin 1981). Cow urine contains iron, urea, uric acid, estrogen and progesterone which affect the inhibitory response to seed germination, shoot growth and seedling vigour (Dilrukshi, 2009). Plant growth promoting rhizobacteria are the soil bacteria inhabiting around and, on the surface and are directly or indirectly involved in promoting plant growth and development via production and secretion of various regulatory chemicals in the vicinity of rhizosphere. They stimulate plant growth through mobilizing nutrients in soils, producing numerous plant growth regulators, protecting plants from phytopathogens by controlling or inhibiting them, improving soil structure and bioremediating the polluted soils by sequestering toxic heavy metal species and degrading xenobiotic compounds (like pesticides) (Ahemad, 2012; Hayat et al., 2010; Rajkumar et al., 2010; Braud et al., 2009). The present investigation entitled “Effect of cow urine and Plant Growth Promoting Rhizobacteria (PGPR) on seed germination, growth and survival of Karonda (Carissa carandas L.) seedlings” was conducted at Fruit Research Station, Imalia, Department of Horticulture, College of Agriculture, J.N.K.V.V., Jabalpur (M.P.) during the year 2018 - 2019. The experiment was laid out in Factorial Randomized Block Design with three replications. The experiment consist of 8 treatments T0 (Control), T1 (25% cow urine), T2 (50% cow urine), T3 (100% cow urine), T4 (Pseudomonas 6ml/kg seeds), T5 (25% cow urine + Pseudomonas 6ml/kg seeds), T6 (50% cow urine + Pseudomonas 6ml/kg seeds), T7 (100% cow urine + Pseudomonas 6ml/kg seeds). All the seed and soil inoculation treatments showed better germination, growth and survival when compared to un-inoculated control.

National E-Workshop onCurrent Scenario of Post Graduation Research in Agriculture Sector Sept 09-11, 2020
108
Methodology The experiment was conducted at Fruit Research Station, Imalia, Department of Horticulture, College of Agriculture, J.N.K.V.V., Jabalpur, Madhya Pradesh, India, during October 2018 to February 2019. The experimental site was situated at 23.9ºN latitude and 79.58ºE longitude and an altitude of 411.78 meters above Mean Sea Level (MSL).The seeds of Karonda (Carissa carandas L.) were obtained from Fruit Research Station of Jawaharlal Nehru Krishi Vishwa Vidyalaya, Imalia, Jabalpur District, Madhya Pradesh, India. Freshly harvested seeds of Karonda were soaked in cow urine solutions of different concentrations (25%, 50% and 100%) for a period of 24 hours and sown in polybags under the poly house. Treated seeds of Karonda were sown in polythene bags of 15 X 10 cm size filled with and without Pseudomonas treated soil. One seed per poly bag was sown at 2-2.5 cm depth. Findings Seed vigour parameters:The seeds treated with 25% cow urine and sown in soil inoculated with pseudomonas 6ml/kgrecordedearliest germination (5.33 days), minimum days taken to 50% germination (14.50), highest percentage of germination (79.63%),highest coefficient of germination (6.10)and highest speed of germination (9.15). The findings are supported by Shankaranarayanan et al., (1994) who reported that soaking of tamarind seeds in 10% cow urine or cow dung solution for 24 h increased the germination and vigor index as compared to that of untreated seeds. Inoculation of seeds of Phragmites australis with Pseudomonas asplenii improved germination (Bashan et al., 2008). Table.1 Effect of cow urine and plant growth promoting rhizobacteria (PGPR) on seed vigor and growth parameters Treatments
Initiation of germination
(days)
50% germination
(days)
Germination 60 DAS (%)
Speed of germination
Coefficient of
germination
T0 - control (tap water) 9.83 24.50 63.10 5.10 3.95
T1 - 25% cow urine 7.83 18.33 70.68 6.51 4.63
T2 – 50% cow urine 8.50 19.00 70.15 6.43 4.60
T3 – 100% cow urine 8.50 19.38 69.56 6.01 4.50
T4 – Pseudomonas 6ml/kg
9.00 22.83 65.18 5.61 4.30
T5 – 25% cow urine + Pseudomonas 6ml/kg
5.33 14.50 79.63 9.15 6.10
T6 – 50% cow urine + Pseudomonas 6ml/kg
6.33 15.00 78.71 8.80 5.55
T7 – 100% cow urine + Pseudomonas 6ml/kg
6.33 15.50 72.91 8.23 5.35
SEm± 0.15 0.20 0.24 0.02 0.019
CD at 5% level 0.44 0.59 0.71 0.07 0.055

National E-Workshop onCurrent Scenario of Post Graduation Research in Agriculture Sector Sept 09-11, 2020
109
References Ahemad M. 2012. Implications of bacterial resistance against heavy metals in bioremediation: a review. IIOABJ 3, 39-46. Bashan Y., M.E. Puente, L.E. de-Bashan, J.P. Hernandez, 2008. Environmental uses of plant growth-promoting bacteria. In: Barka EA, Clement C (eds) Plantmicrobe interactions. Trivandrum, Kerala, India, pp 69-93. Braud A, Je´ze´quel K, Bazot S, Lebeau T, 2009. Enhanced phytoextraction of an agricultural Cr-, Hg- and Pbcontaminated soil by bioaugmentation with siderophore producing bacteria. Chemosphere 74, 280–286. Chin HF. 1981. Cited in, propagation of tropical and subtropical horticultural crops.ed. Dilrukshi HNN and Perera ANF. 2009.Evaluation of an ancient technique to diagnose the pregnancy in cattle using urine. Wayamba Journal of Animal Science 6-8. Hayat R, Ali S, Amara U, Khalid R, Ahmed I. 2010. Soil beneficial bacteria and their role in plant growth promotion: a review. Ann Microbiol. 60, 579–598. IIlango K., K. Vanangamudi, A. Vanangamudi, R.S. Venkatesh, R.S. Vinayarai and S. Balaji, 1999.Effect of growth stimulants on seed germination and seedling vigour in Albizia lebbeck. Seed Research 27(2): 188-190. Krishnamurthy H.A., A.R. Alagawadi and P.V. Krishnaraj, 1991.Inhibition of phosphate solubilizing activity of microbes and P uptake in green plants by fenvelerate. J. Ecobiol., 3: 175 – 179. Rajkumar M, Ae N, Prasad MNV, Freitas H. 2010. Potential of siderophoreproducing bacteria for improvingheavy metal phytoextraction.Trends Biotechnol.28, 142– 149. Sankaranarayana RM, Vijay Kumar and Rangasamy P. 1994. Cow urine ideal seed germination in Tamarinds Indian Hort. J. 38 (4): 15. Singh S, Krishnamurthi S and Katyal S 1967.The karonda.Fruit Culture in India. ICAR, New Delhi, pp 287-288.
National E-Workshop onCurrent Scenario of Post Graduation Research in Agriculture Sector Sept 09-11, 2020
110
STANDARDIZATION OF MINISETT TECHNIQUE IN GREATER YAM (DIOSCOREA ALATA L.) UNDER SOUTHERN RAJASTHAN
CONDITIONS
Mithlesh Kumari Meena and 1R.S. Rathore Department of Horticulture, MPUAT, Udaipur 313001
1Assoc. Prof., ARS, Bikaner Email: [email protected]
Introduction Greater yam (Dioscorea alata L.) belongs to the family Dioscoreaceae and it has chromosome number (2n=2x=20 & 2n=4x=40). It belongs to genus Dioscorea which contains about 600 species (Coursey, 1967). It contains anthocyanin pigment in its bright lavender colour tuber which can be extracted as food colourant (Jose et al.,2015). It is a very nutritive vegetable and contains starch (27.88 g), energy (108 kcal), vitamin A (138 µg) protein (1.53 g) and fibre (0.65-1.40%) per 100 g of edible part. It is widely used for making vegetable, chips, puri and fried vegetable for canning, dehydration and flour manufacture. The main constraints in cultivation of greater yam are lack of availability of healthy planting materials and low multiplication ratio i.e.1:6, therefore, released varieties take a long time to reach to the farmer. The traditional method of producing of yams involves cutting a yam into small pieces called setts. Each sett weighs 300-350g depending on location and tradition. The sets are then planted and in one hectare area about 18-20 qt. setts are required. This means large quantities of greater yam are required for propagation purpose and marketable tubers are reserved for planting. The cost of planting materials is over 33 percent of the total outlay for yam production, so there is a need to improve the rate of yam multiplication (Okoli and Akorada, 1995). The minisett technique is a unique technique and fulfills the need. It was developed by National Root Crops Research Institute (NRCRI), Nigeria. The minisett technique involves cutting a yam tuber into small size pieces and planting them. The purpose of minisett technique is not to produce large tuber but to produce large number of healthy planting seed yams. The minisett technique is profitable due to lower materials cost and higher yield (Eyitayo et al.,2010). It enhance the multiplication ratio (1:24) to large extent. Buds are spread all over the periderm (body surface) of yam tuber. Hence any portion of yam tuber having is capability to sprouting and producing a new plant (George et al., 2004). It is an effective and viable technology which is quite farmer friendly and farmers oriented. This technique presents a rapid and cheap multiplication method for greater yam and produced healthy greater yams. It also offers a chance to reduce the production cost of greater yam.
Methodology An experiment entitled “Standardization of minisett technique in greater yam (Dioscorea alata L.) Under Southern Rajasthan Conditions.”was conducted at Horticulture farm, Department of Horticulture, Rajasthan College of Agriculture, Maharana Pratap University of Agriculture and Technology, Udaipur which is situated at South Eastern part of Rajasthan. This region has a typical sub-tropical climate, characterized by mild winters and summers. The average rainfall of this tract ranges from 592.5 mm to 620 mm per year. More than 90 per cent of rainfall is received
National E-Workshop onCurrent Scenario of Post Graduation Research in Agriculture Sector Sept 09-11, 2020
111
during mid-June to September with scanty showers during winter months. The experiment was laid out with Randomized Block Design with ten treatments and three replications. In minisett technique, mother seed yam of 500-1000g that have broken dormancy are cut into pieces weighed of 25g, 50g, 75g, 100g, 125g, 150g, 175g, 200g, 225g, 250g, with the help of sharp knife and tubers were treated with fungicide (12% carbendazim + 63% mencozeb). The tubers from each treatment were sown in pots filled with moist growing media containing75% soil + 25% FYM. The pots watered regularly. The experimental field was ploughed once with a mould board plough in the beginning followed by cross harrowing with disc cultivator and finally by planking to prepare the field to fine tilth. Basal application of well rotten FYM @ 3 tons ha-1 was incorporated in experimental area before transplanting. The layout of experiment was made as per treatments and replications. Yam seedlings were ready for transplanting 2 months after sowing of tubers. Seedling were planted at 7.5 cm depth keeping 90 x 90 cm spacing and covered with soil. Irrigation may be given at weekly intervals in the initial stage and afterwards at about 10 daysinterval. Bamboo poles were used as staking material to support the trailing vines. Initially the vines were tied with the coir string. The crop was harvesting manually 8 months after planting. The crop was harvested at full physiological maturity stage. A light irrigation 2-3 days before harvesting was required. Vines were removed first and then tubers were dug out manually with proper care. Cleaning was done to remove adhered roots and soil particles. Findings The results showed significant differences (P=0.05) among the different set of minisetts of greater yam. The maximum sprouting percentage (100%) were recorded in treatment T2 (50 g) and T4 (100 g), whereas, the minimum sprouting percentage (86.67%) were recorded in treatment T1 (25g), T6 (150g). Aswathy and Jessykutty, (2017)reported that the increasing trend of sprouting with increasing weight of planting material in Kasturi turmeric. The maximum speed of emergence (81.50%) was found in treatment T10 (250g) and minimum speed of emergence (60.50%) was recorded in T4 (100g). The speed of emergence is related to minimum days to sprouting. There were gradually increase in no. of leaves per vine, length of vines and leaf area (cm2) as the size of yam increased throughout the samples. The maximum number of leaves (96.00) and highest length of vines (183.73cm) were recorded in T10 (250g) followed by T8 (200g) & T9 (225g), While the minimum number of leaves (51.00) and length of vines (99.09cm) was recorded in T1 (25g). The present finding also supported with Onwuaeme (1972), Asadu et al., (1987) and Cyansa- Ameyaw et al. (1991), Okonmah et al. (2009), Ch’ng et al. (2017)are reported that larger setts are quickly established and more vigorous as compared to small weight of seed yam and promote vegetative growth parameters such as number of leaves, length of vines and basal portion of greater yam. The maximum leaf area (8181.76cm2) was recorded in T10 (250g) followed by 7281.39 cm2 in treatment T8 (200g) and minimum leaf area (2900.89cm2) was recorded in treatment T1 (25g). Leaf area index and leaf area duration increased with an increase in seed size (Enyi, 1972). The maximum node bits produced more leaf area, roots and root length in kasturi turmeric (Aswathy and Jessykutty, 2017). There were no significant difference (P<0.05) between tubers size of 200g, 225g, 250g but they are significantly higher other tuber size viz 25g, 50g,75g, 100g, 125g, 150g,175g. The maximum number of tuber per vine (3.33) was recorded in T8 (200g) followed by 3.27, 3.10 in T9 (225g) & T10 (250g) respectively and minimum number of tuber per vine (1.37) was recorded in T1

National E-Workshop onCurrent Scenario of Post Graduation Research in Agriculture Sector Sept 09-11, 2020
112
(25g). The maximum tuber length (18.18cm), tuber diameter (9.99cm) & tuber yield (1.97kg) per vine were recorded in T8 (200g) and minimum tuber length (12.74cm) tuber diameter (4.95cm) & tuber yield (0.86 kg) per vine were observed in T1 (25g). The maximum tuber yield (24.36t/ha) was recorded in treatment T8 (200g) followed by 23.99 t-1 and 23.93t-1 in treatment T10 (250g) and T9 (225g) respectively and minimum tuber yield (10.61 t/ha) was recorded in T1 (25g). It might be due to increase in vegetative growth with maximum harvest of solar light. Further, bigger size of seed tuber, are directly positively correlated with vegetative growth parameters, which was one of the reasons for achieving higher yield of greater yam in T8 (200g). Although tuber yield increased with increasing sett size and effect was confined to middle setts particularly at the wide spacing. Similarly, larger size tuber helps in development of new cells in meristematic tissue and regulates carbohydrate metabolism & also helps in formation of chlorophyll and absorption of other nutrients in soil and resulted more accumulation in sink. The above results are in conformity with the findings of Onwueme, (1972), Nwoke et al. (1973), Obigbesan, (1980), Kayode, (1984) and Okonmah and Akparobi, (2009) in greater yam. References Asadu, C.L.A., Ezeumah, H.C., Nweke, F.I. and Akammigbo, F.O.R. 1987. The performance of size cultivars of white yam derived from three sources and evaluated across three zones in southern Nigeria, In: “Linking similar environment”, cassava based cropping system. Research I, Ibadan, Nigeria. 16-19 Nov., 1987, pp: 215-223.
Aswathy, T.S. and Jessykutty, P. C. 2017. Rapid multiplication of kasturi turmeric throughminisett technique and nursery management. Journal of Spices and Aromatic Crops, 26 (1): 47-50. Ch’ng, H.Y., Yang, K.K.Y. and Othman, S.B.2017. Influence of minisett size of purple yam towards the seedling emergence and growth rate in production of seedyam. International Journal of Applied Research, 3(4): 367-370. Coursey, D.G. 1967.Yam on the account of the nature, origins, cultivation and utilization of the useful members of the discoreaceae, Longman, London, UK. Cyansa- Ameyaw, C.E., Hahn, S.K., Alarez, M.M. and Doku, E.V. 1991. Determination of optimal sett size for white guinea yam seed yam production: Trends in sprouting in pre sprout nursery and field performance. In: Tropical root crops in developing economy Ofori, F., Hahn, S.K. (eds.), proceeding of the 9th Symposium of the International Society of Tropical Root Crops, 20-26 October, 1991. Enyi, B.A.C. 1972. Effect of seed size and spacing on growth and yield of lesser yam (Dioscorea esculenta).The Journal of Agricultural Science, 72(2): 215-225. Eyitayo, O.A., Anthony, T.O., and Theresas, I. 2010. Economics of seed yam production using minisett technique in Oyo state, Nigeria. Field Actions Science Reports, 4(2): 1-5.
George, J., Nair, S. S. and Sree Kumari, M. T. 2004.Rapid multiplication of quality planting material in tuber crops. pp: 30-33. Central Tuber Crops Research Institute, Sreekariyan, Kerela. Jose, A, and Muhammed, R. 2015. Extraction and evaluation of anthocyanin from Dioscorea alata L. for its application as a natural food colour. The International Journal of Science and Technologies, 3(9): 41-47. Kayode,G.O. 1984. The effect of sett size and spacing on tuber yield of white guinea yam (Dioscorea rotundata) in rain forest and savana zones of Nigeria.Experimental Agriculture, 20(1):53-57. Nwoke, F.I.O., Njoku, E. and Okonkwo, S.N.C. (1973).The effect of size of seed yams on yield of individual plants of Dioscorea rotundata.In: 3rd Intl. Symp. on Tropical Root Crops, Ibadan, Nigeria, 2 9 December 1973. Obigbesan, G.O. 1980. Growth yield and quality of Chinese yam as affected by seed tuber size. In: 1st Triennial Root Crops Symposium. ISRTC- Africa branch. 8-12 Sept. 1980. International Development Center, Ottawa, Canada. Okoli, O.O., and Akoroda, M.O. 1995. Providing seed tubers for the production of food yams.African Journal of Root and Tuber crops, 1(1): 1-6. Okonmah, L.U. and Akparobi, S.O. 2009. Effect of seed yam weight on growth and tuber yield of white yam.Ghana Journal of Agricultural science, 42(1): 1-2. Onwueme, I.C., 1972. Influence of the weight of planted tuber on the growth and performance of white yam plants. Nigeria Agricultural Journal, 19(1): 170-173.
National E-Workshop onCurrent Scenario of Post Graduation Research in Agriculture Sector Sept 09-11, 2020
113
EFFECT OF INTEGRATED NITROGEN MANAGEMENT ON SESAME (SESAMUM INDICUM L.)
Pushpanjali SKN Agriculture University, Jobner (Raj)
Email: [email protected]
Introduction Oilseeds play a vital role in agricultural and industrial economics in world. India is the largest producer and acreage holder (26 per cent) of sesame in the world after China. In Rajasthan, the crop occupied 266919 hectares area and produced 92738 tonnes with the yield of 347.43 kg/ha. The oil content in sesame varies from 46 to 52 per cent.The integrated nutrient management in sesame improves its quantity and quality of produce and reduces the incidence of diseases, pests and cost of cultivation. FYM and Poultry manure improves soil fertility by adding nitrogen and phosphorous as well as micronutrients, and improves moisture and nutrient retention (Farhad et al., 2009).Nitrogen promotes vegetative growth and it provides resistance to insect and fungus attacks, positive impacts on vigour of plant, root growth and yield. Nutrient management through organics play a major role in maintaining soil health.
Methodology The field experiment entitled effect of Integrated Nitrogen Management on Sesame (Sesamum indicum L.)was conducted at agronomy farm, SKN college, Jobner duringkharif season of 2016. The climate of this region is semi arid. The soil of experimental field was loamy sandy in texture, alkaline and poor in available nitrogen. The experiment consisting of 12 treatments was carried out in randomized block design.RT 346 variety is drought tolerant variety of sesame is used for the experiment. Details of crop raising includes various operations that are field preparation, seed rate that is 4kg/ hac , thinning, hoeing, weeding, irrigation, application of fertilizer and at the end harvesting include threshing. Growth parameters are plant stand, plant height, dry matter production, number of branches per plant, chlorophyll content, leaf area index (LAI) and crop growth rate (CGR). Yield attributed includes number of capsules per plant, number of seeds per capsule, test weight (g), seed yield (kg/ha), stalk yield (kg/hac), biological yield (kg/ha) and harvest index (%). Protein content in seed was calculated from percent nitrogen in the seed multiplied by factor 6.25 and oil content is determined by Soxhlet’s Ether Extraction Method (A.O.A.C., 1955).
Findings Based on the results of one year experimentation, it is concluded that the treatments 50% RDN through urea + 50% through poultry manure + Azotobacter (T12) and 50% RDN through urea + 50% through FYM + Azotobacter (T11), were almost effective in increasing seed and stalk yield of sesame. However, these results are only indicative and require further experimentation to arrive at more consistent and final conclusion.

National E-Workshop onCurrent Scenario of Post Graduation Research in Agriculture Sector Sept 09-11, 2020
114
Table 1. Effect of integrated nitrogen management on oil content, oil yield and protein content of sesame
Treatments Oil
content (%)
Oil yield
(kg/ha)
Protein Content
(%) T1-Control 43.25 227.1 14.5 T2-100% RDN through urea 46.85 368.2 17.7 T3-100% RDN through FYM 46.50 330.2 16.3 T4-100% RDN through PM 47.80 363.3 16.8 T5-75% RDN through urea + 25% through FYM 46.90 387.0 17.4 T6-75% RDN through urea + 25% through PM 47.92 407.3 17.4 T7-75% RDN through urea + 25% through FYM + Azo
47.53 406.4 18.1
T8-75% RDN through urea + 25% through PM + Azo
48.30 421.2 18.1
T9-50% RDN through urea + 50% through FYM 47.51 425.2 17.5 T10-50% RDN through urea + 50% through PM 48.39 444.2 17.5 T11-50% RDN through urea + 50% through FYM + Azo
47.88 443.0 18.1
T12-50% RDN through urea + 50% through PM + Azo
48.70 460.2 18.1s
SEm + 0.88 19.02 0.3 CD (P=0.05) 2.59 55.78 1.00
Azo= Azotobacter Reference Anonymous, 2014. Vital Agricultural Statistics, Directorate of Agriculture, Govt. of Rajasthan, pp. 60. A.O.A.C.,1955. Association of Official Agricultural Chemists.Official method of analysis 8th Edn. Assoc. Official Agric Chemist, Washington,D.C Farhad, W., M. F. Saleem, M. A. Cheema and H.M Hammad 2009.Effect of poultry manure levels on the productivity of spring maize (Zea mays L.)The Journal of Animal and Plant Science 19(3);122-125.

National E-Workshop onCurrent Scenario of Post Graduation Research in Agriculture Sector Sept 09-11, 2020
115
EFFECT OF BIOMANURES ON SOIL NUTRIENT STATUS UNDER RAINFED SORGHUM CULTIVATION
P. Rajalakshimi, Dhanalakshmi M and Shamjeevika V
Agricultural College and Research Institute, Madurai Email: [email protected]
Introduction Sorghum, also called as the camel crop because of its drought tolerant nature, stands fifth globally after wheat, rice, maize and barley as the most important cereal crop. The nutritional value of sorghum and corn are nearly the same and hence, is gaining importance as livestock feed. More than 90% of the world’s sorghum area lies in the developing countries, mainly in Africa and Asia. India is 3rd largest producer of sorghum in world and has an area of 56.24 lakh ha (2016-2017) under sorghum cultivation, with a production of 45.68 lakh tones and productivity of 812 kg ha-1. The major sorghum growing states in India are Maharashtra, Karnataka, Madhya Pradesh, Andhra Pradesh, Telangana, Tamil Nadu, Gujarat and Uttar Pradesh.The results of a large number of experiments on manures and fertilizers conducted in India and abroad revealed that individual application of chemical fertilizers or organic manures could not achieve production sustainably (Gallani et al., 2010). Long term experiments on fertility have revealed that combined application of organic manure viz., vermicompost, FYM, Biocompost, etc., along with inorganic fertilizers at graded levels are promising not only in maintaining soil fertility, but also productivity and nutrient uptake (Patelet al, 2013). Also, among several bio-agents, Azospirillum alone or in combination with PSB increases the yield of sorghum (Patidar and Mali, 2004). Considering the above background, the present study was planned to identify the optimum combination of organic and inorganic fertilizers to optimize the available nutrient status of soil thereby enhancing the yield and soil health. Methodology A field experiment was conducted at Agriculture college and Research Institute, Madurai during rabiseason (Nov 2018 – Feb 2019). The soil of the experimental plot was sandy clay loam in texture, neutral in reaction (pH- 7.12) with medium organic carbon (0.62%). The available N, P and K were 180.4, 40, 310 kg ha-1 respectively. The experiment was laid in Randomized Block Design having fifteen treatments replicated thrice. The treatments were absolute control (T1), 100% Recommended Dose of Fertilizer (80:40:0 NPK kg ha-1) (T2), Farm Yard Manure @12.5 t ha-1(T3), vermicompost @ 5 t ha-1 (T4), Biocompost @ 5 t ha-1 (T5), 33% Vermicompost+ 33% of Farm Yard Manure + 33% Biocompost (T6), 75% Recommended Dose of Fertiliser + 25% of Farm Yard Manure(T7),75% Recommended Dose of Fertiliser + 25% of Vermicompost (T8), 75% Recommended Dose of Fertiliser + 25% of Biocompost (T9), 50% Recommended Dose of Fertiliser + 50% of Farm Yard Manure (T10), 50% Recommended Dose of Fertiliser + 50% of Vermicompost(T11), 50% Recommended Dose of Fertiliser + 50% of Biocompost(T12), 25% Recommended Dose of Fertiliser + 75% of Farm Yard Manure (T13), 25% Recommended Dose of Fertiliser + 75% of Vermicompost(T14) and 25% Recommended Dose of Fertiliser + 75% of Biocompost(T15). Azospirillum @ 2kg ha-1 was applied in all treatments except control and the manures were applied in soil before sowing and were

National E-Workshop onCurrent Scenario of Post Graduation Research in Agriculture Sector Sept 09-11, 2020
116
incorporated by ploughing. Inorganic fertilizers were applied as basal.Sorghum var. K12 was dibbled at a spacing of 45 x 15 cm in ridges and furrows on first week of November 2018 and harvested on second week of Febraury. Net plot was converted to hectare basis. Other cultural and plant protection activities were done as per recommendations uniformly for all the treatments. Findings Available N: Soil available N differed significantly with different organic N sources application. The highest available N (250.29, 200.55, 203.31kg ha-1) was associated with75 per cent RDF + 25 per cent vermicompost + Azospirillum @ 2 kg ha-1 (T8) which was significantly higher than the rest.The lowest value was accounted under the control (153.51, 118.00, 106.45 at 30, 60 and 90 DAS, respectively). The available N content showed a declining trend throughout the cropping period in 100 per cent RDF and control whereas gradual increase was observed in organically treated plots. The table depicting the effect of bio-manures on available N status of sorghum under rainfed condition is given in Table 1. Available P: The highest available P on 30 DAS was found in 75 per cent RDF + 25 per cent vermicompost + Azospirillum @ 2 kg ha-1 (T8) which was 32.21 per cent higher than control. This was followed by, 75 per cent RDF + 25 percentbiocompost + Azospirillum @ 2 kg ha-1 (T9) (25.41 kg ha-1). These details are provided in.The soil available P was found increasing gradually from 30 to 60 DAS, and decreased at harvest. However, the control plots showed continued reduction in soil available P while the treatments showed gradual increase upto 60DAS and then a decrease in available P. Available K: The soil available K significantly differed with the treatments. Available K varied between 295.61 to 318.61, 203.67 to 234.14 and 182.41 to 231.45 on 30,60 and 90 DAS respectively. 75 per cent RDF + 25 per cent vermicompost + Azospirillum @ 2 kg ha-1 (T8) recorded the highest available K of 231.45kg ha-1. This was followed by 75 per cent RDF + 25 percentbiocompost + Azospirillum @ 2 kg ha-1
(T9) with the available K of 229.71kg ha-1. T1 recorded lowest available K of 182.45kg ha-1. These details are provided in Table 1.
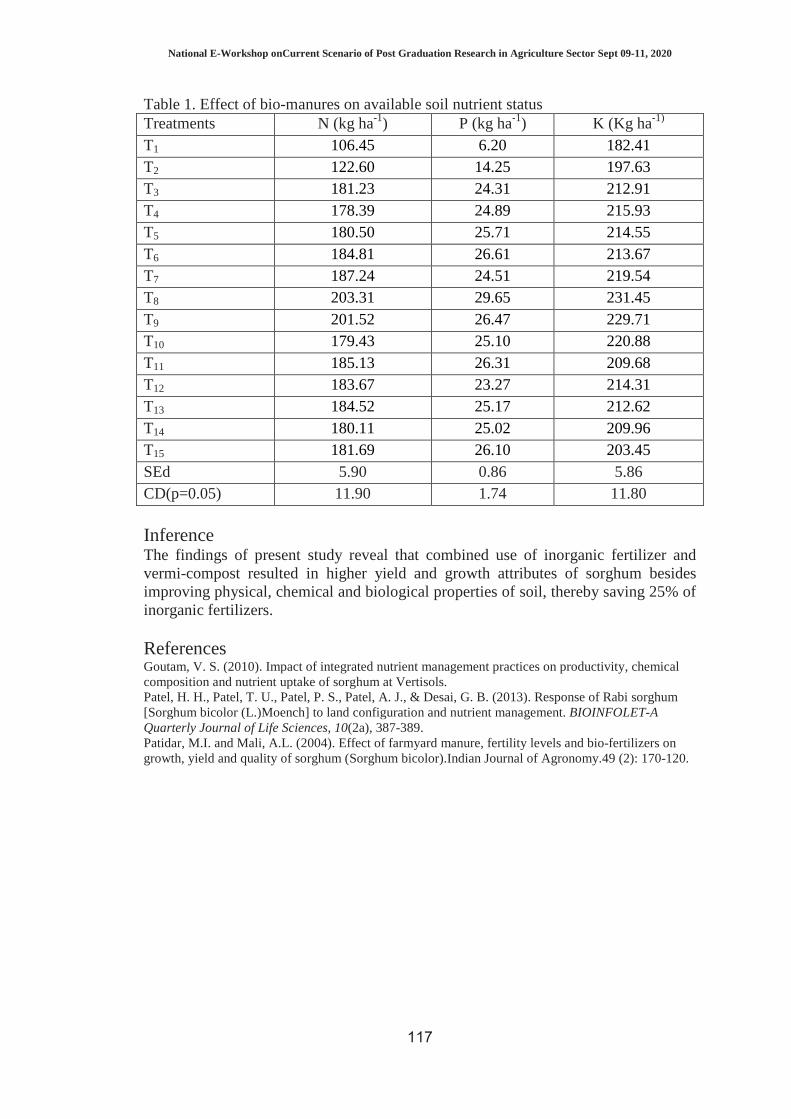
National E-Workshop onCurrent Scenario of Post Graduation Research in Agriculture Sector Sept 09-11, 2020
117
Table 1. Effect of bio-manures on available soil nutrient status Treatments N (kg ha-1) P (kg ha-1) K (Kg ha-1) T1 106.45 6.20 182.41 T2 122.60 14.25 197.63 T3 181.23 24.31 212.91 T4 178.39 24.89 215.93 T5 180.50 25.71 214.55 T6 184.81 26.61 213.67 T7 187.24 24.51 219.54 T8 203.31 29.65 231.45 T9 201.52 26.47 229.71 T10 179.43 25.10 220.88 T11 185.13 26.31 209.68 T12 183.67 23.27 214.31 T13 184.52 25.17 212.62 T14 180.11 25.02 209.96 T15 181.69 26.10 203.45 SEd 5.90 0.86 5.86 CD(p=0.05) 11.90 1.74 11.80 Inference The findings of present study reveal that combined use of inorganic fertilizer and vermi-compost resulted in higher yield and growth attributes of sorghum besides improving physical, chemical and biological properties of soil, thereby saving 25% of inorganic fertilizers. References Goutam, V. S. (2010). Impact of integrated nutrient management practices on productivity, chemical composition and nutrient uptake of sorghum at Vertisols. Patel, H. H., Patel, T. U., Patel, P. S., Patel, A. J., & Desai, G. B. (2013). Response of Rabi sorghum [Sorghum bicolor (L.)Moench] to land configuration and nutrient management. BIOINFOLET-A Quarterly Journal of Life Sciences, 10(2a), 387-389. Patidar, M.I. and Mali, A.L. (2004). Effect of farmyard manure, fertility levels and bio-fertilizers on growth, yield and quality of sorghum (Sorghum bicolor).Indian Journal of Agronomy.49 (2): 170-120.

National E-Workshop onCurrent Scenario of Post Graduation Research in Agriculture Sector Sept 09-11, 2020
118
RESPONSE OF CUMIN (Cuminum cyminum L.) VARIETIES TO LEVELS OF FERTILIZER AND BIOFERTTILIZERS
Rutul Patel and Armi Patel
C. P. College of Agriculture, SK Dantiwada Agricultural University, Sardarkrushinagar
Email: [email protected]
Introduction Seed spices are known as an integral part of Indian culture that’s why India is known as home of spices. The seed spices are annual herbs, whose dried seeds are known as spices and widely used in culinary, confectionary, perfumery, cosmetics and pharmaceutical industries. Cumin is extensively cultivated in India. Cumin aldehyde or cuminol is 36.31 per cent in cumin which attributes the specific value added aroma. It has carminative, stomatic, anti-diarrheal and dyspecial medicinal properties. Cuminoccupies 47.0 per centof total seed spices area but accounts for 35.7 per centof total seed spices production in the country. Among different factors known to augment crop production, identification of new genotype having wider adaptability and responsiveness to input are considered essential for exploiting higher yield potential. The identification of such high yielding adaptable varieties as per crop growing situation is considered to be first and foremost step for development of production technology. It is an established fact that potential of the genotype is realised to the fullest extent when it is grown under optimum environment. Plant nutrients play specific and important role in growth and development of a plant. Adequate mineral fertilization is considered to be one of the most important pre-requisites in this respect. Nitrogen plays a key role in the synthesis of chlorophyll and amino acids, which contributes to the building units of protein and thus growth of plant. It also helps in early establishment of leaf area capable of photosynthesis and increased root development to enable more efficient use of water. Next to nitrogen, phosphorus is of paramount importance in crops for increasing yield. Phosphorus, apart from its role in root development and nodule formation, plays an important role in energy transfer in the living cell by means of high phosphate energy bonds ATP and ADP (Havlin et al., 2003). Therefore, there is need to workout optimum combination of nitrogen and phosphorous for cumin. In recent years the rise in price of chemical fertilizers, scarcity of organic manures and poor nutrient use efficiency has led to search some alternative source of nutrition. Biofertilizers facilitate economizing fertilizer nutrient use through utilizing BNF system, solubilising less mobile nutrients from fixed components and recycling of nutrients from crop residues. It is evidently clear that application of biofertilizers enhances the accumulation of soil enzymes, which is directly reflected on soil fertility index. The proper use of biofertilizers to crop not only provides economic benefit to the farmers, but also helps to improve and to maintain soil fertility and sustainability in natural ecosystem. Methodology The present investigation was conducted during the rabiseason in 2017-18 at Agronomy Instructional Farm of C. P. College of Agriculture, SDAU, Sardarkrushinagar, Dantiwada. It is situated in the North Gujarat Agro-climatic Zone. The soil of research farm was loamy sand in texture, poor in fertility and water holding capacity, having pH 7.61, EC 0.11 dS/m; low in organic carbon (0.31 %) and
National E-Workshop onCurrent Scenario of Post Graduation Research in Agriculture Sector Sept 09-11, 2020
119
available N (136.56 kg/ha) and medium in available P2O5 (43.41 kg/ha) and K2O (253.02 kg/ha). The experiment comprising of two varieties (GC 3 and GC 4) along with two levels of fertilizer (100 % RDF and 50 % RDF) and three levels of biofertilizers (Azotobacter + PSB, Azospirillum + PSB and NPK consortium) were applied in 12 different combinations. The treatments were evaluated und randomized block design (factorial) with four replications. The seeds were inoculated with respective strains of Azotobacter, Azospirillum, PSB and NPK consortium @ 25 ml/kg seed. The crop was raised as per standard recommended cultural practices. Findings Effect of variety:Data indicated that different treatments had a significant influence on growth attributes, yield attributes and yield of cumin. Significantly higher plant height (28.66 cm) and number of branches/plant (7.79) were recorded with GC 4 as compared to GC 3 because it is a varietal character. Inherent characteristic of particular variety plays a vital role on growth and development of crop which might be responsible for plant growth in terms of plant height and number of branches/plant. These findings are in accordance with the results reported earlier by Singh et al. (2003), Anonymous (2010), Sengupta et al. (2014) and Tamboli (2016) in fennel. Variety GC 4 recorded significantly more yield attributes viz., number of umbels/plant (30.04), number of umbellate/umbel (5.79), number of seeds/umbellate (5.96), test weight (4.667 g), harvest index (37.92 %); seed yield (437 kg/ha) andstraw yield (716 kg/ha) as compared to GC 3. The higher yield attributing characters recorded under GC 4 variety might be due to genetic potential of particular variety. Similar results were also observed by Singh et al. (2003), Anonymous (2010) and Sengupta et al. (2014) in fennel and Rawal et al. (2014) in cumin. Better vegetative and reproductive growth of GC 4 is attributed to inherent build up and thereby produced higher number of umbels/plant, umbellate/umbel, seeds/umbellate and test weight. These components play a vital role and showed significant positive correlation with seed yield. Results are in concurrence with those of reported earlier by Anonymous (2010), Meena and Singh (2013) and Tamboli (2016) in fennel and Rawal et al. (2014) in cumin. The difference in yield at different locations might be due to the genotypic differences and ecological variations. Similar results were also reported by Phurailatpam et al. (2016) in coriander.
Effect of levels of fertilizer:Significantly higher plant height (27.95 cm) and number of branches/plant (7.67) were recorded with An application of 100% RDF as compared to 50% RDF because it is a varietal character. The significant rise in growth parameters noticed under higher fertilizer level may be ascribed to the greater uptake of nutrients by the plants favoring better cell division, elongation, amino acid and protein synthesis and it might have produced more plant height, number of branches and plant dry matter production compared to lower fertilizer level. Similar finding was reported by Kumar et al. (2015) in fenugreek. An application of 100% RDF recorded significantly more yield attributes viz., number of umbels/plant (30.29), number of umbellate/umbel (5.54), number of seeds/umbellate (6.13), harvest index (37.19 %); seed yield (424 kg/ha) and straw yield (714 kg/ha) as compared to 50% RDF. Nitrogen and phosphorus fertilization plays a vital role in improving nutritional status of plant in both vegetative and reproductive part. These improvements suggest greater availability of metabolites and nutrients synchronized to demand for growth and development of each reproductive structure. These findings are in accordance with the results of Kumar et al. (2009) in fenugreek. With increased supply of

National E-Workshop onCurrent Scenario of Post Graduation Research in Agriculture Sector Sept 09-11, 2020
120
nitrogen, the process of tissue differentiation from somatic to reproductive meristemic activity and development of floral premordia might have increased, resulting in more yield attributing characters. The results are in close agreement with the findings reported by Bedse et al. (2013) in cumin. The application of 100% RDF probably ensured sufficient supply of nitrogen and phosphorus to plants for development of yield attributes, which ultimately resulted into higher seed and straw yield. These results confirm the findings of Jat et al. (2012) in green gram. Nitrogen availability depends more or less on phosphorus. Phosphorus enhanced the symbiotic nitrogen fixation in legumes and ultimately improves the uptake of nutrients. Our results are in conformity with those reported by Verma et al. (2014) in cowpea.
Effect of levels of biofertilizer: Significantly higher plant height (28.12 cm) and number of branches/plant (7.75) was recorded with An inoculation of Azospirillum + PSB. The growth regulators like NAA and cytokinnins released by biofertilizers might have resulted in breaking of apical dominance and accelerated higher number of branches. These findings are in accordance with the results of Gudadhe et al. (2005) in brown sarson. An inoculation of Azospirillum + PSB recorded significantly more yield attributes viz., number of umbels/plant (30.50), number of umbellates/umbel (5.75) and number of seeds/umbellate (6.06); seed yield (433 kg/ha) and straw yield (750 kg/ha). Significantly higher harvest index (37.19 %) was observed under inoculation of Azotobacter + PSB. The seed inoculation with bacterial mixtures provided more nutrition for the plants and the improvement in root uptake of both nitrogen and phosphorus as a balance result of mechanism of interaction between nitrogen fixing and phosphate solubilising bacteria, which ultimately contributed into higher yield and yield attributing characters. Similar results were observed by Aishwath et al. (2012) in coriander. The increase in seed yield might be attributed to the fixation of atmospheric nitrogen production of biologically active compounds like organic siderophores which regulate the availability of nutrients to the crop. The positive influences as recorded in yield contributing characters under these treatments were manifested in the seed yield. Similar findings were reported by Gudadhe et al. (2005) in brown sarson.
Interaction effect: Data presented in Table 3 and 4, significantly higher seed yield (493 kg/ha) and straw yield (851 kg/ha) were obtained under 100% RDF and seeds inoculated with Azospirillum + PSB. The profound influence of nitrogen and phosphorus fertilization and inoculation with Rhizobium + PSB biofertilizers on biological yield mediated via increased photosynthetic efficiency and nutrient accumulation might have ultimately led to the production of higher yield under its application. The interactive advantages of combining fertility levels and bio-fertilizers generally proved superior. This might be due to synergistic effects of both and enhanced plant growth by promoting the merismatic activity, which favours plant growth and finally leaf and seed yield. Similar results were reported by Mehta et al. (2012) in fenugreek and Singh et al. (2012) in kasuri methi. Significantly higher harvest index (39.32 %) was recorded under 100% RDF and seeds inoculated with Azotobacter + PSB (Table 5). An application of 100% RDF with Rhizobium + PSB inoculation in combination under kasuri methi crop recorded significantly higher harvest index over control and rest of treatments. This is in close accordance with the findings of Singh et al. (2012) in kasuri methi and Mehta et al. (2012) in fenugreek.

National E-Workshop onCurrent Scenario of Post Graduation Research in Agriculture Sector Sept 09-11, 2020
121
Inference In the view of the results obtained from the present investigation, it can be concluded that for securing higher seed yield from cumin (Cuminum cyminum L.) raised on loamy sand soil, the cumin variety GC 4 should be fertilized with 100% RDF (i.e. 40:15:00 kg NPK/ha) alongwith seed inoculation with Azospirillum + PSB @ 25 ml/kg seed each.

National E-Workshop onCurrent Scenario of Post Graduation Research in Agriculture Sector Sept 09-11, 2020
122
INITIATION OF ROOTING IN SHOOT CUTTINGS OF BERBERIS LYCIUM ROYLE THROUGH HORMONAL TREATMENTS
Sachin Verma and Vimal Chauhan
Department of Silviculture and Agroforestry, Dr. Y S Parmar University of Horticulture and Forestry, Nauni, Solan (H P) INDIA
Email: [email protected] Introduction International Union for Conservation of Nature and Natural resources (IUCN) assessed Berberis lycium Royle under the vulnerable status of conservation (Waseem et. al., 2006). The species is found growing in the Himalayan region in its natural habitat between the altitudes of 850-3500 meters above mean sea level (amsl) on moderate to steep slopes (Sood et. al., 2012). It is an evergreen shrub belonging to the family Berberidaceae. Berberis lycium Royle belongs to the over exploited category of wild fruits species in nature (Sood et. al., 2013). It is utilized for fuel wood due to high calorific value of its wood. The plant has gained significance for its medicinal value particularly in ayurvedic drugs as every part of the plant such as roots, bark, shoot and fruits, which are used in various ayurvedic medicinal preparations for curing number of human diseases (Bhattacharjee, 2008). Beside the berberine present in its rhizomes has marked antibacterial effects and the byproduct of the shrub has cancer suppressing properties. Therefore keeping in the importance of Berberis lycium Royle particularly its wider uses in ayurvedic medicines, the present investigation were proposed to research out a breakthrough in its vegetative propagation through the application of different auxins. Methodology Study site: The study was conducted in the experimental field of the Department of Silviculture and Agroforestry, Dr YS Parmar University of Horticulture and Forestry, during the month of February 2018. The study site was located at 30˚85’71” N latitude and 76˚11’75” E longitude situated at an elevation of 1187 meters above mean sea level. The study area falls in the sub-temperate zone, receiving around 1200 mm precipitation annually, the major part of which is received during July to August (monsoon period). Winter showers, though common, are usually mild. Frost occurs frequently from December to February in four to five spells. In general, May to June is the hottest months, where the highest day temperature goes up to 35˚C and lowest night temperature falls down to 22˚C. December to January is the coldest months, where day temperature raises up to 18˚C and night temperature falls down to -2.5˚C. The shoot cuttings of Berberis lycium Royle were obtained from the plants growing in its natural habitat in vicinity of the university campus. The freshly prepared cuttings were treated with different auxins such as T1 (control), T2 (1.00% captan + 2.00% sucrose-talc), T3 (0.20% IBA + 1.00% captan + 2.00% sucrose-talc), T4 (0.40% IBA + 1.00% captan + 2.00% sucrose-talc), T5 (0.60% IBA + 1.00% captan + 2.00% sucrose-talc) T6 (0.80% IBA + 1.00% captan + 2.00% sucrose-talc), T7 (1.00% IBA + 1.00% captan + 2.00% sucrose-talc). In each treatment, 10 cuttings with 3 replications were investigated for recording observations on success in rooting, sprouting, shoot length, root length and main shoot diameter in the nursery beds.
Preparation of cuttings: Cuttings were prepared randomly from the selected shrub of comparable vigour. The length of cuttings was 20 cm long having 1.5 cm thickness of

National E-Workshop onCurrent Scenario of Post Graduation Research in Agriculture Sector Sept 09-11, 2020
123
terminal shoots. The care was taken that the cuttings had at least four viable nodes. The prepared cuttings were immediately taken to the laboratory for treatment with different auxin and its concentration. For each treatment 30 cuttings were taken, by making three replications of 10 cuttings each. The cuttings were placed in bundles with tags indicating the label of applied treatments.
Preparation of rooting powder formulation: A required amount of Indole-3-butyric acid (IBA) was taken in 250 ml beaker and dissolved thoroughly in a small quantity of absolute alcohol (10 ml approximately). Then, a desired amount of talcum powder, sucrose and captan was taken and added into the beaker containing dissolved auxin. The small amount of ethanol (80.00%) was used in preparation of these formulations. The mixture was continuously stirred with glass rod to form homogeneous slurry. The alcohol in the mixture was allowed to evaporate by keeping the beaker covered with thin sheet of paper in a cool dry place in dark to prevent frequent exposure to light to avoid degradation of auxin. The dried formulations were grounded to a fine powder. Treatment of cuttings with rooting powder formulation: The lower portion of desired number of cuttings under each treatment were thoroughly dipped in rooting powder formulation of different auxins for ten seconds, used for the study so that the rooting powder is thoroughly applied to the cuttings. After treating the desired number of cuttings under each treatment, the cuttings were immediately planted in well prepared nursery beds. Timely hoeing and weeding, irrigation and other after cares of the planted cuttings were under taken regularly and precociously.
Findings The treatments of shoot cuttings of Berberis lycium Royle with different doses of auxins for root initiation and other related parameters yielded significant results for all the attributes studied (Table 1). The shoot cuttings treated with T5 (0.60% IBA+1.00% captan+2.00% sucrose-talc) exhibited maximum sprouting percent (36.66%) and rooting percent (30.33%). The maximum root length (3.97 cm) and shoot length (3.40 cm) was recorded in T6 (0.80% IBA+1.00% captan+2.00% sucrose-talc) whereas, the maximum main shoot diameter (2.53 mm) was observed in T4 (0.40% IBA+1.00% captan+2.00% sucrose-talc). The minimum sprouting percent (10.00%), rooting percent (3.33%), root length (0.70 cm) and main shoot diameter (0.87 mm) was recorded in T1 (control). It is well known fact that auxins are known to increase the mobilization of reverse food material by increasing the activity of hydrophilic enzymes, which as a consequence stimulate rooting in shoot cuttings of number of trees and shrubs species. The similar results have been reported by Bhuyan et. al., 2017. From the present investigation, it is concluded that the sprouting percent, rooting percent, shoot length, root length and main shoot diameter of Berberis lycium Royle were significantly influenced by different concentration of auxins. The shoot cuttings when treated with T5 treatment combination (0.60% IBA+1.00% captan+2.00% sucrose-talc) excelled all other treatments including control for root initiation in this hard to root species.

National E-Workshop onCurrent Scenario of Post Graduation Research in Agriculture Sector Sept 09-11, 2020
124
Table 1: Effect of IBA on rooting behaviour of Berberis lycium Treatments Sprouting
(%) Rooting
(%) Root length (cm)
Shoot length (cm)
Shoot diameter
(mm) T1 10.00(3.32) 3.33(1.77) 0.70 2.63 0.87 T2 13.33(3.74) 10.00(3.31) 0.90 2.66 1.87 T3 20.00(4.58) 16.66(4.06) 1.62 3.23 1.90 T4 23.33(4.91) 23.33(4.91) 3.27 2.73 2.53 T5 36.66(6.12) 30.33(5.52) 2.13 2.47 1.97 T6 26.67(5.24) 16.66(4.16) 3.97 3.40 1.10 T7 16.66(4.16) 13.33(3.74) 2.23 2.80 1.24
S.E (m) 2.99 4.30 0.53 0.09 0.18 C.D=0.05 9.34 13.40 1.65 0.28 0.55
The values in parenthesis are transformed values (square root transformation) References Bhattacharjee SK. 2008. Handbook of Medicinal Plants. 5th eds. Pointer Publishers. Jaipur. 494p. Bhuyan L, Sharma CL, Singh B and Sharma MB. 2017. Vegetative propagation of two important Garcinia species of Assam, NE India. Journal of Medicinal Plants Studies5:273-77 Sood P, Modgil R and Sood M. 2012. Berberis lycium a medicinal plant with immense value. Indian Journal of Pharmaceutical and Biological Research1:1-8 Sood P, Modgil R and Sood M. 2013. Berberis lycium a medicinal plant with immense value. Indian Journal of Pharmaceutical and Biological Research1:27-37 Waseem M, Shah MA, Quershi RA, Iqbal M, Afza R and Yousaf S. 2006. Ethno-pharmacological survey of plants used for the treatment of stomach, diabetes and ophthalmic diseases in sudhan gali, Kashmir. Acta Botanica Yunnanica28:535

National E-Workshop onCurrent Scenario of Post Graduation Research in Agriculture Sector Sept 09-11, 2020
125
QUANTIFICATION OF SOIL ORGANIC CARBON STOCK UNDER DIFFERENT FORESTS IN MID HILLS OF HIMACHAL PRADESH
Vijeta Thakur, Mohan Singh and SK Bhardwaj
Department of Environmental Science, Dr. YS Parmar University of Horticulture & Forestry
Nauni – 173 230 Solan (HP) Email: [email protected]
Introduction Forest is a complex ecosystem consisting mainly of trees that buffer the earth and support innumerable life forms. The FAO (Food and Agriculture Organization) has defined forest as land with tree crown cover (or equivalent stocking level) of more than 10% and area of more than 0.5 hectare. The five major groups of forest in India are tropical montane, montane sub-tropical, montane temperate, sub alpine and alpine which is further subdivided into 16 types.Evaluation of soil properties under different forest covers revealed profound impact on soil health. Inputs like forest productivity, litter decomposition and incorporation into the mineral soil whereas the rates of organic matter decay and the return of carbon to the atmosphere through respiration control outputs. Soil organic carbon through soil erosion and dissolution of organic carbon, but these processes may not result in immediate carbon emissions. Deforestation can contribute a large volume of carbon to the atmosphere either by reducing the amount stored in above ground biomass or increasing the oxidation of SOC. Keeping this gap in view the present study was planned to quantify the soil organic carbon stock under different forests in mid hills of Himachal Pradesh focused on organic form of carbon under different types of forests. Methodology Seven different forests types’ viz. Northern dry mixed deciduous forest, Himalayan chir pine forest, Ban oak forest, Mohru oak forest, Moist deodar forest, Low level blue pine forest, Kharsu oak forests of the district were selected for the study. Under each forest type three prominent locations based on spatial variations were identified with three replications. The soil samples were collected from the identified locations at0-20 cm, 20-40 cm and 40-60 cm depth. The samples then brought to the soil analysis laboratory, air dried under the shade, ground with wooden pestle mortar, passed through 2 mm sieve and further through 0.5 mm sieve and stored in cloth bags for analysis. Soil organic carbon was determined by Walkley and Black method and soil bulk density was measured by core method and then the soil organic carbon stock(Mg C ha-1) was calculated by the following formula as: SOC = [SOC] x Bulk Density x Depth x Coarse Fragments x 10 Where: SOC = Soil organic carbon stock for soil of each forests, Mg C ha-1
[SOC]= Concentration of SOC in given soil mass, g C (kg soil)-1, obtained from lab analysis Bulk Density = soil mass per sample volume, Mg m-3 Depth = Sampling depth or thickness or soil layer (m). Coarse Fragments = 1-(% volume of coarse fragments/100) being ration it is dimensionless.

National E-Workshop onCurrent Scenario of Post Graduation Research in Agriculture Sector Sept 09-11, 2020
126
Findings Soil organic carbon (SOC): The highest SOC content (32.3 g kg-1) was recorded under Kharsu forests followed by Deodar (27.7 g kg-1), blue pine (18.6 g kg-1), ban oak (18.5 g kg-1), chir pine (15.7 g kg-1) and mohru oak (13.5 g kg-1) forests (Table 1).The lowest SOC content (11.6 g kg-1) was observed under northern dry mixed deciduous forests .Similarly the highest SOC (22.2 g kg-1) was found in surface layer (D1), followed by D2 (19.6 g kg-1), whereas minimum (17.3 g kg-1) at D3 (40-60 cm). Table 1: Soil Organic carbon (g kg-1) under different forest types at different depths Forest types
Soil depth (cm) D1 D2 D3 Mean
Deodar 31.3 28.3 23.7 27.7 Blue Pine 21.8 18.8 15.3 18.6 Chir Pine 19.4 15.0 12.8 15.7 Ban Oak 20.8 18.3 16.4 18.5 Kharsu Oak 33.9 32.2 31.0 32.3 Mohru Oak 14.9 13.5 12.1 13.5 Northern dry mixed deciduous 13.5 11.2 10.2 11.6 Mean 22.2 19.6 17.3 19.7 Soil bulk density (SBD): Among all the locations and depths the average soil bulk density was ranged from 0.95Mg m-3 to 1.12Mg m-3. It found highest (1.25 Mg m-3) under northern dry mixed deciduous forests at depth D3 followed by Mohru forests (1.24Mg m-3) at the same depth, whereas, lowest (0.86 Mg m-3) was recorded under Kharsu forests at depth D1 (Table 2). Table 2: Bulk Density (Mg m-3) at different depths under different forests types Forest types
Soil depth (cm) D1 D2 D3 Mean
Deodar 0.90 1.04 1.13 1.02 Blue Pine 0.95 1.07 1.19 1.07 Chir Pine 1.01 1.11 1.19 1.10 Ban Oak 1.01 1.09 1.18 1.09 Kharsu Oak 0.86 0.94 1.05 0.95 Mohru Oak 1.01 1.12 1.24 1.12 Northern dry mixed deciduous 1.01 1.12 1.25 1.12 Mean 0.96 1.07 1.17 1.06 Soil coarse fragments (SCF): The average gravel contents of the soil under different forest types and depth was found between 26.8 to 37.4 per cent. Highest coarse fragments were found under Mohru Forest (37.4%) followed by Northern dry mixed deciduous forest (36.7%) which was at par with Blue pine (36.6%), Chir pine forest (33.5%), Kharsu forest (32.3%), Deodar forest (28.6%) and Ban oak forest (26.8%) in descending order (Table 3).

National E-Workshop onCurrent Scenario of Post Graduation Research in Agriculture Sector Sept 09-11, 2020
127
Table 3: The SCF (%) distribution under different forests at various depths Forest types
Soil depth (cm) D1 D2 D3 Mean
Deodar 23.0 27.9 35.1 28.6 Blue Pine 33.1 37.0 39.9 36.6 Chir Pine 29.2 33.9 37.5 33.5 Ban Oak 24.0 26.9 29.7 26.8 Kharsu Oak 25.1 32.9 39.0 32.3 Mohru Oak 35.8 37.2 39.2 37.4 Northern dry mixed deciduous 34.9 36.5 38.7 36.7 Mean 29.3 33.1 37.0 33.1
Soil organic carbon stock (SOCS): The highest SOC stock (41.4 Mg C ha-1) was recorded under Kharsu forests followed by Deodar (39.8 Mg C ha-1), ban oak (29.5 Mg C ha-1), blue pine (25.3 Mg C ha-1), chir pine (22.9 Mg C ha-1) and Mohru oak forests (18.9 Mg C ha-1). The highest SOC stock (1549.3 Gg C) was recorded under Deodar followed by chir pine (777.3 Gg C), Blue pine (525.4 Gg C), ban oak (205.4 Gg C), kharsu forests (197.1 Gg C) and Mohru oak. Whereas, lowest SOC stock was observed under Northern dry mixed deciduous (34.6 Gg C) forests. The total SOC stock of different forest was recorded to the tune of 3344.2 Gg C of the soil. Table 4: The SOCS distribution (Mg C ha-1) under different forests at varying depths
Forest types Soil depth (cm)
D1 D2 D3 Mean Deodar 43.1 41.9 34.4 39.8 Blue Pine 27.9 26.0 22.2 25.3 Chir Pine 27.8 22.1 19.0 22.9 Ban Oak 32.0 29.3 27.2 29.5 Kharsu Oak 44.0 40.4 39.9 41.4 Mohru Oak 19.2 19.1 18.5 18.9 Northern dry mixed deciduous 18.0 16.0 15.9 16.6 Mean 30.2 27.8 25.3 27.7 Inference The contribution of the deodar forests towards the total SOC pool of the district was 46.32 per cent followed by 23.24, 15.7, 6.14, 5.89, 1.64 and 1.03 per cent by chir pine, blue pine, ban oak, Kharsu, Mohru oak and northern dry mixed deciduous forests respectively. Soil organic carbon stock followed an order of Kharsu > Deodar > Ban > Blue pine > Chir pine > Mohru >Northern dry mixed deciduous forest.
National E-Workshop onCurrent Scenario of Post Graduation Research in Agriculture Sector Sept 09-11, 2020
128
INFLUENCE OF STORAGE CONDITION ON DRY FLOWERS OF SPRAY CHRYSANTHEMUM (CHRYSANTHEMUM MORIFOLIUM RAMAT)
CULTIVARS
M. Jangyukala and Hemanta Laishram Department of Horticulture, School of Agricultural Sciences and Rural Development,
Nagaland University, Medziphema -797106 Email: [email protected]
Introduction With advancement in the field of science, scientists have found ways to preserve the beauty of flowers for a longer period of time. Dehydration technology helps in maintaining original colour and shape of flowers for long term utilization with a little care (Singh, 2018). Presently, among all the horticultural produce, Indian floricultural industry has more than 70% share in the export of dry flowers and its value added products. Export of dried flowers and plants from India is more than 100 crore per year. The Indian industry risks losing its competitiveness to suppliers of other origin for lack of reliable processing technologies. To strengthen the dry flower industry, more research is required as to promote and uplift the industry (Dattatray, 2017). There is need to produce high quality dry flowers from commercially available flowers apart from the forest resources to encourage systematic growing and availability of specialized flowers. Dried chrysanthemum flowers are in considerable demand in the global trade (Wilson et al., 2013). Various cultivars of chrysanthemum flower come in wide range of shade and size. Drying the flowers will enhance the growers to gain more value from their products. The life of dried flowers varies with different flowers according to the species, texture of their petals and total consistency of flowers (Vishnupant, 2017). Dried flowers are stored and evaluated for retention in colour, shape and overall quality. The colour and shape of the dried flowers determine their quality and the market value. Storage condition must favour the dried flower quality as storage life also plays an important role in determining the favourable conditions in order to prolong their shelf life while keeping their structural features intact. Hence, the present investigation was undertaken to determine which storage condition was suitable with regard to shape, colour and overall quality that ultimately add value to the dry flower products. Methodology The present investigation was conducted in the Department of Horticulture, School of Agricultural Sciences and Rural Development, Medziphema, Nagaland during the year 2017-2018 to find out suitable storage condition for spray chrysanthemum cultivars i.e. Atom Joya, Pusa Aditya and Yellow Star embedded in five embedding media viz. silica gel (Crystal, Bead and Powder), sand and saw dust in hot air oven at 40 ºC. Storage life of dried flowers was evaluated under three storage conditions viz. opened condition i.e. Glass beaker (S1) and closed conditions i.e. Plastic containers (S2) and Desiccators (S3). The storage life of the dried flowers were observed under both open and closed condition under room temperature and was evaluated by using 5-point hectonic scale score ranging from 5-fully retained, 4-moderately retained, 3-poorly retained, 2-negligibly retained and 1-not retained. Judges were requested to evaluate the keeping quality in terms of colour retention, shape retention and overall quality once in 15 days interval for four months. Based on the score obtained from the five judges, total score and percentage for each product was calculated. The Sensory
National E-Workshop onCurrent Scenario of Post Graduation Research in Agriculture Sector Sept 09-11, 2020
129
evaluation scores are presented in Table 1 and 2. Repeated Measurement Over Time Analysis (Rangaswamy, 1995) was performed on the scores obtained and the results are discussed below. Findings The colour retention of the dried flowers was observed under different storage conditions. Maximum score (2.6) in closed condition i.e. desiccators (S3), which was statistically at par (2.5) with plastic containers (S2) and minimum score (2.3) in opened condition i.e. glass beaker (S1). Scores recorded decreased from maximum (3.2) to minimum (2.0) after 120 days of storage. For the interaction, maximum score (3.3) was recorded in desiccator on the 15th day and minimum (1.9) in glass beaker on the 105th day, which was found to be statistically at par with the score (1.9) on the 120th day. A similar result, Salma (2010) in Dendrobium orchid reported that flowers dried in silica gel and packed in closed condition retained good colour as compared to the dried flowers held with any package in opened condition. Jain et al. (2016) recommended protecting the material from direct sunlight or high light intensity in order to preserve the colour. For shape retention under different storage conditions, closed condition i.e. desiccators (S3), scored maximum (2.7), which was statistically at par (2.4) with plastic containers (S2) and opened condition i.e. glass beaker (S1) gave the minimum score (2.1). Scores recorded decreased from maximum (3.0) to minimum (1.9) after 120 days of storage. For the interaction, Maximum score (3.5) was recorded in desiccator on the 15th day and minimum (1.5) in glass beaker on the 105th day. The result was in accordance with Salma (2010) in Dendrobium orchid dried in silica gel which retained good shape in closed condition as compared to flowers without any package (opened condition). It should be protected from moisture throughout the marketing channel as it leads to loss in shape (Jain et al. 2016). Overall quality scores for the dried flowers under different storage conditions were maximum (2.6) in closed condition i.e. desiccators (S3) and minimum (2.0) in opened condition i.e. glass beaker (S2). Scores recorded decreased from maximum (2.9) to minimum (1.9) after 120 days of storage. For the interaction, maximum score (3.1) was recorded in desiccator on the 15th day and minimum (1.7) in glass beaker on the 75th day, which was found to be statistically at par with the score (1.7) on the 90th, 105th and 120th day. The result observed was in accordance with Kumari (2015) on Gomphrena globosa L. flowers and Sharma (2015) on chincherinchee flowers dried in silica gel where keeping quality was better when stored under covered conditions as compared to those stored under open conditions. Inference Storage condition under closed condition i.e. Desiccators recorded the best scores in keeping the quality of the dried flowers in its best form during the given period of storage

National E-Workshop onCurrent Scenario of Post Graduation Research in Agriculture Sector Sept 09-11, 2020
130
PROTECTED CULTIVATION OF VEGETABLES IN INDIA: PROBLEMS AND FUTURE PROSPECTS
Anita Saini
College of Agriculture, SKRAU, Bikaner-334006 Email: [email protected]
Protected cultivation of vegetables offers distinct advantages of quality, productivity and favourable market price to the growers. Vegetable growers can substantially increase their income by protected cultivation of vegetables in off-season as the vegetables produced during their normal season generally do not fetch good returns due to large availability of these vegetable in the markets.Green house is a house covered with glass or polythene for protection against adverse climatic conditions as well as to provide optimum environment for growth of the plant. Hot bed used for growing small tender seedlings and rooting of cuttings.cold frame and lath house used for hardening of rooted cuttings. Walk-in tunnels are also suitable and effective to raise off-season nursery and off-season vegetable cultivation due to their low initial cost. Insect proof net houses can be used for virus-free cultivation of tomato, chilli, sweet pepper and other vegetables mainly during the rainy season. Low cost greenhouses can be used for high quality vegetable cultivation for long duration (6-10 months) mainly in peri-urban areas of the country to fetch commensurate price of produces. Polytrenches have proved extremely useful for growing vegetables under cold desert conditions in upper reaches of Himalayas in the country.

National E-Workshop onCurrent Scenario of Post Graduation Research in Agriculture Sector Sept 09-11, 2020
131
EFFECT OF FERTILITY LEVELS AND BORON ON QUALITY AND ECONOMICS OF CAULIFLOWER (BRASSICA OLERACEA VAR.
BOTRYTIS L.)
Atma Ram Meena,P.K. Yadav andR.K. Narolia Department of Horticulture, College of Agriculture, SKRAU, Bikaner (Rajasthan)
Email: [email protected]
A field experiment consisting five levels of fertility and four levels of boron in RBD with three replications was conducted at Horticulture Farm, S.K.N. College of Agriculture, Jobner (Jaipur) during Rabi season 2016-17. Results revealed that different fertility and boron levels significantly influenced quality and economics of cauliflower.Nitrogen, Phosphorus, Potassium & Boron content in curd, net returns (Rs 380340 ha-1) and B:C ratio (3.90:1) in relation to curd yield plant-1and curd yield ha-1(190.89 q ha-1) were found highest with application of 50% RDF through inorganic fertilizers and 50% RDF through vermin-compost treatment. Similarly, the boron level with 2.5 kg ha-1significantly increased the Nitrogen, Phosphorus, Potassium & Boron content in curd, net return (Rs 370879 ha-1) and B:C ratio (3.97:1) in relation to curd yield plant-1 and ha-1(185.53 q ha-1) as compared to control and 1.5 kg boron ha-1 but statistically at par with 2.0 kg boron ha-1Further, the combined application of 50% RDF through inorganic fertilizer and 50% through vermincompost alongwith 2.5 kg boron ha-1 proved to be most superior treatment combination but remained at par with 2.0 kg boron ha-1in terms of total yield plot-1(5.35 kg plot-1) and net return (Rs 449866 ha-1)

National E-Workshop onCurrent Scenario of Post Graduation Research in Agriculture Sector Sept 09-11, 2020
132
EFFECT OF NITROGEN, POTASSIUM AND SULPHUR FERTILIZATION ON NUTRIENTS UPTAKE AND YIELD OF
ONION(NASIK RED) IN ARID WESTERN RAJASTHAN
R. K. Bairwa, R. K. Narolia, P. K. Yadav and C. K. Dotaniya College of Agriculture, S. K. Rajasthan Agricultural University, Bikaner-334006,
Rajasthan E-mail: [email protected]
A field experiment was conducted at the Instructional Farm, College of Agriculture, S.K. Rajasthan Agricultural University, Bikaner, during Rabi season in two consecutive years (2016-17 and 2017-18) to find out the effect of nitrogen, potassium and sulphur fertilization on nutrient uptake and yield of onion in arid western Rajasthan. The treatments laid out in a SPD design with three replications. Results of the study have clearly showed that methods and application levels of nitrogen, potassium and sulphur significantly increased N, P, K and S uptake and bulb yield. Similarly, result revolted that the nitrogen fertilization of @ 80 kg N ha-1 (soil application) + 20 kg N ha-1 (4 foliar sprays), recorded highest bulb yield (227.62 q ha-1), which were closely followed by N2 (210.45 q ha-1) which was significantly higher over control.

National E-Workshop onCurrent Scenario of Post Graduation Research in Agriculture Sector Sept 09-11, 2020
133
EFFECT OF NUTRIENT MANAGEMENT ON YIELD, QUALITY AND UPTAKE OF FENUGREEK
C. K. Dotaniya* and Rajeev K. Niranjan1
*ICAR- Indian Institute of Soil Science, Bhopal, M. P., 462038, India 1Nehru Degree College, Lalitpur, Bundelkhand University, Jhansi U.
P. Email: [email protected]
A field experiment was carried out at Agriculture experimental field, Nehru PG collage Lalitpur (U.P.) during 2014-15. Lalitpur district is a part of Bundelkhand plateau. Betwa River is the boundary between Jhansi and Lalitpur in the north. Most of the area is under the average elevation of 300 m to 450 m from the sea level, whereas some portion in south has an elevation above 450m. Its latitudinal extension is from 24°10'N to 25°15'N and longitudinal extension is from 78°10'E to 790°0'E. The experimental comprising four levels of Vermicompost, Farm Yard Manure and Rhizobium was conducted in the factorial randomized block design with 12 treatment combinations and three replications in 30 pots. Application of integrated nutrient management increased the seed & straw yield (kg/ha) as compared to control. Seed and straw yield (kg/ha) of fenugreek crop was found, the maximum 300 gm/pot of vermicompost (1433 kg/ha) and (9267 kg/ha) followed by FYM and Rhizobium. The Application of vermicompost (300 gm/pot) resulted in significantly higher nitrogen phosphorus and potassium uptake than FYM, Rhizobium treatment and control.
National E-Workshop onCurrent Scenario of Post Graduation Research in Agriculture Sector Sept 09-11, 2020
134
POTENTIAL OF POMEGRANATE CULTIVATION IN HOT ARID REGION
J. S. Gora and R. Kumar1
College of Agriculture, Swami Keshwanand Rajasthan Agricultural University, Bikaner
1ICAR-Central Institute for Arid Horticulture, Beechwal-334 006, Bikaner, Rajasthan, India
E-mail:[email protected]
Pomegranate (Punica granatum L.) is an emerging fruit crop of arid regions originated from Iran. In India pomegranate is grown commercially in the states of Maharashtra, Gujarat, Karnataka, Andhra Pradesh, Tamil Nadu, Madhya Pradesh and Rajasthan. India is one of the major producers of pomegranate in the world. Pomegranate has ability to withstand harsh climate and tolerate heat, drought and moisture deficit. The area in hot arid regions of India is increasing fast owing to its high demand, hardy nature and better adaptability, good storage quality and therapeutic values. It has enormous medicinal, nutritional value and one of the richest sources of antioxidants. A number of processed products such as juices, squash, jelly, anardana and mouth freshener are prepared by processing fruit. During 2018-19, pomegranate was grown over 2.62 lakh ha area with production of 30.34 lakh tonnes and a productivity of 11.58 tonnes/ha in India. Maharashtra is the major pomegranate growing state covering 63.23% of the total area and 62.90% of total production followed by Gujarat with 13.04% area and 16.23% production; and Karnataka with 11.10% area and 9.42% production. In Rajasthan, it is commercially grown in Barmer, Bikaner, Jodhpur, Jalore, Bhilwara, Jaisalmer, Jaipur, Ajmer, Alwar, Sri Ganganagar, Pali, Kota, Sawai Madhopur, Bhilwara, Jhunjhunu and Sirohi districts over 12,000 ha area and acreage in Thar desert particularly Barmer, Jodhpur, Bikaner and Jaisalmer is increasing at faster rate. Under hot arid condition, fruit cracking, fungal spot and mite are major challenges which can be managed through proper flower regulation, canopy and nutrient management, and plant protections measures.

National E-Workshop onCurrent Scenario of Post Graduation Research in Agriculture Sector Sept 09-11, 2020
135
BIOFERTILIZERS- AN ALTERNATIVE TO CHEMICAL FERTILIZERS
Kumari Lata, P.K. Yadav and Sheetal Rawat
Department of Horticulture, College of Agriculture, SKRAU, Bikaner Email: [email protected]
As the human population increasing worldwide, the food security of each people raise a big threat because the agriculture land is limited and even getting reduced with time.Therefore, it is essential to meet the agriculture productivity with the large demand of food by emerging population. Now a days farmer are more dependent on chemical fertilizers for huge amount of production but it cause damage to both environment ecology and human health with great severity. The use of microorganisms as biofertilizersare considered to some extent as an alternative to chemical fertilizers in agriculture because they have extensive potential to enhancing crop production and food safety. It has been observed that some microbes including plant growth promoting bacteria (Rhizobium, Azatobacter, Azospirillium), fungi (Endogone, Rhizophagus,Laccaria bicolor, Amanita mascaria), cyanobacteria (Nostoc, Frankia, Anabaena) etc. have bio-fertilizer activities in agriculture sector. Extensive work on biofertilizershave been done which revealed that they provide required nutrients to the plant in sufficient amount and ultimately enhance the crop yield

National E-Workshop onCurrent Scenario of Post Graduation Research in Agriculture Sector Sept 09-11, 2020
136
MANAGEMENT OF NATURAL RESOURCES FOR SUSTAINABLE DRYLAND AGRICULTURE
Pushpanjali1 and DarshanaYadav2
1Department of Agronomy, SKN college of Agriculture, Jobner (Raj) 2Department of Horticulture, MJRP college of Agriculture and Research, Achrol,
Jaipur Email: [email protected].
Dryland agriculture means raising crop with rainwater. India ranks first among the dryland agricultural countries in terms of both extent and value of produce. Out of total 142.1 Mha cultivated land dryland accounts for 91 Mha and nearly 60% population depends on dryland agriculture (Singh, 2001). Rainfall and soil is the key resources of dryland agriculture. So the management strategies includes field survey of available natural resources with the help of GPS, GIS and Remote sensing technique, rainwater harvesting for replenishing ground water, conjunctive use of surface and ground level resources and economically feasible and environmental appropriate technology (farm pond, sprinkler, drip and land shaping equipments). Remote sensing and GIS tools are used in rainfed agriculture for monitoring of watershed development and land use planning. Modern IT tools can be used managing climatic risk in dryland areas through Decision Support System (DSS). Nano technology has excellent scope in dryland agriculture to enhance water holding capacity. Soil and water conservation practices such as land levelling and grading, contour tillage, furrow diking and terracing can be used for surface storage and reduce slope gradient (Joshi and Singh 1994). In situ moisture conservation includes summer tillage and compartmental bunding for conserves moisture and also reduces weed growth for next crop. Mulch cum manure technique and ridge and furrow method is also useful in terms of moisture conservation. Harvested rainwater successfully used for supplementary irrigation of 5-7 cm during period of moisture stress. In context of sustainable soil management the threat of wind erosion is minimized with the use of crop residue management, tillage operations and vegetative barriers (shelterbelt and windbreaks), it improves the fertility status of soil (Singh and Poonia, 2003). Soil health maintenance is achieved through the integrated nutrient management approach, using both organic and inorganic sources of nutrients. Rainfed farming mixed with livestock farming provide a source of income to dryland farmers

National E-Workshop onCurrent Scenario of Post Graduation Research in Agriculture Sector Sept 09-11, 2020
137
PERFORMANCE OF DENDROBIUM CULTIVARS UNDER SHADE HOUSE
Musawer M. M., Nataraj S.K., Chandrashekar S.Y., Ganapathi M and Ramesha Y.S.
College of Horticulture, Mudigere, University of Agricultural and Horticultural Sciences,Shivamogga
Email: [email protected]
An experiment on “Performance of Dendrobium cultivars under shade house” was carried out at Orchidarium, in the experimental field of Department of Floriculture and Landscape Architecture, College of Horticulture, Mudigere, University of Agricultural and Horticultural Sciences, Shivamogga, during the period from 2019 - 20. The experiment was accomplished in a Randomized Completely Block Design (RCBD) with eleven cultivars and three. viz., Big Jumbo, Blue Planet, Pink Strip, Pink Zoo, Hollywood Cherise, Succulent Sonia, Singapore, Udom Red, Burana Jade, Indigo, Sonia-17. The results showed that among the cultivars Big Jumbo had maximum pseudobulb height (35.56 cm), pseudobulb girth (3.44 cm), number of pseudobulbs per plant (6.81), number of leaves per pseudobulb (16.35), length of internode (6.00 cm), leaf length (16.50 cm), leaf breadth (4.90 cm), in physiological growth parameters viz. leaf area (54.78 cm2) and leaf area index (4.89) were observed in cv. Big Jumbo. Whereas in biochemical parameters, chlorophyll content (1.016 mg/g.fr.wt.) was registered maximum in cv. Udom Red. The cv. Hollywood Cherise took the minimum days for bud initiation (139.64 days), cv. Blue Planet for bud development (16.16 days), cv. Udom Red for first floret opening to harvest (15.60 days) has taken less number of days whereas, maximum flowering duration was observed in cv. Big Jumbo (25.47 days) and maximum spike length (32.83 cm), spike girth (7.10 mm), spike weight (20.49 g), number of florets per spike (8.40), length of floret (7.80 cm), floret diameter (7.60 cm), vase life (26.01 days), number of spikes per plant (7.20) and number of spikes per square meter (72.00) were recorded. The result of the present investigation, thus, reveals that cultivars Big Jumbo, Udom Red, Burana Jade and Indigo performs better under the hill zone of Karnataka.

National E-Workshop onCurrent Scenario of Post Graduation Research in Agriculture Sector Sept 09-11, 2020
138
ROLE OF ZINC AND MANGANESE IN POMEGRANATE PRODUCTION
Sheetal Rawat, Kishore Kumar Das, R. S. Rathore and P. K. Yadav
Department of Horticulture, S.K. Rajasthan Agricultural University, Bikaner, Rajasthan
Email: [email protected] Pomegranate (Punica granatum L.) is one of the favorite table fruits grown in tropical and sub-tropical regions. This plant is native of Iran and is extensively cultivated in the arid regions of India. Fruits are grown for its arils, which are eaten fresh or used for making juice, jam and other processed products. In addition, the fruit is also valued for its pharmaceutical properties. The fruit peel, tree stem and leaves and root bark are good source of secondary metabolites such as tannins, dyes and alkaloids. The occurrence of micronutrient deficiencies in fruit crops has increased markedly in recent years due to intensive cropping, losses of micronutrients through leaching, excessive use of chemical fertilizers, soil erosion and use of marginal lands (with high pH and EC) for crop production. Zinc (Zn) is an essential trace element for plants, which have an important role in enzymatic reactions and is necessary for their good growth and development. Zinc is also involved in regulating the protein and carbohydrate metabolism. Zinc availability to plants is reduced in high pH soils. In arid region, calcareous soil posses low solubility of Zn which is to be decreased up to 100 fold per unit increase in pH, and the adsorption of Zn by calcium carbonate (CaCO3) leads to the formation of an insoluble complex resulted in low availability of Zn. Similar to zinc, manganese also is a heavy metal micronutrient, the functions of which are fairly known. It is involved in the oxygen-evolving step of photosynthesis and membrane function, as well as nitrate assimilation and serving as an important activator for the several enzymes. Soil application of Mn is problematic, since its efficiency depends on many soil factors, including soil pH. A suitable method for the correction and /or prevention of Mn deficiency in plants is the foliar application of ionic or chelated solution forms of this nutrient. Manganese and zinc sulfates each had significant effects on pomegranate cultivation. Foliar application of these micronutrients at proper stage helps in improving fruit yield, quality and physiochemical characteristics of pomegranate
National E-Workshop onCurrent Scenario of Post Graduation Research in Agriculture Sector Sept 09-11, 2020
139
TYPE OF MULCHING AND THEIR USES FOR DRYLAND CONDITION
Vijay Singh
College of Agriculture, SKRAU, Bikaner Email: [email protected]
Mulch is any covering material including either organic or inorganic applied on the soil surface to reduce evaporation losses. This material may be grown and maintained in place, or any material grown and modified before placement or any material processed or manufactured and transported before placement. Mulching is one culture practice which can be used to addresses this problem. Covering the ground with mulch saves water by preventing surface evaporation. The layer can also greatly reduce or eliminate weed propagation. Wheat straw, grass clipping and leaf debris are fairly abundant by products. It is help to Heat trapping and to help control soil erosion. Two type of mulch 1.organic mulch. 2. Inorganic mulch. Mulching improve the overall yield of all crops. so mulching is useful for farmers to enhance their farm income.

National E-Workshop onCurrent Scenario of Post Graduation Research in Agriculture Sector Sept 09-11, 2020
140
FIELD EVALUATION OF SOIL MOISTURE SENSORS FOR IRRIGATION SCHEDULING IN RABI MAIZE
DURGA C. Ph.D. Scholar,Kerala Agricultural university,Thrissur ,Vellanikkara
Email id :[email protected]
Artificial intelligence is intelligence exhibited by machines rather than human and animals. There are various artificial intelligence based technologies. Drones, robotics and wireless sensor network are few among them. On this background sensors are used in the field experiment entitled “Field evaluation of soil moisture sensors for irrigation scheduling in rabi maize”was conducted at Water Technology Centre, College farm, College of Agriculture, Rajendranagar, Hyderabad during rabi 2017-18. The experiment was conducted in split plot design with two main treatments comprising of surface furrow (M1) and drip irrigation (M2) methods and six irrigation schedules (S) viz. tensiometer (S1), gypsum block (S2), profile probe (S3), nano sensor (S4), soil moisture indicator (S5), IWCPE ratio (S6 ) was assigned to sub treatments and replicated thrice. The experimental soil is sandy loam in texture and low in available nitrogen, medium in available phosphorus and high in available potassium. Per cent seedling emergence and number of leaves of rabi maize was not significantly influenced by irrigation methods and irrigation schedules. Significantly higher plant height and leaf area in maize were observed in drip irrigation method and among the schedules significantly higher plant height and leaf area was noticed in nano sensor (IITB) closely followed by gypsum block at all growth stages except at 30 DAS. The highest leaf area index and dry matter production was observed with nano sensors and gypsum blocks based irrigation scheduling under drip irrigation and differ significantly over all other treatment combination. The SPAD meter readings observed in rabi maize were not significantly affected by irrigation methods and irrigation schedules at all the growth stages of observation. The maize grain yield was significantly higher with drip irrigation (6.30 t ha-1) compared to surface furrow irrigation (5.68 t ha-1). Significantly higher grain yield (7.05 t ha-1) of maize was observed with nano sensor (IITB) based irrigation scheduling over rest of the irrigation schedules except gypsum block. The lowest grain yield (5.21 t ha-1) was obtained in tensiometer based irrigation scheduling. The straw yield of maize was significantly higher (12.22 t ha-1) with drip irrigation and among the schedules higher straw yield (12.95 t ha-1) was observed in nano sensors (IITB) based irrigation scheduling closely followed by gypsum block (12.59 t ha -1) and the straw yield realized under these two schedules differed significantly over rest of the irrigation schedules studied. Whereas the lowest straw yield was obtained in tensiometer based irrigation scheduling (10.84 t ha-1).The harvest index of maize was not significantly influenced by irrigation methods and irrigation schedules. Drip irrigation shown comparatively higher water productivity (1.96 kg m-3) compared to surface furrow irrigation (1.15 kg m-3) and among the schedules higher water productivity was associated with nano sensor (IITB) and gypsum block based irrigation schedules (1.53, 1.52 kg m-3, respectively) The correlation studies between the tensiometer readings and gravimetric moisture content showed a negative non significant correlation before irrigation in surface furrow irrigation method and negative significant correlation for drip irrigation method. But in case of after irrigation a positive non significant correlation was observed in both drip and surface furrow irrigation methods. The gypsum block
National E-Workshop onCurrent Scenario of Post Graduation Research in Agriculture Sector Sept 09-11, 2020
141
reading and gravimetric moisture content studies showed a negative significant correlation before irrigation in both surface furrow and drip irrigation methods, where as a positive non significant correlation between gypsum block readings and gravimetric moisture content readings were noticed after irrigation in both drip and surface furrow irrigation methods. Similar trend was observed in nano sensor, except that it recorded a positive significant correlation before irrigation in both irrigation methods. The correlation studies between the profile probe readings and gravimetric moisture content showed a negative significant correlation in surface furrow irrigation method at before and after irrigation, whereas, a positive significant correlation was observed after irrigation in drip irrigation method. The nano sensor readings moved very closely with gravimetric moisture content readings in both surface and drip irrigation methods at before irrigation. Whereas profile probe readings and gravimetric moisture content readings showed less deviation after irrigation in both surface and drip irrigation method. Gravimetric moisture content before irrigation in soil moisture indicator based schedule ranges from 15.37- 16.72% and 15.83-17.22% in surface furrow irrigation method and drip irrigation, respectively. The corresponding gravimetric values after irrigation increases to 20.72- 21.97% and 21.08- 22.19% in surface furrow and drip irrigation, respectively. Gravimetric moisture content increases after irrigation as the moisture content in the profile increases. IW/CPE based irrigation scheduling was recorded low gravimetric moisture content before irrigation in surface furrow irrigated plots compared to drip irrigated ones and after irrigation gravimetric moisture content was higher in surface furrow irrigation than that of drip irrigation. The result of the present study clearly indicates that among irrigation method the drip irrigation recorded higher grain yield and whereas in irrigation schedules the nano sensor based irrigation schedules followed by gypsum block recorded higher grain yield.

National E-Workshop onCurrent Scenario of Post Graduation Research in Agriculture Sector Sept 09-11, 2020
142
STUDIES ON DECLINED NAGPUR MANDARIN ORCHARDS IN RELATION TO SOIL CHARACTERISTICS AND LEAF
NUTRITIONAL STATUS
Maya Raut,Shalini Badge,Harsha Mendhe and Nayana Palaspagar Division of Soil Science & Agricultural Chemistry,College of
Agriculture,Gadchiroli, Maharashtra Email : [email protected]
Introduction Citrus is the most important fruit crop in the world and is produced in over 100 countries in all six continents, and it is often regarded as golden fruit or queen of all fruits. Citrus is the World’s leading fruit crop. It occupies about 9% of total land under various fruits in India. It is believed that most of the species under the genus citrus are native to tropical and sub-tropical regions of south-east Asia. The optimum temperature for growth and fruit development is 30 to 35°C. Physiological activities declined beyond 35 °C. High temp above 40°C cause excessive fruit drops. High temperature also causes early maturity of fruits and has been of poor quality. The symptoms of heat injury appear at 35 to 37.7°C. Citrus is grown on various soil types, but in view of high oxygen demand for its roots, light sandy to medium loam soils are considered best. Under prolonged conditions of poor drainage progressive injury and death of root occur, leading to decreased performance of tree. Soil with high clay (> 60%) content should be avoided for cultivation of citrus. Water logging favours spread of soil borne fungal diseases. Most of the feeding roots are confined in the first one meter depth of soil. No hardpan or Kankar layer within 2 m depth is desirable. Water table should be below 2 m depth from surface all through the year. The ideal soil described for mandarin orange (citrus) is medium or loam with slightly heavier subsoil. The optimum pH range for citrus is 5.5 to 6.5. Methodology The present investigation in relation to “Soil characteristics and leaf nutritional status of declined Nagpur mandarin orchards in Morshi tehsil of Amravati district” was undertaken during the year 2017-2018 to assess the nutrient content and quality of Nagpur mandarin considering the different nutrient management practices.The 12 declined Nagpur mandarin orchards were selected from Morshi tehsil of Amravati district and depth wise soil sampling were done along with leaf and fruit sample of Nagpur mandarin.The present investigation on soil characteristics and leaf nutritional status of declined Nagpur mandarin orchards as influenced by various nutrient content was carried out at farmer’s fields in Morshi tehsil of Amravati district. The five locations were selected viz., Nimbhi, Chikhalsawangi, Dapori, Ladaki, Shirkhed. The soils under the study area was medium to deep black (Vertisol) and well drained. In order to study the chemical properties and micronutrients status of soil, a soil profile samples were taken from 0-30 cm, 30-60 cm, and 60-90 cm depth, from randomly selected spots over the field of orchard. Soil samples from all locations were analyzed for various soil properties in order to assess the fertility status of soil.
National E-Workshop onCurrent Scenario of Post Graduation Research in Agriculture Sector Sept 09-11, 2020
143
Soil samples were analyzed for total nitrogen and available nitrogen, phosphorus, potassium, sulphur by modified Kjeldhal’s method (Pipper, 1966), alkaline potassium permanganate method (Subbaih and Asija, 1956) , Olsens method (Jackson,1967),flame photometer method (Jackson,1967)and turbidimetric method (Chopra and Kanwar,1976),respectively.Exchangeable cations (calcium and magnesium) were determined by neutral normal ammonium acetate method (Pipper,1966).Available micronutrients (copper, zinc, iron and manganese) were determined by Atomic absorption spectrophotometer in DTPA- extract (Lindsay and Norvell, 1978). Findings A] Chemical properties of soils of declined Nagpur mandarin orchards Depth wise distribution showed pH of surface soils varied between 7.5 to 8.2 and in respect of all soils of Mandarin orchards. Electrical conductivity gives insight about the presence of soluble salts and used as one of the criteria to differentiate between saline and non –saline soil. The Ec ranged from 0.23 dS
m-1to 0.37 dS m-1. The results are in conformity with the Kumar et al. (2011)
who found that, under both healthy (0.44 - 0.53 dS m-1) and declined (0.45-
0.54 dS m-1) trees showed no significant difference and was well within the critical
limit of 0.9-1.7 dS m-1. Presence of free calcium carbonate denotes the calcareousness of soil.Calcareous soil can be identified in field, if it contains sufficient calcium carbonate (or magnesium /other carbonates) by effervescence when react with cold dilute HCl. The calcium not only improves the structure of soil but is also concerned with the decomposition of soil organic matter and synthesis of humus. The calcium carbonate content ranged between 5.90 to 14.30%. Similar results were observed by Reddy et al. (2013). The importance of soil organic carbon (SOC) in sustaining soil productivity is known since the dawn of human civilization. Soil organic carbon is of prime importance for various plant nutrient cycles and influence soil color, water retention, bulk density, susceptibility to erosion and soil structure. It improves soil aggregation and influences infiltration, movement and retention of soil water, soil aeration,
soil temperature and root penetration. OC it varied from 1.65 to 4.85 g kg-
1with different depths in declined Nagpur mandarin orchards. Similar results were observed by Likhar and Prasad, (2011) . B] Soil nutrient status of declined Nagpur mandarin orchards Available nitrogen content in declined orchards soils varied from 75.00 to
198.27 kg ha-1with different depths in declined Nagpur mandarin orchards. All soils of orange orchards were categorized as low to very low in available nitrogen. Similar findings were reported by Kuchanwar et al. (2017).The available phosphorus
content in declining mandarin orchards soils ranged from 7.45 to 15.63 kg ha-
1with different depths in declined Nagpur mandarin orchards. Similar findings were reported by Kuchanwar et al. (2017) . Available potassium
content in declined orange orchards ranged from 157.80 to 390.65 kg ha-1with different depths in declined Nagpur mandarin orchards. Similar findings were reported by Kuchanwar et al. (2017) who reported that available potassium content in surface soils of declined Nagpur mandarin orchards in Warud
Tehsil of Amravati district were ranged from 327.5 to 750.4 kg ha-1.

National E-Workshop onCurrent Scenario of Post Graduation Research in Agriculture Sector Sept 09-11, 2020
144
The available Sulphur content in declining mandarin orchards soils ranged from
8.24 to 10.58 mg kg-1. The result showed that there was no any uniform increase or decreased in available sulphur content with depth of the soil. C] Available micronutrient status of soils of declined Nagpur mandarin orchards The term micronutrients denote the elements, which are essential for the plant but are required in small amounts. The main source of micronutrients in soil is the parent material or rocks from which the soil have been formed. From the nature of parent material of soil, it is possible to have an idea of the deficiency or excess of micronutrient in it. The over exploitation of soil which are naturally degraded are confronted by a number of problems, among them micronutrient deficiency is common feature in soils of India and in particular, Fe, Mn, Zn and Cu deficiencies are of paramount importance in soils of Maharashtra. DTPA-Fe content in healthy and declined orchards varied from 3.12 to 7.14 mg
kg-1with different depths in declined Nagpur mandarin orchards. Available
manganese content in declined orange orchards ranged from 4.25 to 12.26 mg kg-1.
DTPA-Cu varied from in declining mandarin orchards. 1.05 to 2.90 mg kg-1. Similar observations were also reported by Srivastava and Patel (2014).DTPA-Zn
in soils of declined Nagpur mandarin orchards ranged from 0.20 to 0.55 mg kg-1. Inference The pH and EC of the study area are within the acceptable limit. Organic carbon was found low in declined orchard soils. Available nitrogen, phosphorous and zinc levels in soil were low as per critical limit. Some orchard soils were well supplied with available K, S, and micro-nutrient like iron, manganese and copper. There is a need to increase in the content of organic carbon, available nitrogen, available phosphorus, DTPA extractable Fe, Cu and Zn, it increases the content of nutrients in leaves which turns into yield of mandarin orchards. Similarly increased in content of CaCO3and lowered in the availability of the nutrients. In declined mandarin orchards content of CaCO3increases with increasing depth of soil, this might be interfere with root system of mandarin plant and which results into lowering the yield if mandarin orchards is declined one.

National E-Workshop onCurrent Scenario of Post Graduation Research in Agriculture Sector Sept 09-11, 2020
145
Table 1: Chemical properties of soils of declined Nagpur mandarin orchards Depth (cm) pH Ec (dSm-1) CaCO3( %) Org.C (g kg-1) Location 2: Nimbhi
0-30 7.41 0.276 6.81 3.62
30-60 7.50 0.363 8.72 3.21
60-90 7.54 0.372 9.31 3.12 Location 2: Nimbhi
0-30 7.61 0.272 5.90 3.51
30-60 7.64 0.314 7.56 2.68
60-90 7.66 0.328 7.65 2.30 Location 3: Nimbhi
0-30 7.71 0.272 7.12 4.20
30-60 8.01 0.293 8.23 3.70
60-90 8.02 0.298 8.68 3.41 Location 4: Ladki
0-30 7.62 0.280 6.15 4.13
30-60 7.82 0.246 7.26 3.53
60-90 7.85 0.261 8.37 3.31 Location 5: Ladki
0-30 7.85 0.263 6.10 4.85
30-60 7.90 0.285 7.21 4.13
60-90 7.96 0.295 8.30 3.15 Location 6: Shirkhed
0-30 8.10 0.292 12.70 3.81
30-60 8.22 0.321 13.34 2.95
60-90 8.45 0.353 13.78 2.10
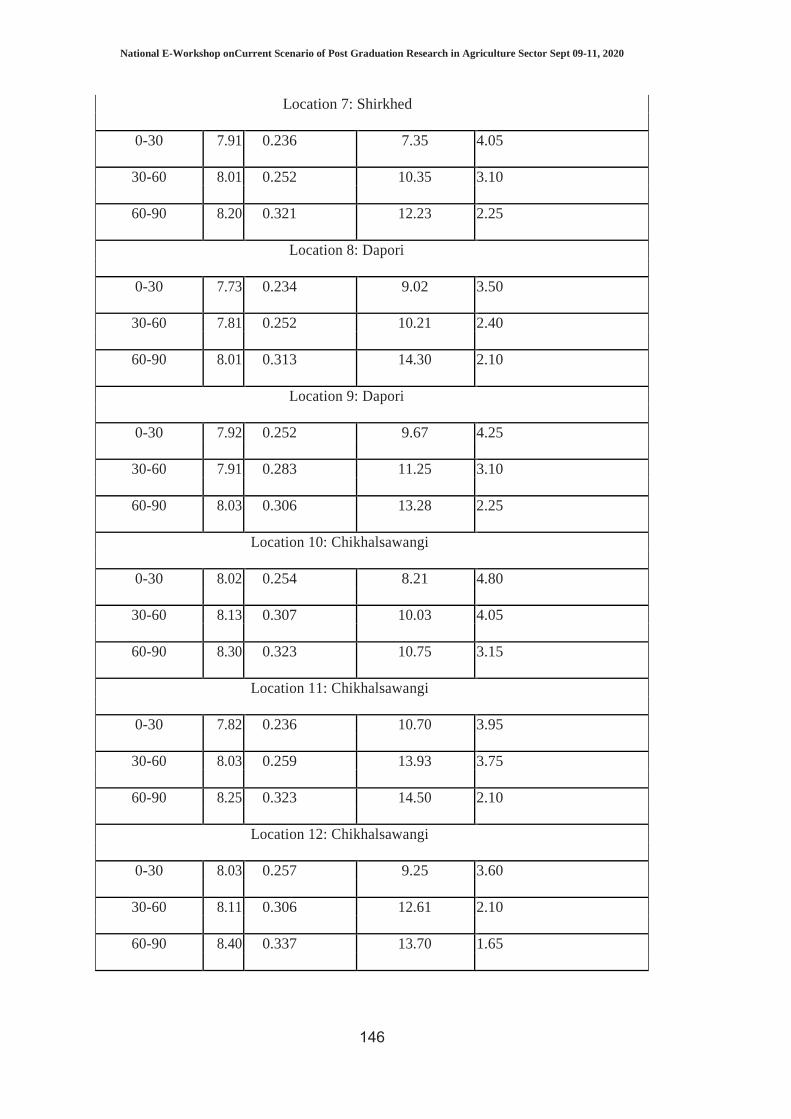
National E-Workshop onCurrent Scenario of Post Graduation Research in Agriculture Sector Sept 09-11, 2020
146
Location 7: Shirkhed
0-30 7.91 0.236 7.35 4.05
30-60 8.01 0.252 10.35 3.10
60-90 8.20 0.321 12.23 2.25 Location 8: Dapori
0-30 7.73 0.234 9.02 3.50
30-60 7.81 0.252 10.21 2.40
60-90 8.01 0.313 14.30 2.10 Location 9: Dapori
0-30 7.92 0.252 9.67 4.25
30-60 7.91 0.283 11.25 3.10
60-90 8.03 0.306 13.28 2.25 Location 10: Chikhalsawangi
0-30 8.02 0.254 8.21 4.80
30-60 8.13 0.307 10.03 4.05
60-90 8.30 0.323 10.75 3.15 Location 11: Chikhalsawangi
0-30 7.82 0.236 10.70 3.95
30-60 8.03 0.259 13.93 3.75
60-90 8.25 0.323 14.50 2.10 Location 12: Chikhalsawangi
0-30 8.03 0.257 9.25 3.60
30-60 8.11 0.306 12.61 2.10
60-90 8.40 0.337 13.70 1.65

National E-Workshop onCurrent Scenario of Post Graduation Research in Agriculture Sector Sept 09-11, 2020
147
Table 2: Soil nutrient status of declined Nagpur mandarin orchards
Depth(cm) N P K S
(kg ha-1) (kg ha-1)
(kg ha-1) (mg kg-1) Location 1: Nimbhi
0-30 185.21 15.41 390.65 9.54
30-60 166.03 13.13 360.38 8.41
60-90 145.10 11.23 256.62 8.25 Location 2: Nimbhi
0-30 190.83 14.25 330.21 9.30
30-60 150.00 11.33 280.20 8.24
60-90 130.30 09.54 205.26 7.18 Location 3: Nimbhi
0-30 195.50 13.28 346.42 9.26
30-60 172.54 11.65 302.81 8.60
60-90 143.09 08.41 235.35 6.97 Location 4: Ladki
0-30 183.23 13.53 336.46 8.25
30-60 155.41 11.48 290.80 7.63
60-90 146.68 09.56 205.34 6.52 Location 5: Ladki
0-30 190.38 14.37 380.69 9.47
30-60 120.23 11.25 265.58 8.78
60-90 100.40 08.61 157.80 7.45 Location 6: Shirkhed
0-30 183.89 15.63 350.07 9.62
30-60 130.12 11.28 320.11 7.99
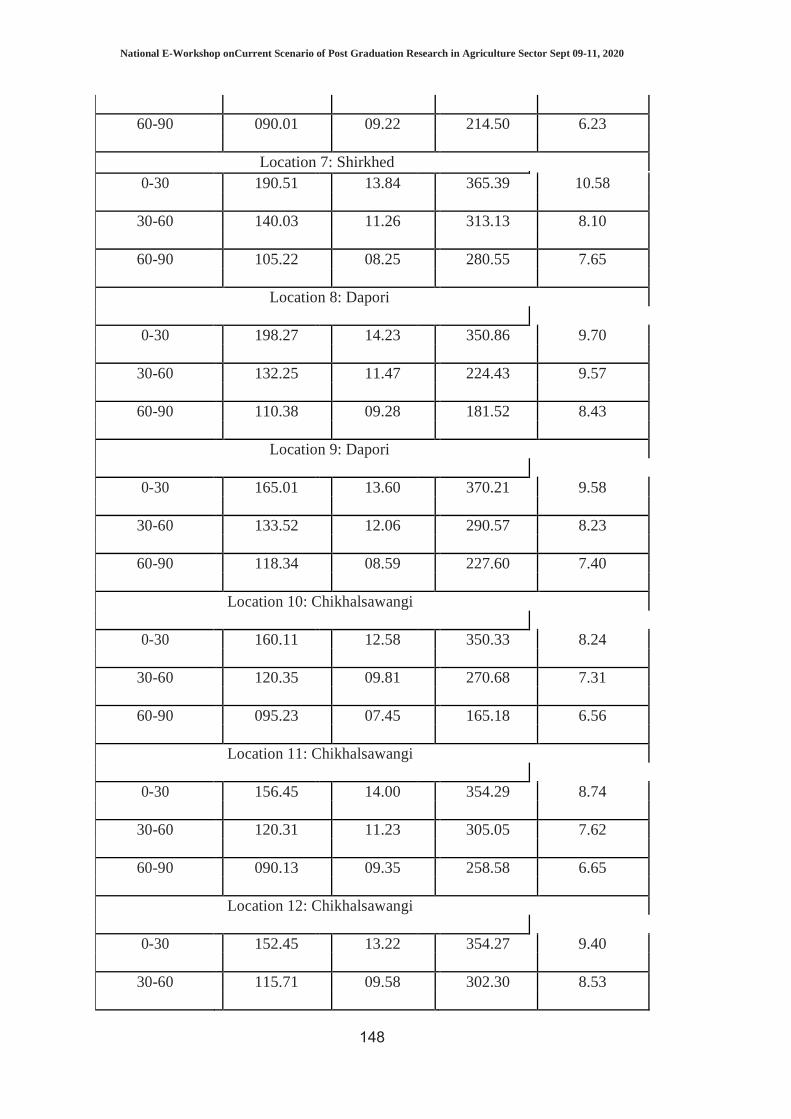
National E-Workshop onCurrent Scenario of Post Graduation Research in Agriculture Sector Sept 09-11, 2020
148
60-90 090.01 09.22 214.50 6.23
Location 7: Shirkhed
0-30 190.51 13.84 365.39 10.58
30-60 140.03 11.26 313.13 8.10
60-90 105.22 08.25 280.55 7.65 Location 8: Dapori
0-30 198.27 14.23 350.86 9.70
30-60 132.25 11.47 224.43 9.57
60-90 110.38 09.28 181.52 8.43 Location 9: Dapori
0-30 165.01 13.60 370.21 9.58
30-60 133.52 12.06 290.57 8.23
60-90 118.34 08.59 227.60 7.40
Location 10: Chikhalsawangi
0-30 160.11 12.58 350.33 8.24
30-60 120.35 09.81 270.68 7.31
60-90 095.23 07.45 165.18 6.56
Location 11: Chikhalsawangi
0-30 156.45 14.00 354.29 8.74
30-60 120.31 11.23 305.05 7.62
60-90 090.13 09.35 258.58 6.65
Location 12: Chikhalsawangi
0-30 152.45 13.22 354.27 9.40
30-60 115.71 09.58 302.30 8.53
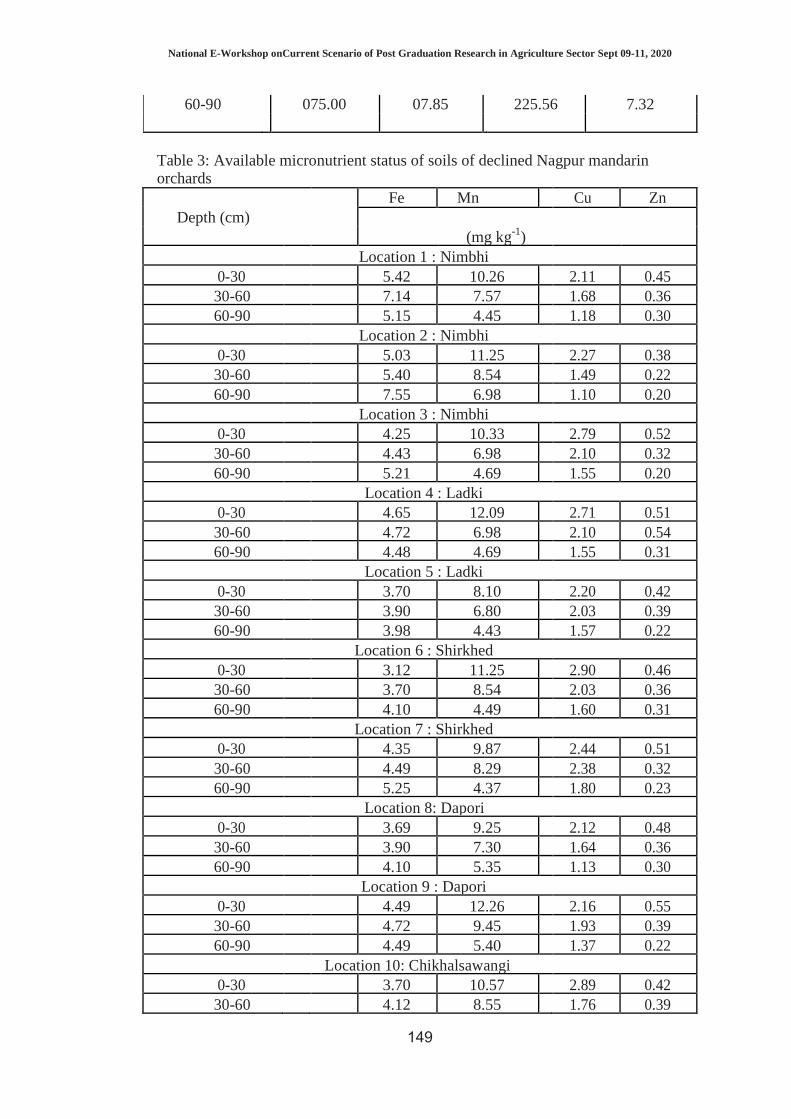
National E-Workshop onCurrent Scenario of Post Graduation Research in Agriculture Sector Sept 09-11, 2020
149
60-90 075.00 07.85 225.56 7.32
Table 3: Available micronutrient status of soils of declined Nagpur mandarin orchards
Depth (cm) Fe Mn Cu Zn
(mg kg-1)
Location 1 : Nimbhi
0-30 5.42 10.26 2.11 0.45 30-60 7.14 7.57 1.68 0.36 60-90 5.15 4.45 1.18 0.30
Location 2 : Nimbhi 0-30 5.03 11.25 2.27 0.38 30-60 5.40 8.54 1.49 0.22 60-90 7.55 6.98 1.10 0.20
Location 3 : Nimbhi 0-30 4.25 10.33 2.79 0.52 30-60 4.43 6.98 2.10 0.32 60-90 5.21 4.69 1.55 0.20
Location 4 : Ladki 0-30 4.65 12.09 2.71 0.51 30-60 4.72 6.98 2.10 0.54 60-90 4.48 4.69 1.55 0.31
Location 5 : Ladki 0-30 3.70 8.10 2.20 0.42 30-60 3.90 6.80 2.03 0.39 60-90 3.98 4.43 1.57 0.22
Location 6 : Shirkhed 0-30 3.12 11.25 2.90 0.46 30-60 3.70 8.54 2.03 0.36 60-90 4.10 4.49 1.60 0.31
Location 7 : Shirkhed 0-30 4.35 9.87 2.44 0.51 30-60 4.49 8.29 2.38 0.32 60-90 5.25 4.37 1.80 0.23
Location 8: Dapori 0-30 3.69 9.25 2.12 0.48 30-60 3.90 7.30 1.64 0.36 60-90 4.10 5.35 1.13 0.30
Location 9 : Dapori 0-30 4.49 12.26 2.16 0.55 30-60 4.72 9.45 1.93 0.39 60-90 4.49 5.40 1.37 0.22
Location 10: Chikhalsawangi 0-30 3.70 10.57 2.89 0.42 30-60 4.12 8.55 1.76 0.39

National E-Workshop onCurrent Scenario of Post Graduation Research in Agriculture Sector Sept 09-11, 2020
150
60-90 4.48 5.25 1.05 0.20 Location11: Chikhalsawangi
0-30 3.50 9.37 2.44 0.45 30-60 3.90 6.49 2.26 0.36 60-90 4.10 5.36 1.61 0.30
Location12: Chikhalsawangi 0-30 4.94 11.68 2.29 0.36 30-60 4.99 8.94 2.12 0.31 60-90 5.17 4.25 1.54 0.25
References : Anonymous. Area, Production and productivity of citrus Indian Horticulture. Database, 2017. http:// www.nhb.gov.in Piper C.S. Soil and Plant analysis Adelaide, Australia, 1966. Jackson M.L. Soil chemical analysis prentice Hall of India, pvt. Ltd. New Delhi, 1967. Subbiah B.V., G.L. Asija. A rapid procedure for determination of available nitrogen in soil. Current Sci.25:256-260,1956. Chopra S.R., J.S. Kanwar. Analytical Agricultural Chemistry. Kalyani Publishers. New Delhi, ,282p,1976. Lindsay W.L., W.A.Norvell. Development of DTPA soil test for Zinc, Iron, Manganese and Copper.Soil Sci. Soc. Am. J. 42:421- 428,1978. Kumar P.S., S.Sharma, Dhanekar, S.Pratap. Studies on ‘Kinnow’ (Citrus reticulata Blanco) decline in relation to soil-plant nutritional status. Electronic 2067-3264 Not. Sci. Biol. 3(3):109-112,2011. Reddy B., V.D. Guldekar, N. Balakrishnan.Influence of soil calcium carbonate on yield and quality of Nagpur mandarin. African J of Agri. Research, 8(42):5193-5196,2013.
National E-Workshop onCurrent Scenario of Post Graduation Research in Agriculture Sector Sept 09-11, 2020
151
EFFECT OF MOISTURE REGIMES, FYM AND LEVELS OF P CARRIERS ON PHOSPHORUSFRACTIONS STATUS OF LOAMY SAND IN LABORATORY
CONDITION
Kashyap N Patel, DA Patel, Vidhi K Patel, Foram B Patel, VR Patel& RP Pavaya Dept of Agricultural Chemistry and Soil Science, C. P. College of Agriculture,
Sardarkrushinagar Dantiwada Agricultural University, Sardarkrushinagar,Gujarat Email : [email protected]
Introduction Phosphorus (P) is essential for plants and animals because of its role in vital life processes, such as in photosynthesis in plants and energy transformations in all forms of life. It also has a significant role in sustaining and building up soil fertility, particularly under intensive systems of agriculture. Soils are known to vary widely in their capacities to supply P to crops because only a small fraction of the total P in soil is in a form available to crops. Thus, unless the soil contains adequate amount of plant-available P, or is supplied with readily available- (inorganic)-P fertilizers, crop growth will suffer (Sanyal and Datta 1991). Phosphorus availability in soils is affected by several factors such as soil reaction, organic matter, texture (Verma 2013), calcium carbonate (Hopkins and Ellsworth 2005), parent material, weathering and climatic conditions (Fuentes et al., 2008). The suitability extent of calcareous soils for agriculture depends on management systems via adding organic materials and some amendments to improve the availability of nutrients, particularly phosphorus (Al-Oud 2011; Karimi et al., 2012). Organic manure additions also caused an increment in Olsen extractable P of soil (Bahl and Toor 2002). In P-fixing soils, applications of organic matter were reported to increase available P because of mineralization (Iyamuremye and Dick 1996). Decomposition of FYM produces different organic acids, which help in mobilizing non-labile P in soil into labile P. Phosphorus uptake is enhanced by the addition of organics due to production of organic acids which in turn, transform P from non-utilizable form to plant utilizable form (Ivanova et al., 2006). Thus, the incorporation of FYM improves soil health and crop yield (Dotaniya 2012). Maintenance of an adequate amount of soil P through the application of inorganic and organic P is critical for the sustainability of the cropping system (Sharpley et al., 1994). For phosphorus requirement plants depend on inorganic form of phosphorus. It has now been established that Saloid-P, Aluminium-P (Al-P), Iron-P (Fe-P), and Calcium-P (Ca-P) are the major soil inorganic fractions and their relative proportion depends upon various factors (Jaggi 1991). The availability and fractions of soil P may change due to long- term continuous P fertilization besides its yield-increasing effect (Fan et al., 2003; Lai et al., 2003). Therefore, the present investigation has been framed with the objectives of studying the effect of moisture regimes, FYM and levels of P carriers on phosphorus fractions status of loamy sand in vitro condition. Methodology Incubation study was carried out in the Department of Agricultural Chemistry and Soil Science, Chimanbhai Patel College of Agriculture, Sardarkrushinagar Dantiwada Agricultural University, Sardarkrushinagar during, 2017. Five hundred gram of soil was taken and required quantity of FYM was added as per treatment followed by a solution of P representing each source was added in each set of respective treatment to give the desired concentration of P. The sample was then transferred to 1000 ml

National E-Workshop onCurrent Scenario of Post Graduation Research in Agriculture Sector Sept 09-11, 2020
152
capacity plastic beaker and the desired moisture regime was brought. After adjustment of the moisture regime, the weight of each beaker was recorded for maintaining the moisture throughout the incubation period. The moisture was maintained by adding the amount of water every day equivalent to the loss in weight. A known amount of sample was withdrawn from each treatment at stipulated intervals. Simultaneously, the sample was also withdrawn for the determination of moisture. The sample was taken as per the interval for the determination of available P2O5 and P fractions content in soil. The Total-P was determined by digesting 1.0 g of 0.15 mm sieved oven-dried soil with HNO3 and HClO4 acids and then followed the vanadomolybdate method (Hesse 1971). The Inorganic-P was extracted with concentrated HCl (Hesse 1971), and the P in solution was determined with cholorotanuous reduced molybdophosphoric blue color method in HCl system (Jackson 1978). The difference between total and Inorganic-P was reported as Organic-P. The fractions of the Inorganic-P, which includes Saloid bound-P, Al-P, Fe-P, Reductant soluble-P, Occluded-P and Calcium-P was extracted successively by the method of Chang and Jackson (Petersen and Corey, 1966) and the blue color was also developed as described by them. Status of different forms of soil phosphorus (%) The amount of P recovered under various fractions varied considerably depending upon the treatments given during the incubation study. All P fractions viz., Saloid-P, Al-P, Fe-P, Ca-P, Occluded-P, Reductant-P and Organic-P increased, when moisture level (100 % available water capacity), phosphatic fertilizers were applied at higher levels (2.68 mg P/100 g soil) either alone or in combination with organics during incubation study. The application without P fertilization did not influence soil P fractions, as under 0.00 mg P/100 g soil treatment. Ca-P with application of all treatment combinations increased 38.3 percent, over Occluded-P content as a result of mean basis. Whereas, the lowest involvement of Occluded-P content (2.42 %) in Total-P. Phosphorus, like any other plant nutrient is present in the soil in two major components i.e. organic and inorganic. Organic P, which is mainly confined to the surface layer, is mineralized into inorganic forms. But the plants mainly depend on inorganic P forms for their phosphorus requirements. Saloid-P, Al-P, Fe-P, Ca-P, Occluded-P and Reductant- P fractions are the main source of P supply to the plants. The proportion of forms of phosphorus such as Ca-P, Al-P, Fe-P, Occluded-P, Reductant-P and Organic-P governs the response to applied P (Singh et al., 2003). Fig.1. Effect of moisture regimes, FYM and levels of P carriers on per cent wise
involvement of different phosphorus fraction in total-P in soil at different intervals
National E-Workshop onCurrent Scenario of Post Graduation Research in Agriculture Sector Sept 09-11, 2020
153
PLANT PROTECTION
National E-Workshop onCurrent Scenario of Post Graduation Research in Agriculture Sector Sept 09-11, 2020
154
GENETIC CHARACTERIZATION OF MAIZE HOSTING SPODOPTERA FRUGIPERDA TARGETING COI AND TPI GENE
SEGMENTS
K. Ashok1*, V. Balasubramani2, J. S. Kennedy3, V. Geethalakshmi4,
P. Jeyakumar5 and N. Sathiah1
1Department of Agricultural Entomology, 2Department of Plant Biotechnology, 3School of Post Graduate Studies, 4Directorate of Crop Management, 5Department of
Crop Physiology, Tamil Nadu Agricultural University, Coimbatore - 641003, India.
Email : [email protected]
Introduction The recently introduced invasive alien species, the fall armyworm (FAW), Spodoptera frugiperda (J. E. Smith, 1797) (Lepidoptera: Noctuidae) causes a serious threat to agriculture in India and cost billions of dollars in terms of reduced production and productivity. There are two strains reported in fall armyworm. These strains differ in their host plant preference, dispersal pattern and response to pesticides. The two stains also show partial reproductive isolation and temporal difference in mating habits of moths. Studies suggest that the behavioural and physiological variations between the strains may influence population monitoring studies, pest control strategies and host plant resistance breeding programs. S. frugiperda subdivided into two host strains based on the observation that certain molecular markers were asymmetrically distributed in populations feeding on rice and corn. These markers which include DNA polymorphisms remains one of the most suited reliable means of discriminating between the morphologically indistinguishable strains of fall armyworm. Amplified Fragment Length Polymorphism (AFLP) and Restriction Fragment Length Polymorphism (RFLP) were the two important techniques have been used in the genetic characterization of the insect population. The present study was conducted with an objective to determine the genetic characterization of maize hosting S. frugiperda targeting COI and Tpi gene segments.
Methodology Present experiment was performed with the DNA isolation and amplification of COI and Tpi gene segments followed by restriction digestion with SacI and MspI enzymes. PCR amplifications were made using 5 µl DNA, 3.5 µl Nuclease free water, 12.5 µl Taq DNA polymerase red Master mix. Two µl of CO1-58 (5′-GGAATTTGAGCAGGAATAGTAGG-3′) was used as forward primer, and 2 µl of JM77 (5 ′ - ATCACCTCCWCCTGCAGGATC-3′) as reverse primer targeting COI gene segment. PCR was programmed for 2 min incubation time at 94 °C, followed by 35 cycles of 45 sec at 94 °C, 45 sec at 56 °C, 60 sec at 72 °C, and a final elongation at 72 °C for 10 min. Similarly, the same procedure was repeated for Tpi gene segment with Tpi-412 (5’-CCGGACTGAAGGTTATCGCTTG-3’) was used as forward primer and (5’- GCGGAAGCATTCGCTGACAACC-3’) as reverse primer targeting COI gene. The amplicon produced were further digested for 2 h at 37 °C with MspI and SacI enzyme. For digestion, 4 µl PCR product was mixed with 0.6 µl NEB buffer 4, 1 µl H2O and 0.4 µl MspI (MspI digest) and another set with 0.6 µl NEB buffer 1, 0.06 µl 100x BSA, 0.94 µl H2O, and 0.4 µl SacI (SacI digest). Each digested product (5 µl) was mixed with 3 µl loading dye and loaded on a 1 % agarose gel, and run at 110 V for 45 min.

National E-Workshop onCurrent Scenario of Post Graduation Research in Agriculture Sector Sept 09-11, 2020
155
The PCR product was sequenced. Molecular phylogenetic tree analyses in Mega 7 program was carried out by using Maximum Likelihood method based on the Tamura 3-parameter model with complete gap deletion and resampled with 2000 bootstrap replications. Nucleotide sequence identity matrix and nucleotide sequence difference count matrix of S. frugiperda was carried out BioEdit. The sequences of the present study populations were submitted with NCBI database. Findings Nucleotide sequences obtained from the present study was analyzed and found that all are identical and population was uniform. BLAST analysis of the sequences with the NCBI database confirmed the identity of invasive alien insect in the present study was S. frugiperda and assigned with accession numbers. The percent of similarity with the rice haplotype (Acc. No. U72977) and corn haplotype (Acc. No. U72974) revealed the presence of rice strain in our population. The results of restriction fragment length polymorphism revealed the presence of rice strain in the present population with SacI digested DNA fragments at 370 bp and 154 bp and no restriction fragments at MspI digestion. The present phylogenetic tree analysis involved 38 nucleotide sequences including 3 generated from this study and 35 sequence retrieved from the NCBI Genbank database which include 34 for S. frugiperda population sequences across the world and one sequence of S. litura which served as outgroup (Figure 1). All positions containing gaps and missing data were eliminated. There were a total of 503 positions in the final dataset. The tree generated by combining sequences of present study populations and NCBI Genbank sequences showed three major clades. The present population of S. frugiperda larva was clustered in a single clade with rice strain whereas corn strain and Tpi gene populations were separated and merged to other two clades, respectively. Figure 1: Molecular phylogenetic tree representing Spodoptera frugiperda populations targeting COI and Tpi gene segments

National E-Workshop onCurrent Scenario of Post Graduation Research in Agriculture Sector Sept 09-11, 2020
156
Inference Nucleotide sequences and Restriction Fragment Length Polymorphism, targeting COI and Tpi gene segments confirmed the presence of rice (R) stain in the maize hosting S. frugiperda. Among the two targeted genes, the cytochrome oxidase I gene of the mitochondrial DNA is the most consistent and convenient marker for distinguishing between the strains.

National E-Workshop onCurrent Scenario of Post Graduation Research in Agriculture Sector Sept 09-11, 2020
157
EXPLORATION OF NATIVE LIGNOCELLULOLYTIC ACTINOBACTERIA AND THEIR EVALUATION AS BIODEGRADER OF WATER HYACINTH BIOMASS
M.H. Patel, H.K.Patel, Y.K. Jhala, H.N.Shelat and R.V. Vyas
Department of Agricultural Microbiology, B.A. College of Agriculture, Anand Agricultural University, Anand-388110 (Gujarat) India
Email:[email protected]
Introduction Exploitation of plant biomass as a renewable resource is an increasing interest which provides an impetus for research on microbial degradation of lignocellulose. Prokaryotes are easy to manipulate for strain improvement and large scale production/cultivation, and actinobacteria are no exception. In addition, their growth as branching hyphae is well adapted to the penetration and degradation of insoluble substrates such as lignocellulose. Actinobacteria are a heterogeneous group of Gram-positive bacteria of which terrigenous saprophytes are the most common forms. Isolates representing a diverse range of actinomycetes genera and exhibiting the full range of degradative enzyme-mediated activities have been recovered in large numbers from soils and composts (Goodfellow M, 1983).Eichhornia crassipes (Water Hyacinth) is a noxious aquatic weed that pollutes all fresh water bodies. It is one of the most productive plants on the earth and is considered the world’s worst aquatic weed.The plant is ideal for composting. Water hyacinth can be used on the land either as a green manure or as compost. Plant biomass is by far the most important renewable resource and its bioconversion is of immense ecological and potentially biotechnological importance. The compost increases soil fertility and crop yield and generally improves the quality of the soil (Lata & Veenapani, 2011).The degradative properties of actinomycetes can be used for the degradation of water hyacinth biomass and convert it into a compost. Hence, present investigation was undertaken to isolation and characterization of lignocellulose biodegrading actinobacteria and their efficacy to degrade lignocellulosic waste of water hyacinth.
Methodology Various lignocellulolytic actinomycetes were isolated from agricultural waste following serial dilution method (Booth et al., 2006). From these 40 isolates, 3 isolates were screened out based on their efficiency to degrade and utilize lignocellulolytic substrates on solid media. In vitro cellulose and lignin degradation efficiency of selected isolates were preliminary examined for cellulose degradation ability by filter paper degradation assay (Egwuatu et al., 2018) and lignin degradation by decolorization of lignin by flask assay (Dineshkumar et al., 2012).The selected efficient isolates were further subjected for characterization and identification based on their morphological, cultural and molecular characters as per Burges Manual of Systematic Bacteriology and standard literature (Halt et al., 1994). Efficacy of

National E-Workshop onCurrent Scenario of Post Graduation Research in Agriculture Sector Sept 09-11, 2020
158
selected isolated was tested in vitro for preparation of compost from lignocellulosic biomass of water hyacinth (Eichhornia crassipes). Effect of actinomycetes isolates on nutrient composition of degraded product was analyzed using standard methodology (Ameen et al., 2016).
Findings Isolation and preliminary screening of cellulose and lignin degrading actinomycetes Upon isolation and preliminary screening of 40 morphologically distinct lignocellulose degrading actinomycetes, 3 most efficient isolates having the highest Solubilization Index (SI) i.e. Isolate M2 (3.11), M10 (2.89) and M16 (2.60) were selected for further detailed characterization, identification, In vitro efficacy of actinomycetes to degrade lignin and cellulose, consortium formulation and In vitro degradation study. Cultural, morphological and molecular characterization of selected isolates The 3 isolates had medium sized colonies with round shape, dry texture and were opaque producing whitish pigments. Isolate M2 and M16 had undulate margin while Isolate M10 had entire margin. Colonies of Isolate M2, M10 and M16 were raised, umbilicate and flat respectively. All 3 isolates were Gram positive and were producing spores. The isolates upon molecular characterization were found to be M 2 (Streptomyces sp. AAUBD M 2), M 10 (Streptomyces rochei AAUBD M 10) and M 16 (Streptomyces chartreusis AAUBD M 16). In vitro efficacy of selected isolates to degrade cellulose and lignin Efficacy of isolates to degrade cellulose was determined by filter paper assay. Fastest biofilm was formed by isolate M10 on 2nd day of inoculation, followed by M2 and M16 on 3rd day. Degradation of filter paper was fastest by M10 on 9th day followed by M16 on 11th day and M2 on 12th day. Moreover, cellulose degradation efficiency of isolates was also determined by estimation of reducing sugar released in the broth after 15 days of inoculation. The highest sugar concentration 108.19 µg/ml was recorded for M2 isolate followed by M16 and M10 as 91.80 and 85.24 µg/ml respectively. To determine the efficacy of isolates to degrade lignin, they were inoculated in 10 ml basal media containing 0.5% lignin as a sole source of carbon in 25 ml capacity tubes and incubated at 30⁰C and 120 rpm on shaker. The decolorization percentage of lignin was recorded in terms of O.D. using spectrophotometer after 5 days. The highest decolorization percentage 84.15% was recorded for M 2 followed by M 10 (61.32%) and M 16 (56.75%). Table 1: Cellulolytic and Lignolytic activity of actinobacterial isolates.
Isolates
Cellulolytic activity Lignolytic activity
SI (On CMC Agar)
Days to Filter paper
Degradation
Sugar Concentration
(µg/ml)
Colony diameter on MSM-L agar
(mm)
Lignin peroxidase
activity
Decolorization percentage
(%)
M 2 2.17 12 108.19 11 + 84.15 M 10 2.18 9 85.24 7 + 61.32 M 16 3.33 11 91.80 10 ++ 56.75
National E-Workshop onCurrent Scenario of Post Graduation Research in Agriculture Sector Sept 09-11, 2020
159
Note: +++ strong, ++ moderate, + mild and - absent In vitro Compatibility of actinobacterial isolates for consortium preparation An important prerequisite for successful development of microbial culture mixtures on consortium depends on the compatibility of co-inoculated microorganisms. The three selected efficient actinobacterial isolates were checked for their compatibility on Nutrient agar plate in vitro with each other and all were found compatible with each other. In vitro essay for preparation of compost from lignocellulosic biomass of water hyacinth. Degradation of water hyacinth biomass by chosen isolates in pots was carried out and fast and efficient degradation was recorded in treatment T4 which contained actinobacterial consortium along with cow dung treatment. Treatment T4 showed black to brown color degraded product and compaction of mass with earthy odour emission. The degradation percentage of T4 was highest of 67.85%. It was also indicative that T4 gave lower C:N ratio 14.2 compared to control T1 (27.3). T4 has the highest amount of moisture (48%) and gave better nutrient content like nitrogen (1.90%), phosphorus (0.95%), potash (1.72%), organic carbon (27.0%). The second best treatment for degradation in net study was treatment T3 with degradation percentage of 48.85%, C:N ratio (14.1), nitrogen content (1.82%), organic carbon (25.7%), potash (1.57%), and phosphorus (0.87%). Table 2: Effect on physical & chemical properties of degraded product at 45 days of inoculation
Treatment Degradation Percentage
Moisture %
pH EC
(dSm-1) OC %
N %
P2O5 %
K2O %
C:N Ratio
T1 Water Hyacinth (control)
43.92 45 7.23 3.01 22.0 0.81 0.39 0.49 27.3
T2 Water Hyacinth + Consortium
49.57 45 7.45 3.20 25.3 1.80 0.79 1.55 14.1
T3 Water Hyacinth + Cow dung
48.85 45 7.47 3.22 25.7 1.82 0.87 1.53 14.1
T4 Water Hyacinth + Consortium + Cow dung
67.85 48 7.51 3.45 27.0 1.90 0.95 1.72 14.2
Sem + - 0.99 - - 1.33 0.025 0.033 0.039 - CD - NS - - NS 0.076 0.100 0.119 - CV % - 3.80 - - 9.28 2.77 6.53 4.57 -
Inference Overall results of present investigation indicated that three actinobacterial native biodegrader isolates individually unveiled significant amount of lignocellulose degradation as well as together as consortium product have significant degradation of water hyacinth biomass and can be utilized for preparation of nutrient rich compost to improve soil fertility in eco-friendly manner.

National E-Workshop onCurrent Scenario of Post Graduation Research in Agriculture Sector Sept 09-11, 2020
160
References Ameen, Ayesha & Ahmad, Jalil & Munir, Neelma & Raza, Shahid. (2016). Physical and chemical analysis of compost to check its maturity and stability. European Journal of Pharmaceutical and Medical Research. 3. 84-87. Booth, C. (2006). Extremophiles. Methods in microbiology 35. Academic Press. p. 543. ISBN 978-0 12-521536-7. Dineshkumar, Bholay & BV, Bhorkhataria & PU, Jadhav & Palekar, Kaveri & Dhalkari, Mayuri & Nalawade, Dr. Pravin. (2012). Bacterial Lignin Peroxidase: A Tool for Biobleaching and Biodegradation of Industrial Effluents. Universal Journal of Environmental Research and Technology. 2. 58-64. Egwuatu TF, Appeh OG (2018) Isolation and Characterization of Filter Paper Degrading Bacteria from the Guts of Coptotermes formosanus. J Bioremediation Biodegradation 9: 440. DOI: 10.4172/2155 6199.1000440 Goodfellow. M. and Williams. S.T. (1983) Ecology of actinomycetes. Ann. Rev. Microbial. 37. 189 216. Halt, J.G., Peter, N.R., Sneath, H.A., Staley, J.T. and William, S.T. (1994). Burgeys Manual of Detriminitave Bacteriology 9th Edition. Pub. : William and Wilkins, Baltimore. pp: 559. Lata, N. and Veenapani, D. (2011). Response of Water Hyacinth Manure on Growth Attributes and Yield in Brassica juncea. Journal of Central European Agriculture. 12(2):336-343.

National E-Workshop onCurrent Scenario of Post Graduation Research in Agriculture Sector Sept 09-11, 2020
161
PATHOGEN ASSOCIATED WITH BLACK POINT SYMPTOMS IN WHEAT
Poonam Rani1 and Anita Singh2
1Assistant Professor,Department of Plant pathology,Baba Farid College, Deon 2Entomologist, Warkem Biotech Pvt. Ltd., Mumbai
Email: [email protected]
Introduction Symptoms of black point in grains of wheat (Triticum aestivum) can cause downgrading of the grain at marketing. A black-point screening process needs to be incorporated into all breeding programs. But to develop a screening test, it is necessary to identify the pathogens involved in black-point symptoms. The literature describes the development of various fungi such as namely Bipolaris sorokiniana, Alternaria alternata, Cladosporium cladosporioides, Curvularia lunata and Fusarium spp.(EL-Gremi et. al., 2017) during anthesis period and storage period is often associated with the development of black point. The present study was to evaluate the real impact of pathogen associated on a broad range of cultivars known to be either susceptible or resistant to black point.
Methodology Kernels were classified according to the level of black-point symptoms intensity (crease completely or partially discoloured) and to the spot colours (brown or black). 100 grams of kernels were studied per plot. Black Point and Black Point-free kernel Seeds were surface sterilized with 1% sodium hypochloride (NaOCl) solution for 3 min, followed by several rinses in sterile distilled water and dried on filter paper (Mittal et. al., 1999). Blotter Paper and Agar Plate methods were used for growth and sporulation of associated fungi to Black point detection of Black Point causing fungi. Each experiment was repeated 3 times. The frequency of the fungus was calculated by the following formula (Pathak & Zaidi 2013):
No. of seeds containing a particular fungus Frequency of the Fungus = --------------------------------------------- × 100
Total seed used The isolated mycoflora were sub-cultured by single spore technique on PDA slants and observed for fungal growth.
Findings In present study, total thirteen fungal species representing 9 fungal genera were isolated and identified by using keys, monographs and text provided by several authors (Chávez and Kohli 2013). The culture of 9 fungal genera isolated from Standard blotter (Plate 1) and Agar plate method (Plate 2) including Alternarias pp. (Plate 3), Aspergillus flavus (Plate 4), Aspergillus niger (Plate 5), Bipolaris

National E-Workshop onCurrent Scenario of Post Graduation Research in Agriculture Sector Sept 09-11, 2020
162
sarokiniana (Helminthosporium sativum) (Plate 6), Curvularia lunata (Plate 7), Fusarium oxysporum (Plate 8), Penicillium spp (Plate 9), Cochliobolus sativus (Plate 10), Rhizopus stolnifer (Plate 11)and Epicoccum spp. was observed on PDA and Blotter paper. The isolated mycoflora were sub cultured on PDA slants and observed fungal growth of Alternaria alternate (Plate 12), Aspergillus flavus (Plate 13), Aspergillus niger (Plate 14), Helminthosporium sativum (Plate 15)Curvularia lunta(Plate 16) Fusarium (Plate 17)Pencillium (Plate 18), Cochliobolus sativus (Plate 19) and Rhizopus (Plate 20) and further identification was done under stereo binocular and compound microscopes.

National E-Workshop onCurrent Scenario of Post Graduation Research in Agriculture Sector Sept 09-11, 2020
163
Plate 1 Plate 2
Plate 3 Plate 4 Plate 5 Plate 6 Plate 7 Plate 8 Plate 9 Plate 10 Plate 11
Plate 12 Plate 13 Plate 14 Plate 15 Plate 16 Plate 17 Plate 18 Plate 19 Plate 20
Slide 1 Slide 3 Slide 4 Slide 6 Slide 7 Slide 8 Slide 10 Slide 12
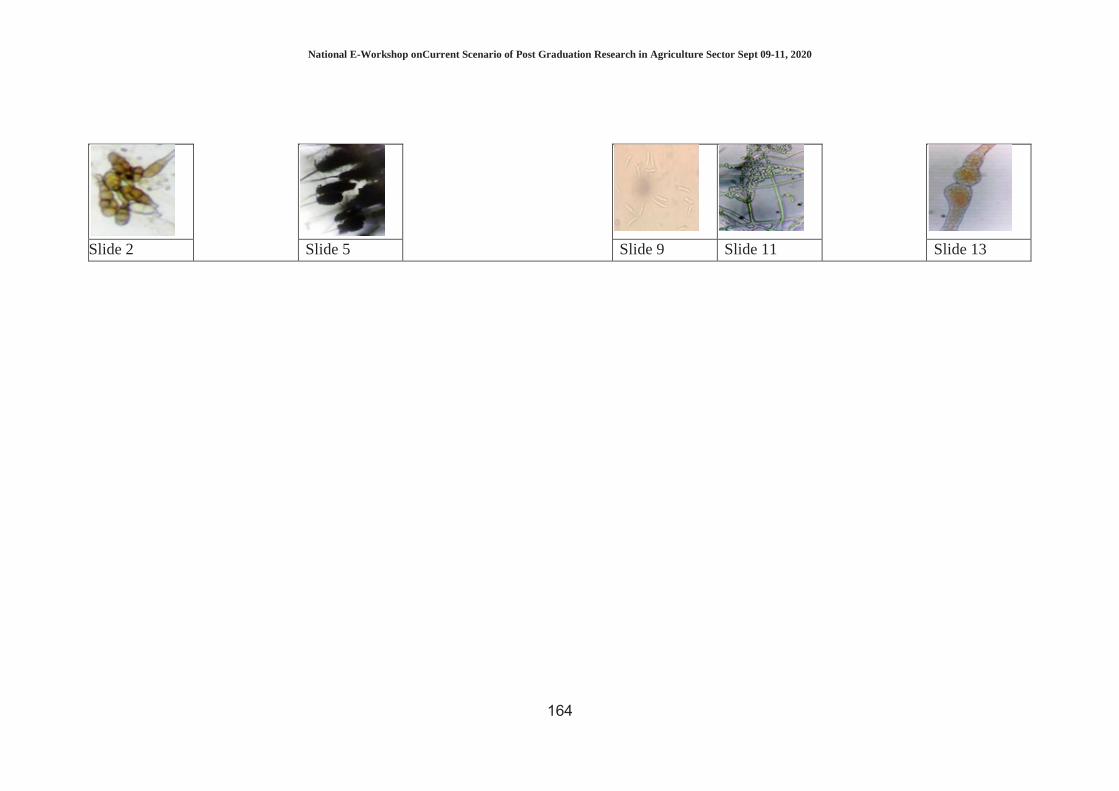
National E-Workshop onCurrent Scenario of Post Graduation Research in Agriculture Sector Sept 09-11, 2020
164
Slide 2 Slide 5 Slide 9 Slide 11 Slide 13

National E-Workshop onCurrent Scenario of Post Graduation Research in Agriculture Sector Sept 09-11, 2020
165
These fungal colonies were identified by using associated characterises: conidia with multicelled transverse and longitudinal septa of Alternaria alternate (Slide 1), Alternaria tenius (Slide 2) attach with mycelium, Spores of Aspergillus flavus attach with mycellium observed (Slide 3), Aspergillus niger (Slide 4), Aspergillus fumigatus (Slide 5), conidia of Helminthosporium sativum (Slide 6), Curvularia luanata (Slide 7), Mycelium of Fusarium oxysporum (Slide 8), conidia of Fusarium oxysporum (Slide 9), Pencillium notatum (Slide 10), Pencillium chrysogenium (Slide 11), Conidia of Fusarium oxysporum (Slide 12), Zygosporangium structure of Rhizopus also observed (Slide 13). The results also revealed that the mean percent infection of all isolated fungi in blotter paper and agar plate method (Table 1). Pathak and Zaidi (2013) reported that isolation of different microorganism associated with seeds of wheat maximum in frequency of Aspergillus spp and Alternaria spp.from the blotter techniques as compared to using other methods. The increasing trend regarding fungal detection was observed towards the blotter paper method because blotter found to be the most efficient, economical and internationally reliable method (Fakhrunnisa et. al., 2006 and Habib et. al., 2011). Table 1: Populations of different fungi incidence (per cent) on wheat seeds
S.No. Name of Fungi Blotter method (%) Agar plate method (%) 1 Fusarium oxysporum 14.0±2.08 12.6±2.02 2 Rhizopus stolnifer 6.33±1.45 8.66±1.20 3 Alternaria alternate 39.3±2.33 37.6±2.60 4 Alternaria tanius 3.3±2.02 5.6±2.60 5 Aspergillus niger 16.6±1.45 14.6±2.02 6 Aspergillus flavus 14.6±1.45 16.3±0.88 7 Aspergillus fumigatus 0.33±0.16 0±0 8 Curvularia lunata 28.6±2.90 31.0±3.46
9 Bipolaris sorokiniana (Helminthosporium sativum)
38.6±2.90 27.3±2.02
10 Penicillium chrysogenium 0.50±0.28 0.33±0.16 11 Penicillium notatum 0.33±0.16 0±0 12 Epicoccum nigrum 0±0 5.3±0.33 13 Epicoccum purpurascens 0.33±0.16 0±0
CD 5.17 3.67
Inference High infection was known to induce black point which is due to interaction of black point associated fungi both field as well as storage fungi. So, in future the Pathologist requires more studies to assess the recurrence of Black point diseases and Even the Plant breeders are having good scope to initiate development of disease résistance varieties.
References EL-Gremi S M, Draz I S and Youssef W A (2017) Biological control of pathogens associated with kernel black point disease of wheat. CROP PROT 91:13-19. Mittal R K, Hansen H J and Thomsen K (1999) Effect of seed treatments and storage temperature on

National E-Workshop onCurrent Scenario of Post Graduation Research in Agriculture Sector Sept 09-11, 2020
166
storability of Syzgium cuminii seeds. IUFRO. Seed Symposium 1998, Recalcitrant seeds, Proc of the Conference Kaula Lampur Malaysia, 12 -15 Oct 1998-99 30(1): 53-63. Pathak N and R Zaidi (2013) Fungi associated with wheat seed discoloration and abnormalities in in vitro study. Agric Sci 4 (9): 516-520. Fakhrunnisa M, Hashmi H and Ghaffar A (2006) Seed-Borne Mycoflora of Wheat, Sorghum and Barley. Pak J Bot 38(1): 185-92. Habib A, Sahi S T, Javed N and Ahmad S (2011) Prevalence of seed-borne fungi on wheat during storage and its impact on seed germination. Pak J Phytopathol 23(1): 42-47. Chávez A and Kohli M (2013) Identification of fungi in black point disease of wheat. Investig Agrar 15 (2): 133-137.
National E-Workshop onCurrent Scenario of Post Graduation Research in Agriculture Sector Sept 09-11, 2020
167
TO MAKE SURVEYS OF PARLATORIA BLANCHARDII TARG. IN THE NORTH-WESTERN REGION OF RAJASTHAN
Rajendra Kumar and A R Naqvi
Dept. of Entomology, College of Agriculture, SKRAU, Bikaner-334006 Email: [email protected]
Introduction Date Palm (Phoenix dactylifera L.) is a great amount of seedling datepalm groves prevail in the western part of the India, at the Kachchh territory of Gujarat state (Johnson et al., 2013).Area under datepalm cultivation is now 19400 hectares with production of 16635 mt and in Rajasthan area about 850 ha (Singh, 2018). White datepalm scale P. blanchardii (Targ.) is the most destructive pests infesting datepalm trees (El-Said, 2000). A characteristic symptom of infestation by P. blanchardi is the appearance and accumulation of its scales on attacked palm parts (El-Said, 2000, El-Sherif et al., 2001 and Blumberg, 2008 and Haldhar et al., 2015). It may hold out to 85-90 percent losses dependent on, resistance of varieties, intensification of infestation andorchard management (Ahmed, 2004).During the last decade datepalm orchards have been established in north western part of Rajasthan so it is imperative to know the status of scale insect population. Survey of insect pests in a particular agro-climatic zone provides the information and instruction about condition of insect which helps in developing adequate pest management planning and approaches. Chemical insecticides/botanicals are only the alternative against this pest, and the present study evaluates treatment with some insecticide/botanicals on Date palm in the hyper arid region of Rajasthan.
Methodology A periodical surveys on infestation of date palm scale insect P. blanchardii was conducted in the north western zone of Rajasthan during two successive years (2017/18 and 2018/2019). Eight orchards i.e. 2 each in Bikaner, Jaisalmer, Hanumangarh and Sri Ganganagar districts of Rajasthan were selected for sampling during the above mentioned period. Five date palm plants of one orchard were randomly selected for population estimation. The population was counted at fortnight interval. The twelve leaflets were taken from every palm at a rate of 3 leaflets from each of the north, east, south and west directions. The population of P. blanchardii was recorded from the area of 1 cm2 of a leaflet with help of hand lence.

National E-Workshop onCurrent Scenario of Post Graduation Research in Agriculture Sector Sept 09-11, 2020
168
Findings Survey of P. blanchardii in the north western region of Rajasthan Surveys were conducted on dateplam scale insect in the orchards at farmer’s field in the eight villages namely; Khajuwala and Khara in Bikaner, Sri Vijaynagar and Raisinghnagar in Sri Ganganagar, Lakhuwali and Jakharanwali in Hanumangarh, Rajmathai and Pokaran in Jaisalmer District of north West region of Rajasthan during 2017-18 and 2018-19. (Table-1). Data depicted in Table 4.1 indicated that on the basis of the population per unit area of scale insect, P. blanchardii Targ. was reported as major pest in all the orchards of four districts in mild to severe form throughout the year. Bikaner During 2017-18 in the Bikaner district P. blanchardii population ranged from 2.10/ cm2 to 26.44/ cm2. The lowest population was reported in Khajuwala (2.10/cm2) at the time of secondfortnight of June, 2018 and highest (26.44/cm2) was recorded at the time of first fortnight of January, 2018 at Khara.In 2018-19 scale population was ranging from 2.00/cm2 to 26.85/cm2 at Khajuwala tehsil of Bikaner district at the time of second fortnight of June, 2019 and first fortnight of January, 2019, respectively. Sri Ganganagar In 2017-18 the population of dateplam scale in Sri Ganganagar district was ranging from 5.20/cm2 to 27.68/cm2. Severe population was reported at Sri Vijaynagar tehsil (27.67/cm2) at the time of first fortnight of January, 2018 while; population was mild at the time of first fortnight of June, 2018 which was observed at Raisinghnagar tehsil.In 2018-19 the population range of P. blanchardii was in between 4.20/cm2 to 28.65/cm2. The highest population of scale insect was recorded at the time of firstfortnight of January, 2019 at Sri Vijaynagar and minimum population was recorded in Raisinghnagar at the time of second fortnight of May, 2019. Hanumangarh The incidence of P. blanchardii of dateplam in Hanumangarh district was ranging 2.50/cm2 to 21.23/cm2 at the time of the 2017-18. The highest population (21.23/cm2) was reported at the time of first fortnight of January, 2018 in village Jakharanwali and minimum population (2.50/cm2) was also recorded in the same village at the time of second fortnight of May, 2018.At the time of 2018-19 the population of scale insect was ranging from 2.00/cm2 to 22.00/cm2. The highest population of P. blanchardii was reported from village Jakharanwali (22.00/ cm2) at the time of first fortnight of January, 2019. While, minimum population (2.00/cm2) was recorded from Lakhuwali village in second fortnight of May, 2018. Jaisalmer

National E-Workshop onCurrent Scenario of Post Graduation Research in Agriculture Sector Sept 09-11, 2020
169
The population of dateplam scale insect was ranging from 1.70/cm2 to 22.25/cm2 at the time of 2017-18. The minimum population (1.70/cm2) was reported from Pokaran tehsil in II fortnight of May, 2018 and highest population was recorded from village Rajmathai (22.25/cm2) at the time of first fortnight of January, 2018.In 2018-19 the population was fluctuating between 1.90/cm2 to 22.75/cm2. The highest population (22.74/cm2) of scale insect on dateplam was recorded in first fortnight of January, 2019 whereas, the minimum population of scale insect was reported in Pokaran tehsil at the time of second fortnight of May, 2019.
Inference Surveyon P. blanchardii recorded in eight villages two each from Bikaner, Jaisalmer, Hanumangarh and Sri Ganganagar districts of Rajasthan. The incidence of scale insect was observed throughout the year in north-western Rajasthan.
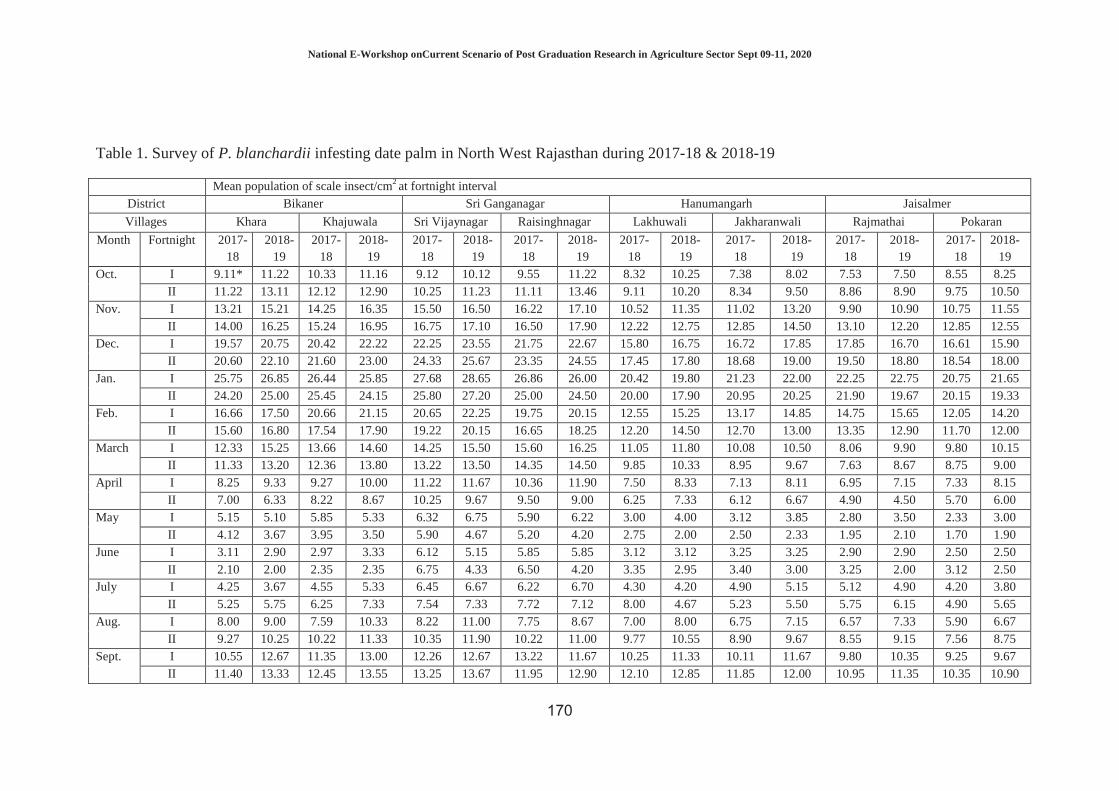
National E-Workshop onCurrent Scenario of Post Graduation Research in Agriculture Sector Sept 09-11, 2020
170
Table 1. Survey of P. blanchardii infesting date palm in North West Rajasthan during 2017-18 & 2018-19
Mean population of scale insect/cm2 at fortnight interval District Bikaner Sri Ganganagar Hanumangarh Jaisalmer
Villages Khara Khajuwala Sri Vijaynagar Raisinghnagar Lakhuwali Jakharanwali Rajmathai Pokaran
Month Fortnight 2017-18
2018-19
2017-18
2018-19
2017-18
2018-19
2017-18
2018-19
2017-18
2018-19
2017-18
2018-19
2017-18
2018-19
2017-18
2018-19
Oct.
I 9.11* 11.22 10.33 11.16 9.12 10.12 9.55 11.22 8.32 10.25 7.38 8.02 7.53 7.50 8.55 8.25 II 11.22 13.11 12.12 12.90 10.25 11.23 11.11 13.46 9.11 10.20 8.34 9.50 8.86 8.90 9.75 10.50
Nov.
I 13.21 15.21 14.25 16.35 15.50 16.50 16.22 17.10 10.52 11.35 11.02 13.20 9.90 10.90 10.75 11.55 II 14.00 16.25 15.24 16.95 16.75 17.10 16.50 17.90 12.22 12.75 12.85 14.50 13.10 12.20 12.85 12.55
Dec. I 19.57 20.75 20.42 22.22 22.25 23.55 21.75 22.67 15.80 16.75 16.72 17.85 17.85 16.70 16.61 15.90 II 20.60 22.10 21.60 23.00 24.33 25.67 23.35 24.55 17.45 17.80 18.68 19.00 19.50 18.80 18.54 18.00
Jan. I 25.75 26.85 26.44 25.85 27.68 28.65 26.86 26.00 20.42 19.80 21.23 22.00 22.25 22.75 20.75 21.65 II 24.20 25.00 25.45 24.15 25.80 27.20 25.00 24.50 20.00 17.90 20.95 20.25 21.90 19.67 20.15 19.33
Feb. I 16.66 17.50 20.66 21.15 20.65 22.25 19.75 20.15 12.55 15.25 13.17 14.85 14.75 15.65 12.05 14.20 II 15.60 16.80 17.54 17.90 19.22 20.15 16.65 18.25 12.20 14.50 12.70 13.00 13.35 12.90 11.70 12.00
March I 12.33 15.25 13.66 14.60 14.25 15.50 15.60 16.25 11.05 11.80 10.08 10.50 8.06 9.90 9.80 10.15 II 11.33 13.20 12.36 13.80 13.22 13.50 14.35 14.50 9.85 10.33 8.95 9.67 7.63 8.67 8.75 9.00
April I 8.25 9.33 9.27 10.00 11.22 11.67 10.36 11.90 7.50 8.33 7.13 8.11 6.95 7.15 7.33 8.15 II 7.00 6.33 8.22 8.67 10.25 9.67 9.50 9.00 6.25 7.33 6.12 6.67 4.90 4.50 5.70 6.00
May I 5.15 5.10 5.85 5.33 6.32 6.75 5.90 6.22 3.00 4.00 3.12 3.85 2.80 3.50 2.33 3.00 II 4.12 3.67 3.95 3.50 5.90 4.67 5.20 4.20 2.75 2.00 2.50 2.33 1.95 2.10 1.70 1.90
June I 3.11 2.90 2.97 3.33 6.12 5.15 5.85 5.85 3.12 3.12 3.25 3.25 2.90 2.90 2.50 2.50 II 2.10 2.00 2.35 2.35 6.75 4.33 6.50 4.20 3.35 2.95 3.40 3.00 3.25 2.00 3.12 2.50
July I 4.25 3.67 4.55 5.33 6.45 6.67 6.22 6.70 4.30 4.20 4.90 5.15 5.12 4.90 4.20 3.80 II 5.25 5.75 6.25 7.33 7.54 7.33 7.72 7.12 8.00 4.67 5.23 5.50 5.75 6.15 4.90 5.65
Aug. I 8.00 9.00 7.59 10.33 8.22 11.00 7.75 8.67 7.00 8.00 6.75 7.15 6.57 7.33 5.90 6.67 II 9.27 10.25 10.22 11.33 10.35 11.90 10.22 11.00 9.77 10.55 8.90 9.67 8.55 9.15 7.56 8.75
Sept. I 10.55 12.67 11.35 13.00 12.26 12.67 13.22 11.67 10.25 11.33 10.11 11.67 9.80 10.35 9.25 9.67 II 11.40 13.33 12.45 13.55 13.25 13.67 11.95 12.90 12.10 12.85 11.85 12.00 10.95 11.35 10.35 10.90

National E-Workshop onCurrent Scenario of Post Graduation Research in Agriculture Sector Sept 09-11, 2020
171
FIELD SCREENING OF SESAME VARIETIES AGAINST LEAF WEBBER AND CAPSULE BORER, ANTIGASTRA CATALAUNALIS
(DUP.)
Rakesh Yalawar* and V. S. Acharya Department of Entomology, College of Agriculture, SKRAU, Bikaner
Email:[email protected]
Introduction Sesame (Sesamum indicum L.) commonly called as Til, is one of most ancient and important oilseed crops cultivated over 5000 years by human beings. It belongs to family Pedaliaceae and described as ‘Queen of Oilseed crops’ for its high oil content (46-52%) and high protein content (18-20). The leaf webber and capsule borer, Antigastra catalaunalis (Dup.) as one of the major pest of sesame in India, that caused economic losses in crop yield. This pest is active from germination to till the harvest of the crop, so called this pest as Key pest of sesame (Thakur and Ghorpade, 2006). The larvae web together with top leaves or bore into tender shoots and capsules and feed on them. The damage results in webbed leaves at top with young caterpillars, bored shoots, flower buds and pods in case of severe infestation the yields are drastically reduced. This insect pest causes 10-70 per cent infestation of leaves, 34-62 per cent of flower buds/ flowers and 10-44 per cent infestation of capsules resulting in upto 72 per cent loss in yield (Ahirwar et al., 2010). Varietal resistance has been recognized as one of the most desirable and economic tactic in the management of A. catalaunalis and is the best alternative to synthetic insecticides (Karuppaiah, V. and Nadarajan, L. 2011). In order to subdue the threat of this pest, the growers primarily rely on chemical insecticides which had led to several problems viz., toxic residues, elimination of natural enemies, environmental disharmony and development of resistance among different pests (Vijaykumar et al. 2018). Keeping all these points in view, the present study was undertaken to investigate the available sesame varieties for resistance against A. catalaunalis.
Methodology The present investigation was conducted at research farm College of Agriculture, Bikaner during Kharif, 2019. The experiment was conducted in simple randomized block design with three replications each varieties has ten rows of 1.8 m length considered as a single plot thus the plot size was 3 m x 1.8 m. The seeds of 10 different varieties of sesame were sown on 23rd July keeping row to row and plant to plant distance of 30 cm and 10 cm, respectively. As soon as the larval population appeared, the numbers of leaf webber larvae per plant and number of damaged and healthy pods per plant were counted in early morning hours at weekly interval from appearance to harvesting of the crop. The data on sesame leaf and capsule borer population were transformed into √ X + 0.5 (Gomez and Gomez, 1976) and were subjected to analysis of variance. The per cent damage of pods done by A.

National E-Workshop onCurrent Scenario of Post Graduation Research in Agriculture Sector Sept 09-11, 2020
172
catalaunalis were transformed into angular values (arc sin √P) and subjected to analysis of variance.
Findings During Kharif, 2019 the initial observation was recorded on thirty third standard meteorological week in which the larval population of A. catalaunalis on different varieties was ranged from 0.23 to 1.98 larvae per five plants. The lowest larval population (0.23 larvae/5 plants) noticed on variety RT-54 followed by RT-346 (0.30 larvae/5 plants), however these at par and found superior over other varieties. The maximum larval population (1.98 larvae/5 plants) was recorded on variety RT-46 which was followed by GT-10 and PRAGATI where such counts were 1.93 and 1.85 larvae per five plants, respectively. The larval population reached to peak on thirty seventh standard meteorological week where the population was varied from 2.54 to 7.70 larvae per five plants. The minimum larval population (2.54 larvae/5 plants) was observed on variety RT-54 followed by RT-346 and RT-103 in which population of leaf webber larvae per five plants was 2.59 and 2.64, respectively. These varieties were found superior over other varieties and at par to each other. The larval population in varieties, RT-125, RT-351, TKG-22, RT-127, were 6.11, 6.16, 6.24 and 6.30 larvae per five plants, respectively. The maximum larval population (7.70 larvae/5 plants) was observed on variety RT-46 which was at par with variety GT-10 (7.62 larvae/5 plants) and PRAGATI (7.52 larvae/5 plants). The present investigations are in agreement with that of Choudhary et al (2018) who reported that variety RT-351 and RT-125 were moderately susceptible and RT-46 was most susceptible to A. catalaunalis. Contrary to the present investigation, Chaudhary et al (2018) observed RT-346 and RT-103 as moderately susceptible. These findings also corroborate with that of Karuppaiah and Nadarajan (2011) who tested 43 genotypes against A. catalaunalis and found TKG-22 was moderately susceptible. The results on per cent pod damage recorded among ten varieties revealed that the pod damage by leaf webber was initially observed on 1st week of September in all the varieties which increased gradually up to the 3rd week of September thereafter it start declining. The pod damage varied from 6.80 to 18.73 per cent on different varieties throughout the crop season. The mean per cent pod damage of A. catalaunalis at peak ranged from 10.05 to 18.73. The pod damage of A. catalaunalis was found significantly less in RT- 54 which was at par with RT-346 and RT-103. The maximum pod damage was recorded on RT-46 followed by GT-10, and PRAGATI, however, all these varieties were at par. These findings also corroborate with those of Karuppaiah and Nandarajan (2011) and Chaudhary et al. (2018) who tested different genotypes of sesame against A. catalaunalis and found RT-351 TKG-22 was moderately susceptible. Contrary to the present investigation, Chaudhary et al (2018) RT-346 and RT-103 reported these varieties as moderately susceptible. The sequence of the varieties according to the increased per cent pod damage was found to be, RT-54< RT- 346 <RT-103 < RT-125 < RT-351 < TKG-22 < RT-127 < PRAGATI< GT-10 < RT-46.
National E-Workshop onCurrent Scenario of Post Graduation Research in Agriculture Sector Sept 09-11, 2020
173
Inference Out of ten varieties screened against A. catalaunalis revealed that RT-54, RT-346 and RT-103 are least susceptible, varieties RT-125, RT-351, TKG-22 and RT-127 were moderately susceptible and the varieties like PRAGATI, GT-10 and RT-46 are highly susceptible for leaf webber larval incidence.
The varieties were also categorized on the basis pod damage. Based on per cent pod damage three varieties viz., RT-54, RT-346 and RT-103 were rated as less susceptible, four varieties namely, RT-125, RT-351, TKG-22 and RT-127 rated as moderately susceptible and three varieties namely, PRAGATI, GT-10 and RT-46 were found highly susceptible to leaf webber.

National E-Workshop onCurrent Scenario of Post Graduation Research in Agriculture Sector Sept 09-11, 2020
174
Table 1. Incidence of A. catalaunalis on different varieties of sesame during Kharif, 2019. (Based on larval population) Varieties larvae** / 5 plants at different standard week Mean
33 34 35 36 37 38 39 40 41 42 43 44 45 46
RT-103 0.31 0.68 1.27 2.38 2.64 2.67 2.50 2.20 2.10 2.08 1.74 1.55 0.84 0.55 1.68
(0.90)* (1.09) (1.33) (1.69) (1.76) (1.77) (1.72) (1.64) (1.61) (1.60) (1.49) (1.42) (1.15) (1.01)
RT-54 0.23 0.45 1.12 2.30 2.54 2.49 2.40 2.12 2.04 1.88 1.58 1.41 0.68 0.45 1.55
(0.85) (0.98) (1.27) (1.67) (1.74) (1.72) (1.70) (1.61) (1.59) (1.54) (1.43) (1.37) (1.08) (0.95)
RT127 1.21 1.47 2.92 4.44 6.30 5.28 5.20 4.52 3.67 3.47 3.41 3.08 2.21 1.56 3.48
(1.31) (1.40) (1.85) (2.22) (2.60) (2.40) (2.38) (2.23) (2.04) (1.98) (1.94) (1.89) (1.64) (1.43)
RT-351 0.98 1.25 2.81 4.36 6.16 5.16 5.06 4.58 3.55 3.32 3.16 2.92 2.08 1.47 3.35
(1.22) (1.32) (1.82) (2.20) (2.58) (2.38) (2.35) (2.25) (2.01) (1.95) (1.91) (1.84) (1.60) (1.39)
RT-46 1.98 2.38 4.47 6.78 7.70 7.14 7.13 6.20 5.75 5.63 5.00 4.72 3.64 3.09 5.11
(1.57) (1.70) (2.23) (2.69) (2.86) (2.76) (2.76) (2.58) (2.49) (2.47) (2.34) (2.28) (2.03) (1.89)
RT-125 0.80 1.15 2.75 4.27 6.11 5.14 5.00 4.54 3.48 3.30 3.16 2.90 2.00 1.42 3.29
(1.14) (1.28) (1.80) (2.18) (2.56) (2.37) (2.34) (2.24) (1.90) (1.94) (1.91) (1.84) (1.58) (1.38)
GT-10 1.93 2.34 4.42 6.69 7.62 7.05 7.04 6.16 5.70 5.60 4.91 4.66 3.59 2.92 5.04
(1.56) (1.68) (2.21) (2.68) (2.84) (2.74) (2.75) (2.58) (2.49) (2.46) (2.32) (2.27) (2.02) (1.84)
TKG-22 1.11 1.34 2.83 4.38 6.24 5.23 5.14 4.65 3.61 3.40 3.19 3.01 2.16 1.49 3.41
(1.27) (1.36) (1.82) (2.20) (2.59) (2.39) (2.37) (2.26) (2.02) (1.97) (1.92) (1.87) (1.63) (1.41)
PRAGATI 1.85 2.32 4.41 6.63 7.52 7.00 6.92 6.09 5.61 5.46 4.86 4.59 3.58 2.81 4.98
(1.53) (1.68) (2.21) (2.66) (2.83) (2.73) (2.72) (2.56) (2.47) (2.44) (2.31) (2.25) (2.01) (1.81)
RT-346 0.30 0.60 1.19 2.31 2.59 2.59 2.44 2.18 2.07 1.98 1.67 1.46 0.77 0.46 1.62
(0.90) (1.04) (1.29) (1.67) (1.75) (1.75 (1.71) (1.63) (1.59) (1.57) (1.47) (1.39) (1.12) (0.97)
S.Em + 0.05 0.04 0.04 0.03 0.06 0.03 0.06 0.04 0.05 0.06 0.04 0.06 0.04 0.06
C.D. at 5% 0.15 0.13 0.11 0.09 0.20 0.09 0.17 0.12 0.16 0.18 0.13 0.04 0.13 0.18
*Figures in Parentheses are √X+0.5 transformed values. ** Mean of three replication.

National E-Workshop onCurrent Scenario of Post Graduation Research in Agriculture Sector Sept 09-11, 2020
175
Table 2. Incidence of A. catalaunalis on different varieties of sesame during Kharif, 2019. (Based on per cent pod damage)
Varieties Per cent pod damage at different standard week** Mean
36 37 38 39 40 41 42 43 44 45 46 47 RT-103 7.36 11.43 11.91 11.65 9.65 9.03 8.36 7.16 5.52 3.97 2.65 1.03 7.48 (2.71)* (3.38) (3.45) (3.41) (3.11) (3.00) (2.89) (2.67) (2.35) (1.99) (1.63) (1.01) RT-54 6.80 9.71 10.05 9.84 8.87 8.60 7.79 6.54 4.88 3.56 1.77 0.78 6.60 (2.61) (3.11) (3.17) (3.14) (2.98) (2.93) (2.79) (2.56) (2.21) (1.89) (1.32) (0.88) RT127 13.20 15.53 15.45 13.96 13.44 12.07 10.82 9.99 9.07 6.91 4.89 2.78 10.67 (3.62) (3.94) (3.92) (3.74) (3.67) (3.47) (3.29) (3.16) (3.01) (2.63) (2.21) (1.67) RT-351 11.16 14.02 15.13 13.33 12.10 11.39 10.15 9.06 7.55 5.92 3.99 2.58 9.70 (3.34) (3.74) (3.99) (3.65) (3.48) (3.38) (3.19) (3.01) (2.75) (2.42) (2.00) (1.60) RT-46 16.08 17.59 18.73 16.66 15.21 14.54 13.07 12.26 11.13 9.49 6.59 6.01 13.11 (4.01) (4.19) (4.32) (4.08) (3.90) (3.81) (3.61) (3.50) (3.33) (3.08) (2.56) (2.45) RT-125 10.47 13.80 14.84 13.30 11.56 11.08 9.78 8.42 7.03 5.03 3.71 2.06 9.26 (3.23) (3.71) (3.85) (3.65) (3.40) (3.31) (3.13) (2.90) (2.62) (2.24) (1.92) (1.41) GT-10 15.99 17.55 18.33 16.47 15.19 13.99 12.51 11.59 9.98 8.54 6.23 5.73 12.68 (4.00) (4.19) (4.28) (4.06) (3.90) (3.74) (3.54) (3.40) (3.16) (2.92) (2.50) (2.39) TKG-22 11.62 14.26 15.42 13.85 12.53 11.84 10.56 9.44 7.98 6.38 4.27 2.61 10.06 (3.41) (3.78) (3.93) (3.72) (3.54) (3.44) (3.25) (3.07) (2.82) (2.52) (2.06) (1.61) PRAGATI 15.21 17.52 17.25 16.04 15.06 13.73 12.45 11.37 9.92 8.17 6.03 5.64 12.37 (3.90) (4.19) (4.15) (4.00) (3.88) (3.70) (3.53) (3.37) (3.15) (2.86) (2.45) (2.37) RT-346 7.14 10.15 10.22 10.15 9.15 8.80 8.03 6.85 5.05 3.93 2.05 0.93 6.87
(2.67) (3.18) (3.20) (3.19) (3.02) (2.97) (2.83) (2.62) (2.25) (1.98) (1.43) (0.97)
S.Em + 0.08 0.07 0.07 0.04 0.05 0.09 0.05 0.06 0.11 0.08 0.08 0.08 C.D. at 5% 0.22 0.22 0.21 0.12 0.16 0.26 0.16 0.18 0.31 0.22 0.23 0.24

National E-Workshop onCurrent Scenario of Post Graduation Research in Agriculture Sector Sept 09-11, 2020
176
References Ahirwar, R.M., Gupta, M. P., Banerjee, S. (2010) Field efficacy of natural and indigenous products on sucking pests of sesame. Indian Journal of Natural Product Resources. 2010; 1(2):221-226. Choudhary, M. D., Kumawat, K. C., Yadav, M. K. and Samota, R. G. (2018) Host plant resistance in sesame genotypes to Antigastra catalaunalis Dup. Journal of Entomology and Zoology Studies,6(1): 1012-1015. Gomez, K. A. and Gomez, A. A. (1976) Problem data. Statistical procedures for agricultural research (2nd Ed.). John Willey and Sons, New York, 272-315. Karuppaiah, V. and Nadarajan, L. (2011) Evaluation of sesame genotypes for resistance to sesame leaf roller and capsule borer, Antigastra catalaunalis Duponchel (Pyraustidae: Lepidoptera). Archives of Phytopathology and Plant Protection, 44 (9):125-130. Karuppaiah, V. and Nadarajan, L. (2011) Evaluation of sesame genotypes for resistance to sesame leaf roller and capsule borer, Antigastra catalaunalis Duponchel (Pyraustidae: Lepidoptera). Archives of Phytopathology and Plant Protection, 44 (9):125-130. Thakur, S. G. and Ghorpade, S. A. (2006) Sesame leaf webber and capsule borer, Antigastra catalaunalis Dup. a review. Journal of Maharashtra Agricultural University, 31 (3): 300-307. Vijayakumar, L., Jyothi, J., Madhusudan, K. and Shivanna, B. (2018). New sources of resistance against leaf webber and capsule borer, Antigastra catalaunalis Duponchel. (Pyraustidae: Lepidoptera) in Karnataka. Journal of Entomology and Zoology Studies, 6(1): 942-946.

National E-Workshop onCurrent Scenario of Post Graduation Research in Agriculture Sector Sept 09-11, 2020
177
INTEGRATED MANAGEMENT OF ROOT ROT OF COTTON CAUSED BY RHIZOCTONIA SOLANI (KUHN.)
Ramniwas Yadav1 and Dr. R. N. Bunker2
1.Ph.D Scholar, RARI, (SKNAU, Jobner) Jaipur 2.Assistant Professor, Rajasthan College of Agriculture, MPUAT, Udaipur
Mail : [email protected]
Introduction Cotton (Gossypium spp.) is one of the most important fibers and cash crop belongs to genus Gossypium of the family Malvaceae, originated as a tropical and subtropical perennial plant, but is produced as an annual crop in many temperate regions around the world. India is the first largest cotton producer, consumer and exporter in the world, it is cultivated in an area about 11.87 million hectares with the 30.15 million tons production and 4.32 q ha-1 productivity respectively, Agriculture statistics at a glance-2016 (2017-a). It is popularly known as “white gold” and it is the crop with multiple uses that supplies five basic products viz. - lint, oil, seed, hulls and linters. Among them the lint is the most important product of cotton plant and provides much of the high quality fiber for the textile industry. Damping-off and root rot of cotton caused by Rhizoctonia solani showed heavy losses particularly during the early stage of crop growth (Nawar, 2008), plant stand and significant losses in cotton production throughout the cotton growing countries of the world (Michael et al. 2007, Koenning 2008). Rhizoctonia is a widespread, destructive and versatile plant pathogen, are distributed worldwide in both agriculture and forest soils and are known to cause root diseases of several crop plants (Gracia et al. 2006). The severity of this disease varies from locality to locality and attends maximum intensity (up to 90 %) during rainy season in cotton (Singh and Verma 1988). The soil moisture of 20 per cent and temperature of 35 °C have been reported most suitable for infection (Monga and Sheoraj, 1994; Haq et al. 1999).Root rot of cotton symptoms include seed decay, decay of the seedling before emergence, partial or complete girdling of the emerged seedling stems, and seedling root rot are common. Damaged seedlings that emerge are pale with sore shine, stunted, slower growing and sometimes die within a few days. (Heydary et al. 2005). In view of increasing importance and severity of root rot of cotton in Rajasthan, the present studies were therefore, undertaken. Methodology Multiplication of R. solani for soil application For the micro plot experiment, virulent isolate of R. solani were multiplied on autoclaved sorghum grains for 3 weeks. This inoculum soil mixture was mixed with field soil in micro plots @ 20 g/plot (1.8 x 1.8m2 size). For comparison, control plot (pathogen inoculated soil) were kept. For each treatment three plots as three replications were maintained. All the plots were lightly irrigated immediately after inoculation. The plots were free for 10 days, to allow establishment of the pathogen before sowing.

National E-Workshop onCurrent Scenario of Post Graduation Research in Agriculture Sector Sept 09-11, 2020
178
Soil application and seed treatment with bio-control agents, neem cake and fungicides Fungicide and biocontrol agent found effective in vitro were evaluated in different treatments as individually and in combinations as treatment in micro plot experiment. For seed treatment, cultures of the biocontrol agents were individually grown on 2 per cent malt extract agar (MEA), The spores colonies so developed were harvested by suspending in 20 ml water in each Petri dish and mixed with sterilized fine clay (talc powder) 10 gm to make a slurry. This formulation of the BCA was used for seed treatments @ 8 g/kg seed. The coated seeds were kept overnight in moist chamber so as to enable the antagonists to establish on seeds. Soil application of bio agents done after pre-incubated in well decomposed farm yard manure for fifteen days. Fungicidal seed treatment Since as only small quantity of fungicide to be used for seed treatment (found promising in-vitro), the seeds were mixed and coated with Carbendazim 50 WP @ 0.1 % for 30 minutes. The treated seeds were air dried in shade and then sown. Sowing and inter-culture operations The various treated seeds of cotton cultivar “Jai BG-II” were sown in plots (sized 1.8x1.8m) at spacing (60 x 60cm) keeping three replications for each treatment. Agronomic practices or inter-culture operations (viz., recommended dose of NPK, weeding, hoeing) as follows as prescribed. Observations The numbers of total germinated seedlings were recorded 10 days after sowing. The numbers of root rot (post-emergence mortality) infected plants were recorded from germination to 90 days after sowing (viz., 45, 60 and 90 DAS, respectively).
Per cent plant mortality =
Number of diseased plant / dead plant X 100
Total number of plant observed
Findings Per cent germination The fungicide and biocontrol agent which was found most effective in in-vitro study, were further tested in the field for the suppression of root rot of cotton in alone as well as in various combinations.The results thus obtained are presented in (Table-1). The data reveals that maximum 73.0 per cent seed germination was recorded in treatment combination of [Carbendazim (ST) + (T. viride + neem cake) (SA)], followed by [Carbendazim (ST) + T. viride (SA) with 70.0 per cent germination, while application of [Carbendazim (ST) + Neem cake (SA)] was found at par with [T. viride (ST) + Neem cake (SA)] with 67.0 per cent seed germination, whereas alone application of Carbendazim (ST) showed 64 per cent seed germination, followed by soil application of neem cake 60.0 and T. viride (ST) 57.1 per cent. The lowest per cent germination 55.5 per cent was recorded in control plot (Table-1).
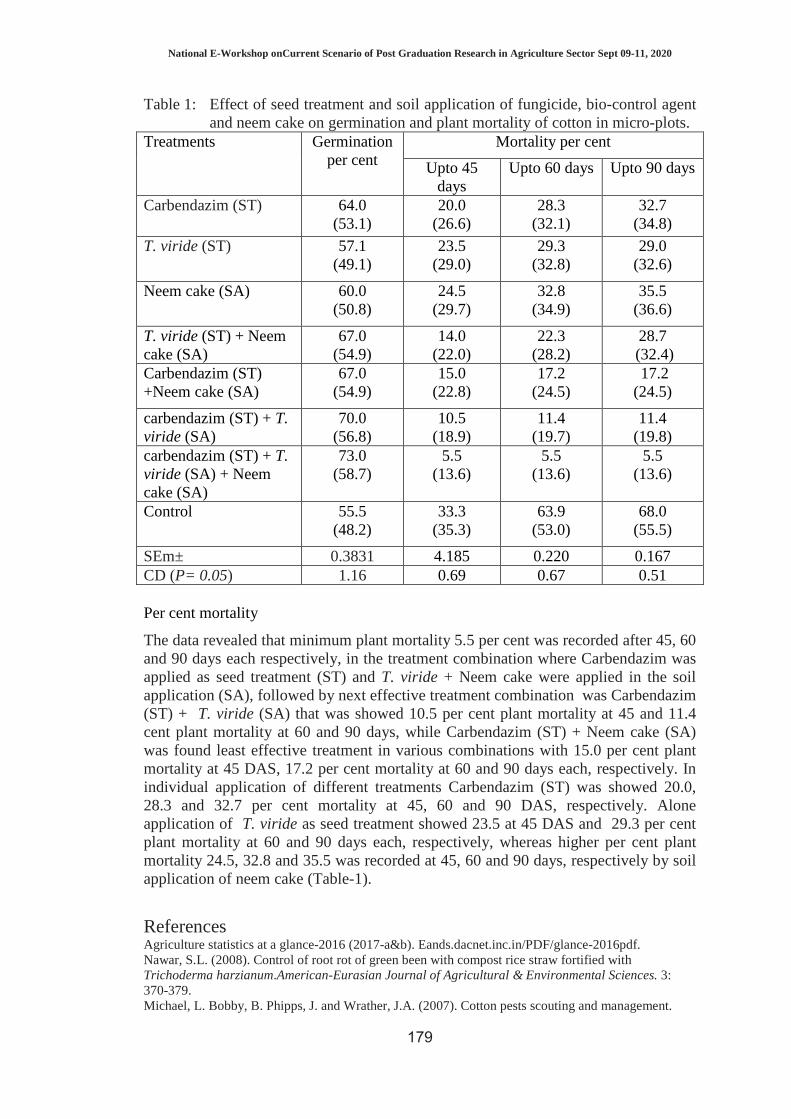
National E-Workshop onCurrent Scenario of Post Graduation Research in Agriculture Sector Sept 09-11, 2020
179
Table 1: Effect of seed treatment and soil application of fungicide, bio-control agent and neem cake on germination and plant mortality of cotton in micro-plots.
Treatments Germination per cent
Mortality per cent
Upto 45 days
Upto 60 days Upto 90 days
Carbendazim (ST) 64.0 (53.1)
20.0 (26.6)
28.3 (32.1)
32.7 (34.8)
T. viride (ST) 57.1 (49.1)
23.5 (29.0)
29.3 (32.8)
29.0 (32.6)
Neem cake (SA) 60.0 (50.8)
24.5 (29.7)
32.8 (34.9)
35.5 (36.6)
T. viride (ST) + Neem cake (SA)
67.0 (54.9)
14.0 (22.0)
22.3 (28.2)
28.7 (32.4)
Carbendazim (ST) +Neem cake (SA)
67.0 (54.9)
15.0 (22.8)
17.2 (24.5)
17.2 (24.5)
carbendazim (ST) + T. viride (SA)
70.0 (56.8)
10.5 (18.9)
11.4 (19.7)
11.4 (19.8)
carbendazim (ST) + T. viride (SA) + Neem cake (SA)
73.0 (58.7)
5.5 (13.6)
5.5 (13.6)
5.5 (13.6)
Control 55.5 (48.2)
33.3 (35.3)
63.9 (53.0)
68.0 (55.5)
SEm± 0.3831 4.185 0.220 0.167 CD (P= 0.05) 1.16 0.69 0.67 0.51 Per cent mortality
The data revealed that minimum plant mortality 5.5 per cent was recorded after 45, 60 and 90 days each respectively, in the treatment combination where Carbendazim was applied as seed treatment (ST) and T. viride + Neem cake were applied in the soil application (SA), followed by next effective treatment combination was Carbendazim (ST) + T. viride (SA) that was showed 10.5 per cent plant mortality at 45 and 11.4 cent plant mortality at 60 and 90 days, while Carbendazim (ST) + Neem cake (SA) was found least effective treatment in various combinations with 15.0 per cent plant mortality at 45 DAS, 17.2 per cent mortality at 60 and 90 days each, respectively. In individual application of different treatments Carbendazim (ST) was showed 20.0, 28.3 and 32.7 per cent mortality at 45, 60 and 90 DAS, respectively. Alone application of T. viride as seed treatment showed 23.5 at 45 DAS and 29.3 per cent plant mortality at 60 and 90 days each, respectively, whereas higher per cent plant mortality 24.5, 32.8 and 35.5 was recorded at 45, 60 and 90 days, respectively by soil application of neem cake (Table-1).
References Agriculture statistics at a glance-2016 (2017-a&b). Eands.dacnet.inc.in/PDF/glance-2016pdf. Nawar, S.L. (2008). Control of root rot of green been with compost rice straw fortified with Trichoderma harzianum.American-Eurasian Journal of Agricultural & Environmental Sciences. 3: 370-379. Michael, L. Bobby, B. Phipps, J. and Wrather, J.A. (2007). Cotton pests scouting and management.

National E-Workshop onCurrent Scenario of Post Graduation Research in Agriculture Sector Sept 09-11, 2020
180
http://extension. Missouri.edu/explore/agguides/pests/ipm. Koenning, S. (2008). Cotton seedling diseases. http://WWW.ces.ncsu.Edu/deptd/ pp/note/cotton.USA. Garcia, G.V. Onco, M.A.P and Susan, V.R. (2006). Review: biology and systematic of the formgenus Rhizoctonia. Spanish Journal of Aricultural Research. 4:55-79. Singh, R. and Verma, J.P. (1988). Disease of cotton in India and their management. Rev. Tropical Plant Pathology.5: 207-54. Monga, D. and Sheoraj. (1994). Progress of root rot in American (Gossypium hirsutum) and desi (G. arboretum) cotton varieties in northern region. National symposium on “currents trends in the management of plant disease” held at CCS HAU, Hisar in nov. 10-11. Haq, I. Khan, S.M. and Ahmed, R. (1999). Physiological studies on six fungal isolates from rotted roots of cotton. Pakisthan Journal of Phytopathology. 11: 173-177. Heydary, A. Fattahi, H. Zamanizadeh, H. R. Hassanzadeh, N. (2005). Investigation on the possibility of using bacterial antagonists for biological control of cotton seedling damping-off in green house. Applied Entomology and Phytopathology. 72: 51-69.

National E-Workshop onCurrent Scenario of Post Graduation Research in Agriculture Sector Sept 09-11, 2020
181
NOVEL MANAGEMENT APPROACHES FOR EARLY BLIGHT OF TOMATO AND BIOCHEMICAL EVALUATION FOR HOST
RESISTANCE 1Surbhi Garg and 2 Data Ram Kumhar
1Ph.D Plant Pathology, MPUAT, Udaipur 2Department of Plant Pathology, SKRAU, Bikaner
Email:[email protected]
Introduction
Early blight of tomato caused by Deuteromycetes fungus Alternaria solani causing great loss worldwide as it leads to loss both at pre as well as post harvest stage that leads to deduction of 35 to 78 % in yield. Disease appears on leaves, stems, petiole, twig and fruits resulting in defoliation, drying off of twigs and premature fruit drop. Symptoms appear as brown to dark leathery necrotic spots that appear first on the leaflets and oval or angular shaped spots of 0.3 to 0.4 cm diameter with usually narrow chlorotic zone around the spot. As the spots mature, concentric rings of raised and depressed brown tissue are evident. The fungus survives in the crop debris in or on the soil; disease is favoured by high humidity, dew and rainfall. The spores are disseminated by water, wind, insects and other means includes man and machinery. This disease is more severe in June to July sown crop than in the winter crop. Infection accompanied by the production of toxins by A. solani, including some non-host specific toxins called alternaric acid, zinniol, altersolanol and macrosporin. Therefore, keeping in view these aspects, trial was conducted at agriculture farm SKRAU, Bikaner to devise integrated approach for managing the diseases is reviewed, that consists use of novel fungicides, seed treatment, resistant source, antagonists, plant extract and host resistance induction that not only effective in managing the disease but also economic and ecofriendly. Experiment was carried out
with following objectives
1. To isolate and prove the pathogenicity of Alternaria solani. 2. To evaluate the efficacy of different plant extracts & bio-agents against Alternaria
solani in vitro. 3. To study the bio-chemicals changes in host plants of tomato. 4. To manage the early leaf spot of tomato by using novel fungicides & cow by
products in vivo and in vitro.
Findings
The pathogen A. solani was isolated and purified from tomato leaves showing typical concentric rings on fruits and on leaves that is a typical symptom of Alternaria. Successful pathogenicity test of the fungus on tomato was proved by Koch postulates by inoculating the spore and mycelial suspension.

National E-Workshop onCurrent Scenario of Post Graduation Research in Agriculture Sector Sept 09-11, 2020
182
Efficacy of ten plant extracts viz. Datura stramonium (Datura), Allium sativum (Garlic), Allium cepa (onion), Azadirachta indica (Neem),NSKE, Calotropis procera (Aak), Eucalyptus globules (Eucalyptus), Citrullus colocynthis (Tumba), Tinospora cordifolia (Giloy), Curcuma longa (Turmeric) were evaluated against A. solani with different concentrations. Inhibitory effect increases with increase in concentration. At 15% concentration, Datura was most effective followed by NSKE and Neem leaf extract whereas minimum effectiveness was observed by Turmeric.
Efficacy of bioagents viz. T. harzianum, T. viride, Bacillus subtilis and Pseudomonas fluorescens were evaluated against Alternaria solani that all the bio-control agents were significantly superior in inhibiting the mycelial growth of test fungus over the control. Maximum mycelial inhibition was recorded by T. harzianum and minimum inhibition was by Bacillus subtilis.
Biochemical analysis of total soluble sugars, reducing and non reducing sugars, phenol content, chlorophyll content and total soluble protein were compared between healthy and infected plants. There was decrease in amount of total soluble sugars, reducing and non reducing sugars, chlorophyll content in infected plants whereas significant increase in protein content and phenol content in infected plants were recorded.
Inhibition effect of eight fungicides viz., Propiconazole 25%EC, Copper oxychloride 50%WP, Chlorothalonil 75%WP, Mancozeb 50%WP, Mancozeb 64% +Thiophenate methyl 12%, Thiophenate methyl 15% + Copper oxychloride 40%WP, Carbendazin 25%+ Iprodione 25%, Carbendazin 12%+ Mancozeb 63 % were tested against A. solaniin vitro. Inhibition effect increases with increase in concentration. At 250 ppm Propiconazole 25%EC followed by Mancozeb 50%WP, Carbendazin 12%+ Mancozeb 63 % and Thiophenate methyl 15% + Copper oxychloride 40%WP were highly effective.
Efficacy of cow by products viz., cow urine, cow dung and butter milk were evaluated against A. solani. Inhibition effect increases with increase in concentration. At 20% concentration cow urine was most effective followed by cow dung and butter milk.
Under in vivo condition, the efficacy of eight fungicides viz., Propiconazole 25%EC, Copper oxychloride 50%WP, Chlorothalonil 75%WP, Mancozeb 50%WP, Mancozeb 64% + Thiophenate methyl 12%, Thiophenate methyl 15% + Copper oxychloride 40WP, Carbendazin 25%+ Iprodione 25%, Carbendazin 12% + Mancozeb 63 % and cow by products were tested against A. solani and parameters such as disease intensity and fruit yield were calculated. All the fungicides and cow by products were found to be significantly superior over control Propiconazole 25%EC (0.2%) was found highly effective as it gave minimum disease intensity and maximum fruit yield followed by Mancozeb 64% + Thiophenate methyl 12%, Thiophenate methyl 15% + Copper oxychloride 40%WP. It can also be stated that combi product of fungicides were more effective than individual fungicide. Among Cow by products, cow urine was most effective followed by cow dung and butter milk @ 10 per cent concentration.

National E-Workshop onCurrent Scenario of Post Graduation Research in Agriculture Sector Sept 09-11, 2020
183
Inference Maximum percent inhibition was shown by Datura followed by NSKE and Neem leaf extract among all tested plant extracts and Trichoderma harzianum was most effective among tested bioagents against A. solani in vitro.There was decrease in amount of total soluble sugars, reducing and non reducing sugars, chlorophyll content in infected plants whereas increase in protein content and phenol content in infected plants.
Propiconazole 25%EC @ 250 ppm was most effective followed by Mancozeb 50%WP, Carbendazin 12%+ Mancozeb 63 % and Thiophenate methyl 15% + Copper oxychloride 40%WP over control in vitro among tested fungicides.20% concentration of cow urine was most effective followed by cow dung and butter milk in vitro.Propiconazole 25%EC @ 0.2% as a foliar application gave minimum disease intensity and maximum fruit yield; hence most effective followed by Mancozeb 64% + Thiophenate methyl 12%, Thiophenate methyl 15% + Copper oxychloride 40%WP over control in vitro.
Combined effect of seed treatment and foliar application of cow urine @ 10% concentration was most effective followed by cow dung and butter milk in vivo.By this experiment we have highlighted differentmanagement strategies which are effective in controlling the disease such as plant extracts, bio agents, cow by products and novel fungicides compared as single and mixture effects. Biochemical analysis was done to determine factors affecting host resistance and induce defense response against pathogen. However, more research is required before these strategies will be viable option.

National E-Workshop onCurrent Scenario of Post Graduation Research in Agriculture Sector Sept 09-11, 2020
184
MANAGEMENT OF ALTERNARIA LEAF SPOT OF LEHSUATHROUGH PLANT EXTRACTS AND FUNGICIDES
Sushila Choudhary and Dr. RP Ghasolia Division of Plant Pathology, RARI, Durgapura (SKNAU, Jobner, Jaipur, Rajasthan)
Mail : [email protected]
Introduction Lehsua (CordiamyxaRoxb.), also known as Lasoda, Gunda and Indian cherry, is a major fruit of the family Boraginaceae. It is native of North-western India and distributed throughout the country in arid and semi arid regions especially in warmer regions up to 5,000 ft. It is a perennial, medium size tree with crooked stem attaining a height of nearly 3 to 4 meter and the total height of the tree comes to nearly 10 to 15 meter. Fruits of lehsua contain a good amount of protein (2%), carbohydrate (92%), fat (2%) and also a good source of vitamins, calcium and minerals (Duhanet al., 1992 and Chandra et al., 1994). Lehsua is affected by foliar and post harvest diseases, which are responsible for their qualitative and quantitative deterioration. The symptoms of the disease initially were observed as brown or black coloured spots of indefinite size appearing on leaves with light brown or dark brown rings and prominent bright yellow halo. Affected leaves further blighted and fall down (Mauryaet al., 2016).The intensity of Alternaria leaf spot (Alternaria alternata) has been recorded in the range of 2.00-22.00 per cent in surveyed areas of Rajasthan (Anonymous, 2017b and 2018). Therefore, it was decided to control the disease through plant extracts and fungicides for improving quality and quantity of the produce.
Methodology
Efficacy of plant extracts (in vitro) The present investigation was carried out using five natural phyto-extracts viz. neem (Azadirachta indica), ginger (Zingiber officinale), garlic (Allium sativum), Alstonia
(Alstonia scholaris) and datura(Datura stramonium) to see their antimycoticbehaviour
on the growth of Alternaria alternate on PDA following Poisoned Food Technique (Schmitzs,1930) at 5 and 10 per cent concentrations.Each plate was inoculated with 5 mm disc of mycelial bit taken with the help of sterilized cork borer from the periphery of 7 days old culture of A. alternata growing on PDA. The inoculated petridishes were incubated at 25+1ºC. Four petridishes were used for each treatment serving as four replications. A control was also maintained where medium was not supplemented with any plant extract. The experiment was conducted in completely Randomized Design (CRD). Colony diameter (two diagonals) was measured at 7thday of
National E-Workshop onCurrent Scenario of Post Graduation Research in Agriculture Sector Sept 09-11, 2020
185
incubation. Per cent growth inhibition was calculated by Vincent’s (1947) formula as follows:
C - T Per cent growth inhibition = ------------- x 100
C Where,
C = diameter of the colony in check (average of both diagonals)
T = diameter of colony in treatment (average of both diagonals)
Efficacy of plant extracts (in vivo) Extracts (10%) of above five plants, were also tested in orchard by spraying twice at an interval of 20 days with four replications. First foliar spray of plant extracts was applied at the time of disease initiation (3rdweek of May). Per cent disease intensity (PDI) was recorded 20 days after of last spray as follows:
PDI = Sum of all numerical ratings
x 100 Total number of leaves observed x Maximum disease grade
Efficacy of fungicides (in vitro) Efficacy of five systemic and non-systemic fungicides viz., tebuconazole + trifloxystrobin (Nativo), mancozeb (Indofil M 45), hexaconazole (Avone Plus) copper oxychloride (Blitox 50) and carbendazim + mancozeb (Companion) was assessed against mycelial growth of A. alternata by Poisoned Food Technique (Schmitzs,1930). Three different concentrations viz., 100, 300 and 500 ppm of each fungicide was tested. Efficacy of fungicides (in vivo) Abovefive systemic and non-systemic fungicides were also tested in orchard by spraying twice at an interval of 20 days with four replications. PDI was recorded 20 days after of last spray.

National E-Workshop onCurrent Scenario of Post Graduation Research in Agriculture Sector Sept 09-11, 2020
186
Findings
Plant extracts
Plant extracts is of much significance in view of hazards caused by toxic chemicals or
in a situation where pathogens develop resistance to fungi toxicants.Among five plant
extracts, extract of garlic cloves was found most effective in inhibiting mycelial
growth (83.33%) of Alternaria alternata at 10 per cent concentration, followed by
neem leaves (79.03%) and ginger (74.08%) over control. Extracts of datura (52.44%)
and Alstonia (42.41%) were found least effective in inhibiting mycelial growth of
Alternria alternate over control. All the concentrations (5 and 10%) of all the tested
plant extracts were found significantly superior with each other.
Table 1: Fungitoxicity of plant extracts against Alternaria alternata by poisoned food
technique at 7th day of incubation at 25 + 1 0C
Common name of plant
Part used Per cent inhibition of mycelial growth at different concentrations*
Mean
5 % 10 % Garlic Clove 75.55 83.33 79.44 (60.37) (65.90) (63.04) Neem Leaf 71.25 79.03 75.14 (57.58) (62.75) (60.09) Ginger Rhizome 56.25 74.08 65.16 (48.59) (59.39) (53.83) Datura Leaf 43.66 52.44 48.05 (41.36) (46.40) (43.88) Alstonia Leaf 31.41 42.41 36.91 (34.09) (40.63) (37.41) Control - 0.00 0.00 - (0.00) (0.00) - SEm+ CD (p = 0.05)
P 0.35 1.01 Con. 0.20 0.58 P x Con. 0.57 1.64
*Average of four replications. Figures given in parentheses are angular transformed
A perusal of data (Table 2) revealed that minimum disease intensity (11.17%) was
recorded with garlic cloves extract (10%) by applying twice at 20 days interval
followed by neem leaf extract (12.52%) at 20 days after second spray and statistically
found at par with each other. Leaf extract (10%) of Alstonia was found least effective
in reducing disease intensity (28.10%) over control. Two sprays of garlic extract

National E-Workshop onCurrent Scenario of Post Graduation Research in Agriculture Sector Sept 09-11, 2020
187
(10%) at an interval of 20 days were found promising in reducing disease intensity in
orchard of lehsua followed by neem leaves extract.
Table 2: Efficacy of plant extracts against Alternaria leaf spot of lehsua (in vivo)
Common name of plant
Dose
(%)
Per cent disease intensity*
Per cent disease reduction over control
Garlic 10 11.17 51.85 (19.52) Neem 10 12.52 46.03 (20.72)
Ginger 10 13.90 40.09 (21.89) Datura 10 14.82 36.12 (22.64) Alstonia 10 16.68 28.10 (24.11) Control - 23.20 - (28.79) SEm+ 0.47 CD (p=0.05) 1.42 * Average of four replications. Figures given in parentheses are angular transformed
Fungicides
The importance of chemicals cannot be denied in disease management. In lieu of this,
the efficacy of five fungicides (Table 3) was tested in vitro at three concentrations viz.
100, 300 and 500 ppm against A. alternate, among themtebuconazole +
trifloxystrobin was found most effective in inhibiting mycelial growth (96.20, 100 and
100%) at 100, 300 and 500 ppm, respectively followed by hexaconazole (91.14, 95.56
and 98.61%) over control. Fungicides, carbendazim + mancozeb (68.75, 77.00 and
87.17%), copper oxychloride (66.69, 78.81 and 88.64%) and mancozeb (64.33, 75.67
and 84.75%) were found least effective in inhibiting mycelial growth over control. All
the concentrations (100, 300 and 500 ppm) of tested fungicides were found
significantly superior with each other except tebuconazole +trifloxystrobin at 300 and
500 ppm.

National E-Workshop onCurrent Scenario of Post Graduation Research in Agriculture Sector Sept 09-11, 2020
188
Table 3: Efficacy of fungicides on mycelial growth of Alternaria alternata at 7th day
of incubation at 25 + 1 0C( in vitro)
Fungicide Per cent growth inhibition at various concentration (ppm)*
Mean
100 300 500 Mancozeb 64.33 75.67 84.75 74.92 (53.33) (60.45) (67.01) (59.94) Copper oxychloride 66.69 78.81 88.64 78.05 (54.75) (62.59) (70.30) (62.06) Carbendazim + Mancozeb 68.75 77.00 87.17 77.64 (56.01) (61.34) (69.01) (61.78) Hexaconazole 91.14 95.56 98.61 95.10 (72.68) (77.84) (83.23) (77.22) Tebuconazole + Trifloxystrobin 96.20 100.00 100.00 98.73 (78.76) (90.00) (90.00) (83.54) Control 0.00 0.00 0.00 (0.00) (0.00) (0.00) SEm+ CD(p=0.05)
F 0.61 1.73 C 0.43 1.22 FxC 1.22 3.46
*Average of 4 replications, Figures given in parentheses are angular transformed
The results depicted in (Table 4) revealed that two sprays of all the fungicides at an
interval of 20 days were found significantly superior over control in reducing disease
intensity after 20 days of last spray. Minimum per cent disease intensity (4.27%) was
recorded with tebuconazole + trifloxystrobin(0.1%) followed by hexaconazole
(5.55%) and found at par with each other. Maximum disease control over check was
also recorded with tebuconazole + trifloxystrobin(80.44%) followed by hexaconazole
(74.58%) over control at 20th day of last spray.Among these fungicides, the least
effective in reducing per cent disease intensity was mancozeb (60.10%) followed by
copper oxychloride (66.24%).
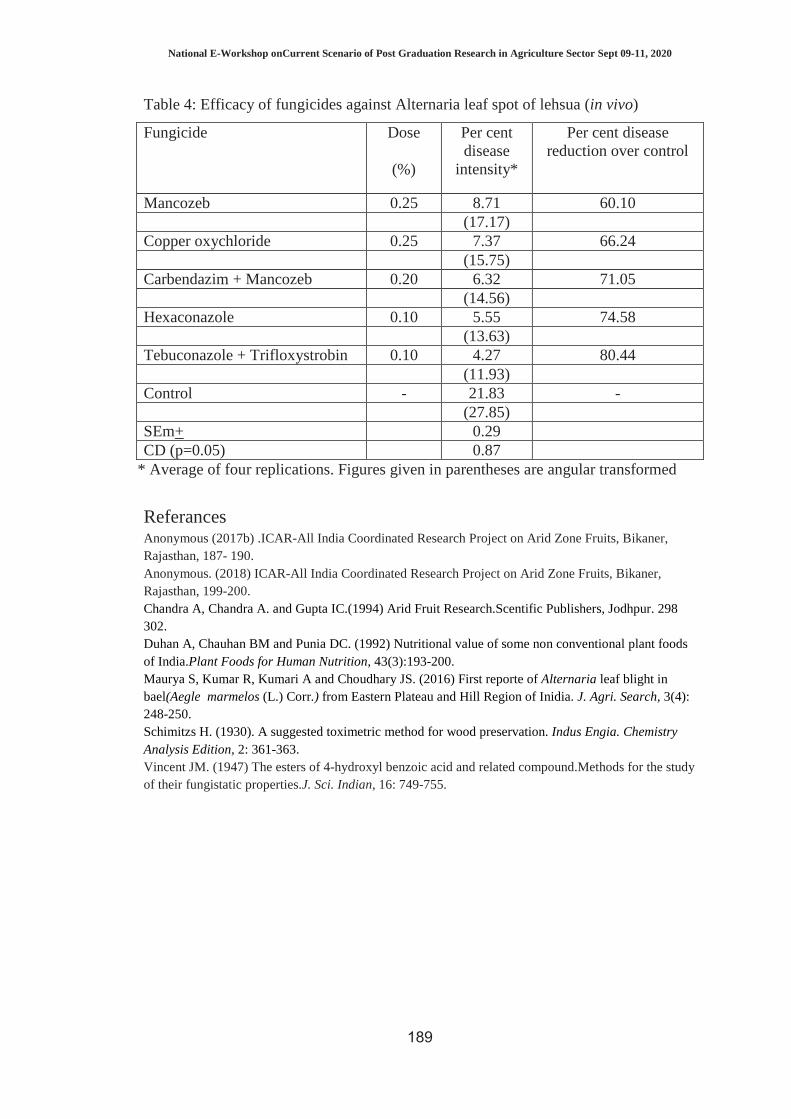
National E-Workshop onCurrent Scenario of Post Graduation Research in Agriculture Sector Sept 09-11, 2020
189
Table 4: Efficacy of fungicides against Alternaria leaf spot of lehsua (in vivo)
Fungicide Dose
(%)
Per cent disease
intensity*
Per cent disease reduction over control
Mancozeb 0.25 8.71 60.10 (17.17) Copper oxychloride 0.25 7.37 66.24 (15.75) Carbendazim + Mancozeb 0.20 6.32 71.05 (14.56) Hexaconazole 0.10 5.55 74.58 (13.63) Tebuconazole + Trifloxystrobin 0.10 4.27 80.44 (11.93) Control - 21.83 - (27.85) SEm+ 0.29 CD (p=0.05) 0.87
* Average of four replications. Figures given in parentheses are angular transformed
Referances Anonymous (2017b) .ICAR-All India Coordinated Research Project on Arid Zone Fruits, Bikaner, Rajasthan, 187- 190. Anonymous. (2018) ICAR-All India Coordinated Research Project on Arid Zone Fruits, Bikaner, Rajasthan, 199-200. Chandra A, Chandra A. and Gupta IC.(1994) Arid Fruit Research.Scentific Publishers, Jodhpur. 298 302. Duhan A, Chauhan BM and Punia DC. (1992) Nutritional value of some non conventional plant foods of India.Plant Foods for Human Nutrition, 43(3):193-200. Maurya S, Kumar R, Kumari A and Choudhary JS. (2016) First reporte of Alternaria leaf blight in bael(Aegle marmelos (L.) Corr.) from Eastern Plateau and Hill Region of Inidia. J. Agri. Search, 3(4): 248-250. Schimitzs H. (1930). A suggested toximetric method for wood preservation. Indus Engia. Chemistry Analysis Edition, 2: 361-363. Vincent JM. (1947) The esters of 4-hydroxyl benzoic acid and related compound.Methods for the study of their fungistatic properties.J. Sci. Indian, 16: 749-755.

National E-Workshop onCurrent Scenario of Post Graduation Research in Agriculture Sector Sept 09-11, 2020
190
EFFICACY OF VARIOUS BIOAGENTS AGAINST FUSARIUM
OXYSPORUM F. SP. LYCOPERSICI, CAUSING WILT OF
TOMATO
Gadhave AD, Patil PD1 and Giri VV
Department of Plant Pathology, College of Agriculture, Dapoli. 1Regional Agricultural, Research station, Karjat, Dist- Raigad,
Dr. Balasaheb Sawant Konkan Krishi Vidyapeeth, Dapoli – 415 712 (M.S.) [email protected]
Tomato (Lycopersicon esculentum Mill.) is one of the most important vegetable crops. This vegetable crop suffers from various diseases that significantly affect its growth and yield. A number of economically important tomato diseases caused by fungi are transmitted by seed or transplants. A diseases, causing heavy losses ranging from 20-80 per cent. Keeping in mind economic importance of tomato and losses incurred by Fusarium oxysporum f. sp. lycopersici, present studies was conducted at the Department Of Plant Pathology, College Of Agriculture, Dr. Balasaheb Sawant Konkan Krishi Vidyapeeth, Dapoli.Biological control of Fusarium oxysporum f. sp. lycopersici (FOL) causing wilt disease of tomato was studied in vitro as well as under pot conditions. The present study was carried out in vitro conditions to assess the possible use of biocontrol agentsViz.,Trichoderma harzianum, Trichoderma viride,Trichoderma virens,Trichoderma koningii, Trichoderma hamatum and Pseudomonas fluorescens were evaluated for their antagonistic activity against F. oxysporum f. sp. lycopersici, under in vitro conditions. Different biocontrol agents showed varying degrees of antagonism. The test biocontrol agents significantly inhibited mycelial growth of F. oxysporum f. sp. lycopersici, over untreated control. However, T. harzianum was found most effective with significantly least mycelial growth (42.90 mm) and it’s highest inhibition (52.33%), followed by T. virens (45.53 mm and 49.41%, respectively), T. koningii (53.50 mm and 40.55%, respectively.), T. viride (60.83 mm and 32.41%, respectively), T. hamatum (64.67 mm and 28.14%respectively), P. fluorescens (70.50 mm and 21.66%, respectively).

National E-Workshop onCurrent Scenario of Post Graduation Research in Agriculture Sector Sept 09-11, 2020
191
MORPHOLOGICAL AND BIOCHEMICAL CHARACTERISTICS OF R. SOLANACEARUM CAUSING BACTERIAL WILT OF POTATO
Phondekar UR, Bhagwat RG1 and Rathod RR
Department of Plant Pathology, College of Agriculture, Dapoli. 1Central Experiment Station, Wakavali, Dist- Ratnagiri
Dr. Balasaheb Sawant Konkan Krishi Vidyapeeth, Dapoli – 415 712 (M.S.) Email: [email protected]
The Potato (Solanum tuberosum L.) belonging to family Solanaceae is a vitally important starchy food crop of the world, commonly known as the “Poor Man’s Friend”. The potato crop is infested by many bacterial, fungal, viral, viroidal, nematodal etc. diseases. Bacterial wilt or brown rot is caused by the pathogenic bacterium Ralstonia solanacearum (Smith)Yabuuchi. In case of potato, bacterial wilt (Ralstonia solanacearum) pathogen is seed (tuber) borne. Keeping these facts in mind,the present studyfocusing on bacterial wilt disease of potato was carried out at the Department of Plant Pathology, College of Agriculture, Dapoli. The isolation of test bacterium (R. solanacearum) was carried out by streak plate method on 2,3,5-Triphenyl Tetrazolium Chloride (TZC) agar medium by using bacterial suspension which was obtained from diseased plant stem tissue. Morphological and biochemical characterstics of R. solanacearum were studied by applying the following biochemical tests viz., Gram staining, KOH solubility test, acid production, starch hydrolysis, catalase test, production of hydrogen sulphide, motility and casein hydrolysis by following standard proceduresgiven bySchaad, 1980. The typical virulent colonies of test bacterium appeared as, dull white or creamy colour, irregularly round fluidal colonies and opaque with light pink or red center and non virulent colonies appeared as, dark red in colour. In case of morphological observations, the pathogen was gram negative, rod shaped and the size ranged between 2-3 µm. Out of different biochemical tests were carried out against test pathogen, R. solanacearum gave positive response for all the biochemical tests while negative responded for gram staining test.

National E-Workshop onCurrent Scenario of Post Graduation Research in Agriculture Sector Sept 09-11, 2020
192
MANAGEMENT OF POWDERY MILDEW OF MUSTARD CAUSED BY ERYSIPHE CRUCIFERARUM
M. H. Shete, Kirti D. Modak and Bhalerao V. K.
Department of Plant Pathology and Agricultural Microbiology, Mahatma Phule Krishi Vidyapeeth, Rahuri, Dist. Ahmednagar (M.S.)
Email: [email protected]
Epidemiological and management study was undertaken of powdery mildew of
mustard incited by Erysiphe cruciferarum and results revealed that maximum spore
germination of E.cruciferarum occurred at 25±1oC temperature after 10 hours of
incubation. Under filed condition average temperature ranges between minimum
9.24oC to maximum 28.65oCand humidity range between morning 55.42 % to
evening 30.15 % with 8.74 sunshine hours and 0.71 km/hr wind velocity was ideal
condition for development powdery mildew of mustard. Dinocap @0.1% found
effective and significantly superior in reducing the disease intensity (9.00%)of
powdery mildew of mustard whereas biocontrol agent Ampelomyces quisqualis @0.5
recorded 19.11 % disease intensity. Dinocap resulted in maximum yield (1417 kg/ha)
and found at par with Hexaconazole @ 0.1(1376.3 kg/ha) whereas Ampelomyces
quisqualis recorded 1096.6 kg/ ha yield of mustard. Highest B:C ratio was recorded in
Hexaconazole (2.77) followed by Dinocap (2.73).

National E-Workshop onCurrent Scenario of Post Graduation Research in Agriculture Sector Sept 09-11, 2020
193
POST-HARVEST MANAGEMENT

National E-Workshop onCurrent Scenario of Post Graduation Research in Agriculture Sector Sept 09-11, 2020
194
ULTRASOUND ASSISTED EXTRACTION OF PECTIN FROM SWEET LIME PEEL
1Arshi Siddiqui, 2Khan Chand and 3Dhiraj Kumar Department of Post Harvest Process and Food Engineering, College of Technology, G.B. Pant University of Agriculture and technology, Pantnagar, Uttarakhand, India
Email: [email protected] Introduction Pectin is a polysaccharide present in the cell wall and middle lamellae of many fruits and vegetable crops. Pectin is the methylated ester of polygalacturonic acid that contains α-(1, 4) galacturonic acid residues5. It is mainly used as gelling, stabilizing and thickening agent in food systems. Pectin is used as a good additive in jams, soft drinks and milk products12. It is also used as fat substitute in emulsified meat products, spreads, ice cream and salad dressing3. Pectin is considered as an effective biomaterial film due to its biodegradability, biocompatibility and non-toxicity11. Conventionally, pectin is extracted from citrus peel using hot-acidified water in several hours. However, this conventional extraction method have numerous limitations such as long processing time, high energy requirement and high solvent consumption with high amount of wastewater generation. Thus various novel techniques like microwave assisted extraction, ultrasound assisted extraction and enzyme assisted extraction were developed for the extraction process9. Among these methods, ultrasound assisted extraction is a green technique that have cavitational effect of ultrasound waves which improves the destruction of plant cell wall, by which mass transfer rate increases, which leads to the higher efficiency and quality of the recoverable pectin with a shorter extraction time7. Ultrasound assisted extraction can be a suitable alternative to conventional extraction method due to the lower consumption of solvent and energy4. This technique is widely used in food industry due to its capability to induce chemical and physical changes of food components. Also, ultrasound processing has some of the improvements on foods such as increased emulsifying capacity, release and diffusion of cell material and enhanced foaming2. Several authors already reported the extraction of pectin from various citrus fruits. However, none research report has been found on the ultrasound assisted extraction of pectin from waste sweet lime peel. Therefore, the present study was undertaken to extract pectin from sweet lime peel using ultrasound technique and optimized the process parameters by RSM approach. Methodology Raw material and reagents Sweet lime peel (10 kg, IMC 80%) was procured from the local market of Pantnagar, Uttarakhand. Peels were cleaned, washed and dried using tray drier at 60⁰C for 48 hours. The dried peel (2-3 kg) was ground using hammer mill (Make: Butex Engineering Company, Kanpur) and sieved to obtain uniform particle size of 300 microns. The obtained powder (1-2 kg) was stored in sealed plastic bags prior to

National E-Workshop onCurrent Scenario of Post Graduation Research in Agriculture Sector Sept 09-11, 2020
195
experiments. Analytical grade chemicals were utilized in the study. Citric acid was mixed in deionized water to prepare acidic medium of pH 1.8 for pectin extraction. Ultrasonication and pectin extraction The dried sweet lime peel powder (10 g) was mixed with the solvent (Citric acid) in the solid-solvent ratio (1:18, 1:24 and 1:30) in the beaker. The pectin was extracted using ultrasonicator (Electronic industries model - EI – 250, 230 VAC Single phase, 250 watts ultrasonic power) consist of 20 mm diameter probe, which directly contacted the mixture solution. The sample was treated at ultrasound power intensity (48, 64 and 80 W/cm2) and time (15, 25 and 35) combinations given in Table 1. The suspension was then filtered after ultrasonic treatment using muslin cloth and centrifuged at 8000 rpm for 15 min. Equal volume of absolute ethanol was added in the collected supernatant and was kept untouched for an hour. The coagulated pectin was then washed 2-3 times with ethanol followed by dried in hot air oven at 45°C until it attains a constant weight. The extracted sweet lime peel pectin was weighed and its yield was calculated on dry basis using the following equation10.
PectinYield(g/100g) =WeightofPectin
Weightofdrypowder× 100
Statistical experimental design In this study, Box-Behnken design of response surface methodology was employed to identify the highest yield of extraction of pectin from sweet lime peel at the different process variables such as solid-solvent ratio (1:10, 1:20 and 1:30 g/ml), ultrasound power intensity (48, 64 and 80 W/cm2) and sonication time (15, 25 and 35 min). A total of 17 experiments with 5 centre points were designed using Design Expert software 10.0.1. All the experimental data collected were subjected to regression analysis to determine the existing relationship between independent and dependent variables using Design Expert software 10.0.1. The response (pectin yield) was represented by a mathematical equation that correlates the response surface. The following second-order polynomial equation was used to fit the experimental data: Y = �� + ∑ �"#"
$"%& +∑ �""
$"%& #"
$ +∑ ∑ �""$'%"%&
$"%& #"#' (4)
Where, Y = response, β0,βi βii are regression coefficients and n = number of independent variables (n=3) X i and Xj = independent variables (where, i = 1, 2, …n and j = 1, 2 …n) The model developed was then examined for significance and lack-of-fit, and response surface graphs were plotted after removal of the non-significant terms with the same software.

National E-Workshop onCurrent Scenario of Post Graduation Research in Agriculture Sector Sept 09-11, 2020
196
Table 1.Box-Behnken design of pectin yield from sweet lime peel
Exp. No. Solid-solvent ratio
(X1, g/ml)
Ultrasound power intensity
(X2, W/cm2)
Sonication time (X3, min)
Pectin Yield (g/100g)
1 1:24 48 35 34.3
2 1:30 64 35 36.8
3 1:24 64 25 30.8
4 1:24 80 35 36.9
5 1:24 64 25 32.5
6 1:24 48 15 31.5
7 1:24 64 25 31.1
8 1:24 80 15 38.8
9 1:24 64 25 31.3
10 1:18 80 25 26.2
11 1:30 64 15 27.9
12 1:24 64 25 30.6
13 1:18 64 35 28.1
14 1:30 80 25 36.5
15 1:18 64 15 31.2
16 1:18 48 25 29.2
17 1:30 48 25 25.2
Findings Effect of processing variables on pectin yield Table 1 indicated that the pectin yield ranged between 25.2 g/100g (exp. no. 17) and 38.8 g/100g (exp. no.8). The maximum pectin yield was obtained under the experimental conditions of solid-solvent ratio of 1:24 g/ml, ultrasound power intensity at 80 W/cm2 and sonication time 15 minutes. The higher pectin yield might be because of the maximum level of ultrasound power intensity and the low pH extracting solvent used in the extraction process. UAE increases rupture of sweet lime cell wall matrix, leading to better interactions between solvent and extracted material. Thus, the pectin yield increased with the increase in ultrasound power intensity. Also, the lower acidic extraction solvent has the ability to contact the insoluble pectin directly and favored the hydrolysis of the insoluble pectin constituents into soluble pectin, thus increasing the pectin yield6. However, the minimum pectin yield was found under the experimental conditions of solid-solvent ratio of 1:30 g/ml, ultrasound power intensity at 48 W/cm2 and sonication time at 25 min. The higher solid-solvent ratio and lower ultrasound power intensity levels could potentially decrease the pectin yield. The extraction yield was affected negatively by the higher solid-solvent ratio that also complicates the recovery of pectin during the further extraction step by alcohol precipitation. Thus, further increment in solid-solvent ratio leads to decrement in pectin yield. Similar effect was observed for ultrasound assisted extraction of pectin from pomegranate peel7.

National E-Workshop onCurrent Scenario of Post Graduation Research in Agriculture Sector Sept 09-11, 2020
197
Plate 1. Extracted wet pectin in jelly form
Plate 2. Dried pectin in powder form
Statistical analysis of pectin yield BBD for the three variables in three levels was applied to optimize the pectin yield. The statistical significance of the proposed quadratic model for pectin yield was evaluated by ANOVA and the results were listed in Table 2. In this analysis, the F-value of model for the pectin yield was 32.75, which was associated with p-value of < 0.0001. Also, lack of fit value for regression model was not found significant, which indicated that the model equation was adequate to describe the pectin yield. Moreover, R2 value for pectin yield was 0.9768, which revealed that the model was adequate. Based on the results, the second order equation related to pectin yield for achieving maximum yield was expressed as follows,
PectinYield ( g100g)� 31.26 1.46#& 2.28#0 0.84#1 3.57#� 3.00# 1.17#0#1 4 3.18#&0 1.19#00 2.92#10
The sign and magnitude of the coefficients in above equation indicates the effect of the significant independent variables on the pectin yield. From the above equation, it was observed that the positive coefficient of solid-solvent ratio (X1), ultrasound power intensity (X2) and sonication time (X3) signified the increase in the pectin yield with increase in level of these parameters. However, the larger coefficient of ultrasound power intensity (X2) showed the higher effect on all the responses in comparison with other independent variables. The positive coefficient of combined effect of solid-solvent ratio and ultrasound power intensity (X1X2) and solid-solvent ratio and sonication time (X1X3) on the pectin yield suggests that pectin yield increases when high level of solid-solvent ratio was used with high level of ultrasound power intensity and when high level of solid-solvent ratio was used with high level of sonication time respectively. However, the negative coefficient of combined effect of ultrasound power intensity and sonication time (X2X3) on the pectin yield suggests that it decreases when high ultrasound power intensity was used with increased sonication time. At quadratic level, the negative coefficient of solid-solvent ratio (X1
2) showed that pectin yield decrease with increase in level of this parameter. However, at quadratic level, the positive coefficient of ultrasound power intensity (X2
2) and sonication time (X32) signified that
when its level increased the pectin yield also increased.
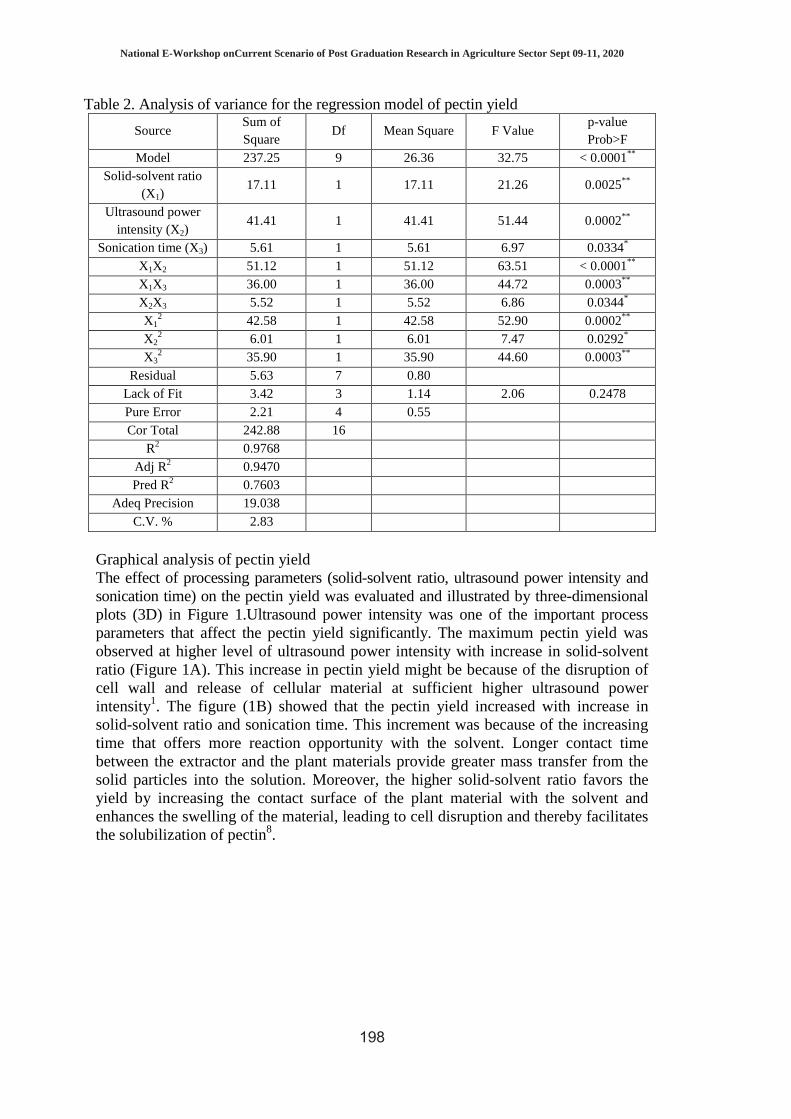
National E-Workshop onCurrent Scenario of Post Graduation Research in Agriculture Sector Sept 09-11, 2020
198
Table 2. Analysis of variance for the regression model of pectin yield
Source Sum of Square
Df Mean Square F Value p-value Prob>F
Model 237.25 9 26.36 32.75 < 0.0001**
Solid-solvent ratio (X1)
17.11 1 17.11 21.26 0.0025**
Ultrasound power intensity (X2)
41.41 1 41.41 51.44 0.0002**
Sonication time (X3) 5.61 1 5.61 6.97 0.0334* X1X2 51.12 1 51.12 63.51 < 0.0001** X1X3 36.00 1 36.00 44.72 0.0003**
X2X3 5.52 1 5.52 6.86 0.0344*
X12 42.58 1 42.58 52.90 0.0002**
X22 6.01 1 6.01 7.47 0.0292*
X32 35.90 1 35.90 44.60 0.0003**
Residual 5.63 7 0.80 Lack of Fit 3.42 3 1.14 2.06 0.2478 Pure Error 2.21 4 0.55 Cor Total 242.88 16
R2 0.9768 Adj R2 0.9470 Pred R2 0.7603
Adeq Precision 19.038 C.V. % 2.83
Graphical analysis of pectin yield The effect of processing parameters (solid-solvent ratio, ultrasound power intensity and sonication time) on the pectin yield was evaluated and illustrated by three-dimensional plots (3D) in Figure 1.Ultrasound power intensity was one of the important process parameters that affect the pectin yield significantly. The maximum pectin yield was observed at higher level of ultrasound power intensity with increase in solid-solvent ratio (Figure 1A). This increase in pectin yield might be because of the disruption of cell wall and release of cellular material at sufficient higher ultrasound power intensity1. The figure (1B) showed that the pectin yield increased with increase in solid-solvent ratio and sonication time. This increment was because of the increasing time that offers more reaction opportunity with the solvent. Longer contact time between the extractor and the plant materials provide greater mass transfer from the solid particles into the solution. Moreover, the higher solid-solvent ratio favors the yield by increasing the contact surface of the plant material with the solvent and enhances the swelling of the material, leading to cell disruption and thereby facilitates the solubilization of pectin8.
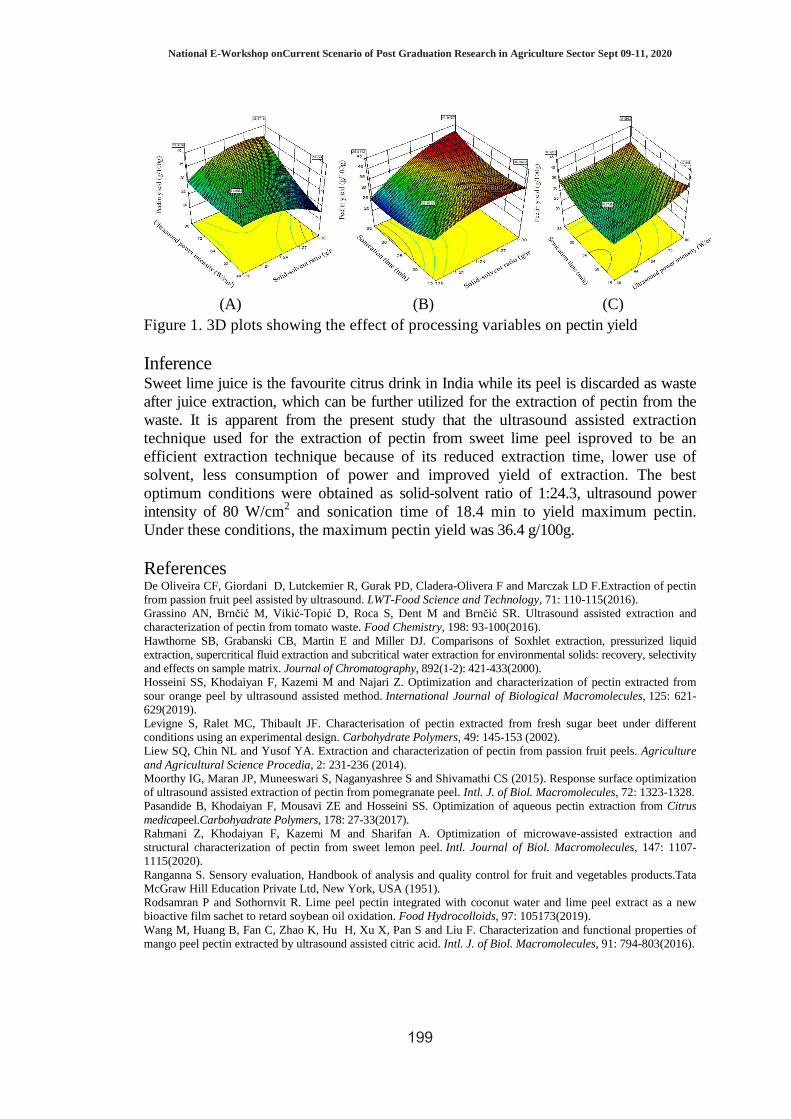
National E-Workshop onCurrent Scenario of Post Graduation Research in Agriculture Sector Sept 09-11, 2020
199
(A) (B) (C) Figure 1. 3D plots showing the effect of processing variables on pectin yield Inference Sweet lime juice is the favourite citrus drink in India while its peel is discarded as waste after juice extraction, which can be further utilized for the extraction of pectin from the waste. It is apparent from the present study that the ultrasound assisted extraction technique used for the extraction of pectin from sweet lime peel isproved to be an efficient extraction technique because of its reduced extraction time, lower use of solvent, less consumption of power and improved yield of extraction. The best optimum conditions were obtained as solid-solvent ratio of 1:24.3, ultrasound power intensity of 80 W/cm2 and sonication time of 18.4 min to yield maximum pectin. Under these conditions, the maximum pectin yield was 36.4 g/100g. References De Oliveira CF, Giordani D, Lutckemier R, Gurak PD, Cladera-Olivera F and Marczak LD F.Extraction of pectin from passion fruit peel assisted by ultrasound. LWT-Food Science and Technology, 71: 110-115(2016). Grassino AN, Brnčić M, Viki ć-Topić D, Roca S, Dent M and Brnčić SR. Ultrasound assisted extraction and characterization of pectin from tomato waste. Food Chemistry, 198: 93-100(2016). Hawthorne SB, Grabanski CB, Martin E and Miller DJ. Comparisons of Soxhlet extraction, pressurized liquid extraction, supercritical fluid extraction and subcritical water extraction for environmental solids: recovery, selectivity and effects on sample matrix. Journal of Chromatography, 892(1-2): 421-433(2000). Hosseini SS, Khodaiyan F, Kazemi M and Najari Z. Optimization and characterization of pectin extracted from sour orange peel by ultrasound assisted method. International Journal of Biological Macromolecules, 125: 621-629(2019). Levigne S, Ralet MC, Thibault JF. Characterisation of pectin extracted from fresh sugar beet under different conditions using an experimental design. Carbohydrate Polymers, 49: 145-153 (2002). Liew SQ, Chin NL and Yusof YA. Extraction and characterization of pectin from passion fruit peels. Agriculture and Agricultural Science Procedia, 2: 231-236 (2014). Moorthy IG, Maran JP, Muneeswari S, Naganyashree S and Shivamathi CS (2015). Response surface optimization of ultrasound assisted extraction of pectin from pomegranate peel. Intl. J. of Biol. Macromolecules, 72: 1323-1328. Pasandide B, Khodaiyan F, Mousavi ZE and Hosseini SS. Optimization of aqueous pectin extraction from Citrus medicapeel.Carbohyadrate Polymers, 178: 27-33(2017). Rahmani Z, Khodaiyan F, Kazemi M and Sharifan A. Optimization of microwave-assisted extraction and structural characterization of pectin from sweet lemon peel. Intl. Journal of Biol. Macromolecules, 147: 1107-1115(2020). Ranganna S. Sensory evaluation, Handbook of analysis and quality control for fruit and vegetables products.Tata McGraw Hill Education Private Ltd, New York, USA (1951). Rodsamran P and Sothornvit R. Lime peel pectin integrated with coconut water and lime peel extract as a new bioactive film sachet to retard soybean oil oxidation. Food Hydrocolloids, 97: 105173(2019). Wang M, Huang B, Fan C, Zhao K, Hu H, Xu X, Pan S and Liu F. Characterization and functional properties of mango peel pectin extracted by ultrasound assisted citric acid. Intl. J. of Biol. Macromolecules, 91: 794-803(2016).
National E-Workshop onCurrent Scenario of Post Graduation Research in Agriculture Sector Sept 09-11, 2020
200
INFLUENCE OF STORAGE CONDITION ON DRY FLOWERS OF SPRAY CHRYSANTHEMUM (Chrysanthemum morifoliumRamat.)
CULTIVARS
M. Jangyukala, LaishramHemanta, M Preema Devi1and Nini R. Kuotsu
Department of Horticulture, School of Agricultural Sciences and Rural Development, Nagaland University, Medziphema -797106
1Department of Pomology and Post Harvest Technology, UBKV, Pundibari, Cooch Behar, West Bengal
Email.ID: [email protected] Introduction With advancement in the field of science, scientists have found ways to preserve the beauty of flowers for a longer period of time. Dehydration technology helps in maintaining original colour and shape of flowers for long term utilization with a little care (Singh, 2018). Presently, among all the horticultural produce, Indian floricultural industry has more than 70% share in the export of dry flowers and its value added products. Export of dried flowers and plants from India is more than 100 crore per year. The Indian industry risks losing its competitiveness to suppliers of other origin for lack of reliable processing technologies. To strengthen the dry flower industry, more research is required as to promote and uplift the industry (Dattatray, 2017). There is need to produce high quality dry flowers from commercially available flowers apart from the forest resources to encourage systematic growing and availability of specialized flowers. Dried chrysanthemum flowers are in considerable demand in the global trade (Wilson et al., 2013). Various cultivars of chrysanthemum flower come in wide range of shade and size. Drying the flowers will enhance the growers to gain more value from their products. The life of dried flowers varies with different flowers according to the species, texture of their petals and total consistency of flowers (Vishnupant, 2017). Dried flowers are stored and evaluated for retention in colour, shape and overall quality. The colour and shape of the dried flowers determine their quality and the market value. Storage condition must favour the dried flower quality as storage life also plays an important role in determining the favourable conditions in order to prolong their shelf life while keeping their structural features intact. Hence, the present investigation was undertaken to determine which storage condition was suitable with regard to shape, colour and overall quality that ultimately add value to the dry flower products. Methodology The present investigation was conducted in the Department of Horticulture, School of Agricultural Sciences and Rural Development, Medziphema, Nagaland during the year 2017-2018 to find out suitable storage condition for spray chrysanthemum cultivars i.e. Atom Joya, Pusa Aditya and Yellow Star embedded in five embedding media viz. silica gel (Crystal, Bead and Powder), sand and saw dust in hot air oven at 40 ºC. Storage life of dried flowers was evaluated under three storage conditions viz.opened condition i.e. Glass beaker (S1) and closed conditions i.e. Plastic containers (S2) and Desiccators (S3). The storage life of the dried flowers were observed under both open and closed condition under room temperature and was evaluated by using 5-point hectonic scale score ranging from 5-fully retained, 4-moderately retained, 3-

National E-Workshop onCurrent Scenario of Post Graduation Research in Agriculture Sector Sept 09-11, 2020
201
poorly retained, 2-negligibly retained and 1-not retained. Judges were requested to evaluate the keeping quality in terms of colour retention, shape retention and overall quality once in 15 days interval for four months. Based on the score obtained from the five judges, total score and percentage for each product was calculated. Findings The colour retention of the dried flowers was observed under different storage conditions. Maximum score (2.6) in closed condition i.e. desiccators (S3), which was statistically at par (2.5) with plastic containers (S2) and minimum score (2.3) in opened condition i.e. glass beaker (S1). Scores recorded decreased from maximum (3.2) to minimum (2.0) after 120 days of storage. For the interaction, maximum score (3.3) was recorded in desiccator on the 15th day and minimum (1.9) in glass beaker on the 105th day, which was found to be statistically at par with the score (1.9) on the 120th day. A similar result, Salma (2010) in Dendrobiumorchid reported that flowers dried in silica gel and packed in closed condition retained good colour as compared to the dried flowers held with any package in opened condition. Jain et al. (2016) recommended protecting the material from direct sunlight or high light intensity in order to preserve the colour. For shape retention under different storage conditions, closed condition i.e. desiccators (S3), scored maximum (2.7), which was statistically at par (2.4) with plastic containers (S2) and opened condition i.e. glass beaker (S1) gave the minimum score (2.1). Scores recorded decreased from maximum (3.0) to minimum (1.9) after 120 days of storage. For the interaction, Maximum score (3.5) was recorded in desiccator on the 15th day and minimum (1.5) in glass beaker on the 105th day. The result was in accordance with Salma (2010) in Dendrobiumorchid dried in silica gel which retained good shape in closed condition as compared to flowers without any package (opened condition). It should be protected from moisture throughout the marketing channel as it leads to loss in shape (Jain et al. 2016). Overall quality scores for the dried flowers under different storage conditions were maximum (2.6) in closed condition i.e. desiccators (S3) and minimum (2.0) in opened condition i.e. glass beaker (S2). Scores recorded decreased from maximum (2.9) to minimum (1.9) after 120 days of storage. For the interaction, maximum score (3.1) was recorded in desiccator on the 15th day and minimum (1.7) in glass beaker on the 75th day, which was found to be statistically at par with the score (1.7) on the 90th, 105th and 120th day.The result observed was in accordance with Kumari (2015) on Gomphrenaglobosa L. flowers and Sharma (2015) on chincherinchee flowers dried in silica gel where keeping quality was better when stored under covered conditions as compared to those stored under open conditions.

National E-Workshop onCurrent Scenario of Post Graduation Research in Agriculture Sector Sept 09-11, 2020
202
DEVELOPMENT OF GERMINATED WHEAT (TRITICUM AESTIVUM) FLOUR COOKIES FORTIFIED WITH PUMPKIN
(CUCURBITA SPP.) SEED AND BEET GREEN (BETA VULGARIS L.) POWDER AND ITS ORGANOLEPTIC EVALUATION
Princy Gautam and Vinita Singh
Department of Food Science and Nutrition, College of Home Science, Chandra Shekhar Azad University of Agriculture and Technology, Kanpur, (UP)
Introduction Cereal grains form a major source of dietary nutrients for all the people, particularly those in the developing countries. However, the nutritional quality of cereal grains and sensory properties of their products are inferior due to lower protein content, deficiency of certain essential amino acids, lower protein and starch availabilities, presence of certain anti-nutrients, and the coarse nature of the whole grains. Today, where women and men both are at equal level of each and every aspect, everyone wants to be fit and healthy to make their personality more effective and dynamic. But, due to busy schedule and even after having so much knowledge about healthy eating, people fail to do so and end up on consuming junk foods, processed foods, etc. which is the ultimate reason of increasing risks of constipation, obesity, diabetes, cardiovascular disease, heart disease, etc. worldwide. Constipation is the most common among all. To combat harmful life – threatening diseases, people must follow healthy eating habits. They must consume home-cooked food on a daily basis instead of junk food. People must use whole grain cereals and whole grain flour as they are packed with good amount of fiber which is necessary to maintain a healthy digestive system. But when the flour is prepared, its nutritional value reduces during processing. So, for maintaining it, the process of germination is used. Health and nutritional benefits of sprouted wheat flour include improved digestion, prevention of type 2 diabetes, helps in weight loss, reduced risk of metabolic syndrome and protection against breast cancer. Fortification of beet green was done as it contains good amount of nutrients which helps to reduce dietary deficiencies.While many people discard greens and only consume their round root portion, beet greens are actually the most versatile and nutrient-rich part of the plant and provide amazing health benefits if consumed regularly. Beet greens can also be used in the powdered form after sun drying for up to 3 months and various healthy food products can be prepared by using the powder. Combinations can also be made. Drying vegetable is a safe, and long- lasting method of preserving them. One of the greatest benefits is that the nutritional content of the dried vegetables is left relatively unchanged and can be used to meet daily intake. Beet greens aids digestion, prevents blood clotting, strengthens bones, boosts immune system and prevents night blindness. Nuts and seeds make-up part of a healthy and balanced diet. Pumpkin seeds boosts intake of several essential nutrients. While both raw and roasted pumpkin seeds offer health benefits, raw pumpkin seeds offer more nutritional value because some nutrients are destroyed during the roasting process. Pumpkin seeds are packed with full of valuable nutrients providing fats, magnesium and zinc. Health benefits of pumpkin seeds include; reduction in inflammation for arthritis, prevents kidney stone formation, improves prostate and bladder health, prevents constipation and provides restful sleep.

National E-Workshop onCurrent Scenario of Post Graduation Research in Agriculture Sector Sept 09-11, 2020
203
Methodology Procurement of raw materials Raw materials for the development of products were procured from different places. Wheat was procured from Section of Rabi Cereals, EBR department of Chandra Shekhar Azad University of Agriculture and Technology, Kanpur. Beet greens were procured from local market of Kanpur. Pumpkin seeds were procured online. Preparation of flour and powder Wheat was collected, cleaned, washed and soaked for 24 hours. After soaking, wheat seeds were kept in cloth for 48 hours for germination. After the germination process, it was kept for sun drying for 48 hours and cleaned by using sieve to remove dirt. Wheat was then ground properly in mixer for preparing flour. Beet greens were cleaned, washed thoroughly and sun-dried for 48 hours. After sun-drying, greens were cleaned by using sieve to remove dirt or any other extraneous material. Beet greens were then ground properly in an electronic mixer and beet green powder was obtained. Raw, de-shelled pumpkin seeds were ground in an electronic mixer and pumpkin seed powder was prepared. Preparation of Products The research was conducted to develop cookies because these are common among people and so, their acceptance is more as compared to that of any new product. Products were prepared in four variants (T0, T1, T2 and T3) using germinated wheat flour with the fortification of pumpkin seed and beet green powder in the ratio of 100:0:0, 90:5:5, 80:10:10 and 70:15:15. Organoleptic evaluation of cookies Cookies were developed using germinated wheat flour. For each product, control samples were prepared using basic ingredients and three test samples were prepared with 10%, 20% and 30% fortification levels of both pumpkin seed powder and beet green powder. The developed products were organoleptically evaluated by a semi- trained panel of 8 judges. The judges were served each preparation with one control sample and three experimental samples. Products were served in coded plastic containers randomly. The judgment was done on the basis of sensory attributes i.e., appearance, taste, flavor, texture and color and the scoring were done on the basis of 9 point hedonic scale (1= dislike extremely, 5= neither like nor dislike and 9= like extremely).
Findings The experiment was laid out in Factorial Completely Randomized Design (CRD). The experiment compares the value of a response variable based on the different levels of that primary factor. Table 1: Mean Score of organoleptic evaluation of germinated wheat flour cookies
fortified with Pumpkin Seed Powder and Beet Green Powder Parameters Treatments
T0 T1 T2 T3 SE (diff.) CD Appearance 6.9 7.4 7.5 7.6 0.2 0.408
Taste 6.4 7.1 7.4 8.1 0.22 0.45 Flavor 7 7.4 7.45 8 0.23 0.46 Texture 6.7 7.41 7.45 8.2 0.16 0.32 Color 7.35 7.37 7.63 8 0.32 0.28

National E-Workshop onCurrent Scenario of Post Graduation Research in Agriculture Sector Sept 09-11, 2020
204
Table 1 is showing mean score of organoleptic evaluation of cookies. Result indicates significant differences in sensory attributes of products. Mean score of sensory attributes of cookies increased with increase in levels of fortification. Sensory evaluation of fortified cookies with 30% level of fortification was highly acceptable in terms of appearance, taste, flavor, texture and color. Organoleptic evaluation of germinated wheat flour cookies fortified with pumpkin seed and beet green powder revealed that, cookies with 30% level of fortification was liked extremely, laddu, cookies and mathri with 20% level of fortification was liked very much and laddu, cookies and mathri with 10% level of fortification was liked moderately as compared to that of control product. Inference On the basis of results of the present study, it is concluded that fortification level of 30% pumpkin seed and beet green powder in cookies was found to be better as compared to that of 10% and 20% levels of fortification in terms of appearance, taste, flavor, texture, color and overall acceptability. Therefore, pumpkin seed and beet green powder can be incorporated to develop wide range of food products. References Adams, G.G., Imran, S., Wang, S., Mohammad, A., Kok, M.S., Gray, D.A., Channell, G.A., & Harding, S.E. (2014). Crit. Rev Food Sci. Nutr. 54(10). 1322-9. doi: 10.1080/ 1040839 8.2011.635816 Agrahar-Murugkar, et al(2015). Evaluation of nutritional, textural and particle size characteristics of dough and biscuits made from composite flours containing sprouted and malted ingredients. Journal of Food Sci Technol. 52(8). 5129-5137.doi:10.1007/s13197-014-1597-y El-Soukkary, F.A. (2001). Evaluation of pumpkin seed products for bread fortification. Plant Foods Human Nutr., 56(4). 365-384. doi:10.1023/A: 1011802014770. Kakde, S.B., Hathan, B.S., & Neeha, V.S. (2015). Utilization of beetroot (Beta Vulgaris L.) leaves powder in cereals based extruded product. Int. Res. Journal of Engg. and Technol.2(3).2153-2160. p-ISSN: 2395-0072. Singh, A.K., Rehal, J., Kaur, A., &Jyot,G. (2015). Enhancement of attributes of cereals by germination and fermentation: a review. Crit Rev Food SciNutr. 55(11). 1575-1589.doi:10.1080/10408398.2012.706661

National E-Workshop onCurrent Scenario of Post Graduation Research in Agriculture Sector Sept 09-11, 2020
205
STUDY THE EFFECT OF TEMPERATURE AND PACKAGING MATERIALS ON SHELF LIFE OF GLADIOULS CV. PUNJAB
DAWN
Priyanka Kumawat Department of Horticulture, College of Agriculture,
Swami Keshwanand Rajasthan Agriculture University, Bikaner-334006 (Rajasthan) Email: [email protected]
Introduction Floral industry is a vigorous, globally fast growing industry which has achieved significant growth rates during the past few decades. Gladiolus is a high value crop known as sward lily. The fascinating spikes bear a large number of florets with varying sizes and forms with smooth ruffled or crinkled tepals (Singh, 2006). In case of glut production, storage of spikes extends the marketing season and regulates marketing. Appropriate method of storing flowers offers the possibility of long term shipment (Jain et al., 2006). Longevity of cut flower spike depends on many factors like reserved carbohydrate in flowers, stomatal functioning, osmotic concentrations and pressure potential of petal cells, dissimilarity in stem diameter and rigidity, differences in the number of thick walled supporting cells in the xylem elements and phloem fiber, lignifications and level of plant hormones and vulnerability of diseases and pests (Bhattacharjee, 1999). Use of packaging materials enhance the vase life of spikes. Various type of packaging materials can be used to extend the shelf life of flowers viz., news paper, butter paper, cellophane paper, plastic bags, CFBoxes, etc. which help in slow opening of florets. Packaging materials increase the amount of CO2 and reduces the quantity of O2, this mechanism slow down the metabolic process which prolongs the shelf life of flower. Low temperature improve the quality of flower and extend shelf life by reducing the amount of ethylene. The spike could also be stored upto 15 days under controlled atmosphere (CA) storage in poly propylene sleeves with 2% and 5% O2 and CO2 respectively (Singh, 2006). Therefore, an experiment was conducted to study the interaction of various packaging materials and different temperature on shelf life of cut gladiolus spikes cv. Punjab Dawn. Methodology The corms of gladiolus cv. Punjab Dawn were raised at Horticulture Research Farm, Institute of Agricultural Sciences, Banaras Hindu University, Varanasi, Uttar Pradesh following standard cultural practices. The experiment was carried out in the Post-harvest Laboratory, Department of Horticulture during the year 2017. Spikes were harvested in early morning when three lower florets show colour. A slant cut was given with the help of a sharp knife as close to the base. After harvesting, cut spikes were kept in a bucket containing water and immediately brought to the laboratory for post-harvest studies. All the leaves were removed and again a cut was given to the spikes with the help of a sharp knife. Standard length of spike was maintained. After weighing fresh weight and measuring length of spikes, the spikes were kept in envelops of different packaging materials viz., blotting paper, brown paper, butter paper, cellophane paper and news paper. Envelops were put in cardboard boxes and placed at different temperature conditions. Observations were recorded on various post-harvest attributes and data were analyzed statistically.

National E-Workshop onCurrent Scenario of Post Graduation Research in Agriculture Sector Sept 09-11, 2020
206
Findings Gladiolus spike stored at 16ºC (cool chamber condition) and 22 ± 2ºC (ambient condition) failed to exert any significant effect on days to open of third and fifth floret, percentage of opened florets, diameter of fifth floret and length of fifth floret. However, significantly slow opening was observed under cool chamber condition (16ºC). Similarly, lesser diameter of first and third floret was observed under cool chamber condition (22 ± 2ºC). Low temperature helps to reduce the amount of ethylene and decrease the rate of respiration, which is responsible for flower opening. Therefore, rate of opening of florets was found slow in cool chamber condition (16ºC). Beura and Singh (2003) and Grover et al. (2005) were also found same results. Various packaging materials failed to give any pronounce effect on days to fifth floret opening, percentage of opened floret, diameter of fifth floret and length of third and fifth floret. However, there was significant effect of different characters due to various packaging materials (Table 1). Late opening of first floret was observed with news paper, brown paper, butter paper and even control in comparison to cellophane paper. However, third floret was opened late in the spike packed in brown paper followed by news paper. Fast opening of third floret and maximum diameter of first and third florets were observed in cellophane paper packaging. However, it was significantly minimum with packaging of spikes in brown paper. Maximum length of first floret was observed with spike packed in news paper which was significant to packaging of spike in butter paper. This might be due to the wrapping with polypropylene sheet, makes the microenvironment become rich in CO2 with less O2,
thus might have reduced the rate of respiration as well as inhibiting ethylene action (Munsiet al., 2011). Similar result was lent credence with the finding of Reddy (2016) in tuberose. There was no any significant difference between ambient (22 ± 2ºC) and cool chamber condition (16ºC) on weight of spike at third, sixth and ninth day, days to withering of first and third floret and shelf life of spike. However, spikes stored in cool chamber resulted in maximum days to withering of fifth floret which was significantly higher than ambient condition. Maximum weight of spike at third, sixth and ninth day was observed with spikes stored in cellophane paper followed by brown paper and news paper treatments. Significantly lower weight of spike was recorded with control condition. Maximum days taken to withering of first floret were recorded with spikes placed in cellophane paper which was statistically higher than other packaging materials. Similarly, maximum days taken to withering of third floret were recorded with cellophane paper which was statistically at par with butter paper and brown paper treatments and significant to news paper, blotting paper and control. Cellophane paper treatment was also resulted in longest shelf life of spikes, found significantly higher than control, which was at par with other treatments and significant to control. In cellophane paper there is no source of air motion therefore, reduction in weight of spike observed low due to low rate of respiration. Freshness of florets remain for longer duration due to less water loss from cellophane paper packed spike, therefore, withering of floret takes longer duration in spikes packed with cellophane paper. Cellophane paper packed spikes at low temperature condition was found significant. Palanikumar and Bhattacharjee (2001),Zeltzeret al. (2001), Naz (2003), Jain (2006) and Ahmadet al. (2013) were found similar results in rose. Inference The gladiolus spike stored at 16ºC (cool chamber condition) and 22 ± 2ºC (ambient condition) failed to exert any significant effect on days to open of third and fifth
National E-Workshop onCurrent Scenario of Post Graduation Research in Agriculture Sector Sept 09-11, 2020
207
floret, percentage of opened florets, diameter of fifth floret and length of fifth floret. Maximum diameter, days to withering of first and third florets, weight of spike at third, sixth and ninth day and shelf life was recorded with cellophane paper packaging. There was no any significant difference between ambient (22 ± 2ºC) and cool chamber condition (16ºC) on weight of spike at third, sixth and ninth day, days to withering of first and third floret and shelf life of spike. Whereas, maximum length of first floret was observed with spike packed in news paper. Spikes stored in cool chamber resulted in maximum days to withering of fifth floret. References
Ahmad, I., Dole, J.M., Saleem, M., Khan, M.A., Akram, A. and Khan, A.S. (2013). Preservatives and packaging material have an impact on the post-harvest longevity of cut Rosa hybrida L. Kardinal flowers. The Journal of Horticultural Science and Biotechnology, 88(3): 251-256. Beura, S. and Singh, R. (2003). Effect of storage temperature and wrapping material on post-harvest life of gladiolus cultivar Her Majesty. Journal of Ornamental Horticulture, 6(4): 322-327. Bhattacharjee, S.K. (1999). Research on agrotechnology in roses at IARI, New Delhi. Indian Rose Annual, 15: 80-86. Grover, J.K., Gupta, A.K., Singh, K. and Brar, J.S. (2005). Modified atmosphere packaging of cut flowers in polymeric films-suitable technology for India. Proce: International Conference on Plasticulture and Precision Farming. New Delhi, India, 17-21 November, p. 258. Jain, R., Bhalla, R., Gupta, Y.C., Thakur, K.S. and Thakur, R. (2006). Effect of wrapping material and dry storage on postharvest quality of rose cv. First Red cut flowers. Journal of Ornamental Horticulture, 9(3): 192-195. Munsi, P., Chakrabarty, S. and Roychowdhury, N. (2011). Effect of storage conditions and packaging supplemented with different solutions (wet packing) on vase life of gladiolus. ActaHorticulturae, pp. 351-357. Naz, S. (2003). Effect of different packing materials on the post-harvest life of rose. Journal of Research Science, 14(2): 187-192. Palanikumar, S. and S.K. Bhattacharjee (2001). Effect of wet storage on post-harvest life and flower quality of cut roses. Journal of Ornamental Horticulture, 4(2): 87-90. Reddy (2016). Effect of post-harvest dipping, packaging and storage temperatures on keeping quality of loose flowers of tuberose (PolianthestuberosaL.). M.Sc. Thesis, College of Horticulture, Rajendranagar, Hyderabad Dr. Y.S.R. Horticultural University. Singh A.K. (2006). Flower Crops: Cultivation and Management, New India Publishing Agency, New Delhi, India. p. 447. Zeltzer, S., Meir, S. and Mayak, S. (2001). Modified atmosphere packaging (MAP) for long- term shipment of cut flowers. ActaHorticulturae, 553: 631-634.

National E-Workshop onCurrent Scenario of Post Graduation Research in Agriculture Sector Sept 09-11, 2020
208
Table 1. Effect of temperature and packaging materials on days to opening of floret, percent of opened florets, diameter of floret and length of floret
in post-harvest life of gladiolus cultivar Punjab Dawn
Temperature Days to opening of floret %of opened florets
Diameter of floret (cm) Length of floret (cm) First floret
Third floret
Fifth floret
First floret
Third floret
Fifth floret
First floret
Third floret
Fifth floret
Ambient condition (22±2ºC) 3.50 4.44 4.11 46.89 6.74 7.02 4.82 8.08 7.43 5.08 Cool chamber condition (16ºC) 3.11 4.33 5.22 45.96 6.26 6.19 5.26 7.37 6.28 5.98 CD at 5% 0.36 NS NS NS 0.29 0.28 NS 0.52 0.46 NS Packaging material Control 3.50 4.33 4.67 44.48 6.45 6.58 5.08 8.10 6.40 5.12 Blotting paper 3.33 4.17 4.50 51.65 6.57 6.73 5.53 7.87 7.10 6.17 Brown paper 3.50 5.50 5.83 40.81 5.97 6.17 4.87 7.40 7.48 5.77 Butter paper 3.50 4.17 4.17 45.38 6.73 6.68 4.18 6.50 6.50 4.25 Cellophane paper 2.50 3.50 4.17 50.21 7.17 7.25 6.50 8.18 6.55 7.02 News paper 3.50 4.67 4.67 46.03 6.10 6.23 4.05 8.30 7.10 4.85 CD at 5% 0.63 0.89 NS NS 0.51 0.48 NS 0.89 NS NS

National E-Workshop onCurrent Scenario of Post Graduation Research in Agriculture Sector Sept 09-11, 2020
209
Table 2. Effect of temperature and packaging materials on weight of spike, days to withering of floret and shelf life in post-harvest life of gladiolus
cultivar Punjab Dawn
Weight of spike (g) Days to withering of floret Shelf life Third day Sixth day Ninth day First floret Third floret Fifth floret (days)
Temperature Ambient condition (22±2ºC) 32.44 29.52 25.48 2.83 4.33 2.83 8.22 Cool chamber condition (16ºC) 33.17 30.68 26.66 3.00 4.56 4.28 8.44 CD at 5% NS NS NS NS NS 1.27 NS Packaging material Control 32.18 28.32 21.76 2.50 3.83 3.83 6.83 Blotting paper 31.77 28.63 25.10 2.50 4.17 4.17 8.33 Brown paper 33.32 30.78 26.04 2.17 4.50 3.00 8.33 Butter paper 29.74 26.46 21.94 3.17 4.83 2.50 8.33 Cellophane paper 37.29 36.74 36.16 4.17 5.83 5.50 9.17 News paper 32.53 29.69 25.41 3.00 3.50 2.33 9.00 CD at 5% 4.30 4.00 3.72 0.92 1.41 NS 0.98

National E-Workshop onCurrent Scenario of Post Graduation Research in Agriculture Sector Sept 09-11, 2020
210
DEVELOPMENT AND PERFORMANCE EVALUATION OF QUINOA (CHENOPODIUM QUINOA WILLD. ) POLISHER
Sagar M. Chavan
Department of Processing and Food Engineering, CTAE, MPUAT, Udaipur, Raj. Email: [email protected]
Introduction Quinoa (Chenopodium quinoa Willd.) is a traditional food crop of the Chenopodiaceae family, has a good nutritional values ranging from 10 to 18, 45 to 75, 41 to 42, 24 to 36 and 21 to 49% for protein, crude fat, carbohydrates, ash and crude fibre, respectively. Quinoa also is a good source of vitamin E, iron and calcium which is substantially higher than other grain crops. The year 2013 was declared as the International Year of Quinoa by Food and Agriculture Organization (FAO) as a recognition of the "crop's resilience, adaptability and its potential contribution in the fight against hunger and malnutrition". Although high in nutritional value, bitter taste saponins content varies from 4.7 to 11.3 g/kg dry matter located in the outer layers of quinoa grain. A saponin free Quinoa is highly nutritive and can be used to make flour, biscuits, noodles, pastries, soup, fortify Ready to eat snacks, other breakfast products and alcohol. Traditionally, water washing is used for removal of saponin. However this method requires further drying to go for value addition and processing. Drying is an energy intensive process. If the method developed for saponin removal is simple enough, it can be employed on farm and can be carried out by the farmers. It can add value to the crop and will increase the farmer’s profit derived out of quinoa crop. In the polishing process (dry method) the bran layer particles still sticking to the surface of the grain are removed and the surface is slightly polished to give it a shinier appearance. There is no mechanical polisher specially designed for quinoa. Hence a need was felt to develop a continuous type mechanical polishing machine for quinoa for reducing outer layer and remove saponin content of quinoa grain. Therefore a study has been undertaken at Department of Processing and Food Engineering, College of Technology and Engineering, MPUAT, Udaipur (Rajasthan) during 2018-19 with following objectives:
1. To study the engineering properties of quinoa 2. To develop a quinoa polisher 3. To evaluate the performance of the developed quinoa polisher 4. To study the cost-economics of developed quinoa polisher
Methodology Raw material The local variety of quinoa grain named Chittor was procured from Rajasthan State Seed Corporation, Udaipur (Rajasthan). The initial moisture content of quinoa grains was found as 4±0.15 per cent (wb) by hot air oven method. The of different moisture

National E-Workshop onCurrent Scenario of Post Graduation Research in Agriculture Sector Sept 09-11, 2020
211
levels samples were prepared by drying or adding calculated amounts of distilled water, thorough mixing, tempering and then sealing in separate polyethylene bag. All polishing experiments were conducted in the laboratory at an ambient temperature of about30±2°C and relative humidity of 55 to 65 per cent. Engineering Properties of Quinoa Grains The engineering properties such as physical (dimension (shape and size), sphericity, surface area, bulk density, true density and porosity), aerodynamic (terminal velocity) and frictional properties (angle of repose, angle of friction and coefficient of friction) of quinoa grains were determined using standard procedure and formulas described by AOAC, 2005. Development of Quinoa polisher Based on physical and mechanical properties of quinoa, a polishing machine was developed. The innovative aspect of machine is based on mechanical abrasion/ friction using eight emery roller and control in feeding, speed of rotational, time of residence, moisture levels, etc. In operation, the cleaned quinoa grains were gravity fed through the hopper into polishing chamber at which 10 mm clearance between screen roller and abrasive roller. Polishing (removal of outer layer) operation done due to friction of grains can be achieved by abrasion, impact and shear forces generated by the rotation of the abrasive surface of the polishing roller along with the inter-granular frictional forces generated due to movement of the grains in polishing chamber. The bran abraded-off from quinoa grain powder is moved outside from screen roller and sucks by aspirator and collected in cyclone separator and the polished grains come out through the outlet. Performance Evaluation of Developed Quinoa Polisher The experiments were conducted at five roller speed (2100, 2300, 2500, 2700, and 2900 rpm), five feed rate (22, 24, 26, 28 and 30 kg/h), five roller inclination (0, 5, 10, 15, and 20 degree) and five moisture content level of quinoa grain (3, 5, 7, 9, and 11 per cent wb). As per using CCRD design for 4 variables with 5 levels each, thirty experiments were performed. For performing each experiment, about 2 kg of quinoa grains were taken and fed into the abrasive polisher. All these experiments were replicated thrice and the average of the experimental data reported. The performance of developed polisher was evaluated to work out optimum value of machine and grain parameter for maximization of saponin removal, polishing efficiency and colour value and minimization of degree of polishing, percent broken at feasible cost by using standard equations in percent. The adequacies of the models were determined using model analysis, lack-of-fit test, and R2 (coefficient of determination) analysis as outlined by Lee et al. (2000), Sastry and Barach (2000) and Weng et al. (2001). Quality analysis Organoleptic evaluation was carried out using nine point hedonic scale by the panel (ten judges) for its evaluation on the basis of bitterness taste and visual appearance.The nutritional quality of the raw and polished quinoa grain such as

National E-Workshop onCurrent Scenario of Post Graduation Research in Agriculture Sector Sept 09-11, 2020
212
protein, potassium (P), phosphorous (K), ferrous (Fe), zinc (Zn), magnesium (Mg), calcium (Ca), copper (Cu), boron (B), carbohydrates, fat, energy/calories were evaluated using standard AOAC methods. Cost economics The cost-economics of developed quinoa polisher on the basis of net present worth, benefit-cost ratio, payback period and internal rate of return
Findings The range for length, thickness, 1000 grain mass, sphericity, surface area, true densityand porosity of quinoa grains was observed as 1.76 to 2.325 mm, 0.980 to 1.356 mm, 2.55 to 2.79 g, 0.823 to 0.835, 6.583 to 11.821 mm2, 923.54 to 1071.42 kg/m3and 0.144 to 0.306, respectively with increase in moisture content from 3 to 15 per cent whereas bulk density decreased from 803.23 to 743.43 kg/m3 with incrementin experimental range of moisture content. The increase in terminal velocity (0.68 to 0.90), angle of repose (31.12 to 34.23°), angle of friction (21.5 to 24°, 21.3 to 26°, 22 to 27.5° and 23.5 to 30° for glass, mild steel, iron and wood surfaces respectively) and coefficient of friction (0.20 to 0.24, 0.21 to 0.32, 0.20 to 0.34 and 0.22 to 0.41 for glass, mild steel, iron and wood surfaces respectively) was observed with increase in moisture content. Quinoa polisher machine was designed on abrasion principle and fabrication was arranged. The capacity of the polisher was observed as 26.25 kg/h. The machine performance was demonstrated in front of faculty members, students and farmers. The optimum performance of machine was obtained out as 2700 rpm of roller speed, 26.25 kg/h of feed rate, 8.80° of roller inclination and 5.00% of moisture content with saponin removal 88.49%, polishing efficiency 83.73%, degree of polishing 7.90%, percent broken 8.26% and colour value 60.83 with desirability of 0.735. The saponin removal, polishing efficiency, degree of polishing, percent broken and colour value were found from 74.94 to 89.52 per cent, 79.88 per cent to 98.35 per cent, 1.09 to 9.68 per cent, 0.11 to 10.42 per cent and 56.25 to 61.18 respectively for all experiments. The saponinremoval value increases with increase in roller speed, decrease in roller inclination and decrease in moisture content. With increase in feed rate, saponin removal value increases initially and then decreases. The polishing efficiency increases with decrease in roller speed, increase in roller inclination and moisture content. With increase in feed rate, polishing efficiency value increases initially and then decreases. The both degree of polishing and percent broken value increases with increase in roller speed; increase in feed rate; decrease in roller inclination and decrease in moisture content. The colour value increases with an increase in roller speed and decrease in moisture content. With increase in feed rate and roller inclination, the colour value increases initially and then decreases. The average organoleptic score for taste and visual appearance of polished quinoa grains was 7.8 (liked very much) and 7 (liked moderately) respectively based on 9 point scale hedonic scale. The original raw (unpolished) quinoa grain has a very bitter taste with organoleptic score of 1.8 (disliked very much).The total manufacturing cost

National E-Workshop onCurrent Scenario of Post Graduation Research in Agriculture Sector Sept 09-11, 2020
213
and annual operating cost of the polisher was estimated as � 40,000 and � 1,02,485 (� 71.17 per hour). The benefit-cost ratio was worked out to be 1.76 with payback period of 0.52 year and net present worth of the cash flow as � 4,36,296.
Inference The engineering properties showed simple linear moisture dependence relationships with good correlation coefficients. Quinoa polisher machine was designed on abrasion principle and fabrication was arranged. The capacity of the polisher was observed as 26.25 kg/h. The optimum performance was obtained out as 2700 rpm of roller speed, 26.25 kg/h of feed rate, 8.80° of roller inclination and 5.00% of moisture content with saponin removal 88.49%, polishing efficiency 83.73%, degree of polishing 7.90%, percent broken 8.26% and colour value 60.83 with desirability of 0.735. The nutritional quality and average organoleptic score for polished quinoa grains was acceptable. The total manufacturing cost of the polisher was estimated as � 40,000 with operating cost � 71.17 per hour. The benefit-cost ratio was worked out to be 1.76 with payback period of 0.52 year.

National E-Workshop onCurrent Scenario of Post Graduation Research in Agriculture Sector Sept 09-11, 2020
214
NEW APPROACH TO MICROWAVE DRYING OF SPROUTED GREEN GRAM
1Sejal R. Sedani, 2 Ishvar L. Pardeshi,3Anil K. Kamble
1 Dept. of Agril. Process Engg., Post Graduate Institute, Dr. PDKV, Akola, Maharashtra
2Dept. of PHM of Food Grains and Seeds, Post Graduate Institute of Post Harvest Management, Dr. BSKKV, Killa-Roha, Dist. Raigad, Maharashtra
3Dept. of Farm Power and Machinery, Dr. PDKV, Akola-444104, Maharashtra, India Email : [email protected]
Introduction Legumes are rich source of protein and contribute important role of fulfilling protein content in diet of Indian people. Mung beanis widely consumed in India. Due to inherent antinutritional factors like phytate, polyphenols, saponins, protease, lictins amylase inhibitors etc., its utilization for nutrition of human is constrained (Salunkhe, 1982).The nutritional profile of mung bean consists of protein, dietary fiber, minerals, vitamins and significant amounts of bioactive compounds (Gan et. al, 2017).Mung bean is a low-cost protein rich legume and is easily digestible than other legumes (Mubarak, 2005; Shen et. al. 2010). “Consumption of the mung bean combined with cereals has been recommended to significantly increase the quality of protein, because cereals are rich in sulfur-containing amino acids but deficient in lysine” (Boye et. al. 2010). Hussain et. al., 1983 reported that protein digestibility of combination of rice and mung bean was found to be 84.4%, while the combination of rice- meat combination diet has less protein digestibility in infants. Table 1 represents protein quality of cooked mung bean. Legume grains are processed with different techniques like soaking, boiling, sprouting, pressure cooking and fermentation for human consumption. Mung bean sprouts prepared by sprouting mung beans. The process of sprouting includes soaking and germination (wrapping the soaked grains in cotton cloth and placed in shade by sprinkling some amount of water on it. East Asia is largest cultivar and consumer of Mung bean. This Mung bean sprouts can be microwaved or stir fried, also be used as an ingredient, e.g., for spring rolls (Anonymous, 2019). Mung beans isnot only a good source of protein but also contain useful amounts of fiber, soluble fiber, potassium and B vitamins. Fat, cholesterol and sodium are found in least amount. “The overall composition of mung beans is similar to that of other grain legumes” (Savage 1988; Savage and Deo, 1989a and 1989b). Table 1. Protein Quality of Cooked Mung Beans* Particulars Non-germinated 24hGerminated 72hGerminated
True Digestibility (%) 68.4 72.2 81.2 Biological Value 62.0 59.0 63.0 Net Protein Utilization (%) 42.4 42.6 51.2 *Adapted from Venkataraman et. al., 1976 The dried seeds of mung bean consumed by processing it in different ways like it can be eaten as whole or split, cooked or fermented or parched, milled and ground into flour. “Whole or split seeds are used to make dhal, soups and curries and are added to various spiced or fried dishes. The popular fermented foods of India, such as idli and dosa, are made from mixtures of rice and mung bean ground together. It is well known that the sprouting process results in an improvement in the vitamin content”.

National E-Workshop onCurrent Scenario of Post Graduation Research in Agriculture Sector Sept 09-11, 2020
215
Whole dry mung bean seeds contained 2.69 mg/kg of folic acid (Magaram et. al.,1985). The 1.78 mg/kg (wet weight) of folic acid content was observed after 5 days of germination, indicating that considerable synthesis of folic acid occurs. Mung beans provide a wide range of minerals to balance the dietary requirements of humans. The total phosphorus content of the seed is relatively high, is present as phytate. “The phyate ion complexes with divalent cations of zinc, calcium, magnesium and iron and ferric ions, making insoluble compounds that are not absorbed from the gastrointestinal tract”. Experiments have shown that the bioavailability of iron for instance is extremely low (2.6%) in mung beans. Germination, Soaking, Fermentation and Cooking are useful techniques in reduction of phytate in legumes. Germination of mung beans for 72 hours results in a fall in the phytic acid content from 2.05 g/kg of dry beans to 1.42 g/kg for soaked and germinated beans, while the total phosphorus content of the beans remained constant (4.4 g/kg) during germination, the proportion of inorganic phosphorus rose as germination proceeded (Tabekhia and Luh,1980). Reddy et al. (1978) pointed out that during germination, phytase breaks down phytic acid in the seed, yielding a source of phosphorus, cations and inositol to the germinating seeds. It can be assumed that the phosphorus content of germinated seeds is more available than in that in non-germinated seeds. Table 2 represents the nutritional content of mung bean. Table 2. Nutritive compositions of mung bean in 100 g of edible portion Nutrients Raw Sprouted Water, g 9.05 90.40 Energy, kcal 347 30 Protein, g 23.86 3.04 Fat, g 1.15 0.18 Ash, g 3.32 0.44 Carbohydrate, g 62.62 5.94 Total Dietary Fiber, g 16.3 1.8 Total Sugars, g 6.60 4.13 Source: USDA, 2016 Dried mung bean seeds have longer shelf life and sprouts can be easily obtained by germinating the seeds in the dark for4 days. Sprouting is independent process which do not require soil or solar radiation and is not restricted to seasonal growth. Sprouts can be obtained in maximum quantity in a relatively short time. Some vitamins are synthesized in the germinating seeds during sprouting. Sprouted mung beans contain similar amounts of lipids, protein, starch, polysaccharides other than starch, lignin and ash compared to the raw bean, but sprouted seeds contain less raffinose as they are used as a source of available energy in the process of germination (Rao and Belavady, 1978). As a linkages are indigestible by mammalian enzymes, the reduction of these oligosaccharides during germination leads to a reduction of the flatus potential of the beans caused by the action of intestinal anaerobic microorganisms (Farhangi and Valadon 1982). Jaya and Venkataraman (1981) noted that as the raffinose family oligosaccharides were degraded during sprouting, a significant increase in glucose, galactose and sucrose also occurred. “Germination of mung beans for 48 hours resulted in significant reductions in the phytate and tannin contents with a consequent increase in the ionizable iron content” (Rao and Prabhavathi, 1982). The tannin content of mung beans seed may be reduced by removal of seed coat. The germination process also reduced the tannin content of seed, andincreases iron availability.This increase in iron availability may be quite
National E-Workshop onCurrent Scenario of Post Graduation Research in Agriculture Sector Sept 09-11, 2020
216
significant in areas where iron deficiency is widespread and mung beans form a significant portion of the local diet. Madar et. al. (2017) found the nutritional composition of mung beans to have slightly higher carbohydrate content (0.021 mg/g) after germination. “The amino acid (0.239 mg/g) and protein content (0.207 mg/g) were appreciably increased compared to that in dry seeds”. Methodology 2.1 Material preparation The seeds of mung bean were soaked by submerging in distilled water in 1:5 (w/v) proportion for 10 h at room temperature (Hussain and Burhanddin, 2011). After soaking the seeds were taken out from the glass container and the adherent moisture removed by gently rolling them on thick absorbent cloth and kept for sprouting for 72 h (Venkataraman et. al., 1976, Hussain and Burhanddin, 2011) for obtaining superior quality of mung bean sprouts. The rinsing at interval of 6 h in clean water during sprouting was followed (Pardeshi and Tayade, 2013).Mung Bean Sprouts were washed and allowed to remove surface moisture. The moisture content of fresh mung bean sprouts was observed to be 163.2542 kg/kg dry matter. The fresh sprouted mung beans were washed and 50 g sample was loaded on rotating plate in microwave oven for further experimentation of drying study undertaken under this work. 2.2 Experimental set up and plan of experiment for Sprouted Mung bean Experimental Setup consisted of Microwave oven of IFB Company with 900W rated power with model No. 30SC4, Stopwatch for measuring laps time and weighing balance with precision of 0.001g.As observed by Sedani and Pardeshi (2018), in case of microwave drying of dill leaves and (Rajole, 2019) in case of microwave drying of tomato wedges, during drying at higher levels of microwave power, the burning effect do occur before reaching to the required final moisture content and at lower microwave power levels, the prolonged exposure of product to microwave field lead to change in colour to a great extent. Therefore, as per experimentation suggested by Sedani (2019), the Central Composite Rotatable Design (CCRD) was used for carrying out this experiment. In this study, two variables i.e., ON time and OFF time with range of 60 s to 200 s and 30 s to 150 s, respectively, were taken. These ranges were selected on basis of filler trials as per procedure suggested by Sedani (2019). After selection of the ranges, the experimental design was applied. Thirteen experiments were carried out with 2 variables and five levels. In order to minimize the effects of unexplained variability in the observed responses due to extraneous factors, experiments were randomized. “The centred point in the design was repeated five times to calculate the reproducibility of the method” (Montgomery, 2001). The pulse ratio was estimated by the Equation(1).
67(689:;7<=>?) =@AB"CDE@FFB"CD
@AB"CD (1)
2.3 Moisture: The moisture content of the fresh and dehydrated GLVs was determined by AOAC method (AOAC, 2000). The moisture content of the GLVs was computed using Equation (2).
G?>:=8H;I?J=;J=(KL 100KL⁄ N;=O<==;H) = PQRPSPQ
× 100
National E-Workshop onCurrent Scenario of Post Graduation Research in Agriculture Sector Sept 09-11, 2020
217
(2)
G?>:=8H;I?J=;J=(KL 100KL⁄ THUO<==;H) =PQRPSPS
× 100
(3) Where, M1 is the weight of sample before oven drying (g), M2 is the weight of sample after oven drying (g). The samples were placed in Hot Air Oven set at 105°C for 24 h (AOAC, 2000). The weight M2 was taken after allowing the samples to cool down upto atmospheric temperature, by keeping the samples in desiccators having filled with silica gel in its bottom portion. The samples were weighed using electronic weighing balance with accuracy 0.001 g. For microwave oven drying, the equilibrium moisture content was assumed zero (Maskan, 2000) as removal of moisture continues with time and subsequently product may get burnt (Soysal, 2004). The moisture content was expressed as kg/100 kg dry matter i.e., kg/100 kg dm.
2.4 Color analysis The colour (L, a and b-value) was measured using Chromameter (CR-400).Hunter L, a, b color scales was used for colour analysis which is based on the Opponent-Color Theory. According to this theory the receptors in the human eye perceive color as the following pairs of opposites.
• L scale: Light vs. dark where a low number (0-50) indicates dark and a high number (51-100) indicates light.
• a scale: Red vs. green where a positive number indicates red and a negative number indicates green.
• b scale: Yellow vs. blue where a positive number indicates yellow and a negative number indicates blue.
The “L” value for each scale therefore indicates the level of light or dark, the “a” value redness or greenness, and the “b” value yellowness or blueness. All three values are required to completely describe an object’s color. A three-dimensional representation of L, a, b color space is shown in Figure1 (Hunter et al. 1987). ∆ a = afresh –a’ (4) ∆ b = bfresh –b’ (5) ∆ L = Lfresh –L’ (6)
∆W =√(∆Y0 + ∆<0 + ∆Z0) (7) Where, ∆E = Change in colour of dried sample with respect to fresh sample of
sprouted mung bean
2.5 Statistical analysis The data were analyzed for its stepwise regression analysis in trail version of Design Expert 12 Software (StatEase, 2018). 1.Results and Discussion 3.1 Effect of process parameter on final moisture content (kg/ 100 kg of dm) on intermittent and Stepwise decreasing microwave power drying (ISDMD) Sprouted Mung Bean In view of finding effect of ON time and OFF time, respectively at and between successive decreasing levels of Microwave power, the experiment was designed using CCRD as given in Table 3, wherein the requisite treatment combinations and the observations recorded for responses as final moisture content (FMC, kg/kg dm) are shown. Table 4 shows the stepwise regression analysis of data.

National E-Workshop onCurrent Scenario of Post Graduation Research in Agriculture Sector Sept 09-11, 2020
218
Table 3. Treatment combinations for intermittent and stepwise decremental microwave power drying of Mung Bean Sr. No. Coded Values Actual Values Response 1 Response 2
X1 X2 ON time OFF time FMC, kg/ 100 kg dm ∆e*
1. -1 -1 80 48 57.3214 4.1847
2. 1 -1 80 132 66.3311 3.76691
3. -1 1 180 48 14.2765 10.6747
4. 1 1 180 132 20.2743 4.71584
5. -1.414 0 60 90 61.5515 3.1114
6. 1.414 0 200 90 5.3934 6.69971
Table 4. ANOVA for Reduced Cubic Model of Sprouted Mung Bean for final moisture
content (kg/ 100 kg of dm) Source Sum of Squares Df Mean Square F-value p-value
Model 3990.15 4 997.54 83.50 < 0.0001*
A-A- ON Time 3551.90 1 3551.90 297.31 < 0.0001*
B-B- OFF Time 341.71 1 341.71 28.60 0.0007*
A² 40.24 1 40.24 3.37 0.1038***
A²B 58.86 1 58.86 4.93 0.0572**
Residual 95.57 8 11.95
Lack of Fit 57.96 4 14.49 1.54 0.3428NS
R² 0.9766
Adjusted R² 0.9649
Predicted R² 0.9096
Std. Dev. 3.46
It was found that the FMC ranged between 5.3934 to 66.3311 kg/ 100 kg dm. The reduced cubic model was fitted to the experimental data. The statistical significance for terms was calculated for final moisture content. The R2(0.9766) was calculated by a least square technique. It showed good fit of model to the data. The F-value of model(83.50)implies that the model was significant (P < 0.0001).A is ON time and B is OFF time. The F-value of lack of fit was non-significant, which indicates that the developed model was adequate for predicting the response. Moreover, the model adequacy evaluated with predicted R2 of 0.9096 showed it to be in reasonable agreement with the adjusted R2 of 0.9649. This indicated that the non-significant terms have not been included in the model. Therefore this model could be used to navigate the design space. The regression equation describing the effects of the process variables on final moisture content in terms of actual levels of variables is given in Equation (8). Final moisture Content (FMC) = 0.491588908A + 0.399735207B–0.002341909A2–1.12231× 10R[A0B (8)

National E-Workshop onCurrent Scenario of Post Graduation Research in Agriculture Sector Sept 09-11, 2020
219
The combined effect of both variables on the final moisture content, the response surface and contour plots were generated for the fitted model as a function of two variables. It could be observed from Figure2 (A) that final moisture content decreased with increase in ON time as depicted in Equation 8. It may be due to utilization of residual heat of product to remove moisture during OFF time. When product was heated during ON time, the total heat generated was more than that required for removing moisture during ON time. Thus accumulated residual heat was utilized during OFF time for subsequent removal of moisture.
3.2 Effect of process parameter on change in colour (∆e*) for intermittent and Stepwise decreasing microwave power drying (ISDMD) Sprouted Mung Bean The treatment combinations of ON time and OFF time as discussed earlier and the observations recorded on change in colour (∆E) were as shown in Table 3. Table 5 shows the stepwise regression analysis of data. Table 5. ANOVA for reduced quadratic model for change in colour (∆e*) for Sprouted Mung Bean Source Sum of Squares Df Mean
Square F-value p-value
Model 111.82 3 37.27 12.12 0.0016
A-A- ON Time 19.61 1 19.61 6.38 0.0325
B-B- OFF Time 45.47 1 45.47 14.79 0.0039
A² 46.73 1 46.73 15.19 0.0036
Residual 27.68 9 3.08
Lack of Fit 18.39 5 3.68 1.58 0.3383NS
R² 0.8016
Adjusted R² 0.7354
Predicted R² 0.5517
Std. Dev. 1.75
C.V., % 22.97
It was found that the values of ∆E were from 3.1114to 14.5836. The Reduced Quartic model was fitted to the experimental data and statistical significance for linear and quadratic terms was calculated for ∆E. The R2 value was calculated by a least square technique and found to be 0.8016, showing good fit of model to the data. The model F-value of 12.12 implies that the model was significant (P < 0.01). The term A indicates ON time and term B indicates OFF time. The term B and A2is significant (P < 0.01) while term A is significant (P < 0.1) model terms. The lack of fit F-value was non-significant for the model obtained shown in Equation 9. Moreover, the predicted R2 of 0.5517 was in reasonable agreement with the adjusted R2 of 0.7354.This indicated that the non-significant terms have not been included in the model. Therefore this model could be used to navigate the design space. The regression equation describing the effects of the process variables on ∆e* in terms of actual levels of variables as given in Equation (9) Changeincolour(∆e ∗) = −7.42841 + 0.302950A − 0.056478B − 0.001044A0 (9)

National E-Workshop onCurrent Scenario of Post Graduation Research in Agriculture Sector Sept 09-11, 2020
220
The comparative effect of ON time and OFF time on the ∆e* could be observed by the F-values in the ANOVA and also by the magnitudes of coefficients of the coded variables. The F-values indicated that A2 was more influencing followed by B and A. The ∆e* followed non-linear behaviour with A and B due quadratic terms of A2 Equation 8. The ∆e* increased with increase in ON time upto certain maxima and decresased thereafter with increase OFF time. Soysal et al (2009) reported that the continuous microwave-convective drying resulted in darker product colour as compared to intermittent microwave-convective drying or convective drying during the drying of red pepper, possibly due to the non-enzymatic browning. Thus, for longer ON time, the product might be getting more browned during drying, itself causing lowered L-value (brightness) in colour for the dried product. The improvement in L-value can be accredated to higher OFF time as it utilizes the product heat for moisture removal and decreased L-value (brightness) may be due to prolonged exposure of product to higher temperature (ON time), leading to the browning of dried sample. The same could be revealed from Figure2 (B) by visualizing the combined effect of two variables on the ∆e*, the response surface and contour plots generated for the fitted model as a function of two variables.
(a) (b) Fig: The contour and response surface plots showing the effect of Final Moisture Content and Change in colour during ISDMD of Sprouted Mung Bean
3.3 Optimization of intermittent and stepwise decremental microwave power drying of Sprouted Mung Bean Numerical and graphical optimization was carried out for the process parameters for Intermittent and Stepwise Decremental Microwave Power Drying (ISDMD) of Sprouted Mung Beans for obtaining the best product. To perform this operation, trail version of Design Expert - version 12 software (Stat Ease, 2018), was used for simultaneous optimization of the multiple responses. Table 6 shows that the software generated optimum condition of independent variables with the predicted values of responses. Solution No. 1, having the maximum desirability value (0.680) and was selected as the optimum conditions of ISDMD of Sprouted Mung Bean. Numerical optimization given the optimum values of process variables as follows: ON time (A): 200 s; OFF time (B): 100 s;

National E-Workshop onCurrent Scenario of Post Graduation Research in Agriculture Sector Sept 09-11, 2020
221
Table 6. Solutions generated by the software for ISDMD of Sprouted Mung Bean Sr. No.
ON time (s)
OFF time (s) Final Moisture Content, kg/ 100 kg dm
∆e* Desirability
1 200 100 5.3794 5.7478 0.680# 2 200 103 5.2795 5.5821 0.667 3 200 106 5.1897 5.4331 0.654 4 200 127 4.4447 4.1974 0.501 #selected The superimposed contours of responses for Final Moisture Content and Change in Colour (∆e*) (Figure3) and their intersection zone for minimum Final Moisture Content and minimum ∆e* indicated the ranges of variables which could be considered as the optimum range for best product quality. The pulse ratio calculated using Equation (1), was found to be 1.50 with respect of optimal ON time of 200 s and OFF time of 100 s.
Fig: Superimposed counters for Final Moisture Content and Change in colour for
ISDMD of Sprouted Mung Bean 3.4 Verification of the model for intermittent and Stepwise decreasing microwave power drying (ISDMD) of Sprouted Mung Beans ISDMD of Sprouted Mung Beans experiments were conducted at the optimum process condition as shown in Table 6 and the quality attributes of the resulting product were determined. The observed experimental values (mean of 5 measurements) and values predicted by the equations of the model are presented in Table 7. “The values of variation<10% i.e, the closeness between the experimental and predicted values of the quality parameters indicated the suitability of the corresponding models” (Snedecor and Cochran 1967; Nath et al. 2011). Table 7. Comparison between predicted and actual response variables at optimum
process conditions for ISDMD of Sprouted Mung Beans Response Predicted value Actual Value(±SD) Variation % Final Moisture Content (kg/ 100 kgdm) 5.3794 5.9389 (b0.4489) 9.42
∆e* 5.7478 6.167(b0.4015) 6.79
3.5 Total Drying Time
National E-Workshop onCurrent Scenario of Post Graduation Research in Agriculture Sector Sept 09-11, 2020
222
As depicted in Table 6 and 7, the ON time of 200 s and OFF time 100 s was required to dry mung bean sprouts at successively decreasing levels of microwave powers of 900 W, 720 W, 540 W, 360 W and 180 W, wherefrom the total drying could be accessed as in TOTO 1000 s as ON time and in TOTO 500 s as OFF time, thus total 1500 s(25 min) time of drying, to dry fresh sprouted mung beans from its initial moisture content of 163.2542 kg/100 kg dm to final moisture content of 5.9389 kg/100 kg dm. This drying time was too short as compared to 8 h at 60 °C used for drying sprouted mung beans by Hussain and Burhanddin (2011). Inference Intermittent and Stepwise Decreasing Microwave Power Drying (ISDMPD) of Sprouted Mung Beans at decreasing microwave power levels (900W, 720W, 540W, 360W and 180W) and by allowing drying for specified ON-time(200 s) at each microwave power level and by allowing OFF-time(100 s) between two successive ON-time periods at varied and decreasing microwave power levels, the desired moisture content of 5.9389 kg/100 kg dm with minimum variation in colour (∆e*) of 6.167 was achieved in case of sprouted mung bean considered for experimentation. The total drying time required was 1500 s, i.e. 25 min.
References Anonymous.(2019). Mung Bean, Wikipedia: the free encyclopedia,Retrieved on 10/09/2019.https://en.wikipedia.org/wiki/ Mung_bean; AOAC. (2000). Official Method of Analysis of AOAC International, 17th edition, Washington D. C. Boye, J., Zare, F. and Pletch, A. (2010). Pulse proteins: Processing, characterization, functional properties and applications in food and feed. Food Research International. 43, 414–431. Farhangi, M. and Valadon, L. R. G. (1982). Effects of acidified processing and storage on proteins and lipids in mung bean sprouts. Food Science. 47, 1158-63. Gan, R. Y., Lui, W. Y., Wu, K.; Chan, C. L., Dai, S. H. Sui, Z. Q. and Corke, H. (2017). Bioactive compounds and bioactivities of germinated edible seeds and sprouts: An updated review. Trends in Food Science Technology. 59, 1-14. Hunter, Richard S. and Harold, Richard W. (1987). The Measurement of Appearance, 2nd Edition, John Wiley and Sons, Inc. New York, USA. Hussain, I. and M. Burhanddin. (2001). Optimization of germination conditions for germinated Mungbean flour by response surface methodology. African Journal of Food Science and Technology. 2(10), 232-239. Hussain, T., Tontisirin, K. and Chaowanakarnkit, L. (1983). Protein digestibility of weaning foods prepared from rice-minced meat and rice-mungbean combination in infants using a short term nitrogen balance method. Journal Nutrition Science Vitaminol. 29, 497–508. Jaya, T.V. and Venkataraman, L.V. (1981). Changes in the carbohydrate constituents of chickpea and greengram during germination. Food Chemistry. 7, 95-104. Madar, I. H., Asangani A. H., Shrinivasan, S., Tayubi, I. A. and Ogu, G. I. (2017).Nutritional and Biochemical Alterations in Vigna Radiata (Mung Bean) Seeds by Germination. International Journal Current Microbiology Applied Science.6(9), 3307-3313. Magaram, M.F., Stotts, C.L., Chen, T.S., Smith, C.H. and Kirsch, A.J. (1985). Folacin content of alfalfa and mung bean sprouts: the effect of extraction procedures and maturity. Journal Science Food Agriculture. 36, 1155-1160. Maskan, M. (2000). Microwave air and microwave finish drying of banana. Journal of Food Engineering. 44, 71-78. Montgomery, D. C. (2001). Design and analysis of experiments (5th Edition). New York: John Wiley. 455–492. Mubarak, A.E. (2005). Nutritional composition and antinutritional factors of mung bean seeds (Phaseolus aureus) as affected by some home traditional processes. Food Chemistry. 89, 489–495. Nath, A., Chatopadhyay P. K. and Majumdar G. C. (2011). Optimization of HTST process parameters for production of ready-to-eat potato-soy snack. Journal of Food Science Technology. 49(4), 427-428.
National E-Workshop onCurrent Scenario of Post Graduation Research in Agriculture Sector Sept 09-11, 2020
223
Pardeshi, I.L. and Tayade, P.T.(2013). Development of appropriate process for sprouting of soybeans. Journal of Food Research and Technology. 1(1), 36-44. Rajole, B. D. (2019). Development of tomato powder using microwavedrying technique. (Unpublished B. Tech. Project Report) submitted to Department of Agricultural ProcessEngineering, Dr. Panjabrao Deshmukh Krishi Vidyapeeth, Akola, India. Rao, B. S. N. and Prabhavathi T. (1982). Tannin content of foods commonly consumed in India and its influence on ionisable iron. Journal Sci Food Agric. 33, 89-96. Rao, P.U. and Belavady, B. (1978). Oligosaccharides in pulses; varietal differences and effects of cooking and germination. Journal of Agriculture Food Chemistry. 26, 316-319. Reddy, N.R., Balakrishnan, C.V. and Salunkhe, D.K. (1978). Phytate phosphorus and mineral changes during germination and cooking of black gram (Phaseolus mungo L.) seeds. Food Science. 43, 540 543. Salunkhe, D. K.(1982). Legumes in human nutrition. Current status and future research needs. Current Science. 51, 387-394. Savage, G.P. (1988). The composition and nutritive value of lentils. (Lens culingris). Nutrition Abstract Review Ser A. 58, 319-43. Savage, G.P. and Deo S. (1989a). The nutritional value of peas (Pisum sativum) Nutr Abstr Rev Ser A. 59, 65-88. Savage, G.P. and Deo S. (1989b). The nutritional value of mung bean and urd (Vigna radiata var. aureus and var. mungo) Nutr Abstr Rev Ser A. 59, 639-62. Sedani, S. R. (2019). Intermittent and stepwise decremental microwave power drying of green leafy vegetables.(Unpublished M. Tech. Thesis) submitted to Department of Agricultural ProcessEngineering, Dr. Panjabrao Deshmukh Krishi Vidyapeeth, Akola, India Sedani, S. R. and Pardeshi, I. L. (2018). Studies on Microwave Drying of Dill Leaves. Journal of Ready to Eat Foods. 5(4), 41-47. Shah, S. A., Zeb, A., Masood, T., Noreen, N., Abbas, A. J., Samiullah, M., Alim, Md. A. and Muhammad, A. (2011). Effect of sprouting time on biochemical and nutritional qualities of Mungbean varieties. African Journal of Agricultural Research. 6(22), 5091-5098. Shen, Yi Z., Shuai, S. and FitzGerald, R. (2018). Mung bean proteins and peptides: Nutritional, functional and bioactive properties. Food Nutrition Research. 62. Snedecor, G. W. and Cochran, W. G. (1967). Statistical methods. Ames: Iowa State University Press. Soysal, Y. (2004). Microwave drying characteristics of parsley. Biosystems Engineering. 89(2), 167 173. Soysal, Y., Arslan, M. and Keskin, M. (2009). Intermittent microwave-convective air drying of oregano. Food Science and Technology International. 15(4), 397-406. Stat-Ease, Inc. (2018). Design Expert User’s Guide; Design Expert Version 12.0, The Stat-Ease Inc., MN, USA. Tabekhia, M. M. and Luh, B.S. (1980). Effect of germination, cooking and canning on phosphorus and phy- tate retention in dry beans. Journal of Food Science. 45,406-408. Venkataraman, L. V., Jaya, T.V. and Krishnamourthy, K. S. (1976). Effect of germination on the biological value, digestibiity coefficient and net protein utilization of some legume proteins. Nutr Rep Int. 13, 197-205. USDA. (2016). United States Department of Agriculture. Agricultural Research Service, National Nutrient Database for Standard Reference Release 28, Nutrient database laboratory, homepage:https:// ndb.nal.usda.gov/ndb/search/list.

National E-Workshop onCurrent Scenario of Post Graduation Research in Agriculture Sector Sept 09-11, 2020
224
PHYSICAL CHARACTERISTICS OF MICROENCAPSULATED RED FLESHED DRAGON FRUIT POWDER
Vinod, B. R*., Ramachandra Naik, K., Kirankumar Gorabal, Deepa Terdal and Patil, S. N.
Department of Post-Harvest Technology, KRC College of Horticulture, Arabhavi-591218, UHS, Bagalkot, India
E-mail: [email protected]
Introduction: Dragon fruit, Hylocereus polyrhizus is a climbing vine belongs to family Cactaceae. Fruit exhibits non-climacteric pattern of respiration having short shelf life at ambient condition and seasonality in nature. To overcome this problem and to make the fruits available at every corner of the country and throughout the year, which can be achieved by various processing techniques, one of this technique is to convert them into microencapsulated powder through spray drying. Encapsulation is a process to entrap active agents within a carrier material and it is a useful tool to improve delivery of bioactive molecules into foods. Spray drying is one of the most common and comparatively cheapest techniques used to produce the microencapsulated powder. Dragon fruit can be powdered to have a longer shelf life and therefore could be easily and readily available during off-season and served as a good source of betalains rich functional food ingredient for addition into food products as natural colour or having instant properties such as food ingredient or food products, pharmaceutical or nutraceutical composition and cosmetic.Thus, the present study was carried out to standardize the protocol for preparation of spray dried dragon fruit juice powder and assess the physical characteristics of the produced powder.
Methodology: Sample preparation and Powder analysis: Fresh dragon fruits were washed, peeled manually and juice was extracted through laboratory fruit juice extractor machine under hygienic condition. The juice filtered using a kitchen sieve to remove mucilage content and seeds. Maltodextrin was added to clarified dragon fruit juice and diluted with water in the ratio of 1:0.5 and homogenised for 10 min by a basic lab homogenizer. The mixture was then spray-dried in a laboratory spray dryerat different maltodextrin concentration (15, 17.5 and 20%) and inlet air temperatures (140, 150 and 160 °C)with outlet air temperature and feed flow rate pre-set at 70 °C and 2 ml/min respectively.Spray dried powder was collected and transferred into laminated aluminium pouches and stored in a desiccator at ambient temperature for further studies. Powder recovery (%): Recovery percentage of dragon fruit powder was calculatedaccording to the following formula .
Recovery (%) = × 100
Moisture content (%): Moisture content of dragon fruit powder was estimated by using moisture analyser. One gram of sample was placed in sample petri-dish and dried in electric moisture analyser until it automatically showed constant moisture in percentage.
Weight of powder obtained Weight of juice + Weight of carrier agent

National E-Workshop onCurrent Scenario of Post Graduation Research in Agriculture Sector Sept 09-11, 2020
225
Water activity (aw): Water activity of dragon fruit powder was quantified by digital water activity meter. One fourth volume of the container was filled with sample and it was closed with lid containing sensors and left three minutes for undisturbed. After stabilizing the water activity was displayed by digital water activity meter. Particle size (d.nm): The zetasizer nano range is used to measure particle size of particles or molecules in a liquid medium. Thecomputer system uses the Malvern software for control of the equipment and for showing the results. Others: The solubility was determined as recommended by Cano et al. (2005). The bulk density was measured using the method suggested by Jinapong et al. (2008). Statistical analysis: The data recorded on the physicochemical parameters were subjected to statistical analysis in Completely randomized block design. Analysis done using Web Agri. Stat. Package 2 developed by ICAR research complex, Goa. The level of significance used in ‘F’ test was p ≤ 0.01.
Findings Powder recovery (%): Therecovery percentage of microencapsulated dragon fruit powder varied from 9.41 to 15.78 per cent. Powder recovery can be affected by the inlet temperatures where, higher the inlet temperatures, higher the process yield. But here, the maximum recovery was recorded in the treatment 150°C + 20% MD (Table 1) and this is because, sometimes there will be reduction in the yield as inlet temperature increases due to the melting of the powder and cohesion wall. Therefore, the amount of powder production also reduced. It is also recorded that, as the MD concentration increases the recovery of the powder increased irrespective of inlet air temperatures. Moisture content (%): Moisture content of spray dried dragon fruit powder was in the range of 3.75 to 5.97 per cent, which was sufficient to make food powder biologically safe (Table 1). Generally, increasing the inlet temperature decrease the moisture content of the powder. This may be due to the greater loss of water from powder because of the higher rate of heat transfer into sprayed small particles, which provides a great driving force for moisture evaporation and also due to crust formation on the drop surface. Increase in maltodextrin concentration resulted in the lower moisture content of the powder. This may be due to the addition of maltodextrin into feed before spray-drying increased the total solid content in feed and thus reduced the amount of free water for evaporation. Water activity (aw): The water activity of dragon fruit powder was in the range of 0.25 to 0.42 (Table 1) which was microbiologically and chemically quite stable. Results showed that water activity decreased with increasing maltodextrin concentration and higher inlet air temperature. This might be due to higher level of MD concentration; a rapid drying was occurred and hence powder with low moisture content and water activity was obtained. Solubility (%): The solubility of dragon fruit powder ranged from 90.25 to 96.53 per cent (Table 1). Generally, solubility increased with increase in inlet temperature because increasing the drying air temperature generally produces an increase in particle size and required less time for the powder to dissolve. Moreover, lower moisture content powder was more stable. Further higher MD has resulted in high solubility when compared to low MD concentration. This variation may be attributed to the fact that maltodextrin, which is an amorphous and non-crystalline material, thus it may lead to superior water solubility.

National E-Workshop onCurrent Scenario of Post Graduation Research in Agriculture Sector Sept 09-11, 2020
226
Bulk density (g/ml): Bulk density of microencapsulated dragon fruit powder was observed in a range of 0.66 to 0.71 g/ml (Table 1). Generally, the increase of inlet air temperature causes a decrease in bulk and particle density, it also provides a greater tendency to the hollowness of the particle. Maltodextrin concentration significantly affects the bulk density of the collected powder. An increased in maltodextrin concentration led to a decrease in density of spray dried powder. This effect could be due to the addition of maltodextrin which minimized the thermoplastic particles from sticking and the sticky or less free-flowing nature of powder was associated with a high particle density. Particle size (d.nm): The particles size of dragon fruit was in the range of 331.1 to 714.3 d.nm (Table 1). There is a lot of variations in the size of the particles as it depends on the type of carrier agent used, its concentration and temperature at which it is sprayed. The increase in inlet temperature leads to the production of larger particle size. The use of higher inlet air temperature leads to the production of larger particles and causes higher swelling. In the present study, the sample 150 °C + 15% MD showed deviation against other treatments and earlier findings. The presence of larger particles may be attributed to an incipient agglomeration process, where the formation of irreversible link bridges leads to the production of particles of greater size.
Treatments Recovery
(%) Moisture
(%)
Water activity
(aw)
Solubility (%)
Bulk density (g/ml)
Particle size
(d.nm)
160°C+20% MD
14.96 3.75 0.25 96.53 0.61 714.30
160°C+17.5% MD
11.88 3.84 0.26 96.14 0.62 680.60
160°C+15% MD
10.97 4.14 0.29 95.68 0.64 635.30
150°C+20% MD
15.78 3.86 0.26 96.08 0.65 444.00
150°C+17.5% MD
14.69 3.94 0.28 95.59 0.67 405.70
150°C+15% MD
14.47 4.12 0.29 95.53 0.68 573.70
140°C+20% MD
11.12 4.03 0.29 94.13 0.68 382.00
140°C+17.5% MD
10.73 5.13 0.35 92.59 0.69 341.90
140°C+15% MD
9.41 5.97 0.42 90.25 0.71 331.10

National E-Workshop onCurrent Scenario of Post Graduation Research in Agriculture Sector Sept 09-11, 2020
227
TO STUDY THE EFFECTIVENESS OF DIFFERENT EDIBLE COATINGS ON SHELF LIFE AND QUALITY OF FRESH - CUT RED
PUMPKIN
Survase SS and VK Garande RCSM College of Agriculture, Kolhapur, Maharashtra
Email: [email protected]
Red pumpkin (Cucurbita moschata L.) is a very important seasonal fruit vegetable grown in all tropical and subtropical countries of the world. Pumpkin has shown great potential to expand the market of minimally processed vegetable and fruits as they are large and have considerable difficulties in the marketing, storage and handling, causing many damages and losses. Minimally processed vegetables deteriorate rapidly in quality and have a short storage life. The high moisture content and numerous cut surfaces of minimally processed vegetables provide optimal conditions for the growth of micro-organisms. Use of edible coatings to minimize undesirable changes due to minimal processing has been reported for several commodities. They can provide a partial barrier to water vapor and gas exchange, thus delaying shrinkage of cut produce and creating a modified atmosphere around the commodity. Recently, there has been an increasing market demand for minimally processed fruits and vegetables due to their fresh like character, convenience and human health benefits. The different edible coatings are being used for enhancing the shelf life of many fruits and vegetables. Chitosan has been reported to maintain the quality of cut pumpkin while xanthan gum has been effective in the preservation of minimally processed red pumpkin. Hence, the present investigation was carried out to study the effect of edible coatings on shelf life and quality of minimally processed red pumpkin under different storage conditions at RCSM College of Agriculture, Kolhapur during summer, 2019. The experiment was laid out in completely randomized design with different pre- treatments of edible coatings such as T1= Untreated control, T2= Xanthan gum 0.50%, T3= Chitosan 1%, T4
= Gaur gum 0.25%, T5= Ascorbic acid 0.50%, T6= Glycerol 1% and T7= Sodium benzoate 0.05% with three replications and pre-treated samples were packed in polyethylene bags of 200 gauge with 2% vents and stored at refrigerator storage conditions i.e. 50Cand 90% RH.
The data revealed that, the continuous decrease in physiological loss in weight, total soluble solids, pH, moisture content, firmness, ascorbic acid, total mineral content and increase in rate of ethylene production, titratable acidity was observed in all the samples irrespective of edible coatings with progressive increase in storage period. The red pumpkin pre-treated with 0.50% xanthan gum (T2 ) recorded minimum changes in physico-chemical parameters, microbial count and sensorial attributes on 12th day of storage at refrigerator storage. The lowest PLW, per cent moisture loss, acidity, pH, rate of ethylene production, total microbial count were recorded in T2 (2.50%, 91.27%, 0.58%, 6.01, 71.41ppm,7.47 log cfu/g, followed by T3 (2.87%, 91.20%, 0.65%, 5.72, 73.13 ppm, 8.26 log cfu/g, respectively). The treatment T2 recorded the maximum retention of TSS, firmness, ascorbic acid and total minerals, colour, flavour, taste, appearance, overall acceptability(6.07 Brix, 3.88 kg/cm2, 8.58 mg/100g, 417.02 mg/100g, 8.00, 8.04, 8.25, 8.26, 8.16, respectively) followed by T3 (5.91 � Brix, 3.73

National E-Workshop onCurrent Scenario of Post Graduation Research in Agriculture Sector Sept 09-11, 2020
228
kg/cm2, 8.47 mg/100g, 416.73 mg/100g, 7.83, 7.94, 8.14, 8.16, 8.03, respectively) on 12th day of storage under refrigerator conditions. From this study it is concluded that, xanthan gum @ 0.50% (T2) and chitosan @ 1% (T3) were found effective for extending the shelf life with more retention of physico-chemcial, sensorial qualities and reduced total microbial count of minimally processed red pumpkin up to twelve days at refrigerator storage as compared with remaining treatments.

National E-Workshop onCurrent Scenario of Post Graduation Research in Agriculture Sector Sept 09-11, 2020
229
NUTRITIONAL SUSTAINABILITY WITH VALUE ADDITION
Priyanka Kumawat, Kumari Lata and Manju Verma Department of Horticulture, College of Agriculture, SKRAU, Bikaner
Email: [email protected] Nutritional well-being is a sustainable force for health and development of people and maximization of human genetic potential. Food has been considered as the major factor in maintaining the nutritional values in the human body. Among all food groups, fruits and vegetables play a significant role in human nutrition, especially as a source of vitamins, minerals and dietary fiber. They are rich source of antioxidants and pigments. Significant developments in technology include better understanding of the process of ripening of fruits, optimum harvesting time, pre-cooling of freshly harvested produce, cold storing of the raw fruits and vegetables, sorting, cleaning, waxing, packaging technology for fruits. At CFTRI, DFRL, IIHR, Bangalore; IARI, New Delhi; GBPUA&T, Pantnagar; IIVR, Varanasi and HPKV, Palampur; a number of technologies have been developed. Value addition of fruits and vegetables by formulation of different value-added products are an important source of nutritional security. Effective post-harvest management allows not only the minimization of losses but also increases the value of the marketed agricultural products by transforming the agricultural raw materials (fruit juice, jam, cheese, salting, drying, smoking).
National E-Workshop onCurrent Scenario of Post Graduation Research in Agriculture Sector Sept 09-11, 2020
230
POST HARVEST TECHNOLOGY, LOSSES & TREATMENT
Darshana yadav and Pushpanjali Department of horticulture, MJRP College of Agriculture and Research, Achrol,
Jaipur(Raj. Department of agronomy, SKN college of Agriculture , Agriculture University,
Jobner(Raj.) EMAIL ID :- [email protected]
Horticulture includes tropical and subtropical fruits, vegetable, spices, flowers, medicinal & aromatic plants. Horticulture sector is a major growth of Indian agriculture. India is the second largest producer of fruits & vegetables in the world. But the post harvest loss is because of weak supply chain entities like storage facilities bad transportation facility, market facility & not proper post harvest management. post harvest loss indirectly affect on our india economy. By using modern technologies post harvest loss can be reduced. eg:- Geographic information system(GIS) can be used for analysis of spatial data & helps also in decision making in problems. Lation based recommendation system will also help to recommend the location of cold storage & establishment of new cold storage. post harvest technology have allowed horticultural industries to meet the global demands of local & large-scale production & intercontinental distribution of fresh produce that have high nutritional & sensory quality
National E-Workshop onCurrent Scenario of Post Graduation Research in Agriculture Sector Sept 09-11, 2020
231
VALUE ADDED PRODUCTS FROM INDIAN JUJUBE
Deepak Singh Rathore and Saket Mishra
Department of Horticulture Naini Agricultural Institute
Sam Higginbottom University of Agriculture, Technology and Sciences, Prayagraj Email: [email protected]
Introduction Indian jujube (Z. mauritiana L.) is a fast growing, spiny, thicket-forming shrub or tree, However, it is also a valuable commercial fruit crop in its native Asia, mostly in India and China, The fruits of cultivar Gola were suitable for eating for up to 8 days of storage. In contrast to this that Ber fruits stored at ambient temperature had a short life of 3 days only. Extensive studies have been carried out using Ber fruits to prepare various processed products, such as candy dehydrated products juice and wine jam, jelly, shreds and powder with increased production of a particular fruit in a season, there is a glut in the market and the farmer is at loss due to low market price for his produce.This is also true in case of Ber. It is therefore necessary to develop suitable technology for processing of the fruits. Thus the processing of Ber into marketable demanded products likes, pulp, juice concentrates, jams, jelly, syrup, Ber candy, Ber powder, tutti-fruity, slices, shreds and wine will help to increase the shelf life, minimize the glut in the market during its peak season of production, reduces post-harvest losses, enhances the export, which ultimately fetches the valuable foreign exchange and improves socio economic conditions of farmers, processors and entrepreneurs. Methodology The Experimental was conducted in Completely Randomized Design (CRD) with 9 treatments of and three replications in the Post Harvest Laboratory of Department of Horticulture, Sam Higginbottom University of Agriculture, Technology and Sciences, Prayagraj during December, 2019 to March, 2020. Total number of treatments were nineviz.T1(Stepping in 650Brix syrup), T2 (Stepping in 70 0Brix syrup), T3 (Stepping in 750Brix syrup), T4 (Stepping in 650Brix syrup + blanching in 0.2% KMS solution), T5 (Stepping in700Brix syrup + blanching in 0.2% KMS solution), T6 (Stepping in 750Brix syrup + blanching in 0.2% KMS solution), T7 (Stepping in 650Brix syrup + blanching in 0.2% KMS solution + 1% citric acid), T8 (Stepping in 70 0Brix syrup + blanching in 0.2% KMS solution + 1% citric acid) and T9 (Stepping in 750Brix syrup + blanching in 0.2% KMS solution + 1% citric acid) Gola variety of Ber was used for processing.
Findings The present investigation was carried out during December 2019 to March 2020 in Post Harvest Laboratory of Department of Horticulture, Naini Agricultural Institute, Sam Higginbottom University of Agriculture, Technology and Sciences, Prayagraj (U.P.) India. The results of the present investigation, regarding the Uniformity of a procedure for the foundation of comfit from Ber, have been discussed and interpreted in the light of previous research work done in India and abroad. The experiment was conducted in Completely Randomized design with 9 treatments, and three replications.

National E-Workshop onCurrent Scenario of Post Graduation Research in Agriculture Sector Sept 09-11, 2020
232
The results of the experiment are summarized below. Acidity (%) In terms of Acidity lowest score (0.89, 0.97, 1.14, 1.29 and 1.46 %) at Initial, 20, 40, 60 and 80 days respectively after storage was observed in treatment T1 (Stepping in 650Brix syrup), followed by treatment T4(Stepping in 650 Brix syrup + blanching in 0.2% KMS solution) with (0.92, 0.99, 1.13, 1.33 and 1.49 %) at Initial, 20, 40, 60 and 80 days after storage, whereas the maximum score was observed in treatment T2 (Stepping in 70° Brix syrup) with (1.40, 1.47, 1.57, 1.75 and 1.96%)during 80 days storage. The acidity (%) of Ber comfit was showed increasing trend in all value added Ber candy during storage.An increase in acidity (%) of Ber candy during storage might be attributed to the chemical interaction between constituents of Ber candy induced by temperature and action of enzymes. Deka, (2000) and Dekaet al., (2004) reported similar finding with lime-aonla blended RTS and Nath and Yadav, (2005b)with ginger-kinnow squash.Agarwal and Sandhu (2006) in kinnow candy and Navitha and Mishra (2018) in Ber Candy. pH In Terms of pH content at different periods of storage. The lowest score of pH (4.16, 4.10, 4.02, 3.95 and 3.89) at Initial, 20 40, 60 and 80 days respectively was observed in treatment T7 (Stepping in 65° Brix syrup + blanching in 0.2% KMS solution + 1% citric acid), followed by treatment T8(Stepping in 700 Brix syrup + blanching in 0.2% KMS solution + 1% citric acid) with (4.27, 4.19, 4.09, 4.01 and 3.94) at initial, 20, 40, 60 and 80 days respectively, whereas the maximum score was observed in treatment T2 (Stepping in 70 0Brix syrup) with (5.18, 5.12, 4.99, 4.86 and 4.63)during 80 days storage. The pH content of Ber comfit was showed decreasing trend in all value added Ber candy during storage.There was a negligible change in pH content decreased of the candy during storage may possibly be due to increase in time interval, temperature and action of enzymes. Similar results were reported by Krishnaveniet. al., (2001) in Jackfruit RTS and Jain et al., (2004)in case of Papaya cubes and Navitha and Mishra (2018) in Ber Candy. Moisture content (%) In terms ofMoisture content at different periods of storage. The minimum score of Moisture content (17.26, 15.01, 13.67, 12.31 and 10.79 %) at Initial, 20, 40, 60 and 80 days respectively was observed in treatment T7 (Stepping in 65 0Brix syrup + blanching in 0.2% KMS solution + 1% citric acid), followed by treatment T6
(Stepping in 750Brix syrup + blanching in 0.2% KMS solution) with (17.73, 15.59, 14.08, 12.79 and 11.09%) whereas the maximum score was observed in treatment T3 (Stepping in 75 0Brix syrup) with (19.35, 17.49, 15.93, 14.46 and 12.91%)during 80 days storage The Moisture content of Ber comfit was showed decreasing trend in all treatments during storage.Results indicated that Moisture content of candy decreased continuously during entire period of storage. This reduction may be due to increase in TSS attributed to the reduction in Moisture content of the product with storage, a tendency of weight reduction was shown with increasing the sugar concentration, Madhan and Dhawan (2005) in Carrot candyandDaisy and Gehlot (2006) reported in Aonla preserve and Navitha and Mishra (2018) in Ber Candy. Score for Colour and Texture: In terms of score for colour and Texture and Body (8.75, 8.41, 8.03, 7.68 and 7.30 for colour) and (8.48, 8.22, 7.97, 7.68 and 7.33 for texture and Body) at Initial, 20, 40, 60

National E-Workshop onCurrent Scenario of Post Graduation Research in Agriculture Sector Sept 09-11, 2020
233
and 80 days respectively was observed in treatment T7 (Stepping in 65 0Brix syrup + blanching in 0.2% KMS solution + 1% citric acid), followed by treatment T8(Stepping in 700Brix syrup + blanching in 0.2% KMS solution + 1% citric acid) with (8.57, 8.23, 7.89, 7.54 and 7.17 for colour) and (8.33, 8.07, 7.77, 7.44 and 7.11) whereas the minimum score was observed in treatment T1 (Stepping in 650Brix syrup) with (7.13, 6.88, 6.55, 6.22 and 5.87 for colour) and (6.93, 6.70, 6.41, 6.13 and 5.82) for textureduring 80 days storage.The colour and appearance and Texture of Ber candy was showed decreasing trend in all value added Ber candy during storage due to increase in time interval, temperature and action of enzymes.
National E-Workshop onCurrent Scenario of Post Graduation Research in Agriculture Sector Sept 09-11, 2020
234
EFFECT OF BIODEGRADABLE NANO FORMULATION ON POST HARVEST LOSSES IN TOMATO (Solanum lycopersicum L.)
Mahendra Meena, K.K. Meena, O.P. Garhwal, Shalini Pilania1
Department of Horticulture, SKN Agriculture University, Jobner, Rajasthan 1Department of Horticulture, Rajasthan College of Agriculture, MPUAT, Udaipur
Email - [email protected]
Introduction Horticulture crops play important role in economic development of the country and it contributes 30.4 per cent to GDP of agriculture. But the post-harvest loss reduced the quality of commodities, in India the estimated loss range from 14-36% in fruits and 10-25% in vegetables. Every year we lost approx 1 lakh crore Rs due to post harvest losses in horticulture crops. Ripened fruits are terribly spoil and prone to transport harm which consequently leads to loss of quality and quantity.This is particularly common in developing countries because of poor post-harvest handling systems, storage facilities and transportation. Various factors responsible forpost-harvest losses can be categorized into two major categories. First, pre harvest losses because of farmers’ poor agricultural techniques (i.e. varieties withlow shelf life, imbalanced use of nutrients, abiotic stresses, insects, pestsand disease infestation), oldharvesting procedures, non-utilization of pre-harvestsuggested methods. Second, harvest losses due to careless harvesting, harvesting at inappropriate stage, dumping producewithout pre-cooling, moisturestrengthening that causes pathogen infestation, bulk packagingwithout grading of produce andreprehensible transportation and storage to distant market distribution. These losses returnlow profits to growers and processors. Traditionally, post-harvest management practices/techniques like pre-cooling after harvest,refrigeration storage, post-harvest uniform heat treatment of tomatoes, modified atmosphere packaging and use of agrochemicals calcium chloride (CaCl2), 1-methylcyclopropene, nitric oxide, H2O2, salicylic acid and sodium selenate are followed to protect/uphold the quality of fresh fruits and vegetables. Treatments with synthetic fungicides namely fenhexamid, pyraclostrobin, boscalid etc. has also been the major practice to overcome the postharvest diseases. But, simultaneously, international worries have also been rising over the indiscriminate use of synthetic fungicides on crops because of their harmful effects on human health and the emergence of pathogen resistance against fungicides. Chemical residues easily distributed in the edible portion of commodities that is responsible for reduced the quality. Toxic organic and inorganic compounds are entering the environment. Long term adverse effects on living organisms. Biodegradable nano formulations are effective as compared to other compounds due to high surface-to-volume ratio, small size of the particles (1nm) and high charge density. Chitosan based nano-materials have been explored in agriculture for plant protection and growth. They are preferably used worldwide for their biodegradability, high permeability, eco-friendly, non-toxicity to human and cost effectiveness. Currently the application of nanomaterials seems to be very attractive in preventing post harvest losses in fruits and vegetable. Nanoparticles are more effective against microbes at very low dose. It also extends the shelf life of fruits and vegetables by controlling growth and developments of micro organisms. That's why we need to explore newer alternatives to reduce the use of synthetic fungicides.

National E-Workshop onCurrent Scenario of Post Graduation Research in Agriculture Sector Sept 09-11, 2020
235
Methodology Synthesis of Cu- chitosan nanoformulation (Cu-CS NPs), a well established and reproducible method of cross-linking coupled with ultra sonication as described earlier was used (Saharan et al., 2013, 2015). Chitosan was dissolved at 0.5% level (w/v) in 1% (v/v) acetic acid followed by stirring on magnetic stirrer (Remi Laboratory Instruments, Mumbai, India) at 200 rpm. Sodium tripolyphosphate (TPP) was dissolved at 1% (w/v) in ultrapure water and cross-linking of chitosan with TPP at equal volume was performed using Pediatric set (Romsons, Agra, India) under magnetic stirrer. Before finishing of cross-linking, CuSO4 (0.01%) was added into the reaction mixture. The resulting formulation was subjected to centrifugation for 10 min at 10,000 rpm and the pellet was re-suspended in ultrapure water followed by ultra-sonication (with 3.0 mm probe, sonicator, Lark Innovative, Chennai, India) at 80% pulser for 100 s at 4ºC. Centrifugation followed by ultra-sonication was repeated thrice and the precipitated nanoformulation was lyophilized and used for further analysis. The developed nanoformulation was characterized for mean size, size distribution, zeta-potential, polydispersity index (PDI) by (DLS: Dynamic Light Scattering), functional group analysis by Fourier Transform Infra Red Spectroscopy (FTIR) and surface morphology and internal structure by Scanning Electron Microscopy (SEM), Transmission Electron Microscopy (TEM) (Saharan et al., 2013, 2015). Chitosan nanoformulations of different concentrations (0.01, 0.04, 0.08, 0.12, 0.16 and 0.2% w/v) as detailed below were used to treat tomato fruit.
Treatment details of experiment:
S. No. Treatments Notation
1. Control T1
2. BCH @ 0.01% T2
3. CuSO4 @ 0.01% T3
4. Cu-CS NPs @ 0.01% T4
5. Cu-CS NPs @ 0.04% T5
6. Cu-CS NPs @ 0.08% T6
7. Cu-CS NPs @ 0.12% T7
8. Cu-CS NPs @ 0.16% T8
9. Cu-CS NPs @ 0.20% T9
Findings Among Cu-CS NPs treatments, 0.04% concentration effectively prevented microbial decay, PLW, maintained fruit firmness and reduced the respiration rate in tomatoes stored at ambient temperature up to 21 days. At same concentration (0.04%), Cu-CS NPs significantly delayed the loss of titratable acidity, retained the TSS, total sugars, reducing sugars, ascorbic acid and lycopene content from day 1 to days 21 as compared with control. Cu-CS NPs (0.04%) significantly (P < 0.05) inhibited PPO activity, effectively preserved L*, a*, b* values and maintained good organoleptic score during storage. On 7th day Maximum B:C ratio was recorded 0.01% Cu-CS NPs in copper chitosan nanoparticle treated tomatoes while, minimum B:C ratio was

National E-Workshop onCurrent Scenario of Post Graduation Research in Agriculture Sector Sept 09-11, 2020
236
recorded in control in copper chitosan nanoparticle treated tomatoes. We witnessed that various parameters measured up to 21 days gave astonishing results and we further submit that chitosan formulations are effective to extend the shelf-life of tomato up to 21 days at ambient temperature. Based on the aforementioned results and comparative evaluation of different doses of bulk-chitosan and Cu-CS NPs, we concluded that Cu-CS NPs are very effective at less concentration and thus exert minimum chemical load on the treated tomatoes. Therefore, it may claim that Cu-CS NPs have potential to be further explored in post-harvest technology. It may be validated in large scale experiments for translation of technology.

National E-Workshop onCurrent Scenario of Post Graduation Research in Agriculture Sector Sept 09-11, 2020
237
CHANGES IN PHYSICAL AND QUALITITATIVE CHARACTERS OF DATE PALM UNDER FREEZE STORAGE CONDITION
Priyanka Kumawat, R.S.Rathore, P.K.Yadav, Sheetal Rawat and Kumari Lata
Department of Horticulture, College of Agriculture, Bikaner Swami Keshwanad Rajasthan Agricultural University, Bikaner
E-mail: [email protected]
Introduction Iraq is the center of origin of date palm (Johnson et al., 2013) and it is reported that it is cultivated from more than 6000 years ago (Abdolvand et al., 2018; Chandrasekaran and Bahkali, 2013).Date palm fruit rich in essential nutrients, vitamins, and minerals which helps in enhance the growth and development of human (Al-Farsi and Lee, 2008; Assirey, 2015; Hamad et al., 2015). It contains 70–80% carbohydrates (fructose and glucose) and minerals like calcium, iron, magnesium, phosphorus, potassium, zinc, selenium and manganese which enhance their nutritional values (Al-Farsi et al., 2005, Elleuch, et al., 2008). Aqueous extracts of date have a potential antioxidant and anti-mutagenic property (Biglari et al., 2008, Saafi et al., 2009). It is rich source of vitamins, especially β-carotene, thiamine, riboflavin, niacin, ascorbic acid and folic acid (El Hadrami and El Hadrami, 2009, El Hadrami et al., 2011). The major date palm growing areas in India are Kutch (Gujarat), Rajasthan, and certain parts of the Punjab, as well as Tamilnadu (Shah, 2014).Area of date palm in Rajasthan is 850 ha with production of 800 tonnes (Singh, 2018). Fruits quality deteriorate at ambient temperature after some days of harvesting. Frozen storage can be utilized in some fruits and vegetables for long time storage. It enhances the shelf life of produce by decreasing the water activity, inhibits microorganism growth and reduces enzymatic activity (Fellows, 2000). Taking into consideration the importance ofstorage at freezing temperature, present study was planned to evaluate the impact of temperature on fruit quality characters of date palm and compare the quality parameter of fresh and stored fruits. Methodology An experiment was conducted during July 2019 to July 2020 at College of Agriculture, SKRAU, Bikaner on “Halawy” cultivar of date palm. Fruits were harvested at doka stage. For each observation 30 random fruits were taken. At the time of harvesting, fruits were taken from uniform bunches. Fruits were pack in net begs and store in deep freeze at - 15oC temperature for period of 12 months. Fruits were thawed before taking observations; fruits were taken from the freeze and leave them for 2 hours at room temperature for thawing. Physical parameters Fruits weight, pulp weight and stone weight was taken in (gm) of fresh and stored fruit at doka stage. Fruit length and diameter was observed by using vernier caliper and then mean values calculated in cm. Quality parameters TSS Total soluble solids (TSS) were determined by using digital hand refrectometer (0-50° Brix). The value was corrected at 20°C and expressed as ° Brix (A.O.A.C, 2007). Acidity

National E-Workshop onCurrent Scenario of Post Graduation Research in Agriculture Sector Sept 09-11, 2020
238
The titrableacidity of the juice was determined by titrating it against 0.1 N NaOH, using phenolphthalein indicator and it was expressed in % malic acid (A.O.A.C., 2007). Ascorbic acid Ascorbic acid contents were determined by the method reported earlier by Ruck (1969). Ten ml of juice was diluted with 0.4% oxalic acid solution and 5 ml of filtered aliquot was titrated against 2, 6-dichlorophenol indophenol dye to light pink colour end point and were determined as mg 100 ml-1 FW. Sugars Total sugar contain determine by Anthrone reagent method (Hedge, 1962). Reducing sugar content was measured by following “Nelson’s modification” of “Somogyi method” (Somogyi, 1952) using aresenomolybdate colour forming reagent and two copper reagent “A” and “B”.The non-reducing sugars were calculated by the deducting the reducing sugar content from the total sugar content and multiplied by the factor 0.95. Findings Physical parameters Table 1: Mean values of the physical characters of date palm cv. Halawy cultivar at Doka stage. Characters Fresh fruits Store fruits (- 15 °C) Fruit weight (g) 7.42 5.18 Pulp weight (g) 6.20 3.99 Stone weight (g) 1.22 1.19 Diameter(cm) 1.92 1.33 Length (cm) 3.87 2.98 The data obtained on physical parameters are given in table no. 1. The average fruit weight of 30 fresh fruits was found 7.42 g. The weight of fruits decreases after 12 months in deep freeze storage at - 15 °C temperature. Initial weight of fresh date fruits at doka stage found 6.20 g and it is also reduces from 6.20 to 3.99 g after 12 months. Stone weight of fruit initially observed 1.22 g and after deep freeze storage slightly loss in weight was found from 1.22 to 1.19 g. Reduction in the weight occurs due to chemical reaction and water loss during storage period. This finding supported by the work of (Yousef et al., 2012) on mango and they found rapid moisture loss in mango during storage and same result also found in apple (Johnston et al., 2001). Length and diameter of the fresh fruit observed 3.87 and 1.92 cm respectively and this size reduced after storage period 2.98 and 1.33 cm. reduction in the length and diameter occurs due to shrinkage in fruit skin. This result confirm with the finding of Al- Yahyai and Al- Kharus (2012). Quality parameters TSS The data obtain on quality parameters are given in table no. 2. Total soluble solids in fresh fruit of Halawy cultivar found 47.52 B° and it was increase in storage condition upto 52.62 B°. The similar trends were observed by Youssef and Labib, 2007 on apricot and Zina, 2000 and Shatta, 2006 on lime. TSS increased in mango irrespective to storage period (Islam, et al., 2013). Acidity Acidity of the date palm fruits were decrease during storage (Table 2). It is commonlyattributedtoconsumptionof organic acids forenergyproduction (Cohen, et
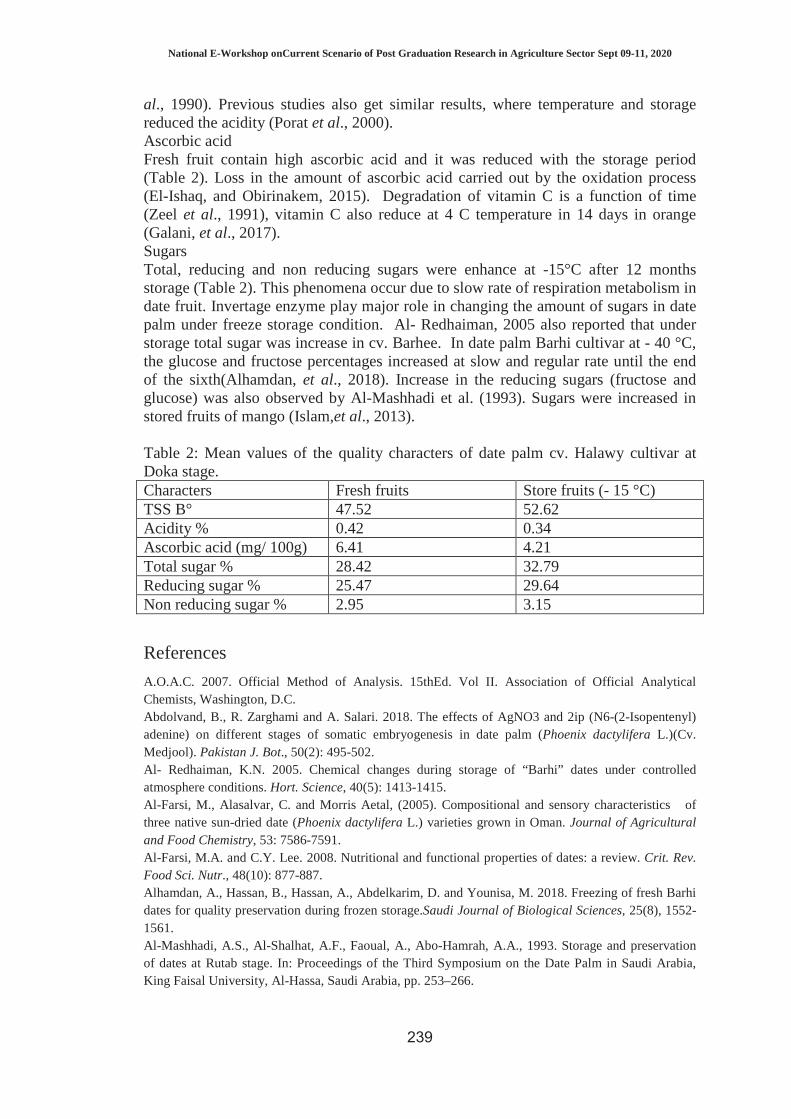
National E-Workshop onCurrent Scenario of Post Graduation Research in Agriculture Sector Sept 09-11, 2020
239
al., 1990). Previous studies also get similar results, where temperature and storage reduced the acidity (Porat et al., 2000). Ascorbic acid Fresh fruit contain high ascorbic acid and it was reduced with the storage period (Table 2). Loss in the amount of ascorbic acid carried out by the oxidation process (El-Ishaq, and Obirinakem, 2015). Degradation of vitamin C is a function of time (Zeel et al., 1991), vitamin C also reduce at 4 C temperature in 14 days in orange (Galani, et al., 2017). Sugars Total, reducing and non reducing sugars were enhance at -15°C after 12 months storage (Table 2). This phenomena occur due to slow rate of respiration metabolism in date fruit. Invertage enzyme play major role in changing the amount of sugars in date palm under freeze storage condition. Al- Redhaiman, 2005 also reported that under storage total sugar was increase in cv. Barhee. In date palm Barhi cultivar at - 40 °C, the glucose and fructose percentages increased at slow and regular rate until the end of the sixth(Alhamdan, et al., 2018). Increase in the reducing sugars (fructose and glucose) was also observed by Al-Mashhadi et al. (1993). Sugars were increased in stored fruits of mango (Islam,et al., 2013). Table 2: Mean values of the quality characters of date palm cv. Halawy cultivar at Doka stage. Characters Fresh fruits Store fruits (- 15 °C) TSS B° 47.52 52.62 Acidity % 0.42 0.34 Ascorbic acid (mg/ 100g) 6.41 4.21 Total sugar % 28.42 32.79 Reducing sugar % 25.47 29.64 Non reducing sugar % 2.95 3.15
References
A.O.A.C. 2007. Official Method of Analysis. 15thEd. Vol II. Association of Official Analytical Chemists, Washington, D.C. Abdolvand, B., R. Zarghami and A. Salari. 2018. The effects of AgNO3 and 2ip (N6-(2-Isopentenyl) adenine) on different stages of somatic embryogenesis in date palm (Phoenix dactylifera L.)(Cv. Medjool). Pakistan J. Bot., 50(2): 495-502. Al- Redhaiman, K.N. 2005. Chemical changes during storage of “Barhi” dates under controlled atmosphere conditions. Hort. Science, 40(5): 1413-1415. Al-Farsi, M., Alasalvar, C. and Morris Aetal, (2005). Compositional and sensory characteristics of three native sun-dried date (Phoenix dactylifera L.) varieties grown in Oman. Journal of Agricultural and Food Chemistry, 53: 7586-7591. Al-Farsi, M.A. and C.Y. Lee. 2008. Nutritional and functional properties of dates: a review. Crit. Rev. Food Sci. Nutr., 48(10): 877-887. Alhamdan, A., Hassan, B., Hassan, A., Abdelkarim, D. and Younisa, M. 2018. Freezing of fresh Barhi dates for quality preservation during frozen storage.Saudi Journal of Biological Sciences, 25(8), 1552-1561. Al-Mashhadi, A.S., Al-Shalhat, A.F., Faoual, A., Abo-Hamrah, A.A., 1993. Storage and preservation of dates at Rutab stage. In: Proceedings of the Third Symposium on the Date Palm in Saudi Arabia, King Faisal University, Al-Hassa, Saudi Arabia, pp. 253–266.
National E-Workshop onCurrent Scenario of Post Graduation Research in Agriculture Sector Sept 09-11, 2020
240
Assirey, E.A.R. 2015. Nutritional composition of fruit of 10 date palm (Phoenix dactylifera L.) cultivars grown in Saudi Arabia. Journal of Taibah University for Science, 9(1): 75-79. Association of Official Agricultural Chemists. 1995. Official methods of Analysis. A.O.A.C. 15th Ed. Published by A.O.A.C. Washington, D.C. (U.S.D). Biglari, F., Al Karkhi, A.F.M. and Easa, A.M. 2008. Antioxidant activity and phenolic content of various date palm (Phoenix dactylifera L.) fruits from Iran. Food Chemistry, 107: 1636–1641. Chandrasekaran, M. and A.H. Bahkali. 2013. Valorization of date palm (Phoenix dactylifera) fruit processing by-products and wastes using bioprocess technology – Review. Saudi J. Biol. Sci., 20(2): 105-120. Cohen, E., Shalom, Y. and Rosenberger, I. 1990. Post- harvest behavior of ‘Ortanique’ (‘Topaz’) tangor citrus fruit during long- term storage at various temperatures. ScientiaHorticulturae, 44: 235–240. El Hadrami, A., Daayf, F. and El Hadrami I. 2011. Secondary metabolites of date palm. In: Jain, S.M., Al-Khayri, J.M. and Johnson, D.V. (eds.) Date palm biotechnology. Springer, Dordrecht, pp 653–674. El Hadrami, I. and El Hadrami, A., (2009). Breeding date palm. In: Jain, S.M. and Priyadarshan, P.M. (eds.) Breeding plantation tree crops. Springer, New York, pp 191–216. El-Ishaq, A. and Obirinakem, S. 2015. Effect of Temperature and Storage on Vitamin C Content in Fruits Juice. International Journal of Chemical and Biomolecular Science, 1(2): 17-21. Elleuch, M., Besbes, S. and Roiseux, O., (2008). Date flesh: Chemical composition and characteristics of the dietary fibre. Food Chemistry, 111: 67–82. Fellows, P.L. 2000. Food processing technology: Principles and practices, second ed. Wood Head Publication. Cambridge, UK, pp. 610. Galani, J. H. Y. Patel, J. S., Patel, N. J. and Talati, J. G. 2017. Storage of Fruits and Vegetables in Refrigerator Increases their Phenolic Acids but Decreases the Total Phenolics, Anthocyanins and Vitamin C with Subsequent Loss of their Antioxidant Capacity. Antioxidants, 6(3): 59. Hamad, I., H. Abd Elgawad, S. Al Jaouni, G. Zinta, H. Asard, S. Hassan, M. Hegab, N. Hagagy and S. Selim. 2015. Metabolic analysis of various date palm fruit (Phoenix dactylifera L.) cultivars from Saudi Arabia to assess their nutritional quality. Molecules, 20(8): 13620- 41. Hedge, J.E. and Hofreiter, B.T. 1962. In: Carbohydrate Chemistry, 17 (Eds. Whistler R.L. and Be Miller, J.N.), Academic Press, New York. Islam, M.K., Khan, M. Z. H., Sarkar, M. A. R., Absar, N. and Sarkar, S. K. 2013. Changes in Acidity, TSS, and Sugar Content at Different Storage Periods of the Postharvest Mango (Mangifera indica L.) Influenced by Bavistin DF. https://doi.org/10.1155/2013/939385 Johnson, D.V., Al-Khayri, J.M. and Jain, S.M. 2013. Seedling date palms (Phoenix dactylifera L.) as genetic resources. Emirates Journal of Food and Agriculture, 25(11): 809–830. Johnston, J.W., Hewett, E.W., Banks, N.H., Harker, F.R., Hertog, M. 2001. Physical change in apple texture with fruit temperature, effect of cultivar and time in storage. Postharvest Biol. Tech., 23: 13-21. Porat, R., Pavoncello, D., Peretz, J., Ben-Yehoshua, S. and Lurie, S. 2000. Effects of various heat treatments on the induction of cold tolerance and on the postharvest qualities of ‘Star Ruby’ grape fruit. Postharvest Biology and Technology, 18: 159–165. Ruck, J.A. 1969. Chemical Methods for Analysis of Fruits and Vegetables. Summerland Res. Stat., Dept. Agri. Canada. SP50, pp. 27-33. Saafi, E.B., El Arem A. and Issaoui, M., (2009). Phenolic content and antioxidant activity of four date palm (Phoenix dactylifera L.) fruit varieties grown in Tunisia. International Journal of Food Science and Technology, 44: 2314–2319. Shah, J. J. 2014. Date palm cultivation in India: An overview of activities. Emirates Journal of Food and Agriculture, 26 (11): 987-999. Shatta, A. A. 2006. Effect of frozen storage and concentration methods on some quality parameters of lime juice and concentrate. J. Agric. Sci. Mansoura Univ., 31 (9): 5795-5807. Singh, R. S. 2018. Date palm: an ideal fruit for health and wealth. Indian Horticulture, 63(5): 17-21. Somogyi, M. 1952. Aresenomolybdate reagent colour development method of reducing sugar determination. Journal Biol. Chem., 200- 245.

National E-Workshop onCurrent Scenario of Post Graduation Research in Agriculture Sector Sept 09-11, 2020
241
Yousef, A.R.M., Emam, H.S., D.M.M. 2012. Storage and hot water treatments on poststorage quality of mango fruit (Mangifera indica L.) variety Copania. Aust. J. Basic Appl. Sci., 6 (13): 490-496. Youssef, K.M. and Labib, A.A.S. 2007. Effect of Frozen Storage on Some Physico-Chemical and Rheological Characteristics of Apricot Pulp. Agricultural Research Journal, 1: 27-32. ZeeL, J.A., Carmichael, D., Codère D. and Poirier, M.F. 1991. Effect of storage conditions on the stability of vitamin C in various fruits and vegetables produced and consumed in Quebec. Journal of Food Composition and Analysis, 4 (1): 77-86. Ziena, H. M. S. 2000. Quality attributes of bears seedless lime (Citrus latifolia Tan) juice during storage. Food Chem., 71(2): 167-172.

National E-Workshop onCurrent Scenario of Post Graduation Research in Agriculture Sector Sept 09-11, 2020
242
SOCIAL SCIENCE

National E-Workshop onCurrent Scenario of Post Graduation Research in Agriculture Sector Sept 09-11, 2020
243
THE COMPARATIVE ECONOMICS OF CHICKPEA PRODUCTION IN RAJASTHAN WITH REFERENCE TO GANGOUR VARIETY
(GNG 1581)
Keshav Kumar1& Dr. Vikram Yogi2
1Ph.D. Scholar, Department of Agricultural Economics, MPUAT, Udaipur 2Assistant Professor, Department of Agricultural Economics, SKRAU, Bikaner
Introduction India is the largest chickpea producing country in the world, grown basically in dried regions. The major chickpea producing states in India are Madhya Pradesh, Maharashtra, Rajasthan, Uttar Pradesh (UP), Andhra Pradesh and Telangana.Rajasthan is the third major chikpea producing state, contributes to around 14% to the country’s total production. The area covered under chickpea cultivation is nearly 7% of the state’s net sown area. Gangour(GNG 1581) is improved Chickpea varieties recommended by the agricultural scientist, based on its economic superiority over the existing varieties. Keeping the importance of these varieties of chickpea cultivation in study area the present study was under taken to analyze the economic impact of GangourVariety (GNG 1581) and constraints affecting the adoption of GangourVariety (GNG1581).Research was carried out with following objective
1. To analyze the comparative economics of chickpea production in Rajasthan with reference to Gangour variety.
2. To assess the varietal impact of chickpea with reference to Gangour variety. 3. To identify the constraints in chickpea production in Rajasthan.
Methodology In Rajasthan, Bikaner district was selected as it has highest production under chickpea cultivation. Then, two tehsils were selected on the basis of highest production. From each selected tehsil, two villages were choosed randomly. From each of the village, 15 farmers were interviewed growing Gangour variety of chickpea and 15 growing local/traditional variety. Thus, a total of 120 farmers were selected for this study. Cost concept was used for the analysis of data. Findings
The Cost C2was worked out to be 32068.10 for Gangour and 30535.43 for local variety, respectively. The yield of Gangour and local variety is 17.70 and 10.65 q/ha respectively. Gross income from the Gangour variety is more as compared to local variety. Gross income from the Gangour variety is 76668.00 and from local variety is 46029.50. The Farm business income from Gangour variety and local variety is
54466.89 and 25823.44 respectively. Farm business income from Gangour variety is more than local variety. Net income from Gangour variety and local variety is 44599.90 and 15494.07 respectively. Net income from Gangour variety is more than local variety. Output-Input Ratio Gangour variety and local variety is 2.39 and 1.51respectively. The cost of production for the Gangour variety is less

National E-Workshop onCurrent Scenario of Post Graduation Research in Agriculture Sector Sept 09-11, 2020
244
than the cost of production of local variety that is 1811.75 per quintal for Gangour and 2867.18 per quintal for local variety. The results revealed that thenetreturnsforGanourwere 34.74%higher than for the local variety. Labor productivity was higher for Gangour (0.74q/day), followed by local variety (0.44q/day), showing that improved chickpea varieties utilized labor more effectively than non adopters. Themarketablesurplusofthosewhoadopted Gangour was higher (89.44%),andthosewhocultivatedlocalvarieties,themarketablesurpluswere83.49 %.The estimated extra revenue generated by the Gangour variety is avg. 760 crore per year, which shows the superiority of the Gangour variety over other local varieties. The problem faced by chickpea growers is to not getting satisfactory price of their produce in both Gangour and local variety grower. The another problem faced by farmers, requirement of more water with reference to Gangour variety and problem of labour availability during the harvesting with reference to local variety.
Inference On the basis of the results obtained in the present study, the following conclusions are drawn:
� The higher yields of improved varieties resulted in a decline in the per unit cost of production and an increase in profitability levels in Gangourvariety.
� The net income over variable cost of improved chickpea varieties was higher in Gangourvariety.
� Average labor productivity was higher forGangour. � The total cost per hectare of Gangour is higher than localvariety. � Gross income from the Gangour variety grower is higher than
local variety. � The Farm business income from Gangour variety grower is higher
than localvariety. � Output-input Ratio Gangour variety grower is higher than local
variety. � The estimated extra revenue generated by the Gangour variety in
Rajasthan 760 crore based on the seed production in the year 2016-17.
� The problem faced by chickpea growers is to not getting satisfactory price of their produce in both Gangour and local variety grower.
� The another problem faced by chickpea grower is, require more water with reference to Gangour and problem of labour availability during the harvesting with reference to localvariety.

National E-Workshop onCurrent Scenario of Post Graduation Research in Agriculture Sector Sept 09-11, 2020
245
USES OF SERVICES OF AGRICULTURAL TECHNOLOGY INFORMATION CENTRE (ATIC) BY THE FARMERS OF
CENTRAL U.P.
Priya Vashishtha and Vinita Singh C.S.A. UNIVERSITY OF AGRICULTURE & TECHNOLOGY, KANPUR
Email : [email protected]
ATIC are established under the innovations in Technology Dissemination component of NATP to provide greater interaction between the researchers and technology users beyond what individual researcher can attempt to disseminate information to farmers. As the gesture of follow up of “single window system” in state Agricultural Universities under NAPT. ATIC at C.S.A. University of Agriculture and Technology, Kanpur came into existence on 12 October 2001. Three-dimensional performance viz. products disposal, services and information dissemination are the foundation pillars of ATIC through which the technology transmission occurs at the centre. The present study was conducted in Kanpur district of U.P. where the ATIC has been in operation since 2001. Multistage random sampling technique was selected. Two blocks namely Kalyanpur & Sarsaul were selected randomly. One village was selected randomly from each block. Total 95 respondents were selected for the present study. The data were analyzed and tabulated according to statistically. It was found that nearly one third of the respondents visited ATIC on regular basis i.e. one in a month whereas, 76.84 per cent respondents visited the centre sometimes only i.e. in every 2-3 months. More than half of the respondents (51.57%) were utilizing plant clinic. The respondents that the visited plant clinic in order to cheek any nutrients deficiency in their plants, to know the amount of fertilizer used in the plants or for insect-pest management. Based on the finding it can be concluded that the extent of utilization of ATIC facilities by the respondents was poor. The probable reason behind not using the ATIC facilities by the respondents was lack of knowledge about ATIC facilities and inadequate provision of inputs due to lack of infrastructure facilities at the centre. Hence there is a need to create awareness about ATIC.

National E-Workshop onCurrent Scenario of Post Graduation Research in Agriculture Sector Sept 09-11, 2020
246
ALOE VERA (GHRITKUMARI) CULTIVATION IN RAJASTHAN- NEED OF SUSTAINABLE VALUE CHAIN MODEL TO INCREASE
INCOME OF THE FARMERS
Rakesh Rathore and Aditi Mathur
Institute of Agri Business Management, SKRAU, Bikaner-334006 Email: [email protected]
Introduction A value chain involves the flow of products, information, finance, payments, and the social capital needed to organize producers and communities. Information is especially important to all value chain players. In a value chain, processors and marketing agents may provide producers with finance, inputs and training in technologies of production. An efficient value chain system can increases the income of the aloe vera cultivation farmers.The National Medicinal Plant Board (NMPB) under the ministry of AYUSH promoted the cultivation of Medicinal plants in the country and also implemented several schemes for cultivation and encouraged farmers towards farming of medicinal plants in sustainable way and also promoted the cultivation, protection, processing up gradation and promotion of trade of medicinal plants in the country. Total 55 species of medicinal plants in India are eligible for 30 per cent subsidy including Brahmi, Pippali, Tulsi, Isabgol, Ghritkumari,Chirmati, Vach, Adusa, Smaller Galanga, Kalmegh, Artemisia, Shatavari, etc. In India Ghritkumariis cultivated in Rajasthan, Chhattisgarh, Haryana and some parts of Madhya Pradesh. Rajasthan is leading in both area and production of Ghritkumari cultivation due to favorable climatic conditions in some parts (arid and semi-arid) of Rajasthan. It is cultivated in Churu, Naguar, Bhilwara, Bikaner, Sikar and some parts of Jaipur district of Rajasthan. The Ghritkumari market is growing steadily over the last decade due to increasing usage of Ghritkumari gel in food, health care, cosmetic and food industry (Anonymous, 2018) Looking into the huge market potential of aloevera has, the companies can think of educating and helping the deprived rural population to undertake Ghritkumari farming. Market is ready for acceptance there should be someone who will bridge this gap of production & Supply (Bodhankar, 2019).There are empirical evidences establishing that successful coordination in the value chain has a significant impact on cost reduction and farm-income enhancement as well as resulting in positive externalities. But, the overarching question is whether the agricultural sector has the necessary and sufficient conditions for the development of successful value chains (Kumar, 2011) Table1: State-wise area, production and yield of Ghritkumariin India (2016-2017)
State Area (ha) Production (ton) Yield (ton/ha) Haryana 103 814.9 7.91 Chhattisgarh 312 2690 8.62 Rajasthan 1153 3120 2.71
(Source: www.Indiastat.com, accessed as on, 18 April 2018) Online Marketing through e-charak e-charak is an online digital market platform for the selling of medicinal plants. To provide an online market portal for the trade of medicinal plants and their produce.
National E-Workshop onCurrent Scenario of Post Graduation Research in Agriculture Sector Sept 09-11, 2020
247
National Medicinal Plant Board (NMPB) has launched an online virtual platform www.e-charak.in. This online gateway could be opened either through an internet browser or the mobile app which could be downloadable. Methodology Multistage sampling adopted for the collection of data. Study carried out in Churu district of Rajasthan which is having highest area under Ghritkumari cultivation. Both primary as well as secondary data and information were collected. Total 80 farmer’s respondents were interviewed to collect primary data and understand the major problems faced by them for marketing of Ghritkumari.Secondary information related to study is collected from various published reports research papers and government and official websites. Findings The economics of Ghritkumari crop cultivation in terms of various ratio depicted in the table Cost-Benefit Ratio of different farmers is depicted and it is clear from the table that the operation cost ratio was found to be decreasing from small to large farm during first year. The operational cost ratio was 403.33, 396.82, 379.0 and 393.50 per cent on small, medium, large and overall farm respectively during first year. Operational cost ratio was 37.91, 37.50 and 37.79 per cent during 3rd 4th and 5th year on small farm respectively. Fixed cost ratio was found highest at 34.24 per cent during first year on small farm 32.78 per cent on medium farm, 31.77 per cent on large farm and 32.87 on overall farm. During second year it was found to be 11.25 per cent on small, 10.64 on medium 10.33 on large and 10.72 per cent on overall farm. Gross cost ratio was also highest at 437.5 per cent on small farm during first year, 429.60 per cent on medium, 410.77 per cent on large and 425.32 per cent on overall farm. During second year gross cost ratio was found highest at 63.58 per cent on medium farm followed by 62.03 per cent on small, 61.88 per cent on large and 62.50 per cent on overall farm. The input-output ratio was found highest at 23.50 per cent on large farm followed by medium farm 23.27 per cent, 22.85 per cent on small and 23.50 per cent on overall farm. Input-output ratio was observed to be increasing from 1st year onwards on small, medium, large and overall farm.

National E-Workshop onCurrent Scenario of Post Graduation Research in Agriculture Sector Sept 09-11, 2020
248
Table 2: Cost-Benefit Ratio of different farmer’s category of Ghritkumari cultivation (in per cent) S. No.
Particular 1st Year 2nd Year 3rd Year 4th Year 5th Year
Small Farmers 1 Operational Cost Ratio 403.33 50.78 37.91 37.50 37.74 2 Fixed Cost Ratio 34.24 11.25 9.64 9.64 9.78 3 Gross Cost Ratio 437.5 62.03 47.55 47.14 47.53 4 Input-Output Ratio 22.85 161.18 210.2 212.09 210.38 Medium Farmers 1 Operational Cost Ratio 396.82 52.93 38.27 36.92 36.19 2 Fixed Cost Ratio 32.78 10.64 8.96 8.96 9.11 3 Gross Cost Ratio 429.60 63.58 47.23 45.88 45.30 4 Input-Output Ratio 23.27 164.03 211.66 217.96 220.77 Large Farmers 1 Operational Cost Ratio 379.0 51.54 37.46 36.75 37.20 2 Fixed Cost Ratio 31.77 10.33 8.86 8.86 9.07 3 Gross Cost Ratio 410.77 61.88 46.18 45.47 46.12 4 Input-Output Ratio 24.34 161.58 215.82 219.19 215.81 Overall Farmers 1 Operational Cost Ratio 393.50 51.77 37.87 36.78 37.04 2 Fixed Cost Ratio 32.87 10.72 9.13 9.13 9.30 3 Gross Cost Ratio 425.32 62.50 47.01 46.17 46.31 4 Input-Output Ratio 23.50 61.62 47.01 46.17 46.31 (Source: Researcher’s own computation from primary data) The input-output ratio of Cultivation of Ghritkumari is found positive and it shows that cultivation of this crop is beneficial for the farmers. The farmers in the study area complaint that there is are problem in marketing of this crop. No any particular Mandiand no specific market yard is there for the marketing of crops. Only one or two traders/wholesaler available but they are not buy the crop timely when it ready for harvesting. They buy crop at very low price and farmers have to sell because no any other buyer available. Some time there crop wastage and loss due to non-availability of buyer and perishable nature of crop specially after harvesting. Farmer’s respondents that if regular market is available for this crop it is beneficial for them to earn better return. Integrated value chain An integrated value chain improve the economic prospects of a farmer. An integrated value chain comprising various actors and markets not only help balance the supply and demand of the crop produce but also maintains the quality of the produce for an extended period. This helps avoid glut in the harvest and also shortage in the off-season. An integrated value chain not only helps the farmers but also the consumers and the economy as well by eliminating wastage of the crop.Marketing is today one of the most important agriculture operations. Minimizing the length between the farm and fork is an ultimate solution for increasing farmers’ income and assuring consumers’ satisfaction. Digitization opportunities for the value chain Public private partnership and co-operatives can work with a network of collection centers or collection of crop for the farmers. These collection centers are further linked to multiple Ghritkumari crop farmers that sell their crop production at the centers. There is a significant opportunity to digitize the payments to farmers directly from theprivate and co-operative with the role of the collection center as a possible transaction of payment.

National E-Workshop onCurrent Scenario of Post Graduation Research in Agriculture Sector Sept 09-11, 2020
249
(1)Farmer to inform progress of planting crop wise on virtual platform through phone (2) Buyers of the crop to advise the demand onvirtual platform (3)Farmer to report likely area under the crop volume and production of crop (4) Concurrent dissemination of information on likely demand and present level of supply while planting of crop (5) Dissemination of likely gap and excess of commodity to all the value chain stakeholders and farmers (6) Demand position to be taken a season in advance from the buyers with a maximum rate at which they willing to buy (7) Aggregators to place supply position a season in advance with minimum expected rate(8) price forecasts to be made based on the on-line information of sowing and demand position. Processing opportunities: Majority of farmers in the state sell their produce in village to local traders because no other option to sell resulting in low return for their produce. There are difference in price of aloe products i.e. at village level very low, wholesale market not well established and not regulated and at retail level is high. The marketing infrastructure and value chain system are weak resulted as whole supply chain suffers from several limitation.
(1) Lack of reliable and up-to-date market information (2) Lack of adequate processing units in nearby areas (3) Mal practices in the existence marketing system (4) Lack of proper transportation facilities etc.
Inference � The direct link and contract farming with herbal industry is needed for the buy-
back agreement of the crop for efficient production and value chain of the crop � To overcome the problem of low price of the produce and higher input cost related
to production and marketing of the crop, integrated extension and research activities are needed for the development of the good agricultural practices and marketing channel of the crop
� The more emphasis should be given to link the farmers directly to the exporters to get better price of their produce.
� Contract farming can give better chances in increasing the flow of commodities to the international market
� Among all the marketing channel direct channel found efficient so major emphasized should be given to promote this particular channel.

National E-Workshop onCurrent Scenario of Post Graduation Research in Agriculture Sector Sept 09-11, 2020
250
ROLE OF WEATHER FORECASTING SERVICES IN FARM MANAGEMENT AND SOCIO-ECONOMIC DEVELOPMENT IN
RAJASTHAN
Rahul Singh Institute of Agri Business Management, SKRAU, Bikaner
Email : [email protected]
Introduction Weather is prediction of condition of atmosphere at a given place or time whereas the climate is the generalized weather conditions for a longer duration for a given location. The role of weather forecasting is very helpful in adjusting the practices of farm activities. The climate of Rajasthan comes in the category of arid and semi arid zones of India. Decision making with respect to agricultural weather forecasting in this study is the process of choosing the best alternative for the purpose of attaining specific goals involving the resources, environment, economic and personal characteristics of a farmer. Farmers are the study respondents who devote time and thought to understand atmospheric conditions, especially to weather forecasting. Crop advisory is also provided by the weather forecasting service which gives updated and most accurate information in relation to the weather. Crop advisory is given through the SMS and group created by the experts on social media platform and this information is sent on daily basis to the registered farmers. Methodology We started by briefly describing the location of study and a survey with service users Description of location of study The study was carried out in Rajasthan state since the researcher belongs to it and familiar with local culture. The scope of the study is mainly five district viz., Alwar, Dausa, Dholpur, Hanumangarh & Shriganganagar of Rajasthan and study was steered in a comprehensive manner so as to accomplish the objective more precisely the studies were conducted in 1B, 3A and 3B region of Rajasthan. Descriptive research was used for studying the objectives.Total 50 farmers from each five district were interviewed to collect primary data to carry out the study. Total 250 responses were taken from farmers study purpose. To select farmers from the area, judgmental sampling was used. Survey with service users The present study carried out descriptive research to investigate the farmers’ reactions towards the weather forecasting services and how satisfactorily it is working. The research methods used in this study was the survey, whereby researchers conducted personal interviews with the respondents. Survey can be called as a data collection method for social science research (Glock, 1967). A list of farmers who had registered to services from the same districts was prepared. Others didn't participate during this initiative following registration method. The reasons can be lack of awareness, lack of motivation to the farmer and communication gap between the knowledgeable, field level workers and farmers. Lack of interest to adopt trendy technologies among the farmers may also be one amongst the explanations for not actively collaborating on the far side the farmers’ registration.

National E-Workshop onCurrent Scenario of Post Graduation Research in Agriculture Sector Sept 09-11, 2020
251
Because of the little range of users, it had been determined to interview all of them. Out of 13,336 registered farmers, 250 participated withinthe survey analysis. The survey is completed victimization associate degree interview schedule consisting of 2 sections: a) Farmer’s socio-economic characteristics: The socio-economic characteristics of farmers like gender, age, education, size of landholding, mass media exposure, originality and use of service were collected b) Benefits perceived and constraints experienced by the farmers during service: In order to analyze the benefits perceived and constraints experienced by farmers during advisories provided through services Findings Respondents’ socio-economic characteristics To provide better insights into the participants, respondents’ socio-economic characteristics including gender, age, education, landholding size, and usage of multimedia mobile were analyzed. Gender composition consists of nearly 96% male participants. 31% of the respondents were middle aged (31 to 40 years), 42% old (41 years and above) and 27% young (<30 years). The frequency distribution showed that there was higher number of older respondents as compared to the younger age group. The analysis of educational background of the farmers showed that 34% had education below 10th and 24% were educated upto secondary level, 22% had studied senior secondary school (up to 12 standards) and 17% were under graduates. Only 3% of the farmers were post graduate. The analysis of landholding of the farmers showed that majority of them was small & marginal farmers (58%) to semi medium (28%) farmers. Of the whole sample of 250 farmers (Figure 4), 57.21% had a medium exposure to the mass media and about 21% high exposure, leaving nearly 22% in the low exposure category. As can be seen in Figure 4, almost 80% of the farmers in all the three districts under study had a medium to high level exposure to mass media. The education level of farmers was low but majority of them had medium to high exposure to mass media. Another interesting observation was that majority (48.91%) of the farmers were medium innovative in adopting the new agricultural technologies in their field (Figure 5). The results also showed that nearly 32% of farmers used mobile multimedia agricultural advisory system frequently as and when they needed information Out of 250 respondents 230 gave the first rank to as timely weather forecast information a main response. Whereas, information about the proper use of agricultural inputs was given second rank by farmers with a score of 66.62. The third response was knowledge of crop insurance and other financial instruments with a score of 48.8. Farmers were not satisfied with the knowledge provided for farming according to climate and gave it last rank. Rank 1: Timely weather forecast information Information is provided by using various ICT tools like Short Message Services (SMS), Interactive Voice Response (IVR), Whatsapp groups, Web portal and Weather display boards. The information is given on day to day basis. Rank 2: Information about the proper use of agricultural inputs The service provider also gives crop advisory and helps the farmers to take judicious use of the available resources on the farm. Therefore they are providing precision farming to the farmers. Rank 3: Knowledge of crop insurance and other financial instruments

National E-Workshop onCurrent Scenario of Post Graduation Research in Agriculture Sector Sept 09-11, 2020
252
To create the awareness level about the crop insurance schemes the services provider avail the meetings and keep reminding the farmers about the crop insurance schemes and other financial instruments with the help of government officers Rank 4: Knowledge of farming according to climate Famers were seeking more accuracy for climate related farming as micro climate of one village differs from other village. The factors influencing satisfaction level of farmers, data needed for farming activities and simple creating crop choice choices were the factors of prime concern for respondents as its weighted average is highest among all. Ablated weather connected hazards and magnified crop productivity were at second and third most vital factors severally for farmers. Whereas, farmers appear moderately happy with management of labour work and even handed use of fertilizers, irrigation and pesticides. Whereas, farmers weren't significantly happy with cropping intensity that shows that there's a desire of improvement in techniques of farming to require additional crop annually. it had been apparent from table that data needed for farming activities occupies a pre dominant position with (1.04) followed by and simple creating crop choice decisions (1). It had been evident that farmers weren't happy with the cropping intensity and was a minimum of position (0.56).

National E-Workshop onCurrent Scenario of Post Graduation Research in Agriculture Sector Sept 09-11, 2020
253
1.04
1
0.96
0.94
0.7
0.56
0 0.2 0.4 0.6 0.8 1 1.2
Information required to decide farming activities (saving, weeding, irrigation,
harvesting)
Ease of making crop selection decisions
Weather related hazards have decreased
Crop productivity has increased
The Labor worker is better managed Proper use of irrigation, fertilizer and
pesticides
Crop intensity has increased
Weighted mean score

National E-Workshop onCurrent Scenario of Post Graduation Research in Agriculture Sector Sept 09-11, 2020
254
NUTRIENT INTAKE THROUGH MID-DAY MEAL OF SCHOOL GOING CHILDREN AGED 7-9 YEARS RESIDING IN BIKANER
DISTRICT (RAJASTHAN)
Rita Mishraand Vimla Dunkwal
Department of Food & Nutrition, College of Community Science, SKRAU, Bikaner Email : [email protected]
Introduction Mid-day meal programme (MDMP) is the largest school lunch programme in the nation. The mid-day meal scheme has catered to the nutritional needs of school children in both rural and urban areas. A mid-day meal (MDM) is a great initiative for combating class room hunger and promoting better learning as explained by Kaur et al. (2013). Globally, malnutrition among school-age children is becoming a major public health problem. Mitra et al. (2007) pointed out that if, there is no action taken, about 1 billion school children will grow up and their physical and mental development will be impaired by 2020. The National Programme for Nutrition Assistance in Primary Education, commonly known as the mid-day meal scheme, was launched nationwide on August 15, 1995, by the Department of Elementary Education and Literacy, Ministry of Human Resources Development by the Government of India. Mid-day meal is available to all the eligible students studying in government and government aided schools. In 2002, Rajasthan became one of the first states to implement the SC directive of providing cooked mid-day meals across all 32 districts. India has committed to provide adequate nutritious food to children with the objective of improving tolerance level within various communities, castes and religions. Mid-day meal has a crucial role in ending all gender differences and social gaps at primary and upper-primary levels. It ensures that social issues don’t come in between the children and education because proper and good education is very important as it facilitates quality learning through all the life among people of any age, caste, creed and region. It is an irrefutable argument that Mid Day Meal Programme exerts a positive influence on the enrollment and attendance in schools. But, there is a question mark: Does the Mid-Day Meal improve the nutritional status of children too? Therefore, the present study has been undertaken to assess the nutritional contribution of mid-day meal to the dietary intake of school children.
Methodology Selection of schools The study was conducted in urban and rural areas of Bikaner district of Rajasthan. Tweleve schools (6 rural & 6 urban) were selected and made to study the nutrition interventions. Selection of subjects Eight hundred and twenty-sevenrural as well as urban children were selected randomly for the assessment. Data collection

National E-Workshop onCurrent Scenario of Post Graduation Research in Agriculture Sector Sept 09-11, 2020
255
Data was collected by the researcher using questionnaire method and further calculations were done to obtain the results. Findings Selected primary schools were visited frequently for collecting the data. Nutrient-intake of children through mid-day meal was calculated and results are presented in tables I & II. Table I. Nutrient-intake through mid-day meal (MDM) of rural children (7-9 years)
Day Nutrient intake of rural children Energy(kcal) Energy deficit (%) Protein (g) Protein deficit (%)
Monday 279 38 6.37 47 Tuesday 292 35.5 7.36 38.7
Wednesday 289 35.8 10.21 15 Thursday 255 43.4 5.2 56.67
Friday 279 38 6.37 47 Saturday 289 35.8 10.21 38.7
Note: GoI recommended 450 calories & 12 grams protein/day under MDM programme Table I is showing data regarding nutrient-intake through mid-day meals available to rural school children aged 7-9 years.
The table indicates that energy consumption of children throughout the week i.e., from Monday to Saturday was 255 to 292 kcals whereas consumption of protein was 5.2 to 10.21 g. Energy deficit throughout the week was 35.5 to 43.4 per cent whereas protein deficit was 15 to 56.67 per cent.
Table II. Nutrient intake through mid-day meal (MDM) to urban children (7-9 years)
Day Nutrient intake of urban children
Energy (kcal)
Energy deficit (%)
Protein(g) Protein deficit (%)
Monday 213 52.67 8.54 28.9 Tuesday 290 35.56 7.73 35.6
Wednesday 288 36 10.58 11.9 Thursday 290 35.56 7.73 35.6
Friday 213 52.67 8.54 28.9 Saturday 288 36 10.58 11.9
Note: GoI recommended 450 calories & 12 grams protein/day under MDM programme
The table II is showing data regarding nutrient intake through mid-day meals available to urban school children aged 7-9 years.
Table indicates that energy consumption of children throughout the week i.e., from Monday to Saturday was 213 to 290 kcals whereas consumption of protein was 7.73 to 10.58 g. Energy deficit throughout the week was 35.56 to 52.67 per cent whereas protein deficit was 11.9 to 35.6 per cent. Results of table I & II reveals that overall energy and protein intake of rural as well as urban children on daily basis is 213-292 kcals and 5.2-10.58 g. Present findings are

National E-Workshop onCurrent Scenario of Post Graduation Research in Agriculture Sector Sept 09-11, 2020
256
contradictory with the results obtained by Mehtaet al. (2013) that the energy and protein content of six days menu varied from 350-386 kcals and 10.9 - 11.9 g protein. The contradictions are due to the differences in the mid-day meal menus. Inference It is concluded from the results that the percentage of energy and protein deficit of 7-9 years old rural and urban children is more as compared to that of consumption because they were not consuming the quantity of food prescribed by GoI under the mid-day meal scheme. Hence, the nutritional contribution of mid-day meals did not show any significant impact on the nutritional improvement of children. But, it improved the enrolment status and attendance of children, which is mandatory to increase the literacy rate and to reduce poverty in our country. It also fulfills nearly a part of energy and protein intake. It develops as a perspective of looking at life in a better and progressive way. References Hira, K., et. al. (1999). All India Coordinate research project in Home Science, Food and Nutrition Unit, College of Home Science, PAU, Ludhiana Mehta, B., Grover, K & Kaur, R. (2013). Nutritional contribution of mid-day meal to dietary intake of school children in Ludhiana District of Punjab. J. Nutr food sci; 3:183.doi: 10.4172/2155-9600.1000183 Mitra., et. al. (2007). Nutritional status of kamar tribal children, Chhattisgarh. Indian Journal of pediatrics, 74(4):381-384
National E-Workshop onCurrent Scenario of Post Graduation Research in Agriculture Sector Sept 09-11, 2020
257
TRADE COMPETITIVENESS AND EXPORT PERFORMANCE OF SHRIMPS IN INDIA WITH SPECIAL REFERENCE TO ANDHRA PRADESH
KJVK Sirisha1, D V Subba Rao1, Y Radha2, V Srinivasa Rao3, P Rambabu4
1 Department of Agricultural Economics, Agricultural College, Bapatla 2College of Food science and Technology, ANGRAU
3 Dept. of Statistics & Computer Applications, Agricultural College, Bapatla 4ANGRAU-Directorate of Extension, Lam, Guntur
Introduction
The international trade in fish and fishery products has been growing steadily. The growing demand for fishery products across the world during the recent years is attributed to a change in the dietary habits in favor of fish due to its health enhancing features. (FAO, 2016). Shrimp represents one of the most important commodity in sea foods traded internationallyand generating substantial foreign exchange earnings and employment. Asian nations are significant players in the international seafood market, both as importers and exporters. Over time, the seafood export sector has grown to be a significant earner of foreign exchange and a major contributor to India’s national income (Mukherjee, 2012). Aquaculture in India is an important sector of food production, providing nutritional security to the food basket, besides contributing to the exports. It employs fourteen million people in different activities in the country. The total fish production during 2017-18 was 12.60 million tons of which nearly 65% was from inland sector. The total seafood exports during the period 2017-18 was 13.8 lakh tonnes as compared to 11.3 lakh tonnes in the previous year 2016-17. In rupee terms exports were valued at Rs. 45,106.89 crore in 2017-18 as against Rs. 37,870.90 crore in 2016-17, indicated of 21.35 per cent growth. Frozen shrimp maintained its position as the key contributor to the seafood export basket, accounting for 41 per cent in quantity and 68.46 per cent of the total dollar earnings. This indicates that major part of income from marine fishery flows from the export performance of shrimps. The Government of Andhra Pradesh created a policy for the rapid growth in fisheries and aquaculture for the period 2015-20, with a vision of promotion of “Andhra Pradesh as the Aqua hub of India”. Hence the present research work on “Trade competitiveness and export performance of shrimps in India with special reference to Andhra Pradesh” was undertaken with the following objectives: 1. to study the growth rates of shrimp production and exports in India and Andhra
Pradesh 2. to analyze the direction and structural stability of Indian shrimp exports 3. to analyze the trade competitiveness of India’s shrimp exports in the world market 4. to analyze the factors influencing the export performance and trade
competitiveness of shrimps in Andhra Pradesh. Methodology The secondary data on marine products and shrimps in terms of quantity and value for India and Andhra Pradesh were collected from Marine Product Export Development Authority (MPEDA), Food and Agriculture Organization (FAO) and trade Map data base developed by International Trade Centre (ITC), Geneva, Switzerland.
National E-Workshop onCurrent Scenario of Post Graduation Research in Agriculture Sector Sept 09-11, 2020
258
Primary data was collected from Andhra Pradesh because it is the hub of aquaculture in India along Visakhapatnam, Nellore and West Godavari districts were selected based on export potential and processing of shrimp. Thirty exporters were selected tippet random number method. Growth rate and instability: For estimating the growth rate compound growth rates were calculated using exponential growth model. Cuddy and Della instability index was used to find the Instability in growth. Forecasting the exports of shrimp in India and Andhra Pradesh: To know the predicted trend in shrimp exports the Box-Jenkins Autoregressive Integrated Moving Average (ARIMA) model was fitted. Direction and structural stability of Shrimp exports: The changes in the export of shrimps to different countries were analyzed by employing a first order finite Markov chain model. It captures the net effect of changes in export of shrimps over a period of time. Trade competitiveness of shrimp exports: Revealed Comparative Advantage index (RCA) was used to evaluate the degree of Indian shrimp comparative advantage in major shrimp importing markets like US, Japan EU, SEA and ME markets. By selecting the other leading shrimp exporters like Thailand, Vietnam and Indonesia. Performance of shrimp in Andhra Pradesh: To find out the most preferred attributes for exporting shrimps aconjoint analysis full-profile approach was employed as it is more realistic and economically valid since all factors are considered simultaneously. Likerts summated rating technique was used to construct the attitude scale of shrimp exporters. Multiple linear regression analysis was used to study the factors influencing revenue of the shrimp industry in Andhra Pradesh. Constraints experienced by shrimp exporters: In the quantification of constraints expressed by shrimp exporters Responses Priority Index (RPI) was used. Findings The growth rates registered for shrimp exports were positive and significant in both India and Andhra Pradeshduring the period 1995-96 to 2017-18.In India the observed registered growth rates were 7.03 per cent and 10.73 per cent in terms of quantity and value respectively.While in Andhra Pradesh the observed registered growth rates were 12.4 per cent and 14.8 per cent in terms of quantity and value. The instability is increasing in nature for shrimp exports in India and Andhra Pradesh respectively during the period, 1995-96 to 2017-18 i.e. 0.3 in India, 0.52 in Andhra Pradesh.The selected ARIMA models were appropriate for forecasting the shrimp exports during the period under study.The shrimp exports were forecasted up to 2023-24.The forecast are also depicted that there is narrow variations in between the actual and forecasted values.The direction of trade indicates that the European Union and Other Pooled Countries were found to be highly loyal markets for Indian shrimp. Followed by USA, Japan and South East Asia, whereas China and Middle East were found be most unstable markets for Indian shrimp exports.The Indian shrimp has relatively better comparative advantage in South East Asia and Middle East markets, whereas it was low in developed markets like European Union, USA and Japan. However there is a need to improve export competitiveness of Indian shrimp in developed markets like EU, USA and Japan to achieve high unit price realization. The shrimp exports from Andhra Pradesh had a significant comparative advantage in India. It reflects greater scope for the expansion of seafood export industry.The shrimp exporters they give most preferences to those attributes which influence the shrimp exports in

National E-Workshop onCurrent Scenario of Post Graduation Research in Agriculture Sector Sept 09-11, 2020
259
Andhra Pradesh are, the raw (frozen) form is a major influence on exports than other forms like value added products. This is due to the greater demand from South East Asian countries for raw (frozen) products. Certification and labeling plays a vital role in promoting the export of shrimps. Price attribute has a strong influence on exports if the quality of shrimp increases. The exporters are highly preferable for exporting large sized shrimps. In case branding foreign buyers’ brand had major influence on exports than own branding. Apart from these translucent with dusky bands colour with strong marine odour shrimps are more preferable for the exports. Years of experience in shrimp processing, BAP star rating and quantity of exports from A.P. were positively significant on revenue of shrimp industry in Andhra Pradesh whereas business operation was negatively significant. The availability of quality raw material was the most important constraint for the exporters followed by high cost of investment, lack of diversified products, poor technical advancement, uncertainty in prices, lack of research and development and competition among the exporters.
Inference
1. The positive trend indicates the potential prospects for the exporting of Indian shrimp in the international market so need to take initiatives to promote exports of shrimp and utilize opportunity of comparative advantage for augmenting foreign exchange reserves. For reducing instability index exporters may be facilitated to enter into long term contracts with the international buyers.
2. Japan was found to be most stable market as indicated by retention probability of 72% of market share for Indian shrimp. However, export growth rate to Japan was found to be negative due to certain barriers like presence of antibiotics in shrimp consignments so that traceability of commodity is needed which initiated in Thailand by Department of Fisheries.
3. India continues to remain as a supplier of raw-materials of shrimp products Therefore processing facilities are to be expanded, in order to realize high export prices and to reach high-end markets, it is high time for India to export more of value added products.
4. By looking at the issues and challenges faced by the Andhra Pradesh exporter’s two approaches are recommended the former one is proposal for coastal corridor to reduce transportation cost and travel time.The later one is creating a unique brand for Indian shrimp and to be promoted by MPEDA by highlighting country of origin. Permission should be given only to those exporters who have MPEDA’s quality certificate for export and provide specified levels of processing/value addition.
5. As shrimp export is the backbone of Indian seafood industry, the sustainability of the industry and export earnings largely depend on production and export scenario, there is large scope for product diversification and value addition for which industrial support is very essential.

National E-Workshop onCurrent Scenario of Post Graduation Research in Agriculture Sector Sept 09-11, 2020
260
PERCEPTION OF FARMERS TOWARDS SOIL HEALTH CARD SCHEME IN RAYALASEEMA REGION OF ANDHRA PRADESH
S Lokesh Babu1, T Lakshmi1, SVPrasad1, S Hemalatha1 and B Ravindra Reddy2
1College of Horticulture, Chinalataripi 2SVAgricultural College, Tirupati
Introduction “Earth needs to be nurtured with mother’s care because earth gives us everything for sustaining life”. So any kind of torture on it is a sin.Soil health plays a vital role to ensure agricultural production in a sustainable manner. Soil health needs to be assessed at regular intervals so as to ensure that farmers apply the required nutrients while taking advantage of the nutrients already present in the soil.India has a long history of soil conservation interventions and programmes. From the early 20th century, though, soil conservation was not among the policy priorities until the 1980s. As the extent of degradation increased over the years, soil conservation has gained policy attention. However, a more focused approach to soil management has been adopted only after 2014-15. This has coincided with the declaration of the international year of soils by the UN.Soil Health is a holistic concept which includes chemical, physical, biological health of the soilhas introduced the Soil Health Card (SHC) scheme on 5th December 2015. The scheme is an improvement over the earlier National project on Management of Soil Health and Fertility that was launched during 2008-09.According to “Degraded and Waste Lands of India” report by the Indian Council for Agricultural Research (ICAR) and the National Academy for Agricultural Sciences, of the 141 million hectares of total geographical area about 328.2 million hectares is under cultivation. Of this, about 100 million hectares — or 70% — is heading down a path where it will be incapable of supporting farming. Farmers are making the soil work more, growing two or more crops a year, instead of one without proper soil health management. This unplanned intensification is exacerbating nutrient shortages and changing soils’ chemical composition. Levels of organic carbon in soil are dropping across the country, making soils more vulnerable to erosion and possibly resulting in the number of earthworms falling. Not only are these excesses and imbalances reducing the productivity and life of soils, they are now resulting in poor nutritional value of our food. For, if the soils are deficient in some nutrients, so are the food crops grown on them. Indian soils nutritional status: Indian Institute of Soil Science, (IISS) data shows that large parts of India are deficient in two or more critical nutrients. Regions like the Indo Gangetic plains – Punjab, Haryana, Uttar Pradesh and Bihar which produce nearly 50% of our grains and feed about 40% of our population are seeing multiple nutrient deficiencies. The reason being the imbalance use of organic and inorganic inputs. In the past, farmers used to plough the stalks left standing on the field after the harvest, cow dung, etc., back into the soil. This ensured that nutrients taken out of the soil were replenished. The green revolution, which started in the sixties, changed all that. High yielding crop varieties need more water and nutrients – which span from macro-nutrients like Nitrogen and Phosphorus to micro-nutrients like Copper and Boron. However, due to imbalanced fertilizer use, hardly any of these nutrient cycles are being completed. Farmers today use more of Urea (Nitrogen), some Potassium and Phosphorus, but not much else. Further, they choose fertilizers more by affordability and availability than

National E-Workshop onCurrent Scenario of Post Graduation Research in Agriculture Sector Sept 09-11, 2020
261
what the soils need. Apart from retarding growth in yields, this unbalanced use has also damaged soils. Too much urea, for instance, turns soils acidic. The ICAR report estimates that 6.98 million hectares or 2% of India’s total geographical area, have acidic soils. These are mostly in North East India, south Chhattisgarh and Kerala. Another 6.7 million hectares are salt-affected. In the absence of historical data on nutrients, the degree of decline cannot be ascertained. These soils are increasingly incapable of supporting agriculture. Soil health card: The soil health card helps in studying and reviewing the health of soil or to a certain extent we can say a complete evaluation of the quality of soil right from its functional characteristics to water and nutrients content and other biological properties. These soil health cards are useful to farmers as they provide a well monitored report of their soil health. Monitoring of farm fields by experts regularly helps farmers to cultivate crops and use fertilizers in coherence with concept of sustainability and profitability. Regular monitoring of farm fields will help the farmers to get a long-term soil health record and accordingly can study and evaluate the results of different soil management practices. The soil health card helps the farmers to get an idea on the crop-wise recommendations of nutrients and fertilizers required in each type of soil. This can help in enhancing the crop yield. The card shall also be accompanied by advisory on curative measures a farmer should take for enhancing soil health and better yield. The advantage of the soil health card is that it would provide an appraisal about use of major fertilizers and making him aware of the missing nutrients and those which could be added for a balanced soil. Methodology Ex-post-facto research design was followed for carrying out the study. The present study was conducted in Rayalaseema region of Andhra Pradesh state. Anantapuramu district was selected for the study because there exists diversified crops which require different types of soils. Six mandals from Anantapuramu district were selected randomly by following lottery method of simple random sampling. Six mandals namely Raptadu, Kanekal, Tadipatri, Gudibanda, Dharmavaram, Gorantla were selected randomly by following lottery method of sampling. Two villages were selected from each of the 6 mandals by following simple random sampling thus making a total of 12 villages. From each village, 20 farmers were selected by following simple random sampling procedure, thus making a total of 240 respondents who were having soil health cards had been selected for the study. The data were collected through personal interview method with the help of pre- structured scheduled from October 2018 to December 2018 designed with the objective of finding out the perception of farmers towards soil health card scheme. The collected data was analysed and frequency and percentage were calculated and tabulated.It can also be defined as an active process of becoming aware or getting meaningful understanding about situation. Perception about soil health card scheme by respondents was the centre point in the study. The perception inspires an individual to behave in expected form and carry out the work effectively. Total 32 statements were administered on the sample farmers and asked to express their reaction in terms of their agreement or disagreement with each item by selecting any one of three response categories viz., Agree, Undecided and Disagree. The scores given for the statements were 3, 2 and 1 for Agree, Undecided and Disagree responses, respectively.

National E-Workshop onCurrent Scenario of Post Graduation Research in Agriculture Sector Sept 09-11, 2020
262
Findings Table 1. Distribution of farmers according to their level of perception towards Soil Health Card Scheme (n=240) S. No. Level of perception Frequency Percentage
1 Poor perception 20.00 08.33 2 Moderate perception 191.00 79.58 3 Good perception 29.00 12.09
Total 240 100.00 Mean = 74.53 SD= 12.24
It was perceivable from Table 1 and figure 1 that majority (79.58%) of SHC scheme farmers had possessed moderate level of perception about SHC scheme followed by 12.09 and 8.33 per cent had good and poor level of perception about SHC scheme respectively. The likely reason for this result could be the fact that farmer had education above secondary level of education, medium level of mass media exposure and medium scientific orientation. So the level of perception of SHC scheme farmers was medium. S. No. Statements A(3) UD(2) DA(1)
f % f % f % 1 Soil health card can be obtained after the soil testing 224 93.30 16 6.70 0 0.00 2 Soil health can be maintained by fulfilling the nutrient
deficiency in soil as given in soil health card.
121
50.40
116
48.30
3
1.30
3 Soil fertility and productivity can be maintained with the help of soil health card.
139
57.90
90
37.50
11
4.60
4 Systematic crop planning can be done by using soil health card information.
115
47.90
113
47.10
12
5.00
5 Economic achievement can be obtained by using soil health card information.
145
60.40
76
31.70
19
7.90
6 Fallow land can be converted into cultivable land by using soil health card information.
114
47.50
102
42.50
24
10.00
7 Farming can be done in scientific way by using SHC information.
145
60.40
75
31.30
20
8.30
8 Soil health card may help to establish coordination among farmers, extension workers and experts.
133
55.40
83
34.60
24
10.00
9 The quantity of available nutrients in soil can be known with help of soil health card.
132
55.00
84
35.00
24
10.00
10 Deficient soils can be reclaimed by using suitable reclamation activities.
116
48.30
99
41.30
25
10.40
11 Soil health card gives information about amount of fertilizers to be applied.
131
54.60
83
34.60
26
10.80
12 Crop planning can be done according to type of land. 119 49.60 93 38.80 28 11.70 13 Unnecessary expenditure can be reduced by using
information given in soil health card.
151
62.90
64
26.70
25
10.40
14 Soil degradation can be reduced. 99 41.30 105 43.80 36 15.00
15 Acidity, alkalinity of the soils can be known with help of soil health card information.
99
41.30
79
32.90
62
25.80
16 We can know the quantity of available organic elements in the soil by information given in soil health card.
169
70.40
51
21.30
20
8.30
17 We can apply the necessary quantity of organic matter in the soil with help of information given in soil health card.
116
48.30
103
42.90
21
8.80
18 We can know the quantity of available nitrogen in the soil by information given in soil health card.
112
46.70
95
39.60
33
13.80
19 We can apply the necessary quantity of nitrogen into the soil with the help of information given in soil health card.
110
45.80
97
40.40
33
13.80
20 We can know the quantity of available phosphorous in the soil by information given in soil health card.
118
49.20
84
35.00
38
15.80
21 We can apply the necessary quantity of phosphorous into the soil with the help of information given in soil
133
55.40
79
32.90
28
11.70
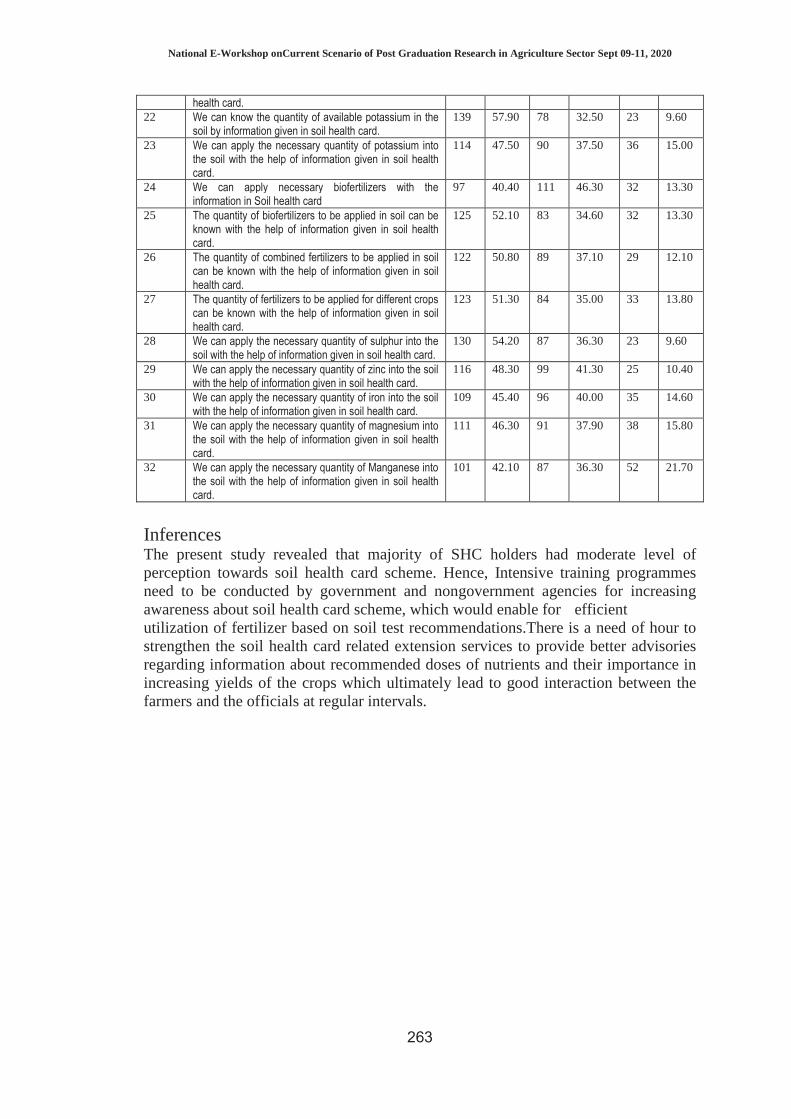
National E-Workshop onCurrent Scenario of Post Graduation Research in Agriculture Sector Sept 09-11, 2020
263
health card.
22 We can know the quantity of available potassium in the soil by information given in soil health card.
139
57.90
78
32.50
23
9.60
23 We can apply the necessary quantity of potassium into the soil with the help of information given in soil health card.
114
47.50
90
37.50
36
15.00
24 We can apply necessary biofertilizers with the information in Soil health card
97
40.40
111
46.30
32
13.30
25 The quantity of biofertilizers to be applied in soil can be known with the help of information given in soil health card.
125
52.10
83
34.60
32
13.30
26 The quantity of combined fertilizers to be applied in soil can be known with the help of information given in soil health card.
122
50.80
89
37.10
29
12.10
27 The quantity of fertilizers to be applied for different crops can be known with the help of information given in soil health card.
123
51.30
84
35.00
33
13.80
28 We can apply the necessary quantity of sulphur into the soil with the help of information given in soil health card.
130
54.20
87
36.30
23
9.60
29 We can apply the necessary quantity of zinc into the soil with the help of information given in soil health card.
116
48.30
99
41.30
25
10.40
30 We can apply the necessary quantity of iron into the soil with the help of information given in soil health card.
109
45.40
96
40.00
35
14.60
31 We can apply the necessary quantity of magnesium into the soil with the help of information given in soil health card.
111
46.30
91
37.90
38
15.80
32 We can apply the necessary quantity of Manganese into the soil with the help of information given in soil health card.
101
42.10
87
36.30
52
21.70
Inferences The present study revealed that majority of SHC holders had moderate level of perception towards soil health card scheme. Hence, Intensive training programmes need to be conducted by government and nongovernment agencies for increasing awareness about soil health card scheme, which would enable for efficient utilization of fertilizer based on soil test recommendations.There is a need of hour to strengthen the soil health card related extension services to provide better advisories regarding information about recommended doses of nutrients and their importance in increasing yields of the crops which ultimately lead to good interaction between the farmers and the officials at regular intervals.

National E-Workshop onCurrent Scenario of Post Graduation Research in Agriculture Sector Sept 09-11, 2020
264
PROBLEMS FACED BY INPUT DEALERS DURING DAESI (DIPLOMA IN AGRICULTURAL EXTENSION SERVICES FOR
INPUT DEALERS) PROGRAMME IN RAJASTHAN
Priti Singh, Madhuri Joshi, Kiran Gaur Department of Extension Education, S.K.N. College of Agriculture, Jobner, Jaipur
Introduction In India, most of the extension work is carried out by the Public sector i.e. Ministry of Agriculture and Farmers' Welfare, KVKs and some other agencies. At the national level, the ratio of extension workers to farmers is very low (1:1162) as against the recommended ratio of 1:750. (Nandi and Nedumaran, 2019). It is in this context, the MANAGE Hyderabad, had designed a one-year diploma course titled DAESI, for inputdealers which imparts agricultural education to equip them with sufficient knowledge to transform them into para-extension professionals so as to enable them to solve day-to-day problems of the farmers .The main objective of the study was to find out the technical as well as administrative problems faced by the input dealers in DAESI programme. Methodology The study was conducted on 120 input dealers, from 3 selected different kind of NTIs, coming under the jurisdiction of SKNAU, Jobner Jaipur, Rajasthan i.e.Agriculture Research Station (ARS), Navgaon, Alwar, State Institute of Agricultural Management ( SIAM), Jaipur and Krishi Vigyan Kendra (KVK, Tabiji), Ajmer , where at least 50 per cent of the course (Theory & Practical ) was complete by the time of data collection ( May, 2020). The data was collected through a Google questionnaire containing a list of all possible problems &the responses of the input dealers were recorded on a three point continuum ranging from most Severe , Severe and Not a severe problem and scores 3, 2, 1 were assigned respectively. Findings 1. Technical problems faced by the input dealers were as follows: (A) Problems related to Course content i) Problems related to Course content (Theory)
Perusal of overall results of Course content related to theory section has revealed that majority (39.16 per cent) of input dealers felt ‘Courses are too lengthy’ as the most severe problem followed by 37.50 per cent for ‘Course material is not available in Hindi’, 35.83 per cent for ‘Courses do not help in better running of the business’ and 35.00 per cent for ‘General aspects of Agriculture are not taught’. ii) Problems related to Course content (Practical) The perusal of overall results related to practical have revealed that majority of the input dealers (38.33 per cent) felt ‘Less number of field visits to different institutions and Agro- industries’ as the most severe problem followed by 36.66 per cent for ‘Transport facilities are not available for visits’ and 32.50 per cent for ‘Assignments and presentations makes syllabus lengthy and hectic’ ( B) Problems related to Faculty and method of teaching Perusal of the overall results are concerned 33.33 per cent input dealers have realized ‘Resource persons invited for lectures are not competent’ as the most severe problem

National E-Workshop onCurrent Scenario of Post Graduation Research in Agriculture Sector Sept 09-11, 2020
265
followed by 27.50 per cent for ‘Resource persons don’t use local language in classroom’, ‘Experts do not create a friendly environment’ and ‘No space for question answer session’ and 26.66 per cent for ‘Same resource persons were invited repeatedly’. ( C) Problems related to Duration/ timing of DAESI training The perusal of overall results have shown that majority of the input dealers i.e. 42.50 per cent felt ‘Classroom session is too long to concentrate’ as the most severe problem faced by them followed by 39.16 per cent who felt the same for ‘Programme is too long’ and 38.33 per cent for ‘Difficulty in memorizing things’. 2. Administrative problems faced by input dealers under DAESI programme The results on administrative problems faced by input dealers under DAESI programme are presented in Table 2 and are discussed under different sub heads:

National E-Workshop onCurrent Scenario of Post Graduation Research in Agriculture Sector Sept 09-11, 2020
266
Table 1: Distribution of input dealers as per the technical problemsfaced by the input dealers during DAESI programme S. No.
Technical problems faced by the input dealers
NTIs Total (n=120) KVK, Ajmer (n1=40) ARS, ALWAR (n2= 40) SIAM, Jaipur ( n3=40)
Most severe
Problem
Severe problem
Not a severe
problem
Most severe
problem
Severe problem
Not a severe
problem
Most severe
problem
Severe problem
Not a severe
problem
Most severe
problem
Severe problem
Not a severe
problem
A Course content
i) (Theory)
1 Courses are too lengthy
16 (40.00)
18 (45.00)
6 (15.00)
16 (40.00)
15 (37.50)
9 (22.50)
15 (37.50)
17 (42.50)
8 (20.00)
47 (39.16)
50 (41.66)
23 (19.16)
2 Syllabus has irrelevant courses
6 (15.00)
21 (52.50)
13 (32.50)
5 (12.50)
21 (52.50)
14 (35.00)
10 (25.00)
19 (47.50)
11 (27.50)
21 (17.50)
61 (50.83)
38 (31.66)
3 General aspects of Agriculture are not taught
12 (30.00)
22 (55.00)
6 (15.00)
16 (40.00)
14 (35.00)
10 (25.00)
14 (35.00)
19 (47.50)
7 (17.50)
42 (35.00)
55 (45.83)
23 (19.16)
4 It does not cover all chapters
5 (12.50)
27 (67.50)
8 (20.00)
14 (35.00)
16 (40.00)
10 (25.00)
16 (40.00)
17 (42.50)
7 (17.50)
35 (29.16)
60 (50.00)
25 (20.83)
5 Course do not help in better running of business
10 (25.00)
22 (55.00)
8 (20.00)
19 (47.50)
10 (25.00)
11 (27.50)
14 (35.00)
17 (42.50)
9 (22.50)
43 (35.83)
49 (40.83)
28 (23.33)
6 Course material is not available in Hindi
12 (30.00)
20 (50.00)
8 (20.00)
17 (42.50)
12 (30.00)
11 (27.50)
16 (40.00)
14 (35.00)
10 (25.00)
45 (37.50)
46 (38.33)
29 (24.16)
ii) Practical 8 Less number of
skill oriented classes are conducted
7 (17.50)
21 (52.50)
12 (30.00)
11 (27.50)
18 (45.00)
11 (27.50)
13 (32.50)
18 (45.00)
9 (22.50)
31 (25.83)
57 (47.50)
32 (26.66)
9 Technical skills 8 24 8 11 16 13 8 17 15 27 57 36
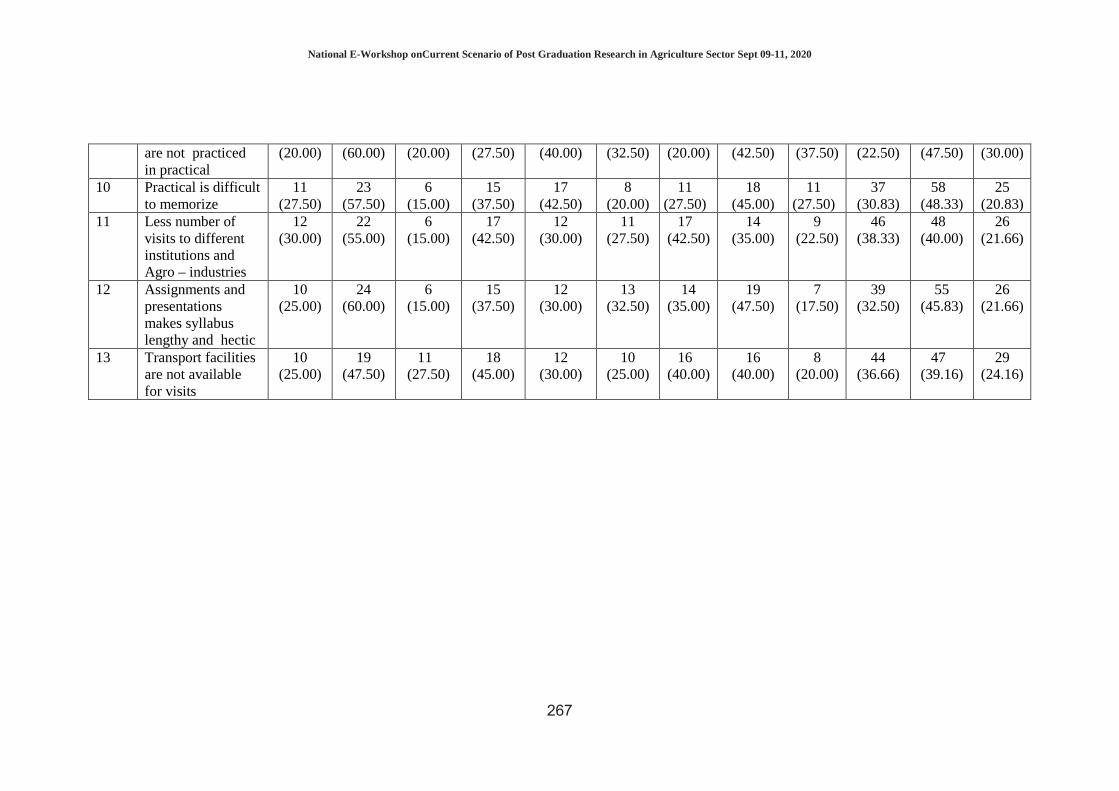
National E-Workshop onCurrent Scenario of Post Graduation Research in Agriculture Sector Sept 09-11, 2020
267
are not practiced in practical
(20.00) (60.00) (20.00) (27.50) (40.00) (32.50) (20.00) (42.50) (37.50) (22.50) (47.50) (30.00)
10 Practical is difficult to memorize
11 (27.50)
23 (57.50)
6 (15.00)
15 (37.50)
17 (42.50)
8 (20.00)
11 (27.50)
18 (45.00)
11 (27.50)
37 (30.83)
58 (48.33)
25 (20.83)
11 Less number of visits to different institutions and Agro – industries
12 (30.00)
22 (55.00)
6 (15.00)
17 (42.50)
12 (30.00)
11 (27.50)
17 (42.50)
14 (35.00)
9 (22.50)
46 (38.33)
48 (40.00)
26 (21.66)
12 Assignments and presentations makes syllabus lengthy and hectic
10 (25.00)
24 (60.00)
6 (15.00)
15 (37.50)
12 (30.00)
13 (32.50)
14 (35.00)
19 (47.50)
7 (17.50)
39 (32.50)
55 (45.83)
26 (21.66)
13 Transport facilities are not available for visits
10 (25.00)
19 (47.50)
11 (27.50)
18 (45.00)
12 (30.00)
10 (25.00)
16 (40.00)
16 (40.00)
8 (20.00)
44 (36.66)
47 (39.16)
29 (24.16)

National E-Workshop onCurrent Scenario of Post Graduation Research in Agriculture Sector Sept 09-11, 2020
268
Table 2. Distribution of input dealers as per the administrative problems faced by the input dealers
S.No. Administrative problems faced by the input dealers
NTIs Total n=120 KVK, Ajmer (n1=40) ZRS, ALWAR (n2= 40) SIAM, Jaipur (n3=40)
Most severe
problem
Severe problem
Not a severe
problem
Most severe
problem
Severe problem
Not a severe
problem
Most severe
problem
Severe problem
Not a severe
problem
Most severe
problem
Severe problem
Not a severe
problem
a) Infrastructure facilities at the centre
1 No proper arrangement for drinking water
8 (20.00)
19 (47.50)
13 (32.50)
16 (40.00)
8 (20.00)
16 (40.00)
17 (42.50)
13 (32.50)
10 (25.00)
41 (34.16)
40 (33.33)
39 (32.50)
2 Frequent power cuts 7 (17.50)
19 (47.50)
14 (35.00)
15 (37.50)
16 (40.00)
9 (22.50)
15 (37.50)
11 (27.50)
14 (35.00)
37 (30.83)
46 (38.33)
37 (30.83)
3 No comfortable chairs 8 (20.00)
20 (50.00)
12 (30.00)
13 (32.50)
14 (35.00)
13 (32.50)
15 (37.50)
14 (35.00)
11 (27.50)
36 (30.00)
48 (40.00)
36 (30.00)
4 Suffocating classrooms 8 (20.00)
20 (50.00)
12 (30.00)
12 (30.00)
16 (40.00)
12 (30.00)
14 (35.00)
15 (37.50)
11 (27.50)
34 (28.33)
51 (42.50)
35 (29.16)
5 Washrooms are not maintained 9 (22.50)
19 (47.50)
12 (30.00)
11 (27.50)
12 (30.00)
17 (42.50)
16 (40.00)
17 (42.50)
7 (17.50)
36 (30.00)
48 (40.00)
36 (30.00)
b) Methods of Evaluation 6 Practical exams are not evaluated 9
(22.50) 21
(52.50) 10
(25.00) 4
(10.00) 18
(45.00) 18
(45.00) 16
(40.00) 14
(35.00) 10
(25.00) 29
(24.16) 53
(44.16) 38
(31.66)
7 Evaluation is biased 7 (17.50)
21 (52.50)
12 (30.00)
5 (12.50)
18 (45.00)
17 (42.50)
14 (35.00)
14 (35.00)
12 (30.00)
26 (21.66)
53 (44.16)
41 (34.16)
8 Classroom performance and attendance marks are not counted
10 (25.00)
20 (50.00)
10 (25.00)
10 (25.00)
14 (35.00)
16 (40.00)
15 (37.50)
16 (40.00)
9 (22.50)
35 (29.16)
50 (41.66)
35 (29.16)
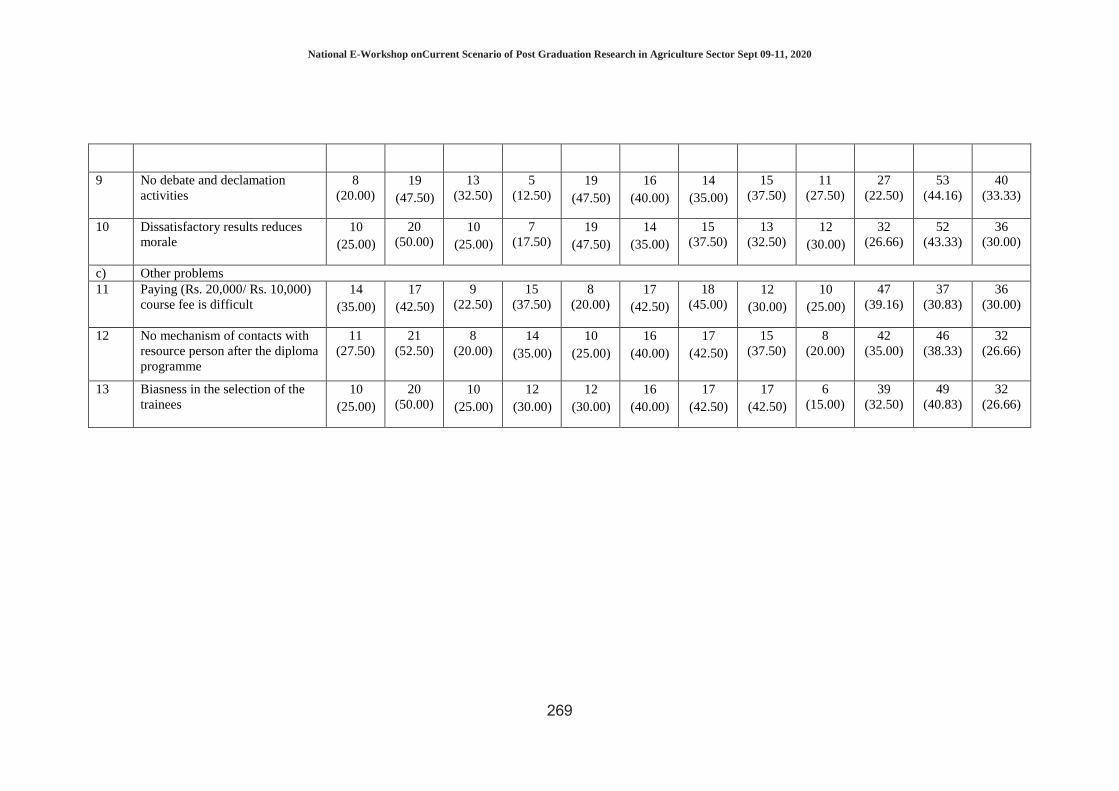
National E-Workshop onCurrent Scenario of Post Graduation Research in Agriculture Sector Sept 09-11, 2020
269
9 No debate and declamation activities
8 (20.00)
19 (47.50)
13 (32.50)
5 (12.50)
19 (47.50)
16 (40.00)
14 (35.00)
15 (37.50)
11 (27.50)
27 (22.50)
53 (44.16)
40 (33.33)
10 Dissatisfactory results reduces morale
10 (25.00)
20 (50.00)
10 (25.00)
7 (17.50)
19 (47.50)
14 (35.00)
15 (37.50)
13 (32.50)
12 (30.00)
32 (26.66)
52 (43.33)
36 (30.00)
c) Other problems 11 Paying (Rs. 20,000/ Rs. 10,000)
course fee is difficult 14
(35.00) 17
(42.50) 9
(22.50) 15
(37.50) 8
(20.00) 17
(42.50) 18
(45.00) 12
(30.00) 10
(25.00) 47
(39.16) 37
(30.83) 36
(30.00)
12 No mechanism of contacts with resource person after the diploma programme
11 (27.50)
21 (52.50)
8 (20.00)
14 (35.00)
10 (25.00)
16 (40.00)
17 (42.50)
15 (37.50)
8 (20.00)
42 (35.00)
46 (38.33)
32 (26.66)
13 Biasness in the selection of the trainees
10 (25.00)
20 (50.00)
10 (25.00)
12 (30.00)
12 (30.00)
16 (40.00)
17 (42.50)
17 (42.50)
6 (15.00)
39 (32.50)
49 (40.83)
32 (26.66)

National E-Workshop onCurrent Scenario of Post Graduation Research in Agriculture Sector Sept 09-11, 2020
270
The results regarding the administrative problems faced by the input dealers presented in table 2 are discussed under the following sub heads: (A) Problems related to Infrastructure facilities available at the centre Perusal of overall results have shown that 34.16 per cent of the input dealers felt ‘No proper arrangement for drinking water’ as the most severe problem followed by 30.83 per cent for ‘Frequent power cuts’ and 30.00 per cent for ‘No comfortable chairs’ and also for ‘Washrooms are not maintained’. (B) Problems related to the Methods of evaluation The overall results reveal that 29.16 per cent of the input dealers have expressed ‘Classroom performance and attendance marks are not counted’ as the most severe problem followed by 26.66 per cent for ‘Dissatisfactory results reduces morale’ and 24.16 per cent for ‘Practical exams are not being evaluated’.. (C) Other problems Perusal of overall results have shown that majority of the input dealers (39.16 per cent) have expressed ‘Paying course fee is difficult’ as the most severe problem followed by 35.00 per cent for ‘No mechanism of contact with resource person after the diploma’ and 32.50 per cent ‘Biasness in the selection of the trainees’. Inference The results have shown that the most severe problems faced by the input dealers were ‘Courses are too lengthy’(39.16 per cent), ‘Less number of field visits to different institutions and Agro- industries’ (38.33 per cent), ‘Resource persons invited for lectures are not competent’ (33.33 per cent), ‘Classroom session is too long to concentrate’ (42.50 per cent), ‘No proper arrangement for drinking water’ (34.16 per cent), ‘Classroom performance and attendance marks are not counted’ (29.16 per cent), ‘Paying course fee is difficult’ (39.16 per cent). Therefore appropriate corrective measures should be taken to resolve these problems to improve the quality of the DAESI prog.

National E-Workshop onCurrent Scenario of Post Graduation Research in Agriculture Sector Sept 09-11, 2020
271
IMPACT OF DRIP IRRIGATION ON COSTS AND RETURNS OF BANANA GROWERS IN MIDDLE GUJARAT
Rachana Kumari Bansal, KS Jadav and AS Shaikh
Department of Agricultural Economics, B. A. College of Agriculture, Anand Agricultural University, Anand – 388110, Gujarat (India)
Introduction Banana “Apple of Paradise” is one of the most important commercial tropical fruits traded in India. It is cultivated in about 120 countries. India is the world’s largest producer of banana, with 26% share (www.fao.org). The major producing states in India are Tamil Nadu (14.87%), Gujarat (14.37%), Andhra Pradesh (12.26%), Uttar Pradesh (10.51%) and Maharashtra (10.38%) (www.indiastats.com). The consequent effects of drip irrigation system are reflected in terms of generating more income in banana by saving of water, labour, fertilizers and plant protection measures, improving yields and quality of produce which ultimately improving the overall economic condition of banana growers. Therefore, any technology that is adopted needs to be assessed periodically in terms of cost & returns and its impact on resources and yield. Methodology In middle Gujarat, Anand and Vadodara was purposively selected, as they are the major growing as well as producing districts of banana, contributing together 28.45% of area and 28.08% of production under banana in Gujarat. Further, two talukas from each district and two villages randomly from each taluka were selected. Thus, in total eight villages were selected for the study. Further, 10 drip and 10 conventional banana growers from each selected villages were selected randomly. Thus total 160 banana growers comprising of 80 drip and 80 conventional irrigated farmers formed an ultimate sample for this study. To ascertain the impact of drip irrigation technology “with” or “without” approach was followed. The primary data regarding level of input use, production pattern, income and cost and price received etc. were collected by using pre tested interview schedule. For this study, data was collected for the year 2017-18, compiled, systematically analyzed and presented in tabular form. Techniques such as mean, percentage, ratios and simple comparisons were used in whole study for interpretation, wherever needed. To know whether the difference is significant or not “t-value” worked out with SPSS Software.
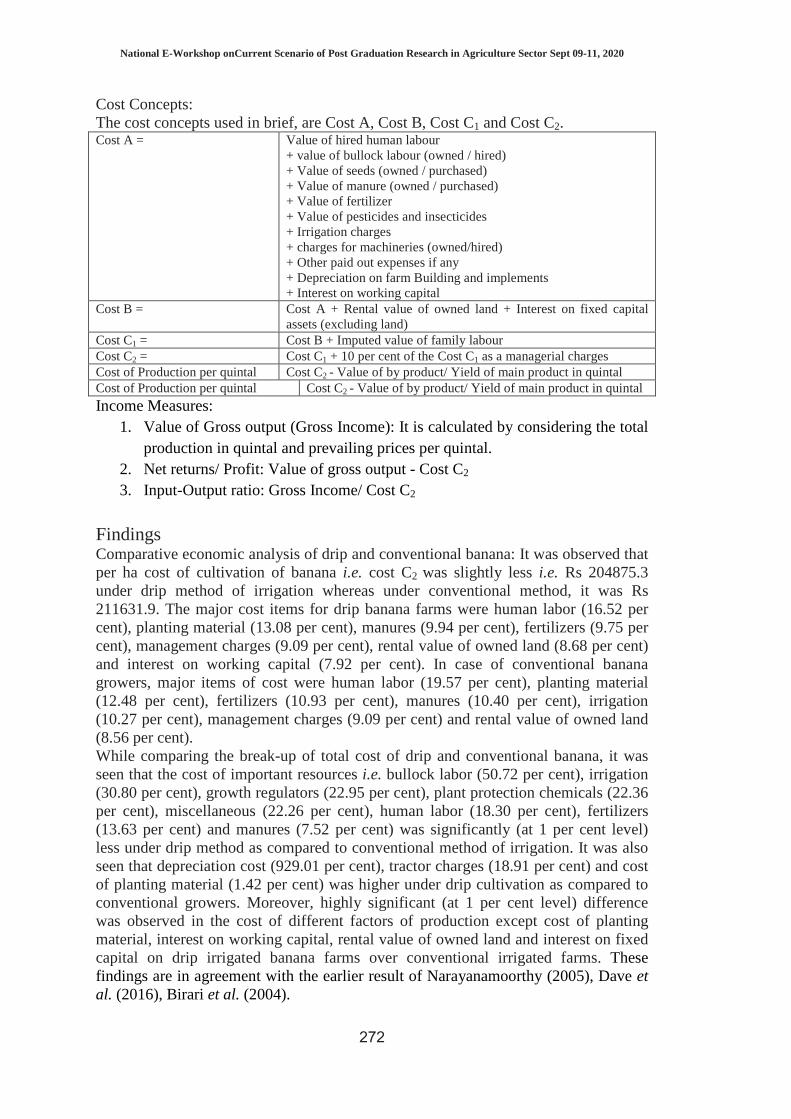
National E-Workshop onCurrent Scenario of Post Graduation Research in Agriculture Sector Sept 09-11, 2020
272
Cost Concepts: The cost concepts used in brief, are Cost A, Cost B, Cost C1 and Cost C2. Cost A = Value of hired human labour
+ value of bullock labour (owned / hired) + Value of seeds (owned / purchased) + Value of manure (owned / purchased) + Value of fertilizer + Value of pesticides and insecticides + Irrigation charges + charges for machineries (owned/hired) + Other paid out expenses if any + Depreciation on farm Building and implements + Interest on working capital
Cost B = Cost A + Rental value of owned land + Interest on fixed capital assets (excluding land)
Cost C1 = Cost B + Imputed value of family labour Cost C2 = Cost C1 + 10 per cent of the Cost C1 as a managerial charges Cost of Production per quintal Cost C2 - Value of by product/ Yield of main product in quintal Cost of Production per quintal Cost C2 - Value of by product/ Yield of main product in quintal
Income Measures: 1. Value of Gross output (Gross Income): It is calculated by considering the total
production in quintal and prevailing prices per quintal. 2. Net returns/ Profit: Value of gross output - Cost C2 3. Input-Output ratio: Gross Income/ Cost C2
Findings Comparative economic analysis of drip and conventional banana: It was observed that per ha cost of cultivation of banana i.e. cost C2 was slightly less i.e. Rs 204875.3 under drip method of irrigation whereas under conventional method, it was Rs 211631.9. The major cost items for drip banana farms were human labor (16.52 per cent), planting material (13.08 per cent), manures (9.94 per cent), fertilizers (9.75 per cent), management charges (9.09 per cent), rental value of owned land (8.68 per cent) and interest on working capital (7.92 per cent). In case of conventional banana growers, major items of cost were human labor (19.57 per cent), planting material (12.48 per cent), fertilizers (10.93 per cent), manures (10.40 per cent), irrigation (10.27 per cent), management charges (9.09 per cent) and rental value of owned land (8.56 per cent). While comparing the break-up of total cost of drip and conventional banana, it was seen that the cost of important resources i.e. bullock labor (50.72 per cent), irrigation (30.80 per cent), growth regulators (22.95 per cent), plant protection chemicals (22.36 per cent), miscellaneous (22.26 per cent), human labor (18.30 per cent), fertilizers (13.63 per cent) and manures (7.52 per cent) was significantly (at 1 per cent level) less under drip method as compared to conventional method of irrigation. It was also seen that depreciation cost (929.01 per cent), tractor charges (18.91 per cent) and cost of planting material (1.42 per cent) was higher under drip cultivation as compared to conventional growers. Moreover, highly significant (at 1 per cent level) difference was observed in the cost of different factors of production except cost of planting material, interest on working capital, rental value of owned land and interest on fixed capital on drip irrigated banana farms over conventional irrigated farms. These findings are in agreement with the earlier result of Narayanamoorthy (2005), Dave et al. (2016), Birari et al. (2004).

National E-Workshop onCurrent Scenario of Post Graduation Research in Agriculture Sector Sept 09-11, 2020
273
Table 1: Comparative cost of cultivation of banana under drip and conventional system (Rs/ha) S. No. Items Drip Conventional Change in drip over conventional farms
Value Per cent Value Percent Value Per cent “t” statistics 1. Hired labor 19396.14 9.47 23858.63 11.27 -4462.49 -18.70 6.49** 2. Family labor 14447.4 7.05 17565.7 8.30 -3118.3 -17.75 3.43** 3. Total human labor 33843.54 16.52 41424.33 19.57 -7580.79 -18.30 11.83** 4. Bullock labor 1140.84 0.56 2315.27 1.09 -1174.43 -50.72 8.68** 5. Tractor charges 7386.99 3.61 6212.07 2.94 1174.92 18.91 6.56** 6. Manures 20361.94 9.94 22016.52 10.40 -1654.58 -7.52 2.89** 7. Fertilizers 19983.67 9.75 23137.68 10.93 -3154.01 -13.63 5.24** 8. Planting material 26793.91 13.08 26419.98 12.48 373.93 1.42 1.73 9. Irrigation 15046 7.34 21741.77 10.27 -6695.77 -30.80 19.93** 10. Plant protection chemicals 5593.78 2.73 7205.02 3.40 -1611.24 -22.36 12.70** 11. Repair & maintenance 523.77 0.26 - 0.00 523.77 - 39.26** 12. Growth regulators 852.96 0.42 1107.08 0.52 -254.12 -22.95 4.92** 13. Miscellaneous 1578.09 0.77 2029.95 0.96 -454.86 -22.26 11.59** 14. Depreciation 16635.57 8.12 1616.65 0.76 15018.92 929.01 296.62** 15. Total working cost 135293.7 66.04 137660.6 65.05 -2366.96 -1.72 1.53 16. Interest on working capital 16235.24 7.92 16519.27 7.81 -284.035 -1.72 1.53 17. Cost A 151528.9 73.96 154179.9 72.85 -2651 -1.72 1.53 18. Rental value of owned land 17776.2 8.68 18121.15 8.56 -344.95 -1.90 .025 19. Interest on fixed capital 2497.75 1.22 2525.93 1.19 -28.18 -1.11 1.68 20. Cost B 171802.8 83.86 174827 82.61 -3024.13 -1.73 1.44 21. Cost C1 186250.3 90.91 192392.7 90.91 -6142.43 -3.19 3.98** 22. Management charges 18625.03 9.09 19239.27 9.09 -614.24 -3.19 3.98** 23. Cost C2 204875.3 100.00 211631.9 100.00 -6756.67 -3.19 3.98** Source: Field Survey **significant at 1 per cent * significant at 5 per cent

National E-Workshop onCurrent Scenario of Post Graduation Research in Agriculture Sector Sept 09-11, 2020
274
Comparative returns from drip and conventional banana: A perusal of table showed that the average yields per ha was 743.56 and 642.36 quintal for drip and conventional banana growers, respectively. The yield was found significantly higher (about 15 per cent) on drip farms over conventional irrigated farms, which indicated that productivity was higher in drip method due to efficient use of inputs and weed free plots. The price (per quintal) received by two types of cultivators observed unison. The drip banana growers received slightly higher price as compared to non-drip farmers due to good quality of fruits. The value of gross output was 519488.9 Rs/ha and 449094 Rs/ha for drip and conventional farms, respectively. It was significantly higher by 15.67 per cent on drip farms in middle Gujarat condition. Drip irrigation system provides 32.49 per cent significantly higher net profit compared to conventional method of irrigation. The cost of production of banana (Cost C2) per quintal under drip farms was Rs 275.53 whereas on conventional farms it was Rs 329.46. So, banana cultivation using conventional irrigation method required higher investment by about 54 Rs/q than the drip irrigated method. It indicated that an investment worth Rs 1 on all inputs used in the cultivation of drip and conventional banana yielded an output worth Rs 2.54 and 2.12 for drip and conventional banana farms, respectively.
Table 2: Comparative yield, FHP and Gross Income of banana under drip and conventional system S. No.
Items Drip Conventional Change in drip over conventional farms Value Percent “t” statistics
1. Bunch No. 2478.8 2443.78 35.02 1.43 1.23 2. Bunch Weight (kg) 30.70 26.6 4.1 15.41 9.77** 3. Yield (q/ha) 743.56 642.36 101.2 15.75 8.68** 4. Average FHP (Rs/q) 702.14 698.08 4.06 0.58 0.770 5. Gross income (Rs/ha) 519488.9 449094 70394.9 15.67 7.88** 6. Net Returns 314613.7 237462.1 77151.6 32.49 8.74** 7. Cost of Production
(Rs/q) 275.53 329.46 -54.13 -16.43
8. FHP 702.14 698.08 4.06 0.58 9. Input-output ratio 2.54 2.12 Source: Field Survey **significant at 1 per cent * significant at 5 per cent Inference In this study an attempt has been made to analyze the technological impact in banana as India is the largest producer globally. The analysis of economics of banana cultivation under drip and traditional method has revealed that the drip method of irrigation has a significant impact on resources saving [labor (18.30 per cent), water (30.80 per cent), growth regulators (22.95 per cent), plant protection chemicals (22.36 per cent), fertilizers (13.63 per cent) and manures (7.52 per cent)), cost of cultivation (Rs 6756.67/ha), yield of crops (101.2 q/ha) and farm profitability. The net change in income due to drip technology was 77154.56 Rs. Banana growers also received higher prices for the banana when adopted drip irrigation system as quality was better in drip farms. The findings of this study demonstrate the superiority of drip in terms of yield and returns advantage by spending less on all inputs.
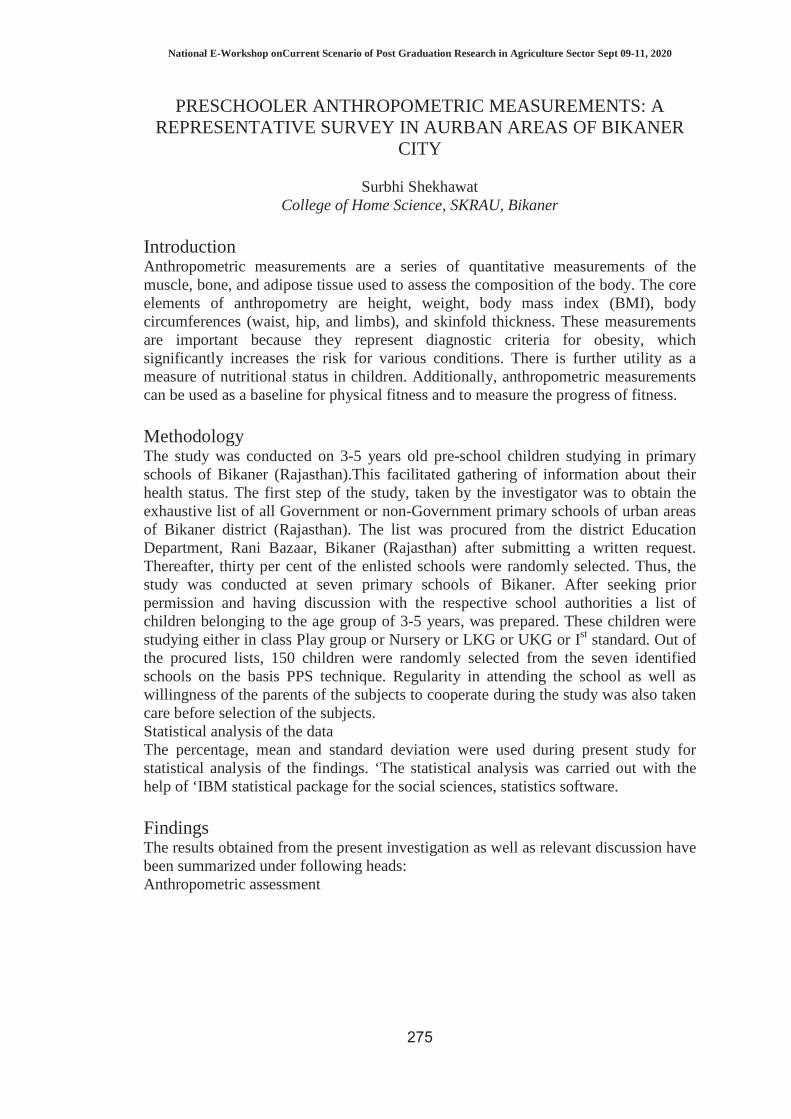
National E-Workshop onCurrent Scenario of Post Graduation Research in Agriculture Sector Sept 09-11, 2020
275
PRESCHOOLER ANTHROPOMETRIC MEASUREMENTS: A REPRESENTATIVE SURVEY IN AURBAN AREAS OF BIKANER
CITY
Surbhi Shekhawat College of Home Science, SKRAU, Bikaner
Introduction Anthropometric measurements are a series of quantitative measurements of the muscle, bone, and adipose tissue used to assess the composition of the body. The core elements of anthropometry are height, weight, body mass index (BMI), body circumferences (waist, hip, and limbs), and skinfold thickness. These measurements are important because they represent diagnostic criteria for obesity, which significantly increases the risk for various conditions. There is further utility as a measure of nutritional status in children. Additionally, anthropometric measurements can be used as a baseline for physical fitness and to measure the progress of fitness. Methodology The study was conducted on 3-5 years old pre-school children studying in primary schools of Bikaner (Rajasthan).This facilitated gathering of information about their health status. The first step of the study, taken by the investigator was to obtain the exhaustive list of all Government or non-Government primary schools of urban areas of Bikaner district (Rajasthan). The list was procured from the district Education Department, Rani Bazaar, Bikaner (Rajasthan) after submitting a written request. Thereafter, thirty per cent of the enlisted schools were randomly selected. Thus, the study was conducted at seven primary schools of Bikaner. After seeking prior permission and having discussion with the respective school authorities a list of children belonging to the age group of 3-5 years, was prepared. These children were studying either in class Play group or Nursery or LKG or UKG or Ist standard. Out of the procured lists, 150 children were randomly selected from the seven identified schools on the basis PPS technique. Regularity in attending the school as well as willingness of the parents of the subjects to cooperate during the study was also taken care before selection of the subjects. Statistical analysis of the data The percentage, mean and standard deviation were used during present study for statistical analysis of the findings. ‘The statistical analysis was carried out with the help of ‘IBM statistical package for the social sciences, statistics software. Findings The results obtained from the present investigation as well as relevant discussion have been summarized under following heads: Anthropometric assessment

National E-Workshop onCurrent Scenario of Post Graduation Research in Agriculture Sector Sept 09-11, 2020
276
Table: 1.1 Distribution of the subjects according to their height & weight
Age (in years)
Gender (N=150)
Height (cm) NCHS standards
Mean ± SD (cm)
Percent adequacy
Weight (kg) NCHS standards
Mean ± SD (kg)
Percent adequacy
3 Boys(n=32) 94.9 95.8 ± 3.3 100.9 14.6 15.7 ± 4.5 107.5 Girls(n=27) 93.9 92.2 ± 4.7 98.1 14.1 13.9 ± 2.5 98.5 4 Boys(n=35) 102.9 104.4 ± 6.0 101.4 16.7 14.9 ± 1.84 89.2
Girls(n=24) 101.6 100.9 ± 8.12
99.3 16.0 15.01 ± 2.06
93.8
5 Boys(n=15) 109.9 111.2 ± 6.5 101.1. 18.7 16.1 ± 1.8 86.0
Girls(n=17) 108.4 107.9 ± 7.45
99.5 17.7 15.9± 1.7 89.8
Overall mean 100.9 ±8.3 Overall mean
15.2 ± 3.17
Note: Values in parenthesis indicate percentage of the subjects Height for age: Height is affected only by long-term nutritional deprivation; it is considered as an index of chronic or long duration malnutrition (Srilakshmi, 2008). It is clear from the table 1.1 that the mean height values were found to be 99.5 to 104.8 percent of the NCHS standards. Further, the boys were noted to be taller than girls.Similar to present findings, Lenka et.al. (2013) also reported that boys were taller than girls while studying preschool children of Odisha for their nutritional status. Weight for age: Weight of an individual indicates the current nutritional status. It is proportional to the dietary intake and any fluctuation may lead to malnutrition of either deficit or excess. Therefore, weight deficiency may be a precise indicator of the prevalence of protein energy malnutrition among any age group (Gibson, 1990). It can be perceived from the table 1.1 that the mean values for body weight of the subject were noted to be 86.0-107.5 percent of the NCHS standards. Mid upper arm circumference (MUAC): The measurement of mid upper arm circumference for determining community nutritional status appears to be useful in practice and ease of performance (Rao et al, 1976). In the present study, the mean value of MUAC was found to be15.6 ± 1.11 and 14.73 ± 1.55 cm for 3-4 and 4-5 years of the subjects indicating 97.5 and 92.0 percent adequacy of reference value (16.0 cm) respectively. Srilakshmi (2010) also has stated that MUAC correlated well with body weight. Lenka et.al. (2013) also had reported low MUAC adequacy (73.29-83.12 %) for preschool children (1-5 years) of Odisha. Table: 1.2: Distribution of the subjects according to their MUAC
Age wise no. of subjects
Mid upper arm circumference standard* value
Mean ± SD (cm)
Percent adequacy
3-4 years(n=59) 16 15.6 ± 1.11 97.5 4-5 years(n=91) 16 14.73± 1.55 92.0 Note: Values in parenthesis indicate percentage of the subjects * NCHS (1990 Head & chest circumference: Head size relates mainly to the size of brain, which increases quite rapidly during infancy. The chest in a normally nourished child grows faster then head during the second and third year of life. According to present data,
National E-Workshop onCurrent Scenario of Post Graduation Research in Agriculture Sector Sept 09-11, 2020
277
the chest/head circumference ratio was calculated and the values were found to be 1.02± 0.93 and 0.99 ± 0.72cm for both the age groups respectively. Table: 1.3: Distribution of the subjects according to their head and chest
Age wise no. of subjects Mean ± SDn(cm) Chest &head circumference ratio Percent
adequacy HC CC
Reference value*
Mean ± SD
3-4 years(n=59) 49.4 ±2.5 50.8 ± 1.9 >1 1.02±0.93 102
4-5 years(n=91) 50.0±2.29 49.7±2.7 - 0.99±0.72 -
Note: Values in parenthesis indicate percentage of the subjects
*NCHS (1990) HC=Head circumference, CC= chest circumference
Inference Due to high intake of fat, majority of the subjects in both the age groups had normal health status with reference to their body weight.

National E-Workshop onCurrent Scenario of Post Graduation Research in Agriculture Sector Sept 09-11, 2020
278
OVERALL JOB PERCEPTION AND JOB PERFORMANCE OF AGRICULTURE SUPERVISORS OF JAIPUR DIVISION OF
RAJASTHAN
Nisha Meena1,a,b, Madhuri Joshi,2JK Meena2, Divya Rajpurohit3, Sarita Meena1, Renuka1
Shri Karan Narendra Agriculture University, Jobner1-a, Faculty of Science (Agriculture), Jagannath University1-b
Shri Karan Narendra Agriculture University, Jobner2 College of Home Science, SKRAU, Bikaner3
Introduction In India the main occupation of our working population is Farming. Indian agriculture has registered an impressive growth over last few decades.Service sector is the largest sector of India. Gross Value Added (GVA) at current prices for Services sector is estimated at 92.26 lakh crore INR in 2018-19. Services sector accounts for 54.40 percent of total India's GVA (Gross Value Added) of 169.61 lakh crore Indian rupees. Industry sector contributes 29.73 percent to, Agriculture and allied sector shares 15.87% (Anonymous, 2018-19). In 2011-12 prices, composition of Agriculture & allied Industry, and Services sector are 14.39%, 31.46%, and 54.15%, respectively. Share of primary (Agriculture, forestry, fishing and mining & quarrying), secondary (manufacturing, electricity, gas, water supply & other utility services, and construction) and tertiary (service) sectors have been estimated as 18.57 per cent, 27.03 per cent and 54.40 per cent. India’s accounts for 7.39 percent of total global agricultural output. India is way behind china which has $ 991 by GDP in agriculture sector.In order to achieve the objectives of Department of Agriculture, various activities and programmes are being carried out through extension personnel. It is being increasingly realised that the ultimate success of agriculture development programmes not only depends on availability of recommended varieties of seed, fertilisers, plant protection measures, improved production and protection technologies but also on the role performed by the persons who have the responsibility to guide the farmers for proper use of farm resources for their greater advantage.Job perception relates to the way in which the employees look at their jobs. The differences in perceptual frame work can lead people to behave differently in the face of common circumstances. Thus, the study of perception is a pre-requisite to understand and explain the work behaviour in all its variety and complexity. A Study by Child (1972), has shown the influence of role perception of extension workers in determining actions reported that Unfavourable outcomes from the organizational goals, probably due to low role perception may lower the level of aspiration and satisfaction of an employee and thereby, creating conflict between him and the organization (Banmeke and Ajayi, 2005).Job performance is how the people put their perception into realities. The job performance has a great significance for the functioning of any organization. Greater job performance is likely to lead eventually to a more effective functioning of the individual and the organization as a whole. The job performance depends on professional competency and training received by workers, Job factors such as pay, job itself, promotion opportunities, support from supervisors & relationship with co-workers can affect employee’s satisfaction (Ahmad et. al. 2002).

National E-Workshop onCurrent Scenario of Post Graduation Research in Agriculture Sector Sept 09-11, 2020
279
Methodology The present study was conducted purposively in zone IIIa (Semi arid Eastern Plain) of Jaipur division comprising of Jaipur, Ajmer, Dausa&Tonk districts of Rajasthan as this zone falls under the jurisdiction of SKN Agriculture University Jobner& the researcher is acquainted with the area being local.respondents were selected on the basis of proportionate sampling 25 per cent of the total respondents i.e. 86 from Jaipur, 40 from Dausa, 54 from Ajmer & 49 from Tonk District were selected randomly. Thus in all, 229 Agriculture Supervisors were selected in the sample of the study.respondents were asked to fill up all the in formations in the questionnaire. hypotheses were formulated and appropriate statistical tests were used to arrive at statistical conclusion. The statistical measures used were percentage, mean, MPS (Mean Percent Score), SD (standard deviation), correlation coefficient, chi-square test. Findings General Information about the Agriculture Supervisors (Age, Education, Work experience) The data in Table 1 indicate that majority (48.00 per cent) of the Agriculture Supervisors were in the middle age group ( 36-55 years) whereas 31.80 per cent were in young age group (18-35 years ). Only 20.0 per cent were in old age group (above 55 years). Fruther, majority of the Agriculture Supervisors (49.34 percent) were having higher secondary education whereas 34.93 percent were B.Sc. (Ag.) Further 12.66 percent were M.Sc. (Ag.) and only 3.05 were Ph.D. in Agriculture. Followed by majority (55.89 per cent) of the respondents were having work experience of below 10 years as Agriculture Supervisors whereas (30.13 per cent) were having above 20 years’ experience. Only (13.97 per cent) of the Agriculture Supervisors were in 10 -20 years’ work experience group. Table 1: General information about the Agriculture Supervisors [n=229] S.No. Particulars Dausa
(n1=40) Ajmer(n2=54) Tonk(n3=49) Jaipur
(n4=86) Overall(n=229)
Age 1 Young (18-35
years) 6 (15.00) 7 (12.96) 25 (51.02) 35 (40.69) 73 (31.87)
2 Adult (36-55 years)
30 (75.00) 26 (48.14) 24 (48.97) 30 (34.88) 110 (48.03)
3. Old (>55 years) 4 (10.00) 21 (38.88) 0 (0.00) 21 (24.41) 46 (20.08) Educational Level
1. Higher Secondary (Ag.)
17 (42.50) 31 (57.40) 24 (48.97) 41 (47.67) 113 (49.34)
2. B.Sc.(Ag.) 20 (50.00) 17(31.48) 14 (28.57) 29 (33.72) 80 (34.93) 3. M.Sc.(Ag.) 3 (7.50) 4 (7.40) 9 (18.36) 13 (15.11) 29 (12.66) 4. Ph.D.(Ag.) 0(0.00) 2(3.70) 2(4.08) 3(3.48) 7(3.05)
Working experience 1. Below 10 years 30(75.00) 14(25.92) 32(65.30) 52(60.46) 128(55.89) 2. From 10 to 20
years 6(15.00) 8(14.81) 7(14.28) 11(12.89) 32(13.97)
3. Above 20 years 4(10.00) 32(59.25) 10(20.40) 23(26.74) 69(30.13) (Figures in the parentheses indicate percentages) Job Perception of the Agriculture Supervisors

National E-Workshop onCurrent Scenario of Post Graduation Research in Agriculture Sector Sept 09-11, 2020
280
The job perception is indicative of what the Agriculture Supervisors’ thinks about their job. The overall job perception of the Agriculture Supervisors was calculated on the basis of total scores obtained by an individual Agriculture Supervisor in all the components of Job perception mentioned above. They were classified into 3 perception categories “Low”, “Medium” and “High” on the basis of mean (164.484) and standard deviation (11.781) as follows: (i) Low job perception - Score < 152.70 (ii) Medium job perception - Score between 152.70 to 175.26 (iii) High job perception Score - >175.26 Table 2 : Overall Job Perception of the Agriculture Supervisors [n=229]
S.No. Categories of Job Perception
Dausa (n1=40)
Ajmer (n2=54)
Tonk (n3=49)
Jaipur (n4=86)
Overall (n=229)
f /% f /% f /%
f /%
f /%
1. Low(<152.70) 0(0.00) 1(1.85) 1(2.04) 61(70.93) 63(27.51)
2. Medium (152.70-175.26)
30(75.00) 40(74.07) 30(61.22) 25(29.06) 125(54.58)
3. High(>175.26) 10(25.00) 13(24.07) 18(36.73) 0(0.00) 41(17.90) (Mean = 164.484, SD = 11.781)(Figures in the parentheses indicate percentages) The results in Table 2 (Fig. 1) revealed that 54.48 per cent of the Agriculture Supervisors had medium level of job perception, while 27.51 and 17.90 per cent of them were in low and high level of job perception categories, respectively. This may be because of less education and age of the respondents under the present study.
Fig.1: Overall Job Perception of Agriculture Supervisors
Job Performance of the Agriculture Supervisors For successful implementation of any programme, merely perception of the job responsibilities is not sufficient. Rather it is necessary for the workers to perform their duties effectively whatever they perceive. The job performance is indicative of work effectiveness of the Agriculture Supervisors. An attempt was made in this study to assess the level of job performance of the Agriculture Supervisors through self-rating.On the basis of the total score obtained by each respondent, they were classified into 3 levels of job performance as “Low”, “Medium” and “High” on the basis of mean (125.48) and standard deviation (13.57) as follows:
(i) Low- job performance score below <111.91
-80
-60
-40
-20
0
20
40
60
80
100

National E-Workshop onCurrent Scenario of Post Graduation Research in Agriculture Sector Sept 09-11, 2020
281
(ii) Medium -job performance score between 111.91 to 139.05 (iii) High - job performance score >139.05
The overall Job performance was calculated by summing up all the scores obtained by the Agriculture Supervisors in all the components .The data in table 3 (Fig. 2) presents the results of overall job performance of the Agriculture Supervisors. Table 3 : Overall Job Performance of the Agriculture Supervisors [n=229]
S. No.
Categories of Job Performance
Dausa (n1=40)
Ajmer (n2=54)
Tonk (n3=49)
Jaipur (n4=86)
Overall (n=229)
f/ % f/% f/ % f/ % f/%
1. Low (<111.91)
11 (27.5)
10 (18.5)
5 (10.20)
4 (4.65)
30 (13.10)
2. Medium (between 111.91-139.05)
29 (72.5)
43 (79.62)
34 (69.38)
77 (89.53)
183 (79.91)
3. High (>139.05)
0 (0.00)
1 (1.85)
10 (20.40)
5 (5.81)
16 (6.98)
Mean= 125.48, SD= 13.57
(Figures in the parenthesis indicates the percentage) The results in Table 3 reveaedl that majority of the Agriculture Supervisors (79.91per cent) were found in medium level of job performance followed by low (13.10 per cent) and only 6.98 per cent were found in high level of job performance, which is quite unfortunate.
Fig. 2 : Overall Job Performance of the Agriculture
Problems faced by the Agriculture Supervisors These are some problems reveled from the findings of the present investigation which was faced by the Agriculture Superviosrs at their work place “Technical Problems faced by the Agriculture Supervisors” reveal that “Lack of computer literacy” (80.64 MPS) were the most important problem followed by “Lack of computers with internet connection in the office” (75.69 MPS) & “Technologies available are not as per the problems of the farmers” (74.23 MPS).“Administrative problems faced by the Agriculture Supervisors” were “No Additional charge for another village” (92.72 MPS) followed by “No transparent Transfer Policy” (91.41 MPS) &“No facility of
-100
-80
-60
-40
-20
0

National E-Workshop onCurrent Scenario of Post Graduation Research in Agriculture Sector Sept 09-11, 2020
282
Vehicle for field visits” (88.64 MPS).“Financial Problems, “General Problems faced by the Agriculture Supervisors” were “Children’s education suffers due to the stay in village” (88.20 MPS) followed by “Lack of response from the farmers & Shyness of farmers” (86.46 MPS) & “No recognition for good work from the villagers” (83.11 MPS) & so on. Inference Based on the findings and observations it was concluded that Majority of the Agriculture Supervisors were having medium level of job perception performance job satisfaction into their job. Therefore it is recommended that Departments of Agriculture should conduct orientation programme before joining of the Agriculture supervisors so that they can understand their responsibilities before they start the work. Similarly refresher courses should also be organized from time to time to update them with the new technologies. To improve the job performance, adequate technical support from the superiors should be provided to the Agriculture Supervisors like computers with internet facilities, computer trainings etc. for improving the job efficiency. Regular monitoring of the performance of Agriculture Supervisors should be done.

National E-Workshop onCurrent Scenario of Post Graduation Research in Agriculture Sector Sept 09-11, 2020
283
VALUATION OF ALDER BASED FARMING SYSTEM IN NAGALAND
Limasunep Ozukum, S.M. Feroze, ZohmingmawiiSailo
Introduction Valuation of the environment is necessary for achieving greater sustainability, assessing management efficiency and make possible to include the non-measurable environmental impacts in terms of cost benefit analysis (Kiran and Kaur, 2011). Every biological system consists of natural resources which provide goods (physical component) and services (non-physical components). Physical components are those which are tangible and have monetary market value while the services cannot be easily defined in monetary value (Dixon and Pagiola, 1998).Environmental goods viz., food, timber, energy, recreation, and materials for which there are economic markets can be easily valued. However, the majority of environmental services do not have any existing economic market. The alder based farming system (AFS) is one such man made ecosystem wherethe various components have potential use values to the society (Mburuet al., 2007). AFS is the incorporation of species of Alder (Alnusnepalensis)trees in the practice of jhum farming (Cairns, 2007). This is a non-leguminous tree which fixes nitrogen through root nodules (Sharma and Ambasht, 1986; Sharma et al., 1998; Rathoreet al., 2010) and also a promising fuel wood tree species, which can be used for timber, tannins and dyes (Jackson, 1994; Lamichhaney, 1995). The AFS is a highly productive form
of jhum (shifting cultivation or swidden agriculture) has been developed at Khonoma village. The system provides at least 57 food crops to supplement the rice grown in nearby wet terrace rice cultivation (NEPED and IIRR,1999).The normal cycle of jhum cultivation in the area is about 3-4 years which has reduced from 15-20 years (Rathoreet al., 2010). But the AFS allows two harvests in two out of every four to five years i.e., 1:1 ratio of cropping to fallow (NEPED and IIRR, 1999).The AFS is a better incentive in comparison to the traditional jhumpractice in many aspects as a stable and sustainable agricultural base (Kithan, 2014). The jhum is considered stable if the cycle is for 15-20 years. The major economic components that constitutes the AFS are the goodsviz., trees, biomass, the crops grown and the services that the trees provides such as soil amelioration, nitrogen fixing and preventing of depletion of the ozone layer (Freeman, 2003; Mburu et al., 2007). Rationale/Justification of the study The key problem driving the accelerating widespread destruction and degradation of the natural environment is that the importance of environmental conservation and sustainable development to socio-economic development is undervalued by our society (ET, 1996). The environmental valuation techniques can provide useful evidence to support habitat conservation policies by quantifying the economic value associated with the protection of biological resources (Hanley et al., 2001). AFS can emerge as a potential system to restore the land degraded by the slash and burn cultivation on hilly areas where other commercial agricultural activities cannot economically be carried out (Sharma et al., 1998; Kithan, 2014).Those services are often not reflected in monetary form which prevents us in knowing the total value of the AFS (Hanley et al., 2001).The positive externalities need to be reflected into monetary form of both the use and non-use values to highlight the overall significance

National E-Workshop onCurrent Scenario of Post Graduation Research in Agriculture Sector Sept 09-11, 2020
284
of the AFS. Thus, this study attempts to evaluate the AFS i.e., both the goods it provides. Methodology Description of the study area, sampling plan and technique The present study has been conducted at Khonoma which is located about 20 km west of Kohima district of Nagaland. Khonoma village was selected purposively as the study area because the alder based farming system (AFS) is primarily confined in this as it has the highest area under the AFS (Kithan, 2014). Two alder based farming khelswereselected purposively based on the population engaged in farming. One focus group discussion (FGD) was conducted in each of the selected farming khel and 30 farmers participated in each of the FGDs and were followed up with personal in-depth interviews. Data Primary data on variables like area of land holdings, the land use pattern, crop productivity and the system of alder based farming was collected through FGDs and personal interviews using semi-structured schedule and employing tools like seasonal calendar, cropping calendar etc. The measurement of biomass was experimentally conducted. Secondary data of the state about area, production and productivity of major crops was collected from the different publications of Department of Economics and Statistics, Government of Nagaland. Analytical tools The analytical tools used for the present study are given below Table. Table 1. Methods and approaches for attainment of research objectives Objective Particulars Approach Method
Valuation of goods provided by the system
Biomass Revealed preference method Direct market price Crop(s)
productivity Revealed preference method -
Findings Valuation of goods provided by the system The sampling plan for alder wood estimation and crop productivity is given in Table 2. Table 2 Estimation of alder wood Particulars Activity Sampling plan
Estimation of no. of alder trees in AFS field based on area and age
Personal interview, field measurement counting of trees
Sixty farmers practicing AFS
Biomass (wood) estimation
Measurement of length, breadth and girth (m)
Five alder trees were selected randomly under each age and per farm category
Crop productivity Collection of productivity of the main crops grown in AFS farming in the previous year (kg/ha/year)
Primary data on input and outputs for different crops cultivated was collected from 60 farmers engaged in alder based farming who participated in the FGDs

National E-Workshop onCurrent Scenario of Post Graduation Research in Agriculture Sector Sept 09-11, 2020
285
Results and Discussion Valuationof goods 1. Valuation of firewood Direct market price method under the revealed preference approach was used (Jantzen, 2006) to quantify the value of wood. The volume of firewood harvested from the alder trees and gross returns (�) from the firewood is presented in Table 3. Table 3. Estimated firewood and returns per farm across AFS land holding category Farm size (ha) Firewood (m3) Returns (�)
Mean Minimum Maximum Mean Minimum Maximum Marginal (<0.32) 2.00 0.18 5.40 4280 386 11575
Small (0.33 -0.76) 8.15 4.95 11.35 17463 10610 24299 Medium (>0.77) 20.47 11.25 36.72 43870 24114 78701 Overall 7.99 0.18 36.90 17033 386 78701
The estimated average volume of firewood harvested from a farm was 7.99 m3; minimum being 2.00 m3 for marginal and maximum being 36.72 m3 in case of medium AFS farms. The market price of the firewood was �2132.90/m3. Hence, the gross return from selling of firewood was �17033/farm. The maximum gross return was as high �78701/farm in case of the medium farms due to presence of higher number of standing alder trees. The relationship between the land holding category and the gross return from selling of alder trees is depicted in Fig. It can be observed that the gross returns increased with increase land holding size due to higher number of trees in larger farms (Fig.1).
Figure 1 Gross return (�/household) from firewood across AFS land holding category
1. Valuation of crops
The gross returns from the crops cultivated and their share in the total returns is given below in Table. The estimated average gross return from cultivation of crops was �21915.74/household and �3.50 lakh/ha as shown in Table 4.
y = 6998.7x2 - 6776.4x + 4057.2
R² = 0.82
0
50000
100000
0 0.5 1 1.5 2 2.5 3 3.5
₹/h
ou
seh
old
Land holding category (1=marginal, 2=small,3=medium)

National E-Workshop onCurrent Scenario of Post Graduation Research in Agriculture Sector Sept 09-11, 2020
286
Table 4. Gross return from different crops cultivated in AFS land S. No. Crops N Av. price
(�/kg) Gross return(�/ha) Gross return (�/household)
1 Naga garlic
24 100 223144.02 16302.17
2 Potato 45 35 158614.50 15203.61 3 Maize 22 25 58819.91 4384.09 4 French
bean 2 55 94436.26 8800.00
5 Cabbage 6 13 275695.57 7800.00 6 Carrot 9 42 88263.06 3707.66 7 Ginger 4 56 462125.56 3290.00 8 Chilly 4 65 440104.20 975.00 9 Coriander 1 12 18000.00 180.00
10 Brinjal 1 33 270600.00 541.20 Av. returns from total vegetables and spices 350380.69 21915.74
The average per farm and per hectare gross returns from AFS biomass is presented in Table 5. Table 5. Gross return (�) from total biomass N=60 S. No. Particulars Per farm Per hectare 1 Firewood 17033.00 35485.42 2 Crops 21915.74 350381.00 3 Total gross returns 38948.74 385866.42
The estimated gross return from the biomass acquired from the AFS jhum field at Khonoma was �38948.74/farm and �3.86 lakh/ha which is the calculated value of the goods provided by the AFS. Verma (2000) studied on the economic valuation of forest (3698600 ha) of Himachal Pradesh and reported that the economic value of the total goods obtained from the forest such as timber, fuel wood, fodder and other minor forest was �3000/ha.

National E-Workshop onCurrent Scenario of Post Graduation Research in Agriculture Sector Sept 09-11, 2020
287
OPINION, REASONS AND BENEFITS OF JOINING SELF HELP GROUPS IN TRIBAL SUB PLAN REGION OF RAJASTHAN-AN
EVALUATIVE STUDY
Dr. Satyveer Singh Meena1& Dr. Hanuman Prasad2
1Institute of Agri Business Management, SKRAU, Bikaner 2Faculty of Management Studies, ML Sukhadia University, Udaipur, Rajasthan
Email: [email protected] Introduction Poverty means those people who have nothing, whose lives are in constant hazard due to the shortage of all basic resources that are required for their survival. In broad-spectrum, excessive poverty means extreme deprivation i.e. deprivation of all basic amenities of life. It is seen that along with the urbanization and modernization people met with different forms of poverty and every definition related to poverty also changes with the inclusion of new dimensions. Eradication of poverty is the main purpose of planning in India from the inception of planning periods and NITI Ayog. Poverty has global presence and varied genesis and dimensions. It does not mean only human or income poverty but it also covers deprivation of human dignity caused by vulnerability to social and cultural shocks. Development Economics, till 1970s was considered that the “Trickle Down Effect” of growth oriented GNP will help to eradicate poverty gradually (Mansuri, 2010). In recent years improving the situation of women and rural household through literacy, skill development and enhancing income generating capacity by way of more gainful employment on one hand coupled with the ‘empowerment’, through right to use to information, economic autonomy resulting from revenue generating activities and combined action on the other hand have become focal point of strategies for women and rural households’ growth. Today Self-help groups (SHGs) play a major role in poverty alleviation in rural India. An increasing number of deprived people in a series of parts of India are members of SHGs and are keenly engaged in savings and credit, as well as in other activities eg. Income generation, natural resources management, literacy, child concern and nutrition, etc. The SHG system has proven to be very appropriate and helpful in offering women the possibility to break away gradually from exploitation and isolation. Nearly all main donor agencies support SHGs in India in one mode or another and a lot of success stories are available, unfolding how membership in a SHG changed the life of a particular human being or group for the improvement. Lots of NGOs are encouraging the SHG instrument and linking it to a variety of other development interferences. Whereas there is sufficient evidence that the SHG approach is a very successful, efficient and related tool for organizing and empowering the poor, do arise with design, growth and introduction of programmes to encourage Income-Generating Activities (IGAs) that will generate adequate, sustainable and regular income (Saravanan, 2016).
A SHG is a group of about 10 to 20 people from a uniform class, who come jointly for addressing their frequent troubles. They are promoted to create voluntary thrift on a continuous basis. They used the pooled resource to create tiny interest bearing loans
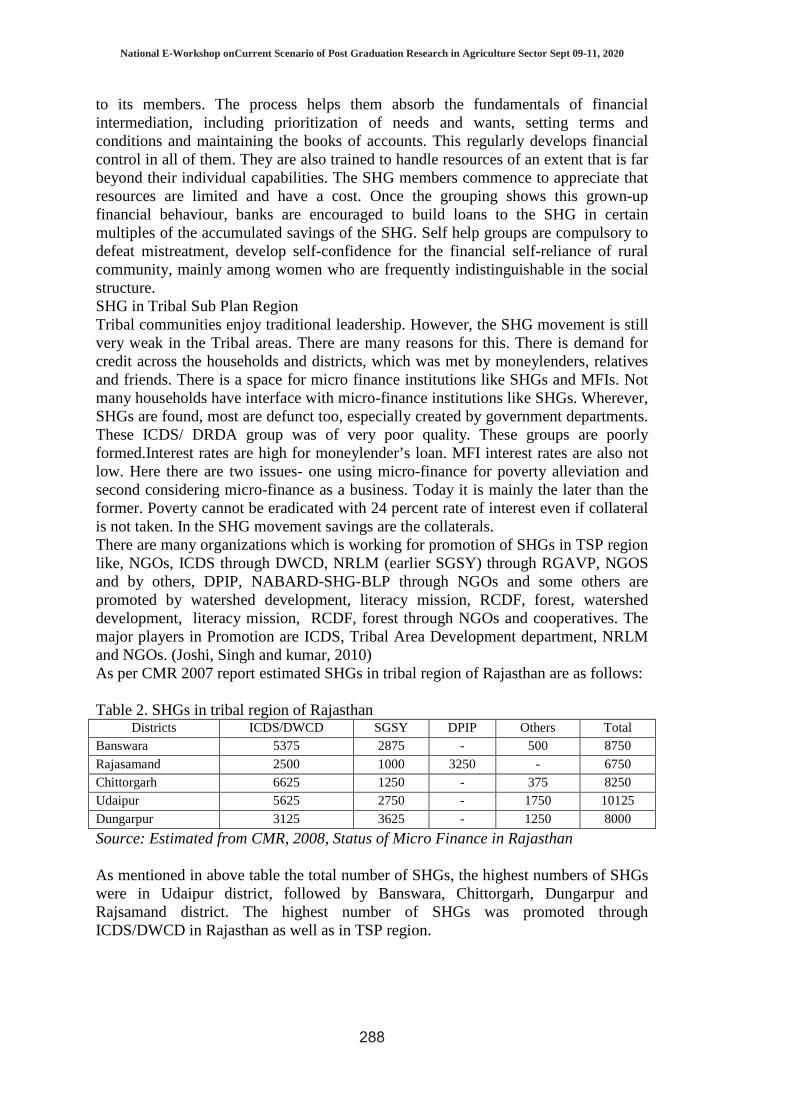
National E-Workshop onCurrent Scenario of Post Graduation Research in Agriculture Sector Sept 09-11, 2020
288
to its members. The process helps them absorb the fundamentals of financial intermediation, including prioritization of needs and wants, setting terms and conditions and maintaining the books of accounts. This regularly develops financial control in all of them. They are also trained to handle resources of an extent that is far beyond their individual capabilities. The SHG members commence to appreciate that resources are limited and have a cost. Once the grouping shows this grown-up financial behaviour, banks are encouraged to build loans to the SHG in certain multiples of the accumulated savings of the SHG. Self help groups are compulsory to defeat mistreatment, develop self-confidence for the financial self-reliance of rural community, mainly among women who are frequently indistinguishable in the social structure. SHG in Tribal Sub Plan Region Tribal communities enjoy traditional leadership. However, the SHG movement is still very weak in the Tribal areas. There are many reasons for this. There is demand for credit across the households and districts, which was met by moneylenders, relatives and friends. There is a space for micro finance institutions like SHGs and MFIs. Not many households have interface with micro-finance institutions like SHGs. Wherever, SHGs are found, most are defunct too, especially created by government departments. These ICDS/ DRDA group was of very poor quality. These groups are poorly formed.Interest rates are high for moneylender’s loan. MFI interest rates are also not low. Here there are two issues- one using micro-finance for poverty alleviation and second considering micro-finance as a business. Today it is mainly the later than the former. Poverty cannot be eradicated with 24 percent rate of interest even if collateral is not taken. In the SHG movement savings are the collaterals. There are many organizations which is working for promotion of SHGs in TSP region like, NGOs, ICDS through DWCD, NRLM (earlier SGSY) through RGAVP, NGOS and by others, DPIP, NABARD-SHG-BLP through NGOs and some others are promoted by watershed development, literacy mission, RCDF, forest, watershed development, literacy mission, RCDF, forest through NGOs and cooperatives. The major players in Promotion are ICDS, Tribal Area Development department, NRLM and NGOs. (Joshi, Singh and kumar, 2010) As per CMR 2007 report estimated SHGs in tribal region of Rajasthan are as follows: Table 2. SHGs in tribal region of Rajasthan
Districts ICDS/DWCD SGSY DPIP Others Total Banswara 5375 2875 - 500 8750 Rajasamand 2500 1000 3250 - 6750 Chittorgarh 6625 1250 - 375 8250 Udaipur 5625 2750 - 1750 10125 Dungarpur 3125 3625 - 1250 8000
Source: Estimated from CMR, 2008, Status of Micro Finance in Rajasthan As mentioned in above table the total number of SHGs, the highest numbers of SHGs were in Udaipur district, followed by Banswara, Chittorgarh, Dungarpur and Rajsamand district. The highest number of SHGs was promoted through ICDS/DWCD in Rajasthan as well as in TSP region.
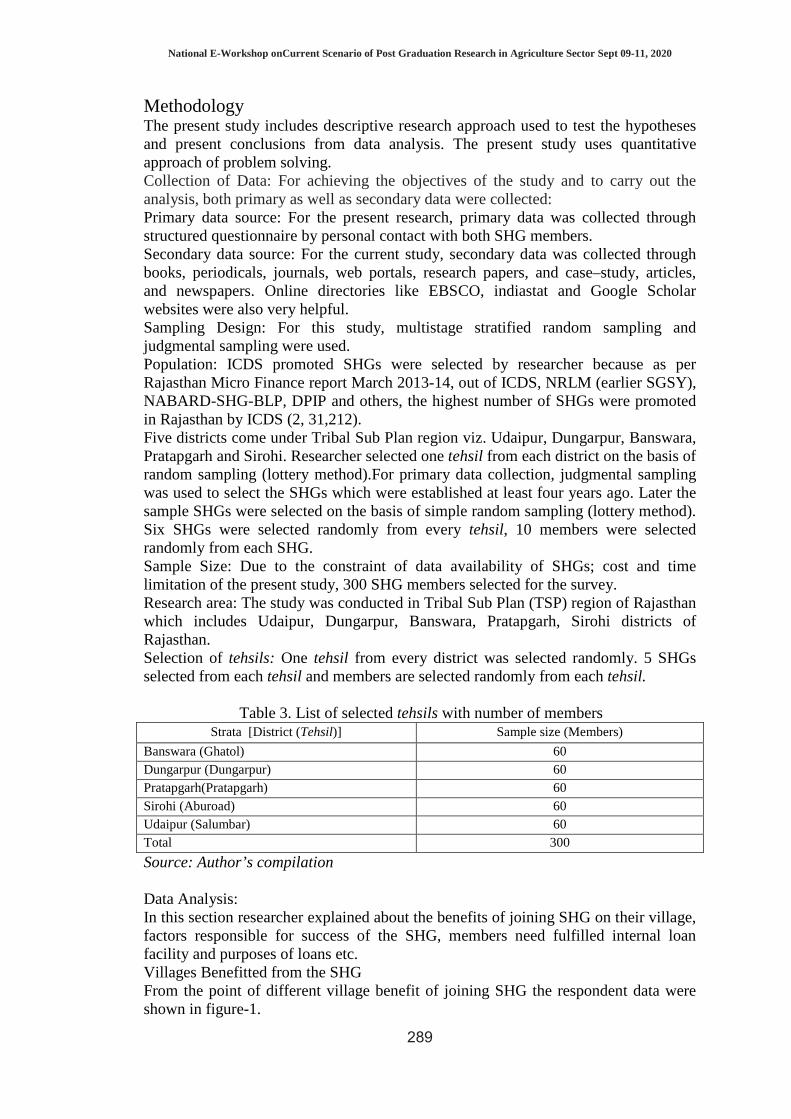
National E-Workshop onCurrent Scenario of Post Graduation Research in Agriculture Sector Sept 09-11, 2020
289
Methodology The present study includes descriptive research approach used to test the hypotheses and present conclusions from data analysis. The present study uses quantitative approach of problem solving. Collection of Data: For achieving the objectives of the study and to carry out the analysis, both primary as well as secondary data were collected: Primary data source: For the present research, primary data was collected through structured questionnaire by personal contact with both SHG members. Secondary data source: For the current study, secondary data was collected through books, periodicals, journals, web portals, research papers, and case–study, articles, and newspapers. Online directories like EBSCO, indiastat and Google Scholar websites were also very helpful. Sampling Design: For this study, multistage stratified random sampling and judgmental sampling were used. Population: ICDS promoted SHGs were selected by researcher because as per Rajasthan Micro Finance report March 2013-14, out of ICDS, NRLM (earlier SGSY), NABARD-SHG-BLP, DPIP and others, the highest number of SHGs were promoted in Rajasthan by ICDS (2, 31,212). Five districts come under Tribal Sub Plan region viz. Udaipur, Dungarpur, Banswara, Pratapgarh and Sirohi. Researcher selected one tehsil from each district on the basis of random sampling (lottery method).For primary data collection, judgmental sampling was used to select the SHGs which were established at least four years ago. Later the sample SHGs were selected on the basis of simple random sampling (lottery method). Six SHGs were selected randomly from every tehsil, 10 members were selected randomly from each SHG. Sample Size: Due to the constraint of data availability of SHGs; cost and time limitation of the present study, 300 SHG members selected for the survey. Research area: The study was conducted in Tribal Sub Plan (TSP) region of Rajasthan which includes Udaipur, Dungarpur, Banswara, Pratapgarh, Sirohi districts of Rajasthan. Selection of tehsils: One tehsil from every district was selected randomly. 5 SHGs selected from each tehsil and members are selected randomly from each tehsil.
Table 3. List of selected tehsils with number of members Strata [District (Tehsil)] Sample size (Members)
Banswara (Ghatol) 60 Dungarpur (Dungarpur) 60 Pratapgarh(Pratapgarh) 60 Sirohi (Aburoad) 60 Udaipur (Salumbar) 60 Total 300
Source: Author’s compilation Data Analysis: In this section researcher explained about the benefits of joining SHG on their village, factors responsible for success of the SHG, members need fulfilled internal loan facility and purposes of loans etc. Villages Benefitted from the SHG From the point of different village benefit of joining SHG the respondent data were shown in figure-1.

National E-Workshop onCurrent Scenario of Post Graduation Research in Agriculture Sector Sept 09-11, 2020
290
Figure 1: Villages benefitted from the SHG
Source: Author’s compilation Figure 1 analysis concluded that majority of village (95 percent) have been benefited from SHG activities and only 5 percent villages have not been benefited from joining of SHG. So the impact of joining SHG is growing rapidly in the region. Ways by which SHG benefited the village The respondents were asked about the ways by which SHG benefited the village. The data so obtained about the ways by which SHG benefited the villages are shown in figure 2. Figure 2: Ways by which SHG benefited the village
Source: Author’s compilation
95%
5%
0%
10%
20%
30%
40%
50%
60%
70%
80%
90%
100%
Yes No
Figure 1: Villages benefitted from the SHG
Village benefitted from the
SHG
20% 26%
53%
1%
0%
20%
40%
60%
Mutual cooperation Women
empowerment
Easy credit
availability
Awareness creation
Figure 2: Ways by which SHG benefited the village

National E-Workshop onCurrent Scenario of Post Graduation Research in Agriculture Sector Sept 09-11, 2020
291
Figure 2 revealed the fact that majority of SHG members are benefited by the easy credit availability (53 percent) from SHG followed by women empowerment (26 percent), mutual cooperation among members of the group (20 percent) and awareness creation (1 percent). So on the basis of above statistics members want more focus on easy credit availability form SHG. Factors responsible for the success of SHGs Respondents have been asked about the factors responsible for success of SHGs. The responses generated are summarized in factors’ rank in Table 4. Table 4: Factors responsible for the success of SHGs
Factors responsible for the success of SHGs Rank Mean Efficient leaders 1 2.72 Support of promotion agency 2 3.08 Active support of SHG member 3 3.38 Regular saving habit of members 4 3.40 Proper maintenance of accounts 5 3.96 Regular SHG meeting 6 4.43 Source: Author’s compilation Table 4 shows that majority of SHG members believe that efficient leadership and support from promotion agencies are the most important factors responsible for the success of SHG. Other important factors contributing the achievements of SHG include active support of SHG member, regular saving habit of members, proper maintenance of accounts and regular SHG meeting. 4.4. Members needs fulfilled by the SHGs In questionnaire respondent were asked about their needs fulfilled by the SHGs. The members’ responses presented in Figure 3. Figure 3: Members’ needs fulfilled by SHGs
Source: Primary Data Figure 3 revealed the fact that SHG members strongly believed that they are benefited from the various schemes and support activities of their SHG and support organizations. Main reasons for joining SHG The questionnaire included a question asking the main reason for joining SHG. The responses are summarized in figure 4.
Members needs
fulfilled, 0% 0%
50%
100%
150%
Yes No
Ax
is T
itle
Figure 3: Members’ needs fulfilled by SHGs

National E-Workshop onCurrent Scenario of Post Graduation Research in Agriculture Sector Sept 09-11, 2020
292
Figure 4: Reasons for joining SHG
Source: Primary Data Figure 4 concluded that majority of SHG members (45 percent) join the SHG to provide better support to their families, easy availability of loans (30 percent) and increase in the savings for future (22 percent). SHG also give support to establish business to support of their livelihood. Loan benefits to respondents In this section respondents were asked about the internal loan for members from SHG, details of loan, purpose of loan, repayment of loan amount and performance of SHG. (a) SHG provide internal loan for Members The respondents were asked about internal loan facility to them from SHG. The data so obtained about internal loan for members are shown in figure 5. Figure 5: Internal loan for SHG members
Source: Primary Data Figure 5 show that majority of SHG members believe that their SHG provide internal loan facilities for their members. (b) Details of amount of loan taken by respondents The amounts of loan were classified in five categories. The responses are summarized in the Table 5.
Table 5: Details of amount of loan taken by respondents Loan Amount Frequency Percentage up to 5000 33 11 >5000-10000 177 59 >10000-15000 51 17 >15000-20000 30 10 > 20000 9 3
Source: Primary Data
45%
3%
30% 22%
0%
50%
To Family Support Business
Assistance
Easy availability of
loan
Increases Savings
Figure 4: Reasons for joining SHG
100%
0% 0%
50%
100%
150%
Yes No
Figure 5: Internal loan for SHG members

National E-Workshop onCurrent Scenario of Post Graduation Research in Agriculture Sector Sept 09-11, 2020
293
Table 5 concluded that majority of SHG members taken a loan amount of 5-10 thousand rupees. However, 17 percent of members agreed to avail the loan facility for 10 -15 thousand rupees, 10 percent of members agreed to avail the loan facility for 15-20 thousand rupees and 3 percent of members agreed to avail the loan facility more than 20 thousand rupees. (c) Purpose of loan Respondents were asked about the purpose of loan. The responses are presented in Table 6. Table 6: Purpose of loan
Purpose of loan Frequency Percentage Productive purpose 69 23 Starting new venture 42 14 Health purpose 0 0 Education 0 0 Children Marriage 21 7 Agriculture purpose 24 8 Other 144 48
Source: Primary Data Table 6 revealed the fact that the most popular reason for applying for the loan is for productive purpose followed by starting new business, agriculture purposes, and children marriage. 48 percent members take loan for other purposes. (d) Timely repayment of loan amount
To have an idea about the respondents’ repaying loan on time a question was asked about it. The responses are presented in figure 6. Figure 6: Repayment of loan amount
Source: Primary Data
Figure 6 shows that majority of SHG members (92 percent) agreed for the timely payment of their loan amount back to SHG. While 8 percent told that they are unable to pay loan on time (e) SHG performance To have an idea about the SHGs performance. Therefore, the most prominently used likert scale has been used here. Responses are presented in Figure 7.
92%
8%
0%
50%
100%
Yes No
Figure 6: Repayment of loan amount
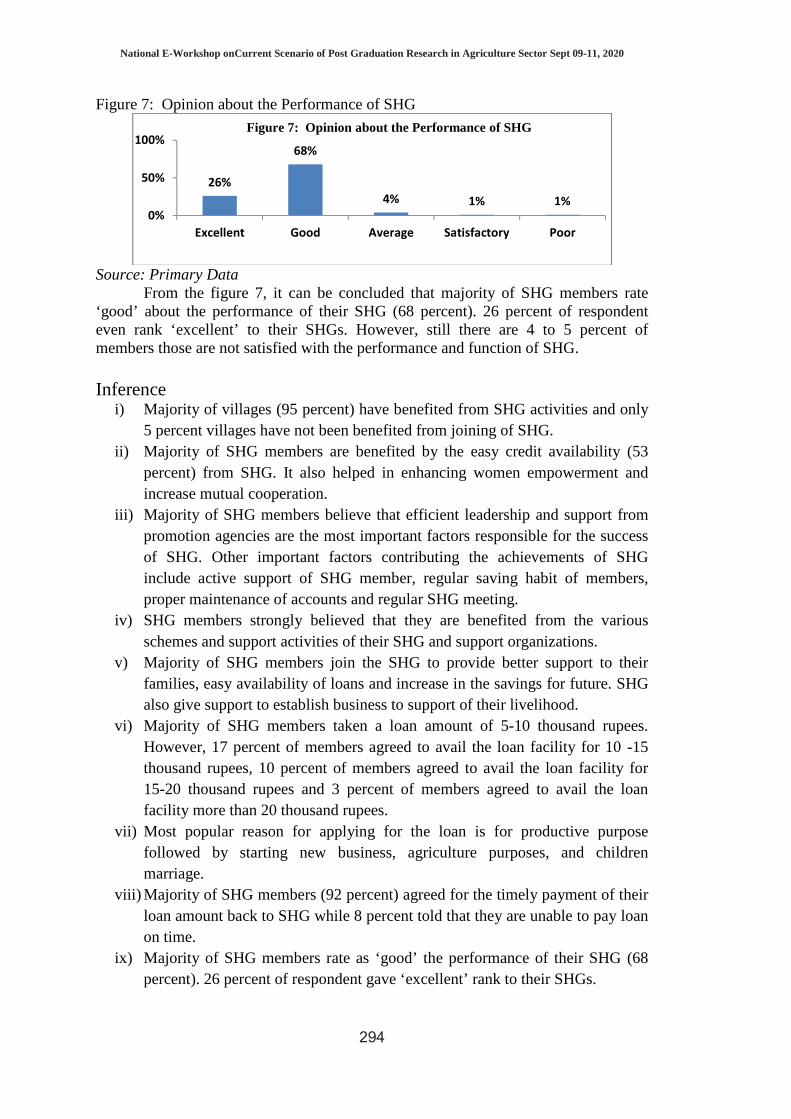
National E-Workshop onCurrent Scenario of Post Graduation Research in Agriculture Sector Sept 09-11, 2020
294
Figure 7: Opinion about the Performance of SHG
Source: Primary Data
From the figure 7, it can be concluded that majority of SHG members rate ‘good’ about the performance of their SHG (68 percent). 26 percent of respondent even rank ‘excellent’ to their SHGs. However, still there are 4 to 5 percent of members those are not satisfied with the performance and function of SHG. Inference
i) Majority of villages (95 percent) have benefited from SHG activities and only 5 percent villages have not been benefited from joining of SHG.
ii) Majority of SHG members are benefited by the easy credit availability (53 percent) from SHG. It also helped in enhancing women empowerment and increase mutual cooperation.
iii) Majority of SHG members believe that efficient leadership and support from promotion agencies are the most important factors responsible for the success of SHG. Other important factors contributing the achievements of SHG include active support of SHG member, regular saving habit of members, proper maintenance of accounts and regular SHG meeting.
iv) SHG members strongly believed that they are benefited from the various schemes and support activities of their SHG and support organizations.
v) Majority of SHG members join the SHG to provide better support to their families, easy availability of loans and increase in the savings for future. SHG also give support to establish business to support of their livelihood.
vi) Majority of SHG members taken a loan amount of 5-10 thousand rupees. However, 17 percent of members agreed to avail the loan facility for 10 -15 thousand rupees, 10 percent of members agreed to avail the loan facility for 15-20 thousand rupees and 3 percent of members agreed to avail the loan facility more than 20 thousand rupees.
vii) Most popular reason for applying for the loan is for productive purpose followed by starting new business, agriculture purposes, and children marriage.
viii) Majority of SHG members (92 percent) agreed for the timely payment of their loan amount back to SHG while 8 percent told that they are unable to pay loan on time.
ix) Majority of SHG members rate as ‘good’ the performance of their SHG (68 percent). 26 percent of respondent gave ‘excellent’ rank to their SHGs.
26%
68%
4% 1% 1% 0%
50%
100%
Excellent Good Average Satisfactory Poor
Figure 7: Opinion about the Performance of SHG
National E-Workshop onCurrent Scenario of Post Graduation Research in Agriculture Sector Sept 09-11, 2020
295
Based on the major findings of the research, the following conclusion has been drawn from member’s perspective: Majority of the Self Help Group member interviewed indicated that, they have benefited from the being part of Self Help Group. Notable among the benefits are easiness in accessing credit, empowerment of members and increase mutual cooperation. Based on this, majority of the Self Help Group members ranked the performance of their groups as good especially efficient leadership and support of promoting agency.Study revealed that member’s needs were fulfilled by their SHGs and internally they were getting loan for productive purposes and for starting new venture specially. The important reason for joining SHG was to support to their family.

National E-Workshop onCurrent Scenario of Post Graduation Research in Agriculture Sector Sept 09-11, 2020
296
MARKET OPPORTUNITIES OF PLANT PROTECTION CHEMICALS FOR GRAPE CULTIVATION IN NASIK DISTRICT OF
MAHARASHTRA
Gamdha Vivek Jaysukhbhai Institute of Agribusiness Management, SK Rajasthan Agricultural University, Bikaner
Email: [email protected]
Introduction Grape is an important perennial fruit crop of India. Maharashtra, Karnataka, Tamil Nadu, Telangana and Andhra Pradesh are major grape growing states in the country. The area under grape cultivation in the country is 1.39 Lac Ha with the production of 29.58 Lac MT. India has been exporting grapes to Europe and Gulf countries, as well as to neighbouring countries like Sri Lanka and Bangladesh. During the year 2018-19, total grape export was 2.46 Lac MT which fetched foreign exchange of INR 2335.24 crores /334.79 million USD. The application of appropriate agrochemicals in grape crop provides protection against diseases and pests which results into higher yield and superior quality; and enhanced export potential and foreign exchange also. The present study entitled “Marketing Opportunities of Plant Protection Chemicals for Grape Cultivation in Nasik District of Maharashtra” was undertaken to identify various agrochemicals used for grapevine, competitiveness of market, buying behavior of farmers, traders perception towards marketing mix for new product. In this investigation, primary data ragarding various agrochemicals used by farmers for grapevine, buying behaviour of farmers, identify major players in the market, traders perception towards marketing mix for new product was collected through personal interview using prestructured schedule. Secondary data regarding area, production and productivity of grape, package of practices for grapevine were collected from Web Portal, Magazines, Department of Agriculture, Department of Horticulture, ICAR National Research Centre for Grapes, Pune. Area under grape cultivation and its production are increasing which is an indicator for potential of agrochemicals market in Nasik district of Maharashtra.
Table 1: Major Grapes Producing States in India. States Area (In ‘000 Ha) Production(In ‘000 MT) Productivity (In MT/Ha)
Maharashtra 105.5 2286.44 21.67 Karnataka 26.61 524.2 19.7 Tamilnadu 2.16 58.93 27.27
In Maharashtra Nasik district is leading district in production of grapes.Area under grape cultivation and its production are increasing which is an indicator for potential of agrochemicals market in Nasik district of Maharashtra.
National E-Workshop onCurrent Scenario of Post Graduation Research in Agriculture Sector Sept 09-11, 2020
297
Methodology The methodology will contain the study area, sampling procedure, sources of data, analytical tools and techniques used, etc.The project will be carried out to fulfil the specified objectives depending upon analysis and interpretation of facts and figures. Objective 1-To study the market potential of plant protection chemicals for grape
cultivation For finding the market potential of various plant protection chemicals for grapes cultivation, data will be collected from farmers and retailers for the management of insect, pest and disease in grapes.
Market Potential = A × Q Where, A = Total area under grape cultivation (hectare) Q = Average application of plant protection chemicals per hectare (litre/gm.)
Objective 2 -To identify the market share of major fungicides and insecticides being used in the study area for grape cultivation.
Data will be collected from retailers and farmers regarding various plant protection chemicals used in the area for grapes cultivation and influencing of various promotional activities in buying decision of various pesticides.Competitive analysis for the fungicides and insecticides are available in the grapes market. Market Share:It is portion of total sales in relation to the market or industry in which it operates.
Market Share = Company sales/ Entire market sales Herfindahl-Hirschman Index: The Herfindahl-Hirschman Index is an index that measures the market concentration of an industry it has been calculated as follow:
HHI = ∑ c>0$"%&
Where,S= Percentage market share of company If HHI index, ≤ 1500 Competitive market, 1500 < HHI index ≤ 2500 then concentrated market and HHI index > 2500 then highly concentrated market. Concentration Ratio:It is the ratio that indicates the size of firm in relation to their industry as whole.
CR5= (X1+X2+X3+X4+X5) / T Where, X= Total sales of an individual firm, T= Total sales of an industry If CR Ratio, <40% = Oligopoly Market, >40%= Oligopoly deemed to exit, Closet to 100% = Monopoly Market Objective 3- To assess the marketing mix for a new product of plant protection chemical based on the farmers and traders’ expectations. The reasons for purchase of plant protection chemicals for grapevine were obtained in order to know thefactors contributing to the purchase of plant protection chemicals.The respondents were asked to indicate the important factors for purchase of plant protection molecules. Factors: Price, Brand image of product, Product quality, Packaging by size, Media advertising, Discount, Retailers advice, Fellow farmer, Farmer meeting, Demonstration, Availability, Education.In order to get the factor loading, the principal component analysis method was used.
National E-Workshop onCurrent Scenario of Post Graduation Research in Agriculture Sector Sept 09-11, 2020
298
Finding Objective wise analyses are given as under:
• The area under grape cultivation in Maharashtra is 1.05 Lacs hectare with the production of 22.86 Lacs MT and the productivity is 21.67 MT/ha.
• Trend in area of grape cultivation increases at quardatic equation • Y= 2.37X + 47.70. Projected area for grape cultivation in 2019-20 wilbe.
• Market potential of different plant protection chemicals are Dimethomorph 50% WP will be 38258 Kg. in 2019-20 and others are according to d.
• Market share of different major plyers by its product sale in market. There is 29.48% market covered by Bayer crop science Pvt Ltd. 17.1% market covered by BASF Pvt Ltd. 14.4% market covered by Syngenta, 12.33% market covered by TATA Rallis and remaining was with Fmc, Corteva, Sumitomo, Biostat and others.
• HHI index of an industry in study area is 1756.75 and concentration ration of major firm is 73% that indicates that concentrated market is there and few large firm dominate market and small firm also operate in market so that market is oligopoly
• Traders perception towards marketing mix for new plant protection chemicals are good quality product and give more emphasis on promotional activities like demostration, farmer meeting and field support to the farmers.
• Four factors accounts for more than sixty-one per cent (61.164) .The first factor can alone explain 21.762 per cent of the total variability the second factor can alone explain 16.555 per cent of the total variability and the first two factors, in combination, can explain 38.317 per cent of the total variability. The third factor can explain alone 13.049 per cent of the total variability and the three factors, in combination, can explain 51.366 per cent of the total variability. The fourth factor can explain 9.798 per cent and the four factors, in combination, can explain 61.164 per cent of the total variability.
Inference Agrochemicals of several companies are prevailing in the market. Major market share is covered by Bayer (29.48%), BASF (17.14%), Syngenta (14.40%), TATA Rallis (12.33%) and other small companies. Therefore, agrochemical market structure of district Nasik is oligopoly. Traders perception towards marketing mix for new product of plant protection chemicals are good quality product and give more emphasis on promotional activities like demostration, farmer meetings and technical support to farmers.
National E-Workshop onCurrent Scenario of Post Graduation Research in Agriculture Sector Sept 09-11, 2020
299
AWARENESS AND ADAPTATION STRATEGIES OF CLIMATE SMART AGRICULTURE
Harsha S Mendhe, SSSadaphal, Neha KChopde, Seema Thakre
College of Agriculture-Gadchiroli, Dr PDKV, Akola
Climate smart agriculture is an integrated approach which sustainably increases productivity, enhances resilience (adaptation), reduces/removes GHGs (mitigation) where possible, and enhances achievement of national food security and development goals. Global agriculture will be under significant pressure to meet the demands of rising populations using limited, often degraded, soil and water resources that are predicted to be further stressed by the impact of climate change. The study was conducted in Gadchiroli district of mh. During the year 2018-19. Gadchiroli district was randomly selected for the study. It covers 12 tahsils, out of 12 tahsils, two tahsils namely, Chamorshi and Mulchera were randomly selected. From each tahsils, two villages and from each village, 25 respondent were selected. Thus the total sample for the study was 100 respondents. The findings of the study reveal that, the (51.50%) of the respondents had medium age group, 55.17 per cent medium size of family group, 21.00 per cent functionally literate, 62.83 per cent farming experience group, 47.83 per cent small size of operational land holding, 65.17 medium (100,000/- to 1,500,000/-) income group, 76.17 agriculture as their primary occupation followed by majority 79.50 per cent of respondents had dairying as their secondary occupation. As far as social participation is concerned about 62.00 per cent, 55.83 per cent personal localities contacts, 61.83 per cent personal cosmopolite contacts, and 66.00 of the respondent had medium mass media participation group. Majority (65.67%) of the respondents had medium level of awareness fallowed by high level (17.50%) awareness and (16.67%) of low level of awareness regarding climate smart agriculture. In case of adaptation, most of the farmers (79.17%) have taken adaptation strategies like short duration varieties; on the other hand, 71.67 per cent have crop-livestock system, 71.67 per cent mixed cropping, 76.67 per cent and 60.00 per cent of the respondents were adopted animal manure and compost in their farm. Majority (81.67%) of the respondents were constraints faced by poor support of local and national authorities with climate related issue(rank i), followed by 79.33 per cent lack of financial resource (rank ii), and 78.50 per cent lack of knowledge about adaptive practices (rank iii), respectively.

National E-Workshop onCurrent Scenario of Post Graduation Research in Agriculture Sector Sept 09-11, 2020
300
KNOWLEDGE LEVEL OF FARMERS REGARDING RECOMMENDED SOYBEANCULTIVATION PRACTICES
Surendra Kumar and NK.Sharma
RNT College of Agriculture, Kapasan, Chittorgarh, Rajasthan
Introduction Soybean [ Glycine max (L.) Marril ] belongs to family leguminoceae, sub family papilionaceae and genus Glycine. It is mainly grown in kharif season. Soybean is reported to have originated in eastern Asia or China and has been to man over 5000 years. It was introduced in USA in the year 1804 and has since revolutionized the agriculture of that country. In India efforts have been made since 1969 to popularize its cultivation and consumption. Soybean has been known by various names in India such as Bhat, Bhatman, Ramkuithi etc. It is called the miracle crop of the twentieth century and is popularly known as “queen of pulses,” wonder crop, farmer’s friend and agriculture’s Cinderella. It is the cheapest source of high quality protein. It contains 20 per cent oil and 40 per cent high quality protein. Its oil is used for manufacturing vanaspati ghee and several other industrial products. Soybean is widely used in the antibiotic industry for making penicillin and allied drugs.
Methodology
The present investigation was conducted in Kota region of Rajasthan purposively because this region stands first in area 822329 hactare and production 1197758 tonnes of soybean cultivation among all ten agriculture regions of Rajasthan. Kota region comprises four districts viz., Kota, Baran, Bundi and Jhalawar.Out of these two districts viz., Kota and Jhalawar were selected purposively for this study because of highest area and production. Kota and Jhalawar districts comprise five and seven tehsils, respectively. Out of which two tehsil from Kota (Degod and Ramganj Mandi ) and two tehsil from Jhalawar (Khanpur and Manohar Thana) (as per the data of 2014-15) district were selected randomly. Out of these 6 villages were selected from each selected tehsil on the basis of random sampling method. Thus, the total 24 villages,. were selected.
Measurement of knowledge level of farmers regarding recommended soybean cultivate practicesMeasuring the knowledge level of farmers’ regarding recommended soybean cultivation practices in a scientific manner.English and English (1961) defined knowledge as a body of understood information possessed by an individual or by a culture. According to Singh and Singh (1976), knowledge is totality of understood information possessed by an individual. A knowledge has been defined by Bloom et al. (1955) as a test which refers to those behaviour and test situations which emphasized the remembering by the recall of ideas, material or phenomena. For the purpose of present study knowledge was operationalised as the amount of information possessed and understanding of the respondents regarding recommended soybean cultivation practices. Method of scoring knowledge The final knowledge score had 68 items relating to recommended soybean cultivation practices. Equal weightage was given to each item. The measuring the knowledge level of respondents on the line of a knowledge test developed by Chaturvedi (2000) was adopted used for the study. For correct answer ‘1’ score was

National E-Workshop onCurrent Scenario of Post Graduation Research in Agriculture Sector Sept 09-11, 2020
301
awarded and ‘0’ for wrong answers. Thus, knowledge score was ready for administering to the actual soybean cultivating farmers. The knowledge score was calculated on the basis of following formula.
Total score obtainable by respondents MPS = ---------------------------------------------------------------- x 100
Maximum obtainable score Where, MSP = Mean per cent score The possible maximum score one could obtain was 68. The mean and standard deviation of all the farmers were computed for classifying the knowledge level in different categories. Based on the mean score and standard deviation, three category of knowledge of recommended soybean cultivation practices were categorized under low, medium and high. The categorization was done according to following consideration: Category Scores were Low knowledge level = < Mean knowledge – S.D. Medium knowledge level = Mean knowledge + S.D. High knowledge level = > Mean knowledge + S.D. Where, SD = Standard deviation. Findings 1. Measurement of knowledge level of farmers about recommended soybean cultivation practices (i) It was found that the majority of the farmers Knowledge level about recommended soybean cultivation practices concluded was that 62.40 per cent of soybean growers were having medium knowledge level about soybean cultivation practices and 15.85 per cent farmers were having high knowledge level, whereas, 21.75 per cent of farmers were having low knowledge level. (ii) It was also found that the respondents possessed highest (88.02 MPS) knowledge about “Soil and field preparation” and hence this practice was ranked first. The second highest farmers’ knowledge was (84.31MPS) about “High yielding varieties” which was ranked. Similarly, they possessed Lowest knowledge about “Plant protection measures (72.18 MPS)”, and “Seed treatment (69.54MPS)”, IX and X rank were assigned to them, respectively. Inference (i) Majority of the farmers had medium knowledge level about the recommended soybean cultivation practices. (ii) Majority of soybean growers had good knowledge about recommended soybean cultivation practices like “Soil and field preparation” “High yielding varieties (HYVs)” “Time of sowing” while minimum knowledge about recommended soybean cultivation practices was about “Plant protection measures” and “Seed treatment”.

National E-Workshop onCurrent Scenario of Post Graduation Research in Agriculture Sector Sept 09-11, 2020
302
COST EFFECTIVE MANAGEMENT OF POST-HARVEST
ANTHRACNOSE OF MANGO BY PRE AND POST-HARVEST TREATMENTS
V. K. Bhalerao, Shete M. H. and Garande V. K. AICRP on Fruits, MPKV, Rahuri, Dist : Ahmednagar
Email : [email protected]
Mangifera indica, common name is mango, it is a species of flowering plant it belongs to family Anacardiaceae, having drupe type of fruit. It is native to the Indian subcontinent where it is indigenous. It is known as king of Indian fruits. Due to the diverse production conditions and the vast area under cultivation mango suffers from large number of diseases which leads to less production or completely unmarketable fruits. Most destructive diseases of mango is post harvest anthracnose. The study was undertaken for four consecutive years with six different treatments against the post-harvest fruit rot (anthracnose) which was examined on 5th, 10th and 15th days after harvest. On 5th day after harvest, rotting was not observed or very minimum in most of the treatments including controls the fruits are unripe.The pooled data indicate that, at 10th day after harvest, the treatment T4 (three sprays of hexaconazole (0.1%) followed by HWT at 520 C for 10 min) was recorded significantly lowest post-harvest anthracnose rot incidence (6.69 %) over all other treatments. The fruits were kept under observation up to 15 days after harvest to know the persistent efficacy of fungicides. The treatment T4 recorded significantly lowest disease incidence of post-harvest anthracnose (33.15 %) on 15th DAH which was followed by treatment T6 (68.62 %) and T2 (72.64) Moreover, the pooled data on percent disease severity revels that, the same treatment T4 (three sprays of hexaconazole (0.1%) followed by HWT at 520 C for 10 min) was recorded significantly lowest post-harvest anthracnose rot severity (2.59 %) over all other treatments on 10th DAH. The significantly lowest disease severity of post harvest anthracnose (13.88 %) was recorded by the treatment T4 on 15th days after harvest. The highest per cent disease incidence (96.93 %) and severity (70.37 %) was recorded in the control treatment on 15th DAH. The treatment T4 was significantly superior for the management of anthracnose up to 15 DAH.
The pooled yield data showed that significant highest marketable fruit yield of 90.70 kg/tree was recorded in the treatment T4 (three sprays of hexaconazole (0.1%). There was no much variation in shelf life of the fruits as well as in fruit quality parameters due to different treatments.
National E-Workshop onCurrent Scenario of Post Graduation Research in Agriculture Sector Sept 09-11, 2020
303
FARMERS PERCEPTION TOWARDS THE EXTENSION SERVICE OF KRISHI VIGYAN KENDRA
S. D. Sarnaik PP Bhople D.M.MankarVS Tekale
Department of Extension Education, PGI, Dr. PDKV, Akola (MS)- 444 001
Introduction India is an agrarian country as agriculture is the primary source of livelihood for about 54.60 per cent of Indian population (Census of India, 2011). Awareness about the improved agricultural technology is the one of the key input for the farming community. Krishi Vigyan Kendra (KVK) is the most vibrant project initiated by Indian Council of Agricultural Research (ICAR) for the transfer of technology. The project is intended to create dedicated and energetic human resource for the agricultural development of the country (Chauhan, 2011). The farmer’s satisfaction about different extension activities implemented by KVKs is crucial, which may lead towards the adoption of technology on other hand helps to enhance the production. Analysis of farmer’s perception is essential as gap between technology generated and technology transfer lead towards ambiguity. In order to access the usefulness of extension service implemented by KVKs, the present study was undertaken with an objectives to study the perception of the farmers towards extension service of KVKs as well as to study the relationship between selected characteristics of the respondents with their perception towards extension service of KVK.
Methodology An Exploratory Research Design of social research has been used in the doctoral research work which was carried out in Western Vidarbha Zone of Maharashtra State during the year 2018-2019. The region comprise of fourteen KVKs devoted for dissemination of technology, out of which eight KVKs were selected purposively. In order to give the equal representation to each and every discipline, five contact farmers against each Subject Matter Specialists (SMSs), who were in regular contact, with KVKs were selected randomly. In each KVK six SMSs of different disciplines are working, hence from each KVK 30 contact farmers were selected, thus, total 240 contact farmers constituted the sample representatives for the present study. Rao and Narayan (1998) describe perception is the process whereby people select, organize, and interpret sensory stimulations into meaningful information about their work environment. In the context of the present study, perception operationally defined as the awareness, opinion and conception of the individual farmer towards the extension service of KVK’s. The perceived usefulness of extension service of KVK was worked out with the help of scale developed by Chavda (2006) with slight modifications as per the objectives of the research work. The perception of the respondents were measured on five continuum from strongly agree to strongly disagree while undecided as middle
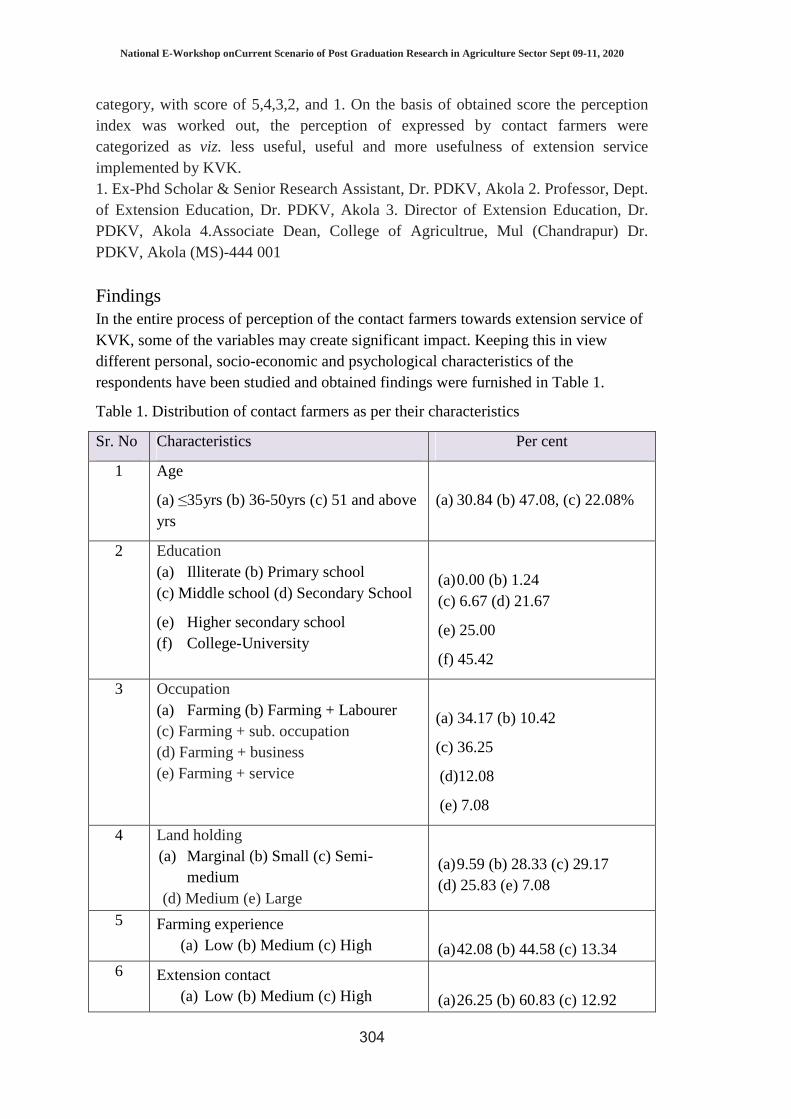
National E-Workshop onCurrent Scenario of Post Graduation Research in Agriculture Sector Sept 09-11, 2020
304
category, with score of 5,4,3,2, and 1. On the basis of obtained score the perception index was worked out, the perception of expressed by contact farmers were categorized as viz. less useful, useful and more usefulness of extension service implemented by KVK. 1. Ex-Phd Scholar & Senior Research Assistant, Dr. PDKV, Akola 2. Professor, Dept. of Extension Education, Dr. PDKV, Akola 3. Director of Extension Education, Dr. PDKV, Akola 4.Associate Dean, College of Agricultrue, Mul (Chandrapur) Dr. PDKV, Akola (MS)-444 001
Findings In the entire process of perception of the contact farmers towards extension service of KVK, some of the variables may create significant impact. Keeping this in view different personal, socio-economic and psychological characteristics of the respondents have been studied and obtained findings were furnished in Table 1.
Table 1. Distribution of contact farmers as per their characteristics
Sr. No Characteristics Per cent
1 Age
(a) ≤35yrs (b) 36-50yrs (c) 51 and above yrs
(a) 30.84 (b) 47.08, (c) 22.08%
2 Education (a) Illiterate (b) Primary school (c) Middle school (d) Secondary School
(e) Higher secondary school (f) College-University
(a) 0.00 (b) 1.24 (c) 6.67 (d) 21.67
(e) 25.00
(f) 45.42
3 Occupation (a) Farming (b) Farming + Labourer (c) Farming + sub. occupation (d) Farming + business (e) Farming + service
(a) 34.17 (b) 10.42
(c) 36.25
(d)12.08
(e) 7.08
4 Land holding (a) Marginal (b) Small (c) Semi-
medium (d) Medium (e) Large
(a) 9.59 (b) 28.33 (c) 29.17 (d) 25.83 (e) 7.08
5 Farming experience (a) Low (b) Medium (c) High
(a) 42.08 (b) 44.58 (c) 13.34 6 Extension contact
(a) Low (b) Medium (c) High
(a) 26.25 (b) 60.83 (c) 12.92
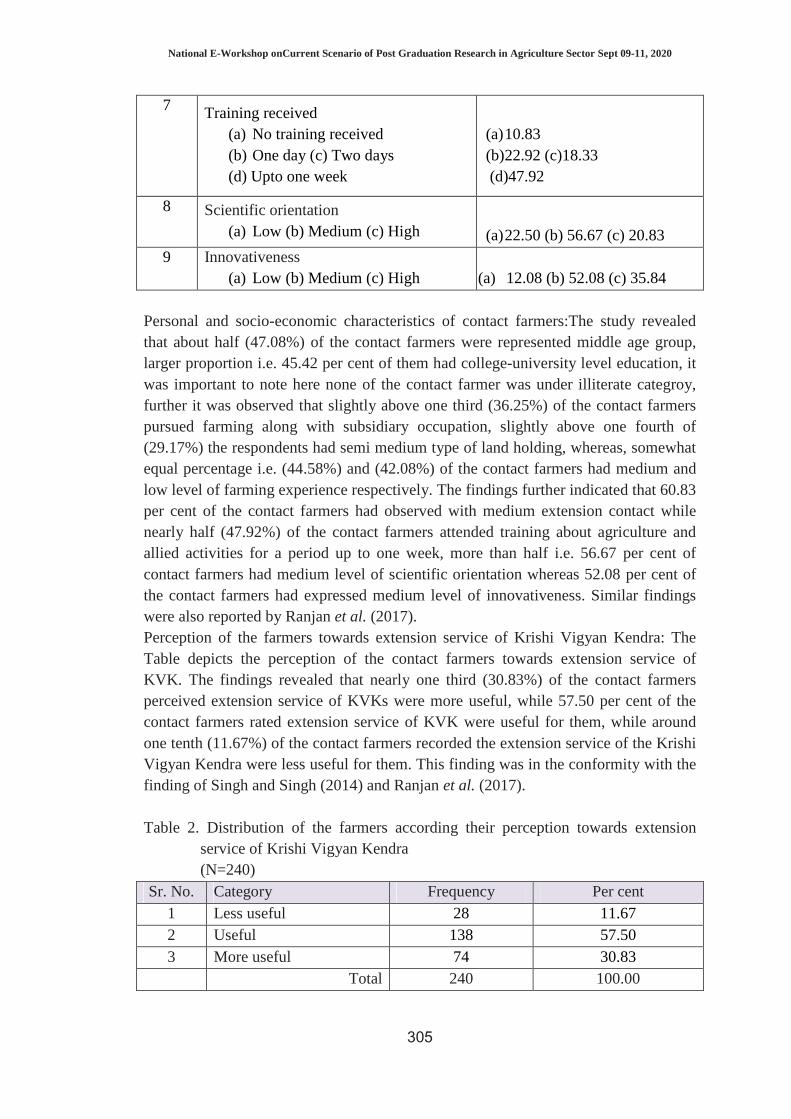
National E-Workshop onCurrent Scenario of Post Graduation Research in Agriculture Sector Sept 09-11, 2020
305
7 Training received (a) No training received (b) One day (c) Two days (d) Upto one week
(a) 10.83 (b) 22.92 (c)18.33 (d)47.92
8 Scientific orientation (a) Low (b) Medium (c) High
(a) 22.50 (b) 56.67 (c) 20.83 9 Innovativeness
(a) Low (b) Medium (c) High (a) 12.08 (b) 52.08 (c) 35.84 Personal and socio-economic characteristics of contact farmers:The study revealed that about half (47.08%) of the contact farmers were represented middle age group, larger proportion i.e. 45.42 per cent of them had college-university level education, it was important to note here none of the contact farmer was under illiterate categroy, further it was observed that slightly above one third (36.25%) of the contact farmers pursued farming along with subsidiary occupation, slightly above one fourth of (29.17%) the respondents had semi medium type of land holding, whereas, somewhat equal percentage i.e. (44.58%) and (42.08%) of the contact farmers had medium and low level of farming experience respectively. The findings further indicated that 60.83 per cent of the contact farmers had observed with medium extension contact while nearly half (47.92%) of the contact farmers attended training about agriculture and allied activities for a period up to one week, more than half i.e. 56.67 per cent of contact farmers had medium level of scientific orientation whereas 52.08 per cent of the contact farmers had expressed medium level of innovativeness. Similar findings were also reported by Ranjan et al. (2017). Perception of the farmers towards extension service of Krishi Vigyan Kendra: The Table depicts the perception of the contact farmers towards extension service of KVK. The findings revealed that nearly one third (30.83%) of the contact farmers perceived extension service of KVKs were more useful, while 57.50 per cent of the contact farmers rated extension service of KVK were useful for them, while around one tenth (11.67%) of the contact farmers recorded the extension service of the Krishi Vigyan Kendra were less useful for them. This finding was in the conformity with the finding of Singh and Singh (2014) and Ranjan et al. (2017). Table 2. Distribution of the farmers according their perception towards extension
service of Krishi Vigyan Kendra (N=240)
Sr. No. Category Frequency Per cent 1 Less useful 28 11.67 2 Useful 138 57.50 3 More useful 74 30.83 Total 240 100.00

National E-Workshop onCurrent Scenario of Post Graduation Research in Agriculture Sector Sept 09-11, 2020
306
Perception of farmers towards different areas of work performed by SMSs for the extension service of KVKs
The statements used to measure the perception of the farmers towards the extension service were grouped as per the areas of work assigned to these SMSs viz.Knowledge dissemination, field & diagnostic visits and use of mass media & group discussion for dissemination of technological knowledge about crop cultivation practices towards the farming community. Knowledge dissemination: The prime motive of the extension service of the KVKs, is dissemination of knowledge towards the farmers. The average response of the contact farmers indicated that larger proportion (65.90%) of the farmers strongly agree with the knowledge disseminated by the SMSs were useful for them, whereas meagre (2.92%) respondents quoted their disagreement towards the same. Field & diagnostic visit: The SMSs provide on the spot technical guidance to the farming community during their field & diagnostic visits. The finding indicated that nearly half (47.55%) of the contact farmers quoted strong agreement towards usefulness of field and diagnostic visits made by the SMSs. Mass media & Group discussion: In the era of globalization use of mass media and group meeting proved beneficial towards the dissemination of technological advances. Slightly above one third (37.08) of the contact farmers recorded their agreement about the use of mass media by the SMSs in dissemination of technological knowledge was useful for them to understand the technology in more effective manner.
Table 3. Distribution of the farmers according to their perception towards areas of
work performed by SMSs for the extension service of KVKs Sr. No
Areas of work performed by SMSs SA A UD DA SDA
1 Knowledge dissemination 65.90 21.94 8.89 2.92 0.35 2 Field & Diagnostic visit 47.55 38.80 16.25 5.79 2.73 3 Mass media & Group discussion 32.99 37.08 19.51 7.57 2.85
SA-Strongly agree A- Agree UN- Undecided DA- Disagree SDA-Strongly disagree Relationship between selected characteristics of the contact farmers with their perception towards extension service of KVK. The association of selected characteristics of the respondents with their perception about usefulness of extension service was computed with help of coefficient of correlation and the emerged findings furnished in Table 4.It was evident from Table 4 that, extension contact, training received, scientific orientation and innovativeness had positive and highly significant with their perception towards extension service of KVK at 0.01 level of probability whereas, age, education and farming experience were established positive and significant relation with perception of farmers towards extension service of KVK at 0.05 level of probability. The above findings are in consonance with the findings reported by Thangjam et al. (2017).
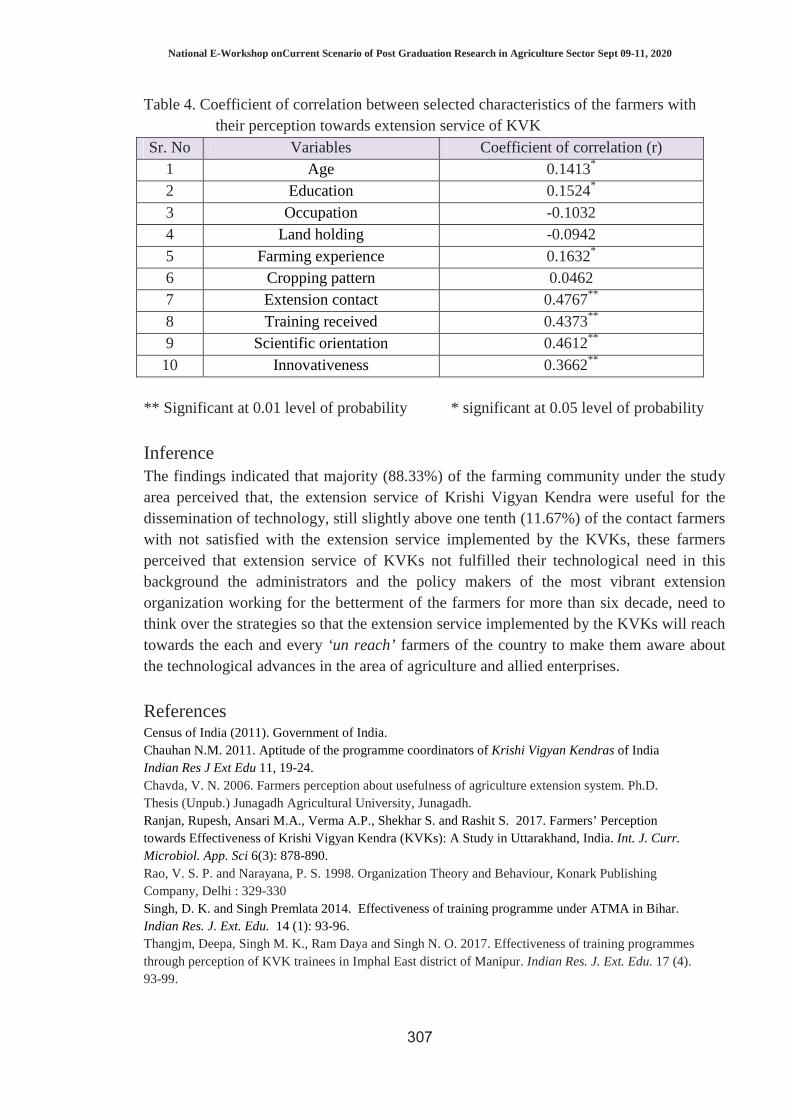
National E-Workshop onCurrent Scenario of Post Graduation Research in Agriculture Sector Sept 09-11, 2020
307
Table 4. Coefficient of correlation between selected characteristics of the farmers with their perception towards extension service of KVK
Sr. No Variables Coefficient of correlation (r) 1 Age 0.1413* 2 Education 0.1524* 3 Occupation -0.1032 4 Land holding -0.0942 5 Farming experience 0.1632* 6 Cropping pattern 0.0462 7 Extension contact 0.4767** 8 Training received 0.4373** 9 Scientific orientation 0.4612** 10 Innovativeness 0.3662**
** Significant at 0.01 level of probability * significant at 0.05 level of probability
Inference The findings indicated that majority (88.33%) of the farming community under the study area perceived that, the extension service of Krishi Vigyan Kendra were useful for the dissemination of technology, still slightly above one tenth (11.67%) of the contact farmers with not satisfied with the extension service implemented by the KVKs, these farmers perceived that extension service of KVKs not fulfilled their technological need in this background the administrators and the policy makers of the most vibrant extension organization working for the betterment of the farmers for more than six decade, need to think over the strategies so that the extension service implemented by the KVKs will reach towards the each and every ‘un reach’ farmers of the country to make them aware about the technological advances in the area of agriculture and allied enterprises.
References Census of India (2011). Government of India. Chauhan N.M. 2011. Aptitude of the programme coordinators of Krishi Vigyan Kendras of India Indian Res J Ext Edu 11, 19-24. Chavda, V. N. 2006. Farmers perception about usefulness of agriculture extension system. Ph.D. Thesis (Unpub.) Junagadh Agricultural University, Junagadh. Ranjan, Rupesh, Ansari M.A., Verma A.P., Shekhar S. and Rashit S. 2017. Farmers’ Perception towards Effectiveness of Krishi Vigyan Kendra (KVKs): A Study in Uttarakhand, India. Int. J. Curr. Microbiol. App. Sci 6(3): 878-890. Rao, V. S. P. and Narayana, P. S. 1998. Organization Theory and Behaviour, Konark Publishing Company, Delhi : 329-330 Singh, D. K. and Singh Premlata 2014. Effectiveness of training programme under ATMA in Bihar. Indian Res. J. Ext. Edu. 14 (1): 93-96. Thangjm, Deepa, Singh M. K., Ram Daya and Singh N. O. 2017. Effectiveness of training programmes through perception of KVK trainees in Imphal East district of Manipur. Indian Res. J. Ext. Edu. 17 (4). 93-99.

National E-Workshop onCurrent Scenario of Post Graduation Research in Agriculture Sector Sept 09-11, 2020
308
A STUDY ON THE EXTENT OF ACCESSIBILITY AND UTILIZATION OF MASS MEDIA AMONG SCHOOL GOING
CHILDREN IN BIKANER DISTRICT
Varsha Kumari and Prasanlata Arya
Dept of Ext Edu & Communication Management, CHSc., SKRAU, Bikaner [email protected]
Introduction The term media is derived from Medium, which means carrier or mode. Media denotes an item specially designed to reach a large audience or viewers. The term was first used with the advent of newspaper and magazines. Mass media has played a major role in enhancing socialization among children. With the advance technology, children can easily access the internet which is a major socialization tool and can also be used as a research tool that can be utilized positively by students. (Mumi, 2010). Today’s generation of children and adolescents are growing up immersed in media, including broadcast and social media. Mass media is undoubtedly an important tool in bringing about large scale directed social change and modernization in developing nation for transmitting knowledge, disseminating facts and directing various emotional appeals to influence public opinion. Methodology The present study was confined to measure the level of accessibility and utilization pattern of electronic and print media among school going children. One panchayat samiti of Bikaner district was selected by chit method i.e. Bikaner. A total of 8 Government senior secondary schools were selected from urban and rural areas of Bikaner panchayat samiti of Bikaner district through systematic random sampling technique. 160 (80 boys + 80 girls) school going childrenstudying in 11th and 12th standards (10 girls + 10 boys were select from each school) were selected simple random technique. Thus, the final sample comprising 160 respondents. Keeping in view the objectives and the variables under study, questionnaire was framed. The questionnaire contained the background data of respondents, Subscription/possession, purpose, factors affecting and opinion of respondents regarding mass media. The data so collected were classified, tabulated and analyzed in light of the objectives by the application of statistical tools viz., frequency, percentage, mean score, standard deviation, rank, co-efficient of correlation and t-test.
Findings This chapter contains the results obtained from analysis of data collected from the urban and rural area of Bikaner district in according with the objectives of the study. The results have been presented under the following sections: 4.1 Personal and socio-economic characteristics of the school going Children. 4.2 Possession/subscription of mass media among school going children. 4.3 Utilization pattern of mass media among school going children. 4.1 Personal and socio-economic characteristics of the school going Children

National E-Workshop onCurrent Scenario of Post Graduation Research in Agriculture Sector Sept 09-11, 2020
309
1. Majority of the respondents (72.5%) belonged to 16 to 17 years of age group, followed by 14.4 per cent of respondents belonged to below 16 years and 13.1 per cent of respondents belonged to above 18 years of age group.
2. Majority of the respondents (46.9%) were from other backward caste, followed by general caste (31.2%) and schedule caste/schedule tribe (21.9%).
3. Majority of the respondents (85.6%) had Nuclear family system, followed by joint family system (14.4%).
4. Majority of the respondents (55%) belonged to small family size, followed by 34.4% respondents belonged to medium family size and only 1.6 per cent respondents belonged to large family size.
5. Majority of the respondents (67.5%) belong to low income group followed by 26.3 per cent respondents belonged to medium income group and 6.3 per cent of respondents belonged to high income group.
4.2 Possession, accessibility level of electronic and print media 1. Majority of boys in urban and rural area possessed phone (mobile) (100%, 75%)
and majority of girls in urban and rural area possessed television (95.0%,77.5%) 2. First three ranked electronic media to which urban school going children had
accessibility were television, mobile phone and internet. Whereas rural school going children had accessibility were television, mobile and radio.
3. There was significant difference among mean scores of urban school going children and rural school going children in accessibility to different mass media among school going children.
4. Majority of urban boys and rural boys (75%, 72.5%) had medium level of accessibility to mass media.
4.3 Utilization level and utilization pattern of electronic and print media among school going children Majority of the urban and rural boys (72.5%) were fallen in the category of medium level of utilization of electronic and print media. In case of rural and urban girls majority (77.5%, 70%) were fallen in the category of medium level of utilization of electronic and print media. Inference From the above findings it can be concluded that in general information majority of the respondents belonged to 16 to 17 years of age group, possessed television and phone (mobile) both in urban area. Overall accessibility and utilization level of respondents was found medium both urban and rural area.As it has been observed from the findings that majority of boys and girls have showed least interest towards print media such as newspaper and magazine because of poor subscription rate and accessibility. Thus, they should be encouraged to make uses of print media as it will help to provide authentic information and improving reading skills.

National e-Workshop Brochure


Copyright © 2022 FDOKUMEN