2020-FSHS_PROC_FINAL.pdf - Florida State Horticultural ...
263
Florida State Horticultural Society Proceedings 2020 Volume 133
-
Upload
khangminh22 -
Category
Documents
-
view
0 -
download
0
Transcript of 2020-FSHS_PROC_FINAL.pdf - Florida State Horticultural ...
1
Florida State Horticultural Society
Proceedings 2020
Volume 133
2
Front and Back covers
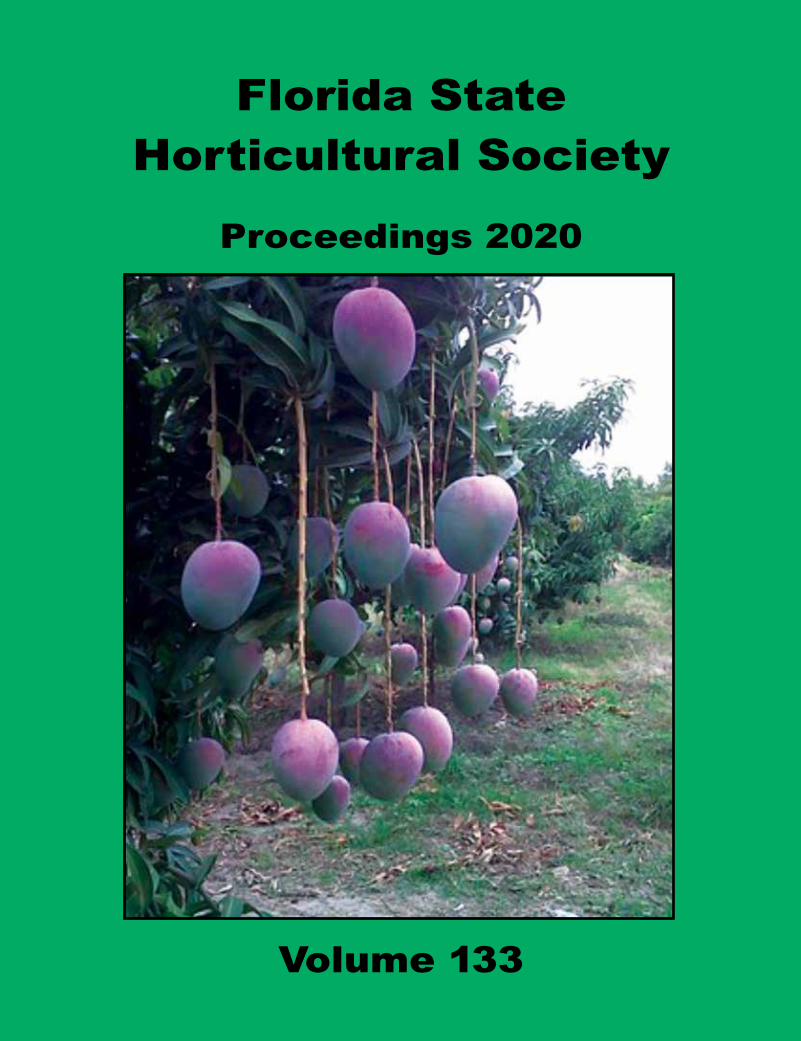
Mangos in Florida and the WorldMango (Mangifera indica L.) originated in tropical south
and southeast Asia about 4000 years ago. According to the United Nations, most production is found in the intertropical region, with six countries accounting for most of the world’s production: India, China, Thailand, Indonesia, Mexico, and Pakistan. While most production is consumed domestically, a slightly different six countries supply most of the exports: Mexico, India, Thailand, Brazil, Pakistan, and Peru.
The early Florida State Horticultural Society Proceedings provide several reflections on the introduction of mango into Florida, plus early culture, and shipping and marketing by: A.A. Boggs (1903, vol. 16); P.H. Rolfs (1906, vol. 19); E.V. Blackman (1909, vol. 22); Mrs. P.H. Rolfs (1915, vol. 28); J.W. Barney (1924, vol. 37); Paul Heyman (1930, vol. 43); David Fairchild (1931, vol. 44; 1938, vol. 51); H.S. Wolf (1937, vol. 50); and many others.
The mango was first introduced to south Florida from Mexico in 1833, but likely did not survive. Additional at-tempts were made on the west coast with plants from Cuba and other countries over the next few decades, but also failed for various reasons including frosts. The first successful plantings were made in the Miami area in 1861 and 1868.
‘Number 11’ and ‘Peach’ mangos were recognized in the late 1800s. ‘Number 11’ arrived in Jamaica with French sailors prior to its arrival in Cuba and Florida. It is a fibrous yellow fruit now known as ‘Turpentine’. In 1889, ‘Mulgoba’ and ‘Alphonso’ were the two surviving cultivars of the six introduced by the federal government (an agency that that later became the US Department of Agriculture).
‘Turpentine’ and ‘Mulgoba’ somehow crossbred in West Palm Beach, but the progeny were not recognized until in 1910, when a ‘Mulgoba’ seed in the back yard of Florence Haden of Coconut Grove produced what we now know as the ‘Haden’ mango. It was a beautiful fruit with an eye-stopping display of reds and yellows combined with an excellent flavor. It quickly thrived and dominated the mango industry of Florida. ‘Haden’ also proved to be a good parent, giving rise important export mango cultivars such as ‘Kent’ (Miami), ‘Keitt’ (Homestead), and ‘Tommy Atkins’ (Fort Lauderdale).
The turn of the 20th century was considered to be the beginning of a real mango industry in Florida. The 1918 catalog from Glen Saint Mary Nursery in Glen Saint Mary, FL. listed three sizes of mango trees, none priced higher
than $1.00. Two former presidents of the Florida State Hor-ticultural Society, G.L. Taber (1897–1904) and H. Harold Hume (1910–22), were the nursery’s president and vice president, respectively.
Breeding programs around the world have worked to develop new mango cultivars. These efforts include field production criteria such as tree size, natural disease toler-ance in blooms, as well as young and mature fruit, flavor, and productivity.
The 2017 Census of Agriculture reported approximately 2672 acres of commercial mangos grown in Florida—which means it is a small industry. Most are grown in Miami-Dade County, followed by Palm Beach, and Lee Counties.
To keep the industry viable in the face of competition from major exporting countries such as Mexico, Florida growers must become be creative, experimenting with new products and exploring new markets. Early cultivars such as ‘Mallika’, ‘Nam Doc Mai’, and ‘Angie’ can start the season in May. These cultivars generally have a small tree size, considerable disease tolerance, and excellent fruit quality. They also appeal to distinct ethnic groups.
The future of the Florida mango industry depends at least in part on the selection, testing, and adoption of new cultivars that can distinguish themselves in terms of eat-ing quality and also in horticultural traits such as smaller trees, which are adapted to smaller plantings. Finding new cultivars and targeting new niches that increase profits are some of the challenges facing small-scale producers.
Farmers markets have become increasingly popular in south Florida, focusing more on locally-grown produce. Restaurants can easily adapt their menus to accommodate the seasonal availability of local produce compared to grocery stores and fast-food chains. Seasonal cooking has also become popular with the local food movement. Using the direct-from-farm sales model, local growers have been setting up their own distribution channels.
Front cover: An orchard of ‘Lily’ mango.
Back cover: Clockwise from the top left: ‘Kent’ mango orchard in Florida, ‘Pickering’ mango inflorescence, Dooryard mango in Florida, bowl of ‘Rapoza’ and ‘Sunset’ mangos
Photos by Noris Ledesma and George Fitzpatrick
iProc. Fla. State Hort. Soc. 133: 2020.
Proceedings of the 133rd AnnuAl Meeting
of the
Library of Congress Catalogue No. 9-1702. This Library of Congress number is ongoing, having been assigned to these Proceedings in 1909.ISSN 0886-7283
Held virtually
October 19 – 20, 2020
FLORIDA STATEHORTICULTURAL SOCIETY
ii Proc. Fla. State Hort. Soc. 133: 2020
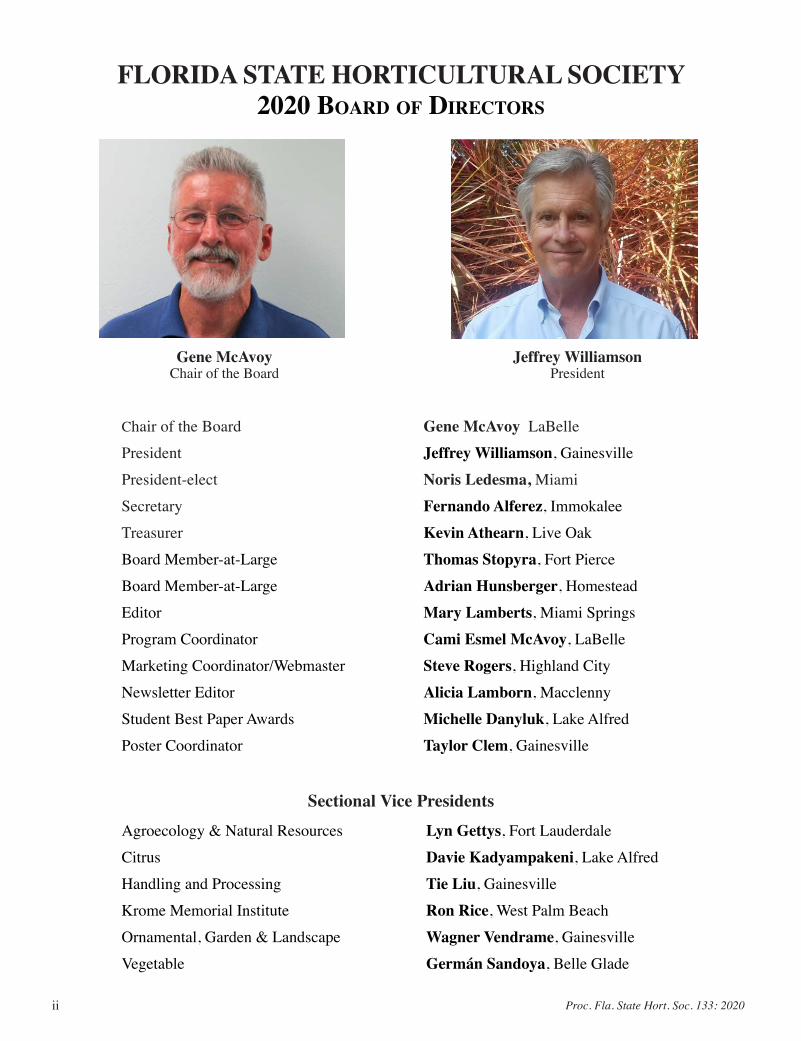
FLORIDA STATE HORTICULTURAL SOCIETY2020 BoArd of directors
Gene McAvoyChair of the Board
Jeffrey WilliamsonPresident
Chair of the Board Gene McAvoy LaBelle
President Jeffrey Williamson, Gainesville
President-elect Noris Ledesma, Miami
Secretary Fernando Alferez, Immokalee
Treasurer Kevin Athearn, Live Oak
Board Member-at-Large Thomas Stopyra, Fort Pierce
Board Member-at-Large Adrian Hunsberger, Homestead
Editor Mary Lamberts, Miami Springs
Program Coordinator Cami Esmel McAvoy, LaBelle
Marketing Coordinator/Webmaster Steve Rogers, Highland City
Newsletter Editor Alicia Lamborn, Macclenny
Student Best Paper Awards Michelle Danyluk, Lake Alfred
Poster Coordinator Taylor Clem, Gainesville
Sectional Vice Presidents
Agroecology & Natural Resources Lyn Gettys, Fort Lauderdale
Citrus Davie Kadyampakeni, Lake Alfred
Handling and Processing Tie Liu, Gainesville
Krome Memorial Institute Ron Rice, West Palm Beach
Ornamental, Garden & Landscape Wagner Vendrame, Gainesville
Vegetable Germán Sandoya, Belle Glade
iiiProc. Fla. State Hort. Soc. 133: 2020.
Proceedings of the Florida State Horticultural Society 2020
Board of Directors for 2020.................................................................. ii
Presidential Address: Gene McAvoy .................................................. vii
Awards of the Society .......................................................................... ix
Honorary Members ........................................................................... xvii
List of Presidents, 1988 to Present ..................................................xviii
Outstanding Growers or Commercial Horticulturists ....................... xix
Host Cities.......................................................................................... xix
Keynote Address—Expanding Our Plant Palette: The Role of Native and Non-invasive Cultivars .................................................... xx
Sandra B. Wilson
Author Index ..................................................................................... 233
Published PapersKroMe MeMoriAl institute (troPicAls)
Evaluation of Vigor of Four Mango Cultivars In South Florida ......... 1Noris Ledesma and Javier Medina
Current Recommendations for Control of Laurel Wilt and Its Ambrosia Beetle Vectors In Florida’s Commercial Avocado
Groves ................................................................................................. 4Jonathan H. Crane, Daniel Carrillo, Edward A. Evans, Romina Gazis, Bruce Schaffer, Fredy Ballen, and Jeff Wasielewski
The Introduction and Utilization of Kasturi to South Florida (Mangifera casturi) ............................................................................. 7
Noris Ledesma, Tomas Ayala Silva, and Stephen Brady
‘Jumbo Kesar’ Mango for South Florida .......................................... 10Noris Ledesma and Bhaskar Savani
Sustainable Strategies to Combat the Papaya Ringspot Virus .......... 12Sarah E. Brewer and Alan H. Chambers
University of Florida, IFAS, Tropical Research and Education Center—Efforts to Register Pest Control Substances for Florida’s Tropical Fruit Industry, 1999–2019 .................................................. 14
Jonathan H. Crane, Rebecca Tannenbaum, and Janine M. Spies
O47-16-10: A Pierce’s Disease-resistant and Premium Wine Producing Bunch Grape Hybrid with Later Bud Burst in Spring ..... 18
Zhongbo Ren, Violet Tsolova, and Islam El-Shakarway
Low Cost High Tunnel versus Open Field Production of Organically Grown Strawberries in North Florida:A Three-year Evaluation ....... 21
Alex Bolques, Gilbert Queeley, Fanny Ospina, and Vonda Richardson
Comparison of Drought Tolerance in Five Blueberry Cultivars by Using Dehydration Leaf Assay ......................................................... 25
Amir Rezazadeh and Eric T. Stafne
—Scientific Notes—
Artificial Chilling for Blackberry Production in Florida .................. 28Jonathan Denison, Christianah Oladoye, Jeffrey Williamson, and Guodong Liu
Vanilla Chromosome Counting—Techniques and Implications ....... 29Maria Brym and Alan H. Chambers
Breeding Specialty Vanilla for Production In the United States ....... 31Alan H. Chambers
Fertigation in Avocado: Monitoring Soil Ions as a Diagnosis in Nutrition ............................................................................................ 33
Esteban Sánchez-Rodríguez, Víctor García-Gaytán, and Jesús Bautista
—Reprints—
Exogenous Gibberellic Acid and Cytokinin Effects on Budbreak, Flowering, and Yield of Blackberry Grown under Subtropical Climatic Conditions ............................................................................ 34
Syuan-You Lin and Shinsuke Agehara
citrus section
Influence of Elevated Manganese Rates on Growth Parameters, Nutrient, and Biomass Accumulation of HLB-affected Trees In Florida ............................................................................................... 42
Samuel Kwakye, Davie Kadyampakeni, and Tripti Vashisth
Performance of HLB-affected Trees to Soil Macro- and Micronutrient Applications ...................................................................................... 47
Tanyaradzwa Chinyukwi, Samuel Kwakye, and Davie M. Kadyampakeni
Performance of Leaf Wetness Sensors for Applicability In Decision-support Systems for Management of Citrus, Blueberry, and Strawberry Diseases .......................................................................... 55
Andre B. Gama, Megan M. Dewdney, Clyde Fraisse, and Natalia A. Peres
—Scientific Notes—
Flushing Pattern, Asian Citrus Psyllid Colonization and Candidatus Liberibacter asiaticus Transmission In Different Graft Combinations of Citrus ............................................................................................ 59
Caroline Tardivo, Kim D. Bowman, Jawwad Qureshi, and Ute Albrecht
Citrus Nutrition Trends In the Florida Citrus Industry ..................... 61Jamie D. Burrow, Davie Kadyampakeni, and Tripti Vashisth
PAPS: A Portable and Adjustable Prototype Sprayer to Analyze Fungal Biopesticide Deposition In the Greenhouse .......................... 62
contentsVolume CXXXIII PrInted may 2021
iv Proc. Fla. State Hort. Soc. 133: 2020
Sandra M. Guzman, Eric Herrera, Pasco B. Avery, and Robert C. Adair
—Reprints—
Field Performance of ‘Hamlin’ Orange Trees Grown on Various Rootstocks in Huanglongbing-endemic Conditions ......................... 63
Sudip Kunwar, Jude Grosser, Fred G. Gmitter Jr., William S. Castle, and Ute Albrecht
Horticultural Attributes and Root Architectures of Field-grown ‘Valencia’ Trees Grafted on Different Rootstocks Propagated by Seed, Cuttings, and Tissue Culture .........................................73
Sameer Pokhrel, Bo Meyering, Kim D. Bowman, and Ute Albrecht
VegetABle section
Enhancing Strawberry Productivity Using Drip Irrigation, Plastic Mulch, and New Cultivars in Bangladesh ........................................ 83
Prosanta K. Dash, Carlene A. Chase, Shinsuke Agehara, and Lincoln Zotarelli
Management of Diamondback Moth, Plutella xylostella (Lin.) (Lepidoptera: Plutellidae) In Cabbage using Reduced-risk Insecticides ........................................................................................ 90
Rafia Khan, Dakshina Seal, Catherine Sabines, and Shawbeta Seal
Biology and Abundance of Cowpea Weevil, on Different Leguminous Seeds ............................................................................ 94
Garima Garima, and Dakshina Seal
Application of Small Unmanned Aerial Vehicles to Improving Vegetable Crop Management ............................................................ 98
Qingren Wang
Effect of IN-M1 Concentric® on Plant Growth and Fruit Yield of Tomato In South Florida ................................................................. 101
Qingchun Liu and Shouan Zhang
Physiological, Growth and Yield Responses of Yellow Squash and Snapbean to a Potassium and Zinc Foliar Fertilizer ....................... 104
Ana I. Vargas, Dakshina Seal, and Bruce Schaffer
Management of the Pepper Weevil, Anthonomus eugenii Cano (Coleoptera: Curculionidae) using Bio-rational Insecticides In Combination with Aggregation Pheromone .................................... 110
Victoria O. Adeleye, Dakshina SeaL, Oscar Liburd, Heather McAuslane, and Hans Alborn
Harvest Yields for Sweet Corn Variety Trial In Northeast Florida ............................................................................................. 116
Wendy Mussoline, Juan Gonzalez, Christian Christensen, and Marcio Resende
—Scientific Notes—
Promotion of Hops as an Alternative Crop In Florida using Group and Mass Media Extension Approaches ................................................ 120
Mariel Gallardo, Aleyda Acosta-Rangel, Amanda Rivera, Zhanao Deng, Jack Rechcigl, Simon Bollin, and Shinsuke Agehara
Lettuce in Advanced Production Systems as an Early Fall Alternative Crop .............................................................................. 121
Gary K. England, German Sandoya, Wendy Mussoline, and Gustavo Kreutz
Field Evaluation of a New Mechanical Strawberry Gripper Developed for Autonomous Harvesting .......................................... 122
Shinsuke Agehara, Weining Wang, Jonah Mapes, and Yunjun Xu
Characterization of Leaf Gas Exchange in Hops Grown In the Subtropical Production System with Supplemental Lighting ......... 123
Aleyda Acosta Rangel, Jack Rechcigl, and Shinsuke Agehara
Globe Artichoke Variety Trials Using Controlled-release Fertilizer In Northeast Florida ............................................................................ 124
Evelyn “Prissy” Fletcher and Gary England
Developing Interspecific Bridges between Cucurbita pepo and C. moschata..................................................................................... 126
Yuqing Fu, Vincent Michael, Pamela Moon, Christine Waddill, Shouan Zhang, and Geoffrey Meru
The Genetic Diversity of the Genus Lactuca for Resistance to Fusarium wilt .................................................................................. 127
Gulnoz Hisamutdinova, Jesse J. Murray, Richard N. Raid, Maria José Truco, and Germán V. Sandoya
Resistance to Cucurbit Leaf Crumple Virus in Squash ................... 129Geoffrey Meru, Emily Wang, Yuqing Fu, Renato Carvalho, Melanie Kalischuk, and Matthews Paret
QTL-seq for Rapid Mapping of Genomic Regions Associated With Zucchini Yellow Mosaic Virus Resistance In Squash ..................... 130
Swati Shrestha, Yuquing Fu, Vincent Michael, and Geoffrey Meru
Alternative Fumigant Application Strategies to Manage Plant Parasitic Nematodes In Vegetable Crops ....................................................... 131
Sarah da Silva Benevenute, Joshua H. Freeman, and Rui Yang
Effect of Multispecies Cover Crop Mixture on Root Colonization by Arbuscular Mycorrhizal Fungi ........................................................ 132
Thioro Fall, Guodong Liu, Elias Bassil, Yuncong Li, Bruce Schaffer, Kelly Morgan and Andy Ogram
Post-planting Root Growth Dynamics and Morphology of Bare-root and Plug Strawberry Transplants and Their Impacts on Field Performance ........................................................................... 134
Jose Hernandez-Monterroza and Shinsuke Agehara
QTL Mapping of Phytophthora Crown Rot Resistance In Squash ............................................................................................. 135
Vincent Njung’e Michael, Yuqing Fu, and Geoffrey Meru
Evaluation of Biostimulant Products for Tomato Production In Florida ......................................................................................... 136
Weining Wang, Christopher Delcastillo, Aleyda Acosta-Rangel, Syuan-You Lin, Jose Hernandez-Monterroza, Mariel Gallardo, and Shinsuke Agehara
Rapid Screening for Phosphorous-efficient Genotypes from Tomato Germplasm Banks In an Artificial Soil Solution ............................. 137
Tanumoy Bera and Guodong Liu

vProc. Fla. State Hort. Soc. 133: 2020.
Understanding Lettuce Downy Mildew: Pathogen Distribution and Available Host Resistance In Florida .............................................. 138
Lis Natali R. Porto, Richard N. Raid, and Germán V. Sandoya
Screening for Resistance to Stemphylium in Florida-adapted Baby Leaf Spinach ................................................................................... 139
Lis Natali R. Porto, Richard N. Raid, and Germán V. Sandoya
Varieties of Tomato Saladette Type: Plastic Mulches, Nutrition, and Production In a Greenhouse ............................................................ 140
Víctor García-Gaytán and Jesús Bautista
hAndling & Processing section
Effect of ‘Tahiti’ Lime Fruit Size on the Percent of Juice Content Measured by the Standard USDA Volume Method and an Alternative Weight Method ................................................................................ 141
Jonathan H. Crane, Steven A. Sargent, Carlos F. Balerdi, Jay Harrison, and Lilia Caldeira
—Scientific Notes—
Produce Safety In Florida: Education, Outreach, and Compliance .. 145Taylor Langford, Joyjit Saha, Scott McClure, Matthew Krug, Travis Chapin, Renée Goodrich, and Michelle Danyluk
Sensory and Quality Analysis of HLB-tolerant Citrus Cultivars for Juice Production .............................................................................. 146
Stephanie Hricik, Charles Sims, Yu Wang, Zhifeng Gao, and Renee Goodrich-Schneider
Food Safety and Regulatory Guidance for Florida Food Processors Operating Out of Shared-use Commercial Kitchens ...................... 147
Matt Krug, Sarah Ellis, Jennifer Hagen, and Jessica Ryals
Recovery of Ripening by Mature Green Banana Fruit following 1-Methylcyclopropene Application ................................................ 148
Lan-Yen Chang and Jeffrey K. Brecht
—Reprints—
Nano- and Micro- Carnauba Wax Emulsions versus Shellac Protective Coatings on Postharvest Citrus Quality .......................................... 149
Marcela Miranda, Xiuxiu Sun, Christopher Ference, Anne Plotto, Jinhe Bai, and David Wood, Odílio Benedito Garrido Assis and Marcos David Ferreira, and Elizabeth Baldwin
Edible Coatings as Carriers of Antibrowning Compounds to Maintain Appealing Appearance of Fresh-cut Mango ................................... 159
Anna Marıin, Elizabeth A. Baldwin, Jinhe Bai, David Wood, Christopher Ferenc, Xiuxiu Sun, Jeffrey K. Brecht, and Anne Plotto
ornAMentAl, gArden & lAndscAPe section
Provoking Behavior Change In Residential Fertilizer Users .......... 168Tina McIntyre
Shifting Tides: Lessons Learned from Virtual Plant Clinics........... 170Michelle Leonard-Mularz
Selecting Preemergent Herbicides for Use In Container-grown Amaryllis ......................................................................................... 172
Shawn Steed and Michael Sweet
Landscaping for Livestock .............................................................. 174Maxine Hunter and Caitlin Bainum
—Scientific Notes—
Micropropagation of a Novel Cordyline Hybrid ............................. 177David Beleski, Wagner Vendrame, Jane Nguyen, Daniella Menendez, Damaris Hernandez, and Jian Jian X
Estimating Neonicotinoid Insecticides Related Information Effects on Consumers’ Preferences for Ornamental Plants......................... 178
Hayk Khachatryan and Xuan Wei
Protocol Development for Genome Size Estimation of Begonia Accessions ....................................................................................... 179
Julian Ginor, Heqiang Huo, Sandra Wilson
Equipping Brevard County’s Turfgrass Industry with Sustainable Production Know-how through the Space Coast Golf and Turf Association ...................................................................................... 180
Bonnie C. Wells
Multispecies Lawns: An Alternative Strategy for Water Conservation and Ecosystem Functions ................................................................ 181
Brooke Moffis, Basil Iannone, Adam Dale, J. Bryan Unruh, Julia Rycyna, Sandra Wilson, and Wendy Wilber
—Reprints—
‘UF-1013-1’: An Infertile Cultivar of Lantana camara ................. 183Zhanao Deng, Sandra Wilson, Xiaobao Ying, Chunxian Chen, Rosanna Freyre , Victor Zayas, and David M. Czarnecki II
Morphological and Cytological Characterization of Five Porterweed (Stachytarpheta) Selections ............................................................ 189
Renjuan Qian, S. Brooks Parrish, Sandra B. Wilson, Gary W. Knox, and Zhanao Deng
Agroecology And nAturAl resources section
Connecting with Small Scale, Urban, Hobby, and Community Garden Farmers through Video Mediums and Facebook Live ....... 195
Lisa Hickey, Jessica Ryals, and Sarah Bostick
Growth of Arugula In a Hydroponic Ebb and Flood System Supplemented with Lactobacillus ................................................... 197
Michelle Incledon, Kimberly Moore, Luci Fisher, and Conor McKee
Restoring a 1920s Golf Course Into an Ecological Park: A Case Study of the Rolling Hills ............................................................... 201
Tina McIntyre, Adam Dale, Gail Hansen, Kaydie McCormick and Audrey Genest
—Scientific Notes—
Homeowner Perceptions of Florida Wildflowers for Ecological
vi Proc. Fla. State Hort. Soc. 133: 2020
Landscaping .................................................................................... 203Tiare Silvasy, Liz Felter, and John W. Roberts
Plant Diversity Across Agroecosystems Representing Different Disturbance Regimes In South Florida ........................................... 204
Cliff G. Martin, Daniel Calzadilla, and Zachary T. Brym
Experiential Urban Forestry Extension: Treejuvenation Florida .... 205Marguerite Beckford
—Reprints—
Calcium Management and the Usage of Organic Acids: Impacts on Marketable Fruit Yield In Strawberries .......................................... 206
Jared Essman, Michael Mulvaney, Gabriel Maltais-Landry, and Shinsuke Agehara
Evaluating the Effects of Acetic Acid and d-Limonene on Four Aquatic Plants ................................................................................. 217
Lyn A. Gettys, Kyle L. Thayer, and Joseph W. Sigmon
Martin County, Florida Food System Study ................................... 226William A. Messina, Jr., Lisa House, Yvette Goodiel, and
Carol Alberts
Poster section
Increasing Adoption of Water-saving Technologies on Farms ....... 230Tatiana Sanchez
Extending Extension’s Education to Half a Million ....................... 231Hannah Wooten
Surveys for Resistance-breaking Tospoviruses in Southwest and South Florida Tomato Fields ........................................................... 232
Salih Yilmaz, Felicia Parks, Leon Lucas, H. Charles Mellinger, Tong Geon Lee, Samuel F. Hutton, Scott Adkins, and Ozgur Batuman
viiProc. Fla. State Hort. Soc. 133: 2020.
2020 PRESIDENTIAL ADDRESS
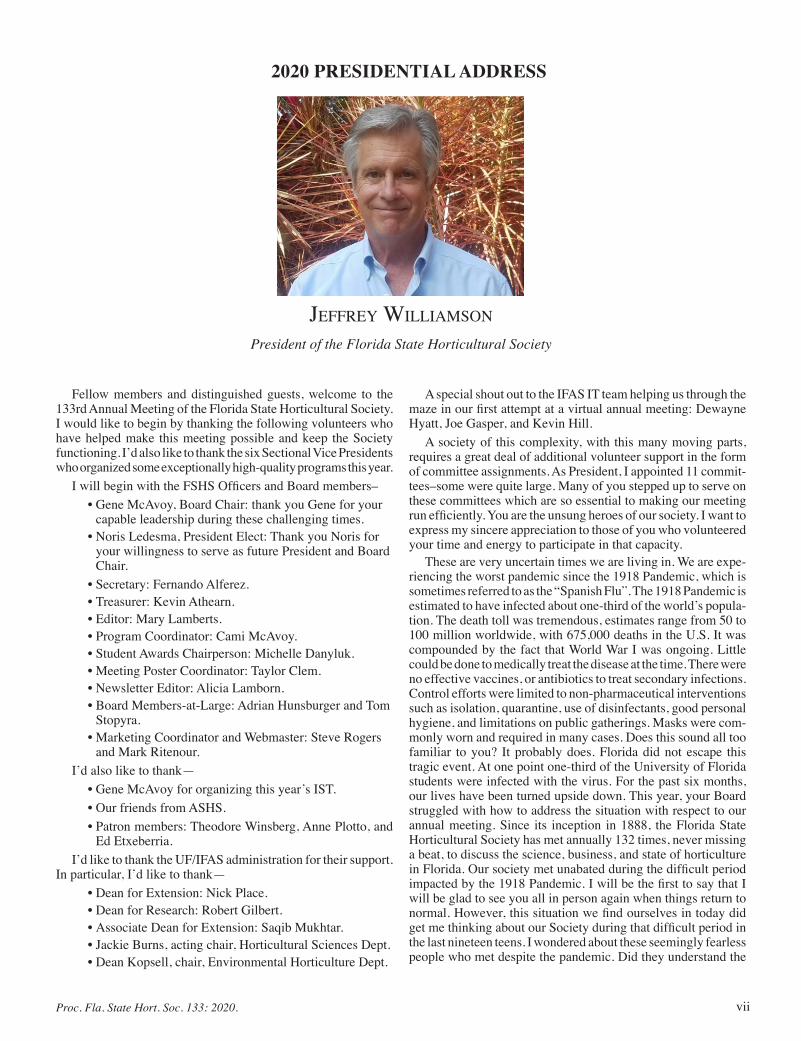
Jeffrey WIllIamson
President of the Florida State Horticultural Society
Fellow members and distinguished guests, welcome to the 133rd Annual Meeting of the Florida State Horticultural Society. I would like to begin by thanking the following volunteers who have helped make this meeting possible and keep the Society functioning. I’d also like to thank the six Sectional Vice Presidents who organized some exceptionally high-quality programs this year.
I will begin with the FSHS Officers and Board members–• Gene McAvoy, Board Chair: thank you Gene for your
capable leadership during these challenging times. • Noris Ledesma, President Elect: Thank you Noris for
your willingness to serve as future President and Board Chair.
• Secretary: Fernando Alferez.• Treasurer: Kevin Athearn.• Editor: Mary Lamberts.• Program Coordinator: Cami McAvoy.• Student Awards Chairperson: Michelle Danyluk.• Meeting Poster Coordinator: Taylor Clem.• Newsletter Editor: Alicia Lamborn.• Board Members-at-Large: Adrian Hunsburger and Tom
Stopyra.• Marketing Coordinator and Webmaster: Steve Rogers
and Mark Ritenour.I’d also like to thank—
• Gene McAvoy for organizing this year’s IST.• Our friends from ASHS.• Patron members: Theodore Winsberg, Anne Plotto, and
Ed Etxeberria.I’d like to thank the UF/IFAS administration for their support.
In particular, I’d like to thank—• Dean for Extension: Nick Place.• Dean for Research: Robert Gilbert.• Associate Dean for Extension: Saqib Mukhtar.• Jackie Burns, acting chair, Horticultural Sciences Dept. • Dean Kopsell, chair, Environmental Horticulture Dept.
A special shout out to the IFAS IT team helping us through the maze in our first attempt at a virtual annual meeting: Dewayne Hyatt, Joe Gasper, and Kevin Hill.
A society of this complexity, with this many moving parts, requires a great deal of additional volunteer support in the form of committee assignments. As President, I appointed 11 commit-tees–some were quite large. Many of you stepped up to serve on these committees which are so essential to making our meeting run efficiently. You are the unsung heroes of our society. I want to express my sincere appreciation to those of you who volunteered your time and energy to participate in that capacity.
These are very uncertain times we are living in. We are expe-riencing the worst pandemic since the 1918 Pandemic, which is sometimes referred to as the “Spanish Flu”. The 1918 Pandemic is estimated to have infected about one-third of the world’s popula-tion. The death toll was tremendous, estimates range from 50 to 100 million worldwide, with 675,000 deaths in the U.S. It was compounded by the fact that World War I was ongoing. Little could be done to medically treat the disease at the time. There were no effective vaccines, or antibiotics to treat secondary infections. Control efforts were limited to non-pharmaceutical interventions such as isolation, quarantine, use of disinfectants, good personal hygiene, and limitations on public gatherings. Masks were com-monly worn and required in many cases. Does this sound all too familiar to you? It probably does. Florida did not escape this tragic event. At one point one-third of the University of Florida students were infected with the virus. For the past six months, our lives have been turned upside down. This year, your Board struggled with how to address the situation with respect to our annual meeting. Since its inception in 1888, the Florida State Horticultural Society has met annually 132 times, never missing a beat, to discuss the science, business, and state of horticulture in Florida. Our society met unabated during the difficult period impacted by the 1918 Pandemic. I will be the first to say that I will be glad to see you all in person again when things return to normal. However, this situation we find ourselves in today did get me thinking about our Society during that difficult period in the last nineteen teens. I wondered about these seemingly fearless people who met despite the pandemic. Did they understand the
viii Proc. Fla. State Hort. Soc. 133: 2020
risks they were taking? I believe they probably did. After reading the President’s address, delivered by Harold Hume (a former UF president), it became apparent to me that they were consumed by what they perceived to be a far greater threat than the relatively new threat of the pandemic; rather the threat of war which had been raging in Europe for several years. President Hume’s address did not mention the 1918 Flu but focused entirely on the war effort and what those in attendance should do to support their country during that difficult period. To me, the fact that they met at all under such difficult circumstances demonstrates the importance of the FSHS to their daily lives. Aside from President Hume, a few other notable people in attendance at the 1918 meeting in-cluded W.J. Krome (railroad builder and tropical fruit pioneer), Wilson Popenoe (Agricultural Explorer and the first director of the Panamerican Agricultural School, Zamorano, Honduras), and P.H. Rolfs (UF Dean and Director of the College of Agriculture for whom Rolfs Hall on the UF campus is named). An influential group of individuals to say the least.
Fast forward about a century and we find ourselves striving to carry on the rich traditions of this society while at the same time not putting our membership at risk of contracting the coronavirus. With the rise in coronavirus cases throughout the summer, the possibility of an on-site meeting was out of the question. Thank-fully, today’s technology allows us to meet virtually from the safety of our homes and offices. I want to thank Gene McAvoy for reaching out to our IFAS IT specialists to help us implement the TEAMS platform for this virtual meeting. I also want to thank Tracy Shawn from ASHS for renegotiating our contract with the conference hotel to move the meeting date to 2022 without any penalty. I also want to thank Mark Ritenour for doing a yeoman’s job of putting the collection of past FSHS proceedings online, so
that we have the history of Florida horticulture at our fingertips. I encourage you all to look at some of the older proceedings as they make for very interesting reading. As I mentioned before, I look forward to when we can once again meet in person, but for now, I hope you will enjoy and benefit from this year’s first virtual FSHS annual meeting.
Before I conclude my remarks, I would like to emphasize that our society operates solely on a volunteer basis. Thus, our society is only as strong as our membership. I encourage each and every one of you to step up and volunteer some of your time and expertise to keep our society strong and functioning efficiently. There are many standing committees as well as specially appointed committees that need your help. Educating and training students is a large part of what we do and our annual meetings provide the perfect environment to give students the added experience of presenting their work to their peers before they participate in a national or international meeting. Please continue to support and encourage your students to participate in our annual meetings. They represent our future. Authors, please submit your manu-scripts in a timely manner. This alone will be a tremendous help for maintaining the high quality of our proceedings which are among the very best of any state horticultural society or similar organization in the country. Remember that our proceedings not only provide current and relevant research results for Floridians, but they also serve as a comprehensive source for the history of Florida horticulture.
Last, let me say that it has been my distinct pleasure to serve as your president and I hope you find this year’s program infor-mative, productive, and enjoyable. Thank you.

ixProc. Fla. State Hort. Soc. 133: 2020.
2020 MERITORIOUS SERVICE AWARDSFor significant contributions to Florida horticulture
Presidential Gold Medal AwardFor having contributed the most to Florida horticulture through work published in the Proceedings of FSHS
over the preceding five-year period
Shawn SteedOrnamental, Landscape and Gardening Section
Outstanding Commercial Horticulturist AwardPresented to the person who has made significant and historical contributions to Florida’s commercial horticulture
industry and to FSHS’s Krome Memorial Institute
Noris LedesmaKrome Memorial Institute
2020 Awards of the Society

x Proc. Fla. State Hort. Soc. 133: 2020
Friends of the Florida State Horticultural Society AwardTo recognize individuals for their longtime commitment and support of the Florida State Horticulture Society
(not awarded)
Florida Tomato Research AwardThis award shall be given to the individual or group who have done work with the most potential to further
the fresh market tomato industry in Florida through advances reported in any single publication during the two (2) previous calendar years
(not awarded)
President’s Industry AwardThe award is presented for the best paper given at the FSHS annual meeting during the previous year
by an industry author.
Nicholas A. LarsenGrowing Bananas in the Everglades Agricultural Area
Proc Fla. State Hort. Soc. 132:32–36. 2019.
2020 Patron MembersMembers who annually pledge additional support for the student programs of the Society
Ed Etxeberria
Anne Plotto
Theodore Winsberg

xiProc. Fla. State Hort. Soc. 133: 2020.
SECTIONAL BEST PAPER AWARDSFrom the Proceedings of the Florida State Horticultural Society Volume 132
Awarded to the senior author of the best and most meritorious paper as printed in the previous year’s Proceedings in each of the six sections
Agroecology and Natural Resources Section
Lyn A. Gettys
Herbicide Efficacy on the Small Floating Weeds Redroot Floater and Feathered Mosquitofern Proc. Fla. State Hort. Soc. 132:241–244. 2019.
Authors: Lyn A. Gettys, Kyle L. Thayer, Joseph W. Sigmon, Ian J. Markovich, and Mohsen TootoonchiFort Lauderdale Research and Education Center, University of Florida/IFAS, Fort Lauderdale, FL
Pictured: Rayane Barcelos Bisi (left) and Ute Albrecht (co-author, right)
Seed and Seedling Nursery Characteristics for 10 USDA Citrus Rootstocks Proc. Fla. State Hort. Soc. 132:88–92. 2019
Authors: Rayane Barcelos Bisi1, Ute Albrecht1, and Kim D. Bowman2
1Southwest Florida Research and Education Center, University of Florida/IFAS, Immokalee, FL 2US Horticultural Research Laboratory, USDA, ARS, Fort Pierce, FL
Citrus Section
xii Proc. Fla. State Hort. Soc. 133: 2020
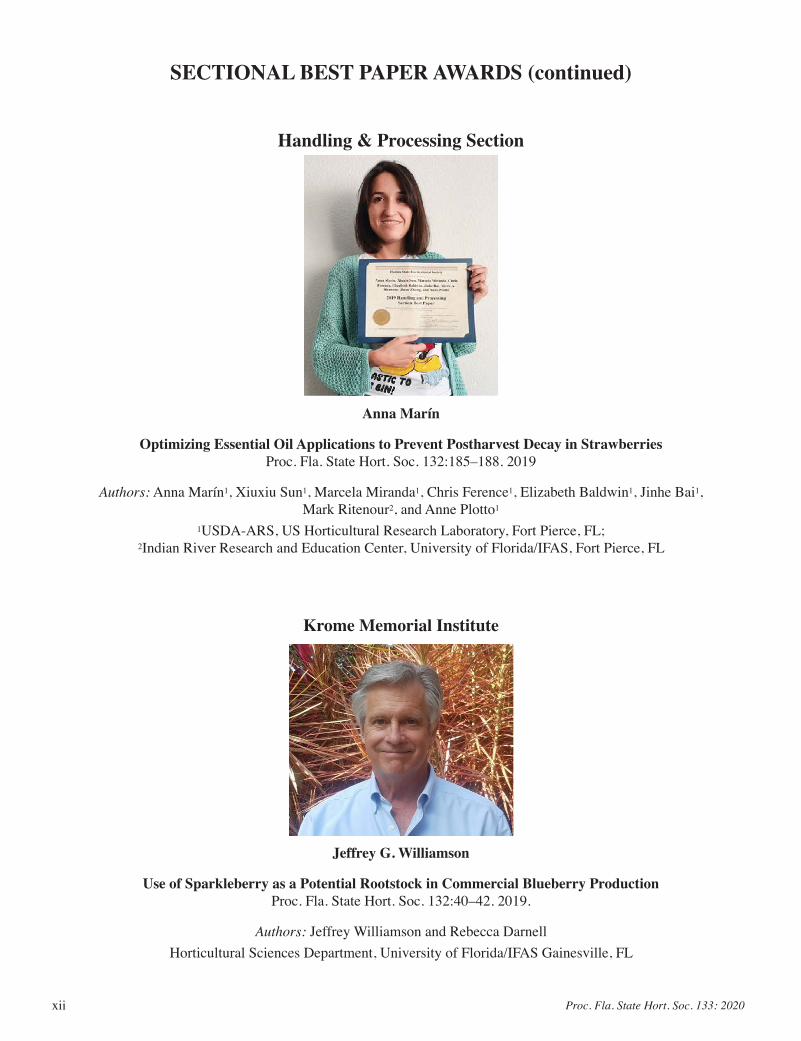
Handling & Processing Section
SECTIONAL BEST PAPER AWARDS (continued)
Anna Marín
Optimizing Essential Oil Applications to Prevent Postharvest Decay in Strawberries Proc. Fla. State Hort. Soc. 132:185–188. 2019
Authors: Anna Marin1, Xiuxiu Sun1, Marcela Miranda1, Chris Ference1, Elizabeth Baldwin1, Jinhe Bai1, Mark Ritenour2, and Anne Plotto1
1USDA-ARS, US Horticultural Research Laboratory, Fort Pierce, FL; 2Indian River Research and Education Center, University of Florida/IFAS, Fort Pierce, FL
Krome Memorial Institute
Jeffrey G. Williamson
Use of Sparkleberry as a Potential Rootstock in Commercial Blueberry Production Proc. Fla. State Hort. Soc. 132:40–42. 2019.
Authors: Jeffrey Williamson and Rebecca DarnellHorticultural Sciences Department, University of Florida/IFAS Gainesville, FL
xiiiProc. Fla. State Hort. Soc. 133: 2020.
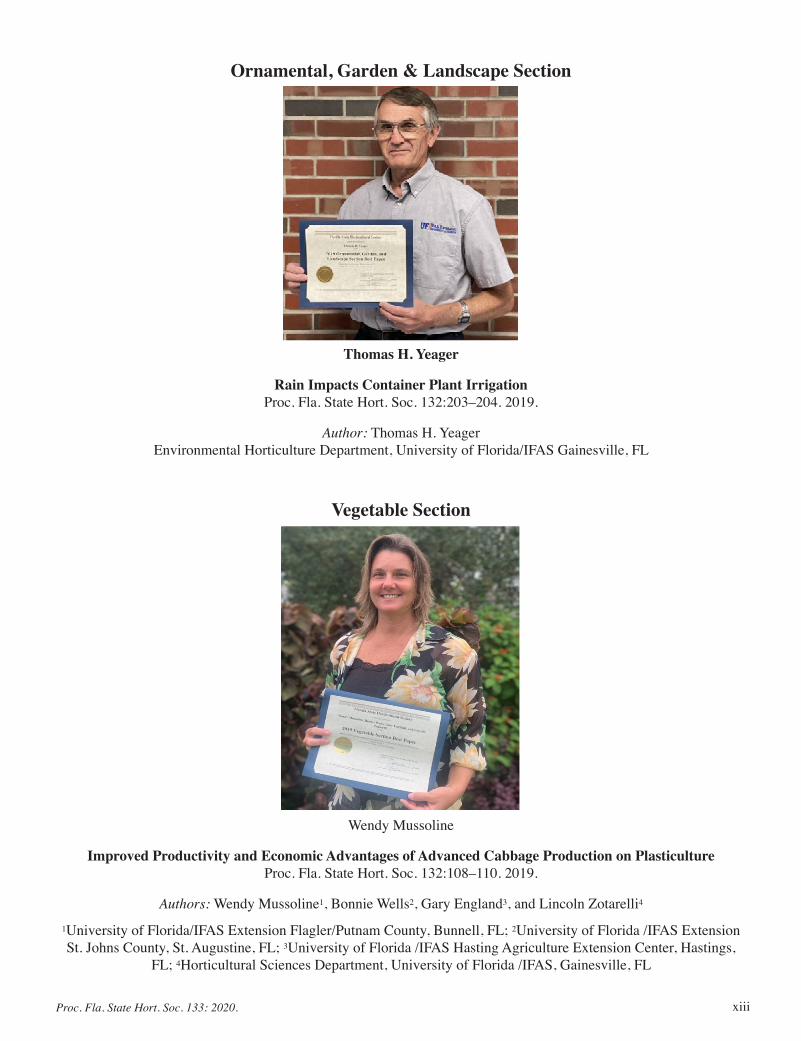
Ornamental, Garden & Landscape Section
Thomas H. Yeager
Rain Impacts Container Plant Irrigation Proc. Fla. State Hort. Soc. 132:203–204. 2019.
Author: Thomas H. YeagerEnvironmental Horticulture Department, University of Florida/IFAS Gainesville, FL
Vegetable Section
Wendy Mussoline
Improved Productivity and Economic Advantages of Advanced Cabbage Production on Plasticulture Proc. Fla. State Hort. Soc. 132:108–110. 2019.
Authors: Wendy Mussoline1, Bonnie Wells2, Gary England3, and Lincoln Zotarelli4
1University of Florida/IFAS Extension Flagler/Putnam County, Bunnell, FL; 2University of Florida /IFAS Extension St. Johns County, St. Augustine, FL; 3University of Florida /IFAS Hasting Agriculture Extension Center, Hastings,
FL; 4Horticultural Sciences Department, University of Florida /IFAS, Gainesville, FL

xiv Proc. Fla. State Hort. Soc. 133: 2020
BEST STUDENT ORAL PRESENTATION AWARDS
first—Jose Hernandez-Monterroza and Shinsuke Agehara Gulf Coast Research and Education Center, University of Florida/IFAS, Wimauma, FLTitle: Post-planting Root Growth Dynamics and Morphology of Bare-root and Plug Strawberry Transplants and Their Impacts on Field Performance
second—Samuel Kwakye, Davie Kadyampakeni, Tripti Vashisth Citrus Research and Education Center, University of Florida/IFAS, Lake Alfred, FLTitle: Evaluation of Varying Rates of Manganese on HLB-affected Trees (Valencia) in Florida
third —Susmita Gaire, Fernando Alferez, Ute Albrecht Southwest Florida Research and Education Center, University of Florida/IFAS, Immokalee, FLTitle: Canopy Growth and Physiological Assessment of ‘Valencia’ Orange Trees (Citrus sinensis) With and Without Individual Protective Covers
STUDENT BEST WRITTEN PAPER AWARDSThese awards are given to encourage student participation in the published FSHS Proceedings, and are given to the students with the best papers submitted for publication in the Proceedings.
Best Written Papers from the 2018 Proceedings
first—Stephen Deschamps (not pictured) and Shinsuke Agehara Gulf Coast Research and Education Center, University of Florida/IFAS, Wimauma, FLTitle: Optimization of Microenvironments By Metalized-striped Plastic Mulch Improves Earliness and Total Yield of StrawberryProc. Fla. State Hort. Soc. 131:164–170. 2018
Yanlin Wang
second—Yanlin Wang (pictured, right), Yue, Y., McKenzie De New, and Bala Rathinasabapathi Horticultural Sciences Dept., University of Florida/IFAS, Gainesville, FL Title: Stem and Canopy Architecture Differences and Their Relationship to Productivity in Capsicum annuum LinesProc. Fla. State Hort. Soc. 131:121–125. 2018
third—Prabhiot Kaur (not pictured), Daniel Stanton, Jude Grosser, Manjul Dutt. Citrus Research and Education Center, University of Florida/IFAS, Lake Alfred, FLTitle: Genetic Modification of Citrus Utilizing Protoplasts Derived from Either Cell Suspension Cultures or Embryogenic CallusProc. Fla. State Hort. Soc. 131:65–69. 2018.
xvProc. Fla. State Hort. Soc. 133: 2020.
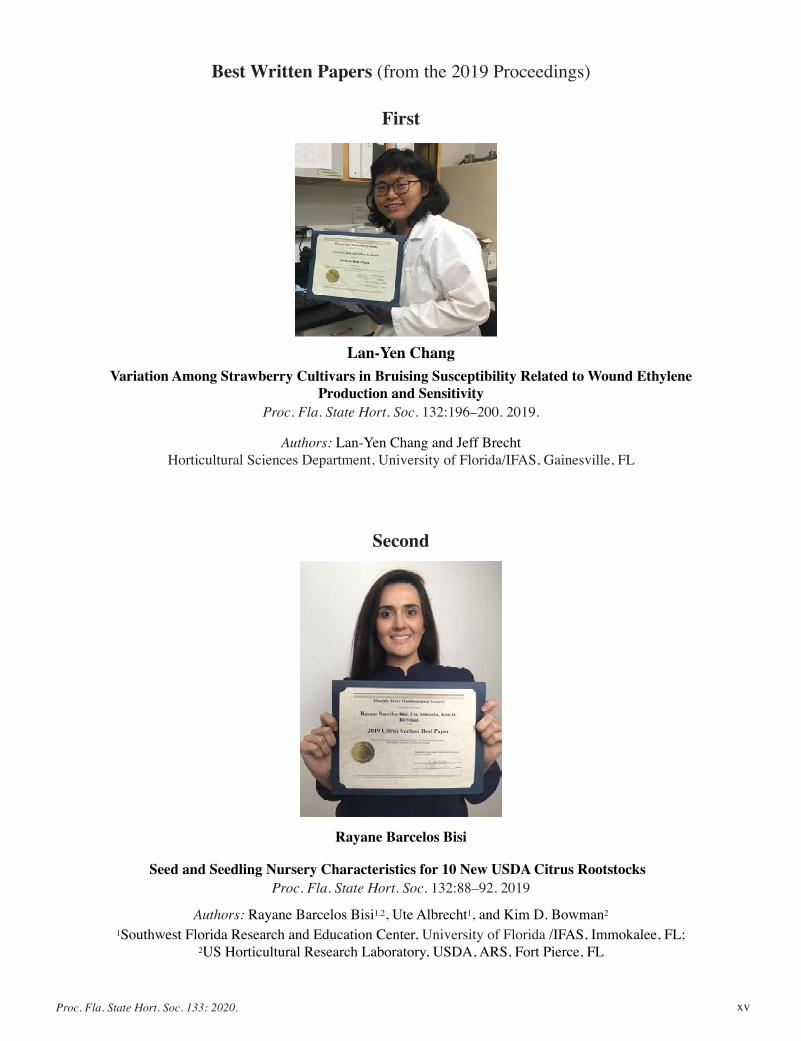
Best Written Papers (from the 2019 Proceedings)
Lan-Yen Chang
Rayane Barcelos Bisi
Variation Among Strawberry Cultivars in Bruising Susceptibility Related to Wound Ethylene Production and Sensitivity
Proc. Fla. State Hort. Soc. 132:196–200. 2019.
Authors: Lan-Yen Chang and Jeff Brecht Horticultural Sciences Department, University of Florida/IFAS, Gainesville, FL
Seed and Seedling Nursery Characteristics for 10 New USDA Citrus RootstocksProc. Fla. State Hort. Soc. 132:88–92. 2019
Authors: Rayane Barcelos Bisi1,2, Ute Albrecht1, and Kim D. Bowman2
1Southwest Florida Research and Education Center, University of Florida /IFAS, Immokalee, FL; 2US Horticultural Research Laboratory, USDA, ARS, Fort Pierce, FL
First
Second
xvi Proc. Fla. State Hort. Soc. 133: 2020
John Santiago
Influence of Rootstock and Soil Environment on Citrus Rhizosphere CompositionProc. Fla. State Hort. Soc. 132:54–61. 2019
Authors: John Santiago, Ute Albrecht, and Sarah L StraussSouthwest Florida Research and Education Center, University of Florida /IFAS, Immokalee, FL
Sponsorship for Best Written Papers
Partial sponsorship by Mary Lamberts in honor of her father, J.J. Lamberts, who was a Professor of English at Arizona State University, specializing
in contemporary English usage.
Student Scholarship Recipients
None awarded for 2020
Best Written Papers from the 2019 Proceedings (continued)
Third
xviiProc. Fla. State Hort. Soc. 133: 2020.
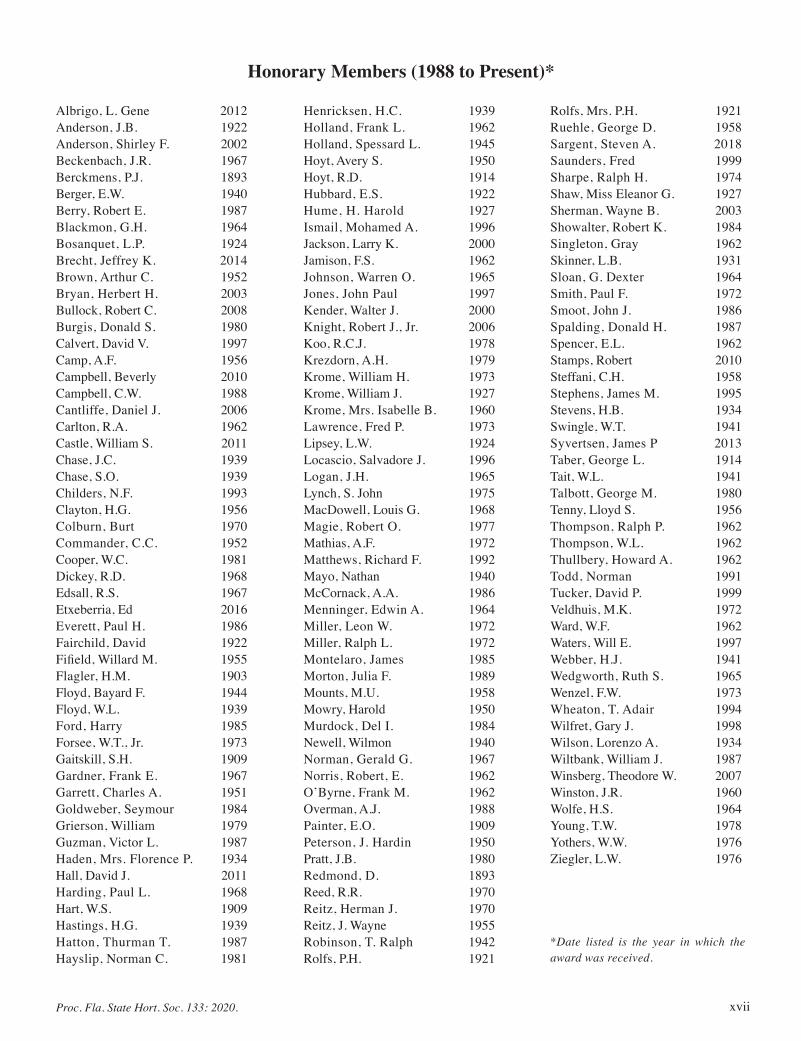
Honorary Members (1988 to Present)*
Albrigo, L. Gene 2012Anderson, J.B. 1922Anderson, Shirley F. 2002Beckenbach, J.R. 1967Berckmens, P.J. 1893Berger, E.W. 1940Berry, Robert E. 1987Blackmon, G.H. 1964Bosanquet, L.P. 1924Brecht, Jeffrey K. 2014Brown, Arthur C. 1952Bryan, Herbert H. 2003Bullock, Robert C. 2008Burgis, Donald S. 1980Calvert, David V. 1997Camp, A.F. 1956Campbell, Beverly 2010Campbell, C.W. 1988Cantliffe, Daniel J. 2006Carlton, R.A. 1962Castle, William S. 2011Chase, J.C. 1939Chase, S.O. 1939Childers, N.F. 1993Clayton, H.G. 1956Colburn, Burt 1970Commander, C.C. 1952Cooper, W.C. 1981Dickey, R.D. 1968Edsall, R.S. 1967Etxeberria, Ed 2016Everett, Paul H. 1986Fairchild, David 1922Fifield, Willard M. 1955Flagler, H.M. 1903Floyd, Bayard F. 1944Floyd, W.L. 1939Ford, Harry 1985Forsee, W.T., Jr. 1973Gaitskill, S.H. 1909Gardner, Frank E. 1967Garrett, Charles A. 1951Goldweber, Seymour 1984Grierson, William 1979Guzman, Victor L. 1987Haden, Mrs. Florence P. 1934Hall, David J. 2011Harding, Paul L. 1968Hart, W.S. 1909Hastings, H.G. 1939Hatton, Thurman T. 1987Hayslip, Norman C. 1981
Henricksen, H.C. 1939Holland, Frank L. 1962Holland, Spessard L. 1945Hoyt, Avery S. 1950Hoyt, R.D. 1914Hubbard, E.S. 1922Hume, H. Harold 1927Ismail, Mohamed A. 1996Jackson, Larry K. 2000Jamison, F.S. 1962Johnson, Warren O. 1965Jones, John Paul 1997Kender, Walter J. 2000Knight, Robert J., Jr. 2006Koo, R.C.J. 1978Krezdorn, A.H. 1979Krome, William H. 1973Krome, William J. 1927Krome, Mrs. Isabelle B. 1960Lawrence, Fred P. 1973Lipsey, L.W. 1924Locascio, Salvadore J. 1996Logan, J.H. 1965Lynch, S. John 1975MacDowell, Louis G. 1968Magie, Robert O. 1977Mathias, A.F. 1972Matthews, Richard F. 1992Mayo, Nathan 1940McCornack, A.A. 1986Menninger, Edwin A. 1964Miller, Leon W. 1972Miller, Ralph L. 1972Montelaro, James 1985Morton, Julia F. 1989Mounts, M.U. 1958Mowry, Harold 1950Murdock, Del I. 1984Newell, Wilmon 1940Norman, Gerald G. 1967Norris, Robert, E. 1962O’Byrne, Frank M. 1962Overman, A.J. 1988Painter, E.O. 1909Peterson, J. Hardin 1950Pratt, J.B. 1980Redmond, D. 1893Reed, R.R. 1970Reitz, Herman J. 1970Reitz, J. Wayne 1955Robinson, T. Ralph 1942Rolfs, P.H. 1921
Rolfs, Mrs. P.H. 1921Ruehle, George D. 1958Sargent, Steven A. 2018Saunders, Fred 1999Sharpe, Ralph H. 1974Shaw, Miss Eleanor G. 1927Sherman, Wayne B. 2003Showalter, Robert K. 1984Singleton, Gray 1962Skinner, L.B. 1931Sloan, G. Dexter 1964Smith, Paul F. 1972Smoot, John J. 1986Spalding, Donald H. 1987Spencer, E.L. 1962Stamps, Robert 2010Steffani, C.H. 1958Stephens, James M. 1995Stevens, H.B. 1934Swingle, W.T. 1941Syvertsen, James P 2013Taber, George L. 1914Tait, W.L. 1941Talbott, George M. 1980Tenny, Lloyd S. 1956Thompson, Ralph P. 1962Thompson, W.L. 1962Thullbery, Howard A. 1962Todd, Norman 1991Tucker, David P. 1999Veldhuis, M.K. 1972Ward, W.F. 1962Waters, Will E. 1997Webber, H.J. 1941Wedgworth, Ruth S. 1965Wenzel, F.W. 1973Wheaton, T. Adair 1994Wilfret, Gary J. 1998Wilson, Lorenzo A. 1934Wiltbank, William J. 1987Winsberg, Theodore W. 2007Winston, J.R. 1960Wolfe, H.S. 1964Young, T.W. 1978Yothers, W.W. 1976Ziegler, L.W. 1976
*Date listed is the year in which the award was received.
xviii Proc. Fla. State Hort. Soc. 133: 2020
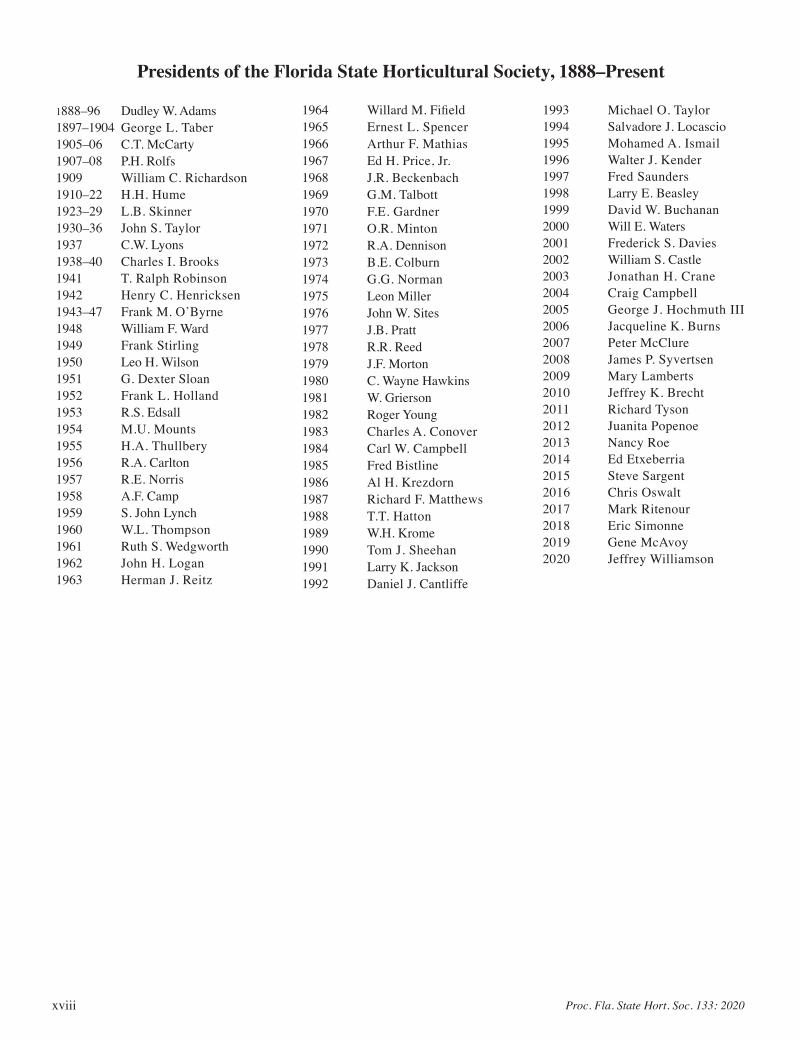
Presidents of the Florida State Horticultural Society, 1888–Present
1888–96 Dudley W. Adams1897–1904 George L. Taber1905–06 C.T. McCarty1907–08 P.H. Rolfs1909 William C. Richardson1910–22 H.H. Hume1923–29 L.B. Skinner1930–36 John S. Taylor1937 C.W. Lyons1938–40 Charles I. Brooks1941 T. Ralph Robinson1942 Henry C. Henricksen1943–47 Frank M. O’Byrne1948 William F. Ward1949 Frank Stirling1950 Leo H. Wilson1951 G. Dexter Sloan1952 Frank L. Holland1953 R.S. Edsall1954 M.U. Mounts1955 H.A. Thullbery1956 R.A. Carlton1957 R.E. Norris1958 A.F. Camp1959 S. John Lynch1960 W.L. Thompson1961 Ruth S. Wedgworth1962 John H. Logan1963 Herman J. Reitz
1964 Willard M. Fifield1965 Ernest L. Spencer1966 Arthur F. Mathias1967 Ed H. Price, Jr.1968 J.R. Beckenbach1969 G.M. Talbott1970 F.E. Gardner1971 O.R. Minton1972 R.A. Dennison1973 B.E. Colburn1974 G.G. Norman1975 Leon Miller1976 John W. Sites1977 J.B. Pratt1978 R.R. Reed1979 J.F. Morton1980 C. Wayne Hawkins1981 W. Grierson1982 Roger Young1983 Charles A. Conover1984 Carl W. Campbell1985 Fred Bistline1986 Al H. Krezdorn1987 Richard F. Matthews1988 T.T. Hatton1989 W.H. Krome1990 Tom J. Sheehan1991 Larry K. Jackson1992 Daniel J. Cantliffe
1993 Michael O. Taylor1994 Salvadore J. Locascio1995 Mohamed A. Ismail1996 Walter J. Kender1997 Fred Saunders1998 Larry E. Beasley1999 David W. Buchanan2000 Will E. Waters2001 Frederick S. Davies2002 William S. Castle2003 Jonathan H. Crane2004 Craig Campbell2005 George J. Hochmuth III2006 Jacqueline K. Burns2007 Peter McClure2008 James P. Syvertsen2009 Mary Lamberts2010 Jeffrey K. Brecht2011 Richard Tyson2012 Juanita Popenoe2013 Nancy Roe2014 Ed Etxeberria2015 Steve Sargent2016 Chris Oswalt2017 Mark Ritenour2018 Eric Simonne2019 Gene McAvoy2020 Jeffrey Williamson

xixProc. Fla. State Hort. Soc. 133: 2020.
1997 Norman Todd Grove Crafters, Labelle, FL1998 Ted Winsberg Green Cay Farms, Boynton Beach, FL1999 Larry K. Jackson Horticultural Consultant, Auburndale, FL2000 Gary E. Zill Zill High Performance Plants, Boynton Beach, FL2001 Murray J. Corman Garden of Delights, Davie, FL2002 Craig Campbell Valent Biosciences, Orlando, FL2003 Derek Burch Masterworks, Plantation, FL2004 Scott Emerson Citrus & Vegetable Magazine, Tampa, FL2005 James “Buster” Pratt Hanes City, FL2008 David J. Hall HDH Agri Products, Tavares, FL2009 Kenneth Shuler Stephen’s Produce, Jupiter, FL
Outstanding Growers or Commercial Horticulturists2010 Peter McClure Evans Properties, Okeechobee, FL2011 Michael Edenfield Bayer CropScience, Windemere, FL2012 Robert T. McMillan, Jr. Kerry’s Bromeliads Nursery Inc., Homestead, FL2013 Alvin Cheng JBT FoodTech, Lakeland, FL2014 not awarded2015 not awarded2016 Steve Rogers Ecostat Inc., Highland City, FL2017 Noris Ledsesma Fairchild Tropical Bodanic Garden, Homestead, FL2018 Erin Harlow Dubal County Extension, Jacksonville, FL2019 not awarded2020 Noris Ledesma Miami, FL
1888 Ocala1889 Orlando1890 De Land1891 Interlachen1892 Ormond Beach1893 Pensacola1894 Jacksonville1895 Jacksonville1896 Jacksonville1897 Orlando1898 Orlando1899 Jacksonville1900 Jacksonville1901 St. Augustine1902 Tampa1903 Miami1904 Jacksonville1905 Jacksonville1906 Jacksonville1907 St. Petersburg1908 Gainesville1909 Daytona1910 Orlando1911 Jacksonville1912 Miami and Havana, Cuba1913 DeLand1914 Palatka1915 Tampa1916 Arcadia1917 Arcadia1918 Ft. Myers1919 Orlando1920 Ocala
1921 Miami1922 Lakeland1923 Orlando1924 Tampa1925 Eustis1926 Cocoa Beach1927 Bradenton1928 Winter Haven1929 Clearwater1930 Sebring1931 Miami and Homestead (spring meeting) Mariana (fall meeting)1932 Gainesville1933 Lake Wales1924 Orlando1935 Vero Beach1936 DeLand1937 Ocala1939 Winter Haven1939 Hollywood1940 Tampa1941 Orlando1942 West Palm Beach1943 Winter Haven1944 Winter Haven1945 Orlando1946 Miami1947 St. Petersburg1948 West Palm Beach1949 Tampa1950 Winter Haven1951 West Palm Beach1952 St. Petersburg
1953 Daytona Beach1954 Miami Beach1955 Clearwater1956 Orlando 1957 Miami Beach1958 Clearwater1959 Miami1960 Tampa1961 Miami Beach1962 Miami Beach1963 Miami Beach1964 Miami Beach1965 Miami Beach1966 Miami Beach1967 Miami Beach1968 Miami Beach1969 Miami Beach1970 Miami Beach1971 Miami Beach1972 Miami Beach1973 Miami Beach1974 Miami Beach1975 Lake Buena Vista1976 Miami Beach1977 Lake Buena Vista1978 Miami Beach1979 Lake Buena Vista1980 Miami Beach1981 Lake Buena Vista1982 Miami Beach1983 Daytona Beach1984 Miami Beach1985 Tampa1986 Miami Beach
1987 Orlando1988 Miami Beach1989 Tampa1990 Lake Buena Vista1991 Miami Beach1992 Tampa1993 Miami Beach1994 Orlando1995 Orlando1996 Orlando1997 Orlando1998 St. Petersburg1999 Stuart2000 Lake Buena Vista2001 Stuart2002 Marco Island2003 Orlando2004 Orlando2005 Tampa2006 Tampa2007 Palm Beach Gardens2008 Ft. Lauderdale2009 Jacksonville2010 Crystal River2011 St. Petersburg2012 Delray Beach2013 Sarasota2014 Clearwater2015 St. Augustine2016 Stuart2017 Tampa2018 Fort Lauderdale2019 Maitland2020 Online via UF TEAMS
FSHS Annual Meeting Host Cities
xx Proc. Fla. State Hort. Soc. 133: 2020
2020 Florida State Horticulture Society Keynote Address
Expanding Our Plant Palette: The Role of Native and Non-invasive Cultivars
sandra B. WIlson*Department of Environmental Horticulture, University of Florida, IFAS, P.O. Box 110670,
Gainesville, FL 32611
Additional index words. invasiveness, ornamentals, propagation, variety trials
Ornamental horticulture has been recognized as the fastest growing segment of U.S. agriculture, as well as the main source of plant invasions worldwide. Florida ranks second among U.S. states in the degree of ecosystem devastation as a result of exotic invasive species. In the past two decades in Florida, tremendous advances have been made to identify and/or select non-invasive improved forms of a number of popular ornamental species such as Chinese privet (Ligustrum chinensis), fountain grass (Pennisetum setaceum), heavenly bamboo (Nandina domestica), lantana (Lantana camara), maiden silvergrass (Miscanthus sinensis), Mexican petunia (Ruellia simplex), porterweed (Stachytarpheta cayennensis), and trailing lantana (Lantana montevidensis). In addition to promoting superior, research-based, non-native cultivars or selections as viable alternatives to invasive ornamental plants, much progress has been made to identify/propagate and/or select ornamental native species that can also serve as suitable alternatives. Florida boasts abundant richness in native flora with over 3,300 native plant species, yet less than a quarter of these are in cultivation. When used cor-rectly, native plants can naturally offer desired aesthetic attributes such as color and form, while bringing biodiversity and function to sustainable landscapes and gardens. While propagation protocols are lacking for many native species with ornamental value in Florida, significant progress has been made in the propagation, production, and landscape trialing of a number of species such as sandhill milkweed (Asclepias humistrata), squareflower (Paronychia erecta), coastalplain honeycombhead (Balduina angustifolia), wireweeds (Polygonella sp.), goldenasters (Chrysopsis sp.), wild coffees (Psychotria sp.), and sweet acacia (Vachellia farnesiana), to name a few. Undeniably, opportunities exist for better consumer awareness, marketing and promotion of environmentally friendly plants that can offer similar form, flowering, fruiting, and growing requirements (sun, soil, moisture) as popular invasive exotics.
Throughout time, plant exploration and introduction have played integral roles in U.S. agriculture. While the majority of in-troduced ornamental plants do not escape cultivation, some plants spread into natural areas, develop self-sustaining populations, and subsequently disrupt function and form of natural ecosystems (van Kleunen et al., 2018). Through the U.S. Executive Order 13112, an invasive species is defined as an alien species whose introduction does or is likely to cause economic or environmental harm or harm to human health [U.S. Department of Agriculture, National Invasive Species Information Center (USDA, NISIC), 2021)]. This is a global issue with worldwide efforts underway to increase our understanding of invasion biology (Dai et al., 2020), management/control (Strgulc Krajšek et al., 2020), and risk/prevention (Bayón and Vilà, 2019; Conser et al., 2015).
Alien (exotic non-native) species are thought to comprise as much as 80% of the plant inventory held by U.S. nurseries (Hulme et al., 2018). Traits that might be economically benefi-cial to a nursery professional such as disease/pest resistance, uniform germination and plant growth, and high fertility are
traits that could also increase invasive potential (Anderson et al., 2006). The probability of plants becoming naturalized increases significantly with the number of years the plants were marketed and their ornamental value (Pemberton and Liu, 2009). Hence, unintentionally but indisputably, the ornamental horticulture industry has long been the primary source for invasive plants; and this is a targeted issue of many countries (Hulme et al., 2018; Pyšek et al., 2011; van Kleunen et al., 2018).
In the past decade, significant progress has been made by the ornamental industry to minimize the risk of invasive plant introductions. Voluntary codes of conduct have been adopted nationally by botanic gardens and the horticulture trade to help reduce the pathway of invasive plants (Heywood, 2014). Regional results of such efforts are promising; as a recent survey revealed that of the 6885 taxa grown by mid-Atlantic nurseries, only 4% were considered invasive in these respective states (Coombs et al., 2020). Simultaneously, plant breeders have been looking for and developing new cultivars with much reduced or eliminated invasive potential that can replace invasive ones (Li et al., 2004; Vining et al., 2012). These efforts are favorably supported by industry professionals, as a 2015 survey of the southeastern nurs-ery industry reported 74% of participants expressed a positive opinion of sterile cultivar research (Bechtloff et al., 2019) and a willingness to share information about alternatives to invasive species with their customers (Coats et al., 2011). Still, it can be acclaimed that attitude change alone is simply not enough to curtail landscape use of invasive ornamentals, as newly released cultivars are largely not subject to invasive screening or intro-duction fees (Barbier et al., 2013).
Funding support is greatly acknowledged from the Florida Department of Agri-culture and Consumer Services (FDACS) Specialty Crop Block Grant Program, the Florida Fish and Wildlife Conservation Commission, the Center for Applied Nursery Research, the Florida Wildflower Foundation, and the Florida Nursery Growers and Landscape Association Endowment Fund. This paper was originally presented at the 2020 meeting of the Florida State Horticultural Society*Email: [email protected]
xxiProc. Fla. State Hort. Soc. 133: 2020.
The Situation in Florida
Florida has the second largest ornamental industry in the country with total annual industry sales estimated at $10.7 billion (Hodges et al., 2016). Significant efforts have been made to accurately assess and predict the invasiveness of some exotic plant species commonly grown in Florida (Fox and Gordon, 2009). The Florida Department of Agriculture and Consumer Services (FDACS) is the only agency with regulatory authority to prevent the sale and distribution of invasive plants in the state (FDACS, Division of Plant Industry, 2021). Yet, it is often too late for effective control once a plant species makes it to a governed noxious weed list. Many of the ornamentals listed as invasive by Florida’s Exotic Pest Plant Council (FLEPPC, 2021) or University of Florida/Institute of Food and Agricultural Sciences’ (UF/IFAS’) Status Assessment on Non-native Plants in Florida’s Natural Areas (UF/IFAS Assessment, 2021) are still in commercial production as cultivated forms that differ from the wild type or resident taxon (Bechtloff et al., 2019). In Florida, if a species is designated as invasive, all cultivars fall under this classification unless proven otherwise through an internally approved UF/IFAS Infraspecific Taxon Protocol (IFTP) Evaluation. This protocol consists of 12 questions to determine 1) if the taxon displays invasive traits that cause greater ecological impact than the wild type or resident species and if it can be readily distinguished; and 2) the fecundity of the taxon and its chances of regression or hybridization to characteristics of the resident/wild type species (Lieurance, 2016). Consequently, all new ornamental cultivars (i.e., those closely related to an invasive resident taxon) proposed for release by UF breeders are subjected to this invasive screening prior to approval.
Identifying exotic non-invasive cultivars as alternatives to invasive species
Over the last two decades, UF researchers have been working to determine the invasive potential of nearly 20 ornamental spe-cies and their cultivars, including popular landscape plants such as trailing lantana (Lantana montevidensis) (Wilson et al., 2020), porterweed (Stachytarpheta cayennensis) (Qian et al., 2021; Wilson et al., 2009), butterfly bush (Buddleja davidii) (Wilson et al., 2004), Chinese privet (Ligustrum sinense) (Fetouh et al., 2020), fountain grass (Pennisetum setaceum) (Wilson and Knox, 2009), maiden silver grass (Miscanthus sinensis) (Wilson and Knox, 2006), and heavenly bamboo (Nandina domestica) (Wilson et al., 2021). In addition, as part of planned breeding programs, UF breeders have developed genetic and molecular techniques to reduce the fecundity of plants, leading to numerous sterile cultivars of Mexican petunia (Ruellia simplex) (Freyre et al., 2016) and lantana (Lantana camara) (Deng et al., 2020). As a result of these efforts, the invasive wild type forms are gradually being replaced with newer non-invasive, UF-IFAS IFTP-approved cultivars that are superior in flowering and performance. Even without planned breeding, sterility is not uncommon to find among cultivars of a number of species. To illustrate, Wilson et al. (2021) claimed nearly three-fourths of the 25 heavenly bamboo cultivars evalu-ated were non-fruiting, meriting consideration for use. In another study, porterweed selections were found to vary considerably in their chromosome number, pollen stainability, and nuclear DNA content (Qian et al., 2021), with half of the selections evaluated having high female sterility (Wilson et al., 2009).
Despite much progress in the identification of safe non-invasive alternatives, disagreement remains about the level of fecundity in cultivars that can be tolerated without posing a risk to the en-
vironment. Bufford and Daehler (2014) caution that horticultural selection for sterility (i.e., induced through transgenic techniques, through interspecific hybridization, or through chemically induced polyploidy to create triploid plants) can yield low-risk sterile cultivars of popular ornamentals provided that further hybridiza-tion or allopolyploidy does not restore fertility and vegetative spread is limited. Knight et al. (2011) question how much of a reduction in seed production or seed viability is necessary to create a cultivar that will not be invasive in natural areas; and emphasize that reduced seed production may be insufficient to eliminate the invasive potential of a species. Some examples of policy regulating the use of non-invasive cultivars do exist. For instance, the Oregon Department of Agriculture (ODA) approved seedless cultivars of a noxious weed, butterfly bush, for propaga-tion, transportation, and sale provided they produce less than 2% viable seeds (ODA, 2021). Cultivars have also been exempted at the state level. For example, FDACS exempted two cultivars of a noxious weed, Chinese privet: one variegated (‘Variegatum’) and one chartreuse (‘Sunshine’) (FDACS, 2021). Yet, concern lingers due to the ability chimeral privet cultivars to revert back to their wild type forms (Wilson et al., 2014). Other concerns have been raised about the vegetative aggression some species exhibit, such as Mexican petunia. While new non-fruiting cultivars such as ‘R10-102’ (Mayan Purple), ‘R10-105-Q54’ (Mayan Pink), and ‘R10-108’ (Mayan White) were approved for use in Florida, cautionary restrictions have been applied due to their risk of veg-etative spread (UF IFAS Assessment, 2021). Recently, Datta et al. (2020) reviewed the biological basis of sterility and methods used to generate and confirm sterile cultivars. Noteworthy, are questions they put forward when considering the risk of cultivar invasions; including, what the trait differences are between the proposed safe alternatives and corresponding invasive species, and whether these differences are spatially and temporally stable. Thus, it cannot be overstated that the processes of non-invasive cultivar development that employ forms of genetic mutation and traditional breeding are complex and warrant rigorous scrutiny and screening prior to introduction.
It seems plausible that filling the market with low to no-fruiting cultivars as alternatives to non-regulated (not listed by FDACS) invasive wild type species can help prevent further spread. However, consumer education in distinguishing between recom-mended and non-recommended cultivars is lacking. Furthermore, while significant strides have been made towards promotion of non-invasive plant use, there is little information available on what economically feasible alternatives are suitable and easy to purchase. Alternative lists for north (Knox et al., 2018a), central (Knox et al., 2018b) and south Florida (Knox et al., 2018c) are available that present native and non-native substitutes for common invasive ornamentals. However, only a limited number of sterile non-invasive cultivars have been released and they are largely unknown on a national scale. Sterile non-invasive cultivars are typically not labeled as such in retail markets, despite research that shows informed labeling may increase a consumer’s willingness to buy these plants (Yue et al., 2011).
Confusion among consumers on responsible plant selection and use is echoed by industry interest in making informed decisions on the plant inventory they offer. The voluntary or involuntary regulation of existing invasive nursery inventory is complicated. Drew et al. (2010) point out that the plant availability market is largely driven by consumers who need access to reliable infor-mation about the plants they are buying. Dehnen-Schmutz and Conroy (2018) suggest using a citizen’s science approach where
xxii Proc. Fla. State Hort. Soc. 133: 2020
gardeners are asked to report ornamental plants that are spreading and difficult to control in their landscapes. Clearly, much can be gained from scientists, consumers, and industry professionals working together to identify solutions that help decrease the spread of invasive species.
Using native plants as alternatives to ornamental invasive species
As the ornamental invasive plant issue continues to escalate, some look to natives as obvious options, to avoid the risk of exotic plant invasion. In fact, the popularity of native landscaping has surged in the last decade as more and more consumers recognize the value in sustainable gardens. Native plants have long been admired for their tolerance of a range of conditions, water-use efficiency (Antunes et al., 2018; Cavaleri and Sack, 2010), and tremendous resource value to diverse pollinators (Campbell et al., 2017; Ricker et al., 2019; Seitz et al., 2020). Studies have shown that customers are willing to pay more money for native plants compared to their non-native counterparts (Yue et al., 2011) and even a 14% price premium for pollinator friendly landscape plants (Khachatryan et al., 2017). Yet it is estimated that three fourths of native flora is not in cultivation, representing only 15.9% of total nursery sales in Florida (Hodges et al., 2016). White et al. (2018) identified a little more than 800 active native vendors selling about 26% of all US native flora. Similarly, in Florida we estimate that less than 25% of our 3,300 native plant species are in cultivation (FANN, 2021; Wunderlin et al., 2021). Thus, great opportunity exists to increase our native plant palette by evaluating whether native plants that are ornamentally attractive in their natural set-tings can adapt to our modified urban landscapes and gardens.
Major challenges for the promotion of native plants for wider landscape uses typically include: a lack of species-specific propagation protocols; necessary consumer and industry educa-tion (Kauth and Perez, 2011); and identification of native plant candidates that are not only aesthetically pleasing and ecologi-cally functional but also economically viable. To these accounts, encouraging progress has been made as reflected by new niche markets for native plants, genotype trialing and selection (Wilde et al., 2015), research-based determination of efficient and reli-able propagation by seed, cuttings, and micropropagation (Smith et al., 2014; Trigiano et al., 2018; Campbell et al., 2021), and the establishment of a central, online repository of propagation resources that includes a searchable database (RNGR, 2021).
In summary, a diverse palette of native and nonnative plant options exists as viable alternatives to ornamental invasives worldwide. As our ornamental industry continues to evolve and adapt to emerging issues to stay competitive, horticultural research, teaching and outreach will undoubtedly remain integral to advancing sustainable landscapes and gardens.
Literature Cited
Anderson, N.O., S.M. Galatowitsch, and N. Gomez. 2006. Selection strategies to reduce invasive potential in introduced plants. Euphytica 148:203–206, doi: 10.1007/s10681-006-5951-7.
Antunes, C., A.J. Pereira, P. Fernandes, M. Ramos, L. Ascensáo, O. Correia, and C. Máguas. 2018. Understanding plant drought resis-tance in a Mediterranean coastal sand dune ecosystem: Differences between native and exotic invasive species. J. Plant Ecol. 11:26-38, doi:10.1093/jpe/rtx014.
Barbier, E.B., D. Knowler, J. Gwatipedza, S.H. Reichard, and A. R. Hodges. 2013. BioScience 63:132-138, doi: https://doi.org/10.1525/bio.2013.63.2.9.
Bayón, Á. and M. Vilà. 2019. Horizon scanning to identify invasion risk of ornamental plants marketed in Spain. NeoBiota 52:47-86, doi:10.3897/neobiota.52.38113.
Bechtloff, A., C. Reinhardt Adams, S. Wilson, Z. Deng, and C. Wiese. 2019. Insights from southeastern US nursery growers guide re-search for sterile ornamental cultivars. J. Environ. Hort. 37(1):9-18, doi:10.24266/0738-2898-37.1.9.
Bufford, J.L. and C.C. Daehler. 2014. Sterility and lack of pollinator services explain reproductive failure in non-invasive ornamental plants. Diversity Distrib. 20:975-985, doi:10.1111/ddi.12224.
Campbell, G.E., C. Steppe, S.B. Wilson and M. Thetford. 2021. Effect of temperature, light and seed provenance on germination of Paronychia erecta: a native plant with ornamental potential. Native Plants J. In press.
Campbell, B., H. Khachatryan, and A. Rihn. 2017. Pollinator-friendly plants: reasons for and barriers to purchase. HortTechnology 27(6):831-839, doi:10.21273/HORTTECH03829-17.
Cavaleri, M. and L. Sack. 2010. Comparative water use of native and invasive plants global meta-analysis. Ecology. 19:2705-2715, doi: 10.2307/27860847.
Coats, V.C., L.B. Stack, and M.E. Rumpho. 2011. Maine nursery and landscape industry perspectives on invasive plant issues. Invasive Plant Sci. Mgt. 4:378-389.
Coombs, G., D. Gilchrist, and P. Watson. 2020. An assessment of the native and invasive horticultural plants sold in the mid-Atlantic region. Native Plants J. 21:75-82, doi: 10.3368/npj.21.1.74.
Conser, C., L. Seebacher, D.W. Fujino, S. Reichard, and J.M. DiTomaso. 2015. The development of a plant risk evaluation (PRE) tool for as-sessing the invasive potential of ornamental plants. PLOS One. 10(3), doi:10.1371/journal.pone.0121053.
Dai, Z.-C., L.-Y. Wan, S.-S. Qi, S. Rutherford, G.-Q. Ren, J.S.H. Wan, and D.-L. Du. 2020. Synergy among hypothesis in the invasion process of alien plants: A road map within a timeline. Per. Plant Ecol. Evol. Syst. 47, doi:10.1016/j.ppees.2020.125575.
Datta, A., S. Kumschick, S. Geerts, and J.R.U. Wilson. 2020. Identify-ing safe cultivars of invasive plants: six questions for risk assessment, management, and communication. NeoBiota 62: 81–97, doi:10.3897/neobiota.62.51635.
Dehnen-Schmutz, K. and J. Conroy. 2018. Working with gardeners to identify potential invasive ornamental garden plants: testing a citi-zen science approach. Biol. Invasions. 20:3069-3077, doi:10.1007/s10530-018-1759-3.
Deng, Z., S.B. Wilson, X. Ying, C. Chen, R. Freyre, V. Zayas, and D. Czarnecki. 2020. ‘UF-1013-1’: An infertile cultivar of Lantana camara. HortScience. 55:953-958, doi:10.21273/HORTSCI14911-20.
Drew, J., N. Anderson, and D. Andow. 2010. Conundrums of a complex vector for invasive species control: a detailed examination of the horticultural industry. Biol. Invasions. 12:2837-2851, doi: 10.1007/s10530-010-9689-8.
Fetouh, M.I., Z. Deng, S.B. Wilson, C.R. Adams, and G.W. Knox. 2020. In-duction and characterization of tetraploids in Chinese privet (Ligustrum sinense Lour.). Scientia Hort. 271, doi:10.1016/j.scienta.2020.109482.
Florida Department of Agriculture and Consumer Services Division of Plant Industry (FDACS DPI). 2021. Noxious weed list. Accessed 8 Feb. 2021. <https://www.flrules.org/>.
Florida Exotic Pest Plant Council (FLEPPC). 2021. List of invasive plant species. Florida Exotic Pest Plant Council. 2 Feb. 2021. <http://www.fleppc.org/>.
Florida Association of Native Nurseries (FANN). 2021. Growing, plant-ing and promoting Florida native plants for sustainable landscapes. 6 Feb. 2021. http://fann.org.
Fox, A.M. and D.R. Gordon. 2009. Approaches for assessing the status of nonnative plants: A comparative analysis. Invasive Plant Sci. Mgt. 2:166-184, doi:10.1614/IPSM-08-112.1.
Freyre, R., Z. Deng, G.W. Knox, S. Montalvo, and V. Zayas. 2016. Fruitless Ruellia simplex R12-2-1 (Mayan compact purple). HortScience 51(8):1057-1061.
Heywood, V. 2014. Voluntary codes of conduct for botanic gardens and horticulture and engagement with the public. Bulletin 44(2):223-
xxiiiProc. Fla. State Hort. Soc. 133: 2020.
231, doi: 10.1111/epp.12112.Hodges, A.W., H. Khachatryan, M. Rahmani, and C.D. Court. 2016.
Economic contributions of the environmental horticulture industry in Florida in 2015. University of Florida/IFAS, Food and Resource Eco-nomics Department publication. Accessed 6 Feb. 2021. <http://fred.ifas.ufl.edu/pdf/EconContEnvirHortIndFL2015-11-15-16.pdf>.
Hulme, P.E., G. Brundu, M. Carboni, K. Dehnen-Schmutz, S. Dull-inger, R. Early, F. Essl, P. Gonzalez-Moreno, Q.J. Groom, C. Kueffer, I. Kuhn, N. Maurel, A. Novoa, J. Pergl, P. Pyšek, H. Seebens, R. Tanner, J.M. Touza, M. van Kleunen, and L.N.H. Verbrugge. 2018. Integrating invasive species policies across ornamental horticulture supply-chains to prevent plant invasions. J. Appl. Ecol. 55:92-98, doi:10.1111/1365-2664.12953.
Kauth, P. J. and H.E. Pérez. 2011. Industry survey of the native wildflower market in Florida. HortTechnol. 21:779-788, doi:10.21273/HORTTECH.21.6.779.
Khachatryan, H., A.L. Rihn, B. Campbell, C. Yue, C. Hall, and B. Behe. 2017. Visual attention to eco-labels predicts consumer preferences for pollinator friendly plants. Sustainability, 9(10):1743, doi:10.3390/su9101743.
Knight, T.M., K. Havens, and P. Vitt. 2011. Will the use of less fe-cund cultivars reduce the invasiveness of perennial plants? BioScience 61:816-822, doi:10.1525/bio.2011.61.10.11.
Knox, G.W., S.B. Wilson, Z. Deng, and R. Freyre. 2018a. Alterna-tives to invasive plants commonly found in north Florida landscapes. University of Florida/IFAS Extension Publication, ENH1206. Accessed 14 Jan. 2021. <http://edis.ifas.ufl.edu/ep467>.
Knox, G.W., R. Freyre, S.B. Wilson and Z. Deng. 2018b. Alterna-tives to invasive plants commonly found in central Florida landscapes. University of Florida/IFAS Extension Publication, ENH1207. Accessed 14 Jan. 2021. <http://edis.ifas.ufl.edu/ep468>.
Knox, G.W., S.B. Wilson, Z. Deng, and R. Freyre. 2018c. Alterna-tives to invasive plants commonly found in south Florida landscapes. University of Florida/IFAS Extension Publication, ENH1222. Accessed 14 Jan. 2021. <https://edis.ifas.ufl.edu/ep483>.
Li, Y., Z. Cheng, W. Smith, D. Ellis, Y. Chen, X. Zheng, Y. Pei, K. Luo, D. Zhao, Q. Yao, H. Duan, and Q. Li. 2004. Invasive ornamental plants: Problems, challenges, and molecular tools to neutralize their invasive-ness. Crit. Rev. Plant Sci. 23:381-389, doi:10.1080/07352680490505123.
Lieurance, D. 2016. Protocols for testing the invasiveness of plants in Florida. Proc. Inter. Plant Prop. Soc. Acta Hortic. 1140:279-283, doi: 10.17660/ActaHortic.2016.1140.61.
Oregon Department of Agriculture (ODA). 2021. Butterfly bush ap-proved cultivars. 15 Jan. 2021. <https://www.oregon.gov/oda/programs/NurseryChristmasTree/Pages/ButterflyBush.aspx>.
Pemberton, R.W. and H. Liu. 2009. Marketing time predicts natural-ization of horticultural plants. Ecol. Soc. Amer. 90: 69-80.
Pyšek, P., V. Jarošik, and J. Pergl. 2011. Alien plants introduced by different pathways differ in invasive success: Unintentional introductions as a threat to natural areas. PlosOne, doi:10.1371/journal.pone.0024890.
Qian, R., S.B. Parrish, S.B. Wilson, G.W. Knox and Z. Deng. 2021. Morphological and cytological characterization of five por-terweed (Stachytarpheta) selections. HortScience, doi:10.21273/HORTSCI15594-20.
Reforestation, Nurseries, and Genetic Resources (RNGR). 2021. Propagation protocol database. 6 Feb. 2021. <https://npn.rngr.net/propagation>.
Ricker, J.G., J.D. Lubell and M.H. Brand. 2019. Comparing insect pollinator visitation for six native shrub species and their cultivars. HortScience 54:2086-2090, doi:10.21273/HORTSCI14375-19.
Seitz, N., D. vanEngelsdorp, and S.D. Leonhardt. 2020. Are native and non-native pollinator friendly plants equally valuable for native wild bee communities? 10:12838-12850, doi:10.1002/ece3.6826.
Smith, A.M., S.B. Wilson, M. Thetford, K.L. Nolan, and C. Adams. 2014. Performance of nine Florida native wildflower species grown in varying container substrates. Native Plants J. 15:75-86.Strgulc Krajšek, S., E. Bahčič, U. Čoko, and J. Dolenc Koce. 2020.
Disposal methods for selected invasive plant species used as orna-
mental garden plants. Mgt. Biol. Invasions. 11:292-305, doi:10.3391/mbi.2020.11.2.08.
Trigiano, R.N., S.B. Wilson, and C.N. Steppe. 2018. Whorled sunflower (Helianthus verticillatus)– A potential landscape plant. Comb. Proc. Intern. Plant Prop. Soc. 68:1-13.
U.S. Department of Agriculture (USDA), National Invasive Species Information Center (NISIC). 2021. Executive order 13112 definitions. 8 Jan. 2021. <https://www.invasivespeciesinfo.gov/executive-order-13112-section-1-definitions>.
University of Florida/IFAS (UF/IFAS). 2021. Assessment of nonnative plants in Florida’s natural areas. 8 Jan. 2021. <https://assessment.ifas.ufl.edu/assessments>.
van Kleunen, M., F. Essl, J. Pergl, G. Brundu, M. Carboni, S. Dullinger, R. Early, P. Gonzalez-Moreno, Q.J. Groom, P.E. Hulme, C. Kueffer, I. Kuhn, C. Maguas, N. Maurel, A. Novoa, M. Parepa, P. Pyšek, H. Seebens, R. Tanner, T. Youza, L. Verbrugge, E. Weber, W. Dawson, H. Kreft, P. Weigelt, M. Winter, G. Klonner, M.V. Talluto, and K. Dehnen-Schmutz. 2018. The changing role of ornamental horticulture in alien plant invasions. Biol. Rev. Camb. Philos. Soc. 93:1421-1437, doi: 10.1111/brv.12402.
Vining, K.J., R.N. Contreras, M. Ranik, and S.H. Strauss. 2012. Genetic methods for mitigating invasiveness of woody ornamental plants: Re-search needs and opportunities. HortScience 47:1210-1216, doi:10.21273/HORTSCI.47.9.1210.
White, A., J.B. Fant, K. Havens, M. Skinner, and A.T. Kramer. 2018. Restoring species diversity: Assessing capacity in the U.S. native plant industry. Restor. Ecol. 26(4):605-611, doi: 10.1111/rec.12705.
Wilde, H.D., K.J.K. Gandhi, and G. Colson. 2015. State of the science and challenges of breeding landscape plants with ecological function. Hort. Res. 2:14069, doi: 10.1038/hortres.2014.69.
Wilson, S.B., C. Steppe, Z. Deng, and G. Knox. 2020. Landscape performance and invasive potential of 8 Lantana montevidensis culti-vars grown in north and central Florida. HortScience. 55:1737-1743, doi:10.21273/HORTSCI15120-20.
Wilson, S.B. and G.W. Knox. 2006. Landscape performance, flowering, and seed viability of 15 japanese silver grass cultivars grown in northern and southern Florida. HortTechnology 16(4):1-8.
Wilson, S.B., G.W. Knox, K.L. Muller, R. Freyre, and Z. Deng. 2009. Seed production and viability of eight porterweed selections grown in northern and southern Florida. HortScience 44:1842-1849, doi: 10.21273/HORTSCI.44.7.1542.
Wilson, S.B. and G.W. Knox. 2009. Landscape performance of green fountain grass alternatives grown in northern and southern Florida. HortTechnology 19:471-476, doi: 10.21273/HORTSCI.19.2.471.
Wilson, S.B., M. Thetford, L.K. Mecca, J.S. Raymer, and J.A. Gersony. 2004. Evaluation of 14 butterfly bush taxa grown in western and southern Florida: II. Seed production and germination. HortTechnology 14(4):612-618, doi: 10.21273/HOTTECH.14.4.0612.
Wilson, S.B., G.W. Knox, K.L. Nolan, and J. Aldrich. 2014. Landscape performance and fruiting of 12 privet selections grown in northern and southern Florida. HortTechnology 24:148-155, https://doi.org/10.21273/HORTTECH.24.1.148.
Wilson, S.B., J. Rycnya, Z. Deng, and G. Knox. 2021. Summary of 26 Nandina domestica (heavenly bamboo) selections evaluated for invasive potential in Florida. HortTechnology In press.
Wunderlin, R.P., B.F. Hansen, A.R. Franck, and F.B. Essig. 2021. Atlas of Florida Plants. Institute for Systematic Botany, University of South Florida, Tampa. Accessed 6 Feb. 2021. <http://florida.plantatlas.usf.edu/>
Yue, C., T.M. Hurley, and N. Anderson. 2011. Do native and invasive labels affect consumer willingness to pay for plants? Evidence from experimental auctions. J. Agr. Econ. 42:195-205, doi: 10.1111/j.1574-0862.2010.00510.x.

xxiv Proc. Fla. State Hort. Soc. 133: 2020
1Proc. Fla. State Hort. Soc. 133: 2020.
Proc. Fla. State Hort. Soc. 133:1–3. 2020.
Krome Memorial Section
*Corresponding author. Email: [email protected]
Evaluation of Vigor of Four Mango Cultivars In South Florida
Noris Ledesma1* aNd Javier mediNa2
1Tropical Research and Education Center, University of Florida IFAS, 18905 SW 280th St., Homestead, FL 33031
2University of Almería, Cerretera Sacremento s/n, 04120 La Cañada de San Urbano, Almería, Spain
AdditionAl index words. ‘Angie’, ‘Mallika’, ‘Nam Doc Mai’ and ‘Esmeralda’, growth flows, stem diameter, canopy volume, dwarf mango
Mango (Mangifera indica) in South Florida is primarily grown in Miami-Dade, Lee and Palm Beach Counties. There is an increasing demand for dwarf and semi-dwarf mango cultivars in South Florida because they are more efficient and less likely to suffer wind damage. Mango tree vigor appears to be controlled by genotypes, although climate and other environmental factors can influence their growth habit. This study evaluated four mango cultivars: ‘Angie’, ‘Mallika’, ‘Nam Doc Mai’, and ‘Esmeralda’. The trial was conducted at a private mango farm in the Redland farming district of South Florida. The results are preliminary and include data for 2018 and 2019. The variables measured were height of the tree, stem or trunk diameter, canopy volume, and growth flows. Additional analysis of the xylem and phloem cells of the mango varieties were compared. The results show significant differnces in vigor of the cultivars in the study. ‘Angie’ seemed to have considerably lower vigor than the other cultivars evaluated.
The mango industry in Florida started more than 100 years ago. Today, mango is grown primarily in south Florida. In 2013, Florida’s mango acreage was principally located in Miami-Dade County with 600 acres. The remaining mango acreage is located in Lee, Palm Beach, and other counties with an appropriate climate. (Ledesma, 2015). Farms in Dade County are a mix of urban and rural locations, with sizes ranging from 1/4 of an acre to almost 30 acres. Growers’ farming experience varies greatly. Some are very experienced at growing other crops such as avocado, longan, mamey sapote, guava, etc. There are others who have no prior experience with farming. The smallest farms are usually in grower’s backyards that have been turned over to their farming efforts. The mango continues to grow in importance in the local market due to interest in the local food movement and the poor quality of imported mangos. These factors have led to an interest in new mango plantings in Miami-Dade and other Florida counties.
For small-scale specialty mango production in south Florida, growers must be actively seeking alternative markets to increase their profitability. There are increasing opportunities for mango production using innovative production systems and new cultivars that can readily be distinguished from commercially available ones and will allow for better prices and profit (Ledesma and Campbell, 2017).
Three major aspects of tree vigor control in mango are ge-netic selection, rootstock/interstock combinations, and chemical growth regulators. Publications from other regions discuss these (Rashedy et al., 2014). Additional factors contributing to mango tree vigor are grafting height, method of propagation, type of
rootstock, planting density, training and pruning, regularity of bearing, intercroping, climate and other environmental factors such as soil, water, diseases and pests, etc. This paper examens how these factors affect the ‘Angie’, ‘Mallika’, ‘Nam Doc Mai’, and ‘Esmeralda’ mango cultivars.
Methodology
This study evaluates four mango cultivars: ‘Angie’, ‘Mallika’, ‘Nam Doc Mai’, and ‘Esmeralda’. The trial used10 mature trees per cultivar with an average age of 5 years. The evaluation was conducted from March through September of 2018 and 2019.
locAtion. The study was conducted at a private mango farm in the Redland farming district of Miami-Dade County in south Florida. The orchard consists of 1.5 acres with a spacing of 4 m within rows and 6 m between rows. The experimental site consisted of a crushed oolitic limestone substrate that had been rock-plowed for several decades, but left fallow for the past 20 years. The trees are grafted on ‘Turpentine’ rootstock, and have been hand pruned every year after harvest, except for the years of evaluation, 2018 and 2019. Fertilization and disease control were minimal, using a low input of chemicals and a reliance on hand labor.
VAriAbles. Vigor is defined as a visual estimate of the syn-thetic growth summary. The variables measured to estimate vigor consider: the height of the tree, stem diameter, canopy volume (Vázquez-Valdivia et al., 2005), and growth flows (El-Khawaga and Maklad, 2013). Tree measurements were recorded, and the trees separated into different parts.
stem diAmeter. Using a graduated tape and measuring the circumference of the stem.
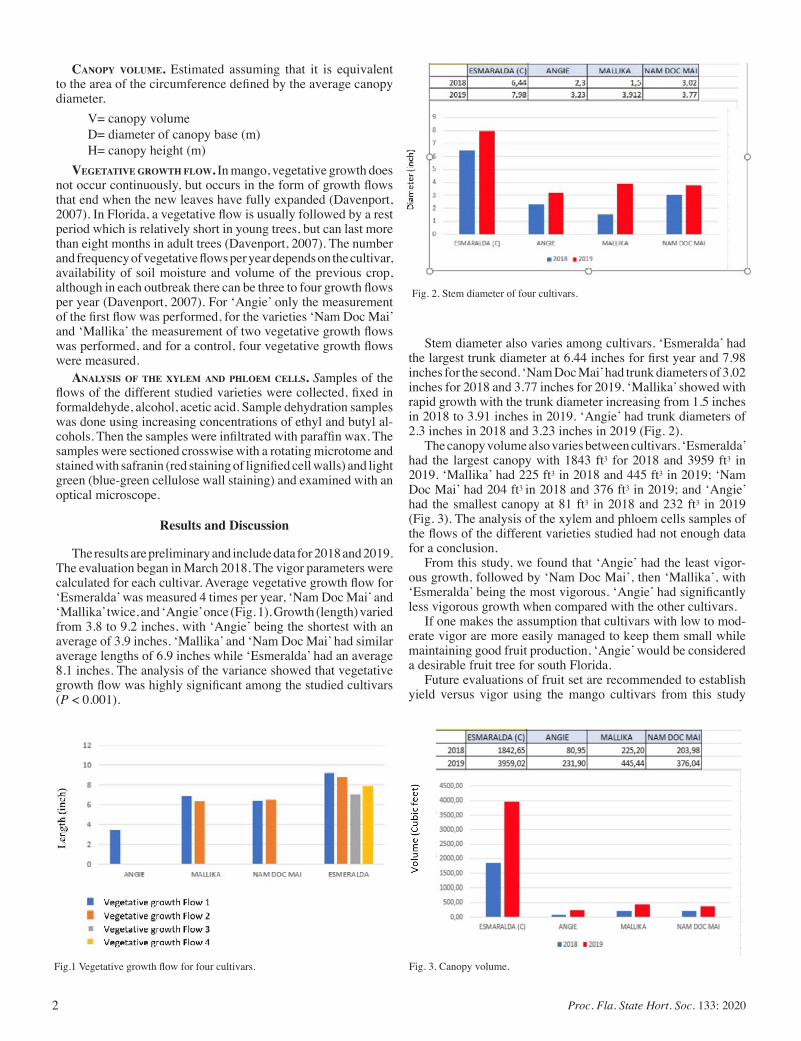
2 Proc. Fla. State Hort. Soc. 133: 2020
cAnopy Volume. Estimated assuming that it is equivalent to the area of the circumference defined by the average canopy diameter.
V= canopy volumeD= diameter of canopy base (m)H= canopy height (m)
VegetAtiVe growth flow. In mango, vegetative growth does not occur continuously, but occurs in the form of growth flows that end when the new leaves have fully expanded (Davenport, 2007). In Florida, a vegetative flow is usually followed by a rest period which is relatively short in young trees, but can last more than eight months in adult trees (Davenport, 2007). The number and frequency of vegetative flows per year depends on the cultivar, availability of soil moisture and volume of the previous crop, although in each outbreak there can be three to four growth flows per year (Davenport, 2007). For ‘Angie’ only the measurement of the first flow was performed, for the varieties ‘Nam Doc Mai’ and ‘Mallika’ the measurement of two vegetative growth flows was performed, and for a control, four vegetative growth flows were measured.
AnAlysis of the xylem And phloem cells. Samples of the flows of the different studied varieties were collected, fixed in formaldehyde, alcohol, acetic acid. Sample dehydration samples was done using increasing concentrations of ethyl and butyl al-cohols. Then the samples were infiltrated with paraffin wax. The samples were sectioned crosswise with a rotating microtome and stained with safranin (red staining of lignified cell walls) and light green (blue-green cellulose wall staining) and examined with an optical microscope.
Results and Discussion
The results are preliminary and include data for 2018 and 2019. The evaluation began in March 2018. The vigor parameters were calculated for each cultivar. Average vegetative growth flow for ‘Esmeralda’ was measured 4 times per year, ‘Nam Doc Mai’ and ‘Mallika’ twice, and ‘Angie’ once (Fig. 1). Growth (length) varied from 3.8 to 9.2 inches, with ‘Angie’ being the shortest with an average of 3.9 inches. ‘Mallika’ and ‘Nam Doc Mai’ had similar average lengths of 6.9 inches while ‘Esmeralda’ had an average 8.1 inches. The analysis of the variance showed that vegetative growth flow was highly significant among the studied cultivars (P < 0.001).
Stem diameter also varies among cultivars. ‘Esmeralda’ had the largest trunk diameter at 6.44 inches for first year and 7.98 inches for the second. ‘Nam Doc Mai’ had trunk diameters of 3.02 inches for 2018 and 3.77 inches for 2019. ‘Mallika’ showed with rapid growth with the trunk diameter increasing from 1.5 inches in 2018 to 3.91 inches in 2019. ‘Angie’ had trunk diameters of 2.3 inches in 2018 and 3.23 inches in 2019 (Fig. 2).
The canopy volume also varies between cultivars. ‘Esmeralda’ had the largest canopy with 1843 ft3 for 2018 and 3959 ft3 in 2019. ‘Mallika’ had 225 ft3 in 2018 and 445 ft3 in 2019; ‘Nam Doc Mai’ had 204 ft3 in 2018 and 376 ft3 in 2019; and ‘Angie’ had the smallest canopy at 81 ft3 in 2018 and 232 ft3 in 2019 (Fig. 3). The analysis of the xylem and phloem cells samples of the flows of the different varieties studied had not enough data for a conclusion.
From this study, we found that ‘Angie’ had the least vigor-ous growth, followed by ‘Nam Doc Mai’, then ‘Mallika’, with ‘Esmeralda’ being the most vigorous. ‘Angie’ had significantly less vigorous growth when compared with the other cultivars.
If one makes the assumption that cultivars with low to mod-erate vigor are more easily managed to keep them small while maintaining good fruit production, ‘Angie’ would be considered a desirable fruit tree for south Florida.
Future evaluations of fruit set are recommended to establish yield versus vigor using the mango cultivars from this study
Fig.1 Vegetative growth flow for four cultivars.
Fig. 2. Stem diameter of four cultivars.
Fig. 3. Canopy volume.
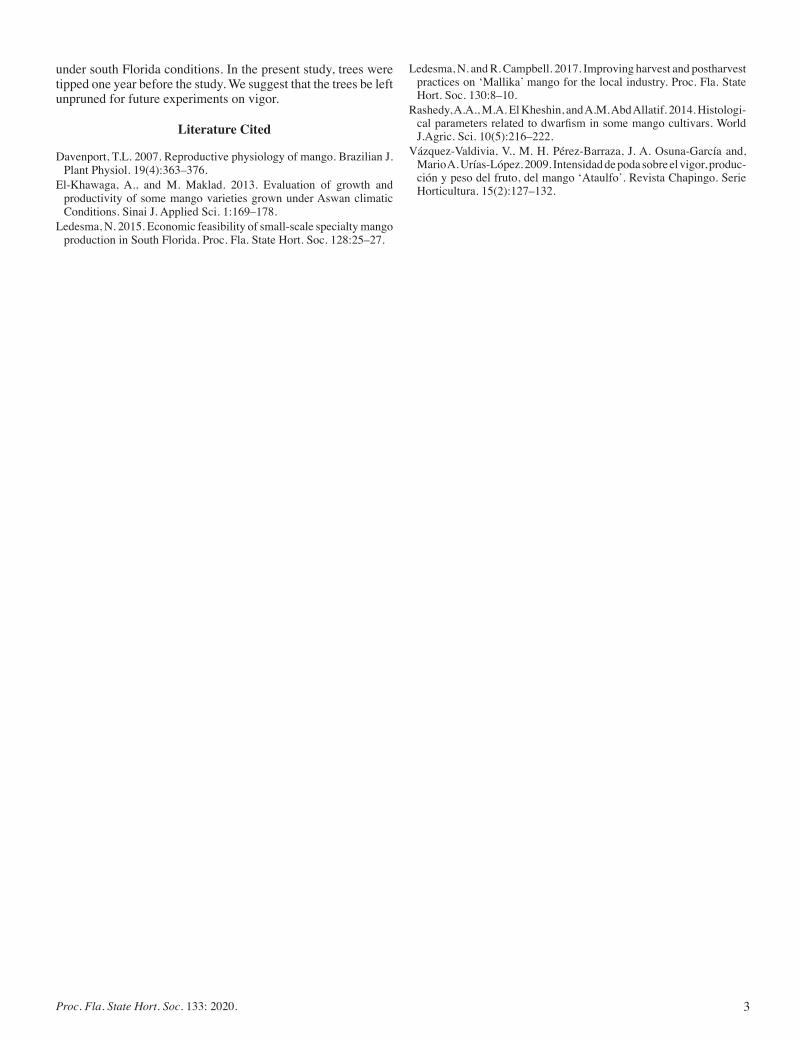
3Proc. Fla. State Hort. Soc. 133: 2020.
under south Florida conditions. In the present study, trees were tipped one year before the study. We suggest that the trees be left unpruned for future experiments on vigor.
Literature Cited
Davenport, T.L. 2007. Reproductive physiology of mango. Brazilian J. Plant Physiol. 19(4):363–376.
El-Khawaga, A., and M. Maklad. 2013. Evaluation of growth and productivity of some mango varieties grown under Aswan climatic Conditions. Sinai J. Applied Sci. 1:169–178.
Ledesma, N. 2015. Economic feasibility of small-scale specialty mango production in South Florida. Proc. Fla. State Hort. Soc. 128:25–27.
Ledesma, N. and R. Campbell. 2017. Improving harvest and postharvest practices on ‘Mallika’ mango for the local industry. Proc. Fla. State Hort. Soc. 130:8–10.
Rashedy, A.A., M.A. El Kheshin, and A.M. Abd Allatif. 2014. Histologi-cal parameters related to dwarfism in some mango cultivars. World J.Agric. Sci. 10(5):216–222.
Vázquez-Valdivia, V., M. H. Pérez-Barraza, J. A. Osuna-García and, Mario A. Urías-López. 2009. Intensidad de poda sobre el vigor, produc-ción y peso del fruto, del mango ‘Ataulfo’. Revista Chapingo. Serie Horticultura. 15(2):127–132.
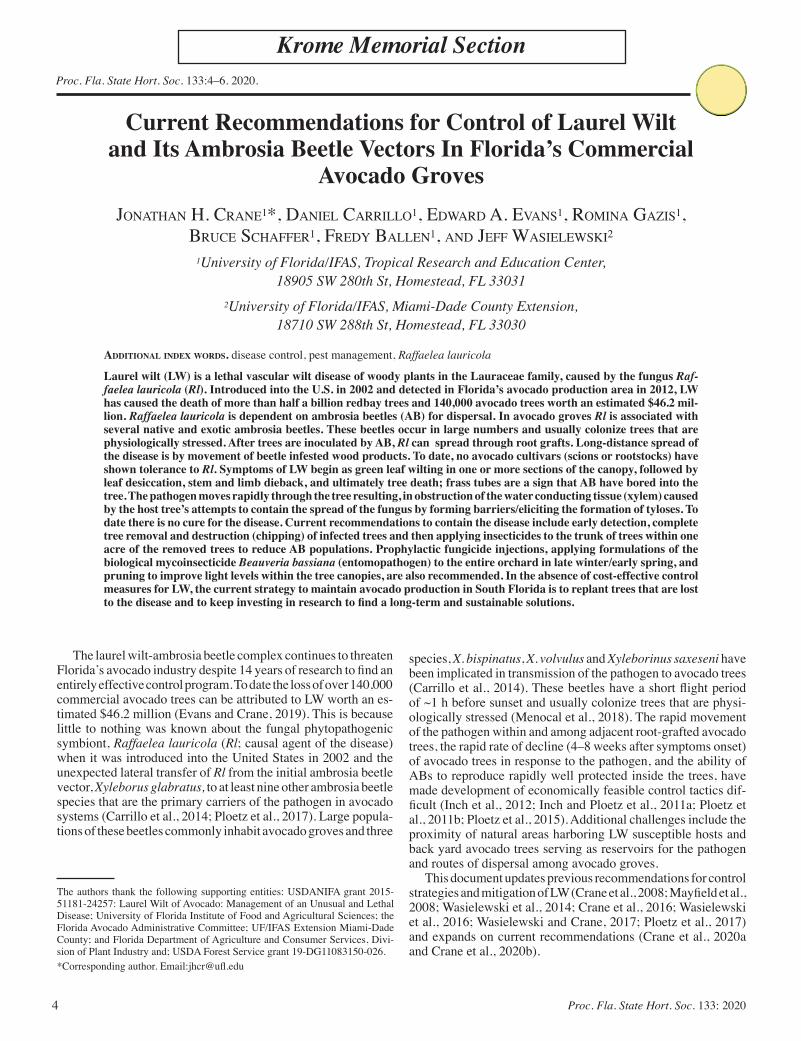
4 Proc. Fla. State Hort. Soc. 133: 2020
Proc. Fla. State Hort. Soc. 133:4–6. 2020.
Krome Memorial Section
The authors thank the following supporting entities: USDANIFA grant 2015-51181-24257: Laurel Wilt of Avocado: Management of an Unusual and Lethal Disease; University of Florida Institute of Food and Agricultural Sciences; the Florida Avocado Administrative Committee; UF/IFAS Extension Miami-Dade County; and Florida Department of Agriculture and Consumer Services, Divi-sion of Plant Industry and; USDA Forest Service grant 19-DG11083150-026.*Corresponding author. Email:[email protected]
Current Recommendations for Control of Laurel Wilt and Its Ambrosia Beetle Vectors In Florida’s Commercial
Avocado GrovesJonathan h. Crane1*, Daniel Carrillo1, eDwarD a. evans1, romina Gazis1,
BruCe sChaffer1, freDy Ballen1, anD Jeff wasielewski2
1University of Florida/IFAS, Tropical Research and Education Center, 18905 SW 280th St, Homestead, FL 33031
2University of Florida/IFAS, Miami-Dade County Extension, 18710 SW 288th St, Homestead, FL 33030
AdditionAl index words. disease control, pest management, Raffaelea lauricola
Laurel wilt (LW) is a lethal vascular wilt disease of woody plants in the Lauraceae family, caused by the fungus Raf-faelea lauricola (Rl). Introduced into the U.S. in 2002 and detected in Florida’s avocado production area in 2012, LW has caused the death of more than half a billion redbay trees and 140,000 avocado trees worth an estimated $46.2 mil-lion. Raffaelea lauricola is dependent on ambrosia beetles (AB) for dispersal. In avocado groves Rl is associated with several native and exotic ambrosia beetles. These beetles occur in large numbers and usually colonize trees that are physiologically stressed. After trees are inoculated by AB, Rl can spread through root grafts. Long-distance spread of the disease is by movement of beetle infested wood products. To date, no avocado cultivars (scions or rootstocks) have shown tolerance to Rl. Symptoms of LW begin as green leaf wilting in one or more sections of the canopy, followed by leaf desiccation, stem and limb dieback, and ultimately tree death; frass tubes are a sign that AB have bored into the tree. The pathogen moves rapidly through the tree resulting, in obstruction of the water conducting tissue (xylem) caused by the host tree’s attempts to contain the spread of the fungus by forming barriers/eliciting the formation of tyloses. To date there is no cure for the disease. Current recommendations to contain the disease include early detection, complete tree removal and destruction (chipping) of infected trees and then applying insecticides to the trunk of trees within one acre of the removed trees to reduce AB populations. Prophylactic fungicide injections, applying formulations of the biological mycoinsecticide Beauveria bassiana (entomopathogen) to the entire orchard in late winter/early spring, and pruning to improve light levels within the tree canopies, are also recommended. In the absence of cost-effective control measures for LW, the current strategy to maintain avocado production in South Florida is to replant trees that are lost to the disease and to keep investing in research to find a long-term and sustainable solutions.
The laurel wilt-ambrosia beetle complex continues to threaten Florida’s avocado industry despite 14 years of research to find an entirely effective control program. To date the loss of over 140,000 commercial avocado trees can be attributed to LW worth an es-timated $46.2 million (Evans and Crane, 2019). This is because little to nothing was known about the fungal phytopathogenic symbiont, Raffaelea lauricola (Rl; causal agent of the disease) when it was introduced into the United States in 2002 and the unexpected lateral transfer of Rl from the initial ambrosia beetle vector, Xyleborus glabratus, to at least nine other ambrosia beetle species that are the primary carriers of the pathogen in avocado systems (Carrillo et al., 2014; Ploetz et al., 2017). Large popula-tions of these beetles commonly inhabit avocado groves and three
species, X. bispinatus, X. volvulus and Xyleborinus saxeseni have been implicated in transmission of the pathogen to avocado trees (Carrillo et al., 2014). These beetles have a short flight period of ~1 h before sunset and usually colonize trees that are physi-ologically stressed (Menocal et al., 2018). The rapid movement of the pathogen within and among adjacent root-grafted avocado trees, the rapid rate of decline (4–8 weeks after symptoms onset) of avocado trees in response to the pathogen, and the ability of ABs to reproduce rapidly well protected inside the trees, have made development of economically feasible control tactics dif-ficult (Inch et al., 2012; Inch and Ploetz et al., 2011a; Ploetz et al., 2011b; Ploetz et al., 2015). Additional challenges include the proximity of natural areas harboring LW susceptible hosts and back yard avocado trees serving as reservoirs for the pathogen and routes of dispersal among avocado groves.
This document updates previous recommendations for control strategies and mitigation of LW (Crane et al., 2008; Mayfield et al., 2008; Wasielewski et al., 2014; Crane et al., 2016; Wasielewski et al., 2016; Wasielewski and Crane, 2017; Ploetz et al., 2017) and expands on current recommendations (Crane et al., 2020a and Crane et al., 2020b).
5Proc. Fla. State Hort. Soc. 133: 2020.
Current research findings related to control strategiesThe LW pathogen is highly virulent and moves through the
xylem rapidly within avocado trees and among mature root-grafted avocado trees. As few as 39 CFU (colony forming units) can induce symptoms of LW and the eventual death of mature avocado trees.
Prophylactic injection of propiconazole (Tilt®) every 12 to 24 months appears to be effective in protecting avocado trees from developing symptoms of LW. However, the time from injection to systemic coverage within a tree takes seven to eight months.
Ambrosia beetles implicated in Rl transmission are present year-round and their flight activity increases during late win-ter–early spring.
Groves with higher light levels have significantly reduced AB abundance compared to groves allowed to form dense canopy resulting in shaded conditions. Pruning (hedging, topping or se-lective pruning) to maintain higher canopy and grove light levels, re-establishing tree canopies (rejuvenating old non-productive trees) with severe pruning (e.g., hat-racking or stumping trees to four ft) and top-working large trees increase grove light levels and suppress AB activity.
Current control recommendationsPromote and maintain healthy trees through proper fertilizer,
irrigation, and pest management. Poorly maintained and environ-mentally stressed trees (e.g., affected by drought, flood, drought, other diseases, wind/storm damage and/or freeze exposure) are attractive to AB and increase their chances of being colonized by AB carrying Rl.
Scout groves to detect trees with early LW symptoms such as green-leaf wilting. The earlier infected trees are removed and destroyed, the more likely the disease outbreak may be contained. When trees are showing symptoms associated to later stages of disease progress (i.e., large segments of the canopy with desic-cated foliage), the LW pathogen has probably already moved through root grafts to adjacent health trees.
Rogue (uproot and chip/shred) LW-affected trees immedi-ately upon detection. Severing the root system of adjacent trees is the most important step to limiting the spread of the pathogen to adjacent root grafted trees. In addition, rogueing helps to reduce AB populations by destroying the galleries where they reproduce. Spray the chipped or shredded wood twice with a contact insecticide. Insecticides registered for use on avocado include Malathion, Danitol®, Agri-Mek®SC, Talstar®S, Hero® (nonbearing trees only), Botanigard®, and Mycotrol® (Beauveria bassiana).
Two trunk and lower limb directed contact insecticide applica-tions (fifteen days apart) should be made to protect healthy trees within a one-acre area of rogued LW-affected tree(s).
During late winter–early spring, when AB populations and activity increase, apply two grove-wide applications of the mycoinsecticides BotaniGard®ES or Mycotrol® (Beauveria bassiana) to suppress AB populations.
Productive groves with the lower canopy intact should be pruned annually to maintain canopy light levels and produc-tion. Groves with overgrown trees that have lost their lower canopy should be rejuvenated, i.e., cut back to four to eight feet to re-establish the lower canopy and then maintained at a height no higher than two-thirds the distance between rows. The re-established productive canopy of top-worked trees grafted to alternative cultivars should also be pruned to maintain the new productive lower canopy through regular pruning.
Consider, injecting non-LW affected groves prophylactically with propiconazole (Tilt®). If this is not possible, rogue LW-symptomatic trees and inject all remaining healthy appearing trees. Some loss of these trees may be expected due to the spread of the pathogen prior to injection. When additional avocado trees show LW symptoms, remove them as soon as possible. Injected trees will need to be reinjected on at 12 to 24-month interval depending upon pest pressure.
Current mitigation recommendationsReplant avocado trees lost to LW to establish future fruit
production and maintain economic viability (Evans et al., 2010; Mosquera et al., 2015). Movement of the LW pathogen by tree-to-tree root grafting is not an issue in young trees because: it takes many years for root grafts to form; young trees are not a preferred host of AB; and the high light exposure of the area around these trees suppresses AB activity.
On-going and future researchThe research into the biology and strategies to control and
mitigate the LW epidemic continue. Control tactics that show promise include:
• Underlying biotic and abiotic factors that cause physi-ological stress on avocado trees making them attractive to ambrosia beetles,
• Push-pull (trap-kill) systems to repel, attract and kill AB, • Understanding the microbiome of AB and how they may
be manipulated to suppress AB populations, • Cross protection of avocado trees with nonpathogenic
species of Rl or other less virulent vascular fungi or non-viable Rl,
• Search for, document, and monitor healthy productive avocado trees that are positive to Rl to better understand how they are surviving the pathogen infection,
• Understanding the physiology scion-rootstock relationship and responses to Rl, and
• Understanding the molecular basis for disease development and how it may be manipulated to provide avocado trees tolerance to the pathogen.
Conclusion
The laurel wilt disease complex has posed the most significant challenge to avocado production in the western hemisphere. Understanding the biology of the pathogen and its vectors is in progress with the aim of providing new strategies for avocado producers to control and/or mitigate the effects of this devastat-ing epidemic.
Literature Cited
Carrillo, D., R.E. Duncan, and J.E. Peña. 2012. Ambrosia beetles (Co-leoptera: Curculionidae: Scolytinae) that breed in avocado wood in Florida. The Fla. Entomologist 95:573–579.
Carrillo, D., R.E. Duncan, J.N. Ploetz, A.F. Campbell, R.C. Ploetz, and J.E. Peña. 2014. Lateral transfer of a phytopathogenic pathogenic symbiont among native and exotic ambrosia beetles. Plant Pathology 63:54-62.
Crane, J.H., J. Peña, and J.L. Osborne. 2008. Redbay ambrosia beetle-laurel wilt fungus: a potential major problem for Florida avocados. Horticultural Sciences Department, University of Florida/IFAS Exten-sion. <https://journals.flvc.org/edis/article/view/119075> Accessed: 4 May 2020.
Crane, J.H., D. Carrillo, E.A. Evans, R. Gazis, B. Schaffer, F. Ballen and

6 Proc. Fla. State Hort. Soc. 133: 2020
J. Wasielewski. 2020a. Recommendations for control and mitigation of laurel wilt and ambrosia beetle vectors in commercial avocado groves in Florida. Horticultural Sciences Department, University of Florida/IFAS Extension. <https://edis.ufl.edu/hs1360> Accessed: 4 May 2020.
Crane, J.H., D. Carrillo, E.A. Evans, R. Gazis, B. Schaffer, F. Ballen, and J. Wasielewski. 2020b. Recommendations for control and mitiga-tion of laurel wilt and ambrosia beetle vectors in commercial avocado groves. Horticultural Sciences Department, University of Florida/IFAS Extension. <https://edis.ifas.ufl.edu/hs1360> Accessed: 4 May 2020.
Crane, J., R. Ploetz, D. Carrillo, E. Evans, J. Wasielewski, and D. Py-bas. 2016. Current management recommendations for laurel wilt of avocados. Proc. Fla. State Hort. Soc. 129:4–10.
Evans, E.A. and J.H. Crane. 2019. Estimates of the replacement costs of commercial and backyard avocado trees in south Florida. Food and Resource Economics Department, University of Florida/IFAS Extension. <https://edis.ifas.ufl.edu/fe825> Accessed: 4 May 2020.
Evans, E. A., J. Crane, A. Hodges, and J. L. Osborne. 2010. Potential economic impact of laurel wilt disease on the Florida avocado industry. HortTechnology 20:234–238.
Inch, S.A. and R.C. Ploetz. 2011. Impact of laurel wilt, caused by Raf-faelea lauricola, on xylem function in avocado, Persea americana. Forest Pathol. https://doi.org/10.1111/j.1439-0329.2011.00749.x
Inch, S., R. Ploetz, B. Held, and R. Blanchette. 2012. Histological and anatomical responses in avocado, Persea americana, induced by the vascular wilt pathogen, Raffaelea lauricola. Botany 90:627–635.
Mayfield III, A.E., J.H. Crane, and J.A. Smith. 2008. Laurel wilt: A threat to redbay, avocado and related trees in urban and rural landscapes. Horticultural Sciences Department, University of Florida/IFAS Exten-sion, Gainesville, FL.
Menocal O., P.E. Kendra, W.S. Montgomery, J.H. Crane, and D. Carrillo. 2018. Vertical distribution and daily flight periodicity of ambrosia beetles (Coleoptera: Curculionidae) in Florida avocado orchards affected by
laurel wilt. J. Economic Entomol. 11(3):1190–1196.Mosquera, M., E. A. Edwards, and R. Ploetz. 2015. Assessing the profit-
ability of avocado production in south Florida in the presence of laurel wilt. Theoretical Economics Letters 5: 343–356.
Ploetz, R.C., J.M. Pérez-Martínez, E.A. Evans and S.A. Inch. 2011a. Toward fungicidal management of laurel wilt of avocado. Plant Dis-ease 95:977–982.
Ploetz, R.C., J.M. Pérez-Martínez, J.A. Smith, M. Hughes, T.J. Dreaden, S.A. Inch, and Y. Fu. 2011b. Responses of avocado to laurel wilt, caused by Raffaelea lauricola. Plant Pathol. https://doi.org/10.1111/j.1365-3059.2011.02564.x
Ploetz, R.C., B. Schaffer, A.I. Vargas, J.L. Konkol, J. Salvateirra, and R. Wideman. 2015. Impact of laurel wilt, caused by Raffaelea lauricola, on leaf gas exchange and xylem sap flow in avocado, Persea americana. Phytopathology 105:433-440.
Ploetz, R.C., J.L. Konkol, J.M. Pérez-Martínez and R. Fernandez. 2017. Management of laurel wilt of avocado, caused by Raffaelea lauricola. Eur. J. Plant Pathol.149:133–143. https://doi.org/10.1007/s10658-017-1173-1
Ploetz, R.C., J.L. Konkol, T. Narvaez, R.E. Duncan, R.J. Saucedo, A. Campbell, J. Mantilla, D. Carrillo, and P.E. Kendra. 2017. Presence and prevalence of Raffaelea lauricola, cause of laurel wilt, in different species of ambrosia beetle in Florida, USA. J. Econ. Ent. 110:347–354.0
Wasielewski, J. and J. Crane. 2017. Suppressing laurel wilt through collaboration and education. Proc. Fla. State Hort. Soc. 130:24–26.
Wasielewski, J., J.H. Crane, and D. Carrillo. 2016. Laurel wilt – an update on the disease’s impact on South Florida’s avocado industry. Proc. Fla. State Hort. Soc. 129:1–3.
Wasielewski, J., J.H. Crane, and D. Pybas. 2014. Laurel wilt in avoca-dos—History, current strategies, and a look to the future. Proc. Fla. State Hort. Soc. 127:3–5.
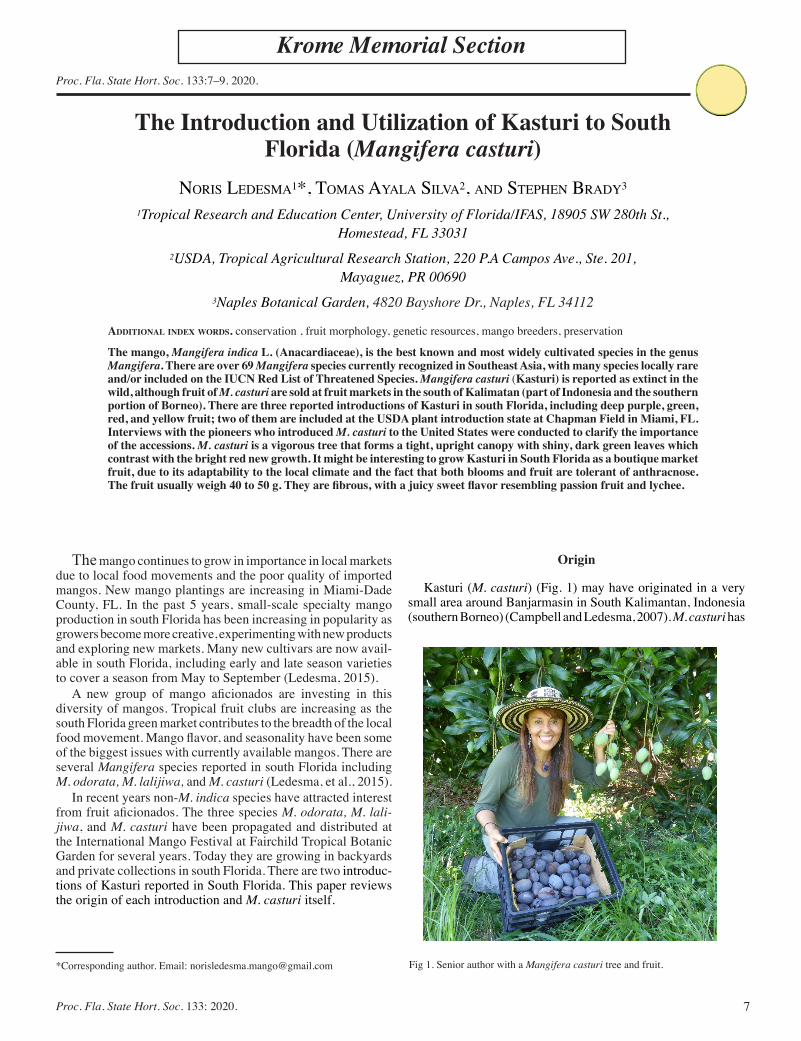
7Proc. Fla. State Hort. Soc. 133: 2020.
Proc. Fla. State Hort. Soc. 133:7–9. 2020.
Krome Memorial Section
*Corresponding author. Email: [email protected]
The Introduction and Utilization of Kasturi to South Florida (Mangifera casturi)
Noris Ledesma1*, Tomas ayaLa siLva2, aNd sTepheN Brady3
1Tropical Research and Education Center, University of Florida/IFAS, 18905 SW 280th St., Homestead, FL 33031
2USDA, Tropical Agricultural Research Station, 220 P.A Campos Ave., Ste. 201, Mayaguez, PR 00690
3Naples Botanical Garden, 4820 Bayshore Dr., Naples, FL 34112
AdditionAl index words. conservation , fruit morphology, genetic resources, mango breeders, preservation
The mango, Mangifera indica L. (Anacardiaceae), is the best known and most widely cultivated species in the genus Mangifera. There are over 69 Mangifera species currently recognized in Southeast Asia, with many species locally rare and/or included on the IUCN Red List of Threatened Species. Mangifera casturi (Kasturi) is reported as extinct in the wild, although fruit of M. casturi are sold at fruit markets in the south of Kalimatan (part of Indonesia and the southern portion of Borneo). There are three reported introductions of Kasturi in south Florida, including deep purple, green, red, and yellow fruit; two of them are included at the USDA plant introduction state at Chapman Field in Miami, FL. Interviews with the pioneers who introduced M. casturi to the United States were conducted to clarify the importance of the accessions. M. casturi is a vigorous tree that forms a tight, upright canopy with shiny, dark green leaves which contrast with the bright red new growth. It might be interesting to grow Kasturi in South Florida as a boutique market fruit, due to its adaptability to the local climate and the fact that both blooms and fruit are tolerant of anthracnose. The fruit usually weigh 40 to 50 g. They are fibrous, with a juicy sweet flavor resembling passion fruit and lychee.
The mango continues to grow in importance in local markets due to local food movements and the poor quality of imported mangos. New mango plantings are increasing in Miami-Dade County, FL. In the past 5 years, small-scale specialty mango production in south Florida has been increasing in popularity as growers become more creative, experimenting with new products and exploring new markets. Many new cultivars are now avail-able in south Florida, including early and late season varieties to cover a season from May to September (Ledesma, 2015).
A new group of mango aficionados are investing in this diversity of mangos. Tropical fruit clubs are increasing as the south Florida green market contributes to the breadth of the local food movement. Mango flavor, and seasonality have been some of the biggest issues with currently available mangos. There are several Mangifera species reported in south Florida including M. odorata, M. lalijiwa, and M. casturi (Ledesma, et al., 2015).
In recent years non-M. indica species have attracted interest from fruit aficionados. The three species M. odorata, M. lali-jiwa, and M. casturi have been propagated and distributed at the International Mango Festival at Fairchild Tropical Botanic Garden for several years. Today they are growing in backyards and private collections in south Florida. There are two introduc-tions of Kasturi reported in South Florida. This paper reviews the origin of each introduction and M. casturi itself.
Origin
Kasturi (M. casturi) (Fig. 1) may have originated in a very small area around Banjarmasin in South Kalimantan, Indonesia (southern Borneo) (Campbell and Ledesma, 2007). M. casturi has
Fig 1. Senior author with a Mangifera casturi tree and fruit.
8 Proc. Fla. State Hort. Soc. 133: 2020
been reported as extinct in the wild, although fruit of M. casturi are grown and sold at fruit markets in South Kalimatan. In the Americas, M. casturi has been reported in private collections and Botanical gardens in Guatemala, Peru, Brazil, Hawaii, Puerto Rico, and Florida. Three introductions of Kasturi have been reported in south Florida. Interviews with the pioneers than introduced M. casturi to the United States were conducted to clarify the timing of the accessions.
One Florida introduction was from Hawaii by Frankie’s Nursery located in Waimanalo, HI. The tree was collected from Banjarmasin, Borneo, southern Kalimantan, Indonesia (Frankie Sekiya, personal communication, 2020). This tree was propagated by Zill’s Nursery in Boynton Beach, FL. and donated to the Fair-child Tropical Botanic Garden (FTBG) Fruit Collection. FTNG made two trees from their original one. They were donated to the USDA collection at Chapman Field in Mar. 2001 as Accession number MIA 36626 (Purple) and in 2003 with accession number MIA 36625 98-2186. Both accessions are listed in the Genetic Resources Information Network (GRIN) database system. The two trees were clonally propagated from same original accession but show differences in productivity and size, perhaps due to being grafted onto different rootstocks. MIA 36626 (Purple), is reported as being a more productive tree than MIA 36625 98-2186, the Green with inferior in quality. The fruit weigh an average of 105 g have a dark green non-waxy skin when immature which turns purple-black with yellowish lenticels at maturity ( Ayala et al., 2013).
A second introduction was made by Vivian Murray of Treehouse Nursery formerly in Bokeelia, FL. She brought in budwood of Mangifera casturi from the Botanical Ark in Australia (Stephen Brady, personal communication, 2020). The tree was propagated by Stephen Brady and donated to the Naples Botanical Garden and Fairchild Tropical Botanic Garden. Both gardens still have this accession in their collection. It is a vigorous tree that forms a tight, upright canopy with shiny, dark green leaves which contrast with the bright red new growth. The fruit are usually 40–50 g. They are fibrous, with a juicy sweet flavor resembling passion fruit and lychee. The skin is thick and deep purple with few yel-lowish lenticels. DNA evaluations are underway to determine the differences between the accessions.
Horticultural Remarks
ProPAgAtion. M. casturi has been of use for propagation as an interstock to graft other species of Mangifera, including M. griffithii, M. lalajiwa, and M. merillii ( Campbell and Ledesma, 2007) on M. indica. M. casturi, has been grafted successfully on ‘Turpentine’ rootstock and trees have been grown in the field for 14 years and have been shown to be a good rootstock/interstock combination for other species (Campbell and Ledesma, 2013). Mangifera casturi is compatible with M. indica ‘Turpentine, and Mangifera rubrapetala rootstocks and vice versa. Preliminary observations show that Kasturi rootstocks under Mangifera rubrapetala generate dwarf trees, which are more precocious than trees propagated using M. indica ‘Turpentine’ rootstock. Kasturi has been growing in Guatemala for over 15 years from seeds. They start to bear fruit in four or five years. They are consistently productive every year. Kasturi has polyembryonic seeds. For better germination it is that the husk-like seed coat be removed. Then the bare seeds should be soaked at a temperature of around 30–35 °C for about 6 hours. After soaking, the seeds should be sown in soil or a potting mix (light, sandy soil). Seeds
sprout within 1–3 weeks. Young seedlings should be kept in a moderately sunny situation with around 60% of full sunlight.
Breeding. Kasturi has been used in breeding to improve mangos and produce new hybrids with reduced susceptibility to disease which will naturally flower in the tropics with no induction and produce good quality marketable fruit ( Ledesma, et al., 2015).
tree size And fruit Production. An M. casturi tree can be a large tree reaching up to 20 m high, with a trunk diameter of 100 cm and a dense and spreading canopy ( Campbell, 2016; Ledesma and Campbell, 2014). Compared to M. indica, Kasturi is adapted to high humidity and wet soils. For planting, soils should be made as fertile as possible. Young trees benefit from mulching. Such amendments improve water-holding capacity, nutrient retention and availability, and soil structure (Fig. 1).
Low humidity is detrimental to the health of young trees. Fer-tilization is best done as three applications per year of an 8–3–9 or other fruit tree formulation in March, July, and September.
Kasturi trees will form a stately, dense and rounded canopy without proper pruning. Horticultural management is necessary to maintain small, healthy and productive trees. With annual pruning the tree is easily maintained at a height and spread of 6.5 to 2–3 ft, respectively. Pruning should be done once per year following harvest of the main crop, or towards the end of the growing season.
Trees grown in Florida have been reported not to flower con-sistently (Ayala et al., 2013). However, Kasturi trees grafted on M. rubrapetala have been observed consistently producing fruit for the past five years. These trees are considerably smaller and easer to control.
Kasturi is early season and have a fruiting duration of about 30–45 d with maturation dates ranging from mid-May to June(Ayala et al., 2013).
diseAse resistAnce. Kasturi has been reported as resistant to the attack of the oriental fruit fly, Bactrocera dorsalis (Diptera: Tephritidae) (McQuate et al., 2017). M. casturi blooms and fruit are tolerant of anthracnose but can be susceptible to powdery mildew, a problem commonly found in many M. indica cultivars (Ledesma et al., 2018).
Utilization
Kasturi has been popular and held in high regard across Indonesia, Myanmar, and Thailand. Traditionally the fruits are grown from seeds and consumed locally (Campbell and Ledesma, 2007). More recently, trees have been cultivated by locals in their backyards or on small farms in south Florida as a curiosity. Fruit is occasionally offered by local vendors and has been gaining popularity over the past few years.
The tree is handsome, with a charming dense canopy with deep green shiny leaves and can be used as a ornamental. The inflorescensce are up to 30 cm long, multiflowered and smell like jasmine and are visited by honeybees (Ledesma, et al., 2018). Of course, one of the best features of this beautiful tree is the fruit. The fruit is a beautiful and unique with a deep purple skin coated with heavy wax that looks blue after harvest. The fruits can be picked up off the ground and allowed to finish ripening indoors. The flesh is sweet with a perfect balance of acidity and sweetness. Kasturi has overtones of passion fruit and lychee. It has some fiber and the fruit are small, nevertheless it is a novelty as a mango which is resistant to anthracnose allowing it to be grown without pesticides.
9Proc. Fla. State Hort. Soc. 133: 2020.
There are reports that the methanolic extract of Mangifera casturi fruit have high antioxidant activity with terpenoid and phe-nolic compounds, with possible applications as anti-inflammatory supplements (Fakhrudin et al., 2013). Studies also report than the pulp of M. casturi has a higher nutritional quality in terms of vi-tamins and minerals than Mangifera indica (Barbosa et al.,2017).
Literature Cited
Ayala Silva, T., H. Gubbuk, and C. Urbina. 2013. Physico-chemical evaluation of ‘Casturi’ mango. Proc. Fla. State Hort. Soc. 126:17–20.
Barbosa Gamez, I., K.C. Montoya, N. Ledesma, S.G. Sáyago Ayerdi, M. de Lourdes García Magaña, E.J.B. vonWettberg, and E. Montalvo-González. 2017. Changes in the nutritional quality of five Mangifera species harvested at two maturity stages. J. Sci. Food and Agric. 97. 10.1002/jsfa.8377.
Campbell, R., and N. Ledesma. 2007. Finding a suitable interstock for wild mangos. 2007. Proc. Fla. State Hort. Soc. 120:15-16.
Campbell, R. 2016. Kastooree (Mangifera casturi) as a graft inter finding a suitable interstock for three Mangifera species from tropical Asia. Proc. Fla. State Hort. Soc. Vol 129:17–18.
Campbell, R., and N. Ledesma. 2013. Update on new Mangifera species in Florida USA. Acta Hortic. 992:95–98.
Fakhrudin, N., P.S. Putri, S. Sutomo, and S. Wahyuono. 2013. Anti-inflammatory activity of methanolic extract of Mangifera casturi in thioglycollate-induced leukocyte migration on mice. Trad. Med. J. 18(3):151–156.
Ledesma, N. 2015. Economic feasibility of small-scale specialty mango production in south Florida. Fla. State Hort. Soc. 128:25–27.
Ledesma, N., R.J. Campbell. 2014. Conservation and commercial development of Mangifera species (wild mangos). Proc. Fla. State Hort. Soc. 127:10–13.
Ledesma, N., R.J. Campbell, M. Hass, and T.B. Campbell. 2015. Inter-specific hybrids between Mangifera indica and related species, Acta Hortic. 1183:83–88.
Ledesma, N., F.D. Algarin Rovira, and F. Segundo Varela. 2018. Mor-phology characterization of inflorescences and flowers of 200 mango varieties (Mangifera indica L.) Proc. Fla. State Hort. Soc. 129:49–51.
McQuate, G.T. C.D. Sylva, and N.J. Liquido. 2017. Natural field infesta-tion of Mangifera casturi and Mangifera lalijiwa by oriental fruit fly, Bactrocera dorsalis (Diptera: Tephritidae. Intl. J. Insect Science. 9:1–7.
10 Proc. Fla. State Hort. Soc. 133: 2020
Proc. Fla. State Hort. Soc. 133:10–11. 2020.
Krome Memorial Section
*Corresponding author. Email: [email protected]
‘Jumbo Kesar’ Mango for South FloridaNoris Ledesma1* aNd Bhaskar savaNi2
1Tropical Research and Education Center, University of Florida/IFAS, 18905 SW 280th St, Homestead, FL 33031
2Savani Farms, 401 Commerce Dr. #108, Fort Washington, PA 19034
AdditionAl index words. estate agriculture, home garden, Indian mangos, mango cultivars
The air-shipment of mangos from India to the United States during the last 3 seasons has increased interest in the production of Indian mango cultivars in south Florida. ‘Jumbo Kesar’ is originally from India. The original tree was a descendant of the ‘Kesar’ mango grown at Dedakyali, a village near the town of Gir, Gujarat state. It was introduced in south Florida in 2008. Since that time, trees and fruit have been evaluated. The tree seems to be adapted to home garden and estate agriculture in south Florida. It has better productivity than other Indian cultivars when grown in south Florida as well as better disease resistance and overall fruit quality. The average fruit weighs 550 g and is greenish yellow with a red blush (when exposed to the sun). The flesh hass a deep yellow almost saffron color, is firm and juicy with a complex coconut flavor. The tree is medium sized and manageable with annual pruning. Size can be maintained at or below six feet while maintaining consistent production. The tree and fruit are somewhat tolerant to wet conditions, although fruit quality suffers when the monsoon comes early. The author recommends making larger test plantings of ‘Jumbo Kesar’ to further evaluate its suitability in south Florida.
Mangos have been cultivated in India since ancient times and are an important part of the Indian culture and economy. India exports nearly 30 varieties of mangos. Important export cultivars include ‘Totapuri’, ‘Alphonso’, ‘Dashehri’, and ‘Kesar’. Mangos have been exported from India to the United States since an irradiation treatment was approved in 2002. Since then, air-shipments of mangos from India to the United States have led to an increased interest in the production of Indian mango cultivars in south Florida. Attractive per-box prices and quality issues associated with the long-distance transport and the neces-sary postharvest treatment of the imported product have made the production of these cultivars in the Western Hemisphere an opportunity for growers (Campbell and Ledesma, 2013).
There is little reliable information regarding the most suitable locations for the commercial production of Indian mangos in south Florida as they are notorious for their horticultural challenges here. Indian cultivars have been introduced to south Florida over the decades with little success. There is some experience with ‘Kesar’ mango grown by local farmers in south Florida, but low productivity and large tree size have caused problems. The objective of this paper is to discuss ‘Jumbo Kesar’ as a candidate cultivar for south Florida, based on observations of ‘Jumbo Kesar’ trees grown in a local commercial orchard. The trees have been under evaluation for fruit and flower characteristics since they were planted in 2008. The authors recommend further evaluations with more details for growth management and productivity of ‘Jumbo Kesar’ in south Florida.
‘Jumbo KesAr’ in south FloridA. The observations were recorded for 5 years in a commercial orchard in south Florida, using 20 trees grafted on ‘Turpentine’ rootstock. The trees are
now 6 years old. Additional evaluations of fruit and flower mor-phology were conducted at the Fairchild Farm mango collection in Homestead, FL.
Origin
‘Jumbo Kesar’ is a seedling of ‘Kesar’mango originally grown in Dedakyali village, Gujarat State. Madhavray Savani, a mango farmer from Mota Bhamodra village, started propagating the tree inspired by the improved size of the fruit. The ‘Jumbo Kesar’ started gaining popularity in the region, and many farm-ers started growing it. Today the Savani’s family has established the Gir Nature Trust, promoting sustainable farming and helping local farmers create a mango corridor using mangos including ‘Jumbo Kesar’ for wildlife migration. The tree was cloned and established at the living collection of Reliance Industries located at Jamnagar, Gujarat, and from there it was introduced to south Florida in 2008.
tree. The tree is medium sized and can be kept at or below 6 ft. without interfering with fruiting with annual pruning. Grafted trees have a spreading growth habit and dense foliage. Mature leaves are dark green while the new growth has a reddish-brown color. The tree and fruit have some tolerance to wet conditions, although fruit quality suffers when rainfall starts early. Prun-ing must occur after harvesting every year to limit tree size. It is advisable to avoid nitrogenous fertilizers and supplemental watering until flowering has occurred. The tree flushes twice or three times a year, with 13-inch internodes. Trees start bearing fruit at the age of 3–5 years and are productive compared with other Indian mangos.
Flowers. ‘Jumbo Kesar’ inflorescence (Fig 1.) is an average of 24–26 cm long and has an average of 50% to 70% hermaphroditic flowers. Flowers are produced on terminal inflorescences with

11Proc. Fla. State Hort. Soc. 133: 2020.
thousands of individuals both male and hermaphroditic, which have 5 petals and sepals with a cream color with light violet tones (Ledesma, et al., 2018). Blooming is consistent and generally occurs from December to January depending on temperature. It is better when winters are cool and dry. The tree has a low suscep-tibility to anthracnose, though powdery mildew can be a problem when relatively high humidity occurs during flowering. ‘Jumbo Kesar’ requires a spray program for commercial production.
Fruit. ‘Jumbo Kesar’ has a subtle, floral aroma with compo-nents of coconut, honeysuckle, vanilla, and banana. The flavor is excellent and rich with strong notes of coconut, lemon peel, mandarin, lychee, honey, and milk as well as clove and cinnamon. It has a creamy, smooth texture, a Brix of 25%, and a long flavor life in storage. It is a fruit with high overall quality, and is a good alternative for local mango growers and consumers interested in good flavor. Consumer acceptance and eating quality is excel-lent. The fruit can be marketed to both ethnic and mainstream customers at attractive prices.
The fruit has an average weight of 550 g and is greenish yellow with a red blush when exposed to the sun. The flesh has a deep yellow almost saffron color, and is firm and juicy with
Fig 1. ‘Jumbo Kesar’ Flowers (left) and inflorescence (right).
Fig 2. ‘Jumbo Kesar’ fruit.
small amount of fiber (Fig. 2). Skin is smooth with small, sparse pale-yellow lenticels. It is a monoembryonic cultivar.
mAturity And hArvesting. The fruit are ready for harvest from June to July in south Florida. Harvesting should be done when the fruit are mature but not ripe. The best flavor is obtained when the fruit is harvested at 25% maturity and stored at room temperature. Postharvest life is short at ambient temperatures, but low temperatures can ruin the flavor.
Literature Cited
Campbell, R.J. and N. Ledesma. 2013. Locations and Cultivars for Indian Mango Production in the Americas. Acta Hortic. 992:59–62.
Ledesma, N., F. Segundo Varela, F. David Algarin, and R.J. Campbell. 2018. Morphological Characterization of Inflorescence and Flowers of 200 Mango Varieties (Mangifera indica L.). Proc Fla. State Hort. Soc. 129:49–51.
12 Proc. Fla. State Hort. Soc. 133: 2020
Proc. Fla. State Hort. Soc. 133:12–13. 2020.
Krome Memorial Section
The authors acknowledge the USDA Southern SARE program for funding this project. *Corresponding author. Email:[email protected]
Sustainable Strategies to Combat the Papaya Ringspot Virus
Sarah E. BrEwEr1 and alan h. ChamBErS1*1 Tropical Research and Education Center, University of Florida/IFAS 18905 SW 280th Street,
Homestead, FL, 33031
AdditionAl index words. aphid, vector, trap crop, potyvirus, ‘Red Lady’
The papaya ringspot virus (PRSV) is a limiting factor for papaya production. All papayas are susceptible to PRSV, except where resistance has been genetically engineered. Studies conducted in Hawai’i suggest that the use of trans-genic PRSV-resistant accessions as border rows may prevent aphid-mediated transmission of the virus to susceptible interior plants, potentially expanding the range of varieties that can be cultivated profitably. A field trial to evaluate this technique was carried out at the Tropical Research and Education Center (TREC) in Homestead, Florida. In this experiment, we found that the use of virus-resistant border rows did not meaningfully impede transmission of PRSV to the susceptible cultivar ‘Red Lady’.
Viral diseases are a significant impediment to papaya produc-tion worldwide, including domestic growing regions of southern Florida, Puerto Rico and Hawai’i. The most significant of these is papaya ringspot virus (PRSV), which dramatically reduces yield and can lead to plant stunting or death. Current strategies to combat PRSV in papaya are limited and consist primarily of copious insecticide applications to control the aphid vector, rogue-ing and replanting of infected fields, or cultivation of transgenic, PRSV-resistant varieties. Engineered PRSV resistance has been the most effective control strategy, but it has limitations. Fruits of genetically engineered crops can be difficult to market due to the stigma surrounding genetically modified organisms (GMOs). Furthermore, there are few PRSV-resistant varieties available, which limits growers’ choices. We therefore sought to expand the range of options available to local papaya growers by evaluating the use of PRSV-resistant border plantings to protect susceptible papaya varieties, an approach recently pioneered by researchers at the USDA-ARS in Hawai’i with promising preliminary results (Matsumoto et al., 2014). The strategy relies on the non-persistent manner in which aphids transmit PRSV. The rationale is that infectious vectors are likely to feed first on resistant plants at the perimeter of the field. In the process, the proboscis and stylus are cleansed of the virus, preventing subsequent transmission. We have evaluated the efficacy of this new PRSV-management technique under southern Florida’s distinct growing conditions using regionally relevant papaya accessions.
Materials and Methods
The field trial was established in Spring 2020 at University of Florida’s Tropical Research and Education Center (TREC) in Homestead, FL. On 21 Jan. 2020, seeds were sown into trays filled
with 1 part Pro-Mix BX Mycorrhizae to 1 part perlite, top-dressed with 14–14–14 slow release fertilizer, and kept in the greenhouse for 9 weeks followed by a one-week acclimation period. Seedlings were transplanted outdoors on 30 Mar. 2020. PRSV-resistant border plants were derived from open-pollinated (OP) seeds of the University of Florida breeding line S40-2228 (Davis and Ying, 2004). ‘Red Lady 786 F1 Hybrid’ from Known-You Seeds was used as the susceptible cultivar. The field plot consisted of 21 rows of raised beds with 37 plants in each row. Spacing was 5 ft within-row and 12 ft between rows. Liquid 3–0–10 (N–P–K) fertilizer was supplied daily with irrigation at a rate of 0.25 lb N per acre per day for the first 8 weeks, 0.5 lb N per acre per day for the next 4 weeks, and 1 lb N per acre per day subsequently. Glyphosate was applied as-needed to control weeds.
The experiment included two treatments with four replicates each in a randomized row-column design (see Fig. 1 for field diagram). Treatment A consisted of 6 susceptible ‘Red Lady’ plants surrounded by 3 additional rows of ‘Red Lady’ seedlings on all sides. Treatment B consisted of 6 susceptible ‘Red Lady’ plants surrounded by 3 rows of PRSV-resistant OP S40-2228 seedlings. Each replicate plot was surrounded by one additional row of ‘Red Lady’ plants on all sides. These plants were artificially inoculated with PRSV on 20 July and again on 3 Aug. 2020 to ensure disease pressure throughout the field.
Results
Six months after trial establishment, plants were 5–6 ft tall and bore mature green fruits, but none had yet begun to ripen. Clas-sic PRSV symptoms were evident throughout the field including mosaic, chlorosis, and distorted leaves, as well as ring spots on the surface of green fruits (Fig. 2). The 6 interior plants within each replicate plot were visibly scored for presence or absence of PRSV symptoms on 27 Sept. 2020 (Table 1). PRSV symptoms were apparent on at least 1 of the 6 plants in every replicate, regardless of border row treatment. Overall, more than 40% of monitored plants were visibly infected across both treatments.
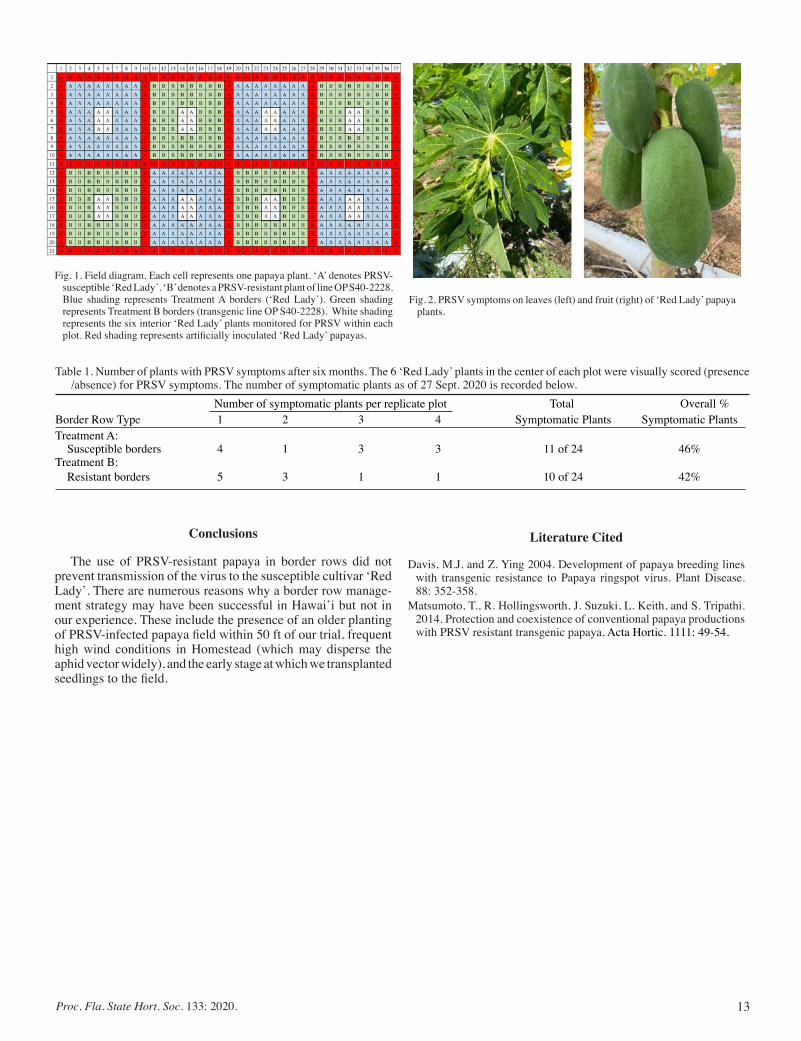
13Proc. Fla. State Hort. Soc. 133: 2020.
Conclusions
The use of PRSV-resistant papaya in border rows did not prevent transmission of the virus to the susceptible cultivar ‘Red Lady’. There are numerous reasons why a border row manage-ment strategy may have been successful in Hawai’i but not in our experience. These include the presence of an older planting of PRSV-infected papaya field within 50 ft of our trial, frequent high wind conditions in Homestead (which may disperse the aphid vector widely), and the early stage at which we transplanted seedlings to the field.
Number of symptomatic plants per replicate plot Total Overall %Border Row Type 1 2 3 4 Symptomatic Plants Symptomatic PlantsTreatment A: Susceptible borders 4 1 3 3 11 of 24 46%Treatment B: Resistant borders 5 3 1 1 10 of 24 42%
Table 1. Number of plants with PRSV symptoms after six months. The 6 ‘Red Lady’ plants in the center of each plot were visually scored (presence /absence) for PRSV symptoms. The number of symptomatic plants as of 27 Sept. 2020 is recorded below.
Literature Cited
Davis, M.J. and Z. Ying 2004. Development of papaya breeding lines with transgenic resistance to Papaya ringspot virus. Plant Disease. 88: 352-358.
Matsumoto, T., R. Hollingsworth, J. Suzuki, L. Keith, and S. Tripathi. 2014. Protection and coexistence of conventional papaya productions with PRSV resistant transgenic papaya, Acta Hortic. 1111: 49-54.
Fig. 1. Field diagram. Each cell represents one papaya plant. ‘A’ denotes PRSV-susceptible ‘Red Lady’. ‘B’ denotes a PRSV-resistant plant of line OP S40-2228. Blue shading represents Treatment A borders (‘Red Lady’). Green shading represents Treatment B borders (transgenic line OP S40-2228). White shading represents the six interior ‘Red Lady’ plants monitored for PRSV within each plot. Red shading represents artificially inoculated ‘Red Lady’ papayas.
Fig. 2. PRSV symptoms on leaves (left) and fruit (right) of ‘Red Lady’ papaya plants.
14 Proc. Fla. State Hort. Soc. 133: 2020
Proc. Fla. State Hort. Soc. 133:14–17. 2020.
Krome Memorial Section
University of Florida/IFAS, Tropical Research and Education Center—Efforts to Register Pest Control
Substances for Florida’s Tropical Fruit Industry, 1999–2019Jonathan h. Crane1*, rebeCCa tannenbaum1, and Janine m. SpieS2
1Tropical Research and Education Center, University of Florida/IFAS, 18905 SW 280 St, Homestead, FL 33031
2IR-4 Southern Region, University of Florida/IFAS, Food and Environmental Toxicology Lab, P.O. Box 110720, Gainesville, FL 32611
AdditionAl index words. fruit production, pest management, specialty crop
Insect and disease pests are a major financial constraint for Florida’s tropical fruit industry. Every year one or more invasive insect, disease, or weed becomes established in Florida resulting in mild to drastic reductions in fruit production and/or qual-ity. The IR-4 Project was established in 1963 to facilitate registration of conventional and biopesticides for specialty crops in the U.S. These specialty crops make up about 40% of the U.S. crop value. Florida’s tropical fruit industry consists of about 14,562 acres and is worth more than $300 million annually. The IR-4 Project is a collaboration among USDA (NIFA, ARS, APHIS, and FAS), Land Grant Universities (State Agricultural Experiment Stations), EPA, the crop protection industry, and agricultural crop producers. The program is designed to determine which crop protection substances are efficacious, then conduct field trials to collect fruit samples for residue analysis, and ultimately register crop protection substances with the EPA for use by crop producers. An IR-4 Field Station was established at the Tropical Research and Education Center (TREC) in Homestead, FL, in 1993. Since that time researchers have conducted four to twenty field trials per year. This col-laboration with IR-4 has resulted in the registration of over 52 pest control active ingredients and numerous brand-named products for Florida’s tropical fruit producers since 1999.
Florida’s tropical and subtropical fruit industry has had a long and significant social and economic impact locally, nationally and internationally (Crane, 2018; Degner et al., 2002a; Degner et al., 2002b; Krome and Goldweber, 1987; Campbell, 1971; Goldweber, 1961; Knight et al., 1984; Steele and Crane, 2006). Horticultural scientists, producers, and fruit enthusiasts have introduced hun-dreds of fruit crop species and cultivars since the 1890’s (Krome and Goldweber, 1987; Fairchild, 1934; Fairchild 1937; Fairchild, 1938; Imbruce, 2007; McGuire et al., 1999; Whitman and Biebel, 1962). Today in Florida there are an estimated 14,562 acres of tropical fruit crops distributed in 16 counties (Crane, 2018). There is no current estimate of the economic impact of Florida’s tropical fruit industry; however, earlier estimates and estimates of indi-vidual crops suggest the overall economic impact exceeds $300 million annually. Fruit crops include avocado, banana, caimito, canistel, carambola, dragon fruit, guava, guanabana (soursop), jackfruit, longan, lychee, mamey sapote, mango, miracle fruit, papaya, passion fruit, sapodilla, Spondias sp., sugar apple, and wax jambu (Crane, 2018).
The challenges faced by tropical fruit producers from insects, diseases, and weeds have been devastating economically, socially, and environmentally. Two recent Florida examples include citrus greening (Alvarez et al, 2016; Singerman and Rogers, 2020) and
laurel wilt of avocado (Mosquera et al., 2015). Both have resulted in dramatic decreases in the number of farms producing citrus and avocado, reduced production, and the dislocation of ancillary industries (e.g., juice plants). International trade and travel have exacerbated and intensified the pest problems faced by agriculture (Jenkins, 1996; Penca et al., 2016; Work et al., 2004).
Historically, few conventional pest control products were available to commercial tropical fruit producers in the U.S. and Florida in particular. This is because the potential sales value of pest control products is inadequate to meet the costs of testing and registering them with the Environmental Protection Agency (EPA) which are generally borne by the manufacturers. Fortunately, the need for pest control products for use on minor crops was recognized, and in 1963 the Directors of the State Agricultural Experiment Stations (Land Grant Universities) established a col-laborative program designated by the USDA as the IR-4 Project (IR-4, 2020a). This collaboration includes the USDA-National Institute of Food and Agriculture, USDA-Agricultural Research Service, USDA-Foreign Agricultural Service, USDA-Animal and Plant Health Inspection Service, State Agricultural Experi-ment Stations (Land Grant Institutions), the US-Environmental Protection Agency, the agrochemical industry, commodity groups and growers. The mission of the project is to facilitate regulatory (EPA) approval of sustainable pest management products for specialty crops and specialty uses to promote the public wellbe-ing (IR-4, 2020a).
Before the establishment of recent crop groupings for tropical and subtropical fruits, each tropical or subtropical fruit crop and active ingredient (ai) had to be field tested and residues deter-
The authors would like to thank the many local subtropical and tropical fruit growers who have collaborated with the TREC IR-4 Field Station to perform these trials and the IR-4 Project for funding. *Corresponding author. Email: [email protected]
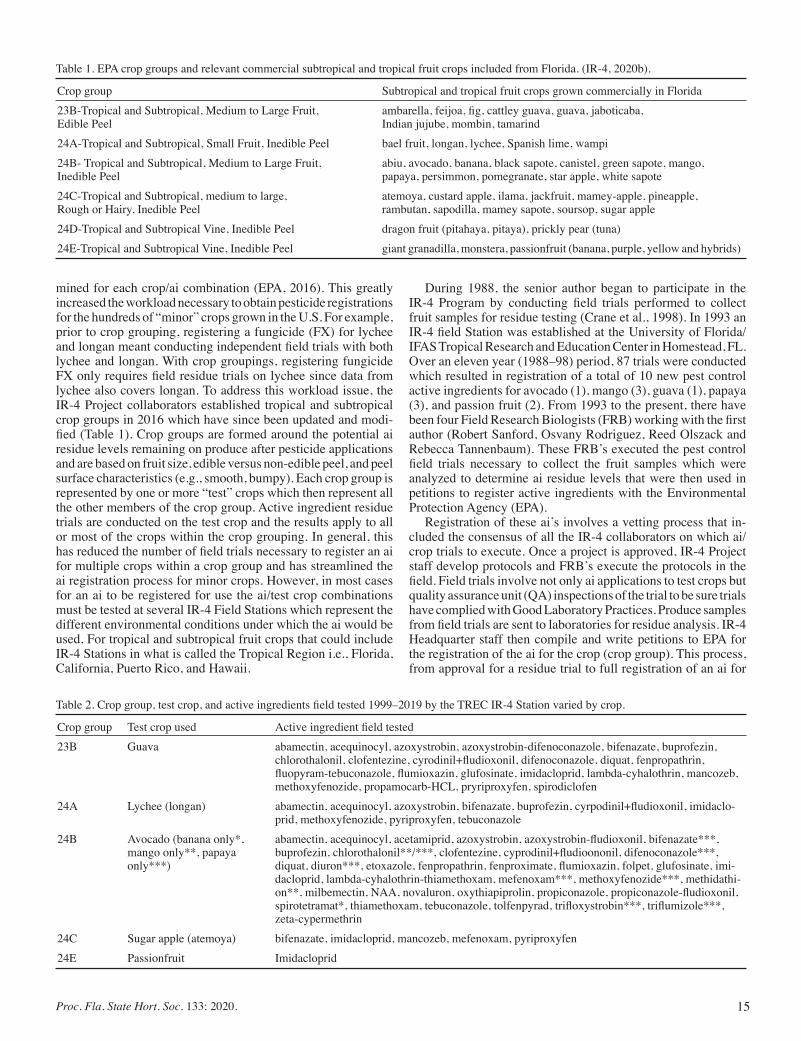
15Proc. Fla. State Hort. Soc. 133: 2020.
mined for each crop/ai combination (EPA, 2016). This greatly increased the workload necessary to obtain pesticide registrations for the hundreds of “minor” crops grown in the U.S. For example, prior to crop grouping, registering a fungicide (FX) for lychee and longan meant conducting independent field trials with both lychee and longan. With crop groupings, registering fungicide FX only requires field residue trials on lychee since data from lychee also covers longan. To address this workload issue, the IR-4 Project collaborators established tropical and subtropical crop groups in 2016 which have since been updated and modi-fied (Table 1). Crop groups are formed around the potential ai residue levels remaining on produce after pesticide applications and are based on fruit size, edible versus non-edible peel, and peel surface characteristics (e.g., smooth, bumpy). Each crop group is represented by one or more “test” crops which then represent all the other members of the crop group. Active ingredient residue trials are conducted on the test crop and the results apply to all or most of the crops within the crop grouping. In general, this has reduced the number of field trials necessary to register an ai for multiple crops within a crop group and has streamlined the ai registration process for minor crops. However, in most cases for an ai to be registered for use the ai/test crop combinations must be tested at several IR-4 Field Stations which represent the different environmental conditions under which the ai would be used. For tropical and subtropical fruit crops that could include IR-4 Stations in what is called the Tropical Region i.e., Florida, California, Puerto Rico, and Hawaii.
During 1988, the senior author began to participate in the IR-4 Program by conducting field trials performed to collect fruit samples for residue testing (Crane et al., 1998). In 1993 an IR-4 field Station was established at the University of Florida/IFAS Tropical Research and Education Center in Homestead, FL. Over an eleven year (1988–98) period, 87 trials were conducted which resulted in registration of a total of 10 new pest control active ingredients for avocado (1), mango (3), guava (1), papaya (3), and passion fruit (2). From 1993 to the present, there have been four Field Research Biologists (FRB) working with the first author (Robert Sanford, Osvany Rodriguez, Reed Olszack and Rebecca Tannenbaum). These FRB’s executed the pest control field trials necessary to collect the fruit samples which were analyzed to determine ai residue levels that were then used in petitions to register active ingredients with the Environmental Protection Agency (EPA).
Registration of these ai’s involves a vetting process that in-cluded the consensus of all the IR-4 collaborators on which ai/crop trials to execute. Once a project is approved, IR-4 Project staff develop protocols and FRB’s execute the protocols in the field. Field trials involve not only ai applications to test crops but quality assurance unit (QA) inspections of the trial to be sure trials have complied with Good Laboratory Practices. Produce samples from field trials are sent to laboratories for residue analysis. IR-4 Headquarter staff then compile and write petitions to EPA for the registration of the ai for the crop (crop group). This process, from approval for a residue trial to full registration of an ai for
Table 1. EPA crop groups and relevant commercial subtropical and tropical fruit crops included from Florida. (IR-4, 2020b).
Crop group Subtropical and tropical fruit crops grown commercially in Florida23B-Tropical and Subtropical, Medium to Large Fruit, Edible Peel
ambarella, feijoa, fig, cattley guava, guava, jaboticaba, Indian jujube, mombin, tamarind
24A-Tropical and Subtropical, Small Fruit, Inedible Peel bael fruit, longan, lychee, Spanish lime, wampi24B- Tropical and Subtropical, Medium to Large Fruit, Inedible Peel
abiu, avocado, banana, black sapote, canistel, green sapote, mango, papaya, persimmon, pomegranate, star apple, white sapote
24C-Tropical and Subtropical, medium to large, Rough or Hairy, Inedible Peel
atemoya, custard apple, ilama, jackfruit, mamey-apple, pineapple, rambutan, sapodilla, mamey sapote, soursop, sugar apple
24D-Tropical and Subtropical Vine, Inedible Peel dragon fruit (pitahaya, pitaya), prickly pear (tuna)24E-Tropical and Subtropical Vine, Inedible Peel giant granadilla, monstera, passionfruit (banana, purple, yellow and hybrids)
Table 2. Crop group, test crop, and active ingredients field tested 1999–2019 by the TREC IR-4 Station varied by crop.
Crop group Test crop used Active ingredient field tested23B Guava abamectin, acequinocyl, azoxystrobin, azoxystrobin-difenoconazole, bifenazate, buprofezin,
chlorothalonil, clofentezine, cyrodinil+fludioxonil, difenoconazole, diquat, fenpropathrin, fluopyram-tebuconazole, flumioxazin, glufosinate, imidacloprid, lambda-cyhalothrin, mancozeb, methoxyfenozide, propamocarb-HCL, pryriproxyfen, spirodiclofen
24A Lychee (longan) abamectin, acequinocyl, azoxystrobin, bifenazate, buprofezin, cyrpodinil+fludioxonil, imidaclo-prid, methoxyfenozide, pyriproxyfen, tebuconazole
24B Avocado (banana only*, mango only**, papaya only***)
abamectin, acequinocyl, acetamiprid, azoxystrobin, azoxystrobin-fludioxonil, bifenazate***, buprofezin, chlorothalonil**/***, clofentezine, cyprodinil+fludioononil, difenoconazole***, diquat, diuron***, etoxazole, fenpropathrin, fenproximate, flumioxazin, folpet, glufosinate, imi-dacloprid, lambda-cyhalothrin-thiamethoxam, mefenoxam***, methoxyfenozide***, methidathi-on**, milbemectin, NAA, novaluron, oxythiapiprolin, propiconazole, propiconazole-fludioxonil, spirotetramat*, thiamethoxam, tebuconazole, tolfenpyrad, trifloxystrobin***, triflumizole***, zeta-cypermethrin
24C Sugar apple (atemoya) bifenazate, imidacloprid, mancozeb, mefenoxam, pyriproxyfen24E Passionfruit Imidacloprid
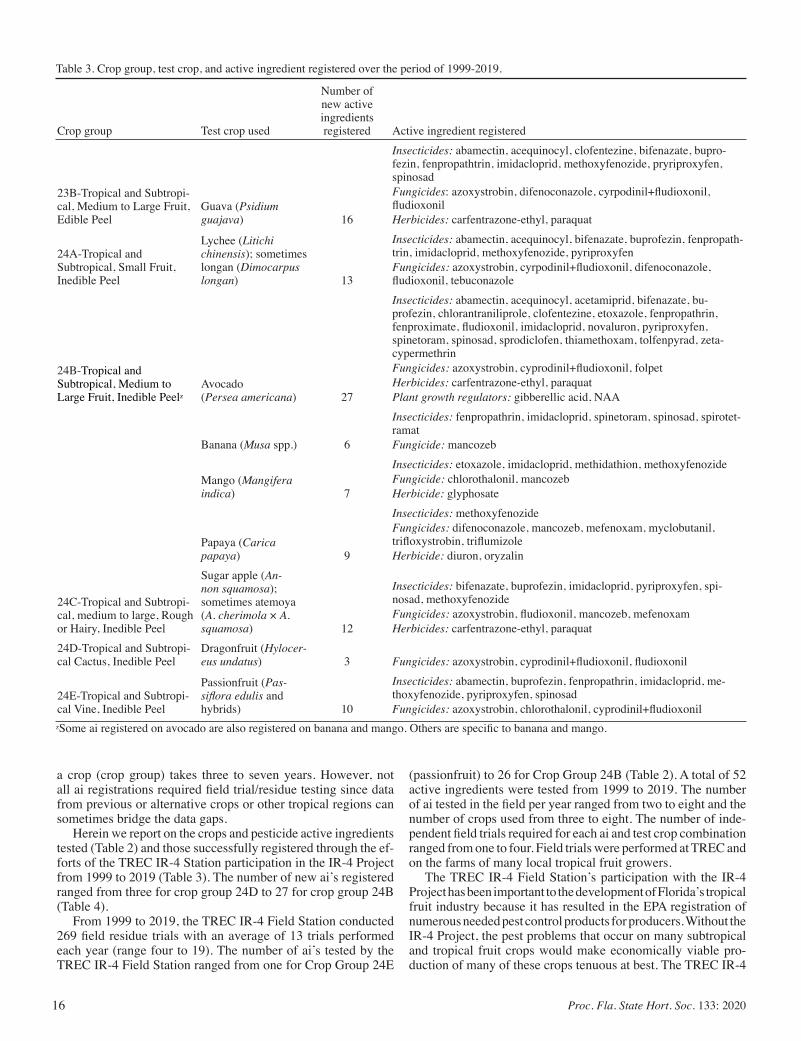
16 Proc. Fla. State Hort. Soc. 133: 2020
Table 3. Crop group, test crop, and active ingredient registered over the period of 1999-2019.
Crop group Test crop used
Number of new active ingredients registered Active ingredient registered
23B-Tropical and Subtropi-cal, Medium to Large Fruit, Edible Peel
Guava (Psidium guajava) 16
Insecticides: abamectin, acequinocyl, clofentezine, bifenazate, bupro-fezin, fenpropathtrin, imidacloprid, methoxyfenozide, pryriproxyfen, spinosadFungicides: azoxystrobin, difenoconazole, cyrpodinil+fludioxonil, fludioxonilHerbicides: carfentrazone-ethyl, paraquat
24A-Tropical and Subtropical, Small Fruit, Inedible Peel
Lychee (Litichi chinensis); sometimes longan (Dimocarpus longan) 13
Insecticides: abamectin, acequinocyl, bifenazate, buprofezin, fenpropath-trin, imidacloprid, methoxyfenozide, pyriproxyfenFungicides: azoxystrobin, cyrpodinil+fludioxonil, difenoconazole, fludioxonil, tebuconazole
24B-Tropical and Subtropical, Medium to Large Fruit, Inedible Peelz
Avocado (Persea americana) 27
Insecticides: abamectin, acequinocyl, acetamiprid, bifenazate, bu-profezin, chlorantraniliprole, clofentezine, etoxazole, fenpropathrin, fenproximate, fludioxonil, imidacloprid, novaluron, pyriproxyfen, spinetoram, spinosad, sprodiclofen, thiamethoxam, tolfenpyrad, zeta-cypermethrinFungicides: azoxystrobin, cyprodinil+fludioxonil, folpetHerbicides: carfentrazone-ethyl, paraquatPlant growth regulators: gibberellic acid, NAA
Banana (Musa spp.) 6
Insecticides: fenpropathrin, imidacloprid, spinetoram, spinosad, spirotet-ramatFungicide: mancozeb
Mango (Mangifera indica) 7
Insecticides: etoxazole, imidacloprid, methidathion, methoxyfenozideFungicide: chlorothalonil, mancozebHerbicide: glyphosate
Papaya (Carica papaya) 9
Insecticides: methoxyfenozideFungicides: difenoconazole, mancozeb, mefenoxam, myclobutanil, trifloxystrobin, triflumizoleHerbicide: diuron, oryzalin
24C-Tropical and Subtropi-cal, medium to large, Rough or Hairy, Inedible Peel
Sugar apple (An-non squamosa); sometimes atemoya (A. cherimola × A. squamosa) 12
Insecticides: bifenazate, buprofezin, imidacloprid, pyriproxyfen, spi-nosad, methoxyfenozideFungicides: azoxystrobin, fludioxonil, mancozeb, mefenoxamHerbicides: carfentrazone-ethyl, paraquat
24D-Tropical and Subtropi-cal Cactus, Inedible Peel
Dragonfruit (Hylocer-eus undatus) 3 Fungicides: azoxystrobin, cyprodinil+fludioxonil, fludioxonil
24E-Tropical and Subtropi-cal Vine, Inedible Peel
Passionfruit (Pas-siflora edulis and hybrids) 10
Insecticides: abamectin, buprofezin, fenpropathrin, imidacloprid, me-thoxyfenozide, pyriproxyfen, spinosadFungicides: azoxystrobin, chlorothalonil, cyprodinil+fludioxonil
zSome ai registered on avocado are also registered on banana and mango. Others are specific to banana and mango.
a crop (crop group) takes three to seven years. However, not all ai registrations required field trial/residue testing since data from previous or alternative crops or other tropical regions can sometimes bridge the data gaps.
Herein we report on the crops and pesticide active ingredients tested (Table 2) and those successfully registered through the ef-forts of the TREC IR-4 Station participation in the IR-4 Project from 1999 to 2019 (Table 3). The number of new ai’s registered ranged from three for crop group 24D to 27 for crop group 24B (Table 4).
From 1999 to 2019, the TREC IR-4 Field Station conducted 269 field residue trials with an average of 13 trials performed each year (range four to 19). The number of ai’s tested by the TREC IR-4 Field Station ranged from one for Crop Group 24E
(passionfruit) to 26 for Crop Group 24B (Table 2). A total of 52 active ingredients were tested from 1999 to 2019. The number of ai tested in the field per year ranged from two to eight and the number of crops used from three to eight. The number of inde-pendent field trials required for each ai and test crop combination ranged from one to four. Field trials were performed at TREC and on the farms of many local tropical fruit growers.
The TREC IR-4 Field Station’s participation with the IR-4 Project has been important to the development of Florida’s tropical fruit industry because it has resulted in the EPA registration of numerous needed pest control products for producers. Without the IR-4 Project, the pest problems that occur on many subtropical and tropical fruit crops would make economically viable pro-duction of many of these crops tenuous at best. The TREC IR-4
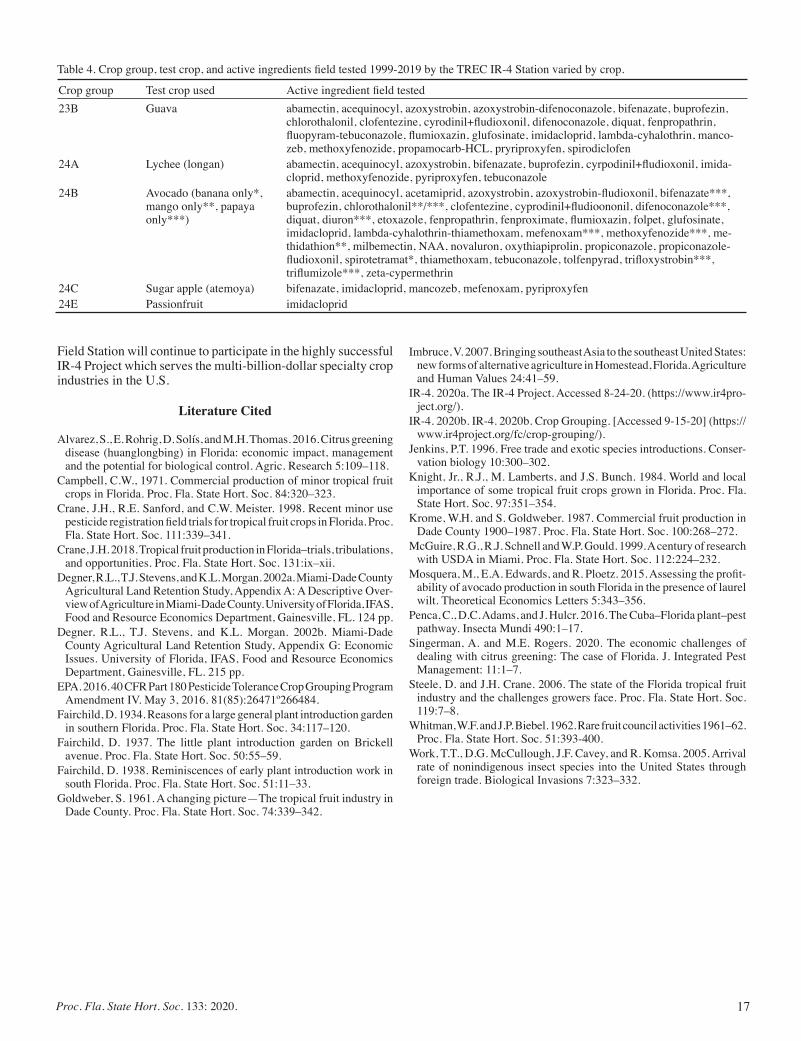
17Proc. Fla. State Hort. Soc. 133: 2020.
Field Station will continue to participate in the highly successful IR-4 Project which serves the multi-billion-dollar specialty crop industries in the U.S.
Literature Cited
Alvarez, S., E. Rohrig, D. Solís, and M.H. Thomas. 2016. Citrus greening disease (huanglongbing) in Florida: economic impact, management and the potential for biological control. Agric. Research 5:109–118.
Campbell, C.W., 1971. Commercial production of minor tropical fruit crops in Florida. Proc. Fla. State Hort. Soc. 84:320–323.
Crane, J.H., R.E. Sanford, and C.W. Meister. 1998. Recent minor use pesticide registration field trials for tropical fruit crops in Florida. Proc. Fla. State Hort. Soc. 111:339–341.
Crane, J.H. 2018. Tropical fruit production in Florida–trials, tribulations, and opportunities. Proc. Fla. State Hort. Soc. 131:ix–xii.
Degner, R.L., T.J. Stevens, and K.L. Morgan. 2002a. Miami-Dade County Agricultural Land Retention Study, Appendix A: A Descriptive Over-view of Agriculture in Miami-Dade County. University of Florida, IFAS, Food and Resource Economics Department, Gainesville, FL. 124 pp.
Degner, R.L., T.J. Stevens, and K.L. Morgan. 2002b. Miami-Dade County Agricultural Land Retention Study, Appendix G: Economic Issues. University of Florida, IFAS, Food and Resource Economics Department, Gainesville, FL. 215 pp.
EPA. 2016. 40 CFR Part 180 Pesticide Tolerance Crop Grouping Program Amendment IV. May 3, 2016. 81(85):26471º266484.
Fairchild, D. 1934. Reasons for a large general plant introduction garden in southern Florida. Proc. Fla. State Hort. Soc. 34:117–120.
Fairchild, D. 1937. The little plant introduction garden on Brickell avenue. Proc. Fla. State Hort. Soc. 50:55–59.
Fairchild, D. 1938. Reminiscences of early plant introduction work in south Florida. Proc. Fla. State Hort. Soc. 51:11–33.
Goldweber, S. 1961. A changing picture—The tropical fruit industry in Dade County. Proc. Fla. State Hort. Soc. 74:339–342.
Table 4. Crop group, test crop, and active ingredients field tested 1999-2019 by the TREC IR-4 Station varied by crop.
Crop group Test crop used Active ingredient field tested23B Guava abamectin, acequinocyl, azoxystrobin, azoxystrobin-difenoconazole, bifenazate, buprofezin,
chlorothalonil, clofentezine, cyrodinil+fludioxonil, difenoconazole, diquat, fenpropathrin, fluopyram-tebuconazole, flumioxazin, glufosinate, imidacloprid, lambda-cyhalothrin, manco-zeb, methoxyfenozide, propamocarb-HCL, pryriproxyfen, spirodiclofen
24A Lychee (longan) abamectin, acequinocyl, azoxystrobin, bifenazate, buprofezin, cyrpodinil+fludioxonil, imida-cloprid, methoxyfenozide, pyriproxyfen, tebuconazole
24B Avocado (banana only*, mango only**, papaya only***)
abamectin, acequinocyl, acetamiprid, azoxystrobin, azoxystrobin-fludioxonil, bifenazate***, buprofezin, chlorothalonil**/***, clofentezine, cyprodinil+fludioononil, difenoconazole***, diquat, diuron***, etoxazole, fenpropathrin, fenproximate, flumioxazin, folpet, glufosinate, imidacloprid, lambda-cyhalothrin-thiamethoxam, mefenoxam***, methoxyfenozide***, me-thidathion**, milbemectin, NAA, novaluron, oxythiapiprolin, propiconazole, propiconazole-fludioxonil, spirotetramat*, thiamethoxam, tebuconazole, tolfenpyrad, trifloxystrobin***, triflumizole***, zeta-cypermethrin
24C Sugar apple (atemoya) bifenazate, imidacloprid, mancozeb, mefenoxam, pyriproxyfen24E Passionfruit imidacloprid
Imbruce, V. 2007. Bringing southeast Asia to the southeast United States: new forms of alternative agriculture in Homestead, Florida. Agriculture and Human Values 24:41–59.
IR-4. 2020a. The IR-4 Project. Accessed 8-24-20. (https://www.ir4pro-ject.org/).
IR-4. 2020b. IR-4. 2020b. Crop Grouping. [Accessed 9-15-20] (https://www.ir4project.org/fc/crop-grouping/).
Jenkins, P.T. 1996. Free trade and exotic species introductions. Conser-vation biology 10:300–302.
Knight, Jr., R.J., M. Lamberts, and J.S. Bunch. 1984. World and local importance of some tropical fruit crops grown in Florida. Proc. Fla. State Hort. Soc. 97:351–354.
Krome, W.H. and S. Goldweber. 1987. Commercial fruit production in Dade County 1900–1987. Proc. Fla. State Hort. Soc. 100:268–272.
McGuire, R.G., R.J. Schnell and W.P. Gould. 1999. A century of research with USDA in Miami. Proc. Fla. State Hort. Soc. 112:224–232.
Mosquera, M., E.A. Edwards, and R. Ploetz. 2015. Assessing the profit-ability of avocado production in south Florida in the presence of laurel wilt. Theoretical Economics Letters 5:343–356.
Penca, C., D.C. Adams, and J. Hulcr. 2016. The Cuba–Florida plant–pest pathway. Insecta Mundi 490:1–17.
Singerman, A. and M.E. Rogers. 2020. The economic challenges of dealing with citrus greening: The case of Florida. J. Integrated Pest Management: 11:1–7.
Steele, D. and J.H. Crane. 2006. The state of the Florida tropical fruit industry and the challenges growers face. Proc. Fla. State Hort. Soc. 119:7–8.
Whitman, W.F. and J.P. Biebel. 1962. Rare fruit council activities 1961–62. Proc. Fla. State Hort. Soc. 51:393-400.
Work, T.T., D.G. McCullough, J.F. Cavey, and R. Komsa. 2005. Arrival rate of nonindigenous insect species into the United States through foreign trade. Biological Invasions 7:323–332.
18 Proc. Fla. State Hort. Soc. 133: 2020
Proc. Fla. State Hort. Soc. 133:18–20. 2020.
Krome Memorial Section
*Corresponding author. Email: [email protected]
O47-16-10: A Pierce’s Disease-resistant and Premium Wine Producing Bunch Grape Hybrid with Later Bud
Burst in SpringZhongbo Ren*, Violet tsoloVa, and islam el-shakaRway
Center for Viticulture & Small Fruit Research, College of Agriculture and Food Sciences, Florida A&M University, Tallahassee, FL 32317
AdditionAl index words. hot-humid environment, adaptation, frost damage, productivity, fruit rot, vine vigor
‘O47-16-10’ is a newly developed breeding line at the Viticulture Center, Florida A&M University, Tallahassee, Fl. This premium wine producing bunch grape is superior in being adaptable to Florida’s hot-humid growing environ-ment and is resistant to Pierce’s Disease. It posses several additional advantages preferred by grape industry, such as self-fertile flowers, high productivity, and low ripe rot during ripening. The later starting of vegetative activity of the vine in spring could minimize the frequent later frost damage for the grape industry in Florida.
Florida grape industry is challenged all the time by Pierce’s disease (PD) due to the hot-humid growing environment, which limits growing of Vitis vinifera grapes that produce exceptional quality wines to virtually zero in the region. The commercial growing of bunch grapes has solely been based on a few Florida hybrid grapes that are adapted to Florida’s hot-humid climate and resistant or tolerant to PD, such as ‘Blanc du Bois’, ‘Stover’, and ‘Conquistador’. These cultivars could produce good wines, but production is costly due to their susceptibility to other diseases related to heat and humidity such as the fungal disease anthrac-nose and downy mildew, which require intense spray programs. The ripe rot on ‘Blanc du Bois’ during ripening might also be a severe problem for both growers and wineries.
Florida grape industry frequently suffers from spring frost damage in addition to the heat and humidity related diseases. These often result in significant production losses or even eco-nomic disasters. Open buds and young shoots are sensitive to freezing temperatures, so a short period of exposure to freezing during a spring frost could be lethal to open primary buds and shoots. After severe damage or the death of primary shoots, the subsequent development of shoots from the secondary growing points or buds produce some fruit, but this could be 50% lower than production from primary shoots for most grapes.
With these problems facing the local grape industry, focused continuous breeding efforts to improve existing cultivars and develop new grape cultivars with superior qualities is needed for the development and growth of the grape and wine enterprises, integrating PD resistance, adaption to Florida’s hot-humid climate, and fine wine quality. All these would allow a wine grape to be grown successfully in Florida. The grape breeding program in Florida A&M University (FAMU) has been working intensively for the past 2 decades to develop fine wine producing grapes that can grow successfully in Florida. This work has resulted in several valuable hybrids, among which ‘O47-16-10’ has showed good potential as a premium wine producing selection, and is reported on here.
Origin
‘O47-16-10’ originated from a cross between ‘N18-6’ and ‘Merlot’ in 1999. The female parent ‘N18-6’ is a complex germ-plasm line, which has shown a high degree of resistance to PD and anthracnose over the past 20 more years. It also possesses several desirable commercial characteristics such as high yield, high sugar level, moderate vigor, and easy canopy management. It also shows strong tendency to transmit these characters to its decedents. This selection has been used extensively in our breeding programs (Ren, et al. 2009). ‘Merlot’, the male parent, is a lead-ing premium wine grape cultivar that produces both varietal and blending red wines. ‘Merlot’ has been less bothered by diseases than other V. vinifera cultivars that are PD free and cage-grown in Tallahassee, FL.
The hybrids were planted in Summer 2000, but the majority of them died before 2008 with only a few vines surviving in July, 2020; ‘O47-16-10’ is one of the survivors. It has been growing well since 2000, has shown a superior adaptability to Florida’s environment and has PD resistance. The vine’s horticultural potential first received attention in 2005 while its enology traits have been observed since 2007. Both horticultural and enological characteristics have been evaluated and compared with ‘Blanc du Bois’ and ‘Stover’, the two most important Florida grown wine cultivars, under same conditions.
Plant and Wine Characteristics
Plant characteristicsFlowers And inFlorescences. ‘O47-16-10’ produces her-
maphrodite (self-fertile, perfect) flowers, as both male and female organs of ‘O47-16-10’ flowers are fully developed, pollinators are not necessarily required. No cap-sticking which has ever been observed during evaluation indicates that the flowers of the hybrid are healthy. The flower clusters generally grow at 2nd to 4th node (Fig. 1).
Productivity.‘O47-16-10’ is highly productive (Fig. 2). A 10-ft canopy of ‘O47-16-10’ which was vine trained as a 2-arm cordon on a single wire system with spur pruning produced on

19Proc. Fla. State Hort. Soc. 133: 2020.
average 18 lb grapes, which was the same as that of the high yield cultivar ‘Blanc du Bois’, and was more than ‘Stover’ (Table 1). These yields have been constant during the evaluation period.
The spur productivity of ‘O47-16-10’ was 417 g fruit/spur, which was similar to the high yield cultivar ‘Blanc du Bois’, but and greater than ‘Stover’ (Table 1). As the basic productive part of a grape vine, spur productivity is useful in grape yield studies. It has suggested the high production potential of ‘O47-16-10’.
Fruit clusters. Mid-large semi-dense fruit clusters weigh roughly 125 g, consist of about 87 individual fruits, the pedicels are partial visible (Figs. 2 and 3). Fruits are movable and it is somewhat difficult to detach fruits from the pedicels. The semi-dense clusters enable air flow and sprays penetrating inside the clusters. These may reduce fruit rot during ripening and is a trait desired by grape growers.
Table 1. Productivity, fruit enological traits, and wine evaluation of ‘O47-16-10’ compared with two premium Florida wine hybridsCultivar Spur fruit wt (g) Yield (lb/vine) Fruit rot rate (%) Fruit size (g) SSC (%) pH TA (g/L) Wine scorez
‘O47-16-10’ 417 18 4 1.4 16.2 2.98 0.70 13.0‘Blanc du Bois’ 428 19 37 2.8 17.9 3.05 0.57 --‘Stover’ 227 13 4 2.4 15.2 3.08 0.51 12.6zAmerican Wine Society (AWS) evaluation standard, total of 20 scores.SSC = soluable solids content; TA = tritatable acidity.
Fig. 1. Young shoots and inflorescences of ‘Blanc du Bois’ (top), ‘Stover’ (middle), and ‘O47-16-10’ (bottom). The differences in shoot sizes corresponds with vine vigor.
Fig. 2. Fruit clusters and productivity of ‘O47-16-10’.
Fruit ProFile oF ‘o47-16-10’. The fruits of ‘O47-16-10’ are small and round in shape generally, about 1.3cm in diameter with the length slightly longer than the diameter, and weigh 1.4g (Table 1). Fruit skin is medium thin and smooth with a dark green-yellow color (Fig. 3) and can easily be separated from the pulp. Fruits are semi-soft textured, with neutral or no outstanding flavors.
Fruit sugar content (SSC) averaged 16.2%, titratable acid averaged 0.70g/L with pH 2.98 (Table 1).
Adaptation to hot-humid environment and disease resistance
‘O47-16-10’ has been growing and fruiting well in Tallahassee, Fla since 2000. During this time, plants have experienced numer-ous hot-humid related pressures and have shown an outstanding adaptation to Florida’s hot-humid growing environment.
Using a 0-5 score criteria, ‘O47-16-10’ has not shown PD symptoms while light PD symptoms could be observed occasion-ally on ‘Blanc du Bois’ and ‘Stover (Table 2).
‘O47-16-10’ showed minor anthracnose symptoms which was lighter than in ‘Blanc du Bois’ during evaluation period (Table 2).
‘O47-16-10’ had less fruit rot or ripe rot at harvest. This is a frustrating epidemic for Florida’s grape industry. Its 4% fruit rot rate was similar to that of ‘Stover’, but lower than ‘Blanc du Bois’ (Table 1). These should make difference for the grape industry; a lower fruit rot rate suggests that growers may be able to harvest more fruit for commercial use while a higher fruit rot rate suggests the opposite.
Vine vigorThe vines of ‘O47-16-10’ grow vigorously to very vigorously,
i.e., the growth of a shoot could easily reach 10 to 20 feet in a growing season. Vine have largr internodes and leaves (Fig. 1, Table 2), which results in a higher pruning weight. The average pruning weight was 5.6 lb/vine from 10-feet of canopy. ‘O47-16–10’ vines are trained as a 2-arm cordon single wire system with spur pruning techniques, which was the same as the vigor-ous ‘Blanc du Bois’, and was higher than ‘Stover’ (Table 2). The internode size of ‘O47-16-10’ averaged 11.0cm in length and 1.11cm in diameter, which were larger than the vigorous ‘Blanc du Bois’ and the moderately vigorous ‘Stover’ (Table 2). Similarly, ‘O47-16-10’ has larger leaves (12.8 × 14.9cm, L×W) than either ‘Blanc du Bois’ or ‘Stover’ (Table 2). Because of its high vine vigor, ‘O47-16-10’ would not require grafting, which would substantially reduce planting costs.
Later bud break and blooming—Annual growth cycle of the grape vine
The start of the vegetative activities of ‘O47-16-10’ in the spring is about 3 weeks later than almost all bunch grapes includ-ing ‘Blanc du Bois’ and ‘Stover’ in Tallahassee, FL (Table 2), which enabled ‘O47-16-10’ to avoid late frost damage during the evaluation period, while other cultivars frequently suffered
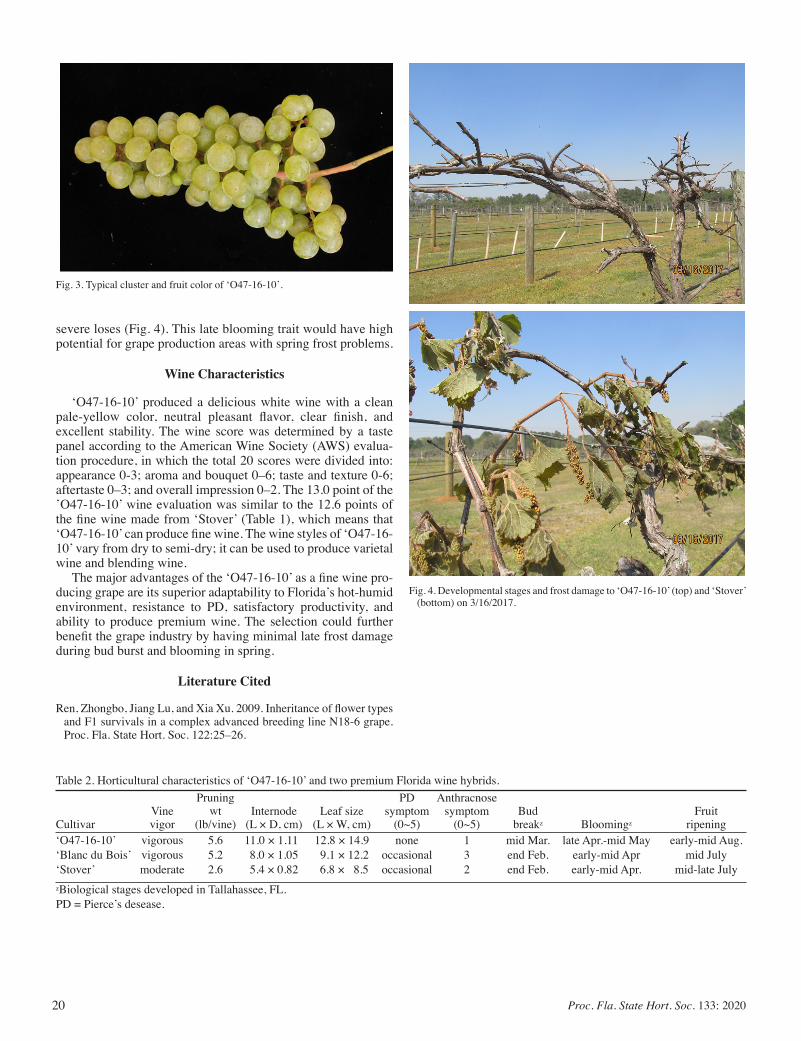
20 Proc. Fla. State Hort. Soc. 133: 2020
Table 2. Horticultural characteristics of ‘O47-16-10’ and two premium Florida wine hybrids. Pruning PD Anthracnose Vine wt Internode Leaf size symptom symptom Bud FruitCultivar vigor (lb/vine) (L × D, cm) (L × W, cm) (0~5) (0~5) breakz Bloomingz ripening‘O47-16-10’ vigorous 5.6 11.0 × 1.11 12.8 × 14.9 none 1 mid Mar. late Apr.-mid May early-mid Aug.‘Blanc du Bois’ vigorous 5.2 8.0 × 1.05 9.1 × 12.2 occasional 3 end Feb. early-mid Apr mid July‘Stover’ moderate 2.6 5.4 × 0.82 6.8 × 8.5 occasional 2 end Feb. early-mid Apr. mid-late JulyzBiological stages developed in Tallahassee, FL.PD = Pierce’s desease.
Fig. 3. Typical cluster and fruit color of ‘O47-16-10’.
Fig. 4. Developmental stages and frost damage to ‘O47-16-10’ (top) and ‘Stover’ (bottom) on 3/16/2017.
severe loses (Fig. 4). This late blooming trait would have high potential for grape production areas with spring frost problems.
Wine Characteristics
‘O47-16-10’ produced a delicious white wine with a clean pale-yellow color, neutral pleasant flavor, clear finish, and excellent stability. The wine score was determined by a taste panel according to the American Wine Society (AWS) evalua-tion procedure, in which the total 20 scores were divided into: appearance 0-3; aroma and bouquet 0–6; taste and texture 0-6; aftertaste 0–3; and overall impression 0–2. The 13.0 point of the ’O47-16-10’ wine evaluation was similar to the 12.6 points of the fine wine made from ‘Stover’ (Table 1), which means that ‘O47-16-10’ can produce fine wine. The wine styles of ‘O47-16-10’ vary from dry to semi-dry; it can be used to produce varietal wine and blending wine.
The major advantages of the ‘O47-16-10’ as a fine wine pro-ducing grape are its superior adaptability to Florida’s hot-humid environment, resistance to PD, satisfactory productivity, and ability to produce premium wine. The selection could further benefit the grape industry by having minimal late frost damage during bud burst and blooming in spring.
Literature Cited
Ren, Zhongbo, Jiang Lu, and Xia Xu. 2009. Inheritance of flower types and F1 survivals in a complex advanced breeding line N18-6 grape. Proc. Fla. State Hort. Soc. 122:25–26.
21Proc. Fla. State Hort. Soc. 133: 2020.
Proc. Fla. State Hort. Soc. 133:21–24. 2020.
Krome Memorial Section
This research was funded by an USDA/NIFA/Organic Agriculture Research and Extension Initiative (OREI) Grant.*Corresponding author. Email: [email protected]
Low Cost High Tunnel versus Open Field Production of Organically Grown Strawberries in North Florida:
A Three-year EvaluationAlex Bolques1*, GilBert queeley2, FAnny ospinA1, And VondA richArdson2
1Florida A&M University, Research and Extension Center, 4259 Bainbridge Highway, Quincy, FL 32352
2Florida A&M University, Cooperative Extension Programs, 215 Perry Paige, Bldg. South., Tallahassee, FL 32307
AdditionAl index words. protected agriculture, high tunnel, farm profitability
In north Florida, crop production can be limited by freezing temperatures during winter months and as such, many fresh market, organic and small scale producers utilize season extension techniques to protect specialty crops from damage. Low cost high tunnels (LCHT) are temporary crop protective structures that can be easily constructed in the field to protect crops from adverse weather conditions and pests. They are naturally heated and ventilated by roll-up sides as a means of controlling environmental conditions inside the tunnel. In this study, we present the results of a 3-year evaluation of strawberries grown in a LCHT versus open field (OF) treatment. The objective was to determine whether the LCHT provided any agronomic benefits, relative to fruit yield, over the OF. Four strawberry (Fragaria ×ananassa) cultivars [SensationTM, (‘Florida 127’), ‘Florida Brilliance’, ‘Florida Radiance’, and ‘Florida Beauty’] were grown in each production system. Experimental plots consisted of 16 subplots each containing 16 strawberry plants per cultivar in a randomized complete block design with four replications. Yield data were collected weekly during the 2016/17, 2017/18, and 2019/20 Fall through Spring growing seasons. Descriptive statistics were generated using SAS ver. 9.4. The three-year average yield from the LCHT and OF treatments were 1744 lb/acre and 949 lb/acre, respectively. An independent samples t test was used to compare treatment means. The yield obtained from the LCHT was significantly higher (P < 0.001). The study concluded that the LCHT is a sustainable alternative to OF production of strawberries in north Florida.
For the past four winter seasons in north Florida (excluding the 2018-19 strawberry season due to damaged caused by Hurricane Michael), low cost high tunnel (LCHT) production of organically grown strawberries has been evaluated against the risk of winter injury or damage to strawberry plants, flowers, and fruit. This damage can occur when ambient air temperatures fall below 32 °F (0 °C). To determine whether a LCHT can provide any agronomic benefits, including fruit yield, strawberry production inside the LCHT were compared to fruit production in an open field (OF). This comparative study also served as an extension outreach demonstration to validate the feasibility of growing strawberries for small-scale production.
In the first year of the study, Oct. 2016 to Apr. 2017, it was determined that the risk of winter injury or damage could reduce marketable fruit yield thereby reducing crop profitability (Bolques et al., 2018). The study was repeated for a second year during the Oct. 2017 to Apr. 2018 strawberry season. In this paper, we discuss the results of a low cost high tunnel structure versus open field production of organically grown strawberries in North Florida during the third and final year.
Materials and Methods
experimentAl design. This study was conducted at the Florida A&M University, Research and Extension Center in Quincy, FL, and covers three strawberry growing seasons. For the first season, Oct. 2016 to Apr. 2017, four strawberry cultivars [SensationTM (Florida 127) (Whitaker et al, 2014), WinterstarTM (FL 05-107) (Whitaker et al., 2012), ‘Florida Radiance’, and ‘Strawberry Festival’] were evaluated for their performance in two 12 ft (3.6 m) wide × 100 ft (30 m) low cost high tunnels and one 12 ft (3.6 m) wide × 100 ft (30 m) open field arrange-ments. Likewise, for the 2017–2018 growing season, LCHT and OF strawberry cultivars were the same with the exception of ‘Strawberry Festival’ which was replaced by ‘Florida Beauty’. For the final year, 2019–2020, LCHT and OF strawberry culti-vars were the same with the exception of WinterstarTM, which was replaced by ‘Florida Brilliance’. The objectives, methods and data analytical procedures were the same as those utilized in years 1 and year 2 studies (Bolques et al., 2018 and Bolques et al., 2019).
The soil at the study site is an Orangeburg loamy sand with moderate permeability and water holding capacity (USDA NRCS, 2017). Soil preparation consisted of growing a sunn hemp cover crop, Crotalaria juncea, during the late summer (Aug.–Sept.). The cover crop was selected for its ability to fix nitrogen and when incorporated into the soil, can release allelopathic compounds
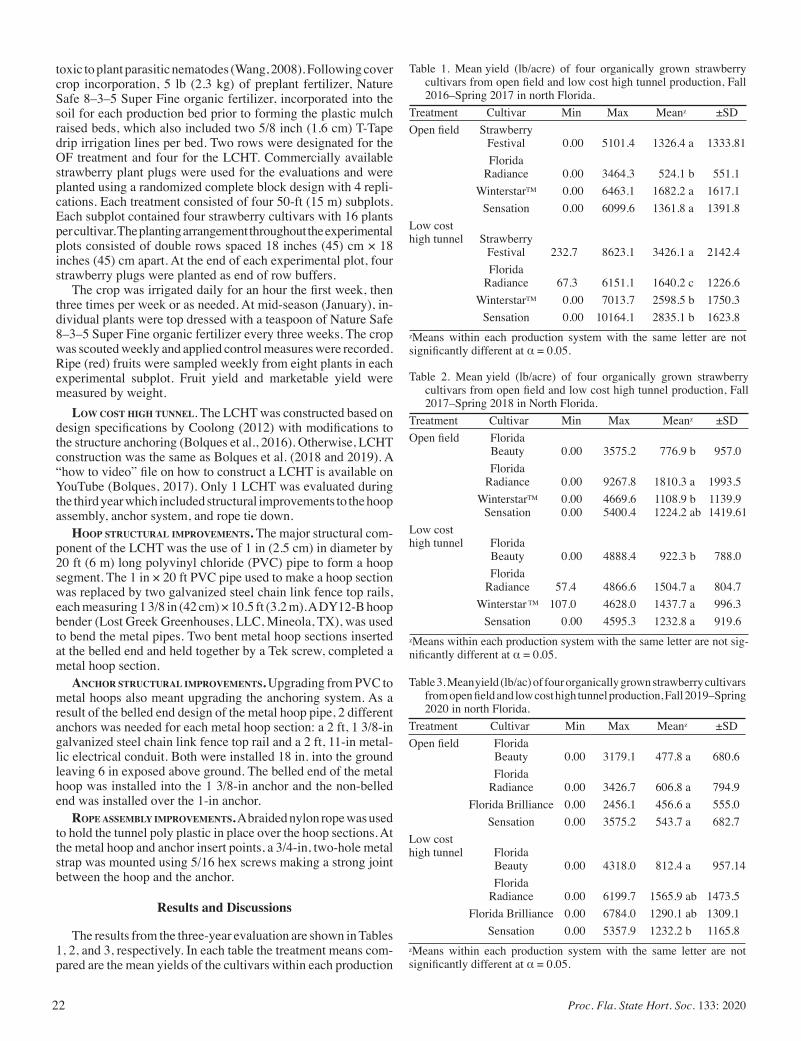
22 Proc. Fla. State Hort. Soc. 133: 2020
toxic to plant parasitic nematodes (Wang, 2008). Following cover crop incorporation, 5 lb (2.3 kg) of preplant fertilizer, Nature Safe 8–3–5 Super Fine organic fertilizer, incorporated into the soil for each production bed prior to forming the plastic mulch raised beds, which also included two 5/8 inch (1.6 cm) T-Tape drip irrigation lines per bed. Two rows were designated for the OF treatment and four for the LCHT. Commercially available strawberry plant plugs were used for the evaluations and were planted using a randomized complete block design with 4 repli-cations. Each treatment consisted of four 50-ft (15 m) subplots. Each subplot contained four strawberry cultivars with 16 plants per cultivar. The planting arrangement throughout the experimental plots consisted of double rows spaced 18 inches (45) cm × 18 inches (45) cm apart. At the end of each experimental plot, four strawberry plugs were planted as end of row buffers.
The crop was irrigated daily for an hour the first week, then three times per week or as needed. At mid-season (January), in-dividual plants were top dressed with a teaspoon of Nature Safe 8–3–5 Super Fine organic fertilizer every three weeks. The crop was scouted weekly and applied control measures were recorded. Ripe (red) fruits were sampled weekly from eight plants in each experimental subplot. Fruit yield and marketable yield were measured by weight.
low cost high tunnel. The LCHT was constructed based on design specifications by Coolong (2012) with modifications to the structure anchoring (Bolques et al., 2016). Otherwise, LCHT construction was the same as Bolques et al. (2018 and 2019). A “how to video” file on how to construct a LCHT is available on YouTube (Bolques, 2017). Only 1 LCHT was evaluated during the third year which included structural improvements to the hoop assembly, anchor system, and rope tie down.
hoop structurAl improvements. The major structural com-ponent of the LCHT was the use of 1 in (2.5 cm) in diameter by 20 ft (6 m) long polyvinyl chloride (PVC) pipe to form a hoop segment. The 1 in × 20 ft PVC pipe used to make a hoop section was replaced by two galvanized steel chain link fence top rails, each measuring 1 3/8 in (42 cm) × 10.5 ft (3.2 m). A DY12-B hoop bender (Lost Greek Greenhouses, LLC, Mineola, TX), was used to bend the metal pipes. Two bent metal hoop sections inserted at the belled end and held together by a Tek screw, completed a metal hoop section.
Anchor structurAl improvements. Upgrading from PVC to metal hoops also meant upgrading the anchoring system. As a result of the belled end design of the metal hoop pipe, 2 different anchors was needed for each metal hoop section: a 2 ft, 1 3/8-in galvanized steel chain link fence top rail and a 2 ft, 11-in metal-lic electrical conduit. Both were installed 18 in. into the ground leaving 6 in exposed above ground. The belled end of the metal hoop was installed into the 1 3/8-in anchor and the non-belled end was installed over the 1-in anchor.
rope Assembly improvements. A braided nylon rope was used to hold the tunnel poly plastic in place over the hoop sections. At the metal hoop and anchor insert points, a 3/4-in, two-hole metal strap was mounted using 5/16 hex screws making a strong joint between the hoop and the anchor.
Results and Discussions
The results from the three-year evaluation are shown in Tables 1, 2, and 3, respectively. In each table the treatment means com-pared are the mean yields of the cultivars within each production
Table 1. Mean yield (lb/acre) of four organically grown strawberry cultivars from open field and low cost high tunnel production, Fall 2016–Spring 2017 in north Florida.
Treatment Cultivar Min Max Meanz ±SDOpen field Strawberry Festival 0.00 5101.4 1326.4 a 1333.81 Florida Radiance 0.00 3464.3 524.1 b 551.1 WinterstarTM 0.00 6463.1 1682.2 a 1617.1 Sensation 0.00 6099.6 1361.8 a 1391.8Low costhigh tunnel Strawberry Festival 232.7 8623.1 3426.1 a 2142.4 Florida Radiance 67.3 6151.1 1640.2 c 1226.6 WinterstarTM 0.00 7013.7 2598.5 b 1750.3 Sensation 0.00 10164.1 2835.1 b 1623.8zMeans within each production system with the same letter are not significantly different at α = 0.05.
Table 2. Mean yield (lb/acre) of four organically grown strawberry cultivars from open field and low cost high tunnel production, Fall 2017–Spring 2018 in North Florida.
Treatment Cultivar Min Max Meanz ±SDOpen field Florida Beauty 0.00 3575.2 776.9 b 957.0 Florida Radiance 0.00 9267.8 1810.3 a 1993.5 WinterstarTM 0.00 4669.6 1108.9 b 1139.9 Sensation 0.00 5400.4 1224.2 ab 1419.61Low costhigh tunnel Florida Beauty 0.00 4888.4 922.3 b 788.0 Florida Radiance 57.4 4866.6 1504.7 a 804.7 Winterstar TM 107.0 4628.0 1437.7 a 996.3 Sensation 0.00 4595.3 1232.8 a 919.6zMeans within each production system with the same letter are not sig-nificantly different at α = 0.05.
Table 3. Mean yield (lb/ac) of four organically grown strawberry cultivars from open field and low cost high tunnel production, Fall 2019–Spring 2020 in north Florida.
Treatment Cultivar Min Max Meanz ±SDOpen field Florida Beauty 0.00 3179.1 477.8 a 680.6 Florida Radiance 0.00 3426.7 606.8 a 794.9 Florida Brilliance 0.00 2456.1 456.6 a 555.0 Sensation 0.00 3575.2 543.7 a 682.7Low costhigh tunnel Florida Beauty 0.00 4318.0 812.4 a 957.14 Florida Radiance 0.00 6199.7 1565.9 ab 1473.5 Florida Brilliance 0.00 6784.0 1290.1 ab 1309.1 Sensation 0.00 5357.9 1232.2 b 1165.8zMeans within each production system with the same letter are not significantly different at α = 0.05.
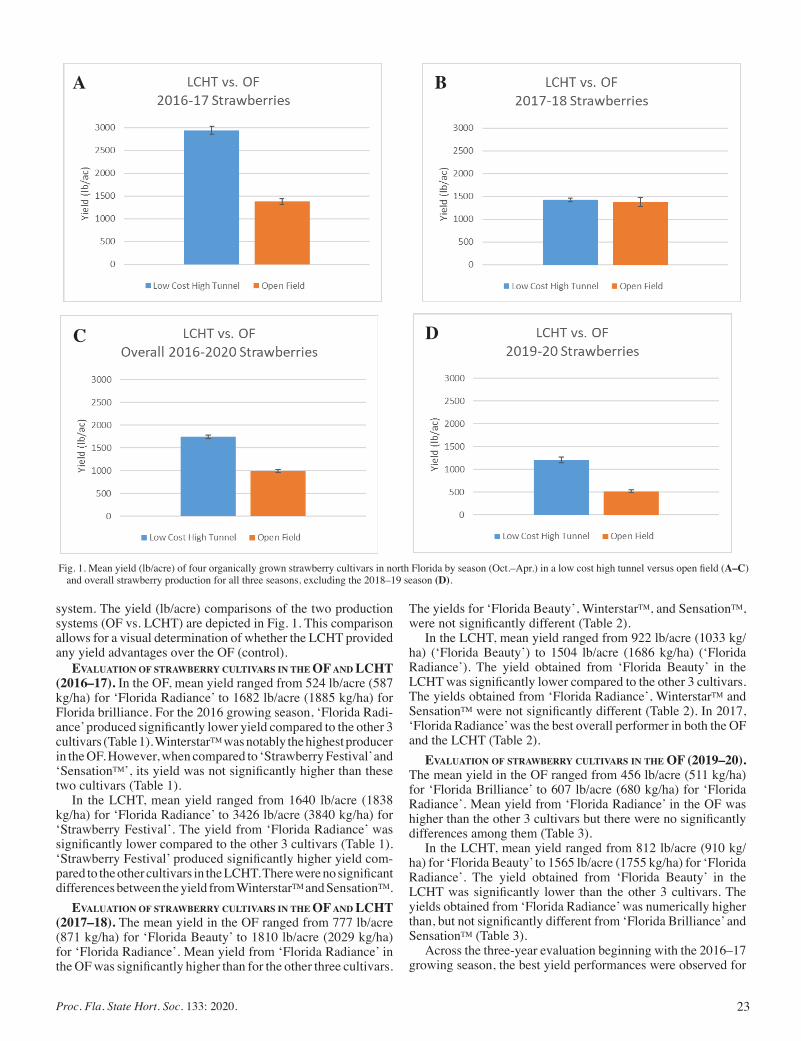
23Proc. Fla. State Hort. Soc. 133: 2020.
system. The yield (lb/acre) comparisons of the two production systems (OF vs. LCHT) are depicted in Fig. 1. This comparison allows for a visual determination of whether the LCHT provided any yield advantages over the OF (control).
evAluAtion of strAwberry cultivArs in the OF And LCHT (2016–17). In the OF, mean yield ranged from 524 lb/acre (587 kg/ha) for ‘Florida Radiance’ to 1682 lb/acre (1885 kg/ha) for Florida brilliance. For the 2016 growing season, ‘Florida Radi-ance’ produced significantly lower yield compared to the other 3 cultivars (Table 1). WinterstarTM was notably the highest producer in the OF. However, when compared to ‘Strawberry Festival’ and ‘SensationTM’, its yield was not significantly higher than these two cultivars (Table 1).
In the LCHT, mean yield ranged from 1640 lb/acre (1838 kg/ha) for ‘Florida Radiance’ to 3426 lb/acre (3840 kg/ha) for ‘Strawberry Festival’. The yield from ‘Florida Radiance’ was significantly lower compared to the other 3 cultivars (Table 1). ‘Strawberry Festival’ produced significantly higher yield com-pared to the other cultivars in the LCHT. There were no significant differences between the yield from WinterstarTM and SensationTM.
evAluAtion of strAwberry cultivArs in the OF And LCHT (2017–18). The mean yield in the OF ranged from 777 lb/acre (871 kg/ha) for ‘Florida Beauty’ to 1810 lb/acre (2029 kg/ha) for ‘Florida Radiance’. Mean yield from ‘Florida Radiance’ in the OF was significantly higher than for the other three cultivars.
Fig. 1. Mean yield (lb/acre) of four organically grown strawberry cultivars in north Florida by season (Oct.–Apr.) in a low cost high tunnel versus open field (A–C) and overall strawberry production for all three seasons, excluding the 2018–19 season (D).
A b
c d
The yields for ‘Florida Beauty’, WinterstarTM, and SensationTM, were not significantly different (Table 2).
In the LCHT, mean yield ranged from 922 lb/acre (1033 kg/ha) (‘Florida Beauty’) to 1504 lb/acre (1686 kg/ha) (‘Florida Radiance’). The yield obtained from ‘Florida Beauty’ in the LCHT was significantly lower compared to the other 3 cultivars. The yields obtained from ‘Florida Radiance’, WinterstarTM and SensationTM were not significantly different (Table 2). In 2017, ‘Florida Radiance’ was the best overall performer in both the OF and the LCHT (Table 2).
evAluAtion of strAwberry cultivArs in the OF (2019–20). The mean yield in the OF ranged from 456 lb/acre (511 kg/ha) for ‘Florida Brilliance’ to 607 lb/acre (680 kg/ha) for ‘Florida Radiance’. Mean yield from ‘Florida Radiance’ in the OF was higher than the other 3 cultivars but there were no significantly differences among them (Table 3).
In the LCHT, mean yield ranged from 812 lb/acre (910 kg/ha) for ‘Florida Beauty’ to 1565 lb/acre (1755 kg/ha) for ‘Florida Radiance’. The yield obtained from ‘Florida Beauty’ in the LCHT was significantly lower than the other 3 cultivars. The yields obtained from ‘Florida Radiance’ was numerically higher than, but not significantly different from ‘Florida Brilliance’ and SensationTM (Table 3).
Across the three-year evaluation beginning with the 2016–17 growing season, the best yield performances were observed for

24 Proc. Fla. State Hort. Soc. 133: 2020
WinterstarTM in the OF and ‘Strawberry Festival’ in the LCHT. For the 2017–18 growing season, ‘Florida Radiance’ performed best in both the OF and the LCHT. In 2019–20, ‘Florida Radi-ance’ also performed better in the OF and in the LCHT (Table 4 and Table 5, respectively).
evAluAting the of vs. LCHT. Total strawberry yields by production system was used to help determine the feasibility of growing in a low cost high tunnel vs. open field for small-scale strawberry production in north Florida. Temperatures below 30 °F (–1 °C) can be a common occurrence during the fall and winter months. While strawberry plants can tolerate temperatures near 22 °F (–6 °C) before serious damage to the plant crown occurs, many growers use frost blankets, row covers and latent heat from overhead irrigation to protect the crop from freezes. With the popularity and convenience of growing under cover, many small-scale farmers have begun to grow crops in high tunnels mainly because they provide a layer of protection against frost. A common high tunnel management practice is the closing or rolling down of poly plastic curtains and entry ways. The low
cost high tunnel evaluated has pull down sides along both sides of the structure to help insulate the crop against freeze and when pulled-up it acts to ventilate the interior of the structure.
It was observed that during the 2016–17 season there were two major freeze events where temperatures dropped as low as 23 °F (–5 °C). In 2017–18, there were five events reaching as low as 19 °F (–7 °C) and for the 2019–20 season there were three events where temperatures dropped to 26 °F (–3 °C). We believe that the 2017–18 freezing events may have caused plant growth to slow down considerably (Fig. 1). In this case, we conclude that the LCHT did not provide any statistically significant yield advantage over the OF. It must be mentioned however, that the LCHT provided other benefits such as: protection from frost, insect and disease management thereby improving plant health and quality of fruit. However, small-scale and limited resource farmers will still have to balance the additional cost of constructing a LCHT with the benefits it can provide before making a decision regarding whether or not to use it as an alternative production system for organically grown strawberries.
Literature Cited
Bolques, A., G. Queeley, F. Ospina, and V. Richardson. 2016. Season extension and overwintering of scotch bonnet hot pepper in north Florida. Proc. Fla. State Hort. Soc. 129:134–136.
Bolques, A. 2017. Steps to create a low cost high tunnel [Video file]. 4. October 2017. <https://www.youtube.com/watch?v=ILkWswp9jBM>.
Bolques, A., G. Queeley, F. Ospina, and V. Richardson. 2018. Low cost high tunnel versus open field production of organically grown strawberries in north Florida. Proc. Fla. State Hort. Soc. 131:106–109.
Bolques, A., G. Queeley, F. Ospina, and V. Richardson. 2019. Low cost high tunnel versus open field production of organically grown strawberries in north Florida: Second year evaluation. Proc. Fla. State Hort. Soc. 132:120–122.
Coolong, T. 2012. Low cost high tunnel construction. eXtension article, eOrganic 2311. 4 June 2016. <http://articles.extension.org/pages/18356/low-cost-high-tunnel-construction>.
Poling, B. 2013. Cold injury to strawberry crowns. 5 May 2017. <https://strawberries.ces.ncsu.edu/ 2010/03/cold-injury-to-strawberry-crowns/>.
United States Department of Agriculture, Natural Resources Conserva-tion Service. 2007. Soil survey of Gadsden County, Florida. Revised 2009. <http://soils.usda.gov/ survey/printed_surveys/>.
Wang, K-H. 2008. Sunn hemp and its allelopathic compounds for vegetable production in Hawaii and beyond. Western SARE Hawaii Conference. 15 Aug. 2018. <https://www.westernsare.org/Learning-Center/Conference-Materials/Western-SARE-Subregional-Materials/ Hawaii-Conference/Hawaii-Posters-and-Handouts>.
Whitaker, V.M., C.K. Chandler, BM. Santos, and N.A. Peres. 2012. WinterstarTM Brand (Florida 05-107) strawberry. HS1198. Horticultural Sciences Dept., University of Florida/IFAS, Gainesville, FL.
Whitaker, V.M., C.K. Chandler, and N.A. Peres. 2014. SensationTM Brand ‘Florida127’ Strawberry. HS1256. Horticultural Sciences Dept., University of Florida /IFAS, Gainesville, FL.
Table 4. Best vs. poor yielding strawberry cultivar performance by production season and production system.
Performance Season System Cultivarz
Best 2016–17 LCHTy Strawberry Festival 2017–18 OFx Fla Radiance 2019–20 LCHT Fla RadiancePoor 2016–17 OF Fla Radiance 2017–18 OF Fla Beauty 2019–20 OF Fla BrilliancezFor cultivars evaluated by season and production mean values refer appropriately to Table 1, 2, and 3.yLCHT = low cost high tunnel.xOF = open field.
Table 5. Highest yielding strawberry cultivarsz by production season and production system.
Season System Cultivarz
2016–17 OF WinterstarTM
LCHT Strawberry Festival2017–18 OF Fla Radiance LCHT Fla Radiance2019–20 OF Fla Radiance LCHT Fla RadiancezFor cultivars evaluated by season and production mean values refer appropriately to Table 1, 2, and 3.yLCHT = low cost high tunnel.xOF = open field.
25Proc. Fla. State Hort. Soc. 133: 2020.
Proc. Fla. State Hort. Soc. 133:25–27. 2020.
Krome Memorial Section
*Corresponding author. Email: [email protected]
Comparison of Drought Tolerance in Five Blueberry Cultivars by Using Dehydration Leaf Assay
Amir rezAzAdeh1* And eric T. STAfne2
1University of Florida/IFAS Extension St. Lucie County, 8400 Picos Rd., Ste 101, Fort Pierce, FL 34945
2Mississippi State University, South Mississippi Branch Experiment Station, 810 Highway 26 W. Poplarville, MS 39470
AdditionAl index words. dehydration, drought-tolerance
The effect of water stress on the physiological characteristics of two rabbiteye blueberry cultivars (‘Premier’ and ‘Climax’) and three Southern highbush cultivars (‘Star’, ‘Rebel’, and ‘Springhigh’) was investigated. A dehydration leaf assay was used to evaluate the drought-tolerance of blueberry types and cultivars. Fully developed leaves were placed in an airtight plastic box containing a salt solution for seven hours. This provided a controlled environment to study leaf water loss. Drought tolerance differed significantly between rabbiteye and southern highbush blueberries cultivars may indicate different sensitivites to dehydration. Despite having the highest stomatal density, ‘Rebel’ and ‘Springhigh’ lost the least amount of water, indicating they were least sensitive to dehydration. Application of abscisic acid (ABA) before the experiment decreased the amount of water loss in leaves, indicating the effectiveness of the as-say to detect different responses of leaves to dehydration. Water loss was significantly affected by leaf age as younger leaves lost more water compared to intermediate and old leaves. A leaf dehydration assay can be used as a simple and reliable method to compare plant responses to water stress among blueberry cultivars.
Drought stress is one of the major constraints limiting crop production worldwide. The water deficit adversely affects a plant’s phenology, development, and reproduction. Drought stress reduces water content, turgor loss, cell growth, leaf water potential, plant growth and development, and yield in the following season (Morales et al., 2013; Hazrati et al., 2016).
Plants respond to drought by stomatal closure to conserve water. Stomata allow for gas exchange by letting in carbon dioxide (CO2) essential for photosynthesis and regulating water movement through transpiration. Transpiration is affected by water deficiency. In response to a water deficit, guard cells play an important role by controlling transpiration and water loss by stomatal closure. Abscisic acid (ABA) is an important plant hormone which signals stomatal closure under abiotic conditions such as drought.
Southern highbush blueberry (Vaccinium corymbosum L.) is the most commercially important and commonly cultivated spe-cies of the genus Vaccinium in the southern U.S because of low chilling requirements and other adaptive features such as short fruit development periods and increased drought resistance that are inherited from an ancestor species (Lang, 1993). Few stud-ies have focused on the water relations of this species (Lareau, 1989). Highbush blueberry responds very quickly to water stress by reducing transpiration (Mingeau et al., 2001). The rabbiteye blueberry (V. ashei) has moderate drought tolerance compared to other crops such as field beans, sorghum, and apples due to a low critical water potential for stomatal closure and low tran-
spiration ratios (Davies and Johnson, 1982). It was also reported that ‘Bluegem’, a rabbiteye cultivar, had a relatively low critical water potential for stomatal closure and a low transpiration ratio.
There are few studies on the leaf level dehydration response of blueberry plants (Ameglio et al. 2000). Evaluation of drought tolerance in blueberry cultivars in the field requires many years for plant establishment because multiple environmental factors significantly affect plant growth and development. A leaf dehy-dration assay (Hooper et el., 2014) is a reliable way of pheno-typing blueberry cultivars for drought tolerance. The response of leaves in our study was consistent with reported field results. The objective of this study was to compare the relative drought tolerance of five blueberry cultivars based on their response to a leaf dehydration assay.
Materials and Methods
PlAnt mAteriAls. Two to three year old plants of southern highbush cultivars ‘Star’, ‘Rebe’, and ‘Springhigh’, and rabbiteye cultivars ‘Climax’ and ‘Premier’, were grown in 3-L pots contain-ing a mixture of coarsely ground pine bark and sand (1:1, vol:vol). Plants were grown in a glass greenhouse with supplemental LED lighting (16 h light) at 28 °C day/18 °C night. A slow-release fertilizer was added in one application after 2 weeks (15 g/pot). Fully developed leaves from each cultivar were selected. The leaves were considered “fully developed” when there was no additional increase in size.
leAf dehydrAtion AssAy. Four leaves were detached (with no petiole) from each plant (cultivar) and immediately placed in an airtight plastic box (1.2-L Rubbermaid Takealong© container, Newell Rubbermaid, Atlanta, GA) containing 50 mL of a 333 mM
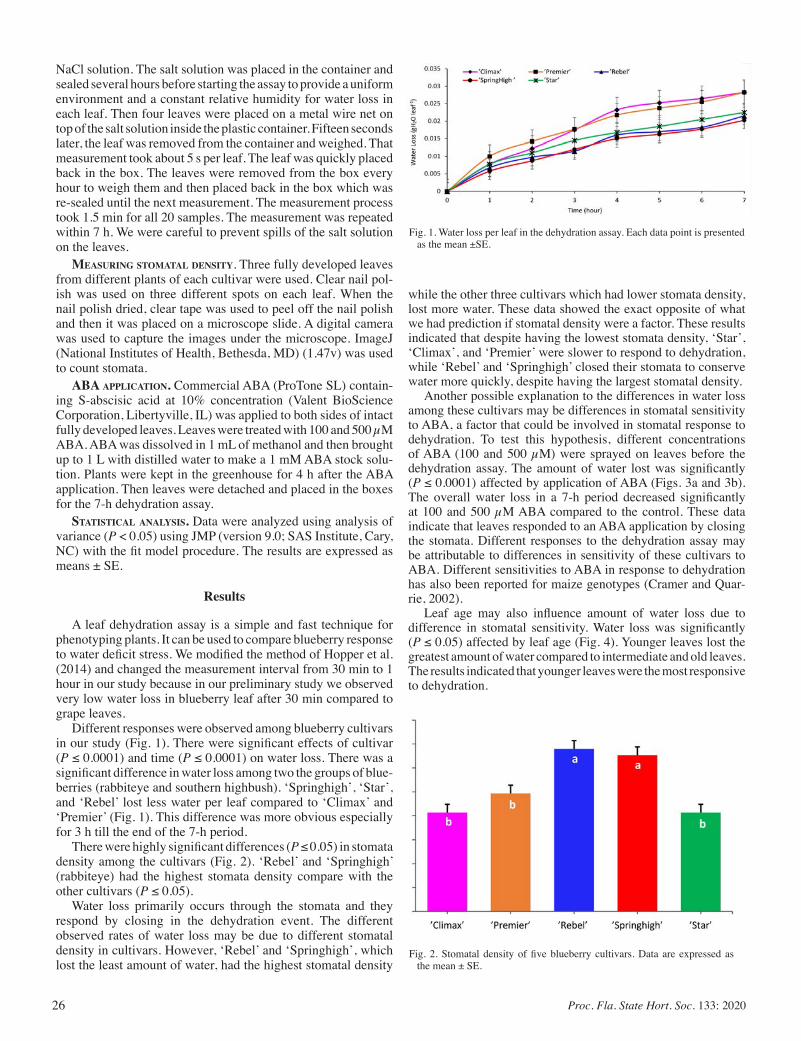
26 Proc. Fla. State Hort. Soc. 133: 2020
NaCl solution. The salt solution was placed in the container and sealed several hours before starting the assay to provide a uniform environment and a constant relative humidity for water loss in each leaf. Then four leaves were placed on a metal wire net on top of the salt solution inside the plastic container. Fifteen seconds later, the leaf was removed from the container and weighed. That measurement took about 5 s per leaf. The leaf was quickly placed back in the box. The leaves were removed from the box every hour to weigh them and then placed back in the box which was re-sealed until the next measurement. The measurement process took 1.5 min for all 20 samples. The measurement was repeated within 7 h. We were careful to prevent spills of the salt solution on the leaves.
meAsuring stomAtAl density. Three fully developed leaves from different plants of each cultivar were used. Clear nail pol-ish was used on three different spots on each leaf. When the nail polish dried, clear tape was used to peel off the nail polish and then it was placed on a microscope slide. A digital camera was used to capture the images under the microscope. ImageJ (National Institutes of Health, Bethesda, MD) (1.47v) was used to count stomata.
ABA APPlicAtion. Commercial ABA (ProTone SL) contain-ing S-abscisic acid at 10% concentration (Valent BioScience Corporation, Libertyville, IL) was applied to both sides of intact fully developed leaves. Leaves were treated with 100 and 500 µM ABA. ABA was dissolved in 1 mL of methanol and then brought up to 1 L with distilled water to make a 1 mM ABA stock solu-tion. Plants were kept in the greenhouse for 4 h after the ABA application. Then leaves were detached and placed in the boxes for the 7-h dehydration assay.
stAtisticAl AnAlysis. Data were analyzed using analysis of variance (P < 0.05) using JMP (version 9.0; SAS Institute, Cary, NC) with the fit model procedure. The results are expressed as means ± SE.
Results
A leaf dehydration assay is a simple and fast technique for phenotyping plants. It can be used to compare blueberry response to water deficit stress. We modified the method of Hopper et al. (2014) and changed the measurement interval from 30 min to 1 hour in our study because in our preliminary study we observed very low water loss in blueberry leaf after 30 min compared to grape leaves.
Different responses were observed among blueberry cultivars in our study (Fig. 1). There were significant effects of cultivar (P ≤ 0.0001) and time (P ≤ 0.0001) on water loss. There was a significant difference in water loss among two the groups of blue-berries (rabbiteye and southern highbush). ‘Springhigh’, ‘Star’, and ‘Rebel’ lost less water per leaf compared to ‘Climax’ and ‘Premier’ (Fig. 1). This difference was more obvious especially for 3 h till the end of the 7-h period.
There were highly significant differences (P ≤ 0.05) in stomata density among the cultivars (Fig. 2). ‘Rebel’ and ‘Springhigh’ (rabbiteye) had the highest stomata density compare with the other cultivars (P ≤ 0.05).
Water loss primarily occurs through the stomata and they respond by closing in the dehydration event. The different observed rates of water loss may be due to different stomatal density in cultivars. However, ‘Rebel’ and ‘Springhigh’, which lost the least amount of water, had the highest stomatal density
while the other three cultivars which had lower stomata density, lost more water. These data showed the exact opposite of what we had prediction if stomatal density were a factor. These results indicated that despite having the lowest stomata density, ‘Star’, ‘Climax’, and ‘Premier’ were slower to respond to dehydration, while ‘Rebel’ and ‘Springhigh’ closed their stomata to conserve water more quickly, despite having the largest stomatal density.
Another possible explanation to the differences in water loss among these cultivars may be differences in stomatal sensitivity to ABA, a factor that could be involved in stomatal response to dehydration. To test this hypothesis, different concentrations of ABA (100 and 500 µM) were sprayed on leaves before the dehydration assay. The amount of water lost was significantly (P ≤ 0.0001) affected by application of ABA (Figs. 3a and 3b). The overall water loss in a 7-h period decreased significantly at 100 and 500 µM ABA compared to the control. These data indicate that leaves responded to an ABA application by closing the stomata. Different responses to the dehydration assay may be attributable to differences in sensitivity of these cultivars to ABA. Different sensitivities to ABA in response to dehydration has also been reported for maize genotypes (Cramer and Quar-rie, 2002).
Leaf age may also influence amount of water loss due to difference in stomatal sensitivity. Water loss was significantly (P ≤ 0.05) affected by leaf age (Fig. 4). Younger leaves lost the greatest amount of water compared to intermediate and old leaves. The results indicated that younger leaves were the most responsive to dehydration.
Fig. 2. Stomatal density of five blueberry cultivars. Data are expressed as the mean ± SE.
Fig. 1. Water loss per leaf in the dehydration assay. Each data point is presented as the mean ±SE.
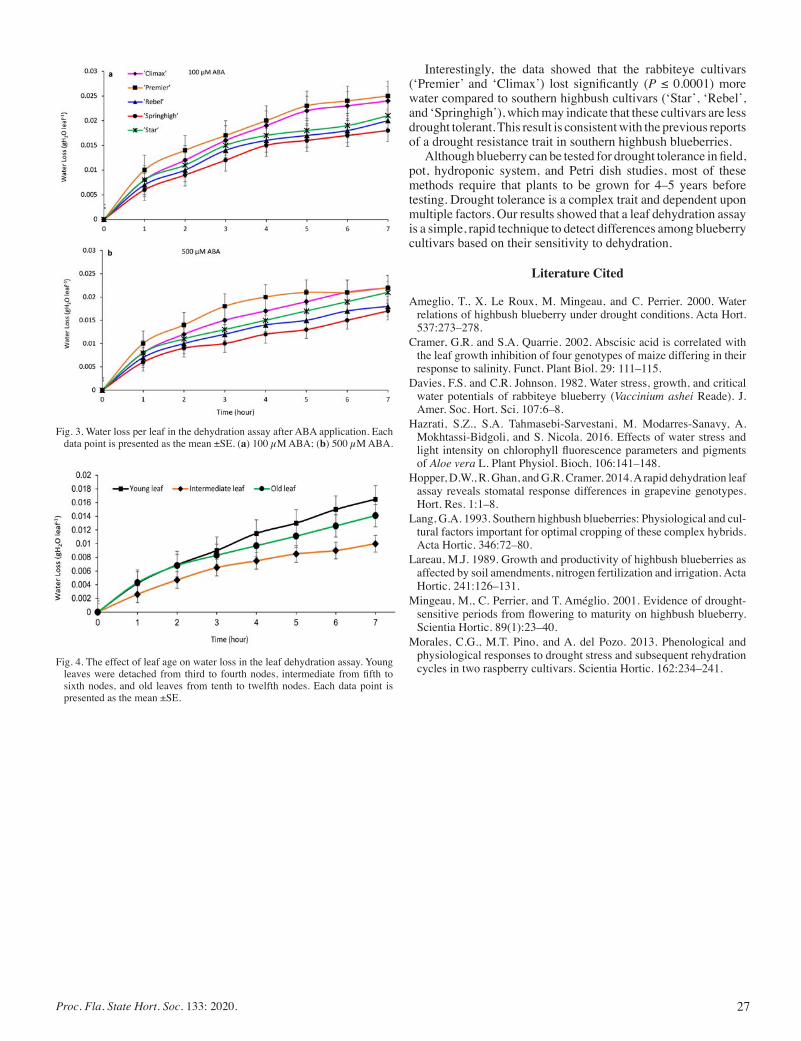
27Proc. Fla. State Hort. Soc. 133: 2020.
Interestingly, the data showed that the rabbiteye cultivars (‘Premier’ and ‘Climax’) lost significantly (P ≤ 0.0001) more water compared to southern highbush cultivars (‘Star’, ‘Rebel’, and ‘Springhigh’), which may indicate that these cultivars are less drought tolerant. This result is consistent with the previous reports of a drought resistance trait in southern highbush blueberries.
Although blueberry can be tested for drought tolerance in field, pot, hydroponic system, and Petri dish studies, most of these methods require that plants to be grown for 4–5 years before testing. Drought tolerance is a complex trait and dependent upon multiple factors. Our results showed that a leaf dehydration assay is a simple, rapid technique to detect differences among blueberry cultivars based on their sensitivity to dehydration.
Literature Cited
Ameglio, T., X. Le Roux, M. Mingeau, and C. Perrier. 2000. Water relations of highbush blueberry under drought conditions. Acta Hort. 537:273–278.
Cramer, G.R. and S.A. Quarrie. 2002. Abscisic acid is correlated with the leaf growth inhibition of four genotypes of maize differing in their response to salinity. Funct. Plant Biol. 29: 111–115.
Davies, F.S. and C.R. Johnson. 1982. Water stress, growth, and critical water potentials of rabbiteye blueberry (Vaccinium ashei Reade). J. Amer. Soc. Hort. Sci. 107:6–8.
Hazrati, S.Z., S.A. Tahmasebi-Sarvestani, M. Modarres-Sanavy, A. Mokhtassi-Bidgoli, and S. Nicola. 2016. Effects of water stress and light intensity on chlorophyll fluorescence parameters and pigments of Aloe vera L. Plant Physiol. Bioch. 106:141–148.
Hopper, D.W., R. Ghan, and G.R. Cramer. 2014. A rapid dehydration leaf assay reveals stomatal response differences in grapevine genotypes. Hort. Res. 1:1–8.
Lang, G.A. 1993. Southern highbush blueberries: Physiological and cul-tural factors important for optimal cropping of these complex hybrids. Acta Hortic. 346:72–80.
Lareau, M.J. 1989. Growth and productivity of highbush blueberries as affected by soil amendments, nitrogen fertilization and irrigation. Acta Hortic. 241:126–131.
Mingeau, M., C. Perrier, and T. Améglio. 2001. Evidence of drought-sensitive periods from flowering to maturity on highbush blueberry. Scientia Hortic. 89(1):23–40.
Morales, C.G., M.T. Pino, and A. del Pozo. 2013. Phenological and physiological responses to drought stress and subsequent rehydration cycles in two raspberry cultivars. Scientia Hortic. 162:234–241.
Fig. 3. Water loss per leaf in the dehydration assay after ABA application. Each data point is presented as the mean ±SE. (a) 100 µM ABA; (b) 500 µM ABA.
Fig. 4. The effect of leaf age on water loss in the leaf dehydration assay. Young leaves were detached from third to fourth nodes, intermediate from fifth to sixth nodes, and old leaves from tenth to twelfth nodes. Each data point is presented as the mean ±SE.
28 Proc. Fla. State Hort. Soc. 133: 2020
Proc. Fla. State Hort. Soc. 133:28. 2020.
Krome Memorial Section
*Corresponding author. Email: [email protected]
—Scientific Note—
Artificial Chilling for Blackberry Production in Florida Jonathan Denison1, Christianah olaDoye2, Jeffrey Williamson1,
anD GuoDonG liu1*1Horticultural Sciences Department, University of Florida IFAS, P.O. Box 110690,
Gainesville, FL 326112Clemson University, Edisto Research Station, 64 Research St., Blackville, SC 29817
AdditionAl index words. artificial cooling unit; blackberry yield, vernalization
The devastation of Florida’s citrus injury caused by citrus greening disease (HLB) has created a need for alternative crops to replace citrus. Blackberry is a crop with some potential to fill this gap, given the experience commercial growers in Florida have with other berry crops. However, blackberry cultivars have variable chill-ing requirements for productive fruiting (Yazzetti and Clark, 2001). Florida currently has only a small amount of commercial blackberry production, mostly using Arkansas blackberry cultivars, which require more chilling than is available in most of Florida (Andersen and Crocker, 2013). The objectives of this study are to quantify the yield increases possible from additional chilling and to explore the viability of artificial cooling systems to provide needed chilling requirements for Florida blackberry production.
This experiment was a field trial continuation of a trial took place in 2019 at the University of Florida IFAS greenhouses in Gainesville, FL. Two blackberry cultivars commonly grown in Northern Florida, ‘Natchez’ and ‘Ouachita’, were used in the trial. Plants from each variety were split into four groups: one untreated control that remained outdoors over the winter, and three treated groups that were artificially chilled in an insulated refrigeration unit at 4 °C for either 250, 500, or 750 h. The treated plants received artificial lighting while in the cooling unit and were placed with the control plants after receiving the prescribed number of chilling hours. After all chilling treatments were applied, the potted plants were grown at a commercial organic blackberry farm near Hawthorne, FL. Fruit were counted and harvested regularly during ripening and yield was recorded.
The yield data from 2020 showed an increase in yield in ‘Ouachita’ from the control to the 500-hour treat-ment and a decrease in yield beyond 500 hours. ‘Natchez’ increased in yield with every increase in chilling hours, although yields of both varieties, and especially ‘Ouachita’ were lower than they had been in 2019. This is likely the result of significant plant mortality and stunting from cane blight, which affected plants from both varieties, but particularly ‘Ouachita’. Despite these setbacks, the data show a similar trend to data from the 2019 trial. In both years ‘Ouachita’ had the highest yield at 500 chilling hours. In 2019 this was significantly higher than the control but not the 250- or 750-h treatments. ‘Natchez’ seemed to trend towards higher yields with each additional increment of chilling hours. While this research shows some promising trends, further studies are needed to get a consistent, statistically significant result. Furthermore, the viability of artificial cooling for com-mercial production is still very much in doubt, and further research should explore its viability and alternatives. Additional research on this topic should be expanded to search for other viable cultivars for Florida production, as well as breeding Florida-adapted cultivars.
Literature Cited
Andersen, P.C. and T.E. Crocker. 2013. The blackberry. Florida Small Farms and Alternative Enterprises Conference. University of Florida-IFAS and Florida Agricultural and Mechanical University-CAPS.
Yazzetti, D. and J.R. Clark. 2001. Evaluation of chilling requirements for six Arkansas blackberry cultivars utilizing stem cuttings. Discovery, The Student Journal of Dale Bumpers College of Agricultural, Food and Life Sciences. 2:57–62.
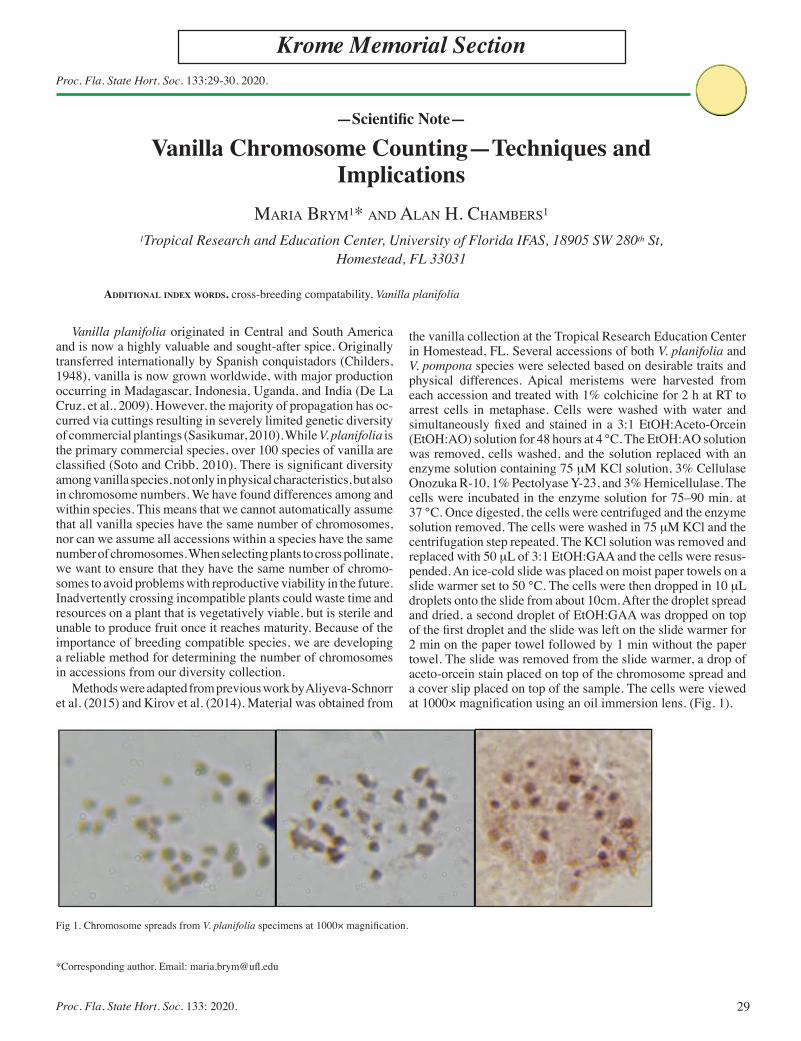
29Proc. Fla. State Hort. Soc. 133: 2020.
Proc. Fla. State Hort. Soc. 133:29-30. 2020.
Krome Memorial Section
*Corresponding author. Email: [email protected]
—Scientific Note—
Vanilla Chromosome Counting—Techniques and Implications
Maria BryM1* and alan H. CHaMBers1
1Tropical Research and Education Center, University of Florida IFAS, 18905 SW 280th St, Homestead, FL 33031
AdditionAl index words. cross-breeding compatability, Vanilla planifolia
Vanilla planifolia originated in Central and South America and is now a highly valuable and sought-after spice. Originally transferred internationally by Spanish conquistadors (Childers, 1948), vanilla is now grown worldwide, with major production occurring in Madagascar, Indonesia, Uganda, and India (De La Cruz, et al., 2009). However, the majority of propagation has oc-curred via cuttings resulting in severely limited genetic diversity of commercial plantings (Sasikumar, 2010). While V. planifolia is the primary commercial species, over 100 species of vanilla are classified (Soto and Cribb, 2010). There is significant diversity among vanilla species, not only in physical characteristics, but also in chromosome numbers. We have found differences among and within species. This means that we cannot automatically assume that all vanilla species have the same number of chromosomes, nor can we assume all accessions within a species have the same number of chromosomes. When selecting plants to cross pollinate, we want to ensure that they have the same number of chromo-somes to avoid problems with reproductive viability in the future. Inadvertently crossing incompatible plants could waste time and resources on a plant that is vegetatively viable, but is sterile and unable to produce fruit once it reaches maturity. Because of the importance of breeding compatible species, we are developing a reliable method for determining the number of chromosomes in accessions from our diversity collection.
Methods were adapted from previous work by Aliyeva-Schnorr et al. (2015) and Kirov et al. (2014). Material was obtained from
the vanilla collection at the Tropical Research Education Center in Homestead, FL. Several accessions of both V. planifolia and V. pompona species were selected based on desirable traits and physical differences. Apical meristems were harvested from each accession and treated with 1% colchicine for 2 h at RT to arrest cells in metaphase. Cells were washed with water and simultaneously fixed and stained in a 3:1 EtOH:Aceto-Orcein (EtOH:AO) solution for 48 hours at 4 °C. The EtOH:AO solution was removed, cells washed, and the solution replaced with an enzyme solution containing 75 mM KCl solution, 3% Cellulase Onozuka R-10, 1% Pectolyase Y-23, and 3% Hemicellulase. The cells were incubated in the enzyme solution for 75–90 min. at 37 °C. Once digested, the cells were centrifuged and the enzyme solution removed. The cells were washed in 75 mM KCl and the centrifugation step repeated. The KCl solution was removed and replaced with 50 mL of 3:1 EtOH:GAA and the cells were resus-pended. An ice-cold slide was placed on moist paper towels on a slide warmer set to 50 °C. The cells were then dropped in 10 mL droplets onto the slide from about 10cm. After the droplet spread and dried, a second droplet of EtOH:GAA was dropped on top of the first droplet and the slide was left on the slide warmer for 2 min on the paper towel followed by 1 min without the paper towel. The slide was removed from the slide warmer, a drop of aceto-orcein stain placed on top of the chromosome spread and a cover slip placed on top of the sample. The cells were viewed at 1000× magnification using an oil immersion lens. (Fig. 1).
Fig 1. Chromosome spreads from V. planifolia specimens at 1000× magnification.

30 Proc. Fla. State Hort. Soc. 133: 2020
Using these methods, we were able to identify differences in our collection among different species, but also within species. Among V. planifolia, we found the most common number of chromosomes was 28. However, among V. pompona, we found either 24 or 28 chromosomes. This technique will allow us to continue screening our collection and determine which species are compatible for cross breeding.
While traditional methods may not always be effective, many methods exist for counting chromosomes. Reliable methods of chromosome counting are crucial to the success of our breeding program and we will continue to learn more about the diversity of our collection as we process more samples.
Literature CitedAliyeva-Schnorr, L., L. Ma, and A. Houben, 2015. A fast air-dry drop-
ping chromosome preparation method suitable for FISH in plants. J Visual. Expt: JoVE. 106:e53470.
Childers, N.F. 1948. Vanilla culture in Puerto Rico. U.S. Dept. Agric.,Washington, D.C. No. 28.
De La Cruz Medina, J., G.C. Rodriguez Jiménes, and H.S. García. 2009. Vanilla: Post-harvest operations. Food and Agriculture Organization of the United Nations, Rome.
Kirov, I., M.Divashuk, K.Van Laere, A. Soloviev, and L. Khrustaleva. 2014. An easy “SteamDrop” method for high quality plant chromosome preparation. Mol. Cytogenet. 7:21.
Sasikumar, Bhas. 2010. Vanilla breeding—A review. Agric. Rev. V. 31. Soto Arenas, Miguel A., and Phillip Cribb. 2010. A new infrageneric
classification and synopsis of the genus Vanilla Plum. ex Mill. (Orchi-daceae: Vanillinae). Lankesteriana. 9(3):355–398.
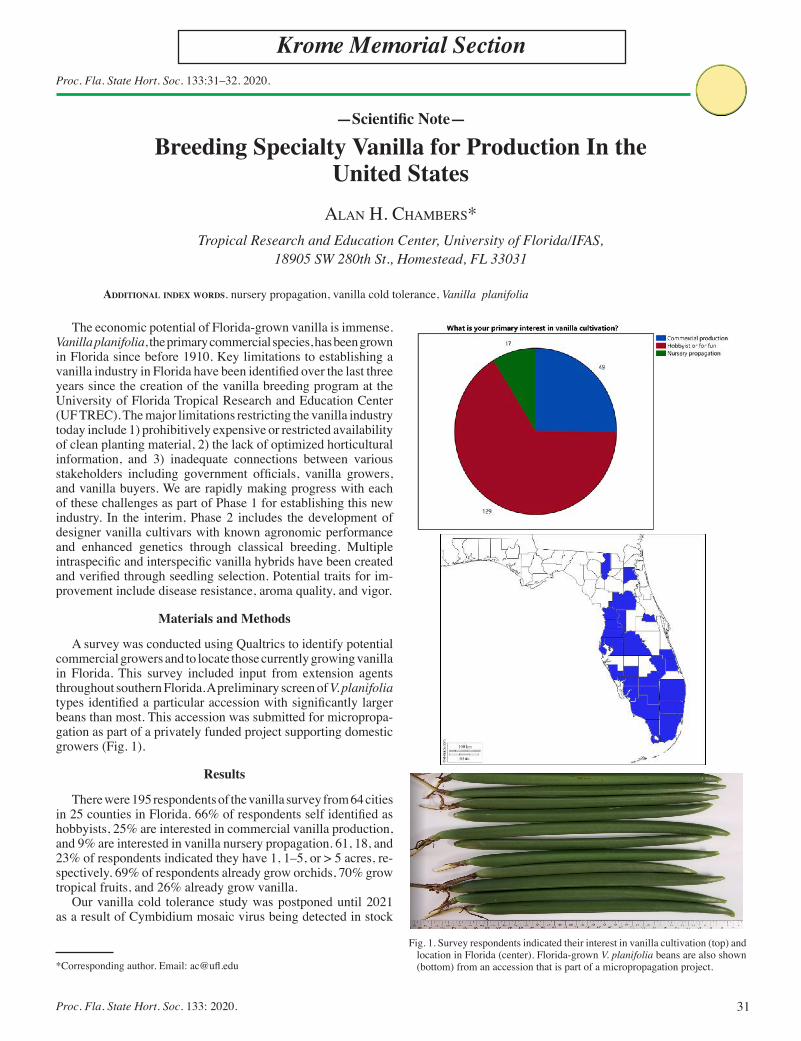
31Proc. Fla. State Hort. Soc. 133: 2020.
Proc. Fla. State Hort. Soc. 133:31–32. 2020.
Krome Memorial Section
*Corresponding author. Email: [email protected]
—Scientific Note—
Breeding Specialty Vanilla for Production In the United States
AlAn H. CHAmbers*Tropical Research and Education Center, University of Florida/IFAS,
18905 SW 280th St., Homestead, FL 33031
AdditionAl index words. nursery propagation, vanilla cold tolerance, Vanilla planifolia
Fig. 1. Survey respondents indicated their interest in vanilla cultivation (top) and location in Florida (center). Florida-grown V. planifolia beans are also shown (bottom) from an accession that is part of a micropropagation project.
The economic potential of Florida-grown vanilla is immense. Vanilla planifolia, the primary commercial species, has been grown in Florida since before 1910. Key limitations to establishing a vanilla industry in Florida have been identified over the last three years since the creation of the vanilla breeding program at the University of Florida Tropical Research and Education Center (UF TREC). The major limitations restricting the vanilla industry today include 1) prohibitively expensive or restricted availability of clean planting material, 2) the lack of optimized horticultural information, and 3) inadequate connections between various stakeholders including government officials, vanilla growers, and vanilla buyers. We are rapidly making progress with each of these challenges as part of Phase 1 for establishing this new industry. In the interim, Phase 2 includes the development of designer vanilla cultivars with known agronomic performance and enhanced genetics through classical breeding. Multiple intraspecific and interspecific vanilla hybrids have been created and verified through seedling selection. Potential traits for im-provement include disease resistance, aroma quality, and vigor.
Materials and Methods
A survey was conducted using Qualtrics to identify potential commercial growers and to locate those currently growing vanilla in Florida. This survey included input from extension agents throughout southern Florida. A preliminary screen of V. planifolia types identified a particular accession with significantly larger beans than most. This accession was submitted for micropropa-gation as part of a privately funded project supporting domestic growers (Fig. 1).
Results
There were 195 respondents of the vanilla survey from 64 cities in 25 counties in Florida. 66% of respondents self identified as hobbyists, 25% are interested in commercial vanilla production, and 9% are interested in vanilla nursery propagation. 61, 18, and 23% of respondents indicated they have 1, 1–5, or > 5 acres, re-spectively. 69% of respondents already grow orchids, 70% grow tropical fruits, and 26% already grow vanilla.
Our vanilla cold tolerance study was postponed until 2021 as a result of Cymbidium mosaic virus being detected in stock

32 Proc. Fla. State Hort. Soc. 133: 2020
plants. Privately funded propagation activities will ensure clean stock material in the future.
Conclusions
Increasing exposure to our vanilla research is elevating the vanilla program. About 400 potential growers in Florida have expressed interest in vanilla cultivation. Surveys have identified
that most of these are small acreage growers in southern Florida. The vanilla cold tolerance study scheduled for 2020 has been delayed until 2021 due to nursery plants testing positive for Cym-bidium mosaic virus. The ultimate impact of this virus on plant productivity is unknown, but distributing virus-infected plants is not an option. The propagation of an exceptional, Florida-adapted V. planifolia will ensure sufficient planting materials for Florida vanilla growers from 2021 into the future.
33Proc. Fla. State Hort. Soc. 133: 2020.
Proc. Fla. State Hort. Soc. 133:33. 2020.
Krome Memorial Section
The project Ionic Movement in Soil would like to thank El Colegio de Michoacán and LADiPA Laboratory.*Corresponding author. Email: [email protected]
—Scientific Note—
Fertigation in Avocado: Monitoring Soil Ions as a Diagnosis in Nutrition
EstEban sánchEz-RodRíguEz1, VíctoR gaRcía-gaytán1*, and JEsús bautista2
1Laboratorio de Análisis y Diagnóstico del Patrimonio (LADIPA), EI Colegio de Michoacán, A.C., Mexico
2Department of Horticulture, University of Georgia, 2360 Rainwater Road, Tifton, GA 31793
AdditionAl index words. diagnosis, fertigation, nutrition
Mexico is one of the main avocado exporters worldwide. Mexico produces three main varieties—‘Hass’, ‘Criollo’, and ‘Fuerte’. A few years ago, the main buyer was the United States. However, interest has increased in countries and regions such as Japan, the European Union and Latin America. These new customers are a benefit for producers and for the entire value chain. Most avocado fertilizers are broadcast on the soil surface which can lead to losses of N through immobilization, denitrification and volatilization.
Performance and quality for avocado can be improved if nutrition is optimized, this includes the composition of the nutrient solution, electrical conductivity (EC) and pH. When roots absorb excessive cations, they offset this by excreting protons (H+), which leads to acidification of the rhizosphere. When they absorb more anions, roots excrete hydroxyl (OH-), which leads to alkalization of the rhizosphere. Fertigation using the correct combination of water and nutrients can produce high yields and high quality fruits and vegetables.
Fertigation uses both nutrients and water more efficiently than broadcast fertilizer applications and non-targeted water use (such as furrow irrigation). An increase in fertigation frequency can reduce the concentration of im-mobile macronutrients, such as phosphorus (P), potassium (K), and micronutrients. Nutrients should also not be added during the entirety of long irrigation runs. Micronutrients, may be applied through the irrigation system in chelated form without causing any precipitation. Through good management, it is possible to increase water use efficiency (WUE).
Materials and Methods
The study was carried out on 98.84 acres in the avocado region of Michoacan, Mexico. Extractors of the soil solution “Chupatubos” were installed in the area of the irrigation bulb, at a depth of 60 cm. Evaluations took place during the months of July and August (rains) 2019. Laboratory analysis of soil and water quality was carried out prior to the application of the nutrient solution. The nutrient solution should consider the relationship between the cations (meq·L-1) (7 K+, 9 Ca++, and 4 Mg++) and anions (meq·L-1) (12 NO3
-, 1 H2PO4-, 7 SO4
=), the combination that corresponds to electrical conductivity (EC) 2.0 dS·m-1.
Results and Discussion
Five samples of the extractors were collected and analyzed with field-specific ion sensors (NO3-, K+, Ca++,
Mg++, Na+, pH, and EC). The concentration of potassium, calcium, magnesium (meq·L-1) were below the dose ap-plied by fertigation. There was variation in the dynamics of NO3
-. Of the five samples analyzed, three were within the target range for the initial nutrient solution preparation. Potassium, calcium, and magnesium were quickly absorbed by the roots of the plants. While the soil nitrate solution is governed by the rapid use of the plant and/or by its rapid infiltration into the soil, both of which are affected by the solubility of the fertilizers. It is necessary to monitor the nutrients in the soil solution applied by fertigation to monitor nutrition programs.
34 Proc. Fla. State Hort. Soc. 133: 2020
Proc. Fla. State Hort. Soc. 133:34–41. 2020.
Krome Memorial Section
Exogenous Gibberellic Acid andCytokinin Effects on Budbreak,Flowering, and Yield of BlackberryGrown under Subtropical ClimaticConditionsSyuan-You Lin and Shinsuke AgeharaGulf Coast Research and Education Center, Institute of Food andAgricultural Sciences, University of Florida, 14625 CR 672, Wimauma, FL33598
Additional index words. Bramble, dormancy, flower abortion, plant growth regulator, Rubus
Abstract. In subtropical climates, inadequate winter chill limits blackberry (Rubus L.subgenus Rubus Watson) production by causing poor and erratic floral budbreak. Tocompensate for a lack of chilling, bud dormancy-breaking agents must be developed forsubtropical blackberry production. Our previous study showed that gibberellic acid(GA3) promotes budbreak in three blackberry cultivars but has potential negative side effects on floral development in ‘Natchez’. 6-benzyladenine (6-BA) is a syntheticcytokinin that can act as an antagonist of gibberellins during floral transition. Theobjectives of this study were to evaluate cultivar 3 exogenous GA3 interactions, characterize dose effects of exogenous GA3, and examine synergistic effects of GA3 and 6-BA. Three field experiments were conducted in west central Florida. All spraytreatments were applied at the end of the chilling period. In the first experiment,‘Natchez’, ‘Navaho’, and ‘Ouachita’ were treated with GA3 at 0 or 99 g·haL1. Budbreak was promoted by exogenous GA3 in all three cultivars (0.9% to 4.5% vs. 42.9% to69.4%), but yield responses varied considerably. Exogenous GA3 increased the yield of‘Navaho’ and ‘Ouachita’ by 560% to 931%, whereas it induced flower abortion andcaused a 15% yield reduction in ‘Natchez’. In the second experiment, ‘Natchez’ wastreated with GA3 at 0, 25, 99, or 198 g·haL1. Budbreak increased linearly with GA3, but yield decreased exponentially with GA3 because of dose-dependent flower abortion. Inthe third experiment, ‘Natchez’ was subjected to five treatments: 1) water control; 2)GA3 spray application; 3) 6-BA spray application; 4) combined spray application of GA3 and 6-BA; and 5) sequential spray application of 6-BA at 9 days after GA3 application.Application rates were 99 and 47 g·haL1 for GA3 and 6-BA, respectively. Exogenous 6-BA suppressed GA3-induced flower abortion only to a limited extent. As a result, GA3-containing treatments caused 65% to 83% yield reductions compared with the control (2382 vs. 410–823 g/plant). These results demonstrate that GA3 is a highly effective bud dormancy-breakingagent for blackberry. However, the drawback of GA3 is cultivar-dependent flower abortion, which cannot be fully mitigated by 6-BA. The use of GA3 can be an important management practice for subtropical blackberry production, but its practical imple-mentation must consider cultivar-dependent responses.
Blackberry (Rubus L. subgenus RubusWatson) is a deciduous berry crop grownprimarily in temperate regions. In recentyears, the global blackberry industry hasgrown significantly, driven by increased con-sumer demand, year-round product avail-ability, improved cultivars, and advancedproduction methods (Clark and Finn, 2014).The leading producers include the UnitedStates, Serbia, Hungary, Mexico, and China(Strik et al., 2007). In the United States,blackberry is the fourth most economicallyimportant berry crop, generating $697 mil-lion in retail sales during 2019 (CaliforniaStrawberry Commission, 2019). Althoughblackberry production was traditionally con-centrated in the West Coast of the UnitedStates, it is currently expanding to the South-eastern United States (Clark and Finn, 2014),
where the production acreage increased by52% (996 vs. 1512 ha) from 2007 to 2017(USDA, 2017).
Adequate winter chill is a prerequisite forsuccessful commercial production of manytemperate fruit crops (Atkinson et al., 2013;Luedeling et al., 2011). For blackberry, budsmust be exposed to a certain amount of winterchill to break bud dormancy in spring. Thisso-called chilling requirement (CR), gener-ally calculated as cumulative hours at tem-peratures below 7.2 �C, varies from 300 to900 h among current major floricane-fruitingblackberry cultivars (Carter et al., 2006;Drake and Clark, 2000). In subtropical cli-mates, mild winter temperatures barely sat-isfy the CR, resulting in incomplete buddevelopment, poor and erratic budbreak,prolonged flowering, nonsynchronous fruit
set, and, ultimately, low fruit yield (Fearand Meyer, 1993; Lin and Agehara, 2020).Therefore, commercial blackberry produc-tion in Florida is limited mostly to small-scale U-pick operations for the local market(Andersen, 2007). Bud dormancy-breakingagents must be developed to improve theproductivity and consistency of subtropicalblackberry production.
Bioactive gibberellins (GA), such as GA3
and GA4, have important roles in the regula-tion of dormancy release in many perennialcrops (Horvath et al., 2003; Ionescu et al.,2016). The high efficacy of exogenous GA toinduce budbreak of fruit and nut crops hasbeen reported for sweet cherry (Prunus aviumL.) (Cai et al., 2019; Vimont et al., 2018),peach (Prunus persica L.) (Chauhan et al.,1961; Donoho and Walker, 1957), pistachio(Pistacia vera L.) (Tzoutzoukou et al., 1998),and Japanese apricot (Prunus mume Sieb. etZucc) (Zhuang et al., 2013). For blackberry,however, exogenous GA has been tested byonly a few studies. Our previous study foundthat exogenous GA3 was highly effective foradvancing the onset of budbreak and increas-ing the yield of ‘Ouachita’ blackberry grownin central Florida (Lin and Agehara, 2020).
Exogenous GA3 exerts different effectson floral development depending on the de-velopment stage (Yamaguchi et al., 2014;Yamaguchi, 2008). GA application duringdormancy can induce budbreak, but applica-tion during flowering or fruit setting canresult in flower or fruit abortion (Southwickand Glozer, 2000). Our previous study foundthat exogenous GA3 applied at the budbreakinitiation stage promoted budbreak butcaused a nonsignificant yield reduction in‘Natchez’ blackberry, suggesting its potentialnegative side effects on floral development(Lin and Agehara, 2020). Cytokinins act asan antagonist of GA during floral transition inapple (Malus ·domestica Borkh.) by upregu-lating the expression of GA degradationgenes and repressing the GA signaling path-way (Li et al., 2018, 2019). In lupin (Lupinusangustifolius L.), the application of 6-benzy-ladenine (6-BA), a synthetic cytokinin, at2 mM completely prevented flower abortion(Atkins and Pigeaire, 1993). Therefore, com-bined application of GA3 and cytokinins mayprovide synergistic effects. In fact, Galindo-Reyes et al. (2004) reported a 421% yieldincrease in ‘Comanche’ blackberry treatedwith both GA3 and thidiazuron, which is acytokinin-like substance. However, individ-ual effects of GA3 and thidiazuron were notevaluated in their study.
The goal of this study was to optimize theapplication protocol of GA3 as a buddormancy-breaking method for subtropicalblackberry production. We evaluated cultivar· exogenous GA3 interactions, characterizeddose effects of exogenous GA3, and exam-ined synergistic effects of GA3 and 6-BA.
Materials and Methods
Experiment sites and plant material. Onefield experiment was conducted at the

35Proc. Fla. State Hort. Soc. 133: 2020.
University of Florida’s Gulf Coast Researchand Education Center in Balm, FL (lat.27�76#N, long. 82�23#W; elevation 39 m)during the 2017 to 2018 season (Expt. 1).Three erect, floricane-fruiting cultivars,Natchez, Navaho, and Ouachita, with esti-mated CRs of 300, 800 to 900, and 400 to500 h, respectively, were used (Drake andClark, 2000; McWhirt, 2016). Plants wereestablished in wooden planter boxes (length3.7m ·width 0.6 m · height 0.3 m) filledwithaged pine bark in Apr. 2013. Each plot (ex-periment unit) consisted of six plants. Plantswere spaced at 0.61mwithin a row and 1.83mbetween rows, and they were grown under a40% black shadecloth to reduce fruit damagecaused by excessive heat and rain. For trailingblackberry canes, we used a three-wire T-trellis system with the upper, middle, andlower wires positioned at 1.5, 1.1, and 0.7 mfrom the ground, respectively. We prunedfloricanes at the ground level after harvestingwas completed. Newly emerged primocaneswere pruned to five canes per plant andtipped when they reached the top wire.Laterals were trained and tied on the closestwires. Blackberry production and cane man-agement practices recommended in thesoutheast region were followed (Fernandezand Krewer, 2008).
Two field experiments were conductedat a commercial blackberry farm located inPlant City, FL (lat. 28�03#N, long. 82�19#W;elevation 39 m) during the 2017 to 2018(Expt. 2) and 2018 to 2019 (Expt. 3) seasons.‘Natchez’ blackberry tissue culture seedlingswere transplanted in raised beds in the openfield in 2015. Each plot consisted of four andfive plants for Expt. 2 and Expt. 3, respec-tively. Plants were spaced at 0.9 m withinrows and 3.6 m between rows. Beds werecovered with black landscape fabric andnorth–south-oriented with a planting densityof 3237 plants/ha. Plants were trained to athree-wire vertical trellis with the upper,middle, and lower wires positioned at 1.4,0.9, and 0.4 m from the ground, respectively.Primocanes were tipped to encourage lateral
growth when they reached the lowest wire.Primocanes were then tied to the trellis andtrained to loop down when they reached thetop wire. Floricanes were pruned in earlyJuly, immediately after the final harvest.
Treatments and experimental design. AllGA3 and 6-BA treatments in this study wereprepared using ProGibb LV Plus with 5.7%active ingredient (a.i.) (Valent Biosciences,Libertyville, IL) and MaxCel with 1.9% a.i.(Valent Biosciences). Immediately beforeapplication, treatment solutions were pre-pared by adding each chemical in water atthe concentrations described. All treatmentswere applied between 9:00 and 10:00 AM
using a CO2-pressured backpack sprayer(model T; Bellspray, Opelousas, LA) equip-ped with two flat nozzle tips (XR8002; TeeJetTechnologies, Wheaton, IL) spaced 0.46 mapart on the spray boom. The spray pressurewas 296 kPa and the spray volume was 935L·ha–1.
In Expt. 1, there were six treatments,including three cultivars (Natchez, Navaho,and Ouachita) and two GA3 application rates(0 and 99 g·ha–1 a.i. or 0 and 106 mg·L–1 a.i.)in a factorial treatment structure. There werefour replicated plots for each treatment thatwere arranged in a split-plot design withcultivar as the main plot factor and GA3
application rate as the subplot factor. Alltreatments were applied on 27 Feb. 2018.The number of accumulated chilling hours attemperatures below 7.2 �C recorded from 1Nov. 2017 through 27 Feb. 2018 was 199 h.
In Expt. 2, treatments comprised fourspray application rates of GA3 (0, 25, 99,and 198 g·ha–1 a.i. or 0, 27, 106, and 212mg·L–1 a.i.). There were five replicated plotsfor each treatment that were arranged in arandomized complete block design. All treat-ments were applied on 20 Feb. 2018. Thenumber of accumulated chilling hours attemperatures below 7.2 �C recorded from 1Nov. 2017 through 20 Feb. 2018 was 227 h.
In Expt. 3, there were five treatments:water control; GA3 (spray application ofGA3); 6-BA (spray application of 6-BA);GA3 + 6-BA (combined spray applicationof GA3 and 6-BA); and GA3 ! 6-BA (se-quential spray application of 6-BA at 9 d afterGA3 application). Application rates were 99and 47 g·ha–1 a.i. for GA3 and 6-BA, respec-tively. There were four replicated plots forthe control and three replicated plots for theother treatments that were arranged in arandomized complete block design. All treat-ments were applied on 19 Feb. 2019, exceptfor the 6-BA application in the GA3 ! 6-BAtreatment, which was applied on 28 Feb.2019. All treatments including the watercontrol were supplemented with a nonionicsurfactant (Regulaid; Kalo, Inc., OverlandPark, KS) at 0.1% (v/v). The number ofaccumulated chilling hours at temperaturesbelow 7.2 �C recorded from 1 Nov. 2018through 19 Feb. 2019 was 201 h.
Floral budbreak and flower number. Weselected five representative floricanes perplot before treatments. For each cane, asection containing 20 nodes, starting with
the third node from the cane tip, was labeledto monitor budbreak.We counted the numberof nodes with budbreak on a mostly weeklybasis. Budbreak was defined as the stage atwhich a green tip was visible. The percentageof budbreak was calculated by dividing thenumber of nodes with budbreak by 20 andmultiplying by 100. Flowers at or above thepopcorn stage were counted as flowers(Fernandez, 2013; Hussain et al., 2016).
Fruit yield, size, and quality. Harvestingwas performed weekly between 9 May and 5July 2018 during Expt. 1, between 7 May and15 June 2018 during Expt. 2, and between 22Apr. and 14 June 2019 during Expt. 3.Harvested berries were graded based on theU.S. Department of Agriculture (USDA)grade standards (USDA, 2016). Both numberand fresh weight of harvested berries wererecorded during Expt. 1, whereas only freshweight was recorded during Expts. 2 and 3.
To determine fruit size and quality, thefour largest (by weight) marketable berrieswere sampled per plot from six peak harvestsduring Expt. 1 and Expt. 2. For each berry,fresh weight was recorded, and berry lengthand width were measured across the longestand widest parts, respectively, using a digitalcaliper. The soluble solids concentration(SSC) was measured using a digital refrac-tometer (PAL-1; ATAGO, Tokyo, Japan) onunfiltered juice. Fruit juice was squeezedfrom the entire berry with a stainless-steelgarlic press.
Statistical analysis. To describe the dose-responses of dependent variables to GA3
application rates during Expt. 2, we fittedeach data set to the following four models byusing SigmaPlot (version 14.0; Systat Soft-ware Inc., San Jose, CA): linear Eq. [1];quadratic Eq. [2]; exponential decay Eq.[3]; and exponential plateau Eq. [4]. The bestmodel was selected based on the smallestcorrected Akaike information criterion(AICc).
y = a + bx [1]
y = a + bx + cx2 [2]
y = a + b expð–kxÞ [3]
y = a + b½1 –expð–kxÞ� [4]
Datawere analyzed by the generalized linearmixed model procedure (PROC GLIMMIX)in SAS statistical software (SAS 9.4; SASInstitute Inc., Cary, NC). In Expt. 1, cultivar,GA3 rate, and cultivar · GA3 rate interactionwere considered fixed effects, and replica-tion and replication · cultivar interactionwere considered random effects. In Expt. 2and Expt. 3, treatments were considered fixedeffects and replication was considered a ran-dom effect.
Continuous data (yield, berry freshweight, berry length, and berry width) weremodeled using a lognormal distribution (DIS-T=LOGNORMAL). For themodel parameter
Received for publication 17 Aug. 2020. Accepted for publication 24 Sept. 2020.Published online 29 October 2020.This study was supported in part by the Florida Spe-cialty Crop Block Grant Program (16SCBGPFL0041). We thank Dustin Groom for allowing us to conduct experiments on his farm and for his cooperation. We thank all members of the Horticultural Crop Physiology Lab at the Gulf Coast Research and Education Center for their technical assistance. This article was presented in the Krome memorial sec-tion at the 2020 Florida State Horticultural Society Annual Meeting.The use of brand names and any mention or listing of commercial products or services in the publica-tion does not imply endorsement by University of Florida nor discrimination against similar products or services not mentioned.S.A. is the corresponding author. E-mail: sagehara@ ufl.edu.This is an open access article distributed under the CC BY-NC-ND license (https://creativecommons.org/licenses/by-nc-nd/4.0/).
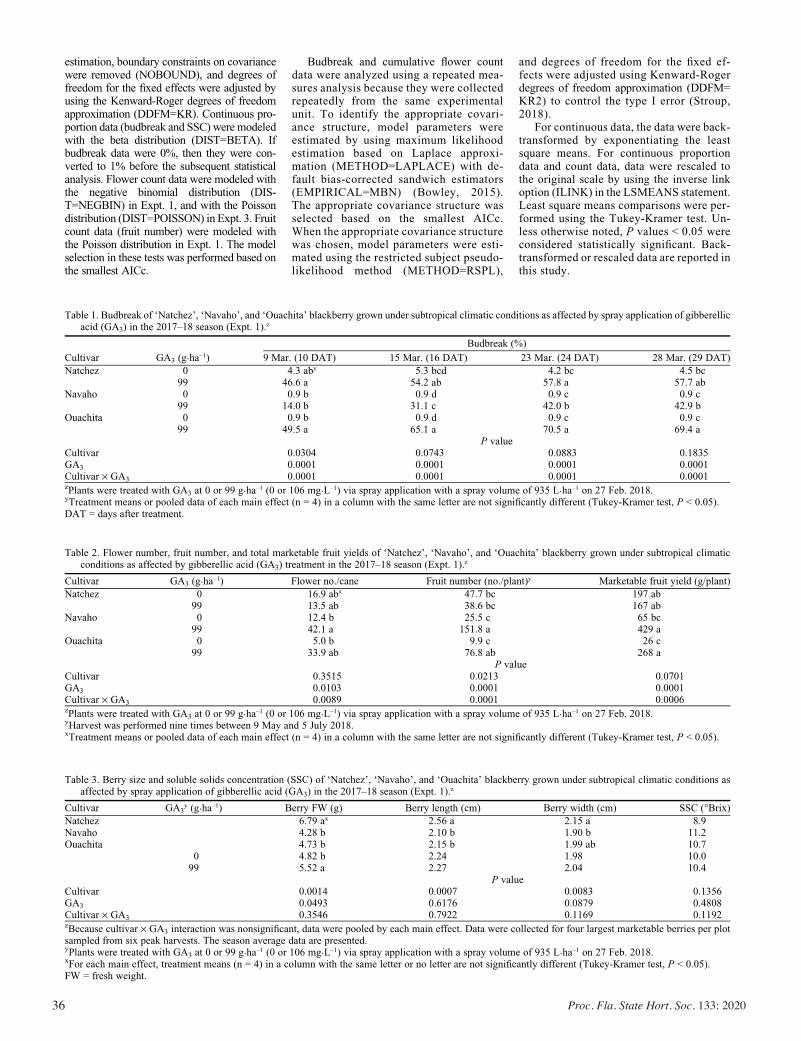
36 Proc. Fla. State Hort. Soc. 133: 2020
estimation, boundary constraints on covariancewere removed (NOBOUND), and degrees offreedom for the fixed effects were adjusted byusing the Kenward-Roger degrees of freedomapproximation (DDFM=KR). Continuous pro-portion data (budbreak and SSC) were modeledwith the beta distribution (DIST=BETA). Ifbudbreak data were 0%, then they were con-verted to 1% before the subsequent statisticalanalysis. Flower count data were modeled withthe negative binomial distribution (DIS-T=NEGBIN) in Expt. 1, and with the Poissondistribution (DIST=POISSON) in Expt. 3. Fruitcount data (fruit number) were modeled withthe Poisson distribution in Expt. 1. The modelselection in these tests was performed based onthe smallest AICc.
Budbreak and cumulative flower countdata were analyzed using a repeated mea-sures analysis because they were collectedrepeatedly from the same experimentalunit. To identify the appropriate covari-ance structure, model parameters wereestimated by using maximum likelihoodestimation based on Laplace approxi-mation (METHOD=LAPLACE) with de-fault bias-corrected sandwich estimators(EMPIRICAL=MBN) (Bowley, 2015).The appropriate covariance structure wasselected based on the smallest AICc.When the appropriate covariance structurewas chosen, model parameters were esti-mated using the restricted subject pseudo-likelihood method (METHOD=RSPL),
and degrees of freedom for the fixed ef-fects were adjusted using Kenward-Rogerdegrees of freedom approximation (DDFM=KR2) to control the type I error (Stroup,2018).
For continuous data, the data were back-transformed by exponentiating the leastsquare means. For continuous proportiondata and count data, data were rescaled tothe original scale by using the inverse linkoption (ILINK) in the LSMEANS statement.Least square means comparisons were per-formed using the Tukey-Kramer test. Un-less otherwise noted, P values < 0.05 wereconsidered statistically significant. Back-transformed or rescaled data are reported inthis study.
Table 1. Budbreak of ‘Natchez’, ‘Navaho’, and ‘Ouachita’ blackberry grown under subtropical climatic conditions as affected by spray application of gibberellicacid (GA3) in the 2017–18 season (Expt. 1).z
Budbreak (%)
Cultivar GA3 (g·ha–1) 9 Mar. (10 DAT) 15 Mar. (16 DAT) 23 Mar. (24 DAT) 28 Mar. (29 DAT)
Natchez 0 4.3 aby 5.3 bcd 4.2 bc 4.5 bc99 46.6 a 54.2 ab 57.8 a 57.7 ab
Navaho 0 0.9 b 0.9 d 0.9 c 0.9 c99 14.0 b 31.1 c 42.0 b 42.9 b
Ouachita 0 0.9 b 0.9 d 0.9 c 0.9 c99 49.5 a 65.1 a 70.5 a 69.4 a
P valueCultivar 0.0304 0.0743 0.0883 0.1835GA3 0.0001 0.0001 0.0001 0.0001Cultivar · GA3 0.0001 0.0001 0.0001 0.0001zPlants were treated with GA3 at 0 or 99 g·ha–1 (0 or 106 mg·L–1) via spray application with a spray volume of 935 L·ha–1 on 27 Feb. 2018.yTreatment means or pooled data of each main effect (n = 4) in a column with the same letter are not significantly different (Tukey-Kramer test, P < 0.05).DAT = days after treatment.
Table 2. Flower number, fruit number, and total marketable fruit yields of ‘Natchez’, ‘Navaho’, and ‘Ouachita’ blackberry grown under subtropical climaticconditions as affected by gibberellic acid (GA3) treatment in the 2017–18 season (Expt. 1).z
Cultivar GA3 (g·ha–1) Flower no./cane Fruit number (no./plant)y Marketable fruit yield (g/plant)
Natchez 0 16.9 abx 47.7 bc 197 ab99 13.5 ab 38.6 bc 167 ab
Navaho 0 12.4 b 25.5 c 65 bc99 42.1 a 151.8 a 429 a
Ouachita 0 5.0 b 9.9 c 26 c99 33.9 ab 76.8 ab 268 a
P valueCultivar 0.3515 0.0213 0.0701GA3 0.0103 0.0001 0.0001Cultivar · GA3 0.0089 0.0001 0.0006zPlants were treated with GA3 at 0 or 99 g·ha–1 (0 or 106 mg·L–1) via spray application with a spray volume of 935 L·ha–1 on 27 Feb. 2018.yHarvest was performed nine times between 9 May and 5 July 2018.xTreatment means or pooled data of each main effect (n = 4) in a column with the same letter are not significantly different (Tukey-Kramer test, P < 0.05).
Table 3. Berry size and soluble solids concentration (SSC) of ‘Natchez’, ‘Navaho’, and ‘Ouachita’ blackberry grown under subtropical climatic conditions asaffected by spray application of gibberellic acid (GA3) in the 2017–18 season (Expt. 1).z
Cultivar GA3y (g·ha–1) Berry FW (g) Berry length (cm) Berry width (cm) SSC (�Brix)
Natchez 6.79 ax 2.56 a 2.15 a 8.9Navaho 4.28 b 2.10 b 1.90 b 11.2Ouachita 4.73 b 2.15 b 1.99 ab 10.7
0 4.82 b 2.24 1.98 10.099 5.52 a 2.27 2.04 10.4
P valueCultivar 0.0014 0.0007 0.0083 0.1356GA3 0.0493 0.6176 0.0879 0.4808Cultivar · GA3 0.3546 0.7922 0.1169 0.1192zBecause cultivar · GA3 interaction was nonsignificant, data were pooled by each main effect. Data were collected for four largest marketable berries per plotsampled from six peak harvests. The season average data are presented.yPlants were treated with GA3 at 0 or 99 g·ha–1 (0 or 106 mg·L–1) via spray application with a spray volume of 935 L·ha–1 on 27 Feb. 2018.xFor each main effect, treatment means (n = 4) in a column with the same letter or no letter are not significantly different (Tukey-Kramer test, P < 0.05).FW = fresh weight.
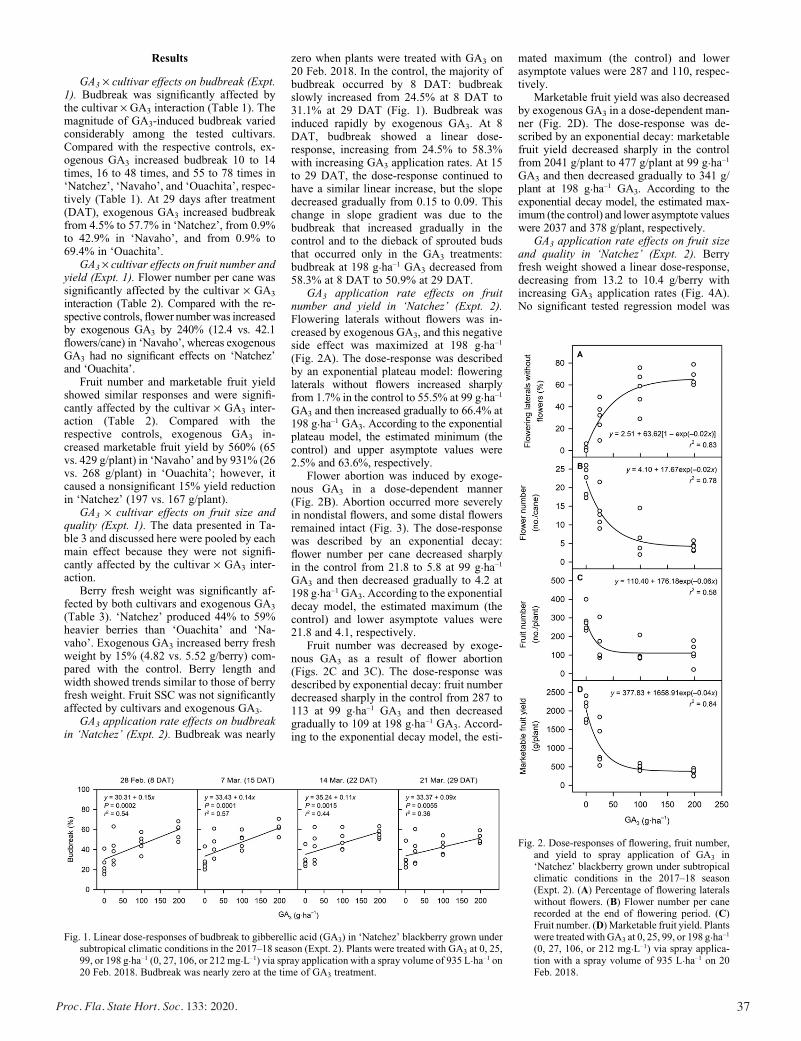
37Proc. Fla. State Hort. Soc. 133: 2020.
Results
GA3 · cultivar effects on budbreak (Expt.1). Budbreak was significantly affected bythe cultivar · GA3 interaction (Table 1). Themagnitude of GA3-induced budbreak variedconsiderably among the tested cultivars.Compared with the respective controls, ex-ogenous GA3 increased budbreak 10 to 14times, 16 to 48 times, and 55 to 78 times in‘Natchez’, ‘Navaho’, and ‘Ouachita’, respec-tively (Table 1). At 29 days after treatment(DAT), exogenous GA3 increased budbreakfrom 4.5% to 57.7% in ‘Natchez’, from 0.9%to 42.9% in ‘Navaho’, and from 0.9% to69.4% in ‘Ouachita’.
GA3 · cultivar effects on fruit number andyield (Expt. 1). Flower number per cane wassignificantly affected by the cultivar · GA3
interaction (Table 2). Compared with the re-spective controls, flower number was increasedby exogenous GA3 by 240% (12.4 vs. 42.1flowers/cane) in ‘Navaho’, whereas exogenousGA3 had no significant effects on ‘Natchez’and ‘Ouachita’.
Fruit number and marketable fruit yieldshowed similar responses and were signifi-cantly affected by the cultivar · GA3 inter-action (Table 2). Compared with therespective controls, exogenous GA3 in-creased marketable fruit yield by 560% (65vs. 429 g/plant) in ‘Navaho’ and by 931% (26vs. 268 g/plant) in ‘Ouachita’; however, itcaused a nonsignificant 15% yield reductionin ‘Natchez’ (197 vs. 167 g/plant).
GA3 · cultivar effects on fruit size andquality (Expt. 1). The data presented in Ta-ble 3 and discussed here were pooled by eachmain effect because they were not signifi-cantly affected by the cultivar · GA3 inter-action.
Berry fresh weight was significantly af-fected by both cultivars and exogenous GA3
(Table 3). ‘Natchez’ produced 44% to 59%heavier berries than ‘Ouachita’ and ‘Na-vaho’. Exogenous GA3 increased berry freshweight by 15% (4.82 vs. 5.52 g/berry) com-pared with the control. Berry length andwidth showed trends similar to those of berryfresh weight. Fruit SSC was not significantlyaffected by cultivars and exogenous GA3.
GA3 application rate effects on budbreakin ‘Natchez’ (Expt. 2). Budbreak was nearly
zero when plants were treated with GA3 on20 Feb. 2018. In the control, the majority ofbudbreak occurred by 8 DAT: budbreakslowly increased from 24.5% at 8 DAT to31.1% at 29 DAT (Fig. 1). Budbreak wasinduced rapidly by exogenous GA3. At 8DAT, budbreak showed a linear dose-response, increasing from 24.5% to 58.3%with increasing GA3 application rates. At 15to 29 DAT, the dose-response continued tohave a similar linear increase, but the slopedecreased gradually from 0.15 to 0.09. Thischange in slope gradient was due to thebudbreak that increased gradually in thecontrol and to the dieback of sprouted budsthat occurred only in the GA3 treatments:budbreak at 198 g·ha–1 GA3 decreased from58.3% at 8 DAT to 50.9% at 29 DAT.
GA3 application rate effects on fruitnumber and yield in ‘Natchez’ (Expt. 2).Flowering laterals without flowers was in-creased by exogenous GA3, and this negativeside effect was maximized at 198 g·ha–1
(Fig. 2A). The dose-response was describedby an exponential plateau model: floweringlaterals without flowers increased sharplyfrom 1.7% in the control to 55.5% at 99 g·ha–1
GA3 and then increased gradually to 66.4% at198 g·ha–1 GA3. According to the exponentialplateau model, the estimated minimum (thecontrol) and upper asymptote values were2.5% and 63.6%, respectively.
Flower abortion was induced by exoge-nous GA3 in a dose-dependent manner(Fig. 2B). Abortion occurred more severelyin nondistal flowers, and some distal flowersremained intact (Fig. 3). The dose-responsewas described by an exponential decay:flower number per cane decreased sharplyin the control from 21.8 to 5.8 at 99 g·ha–1
GA3 and then decreased gradually to 4.2 at198 g·ha–1 GA3. According to the exponentialdecay model, the estimated maximum (thecontrol) and lower asymptote values were21.8 and 4.1, respectively.
Fruit number was decreased by exoge-nous GA3 as a result of flower abortion(Figs. 2C and 3C). The dose-response wasdescribed by exponential decay: fruit numberdecreased sharply in the control from 287 to113 at 99 g·ha–1 GA3 and then decreasedgradually to 109 at 198 g·ha–1 GA3. Accord-ing to the exponential decay model, the esti-
mated maximum (the control) and lowerasymptote values were 287 and 110, respec-tively.
Marketable fruit yield was also decreasedby exogenous GA3 in a dose-dependent man-ner (Fig. 2D). The dose-response was de-scribed by an exponential decay: marketablefruit yield decreased sharply in the controlfrom 2041 g/plant to 477 g/plant at 99 g·ha–1
GA3 and then decreased gradually to 341 g/plant at 198 g·ha–1 GA3. According to theexponential decay model, the estimated max-imum (the control) and lower asymptote valueswere 2037 and 378 g/plant, respectively.
GA3 application rate effects on fruit sizeand quality in ‘Natchez’ (Expt. 2). Berryfresh weight showed a linear dose-response,decreasing from 13.2 to 10.4 g/berry withincreasing GA3 application rates (Fig. 4A).No significant tested regression model was
Fig. 1. Linear dose-responses of budbreak to gibberellic acid (GA3) in ‘Natchez’ blackberry grown undersubtropical climatic conditions in the 2017–18 season (Expt. 2). Plants were treated with GA3 at 0, 25,99, or 198 g·ha–1 (0, 27, 106, or 212 mg·L–1) via spray application with a spray volume of 935 L·ha–1 on20 Feb. 2018. Budbreak was nearly zero at the time of GA3 treatment.
Fig. 2. Dose-responses of flowering, fruit number,and yield to spray application of GA3 in‘Natchez’ blackberry grown under subtropicalclimatic conditions in the 2017–18 season(Expt. 2). (A) Percentage of flowering lateralswithout flowers. (B) Flower number per canerecorded at the end of flowering period. (C)Fruit number. (D) Marketable fruit yield. Plantswere treated with GA3 at 0, 25, 99, or 198 g·ha
–1
(0, 27, 106, or 212 mg·L–1) via spray applica-tion with a spray volume of 935 L·ha–1 on 20Feb. 2018.
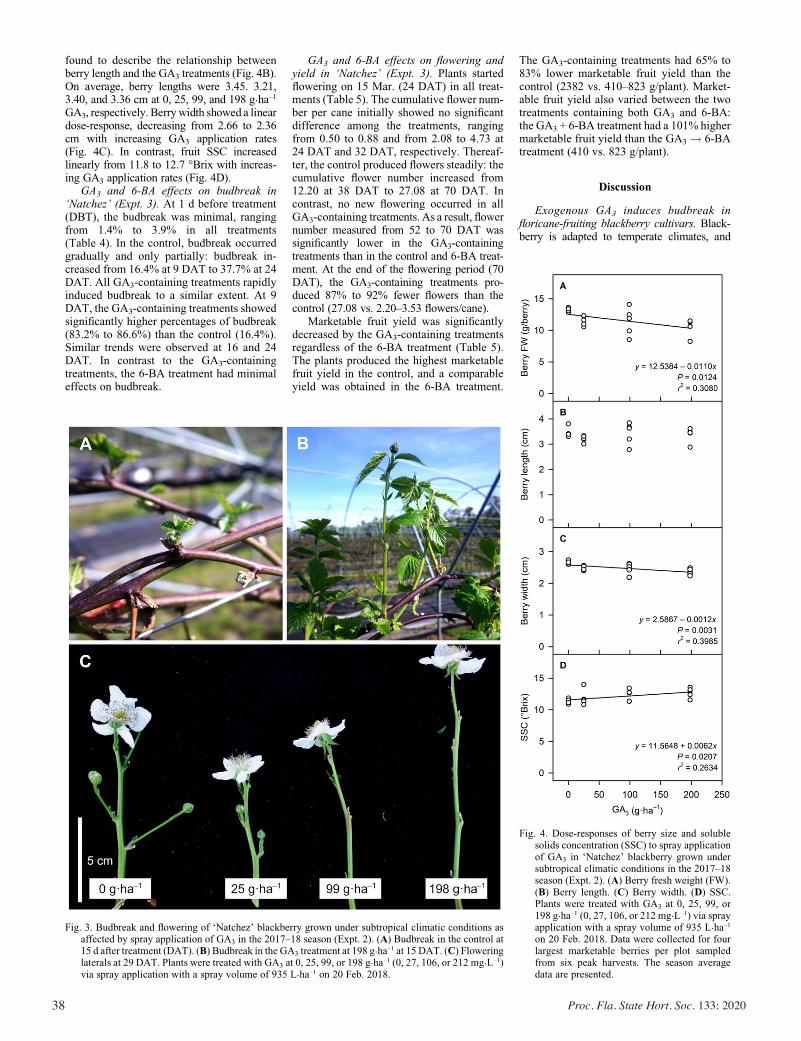
38 Proc. Fla. State Hort. Soc. 133: 2020
found to describe the relationship betweenberry length and the GA3 treatments (Fig. 4B).On average, berry lengths were 3.45. 3.21,3.40, and 3.36 cm at 0, 25, 99, and 198 g·ha–1
GA3, respectively. Berrywidth showed a lineardose-response, decreasing from 2.66 to 2.36cm with increasing GA3 application rates(Fig. 4C). In contrast, fruit SSC increasedlinearly from 11.8 to 12.7 �Brix with increas-ing GA3 application rates (Fig. 4D).
GA3 and 6-BA effects on budbreak in‘Natchez’ (Expt. 3). At 1 d before treatment(DBT), the budbreak was minimal, rangingfrom 1.4% to 3.9% in all treatments(Table 4). In the control, budbreak occurredgradually and only partially: budbreak in-creased from 16.4% at 9 DAT to 37.7% at 24DAT. All GA3-containing treatments rapidlyinduced budbreak to a similar extent. At 9DAT, the GA3-containing treatments showedsignificantly higher percentages of budbreak(83.2% to 86.6%) than the control (16.4%).Similar trends were observed at 16 and 24DAT. In contrast to the GA3-containingtreatments, the 6-BA treatment had minimaleffects on budbreak.
GA3 and 6-BA effects on flowering andyield in ‘Natchez’ (Expt. 3). Plants startedflowering on 15 Mar. (24 DAT) in all treat-ments (Table 5). The cumulative flower num-ber per cane initially showed no significantdifference among the treatments, rangingfrom 0.50 to 0.88 and from 2.08 to 4.73 at24 DAT and 32 DAT, respectively. Thereaf-ter, the control produced flowers steadily: thecumulative flower number increased from12.20 at 38 DAT to 27.08 at 70 DAT. Incontrast, no new flowering occurred in allGA3-containing treatments. As a result, flowernumber measured from 52 to 70 DAT wassignificantly lower in the GA3-containingtreatments than in the control and 6-BA treat-ment. At the end of the flowering period (70DAT), the GA3-containing treatments pro-duced 87% to 92% fewer flowers than thecontrol (27.08 vs. 2.20–3.53 flowers/cane).
Marketable fruit yield was significantlydecreased by the GA3-containing treatmentsregardless of the 6-BA treatment (Table 5).The plants produced the highest marketablefruit yield in the control, and a comparableyield was obtained in the 6-BA treatment.
The GA3-containing treatments had 65% to83% lower marketable fruit yield than thecontrol (2382 vs. 410–823 g/plant). Market-able fruit yield also varied between the twotreatments containing both GA3 and 6-BA:the GA3 + 6-BA treatment had a 101% highermarketable fruit yield than the GA3 ! 6-BAtreatment (410 vs. 823 g/plant).
Discussion
Exogenous GA3 induces budbreak infloricane-fruiting blackberry cultivars. Black-berry is adapted to temperate climates, and
Fig. 3. Budbreak and flowering of ‘Natchez’ blackberry grown under subtropical climatic conditions asaffected by spray application of GA3 in the 2017–18 season (Expt. 2). (A) Budbreak in the control at15 d after treatment (DAT). (B) Budbreak in the GA3 treatment at 198 g·ha–1 at 15 DAT. (C) Floweringlaterals at 29 DAT. Plants were treated with GA3 at 0, 25, 99, or 198 g·ha
–1 (0, 27, 106, or 212 mg·L–1)via spray application with a spray volume of 935 L·ha–1 on 20 Feb. 2018.
Fig. 4. Dose-responses of berry size and solublesolids concentration (SSC) to spray applicationof GA3 in ‘Natchez’ blackberry grown undersubtropical climatic conditions in the 2017–18season (Expt. 2). (A) Berry fresh weight (FW).(B) Berry length. (C) Berry width. (D) SSC.Plants were treated with GA3 at 0, 25, 99, or198 g·ha–1 (0, 27, 106, or 212 mg·L–1) via sprayapplication with a spray volume of 935 L·ha–1
on 20 Feb. 2018. Data were collected for fourlargest marketable berries per plot sampledfrom six peak harvests. The season averagedata are presented.
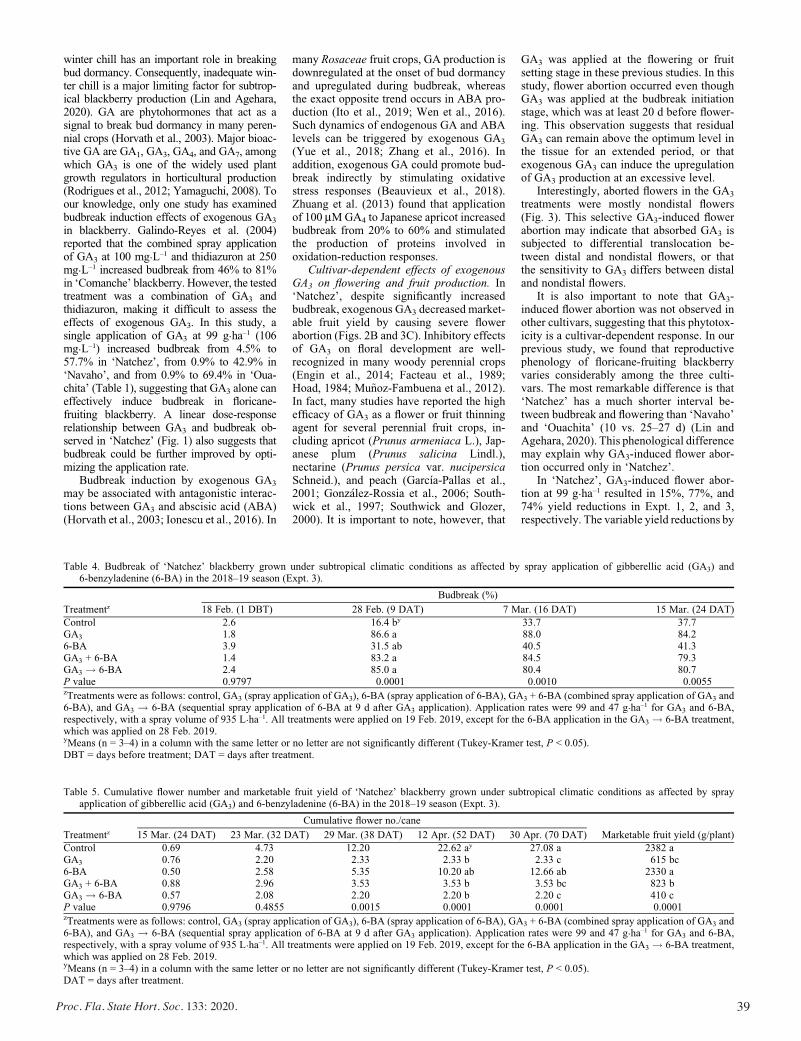
39Proc. Fla. State Hort. Soc. 133: 2020.
winter chill has an important role in breakingbud dormancy. Consequently, inadequate win-ter chill is a major limiting factor for subtrop-ical blackberry production (Lin and Agehara,2020). GA are phytohormones that act as asignal to break bud dormancy in many peren-nial crops (Horvath et al., 2003). Major bioac-tive GA are GA1, GA3, GA4, and GA7, amongwhich GA3 is one of the widely used plantgrowth regulators in horticultural production(Rodrigues et al., 2012; Yamaguchi, 2008). Toour knowledge, only one study has examinedbudbreak induction effects of exogenous GA3
in blackberry. Galindo-Reyes et al. (2004)reported that the combined spray applicationof GA3 at 100 mg·L–1 and thidiazuron at 250mg·L–1 increased budbreak from 46% to 81%in ‘Comanche’ blackberry. However, the testedtreatment was a combination of GA3 andthidiazuron, making it difficult to assess theeffects of exogenous GA3. In this study, asingle application of GA3 at 99 g·ha–1 (106mg·L–1) increased budbreak from 4.5% to57.7% in ‘Natchez’, from 0.9% to 42.9% in‘Navaho’, and from 0.9% to 69.4% in ‘Oua-chita’ (Table 1), suggesting that GA3 alone caneffectively induce budbreak in floricane-fruiting blackberry. A linear dose-responserelationship between GA3 and budbreak ob-served in ‘Natchez’ (Fig. 1) also suggests thatbudbreak could be further improved by opti-mizing the application rate.
Budbreak induction by exogenous GA3
may be associated with antagonistic interac-tions between GA3 and abscisic acid (ABA)(Horvath et al., 2003; Ionescu et al., 2016). In
many Rosaceae fruit crops, GA production isdownregulated at the onset of bud dormancyand upregulated during budbreak, whereasthe exact opposite trend occurs in ABA pro-duction (Ito et al., 2019; Wen et al., 2016).Such dynamics of endogenous GA and ABAlevels can be triggered by exogenous GA3
(Yue et al., 2018; Zhang et al., 2016). Inaddition, exogenous GA could promote bud-break indirectly by stimulating oxidativestress responses (Beauvieux et al., 2018).Zhuang et al. (2013) found that applicationof 100 mMGA4 to Japanese apricot increasedbudbreak from 20% to 60% and stimulatedthe production of proteins involved inoxidation-reduction responses.
Cultivar-dependent effects of exogenousGA3 on flowering and fruit production. In‘Natchez’, despite significantly increasedbudbreak, exogenous GA3 decreased market-able fruit yield by causing severe flowerabortion (Figs. 2B and 3C). Inhibitory effectsof GA3 on floral development are well-recognized in many woody perennial crops(Engin et al., 2014; Facteau et al., 1989;Hoad, 1984; Mu~noz-Fambuena et al., 2012).In fact, many studies have reported the highefficacy of GA3 as a flower or fruit thinningagent for several perennial fruit crops, in-cluding apricot (Prunus armeniaca L.), Jap-anese plum (Prunus salicina Lindl.),nectarine (Prunus persica var. nucipersicaSchneid.), and peach (García-Pallas et al.,2001; Gonz�alez-Rossia et al., 2006; South-wick et al., 1997; Southwick and Glozer,2000). It is important to note, however, that
GA3 was applied at the flowering or fruitsetting stage in these previous studies. In thisstudy, flower abortion occurred even thoughGA3 was applied at the budbreak initiationstage, which was at least 20 d before flower-ing. This observation suggests that residualGA3 can remain above the optimum level inthe tissue for an extended period, or thatexogenous GA3 can induce the upregulationof GA3 production at an excessive level.
Interestingly, aborted flowers in the GA3
treatments were mostly nondistal flowers(Fig. 3). This selective GA3-induced flowerabortion may indicate that absorbed GA3 issubjected to differential translocation be-tween distal and nondistal flowers, or thatthe sensitivity to GA3 differs between distaland nondistal flowers.
It is also important to note that GA3-induced flower abortion was not observed inother cultivars, suggesting that this phytotox-icity is a cultivar-dependent response. In ourprevious study, we found that reproductivephenology of floricane-fruiting blackberryvaries considerably among the three culti-vars. The most remarkable difference is that‘Natchez’ has a much shorter interval be-tween budbreak and flowering than ‘Navaho’and ‘Ouachita’ (10 vs. 25–27 d) (Lin andAgehara, 2020). This phenological differencemay explain why GA3-induced flower abor-tion occurred only in ‘Natchez’.
In ‘Natchez’, GA3-induced flower abor-tion at 99 g·ha–1 resulted in 15%, 77%, and74% yield reductions in Expt. 1, 2, and 3,respectively. The variable yield reductions by
Table 4. Budbreak of ‘Natchez’ blackberry grown under subtropical climatic conditions as affected by spray application of gibberellic acid (GA3) and6-benzyladenine (6-BA) in the 2018–19 season (Expt. 3).
TreatmentzBudbreak (%)
18 Feb. (1 DBT) 28 Feb. (9 DAT) 7 Mar. (16 DAT) 15 Mar. (24 DAT)
Control 2.6 16.4 by 33.7 37.7GA3 1.8 86.6 a 88.0 84.26-BA 3.9 31.5 ab 40.5 41.3GA3 + 6-BA 1.4 83.2 a 84.5 79.3GA3 ! 6-BA 2.4 85.0 a 80.4 80.7P value 0.9797 0.0001 0.0010 0.0055zTreatments were as follows: control, GA3 (spray application of GA3), 6-BA (spray application of 6-BA), GA3 + 6-BA (combined spray application of GA3 and6-BA), and GA3 ! 6-BA (sequential spray application of 6-BA at 9 d after GA3 application). Application rates were 99 and 47 g·ha–1 for GA3 and 6-BA,respectively, with a spray volume of 935 L·ha–1. All treatments were applied on 19 Feb. 2019, except for the 6-BA application in the GA3 ! 6-BA treatment,which was applied on 28 Feb. 2019.yMeans (n = 3–4) in a column with the same letter or no letter are not significantly different (Tukey-Kramer test, P < 0.05).DBT = days before treatment; DAT = days after treatment.
Table 5. Cumulative flower number and marketable fruit yield of ‘Natchez’ blackberry grown under subtropical climatic conditions as affected by sprayapplication of gibberellic acid (GA3) and 6-benzyladenine (6-BA) in the 2018–19 season (Expt. 3).
TreatmentzCumulative flower no./cane
15 Mar. (24 DAT) 23 Mar. (32 DAT) 29 Mar. (38 DAT) 12 Apr. (52 DAT) 30 Apr. (70 DAT) Marketable fruit yield (g/plant)
Control 0.69 4.73 12.20 22.62 ay 27.08 a 2382 aGA3 0.76 2.20 2.33 2.33 b 2.33 c 615 bc6-BA 0.50 2.58 5.35 10.20 ab 12.66 ab 2330 aGA3 + 6-BA 0.88 2.96 3.53 3.53 b 3.53 bc 823 bGA3 ! 6-BA 0.57 2.08 2.20 2.20 b 2.20 c 410 cP value 0.9796 0.4855 0.0015 0.0001 0.0001 0.0001zTreatments were as follows: control, GA3 (spray application of GA3), 6-BA (spray application of 6-BA), GA3 + 6-BA (combined spray application of GA3 and6-BA), and GA3 ! 6-BA (sequential spray application of 6-BA at 9 d after GA3 application). Application rates were 99 and 47 g·ha–1 for GA3 and 6-BA,respectively, with a spray volume of 935 L·ha–1. All treatments were applied on 19 Feb. 2019, except for the 6-BA application in the GA3 ! 6-BA treatment,which was applied on 28 Feb. 2019.yMeans (n = 3–4) in a column with the same letter or no letter are not significantly different (Tukey-Kramer test, P < 0.05).DAT = days after treatment.
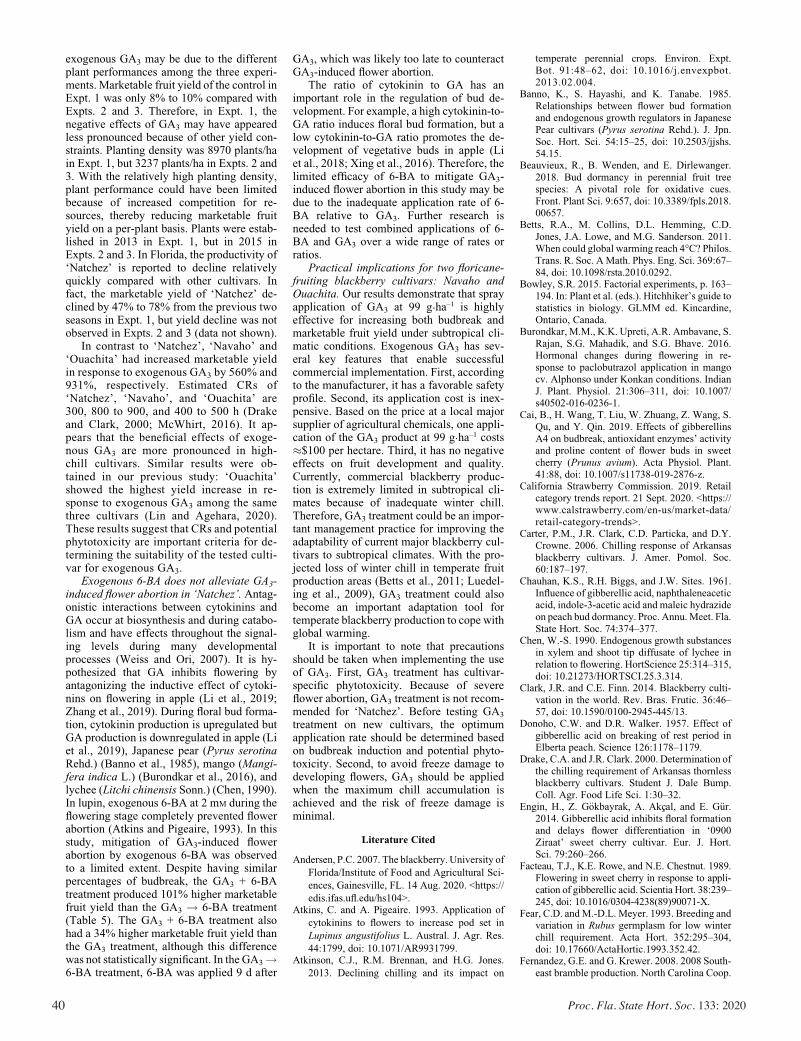
40 Proc. Fla. State Hort. Soc. 133: 2020
exogenous GA3 may be due to the differentplant performances among the three experi-ments. Marketable fruit yield of the control inExpt. 1 was only 8% to 10% compared withExpts. 2 and 3. Therefore, in Expt. 1, thenegative effects of GA3 may have appearedless pronounced because of other yield con-straints. Planting density was 8970 plants/hain Expt. 1, but 3237 plants/ha in Expts. 2 and3. With the relatively high planting density,plant performance could have been limitedbecause of increased competition for re-sources, thereby reducing marketable fruityield on a per-plant basis. Plants were estab-lished in 2013 in Expt. 1, but in 2015 inExpts. 2 and 3. In Florida, the productivity of‘Natchez’ is reported to decline relativelyquickly compared with other cultivars. Infact, the marketable yield of ‘Natchez’ de-clined by 47% to 78% from the previous twoseasons in Expt. 1, but yield decline was notobserved in Expts. 2 and 3 (data not shown).
In contrast to ‘Natchez’, ‘Navaho’ and‘Ouachita’ had increased marketable yieldin response to exogenous GA3 by 560% and931%, respectively. Estimated CRs of‘Natchez’, ‘Navaho’, and ‘Ouachita’ are300, 800 to 900, and 400 to 500 h (Drakeand Clark, 2000; McWhirt, 2016). It ap-pears that the beneficial effects of exoge-nous GA3 are more pronounced in high-chill cultivars. Similar results were ob-tained in our previous study: ‘Ouachita’showed the highest yield increase in re-sponse to exogenous GA3 among the samethree cultivars (Lin and Agehara, 2020).These results suggest that CRs and potentialphytotoxicity are important criteria for de-termining the suitability of the tested culti-var for exogenous GA3.
Exogenous 6-BA does not alleviate GA3-induced flower abortion in ‘Natchez’. Antag-onistic interactions between cytokinins andGA occur at biosynthesis and during catabo-lism and have effects throughout the signal-ing levels during many developmentalprocesses (Weiss and Ori, 2007). It is hy-pothesized that GA inhibits flowering byantagonizing the inductive effect of cytoki-nins on flowering in apple (Li et al., 2019;Zhang et al., 2019). During floral bud forma-tion, cytokinin production is upregulated butGA production is downregulated in apple (Liet al., 2019), Japanese pear (Pyrus serotinaRehd.) (Banno et al., 1985), mango (Mangi-fera indica L.) (Burondkar et al., 2016), andlychee (Litchi chinensis Sonn.) (Chen, 1990).In lupin, exogenous 6-BA at 2 mM during theflowering stage completely prevented flowerabortion (Atkins and Pigeaire, 1993). In thisstudy, mitigation of GA3-induced flowerabortion by exogenous 6-BA was observedto a limited extent. Despite having similarpercentages of budbreak, the GA3 + 6-BAtreatment produced 101% higher marketablefruit yield than the GA3 ! 6-BA treatment(Table 5). The GA3 + 6-BA treatment alsohad a 34% higher marketable fruit yield thanthe GA3 treatment, although this differencewas not statistically significant. In the GA3!6-BA treatment, 6-BA was applied 9 d after
GA3, which was likely too late to counteractGA3-induced flower abortion.
The ratio of cytokinin to GA has animportant role in the regulation of bud de-velopment. For example, a high cytokinin-to-GA ratio induces floral bud formation, but alow cytokinin-to-GA ratio promotes the de-velopment of vegetative buds in apple (Liet al., 2018; Xing et al., 2016). Therefore, thelimited efficacy of 6-BA to mitigate GA3-induced flower abortion in this study may bedue to the inadequate application rate of 6-BA relative to GA3. Further research isneeded to test combined applications of 6-BA and GA3 over a wide range of rates orratios.
Practical implications for two floricane-fruiting blackberry cultivars: Navaho andOuachita. Our results demonstrate that sprayapplication of GA3 at 99 g·ha–1 is highlyeffective for increasing both budbreak andmarketable fruit yield under subtropical cli-matic conditions. Exogenous GA3 has sev-eral key features that enable successfulcommercial implementation. First, accordingto the manufacturer, it has a favorable safetyprofile. Second, its application cost is inex-pensive. Based on the price at a local majorsupplier of agricultural chemicals, one appli-cation of the GA3 product at 99 g·ha–1 costs�$100 per hectare. Third, it has no negativeeffects on fruit development and quality.Currently, commercial blackberry produc-tion is extremely limited in subtropical cli-mates because of inadequate winter chill.Therefore, GA3 treatment could be an impor-tant management practice for improving theadaptability of current major blackberry cul-tivars to subtropical climates. With the pro-jected loss of winter chill in temperate fruitproduction areas (Betts et al., 2011; Luedel-ing et al., 2009), GA3 treatment could alsobecome an important adaptation tool fortemperate blackberry production to cope withglobal warming.
It is important to note that precautionsshould be taken when implementing the useof GA3. First, GA3 treatment has cultivar-specific phytotoxicity. Because of severeflower abortion, GA3 treatment is not recom-mended for ‘Natchez’. Before testing GA3
treatment on new cultivars, the optimumapplication rate should be determined basedon budbreak induction and potential phyto-toxicity. Second, to avoid freeze damage todeveloping flowers, GA3 should be appliedwhen the maximum chill accumulation isachieved and the risk of freeze damage isminimal.
Literature Cited
Andersen, P.C. 2007. The blackberry. University ofFlorida/Institute of Food and Agricultural Sci-ences, Gainesville, FL. 14 Aug. 2020. <https://edis.ifas.ufl.edu/hs104>.
Atkins, C. and A. Pigeaire. 1993. Application ofcytokinins to flowers to increase pod set inLupinus angustifolius L. Austral. J. Agr. Res.44:1799, doi: 10.1071/AR9931799.
Atkinson, C.J., R.M. Brennan, and H.G. Jones.2013. Declining chilling and its impact on
temperate perennial crops. Environ. Expt.Bot. 91:48–62, doi: 10.1016/j.envexpbot.2013.02.004.
Banno, K., S. Hayashi, and K. Tanabe. 1985.Relationships between flower bud formationand endogenous growth regulators in JapanesePear cultivars (Pyrus serotina Rehd.). J. Jpn.Soc. Hort. Sci. 54:15–25, doi: 10.2503/jjshs.54.15.
Beauvieux, R., B. Wenden, and E. Dirlewanger.2018. Bud dormancy in perennial fruit treespecies: A pivotal role for oxidative cues.Front. Plant Sci. 9:657, doi: 10.3389/fpls.2018.00657.
Betts, R.A., M. Collins, D.L. Hemming, C.D.Jones, J.A. Lowe, and M.G. Sanderson. 2011.When could global warming reach 4�C? Philos.Trans. R. Soc. AMath. Phys. Eng. Sci. 369:67–84, doi: 10.1098/rsta.2010.0292.
Bowley, S.R. 2015. Factorial experiments, p. 163–194. In: Plant et al. (eds.). Hitchhiker’s guide tostatistics in biology. GLMM ed. Kincardine,Ontario, Canada.
Burondkar, M.M., K.K. Upreti, A.R. Ambavane, S.Rajan, S.G. Mahadik, and S.G. Bhave. 2016.Hormonal changes during flowering in re-sponse to paclobutrazol application in mangocv. Alphonso under Konkan conditions. IndianJ. Plant. Physiol. 21:306–311, doi: 10.1007/s40502-016-0236-1.
Cai, B., H. Wang, T. Liu, W. Zhuang, Z. Wang, S.Qu, and Y. Qin. 2019. Effects of gibberellinsA4 on budbreak, antioxidant enzymes’ activityand proline content of flower buds in sweetcherry (Prunus avium). Acta Physiol. Plant.41:88, doi: 10.1007/s11738-019-2876-z.
California Strawberry Commission. 2019. Retailcategory trends report. 21 Sept. 2020. <https://www.calstrawberry.com/en-us/market-data/retail-category-trends>.
Carter, P.M., J.R. Clark, C.D. Particka, and D.Y.Crowne. 2006. Chilling response of Arkansasblackberry cultivars. J. Amer. Pomol. Soc.60:187–197.
Chauhan, K.S., R.H. Biggs, and J.W. Sites. 1961.Influence of gibberellic acid, naphthaleneaceticacid, indole-3-acetic acid and maleic hydrazideon peach bud dormancy. Proc. Annu.Meet. Fla.State Hort. Soc. 74:374–377.
Chen, W.-S. 1990. Endogenous growth substancesin xylem and shoot tip diffusate of lychee inrelation to flowering. HortScience 25:314–315,doi: 10.21273/HORTSCI.25.3.314.
Clark, J.R. and C.E. Finn. 2014. Blackberry culti-vation in the world. Rev. Bras. Frutic. 36:46–57, doi: 10.1590/0100-2945-445/13.
Donoho, C.W. and D.R. Walker. 1957. Effect ofgibberellic acid on breaking of rest period inElberta peach. Science 126:1178–1179.
Drake, C.A. and J.R. Clark. 2000. Determination ofthe chilling requirement of Arkansas thornlessblackberry cultivars. Student J. Dale Bump.Coll. Agr. Food Life Sci. 1:30–32.
Engin, H., Z. G€okbayrak, A. Akcxal, and E. G€ur.2014. Gibberellic acid inhibits floral formationand delays flower differentiation in ‘0900Ziraat’ sweet cherry cultivar. Eur. J. Hort.Sci. 79:260–266.
Facteau, T.J., K.E. Rowe, and N.E. Chestnut. 1989.Flowering in sweet cherry in response to appli-cation of gibberellic acid. Scientia Hort. 38:239–245, doi: 10.1016/0304-4238(89)90071-X.
Fear, C.D. andM.-D.L. Meyer. 1993. Breeding andvariation in Rubus germplasm for low winterchill requirement. Acta Hort. 352:295–304,doi: 10.17660/ActaHortic.1993.352.42.
Fernandez, G.E. and G. Krewer. 2008. 2008 South-east bramble production. North Carolina Coop.
41Proc. Fla. State Hort. Soc. 133: 2020.
This paper was presented during the 2020 FSHS Annual Meeting and originally published in HortScience [HORTSCIENCE 55(12):1938–1945. 2020. https://doi.org/10.21273/HORTSCI153818-20]. The paper is included in this Proceedings as a reprint (with permission).
Extension. 28Apr. 2015. <http://content.ces.ncsu.edu/southeast-regional-caneberry-production-guide>.
Fernandez, G.E. 2013. Buds are tight but not forlong. Coop. Extension. North Carolina Coop.Extension. 30 May 2013. <http://teamrubus.blogspot.com/2013/04/buds-are-tight-but-not-for-long.html>.
Galindo-Reyes, M.A., V.A. Gonz�alez-Hern�andez,A. Muratalla-L�ua, R.M. Soto-Hern�andez, andM. Livera-Mu~noz. 2004. Forced production ofblackberry ‘Comanche’ through growth regu-lators. Rev. Chapingo Ser. Hort. 10:205–209.(in Spanish with English abstract).
García-Pallas, I., J. Val, and A. Blanco. 2001. Theinhibition of flower bud differentiation in ‘Crim-sonGold’ nectarine withGA3 as an alternative tohand thinning. Scientia Hort. 90:265–278, doi:10.1016/S0304-4238(01)00229-1.
Gonz�alez-Rossia, D., M. Juan, C. Reig, and M.Agustí. 2006. The inhibition of flowering bymeans of gibberellic acid application reduces thecost of hand thinning in Japanese plums (Prunussalicina Lindl.). Scientia Hort. 110:319–323,doi: 10.1016/j.scienta.2006.07.022.
Hoad, G.V. 1984. Hormonal regulation of fruit-budformation in fruit trees. Acta Hort. 149:13–24,doi: 10.17660/ActaHortic.1984.149.1.
Horvath, D.P., J.V. Anderson, W.S. Chao, and M.E.Foley. 2003. Knowing when to grow: Signalsregulating bud dormancy. Trends Plant Sci.8:534–540, doi: 10.1016/j.tplants.2003.09.013.
Hussain, I., S.R. Roberto, I.C.B. Fonseca, A.M. deAssis, R. Koyama, and L.E.C. Antunes. 2016.Phenology of ‘Tupy’ and ‘Xavante’ blackberriesgrown in a subtropical area. Scientia Hort.201:78–83, doi: 10.1016/j.scienta.2016.01.036.
Ionescu, I.A., B.L. Møller, and R. S�anchez-P�erez.2016. Chemical control of flowering time. J. Expt.Bot. 68:369–382, doi: 10.1093/jxb/erw427.
Ito, A., P.A. Tuan, T. Saito, S. Bai, M. Kita, and T.Moriguchi. 2019. Changes in phytohormonecontent and associated gene expressionthroughout the stages of pear (Pyrus pyrifoliaNakai) Dormancy. Tree Physiol. tpz101, doi:10.1093/treephys/tpz101.
Li, Y., D. Zhang, X. Zhang, L. Xing, S. Fan, J. Ma, C.Zhao, L. Du, and M. Han. 2018. A transcriptomeanalysis of two apple (Malus · domestica) culti-vars with different flowering abilities reveals agene network module associated with floral tran-sitions. Scientia Hort. 239:269–281, doi: 10.1016/j.scienta.2018.04.048.
Li, Y., D. Zhang, N. An, S. Fan, X. Zuo, X. Zhang,L. Zhang, C. Gao, M. Han, and L. Xing. 2019.Transcriptomic analysis reveals the regulatorymodule of apple (Malus · domestica) floraltransition in response to 6-BA. BMC PlantBiol. 19:93, doi: 10.1186/s12870-019-1695-0.
Lin, S.-Y. and S. Agehara. 2020. Exogenousgibberellic acid advances reproductive phenol-ogy and increases early-season yield in sub-
tropical blackberry production. Agronomy10:1317, doi: 10.3390/agronomy10091317.
Luedeling, E., M. Zhang, and E.H. Girvetz. 2009.Climatic changes lead to declining winter chillfor fruit and nut trees in California during1950–2099. PLoS One 4:e6166, doi: 10.1371/journal.pone.0006166.
Luedeling, E., E.H. Girvetz, M.A. Semenov, andP.H. Brown. 2011. Climate change affectswinter chill for temperate fruit and nut trees.PLoS One 6:e20155, doi: 10.1371/journal.pone.0020155.
McWhirt, A. 2016. Blackberry variety selection. 29Jan. 2018. <http://extension.missouri.edu/greene/documents/Horticulture/Blackberry/Blackberry-Cultivars%2C McWhirt Nov_15%2C2016.pdf>.
Mu~noz-Fambuena, N., C. Mesejo, M.C. Gonz�alez-Mas, D.J. Iglesias, E. Primo-Millo, and M.Agustí. 2012. Gibberellic acid reduces flower-ing intensity in sweet orange [Citrus sinensis(L.) Osbeck] by repressing CiFT gene expres-sion. J. Plant Growth Regul. 31:529–536, doi:10.1007/s00344-012-9263-y.
Rodrigues, C., L.P. de S. Vandenberghe, J. deOliveira, and C.R. Soccol. 2012. New perspec-tives of gibberellic acid production: A review.Crit. Rev. Biotechnol. 32:263–273, doi:10.3109/07388551.2011.615297.
Southwick, S.M., J.T. Yeager, and K.G. Weis. 1997.Use of gibberellins on ‘Patterson’ apricot (Pru-nus armeniaca) to reduce hand thinning andimprove fruit size and firmness: Effects overthree seasons. J. Hort. Sci. Biotechnol. 72:645–652, doi: 10.1080/14620316.1997.11515554.
Southwick, S.M. and K. Glozer. 2000. Reducingflowering with gibberellins to increase fruit sizein stone fruit trees: Applications and implicationsin fruit production. HortTechnology 10:744–751,doi: 10.21273/HORTTECH.10.4.744.
Strik, B.C., J.R. Clark, C.E. Finn, andM.P. Ban. 2007.Comprehensive crop reports worldwide black-berry production. HortTechnology 17:205–213,doi: 10.21273/HORTTECH.17.2.205.
Stroup,W.W. 2018. Analysis of non-gaussian data,p. 449–509. In: B. Glaz and K.M. Yeaters(eds.). Applied statistics in agricultural, biolog-ical, and environmental sciences. AmericanSociety of Agronomy, Crop Science Societyof America, and Soil Science Society of Amer-ica, Madison, WI. https://doi.org/10.2134/appliedstatistics.2015.0081.c16.
Tzoutzoukou, C.G., C.A. Pontikis, and A. Tolia-Marioli. 1998. Effects of gibberellic acid onbloom advancement in female pistachio (Pista-cia vera L.). J. Hort. Sci. Biotechnol. 73:517–526, doi: 10.1080/14620316.1998.11511008.
U.S. Department of Agriculture. 2016. United Statesstandards for grades of dewberries and blackberries.25 Apr. 2017. <www.ams.usda.gov/sites/default/files/media/DewberriesBlackberriesStandard.pdf>.
U.S. Department of Agriculture. 2017. USDA/NASS Quickstats Ad-Hoc Query Tool. 8 July2019. <https://quickstats.nass.usda.gov/results/08D195DC-7B67-32E7-9167-4314A69E6E69>.
Vimont, N., A. Schwarzenberg, M. Domijan, R.Beauvieux, M. Arkoun, J.-C. Yvin, S. Cortijo,P.A. Wigge, E. Dirlewanger, and B. Wenden.2018. Hormonal balance finely tunes dormancystatus in sweet cherry flower buds. bioRxiv423871: doi: 10.1101/423871.
Weiss, D. and N. Ori. 2007. Mechanisms of crosstalk between gibberellin and other hormones.Plant Physiol. 144:1240–1246, doi: 10.1104/pp.107.100370.
Wen, L.H., W.J. Zhong, X.M. Huo, W.B. Zhuang,Z.J. Ni, and Z.H. Gao. 2016. Expression anal-ysis of ABA-and GA-related genes during fourstages of bud dormancy in Japanese apricot(Prunus mume Sieb. et Zucc). J. Hort. Sci.Biotechnol. 91:362–369, doi: 10.1080/14620316.2016.1160546.
Xing, L., D. Zhang, C. Zhao, Y. Li, J. Ma, N. An,and M. Han. 2016. Shoot bending promotesflower bud formation by miRNA-mediatedregulation in apple (Malus domestica Borkh.).Plant Biotechnol. J. 14:749–770, doi: 10.1111/pbi.12425.
Yamaguchi, N., C.M. Winter, M.F. Wu, Y. Kanno,A. Yamaguchi, M. Seo, and D. Wagner. 2014.Gibberellin acts positively then negatively tocontrol onset of flower formation in Arabidop-sis. Science 344:638–641, doi: 10.1126/sci-ence.1250498.
Yamaguchi, S. 2008. Gibberellin metabolism and itsregulation.Annu.Rev. PlantBiol. 59:225–251, doi:10.1146/annurev.arplant.59.032607.092804.
Yue, C., H. Cao, X. Hao, J. Zeng,W. Qian, Y. Guo, N.Ye, Y. Yang, and X. Wang. 2018. Differentialexpression of gibberellin- and abscisic acid-relatedgenes implies their roles in the bud activity-dormancy transition of tea plants. Plant Cell Rpt.37:425–441, doi: 10.1007/s00299-017-2238-5.
Zhang, S., D. Zhang, S. Fan, L. Du, Y. Shen, L.Xing, Y. Li, J. Ma, and M. Han. 2016. Effect ofexogenous GA3 and its inhibitor paclobutrazolon floral formation, endogenous hormones, andflowering-associated genes in ‘Fuji’ apple(Malus domestica Borkh.). Plant Physiol.Biochem. 107:178–186, doi: 10.1016/j.plaphy.2016.06.005.
Zhang, S., C. Gottschalk, and S. van Nocker. 2019.Genetic mechanisms in the repression of flow-ering by gibberellins in apple (Malus · domes-tica Borkh.). BMC Genomics 20:1–15, doi:10.1186/s12864-019-6090-6.
Zhuang, W., Z. Gao, L. Wang, W. Zhong, Z. Ni,and Z. Zhang. 2013. Comparative proteomicand transcriptomic approaches to address theactive role of GA4 in Japanese apricot flowerbud dormancy release. J. Expt. Bot. 64:4953–4966, doi: 10.1093/jxb/ert284.
42 Proc. Fla. State Hort. Soc. 133: 2020
Proc. Fla. State Hort. Soc. 133:42–46. 2020.
Citrus Section
*Corresponding author. Email: [email protected]
Influence of Elevated Manganese Rates on Growth Parameters, Nutrient, and Biomass Accumulation of
HLB-affected Trees In FloridaSamuel KwaKye, Davie KaDyampaKeni*, anD TripTi vaShiSTh
University of Florida/Institute of Food and Agriculture Science, Citrus Research and Education Center, 700 Experiment Station Road, Lake Alfred, FL 33850
AdditionAl index words. biomass accumulation, Candidatus Liberibacter asiaticus (CLas), Citrus sinensis, huanglongbing (HLB), nutrient use efficiency
Enhancing nutrient uptake and tree health play an important role in managing huanglongbing (HLB) affected citrus trees in Florida. A greenhouse experiment was established to evaluate the effect of varying rates of manganese (Mn) on growth and development of 1-year-old HLB-affected sweet orange (Citrus sinensis) trees in October 2018 at the University of Florida IFAS (UF/IFAS)Citrus Research and Education Center in Lake Alfred, FL. Fifty percent of the trees were graft-inoculated with the HLB pathogen and the rest of the trees were used as the HLB-free (NHLB), control trees. Four treatments were applied on both sets of the trees in a randomized complete block design with 7 replicates. Data including trunk diameter, tree height and leaf samples were collected, processed and analyzed from trees treated with from four treatments, 0.0 kg·ha-1 Mn (Control), 5.6 kg·ha-1 Mn (1×, the UF/IFAS recommended rate), 11.2 kg·ha-1 Mn (2× UF/IFAS recommended rate), and 22.4 kg·ha-1 Mn (4× UF/IFAS recommended rate) on HLB- and NHLB-affected citrus trees. All the other essential nutrients were maintained at current recommendations in all the treatments. Leaf Mn concentrations, tree height and trunk diameter were analyzed by year with repeated measures in SAS-GLIMMIX. Leaf-Mn concentrations were significantly different (P < 0.0001) among Mn rates, and across sampling times in both HLB and NHLB trees in 2019. In both HLB and NHLB-affected trees, the Mn rate of 22.4 kg·ha-1 Mn recorded the highest leaf Mn concentration with the least square mean (LSM) of 1131 μg·g-1 of dry weight. Tree height and trunk diameter presented significant differences across sampling times in both HLB- and NHLB-affected trees in 2019. The 11.2 kg·ha-1 Mn rate increased tree height in HLB-affected trees across sampling-time, while the 22.4 kg·ha-1 Mn rate increased the trunk diameter of HLB-affected trees. The results presented in this study show that HLB-affected trees would require higher Mn concentrations than healthy trees (NHLB), for similar physiological functions. The results from this study support higher Mn treatments; specifically, 11.2- and 22.4-kg·ha-1 Mn (2× and 4×, respectively) than the UF/IFAS recommendation for better tree growth in HLB-affected trees.
During the past decade, the total citrus production in the United States has declined significantly (Blauer, 2020). Florida, the second-largest citrus producer in the country, has recorded the greatest reduction of more than 70%, from 13.5 million tons in 1998 to about 3.5 million tons in 2019 (Blauer, 2020; USDA, 2019). Despite this reduction, citrus remains the leading tree crop produced in Florida, contributing about $9 billion annually to the state’s economy, and employing about 45,000 workers (USDA, 2019). Citrus production decline has been attributed to many causes, primarily huanglongbing (HLB), which was first reported in Florida around 2005. The disease was first found in China in the 19th century and has now spread to most parts of the world thus threatening the citrus industry (Blauer, 2020; Hall and Gottwald, 2011; USDA, 2019).
The HLB is caused by a phloem-limited bacterium called Candidatus Liberibacter asiaticus (CLas) and spread by an insect vector Diaphorina citri (Asian citrus psyllid, ACP) (Gilani et al., 2019; Gottwald et al., 2012; Hijaz et al., 2016; Killiny and Nehela, 2017). The insect-vector pierces through the phloem where it
introduces the CLas. Once the is in the phloem, the plant blocks the phloem as a defense response and translocation of nutrients occurs (Spreen et al., 2014). One of the effects of the latter is a decline in roots and fibrous root density, which leads to a reduc-tion in nutrient and water uptake, hence, a decrease in citrus yield (Graham et al., 2013; Hamido et al., 2017; Kadyampakeni et al., 2014b, 2014c; Killiny and Nehela, 2017). Since the disease has no cure, the management programs adapted are: intensive chemical control of the ACP, aggressive removal of HLB-affected trees, severe pruning, planting disease-free nursery stock (Hall and Gottwald, 2011; Rouse, 2017) and balanced-nutrition (Vashisth and Kadyampakeni, 2020). But the latter has called for much at-tention because balanced-nutrition tend to improve tree canopy and yield (Morgan et al., 2016; Nwugo et al., 2013; Rouse et al., 2017; Spann and Schumann, 2009).
Currently, there are no guidelines to determine optimal manga-nese (Mn) concentration in HLB-affected citrus trees in Florida. These guidelines would enable us to better understand the role Mn plays in the nutrition of HLB-affected trees. The University of Florida’s Institute of Food and Agricultural Sciences (UF/IFAS) has updated its citrus nutrition guidelines (Morgan and Kadyampakeni, 2020) to guide farm managers and research

43Proc. Fla. State Hort. Soc. 133: 2020.
scientists on balanced citrus nutrition with essential nutrients and their relationship to productivity. However, there is insuf-ficient information on how much more Mn the HLB-affected trees require to maintain balanced levels in tissues of the tree. This study sought to generate information on how much Mn the HLB-affected trees require.
Manganese is an essential plant nutrient present in most plant metabolic processes, particularly in photosynthesis (Millaleo et al., 2010). The form of Mn taken up by plants is Mn2+, a reduced form of Mn. Studies done by most researchers show that Mn is taken up by an active transport system in epidermal root cells, where it is transported by the xylem as Mn2+ into the plant system (Gherardi and Rengel, 2004; Marschner, 1995; Millaleo et al., 2010; Pittman, 2005). According to Graham (1979), Mn plays three major roles in the plant system: it assists the movement of electrons in photosynthesis, it affects the reduction of nitrate in nitrogen metabolism, and it acts as a precursor for aromatic amino acids and hormones as in auxins, phenols and lignin (Clarkson, 1988). Insufficient Mn in the plant triggers deficiency symptoms, which are usually observed when plant growth is extremely depressed. However, the productivity of plants is already af-fected when deficiency symptoms are observed (Schmidt et al., 2016). Zekri and Obreza (2012) reported that Mn deficiency in citrus might significantly reduce yield and fruit quality (Zekri and Obreza, 2012). Deficiency symptoms are observed in newly emerged leaves because Mn is immobile in the phloem, and as a result the remobilization of Mn from older to younger leaves is not possible (Schmidt et al., 2016).
Marschner (1995) mentioned that high levels of Mn could be toxic to biological cells, and intensity of the toxicity will depend on the excess Mn concentration in the plant (Lambers et al., 2015; Marschner, 1995). Finding the level of Mn at which HLB-affected citrus trees may be tolerant is deemed necessary, most importantly, for competition between Mn and other es-sential nutrients. This is because antagonism between Mn and other mineral elements has been reported; where excess Mn seems to limit the uptake of iron, molybdenum and magnesium, which are equally important for plants growth and development (Rietra et al., 2017).
Even though the mechanism at which HLB-affected trees metabolize Mn is not well understood, elevated levels of Mn has proven to correct deficiency symptoms and reduced CLas bacterial titers (Zambon et al., 2019). However, it is still not very clear how much the HLB-affected trees require Mn to maintain optimal concentration. Therefore, the objective of this study was to evaluate the effect of varying rates of manganese (Mn) on the growth and development of 1-year-old HLB-affected Citrus sinensis ‘Valencia’ trees under greenhouse conditions in Florida.
Materials and Methods
site description And triAl estAblishment. This study was conducted for two years in the greenhouse at the UF/IFAS Cit-rus Research and Education Center (CREC) in Lake Alfred, FL (Latitude 28°5’37”; Longitude 81°43’30”), to evaluate varying Mn rates on one-year old ‘Valencia’ (Citrus sinensis) trees on Kuharske citrange rootstock (Citrus sinensis × Poncirus trifo-liata). The trees were planted in 8.7-L nursery containers. Fifty percent of the trees were graft-inoculated with the HLB-causal pathogen CLas. At least 3 leaves were grafted to enhance the prob-ability of CLas inoculation. Trees were then left for 3 months for infection establishment. Composite soil samples were collected
and analyzed for soil pH and Mehlich-3 extractable nutrients to correct for any deficiency.
Initial measurements of tree height and trunk diameter were taken from each plant before treatments were applied. At the same time, leaves were sampled and analyzed for Leaf-Mn and other essential nutrients. Treatments were then applied once confirmed for CLas inoculation using a quantitative polymerase chain reaction analysis (qPCR—Applied Biosystems 7500 Fast Real-Time PCR System; Thermo Fisher Scientific). Water was supplied to each container using a drip irrigation system with pressure-compensating drip emitters at a rate of 2 L·h-1 (MaxiJet, Dundee, FL) and trees were provided with all essential nutrients according to the UF/IFAS nutritional guide for citrus production (Morgan and Kadyampakeni, 2020).
treAtment ApplicAtion. Four treatments were applied in total; four treatments including the control for each of the HLB and NHLB-affected trees. Each treatment had a seven single tree replication, arranged in a randomized complete block design (using HLB and NHLB as blocks). The treatments comprised of soil application of varying rates of Mn from manganese (II) sulfate monohydrate (MnS04·H2O, 16% Mn). All treatments were applied and mixed within 5-cm depth of the soil by hand, three times a year. Treatments were as follows:
1. Control: 0.00 kg·ha-1 Mn; trees that received this treatment were only supplied with other essential plant nutrients apart from Mn.
2. Standard UF/IFAS recommendation (hereafter denoted 1×): 5.6 Mn; this treatment represents the standard practice for Mn fertilizer application on citrus in Florida.
3. Two times the standard rate (hereafter denoted 2×): 11.2 kg·ha-1 Mn; this treatment represents a twice the standard recommendation rate.
4. Four times the standard rate (hereafter denoted 4x): 22.4 kg·ha-1 Mn ; this treatment represents four times the standard recommendation rate.
tree height And trunk diAmeter. Initial tree height and trunk diameter were recorded for each replicate before treatments were applied. Subsequently, in every three-month interval, a measuring pole height stick (model 807396 by SOKKIA Corp., Olathe, KS) and a digital caliper were used to measure tree height and diameter for each replicate in each treatment. The digital caliper recorded the trunk diameter in the North-South (NS) and East–West (EW) directions of the tree. The results were then averaged and converted into cross-sectional area assuming a circular shape. In terms of tree height and trunk diameter, relative growth was estimated for each replicate by subtracting the first measurements (before treatments were applied) from the subsequent measurements (after treatments were applied) for each measurement period.
leAf And soil sAmpling. Leaf samples were collected for each replicate before treatments were applied and afterwards every three months, following treatment application. About 15 fully expanded leaves aged 4–6 months were sampled. Immature-, abnormal-appearing-, and dead-leaves were avoided during every sampling period. The leaves were hand-washed immediately after sampling to remove any surface contamination. Sampled leaves were put into clean paper bags and dried in a ventilated oven at 65 °C for at least 72 h (Morgan and Kadyampakeni, 2020). After drying, leaves were ground with Thomas Type Lab Willey Grinder (PSAW-180, Swedesboro, NJ) with a 20-mesh sieve. Leaf tissue samples were then sent to Waters Agricultural Laboratories, Inc.
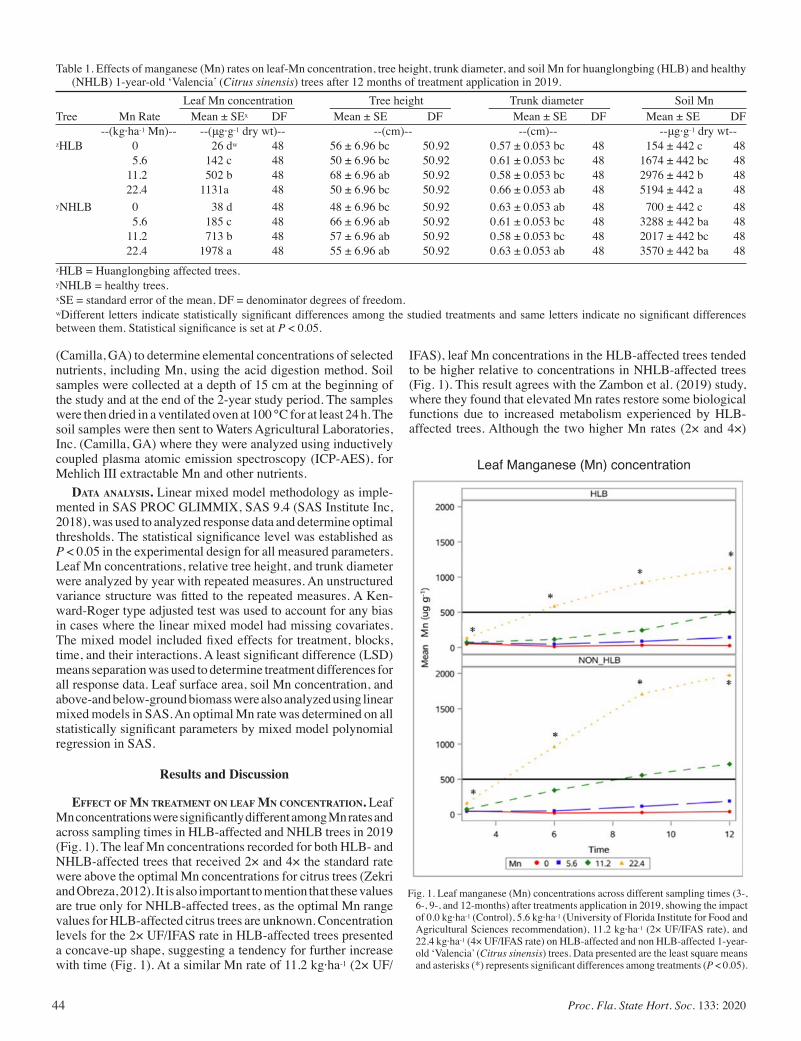
44 Proc. Fla. State Hort. Soc. 133: 2020
(Camilla, GA) to determine elemental concentrations of selected nutrients, including Mn, using the acid digestion method. Soil samples were collected at a depth of 15 cm at the beginning of the study and at the end of the 2-year study period. The samples were then dried in a ventilated oven at 100 °C for at least 24 h. The soil samples were then sent to Waters Agricultural Laboratories, Inc. (Camilla, GA) where they were analyzed using inductively coupled plasma atomic emission spectroscopy (ICP-AES), for Mehlich III extractable Mn and other nutrients.
dAtA AnAlysis. Linear mixed model methodology as imple-mented in SAS PROC GLIMMIX, SAS 9.4 (SAS Institute Inc, 2018), was used to analyzed response data and determine optimal thresholds. The statistical significance level was established as P < 0.05 in the experimental design for all measured parameters. Leaf Mn concentrations, relative tree height, and trunk diameter were analyzed by year with repeated measures. An unstructured variance structure was fitted to the repeated measures. A Ken-ward-Roger type adjusted test was used to account for any bias in cases where the linear mixed model had missing covariates. The mixed model included fixed effects for treatment, blocks, time, and their interactions. A least significant difference (LSD) means separation was used to determine treatment differences for all response data. Leaf surface area, soil Mn concentration, and above-and below-ground biomass were also analyzed using linear mixed models in SAS. An optimal Mn rate was determined on all statistically significant parameters by mixed model polynomial regression in SAS.
Results and Discussion
effect of mn treAtment on leAf mn concentrAtion. Leaf Mn concentrations were significantly different among Mn rates and across sampling times in HLB-affected and NHLB trees in 2019 (Fig. 1). The leaf Mn concentrations recorded for both HLB- and NHLB-affected trees that received 2× and 4× the standard rate were above the optimal Mn concentrations for citrus trees (Zekri and Obreza, 2012). It is also important to mention that these values are true only for NHLB-affected trees, as the optimal Mn range values for HLB-affected citrus trees are unknown. Concentration levels for the 2× UF/IFAS rate in HLB-affected trees presented a concave-up shape, suggesting a tendency for further increase with time (Fig. 1). At a similar Mn rate of 11.2 kg·ha-1 (2× UF/
Leaf Manganese (Mn) concentration
Fig. 1. Leaf manganese (Mn) concentrations across different sampling times (3-, 6-, 9-, and 12-months) after treatments application in 2019, showing the impact of 0.0 kg·ha-1 (Control), 5.6 kg·ha-1 (University of Florida Institute for Food and Agricultural Sciences recommendation), 11.2 kg·ha-1 (2× UF/IFAS rate), and 22.4 kg·ha-1 (4× UF/IFAS rate) on HLB-affected and non HLB-affected 1-year-old ‘Valencia’ (Citrus sinensis) trees. Data presented are the least square means and asterisks (*) represents significant differences among treatments (P < 0.05).
IFAS), leaf Mn concentrations in the HLB-affected trees tended to be higher relative to concentrations in NHLB-affected trees (Fig. 1). This result agrees with the Zambon et al. (2019) study, where they found that elevated Mn rates restore some biological functions due to increased metabolism experienced by HLB-affected trees. Although the two higher Mn rates (2× and 4×)
Table 1. Effects of manganese (Mn) rates on leaf-Mn concentration, tree height, trunk diameter, and soil Mn for huanglongbing (HLB) and healthy (NHLB) 1-year-old ‘Valencia’ (Citrus sinensis) trees after 12 months of treatment application in 2019.
Leaf Mn concentration Tree height Trunk diameter Soil MnTree Mn Rate Mean ± SEx DF Mean ± SE DF Mean ± SE DF Mean ± SE DF --(kg·ha-1 Mn)-- --(μg·g-1 dry wt)-- --(cm)-- --(cm)-- --μg·g-1 dry wt--zHLB 0 26 dw 48 56 ± 6.96 bc 50.92 0.57 ± 0.053 bc 48 154 ± 442 c 48 5.6 142 c 48 50 ± 6.96 bc 50.92 0.61 ± 0.053 bc 48 1674 ± 442 bc 48 11.2 502 b 48 68 ± 6.96 ab 50.92 0.58 ± 0.053 bc 48 2976 ± 442 b 48 22.4 1131a 48 50 ± 6.96 bc 50.92 0.66 ± 0.053 ab 48 5194 ± 442 a 48yNHLB 0 38 d 48 48 ± 6.96 bc 50.92 0.63 ± 0.053 ab 48 700 ± 442 c 48 5.6 185 c 48 66 ± 6.96 ab 50.92 0.61 ± 0.053 bc 48 3288 ± 442 ba 48 11.2 713 b 48 57 ± 6.96 ab 50.92 0.58 ± 0.053 bc 48 2017 ± 442 bc 48 22.4 1978 a 48 55 ± 6.96 ab 50.92 0.63 ± 0.053 ab 48 3570 ± 442 ba 48zHLB = Huanglongbing affected trees.yNHLB = healthy trees.xSE = standard error of the mean, DF = denominator degrees of freedom.wDifferent letters indicate statistically significant differences among the studied treatments and same letters indicate no significant differences between them. Statistical significance is set at P < 0.05.
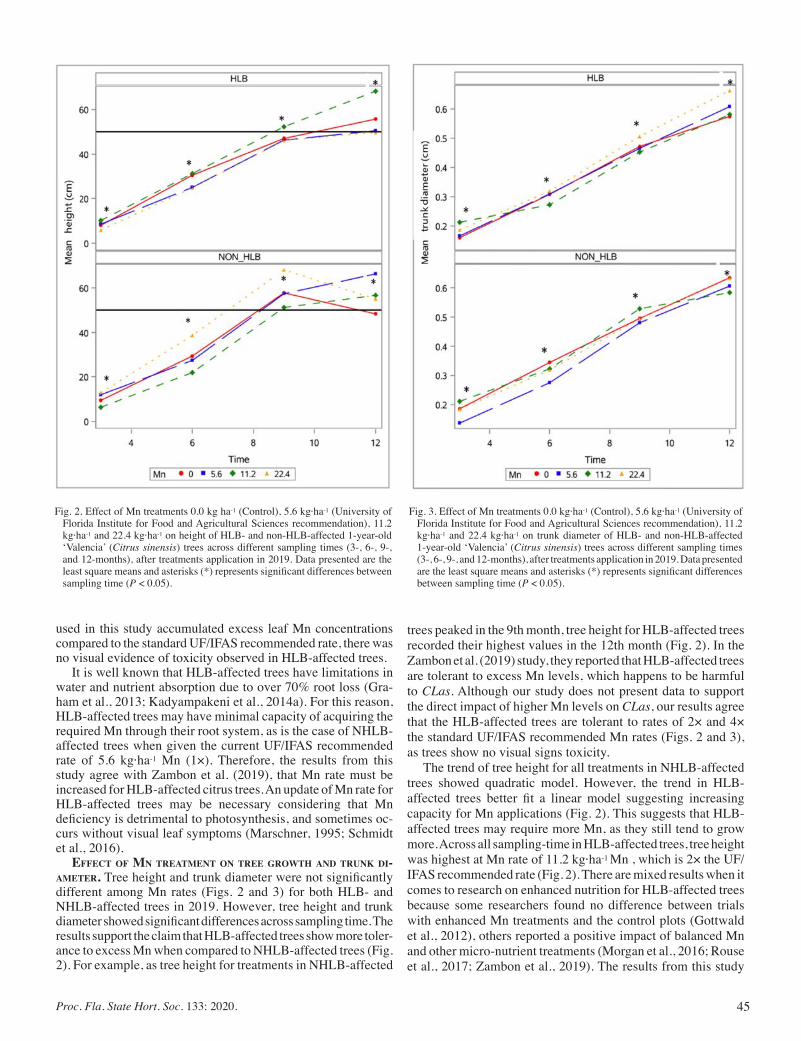
45Proc. Fla. State Hort. Soc. 133: 2020.
used in this study accumulated excess leaf Mn concentrations compared to the standard UF/IFAS recommended rate, there was no visual evidence of toxicity observed in HLB-affected trees.
It is well known that HLB-affected trees have limitations in water and nutrient absorption due to over 70% root loss (Gra-ham et al., 2013; Kadyampakeni et al., 2014a). For this reason, HLB-affected trees may have minimal capacity of acquiring the required Mn through their root system, as is the case of NHLB-affected trees when given the current UF/IFAS recommended rate of 5.6 kg·ha-1 Mn (1×). Therefore, the results from this study agree with Zambon et al. (2019), that Mn rate must be increased for HLB-affected citrus trees. An update of Mn rate for HLB-affected trees may be necessary considering that Mn deficiency is detrimental to photosynthesis, and sometimes oc-curs without visual leaf symptoms (Marschner, 1995; Schmidt et al., 2016).
effect of mn treAtment on tree growth And trunk di-Ameter. Tree height and trunk diameter were not significantly different among Mn rates (Figs. 2 and 3) for both HLB- and NHLB-affected trees in 2019. However, tree height and trunk diameter showed significant differences across sampling time. The results support the claim that HLB-affected trees show more toler-ance to excess Mn when compared to NHLB-affected trees (Fig. 2). For example, as tree height for treatments in NHLB-affected
trees peaked in the 9th month, tree height for HLB-affected trees recorded their highest values in the 12th month (Fig. 2). In the Zambon et al. (2019) study, they reported that HLB-affected trees are tolerant to excess Mn levels, which happens to be harmful to CLas. Although our study does not present data to support the direct impact of higher Mn levels on CLas, our results agree that the HLB-affected trees are tolerant to rates of 2× and 4× the standard UF/IFAS recommended Mn rates (Figs. 2 and 3), as trees show no visual signs toxicity.
The trend of tree height for all treatments in NHLB-affected trees showed quadratic model. However, the trend in HLB-affected trees better fit a linear model suggesting increasing capacity for Mn applications (Fig. 2). This suggests that HLB-affected trees may require more Mn, as they still tend to grow more. Across all sampling-time in HLB-affected trees, tree height was highest at Mn rate of 11.2 kg·ha-1 Mn , which is 2× the UF/IFAS recommended rate (Fig. 2). There are mixed results when it comes to research on enhanced nutrition for HLB-affected trees because some researchers found no difference between trials with enhanced Mn treatments and the control plots (Gottwald et al., 2012), others reported a positive impact of balanced Mn and other micro-nutrient treatments (Morgan et al., 2016; Rouse et al., 2017; Zambon et al., 2019). The results from this study
Fig. 2. Effect of Mn treatments 0.0 kg ha-1 (Control), 5.6 kg·ha-1 (University of Florida Institute for Food and Agricultural Sciences recommendation), 11.2 kg·ha-1 and 22.4 kg·ha-1 on height of HLB- and non-HLB-affected 1-year-old ‘Valencia’ (Citrus sinensis) trees across different sampling times (3-, 6-, 9-, and 12-months), after treatments application in 2019. Data presented are the least square means and asterisks (*) represents significant differences between sampling time (P < 0.05).
Fig. 3. Effect of Mn treatments 0.0 kg·ha-1 (Control), 5.6 kg·ha-1 (University of Florida Institute for Food and Agricultural Sciences recommendation), 11.2 kg·ha-1 and 22.4 kg·ha-1 on trunk diameter of HLB- and non-HLB-affected 1-year-old ‘Valencia’ (Citrus sinensis) trees across different sampling times (3-, 6-, 9-, and 12-months), after treatments application in 2019. Data presented are the least square means and asterisks (*) represents significant differences between sampling time (P < 0.05).
46 Proc. Fla. State Hort. Soc. 133: 2020
support an increase in tree height and trunk diameter with time for HLB-affected trees, when treated with elevated levels of Mn.
Conclusion
The results of this study support higher than the standard Mn treatments (2× and 4×, 11.2- and 22.4-kg·ha-1, respectively) can be beneficial for HLB-affected trees. The rate of 11.2 kg·ha-1 Mn increased tree height in HLB-affected trees across sampling time, while the 4× rate of 22.4-kg·ha-1 increased the trunk diameter of HLB-affected trees. When trees are affected by HLB, they require higher Mn concentrations than healthy trees (NHLB), for similar physiological functions and possibly, to combat biotic stress. HLB-affected trees that received 22.4-kg Mn·ha-1, which is about 4-times the UF/IFAS recommendation rate presented no visual signs of toxicity.
Literature Cited
Blauer, R., 2020. Citrus: World markets and trade. USDA Foreign Ag-ricultural Service. USDA Foreign Agric. Serv. 13.
Citation, S., 2010. Strategic planning for the Florida Cctrus industry: Addressing citrus greening, strategic planning for the Florida citrus industry: Addressing Citrus Greening. https://doi.org/10.17226/12880
Clarkson, D.T. 1988. The uptake and translocation of manganese by plant roots. Manganese in Soils and Plants:101–111. https://doi.org/10.1007/978-94-009-2817-6_8
Gherardi, M.J.and Z. Rengel. 2004. The effect of manganese supply on ex-udation of carboxylates by roots of lucerne (Medicago sativa). Plant Soil 260:271–282. https://doi.org/10.1023/B:PLSO.0000030182.11473.3b
Gilani, K., S. Naz, F. Aslam, and W. Gurley. 2019. A comparison of zinc, phosphorous and potassium levels in leaves and fruit pulp of healthy and huanglongbing affected citrus cultivars. J. Plant Physiol. Pathol. 07:1–8. https://doi.org/10.4172/2329-955x.1000192
Gottwald, T.R., J.H. Graham, M.S. Irey, T.G. McCollum, and B.W. Wood. 2012. Inconsequential effect of nutritional treatments on huanglongbing control, fruit quality, bacterial titer and disease progress. Crop Prot. 36:73–82. https://doi.org/10.1016/j.cropro.2012.01.004
Graham, J.H., E.G. Johnson, T.R. Gottwald, and M.S. Irey. 2013. Presymp-tomatic fibrous root decline in citrus trees caused by huanglongbing and potential interaction with Phytophthora spp. Plant Dis. 97:1195–1199. https://doi.org/10.1094/PDIS-01-13-0024-RE
Hall, D.G. and T.R. Gottwald. 2011. Pest management practices aimed at curtailing citrus huanglongbing disease. Outlooks Pest Manag. 22:189–192. https://doi.org/10.1564/22aug11
Hamido, S.A., K.T. Morgan, R.C. Ebel, and D.M. Kadyampakeni. 2017. Improved irrigation management of sweet orange with huan-glongbing. HortScience 52(6):916–921. https://doi.org/10.21273/HORTSCI12013-17
Hijaz, F., Y. Nehela, and N. Killiny 2016. Possible role of plant volatiles in tolerance against huanglongbing in citrus. Plant Signal. Behav. 11:1–12. https://doi.org/10.1080/15592324.2016.1138193
Kadyampakeni, D.M., K.T. Morgan, A.W. Schumann, and P., Nkedi-Kizza. 2014a. Effect of irrigation pattern and timing on root density of young citrus trees infected with huanglongbing disease. HortTechnology 24:209–221. https://doi.org/10.21273/horttech.24.2.209
Kadyampakeni, D.M., K.T. Morgan, A.W. Schumann, P. Nkedi-Kizza, and K. Mahmoud. 2014b. Ammonium and nitrate distribution in soil using drip and microsprinkler irrigation for citrus production. Soil Sci. Soc. Am. J. 78:645–654. https://doi.org/10.2136/sssaj2013.07.0319
Kadyampakeni, D.M., K.T. Morgan, A.W. Schumann, P. Nkedi-Kizza, and T.A. Obreza. 2014c. Water use in drip- and microsprinkler-irrigated
citrus trees. Soil Sci. Soc. Am. J. 78:1351–1361. https://doi.org/10.2136/sssaj2014.02.0054
Killiny, N. and Y. Nehela. 2017. Metabolomic response to huanglong-bing: Role of carboxylic compounds in Citrus sinensis response to ‘Candidatus liberibacter asiaticus’ and its vector, Diaphorina citri. Mol. Plant-Microbe Interact. 30:666–678. https://doi.org/10.1094/MPMI-05-17-0106-R
Lambers, H., P.E. Hayes, E. Laliberté, R.S. Oliveira, and B.L. Turner. 2015. Leaf manganese accumulation and phosphorus-acquisition efficiency. Trends Plant Sci. 20:83–90. https://doi.org/10.1016/j.tplants.2014.10.007
Marschner, H. 1995. Mineral nutrition of higher plants.second edi-tion. 889pp. London: Ann. Bot. 78:527–528. https://doi.org/10.1006/anbo.1996.0155
Millaleo, R., M. Reyes- Diaz, A. Ivanov, M. Mora, and M. Alberdi. 2010a. Manganese as essential and toxic element for plants: Trans-port, accumulation and resistance mechanisms. J. Soil Sci. Plant Nutr. 10:470–481. https://doi.org/10.4067/S0718-95162010000200008
Morgan, K.T. and D.M. Kadyampakeni. 2020. Nutrition of Florida citrus trees, 3rd edition. Extension publication SL 253, Univ. Florida, Gainesville.
Morgan, K.T., R.E. Rouse, and R.C. Ebel. 2016. Foliar applications of essential nutrients on growth and yield of ‘Valencia’ sweet orange infected with huanglongbing. HortScience 51:482–1493. https://doi.org/10.21273/HORTSCI11026-16
Nwugo, C.C., Y. Duan, and H. Lin. 2013. Study on citrus response to huanglongbing highlights a down-regulation of defense-related proteins in lemon plants upon ‘Ca. Liberibacter asiaticus’ Infection. PLoS One 8:1–13. https://doi.org/10.1371/journal.pone.0067442
Pittman, J.K., 2005. Managing the manganese: Molecular mechanisms of manganese transport and homeostasis. New Phytol. 167:733–742. https://doi.org/10.1111/j.1469-8137.2005.01453.x
Rietra, R.P.J.J., M. Heinen, C.O. Dimkpa, and P.S. Bindraban. 2017. Effects of nutrient antagonism and synergism on yield and fertilizer use efficiency. Commun. Soil Sci. Plant Anal. 48:1895–1920. https://doi.org/10.1080/00103624.2017.1407429
Rouse, R.E., M. Ozores-Hampton, F.M. Roka, and P. Roberts. 2017. Re-habilitation of huanglongbing-affected citrus trees using severe pruning and enhanced foliar nutritional treatments. HortScience 52(7):972-978. https://doi.org/10.21273/HORTSCI11105-16
SAS Institute Inc, 2018. SAS/STAT® 15.1 User’s Guide. SAS Inst. Inc., Cary, N.C.
Schmidt, S.B., P.E. Jensen, and S. Husted. 2016. Manganese deficiency in plants: The impact on photosystem II. Trends Plant Sci. 21:622–632. https://doi.org/10.1016/j.tplants.2016.03.001
Spann, T.M. and A.W. Schumann. 2009. The role of plant nutrients in disease development with emphasis on citrus and huanglongbing. Proc. Florida State Horicultural Sci. 122:169–171.
Spreen, T.H., J.P. Baldwin, and S.H. Futch. 2014. An economic assess-ment of the impact of huanglongbing on citrus tree plantings in Florida. HortScience 49:1052–1055.
USDA, National Agricultural Statistics Service, 2019. Citrus fruits 2018 Summary 35.
Vashisth, T. and D. Kadyampakeni. 2020. Diagnosis and management of nutrient constraints in citrus. In: Fruit Crops (p. 723–737). Elsevier, Amsterdam, The Netherlands.
Zambon, F.T., D.M. Kadyampakeni, and J.W. Grosser. 2019. Ground application of overdoses of manganese have a therapeutic effect on sweet orange trees infected with Candidatus Liberibacter asi-aticus. HortScience 54(6):1077–1086. https://doi.org/10.21273/HORTSCI13635-18
Zekri, M. and T.A. Obreza. 2012. Plant nutrients for citrus trees. Exten-sion publication SL 200, Univ. Florida, Gainesville.
47Proc. Fla. State Hort. Soc. 133: 2020.
Proc. Fla. State Hort. Soc. 133:47–54. 2020.
Citrus Section
The authors thank the CRDF for funding this project. Special thanks also to the UF-CREC Water and Nutrient Management lab members for technical assistance.*Corresponding author. Email: [email protected]
Performance of HLB-affected Trees to Soil Macro- and Micronutrient Applications
Tanyaradzwa Chinyukwi, Samuel kwakye, and davie kadyampakeni*University of Florida, Citrus Research and Education Center, 700 Experiment Station Rd.,
Lake Alfred, FL 33850
AdditionAl index words. Candidatus Liberibacter asiaticus, Citrus sinensis, nutrient use efficiency, optimal fertilization rates
The huanglongbing (HLB) causative agent, Candidatus Liberibacter asiaticus, lowers tree performance by reducing water and nutrient uptake as a result of root loss. HLB-affected trees have a fibrous root loss of about 30 to 80%, which increases as HLB symptoms develop in the canopy. Investigating optimal nutrient concentrations in citrus roots thus improves our understanding of HLB dynamics concerning root nutrition and fertilizer application methods. This study sought to evaluate nutrient uptake of HLB-affected orange trees via soil fertilizer applications for 5- to 6-year-old Citrus sinensis ‘Valencia’ orange trees on Swingle rootstock at Ridge and Flatwoods sites. Macronutrients and micronutrients were applied at varying fertilization rates of standard fertilization via fertigation according to the University of Florida Institute of Food and Agricultural Science guidelines. For macronutrients, the rates were: a) standard fertilization + 40 lb/acre Ca + 40 lb/acre Mg + 220 lb/acre K and b) standard fertilization + 90 lb/acre Ca + 90 lb/acre Mg + 440 lb/acre K. For micronutrients, the rates were: a) standard fertilization + 5 lb/acre Fe, 5 lb/acre Mn, 5 lb/acre Zn+ 1 lb/acre
B; b) standard fertilization + 10 lb/acre Fe, 10 lb/acre Mn, 10 lb/acre Zn + 2 lb/acre B; and c) standard fertilization + 20 lb/acre Fe, 20 lb/acre Mn + 20 lb/acre Zn + 4 lb/acre B. Soil and leaf samples were collected for nutrient concentra-tion analysis in Spring and Fall 2019 and Summer 2020. No significant differences among treatments (P < 0.05) were observed for tissue and soil nutrient concentrations due to nutrient interactions. Fruit yield between the 2019 and 2020 harvest seasons increased with increased nutrient availability. Therefore, at higher fertilization rates of (standard fer-tilization + 40 lb/acre Ca + 40 lb/acre Mg + 220 lb/acre K + 20 lb/acre Fe, 20 lb/acre Mn + 20 lb/acre Zn + 4 lb/acre B), HLB-affected trees showed increased nutrient uptake, improving overall tree performance.
Florida citrus production has been on the decline for the past two decades, with orange production declining by 72%, from about 8 to 2 billion tons from 2007–2008 to 2017 –2018 (National Agricultural Statistics Service, 2020). Citrus production area in Florida has also declined from over 750,000 acres in 2000 to approximately 392,515 acres in 2019 (National Agricultural Sta-tistics Service, 2020). The decline in citrus production is mainly due to citrus greening and damages from the Hurricane Irma in 2017 (Dala-Paula et al., 2019).
Citrus greening (also known as huanglongbing or HLB), is a disease caused by a bacterium Candidatus Liberibacter asiaticus (CLas), which lowers tree performance due to reduced uptake and accumulation of water and nutrients (Kadyampakeni et al., 2014). The decline in uptake and accumulation of water and nutrients is due to an alteration of the plant’s photosynthesis mechanism, root length density and the vascular system (Graham et al., 2013). Symptoms of HLB can be detected on several parts of the plant, from roots to leaves as well as increased acidity and bitterness of the fruit, thus changing the chemical and sensory characteristics of the fruit (Bassanezi et al., 2009; Bové, 2006). HLB-affected trees have a reduced canopy, leaves show chlorotic patterns and fruit size is reduced. The fruit contains small, brownish, aborted
seeds that can be seen when the orange fruit is sectioned perpen-dicularly to the fruit axis. The presence of CLas pathogen in a plant causes the fruits to drop prematurely causing a 30 to 100% yield reduction, resulting in fruit losses of approximately $150 million annually (Gottwald et al., 2007).
Management strategies for HLB-affected trees include pre-venting the spread of infection by vector control and eliminating affected trees, while management of affected trees include pH regulation and foliar spray of readily absorbable nutrients and phytohormones to improve nutrient uptake (Dala-Paula et al., 2019). HLB-affected trees have a poorly developed and dam-aged root system due to fibrous root density loss of about 30 to 50%, which increases as HLB symptoms develop in the canopy. Thus, there is reduced nutrient uptake by the plants (Johnson and Graham, 2015).
The development of a proper nutrition program for citrus trees is important as it provides the essential elements required by the trees for maintenance, improved yield, and fruit quality (Aular et al., 2017). For green plants to function and grow well, 17 elements are essential, and among these, oxygen (O), carbon (C), and hydrogen (H) are freely abundant in nature (Havlin et al., 2014). The 14 other mineral elements are divided into macronutrients and micronutrients. Macronutrients are elements that a plant requires in large quantities while micronutrients are required in small quantities. Macronutrients include nitrogen (N), phosphorus (P), potassium (K), calcium (Ca), magnesium (Mg), sulfur (S), and micronutrients include iron (Fe), zinc (Zn),

48 Proc. Fla. State Hort. Soc. 133: 2020
manganese (Mn), boron (B), copper (Cu), molybdenum (Mo), nickel (Ni), and chlorine (Cl) (Havlin et al., 2014; Timilsena et al., 2014; Barker and Pilbeam, 2015; Zekri and Obreza, 2016). When an essential element is deficient, tree performance declines. Nutrient deficiencies result in distinct symptoms that can be ex-hibited in the leaves, twigs, and fruits while an excessive amount of an essential element can lead to toxicity, which hinders tree performance (Obreza and Morgan, 2008).
Potassium is an important macronutrient that helps in sugar and starch metabolism and protein synthesis (Abbas and Fares, 2009). Potassium is essential in citrus production because it helps improve fruit size, fruit number and fruit quality (Aly et al., 2015). K deficiency in citrus causes slow vegetative growth, which leads to reduced fruit number, thinning of foliage, fruit drop, and fruit splitting (Ritenour et al., 2003; Obreza and Morgan, 2008; Zekri and Obreza, 2016). Excess K content causes a decrease in juice quality because of a decrease in fruit total soluble solids, juice content, juice color, and sugar to acid ratio of the citrus (Ritenour et al., 2003). Sources of K in intensive citrus production systems in Florida are potassium chloride (KCl), potassium sulfate and potassium nitrate, with KCl having the greatest consumption in the US (Havlin et al., 2014).
Calcium is an essential nutrient in citrus production that helps to strengthen the cell wall structure and aids in root development and functioning (Crowley, 2012; Havlin et al, 2014). An adequate supply of Ca is essential in promoting tree growth and fruit devel-opment (Zekri and Obreza, 2016). An insufficient supply of Ca causes poor nutrient and water uptake due to low carbohydrate content in the roots, resulting in reduced plant growth and fruit yield (Havlin, et al, 2014; Zekri and Obreza, 2016).
Iron is an essential element in plant nutrition because of its vital role in nitrogen fixation (Srivastava, 2013). Iron availability is affected by phosphorus heavy metals. High P content and ac-cumulation of heavy metals such as Cu cause Fe deficiency in the soil. Fe deficiency can also be induced by Zn and Mn deficiencies (Zekri and Obreza, 2016).
Zinc is important for the formation of auxins that promote growth in plants, the formation of chlorophyll, plant carbon metabolism and improving water uptake by plants (Hansch and Mendel 2009). Thus, an inadequate supply of Zn results in de-creased plant growth, stress tolerance and chlorophyll synthesis (Kawachi et al. 2009). Thus, Zn fertilization is vital because it increases the availability of the nutrient in the soil and the content in the orange trees (Hippler, 2015).
Currently, there are no clear guidelines for determining optimal nutrient concentrations in citrus roots to understand the relation-ship between root nutrition and HLB-affected trees for improved management strategies (Morgan et al., 2006; Eissenstat, 1991; Castle and Krezdorn, 1975). Therefore, investigating optimal nutrient concentrations in citrus roots would help to improve our understanding of the dynamics of HLB concerning root nutrition and fertilizer application methods, most importantly fertigation and soil application. This study was conducted to evaluate nutri-ent uptake of HLB-affected orange trees because of differential macro- and micronutrient fertilization. The specific objectives were: 1) to determine optimal nutrient concentrations in the soil and leaves for orange trees and 2) compare soil fertilization rates to identify optimal fertilizer rate for nutrient uptake into both underground and above ground components. The study hy-pothesized that higher soil nutrient, and fertilization rates would result in optimal nutrient concentrations for improved tree health in HLB-affected orange trees and higher rates of micronutrient
fertilization guidelines would improve root health of HLB af-fected orange trees, thereby improving the overall performance of the orange trees.
Materials and Methods
site description. The study was conducted at the Citrus Research and Education Center (CREC), Lake Alfred, FL. (28°06’28.6”N; 81°41’07.8”W) and on a Flatwoods site near Clewiston, FL. (N 26°44’20.851”; W–81°4’54.568”) to determine optimal fertigation and fertilization schemes. The two sites have 5- to 6-year-old Citrus sinensis ‘Valencia’ orange trees on Swingle rootstock. The Ridge soils at CREC site are Entisols classified as hyperthermic, uncoated lamellic quartzipsamments family (United States Department of Agriculture: Natural Resources Conservation Service, 2013). These soils are excessively drained and formed from eolian deposits and sandy marine deposits. The slope of the Ridge soils is 0 to 5% (United States Department of Agriculture: Natural Resources Conservation Service, 2019). Soils at the southwest Flatwoods site are Entisols of the siliceous, hyperthermic family of Mollic Psammaquents. The soils are poorly drained, rapidly permeable soils that are formed in sandy marine sediment underlain by limestone. The slope of these soils is 0 to 2% (United States Department of Agriculture: Soil Conservation Service, 1990). The Ridge soils have a high density of trees of about 1359 trees/ha while the Flatwoods soils of southwest Florida have a lower tree density of about 716 trees/ha.
experimentAl design. The experimental design was a ran-domized complete block factorial design with an evaluation of macronutrients K and Ca at: a) 220 lb/acre K and 40 lb/acre
Ca (1× macronutrients) and b) 440 lb/acre K and 90 lb/acre Ca (2× macronutrients); and micronutrients (Zn and Fe) at: a) 5 lb/acre (1× micronutrients), b)10 lb/acre (2× micronutrients), and c) 20 lb/acre (4× of micronutrients) of the current University of Florida Institute of Food and Agricultural Science (UF IFAS) fertilization guidelines (Obreza and Morgan, 2008; Morgan and Kadyampakeni, 2020). Macronutrients and micronutrients were applied three times per year on the soil. Each plot had 10 trees where the middle 8 trees were the experimental unit. All treat-ments were replicated 6 times.
The treatments were as follows:• Control with standard fertilization via fertigation of N, P, S,
Mo, and Cu fertilization according to UF IFAS guidelines. No extra K, Mg, Ca, Mn, Fe, B, and Zn.
• Standard fertilization + 1X macronutrient (MA) + 1× micronutrient (MI) (soil applied).
• Standard fertilization + 1× MA + 2× MI (soil applied).• Standard fertilization + 1× MA + 4× MI (soil applied).• Standard fertilization + 2× MA + 1× MI (soil applied).• Standard fertilization + 2× MA + 2× MI (soil applied).• Standard fertilization + 2× MA + 4× MI (soil applied).
sAmpling methods. To determine optimal nutrient concentra-tions in the soil and leaves for orange trees, leaf and soil nutrient concentrations were evaluated in May and Nov. 2019 and July 2020. About 20 mature leaves were collected at each time point in in the northwest, southwest, northeast, and southeast direc-tions with reference to the sampled orange tree. Soil samples were collected at a depth of 0–15 cm. Soil and leaf samples were processed for nutrient content analysis.
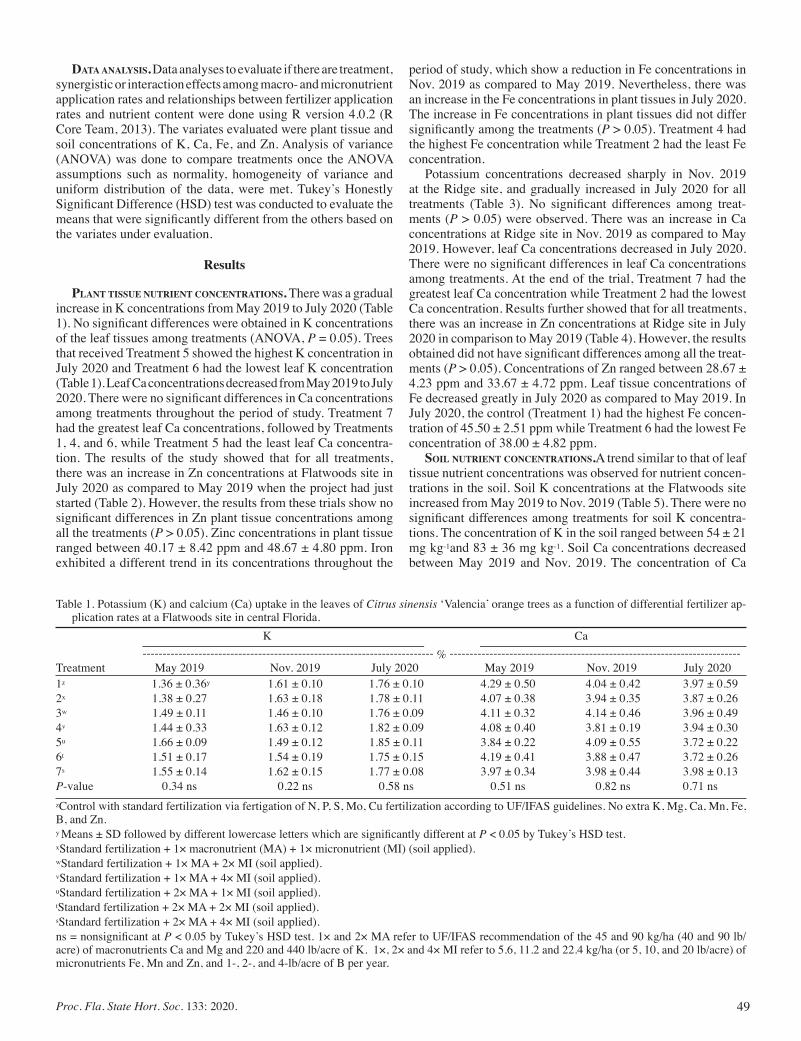
49Proc. Fla. State Hort. Soc. 133: 2020.
dAtA AnAlysis. Data analyses to evaluate if there are treatment, synergistic or interaction effects among macro- and micronutrient application rates and relationships between fertilizer application rates and nutrient content were done using R version 4.0.2 (R Core Team, 2013). The variates evaluated were plant tissue and soil concentrations of K, Ca, Fe, and Zn. Analysis of variance (ANOVA) was done to compare treatments once the ANOVA assumptions such as normality, homogeneity of variance and uniform distribution of the data, were met. Tukey’s Honestly Significant Difference (HSD) test was conducted to evaluate the means that were significantly different from the others based on the variates under evaluation.
Results
plAnt tissue nutrient concentrAtions. There was a gradual increase in K concentrations from May 2019 to July 2020 (Table 1). No significant differences were obtained in K concentrations of the leaf tissues among treatments (ANOVA, P = 0.05). Trees that received Treatment 5 showed the highest K concentration in July 2020 and Treatment 6 had the lowest leaf K concentration (Table 1). Leaf Ca concentrations decreased from May 2019 to July 2020. There were no significant differences in Ca concentrations among treatments throughout the period of study. Treatment 7 had the greatest leaf Ca concentrations, followed by Treatments 1, 4, and 6, while Treatment 5 had the least leaf Ca concentra-tion. The results of the study showed that for all treatments, there was an increase in Zn concentrations at Flatwoods site in July 2020 as compared to May 2019 when the project had just started (Table 2). However, the results from these trials show no significant differences in Zn plant tissue concentrations among all the treatments (P > 0.05). Zinc concentrations in plant tissue ranged between 40.17 ± 8.42 ppm and 48.67 ± 4.80 ppm. Iron exhibited a different trend in its concentrations throughout the
period of study, which show a reduction in Fe concentrations in Nov. 2019 as compared to May 2019. Nevertheless, there was an increase in the Fe concentrations in plant tissues in July 2020. The increase in Fe concentrations in plant tissues did not differ significantly among the treatments (P > 0.05). Treatment 4 had the highest Fe concentration while Treatment 2 had the least Fe concentration.
Potassium concentrations decreased sharply in Nov. 2019 at the Ridge site, and gradually increased in July 2020 for all treatments (Table 3). No significant differences among treat-ments (P > 0.05) were observed. There was an increase in Ca concentrations at Ridge site in Nov. 2019 as compared to May 2019. However, leaf Ca concentrations decreased in July 2020. There were no significant differences in leaf Ca concentrations among treatments. At the end of the trial, Treatment 7 had the greatest leaf Ca concentration while Treatment 2 had the lowest Ca concentration. Results further showed that for all treatments, there was an increase in Zn concentrations at Ridge site in July 2020 in comparison to May 2019 (Table 4). However, the results obtained did not have significant differences among all the treat-ments (P > 0.05). Concentrations of Zn ranged between 28.67 ± 4.23 ppm and 33.67 ± 4.72 ppm. Leaf tissue concentrations of Fe decreased greatly in July 2020 as compared to May 2019. In July 2020, the control (Treatment 1) had the highest Fe concen-tration of 45.50 ± 2.51 ppm while Treatment 6 had the lowest Fe concentration of 38.00 ± 4.82 ppm.
soil nutrient concentrAtions.A trend similar to that of leaf tissue nutrient concentrations was observed for nutrient concen-trations in the soil. Soil K concentrations at the Flatwoods site increased from May 2019 to Nov. 2019 (Table 5). There were no significant differences among treatments for soil K concentra-tions. The concentration of K in the soil ranged between 54 ± 21 mg kg-1and 83 ± 36 mg kg-1. Soil Ca concentrations decreased between May 2019 and Nov. 2019. The concentration of Ca
Table 1. Potassium (K) and calcium (Ca) uptake in the leaves of Citrus sinensis ‘Valencia’ orange trees as a function of differential fertilizer ap-plication rates at a Flatwoods site in central Florida.
K Ca ------------------------------------------------------------------------- % -------------------------------------------------------------------------Treatment May 2019 Nov. 2019 July 2020 May 2019 Nov. 2019 July 20201z 1.36 ± 0.36y 1.61 ± 0.10 1.76 ± 0.10 4.29 ± 0.50 4.04 ± 0.42 3.97 ± 0.592x 1.38 ± 0.27 1.63 ± 0.18 1.78 ± 0.11 4.07 ± 0.38 3.94 ± 0.35 3.87 ± 0.263w 1.49 ± 0.11 1.46 ± 0.10 1.76 ± 0.09 4.11 ± 0.32 4.14 ± 0.46 3.96 ± 0.494v 1.44 ± 0.33 1.63 ± 0.12 1.82 ± 0.09 4.08 ± 0.40 3.81 ± 0.19 3.94 ± 0.305u 1.66 ± 0.09 1.49 ± 0.12 1.85 ± 0.11 3.84 ± 0.22 4.09 ± 0.55 3.72 ± 0.226t 1.51 ± 0.17 1.54 ± 0.19 1.75 ± 0.15 4.19 ± 0.41 3.88 ± 0.47 3.72 ± 0.267s 1.55 ± 0.14 1.62 ± 0.15 1.77 ± 0.08 3.97 ± 0.34 3.98 ± 0.44 3.98 ± 0.13P-value 0.34 ns 0.22 ns 0.58 ns 0.51 ns 0.82 ns 0.71 nszControl with standard fertilization via fertigation of N, P, S, Mo, Cu fertilization according to UF/IFAS guidelines. No extra K, Mg, Ca, Mn, Fe, B, and Zn.y Means ± SD followed by different lowercase letters which are significantly different at P < 0.05 by Tukey’s HSD test.xStandard fertilization + 1× macronutrient (MA) + 1× micronutrient (MI) (soil applied).wStandard fertilization + 1× MA + 2× MI (soil applied).vStandard fertilization + 1× MA + 4× MI (soil applied).uStandard fertilization + 2× MA + 1× MI (soil applied).tStandard fertilization + 2× MA + 2× MI (soil applied).sStandard fertilization + 2× MA + 4× MI (soil applied).ns = nonsignificant at P < 0.05 by Tukey’s HSD test. 1× and 2× MA refer to UF/IFAS recommendation of the 45 and 90 kg/ha (40 and 90 lb/acre) of macronutrients Ca and Mg and 220 and 440 lb/acre of K. 1×, 2× and 4× MI refer to 5.6, 11.2 and 22.4 kg/ha (or 5, 10, and 20 lb/acre) of micronutrients Fe, Mn and Zn, and 1-, 2-, and 4-lb/acre of B per year.

50 Proc. Fla. State Hort. Soc. 133: 2020
Table 2. Zinc (Zn) and iron (Fe) uptake in the leaves of Citrus sinensis ‘Valencia’ orange trees as a function of differential fertilizer application rates at a Flatwoods site in central Florida.
Zn Fe ------------------------------------------------------------------------ ppm ---------------------------------------------------------------------------Treatment May 2019 Nov. 2019 July 2020 May 2019 Nov. 2019 July 20201z 22.54 ± 3.68y 29.00 ± 4.47 44.50 ± 9.85 61.77 ± 6.26 58.67 ± 6.86 66.30 ± 14.102x 22.47 ± 3.11 28.67 ± 2.58 40.17 ± 8.42 60.11 ± 7.26 54.33 ± 2.73 64.67 ± 13.293w 26.06 ± 3.43 28.00 ± 2.90 46.33 ± 9.29 65.06 ± 11.38 57.50 ± 6.22 71.50 ± 9.404v 23.73 ± 2.02 28.83 ± 4.92 48.67 ± 4.80 66.25 ± 4.26 63.50 ± 17.21 72.50 ± 9.615u 26.48 ± 2.79 27.00 ± 2.00 44.50 ± 4.89 63.11 ± 10.48 51.17 ± 4.49 63.67 ± 6.596t 25.06 ± 4.95 28.33 ± 5.16 42.50 ± 6.09 61.64 ± 3.83 58.33 ± 10.56 70.17 ± 12.377s 23.51 ± 3.36 27.83 ± 2.48 42.83 ± 9.87 63.44 ± 4.46 57.50 ± 3.02 71.33 ± 14.22P-value 0.27 ns 0.97 ns 0.63 ns 0.81 ns 0.35 ns 0.75 nszControl with standard fertilization via fertigation of N, P, S, Mo, and Cu fertilization according to UF/IFAS guidelines. No extra K, Mg, Ca, Mn, Fe, B, and Zn.yMeans ± SD followed by different lowercase letters which are significantly different at P < 0.05 by Tukey’s HSD test.xStandard fertilization + 1× macronutrient (MA) + 1× micronutrient (MI) (soil applied).wStandard fertilization + 1× MA + 2× MI (soil applied).vStandard fertilization + 1× MA + 4× MI (soil applied).uStandard fertilization + 2× MA + 1× MI (soil applied).t Standard fertilization + 2× MA + 2× MI (soil applied).sStandard fertilization + 2× MA + 4× MI (soil applied).ns = nonsignificant at P < 0.05 by Tukey’s HSD test. 1× and 2× MA refer to UF/IFAS recommendation of the 45 and 90 kg/ha (40 and 90 lb/acre) of macronutrients Ca and Mg and 220 and 440 lb/acre of K. 1×, 2v, and 4v MI refer to 5.6, 11.2, and 22.4 kg/ha (or 5, 10. and 20 lb/acre) of micronutrients Fe, Mn, and Zn, and 1-, 2- and 4-lb/acre of B per year.
Table 3. Potassium (K) and calcium (Ca) uptake in the leaves of Citrus sinensis ‘Valencia’ orange trees as a function of differential fertilizer ap-plication rates at a Ridge site in central Florida. K CA ------------------------------------------------------------------------- ppm --------------------------------------------------------------------------Treatment May 2019 Nov. 2019 July 2020 May 2019 Nov. 2019 July 20201z 1.71 ± 0.12y 1.30 ± 0.11 1.31 ± 0.1 3.56 ± 0.10 3.85 ± 0.27 3.16 ± 0.122x 1.67 ± 0.10 1.21 ± 0.13 1.50 ± 0.07 3.41 ± 0.22 4.26 ± 0.40 3.08 ± 0.203w 1.69 ± 0.11 1.24 ± 0.28 1.39 ± 0.19 3.28 ± 0.25 4.21 ± 0.33 3.23 ± 0.224v 1.66 ± 0.11 1.30 ± 0.25 1.48 ± 0.16 3.30 ± 0.24 3.97 ± 0.33 3.09 ± 0.265u 1.69 ± 0.09 1.21 ± 0.09 1.39 ± 0.31 3.50 ± 0.24 4.14 ± 0.34 3.16 ± 0.16t 1.72 ± 0.07 1.26 ± 0.14 1.40 ± 0.23 3.25 ± 0.33 4.03 ± 0.25 3.24 ± 0.247s 1.78 ± 0.14 1.20 ± 0.18 1.39 ± 0.24 3.25 ± 0.26 4.35 ± 0.30 3.27 ± 0.27P-value 0.62 ns 0.92 ns 0.72 ns 0.17 ns 0.13 ns 0.64 nszControl with standard fertilization via fertigation of N, P, S, Mo, Cu fertilization according to UF/IFAS guidelines. No extra K, Mg, Ca, Mn, Fe, B, and Zn.yMeans ± SD followed by different lowercase letters which are significantly different at P < 0.05 by Tukey’s HSD testxStandard fertilization + 1× macronutrient (MA) + 1× micronutrient (MI) (soil applied).wStandard fertilization + 1× MA + 2× MI (soil applied).vStandard fertilization + 1× MA + 4× MI (soil applied).uStandard fertilization + 2× MA + 1× MI (soil applied).tStandard fertilization + 2× MA + 2× MI (soil applied).sStandard fertilization + 2× MA + 4× MI (soil applied).ns = nonsignificant at P < 0.05 by Tukey’s HSD test. 1× and 2× MA refer to UF/IFAS recommendation of the 45 and 90 kg/ha (40 and 90 lb/acre) of macronutrients Ca and Mg and 220 and 440 lb/per acre of K. 1×, 2× and 4× MI refer to 5.6, 11.2 and 22.4 kg/ha (or 5, 10, and 20 lb/acre) of micronutrients Fe, Mn, and Zn, and 1-, 2-, and 4-lb/acre of B per year.
ranged between 793 ± 224 mg kg-1 and 1335 ± 832 mg kg-1. No significant differences were observed among treatments for Ca concentrations in the soil. Soil Zn concentration increased between May 2019 and Nov. 2019 (Table 6). No significant dif-ferences among treatments were observed for Zn concentrations. Treatment 7 had the highest Zn concentration of 38 ±23 mg kg-1 while Treatment 2 had the least Zn concentration of 19±7 mg kg-1. Generally, there was a decrease in Fe concentration from
May 2019 to Nov. 2019. Soil Fe concentrations ranged between 126 ± 24 mg kg-1 and 147 ± 26 mg kg-1 (Table 6).
Similarly, soil K concentrations at Ridge site decreased from May 2019 to July 2020 (Table 7). The difference in K concen-trations among treatments was not significant in July 2020. Treatment 2 had the highest K concentration of 32 ± 11 mg kg-1 while Treatment 1
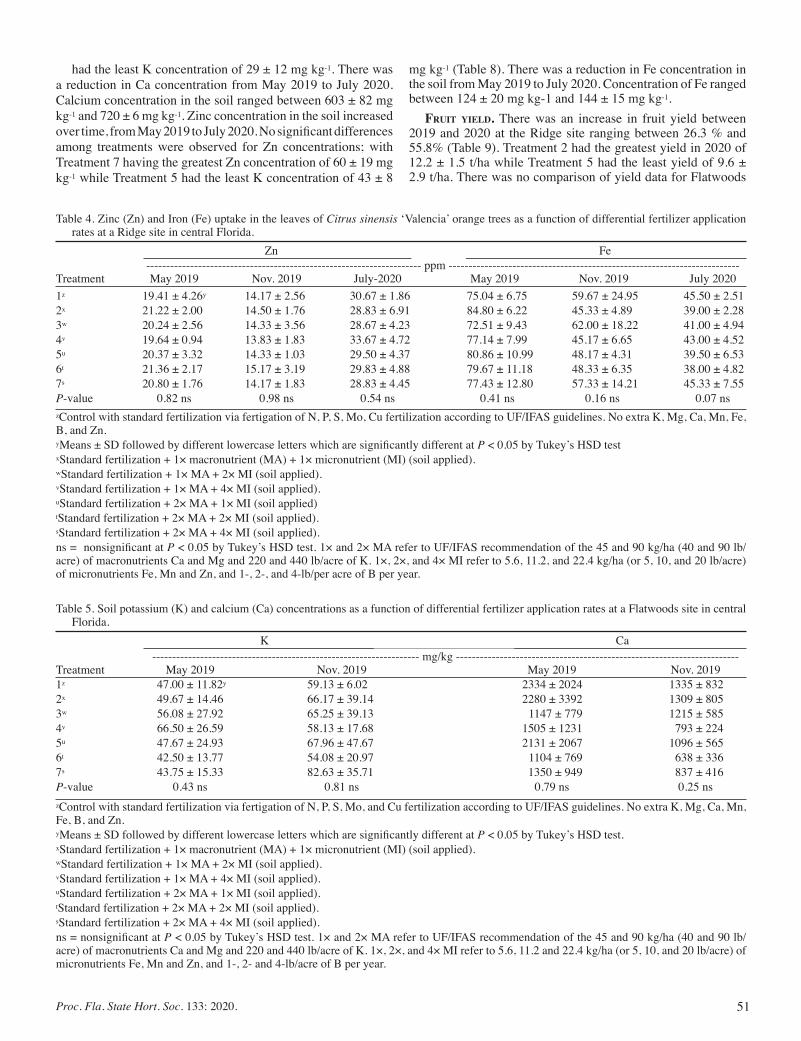
51Proc. Fla. State Hort. Soc. 133: 2020.
mg kg-1 (Table 8). There was a reduction in Fe concentration in the soil from May 2019 to July 2020. Concentration of Fe ranged between 124 ± 20 mg kg-1 and 144 ± 15 mg kg-1.
Fruit yield. There was an increase in fruit yield between 2019 and 2020 at the Ridge site ranging between 26.3 % and 55.8% (Table 9). Treatment 2 had the greatest yield in 2020 of 12.2 ± 1.5 t/ha while Treatment 5 had the least yield of 9.6 ± 2.9 t/ha. There was no comparison of yield data for Flatwoods
had the least K concentration of 29 ± 12 mg kg-1. There was a reduction in Ca concentration from May 2019 to July 2020. Calcium concentration in the soil ranged between 603 ± 82 mg kg-1 and 720 ± 6 mg kg-1. Zinc concentration in the soil increased over time, from May 2019 to July 2020. No significant differences among treatments were observed for Zn concentrations; with Treatment 7 having the greatest Zn concentration of 60 ± 19 mg kg-1 while Treatment 5 had the least K concentration of 43 ± 8
Table 4. Zinc (Zn) and Iron (Fe) uptake in the leaves of Citrus sinensis ‘Valencia’ orange trees as a function of differential fertilizer application rates at a Ridge site in central Florida.
Zn Fe --------------------------------------------------------------------- ppm -------------------------------------------------------------------------Treatment May 2019 Nov. 2019 July-2020 May 2019 Nov. 2019 July 20201z 19.41 ± 4.26y 14.17 ± 2.56 30.67 ± 1.86 75.04 ± 6.75 59.67 ± 24.95 45.50 ± 2.512x 21.22 ± 2.00 14.50 ± 1.76 28.83 ± 6.91 84.80 ± 6.22 45.33 ± 4.89 39.00 ± 2.283w 20.24 ± 2.56 14.33 ± 3.56 28.67 ± 4.23 72.51 ± 9.43 62.00 ± 18.22 41.00 ± 4.944v 19.64 ± 0.94 13.83 ± 1.83 33.67 ± 4.72 77.14 ± 7.99 45.17 ± 6.65 43.00 ± 4.525u 20.37 ± 3.32 14.33 ± 1.03 29.50 ± 4.37 80.86 ± 10.99 48.17 ± 4.31 39.50 ± 6.536t 21.36 ± 2.17 15.17 ± 3.19 29.83 ± 4.88 79.67 ± 11.18 48.33 ± 6.35 38.00 ± 4.827s 20.80 ± 1.76 14.17 ± 1.83 28.83 ± 4.45 77.43 ± 12.80 57.33 ± 14.21 45.33 ± 7.55P-value 0.82 ns 0.98 ns 0.54 ns 0.41 ns 0.16 ns 0.07 nszControl with standard fertilization via fertigation of N, P, S, Mo, Cu fertilization according to UF/IFAS guidelines. No extra K, Mg, Ca, Mn, Fe, B, and Zn.yMeans ± SD followed by different lowercase letters which are significantly different at P < 0.05 by Tukey’s HSD testxStandard fertilization + 1× macronutrient (MA) + 1× micronutrient (MI) (soil applied).wStandard fertilization + 1× MA + 2× MI (soil applied).vStandard fertilization + 1× MA + 4× MI (soil applied).uStandard fertilization + 2× MA + 1× MI (soil applied)tStandard fertilization + 2× MA + 2× MI (soil applied).sStandard fertilization + 2× MA + 4× MI (soil applied).ns = nonsignificant at P < 0.05 by Tukey’s HSD test. 1× and 2× MA refer to UF/IFAS recommendation of the 45 and 90 kg/ha (40 and 90 lb/acre) of macronutrients Ca and Mg and 220 and 440 lb/acre of K. 1×, 2×, and 4× MI refer to 5.6, 11.2, and 22.4 kg/ha (or 5, 10, and 20 lb/acre) of micronutrients Fe, Mn and Zn, and 1-, 2-, and 4-lb/per acre of B per year.
Table 5. Soil potassium (K) and calcium (Ca) concentrations as a function of differential fertilizer application rates at a Flatwoods site in central Florida.
K Ca ------------------------------------------------------------------- mg/kg -----------------------------------------------------------------------Treatment May 2019 Nov. 2019 May 2019 Nov. 20191z 47.00 ± 11.82y 59.13 ± 6.02 2334 ± 2024 1335 ± 8322x 49.67 ± 14.46 66.17 ± 39.14 2280 ± 3392 1309 ± 8053w 56.08 ± 27.92 65.25 ± 39.13 1147 ± 779 1215 ± 5854v 66.50 ± 26.59 58.13 ± 17.68 1505 ± 1231 793 ± 2245u 47.67 ± 24.93 67.96 ± 47.67 2131 ± 2067 1096 ± 5656t 42.50 ± 13.77 54.08 ± 20.97 1104 ± 769 638 ± 3367s 43.75 ± 15.33 82.63 ± 35.71 1350 ± 949 837 ± 416P-value 0.43 ns 0.81 ns 0.79 ns 0.25 nszControl with standard fertilization via fertigation of N, P, S, Mo, and Cu fertilization according to UF/IFAS guidelines. No extra K, Mg, Ca, Mn, Fe, B, and Zn.yMeans ± SD followed by different lowercase letters which are significantly different at P < 0.05 by Tukey’s HSD test.xStandard fertilization + 1× macronutrient (MA) + 1× micronutrient (MI) (soil applied).wStandard fertilization + 1× MA + 2× MI (soil applied).vStandard fertilization + 1× MA + 4× MI (soil applied).uStandard fertilization + 2× MA + 1× MI (soil applied).tStandard fertilization + 2× MA + 2× MI (soil applied).sStandard fertilization + 2× MA + 4× MI (soil applied).ns = nonsignificant at P < 0.05 by Tukey’s HSD test. 1× and 2× MA refer to UF/IFAS recommendation of the 45 and 90 kg/ha (40 and 90 lb/acre) of macronutrients Ca and Mg and 220 and 440 lb/acre of K. 1×, 2×, and 4× MI refer to 5.6, 11.2 and 22.4 kg/ha (or 5, 10, and 20 lb/acre) of micronutrients Fe, Mn and Zn, and 1-, 2- and 4-lb/acre of B per year.

52 Proc. Fla. State Hort. Soc. 133: 2020
site since no data collection for 2020 was done due to the COVID-19 lockdown.
Discussion
tissue nutrient concentrAtions. The trend in calcium foliar concentrations can be due to interactions with K concentra-tions in the soil. Increased K concentrations in the soil cause a decrease in root uptake of Ca and Mg (Jakobsen, 1993). Thus, for the Flatwoods site, there was an increase in K concentrations
throughout the period of study, which had an antagonistic effect on Ca, resulting in reduced Ca concentrations. Similarly, for the Ridge site, Ca concentrations were relatively high, which resulted in reduced K concentrations in leaf tissues.
Calcium and Fe also have an antagonistic effect on Zn avail-ability and translocation within the plant. At higher fertilization rates, there was an increase in Ca and Fe concentrations, which reduce the absorption of Zn by the roots and its translocation to the leaves (Prasad et al., 2016). Similar trends were also observed by Phuyal et. al (2020), whose study conducted on HLB-affected
Table 6. Soil zinc (Zn) and iron (Fe) concentrations as a function of differential fertilizer application rates at a Flatwoods site in central Florida. Zn Fe ---------------------------------------------------------------- mg/kg -----------------------------------------------------------------Treatment May 2019 Nov. 2019 May 2019 Nov. 20191z 14.68 ± 7.92y 32.75 ± 32.51 127.92 ± 41.03 138.92 ± 21.142x 13.31 ± 8.39 19.21 ± 7.19 136.58 ± 54.45 125.50 ± 24.243w 20.78 ± 16.09 22.40 ± 10.18 169.83 ± 25.86 157.54 ± 18.394v 17.32 ± 10.78 29.27 ± 13.68 126.17 ± 34.28 146.96 ± 25.955u 20.71 ± 6.03 28.80 ± 7.03 151.33 ± 46.17 131.75 ± 12.996t 11.26 ± 7.27 25.92 ± 7.03 150.17 ± 18.09 134.21 ± 36.827s 14.93 ± 7.69 37.45 ± 22.53 155.83 ± 50.31 132.29 ± 27.76P-value 0.54 ns 0.58 ns 0.49 ns 0.36 nszControl with standard fertilization via fertigation of N, P, S, Mo, and Cu fertilization according to UF/IFAS guidelines. No extra K, Mg, Ca, Mn, Fe, B, and Zn.yMeans ± SD followed by different lowercase letters which are significantly different at P < 0.05 by Tukey’s HSD test.xStandard fertilization + 1× macronutrient (MA) + 1× micronutrient (MI) (soil applied).wStandard fertilization + 1× MA + 2× MI (soil applied).vStandard fertilization + 1× MA + 4× MI (soil applied).uStandard fertilization + 2× MA + 1× MI (soil applied).tStandard fertilization + 2× MA + 2× MI (soil applied).sStandard fertilization + 2× MA + 4× MI (soil applied).ns = nonsignificant at P < 0.05 by Tukey’s HSD test. 1× and 2× MA refer to UF/IFAS recommendation of the 45 and 90 kg/ha (40 and 90 lb/acre) of macronutrients Ca and Mg and 220 and 440 lb/acre of K. 1×, 2× and 4× MI refer to 5.6, 11.2, and 22.4 kg/ha (or 5, 10, and 20 lb/acre) of micronutrients Fe, Mn and Zn, and 1-, 2-, and 4-lb/per acre of B per year.
Table 7. Soil potassium (K) and calcium (Ca) concentrations as a function of differential fertilizer application rates at a Ridge site in central Florida. K Ca ------------------------------------------------------------------- mg/kg -----------------------------------------------------------------------Treatment May 2019 Nov. 2019 July 2020 May 2019 Nov. 2019 July 20201z 73.08 ± 14.94y 40.46 ± 6.57 b 24.75 ± 5.15 760.33 ± 102.29 596.92 ± 82.85 720.42 ± 96.122x 62.25 ± 9.50 53.54 ± 18.00 ab 31.67 ± 10.87 786.50 ± 195.10 429.75 ± 141.64 616.17 ± 63.663w 69.58 ± 10.22 49.75 ± 15.88 b 29.92 ± 9.47 811.83 ± 131.26 519.42 ± 109.06 811.08 ± 301.294v 65.33 ± 13.63 61.04 ± 36.26 ab 29.67 ± 6.66 752.50 ± 263.53 452.50 ± 65.86 602.58 ± 82.365u 66.75 ± 15.01 51.88 ± 21.79 ab 30.42 ± 16.45 866.25 ± 97.13 486.63 ± 191.64 626.25 ± 98.586t 68.25 ± 10.12 117.67 ± 74.72 a 28.67 ± 11.59 765.17 ± 156.75 527.25 ± 67.80 681.17 ± 150.077s 71.92 ± 9.33 78.58 ± 40.49 ab 30.08 ± 6.51 880.75 ± 177.85 564.83 ± 87.21 711.33 ± 131.63P-value 0.74 ns 0.02* 0.94 ns 0.76 ns 0.17 ns 0.17 nszControl with standard fertilization via fertigation of N, P, S, Mo, Cu fertilization according to UF/IFAS guidelines. No extra K, Mg, Ca, Mn, Fe, B, and Zn.yMeans ± SD followed by different lowercase letters which are significantly different at P < 0.05 by Tukey’s HSD test.xStandard fertilization + 1× macronutrient (MA) + 1× micronutrient (MI) (soil applied).wStandard fertilization + 1× MA + 2× MI (soil applied).vStandard fertilization + 1× MA + 4× MI (soil applied).uStandard fertilization + 2× MA + 1× MI (soil applied).tStandard fertilization + 2× MA + 2× MI (soil applied).sStandard fertilization + 2× MA + 4× MI (soil applied).ns, * = nonsignificant or significant at P < 0.05 by Tukey’s HSD test, respectively. 1× and 2× MA refer to UF/IFAS recommendation of the 45 and 90 kg/ha (40 and 90 lb/acre) of macronutrients Ca and Mg and 220 and 440 lb/acre of K. 1×, 2×, and 4× MI refer to 5.6, 11.2 and 22.4 kg/ha (or 5, 10, and 20 lb.acre) of micronutrients Fe, Mn and Zn, and 1-, 2-, and 4-lb/acre of B per year.
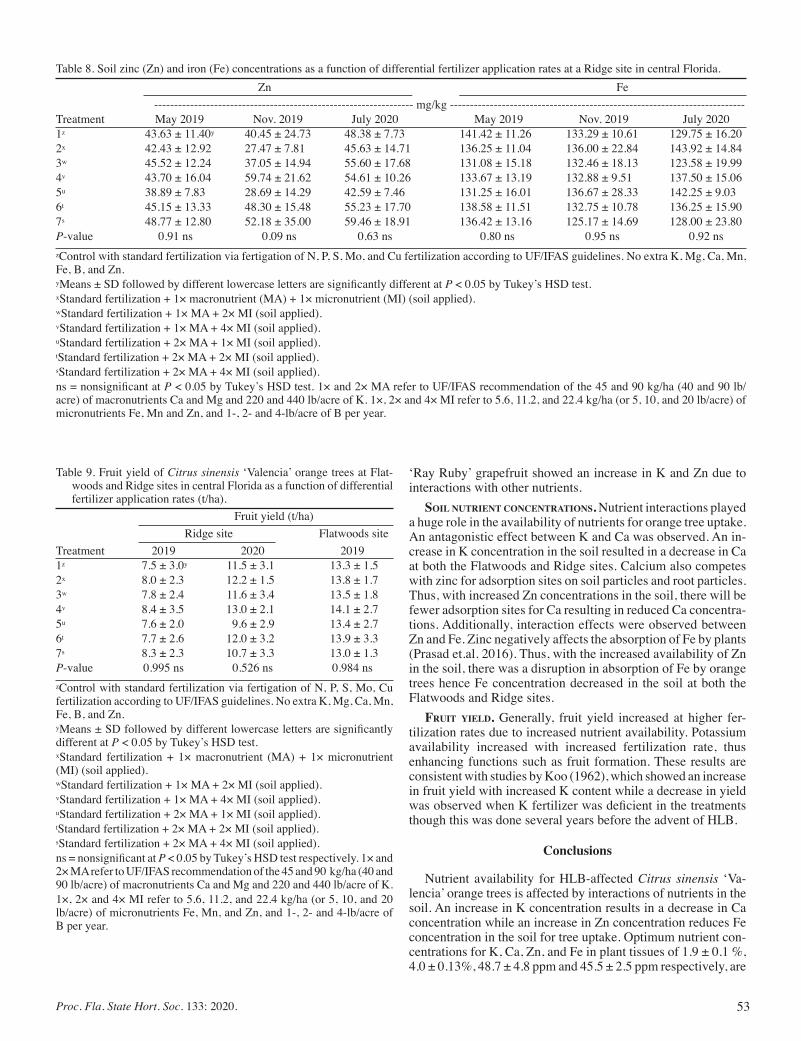
53Proc. Fla. State Hort. Soc. 133: 2020.
Table 9. Fruit yield of Citrus sinensis ‘Valencia’ orange trees at Flat-woods and Ridge sites in central Florida as a function of differential fertilizer application rates (t/ha).
Fruit yield (t/ha) Ridge site Flatwoods siteTreatment 2019 2020 20191z 7.5 ± 3.0y 11.5 ± 3.1 13.3 ± 1.52x 8.0 ± 2.3 12.2 ± 1.5 13.8 ± 1.73w 7.8 ± 2.4 11.6 ± 3.4 13.5 ± 1.84v 8.4 ± 3.5 13.0 ± 2.1 14.1 ± 2.75u 7.6 ± 2.0 9.6 ± 2.9 13.4 ± 2.76t 7.7 ± 2.6 12.0 ± 3.2 13.9 ± 3.37s 8.3 ± 2.3 10.7 ± 3.3 13.0 ± 1.3P-value 0.995 ns 0.526 ns 0.984 nszControl with standard fertilization via fertigation of N, P, S, Mo, Cu fertilization according to UF/IFAS guidelines. No extra K, Mg, Ca, Mn, Fe, B, and Zn.yMeans ± SD followed by different lowercase letters are significantly different at P < 0.05 by Tukey’s HSD test.xStandard fertilization + 1× macronutrient (MA) + 1× micronutrient (MI) (soil applied).wStandard fertilization + 1× MA + 2× MI (soil applied).vStandard fertilization + 1× MA + 4× MI (soil applied).uStandard fertilization + 2× MA + 1× MI (soil applied).tStandard fertilization + 2× MA + 2× MI (soil applied).sStandard fertilization + 2× MA + 4× MI (soil applied).ns = nonsignificant at P < 0.05 by Tukey’s HSD test respectively. 1× and 2× MA refer to UF/IFAS recommendation of the 45 and 90 kg/ha (40 and 90 lb/acre) of macronutrients Ca and Mg and 220 and 440 lb/acre of K.1×, 2× and 4× MI refer to 5.6, 11.2, and 22.4 kg/ha (or 5, 10, and 20 lb/acre) of micronutrients Fe, Mn, and Zn, and 1-, 2- and 4-lb/acre of B per year.
‘Ray Ruby’ grapefruit showed an increase in K and Zn due to interactions with other nutrients.
soil nutrient concentrAtions. Nutrient interactions played a huge role in the availability of nutrients for orange tree uptake. An antagonistic effect between K and Ca was observed. An in-crease in K concentration in the soil resulted in a decrease in Ca at both the Flatwoods and Ridge sites. Calcium also competes with zinc for adsorption sites on soil particles and root particles. Thus, with increased Zn concentrations in the soil, there will be fewer adsorption sites for Ca resulting in reduced Ca concentra-tions. Additionally, interaction effects were observed between Zn and Fe. Zinc negatively affects the absorption of Fe by plants (Prasad et.al. 2016). Thus, with the increased availability of Zn in the soil, there was a disruption in absorption of Fe by orange trees hence Fe concentration decreased in the soil at both the Flatwoods and Ridge sites.
Fruit yield. Generally, fruit yield increased at higher fer-tilization rates due to increased nutrient availability. Potassium availability increased with increased fertilization rate, thus enhancing functions such as fruit formation. These results are consistent with studies by Koo (1962), which showed an increase in fruit yield with increased K content while a decrease in yield was observed when K fertilizer was deficient in the treatments though this was done several years before the advent of HLB.
Conclusions
Nutrient availability for HLB-affected Citrus sinensis ‘Va-lencia’ orange trees is affected by interactions of nutrients in the soil. An increase in K concentration results in a decrease in Ca concentration while an increase in Zn concentration reduces Fe concentration in the soil for tree uptake. Optimum nutrient con-centrations for K, Ca, Zn, and Fe in plant tissues of 1.9 ± 0.1 %, 4.0 ± 0.13%, 48.7 ± 4.8 ppm and 45.5 ± 2.5 ppm respectively, are
Table 8. Soil zinc (Zn) and iron (Fe) concentrations as a function of differential fertilizer application rates at a Ridge site in central Florida. Zn Fe ----------------------------------------------------------------- mg/kg --------------------------------------------------------------------------Treatment May 2019 Nov. 2019 July 2020 May 2019 Nov. 2019 July 20201z 43.63 ± 11.40y 40.45 ± 24.73 48.38 ± 7.73 141.42 ± 11.26 133.29 ± 10.61 129.75 ± 16.202x 42.43 ± 12.92 27.47 ± 7.81 45.63 ± 14.71 136.25 ± 11.04 136.00 ± 22.84 143.92 ± 14.843w 45.52 ± 12.24 37.05 ± 14.94 55.60 ± 17.68 131.08 ± 15.18 132.46 ± 18.13 123.58 ± 19.994v 43.70 ± 16.04 59.74 ± 21.62 54.61 ± 10.26 133.67 ± 13.19 132.88 ± 9.51 137.50 ± 15.065u 38.89 ± 7.83 28.69 ± 14.29 42.59 ± 7.46 131.25 ± 16.01 136.67 ± 28.33 142.25 ± 9.036t 45.15 ± 13.33 48.30 ± 15.48 55.23 ± 17.70 138.58 ± 11.51 132.75 ± 10.78 136.25 ± 15.907s 48.77 ± 12.80 52.18 ± 35.00 59.46 ± 18.91 136.42 ± 13.16 125.17 ± 14.69 128.00 ± 23.80P-value 0.91 ns 0.09 ns 0.63 ns 0.80 ns 0.95 ns 0.92 nszControl with standard fertilization via fertigation of N, P, S, Mo, and Cu fertilization according to UF/IFAS guidelines. No extra K, Mg, Ca, Mn, Fe, B, and Zn. yMeans ± SD followed by different lowercase letters are significantly different at P < 0.05 by Tukey’s HSD test.xStandard fertilization + 1× macronutrient (MA) + 1× micronutrient (MI) (soil applied).wStandard fertilization + 1× MA + 2× MI (soil applied).vStandard fertilization + 1× MA + 4× MI (soil applied).uStandard fertilization + 2× MA + 1× MI (soil applied).tStandard fertilization + 2× MA + 2× MI (soil applied).sStandard fertilization + 2× MA + 4× MI (soil applied).ns = nonsignificant at P < 0.05 by Tukey’s HSD test. 1× and 2× MA refer to UF/IFAS recommendation of the 45 and 90 kg/ha (40 and 90 lb/acre) of macronutrients Ca and Mg and 220 and 440 lb/acre of K. 1×, 2× and 4× MI refer to 5.6, 11.2, and 22.4 kg/ha (or 5, 10, and 20 lb/acre) of micronutrients Fe, Mn and Zn, and 1-, 2- and 4-lb/acre of B per year.
54 Proc. Fla. State Hort. Soc. 133: 2020
suggested. For soil nutrient content, optimum nutrient concentra-tions of 83 ± 36 mg·kg-1, 38 ± 23 mg·kg-1 and 147 ± 26 mg·kg-1 are suggested for Ca, Zn, and Fe, respectively. Higher fertilizer application rates increase nutrient availability, particularly K, which subsequently results in increased yield of HLB-affected orange trees.
Literature Cited
Abbas, F. and A. Fares. 2009. Best management practices in citrus pro-duction. Global Science Books Online. Accessed 30 Oct. 2020. <http://www.globalsciencebooks.info/Online/GSBOnline/images/0906/TFSB_3(SI1)/TFSB_3(SI1)1-11o.pdf>
Aly, M.A., M.M. Harhash, R.M. Awad, and H.R. El-Kelawy. 2015. Effect of foliar application with calcium, potassium, and zinc treatments on yield and fruit quality of Washington navel orange trees. Middle East J. Agric. 4(3):564–568.
Aular, J., M. Casares, and W. Natale. 2017. Factors affecting citrus fruit quality: Emphasis on mineral nutrition. Jaboticabal 45(1):64–72. https://doi.org/10.15361/1984-5529.2017v45n1p64-72
Barker, A.V. and D.J. Pilbeam. 2015. Handbook of plant nutrition, 2nd ed. Accessed 30 Oct. 2020. https://doi.org/10.1201/b18458
Bassanezi, R.B., A. Bergamin Filho, L. Amorim, N. Gimenes-Fernandes, T.R. Gottwald, and J.M. Bové, J.M. 2003. Spatial and temporal analyses of citrus sudden death as a tool to generate hypotheses concerning its etiology. Phytopathology 93(4):502–512
Bové, J.M. 2006. Huanglongbing: A destructive, newly-emerging, century-old disease of citrus. J. Plant Pathol. 88(1):7–37.
Castle, W.S. and A.H. Krezdorn. 1975. Effect of citrus rootstocks on root distribution and leaf mineral content of ‘Orlando’ tangelo tree. J. Amer. Soc. Hort. Sci. 100:1–4
Crowley, D. 2012. Macronutrients: Their role in citrus production. Accessed 30 Oct. 2020. <http://www.citrusresearch.org/wpcontent/uploads/Crowley_David_Macronutrients_theirrollcitrus.pdf.>
Dala-Paula, B.M., A. Plotto, J. Bai, J.A. Manthey, E.A. Baldwin, R.S. Ferrarezi, and M.B.A. Gloria. 2019. Effect of hualongbing or greening disease on orange juice quality, a review. Frontiers in Plant Science (9):1976. https://doi.org/10.3389/fpls.2018.01976.
Eissenstat, D.M. 1991. On the relationship between specific root length and the rate of root proliferation: A field study using citrus rootstocks. New Phytol. 118:63–68.
Gottwald, T.R., and M. Irey. 2007. Post-hurricane analysis of citrus canker II: Predictive model estimation of disease spread and area potentially impacted by various eradication protocols following catastrophic weather events. Plant Health Progress. https://doi.org/10.1094/PHP-2007-0405-01-RS.
Graham, J. 2013. Root health of HLB-affected groves: What are the issues and can we manage them? <http://citrusagents.ifas.ufl.edu/events/GrowersInstitute2013/PDF/3-Graham%20HLB%20Root%20health%20Citrus%20Inst.pdf> Accessed 30 Oct. 2020.
Hansch, R. and R.R. Mendel. 2009. Physiological functions of mineral micronutrients (Cu, Zn, Mn, Fe, Ni, Mo, B, Cl). Current Opinion in Plant Biology 12(3):259–266. https://doi.org/10.1016/j.pbi.2009.05.006
Havlin, J.L., S.L. Tisdale, W.L. Nelson, and J.D. Beaton. 2014. Soil fertility and fertilizers: An introduction to nutrient management, 8th ed. Pearson, New York, N.Y. ISBN-13:978-0-13-503373-9.
Hippler, F.R.W., R.M. Boaretto, J.A. Quaggio, R.A. Azevedo, and D. Mattos. 2015. Towards soil management with Zn and Mn: Estimates
of fertilization efficacy of citrus trees. Annals of Applied Biology 166(3):484–495.
Jakobsen, S.T. 1993. Interaction between plant nutrients: III. Antago-nism between potassium, magnesium and calcium, Acta Agriculturae Scandinavica, Section B—Soil and Plant Science 43(1):1–5. https://doi.org/10.1080/09064719309410223
Johnson, E. and J. Graham. 2015. Root health in the age of HLB. <https://crec.ifas.ufl.edu/extension/trade_journals/2015/2015_August_root.pdf.> Accessed 10-30-2020.
Kawachi, M., Y. Kobae, H. Mori, R. Tomioka, Y. Lee, and M. Mae-shima. 2009. A mutant strain Arabidopsis thaliana that lacks vacuolar membrane zinc transporter MTP1 revealed the latent tolerance to excessive zinc. Plant Cell Physiol. 50:1156–1170.
Koo, R.C.J. 1962. The use of leaf, fruit, and soil analysis in estimating potassium status of orange trees. Proc. Fl. State Hort. Soci. 75:67–72.
Morgan, K., D. Kadyampakeni, M. Zekri, A. Shumann, T. Vashisth, and T. Obreza. 2019. 2019–2020 Florida Citrus Production Guide: Nutrition Management for Citrus Trees. Extension publication CG 101. University of Florida, Gainesville. Accessed 30 Oct. 2020. <https://edis.ifas.ufl.edu/cg091>
Morgan, K.T., T.A. Obreza, J.M.S. Scholberg, L.R. Parsons, and T.A. Wheaton. 2006. Citrus water uptake dynamics on a sandy Florida Entisol. Soil Sci. Soc. Amer. J. 70:90–97.
National Agricultural Statistics Service, 2020. Florida citrus fruit sta-tistics 2018–2019. <https://www.nass.usda.gov/Statistics_by_State/Florida/Publications/Citrus/Citrus_Statistics/2018-19/fcs1819.pdf.> Accessed 30 Oct. 2020.
Obreza, T.A. and K.T. Morgan (eds.). 2008. Nutrition of Florida citrus trees. Extension publication SL 253. University of Florida, Gainesville.
Obreza, T.A. 2003. Importance of potassium in a Florida citrus nutrition program. Better Crops 87(1):19–22.
Phuyal, D., T.A.R. Nogueira., A.D. Jani, D.M. Kadyampakeni, K.T. Morgan, and R.S. Ferrarezi. 2020. ‘Ray Ruby’ grapefruit affected by Huanglongbing II. Planting density and soil nutrient manage-ment. HortScience. 55(9):1411–1419. https://doi.org/10.21273/HORTSCI15255-20
Prasad, R.,Y.S. Shivay, and D. Kumar. 2016. Interactions of zinc with other nutrients in soils and plants—A review. Indian Journal of Fer-tilisers 12(5):16–26.
R Core Team. 2013. R: A language and environment for statistical computing. R Foundation for Statistical Computing, Vienna, Austria.
Rhodes, R. 2018. Interactions between potassium, calcium, magnesium in sugarcane grown on two contrasting soils in South Africa. Fields Crops Research. https://doi.org/10.1016/j.fcr.2018.01.001
Ritenour, M.A., W.F. Wardowski, and D.P. Tucker. 2003. Effects of water and nutrients on the postharvest quality and shelf life of citrus. Extension publication HS 942, University of Florida, Gainesville.
Srivastava, A. K. 2013. Nutrient deficiency symptomology in citrus: An effective diagnostic tool or just an aid for post-mortem analysis. Agricultural Advances 2(6):177–194. ISSN 2251-7820.
Timilsena, Y.P., R. Adhikari, P. Casey, T. Muster, and B. Adhikari. 2014. Enhanced efficiency fertilisers: a review of formulation and nutri-ent release patterns. Journal of the Science of Food and Agriculture 95(6):1131–1142. https://doi.org/10.1002/jsfa.6812
Zekri, M. and T. Obreza. 2016. Citrus tree nutrient series. Extension publications SL 378, SL 379, SL 380, SL 381, SL 382, SL 403, SL 404, SL 405, and SL 406. University of Florida, Gainesville.
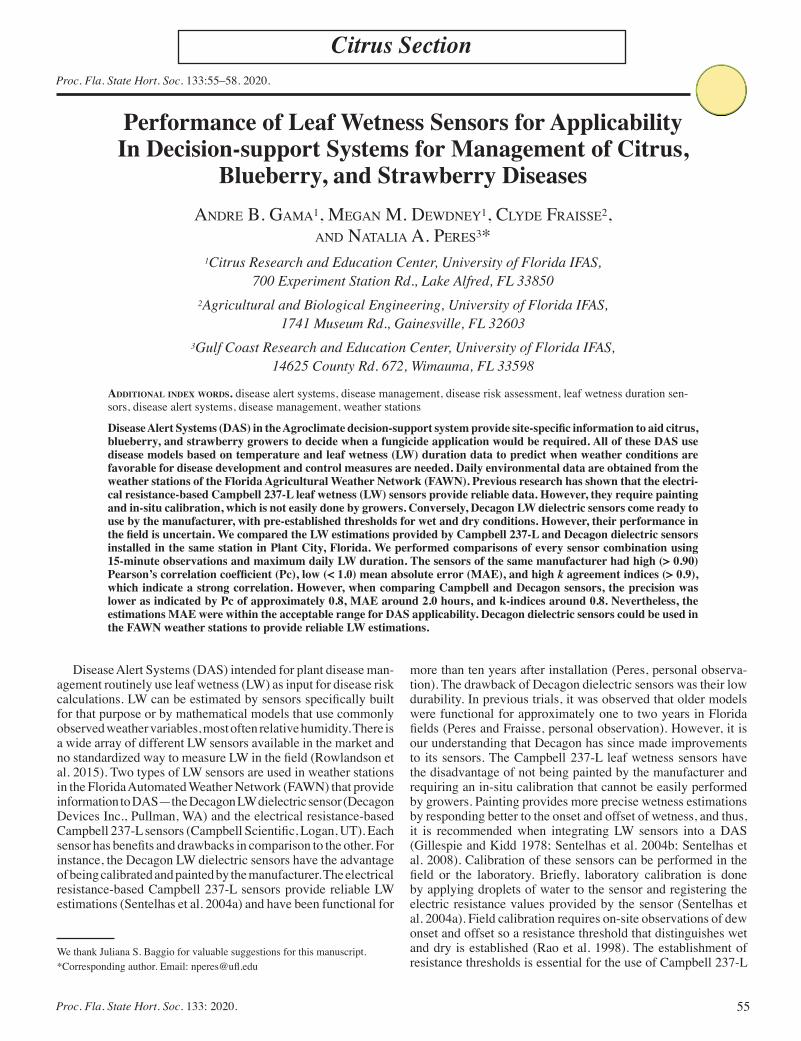
55Proc. Fla. State Hort. Soc. 133: 2020.
Proc. Fla. State Hort. Soc. 133:55–58. 2020.
Citrus Section
We thank Juliana S. Baggio for valuable suggestions for this manuscript.*Corresponding author. Email: [email protected]
Performance of Leaf Wetness Sensors for Applicability In Decision-support Systems for Management of Citrus,
Blueberry, and Strawberry DiseasesAndre B. GAmA1, meGAn m. dewdney1, Clyde FrAisse2,
And nAtAliA A. Peres3*1Citrus Research and Education Center, University of Florida IFAS,
700 Experiment Station Rd., Lake Alfred, FL 338502Agricultural and Biological Engineering, University of Florida IFAS,
1741 Museum Rd., Gainesville, FL 326033Gulf Coast Research and Education Center, University of Florida IFAS,
14625 County Rd. 672, Wimauma, FL 33598
AdditionAl index words. disease alert systems, disease management, disease risk assessment, leaf wetness duration sen-sors, disease alert systems, disease management, weather stations
Disease Alert Systems (DAS) in the Agroclimate decision-support system provide site-specific information to aid citrus, blueberry, and strawberry growers to decide when a fungicide application would be required. All of these DAS use disease models based on temperature and leaf wetness (LW) duration data to predict when weather conditions are favorable for disease development and control measures are needed. Daily environmental data are obtained from the weather stations of the Florida Agricultural Weather Network (FAWN). Previous research has shown that the electri-cal resistance-based Campbell 237-L leaf wetness (LW) sensors provide reliable data. However, they require painting and in-situ calibration, which is not easily done by growers. Conversely, Decagon LW dielectric sensors come ready to use by the manufacturer, with pre-established thresholds for wet and dry conditions. However, their performance in the field is uncertain. We compared the LW estimations provided by Campbell 237-L and Decagon dielectric sensors installed in the same station in Plant City, Florida. We performed comparisons of every sensor combination using 15-minute observations and maximum daily LW duration. The sensors of the same manufacturer had high (> 0.90) Pearson’s correlation coefficient (Pc), low (< 1.0) mean absolute error (MAE), and high k agreement indices (> 0.9), which indicate a strong correlation. However, when comparing Campbell and Decagon sensors, the precision was lower as indicated by Pc of approximately 0.8, MAE around 2.0 hours, and k-indices around 0.8. Nevertheless, the estimations MAE were within the acceptable range for DAS applicability. Decagon dielectric sensors could be used in the FAWN weather stations to provide reliable LW estimations.
Disease Alert Systems (DAS) intended for plant disease man-agement routinely use leaf wetness (LW) as input for disease risk calculations. LW can be estimated by sensors specifically built for that purpose or by mathematical models that use commonly observed weather variables, most often relative humidity. There is a wide array of different LW sensors available in the market and no standardized way to measure LW in the field (Rowlandson et al. 2015). Two types of LW sensors are used in weather stations in the Florida Automated Weather Network (FAWN) that provide information to DAS—the Decagon LW dielectric sensor (Decagon Devices Inc., Pullman, WA) and the electrical resistance-based Campbell 237-L sensors (Campbell Scientific, Logan, UT). Each sensor has benefits and drawbacks in comparison to the other. For instance, the Decagon LW dielectric sensors have the advantage of being calibrated and painted by the manufacturer. The electrical resistance-based Campbell 237-L sensors provide reliable LW estimations (Sentelhas et al. 2004a) and have been functional for
more than ten years after installation (Peres, personal observa-tion). The drawback of Decagon dielectric sensors was their low durability. In previous trials, it was observed that older models were functional for approximately one to two years in Florida fields (Peres and Fraisse, personal observation). However, it is our understanding that Decagon has since made improvements to its sensors. The Campbell 237-L leaf wetness sensors have the disadvantage of not being painted by the manufacturer and requiring an in-situ calibration that cannot be easily performed by growers. Painting provides more precise wetness estimations by responding better to the onset and offset of wetness, and thus, it is recommended when integrating LW sensors into a DAS (Gillespie and Kidd 1978; Sentelhas et al. 2004b; Sentelhas et al. 2008). Calibration of these sensors can be performed in the field or the laboratory. Briefly, laboratory calibration is done by applying droplets of water to the sensor and registering the electric resistance values provided by the sensor (Sentelhas et al. 2004a). Field calibration requires on-site observations of dew onset and offset so a resistance threshold that distinguishes wet and dry is established (Rao et al. 1998). The establishment of resistance thresholds is essential for the use of Campbell 237-L
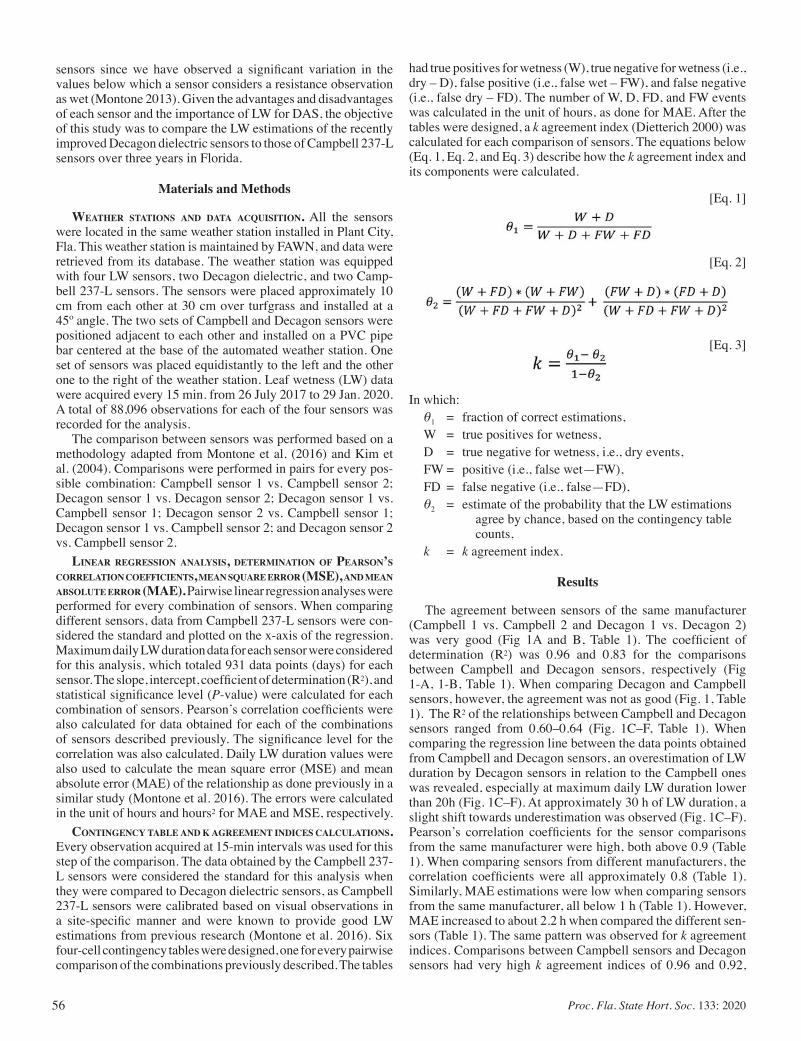
56 Proc. Fla. State Hort. Soc. 133: 2020
sensors since we have observed a significant variation in the values below which a sensor considers a resistance observation as wet (Montone 2013). Given the advantages and disadvantages of each sensor and the importance of LW for DAS, the objective of this study was to compare the LW estimations of the recently improved Decagon dielectric sensors to those of Campbell 237-L sensors over three years in Florida.
Materials and Methods
weAther stAtions And dAtA Acquisition. All the sensors were located in the same weather station installed in Plant City, Fla. This weather station is maintained by FAWN, and data were retrieved from its database. The weather station was equipped with four LW sensors, two Decagon dielectric, and two Camp-bell 237-L sensors. The sensors were placed approximately 10 cm from each other at 30 cm over turfgrass and installed at a 45º angle. The two sets of Campbell and Decagon sensors were positioned adjacent to each other and installed on a PVC pipe bar centered at the base of the automated weather station. One set of sensors was placed equidistantly to the left and the other one to the right of the weather station. Leaf wetness (LW) data were acquired every 15 min. from 26 July 2017 to 29 Jan. 2020. A total of 88,096 observations for each of the four sensors was recorded for the analysis.
The comparison between sensors was performed based on a methodology adapted from Montone et al. (2016) and Kim et al. (2004). Comparisons were performed in pairs for every pos-sible combination: Campbell sensor 1 vs. Campbell sensor 2; Decagon sensor 1 vs. Decagon sensor 2; Decagon sensor 1 vs. Campbell sensor 1; Decagon sensor 2 vs. Campbell sensor 1; Decagon sensor 1 vs. Campbell sensor 2; and Decagon sensor 2 vs. Campbell sensor 2.
lineAr regression AnAlysis, determinAtion of PeArson’s correlAtion coefficients, meAn squAre error (mse), And meAn Absolute error (mAe). Pairwise linear regression analyses were performed for every combination of sensors. When comparing different sensors, data from Campbell 237-L sensors were con-sidered the standard and plotted on the x-axis of the regression. Maximum daily LW duration data for each sensor were considered for this analysis, which totaled 931 data points (days) for each sensor. The slope, intercept, coefficient of determination (R2), and statistical significance level (P-value) were calculated for each combination of sensors. Pearson’s correlation coefficients were also calculated for data obtained for each of the combinations of sensors described previously. The significance level for the correlation was also calculated. Daily LW duration values were also used to calculate the mean square error (MSE) and mean absolute error (MAE) of the relationship as done previously in a similar study (Montone et al. 2016). The errors were calculated in the unit of hours and hours2 for MAE and MSE, respectively.
contingency tAble And k Agreement indices cAlculAtions. Every observation acquired at 15-min intervals was used for this step of the comparison. The data obtained by the Campbell 237-L sensors were considered the standard for this analysis when they were compared to Decagon dielectric sensors, as Campbell 237-L sensors were calibrated based on visual observations in a site-specific manner and were known to provide good LW estimations from previous research (Montone et al. 2016). Six four-cell contingency tables were designed, one for every pairwise comparison of the combinations previously described. The tables
had true positives for wetness (W), true negative for wetness (i.e., dry – D), false positive (i.e., false wet – FW), and false negative (i.e., false dry – FD). The number of W, D, FD, and FW events was calculated in the unit of hours, as done for MAE. After the tables were designed, a k agreement index (Dietterich 2000) was calculated for each comparison of sensors. The equations below (Eq. 1, Eq. 2, and Eq. 3) describe how the k agreement index and its components were calculated.
[Eq. 1]
[Eq. 2]
[Eq. 3]
In which: θ1 = fraction of correct estimations,W = true positives for wetness, D = true negative for wetness, i.e., dry events,FW = positive (i.e., false wet—FW), FD = false negative (i.e., false—FD),θ2 = estimate of the probability that the LW estimations agree by chance, based on the contingency table counts,k = k agreement index.
Results
The agreement between sensors of the same manufacturer (Campbell 1 vs. Campbell 2 and Decagon 1 vs. Decagon 2) was very good (Fig 1A and B, Table 1). The coefficient of determination (R2) was 0.96 and 0.83 for the comparisons between Campbell and Decagon sensors, respectively (Fig 1-A, 1-B, Table 1). When comparing Decagon and Campbell sensors, however, the agreement was not as good (Fig. 1, Table 1). The R2 of the relationships between Campbell and Decagon sensors ranged from 0.60–0.64 (Fig. 1C–F, Table 1). When comparing the regression line between the data points obtained from Campbell and Decagon sensors, an overestimation of LW duration by Decagon sensors in relation to the Campbell ones was revealed, especially at maximum daily LW duration lower than 20h (Fig. 1C–F). At approximately 30 h of LW duration, a slight shift towards underestimation was observed (Fig. 1C–F). Pearson’s correlation coefficients for the sensor comparisons from the same manufacturer were high, both above 0.9 (Table 1). When comparing sensors from different manufacturers, the correlation coefficients were all approximately 0.8 (Table 1). Similarly, MAE estimations were low when comparing sensors from the same manufacturer, all below 1 h (Table 1). However, MAE increased to about 2.2 h when compared the different sen-sors (Table 1). The same pattern was observed for k agreement indices. Comparisons between Campbell sensors and Decagon sensors had very high k agreement indices of 0.96 and 0.92,
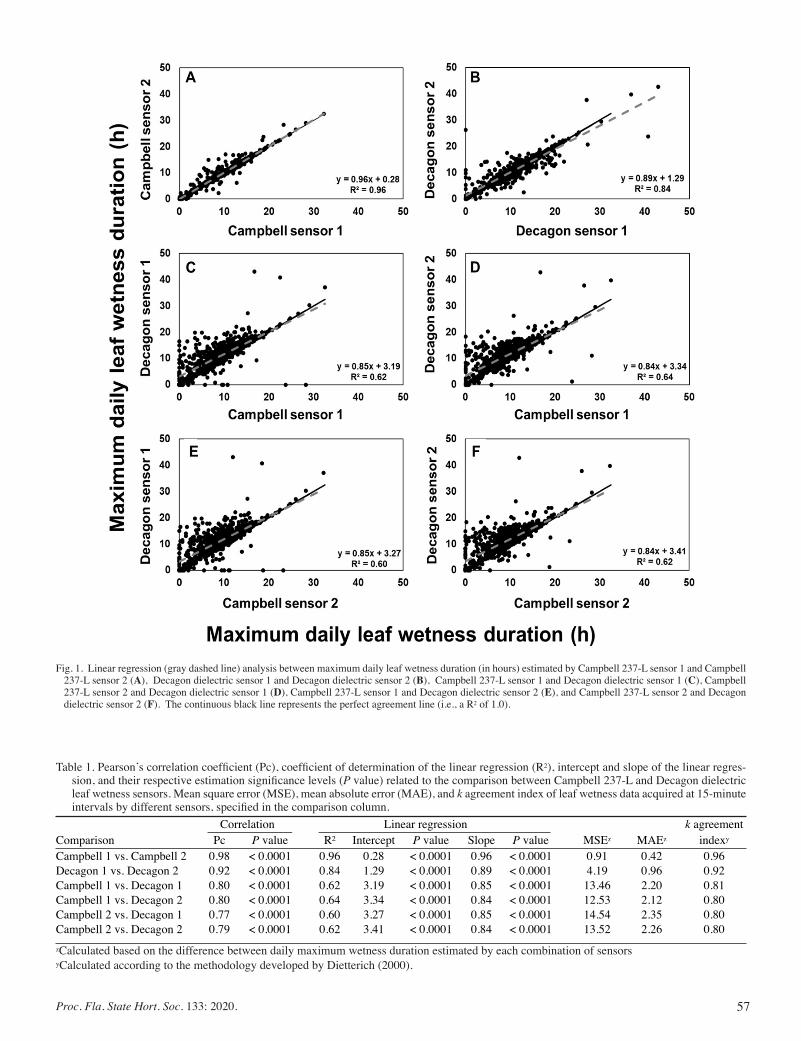
57Proc. Fla. State Hort. Soc. 133: 2020.
Fig. 1. Linear regression (gray dashed line) analysis between maximum daily leaf wetness duration (in hours) estimated by Campbell 237-L sensor 1 and Campbell 237-L sensor 2 (A), Decagon dielectric sensor 1 and Decagon dielectric sensor 2 (B), Campbell 237-L sensor 1 and Decagon dielectric sensor 1 (C), Campbell 237-L sensor 2 and Decagon dielectric sensor 1 (D), Campbell 237-L sensor 1 and Decagon dielectric sensor 2 (E), and Campbell 237-L sensor 2 and Decagon dielectric sensor 2 (F). The continuous black line represents the perfect agreement line (i.e., a R2 of 1.0).
Table 1. Pearson’s correlation coefficient (Pc), coefficient of determination of the linear regression (R2), intercept and slope of the linear regres-sion, and their respective estimation significance levels (P value) related to the comparison between Campbell 237-L and Decagon dielectric leaf wetness sensors. Mean square error (MSE), mean absolute error (MAE), and k agreement index of leaf wetness data acquired at 15-minute intervals by different sensors, specified in the comparison column.
Correlation Linear regression k agreementComparison Pc P value R² Intercept P value Slope P value MSEz MAEz indexy
Campbell 1 vs. Campbell 2 0.98 < 0.0001 0.96 0.28 < 0.0001 0.96 < 0.0001 0.91 0.42 0.96Decagon 1 vs. Decagon 2 0.92 < 0.0001 0.84 1.29 < 0.0001 0.89 < 0.0001 4.19 0.96 0.92Campbell 1 vs. Decagon 1 0.80 < 0.0001 0.62 3.19 < 0.0001 0.85 < 0.0001 13.46 2.20 0.81Campbell 1 vs. Decagon 2 0.80 < 0.0001 0.64 3.34 < 0.0001 0.84 < 0.0001 12.53 2.12 0.80Campbell 2 vs. Decagon 1 0.77 < 0.0001 0.60 3.27 < 0.0001 0.85 < 0.0001 14.54 2.35 0.80Campbell 2 vs. Decagon 2 0.79 < 0.0001 0.62 3.41 < 0.0001 0.84 < 0.0001 13.52 2.26 0.80zCalculated based on the difference between daily maximum wetness duration estimated by each combination of sensorsyCalculated according to the methodology developed by Dietterich (2000).
58 Proc. Fla. State Hort. Soc. 133: 2020
respectively (Table 1). The k agreement indices of comparisons made between Campbell and Decagon sensors were all ap-proximately 0.8 (Table 1). Our results do not indicate any loss in precision for the two types of sensors over the course of the three years of data analyzed in this study.
Discussion
While the Campbell 237-L sensors are the gold standard, the Decagon sensors can be viable options for weather stations used for plant disease risk calculation based on our results. These sen-sors provide LWD estimation within the acceptable MAE margin for application in DAS of approximately 2 h (Sentelhas et al. 2008) compared to in-situ calibrated Campbell 237-L sensors. The convenience of being painted and calibrated with a pre-established LW threshold makes the Decagon dielectric sensors suitable options to be installed in FAWN or grower-owned weather stations. The comparisons of the four sensors yielded very similar regression equations and results. The analysis of three-years of data was important to verify the durability of the sensors, i.e., to confirm if the measurements would lose accuracy over time. Growers and researchers should keep monitoring the data from weather stations to identify erroneous data in DAS, especially during critical periods for plant disease management in Florida.
In Florida, the Agroclimate decision-support system contains three DAS, intended for strawberry, citrus, and blueberry grow-ers (Fraisse et al. 2016; Gama et al. 2021; Pavan et al. 2011; Perondi et al. 2020). They all rely on LW data to calculate and provide daily disease risk assessments to growers. LW sensors must be reliable when feeding information to the DAS once the implementation of disease management practices must be deployed as promptly as possible to maximize efficacy. It is also desirable for sensors to be durable to provide results for more than one season. Our results could be used by growers, extension specialists, and stakeholders when deciding which LW sensor to install in weather stations used for DAS application in Florida.
Literature Cited
Dietterich T.G. 2000. An experimental comparison of three methods for constructing ensembles of decision trees: Bagging, boosting, and randomization. Mach Learn 40:139–157.
Fraisse, C., J.H. Andreis, T. Borba, V. Cerbaro, E. Gelcer, W. Pavan, D. Pequeno, D. Perondi, X. Shen, C. Staub, O. Uryasev, and A.P. Wagner. 2016. AgroClimate—tools for managing climate risk in agriculture. Agrometeoros 24:121–129.
Gama, A.B., L.G., Cordova, C.S. Rebello, and N.A. Peres. 2021. Validation of a decision-support system for blueberry anthracnose and fungicide sensitivity of Colletotrichum gloeosporioides isolates. Plant Dis. https://doi.org/10.1094/PDIS-09-20-1961-RE.
Gillespie, T.J. and G.E. Kidd. 1978. Sensing duration of leaf moisture retention using electrical impedance grids. Can. J. Plant Sci. 58:179–187.
Kim, K.S., S.E. Taylor, and M.L. Gleason. 2004. Development and validation of a leaf wetness duration model using a fuzzy logic system. Agric. For. Meteoro. 127:53–64.
Montone, V.O. 2013. Leaf wetness duration modeling and spatialization to optimize fungicide application in strawberry production systems. M.S. Thesis, Univ. of Florida, Gainesville.
Montone, V.O., C.W. Fraisse, N.A. Peres, P.C. Sentelhas, M. Gleason, M. Ellis, and G. Schnabel. 2016. Evaluation of leaf wetness duration models for operational use in strawberry disease-warning systems in four US states. Int. J. Biometeorol. 60: 1761–1774.
Pavan, W., C.W. Fraisse, and N.A. Peres. 2011. Development of a web-based disease forecast system for strawberries. Comput. Electron. Agric. 75:169-175.
Perondi, D., C.W. Fraisse, M.M. Dewdney, V.A. Cerbaro, J.H.D. Andreis, A.B. Gama, G.J. Silva Jr., L. Amorim, W. Pavan, and N.A. Peres. 2020. Citrus advisory system: A web-based postbloom fruit drop dis-ease alert system. Comput. Electron. Agric. https://doi.org/10.1016/j.compag.2020.105781.
Rao, P.S., T.J. Gillespie, and A.W. Schaafsma. 1998. Estimating wetness duration on maize ears from meteorological observations. Can. J. Soil Sci. 78:149–154.
Rowlandson, T., M. Gleason, P. Sentelhas, T. Gillespie, C. Thomas, and B. Hornbuckle. 2015. Reconsidering leaf wetness duration determina-tion for plant disease management. Plant Dis. 99:310–319.
Sentelhas, P.C., T.J. Gillespie, M.L. Gleason, J.E.B.A. Monteiro, and S.T. Helland. 2004a. Operational exposure of leaf wetness sensors. Agric. For. Meteorol. 126:59–72.
Sentelhas, P.C., J.E.B.A. Monteiro, and T.J. Gillespie. 2004b. Electronic leaf wetness duration sensor: Why it should be painted. Int. J. Biome-teorol. 48:202–205.
Sentelhas, P.C., A. Dalla Marta, S. Orlandini, E.A., Santos, T. J. Gil-lespie, and M.L. Gleason. 2008. Suitability of relative humidity as an estimator of leaf wetness duration. Agric. For. Meteorol. 148:392–400.
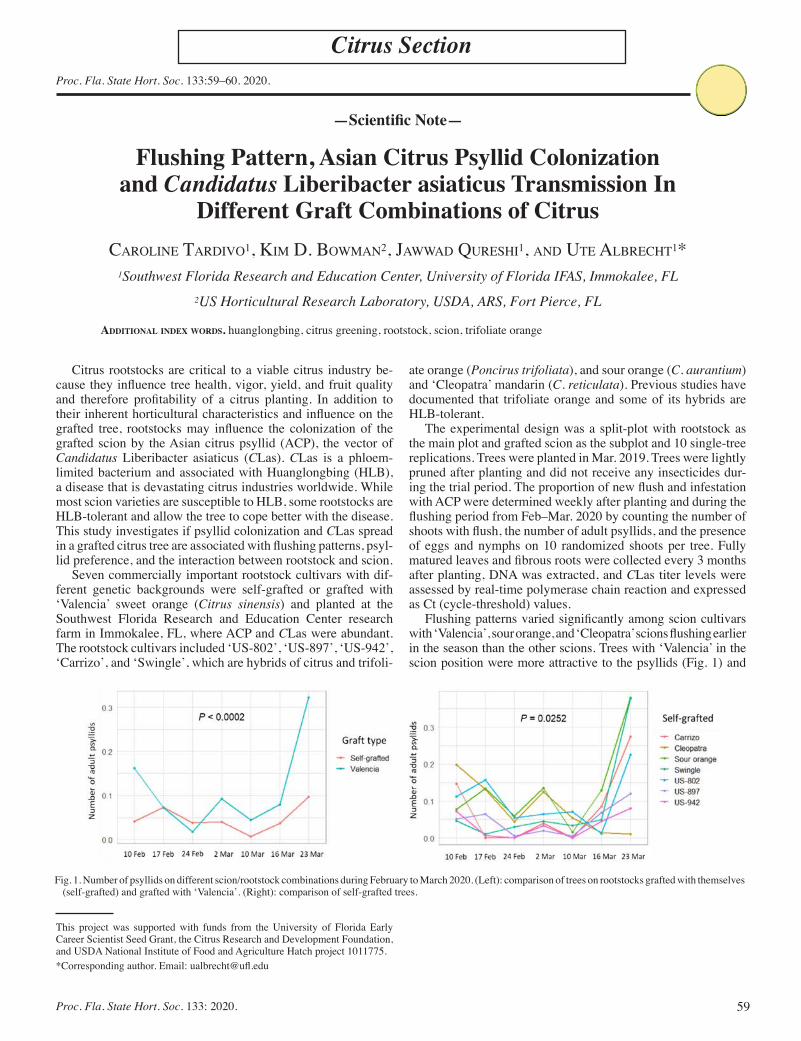
59Proc. Fla. State Hort. Soc. 133: 2020.
Proc. Fla. State Hort. Soc. 133:59–60. 2020.
Citrus Section
This project was supported with funds from the University of Florida Early Career Scientist Seed Grant, the Citrus Research and Development Foundation, and USDA National Institute of Food and Agriculture Hatch project 1011775.*Corresponding author. Email: [email protected]
—Scientific Note—
Flushing Pattern, Asian Citrus Psyllid Colonization and Candidatus Liberibacter asiaticus Transmission In
Different Graft Combinations of CitrusCaroline Tardivo1, Kim d. Bowman2, Jawwad Qureshi1, and uTe alBreChT1*
1Southwest Florida Research and Education Center, University of Florida IFAS, Immokalee, FL2US Horticultural Research Laboratory, USDA, ARS, Fort Pierce, FL
AdditionAl index words. huanglongbing, citrus greening, rootstock, scion, trifoliate orange
Citrus rootstocks are critical to a viable citrus industry be-cause they influence tree health, vigor, yield, and fruit quality and therefore profitability of a citrus planting. In addition to their inherent horticultural characteristics and influence on the grafted tree, rootstocks may influence the colonization of the grafted scion by the Asian citrus psyllid (ACP), the vector of Candidatus Liberibacter asiaticus (CLas). CLas is a phloem-limited bacterium and associated with Huanglongbing (HLB), a disease that is devastating citrus industries worldwide. While most scion varieties are susceptible to HLB, some rootstocks are HLB-tolerant and allow the tree to cope better with the disease. This study investigates if psyllid colonization and CLas spread in a grafted citrus tree are associated with flushing patterns, psyl-lid preference, and the interaction between rootstock and scion.
Seven commercially important rootstock cultivars with dif-ferent genetic backgrounds were self-grafted or grafted with ‘Valencia’ sweet orange (Citrus sinensis) and planted at the Southwest Florida Research and Education Center research farm in Immokalee, FL, where ACP and CLas were abundant. The rootstock cultivars included ‘US-802’, ‘US-897’, ‘US-942’, ‘Carrizo’, and ‘Swingle’, which are hybrids of citrus and trifoli-
ate orange (Poncirus trifoliata), and sour orange (C. aurantium) and ‘Cleopatra’ mandarin (C. reticulata). Previous studies have documented that trifoliate orange and some of its hybrids are HLB-tolerant.
The experimental design was a split-plot with rootstock as the main plot and grafted scion as the subplot and 10 single-tree replications. Trees were planted in Mar. 2019. Trees were lightly pruned after planting and did not receive any insecticides dur-ing the trial period. The proportion of new flush and infestation with ACP were determined weekly after planting and during the flushing period from Feb–Mar. 2020 by counting the number of shoots with flush, the number of adult psyllids, and the presence of eggs and nymphs on 10 randomized shoots per tree. Fully matured leaves and fibrous roots were collected every 3 months after planting, DNA was extracted, and CLas titer levels were assessed by real-time polymerase chain reaction and expressed as Ct (cycle-threshold) values.
Flushing patterns varied significantly among scion cultivars with ‘Valencia’, sour orange, and ‘Cleopatra’ scions flushing earlier in the season than the other scions. Trees with ‘Valencia’ in the scion position were more attractive to the psyllids (Fig. 1) and
Fig. 1. Number of psyllids on different scion/rootstock combinations during February to March 2020. (Left): comparison of trees on rootstocks grafted with themselves (self-grafted) and grafted with ‘Valencia’. (Right): comparison of self-grafted trees.

60 Proc. Fla. State Hort. Soc. 133: 2020
had significantly higher incidences of eggs and nymphs, higher leaf CLas titers, and displayed more foliar disease symptoms than self-grafted trees. The rootstock cultivar did not have any significant effect on the grafted ‘Valencia’ scion for these variables. Leaf CLas titers were higher than root CLas titers regardless of the rootstock cultivar with no significant rootstock effect on the scion. In contrast, CLas titer levels of roots varied significantly among self-grafted trees (Fig. 2).
The flushing pattern was influenced by the cultivar in the scion position but not by the cultivar in the rootstock position.
Fig. 2. Ct values of roots from trees composed of different scion/rootstock combinations during April 2019 and March 2020. (Left): comparison of trees on rootstocks grafted with themselves (self-grafted) and grafted with ‘Valencia’. (Right): comparison of self-grafted trees.
Psyllids were more attracted to ‘Valencia’ leaves than to leaves of the other cultivars, which may have contributed to the higher CLas titers measured in ‘Valencia’ leaves compared to the other cultivars. CLas titers were also influenced by the rootstock cul-tivar, but only in the roots of self-grafted trees. Taken together, the results suggest that psyllid colonization and leaf CLas titer levels of grafted trees are influenced predominantly by the scion cultivar, but that CLas levels of roots depend on the rootstock cultivar, which may affect the grafted tree tolerance to HLB in the long-term.
61Proc. Fla. State Hort. Soc. 133: 2020.
Proc. Fla. State Hort. Soc. 133:61. 2020.
Citrus Section
*Corresponding author. Email: [email protected]
—Scientific Note—
Citrus Nutrition Trends In the Florida Citrus IndustryJamie D. Burrow, Davie KaDyampaKeni, anD TripTi vashisTh*
Citrus Research and Education Center, University of Florida, IFAS, 2700 Experiment Station Rd., Lake Alfred, FL 33850
Since the discovery of Huanglongbing (HLB; citrus greening) in Florida, citrus tree health has been on a continual decline. There has been controversy if changes in nutrition management practices would be beneficial for HLB-affected trees. In the last few years, studies have shown that enhanced nutrition such as maintaining nutrient levels through small, frequent applications, customizing nutrition management for individual groves, and applying higher rates of micronutrients than previously recommended for healthy trees has been beneficial for HLB-affected trees (Vashisth and Livingston, 2019; Zambon et al., 2019; Vashisth, 2020).
In Oct. 2019, the citrus nutrition box program was initiated for Florida citrus growers. The primary objectives were to determine the current status and trends of nutrition levels and soil pH in commercial citrus groves and to demonstrate role of regular leaf nutrient analysis in fertilization management for HLB-affected groves. The program was designed to be a demonstration, not a scientific experiment.
For the first quarter, there were 75 samples collected and analyzed from 17 counties between Oct. 2019 and Jan. 2020. There was a wide range of variables such as variety and root-stock combinations, location, tree age, and tree health. Using the University of Florida Institute of Food and Agricultural Science (UF IFAS) recommended optimum nutrition ranges for healthy orange trees, nutrient leaf concentration averages were calculated on the statewide, regional, and county levels.
From a statewide perspective, all nutrients were in the optimum range except copper. Copper levels were high in several coun-ties. The counties with the highest levels of copper are known for growing fresh fruit or are on the coastal regions versus counties with optimum ranges that are often known for growing processed fruit. This is thought to be caused by the last copper application for preventing citrus canker before harvest. The highest copper level was 97 on flame grapefruit.
All counties were in the optimum range for potassium, cal-cium, manganese, and zinc. St. Lucie County was slightly low in magnesium, but all other counties were in the optimum range for magnesium.
Iron levels were low in counties from the western and southern regions. The cause of the low iron was uncertain, but early con-siderations are soil type due to which iron was unavailable to the plant for uptake (Zekri, et al., 2018), possible nutrient competition during uptake (Morgan, et al., 2020), and use of lowly available iron fertilizer (such as non-chelated forms) (Basiouny et al., 1971). There were no high iron levels in any individual samples analyzed throughout the state.
High boron was observed in Indian River and Charlotte Counties. These two counties are on the east and west coasts
respectively; therefore, the high boron levels were not likely re-gional. It is thought that growers may be trying additional boron applications in their groves based on previous research (Grosser and Barthe, 2015). Other considerations for high boron levels may be the possible buildup of boron over the years or little rainfall since samples were collected during the dry season. Of the 75 individual samples, 28% had high boron and no toxicity symptoms had been reported. The highest boron level was 206 ppm on ‘Hamlin’ oranges (Citrus sinensis).
Several counties were in the high range for nitrogen and phos-phorus. Polk and Highlands Counties were the only two counties that were in the optimum range for all nutrients.
The optimum soil pH range for citrus is 6.0–6.5 (Morgan, et al, 2020), but the pH range for the samples analyzed varied (4.4–7.8 pH). An overall average on the county level indicated optimum or low levels. The lowest pH averages were observed in DeSoto and Charlotte Counties. Poor water quality caused by bicarbonates can be corrected by using acidification practices to reduce high pH levels (Graham, et al., 2015). Due to the alkaline soil in those areas, it is common for soil acidification practices to be used to lower soil pH.
Moving forward, the additional quarterly data collected from the nutrition box program samples will be evaluated to record seasonal and geographical leaf nutrient trends as well as regular leaf nutrient analysis in effective fertilization. The program will be repeated in 2020–21 to allow for a second year of observation. A three-year research field trial will begin in 2021 to determine trends and relationships of leaf concentrations.
Literature CitedBasiouny, F.M. and R.H. Biggs. 1971. Uptake and distribution of iron in
citrus. Proc. Fl. State Hort. Soc. 84:17–23.Graham, J. and K. Morgan. 2015. Managing excessive bicarbonates with
acidification. Citrus Industry Magazine, 96(5):8–11.Grosser, J.W. and G.A. Barthe. 2015. Soil applied controlled release fertilizer
(CRF) treatments impact the health and growth of HLB infected trees-results from greenhouse and field experiments. In: International Research Conference HLB IV.
Morgan, K.T. and D.M. Kadyampakeni. 2020. Nutrition of Florida citrus trees. Ext. Pub. SL 253, Univ. of Florida, Gainesville.
Vashisth, T. 2020. Nutrition: No one size fits all. Citrus Industry Magazine 101(3):8,10–13.
Vashisth, T. and T. Livingston. 2019. Assessment of pruning and controlled-release fertilizer to rejuvenate Huanglongbing-affected sweet orange. HortTechnology 29(6):933–940.
Zambon, F.T., D.M. Kadyampakeni, and J.W. Grosser. 2019. Ground ap-plication of overdoses of manganese have a therapeutic effect on sweet orange trees infected with Candidatus Liberibacter asiaticus. HortScience 54(6):1077–1086.
Zekri, M. and T.A. Obreza. 2018. Micronutrient deficiencies in citrus: Iron, zinc, and manganese. Ext. Pub. SL 204, Univ. of Florida, Gainesville.
AdditionAl index words. fertilizer, nutrient management

62 Proc. Fla. State Hort. Soc. 133: 2020
Proc. Fla. State Hort. Soc. 133:62. 2020.
Citrus Section
*Corresponding author. Email: [email protected]
—Scientific Note—
PAPS: A Portable and Adjustable Prototype Sprayer to Analyze Fungal Biopesticide Deposition In the
GreenhouseSandra M. GuzMan1*, Eric HErrEra1, PaSco B. avEry2, and roBErt c. adair3
1Department of Agricultural and Biological Engineering, University of Florida, IFAS, Indian River Research and Education Center, 2199 Rock Rd., Fort Pierce, FL 34945
2Department of Entomology and Nematology, University of Florida, IFAS, Indian River Research and Education Center, 2199 Rock Rd., Fort Pierce, FL 34945
3The Florida Research Center for Agricultural Sustainability, 7055 33rd St., Vero Beach, FL 32966
AdditionAl index words. air blast sprayer, droplet size, leaf coverage, Huanglongbing, ultra-low volume sprayer
When evaluating spray leaf coverage of fungal-based biopes-ticides for insects associated with Huanglongbing management in citrus, a significant amount of data is needed to: 1) analyze the efficiency of the sprayer in applying a uniform amount of biopes-ticide, and 2) evaluate the biopesticide efficacy for management of pest populations. To collect this data, it is necessary to have controlled environmental and field conditions. These parameters which include the absence of wind, availability of the spraying machine, field management strategies, etc. significantly increase the cost and time required to obtain meaningful research outcomes. In addition, cost-efficient sprayer devices that can simulate the spraying patterns of field machines in a lab setting are not avail-able. The goal of this study was to develop a cost-efficient por-table and adjustable prototype sprayer (PAPS), that can be used under controlled environmental conditions, including laboratory and greenhouse, for the evaluation of biopesticide leaf coverage.
To define the spraying simulation patterns in PAPS, two com-monly used sprayer machines for citrus management applications were selected the air-blast (AB) sprayer and ultra-low volume (ULV) sprayer. AB is characterized in distributing the pesticide by creating a wind blast hitting the leaves under a specified pressure and, ULV by producing a mist of very fine droplets of pesticide directed through a set of ventilators.
To assess the feasibility of PAPS, we calibrated multiple vari-ables including droplet size, air speed, and pesticide incidence angle. The initial calibration of the AB and ULV spray applica-tion machines was performed at the Florida Research Center for Agricultural Sustainability (FLARES) in Vero Beach, FL. The conditions used by crop managers in a commercial citrus field were reproduced. Calibration of PAPS was performed at the University of Florida, Indian River Research and Education Center (IRREC), in Fort Pierce, FL, under greenhouse condi-tions. Sensitive paper and a handheld anemometer were used for the collection of droplet size-distribution and air speed data, respectively. Measurements were collected at a wall with sensitive
paper located 2.1 m from the prototype application device. The sensitive paper was placed following a quadrant across the PAPS nozzles wet pattern. Preliminary results using water showed that, based on droplet size estimations, this prototype can represent the conditions of the AB and ULV sprayer in the laboratory or greenhouse. A summary of the field and the prototype sprayer calibrations are presented in Table 1.
The observed spray droplet sizes were within the range of 131.6 to 390 µm and 31.6–139.3 µm for PAPS-AB and PAPS-ULV, respectively. This confirms that PAPS can accurately represent the conditions of the AB and ULV field application machines. It is important to understand that if the distance from PAPS to the target is modified, the pressure and droplet size would be modi-fied as well. Results of air speed tests indicated that the average difference in speed between AB and ULV for both the field application machines and PAPS is nearly 30%. Values in PAPS are lower due to the reduction in scale from the field application machines. The implementation of PAPS in the greenhouse is a cost-effective and time saving solution to gather sprayer efficiency data, determine leaf coverage, and indirectly evaluate the effects of biopesticides for management of pest populations. A 360 visu-alization of PAPS can be found at: <https://www.youtube.com/watch?v=T0jMVDacXek>. Future work includes the evaluation of the relationship between changes in incidence angle and leaf coverage, and laboratory assessment of pest control comparing the field machines with PAPS.
Table 1. Sprayer calibration results of air blast (AB) and ultra-low volume (ULV) sprayers in the field vs. portable and adjustable prototype sprayer (PAPS) calibration results (PAPS–AB and PAPS–ULV) using water.
Parameter AB ULV PAPS–AB PAPS–ULVDroplet size (µm) 131.6–390 31.6–139.3 200 110Air speed (m/s) 53.65 41.12 4–15 6.71
63Proc. Fla. State Hort. Soc. 133: 2020.
Proc. Fla. State Hort. Soc. 133:63–72. 2020.
Citrus Section
Field Performance of ‘Hamlin’ OrangeTrees Grown on Various Rootstocks inHuanglongbing-endemic ConditionsSudip KunwarSouthwest Florida Research and Education Center, University of Florida,Institute of Food and Agricultural Sciences, Immokalee, FL 34142
Jude Grosser, Fred G. Gmitter Jr., and William S. CastleCitrus Research and Education Center, University of Florida, Institute ofFood and Agricultural Sciences, Lake Alfred, FL 33850
Ute AlbrechtSouthwest Florida Research and Education Center, University of Florida,Institute of Food and Agricultural Sciences, Immokalee, FL 34142Additional index words. allotetraploid, Citrus reticulata, Citrus maxima, dwarfing, Poncirustrifoliata, somatic hybrids
Abstract. Most of the commercially important citrus scion cultivars are susceptible toHuanglongbing (HLB), which is the most devastating disease the citrus industry has everfaced. Because the rootstock can influence the performance of the scion in various ways,including disease and pest tolerance, use of superior rootstocks can assist citrus growerswith minimizing the negative effects of HLB. The objective of this study was to assessrootstock effects on the horticultural performance and early production potential of‘Hamlin’ sweet orange (Citrus sinensis) trees in commercial field settings under HLB-endemic conditions. Two field trials were conducted in different locations in Central andSoutheast Florida. The trials were established in 2015 and included 32 diverse diploidand tetraploid rootstock cultivars and advanced selections. One trial was performed inHighlands County, FL, on a poorly drained flatwoods-type site. Another trial wasperformed in Polk County, FL, on a well-drained sandy Central Florida Ridge site.Horticultural traits including tree height, canopy volume, trunk diameter, canopy health,leaf nutrient content, yield, and fruit quality were assessed during the 2018–19 and 2019–20 production years. Significant differences were found among trees on differentrootstocks for most of the measured traits, particularly tree vigor and productivity,but rootstock effects also varied by location. Rootstocks that induced large tree sizes,such as the diploid mandarin 3 trifoliate orange hybrids ‘X-639’, ‘C-54’, ‘C-57’, and ‘C-146’, also induced higher yield, but with lower yield efficiency. Most of the tetraploidrootstocks significantly reduced tree size, among which ‘Changsha+Benton’, ‘Green-3’,‘Amb+Czo’, ‘UFR-3’, and ‘UFR-5’ induced high yield efficiency. Therefore, theserootstocks have the potential to be used in high-density plantings. However, trees onsome of these small size-inducing rootstocks had a higher mortality rate and were morevulnerable to tropical force winds. This study provides important information for theselection of rootstocks with the greatest production potential in an HLB-endemicenvironment, especially during the early years of production.
The success of modern citrus industriesrelies on the suitable combination of superiorscions and rootstocks and their adaptability todiverse soil and environmental conditions(Castle, 2010; Castle and Gmitter, 1998).The importance of rootstocks in the citrusindustry has increased since they were rec-ognized to provide tolerance against variouspests and diseases. Use of sour orange root-stock to protect previously own-rooted citrustrees from Phytophthora disease and the useof trifoliate orange-type rootstocks to protecttrees from citrus tristeza virus (CTV) are themajor events (Roistacher et al., 2010) thatshaped the citrus industry in Florida and otherproduction areas. Furthermore, rootstockscan generate tolerance against various abioticstresses such as drought, flooding, extremepH conditions, extreme temperatures, and
salinity (Cimen and Yesiloglu, 2016). Theinfluences of rootstocks on the precocity offlowering and fruiting and on other horticul-tural traits of the scion, such as tree vigor,nutrient uptake, yield, and fruit quality, havealso been established (Castle, 2010; Forner-Giner et al., 2003; Nimbolkar et al., 2016;Webster, 1995; Wutscher, 1979). Therefore,rootstock selection is crucial for determiningthe sustainability, productivity, and long-termprofitability of a citrus orchard (Castle, 2010;Nimbolkar et al., 2016; Webster, 1995).
The Florida citrus industry grew from theintroduction of seeds and plants of sourorange, sweet orange, lemon, lime, and citronby the Spanish in the 16th century, and theuse of grafted trees commenced in the1830s(Castle et al., 1993). Since then, the industryhas changed over time to adapt to differentpests and diseases and environmental events.The introduction of the destructive diseaseHLB is the most recent event, and it con-tinues to impact citrus production not only inFlorida but also worldwide.
HLB is a disease associated with thephloem-limited bacterium Candidatus Liber-ibacter asiaticus that is transmitted by Asiancitrus psyllids (Diphorina citri); it was foundin Florida in 2005 (Gottwald et al., 2007).Since the confirmation of HLB in Florida, theHLB incidence has rapidly increased from0.2% in 2006 to essentially 100% at present(Graham et al., 2020). This has resulted intremendous economic losses of more than70% in citrus production (year 2018–19)compared with the era before HLB (year2003–04) (FDACS, 2020a). Different diseasemanagement strategies include vector exclu-sion (Ferrarezi et al., 2019; Schumann andSingerman 2016), vector control (Gottwaldet al., 2007; Stansly et al., 2014), nutrientmanagement (Rouse et al., 2017; Stanslyet al., 2014; Zambon et al., 2019), and theapplication of plant defense inducers andantibiotics (Hu and Wang 2016; Hu et al.,2018). However, there are difficulties adoptingsome of these technologies under large-scalefield conditions because of environmental oreconomic constraints.
Most citrus scion cultivars are HLB-susceptible and decline quickly if not man-aged properly (Miles et al., 2017). In contrast,several rootstock cultivars are tolerant toHLB and can render grafted trees more pro-ductive in the presence of the disease(Albrecht and Bowman, 2012; Bowman andMcCollum, 2015; Bowman et al., 2016a,2016b). The recognition of the importanceof rootstocks for sustaining citrus productionin an HLB-endemic environment has led to ashift in rootstock use in Florida, such as thepreference for US-942 and other rootstocksover Swingle, which for decades has been themost propagated rootstock in Florida (FDACS,2020b). The demand for other rootstocksbred to combine many of the most desiredrootstock traits is increasing and necessitatesfield evaluation in a commercial productionenvironment.
Bowman and Joubert (2020) identified 21rootstocks as major world rootstocks; of
Received for publication 29 Oct. 2020. Acceptedfor publication 8 Dec. 2020.Published online 11 January 2021.The manuscript is associated with a presentationgiven at the 2020 Florida State Horticultural Soci-ety Annual Meeting, held virtually 19–20 Oct.2020.We thank John Gose and the Lykes Bros. team forpropagating the trees in their nursery and providingspace and tree care in their groves. This study wassupported with funds from the Citrus Research andDevelopment Foundation (CRDF).U.A. is the corresponding author. E-mail: [email protected] is an open access article distributed under theCC BY-NC-ND license (https://creativecommons.org/licenses/by-nc-nd/4.0/).
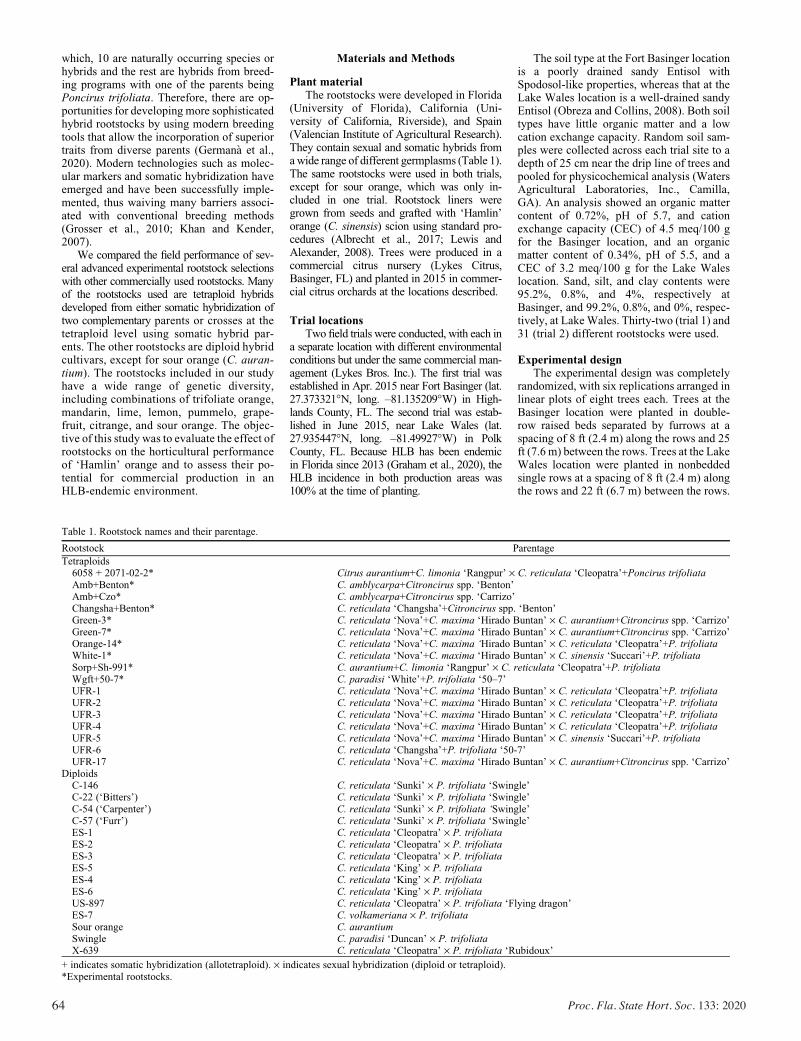
64 Proc. Fla. State Hort. Soc. 133: 2020
which, 10 are naturally occurring species orhybrids and the rest are hybrids from breed-ing programs with one of the parents beingPoncirus trifoliata. Therefore, there are op-portunities for developing more sophisticatedhybrid rootstocks by using modern breedingtools that allow the incorporation of superiortraits from diverse parents (German�a et al.,2020). Modern technologies such as molec-ular markers and somatic hybridization haveemerged and have been successfully imple-mented, thus waiving many barriers associ-ated with conventional breeding methods(Grosser et al., 2010; Khan and Kender,2007).
We compared the field performance of sev-eral advanced experimental rootstock selectionswith other commercially used rootstocks. Manyof the rootstocks used are tetraploid hybridsdeveloped from either somatic hybridization oftwo complementary parents or crosses at thetetraploid level using somatic hybrid par-ents. The other rootstocks are diploid hybridcultivars, except for sour orange (C. auran-tium). The rootstocks included in our studyhave a wide range of genetic diversity,including combinations of trifoliate orange,mandarin, lime, lemon, pummelo, grape-fruit, citrange, and sour orange. The objec-tive of this study was to evaluate the effect ofrootstocks on the horticultural performanceof ‘Hamlin’ orange and to assess their po-tential for commercial production in anHLB-endemic environment.
Materials and Methods
Plant materialThe rootstocks were developed in Florida
(University of Florida), California (Uni-versity of California, Riverside), and Spain(Valencian Institute of Agricultural Research).They contain sexual and somatic hybrids fromawide range of different germplasms (Table 1).The same rootstocks were used in both trials,except for sour orange, which was only in-cluded in one trial. Rootstock liners weregrown from seeds and grafted with ‘Hamlin’orange (C. sinensis) scion using standard pro-cedures (Albrecht et al., 2017; Lewis andAlexander, 2008). Trees were produced in acommercial citrus nursery (Lykes Citrus,Basinger, FL) and planted in 2015 in commer-cial citrus orchards at the locations described.
Trial locationsTwo field trials were conducted, with each in
a separate location with different environmentalconditions but under the same commercial man-agement (Lykes Bros. Inc.). The first trial wasestablished in Apr. 2015 near Fort Basinger (lat.27.373321�N, long. –81.135209�W) in High-lands County, FL. The second trial was estab-lished in June 2015, near Lake Wales (lat.27.935447�N, long. –81.49927�W) in PolkCounty, FL. Because HLB has been endemicin Florida since 2013 (Graham et al., 2020), theHLB incidence in both production areas was100% at the time of planting.
The soil type at the Fort Basinger locationis a poorly drained sandy Entisol withSpodosol-like properties, whereas that at theLake Wales location is a well-drained sandyEntisol (Obreza and Collins, 2008). Both soiltypes have little organic matter and a lowcation exchange capacity. Random soil sam-ples were collected across each trial site to adepth of 25 cm near the drip line of trees andpooled for physicochemical analysis (WatersAgricultural Laboratories, Inc., Camilla,GA). An analysis showed an organic mattercontent of 0.72%, pH of 5.7, and cationexchange capacity (CEC) of 4.5 meq/100 gfor the Basinger location, and an organicmatter content of 0.34%, pH of 5.5, and aCEC of 3.2 meq/100 g for the Lake Waleslocation. Sand, silt, and clay contents were95.2%, 0.8%, and 4%, respectively atBasinger, and 99.2%, 0.8%, and 0%, respec-tively, at LakeWales. Thirty-two (trial 1) and31 (trial 2) different rootstocks were used.
Experimental designThe experimental design was completely
randomized, with six replications arranged inlinear plots of eight trees each. Trees at theBasinger location were planted in double-row raised beds separated by furrows at aspacing of 8 ft (2.4 m) along the rows and 25ft (7.6 m) between the rows. Trees at the LakeWales location were planted in nonbeddedsingle rows at a spacing of 8 ft (2.4 m) alongthe rows and 22 ft (6.7 m) between the rows.
Table 1. Rootstock names and their parentage.
Rootstock Parentage
Tetraploids6058 + 2071-02-2* Citrus aurantium+C. limonia ‘Rangpur’ · C. reticulata ‘Cleopatra’+Poncirus trifoliataAmb+Benton* C. amblycarpa+Citroncirus spp. ‘Benton’Amb+Czo* C. amblycarpa+Citroncirus spp. ‘Carrizo’Changsha+Benton* C. reticulata ‘Changsha’+Citroncirus spp. ‘Benton’Green-3* C. reticulata ‘Nova’+C. maxima ‘Hirado Buntan’ · C. aurantium+Citroncirus spp. ‘Carrizo’Green-7* C. reticulata ‘Nova’+C. maxima ‘Hirado Buntan’ · C. aurantium+Citroncirus spp. ‘Carrizo’Orange-14* C. reticulata ‘Nova’+C. maxima ‘Hirado Buntan’ · C. reticulata ‘Cleopatra’+P. trifoliataWhite-1* C. reticulata ‘Nova’+C. maxima ‘Hirado Buntan’ · C. sinensis ‘Succari’+P. trifoliataSorp+Sh-991* C. aurantium+C. limonia ‘Rangpur’ · C. reticulata ‘Cleopatra’+P. trifoliataWgft+50-7* C. paradisi ‘White’+P. trifoliata ‘50–7’UFR-1 C. reticulata ‘Nova’+C. maxima ‘Hirado Buntan’ · C. reticulata ‘Cleopatra’+P. trifoliataUFR-2 C. reticulata ‘Nova’+C. maxima ‘Hirado Buntan’ · C. reticulata ‘Cleopatra’+P. trifoliataUFR-3 C. reticulata ‘Nova’+C. maxima ‘Hirado Buntan’ · C. reticulata ‘Cleopatra’+P. trifoliataUFR-4 C. reticulata ‘Nova’+C. maxima ‘Hirado Buntan’ · C. reticulata ‘Cleopatra’+P. trifoliataUFR-5 C. reticulata ‘Nova’+C. maxima ‘Hirado Buntan’ · C. sinensis ‘Succari’+P. trifoliataUFR-6 C. reticulata ‘Changsha’+P. trifoliata ‘50-7’UFR-17 C. reticulata ‘Nova’+C. maxima ‘Hirado Buntan’ · C. aurantium+Citroncirus spp. ‘Carrizo’
DiploidsC-146 C. reticulata ‘Sunki’ · P. trifoliata ‘Swingle’C-22 (‘Bitters’) C. reticulata ‘Sunki’ · P. trifoliata ‘Swingle’C-54 (‘Carpenter’) C. reticulata ‘Sunki’ · P. trifoliata ‘Swingle’C-57 (‘Furr’) C. reticulata ‘Sunki’ · P. trifoliata ‘Swingle’ES-1 C. reticulata ‘Cleopatra’ · P. trifoliataES-2 C. reticulata ‘Cleopatra’ · P. trifoliataES-3 C. reticulata ‘Cleopatra’ · P. trifoliataES-5 C. reticulata ‘King’ · P. trifoliataES-4 C. reticulata ‘King’ · P. trifoliataES-6 C. reticulata ‘King’ · P. trifoliataUS-897 C. reticulata ‘Cleopatra’ · P. trifoliata ‘Flying dragon’ES-7 C. volkameriana · P. trifoliataSour orange C. aurantiumSwingle C. paradisi ‘Duncan’ · P. trifoliataX-639 C. reticulata ‘Cleopatra’ · P. trifoliata ‘Rubidoux’
+ indicates somatic hybridization (allotetraploid). · indicates sexual hybridization (diploid or tetraploid).*Experimental rootstocks.
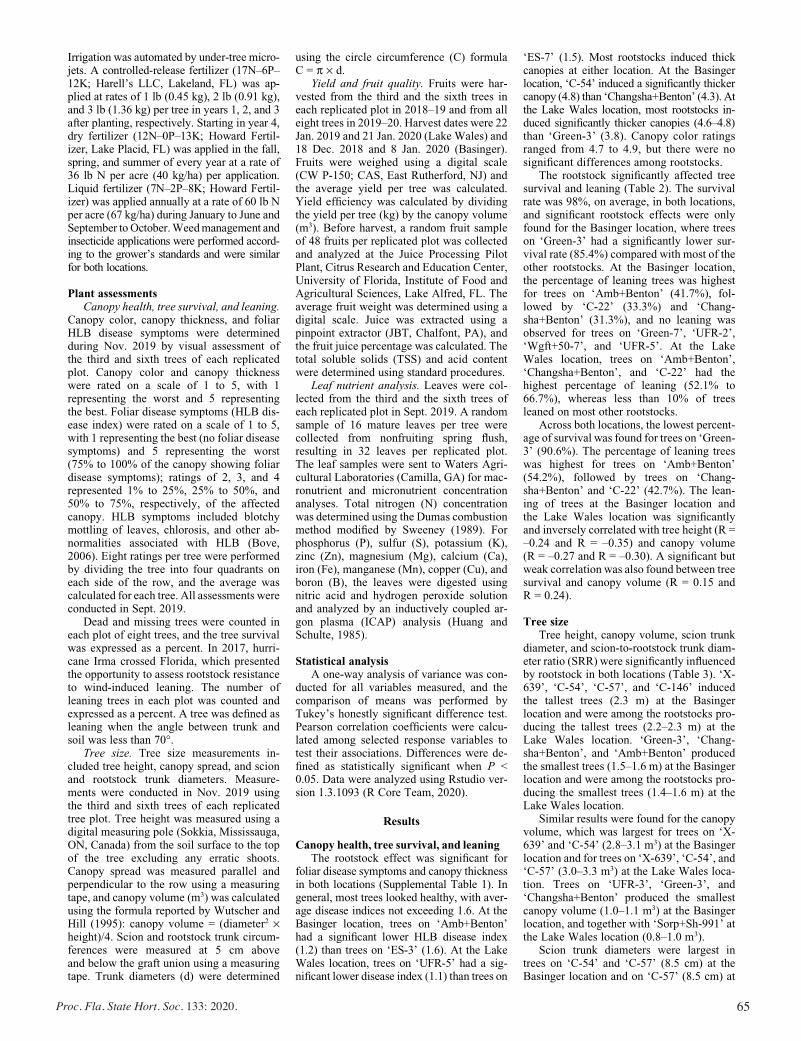
65Proc. Fla. State Hort. Soc. 133: 2020.
Irrigation was automated by under-tree micro-jets. A controlled-release fertilizer (17N–6P–12K; Harell’s LLC, Lakeland, FL) was ap-plied at rates of 1 lb (0.45 kg), 2 lb (0.91 kg),and 3 lb (1.36 kg) per tree in years 1, 2, and 3after planting, respectively. Starting in year 4,dry fertilizer (12N–0P–13K; Howard Fertil-izer, Lake Placid, FL) was applied in the fall,spring, and summer of every year at a rate of36 lb N per acre (40 kg/ha) per application.Liquid fertilizer (7N–2P–8K; Howard Fertil-izer) was applied annually at a rate of 60 lb Nper acre (67 kg/ha) during January to June andSeptember toOctober.Weedmanagement andinsecticide applications were performed accord-ing to the grower’s standards and were similarfor both locations.
Plant assessmentsCanopy health, tree survival, and leaning.
Canopy color, canopy thickness, and foliarHLB disease symptoms were determinedduring Nov. 2019 by visual assessment ofthe third and sixth trees of each replicatedplot. Canopy color and canopy thicknesswere rated on a scale of 1 to 5, with 1representing the worst and 5 representingthe best. Foliar disease symptoms (HLB dis-ease index) were rated on a scale of 1 to 5,with 1 representing the best (no foliar diseasesymptoms) and 5 representing the worst(75% to 100% of the canopy showing foliardisease symptoms); ratings of 2, 3, and 4represented 1% to 25%, 25% to 50%, and50% to 75%, respectively, of the affectedcanopy. HLB symptoms included blotchymottling of leaves, chlorosis, and other ab-normalities associated with HLB (Bove,2006). Eight ratings per tree were performedby dividing the tree into four quadrants oneach side of the row, and the average wascalculated for each tree. All assessments wereconducted in Sept. 2019.
Dead and missing trees were counted ineach plot of eight trees, and the tree survivalwas expressed as a percent. In 2017, hurri-cane Irma crossed Florida, which presentedthe opportunity to assess rootstock resistanceto wind-induced leaning. The number ofleaning trees in each plot was counted andexpressed as a percent. A tree was defined asleaning when the angle between trunk andsoil was less than 70�.
Tree size. Tree size measurements in-cluded tree height, canopy spread, and scionand rootstock trunk diameters. Measure-ments were conducted in Nov. 2019 usingthe third and sixth trees of each replicatedtree plot. Tree height was measured using adigital measuring pole (Sokkia, Mississauga,ON, Canada) from the soil surface to the topof the tree excluding any erratic shoots.Canopy spread was measured parallel andperpendicular to the row using a measuringtape, and canopy volume (m3) was calculatedusing the formula reported by Wutscher andHill (1995): canopy volume = (diameter2 ·height)/4. Scion and rootstock trunk circum-ferences were measured at 5 cm aboveand below the graft union using a measuringtape. Trunk diameters (d) were determined
using the circle circumference (C) formulaC = p · d.
Yield and fruit quality. Fruits were har-vested from the third and the sixth trees ineach replicated plot in 2018–19 and from alleight trees in 2019–20. Harvest dates were 22Jan. 2019 and 21 Jan. 2020 (Lake Wales) and18 Dec. 2018 and 8 Jan. 2020 (Basinger).Fruits were weighed using a digital scale(CW P-150; CAS, East Rutherford, NJ) andthe average yield per tree was calculated.Yield efficiency was calculated by dividingthe yield per tree (kg) by the canopy volume(m3). Before harvest, a random fruit sampleof 48 fruits per replicated plot was collectedand analyzed at the Juice Processing PilotPlant, Citrus Research and Education Center,University of Florida, Institute of Food andAgricultural Sciences, Lake Alfred, FL. Theaverage fruit weight was determined using adigital scale. Juice was extracted using apinpoint extractor (JBT, Chalfont, PA), andthe fruit juice percentage was calculated. Thetotal soluble solids (TSS) and acid contentwere determined using standard procedures.
Leaf nutrient analysis. Leaves were col-lected from the third and the sixth trees ofeach replicated plot in Sept. 2019. A randomsample of 16 mature leaves per tree werecollected from nonfruiting spring flush,resulting in 32 leaves per replicated plot.The leaf samples were sent to Waters Agri-cultural Laboratories (Camilla, GA) for mac-ronutrient and micronutrient concentrationanalyses. Total nitrogen (N) concentrationwas determined using the Dumas combustionmethod modified by Sweeney (1989). Forphosphorus (P), sulfur (S), potassium (K),zinc (Zn), magnesium (Mg), calcium (Ca),iron (Fe), manganese (Mn), copper (Cu), andboron (B), the leaves were digested usingnitric acid and hydrogen peroxide solutionand analyzed by an inductively coupled ar-gon plasma (ICAP) analysis (Huang andSchulte, 1985).
Statistical analysisA one-way analysis of variance was con-
ducted for all variables measured, and thecomparison of means was performed byTukey’s honestly significant difference test.Pearson correlation coefficients were calcu-lated among selected response variables totest their associations. Differences were de-fined as statistically significant when P <0.05. Data were analyzed using Rstudio ver-sion 1.3.1093 (R Core Team, 2020).
Results
Canopy health, tree survival, and leaningThe rootstock effect was significant for
foliar disease symptoms and canopy thicknessin both locations (Supplemental Table 1). Ingeneral, most trees looked healthy, with aver-age disease indices not exceeding 1.6. At theBasinger location, trees on ‘Amb+Benton’had a significant lower HLB disease index(1.2) than trees on ‘ES-3’ (1.6). At the LakeWales location, trees on ‘UFR-5’ had a sig-nificant lower disease index (1.1) than trees on
‘ES-7’ (1.5). Most rootstocks induced thickcanopies at either location. At the Basingerlocation, ‘C-54’ induced a significantly thickercanopy (4.8) than ‘Changsha+Benton’ (4.3). Atthe Lake Wales location, most rootstocks in-duced significantly thicker canopies (4.6–4.8)than ‘Green-3’ (3.8). Canopy color ratingsranged from 4.7 to 4.9, but there were nosignificant differences among rootstocks.
The rootstock significantly affected treesurvival and leaning (Table 2). The survivalrate was 98%, on average, in both locations,and significant rootstock effects were onlyfound for the Basinger location, where treeson ‘Green-3’ had a significantly lower sur-vival rate (85.4%) compared with most of theother rootstocks. At the Basinger location,the percentage of leaning trees was highestfor trees on ‘Amb+Benton’ (41.7%), fol-lowed by ‘C-22’ (33.3%) and ‘Chang-sha+Benton’ (31.3%), and no leaning wasobserved for trees on ‘Green-7’, ‘UFR-2’,‘Wgft+50-7’, and ‘UFR-5’. At the LakeWales location, trees on ‘Amb+Benton’,‘Changsha+Benton’, and ‘C-22’ had thehighest percentage of leaning (52.1% to66.7%), whereas less than 10% of treesleaned on most other rootstocks.
Across both locations, the lowest percent-age of survival was found for trees on ‘Green-3’ (90.6%). The percentage of leaning treeswas highest for trees on ‘Amb+Benton’(54.2%), followed by trees on ‘Chang-sha+Benton’ and ‘C-22’ (42.7%). The lean-ing of trees at the Basinger location andthe Lake Wales location was significantlyand inversely correlated with tree height (R =–0.24 and R = –0.35) and canopy volume(R = –0.27 and R = –0.30). A significant butweak correlation was also found between treesurvival and canopy volume (R = 0.15 andR = 0.24).
Tree sizeTree height, canopy volume, scion trunk
diameter, and scion-to-rootstock trunk diam-eter ratio (SRR) were significantly influencedby rootstock in both locations (Table 3). ‘X-639’, ‘C-54’, ‘C-57’, and ‘C-146’ inducedthe tallest trees (2.3 m) at the Basingerlocation and were among the rootstocks pro-ducing the tallest trees (2.2–2.3 m) at theLake Wales location. ‘Green-3’, ‘Chang-sha+Benton’, and ‘Amb+Benton’ producedthe smallest trees (1.5–1.6 m) at the Basingerlocation and were among the rootstocks pro-ducing the smallest trees (1.4–1.6 m) at theLake Wales location.
Similar results were found for the canopyvolume, which was largest for trees on ‘X-639’ and ‘C-54’ (2.8–3.1 m3) at the Basingerlocation and for trees on ‘X-639’, ‘C-54’, and‘C-57’ (3.0–3.3 m3) at the Lake Wales loca-tion. Trees on ‘UFR-3’, ‘Green-3’, and‘Changsha+Benton’ produced the smallestcanopy volume (1.0–1.1 m3) at the Basingerlocation, and together with ‘Sorp+Sh-991’ atthe Lake Wales location (0.8–1.0 m3).
Scion trunk diameters were largest intrees on ‘C-54’ and ‘C-57’ (8.5 cm) at theBasinger location and on ‘C-57’ (8.5 cm) at

66 Proc. Fla. State Hort. Soc. 133: 2020
however, separation of means was not sig-nificant in either production year.
The average yield at the Lake Waleslocation was similar in both production years(Table 4). ‘UFR-5’ and ‘ES-1’ induced thehighest yields per tree in 2018–19 (20.2 and18.0 kg), and ‘X-639’ and ‘C-54’ induced thehighest yields per tree (19.9 and 18.3 kg) in2019–20. The lowest yields per tree wereinduced by ‘Sorp+Sh-991’, ‘Wgft+50-7’,‘UFR-3’, and ‘Amb+Benton’ (4.6–6.8 kg) inyear 2018–19, and by ‘Changsha+Benton’ and‘Sorp+Sh-991’ (4.6 and 4.9 kg) in 2019–20.
Across both locations, the most produc-tive rootstocks in terms of average cumula-tive yield were ‘ES-1’ (29.5 kg/tree),followed by ‘UFR-5’, ‘C-54’, and ‘X-639’(27.8–28.0 kg/tree). The least productiverootstocks were ‘UFR-3’ (13.1 kg), followedby ‘Sorp+Sh-991’ (14.1 kg), ‘Chang-sha+Benton’ (15.3 kg), and ‘Amb+Benton’(15.6 kg/tree). Fruit yield per tree was sig-nificantly correlated with canopy volume atthe Basinger location (R = 0.39) and at theLake Wales location (R = 0.66).
Yield efficiencyThe rootstock effect was significant for
yield efficiency in both locations and bothproduction years (Table 5). In 2018–19, yieldefficiency at the Basinger location ranged from2.1 kg/m3 for trees on ‘X-639’ to 9.9 kg/m3 fortrees on ‘Amb+Benton’, but the mean separa-tion was not significant. In 2019–20, the aver-
age yield efficiency was highest for trees on‘Green-3’ (14.3 kg/m3) and lowest for trees on‘C-146’, ‘C-54’, and ‘C-22’ (4.3–5.4 kg/m3).
At the Lake Wales location, ‘UFR-5’,‘Green-3’, and ‘Changsha+Benton’ inducedthe highest yield efficiency (15.7–17.3 kg/m3)and ‘ES-2’, ‘ES-3’, ‘C-57’, and ‘UFR-2’ in-duced the lowest (6.1–6.2 kg/m3) in 2018–19.In 2019–20, ‘Green-3’ induced the highestyield efficiency (10.5 kg/m3) and ‘UFR-6’,‘UFR-17’, ‘ES-6’, ‘UFR-4’, ‘UFR-2’, ‘ES-3’,and ‘ES-2’ induced the lowest yield efficiency(4.2–5.1 kg/m3).
Across both locations and years, the high-est average yield efficiency was inducedby ‘Green-3’ (11.9 kg/m3), followed by‘Amb+Benton’ (10.5 kg/m3), ‘Chang-sha+Benton’ (10.2 kg/m3), and ‘ES-4’(10.0 kg/m3), whereas the lowest yield effi-ciency was induced by ‘ES-2’ (4.8 kg/m3),followed by ‘C-146’, ‘ES-3’, and ‘X-639’(5.2–5.4 kg/m3). Yield efficiency was signifi-cantly and inversely correlated with canopyvolume at the Basinger location (R = –0.59)and the Lake Wales location (R = –0.30).
Fruit qualityFruit quality variables were measured in
the production year 2019–20. The rootstockeffect was significant for most variables inboth locations. In the Basinger trial, ‘Green-3’ induced the highest weight fruit (174 g)and ‘ES-2’ induced the lowest fruit weight(140 g) (Table 6). The juice percentage was
Table 2. Tree survival and leaning of ‘Hamlin’ orange trees on different rootstocks.
Trial 1 (Basinger) Trial 2 (Lake Wales) Avg
Rootstock Survival (%) Leaning (%) Survival (%) Leaning (%) Survival (%) Leaning (%)
Amb+Benton 93.8 ab 41.7 a 100 66.7 a 96.9 a-c 54.2 aChangsha+Benton 97.9 a 31.3 a-c 95.8 54.2 ab 96.9 a-c 42.7 abC-22 97.9 a 33.3 ab 100 52.1 a-c 99.0 ab 42.7 ab6058+2071-02-2 100 a 20.8 a-d 100 29.2 b-d 100 a 25.0 bcUFR-4 100 a 20.8 a-d 100 27.1 b-d 100 a 24.0 bcUFR-6 97.9 a 18.8 a-d 100 27.1 b-d 99.0 ab 22.9 bcSorp+Sh-991 100 a 16.7 a-d 97.9 27.1 b-d 99.0 ab 21.9 bcUFR-17 93.8 ab 12.5 a-d 97.9 25.0 b-d 95.8 a-c 18.8 bcGreen-3 85.4 b 16.7 a-d 95.8 16.7 cd 90.6 c 16.7 cES-7 97.9 a 10.4 b-d 100 16.7 cd 99.0 ab 13.5 cUFR-3 91.7 ab 16.7 a-d 95.8 8.3 d 93.8 a-c 12.5 cUS-897 100 a 12.5 a-d 100 12.5 d 100 a 12.5 cUFR-1 100 a 8.3 b-d 100 12.5 d 100 a 10.4 cWhite-1 89.6 ab 6.3 b-d 95.8 14.6 d 92.7 bc 10.4 cES-4 100 a 8.3 b-d 100 12.5 d 100 a 10.4 cAmb+Czo 100 a 8.3 b-d 100 10.4 d 100 a 9.4 cES-2 100 a 12.5 a-d 100 4.2 d 100 a 8.3 cC-54 100 a 2.1 cd 100 12.5 d 100 a 7.3 cC-57 100 a 10.4 b-d 100 4.2 d 100 a 7.3 cGreen-7 100 a 0 d 97.9 12.5 d 99.0 ab 6.3 cES-6 100 a 2.1 cd 100 7.5 d 100 a 4.6 cUFR-5 97.9 a 0 d 100 8.3 d 99.0 ab 4.2 cC-146 100 a 6.3 b-d 100 2.1 d 100 a 4.2 cES-3 97.9 a 2.1 cd 100 6.3 d 99.0 ab 4.2 cES-5 100 a 6.3 b-d 100 2.1 d 100 a 4.2 cOrange-14 100 a 2.1 cd 100 4.2 d 100 a 3.1 cUFR-2 97.9 a 0 d 95.8 4.2 d 96.9 a-c 2.1 cWgft+50-7 100 a 0 d 97.9 4.2 d 99.0 ab 2.1 cES-1 97.9 a 2.1 cd 100 2.1 d 99.0 ab 2.1 cX-639 97.9 a 4.2 b-d 100 0 d 99.0 ab 2.1 cSwingle 97.5 a 2.5 b-d 100 0 d 98.8 ab 1.3 cSour orange 97.9 a 2.1 cd — — — —F value 3.14*** 3.35*** 1.497 6.03*** 3.78*** 8.76***
Different letters within columns indicate significant differences according to Tukey’s honestly significant difference test. *P < 0.05; **P < 0.01; ***P < 0.001.
the Lake Wales location. The smallest scion trunk diameters were found in trees on ‘Green-3’ (5.3 cm) at the Basinger location and in trees on ‘UFR-3’ (5.1 cm) at the Lake Wales location. The SRR was highest (0.86) for trees on rootstocks ‘ES-5’ and sour orange at the Basinger location and for trees on ‘Changsha+Benton’ (0.88) and ‘Amb+Czo’ (0.87) at the Lake Wales location. The lowest SRR (0.63) was found for the trees on ‘Swingle’ at both locations along with trees on ‘Wgft+50-7’ (0.63) at the Basinger loca-tion and ‘UFR-3’ (0.65) at the Lake Wales location.
Tree height was significantly correlated with both canopy volume and scion trunk diameter at the Basinger location (R = 0.92 and R = 0.88, respectively) and the Lake Wales location (R = 0.89 and R = 0.85, respectively).
Fruit yieldFruit yield was measured in production
years 2018–19 and 2019–20, and the cumu-lative yield was calculated. Rootstock effects on yield were significant for both years and at both locations (Table 4). At the Basinger location, the average yield was nearly three-fold lower in 2018–19 (5.6 kg/tree) than in 2019–20 (15.4 kg/tree). Yield per tree ranged from 2.8 kg/tree for trees on ‘ES-5’ to 8.5 kg/tree for trees on ‘US-897’ in 2018–19, and from 9.6 kg/tree for trees on ‘UFR-3’ to 20.2 kg/tree for trees on ‘ES-1’ in year 2019–20;
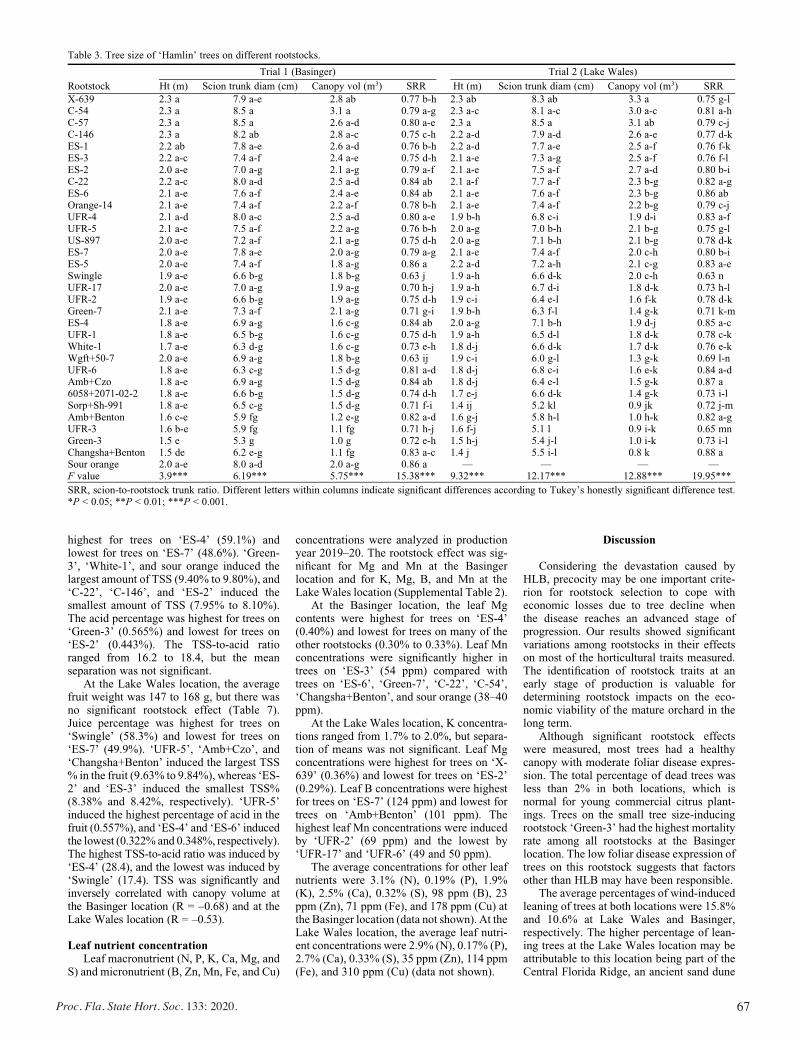
67Proc. Fla. State Hort. Soc. 133: 2020.
highest for trees on ‘ES-4’ (59.1%) andlowest for trees on ‘ES-7’ (48.6%). ‘Green-3’, ‘White-1’, and sour orange induced thelargest amount of TSS (9.40% to 9.80%), and‘C-22’, ‘C-146’, and ‘ES-2’ induced thesmallest amount of TSS (7.95% to 8.10%).The acid percentage was highest for trees on‘Green-3’ (0.565%) and lowest for trees on‘ES-2’ (0.443%). The TSS-to-acid ratioranged from 16.2 to 18.4, but the meanseparation was not significant.
At the Lake Wales location, the averagefruit weight was 147 to 168 g, but there wasno significant rootstock effect (Table 7).Juice percentage was highest for trees on‘Swingle’ (58.3%) and lowest for trees on‘ES-7’ (49.9%). ‘UFR-5’, ‘Amb+Czo’, and‘Changsha+Benton’ induced the largest TSS% in the fruit (9.63% to 9.84%), whereas ‘ES-2’ and ‘ES-3’ induced the smallest TSS%(8.38% and 8.42%, respectively). ‘UFR-5’induced the highest percentage of acid in thefruit (0.557%), and ‘ES-4’ and ‘ES-6’ inducedthe lowest (0.322% and 0.348%, respectively).The highest TSS-to-acid ratio was induced by‘ES-4’ (28.4), and the lowest was induced by‘Swingle’ (17.4). TSS was significantly andinversely correlated with canopy volume atthe Basinger location (R = –0.68) and at theLake Wales location (R = –0.53).
Leaf nutrient concentrationLeaf macronutrient (N, P, K, Ca, Mg, and
S) and micronutrient (B, Zn, Mn, Fe, and Cu)
concentrations were analyzed in productionyear 2019–20. The rootstock effect was sig-nificant for Mg and Mn at the Basingerlocation and for K, Mg, B, and Mn at theLakeWales location (Supplemental Table 2).
At the Basinger location, the leaf Mgcontents were highest for trees on ‘ES-4’(0.40%) and lowest for trees on many of theother rootstocks (0.30% to 0.33%). Leaf Mnconcentrations were significantly higher intrees on ‘ES-3’ (54 ppm) compared withtrees on ‘ES-6’, ‘Green-7’, ‘C-22’, ‘C-54’,‘Changsha+Benton’, and sour orange (38–40ppm).
At the Lake Wales location, K concentra-tions ranged from 1.7% to 2.0%, but separa-tion of means was not significant. Leaf Mgconcentrations were highest for trees on ‘X-639’ (0.36%) and lowest for trees on ‘ES-2’(0.29%). Leaf B concentrations were highestfor trees on ‘ES-7’ (124 ppm) and lowest fortrees on ‘Amb+Benton’ (101 ppm). Thehighest leaf Mn concentrations were inducedby ‘UFR-2’ (69 ppm) and the lowest by‘UFR-17’ and ‘UFR-6’ (49 and 50 ppm).
The average concentrations for other leafnutrients were 3.1% (N), 0.19% (P), 1.9%(K), 2.5% (Ca), 0.32% (S), 98 ppm (B), 23ppm (Zn), 71 ppm (Fe), and 178 ppm (Cu) atthe Basinger location (data not shown). At theLake Wales location, the average leaf nutri-ent concentrations were 2.9% (N), 0.17% (P),2.7% (Ca), 0.33% (S), 35 ppm (Zn), 114 ppm(Fe), and 310 ppm (Cu) (data not shown).
Discussion
Considering the devastation caused byHLB, precocity may be one important crite-rion for rootstock selection to cope witheconomic losses due to tree decline whenthe disease reaches an advanced stage ofprogression. Our results showed significantvariations among rootstocks in their effectson most of the horticultural traits measured.The identification of rootstock traits at anearly stage of production is valuable fordetermining rootstock impacts on the eco-nomic viability of the mature orchard in thelong term.
Although significant rootstock effectswere measured, most trees had a healthycanopy with moderate foliar disease expres-sion. The total percentage of dead trees wasless than 2% in both locations, which isnormal for young commercial citrus plant-ings. Trees on the small tree size-inducingrootstock ‘Green-3’ had the highest mortalityrate among all rootstocks at the Basingerlocation. The low foliar disease expression oftrees on this rootstock suggests that factorsother than HLB may have been responsible.
The average percentages of wind-inducedleaning of trees at both locations were 15.8%and 10.6% at Lake Wales and Basinger,respectively. The higher percentage of lean-ing trees at the Lake Wales location may beattributable to this location being part of theCentral Florida Ridge, an ancient sand dune
Table 3. Tree size of ‘Hamlin’ trees on different rootstocks.
Rootstock
Trial 1 (Basinger) Trial 2 (Lake Wales)
Ht (m) Scion trunk diam (cm) Canopy vol (m3) SRR Ht (m) Scion trunk diam (cm) Canopy vol (m3) SRR
X-639 2.3 a 7.9 a-e 2.8 ab 0.77 b-h 2.3 ab 8.3 ab 3.3 a 0.75 g-lC-54 2.3 a 8.5 a 3.1 a 0.79 a-g 2.3 a-c 8.1 a-c 3.0 a-c 0.81 a-hC-57 2.3 a 8.5 a 2.6 a-d 0.80 a-e 2.3 a 8.5 a 3.1 ab 0.79 c-jC-146 2.3 a 8.2 ab 2.8 a-c 0.75 c-h 2.2 a-d 7.9 a-d 2.6 a-e 0.77 d-kES-1 2.2 ab 7.8 a-e 2.6 a-d 0.76 b-h 2.2 a-d 7.7 a-e 2.5 a-f 0.76 f-kES-3 2.2 a-c 7.4 a-f 2.4 a-e 0.75 d-h 2.1 a-e 7.3 a-g 2.5 a-f 0.76 f-lES-2 2.0 a-e 7.0 a-g 2.1 a-g 0.79 a-f 2.1 a-e 7.5 a-f 2.7 a-d 0.80 b-iC-22 2.2 a-c 8.0 a-d 2.5 a-d 0.84 ab 2.1 a-f 7.7 a-f 2.3 b-g 0.82 a-gES-6 2.1 a-e 7.6 a-f 2.4 a-e 0.84 ab 2.1 a-e 7.6 a-f 2.3 b-g 0.86 abOrange-14 2.1 a-e 7.4 a-f 2.2 a-f 0.78 b-h 2.1 a-e 7.4 a-f 2.2 b-g 0.79 c-jUFR-4 2.1 a-d 8.0 a-c 2.5 a-d 0.80 a-e 1.9 b-h 6.8 c-i 1.9 d-i 0.83 a-fUFR-5 2.1 a-e 7.5 a-f 2.2 a-g 0.76 b-h 2.0 a-g 7.0 b-h 2.1 b-g 0.75 g-lUS-897 2.0 a-e 7.2 a-f 2.1 a-g 0.75 d-h 2.0 a-g 7.1 b-h 2.1 b-g 0.78 d-kES-7 2.0 a-e 7.8 a-e 2.0 a-g 0.79 a-g 2.1 a-e 7.4 a-f 2.0 c-h 0.80 b-iES-5 2.0 a-e 7.4 a-f 1.8 a-g 0.86 a 2.2 a-d 7.2 a-h 2.1 c-g 0.83 a-eSwingle 1.9 a-e 6.6 b-g 1.8 b-g 0.63 j 1.9 a-h 6.6 d-k 2.0 c-h 0.63 nUFR-17 2.0 a-e 7.0 a-g 1.9 a-g 0.70 h-j 1.9 a-h 6.7 d-i 1.8 d-k 0.73 h-lUFR-2 1.9 a-e 6.6 b-g 1.9 a-g 0.75 d-h 1.9 c-i 6.4 e-l 1.6 f-k 0.78 d-kGreen-7 2.1 a-e 7.3 a-f 2.1 a-g 0.71 g-i 1.9 b-h 6.3 f-l 1.4 g-k 0.71 k-mES-4 1.8 a-e 6.9 a-g 1.6 c-g 0.84 ab 2.0 a-g 7.1 b-h 1.9 d-j 0.85 a-cUFR-1 1.8 a-e 6.5 b-g 1.6 c-g 0.75 d-h 1.9 a-h 6.5 d-l 1.8 d-k 0.78 c-kWhite-1 1.7 a-e 6.3 d-g 1.6 c-g 0.73 e-h 1.8 d-j 6.6 d-k 1.7 d-k 0.76 e-kWgft+50-7 2.0 a-e 6.9 a-g 1.8 b-g 0.63 ij 1.9 c-i 6.0 g-l 1.3 g-k 0.69 l-nUFR-6 1.8 a-e 6.3 c-g 1.5 d-g 0.81 a-d 1.8 d-j 6.8 c-i 1.6 e-k 0.84 a-dAmb+Czo 1.8 a-e 6.9 a-g 1.5 d-g 0.84 ab 1.8 d-j 6.4 e-l 1.5 g-k 0.87 a6058+2071-02-2 1.8 a-e 6.6 b-g 1.5 d-g 0.74 d-h 1.7 e-j 6.6 d-k 1.4 g-k 0.73 i-lSorp+Sh-991 1.8 a-e 6.5 c-g 1.5 d-g 0.71 f-i 1.4 ij 5.2 kl 0.9 jk 0.72 j-mAmb+Benton 1.6 c-e 5.9 fg 1.2 e-g 0.82 a-d 1.6 g-j 5.8 h-l 1.0 h-k 0.82 a-gUFR-3 1.6 b-e 5.9 fg 1.1 fg 0.71 h-j 1.6 f-j 5.1 l 0.9 i-k 0.65 mnGreen-3 1.5 e 5.3 g 1.0 g 0.72 e-h 1.5 h-j 5.4 j-l 1.0 i-k 0.73 i-lChangsha+Benton 1.5 de 6.2 e-g 1.1 fg 0.83 a-c 1.4 j 5.5 i-l 0.8 k 0.88 aSour orange 2.0 a-e 8.0 a-d 2.0 a-g 0.86 a — — — —F value 3.9*** 6.19*** 5.75*** 15.38*** 9.32*** 12.17*** 12.88*** 19.95***
SRR, scion-to-rootstock trunk ratio. Different letters within columns indicate significant differences according to Tukey’s honestly significant difference test.*P < 0.05; **P < 0.01; ***P < 0.001.
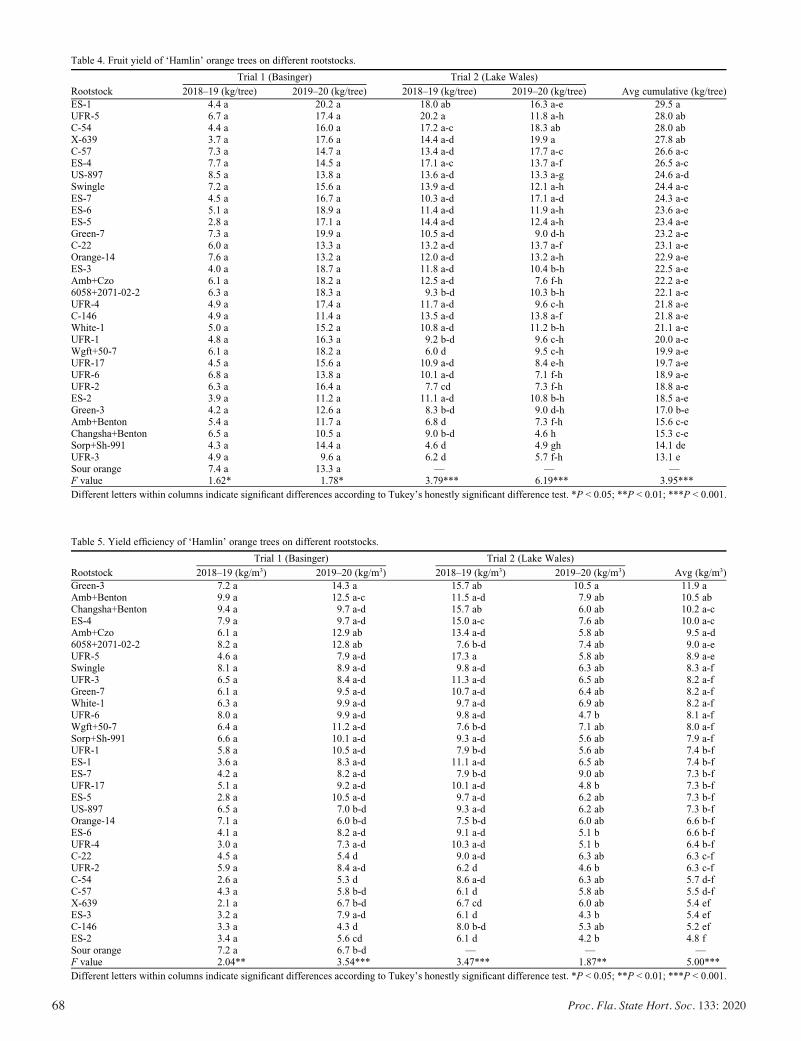
68 Proc. Fla. State Hort. Soc. 133: 2020
Table 4. Fruit yield of ‘Hamlin’ orange trees on different rootstocks.
Rootstock
Trial 1 (Basinger) Trial 2 (Lake Wales)
Avg cumulative (kg/tree)2018–19 (kg/tree) 2019–20 (kg/tree) 2018–19 (kg/tree) 2019–20 (kg/tree)
ES-1 4.4 a 20.2 a 18.0 ab 16.3 a-e 29.5 aUFR-5 6.7 a 17.4 a 20.2 a 11.8 a-h 28.0 abC-54 4.4 a 16.0 a 17.2 a-c 18.3 ab 28.0 abX-639 3.7 a 17.6 a 14.4 a-d 19.9 a 27.8 abC-57 7.3 a 14.7 a 13.4 a-d 17.7 a-c 26.6 a-cES-4 7.7 a 14.5 a 17.1 a-c 13.7 a-f 26.5 a-cUS-897 8.5 a 13.8 a 13.6 a-d 13.3 a-g 24.6 a-dSwingle 7.2 a 15.6 a 13.9 a-d 12.1 a-h 24.4 a-eES-7 4.5 a 16.7 a 10.3 a-d 17.1 a-d 24.3 a-eES-6 5.1 a 18.9 a 11.4 a-d 11.9 a-h 23.6 a-eES-5 2.8 a 17.1 a 14.4 a-d 12.4 a-h 23.4 a-eGreen-7 7.3 a 19.9 a 10.5 a-d 9.0 d-h 23.2 a-eC-22 6.0 a 13.3 a 13.2 a-d 13.7 a-f 23.1 a-eOrange-14 7.6 a 13.2 a 12.0 a-d 13.2 a-h 22.9 a-eES-3 4.0 a 18.7 a 11.8 a-d 10.4 b-h 22.5 a-eAmb+Czo 6.1 a 18.2 a 12.5 a-d 7.6 f-h 22.2 a-e6058+2071-02-2 6.3 a 18.3 a 9.3 b-d 10.3 b-h 22.1 a-eUFR-4 4.9 a 17.4 a 11.7 a-d 9.6 c-h 21.8 a-eC-146 4.9 a 11.4 a 13.5 a-d 13.8 a-f 21.8 a-eWhite-1 5.0 a 15.2 a 10.8 a-d 11.2 b-h 21.1 a-eUFR-1 4.8 a 16.3 a 9.2 b-d 9.6 c-h 20.0 a-eWgft+50-7 6.1 a 18.2 a 6.0 d 9.5 c-h 19.9 a-eUFR-17 4.5 a 15.6 a 10.9 a-d 8.4 e-h 19.7 a-eUFR-6 6.8 a 13.8 a 10.1 a-d 7.1 f-h 18.9 a-eUFR-2 6.3 a 16.4 a 7.7 cd 7.3 f-h 18.8 a-eES-2 3.9 a 11.2 a 11.1 a-d 10.8 b-h 18.5 a-eGreen-3 4.2 a 12.6 a 8.3 b-d 9.0 d-h 17.0 b-eAmb+Benton 5.4 a 11.7 a 6.8 d 7.3 f-h 15.6 c-eChangsha+Benton 6.5 a 10.5 a 9.0 b-d 4.6 h 15.3 c-eSorp+Sh-991 4.3 a 14.4 a 4.6 d 4.9 gh 14.1 deUFR-3 4.9 a 9.6 a 6.2 d 5.7 f-h 13.1 eSour orange 7.4 a 13.3 a — — —F value 1.62* 1.78* 3.79*** 6.19*** 3.95***
Different letters within columns indicate significant differences according to Tukey’s honestly significant difference test. *P < 0.05; **P < 0.01; ***P < 0.001.
Table 5. Yield efficiency of ‘Hamlin’ orange trees on different rootstocks.
Rootstock
Trial 1 (Basinger) Trial 2 (Lake Wales)
Avg (kg/m3)2018–19 (kg/m3) 2019–20 (kg/m3) 2018–19 (kg/m3) 2019–20 (kg/m3)
Green-3 7.2 a 14.3 a 15.7 ab 10.5 a 11.9 aAmb+Benton 9.9 a 12.5 a-c 11.5 a-d 7.9 ab 10.5 abChangsha+Benton 9.4 a 9.7 a-d 15.7 ab 6.0 ab 10.2 a-cES-4 7.9 a 9.7 a-d 15.0 a-c 7.6 ab 10.0 a-cAmb+Czo 6.1 a 12.9 ab 13.4 a-d 5.8 ab 9.5 a-d6058+2071-02-2 8.2 a 12.8 ab 7.6 b-d 7.4 ab 9.0 a-eUFR-5 4.6 a 7.9 a-d 17.3 a 5.8 ab 8.9 a-eSwingle 8.1 a 8.9 a-d 9.8 a-d 6.3 ab 8.3 a-fUFR-3 6.5 a 8.4 a-d 11.3 a-d 6.5 ab 8.2 a-fGreen-7 6.1 a 9.5 a-d 10.7 a-d 6.4 ab 8.2 a-fWhite-1 6.3 a 9.9 a-d 9.7 a-d 6.9 ab 8.2 a-fUFR-6 8.0 a 9.9 a-d 9.8 a-d 4.7 b 8.1 a-fWgft+50-7 6.4 a 11.2 a-d 7.6 b-d 7.1 ab 8.0 a-fSorp+Sh-991 6.6 a 10.1 a-d 9.3 a-d 5.6 ab 7.9 a-fUFR-1 5.8 a 10.5 a-d 7.9 b-d 5.6 ab 7.4 b-fES-1 3.6 a 8.3 a-d 11.1 a-d 6.5 ab 7.4 b-fES-7 4.2 a 8.2 a-d 7.9 b-d 9.0 ab 7.3 b-fUFR-17 5.1 a 9.2 a-d 10.1 a-d 4.8 b 7.3 b-fES-5 2.8 a 10.5 a-d 9.7 a-d 6.2 ab 7.3 b-fUS-897 6.5 a 7.0 b-d 9.3 a-d 6.2 ab 7.3 b-fOrange-14 7.1 a 6.0 b-d 7.5 b-d 6.0 ab 6.6 b-fES-6 4.1 a 8.2 a-d 9.1 a-d 5.1 b 6.6 b-fUFR-4 3.0 a 7.3 a-d 10.3 a-d 5.1 b 6.4 b-fC-22 4.5 a 5.4 d 9.0 a-d 6.3 ab 6.3 c-fUFR-2 5.9 a 8.4 a-d 6.2 d 4.6 b 6.3 c-fC-54 2.6 a 5.3 d 8.6 a-d 6.3 ab 5.7 d-fC-57 4.3 a 5.8 b-d 6.1 d 5.8 ab 5.5 d-fX-639 2.1 a 6.7 b-d 6.7 cd 6.0 ab 5.4 efES-3 3.2 a 7.9 a-d 6.1 d 4.3 b 5.4 efC-146 3.3 a 4.3 d 8.0 b-d 5.3 ab 5.2 efES-2 3.4 a 5.6 cd 6.1 d 4.2 b 4.8 fSour orange 7.2 a 6.7 b-d — — —F value 2.04** 3.54*** 3.47*** 1.87** 5.00***
Different letters within columns indicate significant differences according to Tukey’s honestly significant difference test. *P < 0.05; **P < 0.01; ***P < 0.001.

69Proc. Fla. State Hort. Soc. 133: 2020.
Table 6. Fruit quality of ‘Hamlin’ orange trees on different rootstocks in trial 1 (Basinger).
Rootstock Fruit wt (g) Juice (%) TSS (%) Acid (%) TSS-to-acid ratio
Green-3 174 a 57.2 a-d 9.80 a 0.565 a 17.4 aWhite-1 162 a-f 56.6 a-d 9.53 ab 0.547 a-e 17.5 aSour orange 153 a-g 56.5 a-d 9.40 a-c 0.518 a-f 18.2 aChangsha+Benton 169 ab 57.4 a-c 9.28 a-d 0.558 a-c 16.7 aWgft+50-7 171 ab 58.1 ab 9.27 a-d 0.562 ab 16.6 aUFR-6 165 a-f 57.6 a-c 9.25 a-d 0.563 ab 16.5 aAmb+Benton 167 a-d 57.0 a-d 9.23 a-e 0.547 a-e 16.9 aUFR-1 158 a-g 57.1 a-d 9.18 a-f 0.543 a-e 16.9 aAmb+Czo 164 a-f 57.1 a-d 9.14 a-g 0.548 a-d 16.7 aSorp+Sh-991 158 a-g 55.2 a-d 9.12 a-h 0.515 a-g 17.7 aES-4 161 a-g 59.1 a 9.11 a-h 0.520 a-f 17.5 aSwingle 149 b-g 57.2 a-d 9.06 a-i 0.522 a-f 17.3 aUFR-5 157 a-g 57.1 a-d 8.90 a-i 0.542 a-e 16.5 aUFR-3 165 a-f 55.0 a-e 8.81 a-i 0.518 a-f 17.0 a6058+2071-02-2 166 a-e 53.4 a-e 8.72 b-i 0.507 a-g 17.3 aUS-897 145 e-g 57.8 a-c 8.72 b-i 0.487 c-g 18.0 aES-5 161 a-g 52.8 a-e 8.69 b-i 0.473 e-g 18.4 aGreen-7 164 a-f 51.2 c-e 8.55 b-i 0.492 a-g 17.4 aUFR-2 158 a-g 55.0 a-e 8.53 b-i 0.487 c-g 17.6 aUFR-17 169 ab 53.7 a-e 8.49 b-i 0.515 a-g 16.5 aES-1 153 a-g 53.8 a-e 8.42 c-i 0.465 fg 18.1 aC-54 146 c-g 52.4 b-e 8.35 c-i 0.458 fg 18.3 aUFR-4 164 a-f 53.4 a-e 8.31 d-i 0.487 c-g 17.2 aC-57 147 c-g 51.5 b-e 8.28 d-i 0.462 fg 18.0 aES-3 154 a-g 50.7 de 8.28 d-i 0.458 fg 18.1 aES-7 143 fg 48.6 e 8.28 d-i 0.457 fg 18.2 aES-6 168 a-c 51.7 b-e 8.27 d-i 0.463 fg 17.9 aOrange-14 167 a-e 51.6 b-e 8.17 e-i 0.503 a-g 16.2 aX-639 146 d-g 52.8 a-e 8.15 f-i 0.475 d-g 17.2 aES-2 140 g 51.5 b-e 8.10 g-i 0.443 g 18.3 aC-146 149 b-g 51.7 b-e 8.08 hi 0.490 b-g 16.6 aC-22 144 fg 50.5 de 7.95 i 0.465 fg 17.3 aF value 5.59*** 5.39*** 6.50*** 7.53*** 2.01**
Different letters within columns indicate significant differences according to Tukey’s honestly significant difference test. *P < 0.05; **P < 0.01; ***P < 0.001.
Table 7. Fruit quality of ‘Hamlin’ orange trees on different rootstocks in trial 2 (Lake Wales).
Rootstock Fruit wt (g) Juice (%) TSS (%) Acid (%) TSS-to-acid ratio
UFR-5 153 57.2 a-e 9.84 a 0.557 a 17.7 efAmb+Czo 149 57.8 a-c 9.65 ab 0.505 a-g 19.1 c-fChangsha+Benton 162 57.9 ab 9.63 ab 0.522 a-c 18.6 d-fWhite-1 155 57.2 a-f 9.57 a-c 0.507 a-f 18.9 c-fGreen-3 157 55.0 a-g 9.47 a-d 0.510 a-e 18.6 d-fUFR-1 149 57.4 a-d 9.47 a-d 0.515 a-d 18.4 d-fWgft+50-7 159 57.9 ab 9.46 a-d 0.537 ab 17.6 efSorp+Sh-991 150 55.8 a-g 9.43 a-e 0.503 a-h 18.8 c-fAmb+Benton 168 57.2 a-e 9.42 a-e 0.497 b-i 19.0 c-fUFR-6 159 56.6 a-g 9.38 a-f 0.508 a-e 18.5 d-fUFR-17 161 54.3 a-g 9.36 a-f 0.493 b-i 19.0 c-fUFR-3 153 53.8 c-i 9.30 a-g 0.498 a-h 18.8 c-fES-5 151 54.2 b-g 9.29 a-g 0.477 c-j 19.5 c-fGreen-7 157 54.9 a-g 9.17 b-h 0.510 a-e 18.0 d-fSwingle 150 58.3 a 9.16 b-h 0.526 a-c 17.4 fOrange-14 157 55.9 a-g 9.09 b-h 0.500 a-h 18.2 d-fUS-897 148 58.0 ab 9.06 b-i 0.458 d-k 19.8 c-fUFR-4 152 55.4 a-g 9.06 b-i 0.445 h-k 20.4 c-eES-4 156 54.9 a-g 9.05 b-i 0.322 l 28.4 aC-22 154 53.1 g-i 8.97 c-j 0.432 jk 20.8 cdUFR-2 157 55.2 a-g 8.88 d-j 0.478 b-j 18.6 d-fC-54 149 55.7 a-g 8.83 d-j 0.460 d-k 19.3 c-fES-7 156 49.9 i 8.78 e-j 0.408 k 21.5 c6058+2071-02-2 161 53.2 f-i 8.77 e-j 0.502 a-h 17.6 efC-146 159 53.6 d-i 8.74 f-j 0.438 i-k 20.0 c-fX-639 155 54.0 b-h 8.68 g-j 0.452 e-k 19.2 c-fES-1 158 52.8 g-i 8.67 g-j 0.447 g-k 19.5 c-fC-57 158 52.7 g-i 8.61 h-j 0.432 jk 20.0 c-fES-6 159 53.6 d-i 8.51 h-j 0.348 l 24.6 bES-3 151 50.0 hi 8.42 ij 0.448 f-k 18.8 c-fES-2 147 53.3 e-i 8.38 j 0.438 i-k 19.2 c-fF value 1.15 8.97*** 10.29*** 21.65*** 16.08***
Different letters within columns indicate significant differences according to Tukey’s honestly significant difference test. *P < 0.05; **P < 0.01; ***P < 0.001.
70 Proc. Fla. State Hort. Soc. 133: 2020
ducted on both flatwood and Central Ridge sites in Florida (Grosser et al., 2011). During those trials, many of the tetraploid rootstocks induced a tree size smaller than 9 ft (2.7 m) after 10 years of growth. The dwarfing ca-pacity of tetraploid rootstocks was suggested to be a graft union response because diploid and tetraploid cells differ morphologically, with the latter being larger and containing thicker cell walls (Grosser et al., 2011). However, the reduced growth of tetraploid rootstocks in comparison with diploid root-stocks was also observed at the seedling stage (Allario et al., 2011; Guerra et al., 2014). It is generally recognized that the reduced capac-ity of the dwarfing rootstocks to transport water from the soil to the aboveground part of the plant contributes to the vigor-inducing potential of a rootstock. Lower hydraulic conductivity was reported for apple trees on the dwarfing rootstock M.27 compared to those on the invigorating rootstock MM.106 (Atkinson et al., 2003). Forner-Giner et al.(2014) reported a reduced hydraulic conduc-tance of ‘Navelina’ orange trees on dwarfing rootstocks ‘FA-517’ and ‘FA-418’ compared with trees on Carrizo rootstock. Factors such as soil and environmental conditions, man-agement practices, pest and disease pressure, and rootstock compatibility with the scion may further affect the rootstock influence on tree size (Bowman and Joubert, 2020). The observed variations in the tree size induced at different locations for some of the rootstocks in our study were likely due to the differences in the soil and other environmental condi-tions because both sites had similar manage-ment practices, the same scion, and similar HLB disease pressure.
The SRR represents the smoothness of the graft union, and it has often been considered an indicator of the compatibility of scion and rootstocks (Kallsen and Parfitt, 2011). How-ever, different vigor of the grafting partners can also result in overgrowth of one of the partners without posing any hazard to trunk health and tree physiology (Bowman and Joubert, 2020), as demonstrated by the long-time dominance of ‘Swingle’. Together with ‘Wgft+50-7’, ‘Swingle’ induced the lowest SRR value in both trials.
The average yield at the Basinger location in 2018–19 was considerably lower than that at the Lake Wales location. One reason for this was an unusually high incidence of Xanthomonas citri, the causal organism of citrus canker, at the Basinger location, pos-sibly as aftermath of hurricane Irma. Most of the high vigor-inducing rootstocks, such as ‘X-639’, ‘ES-1’, ‘C-54’, and ‘C-57’, were among the rootstocks that induced the highest cumulative yields across both production years and both locations, amounting to 149 to 158 boxes of fruit per acre (1 box = 90 lb or 40.8 kg of fruit). Although this amount is not yet considered commercially significant, many of the low vigor-inducing tetraploid rootstocks induced less than half this amount (70–83 boxes/acre), which, if this trend con-tinues, mayprevent their commercial accep-tance. Similar to our findings, in a rootstock
trial with ‘Marsh’ grapefruit, ‘X-639’ and ‘C-54’ induced high cumulative yields and largetree sizes (Castle et al., 2011). In that trial,‘C-146’ also produced high cumulativeyields; however, our yield on this rootstockwas average to low.
It is generally recognized that the size ofthe canopy is positively related to fruit yield(Anderson, 1987). An association betweentree size and yield was also observed duringrootstock trials with ‘Valencia’ and ‘Hamlin’scion in Florida and with ‘Pera’ scion inBrazil (Albrecht et al., 2012; Bowman et al.,2016a; Quaggio et al., 2004). Despite thegeneral relationship between canopy sizeand yield, in the present study, the mediumvigor-inducing rootstock ‘UFR-5’ and thelower vigor-inducing ‘ES-4’ were amongthe rootstocks that induced higher than aver-age cumulative yields. In contrast, the highvigor-inducing ‘ES-2’ rootstock induced alower-than-average cumulative yield. Thecorrelation between canopy size and yieldin our trials was moderate (0.39) to high(0.66), depending on the location, suggestingthat the canopy size of a citrus tree may notalways be a good predictor of yield.
High yield-inducing rootstocks do notnecessarily increase the productivity of acitrus orchard if the planting density is notoptimized for the size of the mature produc-tive tree (Bowman and Joubert, 2020).Hence, yield efficiency (yield per unit canopyvolume) is a more suitable variable for de-termining productivity of a mature orchard.In two recent studies of ‘Ray Ruby’ grape-fruit, high-density planting resulted in in-creased yield per hectare, increased fruitTSS contents, and decreased canopy volume(Phuyal et al., 2020). This demonstrates thatthe use of high-yield efficient rootstocks andoptimized planting density can increase pro-ductivity and minimize cost per unit produc-tion.
Most of the high vigor-inducing rootstocks,such as ‘X-639’, ‘C-54’, ‘C-57’, and ‘C-146’,and some of the medium vigor-inducingrootstocks, such as ‘ES-2’ and ‘ES-3’, werenot as yield-efficient in our study as thelower vigor-inducing rootstocks. Amongthe rootstocks that induced the highestyield efficiency were the tetraploid rootstocks‘Green-3’, ‘Amb+Benton’, ‘Changsha+Benton’,‘Amb+Czo’, and ‘6058+2071-02-2’, whichproduced some of the smallest trees in thetrials. However, despite having high yieldefficiency, the overall yield potential of theserootstocks may not be sufficient, in the longer-term, to compete with the more vigorousrootstocks. Moreover, some of these smallsize-inducing rootstocks were leaning becauseof the strong winds imposed by the hurricanein 2017; the long-term impact remains to beinvestigated. ‘ES-4’, ‘UFR-5’, and ‘Swingle’were among the rootstocks inducing higher-than-average yield efficiency across both lo-cations and production years while producingmedium-sized trees.
The priority for different fruit qualitytraits varies in different production areasbased on the scion used and purpose (fresh
representing the highest elevation in Florida, and its characteristic sandy soils. Trees on some of the dwarfing rootstocks leaned more than trees on some of the larger size-inducing rootstocks, but the (inverse) correlation be-tween tree size and leaning was weak. One of the exceptions was ‘C-22’, which induced a high percentage of leaning while producing larger than average trees. The leaning of trees did not appear to have a negative influence on tree health and productivity at the time of evaluation; however, it is expected that growers will prefer wind-tolerant rather than wind-susceptible cultivars. To our knowl-edge, this is the first report of citrus that compared rootstock cultivar effects on the ability of citrus trees to withstand tropical force winds. A study of apple rootstocks also found that trees on dwarfing rootstocks leaned more than trees on vigorous root-stocks (Schupp, 1992); this was attributed to the heavy crop load of dwarfing trees and weak anchorage. Differences in wind resis-tance among rootstocks observed in our study are likely associated with different root ar-chitectures because trees were bearing few fruit at the time of the hurricane. A study following the aftermath of hurricane Andrew, which destroyed much of the tropical fruit acreage in South Florida in 1992, found that the percentage of toppled and surviving trees was correlated with tree height and age and depended on the crop species and other fac-tors (Crane et al., 1993).
The rootstocks induced a wide range of vigor in the ‘Hamlin’ scion. The diploid rootstocks produced mostly medium to large trees, with ‘X-639’, ‘C-54’, ‘C-57’, ‘C-146’, and ‘ES-1’ producing the largest trees in the trials. Surprisingly, ‘US-897’ and ‘C-22’, which are generally regarded as small tree size-inducing rootstocks (Bowman et al., 2008; Siebert et al., 2010), produced medium trees in both locations when compared with the rootstock standards ‘Swingle’ and sour orange which are known to produce medium trees. Other studies that included the root-stocks ‘C-22’, ‘C-54’, ‘C-57’, ‘C-146’, and ‘X-639’ showed similar results (Castle et al., 2011; Louzada et al., 2008; Roose, 2008). It is anticipated that the size-limiting effect of ‘US-897’ and ‘C-22’ will manifest during later production years. The delayed effect of ‘US-897’ on tree size has also been observed by commercial citrus growers (personal com-munications). It must be noted that some hybrids of C. reticulata and P. trifoliata (citrandarins) are regarded as HLB-tolerant (Albrecht and Bowman, 2012; Boava et al., 2014). A higher level of tolerance may have contributed to the vigorous growth of trees on the citrandarin rootstocks ‘X-639’, ‘C-54’, ‘C-57’, ‘C-146’, ‘ES-1’, ‘US-897’, and ‘C-22’ observed in our study.
Among the tetraploid rootstocks, ‘Or-ange-14’, ‘UFR-4’, and ‘UFR-5’ induced the largest tree size, which was average when compared across all rootstocks. Most of the other tetraploid rootstocks induced below-average size trees, which is in accordance with the results from other field trials con-
71Proc. Fla. State Hort. Soc. 133: 2020.
fruit or juice production). For sweet orangeslike ‘Hamlin’ that are grown for juice pro-cessing, TSS (Brix) is the most importantfruit quality variable, followed by the acidcontent and the ratio of the two. Similar toother citrus studies, rootstocks in this studyinduced significant differences in all mea-sured fruit quality variables in both trials(Bowman et al., 2016b; Grosser et al., 2011;McCollum and Bowman, 2017).
Most rootstocks induced more than 50%juice, except for ‘ES-7’, which is a lemon-type hybrid. Despite differences among lo-cations for some of the rootstocks, there was atendency for dwarfing and semi-dwarfingrootstocks to induce larger amounts of TSSthan vigorous rootstocks. The inverse corre-lation between tree size and TSS was moreevident at the Basinger location (R = –0.78)than at the Lake Wales location (R = –0.53).Among the highest TSS-inducing rootstocksin both locations were the smallest size-inducing tetraploid rootstocks ‘Green-3’,‘White-1’, ‘Changsha+Benton’, ‘Amb+Benton’,‘Amb+Czo’, ‘Wgft+50-7’, ‘UFR-1’, and‘UFR-6’. These rootstocks were also foundto induce excellent fruit quality during aprevious field trial with ‘Valquarius’ scion(Grosser et al., 2011). The low vigor-inducingrootstock ‘US-897’ and the high vigor-inducing rootstock ‘X-639’ induced the high-est and lowest TSS contents, respectively,during a study of ‘Ray Ruby’ grapefruit trees(McCollum and Bowman, 2017).
The influence of rootstocks on fruit qual-ity is assumed to be due to the different rolesof rootstocks in the translocation of photo-assimilates to the fruits (Gardner, 1969) andthe movement of water and sucrose to thejuice sacs (Castle, 1995). Because these fac-tors also affect the vegetative growth of atree, the inverse correlation found betweenTSS and the vigor-inducing capacity of root-stock is expected. In addition to rootstockcultivar, climatic factors (Davies, 1997) anddiseases such as HLB can affect the citrusfruit quality (Baldwin et al., 2018; Liao andBurns, 2012) and interact with the rootstock(Dala-Paula et al., 2019). Two of the root-stocks (‘ES-4’ and ‘ES-6’) at the Lake Waleslocation induced a very low acid content,thereby increasing the TSS-to-acid ratio tomore than 24. In general, acid ratios werevery low in the 2019–20 production season.Unusually high temperatures and excessiverainfall throughout the year, particularly dur-ing the preharvest period, may have beenresponsible for this. The negative influence ofwarm temperatures on TSS and acid contentwas previously highlighted (Reuther, 1980;Zekri, 2011).
It is accepted that rootstocks differ in theircapacity to uptake nutrients from the soil anddistribute them through the scion (Brownet al., 1994; Toplu et al., 2012; Wutscher,1973). In our study, the rootstock effect wasnot significant for most of the leaf nutrientsand not consistent across both trials. Overall,most of the nutrients were in the range deemedoptimal or high for citrus (Kadyampakeni andMorgan, 2020). The high Cu concentration
measured in trees at both locations are theresult of frequent Cu applications to controlcitrus canker, which is widespread in Florida(Dewdney et al., 2001; Zambon et al., 2019).
Conclusions
The diploid and tetraploid rootstocks in-vestigated during this study differed in theireffects on the ‘Hamlin’ scion. Among themost prominent effects were those on treesize and productivity. The early production ofhigh-quality fruits and high productivitycomprise one strategy that can result ingrowing citrus profitably under HLB-endemic conditions. Many of the tetraploidrootstocks reduced tree size significantly andconsequently reduced yield; however, theyincreased yield efficiency. Therefore, theserootstocks may be suitable for high-densityplantings to increase orchard productivityduring the early production years. However,many of the small size-inducing rootstocksrendered the trees more vulnerable to tropicalforce winds than the large size-inducingrootstocks. Although this study was conduct-ed during the early production years, theresults are valuable for predicting rootstockresilience and their economic potential in thelonger term.
Literature Cited
Albrecht, U. and K.D. Bowman. 2012. Toleranceof trifoliate citrus rootstock hybrids to Candi-datus Liberibacter asiaticus. Scientia Hort.147:71–80, doi: 10.1016/j.scienta.2012.08.036.
Albrecht, U., G. McCollum, and K.D. Bowman.2012. Influence of rootstock variety on Huan-glongbing disease development in field-grownsweet orange (Citrus sinensis [L.] Osbeck)trees. Scientia Hort. 138:210–220, doi:10.1016/j.scienta.2012.02.027.
Albrecht, U., M. Zekri, and J. Williamson. 2017.Citrus propagation. University of Florida IFASExtension (edis.ifas.ufl.edu), publicationHS1309.
Allario, T., J. Brumos, J.M. Colmenero-Flores, F.Tadeo, Y. Froelicher, M. Talon, L. Navarro, P.Ollitrault, and R. Morillon. 2011. Largechanges in anatomy and physiology betweendiploid Rangpur lime (Citrus limonia) and itsautotetraploid are not associated with largechanges in leaf gene expression. J. Expt. Bot.62(8):2507–2519, doi: 10.1093/jxb/erq467.
Anderson, C.A. 1987. Calcium: Fruit yields, treesize, and mineral nutrition relationships in‘Valencia’ orange trees as affected by liming.J. Plant Nut 10(9-16):1907–1916.
Atkinson, C.J., M.A. Else, L. Taylor, and C.J.Dover. 2003. Root and stem hydraulic conduc-tivity as determinants of growth potential ingrafted trees of apple (Malus pumila Mill.). J.Expt. Bot. 54(385):1221–1229, doi: 10.1093/jxb/erg132.
Baldwin, E., A. Plotto, J. Bai, J. Manthey,W. Zhao,S. Raithore, and M. Irey. 2018. Effect ofabscission zone formation on orange (Citrussinensis) fruit/juice quality for trees affected byHuanglongbing (HLB). J. Agr. Food Chem.66(11):2877–2890.
Boava, L.P., C.H. Sagawa, M. Cristofani-Yaly, andM.A. Machado. 2014. Incidence of ‘CandidatusLiberibacter asiaticus’-infected plants amongcitrandarins as rootstock and scion under field
conditions. Phytopathology 105(4):518–524,doi: 10.1094/PHYTO-08-14-0211-R.
Bove, J.M. 2006. Huanglongbing: A destructive,newly-emerging, century-old disease of citrus.J. Plant Pathol. 88:7–37.
Bowman, K.D. and J. Joubert. 2020. Citrus root-stocks, p. 105–127. In: M. Talon, M. Caruso,and F.G. Gmitter (eds.). The genus citrus.Woodhead Publishing, Cambridge, MA.
Bowman, K.D. and G. McCollum. 2015. Five newcitrus rootstocks with improved tolerance tohuanglongbing. HortScience 50(11):1731–1734, doi: 10.1016/j.plantsci.2011.09.008.
Bowman, K.D., L. Faulkner, and M. Kesinger.2016a. New citrus rootstocks released byUSDA2001–2010: Field performance and nurserycharacteristics. HortScience 51(10):1208–1214,doi: 10.21273/HORTSCI10970-16.
Bowman, K.D., G. McCollum, and U. Albrecht.2016b. Performance of ‘Valencia’ orange (Cit-rus sinensis [L.] Osbeck) on 17 rootstocks in atrial severely affected by huanglongbing. Sci-entia Hort. 201:355–361, doi: 10.1016/j.sci-enta.2016.01.019.
Bowman, K.D., U. Albrecht, and G. Mccollum.2008. Comparison of three new citrus root-stocks from USDA: US-802, US-812, US-897.Proc. Intl. Soc. Citriculture, 198–199.
Brown, P.H., Q. Zhang, and L. Ferguson. 1994.Influence of rootstock on nutrient acquisitionby pistachio. J. Plant Nutr. 17(7):1137–1148.
Castle, W.S. 1995. Rootstock as a fruit qualityfactor in citrus and deciduous tree crops. N. Z.J. Crop Hort. Sci. 23(4):383–394, doi: 10.1080/01140671.1995.9513914.
Castle, W.S. 2010. A career perspective on citrusrootstocks, their development, and commer-cialization. HortScience 45(1):11–15, doi:10.21273/HORTSCI.45.1.11.
Castle, W.S., K.D. Bowman, J.C. Baldwin, J.W.Grosser, and F.G. Gmitter. 2011. Rootstocksaffect tree growth, yield, and juice quality of‘Marsh’ grapefruit. HortScience 46(6):841–848, doi: 10.21273/HORTSCI.46.6.841.
Castle, W.S., D.P.H. Tucker, A.H. Krezdorn, andC.O. Youtsey. 1993. Rootstocks for Floridacitrus: Rootstock selection. University of Flor-ida, Sept. 1993, 2nd ed. <https://crec.ifas.ufl.edu/extension/citrus_rootstock/Rootstock-Literature/Rootstocks%20for%20Florida%20Citrus.pdf>.
Castle, W.S. and F.G. Gmitter, Jr. 1998. Rootstockand scion selection, p. 21–34. In: L.W. Timmerand L.W. Duncan (eds.). Citrus health manage-ment. APS Press, St. Paul, MN.
Cimen, B. and T. Yesiloglu. 2016. Rootstockbreeding for abiotic stress tolerance in citrus.In: Abiotic and biotic stress in plants-recentadvances and future perspectives. IntechOpen.doi: 10.5772/62047.
Crane, J.H., R.J. Campbell, and C.F. Balerdi. 1993.Effect of hurricane Andrew on tropical fruittrees. In: Proc. FSHS 106:139.
Dala-Paula, B.M., A. Plotto, J. Bai, J.A. Manthey,E.A. Baldwin, R.S. Ferrarezi, and M.B.A. Glo-ria. 2019. Effect of huanglongbing or greeningdisease on orange juice quality, a review. Front.Plant Sci. 9:1976, doi: 10.3389%2Ffpls.2018.01976.
Davies, F.S. 1997. An overview of climatic effectson citrus flowering and fruit quality in variousparts of the world. Proc. Citrus Flowering andFruit Short Course. IFAS, CREC, UF, 1–4.
Dewdney, M.M., M. Zekri, P.D. Roberts, and J.D.Burrow. 2001. Homeowner fact sheet: Citrus canker. UF-IFAS, Gainesville. <https://edis. ifas.ufl.edu/pdffiles/PP/PP11600.pdf>.

72 Proc. Fla. State Hort. Soc. 133: 2020
Ferrarezi, R.S., J.A. Qureshi, A.L. Wright, M.A.Ritenour, and N.P. Macan. 2019. Citrus pro-duction under screen as a strategy to protectgrapefruit trees from huanglongbing disease.Front. Plant Sci. 10:1598.
Florida Department of Agriculture and ConsumerServices. 2020a. Florida citrus statistics 2018-2019.<https://www.nass.usda.gov/Statistics_by_State/Florida/Publications/Citrus/Citrus_Statistics/2018-19/fcs1819.pdf>.
Florida Department of Agriculture and ConsumerServices. 2020b. Citrus budwood annual report2019-20. <https://www.fdacs.gov/content/download/94009/file/2019-2020-Annual-Report.pdf>.
Forner-Giner, M.A., A. Alcaide, E. Primo-Millo,and J.B. Forner. 2003. Performance of‘Navelina’ orange on 14 rootstocks in NorthernValencia (Spain). Scientia Hort. 98(3):223–232, doi: 10.1016/S0304-4238(02)00227-3.
Forner-Giner, M.A., J. Rodriguez-Gamir, B. Martí-nez-Alc�antara, A. Quinones, D.J. Iglesias, E.Primo-Millo, and J. Forner. 2014. Performanceof Navel orange trees grafted onto two newdwarfing rootstocks (Forner-Alcaide 517 andForner-Alcaide 418). Scientia Hort. 179:376–387.
Gardner, F.E. 1969. A study of rootstock influenceon citrus fruit quality by fruit grafting. In: Proc.First Int Citrus Symp. 1:359-364.
German�a, M.A., P. Aleza, J.W. Grosser, M. Dutt,N. Wang, J. Cuenca, and P. Kaur. 2020. Citrusbiotechnology. In: M. Talon, M. Caruso, andF.G. Gmitter (eds.). The genus citrus. Wood-head Publishing, Cambridge, MA.
Gottwald, T.R., J.V.D. Gracxa, and R.B. Bassanezi.2007. Citrus huanglongbing: The pathogen andits impact. Plant Health Prog. 8(1):31.
Graham, J., T. Gottwald, and M. Setamou. 2020.Status of Huanglongbing (HLB) outbreaks inFlorida, California and Texas. Trop. PlantPathol. 45:265–278, doi: 10.1007/s40858-020-00335-y.
Grosser, J.W.,M. Calovic, and E.S. Louzada. 2010.Protoplast fusion technology—somatic hybridiza-tion and cybridization, p. 175–198. In: M.R.Davey and P. Anthony (eds.). Plant cell culture:Essentialmethods. JohnWiley&Sons, Ltd.,WestSussex, UK. doi: 10.1002/9780470686522.ch10.
Grosser, J.W., J.L. Chandler, P. Ling, and G.A.Barthe. 2011. New somatic hybrid rootstockcandidates for tree-size control and high juicequality. Proc. Annu. Meet. Fla. State Hort. Soc.124:131–135.
Guerra, D., M.T.S. Wittmann, S.F. Schwarz,P.V.D.D. Souza, M.P. Gonzatto, and R.L.Weiler. 2014. Comparison between diploidand tetraploid citrus rootstocks: Morphologicalcharacterization and growth evaluation. Bra-gantia 73(1):1–7, doi: 10.1590/brag.2014.007.
Hu, J. and N. Wang. 2016. Evaluation of thespatiotemporal dynamics of oxytetracyclineand its control effect against citrus Huan-glongbing via trunk injection. Phytopathology106(12):1495–1503, doi: 10.1094/PHYTO-02-16-0114-R.
Hu, J., J. Jiang, and N. Wang. 2018. Control ofcitrus Huanglongbing via trunk injection ofplant defense activators and antibiotics. Phyto-
pathology 108(2):186–195, doi: 10.1094/PHYTO-05-17-0175-R.
Huang, C.Y.L. and E.E. Schulte. 1985. Digestionof plant tissue for analysis by ICP emissionspectroscopy. Commun. Soil Sci. Plant Anal.16(9):943–958, doi: 10.1080/00103628509367657.
Kadyampakeni, D.M. and K.T. Morgan. 2020.Nutrition of Florida Citrus Trees. EDIS2020(2). <https://edis.ifas.ufl.edu/pdffiles/SS/SS47800.pdf>.
Kallsen, C.E. and D.E. Parfitt. 2011. Comparisonsof scion/rootstock growth rates among USpistachio cultivars. HortScience 46(2):197–200, doi: 10.21273/HORTSCI.46.2.197.
Khan, I.A. andW.J. Kender. 2007. Citrus breeding:Introduction and objectives, p. 1–8. In: I.A.Khan (ed.). Citrus genetics, breeding and bio-technology. CAB International, Cambridge,MA. <http://www.cabi.org/cabebooks/ebook/20083096339>.
Lewis, W.J. and D. Alexander. 2008. Grafting andbudding: A practical guide for fruit and nutplants and ornamentals. Landlinks Press.
Liao, H.L. and J.K. Burns. 2012. Gene expressionin Citrus sinensis fruit tissues harvested fromhuanglongbing-infected trees: Comparisonwith girdled fruit. J. Expt. Bot. 63(8):3307–3319.
Louzada, E.S., H.S.D. Rio, M. Setamou, J.W.Watson, and D.M. Swietlik. 2008. Evaluationof citrus rootstocks for the high pH, calcareoussoils of South Texas. Euphytica 164(1):13–18,doi: 10.1007/s10681-008-9701-x.
McCollum, G. and K.D. Bowman. 2017. Rootstockeffects on fruit quality among ‘Ray Ruby’grapefruit trees grown in the Indian RiverDistrict of Florida. HortScience 52(4):541–546.
Miles, G.P., E. Stover, C. Ramadugu, M.L. Kere-mane, and R.F. Lee. 2017. Apparent toleranceto Huanglongbing in citrus and citrus-relatedgermplasm. HortScience 52(1):31–39, doi:10.21273/HORTSCI11374-16.
Nimbolkar, P.K., B. Shiva, and A.K. Rai. 2016.Rootstock breeding for abiotic stress tolerancein fruit crops. J. Environ 9(3):375–380.
Obreza, T.A. and M.E. Collins. 2008. Commonsoils used for citrus production in Florida.<https://ufdcimages.uflib.ufl.edu/IR/00/00/31/34/00001/SS40300.pdf>.
Phuyal, D., T.A.R. Nogueira, A.D. Jani, D.M.Kadyampakeni, K.T. Morgan, and R.S. Ferrarezi.2020. ‘Ray Ruby’ grapefruit affected by Huan-glongbing I. planting density and soil nutrientmanagement. HortScience 55(9):1411–1419, doi:10.21273/HORTSCI15111-20.
Quaggio, J.A., D. Mattos, Junior, H. Cantarella,E.S. Stuchi, and O.R. Sempionato. 2004. Sweetorange trees grafted on selected rootstocksfertilized with nitrogen, phosphorus and potas-sium. Pesqui. Agropecu. Bras. 39(1):55–60,doi: 10.21273/HORTSCI.46.6.841.
R Core Team. 2020. RStudio: Integrated Develop-ment for R (version 1.3.1093) [Computer soft-ware]. RStudio, Boston, MA.
Reuther, W. 1980. Climatic effects and quality ofcitrus in the tropics. Proc. Tropical Regions,Amer. Soc. Hort. 24:15–28. <https://www.cab-direct.org/cabdirect/abstract/19850331515>.
Roistacher, C.N., J.V. da Gracxa, and G.W. M€uller.2010.Cross protection against citrus tristeza virus -a review. Proc. Intl. Org. Citrus Vir. Conf. 17(17).<https://escholarship.org/uc/item/73v0t59c>.
Roose, M.L. 2008. Citrus rootstock breeding andevaluation. Citrograph 7-9. <https://www.citrusresearch.org/wp-content/uploads/2008-Michael-L-Roose-Rootstock-Breeding-Eval-uation.pdf>.
Rouse, R.E., M. Ozores-Hampton, F.M. Roka, and P.Roberts. 2017. Rehabilitation of huanglongbing-affected citrus trees using severe pruningand enhanced foliar nutritional treatments.HortScience 52(7):972–978, doi: 10.21273/HORTSCI11105-16.
Siebert, T., R. Krueger, T. Kahn, J. Bash, and G.Vidalakis. 2010. Descriptions of new varietiesrecently distributed from the Citrus ClonalProtection Program. Citrograph 1(2):20–26.
Schumann, A. and A. Singerman. 2016. The eco-nomics of citrus undercover production sys-tems and whole tree thermotherapy. Citrus Ind.14–18.
Schupp, J.R. 1992. Growth and fruiting of ‘Deli-cious’ apple on clonal rootstocks in the 1984NC-140 plantings in Maine. HortScience27(11):1162e–1162.
Stansly, P.A., H.A. Arevalo, J.A. Qureshi, M.M.Jones, K. Hendricks, P.D. Roberts, and F.M.Roka. 2014. Vector control and foliar nutritionto maintain economic sustainability of bearingcitrus in Florida groves affected by huan-glongbing. Pest Manag. Sci. 70(3):415–426,doi: 10.1002/ps.3577.
Sweeney, R.A. 1989. Generic combustion methodfor determination of crude protein in feeds:Collaborative study. J. AOAC Intl. 72(5):770–774, doi: 10.1093/jaoac/72.5.770.
Toplu, C., V. Uygur, M. Kaplankıran, T.H. Demi-rkeser, and E. Yıldız. 2012. Effect of citrusrootstocks on leaf mineral composition of‘Okitsu’, ‘Clausellina’, and ‘Silverhill’ manda-rin cultivars. J. Plant Nutr. 35(9):1329–1340,doi: 10.1080/01904167.2012.684125.
Webster, A.D. 1995. Rootstock and interstockeffects on deciduous fruit tree vigour, precoc-ity, and yield productivity. N. Z. J. Crop Hort.Sci. 23:373–382.
Wutscher, H.K. and L.L. Hill. 1995. Performanceof ‘Hamlin’ orange on 16 rootstocks in east-central Florida. HortScience 30(1):41–43.<https://journals.ashs.org/hortsci/view/journals/hortsci/30/1/article-p41.xml>.
Wutscher, H.K. 1973. Rootstocks and mineralnutrition of citrus. In: Proc. First Intern. CitrusShort Course, 97–113.
Wutscher, H.K. 1979. Citrus rootstocks, p. 230–269. In: J. Janick (ed.). Horticultural reviews.AVI Publishing Company, Westport, CT.
Zambon, F.T., D.M. Kadyampakeni, and J.W.Grosser. 2019. Ground application of over-doses of manganese have a therapeutic effecton sweet orange trees infected with CandidatusLiberibacter asiaticus. HortScience 54(6):1077–1086.
Zekri, M. 2011. Factors affecting citrus productionand quality. Trees. <https://crec.ifas.ufl.edu/extension/trade_journals/2011/2011_dec_factors_citrus.pdf>.
This paper was presented during the 2020 FSHS Annual Meeting and originally published in HortScience HORTSCIENCE 56(2):244–253. 2021. https://doi.org/10.21273/HORTSCI15550-20
The paper is included in this Proceedings as a reprint (with permission).
73Proc. Fla. State Hort. Soc. 133: 2020.
Proc. Fla. State Hort. Soc. 133:73–82. 2020.
Citrus Section
Horticultural Attributes and RootArchitectures of Field-grown‘Valencia’ Trees Grafted on DifferentRootstocks Propagated by Seed,Cuttings, and Tissue CultureSameer Pokhrel and Bo MeyeringUniversity of Florida/Institute of Food and Agricultural Sciences, SouthwestFlorida Research and Education Center, Immokalee, FL 34142
Kim D. BowmanU.S. Horticultural Research Laboratory, U.S. Department of Agriculture,Agricultural Research Service, Fort Pierce, FL 34945
Ute AlbrechtUniversity of Florida/Institute of Food and Agricultural Sciences, SouthwestFlorida Research and Education Center, Immokalee, FL 34142Additional index words. citrus, grafting, rootstock, root architecture, root traits
Abstract. Huanglongbing (HLB) is a devastating disease of citrus that is found in most citrus production areas around the world. The bacterium associated with HLB resides in and damages the phloem, restricting the movement of photosynthates throughout the plant and leading to tree decline. Considerable root loss can be observed in affected trees even when few disease symptoms are visible aboveground. Root traits can substantially influence tree performance and use of superior rootstocks is one strategy to manage tree health and reduce production losses in a disease-endemic environment. Citrus rootstocks are typically propagated by seed, but due to the increased demand for some of the best-performing cultivars, propagation by other methods is being used to overcome seed shortages. In this research, differences in root architecture and root growth of six different rootstocks propagated by seed, cuttings, and tissue culture, and their influence on the grafted ‘Valencia’ (Citrus sinensis) scion were investigated. A field trial was established in southwest Florida in 2017. Trees were evaluated for their performance during the first 2 years after planting and a subset of trees was excavated for detailed analysis of root architectures and biomass distribution. Significant differences among propagation methods were found for the rootstock trunk diameter and the lateral (structural) root length, which were largest in seed-propagated rootstocks. Most of the other horticultural and root architectural traits were not significantly influenced by the rootstock-propagation method; however, many of the measured variables were signif-icantly influenced by the rootstock cultivar regardless of the propagation method. The results showed that rootstocks propagated by cuttings and tissue culture were similar to seed-propagated rootstocks in their influence on the grafted tree during the early years of growth in the field.
Until the 1800s, the typical method ofcitrus propagation was by growing seed ofthe desired fruiting variety (Castle, 2010).Although grafting in citrus has been reportedsince the Roman era, the commercial culti-vation of grafted citrus did not commenceuntil the 19th century (Mudge et al., 2009).The most used rootstocks for grafting beforethe 1970s were sour orange (Citrus auran-tium) and rough lemon (Citrus ·jambhiri).As the importance of rootstocks for citrusproduction was recognized, other rootstockscame into use (Castle, 2010). Historically,major disease events in citrus such as gum-mosis (1834), phytophthora root rot (1842),and citrus tristeza virus (1930s), which dec-imated citrus production on a large scale,were managed by using disease-resistant or
tolerant rootstock cultivars (Bitters, 1986;Bowman and Joubert, 2020). The rootstockalso plays an important role in reducing plantjuvenility, inducing tolerance to various abioticand biotic stresses, and enhancing the horticul-tural performance of the tree (Bowman andJoubert, 2020).
HLB, also known as citrus greening, isone of the most devastating diseases of citrus,and affects citrus production worldwide(Bove, 2006; McCollum and Baldwin,2017). Since the discovery of HLB in Floridain 2005, citrus production has declined from13million tons in 2003–04 to 3.5 million tonsin 2018–19 (www.nass.usda.gov/fl). With nocure available, various management strate-gies are used to reduce the negative impactsof the disease on trees. HLB is associatedwith nonculturable bacteria of the genusLiberibacter, among which Candidatus Lib-eribacter asiaticus is the most prevalent spe-cies. Control of the HLB vector, the Asiancitrus psyllid, is crucial to prevent infection,and insecticide applications (Qureshi et al.,2014) and introduction of natural predators(Qureshi et al., 2009), are common practice.To maintain tree productivity and longevityin HLB-affected groves, enhanced applica-tion of micronutrients and irrigation manage-ment are included for an integrated diseasemanagement (Morgan et al., 2016; Stanslyet al., 2014; Xia et al., 2018).
Although most commercial citrus scioncultivars are susceptible (McClean andSchwarz, 1970), several rootstock cultivarsare tolerant to HLB (Albrecht and Bowman,2011, 2012; Folimonova et al., 2009;Ramadugu et al., 2016). The exact mecha-nisms for the beneficial influence of root-stocks on the scion are unclear. Root traitssuch as the root system architecture, root sizedistribution, and the regeneration capacity offibrous roots are important attributes thatwere shown to influence tree growth andtolerance to biotic and abiotic stresses (Atuchaet al., 2014; Freeland, 2016; Graham 1995).The suggested mechanisms influencing treevigor are related to the xylem vessel anatomyand the hydraulic conductivity of the root-stock (Forner-Giner et al., 2014; Martínez-Alc�antara et al., 2013; Vasconcellos andCastle, 1994).
With the endemic presence of HLB inFlorida, rootstocks have gained renewed in-terest because they provide a tool to manageHLB at no additional cost. Although thedegree by which HLB-tolerant rootstockscan influence the grafted tree tolerance isnot sufficient to completely suppress thedisease, some rootstocks can significantlyimprove tree performance and productivityin an HLB-endemic environment (Boavaet al., 2015; Bowman et al., 2016a, 2016b;Bowman and McCollum, 2015; Shokrollahet al., 2011).
The phenomenon of nucellar embryonyin citrus allows the true-to-type productionof plants from the seeds of many citrusspecies (Koltunow et al., 1995), including allrootstocks of commercial importance. How-ever, because of the high demand for new
Received for publication 7 Oct. 2020. Accepted for publication 17 Nov. 2020.Published online 23 December 2020.We thank Adam Hoeffner, Murilo Piccin, Respect Musiyawa, Gabriel Pugina, and Caroline de Tar-divo for their help with tree excavations and root analyses. This study was supported with funds from the University of Florida/Institute of Food and Agricultural Sciences Citrus Research Initiative and the Citrus Research and Development Foun-dation.This manuscript is associated with a presentation given at the 2020 Florida State Horticultural Soci-ety Annual Meeting, held virtually 19 to 20 Oct. 2020.U.A. is the corresponding author. E-mail: ualbrecht@ ufl.edu.This is an open access article distributed under the CC BY-NC-ND license (https://creativecommons. org/licenses/by-nc-nd/4.0/).

74 Proc. Fla. State Hort. Soc. 133: 2020
HLB-tolerant rootstocks, there is a shortageof seeds for some of the most desired cultivars(Albrecht, et al., 2020). In addition, althoughnucellar embryony is common, not all culti-vars exhibit this trait and some outstandingnew rootstock cultivars may be unsuitable forseed propagation (Bisi et al., 2020). For thesereasons, it is valuable to also make use ofalternative propagation methods such as cut-tings and tissue culture to produce geneticallyidentical rootstocks that can be used as linersfor grafting (Albrecht et al., 2017a).
Based on traditional views, some growersand nursery owners are reluctant to use cut-tings- and tissue culture–propagated root-stocks because they perceive them asinferior to seedling rootstocks. One of themain concerns is the different root systemarchitecture of vegetative propagated root-stocks, particularly the absence of a taproot.During the nursery stage, seed-propagatedrootstocks usually have a well-defined singletap root system, whereas cuttings- and tissueculture–propagated rootstocks have an ad-ventitious root system with multiple smaller-diameter roots (Albrecht et al., 2017a, 2020).It is generally assumed that the lack of a taproot system can render trees more susceptibleto wind-induced uprooting, which is of con-cern in Florida where tropical storms andhurricanes are an annual threat (Castle, 1977;Crane et al., 1993).
Fibrous roots are responsible for the up-take of water and nutrients from the soil. Itwas suggested that HLB significantly affectsthe citrus root system and causes fibrous rootloss before manifestation of disease symp-toms in the tree canopy (Johnson et al., 2013;Kumar and Kiran, 2018). Therefore, a well-structured root system with healthy fibrousroots is likely to be beneficial in an HLB-endemic environment.
It is well documented that different root-stock cultivars exhibit differences in theirroot architecture (Albrecht et al., 2020; Cas-tle and Youtsey, 1977; Eissenstat, 1991) thatcontribute to their influence on the above-ground horticultural traits (Bowman et al.,2016a, 2016b; Bowman and Joubert, 2020)and may interact with the propagation method.In our laboratory, we recently investigatedroot architectures of rootstock liners andgrafted trees during the nursery stage(Albrecht et al., 2017a, 2020). Here we exam-ined in detail the root growth and root archi-tectures of ‘Valencia’ orange (Citrus sinensis)trees grafted on different rootstocks propa-gated by seed, cuttings, and tissue culture, andtheir influence on aboveground horticulturaltraits after 2 years of growth in a southwestFlorida field environment. The objective wasto determine whether the method of propaga-tion influences tree growth in an open fieldsetting and whether the rootstock cultivar is aninteracting factor.
Materials and Methods
Plant materialRootstock cultivars. Six commercial root-
stock cultivars were used: ‘US-802’ [‘Siamese’
pummelo (Citrus maxima) · ‘Gotha Road’trifoliate orange (Poncirus trifoliata)], ‘US-897’ [‘Cleopatra’ mandarin (Citrus reticulata) ·‘Flying Dragon’ trifoliate orange], ‘US-812’[‘Sunki’ mandarin (C. reticulata) · ‘Benecke’trifoliate orange], ‘US-942’ (‘Sunki’ mandarin ·‘Flying Dragon’ trifoliate orange), ‘Swingle’[‘Duncan’ grapefruit (Citrus ·paradisi) ·trifoliate orange], and ‘US-1516’ [‘African’pummelo (Citrus maxima) · ‘Flying Dragon’trifoliate orange]. These rootstocks wereamong the top 15 most propagated rootstocksin Florida during the most recent productionyears (Florida Department of Agriculture andConsumer Services, 2020). All rootstockswere propagated by seed, by cuttings, or bytissue culture as described below. Plants weregrown in the U.S. Department of AgricultureHorticultural Research Laboratory (USHRL)greenhouses in Fort Pierce, FL.
Seed propagation. Seeds were extractedfrom fruits as described in Albrecht et al.(2017a). Seeds were sown into premoistenedsoilless potting mix (Pro Mix BX; PremierHorticulture, Inc., Quakertown, PA) con-tained in racks of 3.8 cm · 21 cm cone cells(Cone-tainers; Stuewe and Sons, Tangent,OR). After germination, any off-types arisingfrom zygotic embryos were identified basedon their different leaf morphological traitsand discarded. Plants were irrigated by handas needed and fertilized biweekly using awater-soluble fertilizer with micronutrients(20N–10P–20K; Peters Professional, TheScotts Company, Marysville, OH) at a rateof 400 mg N/L. Insecticides were applied asneeded.
Cuttings propagation. Cuttings were pre-pared following the method described inBowman and Albrecht (2017). Single-nodecuttings were excised fromwoody sections of1- to 2-year-old greenhouse-grown nucellarseedlings. The leaves on each node weretrimmed to reduce the leaf area to 20% to30%. The basal end of each cutting wasdipped in a commercial rooting powder(Hormodin 2; E.C. Geiger, Inc., Harleysville,PA) containing 0.3% indole-3-butyric acid(IBA). Cuttings were inserted into premois-tened potting medium in cone cells as de-scribed for seed propagation and placed on amist bench. Misting was applied for a dura-tion of 6 weeks under shading from 9:00 AM
to 6:00 PM daily. Liquid fertilizer was appliedafter 4 weeks as described previously, andagain after 2 weeks, at which time chelatediron (Sequestrene 138 Fe; Ciba-Geigy Corp.,Greensboro, NC) was applied simultaneously.After 7 weeks, plants were maintained in thesame manner described for seedlings.
Tissue culture propagation. The source ofexplants for tissue culture–propagated plantswere nucellar embryos from seeds obtainedfrom fruit collected from foundation treesat the Bureau of Citrus Budwood Registra-tion, Florida Department of Agriculture andConsumer Services, Chiefland, FL. Tissueculture propagation followed the proceduredescribed in Albrecht et al. (2020). Disin-fected embryos were placed into clear poly-propylene containers containing Murashige
and Skoog (MS) agar-nutrient medium(Murashige and Skoog, 1962) without addedgrowth regulators. Embryos were dissectedafter pre-germination of seeds and identifiedas nucellar based on leaf morphology anduniformity of growth of the regeneratedplant. Multiple shoot clusters were producedby alternating between media containing MSmedium with 1.0 mg/L benzyladenine (BA),0.5 mg/L kinetin, and 0.5 mg/L naphthaleneacetic acid (NAA) (Bowman et al., 1997),and MS medium or EXS-III basal medium(PhytoTechnology Laboratories, Lenexa,KS) with no added growth regulators. Clus-ters were divided and placed in newmedia ona cycle of �5 weeks. Elongated shoots wereproduced by serial transfers on hormone-freemedium and single shoots with at least fournodes were excised and placed on MS basalmedium containing 2.0 mg/L NAA and 1 g/Lactive charcoal. After rooting for �6 weeks,plantlets were removed from the medium,roots were trimmed to 3 to 6 cm length, andplaced into cone cells with premoistenedpotting medium, as described for seed prop-agation. Plants were kept in high humidity ina plant growth chamber (EGC Model M36;Environmental Growth Chambers, ChagrinFalls, OH) with a 16 h light/8 h darknessphotoperiod. Humidity was gradually re-duced over 3 to 4 weeks and plants weretransferred to the greenhouse and maintainedas described for seedlings.
Grafting. When rootstock liners were ofa suitable size (4–6 mm stem diameter),they were transplanted into 15.2 cm · 15.2cm · 30.5 cm plastic treepots (Stuewe &Sons) containing Pro Mix BX pottingmedium. After an acclimatization period,liners were budded with certified disease-free ‘Valencia’ orange budwood using theinverted T method (Albrecht et al., 2017b).Plants remained under natural light con-ditions and were irrigated as needed. Fer-tilization occurred biweekly as describedpreviously and insecticides were applied asneeded.
Experimental designThe field trial was established in Nov.
2017 at the Southwest Florida Research andEducation Center in Immokalee, FL (CollierCounty, 26.462996, –81.443710). Graftedtrees were planted in two, double-row bedsseparated by furrows. The distance betweenrows was 22 ft (6.7 m) and trees in each rowwere spaced at 4 ft (1.2 m). Trees werearranged in a randomized split plot designwith rootstock cultivar as the main plot factorand propagation method as the subplot factor.Four replications (one per row) were in-cluded in the trial with each subplot consist-ing of four trees. Two border trees wereplanted at the end of each row. The treeswere maintained according to commercialgrower standards with regular root drenchesof neonicotinoids, foliar sprays of other in-secticides, and weed management, as needed.Irrigation was by under-tree microjets. Gran-ular and slow-release fertilizer (12N–3P–9K;Harrell’s fertilizer, Lakeland FL) was applied
75Proc. Fla. State Hort. Soc. 133: 2020.
conducted as described in Albrecht and Bow-man (2019) using primers HLBas/HLBr andprobe HLBp (Li et al., 2006); primers Coxf/Coxr and probe Coxp were used for assessingthe quality of DNA extraction and for nor-malization.
Leaf nutrient analysis. Leaf nutrientswere analyzed in July 2018 and 2019. Matureleaves from the recent spring flush wererandomly collected from each tree withineach subplot and pooled for a total of 30leaves per sample. Analysis of macro- (N,P, K, Ca, Mg, S) and micronutrients (B, Zn,Mn, Fe, Cu) was conducted by WatersAgricultural Laboratories, Inc. The totalnitrogen content was determined by thecombustion method described in Sweeney(1989). The other macro- and micronutrientswere analyzed using inductively coupled ar-gon plasma atomic emission spectroscopy(Havlin and Soltanpour, 1980; Huang andSchulte, 1985) after digesting leaves withnitric acid and hydrogen peroxide.
Root growth measurement. To study theroot growth, 6 cm · 50-cm clear acrylicminirhizotron tubes (CID BioScience, Camas,WA) were inserted next to a subset of treesimmediately after planting. The tubes, whichwere closed on the bottom, were inserted intothe soil at an angle of 45�with the soil surfaceand 45 cm from the tree trunk. A black foamcore was placed in each tube and the portionof each tube protruding from the soil wascovered with a black plastic bag to preventsunlight and water from entering the tubes.Every second plant in each subplot receivedone minirhizotron for a total of 144 tubes.Root images were captured monthly startingin Dec. 2017. Images were captured witha CI-600 in situ root imaging system (CIDBio-Science). Each image represented a360-degree view of the root zone facing thetube and was 30.5 · 20.0 cm in size. Twoimages were taken per minirhizotron, whichrepresented the top 33 cm of the soil. Rootimages were analyzed using WinRhizoTRONsoftware (Regent Instruments Inc., Quebec,Canada). Root growth was measured as thesum of roots visible in the imaging areaand expressed in centimeters; live and deadroots were distinguished by their color andstructural integrity. Growth was measuredfor 1 year, during which time there was nooverlap of roots from adjacent trees.
Root architecture and biomassdistribution
Tree excavation. Two years after plant-ing, one tree per subplot (72 trees total) wasexcavated for a detailed evaluation of rootarchitectures and aboveground and below-ground biomass distribution. Tree excavationwas performed using a pneumatic arboristtool (2000 Model HT142; Airspade, Chico-pee, MA) and compressed air. This allowedthe excavation of the whole root systemwithout damage or loss of fibrous roots.
Scion biomass and leaf area. Trees werecut at the graft union using a pruning saw.Leaves were removed, and a random sub-sample of 30 mature leaves was used for leaf
area determination. Leaf subsamples werescanned on a flatbed scanner (Epson perfec-tion V850; Epson America Inc., Long Beach,CA) at 300 dpi, and the leaf area was mea-sured using Assess 2.0 software (The Amer-ican Phytopathological Society, St. Paul,MN). Leaves and the remaining scion wereplaced in paper bags, oven dried at 49 �C untilconstant weight, and weighed. The specificleaf area (SLA) was determined as the ratio ofthe leaf area (m2) to the leaf dry weight (g).The total leaf area of the tree was calculatedby multiplying SLA with the total leaf drymass of the tree.
Rootstock biomass and root architecture.After excavation, the lateral (structural) roots(>2 mm in diameter) were cut off at 5 inches(13 cm) from the center of the root crown.Root system depth was measured fromthe soil level to the depth of the most distalroots on the root crown. Lateral roots werecounted, and root diameters weremeasured atthe point of separation from the root crownusing a digital caliper (Mitutoyo America,Aurora, IL). Fibrous roots (<2 mm in diam-eter) were separated from the lateral roots,and a subset was used for determination ofthe specific root length (SRL). Roots werescanned on a flatbed scanner (Epson Perfec-tion V850) at 400 dpi and the total root lengthwas measured using Assess 2.0. Root crowns(including the rootstock trunk portion belowthe graft union), lateral roots, and fibrousroots were dried and weighed as describedpreviously. The SRL was determined as theratio of the fibrous root length (m) to its dryweight (g).
Statistical analysisAnalysis of variance (ANOVA) was con-
ducted using R version 3.6.2 (R Core Team,Vienna, Austria, 2019) for all variables. Alinear mixed model was used for ANOVAwith block as a random factor and rootstockand method of propagation as fixed factors.Monthly root growth was analyzed usingrepeated measures ANOVA. Mean separa-tion was performed by Tukey’s honestlysignificant difference test. Differences weredefined as statistically significant when the Pvalue was < 0.05.
Results
Horticultural attributes and canopy health.After 2 years of field growth, trees were 128to 131 cm tall with a canopy volume of0.53 to 0.60 m3 and a scion trunk diameterof 3.7 to 3.9 cm, but none of these variableswere influenced by the rootstock-propagationmethod (Table 1). In contrast, the rootstocktrunk diameter was significantly larger (5.6cm) for rootstocks propagated by seed thanby cuttings (5.2 cm). The scion to rootstocktrunk diameter ratio was significantly differentamong trees, with trees on cuttings-propagatedrootstocks having the highest ratio (0.75).
All horticultural attributes measured weresignificantly influenced by the rootstock cul-tivar. Trees on ‘US-897’ were shortest (119cm) and had the smallest canopy volume
at a rate of 1 pound (0.45 kg) per tree, three times per year (spring, summer, and fall).
The soil type at this location is a sandy spodosol of the Immokalee series with little organic matter, low cation exchange capac-ity, poor drainage, and low water-holding capacity (Mylavarapu et al., 2016). At the end of the trial, random soil samples were collected across each row to a depth of 25 cm near the canopy drip line and pooled for physicochemical analysis (Waters Agricul-tural Laboratories, Inc., Camilla, GA). Soil analysis found an organic matter content of 0.47%, a pH of 7.53, and a cation exchange capacity of 4.25 meq/100 g. Sand, silt, and clay contents were 94.74%, 3%, and 2.1%, respectively.
Plant assessmentsHorticultural attributes. Aboveground
horticultural attributes were evaluated 2 years (Nov. 2019) after planting. Tree height was measured from the soil surface to the top of the canopy (excluding any erratic shoots) using a measuring tape. Canopy spread was measured in two cardinal directions and can-opy diameter was expressed as the average of the two measures. Canopy volume was cal-culated using the formula described in Wutscher and Hill (1995), given as follows: canopy volume = (diameter2 · height)/4. Scion and rootstock trunk diameters were measured at 5 cm above and below the graft union using a digital caliper (Mitutoyo Amer-ica, Aurora, IL). Two measurements were taken perpendicular to one another, and av-erages were determined.
Canopy health and foliar disease symptoms indices. Canopy health (canopy color and canopy thickness) and foliar disease symp-toms were assessed in Oct. 2019 by visual ratings. Canopy color and canopy thickness were rated on a scale of 1 to 5, with 1 representing the worst (very yellow un-healthy canopy; very thin canopy) and 5 representing the best (very healthy dark green canopy; very thick canopy). Foliar HLB dis-ease symptoms were rated on a scale of 1 to 5, with 1 representing the best (no symptoms) and 5 representing the worst (75% to 100% of the canopy displaying symptoms); ratings of 2, 3, and 4 represented 1% to 25%, 25% to 50%, and 50% to 75% of affected canopy, respectively. Two ratings on opposite sides of each tree were conducted and expressed as averages.
DNA extraction and Candidatus Liberibacter asiaticus (CLas) detection. Ten mature leaves were randomly collected from each tree in Oct. 2019 and leaves were pooled within a subplot. Midribs and petioles were excised and pulverized in liquid nitrogen using a mortar and pestle. One hundred mil-ligrams of ground sample was used for DNA extraction. DNA was extracted using the DNeasy Plant Mini Kit (Qiagen, MD) according to the manufacturer’s instructions. Quantitative real-time polymerase chain re-action (qPCR) was conducted using a CFX96 Real-Time PCR detection system (Bio-Rad, Hercules, CA). PCR detection of CLas was
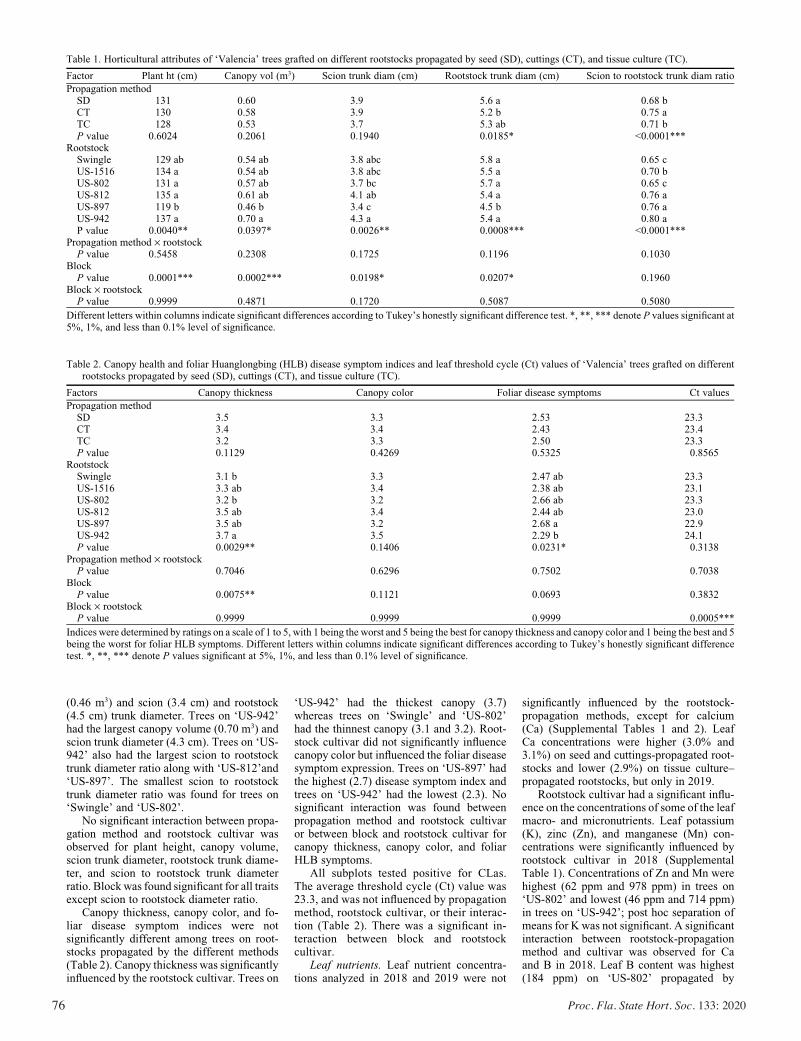
76 Proc. Fla. State Hort. Soc. 133: 2020
(0.46 m3) and scion (3.4 cm) and rootstock(4.5 cm) trunk diameter. Trees on ‘US-942’had the largest canopy volume (0.70 m3) andscion trunk diameter (4.3 cm). Trees on ‘US-942’ also had the largest scion to rootstocktrunk diameter ratio along with ‘US-812’and‘US-897’. The smallest scion to rootstocktrunk diameter ratio was found for trees on‘Swingle’ and ‘US-802’.
No significant interaction between propa-gation method and rootstock cultivar wasobserved for plant height, canopy volume,scion trunk diameter, rootstock trunk diame-ter, and scion to rootstock trunk diameterratio. Block was found significant for all traitsexcept scion to rootstock diameter ratio.
Canopy thickness, canopy color, and fo-liar disease symptom indices were notsignificantly different among trees on root-stocks propagated by the different methods(Table 2). Canopy thickness was significantlyinfluenced by the rootstock cultivar. Trees on
‘US-942’ had the thickest canopy (3.7)whereas trees on ‘Swingle’ and ‘US-802’had the thinnest canopy (3.1 and 3.2). Root-stock cultivar did not significantly influencecanopy color but influenced the foliar diseasesymptom expression. Trees on ‘US-897’ hadthe highest (2.7) disease symptom index andtrees on ‘US-942’ had the lowest (2.3). Nosignificant interaction was found betweenpropagation method and rootstock cultivaror between block and rootstock cultivar forcanopy thickness, canopy color, and foliarHLB symptoms.
All subplots tested positive for CLas.The average threshold cycle (Ct) value was23.3, and was not influenced by propagationmethod, rootstock cultivar, or their interac-tion (Table 2). There was a significant in-teraction between block and rootstockcultivar.
Leaf nutrients. Leaf nutrient concentra-tions analyzed in 2018 and 2019 were not
significantly influenced by the rootstock-propagation methods, except for calcium(Ca) (Supplemental Tables 1 and 2). LeafCa concentrations were higher (3.0% and3.1%) on seed and cuttings-propagated root-stocks and lower (2.9%) on tissue culture–propagated rootstocks, but only in 2019.
Rootstock cultivar had a significant influ-ence on the concentrations of some of the leafmacro- and micronutrients. Leaf potassium(K), zinc (Zn), and manganese (Mn) con-centrations were significantly influenced byrootstock cultivar in 2018 (SupplementalTable 1). Concentrations of Zn and Mn werehighest (62 ppm and 978 ppm) in trees on‘US-802’ and lowest (46 ppm and 714 ppm)in trees on ‘US-942’; post hoc separation ofmeans for K was not significant. A significantinteraction between rootstock-propagationmethod and cultivar was observed for Caand B in 2018. Leaf B content was highest(184 ppm) on ‘US-802’ propagated by
Table 1. Horticultural attributes of ‘Valencia’ trees grafted on different rootstocks propagated by seed (SD), cuttings (CT), and tissue culture (TC).
Factor Plant ht (cm) Canopy vol (m3) Scion trunk diam (cm) Rootstock trunk diam (cm) Scion to rootstock trunk diam ratio
Propagation methodSD 131 0.60 3.9 5.6 a 0.68 bCT 130 0.58 3.9 5.2 b 0.75 aTC 128 0.53 3.7 5.3 ab 0.71 bP value 0.6024 0.2061 0.1940 0.0185* <0.0001***
RootstockSwingle 129 ab 0.54 ab 3.8 abc 5.8 a 0.65 cUS-1516 134 a 0.54 ab 3.8 abc 5.5 a 0.70 bUS-802 131 a 0.57 ab 3.7 bc 5.7 a 0.65 cUS-812 135 a 0.61 ab 4.1 ab 5.4 a 0.76 aUS-897 119 b 0.46 b 3.4 c 4.5 b 0.76 aUS-942 137 a 0.70 a 4.3 a 5.4 a 0.80 aP value 0.0040** 0.0397* 0.0026** 0.0008*** <0.0001***
Propagation method · rootstockP value 0.5458 0.2308 0.1725 0.1196 0.1030
BlockP value 0.0001*** 0.0002*** 0.0198* 0.0207* 0.1960
Block · rootstockP value 0.9999 0.4871 0.1720 0.5087 0.5080
Different letters within columns indicate significant differences according to Tukey’s honestly significant difference test. *, **, *** denote P values significant at5%, 1%, and less than 0.1% level of significance.
Table 2. Canopy health and foliar Huanglongbing (HLB) disease symptom indices and leaf threshold cycle (Ct) values of ‘Valencia’ trees grafted on differentrootstocks propagated by seed (SD), cuttings (CT), and tissue culture (TC).
Factors Canopy thickness Canopy color Foliar disease symptoms Ct values
Propagation methodSD 3.5 3.3 2.53 23.3CT 3.4 3.4 2.43 23.4TC 3.2 3.3 2.50 23.3P value 0.1129 0.4269 0.5325 0.8565
RootstockSwingle 3.1 b 3.3 2.47 ab 23.3US-1516 3.3 ab 3.4 2.38 ab 23.1US-802 3.2 b 3.2 2.66 ab 23.3US-812 3.5 ab 3.4 2.44 ab 23.0US-897 3.5 ab 3.2 2.68 a 22.9US-942 3.7 a 3.5 2.29 b 24.1P value 0.0029** 0.1406 0.0231* 0.3138
Propagation method · rootstockP value 0.7046 0.6296 0.7502 0.7038
BlockP value 0.0075** 0.1121 0.0693 0.3832
Block · rootstockP value 0.9999 0.9999 0.9999 0.0005***
Indices were determined by ratings on a scale of 1 to 5, with 1 being the worst and 5 being the best for canopy thickness and canopy color and 1 being the best and 5being the worst for foliar HLB symptoms. Different letters within columns indicate significant differences according to Tukey’s honestly significant differencetest. *, **, *** denote P values significant at 5%, 1%, and less than 0.1% level of significance.
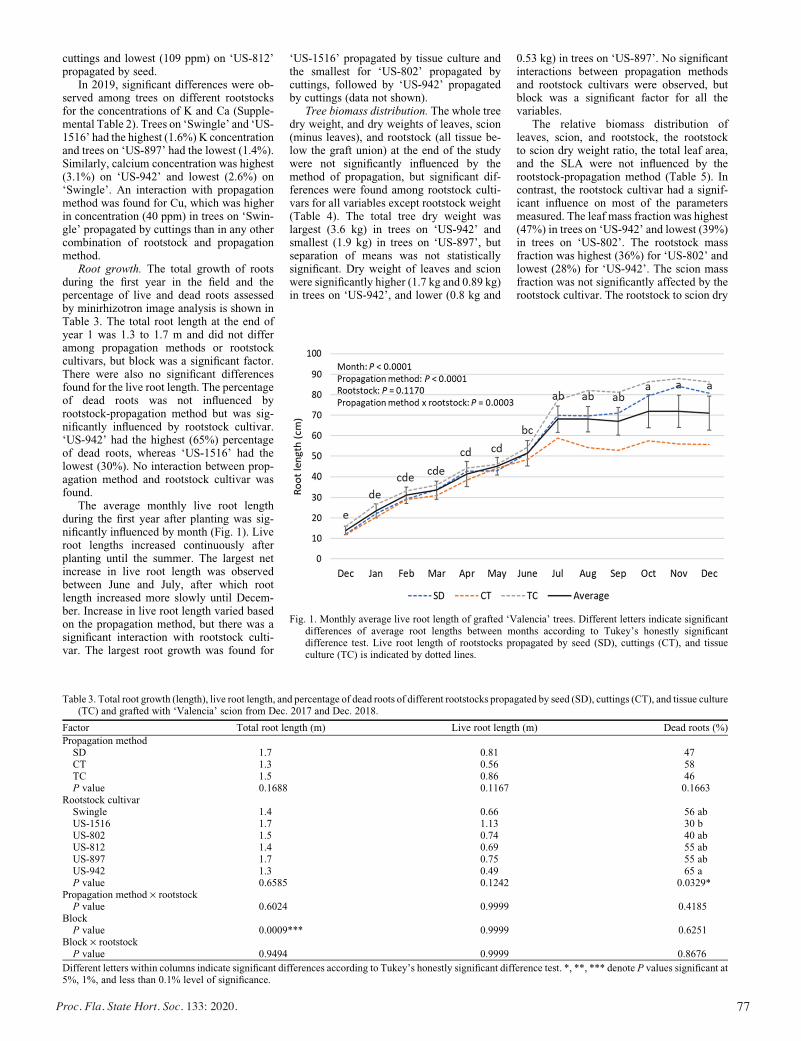
77Proc. Fla. State Hort. Soc. 133: 2020.
cuttings and lowest (109 ppm) on ‘US-812’propagated by seed.
In 2019, significant differences were ob-served among trees on different rootstocksfor the concentrations of K and Ca (Supple-mental Table 2). Trees on ‘Swingle’ and ‘US-1516’ had the highest (1.6%) K concentrationand trees on ‘US-897’ had the lowest (1.4%).Similarly, calcium concentration was highest(3.1%) on ‘US-942’ and lowest (2.6%) on‘Swingle’. An interaction with propagationmethod was found for Cu, which was higherin concentration (40 ppm) in trees on ‘Swin-gle’ propagated by cuttings than in any othercombination of rootstock and propagationmethod.
Root growth. The total growth of rootsduring the first year in the field and thepercentage of live and dead roots assessedby minirhizotron image analysis is shown inTable 3. The total root length at the end ofyear 1 was 1.3 to 1.7 m and did not differamong propagation methods or rootstockcultivars, but block was a significant factor.There were also no significant differencesfound for the live root length. The percentageof dead roots was not influenced byrootstock-propagation method but was sig-nificantly influenced by rootstock cultivar.‘US-942’ had the highest (65%) percentageof dead roots, whereas ‘US-1516’ had thelowest (30%). No interaction between prop-agation method and rootstock cultivar wasfound.
The average monthly live root lengthduring the first year after planting was sig-nificantly influenced by month (Fig. 1). Liveroot lengths increased continuously afterplanting until the summer. The largest netincrease in live root length was observedbetween June and July, after which rootlength increased more slowly until Decem-ber. Increase in live root length varied basedon the propagation method, but there was asignificant interaction with rootstock culti-var. The largest root growth was found for
‘US-1516’ propagated by tissue culture andthe smallest for ‘US-802’ propagated bycuttings, followed by ‘US-942’ propagatedby cuttings (data not shown).
Tree biomass distribution. The whole treedry weight, and dry weights of leaves, scion(minus leaves), and rootstock (all tissue be-low the graft union) at the end of the studywere not significantly influenced by themethod of propagation, but significant dif-ferences were found among rootstock culti-vars for all variables except rootstock weight(Table 4). The total tree dry weight waslargest (3.6 kg) in trees on ‘US-942’ andsmallest (1.9 kg) in trees on ‘US-897’, butseparation of means was not statisticallysignificant. Dry weight of leaves and scionwere significantly higher (1.7 kg and 0.89 kg)in trees on ‘US-942’, and lower (0.8 kg and
0.53 kg) in trees on ‘US-897’. No significantinteractions between propagation methodsand rootstock cultivars were observed, butblock was a significant factor for all thevariables.
The relative biomass distribution ofleaves, scion, and rootstock, the rootstockto scion dry weight ratio, the total leaf area,and the SLA were not influenced by therootstock-propagation method (Table 5). Incontrast, the rootstock cultivar had a signif-icant influence on most of the parametersmeasured. The leaf mass fraction was highest(47%) in trees on ‘US-942’ and lowest (39%)in trees on ‘US-802’. The rootstock massfraction was highest (36%) for ‘US-802’ andlowest (28%) for ‘US-942’. The scion massfraction was not significantly affected by therootstock cultivar. The rootstock to scion dry
Table 3. Total root growth (length), live root length, and percentage of dead roots of different rootstocks propagated by seed (SD), cuttings (CT), and tissue culture(TC) and grafted with ‘Valencia’ scion from Dec. 2017 and Dec. 2018.
Factor Total root length (m) Live root length (m) Dead roots (%)
Propagation methodSD 1.7 0.81 47CT 1.3 0.56 58TC 1.5 0.86 46P value 0.1688 0.1167 0.1663
Rootstock cultivarSwingle 1.4 0.66 56 abUS-1516 1.7 1.13 30 bUS-802 1.5 0.74 40 abUS-812 1.4 0.69 55 abUS-897 1.7 0.75 55 abUS-942 1.3 0.49 65 aP value 0.6585 0.1242 0.0329*
Propagation method · rootstockP value 0.6024 0.9999 0.4185
BlockP value 0.0009*** 0.9999 0.6251
Block · rootstockP value 0.9494 0.9999 0.8676
Different letters within columns indicate significant differences according to Tukey’s honestly significant difference test. *, **, *** denote P values significant at5%, 1%, and less than 0.1% level of significance.
Fig. 1. Monthly average live root length of grafted ‘Valencia’ trees. Different letters indicate significantdifferences of average root lengths between months according to Tukey’s honestly significantdifference test. Live root length of rootstocks propagated by seed (SD), cuttings (CT), and tissueculture (TC) is indicated by dotted lines.
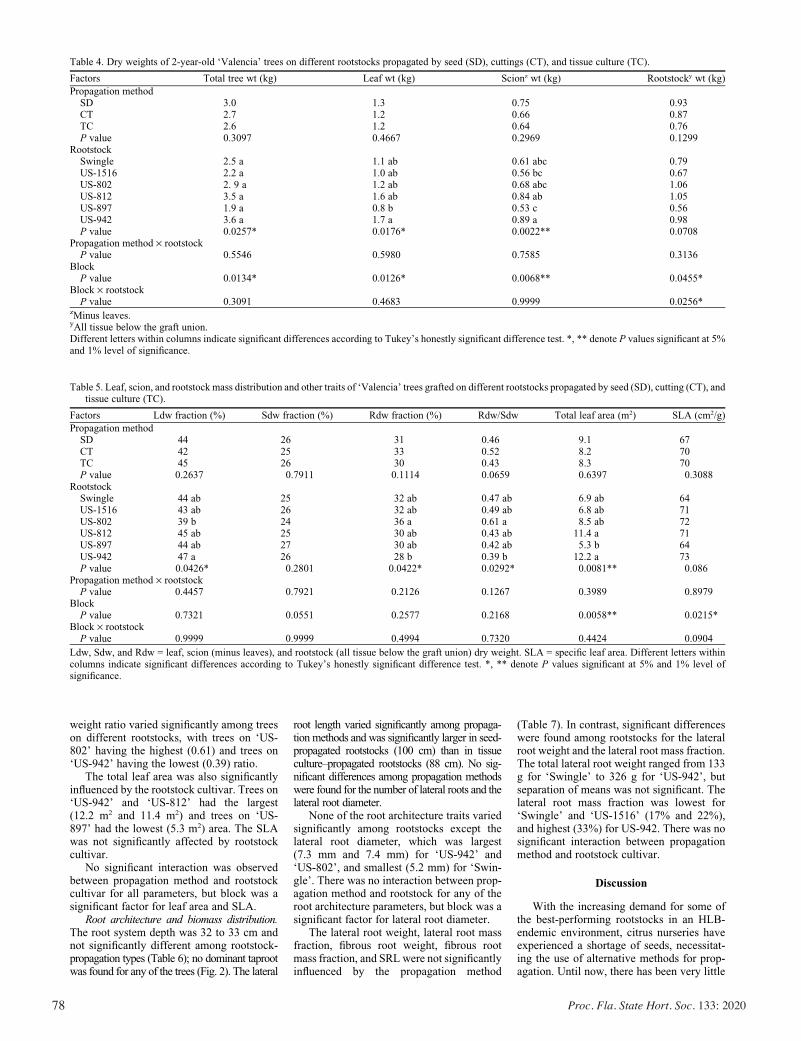
78 Proc. Fla. State Hort. Soc. 133: 2020
weight ratio varied significantly among treeson different rootstocks, with trees on ‘US-802’ having the highest (0.61) and trees on‘US-942’ having the lowest (0.39) ratio.
The total leaf area was also significantlyinfluenced by the rootstock cultivar. Trees on‘US-942’ and ‘US-812’ had the largest(12.2 m2 and 11.4 m2) and trees on ‘US-897’ had the lowest (5.3 m2) area. The SLAwas not significantly affected by rootstockcultivar.
No significant interaction was observedbetween propagation method and rootstockcultivar for all parameters, but block was asignificant factor for leaf area and SLA.
Root architecture and biomass distribution.The root system depth was 32 to 33 cm andnot significantly different among rootstock-propagation types (Table 6); no dominant taprootwas found for any of the trees (Fig. 2). The lateral
root length varied significantly among propaga-tion methods and was significantly larger in seed-propagated rootstocks (100 cm) than in tissueculture–propagated rootstocks (88 cm). No sig-nificant differences among propagation methodswere found for the number of lateral roots and thelateral root diameter.
None of the root architecture traits variedsignificantly among rootstocks except thelateral root diameter, which was largest(7.3 mm and 7.4 mm) for ‘US-942’ and‘US-802’, and smallest (5.2 mm) for ‘Swin-gle’. There was no interaction between prop-agation method and rootstock for any of theroot architecture parameters, but block was asignificant factor for lateral root diameter.
The lateral root weight, lateral root massfraction, fibrous root weight, fibrous rootmass fraction, and SRLwere not significantlyinfluenced by the propagation method
(Table 7). In contrast, significant differenceswere found among rootstocks for the lateralroot weight and the lateral root mass fraction.The total lateral root weight ranged from 133g for ‘Swingle’ to 326 g for ‘US-942’, butseparation of means was not significant. Thelateral root mass fraction was lowest for‘Swingle’ and ‘US-1516’ (17% and 22%),and highest (33%) for US-942. There was nosignificant interaction between propagationmethod and rootstock cultivar.
Discussion
With the increasing demand for some ofthe best-performing rootstocks in an HLB-endemic environment, citrus nurseries haveexperienced a shortage of seeds, necessitat-ing the use of alternative methods for prop-agation. Until now, there has been very little
Table 4. Dry weights of 2-year-old ‘Valencia’ trees on different rootstocks propagated by seed (SD), cuttings (CT), and tissue culture (TC).
Factors Total tree wt (kg) Leaf wt (kg) Scionz wt (kg) Rootstocky wt (kg)
Propagation methodSD 3.0 1.3 0.75 0.93CT 2.7 1.2 0.66 0.87TC 2.6 1.2 0.64 0.76P value 0.3097 0.4667 0.2969 0.1299
RootstockSwingle 2.5 a 1.1 ab 0.61 abc 0.79US-1516 2.2 a 1.0 ab 0.56 bc 0.67US-802 2. 9 a 1.2 ab 0.68 abc 1.06US-812 3.5 a 1.6 ab 0.84 ab 1.05US-897 1.9 a 0.8 b 0.53 c 0.56US-942 3.6 a 1.7 a 0.89 a 0.98P value 0.0257* 0.0176* 0.0022** 0.0708
Propagation method · rootstockP value 0.5546 0.5980 0.7585 0.3136
BlockP value 0.0134* 0.0126* 0.0068** 0.0455*
Block · rootstockP value 0.3091 0.4683 0.9999 0.0256*
zMinus leaves.yAll tissue below the graft union.Different letters within columns indicate significant differences according to Tukey’s honestly significant difference test. *, ** denote P values significant at 5%and 1% level of significance.
Table 5. Leaf, scion, and rootstock mass distribution and other traits of ‘Valencia’ trees grafted on different rootstocks propagated by seed (SD), cutting (CT), andtissue culture (TC).
Factors Ldw fraction (%) Sdw fraction (%) Rdw fraction (%) Rdw/Sdw Total leaf area (m2) SLA (cm2/g)
Propagation methodSD 44 26 31 0.46 9.1 67CT 42 25 33 0.52 8.2 70TC 45 26 30 0.43 8.3 70P value 0.2637 0.7911 0.1114 0.0659 0.6397 0.3088
RootstockSwingle 44 ab 25 32 ab 0.47 ab 6.9 ab 64US-1516 43 ab 26 32 ab 0.49 ab 6.8 ab 71US-802 39 b 24 36 a 0.61 a 8.5 ab 72US-812 45 ab 25 30 ab 0.43 ab 11.4 a 71US-897 44 ab 27 30 ab 0.42 ab 5.3 b 64US-942 47 a 26 28 b 0.39 b 12.2 a 73P value 0.0426* 0.2801 0.0422* 0.0292* 0.0081** 0.086
Propagation method · rootstockP value 0.4457 0.7921 0.2126 0.1267 0.3989 0.8979
BlockP value 0.7321 0.0551 0.2577 0.2168 0.0058** 0.0215*
Block · rootstockP value 0.9999 0.9999 0.4994 0.7320 0.4424 0.0904
Ldw, Sdw, and Rdw = leaf, scion (minus leaves), and rootstock (all tissue below the graft union) dry weight. SLA = specific leaf area. Different letters withincolumns indicate significant differences according to Tukey’s honestly significant difference test. *, ** denote P values significant at 5% and 1% level ofsignificance.
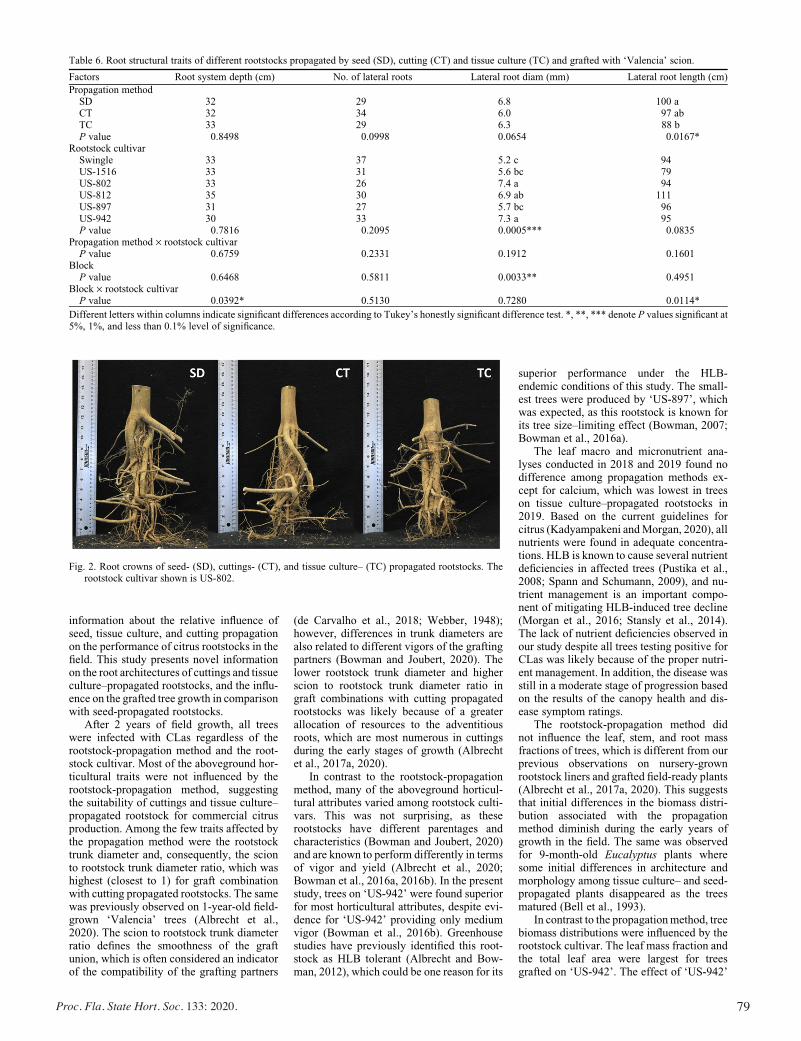
79Proc. Fla. State Hort. Soc. 133: 2020.
(de Carvalho et al., 2018; Webber, 1948);however, differences in trunk diameters arealso related to different vigors of the graftingpartners (Bowman and Joubert, 2020). Thelower rootstock trunk diameter and higherscion to rootstock trunk diameter ratio ingraft combinations with cutting propagatedrootstocks was likely because of a greaterallocation of resources to the adventitiousroots, which are most numerous in cuttingsduring the early stages of growth (Albrechtet al., 2017a, 2020).
In contrast to the rootstock-propagationmethod, many of the aboveground horticul-tural attributes varied among rootstock culti-vars. This was not surprising, as theserootstocks have different parentages andcharacteristics (Bowman and Joubert, 2020)and are known to perform differently in termsof vigor and yield (Albrecht et al., 2020;Bowman et al., 2016a, 2016b). In the presentstudy, trees on ‘US-942’ were found superiorfor most horticultural attributes, despite evi-dence for ‘US-942’ providing only mediumvigor (Bowman et al., 2016b). Greenhousestudies have previously identified this root-stock as HLB tolerant (Albrecht and Bow-man, 2012), which could be one reason for its
superior performance under the HLB-endemic conditions of this study. The small-est trees were produced by ‘US-897’, whichwas expected, as this rootstock is known forits tree size–limiting effect (Bowman, 2007;Bowman et al., 2016a).
The leaf macro and micronutrient ana-lyses conducted in 2018 and 2019 found nodifference among propagation methods ex-cept for calcium, which was lowest in treeson tissue culture–propagated rootstocks in2019. Based on the current guidelines forcitrus (Kadyampakeni andMorgan, 2020), allnutrients were found in adequate concentra-tions. HLB is known to cause several nutrientdeficiencies in affected trees (Pustika et al.,2008; Spann and Schumann, 2009), and nu-trient management is an important compo-nent of mitigating HLB-induced tree decline(Morgan et al., 2016; Stansly et al., 2014).The lack of nutrient deficiencies observed inour study despite all trees testing positive forCLas was likely because of the proper nutri-ent management. In addition, the disease wasstill in a moderate stage of progression basedon the results of the canopy health and dis-ease symptom ratings.
The rootstock-propagation method didnot influence the leaf, stem, and root massfractions of trees, which is different from ourprevious observations on nursery-grownrootstock liners and grafted field-ready plants(Albrecht et al., 2017a, 2020). This suggeststhat initial differences in the biomass distri-bution associated with the propagationmethod diminish during the early years ofgrowth in the field. The same was observedfor 9-month-old Eucalyptus plants wheresome initial differences in architecture andmorphology among tissue culture– and seed-propagated plants disappeared as the treesmatured (Bell et al., 1993).
In contrast to the propagationmethod, treebiomass distributions were influenced by therootstock cultivar. The leaf mass fraction andthe total leaf area were largest for treesgrafted on ‘US-942’. The effect of ‘US-942’
Table 6. Root structural traits of different rootstocks propagated by seed (SD), cutting (CT) and tissue culture (TC) and grafted with ‘Valencia’ scion.
Factors Root system depth (cm) No. of lateral roots Lateral root diam (mm) Lateral root length (cm)
Propagation methodSD 32 29 6.8 100 aCT 32 34 6.0 97 abTC 33 29 6.3 88 bP value 0.8498 0.0998 0.0654 0.0167*
Rootstock cultivarSwingle 33 37 5.2 c 94US-1516 33 31 5.6 bc 79US-802 33 26 7.4 a 94US-812 35 30 6.9 ab 111US-897 31 27 5.7 bc 96US-942 30 33 7.3 a 95P value 0.7816 0.2095 0.0005*** 0.0835
Propagation method · rootstock cultivarP value 0.6759 0.2331 0.1912 0.1601
BlockP value 0.6468 0.5811 0.0033** 0.4951
Block · rootstock cultivarP value 0.0392* 0.5130 0.7280 0.0114*
Different letters within columns indicate significant differences according to Tukey’s honestly significant difference test. *, **, *** denote P values significant at5%, 1%, and less than 0.1% level of significance.
Fig. 2. Root crowns of seed- (SD), cuttings- (CT), and tissue culture– (TC) propagated rootstocks. Therootstock cultivar shown is US-802.
information about the relative influence of seed, tissue culture, and cutting propagation on the performance of citrus rootstocks in the field. This study presents novel information on the root architectures of cuttings and tissue culture–propagated rootstocks, and the influ-ence on the grafted tree growth in comparison with seed-propagated rootstocks.
After 2 years of field growth, all trees were infected with CLas regardless of the rootstock-propagation method and the root-stock cultivar. Most of the aboveground hor-ticultural traits were not influenced by the rootstock-propagation method, suggesting the suitability of cuttings and tissue culture–propagated rootstock for commercial citrus production. Among the few traits affected by the propagation method were the rootstock trunk diameter and, consequently, the scion to rootstock trunk diameter ratio, which was highest (closest to 1) for graft combination with cutting propagated rootstocks. The same was previously observed on 1-year-old field-grown ‘Valencia’ trees (Albrecht et al., 2020). The scion to rootstock trunk diameter ratio defines the smoothness of the graft union, which is often considered an indicator of the compatibility of the grafting partners

80 Proc. Fla. State Hort. Soc. 133: 2020
on leaf mass and area might be related to itstolerance to HLB (Albrecht and Bowman,2012) and its general good adaptability to awide range of stresses (Bowman and Joubert,2020). The root mass fractions were largestfor trees grafted on ‘US-802’, which isknown for its vigor-inducing effect on thescion (Bowman et al., 2016a). Similar resultswere found in our previous study on field-ready grafted trees (Albrecht et al., 2020).Trees on ‘US-802’ also had the highest rootto shoot mass ratio of all trees. This stronganchorage is essential, as trees on this root-stock can reach a height of more than 6 m(Bowman and Joubert, 2020) and require awell-developed root system for support.
It is commonly thought that having a longand strong taproot system is important forresisting wind-induced uprooting. Interest-ingly, no taproot was found in any of theexcavated trees, and roots were shallow,occupying only the upper 36 cm of the soil.This contrasts with older studies on citrus,which described taproot systems penetrating3 to 4 feet (90–120 cm) deep in the soil(Savage et al., 1945). Unlike those past stud-ies, which were conducted on the sandy well-drained soils in central Florida, our study wasconducted in southwest Florida where soilsare poorly drained, preventing the formationof deeper roots (Freeland, 2016; Mylavarapuet al., 2016). Another contributing factor maybe the switch from field to container produc-tion of citrus nursery trees, which began inFlorida in �1977 (Zekri, 1999). Growth ofcitrus nursery rootstocks in containers gen-erally limits the formation of a deep taprootbefore field planting, although this is affectedby the particular container depth. A shallowsoil penetration of roots was also found for 3-year-old citrus trees in Brazil, which hadroots concentrated in the upper 40 cm of thesoil (Meneses et al., 2020). Limited taprootgrowth was also observed in Eucalyptustrees, and it was suggested that anchorage isdetermined by the lateral roots (McComb
et al., 1997). In fact, Dobson and Moffat(1995) noted that taproots are rarely found inmature trees and that horizontally growing(lateral) roots form at an early stage to pro-vide the main structural support.
Resistance to wind-induced uprooting ofcitrus trees grown under the present produc-tion system in Florida is mainly determinedby the root distribution and anchorage in theupper areas of the soil, which our resultssuggest is influenced more by the rootstockcultivar than the method of propagation.However, in field-grown Eucalyptus trees, ahigher vertical uprooting resistance was ob-served in seed-propagated than micro-propagated plants, which had a larger numberof lateral roots (Mokotedi et al., 2010). Incontrast, our study observed no difference inthe number of lateral roots attributed to thepropagation method. This is different fromour previous studies, which found a largernumber of lateral roots in cuttings duringthe nursery stage (Albrecht et al., 2017a,2020). Therefore, considering the root depthand root distribution near the soil surface,the cuttings- and tissue culture–propagatedrootstocks do not appear to be more vulner-able to wind-induced uprooting than seed-propagated rootstocks when grown under theconditions of this study. Whether the smallerrootstock trunk diameter of cuttings and theshorter lateral roots of tissue culture–propagated rootstocks will result in a highervulnerability to windthrow is being investi-gated in an ongoing study.
The fine roots are the parts of the rootsystem that is responsible for absorption ofwater and nutrients from the soil. HLB-affected trees have a reduced root biomass,and fibrous root loss was suggested to com-mence during the early presymptomatic dis-ease stage (Graham et al., 2013; Johnsonet al., 2013; Kumar and Kiran, 2018). It istherefore important to understand the dynam-ics of fibrous root production under HLB-endemic conditions. We found no influence
of rootstock-propagation method on fibrousroot mass production and SRL. Similarresults were found in our previous studyon field-ready nursery-grown citrus trees(Albrecht et al., 2020). In contrast, a studyconducted by Castle (1977) with 9-year-oldsweet orange trees on ‘Milam’ rootstockreported a larger feeder root weight in theupper zone of the soil for trees on cuttingsthan on seedlings and suggested a residualinfluence from the manner of root systemdevelopment in young cuttings as a probablereason. In that study, trees were grown in thewell-drained sandy soils of the Central Flor-ida Ridge and under HLB-free conditions,which is different from our study. The fieldproduction of nursery trees at that time, asmentioned previously, may also have con-tributed to the residual influence of propaga-tion method on the root system of ‘Milam’rootstock.
Minirhizotron analysis showed a contin-uous pattern of root growth during the firstmonths after planting followed by a higherrate of growth during the summer and littlegrowth during the winter. A similar growthpattern was reported for 16-month-old‘Valencia’ orange trees by Bevington andCastle (1985), who found continuous rootgrowth from February to November with anincreased intensity during the summer whensoil temperatures were above 27�C. Citrusroot growth is also known to follow shootgrowth flush, especially after the main flush-ing period in spring (Bevington and Castle,1985; Hall and Albrigo, 2007). Monthly netroot growth was affected by the combinationof rootstock and propagation method, sug-gesting that not all rootstock cultivars may besuited equally for the different propagationmethods.
The total root growth measured by mini-rhizotron analysis during the first year afterplanting was unaffected by the propagationmethod or the rootstock cultivar. However,the percentage of dead roots varied among
Table 7. Lateral and fibrous root masses, root mass fractions, and specific root length (SRL) of different rootstocks propagated by seed (SD), cutting (CT), andtissue culture (TC) and grafted with ‘Valencia’ scion.
Factors Total lateral root wt (g) Lateral roots (%) Total fibrous root wt (g) Fibrous roots (%) SRL (m/g)
Propagation methodSD 246 25 91 10 16CT 222 23 99 11 17TC 199 25 78 11 16P value 0.3869 0.7087 0.2448 0.3054 0.8566
Rootstock cultivarSWG 133 a 17 b 85 11 14US-1516 146 a 22 b 71 11 14US-802 290 a 24 ab 96 9 16US-812 285 a 25 ab 128 12 17US-897 154 a 25 ab 53 10 20US-942 326 a 33 a 102 10 16P value 0.0215* 0.0002*** 0.2012 0.7236 0.1138
Propagation method · rootstock cultivarP value 0.3517 0.5577 0.9413 0.5332 0.9412
BlockP value 0.0685 0.4758 0.1896 0.9999 0.9461
Block · rootstock cultivarP value 0.1798 0.9999 0.0240* 0.3047 0.5659
Root mass fractions are expressed in relation to the total below graft union weight. Different letters within columns indicate significant differences according toTukey’s honestly significant difference test. *, *** denote P values significant at 5% and less than 0.1% level of significance.
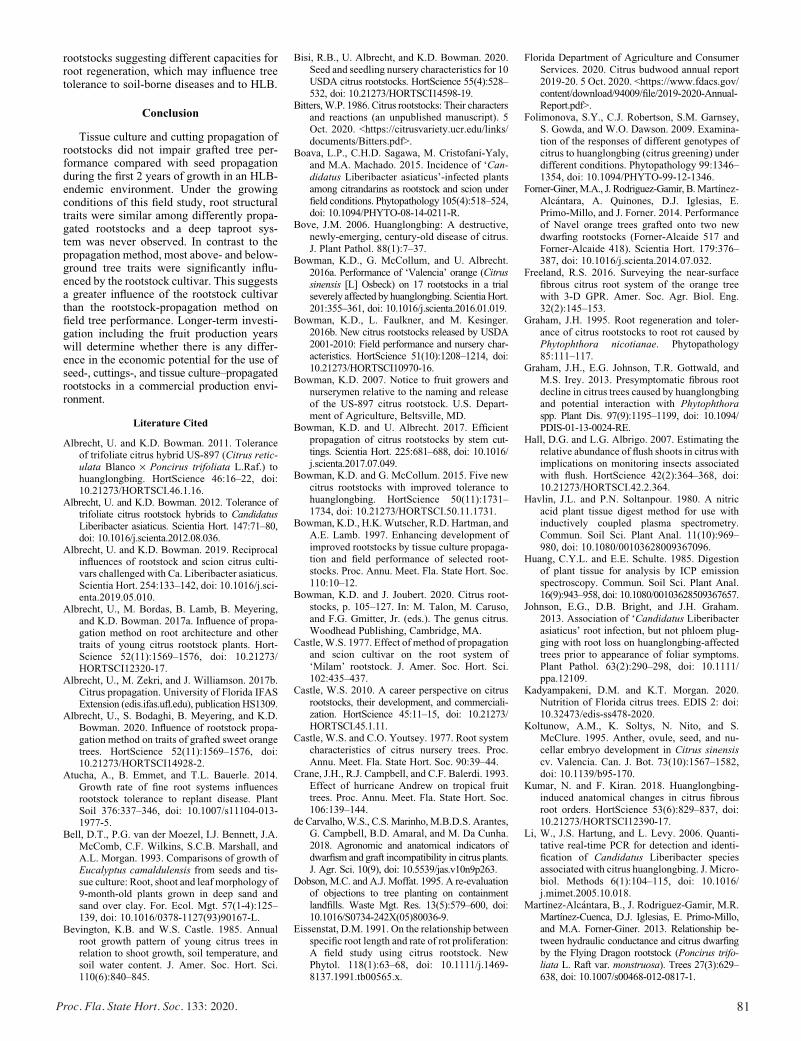
81Proc. Fla. State Hort. Soc. 133: 2020.
rootstocks suggesting different capacities forroot regeneration, which may influence treetolerance to soil-borne diseases and to HLB.
Conclusion
Tissue culture and cutting propagation ofrootstocks did not impair grafted tree per-formance compared with seed propagationduring the first 2 years of growth in an HLB-endemic environment. Under the growingconditions of this field study, root structuraltraits were similar among differently propa-gated rootstocks and a deep taproot sys-tem was never observed. In contrast to thepropagation method, most above- and below-ground tree traits were significantly influ-enced by the rootstock cultivar. This suggestsa greater influence of the rootstock cultivarthan the rootstock-propagation method onfield tree performance. Longer-term investi-gation including the fruit production yearswill determine whether there is any differ-ence in the economic potential for the use ofseed-, cuttings-, and tissue culture–propagatedrootstocks in a commercial production envi-ronment.
Literature Cited
Albrecht, U. and K.D. Bowman. 2011. Toleranceof trifoliate citrus hybrid US-897 (Citrus retic-ulata Blanco · Poncirus trifoliata L.Raf.) tohuanglongbing. HortScience 46:16–22, doi:10.21273/HORTSCI.46.1.16.
Albrecht, U. and K.D. Bowman. 2012. Tolerance oftrifoliate citrus rootstock hybrids to CandidatusLiberibacter asiaticus. Scientia Hort. 147:71–80,doi: 10.1016/j.scienta.2012.08.036.
Albrecht, U. and K.D. Bowman. 2019. Reciprocalinfluences of rootstock and scion citrus culti-vars challenged with Ca. Liberibacter asiaticus.Scientia Hort. 254:133–142, doi: 10.1016/j.sci-enta.2019.05.010.
Albrecht, U., M. Bordas, B. Lamb, B. Meyering,and K.D. Bowman. 2017a. Influence of propa-gation method on root architecture and othertraits of young citrus rootstock plants. Hort-Science 52(11):1569–1576, doi: 10.21273/HORTSCI12320-17.
Albrecht, U., M. Zekri, and J. Williamson. 2017b.Citrus propagation. University of Florida IFASExtension (edis.ifas.ufl.edu), publication HS1309.
Albrecht, U., S. Bodaghi, B. Meyering, and K.D.Bowman. 2020. Influence of rootstock propa-gation method on traits of grafted sweet orangetrees. HortScience 52(11):1569–1576, doi:10.21273/HORTSCI14928-2.
Atucha, A., B. Emmet, and T.L. Bauerle. 2014.Growth rate of fine root systems influencesrootstock tolerance to replant disease. PlantSoil 376:337–346, doi: 10.1007/s11104-013-1977-5.
Bell, D.T., P.G. van der Moezel, I.J. Bennett, J.A.McComb, C.F. Wilkins, S.C.B. Marshall, andA.L. Morgan. 1993. Comparisons of growth ofEucalyptus camaldulensis from seeds and tis-sue culture: Root, shoot and leaf morphology of9-month-old plants grown in deep sand andsand over clay. For. Ecol. Mgt. 57(1-4):125–139, doi: 10.1016/0378-1127(93)90167-L.
Bevington, K.B. and W.S. Castle. 1985. Annualroot growth pattern of young citrus trees inrelation to shoot growth, soil temperature, andsoil water content. J. Amer. Soc. Hort. Sci.110(6):840–845.
Bisi, R.B., U. Albrecht, and K.D. Bowman. 2020.Seed and seedling nursery characteristics for 10USDA citrus rootstocks. HortScience 55(4):528–532, doi: 10.21273/HORTSCI14598-19.
Bitters,W.P. 1986. Citrus rootstocks: Their charactersand reactions (an unpublished manuscript). 5Oct. 2020. <https://citrusvariety.ucr.edu/links/documents/Bitters.pdf>.
Boava, L.P., C.H.D. Sagawa, M. Cristofani-Yaly,and M.A. Machado. 2015. Incidence of ‘Can-didatus Liberibacter asiaticus’-infected plantsamong citrandarins as rootstock and scion underfield conditions. Phytopathology 105(4):518–524,doi: 10.1094/PHYTO-08-14-0211-R.
Bove, J.M. 2006. Huanglongbing: A destructive,newly-emerging, century-old disease of citrus.J. Plant Pathol. 88(1):7–37.
Bowman, K.D., G. McCollum, and U. Albrecht.2016a. Performance of ‘Valencia’ orange (Citrussinensis [L] Osbeck) on 17 rootstocks in a trialseverely affected by huanglongbing. ScientiaHort.201:355–361, doi: 10.1016/j.scienta.2016.01.019.
Bowman, K.D., L. Faulkner, and M. Kesinger.2016b. New citrus rootstocks released by USDA2001-2010: Field performance and nursery char-acteristics. HortScience 51(10):1208–1214, doi:10.21273/HORTSCI10970-16.
Bowman, K.D. 2007. Notice to fruit growers andnurserymen relative to the naming and releaseof the US-897 citrus rootstock. U.S. Depart-ment of Agriculture, Beltsville, MD.
Bowman, K.D. and U. Albrecht. 2017. Efficientpropagation of citrus rootstocks by stem cut-tings. Scientia Hort. 225:681–688, doi: 10.1016/j.scienta.2017.07.049.
Bowman, K.D. and G. McCollum. 2015. Five newcitrus rootstocks with improved tolerance tohuanglongbing. HortScience 50(11):1731–1734, doi: 10.21273/HORTSCI.50.11.1731.
Bowman, K.D., H.K.Wutscher, R.D. Hartman, andA.E. Lamb. 1997. Enhancing development ofimproved rootstocks by tissue culture propaga-tion and field performance of selected root-stocks. Proc. Annu. Meet. Fla. State Hort. Soc.110:10–12.
Bowman, K.D. and J. Joubert. 2020. Citrus root-stocks, p. 105–127. In: M. Talon, M. Caruso,and F.G. Gmitter, Jr. (eds.). The genus citrus.Woodhead Publishing, Cambridge, MA.
Castle,W.S. 1977. Effect of method of propagationand scion cultivar on the root system of‘Milam’ rootstock. J. Amer. Soc. Hort. Sci.102:435–437.
Castle, W.S. 2010. A career perspective on citrusrootstocks, their development, and commerciali-zation. HortScience 45:11–15, doi: 10.21273/HORTSCI.45.1.11.
Castle, W.S. and C.O. Youtsey. 1977. Root systemcharacteristics of citrus nursery trees. Proc.Annu. Meet. Fla. State Hort. Soc. 90:39–44.
Crane, J.H., R.J. Campbell, and C.F. Balerdi. 1993.Effect of hurricane Andrew on tropical fruittrees. Proc. Annu. Meet. Fla. State Hort. Soc.106:139–144.
de Carvalho,W.S., C.S. Marinho,M.B.D.S. Arantes,G. Campbell, B.D. Amaral, and M. Da Cunha.2018. Agronomic and anatomical indicators ofdwarfism and graft incompatibility in citrus plants.J. Agr. Sci. 10(9), doi: 10.5539/jas.v10n9p263.
Dobson, M.C. and A.J. Moffat. 1995. A re-evaluationof objections to tree planting on containmentlandfills. Waste Mgt. Res. 13(5):579–600, doi:10.1016/S0734-242X(05)80036-9.
Eissenstat, D.M. 1991. On the relationship betweenspecific root length and rate of rot proliferation:A field study using citrus rootstock. NewPhytol. 118(1):63–68, doi: 10.1111/j.1469-8137.1991.tb00565.x.
Florida Department of Agriculture and ConsumerServices. 2020. Citrus budwood annual report2019-20. 5 Oct. 2020. <https://www.fdacs.gov/content/download/94009/file/2019-2020-Annual-Report.pdf>.
Folimonova, S.Y., C.J. Robertson, S.M. Garnsey,S. Gowda, and W.O. Dawson. 2009. Examina-tion of the responses of different genotypes ofcitrus to huanglongbing (citrus greening) underdifferent conditions. Phytopathology 99:1346–1354, doi: 10.1094/PHYTO-99-12-1346.
Forner-Giner,M.A., J. Rodriguez-Gamir, B.Martínez-Alc�antara, A. Quinones, D.J. Iglesias, E.Primo-Millo, and J. Forner. 2014. Performanceof Navel orange trees grafted onto two newdwarfing rootstocks (Forner-Alcaide 517 andForner-Alcaide 418). Scientia Hort. 179:376–387, doi: 10.1016/j.scienta.2014.07.032.
Freeland, R.S. 2016. Surveying the near-surfacefibrous citrus root system of the orange treewith 3-D GPR. Amer. Soc. Agr. Biol. Eng.32(2):145–153.
Graham, J.H. 1995. Root regeneration and toler-ance of citrus rootstocks to root rot caused byPhytophthora nicotianae. Phytopathology85:111–117.
Graham, J.H., E.G. Johnson, T.R. Gottwald, andM.S. Irey. 2013. Presymptomatic fibrous rootdecline in citrus trees caused by huanglongbingand potential interaction with Phytophthoraspp. Plant Dis. 97(9):1195–1199, doi: 10.1094/PDIS-01-13-0024-RE.
Hall, D.G. and L.G. Albrigo. 2007. Estimating therelative abundance of flush shoots in citrus withimplications on monitoring insects associatedwith flush. HortScience 42(2):364–368, doi:10.21273/HORTSCI.42.2.364.
Havlin, J.L. and P.N. Soltanpour. 1980. A nitricacid plant tissue digest method for use withinductively coupled plasma spectrometry.Commun. Soil Sci. Plant Anal. 11(10):969–980, doi: 10.1080/00103628009367096.
Huang, C.Y.L. and E.E. Schulte. 1985. Digestionof plant tissue for analysis by ICP emissionspectroscopy. Commun. Soil Sci. Plant Anal.16(9):943–958, doi: 10.1080/00103628509367657.
Johnson, E.G., D.B. Bright, and J.H. Graham.2013. Association of ‘Candidatus Liberibacterasiaticus’ root infection, but not phloem plug-ging with root loss on huanglongbing-affectedtrees prior to appearance of foliar symptoms.Plant Pathol. 63(2):290–298, doi: 10.1111/ppa.12109.
Kadyampakeni, D.M. and K.T. Morgan. 2020.Nutrition of Florida citrus trees. EDIS 2: doi:10.32473/edis-ss478-2020.
Koltunow, A.M., K. Soltys, N. Nito, and S.McClure. 1995. Anther, ovule, seed, and nu-cellar embryo development in Citrus sinensiscv. Valencia. Can. J. Bot. 73(10):1567–1582,doi: 10.1139/b95-170.
Kumar, N. and F. Kiran. 2018. Huanglongbing-induced anatomical changes in citrus fibrousroot orders. HortScience 53(6):829–837, doi:10.21273/HORTSCI12390-17.
Li, W., J.S. Hartung, and L. Levy. 2006. Quanti-tative real-time PCR for detection and identi-fication of Candidatus Liberibacter speciesassociated with citrus huanglongbing. J. Micro-biol. Methods 6(1):104–115, doi: 10.1016/j.mimet.2005.10.018.
Martínez-Alc�antara, B., J. Rodriguez-Gamir, M.R.Martínez-Cuenca, D.J. Iglesias, E. Primo-Millo,and M.A. Forner-Giner. 2013. Relationship be-tween hydraulic conductance and citrus dwarfingby the Flying Dragon rootstock (Poncirus trifo-liata L. Raft var. monstruosa). Trees 27(3):629–638, doi: 10.1007/s00468-012-0817-1.

82 Proc. Fla. State Hort. Soc. 133: 2020
McClean, A.P.D. and R.E. Schwarz. 1970. Greeningor blotchy-mottle disease of citrus. Phytophy-lactica 2(3):177–194.
McCollum, G. and E. Baldwin. 2017. Huanglongb-ing: Devastating disease of citrus. Hort. Rev.44:315–361.
McComb, J.A., E. Steel, D.T. Bell, P. Van derMoezl, I.J. Bennett, B. Dell, and I. Colquhoun.1997. Root growth of seedlings and tissuecultured plants of Eucalyptus, p. 259–265. In:A. Waltman and Y. Waisel (eds.). Biology ofroot formation and development. Springer,Boston, MA.
Meneses, T.N., M.A. Coelho Filho, H.P. SantosFilho, L.L. de A. dos Santos, A. da S. Gesteira,and W. dos S. Soares Filho. 2020. Rootstocksand planting types on root architecture andvegetative vigor of ‘Pera’ sweet orange trees.Rev. Bras. de Eng. Agricola e Ambiental-Agriambi 24(10):689–693, doi: 10.1590/1807-1929/agriambi.v24n10p685-693.
Mokotedi, M.E., M.P. Watt, and N.W. Pammenter.2010. Analysis of differences in field perfor-mance of vegetatively and seed-propagatedEucalyptus varieties II: Vertical uprooting re-sistance. South. For. 72(1):31–36, doi:10.2989/SF.2009.71.4.3.1030.
Morgan, K.T., R.E. Rouse, and R.C. Ebel. 2016.Foliar applications of essential nutrients ongrowthandyieldof ‘Valencia’ sweet orange infectedwith Huanglongbing. HortScience 51(12):1482–1493, doi: 10.21273/HORTSCI11026-16.
Mudge, K., J. Janick, S. Steven, and E.E. Goldschmidt.2009. A history of grafting. Hort. Rev. 35:437–493.
Murashige, T. and F. Skoog. 1962. A revisedmedium for rapid growth and bio assays withtobacco tissue cultures. Physiol. Plant.15(3):473–497.
Mylavarapu, R., W. Harris, and G. Hochmuth.2016. Agricultural soils of Florida. Universityof Florida IFAS Extension (edis.ifas.ufl.edu),publication SL441.
Pustika, A.B., S. Subandiyah, P. Holford, G.A.C.Beattie, T. Iwanami, and Y. Masaoka. 2008.Interactions between plant nutrition and symp-tom expression in mandarin trees infected withthe disease huanglongbing. Australas. PlantDis. Notes 3(1):112–115.
Qureshi, J.A., B.C. Kostyk, and P.A. Stansly. 2014.Insecticidal suppression of Asian citrus psyllidDiaphorina citri (Hemiptera: Liviidae) vectorof huanglongbing pathogens. PLoS One9(12):e112331, doi: 10.1371/journal.pone.0112331.
Qureshi, J.A., M. Rogers, D. Hall, and P. Stansly.2009. Incidence of invasive Diaphorina citri(Hemiptera:Psyllidae) and its introduced para-sitoid Tamarixia radiata (Hymenoptera: Eulo-phidae) in Florida citrus. J. Econ. Entomol.102:247–256, doi: 10.1603/029.102.0134.
Ramadugu, C., M.L. Keremane, S.E. Halbert, Y.P.Duan, M.L. Roose, E. Stover, and R.F. Lee.2016. Long-term field evaluation reveals Huan-glongbing resistance in Citrus relatives. PlantDis. 100(9):1858–1869, doi: 10.1094/PDIS-03-16-0271-RE.
Savage, E.M., W.C. Cooper, and R.B. Piper. 1945.Root systems of various citrus rootstocks. Proc.Annu. Meet. Fla. State Hort. Soc. 58:44–48.
Shokrollah, H., T.L. Abdullah, K. Sijam, and S.N.A.Abdullah. 2011. Potential use of selected citrusrootstocks and interstocks against HLB diseasein Malaysia. Crop Prot. 30(5):521–525, doi:10.1016/j.cropro.2010.09.005.
Spann, T.M. and A.W. Schumann. 2009. The roleof plant nutrients in disease development with
emphasis on citrus and huanglongbing. Proc.Annu.Meet. Fla. State Hort. Soc. 122:169–171.
Stansly, P.A., H.A. Arevalo, J.A. Qureshi, M.M.Jones, K. Hendricks, P.D. Roberts, and F.M.Roka. 2014. Vector control and foliar nutritionto maintain economic sustainability of bearingcitrus in Florida groves affected by huan-glongbing. Pest Mgt. Sci. 70(3):415–426, doi:10.1002/ps.3577.
Sweeney, R.A. 1989. Generic combustion methodfor determination of crude protein in feeds:Collaborative study. J. Assn. Offic. Anal. Chem.72(5):770–774, doi: 10.1093/jaoac/72.5.770.
Vasconcellos, L.A.B.C. and W.S. Castle. 1994.Trunk xylem anatomy of mature healthy andblighted grapefruit trees on several rootstocks.J. Amer. Soc. Hort. Sci. 119(2):185–194, doi:10.21273/JASHS.119.2.185.
Webber, H.J. 1948. Rootstocks: their character andreactions, p. 69–168. In: L.D. Batchelor andH.J.Webber (eds.). The citrus industry (Vol. 2),Univ. of California Press, Berkeley and LosAngeles.
Wutscher, H.K. and L.L. Hill. 1995. Performanceof ‘Hamlin’ orange on 16 rootstocks in east-central Florida. HortScience 30(1):41–43, doi:10.21273/HORTSCI.30.1.41.
Xia, Y., G. Ougang, R. Sequeira, Y. Takeuchi, I.Baez, and J. Chen. 2018. A review of huan-glongbing (HLB) management in citrus usingnutritional approaches in China. Plant HealthProg. 12(1):24, doi: 10.1094/PHP-2010-1003-01-RV.
Zekri, M. 1999. Evaluation of citrus trees planteddirectly from the nursery and trees grown fortwo additional years in bags before transplant-ing in the field. Proc. Annu. Meet. Fla. StateHort. Soc. 112:55–59.
This paper was presented during the 2020 FSHS Annual Meeting and originally published in HortScience [HORTSCIENCE 56(2):163–172. 2021. https://doi.org/10.21273/HORTSCI15507-20].
The paper is included in this Proceedings as a reprint (with permission).
Supplemental material is not included in this reprint.
83Proc. Fla. State Hort. Soc. 133: 2020.
Proc. Fla. State Hort. Soc. 133:83–89. 2020.
Vegetable Section
Enhancing Strawberry Productivity Using Drip Irrigation, Plastic Mulch, and New Cultivars
in BangladeshProsanta K. Dash1, Carlene a. Chase2*, shinsuKe agehara3,
anD linColn Zotarelli2
1Faculty of Agrotechnology Discipline, Khulna University, Khulna-9208, Bangladesh2Horticultural Sciences Department, University of Florida, P.O. Box. 110690, Gainesville, FL 32611
3Gulf Coast Research and Education Center, University of Florida, 14625 CR672, Wimauma, FL 33598
AdditionAl index words. Fragaria ×ananassa, furrow irrigation, ‘Florida Radiance’, ‘Florida Fortuna’, Sweet Sensation® ‘Florida 127’
Strawberry (Fragaria ×ananassa) is a relatively new crop in Bangladesh that has excellent potential since it can be grown during the cool season when less fruit is available. However, strawberry productivity is low due to the underutilization of improved production techniques. To address production constraints identified by Bangladeshi farmers, a study was conducted at Rajshahi University to compare the use of drip irrigation, plastic mulch and University of Florida (UF) cultivars with the current farmer practice in Bangladesh during the 2018–2019 season. The field trial was conducted using a split-plot design in which main plot treatments were either System 1 (drip irrigation with black plastic mulch) or System 2 (furrow irrigation with straw mulch) were arranged in a block design with restricted randomization and replicated four times. In the subplots, the UF strawberry cultivars ‘Florida Radiance’ and Sweet Sensation® ‘Florida 127’ were compared with Bangladeshi cultivars ‘RU-2’ and ‘RU-3’. System 1 resulted in lower water use [655,578 gallons/acre (gal/acre)] than System 2 (994,381 gal/acre). System 1 plants had greater survival, vigor, and vegetative growth than System 2 plants. Flowering occurred earlier in System 1 than in System 2. Total marketable yield was generally higher with System 1 (697.5 g/plant) than with System 2 (450.6 g/plant). ‘Florida 127’ had the highest total marketable yield and produced fruits with higher total soluble solids than the other cultivars throughout the season. Therefore, a combination of drip irrigation with black plastic mulch and the ‘Florida 127’ strawberry cultivar appears to be the best option for enhancing strawberry productivity in Bangladesh.
As a relatively new crop in Bangladesh, knowledge about strawberry within the public and academic spheres is limited. However, strawberry production has been increasing during the cool season from November to April when many fruits commonly grown in Bangladesh are not available. Expansion of strawberry production in Bangladesh will increase fruit availability during this period of fruit scarcity (Ahmad and Uddin, 2012). Addition-ally, because strawberry production may allow the farmers of Bangladesh to earn lucrative profits from a small land area, their interest in the crop has been increasing. A farmer could easily earn $14,826 to $18,533 (US) from a strawberry crop on one
This research was supported by a fellowship to P.K. Dash funded by the United States Agency for International Development (USAID) through the International Maize and Wheat Improvement Center (CIMMYT) and Michigan State Univer-sity (MSU) under the Borlaug Higher Education for Agricultural Research and Development (BHEARD) program. The findings, opinions, and recommendations expressed in this document are those of the authors and not necessarily those of USAID, CIMMYT or MSU.We thank Dr. Monzur Hossain, Professor, Department of Botany, Rajshahi University, Bangladesh for his support and for providing the research site at Rajshahi University.*Corresponding author. Email [email protected]
hectare of land during the winter season (BSS, 2015). Including strawberry in existing crop rotations of rice and vegetables and between tree rows of young orchards may enhance the economic productivity of existing cropping systems.
Strawberry is now grown in a few regions of Bangladesh, with the greatest concentration in the northern region, which has the most favorable growing conditions. The climate in Bangladesh is sub-tropical with hot summers (May–August) and mild winters (December-February) (Rahman et al., 2015). Initially, only a few farmers were involved in strawberry cultivation, but the number of strawberry farmers has gradually increased as more farmers recognize that the crop can be commercially viable. However, Bangladesh has only a few locally developed strawberry cultivars namely BADC Strawberry, BARI Strawberry-1, ‘RU-1’, ‘RU-2’, and ‘RU-3’ (Chowhan et al., 2016; Rahman, 2009). Farmers usually use the indigenous strawberry cultivars; however, some research stations have evaluated imported cultivars such as ‘Strawberry Festival’, ‘Florida Radiance’, ‘Sweet Charlie’, ‘Camarosa’, and ‘FL 05-107’ (Chowhan et al., 2016; Rahman et al., 2015).
Selecting adapted cultivars is considered by Asrey and Singh (2004) to be the most important factor for fruitful strawberry production. However, the performance of strawberry cultivars also depends on transplant quality (Johnson et al., 2005; Le
84 Proc. Fla. State Hort. Soc. 133: 2020
Miere et al., 1998; Perez de Camacaro et al., 2004; Shokaeva, 2004). As a relatively new crop in Bangladesh, research emphasis has been placed on comparing strawberry cultivar yield, yield contributing characteristics, and fruit quality (Rahman et al., 2015). In previous work, Biswas et al. (2009) focused on using somaclonal variation to develop new cultivars. Although BARI Strawberry-1, a released of the Bangladesh Agricultural Research Institute, had the higher total soluble solids than ‘Camarosa’ and ‘Strawberry Festival’ it was considered to be unable to meet the increasing demand for strawberries in Bangladesh due to low yields (Chowhan et al., 2016). Genotypes FA 005, FA 006, and FA 007 from local and exotic sources performed well based on physico-chemical characteristics among thirteen genotypes tested in subtropical climates (Rahman et al., 2015).
In addition to better cultivars, technology such as plasticul-ture and drip irrigation may also have potential for improving strawberry productivity. Plasticulture systems have been shown to provide better soil moisture conservation, weed control, fer-tigation application efficiency, fruit size, and early yield than a conventional matted row system (O’Dell and Williams, 2000). In the Sylhet district of Bangladesh, micro-drip irrigation with plasticulture enhanced plant growth and development, reduced chemical use and production cost, and improved fruit quality and yield of tissue culture plantlets of strawberry compared to the conventional practice with no mulch and manual irrigation (Zobayer et al., 2011). While black plastic mulch and straw mulch was compared for strawberry production by Rannu et al. (2018), their study evaluated a single germplasm line (FA-007) and did not evaluate drip irrigation.
Farmers in Bangladesh are commonly using the ‘RU-2’ and ‘RU-3’ strawberry cultivars, which are characterized by good canopy size, large fruits, uniform color, anthracnose resistance and relatively higher yield among the Bangladeshi cultivars (Rah-man, 2009). Cultivars developed for use in Florida may prove to be well-adapted to the subtropical conditions in Bangladesh and may offer improved quality and productivity compared to local cultivars. ‘Florida Radiance’ (marketed as ‘Florida Fortuna’ outside of the USA) was released in 2008 by the University of Florida (UF) (Chandler et al. 2009) and is adapted to regions where winter and early spring production is practiced. While having a number of desirable characteristics that make it well suited to the winter plasticulture production system, fruit firmness is just acceptable and disease susceptibility requires careful management to limit plant and fruit loss due to pathogens (Whitaker et al., 2016). A more recently released UF cultivar, Sweet Sensation® ‘Florida 127’ is also highly adapted to the winter plasticulture growing system, and produces a plant that is compact, robust and upright with long pedicels that facilitate easy harvesting (Whitaker et al., 2017). The fruits are uniform and large with prolonged shelf life and high Brix content. The plants are resistant to anthrac-nose but susceptible to botrytis. Low strawberry productivity in Bangladesh is likely due to the underutilization of improved production techniques. To address production constraints identi-fied by Bangladeshi farmers as a means of improving strawberry productivity and quality, a study was undertaken to compare the use of drip irrigation, plastic mulch and new cultivars with the current farmer practice in Bangladesh.
Although common in many other areas with subtropical straw-berry production, the annual hill (raised bed) system with plastic mulch and drip irrigation is not well understood by Bangladeshi farmers. As a result, there is a need for relevant research and extension of these methods to strawberry farmers. Therefore,
the objective of this study was to evaluate drip irrigation, plastic mulch, and University of Florida cultivars for improved strawberry productivity in Bangladesh.
Materials and Methods
A field trial was conducted at Rajshahi University (RU) (lat. 24°36'N, long. 88°64'E), Bangladesh, during the 2018–19 growing season. The soil texture of the RU experimental site is classified as clay loam with 2.5% organic matter and pH of 6.9 (Islam et al., 2017). The experimental land was prepared by tillage to an approximate depth of 15 cm (Power tiller, SIFANG-121, Sifang, China). The trial was conducted using a split-plot design in which main plot treatments were either System 1 (drip irrigation with black plastic mulch) or System 2 (furrow irrigation with straw mulch) were arranged in a block design with restricted ran-domization and replicated 4 times. The subplot treatments were strawberry cultivars: ‘RU-2’, ‘RU-3’, ‘Florida Radiance,’ and Sweet Sensation® ‘Florida 127’. The plug transplants of ‘RU-2’ and ‘RU-3’ were obtained from Akafuji Agro-technologies farm (Rajshahi, Bangladesh) and ‘Florida Radiance,’ and ‘Florida 127’ plug transplants were obtained from an Ekland Marketing Company-affiliated nursery in India (Zopar Exports Pvt. Ltd., Aizawl, Mizoram, India). Strawberry cultivars were randomly assigned to the subplots. Beds were prepared manually on 1.2-m centers with approximate bed heights and widths of 18 cm and 71 cm for System 1 and 10 cm and 71 cm for System 2, respectively.
For System 1 black plastic mulch (0.09-mm thickness; BPS Industries Corp., Beijing, China) was laid manually on the surface of raised beds prior to transplanting, and a single drip tape line (7.5 L/30 m, 0.03-mm thickness, 140-mm diameter, 30.5-cm emitter spacing, Advanced Plastic Technology, Barletta, Italy) was placed along the center of the bed during the laying of the mulch film. System 2 utilized locally sourced straw mulch. Col-ored spray paint (for plastic mulch plots) and wooden stakes (for straw mulch plots) were used to divide the beds into plots 2.29 m in length. At RU, 14 strawberry plug transplants per plot were planted in two offset rows per bed with a between-row spacing of 30.5 cm and a 38-cm within-row spacing on 26 Nov. 2018. Planting holes were punched through the plastic mulch using metal stakes to facilitate transplanting.
Crop MAnAgeMent. Drip irrigation was applied in System 1 twice a day for 55 minutes per application until December, and 70 minutes per application from January to March to maintain optimal soil moisture content for strawberry growth and yield (Sanchez, 2018). Water was supplied by gravity feed from an elevated water tank (500 L, Gazi Tank, Dhaka, Bangladesh), which was filled by an electric pump. In System 2, irrigation was applied at 15-day intervals after transplant establishment. During establishment, transplants were irrigated with a water-ing can (1.5-L Plastic Can, Fixit.Com.BD, Dhaka, Bangladesh). Soil moisture was monitored at 7-d interval in each system using a tensiometer (Irrometer, Model-P, Shelburne, VT 05482, Part number-P-2001, portable soil water tension detector; Mega Depot, LLC, Hinesburg, VT).
Diammonium phosphate (68 kg/ha) and muriate of potash (17 kg/ha) were applied as basal fertilizers during land preparation for System 2. A mixture of urea, muriate of potash, calcium nitrate, magnesium nitrate, zinc sulfate, and borax (6:8:2:0.4:0.02:0.02) at 5.9 kg/week/ha was applied throughout the season via the drip tape in System 1 and as manual spray applications for System 2. All fertilizers were purchased from the local Bangladesh market.

85Proc. Fla. State Hort. Soc. 133: 2020.
dAtA ColleCtion. Data were collected from the inner the plants within each row to avoid border effects. Plant vigor was assessed using a scale of 0 to 10 with 0 being dead plants and 10 being the most vigorous plants, a slightly modification of the method used by Monfort et al. (2007) (0–10 rating used instead 1–10). Strawberry transplant survival was assessed at 2 and 4 weeks after transplanting and expressed as a percentage. Days to first flowering was assessed as the number of days from planting to the first flower opening in each plot. Numbers of runners and leaves were assessed from six randomly selected plants per plot. Crown size was measured on four randomly selected plants using digital slide calipers. A ruler was used to measure the width and length of the canopies of four randomly selected plants and canopy size was calculated as an area by multiplying the two measurements.
Strawberries were harvested by hand early in the day while air temperatures were cool, every 3–4 d. The fruit was harvested at commercial maturity after > 80% of the fruit surface turned a uniform red color. Immediately after harvest, strawberries were sorted into marketable and unmarketable (cull) fruits. The number and fresh weight of marketable and cull fruits were determined from 10 sample plants per plot. The fruit yields from January through March are considered the total yield. Total soluble solids (TSS) were measured as degrees Brix once per month (Digital/Brix/RI-Check Refractometer, Reichert Technologies, Inc. Japan).
stAtistiCAl AnAlysis. Data were analyzed using the GLIMMIX procedure of SAS Version 9.4 (SAS Institute Inc, Cary, NC). The main effects of irrigation system and cultivar and their interac-tion were considered fixed. Least squares mean separation was accomplished using the Tukey-Kramer adjustment. The level of significance used was 5%. Repeated measures analysis was used for variables for which the effect of the treatments on the same experimental unit at several different times.
Results
soil Moisture. More uniform soil moisture was observed with System 1 than with System 2 throughout the season (Fig. 1). On 22 Feb., soil moisture was very high in both systems due to heavy rainfall. Irrigation water use was lower with System 1 than System 2, which was expected (Table 1). This was because the drip irrigation could be controlled more precisely than the furrow irrigation. System 1 (655,578 gal/acre) provided more efficient water use with 338,803 gal/acre less water used than System 2 (994,381 gal/acre).
plAnt survivAl, vigor, Crown diAMeter And dAys to first flower. Significantly higher plant survival was obtained with System 1 than System 2 (Table 2). Transplant mortality was higher with ‘Florida Radiance’ compared to the other strawberry cultivars tested. A similar trend was found for plant vigor in both systems. In the case of vigor, ‘Florida 127’ performed better than ‘Florida Radiance’ and ‘RU-2’ but did not differ from ‘RU-3’. A significant difference in days to first flower was obtained with the two systems. Earlier flowering occurred with System 1 than with System 2. However, there was no difference in days to flowering among the strawberry cultivars.
At 8 and 12 weeks after transplanting, there was a significant system by cultivar interaction for crown diameter and, therefore, the simple effects of system and cultivar were assessed for these sample dates (Table 2). However, the system by cultivar interaction was not significant at 4 and 16 WAT for crown diameter and the main effects of system and cultivar are presented for these dates. At all four sample dates crown diameter was greater for System 1 than System 2. When cultivars were compared, ‘Florida 127’ had larger crown diameter than ‘Florida Radiance’ and ‘RU-2’ with no statistical differences with ‘RU-3’ at 4 WAT. At 8 and 12 WAT no difference in crown diameter was apparent among the cultivars in System 1; however, in System 2 ‘Florida 127’ had the largest crown diameter. ‘Florida Radiance’ had the smallest crown diameter at 8 WAT in the System 1 with no difference observed among ‘Florida Radiance’, ‘RU-2’, and ‘RU-3’ at 12 WAT. By 16 WAT. Averaged over system, ‘Florida127’ had the largest crown diameter of the four cultivars.
leAf nuMber, CAnopy size, And runner nuMber. There was no interaction between system and cultivar for leaf number at 4 and 8 WAT but a significant system by cultivar interaction was found at 12 and 16 WAT (Table 3). Leaf number was higher with System 1 than System 2 at 4 and 8 WAT. ‘Florida 127’ produced more leaves than ‘Florida Radiance’ and ‘RU-2’ but leaf number was not statistically different from that of ‘RU-3’ at 4 WAT. Cul-
Fig. 1. Soil moisture (kPa) at a weekly interval in drip and furrow irrigation systems measured using tensiometers.
Table 1. Comparisons of irrigation water use in drip irrigation and fur-row irrigation systems
System (S) Duration GPAz
S1 = Drip irrigation + plastic mulch 26 Nov.–29 Mar. 655,578S2 =Furrow irrigation + straw mulch 26 Nov.–29 Mar. 994,381Difference – 338,803zGPA = gallons per acre (gal/acre).

86 Proc. Fla. State Hort. Soc. 133: 2020
tivars did not differ in leaf number at 8 WAT. ‘Florida 127’ with System 1 and produced more leaves than ‘Florida Radiance’ and ‘RU-3’ at 12 WAT and had more leaves than all other cultivars at 16 WAT (Table 3). The canopy size of strawberry plants in System 1 was larger than in System 2 throughout the season. However, strawberry cultivars did not differ in canopy size at any of the sample dates. Runner production was very low and there was no significant effect of treatments at 4, 8, 12, and 16 WAT (Table 4).
totAl soluble solids And fruit yield. For TSS, the sys-tem by cultivar interaction was not significant in January, but a significant interaction was observed in February and March. In January, System 1 produced sweeter fruits than System 2 (Table 4). ‘Florida 127’ resulted in sweeter fruits than other cultivars. In System 1 ‘Florida 127’ produced sweeter fruits than the other cultivars in February and March. Only ‘Florida 127’ resulted in higher TSS in System 1 than System 2 in February and March. For the other three cultivars there was no difference in TSS between
the systems. In general, ‘Florida Radiance’ had higher TSS than both ‘RU-2’ and ‘RU-3’.
In the case of number of marketable fruit number and weight in January, a significant system by cultivar interaction was obtained (Table 5). In System 1, ‘Florida 127’ produced more fruits than ‘Florida Radiance’ and ‘RU-2’, but its marketable fruit number was not different from that of ‘RU-3’. For fruit weight in January, in System 1 marketable fruit weight was highest with ‘Florida 127’. In System 2 there was no cultivar difference in either fruit number or fruit weight in January.
There was no system by cultivar interaction for marketable fruit number and fruit weight in February and March and for season total marketable fruit number and fruit weight (Table 5). The System 1 produced more fruits than System 2. In February, ‘Florida 127’ produced more fruits and greater fruit weight than ‘RU-3’ with no difference when compared with ‘Florida Radi-ance’ and ‘RU-2’. In March, ‘Florida 127’ produced more fruits
Table 2. Effect of production system and strawberry cultivar on plant survival, vigor, days to first flower, and crown diameter. Plant survival (%) Plant vigor Days to Crown diameter (cm)Treatments 2 WATz 4 WAT 2 WAT 4 WAT first flower 4 WAT 8 WAT 12 WAT 16 WATSystem (S)S1y 91.5 a 87.5 a 6.3 a 6.9 a 36.9 b 0.85 a – – 3.5 aS2x 73.7 b 71.0 b 3.9 b 4.6 b 40.9 a 0.70 b – – 2.6 bCultivar (C) S1 S2 S1 S2 Florida 127 83.9 a 79.5 a 6.0 a 6.8 a 38.3 0.80 a 1.6 a 1.3 d 2.8 a 2.0 c 3.2 aFlorida Radiance 71.4 b 67.9 b 4.3 b 5.3 b 39.1 0.75 b 1.4 c 1.2 d 2.3 b 1.9 c 2.9 bRU-2 85.7 a 83.9 a 4.9 b 5.1 b 39.5 0.76 b 1.5 b 1.2 d 2.4 b 2.0 c 3.0 bRU-3 89.3 a 85.7 a 5.1 ab 5.9 ab 38.9 0.77 ab 1.5 b 1.2 d 2.5 b 2.1 c 3.0 bSignificanceSystem (S) ** ** *** *** *** *** *** *** ***Cultivar (C) *** *** *** ** NS ** *** *** ***S × C NS NS NS NS NS NS *** *** NSzWAT = weeks after transplanting.yS1 = drip irrigation with black plastic mulch.xS2 = furrow irrigation with straw mulch. Least squares means in columns followed by the same letters do not differ significantly according to the Tukey-Kramer test.NS, **, *** indicate nonsignificant or significant at P < 0.01 and 0.001, respectively.
Table 3. Effect of production system and strawberry cultivar on leaf number and canopy sizez. Leaf number/plant Canopy size (cm2)Treatments 4 WATz 8 WAT 12 WAT 16 WAT 4 WAT 8 WAT 12 WAT 16 WATSystem (S)S1y 5.6 a 10.6 a – – 67.6 a 158.3 a 237.8 a 330.4 aS2x 4.5 b 7.9 b – – 40.5 b 85.3 b 163.2 b 232.3 bCultivars(C) S1 S2 S1 S2Florida 127 5.6 a 9.6 23.0 a 14.3 c 36.5 a 23.5 c 55.9 132.7 217.8 299.7 Florida Radiance 4.5 c 8.8 18.3 b 14.0 c 31.8 b 21.5 c 49.8 111.1 188.3 268.6RU-2 5.6 bc 9.1 20.3 ab 14.3 c 29.3 b 21.5 c 55.6 121.6 199.7 281.0RU-3 5.5 ab 9.6 18.5 b 13.8 c 31.5 b 23.0 c 54.9 121.6 196.2 275.9SignificanceSystem (S) * *** *** ** * *** * ***Cultivar (C) ** NS ** *** NS NS NS NSS × C NS NS ** * NS NS NS NSzWAT = weeks after transplanting.yS1 = drip irrigation with black plastic mulch.xS2 = furrow irrigation with straw mulch. Least squares means followed by the same letters within columns do not differ significantly according to the Tukey-Kramer test.NS, *, **, *** indicate nonsignificant or significant at P < 0.05, 0.01, and 0.001, respectively.
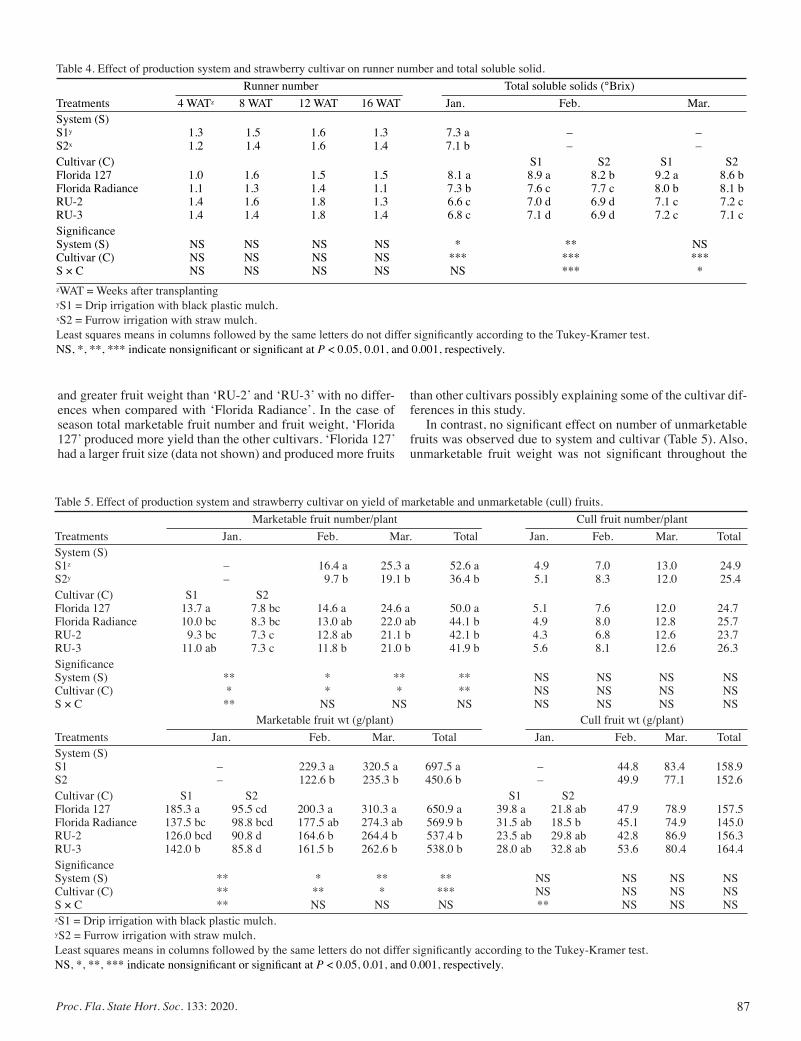
87Proc. Fla. State Hort. Soc. 133: 2020.
and greater fruit weight than ‘RU-2’ and ‘RU-3’ with no differ-ences when compared with ‘Florida Radiance’. In the case of season total marketable fruit number and fruit weight, ‘Florida 127’ produced more yield than the other cultivars. ‘Florida 127’ had a larger fruit size (data not shown) and produced more fruits
than other cultivars possibly explaining some of the cultivar dif-ferences in this study.
In contrast, no significant effect on number of unmarketable fruits was observed due to system and cultivar (Table 5). Also, unmarketable fruit weight was not significant throughout the
Table 4. Effect of production system and strawberry cultivar on runner number and total soluble solid. Runner number Total soluble solids (°Brix)Treatments 4 WATz 8 WAT 12 WAT 16 WAT Jan. Feb. Mar.System (S)S1y 1.3 1.5 1.6 1.3 7.3 a – –S2x 1.2 1.4 1.6 1.4 7.1 b – –Cultivar (C) S1 S2 S1 S2Florida 127 1.0 1.6 1.5 1.5 8.1 a 8.9 a 8.2 b 9.2 a 8.6 bFlorida Radiance 1.1 1.3 1.4 1.1 7.3 b 7.6 c 7.7 c 8.0 b 8.1 bRU-2 1.4 1.6 1.8 1.3 6.6 c 7.0 d 6.9 d 7.1 c 7.2 cRU-3 1.4 1.4 1.8 1.4 6.8 c 7.1 d 6.9 d 7.2 c 7.1 cSignificanceSystem (S) NS NS NS NS * ** NSCultivar (C) NS NS NS NS *** *** ***S × C NS NS NS NS NS *** *zWAT = Weeks after transplantingyS1 = Drip irrigation with black plastic mulch.xS2 = Furrow irrigation with straw mulch.Least squares means in columns followed by the same letters do not differ significantly according to the Tukey-Kramer test.NS, *, **, *** indicate nonsignificant or significant at P < 0.05, 0.01, and 0.001, respectively.
Table 5. Effect of production system and strawberry cultivar on yield of marketable and unmarketable (cull) fruits. Marketable fruit number/plant Cull fruit number/plantTreatments Jan. Feb. Mar. Total Jan. Feb. Mar. TotalSystem (S)S1z – 16.4 a 25.3 a 52.6 a 4.9 7.0 13.0 24.9S2y – 9.7 b 19.1 b 36.4 b 5.1 8.3 12.0 25.4Cultivar (C) S1 S2Florida 127 13.7 a 7.8 bc 14.6 a 24.6 a 50.0 a 5.1 7.6 12.0 24.7Florida Radiance 10.0 bc 8.3 bc 13.0 ab 22.0 ab 44.1 b 4.9 8.0 12.8 25.7RU-2 9.3 bc 7.3 c 12.8 ab 21.1 b 42.1 b 4.3 6.8 12.6 23.7RU-3 11.0 ab 7.3 c 11.8 b 21.0 b 41.9 b 5.6 8.1 12.6 26.3SignificanceSystem (S) ** * ** ** NS NS NS NSCultivar (C) * * * ** NS NS NS NSS × C ** NS NS NS NS NS NS NS Marketable fruit wt (g/plant) Cull fruit wt (g/plant)Treatments Jan. Feb. Mar. Total Jan. Feb. Mar. TotalSystem (S)S1 – 229.3 a 320.5 a 697.5 a – 44.8 83.4 158.9S2 – 122.6 b 235.3 b 450.6 b – 49.9 77.1 152.6Cultivar (C) S1 S2 S1 S2Florida 127 185.3 a 95.5 cd 200.3 a 310.3 a 650.9 a 39.8 a 21.8 ab 47.9 78.9 157.5Florida Radiance 137.5 bc 98.8 bcd 177.5 ab 274.3 ab 569.9 b 31.5 ab 18.5 b 45.1 74.9 145.0RU-2 126.0 bcd 90.8 d 164.6 b 264.4 b 537.4 b 23.5 ab 29.8 ab 42.8 86.9 156.3RU-3 142.0 b 85.8 d 161.5 b 262.6 b 538.0 b 28.0 ab 32.8 ab 53.6 80.4 164.4SignificanceSystem (S) ** * ** ** NS NS NS NSCultivar (C) ** ** * *** NS NS NS NSS × C ** NS NS NS ** NS NS NS zS1 = Drip irrigation with black plastic mulch.yS2 = Furrow irrigation with straw mulch.Least squares means in columns followed by the same letters do not differ significantly according to the Tukey-Kramer test.NS, *, **, *** indicate nonsignificant or significant at P < 0.05, 0.01, and 0.001, respectively.
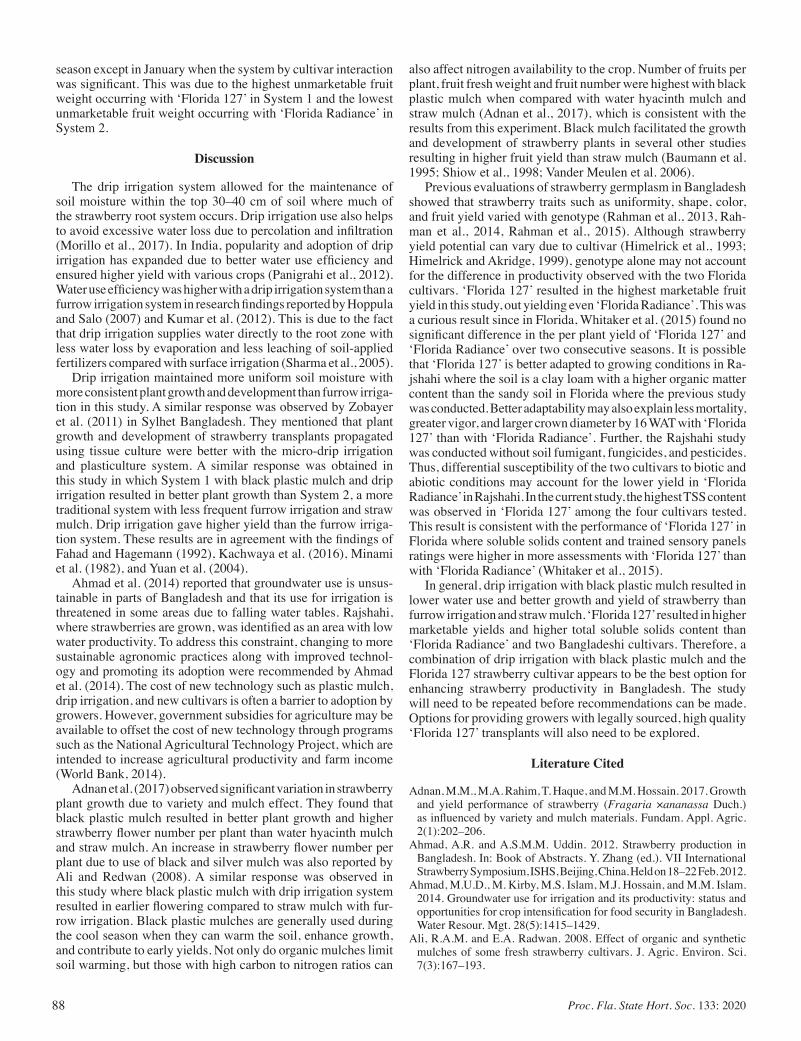
88 Proc. Fla. State Hort. Soc. 133: 2020
season except in January when the system by cultivar interaction was significant. This was due to the highest unmarketable fruit weight occurring with ‘Florida 127’ in System 1 and the lowest unmarketable fruit weight occurring with ‘Florida Radiance’ in System 2.
Discussion
The drip irrigation system allowed for the maintenance of soil moisture within the top 30–40 cm of soil where much of the strawberry root system occurs. Drip irrigation use also helps to avoid excessive water loss due to percolation and infiltration (Morillo et al., 2017). In India, popularity and adoption of drip irrigation has expanded due to better water use efficiency and ensured higher yield with various crops (Panigrahi et al., 2012). Water use efficiency was higher with a drip irrigation system than a furrow irrigation system in research findings reported by Hoppula and Salo (2007) and Kumar et al. (2012). This is due to the fact that drip irrigation supplies water directly to the root zone with less water loss by evaporation and less leaching of soil-applied fertilizers compared with surface irrigation (Sharma et al., 2005).
Drip irrigation maintained more uniform soil moisture with more consistent plant growth and development than furrow irriga-tion in this study. A similar response was observed by Zobayer et al. (2011) in Sylhet Bangladesh. They mentioned that plant growth and development of strawberry transplants propagated using tissue culture were better with the micro-drip irrigation and plasticulture system. A similar response was obtained in this study in which System 1 with black plastic mulch and drip irrigation resulted in better plant growth than System 2, a more traditional system with less frequent furrow irrigation and straw mulch. Drip irrigation gave higher yield than the furrow irriga-tion system. These results are in agreement with the findings of Fahad and Hagemann (1992), Kachwaya et al. (2016), Minami et al. (1982), and Yuan et al. (2004).
Ahmad et al. (2014) reported that groundwater use is unsus-tainable in parts of Bangladesh and that its use for irrigation is threatened in some areas due to falling water tables. Rajshahi, where strawberries are grown, was identified as an area with low water productivity. To address this constraint, changing to more sustainable agronomic practices along with improved technol-ogy and promoting its adoption were recommended by Ahmad et al. (2014). The cost of new technology such as plastic mulch, drip irrigation, and new cultivars is often a barrier to adoption by growers. However, government subsidies for agriculture may be available to offset the cost of new technology through programs such as the National Agricultural Technology Project, which are intended to increase agricultural productivity and farm income (World Bank, 2014).
Adnan et al. (2017) observed significant variation in strawberry plant growth due to variety and mulch effect. They found that black plastic mulch resulted in better plant growth and higher strawberry flower number per plant than water hyacinth mulch and straw mulch. An increase in strawberry flower number per plant due to use of black and silver mulch was also reported by Ali and Redwan (2008). A similar response was observed in this study where black plastic mulch with drip irrigation system resulted in earlier flowering compared to straw mulch with fur-row irrigation. Black plastic mulches are generally used during the cool season when they can warm the soil, enhance growth, and contribute to early yields. Not only do organic mulches limit soil warming, but those with high carbon to nitrogen ratios can
also affect nitrogen availability to the crop. Number of fruits per plant, fruit fresh weight and fruit number were highest with black plastic mulch when compared with water hyacinth mulch and straw mulch (Adnan et al., 2017), which is consistent with the results from this experiment. Black mulch facilitated the growth and development of strawberry plants in several other studies resulting in higher fruit yield than straw mulch (Baumann et al. 1995; Shiow et al., 1998; Vander Meulen et al. 2006).
Previous evaluations of strawberry germplasm in Bangladesh showed that strawberry traits such as uniformity, shape, color, and fruit yield varied with genotype (Rahman et al., 2013, Rah-man et al., 2014, Rahman et al., 2015). Although strawberry yield potential can vary due to cultivar (Himelrick et al., 1993; Himelrick and Akridge, 1999), genotype alone may not account for the difference in productivity observed with the two Florida cultivars. ‘Florida 127’ resulted in the highest marketable fruit yield in this study, out yielding even ‘Florida Radiance’. This was a curious result since in Florida, Whitaker et al. (2015) found no significant difference in the per plant yield of ‘Florida 127’ and ‘Florida Radiance’ over two consecutive seasons. It is possible that ‘Florida 127’ is better adapted to growing conditions in Ra-jshahi where the soil is a clay loam with a higher organic matter content than the sandy soil in Florida where the previous study was conducted. Better adaptability may also explain less mortality, greater vigor, and larger crown diameter by 16 WAT with ‘Florida 127’ than with ‘Florida Radiance’. Further, the Rajshahi study was conducted without soil fumigant, fungicides, and pesticides. Thus, differential susceptibility of the two cultivars to biotic and abiotic conditions may account for the lower yield in ‘Florida Radiance’ in Rajshahi. In the current study, the highest TSS content was observed in ‘Florida 127’ among the four cultivars tested. This result is consistent with the performance of ‘Florida 127’ in Florida where soluble solids content and trained sensory panels ratings were higher in more assessments with ‘Florida 127’ than with ‘Florida Radiance’ (Whitaker et al., 2015).
In general, drip irrigation with black plastic mulch resulted in lower water use and better growth and yield of strawberry than furrow irrigation and straw mulch. ‘Florida 127’ resulted in higher marketable yields and higher total soluble solids content than ‘Florida Radiance’ and two Bangladeshi cultivars. Therefore, a combination of drip irrigation with black plastic mulch and the Florida 127 strawberry cultivar appears to be the best option for enhancing strawberry productivity in Bangladesh. The study will need to be repeated before recommendations can be made. Options for providing growers with legally sourced, high quality ‘Florida 127’ transplants will also need to be explored.
Literature Cited
Adnan, M.M., M.A. Rahim, T. Haque, and M.M. Hossain. 2017. Growth and yield performance of strawberry (Fragaria ×ananassa Duch.) as influenced by variety and mulch materials. Fundam. Appl. Agric. 2(1):202–206.
Ahmad, A.R. and A.S.M.M. Uddin. 2012. Strawberry production in Bangladesh. In: Book of Abstracts. Y. Zhang (ed.). VII International Strawberry Symposium, ISHS, Beijing, China. Held on 18–22 Feb. 2012.
Ahmad, M.U.D., M. Kirby, M.S. Islam, M.J. Hossain, and M.M. Islam. 2014. Groundwater use for irrigation and its productivity: status and opportunities for crop intensification for food security in Bangladesh. Water Resour. Mgt. 28(5):1415–1429.
Ali, R.A.M. and E.A. Radwan. 2008. Effect of organic and synthetic mulches of some fresh strawberry cultivars. J. Agric. Environ. Sci. 7(3):167–193.
89Proc. Fla. State Hort. Soc. 133: 2020.
Asrey, R. and R. Singh. 2004. Evaluation of strawberry varieties under semi-arid irrigated region in Punjab. Indian J. Hortic. 61(2):122–124.
Bangladesh Songbad Sonsta (BSS, Rajshahi). 2015. Strawberry farming gains momentum in Rajshahi, Bangladesh. https://www.thedailystar.net/strawberry-farming-gains-momentum-in-rajshahi-58742. Accessed on 24 June 2018.
Baumann, T.E., G.W. Eaton, A. Machholz, and D. Spaner. 1995. Day-neutral strawberry production on raised beds in British Columbia. Adv. Strawberry Res. 14:53–57.
Biswas, M.K., M. Dutt, U.K. Roy, R. Islam, and M. Hossain. 2009. De-velopment and evaluation of in vitro somaclonal variation in strawberry for improved horticultural traits. Sci. Hortic. 122:409–416.
Chandler, C.K., B.M. Santos, N.A. Peres, C. Joquand, A. Plotto, and C.A. Sims. 2009. ‘Florida Radiance’ Strawberry. HortScience 44:1769–1770.
Chowhan, S., M.M. Hossain, M.A. Hoque, G. Rasul, and M.S. Roni. 2016. Yield performance of strawberry genotypes. Bangladesh J. Agric. Res. 41(3):481–489.
Fahad, A.H. and N. Hagemann. 1992. Differences in water requirement with sprinkler and drip irrigation. Gartenbau Mag. 1(4):64–65.
Himelrick, D.G. and J.R. Akridge, J.R.1999. Basic black is best: Study evaluate influence of colored mulches on commercial strawberry production. Auburn Univ., Highlights Agric. Res. 46(1).
Himelrick, D.G., W.A. Dozier Jr., and J.R. Akridge.1993. Effect of mulch type in annual hill strawberry plasticulture systems. Acta Hortic. 348:207–212.
Hoppula, R.I. and T.J. Salo. 2007. Tensiometer based irrigation scheduling in perennial strawberry cultivation. Irri. Sci. 25:401–409.
Islam, M.A., M. Hasan, and M. Farukh. 2017. Application of GIS in general soil mapping of Bangladesh. J. Geogr. Inf. Syst. 9(5):604–621.
Johnson, Ch., T. Raiford, and K. Whitley. 2005. Initial crown diameter of transplants influences marketable yield components of two strawberry cultivars in annual hill production system. Int. J. Fruit Sci. 5:23–29.
Kachwaya, D.S., J.S. Chandel, G. Vikas, and B. Khanchi. 2016. Effect of drip and furrow irrigation on yield and physiological performance of strawberry (Fragaria ×ananassa Duch.) cv. Chandler. Ind. J. Plant Physiol. 21(3):341–344.
Kumar, P.S., V.K. Chaudhary, and R. Bhagawati. 2012. Influence of mulching and irrigation level on water-use efficiency, plant growth and quality of strawberry (Fragaria × ananassa). Indian J. Agric. Sci. 82(2):127–133.
Le Miere, P., P. Hadley, J. Darby, and N.H. Battey.1998. The effect of thermal environment, planting date and crown size on growth, development and yield of Fragaria × ananassa Duch. J. Hort. Sci. Biotech. 73:786–795.
Minami, K., A.F. Olitta, D. Barbin, and C.G.B. Demetrio. 1982. Study of Drip Irrigation in Strawberry (Fragaria sp.) Culture. Proc. Trop. Reg. Amer. Soc. Hort. Sci. 25: 63–370.
Monfort, W.S., A.S. Csinos, J. Desaeger, K. Seebold, T.M. Webster, and J.C. Diaz-Perez. 2007. Evaluating Brassica species as an alternative control measure for root-knot nematode (M. incognita) in Georgia vegetable plasticulture. J. Crop Prot. 26(9):1359–1368.
Morillo, J.G., J.A. Rodriguez Diaz, E. Camacho, and P. Montesinos. 2017. Drip irrigation scheduling using hydrus 2-D numerical model application for strawberry production in southwest Spain. Irrig. and Drain. 66:797–807.
O’Dell, C.R. and C.R. Williams. 2000. Hill system plastic mulched strawberry production guide for colder areas. Publication 438-018, Virginia Cooperative Extension, Virginia Tech, Blacksburg, VA.
Panigrahi, P., A.K. Srivastava, and A.D. Huchche. 2012. Effects of Drip Irrigation Regimes and Basin Irrigation on Nagpur Mandarin Agronomi-cal and Physiological Performance. Agric. Water Mgmt. 104:79-88.
Perez de Camacaro, M.E., G.J. Camacaro, P. Hadley, M.D. Dennett, N.H. Battey, and J.G. Carew. 2004. Effect of plant density and initial crown size on growth, development and yield in strawberry cultivars. J. Hort. Sci. Biotech. 79:739–746.
Rahman, M.M., M.M. Rahman, M.M. Hossain, M.M.A. Khaleque, and Q.A. Khaliq. 2013. Characterization and filed performance of 15 strawberry germplasm under Bangladesh conditions. SAARC J. Agric. 11(2):81–94.
Rahman, M.M., M.M. Rahman, M.M. Hossain, M.M.A. Khaleque, and Q.A. Khaliq. 2015. Field performance and fruit quality of straw-berry genotypes under subtropical climate. Bangladesh J. Agric. Res. 40(1):137–151.
Rahman, M.M., M.M. Rahman, M.M. Hossain, Q.A. Khaliq, and M. Moniruzzaman. 2014. Effect of planting time and genotypes growth, yield and quality of strawberry (Fragaria ×ananassa Duch.). Sci. Hortic. 167:56–62.
Rahman, T. 2009. Agriculture: strawberry farming in Bangladesh. http://nextbd.blogspot.com/2009/07/agriculture-strawberry-farming-in.html?view=sidebar. Accessed on 1 Aug. 2019.
Rannu, R.P., R. Ahmed, A. Siddiky, A.S.M.Y. Ali, K.F. Ibn Murad, and P.K. Sarkar. 2018. Effect of irrigation and mulch on the yield and water use of strawberry. Int. J. Agron. 2018:1–10. https://doi.org/10.1155/2018/2903706
Sanchez, E. 2018. Determining how long to run drip irrigation systems for vegetables. PennState Extension, College of Agricultural Sciences. https://extension.psu.edu/determining-how-long-to-run-drip-irrigation-systems-for-vegetables. Accessed on 24 June 2018.
Sharma, I.P., S. Kumar, and P. Kumar. 2005. Effect of drip irrigation and mulches on yield, quality and water-use efficiency in strawberry under mid hill conditions. Acta Hortic. 696:259–264.
Shiow, Y.W., G.J. Galletta, and M.J. Camp.1998. Mulch types affect fruit quality and composition of two strawberry genotypes. HortScience 33(4):636–640.
Shokaeva, D. 2004. Factors influencing marketable yield and berry size in short day strawberry varieties in two fruiting seasons. J. Fruit Ornam. Plant Res. 12:159–166.
Vander Meulen, E.S., L. Nol, and L.H. Cammeraat. 2006. Effects of irrigation and plastic mulch on soil properties on semiarid abandoned fields. Soil. Sci. Soc. Am. J. 70:930–939.
Whitaker, V.M., C.K. Chandler, and N.A. Peres. 2017. Sensation™ Brand ‘Florida127’ Strawberry. HS1256. Gainesville: University of Florida Institute of Food and Agricultural Sciences. <http://edis.ifas.ufl.edu/hs1256>. Accessed on 4 May 2019.
Whitaker, V.M., C.K. Chandler, N.A. Peres, M.C.N. Nunes, A. Plotto, and C.A. Sims. 2015. Sensation™ ‘Florida127’ strawberry. 2015. HortScience 50:1088–1091.
Whitaker, V.M., C.K. Chandler, B.M. Santos, and N.A. Peres. 2016. ‘Florida Radiance’ Strawberry. HS1151. Gainesville: University of Florida Institute of Food and Agricultural Sciences. <http://edis.ifas.ufl.edu/hs400>. Accessed on 4 May 2019.
World Bank. 2014. Pairing agriculture with technology in Bangladesh. <https://www.worldbank.org/en/news/feature/2014/06/23/pairing-ag-riculture-with-technology-in-bangladesh>. Accessed on July 30, 2019.
Yuan, B.Z., J. Sun, and S. Nishiyama. 2004. Effect of drip irrigation on strawberry and yield inside a plastic greenhouse. Biosyst. Eng. 87(2):237–245.
Zobayer, N., S.H. Prodhan, S.U. Sikdar, F. Azim, and M. Ashrafuzzaman. 2011. Study of shoot multiplication of strawberry (Fragaria ananassa). Int. J. Agric. Res. Inn. Tech. 1(1&2):69–72.
90 Proc. Fla. State Hort. Soc. 133: 2020
Proc. Fla. State Hort. Soc. 133:90–93. 2020.
Vegetable Section
*Corresponding author. Email: [email protected]
Management of Diamondback Moth, Plutella xylostella (Lin.) (Lepidoptera: Plutellidae) In Cabbage using
Reduced-risk InsecticidesRafia Khan*, DaKshina seal, CatheRine sabines,
anD shawbeta seal
Tropical Research and Education Center, University of Florida/IFAS, 18905 SW 288th St, Homestead, FL 33031
Keywords. cabbage, Diamondback moth, reduced-risk insecticide
Cabbage is a valuable crop in Florida as it produces 13% of the nation’s fresh market crop. Diamondback moth (DBM) (Plutella xylostella L.) is the most destructive pest of cabbage and other cruciferous crops. Even though growers use sound chemical control strategies to manage this serious pest, they cannot truly control it and are also increasing the possibility of insecticide resistance. In the present study, we evaluated different reduced-risk insecticides to manage DBM larvae and pupae. The insecticides Xentari-Knack, Entrust, BioProtect, and Bacillus thuringiensis, subsp. aiza-wai, Strain ABTS-1857 with pyriproxyfen, and Spear in combination with BioProtect were significantly reduced both DBM larvae and pupae in cabbages than the other insecticides and untreated control. Information from this study may be helpful to local growers to use some reduced-risk insecticides to avoid the resistance problem and increase yield.
Florida produces 13% of US cabbage and ranks third na-tionally in the production of fresh market cabbage. Cabbage, Brassica oleracea var. capitata L. is the nineth most important vegetable crop in Florida (Florida Department of Agriculture and Consumer Services 2012). Florida growers plant cabbages annually on more than 17,000 acres (Hochmuth, 1988, Freeman et al. 2021). Insect pests are the main constraint to growing cab-bage in Florida. Among these, the diamondback moth (DBM) (Plutella xylostella L.) is considered the most destructive pest of cabbage. The pest is from the southern Africa and is an invasive species to the United States (Talekar and Shelton 1993). The larval stages are the most destructive life stages of DBM. Crop damage is initiated by larval feeding and the presence of larvae contaminating produce (Shelton et al. 2000). The first instar larvae mine leaf tissue and the later instars consume leaf tissue from the underside of the leaves, giving them a window-like appearance (Philips et al. 2014). The high reproductive potential, the lack of natural enemies in nature and the ability to become resistant to a wide variety of chemicals have established DBM as the pest most successful at challenging modern pest management approaches. Diamondback moth is a widely distributed serious insect pest of Brassica and costs the world economy $4–5 billion (US) annually (Zaluchi et al. 2012). Historically, the DBM was managed by repeated insecticide applications which lead to the development of resistance (Furlong et al. 2013). In the North America, the most severe cases of DBM resistance has been reported from the southern US (Shelton and Wyman, 1993).
Insecticides with different mode of actions have been applied to manage DBM and increase crop yields. The increase in resis-tance of insect pests, killing natural enemies of insect pests, and environmental pollution are all harmful effects of the intensive use of chemical insecticides (Barriuso and Koskinen 1996; Liu et
al., 1982). Diamondback moth has evolved resistance to at least 79 insecticides from a variety of insecticidal classes including carbamates, pyrethroids, organophosphates, Spinosad, abamec-tin, and Bacillus thuringiensis-based products (Liu et al., 1981; Kobayashi et al., 1993; Sun et al. 2012). Shelton and Wyman (1990) reported that the North American populations of DBM are > 100-fold resistant to pyrethroids and some carbamates and > 200-fold to B. thuringiensis. However, the level of insecticide resistance varies by region (Cordero and Kuhar 2007). Diamond-back moth has a remarkable ability to rapidly develop resistance (Philips et al. 2014) after only a few generations. Therefore, extending the intervals between applications of the same insec-ticide can delay the development of resistance (Tabashnik 1986). However, growers are using chemical treatments as the principal tool to save their crop from DBM (Mazlan and Mumford.2005, Grzywacz et al. 2010).
Alternative management strategies need to be evaluated to reduce the harmful effects of chemical insecticides and insect resistance while developing a sound integrated management program. In the present study, we made some efforts to manage the diamondback moth using various reduced-risk insecticides. In different research experiments, we used Azadirachtin, Bacil-lus thuringiensis, subsp. kurstaki, strain ABTS-351, Bacillus thuringiensis subsp. aizawai, Strain ABTS-1857, pyriproxyfen, 3-(trihydroxysilyl)propyldimethyloctadecyl ammonium chloride, spinosad, and Chromobacterium subtsugae strain PRAA4-1T to determine their efficacy in managing DBM larvae and pupae in cabbage.
Materials and Methods
First study. ‘Gourmet’ cabbage transplants were set in an experimental field in Mar. 2020 at the Tropical Research and Education Center, Homestead, FL. The soil type was Krome gravelly loam (loamy-skeletal, carbonatic hyperthermic lithic

91Proc. Fla. State Hort. Soc. 133: 2020.
Udorthents), which consists of about 33% soil and 67% pebbles (> 2 mm). Beds were covered with polyethylene mulch Each plot consisted of two parallel raised beds 36 inches wide, 25 ft long, and separated by a 5 ft alley. Plants were spaced 18 inches apart within each row. Trifluralin (Treflan® 4EC) was incorporated into the soil of each bed 2 weeks before planting. Plants were fertilized by applying granular fertilizer (6 N–12 P–12 K) at 1345 kg/ha in a 10-cm-wide band on each side of the center of each raised bed, which was then incorporated before placement of plastic mulch. Liquid fertilizer (4 N–0 P–8 K) was also applied at 0.56 kg/ha N through a drip system at 2, 3, 4, and 5 weeks after planting. Plants were irrigated every day for one hour using two parallel lines of drip tube (T-systems, DripWorks Inc., Willits, CA), A 3 ft wide nonplanted area separated plots from each other. The treatments evaluated in this study included: a) Azdirachtin (40.0 oz/acre); b) Bacillus thuringiensis, subsp. Kurstaki (Btk), strain ABTS-35 (1.0 lb/acre); c) V-10433 (11 oz/acre); d) Spinosad (4 oz/acre); e) Bacillus thuringiensis, subsp. aizawai, Strain ABTS-1857 (1 lb/acre) with Pyriproxyfen (5 oz/acre); and f) an untreated control. We used a randomized complete-block design with four replications of each treatments. Insecticides were applied on four dates (10 Apr., 17 Apr., 25 Apr., and 30 Apr.). Applications of insecticides were made using a backpack sprayer with two D-4 hollow cone nozzles/bed delivering 70 gal/acre at 30 psi. We evaluated the insecticide treatments and untreated control by counting larvae and pupae from five randomly selected plants from each treated beds 48 h after chemical application.
second study. This study was conducted in an experimental field of the Tropical Research and Education Center, Home-stead, FL, starting in Feb. 2020. The preparation of the beds, experimental design and plant materials were similar as mentioned earlier under the “first study.” The various treatments used in this study included: a) Spear (GS-omega/Kappa-HxTx-Hv1a) (1 pt/acre) in combination with BioProtect [3-(trihydroxysilyl)propyldimethyloctadecyl ammonium chloride] (1 pt/acre); b) Spear (GS-omega/Kappa-HxTx-Hv1a) (2 pt/acre) in combina-tion with BioProtect [3-(trihydroxysilyl)propyldimethyloctadecyl ammonium chloride] (1 pt/acre); c) BioProtect [3-(trihydroxysi-lyl)propyldimethyloctadecyl ammonium chloride] (1 pt/acre); d) Spinosad (5 oz/acre); and e) an untreated control. Each treatment was replicated 4 times in a randomized complete block design. Applications of insecticides were made using a backpack sprayer with two D-4 hollow cone nozzles/bed delivering 70 gal/acre at 30 psi. Treatments were applied five weeks after transplanting cabbage. Evaluations of treatments was made by thoroughly checking five randomly selected plants/plot for diamondback moth life stages (larvae and pupae) 48 h after chemical applica-tion each week for 14 weeks.
third study. This study was conducted in the TREC research plots. The plant materials were planted and maintained by fol-lowing the similar experimental design and cultural practices mentioned earlier under “first study.” Treatments evaluated in this study included: a) Spear (GS-omega/Kappa-HxTx-Hv1a) (1 pt/acre) with Bacillus thuringiensis kurstaki (1 pt/acre); b) Spear (GS-omega/Kappa-HxTx-Hv1a) (2 pt/acre) with Bacil-lus thuringiensis kurstaki (1 pt/acre); c) Bacillus thuringiensis kurstaki (1 pt/acre); d) Spinosad (4 oz/ acre); and e) an untreated control. Methylated seed oil at 0.125% v/v was added to each treatment. A randomized complete-block design was used with each treatment replicated four times. Treatments were applied 5 weeks after transplanting. All insecticides were applied once in a
week and continued for six weeks. We used a backpack sprayer with two D-4 hollow cone nozzles/ bed delivering 70 gal/acre at 30 psi. Treatments were evaluated 48 h after each weekly application by checking five randomly selected plants/plot for diamondback larvae and moths.
Fourth study. In this study, ‘Rio Verde’ cabbage seedlings were transplanted on raised beds on 2 Feb. 2020, at the Tropical Research and Education Center, Homestead, FL.The experimental design, land prepation and maintenance of the plant were same as mentioned earlier under “first study.” Different treatments used in this study includes: a) Bacillus thuringiensis, subsp. aizawai, Strain ABTS-1857 (1.0 lb/acre); b) Chromobacterium subtsugae strain PRAA4-1T WDG (1 lb/acre); c) Chromobacterium subtsugae strain PRAA4-1T WDG (2 lb/acre); d) Chromobacterium subtsugae strain PRAA4-1T S30(1 lb/acre); e) Chromobacterium subtsugae strain PRAA4-1T S30 (2 lb/acre); f) Chromobacterium subtsugae strain PRAA4-1T (1 qt/acre); g) Chromobacterium subtsugae strain PRAA4-1T (2 qt/acre); and h) an untreated control. Treatments were applied on three dates 4, 11, and 23 Mar. 2020 delivering 50 GPA per treatment using a backpack sprayer at 25–30 psi. A pre-count of insects was done on 2 Mar. before insecticide applica-tions began. Evaluation of treatments for controlling diamondback moth was made by counting all larvae and pupae on randomly selected five plants in each treatment plot on three dates: 6, 13, and 23 Mar., 48 h. after each application of insecticides.
statistical analysis. Data on the abundance of the various development stages of diamondback moth were transformed using square-root of X + 0.25 before performing an analysis of variance (ANOVA). The transformed data were analyzed by least squares ANOVA (PROC GLM, SAS Institute, 1989). However, for ease of interpretation, the means of the original data are presented in the table.
Results and Discussion
In the first study, five treatments were evaluated. Among those, the insecticides Spinosad and Bacillus thuringiensis, subsp. aiza-wai, Strain ABTS-1857 with pyriproxyfen was the most effective insecticides to control DBM larvae compared to the untreated control (Fig. 1). In both treatments the lowest number of DBM larvae was observed on the last sampling date. On the 2nd, 3rd, and 4th sampling dates, the DBM larval population was observed to be significantly low than untreated control except for the treat-ment with V-10433 (11 oz/acre). The DBM pupal population was found to be significantly lower in all treated cabbages than the untreated control (Fig. 2). The insecticide V-10433 did not differ from the untreated control in respect to the mean number of pupal populations.
Fig. 1. Mean number of DBM larvae on different sampling dates treated with various reduce-risk insecticide and untreated control

92 Proc. Fla. State Hort. Soc. 133: 2020
In the second study, we observed the DBM larval and pupal population over 14 sampling dates. In the beginning of sampling, both larval and pupal populations were very low (Fig. 3). The larval population of DBM increased after the 3rd sampling date peaking on the 12th sampling date as can be seen in the untreated control. We observed a sharp decline of larval DBM on the 13th sampling date, but there was a sharp increase in the untreated control on the 14th sampling date. Both 3-(trihydroxysilyl)propyldimethyloctadecyl ammonium chloride (1 pt/acre) and Spinosad (5 oz/acre) significantly reduced the larval population compared to the other insecticide treatments the and untreated con-trol. The GS-omega/Kappa-HxTx-Hv1a (1 pt/acre) in combination with 3-(trihydroxysilyl)propyldimethyloctadecyl ammonium chloride (1pt/acre) and GS-omega/Kappa-HxTx-Hv1a (2 pt/acre) in combination with 3-(trihydroxysilyl)propyldimethyloctadecyl ammonium chloride (1pt/acre) also showed a significant reduction of larval DBM compared to the untreated control. We observed an increase in pupal population in the untreated control from the 4th to the 8th sampling date (Fig. 4). Then the pupal population declined up to the 11th sampling date and increased again. Like the larval population, the pupal population was observed signifi-cantly lower in the 3-(trihydroxysilyl)propyldimethyloctadecyl ammonium chloride (1pt/acre) and Spinosad (5 oz/acre) treated cabbages compared to the other insecticide treatments and the untreated control. The GS-omega/Kappa-HxTx-Hv1a (1 pt/acre) in combination with 3-(trihydroxysilyl)propyldimethyloctadecyl ammonium chloride (1pt/acre) and GS-omega/Kappa-HxTx-Hv1a (2 pt/acre) in combination with 3-(trihydroxysilyl)propyldimethy-loctadecyl ammonium chloride (1pt/acre) significantly reduced the pupal population than the untreated control throughout the sampling dates.
In the third study, we observed significantly more DBM larvae in the untreated control than in treated cabbages for the first three sampling dates (Fig. 5). The larval population showed an increase after the 4th sampling date. The larval population was significantly lower in Spinosad treated cabbages on the last sampling date compared to the other insecticide treatments and the untreated control. Other than Spinosad, GS-omega/Kappa-HxTx-Hv1a (1 pt/acre) with Bacillus thuringiensis kurstaki (1 pt/acre) and GS-omega/Kappa-HxTx-Hv1a (2 pt/acre) with Bacil-lus thuringiensis kurstaki (1 pt/acre) reduced the larval DBM population more on the last sampling date (6 May, 2020) than the other insecticide treatments and the untreated control. The pupal population increase sharply from the 3rd (16 Apr. 2020) to the 5th sampling date (30 Apr. 2020) in all treated and untreated cabbages (Fig 6). On the 5th sampling date, Spinosad significantly
Fig. 3. Mean number of DBM larvae on different sampling dates treated with various reduce-risk insecticide and untreated control
Fig. 2. Mean number of DBM pupae on different sampling dates treated with various reduce-risk insecticide and untreated control
Fig. 4. Mean number of DBM pupae on different sampling dates treated with various reduce-risk insecticide and untreated control
Fig. 5. Mean number of DBM larvae on different sampling dates treated with various reduce-risk insecticide and untreated control
Fig. 6. Mean number of DBM pupae on different sampling dates treated with various reduce-risk insecticide and untreated control
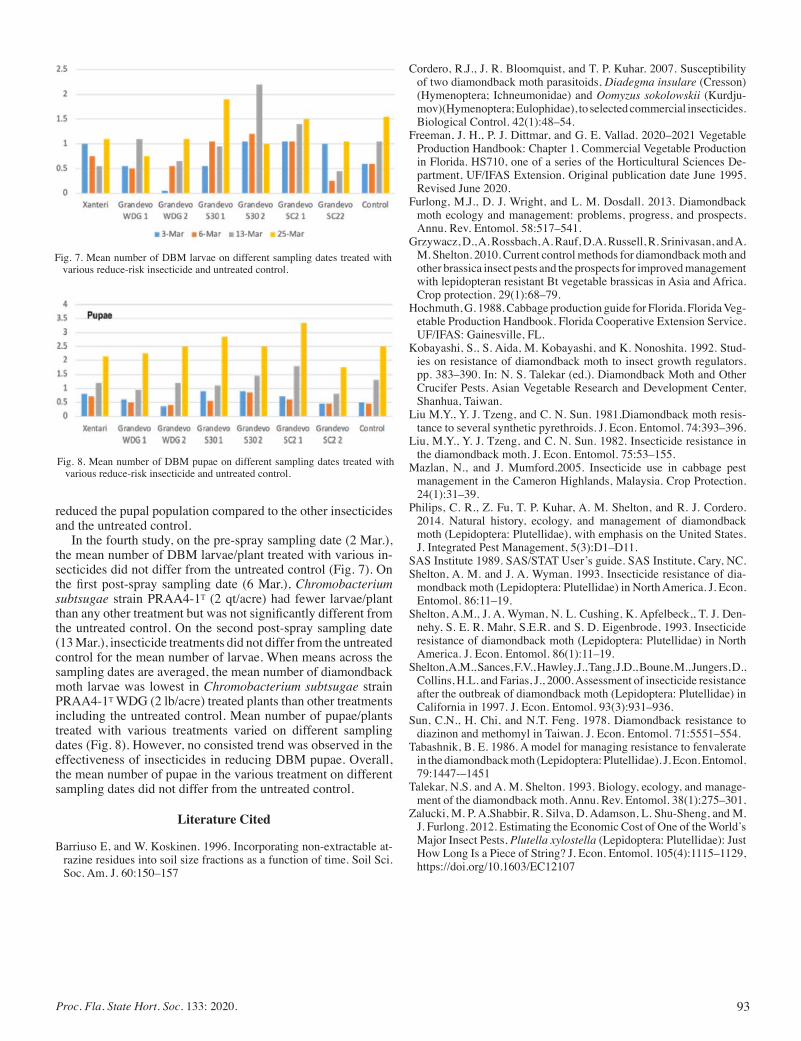
93Proc. Fla. State Hort. Soc. 133: 2020.
reduced the pupal population compared to the other insecticides and the untreated control.
In the fourth study, on the pre-spray sampling date (2 Mar.), the mean number of DBM larvae/plant treated with various in-secticides did not differ from the untreated control (Fig. 7). On the first post-spray sampling date (6 Mar.), Chromobacterium subtsugae strain PRAA4-1T (2 qt/acre) had fewer larvae/plant than any other treatment but was not significantly different from the untreated control. On the second post-spray sampling date (13 Mar.), insecticide treatments did not differ from the untreated control for the mean number of larvae. When means across the sampling dates are averaged, the mean number of diamondback moth larvae was lowest in Chromobacterium subtsugae strain PRAA4-1T WDG (2 lb/acre) treated plants than other treatments including the untreated control. Mean number of pupae/plants treated with various treatments varied on different sampling dates (Fig. 8). However, no consisted trend was observed in the effectiveness of insecticides in reducing DBM pupae. Overall, the mean number of pupae in the various treatment on different sampling dates did not differ from the untreated control.
Literature Cited
Barriuso E, and W. Koskinen. 1996. Incorporating non-extractable at-razine residues into soil size fractions as a function of time. Soil Sci. Soc. Am. J. 60:150–157
Fig. 7. Mean number of DBM larvae on different sampling dates treated with various reduce-risk insecticide and untreated control.
Fig. 8. Mean number of DBM pupae on different sampling dates treated with various reduce-risk insecticide and untreated control.
Cordero, R.J., J. R. Bloomquist, and T. P. Kuhar. 2007. Susceptibility of two diamondback moth parasitoids, Diadegma insulare (Cresson)(Hymenoptera; Ichneumonidae) and Oomyzus sokolowskii (Kurdju-mov)(Hymenoptera; Eulophidae), to selected commercial insecticides. Biological Control. 42(1):48–54.
Freeman, J. H., P. J. Dittmar, and G. E. Vallad. 2020–2021 Vegetable Production Handbook: Chapter 1. Commercial Vegetable Production in Florida. HS710, one of a series of the Horticultural Sciences De-partment, UF/IFAS Extension. Original publication date June 1995. Revised June 2020.
Furlong, M.J., D. J. Wright, and L. M. Dosdall. 2013. Diamondback moth ecology and management: problems, progress, and prospects. Annu. Rev. Entomol. 58:517–541.
Grzywacz, D., A. Rossbach, A. Rauf, D.A. Russell, R. Srinivasan, and A. M. Shelton. 2010. Current control methods for diamondback moth and other brassica insect pests and the prospects for improved management with lepidopteran resistant Bt vegetable brassicas in Asia and Africa. Crop protection. 29(1):68–79.
Hochmuth, G. 1988. Cabbage production guide for Florida. Florida Veg-etable Production Handbook. Florida Cooperative Extension Service. UF/IFAS: Gainesville, FL.
Kobayashi, S., S. Aida, M. Kobayashi, and K. Nonoshita. 1992. Stud-ies on resistance of diamondback moth to insect growth regulators. pp. 383–390. In: N. S. Talekar (ed.). Diamondback Moth and Other Crucifer Pests. Asian Vegetable Research and Development Center, Shanhua, Taiwan.
Liu M.Y., Y. J. Tzeng, and C. N. Sun. 1981.Diamondback moth resis-tance to several synthetic pyrethroids. J. Econ. Entomol. 74:393–396.
Liu, M.Y., Y. J. Tzeng, and C. N. Sun. 1982. Insecticide resistance in the diamondback moth. J. Econ. Entomol. 75:53–155.
Mazlan, N., and J. Mumford.2005. Insecticide use in cabbage pest management in the Cameron Highlands, Malaysia. Crop Protection. 24(1):31–39.
Philips, C. R., Z. Fu, T. P. Kuhar, A. M. Shelton, and R. J. Cordero. 2014. Natural history, ecology, and management of diamondback moth (Lepidoptera: Plutellidae), with emphasis on the United States. J. Integrated Pest Management, 5(3):D1–D11.
SAS Institute 1989. SAS/STAT User’s guide. SAS Institute, Cary, NC.Shelton, A. M. and J. A. Wyman. 1993. Insecticide resistance of dia-
mondback moth (Lepidoptera: Plutellidae) in North America. J. Econ. Entomol. 86:11–19.
Shelton, A.M., J. A. Wyman, N. L. Cushing, K. Apfelbeck,, T. J. Den-nehy, S. E. R. Mahr, S.E.R. and S. D. Eigenbrode, 1993. Insecticide resistance of diamondback moth (Lepidoptera: Plutellidae) in North America. J. Econ. Entomol. 86(1):11–19.
Shelton, A.M., Sances, F.V., Hawley, J., Tang, J.D., Boune, M., Jungers, D., Collins, H.L. and Farias, J., 2000. Assessment of insecticide resistance after the outbreak of diamondback moth (Lepidoptera: Plutellidae) in California in 1997. J. Econ. Entomol. 93(3):931–936.
Sun, C.N., H. Chi, and N.T. Feng. 1978. Diamondback resistance to diazinon and methomyl in Taiwan. J. Econ. Entomol. 71:5551–554.
Tabashnik, B. E. 1986. A model for managing resistance to fenvalerate in the diamondback moth (Lepidoptera: Plutellidae). J. Econ. Entomol. 79:1447-–1451
Talekar, N.S. and A. M. Shelton. 1993. Biology, ecology, and manage-ment of the diamondback moth. Annu. Rev. Entomol. 38(1):275–301.
Zalucki, M. P. A.Shabbir, R. Silva, D. Adamson, L. Shu-Sheng, and M. J. Furlong. 2012. Estimating the Economic Cost of One of the World’s Major Insect Pests, Plutella xylostella (Lepidoptera: Plutellidae): Just How Long Is a Piece of String? J. Econ. Entomol. 105(4):1115–1129, https://doi.org/10.1603/EC12107

94 Proc. Fla. State Hort. Soc. 133: 2020
Proc. Fla. State Hort. Soc. 133:94–97. 2020.
Vegetable Section
Biology and Abundance of Cowpea Weevil, on Different Leguminous SeedsGarima Garima*, and dakshina seal
Tropical Research and Education Center University of Florida, IFAS, 18905 SW 280th St., Homestead, FL 33031
AdditionAl index words. Bean weevil, legumes, development period, sex ratio
Cowpea weevil (Callosobruchus maculatus) is an important stored grain pest of leguminous crops in tropical and sub-tropical regions of the world. It is also used to rear the biocontrol agent, Catolaccus hunteri, of pepper weevil (Anthonomus eugenii) under laboratory conditions. The fecundity and survival of cowpea weevils can be different on various legume seeds. Experiments were conducted in a growth chamber to determine the host preference of cowpea weevil using five different seeds including mung (Vigna radiate (L.) R. Wilczek), chickpea, a.k.a garbanzo bean (Cicer arietinum L.), black bean (Phaseolus vulgaris L.), black-eyed pea (Vigna unguiculata L. Walp.), and kidney bean (Phaseolus vulgaris L.). The survival rate and developmental time of cowpea weevil on these seeds was evaluated. Parameters evaluated were: fecundity, life cycle, oviposition period, sex ratio, and developmental time. Newly emerged pairs of adults were introduced to Petri dishes, each containing 20 g of seeds. Each petri dish had one pair of adult weevils. Each treat-ment was replicated three times. The weevils were left in the petri dishes until they died. The number of eggs laid was counted on each type of seed at two-day intervals. The emergence of adults and the sex ratio was recorded on the dif-ferent legume seeds.
Cowpea weevil, Calosobruchus maculatus Fabricius (Coleop-tera: Chrysomelidae) is an important pest of legume seeds (Beck and Blumer, 2014). It originated in Asia and Africa and later spread to tropical and sub-tropical parts of the world (Beck and Blumer, 2014). Each female has the potential to lay more than 100 eggs during its lifetime (Beck and Blumer, 2014). Eggs are glued to the surface of seeds. When the egg hatches it produces frass and the egg shell becomes opaque (Devereau et al., 2003). The larva bores inside the seed and feeds on it. The larva turns into a pupa. Pupation is marked by thinning of the seed shell (Beck and Blumer, 2014). The adult chews on the seed and emerges. The male and female of cowpea weevils show distinct polymorphism. The female is characterized by having a large black plate at the end of the abdomen with a white longitudinal strip, whereas the male plate is smaller and lacks this strip (Beck and Blumer 2014). The life cycle is completed in 3–4 weeks (Beck and Blumer, 2014).
The generation time depends on the host, temperature and relative humidity (Howe and Currie, 1964; Schoof, 1941). The larvae cause the major damage to seeds. Cowpea weevils can cause 100% damage to stored grains in six to nine months if left unchecked. They can also cause weight loss in seeds of up to 60% (Rees, 2004). It is estimated that the economic losses caused by cowpea weevil infestation in stored grain legumes are 35%, 7 to 13%, and 73% in Central America, South America, and Kenya respectively (Nahdy, 1994; Hu et al., 2009; and Tanzubil, 1991).
Cowpea weevil is used for rearing of Catolacus hunteri, a biocontrol agent of pepper weevil (Anthonomus eugenii) (Seal et al., 2002; Vásquez et al., 2005). It is important to identify the hosts for rearing the cowpea weevil. There is also a need to determine the damage caused by cowpea weevil on different leguminous seeds. The objective of this study was to determine the fecundity, sex ratio, and oviposition period on cowpea weevil on five different legume hosts including mung beans, black beans, black-eyed peas, kidney beans, and garbanzo beans (chickpeas).
Materials and Methods
The study was conducted in a growth chamber in a labora-tory at Tropical Research and Education Center, Homestead, FL. The growth chamber was maintained at 30 °C, 70% relative humidity with a daily light regime of 14/10 h (light/dark) The treatment included five leguminous hosts: mung bean, black bean, black-eyed peas, kidney beans, and garbanzo beans (chickpea) (Fig.1). Mung beans were bought from Oh nuts (Hollywood, Fla), garbanzo beans from Rani (Houston, TX), black-eyed peas and lidney beans from Goya (Secaucus, NJ) and black beans from Iberia (Brooklyn, NY). Prior to initiating the study, seeds of each crop (treatment) were washed with 10% Clorox to remove any preservatives. Each treatment was replicated three times. For each replicate, 20 g of seeds were kept in a Petri dish (5 mm diam). and one pair of newly emerged (0–4 h old) male and female cowpea weevils was placed in each Petri dish. Eggs were counted and separated every other day until the male and female died in each Petri plate. After removal of the infested seeds, the same number of similar fresh seeds were added to the Petri plate.
The pre-oviposition, oviposition and post-oviposition periods were also recorded for newly (0–4 hr–old) emerged females.
We thank Dr. Bruce for critically reviewing the paper and my lab members for their continuous support. A special thanks to Victoria and Rosan for their help in data analysis.*Corresponding author. Email: [email protected]
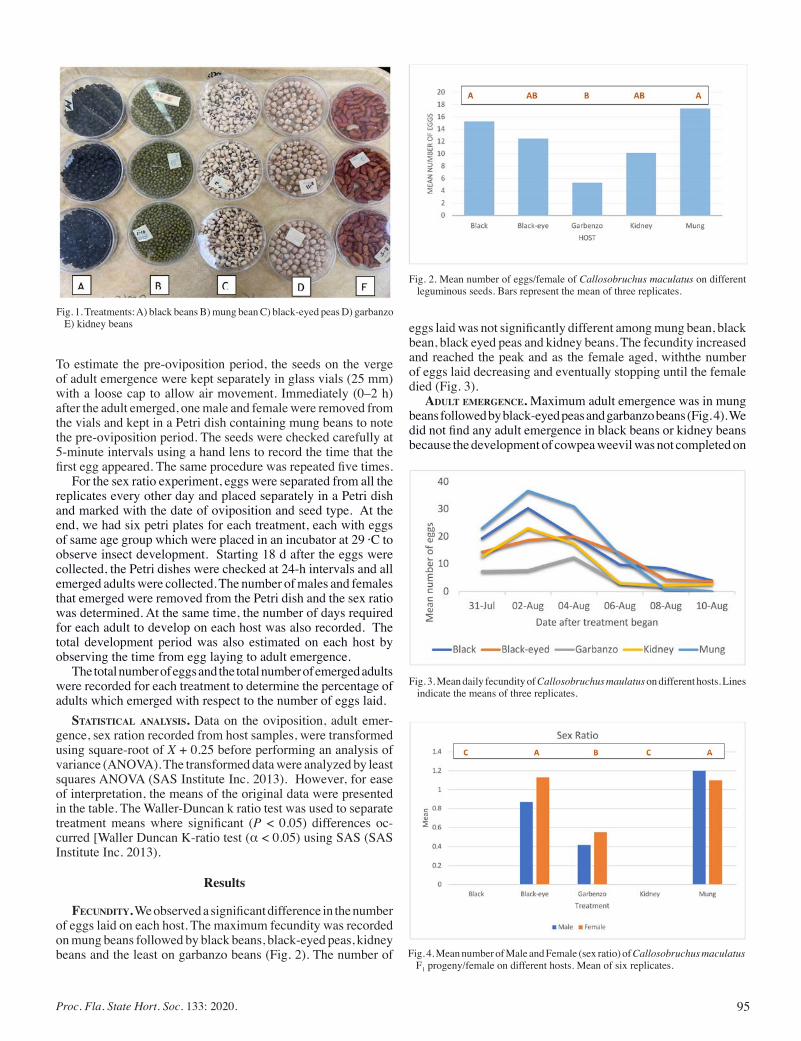
95Proc. Fla. State Hort. Soc. 133: 2020.
To estimate the pre-oviposition period, the seeds on the verge of adult emergence were kept separately in glass vials (25 mm) with a loose cap to allow air movement. Immediately (0–2 h) after the adult emerged, one male and female were removed from the vials and kept in a Petri dish containing mung beans to note the pre-oviposition period. The seeds were checked carefully at 5-minute intervals using a hand lens to record the time that the first egg appeared. The same procedure was repeated five times.
For the sex ratio experiment, eggs were separated from all the replicates every other day and placed separately in a Petri dish and marked with the date of oviposition and seed type. At the end, we had six petri plates for each treatment, each with eggs of same age group which were placed in an incubator at 29 ·C to observe insect development. Starting 18 d after the eggs were collected, the Petri dishes were checked at 24-h intervals and all emerged adults were collected. The number of males and females that emerged were removed from the Petri dish and the sex ratio was determined. At the same time, the number of days required for each adult to develop on each host was also recorded. The total development period was also estimated on each host by observing the time from egg laying to adult emergence.
The total number of eggs and the total number of emerged adults were recorded for each treatment to determine the percentage of adults which emerged with respect to the number of eggs laid.
stAtisticAl AnAlysis. Data on the oviposition, adult emer-gence, sex ration recorded from host samples, were transformed using square-root of X + 0.25 before performing an analysis of variance (ANOVA). The transformed data were analyzed by least squares ANOVA (SAS Institute Inc. 2013). However, for ease of interpretation, the means of the original data were presented in the table. The Waller-Duncan k ratio test was used to separate treatment means where significant (P < 0.05) differences oc-curred [Waller Duncan K-ratio test (α < 0.05) using SAS (SAS Institute Inc. 2013).
Results
Fecundity. We observed a significant difference in the number of eggs laid on each host. The maximum fecundity was recorded on mung beans followed by black beans, black-eyed peas, kidney beans and the least on garbanzo beans (Fig. 2). The number of
eggs laid was not significantly different among mung bean, black bean, black eyed peas and kidney beans. The fecundity increased and reached the peak and as the female aged, withthe number of eggs laid decreasing and eventually stopping until the female died (Fig. 3).
Adult emergence. Maximum adult emergence was in mung beans followed by black-eyed peas and garbanzo beans (Fig. 4). We did not find any adult emergence in black beans or kidney beans because the development of cowpea weevil was not completed on
Fig. 1. Treatments: A) black beans B) mung bean C) black-eyed peas D) garbanzo E) kidney beans
Fig. 2. Mean number of eggs/female of Callosobruchus maculatus on different leguminous seeds. Bars represent the mean of three replicates.
Fig. 3. Mean daily fecundity of Callosobruchus maulatus on different hosts. Lines indicate the means of three replicates.
Fig. 4. Mean number of Male and Female (sex ratio) of Callosobruchus maculatus F1 progeny/female on different hosts. Mean of six replicates.
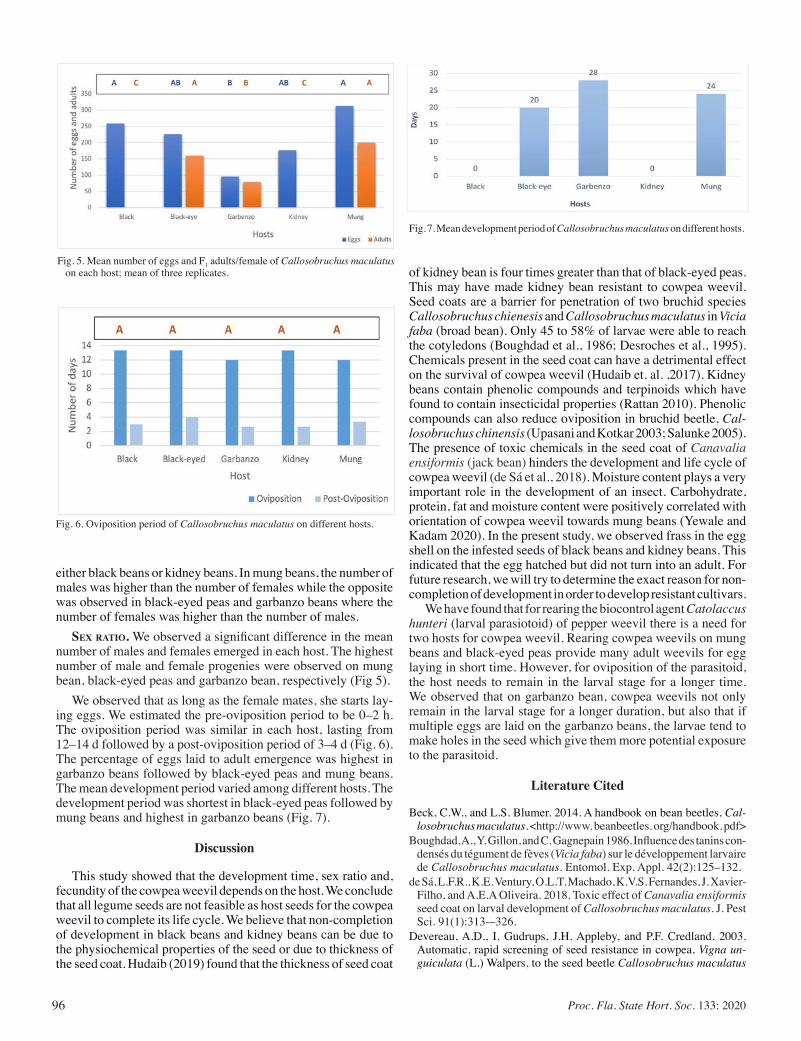
96 Proc. Fla. State Hort. Soc. 133: 2020
either black beans or kidney beans. In mung beans, the number of males was higher than the number of females while the opposite was observed in black-eyed peas and garbanzo beans where the number of females was higher than the number of males.
sex rAtio. We observed a significant difference in the mean number of males and females emerged in each host. The highest number of male and female progenies were observed on mung bean, black-eyed peas and garbanzo bean, respectively (Fig 5).
We observed that as long as the female mates, she starts lay-ing eggs. We estimated the pre-oviposition period to be 0–2 h. The oviposition period was similar in each host, lasting from 12–14 d followed by a post-oviposition period of 3–4 d (Fig. 6). The percentage of eggs laid to adult emergence was highest in garbanzo beans followed by black-eyed peas and mung beans. The mean development period varied among different hosts. The development period was shortest in black-eyed peas followed by mung beans and highest in garbanzo beans (Fig. 7).
Discussion
This study showed that the development time, sex ratio and, fecundity of the cowpea weevil depends on the host. We conclude that all legume seeds are not feasible as host seeds for the cowpea weevil to complete its life cycle. We believe that non-completion of development in black beans and kidney beans can be due to the physiochemical properties of the seed or due to thickness of the seed coat. Hudaib (2019) found that the thickness of seed coat
of kidney bean is four times greater than that of black-eyed peas. This may have made kidney bean resistant to cowpea weevil. Seed coats are a barrier for penetration of two bruchid species Callosobruchus chienesis and Callosobruchus maculatus in Vicia faba (broad bean). Only 45 to 58% of larvae were able to reach the cotyledons (Boughdad et al., 1986; Desroches et al., 1995). Chemicals present in the seed coat can have a detrimental effect on the survival of cowpea weevil (Hudaib et. al. ,2017). Kidney beans contain phenolic compounds and terpinoids which have found to contain insecticidal properties (Rattan 2010). Phenolic compounds can also reduce oviposition in bruchid beetle, Cal-losobruchus chinensis (Upasani and Kotkar 2003; Salunke 2005). The presence of toxic chemicals in the seed coat of Canavalia ensiformis (jack bean) hinders the development and life cycle of cowpea weevil (de Sá et al., 2018). Moisture content plays a very important role in the development of an insect. Carbohydrate, protein, fat and moisture content were positively correlated with orientation of cowpea weevil towards mung beans (Yewale and Kadam 2020). In the present study, we observed frass in the egg shell on the infested seeds of black beans and kidney beans. This indicated that the egg hatched but did not turn into an adult. For future research, we will try to determine the exact reason for non-completion of development in order to develop resistant cultivars.
We have found that for rearing the biocontrol agent Catolaccus hunteri (larval parasiotoid) of pepper weevil there is a need for two hosts for cowpea weevil. Rearing cowpea weevils on mung beans and black-eyed peas provide many adult weevils for egg laying in short time. However, for oviposition of the parasitoid, the host needs to remain in the larval stage for a longer time. We observed that on garbanzo bean, cowpea weevils not only remain in the larval stage for a longer duration, but also that if multiple eggs are laid on the garbanzo beans, the larvae tend to make holes in the seed which give them more potential exposure to the parasitoid.
Literature Cited
Beck, C.W., and L.S. Blumer. 2014. A handbook on bean beetles, Cal-losobruchus maculatus. <http://www. beanbeetles. org/handbook. pdf>
Boughdad, A., Y. Gillon, and C. Gagnepain 1986. Influence des tanins con-densés du tégument de fèves (Vicia faba) sur le développement larvaire de Callosobruchus maculatus. Entomol. Exp. Appl. 42(2):125–132.
de Sá, L.F.R., K.E. Ventury, O.L.T. Machado, K.V.S. Fernandes, J. Xavier-Filho, and A.E.A Oliveira. 2018. Toxic effect of Canavalia ensiformis seed coat on larval development of Callosobruchus maculatus. J. Pest Sci. 91(1):313-–326.
Devereau, A.D., I. Gudrups, J.H. Appleby, and P.F. Credland. 2003. Automatic, rapid screening of seed resistance in cowpea, Vigna un-guiculata (L.) Walpers, to the seed beetle Callosobruchus maculatus
Fig. 5. Mean number of eggs and F1 adults/female of Callosobruchus maculatus on each host; mean of three replicates.
Fig. 6. Oviposition period of Callosobruchus maculatus on different hosts.
Fig. 7. Mean development period of Callosobruchus maculatus on different hosts.
97Proc. Fla. State Hort. Soc. 133: 2020.
(F.) (Coleoptera: Bruchidae) using acoustic monitoring. J. Stored Prod. Res. 39(1):117–129.
Desroches, P., E. El Shazly, N.E. Mandon, G. Duc and J. Huignard. 1995. Development of Callosobruchus chinensis (L.) and C. maculatus (F.)(Coleoptera: Bruchidae) in seeds of Vicia faba L. differing in their tannin, vicine and convicine contents. J. Stored Prod. Res. 31(1):83–89.
Howe, R.W. and J.E. Currie. 1964. Some laboratory observations on the rates of development, mortality and oviposition of several species of Bruchidae breeding in stored pulses. Bull. Entomol Res. 55(3):437–477.
Hu, F., G.N. Zhang, and J.J. Wang. 2009. Scanning electron microscopy studies of antennal sensilla of bruchid beetles, Callosobruchus chinen-sis (L.) and Callosobruchus maculatus (F.) (Coleoptera: Bruchidae). Micron.40(3):320–326.
Hudaib, T. 2019. The role of seed coat thickness in resistance/susceptibility of legumes to cowpea beetle (Callosobruchus maculatus) infestation. European J. Biomed. Pharm. Sci. 6(4):33–35.
Hudaib, T., W. Hayes, S. Brown, and P.E. Eady. 2017. Seed coat phytochemistry of both resistant and susceptible seeds affords some protection against the granivorous beetle Callosobruchus maculatus. J. Stored Prod. Res. 74:27–32.
Nahdy, M.S. 1994. Bean sieving, a possible control measure for the dried bean beetles, Acanthoscelides obtectus (Say) (Coleoptera: Bruchidae) J. Stored Prod. Res. 30(1):65–69.
Rattan, R.S. 2010. Mechanism of action of insecticidal secondary me-tabolites of plant origin. Crop Prot. 29(9):913–920.
Rees, D.P. 2004. Insects of stored products. CSIRO publishing.Salunke, B.K., H.M. Kotkar, P.S. Mendki, S.M. Upasani, and V.L. Ma-
heshwari. 2005. Efficacy of flavonoids in controlling Callosobruchus chinensis (L.) (Coleoptera: Bruchidae), a post-harvest pest of grain legumes. Crop Prot. 24(10):888–893.
Schoof, H.F. 1941. The effects of various relative humidities on the life proceses of the southern cowpea weevil, Callosobruchus maculatus (Fabr.) at 30 °C., ± 0.8 degrees. Ecol. 22(3):297–305.
Seal, D.R., P.A. Stansly, and D.J., Schuster. 2002. Influence of temperature and host on life history parameters of Catolaccus hunteri (Hymenoptera: Pteromalidae). Environ Entomol. 31(2):354–360.
Tanzubil, P.B. 1991. Control of some insect pests of cowpea (Vigna unguiculuta) with neem (Azadirachta indica A Juss.) in Northern Ghana. Int J. Pest Mgt. 37(3):216–217.
Upasani, S.M., H.M. Kotkar, P.S. Mendki, and V.L. Maheshwari. 2003. Partial characterization and insecticidal properties of Ricinus communis L foliage flavonoids. Pest Manag. Sci. 59(12):1349–1354.
Vásquez, E., D. Dean, D. Schuster, and P. Van Etten. 2005. A laboratory method for rearing Catolaccus hunteri (Hymenoptera: Pteromalidae), a parasitoid of the pepper weevil (Coleoptera: Curculionidae). Fla Entomol. 88(2):191–194.
Yewale, P.S., and U.K. Kadam. 2020. Evaluation of bio-chemical con-stituents in green gram associated with resistance to Callosobruchus maculatus during storage. J. Pharmacogn. Phytochem. 9(5):2145–2148.

98 Proc. Fla. State Hort. Soc. 133: 2020
Proc. Fla. State Hort. Soc. 133:98–100. 2020.
Vegetable Section
The author would like to express his gratitude to the Florida Department of Ag-riculture and Consumer Services for the financial support needed to accomplish this project, Drs. Kelly Morgan and James Fletcher for their coordination in the Statewide BMP Program, and to local vegetable growers for the use of their land to carry out these surveys.*Corresponding author. Email: [email protected]
Application of Small Unmanned Aerial Vehicles to Improving Vegetable Crop Management
Qingren Wang*University of Florida/IFAS Extension Miami-Dade County,18710 SW 288th St.,
Homestead, FL 33030
AdditionAl index words. crop management, disease, sUAV, multispectral sensing, vegetables
Small Unmanned Aerial Vehicles (sUAV) have potential advantages in the agricultural industry. This publication is to describe the use of sUAV in vegetable crop management detecting plant stress and how widely it is distributed. Examples include the detection of dead patches in a tomato field, plant death of yellow squash caused by anthracnose, and the distribution of Bean Golden Mosaic Virus. The devices used are a DJI Phantom 4 Pro with a preinstalled High Definition (HD) camera and a multispectral sensor—Sentera double 4k specifically for agriculture. The autonomous flight setup with appropriate parameters was used to cover the targeted fields. The results showed that in a single flight, multiple images including color, Red, Green and Blue (RGB), Near-Infrared (NIR), Normalized Difference Vegetation Index (NDVI), and Normalized Difference Red Edge (NDRE) were collected simultaneously. With software designed for this purpose, flight data were processed to generate various images based on plant health status and damage caused by diseases. This technology can provide timely information to vegetable growers so they can manage their crops and minimize yield losses.
used in agriculture. However, a NIR image is black and white in color. To improve its visibility, some multispectral sensors have been developed and combined with RGB to generate colorful images, i.e., Normalized Difference Vegetation Index (NDVI), and Normalized Difference Red Edge (NDRE). Similarly, the individual images of NIR, NDVI or NDRE captured or derived from separate sensors need to be stitched together to form a single mosaic mapping image with software such as FieldAgentTM. To use an sUAV system in a local vegetable setting, this paper gives some examples of applications in vegetable fields which can be used to improve crop management.
Materials and Methods
An sUAV system with a model DJI Phantom 4 Pro with a HD camera and double 4k multispectral sensor (Sentera, MN) preinstalled (Fig. 1, top) was used in field surveys for various vegetable crops from 2018–19 across a major agricultural area the Redland in southwest Miami-Dade County (Fig.1, bottom). The vegetable crops included in these surveys were snapbeans, squash, and tomato. Field size ranged from 20 to 40 acres. The program FieldAgent (Sentera, MN) can be downloaded to either an iPhone or an iPad. Then an autonomous flight was set up for each field with appropriate parameters, such as picture overlap 80%, flight altitude 200–400 ft above the ground, travel speed 10–20 miles per hour (mph), and an orientation based on the wind direction, the objective of the survey, crop type, growth stage, and type of stresses. Once each corner of the field was marked with Google Maps on the mobile device, the system would display the field size, the number of images would be collected, the number of batteries needed, the duration of flight time, the picture pixel size, and Ground Survey Distance (GSD) in inches (in) or centimeters (cm) per pixel (Wang, 2019).
To understand the kind of stress(es) caused the dead patch, the surveyor has to zoom in on the particular spot or to con-
The use of a small Unmanned Aerial Vehicle (sUAV), also called small Unmanned Aerial System (sUAS) or simply called a drone, has shown the ability to change many aspects of human life. With rapid development of artificial intelligence (AI), the implementation of sUAV systems has been applied to agriculture with labor cost savings and real time information collection to assist growers. It has been used in many surveys and to create spatial mapping related to soil properties (Abbas et al., 2013) and crop health, such as estimating plant canopy (Mathews and Jensen, 2013), detecting plant diseases (Johansen et al., 2014; Wang et al., 2020; Wang and Zhang, 2021), evaluating intact crop biomass (Wang et al., 2019) and estimating plant nutrient levels (Bendig et al., 2014; Vega et al., 2015).
The effective use of an sUAV ultimately depends on the type and model of the device and a setup with appropriate flight parameters, and data collection and processing. For instance, a high definition (HD) camera preinstalled on a sUAV can take a lot of high-quality colorful photos across an entire field based on its size, flight height, speed, and overlaps between any two photos. Color is a combination of three spectrum bands—red, green, and blue (RGB). All these individual photos need to be stitched together to generate an integrated spatial image, called RGB. In addition to the HD camera, a specific sensor is needed because the human eye can only see a very narrow band of the light spectrum with a wavelength of 400–700 nm. A Near-Infrared (NIR) or thermal sensor with the wavelength beyond 700 nm can easily detect plant health status based on plant chlorophyll con-tent. Therefore, NIR sensors have been developed and are widely

99Proc. Fla. State Hort. Soc. 133: 2020.
Fig. 2. A series of mosaic images (from top left: RGB, NIR, NDVI, and NDRE) of a surveyed tomato field with a dead patch.
Fig. 1. The sUAV system (top) applied (Sentera, MN) and the distribution of field surveys across the major agricultural area of Miami-Dade County (bottom) in the last a couple of years.
duct a physical ground survey. For instance, the ground survey showed that the dead patch in Fig. 2 was caused by a physical or mechanical practice because the plants on the left side of the field had been harvested once. That is why the plants on the right side of the block looked greener and better than those on the left (Fig. 2). By using the same technology, the distribution pattern of tomato chlorotic spot virus (TCSV) was detected in another field (Wang et al., 2020).
Field survey on squAsh. Based on an NDVI mosaic image derived from the sUAV system from a squash field, one can tell that plants were not growing uniformly because of the many yellow (dying) and red (bared ground) dots distributed on the image except for field edges and driveways across the field (Fig. 3 left). A close look at the RGB image from the same spot showed that many plants had died in this field (Fig. 3 right). A further investigation with sampling and diagnosis showed that the dead plants were caused by anthracnose, which is related to excess rainfall or irrigation water.
Similarly, some dead patches caused by phytophthora plant rot in yellow squash which were caused by excess rain with water logging in patches because of uneven land (Wang and Zhang, 2021) were identified using sUAV. Laser levelling of the land before growing yellow squash to prevent water-logging would
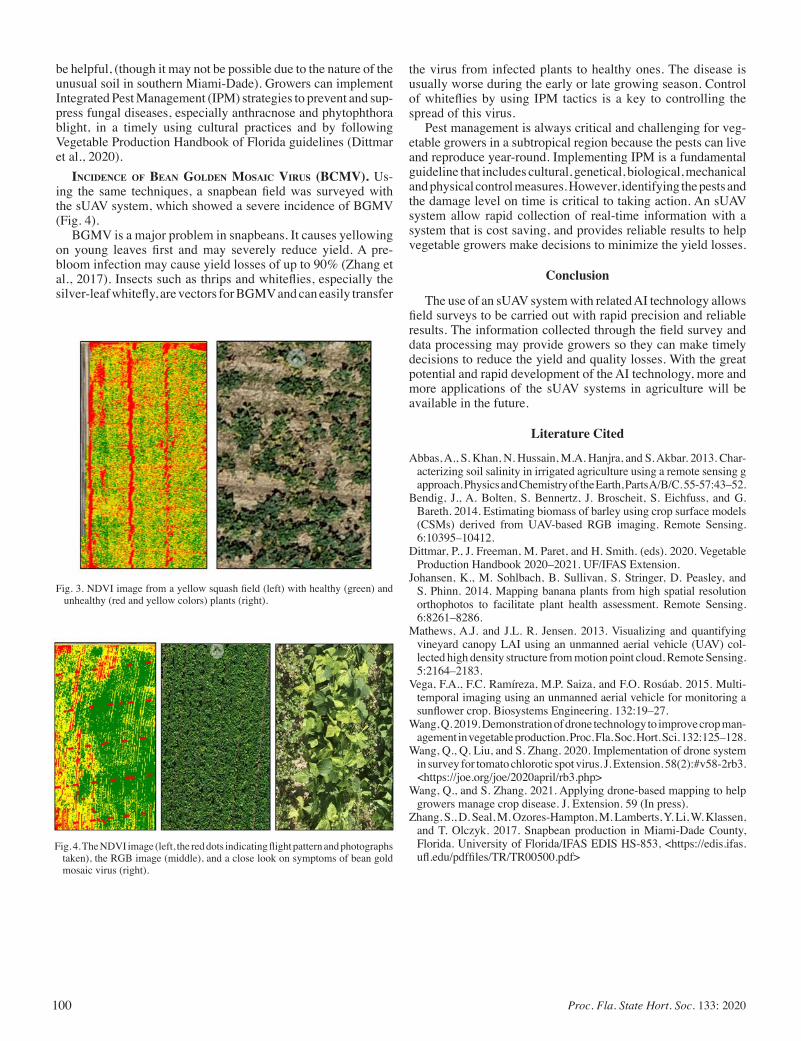
100 Proc. Fla. State Hort. Soc. 133: 2020
be helpful, (though it may not be possible due to the nature of the unusual soil in southern Miami-Dade). Growers can implement Integrated Pest Management (IPM) strategies to prevent and sup-press fungal diseases, especially anthracnose and phytophthora blight, in a timely using cultural practices and by following Vegetable Production Handbook of Florida guidelines (Dittmar et al., 2020).
incidence oF BeAn Golden MosAic virus (BcMv). Us-ing the same techniques, a snapbean field was surveyed with the sUAV system, which showed a severe incidence of BGMV (Fig. 4).
BGMV is a major problem in snapbeans. It causes yellowing on young leaves first and may severely reduce yield. A pre- bloom infection may cause yield losses of up to 90% (Zhang et al., 2017). Insects such as thrips and whiteflies, especially the silver-leaf whitefly, are vectors for BGMV and can easily transfer
Fig. 3. NDVI image from a yellow squash field (left) with healthy (green) and unhealthy (red and yellow colors) plants (right).
Fig. 4. The NDVI image (left, the red dots indicating flight pattern and photographs taken), the RGB image (middle), and a close look on symptoms of bean gold mosaic virus (right).
the virus from infected plants to healthy ones. The disease is usually worse during the early or late growing season. Control of whiteflies by using IPM tactics is a key to controlling the spread of this virus.
Pest management is always critical and challenging for veg-etable growers in a subtropical region because the pests can live and reproduce year-round. Implementing IPM is a fundamental guideline that includes cultural, genetical, biological, mechanical and physical control measures. However, identifying the pests and the damage level on time is critical to taking action. An sUAV system allow rapid collection of real-time information with a system that is cost saving, and provides reliable results to help vegetable growers make decisions to minimize the yield losses.
Conclusion
The use of an sUAV system with related AI technology allows field surveys to be carried out with rapid precision and reliable results. The information collected through the field survey and data processing may provide growers so they can make timely decisions to reduce the yield and quality losses. With the great potential and rapid development of the AI technology, more and more applications of the sUAV systems in agriculture will be available in the future.
Literature Cited
Abbas, A., S. Khan, N. Hussain, M.A. Hanjra, and S. Akbar. 2013. Char-acterizing soil salinity in irrigated agriculture using a remote sensing g approach. Physics and Chemistry of the Earth, Parts A/B/C. 55-57:43–52.
Bendig, J., A. Bolten, S. Bennertz, J. Broscheit, S. Eichfuss, and G. Bareth. 2014. Estimating biomass of barley using crop surface models (CSMs) derived from UAV-based RGB imaging. Remote Sensing. 6:10395–10412.
Dittmar, P., J. Freeman, M. Paret, and H. Smith. (eds). 2020. Vegetable Production Handbook 2020–2021. UF/IFAS Extension.
Johansen, K., M. Sohlbach, B. Sullivan, S. Stringer, D. Peasley, and S. Phinn. 2014. Mapping banana plants from high spatial resolution orthophotos to facilitate plant health assessment. Remote Sensing. 6:8261–8286.
Mathews, A.J. and J.L. R. Jensen. 2013. Visualizing and quantifying vineyard canopy LAI using an unmanned aerial vehicle (UAV) col-lected high density structure from motion point cloud. Remote Sensing. 5:2164–2183.
Vega, F.A., F.C. Ramíreza, M.P. Saiza, and F.O. Rosúab. 2015. Multi-temporal imaging using an unmanned aerial vehicle for monitoring a sunflower crop. Biosystems Engineering. 132:19–27.
Wang, Q. 2019. Demonstration of drone technology to improve crop man-agement in vegetable production. Proc. Fla. Soc. Hort. Sci. 132:125–128.
Wang, Q., Q. Liu, and S. Zhang. 2020. Implementation of drone system in survey for tomato chlorotic spot virus. J. Extension. 58(2):#v58-2rb3. <https://joe.org/joe/2020april/rb3.php>
Wang, Q., and S. Zhang. 2021. Applying drone-based mapping to help growers manage crop disease. J. Extension. 59 (In press).
Zhang, S., D. Seal, M. Ozores-Hampton, M. Lamberts, Y. Li, W. Klassen, and T. Olczyk. 2017. Snapbean production in Miami-Dade County, Florida. University of Florida/IFAS EDIS HS-853, <https://edis.ifas.ufl.edu/pdffiles/TR/TR00500.pdf>
101Proc. Fla. State Hort. Soc. 133: 2020.
Proc. Fla. State Hort. Soc. 133:101–103. 2020.
Vegetable Section
*Corresponding author. Email: [email protected]
Effect of IN-M1 Concentric® on Plant Growth and Fruit Yield of Tomato In South Florida
Qingchun Liu and Shouan Zhang*Tropical Research and Education Center, University of Florida, IFAS,
18905 SW 280th St., Homestead, FL 33031
AdditionAl index words. biostimulant, tomato, IN-M1, garden solution, fertilizer rate
The effect of a biostimulant, IN-M1 Concentric®, in promoting plant growth and yield of tomato was evaluated under field conditions in Homestead, FL, over two growing seasons. ‘Sanibel’ tomato was used both seasons. All treatments were arranged in a randomized complete block (RCB) design with six replications for each treatment. In the 2017–18 season, IN-M1 was first applied at 1% by soil drench at transplanting and then as a foliar spray at flowering. Four fertilization levels, 25%, 50%, 75%, and 100% of the recommended rate were applied through irrigation drip lines. No significant increases in fruit yield were detected in any treatments compared to the untreated control. However, a ben-eficial effect on fruit yield was found with 75% fertilization level, where total yield from the first two harvests increased by 5.1%. In the 2018–19 season, IN-M1 was applied through irrigation drip immediately after transplanting and at flowering. Three rates of IN-M1 [0.25, 0.5, and 1.0 gallons/acre (gal/A)] were tested on tomato plants grown at 90% of the recommended fertilization rate. IN-M1 at 0.5 gal/A significantly (P < 0.1) increased plant height compared to the untreated control. Though the effect of IN-M1 on fruit yield was not significant at (P = 0.1) compared to the untreated control, beneficial effects on fruit yield were observed. IN-M1 at 0.25, 0.5, and 1.0 gal/A increased yield of extra-large and large sized fruit by 12.7%, 18.3%, and 9.3%, respectively, compared to the untreated control. The biostimulant IN-M1 could be applied to promote plant growth, increase fruit yield, and reduce fertilizer use in tomatoes in south Florida.
Florida ranks first in the production of winter fresh market tomato in the United States (Tomato101). Florida provides more than 50% of fresh tomatoes in the country on 31,500 acres. The total value of tomato exceeds $600 million, which accounts about one third of the total value of all fresh vegetable crops in Florida.
Tomato plants in open field conditions often face various stresses in Florida at different developmental stages, including transplanting shock, heat, chilling, etc. One approach to coping with such environmental stresses is to apply biostimulants (Bulgari et al., 2019; Colla and Rouphae, 2015). Plant biostimulants are products prepared from different organic or inorganic substances and/or microorganisms, that have beneficial effects on improving plant growth, productivity, and alleviating negative effects of abiotic stresses (Bulgari et al., 2019).
IN-M1 Concentric® is a plant biostimulant and registered as ‘Garden Solution’ in the US. It is a mixture of beneficial microor-ganisms and their metabolites <http://www.concentricag.com/>. IN-M1 has been applied in high value vegetable crops, such as lettuce, strawberry and fresh market tomato to promote plant growth and fruit yield. IN-M1 contains seven beneficial bacterial species and three fungal species. It also has been reported that IN-M1 can be used to reduce fertilizer rates, particularly nitrogen, in vegetable crops. In this study, we conducted two field trials to evaluate the beneficial effects of IN-M1 on tomato production in south Florida: 1) effect of IN-M1 on tomato fruit yield and reducing fertilizer use during 2017–18 and 2) effect of IN-M1 rate on tomato plant growth and fruit yield during 2018–19.
Materials and Methods
Field prepArAtion And crop mAnAgement. The field trials were conducted over two tomato growing seasons (2017–18 and 2018–19) at the University of Florida’s Tropical Research and Education Center, Homestead, FL. Tomato (cv. Sanibel) seedlings were transplanted in beds covered with black plastic mulch in both growing seasons. Irrigation and fertigation were provided by two drip irrigation tapes passing on both sides of each plant, following guidelines from the Vegetable Production Handbook of Florida, 2017–18 (Ditmar et al, 2017). Standard spray programs developed in the lab were followed to control common diseases and pests on tomato.
eFFect oF in-m1 on tomAto Fruit yield And reducing Fertilizer usAge. A field trial was conducted in the 2017-2018 growing season to evaluate the effect of IN-M1 on tomato fruit yield and reducing fertilizer usage. Each plot consisted of a 22-ft section on a single bed with a 2-ft buffer zone between adjacent plots. Within each plot, 11 plants were planted 2-ft apart. Each bed received one of four levels of fertilization, 100%, 75%, 50%, and 25% of the recommended rate from the Vegetable Production Handbook of Florida 2017–18 (Ditmar, et al., 2017). After trans-planting, liquid fertilizer 3–0–10, was applied to each bed twice a week throughout the growing season at the specified rate. Plots treated with IN-M1 and untreated plots were arranged randomly on each bed, with six replicates per treatment.
Tomato seedlings were transplanted into beds on 7 Dec. 2017. After transplanting, seedlings were drenched with Danitol (fen-propathin) at 3.0 mL/gallon to protect seedlings from damage by cutworms. IN-M1 was applied at 1% (v:v) as a soil drench at the base using about 120 mL /plant right after transplanting. A boost
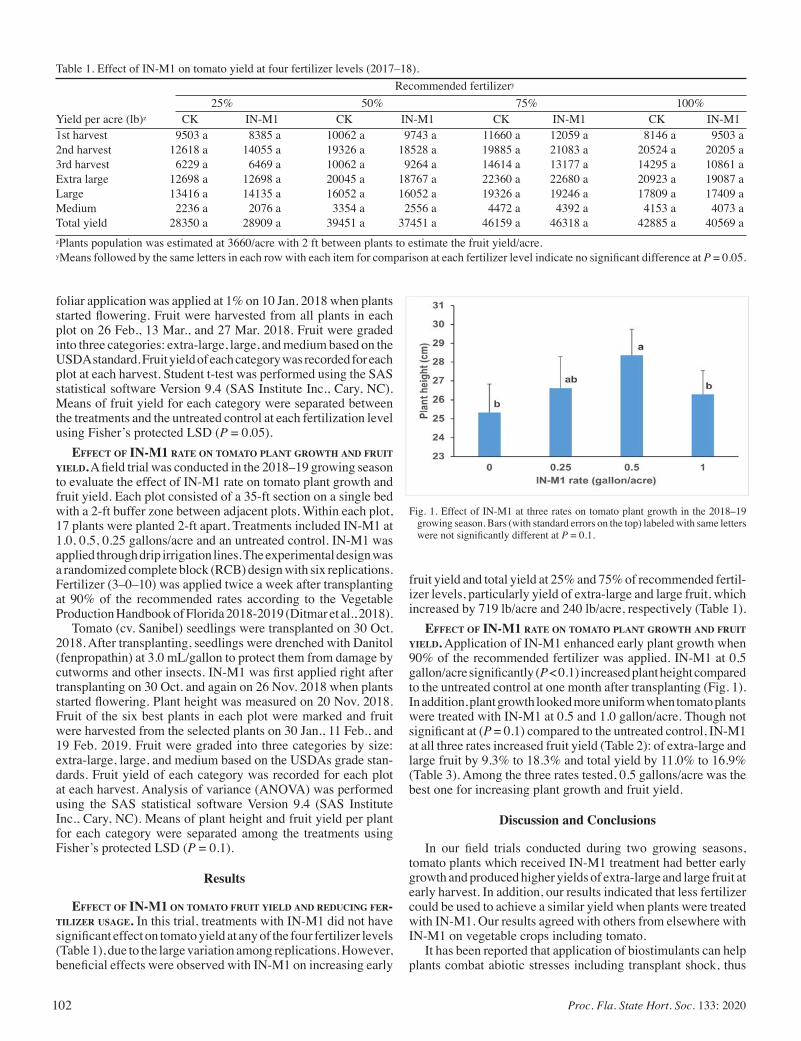
102 Proc. Fla. State Hort. Soc. 133: 2020
foliar application was applied at 1% on 10 Jan. 2018 when plants started flowering. Fruit were harvested from all plants in each plot on 26 Feb., 13 Mar., and 27 Mar. 2018. Fruit were graded into three categories: extra-large, large, and medium based on the USDA standard. Fruit yield of each category was recorded for each plot at each harvest. Student t-test was performed using the SAS statistical software Version 9.4 (SAS Institute Inc., Cary, NC). Means of fruit yield for each category were separated between the treatments and the untreated control at each fertilization level using Fisher’s protected LSD (P = 0.05).
eFFect oF in-m1 rAte on tomAto plAnt growth And Fruit yield. A field trial was conducted in the 2018–19 growing season to evaluate the effect of IN-M1 rate on tomato plant growth and fruit yield. Each plot consisted of a 35-ft section on a single bed with a 2-ft buffer zone between adjacent plots. Within each plot, 17 plants were planted 2-ft apart. Treatments included IN-M1 at 1.0, 0.5, 0.25 gallons/acre and an untreated control. IN-M1 was applied through drip irrigation lines. The experimental design was a randomized complete block (RCB) design with six replications. Fertilizer (3–0–10) was applied twice a week after transplanting at 90% of the recommended rates according to the Vegetable Production Handbook of Florida 2018-2019 (Ditmar et al., 2018).
Tomato (cv. Sanibel) seedlings were transplanted on 30 Oct. 2018. After transplanting, seedlings were drenched with Danitol (fenpropathin) at 3.0 mL/gallon to protect them from damage by cutworms and other insects. IN-M1 was first applied right after transplanting on 30 Oct. and again on 26 Nov. 2018 when plants started flowering. Plant height was measured on 20 Nov. 2018. Fruit of the six best plants in each plot were marked and fruit were harvested from the selected plants on 30 Jan., 11 Feb., and 19 Feb. 2019. Fruit were graded into three categories by size: extra-large, large, and medium based on the USDAs grade stan-dards. Fruit yield of each category was recorded for each plot at each harvest. Analysis of variance (ANOVA) was performed using the SAS statistical software Version 9.4 (SAS Institute Inc., Cary, NC). Means of plant height and fruit yield per plant for each category were separated among the treatments using Fisher’s protected LSD (P = 0.1).
Results
eFFect oF in-m1 on tomAto Fruit yield And reducing Fer-tilizer usAge. In this trial, treatments with IN-M1 did not have significant effect on tomato yield at any of the four fertilizer levels (Table 1), due to the large variation among replications. However, beneficial effects were observed with IN-M1 on increasing early
fruit yield and total yield at 25% and 75% of recommended fertil-izer levels, particularly yield of extra-large and large fruit, which increased by 719 lb/acre and 240 lb/acre, respectively (Table 1).
eFFect oF in-m1 rAte on tomAto plAnt growth And Fruit yield. Application of IN-M1 enhanced early plant growth when 90% of the recommended fertilizer was applied. IN-M1 at 0.5 gallon/acre significantly (P < 0.1) increased plant height compared to the untreated control at one month after transplanting (Fig. 1). In addition, plant growth looked more uniform when tomato plants were treated with IN-M1 at 0.5 and 1.0 gallon/acre. Though not significant at (P = 0.1) compared to the untreated control, IN-M1 at all three rates increased fruit yield (Table 2): of extra-large and large fruit by 9.3% to 18.3% and total yield by 11.0% to 16.9% (Table 3). Among the three rates tested, 0.5 gallons/acre was the best one for increasing plant growth and fruit yield.
Discussion and Conclusions
In our field trials conducted during two growing seasons, tomato plants which received IN-M1 treatment had better early growth and produced higher yields of extra-large and large fruit at early harvest. In addition, our results indicated that less fertilizer could be used to achieve a similar yield when plants were treated with IN-M1. Our results agreed with others from elsewhere with IN-M1 on vegetable crops including tomato.
It has been reported that application of biostimulants can help plants combat abiotic stresses including transplant shock, thus
Table 1. Effect of IN-M1 on tomato yield at four fertilizer levels (2017–18). Recommended fertilizery
25% 50% 75% 100%Yield per acre (lb)z CK IN-M1 CK IN-M1 CK IN-M1 CK IN-M11st harvest 9503 a 8385 a 10062 a 9743 a 11660 a 12059 a 8146 a 9503 a2nd harvest 12618 a 14055 a 19326 a 18528 a 19885 a 21083 a 20524 a 20205 a3rd harvest 6229 a 6469 a 10062 a 9264 a 14614 a 13177 a 14295 a 10861 aExtra large 12698 a 12698 a 20045 a 18767 a 22360 a 22680 a 20923 a 19087 aLarge 13416 a 14135 a 16052 a 16052 a 19326 a 19246 a 17809 a 17409 aMedium 2236 a 2076 a 3354 a 2556 a 4472 a 4392 a 4153 a 4073 aTotal yield 28350 a 28909 a 39451 a 37451 a 46159 a 46318 a 42885 a 40569 azPlants population was estimated at 3660/acre with 2 ft between plants to estimate the fruit yield/acre.yMeans followed by the same letters in each row with each item for comparison at each fertilizer level indicate no significant difference at P = 0.05.
Fig. 1. Effect of IN-M1 at three rates on tomato plant growth in the 2018–19 growing season. Bars (with standard errors on the top) labeled with same letters were not significantly different at P = 0.1.
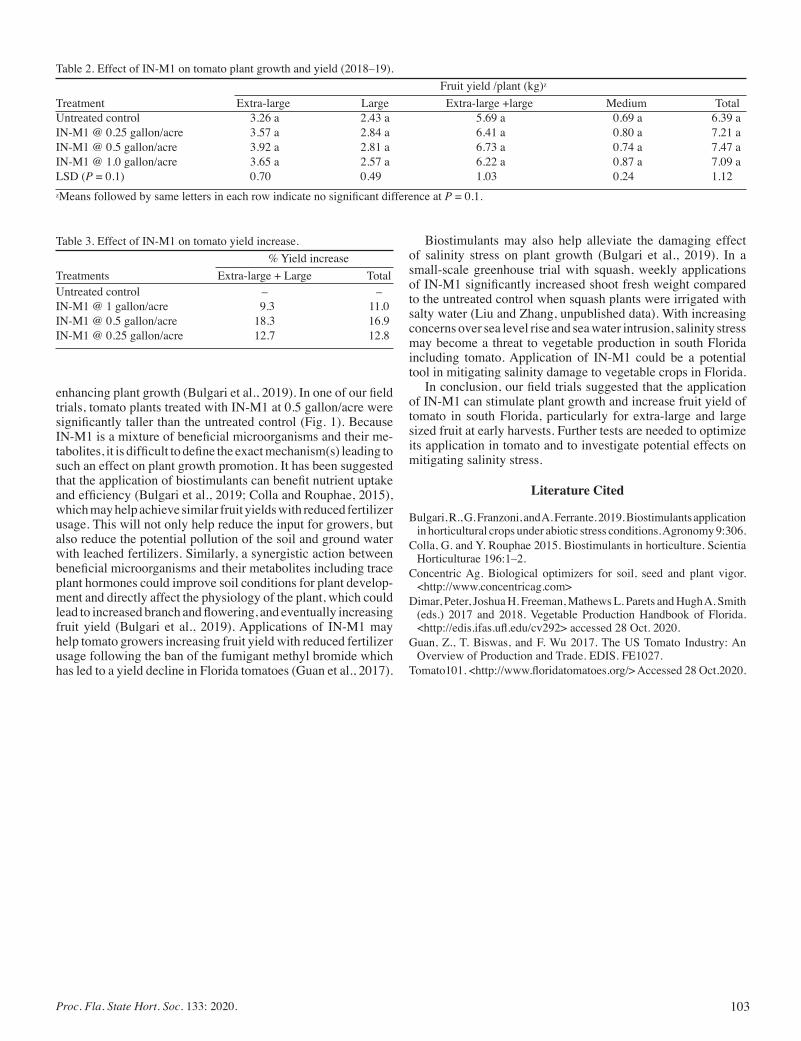
103Proc. Fla. State Hort. Soc. 133: 2020.
enhancing plant growth (Bulgari et al., 2019). In one of our field trials, tomato plants treated with IN-M1 at 0.5 gallon/acre were significantly taller than the untreated control (Fig. 1). Because IN-M1 is a mixture of beneficial microorganisms and their me-tabolites, it is difficult to define the exact mechanism(s) leading to such an effect on plant growth promotion. It has been suggested that the application of biostimulants can benefit nutrient uptake and efficiency (Bulgari et al., 2019; Colla and Rouphae, 2015), which may help achieve similar fruit yields with reduced fertilizer usage. This will not only help reduce the input for growers, but also reduce the potential pollution of the soil and ground water with leached fertilizers. Similarly, a synergistic action between beneficial microorganisms and their metabolites including trace plant hormones could improve soil conditions for plant develop-ment and directly affect the physiology of the plant, which could lead to increased branch and flowering, and eventually increasing fruit yield (Bulgari et al., 2019). Applications of IN-M1 may help tomato growers increasing fruit yield with reduced fertilizer usage following the ban of the fumigant methyl bromide which has led to a yield decline in Florida tomatoes (Guan et al., 2017).
Table 3. Effect of IN-M1 on tomato yield increase. % Yield increaseTreatments Extra-large + Large TotalUntreated control – –IN-M1 @ 1 gallon/acre 9.3 11.0IN-M1 @ 0.5 gallon/acre 18.3 16.9IN-M1 @ 0.25 gallon/acre 12.7 12.8
Table 2. Effect of IN-M1 on tomato plant growth and yield (2018–19). Fruit yield /plant (kg)z
Treatment Extra-large Large Extra-large +large Medium TotalUntreated control 3.26 a 2.43 a 5.69 a 0.69 a 6.39 aIN-M1 @ 0.25 gallon/acre 3.57 a 2.84 a 6.41 a 0.80 a 7.21 aIN-M1 @ 0.5 gallon/acre 3.92 a 2.81 a 6.73 a 0.74 a 7.47 aIN-M1 @ 1.0 gallon/acre 3.65 a 2.57 a 6.22 a 0.87 a 7.09 aLSD (P = 0.1) 0.70 0.49 1.03 0.24 1.12zMeans followed by same letters in each row indicate no significant difference at P = 0.1.
Biostimulants may also help alleviate the damaging effect of salinity stress on plant growth (Bulgari et al., 2019). In a small-scale greenhouse trial with squash, weekly applications of IN-M1 significantly increased shoot fresh weight compared to the untreated control when squash plants were irrigated with salty water (Liu and Zhang, unpublished data). With increasing concerns over sea level rise and sea water intrusion, salinity stress may become a threat to vegetable production in south Florida including tomato. Application of IN-M1 could be a potential tool in mitigating salinity damage to vegetable crops in Florida.
In conclusion, our field trials suggested that the application of IN-M1 can stimulate plant growth and increase fruit yield of tomato in south Florida, particularly for extra-large and large sized fruit at early harvests. Further tests are needed to optimize its application in tomato and to investigate potential effects on mitigating salinity stress.
Literature Cited
Bulgari, R., G. Franzoni, and A. Ferrante. 2019. Biostimulants application in horticultural crops under abiotic stress conditions. Agronomy 9:306.
Colla, G. and Y. Rouphae 2015. Biostimulants in horticulture. Scientia Horticulturae 196:1–2.
Concentric Ag. Biological optimizers for soil, seed and plant vigor. <http://www.concentricag.com>
Dimar, Peter, Joshua H. Freeman, Mathews L. Parets and Hugh A. Smith (eds.) 2017 and 2018. Vegetable Production Handbook of Florida. <http://edis.ifas.ufl.edu/cv292> accessed 28 Oct. 2020.
Guan, Z., T. Biswas, and F. Wu 2017. The US Tomato Industry: An Overview of Production and Trade. EDIS. FE1027.
Tomato101. <http://www.floridatomatoes.org/> Accessed 28 Oct.2020.
104 Proc. Fla. State Hort. Soc. 133: 2020
Proc. Fla. State Hort. Soc. 133:104–109. 2020.
Vegetable Section
Physiological, Growth and Yield Responses of Yellow Squash and Snapbean to a Potassium and
Zinc Foliar FertilizerAnA I. VArgAs, DAkshInA seAl*, AnD Bruce schAffer
Tropical Research and Education Center, University of Florida/IFAS, 18905 SW 280 St., Homestead, FL 33031
AdditionAl index words. leaf chlorophyll index, chlorophyll fluorescence, net CO2 assimilation, transpiration, stomatal conductance
Yellow squash (Cucurbita pepo L.) and snapbean (Phaseolus vulgaris L.) are two of the main vegetable crops grown in south Florida. A field study was conducted to evaluate the effectiveness of a foliar-applied commercial fertilizer formulation (Strong Billow K®) containing potassium (K), zinc (Zn) and organic carbon on physiology, growth and yield of yellow squash and snapbean. Each crop was divided into three treatments: (T1) control (foliar applications of tap water), (T2) foliar applications of Strong Billow K® at the manufacturer’s recommended rate (2.5 ml L-1), and (T3) foliar application of K (as K2O) and soluble Zn, applied at the same concentration as in the Strong Billow K® treatment. Application of Strong Billow K® had a positive effect on the leaf chlorophyll index (SPAD values), variable to maximum chlorophyll fluorescence ratio (Fv/Fm), net CO2 assimilation (A), stomatal conductance (gs), transpira-tion (E), and total fruit number per plant of squash and snapbean, as well as total fruit weight per plant of snapbean compared to the other two treatments. The effectiveness of Strong Billow K® on improving physiology, growth, and yield of yellow squash and snapbean were not due solely to the addition K and Zn in the Strong Billow K® formulation because applying these elements alone was no more effective than the control treatment.
The application of foliar fertilizers can decrease nitrogen (N), phosphorous (P), and potassium (K) soil fertilizers by up to 25%, thus reducing soil pollution and enhancing soil fertility (Alexander and Schoeder, 1987). Foliar fertilizers have been shown to increase net CO2 assimilation (A), transpiration (E), stomatal conductance (gs) (Haytova, 2015), vegetative and fruit biomass (Dimpka and Bindraban, 2016), and crop yield (Fageria et al., 2009). An advantage of foliar fertilizers over soil-applied formulations is that foliar fertilizers are often absorbed more rapidly than soil-applied fertilizers. Therefore, nutrients become available and accessible to the plant in a relatively short time (Baloch et al., 2008).
In addition to nutrient elements, commercial foliar fertilizer formulations often contain additional substances including vita-mins, phytohormones, amino acids, humic acids, and adjuvants. Some of these substances provide additional benefits to the plant. For example, humic acids have been shown to increase soil water holding capacity (Behzad, 2014), plant dry weight, (Khaled and Fawy, 2011) and crop yields (Bakry et al., 2013).
Yellow squash (Cucurbita pepo L. cv. Enterprise) and snapbean (Phaseolus vulgaris L. cv. Caprice) also called green bean, are two of the main vegetable crops grown in Miami-Dade County, FL (Seal et al., 2016). Florida accounts for about 90% of the United States squash and fresh snapbean production. About 57% (11,050 ha) of Florida’s snapbeans are grown in Miami-Dade
County with a yield/ha of 321–494 bushels (13.6 kg = 1 bushel) (Zhang et. al., 2017). Miami-Dade grows about 2430 ha of yel-low squash i and accounts for about 21% of Florida’s yellow squash production (Hochmuth and Hanlon, 2017). The yield/ha is 741–1111 bushels (19.1 kg = 1 bushel) (Seal et. al., 2016). In southern Florida, yellow squash and snapbean are grown in oolitic limestone soils classified as Krome or Chekika very gravelly loam, characterized as loamy-skeletal, carbonatic hyperthermia lithic rendolls (Noble et al., 1996). These soils are alkaline (pH of 7.2–8.0), low in organic matter, very porous and have very low water- and nutrient-holding capacities (Li, 2001). Due to the high pH of these soils, minor elements applied to the soil are often bound or precipitated and not available to the plants un-less applied as very expensive chelated formulations (Li, 2001). Application of foliar fertilizers, particularly minor elements, can overcome these soil nutrient limitations. Thus, identifying effec-tive foliar micronutrient formulations is of paramount importance for vegetable crops grown on alkaline soils.
The objective of this study was to evaluate the effectiveness of a commercial foliar fertilizer formulation (Strong Billow K®; Grupo, Kaikun S.A.S., Medellin, Colombia) containing K2O, zinc (Zn), and organic carbon on the physiology, growth, and yield of yellow squash and snapbean grown in an alkaline soil.
Materials and Methods
The study was conducted from 19 Dec. 2017 to 15 Feb. 2018 at the Tropical Research and Educational Center (UF-TREC) in Homestead, FL. (Lat. 25º30’40.809” N; Long. 80º30’3.983”). During the experiment, air temperature, humidity, rainfall and evapotranspiration data were collected from a Florida Automated
We would like to thank StrongBillow K®; Grupo, Kaikun S.A.S., Medelling, Colombia who supported this study. We thank our laboratory technical group and field workers who helped us maintain these crops.*Corresponding author. Email:[email protected]
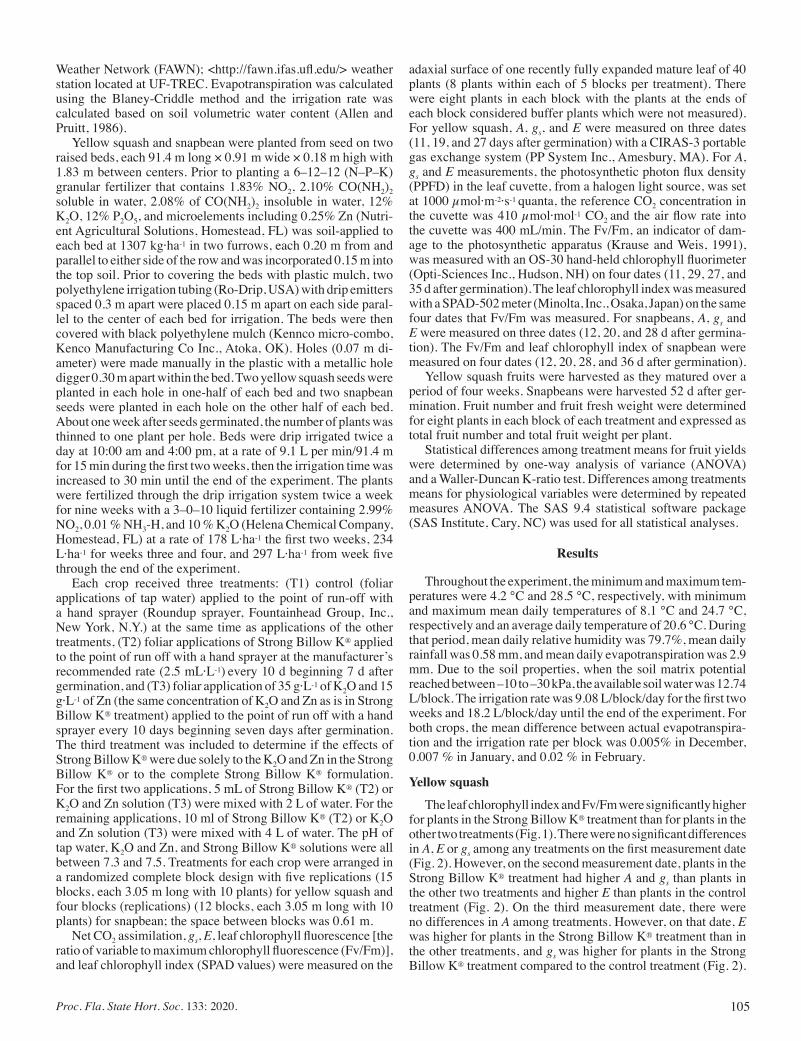
105Proc. Fla. State Hort. Soc. 133: 2020.
Weather Network (FAWN); <http://fawn.ifas.ufl.edu/> weather station located at UF-TREC. Evapotranspiration was calculated using the Blaney-Criddle method and the irrigation rate was calculated based on soil volumetric water content (Allen and Pruitt, 1986).
Yellow squash and snapbean were planted from seed on two raised beds, each 91.4 m long × 0.91 m wide × 0.18 m high with 1.83 m between centers. Prior to planting a 6–12–12 (N–P–K) granular fertilizer that contains 1.83% NO2, 2.10% CO(NH2)2 soluble in water, 2.08% of CO(NH2)2 insoluble in water, 12% K2O, 12% P2O5, and microelements including 0.25% Zn (Nutri-ent Agricultural Solutions, Homestead, FL) was soil-applied to each bed at 1307 kg·ha-1 in two furrows, each 0.20 m from and parallel to either side of the row and was incorporated 0.15 m into the top soil. Prior to covering the beds with plastic mulch, two polyethylene irrigation tubing (Ro-Drip, USA) with drip emitters spaced 0.3 m apart were placed 0.15 m apart on each side paral-lel to the center of each bed for irrigation. The beds were then covered with black polyethylene mulch (Kennco micro-combo, Kenco Manufacturing Co Inc., Atoka, OK). Holes (0.07 m di-ameter) were made manually in the plastic with a metallic hole digger 0.30 m apart within the bed. Two yellow squash seeds were planted in each hole in one-half of each bed and two snapbean seeds were planted in each hole on the other half of each bed. About one week after seeds germinated, the number of plants was thinned to one plant per hole. Beds were drip irrigated twice a day at 10:00 am and 4:00 pm, at a rate of 9.1 L per min/91.4 m for 15 min during the first two weeks, then the irrigation time was increased to 30 min until the end of the experiment. The plants were fertilized through the drip irrigation system twice a week for nine weeks with a 3–0–10 liquid fertilizer containing 2.99% NO2, 0.01 % NH3-H, and 10 % K2O (Helena Chemical Company, Homestead, FL) at a rate of 178 L·ha-1 the first two weeks, 234 L·ha-1 for weeks three and four, and 297 L·ha-1 from week five through the end of the experiment.
Each crop received three treatments: (T1) control (foliar applications of tap water) applied to the point of run-off with a hand sprayer (Roundup sprayer, Fountainhead Group, Inc., New York, N.Y.) at the same time as applications of the other treatments, (T2) foliar applications of Strong Billow K® applied to the point of run off with a hand sprayer at the manufacturer’s recommended rate (2.5 mL·L-1) every 10 d beginning 7 d after germination, and (T3) foliar application of 35 g·L-1 of K2O and 15 g·L-1 of Zn (the same concentration of K2O and Zn as is in Strong Billow K® treatment) applied to the point of run off with a hand sprayer every 10 days beginning seven days after germination. The third treatment was included to determine if the effects of Strong Billow K® were due solely to the K2O and Zn in the Strong Billow K® or to the complete Strong Billow K® formulation. For the first two applications, 5 mL of Strong Billow K® (T2) or K2O and Zn solution (T3) were mixed with 2 L of water. For the remaining applications, 10 ml of Strong Billow K® (T2) or K2O and Zn solution (T3) were mixed with 4 L of water. The pH of tap water, K2O and Zn, and Strong Billow K® solutions were all between 7.3 and 7.5. Treatments for each crop were arranged in a randomized complete block design with five replications (15 blocks, each 3.05 m long with 10 plants) for yellow squash and four blocks (replications) (12 blocks, each 3.05 m long with 10 plants) for snapbean; the space between blocks was 0.61 m.
Net CO2 assimilation, gs, E, leaf chlorophyll fluorescence [the ratio of variable to maximum chlorophyll fluorescence (Fv/Fm)], and leaf chlorophyll index (SPAD values) were measured on the
adaxial surface of one recently fully expanded mature leaf of 40 plants (8 plants within each of 5 blocks per treatment). There were eight plants in each block with the plants at the ends of each block considered buffer plants which were not measured). For yellow squash, A, gs, and E were measured on three dates (11, 19, and 27 days after germination) with a CIRAS-3 portable gas exchange system (PP System Inc., Amesbury, MA). For A, gs and E measurements, the photosynthetic photon flux density (PPFD) in the leaf cuvette, from a halogen light source, was set at 1000 µmol·m-2·s-1 quanta, the reference CO2 concentration in the cuvette was 410 µmol·mol-1 CO2 and the air flow rate into the cuvette was 400 mL/min. The Fv/Fm, an indicator of dam-age to the photosynthetic apparatus (Krause and Weis, 1991), was measured with an OS-30 hand-held chlorophyll fluorimeter (Opti-Sciences Inc., Hudson, NH) on four dates (11, 29, 27, and 35 d after germination). The leaf chlorophyll index was measured with a SPAD-502 meter (Minolta, Inc., Osaka, Japan) on the same four dates that Fv/Fm was measured. For snapbeans, A, gs and E were measured on three dates (12, 20, and 28 d after germina-tion). The Fv/Fm and leaf chlorophyll index of snapbean were measured on four dates (12, 20, 28, and 36 d after germination).
Yellow squash fruits were harvested as they matured over a period of four weeks. Snapbeans were harvested 52 d after ger-mination. Fruit number and fruit fresh weight were determined for eight plants in each block of each treatment and expressed as total fruit number and total fruit weight per plant.
Statistical differences among treatment means for fruit yields were determined by one-way analysis of variance (ANOVA) and a Waller-Duncan K-ratio test. Differences among treatments means for physiological variables were determined by repeated measures ANOVA. The SAS 9.4 statistical software package (SAS Institute, Cary, NC) was used for all statistical analyses.
Results
Throughout the experiment, the minimum and maximum tem-peratures were 4.2 °C and 28.5 °C, respectively, with minimum and maximum mean daily temperatures of 8.1 °C and 24.7 °C, respectively and an average daily temperature of 20.6 °C. During that period, mean daily relative humidity was 79.7%, mean daily rainfall was 0.58 mm, and mean daily evapotranspiration was 2.9 mm. Due to the soil properties, when the soil matrix potential reached between –10 to –30 kPa, the available soil water was 12.74 L/block. The irrigation rate was 9.08 L/block/day for the first two weeks and 18.2 L/block/day until the end of the experiment. For both crops, the mean difference between actual evapotranspira-tion and the irrigation rate per block was 0.005% in December, 0.007 % in January, and 0.02 % in February.
Yellow squash
The leaf chlorophyll index and Fv/Fm were significantly higher for plants in the Strong Billow K® treatment than for plants in the other two treatments (Fig. 1). There were no significant differences in A, E or gs among any treatments on the first measurement date (Fig. 2). However, on the second measurement date, plants in the Strong Billow K® treatment had higher A and gs than plants in the other two treatments and higher E than plants in the control treatment (Fig. 2). On the third measurement date, there were no differences in A among treatments. However, on that date, E was higher for plants in the Strong Billow K® treatment than in the other treatments, and gs was higher for plants in the Strong Billow K® treatment compared to the control treatment (Fig. 2).
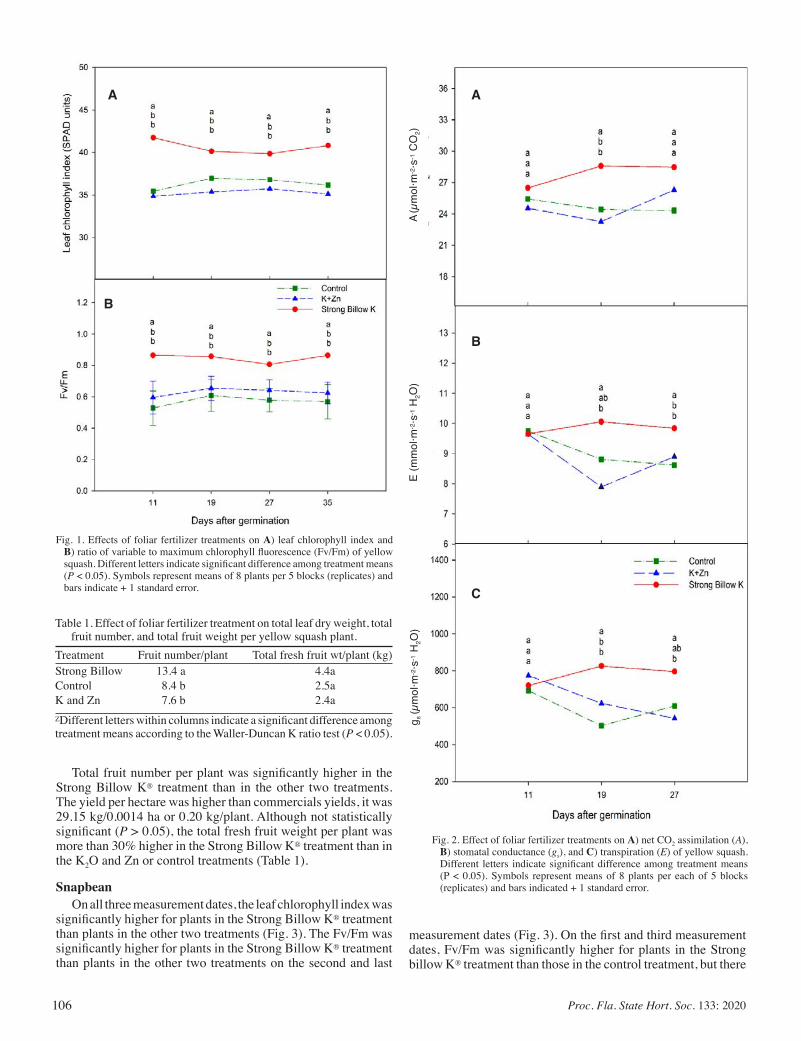
106 Proc. Fla. State Hort. Soc. 133: 2020
Total fruit number per plant was significantly higher in the Strong Billow K® treatment than in the other two treatments. The yield per hectare was higher than commercials yields, it was 29.15 kg/0.0014 ha or 0.20 kg/plant. Although not statistically significant (P > 0.05), the total fresh fruit weight per plant was more than 30% higher in the Strong Billow K® treatment than in the K2O and Zn or control treatments (Table 1).
SnapbeanOn all three measurement dates, the leaf chlorophyll index was
significantly higher for plants in the Strong Billow K® treatment than plants in the other two treatments (Fig. 3). The Fv/Fm was significantly higher for plants in the Strong Billow K® treatment than plants in the other two treatments on the second and last
Fig. 1. Effects of foliar fertilizer treatments on A) leaf chlorophyll index and B) ratio of variable to maximum chlorophyll fluorescence (Fv/Fm) of yellow squash. Different letters indicate significant difference among treatment means (P < 0.05). Symbols represent means of 8 plants per 5 blocks (replicates) and bars indicate + 1 standard error.
Fig. 2. Effect of foliar fertilizer treatments on A) net CO2 assimilation (A), B) stomatal conductance (gs), and C) transpiration (E) of yellow squash. Different letters indicate significant difference among treatment means (P < 0.05). Symbols represent means of 8 plants per each of 5 blocks (replicates) and bars indicated + 1 standard error.
Table 1. Effect of foliar fertilizer treatment on total leaf dry weight, total fruit number, and total fruit weight per yellow squash plant.
Treatment Fruit number/plant Total fresh fruit wt/plant (kg)Strong Billow 13.4 a 4.4aControl 8.4 b 2.5aK and Zn 7.6 b 2.4aZDifferent letters within columns indicate a significant difference among treatment means according to the Waller-Duncan K ratio test (P < 0.05).
measurement dates (Fig. 3). On the first and third measurement dates, Fv/Fm was significantly higher for plants in the Strong billow K® treatment than those in the control treatment, but there
g s (µ
mol
·m-2·s
-1 H
2O)
E (m
mol
·m-2·s
-1 H
2O)
A (µ
mol
·m-2·s
-1 C
O2)
A
B
B
A
C
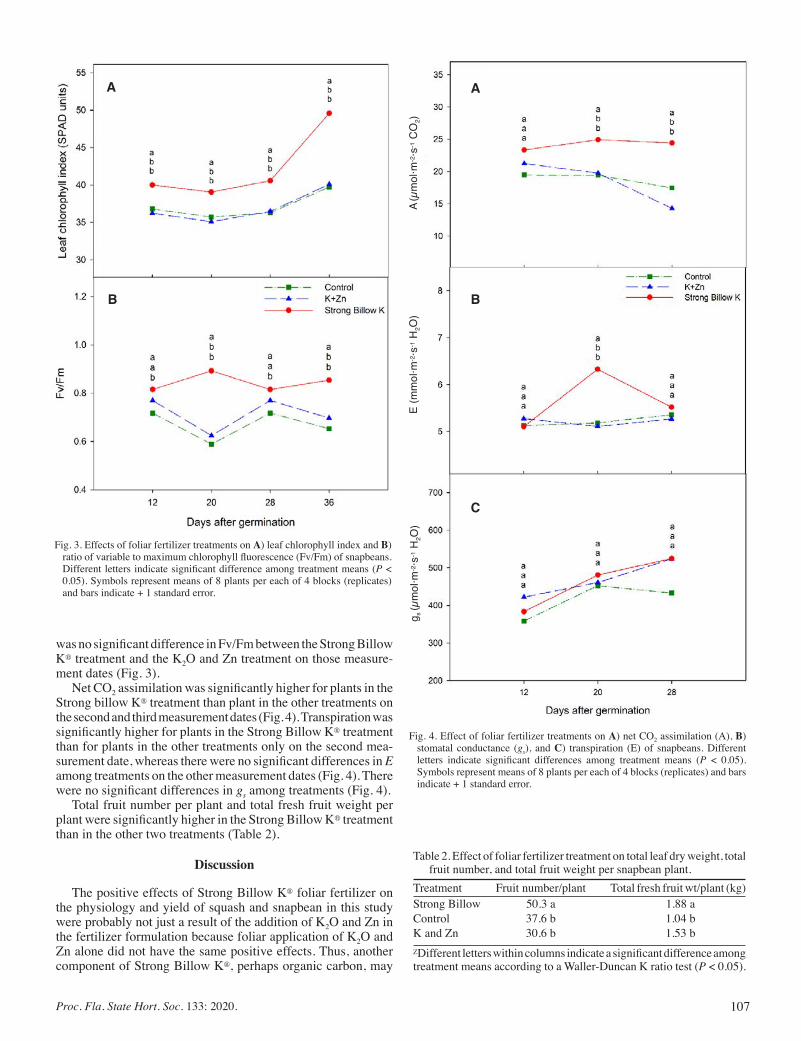
107Proc. Fla. State Hort. Soc. 133: 2020.
was no significant difference in Fv/Fm between the Strong Billow K® treatment and the K2O and Zn treatment on those measure-ment dates (Fig. 3).
Net CO2 assimilation was significantly higher for plants in the Strong billow K® treatment than plant in the other treatments on the second and third measurement dates (Fig. 4). Transpiration was significantly higher for plants in the Strong Billow K® treatment than for plants in the other treatments only on the second mea-surement date, whereas there were no significant differences in E among treatments on the other measurement dates (Fig. 4). There were no significant differences in gs among treatments (Fig. 4).
Total fruit number per plant and total fresh fruit weight per plant were significantly higher in the Strong Billow K® treatment than in the other two treatments (Table 2).
Discussion
The positive effects of Strong Billow K® foliar fertilizer on the physiology and yield of squash and snapbean in this study were probably not just a result of the addition of K2O and Zn in the fertilizer formulation because foliar application of K2O and Zn alone did not have the same positive effects. Thus, another component of Strong Billow K®, perhaps organic carbon, may
Fig. 3. Effects of foliar fertilizer treatments on A) leaf chlorophyll index and B) ratio of variable to maximum chlorophyll fluorescence (Fv/Fm) of snapbeans. Different letters indicate significant difference among treatment means (P < 0.05). Symbols represent means of 8 plants per each of 4 blocks (replicates) and bars indicate + 1 standard error.
Fig. 4. Effect of foliar fertilizer treatments on A) net CO2 assimilation (A), B) stomatal conductance (gs), and C) transpiration (E) of snapbeans. Different letters indicate significant differences among treatment means (P < 0.05). Symbols represent means of 8 plants per each of 4 blocks (replicates) and bars indicate + 1 standard error.
Table 2. Effect of foliar fertilizer treatment on total leaf dry weight, total fruit number, and total fruit weight per snapbean plant.
Treatment Fruit number/plant Total fresh fruit wt/plant (kg)Strong Billow 50.3 a 1.88 aControl 37.6 b 1.04 bK and Zn 30.6 b 1.53 bZDifferent letters within columns indicate a significant difference among treatment means according to a Waller-Duncan K ratio test (P < 0.05).
g s (µ
mol
·m-2·s
-1 H
2O)
E (m
mol
·m-2·s
-1 H
2O)
A (µ
mol
·m-2·s
-1 C
O2)
A A
BB
C
108 Proc. Fla. State Hort. Soc. 133: 2020
have either had a direct effect on plant physiology and growth, or indirectly affected K2O or Zn in the solution, making it more easily absorbed or metabolized by the plants. Many studies have shown positive results using similar combinations of K2O and Zn with other substances. For example, K combined with humic acid can facilitate the delivery of high levels of organic soluble K to the plant through foliar or soil applications (Shafeek et al., 2015). In a previous study, the combination of foliar Zn and chi-tosan had a positive effect on seed yield of dry bean (Ibrahim and Ramadan, 2015). In the present experiment, foliar application of Strong Billow K® on yellow squash and snapbean resulted in an increase in the leaf chlorophyll index and Fv/Fm in both yellow squash and snapbean. Kaya et al. (2002) observed an increase in chlorophyll content in tomato leaves after foliar application of Zn at 0.35 μmol·L-1 compared with a control treatment with 7.7 μmol·L-1 Zn in the nutrient solution. Similar results were found in several varieties of mungbean with 2 μM of Zn applied to the foliage (Tayyeba et al., 2013). An increase in the leaf chlorophyll index was observed in green bean, cucumber, and tomato with foliar applications of aminochelate (Souri et al., 2017), which may have chelated Zn to a form more available for plant metabolism. Brennan (1991) showed that foliar application of Zn in a che-lated form (ZnEDTA) increased grain yield of wheat compared to foliar application of a non-chelated form of Zn (ZnSO4). The higher Fv/Fm of yellow squash and snapbean the Strong Billow K® treatment compared to the other treatments studied may have also been due, at least in part, to K2O in the Strong Billow K®. In coriander plants, increased leaf chlorophyll index and Fv/Fm were observed with foliar applications of K (Roosta, 2014).
In both yellow squash and snapbean, foliar applications of Strong Billow K® resulted in higher A and E compared to foliar application of K2O and Zn or tap water. Similarly, an increase in leaf gas exchange variables of zucchini was observed with the foliar application of three commercial products with different chemical formulations [Fitona® 3 (5.20% K2O and 0.007% Zn), Hortigrow® (20% K2O and 0.02% Zn), and Humustim® (7.83% K2O and 0.01% Zn)], each containing K and Zn (Haytova, 2015). An increase in A and E were observed on jatropha plants with the foliar application of BAM-FXTM, containing 7.14% Zn, when the soil application rate of nitrogen (N), phosphorous (P) and potassium (K) were low (Bosco de Oliveira et al., 2019). In coffee plants, A and gs increased 55% in response to a foliar application of ZnSO4, N and P compared to a control treatment with no foliar fertilizer applied (Rossi et al., 2018).
Fruit number per plant of both yellow squash and snapbean was significantly higher for plants treated with Strong Billow K® than those in the other two treatments. Foliar application of K or Zn has been shown to increase crop reproductive development and yield. For example, the number of seeds and seed weight per plant increased with the combination of Zn and humic acid applied to the foliage of bean plants (Kaya et al., 2005). Also, foliar application of Zn, K, or Mg had a positive effect on yield and growth of several varieties of mungbean (Thalooth et al., 2006) and foliar application of 100 or 200 ppm K increased plant growth and yield of pepper (Hussein et al., 2012). Kaya and Higgs (2002) reported an increase in chlorophyll content, dry weight and fruit yield of tomato with foliar applications of Zn. In contrast to these findings, in the present study, increased yield of yellow squash and growth and yield of snapbean receiv-ing foliar applications of Strong Billow K® was apparently not solely due to K2O and/or Zn in the formulation, even though leaf Zn concentration (results not shown) was higher in the Strong
Billow K® treatment than in the control treatment for both crops, because applying those elements alone was no more effective than applying tap water. Therefore, the positive effects of Strong Billow K® on snapbean growth and squash and snapbean yields may have been due to direct effects of other components in the Strong Billow K® formulation on plant growth and yield or indirect effects of other components in the formulation on Zn and or K absorption through the foliage. Nevertheless, foliar applications Strong Billow K® significantly increased growth of snapbeans and yield of squash and snapbeans.
Literature Cited
Alexander, A. and M. Schoeder. 1987. Fertilizer use efficiency. J. Plant Nutr. 10:1391–1399.
Allen, R.G. and W.O. Pruitt, 1986. Rational of the FAO Blaney-Criddle formula. J. Irrigation Drainage Engineering 112:139–155.
Bakry, B.A., T.A. Elewa, and A.M. El-Kramany. 2013. Effect of humic and ascorbic acids foliar application on yield and yield components of two wheat cultivars grown under newly reclaimed sandy soil. Internat. J. Argon. Plant Prod. 4:1125–1133.
Baloch, Q.B., Q.I. Chachar, and M.N. Tareen. 2008. Effect of foliar ap-plication of macro and micro-nutrients on production of green chilies (Capsicum annuum L.). J. Agric. Technol. 4:174–184.
Behzad, S. 2014. Foliar application of humic acid on plant height in canola. Science Direct 8:82–86.
Bosco de Oliveira, A., A.P. Costa, L.C.N. Londe, B. Schaffer, A.I. Vargas, and W.A. Vendrame. 2018. Effectiveness of a micronutrient delivery system Fertilizer in jatropha plants is related to enhanced photosyn-thesis, gas exchange, and biomass allocation. Bioscience J. 34:97–107.
Dimkpa, C.O. and P.S. Bindraban. 2016. Fortification of micronutrients for efficient agronomic production: a review. Agron. Sustain. Dev. 36:7.
Fageria, N.K., F.M. P. Barbosa, A. Moreira, and C.M. Guimarães. 2009. Foliar fertilization of crop plants. J. Plant Nutr. 32:1044-1064.
Haytova, D. 2015. Physiological response of zucchini squash (Cucurbita pepo L. var. Giromontia) to foliar fertilization. Scientia Agric. 9:30–33.
Hochmuth, G. and E. Hanlon. 2017. A summary of N, P, K research with squash in Florida. University of Florida, IFAS Extension Publ. SL343, Gainesville, FL. <http://edis.ifas.ufl.edu/cv227>
Hussein, M.M., S.Y. El-Faham, and A.K. Alva. 2012. Pepper plants growth, yield, photosynthetic pigments, and total phenols as affected by foliar application of potassium under different salinity irrigation water. Agricultural Sci. 3:241–248.
Ibrahim, E. A. and W.A. Ramadan. 2015. Effect of zinc foliar spray alone and combined with humic acid or/and chitosan on growth, nutrient elements content and yield of dry bean (Phaseolus vulgaris L.) plants sown at different dates. Scientia Hort. 184:101–105.
Kaya, M., M. Atak, K.M. Khawar, C.Y. Ciftcit, and S. Ozcan. 2005. Effect of pre-sowing seed treatment with zinc and foliar spray of humic acids on yield of common bean (Phaseolus vulgaris L.). Int. J. Agric. 7:875–878.
Kaya, C. and D. Higgs. 2002. Response of tomato (Lycopersicon escu-lentum L.) cultivars to foliar application of zinc when grown in sand culture at low zinc. Scientia Hort. 93:53–64.
Khaled, H. and F.A. Fawy. 2011. Effect of different levels of humic acids on the nutrient content, plant growth, and soil properties under conditions of salinity. Soil Water Res. 6:21–29.
Krause, G.H. and E. Weis, 1991. Chlorophyll fluorescence as a tool in plant physiology, II. Interpretation of fluorescence signals. Photosyn-thesis Res. 5:139–157.
Li, Y.C. 2001. Calcareous woils in Miami-Dade County. University of Florida, IFAS Extension Publ. SL 183, Gainesville, FL. <http://edis.ifas.ufl.edu>
Roosta, H.R. 2014. Effects of foliar spray of K on mint, radish, parsley, and coriander plants in aquaponic system. J. Plant Nutr. 37:2236–2254.
Rossi, L., Fedenia, L.N., H. Sharifan, X. Ma, and L. Lombardini. 2019. Effects of foliar application of zinc sulfate and zinc nanoparticles in

109Proc. Fla. State Hort. Soc. 133: 2020.
coffee (Coffea arabica L.) plants. Plant Physiol. Biochem. 135:160–166.Seal, D., Zhang, S., M. Ozores-Hampton, P. Dittmar, Y. C. Li., W. Klassen,
Q. Wang, and T. Olczyk. 2016. Summer Squash Production in Miami Dade, Florida. University of Florida, IFAS Extension Bull. HS-861. <http://edis.ifas.ufl.edu/tr012.HS-861>
Shafeek, M.R., Y.I. Helmy, and N.M. Omar. 2015. Use of some bio-stimulants for improving the growth, yield, and bulb quality of onion plants (Allium cepa L.) under sandy soil conditions. Middle East J. Appl. Sci. 5:68–75.
Souri, M.K., F.Y. Sooraki, and M. Moghadamyar. 2017. Growth and quality of cucumber, tomato, and green bean under foliar and soil application of an aminochelate fertilizer. Hort. Environ. Biotechnol. 58:530–536.
Tayyeba, S.H., H.U. Shah, S. Ullah, and M. Javi. 2013. Zinc effect on growth rate, chlorophyll, protein and mineral contents of hydro-ponically grown mungbeans plant (Vigna radiata). Arabian J. Chem. 10:1802–1807.
Thalooth, A.T., M.M. Tawfik, and H.M. Mohamed. 2006. A comparative study on the effect of foliar application of zinc, potassium, and mag-nesium on growth, yield and some chemical constituents of mungbean plants grown under water stress conditions. World J. Agric. Sci. 2:37-46.
Zhang, S., D. Seal, M. Ozores-Hampton, M. Lamberts, Y.C. Li, W. Klassen, and T. Olczyk. 2017. Snapbean Production in Miami-Dade County, Florida. University of Florida, IFAS Extension Publ. HS853, Gainesville, FL. <http://edis.ifas.ufl.edu/tr005>
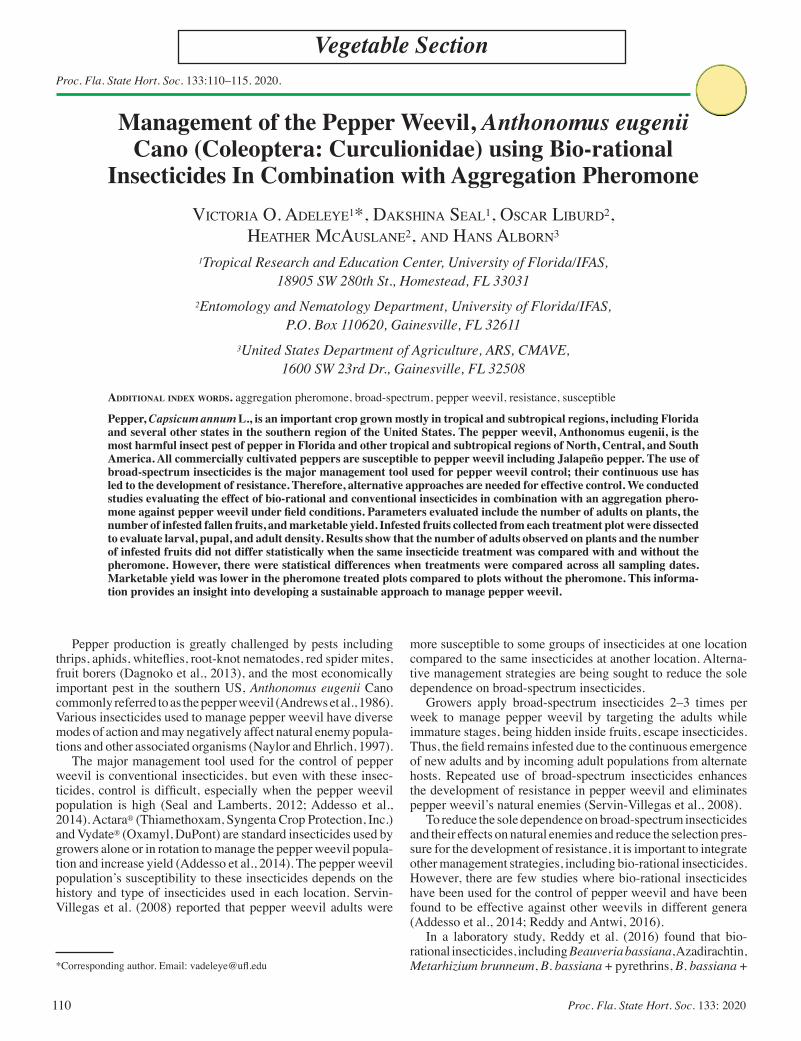
110 Proc. Fla. State Hort. Soc. 133: 2020
Proc. Fla. State Hort. Soc. 133:110–115. 2020.
Vegetable Section
*Corresponding author. Email: [email protected]
Management of the Pepper Weevil, Anthonomus eugenii Cano (Coleoptera: Curculionidae) using Bio-rational
Insecticides In Combination with Aggregation PheromoneVictoria o. adeleye1*, dakshina seal1, oscar liburd2,
heather Mcauslane2, and hans alborn3
1Tropical Research and Education Center, University of Florida/IFAS, 18905 SW 280th St., Homestead, FL 33031
2Entomology and Nematology Department, University of Florida/IFAS, P.O. Box 110620, Gainesville, FL 32611
3United States Department of Agriculture, ARS, CMAVE, 1600 SW 23rd Dr., Gainesville, FL 32508
AdditionAl index words. aggregation pheromone, broad-spectrum, pepper weevil, resistance, susceptible
Pepper, Capsicum annum L., is an important crop grown mostly in tropical and subtropical regions, including Florida and several other states in the southern region of the United States. The pepper weevil, Anthonomus eugenii, is the most harmful insect pest of pepper in Florida and other tropical and subtropical regions of North, Central, and South America. All commercially cultivated peppers are susceptible to pepper weevil including Jalapeño pepper. The use of broad-spectrum insecticides is the major management tool used for pepper weevil control; their continuous use has led to the development of resistance. Therefore, alternative approaches are needed for effective control. We conducted studies evaluating the effect of bio-rational and conventional insecticides in combination with an aggregation phero-mone against pepper weevil under field conditions. Parameters evaluated include the number of adults on plants, the number of infested fallen fruits, and marketable yield. Infested fruits collected from each treatment plot were dissected to evaluate larval, pupal, and adult density. Results show that the number of adults observed on plants and the number of infested fruits did not differ statistically when the same insecticide treatment was compared with and without the pheromone. However, there were statistical differences when treatments were compared across all sampling dates. Marketable yield was lower in the pheromone treated plots compared to plots without the pheromone. This informa-tion provides an insight into developing a sustainable approach to manage pepper weevil.
Pepper production is greatly challenged by pests including thrips, aphids, whiteflies, root-knot nematodes, red spider mites, fruit borers (Dagnoko et al., 2013), and the most economically important pest in the southern US, Anthonomus eugenii Cano commonly referred to as the pepper weevil (Andrews et al., 1986). Various insecticides used to manage pepper weevil have diverse modes of action and may negatively affect natural enemy popula-tions and other associated organisms (Naylor and Ehrlich, 1997).
The major management tool used for the control of pepper weevil is conventional insecticides, but even with these insec-ticides, control is difficult, especially when the pepper weevil population is high (Seal and Lamberts, 2012; Addesso et al., 2014). Actara® (Thiamethoxam, Syngenta Crop Protection, Inc.) and Vydate® (Oxamyl, DuPont) are standard insecticides used by growers alone or in rotation to manage the pepper weevil popula-tion and increase yield (Addesso et al., 2014). The pepper weevil population’s susceptibility to these insecticides depends on the history and type of insecticides used in each location. Servin-Villegas et al. (2008) reported that pepper weevil adults were
more susceptible to some groups of insecticides at one location compared to the same insecticides at another location. Alterna-tive management strategies are being sought to reduce the sole dependence on broad-spectrum insecticides.
Growers apply broad-spectrum insecticides 2–3 times per week to manage pepper weevil by targeting the adults while immature stages, being hidden inside fruits, escape insecticides. Thus, the field remains infested due to the continuous emergence of new adults and by incoming adult populations from alternate hosts. Repeated use of broad-spectrum insecticides enhances the development of resistance in pepper weevil and eliminates pepper weevil’s natural enemies (Servin-Villegas et al., 2008).
To reduce the sole dependence on broad-spectrum insecticides and their effects on natural enemies and reduce the selection pres-sure for the development of resistance, it is important to integrate other management strategies, including bio-rational insecticides. However, there are few studies where bio-rational insecticides have been used for the control of pepper weevil and have been found to be effective against other weevils in different genera (Addesso et al., 2014; Reddy and Antwi, 2016).
In a laboratory study, Reddy et al. (2016) found that bio-rational insecticides, including Beauveria bassiana, Azadirachtin, Metarhizium brunneum, B. bassiana + pyrethrins, B. bassiana +

111Proc. Fla. State Hort. Soc. 133: 2020.
cold-pressed neem extract, and Spinosad were effective against the larvae of alfalfa weevil. The same insecticides were tested against the wheat head armyworm, Dargida diffusa (Lepidoptera: Noctuidae) and Entrust® was the most effective, causing a 100% mortality within three days of treatment, followed by Xpectro® (Reddy and Antwi 2016).
Many of these reduced-risk insecticides are effective against the larvae, the major damage causing life-stage of insect pests, as seen above in the alfalfa weevil. For pepper weevil, all immature life stages develop within the fruit, making the adult the only life stage exposed to insecticides, thus making management difficult. For this reason, most of the products, including cur-rently available insecticides, are directed at the control of the adult stages of the pepper weevil. Therefore, the goal is to develop management strategies to keep the pepper weevil population below the economic threshold level and introduce bio-rational tactics to reduce selection pressure from conventional pesticides.
For weevil species, an aggregation pheromone is produced by males and is used to attract both sexes (Tewari et al., 2014). An aggregation pheromone has been isolated and identified for pepper weevil, and its field activity was also evaluated. However, Eller et al. (1994) said there was a need to improve the efficiency of the traps and the attractiveness of the aggregation pheromone formulation to the pepper weevil. The use of pheromones com-bined with other management tactics has been deemed a potential strategy in reducing the use of broad-spectrum insecticides and the risk of their deleterious effects on non-target and beneficial insects (Witzgall et al., 2008; Eller and Palmquist, 2014).
Since no research has documented the effects of some of the newer bio-rational insecticides for pepper weevil management, this research tested the efficacy of bio-rational insecticides in combination with aggregation pheromones.
Materials and Methods
study site And AreA. The study was carried out in research plots at the Tropical Research and Education Center (TREC) in Homestead, Fla. (25.513°N; –80.504°W) and 3 (25.511°N; –80.501°W). The soil type is a Krome gravelly loam soil classi-fied as a loamy-skeletal, carbonatic hyperthermia lithic rendoll, which consists of 67% limestone pebbles (>2 mm) and 33% finer particles (Noble et al., 1996).
Field prepArAtion. The soil was prepared by plowing the field with a moldboard plow (CASE IH agriculture), and then using a disking machine (Athens Plow Co Inc., TN, USA). Beds were raised to a height of 15 cm with a width of 91 cm and 1.83 m between centers using Kennco superbedders (Kennco Manufac-turing Co. Inc., Atoka, OK, USA). Granular fertilizer (6 N–12 P–12 K) at the rate of 1344 kg/ha (1200 lb/acre) was applied at planting as a broadcast and incorporated before covering the beds with plastic mulch (manufactured by Canslit Inc. Victoriaville, Quebec, Canada, and supplied by IMAFLEX USA, Inc.). The polyethylene mulch was placed on the beds using a plastic layer (Kennco micro-combo, Kennco Manufacturing Co. Inc., Atoka, OK). When laying down plastic, two drip tubes (RO-Drip) with emitters spaced 30 cm apart, one on either side of the plant row at a spacing of 15 cm, were placed for irrigation. ‘Jalapeño’ transplants were planted at the center of each bed in between the two drip tubes. Planting, holes (7 cm diameter) were made manually using a metallic hole digger, maintaining 31 cm (12 inches) between transplants.
plAnt mAteriAl. ‘Jalapeño’ pepper transplants, variety PS 11435807, were provided by Mobley Plant World LLC, Labelle, FL. Transplants were received six-week after germination.
experimentAl design And treAtments. A randomized com-plete block design was used to evaluate insecticide and pheromone treatments. The plots consisted of treatments with and without pheromone traps. Insecticide treatments included Actara® (with and without the pheromone), Xpectro® (with and without the phero-mone), and untreated controls (with and without pheromones). All treatments were randomized within blocks and replicated three times. Each treatment plot was 4.6 m (15 ft) long with a 3.05 (10 ft) non-planted buffer area that separated treatments within the block. For the treatments with the pheromone, a yellow sticky trap (15 cm × 30 cm) baited with the pepper weevil aggregation pheromone septum was tied on an iron rod (122 cm high and 10 cm diameter) and placed in the center of each treatment plot at the same height as the canopy of the plants. Traps were placed the same day jalapeño peppers were transplanted and were checked weekly for trapped pepper weevil adults. Traps were renewed every two weeks with new traps and maintained to observe their effect on the pepper weevil population throughout the season. During the insecticide application, the pheromone traps were covered with polythene bags to prevent spray drift.
Crop mAnAgement. Pepper plants were subjected to recom-mended cultural practices (as described in Boyd et al., 2018) which include irrigation, weeding, fertilizer applications, etc. throughout the season. After planting, plots were subjected to close observation, scouting for the presence and infestation of pepper weevil. Plants were irrigated twice a day (10:00 am and 4:00 pm) for half an hour using the drip irrigation system already described. Immediately after transplanting, the base of each transplant was drenched with starter fertilizer solution (20 N–20 P–20 K) (0.75 oz/gal of water) (Diamond R Fertilizer Inc. Ft. Pierce, Fla) using a back-pack sprayer without a nozzle tip. Granular fertilizer (6 N–6 P–6 K) (Loveland Products Inc., Greely, CO) was applied every three weeks after planting. The fertilizer was applied 20 cm from and parallel to the side of the transplants or plants and incorporated within the top 15 cm of the soil. Weeding was done manually when weeds were present. Bravo Weather Stik® (Chlorothalonil, IRAC group M5 fungicide, Syngenta Crop Protection Inc., Greensboro, NC) was applied at 1.75 L/ha to reduce the effects of fungal pathogens.
AppliCAtion And evAluAtion oF inseCtiCide treAtments. The application of insecticide treatments was initiated five to six weeks after planting and continued at 7 d intervals. Insecticides (Table 1.) were applied to the foliage using a hand-propelled backpack sprayer (Birchmeier 15.14-L Backpack Sprayer, model IRIS, Stetten Switzerland) delivering 280 l/ha (30 GPA) at 2.11 kg/cm2 (30 psi). Insecticides were sprayed weekly, eight and six times in the first and second studies, respectively. The first application in the first study was on 27 Dec. 2019 and that of the second study was on 18 Feb. 2020.
sAmpling. Evaluation of insecticide treatments was made by thoroughly checking five randomly selected plants for pepper weevil adults 24 h after each spray application between 10 am and 12 pm. On the same day, fallen infested fruits from randomly selected five plants/treatment plot were collected. These were transported to the Vegetable IPM laboratory, TREC where they were dissected with a dissecting scalpel, and pepper weevils at different life stages (larva, pupa, and adult) were counted and
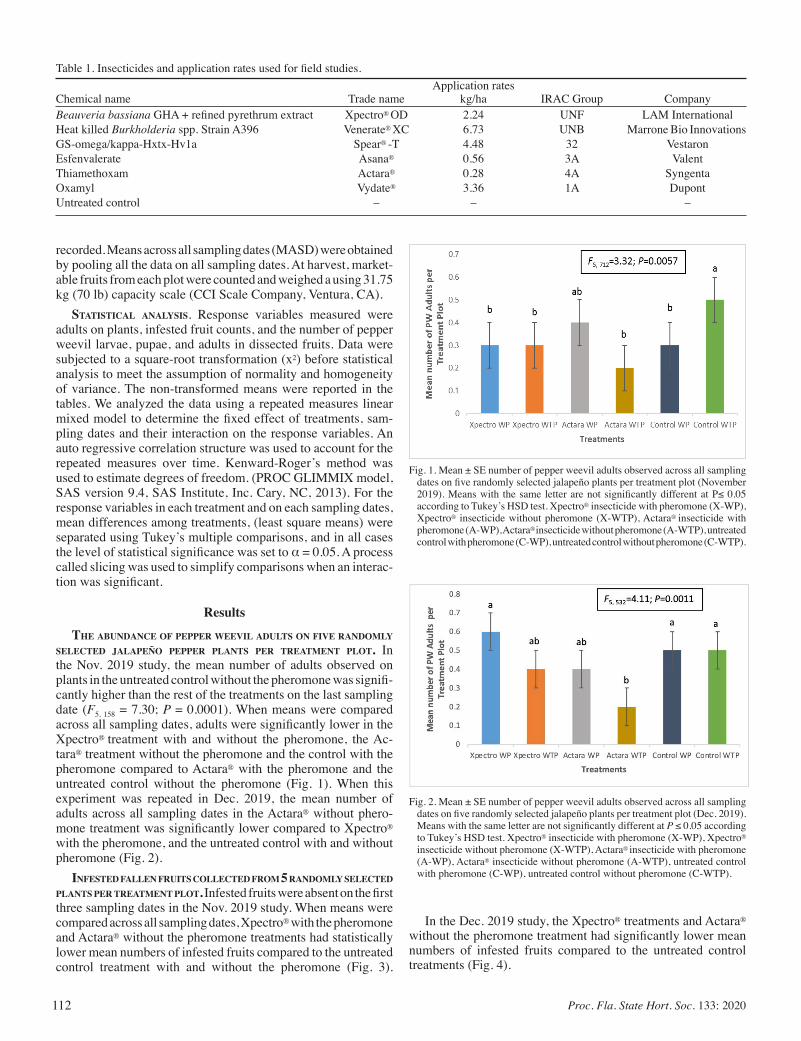
112 Proc. Fla. State Hort. Soc. 133: 2020
recorded. Means across all sampling dates (MASD) were obtained by pooling all the data on all sampling dates. At harvest, market-able fruits from each plot were counted and weighed a using 31.75 kg (70 lb) capacity scale (CCI Scale Company, Ventura, CA).
stAtistiCAl AnAlysis. Response variables measured were adults on plants, infested fruit counts, and the number of pepper weevil larvae, pupae, and adults in dissected fruits. Data were subjected to a square-root transformation (x2) before statistical analysis to meet the assumption of normality and homogeneity of variance. The non-transformed means were reported in the tables. We analyzed the data using a repeated measures linear mixed model to determine the fixed effect of treatments, sam-pling dates and their interaction on the response variables. An auto regressive correlation structure was used to account for the repeated measures over time. Kenward-Roger’s method was used to estimate degrees of freedom. (PROC GLIMMIX model, SAS version 9.4, SAS Institute, Inc. Cary, NC, 2013). For the response variables in each treatment and on each sampling dates, mean differences among treatments, (least square means) were separated using Tukey’s multiple comparisons, and in all cases the level of statistical significance was set to α = 0.05. A process called slicing was used to simplify comparisons when an interac-tion was significant.
Results
the AbundAnCe oF pepper weevil Adults on Five rAndomly seleCted jAlApeño pepper plAnts per treAtment plot. In the Nov. 2019 study, the mean number of adults observed on plants in the untreated control without the pheromone was signifi-cantly higher than the rest of the treatments on the last sampling date (F5, 158 = 7.30; P = 0.0001). When means were compared across all sampling dates, adults were significantly lower in the Xpectro® treatment with and without the pheromone, the Ac-tara® treatment without the pheromone and the control with the pheromone compared to Actara® with the pheromone and the untreated control without the pheromone (Fig. 1). When this experiment was repeated in Dec. 2019, the mean number of adults across all sampling dates in the Actara® without phero-mone treatment was significantly lower compared to Xpectro® with the pheromone, and the untreated control with and without pheromone (Fig. 2).
inFested FAllen Fruits ColleCted From 5 rAndomly seleCted plAnts per treAtment plot. Infested fruits were absent on the first three sampling dates in the Nov. 2019 study. When means were compared across all sampling dates, Xpectro® with the pheromone and Actara® without the pheromone treatments had statistically lower mean numbers of infested fruits compared to the untreated control treatment with and without the pheromone (Fig. 3).
Table 1. Insecticides and application rates used for field studies. Application ratesChemical name Trade name kg/ha IRAC Group CompanyBeauveria bassiana GHA + refined pyrethrum extract Xpectro® OD 2.24 UNF LAM InternationalHeat killed Burkholderia spp. Strain A396 Venerate® XC 6.73 UNB Marrone Bio InnovationsGS-omega/kappa-Hxtx-Hv1a Spear® -T 4.48 32 VestaronEsfenvalerate Asana® 0.56 3A ValentThiamethoxam Actara® 0.28 4A SyngentaOxamyl Vydate® 3.36 1A DupontUntreated control – – –
Fig. 1. Mean ± SE number of pepper weevil adults observed across all sampling dates on five randomly selected jalapeño plants per treatment plot (November 2019). Means with the same letter are not significantly different at P≤ 0.05 according to Tukey’s HSD test. Xpectro® insecticide with pheromone (X-WP), Xpectro® insecticide without pheromone (X-WTP), Actara® insecticide with pheromone (A-WP), Actara® insecticide without pheromone (A-WTP), untreated control with pheromone (C-WP), untreated control without pheromone (C-WTP).
Fig. 2. Mean ± SE number of pepper weevil adults observed across all sampling dates on five randomly selected jalapeño plants per treatment plot (Dec. 2019). Means with the same letter are not significantly different at P ≤ 0.05 according to Tukey’s HSD test. Xpectro® insecticide with pheromone (X-WP), Xpectro® insecticide without pheromone (X-WTP), Actara® insecticide with pheromone (A-WP), Actara® insecticide without pheromone (A-WTP), untreated control with pheromone (C-WP), untreated control without pheromone (C-WTP).
In the Dec. 2019 study, the Xpectro® treatments and Actara® without the pheromone treatment had significantly lower mean numbers of infested fruits compared to the untreated control treatments (Fig. 4).
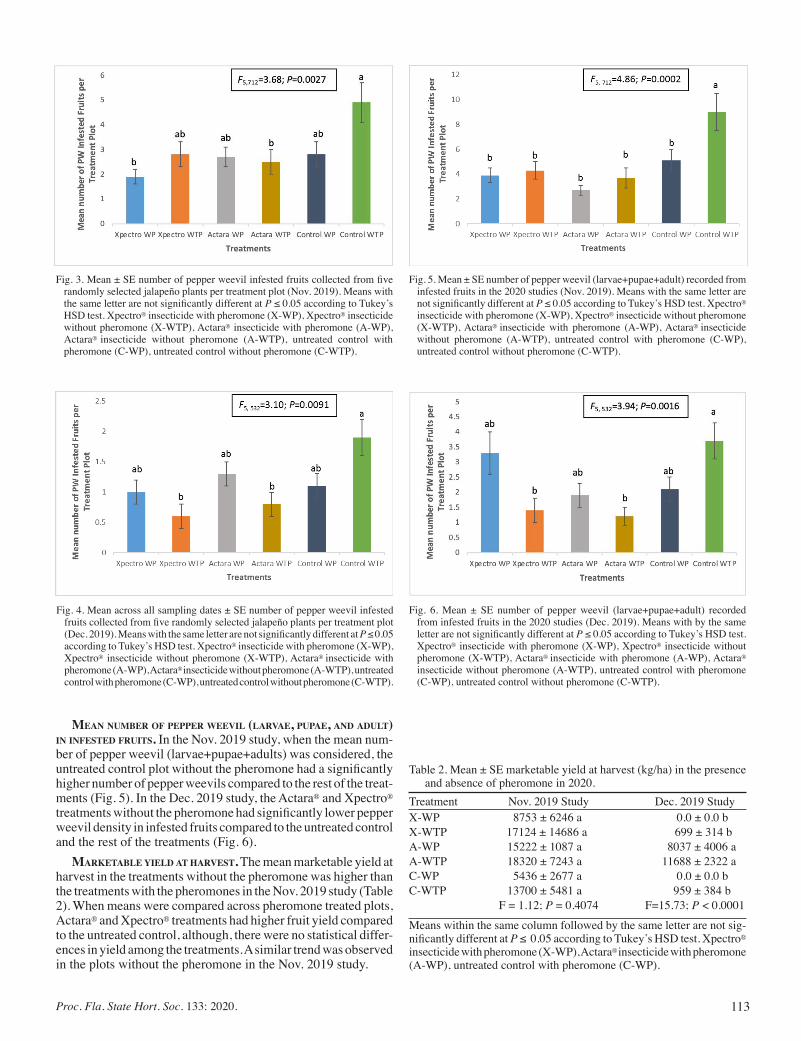
113Proc. Fla. State Hort. Soc. 133: 2020.
meAn number oF pepper weevil (lArvAe, pupAe, And Adult) in inFested Fruits. In the Nov. 2019 study, when the mean num-ber of pepper weevil (larvae+pupae+adults) was considered, the untreated control plot without the pheromone had a significantly higher number of pepper weevils compared to the rest of the treat-ments (Fig. 5). In the Dec. 2019 study, the Actara® and Xpectro® treatments without the pheromone had significantly lower pepper weevil density in infested fruits compared to the untreated control and the rest of the treatments (Fig. 6).
mArketAble yield At hArvest. The mean marketable yield at harvest in the treatments without the pheromone was higher than the treatments with the pheromones in the Nov. 2019 study (Table 2). When means were compared across pheromone treated plots, Actara® and Xpectro® treatments had higher fruit yield compared to the untreated control, although, there were no statistical differ-ences in yield among the treatments. A similar trend was observed in the plots without the pheromone in the Nov. 2019 study.
Fig. 3. Mean ± SE number of pepper weevil infested fruits collected from five randomly selected jalapeño plants per treatment plot (Nov. 2019). Means with the same letter are not significantly different at P ≤ 0.05 according to Tukey’s HSD test. Xpectro® insecticide with pheromone (X-WP), Xpectro® insecticide without pheromone (X-WTP), Actara® insecticide with pheromone (A-WP), Actara® insecticide without pheromone (A-WTP), untreated control with pheromone (C-WP), untreated control without pheromone (C-WTP).
Fig. 4. Mean across all sampling dates ± SE number of pepper weevil infested fruits collected from five randomly selected jalapeño plants per treatment plot (Dec. 2019). Means with the same letter are not significantly different at P ≤ 0.05 according to Tukey’s HSD test. Xpectro® insecticide with pheromone (X-WP), Xpectro® insecticide without pheromone (X-WTP), Actara® insecticide with pheromone (A-WP), Actara® insecticide without pheromone (A-WTP), untreated control with pheromone (C-WP), untreated control without pheromone (C-WTP).
Table 2. Mean ± SE marketable yield at harvest (kg/ha) in the presence and absence of pheromone in 2020.
Treatment Nov. 2019 Study Dec. 2019 StudyX-WP 8753 ± 6246 a 0.0 ± 0.0 bX-WTP 17124 ± 14686 a 699 ± 314 bA-WP 15222 ± 1087 a 8037 ± 4006 aA-WTP 18320 ± 7243 a 11688 ± 2322 aC-WP 5436 ± 2677 a 0.0 ± 0.0 bC-WTP 13700 ± 5481 a 959 ± 384 b F = 1.12; P = 0.4074 F=15.73; P < 0.0001
Means within the same column followed by the same letter are not sig-nificantly different at P ≤ 0.05 according to Tukey’s HSD test. Xpectro® insecticide with pheromone (X-WP), Actara® insecticide with pheromone (A-WP), untreated control with pheromone (C-WP).
Fig. 5. Mean ± SE number of pepper weevil (larvae+pupae+adult) recorded from infested fruits in the 2020 studies (Nov. 2019). Means with the same letter are not significantly different at P ≤ 0.05 according to Tukey’s HSD test. Xpectro® insecticide with pheromone (X-WP), Xpectro® insecticide without pheromone (X-WTP), Actara® insecticide with pheromone (A-WP), Actara® insecticide without pheromone (A-WTP), untreated control with pheromone (C-WP), untreated control without pheromone (C-WTP).
Fig. 6. Mean ± SE number of pepper weevil (larvae+pupae+adult) recorded from infested fruits in the 2020 studies (Dec. 2019). Means with by the same letter are not significantly different at P ≤ 0.05 according to Tukey’s HSD test. Xpectro® insecticide with pheromone (X-WP), Xpectro® insecticide without pheromone (X-WTP), Actara® insecticide with pheromone (A-WP), Actara®
insecticide without pheromone (A-WTP), untreated control with pheromone (C-WP), untreated control without pheromone (C-WTP).
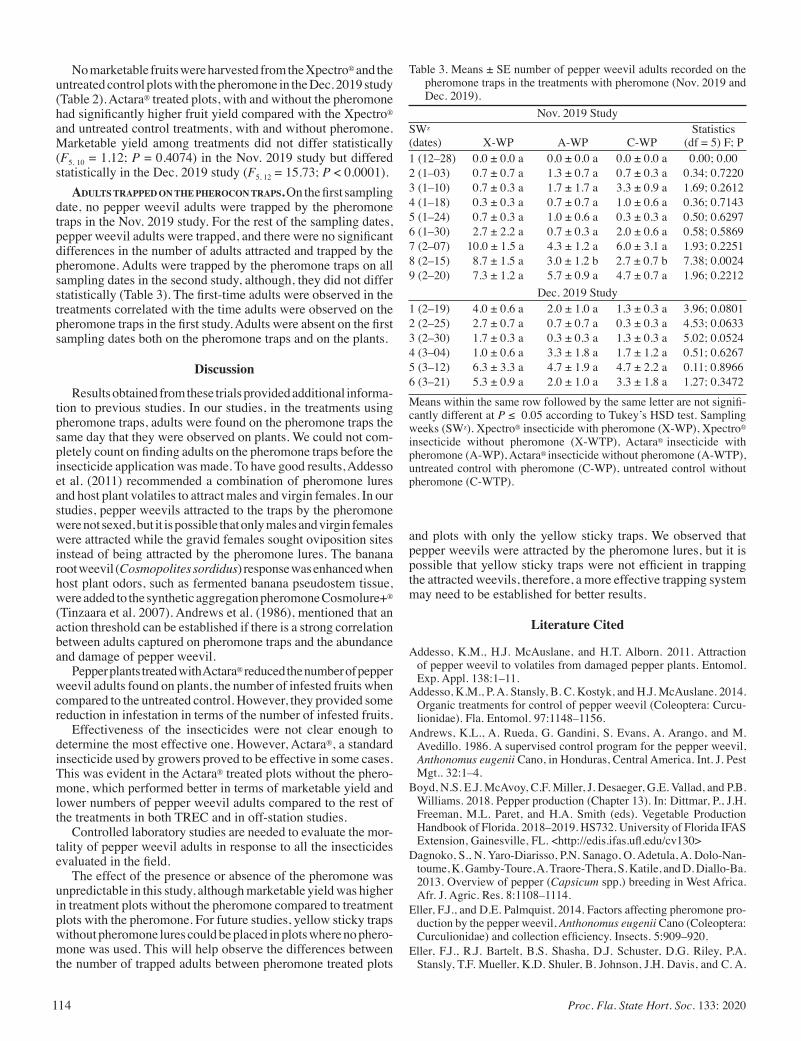
114 Proc. Fla. State Hort. Soc. 133: 2020
Table 3. Means ± SE number of pepper weevil adults recorded on the pheromone traps in the treatments with pheromone (Nov. 2019 and Dec. 2019).
Nov. 2019 StudySWz Statistics (dates) X-WP A-WP C-WP (df = 5) F; P1 (12–28) 0.0 ± 0.0 a 0.0 ± 0.0 a 0.0 ± 0.0 a 0.00; 0.002 (1–03) 0.7 ± 0.7 a 1.3 ± 0.7 a 0.7 ± 0.3 a 0.34; 0.72203 (1–10) 0.7 ± 0.3 a 1.7 ± 1.7 a 3.3 ± 0.9 a 1.69; 0.26124 (1–18) 0.3 ± 0.3 a 0.7 ± 0.7 a 1.0 ± 0.6 a 0.36; 0.71435 (1–24) 0.7 ± 0.3 a 1.0 ± 0.6 a 0.3 ± 0.3 a 0.50; 0.62976 (1–30) 2.7 ± 2.2 a 0.7 ± 0.3 a 2.0 ± 0.6 a 0.58; 0.58697 (2–07) 10.0 ± 1.5 a 4.3 ± 1.2 a 6.0 ± 3.1 a 1.93; 0.22518 (2–15) 8.7 ± 1.5 a 3.0 ± 1.2 b 2.7 ± 0.7 b 7.38; 0.00249 (2–20) 7.3 ± 1.2 a 5.7 ± 0.9 a 4.7 ± 0.7 a 1.96; 0.2212
Dec. 2019 Study1 (2–19) 4.0 ± 0.6 a 2.0 ± 1.0 a 1.3 ± 0.3 a 3.96; 0.08012 (2–25) 2.7 ± 0.7 a 0.7 ± 0.7 a 0.3 ± 0.3 a 4.53; 0.06333 (2–30) 1.7 ± 0.3 a 0.3 ± 0.3 a 1.3 ± 0.3 a 5.02; 0.05244 (3–04) 1.0 ± 0.6 a 3.3 ± 1.8 a 1.7 ± 1.2 a 0.51; 0.62675 (3–12) 6.3 ± 3.3 a 4.7 ± 1.9 a 4.7 ± 2.2 a 0.11; 0.89666 (3–21) 5.3 ± 0.9 a 2.0 ± 1.0 a 3.3 ± 1.8 a 1.27; 0.3472
Means within the same row followed by the same letter are not signifi-cantly different at P ≤ 0.05 according to Tukey’s HSD test. Sampling weeks (SWz). Xpectro® insecticide with pheromone (X-WP), Xpectro® insecticide without pheromone (X-WTP), Actara® insecticide with pheromone (A-WP), Actara® insecticide without pheromone (A-WTP), untreated control with pheromone (C-WP), untreated control without pheromone (C-WTP).
No marketable fruits were harvested from the Xpectro® and the untreated control plots with the pheromone in the Dec. 2019 study (Table 2). Actara® treated plots, with and without the pheromone had significantly higher fruit yield compared with the Xpectro® and untreated control treatments, with and without pheromone. Marketable yield among treatments did not differ statistically (F5, 10 = 1.12; P = 0.4074) in the Nov. 2019 study but differed statistically in the Dec. 2019 study (F5, 12 = 15.73; P < 0.0001).
Adults trApped on the pheroCon trAps. On the first sampling date, no pepper weevil adults were trapped by the pheromone traps in the Nov. 2019 study. For the rest of the sampling dates, pepper weevil adults were trapped, and there were no significant differences in the number of adults attracted and trapped by the pheromone. Adults were trapped by the pheromone traps on all sampling dates in the second study, although, they did not differ statistically (Table 3). The first-time adults were observed in the treatments correlated with the time adults were observed on the pheromone traps in the first study. Adults were absent on the first sampling dates both on the pheromone traps and on the plants.
Discussion
Results obtained from these trials provided additional informa-tion to previous studies. In our studies, in the treatments using pheromone traps, adults were found on the pheromone traps the same day that they were observed on plants. We could not com-pletely count on finding adults on the pheromone traps before the insecticide application was made. To have good results, Addesso et al. (2011) recommended a combination of pheromone lures and host plant volatiles to attract males and virgin females. In our studies, pepper weevils attracted to the traps by the pheromone were not sexed, but it is possible that only males and virgin females were attracted while the gravid females sought oviposition sites instead of being attracted by the pheromone lures. The banana root weevil (Cosmopolites sordidus) response was enhanced when host plant odors, such as fermented banana pseudostem tissue, were added to the synthetic aggregation pheromone Cosmolure+® (Tinzaara et al. 2007). Andrews et al. (1986), mentioned that an action threshold can be established if there is a strong correlation between adults captured on pheromone traps and the abundance and damage of pepper weevil.
Pepper plants treated with Actara® reduced the number of pepper weevil adults found on plants, the number of infested fruits when compared to the untreated control. However, they provided some reduction in infestation in terms of the number of infested fruits.
Effectiveness of the insecticides were not clear enough to determine the most effective one. However, Actara®, a standard insecticide used by growers proved to be effective in some cases. This was evident in the Actara® treated plots without the phero-mone, which performed better in terms of marketable yield and lower numbers of pepper weevil adults compared to the rest of the treatments in both TREC and in off-station studies.
Controlled laboratory studies are needed to evaluate the mor-tality of pepper weevil adults in response to all the insecticides evaluated in the field.
The effect of the presence or absence of the pheromone was unpredictable in this study, although marketable yield was higher in treatment plots without the pheromone compared to treatment plots with the pheromone. For future studies, yellow sticky traps without pheromone lures could be placed in plots where no phero-mone was used. This will help observe the differences between the number of trapped adults between pheromone treated plots
and plots with only the yellow sticky traps. We observed that pepper weevils were attracted by the pheromone lures, but it is possible that yellow sticky traps were not efficient in trapping the attracted weevils, therefore, a more effective trapping system may need to be established for better results.
Literature Cited
Addesso, K.M., H.J. McAuslane, and H.T. Alborn. 2011. Attraction of pepper weevil to volatiles from damaged pepper plants. Entomol. Exp. Appl. 138:1–11.
Addesso, K.M., P. A. Stansly, B. C. Kostyk, and H.J. McAuslane. 2014. Organic treatments for control of pepper weevil (Coleoptera: Curcu-lionidae). Fla. Entomol. 97:1148–1156.
Andrews, K.L., A. Rueda, G. Gandini, S. Evans, A. Arango, and M. Avedillo. 1986. A supervised control program for the pepper weevil, Anthonomus eugenii Cano, in Honduras, Central America. Int. J. Pest Mgt.. 32:1–4.
Boyd, N.S. E.J. McAvoy, C.F. Miller, J. Desaeger, G.E. Vallad, and P.B. Williams. 2018. Pepper production (Chapter 13). In: Dittmar, P., J.H. Freeman, M.L. Paret, and H.A. Smith (eds). Vegetable Production Handbook of Florida. 2018–2019. HS732. University of Florida IFAS Extension, Gainesville, FL. <http://edis.ifas.ufl.edu/cv130>
Dagnoko, S., N. Yaro-Diarisso, P.N. Sanago, O. Adetula, A. Dolo-Nan-toume, K. Gamby-Toure, A. Traore-Thera, S. Katile, and D. Diallo-Ba. 2013. Overview of pepper (Capsicum spp.) breeding in West Africa. Afr. J. Agric. Res. 8:1108–1114.
Eller, F.J., and D.E. Palmquist. 2014. Factors affecting pheromone pro-duction by the pepper weevil, Anthonomus eugenii Cano (Coleoptera: Curculionidae) and collection efficiency. Insects. 5:909–920.
Eller, F.J., R.J. Bartelt, B.S. Shasha, D.J. Schuster, D.G. Riley, P.A. Stansly, T.F. Mueller, K.D. Shuler, B. Johnson, J.H. Davis, and C. A.
115Proc. Fla. State Hort. Soc. 133: 2020.
Sutherland. 1994. Aggregation pheromone for the pepper weevil, An-thonomus eugenii CANO (Coleoptera: Curculionidae): Identification and field activity. J. Chem. Ecol. 20:1537–1555.
Naylor, R.L., and P.R. Ehrlich. 1997. Natural pest control services and agriculture. p. 151–174. In: G. Daily (ed.) Nature’s Services: Societal Dependence on Natural Ecosystems. Island Press, Washington, D.C., Covelo CA
Noble, C.V., R.W. Drew, and V. Slabaugh. 1996. Soil survey of Dade county area, Florida. U.S. Dept. Agric., Natural Resources Conserva-tion Serv., Washington D.C.
Reddy, G.V.P., and F.B. Antwi. 2016. Toxicity of natural insecticides on the larvae of wheat head armyworm, Dargida diffusa (Lepidoptera: Noctuidae). Environ. Toxicol. Phar. 42:156–162.
Reddy G.V.P., F.B. Antwi, G. Shrestha, and T. Kuriwada. 2016. Evalua-tion of toxicity of bio-rational insecticides against larvae of the alfalfa weevil. Toxicol. Rep. 3:473–480.
SAS Institute. 2013. SAS/STAT 9.4 User’s guide. SAS Institute. Cary, NC.Seal D.R., and M.L. Lamberts. 2012. Pepper weevil, Anthonomus eugenii
Cano (Coleoptera: Curculionidae), an important pest of pepper. The Vegetarian Newsletter, No. 574, University of Florida, Gainesville, FL.
Servin-Villegas, R., J. Garcia-Hernandez, A. Tejas-Romero, J.L. Martinez-Carrillo, and M.A. Toapanta. 2008. Susceptibility of pepper weevil (Anthonomus eugenii Cano) (Coleoptera: Curculionidae) to seven insecticides in rural areas of Baja California Sur, Mexico. Acta Zoologica Mexicana. 24:45–54.
Tewari, S., T.C. Leskey, A.L. Nielsen, J.C. Piñero, and C.R. Rodriguez-Saona. 2014. Use of pheromones in insect pest management, with special attention to weevil pheromones (Chapter 9). 141–168. In: D.P. Abrol (ed.). Integrated Pest Management: Current Concepts and Ecological Perspective. Elsevier, Oxford, UK.
Tinzaara, W., C.S. Gold, M. Dicke, A.V. Huis, and P.E. Ragama. 2007. Host plant odours enhance the responses of adult banana weevil to the synthetic aggregation pheromone Cosmolure+®. Int. J. Pest Manage. 53:127–137.
Witzgall, P., P. Kirsch, and A. Cork. 2010. Sex pheromones and their impact on pest management. J. Chem. Ecol. 36:80–100.
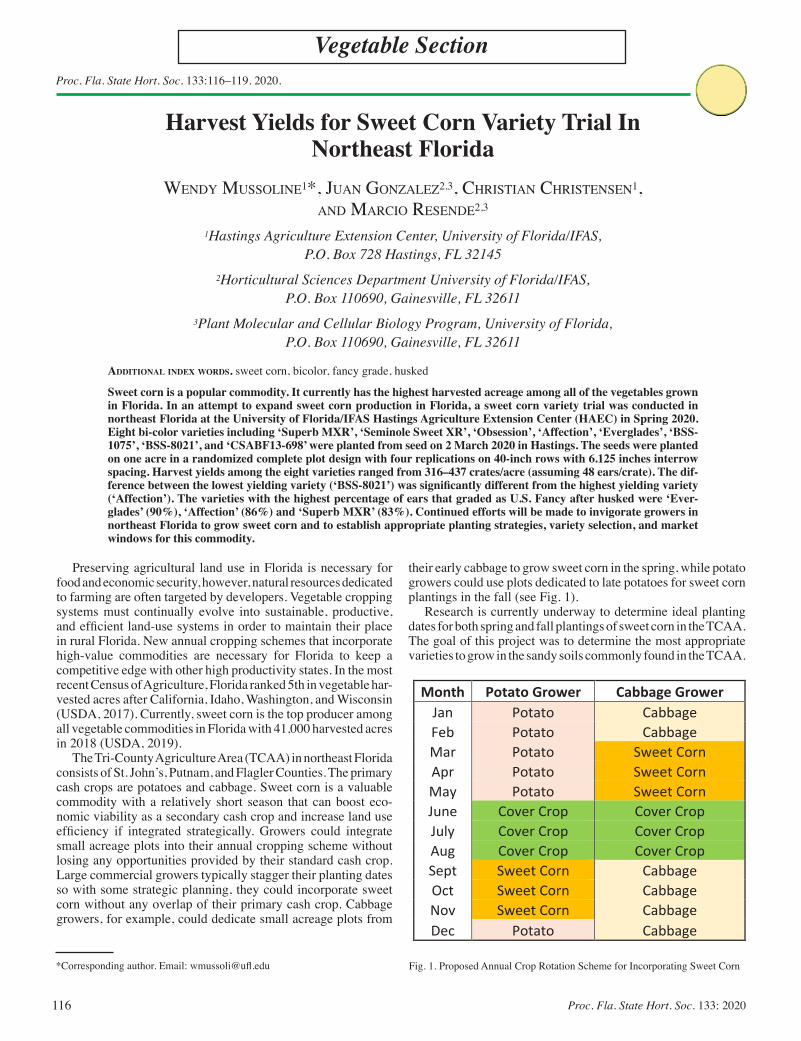
116 Proc. Fla. State Hort. Soc. 133: 2020
Proc. Fla. State Hort. Soc. 133:116–119. 2020.
Vegetable Section
*Corresponding author. Email: [email protected]
Harvest Yields for Sweet Corn Variety Trial In Northeast Florida
Wendy Mussoline1*, Juan Gonzalez2,3, Christian Christensen1, and MarCio resende2,3
1Hastings Agriculture Extension Center, University of Florida/IFAS, P.O. Box 728 Hastings, FL 32145
2Horticultural Sciences Department University of Florida/IFAS, P.O. Box 110690, Gainesville, FL 32611
3Plant Molecular and Cellular Biology Program, University of Florida, P.O. Box 110690, Gainesville, FL 32611
AdditionAl index words. sweet corn, bicolor, fancy grade, husked
Sweet corn is a popular commodity. It currently has the highest harvested acreage among all of the vegetables grown in Florida. In an attempt to expand sweet corn production in Florida, a sweet corn variety trial was conducted in northeast Florida at the University of Florida/IFAS Hastings Agriculture Extension Center (HAEC) in Spring 2020. Eight bi-color varieties including ‘Superb MXR’, ‘Seminole Sweet XR’, ‘Obsession’, ‘Affection’, ‘Everglades’, ‘BSS-1075’, ‘BSS-8021’, and ‘CSABF13-698’ were planted from seed on 2 March 2020 in Hastings. The seeds were planted on one acre in a randomized complete plot design with four replications on 40-inch rows with 6.125 inches interrow spacing. Harvest yields among the eight varieties ranged from 316–437 crates/acre (assuming 48 ears/crate). The dif-ference between the lowest yielding variety (‘BSS-8021’) was significantly different from the highest yielding variety (‘Affection’). The varieties with the highest percentage of ears that graded as U.S. Fancy after husked were ‘Ever-glades’ (90%), ‘Affection’ (86%) and ‘Superb MXR’ (83%). Continued efforts will be made to invigorate growers in northeast Florida to grow sweet corn and to establish appropriate planting strategies, variety selection, and market windows for this commodity.
Preserving agricultural land use in Florida is necessary for food and economic security, however, natural resources dedicated to farming are often targeted by developers. Vegetable cropping systems must continually evolve into sustainable, productive, and efficient land-use systems in order to maintain their place in rural Florida. New annual cropping schemes that incorporate high-value commodities are necessary for Florida to keep a competitive edge with other high productivity states. In the most recent Census of Agriculture, Florida ranked 5th in vegetable har-vested acres after California, Idaho, Washington, and Wisconsin (USDA, 2017). Currently, sweet corn is the top producer among all vegetable commodities in Florida with 41,000 harvested acres in 2018 (USDA, 2019).
The Tri-County Agriculture Area (TCAA) in northeast Florida consists of St. John’s, Putnam, and Flagler Counties. The primary cash crops are potatoes and cabbage. Sweet corn is a valuable commodity with a relatively short season that can boost eco-nomic viability as a secondary cash crop and increase land use efficiency if integrated strategically. Growers could integrate small acreage plots into their annual cropping scheme without losing any opportunities provided by their standard cash crop. Large commercial growers typically stagger their planting dates so with some strategic planning, they could incorporate sweet corn without any overlap of their primary cash crop. Cabbage growers, for example, could dedicate small acreage plots from
their early cabbage to grow sweet corn in the spring, while potato growers could use plots dedicated to late potatoes for sweet corn plantings in the fall (see Fig. 1).
Research is currently underway to determine ideal planting dates for both spring and fall plantings of sweet corn in the TCAA. The goal of this project was to determine the most appropriate varieties to grow in the sandy soils commonly found in the TCAA.
Month Potato Grower Cabbage Grower Jan Potato Cabbage Feb Potato Cabbage Mar Potato Sweet Corn Apr Potato Sweet Corn May Potato Sweet Corn June Cover Crop Cover Crop July Cover Crop Cover Crop Aug Cover Crop Cover Crop Sept Sweet Corn Cabbage Oct Sweet Corn Cabbage Nov Sweet Corn Cabbage Dec Potato Cabbage
Fig. 1. Proposed Annual Crop Rotation Scheme for Incorporating Sweet Corn
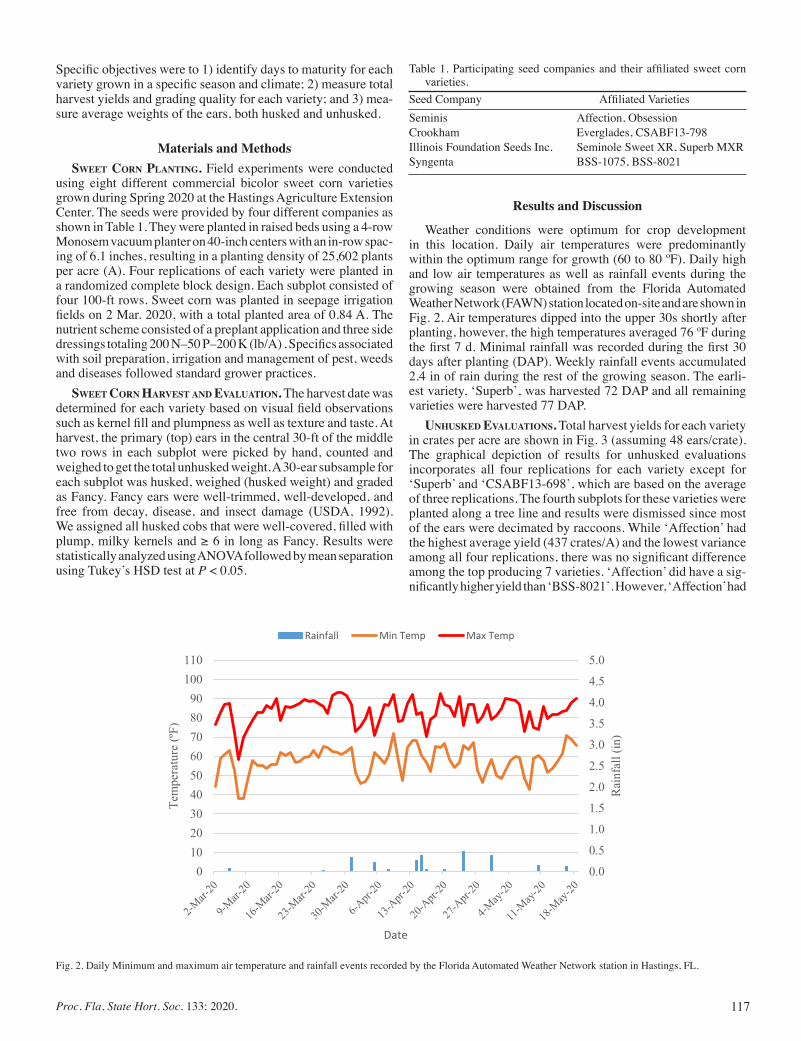
117Proc. Fla. State Hort. Soc. 133: 2020.
Specific objectives were to 1) identify days to maturity for each variety grown in a specific season and climate; 2) measure total harvest yields and grading quality for each variety; and 3) mea-sure average weights of the ears, both husked and unhusked.
Materials and Methodssweet Corn PlAnting. Field experiments were conducted
using eight different commercial bicolor sweet corn varieties grown during Spring 2020 at the Hastings Agriculture Extension Center. The seeds were provided by four different companies as shown in Table 1. They were planted in raised beds using a 4-row Monosem vacuum planter on 40-inch centers with an in-row spac-ing of 6.1 inches, resulting in a planting density of 25,602 plants per acre (A). Four replications of each variety were planted in a randomized complete block design. Each subplot consisted of four 100-ft rows. Sweet corn was planted in seepage irrigation fields on 2 Mar. 2020, with a total planted area of 0.84 A. The nutrient scheme consisted of a preplant application and three side dressings totaling 200 N–50 P–200 K (lb/A) . Specifics associated with soil preparation, irrigation and management of pest, weeds and diseases followed standard grower practices.
sweet Corn HArvest And evAluAtion. The harvest date was determined for each variety based on visual field observations such as kernel fill and plumpness as well as texture and taste. At harvest, the primary (top) ears in the central 30-ft of the middle two rows in each subplot were picked by hand, counted and weighed to get the total unhusked weight. A 30-ear subsample for each subplot was husked, weighed (husked weight) and graded as Fancy. Fancy ears were well-trimmed, well-developed, and free from decay, disease, and insect damage (USDA, 1992). We assigned all husked cobs that were well-covered, filled with plump, milky kernels and ≥ 6 in long as Fancy. Results were statistically analyzed using ANOVA followed by mean separation using Tukey’s HSD test at P < 0.05.
Fig. 2. Daily Minimum and maximum air temperature and rainfall events recorded by the Florida Automated Weather Network station in Hastings, FL.
0.0
0.5
1.0
1.5
2.0
2.5
3.0
3.5
4.0
4.5
5.0
0102030405060708090
100110
Rai
nfal
l (in
)
Tem
pera
ture
(ºF)
Date
Rainfall Min Temp Max Temp
Results and Discussion
Weather conditions were optimum for crop development in this location. Daily air temperatures were predominantly within the optimum range for growth (60 to 80 ºF). Daily high and low air temperatures as well as rainfall events during the growing season were obtained from the Florida Automated Weather Network (FAWN) station located on-site and are shown in Fig. 2. Air temperatures dipped into the upper 30s shortly after planting, however, the high temperatures averaged 76 ºF during the first 7 d. Minimal rainfall was recorded during the first 30 days after planting (DAP). Weekly rainfall events accumulated 2.4 in of rain during the rest of the growing season. The earli-est variety, ‘Superb’, was harvested 72 DAP and all remaining varieties were harvested 77 DAP.
unHusked evAluAtions. Total harvest yields for each variety in crates per acre are shown in Fig. 3 (assuming 48 ears/crate). The graphical depiction of results for unhusked evaluations incorporates all four replications for each variety except for ‘Superb’ and ‘CSABF13-698’, which are based on the average of three replications. The fourth subplots for these varieties were planted along a tree line and results were dismissed since most of the ears were decimated by raccoons. While ‘Affection’ had the highest average yield (437 crates/A) and the lowest variance among all four replications, there was no significant difference among the top producing 7 varieties. ‘Affection’ did have a sig-nificantly higher yield than ‘BSS-8021’. However, ‘Affection’ had
Table 1. Participating seed companies and their affiliated sweet corn varieties.
Seed Company Affiliated VarietiesSeminis Affection, ObsessionCrookham Everglades, CSABF13-798Illinois Foundation Seeds Inc. Seminole Sweet XR, Superb MXRSyngenta BSS-1075, BSS-8021
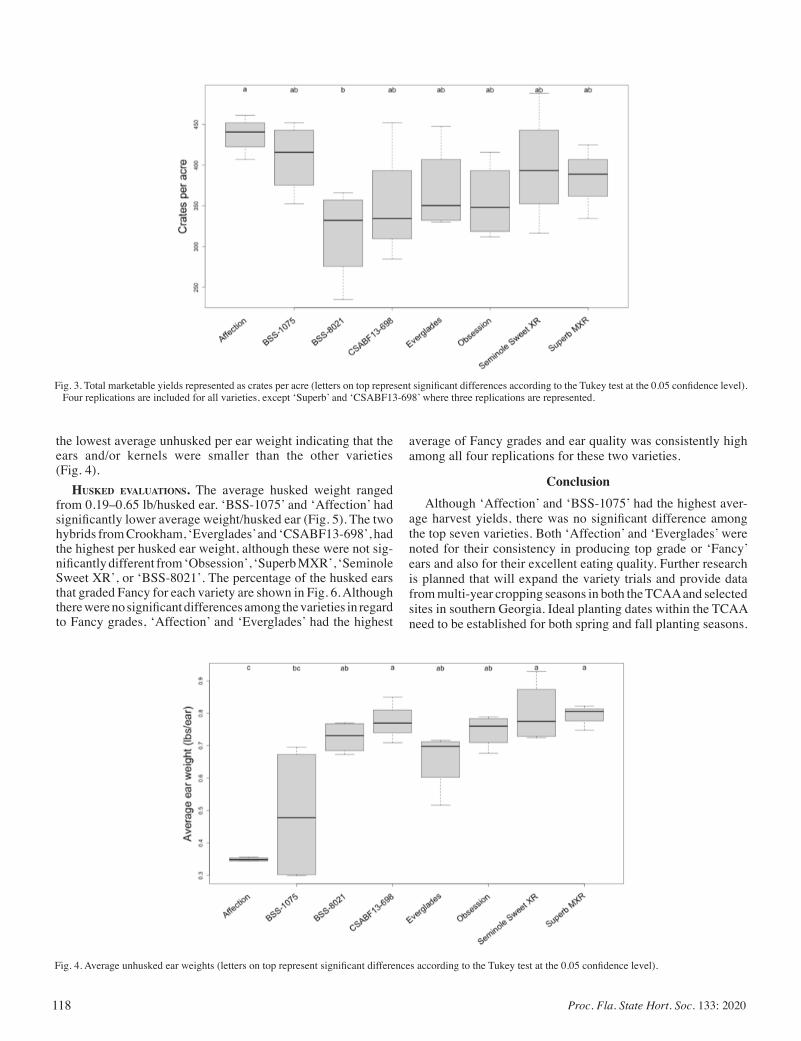
118 Proc. Fla. State Hort. Soc. 133: 2020
the lowest average unhusked per ear weight indicating that the ears and/or kernels were smaller than the other varieties (Fig. 4).
Husked evAluAtions. The average husked weight ranged from 0.19–0.65 lb/husked ear. ‘BSS-1075’ and ‘Affection’ had significantly lower average weight/husked ear (Fig. 5). The two hybrids from Crookham, ‘Everglades’ and ‘CSABF13-698’, had the highest per husked ear weight, although these were not sig-nificantly different from ‘Obsession’, ‘Superb MXR’, ‘Seminole Sweet XR’, or ‘BSS-8021’. The percentage of the husked ears that graded Fancy for each variety are shown in Fig. 6. Although there were no significant differences among the varieties in regard to Fancy grades, ‘Affection’ and ‘Everglades’ had the highest
Fig. 3. Total marketable yields represented as crates per acre (letters on top represent significant differences according to the Tukey test at the 0.05 confidence level). Four replications are included for all varieties, except ‘Superb’ and ‘CSABF13-698’ where three replications are represented.
Fig. 4. Average unhusked ear weights (letters on top represent significant differences according to the Tukey test at the 0.05 confidence level).
average of Fancy grades and ear quality was consistently high among all four replications for these two varieties.
ConclusionAlthough ‘Affection’ and ‘BSS-1075’ had the highest aver-
age harvest yields, there was no significant difference among the top seven varieties. Both ‘Affection’ and ‘Everglades’ were noted for their consistency in producing top grade or ‘Fancy’ ears and also for their excellent eating quality. Further research is planned that will expand the variety trials and provide data from multi-year cropping seasons in both the TCAA and selected sites in southern Georgia. Ideal planting dates within the TCAA need to be established for both spring and fall planting seasons.

119Proc. Fla. State Hort. Soc. 133: 2020.
The ultimate goal of this research is to determine the most suc-cessful planting strategy for sweet corn in north Florida and to invigorate farmers in the TCAA to grow this commodity as a secondary cash crop behind cabbage in the spring or before potatoes in the fall.
Literature Cited
USDA. 1992. United States Standards for Grades of Sweet Corn. <https://www.ams.usda.gov/sites/default/files/media/Corn%2C_Sweet_For_Processing_Standard%5B1%5D.pdf>
Fig. 5. Average husked ear weights (letters on top represent significant differences according to the Tukey test at the 0.05 confidence level).
Fig. 6. Percent of husked ears rated as fancy grade according to USDA standards (letters on top represent significant differences according to the Tukey test at the 0.05 confidence level).
USDA 2017. Census of Agriculture Highlights: Vegetable Product ion . <ht tps : / /www.nass .usda .gov/Publ ica t ions /Highlights/2019/2017Census_Vegetable_Production.pdf>
USDA 2019. State Agriculture Overview: Florida. <https://www.nass.usda.gov/Quick_Stats/Ag_Overview/stateOverview.php?state=FLORIDA.>
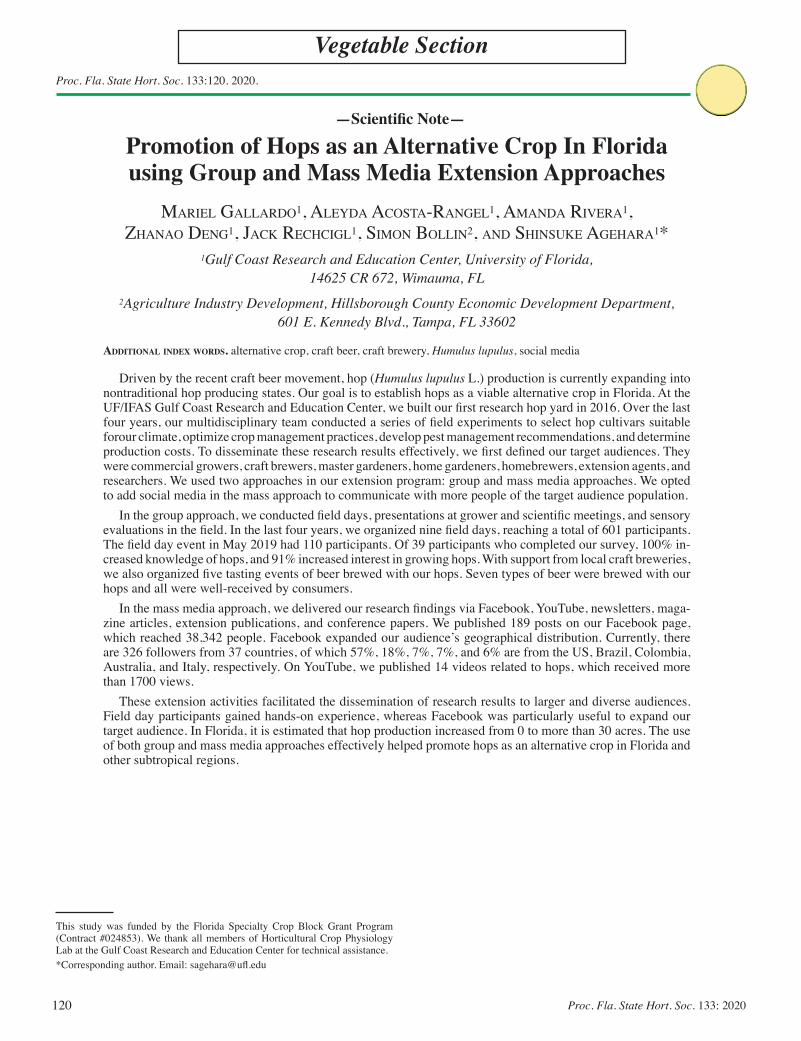
120 Proc. Fla. State Hort. Soc. 133: 2020
Proc. Fla. State Hort. Soc. 133:120. 2020.
Vegetable Section
This study was funded by the Florida Specialty Crop Block Grant Program (Contract #024853). We thank all members of Horticultural Crop Physiology Lab at the Gulf Coast Research and Education Center for technical assistance.*Corresponding author. Email: [email protected]
—Scientific Note—
Promotion of Hops as an Alternative Crop In Florida using Group and Mass Media Extension Approaches
Mariel Gallardo1, aleyda acosta-ranGel1, aManda rivera1, Zhanao denG1, Jack rechciGl1, siMon Bollin2, and shinsuke aGehara1*
1Gulf Coast Research and Education Center, University of Florida, 14625 CR 672, Wimauma, FL
2Agriculture Industry Development, Hillsborough County Economic Development Department, 601 E. Kennedy Blvd., Tampa, FL 33602
AdditionAl index words. alternative crop, craft beer, craft brewery, Humulus lupulus, social media
Driven by the recent craft beer movement, hop (Humulus lupulus L.) production is currently expanding into nontraditional hop producing states. Our goal is to establish hops as a viable alternative crop in Florida. At the UF/IFAS Gulf Coast Research and Education Center, we built our first research hop yard in 2016. Over the last four years, our multidisciplinary team conducted a series of field experiments to select hop cultivars suitable forour climate, optimize crop management practices, develop pest management recommendations, and determine production costs. To disseminate these research results effectively, we first defined our target audiences. They were commercial growers, craft brewers, master gardeners, home gardeners, homebrewers, extension agents, and researchers. We used two approaches in our extension program: group and mass media approaches. We opted to add social media in the mass approach to communicate with more people of the target audience population.
In the group approach, we conducted field days, presentations at grower and scientific meetings, and sensory evaluations in the field. In the last four years, we organized nine field days, reaching a total of 601 participants. The field day event in May 2019 had 110 participants. Of 39 participants who completed our survey, 100% in-creased knowledge of hops, and 91% increased interest in growing hops. With support from local craft breweries, we also organized five tasting events of beer brewed with our hops. Seven types of beer were brewed with our hops and all were well-received by consumers.
In the mass media approach, we delivered our research findings via Facebook, YouTube, newsletters, maga-zine articles, extension publications, and conference papers. We published 189 posts on our Facebook page, which reached 38,342 people. Facebook expanded our audience’s geographical distribution. Currently, there are 326 followers from 37 countries, of which 57%, 18%, 7%, 7%, and 6% are from the US, Brazil, Colombia, Australia, and Italy, respectively. On YouTube, we published 14 videos related to hops, which received more than 1700 views.
These extension activities facilitated the dissemination of research results to larger and diverse audiences. Field day participants gained hands-on experience, whereas Facebook was particularly useful to expand our target audience. In Florida, it is estimated that hop production increased from 0 to more than 30 acres. The use of both group and mass media approaches effectively helped promote hops as an alternative crop in Florida and other subtropical regions.
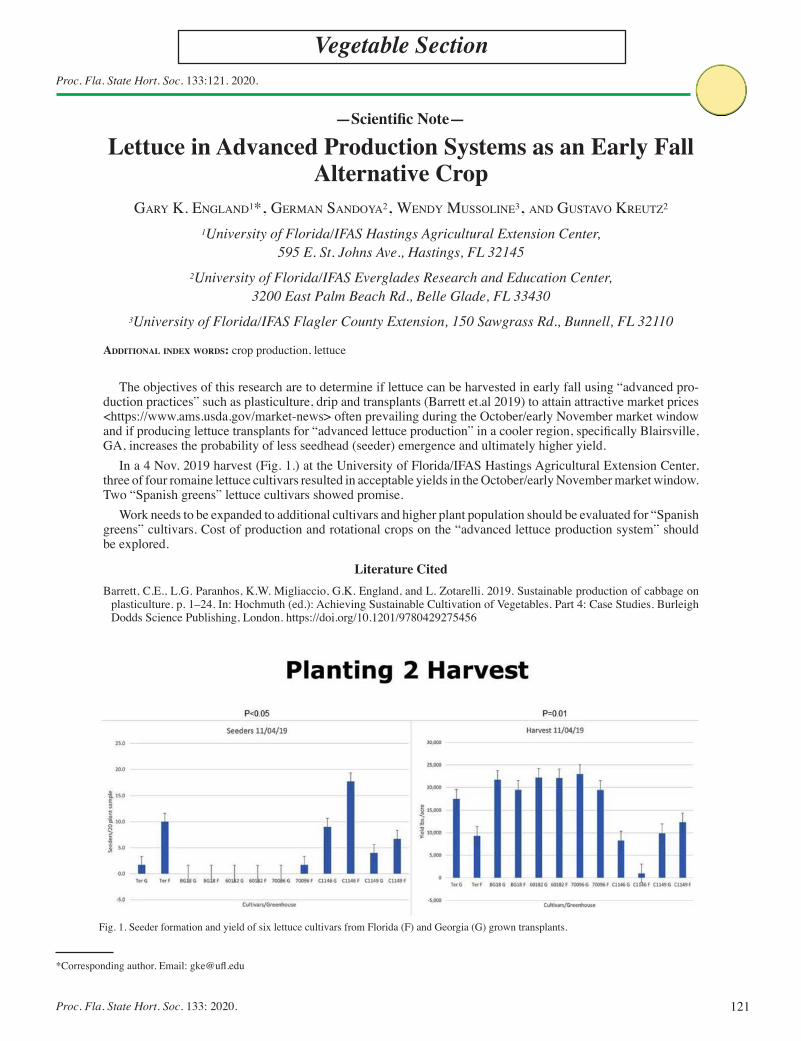
121Proc. Fla. State Hort. Soc. 133: 2020.
Proc. Fla. State Hort. Soc. 133:121. 2020.
Vegetable Section
*Corresponding author. Email: [email protected]
—Scientific Note—
Lettuce in Advanced Production Systems as an Early Fall Alternative Crop
Gary K. EnGland1*, GErman Sandoya2, WEndy muSSolinE3, and GuStavo KrEutz2
1University of Florida/IFAS Hastings Agricultural Extension Center, 595 E. St. Johns Ave., Hastings, FL 32145
2University of Florida/IFAS Everglades Research and Education Center, 3200 East Palm Beach Rd., Belle Glade, FL 33430
3University of Florida/IFAS Flagler County Extension, 150 Sawgrass Rd., Bunnell, FL 32110
AdditionAl index words: crop production, lettuce
The objectives of this research are to determine if lettuce can be harvested in early fall using “advanced pro-duction practices” such as plasticulture, drip and transplants (Barrett et.al 2019) to attain attractive market prices <https://www.ams.usda.gov/market-news> often prevailing during the October/early November market window and if producing lettuce transplants for “advanced lettuce production” in a cooler region, specifically Blairsville, GA, increases the probability of less seedhead (seeder) emergence and ultimately higher yield.
In a 4 Nov. 2019 harvest (Fig. 1.) at the University of Florida/IFAS Hastings Agricultural Extension Center, three of four romaine lettuce cultivars resulted in acceptable yields in the October/early November market window. Two “Spanish greens” lettuce cultivars showed promise.
Work needs to be expanded to additional cultivars and higher plant population should be evaluated for “Spanish greens” cultivars. Cost of production and rotational crops on the “advanced lettuce production system” should be explored.
Literature CitedBarrett, C.E., L.G. Paranhos, K.W. Migliaccio, G.K. England, and L. Zotarelli. 2019. Sustainable production of cabbage on
plasticulture. p. 1–24. In: Hochmuth (ed.): Achieving Sustainable Cultivation of Vegetables. Part 4: Case Studies. Burleigh Dodds Science Publishing, London. https://doi.org/10.1201/9780429275456
Fig. 1. Seeder formation and yield of six lettuce cultivars from Florida (F) and Georgia (G) grown transplants.
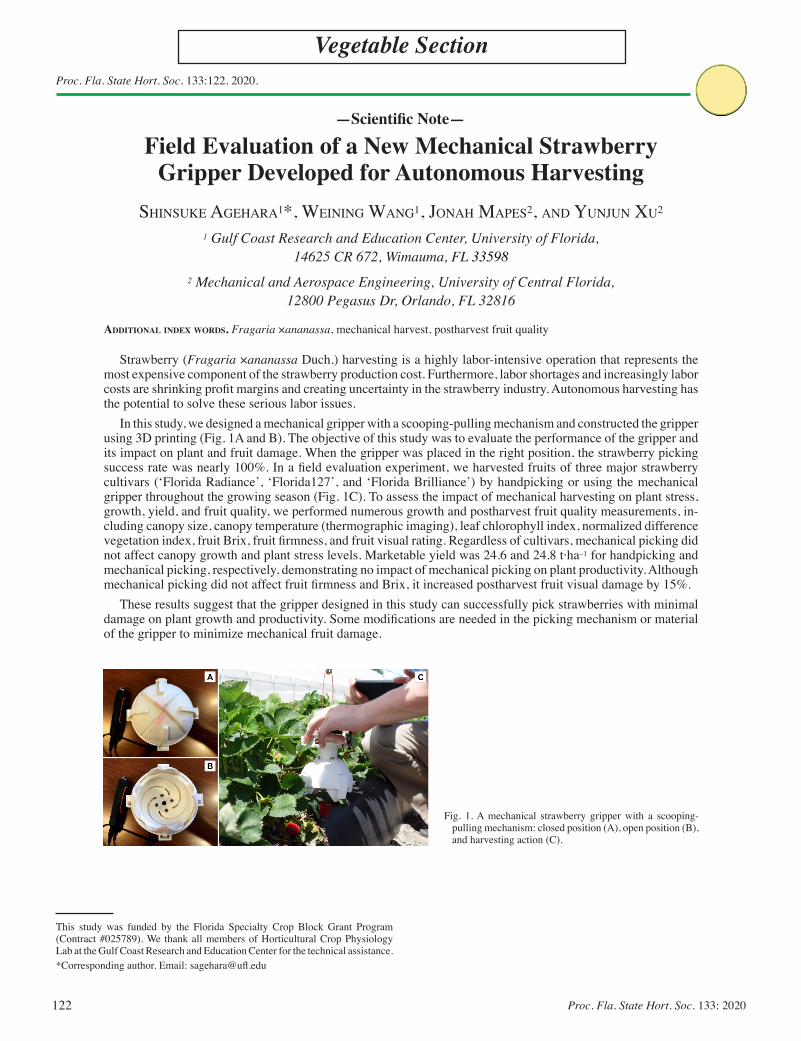
122 Proc. Fla. State Hort. Soc. 133: 2020
Proc. Fla. State Hort. Soc. 133:122. 2020.
Vegetable Section
This study was funded by the Florida Specialty Crop Block Grant Program (Contract #025789). We thank all members of Horticultural Crop Physiology Lab at the Gulf Coast Research and Education Center for the technical assistance.*Corresponding author. Email: [email protected]
—Scientific Note—
Field Evaluation of a New Mechanical Strawberry Gripper Developed for Autonomous Harvesting
ShinSuke AgehArA1*, Weining WAng1, JonAh MApeS2, And YunJun Xu2
1 Gulf Coast Research and Education Center, University of Florida, 14625 CR 672, Wimauma, FL 33598
2 Mechanical and Aerospace Engineering, University of Central Florida, 12800 Pegasus Dr, Orlando, FL 32816
AdditionAl index words. Fragaria ×ananassa, mechanical harvest, postharvest fruit quality
Strawberry (Fragaria ×ananassa Duch.) harvesting is a highly labor-intensive operation that represents the most expensive component of the strawberry production cost. Furthermore, labor shortages and increasingly labor costs are shrinking profit margins and creating uncertainty in the strawberry industry. Autonomous harvesting has the potential to solve these serious labor issues.
In this study, we designed a mechanical gripper with a scooping-pulling mechanism and constructed the gripper using 3D printing (Fig. 1A and B). The objective of this study was to evaluate the performance of the gripper and its impact on plant and fruit damage. When the gripper was placed in the right position, the strawberry picking success rate was nearly 100%. In a field evaluation experiment, we harvested fruits of three major strawberry cultivars (‘Florida Radiance’, ‘Florida127’, and ‘Florida Brilliance’) by handpicking or using the mechanical gripper throughout the growing season (Fig. 1C). To assess the impact of mechanical harvesting on plant stress, growth, yield, and fruit quality, we performed numerous growth and postharvest fruit quality measurements, in-cluding canopy size, canopy temperature (thermographic imaging), leaf chlorophyll index, normalized difference vegetation index, fruit Brix, fruit firmness, and fruit visual rating. Regardless of cultivars, mechanical picking did not affect canopy growth and plant stress levels. Marketable yield was 24.6 and 24.8 t·ha–1 for handpicking and mechanical picking, respectively, demonstrating no impact of mechanical picking on plant productivity. Although mechanical picking did not affect fruit firmness and Brix, it increased postharvest fruit visual damage by 15%.
These results suggest that the gripper designed in this study can successfully pick strawberries with minimal damage on plant growth and productivity. Some modifications are needed in the picking mechanism or material of the gripper to minimize mechanical fruit damage.
Fig. 1. A mechanical strawberry gripper with a scooping-pulling mechanism: closed position (A), open position (B), and harvesting action (C).
123Proc. Fla. State Hort. Soc. 133: 2020.
Proc. Fla. State Hort. Soc. 133:123. 2020.
Vegetable Section
This study was funded by the Florida Specialty Crop Block Grant Program (Contract #024853). We thank all members of Horticultural Crop Physiology Lab at the Gulf Coast Research and Education Center for the technical assistance.*Corresponding author. Email: [email protected]
—Scientific Note—
Characterization of Leaf Gas Exchange in Hops Grown In the Subtropical Production System
with Supplemental LightingAleydA AcostA RAngel, JAck Rechcigl, And shinsuke AgehARA*
Gulf Coast Research and Education Center, University of Florida, 14625 CR 672, Wimauma, FL 33598
AdditionAl index words. abiotic stress, acclimation, alternative crop, Humulus lupulus, photosynthesis, stress adaptation
Subtropical climatic conditions with supplemental lighting allows two growing seasons of hops (Humulus lupulus L.) a year. In central Florida, the spring season is from mid-February to early June, followed immediately by the fall season, which ends by early December. Plants also undergo a hot and humid rainy season from June to September.
To evaluate the physiological adaptation of hops to this unique production system, we characterized leaf gas exchange of ‘Cascade’ hops grown in central Florida over two growing seasons (Spring and Fall 2019). Plants were established in the field with a 6-m high trellis in February 2018. Leaf gas exchange was measured during five developmental stages: bine emergence, bine elongation, lateral branching, cone-development, and cone maturation. Leaf gas exchange showed different patterns between the two seasons and varied consid-erably across developmental stages. In the spring season, net CO2 assimilation rate (A) was highest during the bine elongation stage (21.7 µmol·m–2·s–1) and gradually declined thereafter until the cone maturation stage (13.1 µmol m–2 s–1). In the fall season, A was highest during the bine emergence stage (21.8 µmol·m–2 s–1), despite high heat and humidity levels in early August. A rapidly declined thereafter, recovered to the initial level at the cone development stage, then declined again at the cone maturation stage (14.6 µmol·m–2·s–1). Stomatal conductance showed similar trends as A, indicating stomatal limitation to photosynthesis along the developmental stages in both seasons. When averaging across developmental stages for each season, A was similar in both spring (17.7 µmol·m–2·s–1) and fall seasons (16.7 µmol·m–2·s–1). By contrast, stomatal conductance increased by 20% in the fall season compared to the spring season (0.319 vs. 0.390 mol·m–2·s–1) HO2, indicating enhanced stomatal opening by higher temperatures in the fall season (28.5 to 33.6 °C vs. 29.5 to 35.5 °C). In the spring season, water use efficiency (WUE) was relatively low during the rapid biomass accumulation period, including bine elongation, lateral branching, and cone development stages, compared to bine emergence and cone maturation stages. This decrease in WUE was due to an increase in transpiration rather than to a reduction in A.
These results suggest that hot and humid subtropical climatic conditions are not a limiting factor for gas ex-change of hop plants. The fact that the most active gas exchange occurred during bine regrowth in early summer is particularly notable. It is also important to note that hop plants can maintain the same level of gas exchange in both spring and fall seasons despite different environmental conditions. Changes in gas exchange activities across developmental stages within each growing season are likely associated with development-specific growing behaviors. Overall, hop plants show high physiological adaptation to subtropical climatic conditions.

124 Proc. Fla. State Hort. Soc. 133: 2020
Proc. Fla. State Hort. Soc. 133:124–125. 2020.
Vegetable Section
*Corresponding author. Email: [email protected]
—Scientific Note—
Globe Artichoke Variety Trials Using Controlled-release Fertilizer In Northeast Florida
EvElyn “Prissy” FlEtchEr1* and Gary EnGland2
1St. Johns County Extension, University of Florida/IFAS, 3125 Agricultural Center Dr., St. Augustine, FL 32092
2Hastings Agriculture and Extension Center, University of Florida/IFAS, 595 E. St. Johns Ave., Hastings, FL 32145
AdditionAl index words. artichoke, controlled-releases fertilizer
Introduction and Background
Globe artichokes (Cynara scolymus) are not a commonly grown crop in the state of Florida. California produces 99% of the market supply as its growing conditions are like the Mediter-ranean environment where this plant is indigenous. Artichokes have a moderate salt tolerance, which is important for production in coastal areas such as St. Johns County, FL. The globe artichoke is a thistle plant in the Asteraceae family. The time of maturity from seed planting to harvest can take four to six months. In the 2019 season (March–October), a carton of California-grown artichokes ranged from $15 to $63.50, and up to $58.50 in 2020, with fresh market cartons typically being 24 s and 36 s with regard to head count. With little to no competition on the East coast, there is an opportunity for Florida farmers to diversify with this alternative row crop.
In Florida, the crop is treated as an annual, and typically planted in the early fall as seedlings. For bud development to occur, the plants need to experience adequate chilling (depending on the variety) with temperatures below 50 degrees Fahrenheit. For this reason, growth regulators, such as Gibberellic acid (GA) are used to assist the plant in producing the same hormones as if they had experienced adequate chill. At maturity, the plant can easily reach 4 feet tall and wide.
Materials and Methods
The variety trial took place in Hastings, St. Johns County, FL. at the University of Florida/IFAS Hastings Agriculture and Education Center. The half-acre trial was planted on Alfisol soils using a randomized split-block design representing two plant-ing dates (phase 1 vs. phase 2): 7 Oct.2019 and 11 Nov. 2019. Each block contained six varieties replicated four times, with 12 plants per replication. The varieties/cultivars in the trial include ‘Colorado Red Star’, ‘Green Globe Improved’, ‘Green Queen’, ‘Imperial Star’, ‘Opal’, and ‘Purple Romagna’. Transplants were installed on 72” black plastic (48” row width) with double-line drip irrigation. Artichoke transplants were planted 36” apart with beds raised 6”. A 16–6–11 controlled-release fertilizer blend with
minors from Harrell’s was used pre-plant at 1250 lbs/acre. The plant growth regulator ProGibb (Gibberellic acid) was applied at 20 ppm the fourth true-leaf stage, with a second application 10 d later.
Results and Conclusions
‘Green Globe Improved’, ‘Green Queen’, and ‘Imperial Star’ had the most impressive yields of the six varieties trialed. While ‘Colorado Red Star’ and ‘Opal’ were deemed the favorites by color and appearance in a farmer’s market survey, they did not have adequate yield. ‘Purple Romagna’ failed to produce buds on most of the plants and does not appear to be commercially viable for the area based on this season. When comparing the two phases of varying planting dates, there did not seem to be a significant difference in marketable yield. However, the yield was higher in the November planting date, despite 15% yield loss due to spider mites, blossom end rot and Pectobacterium. The October planting phase was damaged by spider mites and Pythium due to the warm soil and air temperature at planting, in addition to black plastic mulch. Figure 1 shows marketable yield data per cultivar and planting date.
Fig. 1. Marketable yield of 6 artichoke cultivars planted in October vs.November.
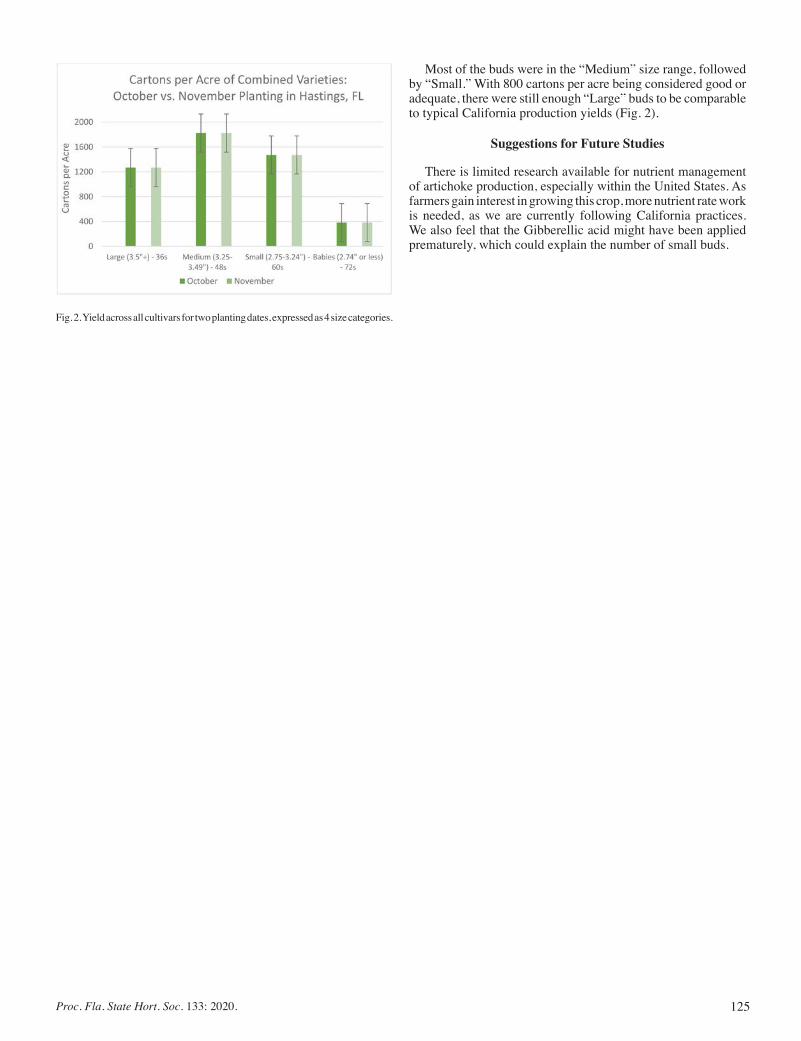
125Proc. Fla. State Hort. Soc. 133: 2020.
Most of the buds were in the “Medium” size range, followed by “Small.” With 800 cartons per acre being considered good or adequate, there were still enough “Large” buds to be comparable to typical California production yields (Fig. 2).
Suggestions for Future Studies
There is limited research available for nutrient management of artichoke production, especially within the United States. As farmers gain interest in growing this crop, more nutrient rate work is needed, as we are currently following California practices. We also feel that the Gibberellic acid might have been applied prematurely, which could explain the number of small buds.
Fig. 2. Yield across all cultivars for two planting dates, expressed as 4 size categories.
126 Proc. Fla. State Hort. Soc. 133: 2020
Proc. Fla. State Hort. Soc. 133:126. 2020.
Vegetable Section
*Corresponding author. Email: [email protected]
—Scientific Note—
Developing Interspecific Bridges between Cucurbita pepo and C. moschata
Yuqing Fu*, Vincent Michael, PaMela Moon, christine Waddill, shouan Zhang, and geoFFreY Meru
1Tropical Research and Education Center, University of Florida/IFAS, 18905 SW 280th St, Homestead, FL 33031
AdditionAl index words. cucurbit, embryo rescue
Interspecific hybridization was performed among 11 C. moschata and 4 C. pepo accessions. One hybrid (C. moschata × C. pepo) of the 24 crosses showed compatibility and immature seeds developed to adult plants via embryo rescue. The progeny of the derived crosses of C. moschata × (C. moschata × C. pepo) and (C. moschata × C. moschata) × (C. moschata × C. pepo) were introgressed with C. pepo and C. moschata to produce a set of bridge materials with different amounts of C. pepo genetic background e.g. 25%, 31.25%, 62.5%, 81.25%, and 90.625%, respectively, some of which held elite traits and potentials of disease resistance.
Interspecific hybridization is an important traditional breeding method for introgressing novel genes and widening genetic variations. C. pepo is the most diverse species for fruit characteristics among the five domes-ticated Cucurbita species and holds elite yield traits, while C. moschata is more tolerant to heat and resistant to pests. Hybridization between the two species is possible, but difficult due to incompatibility issues (Rakha et al., 2012). To develop bridges between these two species, we have tested 24 interspecific crosses for compatibility. By combining practical embryo rescue techniques with introgression across generations, the bridges were created and selected for elite characteristics.
Eleven C. moschata and 4 C. pepo cultigens were used to produce 24 interspecific crosses in 2015. For con-tinuous introgression and breeding purposes, 5 of the above parental C. moschata, some of which are of crown rot and/or powdery mildew resistance genes and other 4 C. pepo cultigens including the very popular ‘Yellow Crookneck’, ‘Early Prolific’, and ‘Table Queen Acorn’ were involved. To overcome the interspecific barriers, im-mature embryos were rescued by culturing on E20 or E21 medium (Nuñez-Palenius et al., 2011).
Findings
Of all the 24 initial crosses, one [C (C. moschata) × J (C. pepo)] was successful. Using the C × J (F1) as the male parent, a three-way cross of O (C. moschata with crown rot resistance) × (C × J) (F1) and a double cross of [Q (C. moschata with crown rot resistance) × D (C. moschata)] (F1) × (C × J)(F1) were developed, resulting in the progeny containing 25% C. pepo genetic background. These progeny, when introgressed with C. pepo or C. moschata, were generally more compatible with higher fertility and viability compared to the initial cross of C × J. Some of the materials grew to normal plants via embryo rescue. A set of bridge materials with 25% to 90.625% C. pepo background were created, and some of them showed elite yield traits e.g. bush type, short in-ternodes, an increase in female flowers, unique fruit color, and potential resistance to diseases. The introgression strategy employed in this study could be adopted to produce interspecific hybrids using other Cucurbita species. With the introgression of the crown rot resistance, we would be one step closer to introduce resistance genes into the extremely susceptible commercial summer squash (C. pepo).
Literature Cited
Nuñez-Palenius, H.G., R. Ramírez-Malagón, and N. Ochoa-Alejo. 2011. Muskmelon embryo rescue techniques using in vitro embryo culture, p. 107-115 In: Thorpe T. A. and E.C. Yeung (eds.) Plant embryo culture: methods and protocols, methods in molecular biology, vol. 710. Springer Science Business Media, New York.
Rakha, M.T., E.I. Metwally, S.A. Moustafa, A.A. Etman and Y.H. Dewir. 2012. Production of Cucurbita interspecific hybrids through cross pollination and embryo rescue technique. World Appl. Sci. J. 20(10):1366-1370.
127Proc. Fla. State Hort. Soc. 133: 2020.
Proc. Fla. State Hort. Soc. 133:127–128. 2020.
Vegetable Section
Hatch Project FLA-EREC-005599, Fulbright Scholarship Program, Specialty Crop Block Program 19SCBFL0015, Foundation for Food and Agricultural Research, Florida Department of Agricultural and Consumer Services, and The Florida Vegetable Exchange.*Corresponding author. Email:[email protected]
—Scientific Note—
The Genetic Diversity of the Genus Lactuca for Resistance to Fusarium wilt
Gulnoz Hisamutdinova1, Jesse J. murray1,2, ricHard n. raid1,3, maria José truco4, and Germán v. sandoya1,2*
1Everglades Research and Education Center, University of Florida/IFAS, 3200 Palm Beach Rd., Belle Glade, FL 33430
2Horticultural Sciences, University of Florida/IFAS, P.O. Box 110690, Gainesville, FL 326113Plant Pathology, University of Florida/IFAS, P.O. Box 110680, Gainesville, FL 32611
4University of California, Davis Genome Center, 451 Health Sciences Dr., Davis, CA 95616
AdditionAl index words. breeding, disease resistance, wildtypes, lettuce
Fusarium wilt of lettuce (FOL) (Lactuca sativa L.) is a soil-borne disease caused by the fungus F. oxysporum f.sp. lactucae. The fungus enters plants via natural apertures or wounds on roots and causes a reddish-brown necrosis in the taproot’s vascular tis-sue. Subsequent decay within root vascular tissue inhibits water and nutrient transport, resulting in wilting, stunting and chlorosis of leaf tissue (Scott et al., 2012). FOL may cause widespread crop losses, particularly in favorably high soil temperatures, and can persist for years in infected fields once the fungus produces resilient resting structures called chlamydospores. In the US, the pathogen was reported first in California in 1990, Arizona in 2001, and Florida in 2017. It may now pose a threat to the $80 million per year lettuce industry if FOL increases in the Ever-glades Agricultural Area (EAA). The lack of control methods against this disease makes breeding for resistance a top priority. Several cultivated lettuces in the USDA-Germplasm Resources Information Network (GRIN) have resistance against FOL, however, many are only partially resistant and to our knowledge, no resistant wildtype or primitive Lactuca have been identified. Additional resistance is needed to increase the genetic pool available for breeding. The purpose of this study was to identify potentially novel sources of resistance within cultivated and wildtype Lactuca accessions from the center of origin.
Two augmented randomized complete-block design experi-ments were conducted in a dedicated greenhouse at the Ever-glades Research and Education Center between January and March of 2020. Five plants per plot of four-week-old seedlings for each accession were inoculated with isolate FOL #51 using the method described by Murray et al. (2020). This isolate was previously identified as the EAA’s most virulent race 1 isolate. Root discoloration incidence (RDI) and severity (RDS) were
recorded after 30 d post-infection using a 0–5 scale, where 0 = no taproot discoloration to 5 = plant death. Root tissue samples of non-symptomatic plants were plated on Komada’s Semi-Selective Media and identified by conidia morphology to confirm the pathogen’s presence inside asymptomatic taproots. The first experiment consisted of 48 accessions obtained from USDA-GRIN, including 35 L. sativa and 13 L. serriola, as well as four controls: 60182, a University of Florida breeding line resistant to FOL race 1; ‘Lolla Rossa’ [Plant Introduction (PI) 617943], and ‘Dark Lolla Rosa’ (PI 667690) with partial resistance; and the susceptible ‘Chosen’. The second experiment consisted of 111 accessions from the University of California, Davis germplasm collection that originated from several countries in Lactuca’s Mediterranean center of origin, including, 98 L. serriola, 5 L. saligna, 8 Lactuca spp. accessions, and the aforementioned controls. Analysis of variance was conducted to test the effect of accessions on RDI and RDS using SAS software, Version 9.4 (SAS, Cary, NC). Post-hoc analysis was conducted with Dunnett’s two-tailed t-test to determine significant differences between each accession and each of the four controls.
Significant differences were found among tested accessions in experiments 1 and 2 for RDI and for RDS (P < 0.0001). In the first experiment, 20 accessions were without root discoloration or foliar symptoms. However, when these taproots were plated onto Komada’s Media, only one, PI 165063, did not develop any FOL colonies and is considered completely resistant. In the second experiment, 27 accessions of wildtypes were without foliar symptoms or root discoloration, and of those, only five L. serriola accessions did not grow FOL colonies when plated on Komada’s media.
Several L. sativa accessions have been described with resis-tance to race 1 for isolates in California and Arizona, includ-ing the romaine cultivars ‘Costa Rica No.4’, ‘Caesar’, ‘King Henry’, ‘Slugger’, ‘King Louie’, and ‘Valmaine’; as well as leaf cultivars ‘Lolla Rossa’ and ‘Red Rossa’ (Matheron and Porchas, 2010; Scott et al., 2010; Scott et al., 2012). However, FOL was recently discovered in Florida and these experiments utilized a
128 Proc. Fla. State Hort. Soc. 133: 2020
novel isolate obtained from local fields. The leaf cultivar ‘Dark Lolla Rossa’ and romaine breeding line 60182 showed little to no disease in these experiments and can be considered resis-tant to FOL. No relationship between origin and resistance to FOL can be established for L. sativa, because only one resistant PI from Turkey has been discovered. However, the five wild-type (L. serriola) resistant accessions were all collected from the Caucasus region of Azerbaijan. Although there is genetic diversity for race 1 of FOL in the genus Lactuca, screening for wildtypes is still needed to have alternative sources of resistance that could be pyramided, especially if resistance is controlled by different loci.
Literature Cited
Matheron, M.E., and M. Porchas. 2010. Evaluation of soil solarization and flooding as management tools for Fusarium wilt of lettuce. Plant Disease 94:1323–1328.
Murray, J.J., R. Raid, C.F. Miller, and G.V. Sandoya Miranda. 2020. First report of Fusarium oxysporum f. sp. lactucae causing vascular wilt of lettuce in Florida. Plant Disease. PDIS-12-19-2625-PDN https://doi.org/10.1094/PDIS-12-19-2625-PDN
Scott, J.C., T.R. Gordon, S.C. Kirkpatrick, S.T. Koike, M.E. Matheron, O.E. Ochoa, M.J. Truco, and R.W. Michelmore. 2012. Crop rotation and genetic resistance reduce risk of damage from Fusarium wilt in lettuce. California Agric. 66:20–24.
Scott, J., S. Kirkpatrick, and T. Gordon 2010. Variation in susceptibility of lettuce cultivars to fusarium wilt caused by Fusarium oxysporum f. sp. lactucae. Plant Pathology. 59:139–146.
129Proc. Fla. State Hort. Soc. 133: 2020.
Proc. Fla. State Hort. Soc. 133:129. 2020.
Vegetable Section
*Corresponding author. Email: [email protected]
—Scientific Note—
Resistance to Cucurbit Leaf Crumple Virus In SquashGeoffrey Meru1*, eMily WanG1, yuqinG fu1, renato Carvalho2,
Melanie KalisChuK2, and MattheWs Paret2
1Tropical Research and Education Center, University of Florida/IFAS, 18905 SW 289th St., Homestead, FL 33031
2North Florida Research and Education Center, University of Florida/IFAS, 155 Research Rd., Quincy FL 32351
AdditionAl index words. breeding, disease resistance, whitefly transmitted viruses
The cucurbit industry in Florida is under threat from damaging outbreaks of Cucurbit leaf crumple virus (CuLCrV), a whitefly transmitted virus. Epidemics caused by CuLCrV have intensified over the last few years causing some growers to abandon their fields or face greatly reduced yields. Management of CuLCrV is difficult due to the development of pesticide resistance in whitefly populations, lack of resistant commercial cultivars, as well as limited knowledge on the biology of the virus and its interaction with plant hosts. Cultural management options reply on suppression of whitefly populations using reflective mulches, removal of volunteer plants and crop rotation; however these are not wholly effective, especially under high whitefly pressure.
The goal of the current study was to identify squash germplasm resistant to CuLCrV under field conditions. One hundred and seventy accessions of squash (Cucurbita spp) were grown at the North Florida Reseach and Educa-tion Center–Suwanee Valley Experiment Station, Live Oak, FL. Twelve seedlings per accession were transplanted on plastic mulch in Sept. 2019, and data on disease severity were collected every week for 5 weeks. Molecular diagnosis to confirm infection with CuLCrV was done using PCR or RPA. Area under disease progress curve (AUDPC) was calculated to determine the rate of disease progression. It ranged from 0–1852 across all accessions. Forty-three accessions showed moderate disease severity (AUDPC = 100–400), while the majority (n = 116) of the accessions were highly susceptible, including the commercial cultivars (mean = 1286). However, 11 accessions (8 C. pepo and 3 C. moschata) did not develop any symptoms (asymptomatic). Identification of these accessions presents the fist step toward development of commercial squash cultivars resistant to CuLCrV for growers.
Further studies are underway in the greenhouse to confirm resistance.
130 Proc. Fla. State Hort. Soc. 133: 2020
Proc. Fla. State Hort. Soc. 133:130. 2020.
Vegetable Section
*Corresponding author. Email: [email protected]
—Scientific Note—
QTL-seq for Rapid Mapping of Genomic Regions Associated With Zucchini Yellow Mosaic Virus
Resistance In SquashSwati ShreStha1*, Yuquing Fu1, Vincent Michael1, and geoFFreY Meru1
Tropical Research and Education Center, University of Florida/IFAS, 18905 SW 280th St., Homestead, FL 33031
AdditionAl index words. cucurbit, genetic markers, pest resistance
Development of Zucchini Yellow Mosaic virus (ZYMV) resistant squash and pumpkin cultivars using traditional breeding approaches relies on rigorous and resource-intensive phenotypic assays. QTL-seq, a whole genome rese-quencing based bulked segregants (BSA) is a powerful tool for mapping quantitative trait loci (QTL) associated with a trait. In the current study, 4 QTLs significantly associated with ZYMV resistance (P < 0.05) were detected in chromosomes 2, 4, 8 and 20 using QTL-seq method. 12 Indel markers were developed within the QTL intervals using BatchPrimer3. Out of the 12 markers, one marker linked to the QTL in chromosome 20 was found to be polymorphic between the resistant and susceptible parents used in the study. The study demonstrated the efficiency of QTL-seq in identifying QTL’s associated with ZYMV resistance. Current efforts involve validating the above identified polymorphic marker in diverse genotype and also developing additional markers that will compliment phenotypic selection in future breeding programs.
ZYMV is one of the major yields limiting factor in Cucurbita production worldwide. Natural source of resis-tance to ZYMV has been identified in an unadapted Cucurbita moschata, ‘Nigerian Local’. Identification of QTL associated with resistance and molecular tagging of resistant loci would assist in marker assisted pyramiding of resistant alleles in commercial cultivars through marker assisted selection.
A mapping population was developed by crossing ‘Nigerian Local’ (ZYMV resistant) X ‘Butterbush’ (suscep-tible). Briefly, controlled crosses were made to produce the F1 generation. These were selfed to produce the F2 or the mapping population. The F2 population was mechanically inoculated with ZYMV and screened phenotypically to select the 10 most resistant and the 10 most susceptible individuals. DNA from the 10 most resistant and the 10 most susceptible individuals were pooled together for preparation of resistant and susceptible bulk, respectively. Resistant and susceptible parents, and resistant and susceptible bulks were sent for whole genome sequencing and sequencing results were used for variant calling and QTL analysis.
Grouping of F2 populations as resistant and susceptible served the purpose of phenotypic screening. QTL seq analysis using QTL-seqr identified 4 QTL’s associated with ZYMV resistance on chromosomes 2, 4, 8, and 20. Indel markers were developed from the vicinity of QTL regions. Markers were checked for polymorphism and one marker in chromosome 20 could confidently discriminate resistant and susceptible individuals. Future work involves identifying Single nucleotide polymorphism markers to develop higher confidence in marker assisted selection for ZYMV resistance development.
131Proc. Fla. State Hort. Soc. 133: 2020.
Proc. Fla. State Hort. Soc. 133:131. 2020.
Vegetable Section
*Corresponding author. Email: [email protected]
—Scientific Note—
Alternative Fumigant Application Strategies to Manage Plant Parasitic Nematodes In Vegetable Crops
Sarah da Silva Benevenute, JoShua h. Freeman*, and rui Yang
North Florida Research and Education Center, 155 Research Rd., University of Florida/IFAS, Quincy, FL 32351
AdditionAl index words. disease and management
Pre-plant soil fumigation has been a fundamental treatment in intensive Florida plasticulture production since the 1960s. Since the phase-out of methyl bromide (MBr) in 2005, the incidence and severity of nematode-infested fields have increased in vegetable producing systems and a soilborne pest and disease management program with reliable and consistent efficacy remains elusive. Unlike MBr, alternative fumigants have lower vapor pressure and higher boiling point, and consequently, poorer vertical and horizontal distribution in soils. A point of concern when making a pre-plant fumigation is the depth at which the fumigant is applied. Previous research in cotton and strawberry has shown that root-knot nematodes [(RKN) Meloidogyne spp.] and the reniform nematodes (Roty-lenchulus reniformis) can inhabit very deep soil profiles, below the depths to which any of the current shank- or drip-applied fumigants diffuse. Because these nematodes at greater depth can rapidly recolonize fumigated soils, a reassessment of fumigant application depth for plasticulture systems is needed. The objective of this study was to evaluate the efficacy of deep, shallow, and shallow plus deep drip (combo) fumigation for RKN and reniform nematode management.
A field experiment was performed at the North Florida Research and Education Center in Quincy during fall 2019. The study evaluated seven treatments: a non-treated control and two fumigants [1,3-dichloropropene (1,3-d) and dimethyl disulfide (DMDS) at 169 L/ha and 375 L/ha, respectively) applied at three different depths {shallow drip (2.5 cm), deep drip (38 cm), and a combo [shallow and deep, (2.5 and 38 cm)]} through a single drip tape buried at each depth. All experimental plots were covered with white-on-black totally impermeable film mulch prior to fumigation. Fifteen cantaloupe (cv. Athena) seedlings were transplanted in each plot 3 weeks after fumigation. The experiment was established in an area known to have naturally occurring RKN and reniform nematode populations. The experimental design was a randomized complete-block design with 4 replications.
Marketable fruit yield was estimated for each plot at fruit maturity. Three 6-inch deep soil core samples and five root systems were collected from each plot for nematode quantification and root galling index (RGI) rating. Analysis of variance (ANOVA) was performed using SAS® software, version 9.4 (SAS, Cary, NC) to test the effect of fumigant, depth, and fumigant × depth interaction. The LD_CI macro was used to calculate the relative marginal effects (RMEs) of RGI rating and their 95% confidence intervals. Orthogonal contrasts were calculated to compare each of the fumigant treatments against the control. ANOVA indicated no significant differences (P > 0.05) for marketable fruit yield among treatments. However, a trend of greater yields was observed in the fumigant treatments compared the control, except for the 1,3-d applied at a deep depth. In general, DMDS shallow and 1,3-d deep resulted in a lower number of reniform nematodes in the soil, though, differences were not statistically significant (P > 0.05), and no differences in RKN count for both soil and roots were observed among treatments. Linear contrasts of RMEs for RGI showed that DMDS shallow and 1,3-d deep were significantly different (P < 0.05) compared to the control. Overall nematode populations were low in the trial area which resulted in variable data. These results may suggest that deep drip fumigation will not necessarily improve overall nematode control or crop yield.
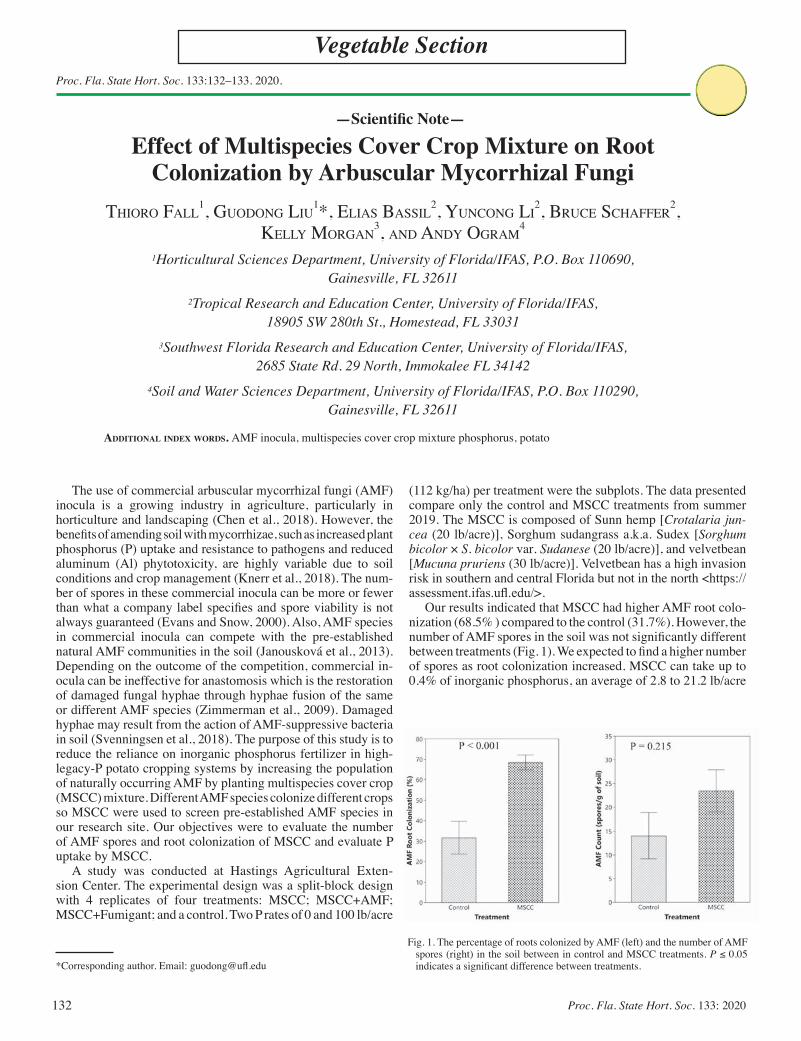
132 Proc. Fla. State Hort. Soc. 133: 2020
Proc. Fla. State Hort. Soc. 133:132–133. 2020.
Vegetable Section
*Corresponding author. Email: [email protected]
—Scientific Note—
Effect of Multispecies Cover Crop Mixture on Root Colonization by Arbuscular Mycorrhizal Fungi
Thioro Fall1, GuodonG liu
1*, Elias Bassil2, YunconG li
2, BrucE schaFFEr2,
KEllY MorGan3, and andY oGraM
4
1Horticultural Sciences Department, University of Florida/IFAS, P.O. Box 110690, Gainesville, FL 32611
2Tropical Research and Education Center, University of Florida/IFAS, 18905 SW 280th St., Homestead, FL 33031
3Southwest Florida Research and Education Center, University of Florida/IFAS, 2685 State Rd. 29 North, Immokalee FL 34142
4Soil and Water Sciences Department, University of Florida/IFAS, P.O. Box 110290, Gainesville, FL 32611
The use of commercial arbuscular mycorrhizal fungi (AMF) inocula is a growing industry in agriculture, particularly in horticulture and landscaping (Chen et al., 2018). However, the benefits of amending soil with mycorrhizae, such as increased plant phosphorus (P) uptake and resistance to pathogens and reduced aluminum (Al) phytotoxicity, are highly variable due to soil conditions and crop management (Knerr et al., 2018). The num-ber of spores in these commercial inocula can be more or fewer than what a company label specifies and spore viability is not always guaranteed (Evans and Snow, 2000). Also, AMF species in commercial inocula can compete with the pre-established natural AMF communities in the soil (Janousková et al., 2013). Depending on the outcome of the competition, commercial in-ocula can be ineffective for anastomosis which is the restoration of damaged fungal hyphae through hyphae fusion of the same or different AMF species (Zimmerman et al., 2009). Damaged hyphae may result from the action of AMF-suppressive bacteria in soil (Svenningsen et al., 2018). The purpose of this study is to reduce the reliance on inorganic phosphorus fertilizer in high-legacy-P potato cropping systems by increasing the population of naturally occurring AMF by planting multispecies cover crop (MSCC) mixture. Different AMF species colonize different crops so MSCC were used to screen pre-established AMF species in our research site. Our objectives were to evaluate the number of AMF spores and root colonization of MSCC and evaluate P uptake by MSCC.
A study was conducted at Hastings Agricultural Exten-sion Center. The experimental design was a split-block design with 4 replicates of four treatments: MSCC; MSCC+AMF; MSCC+Fumigant; and a control. Two P rates of 0 and 100 lb/acre
(112 kg/ha) per treatment were the subplots. The data presented compare only the control and MSCC treatments from summer 2019. The MSCC is composed of Sunn hemp [Crotalaria jun-cea (20 lb/acre)], Sorghum sudangrass a.k.a. Sudex [Sorghum bicolor × S. bicolor var. Sudanese (20 lb/acre)], and velvetbean [Mucuna pruriens (30 lb/acre)]. Velvetbean has a high invasion risk in southern and central Florida but not in the north <https://assessment.ifas.ufl.edu/>.
Our results indicated that MSCC had higher AMF root colo-nization (68.5% ) compared to the control (31.7%). However, the number of AMF spores in the soil was not significantly different between treatments (Fig. 1). We expected to find a higher number of spores as root colonization increased. MSCC can take up to 0.4% of inorganic phosphorus, an average of 2.8 to 21.2 lb/acre
Fig. 1. The percentage of roots colonized by AMF (left) and the number of AMF spores (right) in the soil between in control and MSCC treatments. P ≤ 0.05 indicates a significant difference between treatments.
AdditionAl index words. AMF inocula, multispecies cover crop mixture phosphorus, potato
133Proc. Fla. State Hort. Soc. 133: 2020.
of P depending on the average shoot dry weight of the combined cover crops (Table 1). AMF inocula are naturally occurring AMF species vary depending numerous factors such as soil type, soil nutrients, previous crops, etc. and that commercial inocula often don’t contain any of the naturally occurring species. Since natu-rally occurring species are adapted to the crops planted at their location, they may be much more effective than AMF species in commercial mixtures and commercial AMF mixtures may be totally ineffective depending on the AMF species included. There-fore, it is important to produce naturally occurring AMF inocula. Thus, future research will evaluate the AMF root colonization of ‘Atlantic’ potato following MSCC and assess its effect on tuber yield and yield components.
Literature Cited
Chen, M., M. Arato, L. Borghi, E. Nouri, and D. Reinhardt. 2018. Beneficial services of arbuscular mycorrhizal fungi—From ecology to application. Front.Plant Sci. 4 Sept. 2018. 9:1270.
Evans, R.Y. and S. Snow. 2000. Survey of commercial sources of
mycorrhiza inocula for horticultural use. Slosson report 1999–2000. Univ. Calif., Div. Agric. Nat. Res. E.J. Slosson Endowment for Ornamental Horticulture. <http://slosson.ucdavis.edu/newsletters/Evans_200029034.pdf>. Accessed 11 Oct. 2020.
Janousková, M., K. Krak, C. Wagg, H. Štorchová, P. Caklová, and M. Vosátka. 2013. Effects of inoculum additions in the presence of a preestablished arbuscular mycorrhizal fungal community. Applied and environmental microbiology 79:6507–6515.
Knerr, A.J., D. Wheeler, D. Schlatter, D. Sharma-Poudyal, L. Du Toit, and T. Paulitz. 2018. Arbuscular mycorrhizal fungal communities in organic and conventional onion crops in the Columbia Basin of the Pacific Northwest United States. Phytobiomes Journal 2(4):194–207.
Svenningsen, N.B., S.J. Watts-Williams, E. Joner, F. Battini, A. Efthy-miou, C. Cruz-Paredes, O. Nybroe, and I. Jakobsen. 2018. Suppression of the activity of arbuscular mycorrhizal fungi by the soil microbiota. The ISME Journal 12:1296–1307.
Zimmerman, E., M. St.-Arnaud, and M. Hijri. 2009. Sustainable agri-culture and the multigenomic model: How advances in the genetics of arbuscular mycorrhizal fungi will change soil management. Molecular Plant-Microbe Interactions, 269–287.
Table 1. Growth and macronutrient content of individual cover crop species within the multispecies cover crops (MSCC). Growth parameters Macronutrient content Height Plant density Shoot dry wt N P K Mg Ca SMSCC (ft) (acre *1000) (lb/acre) (lb/acre) ......................................... % ........................................Sunn hemp 4.9 181 5159.7 5715 3.07 0.41 1.19 0.55 1.60 0.31Velvetbean 3.7 23 646.8 625 2.07 0.43 1.44 0.52 1.21 0.27Sudex 4.5 138 1290.8 1249 2.61 0.41 1.28 0.55 1.39 0.27
134 Proc. Fla. State Hort. Soc. 133: 2020
Proc. Fla. State Hort. Soc. 133:134. 2020.
Vegetable Section
We thank all members of the Horticultural Crop Physiology Lab at the Gulf Coast Research and Education Center for their technical assistance.*Corresponding author. Email:[email protected]
—Scientific Note—
Post-planting Root Growth Dynamics and Morphology of Bare-root and Plug Strawberry Transplants and Their
Impacts on Field PerformanceJose Hernandez-Monterroza and sHinsuke ageHara*
Gulf Coast Research and Education Center, University of Florida/IFAS, 14625 County Rd. 672, Wimauma, FL 33598
AdditionAl index words. Fragaria ×ananassa, image analysis, ImageJ, rhizotron, root morphology, stand establishment
The use of plug transplants for strawberry (Fragaria ×ananassa Duch.) production has increased recently because their establishment in the field is quicker and does not require overhead irrigation compared with bare-root transplants. The most notable difference between the two transplant types is in their root systems. Plug transplants have alive and functional roots, whereas most fine roots of bare-root transplants are desiccated desiccated at the time of transplanting, resulting in a limited water nutrient uptake capacity.
We conducted a greenhouse experiment using a scanner-based rhizotron system to characterize initial root growth dynamics and morphology of bare-root and plug strawberry (‘Florida Radiance’) transplants. Each rhizotron had 2655 cm3 of soil with a 23 × 30 cm scannable window on each side. The soil was collected from a research strawberry field and packed in the rhizotrons using the field bulk density. Rhizotrons are inclined at 30° to promote root growth on the bottom side window. Plants were grown over 42 days in the rhizotrons. We measured canopy and root projected area weekly via image analysis of overhead canopy and root scan images.
In bare-root transplants, most initial roots were desiccated before transplanting and decayed during the ex-periment. They developed new roots from the basal part of the crown tissue or tips of some initial roots, most of which were detected in the upper middle 15 cm of the soil profile. By contrast, plug transplants had relatively undamaged initial roots, which continued to grow and developed uniformly into the entire soil profile. Compared with bare-root transplants, plug transplants showed more rapid canopy growth, with canopy projected area in-creasing by 61% to 135% during the experiment period. Root growth showed different vertical root distribution between the two transplant types.
At the end of the experiment, although root projected area in the upper 15 cm was similar in both transplant types, plug transplants had 246% larger root projected area in the lower 15 cm than bare-root transplants. In a follow-up field experiment, plant growth and yield performance of bare-root and plug strawberry transplants were evaluated. The faster initial canopy development of plug transplants compared to bare-root transplants was observed, with up to 39% larger canopy projected area at 28 days after transplanting. Consequently, plug transplants produced 52% and 23% higher early and total season yields than bare-root transplants, respectively.
These results suggest that rapid establishment and improved fruit earliness of plug transplants is due partly to their functional initial roots that can continue to develop and quickly explore the soil for water and nutrients after transplanting.
135 Proc. Fla. State Hort. Soc. 133: 2020
Proc. Fla. State Hort. Soc. 133:135. 2020.
Vegetable Section
*Corresponding author. Email: [email protected]
—Scientific Note—
QTL Mapping of Phytophthora Crown Rot Resistance in Squash
Vincent Michael*, Yuqing Fu, and geoFFreY Meru
Tropical Research and Education Center, University of Florida/IFAS, 18905 SW 280th St., Homestead, FL 33031
AdditionAl index words. Phytophthora capsici, squash breeding
Squash (Cucurbita pepo L.) is an important vegetable crop in Florida valued at over 30 million US dollars (USDA-NASS, 2020). Losses due to Phytophthora capsici Leonian are a major challenge throughout the state. P. capsici is the causal agent of Phytophthora crown rot in squash, is a disease exacerbated by frequent flooding in Florida. Cultural management techniques are ineffective under heavy disease pressure and the pathogen rapidly develops insensitivity to fungicides. Although host resistance is preferred, no commercial summer squash cultivars resistant to the pathogen are currently available. A breeding line, UF-PhytoR1, with high resistance to Phytophthora crown rot was developed at the University of Florida (Michael et al., 2019). This study was conducted to map QTL loci associated with Phytophthora crown rot resistance in UF-PhytoR1 and identify any linked molecular markers for application in marker assisted backcrossing.
Materials and Methods
An F2 mapping population was developed from a cross between UF-PhytoR1 and ‘Table Queen Acorn’, an elite susceptible cultivar and subsequently selfed to produce F2:3 seeds. For phenotyping, 12 seeds of each F2:3 family and 10 seeds of each parent were sown in 4-inch pots and inoculated at 2–3 leaf stage with a virulent P. capsici strain by spraying 1.5 mL (vol.) of zoospore suspension (2.0 × 10⁴ zoospore/mL) at the crown. Disease severity (DS) was recorded every 48 h starting 6 d post-inoculation (dpi) using a scale of 0 to 5 in which, 0 = no symptoms and 5 = plant death. Area under disease progress curve (AUDPC) values calculated from mean DS scores of each F2:3 family were used in QTL map-ping. Concurrently, genomic DNA extracted from each F2 plant and the parents was genotyped with 522 squash single-nucleotide polymorphism (SNP) markers on a SeqSNP platform. A genetic map was constructed with polymorphic SNP markers between UF-PhytoR1 and ‘Table Queen Acorn’ by assembling them into linkage groups using Kosambi mapping function (LOD = 4.97, recombination fraction = 0.5) in R/onemap (Margarido et al., 2007). Finally, significant QTLs were identified by composite interval mapping using Harley-Knott regression with LOD thresholds of 4.14 determined with 10,000 permutations in R/qtl2 (Broman et al., 2019).
Results and Discussion
On the last day of screening, all ‘Table Queen Acorn’ plants had died (mean DS score = 5) while all UF-PhytoR1 plants had a mean DS of 0.55 and exhibited no typical Phytophthora crown rot symptoms. Meanwhile, AUDPC scores of F2:3 families ranged from 15.45 to 45.01 (mean = 35.39) and displayed a moderately left skewed normal distribution (Pearson coefficient of skewness = –1.105). A significant QTL region (qtlpc) spanning approximately 0.66MB in chromosome 13 was detected. Several candidate defense-related genes were found within the confidence interval of the QTL, including dirigent (DIR) proteins involved in ligni-fication during biotic stress, homologs for innate plant defenses, and homologs of oxidative stress protection. Presence of qtlpc and underlying genes contributes Phytophthora crown rot resistance through anti-oxidative defense and structural reinforcement to inhibit pathogen penetration and cell death. Indeed, UF-PhytoR1 and similarly resistant F2:3 plants remained healthy or exhibited minimal localized lesions around the crown. At least five SNPs lie within these candidate genes (LOD 2.5 to 4.20) offering op-portunity for application in marker-assisted backcrossing within a squash breeding program.
Literature Cited
Broman, K.W., D.M. Gatti, P. Simecek, N.A. Furlotte, P. Prins, S. Sen, B.S. Yandell, and G.A. Churchill. 2019. R/qtl2: Software for mapping quantitative trait loci with high-dimensional data and multiparent populations. Genetics 211(2):495–502.
Krasnow, C.S., R. Hammerschmidt, and M.K. Hausbeck. 2017. Charac-teristics of resistance to Phytophthora root and crown rot in Cucurbita pepo. Plant Dis. 101(5):659–665.
Margarido, G.R.A., A.P. Souza, and A.A.F. Garcia. 2007. OneMap: Software for genetic mapping in outcrossing species. Hereditas 144(3):78–79.
Michael, V.N., Y. Fu, and G. Meru. 2019. Inheritance of resistance to Phy-tophthora crown rot in Cucurbita pepo. HortScience 54(7):1156–1158.
USDA-NASS. 2020. Statistics of vegetables and melons (USDA-NASS, ed.). US Government Printing Office, Washington, DC.
136 Proc. Fla. State Hort. Soc. 133: 2020
Proc. Fla. State Hort. Soc. 133:136. 2020.
Vegetable Section
*Corresponding author. Email: [email protected]
—Scientific Note—
Evaluation of Biostimulant Products for Tomato Production In Florida
Weining Wang, Christopher DelCastillo, aleyDa aCosta-rangel, syuan-you lin, Jose hernanDez-Monterroza1, Mariel gallarDo,
anD shinsuke agehara*Gulf Coast Research and Education Center, University of Florida/IFAS, Wimauma, FL 33598
AdditionAl index words. humic acid, mycorrhiza, seaweed extract, Solanum lycopersicum
Florida is the largest producer of fresh tomatoes (Solanum lycopersicum L.) in the United States. Many nutri-ent management approaches to improving yield and quality of tomato have been discovered, one of which is the application of biostimulants. Biostimulants are substances or microorganisms that could be applied to the plants and stimulate natural processes to enhance nutrient uptake, stress tolerance, and in some cases, quality attributes, such as nutritional content and shelf life. Some common types of biostimulants include humic acid, fulvic acid, amino acid, crab shell powder, seaweed extracts, algae, and mycorrhiza. To evaluate the effectiveness of various biostimulant products in tomato production in Florida, two independent field experiments were conducted at the Gulf Coast Research and Education Center in Balm, FL.
In the first field experiment, humic acid and seaweed extract products were applied through drenching and drip tape injection, following the manufacturer’s recommendations. Both humic acid and seaweed extract treatments significantly increased marketable fruit yields by 10% (92.6 vs. 101.5–101.6 t·ha–1) compared to the control, although no significant treatment effects were found on plant canopy area and plant biomass. In the second field experiment, tomato seedlings were treated with a mycorrhizal product via spray application before transplanting or drench application immediately after transplanting. Light microscopy revealed that spray and drench mycorrhizal treatments increased the mycorrhizal colonization rate at harvest from 5.8% to 11.4% and 27.8%, respectively. Spray and drench mycorrhizal treatments also increased marketable fruit yields by 3% and 10% (82.2 vs. 85.0–90.4 t·ha–1), respectively, although no significant treatment effects were found on plant canopy area and plant biomass. These results demonstrate the potential of various biostimulant products to improve tomato production in Florida.
Future studies will evaluate treatment effects on root responses in an effort to explain the underlying mecha-nisms of growth stimulation by various biostumulants. In addition, considering the decent fruit yield in the control treatments, it might be worthwhile to challenge tomato plants with a stress environment to better display the beneficial effects of biostimulants.

137Proc. Fla. State Hort. Soc. 133: 2020.
Proc. Fla. State Hort. Soc. 133:137. 2020.
Vegetable Section
*Corresponding author. Email: [email protected]
—Scientific Note—
Rapid Screening for Phosphorous-efficient Genotypes from Tomato Germplasm Banks In
an Artificial Soil SolutionTanumoy Bera and GuodonG Liu*
Horticultural Sciences Department, University of Florida/IFAS, P.O. Box 110690, Gainesville, FL 32611
AdditionAl index words. tomato, fertilizer, vegetable crop
Tomato is the second most important vegetable crop (potato ranks first) in the world. The total world production of tomatoes is 182.3 million tons with a value of $74.1 billion (FAO, 2019). In USA, the area planted to tomato was 282,000 acres and produced 239,399,500 cwt with a value of $1.6 billion in 2019 (USDA-NASS, 2019). Florida ranked No. 1 in the nation for commercial fresh market tomato production in 2019: planted acreage of 27,000 acres and yield of 7,729,800 cwt with a value of nearly $426 million (USDA-NASS). It is estimated that tomato crops used approximately 3000 tons of P2O5. Due to inorganic fixation and low ability of modern cultivars to mobilize sparsely soluble phosphates in soil, up to 80% of phosphorous (P) fertilizers ap-plied may be unused or unavailable to plants (Holford, 1997). This low use efficiency indicates that approximately 2400 tons of P2O5 applied do not contribute to tomato productivity every year. This unused P fertilizer may have adverse impacts on the environment. It is imperative for us to improve phosphorus use efficiency for tomato production.
P fertilizer is produced from phosphate rock, which is nonre-newable. This resource is being depleted and may run out soon. Developing P efficient crop varieties is imperative to overcome the predicted P crisis. There is an urgent need to use elite geno-types to breed P-efficient tomato cultivars. Field trials are time and resource consuming and cannot be adopted for easy and rapid screening for P-efficient genotypes. In the present study, a simulated soil solution (SSS) was designed and evaluated to identify P-efficient genotypes of tomato (Solanum lycopersicum). A soil solution has a low but buffered concentration of bioavail-able P. When a sparely soluble phosphate is used as the only P source in a nutrient solution with extra companion cation, e.g., calcium ion for tricalcium phosphate [Ca3(PO4)2] in the follow-ing chemical equilibrium, an artificial or stimulated soil solution can be prepared.
Our new publication on tomato has the detailed description for the novel identification method (Bera et al., 2019).
In this study, 30 randomly selected tomato genotypes from commercially available sources were used in hydroponics with
tricalcium phosphate as the only P source plus 15 extra mM Ca2+ as low-P stress compared with the sufficient P growth conditions with sodium dihydrogen phosphate (NaH2PO4) as the control. Specific biomass of shoots (SBS) was used as the criterion to identify the genotypes.
The results showed that ‘Japanese Black Trifele Og’ (JBT) and ‘Great White’ Og (GW) were P efficient (SB > 0.5 g/plant) whereas ‘Green Tiger’ (GT) and ‘Mariana’ F1 P-inefficient (SB < 0.1 g/plant). JBT had the greatest root morphological traits includ-ing root dry mass, length, volume, and fork number. By contrast, the P-inefficient genotypes performed poorly under low-P stress.
Hydroponic identification is a rapid and economical method for screening P-efficient genotypes from germplasm banks and commercially available sources. After the P-efficient genotypes have been identified, they should be planted in on-farm trials to double check their P-use efficiency. Once P-use efficiency is con-firmed in on-farm trials, these elite genotypes can be directly used for tomato production with less P input for sustainable vegetable production. Elite genotypes can also be used for P-efficient tomato breeding in the future. P-efficient cultivars are necessary for us to overcome the challenges of P-crisis on the horizon.
Literature Cited
Bera,T., F. Song, and G.D. Liu. 2019. Rapid identification of phosphorus-efficient genotypes from commercially grown tomato (Solanum lycop-ersicum L.) varieties in a simulated soil solution. J. Hort. Sci. Biotech. 95(3):395–404. Accessed 3 Feb. 2021. <https://www.tandfonline.com/doi/full/10.1080/14620316.2019.1684210>
FAO. 2019. Global production of vegetables in 2019. Accessed 3 Feb. 2021. <https://www.statista.com/statistics/264065/global-production-of-vegetables-by-type/>
Holford, I.C.R. 1997. Soil phosphorus: Its measurement, and its uptake by plants. Aust. J. Soil Res., 35:227–239.
USDA-NASS, 2019. Vegetable 2019 Summary. February 2020. ISSN: 0884-6413. Accessed 3 Feb. 2021. <https://www.nass.usda.gov/Pub-lications/Todays_Reports/reports/vegean20.pdf>

138 Proc. Fla. State Hort. Soc. 133: 2020
Proc. Fla. State Hort. Soc. 133:138. 2020.
Vegetable Section
*Corresponding author. Email: [email protected]
—Scientific Note—
Understanding Lettuce Downy Mildew: Pathogen Distribution and Available Host Resistance In Florida
Lis NataLi R. PoRto, RichaRd N. Raid, aNd GeRmáN V. saNdoya*Everglades Research and Education Center, University of Florida/IFAS,
3200 Palm Beach Rd., Belle Glade, FL 33430
AdditionAl index words. fungicide, pathogen races
Florida ranks third in the US for lettuce (Lactuca sativa L.) production, with most concentrated on the Everglades Agricul-tural Area’s (EAA) rich “muck” soils. Lettuce Downy Mildew (LDM), caused by Bremia lactucae, is the most important lettuce disease worldwide, causing significant direct and indirect yield losses. It is worse with high humidity (> 95%) and temperatures ranging from 40 to 60° F. Fungicide use and resistant cultivars are the most common methods of LDM management (Santos et al., 2018). However, to preserve the stability and efficacy of these control methods, it is essential to understand pathogen races. Bremia lactucae is genetically diverse, with 10 races described in the western US and 15 in the European Union. Information regarding pathogenic B. lactucae races in Florida remains un-known (van Treuren et al., 2013; Spring et al., 2018). Thus, the first objective of the present work was to identify the races of B. lactucae currently present in Florida. The second objective to screen adapted lettuce cultivars and breeding lines for LDM.
For the first objective, diseased samples were collected from several lettuce fields in the EAA. Additionally, a standard set of 17 differential cultivars: ‘Green Towers’, ‘Dandie’, R4T57D, UCDM14, ‘NunDM15’, CGDM16, ‘Colorado’, FrRsal-1, ‘Ar-gelès’, ‘Muraires’, ‘Silvinas’, ‘Bedford’, ‘Balesta’, ‘Bartoli’, ‘Design’, ‘Kibrille’, and ‘Bataille’ (IBEB, 2020) were planted in two field experiments to collect and characterize races of B. lactucae. Diseased samples from random fields and from the differential experiments were used to inoculate 7-day-old seedlings of the universal susceptible cultivar ‘Green Tower’ grown in Magenta Boxes® and kept in a growth chamber with 12 h light/12 h dark photoperiod at 60 °F. To elucidate races of B. lactucae present in Florida, lettuce differentials were evaluated using a subjective rating scale from 0 (no symptoms) to 5 (> 75% symptoms). Ratings were performed 51 and 65 days after planting, in experiments 1 and 2, respectively. A second objective was to evaluate 10 commercial cultivars and 70 University of Florida/IFAS (UF/IFAS) lettuce breeding lines for LDM resistance under natural field conditions.
For objective 1, only 2 isolates were recovered from 200 inoculations during the 2019–20 season. Prophylactic fungicide
applications for LDM are very common in lettuce and it is likely that samples collected from grower fields were treated with fun-gicides before they reached the lab. However, disease severity evaluated on the 17 differentials cultivars indicated that R4T57D, NunDM15, ‘Argeles’, ‘Muraires’, ‘Silvinas’, ‘Balesta’, and ‘Bar-toli’ showed a resistant reaction to the pathogen. The remaining differentials had varying levels of disease severity with ‘Green Towers’ consistently highly diseased. These data indicate the presence of a mixture of races 7, 8, and 9 in the field.
In objective 2, commercial lettuce cultivars exhibited high disease severity indicating that all commercial cultivars planted in the EAA are susceptible to LDM. Most UF/IFAS breeding lines were more susceptible than commercial cultivars; however, a few breeding lines had good resistance to field isolates of B. lactucae and these may be useful as parents to improve resistance in lettuce against LDM. Additional studies are needed to fully determine the complexity of races of LDM present in Florida, as the pathogen continues to adapt, evolving into newer races. Once a race structure is identified, a detailed screening of the UF/IFAS lettuce germplasm should be conducted.
Literature Cited
International Bremia Evaluation Board (IBEB). 2020. Bremia lactucae. <https://www.worldseed.org/our-work/plant-health/other-initiatives/ibeb/>.
Santos, B.M., P.J. Dittmar, R.N. Raid, and S.E. Webb. 2012. Lettuce, Endive, and Escarole Production in Florida. EDIS Horticultural Sciences Department, UF/IFAS Extension (HS710 series).<https://ufdcimages.uflib.ufl.edu/IR/00/00/34/79/00001/CV12600.pdf>.
Spring, O., J. Gomez-Zeledon, D. Hadziabdic, R.N. Trigiano, M. Thines, and A. Lebeda. 2018. Biological Characteristics and Assessment of Virulence Diversity in Pathosystems of Economically Important Bio-trophic Oomycetes. Critical Reviews in Plant Sciences, 37: 439-495, DOI: 10.1080/07352689.2018.1530848.
van Treuren, R., A.J.M. van der Arend, and J.W. Schut. 2013. Distribution of downy mildew (Bremia lactucae Regel) resistances in a genebank collection of lettuce and its wild relatives. Plant Genetic Resources, 11:15–25. https://doi.org/10.1017/S1479262111000761.
139Proc. Fla. State Hort. Soc. 133: 2020.
Proc. Fla. State Hort. Soc. 133:139. 2020.
Vegetable Section
*Corresponding author. Email: [email protected]
—Scientific Note—
Screening for Resistance to Stemphylium In Florida-adapted Baby Leaf Spinach
Lis NataLi R. PoRto, RichaRd N. Raid, aNd GeRmáN V. saNdoya-miRaNda*Everglades Research and Education Center (EREC), University of Florida IFAS,
3200 Palm Beach Rd., Belle Glade, FL 33430
AdditionAl index words. Stemphylium leaf spot
Spinach can be grown either for processing or the fresh mar-ket, however, consumers of fresh market demand a convenient, healthy and visually appealing product. Planting density for for baby leaf spinach it ranges from 3.7–7.4 million seeds/acre. Due to this higher planting density, baby spinach is more susceptible to biotic stresses such as diseases. In the Everglades Agricultural Area (EAA) of south Florida, spinach is planted for baby leaf production. Given Florida’s warm temperatures and high humidity, Stemphylium leaf spot (SLS), incited by Stemphylium species, is an serious disease which causes spots on the leaves; only a 3% incidence of leaf spots is tolerated by retailers. Although fungicides are utilized to manage the disease, there are relatively few products labeled for Florida (Raid and Kucharek, 2006) and the pathogen has already developed insensitivity to popular fun-gicides. With host-plant resistance a long-term goal for Florida growers, we performed studies to screen spinach accessions for their resistance to SLS and assessed different fungicides.
For the first objective, two field experiments were conducted with 28 and 31 commercial hybrids and experimental acces-sions during the 2019–20 growing season using a randomized complete design (RCBD). Baby leaf spinach was planted in the field and grown using standard production practices in 9.4-m sections on 1.8-m wide raised beds. Baby spinach was inocu-lated when plants had four to six true leaves using a mixture of three pathogenic isolates. An additional trial was conducted to screen 26 experimental hybrids in the greenhouse using seedling trays to mimic baby leaf production. ‘Kolibri’ seeds known to be infested with Stemphyllium spp. were planted in every other row to ensure exposure to the pathogen. Disease severity was assessed 16 d following inoculation, and was rated as follows: 0 (no foliar symptoms) to 5 (more than of 75% of the total foliage infected with brown spots).
For accomplish the second objective, two additional field trials were chemically treated with 15 fungicides, using the sus-ceptible ‘Stanton’. Treatments were arranged in a RCBD with three replicates.
Baby leaf spinach had different levels of disease pressure in the three germplasm trials. Significant differences (P < 0.0001) were found among accessions in both fields experiments and in the greenhouse test (P = 0.0079). No genetic material tested was completely immune, but the commercial hybrid ‘Caladonia’, and experimental accessions SVVC5663, SV2141VS, and SVVC5761 showed the least amount of disease in all three experiments. Many of the experimental accessions had previously shown resistance to S. boytriosum, but these experiments were inoculated with S. versicarum. This may explain why some of these accessions were not as resistant as expected. Little is known about the race structure of Stemphylium recovered in Florida. A pathogen characteriza-tion should be pursued to understand pathogen population within the state. Host resistance is not sufficient to combat this disease and growers need efficacious fungicides to design an integrated disease management.
In a trial examining low-risk fungicide treatments, LifeGard, Silmatrix, LifeGard alternated with Cueva, Kocide 3000, and OSO demonstrated significant (P > 0.0001) control of SLS but not at commercially acceptable levels. In the second trial, fungicides Luna Sensation, Miravis, Miravis Prime, Xemium, and Pristine significantly (P > 0.0001) reduced SLS in baby spinach. While these newer labeled fungicides offered excellent control of leaf spots in baby spinach, disease reduction was not complete. A combination of several compounds and the use of resistant genet-ics may alleviate the effects of SLS in the long term.
Literature Cited
Raid, R.N., and T. Kucharek. 2006. Florida plant disease management guide: Spinach. EDIS Plant Pathology Department, UF/IFAS Exten-sion (PDMG-V3-48 series). <https://edis.ifas.ufl.edu/pdffiles/PG/PG05400.pdf>
140 Proc. Fla. State Hort. Soc. 133: 2020
Proc. Fla. State Hort. Soc. 133:140. 2020.
Vegetable Section
Varieties of Tomato Saladette Type: Plastic Mulches, Nutrition, and Production In a Greenhouse
Víctor García-Gaytán1* and Jesús Bautista2
1Laboratorio de Análisis y Diagnóstico del Patrimonio (LADIPA), EI Colegio de Michoacán, A.C., Mexico
2Department of Horticulture, University of Georgia, 2360 Rainwater Rd., Tifton, GA 31793
AdditionAl index words. Nutrition, Greenhouse, microenvironment, hydroponics
Tomato (Solanum lycopersicum) is one of the world’s most commonly grown vegetables and is widely consumed. Mexico is one of the leading tomato suppliers, with a 25% market share worldwide. Therefore, it is necessary to continue evaluating and developing varieties with desirable characteristics for the consumer. In this study we evaluated saladette tomato varieties for their market potential. They were grown in soil in a greenhouse with plastic mulch.
Materials and Methods
The current study was carried out for the production, evaluation and subsequent release of saladette-type tomato varieties, by obtaining the best values in the evaluated parameters. The planes evaluated were tomatoes of the varieties V1, V2, V3, V4, V5, V6, V7, V8, V9, and V10. Before carrying out the experiment, three soil samples were taken for subsequent analysis. The experiment was carried out under soil conditions, under a plastic padding. The evaluated variables corresponded to SPAD readings and stem diameter (DT) (mm) at three heights: basal; medial and apex. In addition, the number of bunches was counted. The microenvironment conditions for the tomato variables were: average CO2 concentration of 280 ppm, air temperature 88 degrees Fahrenheit, and relative humidity 50%. Data were analyzed using SAS software ver. 9.3. An analysis of variance (Proc GLM) was performed. The comparison of means was carried out using the Tukey test with a significance value of 95%.
Results and Discussion
Under an analysis of SPAD values, stem diameter and number of clusters showed highly significant differences (Pr < 0.0001, Pr < 0.0004 and Pr < 0.0001). Moreover, these were corroborated by the coefficient of variation (C.V) 7,591, 23.25, and 17.37, respectively . V9 was the variety whose SPAD readings resulted in the highest values. In the case of stem diameter, the variety with the best results was V6. ‘Rafaelo’ had the highest number of clusters. In general, the results suggest the best results for those tomato varieties that have important qualities regarding the number of clusters, so it is suggested that we continue evaluating these materials under different conditions such as hydroponics.
Project: Nutritional diagnosis in fruit trees, vegetables, grasses. To El Colegio de Michoacán and LADiPA Laboratory.*Corresponding author. Email: [email protected]
—Scientific Note—
141Proc. Fla. State Hort. Soc. 133: 2020.
Proc. Fla. State Hort. Soc. 133:141–144. 2020.
Handling & Processing Section
The authors would like to thank the Florida Lime Administrative Committee for their grant in support of this work.*Corresponding author. Email: [email protected]
Effect of ‘Tahiti’ Lime Fruit Size on the Percent of Juice Content Measured by the Standard USDA Volume
Method and an Alternative Weight MethodJonathan h. Crane1*, Steven a. Sargent2, CarloS F. Balerdi3, Jay harriSon4,
and lilia Caldeira1
1Tropical Research and Education Center, University of Florida IFAS, 18905 SW 280 St, Homestead, FL 33031
2Horticultural Sciences Department, University of Florida IFAS, Gainesville, FL3Miami-Dade County Extension, University of Florida IFAS, 18710 SW 288th St,
Homestead, FL 330304Department of Statistics, University of Florida IFAS, P.O. Box 110339, Gainesville, FL 32611
AdditionAl index words: Citrus latifolia Miller, ‘Persian’ lime
The percent juice (% juice) content of ‘Tahiti’ limes is a major factor of fruit quality; the other is fruit size. ‘Tahiti’ limes with low juice content are of poor quality and a problem in the retail marketplace. Florida’s lime industry was once under a federal-state marketing order (MO) which was primarily designed to regulate lime fruit quality and avoid offering poor quality i.e., low juice content limes which depress market demand. The MO stated limes must have a minimum diameter of 1 7/8-inch diameter and at least 42% juice either by volume or weight to be legally sold. Part of the lime fruit quality MO protocol was to determine % fruit juice content by either the volume or weight method; the industry traditionally used the volume method. Experiments were designed to determine the effect of determining % juice content by volume or weight basis and to determine the effect of sampling from mixed lots of limes of different sized fruits versus lots of fruit sized into specific ranges. Percent juice content was determined by volume and weight methods. Percent juice content determined by the weight method was significantly greater than the volume method but had more variability. Sampling limes from a mixed lot of limes resulted in higher % juice content value when two to four limes were undersized and had a lower juice content than large and extra-large limes.
Until 2001, Florida had approximately 3500 acres of ‘Tahiti’ lime and supplied approximately 50% of all the seedless limes consumed in the U.S. However, due to the citrus canker eradication program the trees were destroyed in an effort to stop the spread of Xanthomonas citri the bacterial agent that causes citrus canker in orange and grapefruit trees in central and north Florida. Today, there are only about 60 acres of ‘Tahiti’ limes grown in Florida, although the potential and interest in re-establishing a ‘Tahiti’ lime industry in Florida is strong (Evans et al., 2014).
In 1955, the Florida lime industry with the assistance of the USDA-Agricultural Marketing Service and Florida Department of Agriculture and Consumer Services formed a Federal–State Marketing Order (MO) for ‘Tahiti’ (Persian) limes (Fed-Mkt, 2020). The USDA and industry under the MO formed a Lime Administrative Committee (LAC) made up of growers, packers, and handlers. The purpose of this MO was to organize the industry to regulate the quality (e.g., % juice content and fruit size) and handling (e.g., box dimensions and inspections) of limes grown in and marketed from Florida.
Part of the MO regulations stipulated that the fruit size (diam-eter) and % juice content required of limes at harvest had to meet science-based and industry agreed-upon standards for high quality
limes (Campbell, 1984; Lincoln, 1951; Lynch, 1939; Reeder and Hatton, 1967). However, the MO did not stipulate whether the % juice content had to be determined by volume or weight.
Earlier investigations reported the size (i.e., weight and diam-eter) and % juice content of ‘Tahiti’ limes varied with fruit age (maturity), rootstock, and season (Lincoln, 1949; Lynch, 1939; Lynch, 1942; Hatton et al., 1967). Sampling studies showed that there was significant variation in fruit weight, diameter, and % juice content among lime fruit of the same age (Lynch, 1942; Lincoln, 1949). However, there was a trend for the % juice content, fruit diameter and weight to increase with fruit age.
Research to test and correlate various lime fruit attributes such as fruit weight, diameter, % juice content, peel color, acid content, soluble solids, peel thickness, specific gravity, and peel weight were largely unsuccessful (Hatten et al., 1983; Lynch, 1939; Lincoln, 1949). This may have been due to the effect of various environmental (e.g., temperature, soil moisture content, and vapor pressure deficit), biological (e.g., rootstock, hormones) and cultural factors (e.g., fertilizer and irrigation practices) on lime production and quality. Hatton et al. (1983) found a significant positive correlation (r = 0.98; 5% level) between lime fruit diameter and weight but poor correlation among % juice content and fruit diameter (r = 0.31) or weight (r = 0.40). The volume of the fruit was not reported. A low correlation (r = 0.44) was also calculated from the fruit weight and % juice content data of Lynch (1939) (J.H. Crane, personal observation).
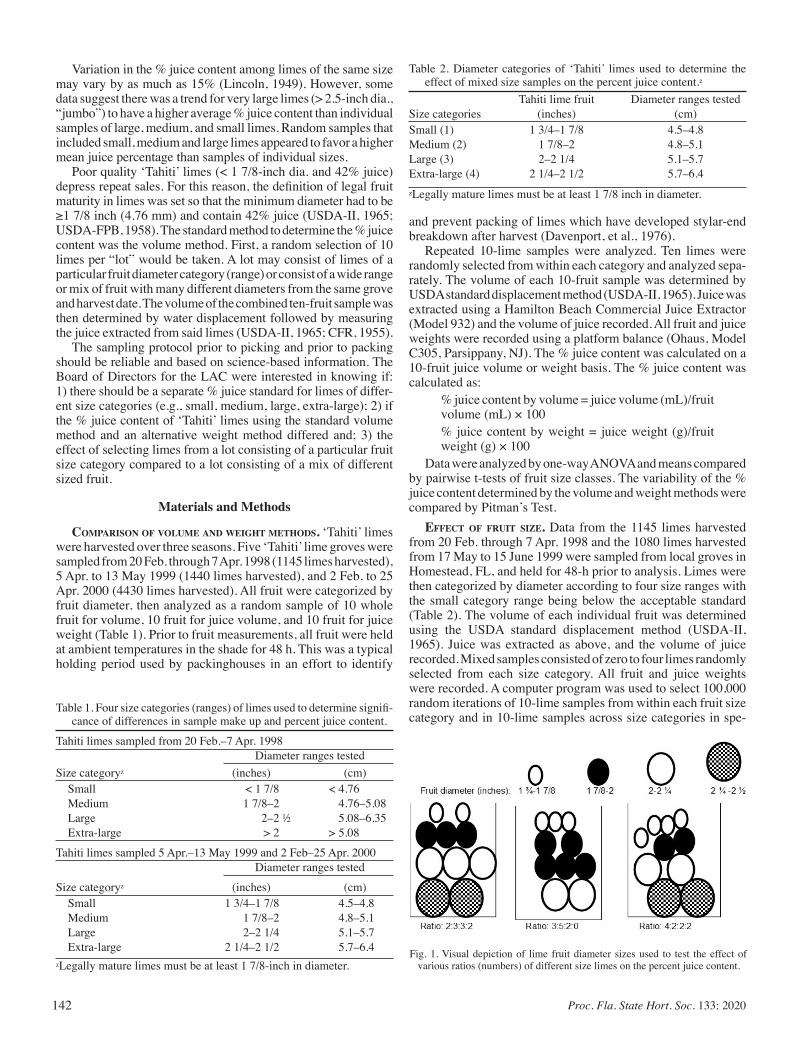
142 Proc. Fla. State Hort. Soc. 133: 2020
Variation in the % juice content among limes of the same size may vary by as much as 15% (Lincoln, 1949). However, some data suggest there was a trend for very large limes (> 2.5-inch dia., “jumbo”) to have a higher average % juice content than individual samples of large, medium, and small limes. Random samples that included small, medium and large limes appeared to favor a higher mean juice percentage than samples of individual sizes.
Poor quality ‘Tahiti’ limes (< 1 7/8-inch dia. and 42% juice) depress repeat sales. For this reason, the definition of legal fruit maturity in limes was set so that the minimum diameter had to be ≥1 7/8 inch (4.76 mm) and contain 42% juice (USDA-II, 1965; USDA-FPB, 1958). The standard method to determine the % juice content was the volume method. First, a random selection of 10 limes per “lot” would be taken. A lot may consist of limes of a particular fruit diameter category (range) or consist of a wide range or mix of fruit with many different diameters from the same grove and harvest date. The volume of the combined ten-fruit sample was then determined by water displacement followed by measuring the juice extracted from said limes (USDA-II, 1965; CFR, 1955).
The sampling protocol prior to picking and prior to packing should be reliable and based on science-based information. The Board of Directors for the LAC were interested in knowing if: 1) there should be a separate % juice standard for limes of differ-ent size categories (e.g., small, medium, large, extra-large); 2) if the % juice content of ‘Tahiti’ limes using the standard volume method and an alternative weight method differed and; 3) the effect of selecting limes from a lot consisting of a particular fruit size category compared to a lot consisting of a mix of different sized fruit.
Materials and Methods
CompArison of volume And weight methods. ‘Tahiti’ limes were harvested over three seasons. Five ‘Tahiti’ lime groves were sampled from 20 Feb. through 7 Apr. 1998 (1145 limes harvested), 5 Apr. to 13 May 1999 (1440 limes harvested), and 2 Feb. to 25 Apr. 2000 (4430 limes harvested). All fruit were categorized by fruit diameter, then analyzed as a random sample of 10 whole fruit for volume, 10 fruit for juice volume, and 10 fruit for juice weight (Table 1). Prior to fruit measurements, all fruit were held at ambient temperatures in the shade for 48 h. This was a typical holding period used by packinghouses in an effort to identify
and prevent packing of limes which have developed stylar-end breakdown after harvest (Davenport, et al., 1976).
Repeated 10-lime samples were analyzed. Ten limes were randomly selected from within each category and analyzed sepa-rately. The volume of each 10-fruit sample was determined by USDA standard displacement method (USDA-II, 1965). Juice was extracted using a Hamilton Beach Commercial Juice Extractor (Model 932) and the volume of juice recorded. All fruit and juice weights were recorded using a platform balance (Ohaus, Model C305, Parsippany, NJ). The % juice content was calculated on a 10-fruit juice volume or weight basis. The % juice content was calculated as:
% juice content by volume = juice volume (mL)/fruit volume (mL) × 100% juice content by weight = juice weight (g)/fruit weight (g) × 100
Data were analyzed by one-way ANOVA and means compared by pairwise t-tests of fruit size classes. The variability of the % juice content determined by the volume and weight methods were compared by Pitman’s Test.
effeCt of fruit size. Data from the 1145 limes harvested from 20 Feb. through 7 Apr. 1998 and the 1080 limes harvested from 17 May to 15 June 1999 were sampled from local groves in Homestead, FL, and held for 48-h prior to analysis. Limes were then categorized by diameter according to four size ranges with the small category range being below the acceptable standard (Table 2). The volume of each individual fruit was determined using the USDA standard displacement method (USDA-II, 1965). Juice was extracted as above, and the volume of juice recorded. Mixed samples consisted of zero to four limes randomly selected from each size category. All fruit and juice weights were recorded. A computer program was used to select 100,000 random iterations of 10-lime samples from within each fruit size category and in 10-lime samples across size categories in spe-
Fig. 1. Visual depiction of lime fruit diameter sizes used to test the effect of various ratios (numbers) of different size limes on the percent juice content.
Table 1. Four size categories (ranges) of limes used to determine signifi-cance of differences in sample make up and percent juice content.
Tahiti limes sampled from 20 Feb.–7 Apr. 1998 Diameter ranges testedSize categoryz (inches) (cm) Small < 1 7/8 < 4.76 Medium 1 7/8–2 4.76–5.08 Large 2–2 ½ 5.08–6.35 Extra-large > 2 > 5.08
Tahiti limes sampled 5 Apr.–13 May 1999 and 2 Feb–25 Apr. 2000 Diameter ranges tested
Size categoryz (inches) (cm) Small 1 3/4–1 7/8 4.5–4.8 Medium 1 7/8–2 4.8–5.1 Large 2–2 1/4 5.1–5.7 Extra-large 2 1/4–2 1/2 5.7–6.4zLegally mature limes must be at least 1 7/8-inch in diameter.
Table 2. Diameter categories of ‘Tahiti’ limes used to determine the effect of mixed size samples on the percent juice content.z
Tahiti lime fruit Diameter ranges testedSize categories (inches) (cm)Small (1) 1 3/4–1 7/8 4.5–4.8Medium (2) 1 7/8–2 4.8–5.1Large (3) 2–2 1/4 5.1–5.7Extra-large (4) 2 1/4–2 1/2 5.7–6.4zLegally mature limes must be at least 1 7/8 inch in diameter.
143Proc. Fla. State Hort. Soc. 133: 2020.
cific size ratios (called a mixed sample) (Fig. 1). The data were analyzed by one-way ANOVA and means separated by pair-wise t-tests.
Results and Discussion
CompArison of volume And weight methods. ‘Tahiti’ lime juice content from the 1998 harvest was below the 42% minimum standard for both methods (Table 3). During this sampling period there were two 18-d periods with little to no rainfall (FAWN, 2020). Furthermore, limes harvested in late winter-early spring generally have less juice content than those harvested in summer (Lincoln, 1939). By contrast, almost all limes harvested in 1999 and 2000 had > 42% juice content. A highly significant (P < 0.0001) difference was found for the % juice content among fruit size (diameter) categories determined by the volume or weight methods (Table 3). The % juice content of fruits increased with increasing fruit diameter whether measured by the standard USDA volume method or the weight method (Table 3).
In general, the % juice content determined by the weight method significantly (P < 0.0001) exceeded the % juice content determined by the volume method (Table 3). However, Pitman’s Test found the % juice content determinations by the weight
method were significantly (P < 0.0001) more variable than those by the volume method.
effeCt of fruit size. The % juice content of limes selected from mixed lots was significantly higher than from limes selected from small, medium, large and extra-large categories (Table 4). On average, the % juice content obtained from a random sampling of ten limes from a mixed lot exceeded the % juice content of ten limes selected from a lot of only small- (< 1 7/8 inch) or medium-sized (1 7/8–2 inch) limes by 8.27% and 3.40%, respectively (Table 5). By contrast, the % juice content measured from a random sampling of a mixed lot had on average, 1.90% and 8.65% lower % juice content than from limes selected from a lot of either large or extra-large sizes respectively (Table 5).
Interestingly, the % juice content of mixed samples from the specific ratios of different diameters tested all resulted in 46% juice content or higher (Table 4). This suggests that the fruit vol-ume and juice content of medium limes and large or extra-large limes compensated for two to four small limes (1 ¾ to 1 7/8-inch dia.) in a mixed sample. Therefore, from 20 to 40% of the limes in a lot that is tested using a mixed sample (which includes two to four undersized limes <1 7/8 inch dia.) may appear to meet Florida lime quality standards (i.e., 42% juice content) when in fact it does not (Table 6).
Table 3. ‘Tahiti’ lime percent juice content determined by the volume and weight methods for four size categories.z
Mean percent juice contentTahiti limes harvested Tahiti limes fruit dia. size categories (inches) (by vol.) (by wt) Small, < 1 7/8 20.1 (± 6.0) 25.4 (± 7.4)20 Feb.–7 Apr. 1998 Medium, 1 7/8–2 24.9 (± 5.1) 30.2 (± 6.1) Large, 2–2 ½ 30.2 (± 5.7) 35.3 (± 6.3) Extra-large, > 2 37.0 (± 7.4) 41.5 (± 8.3)5 Apr.–13 May 1999 Medium, 1 7/8–2 40.0 (± 2.9) 42.5 (± 2.6) Large, 2–2 1/4 38.4 (± 1.7) 40.3 (± 1.8) Extra-large, 2 1/4–2 1/2 49.1 (± 2.1) 51.2 (± 2.1)2 Feb.–25 Apr. 2000 Small, 13/4–1 7/8 38.4 (± 2.7) 40.7 (± 2.8) Medium, 1 7/8–2 40.9 (± 3.5) 42.1 (± 7.4) Large, 2–2 1/4 43.3 (± 3.4) 45.2 (± 3.1) Extra-large, 2 1/4–2 1/2 45.4 (± 3.1) 45.4 (± 3.0)zA significant difference was found in percent juice content among the four size categories tested by the volume or the weight method (t-test; P ≤ 0.95 confidence).
Lime sample mixing status Size of limes in each sampleNumber of limes in category 1, 2, 3, and 4 in each sampley USDA volume method Weight method
Non-mixed lots Small, 1 3/4 – 1 7/8 10:0:0:0 38.4 ± 2.7 40.7 ±2.8 Medium, 1 7/8 – 2 0:10:0:0 40.9 ± 3.5 42.1 ±7.4
Large, 2 – 2 1/4 0:0:10:0 43.3 ± 3.4 45.2 ±3.1 Extra-large, 2 1/4 – 2 1/2 0:0:0:10 45.4 ± 3.1 45.4 ±3.0
Lime sample mixing status Size of limes in each sample Ratio of limes of each size USDA volume method Weight methodMixed lots Small, medium, large, 2:3:3:2 48.1 ± 1.2 50.3 ±1.3
and extra-large 3:5:2:0 46.8 ± 1.0 49.0 ±1.04:2:2:2 46.9 ± 1.2 49.1 ±1.1
zA significant difference was found in percent juice content among the four size categories tested by the volume or the weight method (t-test; P ≤ 0.95 confidence).yA total of 10 limes were in each sample.
Mean percent juice content (%±SD)z
Table 4. Effect of mixing various ‘Tahiti’ limes of different size diameters on the percent juice content by the standard USDA volume method and weight method.
144 Proc. Fla. State Hort. Soc. 133: 2020
Conclusion
In general, the % juice content increased with fruit size whether determined by either the volume or the weight method. The % juice content by the weight method resulted in slightly (although significantly) higher % juice content values compared to those by the volume method. This suggests that requiring different standards of juice content by fruit diameter may be of some value, although if the required 42% juice content standard is exceeded this may not be necessary. However, the % juice content measurements by the weight method were more variable than by the volume method. With respect to reliability, measuring the % juice content by the weight method does not appear to have any advantage over the volume method.
When ten limes were selected at random from a mixed lot that included undersized limes (small, 1 3/4–1 7/8 inch dia.) were compared to those selected from a particular size category of legally minimally sized (≥ 1 7/8 inch dia.) or greater dia. of limes, the average % juice content of was affected by the pro-portion of small, medium, large, and extra-large limes in the lot. Sampling from a mixed lot of fruit which resulted in higher % juice content masked the fact that up to 40% of the limes in the lot could have < 42% juice. This finding suggests that the previous
Table 5. Effect of sampling ten limes randomly from a lot of limes of mixed sizes compared to selecting 10 limes randomly from a specific size range.
Tahiti lime Percent juice content resultsdia. range Random selection Random selection fromcategories from a lot of a lot of limes within(inches) mixed lime sizes a dia. size rangesmall, < 1 7/8 8.27% greater readingmedium, 1 7/8–2 3.40% greater readinglarge, 2–2 1/2 1.90% greater readingextra-large, > 2 8.65% greater reading
Table 6. The percentage of undersized (illegal) limes that pass the legal percent juice content (42%; USDA volume method) when part of a mixed sample in the ratios tested.
Percent Percent of sizeRatio of limes juice content category 1 (undersized)of category USDA method limes in the 1, 2, 3, and 4 (%) sample (%)z
2:3:3:2 48.1 ± 1.2 203:5:2:0 46.8 ± 1.0 304:2:2:2 46.9 ± 1.2 40zLimes of 1 3/4–1 7/8-inch diameter.
practice of selecting limes at random from a mixed lot of fruit may have biased the % juice content determination in favor of higher readings for the lot. This made it appear that all the limes met the 42% juice content standard when in fact, from 20 to 40% may have had a lower juice content.
Perhaps producers and packers should randomly sample limes for diameter prior to harvesting and/or packing to be sure that the vast majority of fruit diameter of the lot meets or exceeds 1 7/8-inch and, if it passes this standard, then test for the ≥ 42% % juice content requirement.
Literature Cited
Campbell, C.W. 1984. Tahiti lime production in Florida. Bulletin 187. Fla. Coop. Extension Service, Univ. of Florida, IFAS, Gainesville, FL. 52 p.
CFR. 1955. ‘Tahiti’ lime fed-state mkt order regulations: Code of Federal Regulations. Title 7—Agriculture, 26 FR 12751, 30 Dec. 1961. 18 p.
Davenport, T.L., C.W. Campbell, and P.G. Orth. 1976. Stylar-end breakdown in ‘Tahiti’ lime: Some causes and cures. Proc. Fla. State Hort. Soc. 89:245–248.
Evans, E.A., F.H. Ballen, and J.H. Crane. 2014. Economic potential of producing ‘Tahiti’ limes in southern Florida in the presence of citrus canker and citrus greening. HortTechnology 24:99–106.
FAWN. 2020. Florida Automated Weather Network. <https://fawn.ifas.ufl.edu/>.
Fed-Mkt. 2020. Part 911—Limes grown in Florida, 26 FR 12751. Code of Federal Regulations, Title 7—Agriculture. Chapter IX—Agricultural Marketing Service, USDA. Accessed 15 Sept. 2020. <https://www.govinfo.gov/content/pkg/CFR-2003-title7-vol8/xml/CFR-2003-title7-vol8-part911.xml#seqnum911.20>.
Hatton, T.T. and W.F. Reeder. 1967. Quality of Persian limes after different packinghouse treatments and storage in various controlled atmospheres. Proc. Tropical Region—Amer. Soc. Hort. Sci. 11:23–32.
Hatton, T.T., W.R. Reeder, and V. Chew. 1983. Some characteristics of Tahiti limes at equal periods of time after different blooms. Proc. Fla. State Hort. Soc. 96:345–346.
Lincoln, F.B. 1949. Investigation of the proper maturity of Tahiti limes for marketing. Proc. Fla. State Hort. Soc. 62:232–238.
Lynch, S.J. 1939. Seasonal variation in juice and acid content of Persian limes. Proc. Fla. State Hort. Soc. 52:81–83.
Lynch, S.J. 1942. Some analytical studies of the Persian lime. Bulletin 368. Univ. of Florida, Agric. Experiment Station, Gainesville, FL.
Reeder, W.F. and T.T. Hatton, Jr. 1967. Physical responses of small limes during holding and storage. Proc. Fla. State Hort. Soc. 80:382–384.
USDA-FPB. 1958. United States Standards for Grades of Persian (Tahiti) Limes. USDA-Agric. Marketing Service, Fruit and Vegetable Division, Fresh Products Branch. 6 p.
USDA-II. 1965. Persian (Tahiti) Limes and Florida Avocados: Inspec-tion Instructions. USDA, ARS, Fruit and Vegetable Division, Fresh Products Branch. 45 p.
145 Proc. Fla. State Hort. Soc. 133: 2020.
Proc. Fla. State Hort. Soc. 133:145. 2020.
Handling & Processing Section
*Corresponding author. Email: [email protected]
—Scientific Note—
Produce Safety In Florida: Education, Outreach, and Compliance
Taylor langford1, JoyJiT Saha2, ScoTT Mcclure3, MaTThew Krug4, TraviS chapin2, renée goodrich1, and Michelle danyluK2*
1Food Science and Human Nutrition Department, University of Florida/IFAS, P.O. Box 110370, Gainesville, FL 32611
2Citrus Research and Education Center, University of Florida/IFAS, 700 Experiment Station Rd., Lake Alfred, FL 33850
3Florida Department of Agriculture and Consumer Services, 170 Century Blvd., Bartow, FL 338304Southwest Florida Research and Education Center, University of Florida/IFAS, 2685 FL-29,
Immokalee, FL 34142
AdditionAl index words. FSMA, foodborne illness, produce safety, PSR inspection, training
The Food Safety Modernization Act (FSMA) was signed into law in 2011 and granted the US Food and Drug Administration (FDA) authority to create seven new foundational food safety rules including the Produce Safety Rule (PSR). For the first time, FSMA PSR establishes science based minimum standards for the safe growing, harvesting, packing, and holding of produce. The primary focus of PSR was to reduce foodborne illness/outbreaks through requirements that mitigate food safety risk by prevent-ing microbial contamination related to: worker training, health, and hygiene; soil amendments; wildlife/domesticated animals; agricultural water quality; sanitation; and recordkeeping. This has established a demand for food safety education and outreach activities in Florida to help farms meet the standards of the PSR. The estimated number of farm operations in Florida covered under the PSR is 3392; implementing the PSR requirements on all each diversified farm represents a challenge.
To address these challenges in Florida, the University of Florida/IFAS (UF/IFAS) Food Safety Team has been building capacity to provide outreach and technical assistance. The team offers a number of resources to assist Florida producers imple-ment the PSR. Some of the key resources are Produce Safety Alliance (PSA) Grower Trainings and conducting voluntary visits called “On Farm Readiness Reviews” (OFRRs) to help interested farmers assess their readiness for PSR regulatory inspections and apply the PSR on their individual operations. Trainings are conducted using a standardized curriculum developed by the Produce Safety Alliance whereas OFFR’s are conducted based on guidelines and materials developed by National Association of State Departments of Agriculture. One of the main goals of these activities is to improve food safety knowledge and prepare growers for PSR inspections.
In order to deliver training materials for PSA training, the UF/IFAS faculty and extension associate team consists of 53 trainers or lead trainers of the PSA training curriculum. Trainers from Florida Department of Agricultural and Consumer Services (FDACS), Florida A&M, Publix (supermarket), and private consultants have also been developed and added to the team, resulting in 108 trainers.
Since 2016, UF/IFAS has offered 72 PSA Grower Train-ings and beginning 2018, conducted 50 OFRRs collaborating with FDACS. In 2020, faced with new challenges presented by COVID-19, PSA trainings are being offered remotely and OFRR’s are conducted based on CDC guidelines.
To measure food safety knowledge gain during PSA trainings, pre- and post-assessments, developed by the Southern Center, were given to each attendee. From 2016–19, out of 25 points, participants scored an average of 16.46 on the pre-test and 20.26 on the post-test (t = -1.72, P < 0.05). Recently pre-test scores have increased to 19.24, indicating an increase in basic knowledge of food safety; however post-test scores remain significantly higher than pre-test scores indicating a significant increase in knowledge.
To assess the OFRR program, at the end of the farm visit, the assessors fill out an anonymous on-line survey to record informa-tion about the farms’ areas of need in terms of overall readiness for PSR compliance. Post OFRR surveys indicate (n = 43) 46% of farms meet the minimum PSR requirements and only 14% needed significant improvements. Assistance required by the farms to meet PSR requirements are time (39%), technical sup-port (19%), and facility upgrades (17%). The top three areas that required the most improvement are: postharvest sanitation (28%); worker training (26%); and preharvest water (18%).
These programs have facilitated knowledge gain and com-pliance of Florida farms regarding the PSR. These efforts help ensure that the produce grown in Florida will continue to meet escalating market-driven and regulatory food safety standards.
146 Proc. Fla. State Hort. Soc. 133: 2020.
Proc. Fla. State Hort. Soc. 133:146. 2020.
Handling & Processing Section
This research was supported by a grant from the Citrus Research and Development Foundation.*Corresponding author. Email: [email protected]
—Scientific Note—
Sensory and Quality Analysis of HLB-tolerant Citrus Cultivars for Juice Production
Stephanie hricik1, charleS SimS1, Yu Wang2, Zhifeng gao3, and renee goodrich-Schneider1*
1Food Science and Human Nutrition Department, University of Florida IFAS, P.O. Box 110370, University of Florida, Gainesville, FL 32611
2Citrus Research and Education Center, University of Florida IFAS, 700 Experimental Farm Rd., University of Florida, Lake Alfred, FL 33850
3Food and Resource Economics Department, University of Florida IFAS, P.O. Box 110240, Gainesville, FL 32611
AdditionAl index words. huanglongbing, orange
Huanglongbing (HLB) is a bacterial disease that has greatly affected the citrus industry since it was first found in the United States in 2005. Since then, there has been an over 70% decrease in orange production. Current research is investigating ways to reduce the effects of HLB on citrus trees as well as identifying cultivars that are tolerant to HLB. One of the cultivars that appears HLB-tolerant is known as ‘Sugar Belle®’. ‘Sugar Belle®’ is a cross between clementine tangerine and ‘Minneola’ tangelo and is recognized as one of the most HLB-tolerant commercial cultivars currently grown. This study aims to evaluate the sensory and chemical analysis of juice and juice blends of ‘Sugar Belle®’ and common sweet oranges (Citrus sinensis) used in juice production. The use of ‘Sugar Belle’ in orange juice will allow for an alternative to the use of HLB susceptible sweet orange cultivars which are more expensive to maintain and produce less.
The effect of ‘Sugar Belle®’ juice on sweet orange juice was analyzed by performing two separate sensory panels analyzing the sensory attributes of ‘Sugar Belle®’ with ‘Hamlin’ and ‘Sugar Belle®’ with ‘Valencia’. Con-sumer panelists were asked to evaluate five samples: 100% ‘Sugar Belle®’, 100% sweet orange (either ‘Hamlin’ or ‘Valencia’), 90/10 sweet orange/’Sugar Belle®’, 50/50 sweet orange/’Sugar Belle®’, and 100% Florida commercial orange juice. These sensory evaluations indicated that in the first panel both the 50/50 blend of ‘Hamlin’/’Sugar Belle®’ and 90/10 ‘Hamlin’/’Sugar Belle®’ were preferred by consumers in overall liking, flavor liking, and overall appearance. In the second panel 100% ‘Valencia’, 90/10 ‘Valencia’/’Sugar Belle®’, 50/50 ‘Valencia’/’Sugar Belle®’ all were indicated to have high consumer acceptability in overall liking, flavor liking, and overall appearance. These samples were also ranked higher by consumers compared to other samples presented.
Blending ‘Sugar Belle®’ with juice from sweet oranges produced a product that had equal to or greater con-sumer acceptability than 100% sweet oranges juice and a commercial product. An understanding of the chemical makeup will be determined by performing chemical analysis on these juices used in sensory analysis. The future use of ‘Sugar Belle®’ in orange juice production over time will be validated by repeating this research to account for changes in subsequent harvests.
147Proc. Fla. State Hort. Soc. 133: 2020.
Proc. Fla. State Hort. Soc. 133:147. 2020.
Handling & Processing Section
*Corresponding author. Email: [email protected]
—Scientific Note—
Food Safety and Regulatory Guidance for Florida Food Processors Operating Out of Shared-use
Commercial KitchensMatt Krug1*, Sarah ElliS2, JEnnifEr hagEn3, and JESSica ryalS4
1Southwest Florida Research and Education Center, University of Florida IFAS, Immokalee, FL2Citrus County Extension, University of Florida IFAS, Lecanto, FL3Lee County Extension, University of Florida IFAS, Ft. Myers, FL4Collier County Extension, University of Florida IFAS, Naples, FL
AdditionAl index words. food-based businesses
Shared-use commercial kitchens (e.g. incubators, accelerators) have emerged as popular options for beginning food entrepreneurs to use as they start a food-based business. In Florida, there are currently at least 30 shared-use commercial kitchens operating to provide adequate space and equipment that meets regulatory standards so that food may be processed and sold through retail markets or wholesale distribution (Krug and Ellis, 2020).
While these facilities provide an economically feasible option for clientele to start or grow a food business, there are still several hurdles they may encounter. One challenge food entrepreneurs face is navigating the various food regulations in order to register their businesses and pass initial and subsequent inspections. Florida is the only state with three different agencies who enforce food regulations in some manner [Florida Department of Agriculture and Consumer Services (FDACS), Department of Business and Professional Regulation (DBPR), and Florida Department of Health (FDOH)], which adds to the complexity of navigating these regulations. Another hurdle may be a lack of knowledge in food safety principles and the ability to execute adequate practices in order to meet the requirements of regulations. Previ-ous survey work with food safety educators and regulators also supports the notion that there may be food safety and regulatory knowledge gaps associated with small food businesses (Harrison et al., 2016). Furthermore, the shared-use aspect of these types of facilities means that multiple food business operators may be processing in the same kitchen space, which heightens the im-portance for adequate sanitation and allergen control to prevent cross-contamination or cross-contact between food products. University of Florida/IFAS (UF/IFAS) extension agents have worked to develop and implement program activities to help food entrepreneurs overcome these hurdles, but it is important to fully understand the needs of the target audience during this process. The objective of this study was to determine clientele needs and help shape current and future extension education activities such as consultations and workshops.
Surveys were distributed to current and potential members of shared-use commercial kitchens located around southern Florida in 2018–19. Surveys were conducted using the software Qualtrics, kept anonymous, and included an appropriate informed consent statement. Questions focused on gathering information about the target audience related to their past experiences operating a food business or selling a food product, the types of food products and method(s) of sale for current or future food business ventures, and prior food safety trainings attended/experience in the field.
Survey responses (n = 51) indicated that only 23.5% of clien-tele were familiar with the specific food regulations applicable to the food product they intended to sell, while only 35.3% had received any prior formal food safety training such as Servsafe®. 52.3% had produced a food product for sale in the past, yet none indicated that they had ever created a formal food safety plan for a product. These results affirm the hypothesis that beginning food entrepreneurs who plan to operate out of a shared-use kitchen may lack knowledge of food regulations and food safety. As a result, UF/IFAS Extension faculty developed and modified training ac-tivities to increase clientele knowledge in these areas and provide other relevant resources for their food businesses. This included consultations directly with clientele or workshops which used representatives from Florida food regulatory agencies as speak-ers. These efforts have been successful in connecting clientele with the regulatory agencies, increasing clientele understanding of applicable regulations (e.g. FDA Food Code, Current Good Manufacturing Practices), and enhancing food safety practices in shared-use commercial kitchen facilities.
Literature Cited
Harrison, J.A., F.J. Critzer, and M.A. Harrison. 2016. Regulatory and food safety knowledge gaps associated with small and very small food businesses as identified by regulators and food safety educators—Im-plications for food safety training. Food Prot. Trends. 38(6):420–427
Krug, M., and S. Ellis. 2020. An introduction to shared-use commercial kitchens. FSHN20-41, Food Science and Human Nutrition Department, UF/IFAS Extension. University of Florida EDIS. Available at: <https://edis.ifas.ufl.edu/fs400>
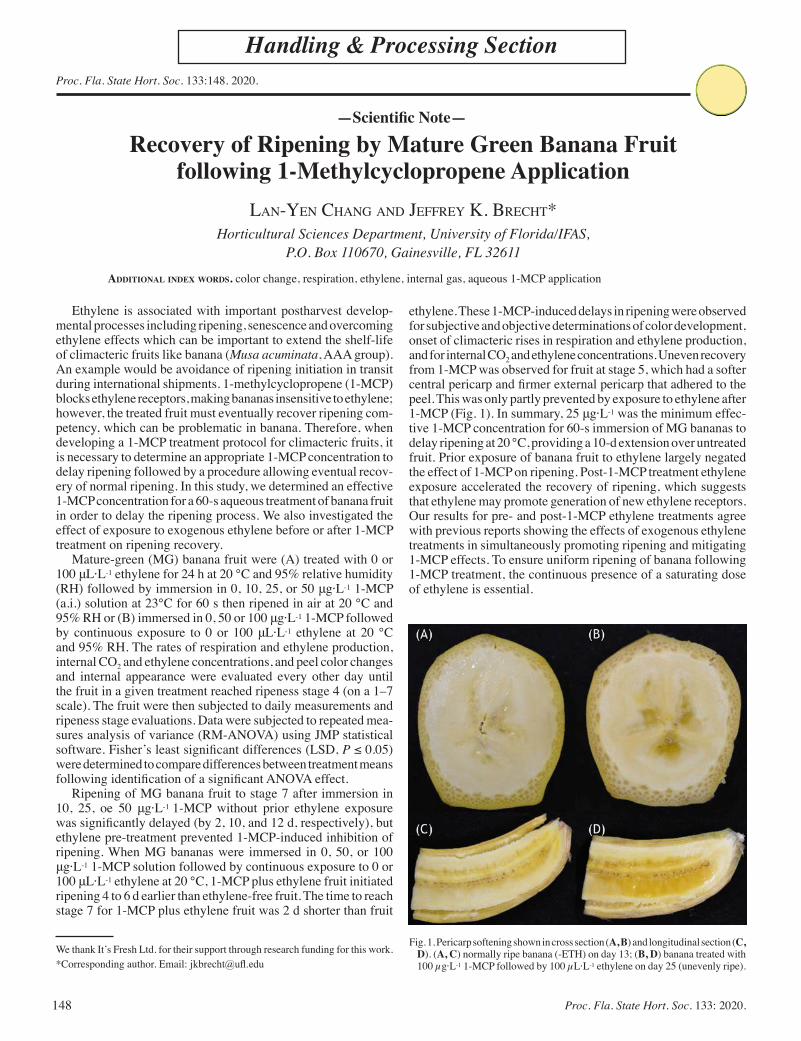
148 Proc. Fla. State Hort. Soc. 133: 2020.
Proc. Fla. State Hort. Soc. 133:148. 2020.
Handling & Processing Section
We thank It’s Fresh Ltd. for their support through research funding for this work.*Corresponding author. Email: [email protected]
—Scientific Note—
Recovery of Ripening by Mature Green Banana Fruit following 1-Methylcyclopropene Application
Lan-Yen Chang and JeffreY K. BreCht*Horticultural Sciences Department, University of Florida/IFAS,
P.O. Box 110670, Gainesville, FL 32611
AdditionAl index words. color change, respiration, ethylene, internal gas, aqueous 1-MCP application
Ethylene is associated with important postharvest develop-mental processes including ripening, senescence and overcoming ethylene effects which can be important to extend the shelf-life of climacteric fruits like banana (Musa acuminata, AAA group). An example would be avoidance of ripening initiation in transit during international shipments. 1-methylcyclopropene (1-MCP) blocks ethylene receptors, making bananas insensitive to ethylene; however, the treated fruit must eventually recover ripening com-petency, which can be problematic in banana. Therefore, when developing a 1-MCP treatment protocol for climacteric fruits, it is necessary to determine an appropriate 1-MCP concentration to delay ripening followed by a procedure allowing eventual recov-ery of normal ripening. In this study, we determined an effective 1-MCP concentration for a 60-s aqueous treatment of banana fruit in order to delay the ripening process. We also investigated the effect of exposure to exogenous ethylene before or after 1-MCP treatment on ripening recovery.
Mature-green (MG) banana fruit were (A) treated with 0 or 100 μL·L-1 ethylene for 24 h at 20 °C and 95% relative humidity (RH) followed by immersion in 0, 10, 25, or 50 μg·L-1 1-MCP (a.i.) solution at 23°C for 60 s then ripened in air at 20 °C and 95% RH or (B) immersed in 0, 50 or 100 μg·L-1 1-MCP followed by continuous exposure to 0 or 100 μL·L-1 ethylene at 20 °C and 95% RH. The rates of respiration and ethylene production, internal CO2 and ethylene concentrations, and peel color changes and internal appearance were evaluated every other day until the fruit in a given treatment reached ripeness stage 4 (on a 1–7 scale). The fruit were then subjected to daily measurements and ripeness stage evaluations. Data were subjected to repeated mea-sures analysis of variance (RM-ANOVA) using JMP statistical software. Fisher’s least significant differences (LSD, P ≤ 0.05) were determined to compare differences between treatment means following identification of a significant ANOVA effect.
Ripening of MG banana fruit to stage 7 after immersion in 10, 25, oe 50 μg·L-1 1-MCP without prior ethylene exposure was significantly delayed (by 2, 10, and 12 d, respectively), but ethylene pre-treatment prevented 1-MCP-induced inhibition of ripening. When MG bananas were immersed in 0, 50, or 100 μg·L-1 1-MCP solution followed by continuous exposure to 0 or 100 μL·L-1 ethylene at 20 °C, 1-MCP plus ethylene fruit initiated ripening 4 to 6 d earlier than ethylene-free fruit. The time to reach stage 7 for 1-MCP plus ethylene fruit was 2 d shorter than fruit
ethylene. These 1-MCP-induced delays in ripening were observed for subjective and objective determinations of color development, onset of climacteric rises in respiration and ethylene production, and for internal CO2 and ethylene concentrations. Uneven recovery from 1-MCP was observed for fruit at stage 5, which had a softer central pericarp and firmer external pericarp that adhered to the peel. This was only partly prevented by exposure to ethylene after 1-MCP (Fig. 1). In summary, 25 μg·L-1 was the minimum effec-tive 1-MCP concentration for 60-s immersion of MG bananas to delay ripening at 20 °C, providing a 10-d extension over untreated fruit. Prior exposure of banana fruit to ethylene largely negated the effect of 1-MCP on ripening. Post-1-MCP treatment ethylene exposure accelerated the recovery of ripening, which suggests that ethylene may promote generation of new ethylene receptors. Our results for pre- and post-1-MCP ethylene treatments agree with previous reports showing the effects of exogenous ethylene treatments in simultaneously promoting ripening and mitigating 1-MCP effects. To ensure uniform ripening of banana following 1-MCP treatment, the continuous presence of a saturating dose of ethylene is essential.
Fig. 1. Pericarp softening shown in cross section (A, B) and longitudinal section (C, D). (A, C) normally ripe banana (-ETH) on day 13; (B, D) banana treated with 100 µg·L-1 1-MCP followed by 100 µL·L-1 ethylene on day 25 (unevenly ripe).
149Proc. Fla. State Hort. Soc. 133: 2020.
Proc. Fla. State Hort. Soc. 133:149–158. 2020.
Handling & Processing Section
Nano- and Micro- Carnauba Wax Emulsionsversus Shellac Protective Coatings on PostharvestCitrus QualityMarcela MirandaS~ao Paulo State University, School of Pharmaceutical Sciences, Araraquara, SP, 14800-901, Brazil
Xiuxiu Sun, Christopher Ference, Anne Plotto, Jinhe Bai, and David WoodU.S. Horticultural Research Laboratory, U.S. Department of Agriculture, Agricultural ResearchService, 2001 South Rock Road, Fort Pierce, FL 34945
Odílio Benedito Garrido Assis and Marcos David FerreiraEmbrapa Instrumentaca~o - Brazilian Agricultural Research Corporation, Sa~o Carlos, SP, 13560-970, Brazil
Elizabeth BaldwinU.S. Horticultural Research Laboratory, U.S. Department of Agriculture, Agricultural ResearchService, 2001 South Rock Road, Fort Pierce, FL 34945ADDITIONAL INDEX WORDS. Aroma volatiles, Citrus reticulata, Citrus sinensis, Copernica cerifera, fermentation, mandarin, tangor
ABSTRACT. Coatings are generally applied to fruit as microemulsions, but nanoemulsions are still experimental. ‘Nova’ mandarins (Citrus reticulata) were coated with shellac or carnauba (Copernica cerifera) microemulsions or an experimental carnauba nanoemulsion; these were compared with an uncoated control during storage for 7 days at 20 8C. Coatings were also tested on ‘Unique’ tangors (C. reticulata · C. sinensis) stored for 14 days at 10 8C followed by a simulated marketing period of 7 days at 20 8C. Fruit quality evaluations included weight loss, gloss, soluble solids (SS), titratable acidity (TA), pH, SS/TA ratio, internal CO2, O2, fruit juice ethanol, and other aroma volatile content. Sensory visual shine and tangerine (C. reticulata) flavor rank tests after storage were conducted, followed by an off-flavor rating. The carnauba waxes resulted in less weight loss compared with the uncoated control and shellac coating during both experiments. There were no differences in gloss measurements of ‘Nova’ mandarins; however, shellac-coated fruit ranked highest for shine in a sensory test. For ‘Unique’ tangors, initially, shellac showed the highest gloss (shine) measurement; however, at the end of storage, the nanoemulsion exhibited the highest gloss, although it was not different from that of the microemulsion. Similarly, after storage, the nanoemulsion ranked highest for visual shine, although it was not different from that of the microemulsion. There were only minor differences in SS, TA, pH, and SS/TA among treatments. The internal CO2 gas concentration and juice ethanol content generally increased and internal O2 decreased during storage. The highest levels of CO2 and ethanol were found for the shellac treatment, as was the lowest O2, indicating anaerobic respiration. There were only minor differences among the other coating treatments; however, they were only sometimes different from those of the control, which generally had the highest O2, lowest CO2, and lowest ethanol. Shellac and the carnauba microemulsion also altered the volatile profile more than the control and the nanoemulsion did, especially for ‘Unique’ tangors. For ‘Unique’ tangors, the control and nanoemulsion ranked highest for tangerine flavor and had the least off-flavor at the end of storage. Among the coatings tested, the carnauba emulsions demonstrated less water loss, imparted more sustainable gloss, and caused less ethanol production than shellac, with the nanoemulsion exhibiting higher gloss measurements, less modifications of the atmosphere and volatile profile, and, consequently, better flavor compared with the microemulsion.
Tangerine/mandarin (Citrus reticulata), clementine (Citrusclementina), and satsuma (Citrus unshiu) world production in2018–19 comprised 32.0 million tonnes of fresh fruit (U.S.Department of Agriculture, 2020). China is the largest producerof mandarins (22.0 million tonnes) and the second largestproducer of fresh oranges (Citrus sp.) in the world, at 7.2million tonnes. The largest sweet orange (C. sinensis) produceris Brazil, with a yield of 19.4 million tonnes (Food andAgricultural Organization of the United Nations, 2020). Thedevelopment and application of protective coatings are recog-nized as alternative environmentally friendly approaches toreduce losses and improve postharvest conservation (Nayaket al., 2019).
Coatings provide a barrier between fruit and the externalenvironment, induce a modified atmosphere within fruit (de-creased O2 and increased CO2), and reduce water vapor diffusion,
Received for publication 9 July 2020. Accepted for publication 13 Oct. 2020.Published online 17 November 2020.We are thankful for the support provided by Coordenac~ao de Aperfeicoamentode Pessoal de Nível Superior–CAPES (PDSE/201688881.132643/2016-01),S~ao Paulo Research Foundation (FAPESP; grant # 2016/23419-5), BrazilianNational Council for Scientific and Technological Development–CNPq (grant #407956/2016-6), and Empresa Brasileira de Pesquisa Agropecu�aria (EMBRAPA)from Brazil. We thank the U.S. Department of Agriculture. We also thankMilene C. Mitsuyuki for statistical advice and Holly Sisson and Elena Brancafor laboratory assistance.This paper was originally presented as an oral contribution at the 131st (2018)meeting of the Florida State Horticultural Society.Mention of a trademark or proprietary product is for identification only and doesnot imply a guarantee or warranty of the product by the U.S. Department ofAgriculture. The U.S. Department of Agriculture prohibits discrimination in all itsprograms and activities on the basis of race, color, national origin, gender, religion,age, disability, political beliefs, sexual orientation, and marital or family status.E.B. is the corresponding author. E-mail: [email protected] is an open access article distributed under the CC BY-NC-ND license(https://creativecommons.org/licenses/by-nc-nd/4.0/).
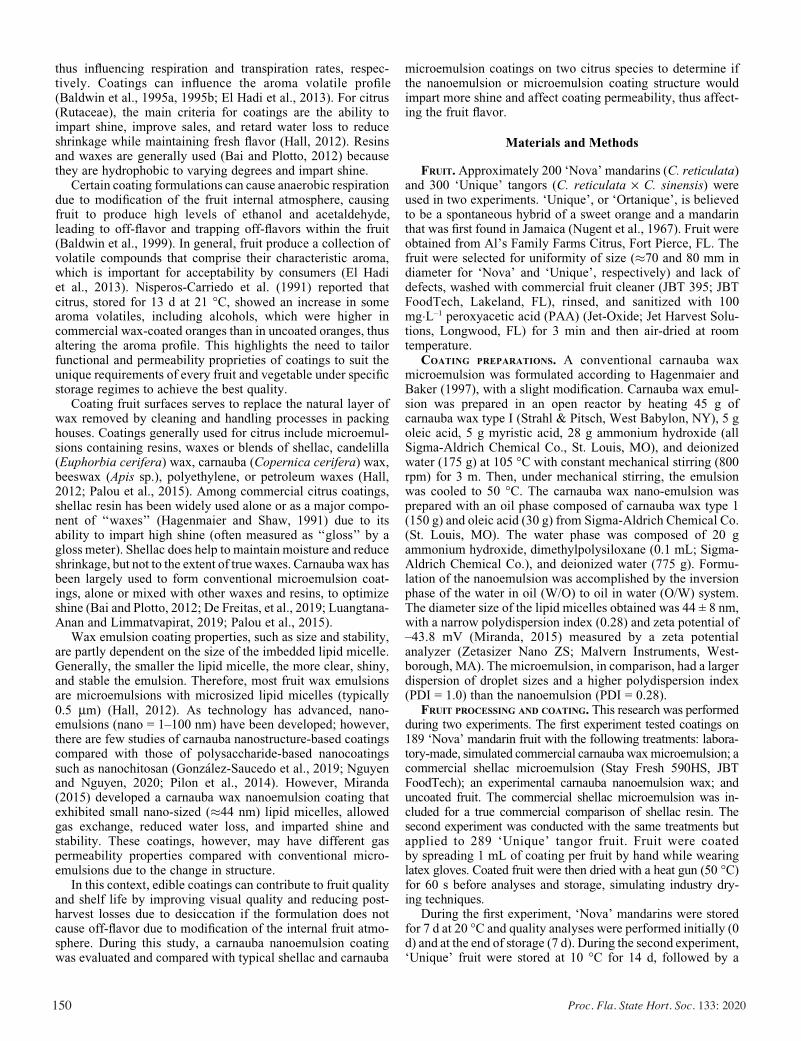
150 Proc. Fla. State Hort. Soc. 133: 2020
microemulsion coatings on two citrus species to determine ifthe nanoemulsion or microemulsion coating structure wouldimpart more shine and affect coating permeability, thus affect-ing the fruit flavor.
Materials and Methods
FRUIT. Approximately 200 ‘Nova’ mandarins (C. reticulata)and 300 ‘Unique’ tangors (C. reticulata · C. sinensis) wereused in two experiments. ‘Unique’, or ‘Ortanique’, is believedto be a spontaneous hybrid of a sweet orange and a mandarinthat was first found in Jamaica (Nugent et al., 1967). Fruit wereobtained from Al’s Family Farms Citrus, Fort Pierce, FL. Thefruit were selected for uniformity of size (�70 and 80 mm indiameter for ‘Nova’ and ‘Unique’, respectively) and lack ofdefects, washed with commercial fruit cleaner (JBT 395; JBTFoodTech, Lakeland, FL), rinsed, and sanitized with 100mg�L–1 peroxyacetic acid (PAA) (Jet-Oxide; Jet Harvest Solu-tions, Longwood, FL) for 3 min and then air-dried at roomtemperature.
COATING PREPARATIONS. A conventional carnauba waxmicroemulsion was formulated according to Hagenmaier andBaker (1997), with a slight modification. Carnauba wax emul-sion was prepared in an open reactor by heating 45 g ofcarnauba wax type I (Strahl & Pitsch, West Babylon, NY), 5 goleic acid, 5 g myristic acid, 28 g ammonium hydroxide (allSigma-Aldrich Chemical Co., St. Louis, MO), and deionizedwater (175 g) at 105 �C with constant mechanical stirring (800rpm) for 3 m. Then, under mechanical stirring, the emulsionwas cooled to 50 �C. The carnauba wax nano-emulsion wasprepared with an oil phase composed of carnauba wax type 1(150 g) and oleic acid (30 g) from Sigma-Aldrich Chemical Co.(St. Louis, MO). The water phase was composed of 20 gammonium hydroxide, dimethylpolysiloxane (0.1 mL; Sigma-Aldrich Chemical Co.), and deionized water (775 g). Formu-lation of the nanoemulsion was accomplished by the inversionphase of the water in oil (W/O) to oil in water (O/W) system.The diameter size of the lipid micelles obtained was 44 ± 8 nm,with a narrow polydispersion index (0.28) and zeta potential of–43.8 mV (Miranda, 2015) measured by a zeta potentialanalyzer (Zetasizer Nano ZS; Malvern Instruments, West-borough, MA). The microemulsion, in comparison, had a largerdispersion of droplet sizes and a higher polydispersion index(PDI = 1.0) than the nanoemulsion (PDI = 0.28).
FRUIT PROCESSING AND COATING. This research was performedduring two experiments. The first experiment tested coatings on189 ‘Nova’ mandarin fruit with the following treatments: labora-tory-made, simulated commercial carnaubawaxmicroemulsion; acommercial shellac microemulsion (Stay Fresh 590HS, JBTFoodTech); an experimental carnauba nanoemulsion wax; anduncoated fruit. The commercial shellac microemulsion was in-cluded for a true commercial comparison of shellac resin. Thesecond experiment was conducted with the same treatments butapplied to 289 ‘Unique’ tangor fruit. Fruit were coatedby spreading 1 mL of coating per fruit by hand while wearinglatex gloves. Coated fruit were then dried with a heat gun (50 �C)for 60 s before analyses and storage, simulating industry dry-ing techniques.
During the first experiment, ‘Nova’ mandarins were storedfor 7 d at 20 �C and quality analyses were performed initially (0d) and at the end of storage (7 d). During the second experiment,‘Unique’ fruit were stored at 10 �C for 14 d, followed by a
thus influencing respiration and transpiration rates, respec-tively. Coatings can influence the aroma volatile profile (Baldwin et al., 1995a, 1995b; El Hadi et al., 2013). For citrus (Rutaceae), the main criteria for coatings are the ability to impart shine, improve sales, and retard water loss to reduce shrinkage while maintaining fresh flavor (Hall, 2012). Resins and waxes are generally used (Bai and Plotto, 2012) because they are hydrophobic to varying degrees and impart shine.
Certain coating formulations can cause anaerobic respiration due to modification of the fruit internal atmosphere, causing fruit to produce high levels of ethanol and acetaldehyde, leading to off-flavor and trapping off-flavors within the fruit (Baldwin et al., 1999). In general, fruit produce a collection of volatile compounds that comprise their characteristic aroma, which is important for acceptability by consumers (El Hadi et al., 2013). Nisperos-Carriedo et al. (1991) reported that citrus, stored for 13 d at 21 �C, showed an increase in some aroma volatiles, including alcohols, which were higher in commercial wax-coated oranges than in uncoated oranges, thus altering the aroma profile. This highlights the need to tailor functional and permeability proprieties of coatings to suit the unique requirements of every fruit and vegetable under specific storage regimes to achieve the best quality.
Coating fruit surfaces serves to replace the natural layer of wax removed by cleaning and handling processes in packing houses. Coatings generally used for citrus include microemul-sions containing resins, waxes or blends of shellac, candelilla (Euphorbia cerifera) wax, carnauba (Copernica cerifera) wax, beeswax (Apis sp.), polyethylene, or petroleum waxes (Hall, 2012; Palou et al., 2015). Among commercial citrus coatings, shellac resin has been widely used alone or as a major compo-nent of ‘‘waxes’’ (Hagenmaier and Shaw, 1991) due to its ability to impart high shine (often measured as ‘‘gloss’’ by a gloss meter). Shellac does help to maintain moisture and reduce shrinkage, but not to the extent of true waxes. Carnauba wax has been largely used to form conventional microemulsion coat-ings, alone or mixed with other waxes and resins, to optimize shine (Bai and Plotto, 2012; De Freitas, et al., 2019; Luangtana-Anan and Limmatvapirat, 2019; Palou et al., 2015).
Wax emulsion coating properties, such as size and stability, are partly dependent on the size of the imbedded lipid micelle. Generally, the smaller the lipid micelle, the more clear, shiny, and stable the emulsion. Therefore, most fruit wax emulsions are microemulsions with microsized lipid micelles (typically 0.5 mm) (Hall, 2012). As technology has advanced, nano-emulsions (nano = 1–100 nm) have been developed; however, there are few studies of carnauba nanostructure-based coatings compared with those of polysaccharide-based nanocoatings such as nanochitosan (Gonz�alez-Saucedo et al., 2019; Nguyen and Nguyen, 2020; Pilon et al., 2014). However, Miranda (2015) developed a carnauba wax nanoemulsion coating that exhibited small nano-sized (�44 nm) lipid micelles, allowed gas exchange, reduced water loss, and imparted shine and stability. These coatings, however, may have different gas permeability properties compared with conventional micro-emulsions due to the change in structure.
In this context, edible coatings can contribute to fruit quality and shelf life by improving visual quality and reducing post-harvest losses due to desiccation if the formulation does not cause off-flavor due to modification of the internal fruit atmo-sphere. During this study, a carnauba nanoemulsion coating was evaluated and compared with typical shellac and carnauba

151Proc. Fla. State Hort. Soc. 133: 2020.
simulated marketing period of 7 d at 20 �C, which is moretypical for the industry. Quality analyses were performedinitially (0 d), after 14 d of cold storage (10 �C), and againafter the simulated marketing period (7 d at 20 �C). The relativehumidity (RH) was 80% to 85% for all storage.
FRUIT QUALITY. Fruit were gently hand-juiced using a foodservice juicer at room temperature to avoid peel oil in the juice(Baldwin et al., 2012). Juice aliquots (3 mL) were immediatelypipetted in crimp-capped vials for gas chromatography (GC),frozen in liquid N2, and stored at –80 �C to optimize the volatilecontent. In addition, 40 mL of juice was pipetted into plastictubes and stored at –20 �C for sugar and acid analyses. The SScontent of the juice was determined by the refractive index witha digital refractometer (PR-101; Atago, Tokyo, Japan). The TAand pHwere calculated from titration of 10 mL of juice with 0.1mol�L–1 NaOH to the pH 8.1 endpoint using an autotitrator(DL50; Mettler Toledo, Columbus, OH) and expressed as thepercent of juice. The ratio (SS/TA) was the proportion of sugarand acid (Baldwin et al., 2012). For SS, TA, pH, and SS/TA, 15fruit were juiced per treatment (five composite replicates ofthree fruit each).
From this same juice, ethanol and other volatile compoundswere quantified by GC (6890; Agilent Technologies, SantaClara, CA) using a standard curve with authentic standards(Baldwin et al., 2012). Temperatures of the oven, injector, anddetector were 70, 250, and 250 �C, respectively. For quantifi-cation of ethanol and other aroma volatiles, 3 mL of fruit juicewas transferred to a 10-mL crimp-capped vial, rapidly frozen inliquid N2, and then stored at –80 �C. Frozen samples were laterthawed under running tap water and inserted in a Gerstel
multipurpose auto sampler for head space injection (3 mL) inthe gas chromatograph equipped with a polar column (Stabil-wax; Restek Corp., Bellefonte, PA), a nonpolar low-bleedcolumn (HP-5; Agilent Technologies) and a flame ionizationdetector. The gas flow rates for He, H2, and air were 10, 35, and350mL�min–1, respectively. Temperatures of the oven, injector,and detector were 90, 200, and 250 �C, respectively. In additionto ethanol, common citrus volatiles were analyzed, includingthe alcohols hexanol, cis-3-hexenol, trans-2-hexenol, metha-nol, 2-methylpropanol, a-terpineol, and linalool; aldehydesacetaldehyde, decanal, and hexanal; esters methybutanoate,ethylbutanoate, ethylacetate, ethylhexanoate, and ethyl-3-hydroxyhexanoate; and terpenoids valencene, limonene, myr-cene, a-pinene, sabinene, and g-terpinene. Volatile compoundidentification was confirmed using solid phase microextraction(SPME) (50/30 mm DVB/CAR/PDMS; Supelco, Bellefonte,PA) and GC-mass spectrometry (MS), as reported by Wanget al. (2015). The instrument and column for SPME injectionwere performed using GC-MS (6890 GC + 5973N MS, AgilentTechnologies) with a nonpolar column (0.25 mm · 60 m, 0.50-mm-thick film thickness, DB-5, Agilent Technologies).
Internal gases, CO2 and O2, from 10 fruit samples pertreatment were evaluated by withdrawing a 10-mL internalfruit gas sample from the fruit columella using a syringe whilethe fruit was submerged in room temperature water. Thesesamples were analyzed using a gas chromatograph (HewlettPackard 5890A, Agilent Technologies) fitted with a CTRcolumn (Cole-Parmer, Vernon Hills, IL) and a thermal con-ductivity detector. The gas flow rates for helium and air were 80and 350 mL�m–1, respectively. Temperatures of the oven,injector, and detector were 70, 250, and 250 �C, respectively.Weight loss of 10 fruit per treatment was measured duringstorage, and results were expressed as a percentage of initialweight.
GLOSS MEASUREMENTS. A reflectometer (micro-TRI-gloss;BYK-Gardner, Colombia, MD) was used to evaluate glossunits, which are an indication of visual shine for coatingformulations on test paper (140 · 254 mm) and on the fruit.For test papers, an aliquot of 0.5 mL of each coating was spreadon a 0.05-mm-thick polished paper (Leneta Co., Mahwah, NJ)with a 0.1-mm castor (BYK-Gardner) with a speed of 1 cm�s–1.The control consisted of uncoated paper. Five papers pertreatment were used, and measurements were repeated fivetimes per paper at different positions. The reflectance wasmeasured at angles of 20� for test papers (Bai et al., 2003a) and60� for fruit (Bai et al., 2003b) according to the manufacturer’sinstructions because the paper is flat and the fruit is round. Forcoated fruit, a case with a circular 19-mm-diameter orifice wasattached to the equipment to accommodate the round fruitshape. For gloss measurements, 10 fruit per treatment wereused and measurements were performed twice at oppositepoints of the equatorial region of the fruit.
SENSORY VISUAL SHINE ANALYSES. Coated fruit were visuallyevaluated for shine by 25 and 19 panelists for ‘Nova’ and‘Unique’ fruit, respectively, for comparison with the gloss unitsmeasured with the reflectometer. Panelists consisted of labora-tory staff familiar with the assessment of citrus products. For‘Nova’, two groups of four fruit were presented, with eachgroup containing all four treatments, and panelists were askedto pair fruit by appearance (tetrad test) (Ennis, 2012). Then,panelists were asked to rank the pairs for shine in decreasingorder of shine intensity (most shine to least shine). For ‘Unique’
Fig. 1. Nanoemulsions and microemulsions of carnauba wax that help to slowwater/weight loss from citrus fruit compared with a commercial shellacmicroemulsion. (A) Weight loss of coated and uncoated ‘Nova’ mandarinsand (B) weight loss of ‘Unique’ tangors (10 fruit/treatment). For each storageperiod, columns with different letters are significantly different according toDuncan’s test (P < 0.05).
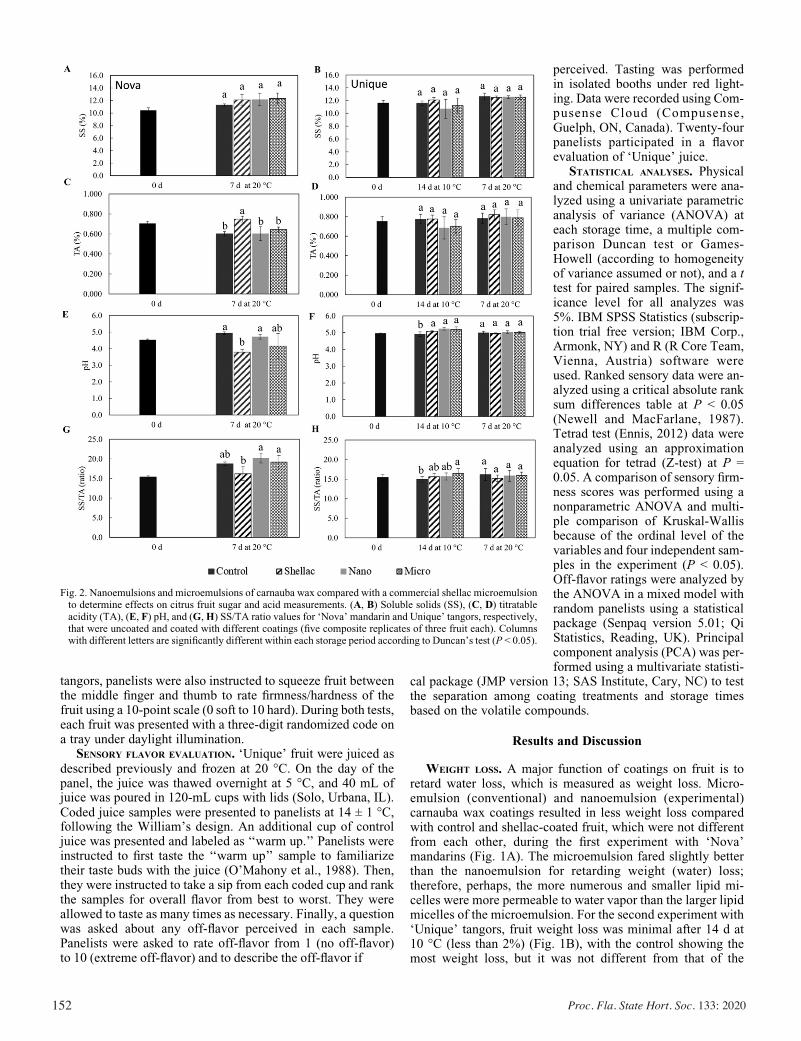
152 Proc. Fla. State Hort. Soc. 133: 2020
perceived. Tasting was performedin isolated booths under red light-ing. Data were recorded using Com-pusense Cloud (Compusense,Guelph, ON, Canada). Twenty-fourpanelists participated in a flavorevaluation of ‘Unique’ juice.
STATISTICAL ANALYSES. Physicaland chemical parameters were ana-lyzed using a univariate parametricanalysis of variance (ANOVA) ateach storage time, a multiple com-parison Duncan test or Games-Howell (according to homogeneityof variance assumed or not), and a ttest for paired samples. The signif-icance level for all analyzes was5%. IBM SPSS Statistics (subscrip-tion trial free version; IBM Corp.,Armonk, NY) and R (R Core Team,Vienna, Austria) software wereused. Ranked sensory data were an-alyzed using a critical absolute ranksum differences table at P < 0.05(Newell and MacFarlane, 1987).Tetrad test (Ennis, 2012) data wereanalyzed using an approximationequation for tetrad (Z-test) at P =0.05. A comparison of sensory firm-ness scores was performed using anonparametric ANOVA and multi-ple comparison of Kruskal-Wallisbecause of the ordinal level of thevariables and four independent sam-ples in the experiment (P < 0.05).Off-flavor ratings were analyzed bythe ANOVA in a mixed model withrandom panelists using a statisticalpackage (Senpaq version 5.01; QiStatistics, Reading, UK). Principalcomponent analysis (PCA) was per-formed using a multivariate statisti-
cal package (JMP version 13; SAS Institute, Cary, NC) to testthe separation among coating treatments and storage timesbased on the volatile compounds.
Results and Discussion
WEIGHT LOSS. A major function of coatings on fruit is toretard water loss, which is measured as weight loss. Micro-emulsion (conventional) and nanoemulsion (experimental)carnauba wax coatings resulted in less weight loss comparedwith control and shellac-coated fruit, which were not differentfrom each other, during the first experiment with ‘Nova’mandarins (Fig. 1A). The microemulsion fared slightly betterthan the nanoemulsion for retarding weight (water) loss;therefore, perhaps, the more numerous and smaller lipid mi-celles were more permeable to water vapor than the larger lipidmicelles of the microemulsion. For the second experiment with‘Unique’ tangors, fruit weight loss was minimal after 14 d at10 �C (less than 2%) (Fig. 1B), with the control showing themost weight loss, but it was not different from that of the
Fig. 2. Nanoemulsions and microemulsions of carnauba wax compared with a commercial shellac microemulsionto determine effects on citrus fruit sugar and acid measurements. (A, B) Soluble solids (SS), (C, D) titratableacidity (TA), (E, F) pH, and (G,H) SS/TA ratio values for ‘Nova’ mandarin and Unique’ tangors, respectively,that were uncoated and coated with different coatings (five composite replicates of three fruit each). Columnswith different letters are significantly different within each storage period according to Duncan’s test (P < 0.05).
tangors, panelists were also instructed to squeeze fruit between the middle finger and thumb to rate firmness/hardness of the fruit using a 10-point scale (0 soft to 10 hard). During both tests, each fruit was presented with a three-digit randomized code on a tray under daylight illumination.
SENSORY FLAVOR EVALUATION. ‘Unique’ fruit were juiced as described previously and frozen at 20 �C. On the day of the panel, the juice was thawed overnight at 5 �C, and 40 mL of juice was poured in 120-mL cups with lids (Solo, Urbana, IL). Coded juice samples were presented to panelists at 14 ± 1 �C, following the William’s design. An additional cup of control juice was presented and labeled as ‘‘warm up.’’ Panelists were instructed to first taste the ‘‘warm up’’ sample to familiarize their taste buds with the juice (O’Mahony et al., 1988). Then, they were instructed to take a sip from each coded cup and rank the samples for overall flavor from best to worst. They were allowed to taste as many times as necessary. Finally, a question was asked about any off-flavor perceived in each sample. Panelists were asked to rate off-flavor from 1 (no off-flavor) to 10 (extreme off-flavor) and to describe the off-flavor if
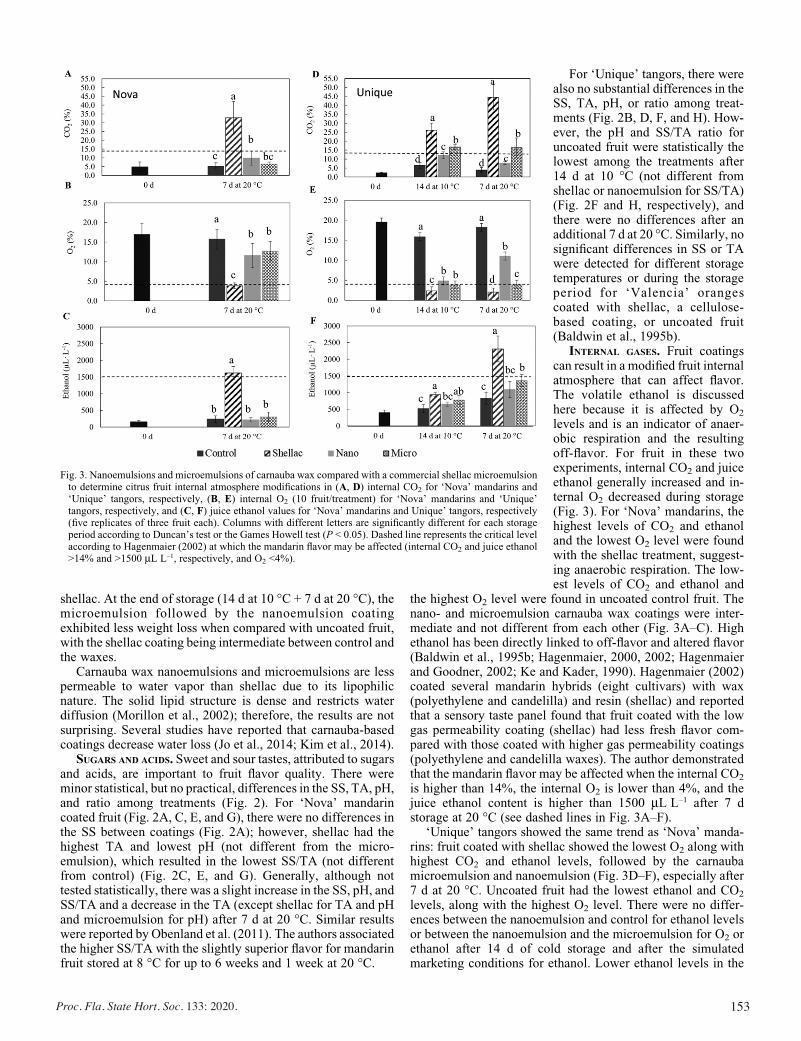
153Proc. Fla. State Hort. Soc. 133: 2020.
shellac. At the end of storage (14 d at 10 �C + 7 d at 20 �C), themicroemulsion followed by the nanoemulsion coatingexhibited less weight loss when compared with uncoated fruit,with the shellac coating being intermediate between control andthe waxes.
Carnauba wax nanoemulsions and microemulsions are lesspermeable to water vapor than shellac due to its lipophilicnature. The solid lipid structure is dense and restricts waterdiffusion (Morillon et al., 2002); therefore, the results are notsurprising. Several studies have reported that carnauba-basedcoatings decrease water loss (Jo et al., 2014; Kim et al., 2014).
SUGARS AND ACIDS. Sweet and sour tastes, attributed to sugarsand acids, are important to fruit flavor quality. There wereminor statistical, but no practical, differences in the SS, TA, pH,and ratio among treatments (Fig. 2). For ‘Nova’ mandarincoated fruit (Fig. 2A, C, E, and G), there were no differences inthe SS between coatings (Fig. 2A); however, shellac had thehighest TA and lowest pH (not different from the micro-emulsion), which resulted in the lowest SS/TA (not differentfrom control) (Fig. 2C, E, and G). Generally, although nottested statistically, there was a slight increase in the SS, pH, andSS/TA and a decrease in the TA (except shellac for TA and pHand microemulsion for pH) after 7 d at 20 �C. Similar resultswere reported by Obenland et al. (2011). The authors associatedthe higher SS/TA with the slightly superior flavor for mandarinfruit stored at 8 �C for up to 6 weeks and 1 week at 20 �C.
For ‘Unique’ tangors, there werealso no substantial differences in theSS, TA, pH, or ratio among treat-ments (Fig. 2B, D, F, and H). How-ever, the pH and SS/TA ratio foruncoated fruit were statistically thelowest among the treatments after14 d at 10 �C (not different fromshellac or nanoemulsion for SS/TA)(Fig. 2F and H, respectively), andthere were no differences after anadditional 7 d at 20 �C. Similarly, nosignificant differences in SS or TAwere detected for different storagetemperatures or during the storageperiod for ‘Valencia’ orangescoated with shellac, a cellulose-based coating, or uncoated fruit(Baldwin et al., 1995b).
INTERNAL GASES. Fruit coatingscan result in a modified fruit internalatmosphere that can affect flavor.The volatile ethanol is discussedhere because it is affected by O2
levels and is an indicator of anaer-obic respiration and the resultingoff-flavor. For fruit in these twoexperiments, internal CO2 and juiceethanol generally increased and in-ternal O2 decreased during storage(Fig. 3). For ‘Nova’ mandarins, thehighest levels of CO2 and ethanoland the lowest O2 level were foundwith the shellac treatment, suggest-ing anaerobic respiration. The low-est levels of CO2 and ethanol and
the highest O2 level were found in uncoated control fruit. Thenano- and microemulsion carnauba wax coatings were inter-mediate and not different from each other (Fig. 3A–C). Highethanol has been directly linked to off-flavor and altered flavor(Baldwin et al., 1995b; Hagenmaier, 2000, 2002; Hagenmaierand Goodner, 2002; Ke and Kader, 1990). Hagenmaier (2002)coated several mandarin hybrids (eight cultivars) with wax(polyethylene and candelilla) and resin (shellac) and reportedthat a sensory taste panel found that fruit coated with the lowgas permeability coating (shellac) had less fresh flavor com-pared with those coated with higher gas permeability coatings(polyethylene and candelilla waxes). The author demonstratedthat the mandarin flavor may be affected when the internal CO2
is higher than 14%, the internal O2 is lower than 4%, and thejuice ethanol content is higher than 1500 mL�L–1 after 7 dstorage at 20 �C (see dashed lines in Fig. 3A–F).
‘Unique’ tangors showed the same trend as ‘Nova’ manda-rins: fruit coated with shellac showed the lowest O2 along withhighest CO2 and ethanol levels, followed by the carnaubamicroemulsion and nanoemulsion (Fig. 3D–F), especially after7 d at 20 �C. Uncoated fruit had the lowest ethanol and CO2
levels, along with the highest O2 level. There were no differ-ences between the nanoemulsion and control for ethanol levelsor between the nanoemulsion and the microemulsion for O2 orethanol after 14 d of cold storage and after the simulatedmarketing conditions for ethanol. Lower ethanol levels in the
Fig. 3. Nanoemulsions and microemulsions of carnauba wax compared with a commercial shellac microemulsionto determine citrus fruit internal atmosphere modifications in (A, D) internal CO2 for ‘Nova’ mandarins and‘Unique’ tangors, respectively, (B, E) internal O2 (10 fruit/treatment) for ‘Nova’ mandarins and ‘Unique’tangors, respectively, and (C, F) juice ethanol values for ‘Nova’ mandarins and Unique’ tangors, respectively(five replicates of three fruit each). Columns with different letters are significantly different for each storageperiod according to Duncan’s test or the Games Howell test (P < 0.05). Dashed line represents the critical levelaccording to Hagenmaier (2002) at which the mandarin flavor may be affected (internal CO2 and juice ethanol>14% and >1500 mL�L–1, respectively, and O2 <4%).
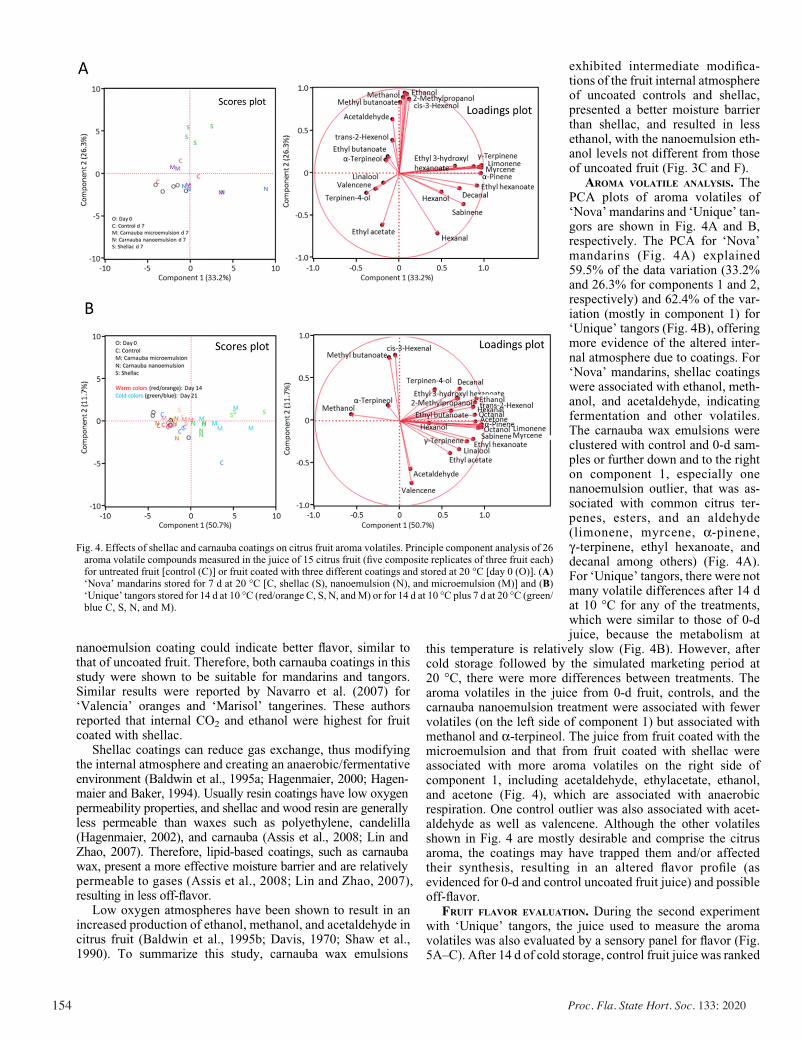
154 Proc. Fla. State Hort. Soc. 133: 2020
exhibited intermediate modifica-tions of the fruit internal atmosphereof uncoated controls and shellac,presented a better moisture barrierthan shellac, and resulted in lessethanol, with the nanoemulsion eth-anol levels not different from thoseof uncoated fruit (Fig. 3C and F).
AROMA VOLATILE ANALYSIS. ThePCA plots of aroma volatiles of‘Nova’ mandarins and ‘Unique’ tan-gors are shown in Fig. 4A and B,respectively. The PCA for ‘Nova’mandarins (Fig. 4A) explained59.5% of the data variation (33.2%and 26.3% for components 1 and 2,respectively) and 62.4% of the var-iation (mostly in component 1) for‘Unique’ tangors (Fig. 4B), offeringmore evidence of the altered inter-nal atmosphere due to coatings. For‘Nova’ mandarins, shellac coatingswere associated with ethanol, meth-anol, and acetaldehyde, indicatingfermentation and other volatiles.The carnauba wax emulsions wereclustered with control and 0-d sam-ples or further down and to the righton component 1, especially onenanoemulsion outlier, that was as-sociated with common citrus ter-penes, esters, and an aldehyde(limonene, myrcene, a-pinene,g-terpinene, ethyl hexanoate, anddecanal among others) (Fig. 4A).For ‘Unique’ tangors, there were notmany volatile differences after 14 dat 10 �C for any of the treatments,which were similar to those of 0-djuice, because the metabolism at
this temperature is relatively slow (Fig. 4B). However, aftercold storage followed by the simulated marketing period at20 �C, there were more differences between treatments. Thearoma volatiles in the juice from 0-d fruit, controls, and thecarnauba nanoemulsion treatment were associated with fewervolatiles (on the left side of component 1) but associated withmethanol and a-terpineol. The juice from fruit coated with themicroemulsion and that from fruit coated with shellac wereassociated with more aroma volatiles on the right side ofcomponent 1, including acetaldehyde, ethylacetate, ethanol,and acetone (Fig. 4), which are associated with anaerobicrespiration. One control outlier was also associated with acet-aldehyde as well as valencene. Although the other volatilesshown in Fig. 4 are mostly desirable and comprise the citrusaroma, the coatings may have trapped them and/or affectedtheir synthesis, resulting in an altered flavor profile (asevidenced for 0-d and control uncoated fruit juice) and possibleoff-flavor.
FRUIT FLAVOR EVALUATION. During the second experimentwith ‘Unique’ tangors, the juice used to measure the aromavolatiles was also evaluated by a sensory panel for flavor (Fig.5A–C). After 14 d of cold storage, control fruit juice was ranked
Fig. 4. Effects of shellac and carnauba coatings on citrus fruit aroma volatiles. Principle component analysis of 26aroma volatile compounds measured in the juice of 15 citrus fruit (five composite replicates of three fruit each)for untreated fruit [control (C)] or fruit coated with three different coatings and stored at 20 �C [day 0 (O)]. (A)‘Nova’ mandarins stored for 7 d at 20 �C [C, shellac (S), nanoemulsion (N), and microemulsion (M)] and (B)‘Unique’ tangors stored for 14 d at 10 �C (red/orange C, S, N, andM) or for 14 d at 10 �C plus 7 d at 20 �C (green/blue C, S, N, and M).
nanoemulsion coating could indicate better flavor, similar to that of uncoated fruit. Therefore, both carnauba coatings in this study were shown to be suitable for mandarins and tangors. Similar results were reported by Navarro et al. (2007) for ‘Valencia’ oranges and ‘Marisol’ tangerines. These authors reported that internal CO2 and ethanol were highest for fruit coated with shellac.
Shellac coatings can reduce gas exchange, thus modifying the internal atmosphere and creating an anaerobic/fermentative environment (Baldwin et al., 1995a; Hagenmaier, 2000; Hagen-maier and Baker, 1994). Usually resin coatings have low oxygen permeability properties, and shellac and wood resin are generally less permeable than waxes such as polyethylene, candelilla (Hagenmaier, 2002), and carnauba (Assis et al., 2008; Lin and Zhao, 2007). Therefore, lipid-based coatings, such as carnauba wax, present a more effective moisture barrier and are relatively permeable to gases (Assis et al., 2008; Lin and Zhao, 2007), resulting in less off-flavor.
Low oxygen atmospheres have been shown to result in an increased production of ethanol, methanol, and acetaldehyde in citrus fruit (Baldwin et al., 1995b; Davis, 1970; Shaw et al., 1990). To summarize this study, carnauba wax emulsions
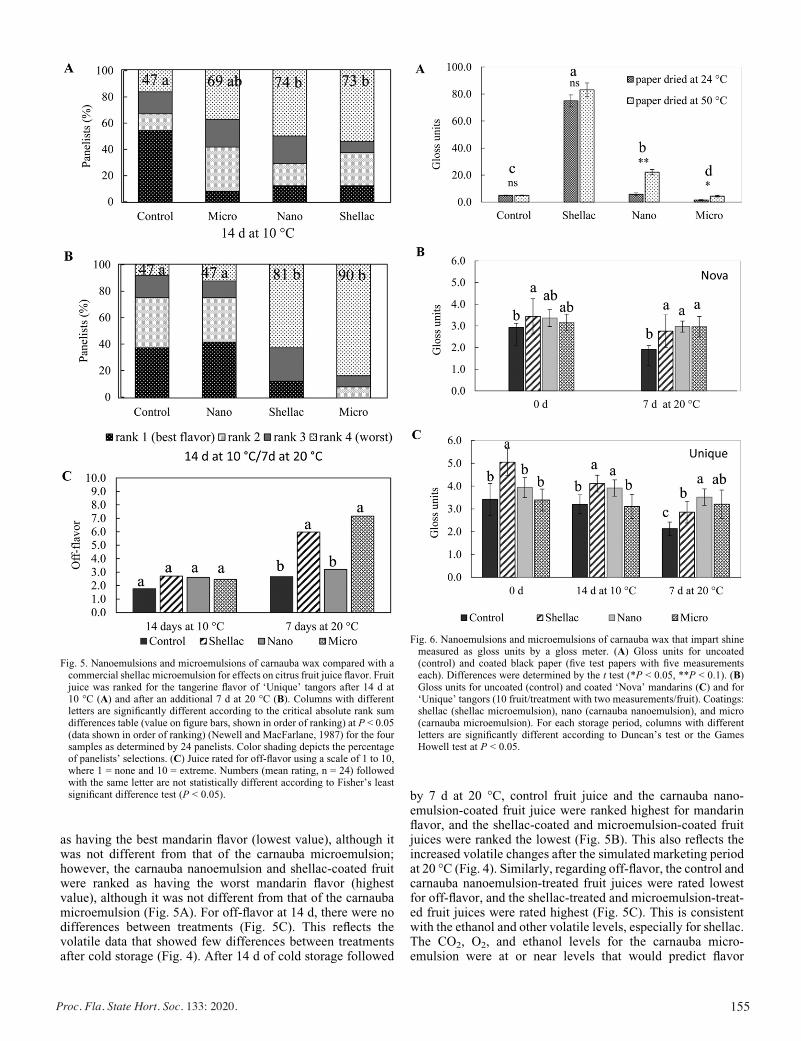
155Proc. Fla. State Hort. Soc. 133: 2020.
as having the best mandarin flavor (lowest value), although itwas not different from that of the carnauba microemulsion;however, the carnauba nanoemulsion and shellac-coated fruitwere ranked as having the worst mandarin flavor (highestvalue), although it was not different from that of the carnaubamicroemulsion (Fig. 5A). For off-flavor at 14 d, there were nodifferences between treatments (Fig. 5C). This reflects thevolatile data that showed few differences between treatmentsafter cold storage (Fig. 4). After 14 d of cold storage followed
by 7 d at 20 �C, control fruit juice and the carnauba nano-emulsion-coated fruit juice were ranked highest for mandarinflavor, and the shellac-coated and microemulsion-coated fruitjuices were ranked the lowest (Fig. 5B). This also reflects theincreased volatile changes after the simulated marketing periodat 20 �C (Fig. 4). Similarly, regarding off-flavor, the control andcarnauba nanoemulsion-treated fruit juices were rated lowestfor off-flavor, and the shellac-treated and microemulsion-treat-ed fruit juices were rated highest (Fig. 5C). This is consistentwith the ethanol and other volatile levels, especially for shellac.The CO2, O2, and ethanol levels for the carnauba micro-emulsion were at or near levels that would predict flavor
Fig. 5. Nanoemulsions and microemulsions of carnauba wax compared with acommercial shellac microemulsion for effects on citrus fruit juice flavor. Fruitjuice was ranked for the tangerine flavor of ‘Unique’ tangors after 14 d at10 �C (A) and after an additional 7 d at 20 �C (B). Columns with differentletters are significantly different according to the critical absolute rank sumdifferences table (value on figure bars, shown in order of ranking) at P < 0.05(data shown in order of ranking) (Newell and MacFarlane, 1987) for the foursamples as determined by 24 panelists. Color shading depicts the percentageof panelists’ selections. (C) Juice rated for off-flavor using a scale of 1 to 10,where 1 = none and 10 = extreme. Numbers (mean rating, n = 24) followedwith the same letter are not statistically different according to Fisher’s leastsignificant difference test (P < 0.05).
Fig. 6. Nanoemulsions and microemulsions of carnauba wax that impart shinemeasured as gloss units by a gloss meter. (A) Gloss units for uncoated(control) and coated black paper (five test papers with five measurementseach). Differences were determined by the t test (*P < 0.05, **P < 0.1). (B)Gloss units for uncoated (control) and coated ‘Nova’ mandarins (C) and for‘Unique’ tangors (10 fruit/treatment with two measurements/fruit). Coatings:shellac (shellac microemulsion), nano (carnauba nanoemulsion), and micro(carnauba microemulsion). For each storage period, columns with differentletters are significantly different according to Duncan’s test or the GamesHowell test at P < 0.05.
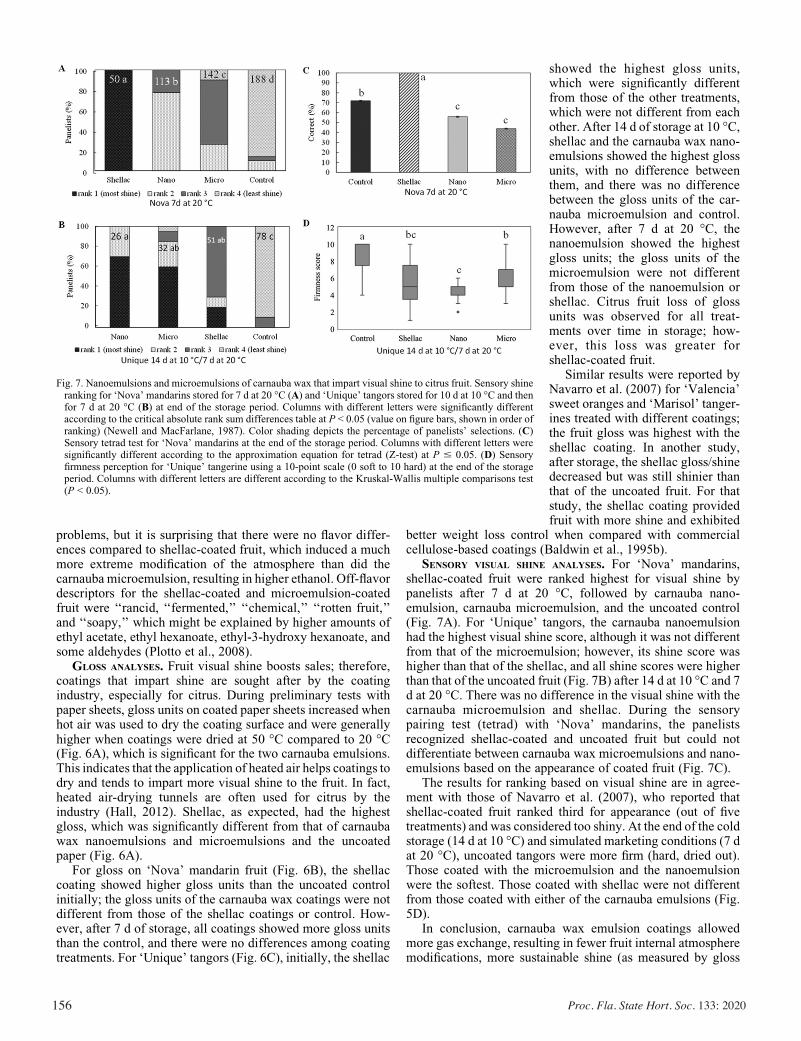
156 Proc. Fla. State Hort. Soc. 133: 2020
showed the highest gloss units,which were significantly differentfrom those of the other treatments,which were not different from eachother. After 14 d of storage at 10 �C,shellac and the carnauba wax nano-emulsions showed the highest glossunits, with no difference betweenthem, and there was no differencebetween the gloss units of the car-nauba microemulsion and control.However, after 7 d at 20 �C, thenanoemulsion showed the highestgloss units; the gloss units of themicroemulsion were not differentfrom those of the nanoemulsion orshellac. Citrus fruit loss of glossunits was observed for all treat-ments over time in storage; how-ever, this loss was greater forshellac-coated fruit.
Similar results were reported byNavarro et al. (2007) for ‘Valencia’sweet oranges and ‘Marisol’ tanger-ines treated with different coatings;the fruit gloss was highest with theshellac coating. In another study,after storage, the shellac gloss/shinedecreased but was still shinier thanthat of the uncoated fruit. For thatstudy, the shellac coating providedfruit with more shine and exhibited
better weight loss control when compared with commercialcellulose-based coatings (Baldwin et al., 1995b).
SENSORY VISUAL SHINE ANALYSES. For ‘Nova’ mandarins,shellac-coated fruit were ranked highest for visual shine bypanelists after 7 d at 20 �C, followed by carnauba nano-emulsion, carnauba microemulsion, and the uncoated control(Fig. 7A). For ‘Unique’ tangors, the carnauba nanoemulsionhad the highest visual shine score, although it was not differentfrom that of the microemulsion; however, its shine score washigher than that of the shellac, and all shine scores were higherthan that of the uncoated fruit (Fig. 7B) after 14 d at 10 �C and 7d at 20 �C. There was no difference in the visual shine with thecarnauba microemulsion and shellac. During the sensorypairing test (tetrad) with ‘Nova’ mandarins, the panelistsrecognized shellac-coated and uncoated fruit but could notdifferentiate between carnauba wax microemulsions and nano-emulsions based on the appearance of coated fruit (Fig. 7C).
The results for ranking based on visual shine are in agree-ment with those of Navarro et al. (2007), who reported thatshellac-coated fruit ranked third for appearance (out of fivetreatments) and was considered too shiny. At the end of the coldstorage (14 d at 10 �C) and simulated marketing conditions (7 dat 20 �C), uncoated tangors were more firm (hard, dried out).Those coated with the microemulsion and the nanoemulsionwere the softest. Those coated with shellac were not differentfrom those coated with either of the carnauba emulsions (Fig.5D).
In conclusion, carnauba wax emulsion coatings allowedmore gas exchange, resulting in fewer fruit internal atmospheremodifications, more sustainable shine (as measured by gloss
Fig. 7. Nanoemulsions and microemulsions of carnauba wax that impart visual shine to citrus fruit. Sensory shineranking for ‘Nova’ mandarins stored for 7 d at 20 �C (A) and ‘Unique’ tangors stored for 10 d at 10 �C and thenfor 7 d at 20 �C (B) at end of the storage period. Columns with different letters were significantly differentaccording to the critical absolute rank sum differences table at P < 0.05 (value on figure bars, shown in order ofranking) (Newell and MacFarlane, 1987). Color shading depicts the percentage of panelists’ selections. (C)Sensory tetrad test for ‘Nova’ mandarins at the end of the storage period. Columns with different letters weresignificantly different according to the approximation equation for tetrad (Z-test) at P # 0.05. (D) Sensoryfirmness perception for ‘Unique’ tangerine using a 10-point scale (0 soft to 10 hard) at the end of the storageperiod. Columns with different letters are different according to the Kruskal-Wallis multiple comparisons test(P < 0.05).
problems, but it is surprising that there were no flavor differ-ences compared to shellac-coated fruit, which induced a much more extreme modification of the atmosphere than did the carnauba microemulsion, resulting in higher ethanol. Off-flavor descriptors for the shellac-coated and microemulsion-coated fruit were ‘‘rancid, ‘‘fermented,’’ ‘‘chemical,’’ ‘‘rotten fruit,’’ and ‘‘soapy,’’ which might be explained by higher amounts of ethyl acetate, ethyl hexanoate, ethyl-3-hydroxy hexanoate, and some aldehydes (Plotto et al., 2008).
GLOSS ANALYSES. Fruit visual shine boosts sales; therefore, coatings that impart shine are sought after by the coating industry, especially for citrus. During preliminary tests with paper sheets, gloss units on coated paper sheets increased when hot air was used to dry the coating surface and were generally higher when coatings were dried at 50 �C compared to 20 �C (Fig. 6A), which is significant for the two carnauba emulsions. This indicates that the application of heated air helps coatings to dry and tends to impart more visual shine to the fruit. In fact, heated air-drying tunnels are often used for citrus by the industry (Hall, 2012). Shellac, as expected, had the highest gloss, which was significantly different from that of carnauba wax nanoemulsions and microemulsions and the uncoated paper (Fig. 6A).
For gloss on ‘Nova’ mandarin fruit (Fig. 6B), the shellac coating showed higher gloss units than the uncoated control initially; the gloss units of the carnauba wax coatings were not different from those of the shellac coatings or control. How-ever, after 7 d of storage, all coatings showed more gloss units than the control, and there were no differences among coating treatments. For ‘Unique’ tangors (Fig. 6C), initially, the shellac
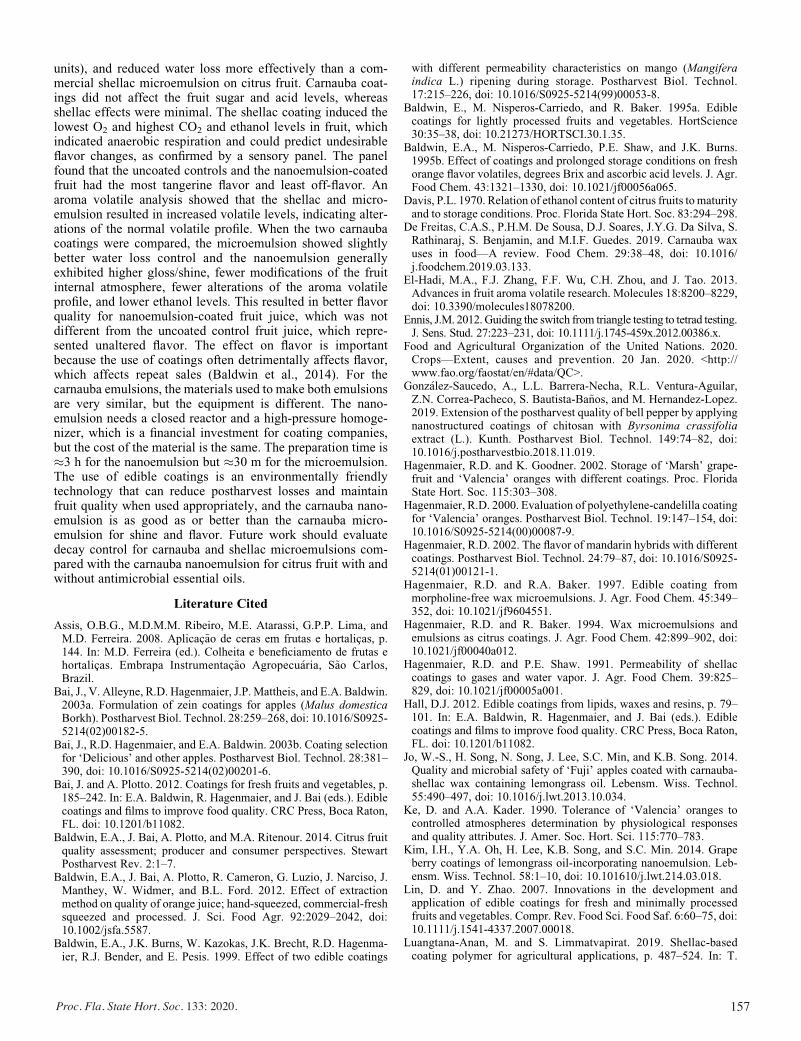
157Proc. Fla. State Hort. Soc. 133: 2020.
units), and reduced water loss more effectively than a com-mercial shellac microemulsion on citrus fruit. Carnauba coat-ings did not affect the fruit sugar and acid levels, whereasshellac effects were minimal. The shellac coating induced thelowest O2 and highest CO2 and ethanol levels in fruit, whichindicated anaerobic respiration and could predict undesirableflavor changes, as confirmed by a sensory panel. The panelfound that the uncoated controls and the nanoemulsion-coatedfruit had the most tangerine flavor and least off-flavor. Anaroma volatile analysis showed that the shellac and micro-emulsion resulted in increased volatile levels, indicating alter-ations of the normal volatile profile. When the two carnaubacoatings were compared, the microemulsion showed slightlybetter water loss control and the nanoemulsion generallyexhibited higher gloss/shine, fewer modifications of the fruitinternal atmosphere, fewer alterations of the aroma volatileprofile, and lower ethanol levels. This resulted in better flavorquality for nanoemulsion-coated fruit juice, which was notdifferent from the uncoated control fruit juice, which repre-sented unaltered flavor. The effect on flavor is importantbecause the use of coatings often detrimentally affects flavor,which affects repeat sales (Baldwin et al., 2014). For thecarnauba emulsions, the materials used to make both emulsionsare very similar, but the equipment is different. The nano-emulsion needs a closed reactor and a high-pressure homoge-nizer, which is a financial investment for coating companies,but the cost of the material is the same. The preparation time is�3 h for the nanoemulsion but �30 m for the microemulsion.The use of edible coatings is an environmentally friendlytechnology that can reduce postharvest losses and maintainfruit quality when used appropriately, and the carnauba nano-emulsion is as good as or better than the carnauba micro-emulsion for shine and flavor. Future work should evaluatedecay control for carnauba and shellac microemulsions com-pared with the carnauba nanoemulsion for citrus fruit with andwithout antimicrobial essential oils.
Literature Cited
Assis, O.B.G., M.D.M.M. Ribeiro, M.E. Atarassi, G.P.P. Lima, andM.D. Ferreira. 2008. Aplicac~ao de ceras em frutas e hortalicas, p.144. In: M.D. Ferreira (ed.). Colheita e beneficiamento de frutas ehortalicas. Embrapa Instrumentac~ao Agropecu�aria, S~ao Carlos,Brazil.
Bai, J., V. Alleyne, R.D. Hagenmaier, J.P. Mattheis, and E.A. Baldwin.2003a. Formulation of zein coatings for apples (Malus domesticaBorkh). Postharvest Biol. Technol. 28:259–268, doi: 10.1016/S0925-5214(02)00182-5.
Bai, J., R.D. Hagenmaier, and E.A. Baldwin. 2003b. Coating selectionfor ‘Delicious’ and other apples. Postharvest Biol. Technol. 28:381–390, doi: 10.1016/S0925-5214(02)00201-6.
Bai, J. and A. Plotto. 2012. Coatings for fresh fruits and vegetables, p.185–242. In: E.A. Baldwin, R. Hagenmaier, and J. Bai (eds.). Ediblecoatings and films to improve food quality. CRC Press, Boca Raton,FL. doi: 10.1201/b11082.
Baldwin, E.A., J. Bai, A. Plotto, and M.A. Ritenour. 2014. Citrus fruitquality assessment; producer and consumer perspectives. StewartPostharvest Rev. 2:1–7.
Baldwin, E.A., J. Bai, A. Plotto, R. Cameron, G. Luzio, J. Narciso, J.Manthey, W. Widmer, and B.L. Ford. 2012. Effect of extractionmethod on quality of orange juice; hand-squeezed, commercial-freshsqueezed and processed. J. Sci. Food Agr. 92:2029–2042, doi:10.1002/jsfa.5587.
Baldwin, E.A., J.K. Burns, W. Kazokas, J.K. Brecht, R.D. Hagenma-ier, R.J. Bender, and E. Pesis. 1999. Effect of two edible coatings
with different permeability characteristics on mango (Mangiferaindica L.) ripening during storage. Postharvest Biol. Technol.17:215–226, doi: 10.1016/S0925-5214(99)00053-8.
Baldwin, E., M. Nisperos-Carriedo, and R. Baker. 1995a. Ediblecoatings for lightly processed fruits and vegetables. HortScience30:35–38, doi: 10.21273/HORTSCI.30.1.35.
Baldwin, E.A., M. Nisperos-Carriedo, P.E. Shaw, and J.K. Burns.1995b. Effect of coatings and prolonged storage conditions on freshorange flavor volatiles, degrees Brix and ascorbic acid levels. J. Agr.Food Chem. 43:1321–1330, doi: 10.1021/jf00056a065.
Davis, P.L. 1970. Relation of ethanol content of citrus fruits to maturityand to storage conditions. Proc. Florida State Hort. Soc. 83:294–298.
De Freitas, C.A.S., P.H.M. De Sousa, D.J. Soares, J.Y.G. Da Silva, S.Rathinaraj, S. Benjamin, and M.I.F. Guedes. 2019. Carnauba waxuses in food—A review. Food Chem. 29:38–48, doi: 10.1016/j.foodchem.2019.03.133.
El-Hadi, M.A., F.J. Zhang, F.F. Wu, C.H. Zhou, and J. Tao. 2013.Advances in fruit aroma volatile research. Molecules 18:8200–8229,doi: 10.3390/molecules18078200.
Ennis, J.M. 2012.Guiding the switch from triangle testing to tetrad testing.J. Sens. Stud. 27:223–231, doi: 10.1111/j.1745-459x.2012.00386.x.
Food and Agricultural Organization of the United Nations. 2020.Crops—Extent, causes and prevention. 20 Jan. 2020. <http://www.fao.org/faostat/en/#data/QC>.
Gonz�alez-Saucedo, A., L.L. Barrera-Necha, R.L. Ventura-Aguilar,Z.N. Correa-Pacheco, S. Bautista-Ba~nos, and M. Hernandez-Lopez.2019. Extension of the postharvest quality of bell pepper by applyingnanostructured coatings of chitosan with Byrsonima crassifoliaextract (L.). Kunth. Postharvest Biol. Technol. 149:74–82, doi:10.1016/j.postharvestbio.2018.11.019.
Hagenmaier, R.D. and K. Goodner. 2002. Storage of ‘Marsh’ grape-fruit and ‘Valencia’ oranges with different coatings. Proc. FloridaState Hort. Soc. 115:303–308.
Hagenmaier, R.D. 2000. Evaluation of polyethylene-candelilla coatingfor ‘Valencia’ oranges. Postharvest Biol. Technol. 19:147–154, doi:10.1016/S0925-5214(00)00087-9.
Hagenmaier, R.D. 2002. The flavor of mandarin hybrids with differentcoatings. Postharvest Biol. Technol. 24:79–87, doi: 10.1016/S0925-5214(01)00121-1.
Hagenmaier, R.D. and R.A. Baker. 1997. Edible coating frommorpholine-free wax microemulsions. J. Agr. Food Chem. 45:349–352, doi: 10.1021/jf9604551.
Hagenmaier, R.D. and R. Baker. 1994. Wax microemulsions andemulsions as citrus coatings. J. Agr. Food Chem. 42:899–902, doi:10.1021/jf00040a012.
Hagenmaier, R.D. and P.E. Shaw. 1991. Permeability of shellaccoatings to gases and water vapor. J. Agr. Food Chem. 39:825–829, doi: 10.1021/jf00005a001.
Hall, D.J. 2012. Edible coatings from lipids, waxes and resins, p. 79–101. In: E.A. Baldwin, R. Hagenmaier, and J. Bai (eds.). Ediblecoatings and films to improve food quality. CRC Press, Boca Raton,FL. doi: 10.1201/b11082.
Jo, W.-S., H. Song, N. Song, J. Lee, S.C. Min, and K.B. Song. 2014.Quality and microbial safety of ‘Fuji’ apples coated with carnauba-shellac wax containing lemongrass oil. Lebensm. Wiss. Technol.55:490–497, doi: 10.1016/j.lwt.2013.10.034.
Ke, D. and A.A. Kader. 1990. Tolerance of ‘Valencia’ oranges tocontrolled atmospheres determination by physiological responsesand quality attributes. J. Amer. Soc. Hort. Sci. 115:770–783.
Kim, I.H., Y.A. Oh, H. Lee, K.B. Song, and S.C. Min. 2014. Grapeberry coatings of lemongrass oil-incorporating nanoemulsion. Leb-ensm. Wiss. Technol. 58:1–10, doi: 10.101610/j.lwt.214.03.018.
Lin, D. and Y. Zhao. 2007. Innovations in the development andapplication of edible coatings for fresh and minimally processedfruits and vegetables. Compr. Rev. Food Sci. Food Saf. 6:60–75, doi:10.1111/j.1541-4337.2007.00018.
Luangtana-Anan, M. and S. Limmatvapirat. 2019. Shellac-basedcoating polymer for agricultural applications, p. 487–524. In: T.
158 Proc. Fla. State Hort. Soc. 133: 2020
Guti�errez (ed.). Polymers for agri-food applications. Springer, NewYork, NY.
Miranda, M. 2015. Revestimento nanoestruturado de cera de carna�ubana manutenc~ao da qualidade p�os-colheita de tomates. MS Thesis,Federal University of S~ao Carlos, S~ao Carlos, Brazil. 14 Oct. 2020.<https://repositorio.ufscar.br/bitstream/handle/ufscar/8588/DissMM.pdf?sequence=1&isAllowed=y>.
Morillon, V., F. Debeaufort, G. Blond, M. Capelle, and A. Voilley.2002. Factors affecting the moisture permeability of lipid-basededible films: A review. Crit. Rev. Food Sci. Nutr. 42:67–89, doi:10.1080/10408690290825466.
Navarro, M.-L., M.B. P�erez-Gago, K. Goodner, and A. Plotto. 2007.New composite coating containing HPMC, beeswax, and shellac for‘Valencia’ oranges and ‘Marisol’ tangerines. Proc. Florida StateHort. Soc. 120:228–234.
Nayak, S.L., S. Sethi, R.R. Shaarma, and U. Prajapati. 2019. Active ediblecoatings for fresh fruits and vegetables, p. 417–432. In: T.J. Guti�errez(ed.). Polymers for agri-food applications. Springer, Cham, Switzerland.
Newell, G.J. and J.D. MacFarlane. 1987. Expanded tables for multiplecomparison procedures in the analysis of ranked data. J. Food Sci52:1721–1725, doi: 10.1111/j.1365-2621.1987.tb05913.x.
Nguyen, N.H.V. and D.H. Nguyen. 2020. Effects of nano-chitosan andchitosan coating on the postharvest quality, polyphenol oxidaseactivity and malondialdehyde content of strawberry (Fragaria·ananassa Duch.). J. Hort. Postharvest Res. 3:11–24, doi:10.22077/JHPR.2019.2698.1082.
Nisperos-Carriedo, M., E. Baldwin, and P. Shaw. 1991. Developmentof an edible coating for extending postharvest life of selected fruitsand vegetables. Proc. Florida State Hort. Soc. 104:122–125.
Nugent, V., K.E. Magnus, and C.V. Bent. 1967. The ortanique orange.Trop. Sci. 19:182–185.
Obenland, D.S., B. Collin, J. Mackey, J. Sievert, and M.L. Arpaia.2011. Storage temperature and time influences sensory quality ofmandarins by altering soluble solids, acidity and aroma volatilecomposition. Postharvest Biol. Technol. 59:187–193, doi: 10.1016/j.postharvestbio.2010.09.011.
O’Mahony, M., U. Thieme, and L.R. Goldstein. 1988. The warm-upeffect as a means of increasing the discriminabilty of sensorydifference tests. J. Food Sci. 53:1848–1850, doi: 1.1111/j.1365-2621.1988.tb07858x.
Palou, L., S.A. Valencia-Chamorro, and M.B. P�erez-Gago. 2015.Antifungal edible coatings for fresh citrus fruit: A review. Coatings5:962–986, doi: 10.3390/coatings5040962.
Pilon, L., P.C. Spricgo, M. Miranda, M.R. Moura, O.B.G. Assis,L.H.C. Mattoso, and M.D. Ferreira. 2014. Chitosan nanoparticlecoatings reduce microbial growth on fresh-cut apples while notaffecting quality attributes. Intl. J. Food Sci. Technol. 50:440–444,doi: 10.1111/ijfs.12616.
Plotto, A., C.A. Margaria, K.L. Goodner, and E.A. Baldwin. 2008.Odour and flavor thresholds for key aroma components in an orangejuice matrix: Esters and miscellaneous compounds. Flavour Fra-grance J. 23:398–406, doi: 1.1002/ffj.1470.
Shaw, P.E., R.D. Carter, M.G. Moshonas, and G. Sadler. 1990.Controlled atmosphere storage of oranges to enhance aqueousessence and essence oil. J. Food Sci. 55:1617–1619, doi: 10.1111/j.1365-2621.1990.tb03584.x.
U.S. Department of Agriculture. 2020. Citrus: World markets and trade.14 Oct. 2020. <https://apps.fas.usda.gov/psdonline/circulars/citrus.pdf>.
Wang, L., E.A. Baldwin, Z. Yu, and J. Bai. 2015. The impact of kitchenand food service preparation practices on the volatile aroma profile inripe tomatoes: Effects of refrigeration and blanching. HortScience50:1358–1364, doi: 10.21273/HORTSCI.50.9.1358.
This paper was presented during the 131st FSHS Annual Meeting (2018) and originally published in the Journal of the American Society for Horticultural Science
[J. AMER.SOC.HORT.SCI. 146(1):40–49. 2021. https://doi.org/10.21273/JASHS04972-20]. The paper is included in this Proceedings as a reprint (with permission).
159Proc. Fla. State Hort. Soc. 133: 2020.
Proc. Fla. State Hort. Soc. 133:159–167. 2020.
Handling & Processing Section
Edible Coatings as Carriers of AntibrowningCompounds to Maintain Appealing Appearanceof Fresh-cut Mango
Anna Mar�ın1, Elizabeth A. Baldwin1, Jinhe Bai1, David Wood1,
Christopher Ference1, Xiuxiu Sun1, Jeffrey K. Brecht2,
and Anne Plotto1
ADDITIONAL INDEX WORDS. Aloe vera, carboxymethylcellulose, browning, sensoryevaluation, shelf life, whey protein isolate
SUMMARY. Fresh-cut mango (Mangifera indica) slices and chunks garner an exoticimage and are highly appreciated for their unique flavor and nutritional value.However, processors tend to use firm unripe mangoes to achieve shelf life of 10 to14 days, which compromises eating quality. The post-processing life of ripe fresh-cut mangoes is limited by tissue softening, translucency, and browning. The currentstudy was undertaken to investigate whether edible coatings can extend the shelf lifeof fresh-cut mangoes processed at an eating-ripe stage. Three edible coatings, car-boxymethylcellulose (1%w/v), aloe (Aloe vera) powder (2%w/v), andwhey proteinisolate (2% w/v), supplemented with calcium ascorbate 2% w/v (firming agent) andthe antioxidants citric acid (0.8%w/v) and acetyl-N-cysteine (0.4%w/v), were used.The mixture of antibrowning agents, whether applied alone or with the ediblecoatings, was themost effective at reducing slice browning up to 10 and 11 days at 5�C for ‘Tommy Atkins’ and ‘Kent’, respectively. In general, there were no differ-ences in firmness and flavor among the three edible coatings. Calcium ascorbatealone did not suppress browning consistently, whereas citric acid appeared to be theingredient having the greatest antibrowning effect on slice quality. Citric acid caneasily be used by processors of fresh-cut mangoes to prevent browning.
Mangoes (Mangifera indica)represent a small part of thefresh-cut industry but their
popularity is growing, as reflected bythe increase in sales by 8% between2013 and 2017 in the United States
(National Mango Board, 2017), andrecently ranking seventh amongfresh-cut fruit sales in 2019 (VanDen Broek, 2020). Their appealingflavor and texture, and the addedconvenience that ready-to-eat fresh-cut products offer compared withwhole fruit, are some of the maincontributing drivers (Brecht et al.,2017).
The process of woundingwhole fruit tissue to obtain fresh-cut fruit stimulates the develop-ment of undesirable color changes,due to enzymatic browning, andtissue softening. It also provides a
substrate for microbial growth, in-creasing the risk of developingpathogens (Baldwin, 2007). There-fore, fresh-cut fruit shelf life isconsiderably shorter than for wholefruit. To delay fresh-cut fruit de-terioration, processors tend to cutmangoes on reception without pre-ripening to avoid overripe, soft,bruised, and decayed fruit (Brechtet al., 2017). Furthermore, fresh-cut mangoes must be maintained atno higher than 5 �C, both to pro-long shelf life and to reduce the riskassociated with potential prolifera-tion of microbial food-borne hu-man pathogens (U.S. Food andDrug Administration, 2017). Un-der these conditions, unripe fresh-cut mangoes do not fully developtheir desirable sensory attributes,which may negatively affect repeatpurchase by consumers. In this con-text, the fresh-cut mango industryneeds to reach a balance betweenacceptable shelf life and appealingorganoleptic features, to offer a high-quality product that meets the expec-tations of all stakeholders involved.Processing riper fruit might be a wayto achieve this goal, but at the sametime can increase susceptibility towounding during processing andshorten shelf life (Beaulieu and Lea,2003; Brecht et al., 2017; Ngam-chuachit et al., 2015).
The use of edible coatings (ECs)for the purpose of extending shelf lifeand improving quality of fresh-cutfruit is an extensively reviewed strategy(Baldwin and Brecht, 2020; Dea et al.,2012; Ghidelli and P�erez-Gago,2018; Yousuf et al., 2018). Delay offlesh browning and tissue softeningare some of their most notable bene-fits. Antibrowning and/or firmingagents such as calcium ascorbate, citricacid, and N-acetyl-L-cysteine are
UnitsTo convert U.S. to SI,multiply by U.S. unit SI unit
To convert SI to U.S.,multiply by
1 % g/100 mL 129,574 fl oz mL 3.3814 ·10–5
29.5735 fl oz mL 0.03383.7854 gal L 0.26422.54 inch(es) cm 0.3937
25.4 inch(es) mm 0.03940.4536 lb kg 2.20464.4482 lbf N 0.2248
28.3495 oz g 0.03531 ppm mg�L–1 11 ppm mL�L–1 1
(�F – 32) O 1.8 �F �C (�C ·1.8) + 32
Received for publication 7 July 2020. Accepted for publication 29 Oct. 2020.
Published online 3 December 2020.1U.S. Department of Agriculture, Agricultural Re-search Service, U.S. Horticultural Research Labora-tory, 2001 South Rock Road, Fort Pierce, FL 349452Horticultural Sciences Department, University of Florida, Institute of Food and Agricultural Sciences, 2550 Hull Road, Gainesville, FL 32611
Funding for this research was provided by the Na-tional Mango Board.
Mention of a trademark or proprietary product is for identification only and does not imply a guarantee or warranty of the product by the U.S. Department of Agriculture. The U.S. Department of Agriculture prohibits discrimination in all its programs and activ-ities on the basis of race, color, national origin, gender, religion, age, disability, political beliefs, sexual orientation, and marital or family status.
This paper was originally presented at the 132nd (2019) meeting of the Florida State Horticultural Society as HP-6.
A.P. is the corresponding author. E-mail: anne. [email protected].
This is an open access article distributed under the CC BY-NC-ND license (https://creativecommons.org/licenses/by-nc-nd/4.0/).

160 Proc. Fla. State Hort. Soc. 133: 2020
frequently used in the fresh-cut in-dustry, and their incorporation intoECs is known as an effective tool toimprove their efficacy. Polysaccharide-based ECs have been widely reportedas good matrices to incorporate com-pounds with antibrowning propertiesin fresh-cut mango and other fruit(Ben�ıtez et al., 2015; Plotto et al.,2010; Robles-S�anchez et al., 2013;Saba and Sogvar, 2016), whereas theapplication of coatings based on pro-teins is more limited, and only a fewstudies with apple (Malus domestica)and persimmon (Diospyros kaki) fruitcan be found in the literature (Alveset al., 2017; Ghidelli et al., 2010;P�erez-Gago et al., 2006).
This study aimed at determininghow the shelf life of fresh-cut mangosprocessed at an eating-ripe stage couldbe extended by treatments with anti-oxidants and/or firming compoundsincorporated into ECs to offset theexpected shelf life limitations causedby using riper fruit. For that purpose,the influence of ECs on physico-chemical and sensory properties offresh-cut mango were analyzed dur-ing storage at 5 �C for 14 d.
Materials and methods
PREPARATION OF THE ANTI-BROWNING COATING SOLUTIONS. Allsolutions were prepared with steriledeionized water and all ingredientswere food grade (Table 1). Calciumascorbate [CaAS (Sigma-Aldrich, St.Louis, MO)] was diluted to 2% (w/v)for 20 min at room temperature.The antioxidant solution (ANTIOX),was a mixture consisting of CaAS(2%), citric acid [0.8% w/v (Sigma-Aldrich)], and N-acetyl-L-cysteine[0.4% w/v (Sigma-Aldrich)] dispersedat room temperature for 20 min. TheANTIOX solution was applied aloneor in combination with ECs. Carboxy-methylcellulose sodium salt [CMC
(Sigma-Aldrich)], was dissolved (1%w/v) in warm water for 2 h, and aftercooling, dextrin [0.5%, w/v, dextrinType II from corn (Zea mays) (Sigma-Aldrich)] was added and the mixturewas stirred for an additional 5 min.Aloe powder [ALOE (S.W. Basics,Brooklyn, NY)] was dissolved at 2%(w/v) for 20min.Whey protein isolate[WPI (The Isopure Co., DownersGrove, IL)] was dissolved (2% w/v)for 30 min at 90 �C to induce proteindenaturation. On cooling, glycerol[0.5% w/v (bioWORLD, Dublin,OH)] was added and the solution washomogenized for 4 min at 12,000rpm using a homogenizer (Bio-GenPRO200; PRO Scientific, Oxford,CT). ANTIOX solution was addedto each EC solution at room temper-ature by stirring for 10 min. Theconcentrations of the different solu-tions were selected based on previousstudies (Blanco-D�ıaz et al., 2014;Plotto et al., 2010). The pH of eachsolution was measured in duplicate(Table 1).
FRUIT SOURCE AND PROCESSING.‘Tommy Atkins’ and ‘Kent’ mangoesfromMexico were purchased from theimporter on arrival (Coast Tropical,Homestead, FL) and brought to theU.S. Horticultural Research Labora-tory (Fort Pierce, FL). Fruit had beensubjected to quarantine hot watertreatments mandated by the U.S.Department of Agriculture (2016),and maintained at 12 �C during ship-ping. On reception, a subsample ofmangoes was randomly selected andkept at room temperature to assessripeness level by nondestructive com-pression firmness measurement usinga texture analyzer (TA.XT plus; StableMicro Systems, Godalming, UK)equipped with a 50-kg load cell andwith a 5-cm-diameter flat plate (TA-25, Stable Micro Systems), and cali-brated with a 5-kg weight. The tests
were performed at a crosshead speedof 0.8 mm�s–1 and force was recordedat 2.5 mm deformation (Dea et al.,2013). Depending on subsample ini-tial firmness, fruit were stored either at13 �C (if firmness was 30 to 40 N for‘Kent’) or 20 �C (if firmness was > 40N for ‘Tommy Atkins’). Whole fruitcompression firmness was monitoredandwhen at least 250mangoes rangedbetween 30 and 50 N (average 43.64 ±0.40 N for ‘Tommy Atkins’, and38.25 ± 0.58N for ‘Kent’), processingwas carried out. An average firmness of35 N before processing was previouslydetermined by Dea et al. (2013), andthen confirmed in preliminary studies(unpublished data) as an appropriateripeness stage for fresh-cut mango interms of handling, visual quality, andquality maintenance during storage.In addition, simulating industry prac-tice, whole fruit firmness was alsomeasured after removal of the peel bypenetration using an 11-mm probe.Any fruit softer than 5.5 N for‘Tommy Atkins’ and 7 N for ‘Kent’,and firmer than 30 N (both cultivars)were discarded. Average penetrationfirmness was 14.12 ± 0.38 N for‘Tommy Atkins’, and 14.96 ± 0.47N for ‘Kent’. Mangoes were pre-washed with a fruit cleaner (JBT395; JBT FoodTech, Lakeland,FL), then sanitized with 100 mL�L–1
peroxyacetic acid [PAA (Jet-Oxide;Jet Harvest Solutions, Longwood,FL)] in warm water (30 ± 3 �C) for 3min and air dried. Fruit were storedat 5 �C overnight. Processing wascarried out at 5 �C in a cold roomand all surfaces and tools were san-itized with 300 mg�L–1 sodium hy-pochlorite (NaOCl) acidified with 2M citric acid solution (pH 6.5),changing the solution every 10 fruit.Mangoes were manually peeled toa depth of �2 mm to ensure com-plete removal of the subepidermal
Table 1. Composition and pH of the different coating solutions applied to fresh-cut mango slices.
Solutionz Edible coating and concn (%) Antibrowning agent and concn (%) pH
CaAS — Calcium ascorbate, 2% 6.52ANTIOX — Calcium ascorbate, 2% 3.56
Citric acid, 0.8%N-acetyl-L-cysteine, 0.4%
CMC Carboxymethylcellulose, 1% + maltodextrin, 0.5% ANTIOX 3.75ALOE Aloe powder, 2% ANTIOX 3.59WPI Whey protein isolate, 2% + glycerol, 0.5% ANTIOX 3.71zCaAS = calcium ascorbate; ANTIOX = calcium ascorbate + citric acid + N-acetyl-L-cysteine; CMC = carboxymethylcellulose + ANTIOX; ALOE = aloe + ANTIOX; WPI =whey protein isolate +ANTIOX.

161Proc. Fla. State Hort. Soc. 133: 2020.
tissue, which tends to discolor(brown) during storage. Each fruitwas cut into halves on each side ofthe seed and then into uniform slicesof 5/8-inch thickness using a com-mercial electric meat slicer (Della8.7 inch; Della Products USA, Cityof Industry, CA), making sure mostof the fruit internal fibers were par-allel as much as possible. Slices wererandomly distributed in sanitizedcolanders and dipped in the corre-sponding coating solutions for 30 s.They were drained and distributedin 16-fl oz polyethylene terephthal-ate, unvented trays with lids (model9057; D6, Portland, OR), 13 to 15slices per container (450 ± 50 g),leaving minimal headspace in thecontainer. There were four con-tainers for each coating solutionand planned storage pull-out. Thecontrol (CTRL) consisted of
noncoated slices, packaged right af-ter slicing without any water dip orrinse, as would be done in amanufacturing plant. Because ofthe amount of time required to pro-cess and coat the fresh-cut mangoes,physicochemical measurements andsensory evaluations were done ei-ther on the day of processing (day0) or after overnight storage at 5 �C(day 1); subsequent measurementsand evaluations were made on days7, 11, and 14 of storage at 5 �C.
Physicochemical assessment ofmango slices included firmness, color,titratable acidity (TA), soluble solidsconcentration (SSC), and containerinternal atmosphere. Measurementswere taken on 10 slices per container.Firmness of fresh-cut slices was de-termined using a texture analyzerequipped with a 7/16-inch diameterMagness-Taylor type probe (TA-212,
Stable Micro Systems) at a speed of0.8 mm�s–1 and recording the force at2.5-mm deformation (Dea et al.,2013). Slices were laid on one of thetwo parallel flat sides, with the probepenetrating perpendicularly to thelongitudinal fibers. Color was mea-sured with a chroma meter (modelCR-400; Konica Minolta, Tokyo, Ja-pan) used as per manufacturer’s in-structions. L*, a*, and b* wererecorded on the center of both flatsides of each of 10 slices per con-tainer. Hue angle was calculated froma* and b* values [h� = arc tan (b*/a*)] (Plotto et al., 2010). For TAand SSC determination, samples werehomogenized with distilled water(50:50, w/w) and homogenate blendswere centrifuged at 15,000 gn for15 min (Avanti J-E centrifuge; Beck-man-Coulter, Brea, CA). The super-natant (6.0 g) was titrated with 0.1mol�L–1 sodium hydroxide (NaOH)to a pH 8.1 endpoint using a titratorequipped with a robotic autosampler(model 855; Metrohm, Herisau,Switzerland), a dosing interface (Dos-ino model 800, Metrohm) and con-trolling software (Tiamo v.2.5,Metrohm). SSC (percent) was deter-mined with a digital refractometer intriplicate measurement (RX5000a;Atago, Tokyo, Japan). Headspace at-mosphere in containers was deter-mined with an oxygen and carbondioxide (O2/CO2) analyzer (model900141; Bridge Analyzers, BedfordHeights, OH) measured at storagetemperature (5 �C).
SENSORY EVALUATION OF MANGO
SLICES. Eight to 10 trained panelistsperformed descriptive sensory analy-sis of slices and rated the samplesusing a line scale with anchors at0 (none) and 10 (high). Attributeswere appearance (hue/color, cut-edge sharpness, flesh browning,moistness, and translucency), texturein mouth (firmness, juiciness, andmelting), taste and mouthfeel (sweet-ness, sourness, bitterness, and astrin-gency), and flavor (mango flavor,piney/terpeney, green/unripe, fer-mented/fizzy, and off flavor). Thepanelists conducted the evaluationsin individual booths at 22 �C underpositive pressure and red lighting.Panelists were presented with threehalf slices (taken from each replicatecontainer) on plates identified withthree-digit codes. The order of pre-sentation followed a Williams’ design
Fig. 1. Firmness of fresh-cut ‘Tommy Atkins’ and ‘Kent’ mango slices coated withdifferent solutions stored at 5 �C (41.0 �F) for 14 d (CTRL = control; CaAS =calcium ascorbate; ANTIOX = antibrowning mix; CMC = carboxymethylcelluloseD ANTIOX; ALOE = aloe D ANTIOXD ANTIOX; WPI = whey protein isolateDANTIOX). Values are means (with SE) of 10measurements per four containers;NS = not significant between coating treatments and within a storage time; *, **,***significant at P < 0.05, 0.01, or 0.001, respectively; 1 N = 0.2248 lbf.

162 Proc. Fla. State Hort. Soc. 133: 2020
(Plotto et al., 2017). A recordingsoftware (Compusense Cloud; Com-pusense, Guelph, ON, Canada) wasused to record panelist scores.
MICROBIAL ASSESSMENT OF
MANGO SLICES. At the end of thestorage period (14 d), three to fiverandom slices (average weight 80 g)were sampled from each container(experimental unit) before doing anyother measurements to avoid externalcontamination. Slices were placed insterile Whirl-Pak bags (Fisher Scien-tific, Pittsburgh, PA) containing 99mL of sterile potassium phosphatebuffer and agitated by an orbitalshaker (Innova 2100; New BrunswickScientific, New Brunswick, NJ) for 30min to retrieve microorganisms fromcut surfaces. Fifty microliters of bufferwere plated on potato dextrose agar[PDA (Difco; BD, Sparks, MD)],
orange serum agar [OSA (Difco;BD)], plate count agar [PCA (Difco;BD)], and Levine Eosin MethyleneBlue agar [EMBA (Remel, Lenaxa,KS)] using a spiral plater (Eddy Jet;NeuTec Group, Farmingdale, NY).The different media types were cho-sen to isolate a broad range of organ-isms. For yeast, viable bacterial, andfecal coliform cultures, plates wereincubated at 31 �C for 48 h, andresults were read on a colony counter(ProtoCOL; Microbiology Interna-tional, Frederick, MD). For moldenumeration, plates were further in-cubated at 24 �C for 7 to 10 d, andvisually assessed. Colony-formingunits (cfu) per milliliter were deter-mined and adjusted for sampleweight. The final results were usedfor mean value calculations and sta-tistical analyses.
STATISTICAL ANALYSIS. Instru-mental data were analyzed by a two-way analysis of variance (ANOVA) with coating and storage as main effects using statistical software (SAS version 9.4; SAS Institute, Cary, NC). Duncan’s multiple range tests were performed to identify significant dif-ferences between samples, within storage across coating treatments, or within coating treatment across stor-age. Significance was defined as P < 0.05. Sensory data were analyzed using statistical software (SenPAQ v. 5.01; Qi Statistics, Reading, UK). A one-way ANOVA was performed for each sensory attribute within each storage date, and for each coating across storage, using a mixed model where ‘‘panelists’’ are random and the main effect is tested against the in-teraction (panelist · sample). Fisher’s least significant difference multiple comparison test was used for means separation. Microbial data (cfu/g) were analyzed by one-way ANOVA (EC treatment effect) using the sta-tistical suite (NCSS, Kaysville, UT).
Results and discussionFIRMNESS. Firmness loss has
a considerable impact on fresh-cut fruit acceptability and is a natural pro-cess caused by enzymatic degradation of pectin and other cell wall macro-molecules (Kader, 2002; Kumar et al., 2018). Although the whole fruit firmness before processing was in the same range in both experi-ments, ‘Tommy Atkins’ slices showed a greater initial firmness than ‘Kent’ (Fig. 1), probably because of their higher fiber content (Abourayya et al., 2011). Fruit firmness progres-sively declined during storage in ‘Tommy Atkins’ from an initial value of 10.5 N to a final average value of 7.09 N, with no differences among samples by day 11. The sharpest de-crease was found between days 1 and 7, when ALOE-coated slices main-tained the highest firmness and were significantly (P = 0.031) different from CTRL and CMC- and WPI-coated slices. Similarly, ‘Kent’ slices softened during storage, decreasing from 7.80 N to an average of 5.47 N. Significant differences (P = 0.004) between EC treatments were found on day 11 in storage, with WPI- and M-coated slices being firmer than all other coatings, but not different
Fig. 2. Color (L*, lightness) of fresh-cut ‘Tommy Atkins’ and ‘Kent’ mango slicescoated with different solutions stored at 5 �C (41.0 �F) for 14 d (CTRL = control;CaAS = calcium ascorbate; ANTIOX = antibrowning mix; CMC =carboxymethylcellulose D ANTIOX; ALOE = aloe D ANTIOX; WPI = wheyprotein isolate D ANTIOX). Values are means (with SE) of 10 measurements perfour containers; NS = not significant between coating treatments and withina storage time; *, **, ***significant at P < 0.05, 0.01, or 0.001, respectively.
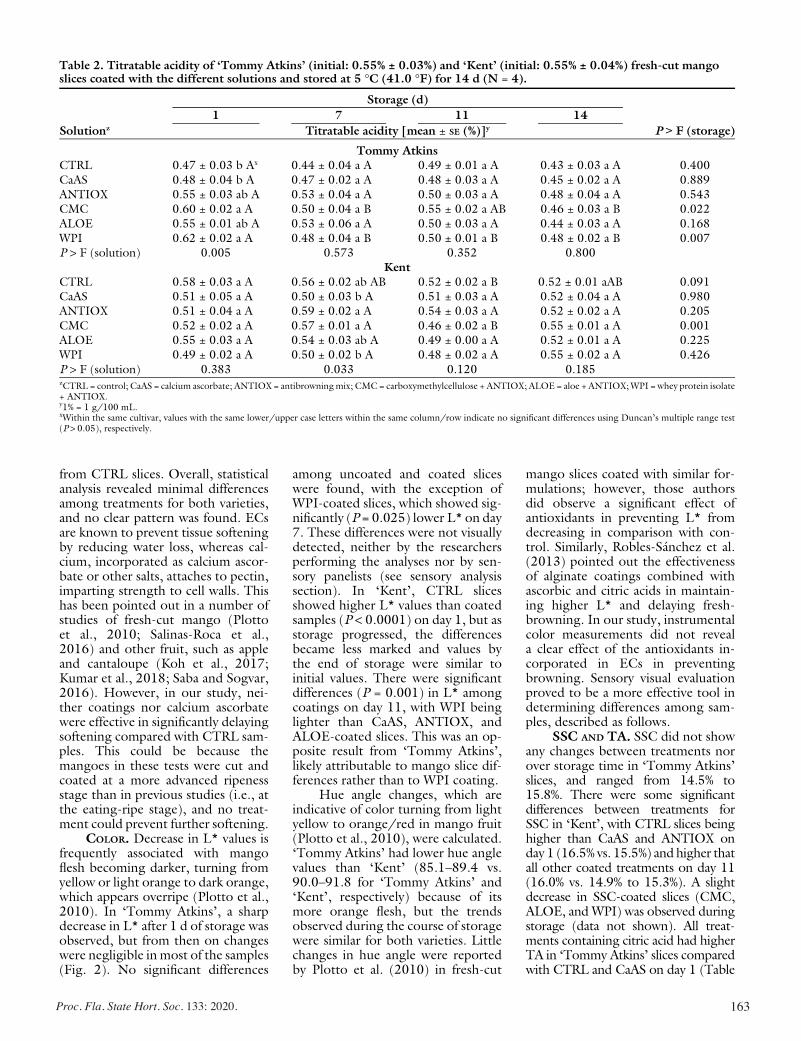
163Proc. Fla. State Hort. Soc. 133: 2020.
from CTRL slices. Overall, statisticalanalysis revealed minimal differencesamong treatments for both varieties,and no clear pattern was found. ECsare known to prevent tissue softeningby reducing water loss, whereas cal-cium, incorporated as calcium ascor-bate or other salts, attaches to pectin,imparting strength to cell walls. Thishas been pointed out in a number ofstudies of fresh-cut mango (Plottoet al., 2010; Salinas-Roca et al.,2016) and other fruit, such as appleand cantaloupe (Koh et al., 2017;Kumar et al., 2018; Saba and Sogvar,2016). However, in our study, nei-ther coatings nor calcium ascorbatewere effective in significantly delayingsoftening compared with CTRL sam-ples. This could be because themangoes in these tests were cut andcoated at a more advanced ripenessstage than in previous studies (i.e., atthe eating-ripe stage), and no treat-ment could prevent further softening.
COLOR. Decrease in L* values isfrequently associated with mangoflesh becoming darker, turning fromyellow or light orange to dark orange,which appears overripe (Plotto et al.,2010). In ‘Tommy Atkins’, a sharpdecrease in L* after 1 d of storage wasobserved, but from then on changeswere negligible in most of the samples(Fig. 2). No significant differences
among uncoated and coated sliceswere found, with the exception ofWPI-coated slices, which showed sig-nificantly (P = 0.025) lower L* on day7. These differences were not visuallydetected, neither by the researchersperforming the analyses nor by sen-sory panelists (see sensory analysissection). In ‘Kent’, CTRL slicesshowed higher L* values than coatedsamples (P < 0.0001) on day 1, but asstorage progressed, the differencesbecame less marked and values bythe end of storage were similar toinitial values. There were significantdifferences (P = 0.001) in L* amongcoatings on day 11, with WPI beinglighter than CaAS, ANTIOX, andALOE-coated slices. This was an op-posite result from ‘Tommy Atkins’,likely attributable to mango slice dif-ferences rather than to WPI coating.
Hue angle changes, which areindicative of color turning from lightyellow to orange/red in mango fruit(Plotto et al., 2010), were calculated.‘Tommy Atkins’ had lower hue anglevalues than ‘Kent’ (85.1–89.4 vs.90.0–91.8 for ‘Tommy Atkins’ and‘Kent’, respectively) because of itsmore orange flesh, but the trendsobserved during the course of storagewere similar for both varieties. Littlechanges in hue angle were reportedby Plotto et al. (2010) in fresh-cut
mango slices coated with similar for-mulations; however, those authorsdid observe a significant effect ofantioxidants in preventing L* fromdecreasing in comparison with con-trol. Similarly, Robles-S�anchez et al.(2013) pointed out the effectivenessof alginate coatings combined withascorbic and citric acids in maintain-ing higher L* and delaying fresh-browning. In our study, instrumentalcolor measurements did not reveala clear effect of the antioxidants in-corporated in ECs in preventingbrowning. Sensory visual evaluationproved to be a more effective tool indetermining differences among sam-ples, described as follows.
SSC AND TA. SSC did not showany changes between treatments norover storage time in ‘Tommy Atkins’slices, and ranged from 14.5% to15.8%. There were some significantdifferences between treatments forSSC in ‘Kent’, with CTRL slices beinghigher than CaAS and ANTIOX onday 1 (16.5% vs. 15.5%) and higher thatall other coated treatments on day 11(16.0% vs. 14.9% to 15.3%). A slightdecrease in SSC-coated slices (CMC,ALOE, and WPI) was observed duringstorage (data not shown). All treat-ments containing citric acid had higherTA in ‘Tommy Atkins’ slices comparedwith CTRL and CaAS on day 1 (Table
Table 2. Titratable acidity of ‘Tommy Atkins’ (initial: 0.55% ± 0.03%) and ‘Kent’ (initial: 0.55% ± 0.04%) fresh-cut mangoslices coated with the different solutions and stored at 5 �C (41.0 �F) for 14 d (N = 4).
Storage (d)
1 7 11 14
Solutionz Titratable acidity [mean ± SE (%)]y P > F (storage)
Tommy AtkinsCTRL 0.47 ± 0.03 b Ax 0.44 ± 0.04 a A 0.49 ± 0.01 a A 0.43 ± 0.03 a A 0.400CaAS 0.48 ± 0.04 b A 0.47 ± 0.02 a A 0.48 ± 0.03 a A 0.45 ± 0.02 a A 0.889ANTIOX 0.55 ± 0.03 ab A 0.53 ± 0.04 a A 0.50 ± 0.03 a A 0.48 ± 0.04 a A 0.543CMC 0.60 ± 0.02 a A 0.50 ± 0.04 a B 0.55 ± 0.02 a AB 0.46 ± 0.03 a B 0.022ALOE 0.55 ± 0.01 ab A 0.53 ± 0.06 a A 0.50 ± 0.03 a A 0.44 ± 0.03 a A 0.168WPI 0.62 ± 0.02 a A 0.48 ± 0.04 a B 0.50 ± 0.01 a B 0.48 ± 0.02 a B 0.007P > F (solution) 0.005 0.573 0.352 0.800
KentCTRL 0.58 ± 0.03 a A 0.56 ± 0.02 ab AB 0.52 ± 0.02 a B 0.52 ± 0.01 aAB 0.091CaAS 0.51 ± 0.05 a A 0.50 ± 0.03 b A 0.51 ± 0.03 a A 0.52 ± 0.04 a A 0.980ANTIOX 0.51 ± 0.04 a A 0.59 ± 0.02 a A 0.54 ± 0.03 a A 0.52 ± 0.02 a A 0.205CMC 0.52 ± 0.02 a A 0.57 ± 0.01 a A 0.46 ± 0.02 a B 0.55 ± 0.01 a A 0.001ALOE 0.55 ± 0.03 a A 0.54 ± 0.03 ab A 0.49 ± 0.00 a A 0.52 ± 0.01 a A 0.225WPI 0.49 ± 0.02 a A 0.50 ± 0.02 b A 0.48 ± 0.02 a A 0.55 ± 0.02 a A 0.426P > F (solution) 0.383 0.033 0.120 0.185zCTRL = control; CaAS = calcium ascorbate; ANTIOX = antibrowningmix; CMC= carboxymethylcellulose + ANTIOX; ALOE = aloe + ANTIOX;WPI =whey protein isolate+ ANTIOX.y1% = 1 g/100 mL.xWithin the same cultivar, values with the same lower/upper case letters within the same column/row indicate no significant differences using Duncan’s multiple range test(P > 0.05), respectively.

164 Proc. Fla. State Hort. Soc. 133: 2020
2); however, this trend did not con-tinue during storage, nor was it ob-served in ‘Kent’ slices. Only ‘TommyAtkins’ slices coated with CMCorWPIexhibited a decrease in TA from itsinitial value (Table 2), and in ‘Kent’,CMC slices had lower TA on day 11but not day 14, indicating little varia-tion over time. Overall, SSC and TAlevels demonstrated an eating-ripe ripe-ness stage of mango slices, in contrastto the previous retail store survey inwhich some recorded SSC values wereas low as 10% and TA as high as 1.5%(Brecht et al., 2017).
CONTAINER INTERNAL ATMOSPHERE.Another function of coatings onfresh-cut fruit is reduction of respira-tion rate by the creation of a modifiedatmosphere around the product(Baldwin, 2007); however, in thisstudy, O2 and CO2 in headspace of
containers were highly variable (CO2
shown in Fig. 3) and there were nodifferences among coatings at any ofthe storage times. Nevertheless, CO2
concentration showed an increasingtrend in storage for all treatmentsexcept in CTRL slices, likely due toa combination of respiration by mi-croorganisms and mango slices (seemicrobial assessment). Some extremevalues, up to 73%CO2weremeasuredin ‘Kent’ stored 11 d. Values above30%CO2 were usually associated withO2 of �0.8% to 5.0%, and a slight offodor was detected on opening thosecontainers, which dissipated quickly.In previous studies with store-boughtfresh-cut mango packaged in thesame container, similar extreme at-mospheres (O2 below 1% and CO2
over 20%) were found; the extremeatmospheres is attributed to the lack
of gas exchange through the con-tainer’s material (Brecht et al., 2017).
SENSORY ANALYSIS. Sensory as-sessment plays a key role in the studyof fresh-cut products because con-sumer buying decisions are greatlyinfluenced by their appearance andfreshness at the time of purchase(Dea et al., 2013). Objective sensoryevaluations were performed after 1, 7,and 11 d of storage by a trained panelusing 17 sensory attributes. Witha few exceptions, significant attributeswithin and across storage were mostlyvisual: browning, cut-edge sharpness,and translucency, as well as moistnessfor ‘Kent’.
The most obvious changes acrossstorage were browning of slices. At thebeginning of storage, little fleshbrowning was noted (ratings <2.0).By day 7, browning rates increased inCTRL slices, and were significantlyhigher than in the coated slices onday 11 for both ‘Tommy Atkins’ (4.3± 0.8) and ‘Kent’ (3.8 ± 0.8) (Table3). Ratings above 5.0 would not beacceptable. Generally, browning rat-ings were higher for ‘Tommy Atkins’than ‘Kent’ slices (Table 3, Figs. 4 and5). In ‘Tommy Atkins’, aqueous treat-ments (CTRL, CaAS, and ANTIOX)showed increased browning over stor-age, whereas coating treatments withfilm formers (CMC, ALOE, andWPI)exhibited no such difference (Table 3).Moreover, ‘Tommy Atkins’ CaAs-treated slices, which did not includecitric acid or N-acetyl-L-cysteine, hadscores close to 5.0 after 7 d of storage.Browning remained low (less than2.0) for ‘Kent’ coated slices, even after11 d, except for CTRL (Table 3).Hence, although instrumental mea-surements did not show differencesin L*, panelists could perceive thedarker slices under white light. Themixture of antioxidants was generallyeffective in preventing flesh browning,both alone and in combination withECs. Solutions of the individual anti-browning ingredients were applied toslices under the same conditions ina preliminary study and flesh browningwas visually evaluated (data notshown). Citric acid was the ingredientshowing the best performance inmaintaining lighter color, probablythrough inactivation of polyphenoloxidase by both lowering pH andchelating copper at the active site ofthe enzyme (He and Luo, 2007). Itshould be noted that browning of
Fig. 3. Carbon dioxide (CO2) concentration in containers with fresh-cut ‘TommyAtkins’ and ‘Kent’ mango slices coated with different solutions stored at 5 �C(41.0 �F) for 14 d (CTRL = control; CaAS = calcium ascorbate; ANTIOX =antibrowning mix; CMC = carboxymethylcellulose D ANTIOX; ALOE = aloe DANTIOX;WPI =whey protein isolateDANTIOX). Values are means (with SE) offour measurements, one per container; NS = not significant between coatingtreatments and within a storage time.
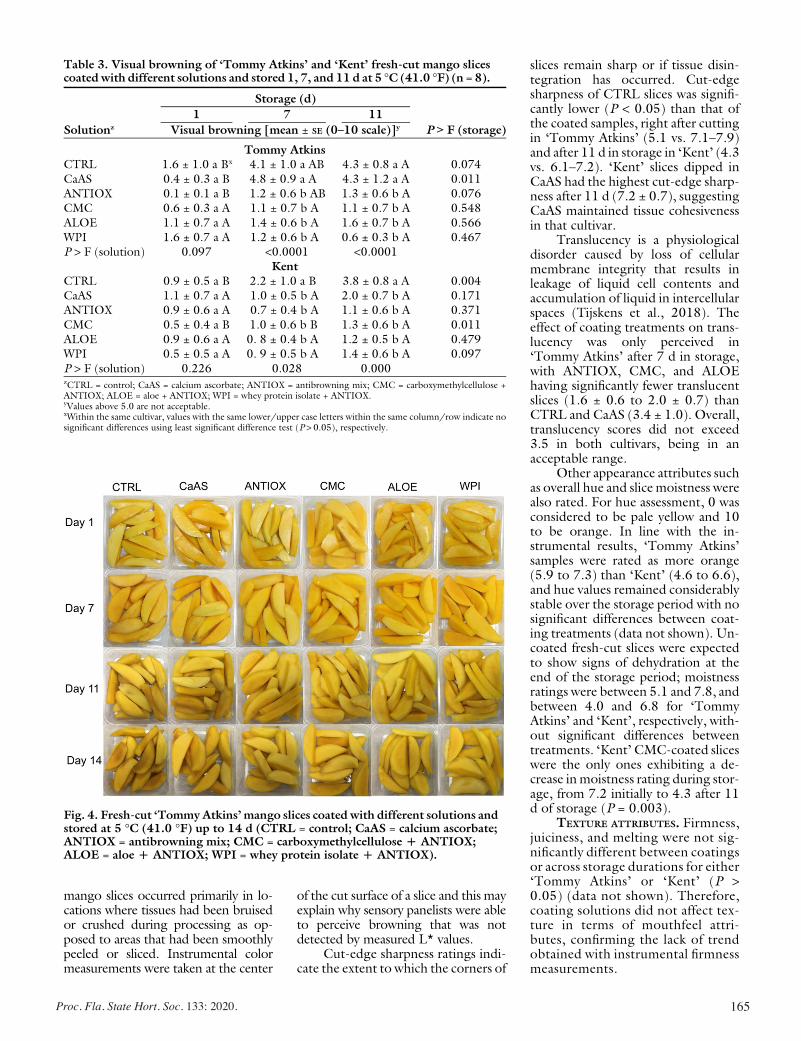
165Proc. Fla. State Hort. Soc. 133: 2020.
mango slices occurred primarily in lo-cations where tissues had been bruisedor crushed during processing as op-posed to areas that had been smoothlypeeled or sliced. Instrumental colormeasurements were taken at the center
of the cut surface of a slice and this mayexplain why sensory panelists were ableto perceive browning that was notdetected by measured L* values.
Cut-edge sharpness ratings indi-cate the extent to which the corners of
slices remain sharp or if tissue disin-tegration has occurred. Cut-edgesharpness of CTRL slices was signifi-cantly lower (P < 0.05) than that ofthe coated samples, right after cuttingin ‘Tommy Atkins’ (5.1 vs. 7.1–7.9)and after 11 d in storage in ‘Kent’ (4.3vs. 6.1–7.2). ‘Kent’ slices dipped inCaAS had the highest cut-edge sharp-ness after 11 d (7.2 ± 0.7), suggestingCaAS maintained tissue cohesivenessin that cultivar.
Translucency is a physiologicaldisorder caused by loss of cellularmembrane integrity that results inleakage of liquid cell contents andaccumulation of liquid in intercellularspaces (Tijskens et al., 2018). Theeffect of coating treatments on trans-lucency was only perceived in‘Tommy Atkins’ after 7 d in storage,with ANTIOX, CMC, and ALOEhaving significantly fewer translucentslices (1.6 ± 0.6 to 2.0 ± 0.7) thanCTRL and CaAS (3.4 ± 1.0). Overall,translucency scores did not exceed3.5 in both cultivars, being in anacceptable range.
Other appearance attributes suchas overall hue and slice moistness werealso rated. For hue assessment, 0 wasconsidered to be pale yellow and 10to be orange. In line with the in-strumental results, ‘Tommy Atkins’samples were rated as more orange(5.9 to 7.3) than ‘Kent’ (4.6 to 6.6),and hue values remained considerablystable over the storage period with nosignificant differences between coat-ing treatments (data not shown). Un-coated fresh-cut slices were expectedto show signs of dehydration at theend of the storage period; moistnessratings were between 5.1 and 7.8, andbetween 4.0 and 6.8 for ‘TommyAtkins’ and ‘Kent’, respectively, with-out significant differences betweentreatments. ‘Kent’ CMC-coated sliceswere the only ones exhibiting a de-crease inmoistness rating during stor-age, from 7.2 initially to 4.3 after 11d of storage (P = 0.003).
TEXTURE ATTRIBUTES. Firmness,juiciness, and melting were not sig-nificantly different between coatingsor across storage durations for either‘Tommy Atkins’ or ‘Kent’ (P >0.05) (data not shown). Therefore,coating solutions did not affect tex-ture in terms of mouthfeel attri-butes, confirming the lack of trendobtained with instrumental firmnessmeasurements.
Table 3. Visual browning of ‘Tommy Atkins’ and ‘Kent’ fresh-cut mango slicescoatedwith different solutions and stored 1, 7, and 11 d at 5 �C (41.0 �F) (n = 8).
Storage (d)
1 7 11
Solutionz Visual browning [mean ± SE (0–10 scale)]y P > F (storage)
Tommy AtkinsCTRL 1.6 ± 1.0 a Bx 4.1 ± 1.0 a AB 4.3 ± 0.8 a A 0.074CaAS 0.4 ± 0.3 a B 4.8 ± 0.9 a A 4.3 ± 1.2 a A 0.011ANTIOX 0.1 ± 0.1 a B 1.2 ± 0.6 b AB 1.3 ± 0.6 b A 0.076CMC 0.6 ± 0.3 a A 1.1 ± 0.7 b A 1.1 ± 0.7 b A 0.548ALOE 1.1 ± 0.7 a A 1.4 ± 0.6 b A 1.6 ± 0.7 b A 0.566WPI 1.6 ± 0.7 a A 1.2 ± 0.6 b A 0.6 ± 0.3 b A 0.467P > F (solution) 0.097 <0.0001 <0.0001
KentCTRL 0.9 ± 0.5 a B 2.2 ± 1.0 a B 3.8 ± 0.8 a A 0.004CaAS 1.1 ± 0.7 a A 1.0 ± 0.5 b A 2.0 ± 0.7 b A 0.171ANTIOX 0.9 ± 0.6 a A 0.7 ± 0.4 b A 1.1 ± 0.6 b A 0.371CMC 0.5 ± 0.4 a B 1.0 ± 0.6 b B 1.3 ± 0.6 b A 0.011ALOE 0.9 ± 0.6 a A 0. 8 ± 0.4 b A 1.2 ± 0.5 b A 0.479WPI 0.5 ± 0.5 a A 0. 9 ± 0.5 b A 1.4 ± 0.6 b A 0.097P > F (solution) 0.226 0.028 0.000zCTRL = control; CaAS = calcium ascorbate; ANTIOX = antibrowning mix; CMC = carboxymethylcellulose +ANTIOX; ALOE = aloe + ANTIOX; WPI = whey protein isolate + ANTIOX.yValues above 5.0 are not acceptable.xWithin the same cultivar, values with the same lower/upper case letters within the same column/row indicate nosignificant differences using least significant difference test (P > 0.05), respectively.
Fig. 4. Fresh-cut ‘TommyAtkins’ mango slices coated with different solutions andstored at 5 �C (41.0 �F) up to 14 d (CTRL = control; CaAS = calcium ascorbate;ANTIOX = antibrowning mix; CMC = carboxymethylcellulose D ANTIOX;ALOE = aloe D ANTIOX; WPI = whey protein isolate D ANTIOX).

166 Proc. Fla. State Hort. Soc. 133: 2020
When applying coating solutionsto fresh-cut produce, one shouldconsider not only the absence offoreign odors/taste from the ingredi-ents, but also the formulation shouldnot modify the product typical tasteand flavor. This study showed noeffect of the applied coatings on tasteor flavor of fresh-cut mango slices.However, a slight decrease in sour-ness [3.8 to 2.3 (P = 0.039)] wasdetected in ‘Kent’ after 11 d forCMC-coated slices.
‘Tommy Akins’ slices stored for1 d had higher piney/terpeney fla-vor (3.5 to 5.0) than ‘Kent’ slices(1.9 to 3.1). Piney flavor decreasedin stored ANTIOX-treated slices for‘Kent’ (P = 0.031), with ratings aslow as 1.0 after 11 d. Scores forgreen/unripe and off flavor werelow, suggesting that the initial firm-ness was appropriate for processingthe fruit and that the solutions andcoatings did not confer any abnor-mal flavor. Overripe fresh-cutmango has been reported to havean off odor (Dea et al., 2013).Ratings for fermented flavor werelow too (data not shown), indicat-ing that no fermentative metabolismtook place, in spite of extreme at-mospheres in a few containers.
MICROBIAL ASSESSMENT. No sta-tistical differences were found betweenEC treatments in either ‘TommyAtkins’ or ‘Kent’ slices at the end ofthe 14-d storage period, indicatingthat neither the antioxidant solutionsnor coatings significantly promoted orinhibited microbial growth relative toCTRL. In general, microbial contam-ination was low in all samples, becausein no case were counts higher than 7.7· 104 cfu/g. Counts were slightlyhigher in ‘Kent’ with values rangingfrom 6.9 · 103 to 5.2 · 104 cfu/g oftotal viable bacteria and from8.4 · 103
to 7.7 · 104 cfu/g of aciduric andputrefactive microorganisms. Micro-bial loads in ‘Tommy Atkins’ rangedbetween 7.1 · 102 and 1.1 · 104 cfu/gfor total viable bacteria and between5.7 · 102 and 3.7 · 103 cfu/g foraciduric and putrefactive microorgan-isms. These results suggest that anyperceived differences in flavor betweentreatments were not due to the pres-ence or activity of microorganisms;however, these levels of microbialgrowth could account for the in-creased in CO2 production after 11and 14 d of storage (Fig. 3).
In this study, our efforts to pro-cess mangoes at an eating-ripe stage(35 N by compression firmness) were
difficult to achieve because of thelarge variation in fruit ripeness onarrival. Mangoes were obtained di-rectly from the importer, as woulda fresh-cut processor. Nevertheless,by adjusting ripening temperature tofruit firmness on arrival, the range ofwhole fruit firmness before cuttingwas narrowed down to 30 to 50 N,with average of 43 N for ‘TommyAtkins’, and 38 N for ‘Kent’. Fur-thermore, mangoes ripen progres-sively from the innermost mesocarptoward the outermost tissue and of-ten exhibit significant firmness differ-ence between the two sides of thefruit. Thus, there was substantialslice-to-slice variability in our sam-ples, explaining the lack of significantdifferences between treatments formany parameters.
‘Tommy Atkins’ responded toantioxidant solutions much morereadily than ‘Kent’ by showing a re-duction in slice browning. ‘TommyAtkins’ slices treated with the antioxi-dant solution had a shelf life of 10 d incomparison with uncoated slices (lessthan 7 d), whereas ‘Kent’ slices wereextended to 11 d. ECs did not addmuch improvement to the antioxidantsolution, but they did not substantiallymodify fruit taste and flavor and theirinfluence on the rest of the examinedparameters was minimal.
In conclusion, antioxidants, spe-cifically citric acid, were beneficial atmaintaining the visual appearance offresh-cut mango slices for up to 11 d,and could be recommended to pro-cessors as a simple strategy to allowmarketing of ripe fresh-cut mango.
Literature cited
Abourayya, M.S., N.E. Kassim, M.H. El-Sheikh, and A.M. Rakha. 2011. Fruitphysical and chemical characteristics atmaturity stage of Tommy Atkins, Keittand Kent mango cultivars grown underNubariya conditions. J. Amer. Sci. 7:228–233, doi: 10.7537/marsjas070311.25.
Alves, M.M., M.P. Goncxalves, andC.M.R. Rocha. 2017. Effect of ferulic acidon the performance of soy protein isolate-based edible coatings applied to fresh-cutapples. Lebensm. Wiss. Technol. 80:409–415, doi: 10.1016/j.lwt.2017.03.013.
Baldwin, E.A. 2007. Surface treatmentsand edible coatings in food preservation,
Fig. 5. Fresh-cut ‘Kent’ mango slices coated with different solutions and stored at5 �C (41.0 �F) up to 14 d (CTRL = control; CaAS = calcium ascorbate; ANTIOX =antibrowning mix; CMC = carboxymethylcellulose D ANTIOX; ALOE = aloe DANTIOX; WPI = whey protein isolate D ANTIOX).
p. 477–507. In: M.S. Rahman (ed.). Handbook of food preservation. CRC Press, Boca Raton, FL.
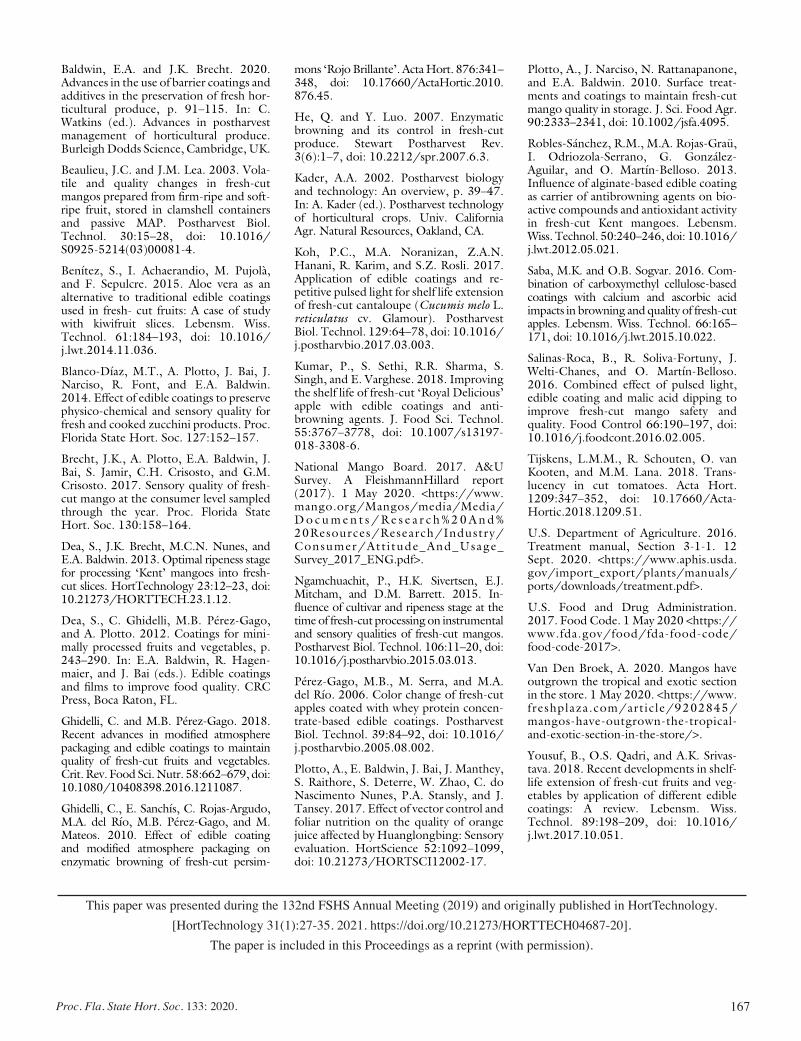
167Proc. Fla. State Hort. Soc. 133: 2020.
Baldwin, E.A. and J.K. Brecht. 2020.Advances in the use of barrier coatings andadditives in the preservation of fresh hor-ticultural produce, p. 91–115. In: C.Watkins (ed.). Advances in postharvestmanagement of horticultural produce.BurleighDodds Science, Cambridge,UK.
Beaulieu, J.C. and J.M. Lea. 2003. Vola-tile and quality changes in fresh-cutmangos prepared from firm-ripe and soft-ripe fruit, stored in clamshell containersand passive MAP. Postharvest Biol.Technol. 30:15–28, doi: 10.1016/S0925-5214(03)00081-4.
Ben�ıtez, S., I. Achaerandio, M. Pujol�a,and F. Sepulcre. 2015. Aloe vera as analternative to traditional edible coatingsused in fresh- cut fruits: A case of studywith kiwifruit slices. Lebensm. Wiss.Technol. 61:184–193, doi: 10.1016/j.lwt.2014.11.036.
Blanco-D�ıaz, M.T., A. Plotto, J. Bai, J.Narciso, R. Font, and E.A. Baldwin.2014. Effect of edible coatings to preservephysico-chemical and sensory quality forfresh and cooked zucchini products. Proc.Florida State Hort. Soc. 127:152–157.
Brecht, J.K., A. Plotto, E.A. Baldwin, J.Bai, S. Jamir, C.H. Crisosto, and G.M.Crisosto. 2017. Sensory quality of fresh-cut mango at the consumer level sampledthrough the year. Proc. Florida StateHort. Soc. 130:158–164.
Dea, S., J.K. Brecht, M.C.N. Nunes, andE.A. Baldwin. 2013. Optimal ripeness stagefor processing ‘Kent’ mangoes into fresh-cut slices. HortTechnology 23:12–23, doi:10.21273/HORTTECH.23.1.12.
Dea, S., C. Ghidelli, M.B. P�erez-Gago,and A. Plotto. 2012. Coatings for mini-mally processed fruits and vegetables, p.243–290. In: E.A. Baldwin, R. Hagen-maier, and J. Bai (eds.). Edible coatingsand films to improve food quality. CRCPress, Boca Raton, FL.
Ghidelli, C. and M.B. P�erez-Gago. 2018.Recent advances in modified atmospherepackaging and edible coatings to maintainquality of fresh-cut fruits and vegetables.Crit. Rev. Food Sci.Nutr. 58:662–679, doi:10.1080/10408398.2016.1211087.
Ghidelli, C., E. Sanch�ıs, C. Rojas-Argudo,M.A. del R�ıo, M.B. P�erez-Gago, and M.Mateos. 2010. Effect of edible coatingand modified atmosphere packaging onenzymatic browning of fresh-cut persim-
mons ‘Rojo Brillante’. ActaHort. 876:341–348, doi: 10.17660/ActaHortic.2010.876.45.
He, Q. and Y. Luo. 2007. Enzymaticbrowning and its control in fresh-cutproduce. Stewart Postharvest Rev.3(6):1–7, doi: 10.2212/spr.2007.6.3.
Kader, A.A. 2002. Postharvest biologyand technology: An overview, p. 39–47.In: A. Kader (ed.). Postharvest technologyof horticultural crops. Univ. CaliforniaAgr. Natural Resources, Oakland, CA.
Koh, P.C., M.A. Noranizan, Z.A.N.Hanani, R. Karim, and S.Z. Rosli. 2017.Application of edible coatings and re-petitive pulsed light for shelf life extensionof fresh-cut cantaloupe (Cucumis melo L.reticulatus cv. Glamour). PostharvestBiol. Technol. 129:64–78, doi: 10.1016/j.postharvbio.2017.03.003.
Kumar, P., S. Sethi, R.R. Sharma, S.Singh, and E. Varghese. 2018. Improvingthe shelf life of fresh-cut ‘Royal Delicious’apple with edible coatings and anti-browning agents. J. Food Sci. Technol.55:3767–3778, doi: 10.1007/s13197-018-3308-6.
National Mango Board. 2017. A&USurvey. A FleishmannHillard report(2017). 1 May 2020. <https://www.mango.org/Mangos/media/Media/Do c umen t s /R e s e a r c h%20And%20Resources/Research/Industry/Consumer/Att i tude_And_Usage_Survey_2017_ENG.pdf>.
Ngamchuachit, P., H.K. Sivertsen, E.J.Mitcham, and D.M. Barrett. 2015. In-fluence of cultivar and ripeness stage at thetime of fresh-cut processing on instrumentaland sensory qualities of fresh-cut mangos.Postharvest Biol. Technol. 106:11–20, doi:10.1016/j.postharvbio.2015.03.013.
P�erez-Gago, M.B., M. Serra, and M.A.del R�ıo. 2006. Color change of fresh-cutapples coated with whey protein concen-trate-based edible coatings. PostharvestBiol. Technol. 39:84–92, doi: 10.1016/j.postharvbio.2005.08.002.
Plotto, A., E. Baldwin, J. Bai, J. Manthey,S. Raithore, S. Deterre, W. Zhao, C. doNascimento Nunes, P.A. Stansly, and J.Tansey. 2017. Effect of vector control andfoliar nutrition on the quality of orangejuice affected by Huanglongbing: Sensoryevaluation. HortScience 52:1092–1099,doi: 10.21273/HORTSCI12002-17.
Plotto, A., J. Narciso, N. Rattanapanone,and E.A. Baldwin. 2010. Surface treat-ments and coatings to maintain fresh-cutmango quality in storage. J. Sci. Food Agr.90:2333–2341, doi: 10.1002/jsfa.4095.
Robles-S�anchez, R.M., M.A. Rojas-Gra€u,I. Odriozola-Serrano, G. Gonz�alez-Aguilar, and O. Mart�ın-Belloso. 2013.Influence of alginate-based edible coatingas carrier of antibrowning agents on bio-active compounds and antioxidant activityin fresh-cut Kent mangoes. Lebensm.Wiss. Technol. 50:240–246, doi: 10.1016/j.lwt.2012.05.021.
Saba, M.K. and O.B. Sogvar. 2016. Com-bination of carboxymethyl cellulose-basedcoatings with calcium and ascorbic acidimpacts in browning andquality of fresh-cutapples. Lebensm. Wiss. Technol. 66:165–171, doi: 10.1016/j.lwt.2015.10.022.
Salinas-Roca, B., R. Soliva-Fortuny, J.Welti-Chanes, and O. Mart�ın-Belloso.2016. Combined effect of pulsed light,edible coating and malic acid dipping toimprove fresh-cut mango safety andquality. Food Control 66:190–197, doi:10.1016/j.foodcont.2016.02.005.
Tijskens, L.M.M., R. Schouten, O. vanKooten, and M.M. Lana. 2018. Trans-lucency in cut tomatoes. Acta Hort.1209:347–352, doi: 10.17660/Acta-Hortic.2018.1209.51.
U.S. Department of Agriculture. 2016.Treatment manual, Section 3-1-1. 12Sept. 2020. <https://www.aphis.usda.gov/import_export/plants/manuals/ports/downloads/treatment.pdf>.
U.S. Food and Drug Administration.2017. Food Code. 1May 2020 <https://www.fda.gov/food/fda-food-code/food-code-2017>.
Van Den Broek, A. 2020. Mangos haveoutgrown the tropical and exotic sectionin the store. 1 May 2020. <https://www.freshplaza.com/article/9202845/mangos-have-outgrown-the-tropical-and-exotic-section-in-the-store/>.
Yousuf, B., O.S. Qadri, and A.K. Srivas-tava. 2018. Recent developments in shelf-life extension of fresh-cut fruits and veg-etables by application of different ediblecoatings: A review. Lebensm. Wiss.Technol. 89:198–209, doi: 10.1016/j.lwt.2017.10.051.
35
This paper was presented during the 132nd FSHS Annual Meeting (2019) and originally published in HortTechnology. [HortTechnology 31(1):27-35. 2021. https://doi.org/10.21273/HORTTECH04687-20].
The paper is included in this Proceedings as a reprint (with permission).
168 Proc. Fla. State Hort. Soc. 133: 2020.
Proc. Fla. State Hort. Soc. 133:168–169. 2020.
Ornamental, Garden & Landscape Section
*Corresponding author. Email: [email protected]
Provoking Behavior Change In Residential Fertilizer Users
Tina McinTyre*University of Florida IFAS, Seminole County Extension,
250 W. County Home Rd., Sanford, FL 32773
AdditionAl index words. fertilizer, residential landscapes
From September 2018 to May 2019 the Florida-Friendly Landscaping team at the Seminole County Extension Office presented Fertilizer Workshops. These workshops targeted homeowners and homeowners associations, and educated participants on Best Management Practices (BMP’s) for residential landscapes. Program participants also received a free bag of fertilizer. By way of mass media and 27 classes, a total of 17,454 people were educated about fertilizer BMP’s. Of those, 288 people completed reflective post-surveys which revealed 97.2% increased their knowledge on the impacts stormwater (including fertilizer run-off) has on local waterbodies, 98.8% intended to use the information to fertilize their yard appropriately, and 95.3% were more confident they could fertilize appropriately. In a 6 month follow up survey, 86.1% of 129 participants reported they were currently using BMP’s or had recommended BMP’s to their landscaper as a result of the fertilizer workshop. These educational efforts resulted in data that shows significant behavior changes which seeks to reduce local levels of nitrogen and phosphorous, pollutants that lead to harmful algae blooms and impairments. Participants better understand sources of water contamination resulting from fertilizer misuse and have acted to change those behaviors.
When the Florida Department of Environmental Protection (FDEP) required counties to update their fertilizer ordinances, a political tug-of-war ensued, involving counties, environmental groups, professional landscapers, residents and University of Florida Institute of Food and Agricultural Science (UF/IFAS) Extension. In many counties, divisions were made, and sides were taken, but in Seminole County, the extension agent worked to find the commonalities of those involved using the science-based Florida-Friendly Landscape (FFL) principles. After the passing of the ordinance in Seminole County, the FFL program partnered with the County Watershed Division and secured a FDEP grant for $150,000. The grant funded a Fertilizer Education Program ran under the direction of the extension agent and the FFL program. The grant funded a program assistant who reported to the extension agent and they presented workshops to attain the following objectives:
1) 80% of participants will report an increase in knowledge of at least 1 of the 9 FFL principles following a program activity as measured by retrospective pre/post-survey.
2) 75.0% of participants will report the intention to adopt at least one FFL related practice following a program activity as measured by retrospective pre/post-survey.
3) 50% of participants will report adopting at least one FFL practice as measured by annual follow-up survey
Many horticulture and FFL extension agents in central Florida have a background in horticulture and have spoken with the Seminole County extension agent about her fertilizer program and other aspects of water. In a recent Central Florida Water Initia-tive meeting, the Seminole County extension agent’s decade plus experience with that organization proved essential in providing
historical insight and perspective moving forward. The agent’s background, experience and programming have propelled her as a leader in this discipline.
The classes, particularly the fertilizer workshops, have been a great success as indicated by surpassing the original goals and objectives. For knowledge gained, 732 respondents reported an average attainment of 97.1%! Not only are people learning when they come to the workshops, but they are inspired to change; an average 74% of 732 respondents reported they intended to change their behaviors related to the Florida-Friendly practices. An average of 75.1% of people who attended the classes and responded to a follow-up survey (238 respondents) are changing their behaviors; for example:
• 99.0% (95/96) avoided blowing leaves and/or grass clipping down the storm-drain or onto pavement.
• 90.6% (77/85) avoided the application of phosphorous without a soil test.
• 86.4% (114/132) are using a slow-release nitrogen product.There is currently no UF/IFAS recommended way to quantify
impacts for the behaviors listed above, but we do know that they affect water quality (Reisinger et al, 2020). Because of this, the extension agent has prompted a discussion among UF/IFAS extension specialist faculty and colleagues from the FDEP to come together to work on setting some standards, which align with the water portion of the road map initiatives. We are cur-rently working on quantifying how much nutrient run-off would be mitigated if people were to adopt specific FFL behaviors. By the end of the summer, I hope to be able to numerically quantify the impacts of these classes. For now, just know that the classes have benefited local waterways and saved the Seminole County money that would be used to treat the algal and vegetative re-sponse the nutrients bring.

169Proc. Fla. State Hort. Soc. 133: 2020.
Success Story
In March 2019, a program participant named Jim attended a Fertilizing Effectively in Sandy Florida Soils workshop. Prior to coming Jim never used slow release nitrogen (SRN) products, would purchase weed n’ feed and apply it to his landscape a few times a year without knowing when or how much to use. His home is in close proximity to a waterbody, but he never thought much of it. He was having patchiness and death issues with his St. Augustine grass when he saw our free class advertised in the Orlando Sentinel, a local newspaper. After attending the work-shop, he followed up by discussing the results of his soil test with the extension agent. When reviewing the soil test data, he realized that the soil pH was very low and it could benefit from an addition of lime. Jim applied lime to the front yard and then, in April, applied the SRN fertilizer. These few actions taken by Jim might seem small, however when considering the impacts to his local waterbody they are huge. Not only did Jim test and alter his soil so the sod would be better equipped to absorb the nutrients he was providing, he used the right product at the right time! If Jim continues to monitor his soil every three years and
use SRN products, he will be benefitting the waterways and tax-payers of Seminole County for years to come. It is possible that Jim has adopted other positive best management practices, but this alone is significant. Jim is one of 1629 people that attended a Fertilizer Workshop or a general FFL class in 2019 to learn about how their yard practices impact their environment and the local economy. Follow-up survey data results are exceptionally positive and show that Jim is not alone. As stated above, 75% of class participants reported they, like Jim, had adopted at least one FFL behavior. With more people within Seminole County adopt-ing BMPs, there will be less nitrogen and phosphorous entering our waterways, less water quality impairments and less money spent by the county and state to remediate the vast number of waterbodies within the county.
Literature Cited
Reisinger, A.J., M.G. Lusk, and A.R. Smyth. 2020. Sources and trans-formations of nitrogen in urban landscapes. Extension publication SL 468, University of Florida, Gainesville.
170 Proc. Fla. State Hort. Soc. 133: 2020.
Proc. Fla. State Hort. Soc. 133:170–171. 2020.
Ornamental, Garden & Landscape Section
*Corresponding author. Email: [email protected]
Shifting Tides: Lessons Learned from Virtual Plant ClinicsMichelle leonard-Mularz*
University of Florida/IFAS, Monroe County Extension, 1100 Simonton St., Suite 2-260, Key West, FL 33040
AdditionAl index words. Master Gardener volunteer, plant clinic, virtual education
Monroe County contains an archipelago of islands, which extend more than 110 miles offshore from the mainland of Florida. There is only one main coastal highway, the Overseas Highway (U.S. Route 1) that connects all of the islands from Key Largo to Key West. Traveling from the southernmost part of the county, where the main extension office is located, to the northern limits can take up to three hours. Due to these geographical restrictions, shifting program-ming efforts and plant clinics online in response to COVID-19 has presented new opportunities and opened extension’s educational opportunities to a new and diverse audience. Through clientele feedback, we have been able to adapt our services and continue to see increases in participation for online events.
The goal of our virtual plant clinics was to create a platform where Master Gardener volunteers and the extension agent were still able to address our clientele’s gardening and landscaping questions and maintain a presence in the community during COVID-19 restrictions, which halted volunteer opportunities and in-person plant clinics.
Materials and Methods
Prior to COVID-19, plant clinics were typically held seven times a month throughout Monroe County at extension offices and other off-site locations. This helped to maximize our avail-ability in the community and offer an easy and informal way of answering any plant questions and concerns through one-on-one consultations between Master Gardener volunteers and Monroe County residents. When these opportunities were restricted, it greatly reduced our reach within the community.
The Environmental Horticulture extension agent and Master Gardener Volunteers started conducting one-hour, online plant clinics every week via Zoom in Apr. 2020. Prior to holding our first online plant clinic, the agent and volunteers met virtually via Zoom for a total of ten hours to strategize and familiarize ourselves with this new platform for programming. When we first started, it was simply an open, virtual space to meet and answer questions, much like the in-person plant clinics. However, we quickly realized the potential for attracting a wider audience and added an educational component to each plant clinic. Starting in July, the format for the plant clinics was modified to include an educational component. Each session began with a 20-min pre-sentation on a topical gardening issue (scales in the landscape, managing plant pests with soaps, fertilizing palms, etc.) then was opened to group discussion for answering clientele questions. The new format was called Plant Clinics Plus. Program participants were also encouraged to send any questions with pictures to the
Master Gardener email address so they could be addressed during the Zoom plant clinic.
In addition to our virtual plant clinics, we also established a dedicated Master Gardener email address and developed a Master Gardener Microsoft Teams page for keeping track of incoming questions and responses, storing fact sheets and documents for quick access, and as a way for Master Gardeners to interact and engage with each other through the chat function within the software.
Results
Thirty four participants attended our ten weekly plant clinics from April through June where we created an open, virtual space for answering resident’s plant questions and concerns. Though participation was low, 40% of the participants had never attended previous in-person plant clinics or other extension programming and the other 60% had not engaged with extension within the last 3 years. From July through October, we held 17 virtual Plant Clinics Plus sessions, and a total of 156 participants attended these modi-fied plant clinics, which included 65 Master Gardener Volunteers.
The new format also became a tool for introducing Florida Friendly Landscaping principles and to offer sustainable solutions for managing pests in the landscape and to introduce residents to a wider plant palette, including native plants. While 90% reported knowledge gained through the educational component of the new plant clinic format, 30% also indicated the adoption of at least one Florida-Friendly, sustainable landscaping practice which included proper identification, reducing pesticide use, and using more environmentally friendly options for controlling pests.
In addition, 30% of the Master Gardener Volunteers that participated in this new online format, had not previously vol-unteered at plant clinics due challenges getting to the various physical locations throughout the county and a feeling of unease answering residents’ questions. One hundred percent of Master Gardener Volunteers that attended the online plant clinics reported knowledge gained and increased confidence in responding to clientele plant questions.
171Proc. Fla. State Hort. Soc. 133: 2020.
Conclusion
Even though many residents that had previously engaged in our in-person plant clinics did not participate in the new online plant clinics, we were able to greatly expand our reach to a wider audience that had not previously attended any extension
programming. Also, adding an educational component to each of the plant clinic sessions, received a lot of positive feedback from residents and Master Gardeners alike and increased participation in the program substantially. Moving forward, as we move back into in-person programming, we will find ways to offer hybrid programs, like our plant clinics, to engage a wider audience.
172 Proc. Fla. State Hort. Soc. 133: 2020.
Proc. Fla. State Hort. Soc. 133:172–173. 2020.
Ornamental, Garden & Landscape Section
Disclaimer. The use of trade names or registered products in this publication is solely for the purpose of providing specific information. UF/IFAS does not guarantee or warranty the products named, and references to them in this publi-cation do not signify our approval to the exclusion of other products of suitable composition. All chemicals should be used in accordance with directions on the manufacturer’s label. Use pesticides safely. Read and follow direction on the manufacturer’s label.*Corresponding author. Email: [email protected]
Selecting Preemergent Herbicides for Use In Container-grown AmaryllisShawn Steed1* and Michael Sweet2
1University of Florida Institute of Food and Agricultural Science, Hillsborough County Extension, 5339 County Rd. 579, Seffner, FL 33584
2Sweet Dream Amaryllis, 3015 Waylon Lane, Valrico, FL 33596
AdditionAl index words. bulbs, bulbils, Hippeastrum sp., weed control
A two-part study was conducted at the nursery of Sweet Dream Amaryllis, in Valrico, Florida, to identify potential pre-emergent herbicides for use in the container production of landscape amaryllis (Hippeastrum spp.) bulbs. An initial trial of preemergent herbicides with labels allowing general use was first conducted and evaluated for visual plant toxicity and damage. Herbicides used in this study were: Corral® 2.68G (pendimethalin), Freehand® 1.75G (dimethenamid-P and pendimethalin), Snapshot® 2.5TG (trifluralin and isoxaben), Tower® (dimethenamid-P), Surflan® (oryzalin) OH2® (oxyfluorfen and pendimethalin), O-O Herbicide® (oxyfluorfen and oxidiazon), Jewel™ (oxadiazon and pendimethalin), and Rout® (oxyfluorfen and oryzalin), and an untreated control. Two additional secondary studies were conducted over six-month time to evaluate herbicides that were deemed “safe for use” on the reproductive potential of propaga-tive bulbil or “pup” formation numbers. These herbicides were: Corral® 2.68G, Freehand® 1.75G, Snapshot® 2.5TG, Tower® and compared to an untreated check. Bulbil counts were made at six months after the treatments were applied.
Amaryllis (Hippeastrum spp.) are an evergreen, tropical to sub-tropical (USDA Zone 8-11) plant, indigenous to South America, primarily from Brazil and the Andes mountains in Peru, Argen-tina, and Bolivia but some species extend to the West Indies and Mexico. They were exported to Europe and the first crosses were produced in England in 1799. In the US, there is limited produc-tion, mainly in California, Texas, and Florida, which was once a major producer of bulbs (Bell, 1973). Hobbyists, enthusiasts, and collectors dominate the niche trade currently in Florida. The University of Florida also had a breeding program and released three varieties named ‘Rio’, ‘Sampa’, and ‘Bahia’ (Meerow, 2000). Amaryllis are primarily sold as a potted bulbs for forcing, however, they make a good addition to the Florida landscape with minimal horticultural effort. In the opinion of the authors, we are somewhat disappointed that they are not more commonplace within the landscape. The main pests are a few chewing insects (eg. grasshoppers, caterpillars), a weevil (amaryllis weevil), mites, a fungus (red scorch (Stagonospora curtisii)), and virus.
Propagation can be accomplished by dividing the base of the bulb. Another way is to split daughter plants or bulbils. The bulbils are then grown in either nursery containers or in common beds and may be further increased in numbers as they age and form bulbils or “pups” of their own. Usually one to three bulbils may form per year.
One of the largest problems for container production may be controlling weeds. With bulbs growing for multiple years in a
container it can quickly develop a crop of weeds that will compete and choke out the growing bulbs. Hand labor is used to remove weeds but if there are a large number of containers in production the problem can quickly become economically costly.
Ornamental container growers typically use preemergent herbicides along with hand weeding to remove and reduce the number of germinating weeds on the surface of containers. With minor crops such as amaryllis there is minimal information on compatible preemergent herbicides that can be safely used to prevent weeds. In order to economically and effectively control weeds in amaryllis and educate growers and landscapers with this information, a preemergent herbicide trial was conducted.
Materials and Methods
Herbicide VisuAl dAmAge triAl. An initial trial of preemer-gent herbicides with labels allowing general use on ornamental plants was first conducted. The highest labeled rates were doubled to prevent over-application injury for growers. One-year old bulbs of the variety ‘Susan Slade’ were potted at three plants per #3 nursery container (10 inches in diameter) in 75% soil filled pots. Potting soil contained 50% compost and 50% shredded tree fines and slow release fertilizer added to the containers. Ir-rigation was provided by overhead sprinklers. The experiment was started in late March 2017. There were eight herbicide treat-ments and rates were: Corral® 2.68G (pendimethalin, 228 lbs/ac), Freehand® 1.75G (dimethenamid-P and pendimethalin, 400 lbs/acre), Snapshot® 2.5TG (trifluralin and isoxaben, 400 lbs/acre), Tower® (dimethenamid-P, 64 oz/acre), OH2® (oxyfluorfen and pendimethalin, 200 lbs/acre), Regal O-O Herbicide® (oxyfluorfen and oxadiazon, 200 lbs/ac), Jewel™ (oxadiazon and pendimeth-alin, 200 lbs/ac), and Rout® (oxyfluorfen and oryzalin, 200 lbs/ac), and an untreated control. Treatments were replicated three times with a nursery container being the treatment unit. Liquid herbicides were applied with a spray bottle and granular herbicides

173Proc. Fla. State Hort. Soc. 133: 2020.
delivered with a shaker can. All herbicides were applied over the top of three pots and replicated under the canopy of three pots for each treatment to determine if there was a difference. Plant leaves were evaluated for visual herbicide toxicity and damage four weeks after treatment. Herbicide injury could show up in slower growth rates, longer term growth, and root damage but these were not evaluated.
bulbil FormAtion triAl. A second experiment was under-taken to test if herbicides considered safe from the initial experi-ment would reduce future propagative potential or offset bulbil (pup) formation. Plants were grown in a similar manner as in the first experiment. The experiment was a complete randomized design with six treatments using the cultivar ‘Susan Slade’. Six replications of #3 nursery containers containing three bulbs each were treated on 22 Feb. 2018. All treatments were watered in for 10 min with overhead irrigation. Treatments and rates were 1) Corral 2.68G (pendimethalin) 114 lbs/ac; 2) Freehand 1.75G (di-methenamid-P and pendimethalin) 200 lbs/ac; 3) Snapshot 2.5TG (trifluralin and isoxaben) 200 lbs/ac; 4) Tower (dimethenamid-P) 21 mL/1000 ft2; 5) Surflan (orazalyin) 3 oz/1000 ft2 and 6), and an untreated control. Surflan was added to this trial although it had not been included in the first experiment. Herbicides were applied in a similar manner as in the first experiment. Bulbil counts were taken four months after herbicide treatment (MAT) and compared to the control.
An additional experiment was conducted with three additional varieties of amaryllis: ‘Sitting Bull’, ‘Queen of the Nile’, and ‘Denise’. This experiment was initiated in Apr. 2019 and finished six months later.
Results and Discussion
Herbicide VisuAl dAmAge triAl. Three weeks after treat-ment, herbicides that appeared to look relatively safe were Corral, FreeHand, Tower, Snapshot. Herbicides that caused phytotoxic injury were OH2, O-O Herbicide, Jewel, and Rout. Almost all damage was in the axils of the leaves right at the top of the bulb (Fig.1). There was less injury when herbicides were applied under the canopy, but no treatment was 100% injury free if it caused damage when applied overhead. It would be extremely difficult to apply these herbicides under the leaf canopy if there were any number of containers to be treated and there would be no way to guarantee the application would be only to the soil.
bulbil FormAtion experiment 1. There were no statistically significant differences between herbicide treatments and the un-treated control with the cultivar ‘Susan Slade’(Fig. 1). The mean values ranged from lowest, Tower with 0.22 new bulbils formed to the highest, Surflan treatment of 0.78 new bulbils. The entire experiment had a mean value of 0.5 new bulbils formed for all treatments. Due to the short, 4 month, duration of the experiment and the application to only one cultivar, an additional experiment was conducted to determine if other cultivars would respond simi-larly and if differences would emerge over a longer time period.
bulbil FormAtion experiment 2. The results for experiment 2 indicated that herbicides did not influence number of bulbils formed. However, there was a significant difference attributable to cultivar, in that a very small number of bulbils formed in the ‘Sitting Bull’ cultivar during this experiment (Table 1). Mean val-ues of bulbils formed ranged from 0.22 with the Corral treatment to 0.88 with both the Tower and the Snapshot treatments. The authors feel that a six-month time period after herbicide treatment
would be sufficient to determine if the herbicide applications would be detrimental to bulbil formation. Most preemergent her-bicides loose efficacy in about 30 days in typical outdoor Florida production areas, especially with overhead irrigation. However, not all cultivars may have the same reaction and caution may be warranted before applying herbicide across different cultivars.
We did observe that ‘Sitting Bull’ did not form many bulbils in this experiment. We believe that this might be due to environ-mental factors and not herbicide interactions. Typically, ‘Sitting Bull’ is a strong bulbil producer.
Literature Cited
Bell, W.D. 1973. New potentials in amaryllis breeding. Proc. Fla. State Hort. Soc. 86:462–466.
Meerow, A. W. 2000. ‘Rio’PPAF, ‘Sampa’PPAF, and ‘Bahia’PPAF, Three new triploid amaryllis cultivars. HortScience 35(1):147–149.
Meerow, A. W. 2009. Tilting at windmills: 20 years of Hippeastrum breeding. Israel J. Plant Sci. 57. https://zenodo.org/record/1236341#.XqcoS0BFxyw
Fig. 1. Mean number of bulbils from Hippeastrum spp. ‘Susan Slade’ amaryllis grown in #3 nursery containers produced four months after treatment as affected by different preemergence herbicides. Error bars represent pooled standard deviation for experiment.
Table 1. Mean number of bulbils produced from Hippeastrum spp. ‘Denise’, ‘Queen of the Nile’, and ‘Sitting Bull’ amaryllis grown in #3 nursery containers six months after treatment as affected by different preemergence herbicides.
Preemergent Mean number of bulbils formed per containerherbicide ‘Denise’ ‘Queen of the Nile’ ‘Sitting Bull’Corral 0.33 0.33 0Freehand 1.33 1.17 0Snapshot 1.0 1.33 0.16Tower 0.5 1.33 0Control 0.67 0.83 0Meanz 0.76 A 1.00 A 0 BTRT NSVariety ***TRT × Variety NSzMean values with the same letters within a row are not significantly different at the P = 0.05 level (Tukey’s honest significant difference test).NS, *, **, *** Nonsignificant, or significant F test at P < 0.05, 0.01, 0.001 level, respectively.
174 Proc. Fla. State Hort. Soc. 133: 2020.
Proc. Fla. State Hort. Soc. 133:174–176. 2020.
Ornamental, Garden & Landscape Section
*Corresponding author. Email: [email protected]
Landscaping for LivestockMaxine Hunter* and Caitlin BainuM
University of Florida IFAS, Marion County Extension, 2232 NE Jacksonville Rd., Ocala, FL 34470
AdditionAl index words. Toxic plants, landscape, livestock, equine, farm management
Marion County, Florida, is known as the “horse capital of the world” with 350,000 acres of pastureland used for live-stock. In addition there are yards, fence rows, and other landscaping features that are often accessible to livestock. Lack of knowledge regarding toxic plants to livestock may cause unintentional mistreatment of animals and could lead to higher costs associated with health care of those animals. The large number of equine enthusiasts that place great value on landscaping and horse health presented a prime need for extension intervention. The Marion County horticulture and livestock extension agents teamed up to provide an in-depth class to train horse owners on various landscape strategies to be both safe and aesthetic for their properties. Topics included Florida-Friendly Landscaping™ principles such as soil testing, proper irrigation, runoff prevention, and correct plant selection. Fifteen property owners attended the workshop and survey results were as follows: 100% intend to soil test prior to fertilization; 80% could identify the proper plants for their landscaping needs and 80% understood proper practices to reduce runoff, protect beneficial insects, and mulch appropriately. The self-reported approximate value of animals if saved from toxic plants as a result of better management and plant selection was estimated at $900,000.
Florida is home to many livestock enterprises, notably the Horse Capital of the World in Ocala with more than 50,000 of the state’s 385,000 horses (American Horse Council, 2017). Beef cattle, small ruminants, and poultry are also livestock enterprises in the state. Poisonous plants can cause extreme economic hard-ships for livestock owners in death losses, treatment of ill animals, or loss of production and decreased value of animals. In order to maintain the health of livestock animals while not sacrificing the aesthetics of farms, an appropriate landscape design is vital in areas accessible to livestock.
The consumption of toxic plants can have a variety of effects on animals including: long-term effects such as poor reproductive performance, low-weight calves taking longer to reach a market-able weight, reduction in an animal’s resistance to disease, or acute effects such as loss of appetite, neurological abnormalities, hallucinations, and convulsions (James et al., 1988).
Toxins are produced by some plant species as defense mecha-nisms against anything that could harm them including insects, pets, livestock, and people. Many plants transmit these toxins through leaves or bark when they are eaten, injured, or disturbed. In some toxic plants, every part of the plant is toxic (or contains toxins). Depending on the route of exposure (ingestion, inhala-tion, or absorption) the toxin can cause mild or severe symptoms (Burrows and Tyrl, 2013).
1. Major toxicity—Can cause serious illness or death. Usually due to consumption of the toxic plant part like the seed of a toxic fruit or plant leaves.
2. Minor toxicity—Can cause minor illness symptoms such as vomiting and diarrhea.
3. Major irritant—Can cause serious allergic symptoms by irritating the skin, mouth, tongue, throat, and stomach. Can result in throat swelling, difficulty breathing, and/or burning pain.
4. Skin irritation (Dermatitis)—Can cause skin rash or ir-ritation by direct or indirect contact with juices, sap, or thorns of plants.
Whether people are new to Florida or uncertain about which landscape plants are most appropriate for this environment as well as the health of livestock, the selection of plants and designing a landscape can be a daunting task. The goals should be plants that are safe, well-adapted, have low invasion risk and are considered Florida-friendly. A list of landscape plants that are common in Central Florida, well adapted to survive in our landscapes, and pose little threat of toxicity are listed in Table 1.
When designing a landscape, it is important to consider the elements and principles of landscape design. There are a few key aspects to understand in order to create an aesthetically pleasing and functional landscape including visual elements such as color and texture, and compositional principles like repetition and pro-portion (Hansen, 2010). Color is the most noticeable element in a landscape and is also the most fleeting, so selection of design based purely on aesthetics can be seasonal (Hansen and Alvarez, 2010). When considering color schemes and designs, do not limit yourself to flower colors, keep in mind colors from fruit, bark, and leaves. Texture can be created by adding different sizes of plants to various areas of the landscape. Hansen et al. (2019) describe additional information on landscape design principles.
It is also imperative to implement the “right plant, right place” method prior to designing your landscape. Be mindful of a plant’s needs and plant them where their needs can be met. If a plant needs full sun and they are planted under a large tree where light cannot find it, it might never reach its full potential. During the landscape design process, consideration should also be taken in creating an environmentally friendly yard. Specifically, Florida–Friendly LandscapingTM techniques should be employed to ensure conservation of soil, filtration of water runoff, maintenance of wildlife habitat, and many other environmentally sound practices. More detailed information on Florida-Friendly LandscapingTM can be found online (Anon. n.d.).

175Proc. Fla. State Hort. Soc. 133: 2020.
Table 1. Florida-Friendly LandscapeTM plants that are considered safe and recommended for planting around livestock.Scientific name Common name Native to Florida? USDA Plant Hardiness Zone Ground coversAjuga reptans Bugleweed no 8 to 9aArachis glabrata Perennial peanut no 8 to 11Aspidistra elatior Cast iron plant no 8b to 11Cyrtomium falcatum Holly fern no 8b to 11Dryopteris Autumn fern varies 8 to 11Dyschoriste oblongifolia Twin flower yes 8 to 11Evolvulus glomeratus Blue daze no 9 to 11Glandularia tampensis Tampa vervain yes 9 to 11Liriope muscari Turf lily no 8 to 9Mimosa strigillosa Powderpuff yes 8 to 11Nephrolepis biserrata Giant Sword fern yes 9 to 11Nephrolepis exaltata Sword fern yes 9 to 11Ophiopogon japonicus Mondo grass no 8 to 11Phyla nodiflora Turkey tangle frog fruit yes 8 to 11Thelypteris kunthii Southern shield fern yes 8 to 11Trachelospermum jasminoides Confederate jasmine no 8b to 10Trachelospermum asiaticum Asiatic jasmine no 8b to 10Small shrubsCarissa macrocarpa Natal plum no 9 to 11Leucophyllum frutescens Barometer bush no 8b to 10aPyracantha coccinea Firethorn no 8 to 9Raphiolepis spp. Indian hawthorn no 8 to 9 Rosa spp. Rose varies 8 to 11Rosmarinus spp. Rosemary no 8 to 11Russelia sarmentosa Firecracker plant no 8b to 11Sabal etonia Scrub palmetto yes 9 to 11Spiraea spp. Reeve’s spirea, Bridal wreath no 8 to 9Large shrubsAbelia × grandiflora Glossy abelia No 8 to 9 Acca sellowiana Pineapple guava No 8 to 11Acrostichum danaeifolium Leather fern Yes 9 to 11Aloysia virgata Sweet almond bush no 8 to 11Ardisia escallonioides Marlberry yes 9 to 11Bambusa spp. (Clump types) Bamboo no 8 to 11Callicarpa americana Beautyberry yes 8 to 10Callistemon viminalis Bottlebrush no 8b to 11Camellia japonica Camellia no 8 to 9 Camellia sasanqua Sasanqua camellia no 8 to 9 Clethra alnifolia Sweet pepperbush yes 8 to 9 Coccoloba uvifera Seagrape yes 9 to 11Crataegus spp. Hawthorn varies 8 to 9 Eugenia spp. Stoppers varies 9 to 11Fatsia japonica Japanese aralia no 8 to 11Hamelia patens Firebush yes 9 to 11Hibiscus spp. Hibiscus yes 8 to 11Itea virginica Virginia sweetspire yes 8 to 9 Jasminum mesnyi Japanese yellow jasmine no 8 to 10Jasminum nitidum Star jasmine no 9 to 11Loropetalum chinense Loropetalum no 8 to 9 Malvaviscus arboreus Turk’s cap no 8b to 11Myrica cerifera Wax myrtle yes 8 to 10Osmanthus americanus Wild olive yes 8b to 9Osmanthus fragrans Tea olive no 8b to 9Philadelphus inodorus English dogwood yes 8 to 9aPittosporum tobira Japanese pittosporum no 8 to 11Severinia buxifolia Boxthorn yes 8b to 10Ternstroemia gymnanthera Cleyera no 8 to 9
(Continued)
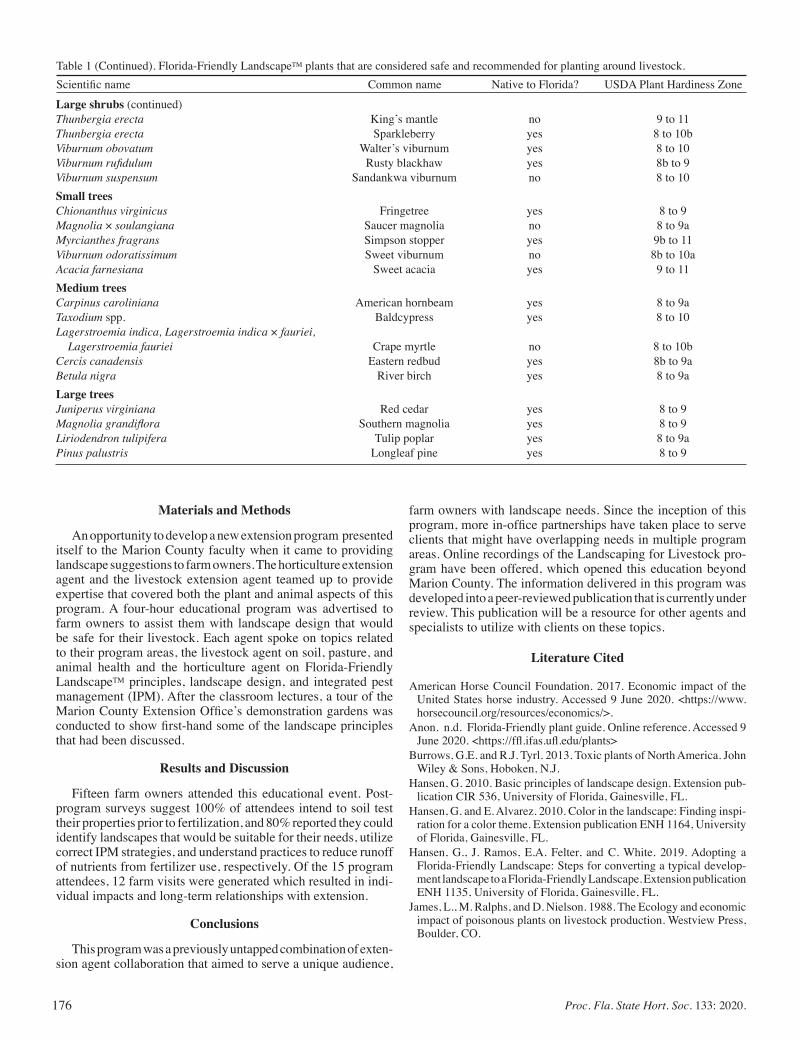
176 Proc. Fla. State Hort. Soc. 133: 2020.
Large shrubs (continued)Thunbergia erecta King’s mantle no 9 to 11Thunbergia erecta Sparkleberry yes 8 to 10bViburnum obovatum Walter’s viburnum yes 8 to 10Viburnum rufidulum Rusty blackhaw yes 8b to 9Viburnum suspensum Sandankwa viburnum no 8 to 10Small treesChionanthus virginicus Fringetree yes 8 to 9Magnolia × soulangiana Saucer magnolia no 8 to 9aMyrcianthes fragrans Simpson stopper yes 9b to 11Viburnum odoratissimum Sweet viburnum no 8b to 10aAcacia farnesiana Sweet acacia yes 9 to 11Medium treesCarpinus caroliniana American hornbeam yes 8 to 9aTaxodium spp. Baldcypress yes 8 to 10Lagerstroemia indica, Lagerstroemia indica × fauriei, Lagerstroemia fauriei Crape myrtle no 8 to 10b Cercis canadensis Eastern redbud yes 8b to 9aBetula nigra River birch yes 8 to 9aLarge treesJuniperus virginiana Red cedar yes 8 to 9Magnolia grandiflora Southern magnolia yes 8 to 9 Liriodendron tulipifera Tulip poplar yes 8 to 9aPinus palustris Longleaf pine yes 8 to 9
Table 1 (Continued). Florida-Friendly LandscapeTM plants that are considered safe and recommended for planting around livestock.Scientific name Common name Native to Florida? USDA Plant Hardiness Zone
Materials and Methods
An opportunity to develop a new extension program presented itself to the Marion County faculty when it came to providing landscape suggestions to farm owners. The horticulture extension agent and the livestock extension agent teamed up to provide expertise that covered both the plant and animal aspects of this program. A four-hour educational program was advertised to farm owners to assist them with landscape design that would be safe for their livestock. Each agent spoke on topics related to their program areas, the livestock agent on soil, pasture, and animal health and the horticulture agent on Florida-Friendly LandscapeTM principles, landscape design, and integrated pest management (IPM). After the classroom lectures, a tour of the Marion County Extension Office’s demonstration gardens was conducted to show first-hand some of the landscape principles that had been discussed.
Results and Discussion
Fifteen farm owners attended this educational event. Post-program surveys suggest 100% of attendees intend to soil test their properties prior to fertilization, and 80% reported they could identify landscapes that would be suitable for their needs, utilize correct IPM strategies, and understand practices to reduce runoff of nutrients from fertilizer use, respectively. Of the 15 program attendees, 12 farm visits were generated which resulted in indi-vidual impacts and long-term relationships with extension.
Conclusions
This program was a previously untapped combination of exten-sion agent collaboration that aimed to serve a unique audience,
farm owners with landscape needs. Since the inception of this program, more in-office partnerships have taken place to serve clients that might have overlapping needs in multiple program areas. Online recordings of the Landscaping for Livestock pro-gram have been offered, which opened this education beyond Marion County. The information delivered in this program was developed into a peer-reviewed publication that is currently under review. This publication will be a resource for other agents and specialists to utilize with clients on these topics.
Literature Cited
American Horse Council Foundation. 2017. Economic impact of the United States horse industry. Accessed 9 June 2020. <https://www.horsecouncil.org/resources/economics/>.
Anon. n.d. Florida-Friendly plant guide. Online reference. Accessed 9 June 2020. <https://ffl.ifas.ufl.edu/plants>
Burrows, G.E. and R.J. Tyrl. 2013. Toxic plants of North America. John Wiley & Sons, Hoboken, N.J.
Hansen, G. 2010. Basic principles of landscape design. Extension pub-lication CIR 536, University of Florida, Gainesville, FL.
Hansen, G. and E. Alvarez. 2010. Color in the landscape: Finding inspi-ration for a color theme. Extension publication ENH 1164, University of Florida, Gainesville, FL.
Hansen, G., J. Ramos, E.A. Felter, and C. White. 2019. Adopting a Florida-Friendly Landscape: Steps for converting a typical develop-ment landscape to a Florida-Friendly Landscape. Extension publication ENH 1135, University of Florida, Gainesville, FL.
James, L., M. Ralphs, and D. Nielson. 1988. The Ecology and economic impact of poisonous plants on livestock production. Westview Press, Boulder, CO.
177 Proc. Fla. State Hort. Soc. 133: 2020.
Proc. Fla. State Hort. Soc. 133:177. 2020.
Ornamental, Garden & Landscape Section
*Corresponding author. Email: [email protected]
—Scientific Note—
Micropropagation of a Novel Cordyline HybridDaviD Beleski*, Wagner venDrame, Jane nguyen, Daniella menenDez,
Damaris HernanDez, anD Jian Jian XEnvironmental Horticulture Department, University of Florida/IFAS,
P.O. Box 110670, Gainesville, FL 32611
AdditionAl index words. in vitro propagation
Cordyline is a genus of shrubs and trees native to areas of the South Pacific Ocean. There is some disagreement as to its natural distribution considering it had been an important agricultural crop prior to European contact. In addition to its agricultural uses Cordyline species and hybrids have been widely adopted as commercially propagated ornamental plants. In this role Cordyline is utilized for its often brightly variegated foliage as well as its palm like growth habit and tropical appearance. In tropical and sub-tropical regions the various cultivars are employed as landscaping plants while in more temperate regions they are widely grown as house plants. New cultivars of Cordyline are often obtained from sports which produce a novel form or coloration different from the original plant. In order to commercially propagate such sports a method for rapid multiplication is desirable. Plant tissue culture and in vitro propagation have been promoted for the rapid clonal propagation of many different genera of plants. The highest rates of multiplication in vitro are often achieved through methods which utilize plant callus tissue as in ideal conditions it can be rapidly and indefinitely propagated. In applying such methods to the propagation of a Cordyline sport there was some uncertainty as to whether the regenerated plants would retain the sport’s desired characteristics or if the micropropagated plants might revert to the original characteristics. This study was undertaken to determine if a novel Cordyline sport could be rapidly multiplied in vitro while maintaining its novel character.
Rooted vegetative cuttings of a single novel Cordyline clone were obtained from a commercial plant nursery. The cuttings were used as a source of three types of explants based on the physiologic origin of the material: Unexpanded leaf sections, meristematic region sections and sub-meristematic sections. The individual explants consisted of horizontally cut, 2–4mm thick disks of tissue. Explants were initiated onto semi-solid MS media, of which each treatment was supplemented with 1 of 9 combinations consisting of an Auxin [indole acetic acid (IAA)] and cytokinin [6-Benzylaminopurine (6-BAP)]. The treatment levels were as follows: IAA (0.05, 0.1, and 0.15 mg/L) and 6-BAP (1.0, 2.5,and 5.0 mg/L). After a period of two months the cultures were evaluated in order to determine which, if any treatments had resulted in the production of shoots. Following shoot initiation, two treatments were tested to determine a method for the rooting of multiplied shoots. The tested treatments consisted of semi-solid MS media supplemented with either 0.05mg/L 6-BAP with 1.0mg/L IBA or 0.1mg/L 6-BAP with 2mg/L IBA. After a period of 30 days the treatments were evaluated based on the percentage of shoots that had rooted successfully. In the evaluation of culture initiation both the type of explant and the initia-tion media were found to be significant. The effect of explant type was highly significant, only meristem region explants were found to result in successfully multiplying cultures. Media composition was also found to have a significant effect. All treatments containing IAA at the level of 0.05mg/L were found to result in significantly greater rates of initiation when compared to the two higher levels of IAA treatments. The tested levels of 6-BAP were not found to have a significant effect on the rate of successful culture initiation. In the evaluation of root-ing success there was no significant difference between the two treatments. Both treatments resulted in 100% rooting success. It was determined that in vitro propagated, rooted and greenhouse hardened plantlets can retain the desired characteristics of a Cordyline sport.
Future studies will look into optimizing multiplication rates, determining the ideal level of cytokinin for multiplication and expanding in vitro propagation to a temporary immersion bioreactor system.
178 Proc. Fla. State Hort. Soc. 133: 2020.
Proc. Fla. State Hort. Soc. 133:178. 2020.
Ornamental, Garden & Landscape Section
*Corresponding author. Email: [email protected]
—Scientific Note—
Estimating Neonicotinoid Insecticides Related Information Effects on Consumers’ Preferences for
Ornamental PlantsHayk kHacHatryan* and Xuan Wei
University of Florida/IFAS, Mid-Florida Research and Education Center, 2727 S. Binion Rd., Apopka, FL 32703
AdditionAl index words. consumer attitudes, information treatment, neonicotinoids, pollinators, plant choice
Studies in social sciences have demonstrated that psychological factors such as individual attitudes, norms, perceptions, and desires are important and integral factors to an individual’s choice and decision-making (e.g., Morikawa et.al, 2002). Despite increasing concerns about the potential negative impacts of neonicotinoid insecticides on pollinator health in the regulatory community, public perceptions about the use of such pest management tools are mainly unknown.
In this study, we jointly modeled consumers’ attitudes toward neonicotinoids and pollinators and their influences on choices for ornamental plants grown with or without neonicotinoids. Project participants were randomly directed to a control or treatment option in an online choice experiment. Respondents in the control group received no additional information during the choice experiment. The respondents viewed pictures of an-nual bedding plants, in 4-inch diameter containers, and perennial plants, in 1-gallon containers, and were asked to make 16 plant choices based on their existing knowledge and beliefs about pollinators and neonicotinoids. In each choice scenario, participants selected the product they preferred from one of three options, marked plant A, plant B, or an opt-out option (i.e., I would not buy any of these plants at this time). Meanwhile, respondents in the treatment group completed the choice experiment after viewing a 3-minute video describing the “negative and deterministic impact” of neonicotinoids on pollinators.
Results showed that additional information on neonicotinoids has a significant and direct impact on respon-dents’ attitudes. Even though ex-ante knowledge about neonicotinoids and pollinators was similar between the control and treatment groups, respondents in the treatment groups were more concerned about the effects of neonicotinoids on pollinators’ health. We observed that information treatment has a significantly positive impact on consumers’ preference for labels disclosing the absence of neonicotinoids relative to labels disclosing the presence of neonicotinoids. We established a causal mapping between individual attitudes and perceptions and preference for important plant attributes.
Future studies may explore the impact of information by expanding this analysis along two dimensions: varia-tions related to information (i.e., types, framing, and sources of information) and variations related to attitudes (i.e., trust of information sources, organizations).
Literature Cited
Morikawa, T., M. Ben-Akiva, and D. McFadden. 2002. “Discrete Choice Models Incorporating Revealed Preferences and Psychometric Data.” Advances in Econometrics (Advances in Econometrics, Vol. 16), Emerald Group Publishing Limited, Bingley, pp. 29–55.
179Proc. Fla. State Hort. Soc. 133: 2020.
Proc. Fla. State Hort. Soc. 133:179. 2020.
Ornamental, Garden & Landscape Section
This research was funded by the University of Florida IFAS PBGI. Greenhouse and lab space was located at the Mid-Florida Research and Education Center. *Corresponding author. Email: [email protected]
—Scientific Note—
Protocol Development for Genome Size Estimation of Begonia Accessions
Julian Ginori1,2*, HeqianG Huo1,2, Sandra WilSon2
1Mid-Florida Research and Education Center, University of Florida IFAS 2725 S Binion Rd., Apopka, FL 32703
2Department of Environmental Horticulture, University of Florida /IFAS P.O. Box 110675, Gainesville, FL 32611-0675
AdditionAl index words. flow cytometry, begonia, genome size
TRIS-MgCl2 Buffer, Woody Plant Buffer, and Sysmex Cystain PI Absolute P (Lincolnshire, IL) (Doležel and Bartos, 2005; Doležel et al., 2007).
Once samples were collected, 1mL of DNA extraction buf-fer and 50μL of RNase was added to approximately 50mm2 of unknown sample and 50 mm2 of a known standard. The samples were then chopped up simultaneously to create a mixture of cells from both samples before filtering through a 50-μm membrane into a 3.5-mL tube. After allowing the mixture to homogenize for 1 min, 50 μm of PI stain was added to the mixture and then run through a Sysmex CyFlow Ploidy Analyzer (Lincolnshire, IL).
Preliminary results indicate that the LB01 buffer yields narrower peaks and a higher count of nuclei per sample when compared to the other extraction buffers tested. One of the pri-mary issues with estimating genome size in Begonia using flow cytometry is the presence of phenolic compounds in the leaves that interfere with the extraction process and subsequent staining and processing through the flow cytometer. Sample browning is also a known issue with many plant samples. To combat the sample browning LB01 buffer and Marie’s Nuclear Isolation Buf-fer utilize β-mercaptoethanol to reduce the oxidation that occurs prior to running samples. Ensuring all samples and buffers are stored on ice also enhances the ability to yield acceptable peaks and results. Future work will utilize this protocol to determine nuclear DNA content of all accessions.
Literature Cited
Arumuganathan, K. and E.D. Earle. 1991. Estimation of nuclear DNA content of plants by flow cytometry. Plant Mol. Biol. Rep. 9(3): 229–241.
Dewitte, A., L., T. Leus, I. Eeckhaut, J. Vanstechelman, J. Van Huylen-broeck and E. Van Bockstaele. 2009. Genome size variation in Begonia. Genome 52(10):829–838.
Dolezel, J. and J. Bartos. 2005. Plant DNA flow cytometry and estimation of nuclear genome size. Annals of Botany 95(1):99–110.
Doležel, J., P. Binarová and S. Lcretti. 1989. Analysis of nuclear DNA content in plant cells by flow cytometry. Biologia Plantarum 31(2):113–120.
Doležel, J., J. Greilhuber and J. Suda. 2007. Estimation of nuclear DNA content in plants using flow cytometry. Nature Protocols 2(9):2233–2244.
Tian, D., Y. Xiao, Y. Tong, N. Fu, Q. Liu and C. Li. 2018. Diversity and conservation of Chinese wild begonias. Plant Diversity 40(3):75–90.
USDA-NASS: 2019 Census of Horticultural Specialties. National Ag-ricultural Statistics Service, USDA 2019.
With over 1800 species thus far and 68 sections (Tian et al. 2018), begonia is among the top five largest plant genera, as well as the top five bedding/potting plants sold in the United States (USDA, 2019). Wax begonia (Begonia × semperflorens-cultorum) is the primary horticultural group sold in the US. Accompanying the diverse range of morphological characters in begonia is an equally diverse range of genome size and chromosome number variation. With 1C values between 0.23 pg and 1.46 pg DNA, and chromosome numbers ranging from 2n = 16 to 2n = 156 (Dewitte et al., 2009), breeding within this genus has proven to be dif-ficult. To make matters more complex, the genome sizes are not correlated with the chromosome numbers, as there is significant variation in chromosome size as well, making chromosome count inferences based off genome size impossible.
The overall goal of this study was to optimize a protocol for efficient flow cytometry genome size determination in begonia. To date, more than 100 accessions of begonia have been collected and organized based on species, sectional classification, foliage and flower morphology, and origin. This inventory will serve as the basis for future phylogenetic, transcriptomic, physiological, and histological studies. Currently, samples gathered from col-lection accessions will be subjected to flow cytometer analysis and staining to determine variation in genome sizes. The results gathered from genome and chromosome characterization can be applied to future begonia breeding. This is a first step towards understanding the mechanisms behind novel breeding of begonia.
All species and accessions are stored in a low-light greenhouse in Apopka, FL. For the most accurate estimation of genome size, fresh, young leaves were collected from each sample and stored on ice until ready for use. Three replicates were used for each species or accession. Internal standards were used to accurately determine the genome size of the unknown Begonia species as outlined in Doležel et al. (1989) and Arumuganathan and Earle (1991). Seeds of Glycine max, Raphanus sativus, and Pisum sativum were obtained from the Centre of Plant Structural and Functional Genomics in Olomouc, Czech Republic.
The protocol development consisted of testing five DNA extraction buffers to determine the most reliable buffer and du-ration for each sample: LB01, Marie’s Nuclear Isolation Buffer,
180 Proc. Fla. State Hort. Soc. 133: 2020.
Proc. Fla. State Hort. Soc. 133:180. 2020.
Ornamental, Garden & Landscape Section
*Corresponding author. Email: [email protected]
—Scientific Note—
Equipping Brevard County’s Turfgrass Industry with Sustainable Production Know-how through the Space
Coast Golf and Turf AssociationBonnie C. Wells*
University of Florida IFAS, Brevard County Extension, 3695 Lake D., Cocoa, FL 32926
AdditionAl index words. golf, sustainability, turfgrass
Implementing sustainable turfgrass management practices is a high priority for golf course superintendents and sports turf professionals in Brevard County, an area extending 72 miles along the Atlantic Ocean on Florida’s Space Coast. Found here is the Indian River Lagoon (IRL), one of the most biodiverse estuaries on the planet with a diverse array of biota whose existence depends on the quality of the water. Protection of the IRL is a high-priority initiative of county government, and educational programs addressing this need are a high-priority of University of Florida IFAS Extension. To support the initiative, a network of turfgrass management professionals in Brevard County, officially known as the Space Coast Golf and Turf Association (SCGTA), were engaged to enhance the relationship among extension and stakeholders while promoting extension education and demonstra-tion. The broad objective of the SCGTA program is to increase the local turfgrass industry’s knowledge of and stimulate the adoption of integrated management strategies to stay profitable, sustainable and stewards of their unique landscape along the Space Coast and beyond.
Specific objectives include: 1) Annually, 75% of turfgrass management professionals in Brevard County will increase their
knowledge about integrated management strategies such as efficient irrigation and fertilization practices, integrated pest management (IPM) or other techniques to increase the sustainability of their production.
2) Annually, 50% of turfgrass management professionals in Brevard County will adopt at least one integrated management strategy to increase the sustainability of their production.
To reach these objectives, five in-service workshops were held from Jan. 2019 to May 2020 reaching a total of 242 participants covering diverse topics in integrated management strategies including pest and nutrient manage-ment. Likert surveys were used to measure knowledge gain and intent to adopt integrated management practices. Sixty-nine site visits were also performed to support the implementation of strategies presented at the workshops.
Of the participants surveyed (n = 205), 95% of respondents reported an increase in knowledge while 92% reported an intent to adopt a new sustainable production practice after attending one of the five workshops. Adoption of practices presented at the workshops were documented with site visits. Examples of these practices include removing grass clippings for bermudagrass mite management, soil testing for nutrient needs and fertilizer applications, rotating modes of action to manage pesticide resistance, soil flushing for mole cricket monitoring and using soil moisture sensors for irrigation management.
The program will continue to actively engage and assist turfgrass growers with implementing the best nutrient, pest and irrigation management strategies that will increase the productivity and profitability of the turf industry in Brevard County while limiting the impact on the Space Coast’s abundant natural resources, such as the IRL. By fostering associations with stakeholders, horticulture extension agents can enhance their relationships with target clientele, and these associations will in turn enhance educational activities that will increase the knowledge and promote the adoption of sustainable productions practices to help the industry stay profitable, sustainable and stewards of their landscapes.

181Proc. Fla. State Hort. Soc. 133: 2020.
Proc. Fla. State Hort. Soc. 133:181–182. 2020.
Ornamental, Garden & Landscape Section
The University of Florida IFAS Center for Land Use Efficiency funded this project. Thanks to the Lake County Master Gardener Volunteers for their time and to Lake Jem Farms for the donation of plant materials.
*Corresponding author. Email: [email protected]
—Scientific Note—
Multispecies Lawns: An Alternative Strategy for Water Conservation and Ecosystem Functions
Brooke Moffis1*, Basil iannone2, adaM dale3, J. Bryan UnrUh4, JUlia rycyna5, sandra Wilson5, and Wendy WilBer6
1University of Florida IFAS, Lake County Extension, 1951 Woodlea Rd., Tavares, FL 327782University of Florida IFAS, School of Forest Resources and Conservation, Box 110410, Gainesville,
FL 32611-04103University of Florida IFAS, Entomology and Nematology Department, 1881 Natural Area Dr., P.O.
Box 110620, Gainesville, FL 32611-06204University of Florida IFAS, West Florida Research and Education Center, 4253 Experiment Dr.,
Highway 182, Jay, FL 325655 University of Florida IFAS, Department of Environmental Horticulture, P.O. Box 110675,
Gainesville, FL 32611-06756 University of Florida IFAS, Center for Landscape Use Efficiency, 2046 IFAS Research Dr.,
Gainesville, FL 32611-0675
Turfgrass is the most common plant type in suburban devel-opments with over 5 million acres of residential turf in Florida. While providing valuable aesthetic, environmental, and recreation benefits, the maintenance of typical Florida turfgrass lawns includes regular irrigation and fertilization. Moreover, turfgrass lawns have low plant diversity. Improper maintenance practices can lead to excessive and unnecessary water usage and degrada-tion to water quality.
Increasing plant diversity in lawns with flowering native spe-cies may reduce the need for irrigation and fertilization, as these species can maintain green coverage with fewer inputs.
Furthermore, insect pollinator populations are declining worldwide. The addition of native flowering plants may enhance ecosystem services such as pest regulation, pollination, and arthro-pod biodiversity. Regardless of the benefits, adding native plants to lawns will only be a viable alternative if homeowners feel this approach is aesthetically appealing and manageable. The overall goal of this project was to determine the aesthetic and functional value of multispecies lawn plantings of turfgrasses, legumes, and forbs compared to bahiagrass (Paspalum notatum) monocultures, a low-input turfgrass species well-suited to Florida.
In Mar. 2019, eighteen 2 × 2 m plots were installed at the Discovery Gardens in Lake County, FL. Each plot was randomly
assigned one of three planting levels: bahiagrass monoculture, bahiagrass-forb mixture, or forbs alone. Selected to represent a diversity of flower color, type, and height, the forb species con-sisted of Salvia lyrata, Phyla nodiflora, Mimosa strigillosa, and Coreopsis leavenworthii (Fig. 1).
Fig. 1.Clockwise from top left: Bahiagrass (Paspalum notatum) monoculture treatment, bahiagrass-forb treatment and forb alone treatment in landscape plots at Discovery Gardens in Lake County, FL.
AdditionAl index words. ecosystem, lawns, multispecies, turfgrass

182 Proc. Fla. State Hort. Soc. 133: 2020.
Initially mowing regimes were the same among all plots in the study, but after careful observation and consideration, mow-ing regimes were adjusted. Bahiagrass monoculture plots were mowed once a week. The bahiagrass-forbs mixture plots were mowed every other week, while forbs plots were mowed only to reduce the reseeding of weed species. Weeds were rogued by hand and after establishment each plot received fifteen minutes of weeding monthly. Irrigation occurred twice after establishment, only during times of severe drought.
Every three months, arthropods were monitored and identi-fied using sticky traps and pitfall traps, pollinator visitation was recorded, flowers were counted and percent plant coverage of plots was estimated. Finally, a 15-question survey was administered to various stakeholder groups to determine how important sustain-able landscaping is to them and how likely they are to integrate any of these plantings into their landscapes.
As predicted, preliminary results suggest that, as abundance and diversity of flowering resources increases, so do pollinator visits and pollinator diversity. Both treatments containing forbs attracted more pollinators than bahiagrass monoculture treat-ments. Interestingly, no difference in ground dwelling arthropod abundance or taxonomic richness was observed among treatments.
During the summer and spring, approximately 10% greater coverage of green plant material occurred in the two treatments
containing forbs compared to bahiagrass monoculture treatments. In the winter, bahiagrass monoculture treatments provided more green coverage. The arthropod and percent coverage data were collected from Summer 2019 through Spring 2020, while analysis from other periods is ongoing.
Covid-19 limited the use of stakeholder surveys, but 21 people from the local green industry completed a survey in early March. Ten percent of participants were likely to use the bahiagrass-forbs mixture as a lawn in their front and side yards, while 14% would use this blend in their backyard. Eighteen percent would use the forbs only treatment in their front yard, while 23% would use forbs as a lawn in their side and backyards. To best capture public perception of blended species lawns, diverse stakeholders must be surveyed. It is notable that this project piqued the interest of a premier wholesale tree farm which is now pursuing the devel-opment and production of alternative plant species for lawns.
Despite the observed benefits of forb treatments, weed pressure was notably greater than the bahiagrass monoculture treatments. The lack of best management practices and tools for establishing multi-species lawns to minimize weed pressure justifies addi-tional research. Areas to further explore also include optimizing irrigation for improved aesthetics, evaluating different species combinations, and expanding the palette of suitable groundcover plant materials.

183Proc. Fla. State Hort. Soc. 133: 2020.
Proc. Fla. State Hort. Soc. 133:183–188. 2020.
Ornamental, Garden & Landscape Section
‘UF-1013-1’: An Infertile Cultivar ofLantana camaraZhanao DengInstitute of Food and Agricultural Sciences, Environmental Horticulture Department, Gulf Coast Research and Education Center, University of Florida, 14625 County Road 672, Wimauma, FL 33598
Sandra B. WilsonEnvironmental Horticulture Department, University of Florida, P.O. Box 110675, Gainesville, FL 32611
Xiaobao YingInstitute of Food and Agricultural Sciences, Environmental Horticulture Department, Gulf Coast Research and Education Center, University of Florida, 14625 County Road 672, Wimauma, FL 33598
Chunxian ChenU.S. Department of Agriculture, Agricultural Research Service, Fruit and Tree Nut Research Laboratory, 21 Dunbar Road, Byron, GA 31008
Rosanna Freyre and Victor ZayasEnvironmental Horticulture Department, University of Florida, P.O. Box 110675, Gainesville, FL 32611
David M. Czarnecki IIInstitute of Food and Agricultural Sciences, Environmental Horticulture Department, Gulf Coast Research and Education Center, University of Florida, 14625 County Road 672, Wimauma, FL 33598Additional index words. cultivar, invasive, lantana, noninvasive, sterile, triploid
Lantana (Lantana L., Verbenaceae) is pro-duced and grown as an ornamental plant in theUnited States and many other countries in theworld. The ornamental value of lantana comesfrom its bright-colored flowers. Other attributesof this plant include attraction to multiplespecies of butterflies; tolerance of drought, heat,and salt; low maintenance requirements; andease of propagation (Bachman, 2018; Schoellhorn,2004). With these attributes, lantana iscommonly used in the landscape and gardens,including butterfly gardens and water-savingxeriscaping gardens. Propagation and produc-tion of lantana plants have been a significantcomponent of the environmental horticultureindustry in a number of countries in the worldand multiple states in the United States. Forexample, a survey of the Florida nursery indus-try indicated that 19% of the responding nurs-eries produced lantana and the annual salesvalue of lantana in Floridawas atmore than $40million (Wirth et al., 2004).
The majority of lantana plants in com-mercial production and landscape use be-longs to Lantana camara L. This species isnative to Central and South America, includ-ing the West Indies (Sanders, 2001) and wasintroduced to the United States in the 1800s(Swearingen and Bargeron, 2016). Sincethen, L. camara has escaped cultivation andbecome naturalized in 13 states in the UnitedStates (Swearingen and Bargeron, 2016). InFlorida, escaped L. camara has hybridized
with Lantana depressa Small, endangeringthis native species (FLEPPC, 2019; Hammer,2004; Sanders, 1987). Lantana camara hasbeen listed as a Category I invasive species inFlorida by the Florida Exotic Pest PlantCouncil (FLEPPC, 2019). The University ofFlorida Institute of Food and AgriculturalSciences (UF/IFAS) Assessment of Non-Native Plants in Florida’s Natural Areasconcluded that invasive L. camara is not tobe recommended for production or landscapeuse in south, central, and north Florida (http://assessment.ifas.ufl.edu/). The assessmentwas based on data collected from escaped,naturalized L. camara. The Georgia ExoticPest Plant Council (GA-EPPC, 2019) listedL. camara as a Category 3 exotic plant, whichis a minor problem in Georgia natural areas,or is not yet known to be a problem inGeorgia but is known to be problem inadjacent states (GA-EPPC, 2019).
A research program was initiated in 2004at UF/IFAS’s Gulf Coast Research and Edu-cation Center (GCREC) to identify and de-velop infertile L. camara cultivars. Themajority of commercial L. camara cultivarswere found to be fertile (Czarnecki, 2011).New infertile cultivars are needed by theenvironmental horticulture industry and forprotecting native species and the environ-ment (Bechtloff et al., 2019). In 2016, wereleased two infertile triploid lantana culti-vars, UF-1013A-2A (Bloomify Red) and UF-1011-2 (Bloomify Rose) (Deng et al., 2017).They performed well in variety trials(Bachman, 2018) and are well received bynursery growers.
‘UF-1013-1’ (Figs. 1 and 2) is a sibling of‘Bloomify Red’ and shares the high level ofmale and female infertility and superior plantperformance with ‘Bloomify Red’, but ‘UF-1013-1’ has shorter plants, larger flowers, ahigher nuclear DNA content, and a differentmolecular marker profile. On the basis of thehigh level of male and female infertility of‘UF-1013-1’ and its lack of hybridizationpotential with L. depressa, an InfraspecificTaxon Protocol request was submitted to theUF/IFAS Invasive Plants Working Group,
Fig. 1. Plant (�11 weeks old) and flowers of ‘UF-1013-1’ lantana (L. camara) in a containertrial in Michigan (from Mr. K. Hurd, ProvenWinners).
Received for publication 4 Feb. 2020. Accepted for publication 5 Mar. 2020.Published online 6 May 2020.The development and evaluation of ‘UF-1013-1’ were funded in part by the U.S. Department of Agriculture (USDA) hatch projects (project nos. FLA-GCR-005065 and FLA-GCC-005507), the USDA/Tropical and Subtropical Agriculture Re-search (TSTAR) program, and the Florida Depart-ment of Agriculture and Consumer Service Specialty Crop Block Grant program.We thank Gail Bowman, Keri Druffel, Mary Der-rick, Patricia Frey, and Joyce Jones for their tech-nical assistance. We are grateful to Dr. Jaroslav Dole�zel (Laboratory of Molecular Cytogenetics and Cytometry, Institute of Experimental Botany, Olomouc, Czech Republic) who provided pea seeds that were used as the internal standards in the flow cytometry analysis. We thank the Proven Winners North America, LLC, and Riverview Flower Farms, Inc., for trialing ‘UF-1013-1’ and sharing some of their observations, seed count data, and photos. We are also grateful to Mr. Hugh Gramling for his inspiration and support of our effort in genetic sterilization of lantana.D.M.C. is a former graduate student at the Univer-sity of Florida. Current affiliation: Ernst Benary of America, Inc., 195 Paulsen Road, Watsonville, CA 95076.Z.D. is the corresponding author. E-mail: zdeng@ ufl.edu.This is an open access article distributed under the CC BY-NC-ND license (https://creativecommons. org/licenses/by-nc-nd/4.0/).
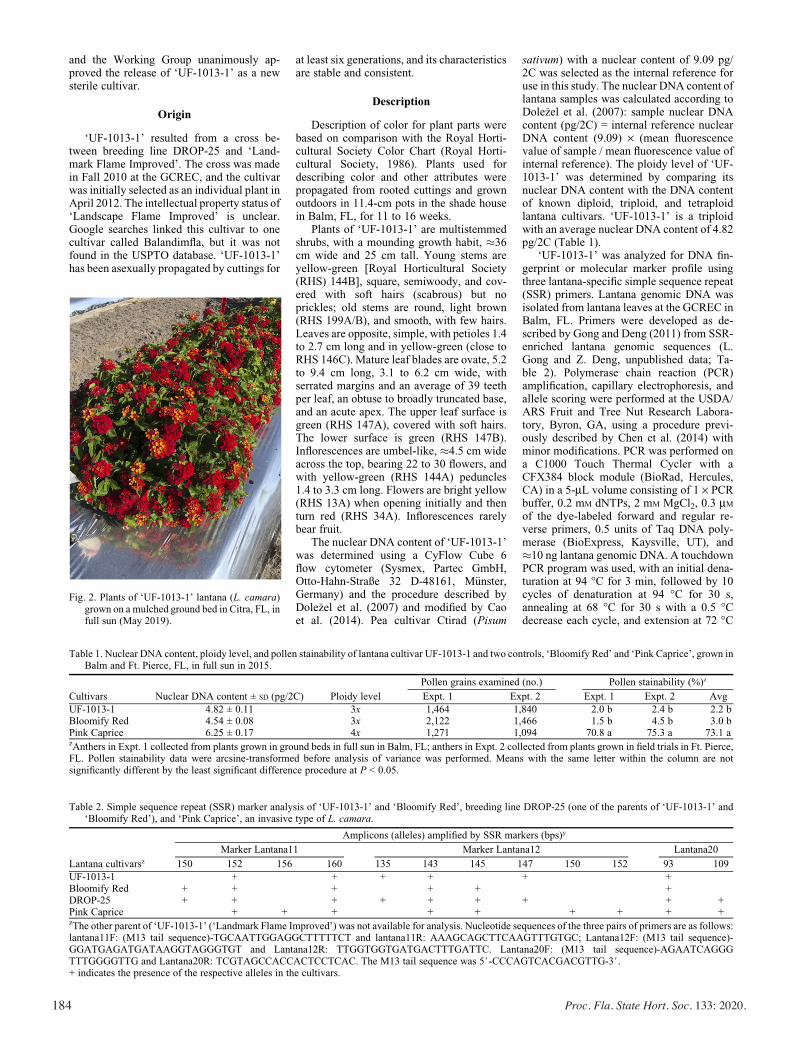
184 Proc. Fla. State Hort. Soc. 133: 2020.
and the Working Group unanimously ap-proved the release of ‘UF-1013-1’ as a newsterile cultivar.
Origin
‘UF-1013-1’ resulted from a cross be-tween breeding line DROP-25 and ‘Land-mark Flame Improved’. The cross was madein Fall 2010 at the GCREC, and the cultivarwas initially selected as an individual plant inApril 2012. The intellectual property status of‘Landscape Flame Improved’ is unclear.Google searches linked this cultivar to onecultivar called Balandimfla, but it was notfound in the USPTO database. ‘UF-1013-1’has been asexually propagated by cuttings for
at least six generations, and its characteristicsare stable and consistent.
Description
Description of color for plant parts werebased on comparison with the Royal Horti-cultural Society Color Chart (Royal Horti-cultural Society, 1986). Plants used fordescribing color and other attributes werepropagated from rooted cuttings and grownoutdoors in 11.4-cm pots in the shade housein Balm, FL, for 11 to 16 weeks.
Plants of ‘UF-1013-1’ are multistemmedshrubs, with a mounding growth habit, �36cm wide and 25 cm tall. Young stems areyellow-green [Royal Horticultural Society(RHS) 144B], square, semiwoody, and cov-ered with soft hairs (scabrous) but noprickles; old stems are round, light brown(RHS 199A/B), and smooth, with few hairs.Leaves are opposite, simple, with petioles 1.4to 2.7 cm long and in yellow-green (close toRHS 146C). Mature leaf blades are ovate, 5.2to 9.4 cm long, 3.1 to 6.2 cm wide, withserrated margins and an average of 39 teethper leaf, an obtuse to broadly truncated base,and an acute apex. The upper leaf surface isgreen (RHS 147A), covered with soft hairs.The lower surface is green (RHS 147B).Inflorescences are umbel-like, �4.5 cm wideacross the top, bearing 22 to 30 flowers, andwith yellow-green (RHS 144A) peduncles1.4 to 3.3 cm long. Flowers are bright yellow(RHS 13A) when opening initially and thenturn red (RHS 34A). Inflorescences rarelybear fruit.
The nuclear DNA content of ‘UF-1013-1’was determined using a CyFlow Cube 6flow cytometer (Sysmex, Partec GmbH,Otto-Hahn-Straße 32 D-48161, M€unster,Germany) and the procedure described byDole�zel et al. (2007) and modified by Caoet al. (2014). Pea cultivar Ctirad (Pisum
sativum) with a nuclear content of 9.09 pg/2C was selected as the internal reference foruse in this study. The nuclear DNA content oflantana samples was calculated according toDole�zel et al. (2007): sample nuclear DNAcontent (pg/2C) = internal reference nuclearDNA content (9.09) · (mean fluorescencevalue of sample / mean fluorescence value ofinternal reference). The ploidy level of ‘UF-1013-1’ was determined by comparing itsnuclear DNA content with the DNA contentof known diploid, triploid, and tetraploidlantana cultivars. ‘UF-1013-1’ is a triploidwith an average nuclear DNA content of 4.82pg/2C (Table 1).
‘UF-1013-1’ was analyzed for DNA fin-gerprint or molecular marker profile usingthree lantana-specific simple sequence repeat(SSR) primers. Lantana genomic DNA wasisolated from lantana leaves at the GCREC inBalm, FL. Primers were developed as de-scribed by Gong and Deng (2011) from SSR-enriched lantana genomic sequences (L.Gong and Z. Deng, unpublished data; Ta-ble 2). Polymerase chain reaction (PCR)amplification, capillary electrophoresis, andallele scoring were performed at the USDA/ARS Fruit and Tree Nut Research Labora-tory, Byron, GA, using a procedure previ-ously described by Chen et al. (2014) withminor modifications. PCR was performed ona C1000 Touch Thermal Cycler with aCFX384 block module (BioRad, Hercules,CA) in a 5-mL volume consisting of 1 · PCRbuffer, 0.2 mM dNTPs, 2 mM MgCl2, 0.3 mM
of the dye-labeled forward and regular re-verse primers, 0.5 units of Taq DNA poly-merase (BioExpress, Kaysville, UT), and�10 ng lantana genomic DNA. A touchdownPCR program was used, with an initial dena-turation at 94 �C for 3 min, followed by 10cycles of denaturation at 94 �C for 30 s,annealing at 68 �C for 30 s with a 0.5 �Cdecrease each cycle, and extension at 72 �C
Fig. 2. Plants of ‘UF-1013-1’ lantana (L. camara)grown on a mulched ground bed in Citra, FL, infull sun (May 2019).
Table 1. Nuclear DNA content, ploidy level, and pollen stainability of lantana cultivar UF-1013-1 and two controls, ‘Bloomify Red’ and ‘Pink Caprice’, grown inBalm and Ft. Pierce, FL, in full sun in 2015.
Cultivars Nuclear DNA content ± SD (pg/2C) Ploidy level
Pollen grains examined (no.) Pollen stainability (%)z
Expt. 1 Expt. 2 Expt. 1 Expt. 2 Avg
UF-1013-1 4.82 ± 0.11 3x 1,464 1,840 2.0 b 2.4 b 2.2 bBloomify Red 4.54 ± 0.08 3x 2,122 1,466 1.5 b 4.5 b 3.0 bPink Caprice 6.25 ± 0.17 4x 1,271 1,094 70.8 a 75.3 a 73.1 azAnthers in Expt. 1 collected from plants grown in ground beds in full sun in Balm, FL; anthers in Expt. 2 collected from plants grown in field trials in Ft. Pierce,FL. Pollen stainability data were arcsine-transformed before analysis of variance was performed. Means with the same letter within the column are notsignificantly different by the least significant difference procedure at P < 0.05.
Table 2. Simple sequence repeat (SSR) marker analysis of ‘UF-1013-1’ and ‘Bloomify Red’, breeding line DROP-25 (one of the parents of ‘UF-1013-1’ and‘Bloomify Red’), and ‘Pink Caprice’, an invasive type of L. camara.
Amplicons (alleles) amplified by SSR markers (bps)y
Lantana cultivarszMarker Lantana11 Marker Lantana12 Lantana20
150 152 156 160 135 143 145 147 150 152 93 109
UF-1013-1 + + + + + +Bloomify Red + + + + + +DROP-25 + + + + + + + + +Pink Caprice + + + + + + + + +zThe other parent of ‘UF-1013-1’ (‘Landmark Flame Improved’) was not available for analysis. Nucleotide sequences of the three pairs of primers are as follows:lantana11F: (M13 tail sequence)-TGCAATTGGAGGCTTTTTCT and lantana11R: AAAGCAGCTTCAAGTTTGTGC; Lantana12F: (M13 tail sequence)-GGATGAGATGATAAGGTAGGGTGT and Lantana12R: TTGGTGGTGATGACTTTGATTC. Lantana20F: (M13 tail sequence)-AGAATCAGGGTTTGGGGTTG and Lantana20R: TCGTAGCCACCACTCCTCAC. The M13 tail sequence was 5#-CCCAGTCACGACGTTG-3#.+ indicates the presence of the respective alleles in the cultivars.
185Proc. Fla. State Hort. Soc. 133: 2020.
for 45 s, followed by 25 more cycles with aconstant annealing temperature at 63 �C(other parameters were the same), plus a finalextension at 72 �C for 15 min. The dye(FAM)-labeled PCR products were separatedon a 3500 Genetic Analyzer (Life Technolo-gies, Carlsbad, CA) to generate the chro-matographic trace files. The SSR allele tableand peak chromatograms were generatedusing GeneMarker 2.4 (SoftGenetics, StateCollege, PA). In ‘UF-1013-1’, two majoramplicons (152 and 160 bp) were detectedwith the Lantana11 marker, three majoramplicons (135, 143, and 147 bp) with theLantana12 marker locus, and one majoramplicon (93 bp) with the Lantana20marker (Table 2). These amplicons areexpected to represent the number of allelesand the status of heterozygosity at eachmarker locus.
In side-by-side field trials in Citra, FL, in2018 and in greenhouse trials in Balm, FL, in2020, plants of ‘UF-1013-1’ were shorter andits flower clusters were larger than its siblingcultivar Bloomify Red. ‘UF-1013-1’ also has6.2% higher nuclear DNA content (4.82 pg/2C vs. 4.54 pg/2C in ‘Bloomify Red’)(Table 1). ‘UF-1013-1’ carries two alleles(135 and 147 bps) at the marker Lantana12that are absent in ‘Bloomify Red’ and doesnot carry the 150-bp allele at the Lantana11that is present in ‘Bloomify Red’ (Table 2).
Replicated Field Trials to Evaluate PlantFertility and Performance
‘UF-1013-1’ and ‘Bloomify Red’ weretested in the same replicated trials (Denget al., 2017). As reported previously (Denget al., 2017), the two field trials were con-ducted at the GCREC in Balm, FL [southwestFlorida, USDA hardiness zone 9a (USDAPlant Hardiness Zone Map, 2019), and AHSheat zone 10 (AHS, 1998)], and at the IndianRiver Research and Education Center(IRREC) in Ft. Pierce, FL (southeast Florida,USDA hardiness zone 9b, and AHS heat zone9–10). The experimental design in the Balmtrial was a randomized complete block withthree blocks and two plants per plot. Groundbeds at the GCREC were raised �20 cm,fumigated with Pic-Clor 60 (active ingredi-ents 1,3-dichloropropene and chloropicrin) at448 kg per hectare in Feb. 2015, and coveredwith white-on-black plastic. The soil wasEauGallie fine sand containing �1% organicmatter and a pH value between 6.2 and 7.4.The experimental design used in the Ft.Pierce trial was a randomized completeblock with four blocks and single-plantplots. Ground beds at the IRREC were notfumigated but treated with a preemergentherbicide [Sandia, 75.0% a.i. (halosulfuron-methyl), Yuma, AZ] at a rate of 0.1056 g·L–1
and a 2% solution of glyphosate (RoundupWeatherMAX, 48.8% a.i., St. Louis, MO)and covered with black groundcover. The soilwas Ankona sand with �2.8% organic mat-ter, pH 5.9. At each site, ‘Pink Caprice’ wasincluded as a ‘‘resident species’’ taxon. Alsoat each site, ‘Bloomify Red’ was included as
a sterile check. In addition, 21 commercialcultivars with various levels of male andfemale fertility were randomly placed in eachblock at both sites where ‘UF-1013-1’ and‘Bloomify Red’ were evaluated.
Before installation in the field trials,plants were propagated at GCREC. Cuttingswere rooted in 128-cell Speedling trays filledwith a customized potting substrate. Thebottom ends of cuttings were treated withDip’n Grow (1:9 dilution, final concentration0.1% indole-3-butyric acid and 0.05%1-naphthaleneacetic acid) (Dip’n Grow Inc.,Clackamas, OR). Rooted cuttings werepinched on 13 Mar. 2015 and transplantedon 5 May 2015 to 10.2-cm plastic containersfilled with a commercial potting mix (Fafard3B) and grown in the greenhouse at GCREC(at 15 �C/night to 33 �C/day). The container-grown plants were transplanted to the groundbeds in the week of 12 June 2015. Each plantwas top-dressed with �15 g of a controlled-release fertilizer (Osmocote; 15N–9P2O5
–12K2O, 5 to 6 months, Scotts, Marysville,OH) and irrigated through a seep system atGCREC and through drip tapes, twice a weekand 2 h per irrigation event, at IRREC.
Pollen Stainability
Lantana pollen stainability has been usedas an indicator of lantana’s male fertility (orsterility) and hybridization potential withLantana depressa (Czarnecki, 2011; Czarneckiet al., 2012, 2014; Dehgan and Guy, 2004).Generally, triploid lantana cultivars with lowpollen stainability (<15%) have little poten-tial to cross-pollinate L. depressa (Czarnecki,2011).
Two experiments were conducted to as-sess the pollen stainability of ‘UF-1013-1’. InExpt. 1, newly opened flowers were collectedfrom plants grown in Balm, FL, in late July2015, whereas in Expt. 2, flowers were col-lected from lantana plants grown in Ft.Pierce, FL, in mid-Aug. 2015. In both exper-iments, anthers were stained with 10–6 M
fluorescein diacetate (Sigma-Aldrich, St.Louis, MO) in 0.22 M sucrose at room tem-perature in the dark for 1 h, as described byCzarnecki et al. (2014) and Deng et al.(2017). Plump, round pollen grains fluo-rescing bright yellowish green light wereconsidered stainable, whereas misshaped,nonfluorescing, or unevenly and lightly fluo-rescing pollen grains were counted as non-stainable.
The number of pollen grains examined foreach lantana cultivar in each staining exper-iment was between 1094 and 2122 (Table 1).An analysis of variance (ANOVA) and meanseparation were conducted using JMP Pro13.2.0 (SAS Institute, Cary, NC) to comparethe pollen stainability of ‘UF-1013-1’ withthat of ‘Bloomify Red’ and ‘Pink Caprice’.The average pollen stainability of ‘UF-1013-1’ was 2.2% (Table 1), comparable to theaverage pollen stainability of the previouslyreleased sterile cultivar Bloomify Red. Theaverage pollen stainability of ‘Pink Caprice’was 73.1%. These results indicate thatT
able
3.Fruitproductionof‘U
F-1013-1’andthetwocontrolcultivarsBloomifyRed
andPinkCaprice
grownoutdoorsin
ground
bedsin
fullsunat
twositesin
Florida
(2015).
Expt.Site
Cultivars
Fruitper
peduncle
8to
21wkposttransplanting(W
PT)
Totalpedunclesexam
ined
(no.)
Totalfruitcollected(no.)
Totalmature
fruitcollected(no.)
Avgfruitper
peduncle
812
16
21
12Aug.
9Sept.
7Oct.
11Nov.
Balm
zUF-1013-1
0.008
by
0.008
b0b
0b
480
20
0.004b
BloomifyRed
0.012
b0.050
b0.025b
0b
481
11
00.023b
PinkCaprice
14.258a
8.850
a10.117a
8.025
a480
4,950
1,416
10.313a
812
17
21
12Aug.
10Sept.
14Oct.
11Nov.
Ft.Piercex
UF-1013-1
0.013b
0b
0.038b
0b
320
43
0.013b
BloomifyRed
0b
0b
0b
0b
320
00
0b
PinkCaprice
11.588a
8.325
a6.263a
5.588a
320
2,541
1,832
7.941a
zTwenty
pedunclesrandomly
sampled
oneach
ofthesixplantsin
threeblocksin
Balm,FL,over
4monthsin
2015.
yMeanswiththesameletter
within
columnswithin
thetrialsite
arenotsignificantlydifferentbytheTukey’shonestlysignificantdifference
procedure
atP<0.05.
xTwenty
peduncles
randomly
sampledoneach
ofthefourplantsin
fourblocksin
Ft.Pierce,FL,over
4monthsin
2015.

186 Proc. Fla. State Hort. Soc. 133: 2020.
the pollen stainability (or male fertility) of‘UF-1013-1’ was reduced by 95% from thatof ‘Pink Caprice’.
Female Sterility
Fruit (seed) production per peduncle andseed germination or seedling emergence arethe primary factors determining lantana’sfemale fertility (or sterility) (Czarnecki,2011; Czarnecki et al., 2012). A femalefertility index (FFI) can be derived by mul-tiplying fruit production per peduncle withseed germination and used to compare thefemale fertility (or sterility) of different lan-tana cultivars.
Fruit production per peduncle in replicatedfield trials. Data were collected from the repli-cated field trials in Balm and Ft. Pierce de-scribed earlier. Four data collections weremadefor each plant at each trial site. In each collec-tion, 20 peduncles were randomly sampledfrom each plant, and drupes on these peduncleswere counted as immature (green) or maturefruit. Thus, in each fruit collection, �120peduncles were sampled for each cultivartrialed in Balm, and �80 peduncles were sam-pled for each cultivar trialed in Ft. Pierce. Thefour fruit collections in Balm were made on 17Aug., 14 Sept., 16 Oct., and 18 Nov. 2015,respectively. The fruit collections in Ft. Piercewere conducted on 12 Aug., 10 Sept., 14 Oct.,and 11 Nov. 2015, respectively. An ANOVAand separation of mean fruit production valuesby the Tukey’s honestly significant differenceprocedure were performed using JMP Pro13.2.0 (SAS Institute) to compare the fruitproduction of ‘UF-1013-1’ with that of ‘Bloo-mify Red’ and ‘Pink Caprice’.
As previously reported by Deng et al.(2017), ‘Pink Caprice’ produced the largestnumber of drupes among all the entries inthe two replicated trials (Table 3). Eachpeduncle had an average of 7.941 drupesin Ft. Pierce and 10.313 drupes in Balm,averaged to 9.127 drupes per peduncleacross the two sites and four harvests. Thenumber of drupes per peduncle for the sterilecultivar Bloomify Red ranged from 0 to0.050 and averaged to 0.015 across the twosites over the 4 months. The number ofdrupes ‘UF-1013-1’ produced per peduncleranged from 0 to 0.038 and averaged to0.009 across two experimental sites and over4 months (Table 3). This level of fruitproduction in ‘UF-1013-1’ represented>99% reduction from the fruit productionof ‘Pink Caprice’.
Seed germination. This was conducted aspreviously reported (Deng et al., 2017). Ma-ture drupes were collected from each plant inthe earlier-described replicated field trials inBalm and Ft. Pierce, FL. Seeds were extract-ed, cleaned, and air-dried at each test site andgerminated at IRREC. Due to having fewfruit for ‘UF-1013-1’ and ‘Bloomify Red’,fruit from four harvests at each site werecombined before seed extraction. Seeds weregerminated in transparent polystyrene germi-nation boxes (Hoffman Manufacturing,Corvallis, OR) containing two sheets ofgermination paper (Anchor Paper Company,St. Paul, MN) moistened with 15 mL ofwater. Germination boxes were placed intemperature and light-controlled chambersequipped with cool-white fluorescent lamps(Model 818; Precision Scientific, Winches-ter, VA). The germination condition was 12 h
light at 25 �C (photosynthetic photon fluxwas 22 to 30 mmol·m–2·s–1 at shelf level)followed by 12 h dark at 15 �C. Germinationof seeds was monitored every other day for aperiod of 60 d. A seed was considered ger-minated when radicle emergence was$2.0 mm. Seeds were removed once germi-nation occurred to prevent inaccurate datacollection.
A subsample of seeds of ‘Pink Caprice’were also sent to a commercial seed testinglaboratory (Midwest Seed Services, Brook-ings, SD) for initial seed viability tests. Thedistal end of the cotyledon of each seed wascut off and seeds were stained overnight at30 �C in 1.0% tetrazolium (2,3,5-triphenylchloride). Seeds were considered viable if theentire embryo stained evenly. ‘UF-1013-1’and ‘Bloomify Red’ produced few or noseeds at either site and were therefore notsubjected to viability tests.
Seeds of ‘Pink Caprice’ showed an aver-age of 65.0% viability, germinated readily,with an average germination percentage of45.0% in 60 d (Deng et al., 2017). For ‘UF-1013-1’, three mature drupes were collectedfrom the Ft. Pierce trial over 4 months. Threeseeds were extracted, but all were abnormalwhen visually examined. Thus, there were noseeds from ‘UF-1013-1’ for seed viability orgermination tests.
FFI.The FFI for ‘Pink Caprice’ was 4.107(Deng et al., 2017). Because of the lack ofseed germination data, it was not possible tocalculate the FFI for ‘UF-1013-1’. However,on the basis of its triploidy and extremely lowfruit production, it was expected that the FFIfor ‘UF-1013-1’ would be close to 0 andsimilar to that of ‘Bloomify Red’.
Table 4. Plant height, width, and size index of ‘UF-1013-1’ compared with ‘Bloomify Red’ and ‘Pink Caprice’ grown in Florida in ground beds and full sun.
Trial site Cultivar
Plant ht (cm)z Plant width (cm)z Plant size indexz
2 MPT 5 MPT 2 MPT 5 MPT 2 MPT 5 MPT
Balm UF-1013-1 35.7 by 47.8 b 51.6 b 86.6 b 0.076 b 0.288 bBloomify Red 42.3 b 53.7 b 51.7 b 90.2 b 0.092 b 0.353 bPink Caprice 59.5 a 89.3 a 103.0 a 211.7 a 0.491 a 3.168 a
Ft. Pierce UF-1013-1 36.8 b 45.8 b 50.4 b 76.5 b 0.074 b 0.211 bBloomify Red 36.3 b 42.0 b 35.8 b 76.5 b 0.049 b 0.212 bPink Caprice 57.0 a 92.5 a 110.5 a 215.3 a 0.551 a 3.406 a
zPlant height measured from the ground level to the highest point of the plant; plant width measured in two perpendicular directions and the average of the twowidths reported. Plant size index (cubic meters) calculated using the following formula: size index = plant height (cm) · p · [plant width (cm) / 2)2 / 1,000,000,where p = 3.14. 2 or 5 MPT = 2 or 5 months posttransplant.yMeans with the same letter within columnswithin the trial sites are not significantly different by the Tukey’s honestly significant difference procedure atP < 0.05.
Table 5. Plant and flower intensity ratings of ‘UF-1013-1’ compared with ‘Bloomify Red’ and ‘Pink Caprice’ grown at the Gulf Coast Research and EducationCenter) in Balm, FL, and at the Indian River Research and Education Center in Fort Pierce, FL, in ground beds in full sun in Aug. through Nov. 2015.
Trial site Lantana cultivar
Plant ratingz Flower intensity ratingy
Eval. 1 Eval. 2 Eval. 3 Eval. 4 Eval. 1 Eval. 2 Eval. 3 Eval. 4
Balm UF-1013-1 4.7 ax 3.8 a 3.7 ab 3.0 a 2.7 a 1.7 b 3.3 b 1.5 abBloomify Red 3.8 ab 3.8 a 4.0 a 3.3 a 2.5 a 2.5 a 4.3 a 1.0 bPink Caprice 3.5 b 3.0 b 3.0 b 2.0 b 1.0 b 1.0 b 3.0 c 2.0 a
Ft. Pierce UF-1013-1 3.5 b 3.0 ab 3.0 b 2.8 NS 3.8 NS 3.3 ab 2.8 NS 2.3 bBloomify Red 3.0 b 2.0 b 3.0 b 2.8 3.0 1.8 b 2.8 2.0 bPink Caprice 5.0 a 4.3 a 4.0 a 2.0 3.8 3.8 a 4.0 3.0 a
zPlants were rated on a scale of 1 to 5, with 1 = performing very poorly and unacceptable, 3 = performing fairly and acceptable as ornamental plants, and 5 =performing outstandingly and highly desirable. Lantana plants were transplanted to ground plants in June 2015. The four evaluations were performed in Aug.(Eval. 1), Sept. (Eval. 2), Oct. (Eval. 3), and Nov. (Eval. 4), 2015, respectively.yFlower intensity was rated on a scale of 1 to 5, with 1 = 0% to 20%, 2 = 21% to 40%, 3 = 41% to 60%, 4 = 61% to 80%, and 5 = 81% to 100% of the maximumflower coverage of the plant. The four evaluations were performed in Aug. (Eval. 1), Sept. (Eval. 2), Oct. (Eval. 3), and Nov. (Eval. 4), 2015, respectively.xMeans with the same letter within columns within the trial sites are not significantly different by the least significant difference procedure at P < 0.05. NS = notsignificantly different by the Tukey’s honestly significant difference procedure at P < 0.05.
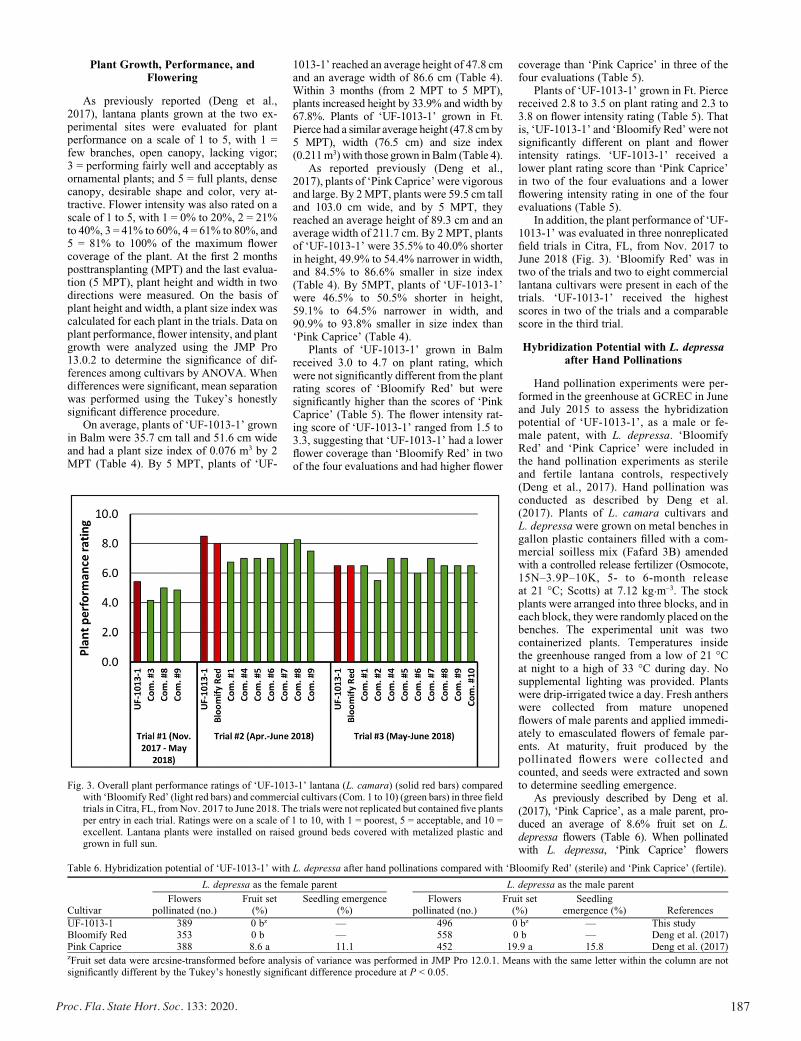
187Proc. Fla. State Hort. Soc. 133: 2020.
Plant Growth, Performance, andFlowering
As previously reported (Deng et al.,2017), lantana plants grown at the two ex-perimental sites were evaluated for plantperformance on a scale of 1 to 5, with 1 =few branches, open canopy, lacking vigor;3 = performing fairly well and acceptably asornamental plants; and 5 = full plants, densecanopy, desirable shape and color, very at-tractive. Flower intensity was also rated on ascale of 1 to 5, with 1 = 0% to 20%, 2 = 21%to 40%, 3 = 41% to 60%, 4 = 61% to 80%, and5 = 81% to 100% of the maximum flowercoverage of the plant. At the first 2 monthsposttransplanting (MPT) and the last evalua-tion (5 MPT), plant height and width in twodirections were measured. On the basis ofplant height and width, a plant size index wascalculated for each plant in the trials. Data onplant performance, flower intensity, and plantgrowth were analyzed using the JMP Pro13.0.2 to determine the significance of dif-ferences among cultivars by ANOVA. Whendifferences were significant, mean separationwas performed using the Tukey’s honestlysignificant difference procedure.
On average, plants of ‘UF-1013-1’ grownin Balm were 35.7 cm tall and 51.6 cm wideand had a plant size index of 0.076 m3 by 2MPT (Table 4). By 5 MPT, plants of ‘UF-
1013-1’ reached an average height of 47.8 cmand an average width of 86.6 cm (Table 4).Within 3 months (from 2 MPT to 5 MPT),plants increased height by 33.9% and width by67.8%. Plants of ‘UF-1013-1’ grown in Ft.Pierce had a similar average height (47.8 cm by5 MPT), width (76.5 cm) and size index(0.211m3)with those grown in Balm (Table 4).
As reported previously (Deng et al.,2017), plants of ‘Pink Caprice’ were vigorousand large. By 2MPT, plants were 59.5 cm talland 103.0 cm wide, and by 5 MPT, theyreached an average height of 89.3 cm and anaverage width of 211.7 cm. By 2MPT, plantsof ‘UF-1013-1’ were 35.5% to 40.0% shorterin height, 49.9% to 54.4% narrower in width,and 84.5% to 86.6% smaller in size index(Table 4). By 5MPT, plants of ‘UF-1013-1’were 46.5% to 50.5% shorter in height,59.1% to 64.5% narrower in width, and90.9% to 93.8% smaller in size index than‘Pink Caprice’ (Table 4).
Plants of ‘UF-1013-1’ grown in Balmreceived 3.0 to 4.7 on plant rating, whichwere not significantly different from the plantrating scores of ‘Bloomify Red’ but weresignificantly higher than the scores of ‘PinkCaprice’ (Table 5). The flower intensity rat-ing score of ‘UF-1013-1’ ranged from 1.5 to3.3, suggesting that ‘UF-1013-1’ had a lowerflower coverage than ‘Bloomify Red’ in twoof the four evaluations and had higher flower
coverage than ‘Pink Caprice’ in three of thefour evaluations (Table 5).
Plants of ‘UF-1013-1’ grown in Ft. Piercereceived 2.8 to 3.5 on plant rating and 2.3 to3.8 on flower intensity rating (Table 5). Thatis, ‘UF-1013-1’ and ‘Bloomify Red’ were notsignificantly different on plant and flowerintensity ratings. ‘UF-1013-1’ received alower plant rating score than ‘Pink Caprice’in two of the four evaluations and a lowerflowering intensity rating in one of the fourevaluations (Table 5).
In addition, the plant performance of ‘UF-1013-1’ was evaluated in three nonreplicatedfield trials in Citra, FL, from Nov. 2017 toJune 2018 (Fig. 3). ‘Bloomify Red’ was intwo of the trials and two to eight commerciallantana cultivars were present in each of thetrials. ‘UF-1013-1’ received the highestscores in two of the trials and a comparablescore in the third trial.
Hybridization Potential with L. depressaafter Hand Pollinations
Hand pollination experiments were per-formed in the greenhouse at GCREC in Juneand July 2015 to assess the hybridizationpotential of ‘UF-1013-1’, as a male or fe-male patent, with L. depressa. ‘BloomifyRed’ and ‘Pink Caprice’ were included inthe hand pollination experiments as sterileand fertile lantana controls, respectively(Deng et al., 2017). Hand pollination wasconducted as described by Deng et al.(2017). Plants of L. camara cultivars andL. depressa were grown on metal benches ingallon plastic containers filled with a com-mercial soilless mix (Fafard 3B) amendedwith a controlled release fertilizer (Osmocote,15N–3.9P–10K, 5- to 6-month releaseat 21 �C; Scotts) at 7.12 kg·m–3. The stockplants were arranged into three blocks, and ineach block, they were randomly placed on thebenches. The experimental unit was twocontainerized plants. Temperatures insidethe greenhouse ranged from a low of 21 �Cat night to a high of 33 �C during day. Nosupplemental lighting was provided. Plantswere drip-irrigated twice a day. Fresh antherswere collected from mature unopenedflowers of male parents and applied immedi-ately to emasculated flowers of female par-ents. At maturity, fruit produced by thepollinated flowers were collected andcounted, and seeds were extracted and sownto determine seedling emergence.
As previously described by Deng et al.(2017), ‘Pink Caprice’, as a male parent, pro-duced an average of 8.6% fruit set on L.depressa flowers (Table 6). When pollinatedwith L. depressa, ‘Pink Caprice’ flowers
Fig. 3. Overall plant performance ratings of ‘UF-1013-1’ lantana (L. camara) (solid red bars) comparedwith ‘Bloomify Red’ (light red bars) and commercial cultivars (Com. 1 to 10) (green bars) in three fieldtrials in Citra, FL, fromNov. 2017 to June 2018. The trials were not replicated but contained five plantsper entry in each trial. Ratings were on a scale of 1 to 10, with 1 = poorest, 5 = acceptable, and 10 =excellent. Lantana plants were installed on raised ground beds covered with metalized plastic andgrown in full sun.
Table 6. Hybridization potential of ‘UF-1013-1’ with L. depressa after hand pollinations compared with ‘Bloomify Red’ (sterile) and ‘Pink Caprice’ (fertile).
Cultivar
L. depressa as the female parent L. depressa as the male parent
Flowerspollinated (no.)
Fruit set(%)
Seedling emergence(%)
Flowerspollinated (no.)
Fruit set(%)
Seedlingemergence (%) References
UF-1013-1 389 0 bz — 496 0 bz — This studyBloomify Red 353 0 b — 558 0 b — Deng et al. (2017)Pink Caprice 388 8.6 a 11.1 452 19.9 a 15.8 Deng et al. (2017)zFruit set data were arcsine-transformed before analysis of variance was performed in JMP Pro 12.0.1. Means with the same letter within the column are notsignificantly different by the Tukey’s honestly significant difference procedure at P < 0.05.
188 Proc. Fla. State Hort. Soc. 133: 2020.
showed 19.9% fruit set (Table 6). Seeds fromcrosses between ‘Pink Caprice’ and L. depressaor reciprocal showed 11.1% or 15.8% seedlingemergence (Table 6). As a male parent, ‘Bloo-mify Red’ did not cause any fruit set on L.depressa flowers. Nor did it set any fruit afterhand pollination with L. depressa.
A total of 389 L. depressa flowers werepollinated with ‘UF-1013-1’, and none of thepollinated flowers set fruit, resulting in 0% fruitset (Table 6). When ‘UF-1013-1’ was used asthe female parent, it did not set any fruit after itwas hand pollinated with L. depressa. Thus,‘UF-1013-1’ did not hybridize with L. depressa(Table 6). These data confirm the high level ofmale and female infertility in ‘UF-1013-1’.
Conclusion
Plants of ‘UF-1013-1’ are of moderatevigor, have an excellent branching habitand form a dense, round canopy. Cuttingsproduce high-quality flowering plants insmall and large containers and perform wellin the landscape. Flowers of ‘UF-1013-1’are yellow/bright red. These attributesmake ‘UF-1013-1’ a desirable replacementof existing fertile lantana cultivars.
Compared with ‘Pink Caprice’, a L. camaracultivar that is the closest to the species’ resi-dent taxon (wild or naturalized type), the pollenstainability of ‘UF-1013-1’ has been reducedby at least 95%. This new triploid cultivar didnot cause fruit set on L. depressa flowers orset any fruit when hand-pollinated with L.depressa. Fruit production of this triploid hasbeen reduced by >99%. Generally ‘UF-1013-1’did not produce viable seeds in replicated fieldtrials. The high level ofmale and female infertilityof this triploid was stable from Balm to Ft. Pierceand Citra. These results indicate that ‘UF-1013-1’has little potential to hybridize with L. depressaand to produce viable interspecific progeny.
Availability
‘UF-1013-1’ has been licensed to ProvenWinners for commercial production andnamed Luscious� Red Zone�. A plant
patent will be applied for this lantana culti-var by the Florida Agricultural ExperimentStation. Production of this cultivar will needa licensing agreement with the FloridaFoundation Seed Producers, Inc. (http://www.ffsp.net/), P.O. Box 309, Greenwood,FL 32443. Information about plant materialand propagation agreement can be obtainedfrom the Florida Foundation Seed Pro-ducers, Inc.
Literature Cited
American Horticultural Society (AHS). 1998.Publications—Heat zone finder. 26 Feb.2011. <http://www.ahs.org/publications/heat_zone_finder.htm>.
Bachman, G.R. 2018. Reliable lantana blooms insummer landscapes. Growing America. 22Aug. 2019. <http://www.growingamerica.com/news/2018/03/reliable-lantana-blooms-summer-landscapes>.
Bechtloff, A., C.R. Adams, S.B. Wilson, Z. Deng,and C. Wise. 2019. Insights from SoutheasternUS nursery growers guide research for sterileornamental cultivars. J. Environ. Hort. 37(1):9–18.
Cao, Z., Z. Deng, and M. McLaughlin. 2014.Interspecific genome size and chromosomenumber variation sheds new light on speciesclassification and evolution of Caladium(Araceae). J. Amer. Soc. Hort. Sci. 49:449–459.
Chen, C., C.H. Bock, W.R. Okie, F.G. Gmitter, Jr.,S. Jung, D. Main, T.G. Beckman, and B.W.Wood. 2014. Genome-wide characterizationand selection of expressed sequence tag simplesequence repeat primers for optimized markerdistribution and reliability in peach. TreeGenet. Genomes 10:1271–1279.
Czarnecki, D.M., II. 2011. Genetic sterilization andreproductive biology of Lantana camara. PhDDiss., Univ. of Fla., Gainesville.
Czarnecki, D.M., II, A. Hershberger, C.D. Robacker,and Z. Deng. 2014. Ploidy level and pollenstainability of Lantana camara cultivars andbreeding lines. HortScience 49:1271–1276.
Czarnecki, D.M., II, S.B. Wilson, G.W. Knox, R.Freyre, and Z. Deng. 2012. UF-T3 and UF-T4 –Two sterile Lantana camara cultivars. Hort-Science 47:132–137.
Dehgan, B. and C.L. Guy. 2004. Reproductivebiology and invasive potential of Lantana
camara. 1 Aug. 2019. <https://portal.nifa.usda.gov/web/crisprojectpages/0191420-reproductive-biology-and-invasive-potential-of-lantana-camara-cultivars.html>.
Deng, Z., S.B. Wilson, X. Ying, and D.M.Czarnecki. 2017. Infertile Lantana camaracultivars UF-1011-2 and UF-1013A-2A.HortScience 52:652–657.
Dole�zel, J., J. Greilhuber, and J. Suda. 2007.Estimation of nuclear DNA content in plantsusing flow cytometry. Nat. Protoc. 2:2233–2244.
Florida Exotic Pest Plant Council (FLEPPC). 2019.Florida Exotic Pest Plant Council’s 2019 list ofinvasive plant species. 26 Aug. 2019. <http://fleppc.org/>.
Georgia Exotic Pest Plant Council (GA-LEPPC).2019. List of non-native invasive plants inGeorgia. 22 Aug. 2019. <https://www.gaeppc.org/list/>.
Gong, L. and Z. Deng. 2011. Development andcharacterization of microsatellite markers forcaladiums (Caladium Vent.). Plant Breed.130(5).
Hammer, R.L. 2004. The Lantana mess—A criticallook at the genus in Florida. The Palmetto23(1):21–23.
Royal Horticultural Society. 1986. RHS ColourChart. Royal Hort. Soc., London.
Sanders, R.W. 1987. Identity of Lantana depressaand L. ovatifolia (Verbenaceae) of Florida andthe Bahamas. Syst. Bot. 12:44–60.
Sanders, R.W. 2001. The genera of Verbenaceae inthe Southeastern United States. Harv. Pap. Bot.5:303–358.
Schoellhorn, R. 2004. Lantana—summer colorthat’s tough as nails. GPN—GreenhouseProduct News 14(3):14–16. <https://gpnmag.com/article/lantana-summer-color-thats-tough-nails/>.
Swearingen J. and C. Bargeron. 2016. Invasiveplant atlas of the United States. University ofGeorgia Center for Invasive Species and Eco-system Health. 22 Aug. 2019. <http://www.in-vasiveplantatlas.org/>.
USDA Plant Hardiness Zone Map. 17 Aug. 2019.<https://planthardiness.ars.usda.gov/PHZMWeb/>.
Wirth, F.F., K.J. Davis, and S.B. Wilson. 2004.Florida nursery sales and economic impacts of14 potentially invasive ornamental plant spe-cies. J. Environ. Hort. 22:12–16.
This paper was presented during the 2020 FSHS Annual Meeting and originally published in HortScience [HORTSCIENCE 55(6):953–958. 2020. https://doi.org/10.21273/HORTSCI14911-20].
The paper is included in this Proceedings as a reprint (with permission).
189Proc. Fla. State Hort. Soc. 133: 2020.
Proc. Fla. State Hort. Soc. 133:189–194. 2020.
Ornamental, Garden & Landscape Section
Morphological and CytologicalCharacterization of Five Porterweed(Stachytarpheta) SelectionsRenjuan QianDepartment of Environmental Horticulture, Gulf Coast Research and Education Center, University of Florida, Institute of Food and Agricultural Sciences (IFAS), Wimauma, FL 33598; and Zhejiang Institute of Subtropical Crops, 334 Xueshan Road, Wenzhou, Zhejiang 325005, China
S. Brooks ParrishDepartment of Environmental Horticulture, Gulf Coast Research and Education Center, University of Florida, IFAS, Wimauma, FL 33598
Sandra B. WilsonDepartment of Environmental Horticulture, University of Florida, IFAS, Gainesville, FL 32611
Gary W. KnoxDepartment of Environmental Horticulture, North Florida Research andEducation Center, University of Florida, IFAS, Quincy, FL 32351
Zhanao DengDepartment of Environmental Horticulture, Gulf Coast Research andEducation Center, University of Florida, IFAS, Wimauma, FL 33598Additional index words. chromosome, DNA content, growth habit, ploidy, pollen, pollen stainability
Abstract. Porterweed (Stachytarpheta spp.), a member of the verbena family, is frequently used in pollinator gardens to attract butterflies. This study was conducted to assess the morpho-logical features, pollen stainability and morphology, nuclear DNA content, and chromosome number of five porterweed selections. Coral porterweed (S. mutabilis), ‘Naples Lilac’ porterweed (S. cayennensis 3 S. mutabilis ‘Violacea’), and nettleleaf porterweed (S. cayennensis) had the largest plant heights. Flower number was significantly higher in nettleleaf porterweed, jamaican porterweed (S. jamaicensis), and U*J3-2 porterweed (S. cayennensis 3 S. jamaicensis), with an average of 65–72 flowers per inflorescence. Internode length and flower width of jamaican porterweed had much lower values than the other selections. Coral porterweed recorded the lowest pollen stainability with only 10.6% stainability, but it had the largest relative pollen production. ‘Naples Lilac’ porterweed had the highest DNA content with an average of 3.79 pg/2C, like jamaican porterweed with 3.73 pg/2C. Ploidy levels varied between selections, and the basic chromosome number was x = 28. Coral, jamaican, and ‘Naples Lilac’ porterweed had 2n = 6x = 168 chromosomes, first reported in this genus. These results provide a guide and a new tool to distinguish native and non-native porterweed and may aid future breeding toward the production of noninvasive cultivars.
Porterweed (Stachytarpheta spp.) at-tracts numerous butterfly species and otherpollinators and is often planted in pollinatorgardens (Gilman, 2014). It is a low-maintenanceplant with high drought tolerance and iscommonly used in the southern UnitedStates in cold hardiness zones 9b through11 (Lamborn, 2017). Porterweed producesflowers from summer through fall beforedying back during winter. The Stachytarphetagenus is vast, with 133 species identified inAustralia (Munir, 1992) and 79 species clas-sified in Brazil (Atkins, 2005). Seed is read-ily available to the public and can be foundfrommany nurseries and online sellers. In thewild, seed is spread through the wind, vehi-cles, and machinery (The State of Queensland,2016).
In Florida, the most sold porterweed spe-cies are jamaican porterweed (Stachytar-pheta jamaicensis), nettleleaf porterweed(Stachytarpheta cayennensis), coral porter-weed (Stachytarpheta mutabilis), purple por-terweed (Stachytarpheta frantzii), and dwarfred porterweed (Stachytarpheta sanguinea)(http://plantANT.com). Jamaican porterweedis native to dunes, shell middens, pine rock-lands, and disturbed sites of central andsouthern Florida (Wunderlin and Hansen,2011); whereas nettleleaf porterweed wasintroduced to the United States from Centraland South America and has escaped cultiva-tion (USDA, NRCS, 2020). While it has notyet altered native plant communities in Flor-ida, nettleleaf porterweed is listed as a Cat-egory II invasive plant by the Florida ExoticPlant Council (FLEPPC) due to its increasedabundance or frequency (FLEPPC, 2019).The University of Florida Institute of Foodand Agricultural Sciences’s (UF/IFAS) statusassessment of nonnative plants in Florida’snatural areas is to ‘‘use with caution’’ (UF/IFAS Assessment, 2020). Hybridization po-tential between the native and invasive con-geners is of concern. For example, in Florida,the introduced lantana (Lantana camara) hashybridized with the native pineland lantana(Lantana depressa), contaminating the genepool of the native species (Hammer, 2004;Sanders, 1987). Proper identification anddistinction between native and invasive spe-cies are crucial components of reducing thespread of invasive ornamentals (Steppe et al.,2019). Although plant experts could observesome differences between jamaican and net-tleleaf porterweed (Wunderlin and Hansen,2011), these two species share a lot of sim-ilarities in plant morphology. These similar-ities make it difficult to identify them reliablybefore making decisions for invasive plantmanagement, especially for those who are notfamiliar with porterweed plants.
In prior work, Wilson et al. (2009) eval-uated seed production and viability of eightporterweed selections in Florida and foundthree of them to be highly female sterile.Female sterile porterweed included the fol-lowing: ‘Violacea’ porterweed (Stachytar-pheta mutabilis), ‘Naples Lilac’ porterweed(S. cayennensis · S.mutabilis ‘Violacea’), and‘Mario Pollsa’ porterweed (Stachytarphetaspp.). Through controlled crosses, the poten-tial for nettleleaf porterweed to hybridize withjamaican porterweed was realized. However,there is a lack of information, such as ploidylevel and pollen stainability on these porter-weeds, which would be useful data in thebreeding of noninvasive plants. Pollen staininghas become a reliable method of determiningpollen viability in hybridization studies(Czarnecki et al., 2014). Other porterweedstudies have described pollen morphologyand stainability for S. angustifolia, S. cayen-nensis, S. chamissonis, S. indica, and S. sericea(Adedeji, 2010; Atkins, 1991; Solanke et al.,2019). These studies revealed diverse mor-phologies and stainability of pollen grains.
Chromosome number and ploidy level areimportant plant characteristics; the latter is an
Received for publication 24 Nov. 2020. Acceptedfor publication 21 Dec. 2020.Published online 22 January 2021.This project was funded in part by the U.S. Depart-ment of Agriculture, National Institute of Food andAgriculture (USDA/NIFA) Hatch projects (projectsFLA-GCR-005065 and FLA-GCC-005507).We gratefully acknowledge Boynton Botanicals(Boynton Beach, FL) for their original donation ofsome of the porterweed selections used in this study.We thank Joyce Jones, Gail Bowman, Zhe Cao, andWeining Wang for their assistance. We greatly ap-preciated that Drs. Kim Moore, Alfred Huo, andKevin Begcy critically reviewed this manuscript be-fore its submission and provided valuable comments.R.Q. is a visiting scholar at the University of Florida.Z.D. is the corresponding author. E-mail: [email protected] is an open access article distributed under theCC BY-NC-ND license (https://creativecommons.org/licenses/by-nc-nd/4.0/).
190 Proc. Fla. State Hort. Soc. 133: 2020.
important factor in determining plant fertilityand hybridization potential. It was previouslyreported that the porterweed genus has vary-ing numbers of chromosomes, from 2n = 18to 2n =160, and varying levels of ploidy(Fedorov, 1974; Sanders, 2001). Flow cytom-etry has become a widely used tool to deter-mine nuclear DNA content and ploidy levelof plants due to high sample throughput(Dole�zel et al., 2007). Polyploids have beenidentified in porterweed using flow cytome-try, but exact ploidy levels need to be deter-mined or confirmed by chromosome counting(Wilson et al., 2009). To accurately interpretthe ploidy level based on nuclear DNA con-tent, somatic chromosomes must be deter-mined to provide references for comparingnuclear DNA content (Dole�zel et al., 2007).
The purpose of this study was to charac-terize morphological and cytological featuresof five representative porterweed selections.The main objective was to count their chro-mosomes in root tip cells, determine nuclearDNA contents by flow cytometrical analysisof leaf tissues, and understand the relation-ship between ploidy level and nuclear DNAcontent in porterweed. A secondary objectivewas to assess pollen morphology and stain-ability among these porterweed selections.This information, along with complete leafand flower morphological profiling, will im-prove identification, promote the use of na-tive porterweed, and control the furtherspread of invasive porterweed.
Materials and Methods
Plant materials. Five porterweed selec-tions were evaluated in this study. Coral,jamaican, ‘Naples Lilac’, and nettleleaf por-terweed plants were obtained from a previousstudy conducted by Wilson et al. (2009).U*J3-2 resulted from controlled crossing ofS. cayennensis and S. jamaicensis in a green-house located at the UF/IFAS Gulf CoastResearch and Education Center (Wimauma,FL). Vegetatively propagated porterweedplants were grown in 3.8-L plastic containersfilled with Fafard 2P mix (Florida PottingSoil, Orlando, FL). Container-grown plantswere hand-watered daily and fertilized witha controlled-release fertilizer (Osmocote;15N–3.9P–10K, 5 to 6 months release at21 �C; The Scotts Company, Marysville,OH) at 6.51 kg·m–3. Plants were grown be-tween July and Nov. 2014 under natural lightin a temperature-controlled greenhouse witha temperature of 29.4 �C during the day and21.1 �C at night.
Morphological characterization. Mature
(Fowler & NSK Max-Cal, Japan). Five rep-licates (five individual plants) were accessedfor each porterweed selection.
Determining nuclear DNA content. AnAccuri C6 flow cytometer (BD Biosciences,San Jose, CA) at the UF’s InterdisciplinaryCenter for Biotechnology Research (ICBR,Gainesville, FL) was used to determine nu-clear DNA content. The flow cytometry pro-tocol recommended by Dole�zel et al. (2007)was followed using rye [Secale cereal‘Da�nkovsk�e’ (16.19 pg/2C)] as the internalstandard. One mL of the LBO1 lysis buffer(Dole�zel et al., 2007) was added to a petridish, and �30 mg of tender leaf tissue ofporterweed and rye were chopped togetherusing a razor blade to release nuclei. Thenuclei preparation was filtered through anylon mesh (50 mm) into a loading tube,and then 50 mL of the DNA fluorochromepropidium iodide (Sigma-Aldrich; 1 mg·mL–1)and RNase (Sigma-Aldrich; 1 mg·mL–1)were added. The nuclei-containing solutionwas fed into the flow cytometer. Three flowcytometrical analyses were run for eachporterweed selection, and a minimum of3000 nuclei were counted per run. NuclearDNA content (pg/2C) was calculated accord-ing to Dole�zel et al. (2007): sample DNAcontent = nuclear DNA content of internalstandard (‘Da�nkovsk�e’ rye) · (mean fluores-cence value of sample O mean fluorescencevalue of internal standard).
Squashing and counting chromosomes.The cell wall degradation hypotonic methodof Chen et al. (1982) was used. Before 10:00AM, vigorously growing root tips (1 cm) wereexcised from porterweed plants and treated in0.002 M 8-hydroxyquinoline for 4 h in thedark. Root tips were fixed in a fixative solu-tion (3 methanol: 1 acetic acid, v/v) for atleast 2 h. The fixed roots were rinsed threetimes in deionized water before a muchsmaller section of the root tips (�1 mm)was excised and macerated in an enzymesolution containing 2.5% cellulase and 2.5%pectinase for 3 h 15min inside an incubator at27 �C. After incubation, macerated root tipswere washed in deionized water for 10 minand then fixed in a fixative solution (3 meth-anol: 1 acetic acid, v/v) for 0.5 h. Root tipswere squashed in a drop of the fixativesolution on a pre-chilled microscopic glassslide. The prepared slide was heated over analcohol burner for a few seconds and stainedwith a 2.5% Giemsa solution for 10 min.Stained glass slides were rinsed in distilledwater, air-dried, and then observed under aBX41 microscope with an Olympus Q-color5 camera (Olympus America Inc., Melville,NY). Darkly stained and well-spread chro-mosomes were photographed at ·1000 mag-nification.
Examining and staining pollen grains.Flowers were collected just before openingand dissected to reveal anther sacs. Pre-dehiscent anthers were removed and im-mersed in 100 mL of cotton blue stain inmicrocentrifuge tubes. Tubes were placed ina 65 �C water bath where anthers werestained overnight. Stained anthers were
rinsed three times in water, squashed in 50ml of 80% glycerol on a microscopic glassslide, and then covered with a glass coverslip.A BX41 microscope with an Olympus Q-color 5 camera (Olympus America Inc.) wasused to observe pollen grains at ·40 and ·100magnification. Images of pollen grains weretaken and analyzed to calculate pollen stain-ability. Pollen grains stained dark blue wereconsidered stainable. Measurements of pol-len grains were taken using ImageJ 1.52s(U.S. National Institutes of Health, Bethesda,MD). At least 12 anthers from three inflores-cences were analyzed for each porterweedselection. Two slides were prepared for eachselection, and three fields of view wereselected at random and photographed. Eachpollen grain was counted and used to calcu-late relative pollen stainability. Pollen graindensity was compared with other selectionsfor relative production.
Statistical analysis. Analysis of variancewas performed in JMP Pro 15.0.0 (SASInstitute, Cary, NC) to determine if therewere significant differences among porter-weed selections in plant height and width,leaf length and width, inflorescence number,flower number, flower width, and pollenstainability. When differences were signifi-cant at P # 0.05, mean separation analysiswas performed in JMP Pro 15.0.0 using theTukey–Kramer honestly significant differ-ence procedure at P # 0.05. Linear regres-sion was performed using JMP Pro 15.0.0 todetermine if a correlation existed betweentwo traits. The Pearson correlation test wasused to calculate the correlation coefficient.
Results and Discussion
Morphological characterization. Re-markable variability was observed amongthe morphological features of the five porter-weed selections. Porterweed growth habitswere categorized as upright, semiupright, andprostrate, with two selections each fallinginto upright and prostrate, and nettleleafidentified as semiupright (Table 1, Fig. 1).Coral and ‘Naples Lilac’ plants were uprightwith shoots extending upwards. Coral porter-weed showed little branching with pink-to-coral flowers, while ‘Naples Lilac’ had afuller appearance with purple flowers(Fig. 2A). Nettleleaf porterweed exhibited asemiupright growth habit with darker-purpleflowers. Plants of this selection grew partiallyto the side of the pot, extending away fromthe base and partially extending upward.U*J3-2 and jamaican porterweed were bothprostrate with low, spreading growth. Bothselections had high branching, but jamaicanporterweed filled the area surrounding allsides of the pot instead of just one side.U*J3-2 displayed purple flowers and jamai-can porterweed had light purple. Leaf mor-phology was identified as ovate for allselections (Fig. 2B). Classification of thesegrowth habits and flower colors alone pro-vides substantial clues to identifying theseporterweed selections. For example, distin-guishing invasive nettleleaf from the native
flowering plants (�100 d after cuttings were made) were used to collect plant morpholog-ical data. Growth habit was identified as upright, semiupright, or prostrate. Plant height, plant width for two perpendicular axes, and inflorescence length were recorded using a standard wooden meter stick. Leaf length, leaf width, and internode length were measured using a stainless-steel ruler. Inter-node diameter and flower width were deter-mined using an electronic digital caliper
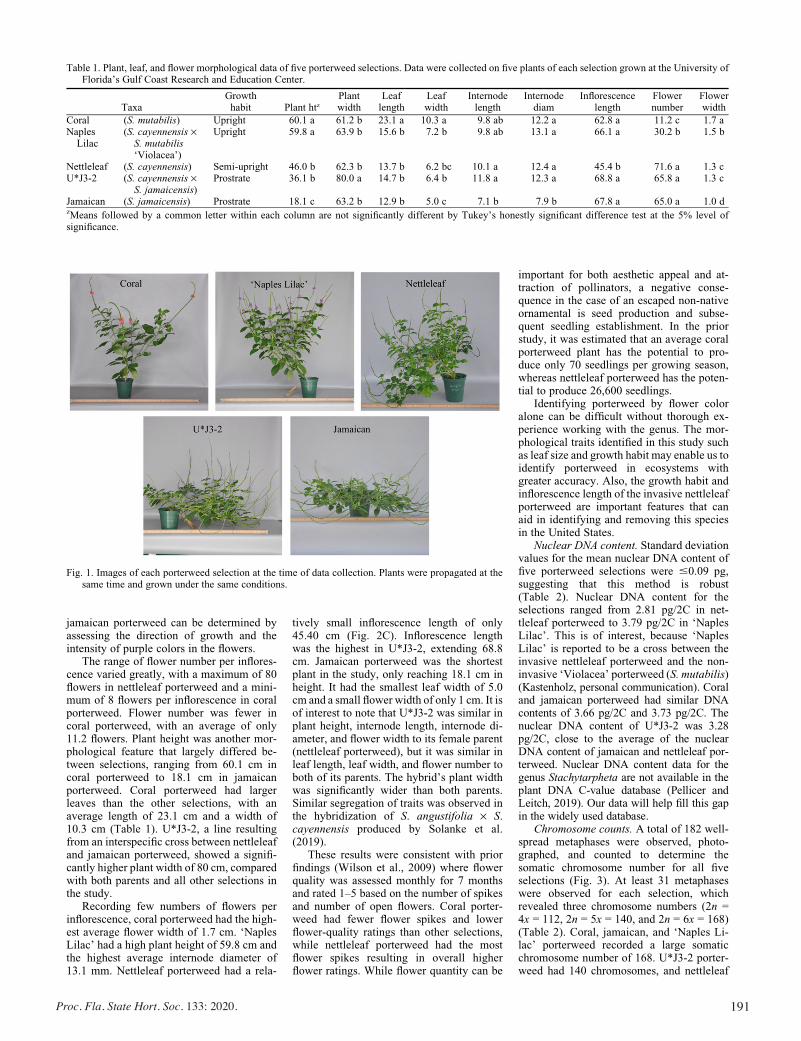
191Proc. Fla. State Hort. Soc. 133: 2020.
jamaican porterweed can be determined byassessing the direction of growth and theintensity of purple colors in the flowers.
The range of flower number per inflores-cence varied greatly, with a maximum of 80flowers in nettleleaf porterweed and a mini-mum of 8 flowers per inflorescence in coralporterweed. Flower number was fewer incoral porterweed, with an average of only11.2 flowers. Plant height was another mor-phological feature that largely differed be-tween selections, ranging from 60.1 cm incoral porterweed to 18.1 cm in jamaicanporterweed. Coral porterweed had largerleaves than the other selections, with anaverage length of 23.1 cm and a width of10.3 cm (Table 1). U*J3-2, a line resultingfrom an interspecific cross between nettleleafand jamaican porterweed, showed a signifi-cantly higher plant width of 80 cm, comparedwith both parents and all other selections inthe study.
Recording few numbers of flowers perinflorescence, coral porterweed had the high-est average flower width of 1.7 cm. ‘NaplesLilac’ had a high plant height of 59.8 cm andthe highest average internode diameter of13.1 mm. Nettleleaf porterweed had a rela-
tively small inflorescence length of only45.40 cm (Fig. 2C). Inflorescence lengthwas the highest in U*J3-2, extending 68.8cm. Jamaican porterweed was the shortestplant in the study, only reaching 18.1 cm inheight. It had the smallest leaf width of 5.0cm and a small flower width of only 1 cm. It isof interest to note that U*J3-2 was similar inplant height, internode length, internode di-ameter, and flower width to its female parent(nettleleaf porterweed), but it was similar inleaf length, leaf width, and flower number toboth of its parents. The hybrid’s plant widthwas significantly wider than both parents.Similar segregation of traits was observed inthe hybridization of S. angustifolia · S.cayennensis produced by Solanke et al.(2019).
These results were consistent with priorfindings (Wilson et al., 2009) where flowerquality was assessed monthly for 7 monthsand rated 1–5 based on the number of spikesand number of open flowers. Coral porter-weed had fewer flower spikes and lowerflower-quality ratings than other selections,while nettleleaf porterweed had the mostflower spikes resulting in overall higherflower ratings. While flower quantity can be
important for both aesthetic appeal and at-traction of pollinators, a negative conse-quence in the case of an escaped non-nativeornamental is seed production and subse-quent seedling establishment. In the priorstudy, it was estimated that an average coralporterweed plant has the potential to pro-duce only 70 seedlings per growing season,whereas nettleleaf porterweed has the poten-tial to produce 26,600 seedlings.
Identifying porterweed by flower coloralone can be difficult without thorough ex-perience working with the genus. The mor-phological traits identified in this study suchas leaf size and growth habit may enable us toidentify porterweed in ecosystems withgreater accuracy. Also, the growth habit andinflorescence length of the invasive nettleleafporterweed are important features that canaid in identifying and removing this speciesin the United States.
Nuclear DNA content. Standard deviationvalues for the mean nuclear DNA content offive porterweed selections were #0.09 pg,suggesting that this method is robust(Table 2). Nuclear DNA content for theselections ranged from 2.81 pg/2C in net-tleleaf porterweed to 3.79 pg/2C in ‘NaplesLilac’. This is of interest, because ‘NaplesLilac’ is reported to be a cross between theinvasive nettleleaf porterweed and the non-invasive ‘Violacea’ porterweed (S. mutabilis)(Kastenholz, personal communication). Coraland jamaican porterweed had similar DNAcontents of 3.66 pg/2C and 3.73 pg/2C. Thenuclear DNA content of U*J3-2 was 3.28pg/2C, close to the average of the nuclearDNA content of jamaican and nettleleaf por-terweed. Nuclear DNA content data for thegenus Stachytarpheta are not available in theplant DNA C-value database (Pellicer andLeitch, 2019). Our data will help fill this gapin the widely used database.
Chromosome counts. A total of 182 well-spread metaphases were observed, photo-graphed, and counted to determine thesomatic chromosome number for all fiveselections (Fig. 3). At least 31 metaphaseswere observed for each selection, whichrevealed three chromosome numbers (2n =4x = 112, 2n = 5x = 140, and 2n = 6x = 168)(Table 2). Coral, jamaican, and ‘Naples Li-lac’ porterweed recorded a large somaticchromosome number of 168. U*J3-2 porter-weed had 140 chromosomes, and nettleleaf
Table 1. Plant, leaf, and flower morphological data of five porterweed selections. Data were collected on five plants of each selection grown at the University ofFlorida’s Gulf Coast Research and Education Center.
TaxaGrowthhabit Plant htz
Plantwidth
Leaflength
Leafwidth
Internodelength
Internodediam
Inflorescencelength
Flowernumber
Flowerwidth
Coral (S. mutabilis) Upright 60.1 a 61.2 b 23.1 a 10.3 a 9.8 ab 12.2 a 62.8 a 11.2 c 1.7 aNaplesLilac
(S. cayennensis ·S. mutabilis‘Violacea’)
Upright 59.8 a 63.9 b 15.6 b 7.2 b 9.8 ab 13.1 a 66.1 a 30.2 b 1.5 b
Nettleleaf (S. cayennensis) Semi-upright 46.0 b 62.3 b 13.7 b 6.2 bc 10.1 a 12.4 a 45.4 b 71.6 a 1.3 cU*J3-2 (S. cayennensis ·
S. jamaicensis)Prostrate 36.1 b 80.0 a 14.7 b 6.4 b 11.8 a 12.3 a 68.8 a 65.8 a 1.3 c
Jamaican (S. jamaicensis) Prostrate 18.1 c 63.2 b 12.9 b 5.0 c 7.1 b 7.9 b 67.8 a 65.0 a 1.0 dzMeans followed by a common letter within each column are not significantly different by Tukey’s honestly significant difference test at the 5% level ofsignificance.
Fig. 1. Images of each porterweed selection at the time of data collection. Plants were propagated at thesame time and grown under the same conditions.
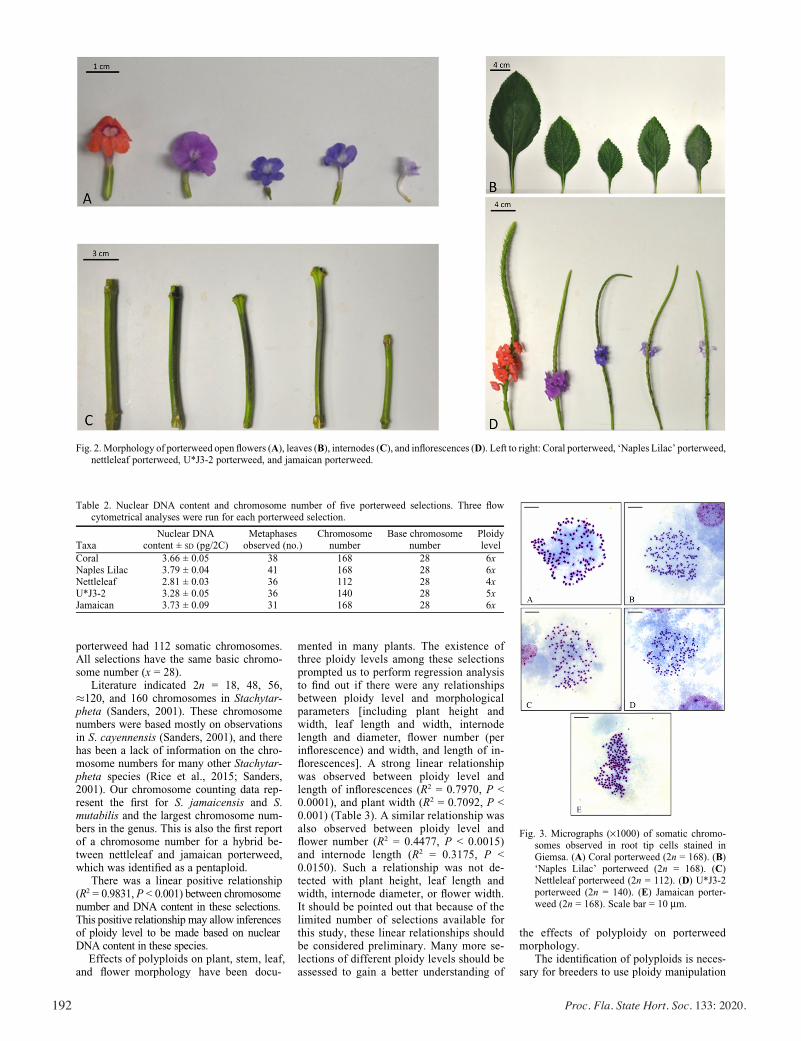
192 Proc. Fla. State Hort. Soc. 133: 2020.
mented in many plants. The existence ofthree ploidy levels among these selectionsprompted us to perform regression analysisto find out if there were any relationshipsbetween ploidy level and morphologicalparameters [including plant height andwidth, leaf length and width, internodelength and diameter, flower number (perinflorescence) and width, and length of in-florescences]. A strong linear relationshipwas observed between ploidy level andlength of inflorescences (R2 = 0.7970, P <0.0001), and plant width (R2 = 0.7092, P <0.001) (Table 3). A similar relationship wasalso observed between ploidy level andflower number (R2 = 0.4477, P < 0.0015)and internode length (R2 = 0.3175, P <0.0150). Such a relationship was not de-tected with plant height, leaf length andwidth, internode diameter, or flower width.It should be pointed out that because of thelimited number of selections available forthis study, these linear relationships shouldbe considered preliminary. Many more se-lections of different ploidy levels should beassessed to gain a better understanding of
the effects of polyploidy on porterweedmorphology.
The identification of polyploids is neces-sary for breeders to use ploidy manipulation
Fig. 2. Morphology of porterweed open flowers (A), leaves (B), internodes (C), and inflorescences (D). Left to right: Coral porterweed, ‘Naples Lilac’ porterweed,nettleleaf porterweed, U*J3-2 porterweed, and jamaican porterweed.
Table 2. Nuclear DNA content and chromosome number of five porterweed selections. Three flowcytometrical analyses were run for each porterweed selection.
TaxaNuclear DNA
content ± SD (pg/2C)Metaphases
observed (no.)Chromosome
numberBase chromosome
numberPloidylevel
Coral 3.66 ± 0.05 38 168 28 6xNaples Lilac 3.79 ± 0.04 41 168 28 6xNettleleaf 2.81 ± 0.03 36 112 28 4xU*J3-2 3.28 ± 0.05 36 140 28 5xJamaican 3.73 ± 0.09 31 168 28 6x
Fig. 3. Micrographs (·1000) of somatic chromo-somes observed in root tip cells stained inGiemsa. (A) Coral porterweed (2n = 168). (B)‘Naples Lilac’ porterweed (2n = 168). (C)Nettleleaf porterweed (2n = 112). (D) U*J3-2porterweed (2n = 140). (E) Jamaican porter-weed (2n = 168). Scale bar = 10 mm.
porterweed had 112 somatic chromosomes. All selections have the same basic chromo-some number (x = 28).
Literature indicated 2n = 18, 48, 56, �120, and 160 chromosomes in Stachytar-pheta (Sanders, 2001). These chromosome numbers were based mostly on observations in S. cayennensis (Sanders, 2001), and there has been a lack of information on the chro-mosome numbers for many other Stachytar-pheta species (Rice et al., 2015; Sanders, 2001). Our chromosome counting data rep-resent the first for S. jamaicensis and S. mutabilis and the largest chromosome num-bers in the genus. This is also the first report of a chromosome number for a hybrid be-tween nettleleaf and jamaican porterweed, which was identified as a pentaploid.
There was a linear positive relationship (R2 = 0.9831, P < 0.001) between chromosome number and DNA content in these selections. This positive relationship may allow inferences of ploidy level to be made based on nuclear DNA content in these species. Effects of polyploids on plant, stem, leaf, and flower morphology have been docu-
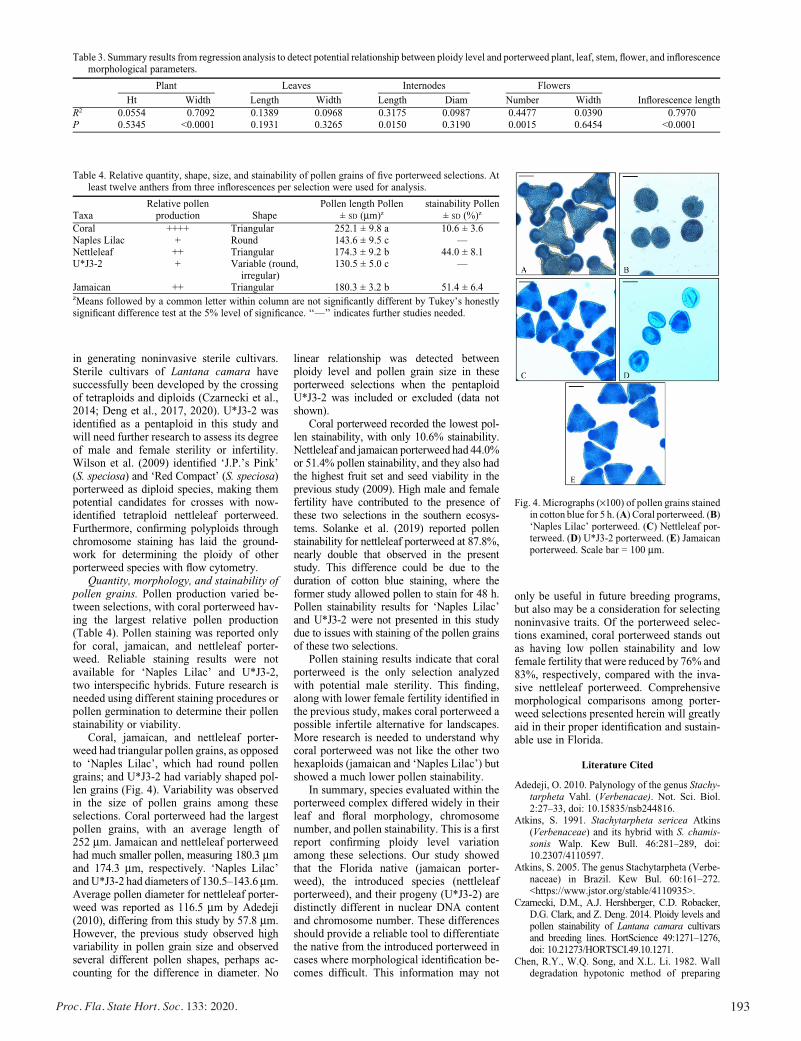
193Proc. Fla. State Hort. Soc. 133: 2020.
in generating noninvasive sterile cultivars.Sterile cultivars of Lantana camara havesuccessfully been developed by the crossingof tetraploids and diploids (Czarnecki et al.,2014; Deng et al., 2017, 2020). U*J3-2 wasidentified as a pentaploid in this study andwill need further research to assess its degreeof male and female sterility or infertility.Wilson et al. (2009) identified ‘J.P.’s Pink’(S. speciosa) and ‘Red Compact’ (S. speciosa)porterweed as diploid species, making thempotential candidates for crosses with now-identified tetraploid nettleleaf porterweed.Furthermore, confirming polyploids throughchromosome staining has laid the ground-work for determining the ploidy of otherporterweed species with flow cytometry.
Quantity, morphology, and stainability ofpollen grains. Pollen production varied be-tween selections, with coral porterweed hav-ing the largest relative pollen production(Table 4). Pollen staining was reported onlyfor coral, jamaican, and nettleleaf porter-weed. Reliable staining results were notavailable for ‘Naples Lilac’ and U*J3-2,two interspecific hybrids. Future research isneeded using different staining procedures orpollen germination to determine their pollenstainability or viability.
Coral, jamaican, and nettleleaf porter-weed had triangular pollen grains, as opposedto ‘Naples Lilac’, which had round pollengrains; and U*J3-2 had variably shaped pol-len grains (Fig. 4). Variability was observedin the size of pollen grains among theseselections. Coral porterweed had the largestpollen grains, with an average length of252 mm. Jamaican and nettleleaf porterweedhad much smaller pollen, measuring 180.3 mmand 174.3 mm, respectively. ‘Naples Lilac’and U*J3-2 had diameters of 130.5–143.6 mm.Average pollen diameter for nettleleaf porter-weed was reported as 116.5 mm by Adedeji(2010), differing from this study by 57.8 mm.However, the previous study observed highvariability in pollen grain size and observedseveral different pollen shapes, perhaps ac-counting for the difference in diameter. No
linear relationship was detected betweenploidy level and pollen grain size in theseporterweed selections when the pentaploidU*J3-2 was included or excluded (data notshown).
Coral porterweed recorded the lowest pol-len stainability, with only 10.6% stainability.Nettleleaf and jamaican porterweed had 44.0%or 51.4% pollen stainability, and they also hadthe highest fruit set and seed viability in theprevious study (2009). High male and femalefertility have contributed to the presence ofthese two selections in the southern ecosys-tems. Solanke et al. (2019) reported pollenstainability for nettleleaf porterweed at 87.8%,nearly double that observed in the presentstudy. This difference could be due to theduration of cotton blue staining, where theformer study allowed pollen to stain for 48 h.Pollen stainability results for ‘Naples Lilac’and U*J3-2 were not presented in this studydue to issues with staining of the pollen grainsof these two selections.
Pollen staining results indicate that coralporterweed is the only selection analyzedwith potential male sterility. This finding,along with lower female fertility identified inthe previous study, makes coral porterweed apossible infertile alternative for landscapes.More research is needed to understand whycoral porterweed was not like the other twohexaploids (jamaican and ‘Naples Lilac’) butshowed a much lower pollen stainability.
In summary, species evaluated within theporterweed complex differed widely in theirleaf and floral morphology, chromosomenumber, and pollen stainability. This is a firstreport confirming ploidy level variationamong these selections. Our study showedthat the Florida native (jamaican porter-weed), the introduced species (nettleleafporterweed), and their progeny (U*J3-2) aredistinctly different in nuclear DNA contentand chromosome number. These differencesshould provide a reliable tool to differentiatethe native from the introduced porterweed incases where morphological identification be-comes difficult. This information may not
only be useful in future breeding programs,but also may be a consideration for selectingnoninvasive traits. Of the porterweed selec-tions examined, coral porterweed stands outas having low pollen stainability and lowfemale fertility that were reduced by 76% and83%, respectively, compared with the inva-sive nettleleaf porterweed. Comprehensivemorphological comparisons among porter-weed selections presented herein will greatlyaid in their proper identification and sustain-able use in Florida.
Literature Cited
Adedeji, O. 2010. Palynology of the genus Stachy-tarpheta Vahl. (Verbenacae). Not. Sci. Biol.2:27–33, doi: 10.15835/nsb244816.
Atkins, S. 1991. Stachytarpheta sericea Atkins(Verbenaceae) and its hybrid with S. chamis-sonis Walp. Kew Bull. 46:281–289, doi:10.2307/4110597.
Atkins, S. 2005. The genus Stachytarpheta (Verbe-naceae) in Brazil. Kew Bul. 60:161–272.<https://www.jstor.org/stable/4110935>.
Czarnecki, D.M., A.J. Hershberger, C.D. Robacker,D.G. Clark, and Z. Deng. 2014. Ploidy levels andpollen stainability of Lantana camara cultivarsand breeding lines. HortScience 49:1271–1276,doi: 10.21273/HORTSCI.49.10.1271.
Chen, R.Y., W.Q. Song, and X.L. Li. 1982. Walldegradation hypotonic method of preparing
Table 3. Summary results from regression analysis to detect potential relationship between ploidy level and porterweed plant, leaf, stem, flower, and inflorescencemorphological parameters.
Plant Leaves Internodes Flowers
Inflorescence lengthHt Width Length Width Length Diam Number WidthR2 0.0554 0.7092 0.1389 0.0968 0.3175 0.0987 0.4477 0.0390 0.7970P 0.5345 <0.0001 0.1931 0.3265 0.0150 0.3190 0.0015 0.6454 <0.0001
Table 4. Relative quantity, shape, size, and stainability of pollen grains of five porterweed selections. Atleast twelve anthers from three inflorescences per selection were used for analysis.
TaxaRelative pollenproduction Shape
Pollen length Pollen± SD (mm)z
stainability Pollen± SD (%)z
Coral ++++ Triangular 252.1 ± 9.8 a 10.6 ± 3.6Naples Lilac + Round 143.6 ± 9.5 c —Nettleleaf ++ Triangular 174.3 ± 9.2 b 44.0 ± 8.1U*J3-2 + Variable (round,
irregular)130.5 ± 5.0 c —
Jamaican ++ Triangular 180.3 ± 3.2 b 51.4 ± 6.4zMeans followed by a common letter within column are not significantly different by Tukey’s honestlysignificant difference test at the 5% level of significance. ‘‘—’’ indicates further studies needed.
Fig. 4. Micrographs (·100) of pollen grains stainedin cotton blue for 5 h. (A) Coral porterweed. (B)‘Naples Lilac’ porterweed. (C) Nettleleaf por-terweed. (D) U*J3-2 porterweed. (E) Jamaicanporterweed. Scale bar = 100 mm.

194 Proc. Fla. State Hort. Soc. 133: 2020.
chromosome samples in plant and its signifi-cance in the cytogenetics. Acta Genet. Sin.9:151–159.
Deng, Z., S.B. Wilson, X. Ying, and D.M. Czar-necki. 2017. Infertile Lantana camara cultivarsUF-1011-2 and UF-1013A-2A. HortScience52:652–657, doi: 10.21273/hortsci11840-17.
Deng, Z., S.B. Wilson, X. Ying, C. Chen, R.Rreyre, V. Zayas, and D.M. Czarnecki. 2020.‘UF-1013-1’: An infertile cultivar of Lantanacamara. HortScience 55(6):953–958, doi:10.21273/HORTSCI14911-20.
Dole�zel, J., J. Greilhuber, and J. Suda. 2007.Estimation of nuclear DNA content in plantsusing flow cytometry. Nat. Protoc. 2:2233–2244, doi: 10.1038/nprot.2007.310.
Fedorov, A. 1974. Chromsome numbers of flower-ing plants. Otto Koeltz, Koenigstein.
Florida Exotic Pest Plant Council (FLEPPC). 2019.Florida exotic pest plant council’s 2019 list ofinvasive plant species. 25 Mar. 2020. <https://www.fleppc.org>.
Gilman, E.F. 2014. Stachytarpheta jamaicensisblue porterweed. University of Florida Instituteof Food and Agricultural Sciences (IFAS) FactSheet, FPS-559. 25 Mar. 2020. <http://edis.ifas.ufl.edu/FP559>.
Hammer, R.L. 2004. The lantana mess: A criticallook at the genus in Florida. The Palmetto23:21–24. <https://www.fnps.org/assets/pdf/palmetto/v23n1lantanacorrection.pdf>.
Lamborn, A.R. 2017. Porterweed Stachytarphetaspp. University of Florida Institute of Food andAgricultural Sciences (IFAS) Extension BakerCounty. 25 Mar. 2020. <https://sfyl.ifas.ufl.edu/media/sfylifasufledu/baker/docs/pdf/horticulture/demonstration-gardens/Porterweed.pdf>.
Munir, A.A. 1992. A taxonomic revision of thegenus Stachytarpheta Vahl (Verbenaceae) inAustralia. J. Adel. Bot. Gard. 14:133–168.<https://www.jstor.org/stable/23874423>.
Pellicer, J. and I.J. Leitch. 2019. The plant DNAC-value database (release 7.1): An updated onlinerepository of plant genome size data for com-parative studies. New Phytol. 226:301–305,doi: 10.1111/nph.16261.
Rice, A., L. Glick, S. Abadi, M. Einhorn, N.M.Kopelman, A. Salman-Minkov, J. Maywel, O.Chay, and I. Mayrose. 2015. The chromosomecounts database (CCDB)—A community re-source of plant chromosome numbers. NewPhytol. 206(1):19–26, doi: 10.1111/nph.13191.
Sanders, R.W. 1987. Identify of Lantana depressaand L. ovatifolia (Verbenaceae) of Florida andthe Bahamas. Syst. Bot. 12(1):44–60, doi:10.2307/2419214.
Sanders, R.W. 2001. The genera of Verbenaceaein the southeastern United States. Harv. Pap.Bot. 5:303–358. <https://www.jstor.org/stable/41761611>.
Solanke, D.S., M. Oziegbe, and S.O. Azeez. 2019.Interspecific hybridization studies of three Sta-
chytarpheta species from Nigeria. Jordan J.Biol. Sci. 12:435–440.
Steppe, C., S.B.Wilson, Z.Deng,K.Druffel, andG.W.Knox. 2019. Morphological and cytological com-parison of eight varieties of trailing lantana (Lan-tanamontevidensis) grown in Florida. HortScience54:2134–2138, doi: 10.21273/hortsci14443-19.
The State of Queensland, Department of Agricultureand Fisheries. 2016. Weeds of Australia—biosecurity Queensland edition fact sheet—Stachytarpheta cayennensis. 25 Mar. 2020.<https://keyserver.lucidcentral.org/weeds/data/media/Html/stachytarpheta_cayennensis.pdf>.
University of Florida, Institute of Food and Agri-cultural Sciences (UF/IFAS). 2020. Assess-ment of non-native plants in Florida’s naturalareas. Stachytarpheta cayennensis. 10 Apr. 2020.<https://assessment.ifas.ufl.edu/assessments/stachytarpheta-cayennensis/>.
USDA, NRCS. 2020. The PLANTS Database.National Plant Data Team, Greensboro, NC.25 Mar. 2020. <https://plants.usda.gov/core/profile?symbol=STUR>.
Wilson, S.D., G.W.Knox, K.L.Muller, R. Freyre, andZ. Deng. 2009. Seed production and viability ofeight porterweed selections grown in northern andsouthern Florida. HortScience 44:1842–1849, doi: 10.21273/hortsci.44.7.1842.
Wunderlin, R.P. and B.F. Hansen. 2011. Guide tothe vascular plants of Florida. 3rd ed. Univer-sity Press of Florida, Gainesville.
This paper was presented during the 2020 FSHS Annual Meeting and originally published in HortScience
[HORTSCIENCE 56(3):330–335. 2021. https://doi.org/10.21273/HORTSCI15594-20]. The paper is included in this Proceedings as a reprint (with permission).
195Proc. Fla. State Hort. Soc. 133: 2020.
Proc. Fla. State Hort. Soc. 133:195–196. 2020.
Agroecology & Natural Resources Section
*Corresponding author. Email:[email protected]
Connecting with Small Scale, Urban, Hobby, and Community Garden Farmers through Video Mediums
and Facebook LiveLisa Hickey1*, Jessica RyaLs2, and saRaH Bostick3
1University of Florida, IFAS, Manatee County Extension, 1303 17th Street W., Palmetto, FL 342212University of Florida, IFAS, Collier County Extension, 14700 Immokalee Rd., Naples, FL 34120
3University of Florida, IFAS, Sarasota County Extension, 6700 Clark Rd., Sarasota, FL 34241
AdditionAl index words. social media, video impacts, small farmers, urban farming
Small scale producers often visit non-science-based websites in search of general and specific information about horti-culture and livestock, disease and pest pressure and cultural conditions required to grow crops. During the COVID-19 pandemic, alternative educational outreach was required to continue supporting the needs of agricultural producers. Several Sustainable Agriculture and Food Systems Extension Agents teamed up and utilized Facebook Live or posted videos on their county Facebook page to reach wide range of urban and rural small-farm producers on an array of agricultural topics. Using this platform gives exposure to science-based information on social media platforms where many producers are already active. An added benefit to using Facebook Live and videos is that community gardeners and home gardeners can access the same information, which provides them with tools for increased success in growing food for home consumption. From zero downloads in March 2020, the downloads grew to more than 6000 views by August 2020. As of August 2020, 21% (n = 1207) of the viewers engaged in comments and 12% (n = 146) the viewers who commented requested additional information. Many growers have expressed their appreciation for the informa-tion in this alternative teaching style.
Changing workloads and demographics have compelled exten-sion professionals to move from face-to-face to virtual teaching over the past decade. The coronavirus pandemic forced profes-sionals across the world to increase guidance, education, and facilitation of peer-to-peer interactions online. The benefit of this shift is reaching new audiences and finding innovative ways to meet the land-grant extension mission of increasing knowledge, changing behavior, and assessing the impacts (Gharis et. al, 2014).
Small-scale producers often use social media for advertising, marketing their farm products, and to educate consumers about how food is grown and where it comes from. Platforms that producers utilize most often include Facebook, YouTube, blogs (Gharis et. al, 2014) and more recently Instagram. Small farm-ers may not necessarily reach out to extension services to find information regarding horticulture, livestock, disease and pests, cultural conditions, or information about programs available to help sustain their operations such as food safety or business plan-ning. Finding the University of Florida extension science-based resources broadcasted on social media platforms where they may already be active, can be a bonus for small farm producers. In addition to small-scale producers, hobbyist, urban and com-munity gardeners, entrepreneurs, and consumers can access the same information, which can provide tools for increased success in growing food for home consumption and increased knowledge about food production.
Additionally, Pew Research Center data roughly estimates 69% of adults pursue social media for socializing, catching up on the news, and as a learning platform (Anon. 2020a) Consumers who visit non-peer reviewed resources may receive inaccurate or misleading information about how food is grown, harvested, processed, and distributed. Farmers have been leaders in cor-recting misinformation regarding food production to the average consumer, often using social media. The spread of misinformation on social media platforms has been heavily documented across sectors including agriculture (Jiang and Wang, 2019). However, research also shows that the public is more likely to say they regularly see content that introduces them to a new idea than to say they regularly see content that seems obviously false or untrue or that provokes negative feelings toward others (Anon. 2020b).
Materials and Methods
Several Sustainable Agriculture and Food Systems extension agents teamed up to utilize informal videos on social media platforms such as Facebook Live, YouTube, Instagram, and blog posts on their county webpages to reach a wide range of urban and rural small-farm producers on an array of agricultural topics such as specialty vegetable crops, beekeeping, livestock manage-ment, tropical fruit and vegetable production, small poultry flocks, on-farm readiness reviews, farm food safety and more. Agents engaged community partners and work colleagues to enhance the diversity of speakers and expert topics. Agents also linked and shared content between county social media platforms to get a wider impact with the audience.
196 Proc. Fla. State Hort. Soc. 133: 2020
Results and Discussion
From zero downloads in March 2020, downloads as of August 2020 grew to more than 9,453 views, with 38% (n=3,646) of the viewers engaged in posts and 5% (n=173) of the engaged viewers following up with the Agents to request additional information.
• Reached = 33,051.• Views = 9453.• Engaged (likes, shares, comments) = 3646.• An average of 82% of the viewers were from Florida but
sometimes as far away as Alaska and Europe.• Increase in viewership as increased video availability.• Producers and gardeners were using science-based infor-
mation.Extension’s mission is to take timely, practical, and science-
based resources to stakeholders. In addition, the added convenience of plugging into platforms where many people are already actively looking for reliable information during uncertain times allowed for several benefits and challenges. Since producers are already active on social media for marketing purposes, agents attempting to meet them on these platforms not only expanded the mission of extension but the increased the likelihood that producers would utilize science-based information.
Benefits included an increase in clientele reached in a short period; immediate response to stakeholder questions during live sessions, general ease of outreach efforts without high video pro-duction, and the ability to make the information ADA accessible. In addition, agents developed new skills for future programming. Extension professionals are required to track impact of their programs, making social media a useful tool that automatically tracks interactions, views, comments, and conversations. Addi-tionally, consumers, community gardeners and home gardeners can access the same information as small farm operators, thereby providing them tools for increased success in growing food for home consumption and an increase knowledge about how food is produced.
A significant challenge was the learning curve utilizing Zoom, the different social media platforms, and the equipment criteria. As familiarization of the technology increased, glitches in tech-nology occurred such as a Facebook hack, overheated phones, distorted pictures, subpar microphone quality on devices, social distancing causing a variant in speaker’s volume, and low storage capabilities on mobile devices. Each county has different standards for video formats and accessibility. There was a learning curve to find the best time for posting information; some videos had too few viewers while other videos had so many comments the presenter could not respond during the Facebook Live session.
An important note is that a significant number of producers in the four counties studied do not have internet access. In some parts of the state of Florida, as many as one out of every three producers do not having internet access.
• 73% of DeSoto County producers have internet access.• 76% of Manatee County producers have internet access.• 77% of Sarasota County producers have internet access.• 84% of Collier County producers have internet access.
(USDA, 2017a, USDA 2017b, USDA 2017c, and USDA 2017d)
Conclusion
While online videos may not bet readily accessible to approxi-mately 25% of the targeted audience, the benefits of using social media platforms outweigh the challenges and inaccessibility. The producers without internet access continue to utilize phone calls and emails to gather science-based resources from the University of Florida Extension Sustainable Agriculture and Food System Agents during COVID-19.
The need for extension agents to interact with stakeholders in person and participate in hands-on teaching is still an important tool for building trust and relationships within the agricultural community. However, the shift to reliable online information in an urgent time proved to be a benefit to stakeholders.
Literature Cited
Anon. 2020a. Demographics of social media users and adoption in the United States. 2020. Pew Research Center: Internet, Science & Tech. <https://www.pewresearch.org/internet/fact-sheet/social-media/>
Anon. 2020b. People say they regularly see false and misleading content on social media—but also new ideas. 2020. Pew Research Center: Internet, Science & Tech. <https://www.pewresearch.org/internet/2019/05/13/users-say-they-regularly-encounter-false-and-misleading-content-on-social-media-but-also-new-ideas/>
Gharis, L., R. Bardon, J. Evan, W. Hubbard, and E. Taylor. 2014. Expand-ing the reach of extension through social media. Journal of Extension 52(3): 52-53. <https://joe.org/joe/2014june/a3.php>
Jiang, S. and W. Fang. 2019. Misinformation and disinformation in sci-ence: Examining the social diffusion of rumors about GMOs. https://doi.org/10.1177/209660831900200407
USDA. 2017a. County Profile, Collier County. 2017. United States Department of Agriculture—National Agricultural Statistics Service. <https://www.nass.usda.gov/Publications/AgCensus/2017/Online_Re-sources/County_Profiles/Florida/cp12021.pdf>
USDA. 2017b. County Profile, DeSoto County. 2017. United States Department of Agriculture—National Agricultural Statistics Service.
<https://www.nass.usda.gov/Publications/AgCensus/2017/Online_Re-sources/County_Profiles/Florida/cp12027.pdf>
USDA. 2017c. County Profile, Manatee County. 2017. United States Department of Agriculture—National Agricultural Statistics Service.
<https://www.nass.usda.gov/Publications/AgCensus/2017/Online_Re-sources/County_Profiles/Florida/cp12081.pdf>
USDA. 2017d. County Profile, Sarasota County. 2017. United States Department of Agriculture—National Agricultural Statistics Service.
<https://www.nass.usda.gov/Publications/AgCensus/2017/Online_Re-sources/County_Profiles/Florida/cp12115.pdf>
197Proc. Fla. State Hort. Soc. 133: 2020.
Proc. Fla. State Hort. Soc. 133:197–200 2020.
Agroecology & Natural Resources Section
This work was completed as part of the senior author’s MS degree at the Uni-versity of Florida*Corresponding author. Email: [email protected]
Growth of Arugula In a Hydroponic Ebb and Flood System Supplemented with Lactobacillus
Michelle incledon*, KiMberly Moore, luci Fisher, and conor McKee
University of Florida, IFAS, Fort Lauderdale Research and Education Center, 3205 College Ave., Davie FL 33314
AdditionAl index words. beneficial microbes, Eruca vesicaria ssp. sativa, nutrient solutions
This study investigated whether the addition of Lactobacillus casei to a hydroponic system would increase the yield of arugula (Eruca vesicaria ssp. sativa) when compared to the control. Arugula was grown using an ebb and flood system with 0, 7, 14, or 21 oz of EM-1 (L. casei) added to the recirculating nutrient solution. Shoot and root growth, nutrient levels in the hydroponic solution and the leaves, and colony-forming units in solution and on the roots were measured. The addition of L. casei did not improve yield, and plant growth was similar among treatments. There was also no difference in nutrient levels in the hydroponic solution among the treatments, suggesting that L. casei did not improve nutrient uptake. This finding was supported by minimal differences in tissue nutrient levels. The number of CFU’s in the nutrient solution decreased each week from levels measured at the beginning of the week. The lowest number of CFUs in solution were for control plants. The CFU recorded on roots was greatest on plants grown with the 21-oz treatment. It appears that L. casei was living on the roots and in the solution. Improved growth with the addition of microbes is often observed when plants are exposed to abiotic or biotic stress. However, when plants are grown under optimum conditions, the benefits of adding microbes are often undetectable.
Arugula (Eruca vesicaria ssp. sativa) is an annual in the Bras-sicaceae family. Many of the plants in this family are popular because of the diverse populations of phytochemicals in their leaves. For example, sulforaphane and erucin found in arugula leaves have been associated with positive health benefits (Was-sermann et al., 2017). Arugula also is very high in glucosino-late, which are suggested to play a role against carcinogenesis, metastasis and protect cells from chronic inflammatory diseases (Wassermann et al., 2017). With the growing demand for food with high nutrient content, arugula has become more popular and has a large following in the health food stores because of its beneficial properties. Arugula is widely sold as a specialized herb and it is commonly found in salad mixes.
Due to arugula’s limited growing season but year-round demand, hydroponic growers are able to fill the gap in produc-tion. The versatility of hydroponics makes it an attractive form to grow a variety of crops in a multitude of ways. Like lettuce (Lactuca sativa), arugula grows well in hydroponic systems that are aerated and have adequate spacing between plants to limit diseases (Lee and Jiyuang, 2015). Commercial growers have also started experimenting with adding beneficial microorganisms to hydroponic systems in order to improve plant growth and protect plants from diseases.
Most rhizospheres can contain up to 100 million to 1 tril-lion microorganisms in a single gram (Kennedy and de Luna, 2005). However, the hydroponic rhizosphere is suspected to be less diverse than soil, so the effects of adding microorganisms into the nutrient solution might have an impact on plant growth.
Hydroponics is limited in organic nutrients that could potentially give growers more fertilizer options. By studying microorganisms that can survive in a hydroponic system, we might help growers protect their plants from disease in addition to improving nutrient absorption. The objective of this study was to determine if the addition of Lactobacillus casei to a hydroponic system would increase the yield of arugula when compared to the control. L. casei is widely known to have a wide range of pH and temperature in which they can thrive and is considered generally safe (GRAS) for use in a hydroponic study (De Angelis and Gobbetti, 2011).
Materials and Methods
Arugula seeds (Johnny’s Selected Seeds, Winslow, ME) were sown directly into 3.75-inch net pots (Gro-Pro.net, Hawthorne Gardening Co. Vancouver, WA) filled with coconut coir (Green Grower Product of India, Tamil Nadu, India). Arugula was grown with either 0, 1, 2, or 3 oz/gallon of EM-1 (Tera Ganix, South Alto, TX) added to the recirculating nutrient solution. (0, 7, 14, or 21 total oz added in a 7-gallon bucket). This product was de-veloped in Japan by Teuro Higa, with the main microorganism being Lactobacillus casei.
Six pots per treatment were set in a 1-inch thick styrofoam that had a reflective coating on top. This rested inside a round black 12.5-L container. A 4-inch weight was placed under the grow tray to increase the angle of the tray and help with drainage. Four containers were set on a greenhouse bench at the University of Florida, Fort Lauderdale Research and Education Center, Davie, FL. Plants were grown in an open-sided greenhouse exposed to ambient air temperatures, light levels, and relative humidity. We ran this experiment from Feb. 2020 to Mar. 2020. The average temperatures in the greenhouse were 26.1/17.2 °C (day/night). Light levels were approximately 184 W/m2, and relative humid-
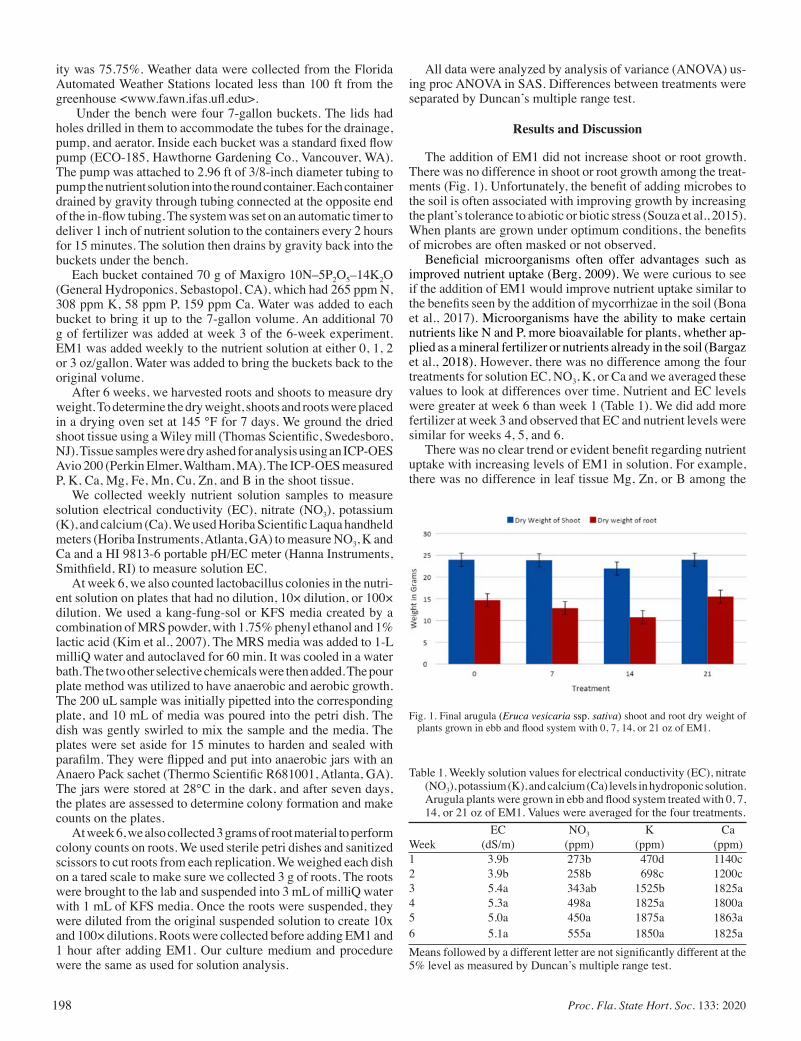
198 Proc. Fla. State Hort. Soc. 133: 2020
ity was 75.75%. Weather data were collected from the Florida Automated Weather Stations located less than 100 ft from the greenhouse <www.fawn.ifas.ufl.edu>.
Under the bench were four 7-gallon buckets. The lids had holes drilled in them to accommodate the tubes for the drainage, pump, and aerator. Inside each bucket was a standard fixed flow pump (ECO-185, Hawthorne Gardening Co., Vancouver, WA). The pump was attached to 2.96 ft of 3/8-inch diameter tubing to pump the nutrient solution into the round container. Each container drained by gravity through tubing connected at the opposite end of the in-flow tubing. The system was set on an automatic timer to deliver 1 inch of nutrient solution to the containers every 2 hours for 15 minutes. The solution then drains by gravity back into the buckets under the bench.
Each bucket contained 70 g of Maxigro 10N–5P2O5–14K2O (General Hydroponics, Sebastopol, CA), which had 265 ppm N, 308 ppm K, 58 ppm P, 159 ppm Ca. Water was added to each bucket to bring it up to the 7-gallon volume. An additional 70 g of fertilizer was added at week 3 of the 6-week experiment. EM1 was added weekly to the nutrient solution at either 0, 1, 2 or 3 oz/gallon. Water was added to bring the buckets back to the original volume.
After 6 weeks, we harvested roots and shoots to measure dry weight. To determine the dry weight, shoots and roots were placed in a drying oven set at 145 ℉ for 7 days. We ground the dried shoot tissue using a Wiley mill (Thomas Scientific, Swedesboro, NJ). Tissue samples were dry ashed for analysis using an ICP-OES Avio 200 (Perkin Elmer, Waltham, MA). The ICP-OES measured P, K, Ca, Mg, Fe, Mn, Cu, Zn, and B in the shoot tissue.
We collected weekly nutrient solution samples to measure solution electrical conductivity (EC), nitrate (NO3), potassium (K), and calcium (Ca). We used Horiba Scientific Laqua handheld meters (Horiba Instruments, Atlanta, GA) to measure NO3, K and Ca and a HI 9813-6 portable pH/EC meter (Hanna Instruments, Smithfield, RI) to measure solution EC.
At week 6, we also counted lactobacillus colonies in the nutri-ent solution on plates that had no dilution, 10× dilution, or 100× dilution. We used a kang-fung-sol or KFS media created by a combination of MRS powder, with 1.75% phenyl ethanol and 1% lactic acid (Kim et al., 2007). The MRS media was added to 1-L milliQ water and autoclaved for 60 min. It was cooled in a water bath. The two other selective chemicals were then added. The pour plate method was utilized to have anaerobic and aerobic growth. The 200 uL sample was initially pipetted into the corresponding plate, and 10 mL of media was poured into the petri dish. The dish was gently swirled to mix the sample and the media. The plates were set aside for 15 minutes to harden and sealed with parafilm. They were flipped and put into anaerobic jars with an Anaero Pack sachet (Thermo Scientific R681001, Atlanta, GA). The jars were stored at 28℃ in the dark, and after seven days, the plates are assessed to determine colony formation and make counts on the plates.
At week 6, we also collected 3 grams of root material to perform colony counts on roots. We used sterile petri dishes and sanitized scissors to cut roots from each replication. We weighed each dish on a tared scale to make sure we collected 3 g of roots. The roots were brought to the lab and suspended into 3 mL of milliQ water with 1 mL of KFS media. Once the roots were suspended, they were diluted from the original suspended solution to create 10x and 100× dilutions. Roots were collected before adding EM1 and 1 hour after adding EM1. Our culture medium and procedure were the same as used for solution analysis.
All data were analyzed by analysis of variance (ANOVA) us-ing proc ANOVA in SAS. Differences between treatments were separated by Duncan’s multiple range test.
Results and Discussion
The addition of EM1 did not increase shoot or root growth. There was no difference in shoot or root growth among the treat-ments (Fig. 1). Unfortunately, the benefit of adding microbes to the soil is often associated with improving growth by increasing the plant’s tolerance to abiotic or biotic stress (Souza et al., 2015). When plants are grown under optimum conditions, the benefits of microbes are often masked or not observed.
Beneficial microorganisms often offer advantages such as improved nutrient uptake (Berg, 2009). We were curious to see if the addition of EM1 would improve nutrient uptake similar to the benefits seen by the addition of mycorrhizae in the soil (Bona et al., 2017). Microorganisms have the ability to make certain nutrients like N and P, more bioavailable for plants, whether ap-plied as a mineral fertilizer or nutrients already in the soil (Bargaz et al., 2018). However, there was no difference among the four treatments for solution EC, NO3, K, or Ca and we averaged these values to look at differences over time. Nutrient and EC levels were greater at week 6 than week 1 (Table 1). We did add more fertilizer at week 3 and observed that EC and nutrient levels were similar for weeks 4, 5, and 6.
There was no clear trend or evident benefit regarding nutrient uptake with increasing levels of EM1 in solution. For example, there was no difference in leaf tissue Mg, Zn, or B among the
Table 1. Weekly solution values for electrical conductivity (EC), nitrate (NO3), potassium (K), and calcium (Ca) levels in hydroponic solution. Arugula plants were grown in ebb and flood system treated with 0, 7, 14, or 21 oz of EM1. Values were averaged for the four treatments.
EC NO3 K CaWeek (dS/m) (ppm) (ppm) (ppm)1 3.9b 273b 470d 1140c2 3.9b 258b 698c 1200c3 5.4a 343ab 1525b 1825a4 5.3a 498a 1825a 1800a5 5.0a 450a 1875a 1863a6 5.1a 555a 1850a 1825aMeans followed by a different letter are not significantly different at the 5% level as measured by Duncan’s multiple range test.
Fig. 1. Final arugula (Eruca vesicaria ssp. sativa) shoot and root dry weight of plants grown in ebb and flood system with 0, 7, 14, or 21 oz of EM1.
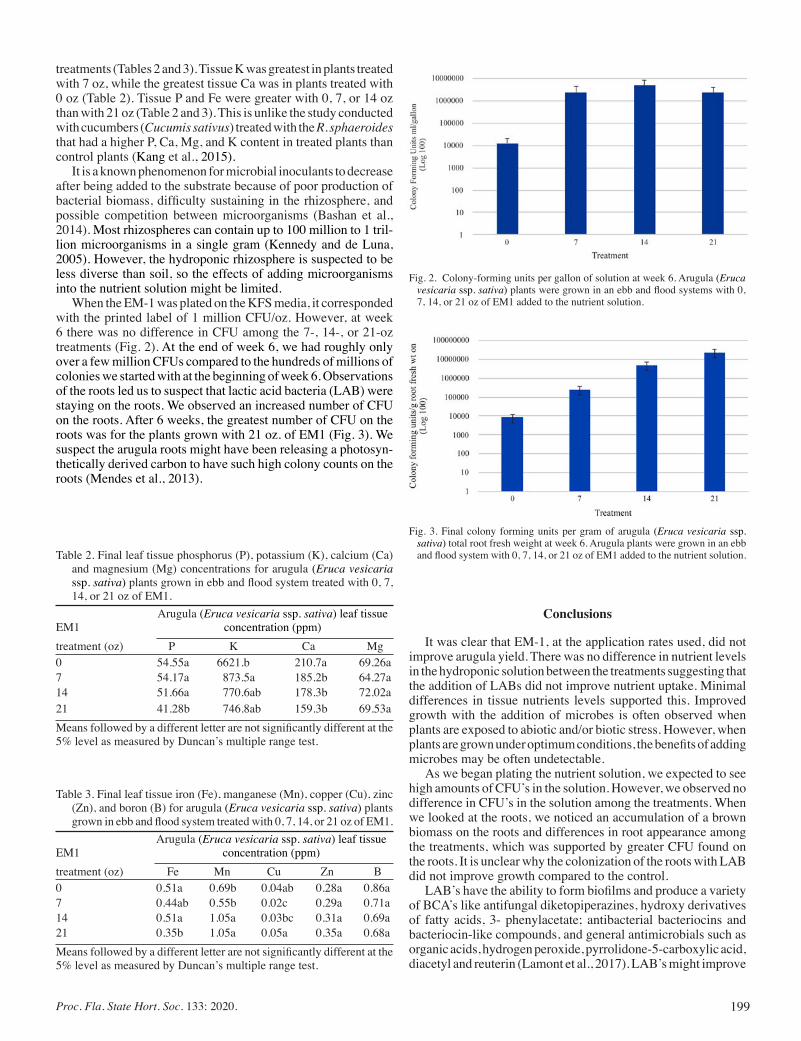
199Proc. Fla. State Hort. Soc. 133: 2020.
treatments (Tables 2 and 3). Tissue K was greatest in plants treated with 7 oz, while the greatest tissue Ca was in plants treated with 0 oz (Table 2). Tissue P and Fe were greater with 0, 7, or 14 oz than with 21 oz (Table 2 and 3). This is unlike the study conducted with cucumbers (Cucumis sativus) treated with the R. sphaeroides that had a higher P, Ca, Mg, and K content in treated plants than control plants (Kang et al., 2015).
It is a known phenomenon for microbial inoculants to decrease after being added to the substrate because of poor production of bacterial biomass, difficulty sustaining in the rhizosphere, and possible competition between microorganisms (Bashan et al., 2014). Most rhizospheres can contain up to 100 million to 1 tril-lion microorganisms in a single gram (Kennedy and de Luna, 2005). However, the hydroponic rhizosphere is suspected to be less diverse than soil, so the effects of adding microorganisms into the nutrient solution might be limited.
When the EM-1 was plated on the KFS media, it corresponded with the printed label of 1 million CFU/oz. However, at week 6 there was no difference in CFU among the 7-, 14-, or 21-oz treatments (Fig. 2). At the end of week 6, we had roughly only over a few million CFUs compared to the hundreds of millions of colonies we started with at the beginning of week 6. Observations of the roots led us to suspect that lactic acid bacteria (LAB) were staying on the roots. We observed an increased number of CFU on the roots. After 6 weeks, the greatest number of CFU on the roots was for the plants grown with 21 oz. of EM1 (Fig. 3). We suspect the arugula roots might have been releasing a photosyn-thetically derived carbon to have such high colony counts on the roots (Mendes et al., 2013).
Conclusions
It was clear that EM-1, at the application rates used, did not improve arugula yield. There was no difference in nutrient levels in the hydroponic solution between the treatments suggesting that the addition of LABs did not improve nutrient uptake. Minimal differences in tissue nutrients levels supported this. Improved growth with the addition of microbes is often observed when plants are exposed to abiotic and/or biotic stress. However, when plants are grown under optimum conditions, the benefits of adding microbes may be often undetectable.
As we began plating the nutrient solution, we expected to see high amounts of CFU’s in the solution. However, we observed no difference in CFU’s in the solution among the treatments. When we looked at the roots, we noticed an accumulation of a brown biomass on the roots and differences in root appearance among the treatments, which was supported by greater CFU found on the roots. It is unclear why the colonization of the roots with LAB did not improve growth compared to the control.
LAB’s have the ability to form biofilms and produce a variety of BCA’s like antifungal diketopiperazines, hydroxy derivatives of fatty acids, 3- phenylacetate; antibacterial bacteriocins and bacteriocin-like compounds, and general antimicrobials such as organic acids, hydrogen peroxide, pyrrolidone-5-carboxylic acid, diacetyl and reuterin (Lamont et al., 2017). LAB’s might improve
Table 2. Final leaf tissue phosphorus (P), potassium (K), calcium (Ca) and magnesium (Mg) concentrations for arugula (Eruca vesicaria ssp. sativa) plants grown in ebb and flood system treated with 0, 7, 14, or 21 oz of EM1.
Arugula (Eruca vesicaria ssp. sativa) leaf tissueEM1 concentration (ppm)treatment (oz) P K Ca Mg0 54.55a 6621.b 210.7a 69.26a7 54.17a 873.5a 185.2b 64.27a14 51.66a 770.6ab 178.3b 72.02a21 41.28b 746.8ab 159.3b 69.53aMeans followed by a different letter are not significantly different at the 5% level as measured by Duncan’s multiple range test.
Table 3. Final leaf tissue iron (Fe), manganese (Mn), copper (Cu), zinc (Zn), and boron (B) for arugula (Eruca vesicaria ssp. sativa) plants grown in ebb and flood system treated with 0, 7, 14, or 21 oz of EM1.
Arugula (Eruca vesicaria ssp. sativa) leaf tissueEM1 concentration (ppm)treatment (oz) Fe Mn Cu Zn B0 0.51a 0.69b 0.04ab 0.28a 0.86a7 0.44ab 0.55b 0.02c 0.29a 0.71a14 0.51a 1.05a 0.03bc 0.31a 0.69a21 0.35b 1.05a 0.05a 0.35a 0.68a Means followed by a different letter are not significantly different at the 5% level as measured by Duncan’s multiple range test.
Fig. 3. Final colony forming units per gram of arugula (Eruca vesicaria ssp. sativa) total root fresh weight at week 6. Arugula plants were grown in an ebb and flood system with 0, 7, 14, or 21 oz of EM1 added to the nutrient solution.
Fig. 2. Colony-forming units per gallon of solution at week 6. Arugula (Eruca vesicaria ssp. sativa) plants were grown in an ebb and flood systems with 0, 7, 14, or 21 oz of EM1 added to the nutrient solution.
200 Proc. Fla. State Hort. Soc. 133: 2020
plant growth under high levels of salinity as well as improve plant response to diseases like Pythium.
Literature Cited
Bargaz, A., K. Lyamlouli, M. Chtouki, Y. Zeroual, and D. Dhiba. 2018. Soil microbial resources for improving fertilizer efficiency in an inte-grated plant nutrient management system. Frontiers in Microbiology 9:1606. https://doi.org/10.3389/fmicb.2018.01606
Bashan, Y., L.E. de-Bashan, and S.R. Prabhu. 2014. Advances in plant growth-promoting bacterial inoculant technology: Formulations and practical perspectives (1998–2013). Plant Soil 378:1–33. https://doi.org/10.1007/s11104-013-1956-x
Berg, G. 2009. Plant–microbe interactions promoting plant growth and health: Perspectives for controlled use of microorganisms in agricul-ture. Applied Microbiology and Biotechnology, 84(1):11–18. https://doi.org/10.1007/s00253-009-2092-7.
Bona E., S. Cantamessa, N. Massa, P. Manassero, F. Marsano, A. Copetta, G. Lingua, G.D’Agostino, E. Gamalero, and G. Berta. 2016. Arbus-cular mycorrhizal fungi and plant growth-promoting pseudomonads improve yield, quality and nutritional value of tomato: a field study. Mycorrhiza. 27(1):1–11. https://doi.org/10.1007/s00572-016-0727-y.
De Angelis, M., and M. Gobbetti. 2011. Lactobacillus SPP.: General characteristics. Encyclopedia of Dairy Sciences, pp. 78–90. https://doi.org/10.1016/B978-0-08-100596-5.00851-9
Kennedy A.C. and L.Z. de Luna. 2005. Rhizosphere. Encylocpedia of Soils in the Environment. 399-406. https://doi.org/10.10106/BO-12-348530-4/00163-6
Kim, S., D. Fung, and D. Kang. 2007. Evaluation of Kang-Fung-Sol medium for selectivity of lactic acid bacteria from laboratory medium and ground beef. Rapid Methods and Automation in Microbiology 9(3):161–169. https://doi.org/10.1111/j.1745-4581.2001.tb00240.x
Lamont, J., O. Wilkins, M. Bywater-Ekgard, and D.L. Smith. 2017. From yogurt to yield: Potential applications of lactic acid bacteria in plant production. Soil Biology and Biochemistry 11:1–9. 0038-0717. https://doi.org/10.1016/j.soilbio.2017.03.015.
Lee, S. and L. Jiyoung. 2015. Beneficial bacteria and fungi in hydroponic systems: Types and characteristics of hydroponic food production methods. Scientia Horticulturae 195:206–215. https://doi.org/10.1016/j.scienta.
Kang,S., R. Radhakrishnan, Y. You, A. Latif Khan, J. Park, S. Lee and I. Lee. 2015. Cucumber performance is improved by inoculation with plant growth-promoting microorganisms. Acta Agriculturae Scandinavica, Section B — Soil & Plant Science 65(1):36-44, DOI: 10.1080/09064710.2014.960889
Mendes, R., P. Garbeva, and M. Raaijmakers. 2013. The rhizosphere microbiome: Significance of plant beneficial, plant pathogenic, and human pathogenic microorganisms, FEMS Microbiology Reviews 37(5):634–663, https://doi.org/10.1111/1574-6976.12028
Souza, R.D., A. Ambrosini, and L.M. Passaglia. 2015. Plant growth-promoting bacteria as inoculants in agricultural soils. Genetics and Molecular Biology 38(4):401–419. https://doi.org/10.1590/S1415-475738420150053
Wassermann, B., Rybakova, D., Müller, C., and G. Berg. 2017. Harness-ing the microbiomes of Brassica vegetables for health issues. Scientific Reports 7(1):17649. https://doi.org/10.1038/s41598-017-17949-z
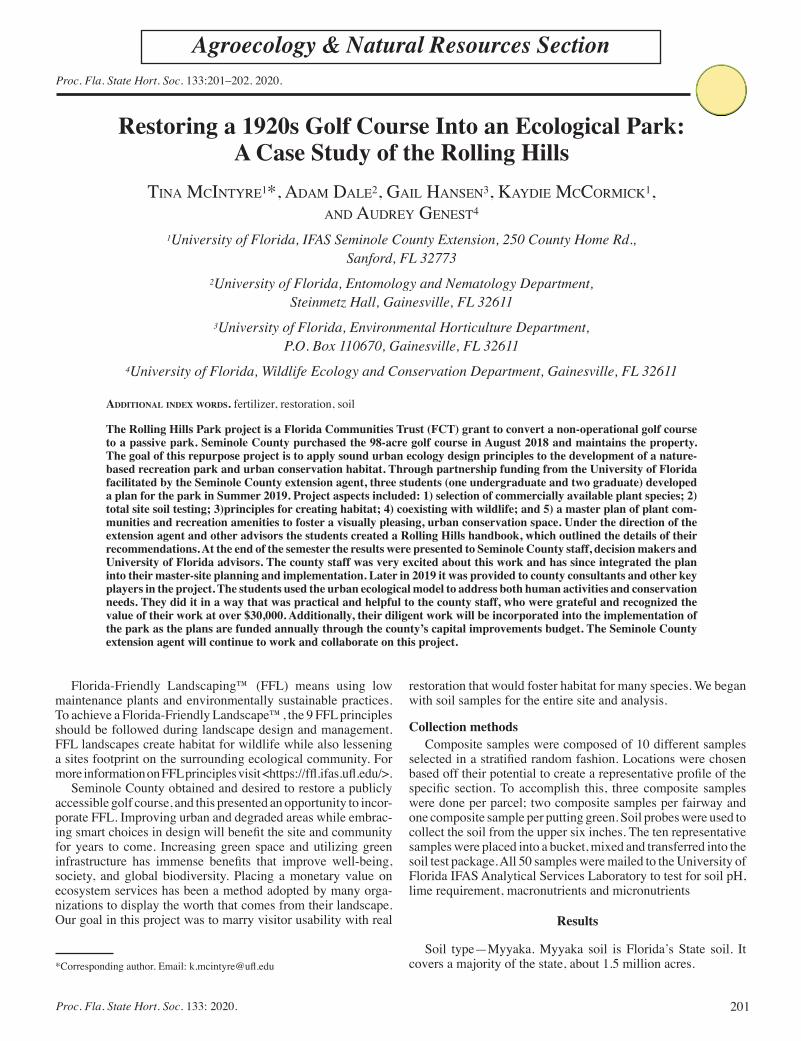
201Proc. Fla. State Hort. Soc. 133: 2020.
Proc. Fla. State Hort. Soc. 133:201–202. 2020.
Agroecology & Natural Resources Section
*Corresponding author. Email: [email protected]
Restoring a 1920s Golf Course Into an Ecological Park: A Case Study of the Rolling Hills
Tina McinTyre1*, adaM dale2, Gail Hansen3, Kaydie MccorMicK1, and audrey GenesT4
1University of Florida, IFAS Seminole County Extension, 250 County Home Rd., Sanford, FL 32773
2University of Florida, Entomology and Nematology Department, Steinmetz Hall, Gainesville, FL 32611
3University of Florida, Environmental Horticulture Department, P.O. Box 110670, Gainesville, FL 32611
4University of Florida, Wildlife Ecology and Conservation Department, Gainesville, FL 32611
AdditionAl index words. fertilizer, restoration, soil
The Rolling Hills Park project is a Florida Communities Trust (FCT) grant to convert a non-operational golf course to a passive park. Seminole County purchased the 98-acre golf course in August 2018 and maintains the property. The goal of this repurpose project is to apply sound urban ecology design principles to the development of a nature-based recreation park and urban conservation habitat. Through partnership funding from the University of Florida facilitated by the Seminole County extension agent, three students (one undergraduate and two graduate) developed a plan for the park in Summer 2019. Project aspects included: 1) selection of commercially available plant species; 2) total site soil testing; 3)principles for creating habitat; 4) coexisting with wildlife; and 5) a master plan of plant com-munities and recreation amenities to foster a visually pleasing, urban conservation space. Under the direction of the extension agent and other advisors the students created a Rolling Hills handbook, which outlined the details of their recommendations. At the end of the semester the results were presented to Seminole County staff, decision makers and University of Florida advisors. The county staff was very excited about this work and has since integrated the plan into their master-site planning and implementation. Later in 2019 it was provided to county consultants and other key players in the project. The students used the urban ecological model to address both human activities and conservation needs. They did it in a way that was practical and helpful to the county staff, who were grateful and recognized the value of their work at over $30,000. Additionally, their diligent work will be incorporated into the implementation of the park as the plans are funded annually through the county’s capital improvements budget. The Seminole County extension agent will continue to work and collaborate on this project.
Florida-Friendly Landscaping™ (FFL) means using low maintenance plants and environmentally sustainable practices. To achieve a Florida-Friendly Landscape™, the 9 FFL principles should be followed during landscape design and management. FFL landscapes create habitat for wildlife while also lessening a sites footprint on the surrounding ecological community. For more information on FFL principles visit <https://ffl.ifas.ufl.edu/>.
Seminole County obtained and desired to restore a publicly accessible golf course, and this presented an opportunity to incor-porate FFL. Improving urban and degraded areas while embrac-ing smart choices in design will benefit the site and community for years to come. Increasing green space and utilizing green infrastructure has immense benefits that improve well-being, society, and global biodiversity. Placing a monetary value on ecosystem services has been a method adopted by many orga-nizations to display the worth that comes from their landscape. Our goal in this project was to marry visitor usability with real
restoration that would foster habitat for many species. We began with soil samples for the entire site and analysis.
Collection methodsComposite samples were composed of 10 different samples
selected in a stratified random fashion. Locations were chosen based off their potential to create a representative profile of the specific section. To accomplish this, three composite samples were done per parcel; two composite samples per fairway and one composite sample per putting green. Soil probes were used to collect the soil from the upper six inches. The ten representative samples were placed into a bucket, mixed and transferred into the soil test package. All 50 samples were mailed to the University of Florida IFAS Analytical Services Laboratory to test for soil pH, lime requirement, macronutrients and micronutrients
Results
Soil type—Myyaka. Myyaka soil is Florida’s State soil. It covers a majority of the state, about 1.5 million acres.
202 Proc. Fla. State Hort. Soc. 133: 2020
Soil texture—sandy. Sand can be characterized as loose, single-grained, gritty to the touch, and easily seen and felt. When sand is moistened, it will perform a weak cast and crumble to touch.
General considerations of sandy soils—due to sandy soil’s decreased surface area and increase pore space, it presents several unique characteristics that should be considered in landscape management. Sandy soils tend to be low in organic matter and native fertility, low in capability to retain moisture and nutrients, low in cation exchange and buffer capacities, and permit rapid movement of water and air (Pearson, 2013).
Soil pH for the entire site is not one for concern. The median soil pH is 6.1 in Florida, characterized as slightly acidic. Ac-cording to University of Florida IFAS recommendations, if the soil pH is between 5.5 and 7.0 there isn’t a need to adjust pH for landscape plants (Shober et al.2008).
The average pH for the fairways was 5.96. Putting greens on average were much more acidic, the median 4.98. These soils can be amended if time and money permits, but there are acid-loving plants that do well in pH values less than 5.5 (Anon., 2015).
Soil macronutrientsResults received from the soil laboratory indicate two ir-
regularities amongst phosphorous and magnesium levels. This was due to differences in soil texture and past maintenance. Soil on greens was relatively more sandy and varied in macronutri-ent levels. This is consistent with the golf industries methods for turfgrass management. Soil levels are compared against Mehlich-3 interpretation levels. The Mehlich-3 interpretations provide a baseline to delineate between macronutrient levels in acidic soils (Mylavarapu et al. 2014).
The sand-based putting greens have lower levels of nutrient-holding and buffering capabilities. Reduction in buffering capabilities decreases the resistance the soil has to maintain a constant pH. With the intensity at which the putting greens were managed, the pH of the soil was highly influenced relative to fairways/historical soil. Putting greens are less than 2% of the square footage of golf courses; yet typically other turfgrass on golf courses are not as intensively maintained (Schlossberg, 2006). Sandy soils combined with prior management resulted in the increased acidity of the putting greens throughout the course.
Calcium (Ca) levels were adequate throughout Rolling Hills. Florida soils are naturally high in Ca because much of the par-ent material of Florida soils is composed of limestone (calcium carbonate, CaCO3) (Shaddox, 2018).
Fertilizer additions will need to be done to supplement low potassium (K) levels. Sandy soils in Florida have low K reten-tion. The results indicated here are not abnormal. Amendments simply require fertilizer application. Smaller and frequent doses should be done during application.
It is typical in Florida soils for there to be sufficient levels of phosphorous (P). Levels at Rolling hills were higher because of historical fertilizer additions containing P. Phosphorous does not leach out of soil easily relative to other macro-nutrients. There will not be a need to apply P in the near future until levels decline.
Magnesium (Mg) levels were adequate in all of the soils, though the putting greens barely fell within base level recommendation because of prior intense management practices.
Soil micronutrients tested included copper (Cu), manganese (Mn), and zinc (Zn). The results were adequate and did not indicate additional fertilization was necessary. These results are preliminary indication and observation should be given to individual plants and plantings to look for sign of deficiency.
Discussion
Fertilizer should be applied where needed. It is suggested that a high percentage of fertilizers used should be slow or controlled release rather than water-soluble quick release fertilizers (Q.R.F.). The latter are not suitable for a site like Rolling Hills. Sandy soils will cause the Q.R.F. to leach before the nutrients can be absorbed by plants.
Slow and controlled release fertilizers are the better alterna-tives because they decrease nutrient losses, enhance nutrient-use efficiency, and require less frequent application. Selecting slow and controlled releases fertilizers can decrease fertilizer use by 20 to 30% of the recommended rate of a conventional fertilizer while obtaining the same yield (Zotarelli et al. 2017). Fertilizers should only contain N and K, the level of P currently in the soil is sufficient. Additional applications of P can cause leaching from the soil into ground water.
To increase Mg levels on putting greens dolomitic lime can be used. Dolomitic lime contains Mg and will also increase the pH. If soil amendments are desired, then Mg will be needed to be added to fertilizer. Long term, the best solution would be amending putting greens with dolomitic lime prior to planting; again, this will increase the pH in acidic areas and raise needed Mg levels.
Rolling Hills master planSubsequent pages of the report go through each of the areas
laid out on the master plan. Each section highlights a proposed landscape design with explanations on elements to consider in-cluding viewpoints, topography, pedestrian access, soil profiles, recommended habitat features, anticipated wildlife and plant selection tips.
Literature CitedAnonymous. 2015. The Florida Yards and Neighborhoods Handbook.
University of Florida Institute of Food and Agricultural Sciences, Gainesville, FL.
Liu, G., L. Zotarelli, Y. Li, D. Dinkins, Q. Wang, and M. Ozores-Hampton. 2014. Controlled-release and slow-release fertilizers as nutrient man-agement tools. Extension Publication HS1255, Cooperative Extension Service, University of Florida, Gainesville, FL.
Mylavarapu, R., T. Obreza, K. Morgan, G. Hochmuth, V. Nair, and A. Wright. 2014. Extraction of soil nutrients using Mehlich-3 reagent for acid-mineral soils of Florida. Extension Publication SL 407, Cooperative Extension Service, University of Florida, Gainesville, FL.
Pearson, B.J. 2013. Soil characteristics and management practices for urban residential landscapes. Extension Publication ENH 1218, Co-operative Extension Service, University of Florida, Gainesville, FL.
Shaddox, T.W. 2018. Calcium for Florida turfgrasses. Extension Publica-tion ENH 1290, Cooperative Extension Service, University of Florida, Gainesville, FL.
Shober, A.L., C. Wiese, G.C. Denny, and R. Mylavarapu. 2008. Soil pH and the home landscape or garden. Extension Publication SL 256, Cooperative Extension Service, University of Florida, Gainesville, FL.

203Proc. Fla. State Hort. Soc. 133: 2020.
Proc. Fla. State Hort. Soc. 132:203. 2020.
Agroecology & Natural Resources Section
*Corresponding author. Email: [email protected]
—Scientific Note—
Homeowner Perceptions of Florida Wildflowers for Ecological Landscaping
Tiare SilvaSy*, liz FelTer1, and John W. roberTS
University of Florida, IFAS Orange County Extension, 6021 S. Conway Rd., Orlando, FL 32812
AdditionAl index words. biodiversity, ecological landscapes, Florida-Friendly, residential landscapes, wildflowers
The biodiversity of flowering plants that once existed in Florida’s natural areas has been reduced as urbanization has converted these areas into housing and retail developments. The diversity of wildflowers and native plants is critical to supporting other native species but they are often lost and rarely replanted in residential landscapes. These native plants have co-evolved with native insects and aid in the support of unique pollinators that ornamental landscapes do not support. These flowers can also help with pest control in the home landscape by attracting beneficial predatory insects that prey on landscape pests (Dale et al., 2020). Residents face barriers to adding native diversity to their landscapes because native plants and wildflowers are hard to find at local retail outlets in central Florida. One way to overcome this is by using wildflower seeds, since they are cheap and can be ordered online and delivered to your house. The objectives of this study were 1) to determine consumer preferences of five wildflower species for cultivation in home landscapes in central Florida and 2) to identify educational needs of residents that can be provided by extension agents to help them establish wildflower plantings in their yards.
Five wildflower species were direct seeded at the Orange County Extension Center in Orlando, FL. Species included two species of tickseed (Coreopsis lanceolata and C. leavenworthii), blanketflower (Gaillardia pulchella), phlox (Phlox drummondii), and milkweed (Asclepias tuberosa). Landscape plots 1.2 × 1.2 meters in area were prepared by loosening the soil with a hoe, leveling it out with a rake, and sprinkling the seeds on the ground and patting them in on 1 Oct. 2019. The experimental design was set up as a randomized complete block design with 4 replications. Plots were maintained with hand weeding and watered twice a week for establishment during the first month and once a per week after establishment. No fertilizer or pesticides were used although yellow aphids were found on the milkweed. A field day was conducted on 20 Feb. 2020 that included an educational PowerPoint presentation, followed by a tour of the wildflower trials and planting demonstration. A consumer preferences survey was administered to the people who attended the field day.
Questions on the likelihood to grow wildflowers at home, wildflower species preferred, and where to buy plants and seeds
were asked. Additional outreach events were conducted by giv-ing a virtual tour of the wildflower trial on Facebook and walk in visitors were also surveyed.
Results showed 80% of respondents (n = 32) indicated they would be extremely likely to grow wildflowers at home. Blan-ketflower was ranked by 46% of respondents as the number one choice for most likely to grow. Phlox and one of the tickseed species (C. lanceolata) were also in the top three most likely to grow choices. Mixed responses were reported for milkweed, which was ranked as both desirable and undesirable. Milkweed is well known as a host for monarch butterflies however it did not score highly in this study. When asked “where would you be willing to go to buy seeds/plants?”, 72% of respondents indicated they would order seeds online from the Florida Wildflower Seed Cooperative, which had been the seed source for this study. Buy-ing plants from a local native nursery and buying seeds/plants at garden festivals, were ranked second and third, respectively. Saving seed from their wildflowers in their yard was well received. The least popular method to obtain plants and seeds was order from other online catalogs, most likely because commercial catalogs do not commonly carry Florida native wildflowers.
Native plants and wildflowers need to be part of a Florida-Friendly Landscape as they are adapted to low inputs of fertilizer and can withstand rainfall and drought. Overall, residents indicated interest in growing many species of wildflowers. More extension resources are needed to help residents cultivate wildflowers in their yards on the topics of seed planting, seedling versus weed identification, maintenance, pest control, seed saving and replant-ing. Educating people to understand that increasing our native plant diversity would also cause an increase in the diversity of native birds and pollinators and also provide food and shelter for wildlife will also be key to creating more eco-friendly home landscapes.
Literature Cited
Dale, A.G., R.L. Perry, G.C. Cope, and N. Benda. 2020. Floral abundance and richness drive beneficial arthropod conservation and biological control on golf courses. Urban Ecosyst. 23:55–66.
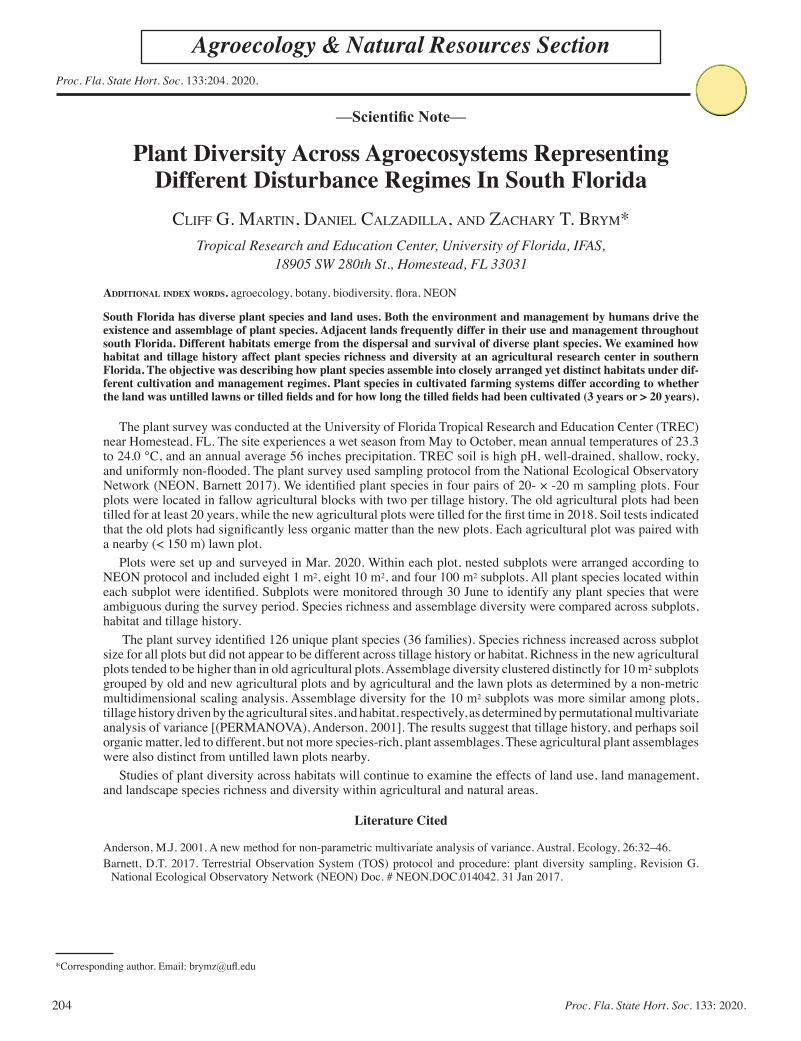
204 Proc. Fla. State Hort. Soc. 133: 2020.
Proc. Fla. State Hort. Soc. 133:204. 2020.
Agroecology & Natural Resources Section
*Corresponding author. Email: [email protected]
—Scientific Note—
Plant Diversity Across Agroecosystems Representing Different Disturbance Regimes In South Florida
Cliff G. Martin, Daniel CalzaDilla, anD zaChary t. BryM*Tropical Research and Education Center, University of Florida, IFAS,
18905 SW 280th St., Homestead, FL 33031
AdditionAl index words. agroecology, botany, biodiversity, flora, NEON
South Florida has diverse plant species and land uses. Both the environment and management by humans drive the existence and assemblage of plant species. Adjacent lands frequently differ in their use and management throughout south Florida. Different habitats emerge from the dispersal and survival of diverse plant species. We examined how habitat and tillage history affect plant species richness and diversity at an agricultural research center in southern Florida. The objective was describing how plant species assemble into closely arranged yet distinct habitats under dif-ferent cultivation and management regimes. Plant species in cultivated farming systems differ according to whether the land was untilled lawns or tilled fields and for how long the tilled fields had been cultivated (3 years or > 20 years).
The plant survey was conducted at the University of Florida Tropical Research and Education Center (TREC) near Homestead, FL. The site experiences a wet season from May to October, mean annual temperatures of 23.3 to 24.0 °C, and an annual average 56 inches precipitation. TREC soil is high pH, well-drained, shallow, rocky, and uniformly non-flooded. The plant survey used sampling protocol from the National Ecological Observatory Network (NEON, Barnett 2017). We identified plant species in four pairs of 20- × -20 m sampling plots. Four plots were located in fallow agricultural blocks with two per tillage history. The old agricultural plots had been tilled for at least 20 years, while the new agricultural plots were tilled for the first time in 2018. Soil tests indicated that the old plots had significantly less organic matter than the new plots. Each agricultural plot was paired with a nearby (< 150 m) lawn plot.
Plots were set up and surveyed in Mar. 2020. Within each plot, nested subplots were arranged according to NEON protocol and included eight 1 m2, eight 10 m2, and four 100 m2 subplots. All plant species located within each subplot were identified. Subplots were monitored through 30 June to identify any plant species that were ambiguous during the survey period. Species richness and assemblage diversity were compared across subplots, habitat and tillage history.
The plant survey identified 126 unique plant species (36 families). Species richness increased across subplot size for all plots but did not appear to be different across tillage history or habitat. Richness in the new agricultural plots tended to be higher than in old agricultural plots. Assemblage diversity clustered distinctly for 10 m2 subplots grouped by old and new agricultural plots and by agricultural and the lawn plots as determined by a non-metric multidimensional scaling analysis. Assemblage diversity for the 10 m2 subplots was more similar among plots, tillage history driven by the agricultural sites, and habitat, respectively, as determined by permutational multivariate analysis of variance [(PERMANOVA), Anderson, 2001]. The results suggest that tillage history, and perhaps soil organic matter, led to different, but not more species-rich, plant assemblages. These agricultural plant assemblages were also distinct from untilled lawn plots nearby.
Studies of plant diversity across habitats will continue to examine the effects of land use, land management, and landscape species richness and diversity within agricultural and natural areas.
Literature Cited
Anderson, M.J. 2001. A new method for non-parametric multivariate analysis of variance. Austral. Ecology, 26:32–46.Barnett, D.T. 2017. Terrestrial Observation System (TOS) protocol and procedure: plant diversity sampling, Revision G.
National Ecological Observatory Network (NEON) Doc. # NEON.DOC.014042. 31 Jan 2017.
205Proc. Fla. State Hort. Soc. 133: 2020.
Proc. Fla. State Hort. Soc. 133:205. 2020.
Agroecology & Natural Resources Section
—Scientific Note—
Experiential Urban Forestry Extension: Treejuvenation Florida
Marguerite Beckford*University of Florida IFAS, Sarasota County Extension,6700 Clark Rd., Sarasota, FL 34241
Treejuvenation© Florida’s project and resource partners include: Andrew Koeser, Environmental Horticulture Department, University of Florida; Brad Oberle, New College of Florida; Sarasota County Extension Master Gardener Volunteers; Sarasota County Parks and Natural Resources Department; Sarasota County Li-brary Department; Project Learning Tree; and iTree© My Tree Benefits database.*Corresponding author. Email: [email protected]
A Sarasota County canopy study in 2013 indicated 35% veg-etation cover in the Urban Service Area. With increasing land development, this canopy has steadily decreased. Urban trees provide significant community benefits, including reduced heat-island effects and improved air quality. To increase urban forestry community engagement and support canopy conservation efforts, an urban forestry extension program—Treejuvenation© Florida—was developed in Sarasota County.
A series of quarterly urban forestry community engagement projects were conducted. These projects were designed to in-crease community awareness of tree assets, increase community engagement in urban forestry activities, increase tree plantings, and identify urban forestry partnership resources. The projects in-cluded: TreeQuest—scavenger hunts for native trees; Talking Trees —urban forestry youth workshops; Tree Trail Tour—tree-centric nature walks; and Adopt-a-Tree—tree planting demonstrations and seminars. As part of the urban forestry extension program, a partnership with New College, a local college was also launched, providing assistance with completing the certification process for the college to be designated as a Tree Campus USA© site.
TreeQuest is an outdoor experiential learning activity designed to promote community awareness of urban tree benefits and hosted on Florida Arbor Day. For the event, native trees in local parks and preserves are marked with “clues” on an 11 × 17 inch vinyl tag, which includes information highlighting benefits of urban trees such as the estimated amount of storm water filtered annually, and lifetime of carbon dioxide sequestered. This information is derived from the iTree©/MyTree© Benefits database. Scavenger hunt participants submit clues online for a prize.
Arbor Day Adopt-a-Tree is a community engagement activ-ity designed to increase the number of tree plantings in Sarasota County. Tree-planting demonstrations and tree adoption events are hosted on National Arbor Day. After attending an urban forestry seminar on tree care, participants pledge to plant a tree on their property and receive up to 3 native trees per local address. To assess new tree survival rates, a follow-up survey is done with participants 1 year after the tree-planting event, with participants having the option of submitting pictures of their newly planted tree(s) in the survey response.
Talking Trees is a series of summer workshops designed to educate youth about the ecosystem services of urban forests. Using experiential learning activities from the Project Learning Tree Curriculum, youth learn about the roles of trees in the carbon cycle and supporting wildlife habitat.
Tree Trail Tour is a series of tree-centric nature walks in local gardens and arboreta, designed to increase urban forestry com-munity engagement, and is hosted in recognition of National NeighborWoods month. Copies of plant maps are distributed, and participants embark on interpretive tours highlighting the urban forestry benefits of specific trees.
Tree Campus USA©: To increase college student engagement in urban forestry activities, the Treejuvenation© Florida Exten-sion program initiated a partnership with New College, one of Sarasota’s colleges, assisting the college to complete the Tree Campus USA© certification eligibility process. Colleges with a Tree Campus USA© designation are annually required to commit staff, student and financial resources to promoting urban forestry awareness on campus, and engaging students in urban forestry activities.
TreeQuest: Feedback from participants over a 3-year period (n = 151) showed that 94% of respondents increased their knowledge about the benefits of urban trees; 83% indicated that they would share the information they learned with others; 61% indicated that the learning activity motivated them to plant a tree.
Adopt-a-Tree: Treejuvenation Florida hosted 11 tree adoption stations over a 3 year period with 355 trees adopted. A one-year post-planting follow-up survey to measure the survival rate of the trees, showed an 84% survival rate (300 trees).
Talking Trees: Ninety percent of the urban forestry youth summer workshop participants indicated that they would share what they learned about trees with others.
Tree Trail Tour: Ninety-eight percent of participants indicated that they learned a lot about urban tree benefits, and they would share what they learnt with others.
Tree Campus USA©: In collaboration with the Treejuvenation© Florida Extension program, New College of Florida successfully completed certification requirements for designation as Florida’s 21st Tree Campus USA© location.
Since its launch in 2017, Treejuvenation© Florida has promoted awareness about the benefits of urban trees, conducted 31 urban forestry extension learning activities, with 421 participants plant-ing 300 native tree trees. With a mature native tree having a lifetime capacity to sequester more than 3000 lbs. of carbon-dioxide-equivalent of carbon, these additional tree plantings represent a carbon sequestration potential of over 900,000 lbs. of carbon.

206 Proc. Fla. State Hort. Soc. 133: 2020
Proc. Fla. State Hort. Soc. 133:206–216. 2020.
Agroecology & Natural Resources Section
Calcium management and the usage of organic acids: Impacts on marketable fruit yield in strawberries Jared Essman, Michael Mulvaney1, Gabriel Maltais-Landry2, and Shinsuke Agehara3
1West Florida Research and Education Center, University of Florida IFAS, Jay, FL 2Soil and Water Sciences Department, University of Florida, Gainesville, FL 3Gulf Coast Research and Education Center, University of Florida IFAS, Wimauma, FL
Introduction The Florida strawberry (Fragaria x ananassa) market is estimated to have a production value around $337 million; comprising roughly 10% of total US production (FDACS, 2017). According to the Agricultural Marketing Resource Center, 82% of production from of this nearly $350-billion US-industry is in fresh market sales (AgMRC, 2019). Fresh market strawberries are particularly susceptible to metrics that negatively affect fruit ship ability (i.e fruit firmness and shelf-life). Influence of disease and certain environmental pressures can thus have significant economic impact. In the past decade, the primary strawberry production area of Central Florida has seen increases in both temperature and solar intensity. The winter months of December, January, and February are peak months for strawberry market and harvest in Florida. The 2019-2020 season marks the ninth consecutive winter with mean temperatures above normal (NOAA, 2019). According to the National Weather Service (NWS), 2018-2019 season in Plant City, FL averaged +3.9°F above the historic mean, making it the sixth warmest winter on record (NOAA, 2019). February of this same season averaged +8.7°F above the historical mean, making it the second warmest February on record for the area (NOAA, 2019). Data from the NWS shows that for this geography, the number of days per year that the Ultra-Violet (UV) Index was recorded as very high or extreme has increased from 143.8 days (5-year avg. 2003-2007) to 189.4 days (5-year avg. 2013-2017) (NOAA, 2017). Increased exposure to high temperature and intensive solar radiation are known to negatively impact the commercial quality of fruit (Rosales et al, 2009). In the past several years as environmental influences continue to trend in this direction, reports from growers and brokers on issues of ship ability have become more predominant. Because of the large potential for economic loss in fresh market strawberries, it is suggested that adjustments to production methods should be considered. Placing an increased importance on sustainable management

207Proc. Fla. State Hort. Soc. 133: 2020.
for calcium (Ca) as a primary nutrient related to cell wall structure may provide a strategy to improve the percentage of marketable fruit with adequate shelf-life. This publication provides an overview of science-based information on the role of calcium in fruit storage and the rhizosphere interactions that can limit Ca-uptake. A field-study is used to investigate how the presence of organic acids as a soil amendment could be a potential option for improving the concentration and mobility of this target nutrient in developing fruit. Calcium Role in Fruit Storage Fruit firmness is a quality component directly associated with cell wall structure and is economically important to shelf-life of fresh market produce. The primary structural strength of the cell wall comes from cellulose fibers bound together by pectic strands in the middle lamella. A majority of the pectic material found in plants is of the form calcium-pectate (Maschner, 1995). Natural processes for ripening involve ethylene-signaled pectinase enzymes (i.e. polygalacturonases) solubilizing pectin in the cell wall of the fruit to create a softer, more edible berry (Pombo et al, 2008). High Ca-concentration in plant tissues has been directly linked to the inhibition of polygalaturonase activity and thus a reduction in the rate of cell wall disassembly (Corden, 1965). Although the biochemical pathways involved with cell wall modification and fruit ripening are complex, they exemplify the significant role calcium plays in maintaining cell wall integrity. The degradation of structural pectins, however, is not solely a plant-regulated process. Dr. Rosales and her colleagues (2009) associated an increase in the solubilization of pectins and the loss of commercial quality in cherry tomatoes with a reduction in Ca content and an increase in oxidative stress caused by temperature, solar radiation, and vapor-pressure deficit. Morales-Quintana et al (2019) elaborated by stating that the disassembly of cell wall components due to high temperatures and certain wavelengths of solar radiation is primarily explained by the biochemical increase of photo-oxidative species within the plant during such climatic conditions. Cellular oxidation is a term used to describe the process by which cell membranes lose their structural integrity. The consequential leakage of low-molecular weight substances (i.e. sugars and amino acids) from the cell via lost cytoplasm can quickly become substrates for secondary pathogenic infection; further inhibiting plant health and agronomic production (Dordas, 2008). A common example of this is the contraction of the fungal species Botrytis cinerea, often exhibited in late season strawberries and evident by a fruit-rotting gray mold on ripening berries. Naradisorn et al (2006) observed a reduction of Botrytis cinerea incidence and an increase in storage life of strawberries when pre-harvest calcium was applied. In summary, inadequate calcium concentration in the plant, and the consequential weaknesses to cell wall structure, can negatively affect both plant health and volume of marketable fruit. In adverse conditions of high temperature, intense solar radiation, or additional nutrient deficiencies, consequences are magnified.

208 Proc. Fla. State Hort. Soc. 133: 2020
Limitations to Calcium Mobility Managing a crop for adequate calcium has challenges, primarily related to the limitations of plant acquisition and nutrient mobility. Being a divalent cation (Ca+2), calcium forms a variety of strong bonds with other soil components, often rendering it inaccessible for plant uptake. Below a pH of roughly 5.5, Al+3 and Fe+2 become more available in soil solution, thus inhibiting Ca+2 uptake (Taylor et al, 2004). Above a pH of roughly 7.5 and calcium begins to form insoluble precipitates with phosphorus (Alvarez et al, 2004). Even within the optimal pH range of 6.0-6.5, plant uptake processes for other essential nutrients (i.e. K+) can compete with Ca+2 acquisition (Taylor et al, 2004). Although Ca+2 uptake is regarded as a passive diffusion process, it is still subject to transpiration forces and the pull of water through the plant (Taylor et al, 2004). Low water availability, high relative humidity, restricted root growth, and low temperature are all factors that inhibit transpiration and thus calcium movement (Taylor et al, 2004). Once in the plant, calcium is heavily restricted to uni-directional movement in the xylem (Taylor et al, 2004). Depending on bond strength of the calcium carrier and number of active exchange sites within the cell walls of the xylem, calcium distribution becomes quite complex (Marschner, 1995). Once established in a specific tissue, calcium translocation from one plant organ to another through the phloem is limited (Marschner, 1995). In addition, plant tissues with higher transpiration rates (i.e. leaf surfaces) become calcium sinks (Marschner 1995). In agricultural systems, this has the potential to disproportionally draw calcium away from high growth rate, low-transpiring fruit organs (Marschner, 1995). This aspect of calcium mobility greatly increases the risk that calcium concentration in developing berries falls below the critical level required for adequate cell wall stabilization (Marschner, 1995). Calcium as Natural Resource in Florida Soils Much of the parent material that geologically formed Florida soils is limestone, solidifying calcium carbonate as a feature in the majority of Central Florida’s cultivated ground (Bostick et al, 2018). Additionally, Central Florida soils are characteristic of having primeval deposits of phosphate rock (FIPR, 2020). An early geological survey of these deposits by the Department of the Interior indicate that the predominant composition of these phosphate rock sources is in the form tricalcium-phosphate (Ca3P2O8)(Matson, 1915). As a result of these geological attributes, calcium is found in relatively high quantities in Central Florida soils. Recent soil samples taken on cultivated ground across the Plant City, FL strawberry production area indicated an average soil concentration of extractable calcium at 1766 lbs Ca/ac (Mehlich I). Despite these relatively high levels, limitations to calcium uptake and plant integration could still inhibit certain crop species from producing fruit with calcium concentrations adequate to counteract adverse environmental conditions.
209Proc. Fla. State Hort. Soc. 133: 2020.
Calcareous soils are generally characterized by low bioavailability of plant nutrients (Strom et al, 2005). As a result, calcicole plants, or plant species that thrive on calcareous soils, have been documented to exhibit increased organic acid root exudation, particularly of oxalic and citric acids (Strom et al, 2005). Based on the soil samples taken from the Plant City, FL strawberry production area, low clay content (mean: 95.3% sand), low organic matter (mean: 1.0%) and low cation exchange capacity (mean: 7.3 meq/100g) suggest a strong likelihood that a large portion of this extractable calcium source is ‘tied-up’ in low-availability forms (i.e. calcium carbonate, calcium phosphate, etc.) as opposed to being bound at the soil exchange complex. Management practices aimed at increasing solubility of unavailable nutrients for agronomic use are needed. Role of Organic Acids Soil organic matter (SOM) plays a centric role in soil health, fertility, and nutrient cycling. Humic acids are a form of high-molecular weight (HMW) organic acids often applied as an amendment to increase agricultural productivity on soils with weak structure or low CEC (Delgado et al, 2002). Commercial production of humic acid is typically derived from naturally occurring carbon deposits of lignite and leonardite. The addition of humic acid has chemical, physical, and biological impacts on the soil (Pettit, 2007). Chemically, the addition of humic acid increases the number of nutrient exchange sites, particularly for cations such as calcium (Pettit, 2007). The negatively charged hydroxyl and carboxyl active groups on the humic colloid are involved with binding and holding cationic nutrients in plant exchangeable forms (Pettit, 2007). In addition, the presence of humic acid has been noted to increase the movement of nutrients into the root system by upregulating active transport proteins (i.e. H+-ATPase) embedded in the root plasma membranes (Table 1)(Pinton et al, 2009). Root exudation is a remarkable process by which plants alter their below-ground environment for more suitable growth and homeostatic balance (Badri et al, 2009). Plant to soil, plant to microbiota, and plant to plant signaling are symbiotic relationships regulated by root-secreted compounds (Haichar et al, 2014). Evidenced by the high cost of photosynthate, with 5-21% of photosynthetically fixed carbon secreted into the rhizosphere, root exudation is a physiological process of great importance for plant success (Haichar et al, 2014, Strom et al 2005). Low-molecular weight (LMW) organic acids are a classification of root exudate with many roles but are commonly associated with nutrient exchange (Figure 1). In the case of organic acids, a proton (H+) dissociates and replaces the target cation on the colloidal exchange site. The anion portion of the organic acid then complexes the target cation to keep it from taking a new, potentially insoluble form (Figure 2). For the case of calcium phosphate, it has been suggested that organic acids produced in the rhizosphere drive the dissolution of CaPO4 by supplying adequate protons (H+) to displace and bind Ca+2 ions (Bolan et al, 1994). Strom et al (2005) documented that at a pH of 7.5 in a calcareous soil solution, citrate and oxalate were the
210 Proc. Fla. State Hort. Soc. 133: 2020
organic acids most effective at solubilizing phosphorous while citrate and malate were the most capable extractors of calcium. Citric acids are also associated with the dissolution of certain carbonate minerals (i.e. CaCO3) resulting in the net release of cations into solution (Jones et al, 1994). When studying the behavior of organic acids in calcareous soil, Strom et al (2005) also noted that the dissolution of CaCO3 by organic acids resulted in the formation of organically-complexed calcium (i.e. calcium-citrate, calcium-oxalate, etc.) and in increase in soil pH explained by the release of carbonate ions (CO3-2). Importantly, the newly formed organo-calcium complex has also been observed to have improved mobility once in the plant. Plants with higher concentrations of organic acids in the vascular tissues are reported to have wider distribution of calcium throughout the plant (Marschner, 1995). Investigative Field Study A non-replicated field study to explore the application of humic and organic acids (HA+OA) as effective soil amendments was performed at three farm locations in Plant City, FL during the 2019-2020 season. At one of these locations, a replicated harvest was performed once a month during peak season (December, January, and February) on strawberries (cv. Brilliance) to establish fruit quality metrics. The data retrieved shows an early and mid-season trend towards increased concentration of calcium in soil solution (Figure 3). While the combined response of all three farm locations to the HA+OA treatment was non-significant (p=0.181), a single-site location considered as “low-input” did have a significant response (p=0.041). Despite these minor increases to concentration of calcium in soil solution, there were not significant changes to calcium concentration in the leaf-tissue. Furthermore, the replicated berry harvest did not exhibit significant changes to calcium concentration within the fruit-tissue nor in fruit firmness. Increases in the number of marketable berries and the weight per marketable berry were, however, observed in the HA+OA treated plots (Table 2). It should be noted that no treatment included additional units of calcium so any observed differences are recognized as the solubilization of calcium-containing compounds in the soil by applied organic acids. The nutritional analysis of soil solution also presented an unexpected but significant (p≤0.05) difference in soluble phosphorous (P) between treatments (Figure 4). This further suggests the dissolution of phosphate rock deposits by organic acids as a primary mode of action for the release of P and Ca into solution. The addition of HMW and LMW organic compounds to the soil may increase the efficacy of applied P fertilizer in calcareous soils by reducing P adsorption and ultimately serving as an effective crop production tool (Delgado et al, 2002). Despite the observed difference in P-solubilization due to organic acid amendment, there were no significant differences in leaf- or fruit-test P between treatments.
211Proc. Fla. State Hort. Soc. 133: 2020.
Conclusion With a landscape of changing climatic influences and a market dominated by fresh sales, production strategies that mitigate environmental variability and positively impact fruit quality in strawberries should be considered. This publication outlines the importance of calcium to cell wall integrity, strawberry shelf-life and how organic acids interact with soil-bound plant nutrition. The literature consistently supports that even relatively small increases to Ca concentration in fruit can be an effective method for improving marketable yield, limiting fungal infection, and avoiding storage disorders that result in economic losses (Singh et al, 2007). Data provides evidence that the addition of organic acids could be promoting the dissolution of calcium and phosphorous from the phosphate rock and lime rich soils of Central Florida, particularly effective in low-input agricultural systems. While the HA+OA amendment did not significantly change fruit firmness, there was a numerical increase of marketable fruit yield. It should be noted that the growing conditions of the 2019-2020 season in Plant City, FL exhibited ideal temperature and precipitation, and a scenario of more extreme circumstances may impact those findings. Further investigation of these concepts is needed to establish a stronger trend. References Agricultural Marketing Resource Center. 2019. Strawberries. https://www.agmrc.org/commodities-products/fruits/strawberries . March 16, 2020 Alvarez R., Evansa L.A., Milhamb P.J., Wilson M.A. (2004). Effects of humic material on the precipitation of calcium phosphate. Geoderma. 118: 245-260 Badri D.V., Vivanco J.M. (2009). Regulation and function of root exudates. Plant, Cell, and Environment. 32: 666-681 Bolan N.S., Naidu R., Mahimairaja S., Baskaran S. (1994). Influence of low-molecular-weight organic acids on the solubilization of phosphates. Biology and Fertility of Soils 18: 311-319 Bostick K.W., Johnson S.A., Main M.B. (2018). Florida’s Geological History. UF-IFAS EDIS Publication WEC189 Corden M.E. (1965). Influence of calcium nutrition on Fusarium wilt in tomato and polygalacturonase activity. Phytopathology. 55:222-224 Dakora F.D., Phillips D.A. (2002). Root exudates as mediators of mineral acquisition in low-nutrient environments. Plant and Soil 245: 35-47
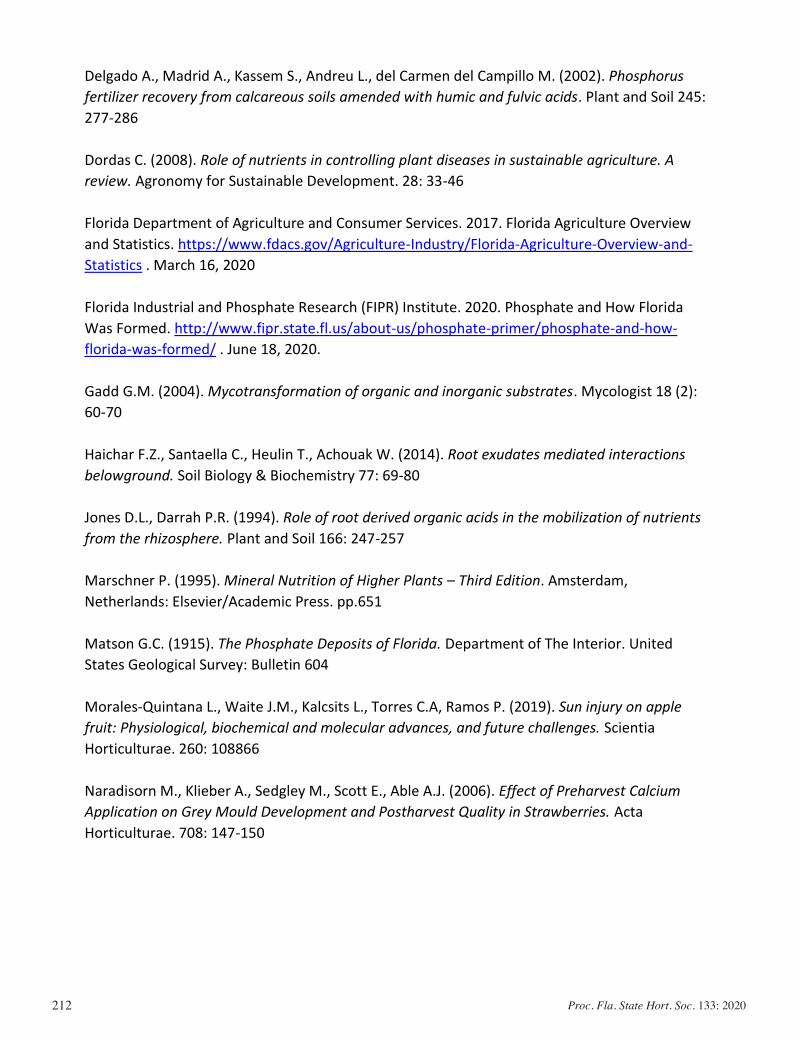
212 Proc. Fla. State Hort. Soc. 133: 2020
Delgado A., Madrid A., Kassem S., Andreu L., del Carmen del Campillo M. (2002). Phosphorus fertilizer recovery from calcareous soils amended with humic and fulvic acids. Plant and Soil 245: 277-286 Dordas C. (2008). Role of nutrients in controlling plant diseases in sustainable agriculture. A review. Agronomy for Sustainable Development. 28: 33-46 Florida Department of Agriculture and Consumer Services. 2017. Florida Agriculture Overview and Statistics. https://www.fdacs.gov/Agriculture-Industry/Florida-Agriculture-Overview-and-Statistics . March 16, 2020 Florida Industrial and Phosphate Research (FIPR) Institute. 2020. Phosphate and How Florida Was Formed. http://www.fipr.state.fl.us/about-us/phosphate-primer/phosphate-and-how-florida-was-formed/ . June 18, 2020. Gadd G.M. (2004). Mycotransformation of organic and inorganic substrates. Mycologist 18 (2): 60-70 Haichar F.Z., Santaella C., Heulin T., Achouak W. (2014). Root exudates mediated interactions belowground. Soil Biology & Biochemistry 77: 69-80 Jones D.L., Darrah P.R. (1994). Role of root derived organic acids in the mobilization of nutrients from the rhizosphere. Plant and Soil 166: 247-257 Marschner P. (1995). Mineral Nutrition of Higher Plants – Third Edition. Amsterdam, Netherlands: Elsevier/Academic Press. pp.651 Matson G.C. (1915). The Phosphate Deposits of Florida. Department of The Interior. United States Geological Survey: Bulletin 604 Morales-Quintana L., Waite J.M., Kalcsits L., Torres C.A, Ramos P. (2019). Sun injury on apple fruit: Physiological, biochemical and molecular advances, and future challenges. Scientia Horticulturae. 260: 108866 Naradisorn M., Klieber A., Sedgley M., Scott E., Able A.J. (2006). Effect of Preharvest Calcium Application on Grey Mould Development and Postharvest Quality in Strawberries. Acta Horticulturae. 708: 147-150
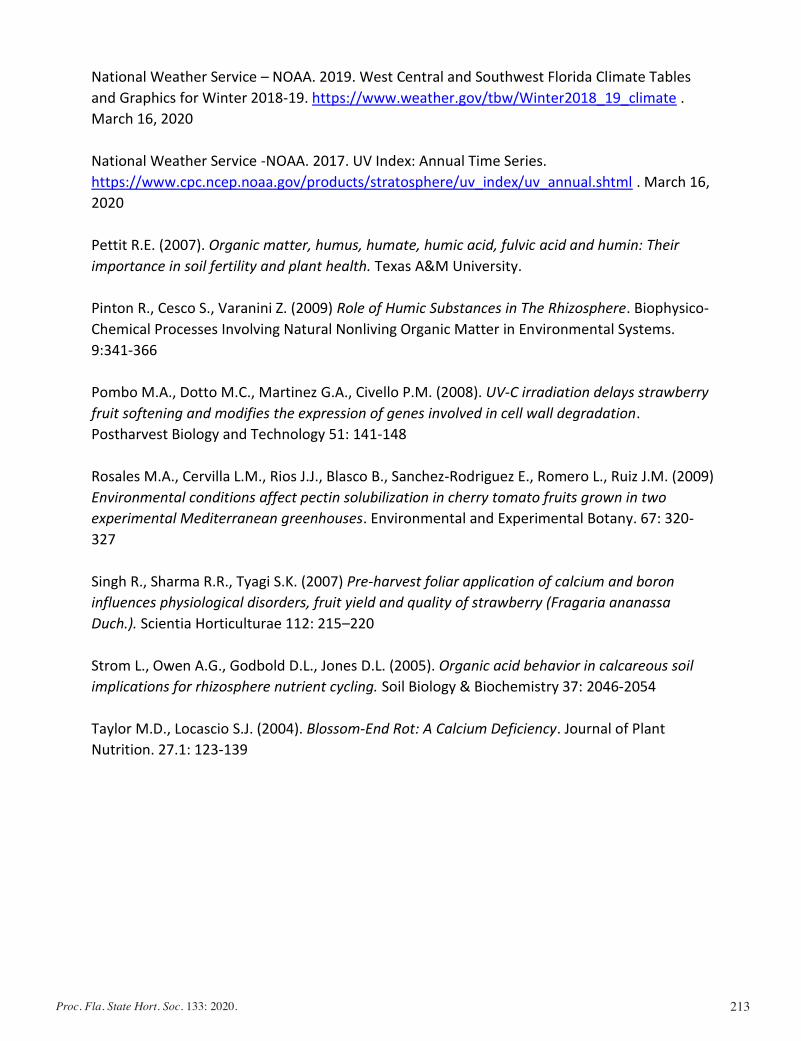
213Proc. Fla. State Hort. Soc. 133: 2020.
National Weather Service – NOAA. 2019. West Central and Southwest Florida Climate Tables and Graphics for Winter 2018-19. https://www.weather.gov/tbw/Winter2018_19_climate . March 16, 2020 National Weather Service -NOAA. 2017. UV Index: Annual Time Series. https://www.cpc.ncep.noaa.gov/products/stratosphere/uv_index/uv_annual.shtml . March 16, 2020 Pettit R.E. (2007). Organic matter, humus, humate, humic acid, fulvic acid and humin: Their importance in soil fertility and plant health. Texas A&M University. Pinton R., Cesco S., Varanini Z. (2009) Role of Humic Substances in The Rhizosphere. Biophysico-Chemical Processes Involving Natural Nonliving Organic Matter in Environmental Systems. 9:341-366 Pombo M.A., Dotto M.C., Martinez G.A., Civello P.M. (2008). UV-C irradiation delays strawberry fruit softening and modifies the expression of genes involved in cell wall degradation. Postharvest Biology and Technology 51: 141-148 Rosales M.A., Cervilla L.M., Rios J.J., Blasco B., Sanchez-Rodriguez E., Romero L., Ruiz J.M. (2009) Environmental conditions affect pectin solubilization in cherry tomato fruits grown in two experimental Mediterranean greenhouses. Environmental and Experimental Botany. 67: 320-327 Singh R., Sharma R.R., Tyagi S.K. (2007) Pre-harvest foliar application of calcium and boron influences physiological disorders, fruit yield and quality of strawberry (Fragaria ananassa Duch.). Scientia Horticulturae 112: 215–220 Strom L., Owen A.G., Godbold D.L., Jones D.L. (2005). Organic acid behavior in calcareous soil implications for rhizosphere nutrient cycling. Soil Biology & Biochemistry 37: 2046-2054 Taylor M.D., Locascio S.J. (2004). Blossom-End Rot: A Calcium Deficiency. Journal of Plant Nutrition. 27.1: 123-139
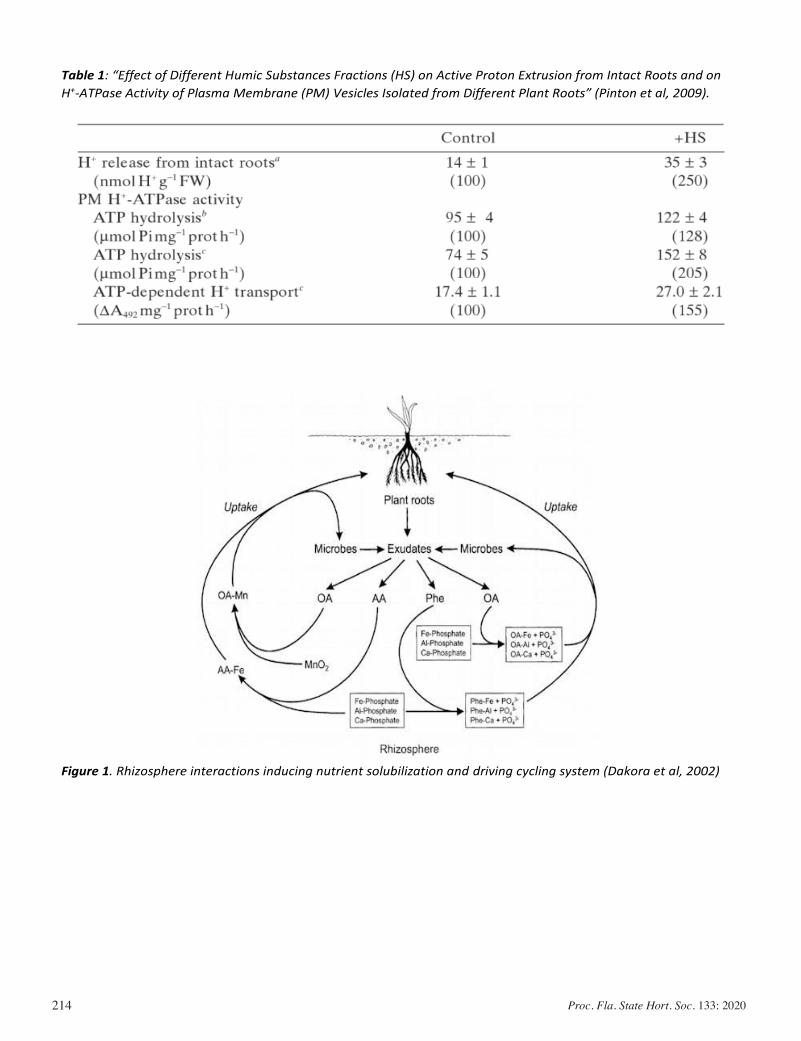
214 Proc. Fla. State Hort. Soc. 133: 2020
Table 1: “Effect of Different Humic Substances Fractions (HS) on Active Proton Extrusion from Intact Roots and on H+-ATPase Activity of Plasma Membrane (PM) Vesicles Isolated from Different Plant Roots” (Pinton et al, 2009).
Figure 1. Rhizosphere interactions inducing nutrient solubilization and driving cycling system (Dakora et al, 2002)
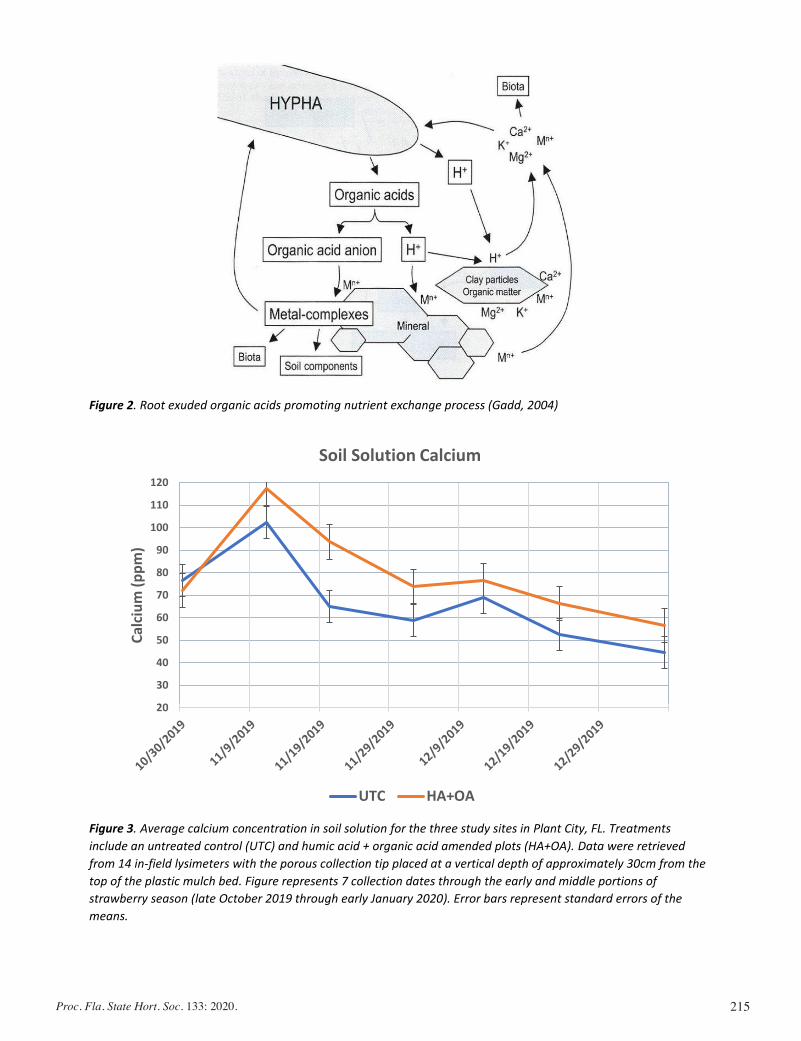
215Proc. Fla. State Hort. Soc. 133: 2020.
Figure 2. Root exuded organic acids promoting nutrient exchange process (Gadd, 2004)
Figure 3. Average calcium concentration in soil solution for the three study sites in Plant City, FL. Treatments include an untreated control (UTC) and humic acid + organic acid amended plots (HA+OA). Data were retrieved from 14 in-field lysimeters with the porous collection tip placed at a vertical depth of approximately 30cm from the top of the plastic mulch bed. Figure represents 7 collection dates through the early and middle portions of strawberry season (late October 2019 through early January 2020). Error bars represent standard errors of the means.
20
30
40
50
60
70
80
90
100
110
120
Calci
um (p
pm)
Soil Solution Calcium
UTC HA+OA
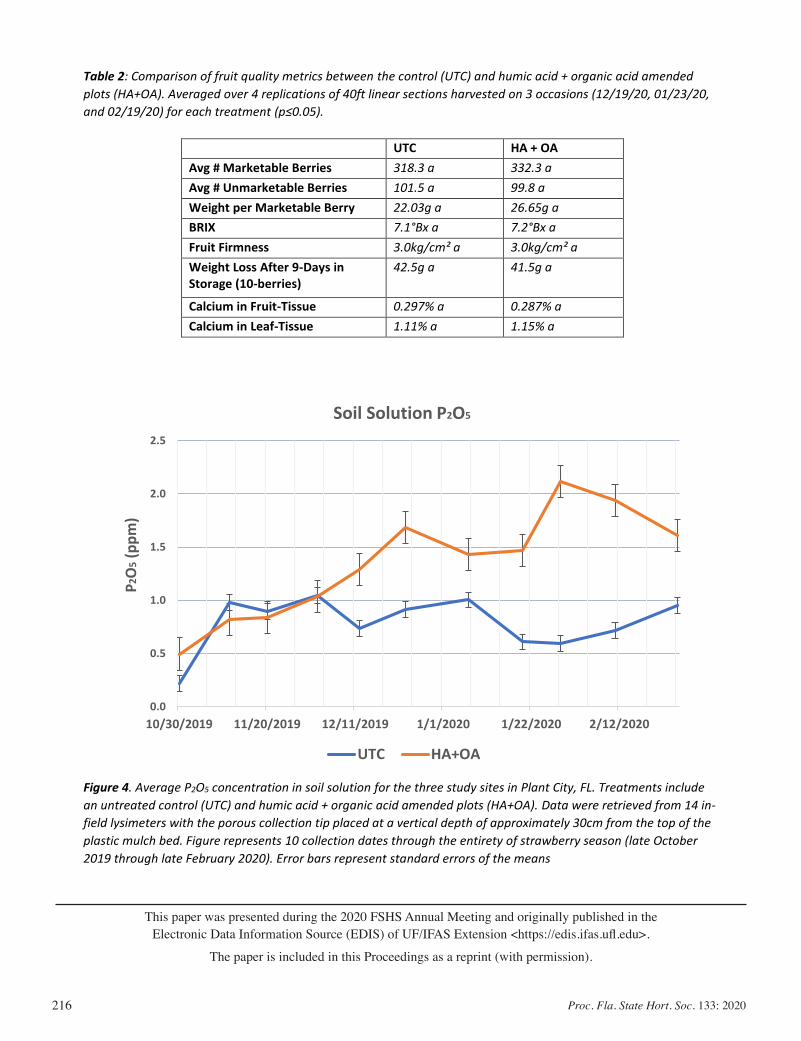
216 Proc. Fla. State Hort. Soc. 133: 2020
Table 2: Comparison of fruit quality metrics between the control (UTC) and humic acid + organic acid amended plots (HA+OA). Averaged over 4 replications of 40ft linear sections harvested on 3 occasions (12/19/20, 01/23/20, and 02/19/20) for each treatment (p≤0.05).
UTC HA + OA Avg # Marketable Berries 318.3 a 332.3 a Avg # Unmarketable Berries 101.5 a 99.8 a Weight per Marketable Berry 22.03g a 26.65g a BRIX 7.1°Bx a 7.2°Bx a Fruit Firmness 3.0kg/cm² a 3.0kg/cm² a Weight Loss After 9-Days in Storage (10-berries)
42.5g a 41.5g a
Calcium in Fruit-Tissue 0.297% a 0.287% a Calcium in Leaf-Tissue 1.11% a 1.15% a
Figure 4. Average P2O5 concentration in soil solution for the three study sites in Plant City, FL. Treatments include an untreated control (UTC) and humic acid + organic acid amended plots (HA+OA). Data were retrieved from 14 in-field lysimeters with the porous collection tip placed at a vertical depth of approximately 30cm from the top of the plastic mulch bed. Figure represents 10 collection dates through the entirety of strawberry season (late October 2019 through late February 2020). Error bars represent standard errors of the means
0.0
0.5
1.0
1.5
2.0
2.5
10/30/2019 11/20/2019 12/11/2019 1/1/2020 1/22/2020 2/12/2020
P2O5
(ppm
)
Soil Solution P2O5
UTC HA+OA
This paper was presented during the 2020 FSHS Annual Meeting and originally published in the Electronic Data Information Source (EDIS) of UF/IFAS Extension <https://edis.ifas.ufl.edu>.
The paper is included in this Proceedings as a reprint (with permission).
217Proc. Fla. State Hort. Soc. 133: 2020.
Proc. Fla. State Hort. Soc. 133:217–225. 2020.
Agroecology & Natural Resources Section
Evaluating the Effects of Acetic Acid andd-Limonene on Four Aquatic Plants
Lyn A. Gettys1, Kyle L. Thayer1, and Joseph W. Sigmon1
ADDITIONAL INDEX WORDS. broadleaf sagittaria, citric acid, Eichhornia crassipes,invasive species, natural herbicides, organic herbicides, pickerelweed, Pistiastratiotes, Pontederia cordata, Sagittaria latifolia, vinegar, waterhyacinth,waterlettuce
SUMMARY. The foundation ofmost aquatic weedmanagement programs in Florida issynthetic herbicides because many of these U.S. Environmental Protection Agency(USEPA)-registered products are effective, selective, and inexpensive comparedwith other strategies such as mechanical harvesting. However, stakeholders haveexpressed concern regarding their use and managers are interested in exploring al-ternative methods for aquatic weed control. To that end, we evaluated the efficacy,selectivity, and costs of the ‘‘natural’’ products acetic acid and d-limonene (alone andin combination with each other and citric acid) on the invasive floating plantswaterhyacinth (Eichhornia crassipes) and waterlettuce (Pistia stratiotes), and thenative emergent plants broadleaf sagittaria (Sagittaria latifolia) and pickerelweed(Pontederia cordata). These products, plus an industry-standard synthetic herbicide(diquat dibromide), were applied once as foliar treatments to healthy plants, whichwere grown out for 8 weeks after treatment to allow development of phytotoxicitysymptoms. A 0.22% concentration of diquat dibromide eliminated all vegetation,but neither ‘‘natural’’ product alone provided acceptable (>80%) control of floatingweeds, even when applied at the maximum concentrations under evaluation (20%acetic acid, 30% d-limonene). Citric acid (5% or 10%) had no effect on the activity ofacetic acid or d-limonene, but some combinations of acetic acid and d-limonenecontrolled floating weeds effectively without causing unacceptable damage to nativeplants. However, these treatments are much more expensive than the syntheticstandard andmanagers would realize a 22- to 26-fold increase in product cost alonewithout factoring in other expenses such as additional labor and application time.Combinations of acetic acid and d-limonene may have utility in some areas wherethe use of synthetic herbicides is discouraged, but broad-scale deployment of thisstrategy would likely be prohibitively expensive.
Florida’s resource managers arecharged with keeping aquaticvegetation at maintenance levels
to facilitate navigation, flood controlefforts, and other uses of state waters.This goal is most often achieved byusing herbicides that have been ap-proved by the U.S. EnvironmentalProtection Agency (USEPA) for usein aquatic systems, with statewideoversight and coordination of treat-ments provided by the Florida Fishand Wildlife Conservation Commis-sion (FWC, 2018, 2019a). For exam-ple, the FWC oversaw the expenditure
of $17.007 million and $15.126 mil-lion in federal and state funds tocontrol aquatic plants in Florida’spublic water bodies in fiscal year (FY)2017–18 and FY 2018–19, respec-tively (FWC, 2018, 2019a). Morethan half of this funding ($10.01million and $8.86 million in FY2017–18 and FY 2018–19, respec-tively) was allocated for managingthe submersed weed hydrilla (Hydrillaverticillata), whereas �25% of thosemonies ($4.04 million in FY 2017–18and $4.19 million in FY 2018–19)was spent for floating plant control,which primarily comprise waterhya-cinth (Eichhornia crassipes) andwaterlettuce (Pistia stratiotes). Exces-sive growth of floating plants causesa number of problems in aquatic eco-systems, including reducing the pene-tration of oxygen and light into thewater column by blocking the air–water interface, creating monoculturesby outcompeting native plants, andinterfering with flood control opera-tions by creating large, dense mats thatobstruct canals and water movementstructures (Gettys, 2019). Waterhya-cinth, a Brazilian species, was intro-duced intentionally to Florida duringthe late 1800s as a water garden orna-mental and was released from cultiva-tion soon thereafter (Gettys, 2020a).The native range of waterlettuce iscryptic and may include the southeast-ern United States, but the speciesexhibits aggressive growth and is con-sidered invasive in Florida regardlessof its true point of origin (Gettys,2020b).
As with all pesticides registeredby the USEPA, aquatic herbicides areonly labeled for use if they ‘‘will notgenerally cause unreasonable adverseeffects on the environment . . . takinginto account the economic, social,and environmental costs and benefitsof the use of any pesticide’’ (USEPA,1996). However, public concerns re-garding herbicide use in aquatic
UnitsTo convert U.S. to SI,multiply by U.S. unit SI unit
To convert SI to U.S.,multiply by
3.7854 gal L 0.26429.3540 gal/acre L�ha–1 0.10692.54 inch(es) cm 0.3937
25.4 inch(es) mm 0.03940.4536 lb kg 2.2046
28.3495 oz g 0.03531 ppm mg�L–1 1
(�F – 32) O 1.8 �F �C (�C · 1.8) + 32
Received for publication 3 Dec. 2020. Accepted for publication 17 Feb. 2021.
Published online 23 March 2021.1University of Florida, Institute of Food and Agricul-tural Sciences, Fort Lauderdale Research and Educa-tion Center, 3205 College Avenue, Davie, FL 33314
This research was supported by the Florida Agricul-tural Experiment Station and by the U.S. Department of Agriculture, National Institute of Food and Agri-culture (HATCH project FLA-FTL-005682). Fund-ing was also provided by the Florida Fish and Wildlife Conservation Commission.
We thank Ian Markovich, Mohsen Tootoonchi, and Angie Diez for their invaluable contributions to this project.
Mention of a trademark, proprietary product, or vendor does not constitute a guarantee or warranty of the product and does not imply its approval to the exclusion of other products or vendors that also may be suitable.
This article is based on a presentation given at the 2020 Florida State Horticultural Society’s annual meeting in Oct. 2020.
L.A.G. is the corresponding author. E-mail: lgettys@ ufl.edu.
This is an open access article distributed under the CC BY-NC-ND license (https://creativecommons.org/licenses/by-nc-nd/4.0/).
218 Proc. Fla. State Hort. Soc. 133: 2020
systems have added to the challengesfaced by managers. The FWC‘‘paused’’ chemical weed manage-ment activities in early 2019 in re-sponse to public outcry and toprovide an opportunity for stake-holder voices to be heard. A primarymessage that arose from listeningsessions during the pause was thatthe public believes ‘‘chemical’’ (her-bicide) usage in aquatic systemsshould be reduced drastically (FWC,2019b). Although other aquaticweed management options such asmechanical harvesting do exist, mosthave greatly increased costs and re-duced efficacy compared with chem-ical control tools. The need for‘‘softer’’ products that can be usedfor aquatic weed control is urgent,and exploration is needed to identifyways for managers to maintain waterresources effectively without the useof synthetic herbicides.
‘‘Natural’’ herbicides are usedextensively by home gardeners, or-ganic farmers, and others who wish toreduce their use of synthetic herbi-cides. Products used for natural weedcontrol include acids [i.e., acetic acid(vinegar) and citric acid], oils [clove(eugenol) (Syzygium aromaticum),pine (Pinus sp.), peppermint (Mentha·piperita), and citronella (Cymbopo-gon sp.)], soaps, iron- or salt-basedherbicides, corn (Zea mays) gluten,and combinations of these products(Smith-Fiola and Gill, 2017). Acidsand oils may destroy cell membranes,which can lead to cell leakage, plantdesiccation, and plant death (Baker,1970; Webber et al., 2018). Whenused in upland (terrestrial) areas,these are nonselective contact foliarsprays that kill most broad-leavedweeds.
There are a number of commer-cially available natural herbicides thatlist acetic acid as the active ingredient.The most common acetic acid con-centration in single-ingredient prod-ucts is 20% [e.g., Maestro-GroOrganic Vinegar (Maestro-Gro, Jus-tin, TX), Vinagreen Natural NonSelective Herbicide (Fleischmann’sVinegar Co., Cerritos, CA), WeedPharm Fast Acting Weed and GrassKiller (Pharm Solutions, Port Town-send, WA)]. Products containing 20%acetic acid are typically labeled asready to use (although some can bediluted to a concentration of 10%),and label instructions regarding spot
treatments state that target weedsshould be sprayed to wet. Productsthat include broadcast instructions in-dicate that 15 to 30 gal/acre of prod-uct should be used.
There are many other acetic acidproducts on the market, but most arenot specifically labeled for weed con-trol. For example, a note on thewebsite for Bradfield Natural Horti-cultural Vinegar (20% acetic acid)states, ‘‘Although many folks, espe-cially in the organic culture, havehistorically used strong vinegars toabate vegetation growth, be advisedthat Acetic Acids of 8% or less whencharacterized as an inert ingredient,in a mixture, are exempt from regis-tration by the USEPA as a pesticideunder USEPA ‘Minimum Risk Pesti-cide’ FIFRA 25B, List 4A. Thus thisproduct (at 20% acidity) is not to belabeled, marketed or characterized inany way as having any herbicidalvirtues’’ (Bradfield Industries, 2019;USEPA, 2004b). Horticultural vine-gar, with an acetic acid concentrationof 30%, is available, but is not listedspecifically as a herbicide. Acetic acidis corrosive and can damage applica-tion equipment when used in highlyconcentrated form, but Evans et al.(2009) stated that lower concentra-tions can be used if application vol-ume is increased to deliver the sametotal amount of acetic acid. For ex-ample, 15% acetic acid applied at 68gal/acre will reportedly yield similarresults as 30% acetic acid at 34 gal/acre (Quarles, 2010).
Although citric acid is oftena component in ‘‘natural’’ herbicidemixes, products that rely only oncitric acid or citrus oil are less com-mon. Avenger Weed Killer Concen-trate (Cutting Edge Formulations,Buford, GA) contains 70% d-limo-nene. The label indicates the productshould be diluted at 1:6 (10% d-limonene for small annual weeds) to1:3 (17.5% d-limonene) for hard-to-control weeds, then sprayed to wet.GreenMatch Burndown Herbicide(Cutting Edge Formulations) is 55%d-limonene, and label instructionsspecify diluting at a 1:6 ratio (8% d-limonene) for broadcast treatmentsor a 1:4 ratio (11% d-limonene) forspot treatments.
Despite widespread interest inreducing synthetic herbicide use,there is a dearth of information avail-able in the scientific literature
regarding the efficacy of natural prod-ucts such as acetic acid and d-limo-nene as weed control agents, eitheralone or in combination. Domen-ghini (2020) reported that acetic acidapplied at a concentration of 20% or30% could be a viable alternative toglyphosate, but that multiple applica-tions would be necessary for pro-longed weed control. Webber et al.(2018) evaluated 5% and 20% aceticacid solutions alone or with sweetorange (Citrus sinensis) or canola(Brassica napus) oil; they found thatweed control increased as acetic acidconcentration increased and thatthere was little or no advantage toadding either type of oil to the aceticacid solutions. Evans and Bellinder(2009) stated that broadcast applica-tions of 15%, 20%, and 30% acetic acidmixed with 1.7% or 3.4% clove oilcould be useful for weed suppressionin sweet corn, onion (Allium cepa),and potato (Solanum tuberosum) cul-tivation. Shrestha et al. (2012)reported that a single application of20% d-limonene provided up to 95%weed control in organic almond (Pru-nus dulcis) orchards 1 week aftertreatment, but that efficacy was re-duced to 53% control 5 weeks aftertreatment, necessitating repeat appli-cations every 5 to 6 weeks.
Even less information is availablein the scientific literature regardingthe use of natural products for weedcontrol in aquatic ecosystems. Theseproducts are not labeled for use asherbicides in aquatic areas, so theyhave not been subjected to the manytests required before USEPA ap-proval, which include environmentalfate and ecological toxicity assess-ments (Stubbs and Layne, 2020),and their effects on aquatic fauna havenot been well-characterized. How-ever, Saha et al. (2006) reported thatacetic acid had a 96-h 50% lethalconcentration value of 273 mg�L–1
on tilapia (Oreochromis mossambicus)(i.e., tilapia populations exposed tothis concentration for 96 h would beexpected to experience death of halfthe population), and that dissolvedoxygen and plankton populationswere reduced after exposure to 17mg�L–1 acetic acid. The USEPA(2004a) stated that technical-gradeand formulated d-limonene is ‘‘prac-tically nontoxic or slightly toxic tobirds, fish and invertebrates,’’ butKim et al. (2013) reported that
219Proc. Fla. State Hort. Soc. 133: 2020.
metabolites of d-limonene may causeskin irritation in humans and otheranimals. As stated earlier, acids andoils can destroy cell membranes(Baker, 1970; Webber et al., 2018)and thus should be considered non-selective and likely to cause damage tooff-target flora that comes into con-tact with these products. Anderson(2007) reported that rhizomes of theemergent aquatic weed smooth cord-grass (Spartina alterniflora) had 90%reductions in shoot number and plantheight 9 months after exposure toacetic acid. Acetic acid reduceshydrilla regrowth from root crowns(Spencer and Ksander, 1995), andinhibits viability and sprouting ofhydrilla and sago pondweed (Stuck-enia pectinata) tubers (Spencer andKsander, 1997, 1999). However, us-ing acetic acid to suppress submersedweed growth would only be practicalwhen employed in conjunction withdewatering, because achieving an ad-equate concentration of acetic acid inthe entire water column is virtuallyimpossible and could cause significantoff-target damage to other flora andfauna in the system. For these rea-sons, the scope of this research islimited to testing the effects of con-tact products on above-water vegeta-tion (i.e., floating and emergent plantmaterial).
The primary goals of this projectwere to evaluate the effects of aceticacid and d-limonene (alone and incombination with each other) on twofloating invasive target species andtwo emergent desirable nontargetspecies, and to compare the costs ofusing these products vs. a syntheticUSEPA-approved aquatic herbicide.According to the FWC National Pol-lution Discharge Elimination Systemreport for calendar year 2018, diquatdibromide, which is nonselective, wasthe most commonly used herbicidefor floating weed management, witha total of 7871.77 gal of formulation(37.3% diquat dibromide) applied(Clark and Dew, 2019), so this prod-uct will serve as the synthetic ‘‘stan-dard practice’’ treatment in theseexperiments.
Materials and methods
EFFICACY STUDIES. Target (weed)species were waterhyacinth and water-lettuce, whereas nontarget (desirable)species were pickerelweed (Pontederia
cordata) and broadleaf sagittaria (Sag-ittaria latifolia). Plants were treatedin pairs of one invasive floating spe-cies and one native emergent spe-cies. Run 1 focused on waterhyacinthand broadleaf sagittaria, whereasrun 2 focused on waterlettuce andpickerelweed.
Target species were field-col-lected or pulled from cultures main-tained at the University of FloridaFort Lauderdale Research and Edu-cation Center (FLREC) in Davie,FL, and were moved to 18-gal plas-tic tubs filled with well water. Run 1tubs (waterhyacinth) were amendedwith 10 g each of crushed 15N–3.9P–10K controlled-release fertil-izer formulated for 6-month releasein Florida (Osmocote Plus; ICL Spe-cialty Fertilizers, Dublin, OH) and7N–0P–0K iron chelate micronu-trient (Sprint 330; BASF Corp.,Research Triangle Park, NC). Run2 tubs (waterlettuce) were amendedwith 3.4 g of 24N–3.5P–13.3K wa-ter-soluble fertilizer (Miracle-GroWater Soluble All Purpose PlantFood; Scotts Miracle-Gro Products,Marysville, OH) and 1.2 g of 7N–0P–0K iron chelate micronutrient.Each tub was initially ‘‘seeded’’ with10 plants of a target species, whichwere grown out for 4 to 6 weeks toallow development of more than 80%surface coverage.
Nontarget species were pur-chased from an aquatic nursery(Aquatic Plants of Florida, MyakkaCity, FL) and transported to a green-house at FLREC, where individualplants were transplanted into 2-Lplastic pots without holes that werefilled with sand [grain diameter0.25–0.5 mm (Multi-Purpose Sand;Sakrete, Charlotte, NC)] amendedwith 4 g of the same controlled-release fertilizer used in run 1 tubs.Plants were grown out on green-house benches and irrigated twiceper day (10:00 AM and 4:00 PM) withthe equivalent of 0.5 inch of waterper irrigation before being used inexperiments. New shoots were cutback during this culture period toensure that each 2-L pot containeda single nontarget plant. When targetplant coverage reached more than80% of the surface of the water, onepotted nontarget plant was intro-duced to each tub (water depth,�20 cm above the surface of the
pots) and all plants were then sub-jected to treatment.
Treatments were applied as sin-gle spot ‘‘spray to wet’’ foliar applica-tions to above-water foliage, and alltreatments included 1% v/v of a non-ionic surfactant (Induce; HelenaAgri-Enterprises, Collierville, TN) toaid in penetration and emulsification.Nine single-product treatments (5%,7.5%, 10%, 15%, and 20% acetic acid;and 10%, 15%, 20%, and 30% d-lim-onene), 30 combination treatments(all combinations of single acetic acidand d-limonene treatments; all con-centrations of acetic acid plus 5% and10% citric acid), three synthetic stan-dard-practice treatments (0.22%,0.45%, and 0.89% diquat dibromide),and an untreated control were evalu-ated, with four replicates of eachtreatment. Base materials were 30%acetic acid (Green Gobbler 30% Vin-egar Home and Garden; EcoCleanSolutions, Copiague, NY), 100% d-limonene (100% Pure TechnicalGrade D-Limonene, EcoClean Solu-tions), 37.3% diquat dibromide (Tri-bune Herbicide; Syngenta CropProtection, Greensboro, NC), and100% citric acid (Milliard Citric Acid;Milliard Brands, Lakewood, NJ).Treatments were applied to run 1and run 2 plants on 12 Nov. 2019and 15 Jan. 2020, respectively. Plantswere monitored weekly for 8 weeksafter treatment and then the projectlead assigned a numerical value of0 through 10 to describe visual qual-ity (0 = dead; 5 = fair quality, accept-able, somewhat desirable form andcolor, little to no chlorosis or necro-sis; 10 = excellent quality, perfectcondition, healthy and robust, excel-lent color and form). Although someauthors (e.g., Cutelle et al., 2013;Koschnick et al., 2005; Mudgeet al., 2007) report visual injury ordamage resulting from herbicidetreatments, we recorded visual qual-ity, which has also been used to de-scribe plant response to differingculture conditions (e.g., Gettys andMoore, 2018, 2019), herbicides(e.g., Gettys and Haller, 2009,2010, 2012; Smith et al., 2014), saltstress (e.g., Tootoonchi et al., 2020),and other experimental factors. Aftervisual scoring, a destructive harvestwas conducted to collect all live bio-mass of floating species and all liveaboveground shoots of emergent spe-cies. Harvested materials were placed
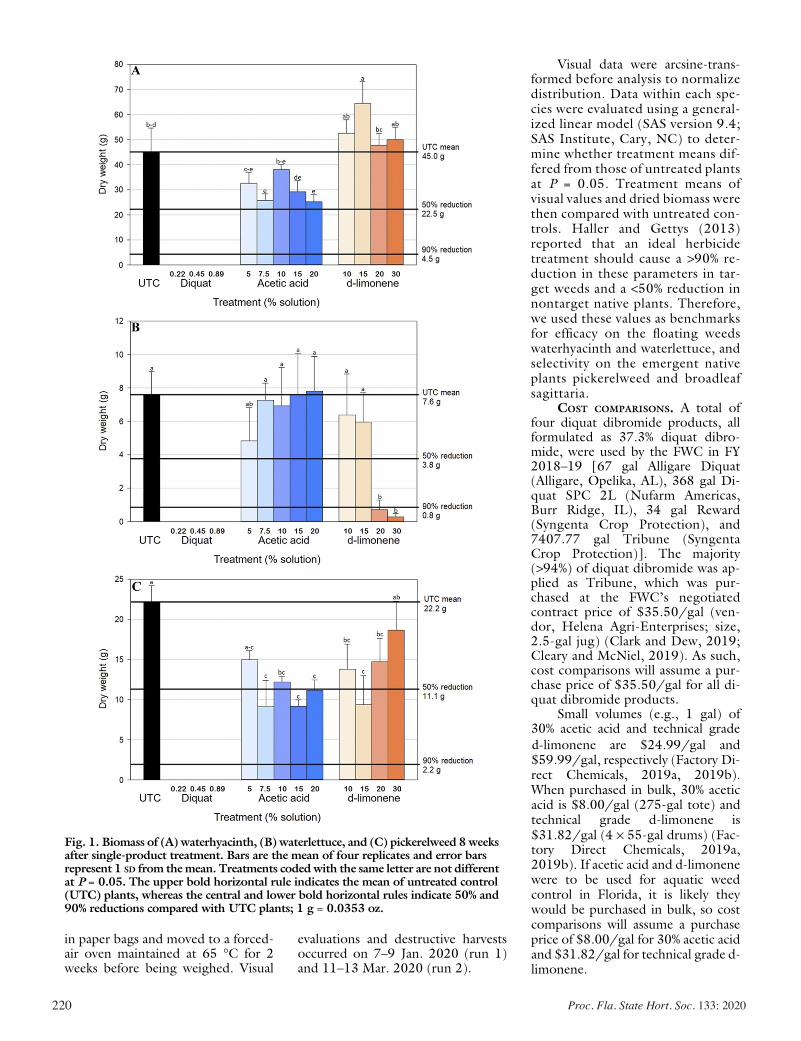
220 Proc. Fla. State Hort. Soc. 133: 2020
in paper bags and moved to a forced-air oven maintained at 65 �C for 2weeks before being weighed. Visual
evaluations and destructive harvestsoccurred on 7–9 Jan. 2020 (run 1)and 11–13 Mar. 2020 (run 2).
Visual data were arcsine-trans-formed before analysis to normalizedistribution. Data within each spe-cies were evaluated using a general-ized linear model (SAS version 9.4;SAS Institute, Cary, NC) to deter-mine whether treatment means dif-fered from those of untreated plantsat P = 0.05. Treatment means ofvisual values and dried biomass werethen compared with untreated con-trols. Haller and Gettys (2013)reported that an ideal herbicidetreatment should cause a >90% re-duction in these parameters in tar-get weeds and a <50% reduction innontarget native plants. Therefore,we used these values as benchmarksfor efficacy on the floating weedswaterhyacinth and waterlettuce, andselectivity on the emergent nativeplants pickerelweed and broadleafsagittaria.
COST COMPARISONS. A total offour diquat dibromide products, allformulated as 37.3% diquat dibro-mide, were used by the FWC in FY2018–19 [67 gal Alligare Diquat(Alligare, Opelika, AL), 368 gal Di-quat SPC 2L (Nufarm Americas,Burr Ridge, IL), 34 gal Reward(Syngenta Crop Protection), and7407.77 gal Tribune (SyngentaCrop Protection)]. The majority(>94%) of diquat dibromide was ap-plied as Tribune, which was pur-chased at the FWC’s negotiatedcontract price of $35.50/gal (ven-dor, Helena Agri-Enterprises; size,2.5-gal jug) (Clark and Dew, 2019;Cleary and McNiel, 2019). As such,cost comparisons will assume a pur-chase price of $35.50/gal for all di-quat dibromide products.
Small volumes (e.g., 1 gal) of30% acetic acid and technical grade
Fig. 1. Biomass of (A) waterhyacinth, (B) waterlettuce, and (C) pickerelweed 8weeksafter single-product treatment. Bars are the mean of four replicates and error barsrepresent 1 SD from themean. Treatments codedwith the same letter are not differentat P = 0.05. The upper bold horizontal rule indicates the mean of untreated control(UTC) plants, whereas the central and lower bold horizontal rules indicate 50% and90% reductions compared with UTC plants; 1 g = 0.0353 oz.
d-limonene are $24.99/gal and$59.99/gal, respectively (Factory Di-rect Chemicals, 2019a, 2019b). When purchased in bulk, 30% acetic acid is $8.00/gal (275-gal tote) and technical grade d-limonene is$31.82/gal (4 · 55-gal drums) (Fac-tory Direct Chemicals, 2019a, 2019b). If acetic acid and d-limonene were to be used for aquatic weed control in Florida, it is likely they would be purchased in bulk, so cost comparisons will assume a purchase price of $8.00/gal for 30% acetic acid and $31.82/gal for technical grade d-limonene.
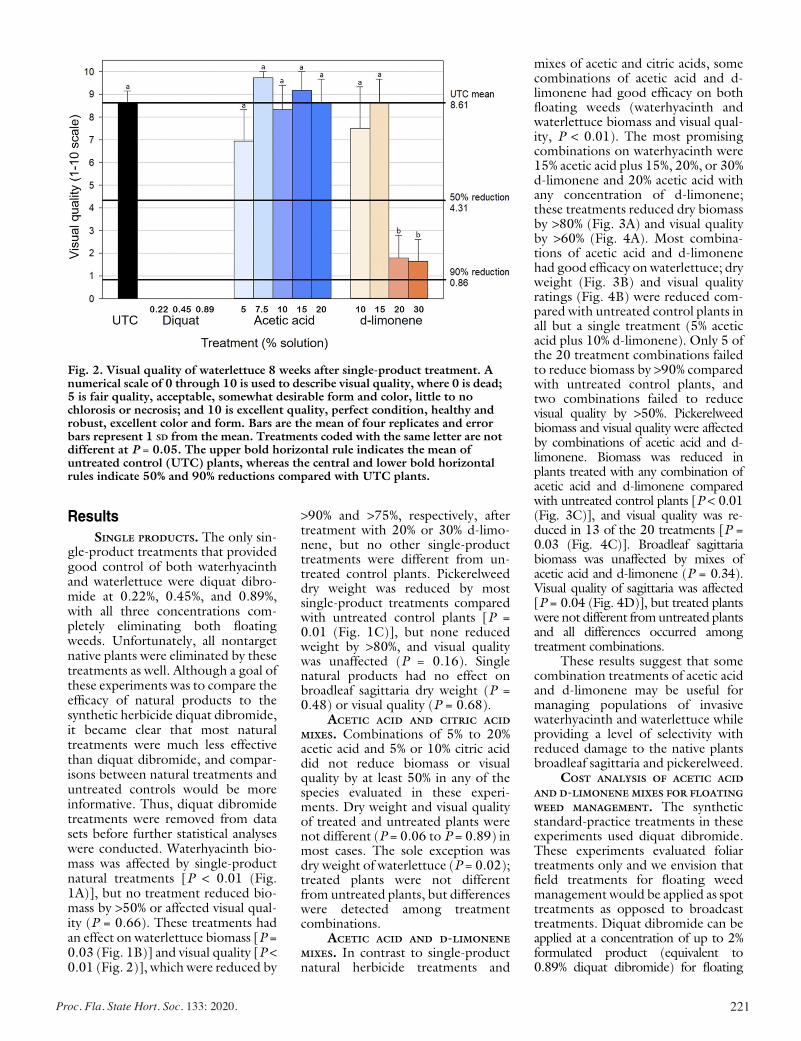
221Proc. Fla. State Hort. Soc. 133: 2020.
Results
SINGLE PRODUCTS. The only sin-gle-product treatments that providedgood control of both waterhyacinthand waterlettuce were diquat dibro-mide at 0.22%, 0.45%, and 0.89%,with all three concentrations com-pletely eliminating both floatingweeds. Unfortunately, all nontargetnative plants were eliminated by thesetreatments as well. Although a goal ofthese experiments was to compare theefficacy of natural products to thesynthetic herbicide diquat dibromide,it became clear that most naturaltreatments were much less effectivethan diquat dibromide, and compar-isons between natural treatments anduntreated controls would be moreinformative. Thus, diquat dibromidetreatments were removed from datasets before further statistical analyseswere conducted. Waterhyacinth bio-mass was affected by single-productnatural treatments [P < 0.01 (Fig.1A)], but no treatment reduced bio-mass by >50% or affected visual qual-ity (P = 0.66). These treatments hadan effect on waterlettuce biomass [P =0.03 (Fig. 1B)] and visual quality [P <0.01 (Fig. 2)], which were reduced by
>90% and >75%, respectively, aftertreatment with 20% or 30% d-limo-nene, but no other single-producttreatments were different from un-treated control plants. Pickerelweeddry weight was reduced by mostsingle-product treatments comparedwith untreated control plants [P =0.01 (Fig. 1C)], but none reducedweight by >80%, and visual qualitywas unaffected (P = 0.16). Singlenatural products had no effect onbroadleaf sagittaria dry weight (P =0.48) or visual quality (P = 0.68).
ACETIC ACID AND CITRIC ACID
MIXES. Combinations of 5% to 20%acetic acid and 5% or 10% citric aciddid not reduce biomass or visualquality by at least 50% in any of thespecies evaluated in these experi-ments. Dry weight and visual qualityof treated and untreated plants werenot different (P = 0.06 to P = 0.89) inmost cases. The sole exception wasdry weight of waterlettuce (P = 0.02);treated plants were not differentfrom untreated plants, but differenceswere detected among treatmentcombinations.
ACETIC ACID AND D-LIMONENE
MIXES. In contrast to single-productnatural herbicide treatments and
mixes of acetic and citric acids, somecombinations of acetic acid and d-limonene had good efficacy on bothfloating weeds (waterhyacinth andwaterlettuce biomass and visual qual-ity, P < 0.01). The most promisingcombinations on waterhyacinth were15% acetic acid plus 15%, 20%, or 30%d-limonene and 20% acetic acid withany concentration of d-limonene;these treatments reduced dry biomassby >80% (Fig. 3A) and visual qualityby >60% (Fig. 4A). Most combina-tions of acetic acid and d-limonenehad good efficacy on waterlettuce; dryweight (Fig. 3B) and visual qualityratings (Fig. 4B) were reduced com-pared with untreated control plants inall but a single treatment (5% aceticacid plus 10% d-limonene). Only 5 ofthe 20 treatment combinations failedto reduce biomass by >90% comparedwith untreated control plants, andtwo combinations failed to reducevisual quality by >50%. Pickerelweedbiomass and visual quality were affectedby combinations of acetic acid and d-limonene. Biomass was reduced inplants treated with any combination ofacetic acid and d-limonene comparedwith untreated control plants [P < 0.01(Fig. 3C)], and visual quality was re-duced in 13 of the 20 treatments [P =0.03 (Fig. 4C)]. Broadleaf sagittariabiomass was unaffected by mixes ofacetic acid and d-limonene (P = 0.34).Visual quality of sagittaria was affected[P = 0.04 (Fig. 4D)], but treated plantswere not different fromuntreated plantsand all differences occurred amongtreatment combinations.
These results suggest that somecombination treatments of acetic acidand d-limonene may be useful formanaging populations of invasivewaterhyacinth and waterlettuce whileproviding a level of selectivity withreduced damage to the native plantsbroadleaf sagittaria and pickerelweed.
COST ANALYSIS OF ACETIC ACID
AND D-LIMONENE MIXES FOR FLOATING
WEED MANAGEMENT. The syntheticstandard-practice treatments in theseexperiments used diquat dibromide.These experiments evaluated foliartreatments only and we envision thatfield treatments for floating weedmanagement would be applied as spottreatments as opposed to broadcasttreatments. Diquat dibromide can beapplied at a concentration of up to 2%formulated product (equivalent to0.89% diquat dibromide) for floating
Fig. 2. Visual quality of waterlettuce 8 weeks after single-product treatment. Anumerical scale of 0 through 10 is used to describe visual quality, where 0 is dead;5 is fair quality, acceptable, somewhat desirable form and color, little to nochlorosis or necrosis; and 10 is excellent quality, perfect condition, healthy androbust, excellent color and form. Bars are the mean of four replicates and errorbars represent 1 SD from the mean. Treatments coded with the same letter are notdifferent at P = 0.05. The upper bold horizontal rule indicates the mean ofuntreated control (UTC) plants, whereas the central and lower bold horizontalrules indicate 50% and 90% reductions compared with UTC plants.
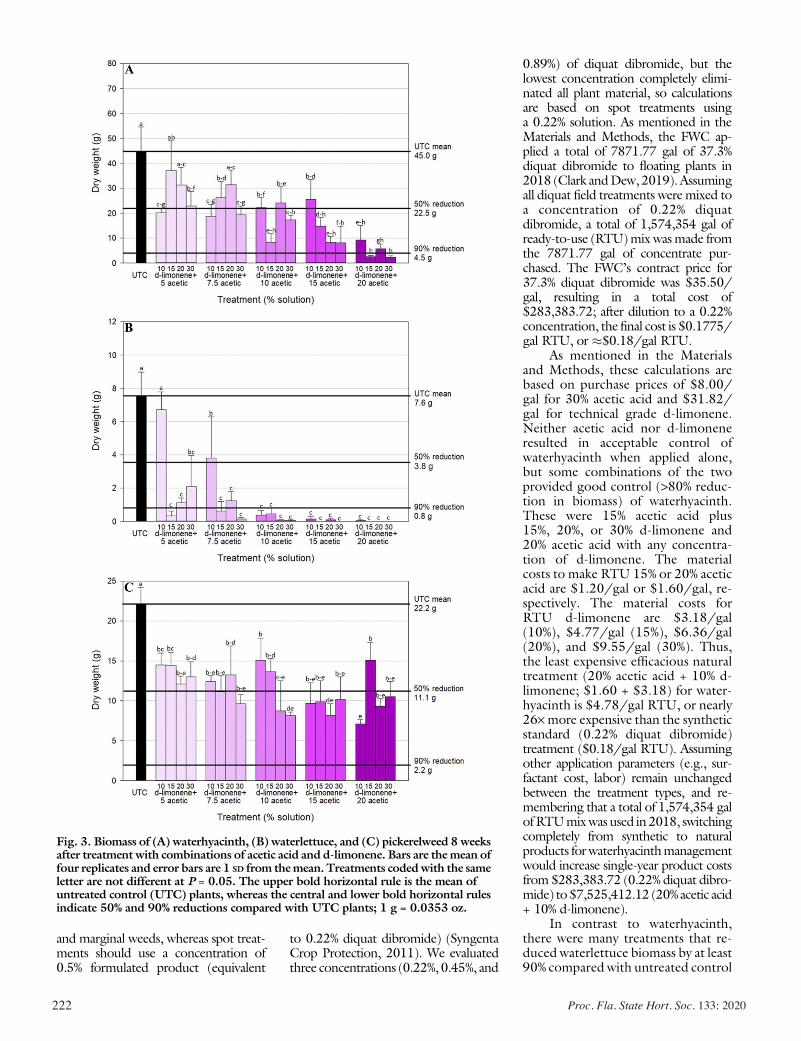
222 Proc. Fla. State Hort. Soc. 133: 2020
and marginal weeds, whereas spot treat-ments should use a concentration of0.5% formulated product (equivalent
to 0.22% diquat dibromide) (SyngentaCrop Protection, 2011). We evaluatedthree concentrations (0.22%, 0.45%, and
0.89%) of diquat dibromide, but thelowest concentration completely elimi-nated all plant material, so calculationsare based on spot treatments usinga 0.22% solution. As mentioned in theMaterials and Methods, the FWC ap-plied a total of 7871.77 gal of 37.3%diquat dibromide to floating plants in2018 (Clark andDew,2019).Assumingall diquat field treatments weremixed toa concentration of 0.22% diquatdibromide, a total of 1,574,354 gal ofready-to-use (RTU)mixwasmade fromthe 7871.77 gal of concentrate pur-chased. The FWC’s contract price for37.3% diquat dibromide was $35.50/gal, resulting in a total cost of$283,383.72; after dilution to a 0.22%concentration, the final cost is $0.1775/gal RTU, or �$0.18/gal RTU.
As mentioned in the Materialsand Methods, these calculations arebased on purchase prices of $8.00/gal for 30% acetic acid and $31.82/gal for technical grade d-limonene.Neither acetic acid nor d-limoneneresulted in acceptable control ofwaterhyacinth when applied alone,but some combinations of the twoprovided good control (>80% reduc-tion in biomass) of waterhyacinth.These were 15% acetic acid plus15%, 20%, or 30% d-limonene and20% acetic acid with any concentra-tion of d-limonene. The materialcosts to make RTU 15% or 20% aceticacid are $1.20/gal or $1.60/gal, re-spectively. The material costs forRTU d-limonene are $3.18/gal(10%), $4.77/gal (15%), $6.36/gal(20%), and $9.55/gal (30%). Thus,the least expensive efficacious naturaltreatment (20% acetic acid + 10% d-limonene; $1.60 + $3.18) for water-hyacinth is $4.78/gal RTU, or nearly26·more expensive than the syntheticstandard (0.22% diquat dibromide)treatment ($0.18/gal RTU). Assumingother application parameters (e.g., sur-factant cost, labor) remain unchangedbetween the treatment types, and re-membering that a total of 1,574,354 galofRTUmixwas used in2018, switchingcompletely from synthetic to naturalproducts forwaterhyacinthmanagementwould increase single-year product costsfrom$283,383.72 (0.22% diquat dibro-mide) to$7,525,412.12 (20%acetic acid+ 10% d-limonene).
In contrast to waterhyacinth,there were many treatments that re-duced waterlettuce biomass by at least90% comparedwith untreated control
Fig. 3. Biomass of (A) waterhyacinth, (B) waterlettuce, and (C) pickerelweed 8weeksafter treatmentwith combinations of acetic acid and d-limonene. Bars are themean offour replicates and error bars are 1 SD from themean. Treatments codedwith the sameletter are not different at P = 0.05. The upper bold horizontal rule is the mean ofuntreated control (UTC) plants, whereas the central and lower bold horizontal rulesindicate 50% and 90% reductions compared with UTC plants; 1 g = 0.0353 oz.
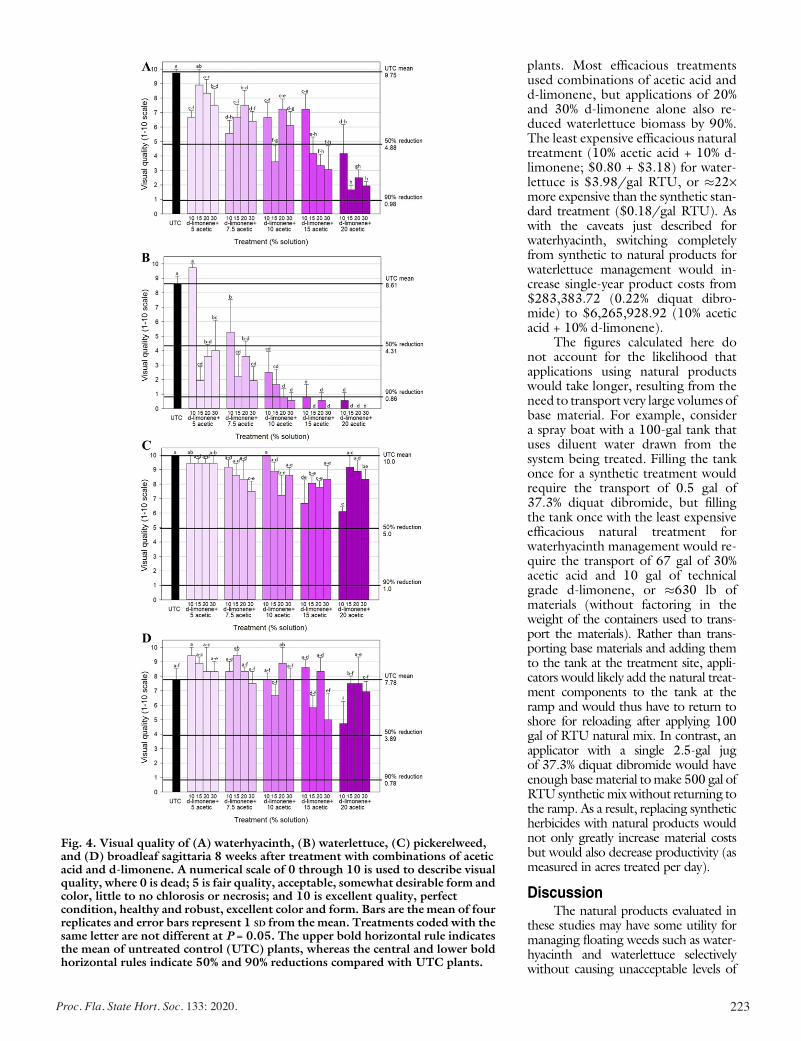
223Proc. Fla. State Hort. Soc. 133: 2020.
plants. Most efficacious treatmentsused combinations of acetic acid andd-limonene, but applications of 20%and 30% d-limonene alone also re-duced waterlettuce biomass by 90%.The least expensive efficacious naturaltreatment (10% acetic acid + 10% d-limonene; $0.80 + $3.18) for water-lettuce is $3.98/gal RTU, or �22·more expensive than the synthetic stan-dard treatment ($0.18/gal RTU). Aswith the caveats just described forwaterhyacinth, switching completelyfrom synthetic to natural products forwaterlettuce management would in-crease single-year product costs from$283,383.72 (0.22% diquat dibro-mide) to $6,265,928.92 (10% aceticacid + 10% d-limonene).
The figures calculated here donot account for the likelihood thatapplications using natural productswould take longer, resulting from theneed to transport very large volumes ofbase material. For example, considera spray boat with a 100-gal tank thatuses diluent water drawn from thesystem being treated. Filling the tankonce for a synthetic treatment wouldrequire the transport of 0.5 gal of37.3% diquat dibromide, but fillingthe tank once with the least expensiveefficacious natural treatment forwaterhyacinth management would re-quire the transport of 67 gal of 30%acetic acid and 10 gal of technicalgrade d-limonene, or �630 lb ofmaterials (without factoring in theweight of the containers used to trans-port the materials). Rather than trans-porting base materials and adding themto the tank at the treatment site, appli-cators would likely add the natural treat-ment components to the tank at theramp and would thus have to return toshore for reloading after applying 100gal of RTU natural mix. In contrast, anapplicator with a single 2.5-gal jugof 37.3% diquat dibromide would haveenough basematerial tomake 500 gal ofRTU syntheticmixwithout returning tothe ramp. As a result, replacing syntheticherbicides with natural products wouldnot only greatly increase material costsbut would also decrease productivity (asmeasured in acres treated per day).
DiscussionThe natural products evaluated in
these studies may have some utility formanaging floating weeds such as water-hyacinth and waterlettuce selectivelywithout causing unacceptable levels of
Fig. 4. Visual quality of (A) waterhyacinth, (B) waterlettuce, (C) pickerelweed,and (D) broadleaf sagittaria 8 weeks after treatment with combinations of aceticacid and d-limonene. A numerical scale of 0 through 10 is used to describe visualquality, where 0 is dead; 5 is fair quality, acceptable, somewhat desirable form andcolor, little to no chlorosis or necrosis; and 10 is excellent quality, perfectcondition, healthy and robust, excellent color and form. Bars are the mean of fourreplicates and error bars represent 1 SD from the mean. Treatments coded with thesame letter are not different at P = 0.05. The upper bold horizontal rule indicatesthe mean of untreated control (UTC) plants, whereas the central and lower boldhorizontal rules indicate 50% and 90% reductions compared with UTC plants.
224 Proc. Fla. State Hort. Soc. 133: 2020
damage todesirable native plants such asbroadleaf sagittaria and pickerelweed.Acetic acid alone did not cause adequate(>50% reduction in biomass and visualquality) damage to either weed species,whereas d-limonene alone caused >90%reduction in biomass of waterlettuceonly when applied at concentrations‡20%. The addition of 5% or 10% citricacid to acetic acid had no effect on aceticacid efficacy, so further investigationswith citric acid are not recommended.Some combinations of acetic acid andd-limonene provided acceptable controlof both floating weeds, with biomassreductions of ‡80%. Waterlettuce wasmore sensitive to treatments than waswaterhyacinth, which is likely a result ofthe structure of the plants. Both float-ing weeds have a rosette form, withleaves attaching to the base of the plant.However, the sessile leaves of water-lettuce create a ‘‘bowl’’ that can captureand hold liquids, which can result inlonger exposure times, whereas thepetiolate leaves of waterhyacinth facili-tate drainage of liquids through theplant and into the water column.
Regardless of the target species andselected treatment chosen, replacementof current industry-standard aquatic her-bicideswith thesenatural productswouldresult in profound increases in manage-ment costs. As mentioned, the material-only cost of treating floating weeds inFlorida with 0.22% diquat dibromide in2018was$283,383.72.Treatingasimilarareawith natural productswould increasematerial-only costs to $7,525,412.12 forwaterhyacinth and $6,265,928.92 forwaterlettuce. Therefore, these naturalproducts may have utility in select areaswhere the use of synthetic herbicides isdiscouraged, but broad-scale deploymentof this management strategy would likelybe prohibitively expensive.
Literature citedAnderson, L. 2007. Potential for sedi-ment-applied acetic acid for control ofinvasive Spartina alterniflora. J. Aquat.Plant Mgt. 45:100–105.
Baker, J.M. 1970. The effects of oils onplants. Environ. Pollut. 1(1):27–44, doi:10.1016/0013-9327(70)90004-2.
Bradfield Industries. 2019. Horticulturalvinegar supplemental info: 20% Aceticacid. 15 May 2019. <https://www.bradfieldind.com/vinegar.htm>.
Clark, R. and A. Dew. 2019. Florida Fishand Wildlife Conservation Commission
annual report of pollutant discharges tothe surface waters of the state from theapplication of pesticides 1 Jan. 2018through 31 Dec. 2018. 20 Mar. 2019.<https://myfwc.com/media/19111/npdes-2018.pdf>.
Cleary, R. and D. McNiel. 2019. Theherbicide bank handbook 2019–20. 15Sept. 2019. <https://bugwoodcloud.org/CDN/floridainvasives/Herbicide_Bank_Handbook2020.pdf>.
Cutelle, M.A., G.R. Armel, J.T. Brosnan,D.A. Kopsell, W.E. Klingeman, P.C. Fla-nagan, G.K. Breeden, J.J. Vargas, R.Koepke-Hill, and M.A. Halcomb. 2013.Evaluation of container ornamental speciestolerance to three p-hydroxyphenylpyruvatedioxygenase-inhibiting herbicides. Hort-Technology 23:319–324, doi: 10.21273/HORTTECH.23.3.319.
Domenghini, J.C. 2020. Comparison ofacetic acid to glyphosate for weed sup-pression in the garden. HortTechnology30:82–87, doi: 10.21273/HORTTECH04453-19.
Evans, G.J. and R.R. Bellinder. 2009. Thepotential use of vinegar and a clove oilherbicide for weed control in sweet corn,potato, and onion. Weed Technol.23(1):120–128, doi: 10.1614/WT-08-002.1.
Evans, G.J., R.R. Bellinder, and M.C.Goffinet. 2009. Herbicidal effects of vin-egar and a clove oil product on redrootpigweed (Amaranthus retroflexus) andvelvetleaf (Abutilon theophrasti). WeedTechnol. 23(2):292–299, doi: 10.1614/WT-08-158.1.
Factory Direct Chemicals. 2019a. Citruscleaners (d-limonene). 20 Mar. 2019.<https://www.factorydirectchemicals.com/collections/d-limonene>.
Factory Direct Chemicals. 2019b. Concen-trated vinegar. 20 Mar. 2019. <https://www.factorydirectchemicals .com/collections/vinegars>.
Florida Fish and Wildlife ConservationCommission. 2018. Florida Fish andWildlife Conservation Commission In-vasive Plant Management Section annualreport of activities conducted under theCooperative Aquatic Plant Control Pro-gram in Florida public waters for fiscal year2017–2018. 10 June2020.<https://myfwc.com/media/19112/annualreport17-18.pdf>.
Florida Fish and Wildlife ConservationCommission. 2019a. Florida Fish andWildlife Conservation Commission In-vasive Plant Management Section annualreport of activities conducted under theCooperative Aquatic Plant Control Pro-gram in Florida public waters for fiscal year
2018–2019. 10 June 2020.<https://myfwc.com/media/22606/annualreport1819_ipm.pdf>.
Florida Fish and Wildlife ConservationCommission. 2019b. FWC implementingenhancements to aquatic plant manage-ment program. 10 Jan. 2021. <https://myfwc.com/news/all-news/aquatic-enhancements/>.
Gettys, L.A. 2019. Breaking bad: Na-tive aquatic plants gone rogue and theinvasive species that inspire them.HortTechnology 29:559–566, doi:10.21273/HORTTECH04333-19.
Gettys, L.A. 2020a. Waterhyacinth, p.71–74. In: L.A. Gettys, W.T. Haller, andD.G. Petty (eds.). Biology and control ofaquatic plants: A best management prac-tices handbook. 4th ed. Aquatic Ecosys-tem Restoration Foundation, Marietta,GA.
Gettys, L.A. 2020b. Waterlettuce, p. 75–78. In: L.A. Gettys, W.T. Haller, andD.G. Petty (eds.). Biology and control ofaquatic plants: A best management prac-tices handbook. 4th ed. Aquatic Ecosys-tem Restoration Foundation, Marietta,GA.
Gettys, L.A. and W.T. Haller. 2009.Tolerance of selected bedding plants tofour herbicides in irrigation water. Hort-Technology 19:546–552, doi: 10.21273/HORTSCI.19.3.546.
Gettys, L.A. and W.T. Haller. 2010. Re-sponse of selected foliage plants to fourherbicides in irrigation water. HortTech-nology 20:921–928, doi: 10.21273/HORTTECH.20.5.921.
Gettys, L.A. and W.T. Haller. 2012. Ef-fect of herbicide-treated irrigation wateron four vegetables. Weed Technol.26(2):272–278, doi: 10.1614/WT-D-11-00120.1.
Gettys, L.A. and K.A. Moore. 2018.Greenhouse culture and production offour ornamental native wetland plants.HortTechnology 28:332–336, doi: 10.21273/HORTTECH03818-17.
Gettys, L.A. and K.A. Moore. 2019.Greenhouse production of native aquaticplants. HortTechnology 29:41–45, doi:10.21273/HORTTECH04212-18.
Haller, W.T. and L.A. Gettys. 2013.Pond, selectivity and irrigation studies onpotential new aquatic herbicides. Aquatics35(2):6–10.
Kim, Y.W., M.J. Kim, B.Y. Chung, D.Y.Bang, S.K. Lim, S.M. Choi, D.S. Lim,
M.C. Cho, K. Yoon, H.S. Kim, K.B. Kim, Y.S. Kim, S.J. Kwack, and B.-M. Lee. 2013. Safety evaluation and risk assess-ment of d-limonene. J. Toxicol. Environ.
225Proc. Fla. State Hort. Soc. 133: 2020.
Health B Crit. Rev. 16(1):17–38, doi:10.1080/10937404.2013.769418.
Koschnick, T.J., W.T. Haller, and G.E.MacDonald. 2005. Turf and ornamentalplant tolerances to endothall in irrigationwater: I. Ornamental species. HortTech-nology 15:318–323, doi: 10.21273/HORTTECH.15.2.0318.
Mudge, C.R., T.J. Koschnick, and W.T.Haller. 2007. Ornamental plant suscepti-bility to diquat in overhead irrigationwater. J. Aquat. Plant Mgt. 45:40–43.
Quarles, W. 2010. Alternative herbicidesin turfgrass and organic agriculture. IPMPract. 32(5/6):1–8. <https://www.birc.org/MayJune2010.pdf>.
Saha, N.C., F. Bhunia, and A. Kaviraj.2006. Comparative toxicity of three or-ganic acids to freshwater organisms andtheir impact on aquatic ecosystems. Hum.Ecol. Risk Assess. 12(1):192–202, doi:10.1080/10807030500430625.
Shrestha, A., M.Moretti, and N.Mourad.2012. Evaluation of thermal implementsand organic herbicides for weed control ina nonbearing almond (Prunus dulcis) or-chard. Weed Technol. 26(1):110–116,doi: 10.1614/WT-D-11-00083.1.
Smith, H.C., J.A. Ferrell, and T.J.Koschnick. 2014. Flurprimidol perfor-mance on ornamental species in relationto trimming time and method of applica-tion. HortScience 49:1305–1308, doi:10.21273/HORTSCI.49.10.1305.
Smith-Fiola, D. and S. Gill. 2017. Vine-gar: An alternative to glyphosate? 10 June2019. <https://extension.umd.edu//sites/extension.umd.edu/files/_docs/p r o g r a m s / i p m n e t / V i n e g a r -AnAlternativeToGlyphosate-UMD-Smith-Fiola-and-Gill.pdf>.
Spencer, D.F. and G.G. Ksander. 1995.Influence of acetic acid on regrowth ofdioecious hydrilla from root crowns. J.Aquat. Plant Mgt. 33:61–63.
Spencer, D.F. and G.G. Ksander. 1997.Dilute acetic acid exposure enhanceselectrolyte leakage byHydrilla verticillataand Potamogeton pectinatus tubers. J.Aquat. Plant Mgt. 35:25–30.
Spencer, D.F. and G.G. Ksander. 1999.Influence of dilute acetic acid treatmentson survival of monoecious hydrilla tubersin the Oregon House Canal, California. J.Aquat. Plant Mgt. 37:67–71.
Stubbs, D. and C.R. Layne. 2020. Re-quirements for registration of aquaticherbicides, p. 155–162. In: L.A. Gettys,W.T. Haller, and D.G. Petty (eds.). Bi-ology and control of aquatic plants: A bestmanagement practices handbook. 4th ed.Aquatic Ecosystem Restoration Founda-tion, Marietta, GA.
Syngenta Crop Protection. 2011. Tri-bune herbicide label. 3 Jan. 2021.<h t t p s : //www . g r e e n boo k . n e t /syngenta-llc/tribune>.
Tootoonchi, M., L.A. Gettys, K.L. Thayer,I.J. Markovich, J.W. Sigmon, and S. Sade-ghibaniani. 2020. Ecotypes of aquatic plantVallisneria americana tolerate different sa-linity concentrations. Diversity 12(2):65,doi: 103390/d12020065.
U.S. Environmental Protection Agency.1996. Summary of the Federal In-secticide, Fungicide, and RodenticideAct. 4 Jan. 2021. <https://www.epa.gov/laws-regulations/summary-federal-insecticide-fungicide-and-rodenticide-act>.
U.S. Environmental Protection Agency.2004a. Exposure and risk assessment onlower risk pesticide chemicals: d-Limo-nene. 8 Jan. 2021. <https://archive.epa.gov/pesticides/reregistration/web/pdf/limonene_tred.pdf>.
U.S. Environmental Protection Agency.2004b. List of inert pesticide ingredients,list 4A—minimal risk inert ingredients—by chemical name. 5 Jan. 2021. <https://www.epa.gov/sites/production/files/2015-10/documents/inerts_list4aname.pdf>.
Webber, C.L., III, P.M. White, Jr., J.W.Shrefler, and D.J. Spaunhorst. 2018. Im-pact of acetic acid concentration, applica-tion volume, and adjuvants on weedcontrol efficacy. J. Agr. Sci. 10(8):1–6, doi:10.5539/jas.v10n8p1.
This paper was based on a presentation given during the 2020 FSHS Annual Meeting and originally published in HortTechnology.[HortTechnology 31(2):225–233. https://doi.org/10.21273/HORTTECH04769-20].
The paper is included in this Proceedings as a reprint (with permission).
226 Proc. Fla. State Hort. Soc. 133: 2020
Proc. Fla. State Hort. Soc. 133:226–229. 2020.
Agroecology & Natural Resources SectionFE1071
Martin County, Florida Food System Study1
William A. Messina, Jr., Lisa House, Yvette Goodiel, and Carol Alberts2
1. This document is FE1071, one of a series of the Food and Resource Economics Department, UF/IFAS Extension. Original publication date December 2019. Visit the EDIS website at https://edis.ifas.ufl.edu for the currently supported version of this publication.
2. William A. Messina, Jr., research and development coordinator, Food and Resource Economics Department; Lisa House, professor and chair, Food and Resource Economics Department; Yvette Goodiel, sustainability & commercial horticulture agent III, UF/IFAS Extension Martin County; and Carol Alberts, community resource development agent I, UF/IFAS Extension St. Lucie County; UF/IFAS Extension, Gainesville, FL 32611.
This publication is a summary of two longer reports: Martin County Food System Feasibility Study and Martin County Food System Infrastructure Analysis.
The Institute of Food and Agricultural Sciences (IFAS) is an Equal Opportunity Institution authorized to provide research, educational information and other services only to individuals and institutions that function with non-discrimination with respect to race, creed, color, religion, age, disability, sex, sexual orientation, marital status, national origin, political opinions or affiliations. For more information on obtaining other UF/IFAS Extension publications, contact your county’s UF/IFAS Extension office. U.S. Department of Agriculture, UF/IFAS Extension Service, University of Florida, IFAS, Florida A & M University Cooperative Extension Program, and Boards of County Commissioners Cooperating. Nick T. Place, dean for UF/IFAS Extension.
BackgroundMartin County has a rich agricultural history with farming (particularly citrus) and cattle ranching being important economic drivers since the early 1930s (Martin County Business Development Board). Even today, almost 50 percent of the county’s land area remains in agricultural production (Martin County Property Appraiser 2019).
According to the most recent (2017) federal Census of Agriculture, Martin County has 594 farms, with 153,732 acres of agricultural land (USDA-NASS 2019). A study by the UF/IFAS Food and Resource Economics Department calculates that in 2016, agriculture, natural resources, and related food industries accounted for 24.2 percent of employment in Martin County, and $1.2 billion worth of Value Added Contribution,1 which represents over 18 percent of the county’s total Value Added Contribution (Court, Hodges, and Rahmani 2018).
Food crops produced in Martin County include vegetables, melons, fruits, sugarcane, fish, poultry/eggs, and beef. The principal vegetable and melon crops grown in Martin County include cabbages, potatoes, tomatoes, and watermelons (FDACS 2016). Top commercial fishing landings are of Spanish and King mackerel (Butch Olsen, Port Salerno Commercial Fishing Dock Authority, personal communication). Court, Hodges, and Rahmani (2018)
estimate value added contributions of $8M for vegetable and melon farming, $61M for fruit farming, $23M for commercial fishing, $6M for poultry and egg production, and $7M for beef cattle ranching and farming.
While agricultural production occurs on almost half of the county’s land and accounts for almost 20 percent of the county’s total value added contribution, the Martin County region struggles to meet the balance between food supply and demand. Farmers often struggle to find sizable, secure, well-paying markets, and the vast majority of consumers do not participate in local food transactions. It therefore was anticipated that the food supply chain in the region might benefit from a “food hub,” defined by the USDA as a “centrally located facility with a business management structure that facilitates the aggregation, storage, process-ing, distribution, and/or marketing of locally/regionally produced food products” (USDA-AMS 2010: 1).
The Martin County Food System Feasibility Study, funded by a USDA Rural Business Development Grant, identified regional food system constraints and opportunities, includ-ing opportunities for a food hub and/or farm incubator to strengthen the food supply chain and opportunities for expanding connectivity among supply chain participants to improve food security and increase access to local foods. While focus was on a county and its surrounding areas, the

227Proc. Fla. State Hort. Soc. 133: 2020.
Martin County, Florida Food System Study
Martin County study methodology can serve as a template for similar studies in other regions, and the study results can contribute toward a better understanding of food system constraints and opportunities on a broader level.
MethodsThe study incorporated over a dozen interviews of supply side participants in the Martin County food system (e.g., growers and producers), and hundreds of demand side interviews (e.g., with consumers, restaurants, food distribu-tors, the local school system, etc.), to assess current food system needs, as well as to analyze existing infrastructure and its potential to address constraints and support oppor-tunities for food system improvement. Local stakeholders serving on the Martin County Agriculture and Natural Resources Advisory Committee helped to guide efforts dur-ing the study, developing a list of potential interviewees and reviewing draft survey tools. Additionally, representatives from the Martin County Business Development Board, Treasure Coast Regional Planning Council, Martin County Economic Development Council, and the Martin County Growth Management Department provided input on the draft reports, particularly in terms of potential food system resources, constraints, and opportunities.
Supply side interviews were conducted with local growers to better understand their current operations and local consumer marketing efforts and to gauge their interest in potential food system enhancements, such as a food hub, expanded local food supply for low-income residents, and/or a farm incubator program.
Demand side interviewees included wholesale distributors, large institutional buyers, retail produce markets, restau-rants, and approximately 350 Martin County residents. Interviewees provided information on their purchases of fruit/vegetable/protein sources, including pricing, purchase criteria, desire for “local” foods, types of fresh fruits/vegetables/proteins purchased, purchase locations, trans-portation, and constraints to purchasing fresh produce and proteins. Additional input was provided by consumers and agribusinesses through public meetings and online surveys.
The analysis of existing food system infrastructure was conducted through interviews with operators of existing infrastructure facilities. Interviewees were asked to identify the capabilities of their operation (processing, packing, commercial kitchen, storage, etc.), discuss sourcing and transport of products, share information on the types of buyers served, note primary months of operation, and indicate whether there would be capacity for additional
products. Lastly, interviewees were asked to share their perspective on the primary needs of the local food system.
RecommendationsThrough the interviews and surveys, it became clear that the region has a strong, though somewhat fragmented, network of growers, distributors, food pantries/banks, small-scale food hubs, processing facilities, markets, and commercial kitchens. Demand side operations expressed a need for additional supply, and over 90 percent of consumer respondents indicated that they think “buying local” is very or at least somewhat important. Therefore, an opportunity exists in Martin County to make the most of the existing food chain structures and non-profit participants and build upon them to potentially cultivate new producers and market channels to better meet local demand. Study results and recommendations have been shared with local decision-makers and other stakeholders to inform future policies and programs.
In determining how to make the best use of existing infrastructure, several key components are recommended, including better connecting participants along the food chain to maximize efficiencies; examining approaches other communities have taken to improve their local food systems; engaging agribusiness and food entrepreneurs in productive discussions with local policy-makers to clarify and revise regulations where needed; training food chain staff and volunteers in food production, food safety, and other needed skill sets; and offering branding options to help producers better market their produce to local consumers. The experience and knowledge of growers who supply local markets, as well as those who supply a wider distribution network, can inform efforts to maximize use of existing local food infrastructure. For example, when asked about the feasibility of supplying a food hub outlet in the region, growers shared that pricing and transportation would first need to be addressed. Additionally, the risk of shifting from established relationships with buyers and distributors to a new hub might preclude growers from participating, unless they could begin engaging through provision of excess product. By more closely connecting growers with one another and with demand side buyers, all could learn more of each other’s capabilities, share food processing resources, improve outreach to and accessibility for consumers, and communicate needs or excess supply year-round.
As food chain participants engage with one another locally, they can also learn from food system innovations in other communities, including mobile food pantries and food
228 Proc. Fla. State Hort. Soc. 133: 2020
Martin County, Florida Food System Study
hubs; hearing from communities about not only their suc-cesses but also their failures can provide valuable insights. Where local food system developments are stymied by concerns over regulations, dialogue with policy-makers and regulators can help to clarify regulations, thereby reducing risk and uncertainty. Where needed, dialogue can lead to policy change, particularly where regulations may not be adapted to, or comprehensive of, new food system innovations.
Risk and uncertainty can also be addressed through training of food system staff and volunteers; interviewees identified training needs in areas such as food safety, food production, methods or systems to allow extension of the production season, alternative crops, hospitality, and worker safety.
Marketing and branding were areas where some felt that additional education and resources would be of benefit. As a first step, connecting more food chain participants (grow-ers, restaurants, farmers markets, wholesalers, distributors, pantries, etc.) with the Florida Department of Agriculture and Consumer Services promotional campaign’s “Fresh from Florida” branding services could help businesses and non-profits capitalize on an established state-wide logo and marketing effort in advertising their products to consumers. Much can be accomplished for the regional food system by drawing on the strengths of local food industry leaders and innovators; connecting them with one another, with local policy-makers, and with food system innovators in other regions; and addressing needs for training, marketing, and other resources.
Given the demand for additional local product, new producers are another vital component for the region’s food system. The idea of a farm incubator or a network of small incubators, which would provide training and technical assistance for beginning farmers, was greeted with considerable interest by small farmers, market managers, and others. Participants saw existing community gardens as forms of pilot incubators, capable of sharing information on costs, by-laws, infrastructure needs, etc. to guide start-up. Potential partners identified by stakeholders include the Boys and Girls Club, Farm Bureau’s Beginning Farmer and Rancher Program, South Fork High School, UF/IFAS Extension, and local farmers. Before an incubator could be established, a lead agency, organization, or business would need to commit to the project; a group of motivated and dedicated participants would need to be identified; and start-up resources (land, funding, etc.) would need to be secured. Lessons learned and materials developed
could then be shared with other stakeholders interested in developing new incubators.
The local food system benefits the Martin County region through provision of fresh produce and protein sources, employment opportunities, and value added economic contributions. With strong demand for local food and a diverse network of growers, food entrepreneurs, food pantries, and markets, the region has an opportunity to more strongly connect with and support existing food system participants. Strengthening the existing food system network can build a path for new producers to enter the marketplace more readily, contributing further to the local economy, improving food security, and expanding access to local foods.
Note1 Value Added Contribution is a broad measure of income, representing the sum of employee compensation, proprietor income, other property income, indirect business taxes and capital consumption (depreciation). Value added is a commonly used measure of the contribution of an industry to a regional economy because it avoids double counting of intermediate sales (Court, Hodges and Rahmani 2018).
ReferencesCourt, C. D., A. W. Hodges, and M. Rahmani. 2018. “Economic Contributions of Agriculture, Natural Resources and Food Industries in Florida in 2016. Economic Impact Analysis Program, Food and Resource Economics Depart-ment, University of Florida, Gainesville, FL. https://fred.ifas.ufl.edu/DEStudio/html/EconomicImpactAnalysis/FloridaAg-FoodIndustryContributions2016WithAppendi-ces.pdf
FDACS. 2016. “2014 Florida Agriculture by the Numbers. Florida Department of Agriculture and Consumer Services, Tallahassee, FL.” https://freshfromflorida.s3.amazonaws.com/Media%2FFiles%2FMarketing-Development-Files%2FFlorida_Agriculture_by_the_Numbers_2014_Sta-tistical_Report.pdf
Martin County Business Development Board. Undated. Martin County Business, Agricultural Edition. Footprint of Agriculture in Martin County. Yesmartinfl.com. https://www.yesmartinfl.com/images/easyblog_images/63/WBU-Edition-21.pdf
229Proc. Fla. State Hort. Soc. 133: 2020.
This paper was presented during the 2019 FSHS Annual Meeting and originally published in the Electronic Data Information Source (EDIS) of UF/IFAS Extension <https://edis.ifas.ufl.edu>.
The paper is included in this Proceedings as a reprint (with permission).
Martin County, Florida Food System Study
Martin County Property Appraiser. 2019. “Classified Agriculture Standard Report.” Martin County Property Appraiser, Hobe Sound, FL. https://www.pa.martin.fl.us/tools-downloads/data-downloads
United States Department of Agriculture, Agricultural Marketing Service (USDA-AMS). 2010. “Getting to Scale with Regional Food Hubs.” United States Department of Agriculture, Agricultural Marketing Service, Washington, D.C. https://www.usda.gov/media/blog/2010/12/14/getting-scale-regional-food-hubs
United States Department of Agriculture, National Agricul-tural Statistics Service (USDA-NASS). 2019. 2017 Census of Agriculture Volume 1. Chapter 2: County Level Data. United States Department of Agriculture, National Agricultural Statistics Service, Washington, D.C. https://www.nass.usda.gov/Publications/AgCensus/2017/Full_Report/Volume_1,_Chapter_2_County_Level/Florida/
230 Proc. Fla. State Hort. Soc. 133: 2020.
Proc. Fla. State Hort. Soc. 133:230. 2020.
Posters Section
*Corresponding author. Email: [email protected]
Increasing Adoption of Water-saving Technologies on Farms
TaTiana Sanchez*University of Florida, IFAS Extension Alachua County, Gainesville, FL
As an effort to improve water use efficiency in Alachua County’s horticultural crops, the agent started an on-farm program in 2018 to demonstrate the use and benefits of installing soil moisture sensors (SMS). The goals were to increase awareness of Best Management Practices (BMPs) and adoption of water-saving technologies and practices to improve water use in farms. Resources to conduct the demos using All-in-one Sentek Soil Moisture Probeswere acquired from the University of Florida/IFAS Minigrant program and the Northwest Florida Research and Education Center-Suwannee Valley.
The probes were rotated on six farms with a variety of vegetable and fruit crops. The agent worked with each grower during the demonstration period to improve irrigation and nutrient management. Two farms were selected to host a field day to display the use of the sensors, and to inform participants about cost-share programs avail-able through multiple sources. Forty-two people attended the field days. Exit surveys for each field day indicated that participants intend to adopt SMS (16% n=26 and 57% n=16), use irrigation scheduling (50%, n = 16) and, self-evaluate water use (50% n = 26, 57% n = 16).
Knowledge gain for these events ranged from 18% to 36%. Three of the six farmers applied for a cost-share program to acquire the sensors. For the remaining three growers, two were indifferent and one disagreed with the adoption of SMS on small, diversified farms. Three farmers adjusted their irrigation practices while using the sensors although all six farmers self-reported water savings. Additional efforts are needed to educate farmers on tools and programs available for water conservation in horticulture.
231Proc. Fla. State Hort. Soc. 133: 2020.
Proc. Fla. State Hort. Soc. 133:231. 2020.
Posters Section
Extending Extension’s Education to Half a Millionhannah WooTen*
Orange County Extension, University of Florida IFAS, Orlando, FL
Research and extension face challenges communicating science to new diverse audiences, while supporting traditional clientele. Science-based education through YouTube and other social media outlets provides on-demand education that facilitates knowledge gain and behavior change. YouTube education caters to visual, auditory, and hearing-impaired learners. Transcripts are generated in over fifty languages to accommodate diverse audiences.
The demand for a popular hydroponics class exceeded the supply beginning in 2017. An easily searchable, science-based, YouTube video entitled “Hydroponic Lettuce Hannah Wooten” <https://www.youtube.com/watch?v=GQey35Tt24I> was developed in Feb. 2018 in partnership with Seminole Government Television to provide on-demand learning about hydroponics. The video supports existing clientele’s adoption of practices, while expanding the reach to audiences far beyond the local extension office resulting in immense value with over 434,000 views with an average view duration of 5 out of 9 minutes. The video has increased the number of subscribers by 1533%, resulted in over 5800 “likes,” and at least 350 comments—many of which commend the educational delivery of information.
As a result of the video, individuals locally, nationally, and internationally have contacted University of Florida/IFAS Extension for more science-based information about growing hydroponically. Additionally, educators who are less experienced in the subject of hydroponics rely on the YouTube video to support their own educational programs, thus extending the reach of expertise without exhausting extension agents and resources.
In conclusion, extension engagement in social media via YouTube delivers science-based information support-ing existing clienteles’ adoption of practices beyond the classroom, while also catering to new diverse audiences.
*Corresponding author. Email: [email protected]
232 Proc. Fla. State Hort. Soc. 133: 2020.
*Corresponding author. Email: [email protected]
Proc. Fla. State Hort. Soc. 133:232. 2020.
Posters Section
Surveys for Resistance-breaking Tospoviruses in Southwest and South Florida Tomato Fields
Salih Yilmaz1*, Felicia ParkS3, leon lucaS3, h. charleS mellinger3, Tong geon lee4, Samuel F. huTTon4, ScoTT adkinS2, and ozgur BaTuman1
1Southwest Florida Research and Education Center, University of Florida IFAS, Immokalee, FL
2U.S. Horticultural Research Laboratory, USDA-ARS Fort Pierce, FL
3Glades Crop Care Inc., Jupiter, FL
4Gulf Coast Research and Education Center, University of Florida IFAS, Wimauma, FL
Viruses within the Tospoviridae family are highly destructive, thrips-transmitted viruses that cause significant losses of up to 100% on tomato production around the world. Therefore, using tospovirus resistant tomato variet-ies (with the Sw-5 gene) as part of integrated pest management is critical to reduce major losses. Sw-5 is a single dominant gene and confers resistance to tomato spotted wilt virus (TSWV), and is also effective against related tospoviruses including tomato chlorotic spot virus (TCSV) and groundnut ringspot virus (GRSV). All three of these tospovirus species have been detected in Florida tomatoes.
In 2019–20, high incidences of tospovirus-like symptoms were observed in multiple tomato fields established with Sw-5 varieties in southwest and south Florida. To assess presence of potential resistance-breaking tospoviruses, we conducted field surveys. Symptomatic samples from both Sw-5 resistant and susceptible tomato plants were collected from Collier and Miami-Dade counties. The presence of the Sw-5 resistance gene and tospovirus infec-tion in all samples were verified by PCR and RT-PCR assays, respectively. Sequences of the NSm (non-structural movement protein) gene from 84 samples collected in 2019 were determined and known resistance-breaking amino acid motifs (C118Y and T120N) in all Florida tospovirus isolates were analyzed.
Based on sequence analysis, none of the known amino acid substations were found in any of the Florida iso-lates. However, a novel amino acid substitution (D17E) in the NSm protein was observed predominantly in TCSV isolates from Sw-5 resistant tomatoes. Future investigations are needed to determine if this mutation is associated with potential resistance breaking.

233Proc. Fla. State Hort. Soc. 133: 2020.
Author Index
AAcosta-Rangel, Aleyda ...................................... 120, 136Adair, Robert C. ........................................................... 62Adeleye, Victoria O.....................................................110Adkins, Scott .............................................................. 232Agehara, Shinsuke ................ 34, 83, 120, 121, 123, 134,136, 206Alberts Carol .............................................................. 226Albrecht, Ute .................................................... 59, 63, 73Alborn, Hans ...............................................................110Avery, Pasco B. ............................................................ 62
BBai, Jinhe .................................................................... 149Baldwin, Elizabeth ..................................................... 149Balerdi, Carlos F. ....................................................... 141Ballen, Fredy .................................................................. 4Bainum, Caitlin .......................................................... 174Bassil, Elias ................................................................ 132Bautista, Jesús ...................................................... 33, 140Batuman, Ozgur ......................................................... 232Beckford, Marguerite ................................................. 205Beleski, David ............................................................ 177Bera, Tanumoy ........................................................... 137Bollin, Simon ............................................................. 120Bolques, Alex ............................................................... 21Bostick, Sarah ............................................................ 195Bowman, Kim D. ................................................... 59, 73Brady, Stephen ............................................................... 7Brecht, Jeffrey K. ....................................................... 148Brewer, Sara E. ............................................................ 12Brym, Maria ................................................................. 29Brym, Zachary T. ....................................................... 204Burrow, Jamie D. ......................................................... 61
CCaldeira, Lilia ............................................................ 141Calzadilla, Daniel ....................................................... 204
Carvalho, Renato ........................................................ 129Castle, William S. ........................................................ 63Chang, Lan-Yen ......................................................... 148Chase, Carlene A. ......................................................... 83Chambers, Alan H. ........................................... 12, 29, 31Chapin, Travis ............................................................ 145Chen, Chunxian .......................................................... 183Chinyukwi, Tanyaradzwa ............................................. 47Christensen, Christia ...................................................116Crane, Jonathan H. ........................................... 4, 14, 141Czarnecki II, David M. ............................................. 183
Dda Silva Benevenute, Sarah ........................................ 131Dale, Adam ........................................................ 181, 201Danyluk, Michelle ...................................................... 145Darrillo, Daniel .............................................................. 4Dash, Prosanta K. ......................................................... 83Delcastillo, Christopher ............................................. 136Deng, Zhanao ............................................. 120, 183, 189Denison, Jonathan ........................................................ 28Dewdney, Megan M. .................................................... 55
EEllis, Sarah ................................................................. 147El-Shakarway, Islam .................................................... 18England, Gary ............................................................ 124Essman, Jared ............................................................. 206Evans, Edward A. ........................................................... 4
FFall, Thioro ................................................................ 132Felter, Liz ................................................................... 203Ference, Christopher .................................................. 149Ferreira, Marcos David .............................................. 149Fisher, Luci ................................................................ 197Fletcher, Evelyn “Prissy” ........................................... 124Fraisse, Clyde ............................................................... 55

234 Proc. Fla. State Hort. Soc. 133: 2020.
Freeman, Joshua H ..................................................... 131Freyre, Rosanna ......................................................... 183Fu, Yuqing ......................................... 126, 129, 130, 135,
GGallardo, Mariel ................................................. 120, 136Gama, Andre B. ............................................................ 55Gao, Zhifeng .............................................................. 146García-Gaytán, Víctor .......................................... 33, 140Garima, Garima ............................................................ 94Garrido Assis, Odílio Benedito ................................. 149Gazia, Romina ................................................................ 4Genest, Audrey ........................................................... 201Gettys, Lyn A. ........................................................... 217Ginori, Julian .............................................................. 179Gmitter Jr., Fred G. ...................................................... 63Goodiel, Yvette........................................................... 226Goodrich, Renée ........................................................ 145Goodrich-Schneider, Renee ....................................... 146Gonzalez, Juan ............................................................116Grosser, Jude ................................................................ 63Guzman, Sandra M. ..................................................... 62
HHagen, Jennifer .......................................................... 147Hansen, Gail ............................................................... 201Harrison, Jay .............................................................. 141Hernandez, Damaris ................................................... 177Hernandez-Monterroza, Jose ............................. 134, 136Herrera, Eric ................................................................. 62Hickey, Lisa ............................................................... 195Hisamutdinova, Gulno ............................................... 127House, Lisa ................................................................ 226Hricik, Stephanie ........................................................ 146Hunter, Maxine .......................................................... 174Huo, Heqiang ............................................................. 179Hutton, Samuel F........................................................ 232
IIncledon, Michelle ..................................................... 197Iannone, Basil ............................................................ 181
KKadyampakeni, Davie ...................................... 42, 47, 61Kalischuk, Melanie .................................................... 129Khachatryan, Hayk .................................................... 178Khan, Rafia .................................................................. 90Knox, Gary W. .......................................................... 189Krug, Matthew ................................................... 145, 147Kunwar, Sudip ............................................................. 63Kwakye, Samuel .................................................... 42, 47
LLangford, Taylor ........................................................ 145Ledesma, Noris .................................................... 1, 7, 10Lee, Tong Geon .......................................................... 232Leonard-Mularez, Michelle ....................................... 170Li, Yuncong ................................................................ 132Liburd, Oscar ..............................................................110Lin, Syuan-You .................................................... 34, 136Liu, Qingchun ............................................................ 101Liu, Guodong ............................................... 28, 132, 137Lucas, Leon ................................................................ 232
MMaltais-Landry, Gabriel ............................................. 206Mapes, Jonah .............................................................. 122Martin, Cliff G. .......................................................... 204McAuslane, Heather ...................................................110McClure, Scott ........................................................... 145McCormick, Kaydie ................................................... 201McIntyre, Tina.................................................... 168, 201McKee, Conor ............................................................ 197Medina, Javier ................................................................ 1Mellinger, H. Charles ................................................. 232Menendez, Daniella ................................................... 177Meru, Geoffrey.................................. 126, 129, 130, 135, Messina Jr., William A. ............................................. 226Meyering, Bo .............................................................. 73Michael, Vincent ........................................ 126, 130, 135Miranda, Marcela ....................................................... 149Moffis, Brooke ........................................................... 181Moore, Kimberly ........................................................ 197
235Proc. Fla. State Hort. Soc. 133: 2020.
Morgan, Kelly ............................................................ 132Murray, Jesse J. .......................................................... 127Mulvaney, Michael .................................................... 206Mussoline, Wendy .......................................................116
NNguyen, Jane .............................................................. 177
OOgram, Andy .............................................................. 132Oladoye, Christianah .................................................... 28Ospina, Fanny .............................................................. 21
PParks, Felicia .............................................................. 232Paret, Matthews .......................................................... 129Parrish, S. Brooks ...................................................... 189Peres, Natalia A. ........................................................... 55Plotto, Anne................................................................ 149Pokhrel, Sameer .......................................................... 73Porto, Lis Natali R. ............................................ 138, 139
QQian, Renjuan ............................................................ 189Queeley, Gilbert ........................................................... 21Qureshi, Jawwad .......................................................... 59
RRaid, Richard N. ........................................ 127, 138, 139Rangel, Aleyda Acosta ............................................... 123Rechcigl, Jack .................................................... 120, 123Ren, Zhongbo ............................................................... 18Resende, Marci ...........................................................116Rezazadeh, Amir .......................................................... 25Richardson, Vonda ....................................................... 21Rivera, Amanda .......................................................... 120Roberts, John W. ........................................................ 203Ryals, Jessica ..................................................... 147, 195
Rycyna, Julia .............................................................. 181
SSabines, Catherine ........................................................ 90Saha, Joyjit ................................................................. 145Sánchez-Rodríguez, Esteban ........................................ 33Sanchez, Tatiana ......................................................... 230Sandoya, Germán V. ................................... 127, 138, 139Sargent, Steven A. ...................................................... 141Savani, Bhaskar ............................................................ 10Seal, Dakshina .........................................90, 94, 104, 110Seal, Shawbeta ............................................................. 90Schaffer, Bruce .............................................. 4, 104, 132, Shrestha, Swati ........................................................... 130Sigmon, Joseph W. .................................................... 217Silva, Tomas Ayala ......................................................... 7Silvasy, Tiare .............................................................. 203Sims, Charles ............................................................. 146Spies, Janine M ............................................................ 14Stafne, Eric T. ............................................................... 25Steed, Shawn .............................................................. 172Sun, Xiuxiu ................................................................ 149Sweet, Michael ........................................................... 172
UUnruh, J. Bryan .......................................................... 181
TTannenbaum, Rebecca ................................................. 14Tardivo, Caroline ......................................................... 59Thayer, Kyle L. ......................................................... 217Truco, Maria José ....................................................... 127Tsolova, Violet ............................................................. 18
VVargas, Ana I. ............................................................. 104Vashisth, Tripti ....................................................... 42, 61Vendrame, Wagner ..................................................... 177
236 Proc. Fla. State Hort. Soc. 133: 2020.
WWaddill, Christine ...................................................... 126Wang, Emily............................................................... 129Wang, Qingren ............................................................. 98Wang, Weining ................................................... 122, 136Wang, Yu .................................................................... 146Wasielewski, Jeff ........................................................... 4Wei, Xuan................................................................... 178Wells, Bonnie C. ........................................................ 180Wilber, Wendy ............................................................ 181Williamson, Jeffrey ...................................................... 28Wilson, Sandra ................................... 179, 181, 183, 189Wood, David .............................................................. 149Wooten, Hannah ......................................................... 231
XX, Jian Jian ................................................................. 177Xu, Yunjun ................................................................. 122
YYang, Rui ................................................................... 131Yilmaz, Salih .............................................................. 232Ying, Xiaobao ............................................................ 183
ZZayas, Victor .............................................................. 183Zhang, Shouan ................................................... 101, 126Zotarelli, Lincoln ......................................................... 83
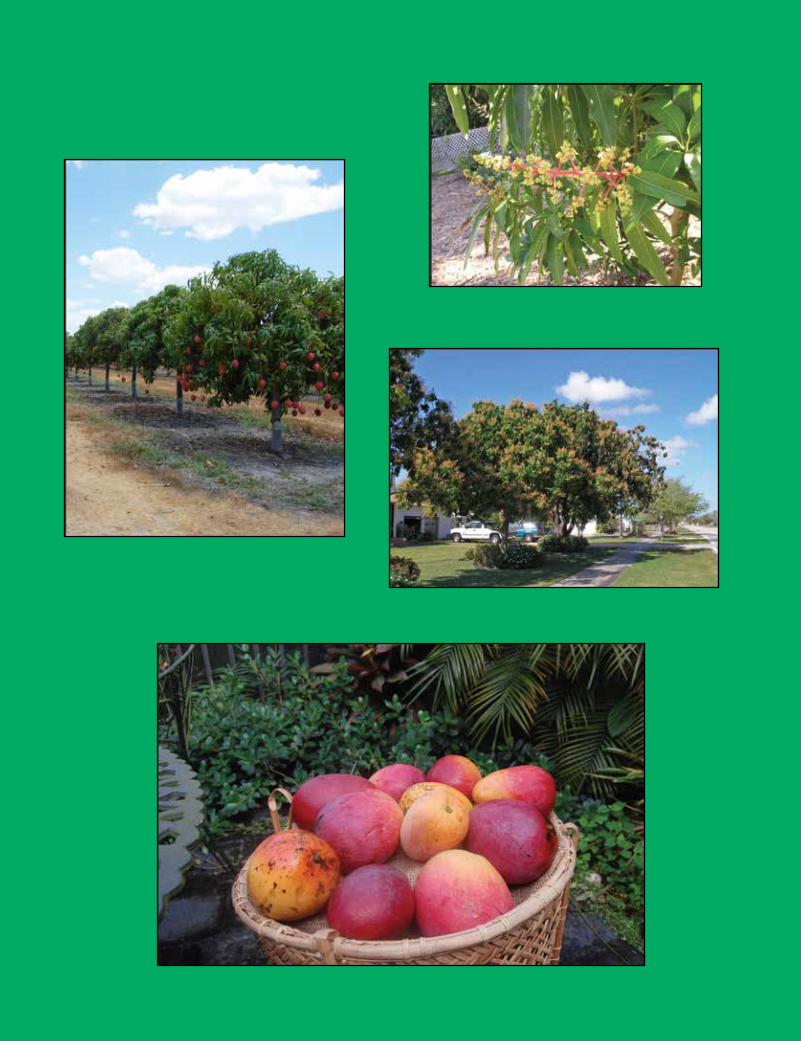
1