Nepalese Journal of Management - Uniglobe College
117
Nepalese Journal of Management A Publication of New Baneshwor, PO Box: 7953, Kathmandu, Nepal | Tel: 977-1-411 56 90 / 411 55 69 Email: [email protected] | URL: www.uniglobe.edu.np Pokhara University Affiliate JULY 2014 VOLUME 1 NUMBER 1 N M J
-
Upload
khangminh22 -
Category
Documents
-
view
6 -
download
0
Transcript of Nepalese Journal of Management - Uniglobe College

Nepalese Journal of Management
A Publication of
New Baneshwor, PO Box: 7953, Kathmandu, Nepal | Tel: 977-1-411 56 90 / 411 55 69
Email: [email protected] | URL: www.uniglobe.edu.np
Pokhara University Affiliate
JULY 2014 VOLUME 1 NUMBER 1
NMJ

Chief Editor Dr. Radhe S. Pradhan Academic Director, Uniglobe CollegeExecutive Editor Dr. Nar Bahadur Bista Principal, Uniglobe CollegeAdvisory Board Prof. Alojzy Z. Nowak Faculty of Management, University of Warsaw Prof. Muhammad Z. Mamun Unversity of Dhaka, Bangladesh Prof. Jayanta K. Parida Utkal University, Bhubaneshwor, India Prof. Voradej Chandarasorn President, Shinawatra University, Thailand Prof. Jawahar Lal Srivastav University of Delhi, India Dr. Khagendra P. Ojha Chairman, Uniglobe College Dr. Manish Thapa IR Director, Uniglobe College Mr. Gangadhar Dahal Executive Director, Uniglobe CollegeEditors Dr. Niraj Poudyal Research Director, Uniglobe College Dr. Ramji Poudyal Visiting Faculty, Uniglobe College Mr. Dipkar Thapa Program Director, Uniglobe College Mr. Keshav Acharya Faculty, Uniglobe College Mr. Shikhar Nepal Faculty, Uniglobe CollegeDesign and Layout Mohan Himamshu Dahal
Production Team Min Bahadur Bista Khima Dahal Madhav Subedi Bishnu ThapaPrinted in Nepal
Nepalese Journal of ManagementJULY 2014 VOLUME 1 NUMBER 1
NMJ

Editorial Policy
Nepalese Journal of Management (NJM) is the official publication of the Uniglobe College (Pokhara University affiliate). It is published on half-yearly basis. Annual subscription rates are Rs. 500 for libraries and organizations, and Rs. 300 for individuals. For availability of back issues, contact Executive Editor, NJM. Claims for missing copies must be made within three months of publication to Executive Editor, NJM, Uniglobe College 977-1-411 56 90/ 411 55 69, Fax: 411 55 69, E-mail: [email protected]. The subscribers are requested to add postage charges on subscription rates. Send address changes and correspondence related to dues and subscriptions to the Executive Editor NJM, Uniglobe College.
The basic objective of the publication is to promote research in the area of management especially in the context of Nepal. This publication also aims at bringing into light research reviews, analysis, theoretical comments, theoretical and empirical research on the various aspects of management with emphasis on the problems of developing countries especially Nepal. It contains articles and research notes related to major issues and the results of research carried out by the members of the College and other professional experts on management. Nepalese Journal of Management (NJM) welcomes contributions from national and international scholars and professionals concerned with Management.
NMJ

NotesArticles are subject to editorial review by referees from the community of Management experts. Comments or notes regarding articles are welcome and will be considered tor publication to the extent that space permits. The opinions and the interpretations expressed in the articles are the personal opinions of authors and reviewers and do not necessarily reflect the views of the publisher and editors, or of any institution with which the author may be associated. The Editorial Board does not guarantee the accuracy of data and the information included in the articles and accepts no responsibility, whatsoever, for any consequences of their use.
Subscription InformationNepalese Journal of Management (NJM) is a Journal published half yearly by the Uniglobe College. The publication is for the benefit of the management experts, economists, planners, professionals as well as those interested in management. Copies of the Journal may be subscribed/purchased from the Uniglobe College. The subscription rates are as follows:
Individuals Library and Institution Per Copy One Year Per Copy One Year Nepal Rs. 300 Rs. 500 Rs. 500 Rs. 900SAARC Countries US $6.0 US $ 10.0 US $8.0 US $ 15.0Other Countries US $8.0 US $ 15.0 US $12.0 US $ 22.0
Mailing charge to be paid extra.Claims for the missing numbers should be made within the month following the regular month of publication. The publisher will supply the missing numbers free of cost only when it is confirmed and when the reserve stock permits.
If you change your address, please notify us immediately, giving both your old and new addresses. Allow five weeks for the change. Back issues prior to last year's volume, if available, can be obtained from the college. Request for the subscriptions should be addressed to:
Nepalese Journal of Management (NJM) Uniglobe College, New Baneshwor
Kathmandu, Nepal.PO Box: 7953
Phone # 977-1-4115690, 4115569.Format for Subscription Request.......................................................................................................................................................................................
I would like to subscribe to Nepalese Journal of Management, a half yearly publication of theUniglobe College, New Baneshwar, Kathmandu, Nepal.
Subscription type: Personal Institutional Vol. ...................... Issue .....
For: 1 Year 2 Years ...................... Years .
Mode of payment: Cash/Cheque/Draft Total amount NRs. /US$ ...........................................
Name & Designation: ............................................................................................................................................
Institution: ...............................................................................................................................................................
Mailing Address: ....................................................................................................................................................
Telephone: ................................................. E-mail: ........................................................ Fax: .............................
.......................................................................................................................................................................................
Please transfer the amount to Nepalese Journal of Management,
- Citizens Bank International Ltd., New Road, Kathmandu
Account No: 0070000032CC, SWIFT: CTZNNPKT
- Please do not send cash by mail.
- Only cheques drawable in Kathmandu will be accepted.

ContentsThe cross-section of expected stock returns in Nepal .......... 1-9 Prof. Dr. Radhe S. Pradhan
Corporate culture and firm performance: A case of Nepalese commercial banks ....................................................................... 10-20Kavina Shrestha
Factors influencing customer adoption in internet banking: A study on Nepalese commercial banks ................ 21-29 Regina Shrestha
Disclosure practices in Nepalese insurance companies........ 30-42Prof. Dr. Prashant Kumar and Rabindra Ghimire
Factors influencing customer adoption in internet banking: A study on Nepalese commercial banks ................ 43-53Jyoti Kafle
CPFR practices in automobile industry in India ............. 54-66Dr. A.K. Verma
Impact of customer relationship management efforts on customer loyalty in Nepalese commercial banks ............. 67-75Neeta Joshi
A comparative study of organizational culture in public and private Banks .............................................. 76-86Shavina Goyal, Angadveer Singh Bhatti & Dr. Navjot Kaur
Employees’ job satisfaction and financial performance: A case of Nepalese commercial banks ........... 87-99Kushal Joshi
Service quality, customers’ satisfaction and customers’ loyalty in commercial banks of Nepal ............... 100-106Manju Maharjan
Nepalese Journal of ManagementJULY 2014 VOLUME 1 NUMBER 1
NMJ


The cross-section of expected stock returns in Nepal
- Prof. Dr. Radhe S. Pradhan*
AbstractThe CAPM asserts that market betas are sufficient to explain the cross section of expected stock returns. However, beta showed either no relationship or a weak relationship with the expected stock returns when other company specific variables affecting stock returns are used. This study aims at examining the ability of beta and other company specific factors such as firm size, book to market ratio, sales to price ratio, dividend yield and earning price ratio to explain cross section of stock returns in Nepal. The study reveals that the beta has a very weak relation with stock returns in Nepal. The coefficient of beta is not significant and hence there is no evidence that beta explains variation of stock returns. The study showed that size, dividend yield, and book to market ratio has been found to be significant factors affecting stock returns in Nepal while beta, earning price ratio, and sales to price ratio do not explain the variation in stock returns.
Keywords: beta, book to market ratio, dividend yield, earning price, firm size, sales to price ratio, stock returns.
*Dr. Pradhan was Professor, Central Department of Management, Tribhuvan University, and currently serving as Academic Director, Uniglobe College affiliated to Pokhara University..
1
Nepalese Journal of Management
1. Introduction
The pricing implication of common stocks has drawn considerable attention since the publication of seminal work of Markowitz (1952) - the mean-variance portfolio theory. Since then there is an ongoing debate on whether the market risk factors explain better or there are some other anomalies influencing common stock returns. Based on the mean-variance portfolio theory, Sharpe (1964), Linter (1965), and Black (1972) then proposed extensively argued asset pricing theory- the capital asset pricing model (CAPM). The central prediction of the CAPM is that the rate of return associated with common stocks investment is determined by the extent to which the common stock returns are correlated with market portfolio. CAPM asserts that the market risk factors proxied by beta can capture significant variation in common stock returns.
Asset pricing theories attempt to understand why some assets have higher returns than other assets. In early stages of the corporate finance, investors and researchers began attributing higher returns for higher risk. It is only with the development of the CAPM that economist
NEPALESE JOURNAL OF MANAGEMENT VOL.1, NO.1, JULY 2014
NMJ

were able to quantify risk and the reward for bearing it. The CAPM asserts that expected returns of assets are a positive linear function of their market betas and market betas are sufficient to describe the cross section of expected returns.
However, empirical work on asset pricing has identified a number of variables that help explain cross sectional variation in stock returns in addition to the market risk variable. Notably, firm size (Banz, 1981; Keim, 1983), leverage (Bhandari,1988), P/E ratio (Basu, 1983), ratio of cash flow to stock price (Rosenberg et al., 1985), book to market equity (Fama and French, 1992), and past sales growth (Lakonishok et al., 1994) are among those that are found to have significant explanatory power in asset pricing tests. In their seminal work, (Fama and French, 1992) found that book to market equity stands out as the most significant factor in explaining cross section of returns. Market risk measured by beta, on the other hand, has no explanatory power. The challenge posed by the (Fama and French, 1992) findings to traditional structural models has created a significant hurdle to the understanding of more complex and dynamic properties of the cross section of stock return.
The study by (Chan et al., 1991) related the cross sectional differences in stock returns on Japanese stocks to the underlying behavior of four fundamentals variables: earnings yield, size, book to market ratio and cash flow yield. Of the four variables considered, book to market value ratio and cash flow yield have been found to be most significant variables affecting expected returns.
The empirical studies pointed out many inconsistencies in the CAPM that prescribes that expected stock return is directly related to systematic risk. The most noteworthy is the size effect on expected stock return. The size, measured as the market value of equity (ME), has significant impact on the stock return, that is, smaller size of the firm, higher would be the returns (Banz and Reinganum, 1981). In Malaysia, size variable alone explains about one third of the expected stock returns (Pandey and Chee, 2001). The finding indicates the significance of B/M ratio disappears in multivariate regressions that also include E/P ratio. It is also indicated that market beta with or without other variables has a positive relation with stock return. The other significant variables include E/P ratio, dividend yield and leverage.The above shows that a number of studies have been conducted on the stock returns in developed and big capital markets but their relevance is yet to be seen in the context of emerging capital markets. Information on stock returns in such emerging capital markets would help development of realistic theoretical models and formulation of relevant hypotheses for empirical testing in finance.
In Nepal, the listing of shares in stock exchange and their trading in the stock market is still not very popular. The Nepalese stock market is still characterized by a low trading volume, absence of professional brokers, early stage of growth, limited movement of share prices, and limited information available to investors. Viewed in this way, this study devoted to stock returns in Nepal carries a lot of significance. There is a need to arouse investors’ interest in stock markets leading to pursuit of higher returns. Little is known about the nature of stock returns in Nepalese capital market.
A study on fundamentals of stock returns in Nepal revealed that dividend yield, capital gain yield and total yield are related to earnings yield, size book to market ratio and cash flow yield (Pradhan and Balampaki, 2006).
Nepalese Journal of Management 2

This study aims at examining the ability of beta and company specific factors like size, book to market ratio, sales to price ratio, dividend yield and earning price ratio to explain stock returns in context of Nepal. The remainder of this paper is organized as follows. Section two describes the sample, data, and methodology. Section three presents the empirical results and the final section draws conclusions and discusses the implications of the study findings.
2. Methodological aspectsThe study is based on the secondary data which were gathered for 23 banks in Nepal for the period 2006/07 to 2011/12, leading to the total of 138 observations. The secondary data have been obtained from data base maintained by office of the Security Board of Nepal (SEBON), NEPSE and other concerned banks.
The pooled cross-sectional data analysis has been undertaken in the study. The research design adopted in this study is causal comparative type as it deals with relationship of beta, size, book to market ratio, sales to price ratio, dividend yield, and earnings price ratio with stock returns. More specifically, the study examines the effect of beta, size, book to market ratio, sales to price ratio, dividend yield, and earnings price ratio on stock returns. These data were collected for the period 2006/07 to 2011/12. Table 1 shows the number of commercial banks selected for the study along with the study period and number of observations.
Table 1: Number of commercial banks selected for the studyS. No. Name of the commercial banks Study period Observations
1 Ratriya Banijya Bank Limited 2006/07-2011/12 6
2 Nepal SBI Bank Limited 2006/07-2011/12 6
3 Bank of Kathmandu Limited 2006/07-2011/12 6
4 Citizens’ Bank International Limited 2006/07-2011/12 6
5 Laxmi Bank Limited 2006/07-2011/12 6
6 DCBL 2006/07-2011/12 6
7 Agricultural Development Bank Limited 2006/07-2011/12 6
8 Bank of Asia Limited 2006/07-2011/12 6
9 Nepal Investment Bank Limited 2006/07-2011/12 6
10 Nepal Standard and Chartered Bank Limited 2006/07-2011/12 6
11 Himalayan Bank Limited 2006/07-2011/12 6
12 NMB Bank Limited 2006/07-2011/12 6
13 Lumbini Bank Limited 2006/07-2011/12 6
14 NABIL Bank Limited 2006/07-2011/12 6
15 NIC Bank Limited 2006/07-2011/12 6
16 Global Bank Limited 2006/07-2011/12 6
17 Kumari Bank Limited 2006/07-2011/12 6
18 Everest Bank Limited 2006/07-2011/12 6
19 Machhapuchhre Bank 2006/07-2011/12 6
20 Prime Bank Limited 2006/07-2011/12 6
21 Sidhartha Bank Limited 2006/07-2011/12 6
22 Sunrise Bank Limited 2006/07-2011/12 6
23 Nepal Bangladesh Bank Limited 2006/07-2011/12 6
Total number of observations 138
Pradhan 3
The cross sectional pooled data analysis has been undertaken for the purpose of the study. The theoretical statement of the models is that the stock return (R) may be regarded as subject to the constraints of beta, size, book to market ratio (BM), sales to price ratio (SP), dividend yield (DY) and earnings price ratio (E/Y). The theoretical statement may be framed as under:R = f (Beta, Size, BM, SP, DY, E/P) ……...… (i)
The study examines the relationship of stock return with the fundamental variables such as Beta, size, BM, SP, DY and E/P by estimating various models. The equation to be estimated has been specified as under:lnRit = α+ β1lnBit+ β2lnLSit+ β3lnBMRit+ β4lnE/Pit+ β5lnDYit+ β6lnSPRit+Uit .............(ii)Where, Rit = Return, B = Beta, LS = Size or Market Capitalization, BM = Book to Market ratio, E/P = Earning Price Ratio, DY = Dividend Yield, SP = Sales to Price Ratio and U = Disturbance or error term.
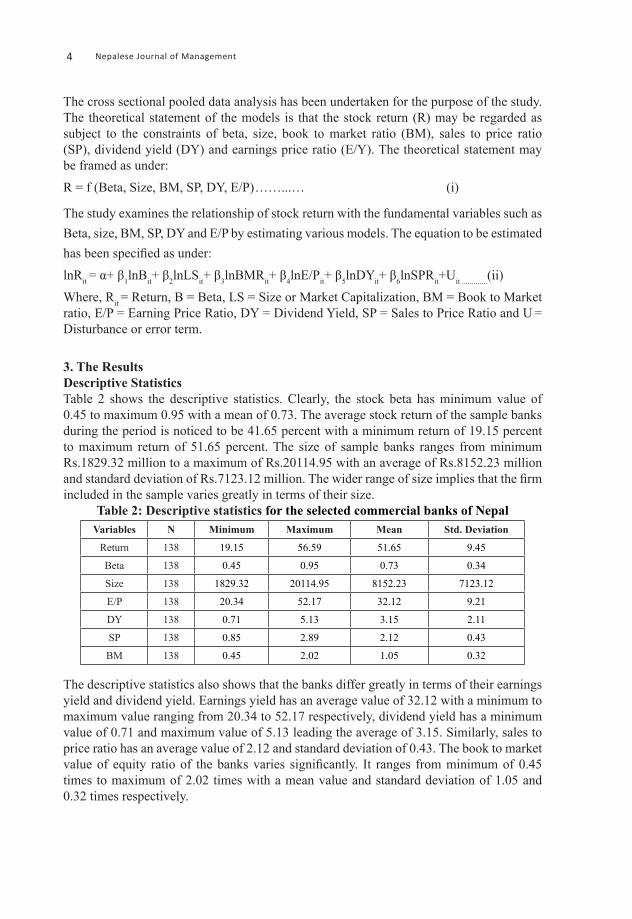
3. The ResultsDescriptive Statistics Table 2 shows the descriptive statistics. Clearly, the stock beta has minimum value of 0.45 to maximum 0.95 with a mean of 0.73. The average stock return of the sample banks during the period is noticed to be 41.65 percent with a minimum return of 19.15 percent to maximum return of 51.65 percent. The size of sample banks ranges from minimum Rs.1829.32 million to a maximum of Rs.20114.95 with an average of Rs.8152.23 million and standard deviation of Rs.7123.12 million. The wider range of size implies that the firm included in the sample varies greatly in terms of their size.
Table 2: Descriptive statistics for the selected commercial banks of NepalVariables N Minimum Maximum Mean Std. Deviation
Return 138 19.15 56.59 51.65 9.45
Beta 138 0.45 0.95 0.73 0.34
Size 138 1829.32 20114.95 8152.23 7123.12
E/P 138 20.34 52.17 32.12 9.21
DY 138 0.71 5.13 3.15 2.11
SP 138 0.85 2.89 2.12 0.43
BM 138 0.45 2.02 1.05 0.32
The descriptive statistics also shows that the banks differ greatly in terms of their earnings yield and dividend yield. Earnings yield has an average value of 32.12 with a minimum to maximum value ranging from 20.34 to 52.17 respectively, dividend yield has a minimum value of 0.71 and maximum value of 5.13 leading the average of 3.15. Similarly, sales to price ratio has an average value of 2.12 and standard deviation of 0.43. The book to market value of equity ratio of the banks varies significantly. It ranges from minimum of 0.45 times to maximum of 2.02 times with a mean value and standard deviation of 1.05 and 0.32 times respectively.
Nepalese Journal of Management 4

Correlation analysisHaving indicated the descriptive statisitics, the Pearson Correlation Coefficients have been computed and the results are presented in Table 3. All the correlations can be considered as low since the highest correlation has been observed to be 0.567 between ln Size and ln SP. The lowest correlation of -0.132 has been observed between stock return and DY. The stock return is negatively related to DY and BM and positively related to beta, size, E/P and SP. Beta has a positive correlation with Size, E/P, and SP.Table 3: Computation of correlation coefficients for the selected commercial banks of
NepallnReturn lnBeta lnSize lnE/P lnDY lnSP ln BM
lnReturn 1
lnBeta .295 (.192) 1
lnSize .253 (.162)
.521* (.012) 1
lnE/P .231 (.289)
.326 (.115)
.455 (.112) 1
lnDY -.132 (.389)
-.453* (.069)
-.552 (.023)
-.732 (.012) 1
lnSP .267 (.189)
.452* (.092)
.567* (.028)
.211* (.298)
-.512* (.039) 1
lnBM -.457* (.102)
-.221 (0.235)
-.239 (.198)
-.235 (.178)
.236 (.178)
-.283 (.281) 1
Notes: 1. Figures in parentheses are t-values.2. The sign * denotes that the results are significant at 5 percent level of significance.
Regressions resultsIn order to analyze the effect of beta, size, E/P, DY, SP and BM on stock returns, the regression equations specified earlier are estimated and the results are presented in Table 4. The regression coefficients for beta are positive in all the regression equations indicating that higher the beta, higher would be the stock returns though the results are not significant at 5 percent level of significance. Stock returns are better explained by size as beta coefficients are all positive and significant at 5 percent level of significance. It indicates that larger the size of the firm, higher would be the stock returns. Among others, this finding supports the findings of Banz (1981), Reinganum (1981), Keim (1983) and Fama and French (1992).
However, the earnings yield (E/P) could explain the variation on stock returns as beta coefficients for this variable are sometimes positive and sometimes negative and the results are also not significant at 5 percent level of significance. But the dividend yield (DY) has been found to be an important factor affecting stock returns as not only beta coefficients are positive but they are also significant at 5 percent level of significance. It indicates that higher dividend yield leads to higher stock returns. This finding on dividend yield, among others, support the findings of Lamont (1980) and Boudoukh et al. (2007). Like earnings yield, sales to price ratio could not explain the variation in stock returns as the signs of beta coefficient
Pradhan 5

are not consistent and the results are also not significant at 5 percent level of significance. However, book to market (BM) has been found to be an important factor affecting stock returns as beta coefficients are consistently negative and significant at 5 percent level of significance in all the equations. It indicates that higher the book to market, lower would be the stock returns. Among others, this finding is in consistency with the findings of Stattman (1980) and Chan et al. (1991).
Table 4: Results for the regression of beta, size, E/P, DY, SP and BM on stock returnsThe results are based on pooled data of 23 selected banks for the period of 2006/07 to 2011/12, leading to the total of 138 observations. The model is, lnRi = α+β1lnBetai+ β2lnSizei+ β3lnBMi+ β4lnE/Pi+ β5lnDYi+ β6lnSPi+Uit where, BM= book to market ratio, E/P = earning price ratio, DY = dividend yield, SP = sales to price ratio.
Models InterceptRegression Coefficients of
Adj. R-bar2 F DW
lnBeta lnSize lnE/P lnDY lnSP lnBM
(1)2.11
(8.21)0.41
(0.92)0.34 20.75 1.34
(2) 9.12(4.23)
1.32(2.32)*
0.43 19.84 1.57
(3) 7.21(2.23)
-0.65(1.32)
0.31 17.45 1.87
(4) 4.78(2.38)
1.98(2.87)*
0.45 30.65 1.35
(5)10.32(2.87)
-0.92(0.78)
0.31 32.72 1.74
(6)-0.92
(2.82)*0.48 29.21 1.60
(7)2.36
(2.23)0.28
(1.43)1.42
(2.91)*-1.85(1.13)
0.78 35.67 2.09
(8)3.21
(3.23)0.33
(0.62)0.28
(2.84)*-1.73
(3.27)*0.82 39.28 1.94
(9)6.21
(2.73)0.46
(0.83)0.86
(2.66)*0.54
(2.87)*-0.45(-3.24)*
0.75 43.31 1.96
(10)3.59
(3.86)0.392(1.34)
1.43
(3.13)*
0.45
(1.45)
2.21(4.14)*
-0.16(-.63)
-0.67(-4.65)*
0.82 47.95 2.04
Nepalese Journal of Management 6

4. Summary and conclusionAttempts were made by asset pricing theories to understand why some assets have higher returns than other assets. According to CAPM, the expected stock returns are a positive linear function of their market betas. The model asserts that market betas are sufficient to explain the cross section of expected stock returns. As a result, the CAPM has been widely used by portfolio mangers, institutional investors, financial mangers and individual investors to predict asset returns. Beta is a measure of systematic risk in CAPM and is assumed to be positively related to stock returns. However, several studies revealed that other variables could significantly explain the variation in stock returns and the beta showed either no relationship or a weak relationship with the expected stock returns.
The studies on cross-sectional variation in common stock returns provide an important insight into the understanding of pricing implication of common stock. This study aims at examining the ability of beta and company specific factors such as firm size, book to market ratio, sales to price ratio, dividend yield and earning price ratio to explain cross section of stock returns of Nepalese stock market.
This study reveals that the beta has a very weak relation with stock returns. The result of regressions show that the coefficient of beta is insignificant and it does not explain variation of stock returns. Firm size displays a positive and statistically significant coefficient in explaining stock returns. The study, therefore, reveals that size has a significant impact on stock returns and suggests larger stocks have higher returns. The relationship of E/P with stock return is uncertain and hence does not explain the variation in stock returns. The coefficients for sales to price ratio (SP) are negative in all the equations but they are not significant. The dividend yield (DY) coefficient is positive and significant indicating that higher dividend yield leads to higher stock returns. The book to market (BM) coefficients are all negative and significant also indicating that higher book to market leads to lower stock returns or vice versa.
To conclude, size, dividend yield, and book to market ratio has been found to be significant factors affecting stock returns in Nepal. Overall, beta, earning price ratio, and sales to price ratio have been observed to be poor predictors of stock returns.
References
Pradhan 7
Banz, R. W. (1981). The relationship between return and market value. Journal of Financial Economics, 3-18.
Banz, R. W., & D. Reinganum, (1981). Size related anomalies and stock return seasonality. The Journal of Financial Economics, 41(5), 54-67.
Barbee, W. C., S. Mukherji, & S., & G. A. Raines (1996). Do sales price and debt equity explain stock returns better than book market and firm size. Financial Analyst Jour-nal, 23(1), 56-60.
Barry, P., M. Blume, & K. Henry (2002). B/M and average stock returns. The Journal of Finance, 21(3), 201-233.
Basu, S. (1983). The relationship between earnings yield, market value and return for NYSE common stocks: Further evidence. Journal of Financial Economics, 41(12), 129-156.

Nepalese Journal of Management 8
Bhandari, L. C. (1988). Debt/equity ratio and expected common stock returns: Empirical evidence. The Journal of Finance, 43(2), 507-528.
Bhatta, G. (2010). Does Nepalese stock market follow random walk? SEBON Journal, 5, 18-58.
Black, F. (1972, June). Capital market equilibrium with restricted borrowing. The Journal of Business, 45(3), 444-455.
Boudoukh, J., R. Michaely, M. Richardson, & M. R. Roberts (2007). On the importance of measuring payout yield: Implications for emprical asset pricing. The Journal of Finance, 62(2), 21-45.
Chan, L. K., Y. Hamao, Y., & J. Lakonishok, (1991). Fundamentals and stock returns in Ja-pan. The Journal of Finance, 46(5), 1739–1764.
Chan, Y. (1991). The cross sectional relationship between stock returns and domestic and global factors in the Tokyo Stock Exchange. School of Economics and Finance, 51(5), 234-241.
Fama, E. F. (1990). Stock returns, expected returns, and real activity. The Journal of Fi-nance, 45(4), 121-137.
Fama, E. F., & K. R. French, (1992, June). The cross-section of expected stock returns. The Journal of Finance, 47(2), 427-465.
Fama, E. F., & K. R. French, (1993). Common risk factors in the returns on stocks and bonds. Journal of Financial Economics, 33(4), 3-56.
Fama, E. F., & K. R. French (1995). Size and book to market factors in earnings and returns. The Journal of Finance, 50(1), 213-245.
Fama, E. F., & K. R. French (1996). Multifactor explanation of asset pricing anomalies. Journal of Finance, 51(1), 55-84.
Fama, E. F., & K. R. Kenneth (2008). Dissecting anomalies. The Journal of Finance, 53(4), 1653-1675.
Fama, E. F., & J. D. MacBeth (1973). Risk, return, and equilibrium: Empirical tests. The Journal of Political Economy, 81(3), 607-636.
Fama, E. F., & W. Schwert (1977). Asset returns and inflation. The Journal of Financial Economics, 4(1), 115-146.
Keim, D. B. (1983, June). Size related anomalies and stock return seasonality. Journal of Financial Economics, 13-32.
Keim, D. B. (1990). A new look at the effect of firm size and E/P ratio on stock return. The Journal of Financial Analysts, 46(2), 56-68.
Lakonishok, J., A. Schleifer, & R. W. Vishny (1994). Contrarian investment, extrapolation and risk. The Journal of Finance, 49(5), 1541-1578.
Lamont, O. (1998, October). Earnings and expected returns. The Journal of Finance, 53(5), 1563-1587.
Lamont, O. A. (1980). Investment plans and stock returns. The Journal of Finance, 55(3), 213-246.

Pradhan 9
Lintner, J. (1965). The valuation of risk assets and the selection of risky investments in stock portfolios and capital budgets. The Review of Economics and Statistics, 471(1), 13-37.
Markowitz, H. (1952). Portfolio selection. The Journal of Finance, 7(1), 77-91.Merton, R. C. (1973). An intertemporal capital asset pricing model. Econometrica, 41(5),
867-887.Pandey, I., & Chee, H. K. (2001). The expected stock returns of Malaysian firms: A panel
data analysis. The Journal of Financial Review, 51(2), 121-143.Porta, R. L. (1996, December). Expectations and the cross-section of stock returns. The Jour-
nal of Finance, 51(5), 1715-1742.Pradhan, R. S. (1993). Stock market behavior in a small capital market:A case of Nepal. The
Nepalese Management Review, 9(1), 23-49.Pradhan, R. S., & S. B. Balampaki (2006). Fundamentals of stock returns in Nepal. Research
in Nepalese Finance, 9(1).Reinganum, M. R. (1981). Misspecification of capital asset pricing empirical anomalies
based on earnings yields and market values. The Journal of Financial Economics, 9(1), 19-46.
Reinganum, M. R. (1990). Empirical tests of multi-factor pricing model. The Journal of Finance, 36(3), 313-321.
Roll, R., & S. A. Ross (1994). On the cross-sectional relation between expected return and betas. The Journal of Finance, 49(1), 101-121.
Rosenberg, B., K. Reid, & R. Lanstein (1985). Persuasive evidence of market inefficiency. The Journal of Portfolio Management, 11(3), 9-16.
Ross, S. A. (1976). The arbitrage theory of capital asset pricing. The Journal of Economic Theory, 13(1), 341-360.
Sharpe, W. F. (1964). Capital asset prices:A theory of market equilibrium under conditions of risk. The Journal of Finance, 19(3), 425-442.
Sharpe, W. F. (1991). Capital asset pricing with and without negative holdings. The Journal of Finance, 42(2), 489-509.
Stattman, D. (1980). Book value and stock returns. The Journal of Finance, 32(1), 215-230.Wang, D., & D. Xu (2004). What determines Chinese stock returns? Journal of Financial
Analysts, 34(2), 221-235.Wong, K. A., R. K. Tan, & W. Liu (2006). The cross-section of stock returns on the Shanghai
Stock Exchange. Quantitative Finance and Accounting, 26(1), 23-39.
10
Corporate culture and firm performance: A case of Nepalese commercial banks
- Kavina Shrestha
Nepalese Journal of Management
Abstract
This paper examines the impact and importance of corporate culture on firm performance. The volume of loan, cost to income ratio and net interest margin are selected as Bank’s performance variables for this study and these three are the Dependent Variables. Cultural strength index is used as proxy for the linkage of corporate culture and firm performance. Credit risk, capital, age of the bank, operating income, cash reserve ratio, total assets and macroeconomic variables (inflation rate and growth rate of GDP) as independent variables. The result shows that culture of bank has no impact on performance of commercial banks because there is no sufficient evidence to prove that culture of bank does have impact on performance of commercial banks. The impact of credit risk and capital are negatively significant and positively significant with volume of loan. Likewise, operating income has negative and significant impact on cost to income ratio of Nepalese commercial banks. Similarly, the results showed that cash reserve ratio has positive and significant impact on net interest margin of commercial banks.
Keywords: corporate culture, cultural strength index, volume of loan, cost to income ratio, net interest margin
1. Introduction
The banking sector acts as the life blood of modern trade and commerce to provide them with a major source of finance. Commercial bank occupies quite an important place in the framework of every economy (Hussain, 2010). It provides capital for the development of industry, trade and business investing the saving collected as deposit. All economic activities of every country are greatly influenced by the commercial banking business of that country. Integrated and speedy development of the country is possible only when competitive banking services reach nooks and corners of the country. The success of banking sector depends upon various factors. Among those factors, organizational culture of the banks is also considered as one of the most important factors that improves the performance of commercial banks. Organizational culture is considered as a critical success factor for organizations because it enhances employee retention, increases productivity, reduces turnover, enhances customer satisfaction and loyalty, improves teamwork and ultimately increases the financial performance of commercial banks(Rashid, Sambasivan & Johari, 2003). The culture of an organization can be defined as the embodiment of its collective systems, beliefs, norms, ideologies, myths and rituals. They can motivate people and can become
NEPALESE JOURNAL OF MANAGEMENT VOL.1, NO.1, JULY 2014
NMJ

valuable source of efficiency and effectiveness (Sudarsanam, 2010). Organizational culture can be described as a combination and admixtures of rites, rituals, traditions, values, regulations, legends, customs, habits, habitats, symbols, cult and artifacts of an organization. Broadly speaking and keeping in view the rapid changes in the organizational dynamics all over the world, the modern day corporate culture revolves around the psychology, attitudes, experiences, beliefs, values, policies and procedures of any corporate body. Corporate culture energizes, empowers and strengthens the organization and gives it a new identity. It aims at the realization of organizational goals and deals with the stakeholders’ return (Kotler & Heskett, 1992) .Hansen & Wemerfelt (1989) have established that corporate culture has a significant effect on an organization’s long-term sustainability and economic performance. They found, over an 11-year period, that organizations with an embedded culture had greater revenue increases, larger workforce expansions, greater increases in share price and larger improvements in net income than their counterparts with weaker cultures. Peters & Waterman (1982) in the analysis of sustained superior financial performance of certain organizations have attributed their success to the specific culture of each of the respective organization. Culture is often conceived as intangible, difficult to understand and worthy of focus only if there is time. However, the ability to identify the cultural traits of an organization provides a platform for better understanding of the operations of the organization for a better performance. Unfortunately, most often organizational cultural issues are overlooked, while attention is directed towards activities that may have little or no positive effect on performance (Davidson, 2007).The powerful and pervasive role of culture plays in shaping organizational life lends plausibility to speculations that cultural factors like participation, consistency and adaptability may be linked with exceptional levels of organizational performance (Alvesson, 1993). A commonly hypothesized link suggests that if an organization’s culture is to contribute to or enhance performance, it must be both “strong” and possess distinctive “traits”: particular values, beliefs, and shared behavior patterns. Some scholars have claimed that positive cultural traits boost performance in proportion to the strength of their manifestation (Denison & Mishra, 1995).The superior financial performance can be either temporary or sustained. Temporary superior performance is the result of competitive dynamics widely described in microeconomics. Suppose a particular firm is able, for any of a variety of reasons, to obtained superior financial performance. Other firms, observing this, typically will seek to obtain this same level of performance by duplicating whatever makes a successful firm successful. Imitation increases the competition to initially successful firm, reduces margins, and decreases the level of financial performance(Ogbonna & Harris, 2000). The link between culture and performance depends on the ability to affect organizational learning in response to internal and external organizational changes. In fact, in stable environment firms with the strong culture has less variable performance (Sorensen, 2001).The major purpose of this study is to examine the relationship between corporate culture and firm performance in context of Nepalese banking sector. The other specific objectives of this study are: to identify the most important determinant of organization’s culture in Nepalese commercial banks, to examine the causal relationship between the organization culture and net interest margin of selected commercial banks of Nepal, to assess the impact of cash reserve ratio and total assets in net interest margin of selected commercial banks in Nepal, to measure the effect of bank’s age in volume of loan, cost to income ratio and
Shrestha 11

net interest margin of selected Nepalese commercial banks and to determine the impact of macroeconomic variables (inflation rate and growth rate of gross domestic product) on volume of loan, cost to income ratio and net interest margin of selected Nepalese commercial banks.
2. MethodologyThe study is based on the both primary and secondary data which were gathered for 17 commercial banks in Nepal. The primary source of data has been used to assess the opinion of bank’s employees regarding the corporate culture and performance of commercial banks in Nepal. The data for the bank specific including amount of loan balances, cost to income ratio and net interest margin have been collected from annual reports of concerned sample banks, supervision reports published by Nepal Rastra Bank (NRB) and official websites of concerned banks. From the each of the strata (joint ventures, non- joint ventures and public banks) essential data have been collected for each year from 2002/03 to 2011/12.This study has used panel data to analyze the relationship between banks’ performance and its determinants.The research design adopted in this study are descriptive and causal comparative type as it deals with relationship between banks specific (loan, net interest margin, cost to income ratio, credit risk, age of bank ,amount of capital balances in bank, cash reserve ratio at the bank, total assets and operating income) and macroeconomic variables (GDP growth rate and inflation rate). The study analyzes the relationship between corporate culture and bank performance using panel data of the selected commercial banks. Volume of loan, cost to income ratio and net interest margin have been used as the dependent variables and proxy for bank performance. Hence, the multiple regression models have been employed in this study to analyze the relationship between banks’ performances and its determinants. The multiple regression models used in this study are:LOANit = α+ β1CSIbnk+ β2LOANit-1+ β3CRit + β4CR it-1+ β5AGEit+ β6Kit+ β7K it-1+ β8INFt+ β9INF t-1 + β10 GDPGR t+ β11GDPGR t-1 + β12t+ β13D1+ β14D2+ εit…………………………………..(1)CIRit = α+ β1CSIbnk+ β2CIRit-1+ β3OIit + β4OI it-1+ β5AGEit+ β6 INF t+ β7INF t-1+ β8 GDPGR t+ β9 GDPGR t-1 + β10t+ β11D1+ β12D2+ uit……………………………………………………………………..(2)NIMit = α+ β1CSIbnk+ β2NIMit-1+ β3AGEit + β4CRR it + β5CRR it-1+ β6 TA it+ β7TA it-1+ β8 INF t+ β9 INF t-1 + β10GDPGR t + β11GDPGR t-1 + β12 t+ β13 D1+ β14D2+ vit …………………..…(3)
Where,i= 1, 2, 3, 4, 5, 6…………, 17, t= 1, 2, 3, 4, 5…………., 10, LOANit= Loan balances of bank i at time period t, α = Intercept of dependent variable, CSIbnk= Cultural strength indexof bank, CRit= Credit risk of bank i at time period t, AGEit = Age of bank i at time period t, Kit= Volume of capital of bank i at time period t, INFt= Inflation rate at time period t, GDPGR t = Growth rate of gross domestic product at time period t, LOANit-1= One year lagged loan balances of bank i at time period t, CR it-1= One year lagged credit risk of bank i at time period t, INFt-1= One year lagged inflation rate at time period t, GDPGR t-1= One year lagged growth rate of gross domestic product at time period t, CIRit= Cost to income ratio of bank i at time period t, OIit= Operating income of bank i at time period t, CIRit-1= One year lagged cost to income ratio of bank i at time period t, OI it-1=One year lagged operating income of bank i at time period t, NIMit= Net interest margin of bank i at time period t, CRRit= Cash reserve ratioof bank i at time period t, TA it=Total assets of bank i at time period t, NIMit-1= One year lagged net interest margin of bank i at time period t, CRR it-1= One year lagged cash reserve
Nepalese Journal of Management 12
ratioof bank i at time period t, TA it-1= One year lagged total assets of bank i at time period t, D1= 1 if joint ventured and 0 for others, D2= 1 if non joint ventured and 0 for others
3. Presentation and analysis of data
Descriptive statistics
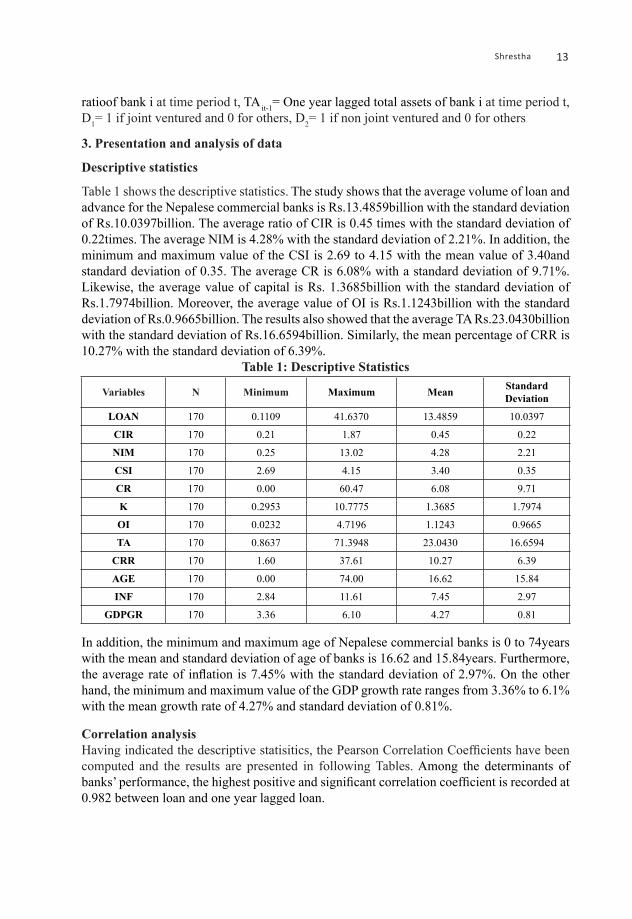
Table 1 shows the descriptive statistics. The study shows that the average volume of loan and advance for the Nepalese commercial banks is Rs.13.4859billion with the standard deviation of Rs.10.0397billion. The average ratio of CIR is 0.45 times with the standard deviation of 0.22times. The average NIM is 4.28% with the standard deviation of 2.21%. In addition, the minimum and maximum value of the CSI is 2.69 to 4.15 with the mean value of 3.40and standard deviation of 0.35. The average CR is 6.08% with a standard deviation of 9.71%. Likewise, the average value of capital is Rs. 1.3685billion with the standard deviation of Rs.1.7974billion. Moreover, the average value of OI is Rs.1.1243billion with the standard deviation of Rs.0.9665billion. The results also showed that the average TA Rs.23.0430billion with the standard deviation of Rs.16.6594billion. Similarly, the mean percentage of CRR is 10.27% with the standard deviation of 6.39%.
Table 1: Descriptive Statistics
Variables N Minimum Maximum Mean Standard Deviation
LOAN 170 0.1109 41.6370 13.4859 10.0397
CIR 170 0.21 1.87 0.45 0.22
NIM 170 0.25 13.02 4.28 2.21
CSI 170 2.69 4.15 3.40 0.35
CR 170 0.00 60.47 6.08 9.71
K 170 0.2953 10.7775 1.3685 1.7974
OI 170 0.0232 4.7196 1.1243 0.9665
TA 170 0.8637 71.3948 23.0430 16.6594
CRR 170 1.60 37.61 10.27 6.39
AGE 170 0.00 74.00 16.62 15.84
INF 170 2.84 11.61 7.45 2.97
GDPGR 170 3.36 6.10 4.27 0.81
In addition, the minimum and maximum age of Nepalese commercial banks is 0 to 74years with the mean and standard deviation of age of banks is 16.62 and 15.84years. Furthermore, the average rate of inflation is 7.45% with the standard deviation of 2.97%. On the other hand, the minimum and maximum value of the GDP growth rate ranges from 3.36% to 6.1% with the mean growth rate of 4.27% and standard deviation of 0.81%.
Correlation analysisHaving indicated the descriptive statisitics, the Pearson Correlation Coefficients have been computed and the results are presented in following Tables. Among the determinants of banks’ performance, the highest positive and significant correlation coefficient is recorded at 0.982 between loan and one year lagged loan.
Shrestha 13

Table 2: Correlations coefficient of loan and its determinants of commercial banks LOAN CSI LOANt-1 CR CR t-1 AGE K K t-1 INF INF t-1 GDPGR G D P G R
t-1
LOAN1
CSI0.005 1
LOAN t-10.982** -0.006 1
CR-0.149 -0.07 -0.098 1
CR t-1-0.181* -0.073 -0.128 0.881** 1
AGE0.453** -0.087 0.452** 0.392** 0.418** 1
K0.618** -0.022 0.633** 0.052 0.085 0.313** 1
K t-10.558** -0.017 0.606** 0.065 0.073 0.294** 0.941** 1
INF0.531** 0 0.473** -0.258** -0.206* 0.157* 0.320** 0.264** 1
INF t-10.517** 0 0.518** -0.244** -0.233** 0.143 0.287** 0.298** 0.629** 1
GDPGR0.194* 0 0.129 -0.127 -0.014 0.05 0.133 0.072 0.218** 0.224** 1
GDPGR t-10.183* 0 0.167* -0.14 -0.111 0.039 0.091 0.113 0.388** 0.187* -0.051 1
The results indicate that volume of loan amount is positively related with the cultural strength index and negatively related with credit risk. The negative correlation betweenone year lagged credit risk and volume of loan indicate that larger the volume of loan, lower would be the credit risk. It is also important to notethat age of the bank, capital, one year lagged capital amount, inflation, one year lagged inflation rate, GDPGR and one year lagged GDPGR is positively correlated with volume of loan. Among the observed correlations, the degree of correlation of one year lagged loan is most strong in order of their importance which means this variable better explain the banks’ performance in case of Nepalese commercial banks.
Table 3 shows that the highest positive and significant correlation coefficient is recorded at 0.836 between cost to income ratio and one year lagged cost to income ratio.Cultural Strength Index (CSI), inflation, GDP growth rate and one year lagged GDP growth rate is negatively correlated with cost to income ratio. This indicate that higher the volume of loan, lower would be CSI, inflation, GDP growth rate and GDP growth rate of previous year. Likewise, one year lagged operating income and age of bank is positively correlated with cost to income ratio. Among the observed correlations, the degree of correlation of one year lagged cost to income ratio is most strong in order of their importance which means this variable better explain the banks’ performance in terms of cost to income ratio of Nepalese commercial banks.
Nepalese Journal of Management 14

Table 3: Correlations coefficient of cost to income ratio and its determinants
CIR CSI CIR t-1 OI OI t-1 AGE INF INF t-1 GDPGR GDPGR t-1
CIR 1
CSI -0.117 1
CIR t-1 0.836** -0.107 1
OI 0.126 -0.027 0.159* 1
OI t-1 0.245** -0.047 0.151 0.982** 1
AGE 0.626** -0.087 0.639** 0.638** 0.656** 1
INF -0.086 0.000 -0.132 0.419** 0.357** \0.157* 1
INF t-1 0.002 0.000 -0.112 0.395** 0.411** 0.143 0.629** 1
GDPGR -0.027 0.000 -0.023 0.121 0.083 0.050 0.218** 0.224** 1
GDPGR t-1 -0.053 0.000 -0.038 0.146 0.096 0.039 0.388** 0.187* -0.051 1
The correlation analysis of net interest margin for the total sample bank of the study has been presented in Table 4 along with the test of significance. One year lagged net interest margin, cash reserve ratio, one year lagged cash reserve ratio, total assets, one year lagged total assets, age of the bank and one year lagged GDP growth rate are the positively correlated with net interest margin. Among the determinants of banks’ performance, the highest positive and significant correlation coefficient is recorded at 0.649 between one year lagged net interest margin and net interest margin. Other variables like cultural strength index, inflation, a year lagged inflation and GDP growth rate is negatively correlated with net interest margin of the Nepalese commercial banks.Table 4: Correlations coefficient of net interest margin and its determinants
NIM CSI NIM t-1 CRR CRR t-1 TA TA t-1 AGE INF INF t-1 GDPGR GDPGR
t-1
CSI -0.044 1
NIM t-1 0.649** -0.043 1
CRR 0.362** -0.132 0.267** 1
CRR t-1 0.420** -0.103 0.400** 0.710** 1
TA 0.102 -0.053 0.038 0.330** 0.247** 1
TA t-1 0.247** -0.071 0.084 0.347** 0.277** 0.981** 1
AGE 0.403** -0.087 0.370** 0.486** 0.507** 0.675** 0.701** 1
INF -0.121 0.000 -0.319** 0.288** 0.148 0.473** 0.414** 0.157* 1
INF t-1 -0.073 0.000 -0.125 0.291** 0.224** 0.460** 0.454** 0.143 0.629** 1
GDPGR t-1 -0.125 0.000 -0.214** 0.116 -0.028 0.167* 0.108 0.05 0.218** 0.224** 1
GDPGR t-1 0.199* 0.000 -0.128 0.106 0.072 0.164* 0.137 0.039 0.388** 0.187* -0.051 1
Regression analysisThe regression of bank performance and its determinants has been analysed by defining bank performance in terms of volume of loan, cost to income ratio and net interest margin. The regression of volume of loan and its determinants is explained in Table 6. The table indicates that beta coefficients are positive for one year lagged volume of loan, age of the bank, capital and growth rate of GDP. Thus higher the volume of loan for previous year,age of the bank and capital, larger would be the volume of loan of the year and beta coefficients is also significant at 1 percent level of significance. However, the beta coefficient of growth rate of GDP is
Shrestha 15

significant at 5 percent level of significance. The result also shows that beta coefficients are positive for cultural strength index,one year lagged credit risk and one year lagged growth rate of GDP but these beta coefficients are insignificant.
The table indicates that beta coefficients are negative for credit risk and one year lagged capital amount. Thus larger the credit risk, lower would be volume of loan and the beta coefficient is significant at 1 percent level of significance. The results also indicate that larger the capital amount of previous year, lower the volume of loan of th year and beta coefficient is also significant at 1 percent level of significance. Likewise, time is insignificant so there is no evidence that there is trend in volume of loan of commercial banks and it depends upon culture. Similarly, both dummies are significant at 1% level of significance. This indicates that there is difference in impact of independent variables on dependent variables among joint ventured, non joint ventured and public banks. The significant coefficients of dummy 1 show that joint ventured bank have better impact on volume of loan than other type of banks. Similarly, the significant coefficient of dummy 2 show that non joint ventured bank have better impact on volume of loan than other type of banks.
Table 5: Estimated regression results of loan and advances and its determinantsThis table shows regression results of variables based on panel data of 17 sample commercial banks with 170 observations from the year 2002/03 to 2011/12. The reported values are intercepts and slope coefficients of respective explanatory variables with t-statistics. Dependent variable is volume of loan denoted as LOAN and independent variables are cultural strength index, one year lagged loan, credit risk, one year lagged credit risk, age of the bank, capital, one year lagged capital, inflation rate, one year lagged inflation rate, growth rate of gross domestic product and one year lagged growth rate of gross domestic product, time, dummy 1 and dummy 2. The reported results also include the values of F-statistics (F), adjusted coefficient of determination (Adj. R2).LOANit = α+ β1CSI+ β2LOANit-1+ β3CRit + β4CR it-1+ β5AGEit+ β6Kit+ β7K it-1+ β8INFt+ β9INF t-1 + β10 GDPGR t+ β11GDPGR t-1 + β12t+ β13D1+ β14D2+ εit………(1)
Variables MODEL I
Coefficient t- value P- value
(Constant) -6.192 -2.756 0.007
CSI 0.273 0.752 0.454
LOAN t-1 1.011 39.945 0.000
CR -0.095 -3.028 0.003
CR t-1 0.009 0.293 0.770
AGE 0.099 3.586 0.000
K 0.923 4.133 0.000
K t-1 -0.757 -3.396 0.001
INF -0.016 -0.177 0.859
INF t-1 -0.155 -1.707 0.090
GDPGR 0.349 2.171 0.032
GDPGR t-1 0.177 1.063 0.290
t 0.089 0.597 0.552
D1 4.448 3.204 0.002
D2 4.480 2.933 0.004
Adjusted R-square 0.976
F-ratio 437.401
Sig. (p-value) 0.000Table 6 shows the concerned with the regression of cost to income ratio and its determinants.
Nepalese Journal of Management 16
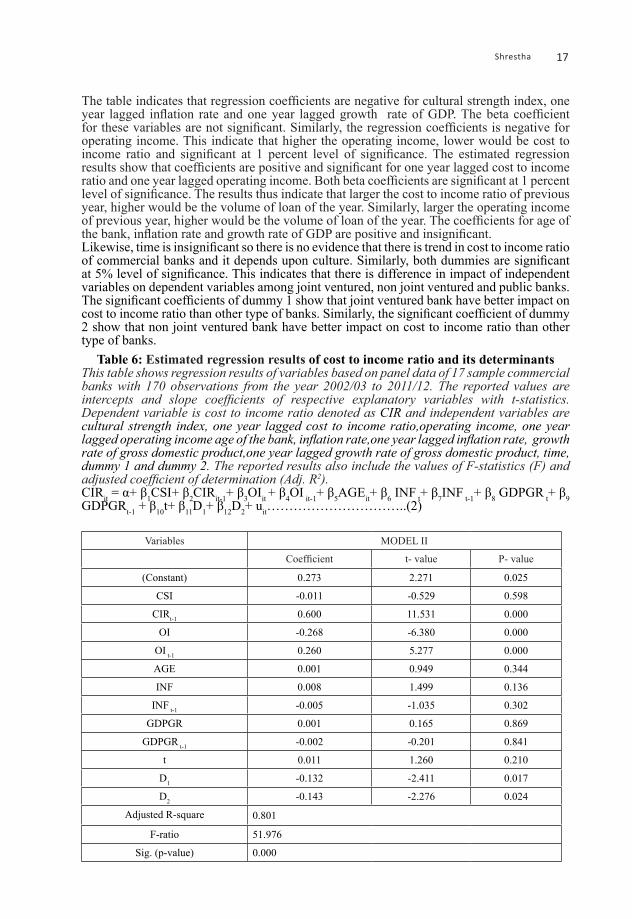
The table indicates that regression coefficients are negative for cultural strength index, one year lagged inflation rate and one year lagged growth rate of GDP. The beta coefficient for these variables are not significant. Similarly, the regression coefficients is negative for operating income. This indicate that higher the operating income, lower would be cost to income ratio and significant at 1 percent level of significance. The estimated regression results show that coefficients are positive and significant for one year lagged cost to income ratio and one year lagged operating income. Both beta coefficients are significant at 1 percent level of significance. The results thus indicate that larger the cost to income ratio of previous year, higher would be the volume of loan of the year. Similarly, larger the operating income of previous year, higher would be the volume of loan of the year. The coefficients for age of the bank, inflation rate and growth rate of GDP are positive and insignificant.Likewise, time is insignificant so there is no evidence that there is trend in cost to income ratio of commercial banks and it depends upon culture. Similarly, both dummies are significant at 5% level of significance. This indicates that there is difference in impact of independent variables on dependent variables among joint ventured, non joint ventured and public banks. The significant coefficients of dummy 1 show that joint ventured bank have better impact on cost to income ratio than other type of banks. Similarly, the significant coefficient of dummy 2 show that non joint ventured bank have better impact on cost to income ratio than other type of banks.
Table 6: Estimated regression results of cost to income ratio and its determinantsThis table shows regression results of variables based on panel data of 17 sample commercial banks with 170 observations from the year 2002/03 to 2011/12. The reported values are intercepts and slope coefficients of respective explanatory variables with t-statistics. Dependent variable is cost to income ratio denoted as CIR and independent variables are cultural strength index, one year lagged cost to income ratio,operating income, one year lagged operating income age of the bank, inflation rate,one year lagged inflation rate, growth rate of gross domestic product,one year lagged growth rate of gross domestic product, time, dummy 1 and dummy 2. The reported results also include the values of F-statistics (F) and adjusted coefficient of determination (Adj. R2).CIRit = α+ β1CSI+ β2CIRit-1+ β3OIit + β4OI it-1+ β5AGEit+ β6 INF t+ β7INF t-1+ β8 GDPGR t+ β9 GDPGRt-1 + β10t+ β11D1+ β12D2+ uit…………………………..(2)
Variables MODEL II
Coefficient t- value P- value
(Constant) 0.273 2.271 0.025
CSI -0.011 -0.529 0.598
CIRt-1 0.600 11.531 0.000
OI -0.268 -6.380 0.000
OI t-1 0.260 5.277 0.000
AGE 0.001 0.949 0.344
INF 0.008 1.499 0.136
INF t-1 -0.005 -1.035 0.302
GDPGR 0.001 0.165 0.869
GDPGR t-1 -0.002 -0.201 0.841
t 0.011 1.260 0.210
D1 -0.132 -2.411 0.017
D2 -0.143 -2.276 0.024
Adjusted R-square 0.801
F-ratio 51.976
Sig. (p-value) 0.000
Shrestha 17

Table 7 shows the the concerned with the regression of net interest margin and its determinants. the table indicates that regression coefficients is negative for total asset indicating that higher the total asset, lower would be the net interest margin and beta coefficiant is significant at 1 percent level of significance. Similarly, the coefficients are also negative for age of the bank, one year lagged cash reserve ratio and one year lagged inflation rate and these cofficients are not significant.The estimated regression results show that coefficients are positive and significant for one year lagged net interest margin, cash reserve ratio, one year lagged total asset, inflation rate, growth rate of GDP and one year lagged growth rate of GDP at 1 percent, and 10 percent level of significance respectively. The results thus indicate that larger the net interest margin of previous year, higher would be the net interest margin of the year. Similarly, higher the cash reserve ratio, higher would be the net interest margin. The result also indicate that higher the total asset of previous year, larger would be net interest margin. Likewise, larger the inflation rate, larger would be the net interest margin. Similarly, higher the growth rate of GDP and one year lagged growth rate of GDP, higher would be the net interest margin of the year.
Table 7: Estimated regression results of net interest margin and its determinantsThis table shows regression results of variables based on panel data of 17 sample commercial banks with 170 observations from the year 2002/03 to 2011/12. The reported values are intercepts and slope coefficients of respective explanatory variables with t-statistics. Dependent variable is net interest margin denoted as NIM and independent variables are cultural strength index, one year lagged net interest margin , age of the bank, cash reserve ratio, one year lagged cash reserve ratio, total assets, one year lagged total assets, inflation rate, one year lagged inflation rate, growth rate of gross domestic product,one year lagged growth rate of gross domestic product, time, dummy 1 and dummy2.The reported results also include the values of F-statistics (F) and adjusted coefficient of determination (Adj. R2).
NIMit = α+ β1CSI+ β2NIMit-1+ β3AGEit + β4CRR it + β5CRR it-1+ β6 TA it+ β7TA it-1+ β8 INF t+ β9 INF t-1 + β10GDPGR t + β11GDPGR t-1+ β12 t+ β13 D1+ β14D2+ vit………….(3)
Variables MODEL VI
Coefficient t- value P- value
(Constant) -1.560 -0.933 0.353
CSI 0.218 0.730 0.467
NIMt-1 0.522 8.576 0.000
AGE -0.014 -0.868 0.387
CRR 0.048 1.855 0.066
CRR t-1 -0.004 -0.147 0.883
TA -0.178 -5.067 0.000
TA t-1 0.201 5.072 0.000
INF 0.238 3.243 0.001
INF t-1 -0.091 -1.143 0.255
GDPGR 0.225 1.715 0.089
GDPGR t-1 0.622 4.605 0.000
t -0.162 -1.259 0.210
D1 -1.368 -1.891 0.061
D2 -1.643 -2.027 0.045
Adjusted R-square 0.655
F-ratio 21.584
Sig. (p-value) 0.000
Nepalese Journal of Management 18

Likewise, time is insignificant so there is no evidence that there is trend in net interest margin of commercial banks and it depends upon culture. Similarly, dummy 1 and dummy 2 are significant at 10% and 5% level of significance. This indicates that there is difference in impact of independent variables on dependent variables among joint ventured, non joint ventured and public banks. The significant coefficients of dummy 1 show that joint ventured bank have better impact on net interest margin than other type of banks. Similarly, the significant coefficient of dummy 2 shows that non joint ventured bank have better impact on net interest margin than other type of banks.
4. Discussion and conclusion
From the past few years, it has been seen that Nepalese commercial banks are playing a significant role in the economic development of a country. There are numerous empirical evidences of developed countries that corporate culture has significant impact on the improving the performance of commercial banks. However, despite of several empirical evidences, corporate culture and bank performance issues are still unsolved in context of Nepalese banking industry. So, determining the strength of corporate culture as well as its impact on the performance of commercial banks has always been a crucial issue for every Nepalese commercial bank. Therefore, this study attempts to identify the determinants of corporate culture and its impact on the performance of Nepalese commercial banks.
The study reveals that one year lagged volume of loan, credit risk, age of the bank, capital and one year lagged capital are the most dominant variables that have significant impact on performance of commercial banks in Nepal as measured by volume of loan from growth perspective. Likewise, from the perspective of cost, one year lagged cost to income ratio, operating income and one year lagged operating income are the most dominant variables that have significant impact on performance of Nepalese commercial banks. Similarly, one year lagged net interest margin, cash reserve ratio, total assets, one year lagged total assets, inflation rate and one year lagged growth rate of gross domestic product are the most dominant variables that have significant impact on performance of commercial banks as measured by net interest margin from the perspective of profit.
The results indicate that culture of bank has no impact on performance of commercial banks because there is no sufficient evidence to prove that culture of bank does have impact on performance of commercial banks. The study also concludes that involvement is the most important factor for maintaining strong culture in the bank followed by consistency, adaptability and mission. Likewise, it can also be concluded that strong culture have more impact on performance level of the employees. The study also concluded that strong culture motivates the employees as well as enhances coordination and control.
Shrestha 19
ReferencesAlvesson, M. (1993). Cultural perspectives on organizations. New York: Cambridge University Press.
Davidson, G. (2007). Organizational culture and financial performance in a South African Investment Bank. SA Journal of Industrial Psychology, 33 (1), 38-48.
Denison, D. R., & A. K. Mishra (1995). Toward a theory of organizational culture and effectiveness. Organizational Science. 6, pp. 204 – 223.

Nepalese Journal of Management 20
Hansen, G., & B. Wernerfelt (1989). ‘Determinants of firm performance: The relative importance of economic and organizational factor. Strategic Management Journal, 10, 399 - 411.
Hussain, G. (2010). Evidencence on structure conduct performance hypothesis in Pakistani commercial banks. International Journal of Business and Management, 5(9), 174-187.
Kotler, J. P., & J. L. Heskett (1992). Corporate culture and performance. New York: Free Press.
Ogbonna, E., & L. Harris (2000). Leadership style, organizational culture and performance: Empirical evidence from UK companies. International Journal of Human Resources Management, 11(4), 766-788.
Peters, T., & R. Waterman (1982). In search of excellence: Lessons from America’s best-r run companies. (p. 75). New York: Harper & Row.
Sudarsanam, J. (2010). Creating value from mergers and acquisition. UK: Pearson Education Ltd.

21
Factors influencing customer adoption in internet banking: A study on Nepalese commercial banks
- Regina Shrestha
Nepalese Journal of Management
AbstractThis paper examines the impact and importance of factors influencing customer adoption in Internet banking. The factors influencing customer adoption considered in this study are Awareness, Perceived Cost, Perceived Usefulness, Perceived Risk, Perceived Ease of Use and Advantage of Internet. The data are collected from primary sources and is based on pre-specified questionnaires through the survey method. 200 questionnaires were distributed in Kathmandu valley through family, relatives and friends. The result shows that there is a positive significant impact of customer adoption on perceived usefulness, awareness, advantage of Internet, perceived risk, perceived ease of use whereas the perceived cost has negative and insignificant effect on customer adoption.
Keywords: customer adoption, Perceived cost, Perceived risk, Perceived usefulness, Perceived ease of use, Awareness, Advantage of Internet banking.
1. IntroductionBanking has recently become a highly information intensive activity that relies heavily on information technology (IT) to acquire, process, and deliver the information to all relevant users. Not only is IT critical in the processing of information, it provides a way for the banks to differentiate their products and services. Banks find that they have to constantly innovate and update to retain their demanding and discerning customers and to provide convenient, reliable, and expedient services. Driven by the challenge to expand and capture a larger share of the banking market, some banks invest in more bricks and mortar to enlarge their geographical and market coverage. Banks have been using the Internet as one of their distribution channels because Internet Banking services benefit both the banks and their customers (Karjaluoto, 2002). Banks are important in every country and have a significant effect in supporting economic development through efficient financial services. They provide a mechanical system to group saving and convert them into investment. For over a decade, banks have been affected by changes associated with globalization and financial liberalization. Reacting to these changes, banks expand the choice of services offered to the customers and increase their reliance on technology (Al-Smadi and Al-Wabel, 2011).
NEPALESE JOURNAL OF MANAGEMENT VOL.1, NO.1, JULY 2014
NMJ

Banks have used electronic channels to do banking operations with both domestic and international customers. Currently, banks are mostly using electronic channels to receive instructions and deliver their products and services to their customers. Although the range of services provided by banks over the electronic channel varies widely in content, this form of banking is generally referred to as electronic banking (Azouzi, 2009).
Sathye (1999) says that the Internet becomes more widely accessible households will conduct their financial transactions over the Internet. This means that, the more widespread the access to computer/Internet the greater the possibility of use of Electronic banking adoption. The terms Internet banking and online banking are often used in the literature to refer the same things. Nowadays the Internet is the main channel for electronic banking. Internet banking offers many benefits to banks and their customers (Karjaluoto, 2002). According to Sathye (1999), while the use of internet banking services is fairly new experience to many people, low awareness of internet banking is a major factor in causing people not to adopt internet banking. Consumers were unaware about the possibilities, advantages/disadvantages involved with internet banking. Furthermore, using electronic services can reduce the cost of resources needed for traditional banking services. The main benefits to banks are cost savings, reaching new segments of the population, efficiency, enhancement of the bank’s reputation and better customer service and satisfaction (Jayawardhena and Foley, 2000).
Internet banking also offers new value to the customers of the banks. With the help of the internet, banking is no longer bound to time or geography. Consumers all over the world have relatively easy access to their accounts 24 hours per day, seven days a week. It makes available to customers a full range of services including some services not offered at branches. Internet banking has the advantage that the customer avoids traveling to and from a bank branch. In this way, Internet banking saves time and money provides convenience and accessibility (Karjauloto, 2003). Davis et al. (1989) suggested that adding external variables to TAM can influence technology adoption indirectly through perceived ease of use and perceived usefulness. Perceived usefulness was defined as the degree to which individuals believe that using a particular system would enhance their job performance whereas perceived ease of use relates to the degree to which individuals believe that using a particular system would require no effort (Davis, 1989).
Many studies regarding factors influencing customer adoption in internet banking was conducted in developed countries and have similar findings. The study that banks will be better able to manage consumer experiences with moving to internet banking if they understand that such experiences involve a process of adjustment and learning over time, and not merely the adoption of a new technology (Sharman and Kirsty, 2006). Furthermore, the study found that perceived ease of use may actually be a causal antecedent to perceived usefulness, as opposed to a parallel, direct determinant of system usage. Implications are drawn for future research on user acceptance (Fred, 2008). A study found that in terms of e-banking, ATM services is adapted by most of the banks in Nepal, while mobile banking getting the popularity but internet (computer-based) banking is still not available (Banstola, 2007).
Chen and Barnes (2007) pointed out that perceived usefulness, perceived security, perceived privacy, perceived good reputation, and willingness to customize are the important antecedents
Nepalese Journal of Management 22

to online initial trust. It is also discovered that both online initial trust and familiarity with online purchasing have a positive impact on purchase intention. Riyadh et al. (2009) stated that “Seven variables affecting e-banking adoption by SMEs are identified. They are: organizational capabilities, perceived benefits, perceived credibility, perceived regulatory support, ICT industries readiness, lack of financial institutions readiness and institutional influence. Among ‘early adopters’, convenience was a more important indicator of intentions to adopt internet banking. Risk, security and prior internet knowledge is also an important factor influencing customers adopting internet banking after convenience (Nasri, 2011). The purpose of this study is to identify the factors that influence internet banking adoption in Nepalese banking sector. It determines the usefulness of internet banking system to the customers. It examines the customer awareness and trust of users on internet banking in Nepal. It evaluates ease of use and risk of internet banking in Nepal. It determines the quality and quantity of information the customers have on the internet banking system. It identifies the customers perceived risk towards internet banking system.
2. MethodologyThe study is based on the primary data which were gathered from 14 banks in Nepal. The primary sources of data is collected from the customer of different commercial banks and will be used to assess the opinion of respondents with respect to overall customer adoption towards internet banking and the importance of these practices in Nepalese commercial banks. The data has been collected through questionnaire from the joint venture banks, public banks and government owned banks. The sample product used for the research purpose was the users of internet banking services provided by commercial banks. The selection of the respondents was made on the basis of personal contact and in a random basis. The respondents have been approached personally and given a detailed explanation about the survey (including its purpose, the meaning of the items and what is expected of the respondents).The research design adopted in this study is descriptive and causal comparative type as it deals with the current level of customer adoption with dimensions of internet banking services. This design has also been employed to assess the opinions and perceptions of customers. The study includes survey method of all kinds, including comparative and correlation methods. The study used variables like customer adoption, perceived ease of use, perceived usefulness, awareness, perceived cost, perceived risk and advantage of internet banking for analysis. The following table 1 shows the number of commercials banks in Kathmandu where data was collected and the numbers of respondents who were taken for the study from each bank.
The model of this study shows the relationship between the awareness in internet banking and customer’s adoption. The independents variable awareness, perceived ease of use, perceived usefulness, perceived risk and perceived cost as impact on dependent variable customer adoption. The model given below shows the relationship between these variables.The equation for Customer Adoption in internet banking is tested as follows:
Equation: Y =α+β1X1+β2X2+β3X3 +β4X4 +β5X5 +β6X6+eWhere, Y= Customer Adoption, X1= Advantage of internet banking, X2= Perceived cost X3=Perceived risk, X4= Perceived ease of use, X5= Perceived usefulness, X6= Awarenessα = Intercept of dependent variable and, β1, β2, β3, β4, β5 and β6 are the beta coefficients of the explanatory variables to be estimated, e = random error term.
Shrestha 23

Table 1: Number of commercial bank selected for the studyStrata Name of bank No. of respondents
Public banks
Prime Commercial Bank Ltd 18
Kumari Bank Ltd 13
Citizen Bank Ltd 13
Laxmi Bank Ltd 29
Machhapuchhre Bank Ltd 12
Siddhartha Bank Ltd 21
Global IME Bank Ltd 18
Nepal Investment Bank Ltd 4
Joint venture banks
Nepal SBI Bank Ltd 9
Himalayan Bank Ltd 7
Nabil Bank Ltd 11
Everest Bank Ltd 10
Government owned banksNepal Bank Ltd 15
Rastriya Banijya Bank Ltd 11
Total 191
AwarenessConsumers’ level of awareness of internet banking influences the adoption of internet banking. The internet banking literature supports that individual factor like knowledge (Singhal and Padhmanabhan, 2008) has an impact on consumer’s adoption of internet banking. Sathye (1999) highlighted that many consumers were simply unaware of internet banking and its unique benefits. Here knowledge refers to the consumers’ awareness of internet banking and the benefits associated with internet banking, and their knowledge of how to use basic technology. Sathye (1999) found that the lack of awareness about electronic banking and its benefits contribute to the non-adoption of electronic banking. Therefore consumers who are more aware of internet banking are more likely to perceive internet banking as more useful, easy to use and more reliable, thereby influencing adoption of internet banking.
Perceived ease of use (PEOU)Perceived ease of use, refers to “the degree to which a person believes that using a particular system would be free of effort.”This follows from the definition of “ease”: “freedom from difficulty or great effort.”Effort is a finite resource that a person may allocate to the various activities for which he or she is responsible (Ramdhony and Ramjee,2010). All else being equal, we claim, an application perceived to be easier to use than another is more likely to be accepted by users.
Perceived usefulness (PU)Perceived usefulness is defined here as “the degree to which a person believes that using a particular system would enhance his or her job performance.”This follows from the definition
Nepalese Journal of Management 24

of the word useful:”capable of being used advantageously.”Within an organizational on-text, people are generally reinforced for good performance by raises, promotions, bonuses, and other rewards Howcroft, Hamilton and Hewer (2002). A system high in perceived usefulness, in turn, is one for which a user believes in the existence of a positive use-performance relationship.Perceived risk (PR)The implicit nature and uncertainty of using online environment for transaction have rendered risk as an inevitable element of online banking system. The main components of perceived risk are trust and security. Due to some planned action and user negative intention, trust and security over online banking system is on the heart of the users and has prevailed as one of the major concern. Trust can be defined as a user’s confident belief in a bank’s honesty toward the user. Perceived trust in online Banking system is consumers’ belief that e-payment transactions will be processed in accordance with their planned expectation and knowledge like: the security of the system; the service provider’s reputation; loss of privacy; and concerns about risks associated with the reliability of online banking. Previous research has found the risk associated with possible losses from the online banking transaction is greater than in traditional environments. Many studies showed PR as an important factor that influences online banking adoption; which is negatively related.
Advantages of internet bankingInternet banking has added an entirely new dimension of convenience to banking. Customers now have unprecedented access to their bank accounts at all times, and never have to wait for banking hours to perform simple banking transactions fees or to find out details about their accounts. There are some internet banking systems that have a slight lag time. Find out whether your bank uses real-time reporting before depending on it for time-sensitive balance and transaction information. Because each bank has its own system, it can be hard to get used to each system and to avoid making mistakes with transactions.
Perceived cost (PC)Cost is one of the single most important factors that influence the consumer adoption of innovation. Suganthy (2001) found that cost as a characteristics of Internet banking. Two types of costs are involved in the Internet banking, i.e. normal costs associated with Internet activities and second is the bank charge and cost Sathye (1999). If consumers are to use new technologies, the technologies must be reasonably priced relative to alternatives. Otherwise, the acceptance of the new technology may not be viable from the standpoint of the consumer. Virtual Society Project researcher point out that millions of users are now turning their backs on the Internet due to its limitations and high access charges.
3. Presentation and analysis of dataCorrelation analysisHaving indicated the descriptive statisitics, the Kendall’s tau Correlation Coefficients have
Shrestha 25

been computed and the results are presented in Table 2. ‘**’Correlation is significant at 1 percent level.’*’ Correlation is significant at 5 percent level.
The Kendall’s tau correlation coefficients between customer adoption measured in terms of advantage of internet banking, perceived cost, perceived risk, perceived usefulness, awareness and perceived ease of use. Customer adoption is positively related with advantages of internet banking, perceived risk, perceived usefulness, awareness and perceived ease of use and they are significant at 1 percent level of significance. There is highest positive relation between advantage of internet banking and customer adoption and lowest positive relation between perceived risk and customer adoption. Perceived cost is negatively related with customer adoption however there is no such evidence to state that the result is significant. This indicates that increase in perceived cost leads to decrease in customer adoption. As perceived risk is positively related to customer adoption, this indicates that customer do not perceived risk as negative term and higher the perceived risk higher would be the customer adoption. Table 2: Kendall’s tau correlation matrix for the dependent and independent variables
CA ADV PC PR PU A PEOU
CA 1.000 .391** -.075 .219** .301** .217** .345**
ADV 1.000 .096 .166** .406** .219** .408**
PC 1.000 .185** .073 .003 .067
PR 1.000 .137* .051 -.032
PU 1.000 .189** .392**
A 1.000 .328**
PEOU 1.000
Regression analysisThe regression of customer adoption has been analyzed in terms of advantage of internet, perceived cost, perceived usefulness, awareness, perceived risk and perceived ease of use. The regression analysis used in the study also help in testing the hypothesis of the study. The regression analyses of the models are shown in table 3.
The beta coefficient of advantage of internet for all the models is positive and significant at 1% level of significance with customer adoption. This implies that increase in advantage of internet, increases the customer adoption. Similarly, beta coefficient of perceived usefulness for all the models is positive and significant at 1% level of significance with customer adoption. This implies that increase in perceived usefulness, increases the customer adoption. The positive coefficients have been observed for awareness, perceived risk and perceived ease of use for all the models.
The coefficients are significant for awareness, perceived risk and perceived ease of use and are significant at 1% level of significance however awareness and perceived ease of use is significant at 5% level of significance with customer adoption. This indicates that higher
Nepalese Journal of Management 26

the awareness, higher would be the customer adoption. Similarly larger the perceived cost larger would be the customer adoption and higher the customer adoption higher would be the perceived ease of use. Customer adoption shows that a beta coefficient for the perceived cost is negative in all the model specification. However, coefficient is significant for perceived cost at 1% level of significance. This indicates that higher the perceived cost lower would be the customer adoption.
Table 3: Estimated stepwise regression results of customer adoptionThis table shows stepwise regression analysis results of variables based on survey of 14 commercial banks. The regression result consists of various specification of model I in the form of simple and multiple regressions. The reported values are intercepts and slope coefficients of respective independent variables with t-statistics in parenthesis. Dependent variable is customer adoption and independent variables are Advantage of internet, Perceived usefulness, Perceived risk, Perceived ease of use. The reported results also include the values of F-statistics (F) and, adjusted coefficient of determination (Adj. R2). ‘**’ sign indicates that t-statistics and F-statistics are significant at 1 percentage level. ‘*’ sign indicates that t-statistics and F-statistics are significant at 5 percentage level.
Specification Intercept Advantage of internet
Perceived usefulness Awareness Perceived
costPerceived
riskPerceivedcase of use Adj-R2 F value
I 116.2 0.716(11.14**) 0.393 124.2**
II 14.45 0.465 (6.368**)
0.512 (5.892**) 0.485 90.51**
III -14.3 0.425 (5.829**)
0.488 (5.683**)
0.166 (2.858**) 0.504 65.36**
IV 16.58 0.444 (6.170**)
0.48 (5.694**)
0.184(3.201**)
-0.147 (-2.75**) 0.521 52.64**
V -7.286 0.424 (5.960**)
0.449 (5.356**)
0.156 (2.724**)
-0.173 (-3.23**)
0.184 (2.72**) 0.537 45.05**
VI -13,32 0.383 (5.279**)
0.359 (3.949**)
0.105(1.723*)
-0.181 (-3.41**)
0.213 (3.14**)
0.175 (2.35*) 0.548 39.38**
Notes: 1. Dependent variable(Y) =Customer adoption2. Figures in parentheses are t values
4. Discussion and conclusion
The growing competition and growing expectations led to increased awareness amongst banks on the role and importance of technology in banking, forcing banks to go in for the latest technologies so as to meet the threat of competition and retain their customer base. There are a lot of benefits through adoption of internet banking for the banks and their customers. On the whole, Internet banking increases operational efficiencies and reduces costs, besides giving a platform for offering value added services to the customer, thereby fulfilling all the essential prerequisites for a flourishing banking industry. With the rapid diffusion of the Internet, banking in cyberspace is fast becoming an alternative channel to provide banking services and products.
Shrestha 27

The study shows that various customers have various perceptions towards the adoption of in-ternet banking. Most of respondent perceive that they get access to internet banking services as soon as they open the account. This helps customer to be loyal towards the bank. Internet banking such as mobile banking, online banking and ATMs should be made as user friendly as possible as not many customer are familiar with internet banking, especially the older generation. Providing online help and giving customer the choice of their preferred language will ease their transaction. Nepalese commercial banks need to focus on the usefulness of the internet banking as it is time saving and easy to do the work. The study found that aware-ness, perceived risk, perceived ease of use, perceived usefulness and advantage of internet banking has positive and significant impact on customer adoption however there is no clear indication that larger the perceived cost would lower the customer adoption as perceived cost is negative. As perceived risk is positively related to customer adoption. This indicates that higher the perceived risk, higher would be the customer adoption.
Customer should make aware of the new product and services as to encourage high adoption rate. But although the customers are aware about the internet banking services but they are not attracted toward utilizing it for their day to day transactions as they fail to provide the proper information about the use, benefits and facilities under internet banking. But majority of respondents knows about the awareness of internet banking services. However public and joint venture bank knows more about awareness than government bank.
References
Nepalese Journal of Management 28
Al-Smadi, & O. Mohammad (2012). Factors affecting adoption of electronic banking: An analysis of the perspec-tives of banks’ Customers. International Journal of Business and Social Science, 3, 294-309.
Azouzi. (2009). The adoption of electronic banking in Tunisia: An exploratory study. Journal of Internet Banking and Commerce, 14(2), 2-11.
Banstola, A. (2007). Prospects and challenges of E-banking in Nepal. The Journal of Nepalese Business Studies, 4, 96-104.
Chen, Y. H. & S. Barnes (2006). Adoption of internet banking: an empirical study in Hong Kong. Decision Support System, 42(3), 1558-1578.
Davis, F. (1989). Perceived usefulness, perceived ease of use & user acceptance of information technology, MIS Quarterly, 13(3), 319-339.
Fred, D. (2008). Perceived usefulness, perceived ease of use, and user acceptance of information Technology. IT Usefulness and Ease of Use, 13, 319-340.
Howcroft, B., R. Hamilton, & P. Hewer (2002). Consumer attitude and the usage and adoption of home-based bank-ing in United Kingdom. The International Journal of Bank Marketing, 20(3), 111-121.
Jayawardhena, C., and P. Foley (2000). Changes in the banking sector- The case of internet banking in Nepal. Inter-net Research:Electronic Network Application and Policy, 10(1), 19-31.
Karjaluoto, H., M. Mattila, & T. Pento (2002). Factors underlying attitude formation towards online banking in Finland. International Journal of Bank Marketing, 20(6), 261-72.

Shrestha 29
Nasri, W. (2011). Factors influencing the adoption of internet banking in Tunisia. International Journal of Business and Management, 6(8), 143-160.
Padachi, K., S. Rojid, & B. Seetanah (2008). Investigating into the factors that influence the adoption of internet banking in Mauritius. Journal of Internet Business(5), 99-120.
Ramdhony, D., & A. Ramjee (2010, November). Factors influencing the use of internet banking in Mauritius. The 9th International Conference on e-Business, 20-25.
Riyadh, A. N., S. Akter, & N. Islam (2009). The adoption of e-banking in developing countries: A theoretical model for SMEs. International Review of Business Research Papers, 5(6), 212-230.

Disclosure practices in Nepalese insurance companies
- Prof. Dr. Prashant Kumar and Rabindra Ghimire*
AbstractThe objective of this paper is to examine the financial reporting and corporate disclosure practices of insurance industry in Nepal. Among 25 insurance companies, 22 companies have been taken for the study. The paper has been prepared on the basis of prevailing rules and regulations, annual reports and secondary information. The paper is descriptive in nature and data has been analysed using both descriptive and inferential statistical tools. Corporate disclosure score has been computed on the basis of four disclosure dimensions: submission deadline of annual report, submission deadline of quarterly reports, completeness of the director’s disclosure reports and organising annual general meeting within the prescribed period. The paper concludes that directors’ disclosure practice and organising AGM within the prescribed period have highest score while timely reporting score has lowest score and quarterly reporting score is moderate. The disclosure practices between life insurance and non-life insurance companies have no significant difference. It has been found that there was no improvement on disclosure practices during the FY 2012/2013 as compared to previous year. Overall disclosure practices have not been found satisfactory under the study period.
Keywords: corporate disclosure, insurance industry, secondary information, descriptive in nature , life insurance.
*Dr. Prashant Kumar is Professor, Faculty of Commerce, Banaras Hindu University, Varanasi, (India), and Rabindra Ghimire is Research Scholar, Faculty of Commerce, Banaras Hindu University, Varanasi (India)
30
Nepalese Journal of Management
1. IntroductionCorporate disclosure is a prerequisite for good governance of any organisation. Presentation of financial statements, directors’ reports and disclosing the information required by regulatory mechanism helps to protect the interest of the stakeholders. Studies have shown that good corporate governance practices have led to significant increase in economic value added of firms, higher productivity and lower risk of systemic financial failures for countries (World Bank, 2005).
The stable and efficient financial reporting and corporate disclosure practices in the insurance industry will be supportive for the sustainable economy. The stability of the industry relies on three main factors: stability and efficiency of the insurance company itself, corporate governance and sound financial reporting (Gibbins, Richardson and Waterhouse, 1990). The high quality accounting standards, good regulatory framework, good governance and ethical framework are basic requirements for sound financial reporting system. Therefore, it is increasingly important for businesses to be financially transparent and for government to
NEPALESE JOURNAL OF MANAGEMENT VOL.1, NO.1, JULY 2014
NMJ

establish a sound regulatory environment for corporate financial reporting. Good corporate disclosure can mitigate the adverse selection problem and increase market liquidity by levelling the playing field among investors (Verrecchia, 2001).
Many efforts have been made to enhance the corporate governance practices in Nepal. After 1990, Central Bank introduced higher corporate governance standards for banks and other financial institutions as part of financial sector reform project. Insurance Board was established in 1992 as an autonomous and apex regulatory authority in insurance sector. The Board issued a numbers of directives, guidelines and revised regulations to ensure good corporate governance and financial reporting practices since last two decades. As a result, insurance sector has got a momentum for the development of market and compliance of rules and regulations. Now, an effective regulatory framework has been developed to supervise and regulate the insurance industries.
This paper aims to examine the corporate reporting and disclosure practices of life and non- life insurance companies in Nepal on the basis of regulatory framework and annual reports of these insurance companies. Furthermore, the paper also compares the disclosure practices between life and non-life insurance companies. Corporate disclosure index has been also formed for life and non-life insurance industry separately.
1.1 Evolution of financial reporting system in NepalCorporate financial reporting history of Nepal is as long as the history of industrialization which was started during 1930s. During the initial phase of industrialization most of the industries were established as proprietorship, partnership and private limited company. During 1960s and 1970s, more than six dozen public enterprises were established and after mid 1980s, private sector was allowed to invest in banking and financial sector. When public limited companies were established with joint venture investment, the importance of fair and internationally accepted financial reporting system had been realised by stockholders and other concerned authorities. During 1980s, financial liberalization policy was gradually adopted by the government. The number of acts were successfully introduced, amended and implemented till 2000. During 1990-2000, statutory and regulatory reform took place in speed. Accounting Standard Board and Auditing Standards Board were established. The Regulatory institutions like Nepal Rastra Bank (1956), Securities Board (1983), Insurance Board (1992) and Institute of Chartered Accountants of Nepal (1997) have been playing vital role. Similarly, Company Act, 2006; Securities Act, 2006; Privatization Act, 1994, Income Tax Act, 2002; Insurance Act, 1992, Nepal Rastra Bank Act, 2002, Bank and Financial Institution Act, 2006 introduced for further improvement of corporate sector and enhance the financial reporting and corporate disclosure practices.
1.2 An Overview of insurance industry in NepalThe first financial institution Nepal Bank Ltd. and first non-life insurance company Nepal Transportation and Insurance Company were established in 1937 and 1947 respectively. First life insurance company was established in 1968. At present, there are 253 banks and financial institutions (NRB Annual Report, 2012) and 25 insurance companies (Insurance Board, 2013). A separate “Insurance Pool” has been established to reinsure the risk related to terrorist violence and riots. The ownership structure, date of establishment and paid up capital of insurance companies has been presented in Table 1.
Kumar and Ghimire 31

Table 1: Insurance companies in nepalName of Company Date of
EstablishmentOwnership Structure Paid Up Capital
(NRs. Million)A) Life and Non Life Insurance Company
1. Rastriya Beema Sansthan 12/15/1968 Government and Public 111.83
B) Life Insurance Companies
2. National Life Insurance Co. Ltd. 1/7/1988 98% Domestic 501.33
3. Nepal Life Insurance Co. Ltd. 4/17/2001 100% Domestic 637.5
4. MetLife Alico Insurance Company* 8/2/2001 Branch of MetLife ALICO N/A
5. Life Insurance Corporation (Nepal) Ltd 8/7/2001 45% Domestic 405
6. Asian Life Insurance Co. Ltd 2/27/2008 100% Domestic 506.72
7. Surya Life Insurance Co. Ltd 3/19/2008 100% Domestic 41.13
8. Gurans Life Insurance Co. Ltd 3/31/2008 100% Domestic 383.4
9. Prime Life Insurance Co. Ltd 5/6/2008 100% Domestic 500
C) Non Life Insurance Companies
10. Nepal Insurance Co. Ltd 9/24/1947 100% Domestic 102.7
11. The Oriental Insurance Co. Ltd* 9/15/1967 Branch of The Oriental India N/A
12. National Insurance Co. Ltd* 1/1/1974 Branch of National India N/A
13. Himalayan General Insurance Co. Ltd. 7/21/1993 100% Domestic 100.8
14. United Insurance Co. Ltd 10/22/1993 100% Domestic 100.8
15. Premier Insurance Co. Ltd 4/21/1994 100% Domestic 102
16. Everest Insurance Co . Ltd 5/31/1994 100% Domestic 101.25
17. Neco Insurance Ltd. 5/30/1996 100% Domestic 135.22
18. Sagarmatha Insurance Co. Ltd 6/26/1996 80% Domestic 129
19. Alliance Insurance Co. Ltd. 7/19/1996 100% Domestic 129
20. N.B. Insurance Co. Ltd 1/23/2000 100% Domestic 147
21. Prudential Insurance Co. Ltd 5/3/2002 100% Domestic 100
22. Shikhar Insurance Co. Ltd 10/4/2004 100% Domestic 125
23. Lumbini General Insurance Co. Ltd 7/15/2005 100% Domestic 140.6
24. NLG Insurance Co. Ltd. 10/9/2005 100% Domestic 157.5
25. Siddartha Insurance Co. Ltd. 4/5/2006 100% Domestic 100
Source: Insurance Board of Nepal, Annual Reports of Insurance Companies* excluded from the study.According to ownership structure, 18 (72%) companies owned by domestic private sector, and 3 (12%) companies are in the form of joint venture, 3 (12%) companies are branch of foreign insurance companies. One company in the name of RBS has been established as state owned corporation.
Nepalese Journal of Management 32

2. Review of legal framework2.1 Legal framework of corporate disclosureThe regulatory framework of corporate disclosure of insurance companies comprises of Company Act, Insurance Act, Securities Act and regulation thereof as well as number of directives and guidelines published by the concerned authority from time to time.
2.2 Insurance boardInsurance Board, established according to Insurance Act, 1992 is an apex body for insurance regulation. Number of Directives, Guidelines, Policies and Circulars has been issued by the Board. Some of them, Directives to Prepare Financial Statements of Life Insurers and Non- Life Insurers, Directives of Analysis of Financial Status and Evaluation of Liabilities of Life and Non-Insurers, Solvency Margin Directives, 2013 for Life Insurers, Corporate Good Governance Directives, 2012, Investments Directives for Life Insurers and Non-Life Insurers, 2005, On Site Inspection Manual of Insurer, 2007, Long Form Audit Report Related Directive, 2009 are comprehensive and ample guidelines while preparation of financial statements and disclosure of required information.
Insurance companies need to submit annual financial statements along with director’s report within six months after completion of reporting year. After getting the approval from Board, report shall be disclosed to shareholders at least one month before the holding of general meeting.
2.3 Office of company registrarOffice of the Company Registrar is a regulating authority of all companies registered under Company Act. According to Company Act, Board of Director is a prime responsible body to disclose all relevant information of the company with its financial statements within a stipulated timeframe and submit to concerned authority in accordance with regulatory framework. The report should include: a) Balance Sheet as at the last date of the financial year, b) Profit and Loss Account of the financial year, and c) Description of cash flow of the financial year and other relevant information to the office (Company Act, 2006). Companies having more than or equal to NRs. 10 million paid up capital are required to disclose additional information as described in Sub-section 4 of Section 109 of the Company Act, 2006 as an integral part of the Annual Report.
2.4 Securities boardSecurities Board is an apex regulator of all listed companies inside Nepal. Insurance ccompanies should be public limited company and require to issue primary share to public. Company listed on capital market are required to submit their annual financial report within five months of preceding fiscal year. Quarterly financial statements are required to submit within one month after completion reported quarter. Company which is going to issue new primary share is required to furnish various information to the Board. Moreover, company should report to Board instantly after taking major decisions.
2.5 Accounting and auditing standards boardThese Boards are responsible to issue the guidelines for accounting and auditing. Accounting Standards Board had issued 40 Nepal Financial Reporting Standards (NFRS) which are announced for the mandatory compliance from 2015 to 2017. These standards are converged in line with IFRS. Auditing Standards are the common guidelines to statutory auditors. (Annual Reports of ICAN, 2013).
Kumar and Ghimire 33

3. Methodology The paper is descriptive in nature. It explores the current provisions and practices of corporate reporting, analyses the situation, derive the conclusion and provide recommendations
3.1 Sources and nature of dataThe data has been collected through secondary sources: annual reports of insurance companies and Insurance Board. Official websites of respective companies have been also visited to obtain quarterly report and other required information. Furthermore, data also has been collected from Economic Survey of Ministry of Finance, Government of Nepal, Nepal Rastra Bank, Securities Board of Nepal and Nepal Stock Exchange Ltd. Qualitative data has been obtained through prevailing acts, rules and directives
3.2 Study periodThe study covers period of two years (FY 2011/12 and 2012/13). Annual reports of FY 2011/12 and quarterly reports of 2012/13 has been taken for the study.
3.3 Population and sample sizeThe universe size of study is 25 life and non-life insurance companies among them three insurance companies have not been included in this study since they are working as the branch office of foreign company and they are statutory not supposed to disclose annual and quarterly report to public. Remaining 22 companies listed in Nepal Stock Exchange Ltd. have been taken as the sample of the study. Name of sample companies is shown in Table 1.
3.4 Data analysisData has been analysed using the descriptive statistics like: Mean, ratio, percentage, graph, and inferential statistics such as: Wilcoxon Singed Ranks Test and Mann Whitney U test and
3.5 Variables of the studyFour broad areas are considered under the study. These are 1. Disclosure of annual reports, 2. Organising of AGM, 3. Disclosure of quarterly reports and 4. Disclosure of Directors’ reports. On the basis of different variables, disclosure index of life and non-life insurance has been prepared.
4. Rresult and discussionIn this section data has been analysed using descriptive and inferential statistical tools.
4.1 Basis of assigning the disclosure score The annual reports of the companies are required to be submitted within the six months after completion of fiscal year and in case of quarterly reports, one month lag has been given. Reporting and disclosure status has been rated considering the time taken by the insurers and the completeness of the content to be disclosed. Four disclosure variables have been discussed and the value has been assigned to each company in Table 2 and 3.
4.1.1 Timeliness of submission of annual report to insurance boardAccording to Section 23 (1) of Insurance Act, 1992; the annual report has to be submitted by the company within six months (180 days) after completion of the fiscal year (i.e. mid July). Thus, the report of FY 2011/12 has to be submitted on or before January 15, 2013. But, it is observed that most of the companies failed to submit their annual reports within the prescribed period. Time taken by each company has been presented in column (2) of Table
Nepalese Journal of Management 34
2 and Table 3 for life and non-life insurance companies respectively. The value mentioned in column (2) is difference between the actual reported date and deadline of reporting. The positive value indicates that annual report has been submitted to Insurance Board earlier than prescribed period that means the disclosure practice of particular company is sound. It is also implied that if a company has more positive gaps, it has better disclosure practice and vice versa. The negative value means annual report has been submitted after prescribed date which indicates that the company has poor disclosure practice. In other words, the company has not complied the rule of timeliness of submission of annual report to Insurance Board. In column (2), value 1 has been assigned for the company who has submitted annual reports within deadline otherwise assigned value 0 has been assigned. No value has been given in between 1 and 0.
4.1.2 Timeliness of submission of quarterly report to insurance board and securities board According to Clause 22 (1) of Securities Registration and Issue Regulations, 2008; all listed companies are required to submit their quarterly reports to Securities Board within one month after completion of the quarter. The report of first ( mid July - mid October ), second ( mid Oct –mid Jan), third (mid Jan mid April) and fourth (mid April –mid July) quarter need to be submitted within mid November, mid February, mid May and mid August respectively. The quarterly report submission date of insurers for four quarter during fiscal year 2012/13 has been obtained from Securities Board of Nepal. Reports of each quarter has got 0.25 score and multiplied by number of quarterly report submitted to Board. Column (4) and (5) in table 2 and 3 are related to the quarterly reporting disclosure and its score. In column (4), numbers of quarterly reports published by company has been recorded and in column (5) total quarterly disclosure score has been assigned (see table 2 and 3).
4.1.3 Timeliness of organizing annual general meetingThe third component of disclosure practice is related to the practice of holding Annual General Meeting (AGM) in time. As per clause 109 (1) of Company Act, annual reports should be disclosed to shareholders at least 30 days before the date of AGM. According to Insurance Board, the AGM should be organised within 60 days after the date of approval of its annual reports from Insurance Board. The AGM disclosure score has been assigned on the basis of 60 days provision of Insurance Board. The prescribed date of AGM by Board to each insurer was different as their annual report of FY 2011/12 had been approved in different dates (see Annex 1). In column (7) the value of respective company has assigned either 1 or 0. Company got score 1 if it has conducted its AGM within 60 days after approval of its annual reports otherwise no value has been assigned. Value in column (6), between 60 to 0 indicates that company has good disclosure practice but if value appeared in negative figure, it is supposed that the company has failed to organise AGM in time.
4.1.4 Completeness of directors’ report According to Section 109 of Company Act, 2006, Directors have to disclose 25 information inside the annual report as “Director’s Report”. The major transaction and events that may materially affect the company in long run and important information of company like: third party transaction, internal control system, remuneration of CEO and directors etc. have to be included in the annual report. Unless, insurer includes all information to be disclosed in annual report, the report would not be approved by Insurance Board. Directors’ disclosure score of life and non-life companies has been mentioned in column (8) of table 2 and 3 respectively. In column (8) value 1 has been assigned to the company having complete information in annual report otherwise 0 value has been assigned.
Kumar and Ghimire 35

4.2 Disclosure score of life insurance companiesOn the basis of the guidelines discussed in section 4.1, the disclosure score of eight life insurance companies has been shown in Table 2.
Table 2: Disclosure score of life insurance companiesComponents of Disclosure
SN Name of Company
1.Annual Report
Disclosure*
2.Quarterly Report
Disclosure**
3.AGM Disclosure
4. Directors' Report Disclosure
Completeness Score
Aggregate Score Rank
Gap Score No. Score Days Score Score
(1) (2) (3) (4) (5) (6) (7) (8) (9) (10)
1 Rastriya Beema Sansthan N 0 0 0.00 N N N 0.00 5
2 National Life -35 0 2 0.50 +27 1 1 0.63 4
3Life Insurance Corporation
(Nepal)+ 106 1 3 0.75 0 1 1 0.94 1
4 Nepal Life -68 0 2 0.50 +21 1 1 0.63 4
5 Asian Life + 28 1 2 0.50 +19 1 1 0.88 2
6 Surya Life -40 0 3 0.75 +24 1 1 0.69 3
7 Gurans Life -23 0 3 0.75 +6 1 1 0.69 3
8 Prime Life -40 0 3 0.75 +22 1 1 0.69 3
Average 0.25 0.56 0.87 0.87 0.64
Source: Annual Reports of LICs, http://www.sebon.org.np *Annual Report for the FY 2011/12, **Quarterly report for FY 2012/13, Note: Gap = Gap between Deadline and Actual Reporting Date, No= No of Reports Disclosed, Days=Days taken for AGM, N = Not available till October 2013.
It has been observed from above table that among eight life insurance companies, LIC has obtained highest disclosure score (94%) followed by Asian Life (88%) and Surya Life, Gurans Life and Prime Life (69%). National Life and Nepal Life have obtained lowest score (63%). Rastriya Beema Sansthan has not disclosed anything hence 0 score has been assigned. Among four disclosure dimensions, highest average score reported 87 percent in AGM and Directors’ report disclosure while lowest score (25%) has been obtained in Annual Report Disclosure and 56 percent has been obtained in Quarterly Report Disclosure in aggregate.
4.3 Disclosure score of non-life insurance companiesThe disclosure score of non-life insurance companies has been tabulated according to the guideline discussed in section 4.1. The score of 14 companies has been presented in Table 3.
Nepalese Journal of Management 36

Table 3: Disclosure score of non-life insurance companies
SN Name of Company
Components of Disclosure
Aggregate Score RankAnnual Report
Disclosure*
Quarterly Report
Disclosure**
AGM Disclosure
Directors' Report Disclosure
Completeness Score
Gap Score No. Score Days Score Score
(1) (2) (3) (4) (5) (6) (7) (8) (9) (10)
1 Nepal 30 1 1 0.25 17 1 1 0.81 1
2 Himalayan -38 0 2 0.5 3 1 1 0.63 3
3 United -72 0 3 0.75 36 1 1 0.69 2
4 Premier -123 0 0 0 40 1 1 0.50 5
5 Everest 0 0 0 0 0 0 0 0 6
6 Neco -72 0 1 0.25 6 1 1 0.56 4
7 Sagarmatha -116 0 2 0.5 27 1 1 0.63 3
8 Alliance -6 0 0 0 24 1 1 0.5 5
9 N.B. 0 0 0 0 0 0 0 0 6
10 Prudential -35 0 0 0 25 1 1 0.50 5
11 Shikhar -103 0 0 0 33 1 1 0.50 5
12 Lumbini 24 1 1 0.25 8 1 1 0.81 1
13 NLG -130 0 1 0.25 -118 1 1 0.56 4
14 Siddhartha -9 0 1 0.25 43 1 1 0.56 4
Average 0.14 0.21 0.86 0.86 0.52
Source: Annual Reports of LICs, http://www.sebon.org.np *Annual Report for the FY 2011/12, **Quarterly report for FY 2012/13, Note: Gap = Gap between Deadline and Actual Reporting Date, No.= No of Reports Disclosed, Days=Days taken for AGM, N = Not available till Oct, 2013.
The above table shows that among 14 non-life insurance companies, Nepal and Lumbini obtained highest disclosure score (81%) followed by United (69%) and Himalayan and Sagarmatha (63%) stood in third position. Four companies stood in last position obtaining 50 percent score whereas Everest and NB obtained zero disclosure score. Among four disclosure dimensions, highest average score has been reported 86 percent in AGM and Directors’ report disclosure while lowest score has been observed 14 percent in Annual Report Disclosure and 21 percent score has been obtained in Quarterly Report Disclosure.
Kumar and Ghimire 37

4.4 Composite disclosure score of insurance companies
Composite disclosure score of life and non-life insurance companies has been presented in Table 4Table 4: Composite disclosure dcore of life and non-life insurance companies
Name of Company
Components of DisclosureComposite
ScoreAnnual Report
Quarterly Report
AGM Directors’ Report
Life Insurance 0.25 0.56 0.87 0.87 0.64
Non-Life Insurance 0.14 0.21 0.86 0.86 0.52
Average Score 0.19 0.39 0.87 0.87 0.58
Difference (Life – Non life) 0.11 0.35 0.02 0.02 0.12
Source: Annual Reports of LICs, http://www.sebon.org.np Table 4 shows that life insurance sector has better disclosure practices than non-life insurance in all dimensions of disclosure. The aggregate disclosure score of life and non-life insurance has been found 64 and 52 percent respectively. The overall disclosure score of insurance industry is 58 percent.
4.5 Trend of disclosure practicesThe quarterly disclosure score has been calculated on the basis of quarterly reports submitted by insurers (see Annex 1). The score of each quarter for FY 2012/13 has been presented in Table 5. The trend of disclosure practice between two years has been compared on the basis of annual report disclosure score of 2011/12 and fourth quarters’ disclosure score during FY 2012/13. Trend of quarterly report disclosure practice during the FY 2012/13 has been also observed.
Table 5: Annual and quarterly reports submission score
Category of Insurance Company
Annual Report
Disclosure score of FY
2011/12
Quarterly Report Disclosure Score During FY 2012/13
1st 2nd 3rd 4th
Life insurance 0.25 0.88 0 0.75 0.63
Non-life insurance 0.14 0.43 0 0.43 0.07
Source: Annual Reports of LICs, http://www.sebon.org.np
The aggregate disclosure trend of life and non-life insurance companies from FY 2011/12 to end of each quarter of FY 2012/13 has been shown in Figure 1.
Nepalese Journal of Management 38

Figure 1: Trend of disclosure score
Source: Annual Reports of LICs, http://www.sebon.org.np
Figure 1 shows that there is no significant progress on disclosure practices of both life and non-life insurance companies. During second quarter none of the company has submitted their quarterly report. However, life insurance has shown better disclosure practice (from 25 percent in previous year to 63 percent in last quarter).
4.6 Inferential analysis In this section further analysis has been done to examine the variations in disclosure practices between life and non-life insurance companies and any significant changes taking place between two years and between first and last quarter.
4.6.1 Disclosure practices between periodsFollowing hypotheses have been formulated to test the progress on disclosure practices of insurance companies (in aggregate) between two periods.
Null hypotheses:H01: Disclosure practices of insurance companies between first and last quarter have no significant difference.H02: Disclosure practices of insurance companies between 2011/12 and 2012/13 have no significant difference.
Alternative hypotheses:H11: Disclosure practices of insurance companies between first and last quarter have significant difference.H12: Disclosure practices of insurance companies between 2011/12 and 2012/13 have significant difference.Wilcoxon Singed Rank Test has been applied to find whether the progress on disclosure practices between first and last quarter and between 2011/12 and 2012/13 is significant. The result of Wilcoxon Singed Rank Test has been presented in Table 6.
Kumar and Ghimire 39

Table 6: Disclosure practice between two periods
Period Between Z p value Remarks
First and Fourth Quarter -2.646a 0.01* negative change
FY 2011/12 and 2012/13 -.707b 0.48
Source: Annual and Quarterly Reports and Researchers’ calculation a based on negative rank. b based on positive rank, * 5% level of significance
4.6.1.1 Disclosure practice between first and fourth quarter The p value of z statistics of Wilcoxon Singed Rank test between the first and fourth quarter is less than 5 percent (i.e. 0.01) which indicates that there is a significant difference in disclosure practices between first and fourth quarters but Z value shows that there is a negative change in fourth quarter. It may be said that the disclosure status has deteriorated in fourth quarter as compared to first quarter.
4.6.1.2 Disclosure practice between FY 2011/12 and FY 2012/13The p value of z statistics of Wilcoxon Singed Rank test between FY 2011/12 and FY 2012/13 is more than 5 percent (i.e. 0.48) which indicates that there is no significant difference in disclosure practices between FY 2011/12 and FY 2012/13. This result suggests that there is no significant improvement in disclosure practices in 2012/13 as compared to 2011/12.
4.6.1 Disclosure practices between life and Non-life Insurance CompaniesFollowing hypotheses have been formulated to test the difference between the disclosure practices of life and non-life insurance companies
H0: Disclosure practices between the life and non-life insurance companies have no significant difference.
H1: Disclosure practices between the life and non-life insurance companies have significant difference.
The disclosure practices between life and non-life insurance companies has been tested by administering Mann Whitney U Test and the value has been exhibited in Table 7.
Table 7: Disclosure practice between life and non-life insurance companiesAnnual Report
Quarterly Reports AGM Held Director’s
Report Overall Score
Mann-Whitney U 50 55.5 55 55 28.5
Z -0.612 -0.035 -0.115 -0.115 -1.898
p value 0.54 0.97 0.91 0.91 0.06
Source: Researchers’ calculation based on Annual and Quarterly ReportsThe p value of Mann Whitney U test of four different dimensions and aggregate disclosure score have been found more than 5 percent. It can be inferred that there is no significant difference between the disclosure practices of life and non-life insurance companies in each dimension.
Nepalese Journal of Management 40

5. Findings and conclusionThe aim of this paper is to explore the corporate disclosure practices of insurance industry in Nepal and to examine whether the practices between life and non-life insurance companies have significant differences and whether the disclosure practices have been improving over the study period.
The comparison between the life and non-life insurance companies disclosure practices of four dimensions, 25 percent life and 14 percent non-life insurance companies have submitted their annual reports within deadline. Similarly, 87 percent life and 86 percent non-life insurance companies have organized their annual general meetings within prescribed time and have disclosed their Director’s report. Quarterly reports have been submitted by only 56 percent life and 21 percent non-life insurance companies. On the basis of descriptive statistics, the composite disclosure score of life insurance companies has been found better (64%) than non-life insurance companies (52%).
Inferential statistics suggest that the differences in disclosure practices between life insurance and non-life insurance companies are not significant. The result shows that the disclosure practices over the quarters and over the years also have not shown improvement. Thus, it may be suggested that more efforts should be made by insurance companies for the improvement in corporate disclosure and financial reporting practices
6. RecommendationCorporate disclosure is essential for the healthy and sound development of the economic sector. Insurance companies are financial intermediaries and they have held large amount of public fund. They should be always under the close surveillance of regulatory authorities. Insurance companies should follow the prevailing regulatory framework while disclosing the information to its shareholders, policyholders and public. Further research can be done in the same issue taking more years data. Impact of corporate disclosure on firm’s profitability and market value may be another topic of research. Similarly, primary research can be done to explore the views of public, insurers, regulators regarding the corporate governance practices in insurance industries in Nepal.
Reference
Kumar and Ghimire 41
Gibbins, M., A. Richardson, and J. Waterhouse. 1990. The management of corporate financial disclosure: Opportunism, ritualism, policies, and processes. Journal of Accounting Research, 28: 121-143.
GoN (2006). Company Act, 2006
GoN (1992). Insurance Act, 1992
GoN (2006). Securities Act, 2006
Insurance Board (2007). On site inspection manual of insurer, 2007
Insurance Board (2008) Directives of analysis of financial status and evaluation of liabilities of life and non life insurers
Insurance Board (2008) Directives to prepare financial statements of life insurers and non life insurers
Insurance Board (2009). Long form audit report related directive, 2009
Insurance Board (2010). Annual report, 2012. Insurance Board: Kathmandu
Insurance Board (2012). Corporate good governance directives, 2012
Insurance Board. (2012). Existing scenario of Nepalese insurance industries, 2012. Kathmandu

Nepalese Journal of Management 42
Insurance Board (2013). Investments directives for life insurers and non- life insurers
Insurance Board (2013). Solvency margin for life insurers, 2013
NRB (2012). Bank Supervision Report, 2012, Nepal Rastra Bank.
Securities Board (2008). Securities Registration and Issue Regulations, 2008. Kathmandu
Verrecchia, R., (2001). Essays on disclosure. Journal of Accounting and Economics 32, 97-180.
World Bank (2005). Corporate Governance Country Assessment Nepal.
Websites cited
http:// www.bsib.org.np/
http:// www.nlg.com.np/
http:// www.suryalife.com/
http://www.allianceinsurance.com.np/
http://www.asianlife.com.np/
http://www.beema.com.np
http://www.everestinsurance.com/
http://www.hgi.com.np/
http://www.lgic.com.np/
http://www.licnepal.com.np/
http://www.metlifealico.com.np
http://www.nationalinsuranceindia.com/
http://www.nationallife.com.np/
http://www.nbinsurance.com.np/
http://www.necoinsurance.com.np/
http://www.nepalinsurance.com.np/
http://www.nepallife.com.np/
http://www.orientalinsurance.org.in/
http://www.premier-insurance.com.np/
http://www.prudential.com.np/
http://www.sagarmathainsurance.com.np/
http://www.shikharinsurance.com/
http://www.siddharthainsurance.com/
http://www.unitedinsurance.com.np/
http://www.ican.org.np

43
Effects of remittance on economic growth and financial sector development in Nepal
- Jyoti Kafle
Nepalese Journal of Management
AbstractThis paper examines the effects of remittance on economic growth and financial sector development in Nepal. The study consider gross domestic product (GDP) per capita, broad money supply, private sector credit, total consumption, gross capital formation, foreign aid, remittance per capita, total remittance inflows, total deposit, total trade and lags of these all variables . Out of these variables GDP per capita, broad money supply, private sector credit, and total consumption are Dependent variables and other are independent variables. This study is based on primary as well as secondary data. The result shows that there foreign aid and lag of GDP per capita have significant impact on GDP per capita where remittance have no impact in GDP per capita in Nepal. Further this study finds out that total remittance inflows and its lag are positively related with broad money supply. This study also find out that total remittance inflows as well as lag of total remittance inflows does not have any effect on private sector credit. Remittances have been boon to household’s level and the economy in the short-term but still remittance is not a long term solution because it will not make economy productive and competitive.
Keywords: remittance, GDP, broad money supply, private sector credit.
1. IntroductionRemittance is a transfer of money by a foreign worker to his or her home country. Remittance is the major sources of foreign exchange earnings and has important developmental implications for the remittance-recipient countries because of their increasing volume in recent times. Since 2000, remittance inflow has been rising by an average rate of 16% per annum in the developing countries (World Bank, 2006). In recent years Nepalese economy has been named “remittance economy” as remittance constitutes almost 23% of (Economic Survey, 2012). Since remittance has brought macroeconomic stability by securing large chunk of foreign reserve of the country and provided income source for the households, identification of effects of remittances in economic development and financial sector in Nepal is crucial. Another critical issue with remittance in Nepal is whether growing contributions of remittance income to GDP will be sustainable.
NEPALESE JOURNAL OF MANAGEMENT VOL.1, NO.1, JULY 2014
NMJ

Remittance enhances the development of banking sector in a three ways. Firstly, remittance supply the households with excess cash that might potentially generate a transaction demand for financial services. Secondly, the fees earned through remittance processing, can add to the profitability of a branch. Banks with the state of the art infrastructure can explore this new market opportunity. Thirdly, banks can target the bottom of the pyramid’ segment of the remittance receiving market, where, a substantial portion of the remittances is likely to remain unbanked (Giuliano & Arranz, 2006).
Rremittance and banking sector have been revealed to have impact on per capita income in all four South Asian nations (Norman and Uddin, 2012). The study also showed that banking sector development, as measured by the private sector credit disbursement by the banking system, is significantly affected by both remittance flow and GDP. Likewise, Anzoategui et.al (2011) revealed that remittances have a positive impact on financial inclusion by promoting the use of deposit accounts. And remittances do not have a significant effect on credit from formal financing institutions. Promoting banking sector development, foreign remittance has an immense direct impact on economic development of receiving nations as well (Adelman et al. 1990). Remittances inflow can directly work for community development (Cordova et al.2004) which can eventually result in economic development. Akinpelu, et.al (2013) revealed that there is a long-run equilibrium relationship between GDP and remittance inflows, exchange rate, foreign direct investment, openness and capital formation. In case of Nepal,(Gaudel, 2006) found that Remittance income and Grants appear to be the most relevant variables to raise nominal GDP in Nepal. Pension and other items have also significant impact on increasing nominal GDP in Nepal.
The major objective of this study is to investigate the causal relationship between foreign remittances, banking sector development and GDP in Nepal. The specific purposes are: to analyze the effect of remittance on economic growth of Nepal, to find out effect of remittance on macroeconomic variables including consumption, investment and financial development, to analyze the relationship between remittance and financial sector development, to examine the sustainability of contribution from remittances income to Nepal’s national and household economies and to assess whether volume of remittances has any effect on banks’ ability to expand credit. The reminder of this paper is organized as follows. Section two describes the sample, data, and methodology. Section three presents the empirical results and the final section draw conclusions and discuss the implications of the study findings.2. MethodologyThis study employs both primary and secondary sources of information. The primary source of data has been used to assess the opinion of remittances receiver towards the uses of re-mittances. Likewise, secondary data has been employed in order to analyze the forms of re-lationship, cause and effect between dependent variable and independent variables employs in this study. Primary data has been collected through questionnaire. The Population of this study for primary data includes all Sukumbasi family residing in Anamnagar, New Bane-shwor and Old Baneshwor area of Kathmandu District. In selecting the most reliable and representative samples, convenient and purposive sampling techniques was used. Out of 130 questionnaire distributed only 125 questionnaire has been collected. Therefore total number of observation for this study is 125.
Similarly, the secondary data has been collected from Monetary Policy, NRB published reports, articles and journals related to remittance impact, Economic Survey Report,
Nepalese Journal of Management 44

International and the official site of Ministry of Foreign Employment Department, Central Bureau of Statistics. The data comprises data from the year 1993 to 2012. The study consider GDP per capita, Broad money supply, Private sector credit, Total consumption, Gross capital formation, Foreign aid, Remittance per capita, total remittance inflows, total deposit total trade and lags of these all variables . Out of these variables GDP per capita, broad money supply, private sector credit, and total consumption are dependent variables and other are independent variables.
lnGDPt = α + β1lnREMt+ β2lnGCFt+β3lnAIDt+ β4lnOptt + β5lnREMt-1+ β6lnGCF t-1+β7lnAID
t-1+ β8lnOpt t-1+ β9lnGDPt-1 + ut ….............................................…(I)lnM2t = α + β1lnGDP t + β2lnTREMIt+ β3lnTDt+ β4nGDP t-1 + β5lnTREMIt-1+β6lnTD
t-1+β7lnM2 t-1+ ut …....................................................................… (II)lnPSCt = α + β1lnGDPt + β2lnTREMIt+ β2lnTDt + β4nGDP t-1 + β5lnTREMIt-1+ β6lnTD t-1+ β7lnPSC t-1+ ut …………........................................................(III)lnCOMNt = α + β1lnGDP t + β2lnTREMIt+ β2lnTDt+ β4nGDP t-1 + β5lnTREMIt-1+ β6lnTD t-1+ β7lnCOMN t-1+ ut ……...................................(IV)where, GDP = gross domestic product, REM = remittance inflow, GCF = M2 = Money supply, PSC = private sector credit, COMN = consumption, AID = foreign aid, TD = total deposit3. Presentation and analysis of dataAs this study has employed descriptive research design, among others, descriptive statistics have been used to describe the characteristics of economic growth and financial sector variables and its determinants during the study period. The descriptive statistics used in this study consists of mean, median, standard deviation, and minimum and maximum values associated with variables under consideration. Descriptive analysis of this study is shown in table 1 given below.
Table 1: Descriptive statisticsVariables N Minimum Maximum Mean Std. Deviation
GDPt (Rs) 20 16.00 25545.00 16414.89 6048.22
AIDt (Billion) 20 5.71 59.21 23.57 15.73
REMt (Rs) 20 1192.72 15650.94 4535.79 4147.78
OPTt (Billion) 20 70.86 633.66 242.29 160.49
GCFt (Billion) 20 44.64 642.91 203.98 176.45
TREMIt (Billion) 20 25.19 430.00 114.47 119.38
PSCt (Billion) 20 21.21 811.35 216.78 243.57
M2t (Billion) 20 58.32 1087.28 341.9046 301.23
CONSMt (Billion) 20 170.05 1542.33 603.71 417.68
TDt (Billion) 20 42.01 921.17 262.20 235.54
Table 1 reveals the descriptive statistics of the GDP per capita, factors of banking sector development and remittances for the data of twenty years of Nepal. The study shows that the average volume of GDP per capita of Nepalese people from 1993 to 2012 is Rs. 16414.89 with the standard deviation of Rs. 6048.22. Likewise, the average volume of remittances per capita from 1993 to 2012 for the Nepalese people is Rs.4535.79with the standard
Kafle 45

deviation of Rs. 4147.78. The average value of foreign aid (AIDt) is Rs.23.57 billion with the standard deviation of Rs.15.73 billion. Similarly the mean value of total trade (OPTt) is Rs.242.29 billion with the standard deviation of Rs.160.49. Likewise, the average value of Gross capital formation for the year 1993 to 2012 is Rs.203.98 billions with the standard deviation of and Rs 176.45 billions.In the other hand the average of total inflow of remittances of the year (TREMIt) is Rs.114.47 with standard deviation of Rs.119.38. In addition to this the minimum value of remittances inflow is Rs.25.19 billion and maximum value is Rs 430 billion. Similarly, the average volume of Broad money supply (M2t) within twenty years period is Rs.341.90 billion where the standard deviation is Rs 301.23 billion. The maximum and minimum volume of Broad money supply is Rs 1087.28 billion and Rs 58.32 respectively.
The average value of private sector credit is Rs 216.78 billion with the standard deviation of Rs.243.57 billion. The value of total consumption ranges from Rs.170.05 billion to Rs .1542.33 billion with the mean value of Rs.603.71 billion and with standard deviation of Rs.417.68 billion. Lastly, the average value of total deposit is Rs. 262.20 billion with the standard deviation of Rs. 235.54 billion.
Correlation analysisCorrelations analysis of GDP per capita and its determinants for the period of 1992 to 2012 is shown in table 2. This table shows that the highest positive and significant correlation coefficient is recorded between GDP per capita and lags GDP per capita. This means that if the lag GDP per capita increases than GDP per capita will also increase. Likewise, other remaining variables are also positively correlated with each other and also with GDP per capita. The coefficient is also significant at different percent level of significance. However, Foreign Aid and lag foreign aid is positively and insignificantly correlated with the GDP per capita. This mean that this year Aid is increases with the increase in last year Aid. Among the observed correlations, the degree of correlation of lag GDP and lag Openness to Trade are most strong in order of their importance which means these variable better explain the dependent variable in case of Nepal.
Correlation analysis of broad money supply and its determinants for the year 1992 to 2012 is shown in table 3 given below.The table shows thatthe highest positive and significant correlation is recorded between broad money supply and total deposit. Similarly, broad money supply is positively related with GDP per capita, total remittance inflows, lag of GDP per capita, lag of total remittance inflows, lag of total deposit and lag of broad money supply. The result indicate that broad money supply increases with the increase with GDP per capita, total remittance inflows, total deposit, lag of GDP per capita, lag of total remittance inflows, lag of total deposit and lag of broad money supply.
Correlations Analysis of Private sector credit and its determinants for the period of 1992 to 2012 is shown in table 4 given below. This Table shows that among the determinants of Private sector credit, the highest positive and significant correlation coefficient is recorded between Private sector credit (lnPSCt) and lag of Private sector credit (lnPSCt-1).
Nepalese Journal of Management 46

Table 2: Correlations Analysis of GDP per capita and its determinants
Variable lnGDPt lnREMt lnAIDt lnOPTt lnGCFtlnGDP
t-1
lnAID
t-1
lnGCF
t-1
lnOPT
t-1lnREMt-1
lnGDPt 1
lnREMt .838** 1
lnAIDt 0.165 .482* 1
lnOPTt .924** .966** 0.422 1
lnGCFt .875** .912** 0.365 .960** 1
lnGDP t-1 .997** .851** 0.188 .915** .851** 1
lnAID t-1 0.113 0.424 .499* 0.37 0.392 0.165 1
lnGCF t-1 .888** .891** 0.134 .921** .863** .875** 0.365 1
lnOPT t-1 .934** .956** 0.34 .990** .947** .924** 0.422 .960** 1
lnREMt-1 .833** .970** .458* .978** .957** .838** .482* .912** .966** 1
This indicates that the previous year private sectors credit influences this year private sector credit. Beside with its lag the private sector credit has highest positive correlation coefficient with total deposit (lnTDt) and lag of total deposit (lnTDt-1). Which means increase in total deposit will eventually leads to increase in private sector credit and deposit of previous year will also influence in private sector credit of this year.
Table 3: Correlations analysis of broad money supply and its determinantsVariables lnM2t lnGDPt lnTREMIt lnTDt lnGDPt-1 lnTREMIt-1 lnTDt-1 lnM2t-1
lnM2t 1
lnGDPt .948** 1
lnTREMIt .807** .664** 1
lnTDt .999** .953** .802** 1
lnGDPt-1 .943** .997** .692** .947** 1
lnTREMIt-1 .798** .639** .738** .797** .664** 1
lnTDt-1 .997** .962** .789** .996** .953** .802** 1
lnM2t-1 .998** .953** .798** .996** .948** .807** .999** 1
Kafle 47

Table 4: Correlations analysis of private sector credit and its determinants
Variables lnPSCt lnGDPt lnTREMIt lnTDt lnGDPt-1 lnTREMIt-1 lnTDt-1 lnPSCt-1
lnPSCt 1
lnGDPt .893** 1
lnTREMIt .832** .664** 1
lnTDt .959** .953** .802** 1
lnGDPt-1 .897** .997** .692** .947** 1
lnTREMIt-1 .745** .639** .738** .797** .664** 1
lnTDt-1 .959** .962** .789** .996** .953** .802** 1
lnPSCt-1 .972** .878** .836** .949** .893** .832** .959** 1
Correlations Analysis of Total consumption and its determinants for the period of 1992 to 2012 is shown in table 5 given below. Among the determinants of total consumption, the highest negative and insignificant correlation coefficient is recorded between total consumption (lnCOMNt) and lag of total consumption (lnCOMNt-1). This indicates that previous year consumption may not influence this year consumption directly.
Table 5: Correlations analysis of total consumption and its determinants
Variables lnCOMNt lnGDPt lnTREMIt lnTDt lnGDPt-1 lnTREMIt-1 lnTDt-1 lnCOMNt-1
lnCOMNt 1
lnGDPt -0.048 1
lnTREMIt -0.193 .664** 1
lnTDt -0.121 .953** .802** 1
lnGDPt-1 -0.069 .997** .692** .947** 1
lnTREMIt-1 -0.184 .639** .738** .797** .664** 1
lnTDt-1 -0.168 .962** .789** .996** .953** .802** 1
lnCOMNt-1 -0.2 -0.102 -0.252 -0.258 -0.048 -0.193 -0.121 1
Now we deal with the regression results from various specifications of the model to examine the estimated relationship of remittance, economic growth and banking sector development from the time series data during the period of 1993/94 through 2012/13.The regression of GDP per capita and its Determinants produced the results as indicated in Table 6.
Table 6 shows that the relationship between remittance per capita and GDP per capita is positive but insignificant. And coefficient for the remittance per capita is computed .007 which indicates that if the remittance per capita increases by Rs 1 then volume of GDP per capita will increase by 7%. Likewise, coefficient for GCFt is computed 0.013 and it is statistically insignificant. This means that increase or decrease in gross capital formation may not affect GDP of the year. Lag of GDP per capita (GDPt-1) is positively related to GDPt and is statistically significant. This means that last year GDP will influence present year
Nepalese Journal of Management 48

GDP and with the increase in last year GDP this year GDP will also increases. The value of Durbin Watson statistic is 2.385 indicate that there is no serial autocorrelations between the residual terms.
Table 6: Regression results of GDP per capita and its determinantsThis table shows regression results of variables based on time series data from the year 1993/94 to 2012/13. The regression result consists of specification of the model I in the form of simple and multiple regressions. The reported values are intercepts and slope coefficients of respective explanatory variables with t-statistics. Dependent variable is the GDP per capita as lnGDPt and independent variables are Remittance per capita, Gross Capital Formation, Foreign Aid , Openness to Trade , lagged GDP per capita, lagged Remittance per capita, lagged Gross Capital Formation, lagged Foreign Aid and lagged Openness to Trade .The reported results also include the values of F-statistics (F), adjusted coefficient of determination (Adj. R2) and Durbin-Watson test. lnGDPt = α+β1lnREMt + β2lnGCFt+ β3lnAIDt+ β4lnOptt+ β5lnREMt-1+ β6lnGCFt-1 +β7lnAID
t-1+ β8lnOpt t-1+ β9lnGDP t-1+ ut
Variables MODEL II
Coefficient t- value P- value
Constant -1.162 -.968 .358
lnREMt .007 .315 .760
LnAIDt -.020 -2.372 .042
LnOPTt -.014 -.139 .893
LnGCFt .013 .558 .591
lnREMt-1 -.034 -.946 .369
lnAID t-1 .002 .354 .731
lnGCF t-1 -.015 -.473 .648
lnOPT t-1 .130 1.590 .146
lnGDP t-1 .772 11.649 .000
Adjusted R2 .998
F-ratio 959.174*
Sig. (p-value) .000a
Durbin-Watson 2.385
Notes: 1.The asterisk (*) sign indicates that the results are significant at 5 percent level and double asterisk (**) sign indicates that result is significant at 1 percent level.2. Dependent variable is GDP per capita.
The regression of broad money supply and its determinants shows that beta coefficients for the total remittance inflows, GDP per capita, total deposit, lagged total remittance inflows, lagged total deposits are positive in all the equations as indicated in Table 7. However, coefficients are not significant for GDP per capita and total remittance inflow but coefficients for lag remittance inflows, total deposits, and lag of total deposits are significant. The negitive coefficients have been observed for lag GDP per capita and lag broad money supply. The coefficients are insignificant for both. The results hence indicate that broad money supply increases when the total remittances inflows (TREMIt) increases. Similarly, total deposit is able to explain Broad money supply. Result revealed that higher broad money supply is associalted with higher total deposits.
Kafle 49

Table 7: Broad money supply and its determinantsThis table shows regression results of variables based on time series data from the year 1993/94 to 2012/13. The regression result consists of specification of the model II in the form of simple and multiple regressions. The reported values are intercepts and slope coefficients of respective explanatory variables with t-statistics. Dependent variable is the Broad money supply as lnM2t and independent variables are Total Remittance inflows, GDP per capita, total deposit, lagged GDP per capita, lagged total remittance inflows, lagged total deposits and lagged Broad money supply. The reported results also include the values of F-statistics (F), adjusted coefficient of determination (Adj. R2) and Durbin-Watson testlnM2t=α+ β1lnGDPt + β2lnTREMIt + β3lnTDt+β4lnGDPt-1+β5lnTREMIt-1 + β6lnTDt-1 + β7lnM2
t-1+ ut
Variables MODEL IVCoefficient t- value P- value
Constant -.714 -2.268 .044lnGDP t .341 1.040 .321
lnTREMIt .018 1.587 .141lnTDt .254 2.614 .024
lnGDPt-1 -.594 -2.159 .054lnTREMIt-1 .024 2.306 .042
lnTDt-1 .837 4.873 .000M2t-1 -.036 -.254 .804
Adjusted R2 .999
F-ratio 4626.067
Sig.(p-value) .000a
Durbin-Watson 2.266
Notes: 1.The asterisk (*) sign indicates that the results are significant at 5 percent level and double asterisk (**) sign indicates that result is significant at 1 percent level.2. Dependent variable is broad money supply.
The next aspect of the study is concerned with the regression of private sector credit and determinants. The regression results are presented in table 8.Table shows that, GDP per capita, total remittances inflows and lag of total remittance inflows are negatively related with private sector credits well as statistically insignificant. It indicates that GDP per capita, total remittances inflows and lag of total remittance inflows are not a good explanatory variable for Private sector credit. Similarly lag of private sector credit is positively related with private sector credit and significant. This indicates that higher the lag of private sector credit higher will be this year private sector credit.
Nepalese Journal of Management 50

Table 8: Private sector credit and determinantsThis table shows regression results of variables based on time series data from the year 1993/94 to 2012/13. The reported values are intercepts and slope coefficients of respective explanatory variables with t-statistics. Dependent variable is the private sector credit denoted as lnPSCt and independent variables are Total Remittance inflows, GDP per capita, total deposit, lagged GDP per capita, lagged total remittance inflows, lagged total deposits and lagged private sector credit. The reported results also include the values of F-statistics (F), adjusted coefficient of determination (Adj. R2) and Durbin-Watson test.lnPSCt = α + β1lnGDPt + β2lnTREMIt+ β2lnTDt + β4nGDP t-1 + β5lnTREMIt-1+ β6lnTD t-1+ β7lnPSC t-1+ ut
Variables MODEL VI
Coefficient t- value P- value
Constant -7.584 -1.809 .098
lnGDP t -6.295 -1.447 .176
lnTREMIt -.075 -.520 .614
lnTDt .572 .452 .660
lnGDPt-1 4.219 1.152 .274
lnTREMIt-1 -.157 -1.080 .303
lnTDt-1 .833 .621 .547
lnPSCt-1 .527 2.258 .045
Adjusted R2 .953
F-ratio 53.645
Sig. (p-value) .000a
Durbin-Watson 1.830
Notes: 1.The asterisk (*) sign indicates that the results are significant at 5 percent level and double asterisk (**) sign indicates that result is significant at 1 percent level.2. Dependent variable is Private sector credit.
The regression of consumption and its determinants shows that beta coefficients for GDP per capita, total remittance inflows, lag of total remittance inflows and lag of total deposits are as indicated in table 9. However, coefficients are also not significant for all of them The positive coefficients have been observed for total deposits, lag of GDP per capita and lag of total consumption. The results hence indicate that GDP per capita, lag GDP per capita, total deposit, remittance inflow and lag of total remittance inflows are not a good explanatory variable for total consumption.
Kafle 51

Table 9: Total consumption and determinantsThis table shows regression results of variables based on time series data from the year 1993/94 to 2012/13. The reported values are intercepts and slope coefficients of respective explanatory variables with t-statistics. Dependent variable is the total consumption denoted as lnCOMNt and independent variables are Total Remittance inflows, GDP per capita, total deposit, lagged GDP per capita, lagged total remittance inflows, lagged total deposits and lagged private sector credit. The reported results also include the values of F-statistics (F), adjusted coefficient of determination (Adj. R2) and Durbin-Watson test.
lnCOMNt = α + β1lnGDP t+ β2lnTREMIt+ β3lnTDt+ β4 lnGDP t-1 + β5lnTREMIt-1+ β6lnTD
t-1+β7lnCOMN t-1+ ut
Variables MODEL VIII
Coefficient t- value P- value
Constant 95.130 1.729 .112
lnGDP t -42.308 -.833 .423
lnTREMIt -1.468 -.818 .431
lnTDt 34.03 1.576 .143
lnGDPt-1 50.031 1.206 .253
lnTREMIt-1 -1.240 -.681 .510
lnTDt-1 -36.765 -2.011 .070
COMNt-1 .014 .035 .973
Adjusted R2 .089
F-ratio 1.252
Sig.(p-value) .354a
Durbin-Watson 2.710
Notes: 1.The asterisk (*) sign indicates that the results are significant at 5 percent level and double asterisk (**) sign indicates that result is significant at 1 percent level.2. Dependent variable is Total Consumption.
4. Discussion and conclusion The study reveals that foreign aid and lag of GDP per capita have significant impact on GDP per capita in Nepal. Further it find out that remittance and GDP per capita are positively related but p-value shows that it is insignificant which meant that even thought they are positively related but result shows that remittance have no impact in GDP per capita. Further this study finds out that total remittance inflows are positively related with broad money supply but lag of total remittance inflows have more significant impact on broad money The major conclusion of the study is that remittance per capita (REMt), Gross capital formation (GCFt), total trade (OPTt), lag of remittance per capita (REMt-1), Gross capital formation (GCFt-1), total trade (OPTt-1) and foreign aid (AID t-1) does not affects the GDP
Nepalese Journal of Management 52

per capita in Nepal. Remittance inflow in the Nepalese economy has helped to significantly increase time-related deposits, savings deposits, and non-institutional money-market funds thereby contributing to financial development. From the study it can be concluded that in Nepal remittances have three important economic implications. First, remittance is the most stable and significant source of foreign exchange reserve that surpasses the foreign aids, grants and exports revenues. Second, remittance is the major source of income for most of the household in the country .Third, remittances have fuel in the development of financial institutions as remittances provide business and funds to banks and financial institutions and increases credit base in the market and thus boost liquidity as well. Remittances have been boon to household’s level and the economy in the short-term but still remittance is not a long term solution because it will not make economy productive and competitive. Remittance has been predominantly used for consumption and not channelized into productive sectors.
References
Kafle 53
Adelman, I., and J. E. Taylor (1990). Is structural adjustment with a human face possible? The case of Mexico. Journal of Development Studies, 26, 387-407.
Akinpelu, Y. A., O. J. Ogunbi, O. T. Bada, & O. S. Omojola (2013). Effect of remittance inflow on economic growth of Nigeria. Department of Banking and Finance, The Federal Polytechnnic, Ilaro, Ogun State.
Anzoategui, D., A. Demirguc-Kunt, & M. S. Peria (2011). Remittances and financial inclusion evidence from EI Salvador. The World Bank.
World Bank, (2006). Global Economic Prospects: Economic Implication of Remittances and Migration. Washing-ton, D.C.
Cordova, E. L. (2004). Globalization, Migration and Development: The Role of Mexican Migrant Remittances. Inter-American Development Bank.
Economic Survey (1993-2012). Government of Nepal, Ministry of Finance.
Fasissa, B. (2008). The impact of remittances on economic growth and development in Africa. Department of Economics and Finance ,Middle Tennessee State University, Murfreesboro.
Gaudel, Y. S. (2006). Remittance income in Nepal. The Journal of Business Studies , III, 9-17.
Giuliano, P., & M. Ruiz-Arranz (2006). Remittances, financial development, and growth. Institute for the Study of Labor (IZA).
M. Noman, A., & G. Uddin (2012). Remittances and banking sector development in South Asia. International Journal of Banking and finance, 121-142.
nrb.org.np. (2012/13). Economic Bulletin.
nrb.org.np. (2012/13). Statistical Bulletin fourth quarter.
World Bank Database

54
CPFR practices in automobile industry in India
- Dr. A.K. Verma*
Nepalese Journal of Management
AbstractGlobalization and increased use of IT have forced industry Pundits to create efficiency and effectiveness in supply chain activities by moving away from functional excellence to functional integration. One of the most recent initiatives aiming at achieving true supply chain integration is collaborative planning, forecasting and replenishment (CPFR). CPFR has become recognized as a breakthrough business model proving integrated and collaborative environment for the sharing of business information and effort to improve the supply chain performance. It enables supply chain partners to utilize Internet-based technologies to collaborate from operational planning through execution. The present paper is based on the following objectives:1.Study of CPFR system, processes and functional areas, to know the current practices followed among the Indian automobile manufacturers. 2.To see how far the CPFR practices have been adopted by the Indian auto industry.3.To see if the participants have experienced the benefits of CPFR in real terms.The scope of the study is limited to the automobile manufacturers of India for studying the CPFR practices and designing the basic model of CPFR. The data for the research is based on primary as well as secondary sources. A detailed study in the Indian Automotive Industry has been done to understand the level of implementation of CPFR practices with the help of a questionnaire. The components of CPFR practices have been studied to understand the interdependence and interrelationships among the automotive firms. The whole process helped in finding the business drivers and benchmark with the best practices to gear up the supply chain. The outcome of this research recommends the use of these business drivers to achieve PACE (Product and Cycle time Excellence) through collaboration.
Keywords: automotive industry, collaborative development, information technology, supply chain management, product data exchange
IntroductionThe global business environment is continuously facing increasing competitive pressures in a volatile economic environment. Obtaining and maintaining a competitive advantage has become more elusive and difficult due to global competition, industry consolidation, new channel development, and shorter product life cycles. Many firms have made tremen-dous efforts to overcome these challenges and establish an advantage through improved sup-ply chain performance (Andraski, 2008). These supply chain improvement efforts initially started with the areas that the firm could control internally such as inventory management, process improvement, and quality. These improvement initiatives gradually progressed ex-
* Dr. A. K. Varma, principal, continental group of institutes, Jalvehra, NH-I, Distt., FGS (Punjab) India.
NEPALESE JOURNAL OF MANAGEMENT VOL.1, NO.1, JULY 2014
NMJ

ternally to include collaboration between the firm and its suppliers as well as between the firm and its customers. Such successful collaboration between firms requires a great deal of trust. Collaboration has become, in a sense, the holy grail of supply chain improvement and has been referred to as the driving force behind effective supply chain management (Jain and Ramani, 2005).
A collaborative partnership has been defined as an “inter-enterprise concept developed and practiced between multiple independent organizations in a vertical relationship within a sup-ply chain (Anderson, 2007).” Since businesses are experiencing the limits of accruing busi-ness benefits out of supply chain management within their own boundaries, therefore these limitations have led organizations to focus on supply chains outside of their own organiza-tional boundaries and bring in trading partners. With the advent of faster technologies in the late 1990’s these partnerships have become a more likely possibility.
A highly acknowledged collaboration initiative used in the modern industry is Collaborative Planning, Forecasting, and Replenishment (CPFR). CPFR’s underlying premise is that wider integration of firms within the supply chain will lead to a better focus on customers through the development of a single shared forecast of demand and a reduction of lead times. The benefits resulting from a successful application of CPFR include reductions in stock-outs, improved inventory management, shorter cycle times, increases in sales revenues, stronger relationships between trading partners, better overall system visibility and customer service, and improved cost structures. Other compelling benefits of utilizing CPFR include enhanced relationships, better category management, improved product offering, reliable and accurate order (Fawcet and McCarter, 2008). CPFR is a paradigm-breaking business model that takes a holistic approach to supply chain management among a network of trading partners. Approved as industry guidelines by the Voluntary Inter-Industry Commerce Standards (VICS) organization and the Uniform Code Council (UCC), CPFR has the potential to deliver increased sales, inter-organizational streamlining and alignment, administrative and operational efficiency, improved cash flow, and improved return-on-assets (ROA) performance.
Overview of CPFR CPFR originated in 1995 as an initiative co-led by Wal-Mart and consulting firm Benchmarking Partners. This initiative originally was called Collaborative Forecasting and Replenishment (CFAR) (http://en.wikipedia.org/wiki/CPFR). With assistance from Benchmarking Partners and IT firms (such as IBM, SAP, i2, and Manugistic), Wal-Mart and Warner-Lambert implemented the first pilot of CFAR to increase sales, reduce inventory, and improve the in-stock position of Listerine, the project’s pilot product (Sherman, 1998). Since this project, CPFR has evolved and is a strategic initiative implemented by many companies throughout North America and Europe. VICS created guidelines for CPFR in 1998. Since the development and publication of these guidelines, over 300 companies have successfully implemented CPFR. The implementation of CPFR has also extended to industry sectors beyond retail, including high-tech industries. Rosettanet, a non-profit consortium of high-tech firms, has developed a collaborative forecasting standard for applying CPFR practices to that industry. Today, the VICS CPFR Committee works “to develop business guidelines and roadmaps for various collaborative scenarios, which include upstream suppliers, suppliers of finished goods and retailers, which integrate demand and supply planning and execution (http://www.vics.org/committees/cpfr/). CPFR enables trading partners to improve
Verma 55

operational efficiency through a structured process of sharing and utilizing information across firm−level boundaries.
Brief review of literatureCollaboration is an important issue in supply chain management. As the operations in companies have reached a level of efficiency, researchers have begun to put their emphasis on collaboration between different stages in a supply chain. The following table shows the research undertaken in various fields of CPFR.
NO. AUTHORS RESEARCH UNDERTAKEN
1.Birt (1999), Dyer et al. (1997), Paton (2007), Wognum and Faber (2003), Blomqvist and Levy (2006)
Competitive Methodology: Sustainable competitive advantage is not possible in knowledge-based competition without continuous innovation. Innovations, by nature, emerge in social interaction in which diverse actors share complementary knowledge. Collaboration capability is considered a prerequisite for actors if they wish to leverage such knowledge. The concept is analyzed through a state-of-the-art review of earlier conceptual and empirical research on network collaboration.
2.Chaloping’s (2006), Kim and Mahoney (2006), Oyelaran-Oyeyinka (2005), Faraj and Alshawi (2004), Motohashi (2007)
CPFR in Varied Industries:The research looks into the rationale, form and extent of collaborative activities of various industries such as copper mining, discount retail industry, Small and Medium Enterprise (SME) footwear clusters in Southeastern Nigeria, pharmaceutical companies. The study identifies the factors underlying this trend, finding that all three factors – technological opportunity, the market conditions factor and the innovation policy factor – are important.
3.Min and Yo (2008), Simatupang and Sridharan (2007), Pecar and Davies (2007), Ling Li (2006), Lauri Ojala (2006),
Information Sharing in CPFR:After recognizing the value of information sharing among supply chain partners, a large number of firms have expressed keen interest in jointly forecasting customer demand and co-managing business functions. In particular, such interest sparked the rapid development and implementation of Collaborative Planning, Forecasting and Replenishment (CPFR) that was proven to be successful in minimizing safety stocks, improving order fill rates, increasing sales, and reducing customer response time.
4.
Bautzer (2005), Hsieh and Chen (2007), Hardy, et al. (2006), Kraines et al.’s, (2004), Smith and Dickson (2003), Chang et al. (2006), Volkmann and Tokarski (2006), Matopoulos et al. (2006), Littler (2006), Littler et al. (1998), Namin et al. (2006), Neubert et al. (2004), Fornasiero and Zangiacomi (2006), Fornasiero and Zangiacomi (2006), Pecar and Davies (2007), Gardan et al. (2006), Gouthier et al. (2006), Jiang-Liang Hou (2004), Blackhurst, et al. (2006), Yoon and Kwon (2006), , Yuen Ling Chan et al. (2006), Bayazit (2007), Belzowski et al. (2006), Msanjila and Afsarmanesh (2007), Alt et al. (2005), Pisano and Verganti (2008), Lapid (2000), Sahay and Mohan (2003)
Collaboration and New product Development:The research strongly contends that Collaboration among enterprises has been rendered as one of the most important issues in the business agenda, either as a result of the globalization and deregulation of markets or as a result of the Information and Communication Technology (ICT) revolution. Both factors have created a business reality where success in the collaboration practices followed, may result in improvements in the competitive position of enterprises. The outcome of the research helps to: determine the degree of collaboration and integration; assess the required level of interconnectivity between SC partners; identify areas of development and improvement; and make decisions related to transport integration.
Nepalese Journal of Management 56

Predecessors to CPFR CPFR is not the first initiative aimed at increasing collaboration and information sharing be-tween trading partners in order to achieve improvements in supply chain management. There have been a number of widely known initiatives started with this objective from time to time. The following initiatives have been well acknowledged and better interact and enhance the application of CPFR. • Vendor-Managed Inventory (VMI)• Efficient Consumer Response (ECR)• Quick Response (QR)
The CPFR modelThe CPFR model (Figure 1)(http://www.vics.org/standards/CPFR_Overview_US-A4.pdf) offers a general framework by which a buyer and seller can use collaborative planning, forecasting, and replenishing processes in order to meet customer demand. To increase per-formance, the buyer and seller are involved in following four collaboration activities listed in logical order. Strategy and Planning- In this activity, the buyer and seller come to an understanding about their relationship and establish product and event plans.Demand and Supply Management - in which customer demand and shipping requirements are forecasted. Execution - the third collaboration activity involves placing, receiving, and paying for or-ders, and also preparing, delivering, and recording sales on shipments. Analysis-for this activity, the execution step is monitored and key performance metrics are measured to work towards continuous improvement. In its first phases, CPFR was interpret-ed as a linked sequence of nine business processes, backed by industry standards. But in practice, CPFR wasn’t as linear as the nine steps implied. So today it is viewed as a wheel that can be entered at any point, as depicted in Figure 1.
Figure 1: CPFR Model
(SOURCE: VICS)
Verma 57

The CPFR model breaks down the activities into further detail. Eight collaboration, supplier and manufacturer tasks are associated with the model. Two sets of tasks, one for the supplier and one for the manufacturer, are associated with each of the four activities listed above. The supplier and manufacturer tasks are called enterprise tasks and link business-to-business collaboration tasks to the entire enterprise operations. Strategy and Planning The first collab-oration task under this activity is Collaboration Arrangement, which is a method for defining the relationship in terms of establishing business goals, defining the scope, and assigning checkpoints and escalation procedures, roles, and responsibilities. The retailer task relat-ed to this collaboration task is Vendor Management, and the manufacturer task is Account Planning. The second collaboration task is Joint Business Plan. This task pinpoints the major actions that affect supply and demand in the planning period. Examples of these are introduc-ing new products, store openings and closings, changing inventory policy, and promotions. The retailer task associated with this is Category Management and the manufacturer task is Market Planning.
Demand and Supply Management Sales Forecasting, which projects point-of-sale consumer demand, is one of the collaboration tasks associated with this activity. The retailer task here is POS Forecasting and the manufacturer task is Market Data Analysis. The other collabo-ration task is Order Planning/Forecasting which uses factors such as transit lead times, sales forecast, and inventory positions to determine future product ordering and requirements for delivery. The associated retailer task is Replenishment Planning, and Demand Planning is the associated manufacturer task. Execution: The first collaboration task under this activity is Order Generation. This task transitions forecasts to demand for the firm. The retailer task re-lated to this collaboration task is Buying/Re-buying, and the manufacturer task is Production and Supply. The second collaboration task is Order Fulfillment and this is the preparation of products for customer purchase through the process of producing, shipping, delivery, and stocking. In this case, both the retailer and manufacturer task is Logistics/Distribution
Analysis Exception Management, which oversees the planning and operations for conditions that are out-of-bounds, is one of the collaboration tasks associated with this activity. The re-tailer task is Store Execution and the manufacturer task is Execution Monitoring. The other collaboration task is Performance Assessment which calculates important metrics in order to discover trends, develop other strategies, and assess the attainment of business goals. The retailer task here is Supplier Scorecard and the manufacturer task is Customer Scorecard.
The model described here is a two-tiered model. However, this model can be extended to include more than two layers in the supply chain. VICS calls this N-tier Collaboration, which is a relationship that develops from retailers through manufacturers/distributors to suppliers.
Overview of India automotive industryA well developed transportation system plays a key role in the development of an economy, and India is no exception to it. With the growth of transportation system the Automotive In-dustry of India is also growing at rapid speed, occupying an important place on the ‘canvas’ of Indian economy. The Indian auto industry is small in size, compared to the world markets ($ 6.73 billion compared to a world market of $ 737 billion) but has experienced a growth rate of 20-25 % the past few years. Over 13 Indian companies have won the Deming prize and quality has improved significantly.
Nepalese Journal of Management 58

Since the first car rolled out on the streets of Mumbai in 1898, the Automobile Industry of India has covered a long way. During its early stages the auto industry was overlooked by the then Government and the policies were also not favorable. The liberalization policy and various tax reliefs by the Govt. of India in recent years have made remarkable impact on Indian Automobile Industry. Indian auto industry, which is currently growing at the pace of around 18 % per annum till the onset of recession, has become a hot destination for global auto players like Volvo, General Motors and Ford. According to Commerce Minister Kamal Nath, India is an attractive destination for global auto giants like BMW, General Motors, Ford and Hyundai who were setting base in India, despite the absence of specific trade agreements. Table 1 shows the growth rates of various segments:
Table 1: Growth in automobile segment
Automobile segments Growth in 2011-12 over 2010-11 (%)
Passenger cars 16-18%
Utility vehicles 12-14%
LCV (Goods) 18-21%
MHCV (Goods) 10-12%
Commercial vehicle Buses 8-10%
Motorcycles 11-13%
Scooters 15-17%
Three wheelers (Cargo) 4-6%
Three wheelers (passengers) 10-12%
Automobile industry 12-15%
(Source-SIAM)
To establish a globally competitive automotive industry in India and to enable its contribution to the economy by 2010 is the vision statement as outlined in the auto policy of India. The opportunity landscape for the Indian auto industry would encompass manufacture of vehicles and components for domestic sales manufacture for exports (both vehicles and components), and export of services in areas such as design, engineering, and back office operations. It is estimated that the total turnover of the automotive industry in India would be in the order of USD 122- 159 billion in 2016 (a substantial increase from the size of USD 34 billion in 2006). Today Indian automotive industry is fully capable of producing various kinds of vehicles and can be divided into three broad categories: Cars, two-wheelers and heavy vehicles. The following table 2 shows the list of auto companies in India.
Verma 59

Table 2: List of automobile companies in India
Variant List of Companies
Motorbike companies
• Bajaj Auto • Hero Honda • Honda Motorcycle & Scooter • Kinetic Motor • Monto Motors • Royal Enfield • Scooters India Ltd.• TVS Motor • Yamaha Motor
Powered
3-wheeler companies
• Bajaj Auto 3W • Force Motors • 320 vcPiaggio• Scooters India • Telcon
4-wheeler makers
• Audi AG• Bentley Motors• BMW• Chevrolet • Daewoo Motors• Escorts• Fiat • Ford • General Motors• Hindustan Motors • Honda Siel • Hyundai • International cars • Mahindra & Mahindra• Mahindra & Renault • Maruti Udyog • Mercedes
• Lamborghini• Mitsubishi Motors• Monto Motors• Nissan • Nissan Motors• Posche• Reva Electric Company• Rolls Royce• San Motors• Skoda • Suzuki Motors• Tata Motors• Terex Vectra• Toyota• Toyota Kirlosker Motors• Volkeswagen
Heavy/ commercial vehicle makers
• Ashok Leyland• BEML • Eicher Motors • Force Motors (Other products) • HMT• Indo Farm Tractors• John Deere
• Sonalika• Swaraj Mazda • Tafe Tractors• Tata Motors (Other products) • Telcon • Volvo Buses & Trucks• Mahindra & Mahindra
CPFR in automobile industryCPFR has also influenced automotive industry sector beyond retail, hard goods, apparel and consumer packaged goods (CPG). The ANX (Automated Network Exchange), COVISINT, The RosettaNet Collaborative Forecasting standard for high-technology companies and the Chemical Industry Data Exchange (CIDX) Supply Chain Collaboration process are prominent examples.Since 1986, VICS has worked to improve the efficiency and effectiveness of the entire supply chain. VICS pioneered the implementation of a cross-industry standard, Quick Response (QR) that simplified the flow of product and information in the retail industry for retailers and suppliers alike.With initiative of ESCAP and coordination by Ministry of Commerce (MOC) and European Article Numbering (EAN)-India, AIMA and ACMA in 1997, a few of the largest
Nepalese Journal of Management 60
manufacturers of vehicle such as Bajaj, M&M, Ashok Leyland and Telco started pilot EDI operations with their dedicated component suppliers viz. MICO, Sundram Fastners, Brakes India, etc. These operations proved to be successful and the manufacturers desired to expand the operations of the linkages with the suppliers on a wider scale. This pilot project addressed the following issues:
Development of common message structuresConnectivity among the tree service providers viz. Satyam Infosys, Mahindra Net-
work Services (MNS) and Global Telecom Systems (GTS)Legal and security issuesA comprehensive tripartite agreement to cover the operationsIntroduction of article numbering and bar coding
The experience gained from pilot and production implementations of CPFR over the past ten years has yielded many insights. A joint committee of VICS and the Efficient Consumer Response (ECR) organization revised the guidelines in 2001 to incorporate global require-ments, sanctioned by the Global Commerce Initiative (GCI). Again in 2004, the VICS CPFR committee developed a major revision of the CPFR model to integrate innovations and over-come shortcomings identified in the original process.The aim of CPFR is achieved by the use of a common control process relating to all relevant planning, forecasting and replenishment issues. All activities of the CPFR process try to provide the highest availability of goods while optimizing the inventory and improving the company’s own position in the market and the optimization of its own value chain. Since the fundamental planning and forecasting of the process require an intensely information exchange, e.g. in logistics, sales management, marketing and finance planning, CPFR is a tool for comprehensive value chain management of an organization
Findings of the study The supply chain of auto industry has completely changed over the years. Major OEM (original equipment manufacturer) players world-wide are increasingly focusing on basic design and assembly operations as well as servicing the after-sales market and prefer to deal with a smaller number of large suppliers. Consequently, the supply chain is morphing into sub-system integrators, component makers, and commodity players. The segregation is increasingly defined by ‘risk sharing’ which was earlier defined by only ‘cost pressure’. Tier 1 suppliers (concentrating on system supply, module assembly and sub supplier management) are taking increasing risk from major players shifting the cost pressure to Tier 2 supplier who concentrate only on production of sub components.
Figure 2 explains this more clearly. In general, suppliers can be divided into few groups such as Systems Integrator (capable of designing and integrating components, subassemblies), Global Standardized–Systems Manufacturer (specialist in design, development and manufacturing of complex systems), Component Specialist (produces specific component or subsystem for a given car or platform) and Raw Material Supplier.
Many companies (such as Volkswagen and Renault) feel that a mono-supplier strategy (such as in Ford) is not good but having limited number of large suppliers are of a better strategy. Ford pushes the supplier to own the tools, a strategy of pushing the risk associated with volume fluctuations onto the supplier rather than Ford. Suppliers will have to be concerned with their amortization schedule when quoting prices because payback for the investment in tools must be included in price.
Verma 61

Figure 2: Improved supply chain structure in auto industry
OEM Tier I Suppliers Tier II Suppliers
Past R & DSourcing Assembly
Component manufacturing
Present
System integration Quality testing Assembly Vendor management
System supplyR & DModule assembly Sub-vendor management
Sub-component manufacturing
On the contrary, Volkswagen and Renault are satisfied with 2 suppliers in each region with an additional one having less responsibility but ready replace any of the existing supplier. Globally, these companies want their suppliers to invest near their plants or transfer their knowledge to local players. Companies bring the quality standards and price reduction condition while developing the contract with the suppliers. In general, contract length and overall value are related to price reduction targets that the supplier is able to commit to. For some of the assemblers, suppliers can also propose alternative designs that have the same economy results. The experience shows that magnitude of reduction per year varies from 2 to 8 percent due to achieving economies of scale. The competitive pressure in the industry is increasingly bringing the cost reduction targets as a major management decision of assemblers. Nowadays, major companies target cost reduction along with the design and models over a period of time. For example, German companies are targeting price reduction of 13% for the next generation model. Ford and Renault targets price reduction of 5-8% per annum and the figure is 13% for Toyota over 3 years.
The automotive supply chain integrates four groups of players: original equipment manufacturers (OEMs), first-tier suppliers, sub-tier suppliers, and infrastructure suppliers. Traditionally, different types of technologies were used to establish the links between these groups. For instance, DaimlerChrysler uses e-mail, EDI, Supply Partner Information Network (SPIN) and Electronic Funds Transfer (EFT) to contact its suppliers. All of these e-commerce transactional methods have been integrated into ANX, along with others (CAD, videoconferencing, etc.). DaimlerChrysler has identified ANX as the core communication platform of its Extended Enterprise strategy. The complexity of designing and producing a motor vehicle is forcing OEMs to identify key first-tier suppliers and give them more responsibilities. A typical motor vehicle consists of approximately 15,000 parts and accessories that must be designed to be compatible and integrated. Hence, instead of having multiple suppliers for the production of a dashboard, OEMs are asking first-tier suppliers to produce and assemble the dashboard (sub-assembly) to certain specifications. In 2011, companies outsourced 65% of all of their manufacturing activities. Next year, this amount should reach more than 70%. Once again, these responsibility shifts” require changes in the (informational) communication infrastructure. One of ANX’s strengths is that it enables the connection of all key players around an industrial value chain. The goal is to bring together the best competencies along a given value chain. ANX is an enabler that facilitates the
Risk sharing
Risk sharing Cost pressure
Nepalese Journal of Management 62

integration of these competencies from different actors or suppliers anywhere around the world. The downstream 2-tier benefits of CPFR can be summarized as follows in table 3:
TABLE 3: Average improvements for manufacturers through CPFR
Factors % change
Systems Cost Avoidance Revenue increase Improvements in Process Cost Inventory Savings Out-of-Stock ImprovementsPromotional Planning increaseImprovements in Service Level Labor--Production
11%5- 8%11%20%6-percent1-3% 3-5%A decrease of 3.5 to 7.5 percent of labor costs
Barriers to adoption
Though, CPFR has experienced widespread adoption in varied industries but still corporate show reluctance in sharing information. Part of this has to do with the lack of education. Some critics have attacked CPFR as either too complex or completely unrealistic. Yet, for the most part, these critics have never attended a CPFR committee meeting, never actively participated in a CPFR program, never spoken with companies that benefited from a CPFR initiative, and so on. Conversely we have corroborated by some of the largest companies in the world, endorsing CPFR and highlighting the opportunities and the benefits realized. A related impediment to the growth of CPFR is the various myths surrounding its adoption. These demand a closer look.
1. CPFR requires a major investment in technology. 2. CPFR is an administrative burden. 3. CPFR requires point-of-sale (POS) information. 4. CPFR is not scaleable. 5. CPFR takes too much time and effort to implement. 6. CPFR is rigid. 7. CPFR is a supply chain activity.
CPFR is really more of a broad business initiative than it is a specific supply chain activity. That’s evident in the first two steps of every CPFR program--establish a collaborative rela-tionship and create a joint business plan. It’s the blending of both demand and supply chains to bring full value to the consumer. CPFR is a holistic business approach that brings together trading partners and enablers--including brokers, third party providers, co-packers, and so on--to improve sales and operating efficiency.
Verma 63

Conclusion
The need of inter-enterprise collaboration and implementing CPFR are indispensable. The benefits and competitive advantage that accrue to the market leaders are also substantial. But, getting there requires unprecedented cooperation among trading partners. Through the technological innovation initiated by the development of the Internet and the emerging market for business applications, implementing this emerging new practice can be affordable, widely deployable, and most importantly executed with a minimum change to existing systems and individual company business processes.
Nepalese Journal of Management 64
References
Anderson, David L., Frank F. Britt, & Donavon J. Favre, 2007. The 7 principles of supply chain management, Supply Chain Management Review, International Journal of Business Innovation and Research 2(3), 53 - 66.
Andraski, Joseph C. & J. Haedicke, 2003. CPFR: time for the breakthrough? (Collaboration).(collaborative planning, forecasting, replenishment). Supply Chain Management Review. Reed Business Information, Inc. (US).
Bautzer, Luiz R., 2005. Bringing together knowledge about the product life cycle to improve inter-firm collaboration capabilities, International Journal of Automotive Technology and Management, 5(2), 184 - 198.
Bayazit, O., 2007. An examination of current collaborative supply chain practices, International Journal of Business Innovation and Research 1(3), 253 - 266.
Belzowski, Bruce M., Michael S. Flynn, Morgan Edwards, Linda Ban, & Gregory Martin, 2006. Supply chain management: new competitive realities in the automotive value chain, International Journal of Automotive Technology and Management 6(4), 387 - 405.
Belzowski, Bruce M., Michael S. Flynn, M. Edwards, L. Ban & G. Martin, 2005. SCM: New competitive realities in the automotive supply Chain, The ICFAI Journal of Operations Management, 4(1), 6-31.
Birt, J.M., 1999. In India Collaboration is the Key, Supply Chain Management Review, Fall, 13-15.
Blackhurst, Jennifer, C. W. Craighead & R. B. Handfield, 2006, Towards supply chain collaboration: an operations audit of VMI initiatives in the electronics industry, International Journal of Integrated Supply Management 2(1/2), 91 - 105.
Blomqvist, K. & J. Levy, 2006. Collaboration capability – a focal concept in knowledge creation and collaborative innovation in network, International Journal of Management Concepts and Philosophy. 2(1), 31 - 48.
Chaloping-March, Minerva, 2006. Collaboration towards social sustainability: the case of a mining corporation, its surrounding communities, and local government in Benguet, Philippines, International Journal of Environment and Sustainable Development 5(2), 109 - 125.
Chan, Yuen Ling, C.F. Cheung, W.B. Lee & S.K. Kwok, 2006. A knowledge-based collaborative simulation system for supply chain integration, International Journal of Enterprise Network Management 1(2), 196 - 212.
Chang, Carl K., J. Zhang, & K.H. Chang, 2006. Survey of computer-supported collaboration in support of business processes, International Journal of Business Process Integration and Management 1(2), 76 - 100.
Dyer, J.H, P. Kale, & H. Singh, 2001. How to make Strategic Alliances Work, Sloan Management Review 42(4), Summer, 37-43.

Verma 65
Faraj, I. & M. Alshawi, 2004. Global project collaboration in the construction industry: standardisation and integration, International Journal of Computer Applications in Technology, 20(1/2/3), 26 - 41.
Fawcett, Stanley E. & M. W. McCarter, 2008. Behavioural issues in supply chain collaboration: communicating the literature via interactive learning, International Journal of Integrated Supply Management 4(2), 159 - 180.
Fornasiero, R. & A. Zangiacomi, 2006. Collaboration mechanisms in SME context: a case study in the footwear sector, International Journal of Networking and Virtual Organisations 3(2), 172 - 184.
Gardan, Y., M. Hillereau & E. Perrin, 2006. DIJA system: a CAD solution for collaboration between designers and manufacturers, International Journal of Product Lifecycle Management 1(4), 436 - 450.
Gouthier, M., C. Kleppel, R.S. e Wehninck, A. Luhn & A. Kremer, 2006. Service-related science-to-business collaborations: case studies from Germany, International Journal of Technology Intelligence and Planning 2(2), 142 - 159.
Hou, J. 2004. ebXML-compatible data models and services for enterprise knowledge distribution in the collaboration network, International Journal of Services and Standards 1(2), 137 - 154.
Hsieh, L. & S. K. Chen, 2007. A study of cross-functional collaboration in new product development: a social capital perspective, International Journal of Productivity and Quality Management. 2(1), 23 - 40.
Jain, V. K. and A.K. Ramani, 2005. A comparative study of supply chain effectiveness of select Indian automobile organizations, The ICFAI Journal of Operations Management IV(2), 30-42.
Kraines, Steven B., H. Komiyama, H. Shigeoka & D.R. Wallace, 2004. Development of an internet-based collaboration platform and application to household waste plastic processing, International Journal of Technology Transfer and Commercialisation 3(2), 129 - 146.
Lapide, L. 2000. True measures of supply chain performance, Supply Chain Management Review, July-August, 8-26.
Lauri,O. & H. Ma, 2006. Benchmarking the collaboration in the supply chain, International Journal of Services and Operations Management 2(4), 367 - 387.
Littler, D., 2006. Alliance enigmas, International Journal of Technology Management 33(2/3), 115 - 129.
Matopoulos, A., M. Vlachopoulou & V. Manthou, 2006. Exploring chain, network and cluster collaborative practices: implications for SMEs, International Journal of Networking and Virtual Organisations 3(2), 142 - 155.
Min, Hokey & ‘Vincent’ Yu, Wen-Bin, 2008. Collaborative planning, forecasting and replenishment: demand planning in supply chain management, International Journal of Information Technology and Management 7(1), 4 - 20.
Motohashi, K., 2007. The changing autarky pharmaceutical R&D process: causes and consequences of growing R&D collaboration in Japanese firms, International Journal of Technology Management 39(1/2), 33 - 48.
Msanjila, S. S. & H. Afsarmanesh, 2007. Modelling trust relationships in Collaborative Networked Organisations, International Journal of Technology Transfer and Commercialisation 6(1), 40 - 55.
Namin, A. S., W. Shen & H. Ghenniwa, 2006. Implementing enterprise collaboration using web services and software agents, International Journal of Networking and Virtual Organisations 3(2), 185 - 201.
Okongwu, U., 2006. Integration of supply chain management systems, World Review of Intermodal Transportation Research 1(1), 24 - 44.
Oyelaran-Oyeyinka, B., 2005. Inter-firm collaboration and competitive pressures: SME footwear clusters in Nigeria, International Journal of Technology and Globalisation 1(3/4), 343 - 360.

Nepalese Journal of Management 66
Paton, B., 2006. Collaboration among industry, civil society, and government for sustainability: a framework for identifying opportunities, Progress in Industrial Ecology, An International Journal 3(1/2), 148 - 162.
Pecar, B. & B. Davies, 2007. A new technology paradigm for collaboration in the supply chain, International Journal of Services Operations and Informatics 2(3), 300 - 314.
Pisano, Gary P. and R. Verganti, 2008. Which kind of collaboration is right for you?, Harvard Business Review, December, 60-69.
Sahay, B.S. & R. Mohan, 2003. Supply chain management practices in Indian industry, International Journal of Physical Distribution and Logistics Management 33 (7), 583-606.
Simatupang, Togar M. & R. Sridharan, 2007. The architecture of supply chain collaboration, International Journal of Value Chain Management 1(3), 304 - 323.
Smith, Helen L. and K. Dickson, 2003. Geo-cultural influences and critical factors in inter-firm collaboration, International Journal of Technology Management 25(1/2), 34-50.
Volkmann, Christine and K.O. Tokarski, 2006. Growth strategies for young e-ventures through structured collaboration, International Journal of Services Technology and Management 7(1), 68 – 84.
Wognum, P.M. and E.C.C. Faber, 2003. Infrastructures for collaboration in virtual organizations, International Journal of Computer Applications in Technology 18(1/2/3/4), 210-224.
Yoon, Han-Seong and I. H. Kwon, 2006. The roles of electronic marketplace for buyer–supplier relationship: collaborative system architecture, International Journal of Services and Operations Management 2(4), 335 - 351.

Impact of customer relationship management efforts on customer loyalty in Nepalese commercial banks
- Neeta Joshi
Nepalese Journal of Management
AbstractThis paper evaluates the effectiveness of Customer Relationship Management Efforts (CRM) of the Nepalese commercial banks and explores the relationship between customer loyalty and CRM efforts. The study uses customer loyalty as the dependent variable and CRM efforts: service quality, convenience, complaint handling, pricing and offers and benefits as independent variable. The study is based on primary source of data. The questionnaire survey was conducted to analyze the characteristics of different customers and their opinions and perceptions with respect to CRM efforts and customer loyalty. The study has employed descriptive research and survey research design. The result of the study shows that CRM efforts: service quality, convenience, complaint handling and pricing have positive and significant impact on customer loyalty and offer and benefit has insignificant impact on
customer loyalty.
Keywords: remittance, GDP, broad money supply, private sector credit. customer relationship management, service quality, convenience, complaint handling, pricing, offers and benefits
1. IntroductionCommercial banks are one of the vital areas of an economy dealing with the process of canalizing the available resources in the needed sectors. They are the service firms that perform in an intensively competitive environment. With the rapid transformation in the banking industry, customers have become the most important part of the business. In the current market trend building and maintaining the relationship with customers is the most important aspect that the banking industry should focus on. Determining the customer’s wishes and needs and meeting them is one of the ways of enabling and enhancing customer loyalty. For this reason, it is pretty important in intensively competitive environment to be in regular contact with the customers and to follow the changes in them closely (Abbasi et. al., 2011). With the transition to automation, customer satisfaction and management of customer relationships have taken place among the subjects spoken of in the banking sector. Today distinction is the most sustainable approaches for which developing good relationship with
67
NEPALESE JOURNAL OF MANAGEMENT VOL.1, NO.1, JULY 2014
NMJ

customers is essential. Hence incorporating efforts which could measure the relations with customers are very important for all the organizations so that they remain in this bonding forever (Ravesteyn and Ackermann, 2006).
CRM efforts refer to the most effective way to achieve the customer loyalty by proactively seeking to build and maintain long-term relationships with customers. CRM efforts are inextricably linked to the marketing concept, which stresses that banks must organize around and be responsive to their customers and their changing needs. CRM efforts are the strongest and the most efficient approach in creating and maintaining relationships with customers. They help the banks in identifying valuable customers, enhance their ability to communicate with customers, provide them feedback in a timely manner, analyze customer information, and customize offerings.
CRM efforts are the business philosophies aimed at achieving customer centricity for the company. They are the strategy for building, managing and strengthening loyal and long-lasting customer relationships. They are customer centric approach based on customer insight. Their ultimate objective is towards ‘Personalized’ handling of customers as distinct entities through the identification and understanding of their differentiated needs, preferences and behaviors.
Akbar and Parvez (2009) argue satisfaction is an important mediator between perceived service quality and customer loyalty. Customer satisfaction alone cannot achieve the objective of creating a loyal customer base as trust came out to be an important antecedent of customer loyalty. The impact of perceived service quality on preference loyalty is considerably strong. Mahmud et. al. (2013) addresses that service quality influences insignificantly toward customer’s satisfaction with a positive relationship and price influences insignificantly toward customer’s satisfaction with a negative relationship, service quality influences insignificantly toward customer’s loyalty with a negative relationship and price influences significantly toward customer’s loyalty with a negative relationship.
Jayakumar and Sathiya (2011) reveal that customers of the banking industry strongly believe that advertisements, communication, guidance, may I help you counters, information pamphlets plays an admirable role to achieve the customer satisfaction. The internet services, advanced technology, core banking, well defined strategies and achievement of customer satisfaction directly create incidental effects on customer and make them to stick on to the same service providers. It is stated that six banking service delivery variables such as communication, empowerment, personalization, ethical behavior, fees and technology influence banks’ relationship marketing and customer retention. The banks should not only improve the quality of the products/service but should also consider paying much attention to customer complaints and as far as possible make their products/service affordable to all persons.
2. Methodological aspectsThe study is based on primary source of data which was collected through a set of questionnaire. The questionnaire contained different questions related to demographic factors, yes/no questions, multiple choice questions, ranking, five point Likert scale items, and one open-end question. The questionnaire survey was basically designed to analyze the
Nepalese Journal of Management 68

characteristics of different customers, to understand their opinions as to how they perceive the CRM efforts used by the Nepalese commercial banks and to identify the impact of CRM efforts on customer loyalty.
The study has employed descriptive and survey research design to deal with the fundamental issues associated with the CRM efforts influencing the loyalty of customer in the Nepalese commercial banks. The survey was carried out using a stratified random sampling method to select the most reliable and representative sample. The total of 168 respondents was used which represents the sample from 18 commercial banks of Nepal.
The ModelThis study intends to study the relationship of dependent variable customer loyalty with independent variables service quality, convenience, complaint handling, pricing and offers and benefits. Therefore, the following functional model is employed to test the hypothesis that is, there is significant and positive relationship of customer loyalty with service quality, convenience, complaint handling, pricing and offers and benefits. The functional model used in this study is mentioned below:CL = ƒ (SQ, CC, CH, PR, OB) Where, CL = Customer Loyalty, SQ = Service Quality, CC = Convenience, CH = Complaint Handling, PR = Pricing, OB =Offers and Benefits
Customer loyaltyLoyalty is the act of keeping customers resulting from service quality and customer satisfaction. It refers to keeping a client’s business rather than have the client use competitors’ services or products. It is a popular marketing strategy as it involves focusing on meeting or exceeding clients’ expectations in order to maintain their loyalty. It is more than giving the customer what they expect; it’s about exceeding their expectations so that they become loyal advocates for the organization. Successful customer retention starts with the first contact an organization has with a customer and continues throughout the entire lifetime of a relationship (Thurau and Klee, 1997). A company’s ability to attract and retain new customers, is not only related to its product or services, but strongly related to the way it serves its existing customers and the reputation it creates within and across the marketplace. An effective customer loyalty management helps to build the business without losing the friendly face on the business.
Service qualityService quality refers to the assessment of how satisfying a delivered service is, according to the customer’s expectations. It is an achievement in customer service. It reflects at each service encounter. Customers form service expectations from recommendation, personal needs, past experiences, word of mouth and advertisement. They compare perceived service with expected service in which if the former falls short of the latter the customers are disappointed. Service quality affects customer satisfaction by providing performance (Hernon et. al., 1999). A business with high service quality meets the customer needs and is successful in retaining them whilst remaining economically competitive (Chinomona and Sandada, 2013). Based on it, this study develops the following hypothesis:H1: There is a significant relationship between service quality and loyalty of customer in Nepalese Commercial banks.
Joshi 69

ConvenienceConvenience is the quality or a situation that makes something easy or useful for someone by reducing the amount of work or time required to do something. It is the state of being able to proceed with something without difficulty. Convenience includes those products and services that are intended to increase ease in accessibility, save resources such as time, effort and energy and decrease frustration. It includes services that may be perfect for the life style of the customers. Convenience is within the reach of the customers and more importantly, it’s within their control. H2: There is a significant relationship between convenience and loyalty of customer in Nepalese Commercial banks
Complaint handlingA complaint is an expression of grief, pain, or dissatisfaction made to an organization, related to its product or services, or the complaint handling process itself. The complaints have the potential to cause several negative consequences. It is therefore important that effective complaint resolution mechanisms are not only in place, but are proactive, so as to pre-empt potential sources of complaints and address them before problems manifest (Kotler and Keller, 2006). Complaint handling has a direct correlation with the overall satisfaction of a customer and their loyalty. The degree to which an organization and its customers in the relationship engage in complaints handling processes will depend on their prior satisfaction with the relationship, the magnitude of the investment in the relationship and the alternatives that the parties have.H3: There is a significant relationship between complaint handling and loyalty of customer in Nepalese Commercial banks.
PricingPrice is the amount of money or goods paid for or given in exchange for something else. Pricing is the process of determining what an organization will receive in exchange for its products and services. It usually depends on the firm’s average cost, and on the customer’s perceived value of the product in comparison to his or her perceived value of the competing products. A good pricing is the one which could balance between the price floor and the price ceiling. An efficient pricing is very close to the maximum that customers are prepared to pay. The needs of the customers can be converted into demand only if the customers have the willingness and capacity to buy the products and services.H4: There is a significant relationship between pricing and loyalty of customer in Nepalese Commercial banks.
Offers and benefitsOffers and benefits refer to the desirable attribute of products or services, which a customer perceives he or she will get from purchasing the products or services of the organization (Verhoef, 2003). Offers and benefits can be expressed numerically as an amount of money that will be saved or generated as the result of an action. It can be in the form of free products and services, services with no charge, coupons and discounts in various outlets. Nowadays, people look for the organization offering various types of offers and benefits. Thus, the organization in order attract the new customers and retain the existing customers and make them loyal towards the organization, they need to provide attractive offers and benefits.
Nepalese Journal of Management 70

H5: There is a significant relationship between offers and benefits and loyalty of customer in Nepalese Commercial banks.
3. Presentation and analysis of dataDemographic characteristicsTable 1 shows the demographic characteristics of the respondents on the basis of different personal characteristics such as gender, age, academic qualification, occupation and income level.
Table 1: Demographic characteristics of the respondentsDemographic Characteristics No. of Respondents Percentage (%)
Gender Male 102 61.0
Female 66 39.0
Age Group
Below 20 11 7.0
20-29 59 35.0
30-39 47 28.0
40- 49 24 14.0
50 and above 27 16.0
Academic Qualification
Masters and above 49 29.0
Bachelors 82 49.0
Intermediate 25 15.0
SLC 8 5.0
Literate 4 2.0
Occupation
Student 34 20.0
Businessman 9 5.0
Salaried Person 115 69.0
Housewife 6 4.0
Others 4 2.0
Monthly Income
Below 10,000 40 24.0
10,000-25,000 65 39.0
25,000-50,000 42 25.0
50,000-1,00,000 21 12.0
Out of the total 168 respondents, 61% of the respondents were male and 39 % were female. In terms of age group, 35% of the respondents fall under the age group of 20-29 and only 7% fall under the age group of below 20. Similarly, in case of education level, majority of the respondents had an academic qualification of bachelor’s degree. Among the total respondents, majority of the respondents i.e. 69.0% of the respondents were salaried person. Similarly, 20.0% of the respondents were student, 5.0% of the respondents were businessman and 4.0% of the respondents were housewife. Majority of the respondents had an income level of 10,000-25,000 which represented 39.0% of the total respondents. Similarly, 24.0% of the respondents had an income below 10,000, 25.0% of the respondents had an income level of 25,000-50,000, 12.0% of the respondents had an income level of 50,000-100,000.
Joshi 71
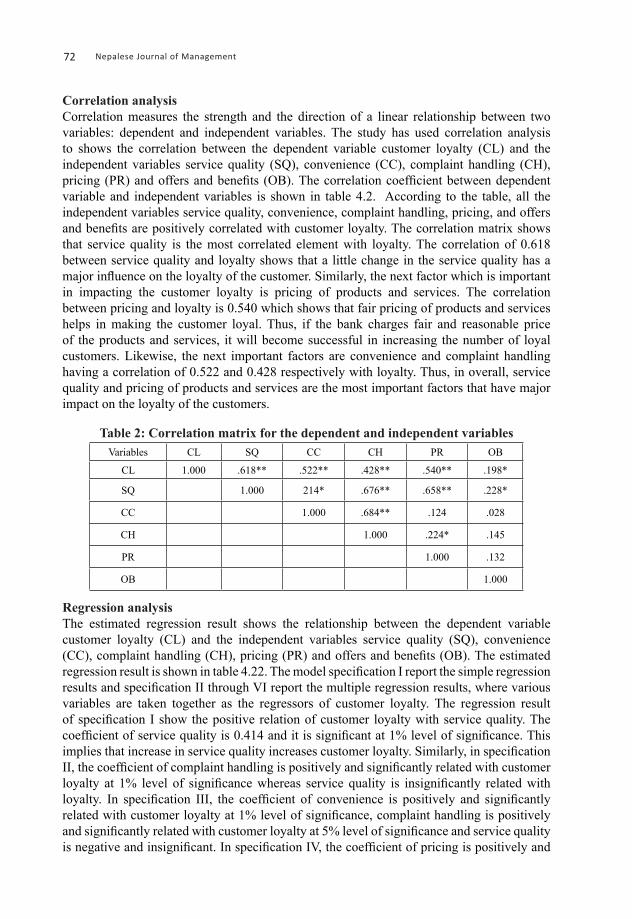
Correlation analysisCorrelation measures the strength and the direction of a linear relationship between two variables: dependent and independent variables. The study has used correlation analysis to shows the correlation between the dependent variable customer loyalty (CL) and the independent variables service quality (SQ), convenience (CC), complaint handling (CH), pricing (PR) and offers and benefits (OB). The correlation coefficient between dependent variable and independent variables is shown in table 4.2. According to the table, all the independent variables service quality, convenience, complaint handling, pricing, and offers and benefits are positively correlated with customer loyalty. The correlation matrix shows that service quality is the most correlated element with loyalty. The correlation of 0.618 between service quality and loyalty shows that a little change in the service quality has a major influence on the loyalty of the customer. Similarly, the next factor which is important in impacting the customer loyalty is pricing of products and services. The correlation between pricing and loyalty is 0.540 which shows that fair pricing of products and services helps in making the customer loyal. Thus, if the bank charges fair and reasonable price of the products and services, it will become successful in increasing the number of loyal customers. Likewise, the next important factors are convenience and complaint handling having a correlation of 0.522 and 0.428 respectively with loyalty. Thus, in overall, service quality and pricing of products and services are the most important factors that have major impact on the loyalty of the customers.
Table 2: Correlation matrix for the dependent and independent variablesVariables CL SQ CC CH PR OB
CL 1.000 .618** .522** .428** .540** .198*
SQ 1.000 214* .676** .658** .228*
CC 1.000 .684** .124 .028
CH 1.000 .224* .145
PR 1.000 .132
OB 1.000
Regression analysisThe estimated regression result shows the relationship between the dependent variable customer loyalty (CL) and the independent variables service quality (SQ), convenience (CC), complaint handling (CH), pricing (PR) and offers and benefits (OB). The estimated regression result is shown in table 4.22. The model specification I report the simple regression results and specification II through VI report the multiple regression results, where various variables are taken together as the regressors of customer loyalty. The regression result of specification I show the positive relation of customer loyalty with service quality. The coefficient of service quality is 0.414 and it is significant at 1% level of significance. This implies that increase in service quality increases customer loyalty. Similarly, in specification II, the coefficient of complaint handling is positively and significantly related with customer loyalty at 1% level of significance whereas service quality is insignificantly related with loyalty. In specification III, the coefficient of convenience is positively and significantly related with customer loyalty at 1% level of significance, complaint handling is positively and significantly related with customer loyalty at 5% level of significance and service quality is negative and insignificant. In specification IV, the coefficient of pricing is positively and
Nepalese Journal of Management 72

significantly related with customer loyalty at 5% level of significance, complaint handling is negative and insignificant and service quality is positive and insignificant. Similarly, in specification V, the coefficient of convenience is positively and significantly related with customer loyalty at 1% level of significance, service quality and complaint handling is positively and significantly related with customer loyalty at 5% level of significance and offer and benefit is positive and insignificant. In specification VI, service quality, complaint handling, convenience and pricing are positively and significantly related with customer loyalty at 1% level of significance and offer and benefit is insignificant. This clarifies that service quality, complaint handling, convenience and pricing plays a significant role in the creating more loyal customers in the banking sector of Nepal.
Table 3: Regression of corporate governance and control variables on return on equityThis table shows stepwise regression analysis results of variables based on the survey of 18 commercial banks of Nepal. The reported values are intercepts and slope coefficients of respective explanatory variable with t-statistics in parenthesis. The reported results also include the values of F-statistics (F) and adjusted coefficient of determination (ADJ R2). ‘**’ sign indicates that t-statistics is significant at 1 percent level and ‘*’ indicates that the correlation is significant at 5 percent level.)
Model InterceptRegression Coefficient of Adj
R2 FSQ CH CC PR OB
1 3.968 (8.38)**
0.414 (3.38)** 0.14 16.32
2 2.586 (7.82)**
0.073 (0.92)
0.172 (2.54)** 0.18 13.51
3 1.653 (3.98)**
-0.024 (-2.34)
0.119 (1.98)*
0.412 (3.32)** 0.20 12.24
4 2.294 (5.24)* *
0.068 (0.74)
-0.98 (-2.78)
0.164 (2.04)* 0.08 9.48
5 1.493 (1.08)
0.128 (1.96)*
0.158 (2.01)*
0.368 (3.18)**
0.054 (0.68) 0.35 22.54
6 1.739 (4.51)**
0.398 (3.29)**
0.196 (2.64)**
0.242 (2.76)**
0.286 (2.98)**
0.098 (1.46) 0.44 23.61
4. Summary and conclusionIn the recent years, the banking industry around the world has been undergoing a rapid transformation. Today, the basic element of modern business understanding is customer satisfaction and customer loyalty. Customer loyalty is winning the confidence of the customer in favor of the organization such that the relationship becomes a win-win situation for both organization as well as the customer. In order to ensure customer loyalty and restrict switching behavior, the commercial banks must be able to anticipate the needs of their customers. Hence incorporating efforts which could measure the relations with customers are very important for all the commercial banks so that they remain in this bonding forever. The CRM efforts can here be used as ‘having the right offer for the right customer, at the right time via the right channel’ by offering high-quality financial solutions that best meet their current needs and long-term goals.
Joshi 73

The commercial banks operate in one of the most competitive markets worldwide, competing for the same client base. Similarly in the case of Nepalese banking industry, the high level of competition has resulted in the loss of existing customers to their rivals as a result of successful attempts to entice customers away. Considering this fact, this study has focused in evaluating the effectiveness of CRM efforts in the Nepalese commercial banks and to analyze the effect of CRM efforts on customer loyalty in the Nepalese commercial banks. This study aims at examining the relationship between CRM efforts and customer loyalty. It determines the impact of service quality, convenience, complaint handling, pricing, offers and benefits on customer loyalty in Nepalese commercial banks. The study is based on primary source of data which was collected through a set of questionnaire containing different questions related to demographic factors, yes/no questions, multiple choice questions, ranking, five point Likert scale items, and one open-end question. The survey was carried out using a stratified random sampling method to select the most reliable and representative sample. The total number of 168 respondents representing the 18 commercial banks of Nepal was used.
The study revealed that CRM efforts: service quality, convenience, complaint handling and pricing are positively and significantly correlated with customer loyalty which means that better service quality, proper convenience, better complaint handling, and fair and reasonable pricing will incur in higher loyalty of the customers. Further, it also reveals that offer and benefit have insignificant impact on customer loyalty. At the same time, as per the correlation analysis, the highest correlation coefficient was recorded between customer loyalty and service quality, which indicates that there is a strong positive relationship and it implies that a little change in the service quality has a major influence on the loyalty. And the correlation with other independent variables such as convenience, complaint handling, pricing and offers and benefits were little lower compared to the service quality.
References
Nepalese Journal of Management 74
Abbasi, A. S., W. Akhter, I. Ali and A. Hasan (2011). Factors affecting customer loyalty in Pakistan. Journal of Business Management, 1167-1174.
Akbar, M. and N. Parvez (2009). Impact of service quality, trust and customer satisfaction on customer loyalty. 24-38.
Chinomona, R. and M. Sandada (2013). Customer satisfaction, trust and loyalty as predictors of customer intention to re-purchase south African retailing industry. Mediterranean Journal of Social Sciences, 437-446.(n.d.).
Hernon, P., D. A. Nitecki, and E. Altman (1999). Service quality and customer satisfaction: An assessment and future directions. The Journal of Academic Librarianship, 9-17.
Jayakumar, A., and N. Sathiya, (2011). A study on customer relationship management practises in banking sector- with special reference to Salem District, Tamil Nadu, India (n.d.).

Joshi 75
Kotler, P. and K. L. Keller, (2006). Marketing Management. New Jersey: Pearson Prentice Hall.
Lombard, M. R. (2011). Customer retention through customer relationship management: The exploration of two-way communication and conflict handling. African Journal of Business Management, 3487-3496.
Mahmud, A., K. Jusoff, and St. Hadijah (2013). The effect of service quality and price on satisfaction and loyalty of customer of commercial flight service industry. World Applied Sciences Journal, 354-359.
Ravesteyn, L. J. and P. L. S. Ackermann (2006). Relationship marketing: The effect of relationship banking on customer loyalty in the retail business banking industry in South Africa. Southern African Business Review, 149-167.
Thurau, T. H. and A. Klee (1997). Impact of customer satisfaction and relationship quality on customer retention: A critical reassessment and model development, 737-764.
Verhoef, P. C. (2003). Understanding the effect of customer relationship management effect on customer retention and customer share development. Journal of Marketing, 30-45.
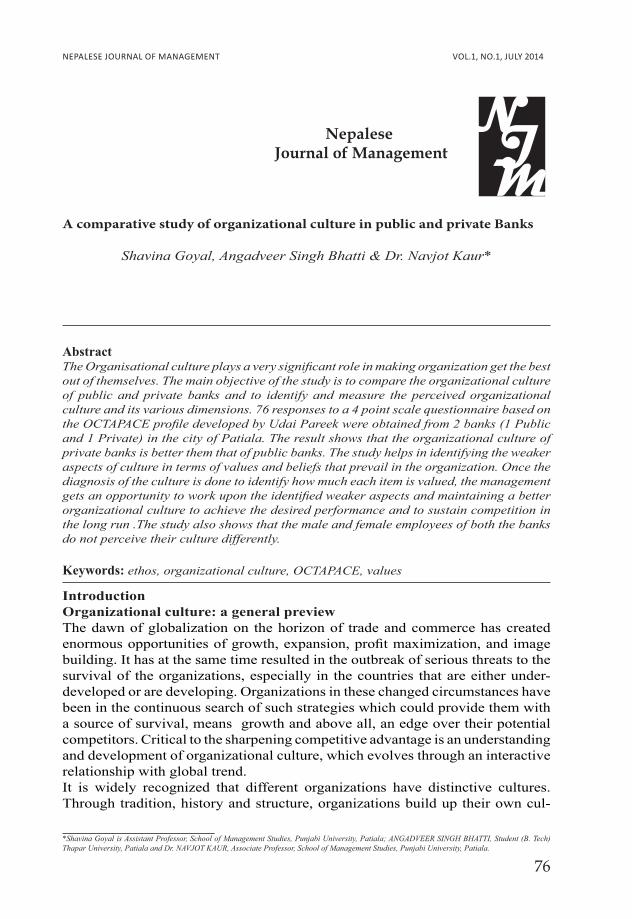
A comparative study of organizational culture in public and private Banks
Shavina Goyal, Angadveer Singh Bhatti & Dr. Navjot Kaur*
Nepalese Journal of Management
AbstractThe Organisational culture plays a very significant role in making organization get the best out of themselves. The main objective of the study is to compare the organizational culture of public and private banks and to identify and measure the perceived organizational culture and its various dimensions. 76 responses to a 4 point scale questionnaire based on the OCTAPACE profile developed by Udai Pareek were obtained from 2 banks (1 Public and 1 Private) in the city of Patiala. The result shows that the organizational culture of private banks is better them that of public banks. The study helps in identifying the weaker aspects of culture in terms of values and beliefs that prevail in the organization. Once the diagno sis of the culture is done to identify how much each item is valued, the management gets an opportunity to work upon the identified weaker aspects and maintaining a better organizational culture to achieve the desired performance and to sustain competiti on in the long run .The study also shows that the male and female employees of both the banks do not perceive their culture differently.
Keywords: ethos, organizational culture, OCTAPACE, values
76
IntroductionOrganizational culture: a general previewThe dawn of globalization on the horizon of trade and commerce has created enormous opportunities of growth, expansion, profit maximization, and im age building. It has at the same time resulted in the outbreak of serious threats to the survival of the organizations, especially in the countries that are either under-developed or are developing. Organizations in these changed circumstances have been in the continuous search of such strategies which could provide them with a source of survival, means growth and above all, an edge over their potential competitors. Critical to the sharpening competitive advantage is an understanding and development of organizational culture, which evolves through an interactive relationship with global trend.It is widely recognized that different organizations have distinctive cultures. Through tradition, history and structure, organizations build up their own cul-
*Shavina Goyal is Assistant Professor, School of Management Studies, Punjabi University, Patiala; ANGADVEER SINGH BHATTI, Student (B. Tech) Thapar University, Patiala and Dr. NAVJOT KAUR, Associate Professor, School of Management Studies, Punjabi University, Patiala.
NEPALESE JOURNAL OF MANAGEMENT VOL.1, NO.1, JULY 2014
NMJ

ture. Culture gives an organisation a sense of identity – ‘who we are’, ‘what we stand for’, ‘what we do’. Culture comprises the symbolic side of an organization, and it shapes the human thought and behavior in the system. The concept of organizational culture is in common use since the 1980s. Organisational re search originally focused strongly on the surveying of corporate climate, but in the 1980s, the organizational climate concept was to a certain extent replaced by the concept of organizational culture. Climate was redefined as the visible expression of organizational values. Organizational culture/ethos is the underlying spirit or character of an organisation and it is made up of its beliefs, customs or practices. The influence of organisa-tions in shaping the attitudes, values, motivation, and performance of people is being increasingly realized. Hofstede (1978) defined culture as “the collective programming of human mind, obtained in the course of life, which is common to the member of one group as opposed to another”.Kroebar and Parsons (1958) defined culture as the “transmitted and created contents and patterns of values, ideas, and other symbolic meaningful sys-tems as factor in shaping human behaviour and the artefacts produced through behaviour”.
The Organisational Culture is a system of organisa tional symbols, beliefs, values and shared assumptions and it is the social force that controls the patterns of organisational behaviour by shaping members’ cognition and perceptions of meanings and realities (Ott 1989).Organisational culture is the “basic assumptions and beliefs that are shared by members of the organisa tion” (Schein 1985). Pareek (1988) relied on the functionalist approach to study culture. Culture related concepts can be seen as multi level concepts. Values, beliefs attitudes and norms are inter-related. Pareek (1997) discussed the concept of ethos, as the underlying spirit of character or group and is made of its beliefs, customs or practices. At the base of ethos are core values i.e., “People need to give and get something from the occupation that goes beyond simply earning a salary”.A healthy organizational culture rests on eight strong pillars of “OCTAPACE” referring to Openness, Confrontation, Trust, Authenticity, Proactive, Autonomy, Collaboration and Empowerment and Experimentation. T. V. Rao introduced the concept of OCTAPAC culture as a good progressive way of building organizations. Udai Pareek and T.V. Rao pioneered the concept of HR Culture and propounded the OCTAPAC culture. An E for Empowerment and Experimentation was later added and it became OCTAPACE. In addition to being an acronym for these values, OCTAPACE is a meaningful term, indicating eight (octa) steps (pace) to create functional ETHOS. These values are discussed below1. Openness: Spontaneous expression of feelings and thoughts and receiving
feedback and information without defensiveness;2. Confrontation: Facing – not shying away from – problems; deeper analysis
of interpersonal problems; taking on challenges;3. Trust: Maintaining confidentiality of information shared by others and not
misusing it; a sense of assurance that others will help when needed and will
Goyal , Bhatt i and Kaur 77

honor mutual obligations an commitments;4. Authenticity: Congruence between what one feels, says, and does; owning
one’s actions and mistakes; unreserved sharing of feelings;5. Proaction: Initiative; planning and preventive action; calculating pay-offs
before taking action;6. Autonomy: Using and giving freedom to plan and act in one’s own sphere;
respecting and encouraging individual and role autonomy;7. Collaboration: Giving help to, and asking for help from, others; team spirit;
working together (individuals and groups) to solve problems; and*8. Experimentation: Using and encouraging innovative approaches to solve
problems; using feedback for improving; taking a fresh look at things; encouraging creativity.
Indian banking sectorFinancial System is the most important institutional and functional vehicle for economic transformation of a nation. Banking sector is reckoned as a hub and barometer of the financial system in a country. As a pillar of the economy, this sector plays a predominant role in the economic development of the country. The geographical pervasiveness of the banks coupled with the range and depth of their services make the system an indispensable medium in every day transactions.The virtual monopoly of banks in `Payment Mechanism’ touches the lives of millions of people every day and every where. Thus the banking sector has been playing a significant role as growth facilitator. The Indian Banking serv ice has made remarkable progress since independence. Having undergone, a major transformation from class banking to mass banking, they are racing against the super multinational banks. The banking scenario has completely changed today despite, the tremendous influence of moneylender even after the introduction of the commercial banks. Ever since the financial sector reforms were introduced in early 90’s the banking sector saw the emergence of new generation private sector banks. These banks gained at most popularity as they have technology edge and better business models when compared to public sector banks. Banking being a service sector industry, productivity of the staff has a significant bearing on the banks overall performance.The business organizations are attaching great importance to human resource because human resources are the biggest source of competitive advantage and has the capability of converting all the other resources in to product/service. The effective performance of this human resource depends on the type of organizational culture that prevails in the organization, if it is good than the employee’s performance will be high but if it is average or poor then the performance will be low. The study of organizational culture is very important for all the organization and the banking sector is not an exception, especially in the present situation of financial recession.The modern banks in India have realized the growing importance of people as their competitive advantage, and hence initiated many innovative HR systems, policies, procedures and practices. But, there are still several gaps on the development aspects of people at work in banks.
Nepalese Journal of Management 78

Rationale of the studyInterpreting and understanding organisational culture is an important activity for managers and consultants because it affects strategic development, productiv-ity and learning at all levels. By studying the OCTAPACE profile, the results can be made used by the HRD professionals and OD consultants to improve organizational values to increase the efficiency of banks.
Review of literatureRiyaz Rainayee (2002) in a study on HRD Climate in Commercial banks found that the overall level of OCTAPAC values in the banks was perceived at a moderate level. Shukla harish, Mishra D. P (1999) found that Organization climate is comprised of mixture of norms, values, expectations, policies, and procedures that influence work motivation, commitment Positive climate encourages, while negative climate inhibits the organizational performance. Organizational climate in a narrow sense means the quality of working environment. Banu (2007) conducted study in public sector Cement Corporation in Tamil Nadu and found that sound HRD Climate is necessary for the success of the public sector undertakings.Srimannarayana M, (2007) conducted a study in local bank of Dubai and found that a good HRD climate was prevalent in the organization. He found out the differences in the perception of employees regarding the HRD climate on the basis of demographic variables.Mufeed & Gurkoo, (2006) attempted to study whole gamut of HRD climate in universities and other equivalent higher level academic institutions by eliciting employee perceptions on HRD climate for which the University of Kashmir, Srinagar is selected as the main focal point of study.Mufeed SA, (2006) examined the HRD climate in major hospitals. The result indicated the existence of poor HRD climate in the hospitals. Sampath & Kalpana, (2005) conducted a study and found that to a large extent organizations where knowledge workers work, enjoy a ‘good’ HRD Climate. The strengths of the HRD Climate emerges from the organization’s belief that the human factor is a critical factor and need commitment to development, team spirit, helpfulness and providing training on skills and knowledge. The result indicated the presence of psychological climate conducive for development. Venkateswaran, (2002) made a study in a public sector undertaking in India and found that, to a large extent, a favorable HRD Climate was prevalent in the organization. Bhardwaj & Mishra, (2002) examined the HRD climate in private sector organization. The result shown the existence of good HRD climate in the organization. The managers were satisfied with the HRD policies and practices of the organization.Alphonsa, (2000) conducted a survey to examine the HRD climate of private hospital. The responses were collected from different departments in the hospital. The researcher found that the perception of the supervisors about the HRD climate is satisfactory and reasonably good climate was prevailing in the hospital.
Goyal , Bhatt i and Kaur 79

Sharma and Purang (2000) conducted a study to find out the relationship between value institutionalization and HRD climate in engineering and manufacturing sector and found the positive relationship between the two variables. Krishna and Rao, (1997) carried out a comprehensive empirical study in. BHEL, Hyderabad and found that HRD climate in the organization encouraged middle and senior managersRao and Abraham, (1986) found that the general HRD climate in the organization appears to be at an general level.Objectives of the study1) To identify and measure the perceived organisa tional culture and its various
dimensions in public banks.2) To identify and measure the perceived organisa tional culture and its various
dimensions in private banks.3) To compare the organizational culture of private and public banks.4) To find out if the male and female employees perceive the culture differently.
HypothesisIn view of the objectives set for the study, following null hypothesis were formulated:1) Null Hypothesis (H01): Various dimensions of the culture exist at the same levels in public banks.Alternative Hypothesis (Ha1): Various dimensions of the culture exist at varying levels in public banks.2) Null Hypothesis (H02): Various dimensions of the culture exist at the same levels in private banks.Alternative Hypothesis (Ha2): Various dimensions of the culture exist at varying levels in private banks(3) Null Hypothesis (H03): There is no significant dif ference in the perception of male and female employees working in an organisation towards its culture.Alternative Hypothesis (Ha3): The male and female workers working in an organisation perceive its culture differently.(4) Null Hypothesis (H04): There is no significant difference in the OCTAPACE culture between the public and private banks. Alternative Hypothesis (Ha4): The level of the OCTAPACE culture is significantly different between the two banks.
Research methodologyData collection50 employees were chosen from Allahabad bank (public bank) and 50 employees were chosen from Ing Vysya bank(private bank) in the city of Patiala (Punjab).So the total sample size was 100 for both the banks and the technique of sampling was convenience sampling. Out of 100 questionnaires distributed only 76 questionnaires were received completed in all respects. So the response rate for the present study is 76 percent.
Nepalese Journal of Management 80

InstrumentsThe 4-point scale developed by Pareek (2003) has been used for the present study. As many as 8 dimen sions were taken to judge the organisational culture. The OCTAPACE profile is a 40 items instrument that gives the profile of the organisation’s ethos in eight values. These values are openness, confrontation, trust, authenticity, pro-action, autonomy, collabora tion and experimentation.Statistical MeasuresTo analyse the results, various statistical measures such as Mean, Standard Deviation,t-test were performed through SPSS 18 and MS Excel 2007.
Analysis and interpretationIn case of OCTAPACE Profile data the answer sheet is suitably designed to tabulate the scores of eight OTAPACE variables. The Classification of Scores in each OCTAPACE variable has been made with the available pattern of score.The mean value of score obtained from Seventy Six respondents on eight dimension using the instrument have been compiled and presented in table 1 below.Pareek while conducting the cultural survey (1997) came up with the tentative norms, based on the values of mean and standard deviation obtained from their survey. The table 2 summarizes those norms. These norms indicate the lowest and highest mean value each dimension can take, i.e., range of each dimension.
Table 1Bank Allahabad Bank ing vysya Bank
Variables Mean S.d Mean S.d
Openness 16.14 1.345 16.31 1.809
Confrontation 15 2.38 16 1.821
trust 13.86 1.773 15.64 2.3
Authenticity 12.86 1.464 13.23 1.63
Pro-Action 15.86 1.464 17.72 4.091
Autonomy 12.14 2.193 13.08 1.869
Collaboration 13 1.528 15.69 2.117
Experimentation 14.14 2.795 14.95 1.746
Table : 2Bank L H
Openness 13 17
Confrontation 10 16
trust 10 16
Authenticity 10 14
Pro-Action 12 18
Autonomy 11 16
Collaboration 13 17
Experimentation 11 16
Goyal , Bhatt i and Kaur 81

Incase of Allahabad bankOn comparing table 1 which shows the mean value of eight dimensions obtained from the research, with the tentative norms given in table 2 above, we find that the scores of openness, Confrontation, Authenticity, Pro-action are much satisfactory as compared to the scores of other dimensions, as they lie in the medium to high range. The major problem areas that emerge out in this study are autonomy and Collaboration, scores of these 2 dimensions are tending towards the lowest side. While the scores of rest of the dimensions namely trust and experimentation was satisfactory average.
Incase of ING VYSYA bankOnly the score of autonomy is tending towards the lowest side while scores of all the other dimensions namely Openness, Confrontation, Trust, Authenticity, Pro-action, Collaboration, Experimentation lie in the medium to high range. The result shows that, on the dimensions of organizational culture in Allahabad Bank, the highest mean scores of openness (M = 16.14), it is followed by pro-action (15.86), Confrontation (M = 15.00), Experimentation (M = 14.14), and Trust (M = 13.46). The mean score is least for autonomy (M = 12.14), shows that employees are having comparatively freedom to plan and act in their own sphere.IN ing vysya Bank, the Pro-action (M = 17.72) is an aspect, which exists in the organisation at a higher level then any other aspect. This meant that people in the organisation are always reaching to take the initiative, preplanning and preventive action calculating the pay-offs of an alternative cause before taking an action.The mean score of the existence of the pro-action is followed by the openness (M = 16.31), which indicates that people are free to express their feeling and thought, and share them without defensiveness. The mean score is the least for the autonomy (M = 3.08) which shows that the employees are having a comparative freedom to plan and act in their own sphere. Experimenting (M = 14.95) shows that the organisation in average encourages its employees towards innovative approaches to solve problems, using the feedback for improving; taking a fresh look at things and that it encourages creativity. This reject the null hypothesis (HO1) and (HO2) and thus aspect the alternate hypothesis (Ha1) and (Ha2) that the various dimensions of the culture exist at varying levels in both public and private banks.
Nepalese Journal of Management 82

Table-3Comparison of the mean of the level of presence of eight aspect (OCTAPACE) of culture in
two organisations
Bank Allahabad Bank ing vysya Bank t-StatisticsVariables Mean MeanOpenness 16.14 16.31 0.229Confrontation 15 16 1.278trust 13.86 15.64 1.944Authenticity 12.86 13.23 0.566Pro-Action 15.86 17.72 1.181Autonomy 12.14 13.08 1.187Collaboration 13 15.69 3.205*Experimentation 14.14 14.95 1.021
* Significant at 95% level of confidence (p < 0.05)
Table 4Comparison of the mean scores of overall culture in two organisation
Bank Allahabad Bank ing vysya Bank t-statistics
Variables Mean Mean
2.492*Mean 14.125 15.326
Std. deviation 1.015 1.198
* Significant at 95% level of confidence (p-0.05)
The table 3 largely focuses on the results of the surveys in the study and presents them in a comparative manner to manifest the cultural profile of two organisation within the same industry. For this purpose, the mean scores on different elements of culture were taken from the organisations under study. t-values, as shown in Table 3, show that except for collaboration, there is no significant difference between the two organisation in relation to the presence of various aspects of the OCTAPACE culture.The Table 3, shows the comparison of mean scores of the overall culture in two organisation under study. The mean scores show the existence of the culture on the basis of the OOCTPACE profile. The mean score (M = 15.326) of the ing vysya bank is better than the mean score (M = 14.125) of the Allahabad bank. The result shows that the eight important values relevant to the institution building i.e., openness, pro-action, collaboration authenticity, experimentation, autonomy, trust and experimentation, are present more in the ing vysya bank than in Allahabad Bank. Again, using the results of the independent sample t-test to test whether there are any significant differences in the OCTAPACE culture among the two organizations, the t-value of 2.492 rejects the null hypothesis (HO3) and thus accepts the alternate hypothesis (Ha3) that the level of the OCTAPACE culture is significantly different between the two banks.
Goyal , Bhatt i and Kaur 83

Table 5Mean and standard deviation of the level of presence of eight aspects (OCTAPACE) of
organizational culture (a comparison of Male and Female employees)
Variables Male Female T-values
Mean Std. deviation Mean Std.
deviation
Allahabad Bank
Openness 15.89 2.261 16.43 1.675 -0.788Confrontation 16.44 1.944 15.87 1.795 0.831Trust 15.89 2.472 15.57 2.285 0.364Authenticity 12.78 2.333 13.37 1.377 -0.95Pro-action 18.11 1.833 17.6 4.576 0.325Autonomy 14 1.936 12.8 1.789 1.733Collaboration 15.44 2.506 15.77 2.029 -0.396Experimentation 16.11 1.537 14.6 1.673 2.417*
ing vysya Bank
Openness 17 0.816 15 1 2.928*Confrontation 15.25 2.629 14.67 2.517 0.295Trust 14.5 1.732 13 1.732 1.134Authenticity 13 0 12.67 2.517 0.274Pro-action 16.25 0.957 15.33 2.082 0.794Autonomy 12.25 0.957 12 3.605 0.137Collaboration 12.75 1.708 13.33 1.527 -0.466Experimentation 15.5 3 12.33 1.154 1.702
* Significant at 95% level of confidence (p < 0.05)
Table 6Comparison of the mean scores of overall culture in the organisations
Mean score for OCTAPACE culture
Organization Male Female t-statistic
ing vysye Bank 15.583 15.2525 0.727 (not significant)
Allahabad Bank 14.563 13.542 1.425 (not significant)
The Table 5 presents the perception of male and female employees of the sample study organization of the values of the OCTAPACE culture. In order to establish a significant difference between the groups in the sample, the comparison of means is not sufficient as the difference may be simply due to the sampling error. Thus, an independent sample t-test is applied to test the significant differences among the groups as shown in Table 5. The t-statistics show that a significant difference lied between the perceptions of the male an female employees in respect of experimentation in the and in openness in the Allahabad Bank.Table 6 represents the mean score of the overall culture from the perspective of male and female employees. The t-statistics of 0.727 for the ing vysye bank and 1.425 for the Allahabad shows that the employees do not differentiate in the perception of organizational culture as per their gender. This, therefore, accepts the null hypothesis (HO4) that there is no significant difference in the perception
Nepalese Journal of Management 84

of the male and female working in an organization towards their culture. This is in consistent with the finding of the study (Niranjana and Pattanayak 2005) which reflected that employees did not differentiate in the perception of organizational ethos as per their gender.
Conclusions and implicationsThe present study provides the information on the prevailing culture of organization under study. The comparison of result of their study with the standards given by Pareek provided useful insights. The mean scores of ING VYSYA Bank (private bank) are better than the Allahabad Bank (Public Bank. But the employees perceive almost the same pattern in which the various values exist in the organization. The findings reflect that that the male and female employees do not differentiate in their perception towards the organizations culture in both the banks.The major problem areas that emerge out in this study are autonomy and collaboration in case of Allahabad Bank and autonomy in case of ING-VYSYA Bank. The employees of the banks feel that they have less freedom to plan and act in their own sphere. Employees in Allahabad bank do not like to work in teams as they as they feel working in a team dilutes individual accountability. Employees are more concerned with finishing the immediate task rather than focusing on large organizational goals. They do not actively partidpate in the formation of long term goals and mission, just restrict themselves to finish the work assigned to them. The main implication of this research on organizational cultural suggest that there is a scope of improvement in both the sample study organizataion which would improve their performance and efficiency.The top management of ING-VYSYA Bank and Allahabad Bank should delegate and empower people. The management of Allahabad Bank should also promote the sense of collaboration among the employees so that the routine issues are resolved effectively without repetition or confusion. Emphasis may be given building t eam in the organization and management may appreciate the collaboration efforts.
Limitations of the study1. The study was conducted in the city of Patiala in selected public and private
sector banks which may not give the exact picture of the situation. 2. The sample size was very small.3. Respondents may be biased in giving their responses.
Goyal , Bhatt i and Kaur 85

Nepalese Journal of Management 86
Alphonsa V.K. (2000): HRD climate in a private hospital in Hyderabad : An empirical study. Indian Journal of Training and development, 30 L 50-67
Bhardwaj G., and P. Mishra (2002): HRD Climate: An empirical study among private sector managers. International journal of Industrial Relations, 38: 64-80
Bielik P., D. Hupkova, M. Vadovic, and V. Benda (2010) : Agricultural basic industry subjects productivity development examination in the region Trnava (SR) by adopting the malmquist indexes. Agricultural Economics – Czech, 56: 108-115
Cameron K., and R. E. Qunnn (1999): Diagnosing and Changing Organisational Culture. Addison-Wesley Publishing Co., USA.
Krishna P.M., & P. S. Rao (1997) : HRD climate in BHEL: An empirical study. The Journal of Publiv Administration, 43: 209-216
Kroebar A.L., T. Parson (`1958): The concept of culture and social system. American sociological Review, 25: 582-583
Kumar S., & S. Patnaik (2002): HRD climate and attributes of teacher in JNVS. Indian Journal of Training and Development, 32 : 31-37
Mangaraj S. (1999) : HRD system : A case study of Rourkela steel plant. The Business Review, 5: 203-210
Mufeed S.A. (2006): The need for a focus on key elements of HRD clime in hospitals : An empirical study. Management of Labour studies, XLRI, 31: 57-65
Mufeed S.A., & G. Gurkoo (2007): Need to focus on key elements of OCTAPACE culture in universities: An empirical assessment. The Journal-Contemporary Management Research, 1: 28-51
Niranjana P., & B. Pattanayak (2005): Influence of learned optimism and organisational ethos on organisational citizenship behaviour: A study of Indian corporations, Human resources Development of and Management, 5: 85-98
Ott J.S. (1989): The Organisational Cultural Perspective. Dorsey Press, Chicago.
Pareek U. (2003): Training Instruments in HRD and OD. 2nd ed. Tata McGraw-Hill Publishing Company Limited, New Delhi.
Rainayee R. (2002): HRD climate in commercial banks : An empirical study. The Business Review, 9:, 19
Rao T.V., E. Abraham (1999): Reading in HRD. Oxford and IBH Publishing Co Pvt. Ltd., New Delhi.
Rohmetra N. (1998): Towards creating a learning organisation: The HRD climate focus. Paradigm, 2: 56-63
Schein E. H. (1985): Defining Organisational culture. In: Shafritz J.M., Ott J.S. (eds): Classics of Organisation Theory. Wadsworth Publishing, New York, pp.430-441
Schein E.H. (1990): Organisational culture. American psychologist, 43: 109-119
Scholz C. (1987(nd): Corporate culture and strategy – the problem of strategic fit. Long Range Planning, 20: 78-87
Shafritz J., & J. S. Ott (2001): Classics of Organisation Theory. Harcourt College Publishers. Fort Worth.
Shakeel A. (1999): Human Resource Development in Universities. APH Publishing Corporation, New Delhi.
Sharma A., & P. Purang (2000): Value institutionalization and HRD climate : A case study of a Navratna Public Sector Organisation. Vision. The Journal of Business Perspective, 4:11-17.
References

Employees’ job satisfaction and financial performance: A case of Nepalese commercial banks
- Kushal Joshi
Nepalese Journal of Management
AbstractJob satisfaction level of employees is considered as one of the most important factors that improves the financial performance of commercial banks. Therefore, this paper aims to investigate the impact of job satisfaction on financial performance of Nepalese commercial banks. This study is based upon both primary and secondary sources of data to deal with level of employees’ job satisfaction and its impact on financial performance of Nepalese commercial banks. In this paper, financial performance has been measured by using three indicators; Internal–based performance measured by Net Interest Margin, Market-based performance measured by Tobin’s Q and Economic–based performance measured by Economic Value Added. The study employed the correlation and multiple regression analysis of panel data from 2002/03–2011/12 to capture the impact of bank specific as well as macroeconomic variables on financial performance of commercial banks. The major conclusion of this study is that cash reserve ratio, operational efficiency, assets management, deposits, earnings per share, residual income, capital, age of the bank and number of branches of the bank are the most dominant variables that have significant impact on the financial performance of Nepalese commercial banks. The study also concluded that increase in job satisfaction level of employees increases the financial performance of commercial banks because the results showed that motivating potential score have significant positive impact on market financial performance and economic financial performance of commercial banks.
Keywords: job satisfaction, motivating potential score, net interest margin, Tobin’s Q, economic value added, cash reserve ratio, gross domestic product and inflation rate.
87
1. IntroductionCommercial banks play an important and active role in the economic development of a country. Banking sector acts as the life blood of modern trade and commerce by providing them with a major source of finance. Commercial bank occupies quite an important place in the framework of every economy (Hussian, 2010). The success of banking sector depends upon various factors. Among those factors, job satisfaction level of human resources in the banks is also considered as one of the most important factors that improves the financial performance of commercial banks. It has been found that employees who have higher job satisfaction are usually less absent, less likely to leave, more productive, more likely to display organizational commitment, and more likely to be satisfied with their lives (Lease, 1998).
NEPALESE JOURNAL OF MANAGEMENT VOL.1, NO.1, JULY 2014
NMJ
Job satisfaction is one of the most popular and widely researched topics in the field of organizational psychology (Spector, 1997). Job satisfaction is a pleasurable or positive emotional state resulting from the appraisal of one’s job or job experiences. Job satisfaction has been studied both as a consequence of many individual and work environment characteristics and as an antecedent to many outcomes (Locke, 1976). Although, there is no universally accepted definition of employees’ job satisfaction, it is conceptualized as “general attitudes of employees towards their jobs” (Wickramasinghe, 2009). Employees’ job satisfaction is a multi-disciplinary concept that results from employees’ perception of their jobs and the degree to which there is a good fit between them and the organization (Ivancevich, Matteson, & Konopaske, 2011). Job satisfaction is regarded as one of the most representative dimensions of organizational behavior (Ghazzawi, 2008). It is defined as positive feelings about one’s job based on one’s evaluation of the characteristics of the job (Robbins & Judge, 2007).
Job satisfaction of employees is important for both employees as well as to the organization. Human resources are the strategic resources that can make a difference to the organization in the positive direction. It is increasingly being realized that by properly managing human resources, organizations can reach their goals in a better manner. If the employees are sat-isfied and contended, their commitment levels will be high and hence, their contribution to the organization also will be high. When employees are satisfied with their jobs, the quality of work improves and productivity increases. Satisfied employees are more loyal to the job and to the organization. Lower employee turnover will further reduce recruiting and training costs for the banking organizations (Vangapandu & Anne, 2013).
The major objective of this study is to determine the impact of job satisfaction on financial performance of Nepalese commercial banks. The specific objectives of this study are: to determine the most important factors contributing to the employees’ job satisfaction in Nepalese commercial banks, to find out whether there is difference in perception regarding job satisfaction among the employees of joint ventured, non-joint ventured and public banks, to determine the relationship of total assets, operational efficiency and assets management with the financial performance of commercial banks, to examine the impact of deposit, credit to deposit ratio and cash reserve ratio on the internal financial performance of commercial banks, to assess the impact of price earnings ratio and earnings per share on the market financial performance of Nepalese commercial banks, to determine the relationship of residual income, capital, loan, deposit, age and number of branches with the economic financial performance of Nepalese commercial banks and finally, to examine the impact of macroeconomic variables (growth rate of gross domestic product and inflation rate) on financial performance of Nepalese commercial banks
1.1 Research hypothesis
The following are the major hypotheses tested in this study:Null Hypothesis 1: There is no significant relationship between skill variety and job satisfaction level in Nepalese commercial banks.Null Hypothesis 2: There is no significant relationship between task identity and job satisfaction level in Nepalese commercial banks.Null Hypothesis 3: There is no significant relationship between task significance and job satisfaction level in Nepalese commercial banks.
Nepalese Journal of Management 88

Null Hypothesis 4: There is no significant relationship between autonomy and job satisfaction level in Nepalese commercial banks.Null Hypothesis 5: There is no significant relationship between feedback and job satisfaction level in Nepalese commercial banks.Null Hypothesis 6: There is no significant relationship between job satisfaction and internal financial performance indicator of Nepalese commercial banks.Null Hypothesis 7: There is no significant relationship between job satisfaction and market financial performance indicator of Nepalese commercial banks.Null Hypothesis 8: There is no significant relationship between job satisfaction and economic financial performance indicator of Nepalese commercial banks.
2. Conceptual framework
Figure 1 shows the conceptual framework of the study that determines the linkage between employees’ job satisfaction and financial performance of selected commercial banks in Nepalese banking sector. The financial performance of commercial banks has been evaluated through internal financial performance perspective, market financial performance perspective and economic financial performance perspective. Similarly, employees’ job satisfaction is evaluated from the perspective of skill variety, task identity, task significance, autonomy and feedback. Employees’ job satisfaction and financial performance of commercial banks has been linked by taking motivating potential score (MPS) as a proxy for employees’ job satisfaction.
Figure 1
Conceptual framework for financial performance evaluation
Specific Independent Variables
• One year lagged Net Interest Margin
• Credit Risk• Cash Reserve Ratio• Credit to Deposit Ratio• Deposit
• One year lagged Tobin’s Q• Earnings Per Share• Growth Rate of Gross
Domestic Product• Inflation Rate
• One year lagged Economic Value Added
• Residual Income• Capital• Loan• Age• Number of Branches• Deposit
Common Independent Variables
Motivating Potential ScoreTotal AssetsOperational EfficiencyAssets Management
Dependent Variables
Net Interest Margin
Tobin’s Q
Economic Value Added
Joshi 89

3. Research methodologyThis study is based upon the descriptive and causal comparative research designs to deal with the fundamental issues associated with the level of employees’ job satisfaction and its impact on financial performance of commercial banks in Nepal. The study is based on both primary and secondary sources of data. Altogether, 17 commercial banks which were established before 2002/03 were taken as the sample for the study. Table 1 shows the number of commercial banks selected for the study along with the study period and number of observations.
Table 1
Number of commercial banks selected for the studyStrata Bank Study Period Observations
Joint Venture Banks
Nepal SBI Bank 2002/03-2011/12 10
Everest Bank 2002/03-2011/12 10
Nabil Bank 2002/03-2011/12 10
Nepal Bangladesh Bank 2002/03-2011/12 10
Himalayan Bank 2002/03-2011/12 10
Standard Chartered Bank 2002/03-2011/12 10
Non-Joint Venture Banks
Nepal Investment Bank 2002/03-2011/12 10
Bank of Kathmandu 2002/03-2011/12 10
Siddhartha Bank 2002/03-2011/12 10
Lumbini Bank 2002/03-2011/12 10
Machhapuchhre Bank 2002/03-2011/12 10
Kumari Bank 2002/03-2011/12 10
Laxmi Bank 2002/03-2011/12 10
Nepal Credit and Commercial Bank 2002/03-2011/12 10
Nepal Industrial and Commerce 2002/03-2011/12 10
Public BanksNepal Bank 2002/03-2011/12 10
Agriculture Development Bank 2002/03-2011/12 10
This study used methods such as descriptive analysis, correlation analysis, portfolio analysis and regression analysis in order to analyze secondary data. The multiple regression models used in this study are:
Model 1:NIMit= α+β1MPSbnk+β2NIMit-1+β3TAit+β4OEit+β5AMit+β6CRit+ β7CRRit+ β8CDRit+ β9DEPit+εit
Model 2:Tobin’s Qit= α+β1MPSbnk+β2TQit-1+β3TAit+β4OEit+β5AMit+β6EPSit+ β7GDPGRt+ β8INFt+uit
Nepalese Journal of Management 90

Model 3:EVA i t=α+β1MPS bnk+β2EVAit-1+β3TAit+β4OE i t+β5AMit+β6RIit+β7CAPit+β8DEP i t+ β9LOANit+β10AGEit+β11NBit+vit
Where, NIMit is the net interest margin of bank i at time period t, Tobin’s Qit refers to ratio of market value to book value of equity of bank i at time period t, EVAit is the difference between net operating profit after tax and dividend paid of bank i at time period t, MPS bnk is motivating potential score of bank, NIMit-1 is one year lagged net interest margin of bank i at time period t-1, TQit-1 is one year lagged Tobin’s Q ratio of bank i at time period t-1 and EVAit-1 is one year lagged economic value added of bank i at time period t-1.
Similarly, TA is the total assets of bank i at time period t, CRit is the ratio of non-performing loan to total loan of bank i at time period t, OEit is ratio of total operating expenses to net interest income of bank i at time period t, AMit is ratio of operating income to total assets of bank i at time period t, CRRit is the cash reserve ratio of bank i at time period t, CDRit is the ratio of total credit to total deposit of bank i at time period t, DEPit is the volume of deposit of bank i time period t, EPSit is the earnings per share of bank i at time period t, GDPGRt is the annual growth rate of gross domestic product at time period t, INFt is the inflation rate at time period t, RIit is the residual income of bank i at time period t, CAPit is the amount of capital balance of bank i at time period t, LOANit is the volume of loan of bank i time period t, AGEit is the age of bank i at time period t and NBit is the number of branches of bank i at time period t. Likewise, α is the intercept of dependent variable and β1, β2, β3, β4, β5, β6, β7, β8, β9, β10 and β11 are the beta coefficients of the explanatory variables to be estimated. Similarly, εit, uit and vit are the error term which are independent and identically distributed following the normal distribution with mean 0 and variance σ2.
4. Data analysis and presentation
This study has used descriptive, correlation, portfolio and regression analysis in order to analyze the relationship between dependent and independent variables.
4.1. Descriptive statistics
Table 2 reveals the descriptive statistics of the financial performance of commercial banks and its determinants. The result shows that the average NIM of sampled commercial banks is 4.28% with the standard deviation of 2.21%. Similarly, the average Tobin’s Q ratio is 3.98times with the standard deviation of 4.08times and the average EVA is Rs.0.0152billion with the standard deviation of Rs.0.4150billion.
Likewise, the average OE ratio is 58.27% with the standard deviation of 31.66% and the average AM ratio is 4.67% with the standard deviation of 1.43%. The average CR is 6.08% with the standard deviation of 9.71%. The results also showed that the average CRR and CDR is 10.27% and 77.74% with the standard deviation of 6.39% and 18.81% respectively. The deposit balance of commercial banks is on an average of Rs.19.9264billion with the standard deviation of Rs.14.2143billion. Likewise, the volume of loan of commercial banks is on an average of Rs.13.4859billion with the standard deviation of Rs.10.0397billion.
Joshi 91

Table 2Descriptive statistics of banks’ financial performance and its determinants
Variables N Min. Max. Mean SD
NIM (in %) 170 0.25 13.02 4.28 2.21
Tobin’s Q (in times) 170 -7.76 21.39 3.98 4.08
EVA (Rs. in billions) 170 -2.1414 1.5001 0.0152 0.4150
TA (Rs. in billions) 170 0.8637 71.3948 23.0430 16.6594
OE (in %) 170 28.22 287.57 58.27 31.66
AM (in %) 170 2.38 10.94 4.67 1.43
CR (in %) 170 0.00 60.47 6.08 9.71
CRR (in %) 170 1.60 37.61 10.27 6.39
CDR (in %) 170 31.63 159.99 77.74 18.81
DEP(Rs. in billions) 170 0.3917 57.0106 19.9264 14.2143
LOAN(Rs. in billions) 170 0.1109 41.6370 13.4859 10.0397
AGE (in years) 170 0.00 74.00 16.62 15.84
NB (in number) 170 1.00 283.00 35.22 57.09
CAP (Rs. in billions) 170 0.2953 10.7775 1.3685 1.7974
EPS (in Rs.) 170 -500.00 242.25 40.53 60.84
PE (in times) 170 -162.16 482.03 26.33 46.01
RI(Rs. in billions) 170 -1.7972 2.3655 0.1645 0.4556
GDPGR (in %) 170 3.36 6.10 4.28 0.81
INF (in %) 170 2.84 11.61 7.45 2.97
MPS (in score) 170 30.74 70.14 48.80 12.04
In addition, the minimum and maximum age of Nepalese commercial banks is 0 to 74 years with the mean and standard deviation of 16.62 and 15.84 years respectively. Likewise, the number of branches of the commercial banks in Nepal range from 1 to 283 with the mean and standard deviation of 35.22 and 57.09 respectively. Similarly, the average value of capital is Rs.1.3685billion with the standard deviation of Rs.1.7974billion. The sampled commercial banks have average EPS of Rs.40.53 with the standard deviation of Rs.60.84. The average value of price earnings ratio is 26.33times with the standard deviation of 46.01times and the average value of RI is Rs.0.1645billion with the standard deviation of Rs.0.4556billion.
Furthermore, the minimum and maximum value of the GDP growth rate ranges from 3.36% to 6.1% with the mean growth rate of 4.28% and standard deviation of 0.81%. On the other hand, the average rate of the inflation is 7.45% with the standard deviation of 2.97%. In addition, the minimum and maximum value of the MPS is 30.74 and 70.14 respectively with the mean value of 48.80 and standard deviation of 12.04.
Nepalese Journal of Management 92

4.2. Relationship between dependent and ndependent variablesThe relationship between the variables employed in this study has been determined with the help of correlation analysis. The correlation analysis has been carried out in this study to investigate the direction and magnitude of relationship between the bank’s financial performance and its determinants. Tables 3, 4 and 5 shows the correlation between variables employed in this study.
Table 3Bivariate Pearson Correlation Coefficients of variables of Model I
Variables NIM MPS NIM t-1 TA OE AM CR CRR CDR DEP
NIM 1
MPS 0.12 1
NIMt-1 0.65** 0.12 1
TA 0.10 0.30** 0.04 1
OE 0.20** -0.02 0.23** 0.17** 1
AM 0.51** 0.31** 0.41** 0.20** -0.23** 1
CR 0.29** 0.05 0.24** 0.01 0.59** 0.23** 1
CRR 0.36** 0.02 0.27** 0.33** 0.28** 0.20** 0.17* 1
CDR 0.07 -0.36** 0.09 -0.28** -0.17* 0.14 -0.05 -0.01 1
DEP 0.1 0.31** 0.01 0.98** 0.18* 0.17* 0.01 0.28** -0.37** 1
Table 3 shows the Pearson correlation between the variables employed in model I. The table shows that all the independent variables are positively correlated with the dependent variable net interest margin. Among the determinants of internal financial performance of commercial banks, the highest positive correlation coefficient is recorded at 0.65 between net interest margin and one year lagged net interest margin which is significant at 1% level of significance. Similarly, the correlation coefficient of net interest margin and assets management is 0.51 which is significant at 1% level of significance. Other determinants of internal financial performance of commercial banks such as operational efficiency, credit risk, and cash reserve ratio are positively and significantly correlated with net interest margin at 1% level of significance. Among the observed correlations, the degree of correlation of one year lagged net interest margin and assets management are most strong in order of their importance which means that these variables better explain the internal financial performance of Nepalese commercial banks.
Joshi 93

Table 4Bivariate Pearson correlation coefficients of variables of Model II
TQ MPS TQ t-1 TA OE AM EPS GDPGR INF
TQ 1
MPS 0.22** 1
TQ t-1 0.58** 0.22** 1
TA 0.10 0.30** 0.18 1
OE -0.39** -0.02 -0.35** 0.17** 1
AM 0.10 0.31** -0.16* 0.20** -0.23** 1
EPS 0.25** 0.26** 0.17* 0.22** -0.02 0.07 1
GDPGR 0.36** 0.00 0.21** 0.17* -0.03 0.01 -0.03 1
INF 0.12 0.00 0.36** 0.47** 0.13 0.12 0.09 0.22** 1
Table 4 shows the Pearson correlation between the variables employed in model II. The table shows that motivating potential score, one year lagged Tobin’s Q, total assets, assets management, earnings per share, GDP growth rate and inflation are positively correlated with Tobin’s Q. Similarly, operational efficiency is negatively correlated with Tobin’s Q. Among the determinants of market financial performance of commercial banks, the highest positive correlation is recorded at 0.58 between Tobin’s Q and one year lagged Tobin’s Q which is significant at 1% level of significance. The correlation between motivating potential score, operational efficiency, earnings per share and GDP growth rate is significant at 1% level of significance. The highest significant correlation of one year lagged Tobin’s Q states that this variable better explain the market financial performance of Nepalese commercial banks.
Table 5 shows the Pearson correlation between the variables employed in model III. The table shows that motivating potential score, one year lagged economic value added, assets management, residual income, deposit and loan are positively correlated with economic value added. Similarly, total assets, operational efficiency, capital, age of bank and number of branches are negatively correlated with economic value added. Among the determinants of economic financial performance of commercial banks, the highest positive correlation is recorded at 0.46 between economic value added and one year lagged economic value added which is significant at 1% level of significance. Similarly, the highest negative correlation is recorded at -0.45 between economic value added and operational efficiency which is significant at 1% level of significance. Likewise, age of the bank and number of branches has weak negative correlation of -0.19 and -0.21 with economic value added and they are both significant at 5% and 1% level of significance respectively.
Nepalese Journal of Management 94

Table 5Bivariate Pearson correlation coefficients of variables of Model III
EVA MPS EVA t-1 TA OE AM RI CAP DEP LOAN AGE NB
EVA 1
MPS 0.04 1
EVA t-1 0.46** 0.04 1
TA -0.07 0.30** -0.06 1
OE -0.45** -0.02 -0.33** 0.17** 1
AM 0.01 0.31** -0.13 0.20** -0.23** 1
RI 0.09 0.07 -0.25** 0.39** 0.06 0.35** 1
CAP -0.34** 0.09 -0.26** 0.52** 0.03 0.43** 0.52** 1
DEP 0.01 0.31** 0.03 0.98** 0.18* 0.17* 0.28** 0.40** 1
LOAN 0.01 0.19* 0.03 0.91** -0.07 0.27** 0.31** 0.62** 0.89** 1
AGE -0.19* 0.27** -0.17* 0.68** 0.58** 0.25** 0.43** 0.31** 0.68** 0.45** 1
NB -0.21** 0.10 -0.24** 0.54** 0.34** 0.43** 0.47** 0.75** 0.48** 0.53** 0.67** 1
4. 3. Financial performance and their determinants Regression analysis has been used in this study to examine the impact of various determinants of bank’s performance in the financial performance of Nepalese commercial banks. Table 6, Table 7 and Table 8 shows the estimated regression results of all three models based on enter method.
Table 6Estimated stepwise regression results of net interest margin and its determinants.
Specifications Intercept NIMt-1 OE AM CRRAdj.
R2 F value
I1.452 0.614
(10.488)**0. 418 109.992**
II -0.6210.462
(8.147)**
0.575
(6.547)**0. 544 91.673**
III -1.6760.392
(6.764)**
0.016
(3.585)**
0.670
(7.557)**0. 577 70.228**
IV -1.6420.381
(6.652)**
0.012
(2.553)*
0.619
(6.931)**
0.047
(2.525)*0. 592 56.166**
Note: ‘*’ sign indicates that t-statistics and F-statistics are significant at 5 percentage level and ‘**’ indicates that t-statistics and F-statistics are significant at 1 percentage level.
Joshi 95
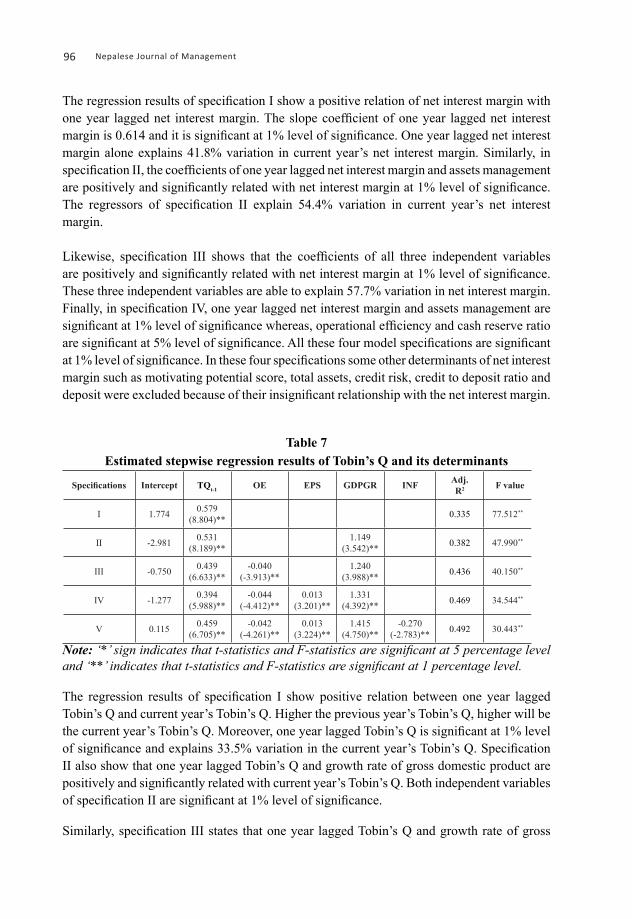
The regression results of specification I show a positive relation of net interest margin with one year lagged net interest margin. The slope coefficient of one year lagged net interest margin is 0.614 and it is significant at 1% level of significance. One year lagged net interest margin alone explains 41.8% variation in current year’s net interest margin. Similarly, in specification II, the coefficients of one year lagged net interest margin and assets management are positively and significantly related with net interest margin at 1% level of significance. The regressors of specification II explain 54.4% variation in current year’s net interest margin.
Likewise, specification III shows that the coefficients of all three independent variables are positively and significantly related with net interest margin at 1% level of significance. These three independent variables are able to explain 57.7% variation in net interest margin. Finally, in specification IV, one year lagged net interest margin and assets management are significant at 1% level of significance whereas, operational efficiency and cash reserve ratio are significant at 5% level of significance. All these four model specifications are significant at 1% level of significance. In these four specifications some other determinants of net interest margin such as motivating potential score, total assets, credit risk, credit to deposit ratio and deposit were excluded because of their insignificant relationship with the net interest margin.
Table 7Estimated stepwise regression results of Tobin’s Q and its determinants
Specifications Intercept TQt-1 OE EPS GDPGR INF Adj.R2 F value
I 1.774 0.579(8.804)** 0.335 77.512**
II -2.981 0.531(8.189)**
1.149(3.542)** 0.382 47.990**
III -0.750 0.439(6.633)**
-0.040(-3.913)**
1.240(3.988)** 0.436 40.150**
IV -1.277 0.394(5.988)**
-0.044(-4.412)**
0.013(3.201)**
1.331(4.392)** 0.469 34.544**
V 0.115 0.459(6.705)**
-0.042(-4.261)**
0.013(3.224)**
1.415(4.750)**
-0.270(-2.783)** 0.492 30.443**
Note: ‘*’ sign indicates that t-statistics and F-statistics are significant at 5 percentage level and ‘**’ indicates that t-statistics and F-statistics are significant at 1 percentage level.
The regression results of specification I show positive relation between one year lagged Tobin’s Q and current year’s Tobin’s Q. Higher the previous year’s Tobin’s Q, higher will be the current year’s Tobin’s Q. Moreover, one year lagged Tobin’s Q is significant at 1% level of significance and explains 33.5% variation in the current year’s Tobin’s Q. Specification II also show that one year lagged Tobin’s Q and growth rate of gross domestic product are positively and significantly related with current year’s Tobin’s Q. Both independent variables of specification II are significant at 1% level of significance.
Similarly, specification III states that one year lagged Tobin’s Q and growth rate of gross
Nepalese Journal of Management 96

domestic product are positively and significantly related with current year’s Tobin’s Q whereas, operational efficiency is negatively and significantly related with current year’s Tobin’s Q. All the independent variables of specification III are significant at 1% level of significance. Likewise, similar kind of significant relationship is observed in specification IV between one year lagged Tobin’s Q, operational efficiency and growth rate of gross domestic product with the dependent variable Tobin’s Q. Specification IV also shows that earnings per share is positively and significantly related with Tobin’s Q. All the independent variables of specification IV are significant at 1% level of significance.
Finally, specification V has added inflation rate as another determinants of Tobin’s Q which is negatively and significantly related with Tobin’s Q at 1% level of significance. Likewise, one year lagged Tobin’s Q, operational efficiency, earnings per share and growth rate of GDP has similar kind of relationship with the dependent variable Tobin’s Q as in specification IV and they all are significant at 1% level of significance. All these five model specifications are significant at 1% level of significance. In these five specifications some other determinants of Tobin’s Q such as motivating potential score, total assets, and assets management were excluded because of their insignificant relationship with the Tobin’s Q.
Table 8Estimated stepwise regression results of economic value added and its determinants
Spec. Int. EVAt-1 TA OE RI CAP DEP LOAN AGE NB Adj. R2 F value
I 0.389 0.272 (4.571)**
“-0.006
(-4.420)**”
“0.442 (7.178)**”
“-0.229 (-8.917)**”
“0.013 (3.744)**”
“-0.008 (-2.836)**”
“0.004 (4.592)**” 0.59 32.219**
II 0.413 0.27 (4.584)**
-0.006 (-4.751)**
0.447 (7.336)**
-0.216 (-8.263)**
0.012 (2.050)*
-0.002 (-0.293)
-0.013 (-3.524)**
0.004 (5.037)** 0.599 29.340**
III 0.406 0.269 (4.589)**
-0.006 (-4.905)**
0.448 (7.386)**
-0.22 (-9.330)**
0.011 (4.309)**
-0.012 (-3.677)**
0.004 (5.092)** 0.601 33.732**
IV 0.387 0.167 (3.044)**
-0.059 (-6.188)**
-0.006 (-5.390)** 0.613
(10.165)**
-0.156 (-6.644)** 0.076
(7.030)**-0.015
(-4.901)**0.004
(5.173)** 0.683 41.894**
Note: ‘*’ sign indicates that t-statistics and F-statistics are significant at 5 percentage level and ‘**’ indicates that t-statistics and F-statistics are significant at 1 percentage level.
Table 8 shows that one year lagged economic value added is positively and significantly related with current year’s economic value added and it is significant at 1% level of signif-icance in all of the four specifications. Similarly, total asset is negatively and significantly related with economic value added in specification IV and it is significant at 1% level of significance. Likewise, operational efficiency is negatively and significantly related with economic value added and it is significant at 1% level of significance in all of the four spec-ifications.
Joshi 97

Similarly, residual income is positively and significantly related with economic value added and capital is negatively and significantly related with economic value added in all of the four specifications. Both residual income and capital are significant at 1% level of signif-icance in all of the four specifications. Likewise, volume of deposit has positive and sig-nificant relationship with the economic value added. Deposit is significant at 5% level of significance in specification II and it is significant at 1% level of significance in specification III and IV. The relationship of loan with economic value contradicts in specification I and II. Loan is positively and significantly related with economic value added in specification I and is significant at 1% level of significance. Whereas, loan is negatively related with economic value added in specification II and it is insignificant. Finally, age of the bank has negative relationship with economic value added and number of branches has positive relationship with economic value added. They both are significant at 1% level of significance in all of the four specifications. All of these four model specifica-tions are significant at 1% level of significance. In these four specifications some other deter-minants of economic value added such as motivating potential score and assets management were excluded because of their insignificant relationship with the economic value added.
5. Discussion and conclusionsFrom the past few decades, it has been seen that Nepalese commercial banks are playing an important and active role in the economic development of a country. There are numerous empirical evidences of developed countries that employees’ job satisfaction has significant impact on the improvement of financial performance of commercial banks. However, despite of several empirical evidences, employees’ job satisfaction and financial performance issues are still unsolved in context of Nepalese banking industry. Determining job satisfaction level of employees as well as its impact on financial performance of commercial banks has always been a crucial issue for Nepalese commercial banks. Therefore, this study attempts to identify the determinants of employees’ job satisfaction and its impact on financial performance of Nepalese commercial banks.
The major conclusion of this study is that cash reserve ratio, operational efficiency, assets management, deposit, earnings per share, residual income, capital, age of the bank and number of branches of the bank are the most dominant variables that have significant impact on the financial performance of Nepalese commercial banks. Likewise, it can also be concluded that lagged variables of net interest margin, Tobin’s Q and economic value added also have significant impact on the financial performance of commercial banks. Moreover, the study also concludes that macro-economic variables such as growth rate of gross domestic product and inflation rate also have significant impact on market financial performance of commercial banks.
Nepalese Journal of Management 98

References
Joshi 99
Ghazzawi, I. (2008, December). Job satisfaction antecedents and consequences: A new conceptual framework and research agenda. The Business Review, 11 (2), 1-11.
Hussain, G. A. (2010). Evidence on structure conduct performance hypothesis in Pakistani commercial banks. In-ternational Journal of Business and Management, 5 (9), 174-187.
Ivancevich, J. M., M. T. Matteson & R. Konopaske (2011). Organizational Behavior and Management (9 th ed.). New York: McGraw-Hill Irwin.
Lease, S. H. (1998, October). Work attitudes and outcomes. Journal of Vocational Behavior, 53 (2), 154-183.
Locke, E. A. (1976). The nature and causes of job satisfaction. In M. D. Dunnette (Ed.), Handbook of Industrial and Organizational Psychology (pp. 1297–1349). Chicago: Rand McNally.
Robbins, S. P., & T. A. Judge, (2007). Organizational Behavior (12 th ed.). Upper Saddle River, New Jersey: Pear-son Prentice Hall.
Spector, P. E. (1997). Job satisfaction: application, assessment, causes, and consequences. California: Sage Pub-lication.
Vangapandu, R. M., & N. Anne (2013, July). An investigation of factors influencing job satisfaction of employees in banking sector of India. International Journal of Research in Organizational Behavior and Human Resource Management, 1 (3)(2320-8724), 107-115.
Wickramasinghe, V. (2009, June). Predictors of job satisfaction among IT graduates. Personnel Review, 38 (4), 413-431.

Service quality, customers’ satisfaction and customers’ loyalty in commercial banks of Nepal
- Manju Maharjan
Nepalese Journal of Management
AbstractThe main objective of this paper is to find the relationship between service quality attributes, customers’ satisfaction and customers’ loyalty in commercial banks in Nepal. A review of literature was conducted to find out the relationship among service quality attributes, customers’ satisfaction and customers’ loyalty. The literatures also confirm the positive relationship between these variables. The questionnaire survey was conducted to collect data. The sample sizes of 223 “A” grade commercial banking customer was drawn from 29 “A” grade commercial banks in Nepal. Correlation and multiple regressions were used to investigate the relationship among service quality attributes, customers’ satisfaction and customers’ loyalty. The correlation result indicates that there is positive relationship service quality attributes customers’ satisfaction and customers’ loyalty. The result of regression test shows that offering the quality service have positive impact on customer satisfaction and customer satisfaction have positive impact on customer loyalty.
Keywords: service quality, customers’ satisfaction, customers’ loyalty, banking industry
100
Introduction
Service quality is one of the critical success factors that influence the service sectors especially in banks. A bank can differentiate itself from competitors by providing quality services at promised time. Service quality is one of the most attractive areas for researchers over the last decade in banking sector. Mudie and Pirrie, (2006) identified some features of services for banking industry. These services are intangible in nature and cannot assure the quality because it cannot be counted, measured, tested, verified and inventoried in. Service are sold and produced and consumed at the same time. There is simultaneous production and consumption of the service. The quality of the service may vary depending on who provides it, as well as when and how it is provided. Moreover, services are variable in nature they don’t follow a same or some kind of linear pattern. Very often polymorphism is also seen in services as services are simple as well as complex.
Customers’ satisfaction is one of the important outcomes of marketing activity. In the competitive banking industry, customers’ satisfaction is considered as the essence of success.
NEPALESE JOURNAL OF MANAGEMENT VOL.1, NO.1, JULY 2014
NMJ

Prabhakaran, (2003) mentioned that the customer is the king. High customers’ satisfaction is important in maintaining a loyal customer base. Kumar, Kee and Manshor, (2009) stated that high quality of service will result in high customers’ satisfaction and increases customers’ loyalty. The customer satisfaction model proposed by Oliver (1980) explains that when the customers compare their perceptions of actual products/services performance with the expectations, then the feelings of satisfaction have arisen. Any discrepancies between the expectations and the performance create the disconfirmation. Oliver, (1980) identified three types of disconfirmation. Positive disconfirmation occurs when product/service performance expectations. In this case, the customers are highly satisfied. Negative disconfirmation occurs when product/service performance expectations. In this case, the customers are highly dissatisfied. Zero disconfirmation occurs when product/service performance equal to expectations. Thus, satisfaction is the customers’ evaluation of a product or service in terms of whether that product or service has met their needs and expectations.
Customer loyalty relates to what customers think and do or try to do (Foss and Stone, 2001). Loyalty is best defined as a state of mind, a set of attitudes, beliefs, desires etc. Loyalty is developed by approaches which reinforce and develop a positive state of mind and the associated behaviors. The exchange of information is one of the key of loyalty, and provides a bridge between state of mind and behavior. Loyal customers are more likely to give information about the service provider (because they trust the service provider and expect from the service provider to use the information with discretion and to their benefits) (Smith and Wright, 2005).
Haskett et al. (1997) suggested that in service sector, the relationships between service quality, customer satisfaction and customer loyalty were self-reinforcing i.e. quality services satisfies customers banking needs and satisfied customer increases the loyal customers. Customers’ loyalty is comprised of both quality services provided by the service industry as well as satisfied customers. The factors of service quality include reliability, responsiveness, empathy, tangibility etc. Similarly, the factors of customers’ satisfaction are few complaints, bank image, pricing plan etc. and the factors of customer loyalty include trust, commitment, profitability, reputation etc.
In sum up, service quality of business affects customers’ satisfaction and customers’ loyalty. Besides, customers’ satisfaction also affects the customers’ loyalty as well as customers’ loyalty included both service quality and customers’ satisfaction in banking industry.
MethodologyThis study is based on primary source of data. The primary source of data has been used to show the quality of service provided by commercial banks, customers’ satisfaction level and customers’ loyalty toward the service provider. The data are also used to show the relationship between the variables of service quality, customers’ satisfaction and customers’ loyalty. The main source of primary data is the structured questionnaire that contains questions related to quality service, customers’ satisfaction and customers’ loyalty. The primary data were collected by fulfilling the questionnaire which contains the respondent related information like yes or no questions, tick mark questions, multiple choice questions, rank questions and 5- scale likert scale questions. There are total 31 commercial banks in Nepal till mid July 2013. While selecting the most
Maharjan 101

reliable sample banks, stratified sampling technique was used. The commercial banks can be used as the strata like public banks, joint venture banks and private (non-joint venture) banks. The sample banks were selected on the basis of respondent representing banks. Table 1 shows the composition of respondents and representing banks.
Table1 shows the composition of respondents and representing banks. Among 31 commercial banks, the respondents represented 29 commercial banks. Out of twenty nine commercial banks, 3 public banks, 6 joint venture banks, and 20 private banks’ customers have been taken as the respondents in this study.
Table 1: Composition of respondents and representing banks
S. No Types of Banks Population (N) No of Respondent Representing Banks
No of respondents Percent %
1 Public Banks 3 3 15 6.73
2 Joint Venture Banks 6 6 59 26.46
3 Private Banks 22 20 149 66.81
Total 31 29 223 100%
Model SpecificationThis study aims to analyze the relationship between service quality, customers’ satisfaction and customers’ loyalty by using simultaneous equation model. Service quality dimensions (like tangibility, reliability responsiveness, empathy, assurance and technology) are used as independent variables. Customers’ satisfaction is taken as both independent and dependent variable and customers’ loyalty is taken as dependent variable only. Multiple regression models are used in this study to analyze the relationship between service quality, customers’ satisfaction and customers’ loyalty. The multiple regression models used in this study are:
CS= α+ β1 TAN+ β2 REL+ β3RES+ β4 ASS+β5 EMP +β6 TEC ………………..…. (i)CL= α+ β1 TAN+ β2 REL+ β3RES+ β4 ASS+β5 EMP +β6 TEC + β7 CS ………. (ii)
Where,CS= Customers’ SatisfactionCL = Customers’ LoyaltyTAN = TangibilityREL = ReliabilityRES = ResponsivenessASS = AssuranceEMP = EmpathyTEC = Technologyα = Intercept of dependent variable and β1, β2, β3, β4, β5, β6 and β7 are the beta coefficients of the explanatory variables to be estimated.
Nepalese Journal of Management 102

Presentation and Analysis of data
Correlation analysisTable 4.9 reveals the spearman’s rho correlation coefficient between dependent variable customers’ loyalty and independent variables like tangibility, reliability, responsiveness, assurance, empathy, technology and customers’ satisfaction. Table shows the strong positive association between independent and dependent variables. The customer loyalty is mostly correlated with customer satisfaction. The correlation value between these variables is 0.65.
Spearman’s Rho correlationThis table presents Spearman’s rho correlation coefficient between dependent variable customer’s loyalty (CL) and independent variables tangibility (TAN), reliability (REL), responsiveness (RES), assurance (ASSS), empathy (EMP), technology (TEC) and customers’ satisfaction (CS).
TAN REL RES ASS EMP TEC CS CL
TAN 1
REL .628** 1
RES .483** .469** 1
ASS 529** .609** .557** 1
EMP .424** .466** .569** .615** 1
TEC .433** .418** .394** .480** .512** 1
CS .491** .573** .505** .562** .512** .511** 1
CL .518** .513** .512** .619** .617** .525** .655** 1
** Correlation is significant at 0.01 level (2-tailed).
The next influencing factor for customer loyalty is assurance. The correlation between assurance and customer loyalty is 0.619. This shows that the trust and confidence of the employees toward the customer are very important for customer loyalty. The polite behavior of the employees, adequate knowledge/information to answer the queries, safe transaction helps to increase customers’ loyalty.
The third influencing factor for customer loyalty is empathy. The correlation value between customer loyalty and empathy is 0.617. The empathy refers to employees’ behavior and personal attention. The personal attentions toward the customer feel that the bank is providing the service with personal touch. Thus, the bank must focus on empathy to increase the customer loyalty.
Hence, it could be concluded that variables like customer satisfaction, assurance and empathy have strong relation with customers’ loyalty then other variables like technology, responsiveness and tangibility.
Maharjan 103

Regression analysisTable 2 present regression results of various models of customers’ satisfaction and service quality factors. The overall result shows that there is the positive relationship between customers’ satisfaction with service quality factors i.e. are assurance, technology, reliability, responsiveness, empathy and tangibility. Among different variables of service quality variables like technology and reliability are significant at 1percent and variables like assurance and responsiveness are significant at 5 percent and remaining like empathy and tangibility are not significant at 5 percent.
The beta coefficient for reliability and technology is higher than other variables which shows that higher the reliability and technology more customer would be satisfied. Since the variables are significant at 1 percentage. Similarly, the beta coefficient for assurance and responsiveness are also higher and they are also significant at 5 percent. Thus to satisfied the customer the focus should be given on the service quality variables like reliability, technology, assurance and responsiveness.
Table 2: Regression analysis of customer satisfaction and service quality factorsThe regression results are based on weighted mean value of perceived likert value of 29 commercial banks of 2013 survey by using linear regression model. The model is, CS = α + β1ASS + β2TEC + β3REL+ β4RES + β5EMP + β6TAN where CS, ASS, TEC, REL, RES, EMP and TAN are customers’ satisfaction, assurance, technology, reliability, responsiveness, empathy and tangibility respectively.
Regression of Coefficient
Models Intercept ASS TEC REL RES EMP TAN Adjr2 SEE F-value
1 0.919 (7.354)**
0.622 (10.872)** 0.346 0.536 118.199
2 0.674 (5.345)**
0.465 (7.595)**
0.270 (5.408)** 0.42 0.504 81.275
3 0.4 (0.9770)*
0.296 (4.285)**
0.241 (4.987)**
0.391 (4.625)** 0.469 0.482 66.337
4 0.249 (2.010)*
0.226 (3.115)**
0.21 (4.304)**
0.357 (4.243)**
0.16 (2.764)** 0.485 0.475 53.171
5 0.249 (1.777)
0.184 (2.412)*
0.187 (3.700)**
0.349 (4.153)**
0.128 (2.128)*
0.109 (1.731) 0.489 0.473 43.525
6 0.232 (1.633)
0.178 (2.280)*
0.181 (3.533)**
0.323 (3.539)**
0.12 (1.960)*
0.11 (1.754)
0.052 (0.742) 0.488 0.474 36.288
Note: i) Figures in parentheses are t- valuesii) ** & * denotes that results are significant at 1 % and 5% level respectively.
Table 3 present regression results of various models of customers’ loyalty and service quality factors as well as customers’ satisfaction. The overall result shows that there is the positive relationship between customers’ satisfaction with service quality factors i.e. are assurance, technology, reliability, responsiveness, empathy and tangibility. Among different variables of service quality variables like technology and reliability are significant at 1percent and variables like assurance and responsiveness are significant at 5 percent and remaining like empathy and tangibility are not significant at 5 percent.
Nepalese Journal of Management 104

The overall result shows that there is the positive relationship between customers’ loyalty with customers’ satisfaction as well as with service quality factors i.e. are assurance, technology, reliability, responsiveness, empathy and tangibility. Customers’ satisfaction is positively significant wit h customers’ loyalty at 1 percent and among different variables of service quality variables like assurance and empathy are significant at 1 percent.
The beta coefficient for customer’ satisfaction is higher than other variables which show that higher the customers’ satisfaction leads to higher customers’ loyalty. Similarly, the beta coefficient for assurance and empathy are also higher and they are also significant at 1 percent. Thus to increase the customer loyalty more focus should be given assurance and empathy.
Table 3: Regression analysis of customers’ loyalty with customers’ satisfaction and service quality factors
The regression results are based on weighted mean value presented in 5 scale likert value of 29 commercial banks of 2013 survey by using linear regression model. The model is CL = α + β1CS+ β2ASS + β3EMP + β4TEC + β5TAN + β6RES where CL, CS, ASS, EMP, TEC, TAN and RES are customers’ loyalty, customers’ satisfaction, assurance, empathy, technology and responsiveness respectively.
Regression of Coefficient
Models Intercept CS ASS EMP TEC TAN RES Adjr2 SEE F-value
1 0.414 (3.265)**
0.764 (13.953)**
0.466 0.54 194.69
2 0.034 (0.267)
0.513 (8.321)**
0.448 (6.896)**
0.559 0.4912 141.635
3 -0.098 (-0.764)
0.446 (7.158)**
0.323 (4.554)**
0.226 (3.835)**
0.585 0.474 105.211
4 -1.28 (-0.988)
0.415 (6.438)**
0.311 (4.376)**
0.198 (3.248)**
0.09 (1.739)
0.589 0.474 80.393
5 -1.87 (-1.375)
0.399 (6.095)**
0.281 (3.800)**
0.196 (3.219)**
0.08 (1.519)
0.089 (1.395)
0.59 0.473 64.983
6 -0.219 (-1.582)
0.388 (5.885)**
0.266 (3.550)**
0.175 (2.774)**
0.076 (1.448)
0.076 (1.163)
0.069 (1.126)
0.602 0.143 54.431
Note: i) Figures in parentheses are t- values
ii) ** & * denotes that results are significant at 1 % and 5% level respectively.
ConclusionThe major conclusion of the study is that service quality, customers’ satisfaction customers’ loyalty in commercial banks of Nepal are positively related. Service quality variables like assurance, technology, reliability and responsiveness have significant positive relation with service quality and variables like customers’ satisfaction, assurance and empathy have significant positive relation with customers’ loyalty. Thus, service quality will help in satisfying customers banking needs and satisfied customer help in retaining the customer for longer period of time and increases customers’ loyalty.
Maharjan 105

The study also reveal that most of customers were satisfied with the services provided by the bank and would like to recommend the bank to their friends, family members and relatives. Customers are also satisfied with the online and internet banking services provided by the bank. As per the study, reliability is the most essential factor for service quality in commercial banks of Nepal and technology is the least essential factor for service quality. Thus, banks must provide timely and error free services to their customers to increase service quality. Bank image is considered as the important factor to increase the satisfaction level of customers and pricing plan considered as the least important factor. So, bank must maintain its image in the financial market to increase the satisfaction level of customers. Trust is the most influencing factor in customer loyalty so bank must gain the trust of customers by bringing the clarity in each transaction and safeguarding customers’ deposits. As per the correlation coefficient the highest relation was recorded between customer loyalty and customers’ satisfaction whereas as correlation between customers’ satisfaction with service quality factors reveal that reliability has the strong relation with customers’ satisfaction.
References
Nepalese Journal of Management 106
Foss, B., and M. Stone, (2001). Successful customer relationship marketing. 1st ed. London: Kogan Page Limited.
Heskett et al. (1997). The service profit chain. New York: The Free Press.
Kumar, M., Kee, F. T., and A. T. Manshor (2009). Determining the relative importance of critical factors in delivering service quality of banks: an application of dominance analysis in SERVQUAL model. Managing Service Quality, 19(2), 211 - 228.
Mudie, P., and A. Pirrie (2006). Services Marketing Management. 3rd ed. Oxford: Elsevier Ltd.
Oliver, R. (1980). A cognitive model of the antecedents and consequences of satisfaction decisions. Journal of Marketing Research, 17(4), 460.
Prabhakaran, S., and S. Satya (2003). An insight into service attributes in banking sector. Journal of Services Research, 3(1), 157-169.

INTERNATIONAL CONFERENCE
CALL FOR PAPERS
Uniglobe College organizes international conference every year on one of the themes related to management. The College invites papers from corporate executives, academicians, research scholars, business entrepreneurs and students for the presentation in International Conference.
The topic may relate to any area of management such as marketing, finance, human resource management, organizational behavior, technology, and accountancy. The paper should preferably be of about 4000 words and preceded by an abstract of around 150 words along with references.
The paper should be original and should not have been submitted anywhere else for any purpose. The participants are requested to send the soft copy of their paper in the standardized format as an attachment.
The paper submitted may be published in conference proceedings or the journals of the college. The acceptance of the paper will be informed at earliest. The abstract should first be submitted at earliest.
More specifically, the research paper may explore any one of the following areas:
1. International business & trade 2. Marketing innovations and ethics
3. Marketing strategies 4. Management information system
5. Entrepreneurship 6. Human resource management
7. Strategic management 8. Operation management
9. Customer relation management 10. Financial management
11. Corporate finance 12. Investment management
13. Financial institutions and markets 14. Business society and ethics
15. International fin. Mgmt.. 16. Global recessions
17. Corporate reporting practice 18. Int’l Actg. Standards
19. Corporate governance 20. Sustainability of fin. Systems
21. Supply chain management 22. E-business
23. Municipal finance 24. Derivatives
25. Insurance and risk management 26. E-governance
27. Financial reporting 28. Management education
29. Banking
More information can be obtained by visiting the College website: www.uniglobe.edu.np.

Pokhara University Affiliate
MBA (FINANCE)MASTER OF BUSINESS ADMINISTRATION (FINANCE)
MBA (Finance)
MBA (Finance) like any other MBA program is more finance focused and contains more finance courses. MBA (Finance) is the only program offered by Pokhara University in Nepal through this college. This academic program is termed as competent both at national and international levels. This two-year program is for those who want to take up the challenging task of becoming managers, entrepreneurs, researchers and academicians. Its uniqueness, among others, in relation to building human capital, is categorically crafted that ensures much needed highly competent human resources in local as well as and global job markets.
Highly competent faculties
Faculties of Uniglobe College are trained in Florida State University, USA; Virginia Polytechnic State University, USA; University of Alabama, USA; Rikkyo University, Japan; University of Tokyo, Japan; University of Warsaw, Poland; Asian Institute of Technology, Thailand; University of Southampton, UK; Cambridge University, UK; Technical University, Germany; Tashkent State University, Uzbekistan; University of Hong Kong, Hong Kong; Indian Institute of Management, Ahmedabad, India; University of Delhi, India; Indian Institute of Mass Communication, India; University of Rajasthan, India; Pune University, India; Banaras Hindu University, India; Tribhuvan University, Nepal; Kathmandu University, Nepal and Pokhara University, Nepal.At Uniglobe College, some of the courses are also taught by foreign faculties who are internationally renowned in their subject areas.
Duration of the CourseMBA (Finance) program is a two-year program stretched over six terms of full-time study, with every academic year having three terms (trimesters).Total credit hours: 69 (more than other MBA program).Eligibility for application: Anyone with minimum 3 years Bachelor’s degree in any discipline with at least 45% in aggregate or CGPA 2.0.Scholarship is available as per the rule of Pokhara University
New Baneshwor, Kathmandu | Tel: 01-4115690, 4115569 | www.uniglobe.edu.np

BBABACHELOR OF BUSINESS ADMINISTRATION
BBA
Uniglobe College runs BBA Program of Pokhara University. It is the most modern and advanced program now offered in Nepal which goes much more beyond the traditional BBA. This four– year rigorous and intensive program is for those who wants to take up the challenging task of becoming middle level managers and entrepreneurs. It also prepares the students for higher level of education.
Pokhara University’s BBA at Uniglobe College realizes the greater needs of business community and prepares the students accordingly. This academic program is, therefore, termed as highly competent and popular at the national level. Its uniqueness, among others, in relation to building human capital, is categorically crafted that ensures much needed highly competent middle level human resources in Nepalese and global job markets.
Highly competent faculties
Faculties at Uniglobe College are trained in Florida State University, USA; Rikkyo University, Japan; Warsaw University, Poland; Asian Institute of Technology, Bangkok; Cambridge College, New Land University, USA; University of Southampton, UK; University of Hong Kong, Hong Kong; Indian Institute of Management, Ahmedabad; University of Delhi, India; Indian Institute of Mass Communication, India; University of Rajasthan, India; Tribhuvan University; Kathmandu University; and Pokhara University, Nepal.
Duration of the Course
BBA program is a four-year program stretched over eight semesters of full-time study, with every academic year having two semesters.Total credit hours 120.
Eligibility for application: Anyone with minimum 3 years Bachelor’s degree in any discipline with at least 45% in aggregate or CGPA 2.0.Scholarship is available as per the rule of Pokhara University
New Baneshwor, KathmanduTel: 01-4115690, 4115569
www.uniglobe.edu.np
Pokhara University Affiliate

BBA-BIBACHELOR OF BUSINESS ADMINISTRATION- BANKING & INSURANCE
BBA-BI
Uniglobe College runs BBA-BI Program of Pokhara University. It is the most modern and advanced focused program now offered in Nepal which goes much more beyond the traditional BBA. This four– year rigorous and intensive program is for those who wants to take up the challenging task of becoming finance focused middle level managers and entrepreneurs. It also prepares the students for higher level of education.
Pokhara University’s BBA-BI at Uniglobe College realizes the greater needs of financial community and prepares the students accordingly. This academic program is, therefore, termed as highly competent and popular at the national level. Its uniqueness, among others, in relation to building finance focused human capital, is categorically crafted that ensures much needed highly competent finance focused middle level human resources in Nepalese and global job markets.
Highly competent faculties
Faculties at Uniglobe College are trained in Florida State University, USA; Rikkyo University, Japan; Warsaw University, Poland; Asian Institute of Technology, Bangkok; Cambridge College, New Land University, USA; University of Southampton, UK; University of Hong Kong, Hong Kong; Indian Institute of Management, Ahmedabad; University of Delhi, India; Indian Institute of Mass Communication, India; University of Rajasthan, India; Tribhuvan University; Kathmandu University; and Pokhara University, Nepal.
Duration of the Course
BBA-BI program is a four-year program stretched over eight semesters of full-time study, with every academic year having two semesters.Total credit hours 120.Eligibility for application: Anyone with minimum 3 years Bachelor’s degree in any discipline with at least 45% in aggregate or CGPA 2.0.Scholarship is available as per the rule of Pokhara University
New Baneshwor, KathmanduTel: 01-4115690, 4115569
www.uniglobe.edu.np
Pokhara University Affiliate

Instructions To Authors1. Papers must be in English. Please submit the manuscript formatted in MS Word 2007 or above in Times New
Roman format in a 12 point font.2. Papers for publication should be sent in quadruplicate to: Dr. Nar Bahadur Bista, Executive Editor, Uniglobe College, P. O. Box 7953, Kathmandu, Nepal. Submission
of a paper will imply that it contains original unpublished work. The Editor does not accept responsibility for damage or loss of papers submitted. Acceptance of an article, means that the author has transferred copyright of the accepted article to the publisher. This transfer will ensure the widest possible dissemination of information. The submission fee is Rs.3000 for members of the Uniglobe College and Rs. 5000 for non- members. Cheques should be made payable to “Nepalese Journal of Management”.
3. Manuscripts should be double spaced with wide margins, and printed on one side of the paper only. All pages should be numbered consecutively. Titles and subtitles should be short, left justified and in the following format:
2. The costs of bankruptcy 2.1. The nature of direct costs 2.1.1. Professional fees and expenses References, tables, and legends for figures should be printed on separate pages.4. The first page of the manuscript should contain the following information: (I) the title; (II) the name(s) and
institutional affiliation(s) of the author(s); (III) an abstract of not more that 100 words. A footnote on the same sheet should give the name, address, telephone number, fax number, and E-mail address of the corresponding author.
5. The first page of the manuscript should also contain key words of about five.6. Acknowledgements and information on grants received can be given in a first footnote which should not be
included in the consecutive numbering of footnotes.7. Footnotes should be kept to a minimum and numbered consecutively throughout the text with superscript Arabic
numerals. They should be single spaced in a 10 point font and not include displayed formulae or tables.8. Displayed formulae should be numbered consecutively throughout the manuscript as (1), (2), etc... against the
-.grit-hand margin of the page. In cases where the derivation of formulae has been abbreviated, it is of great help to the referees if the full derivation can be presented on a separate sheet (not to be published).
9. References to publications should be as follow: “Dahal (1996) reported that...” or “This problem has been studied previously (e.g., Pradhan and Shrestha, 1996)”. The author should make sure that there is a strict one-to-one correspondence between the names and years in the text and those in the references. The list of references should appear at the end of the main text (after any appendices, but before tables). References should be single-spaced and listed in alphabetical order by author’s name. References should appear as follows:
For periodicals: Pradhan and Shrestha, 1994. Seasoned equity offerings: The case of all-equity firms, Nepalese Journal of
Corporate Governance 1(1), 32-43. For working papers: Pradhan, M., 1997. The direct costs of corporate bankruptcy. Working Paper, University of Missouri-Columbia. For books: Theil. H., 1971. Principles of Econometrics. (Wiley, New York, NY). Note that journal titles should not be abbreviated.10. Illustrations will be reproduced photographically from originals supplied by the author; they will not be
redrawn by the publisher. Please provide all illustrations in quadruplicate (one high-contrast original and three photocopies). Care should be taken that lettering and symbols are of a comparable size. The illustrations should not be inserted in the text, and should be marked on the back with figure number, title of paper, and author’s name. All graphs and diagrams should be referred to as figures and should be numbered consecutively in the text in Arabic numerals.
11. Tables should be numbered consecutively in the text in Arabic numerals and printed on separate sheets. The table number should be left justified and appear above the actual table. Underneath the table number and also left justified should appear the table title in bold. Beneath the table title should then follow descriptive material which will allow the table to be read independent of the textual material. Tables should appear as follows:
Table 1 Distribution of debts and costs Frequency distributions are reported for 48 cases of Chapter 7 and 27 cases of Chapter 11 that are filed between 1981 and 1991 in the U.S. Bankruptcy Court (Western District of Tennessee). Debt consists of all claims For figures, follow a format similar to that of tables, but place the figure number, title and description beneath the
figure.12. Any manuscript which does not confirm to the above instructions will be rejected.13. Page proofs may be sent to the corresponding author. Proofs should be corrected carefully; the responsibility for
detecting errors lies with the author. Corrections should be restricted to instances in which the proof is at variance with the manuscript. Extensive alterations will be charged.