Ecological Pyramids - Narajole Raj College
37
COMPILED AND CIRCULATED BY DR. POULAMI ADHIKARY MUKHERJEE, ASSISTANT PROFESSOR, DEPARTMENT OF ZOOLOGY, NARAJOLE RAJ COLLEGE ZOOLOGY: SEM- I, PAPER- C2T: ECOLOGY, UNIT 4: ECOSYSTEM E E c c o o l l o o g g i i c c a a l l P P y y r r a a m m i i d d s s B B B Y Y Y D D R R . . P P O O U U L L A A M M I I A A D D H H I I K K A A R R Y Y M M U U K K H H E E R R J J E E E E A A S S S S I I S S T T A A N N T T P P R R O O F F E E S S S S O O R R D D E E P P A A R R T T M M E E N N T T O O F F Z Z O O O O L L O O G G Y Y N N A A R R A A J J O O L L E E R R A A J J C C O O L L L L E E G G E E
-
Upload
khangminh22 -
Category
Documents
-
view
1 -
download
0
Transcript of Ecological Pyramids - Narajole Raj College
COMPILED AND CIRCULATED BY DR. POULAMI ADHIKARY MUKHERJEE, ASSISTANT
PROFESSOR, DEPARTMENT OF ZOOLOGY, NARAJOLE RAJ COLLEGE
ZOOLOGY: SEM- I, PAPER- C2T: ECOLOGY, UNIT 4: ECOSYSTEM
EEccoollooggiiccaall PPyyrraammiiddss
BBBYYY
DDRR.. PPOOUULLAAMMII AADDHHIIKKAARRYY MMUUKKHHEERRJJEEEE
AASSSSIISSTTAANNTT PPRROOFFEESSSSOORR
DDEEPPAARRTTMMEENNTT OOFF ZZOOOOLLOOGGYY
NNAARRAAJJOOLLEE RRAAJJ CCOOLLLLEEGGEE

COMPILED AND CIRCULATED BY DR. POULAMI ADHIKARY MUKHERJEE, ASSISTANT
PROFESSOR, DEPARTMENT OF ZOOLOGY, NARAJOLE RAJ COLLEGE
ZOOLOGY: SEM- I, PAPER- C2T: ECOLOGY, UNIT 4: ECOSYSTEM
Ecological Pyramid Definition:
An ecological pyramid (also trophic pyramid, Eltonian pyramid, energy
pyramid, or sometimes food pyramid) is a graphical representation
designed to show the biomass or bioproductivity at each trophic level in a
given ecosystem. An ecological pyramid is a graphical representation of
the relationship between the different living organisms at different
trophic levels.
The concept of pyramid of numbers ("Eltonian pyramid") was developed
by Charles Elton (1927). Later, it would also be expressed in terms of

COMPILED AND CIRCULATED BY DR. POULAMI ADHIKARY MUKHERJEE, ASSISTANT
PROFESSOR, DEPARTMENT OF ZOOLOGY, NARAJOLE RAJ COLLEGE
ZOOLOGY: SEM- I, PAPER- C2T: ECOLOGY, UNIT 4: ECOSYSTEM
biomass by Bodenheimer (1938). The idea of pyramid of productivity or
energy relies on works of G. Evelyn Hutchinson and Raymond Lindeman
(1942). It can be observed that these pyramids are in the shape of actual
pyramids with the base being the broadest, which is covered by the
lowest trophic level, i.e., producers. The next level is occupied by the next
trophic level, i.e., the primary consumers and so on. All the calculations
for construction of these types of ecological pyramids must take into
account all the organisms in a particular trophic level because a sample
space of a few numbers or a few species will end up giving a huge level of
errors.
COMPILED AND CIRCULATED BY DR. POULAMI ADHIKARY MUKHERJEE, ASSISTANT
PROFESSOR, DEPARTMENT OF ZOOLOGY, NARAJOLE RAJ COLLEGE
ZOOLOGY: SEM- I, PAPER- C2T: ECOLOGY, UNIT 4: ECOSYSTEM
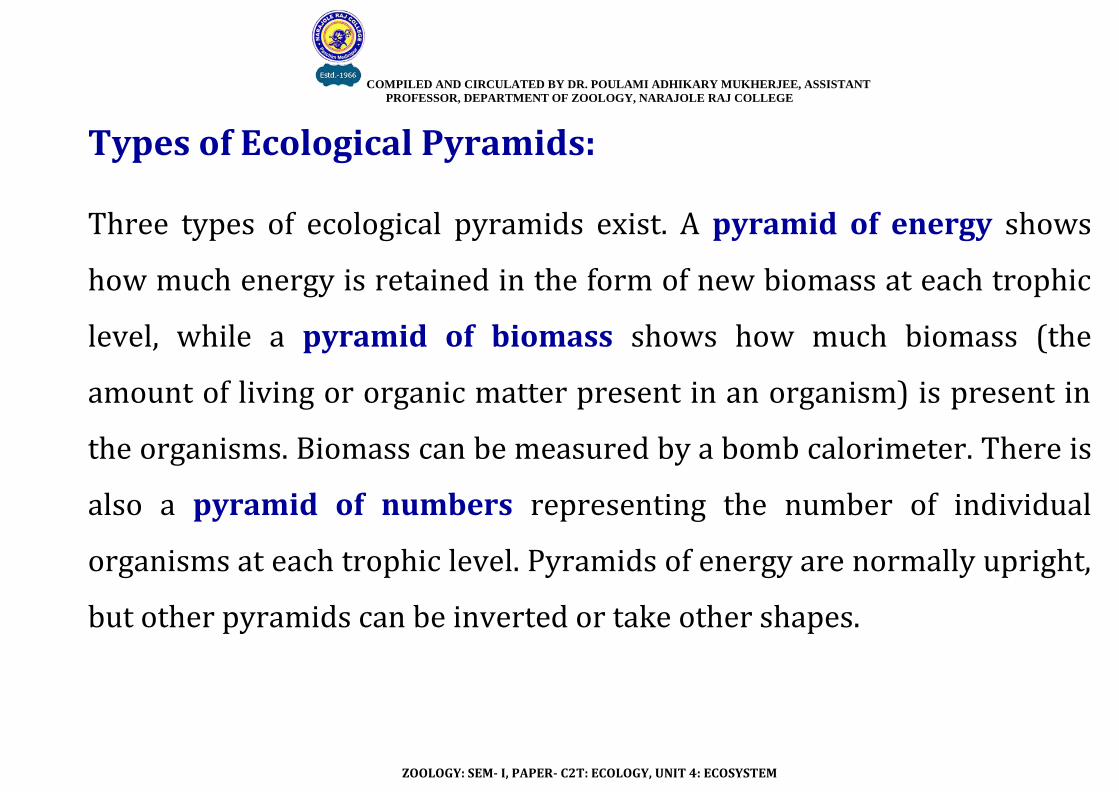
Types of Ecological Pyramids:
Three types of ecological pyramids exist. A pyramid of energy shows
how much energy is retained in the form of new biomass at each trophic
level, while a pyramid of biomass shows how much biomass (the
amount of living or organic matter present in an organism) is present in
the organisms. Biomass can be measured by a bomb calorimeter. There is
also a pyramid of numbers representing the number of individual
organisms at each trophic level. Pyramids of energy are normally upright,
but other pyramids can be inverted or take other shapes.
COMPILED AND CIRCULATED BY DR. POULAMI ADHIKARY MUKHERJEE, ASSISTANT
PROFESSOR, DEPARTMENT OF ZOOLOGY, NARAJOLE RAJ COLLEGE
ZOOLOGY: SEM- I, PAPER- C2T: ECOLOGY, UNIT 4: ECOSYSTEM
COMPILED AND CIRCULATED BY DR. POULAMI ADHIKARY MUKHERJEE, ASSISTANT
PROFESSOR, DEPARTMENT OF ZOOLOGY, NARAJOLE RAJ COLLEGE
ZOOLOGY: SEM- I, PAPER- C2T: ECOLOGY, UNIT 4: ECOSYSTEM
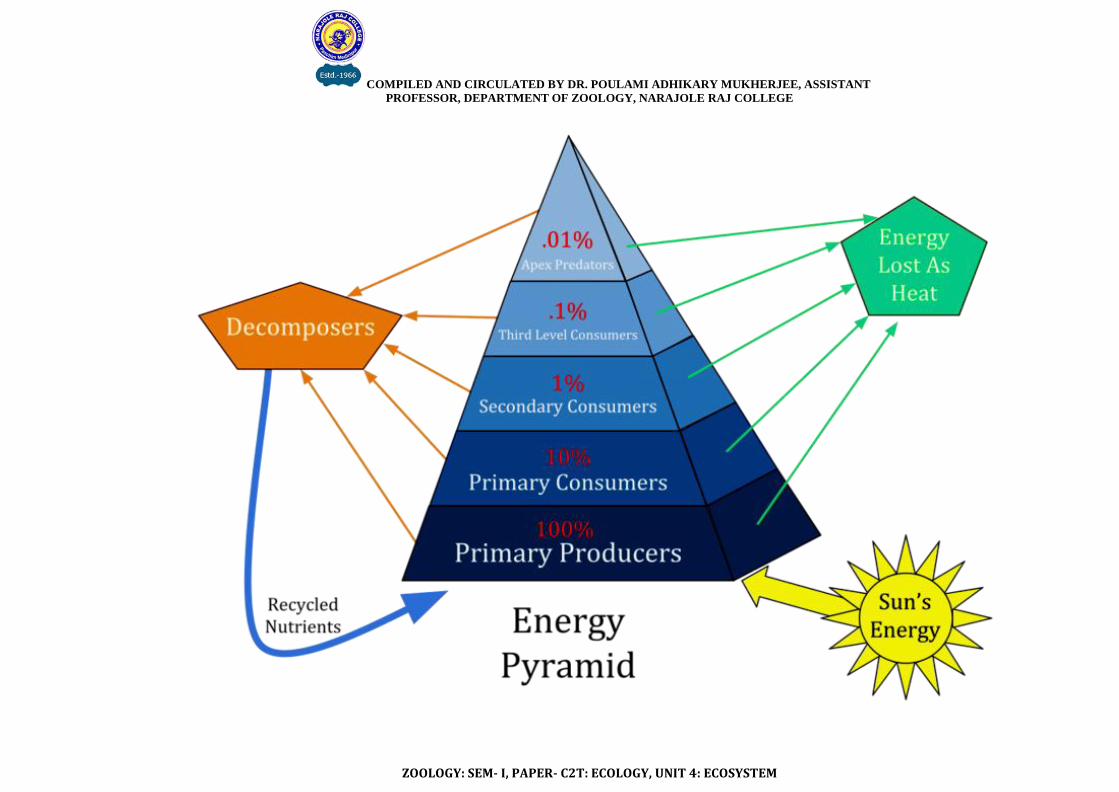
Ecological pyramids begin with producers on the bottom (such as plants)
and proceed through the various trophic levels (such as herbivores that
eat plants, then carnivores that eat flesh, then omnivores that eat both
plants and flesh, and so on). The highest level is the top of the food chain.
The sun has been included in this diagram, as it’s the main source of all
energy, as well the decomposers, like bacteria and fungi, which can
acquire nutrients and energy from all trophic levels by breaking down
dead or decaying organisms. As shown, the nutrients then go back into
the soil and are taken up by plants.
COMPILED AND CIRCULATED BY DR. POULAMI ADHIKARY MUKHERJEE, ASSISTANT
PROFESSOR, DEPARTMENT OF ZOOLOGY, NARAJOLE RAJ COLLEGE
ZOOLOGY: SEM- I, PAPER- C2T: ECOLOGY, UNIT 4: ECOSYSTEM
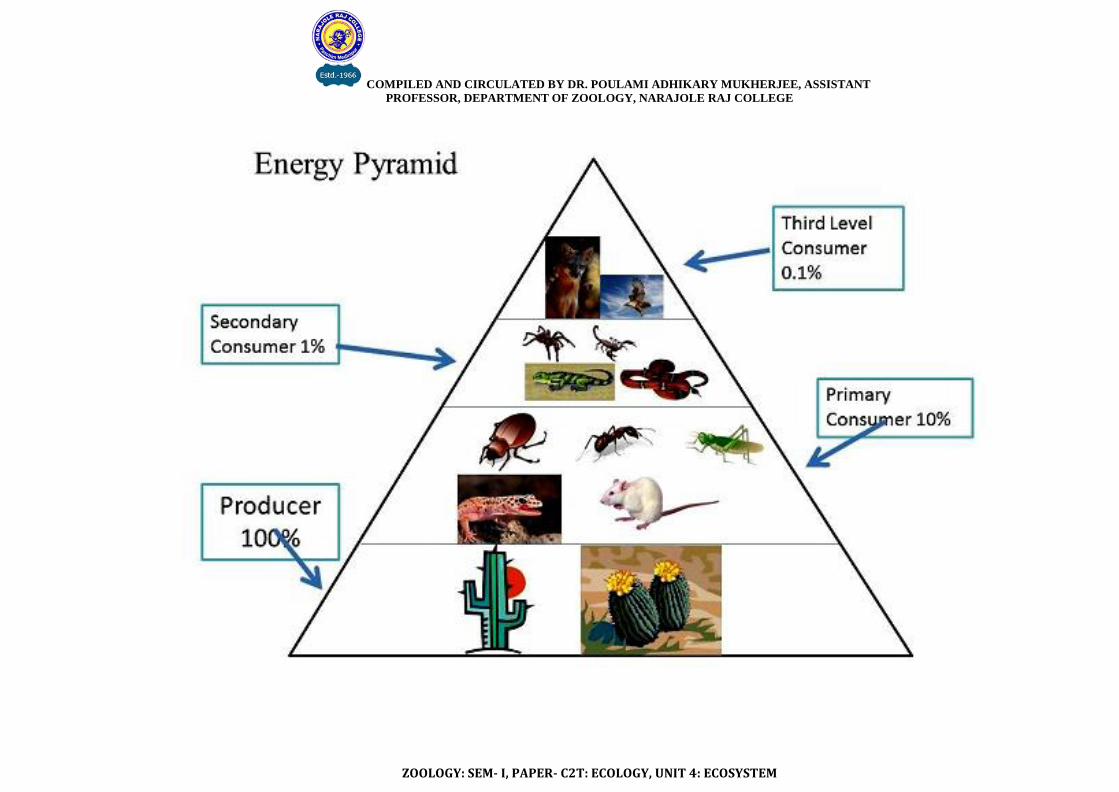
The loss of energy to the surroundings is also shown in this diagram, and
the total energy transfer has been calculated. We start off with the total
amount of energy that the primary producers contain, which is indicated
by 100%. As we go up one level, 90% of that energy is used in ways other
than to create flesh. What the primary consumers end up with is just 10%
of the starting energy, and, 10% of that 10% is lost in the transfer to the
next level. That’s 1%, and so on. The predators at the apex, then, will only
receive 0.01% of the starting energy! This inefficiency in the system is the
reason why productivity pyramids are always upright. A pyramid of
energy represents how much energy, initially from the sun, is retained or

COMPILED AND CIRCULATED BY DR. POULAMI ADHIKARY MUKHERJEE, ASSISTANT
PROFESSOR, DEPARTMENT OF ZOOLOGY, NARAJOLE RAJ COLLEGE
ZOOLOGY: SEM- I, PAPER- C2T: ECOLOGY, UNIT 4: ECOSYSTEM
stored in the form of new biomass at each trophic level in an ecosystem.
Typically, about 10% of the energy is transferred from one trophic level
to the next, thus preventing a large number of trophic levels. Energy
pyramids are necessarily upright in healthy ecosystems, that is, there
must always be more energy available at a given level of the pyramid to
support the energy and biomass requirement of the next trophic level.
Energy moves up the pyramid, starting with the primary producers, or
autotrophs, such as plants and algae at the very bottom, followed by the
primary consumers, which feed on these plants, then secondary
consumers, which feed on the primary consumers, and so on.
COMPILED AND CIRCULATED BY DR. POULAMI ADHIKARY MUKHERJEE, ASSISTANT
PROFESSOR, DEPARTMENT OF ZOOLOGY, NARAJOLE RAJ COLLEGE
ZOOLOGY: SEM- I, PAPER- C2T: ECOLOGY, UNIT 4: ECOSYSTEM
The different types of Pyramids are as follows:
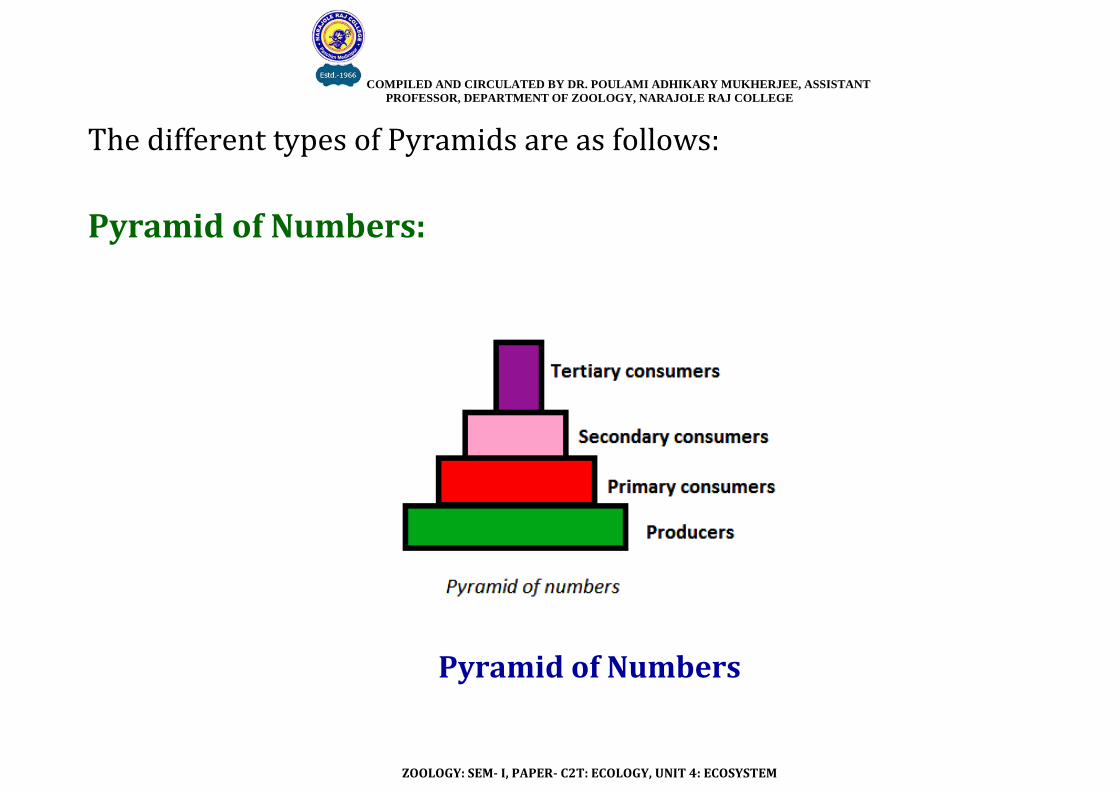
Pyramid of Numbers:
Pyramid of Numbers
COMPILED AND CIRCULATED BY DR. POULAMI ADHIKARY MUKHERJEE, ASSISTANT
PROFESSOR, DEPARTMENT OF ZOOLOGY, NARAJOLE RAJ COLLEGE
ZOOLOGY: SEM- I, PAPER- C2T: ECOLOGY, UNIT 4: ECOSYSTEM
In this type of ecological pyramid, the number of organisms in each
trophic level is considered as a level in the pyramid. A pyramid of number
shows graphically the number of individual organisms involved at each
level in a food chain. In other words, it is the graphic representation of
number of individuals per unit area of various trophic levels. This shows
the number of organisms in each trophic level without any consideration
for their individual sizes or biomass. The pyramid of numbers is usually
upright except for some situations like that of the detritus food chain,
where many organisms feed on one dead plant or animal. The pyramid is
not necessarily upright. For example, it will be inverted if beetles are
COMPILED AND CIRCULATED BY DR. POULAMI ADHIKARY MUKHERJEE, ASSISTANT
PROFESSOR, DEPARTMENT OF ZOOLOGY, NARAJOLE RAJ COLLEGE
ZOOLOGY: SEM- I, PAPER- C2T: ECOLOGY, UNIT 4: ECOSYSTEM
feeding from the output of forest trees, or parasites are feeding on large
host animals. Large number of producers tends to form the base whereas
lower number of top predators or carnivores occupies the tip. The shape
of the pyramid of numbers varies from ecosystem to ecosystem.
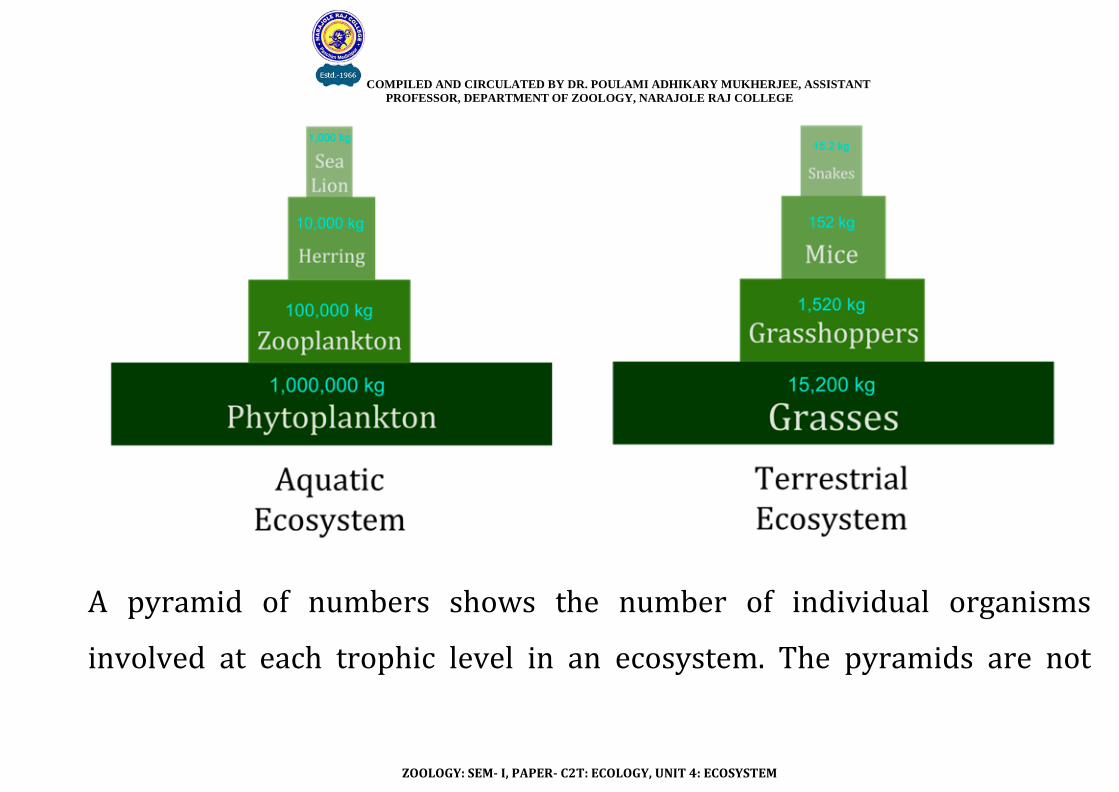
For example, in an aquatic ecosystem or grassland areas, autotrophs or
producers are present in large number per unit area. The producers
support a lesser number of herbivores, which in turn supports fewer
carnivores.
COMPILED AND CIRCULATED BY DR. POULAMI ADHIKARY MUKHERJEE, ASSISTANT
PROFESSOR, DEPARTMENT OF ZOOLOGY, NARAJOLE RAJ COLLEGE
ZOOLOGY: SEM- I, PAPER- C2T: ECOLOGY, UNIT 4: ECOSYSTEM
A pyramid of numbers shows the number of individual organisms
involved at each trophic level in an ecosystem. The pyramids are not
COMPILED AND CIRCULATED BY DR. POULAMI ADHIKARY MUKHERJEE, ASSISTANT
PROFESSOR, DEPARTMENT OF ZOOLOGY, NARAJOLE RAJ COLLEGE
ZOOLOGY: SEM- I, PAPER- C2T: ECOLOGY, UNIT 4: ECOSYSTEM
necessarily upright. In some ecosystems there can be more primary
consumers than producers.
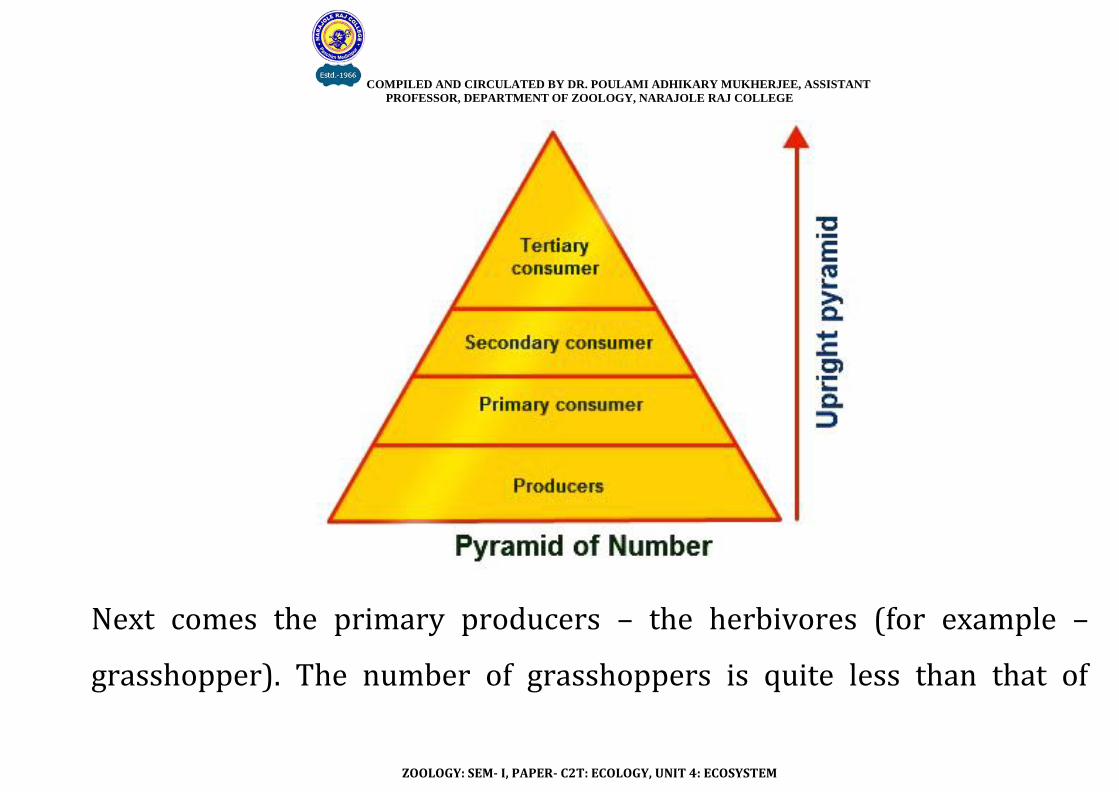
Upright Pyramid of Numbers:
In upright pyramid of numbers, the number of individuals decreases
from the lower level to the higher level. This type of pyramid is usually
found in the grassland ecosystem and the pond ecosystem. The grass in a
grassland ecosystem occupies the lowest trophic level because of its
abundance.
COMPILED AND CIRCULATED BY DR. POULAMI ADHIKARY MUKHERJEE, ASSISTANT
PROFESSOR, DEPARTMENT OF ZOOLOGY, NARAJOLE RAJ COLLEGE
ZOOLOGY: SEM- I, PAPER- C2T: ECOLOGY, UNIT 4: ECOSYSTEM
Next comes the primary producers – the herbivores (for example –
grasshopper). The number of grasshoppers is quite less than that of
COMPILED AND CIRCULATED BY DR. POULAMI ADHIKARY MUKHERJEE, ASSISTANT
PROFESSOR, DEPARTMENT OF ZOOLOGY, NARAJOLE RAJ COLLEGE
ZOOLOGY: SEM- I, PAPER- C2T: ECOLOGY, UNIT 4: ECOSYSTEM
grass. Then, there are the primary carnivores, for example, the rat whose
number is far less than the grasshoppers. The next trophic level is the
secondary consumers such as the snakes who feed on the rats. Then,
there are the top carnivores such as the hawks who eat snakes and
whose number is less than the snakes.
The number of species decreases towards the higher levels in this
pyramidal structure.
Inverted Pyramid of Numbers:
Here, the number of individuals increase from the lower level to the
higher trophic level. For example, the tree ecosystem.
COMPILED AND CIRCULATED BY DR. POULAMI ADHIKARY MUKHERJEE, ASSISTANT
PROFESSOR, DEPARTMENT OF ZOOLOGY, NARAJOLE RAJ COLLEGE
ZOOLOGY: SEM- I, PAPER- C2T: ECOLOGY, UNIT 4: ECOSYSTEM
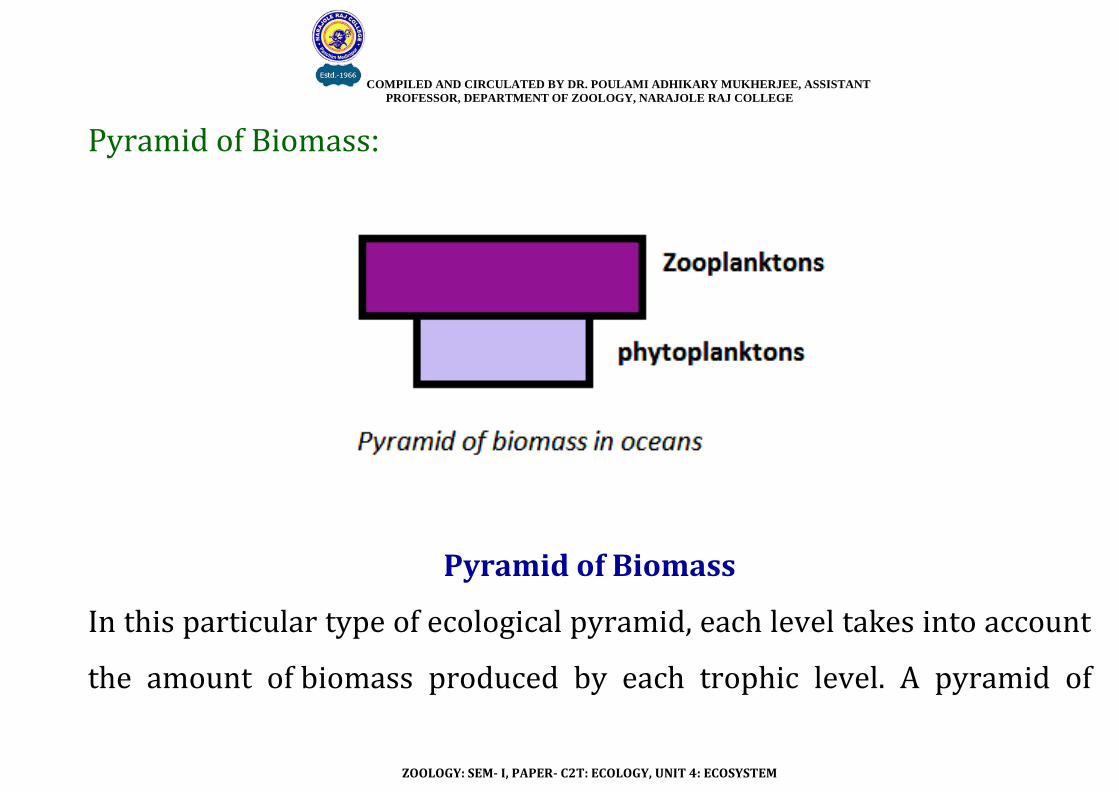
Pyramid of Biomass:
Pyramid of Biomass
In this particular type of ecological pyramid, each level takes into account
the amount of biomass produced by each trophic level. A pyramid of
COMPILED AND CIRCULATED BY DR. POULAMI ADHIKARY MUKHERJEE, ASSISTANT
PROFESSOR, DEPARTMENT OF ZOOLOGY, NARAJOLE RAJ COLLEGE
ZOOLOGY: SEM- I, PAPER- C2T: ECOLOGY, UNIT 4: ECOSYSTEM
biomass shows the relationship between biomass and trophic level by
quantifying the biomass present at each trophic level of an ecological
community at a particular time. It is a graphical representation of
biomass (total amount of living or organic matter in an ecosystem)
present in unit area in different trophic levels. Typical units are grams
per square meter, or calories per square meter. It is drawn with the
producers at the base and the top carnivores at the tip.
Pyramid of biomass is generally ascertained by gathering all organisms
occupying each trophic level separately and measuring their dry weight.
COMPILED AND CIRCULATED BY DR. POULAMI ADHIKARY MUKHERJEE, ASSISTANT
PROFESSOR, DEPARTMENT OF ZOOLOGY, NARAJOLE RAJ COLLEGE
ZOOLOGY: SEM- I, PAPER- C2T: ECOLOGY, UNIT 4: ECOSYSTEM
Each trophic level has a certain mass of living material at a particular
time called standing crop, which is measured as the mass of living
organisms (biomass) or the number in a unit area. The pyramid of
biomass is also upright except for that observed in oceans where large
numbers of zooplanktons depend on a relatively smaller number of
phytoplanktons. The pyramid of biomass may be "inverted". For example,
in a pond ecosystem, the standing crop of phytoplankton, the major
producers, at any given point will be lower than the mass of the
heterotrophs, such as fish and insects. This is explained as the

COMPILED AND CIRCULATED BY DR. POULAMI ADHIKARY MUKHERJEE, ASSISTANT
PROFESSOR, DEPARTMENT OF ZOOLOGY, NARAJOLE RAJ COLLEGE
ZOOLOGY: SEM- I, PAPER- C2T: ECOLOGY, UNIT 4: ECOSYSTEM
phytoplankton reproduce very quickly, but have much shorter individual
lives.
COMPILED AND CIRCULATED BY DR. POULAMI ADHIKARY MUKHERJEE, ASSISTANT
PROFESSOR, DEPARTMENT OF ZOOLOGY, NARAJOLE RAJ COLLEGE
ZOOLOGY: SEM- I, PAPER- C2T: ECOLOGY, UNIT 4: ECOSYSTEM
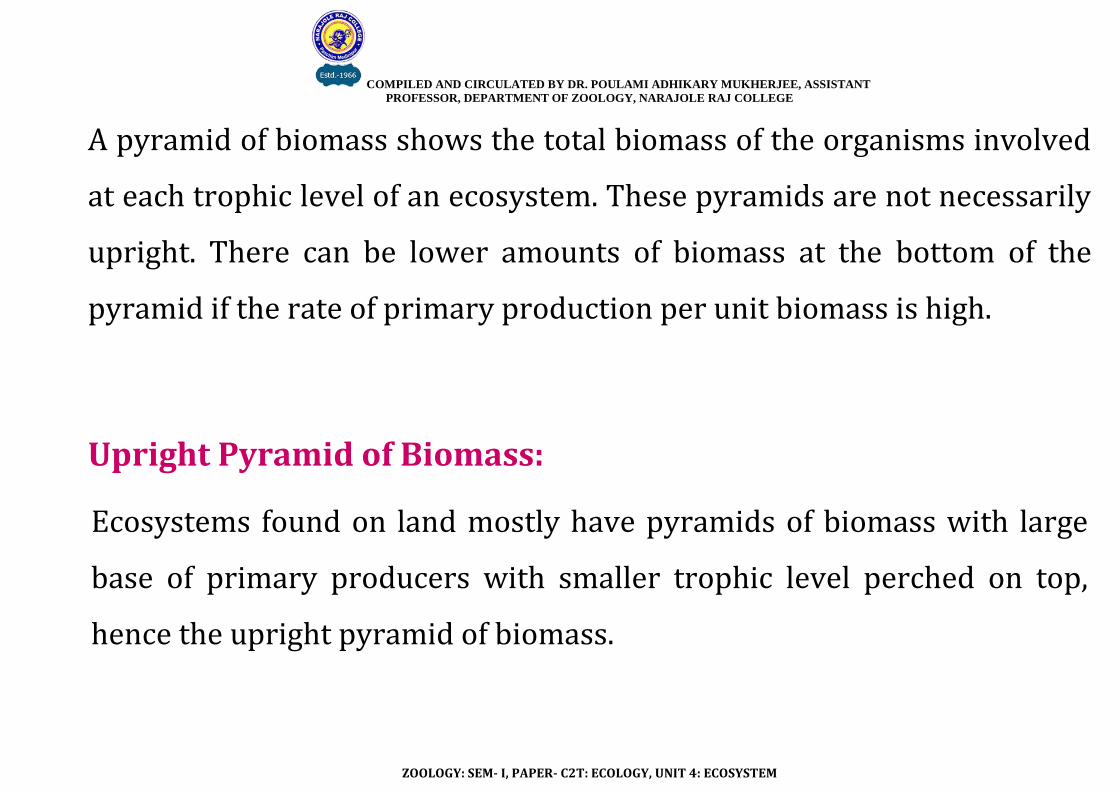
A pyramid of biomass shows the total biomass of the organisms involved
at each trophic level of an ecosystem. These pyramids are not necessarily
upright. There can be lower amounts of biomass at the bottom of the
pyramid if the rate of primary production per unit biomass is high.
Upright Pyramid of Biomass:
Ecosystems found on land mostly have pyramids of biomass with large
base of primary producers with smaller trophic level perched on top,
hence the upright pyramid of biomass.
COMPILED AND CIRCULATED BY DR. POULAMI ADHIKARY MUKHERJEE, ASSISTANT
PROFESSOR, DEPARTMENT OF ZOOLOGY, NARAJOLE RAJ COLLEGE
ZOOLOGY: SEM- I, PAPER- C2T: ECOLOGY, UNIT 4: ECOSYSTEM
COMPILED AND CIRCULATED BY DR. POULAMI ADHIKARY MUKHERJEE, ASSISTANT
PROFESSOR, DEPARTMENT OF ZOOLOGY, NARAJOLE RAJ COLLEGE
ZOOLOGY: SEM- I, PAPER- C2T: ECOLOGY, UNIT 4: ECOSYSTEM
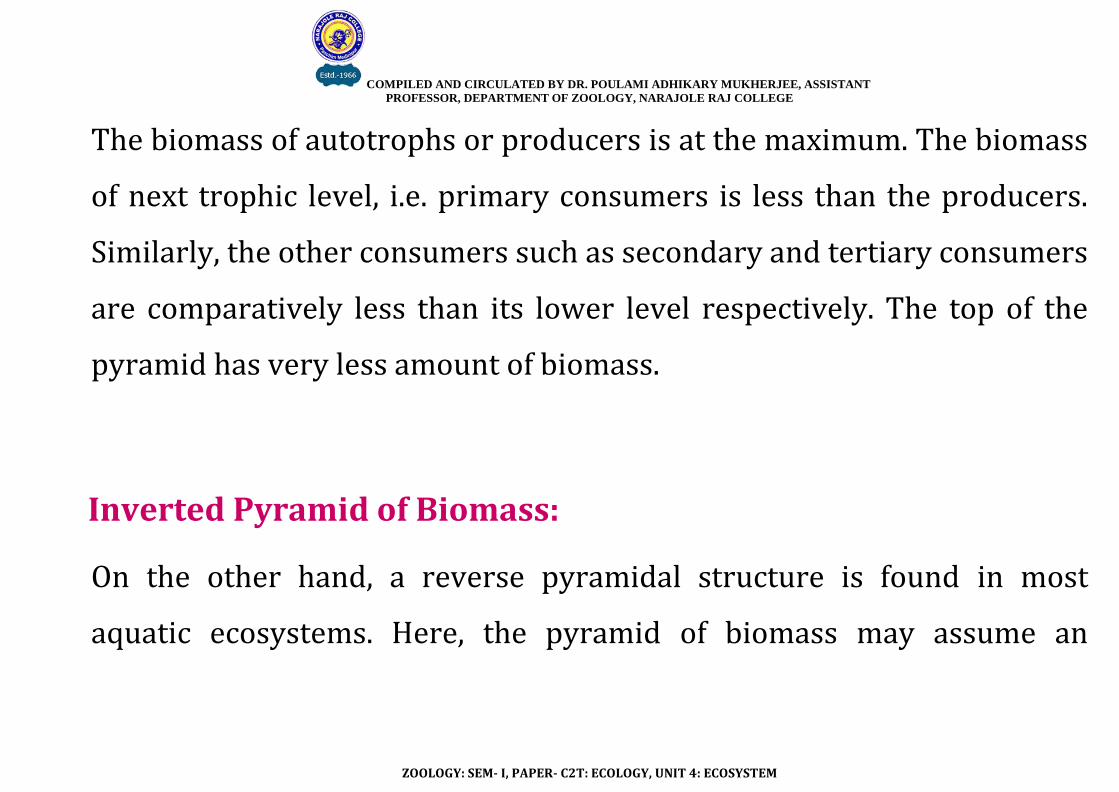
The biomass of autotrophs or producers is at the maximum. The biomass
of next trophic level, i.e. primary consumers is less than the producers.
Similarly, the other consumers such as secondary and tertiary consumers
are comparatively less than its lower level respectively. The top of the
pyramid has very less amount of biomass.
Inverted Pyramid of Biomass:
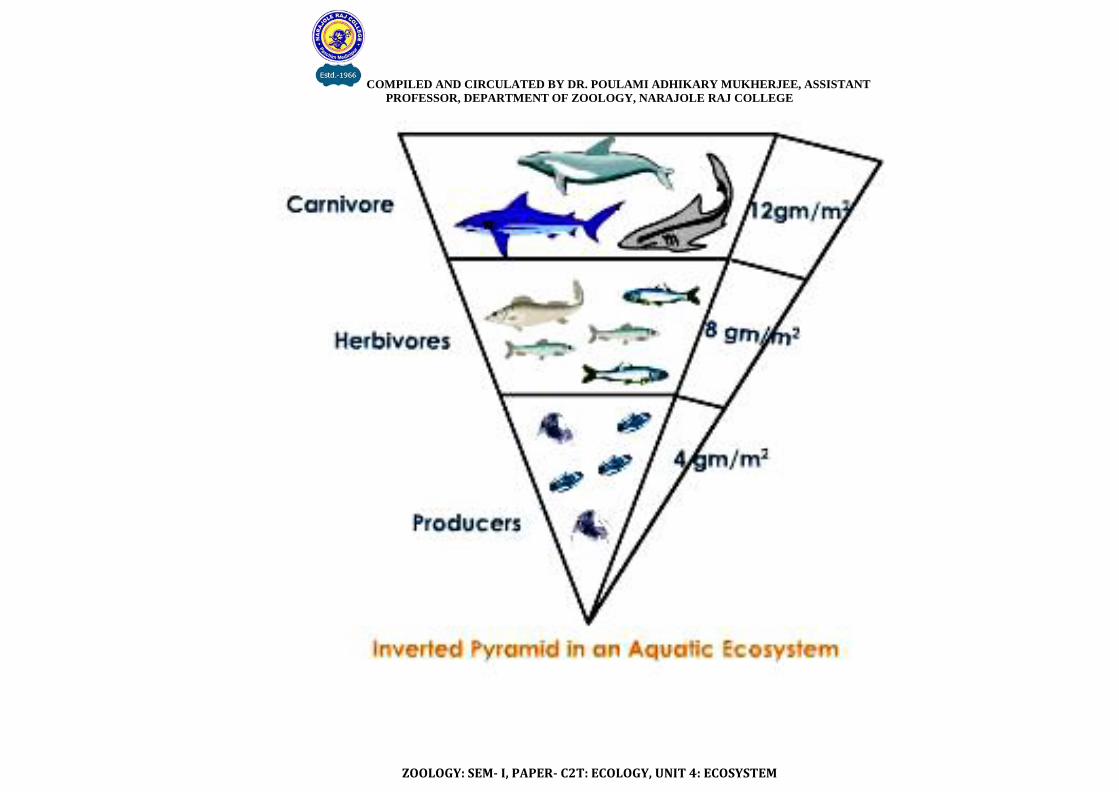
On the other hand, a reverse pyramidal structure is found in most
aquatic ecosystems. Here, the pyramid of biomass may assume an

COMPILED AND CIRCULATED BY DR. POULAMI ADHIKARY MUKHERJEE, ASSISTANT
PROFESSOR, DEPARTMENT OF ZOOLOGY, NARAJOLE RAJ COLLEGE
ZOOLOGY: SEM- I, PAPER- C2T: ECOLOGY, UNIT 4: ECOSYSTEM
inverted pattern. However, pyramid of numbers for aquatic ecosystem is
upright.
In a water body, the producers are tiny phytoplankton that grow and
reproduce rapidly. In this condition, the pyramid of biomass has a small
base, with the producer biomass at the base providing support to
consumer biomass of large weight. Hence, it assumes an inverted shape.
COMPILED AND CIRCULATED BY DR. POULAMI ADHIKARY MUKHERJEE, ASSISTANT
PROFESSOR, DEPARTMENT OF ZOOLOGY, NARAJOLE RAJ COLLEGE
ZOOLOGY: SEM- I, PAPER- C2T: ECOLOGY, UNIT 4: ECOSYSTEM

COMPILED AND CIRCULATED BY DR. POULAMI ADHIKARY MUKHERJEE, ASSISTANT
PROFESSOR, DEPARTMENT OF ZOOLOGY, NARAJOLE RAJ COLLEGE
ZOOLOGY: SEM- I, PAPER- C2T: ECOLOGY, UNIT 4: ECOSYSTEM
Pyramid of Energy:
Pyramid of Energy
COMPILED AND CIRCULATED BY DR. POULAMI ADHIKARY MUKHERJEE, ASSISTANT
PROFESSOR, DEPARTMENT OF ZOOLOGY, NARAJOLE RAJ COLLEGE
ZOOLOGY: SEM- I, PAPER- C2T: ECOLOGY, UNIT 4: ECOSYSTEM
A pyramid of energy or pyramid of productivity shows the production or
turnover (the rate at which energy or mass is transferred from one
trophic level to the next) of biomass at each trophic level. Instead of
showing a single snapshot in time, productivity pyramids show the flow
of energy through the food chain. Typical units are grams per square
meter per year or calories per square meter per year. As with the others,
this graph shows producers at the bottom and higher trophic levels on
top.
COMPILED AND CIRCULATED BY DR. POULAMI ADHIKARY MUKHERJEE, ASSISTANT
PROFESSOR, DEPARTMENT OF ZOOLOGY, NARAJOLE RAJ COLLEGE
ZOOLOGY: SEM- I, PAPER- C2T: ECOLOGY, UNIT 4: ECOSYSTEM
When an ecosystem is healthy, this graph produces a standard ecological
pyramid. This is because in order for the ecosystem to sustain itself, there
must be more energy at lower trophic levels than there is at higher
trophic levels. This allows organisms on the lower levels to not only
maintain a stable population, but also to transfer energy up the pyramid.
The exception to this generalization is when portions of a food web are
supported by inputs of resources from outside the local community. In
small, forested streams, for example, the volume of higher levels is
greater than could be supported by the local primary production.
COMPILED AND CIRCULATED BY DR. POULAMI ADHIKARY MUKHERJEE, ASSISTANT
PROFESSOR, DEPARTMENT OF ZOOLOGY, NARAJOLE RAJ COLLEGE
ZOOLOGY: SEM- I, PAPER- C2T: ECOLOGY, UNIT 4: ECOSYSTEM
Energy usually enters ecosystems from the Sun. The primary producers
at the base of the pyramid use the solar radiation to power
photosynthesis, which produces food. However most wavelengths in
solar radiation cannot be used for photosynthesis, so they are reflected
back into space or absorbed elsewhere and converted to heat. Only 1 to 2
percent of the energy from the sun is absorbed by photosynthetic
processes, and converted into food. When energy is transferred to higher
trophic levels, on average only about 10% is used at each level to build
new biomass, becoming stored energy. The rest goes to metabolic
processes such as growth, respiration, and reproduction.
COMPILED AND CIRCULATED BY DR. POULAMI ADHIKARY MUKHERJEE, ASSISTANT
PROFESSOR, DEPARTMENT OF ZOOLOGY, NARAJOLE RAJ COLLEGE
ZOOLOGY: SEM- I, PAPER- C2T: ECOLOGY, UNIT 4: ECOSYSTEM
Advantages of the pyramid of energy as a representation:
1. It takes account of the rate of production over a period of time.
2. Two species of comparable biomass may have very different life
spans. Thus a direct comparison of their total biomasses is
misleading, but their productivity is directly comparable.
3. The relative energy chain within an ecosystem can be compared
using pyramids of energy; also different ecosystems can be
compared.
4. There are no inverted pyramids.
5. The input of solar energy can be added.
COMPILED AND CIRCULATED BY DR. POULAMI ADHIKARY MUKHERJEE, ASSISTANT
PROFESSOR, DEPARTMENT OF ZOOLOGY, NARAJOLE RAJ COLLEGE
ZOOLOGY: SEM- I, PAPER- C2T: ECOLOGY, UNIT 4: ECOSYSTEM
Disadvantages of the pyramid of energy as a representation:
1. The rate of biomass production of an organism is required, which
involves measuring growth and reproduction through time.
2. There is still the difficulty of assigning the organisms to a specific
trophic level. As well as the organisms in the food chains there is
the problem of assigning the decomposers and detritivores to a
particular trophic level.
Pyramid of energy is the only type of ecological pyramid, which is always
upright as the energy flow in a food chain is always unidirectional. Also,
COMPILED AND CIRCULATED BY DR. POULAMI ADHIKARY MUKHERJEE, ASSISTANT
PROFESSOR, DEPARTMENT OF ZOOLOGY, NARAJOLE RAJ COLLEGE
ZOOLOGY: SEM- I, PAPER- C2T: ECOLOGY, UNIT 4: ECOSYSTEM
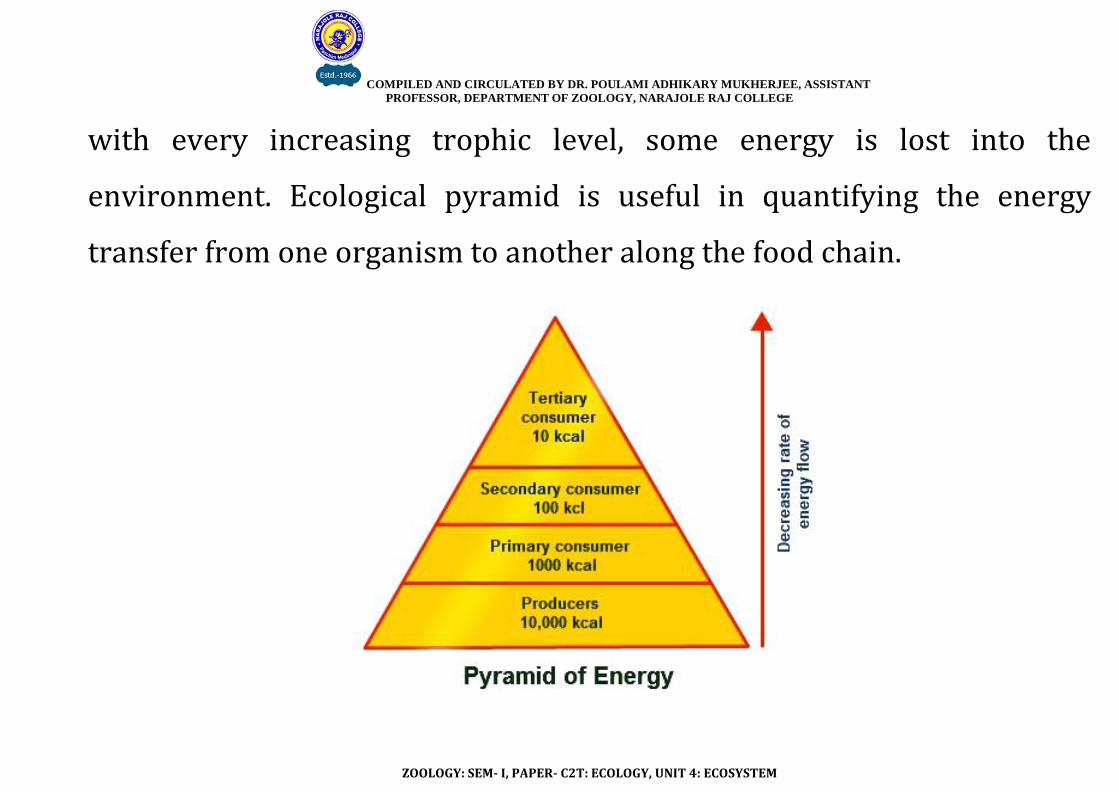
with every increasing trophic level, some energy is lost into the
environment. Ecological pyramid is useful in quantifying the energy
transfer from one organism to another along the food chain.
COMPILED AND CIRCULATED BY DR. POULAMI ADHIKARY MUKHERJEE, ASSISTANT
PROFESSOR, DEPARTMENT OF ZOOLOGY, NARAJOLE RAJ COLLEGE
ZOOLOGY: SEM- I, PAPER- C2T: ECOLOGY, UNIT 4: ECOSYSTEM
Energy decreases as one moves through the trophic levels from the
bottom to the top of the pyramid. Thus, the energy pyramid is always
upward.
Function of Ecological Pyramid:
1. An ecological pyramid not only shows us the feeding patterns of
organisms in different ecosystems, but can also give us an insight
into how inefficient energy transfer is, and show the influence that a
change in numbers at one trophic level can have on the trophic
levels above and below it.
COMPILED AND CIRCULATED BY DR. POULAMI ADHIKARY MUKHERJEE, ASSISTANT
PROFESSOR, DEPARTMENT OF ZOOLOGY, NARAJOLE RAJ COLLEGE
ZOOLOGY: SEM- I, PAPER- C2T: ECOLOGY, UNIT 4: ECOSYSTEM
2. Also, when data are collected over the years, the effects of the
changes that take place in the environment on the organisms can be
studied by comparing the data.
3. If an ecosystem’s conditions are found to be worsening over the
years because of pollution or overhunting by humans, action can be
taken to prevent further damage and possibly reverse some of the
present damage.
COMPILED AND CIRCULATED BY DR. POULAMI ADHIKARY MUKHERJEE, ASSISTANT
PROFESSOR, DEPARTMENT OF ZOOLOGY, NARAJOLE RAJ COLLEGE
ZOOLOGY: SEM- I, PAPER- C2T: ECOLOGY, UNIT 4: ECOSYSTEM
Importance of Ecological Pyramid:
The importance of ecological pyramid can be explained in the following
points:
1. They show the feeding of different organisms in different
ecosystems.
2. It shows the efficiency of energy transfer.
3. The condition of the ecosystem can be monitored, and any further
damage can be prevented.
COMPILED AND CIRCULATED BY DR. POULAMI ADHIKARY MUKHERJEE, ASSISTANT
PROFESSOR, DEPARTMENT OF ZOOLOGY, NARAJOLE RAJ COLLEGE
ZOOLOGY: SEM- I, PAPER- C2T: ECOLOGY, UNIT 4: ECOSYSTEM
Limitations of the Ecological Pyramid:
1. More than one species may occupy multiple trophic levels as in case
of the food web. Thus, this system does not take into account food
webs.
2. The saprophytes and decomposers are not given any place in
ecological pyramids. They are not considered in any of the pyramids
even though they form an important part of the various ecosystems.
3. These pyramids are applicable only to simple food chains, which
usually do not occur naturally.
COMPILED AND CIRCULATED BY DR. POULAMI ADHIKARY MUKHERJEE, ASSISTANT
PROFESSOR, DEPARTMENT OF ZOOLOGY, NARAJOLE RAJ COLLEGE
ZOOLOGY: SEM- I, PAPER- C2T: ECOLOGY, UNIT 4: ECOSYSTEM
4. These pyramids do not deliver any concept in relation to variations
in season and climate.
5. They do not consider the possibility of the existence of the same
species at different levels i.e. belonging to two or more trophic
levels.
6. It assumes a simple food chain and does not accommodate a food
web.

COMPILED AND CIRCULATED BY DR. POULAMI ADHIKARY MUKHERJEE, ASSISTANT
PROFESSOR, DEPARTMENT OF ZOOLOGY, NARAJOLE RAJ COLLEGE
ZOOLOGY: SEM- I, PAPER- C2T: ECOLOGY, UNIT 4: ECOSYSTEM
TTHHAANNKK YYOOUU