Cross Country Stock Market Integration and Portfolio ...
27
Indian Journal of Economics and Business Vol. 20 No. 4 (December, 2021) Copyright@ Ashwin Anokha Publications & Distributions http://www.ashwinanokha.com/IJEB.php 1415 Cross Country Stock Market Integration and Portfolio Diversification Opportunities Sultan Salahuddin 1 , Musarrat Karamat 2 and Aisha Javed 3 1st PhD Finance, Shaheed Zulfiqar Ali Bhutto Institute of Science & Technology, Karachi, Pakistan 2nd Assistant Professor at BUITEMS, Quetta, Pakistan 3rd Assistant Professor at BUITEMS, Quetta, Pakistan Received: 10 th July 2021 Revised: 25 th August 2021 Accepted: 10 th December 2021 Abstract: This study examines Cross country sectoral Stock market integration and diversification opportunities in developed and emerging countries. For this purpose, we select 11 common sectors of 10 developed and 6 emerging countries. Daily data of FTSE sectoral indices from 3rd January 2000 to 29th October 2019 is included for testing the underlying objective. We constructed a panel of the only country-level stock of home country from selected developed and emerging countries denoted with Pjt and find out the relationship with only sectoral data of home country denoted as Pit. Panel cointegration and VECM are applied to test the stock market integration and long & short-run linkages between sectoral and country-level indices to identify international investors' diversification of opportunities. In developed countries, Australia, Finland, Germany, and the USA have long-run diversification opportunities. In emerging countries, only China and Turkey have long-run diversification opportunities and Brazil, Poland, and Turkey in short run. Keywords: Stock Market Integration; Portfolio Diversification; Aggregated data, Disaggregated data, developed markets, Emerging markets JEL: G01, G11, G15, F3, F21, F65 2.Introduction Increasing world globalization enhanced the integration level among various country-level stocks and made global stock market integration more valuable. As a result of increasing globalization, the stock market becomes more integrated and reduces diversification opportunities (Mansourfar, 2010). There is significant research on
-
Upload
khangminh22 -
Category
Documents
-
view
0 -
download
0
Transcript of Cross Country Stock Market Integration and Portfolio ...

Indian Journal of Economics and Business Vol. 20 No. 4 (December, 2021) Copyright@ Ashwin Anokha Publications & Distributions http://www.ashwinanokha.com/IJEB.php
1415
Cross Country Stock Market Integration and Portfolio Diversification Opportunities
Sultan Salahuddin1, Musarrat Karamat2 and Aisha Javed3
1st PhD Finance, Shaheed Zulfiqar Ali Bhutto Institute of Science & Technology, Karachi, Pakistan
2nd Assistant Professor at BUITEMS, Quetta, Pakistan
3rd Assistant Professor at BUITEMS, Quetta, Pakistan
Received: 10th July 2021 Revised: 25th August 2021 Accepted: 10th December 2021
Abstract: This study examines Cross country sectoral Stock market integration and diversification opportunities in developed and emerging countries. For this purpose, we select 11 common sectors of 10 developed and 6 emerging countries. Daily data of FTSE sectoral indices from 3rd January 2000 to 29th October 2019 is included for testing the underlying objective. We constructed a panel of the only country-level stock of home country from selected developed and emerging countries denoted with Pjt and find out the relationship with only sectoral data of home country denoted as Pit. Panel cointegration and VECM are applied to test the stock market integration and long & short-run linkages between sectoral and country-level indices to identify international investors' diversification of opportunities. In developed countries, Australia, Finland, Germany, and the USA have long-run diversification opportunities. In emerging countries, only China and Turkey have long-run diversification opportunities and Brazil, Poland, and Turkey in short run.
Keywords: Stock Market Integration; Portfolio Diversification; Aggregated data, Disaggregated data, developed markets, Emerging markets
JEL: G01, G11, G15, F3, F21, F65
2.Introduction Increasing world globalization enhanced the integration level among various country-level stocks and made global stock market integration more valuable. As a result of increasing globalization, the stock market becomes more integrated and reduces diversification opportunities (Mansourfar, 2010). There is significant research on

Sultan Salahuddin , Musarrat Karamat and Aisha Javed
1416
stock market integration across countries, but there are mostly unexplored differences in integration between industries or market capitalization groups in a single country (Fedorov and Sarkissian, 2000). As we reported reviewed in various studies, stock market integration has increased within developed, emerging, and frontier market and among cross-classification (Salahuddin et al., 2020).Country-level integration has thoroughly examined, and there has not been much attention paid to analyzing global integration processes at the industry level (Ferreira & Gama, 2010; Ullah, Shaikh, Channar, &Shaikh (2021) .So, it is vital to identify the new methods and pattern of diversification for international investors. Sectoral linkage has become one of the most discussed issues in creating portfolios (Yilmaz et al., 2015; Sieczka&Hołyst, 2009). We workedon this idea to explore a new pattern by testing the stock market integration among sectoral stocks/disaggregated data with country-level stock/aggregated data. Carrieri et al. (2004) also suggest the importance of international financial integration at the industry level. Therefore, the International investor should focus on industry-specific variables while diversifying the international portfolios to improve its performance (Emin, 2013). Few other scholars such as Claessens and Schmukler (2007); Khan, Khan, Ullah, Usman, Farhat, 2020);Lucey and Zhang (2010) argued that stock market integration at the disaggregated level and industry-level stock have a different pattern of integration. Because of increasing stock market integration among country-level stock, it is vital to test the stock market integration at the industry level to benefit from international portfolio diversification (Mansourfar et al. (, 2017).
The primary reason for choosing the approach of diversifying the portfolio through sectoral stocks was that not every sector performs in the same way at any given point in time or during each economic cycle. It observed that various sectors might perform differently at different market conditions. No one sector or industry tends to be frequently the top or worst performer (RBC Direct Investing, 2012). There is limited evidence on the identification of diversification opportunities through the sectoral approach.
This study focuses on stock market integration using aggregated and disaggregated data. If the country level stocks highly integrated with world markets, different integration levels exist among various sectors against the country level stock. An international investor could find a new combination of international portfolio diversification within developed and emerging stock markets through this approach. There is very little evidence on stock market integration on the cross country using aggregated and disaggregated data. Our study mainly focuses on the international investors who want to invest in any country for short term and long-term integration. Our contribution in this field of study follows; first, we use both Developed and Emerging markets as there are limited studies that cover both markets into one study for a more extended period of 19 years. Secondly, we use both Aggregated/ country level and disaggregated/Industry-level data approach where 11 Sectors series for 16 countries and 16 countries level series of developed and emerging countries. Third, we use panel data cointegration and Vector Error Correction Model (VECM) to test the integration, the short and long-run association between industry-level assets because panel methodology is famous and rapidly applied in the finance literature.
2. Literature Review Many studies on developed and emerging markets stated the stock market integrated at the country level. Graham and Nikkinen (2011) found stock market integration exists between developed and emerging countries. Batareddy et al. (2012) reported long-term relationships between developed and emerging countries in their study of six developed and emerging countries. Papavassiliou (2014) identifies the long-run relationship within the developed market. Hussain Shahzad et al. (2014) explore developed markets that have an impact on Asian

Cross Country Stock Market Integration and Portfolio Diversification Opportunities
1417
emerging markets. Al Nasser and Hajilee (2016) worked on stock market integration among five selected emerging markets in the U.S., U.K. and Germany (Brazil, China, Mexico, Russia and Turkey). They found short-run and long-run integration exists between developed and emerging countries. Loong and Har (2017) concluded that the integration level is also increasing in Asian emerging markets and that long-run diversification is no longer beneficial within Asian emerging stock markets. Chen, p. (2018) described stock market movement within developed and emerging markets in various factors.
Investigation of the international stock market at the disaggregated level is significant. For example, if a country-level index of the emerging country does not integrate with a developed country, does it mean each sector and company have the same pattern? For that reason, it is important to test the stock market integration at depth using disaggregated data (Emin, D. 2013). We found various studies that focus on aggregated and disaggregated stock market integration; few of them reported in this study. The reviews on the diversification of the sectoral portfolio are limited compared to the vast amount of available literature on international portfolio diversifying stocks. They suggest a small amount of research in this field (Hakim, I., & Masih, M. 2014). Guglielmo et al. (2019) investigated global and regional stock market integration at both aggregated and disaggregated level using two sub-samples periods (pre-crisis and post-global financial crisis of 2008). Their results reveal that at aggregated and disaggregated different rate of converges is found. There is no convergence found for Basic Materials and Consumer Services in the pre-crisis period and Telecommunications and Utilities in the post-crisis period. Carrieri et al. (2004) agree that it is important to investigate international financial integration at the industry level. To do so, they specifically examine whether integration at the country level (segmentation) precludes segmentation at the industry level (integration). Emin, D. (2013) study sectoral and country-level stock market integration by using 18 different industries and concluded that the oil and gas industry is highly integrated and household goods are least integrated. Their finding reveals that significant differences exist in industry level integration against the country level, which shows that various industries could use for global diversification purposes. Ozlen, S. (2015) provide evidence regarding sectoral portfolio diversification opportunities. This study's results on the long-run associations between emerging Turkish stock and three developed stock markets (the German, the U.S. and U.K. stock markets) may benefit the portfolio's international diversification. Few studies focus on stock market integration at a disaggregated level and aggregated level like; Hinojales and Park (2011) estimate a DCC model using weekly data for the year 1993-2009. Arvind (2017); Ullah, Shaikh, Channar, & Shaikh (2021) stated that investors could create a portfolio by sectoral allocation and observe sectoral indices' performance. Investors, fund managers, and other market players' success depend on their market integration knowledge. Studies on stock market integration at the sectoral level emphasize the importance of sectoral analysis because it determines whether the crisis's impact on the major indices is consistent at the sectoral level. Ehling and Ramos (2005) test the performance of portfolio diversification strategies based on country level diversification and industry level diversification. The finding indicates that results are the same in both strategies against the conventional knowledge that country diversification should outperform industry diversification without any constraints. Ahmed et al. (2018), Using a multivariate cointegration and granger causality test, looked at the correlation between sectoral indices on the Colombo stock exchange. The researcher works on a diversified portfolio to reduce the risks and found Colombo stock exchange offers good diversification opportunity to the investors. Kim & Sun (2017) studied dynamic conditional correlations between the Chinese and S&P 500 indexes between 2006 and 2014. They found that correlations among the stocks are varying significantly across sectors and over time.

Sultan Salahuddin , Musarrat Karamat and Aisha Javed
1418
3. Data We use daily data of FTSE Sectoral and country-level Indices, all maintained in U.S. dollar. Data contains the last 19 years' daily stock price from 3rd January 2000 to 29th October 2019. Sixteen countries from classifications of developed, emerging markets selected for testing the level of integration and diversification opportunities for international investors. We constructed portfolios of individual sector Pit and country-level portfolio of other than base country Pjt. The purpose of adopting this method is to determine the stock market integration and identify diversification opportunities using aggregated/country level and disaggregated/disaggregated data by constructing portfolios. 3.1 Developed Countries Portfolios Eleven common sectors of 10 developed countries are selected based on data availability for testing the stock market integration at the disaggregated/sectoral level. Countries are Australia, Canada, Finland, France, Germany, Italy, Japan, Spain, UK, and the USA. Eleven common sectors are Financial, Utilities, Healthcare, consumer services, Telecom, Industrial, Chemical, Pharma and Bio, Technology, Industrial met, Oil and gas. Portfolio (A) Pit constructed by adding only the Financial sector of Australia in the portfolio. At the same time, Pjt(A) is a portfolio containing nine other country-level indices of the mentioned countries, excluding Australia. In all panel models. Pit used as a dependent variable, and Pjtused as an independent variable. 3.2 Emerging Countries Portfolios Eleven common sectors of six emerging countries are selected based on data availability for testing the stock market integration at the disaggregated/sectoral level. Countries are Brazil, China, India, South Korea, Poland, and Turkey. Eleven common sectors are Financial, Utilities, Healthcare, consumer services, Telecom, Industrial, Chemical, Pharma and Bio, Technology, Industrial met, Oil and gas. Portfolio (A) Pit constructed by adding only the Financial sector of Brazil in the portfolio, while Pjt(A) is a portfolio containing nine other country-level indices of the mentioned countries. In all panel models. Pit used as a dependent variable, and Pjt used as an independent variable. 4. Data Analysis Techniques We have selected sixteen Countries, ten from developed and six from emerging countries, for testing the level of integration and diversification opportunities. We Panel Unit Root Testing, Panel cointegration testing, and VECM in both developed and emerging countries data. 4.1 Panel Unit Root Testing Unit Root test is necessary to apply a panel cointegration test. If two series have unit Root at level (price data) and Stationarity found on the first level (return data), we can apply panel cointegration. We provide unit root testing on excluding country panels (pjt). Im, Pesaran further confirm panel unit root testing, and Shin (IPS, 2003) and Levin, Lin and Chu (LLC, 2002).
4.2 Panel Cointegration Test We begin our empirical analysis for a typical investor in any one of the nations, i, with an investment portfolio comprising their own national stock market index and other market indices.
𝑃𝑖𝑡 = 𝛿1𝑖 + 𝜃1𝑖𝑃𝑗𝑡 + 𝑢𝑖𝑡 Eq-1
4.3Panel VAR/ VECM Here, we estimate the short-run relationship between the variables using the panel VECM model. Of interest is the relationship portrayed here in equation (2):
𝛥𝑃𝑖𝑡 = 𝛿2𝑖 + 𝜃1𝑖 ∑ 𝛥𝑛𝑘=1 𝑃𝑗𝑡−𝑘 ++휀𝑖𝑡 Eq-2

Cross Country Stock Market Integration and Portfolio Diversification Opportunities
1419
All variables from equation (3) appear in equation (4) in the first differenced form, represented by ∆. The parameters to be estimated are δ and θs. 𝑃𝑖𝑡is the series of single country sector series use as a dependent variable in the model, 𝑃𝑗𝑡−𝑘is the series other than the base country sector, 𝛥donate the first difference in our study that
contains return series. The Error Correction Term (ECT), which is one lag of the residual from equation (1) if significant and negative, confirms a stable long-run relationship between the variables identified. Short-term linkages decide on the significance of the lag value of the return series against a particular country. VECM's short-run and long-run association estimated among sectoral indices of ten developed and six emerging countries.
5. Results Here we provided empirical analysis including (Panel Unit Root Testing, Panel Cointegration, and VECM) on panel data. 5.1 Panel Unit Root Testing We used panel Pjt for testing the unit root of the series of country-level data of developed countries. At level Pjtseries contain stock prices that show unit root as according to the test value we are unable to reject the null hypothesis in all developed countries when we convert them into first difference (return series), it shows the stationarity in the data as test value suggest we can reject the null hypothesis of unit root and accept the alternative hypothesis of stationarity that is desirable in our case. When two series have unit root at level and stationary at the first difference, we can apply the panel cointegration test. The below-given table below contains panel ADF, IPS, and LLC test results for the low correlated portfolios (country js), excluding the base country. The tests conducted with drift and no trend for FTSE country-level indices' levels and returns.
Table 1. Panel Unit Root Test Results (Developed Countries)
Developed Country level
LLC Statistics At Levels
LLC Statistics
1st Difference
IPS Statistics At Levels
IPS Statistics 1st
Difference
ADF Statistics At Levels
ADF Statistics
1st Difference
Australia 0.92091 -119.478 -0.69299 -113.424 22.8079 1407.23 Canada 0.95187 -119.627 -0.7097 -113.247 22.9232 1412.91 Finland 1.0466 -119.833 -0.15495 -112.999 16.721 1421.17 France 0.6796 -118.553 -0.71147 -112.437 22.9351 1441.15 Germany 0.7177 -117.783 -0.75573 -112.952 23.2171 1422.76 Italy 0.79668 -118.557 -0.76068 -112.977 23.2467 1421.91 Japan 0.74491 -119.983 -0.67031 -113.12 22.6442 1417.08 Spain 0.75061 -117.941 -0.68152 -112.785 22.7261 1428.56 UK 0.77474 -117.501 -0.51975 -112.256 21.3469 1447.88 USA -0.71475 -119.64 -1.72808 -112.821 24.8109 1427.32
Developed Counties Panel Unit Root Testing shows the price data is non-stationary, and Return data is stationary.
Sultan Salahuddin , Musarrat Karamat and Aisha Javed
1420
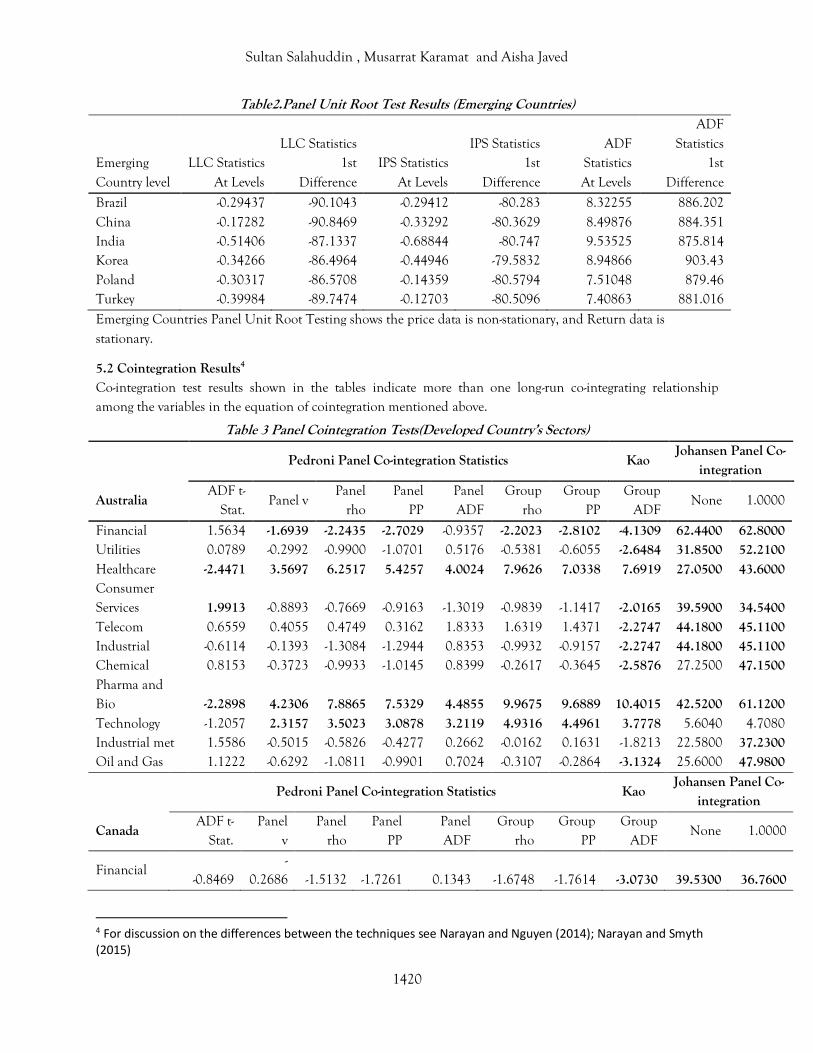
Table2.Panel Unit Root Test Results (Emerging Countries)
Emerging Country level
LLC Statistics At Levels
LLC Statistics 1st
Difference IPS Statistics
At Levels
IPS Statistics 1st
Difference
ADF Statistics At Levels
ADF Statistics
1st Difference
Brazil -0.29437 -90.1043 -0.29412 -80.283 8.32255 886.202 China -0.17282 -90.8469 -0.33292 -80.3629 8.49876 884.351 India -0.51406 -87.1337 -0.68844 -80.747 9.53525 875.814 Korea -0.34266 -86.4964 -0.44946 -79.5832 8.94866 903.43 Poland -0.30317 -86.5708 -0.14359 -80.5794 7.51048 879.46 Turkey -0.39984 -89.7474 -0.12703 -80.5096 7.40863 881.016
Emerging Countries Panel Unit Root Testing shows the price data is non-stationary, and Return data is stationary.
5.2 Cointegration Results4 Co-integration test results shown in the tables indicate more than one long-run co-integrating relationship among the variables in the equation of cointegration mentioned above.
Table 3 Panel Cointegration Tests(Developed Country’s Sectors)
Pedroni Panel Co-integration Statistics Kao
Johansen Panel Co-integration
Australia ADF t-
Stat. Panel v
Panel rho
Panel PP
Panel ADF
Group rho
Group PP
Group ADF
None 1.0000
Financial 1.5634 -1.6939 -2.2435 -2.7029 -0.9357 -2.2023 -2.8102 -4.1309 62.4400 62.8000 Utilities 0.0789 -0.2992 -0.9900 -1.0701 0.5176 -0.5381 -0.6055 -2.6484 31.8500 52.2100 Healthcare -2.4471 3.5697 6.2517 5.4257 4.0024 7.9626 7.0338 7.6919 27.0500 43.6000 Consumer Services 1.9913 -0.8893 -0.7669 -0.9163 -1.3019 -0.9839 -1.1417 -2.0165 39.5900 34.5400 Telecom 0.6559 0.4055 0.4749 0.3162 1.8333 1.6319 1.4371 -2.2747 44.1800 45.1100 Industrial -0.6114 -0.1393 -1.3084 -1.2944 0.8353 -0.9932 -0.9157 -2.2747 44.1800 45.1100 Chemical 0.8153 -0.3723 -0.9933 -1.0145 0.8399 -0.2617 -0.3645 -2.5876 27.2500 47.1500 Pharma and Bio -2.2898 4.2306 7.8865 7.5329 4.4855 9.9675 9.6889 10.4015 42.5200 61.1200 Technology -1.2057 2.3157 3.5023 3.0878 3.2119 4.9316 4.4961 3.7778 5.6040 4.7080 Industrial met 1.5586 -0.5015 -0.5826 -0.4277 0.2662 -0.0162 0.1631 -1.8213 22.5800 37.2300 Oil and Gas 1.1222 -0.6292 -1.0811 -0.9901 0.7024 -0.3107 -0.2864 -3.1324 25.6000 47.9800
Pedroni Panel Co-integration Statistics Kao
Johansen Panel Co-integration
Canada ADF t-
Stat. Panel
v Panel
rho Panel
PP Panel ADF
Group rho
Group PP
Group ADF
None 1.0000
Financial -0.8469
-0.2686 -1.5132 -1.7261 0.1343 -1.6748 -1.7614 -3.0730 39.5300 36.7600
4 For discussion on the differences between the techniques see Narayan and Nguyen (2014); Narayan and Smyth (2015)

Cross Country Stock Market Integration and Portfolio Diversification Opportunities
1421
Utilities -1.0400 0.0637 -1.0281 -1.2286 0.4337 -0.9638 -1.1114 -2.4155 33.1300 37.2600 Healthcare 0.9162 0.1604 0.1383 0.5880 1.6583 1.2683 1.8090 -1.4256 14.8600 37.8000 Consumer Services -2.2666 1.9799 2.3905 2.0105 2.6818 3.3354 3.1122 2.0930 18.7600 3.7960
Telecom -0.7321
-0.0162 -0.7288 -1.0058 0.5578 -0.4459 -0.7626 -2.0901 30.4200 28.0600
Industrial 0.0679 1.2066 1.7329 1.6339 2.5253 3.0630 2.9715 0.8206 38.1300 25.6800
Chemical 0.8135
-0.4977 -0.8927 -1.0634 0.7687 -0.1578 -0.3805 -2.8338 42.5300 54.2100
Pharma and Bio 0.5393 0.3672 0.3047 0.7169 1.8482 1.4637 1.9629 -1.2148 15.0000 35.7000
Technology 1.6056
-3.3726 -4.7964
-4.2937 -1.9067 -4.7546 -4.1975 -6.5750 66.9000 66.4100
Industrial met 1.2600 0.0477 0.2887 0.2472 1.4762 1.4691 1.3960 -1.5835 17.1500 32.2100 Oil and Gas 0.5709
-0.5551 -1.2947 -1.4991 0.7224 -0.6034 -0.9608 -3.3690 30.0400 50.3100
Pedroni Panel Co-integration Statistics Kao
Johansen Panel Co-integration
Finland ADF t-
Stat. Panel v
Panel rho
Panel PP
Panel ADF
Group rho
Group PP
Group ADF
None 1
Financial -1.9999 0.7688 -0.0165 -0.3052 1.9709 0.9550 0.6671 0.0387 16.7500 30.2200 Utilities 2.0466 -1.3724 -1.4995 -1.9133 0.0406 -0.7296 -1.2810 -3.5924 79.3400 85.2100
Healthcare 2.4137 -2.2258 -2.0466 -1.9103
-0.9532 -1.5288 -1.3501 -3.0101 37.1500 45.3800
Consumer Services 2.5254 -2.0406 -1.6220 -1.2968
-0.8201 -0.9077 -0.5431 -1.4000 54.4000 43.5900
Telecom 3.8309 -11.6968
-16.8157
-12.5763
-9.3951
-18.9154
-13.8361
-15.3252 216.8000 49.0200
Industrial -1.8013 1.2826 1.1429 0.7301 2.3655 2.1860 1.7453 1.5450 13.1200 12.7700 Chemical -1.0797 -0.8210 -1.0105 -0.8767 0.4768 -0.1774 -0.0478 0.2439 28.0200 41.3200 Pharma and Bio 9.7163 -9.2922 -6.8816 -7.1641
-7.1476 -7.0620 -7.3964 -9.6129 90.0500 49.1300
Technology 1.1733 -2.7673 -3.7943 -3.5394
-1.2651 -3.5611 -3.2310 -4.9387 39.2900 47.2000
Industrial met 1.6960 0.5927 1.3466 1.2698 1.1051 2.0855 1.9923 0.5505 22.4700 26.8400 Oil and Gas 1.1234 1.2300 2.1592 1.8968 2.6481 3.6550 3.3484 1.1283 7.7880 21.2400
Pedroni Panel Co-integration Statistics Kao
Johansen Panel Co-integration
France ADF t-
Stat. Panel
v Panel
rho Panel
PP Panel ADF
Group rho
Group PP
Group ADF
None 1
Financial 2.3617 - -1.4520 - -0.1075 -0.7680 -1.1390 -3.4505 37.5000 52.8900

Sultan Salahuddin , Musarrat Karamat and Aisha Javed
1422
1.5307 1.7207 Utilities -0.6633 0.9114 0.8675 0.4042 1.7267 1.6418 0.9686 -0.3806 47.3300 43.6700
Healthcare 2.0526
-1.6610 -1.5434
-2.2867 -0.6303 -1.1633 -1.9900 -2.6219 39.3600 42.6200
Consumer Services 2.1546
-4.5097 -5.2488
-5.0232 -3.5356 -5.5409 -5.3197 -7.4670 71.8500 59.0400
Telecom 2.1546
-4.5097 -5.2488
-5.0232 -3.5356 -5.5409 -5.3197
-10.4208 131.5000 62.6800
Industrial 0.5650 1.2868 2.1408 1.4263 1.7772 3.3255 2.6280 0.2393 19.8600 13.5100 Chemical -1.2546 1.2799 1.4243 0.8334 2.1941 2.2615 1.7651 0.5655 15.4900 14.8100 Pharma and Bio 5.2232
-4.7004 -3.8062
-4.5458 -3.4699 -3.7609 -4.6162 -5.1625 63.8200 52.6300
Technology -0.0048
-2.0432 -3.6935
-3.7461 -0.4181 -3.2815 -3.2884 -5.9572 51.5800 60.0600
Industrial met -0.1543 0.8983 0.7663 0.7463 2.0443 1.9685 1.8493 -1.7817 28.8800 36.2200 Oil and Gas 3.8683
-3.7338 -3.3203
-4.1676 -2.8284 -3.3253 -4.4118 -5.4170 61.9400 53.9100
Pedroni Panel Co-integration Statistics Kao
Johansen Panel Co-integration
Germany ADF t-
Stat. Panel
v Panel
rho Panel
PP Panel ADF
Group rho
Group PP
Group ADF
None 1
Financial 1.8188
-2.1201 -2.1248
-2.3897 -1.5669 -1.8643 -2.2610 -4.3789 48.4000 55.2500
Utilities -0.5954 1.0031 1.0209 0.6580 2.0806 2.0565 1.6350 -0.0255 39.4100 38.1200 Healthcare -2.2288 1.2650 0.4561 0.1937 2.6225 1.6178 1.3805 -0.7847 20.3900 29.4600 Consumer Services 3.5911
-2.2195 -1.7926
-1.8365 -0.8355 -1.1580 -1.2951 -3.6631 29.8800 49.7100
Telecom 3.6141
-7.8648 -9.4273
-9.0025 -6.0390 -10.1703 -9.7025
-12.1552 146.2000 64.8100
Industrial 1.8233
-1.2641 -1.2632
-1.4727 -0.5625 -1.0014 -1.2223 -3.1406 32.0600 36.9800
Chemical -1.3831 1.0285 0.5923 0.3794 2.2566 1.6018 1.4081 -1.1156 23.7700 28.3300 Pharma and Bio -0.7103
-0.0696 -1.0264
-1.2932 1.2363 -0.2621 -0.4960 -2.7583 27.1900 40.5300
Technology 1.0601 0.9337 1.7560 1.4171 0.1091 1.9589 1.6453 1.1588 27.0600 11.4400 Industrial met 1.4604
-0.0586 0.1335 0.0743 1.1914 1.1648 1.0774 -1.7105 18.7000 34.8200
Oil and Gas -1.0937
-1.2738 -2.7300
-2.5329 -0.3825 -2.6009 -2.5650 -4.7927 50.5500 64.3000
Pedroni Panel Co-integration Statistics Kao
Johansen Panel Co-integration
Italy ADF t-
Stat. Panel v
Panel rho
Panel PP
Panel ADF
Group rho
Group PP
Group ADF
None 1

Cross Country Stock Market Integration and Portfolio Diversification Opportunities
1423
Financial -1.5833 1.3774 1.3662 1.2902 2.7160 2.8134 2.6991 -0.2440 13.8600 17.8400 Utilities 2.2294 -0.8339 -0.6195 -0.8465 0.7421 0.4968 0.2024 -2.4115 21.6400 39.7600 Healthcare 3.2745 -0.9069 -0.2016 -0.1261 0.2719 0.6212 0.7140 -1.2560 18.4600 26.2700 Consumer Services 1.7581 -1.4058 -1.3429 -1.1640 0.1468 -0.5013 -0.3070 -2.7270 32.1000 40.0900 Telecom -0.3460 -1.3376 -2.1234 -2.0123 0.1226 -1.4671 -1.3610 -4.0836 33.5300 34.6400 Industrial 4.5584 -5.9538 -5.5766 -4.9467 -6.1190 -6.2600 -5.5592 -7.5713 75.8900 60.8800 Chemical 3.1541 -3.2860 -2.5351 -2.3019 -1.6168 -1.9319 -1.6582 -4.0809 47.8500 60.6100 Pharma and Bio 1.8660 -2.1859 -2.0034 -1.9022 -0.8454 -1.3967 -1.2934 -2.6365 37.9500 58.6500
Technology 13.3976
-20.2770
-14.5171
-14.8008 -17.6610
-16.2093
-16.5566
-17.0891 275.4000 56.9600
Industrial met 3.1277 -2.5130 -1.3979 -1.7118 -0.9213 -0.4664 -0.8368 -3.1058 42.5400 25.2900 Oil and Gas 0.3876 -0.2378 -0.5828 -0.6894 0.9910 0.2782 0.0991 -2.6085 26.5800 39.6400
Pedroni Panel Co-integration Statistics Kao
Johansen Panel Co-integration
Japan ADF t-
Stat. Panel v
Panel rho
Panel PP
Panel ADF
Group rho
Group PP
Group ADF
None 1
Financial 2.0068 -0.7279 -0.4246 -0.6474 0.3881 0.3639 0.0963 -1.1308 20.3100 35.3900 Utilities 0.0717 1.7219 2.7814 1.8593 1.0376 3.1982 2.0663 1.8863 25.2100 9.3680 Healthcare 1.2215 0.6512 1.3193 0.7021 -0.3240 1.4548 0.7299 0.7208 29.3700 19.0000 Consumer Services 0.5505 -3.9961 -7.4842 -6.9096 -2.9434 -8.4798 -7.7213 -7.9118 128.1000 47.0800 Telecom 2.0092 -3.5148 -4.1103 -4.0045 -2.5920 -4.2795 -4.0830 -5.3393 51.9100 54.0000 Industrial 2.0858 0.3475 1.0601 0.1360 -0.0219 1.2012 0.0389 -0.3792 21.9600 21.4200 Chemical 1.8088 -0.0098 0.3857 -0.4289 0.6095 0.9441 -0.0547 -1.3692 23.6800 31.0500 Pharma and Bio 1.2508 0.4495 1.1428 0.1150 -0.4387 1.2202 -0.0509 -0.0756 34.9900 21.5700
Technology 2.2520
-12.0050
-16.7969
-14.9867 -10.2519
-19.1339
-17.4734
-19.2862 291.9000 63.9200
Industrial met 2.9422 -1.4813 -1.1633 -1.5642 -2.1874 -1.1494 -1.6653 -1.9289 45.3000 45.0600 Oil and Gas 7.3157 -4.6174 -3.3365 -3.8341 -3.1783 -3.0269 -3.6493 -4.9555 46.4000 52.2100
Pedroni Panel Co-integration Statistics Kao Johansen Panel Co-
integration
Spain ADF t-
Stat. Panel
v Panel
rho Panel
PP Panel ADF
Group rho
Group PP
Group ADF
None 1
Financial 0.0444 0.6751 0.9840 0.7931 1.7414 2.0652 1.8680 -0.9332 15.7300 24.2600
Utilities 0.8639
-0.5183 -0.7886 -0.9363 0.4322 -0.1686 -0.2912 -2.1380 31.8700 32.4200
Healthcare -1.4363 1.5948 2.0010 1.7891 2.3953 2.9562 2.7951 1.4828 14.5700 5.2010 Consumer Services -1.8345 1.1974 0.8893 0.6344 2.5304 2.0633 1.8402 -0.0183 24.4900 27.9000

Sultan Salahuddin , Musarrat Karamat and Aisha Javed
1424
Telecom 0.9539 0.0580 0.2070 0.0219 1.5691 1.4115 1.2060 -1.9475 18.2300 33.4600 Industrial 0.4023 1.5972 2.5732 2.2700 2.1583 3.6411 3.4720 1.2106 19.0900 7.6990 Chemical
Pharma and Bio -0.9810
-0.1298 -0.0280 -0.1376 -0.1879 0.1238 -0.0425 0.5916 37.8700 9.9270
Technology 4.1537
-3.3842 -2.9047 -2.6777 -1.8387 -2.4384 -2.1639 -3.3562 38.7300 42.9600
Industrial met 3.2992
-1.4284 -1.0462 -0.9405 0.1927 -0.0795 0.0329 -2.9232 27.7900 50.5200
Oil and Gas 1.8794
-0.7255 -0.5001 -0.8724 0.7256 0.4832 0.0266 -2.6707 20.8000 40.2600
Pedroni Panel Co-integration Statistics Kao
Johansen Panel Co-integration
UK ADF t-
Stat. Panel v
Panel rho
Panel PP
Panel ADF
Group rho
Group PP
Group ADF
None 1
Financial 2.0068 -0.7279 -0.4246 -0.6474 0.3881 0.3639 0.0963 -1.1308 20.3100 35.3900 Utilities 0.0717 1.7219 2.7814 1.8593 1.0376 3.1982 2.0663 1.8863 25.2100 9.3680 Healthcare 1.2215 0.6512 1.3193 0.7021 -0.3240 1.4548 0.7299 0.7208 29.3700 19.0000 Consumer Services 0.5505 -3.9961 -7.4842 -6.9096 -2.9434 -8.4798 -7.7213 -7.9118 128.1000 47.0800 Telecom 2.0092 -3.5148 -4.1103 -4.0045 -2.5920 -4.2795 -4.0830 -5.3393 51.9100 54.0000 Industrial 2.0858 0.3475 1.0601 0.1360 -0.0219 1.2012 0.0389 -0.3792 21.9600 21.4200 Chemical 1.8088 -0.0098 0.3857 -0.4289 0.6095 0.9441 -0.0547 -1.3692 23.6800 31.0500 Pharma and Bio 1.2508 0.4495 1.1428 0.1150 -0.4387 1.2202 -0.0509 -0.0756 34.9900 21.5700
Technology 2.2520
-12.0050
-16.7969
-14.9867 -10.2519
-19.1339
-17.4734
-19.2862 291.9000 63.9200
Industrial met 2.9422 -1.4813 -1.1633 -1.5642 -2.1874 -1.1494 -1.6653 -1.9289 45.3000 45.0600 Oil and Gas 7.3157 -4.6174 -3.3365 -3.8341 -3.1783 -3.0269 -3.6493 -4.9555 46.4000 52.2100
Pedroni Panel Co-integration Statistics Kao
Johansen Panel Co-integration
USA ADF t-
Stat. Panel
v Panel
rho Panel
PP Panel ADF
Group rho
Group PP
Group ADF
None 1
Financial -0.5819 2.0324 2.8994 1.7974 3.1453 4.4413 3.1696 1.6085 19.4800 22.7100 Utilities -0.0145 1.3532 2.1787 1.6905 2.0558 3.4069 2.8913 2.0236 22.0400 7.5900 Healthcare -2.6318 3.1040 5.0200 4.2198 4.2714 7.3700 6.4564 6.5167 14.7100 10.2500 Consumer Services -2.6128 3.6991 6.7888 5.9333 4.8493 9.6402 8.6973 9.1130 24.2300 33.5400
Telecom 0.9844
-4.1359 -6.7175 -5.7064 -2.4406 -7.0589 -5.9290 -7.7972 84.0100 59.7200
Industrial -1.9178 3.2448 5.4203 4.5844 4.3427 7.7108 6.8685 5.8454 14.9800 14.3300 Chemical -2.2591 2.2839 2.9331 2.2892 3.5218 4.6211 3.9375 2.9197 12.5400 4.6370

Cross Country Stock Market Integration and Portfolio Diversification Opportunities
1425
Pharma and Bio -2.2042 2.5782 3.6709 2.8463 3.8138 5.5750 4.6134 4.0513 11.8400 4.7710 Technology -1.9626 3.8596 7.0268 6.0892 4.9828 9.7099 8.6049 8.1726 22.7900 17.5400 Industrial met 4.8284
-2.2514 -1.3511 -1.3203 -1.4120 -0.8576 -0.8633 -3.6456 30.5900 44.7400
Oil and Gas 0.7588
-0.9142 -1.5469 -1.8167 -0.8801 -1.6300 -1.9927 -3.6472 43.3000 50.5400
All bold values are significant at 5 percent or better, indicating the cointegrating relationship of developed country-level data with each selected developed country’s Sectors.
Table 4Panel Cointegration Tests(Emerging Country’s Sectors)
Pedroni Panel Co-integration Statistics Kao
Johansen Panel Co-integration
Brazil ADF t-
Stat. Panel v
Panel rho
Panel PP Panel ADF
Group rho
Group PP
Group ADF
None 1
Financial 4.3427 -2.2596 -1.5022 -2.3398 -1.1990 -1.0844 -2.0459 -2.1642 16.6500 22.6700 Utilities 2.1183 -1.0430 -0.7609 -1.0835 -0.0539 -0.1789 -0.5814 -1.3683 9.2350 20.4200 Healthcare -0.1610 0.4105 0.9016 0.5923 0.1798 1.0087 0.6328 0.6301 7.3090 5.8980 Consumer Services 4.7832 -2.6379 -1.5560 -2.3808 -1.8090 -1.3018 -2.2240 -1.6820 21.0100 19.4700 Telecom 0.5073 -1.1401 -1.7400 -1.4580 0.0699 -1.3044 -0.9136 -2.5938 9.9940 24.2100 Industrial 3.9163 -2.3966 -1.6337 -2.5676 -1.7249 -1.3849 -2.5544 -1.8987 21.8100 21.7200 Chemical 3.1111 -1.7549 -1.3367 -1.6816 -0.7626 -0.9003 -1.3185 -2.4933 13.1600 25.1200 Pharma and Bio 3.1247 -1.9884 -1.3594 -1.6068 -1.0247 -0.9092 -1.2261 -2.8973 36.2600 40.3400 Technology -0.1175 -1.5254 -2.8827 -2.9352 -0.7874 -2.8912 -2.9756 -4.7545 33.9300 33.2200 Industrial met 0.0569 0.5343 0.5238 0.3241 1.4335 1.3177 1.0750 -0.6492 5.9070 16.9000 Oil and Gas 0.8483 -0.0757 -0.0957 -0.2650 0.8383 0.5586 0.3537 -1.3420 7.0590 19.3300
Pedroni Panel Co-integration Statistics Kao
Johansen Panel Co-integration
China ADF t-
Stat. Panel v
Panel rho
Panel PP
Panel ADF
Group rho
Group PP
Group ADF
None 1
Financial 1.8306
-1.0789 -0.9857 -1.2005 -0.8146 -0.9569 -1.2230 -2.2725 12.4500 21.1100
Utilities 3.6809
-2.6786 -2.4357 -2.7793 -1.4578 -2.1184 -2.5298 -4.1880 22.1400 26.5900
Healthcare 7.9889
-4.9258 -2.8878 -3.0157 -4.4099 -3.0172 -3.1771 -3.9741 24.6700 23.1300
Consumer Services 6.0695
-4.7234 -3.1632 -3.3878 -3.5651 -2.9983 -3.2620 -3.7369 27.2200 24.2600
Telecom 7.0081
-5.4982 -3.4420 -4.1900 -4.1007 -3.2984 -4.1930 -5.2935 38.2800 33.6200
Industrial 6.2063 - -2.5403 -2.5414 -2.4213 -2.1929 -2.1970 -3.5652 17.5500 24.3000

Sultan Salahuddin , Musarrat Karamat and Aisha Javed
1426
3.7784
Chemical 8.0291
-5.5170 -3.4846 -4.0103 -4.6836 -3.5832 -4.2261 -4.6484 57.0500 32.7200
Pharma and Bio 5.6724
-2.9507 -1.7397 -1.8305 -2.5197 -1.6803 -1.8065 -3.2467 20.7200 29.6400
Technology -1.6311 2.2551 3.5320 3.1692 3.1515 4.9182 4.5036 -3.6217 3.1000 4.1090 Industrial met 7.0050
-4.4399 -2.8946 -2.8605 -3.8061 -2.9735 -2.9401 -3.6217 42.2400 31.6100
Oil and Gas 5.5689
-3.5172 -2.3597 -2.6551 -2.8473 -2.2258 -2.5704 -2.8521 22.8300 25.1700
Pedroni Panel Co-integration Statistics Kao
Johansen Panel Co-integration
India ADF t-
Stat. Panel v
Panel rho
Panel PP
Panel ADF
Group rho
Group PP
Group ADF
None 1
Financial 0.8069 0.2929 0.6360 0.3519 -1.6836 -0.1571 -0.4252 -0.8506 16.7000 14.7900
Utilities 4.2177
-2.7435 -1.9648 -2.3851 -2.5208 -2.0107 -2.5227 -2.4596 25.5400 22.9100
Healthcare -0.7330 0.8060 0.6698 0.5899 1.5378 1.3465 1.2590 -0.5705 7.0540 17.7800 Consumer Services 0.6628 0.1905 0.3556 0.0908 0.2824 0.5657 0.2298 -0.8850 9.2270 16.2800
Telecom 2.8093
-1.1271 -0.6538 -1.3296 -0.6271 -0.3480 -1.2188 -1.5813 17.2000 21.7000
Industrial 1.5567
-0.8260 -0.5894 -0.9705 -2.7416 -1.4780 -1.8399 -1.7067 22.9900 18.9700
Chemical -0.1454 1.1626 1.7783 1.2526 0.3899 1.7331 1.0366 0.2609 11.1600 10.3000 Pharma and Bio -0.8384 0.7846 0.6572 0.6223 1.4366 1.2756 1.2441 -0.4924 6.5130 16.2500
Technology 3.1823
-1.2198 -0.5500 -0.6028 -0.9084 -0.3481 -0.4370 -1.9098 13.8200 19.1400
Industrial met 4.1260
-1.9715 -1.4029 -1.8534 -1.4035 -1.2060 -1.8164 -2.1631 18.2900 22.0700
Oil and Gas 7.5561
-3.4167 -1.7889 -1.8293 -2.3666 -1.4790 -1.5284 -2.7170 17.6800 25.5800
Pedroni Panel Co-integration Statistics Kao
Johansen Panel Co-integration
South Korea ADF t-
Stat. Panel v
Panel rho
Panel PP
Panel ADF
Group rho
Group PP
Group ADF
None 1
Financial 3.3657 -1.9293 -1.5204 -2.3326 -1.3809 -1.3530 -2.4248 -2.8332 26.5100 27.5600 Utilities 3.4283 -1.6698 -1.1469 -1.8337 -0.4692 -0.5671 -1.3878 -2.7301 13.8600 24.6400 Healthcare 0.4761 0.5384 0.7009 0.5531 1.4102 1.4779 1.2889 -0.5269 5.1370 17.5000 Consumer Services 5.9031 -4.1560 -2.4954 -3.1881 -3.5725 -2.3982 -3.2553 -2.0822 27.3900 21.4600
Telecom 7.7778 -13.8553 -10.9674 -9.4953
-11.7888
-12.1973
-10.4469
-11.3515 121.4000 27.4100

Cross Country Stock Market Integration and Portfolio Diversification Opportunities
1427
Industrial 4.4950 -2.9089 -2.0053 -2.6014 -2.8966 -2.1387 -2.9352 -2.0902 28.3800 23.2900 Chemical 3.2744 -1.7523 -1.3397 -1.7403 -1.3096 -1.1677 -1.6017 -2.1440 15.5600 23.8900 Pharma and Bio 0.3101 0.6116 0.7726 0.6228 1.4150 1.5202 1.3308 -0.4915 6.3600 17.5200 Technology -1.3698 2.0241 3.0282 2.8654 2.6132 4.0530 3.7971 2.3021 2.3480 2.1000 Industrial met 5.2440 -3.1929 -2.0324 -2.8918 -3.7554 -2.3378 -3.4636 -2.3130 34.3300 25.5200 Oil and Gas 2.9775 -1.2747 -0.9599 -1.7355 -1.4865 -1.0874 -1.9842 -2.0310 18.5000 22.8200
Pedroni Panel Co-integration Statistics Kao
Johansen Panel Co-integration
Poland ADF t-
Stat. Panel v
Panel rho
Panel PP
Panel ADF
Group rho
Group PP
Group ADF
None 1
Financial 2.6988 -1.2707 -1.0109 -1.3254 -0.3369 -0.5327 -0.9637 -2.2347 11.1300 20.4800 Utilities -0.6030 -0.6782 -1.0353 -1.1770 0.1464 -0.5681 -0.7938 -1.4789 23.1000 24.2900
Healthcare 23.4696 -41.0129
-13.5304
-14.4190 -37.1106
-15.2365
-16.2907
-15.9726 176.0000 22.5200
Consumer Services 1.3707 -0.9097 -0.8644 -1.5468 0.2857 -0.2022 -1.0205 -2.7468 9.6680 22.2700 Telecom 0.7773 -0.0183 0.1711 -0.0692 1.1126 1.0385 0.7503 -0.8875 3.2710 14.2900 Industrial 1.5214 -2.2573 -2.8286 -3.0241 -0.9884 -2.5418 -2.7671 -4.5416 25.6300 29.5000 Chemical 4.8606 -1.9088 -0.2799 -3.1681 -0.6863 0.4877 -2.9483 -3.9134 19.6400 17.4000 Pharma and Bio 69.0004
-356.7457
-48.3272
-39.8381
-331.4551
-56.5417
-46.4647
-43.7410 92.1000 21.9600
Technology 8.0739 -6.1904 -3.6171 -3.7333 -4.7457 -3.5008 -3.6416 -3.3499 27.9700 18.6700 Industrial met 5.9337 -3.5955 -2.2683 -2.7734 -2.8735 -2.0844 -2.7747 -2.6001 24.3600 21.3400 Oil and Gas 2.0989 -0.4702 -0.0855 -0.3487 -0.0685 0.2199 -0.1208 -1.1974 7.6410 16.3800
Pedroni Panel Co-integration Statistics Kao
Johansen Panel Co-integration
Turkey ADF t-
Stat. Panel v
Panel rho
Panel PP Panel ADF
Group rho
Group PP
Group ADF
None 1
Financial 4.0138 -1.7026 -0.9784 -1.3142 -0.8356 -0.5810 -1.0201 -2.1133 10.8800 20.7700 Utilities 6.9598 -6.5362 -4.7642 -5.5893 -4.9901 -4.8409 -5.8202 -7.2461 48.0900 23.8300 Healthcare 7.4114 -8.4048 -4.5173 -5.4480 -6.9946 -4.6418 -5.7695 -4.6487 47.0400 19.5500 Consumer Services 2.3822 -1.2386 -0.9654 -1.2188 -1.1749 -1.0013 -1.3607 -1.8574 14.2900 18.3100 Telecom 3.3025 -1.2936 -0.6062 -0.7600 -0.7615 -0.2741 -0.4688 -1.3993 9.9650 22.5400 Industrial 6.1948 -3.6874 -2.4309 -3.3671 -2.7196 -2.2979 -3.4746 -3.6649 37.7400 26.2200 Chemical -0.5590 1.0605 1.1633 1.2380 2.0609 2.1591 2.2485 0.4651 1.4970 9.1770 Pharma and Bio
Technology 3.5587 -5.2966 -5.3952 -6.8204 -3.8110 -5.5810 -7.2721 -8.6775 71.3900 24.8100 Industrial met 5.8138 -3.2502 -2.0681 -2.7322 -3.4527 -2.3332 -3.2117 -3.2364 31.8400 24.2300 Oil and Gas 10.4084 -7.4980 -4.2482 -4.7189 -6.0325 -4.3001 -4.8758 -4.9247 39.4500 23.6700

Sultan Salahuddin , Musarrat Karamat and Aisha Javed
1428
All bold values are significant at 5 percent or better, indicating the cointegrating relationship of emerging country-level data with each selected emerging country’s Sectors.
5.3 VECM Results In results of VECM, we identify the long and short-run association among home country sector and country-level portfolios of developed and emerging countries excluding the home country. We found various combinations for long and short-run diversification opportunities for international investors using this approach.
Table 5 VECM Results (Developed Country’s Sectors) Regressors Intercept Portfolio ret (-1) Portfolio ret (-2) ECT (-1)
Financial 0.00023200 0.21980800 0.00434900 -0.00000406
0.00006770 0.00444900 0.00444900 0.00000053
Utility 0.00027200 0.15021500 -0.01675700 -0.00000124
0.00006980 0.00458100 0.00458000 0.00000019
Health Care 0.00058500 0.11925500 -0.00578800 -0.00000009
0.00006570 0.00431300 0.00431200 0.00000011
Consumer services 0.00019300 0.21230700 0.00694000 -0.00000461
0.00006600 0.00433200 0.00433200 0.00000079
Telecom 0.00009720 0.12172800 0.00401300 -0.00000340
0.00006910 0.00453800 0.00453700 0.00000067
Industrial 0.00036800 0.21956600 -0.00636000 -0.00000335
0.00006880 0.00451700 0.00451700 0.00000048
Chemical 0.00035500 0.27770700 0.01997100 -0.00000122
0.00008620 0.00566400 0.00566300 0.00000020
Pharma and Bio 0.00075600 0.12487600 -0.00893700 -0.00000005
0.00008670 0.00569600 0.00569500 0.00000006
Technology 0.00082700 0.19133700 0.02064400 -0.00000140
0.00013700 0.01280100 0.01280000 0.00000052
Industrial met 0.00072300 0.36164800 -0.07958400 -0.00000376
0.00023500 0.01541800 0.01541500 0.00000093
Oil and Gas 0.00032600 0.33293800 0.00083100 -0.00000112 0.00008050 0.00528900 0.00528800 0.00000017 The error correction term (ECT) is significant and negative for eight sectors means the underlying sector of Australia have a long-run association with developed countries portfolio excluding Australia. There are long-run diversification opportunities for the international investor in case of Healthcare, Pharma & Bio, and Industrial met.Financial, Healthcare, Consumer Services, Telecom, Industrial, Pharma & Bio, Technology, and Industrial met, Oil and Gas are insignificant with developed countries portfolio excluding Australia, which means short-run diversification is possible in these sectors. First-line shows the intercept value, and the second line shows the standard error value, and highlighted values indicate the significance at 5% or more.

Cross Country Stock Market Integration and Portfolio Diversification Opportunities
1429
Table 6VECM Results (Canada’s Sectors) Regressors Intercept Portfolio ret (-1) Portfolio ret (-2) ECT (-1)
Financial 0.00038500 0.05439900 -0.01283200 -0.00000231
0.00006260 0.00408700 0.00408600 0.00000034
Utility 0.00037600 0.02901000 -0.01494100 -0.00000196
0.00005460 0.00356500 0.00356400 0.00000026
Health Care 0.00074300 0.00519000 -0.02997700 -0.00000057
0.00021900 0.01429400 0.01429100 0.00000022
Consumer services 0.00036400 0.02462500 -0.01003400 -0.00000044
0.00005190 0.00338600 0.00338600 0.00000019
Telecom 0.00032800 0.02076700 -0.02109200 -0.00000123
0.00005950 0.00388300 0.00388200 0.00000023
Industrial 0.00024200 0.03085900 -0.03139500 -0.00000167
0.00008320 0.00543100 0.00543000 0.00000044
Chemical 0.00062700 0.04383700 -0.03014000 -0.00000102
0.00009750 0.00636500 0.00636300 0.00000014
Pharma and Bio 0.00219500 -0.06159700 -0.06178200 -0.00000132
0.00066800 0.04359300 0.04358400 0.00000062
Technology -0.00001360 0.03238400 0.00086100 -0.00000431
0.00012800 0.00836900 0.00836700 0.00000086
Industrial met 0.00016400 0.08510800 -0.01920300 -0.00000243
0.00011500 0.00751200 0.00751000 0.00000067
Oil and Gas 0.00038700 0.05356000 -0.02747300 -0.00000244 0.00008230 0.00537700 0.00537600 0.00000033 The error correction term (ECT) is significant and negative for all 11 sectors means the underlying sector of Canada have a long-run association with developed countries portfolio, excluding Canada. There are no long-run diversification opportunities for the international investor in this case. Healthcare and Pharma, and Bio are insignificant with developed countries portfolio excluding Canada, which means short-run diversification is possible in these sectors. First-line shows the intercept value, and the second line shows the standard error value, and highlighted values indicate the significance at 5% or more.
Table 7 VECM Results (Finland’s Sectors) Regressors Intercept Portfolio ret (-1) Portfolio ret (-2) ECT (-1) Financial 0.00048300 0.09275800 -0.03761900 -0.00000204
0.00008700 0.00605300 0.00605300 0.00000040
Utility 0.00049200 0.07660300 -0.02136600 -0.00000141
0.00009560 0.00672200 0.00672200 0.00000016
Health Care 0.00050700 0.01629700 0.02716700 -0.00000598
0.00017800 0.01242100 0.01242100 0.00000111
Consumer services 0.00062900 0.04961500 -0.02505600 -0.00000391
0.00017700 0.01234300 0.01234300 0.00000094
Telecom -0.00009720 0.06471800 -0.03623200 -0.00001340
0.00008370 0.00582400 0.00582400 0.00000127
Industrial 0.00051000 0.07492400 -0.00545100 -0.00000006

Sultan Salahuddin , Musarrat Karamat and Aisha Javed
1430
0.00009160 0.00637600 0.00637600 0.00000002
Chemical -0.00125800 0.04954300 0.14922000 -0.00036800
0.00061100 0.04416900 0.04418300 0.00006620
Pharma and Bio -0.00000319 0.01571700 -0.00061300 -0.00002420
0.00004640 0.00322800 0.00322800 0.00000216
Technology -0.00007580 0.05742700 -0.07760700 -0.00327400
0.00013000 0.00999900 0.00905800 0.00511400
Industrial met -0.00013500 0.07559200 -0.00889000 0.00698700
0.00015300 0.01076200 0.00965000 0.00634400
Oil and Gas 0.00183000 0.10850600 -0.05194900 -0.00000198 0.00041700 0.02900100 0.02900000 0.00000042 The error correction term (ECT) is significant and negative for Nine sectors means the underlying sector of Finland have a long-run association with developed countries portfolio, excluding Finland. There are long-run diversification opportunities for the international investor in the case of Technology and Industrial met. Healthcare, Industrial, Chemical, Pharma and Bio, Industrial met, and Oil & Gas are insignificant with developed countries portfolio excluding Finland, which means short-run diversification is possible in these sectors. First-line shows the intercept value, and the second line shows the standard error value, and highlighted values indicate the significance at 5% or more.
Table 8 VECM Results (France’s Sectors) Regressors Intercept Portfolio ret (-1) Portfolio ret (-2) ECT (-1) Financial 0.00024300 0.08744100 -0.02566200 -0.00000826
0.00009840 0.00650300 0.00650200 0.00000119
Utility 286.151100 22.8182100 16.17099000 0.99913500
0.10924000 7.32254800 7.32186600 0.00082300
Health Care 0.00027300 -0.03375000 -0.02751300 -0.00000235
0.00006870 0.00453900 0.00453700 0.00000035
Consumer services 0.00003580 0.05269300 -0.04223800 -0.00000724
0.00007360 0.00486000 0.00485900 0.00000083
Telecom -0.00009880 -0.00623400 -0.05558600 -0.00000668
0.00008040 0.00531400 0.00531300 0.00000075
Industrial 0.00028900 0.04174400 -0.03914000 -0.00000451
0.00008090 0.00534500 0.00534400 0.00000111
Chemical 0.00041200 0.00462900 -0.04140000 -0.00000110
0.00007690 0.00507800 0.00507700 0.00000026
Pharma and Bio 0.00029700 -0.04114000 -0.02653600 -0.00000166
0.00007820 0.00516500 0.00516400 0.00000018
Technology 0.00003110 0.07177600 -0.03549800 -0.00000254
0.00010200 0.00673200 0.00673000 0.00000044
Industrial met 0.00048200 0.10487100 0.00563900 -0.00000062
0.00015700 0.00950700 0.00950500 0.00000020
Oil and Gas 0.00024100 0.00528900 -0.04227900 -0.00000291 0.00008090 0.00534800 0.00534700 0.00000034
The error correction term (ECT) is significant and negative for all 11 sectors means the underlying sector of France have a long-run association with developed countries portfolio, excluding France. There are no long-run

Cross Country Stock Market Integration and Portfolio Diversification Opportunities
1431
diversification opportunities for the international investor in this case. Telecom, Chemical, and Industrial met are insignificant with developed countries portfolio excluding France, which means short-run diversification is possible in these sectors. First-line shows the intercept value, and the second line shows the standard error value, and highlighted values indicate the significance at 5% or more.
Table 9 VECM Results (Germany’s Sectors) Regressors Intercept Portfolio ret (-1) Portfolio ret (-2) ECT (-1)
Financial 0.00011000 0.04181600 -0.02685200 -0.00001070
0.00009140 0.00605500 0.00605300 0.00000144
Utility 0.00003490 0.01434800 -0.02735000 -0.00000203
0.00009050 0.00600000 0.00599900 0.00000057
Health Care 0.00041500 0.01315200 -0.00558400 -0.00000088
0.00006140 0.00406800 0.00406700 0.00000015
Consumer services 0.00002830 0.06517500 0.00055100 -0.00001510
0.00007540 0.00499600 0.00499500 0.00000228
Telecom -0.00005370 -0.03534100 -0.05865700 -0.00000933
0.00009490 0.00629100 0.00629000 0.00000106
Industrial 0.00028800 0.04206900 -0.03355700 -0.00000489
0.00008460 0.00560600 0.00560500 0.00000084
Chemical 0.00035500 0.02500300 -0.01151500 -0.00000113
0.00008100 0.00537000 0.00536900 0.00000026
Pharma and Bio 0.00038600 0.03486300 -0.00911600 -0.00000107
0.00007370 0.00488600 0.00488500 0.00000016
Technology 0.00034900 0.02965700 -0.02195700 -0.00000334
0.00009940 0.00658700 0.00658600 0.00000090
Industrial met 0.00020600 0.00877600 -0.05475400 -0.00000271
0.00013700 0.00832700 0.00832600 0.00000077
Oil and Gas 133.226900 -28.10951000 13.47461000 29.06998000 0.84339200 55.36230000 50.33301000 25.88891000 The error correction term (ECT) is significant and negative for Ten sectors means the underlying sector of Germany have a long-run association with developed countries portfolio excluding Germany. There are long-run diversification opportunities for the international investor in the case of Oil and Gas. Healthcare, Consumer Services, Pharma & Bio, Industrial met, and Oil &Gas are insignificant with developed countries portfolio excluding Germany, which means short-run diversification is possible in these sectors. First-line shows the intercept value, and the second line shows the standard error value, and highlighted values indicate the significance at 5% or more.

Sultan Salahuddin , Musarrat Karamat and Aisha Javed
1432
Table 10 VECM Results (Italy’s Sectors) Regressors Intercept Portfolio ret (-1) Portfolio ret (-2) ECT (-1)
Financial 0.00010800 0.04607000 -0.02471100 -0.00001070
0.00009140 0.00609000 0.00608900 0.00000144
Utility 0.00003440 0.01729500 -0.02580800 -0.00000202
0.00009060 0.00603600 0.00603500 0.00000057
Health Care 0.00041400 0.01590900 -0.00514100 -0.00000089
0.00006140 0.00409200 0.00409100 0.00000015
Consumer services 0.00002630 0.06822800 0.00347700 -0.00001510
0.00007540 0.00502500 0.00502400 0.00000230
Telecom -0.00005240 -0.03398800 -0.05807700 -0.00000933
0.00009500 0.00632900 0.00632800 0.00000106
Industrial 0.00028700 0.04611000 -0.03105900 -0.00000491
0.00008460 0.00564000 0.00563900 0.00000086
Chemical 0.00035400 0.03090100 -0.01156000 -0.00000113
0.00008100 0.00540200 0.00540100 0.00000026
Pharma and Bio 0.00038400 0.03881500 -0.00745500 -0.00000108
0.00007370 0.00491500 0.00491400 0.00000016
Technology 0.00034700 0.03326200 -0.01888300 -0.00000331
0.00009940 0.00662700 0.00662500 0.00000091
Industrial met 0.00020600 0.01328800 -0.05277000 -0.00000267
0.00013700 0.00833200 0.00833100 0.00000078
Oil and Gas -0.00168800 0.10538500 -0.10419000 -0.00002200 0.00040700 0.02500100 0.02498400 0.00000547 The error correction term (ECT) is significant and negative for all 11 sectors means the underlying sector of Italy have a long-run association with developed countries portfolio excluding Italy. There are no long-run diversification opportunities for the international investor in this case. Healthcare, Consumer Services, Pharma and Bio, and Industrial met are insignificant with developed countries portfolio excluding Italy, which means short-run diversification is possible in these sectors. First-line shows the intercept value, and the second line shows the standard error value, and highlighted values indicate the significance at 5% or more.
Table 11VECM Results (Japan’s Sectors) Regressors Intercept Portfolio ret (-1) Portfolio ret (-2) ECT (-1) Financial 0.00001020 0.07888200 -0.01596300 -0.00001720
0.00006490 0.00424100 0.00424000 0.00000364
Utility 0.00022000 0.16754500 -0.01140800 -0.00000338
0.00005680 0.00370900 0.00370800 0.00000102
Health Care 0.00010800 0.16063200 -0.00488500 -0.00000698
0.00005510 0.00360400 0.00360300 0.00000159
Consumer services 0.00002300 0.23837200 0.00954600 -0.00000687
0.00007740 0.00506000 0.00505800 0.00000094
Telecom -0.00007970 0.28984500 -0.00398100 -0.00003510
0.00008690 0.00567700 0.00567500 0.00000526
Industrial 0.00017000 0.34655400 -0.00357900 -0.00000539

Cross Country Stock Market Integration and Portfolio Diversification Opportunities
1433
0.00006800 0.00444500 0.00444400 0.00000111
Chemical 0.00020500 0.29698900 -0.00899700 -0.00000868
0.00006960 0.00454800 0.00454700 0.00000155
Pharma and Bio 0.00022000 0.16116800 -0.01215800 -0.00000580
0.00006020 0.00393600 0.00393500 0.00000119
Technology -0.00012500 0.36020100 0.00653900 -0.00002630
0.00007630 0.00498800 0.00498600 0.00000223
Industrial met 0.00014400 0.35973400 -0.00764400 -0.00000798
0.00008440 0.00551400 0.00551300 0.00000154
Oil and Gas 0.00020300 0.31600400 -0.01647800 -0.00002650 0.00008390 0.00548600 0.00548500 0.00000309 The error correction term (ECT) is significant and negative for all 11 sectors means the underlying sector of Japan have a long-run association with developed countries portfolio, excluding Japan. There are no long-run diversification opportunities for the international investor in this case. Healthcare, Consumer Services,Telecom, Industrial, Technology, and Industrial met are insignificant with developed countries portfolio excluding Japan, which means short-run diversification is possible in these sectors. First-line shows the intercept value, and the second line shows the standard error value, and highlighted values indicate the significance at 5% or more.
Table 12 VECM Results (Spain’s Sectors) Regressors Intercept Portfolio ret (-1) Portfolio ret (-2) ECT (-1)
Financial 0.00004360 0.03968400 -0.03886700 -0.00000299
0.00009580 0.00638700 0.00638600 0.00000073
Utility 0.00032100 0.00013800 -0.04049100 -0.00000135
0.00007120 0.00474800 0.00474700 0.00000031
Health Care 0.00064800 0.04000700 0.01958700 -0.00000069
0.00008560 0.00570700 0.00570500 0.00000021
Consumer services 312.296000 41.597360 36.318350 0.999631
0.19921800 13.28103000 13.27790000 0.00115100
Telecom 0.00002500 0.02404600 -0.04267400 -0.00000393
0.00008560 0.00570600 0.00570500 0.00000084
Industrial 0.00027500 0.05008800 -0.03600700 -0.00000106
0.00007600 0.00506500 0.00506400 0.00000041
Chemical
Pharma and Bio 0.00046600 0.02449700 0.03886000 -0.00000071
0.00011100 0.00724400 0.00721200 0.00000030
Technology 0.00333900 -0.11905600 0.13003900 -0.00002630
0.00127700 0.08524600 0.08524200 0.00000811
Industrial met 0.00019900 0.05034800 -0.01323300 -0.00000181
0.00009410 0.00626400 0.00626300 0.00000031
Oil and Gas 0.00013900 0.03246700 -0.03208400 -0.00000271 0.00008970 0.00597900 0.00597800 0.00000046 The error correction term (ECT) is significant and negative for all 11 sectors means the underlying sector of Spain have a long-run association with developed countries portfolio excluding Spain. There are no long-run diversification opportunities for the international investor in this case. Utilities and Technology are insignificant
Sultan Salahuddin , Musarrat Karamat and Aisha Javed
1434
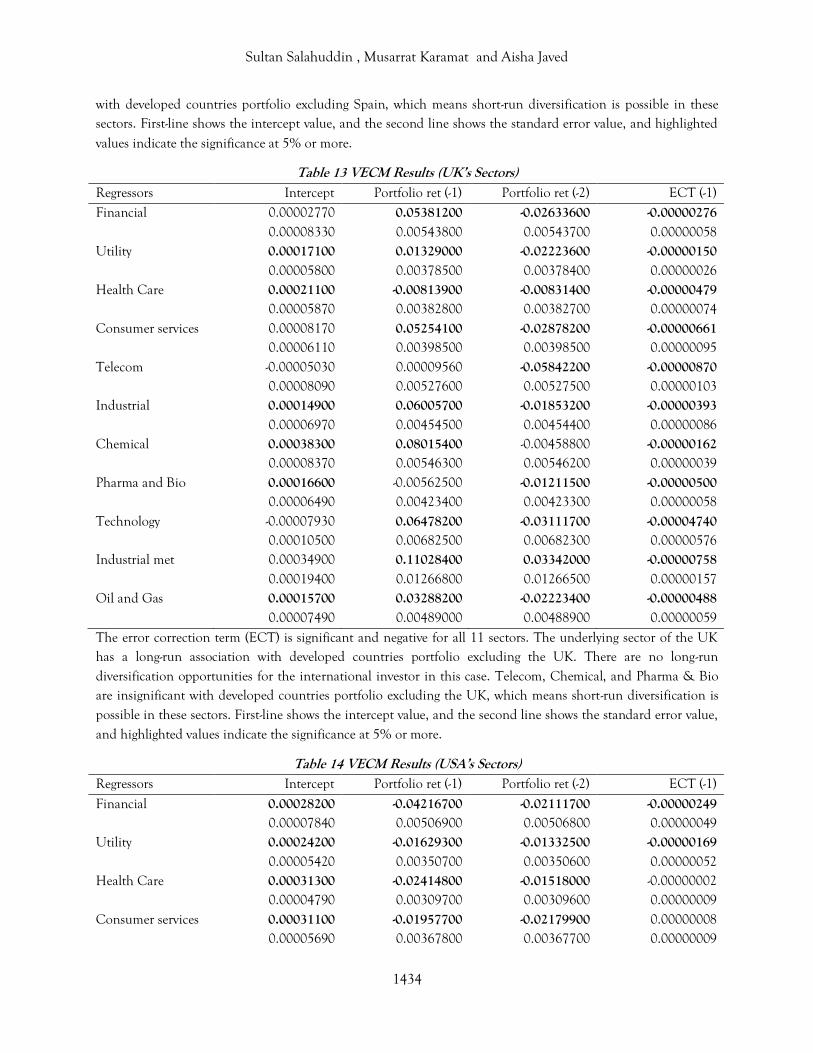
with developed countries portfolio excluding Spain, which means short-run diversification is possible in these sectors. First-line shows the intercept value, and the second line shows the standard error value, and highlighted values indicate the significance at 5% or more.
Table 13 VECM Results (UK’s Sectors) Regressors Intercept Portfolio ret (-1) Portfolio ret (-2) ECT (-1) Financial 0.00002770 0.05381200 -0.02633600 -0.00000276
0.00008330 0.00543800 0.00543700 0.00000058
Utility 0.00017100 0.01329000 -0.02223600 -0.00000150
0.00005800 0.00378500 0.00378400 0.00000026
Health Care 0.00021100 -0.00813900 -0.00831400 -0.00000479
0.00005870 0.00382800 0.00382700 0.00000074
Consumer services 0.00008170 0.05254100 -0.02878200 -0.00000661
0.00006110 0.00398500 0.00398500 0.00000095
Telecom -0.00005030 0.00009560 -0.05842200 -0.00000870
0.00008090 0.00527600 0.00527500 0.00000103
Industrial 0.00014900 0.06005700 -0.01853200 -0.00000393
0.00006970 0.00454500 0.00454400 0.00000086
Chemical 0.00038300 0.08015400 -0.00458800 -0.00000162
0.00008370 0.00546300 0.00546200 0.00000039
Pharma and Bio 0.00016600 -0.00562500 -0.01211500 -0.00000500
0.00006490 0.00423400 0.00423300 0.00000058
Technology -0.00007930 0.06478200 -0.03111700 -0.00004740
0.00010500 0.00682500 0.00682300 0.00000576
Industrial met 0.00034900 0.11028400 0.03342000 -0.00000758
0.00019400 0.01266800 0.01266500 0.00000157
Oil and Gas 0.00015700 0.03288200 -0.02223400 -0.00000488 0.00007490 0.00489000 0.00488900 0.00000059 The error correction term (ECT) is significant and negative for all 11 sectors. The underlying sector of the UK has a long-run association with developed countries portfolio excluding the UK. There are no long-run diversification opportunities for the international investor in this case. Telecom, Chemical, and Pharma & Bio are insignificant with developed countries portfolio excluding the UK, which means short-run diversification is possible in these sectors. First-line shows the intercept value, and the second line shows the standard error value, and highlighted values indicate the significance at 5% or more.
Table 14 VECM Results (USA’s Sectors) Regressors Intercept Portfolio ret (-1) Portfolio ret (-2) ECT (-1)
Financial 0.00028200 -0.04216700 -0.02111700 -0.00000249
0.00007840 0.00506900 0.00506800 0.00000049
Utility 0.00024200 -0.01629300 -0.01332500 -0.00000169
0.00005420 0.00350700 0.00350600 0.00000052
Health Care 0.00031300 -0.02414800 -0.01518000 -0.00000002
0.00004790 0.00309700 0.00309600 0.00000009
Consumer services 0.00031100 -0.01957700 -0.02179900 0.00000008
0.00005690 0.00367800 0.00367700 0.00000009

Cross Country Stock Market Integration and Portfolio Diversification Opportunities
1435
Telecom 0.00000973 -0.02148300 -0.02049300 -0.00000571
0.00006050 0.00391300 0.00391200 0.00000066
Industrial 0.00029300 -0.01522600 -0.02010400 -0.00000019
0.00006140 0.00397300 0.00397200 0.00000018
Chemical 0.00037800 -0.02314100 -0.02544800 -0.00000047
0.00006940 0.00448800 0.00448700 0.00000020
Pharma and Bio 0.00024900 -0.02962800 -0.01778000 -0.00000021
0.00005370 0.00347200 0.00347100 0.00000014
Technology 0.00026800 -0.01830000 -0.01228600 -0.00000008
0.00007750 0.00501200 0.00501100 0.00000021
Industrial met 0.00018300 -0.00431900 -0.02506200 -0.00000455
0.00011000 0.00710200 0.00710100 0.00000076
Oil and Gas 0.00029000 -0.02949500 -0.01816400 -0.00000213 0.00007410 0.00479600 0.00479500 0.00000031 The error correction term (ECT) is significant and negative for six sectors. The USA's underlying sector has a long-run association with developed countries portfolio, excluding the USA. There are long-run diversification opportunities for the international investor in Healthcare, Consumer Services, Industrial, Pharma & Bio, and Technology. Industrial met is the only sector that is insignificant with developed countries portfolio, excluding the USA, means short-run diversification is possible in these sectors. First-line shows the intercept value, and the second line shows the standard error value, and highlighted values indicate the significance at 5% or more.
Table 15 VECM Results (Brazil’s Sectors) Regressors Intercept Portfolio ret (-1) Portfolio ret (-2) ECT (-1) Financial 0.00065800 0.00910900 -0.00584000 -0.00000160
0.00015200 0.00750200 0.00750200 0.00000034
Utility 0.00036500 -0.02134000 0.00646500 -0.00000426
0.00014100 0.00693800 0.00693800 0.00000106
Health Care 0.00055300 -0.00352800 0.00229000 -0.00000077
0.00010500 0.00514400 0.00514400 0.00000021
Consumer services 0.01798200 -0.34110300 -0.38098100 -0.00009990
0.00667600 0.32848600 0.32849200 0.00002330
Telecom -0.00005350 -0.01899600 0.00351100 -0.00001060
0.00014200 0.00696600 0.00696600 0.00000294
Industrial 0.00038900 -0.00372100 0.01132900 -0.00000289
0.00013000 0.00639300 0.00639300 0.00000066
Chemical 0.00276400 0.01407600 0.00400000 -0.00003740
0.00115300 0.05674800 0.05674900 0.00001000
Pharma and Bio 0.00089800 -0.03887200 -0.04933500 -0.00002100
0.00049100 0.03564500 0.03556900 0.00000467
Technology -0.00033800 0.05634100 -0.00777300 -0.00000966
0.00019800 0.01375800 0.01375800 0.00000179
Industrial met 0.00059900 0.01932000 0.00233500 -0.00000122
0.00018000 0.00887600 0.00887700 0.00000039
Oil and Gas 0.00059900 0.01581900 0.00326100 -0.00000100 0.00017900 0.00880200 0.00880200 0.00000028

Sultan Salahuddin , Musarrat Karamat and Aisha Javed
1436
The error correction term (ECT) is significant and negative for all 11 sectors means the underlying sector of Brazil have a long-run association with emerging countries portfolio, excluding Brazil. There are no long-run diversification opportunities for the international investor in this case. In all 11 sectors, Portfolios ret (-2) are insignificant with emerging countries portfolio excluding Brazil, which means short-run diversification is possible in these sectors. First-line shows the intercept value, and the second line shows the standard error value, and highlighted values indicate the significance at 5% or more.
Table 16 VECM Results (China’s Sectors) Regressors Intercept Portfolio ret (-1) Portfolio ret (-2) ECT (-1)
Financial 0.00060600 0.10221700 0.00591400 -0.00000080
0.00012200 0.00576700 0.00576700 0.00000013
Utility 0.00044500 0.08391700 -0.01481900 -0.00000231
0.00010900 0.00518100 0.00518100 0.00000030
Health Care 0.00044500 0.08235200 -0.00469700 -0.00000240
0.00013300 0.00631400 0.00631400 0.00000046
Consumer services 0.00053600 0.10333700 0.00634800 -0.00000123
0.00012500 0.00589900 0.00589900 0.00000020
Telecom 0.00032300 0.09130400 -0.01650800 -0.00000382
0.00013100 0.00667700 0.00667400 0.00000048
Industrial 0.00031000 0.12613100 0.00359400 -0.00000246
0.00011600 0.00551200 0.00551300 0.00000051
Chemical 0.00041800 0.12273300 0.01500000 -0.00000290
0.00014400 0.00680000 0.00680100 0.00000041
Pharma and Bio 0.00046000 0.10138300 -0.00704700 -0.00000195
0.00014700 0.00742500 0.00742400 0.00000041
Technology 0.00061300 0.08733400 0.01005800 -0.00000016
0.00012700 0.00600200 0.00600200 0.00000015
Industrial met 0.00073400 0.17226200 0.00688000 -0.00000053
0.00017600 0.00832900 0.00833000 0.00000009
Oil and Gas 0.00050700 0.12679700 0.00025000 -0.00000081 0.00012700 0.00609600 0.00609500 0.00000013 The error correction term (ECT) is significant and negative for Ten sectors means the underlying sector of China have a long-run association with emerging countries portfolio, excluding China. There are long-run diversification opportunities for the international investor in the case of Technology. Healthcare, Consumer Services, Industrial, Pharma & Bio, Industrial met, and Oil &Gas are insignificant with emerging countries portfolio excluding China. This means short-run diversification is possible in these sectors. First-line shows the intercept value, and the second line shows the standard error value, and highlighted values indicate the significance at 5% or more.
Table 17 VECM Results (India’s Sectors) Regressors Intercept Portfolio ret (-1) Portfolio ret (-2) ECT (-1) Financial 0.000622 0.075276 0.042971 -4.62E-07
0.000123 0.005883 0.005883 1.12E-07
Utility 0.000439 0.059467 0.036066 -1.14E-06
0.000132 0.006329 0.006329 2.46E-07

Cross Country Stock Market Integration and Portfolio Diversification Opportunities
1437
Health Care 0.000282 0.037377 0.016257 -6.09E-07
9.31E-05 0.004466 0.004466 2.14E-07
Consumer services 0.000725 0.069343 0.041647 -4.55E-06
0.000241 0.01158 0.01158 1.33E-06
Telecom 0.000137 0.050418 0.037786 -1.69E-06
0.000144 0.006904 0.006904 5.45E-07
Industrial 0.000488 0.073782 0.036485 -3.25E-07
0.000116 0.005568 0.005568 8.42E-08
Chemical 0.000296 0.040683 0.024179 -2.89E-07
9.75E-05 0.004674 0.004674 1.06E-07
Pharma and Bio 0.000331 0.065011 0.018814 -1.73E-06
0.000141 0.006743 0.006743 5.92E-07
Technology 0.000331 0.065011 0.018814 -1.73E-06
0.000141 0.006743 0.006743 5.92E-07
Industrial met 0.000383 0.116187 0.05781 -8.45E-07
0.000147 0.00704 0.00704 2.07E-07
Oil and Gas 0.000259 0.072217 0.040731 -2.83E-06 0.000125 0.006007 0.006007 6.69E-07 The error correction term (ECT) is significant and negative for all 11 sectors means the underlying sector of India have a long-run association with emerging countries portfolio, excluding India. Portfolios ret (-1) and Portfolio ret (-1) are also significant in all 11 sectors. There are no long run and short run diversification opportunities for the international investor in this case. First-line shows the intercept value, and the second line shows the standard error value, and highlighted values indicate the significance at 5% or more.
Table 18 VECM Results (South Korea’s Sectors) Regressors Intercept Portfolio ret (-1) Portfolio ret (-2) ECT (-1)
Financial 0.00029900 0.15498400 0.02050400 -0.00000210
0.00013900 0.00670900 0.00671000 0.00000036
Utility 388.154400 42.509320 12.566930 0.998030
0.14215900 6.84980700 6.85017500 0.00119600
Health Care 0.00058300 0.07858900 0.01668400 -0.00000037
0.00014300 0.00695500 0.00695500 0.00000016
Consumer services 0.00014500 0.12315400 0.01096800 -0.00000224
0.00012500 0.00601500 0.00601500 0.00000050
Telecom -0.00003980 0.08547800 0.01725800 -0.00002440
0.00011900 0.00573200 0.00573200 0.00000262
Industrial 0.00039600 0.16064400 0.03289900 -0.00000101
0.00014400 0.00692500 0.00692500 0.00000022
Chemical 0.00055800 0.15017800 0.02431900 -0.00000074
0.00017100 0.00825100 0.00825100 0.00000016
Pharma and Bio 0.00078100 0.09023600 0.02895500 -0.00000036
0.00020300 0.01014500 0.01014300 0.00000014
Technology 0.00762600 0.41449200 -0.34771200 -0.00000748

Sultan Salahuddin , Musarrat Karamat and Aisha Javed
1438
0.00341800 0.16472300 0.16472200 0.00000295
Industrial met 0.00031800 0.18829600 0.00729400 -0.00000096
0.00014600 0.00705100 0.00705200 0.00000022
Oil and Gas 0.00053200 0.15590000 0.03062900 -0.00000069 0.00015800 0.00760100 0.00760100 0.00000015 The error correction term (ECT) is significant and negative for all 11 sectors. The underlying sector of South Korea has a long-run association with emerging countries portfolio, excluding South Korea. There are no long-run diversification opportunities for the international investor in this case. Utilities, Consumer Services, and Industrial met are insignificant with emerging countries portfolio excluding South Korea, which means short-run diversification is possible in these sectors. First-line shows the intercept value, and the second line shows the standard error value, and highlighted values indicate the significance at 5% or more.
Table 19VECM Results (Poland ’s Sectors) Regressors Intercept Portfolio ret (-1) Portfolio ret (-2) ECT (-1)
Financial 0.00034300 0.04467800 -0.00697700 -0.00000450
0.00012300 0.00591100 0.00591100 0.00000100
Utility -0.00045400 0.05358800 0.00596400 -0.00000819
0.00016600 0.01045800 0.01045700 0.00000358
Health Care -0.00000924 -0.00190200 -0.00308200 -0.00035800
0.00002670 0.00128100 0.00128100 0.00002050
Consumer services 0.00014000 0.03842200 -0.01659800 -0.00001650
0.00014000 0.00672900 0.00672900 0.00000391
Telecom -0.00013500 0.03119500 -0.00363200 -0.00000774
0.00014500 0.00683400 0.00683400 0.00000440
Industrial -0.00045600 0.00499100 -0.01008400 -0.00001950
0.00011000 0.00520300 0.00520300 0.00000525
Chemical -0.00013300 0.01569600 0.00502500 -0.00007110
0.00008380 0.00396200 0.00396200 0.00001720
Pharma and Bio 0.00002630 -0.00296900 -0.00029800 -0.00154500
0.00003060 0.00146500 0.00146500 0.00004040
Technology 0.00082800 0.03733200 0.03324500 -0.00001870
0.00036600 0.01729600 0.01729600 0.00000445
Industrial met 0.00066300 0.07271900 -0.00485900 -0.00000293
0.00017700 0.00847700 0.00847700 0.00000063
Oil and Gas 0.00049100 0.04098900 -0.00621300 -0.00000375 0.00013300 0.00639100 0.00639100 0.00000099 The error correction term (ECT) is significant and negative for all 11 sectors means the underlying sector of Poland have a long-run association with emerging countries portfolio, excluding Poland. There are no long-run diversification opportunities for the international investor in this case. Ten sectors excluding consumer services are insignificant with emerging countries portfolio, excluding Poland, which means short-run diversification is possible in these sectors. First-line shows the intercept value, and the second line shows the standard error value, and highlighted values indicate the significance at 5% or more.

Cross Country Stock Market Integration and Portfolio Diversification Opportunities
1439
Table 20VECM Results (Turkey’s Sectors) Regressors Intercept Portfolio ret (-1) Portfolio ret (-2) ECT (-1)
Financial 0.00026300 0.06551300 0.00118900 -0.00001590
0.00019000 0.01003400 0.01003400 0.00000363
Utility -0.00009650 -0.01132900 -0.00295900 -0.00004010
0.00012700 0.00670000 0.00670000 0.00000661
Health Care 0.00024900 0.02642400 0.00485900 -0.00004080
0.00012700 0.00668100 0.00668100 0.00000513
Consumer services 0.00041400 0.04008400 -0.01444600 -0.00000862
0.00016800 0.00885300 0.00885300 0.00000221
Telecom 0.00070300 0.05423200 -0.01645800 -0.00002810
0.00034000 0.01818700 0.01818700 0.00000689
Industrial 0.00026000 0.06693700 0.01916900 -0.00002220
0.00017900 0.00941700 0.00941700 0.00000433
Chemical 0.00109500 0.02365300 0.02065900 -0.00000645
0.00047300 0.02494900 0.02495000 0.00000481
Pharma and Bio
Technology -0.00003960 0.01959400 0.00072300 -0.00005140
0.00015500 0.00814900 0.00814900 0.00000865
Industrial met 0.00057900 0.07916800 -0.00321700 -0.00000916
0.00019500 0.01026300 0.01026300 0.00000200
Oil and Gas 0.00073500 0.06504300 -0.01030200 -0.00004990 0.00022400 0.01181400 0.01181500 0.00000701 The error correction term (ECT) is significant and negative for six sectors means the underlying sector of Turkey have a long-run association with emerging countries portfolio, excluding Turkey. There are long-run diversification opportunities for the international investor in Chemical, Pharma & Bio, Technology, Industrial met, and Oil & Gas. Financial, Utilities, Healthcare, Consumer Services, Telecom, Chemical, Pharma & Bio, Technology, Industrial met, and Oil & Gas are insignificant with emerging countries portfolio excluding Turkey, means short-run diversification is possible in the case of these sectors. First-line shows the intercept value, and the second line shows the standard error value, and highlighted values indicate the significance at 5% or more.
6.Conclusion and Discussion We observe short, and long-run diversification opportunities for international investors within developed and emerging countries using the sector and country-level approach. There are few options in all ten developed and six emerging countries that their 11 common sectors have diversification opportunities against the base country portfolio. In Canada, France, Italy, Japan, Spain, and the UK, no long-run diversification opportunity is available in any sector. In case of Australia, (Healthcare, Pharma & Bio, and Industrial met), In Finland; (Technology, and Industrial met), in Germany; (Oil and Gas), and the USA; (Healthcare, Consumer Services Industrial, Pharma & Bio, and Technology)out of 11 common sectors have diversification opportunities with developed country level portfolio excluding home country.
There are various combinations available for short-run diversification in developed countries. They have short-run diversification against portfolio excluding home country. In case of Australia; (Financial, Healthcare, Consumer Services, Telecom, Industrial, Pharma & Bio, Technology, Industrial met, and Oil & Gas), In case of

Sultan Salahuddin , Musarrat Karamat and Aisha Javed
1440
Canada; (Healthcare and Pharma & Bio), in Finland; (Healthcare, Industrial, Chemical, Pharma & Bio, Industrial met, and Oil & Gas), in France; (Telecom, Chemical, and Industrial met), in Germany; (Healthcare, Consumer Services, Pharma & Bio, Industrial met, and Oil & Gas), in Italy;( Healthcare, Consumer Services, Pharma and Bio, and Industrial met), in Japan; (Healthcare, Consumer Services, Telecom, Industrial, Technology, and Industrial met), in Spain; (Utilities and Technology), in the UK; (Telecom, Chemical, and Pharma & Bio),in the USA; (Industrial met) have short-run diversification opportunities.
Emerging countries also have few options of long and short-run diversification opportunities. Brazil, India, South Korea, and Poland have no long-run diversification opportunities in emerging countries. In China; (Technology) and Turkey; (Chemical, Pharma & Bio, Technology, Industrial met, and Oil & Gas). Short-run diversification is available in emerging countries except for India. In case of Brazil, (Financial, Utilities, Healthcare, Consumer Services, Telecom, Industrial, Chemical, Pharma and Bio, Technology, Industrial met, Oil and Gas), in China; (Healthcare, Consumer Services, Industrial, Pharma & Bio, Industrial met, and Oil &Gas), in South Korea;( Utilities, Consumer Services, and Industrial met), in Poland; (Healthcare, Industrial, Pharma & Bio, Industrial met, and Oil &Gas), in South Korea;( Utilities, Consumer Services, and Industrial met), in Turkey; (Financial, Utilities, Healthcare, Consumer Services, Telecom, Chemical, Pharma & Bio, Technology, Industrial met, and Oil & Gas).
We can conclude there are short-run diversification opportunities available in developed and emerging countries at a disaggregated level. Still, only a few options are available in case of long-run diversification. Further, this phenomenon can be tested on aggregated and disaggregated levels using more countries and sectors.
7. References
Ahmed, A., Ali, R., Ejaz, A., & Ahmad, I. (2018). Sectoral integration and investment diversification opportunities: evidence from Colombo Stock Exchange. Entrepreneurship and Sustainability Issues, 5(3), 514-527.
Al Nasser O M and Hajilee M (2016), “Integration of Emerging Stock Markets with Global Stock Markets”, Research in International Business and Finance, Vol. 36, January, pp. 1-12.
Batareddy M, Gopalaswamy K A and Huang C H (2012), “The Stability of Long Run Relationship: A Study on Asian Emerging and Developed Stock Markets (Japan and US)”, International Journal of Emerging Markets, Vol. 7, No. 1, pp. 31-48.
Caporale, G. M., You, K., & Chen, L. (2019). Global and regional stock market integration in Asia: A panel
convergence approach. International Review of Financial Analysis, 65, 101381. Carrieri, F., Errunza, V., And Sarkissian, S., 2004. Industry Risk and Market Integration. Management Science,
50(2), Pp. 207-221. Claessens, S., &Schmukler, S. L. (2007). International financial integration through equity markets: Which
firms from which countries go global? Journal of International Money and Finance, 26(5), 788-813. Ehling, P. And Ramos, S. B. (2005). "Geographic Versus Industry Diversification: Constraints Matter." ECB
Working Paper Series, No. 425. Emin, D. (2013). International Stock Market Integration of Emerging Europe: Analyses from Aggregate Level to
Firm Level, From Tranquil Periods to Shock Periods (Doctoral Dissertation, University of Leicester). Fedorov, P. And Sarkissian, S., 2000. Cross-Sectional Variations in The Degree of Global Integration: The Case
of Russian Equities. Journal of International Financial Markets, Institutions and Money, 10, Pp. 131-150.

Cross Country Stock Market Integration and Portfolio Diversification Opportunities
1441
Ferreira, M. A., & Gama, P. M. (2010). Correlation Dynamics of Global Industry Portfolios. Journal of Multinational Financial Management, 20(1), 35-47.
Graham M and Nikkinen J (2011), “Co-Movement of the Finnish and International Stock Markets: A Wavelet Analysis”, The European Journal of Finance, Vol. 17, Nos. 5&6, pp. 409-425.
Hakim, I., & Masih, M. (2014). Portfolio Diversification Strategy for Malaysia: International and Sectoral Perspectives.
Hinojales, M., & Park, C. Y. (2011). Stock market integration: Emerging East Asia’s experience. The dynamics of Asian financial integration: Facts and analytics.
Hussain Shahzad S J, Ahmed T, Rehman U M and Zakaria M (2014), “Relationship Between Developed, Emerging and South Asian Equity Markets: Empirical Evidence with a Multivariate Framework Analysis”, Munich Personal RePEc Archive, No. 60398, pp. 1-27.
Khan, K. M., Khan, A. M., Ullah M., Usman, A., Farhat, S., (2020). Closing price determination;
extent of manipulation and deterrent strategy formulation: a case of Pakistan Stock Exchange. Journal of Critical Reviews, 7 (14), 2689-2705.
Kim, S. W., Kim, Y. M., & Choi, M. J. (2015). Asia-Pacific stock market integration: new evidence by incorporating regime changes. Emerging Markets Finance and Trade, 51(sup4), S68-S88.
Loong T K and Har W P (2017), “Global Share Market Integration and Diversification: A Study of Asian Emerging Markets”, Asian Economic and Financial Review, Vol. 7, No. 10, pp. 981-991.
Lucey, B.M. And Zhang, Q., 2010. International Financial Integration. Journal of Banking and Finance, 34(12), Pp. 2837-2837.
Mansourfar, G., Didar, H., &Jodatnia, S. (2017). International portfolio diversification at industry level within South-East Asian stock markets. Iranian Journal of Management Studies, 10(1), 91-112.
Ozlen, S. (2015). Market Integration: A Sector Level Approach. International Journal of Academic Research in Economics and Management Sciences, 4(1), 47-59.
Papavassiliou V G (2014), “Equity Market Integration: The New Emerging Economy of Montenegro”, Review of Accounting and Finance, Vol. 13, No. 3, pp. 291-306.
RBC Direct Investing. (2012). “Another view to diversification: Investing by sector.” Direct Investor Quarterly Newsletter, Spring 2012, Toronto, Canada, pp. 1-2.
Salahuddin, S., Kashif, M., & Rehman, M. U. (2020). Time Varying Stock Market Integration and Diversification Opportunities within Emerging and Frontier Markets. PénzügyiSzemle/Public Finance Quarterly, 65(2), 168-195.
Shaikh, S., Channar, P., Shaikh, M., &, Ullah, M., (2021). Financial constraints and listed sugar mills on Pakistan Stock Exchange. International Journal of Management, 12(3), 70-76.
Sieczka, P., &Hołyst, J. A. (2009). Correlations in commodity markets. Physica a: Statistical Mechanics and its Applications, 388(8), 1621-1630.
Yilmaz, M. K., A. Sensoy, K. Ozturk, and E. Hacihasanoglu. 2015. “Cross-Sectoral Interactions in Islamic Equity Markets.” Pacific-Basin Finance Journal 32: 1–20.
Zheng, C., Chen, L. and Yiwei, D. (2012). Proxy to shocks or proxy to diversify, correlation risk and its implications. In Proceedings of the 2nd 3-C (China, Canada, US) Risk Forum and the 5th International Conference on Engineering and Risk Management, Beijing, China, 24–26 September 201.
Ullah, M., Shaikh, M., Channar, P., &Shaikh, S., (2021). Financial forecasting: an individual perspective. International Journal of Management, 12(3), 60-69.