THE APPLICATION OF CUMULATIVE PROSPECT THEORY IN BUILDING OPTIMAL PORTFOLIO IN VIETNAMESE STOCK...
138
1 FOREIGN TRADE UNIVERSITY FACULTY OF BUSINESS ADMINISTRATION ---------***-------- GRADUATION THESIS Major: International Business Administration THE APPLICATION OF CUMULATIVE PROSPECT THEORY IN BUILDING OPTIMAL PORTFOLIO IN VIETNAMESE STOCK MAKRKET Student name: Nguyễn Thị Thu Hằng Student code: 1001020040 Class: A8 Intake: 49
Transcript of THE APPLICATION OF CUMULATIVE PROSPECT THEORY IN BUILDING OPTIMAL PORTFOLIO IN VIETNAMESE STOCK...
1
FOREIGN TRADE UNIVERSITY
FACULTY OF BUSINESS ADMINISTRATION---------***--------
GRADUATION THESISMajor: International Business
Administration
THE APPLICATION OF CUMULATIVE PROSPECT
THEORY IN BUILDING OPTIMAL PORTFOLIO IN
VIETNAMESE STOCK MAKRKET
Student name: Nguyễn Thị Thu
Hằng
Student code: 1001020040
Class: A8
Intake: 49

2
Supervisor: M.Sc. Le Thi Thu
Ha Noi, May 2014
ACKNOWLEDGEMENTS
Firstly, I express my deep sense of gratitude to M.Sc.
Le Thi Thu for her inspiring guidance, scholarly
interpretations and valuable criticisms throughout the
course of my thesis. I am gratefully obliged to the
faculty of Business Administration at Foreign Trade
University, for approving the title and supporting me to
conduct the study. I extend my sincere thanks to Ms Pham
Mai Phuong Linh, Hoang Xuan Huy, Nguyen Viet Phuong, for
their support.
Especially, I also thank my close friends Ngo Bach Thien
Huong, Le Ngoc Hai, Nguyen Tung Minh, Ngo Thi Thu Huong,
Nguyen Lan Anh, Pham Hai Yen and Nguyen Phuong Thanh for
all their encouragement throughout the completion of the
work.
Above all, many thanks to mom, dad, and my younger
brother and sisters who always stimulate and spend all
love for me.

3
Nguyen Thi Thu Hang
Class: A8, Faculty of Business Administration, Intake: 49, Foreign Trade
University

4
CONTENT
CHAPTER 1: INTRODUCTION................................1
1.1.The rationale of the research....................1
1.2.Objectives of the research.......................3
1.3.Scope of the research............................3
1.4.Research methodology.............................3
1.5.Research structure...............................4
CHAPTER 2: CUMULATIVE PROSPECT THEORY..................5
2.1.Introduction to Cumulative Prospect Theory.......5
2.2.Hypotheses of Cumulative Prospect Theory.........6
2.2.1. Three basic hypotheses.............................6
2.2.2. Mathematic form.................................8
2.2.3. Stochastic Dominance approach to test hypotheses........11
2.3.Typical biases explaining for Cumulative Prospect
Theory..............................................18
2.3.1. Loss Aversion...................................19
2.3.2. Anchoring and Adjustment..........................19
2.3.3. Herding Bias....................................20
CHAPTER 3: BUILDING OPTIMAL PORTFOLIO FOR INDIVIDUAL
INVESTORS.............................................22
3.1.Individual investors............................22
3.2.Optimal portfolio...............................23

5
3.2.1. Introduction....................................23
3.2.2. Approaches of portfolio optimization..................24
3.2.3. Processes of portfolio management...................26
3.2.4. Optimization constraints...........................28
3.3.Designing optimal portfolio for individual
investors...........................................29
CHAPTER 4: MODEL OF STATIC PORTFOLIO OPTIMIZATION UNDER
CUMULATIVE PROSPECT THEORY............................31
4.1.Introduction....................................31
4.2.Static Portfolio Choice under Cumulative Prospect
Theory..............................................32
4.2.1. Background....................................32
4.2.2. Content of Static Portfolio Optimization model...........33
4.3.Evaluation of Static Portfolio Optimization Model
36
4.3.1. Advantages.....................................36
4.3.2. Disadvantages..................................37
CHAPTER 5: INTRODUCTION TO VIETNAMESE INDIVIDUAL
INVESTORS.............................................39
5.1.Overview of Vietnamese stock market.............39
5.1.1. A brief history of Vietnamese stock market..............39
5.1.2. Overall movements of Vietnamese stock market during the
period of 2007-2013....................................41

6
5.2.Overview of individual investors................44
5.3.Typical features of individual investor in
designing portfolios................................44
5.3.1. Lack of knowledge................................44
5.3.2. Lack of technological investment tools.................46
5.3.3. Affected by behavioral biases........................47
CHAPTER 6: DATA AND METHODOLOGY.......................52
6.1.Data collection.................................52
6.2.Overview of methodology.........................52
6.3.Research design.................................53
6.3.1. Stochastic Dominance approach.....................53
6.3.2. Questionnaire survey..............................55
6.4.Limitations of the study........................56
CHAPTER 7: EMPIRICAL RESULTS..........................57
7.1.Shape of the value function.....................57
7.2.Shape of the probability weighting function.....58
7.3.Empirical result................................59
CHAPTER 8 – RECOMMENDATION............................61
8.1.Individual investors............................61
8.1.1. Improve knowledge and skills.......................61
8.1.2. Build up plausible investment strategy.................62
8.1.3. Filter information and experts’ opinions................65

7
8.1.4. Apply models in practical investments..................66
8.1.5. Notations......................................67
8.2.Financial institutions and investment service
suppliers...........................................70
8.2.1. Provide instruments for constituting and managing portfolio.70
8.2.2. Provide biases defense for private clients...............72
CONCLUSION............................................73
REFERENCE.............................................75
APPENDIX A: SURVEY....................................79
APPENDIX B: MATHEMATICAL BACKGROUND...................81

8
LIST OF ABBREVIATIONS
BFT
CPT
EMH
EU
GDP
PT
SD
VN-Index
Behavioral Finance Theory
Cumulative Prospect Theory
Efficient Market Hypothesis
Expected Utility Theory
Gross Domestic Product
Prospect Theory
Stochastic Dominance
Vietnamese Index of Stock Price

9
LIST OF TABLES
Table
5.1
HOSE’s listing summary recorded in April
201440
Table
5.2
HNX’s listing summary recorded in April
201441
Table
5.3
Level of knowledge of individual investors in
2000-2007 in Viet Nam45
Table
6.1c and d 54
Table
7.1
List of joint hypotheses in testing the
curvature of value function57
Table
7.2Result of Tasks I, II and III 58
Table
7.3
List of joint hypotheses in testing the
curvature of probability weighting function59
Table
7.4Result of Tasks IV and V 59
LIST OF EXHIBITS
Exhibit
2.1
The value function assumed by Prospect
Theory7
Exhibit The value function u (x) for different values 9
10
2.2 of α,β∧μ
Exhibit
2.3The probabilities distortion functions,γ=0.61 and δ=0.69
10
Exhibit
2.4
Prospect Theory S-shape function and
Reverse S-shape function15
Exhibit
2.5Schematic depiction of the Wc
dclass of
probability weighting function18
Exhibit
3.1The process of portfolio management 26
Exhibit
5.1VN-index in the period of 2004 to 2014 42
Exhibit
5.2HNX-index in the period of 2004 to 2014 42
Exhibit
5.3
Dow Jones and VN-index from the end of 2008
to the end of 201049

1
CHAPTER 1: INTRODUCTION1.1. The rationale of the research
Individual wealth management, especially individual
optimal portfolio has been relatively new but expanding
field that attract more and more the concern of
financial researchers. Numerous studies regarding this
domain are carried out over the world, including
standard finance models and behavioral finance model.
The major characteristics of private investors are small
capital size, lack of technology support and affected by
behavioral biases. Small scale of investments prevents
individual investors from selecting many securities for
their portfolio. The shortage of supporting high-tech
tools poses the problem of how individual practioners
apply optimal portfolio models. Lastly, behavioral
biases are the in-depth reason for investors’ wrong
decisions and mistakes while constituting portfolio. In
three above features, individual behaviors is considered
as the most typical difference, which divides optimal
portfolio models into two approaches: one based on
Standard Finance paradigm, and one based on Behavioral
Finance paradigm.
Standard Finance paradigm proposes Markowitz Portfolio
Theory, which is considered as the best mathematical

2
model for optimizing portfolio. This model of portfolio
optimization bases on the assumption that individual
investors are analytically sophisticated and
knowledgeable about markets. By assumption, private
investors in such these constituted models make optimal
decision in a rational manner. However, MPT is strongly
criticized by behavioral finance scholars. According to
Bernstein (1998), “evidence reveals repeated patterns of
irrationality, inconsistency and incompetency in the
ways human being arrive at decisions and choices when
faced with uncertainty”. Nofsinger (2001) asserts that
assumption of rationality and unbiasedness of economic
participants has been drubbed by psychologist for a long
time.
As the mandatory requirement of financial research,
behavioral finance researchers advance substitute models
of individual portfolio management. The major studies
specializing in portfolio optimization emphasize that
(i) investors are normal (Statman, 2005); (ii) they use
S-shape utility function (Kahneman and Tversky, 1979)
that reflects their attitudes toward risk; (iii)
investors are also affected by their emotions (Lopes,
1987). Derived from these realistic assumptions, a vast
number of researches regarding individual portfolio have
conducted in over the world. The principal contribution
of individual optimal portfolio is with no doubt

3
Cumulative Prospect Theory initiated by Kahneman and
Tversky (1992) – the keystone of Behavioral Finance
Theory.
Moving focus on Vietnamese stock market, due to the
great number of private investors to the financial
market, individual wealth management is still a pivotal
domain. According to the interview result of Tran Dac
Sinh – chairman of HOSE, by the end of the year 2013,
there were 1.3 million trading accounts comprise
1,282,071 accounts of domestic individual investors
compared with 5,081 accounts of domestic institutional
investors, 13,950 accounts of foreign individual
investors and the 1,631 remaining of foreign
institutional investors. In addition, during the
development of the Vietnamese stock market, there is an
increasing number of private investors picking stock and
allocating their portfolio instead of short-term
trading.
Nevertheless, in reality, Vietnamese individual
investors are not equipped by strategic models helping
them to overcome their emotional and cognitive biases.
Many of them simplify portfolio selection process by
using heuristics approach because they find models of
optimal portfolio sophisticate and difficult to apply.
Other individual investors designing portfolio based on
available models are still unable to optimize their

4
wealth because of models’ implausible assumption of
rationality. This status is one of the reasons causing
the speculative bubble crash in 2007, even maybe
threatening the sustainability of Vietnamese stock
market.
Thus, the matter of wrong individual portfolio
investment decisions affecting on the sustainability and
the enhancement of Vietnamese stock market is the
rationale of my thesis “The application of Cumulative
Prospect Theory in building optimal portfolio for
individual investors in Vietnamese stock market”.
1.2. Objectives of the research
Behavioral Finance paradigm is a theoretical and
empirical system that includes numerous sub-theories
such as Heuristics, Prospect Theory, Cumulative Prospect
Theory, behavioral biases, disposition effect, etc. Each
relative theory, which has its mathematic forms, can be
a base constructing models of portfolio optimization.
Due to limited time and a lack of research capacity, my
thesis will only concentrate on Cumulative Prospect
Theory – the keystone of Behavioral Finance Theory, and
the most simple model, which is so-called “Static
Portfolio Optimization model”, with one risky asset and
one free-risk asset in one-period economy.

5
My thesis aims to answer two key research questions. Are
hypotheses of Cumulative Prospect Theory compatible with
Vietnamese individual investors’ characteristics? If the
model is suitable for privately applying, are there any
recommendations to realize the models in practical
investments?
1.3. Scope of the research
Individual investors were picked up for the survey since
they were more likely to have limited knowledge about
application of the Behavioral Finance or Cumulative
Prospect Theory in portfolio construction, hence prone
to make psychological mistakes. The influence has
primarily analyzed in term of whether behavioral factors
affect the portfolio management behavior of individual
investors.
1.4. Research methodology
This study follows the methodology of survey research
design of which data processing was supported by
quantitative approach.
As Holme and Solvang (1996), a quantitative method is
formalized, structured and is characterized by
selectivity as well as a distance from the source of
information. The approach concentrates on numerical
observations and attempts to generalize a phenomenon

6
through formalized analysis of observed data where
statistic indicators are indispensable parts. On the
other hand, a qualitative approach is formalized to a
lesser extent is directed at testing whether the
information is valid. The typical feature of this method
is the use of verbal description instead of purely
numerical data and aims at creating a common
understanding of the subject in research.
In my thesis, by using descriptive survey, primary data
is collected for quantitative and qualitative analyses.
Stochastic Dominance is used to interpret individual
decisions between two options.
1.5. Research structure
Except Introduction, Conclusion and Appendices, the
thesis is structured as follows:
Chapter 2: Cumulative Prospect Theory
Chapter 3: Building Optimal Portfolio for individual
investors
Chapter 4: Static Portfolio Optimization Model Under
Cumulative Prospect Theory
Chapter 5: Introduction to Vietnamese individual
investors in the stock market
Chapter 6: Data and Methodology

7
Chapter 7: Empirical results
Chapter 8: Recommendations

8
CHAPTER 2: CUMULATIVE PROSPECT THEORY 2.1. Introduction to Cumulative Prospect Theory
Cumulative Prospect Theory (Kahneman and Tversky, 1992)
is one of the most important theories of Behavioral
Finance Paradigm. CPT has assistance for behavioral
researchers to understand and explain individual
decision-making process under uncertainty. Hence, CPT
has many important implications in constructing
portfolio.
Cumulative Prospect Theory is the second version of
Prospect Theory (Kahneman and Tversky, 1979). Both of
them are considered as two of the best theories to
explain individual decision under risk. In essence,
there are many such relative theories as Expected Value,
Expected Utility having great contribution to the
financial decision-making process under conditions of
risk, but each of them has its own limitations. Expected
value is calculated by multiplying its payoff with its
probability. This model fails in predicting the final
choice because the value was not always directly related
to its precise monetary worth, but rather dependent on
other psychological factors. Daniel Bernoulli (1738)
releases works discovering this contradiction and
advancing an alternative to the expected value notion.
Throughout his experiments, Bernoulli recognizes that

9
the value a person attaches to an outcome can be
influenced by such factors as the likelihood of winning,
or probability, etc. Expected Utility, however, the
notion of Expected Utility also fails in predicting all-
loss choices.
In 1979, Kahneman and Tversky provided an alternative,
empirically supported theory of choice, so-called
Prospect Theory, one that accurately describes how
people actually go about making their decision. In
short, the theory predicts that individuals tend to be
risk averse in a domain of gains and relatively risk-
seeking in a domain of losses. However, there are some
theoretical problems in PT. The main problem is that the
functional form of PT violates “stochastic dominance”
(Kahneman and Tversky, 1979, pp. 283±284). Stochastic
dominance requires that a shift of probability mass from
bad outcomes to better outcomes leading to an improved
prospect. The theoretical problems have recently been
resolved in a new version of PT, called Cumulative
Prospect Theory (CPT) that was introduced by Tversky and
Kahneman (1992); in particular, CPT satisfies stochastic
dominance.
2.2. Hypotheses of Cumulative Prospect Theory
2.2.1. Three basic hypotheses

10
According to Kahneman and Tversky in their work in 1992,
there are three elements forming the decision making
process of CPT. CPT-investor is defined as an investor
who behaves consistently with Cumulative Prospect
Theory.
Firstly, a CPT –investor will be concerned with the
deviation of his final wealth from a reference level
instead of final value under EU hypothesis. Secondly,
CPT-investor is more sensitive with losses than gains.
Lastly, investors do not evaluate random outcomes using
reasonable probabilities, but base upon distortion by
overestimating low probabilities.
For the first hypothesis, Kahneman and Tversky presented
in their study in 1979 the following experimental
evidence to illustrate that the evaluation of decision
outcomes has to be reference-dependent (“reference” in
this context refers to the current state of wealth), a
principle that is incompatible with Expected Utility. In
this empirical work, experimental participants were
asked to choose between a lottery offering a 25% chance
of winning 3000 and a lottery offering a 20% chance of
4000, 65% of their participants chose the second option
(20%; 4000). On the contrary, when they were asked to
choose between a 100% chance of winning 3000 and an 80%
chance of winning 4000, 80% of them chose the former
(100%, 3000). On contrary to reality, EU predicts that

11
they should not choose different option in both
circumstances as the expected utility in the second
choice is always better than the first one.
To understand this certain situation, consider a gamble:
(x−m,p−m;x−m+1,p−m+1;…;x0,p0;…;xn−1,pn−1;xn,pn )
Where the notation should be understand as “gain xi with
probabilitypi with i=−m,n; where the outcomes are
organized in increasing order, so that xi<xj for i<j, and
where x0 = 0. For instance, a lottery offering a 50%
chance of winning $333 or losing $111 would be
formulated as (−111,12 ;333,12 ). Under EU, a rational
investor valuates the above gamble as:
∑i=−m
npiu(W+xi)
Where: W is the current asset and u(x) is the utility
function that is increasing and concave.
This formulation demonstrates the four key components of
prospect theory: 1) reference – dependence, 2) loss
aversion, 3) diminishing sensitivity, and 4) probability
weighting.

12
Exhibit 2.1: The value function
(Source: Kahneman and Tversky (1979))
According to Miyamoto (1987) and Kahneman and Tversky
(1979), they advance a value function with a reference
point at the outcome, located at zero (see Exhibit 1.1).
Their findings emphasize on the graphic function of u(x)
is S-shape, reflecting the principal of “diminishing
sensitivity” for the outcome evaluation. For example,
the subject strongly discriminates between 0 and 20
rather than between 80 and 100 even though both where
these figures regarding gains and losses. In other
words, a dollar is always appreciated less as an
investor becomes wealthier.

13
Secondly, it is also found that u(x) is more sensitive to
losses than for gains (loss aversion). Empirical tests
conducted by Kahneman and Tversky (1991) indicate that
losses are weighted about twice as heavily as gains –
losing $1 is about twice as painful as the pleasure of
gaining $1.
Last but not least, Kahneman and Tversky find that
preferences of subjects can be modeled by probability
weighting that amplifies small probabilities and reduces
higher probabilities. Therefore, the weighting function
is definitely sensitive to changes in probability near
the final points 0 and 1 but obviously insensitive to
changes in probability in middle region. As Kahneman and
Tversky (1979), weighting function is an important
hypothesis in supporting explanation for investors’
decision.
2.2.2. Mathematic form
Let W and Wref be the wealth and the reference level at
the end of the period.
Define the deviation D from the reference level as
follows:
D=W−Wref

14
D is the random variable that alters and motivates all
decision because each investor has different reference
level, hence different deviation D.
Let FXand SXbe the cumulative distribution function and
the complementary distribution function, respectively.
FX (x)=P (X≤x ) and SX (x)=1−FX (x)
2.2.2.1. The value function
According to Kahneman and Tversky (1992), the value
functionu (x)is defined as follows:
u (x)=¿
Where: x is random variable D, 0<∝<1,α≤β<1∧μ>1
It can be referred from definition of the value function
that the function g (x)and l (x) are positively homogenous,
increasing, invertible, and twice differentiable.
Parameter ∝ and β demonstrate risk aversion, parameter μ
illustrate loss-aversion. Moreover investors show the
tendency to risk-averse for gains and risk-seeking for
losses, hence it is clear to find that α≤β<1. Kahneman
and Tversky (1979) suggest that ∝=0.8, β=0.88 and μ=2.25
. See Exhibit 2.2

15
Exhibit 2.2: The value function u (x) for different values
of α,β∧μ
(Source: Kahneman and Tversky, 1979)
2.2.2.2. The probability weighting function
The third element forming CPT decision-making process
lies in the systematic distortion of physical
probability measure. The probabilities distortion may be
slightly different in case of gains (D>0) and losses (D<0).
The probability distortions (or probability weighting
functions) are denoted by Pgand Pl. For a random variable
D with cumulative distribution function FX and
decumulative distribution SX, Tversky and Kahneman
(1992) suggest the following two probabilities weighting

16
functions with Pg: [0;1 ]→ [0;1 ] for gains andPl: [0;1 ]→ [0;1 ]for
losses:
Pg (p )= pγ
[pγ+(1−p)γ ]1 /γ with0.28<γ<1
Pl (p )= pδ
[pδ+(1−p)δ ]1 /δ with0.28<δ<1
Where:p=FX(D), γ and δ are both less than 1 as if γ=1or
δ=1, there is no distortion in gain domain or loss
domain, respectively.
It is can be referred from the definition of the
probability weighting function Pgand Plthat they are
differentiable. Remember that investors show the
tendency to risk-averse for gains and risk-seeking for
losses, hence it is clear to find that γ<δ.
Kahneman and Tversky (1992) estimated γ=0.61 and δ=0.69
for a typical investor. (See the Exhibit 2.3)
Exhibit 2.3: The probabilities distortion functions,γ=0.61 and δ=0.69

17
(Source: Kahneman and Tversky, 1992)
Ingersoll (2008) shows that the condition of ( γ,δ>0.28)
ensures that Pgand Pl are increasing. Rieger and Wang
(2004) indicate that the probability weighting function
is not monotone for γ≤0.278.
Prelec (1998) proposes an alternative specification for
the weighting function: P (p )=e−(−lnp)γ, where parameter γis
similar to the one in the function proposed by Kahneman
and Tversky.
2.2.2.3. Objective function (Prospect function)
Bernard and Ghossoub (2009) define the objective
function of the CPT-investor, denoted byO (D), as:
O (D)=∫0
+∞
Pg (SX (x ))dg (x)+∫−∞
0
Pl(FX (x ))dl (x )
Or, the CPT-objective function O (D)also rewrite as:

18
O (D)=∫0
+∞
Pg (SX (x ))dg (x)−∫0
+∞
Pl (FX (x ))dl (x)
Where: FX (x) and SX (x) are cumulative distribution function
and decumulative distribution function, respectively
(see page 8), Pland Pgare probability weighting functions
(see page 10)
In order to ensure that both integrals are finite and
computable, the objective function requires thatα<2min (γ;δ) and β<2min (γ;δ), where αandβ is parameter in
the value function (see page 9), γ∧δ are parameters in
the probability weighting function (see page 10)
2.2.3. Stochastic Dominance approach to test hypotheses
2.2.3.1. Overview of approaches
In order to test features of Prospect Theory, Kahneman
and Tversky (1979) employ the Certainty Effect approach
that also supports for Cumulative Prospect Theory. In
their experiments in 1979 and 1992, they rely upon
comparison of two outcomes, one certain, one uncertain;
hence, probabilities distortion function can be
explainable for their results. Wu and Gonalez (1996)
also apply the Certainty Effect approach on their study
supporting Tversky and Kahneman’s probability weighting
function.

19
Even though Certainty Effect approach has many
applications and implications in decision theory under
uncertainty, it has the well-known drawback, recognized
by Levy and Levy (2001). Many experiments show that the
approach is ineffective in case of more than two
outcomes and each outcome has the same probability (for
instance, gain $1000 with probability of 25%; loss -$200
with probability of 25%; gain $0 with probability of
25%; gain -$300 with probability of 25%). The problem of
Certainty Effect poses the need of alternative
approaches.
In their work, Levy and Levy (2001, 2002a) propose to
employ Stochastic Dominance (SD) criteria to analyze
decisions and implied preference in experimental
research. The prominent advantages of SD approach over
Certainty Effect approach are that SD can compare two
uncertain choices with many outcomes, which can be all
positive, all negative or mixed. According to Levy and
Levy (2002b), Certainty Effect approach is not
explainable for the curvature of the preference with
mixed prospects while SD approach can provide
conclusion. Furthermore, based on SD condition, recent
studies suggest experimental designs that can isolate
elements of CPT without having to estimate all
parameters of functions.

20
In my thesis, the experiment, testing whether investors’
decisions are consistent to CPT, is conducted with the
support of SD approach. Firstly, we consider theoretical
framework of Stochastic Dominance Approach.
2.2.3.2. Stochastic Dominance approach
a. Background
In this section, consider an individual investor who has
investor has investment chances in one of the n
portfolios, where return (per unit invested) in a single
period on portfolio i is Xi (non-negative random
variable). Hence, wealth at the end of the period iswXiwith i=1;n.
Let w and v(x)be the current wealth and utility function
respectively. According to expected utility criterion,
the investor will choose portfolio k if:
E [v (wXk )]=max1≤i≤n
E[v (wXi)]
It is clear that if you determine the distribution of
each wXi(i=1;n) and value function of each option, you
can predict and explain the portfolio preferred to
others.
Notation:
The cumulative distribution function of X: FX (x)=P(X≤x)

21
The complementary or tail distribution function of X:SX (x)=FX (x)=1−FX (x)
Density function: fX (x )=F'X (x )
b. Absolute and First-order Stochastic Dominance
Absolute dominance/ almost-sure dominance: Y is
absolutely dominant over X ifP (X≤Y)=1 and there is at
least one y such that FY (y)<FX (y )
First-order stochastic dominance/ simple stochastic
dominance: Y is first-order stochastically dominant over
X if FY (y)≤FX (y )for all y, and there is at least one y such
thatFY (y)<FX (y ). It can be understood that Y has more
chance than X of being bigger than any given value y.
When Y is first order stochastic dominant over X, this
relationship is defined as Y≥fsdX
And,P (Y≤y )=FY (y )≤P (X≤y )=FX (y ), thus, if Y is absolutely
dominant over X, then Y is also first-order
stochastically dominant over X.
Theorem: Supposeu' (x )>0, then portfolio i is preferred to
portfolioj if either wXi is absolutely dominant over wXj
or wXi≥fsdwXj (See the proof in Appendix B)
c. Second-Order Stochastic Dominance

22
Second-order stochastic dominance: Y is second-order
stochastically dominant over X if ∫−∞
x
FY (y )dy≤∫−∞
x
FX (y )dy for
all x, and there is at least one x, for which the above
inequality is strict. When Y is second-order stochastic
dominant over X, this relationship is defined as Y≥ssdX
Theorem: Suppose thatv' (x )>0 (implying that investors
prefer more to less) and v'' (x )<0(implying that investor
is risk averse), WXi is preferred to wXj if wXi is second
- order stochastically dominant overwXj, or:
∫−∞
x
Fi (y )dy≤∫−∞
x
Fj (y )dy
(See the proof in Appendix B)
d. Prospect Stochastic Dominance
Prospect stochastic dominance: Y is prospect
stochastically dominant over X (v'>0,v''>0for x<0 , and
u''<0forx>0) if and only if
{∫y0
FY (x )−FX (x )dx≥0forallx≤0
∫0
x
FY (x )−FX (x )dx≥0forallx≥0
With at least one strict inequality.
2.2.3.3. Applying Stochastic Dominance approach to test
hypotheses of CPT

23
Investors are assumed to abide by the framework of CPT.
It implies that investors are compatible with three
basic hypotheses of CPT (See page 6)
The value function is u (x) where x is defined as the
deviation of wealth in comparison with a determined
reference point) (See page 9)
u (x)=¿
The probability function is Pg(FX (x )) for non-negative
outcomes and Pl (FX (x )) for negative outcomes, with
P (0 )=0,P (1)=1, where FX (x) is the cumulative distribution
function of X. (See page 10)
Pg (p )= pγ
[pγ+(1−p)γ ]1 /γ with0.28<γ<1
Pl (p )= pδ
[pδ+(1−p)δ ]1 /δ with0.28<δ<1
Exhibit 2.4: Prospect Theory S-shape function and
Reverse S-shape function

24
(Source: Levy and Levy (2002a))
Denote UP the set of prospect value functions containingu (x) that are convex for x<0 and concave for x≥0
Denote UP∗¿¿ the set of inverse prospect value functions
containing u (x) that are convex for x<0 and concave forx≥0
Denote Uconvex the set of prospect value functions
containing u (x) that convex for all x
Denote Uconcave the set of inverse prospect value functions
containing u (x) that are concave for all x
In essence, to test the value function or the
probability weighting function, it is advised that
researchers will test the curvature of graphic curves of
both functions. If u (x) that convex for x<0 and concave

25
for x≥0, then u (x) is an element of the set of prospect
value functions. Similarly, if the probability functionP(p) has the reserve S-shape, then P(p) is also a
probability weighting function of Cumulative Prospect
Theory.
Stochastic Dominance Approach relies on comparison of
two outcomes. By analyzing choice results, scholars are
able to predict the shape of the value function and
probability weighting function.
1.3.3.1. Applying Stochastic Dominance to test the value
function
Consider two prospects X and Y:
E [u (X ) ]−E [u (Y )]
¿∫a
b
u (x ) [fX (x )−fY (x) ]dx
¿ [u (x ) [FX (x )−FY (x )] ]b
a−∫a
bu' (x ) [FX (x )−FY (x )]dx
¿−∫a
b
u' (x ) [FX (x)−FY (x) ]dx=∫a
b
u' (x) [FY (x )−FX (x )]dx
Consider the function: h (x)=∫a
x
[FY (y )−FX (y )]dy

26
Let A=[a0,a1 ] and B=[b0,b1 ] be intervals such that
A∪B=[a,b ]. Given prospects X and Y, h (x)=∫a
x
[FY (y )−FX (y )]dy.
Then,
h (x)≤h (a1)fora0≤x<a1, and
h (x)≥h (b0)forb0≤x<b1
Both inequalities hold if and only if X is preferred to
Y for all function u (x), that are convex in A and concave
in B
X dominates Y according to Prospect theory (See page
14), denoted byX≥PY, if and only ifh (x)≤h (0)fora≤x<0, andh (x)≥h (0)for0≤x<b. Remember that X≥PY if and only if X is
preferred to Y according to Prospect Theory or u∈UP
Denote X≥P∗¿ Y ¿ when X dominates Y according to Inverse
Prospect Theory, if and only ifh (x)≥h (a)fora≤x≤0, andh (x)≤h (b)for0≤x≤b. And, X≥P∗¿Y¿ if and only if X is
preferred to Y according to Inverse Prospect Theory for
all u∈UP∗¿ ¿
Denote X≥ssdY when X dominates Y according to second-
order stochastic dominance (see page 18), if and only ifh (x)≥h (a)fora≤x≤b. And, X≥ssdY if and only if X is
preferred to Y according to second-order stochastic
dominance for all u∈Uconvex

27
Denote X≥s∗sdY when X dominates Y according to inverse
second-order stochastic dominance, if and only ifh (x)≤h (b)fora≤x≤b. And, X≥convexY if and only if X is
preferred to Y for all u∈Uconvex
1.3.3.2. Test the probability weighting function
We assume that the decision maker abides by Cumulative
Prospect Theory, we have:
Pg (FX (x ))= Fγ (x)
[Fγ (x)+Sγ (x )]1γ
with0.28<γ<1
Pl (FX (x ))= Fδ (x)
[Fδ (x)+Sδ (x )]1δ
with0.28<δ<1
The empirical researches show that probability weighting
function is “shallow in the open interval and changes
abruptly near the end-points where P (0 )=0,P (1)=1” (Tversky
and Kahneman, 1992). More specifically, an inverse S-
shape probability weighting function will be concave
first, then convex.
Consider the probability distortion functions that are
concave in ¿ and convex in ¿, for given values of d, c
in [0,1]. Denote this class by Wcd (See Exhibit 2.5)
If c<d, then the segment between c and d is nearly
linear, then the probability weighting function is

28
inverse S-shaped and continuous in (0,1) (as
desired)
If c=d, thus c will be the inflection of these
inverse S-shaped function
Ifc>d, the probability weighting function is
unrestricted between d and c. It is hard to
conclude the shape of the probability weighting
function.
Exhibit 2.5: Schematic depiction of the Wcdclass of
probability weighting function
(Source: Manel and Franz (2007))
2.3. Typical biases explaining for Cumulative Prospect
Theory
This thesis focuses on three typical biases explaining
for Cumulative Prospect Theory, namely loss aversion,
29
anchoring - adjustment and herding. Loss aversion is a
pivotal part of risk attitude influencing investment
choices. Analyzed cognitive bias is anchoring –
adjustment, which forms the reference lever, stemming
from faulty reasoning. In addition, emotional biases
such as herding originating from impulsive feelings or
intuition, rather than conscious reasoning and are
hardly possible to be adjusted to traditional
rationality.
2.3.1. Loss Aversion
Kahneman and Tversky (1979, 1992) advanced Prospect
Theory and Cumulative Prospect Theory that describe how
decision-makers actually behave when confronted with
choice under uncertainty. The value function shows the
asymmetry between the values people treat between gains
and losses. This theory hypothesizes that prior losses
increase risk-seeking, while prior gains reduce it. This
asymmetry is called loss aversion.
Empirical tests conducted by Kahneman and Tversky (1991)
indicate that losses are weighted about twice as heavily
as gains – losing $1 is about twice as painful as the
pleasure of gaining $1. In other words, people tend to
hold on losses in the hope that prices will eventually
go back up. It can be explained on the basis of the
Cumulative Prospect Theory, that value function is
30
upward sloping for wealth levers under each individual’s
reference point. In additional, investors are predicted
to be risk averse in gains. Shefrin and Statman (1985)
called this occurrence, stemmed from loss aversion, of
“selling winners too early and riding losers too long”
as disposition effect.
Loss aversion is one of three components of risk
attitude under the lenses of behavioral finance.
Numerous studies resolving the problem of portfolio
optimization derive from the base assumption of risk,
particularly, loss aversion, there can be Static
portfolio optimization model and Multi-stock portfolio
optimization under Prospect Theory for instances.
2.3.2. Anchoring and Adjustment
As proposed by Tversky and Kahneman (1974), Anchoring
and Adjustment heuristic is one strategy for estimating
unknown magnitude by starting from information that is
adjusted to yield the acceptable value. A vast number of
studies demonstrate that regardless of how the initial
anchors were selected, people have the tendency to
adjust their anchors inefficiently, leaving final
estimates too close to the original anchor,
consequently, irrationally. In other words, people are
generally better at relative comparison than absolute
numbers.

31
In his survey carried out in 2006, Pompian require
participants to estimate a good buy price for a share.
Investors are likely to start by using an initial value
as an anchor which can be the 52-week price of stock for
instance. People, then adjust their information by using
their analysis and interpretation which are indicated as
inefficient approach. It is undeniable that investors
anchor their thoughts to a logically irrelevant
reference point while making portfolio investment
decision.
Andersen (2010) presents the involvement of anchoring in
investment decision of market participants by using an
existing arbitraging algorithm. He applies the algorithm
for practical date of Dow Jones Industrial average,
providing evidence that anchoring plays an indispensable
part in the weekly price fixing of the Dow Jones
Industrial Index.
Anchoring and Adjustment bias shapes a reference point
in investors’ mind when they designing portfolios.
People, basing on their experience with their own
anchors, select securities for their portfolio.
Furthermore, reference level of price is also forming in
their invisible cognition. The reference point is the
central point of the S-shape function of the Cumulative
Prospect Theory.

32
2.3.3. Herding Bias
“Herding behavior is an alternative explanation of the
way that investment choices are made by investors”
(Demirer and Kutan, 2006, Ferruz at al., 2008).
Hirshleifer and Teoh (2003) define herding in financial
markets as mutual imitation leading to a convergence of
action. In other words, herding is a fundamental
tendency of human society that people follow the
investment decisions taken by majority. That is why
people tend to alter their “wrong” answer when they are
confronted with the judgment of large group of people.
Popular analysts have considerable influence on private
investors‘ decisions. However, even completely rational
professionals can deal with herding bias when they take
into account other’s viewpoints, even if they know
people react in a herd like manner. One reason is
originating from the past when our ancestors used to
live sociably and generally tend to seek the allowance
from the crowd rather than being a stand-out.
Furthermore, they believe when a large number of people
are unanimous in its judgments, they are certainly right
due to their illusion that the crowd may know something
they do not.
Word of mouth is a pivotal importance of herding.
Investors generally trust their relatives, colleagues,

33
friends instead of credible institutions or media
(printed newspaper, television, radio). Talking to
others seems rapid and effective information - spreading
approach that no means of communication can surpass. In
their study, Shiller and Pound (1986b) with their
intensive survey in investor’s behavior, only six
percent of the respondents specified newspapers and
periodicals.
The existence of herding may have implications for
asset-pricing models because its behavioral affects on
stock price movement. The assumption of EMH is totally
incorrect because in the real world, people, instead be
rationally valuate the stock price, they react in herd-
like manner.
In spite of the fact that herding bias is not a
component of CPT-investor, this important bias provides
a proof that it is not plausible to apply models of
portfolio optimization of which assumption is investors’
rationality and independence.

34
CHAPTER 3: BUILDING OPTIMAL PORTFOLIO FOR INDIVIDUAL
INVESTORS 3.1. Individual investors
An individual investor is a person who buys and sells
securities for their personal account, and not for
another company or organization. Private investors play
an indispensable part in stock market from the developed
stock markets such as USA’s to the emerging financial
market such as Viet Nam’s.
Standard Finance Paradigm assumes that individual
investors are analytically sophisticated and
knowledgeable about markets. By assumption, private
investors in such these constituted models make optimal
decision in a rational manner. However, numerous studies
criticizing the notion of rationality, pointing out that
individual investors are affected by irrational nature
of buying and selling behaviors. According to Bernstein
(1998), “evidence reveals repeated patterns of
irrationality, inconsistency and incompetency in the
ways human being arrive at decisions and choices when
faced with uncertainty”. Nofsinger (2001) asserts that
assumption of rationality and unbiasedness of economic
participants has been drubbed by psychologist for a long
time.

35
The irrationality of individual investors is discovered
during the decision-making process because this process
is a cognitive process resulting in the choice of a
course of action among several alternatives. In this
process, the emphasis is on thinking based on weighting
the outcomes and alternative prior to the last decision.
During this process, individual investors are under the
influence of numerous biases that drive them to wrong
decisions and mistakes.
Regularly, individual investors are irrational while
they have to make buying and selling decisions in the
stock market. In reality, private investors are under
the lack of abilities, knowledge and technology,
therefore, they decide to manage their asset through
investing in an investment trust. The investment trust
is just cognized inside, not the rational entity in the
market. Pompian (2006) lists more than twenty biases
appearing in the decision-making process, which alter
and motivate all decisions of individual investors.
In light of the above discussion, individual investors
are irrational and biased during the process of making
decision or process of buying and selling. Private
investors manage their assets on the basis of investment
trusts instead of investment analyses. Thus, it is
advisable that individual investors should have

36
different investment instruments from institutional
investors.
3.2. Optimal portfolio
3.2.1. Introduction
Wealth management and especially the portfolio choice,
one important bloc of the financial literature, have
developed substantially over several decades, utilizing
the enormous advancement under power of mathematics and
calculus science.
For the start, my thesis provides definitions of
portfolio and optimal portfolio. A portfolio is defined
as a grouping of financial assets such as stocks, bonds
and cash equivalents, as well as their mutual, exchange
– traded and closed-fund counterparts. Optimal portfolio
is a set of portfolios that offers the highest expected
return rate for a particular investor’s acceptable level
of risk or the lowest risk for a given level of expected
return.
Portfolio construction is designed based on underlying
principle of the notion that risk can be diversified by
adding other assets that allow the portfolio to achieve
a better outcome per each risk unit. From an investor’s
perspective, portfolios are to be constructed taking
into account risk return preference of investors with
optimal portfolios lying on the efficient frontier. With
37
each intensive objective either minimizing risk or
maximizing return, more models of portfolio choice are
proposed.
The optimal portfolio literature can be reviewed as
being in two major parts according to the approaches.
The first is Markowitz mean – variance model which is
well-known as “Modern portfolio theory”, which developed
on the premise of expected utility theory by Markowitz
(1952b, 1959) and Tobin (1958, 1965). Each security is
modeled by two parameters: mean and variance of its
return rate. Parameter “mean” is representative for
expected return concept, while “variance” is
representative for risk concept. The key insight of the
model is the expected return is combination weighted
average return of each individual security, but variance
of portfolio is not. Thus, rational investors focus on
the subset of portfolios lying on “efficient frontier”
which achieve the maximum value for a given variance or
the minimum risk for each expected return rate. The
investor’s ultimate decision is on the basis of their
preference along the efficient frontier.
Although the mean-variance model seems attractive and
useful, there is a variety of problems for
practitioners. As Michaud (1989), the principal problems
are stemming from optimization procedure that leads to
concentrated portfolios, corner solutions, the shortage
38
of robustness and especially requirement of much input
data, hence it is unsuitable for private investors. The
model is also strongly criticized by psychologists
because it is built in terms of investors’ rationality.
The underlying assumption of Modern portfolio theory
prevents MPT from applying in reality.
The second approach is developed under the advancement
of behavioral finance that proposes better understanding
of portfolio management behavior as well as decision-
making process. When people confront with risk and gain,
they are affected of invisible biases deriving from
psychology (Kahneman and Tversky, 1979, 1991) and
emotions (Lopes 1987). Furthermore, investors have more
accurate security assessment in long-time rather than
within one year.
Portfolio construction based on behavioral finance
assumes that investors are irrational. Each behavioral
model introduced in this domain concentrates on several
major psychological concepts such as risk asymmetry,
emotions, behavioral biases, the prospect theory, mental
accounting etc. Within this thesis, my concentration is
on the model designed on Cumulative Prospect Theory
base.
3.2.2. Approaches of portfolio optimization

39
The expected utility theory, developed by Von Neumann
and Morgenstern (1947), originates from early working
paper of Bernoulli (1738), providing an idealized,
normative economic model of rational decision under
uncertainty. Complying with the theory, investors
maximize their utility through aggregating the weighted
outcomes. Utilities, formulated in a utility function,
are graphed nonlinearly related to monetary amounts.
In their study in 2005, Copeland, Weston and Shastri
witness that expected utility rests on a set of axioms,
such as comparability or completeness, transitivity and
invariance. Comparability means that agents know exactly
their preference, hence can select the most desired
outcomes. Transitivity implies that people have
consistent preferences that are unable to be altered.
Invariance can be understood that preferences are framed
independently. Based on these assumptions, models of
portfolio optimization, asset allocation and valuation
are constructed. The expected utility model, as with all
theoretical models, is not without its limitations. One
is that the theory considers uncertainty as objective
risk. It is obviously unacceptable to plan for
probabilities of events.
Despite its limitations, EU assumption is irreplaceable
until the occurrence of psychological concept in
finance. Each behavioral concept, such as risk

40
asymmetry, emotions, behavioral biases, prospect theory,
mental accounting, can be added into a model of
portfolio optimization. Nevertheless, Prospect Theory
and Cumulative Prospect Theory are two most popular
approaches to resolve the problem of optimization under
lenses of behavioral finance.
The Prospect Theory is similar in character to that of
utility function, but the major difference between two
theories is the reference point. While EU is the key
background for construction of mean-variance portfolio
theory, PT is an essential premise for models of
portfolio choice in behavioral finance. However, many
researches show the limitation of PT that the theory can
be only applied to gambles with at most two nonzero
outcomes; it predicts that people sometimes choose
dominated gambles.
In modified version published in 1992, the theory known
as “Cumulative Prospect Theory” is popularly accepted
and typically used in both academic and practical
worlds. Empirical research has been testing CPT and
providing evidence of its relevance for models of
investment decision than original version. The
theoretical and empirical studies, proposed by Tversky
and Kahneman (1979), are a striking proof in support of
the CPT when CPT is accessible to resolve some
limitations of Prospect Theory.

41
To conclude, different assumptions shape different
models of portfolio optimization. The Expected Utility
Theory is the key motivation for traditional
mathematical model while PT and CPT are indispensable
parts of the enhancement of optimal portfolio models
accounting for behavioral biases.
3.2.3. Processes of portfolio management
Exhibit 3.1: The process of portfolio management
(Source: CFA Institute, 2014, CFA Level1Book 1, Portfolio
management)
3.2.3.1. Create a policy statement
Policy statement is a commitment of investors about
goals and constraints as it relates to their investment.
This step is judged as the most important of all stages
in portfolio management process.
Create a policy statementDevelop an investment strategyPortfolio selectionAsset allocationMonitor and update portfolios
42
It is requisite for an investor to understand his true
financial needs both in short-run and long-run. Based on
this good understanding, the investor will manage his
portfolio to meet his needs. When there is market
volatility or a change in his private needs, the policy
statement will guide him to make necessary adjustments
in a disciplined manner.
Prior to design a policy statement plan, it is of
pivotal importance for an investor to express his
investment objectives in terms of risk and return.
It is undeniable that return objectives play great roles
in investment decision-making process as they help to
focus investors on reaching financial goal. However,
level of risk tolerance are far more important than
expected return rate. With each risk level, the
requirement of return rate is distinct. Furthermore,
despite the need for a high return, an investor may be
uncomfortable with the risk that is attached to that
higher return portfolio. As such, it is important to
consider not only return, but the risk of the investor
in a policy statement.
3.2.3.2. Develop an investment strategy
Strategic investment plan is the strategy combining
investors’ goals and objectives with current financial
market and economic conditions.

43
Before investment decision, investors should spend time
on researching and analyzing the macroeconomic
situation. There is no one denying the dependence
between the development of stock market upon the
sustainability of national economy and the stability of
manufacturing environment.
Actual experiences show that stock and other asset
prices are important parts of the driving forces to
economic growth. For example, the rise of stock prices
has positive effects to the increased investment of
enterprises (excluding too high speculation and
imperfect information). Stock prices also have effects
to the wealth of the households and their spending.
3.2.3.3. Select securities
Portfolio selection is the process that investors decide
to pick securities for their portfolio. In this stage,
the investor will choose securities including foreign
exchange, gold, stocks, bonds, etc. Portfolio selection
is an indispensable step in portfolio management
process. Based on policy statement, investment strategy
and private screening systems, assets are add in to list
of portfolio.
There are many approaches to pick stock or securities.
Many fundamental investors prefer huge companies that
generate more profit with sustainable growth rates.
44
While some individual investors select technical tools
to pick growing stocks based on market performance
rather than the company’s fundamental factors. Types of
preference lead to the different selection of stocks,
bond or cash.
3.2.3.4. Allocate assets
After having a list of securities, investors jump into
the next stage, allocation. The major objective of this
step is to distribute total original monetary wealth
into different investments. In other words, they have to
answer the following questions: how proportion of cash
should an investor maintain? How much proportion of
asset X should be purchased? In my thesis, the model
Static Portfolio Optimization model, designed on the
basis of Cumulative Prospect Theory, aims to help
investors to answer these questions in real world.
In reality, with the support of such models as Capital
Asset Pricing Model, Fama French Three Factors,
Discounted Cash Flow model, Dividend Discounted Model,
etc, investors are equipped with many screening system
allowing to shorten choosing process.
3.2.3.5. Monitor and update portfolios
The last stage of portfolio management process requires
investors to adjust when both markets and investors’

45
needs change. It is necessary for investors to monitor
for these changes as they occur and update the plan as
soon as the market changes has big influence on
portfolio performance in the foreseeable future.
3.2.4. Optimization constraints
3.2.4.1. Regulation and taxes
Regulation and taxes are constraints imposed on the
optimization process. Investors may be forbidden by law
to hold some assets because in some cases, unconstrained
portfolio optimization would lead to short-selling of
some assets while short-selling can be forbidden in
several countries. Additionally, it is impractical to
hold an asset due to too high associated tax cost.
3.2.4.2. Transaction costs
Transaction costs are the costs of trading in order to
change the portfolio weights. Since the optimal
portfolio changes with time, there is a financial
incentive to optimize again frequently. However, too
frequent trading will lead to too-frequent transactions
costs; hence, the optimal strategy is to find the
frequency of re-optimization and trading that balance
between transaction costs and up-to-date optimal
portfolios.

46
3.3. Designing optimal portfolio for individual
investors
Each individual investor is affected by different types
of cognitive and emotional biases. These biases
influence on purchasing and selling decisions, hence
have great impacts on selection and allocation stages
(See Exhibit 3.1).
Selection stage is the stage when individual investors
choose stocks, bonds and cash for their portfolio. The
choices can deviate from the initial investment policy
and strategy due to herding and anchoring for instances.
Therefore, investors should take advantage of screening
system to isolate them from the craziness of the stock
market.
Allocation is the process of optimization, thus it is of
critical importance to apply suitable models to allocate
portfolios. For example, if one of the most obvious
biases is loss aversion, the investor should apply the
model of portfolio optimization based on loss aversion
index or loss aversion function. Another examples, when
an investor abide by Cumulative Prospect Theory, he
should use models based on theoretical framework of CPT.
To summarize, designing individual portfolio is
different from financial institutions because of
investors’ irrationality. Each investor requires a

47
private model benefiting them in order to optimize their
portfolio. These models should be based on the most
clear biases affecting on them.
48
CHAPTER 4: MODEL OF STATIC PORTFOLIO OPTIMIZATION
UNDER CUMULATIVE PROSPECT THEORY4.1. Introduction
Cumulative Prospect Theory has been emerging as the best
financial premises for constructing optimal portfolio in
comparison with Expected Utility Hypothesis and Prospect
Theory; hence, some theoretical optimization models have
been designed under CPT.
Pirvu and Schulze (2012), in their working paper No.
742, propose advance model of multi-stock portfolio
optimization under CPT. The model is developed on the
basis of Static portfolio optimization of Bernard and
Ghossoub (2009). They consider a CPT-investor in one-
period economy with one riskless bond and multiple risky
stocks, which follow a multivariate elliptical
distribution. The key contribution of their work is a a
two-separation between the riskless bond and a mean-
variance-portfolio. Based on their finding, they resolve
the optimization problem by imposing a regulatory risk
constraint.
He and Zhou (2011) resolve the static problem in the
presence of n risky choices, corresponding to a multi-
stock financial market. They introduce a new measure of
loss aversion for large payoffs, known as large-loss

49
aversion degree (the LLAD), which is proved to be a
pivotal determinant of the model. The problem of
maximizing the prospect value is explicitly demonstrated
for the cases when the reference level is the risk-free
return and when it is not. They compose the LLAD, the
reference point and the curvature of of the probability
distortion within their statics of optimal risky
portfolio.
Gomes (2003) in “Portfolio Choice and Trading Volume
with Loss-Averse Investors” presents a model of
portfolio selection and security trading volume in case
of loss aversion bias. The demand function of model is
discontinuous and non-monotonic risky assets. Loss-
averse investors complying with disposition effect will
not hold stocks unless the equity return rate is quite
high. Gomes provides the cogent proof of that elasticity
of the aggregate demand curve fluctuate considerably,
depending upon the distribution of wealth.
Within the thesis, my principal objective is to
introduce Static portfolio optimization model holding in
a risky asset and a risk- free asset under Cumulative
prospect Theory, in a one-period economy. This model
valid in case of the assumption of CPT-investor is
reasonable.

50
4.2. Static Portfolio Choice under Cumulative Prospect
Theory
4.2.1. Background
Consider the portfolio choice problem in case of one-
period economy with one risk-free asset (return rate p
over the period) and one risky asset (return rate q over
period).
Denote W0 to be the investor’s initial wealth. An amountK (withK>0) is invested in the risky asset and the
remaining (W¿¿0−K)¿ is invested in the risk-free asset.
Assume that short-selling is forbidden.
The final wealth at the end of the period is given by:
W=(W0−K ) (1+p)+K (1+q)=W0 (1+p)+K(q−p)
Define y as the excess return rate on the risky asset
over the risk-free rate:
y=q−p
Define Wref, the reference level of wealth at the end of
period as:
Wref=W0 (1+r )
Wrefis the amount the individual would have receive at
the end of period if he invested all his initial W0 in
the risk-free asset (for example: bank account or
Treasury bills).

51
It is clear to see that:
W=Wref+Ky
The deviation from the reference level is defined as:
D (K)=W−Wref=Ky
4.2.2. Content of Static Portfolio Optimization model
The objective function of the CPT – investor, O(x), is
given by:
O (D)=∫0
+∞
Pg (S (x ))dg (x )−∫0
+∞
Pl (F (−x ))dl(x) (See page 11)
F and S is the cumulative distribution functions and
decumulative distribution functions of risky asset and
risk-free asset, respectively.
Lettingy=xK, in order to x=Ky anddx=Kdy.
Thus, S (x)=S (Ky ) andF (x)=F (Ky ). Then, obtain:
O (D (K ))=∫0
+∞
Pg (S (Ky) )dg(Ky)−∫0
+∞
Pl (F (−Ky ))dl (Ky)
¿∫0
+∞
∝(Ky)∝−1Pg (S (y ))Kdy−∫0
+∞
μβ (Ky )β−1Pl (F (−y ))Kd(y)
¿K∝∫0
+∞
Pg (S (y ))dg (y )−Kβ∫0
+∞
Pl (F (−y))dl(y)
To simplify, rewrite the formulation as follows:
O (D (K ))=G (y )−L (y ) (¿)

52
Where { G (x )=∫0
+∞
Pg (S (y))dg(y )
L (x )=∫0
+∞
Pl (F (−y) )dl(y )
Thus, portfolio optimization holds ifO (D (K ))=max
K>0(K∝G (y )−KβL (y ))
Let denote by R (y ) the ratio of G (y) to L (y). We have:
R (y )=G (y)L (y)
=∫0
+∞
Pg (S (y ))dg (y )
∫0
+∞Pl (F (−y ))dl (y )
CASE 1: Firstly, consider the situation where only
borrowing is allowed, so K>0
Problem 1: Given 0<∝≤β<min {1;2min (δ;γ )} where αandβ is
parameter in the value function (see page 9), γ∧δ are
parameters in the probability weighting function (see
page 10), suppose that short-selling is prohibited and
investors are allowed to borrow in order to invest in
the risky asset. We resolve the optimization problem of
maximizing the prospect value of (¿) (See page 31)
maxK>0
(K∝G (y)−KβL (y) )
Proof:

53
If ∝=β, then we can write O (D)=K∝O (y ), then we consider 3
cases as follows:
- If O (y)=0, any holding in the risky asset is
optimal. The prospect value is constant and equal
to 0
- If O (y)>0, the borrowing finite amount to invest in
the risky asset optimize the portfolio. The
prospect value is equal to +∞.
- If O (y)<0, the optimal amount K to invest in the
risky asset is equal to 0.
If ∝≠β, the maximum prospect value holds when:
d (K∝G (y )−KβL (y ))dK
=0
According to Bernard and Ghossoub (2009), the equality
yields the only root:
K'=(βL (y )αG (y ))
1α−β=(∝β )
1β−α R (y)
1β−α
In order to K' is the optimal point for the equality, it
leads to the requirement as follows:
d2 (K∝G (y)−KβL (y) )d2K
<0
↔ (α−1 )Kα−2<K'α−β (β−1)Kβ−2

54
When K=K', then (α−1)K'∝−2<K'α−2 (β−1 )↔α<β (as desired).
Thus, K' is the optimal allocation when borrowing is
allowed.
CASE 2: Consider the condition where both short-selling
and borrowing constraints are imposed. This leads toK∈ [0;W0 ]
Problem 2: Given 0<∝≤β<min {1;2min (δ;γ )}, where αandβ is
parameter in the value function (see page 9), γ∧δ are
parameters in the probability weighting function (see
page 10), suppose that both short-selling and borrowing
are not allowed, we resolve the optimization problem of
maximizing the prospect value of ( ¿ ) (See page 31)
maxK>0
(K∝G (y)−KβL (y) )
Proof:
If ∝=β, then we can write O (D)=K∝O (y ), then we consider 3
cases as follows:
- If O (y)=0, any holding in the risky asset is
optimal. The prospect value is constant and equal
to 0
- If O (y)>0, It is optimal to invest W0in the risky
asset optimize the portfolio.
- If O (y)<0, the optimal amount K to invest in the
risky asset is equal to 0.
55
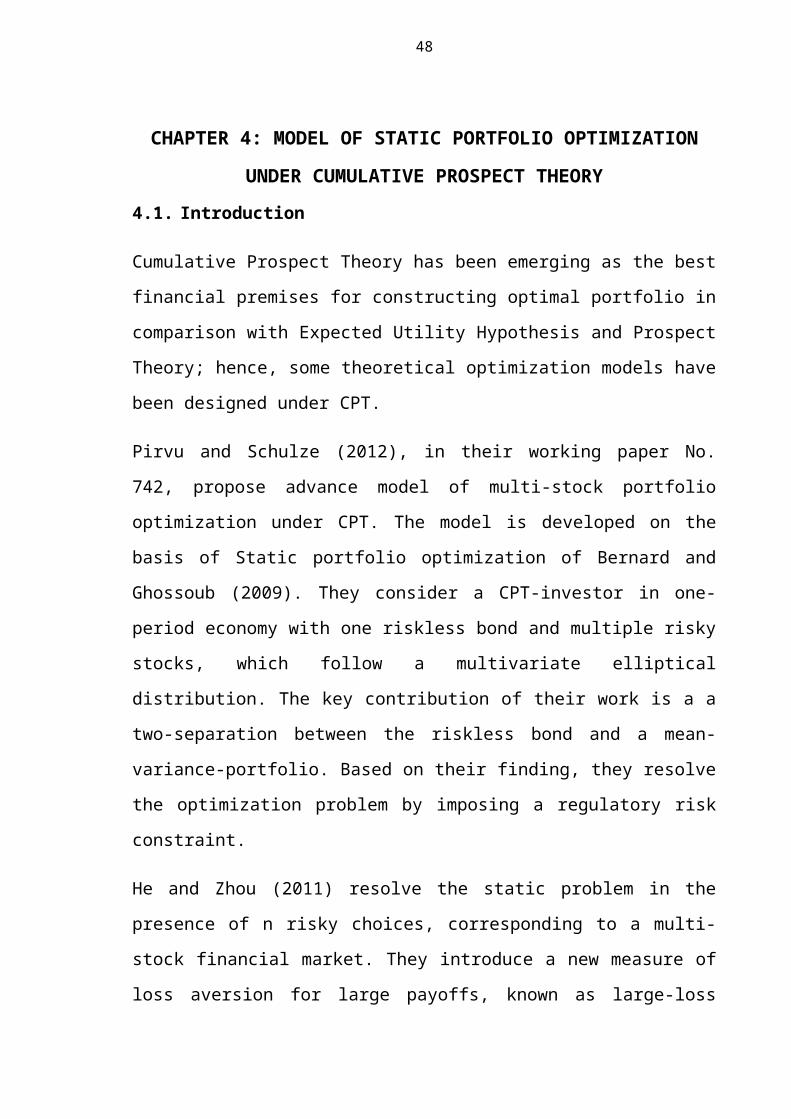
If ∝<β, the maximum prospect value holds when:
K'=min(W0;(∝β )1
β−α R (y)1
β−α)Thus, in this section we have just indicate the optimal
portfolio allocation rate K'. Clearly, the optimal
holding is dependent upon R (y ). As pointed out by Bernard
and Ghossoub, R (y ) is the key to resolve the problem of
portfolio allocation.
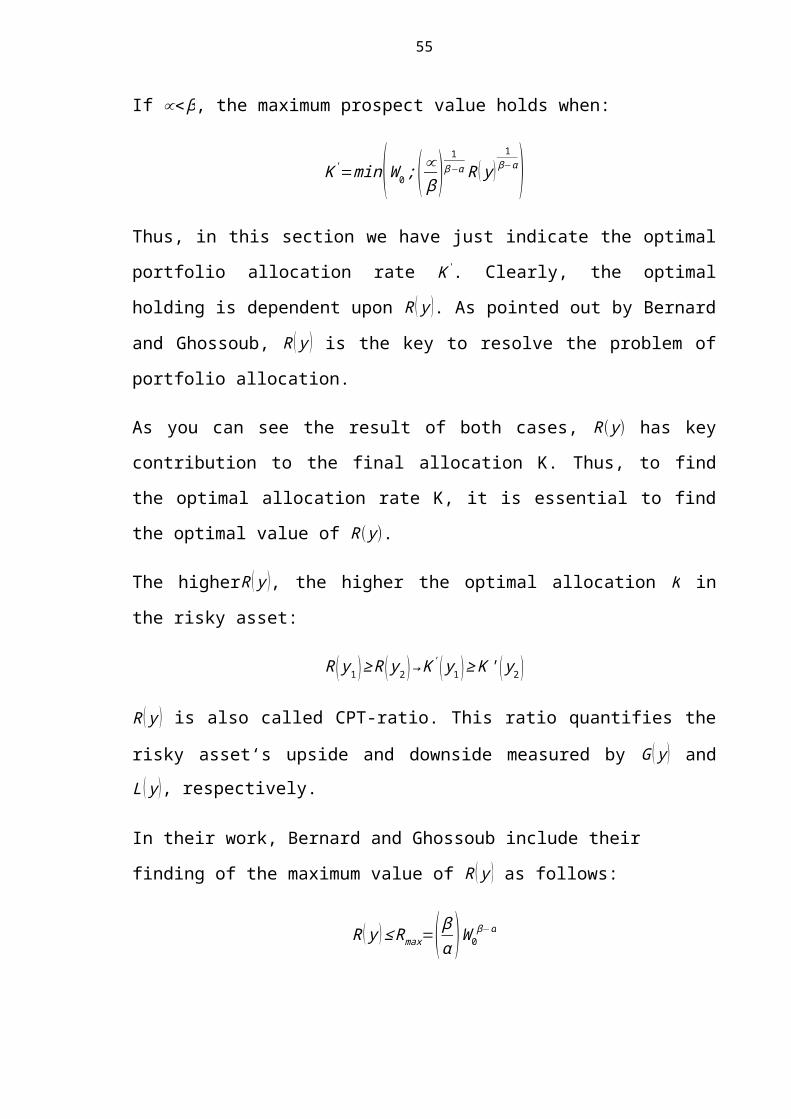
As you can see the result of both cases, R(y) has key
contribution to the final allocation K. Thus, to find
the optimal allocation rate K, it is essential to find
the optimal value of R(y).
The higherR (y ), the higher the optimal allocation K in
the risky asset:
R (y1 )≥R (y2 )→K' (y1 )≥K' (y2 )
R (y ) is also called CPT-ratio. This ratio quantifies the
risky asset‘s upside and downside measured by G (y) andL (y), respectively.
In their work, Bernard and Ghossoub include their
finding of the maximum value of R (y ) as follows:
R (y )≤Rmax=(βα )W0β−α

56
To summarize: ∝<β (See the detailed proof in page 32, 33
when ∝=β)
Case 1: consider the situation where only borrowing is
allowed, so K>0
Koptimal=(∝β )1
β−αR (y )1
β−α
Case 2: Consider the condition where both short-selling
and borrowing constraints are imposed. This leads toK∈ [0;W0 ]
Koptimal=min(W0;(∝β )1
β−αR (y )1
β−α)Where:
R (y )≤Rmax=(βα )W0β−α
4.3. Evaluation of Static Portfolio Optimization Model
4.3.1. Advantages
Static Portfolio Optimization model is the simplest
model resolving the problem of maximizing the prospect
value in one period economy with one risky asset and one
risk-free asset for CPT-investor. The model is
constructed on the basis of Cumulative Prospect Theory,
hence it is applicable for investors who are loss-
averse, anchoring in the reference level and
overweighting small probabilities. Furthermore, this

57
model is easy to understand and apply in practical
world.
To academics, Bernard and Ghossoub introduce a new
approach to resolve the problem of optimization under
the lens of CPT. Based on their working paper, more
researches are conducted with more complex and
sophisticated scenarios.
4.3.2. Disadvantages
4.3.2.1. Violate Loss Aversion Index
Risk attitude consists of three components: (i) the
basis utility; (ii) probability distortion, and (iii)
loss aversion known as “behavioral concept” measured
through LA index. Numerous academics point out that
there are many different alternative measures of
behavioral criterion of loss aversion in the literature
with their own advantages and disadvantages. As
Kobberling and Wakker, loss aversion is illustrated by
an index defined as follows:
LAkw= limx→0−¿l'(x)
limx→0+¿g' (x )
¿ ¿
¿¿
The gist of the formulation is to consider foundations
of risk attitude outside marginal utility by using a
“probabilistic risk attitude” resulting from model of
rank-dependent utility. As Schmidt and Zank (2007), this

58
idea is inherited from Prospect Theory introduced by
Kahneman and Tversky (1979), and Expected Utility
Theory, but is inaccessible to apply under Cumulative
Prospect Theory because it ignore rank dependence. In
their work, Schmidt and Zank (2005) propose an
alternative quantitative approach to define loss
aversion in terms of both the value function and
probabilities distortion.
Consider the Objective function:
For x>0 is a fixed real number, then
Og (d )=∫0
+∞
Pg (S (x))dg(x)=∫0
+∞
Pg¿¿¿
¿∫0
+∞
Pg ¿¿
Similarly, Ol (x)=l (x ) withx>0. Hence, for any x>0, we have
O (x)=g (x)=xα and |O (−x )|=|−l (x)|=μxβ. Consequently, loss
aversion holds when xα<μxβ or μ>xα−β
Obviously, when ∝=βand μ>1, loss aversion holds.
When ∝<β, the model violates the accepted measure of
loss aversion proposed by Kobberling and Wakker in a
neighborhood of the reference point, namely for:
0<x<ε=μ1
α−β
59
However, the violation with loss aversion index
suggested by Kobberling and Wakker is not a serious
matter as some recent experimental studies show that
individuals’ decision sometime violate loss aversion,
Bleichrodt and Pinto’s work of “An Experimental Test of
Loss Aversion and Scale Compatibility” in 1995 is a
typical example.
Thus, in their model of Static portfolio optimization,
Bernard and Mario (2009) consider loss aversion as the
behavioral phenomenon that “losses loom larger than
gains” (Kahneman and Tversky) that do not concern where
loss aversion deriving from, the utility function or
from the probability weighting function or from both.
4.3.2.2. Ignore diversification benefits
It is undeniable that the model is too simple with only
one risky asset and one risk-free asset, which cannot
reach the portfolio diversification. Investors who
desire to invest more types of asset do not take
advantage of the Static portfolio optimization model.
However, this difficulty is surmountable with the
evolutionary model of Pirvu and Schulze (2012) with
multi-stock portfolio optimization under CPT.
60
CHAPTER 5: INTRODUCTION TO VIETNAMESE INDIVIDUAL
INVESTORS5.1. Overview of Vietnamese stock market
5.1.1. A brief history of Vietnamese stock market
On July 2000, Viet Nam took a major step towards
establishing a more robust market and forming a new
channel of capital mobilization for enterprises by
opening Securities Trading Centre in Ho Chi Minh. On the
first day of trading, only two individual stocks with
total market capitalization of VND 444,000 million
(about USD 27.95 million) were transacted on the market.
After four years of preparation and a vast number of
delays, the Government of Viet Nam ultimately fulfilled
its commitment to the opening of Vietnamese stock
market. After 13 years of the enhancement, Vietnamese
stock market has been evolving with significant
contribution to the national economy sustainable
development.
5.1.1.1. HOSE
Due to the rapid growth of the securities market, the
economic innovation and the business restructure, Prime
Minister approved Decision No.599/QĐ-TTg to transform Ho
Chi Minh Trading Centre into Ho Chi Minh Stock Exchange

61
(HOSE), which is current accounting for about 89% of
aggressive capitalization.
Thirteen years after the foundation of the Vietnamese
stock market, at the end of June 2013, the market had
309 listed companies in Ho Chi Minh with capitalization
worth almost USD 40 billion, an increase of 480% in
comparison with year 2000. Especially, the average
trading volume per day during June 2013 reached about
65.69 million shares, equivalent to about USD 51 million
per a trading session. The amazing turnover rate was
42.05% during the first six-month period in 2013.
The products traded on HOSE consist of stock, corporate
bonds, municipal bonds and fund certificates. There are
currently also two types of fund certificates, 38 bonds
listed on HOSE with the volumes of about 30.3 billion
shares, 70 million bonds and 45 million fund
certificates, respectively.
Table 5.1: HOSE’s listing summary recorded in April 2014
ALL STOCK
INVESTMENT
FUND
CERTIFICATE
BOND
Total listed
shares (1
share)
342 302 2 38,00
Percent (%) 100,00 88.30 0.58 11.11

62
Listed
Volume (1000
shares)
30,314,902
.9
30,199,292
.145,417.53 70,092.3
Percentage
(%)100,00 99.62 0.15 0.23
Listed Value
(VND
million)
309,457,33
4.2
301,993,93
0.9454,175.30
7,009,22
8.0
Percentage
(%)100,00 97.59 0.15 2.27
(Source: www.hsx.vn, the official website of Ho Chi Minh Stock
Exchange)
5.1.1.2. HNX
Ha Noi Stock Exchange was established in accordance with
Decision No.01/2009/QDD-TTg by Prime Minister on the
basis of transforming and restructuring Ha Noi
Securities Trading Center.
By the end of June 2013, HNX had 387 listed companies in
Ho Chi Minh with capitalization worth almost USD 4.65
billion compared to USD 40 billion recorded at HOSE,
which implies the considerably small scale of HNX.
Despite the scale of market capitalization, the average
trading volume per day during June 2013 still reached
about 54.03 million shares, equivalent to about USD
19.80 million per a trading session.

63
The products traded on HNX consist of stock, corporate
bonds, municipal bonds and Government underwritten bonds
with the volumes of about 8.89 billion shares, 5.72
billion bonds in total, respectively.
Table 5.2: HNX’s listing summary recorded in April 2014
ALL STOCK BOND UPCOME
Total listed
shares (1
share)
1052 377 532 143
Percent (%) 100 35.84 50.57 13.59Listed
Volume (1000
shares)
16,606,128
.32
8,895,613.5
7
5,720,220.8
3
1,990,293.9
2
Percentage
(%)100 53.57 34.45 11.99
Listed Value
(VND
million)
680,801,16
2.7
88,956,135.
68572,022,088 19,902,939
Percentage
(%)100 13.06 84.01 2.92
(Source: www.hnx.vn, the official website of Ha Noi Stock Exchange)
5.1.2. Overall movements of Vietnamese stock market during the period of
2007-2013
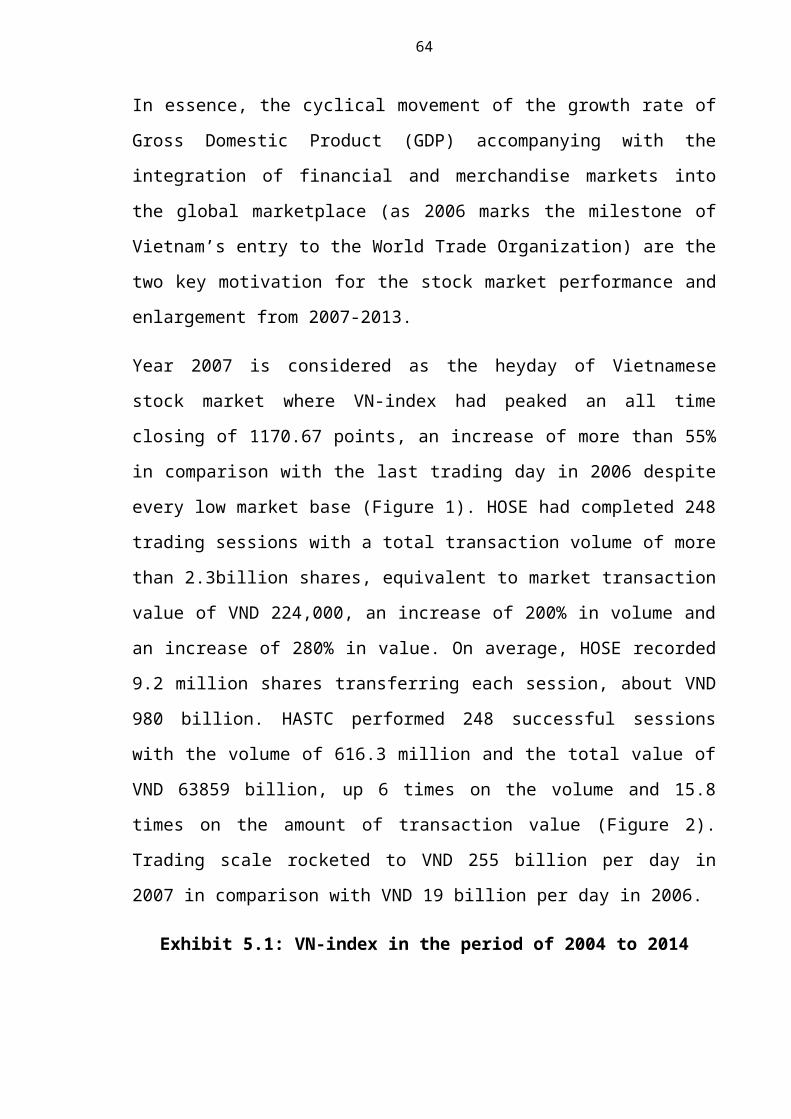
64
In essence, the cyclical movement of the growth rate of
Gross Domestic Product (GDP) accompanying with the
integration of financial and merchandise markets into
the global marketplace (as 2006 marks the milestone of
Vietnam’s entry to the World Trade Organization) are the
two key motivation for the stock market performance and
enlargement from 2007-2013.
Year 2007 is considered as the heyday of Vietnamese
stock market where VN-index had peaked an all time
closing of 1170.67 points, an increase of more than 55%
in comparison with the last trading day in 2006 despite
every low market base (Figure 1). HOSE had completed 248
trading sessions with a total transaction volume of more
than 2.3billion shares, equivalent to market transaction
value of VND 224,000, an increase of 200% in volume and
an increase of 280% in value. On average, HOSE recorded
9.2 million shares transferring each session, about VND
980 billion. HASTC performed 248 successful sessions
with the volume of 616.3 million and the total value of
VND 63859 billion, up 6 times on the volume and 15.8
times on the amount of transaction value (Figure 2).
Trading scale rocketed to VND 255 billion per day in
2007 in comparison with VND 19 billion per day in 2006.
Exhibit 5.1: VN-index in the period of 2004 to 2014

65
(Source: http://www.fpts.com.vn)
Exhibit 5.2: HNX-index in the period of 2004 to 2014
(Source: http://www.fpts.com.vn )
In 2008, Vietnamese stock market was crippled by the
financial crisis originated from USA and the crash of
speculative bubbles inside the securities market
overheated and overestimated. It was the years of the
index decline, the fall of market price of shares, the
illiquidity, the divestments of foreign investors and,
especially, the intervention of Government. Within 2008,
66
there were four times altering the price vibration
amplitude of a share on both stock exchanges. In support
of the securities demand and the market recovery, the
Government proposed and implemented the 19 solutions
group preventing Vietnamese stock market from serious
ruin.
The stock market in 2009 could be divided into two major
periods based on the recovery signals. The first quarter
is known as the stock market bottom when VN-index
declined to 235.50 points (24 February 2009). Investors’
pessimism covered almost sessions from January to March.
The stock market, nevertheless, recovered due to
Government’s painstaking effort by supporting stimulus
package for the remaining period. A large number of
financial incentives were transferred directly to
commercial banks in order to unfreeze capital flow in
enterprises. The stock market indices made a strong
bullish reversal. VN-index reached more than 600 points
– an incredible achievement under global crisis
pressure. By the end of 2009, the absolute market
capitalization was worth of VND 620,000 billion compared
with VND 225,000 billion in 2008, an increase of nearly
300%. The figure of listed companies was up to 447
companies attracting investors for opening about 739,000
new trading accounts. Foreign portfolio investment value
was nearly USD 6.6 billion at the end of December 2009.
67
It can be understood that the period of 2010 to 2013
witnessed no obvious trend. The market volatility was
lying on the range of 400 and 500 with average level of
liquidity. The gist of this condition was indicated by
economic experts because of the caution of investors and
the scarcity of cash-flow. During this period,
Government continued to implement resolutions to
orientate money-flow to manufacturing and limit inflows
to the stock market and the real estate market.
The recovery of stock market in 2013 was the most
predominant signal to illustrate the improvement of
investors’ confidence index. By the end of 2013, VN-
Index gained by 21.97% with close price at 504.63
points, HNX-Index increase 18.83% to 67.84 points.
Average trading volume and transaction worth on both
exchanges were about 108 million shares and VND 1,381
billion per day, equivalently to an increase of 3.14%
and 5.27% respectively compared to that of 2012. The
market size reached to 31% GDP with market
capitalization worth VND 964,000 billion on the rise of
26% compared to the previous years. All major indices
assist Vietnam to be one of countries that has the best
recover rate in the world.
5.2. Overview of individual investors

68
The figure and the quality of individual have been
increasing throughout several years. More and more
people owning idle cash have been participating in the
stock market for profitable investments. For a start,
individual might be untrained and uninformed, however,
after the crash of speculative bubbles in 2007, they
have token awareness of knowledgeable equipment.
According to the interview result of Tran Dac Sinh –
chairman of HOSE, by the end of the year 2013, there
were 1.3 million trading accounts comprise 1,282,071
accounts of domestic individual investors in comparison
with 5,081 accounts of domestic institutional investors,
13,950 accounts of foreign individual investors and the
1,631 remaining of foreign institutional investors.
Furthermore, according to a statistic of www.cafef.vn,
the average daily trading value of individual investors
accounts for 85% of total value trading in a session.
Due to the character of the securities market is a high
risk and affected strongly by the expectation factor of
the investors; it can be seen that the investors can
push the stock prices beyond the long-term trend. The
investors’ expectation is decided by psychological
factor leading to the over reflection in the securities
market; therefore the overoptimistic attitude can make
the prices go up or pessimist spirit can make the prices
go down too much. Thus, it is undeniable that domestic

69
individual investors contribute a critical importance to
the enhancement and movement of the Vietnamese stock
market.
5.3. Typical features of individual investor in
designing portfolios
5.3.1. Lack of knowledge
Despite having great contribution to trading value in
Vietnamese stock market, the quality of individual
investors, has been poor.
In the period of 2000-2005 or establishment phase, with
nearly 2000 accounts, stock market transactions
attracted almost professional investors specializing in
finance. The majority of investors in the first
generation have been successful and influential experts
in financial institutions, security companies. According
to www.laodong.com.vn , based on some criteria, they
showed the table assessing the capacity of individual
investors in the period of 2000-2007 as follows:
Table 5.3: Level of knowledge of individual investors in
2000-2007 in Viet Nam
No CriterionPoint (/10)
2000-2005 2006-20071 Knowledge of finance 4 22 Connections/relationships in 5 1

70
financial market
3Knowledge of Vietnamese stock
market5 2
4Knowledge of Global stock
markets3 1
5 Individual financial resource 4 16 Level of influence 4 17 Level of being affected 4 1
Total 27 10(Source: www.laodong.com.vn (2007), Trinh do nha dau tu ca nhan den
dau?)
In full flourish of the Vietnamese stock market in the
period of 2006-2007, a vast number of investors from
every social level were induced to participate the
securities market even they had had no idea of
securities, fundamental analysis or technical analysis.
The number of accounts rocketed to 300,000 accounts
served by about 70 security companies. According to
www.laodong.com.vn , based on some criteria, they showed
the table assessing the capacity of individual investors
in the period of 2006-2007 (See Exhibit 5.5)
It is clear to find that all criteria are less than ones
in the period prior to 2006. It can be explained by a
vast number of accounts opened from 2005. Numerous
investors came from different jobs, different social
level and educational standard. Many of them have no

71
idea of knowledge base of finance. Level of knowledge of
individual investors in 2006-2007 was calculated to be
about 10/70 points. With about 250,000 accounts, the
average point for individual investors in this period is
about 11.2 point/an investor. In contrast, level of
knowledge of individual investors in 2000-2005 is
calculated to be about 27/70 points. With about 2000
accounts, the average point for individual investors in
this period is about 17.5 point/an investor in
comparison with 11.2 point/an investor in the period of
2000-2005.
After the speculative bubble crash, domestic individual
investors have been aware of the improvement of
knowledge and skills, but they are judged as
unprofessional and risk-taking.
Due to the low quality, almost investors have no
awareness of applying models of optimization into
practical investments. They often invest in short-term
instead of one period economy. Instead of selecting
securities based on fundamental or technical elements,
domestic individuals make decision based on insider
information or rumors. Due to small amounts of money,
they often select shares with high liquidity and high
volume, then conduct as many transactions as they want,
ignoring brokerage and trading costs corroding their
returns. Moreover, they are inaccessible to credible and

72
sufficient data sources that are required for models of
portfolio optimization. Thus, numerous individual
investors do not desire or have ability to apply models
of optimal portfolio in real-world.
5.3.2. Lack of technological investment tools
Without the support of technological investment tools as
well as modern financial services, individual investors
in Vietnam have little opportunities for improve their
portfolio performance. It is common knowledge that
technology has marvelous power in simplifying
mathematical complex function. Hence, if investors are
assisted with models coded in computers then it is no
doubt about the more return rate and less risk level.
Furthermore, technological tools help investors to
shorten the time of making decision as well as to
eliminate behavioral biases such as herding, cognitive
or anchoring, etc.
Due to 13 years of the stock market, a number of
financial investment tools are currently limited. There
are many popular investment tools in big stock markets
such as stock screener, option screener, earning
calendar, IPO calendar, prospectus library, etc., but in
Vietnam, these supporting tools have been a green field.
It is unbelievable that software Excel, provided in
every computer labeled Microsoft, seem be strange to

73
Vietnamese investors. This problem poses many
difficulties for individual investors to be
knowledgeable and rational.
5.3.3. Affected by behavioral biases
5.3.3.1. Loss aversion bias
Majority of experts and brokers confirms the presence of
loss aversion (known as disposition effect) among
investors, including themselves. Clearly, investors have
the propensity to hold on their losing stocks to avoid
realizing loss, then averse the regret of making bad
investment decision. Besides, they sell winning stocks
quickly to avoid the regret of falling price later.
In their empirical study of individual investors’ biases
in Vietnamese stock market, Vuong Duc Hoang Quan and Dao
Quy Phuc (2012), throughout conducting a survey of
behavioral biases, describe loss aversion as one of
biases appearing with high percentage with 47.7%. The
figure presents the fact that a huge number of investors
are influenced by disposition effect. Stemming from this
bias, many evidences are shown for the existence of loss
aversion bias, we would take a shot of the Vietnamese
stock market in 2008 for instance of the presence of
loss aversion.

74
Let us pick the period of 2008 – the time of stock
market bubble crash for instance. Major investors, who
were interviewed, affirmed to keep losers stocks in
their accounts even though loss rate exceeded the figure
of 80%. It would be understood that the more stocks they
kept, the more losses they suffered. 90% of losing
investors had scruples about cutting losses or selling
losers stocks which might assist them to get out of
stock market bubble crashes. Despite cutting loss when
loss rate exceeds a certain level (usually 10%) is of
pivotal importance for rational investors to maintain
their wealth, they continue illusory thought that
holding on losses is a form of long-term investments.
Unfortunately, the price level kept falling down until
their wealth value was impoverished.
According to statistics of the credible financial
website www.cafef.vn, from January 2007 to June 2008,
there were about 40 winning sessions and 80 losing
sessions. Assuming investors bought securities at the
beginning of 2008 and the price reduced 10% after 2
weeks of transaction. Because of high rate of liquidity
in winning session, thus, investors could sell all of
their loser stocks in these trading days, but they did
not. The principal reason of their hesitation to sell
losers was deep-rooted from their prosperity that price
would go back up.

75
Loss aversion is a major part of risk attitude
influencing to how investors constitute their portfolio
and optimize their investments. This bias is a critical
characteristic of CPT-investor, which is tested in this
thesis.
5.3.3.2. Anchoring and Adjustment
Anchoring and Adjustment bias is a popular bias
accounting of wrong portfolio investment decision made
by individual investors. By anchoring in US stock
market, experts’ analyses and predictions and other
information sources, investors adjust information,
deviating reasonable approach to pick profitable
securities.
The bias is considered as significant heuristic having
economic consequences for decision-makers as well as the
efficiency of the Vietnamese stock market. In their
empirical study, Anchoring and Adjustment accounts for
43% of responses for the survey carried out by Vuong Duc
Hoang Quan and Dao Quy Phuc (2012). Furthermore, Nguyen
Duc Hien, Trinh Quang Hung and Bui Huong Giang (2013),
through investigating 661 analysts’ reports forecasting
price in Vietnam from 2009-2012, provide the proof of
the existence of anchoring and adjustment bias among
economic experts when they try to forecast stock
returns. Additionally, they present that anchoring and
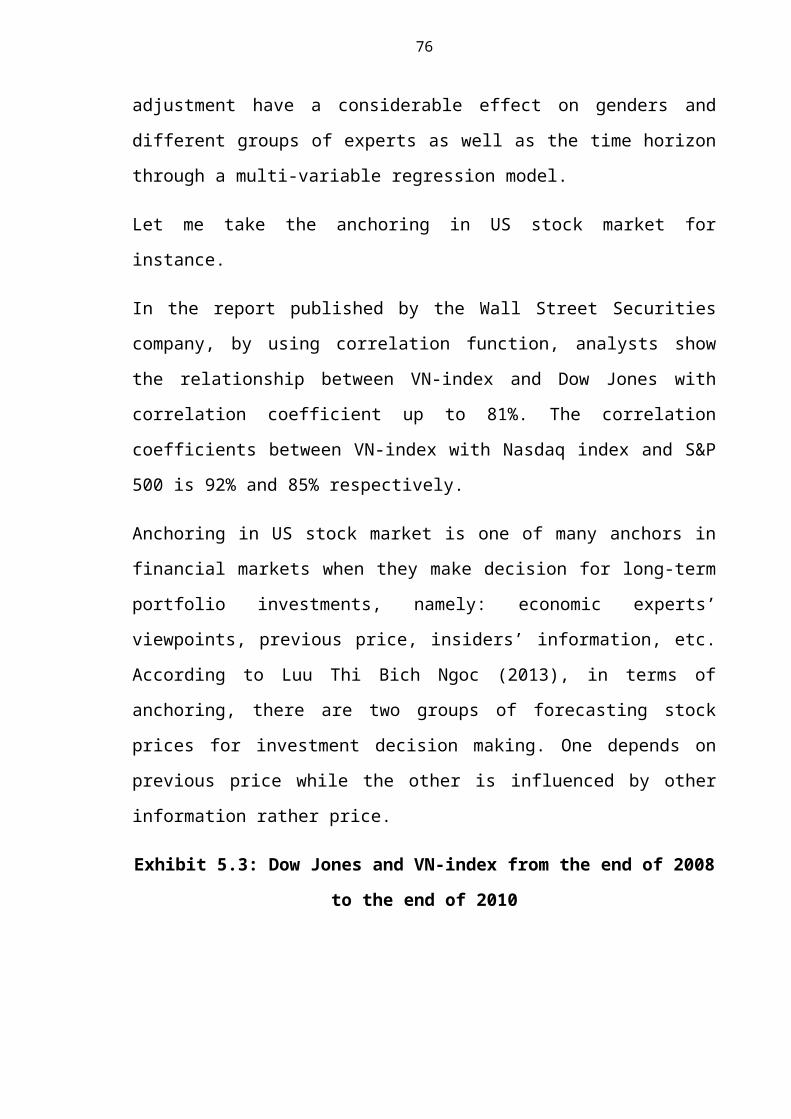
76
adjustment have a considerable effect on genders and
different groups of experts as well as the time horizon
through a multi-variable regression model.
Let me take the anchoring in US stock market for
instance.
In the report published by the Wall Street Securities
company, by using correlation function, analysts show
the relationship between VN-index and Dow Jones with
correlation coefficient up to 81%. The correlation
coefficients between VN-index with Nasdaq index and S&P
500 is 92% and 85% respectively.
Anchoring in US stock market is one of many anchors in
financial markets when they make decision for long-term
portfolio investments, namely: economic experts’
viewpoints, previous price, insiders’ information, etc.
According to Luu Thi Bich Ngoc (2013), in terms of
anchoring, there are two groups of forecasting stock
prices for investment decision making. One depends on
previous price while the other is influenced by other
information rather price.
Exhibit 5.3: Dow Jones and VN-index from the end of 2008
to the end of 2010
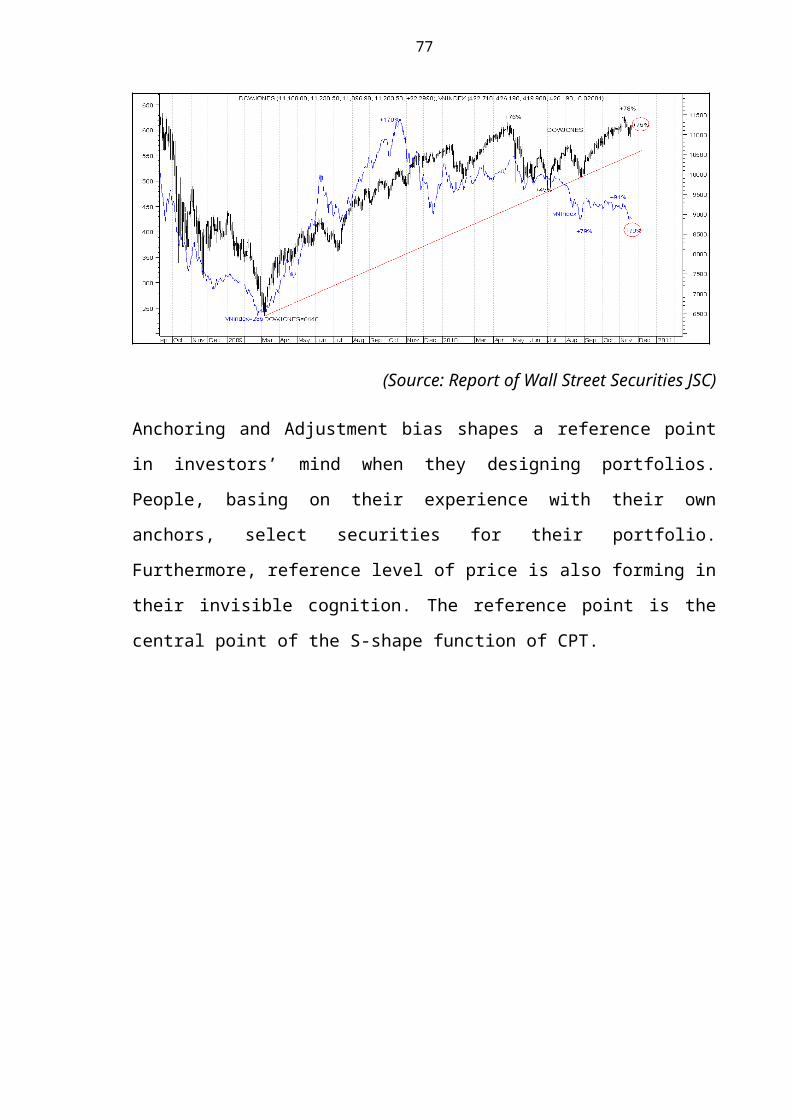
77
(Source: Report of Wall Street Securities JSC)
Anchoring and Adjustment bias shapes a reference point
in investors’ mind when they designing portfolios.
People, basing on their experience with their own
anchors, select securities for their portfolio.
Furthermore, reference level of price is also forming in
their invisible cognition. The reference point is the
central point of the S-shape function of CPT.

78
5.3.3.3. Crowd mentality or Herding bias
During the process of formation and development of the
Vietnamese stock market, herding is a prominent and
tendency in the market. A vast number of investors
entering the securities market with limited knowledge
about the market, neglecting fundamental bases of
stocks. Because of their level of society and
occupations, investors are diversified. Furthermore,
joining with huge expectations is a key driver to push
stock price rocket and be overvalued, then forming
speculative bubbles. The bigger price bubble was; the
more new investors were induced to participate in the
stock market.
A typical example of herd-like manner was highlighted in
speculative bubble crash in 2007. On 29 August 2007,
Hong Kong and Shanghai banking Corporation (HSBC) in
Viet Nam released a report that stock price were
undervalued after adjustment. In support of this
announce, Citigroup Bank confirmed that the Vietnamese
stock market would overcome the global financial crisis,
which is spreading into every aspect of Vietnamese
components. As soon as the optimistic predictions of two
prestige international financial companies were
published, VN-index boosted from about 900 points to
1100 points in mid October 2007.

79
Another example of herd behavior in Vietnamese stock
market is 20 August 2013 when Nguyen Duc Kien, former
vice chairman of the founding council of the Asia
Commercial Bank (listed stock code: ACB), was arrested.
Immediately, pessimistic information spread out, which
made investors sold off ACB stocks as well as bank
securities, VN-index dropped 20.72 points (equivalent to
a decrease of 4.74%). HNX-Index closed at 66.89 points,
a decrease of 5.32% compared to the previous trading
day. ACB’s price went down 6.9% compared to the
reference price at the beginning of the session.
According to Tran Ngo My and Huy Huynh Truong (2011) and
Ngo Thi Diem Huong (2013), they provide empirical
evidences of the presence of herd behavior among
investors. Tran Ngo My and Huy Huynh Truong (2011)
examine the existence of herding in the Vietnamese stock
market and the asymmetric effects of herding which
depends on market movements. Their study indicate that
herding behavior in immature stock market could be
explained by a set of characteristics typical of the
Vietnamese stock market such as a lack of transparency
in information disclosure, small transaction and high
magnitude of market volatility. Ngo Thi Diem Huong
continues to complete the methodology to ensure the
existence of crow mentality in both upward and downward
market condition in the Vietnamese stock market. Based

80
on the research of Gelos and Wei (2002), she uses solid
evidences to show that Vietnamese stock market creates
favorable conditions for herding bias. The major reasons
of herding are derived from incomplete and ineffective
legal framework accompanying with market manipulation,
individuals’ limited abilities, limited financial
commodities and problems regarding of trading session
T+3.
In spite of the fact that herding bias is not a
component of CPT-investor, this important bias provides
a proof that it is not plausible to apply models of
portfolio optimization of which assumption is investors’
rationality and independence.

81
CHAPTER 6: DATA AND METHODOLOGY6.1. Data collection
Primary data, collected for a specific purpose and
required in order to complement secondary data
(Wiedersheim –Paul and Eriksson, 1997), has been
gathered using a questionnaire survey distributed to
investors trading at a brokerage floor and as an online
survey to access investors who prefer to trade via
internet.
The major purpose of the study was to focus on
individual investors, as they were more likely to have
limited knowledge about the application of Behavioral
Finance Theories as well as Cumulative Prospect Theory’s
models of portfolio optimization in practical
investments, hence leading to poor portfolio performance
and wrong investment strategies.
Due to experimental research of decision-making under
Cumulative Prospect Theory, it can be imply that every
individual investor can make the same mistakes and be
affected by biases regardless of the age, gender,
experience, etc. Thus, my thesis only emphasizes on the
considerable samples, does not take care of background
information.

82
The valid number of responses collected by the
questionnaire survey was 204. All of them are investors
having at least one-year experience and trading
currently on HOSE or HNX.
6.2. Overview of methodology
The Static Portfolio Optimization with one risky-asset
and one risk-free asset in one period of time is the
model designed for CPT-investors abide by three
elements. Firstly, they will be concerned with the
deviation of their final wealth from a reference point.
Secondly, they are more sensitive with losses than
gains. In other words, “Losses losses loom larger than
gains”. Lastly, decision-making process is based on
probability distortion function. So, in order to ensure
the possibility of the application of this model, we
have check whether Vietnamese investors comply with
assumptions of CPT. As the model is constructed based on
three fundamental functions developing from CPT
hypotheses excepting for loss aversion function, hence,
we have to conduct an experiment to isolate two
different elements of CPT-investors.
The analytical stochastic dominance conditions
introduced above suggest experimental designs of
prospects to test the value function and probability
weighting function. By using questionnaire with four

83
tasks, each task comprises two prospects with more than
two outcomes, we distribute the survey online, through
trading floors and clients of brokerages, gathering data
for further analysis.
6.3. Research design
6.3.1. Stochastic Dominance approach
After considering the possibility of holding
experimental research and realizing that it could be
implemented, the stochastic dominance method was chosen
for this study. The approach was applied for three major
reasons:
(i) The efficient way to compare pairs of prospects
(ii) Investors were likely to provide credible
information as the nature of survey was anonymous
(iii) The Stochastic Dominance Approach outperforms
other methods in testing Cumulative Prospect
Theory
Stochastic Dominance conditions are sufficient to
characterize combinations of classes of value function
and probability weighting function. We can use the
approach to test joint hypotheses on the curvature of
the utility function and the probability deformation
function.

84
Parameters c and d are the key for the application of
the stochastic dominance (See page 18). Thus, we need to
design tasks to choose c and d such that c is
sufficiently big and d is sufficient small in order to
the probability weighting function concaves up to d and
convex from c. Between c and d, the probability
weighting function is nearly linear. The higher the c
and and the lower the d, the less we assume about the
probability distortion function, but the more
restrictive is the set of portfolios we can design.
Hence, to increase the freedom in choosing the
prospects, we need to understand the minimum of c and
the maximum of d.
As the calculation of Manel and Franz (2007), we receive
the following results as follows:
Table 6.1: c and d
γ c d
1 0.00 1.000.9 0.02 0.980.8 0.05 0.900.7 0.07 0.840.6 0.09 0.790.5 0.1 0.76
(Source: Manel and Franz, 2007)

85
The experimental research can be done in two ways.
Firstly, if we assume that the probability weighting
function is inverse S-shaped, stochastic dominance
conditions provide solid basis of testing the curvature
of the value function. Secondly, if we suppose that the
specifications of CPT for the curvature of the utility
function hold, then the corresponding stochastic
dominance conditions serve the purpose of testing
assumption on the shape of the probability weighting
function.
The content of these tasks is based on the design of
Manel and Franz (2007). Firstly, three tasks are
designed to test the curvature of the value function
with the assumption of inverse S-shaped probability
weighting function. Task I presents an all-gains choice,
task II presents all-losses choice and task III uses a
mixed choice (See table 7.2). All of them are designed
so thatX≥PSDY. The probability weighting function is
assumed to to be inWcd, so it is unnecessary to question
about the shape of the probability weighting function,
which is assumed. Hence, the key is to test whether u (x)
is in UPfor X≥PSDY and whether u (x) is in UP∗¿¿for Y≥P∗SDX.
Secondly, two tasks are designed to focus on the
probability weighting function. The value function is
assumed to follow the specifications of CPT, and then,

86
prospect stochastic dominance is used to test the
convexity of the probability weighting function.
6.3.2. Questionnaire survey
The questionnaire survey was the most convenient
approach for empirical researches, especially for
behavioral experiments. Taylor et al. (2006) show that
questionnaires are sensible option when information is
needed from a large group of people, and is a powerful
method to capture their opinion and attitude.
Three principal points emphasized by Taylor at al.
(2006) orientate me while designing the questionnaire
survey for the purpose of the thesis:
(i) Assuring the participants of confidentiality
(ii) Keeping questionnaire compact and using questions
which focus on core of the research work
(iii) Gathering respondents’ interest and retaining
it
The questionnaire consists of four tasks, each task
includes two uncertainty prospects X and Y, where X
dominates Y by prospect stochastic dominance with CPT’ s
weighting probability weighting function. Investors can
select unique preferred option. Then, software Microsoft
Excel was used for statistical analysis.
87
The survey is demonstrated in the Appendix A. In actual
experiments, the orders of tasks were randomized. The
tasks were introduced with the written question:
“Suppose you decide to invest $10000 in below
portfolios. Which portfolios do you choose, X or Y? when
it is given that the dollar gain or loss one month from
now will be as follows”.
The experimental survey is divided into two sections,
one part to test the value function and the remaining
part to test the probability weighting function. In the
first section, we assume that the probability is inverse
S-shaped and the goal is to investigate the curvature of
the value function. In contrast, in the second section,
we assume that the value function is S-shaped; we have
to test the hypothesis of probability distortion
function.
6.4. Limitations of the study
The major weakness of my thesis is that my thesis aims
to study domestic individual investors’ decisions using
questionnaires. Making financial decisions require a set
of complicated information and elements that differs
from the nature of the questionnaire. However,
individual investors find the questionnaire easy to
understand, relax and novelty, hence they are eager to
finish all tasks without a complaint or discomfort.

88
A second limitation arises out of the number of
responses. Currently, Vietnam has more 1.3 million
individual accounts in the stock market with about 1.23
million active accounts conducting transactions. While
the number of samples collected is 204 responses.
Furthermore, the investors mainly come from Ha Noi,
which accounts for a mere 7,3% of the Vietnamese
population. It remains to further researches whether
investors in other regions of Vietnam would have the
same attitude to choices under uncertainty.

89
CHAPTER 7: EMPIRICAL RESULTS7.1. Shape of the value function
The result of Tasks I, II and III are exhibited in the
rightmost column of Table 7.2. For each task, the number
of responses is provided as well as the percentage of
individuals that chose the respective prospect.
Table 7.1: List of joint hypotheses in testing the
curvature of value function
Task
SD
conditio
ns
Joint hypotheses
Result
Not
question
ed
ConclusionValue
function
Probability
weighting
function
IX≥SSDY
Y≥S∗SDX
u∈UPu∈UP∗¿ ¿
Pg∈W0.1
Pg∈W0.9
Not
rejected
RejectedP
Consistent with u S-
shaped
u is not a element ofUP∗¿¿
IIX≥S∗SDY
Y≥S∗SDX
u∈UPu∈UP∗¿ ¿
Pl∈W0.1
Pl∈W0.9
Not
rejected
RejectedP
Consistent with u S-
shaped
u is not a element ofUP∗¿¿
IIIX≥PSDY
Y≥P∗SDX
u∈UPu∈UP∗¿ ¿
P∈W1 /1
P∈W2 /3
Not
rejected
RejectedP
Consistent with u S-
shaped
u is not a element ofUP∗¿¿
In all three tasks, prospect X is preferred over
prospect Y (See Table 7.2). In task I, the value
function is assumed to convex for gains, but Y is not

90
preferred according to inverse second-order stochastic,
hence, u¿x) cannot be in UP∗¿¿.
Similarly, in the Task II, the value function is assumed
to concave for losses, concluding that u is not in UP∗¿¿.
The result of task III completes the picture for mixed
outcomes. Under the assumption that the probability
weighting function is concave in[0, 23 ], and given that Yis not preferred, the value function cannot be in UP∗¿¿.
In all the three tasks, the majority of individuals
prefer the prospect stochastic dominance X. Based on the
rejected shapes of the value function, the value
function is consistent with the result.
Table 7.2: Result of Tasks I, II and III
X Y CHOICETASK I GAIN/LOSS PROB. GAIN/LOSS PROB. N X[%] Y[%]
X≥SSDY,c=0.1
Y≥S∗SDX,d=0.9
0 10% 0 50% 204 79.41 20.591000 40%2000 40%3000 10% 3000 50%
TASK II GAIN/LOSS PROB. GAIN/LOSS PROB. N X[%] Y[%]

91
X≥S∗SDY,c=0.1
Y≥S∗SDX,d=0.9
-3000 50% -3000 10% 204 86.76 13.24-2000 40%-1000 40%
0 50% 0 10%TASK III GAIN/LOSS PROB. GAIN/LOSS PROB. N X[%] Y[%]
X≥PSDY,c=1 /6
Y≥P∗SDX,d=2 /3
-6000 1/3 -6000 1/6 204 71.07 28.933000 ½ -3000 1/34500 1/6 4500 1/2
(Source: Data collected from the survey in Appendix A)
7.2. Shape of the probability weighting function
The results of Tasks IV and V are presented in the
rightmost columns of Table 7.4 (See page 63).
In Task IV, X is preferred by most subjects. Hence, the
hypothesis that the probability weighting function is
convex from 0.02 cannot be rejected. In other words, P
is a element of W0.02. In Task V, however, the majority of
subjects prefers prospect Y. It can be referred from
this situation that both Pl and Pg are convex in the
corresponding intervals. Together with the results of
Task IV, the reasonable conclusion is that the
probability weighting function is not convex near the
origin. Notice that Task IV is a slight modification of
Task V. In Task IV the extreme outcomes are set equal;
in X the maximum outcome has been added and in Y the
minimum outcome has been added, both with a probability
of 2%. This change is sufficient to reverse the

92
preference of the majority of subjects. The difference
between the result of two tasks suggests that decision
makers use the range of outcomes as a decision
criterion.
Table 7.3: List of joint hypotheses in testing the
curvature of probability weighting function
Task
SD
conditio
ns
Joint hypotheses
Result
Not
question
ed
ConclusionValue
function
Probability
weighting
function
IV X≥PSDY u∈UP P∈W0.02Not
rejectedu Cannot rejectP∈W0.02
V X≥PSDY u∈UP P∈W0 Rejected uu is not a element of
W0
Table 7.4: Result of Tasks IV and V
X Y CHOICETASK IV GAIN/LOSS PROB. GAIN/LOSS PROB. N X[%] Y[%]
X≥PSDY,c=0.02
Y≥P∗SDX,d=00.74
0 10% 0 50% 204 80.8819.1
2
1000 40%
2000 40%
3000 10% 3000 50%TASK V GAIN/LOSS PROB. GAIN/LOSS PROB. N X[%] Y[%]
X≥PSDY,c=0
Y≥P∗SDX,d=1
-3000 50% -3000 10% 204 36.7663.2
4
-2000 40%
-1000 40%
0 50% 0 10%

93
(Source: Data collected from the survey in Appendix A)
7.3. Empirical result
The empirical test is based on the experiments suggested
by Manel and Franz (2007) to test whether individual
investors are compatible with specifications of
Cumulative Prospect Theory including the value function
and the probability weighting function. My experiment is
carried out through brokerage floors and online survey,
attracting 204 investors with at least one-year
experience in HOSE or HNX.
My survey is designed with five tasks, in each task, an
individual investor has to decide to choose prospect X
or prospect Y. In Task I, II, III, IV, the numbers of
responses choosing X are 162, 177, 145, 165 subjects,
respectively. In Task V, prospect Y is preferred with
129 participants. All primary data is processed and
analyzed as above.
By using stochastic dominance, in order to test the
curvature of the value function, the probability
weighting function is assumed to inverse S-shape, which
is inWcd. The results of Task I, II and III are used to
conclude that the value function is consistent to
prospect stochastic dominance, or u(x) is a element of
the set of prospect functions.

94
In order to test the shape of the probability weighting
function, it is advised that the value function is
assumed to be S-shape. In Task IV, the hypothesis that
the weighting function is an element of W0.02 cannot be
rejected. In Task V, the event that 63.24% of
participants prefers prospect Y over prospect X shows
the effect of the range of outcomes upon individual
decisions. In this section, the empirical result proves
the meaningfulness of the probability weighting function
in Vietnamese stock market.
As the result presented and analyzed in the chapter 7,
we conclude that Vietnamese investors’ characteristics
are compatible with Cumulative Prospect Theory. Thus, it
is possible and plausible to apply the Static Portfolio
Optimization model in Vietnamese stock market.

95
CHAPTER 8 – RECOMMENDATION 8.1. Individual investors
8.1.1. Improve knowledge and skills
It is of critical importance to enlarge your knowledge
and skills in securities investment, if not, your
temporary gain will only be on the basis of luck which
cannot bring usual and sustainable return. Take a look
into the investment history, almost investors without
experience and underlying cognition became losers in the
security market. Stock understanding of stock market
consists of fundamental elements, technical analysis,
macroeconomics cycle and especially behavioral biases
including herding, cognitive biases, emotional biases,
PT and CPT. And, skills, which comprise information
processing, decision-making, stock selecting and
portfolio allocating, can be daily exercised. With
sagacity, your active portfolio can beat the market,
which is unable in standard finance, but accessible with
behavioral finance and strategic investors.
There are numerous sources for investors to ameliorate
their understanding of the Vietnamese stock market.
Firstly, textbooks, syllabuses, reference books majoring
in securities investment, which are written by credible
authors or released by famous publishers, are available
source for investors to access. Besides, investors can

96
look for specialized studies of finance domain, or
convincing data source from securities service
companies. Taking advantage of close connection with
your friends, your instructors or investors, you can
study more and earn experience from other’s mistakes.
Last but not least, starting with small-amount
investments, you can avoid losing much money and prevent
you big losses in the future.
90% of loser investors are caused by herding bias which
drives them to out of the game in short-time. Just 10%
of mature, consistent and educated investors can be
succeed and accompany with Vietnamese stock market as
investors owning these characteristics are able to
select right stock in right time with reasonable price.
Thus, the deep-rooted factors contributing to achievers
can be nothing, but knowledgeability and decisiveness.
8.1.2. Build up plausible investment strategy
The first mission of an investor is to have awareness of
himself. It is common knowledge that if you have no idea
about who you are, what you desire, how you reach your
ambitions; you cannot take any action to be the peak. In
the investment world, the basic philosophy is the same.
In order to design an efficient strategy for ourselves,
there are six principal points emphasized for individual
investors, namely:
97
First of all, the age has great influence on investment
period and accepted risk level because each period of
your life requires different financial plans and
investment vectors. For example, when a man in the age
of twenty-five to thirty, has to settle his family,
earns his own house and stable income with his dream
occupation. In the period of constructing, the
acceptable risk levels should be higher than the one in
the age of more than thirty. In addition, the number of
dependents who maybe his wife, children, parents,
reduces the level of risk leading the investor to become
more defensive.
Income plays necessary role in investment decision-
making process, especially portfolio creating in long-
term. The more money you earn; the higher risk level and
the longer investment time you approve. In evidence,
when your income exceed expenditures which can be known
as budget surplus, your financial surplus can support
you to venture upon pennies or conserve a portfolio as
long as you desire.
Large-scale accumulated assets (cash, securities, real
estates, businesses) have significant effect on the
level of risk and expected returns of investors.
Obviously, for a student paying attention at a
university with small amount of money, 30-40% is
desirable return rates which are considered as

98
outstanding portfolio performance for unprofessional
investors. However, for a businessman of wealth, his
investment portfolio should yield at least 100% and
outperform in comparison with other projects having the
same initial investment capital requirement.
Additionally, cash reserve is an important key need to
be weighted. The reserve rate of cash has direct
relationship with investors’ level of confidence. Prior
to project a new portfolio, ensuring the source of cash
is mandatory requirement for each investor. According to
experts’ recommendation, normally, you should reserve
amount of cash equivalent to six-fold the average
monthly spending.
Next, insurance contracts protect investors against
danger of complete losses. The participation of
insurance contracts such as life insurance, non-life
insurance creates the adequate preparation which is
essential for professional investors. Especially, if you
have great mind of long-term investment, insurance
contracts, which reduce the variance, can be added into
your portfolio.
Last but not least, experience and knowledge not only
have assistance to portfolio choice, but also to manage
and allocate wealth. If you experience harsh trials in
period of 2007 and 2009, capture important rules of the

99
movement of Vietnamese stock market or shares, you will
be more equanimous even when your portfolio are
seriously going down.
The second mission of individual investors is to design
an investment strategy suitable for themselves after
preparation. There are four steps creating a reasonable
investment approach, namely, selecting, position
acceptance, position supervision, position close.
Stock choice issues a challenge to every long-term
investor who decides to design and allocate portfolio.
The model proposed in my thesis guide people an
allocating approach on the basis of investors’ behavior
under Cumulative Prospect Theory, hence, individual
investors had better contrive a new screening system
supporting the process of picking securities for their
own portfolio. We first observe the movements of stock
by listing notable securities into your watch lists,
which ensure you to pay more attention. If you are a
fundamental analyst, a watch list requires up-to-date
events and business plans. And, if you are a technical
expert, it is irrefutable that checking daily price
performance is the key for winning. To choose a good
stock to add into the watch list, you should gather both
fundamental analysis and technical predictions. Luckily,
you only get two to three per a group of ten stocks,
thus, it is not a surprise to the majority of loser

100
stocks in your watch list, from which we transfer the
best securities into your official portfolio.
Prior to consider different contexts of position, we
clarify the definition of it. In financial trading,
position is a binding commitment to buy or sell a given
amount of financial instruments such as securities,
currencies or commodities, for a given price. There are
two basic types of position: long and short. Short
position is defined as the sale of a borrowed security,
commodity or currency with the expectation that the
asset will fall in value. For example, an investor who
borrows shares of stock from a broker and sells them on
the open market is said to have a short position in the
stock. The investor eventually returns the borrowed
stock by buying back from the open market. If the stock
price is falling, the investors will earn a profit,
called short position. Long position is the buying of a
security with the expectation that stock price will rise
in value. For example, dealers often take long in
specific securities to maintain inventories and allow
for quick and easy trading, then the trader closed his
position and locked in a profit of 10%.
Position acceptance is an important part of the game.
For a start, you set out to determine which position is
your preference: long or short. Even thou the overall
market trend is upward, investors suffering losses in

101
the past admit the fact that almost stocks go down in
the foreseeable future. Hence, investors are recommended
for avoiding short position in order to prevent them
from being time-consuming and costly. Investors need to
take notice of broker selection. If you are a private
investor, all you need is a discount broker who provides
the most basic services and help you order.
Position supervision is the most critical role of the
investment process because information and
investigations are inputted into trading making-
decisions process. In this step, you alter their
investment decisions if there are changes in the
tendency of securities in your portfolio. If your stock
is a winner stock, continue buying, unless, cut losses
immediately.
An investor close a position when stock price reaches
the target price or its performance cannot meet his
expectation. However, many of us do not determine
exactly when to take profits or cut losses. Normally, it
is recommended that selling in case of significantly
decreasing in underlying fundamental factors such yearly
net income, broad unity and intensive competition.
8.1.3. Filter information and experts’ opinions
In the era of information technology, customers are
supported to access to information system and data

102
resource. Fundamental and technical analysts are able to
get an advantage of daily reports, articles provided by
securities joint stock companies as well as SSC and
other service institutions on the internet and
newspapers. However, availably high-quality sources are
really rare. Moreover, unreliable information source can
lead investors to make investment decisions wrong,
bearing some biases such as herding, anchoring and
adjustment, loss aversion, etc.
Official information sources include financial
statements, formal recommendation of experts and
economists in journals and credible institution. In
particular, given company’s financial statements are one
of the most important documents that investors should
conduct research prior to make investment decision as
these documents capture the financial situation and the
business plan of a company at a point of time. It is
widely known that thorough understanding of the company
reduces the level of risk you suffer. Besides, numerous
sources of expert assessments and reports published each
day are valuable for investment decisions. You had
better subscribe two to three reliable firms or
organization to avoid overloading information. Notice
that financial statements can be manipulated, experts’
opinion can be prejudice investors in favor of some
inferior companies, thus, be intelligent and unbiased.

103
Strategy and tactic plan of foreign investors caught
individual investors’ central attention. Nonetheless,
foreign domestic or institutional investors have
distinct approaches and plans, hence sometimes their
decisions are proved to be wrong to Vietnamese
investors. In addition, foreign transactions may lead to
rumors affecting on Vietnamese stock market. In order
for winners, you ought to isolate you from others,
especially foreign cash flow.
Regarding the advice of family, friends and the crowd,
be careful. Word of mouth is the passing of information
by oral communication that is the easiest way to alter
your decisions and emotional status. Thus, keeping
emotionless and impassive are my advices for you. You
should remember that everyone is engulfed in the herding
if they always listen to others.
8.1.4. Apply models in practical investments
If above recommendations are made for the selecting
process, here is my advice for individual investors
while allocating portfolio under a chosen list of stock.
Static portfolio optimization is one of the most world-
class model of maximizing portfolio with one risky asset
and one risk-free asset in a period of time. The model
is effective against investors who behave under
Cumulative Prospect Theory including three

104
characteristics: using reference point instead of the
final outcomes to compare and decide, loss averse and
overweighting small probabilities. As designed on the
basis of behavioral biases, the model is extremely
appropriate for private investors.
The outstanding features of the model in comparison with
available models are the applicability and simplicity,
especially exclusivity.
Firstly, we consider the applicability of the model.
Though the model is demonstrated sophisticatedly in
chapter three, individual investors should take
advantage of the eventual results. The investors only
need to determine their own functions for themselves.
Furthermore, the model is strongly supported by the vast
number of behavioral researchers in this emerging field.
Besides, in my thesis, chapter four has provided a solid
proof for the possibility of applying the model in
Vietnamese stock market due to the meaningful of two
root functions of the model: the value function and
weighting probability function. Thus, investors, with
some assistant of software excel equipped in private
computers, laptops or tabs, are easily accessible to use
the model.
Secondly, because the model is used for individual
investors, so many unnecessary hypotheses are

105
eliminated. With only three hypotheses, Static model is
easy to understand and apply in real world.
Last but not least, it is undeniable that about 90%
investors behave under financial biases which can be
controlled by institutional investors. Therefore, the
models specializing in overcoming the difficulties of
private clients differ from the models for institutions
like Markowitz portfolio model. In support of this
argument, it is clear that each investor has his
distinct value function and probability weighting
function, thus, he will be self-served for themselves,
which ensure the exclusivity.
8.1.5. Notations
Diversifying your portfolio or “Don’t put all your eggs
in one basket” is the classic advice of the greatest
ever investor Warren Buffet. There are many types of
portfolio diversification: systematic diversification
and idiosyncratic diversification. Idiosyncratic
diversification is simple to achieve by holding more
investments, while systematic diversification is the
obverse of systematic risk, thus, typically harder to
conduct. However, both of them can reduce level of risk
by investing in a variety of asset. For example, in
Static model, Bernard and Ghossoub constitute a
portfolio with one risky asset and one risk free asset.
106
This type of portfolio is also considered as a
diversification. In the evolvement of Static portfolio
optimization, Pirvu and Schulze (2012), in their working
paper No. 742, propose advance model of multi-stock
portfolio optimization under Cumulative Prospect Theory
which is a radical resolution for problem of maximizing
portfolio under CPT. Therefore, investors are
recommended to diversify their portfolios with the
support of Static model and its evolvement models. If
your problem is credit limit, you are advised to invest
into a Mutual Fund or an Exchange-Traded Fund.
In order for successful portfolio choice, my thesis
suggests a famous model known as CAN SLIM (Current
quarterly earnings per share – Annual earnings –New
products – Small supply and large demand – Leader or
Laggard – Institutions’ sponsorship – Market direction).
CAN SLIM, developed by William O’Neil – the co-founder
of Investor’s Business Daily, is a philosophy of
screening, purchasing and selling common stocks. This
investment method is describe in his highly recommended
book “How to make money in stock”.
O’Neil emphasizes the importance of choosing stocks of
which earnings per share ratio (EPS) in in the most
recent quarters have grown on throughout the last year.
The growth rate of a company‘s EPS is heated
controversial debate, but the CAN SLIM system proposes
107
no less than 18-20%. By using statistic analysis method,
O’Neil found that in the period of 1953 to 1993, three-
quarters of the 500 top-performing securities in the US
stock market showed a 70% increase in quarterly EPS
prior to a major price rise. O’Neil also says that: “18-
20% growth is just a rule of thumb, the truly
spectacular earners usually demonstrate growth of 50% or
more.” Nonetheless, some cautions must be mentioned –
for example: shenanigans or red flags. The system
strongly asserts that investors should know how to
recognize the manipulation of company performance, thus,
investors must have underlying understanding about the
company.
CAN SLIM also thanks to the importance of annual
earnings growth. The system indicates that a growing
company should present high annual earnings growth rates
(annual EPS) in each of the last five years. It is
pivotal for fundamental investors who adopt the mindset
that investing of buying a piece of a business, becoming
an owner of it. Annual earnings growth within the 25-50%
range is plausible for value investors in their long-
term investment.
O'Neil's third criterion for a good company is that it
has recently undergone a change, which is often
necessary for a company to become successful. Whether it
is a new management team, a new product, a new market,

108
or a new high in stock price, O'Neil found that 95% of
the companies he studied had experienced something new.
The S in CAN SLIM stands for supply and demand, which
refers to the laws that govern all market activities.
The analysis of supply and demand in the CAN SLIM method
maintains that, all other things being equal, it is
easier for a smaller firm, with a smaller number
of share outstanding, to show outstanding gains. The
reasoning behind this is that a large cap company
requires much more demand than a smaller cap one to
demonstrate the same gains. Besides, O'Neil explores
this further and explains how the lack of liquidity of
large institutional investors restricts them to buying
only large-cap, blue-chip companies, leaving these large
investors at a serious disadvantage that small private
investors can capitalize on. Because of supply and
demand, the large transactions that institutional
investors make can inadvertently affect share price,
especially if the stock's market capitalization is
smaller. Because individual investors invest a
relatively small amount, they can get in or out of a
smaller company without pushing share price in an
unfavorable direction. In support of that, in his study,
O'Neil found that 95% of the companies displaying the
largest gains in share price had fewer than 25 million
shares outstanding when the gains were realized.

109
In this part of CAN SLIM analysis, distinguishing
between market leaders and market laggards is of key
importance. In each industry, there are always those
that lead, providing great gains to shareholders, and
those that lag behind, providing return that are
mediocre at best. The idea is to separate the contenders
from the pretenders. Firstly, The relative price
strength of a stock can range from 1 to 99, where a rank
of 75 means the company, over a given period of time,
has outperformed 75% of the stocks in its market group.
CAN SLIM requires a stock to have a relative price
strength of at least 70. However, O'Neil states that
stocks with relative price strength in the 80–90 range
are more likely to be the major gainers. O’Neil’s system
strongly reminds that Do not let your emotions pick
stock. A company may seem to have the same product and
business model as others in its industry, but do not
invest in that company simply because it appears cheap
or evokes your sympathy. Cheap stocks are cheap for a
reason, usually because they are market laggards. You
may pay more now for a market leader, but it will be
worth it in the end.
Next, CAN SLIM recognizes the importance of companies
having some institutional sponsorship. Basically, this
criterion is based on the idea that if a company has no
institutional sponsorship, all of the thousands of
110
institutional money managers have passed over the
company. CAN SLIM suggests that a stock worth investing
in has at least three to 10 institutional owners.
However, be wary if a very large portion of the
company's stock is owned by institutions. CAN SLIM
acknowledges that a company can be institutionally over-
owned and, when this happens, it is too late to buy into
the company. If a stock has too much institutional
ownership, any kind of bad news could spark a
spiraling sell-off. O'Neil also explores all the factors
that should be considered when determining whether a
company's institutional ownership is of high quality.
Even though institutions are labeled "smart money", some
are a lot smarter than others.
Last but not least, the final CAN SLIM criterion is
market direction. When picking stocks, it is important
to recognize what kind of a market you are in, whether
it is bear or bull. Although O'Neil is not a market
timer, he argues that if investors don't understand
market direction, they may end up investing against the
trend and thus compromise gains or even lose
significantly. Moreover, CAN SLIM maintains that the
best way to keep track of market conditions is to watch
the daily volumes and movements of the markets. This
component of CAN SLIM may require the use of some
111
technical analysis tools, which are designed to help
investors/traders discern trends.
8.2. Financial institutions and investment service
suppliers
8.2.1. Provide instruments for constituting and managing portfolio
Even though the Static portfolio optimization model is
easy to use and understand, individual investors need
more investment services to support their long-term
decision and portfolio allocation.
The major securities screening is carried out on several
investment service websites such as cophieu68.com,
bloomberg.vn, mms.com.vn, etc, but the inefficiency of
tools is clearly proved. My thesis will offer an
adequate explanation for this phenomenon. Firstly,
individual investors with the low degree of awareness
and knowledge cannot design a criterion system to
filter. Furthermore, even when investors are
professional experts and economists, there is no system
providing stock screening to defend their emotional and
cognitive biases. Eventually, after picking stock, they
have no awareness of applying model of asset allocating
for their portfolio. Thus, in light of the above
reasons, investment tools deal with seemingly distorted
and crippled enhancement.

112
These difficulties are not insurmountable, even opening
more opportunities for investment service suppliers.
More training courses of stock market and investment
should be introduced to attract investors’ attention for
knowledge improvement. The content of lectures should be
brief, concise and well-rounded. Especially, behavioral
finance theory needs focusing in these courses with
useful advices to avoid behavioral biases such as
herding, anchoring, loss aversion, regret aversion, etc.
Furthermore, instructors can introduce some models of
picking stock (the implication of CAPM and Fama Three
Factors model), or portfolio optimization.
The second obstacle can be overcome with investment
instruments assisting investors to detect behavior
mistake and provide recommendations. Based on studies of
behavioral biases and their remedies introduced by
Pompian (2006) for instance, financial institutions
supplying investment tools are able to design modern
screening systems that incorporate biases. These new
systems will open a new era of technological tools
controlling emotions and cognitions.
Finally, financial support tool suppliers can design a
system allowing people to remove complicated
calculations when constituting portfolios. For example,
an investor, by answering a questionnaire, can be
determined his principal biases. On the basis of main

113
biases, several model of portfolio optimization
recommended to him, and Static portfolio optimization
for instance.
To summarize, the development of behavioral finance
branch has creates more and more opportunities for
financial service organizations to assist investors in
constituting portfolios in one period.
8.2.2. Provide biases defense for private clients
Psychological factors are still green in financial
academic and practical fields, hence, even though the
behavioral finance domain induces more and more scholars
with a vast of studies and empirical researches, there
is few security companies having awareness of the
importance of designing a defense protecting customers
from wrong and regret decisions.
As Pompian (2006), there are more than twenty biases
affecting investment decision of private investors. The
figure shows the big problem that everyone has to face
to daily trading session. In order for better clients’
performance, service suppliers should construct biases
defense system for their customers. By using this
defense system, customers have capacity at avoiding
unexpected mistakes.

114
CONCLUSIONIndividual domestic investors have important
contribution to the enhancement of Vietnamese stock
market. However, there is seemingly no effective
portfolio optimization model benefiting Vietnamese
investors. This status leads to many serious consequence
on the enhancement of the stock market, that is major
reason for implementing my thesis.
The main body of this thesis consists of four chapters
dealing with selected topic in the field of behavioral
portfolio allocation. A detailed summary of the results
and concluding remarks are presented as follows:
Chapter ONE illustrates the theoretical framework and
literature of one instrument of Behavioral finance
paradigm - Cumulative Prospect Theory, which is the key
base for Static portfolio optimization. This section
also provides general approaches to test hypotheses of
Cumulative Prospect Theory, particularly Stochastic
Dominance conditions.
Chapter TWO deals with a theoretical issue of the
portfolio optimization models. In this chapter, by
comparing several approaches to resolve the problem of
portfolio maximum, my thesis shows the outstanding
features of Cumulative Prospect Theory approach over

115
other approaches. The central objective of this chapter
is to demonstrate the Static portfolio optimization
model which also criticized with some limitations.
In chapter THREE, my thesis summarizes the overall
viewpoint about the Vietnamese stock market with great
movements throughout years from 2007. Then,
characteristics of investors in constituting portfolio
are named such as lack of knowledge, lack of
technological investment tools and affected by such
behavioral biases as loss aversion, anchoring –
adjustment and herding bias.
Chapter FOUR studies the main question whether the model
is possible to be applied in Vietnamese stock market.
The major aim is the test of assumptions of Cumulative
Prospect Theory in Vietnamese stock market. The result
implies the plausibility of applying this model in
Vietnam.
Based on these finding and analysis, the last chapter
provides recommendations for both individual investors
and investment service suppliers in order for applying
and effectively using the Static model in practical
world. The main advices for private investors are to
improve knowledge and skills, design plausible strategy,
filter information, apply the models of optimization in
reality and use CAN SLIM system for portfolio choice.

116
And, service suppliers are recommended to provide more
investment tools such as biases defense system, training
courses, portfolio systems in order for better client’s
performances.
This research determines that the assumptions of CPT
cannot be rejected in Vietnamese stock market.
Additionally, my thesis introduce a new model of asset
allocation of Bernard and Ghossoub (2009) for biased
investors as well as the theoretical framework of
stochastic dominance approach. Moreover, my
recommendations in designing and managing portfolio are
useful for about 85% of domestic investors in HOSE.
Research result can be considered as empirical basis for
the next deep research in behavioral finance in Vietnam,
especially for portfolio issues.
Due to the lack of time and research capacity, my thesis
is not without its limitations, I express my deep
appreciation for contributions to complete my work.
Finally, I would like to acknowledge again my tutor
M.Sc. Le Thi Thu, my family and my friends for their
encouragements during the completion of the thesis.
Ha Noi, 20 May, 2014
Nguyen Thi Thu Hang

117
Class: A8, faculty of Business Administration, Intake: 49, Foreign Trade
University

118
REFERENCE1. Andersen, Jorgen Vitting, 2010, Detecting Anchoring in
Financial Market, Journal of Behavioral Finance, Vol.11,
No.2, 129-133
2. Barberis Nicholas and Thaler Richard, 2003, A survey of
behavioral finance, handbook of the Economics of
Finance, Elsevier Science B.V: 1054-1056
3. Baucells M. and Heukamp F., 2006, Stochastic Dominance
and Cumulative Prospect Theory, Management Science, Vol.
52, No. 9, page 1409-1423
4. Bernstein, Peter L., 1998, Against the Gods: the remarkable
story of risk, USA: John Wiley & Sons Inc.
5. Han Bleichrodt and Jose Luis Pinto, 1995, An
Experimental Test of Loss Aversion and Scale Compatibility, working
paper, University Pompeu Fabra
6. Erikson L., Wiedersheim –Paul F., 1997, Att utreda,
forska och rapportera, liber Ekonomi, 5th edition.
7. Gregory Curtis, 2004, Modern Portfolio Theory and Behavioral
Finance, The Journal of Wealth Management
8. Haim Levy and Moshe Levy, 2004, Prospect Theory and Mean-
Variance Analysis, Review of Financial Studies, Vol.17,
No.4, 1015-1041

119
9. Hersh Shefrin and Meir Statman, 2000, Behavioral
Portfolio Theory, Journal of Financial and Quantitative
Analyses 35, 127-151
10. Hirshleifer, David., and Teoh, Slew Hong, 2003, Herd
Behavior and Cascading in Capital Markets: a Review and Synthesis,
European Financial Management, Vol.9, No.1, 25-66
11. Holme, Idar, and Solvang and Bernt, 1996,
Forskingsmetodik, Student litterateur
12. Jose l.B Fernandes, Juan Ignacio Pena and Benjamin
M.Tabak, 2007, Behavioral Finance and Estimation Risk in
Stochastic Portfolio Optimization
13. Kahneman, Daniel. And Tversky, Amos, 1979, Prospect
Theory: An Analysis of Decision under Risk, Econometrica,
Vol.47, No.2, 263-291
14. Kahneman, Daniel. And Tversky, Amos, 1971, Belief in law
of small number, psychological Bulletin, Vol.76, No.2,
105-110
15. Kobberling V., Wakker P., 2005, An Index of Loss Aversion,
Journal of Economic Theory, 122(1), page 119-131
16. Luu Thi Bich Ngoc, 2014, Behavior pattern of individual
investors in stock market, International Journal of
Business and Management, Vol.9, No.1

120
17. Lopes L., 1987, Between Hope and Fear: The Psychology of Risk,
Advances in Experimental Social Psychology 20, 255-
295
18. Manel Beucells Alibés and Franz H. Heukamp, 2007,
Stochastic Dominance and Cumulative Prospect Theory, working
paper,
19. Markowitz, Harry M., 1952a, The utility of wealth, Journal
of Political Economy 60: 151-158
20. Markowitz Harry, 1959, Portfolio Selection: Diversification of
Investments, New York: John Wiley and Sons
21. Markowitz, Harry M., 1952b, Portfolio Selection, Journal
of Finance 6: 77-91
22. Nguyen Duc Hien, Trinh Quang Hung and Bui Huong
Giang, 2013, The impact of the anchoring and adjustment bias on
analysts’ forecast in Vietnam stock market, Journal of
Economics & Development, Vol.15, No.3, 59-76
23. Neilson W., Stowe J., 2002, A Further Examination of
Cumualtive Prospect Theory Parameterizations, The
journal of Risk and Uncertainty, Vol 24(1), 31-46
24. Nicholas Barberis, 2012, Thirty years of Prospect Theory in
Economics: A Review and Assessment, working paper, Yale
School of Management

121
25. Nofsinger, John R.2001, Investment madness: how psychology
affects your investing – and what to do about it, USA: Pearson
Education.
26. Parikh, Parag, 2011, Value Investing and Behavioral Finance,
New Delhi: tat McGraw Hill
27. Pompian Michael M., 2006, Behavioral Finance and Wealth
Management, USA: John Wiley & Sons
28. Pompian Michael M. và John M. Longo (2004), “A new
paradigm for practical application of behavioral finance”, The
journal of Wealth Management, 2004.
29. Prelec Drazen, 1998, The Probability Weighting Function,
Econometrica 66, page 497-527
30. Schmidt U. and Zank H., 2005, What is Loss
Aversion?, The journal of Risk and Uncertainty,
Vol.30, No.2, page 157-167
31. Schmidt U. and Zank H., 2007, Linear cumulative prospect
theory with applications to portfolio selection and insurance demand,
Decisions in Economic Literature, Vol 38, No.2, page
1-18
32. Schindler, Mark, 2007, Rumors in financial markets: Insights
into Behavioral Finance, West Sussex: John Wiley & Sons
Ltd
33. J. Tobin, 1958, Liquidity Preference as Behavior Toward Risk,
Review of Economic studies, Vol.25, 68-85

122
34. J. Tobin, 1965, The Theory of Portfolio Selection, The Theory
of Interest Rates, F. H. Hahn and F. P. R.
Brechling, editors, London: MacMillan Co.
35. Tran Ngo My and Huy Huynh Truong, 2011, Herding
behavior in an Emerging Stock Market: Empirical evidence from
Vietnam, Research Journal of Business Management,
Vol.5, No.2, 51-76
36. Tversky Amos and Derek J.Kochler, 2002, Support theory:
A non-extensional representation of subjective probability; In Heuristics
and biases: The psychology of intuitive judgment, ed., Thomas
Cilovich, Dale Griffin, and Daniel Kahneman, 441-
473, New York and Cambridge, England: Cambridge
University Press.
37. Tversky Amos and Kahneman Daniel, 1974, Judgment Under
Uncertainty: Heuristics and Biases, Science: 185(4157), 1124-
1131
38. Tversky Amos and Kahneman Daniel, 1981, The framing of
decisions and the psychology of choice, Science 211(94481):
453-458
39. Tversky Amos and Kahneman Daniel, 1992, Advances in
Prospect Theory: Cumulative Representation of Uncertainty, The
Journal of Risk and Uncertainty, Vol. 5, No. 4, page
297-323

123
40. Vuong Duc Hoang Quan, Dao Quy Phuc, 2012, An empirical
study of individual investors’ behavioral biases in the Vietnamese stock
market, Science $Technology Development Journal,
Vol.15, No.Q1
41. Xue Dong He and Xun Yu Zhou, 2010, Portfolio Choice
Under Cumulative Prospect Theory: An Analytical
Treatment, working paper
42. www.laodong.com.vn , 10 October 2007, Trinh do nha dau tu
ca nhan den dau?
43. www.cafef.vn , 24 January 2010, Nha dau tu to chuc Viet
Nam: nguoc thong le
44. The official website of Ho Chi Minh Stock Exchange:
www.hsx.vn
45. The official website of Ha Noi Stock Exchange:
www.hnx.vn
46. www.behaviouralfinance.net
47. http://www.investopedia.com/

124
APPENDIX A: SURVEY
Suppose you decide to invest $10000 in below portfolios.
Which portfolios do you choose, X or Y? when it is given
that the dollar gain or loss one month from now will be
as follows”
TASK I: X Y
GAIN/LOSS PROB. GAIN/LOSS PROB.
0 10% 0 50%1000 40%2000 40%3000 10% 3000 50%
TASK II: X Y
GAIN/LOSS PROB. GAIN/LOSS PROB.
-3000 50% -3000 10%-2000 40%-1000 40%
0 50% 0 10%
TASK III: X Y
GAIN/LOSS PROB. GAIN/LOSS PROB.
-6000 1/3 -6000 1/63000 ½ -3000 1/34500 1/6 4500 1/2

125
TASK IV: X Y
GAIN/LOSS PROB. GAIN/LOSS PROB.
0 10% 0 50%
1000 40%
2000 40%
3000 10% 3000 50%
TASK V: X Y
GAIN/LOSS PROB. GAIN/LOSS PROB.
-3000 50% -3000 10%
-2000 40%
-1000 40%
0 50% 0 10%

126
APPENDIX B: MATHEMATICAL BACKGROUND
Theorem: Supposeu' (x )>0, then portfolio i is preferred to
portfolioj if either wXi is absolutely dominant over wXj
or wXi≥fsdwXj (see the proof in Appendix B)
Proof of theorem:
Because if either wXi is absolutely dominant overwXj,
then wXi≥fsdwXj (as), it is necessary to prove only that
if wXi≥fsdwXj then portfolio i is preferred to portfolioj
E [v (wXi ) ]−E[v (wXj )]
¿∫−∞
+∞
v (y) [fi (y )−fj (y) ]dy
¿ [v (y ) [Fi (y)−Fj (y) ]]+∞
−∞−∫−∞
+∞v' (y )[Fi (y )−Fj (y )]dy
¿0−∫−∞
+∞
v' (y )[Fi (y )−Fj (y )]dy
Thus, if Fi (y )−Fj (y )<0 (or Fi (y )≤Fj (y )forally¿, then:
E [v (wXi ) ]−E [v (wXj) ]>0, or wXi is preferred to wXj
Theorem: Suppose thatv' (x )>0 (implying that investors
prefer more to less) and v'' (x )<0(implying that investor

127
is risk averse), WXi is preferred to wXj if wXi is second
- order stochastically dominant overwXj, or:
∫−∞
x
Fi (y )dy≤∫−∞
x
Fj (y )dy
Proof of the theorem:
Because v' (x )>0 and v'' (x )<0, v' (x ) is a positive strictly
decreasing function, therefore, the limit limx→+∞
u' (x) exists
E [v (wXi ) ]−E[v (wXj )]
¿∫−∞
+∞
v (y) [fi (y )−fj (y) ]dy
¿ [v (y ) [Fi (y)−Fj (y) ]]+∞
−∞−∫−∞
+∞v' (y )[Fi (y )−Fj (y )]dy
¿−∫−∞
+∞
v' (y ) [Fi (y)−Fj (y ) ]dy
¿−[v' (x)∫−∞
xFi (y )−Fj (y )dy] +∞
−∞+∫−∞
+∞v''
(x )∫−∞
xFi (y )−Fj (y )dydx
¿−v' (+∞ )∫−∞
+∞Fi (y)−Fj (y )dy+∫
−∞
+∞ [v'' (x )∫−∞
xFi (y )−Fj (y )dy]
Becausev' (+∞ )>0; ∫−∞
+∞
Fi (y )−Fj (y)dy<0; v'' (x )<0 so, it implies
that :

128
∫−∞
x
Fi (y )−Fj (y)dy<0 , then E [v (wXi ) ]−E [v (wXj) ]>0(as desired)