
Size effect in Indian Stock Market
14
Size Effect in Indian Stock Market An Empirical Study in National Stock Exchange Mishra Radhakrishna 1 , Sahoo Rashmita 2 1 Dept. of Finance, Bijupatnaik Institute of IT and Management Studies, Bhubaneswar, [email protected], #9437287858 2 Dr. Rashmita Sahoo, Dept. of Business Administration, Utkal University, Bhubaneswar, [email protected], #9937034547
Transcript of Size effect in Indian Stock Market

Size Effect in Indian Stock Market
An Empirical Study in National Stock Exchange
Mishra Radhakrishna1, Sahoo Rashmita
2
1Dept. of Finance, Bijupatnaik Institute of IT and Management Studies, Bhubaneswar,
[email protected], #9437287858
2Dr. Rashmita Sahoo, Dept. of Business Administration, Utkal University, Bhubaneswar,
[email protected], #9937034547

Abstract
The present study is based on the study of one of the anomalies of the stock market. It aims to
find out the presence of size effect on stock returns in the Indian stock market. The research is
carried on to study the impact of the size of the company on the returns from its stock in the
stock market (viz. National Stock Exchange). To conduct the study the market capitalization of
the stocks are taken as the size of the company (i.e. Large Cap, Mid Cap and Small Cap).
Returns from the stocks of 50 companies each from all the three sizes of the companies has been
compared to prove the hypothesis. To study the impact of the size effect the daily returns from
the stocks has been compared and further the respective abnormal returns have also been
compared for an elaborate analysis. Moreover the study focuses on finding answer to the
question, “Can anybody outperform the market by designing size based investment strategies?”
The present study is of immense use for the portfolio managers, asset management companies as
well as individual investors. Stock prices of last five years have been taken for the study.
Key words: Anomaly, Abnormal return, Efficient Market Hypothesis, Size effect

Introduction:
The size effect in the stock market is one of the most studied topics in finance theory. Since
some of the researchers like Banz (1981) had found that the small firms had given higher returns
than big firms, a large number of researchers have contributed a lot to this theory with empirical
evidences. However many studies have also proved that, now-a-days the size effect in the stock
market is losing its existence. The size of the firm measured by the market capitalization which
is arrived at by multiplying the market price of the share with the number of shares outstanding
in the market. The different sizes of the firms are categorized as Large Cap, Small cap and Mid
Cap. Post 1990s the Indian stock market has shown enormous changes. The opening up of the
Indian economy has fascinated the foreign institutional investors and the Indian stock market has
shown spectacular growth during this period. With the introduction of modern financial
instruments like derivatives the market is becoming more and more efficient and attractive to the
investors. This also has necessitated the increase in the role of the market regulators. It also has
enforced the modern institutional as well as individual investors to search for strategies which
can give them better return. In such an environment the current study is based on an argument
which has been in lime light since long. It attempts to find out the presence of size premium in
the stock market. In simple terms it attempts to answer a question whether one can make
abnormal return by designing portfolio based on size of the firm. Empirical studies have shown
the availability of extra normal returns by using active investment strategies based on a number
of firm variables such as size (Banz, 1981), leverage (Bhandari, 1988), price earnings ratio
(Basu, 1977), book to market ratio (Stattman, 1980); Rosenberg, Reid and Lanstein, (1985), etc.
These evidences, since inconsistent with the CAPM, are popularly known as CAPM anomalies.
Literature Review:
The presence of size effect is first documented by Banz (1981). He proved with empirical
evidences that the small size firms have outperformed the large size firms. Again the same is
confirmed by Reinganum (1981) and reported that a strong firm size still emerged. Roll (1981)
found that the small size firms are less frequently traded than the large firms; resulting a lower
systematic risk in the daily returns and shown higher returns. Christie and Hertzel (1981) argued
that as the risk measures are non-stationary which causes the size effect. Cook and Rozeff (1984)
studied the universal presence of size effect.
Arbel and Strebel (1983) found out that the size effect is may be due to the neglected firm effect.
According to James and Edmister (1983) the firm size and trading activity are highly correlated,
but differences in trading activity are not the major reason for the firm size anomaly. Keim
(1983) argued that there exists a relationship between the size effect and the seasonality effect or
January effect. He said that nearly fifty percent of the size effect is due to abnormally large
returns on the small size firms in January during the period 1963-1979. Brown, Kleidon and
Marsh (1983) verified that the magnitude of the size effect were not constant during 1967-1979.
Barry and Brown (1984) evidenced that differential information hypothesis is related to the size

effect and can explain a large part of it. Chan, Chen and Hsieh (1985) concluded that small firms
are more sensitive to changes in economic conditions (and hence more prone to risk) than large
firms and therefore carry higher risk. Amihud and Mendelson (1986) argued that a part of size
effect may, in fact, be the liquidity premium. Reinganum (1990) argued that the market
microstructure may have an important influence on the measured size effect. Therefore,
international evidence on size effect with different market organisation and structures should
reveal differences in magnitude of the size premiums across markets.
Rathinasamy and Mantripragda (1996) examined size effect and January effect using risk
adjusted Treynor and Sharpe portfolio performance measures and concluded that while the return
increased along with risk for small firms in January, the extra return was more than what was
warranted by the extra risk. Patel (2000) reported the presence of a strong size effect in 9 out of
22 emerging markets including India over the period 1988 to 1998. In a comprehensive study
regarding firm size and cyclical variations in stock returns, Timmermann and Quiros (2000)
documented that the behaviour of common stock returns for small and large firms varies
significantly over different phases of business cycles; expansion and recession. Annaert,
Crombez, Spinel and Holle (2002) studied size effect for a cross-section of European stocks over
15 European countries and found a large size premium but reported that this premium existed
only in the cross-section of the whole European market. If small and big stocks were selected
relative to the market size of the country, the strategy was no longer profitable. Xu (2002)
reported a strong size effect in China using market capitalization as the size measure. Mohanty
(2001) documented the presence of a strong size effect in Indian stock market over the period
1991.2000 using market capitalization as the measure of firm size. In a survey of mutual fund
managers, investment analysts and stock brokers, Sehgal (2002) found a greater support for size
effect in India, as 60% of the respondents believed that stocks of small companies provide higher
returns than stocks of bigger companies. Sehgal et al (2003) reported the presence of a strong
size effect and a weak and conditional value effect for the Indian stock market over the period
July 1989 to March 1999 using three different measures of size, viz., enterprise value, total assets
and market capitalisation. Contrary to the findings of Berk (1996) Muneesh and Sehgal (2003)
reported the presence of a strong size effect in India even with the use of some non- market
based size measures, i.e., total assets and net sales.
RESEARCH METHODOLOGY:
To study the presence of size effect the data of last 5 years has been taken from the stock market
(National Stock Exchange). Fifty companies each from large cap, mid cap and small cap has
been selected and their daily returns are calculated. The daily prices from the date 1st April 2009
to 31st March 2014 has been taken for research. 1247 prices have been collected and their
respective 1246 returns are compared to prove the hypothesis.

Data Collection
All Large Cap Mid Cap Small Cap
Time Period 1-Apr-2009 to
31-Mar-2014
1-Apr-2009 to
31-Mar-2014
1-Apr-2009 to
31-Mar-2014
1-Apr-2009 to
31-Mar-2014
No. of
Observations 3741 1247 1247 1247
No. of
companies 150 50 50 50
The Daily Returns:
The daily returns from the stocks are calculated by finding out the log value of the daily price
differences.
Rt = [ln (Pt/Pt-1)]*100
The lognormal returns follow the normal distribution more closely than returns. (Lauterbach and
Ungar (1995).
The abnormal return (Error Term):
To find out the abnormal return the theoretical return is calculated for each and every stock on a
daily basis. Then the theoretical return is deducted from the real return, the difference between
them is known as the abnormal return or error term. The theoretical return is calculated by
applying the CAPM model.
Theoretical return Rj= Rf + (Rm-Rf)βj
Here Rj = Expected return from the stock
Rf = Risk free return
Rm = Return from the market
βj = Beta of the stock ‘j’
The abnormal return or the error term is arrived at by deducting the above mentioned theoretical
return from the actual return from the stock.
Ej = Rj – Rj

Descriptive Statistics:
The descriptive statistics such as Mean and Standard deviation is of the actual returns and the
abnormal returns are calculated. The standard deviation is calculated to prove the consistency in
return.
Testable Hypothesis:
The null hypothesis Ho: a1 = a2 = a3
Alternative hypothesis H1: a1 ≠ a2 ≠ a3
Where, a1, a2 and a3, represents the average of the returns from the stocks of different sizes (i.e.
Large Cap, Mid Cap and Small Cap) of firms. To test the hypothesis first the correlation among
the returns is found out. Its significance level will prove that whether the correlation between the
returns is only a matter of chance or permanent. If the correlation is a matter of chance then there
exists the size effect in the stock market.
To test this null hypothesis first ANOVA is applied to find out whether the daily returns and the
abnormal returns are dependent on each other or different.
DATA ANALYSIS:
Analysis of Daily Returns:
Table 1. Descriptives – Daily Return
N Mean Std. Deviation Std. Error
Large Cap 1246 .03816387042531 1.310908162369949 .037137549736836
Mid Cap 1246 .07061040671595 1.247025625404414 .035327780782782
Small Cap 1246 -.81320413364151 16.822684785396845 .476580519412833
Total 3738 -.23480995216675 9.774550889072641 .159873750588057
The table 1 above displays the descriptive statistics of the daily returns from the stocks for the
period of 2004 to 2014. The stock returns are calculated based on the size of the company. The
mean return from the mid cap is maximum i.e. 0.07 with a standard deviation of1.24. The return
from the large cap is lower than mid cap i.e. 0.0381 with bit high standard deviation of 1.31. But
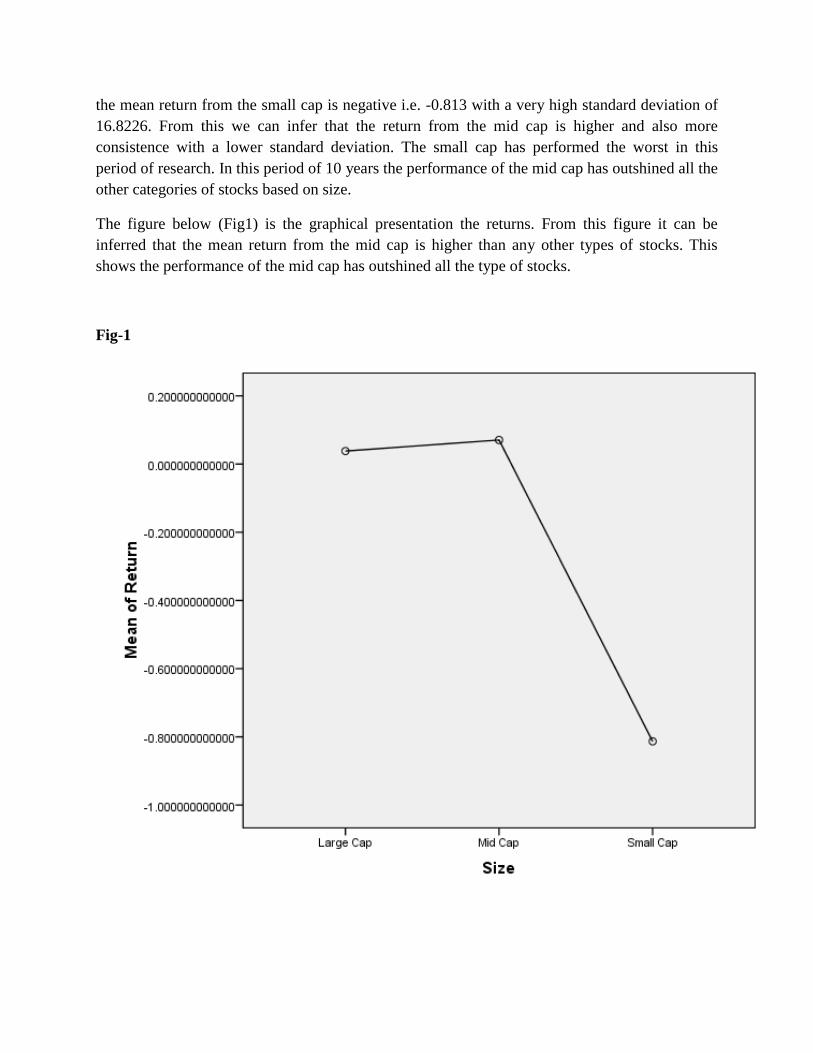
the mean return from the small cap is negative i.e. -0.813 with a very high standard deviation of
16.8226. From this we can infer that the return from the mid cap is higher and also more
consistence with a lower standard deviation. The small cap has performed the worst in this
period of research. In this period of 10 years the performance of the mid cap has outshined all the
other categories of stocks based on size.
The figure below (Fig1) is the graphical presentation the returns. From this figure it can be
inferred that the mean return from the mid cap is higher than any other types of stocks. This
shows the performance of the mid cap has outshined all the type of stocks.
Fig-1

Table-2 Correlations- Daily Return
Large_Cap Mid_cap Small_Cap
Large_Cap Pearson Correlation 1 .831** -.924
**
Sig. (2-tailed) .000 .000
N 1246 1246 1246
Mid_cap Pearson Correlation .831** 1 -.819
**
Sig. (2-tailed) .000 .000
N 1246 1246 1246
Small_Cap Pearson Correlation -.924** -.819
** 1
Sig. (2-tailed) .000 .000
N 1246 1246 1246
**. Correlation is significant at the 0.01 level (2-tailed).
The Table – 2 shows the correlation among the different types of stocks. It shows a strong
positive correlation between the large cap and mid cap i.e. 0.831. But the correlation among the
small cap and large cap is highly negative (i.e. -0.924) and mid cap and small cap (-0.819) is also
highly negative. This increases the chances of earning abnormal return by designing a portfolio
taking different stocks from large cap and small cap or Mid cap and Small Cap.
Though the coefficient of correlations among the large cap and mid cap is very high and positive
but it is highly significant rejecting the null hypothesis. This implies that the correlation is just a
matter of chance and it is not permanent. In case of the coefficient of correlation among large cap
and small cap is also highly hence it proves that this correlation is also a matter of chance. So far
as the level of significance of the coefficient of correlation among the mid cap and small cap is
concerned it is also highly significant, and shows that it is also a matter of chance and not
permanent.
ANOVA:
Table – 3 ANOVA – Daily Return
Sum of Squares df Mean Square F Sig.
Between Groups 625.911 2 312.955 3.280 .038
Within Groups 356413.964 3735 95.425
Total 357039.875 3737

The table 3 above shows the ANOVA of the returns of the different stocks of different sizes. We
can see from the table that the level of significance is less than 0.05 (i.e. 0.038) which proves that
there exist a significant difference among the returns of the stocks. The returns of the different
stocks are independent. Though the ANOVA is highly significant but the coefficient of
correlation among large cap and mid cap is high.
Post-Hoc Test:
The following table (table-4) shows the post hoc analysis of the returns for further analysis. From
the Post-hoc analysis we can find out that which among the three types of stocks has performed
differently. The table-4 shows the post-hoc analysis of the returns. The level of significance
between large cap and small cap is highly significant and also the significance of mid cap and
small cap is also very high. Among the three types of stocks the small cap is independent of the
market and it has performed differently that the other two types of stocks.
(Table – 4) Multiple Comparisons
(I) Size (J) Size
Mean Difference (I-J) Std. Error Sig.
Large Cap Mid Cap -.032446536290634 .391370447853266 .934
Small Cap .851368004066819* .391370447853266 .030
Mid Cap Large Cap .032446536290634 .391370447853266 .934
Small Cap .883814540357453* .391370447853266 .024
Small Cap Large Cap -.851368004066819* .391370447853266 .030
Mid Cap -.883814540357453* .391370447853266 .024
*. The mean difference is significant at the 0.05 level.
Data Analysis – Abnormal Return (Error Term):
(Table – 5) Descriptives – Abnormal Returns
N Mean Std. Deviation Std. Error
Large Cap 1246 -.0010593662 .02080970001 .00058953121
Mid Cap 1246 -.0489514304 1.01136413337 .02865157673
Small Cap 1246 -.8132041336 16.82268478540 .47658051941
Total 3738 -.2877383101 9.73463637058 .15922090384

The magnitude of mean of the error terms (i.e. abnormal returns) of the large cap stocks is lower
as compared to other type of stocks. This shows that the actual return from the large cap stocks is
very close to the theoretical return. In Case of the mid cap stocks the mean is also not very high.
If we see these two stocks we can see that there is not much of size effect in the stock market
during the period. But the mean of the error term is high in case of small cap with a standard
deviation of 16.822. From this we can say that there exists a size effect in the stock market
during the research period.
(Table – 6) Correlations-Error Term
Large Cap Mid Cap Small Cap
Large Cap Pearson Correlation 1 .997** .997
**
Sig. (2-tailed) .000 .000
N 1246 1246 1246
Mid Cap Pearson Correlation .997** 1 1.000
**
Sig. (2-tailed) .000 .000
N 1246 1246 1246
Small Cap Pearson Correlation .997** 1.000
** 1
Sig. (2-tailed) .000 .000
N 1246 1246 1246
**. Correlation is significant at the 0.01 level (2-tailed).
Though the coefficient of correlation in case of the abnormal returns is very strong and positive
but the level of significance is very high. High level of significance proves that the correlation is
not universal but it is only matter of chance.
(Table – 7) ANOVA (Error Terms)
Sum of Squares Df Mean Square F Sig.
Between Groups 517.487 2 258.743 2.733 .065
Within Groups 353612.387 3735 94.675
Total 354129.874 3737

The table – 7 above shows the ANOVA of the abnormal returns. The ANOVA is insignificant
proving that there is no significant difference among the mean of the error terms. From this we
can say that all the three types of firms have shown similar performance so far as abnormal
return or error term is concerned.
Conclusion:
The size effect is one of the most discussed issues of the stock market. From the last ten years
data we can say that there exist a size effect in the Indian stock market. This means that an
investor can achieve better return by designing a portfolio based on the size of the firm. The
coefficient of correlation among the large cap and mid cap is high and positive but the coefficient
of correlation among the large cap and small cap is negative and very strong. Same is in the case
of mid cap and small cap stocks. So here we can conclude that one can make better return from
the stock market by designing portfolios based on size based strategies. If we see the post hoc
test of the actual returns we can see that there exist a size effect in the stock market and the small
cap stocks are the drivers of the size effect. We can see that during this period the mid cap stock
has performed better that the other two types of the stocks. But so far as the abnormal returns are
concerned as the ANOVA is insignificant; we can say that the presence of the size effect in the
Indian stock market is due to the systematic risk component of the stocks.
Bibliography:
Amihud, Y. and Mendelson H., “Liquidity and Stock Returns”, Financial Analysts Journal, May-
June 1986, pp.43-48.
Annaert J., Crombez J., Spinel B., and Holle F.V. "Value and Size Effect: Now You See it, Now
You Don't", 2002 (May), Working Paper, Ghent University, Belgium.
Arbel, Avner, Steven Carvell and Strebel, Paul, “Giraffes, Institutions and Neglected Firms”,
Financial Analysts Journal, May-June, 1983, pp.57-63.
Banz, Rolf W. “The Relationship between Return and Market Value of Common Stock”, Journal
of Financial Economics, March 1981, pp.3-18.
Barry, Christopher B. and Brown, Stepehen J. “Differential Information and the Small Firm
Effect”, Journal of Financial Economics, 1984, 13, pp.283-294.
Basu, Sanjoy, “Investment Performance of Common Stocks in Relation to their Price-Earnings
Ratios: A Test of Efficient Market Hypothesis”, Journal of Finance, 1977, vol.32, pp.663-682.
Berges, A. McConnel J. and Schlabraum G., “The Turn-of-the Year Effect in Canada”, Journal
of Finance, 1984, vol.39, pp.182-192.
Berk, J., "A Critique of Size Related Anomalies", Review of Financial Studies, 1995, 8, pp.275-
286.
Berk, J., "An Empirical Re-examination of the Relation Between Firm Size and Return", Revised
Working Paper, School of Business Administration, University of Washington, October 1996.

Bhandari, L.C., "Debt-Equity Ratio and Expected Common Stock Returns: Empirical Evidence",
Journal of Finance, 1988, 43, pp.507-528.
Black, F., "Capital Market Equilibrium with Restricted Borrowing", Journal of Business, 1972,
45, pp.444-455.
Blume, Marshall E. and Stambaugh R.F., “Biases in Computed Returns: An Application to the
Size Effect”, Journal of Financial Economics, November 1983, pp.387-404.
Brown, Phillip, Keim, Donald B., Kleidon Allan W., and Marsh Terry A., “Stock Return
Seasonalities and `Tax-Loss Selling’ Hypothesis: Analysis of the Arguments and Australian
Evidence”, Journal of Financial Economics, June 1983, 12, pp.105-127.
Brown, Phillip, Kleidon Allan W. and Marsh, Tarry A., “New Evidence on the Nature of Size
Related Anomalies in Stock Prices”, Journal of Financial Economics, June 1983, 12, pp.33-56.
Calvet, A., and Lefoll, J., "Risk and Return on Canadian Capital Markets: Seasonality and Size
Effect", Journal of the French Finance Association, 1989, 10, pp.21-39.
Chan, K.C. and Chen, Nai-Fu, “Structural and Return Characteristics of Small and Large Firms”,
Journal of Finance, September 1991, 56, 4, pp.1467-1484.
Chan, K.C., Chen Nai Fu and Hsieh, David A. :”An Exploratory Investigation of the Firm Size
Effect”, Journal of Financial Economics, 1985, 14, pp.451-471.
Chan, L., Hamalo, Y., and Lakonishok, J., "Fundamentals and Stock Returns in Japan", Journal
of Finance, 1991, 46, pp.1739-1764.
Christie, Andrew A. and Michael Hertzel, 1981, “Capital Asset Pricing ANOMALIES’: Size and
Other Correlations”, Manuscript (University of Rochester, Rochester, NY).
Cook, Thomas J. and Rozeff Michael, “Size and Earnings/Price Ratio Anomalies: One Effect or
Two?” Journal of Financial and Quantitative Analysis, December 1984, pp.449-466.
Corhay, A., Hawawini, G., and Michel, P., "The Pricing of Equity on the London Stock
Exchange: Seasonality and Size Premium", in Stock Market Anomalies, E. Dimson (ed.),
Cambridge University Press, 1988, pp.197-212.
Cornoilay, C. and Pasquier, J., "CAPM, Risk Premium Seasonality and the Size Anomaly: The
Swiss Case", Journal of the French Finance Association, 1991, 21, pp.23-44.
Fama, E., and French, K., "The Cross Section of Expected Stock Returns", Journal of Finance,
1992, 47, pp.427-466.
Fama, E., and French, K., "Common Risk Factors in the Returns of Stocks and Bonds", Journal
of Financial Ecoomics, 1993, 33, pp.3-56.
Fama, E. and French K. "Size and Book to Market Factors in Earnings and Returns", Journal of
Finance, 1995, 50, pp.131-155.
Fama, E., and French, K., "Multifactor Explanations of Asset Pricing Anomalies", Journal of
Finance, 1996, 51, pp.55-84.
Fama, E., and MacBeth, J., "Risk, Return and Equilibrium: Empirical Tests", Journal of Political
Economy, 1973, 71, pp.607-636.

Gupta, L.C., "Return on Indian Equity Shares", reviewed in ICFAI Journal of Applied Finance,
Volume 6, No.4, October 2000.
Hawawini, G., "Stock Market Anomalies and the Pricing on the Tokyo Stock Exchange", in
Japanese Financial Market Research, W. Ziemba, W. Bailey and Y. Hamao (eds.), North -
Holland, 1991, pp.231-250.
Hawawini, G., and Keim, D.B., "The Cross Section of Common Stock Returns: A Review of the
Evidence and Some New Findings”, In Security Market Imperfections in Worldwide Equity
Markets, Keim, D.B. and Ziemba (eds) 2000, Cambridge University Press, pp.3-43.
Hawawini, G., and Viallet, C., "Seasonality, Size Premium and the Relationship Between the
Risk and Return of French Common Stocks", working paper, INSEAD, Fontainebleau, France,
1987.
Herrera, M. and Lockwood, L., "The Size Effect in the Mexican Stock Market", Journal of
Banking and Finance, 1994, 18, pp.621-632.
Ho, Y.K., "Stock Return Seasonalities in Asia Specific Markets", Journal of International
Financial Management and Accounting, 1990, 2, pp.47-77.
James, Christopher and Edmister, Robert O., “The Relation between Common Stock Return,
Trading Activity and Market Value, Journal of Finance, September 1983, 38, pp.1075-1086.
Keim, Donald B., “Size-related Anomalies and Stock Return Seasonality: Further Empirical
Evidence”, Journal of Financial Economics, June 1983, 12, pp.13-32.
Kim, Y.G., Chugh K.H. and Pyun C.S., "Size, Price Earnings Ratio and Seasonal Anomalies in
the Korean Stock Market". In Pacific Basin Capital Market Research, S.G.Rhee and R.P. Chang
(eds.), North-Holland, 1992.
Ma, T., and Shaw, T.Y., "The Relationship between Market Value, P/E Ratio, Trading Volume
and the Stock Return of Taiwan Stock Exchange", in Pacific Basin Capital
Markets Reearch, S.G. Rhee and R.P. Chang (eds.), North-Holland, 1990, pp.313-335.
Mohanty, P., "Efficiency of the Market for Small Stocks", 2001, NSE Research Paper Series
(nseindia.com).
Muneesh K. and Sehgal S., “Company Characteristics and Common Stock Returns: The Indian
Experience”, Working Paper, Department of Financial Studies, University of Delhi, 2003.
Patel, S.A., "Characteristics-based premia in Emerging Markets: Sector Neutrality, Cycles and
Cross Market Correlations" in Security Market Imperfections in Worldwide Equity Markets,
2000, D.B. Keim, W.T. Ziemba (eds.) Cambridge University Press, pp.416-432.
Rathinasany R.S., and Mantripragada, K.G., "The January Size Effect Revisited: Is it a case of
Risk Mismeasurement?". Journal of Financial and Strategic Decisions, 1996, Vol.9, No.3, pp.9-
14.
Reinganum, Marc R., “Misspecifications of Capital Market Pricing: Empirical Anomalies based
on Earnings Yields and Market Values”, Journal of Financial Economics, 1981, 9, pp.19-46.
Reinganum, Marc R., "Market Microstructure and Asset Pricing: An Empirical Investigation of
NYSE and NASADQ Securities", Journal of Financial Economics, 1990, 28, pp.127-148.

Roll, Richard, “A Possible Explanation of the Small Firm Effect”, Journal of Finance, September
1981, 36, pp.879-888.
Rosenberg, B., Reid, K., and Lanstein, R., "Persuasive Evidence of Market Efficiency", Journal
of Portfolio Management, 1985, 11, pp.9-17.
Sehgal S., “Investor Behaviour in the Indian Capital Market”, Review of Commerce Studies,
Jan-June 2002, 20-21, pp.123-152.
Sehgal, S., "Common Factors in Stock Returns: The Indian Evidence", The ICFAI Journal of
Applied Finance, Vol.9, No.1, January 2003, pp.5-16.
Stattman, D., "Book Values and Stock Returns", The Chicago MBA - A Journal of Selected
Papers, 1980, 4, pp.25-45.
Timmermann, Allan and Quiros, P.G., "Firm Size and Cyclical Variations in Stock Returns",
The Journal of Finance, June 2000, pp.1229-1262.
Wong, K.A., and M.S. Lye, "Market Values, Earnings Yields and Stock Returns", Journal of
Banking and Finance, 1990, 14, pp.311-326.
Xu, J., "The Size Effect of the Stock Returns in the Chinese Market", 2002 (March), Working
Paper, Peking University, China.
-----xxxx----