12-scheme-information-document---mirae-asset-savings-fund ...
Upload
khangminh22Category
view
0download
0
PLEASE SEE ANALYST CERTIFICATIONS AND IMPORTANT DISCLOSURES & DISCLAIMERS IN APPENDIX 1 AT THE END OF REPORT.
VIETNAM ECONOMY AND STOCK MARKETNavigating opportunities
Research teamMirae Asset Securities (Vietnam)
Strategy report | June 2022
Mirae Asset Securities (Vietnam) Research2 | Vietnam focus: Strategy
Contents
I. Vietnam economy in the first five months of 2022 3
II. Vietnam stock market May 2022 review 19
III.Vietnam stock market prospects 27
IV. Sector outlook and stock recommendations 33

Mirae Asset Securities (Vietnam) Research3 | Vietnam focus: Strategy
❑ Vietnam’s economy continued its recovery in May, as the number of new infectionstumbled and the economy fully returned to a new normalcy. Specifically, IndustrialProduction maintained its double-digit rally for a second consecutive month, with May’sproduction volume growing at the fastest pace since April 2021; Retail Sales of consumergoods and services achieved a strong YoY improvement; and disbursed FDI inflowsremained positive. Meanwhile, export growth slowed; registered FDI inflows continued todecline, and disbursed public investment capital grew at a slower pace compared withthe same period last year.
❑ CPI continued to accelerate in May (up 2.86% YoY), with increasing prices of food andfoodstuff, input materials, and gasoline rising in line with the world oil prices. Meanwhile,the CPI of Culture, Entertainment, and Tourism and Out-of-home Dining rose sharply onthe rebound in tourism demand and complete re-opening of the economy.
❑ We believe Vietnam's economy is supported by key growth drivers, including: 1) anexpected recovery in consumption; 2) exports regaining momentum, as domesticproduction returns and external demand recovers; 3) expectations for registered FDI torally, as travel between countries is gradually returning to normal, creating favorableconditions for foreign investors to survey and carry out investment procedures inVietnam; and 4) the government’s promotion of public investment.
❑ Key risks for Vietnam’s economic recovery include: 1) increased global supply disruptions;and 2) increasing inflation risks.
I. Vietnam economy in the first five months of 2022
Mirae Asset Securities (Vietnam) Research4 | Vietnam focus: Strategy
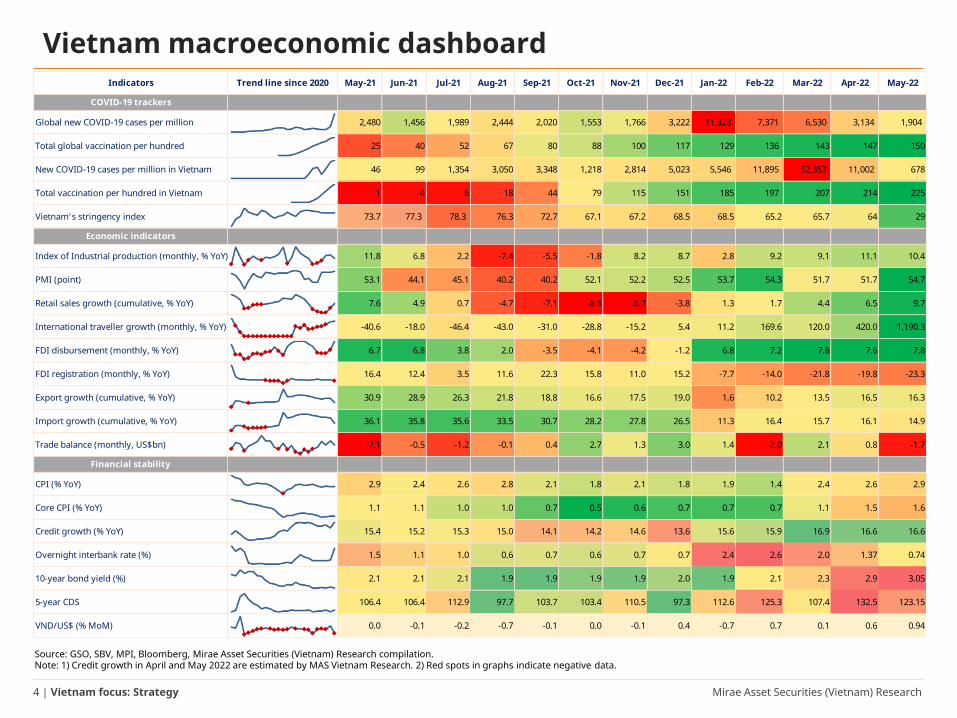
Vietnam macroeconomic dashboard
Source: GSO, SBV, MPI, Bloomberg, Mirae Asset Securities (Vietnam) Research compilation. Note: 1) Credit growth in April and May 2022 are estimated by MAS Vietnam Research. 2) Red spots in graphs indicate negative data.
Indicators Trend line since 2020 May-21 Jun-21 Jul-21 Aug-21 Sep-21 Oct-21 Nov-21 Dec-21 Jan-22 Feb-22 Mar-22 Apr-22 May-22
COVID-19 trackers
Global new COVID-19 cases per million 2,480 1,456 1,989 2,444 2,020 1,553 1,766 3,222 11,328 7,371 6,530 3,134 1,904
Total global vaccination per hundred 25 40 52 67 80 88 100 117 129 136 143 147 150
New COVID-19 cases per million in Vietnam 46 99 1,354 3,050 3,348 1,218 2,814 5,023 5,546 11,895 62,353 11,002 678
Total vaccination per hundred in Vietnam 1 4 6 18 44 79 115 151 185 197 207 214 225
Vietnam's stringency index 73.7 77.3 78.3 76.3 72.7 67.1 67.2 68.5 68.5 65.2 65.7 64 29
Economic indicators
Index of Industrial production (monthly, % YoY) 11.8 6.8 2.2 -7.4 -5.5 -1.8 8.2 8.7 2.8 9.2 9.1 11.1 10.4
PMI (point) 53.1 44.1 45.1 40.2 40.2 52.1 52.2 52.5 53.7 54.3 51.7 51.7 54.7
Retail sales growth (cumulative, % YoY) 7.6 4.9 0.7 -4.7 -7.1 -8.6 -8.7 -3.8 1.3 1.7 4.4 6.5 9.7
International traveller growth (monthly, % YoY) -40.6 -18.0 -46.4 -43.0 -31.0 -28.8 -15.2 5.4 11.2 169.6 120.0 420.0 1,190.3
FDI disbursement (monthly, % YoY) 6.7 6.8 3.8 2.0 -3.5 -4.1 -4.2 -1.2 6.8 7.2 7.8 7.6 7.8
FDI registration (monthly, % YoY) 16.4 12.4 3.5 11.6 22.3 15.8 11.0 15.2 -7.7 -14.0 -21.8 -19.8 -23.3
Export growth (cumulative, % YoY) 30.9 28.9 26.3 21.8 18.8 16.6 17.5 19.0 1.6 10.2 13.5 16.5 16.3
Import growth (cumulative, % YoY) 36.1 35.8 35.6 33.5 30.7 28.2 27.8 26.5 11.3 16.4 15.7 16.1 14.9
Trade balance (monthly, US$bn) -2.1 -0.5 -1.2 -0.1 0.4 2.7 1.3 3.0 1.4 -2.0 2.1 0.8 -1.7
Financial stability
CPI (% YoY) 2.9 2.4 2.6 2.8 2.1 1.8 2.1 1.8 1.9 1.4 2.4 2.6 2.9
Core CPI (% YoY) 1.1 1.1 1.0 1.0 0.7 0.5 0.6 0.7 0.7 0.7 1.1 1.5 1.6
Credit growth (% YoY) 15.4 15.2 15.3 15.0 14.1 14.2 14.6 13.6 15.6 15.9 16.9 16.6 16.6
Overnight interbank rate (%) 1.5 1.1 1.0 0.6 0.7 0.6 0.7 0.7 2.4 2.6 2.0 1.37 0.74
10-year bond yield (%) 2.1 2.1 2.1 1.9 1.9 1.9 1.9 2.0 1.9 2.1 2.3 2.9 3.05
5-year CDS 106.4 106.4 112.9 97.7 103.7 103.4 110.5 97.3 112.6 125.3 107.4 132.5 123.15
VND/US$ (% MoM) 0.0 -0.1 -0.2 -0.7 -0.1 0.0 -0.1 0.4 -0.7 0.7 0.1 0.6 0.94

Mirae Asset Securities (Vietnam) Research5 | Vietnam focus: Strategy
I.1 – Covid-19 situation❑ The number of new infections plummeted in April and May, after peaking in March. In addition, the mortality
rate maintained a low level, thanks to high fully-vaccinated rates and the promotion of vaccine boosters. With
the trend of declining numbers of new infections and a sustained low mortality rate, Vietnam's economy has
fully returned to a new normalcy.
New Covid cases plunged;
mortality rate maintained
low level
Vietnam’s new covid cases tumbled after peaking in March
Source: Our World in Data, Mirae Asset Securities (Vietnam) Research compilationData updated as of 5/30/202
Vietnam’s Covid mortality rate
0.0
0.5
1.0
1.5
2.0
2.5
3.0
3.5
Jun
21
Jul 2
1
Aug
21
Sep
21
Oct
21
Nov
21
Dec
21
Jan
22
Feb
22
Mar
22
Apr
22
May
22
(%)
0
500
1000
1500
2000
2500
3000
Jun
21
Jul 2
1
Aug
21
Sep
21
Oct
21
Nov
21
Dec
21
Jan
22
Feb
22
Mar
22
Apr
22
May
22
New cases per million(# cases)

Mirae Asset Securities (Vietnam) Research6 | Vietnam focus: Strategy
I.2 – Industrial production❑ The May index of industrial production (IIP) continued to expand (+4% MoM and +10.4% YoY), with the IIP of
Manufacturing and Processing up 12.1% YoY. Businesses have adapted to the new normalcy, recovered, and
expanded their production, thanks to the successful containment of Covid-19 and re-opening of the economy.
❑ In 5M22, the IIP grew 8.3% YoY. Notably, production in some secondary industries increased sharply compared
with the same period last year, such as Clothing (+22% YoY); Electrical Equipment (+20.4% YoY); Pharmaceuticals
(+16.8%); and Leather and Related Products (+13.5% YoY).
Monthly IIP Manufacturing IIP in 5M22
Source: GSO, Mirae Asset Securities (Vietnam) Research compilation
Industrial production
has maintained double-
digit growth for two
consecutive months
Source: GSO, Mirae Asset Securities (Vietnam) Research compilation
-15
-10
-5
0
5
10
15
20
25
30
35
Jan
19
Mar
19
May
19
Jul 1
9
Sep
19
Nov
19
Jan
20
Mar
20
May
20
Jul 2
0
Sep
20
Nov
20
Jan
21
Mar
21
May
21
Jul 2
1
Sep
21
Nov
21
Jan
22
Mar
22
May
22
IIP Processing and manufacturing IIP(% YoY)
Seasonal effects
Covid-19 wave
-13.8-9.8
-2.63.53.54.24.44.64.7
7.07.38.18.68.99.2
11.111.211.511.6
13.516.8
20.422.0
Rubber and plastic productsMachinery and equipment installation/repair
Coke, refined petroleum productsBasic metals
Motor vehiclesProcessed wood products
TobaccoChemicals and chemical products
TextilesFood products
FurnitureOther non-metallic mineral products
BeveragesPaper and paper products
ManufacturingPrinting, recorded media reproduction
Machinery and equipmentPrefabricated metal products
Computer, electronic, optical productsLeather and related products
PharmaceuticalsElectrical equipment
Clothing
(% YoY)

Mirae Asset Securities (Vietnam) Research7 | Vietnam focus: Strategy
I.2 – Industrial production (cont’d.) ❑ Vietnam's manufacturing PMI has remained above the 50-point threshold for eight consecutive months, reaching
54.7 in May, up from 51.7 in April. Production output recovered at the fastest pace since April 2021 .
❑ We believe that the main drivers, such as the high vaccination rate, improved demand in both the domestic and
global markets, gradual return of operating capacity to pre-pandemic levels, and increase in working hours, will
continue to support the recovery of industrial production in 2022.
❑ Risks to watch: 1) Possibility of disruption to the material supply chain; and 2) adverse affects on global growth by
the Russia-Ukraine war shock and China's Zero Covid policy. However, China has reopened since June 1, after a
two-month lockdown, so the risks related to China’s “Zero Covid" policy will probably gradually decline in the
coming months.
Industrial production
to continue to
rebound
Vietnam’s PMI has remained above 50-point threshold
Source: Bloomberg, Mirae Asset Securities (Vietnam) Research compilation
Monthly IIP
Source: GSO, Mirae Asset Securities (Vietnam) Research compilation
Year 2021 2022
Month 5 6 7 8 9 10 11 12 1 2 3 4 5
IIP 11.8 6.8 2.2 -7.4 -5.5 -1.8 8.2 8.7 2.8 9.2 9.1 11.1 10.4
Mining -5.9 -4.9 -8.0 -2.4 -7.1 -8.2 6.2 -7.1 -1.7 2.2 7.5 7.9 4.2
Processing and manufacturing 14.4 8.1 2.9 -9.2 -4.9 -0.8 8.6 10.9 2.9 9.7 9.7 11.7 12.1
Production and distribution of electricity 12.7 8.2 6.7 1.5 -9.7 -4.8 6.8 9.1 5.2 11.9 6.5 8.6 2.4
Water supply; waste management and treatment, sewage
4.1 6.0 4.3 0.2 -2.0 -0.5 0.4 0.8 4.1 4.3 -4.6 2.7 5.5
30
35
40
45
50
55
60
Jan
12M
ay 1
2Se
p 12
Jan
13M
ay 1
3Se
p 13
Jan
14M
ay 1
4Se
p 14
Jan
15M
ay 1
5Se
p 15
Jan
16M
ay 1
6Se
p 16
Jan
17M
ay 1
7Se
p 17
Jan
18M
ay 1
8Se
p 18
Jan
19M
ay 1
9Se
p 19
Jan
20M
ay 2
0Se
p 20
Jan
21M
ay 2
1Se
p 21
Jan
22M
ay 2
2
PMI 3-month average PMI(Point)

Mirae Asset Securities (Vietnam) Research8 | Vietnam focus: Strategy
I.2 – Industrial production (cont’d.) Manufacturing PMI
Source: Bloomberg, Mirae Asset Securities (Vietnam) Research compilation
Year 2020 2021 2022
Month 4 5 6 7 8 9 10 11 12 1 2 3 4 5 6 7 8 9 10 11 12 1 2 3 4 5
Global
Euro Area
US
UK
Emerging Markets
China
Japan
South Korea
Vietnam
ASEAN
Mirae Asset Securities (Vietnam) Research9 | Vietnam focus: Strategy
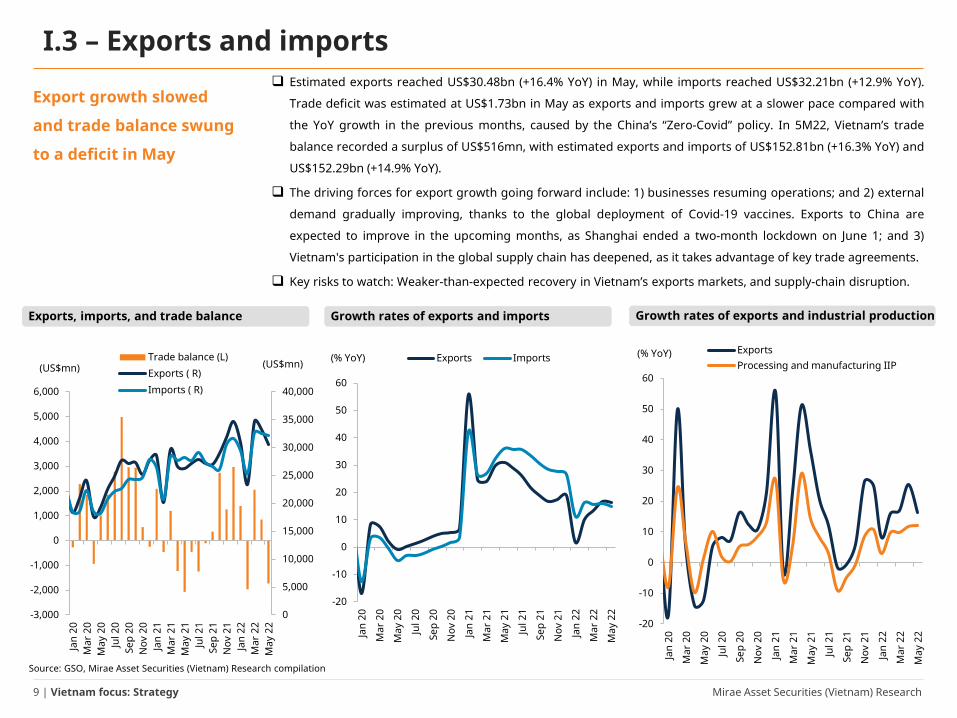
I.3 – Exports and imports❑ Estimated exports reached US$30.48bn (+16.4% YoY) in May, while imports reached US$32.21bn (+12.9% YoY).
Trade deficit was estimated at US$1.73bn in May as exports and imports grew at a slower pace compared with
the YoY growth in the previous months, caused by the China’s “Zero-Covid” policy. In 5M22, Vietnam’s trade
balance recorded a surplus of US$516mn, with estimated exports and imports of US$152.81bn (+16.3% YoY) and
US$152.29bn (+14.9% YoY).
❑ The driving forces for export growth going forward include: 1) businesses resuming operations; and 2) external
demand gradually improving, thanks to the global deployment of Covid-19 vaccines. Exports to China are
expected to improve in the upcoming months, as Shanghai ended a two-month lockdown on June 1; and 3)
Vietnam's participation in the global supply chain has deepened, as it takes advantage of key trade agreements.
❑ Key risks to watch: Weaker-than-expected recovery in Vietnam’s exports markets, and supply-chain disruption.
Export growth slowed
and trade balance swung
to a deficit in May
Exports, imports, and trade balance
Source: GSO, Mirae Asset Securities (Vietnam) Research compilation
Growth rates of exports and imports Growth rates of exports and industrial production
0
5,000
10,000
15,000
20,000
25,000
30,000
35,000
40,000
-3,000
-2,000
-1,000
0
1,000
2,000
3,000
4,000
5,000
6,000
Jan
20M
ar 2
0M
ay 2
0Ju
l 20
Sep
20N
ov 2
0Ja
n 21
Mar
21
May
21
Jul 2
1Se
p 21
Nov
21
Jan
22M
ar 2
2M
ay 2
2
Trade balance (L)Exports ( R)Imports ( R)
(US$mn)(US$mn)
-20
-10
0
10
20
30
40
50
60
Jan
20
Mar
20
May
20
Jul 2
0
Sep
20
Nov
20
Jan
21
Mar
21
May
21
Jul 2
1
Sep
21
Nov
21
Jan
22
Mar
22
May
22
Exports Imports(% YoY)
-20
-10
0
10
20
30
40
50
60
Jan
20
Mar
20
May
20
Jul 2
0
Sep
20
Nov
20
Jan
21
Mar
21
May
21
Jul 2
1
Sep
21
Nov
21
Jan
22
Mar
22
May
22
ExportsProcessing and manufacturing IIP
(% YoY)
Mirae Asset Securities (Vietnam) Research10 | Vietnam focus: Strategy
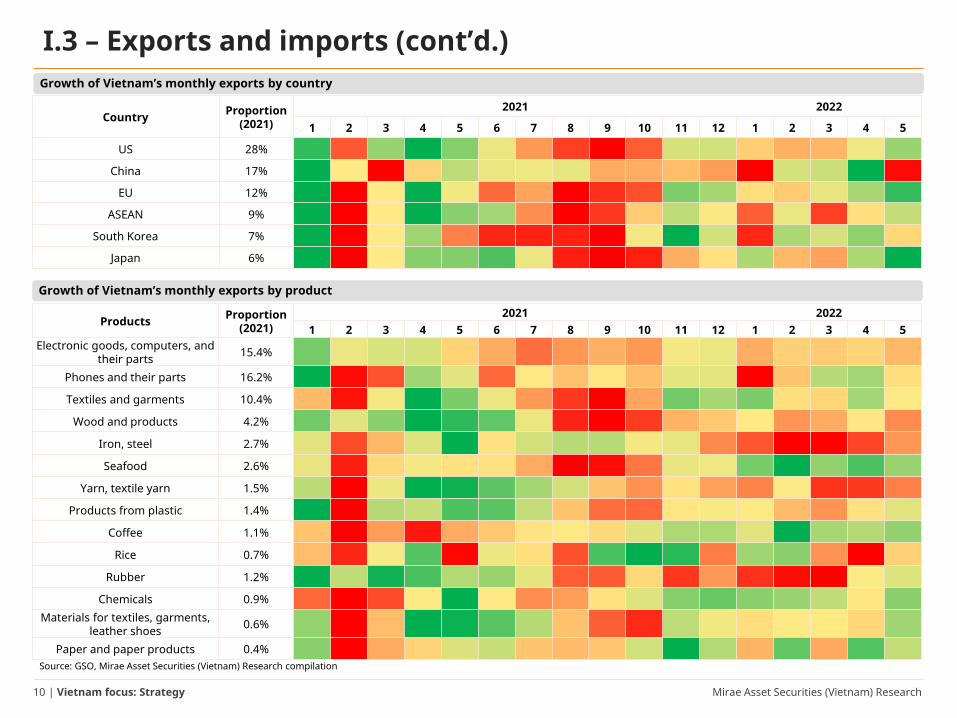
I.3 – Exports and imports (cont’d.)
Growth of Vietnam’s monthly exports by product
Growth of Vietnam’s monthly exports by country
Source: GSO, Mirae Asset Securities (Vietnam) Research compilation
Country Proportion (2021)
2021 2022
1 2 3 4 5 6 7 8 9 10 11 12 1 2 3 4 5
US 28%
China 17%
EU 12%
ASEAN 9%
South Korea 7%
Japan 6%
Products Proportion (2021)
2021 20221 2 3 4 5 6 7 8 9 10 11 12 1 2 3 4 5
Electronic goods, computers, and their parts 15.4%
Phones and their parts 16.2%
Textiles and garments 10.4%
Wood and products 4.2%
Iron, steel 2.7%
Seafood 2.6%
Yarn, textile yarn 1.5%
Products from plastic 1.4%
Coffee 1.1%
Rice 0.7%
Rubber 1.2%
Chemicals 0.9%Materials for textiles, garments,
leather shoes 0.6%
Paper and paper products 0.4%

Mirae Asset Securities (Vietnam) Research11 | Vietnam focus: Strategy
I.4 – Public investment❑ In 5M22, realized investment capital from the State budget was estimated at VND147.8tr, equivalent to
27.7% of the annual plan and up by 9.5% YoY (versus 26.9% of the annual plan and +15.6% YoY in 5M21).
The disbursement of public investment capital grew at a slower pace compared with the same period last
year, partly due to the increase in construction material prices, which has led to delays in construction.
Investment capital from state budget
Public investment
disbursement expected
to be key growth driver
in 2022
Source: GSO, Mirae Asset Securities (Vietnam) Research compilation
-15
-10
-5
0
5
10
15
20
25
30
0
10
20
30
40
50
60
Jan
21
Mar
21
May
21
Jul 2
1
Sep
21
Nov
21
Jan
22
Mar
22
May
22
Monthly investment capital from the State budget YoY growth (accumulative)(VNDtr) (% YoY)

Mirae Asset Securities (Vietnam) Research12 | Vietnam focus: Strategy
I.5 – FDI❑ In 5M22, newly-registered FDI capital reached US$4.1bn (-53.4% YoY), declining 5.7% YoY in terms of the number of
newly-registered FDI projects. Meanwhile, additionally-registered FDI capital (US$5.61bn; +45.4% YoY) and disbursed
FDI capital (US$7.71bn; +7.8% YoY) remained positive in 5M22.
❑ We believe the wave of FDI into Vietnam will improve going forward, thanks to the following: 1) Vietnam’s
vaccination rate has reached a high level and businesses have adapted to the “new normalcy”; 2) travel between
countries is gradually returning to normal, creating favorable conditions for foreign investors to survey and carry out
investment procedures in Vietnam; and 3) Vietnam continues to benefit from the restructuring of the global supply
chain, with the advantage of geographical location and labor costs.
❑ Risks to watch: Increasing competition among countries in attracting foreign investment.
FDI attraction and disbursement
Source: Mirae Asset Securities (Vietnam) Research compilation, GSO, updated as of 05/20/2022
Some major FDI projects in 5M22
Project Country Registered capital
Project of LEGO Group Denmark ~ US$1.32bn
Investment in infrastructure building of Bac Ninh VSIP urban areas and services
SingaporeAdditionally-
registered capital of US$941mn
Project of Samsung Electro-mechanics Vietnam Co., Ltd South Korea
Additionally-registered capital of US$920mn
Factory to manufacture electronic products, media, network equipment and multimedia audio products
Hong KongAdditionally-
registered capital of nearly US$306mn
Registered FDI
plunged, while
disbursed FDI
maintained its
growth momentum
Source: MPI, Mirae Asset Securities (Vietnam) Research compilation
-30
-20
-10
0
10
20
30
40
50
0
5,000
10,000
15,000
20,000
25,000
30,000
2014 2015 2016 2017 2018 2019 2020 2021 5M22
Registered FDI (L)FDI disbursement (L)Registered FDI growth (R)FDI disbursement growth (R)
(US$mn) (% YoY)

Mirae Asset Securities (Vietnam) Research13 | Vietnam focus: Strategy
I.6 – Domestic consumption❑ Retail Sales of consumer goods and services continued to recover in May (+22.6% YoY), reaching a higher scale and growth
rate compared with the same period in pre-pandemic years. Notably, Accommodation and Catering Services and Travel
Services recovered strongly, with revenue up by 69.3% YoY and 324.3% YoY, respectively, thanks to Vietnam’s return to
normalcy, accompanied by the tourism re-opening policy. In 5M22, Retail Sales of consumer goods and services rose 9.7% YoY.
❑ International visitors recovered strongly compared with the same period last year, thanks to a re-opening of tourism and
many international flight routes. International visitors to Vietnam reached 365,300 arrivals, 4.5 times the figure in the same
period last year, but still down 95% compared with the same period in 2019.
❑ We remain optimistic about the recovery of retail and consumer services (although it will take some time to return to pre-
pandemic levels), thanks to: 1) an expected rebound in consumer demand; 2) improvement in workers’ incomes upon a return
to the labor market, thus boosting spending; 3) the reduction of value-added tax, which may help stimulate consumption; and
4) expectations for the tourism industry to gradually prosper in 2022.
❑ The biggest risk to retail and consumption is a resurgence of Covid-19.
Retail sales and consumption services (% YoY)
Consumption
remained the
growth
momentum
Source: GSO, Mirae Asset Securities (Vietnam) Research compilation
International visitors to Vietnam
Source: GSO, Mirae Asset Securities (Vietnam) Research compilation
-80
-60
-40
-20
0
20
40
May
19
Aug
19
Nov
19
Feb
20
May
20
Aug
20
Nov
20
Feb
21
May
21
Aug
21
Nov
21
Feb
22
May
22
Retail sales of consumer goods and servicesRetail sales of goodsAccommodation & Catering ServicesTravel ServicesOther Services
(% YoY)
-100
100
300
500
700
900
1,100
1,300
0
200
400
600
800
1,000
1,200
1,400
1,600
1,800
2,000
Jan
19M
ar 1
9M
ay 1
9Ju
l 19
Sep
19N
ov 1
9Ja
n 20
Mar
20
May
20
Jul 2
0Se
p 20
Nov
20
Jan
21M
ar 2
1M
ay 2
1Ju
l 21
Sep
21N
ov 2
1Ja
n 22
Mar
22
May
22
International visitors (L)
Growth rate (R)
('000 arrivals)(% YoY)
-80
-60
-40
-20
0
20
40
60
Feb
20
May
20
Aug
20
Nov
20
Feb
21
May
21
Aug
21
Nov
21
Feb
22
May
22
Retail and recreationGrocery and pharmacyParksTransit stations
(% change frombaseline)
Vietnam’s community mobility trend
Source: Covid-19 Community Mobility Reports, Mirae Asset Securities (Vietnam) Research compilation
Mirae Asset Securities (Vietnam) Research14 | Vietnam focus: Strategy
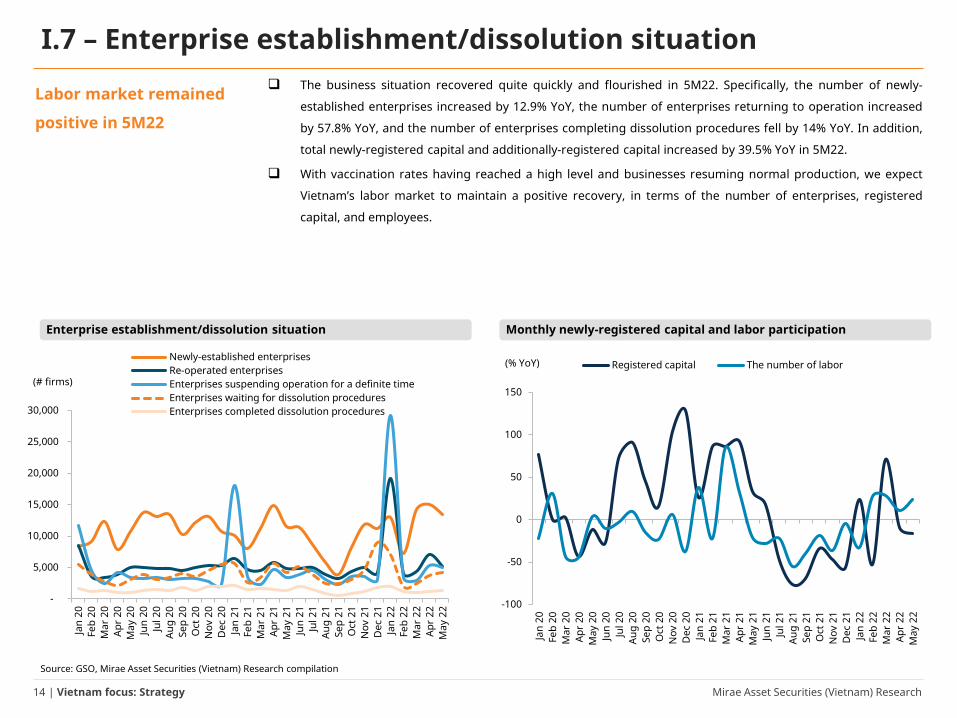
I.7 – Enterprise establishment/dissolution situation❑ The business situation recovered quite quickly and flourished in 5M22. Specifically, the number of newly-
established enterprises increased by 12.9% YoY, the number of enterprises returning to operation increased
by 57.8% YoY, and the number of enterprises completing dissolution procedures fell by 14% YoY. In addition,
total newly-registered capital and additionally-registered capital increased by 39.5% YoY in 5M22.
❑ With vaccination rates having reached a high level and businesses resuming normal production, we expect
Vietnam’s labor market to maintain a positive recovery, in terms of the number of enterprises, registered
capital, and employees.
Monthly newly-registered capital and labor participation
Labor market remained
positive in 5M22
Source: GSO, Mirae Asset Securities (Vietnam) Research compilation
Enterprise establishment/dissolution situation
-
5,000
10,000
15,000
20,000
25,000
30,000
Jan
20Fe
b 20
Mar
20
Apr
20M
ay 2
0Ju
n 20
Jul 2
0Au
g 20
Sep
20O
ct 2
0N
ov 2
0D
ec 2
0Ja
n 21
Feb
21M
ar 2
1Ap
r 21
May
21
Jun
21Ju
l 21
Aug
21Se
p 21
Oct
21
Nov
21
Dec
21
Jan
22Fe
b 22
Mar
22
Apr
22M
ay 2
2
Newly-established enterprisesRe-operated enterprisesEnterprises suspending operation for a definite timeEnterprises waiting for dissolution proceduresEnterprises completed dissolution procedures
(# firms)
-100
-50
0
50
100
150
Jan
20Fe
b 20
Mar
20
Apr
20M
ay 2
0Ju
n 20
Jul 2
0Au
g 20
Sep
20O
ct 2
0N
ov 2
0D
ec 2
0Ja
n 21
Feb
21M
ar 2
1Ap
r 21
May
21
Jun
21Ju
l 21
Aug
21Se
p 21
Oct
21
Nov
21
Dec
21
Jan
22Fe
b 22
Mar
22
Apr
22M
ay 2
2
Registered capital The number of labor(% YoY)

Mirae Asset Securities (Vietnam) Research15 | Vietnam focus: Strategy
I.8 – Exchange rate❑ As of end-May, the VND/US$ exchange rate increased by 0.94% MTD and by 1.56% YTD. The VND depreciated relative to
the US dollar; however, the level of depreciation of the VND was medium compared with the depreciations of other Asian
currencies, partly thanks to a trade surplus, abundant foreign exchange reserves, and optimistic disbursal of FDI capital.
❑ In 2022, the VND is expected to be stable and depreciate within a range of around 1% against the US dollar, in light of: 1)
the SBV's flexible mechanism for regulating foreign currency supply and demand; 2) an expected surplus for the trade
balance in 2022, once exports accelerate; 3) growth of FDI inflows into Vietnam, thanks to production shifts; 4) Vietnam’s
foreign exchange reserves reaching a high level and tending toward increases; and 5) the US Treasury’s mid-April 2021
removal of Vietnam from its list of currency manipulators and end to the tariff threat on the end-July 2021 currency-
dispute truce, which should ease pressure on the VND/US$ exchange rate.
VND/US$ exchange rate and US Dollar Index (DXY) VND depreciated relative to US$ in 5M22
Source: Mirae Asset Securities (Vietnam) Research, Bloomberg, as of 05/30/2022
VND depreciated
relative to US$ in
5M22
Source: Bloomberg, as of 05/30/2022, Mirae Asset Securities (Vietnam) ResearchNote: JPY = Japanese yen, PHP = Philippines peso, CNY = Chinese yuan, VND = Vietnamese dong, INR = Indian rupee, KRW = Korean won, MYR = Malaysian ringgit, THB = Thailand baht, IDR = Indonesian Rupiah
-4
-2
0
2
4
6
8
10
12
14
16
CNY VND PHP
INR MYR IDR
KRW THB JPY
(End 2021 = 0%)
85
90
95
100
105
110
22600
22800
23000
23200
23400
23600
23800
Mar
18
May
18
Jul 1
8Se
p 18
Nov
18
Jan
19M
ar 1
9M
ay 1
9Ju
l 19
Sep
19N
ov 1
9Ja
n 20
Mar
20
May
20
Jul 2
0Se
p 20
Nov
20
Jan
21M
ar 2
1M
ay 2
1Ju
l 21
Sep
21N
ov 2
1Ja
n 22
Mar
22
May
22
VND/US$ (L) DXY (R)(VND) (Point)
Mirae Asset Securities (Vietnam) Research16 | Vietnam focus: Strategy
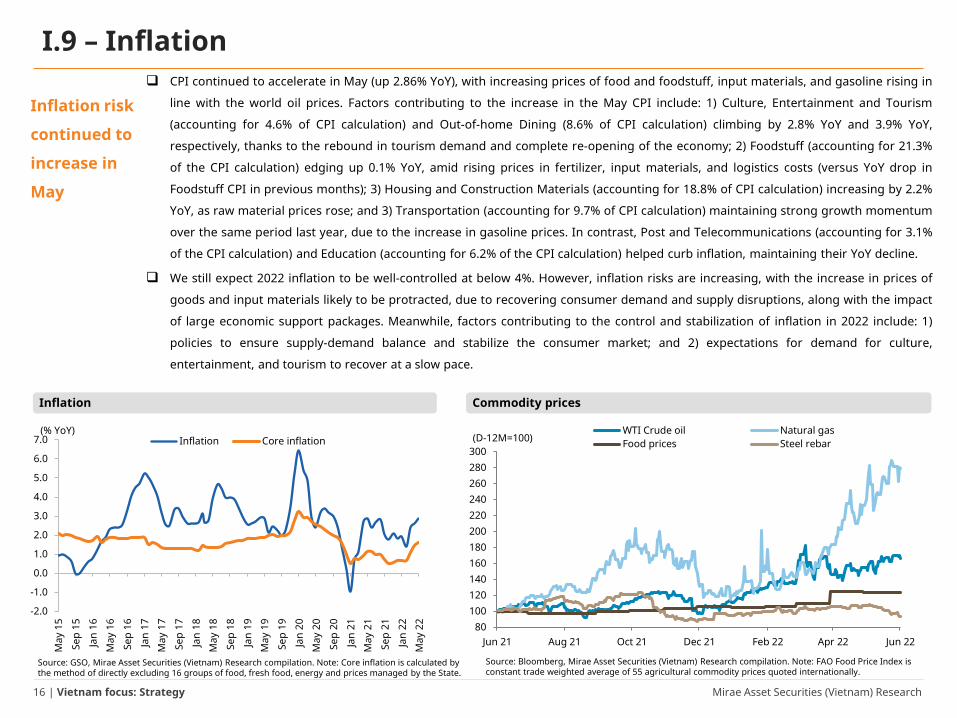
I.9 – Inflation❑ CPI continued to accelerate in May (up 2.86% YoY), with increasing prices of food and foodstuff, input materials, and gasoline rising in
line with the world oil prices. Factors contributing to the increase in the May CPI include: 1) Culture, Entertainment and Tourism
(accounting for 4.6% of CPI calculation) and Out-of-home Dining (8.6% of CPI calculation) climbing by 2.8% YoY and 3.9% YoY,
respectively, thanks to the rebound in tourism demand and complete re-opening of the economy; 2) Foodstuff (accounting for 21.3%
of the CPI calculation) edging up 0.1% YoY, amid rising prices in fertilizer, input materials, and logistics costs (versus YoY drop in
Foodstuff CPI in previous months); 3) Housing and Construction Materials (accounting for 18.8% of CPI calculation) increasing by 2.2%
YoY, as raw material prices rose; and 3) Transportation (accounting for 9.7% of CPI calculation) maintaining strong growth momentum
over the same period last year, due to the increase in gasoline prices. In contrast, Post and Telecommunications (accounting for 3.1%
of the CPI calculation) and Education (accounting for 6.2% of the CPI calculation) helped curb inflation, maintaining their YoY decline.
❑ We still expect 2022 inflation to be well-controlled at below 4%. However, inflation risks are increasing, with the increase in prices of
goods and input materials likely to be protracted, due to recovering consumer demand and supply disruptions, along with the impact
of large economic support packages. Meanwhile, factors contributing to the control and stabilization of inflation in 2022 include: 1)
policies to ensure supply-demand balance and stabilize the consumer market; and 2) expectations for demand for culture,
entertainment, and tourism to recover at a slow pace.
Inflation Commodity prices
Source: GSO, Mirae Asset Securities (Vietnam) Research compilation. Note: Core inflation is calculated by the method of directly excluding 16 groups of food, fresh food, energy and prices managed by the State.
Inflation risk
continued to
increase in
May
Source: Bloomberg, Mirae Asset Securities (Vietnam) Research compilation. Note: FAO Food Price Index is constant trade weighted average of 55 agricultural commodity prices quoted internationally.
-2.0
-1.0
0.0
1.0
2.0
3.0
4.0
5.0
6.0
7.0
May
15
Sep
15
Jan
16M
ay 1
6
Sep
16
Jan
17M
ay 1
7
Sep
17
Jan
18M
ay 1
8
Sep
18
Jan
19M
ay 1
9
Sep
19
Jan
20M
ay 2
0
Sep
20
Jan
21M
ay 2
1
Sep
21
Jan
22M
ay 2
2
Inflation Core inflation(% YoY)
80100120140160180200220240260280300
Jun 21 Aug 21 Oct 21 Dec 21 Feb 22 Apr 22 Jun 22
WTI Crude oil Natural gasFood prices Steel rebar(D-12M=100)

Mirae Asset Securities (Vietnam) Research17 | Vietnam focus: Strategy
I.9 – Inflation (cont’d.)CPI by industry (% YoY)
Source: GSO, Mirae Asset Securities (Vietnam) Research compilation Note: Core inflation is calculated by the method of directly excluding 16 groups of food, fresh food, energy and prices managed by the State.
Item Proportion (%)2021 2022
5 6 7 8 9 10 11 12 1 2 3 4 5
CPI 2.9 2.4 2.6 2.8 2.1 1.8 2.1 1.8 1.9 1.4 2.4 2.6 2.9
Core CPI 1.1 1.1 1.0 1.0 0.7 0.5 0.6 0.7 0.7 0.7 1.1 1.5 1.6
Food and Foodstuff 33.6 0.2 -0.3 0.5 1.2 1.3 0.1 -0.1 0.5 -0.1 -0.2 1.0 1.1 1.3
Food 3.7 4.3 4.4 5.0 5.1 4.7 4.3 3.9 3.9 3.1 1.7 1.8 2.1 2.4
Foodstuff 21.3 -1.1 -2.0 -0.8 0.1 0.4 -1.4 -1.7 -0.8 -1.7 -1.8 -0.1 -0.2 0.1
Out-of-home dining 8.6 2.0 1.9 1.9 2.1 2.1 2.2 2.3 2.4 2.4 3.1 3.4 3.8 3.9
Beverage and Tobacco 2.7 1.6 1.6 1.8 1.9 2.0 2.2 2.4 2.5 2.8 2.2 2.6 2.7 3.0
Garment, Footwear and Hats 5.7 1.0 1.0 0.9 0.9 0.8 0.9 1.0 1.1 0.9 0.7 1.0 1.1 1.3
Housing and Construction Materials 18.8 2.9 4.0 4.4 4.3 1.6 1.1 1.5 1.0 3.5 0.4 1.7 2.7 2.2
Household Appliances and Equipment 6.7 0.6 0.6 0.6 0.6 0.7 0.8 0.9 1.1 1.2 1.2 1.4 1.6 1.8
Medicines and Healthcare 5.4 0.2 0.2 0.2 0.2 0.2 0.2 0.2 0.2 0.3 0.3 0.3 0.3 0.4
Transportation 9.7 21.2 15.5 13.8 13.6 13.6 16.5 20.7 15.8 14.5 15.5 18.3 16.6 18.4
Post and Telecommunications 3.1 -0.9 -0.8 -0.9 -0.9 -0.9 -0.9 -0.7 -0.7 -0.7 -0.7 -0.6 -0.5 -0.3
Education 6.2 4.1 4.1 4.1 4.0 -1.1 -2.2 -3.1 -3.5 -3.8 -3.3 -3.2 -2.3 -2.2
Culture, Entertainment and Tourism 4.6 -0.6 -0.7 -1.1 -0.9 -0.7 -0.5 -0.3 -0.2 -0.1 0.3 0.5 1.8 2.8

Mirae Asset Securities (Vietnam) Research18 | Vietnam focus: Strategy
I.10 – Key macroeconomic indicators
Source: GSO, Vietnam Customs, MPI, Bloomberg, IMF, Mirae Asset Securities (Vietnam) Research Note: Public debt (% GDP) in 2021 is estimated by MOF.
Indicator 2014 2015 2016 2017 2018 2019 2020 2021 2022F
Real GDP growth (%, YoY) 6.0 6.7 6.2 6.8 7.1 7.0 2.9 2.6 5.9
Export growth (%, YoY) 13.8 8.1 9.0 21.1 13.2 8.4 6.5 19 22
Import growth (%, YoY) 12 12.1 5.6 20.8 11.1 6.8 3.6 26.5 21
Trade balance (US$ bn) 2.0 -3.2 2.6 2.7 6.8 11.1 19.1 4.1 8.2
FDI disbursement (US$ bn) 12.4 14.5 15.8 17.5 19.1 20.4 20.0 19.7 21
Retail growth, excluding inflation (%, YoY) 6.2 8.5 8.3 9.3 9.4 9.2 -3.0 -6.2 6.5
Average CPI (%) 4.1 0.6 2.7 3.5 3.5 2.8 3.2 1.8 3.9
Foreign exchange reserve (US$bn) 34.5 30.5 36.7 49.2 55.3 78.5 94.8 107.4 130
Credit growth (%, YoY) 14.2 17.3 18.2 18.3 10.7 13.6 12.2 13.6 13
Exchange rate VND/US$ 21,388 22,485 22,761 22,698 23,175 23,314 23,267 22,826 23,054
Change in VND/US$ (%) 1.4 5.1 1.2 -0.3 2.1 0.5 -0.2 -1.6 1.0
Public debt (%/GDP) 43.6 46.1 47.6 46.3 43.6 43.4 46.6 43.7 46.9
Mirae Asset Securities (Vietnam) Research19 | Vietnam focus: Strategy
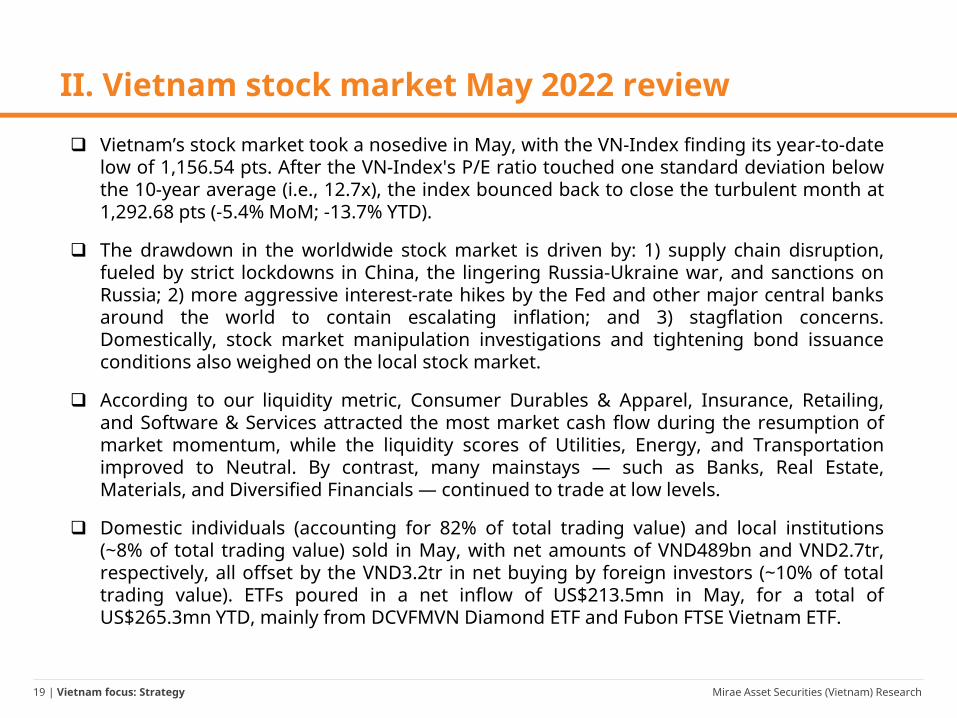
❑ Vietnam’s stock market took a nosedive in May, with the VN-Index finding its year-to-datelow of 1,156.54 pts. After the VN-Index's P/E ratio touched one standard deviation belowthe 10-year average (i.e., 12.7x), the index bounced back to close the turbulent month at1,292.68 pts (-5.4% MoM; -13.7% YTD).
❑ The drawdown in the worldwide stock market is driven by: 1) supply chain disruption,fueled by strict lockdowns in China, the lingering Russia-Ukraine war, and sanctions onRussia; 2) more aggressive interest-rate hikes by the Fed and other major central banksaround the world to contain escalating inflation; and 3) stagflation concerns.Domestically, stock market manipulation investigations and tightening bond issuanceconditions also weighed on the local stock market.
❑ According to our liquidity metric, Consumer Durables & Apparel, Insurance, Retailing,and Software & Services attracted the most market cash flow during the resumption ofmarket momentum, while the liquidity scores of Utilities, Energy, and Transportationimproved to Neutral. By contrast, many mainstays — such as Banks, Real Estate,Materials, and Diversified Financials — continued to trade at low levels.
❑ Domestic individuals (accounting for 82% of total trading value) and local institutions(~8% of total trading value) sold in May, with net amounts of VND489bn and VND2.7tr,respectively, all offset by the VND3.2tr in net buying by foreign investors (~10% of totaltrading value). ETFs poured in a net inflow of US$213.5mn in May, for a total ofUS$265.3mn YTD, mainly from DCVFMVN Diamond ETF and Fubon FTSE Vietnam ETF.
II. Vietnam stock market May 2022 review

Mirae Asset Securities (Vietnam) Research20 | Vietnam focus: Strategy
Source: Mirae Asset Securities (Vietnam) Research, Bloomberg
II.2 – VN-Index and key driving events
1,000
1,100
1,200
1,300
1,400
1,500
Jan 21 Feb 21 Mar 21 Apr 21 May 21 Jun 21 Jul 21 Aug 21 Sep 21 Oct 21 Nov 21 Dec 21 Jan 22 Feb 22 Mar 22 Apr 22 May 22 Jun 22
(Point)
Third Covid-19 wave
The State Bank of Vietnam (SBV) issued Circular 03/2021/TTNHNN on April 2, 2021, amending Cir. 01/2020/TT-NHNN to extend the debt moratorium for loans hit by Covid-19 and allow banks to apply a 3-year provisioning roadmap for these loans.
The Government promulgates Decree 52/2021/ND-CP on extension of time limit for payment of value-added tax, corporate income tax, personal income tax, and land rental in 2021.
Fourth Covid-19 resurgence
Resolution No. 68/NQ-CP is issued, with a support package of VND26,000bn
Social distancing period
Vietnam officially launches its largest-ever vaccination campaign
Social distancing eased
Resolution No. 128/NQ-CP of the Government promulgating the regulation "Safely and flexibly adapting, effectively controlling the Covid-19 pandemic"
The Government issuesOfficial Letter 7776/CD-VPCP on accelerating the disbursement of public investment capital in 2021
Government submits the Economic Restructuring Plan for the 2021−2025 period to the National Assembly
A new Covid variant —Omicron —detected in South Africa
The first case of Omicron variant appears in Vietnam
Resolution No. 105/NQ-CP on supporting businesses, cooperatives, and business households negatively affected by Covid-19
Package of tax exemptions,reductions for businesses and individual business households worth VND21tr
RCEP officially takes effect
Promulgating Resolution 43/2022/QH15 on fiscal and monetary policies to support the socio-economic recovery and development program
Main events in the past five months of 2022:1) VAT officially reduced by 2 percentage points to 8% from Feb. 1, 2022 to the end of 2022.2) Resolution No. 18/NQ-CP issued, implementing Resolution No. 44/2022/QH15, dated January 11, 2022, of the National Assembly on investment policy of the East South–North expressway construction project in the period of 2021–2025.3) The government announces full reopening of tourism from Mar. 15.4) Russia’s President orders military operation in Ukraine.5) Vietnam reopens international and domestic tourism activities.6) The Government promulgates the program to prevent and control the Covid-19 pandemic for the period of 2022–2023.7) The Government approved the Resolution of the National Assembly extending the application period of Resolution 42 on bad debtsettlement to August 15, 2025.8) Deputy Prime Minister signed and promulgated Official Dispatch No. 304/CD-TTg of the Prime Minister, dated April 7, 2022, on rectification of corporate bond market activities and land use rights auctions.9) The National Assembly agrees to extend pilot resolution 42/2017/QH14 on bad debt settlement until the end-2023.10) The Federal Reserve raises the Fed Funds Rate by half a point to 0.75%–1%.
1
2
3
4
56
7 8
9
10
Mirae Asset Securities (Vietnam) Research21 | Vietnam focus: Strategy
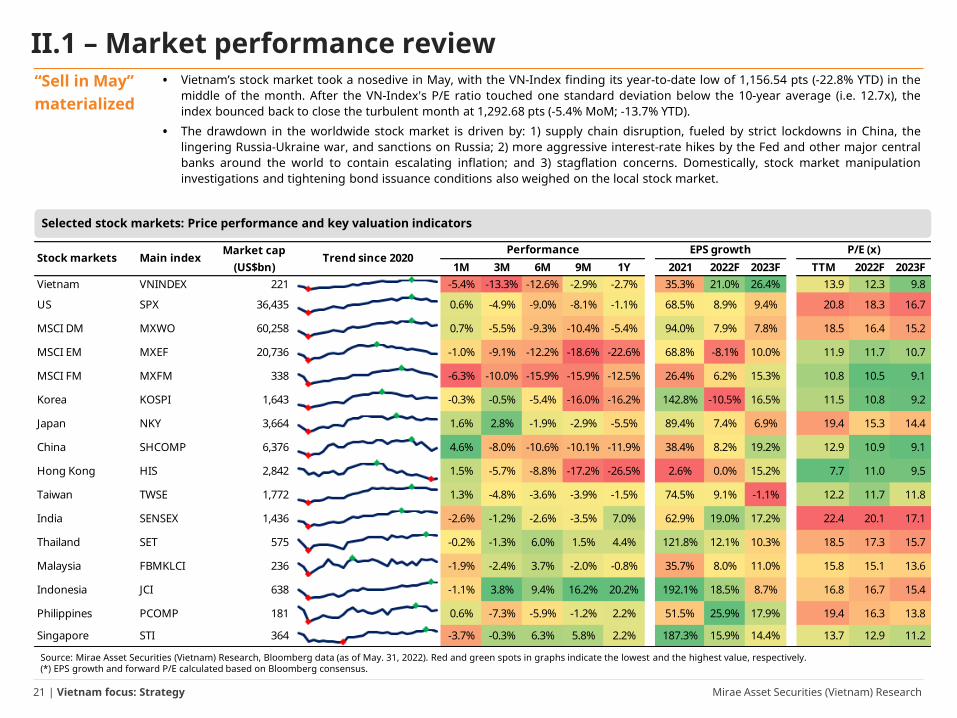
• Vietnam’s stock market took a nosedive in May, with the VN-Index finding its year-to-date low of 1,156.54 pts (-22.8% YTD) in themiddle of the month. After the VN-Index's P/E ratio touched one standard deviation below the 10-year average (i.e. 12.7x), theindex bounced back to close the turbulent month at 1,292.68 pts (-5.4% MoM; -13.7% YTD).
• The drawdown in the worldwide stock market is driven by: 1) supply chain disruption, fueled by strict lockdowns in China, thelingering Russia-Ukraine war, and sanctions on Russia; 2) more aggressive interest-rate hikes by the Fed and other major centralbanks around the world to contain escalating inflation; and 3) stagflation concerns. Domestically, stock market manipulationinvestigations and tightening bond issuance conditions also weighed on the local stock market.
“Sell in May” materialized
Selected stock markets: Price performance and key valuation indicators
II.1 – Market performance review
Source: Mirae Asset Securities (Vietnam) Research, Bloomberg data (as of May. 31, 2022). Red and green spots in graphs indicate the lowest and the highest value, respectively.(*) EPS growth and forward P/E calculated based on Bloomberg consensus.
1M 3M 6M 9M 1Y 2021 2022F 2023F TTM 2022F 2023FVietnam VNINDEX 221 -5.4% -13.3% -12.6% -2.9% -2.7% 35.3% 21.0% 26.4% 13.9 12.3 9.8
US SPX 36,435 0.6% -4.9% -9.0% -8.1% -1.1% 68.5% 8.9% 9.4% 20.8 18.3 16.7
MSCI DM MXWO 60,258 0.7% -5.5% -9.3% -10.4% -5.4% 94.0% 7.9% 7.8% 18.5 16.4 15.2
MSCI EM MXEF 20,736 -1.0% -9.1% -12.2% -18.6% -22.6% 68.8% -8.1% 10.0% 11.9 11.7 10.7
MSCI FM MXFM 338 -6.3% -10.0% -15.9% -15.9% -12.5% 26.4% 6.2% 15.3% 10.8 10.5 9.1
Korea KOSPI 1,643 -0.3% -0.5% -5.4% -16.0% -16.2% 142.8% -10.5% 16.5% 11.5 10.8 9.2
Japan NKY 3,664 1.6% 2.8% -1.9% -2.9% -5.5% 89.4% 7.4% 6.9% 19.4 15.3 14.4
China SHCOMP 6,376 4.6% -8.0% -10.6% -10.1% -11.9% 38.4% 8.2% 19.2% 12.9 10.9 9.1
Hong Kong HIS 2,842 1.5% -5.7% -8.8% -17.2% -26.5% 2.6% 0.0% 15.2% 7.7 11.0 9.5
Taiwan TWSE 1,772 1.3% -4.8% -3.6% -3.9% -1.5% 74.5% 9.1% -1.1% 12.2 11.7 11.8
India SENSEX 1,436 -2.6% -1.2% -2.6% -3.5% 7.0% 62.9% 19.0% 17.2% 22.4 20.1 17.1
Thailand SET 575 -0.2% -1.3% 6.0% 1.5% 4.4% 121.8% 12.1% 10.3% 18.5 17.3 15.7
Malaysia FBMKLCI 236 -1.9% -2.4% 3.7% -2.0% -0.8% 35.7% 8.0% 11.0% 15.8 15.1 13.6
Indonesia JCI 638 -1.1% 3.8% 9.4% 16.2% 20.2% 192.1% 18.5% 8.7% 16.8 16.7 15.4
Philippines PCOMP 181 0.6% -7.3% -5.9% -1.2% 2.2% 51.5% 25.9% 17.9% 19.4 16.3 13.8
Singapore STI 364 -3.7% -0.3% 6.3% 5.8% 2.2% 187.3% 15.9% 14.4% 13.7 12.9 11.2
Trend since 2020Stock markets Main indexMarket cap
(US$bn)Performance EPS growth P/E (x)
Mirae Asset Securities (Vietnam) Research22 | Vietnam focus: Strategy
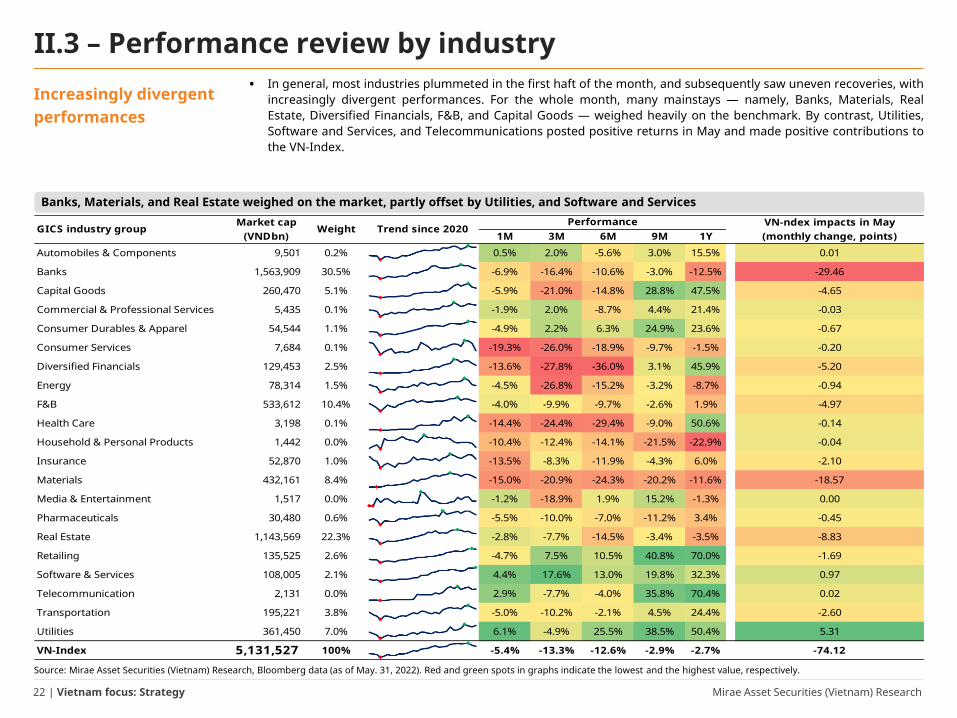
• In general, most industries plummeted in the first haft of the month, and subsequently saw uneven recoveries, withincreasingly divergent performances. For the whole month, many mainstays — namely, Banks, Materials, RealEstate, Diversified Financials, F&B, and Capital Goods — weighed heavily on the benchmark. By contrast, Utilities,Software and Services, and Telecommunications posted positive returns in May and made positive contributions tothe VN-Index.
Increasingly divergent performances
Banks, Materials, and Real Estate weighed on the market, partly offset by Utilities, and Software and Services
II.3 – Performance review by industry
Source: Mirae Asset Securities (Vietnam) Research, Bloomberg data (as of May. 31, 2022). Red and green spots in graphs indicate the lowest and the highest value, respectively.
Market cap VN-ndex impacts in May(VNDbn) 1M 3M 6M 9M 1Y (monthly change, points)
Automobiles & Components 9,501 0.2% 0.5% 2.0% -5.6% 3.0% 15.5% 0.01
Banks 1,563,909 30.5% -6.9% -16.4% -10.6% -3.0% -12.5% -29.46
Capital Goods 260,470 5.1% -5.9% -21.0% -14.8% 28.8% 47.5% -4.65
Commercial & Professional Services 5,435 0.1% -1.9% 2.0% -8.7% 4.4% 21.4% -0.03
Consumer Durables & Apparel 54,544 1.1% -4.9% 2.2% 6.3% 24.9% 23.6% -0.67
Consumer Services 7,684 0.1% -19.3% -26.0% -18.9% -9.7% -1.5% -0.20
Diversified Financials 129,453 2.5% -13.6% -27.8% -36.0% 3.1% 45.9% -5.20
Energy 78,314 1.5% -4.5% -26.8% -15.2% -3.2% -8.7% -0.94
F&B 533,612 10.4% -4.0% -9.9% -9.7% -2.6% 1.9% -4.97
Health Care 3,198 0.1% -14.4% -24.4% -29.4% -9.0% 50.6% -0.14
Household & Personal Products 1,442 0.0% -10.4% -12.4% -14.1% -21.5% -22.9% -0.04
Insurance 52,870 1.0% -13.5% -8.3% -11.9% -4.3% 6.0% -2.10
Materials 432,161 8.4% -15.0% -20.9% -24.3% -20.2% -11.6% -18.57
Media & Entertainment 1,517 0.0% -1.2% -18.9% 1.9% 15.2% -1.3% 0.00
Pharmaceuticals 30,480 0.6% -5.5% -10.0% -7.0% -11.2% 3.4% -0.45
Real Estate 1,143,569 22.3% -2.8% -7.7% -14.5% -3.4% -3.5% -8.83
Retailing 135,525 2.6% -4.7% 7.5% 10.5% 40.8% 70.0% -1.69
Software & Services 108,005 2.1% 4.4% 17.6% 13.0% 19.8% 32.3% 0.97
Telecommunication 2,131 0.0% 2.9% -7.7% -4.0% 35.8% 70.4% 0.02
Transportation 195,221 3.8% -5.0% -10.2% -2.1% 4.5% 24.4% -2.60
Utilities 361,450 7.0% 6.1% -4.9% 25.5% 38.5% 50.4% 5.31
VN-Index 5,131,527 100% -5.4% -13.3% -12.6% -2.9% -2.7% -74.12
GICS industry groupPerformance
Weight Trend since 2020

Mirae Asset Securities (Vietnam) Research23 | Vietnam focus: Strategy
Top leading and lagging contributors to VN-Index’s performance in May
II.3 – Performance review by industry (cont’d.)
Source: Mirae Asset Securities (Vietnam) Research, Bloomberg data
0.0
1.0
2.0
3.0
4.0
5.0
6.0
0
5
10
15
20
25
30
GAS VN POW VN VSH VN GEG VN FPT VN PVD VN PVT VN PNJ VN REE VN BCG VN VJC VN GMD VN KDC VN BAF VN ANV VN VHM VN KBC VN EIB VN HDB VN CTG VN
Utilities Software& Services
Energy ConsumerDurables& Apparel
Capital Goods Transportation F&B Real Estate Banks
1M change (L) Impact (R)(% MoM) (index points)
-12
-10
-8
-6
-4
-2
0
-30
-25
-20
-15
-10
-5
0VPB VN TCB VN VIB VN STB VN BID VN VCB VN MBB VN OCB VN HPG VN GVR VN BCM VN NVL VN DXG VN VND VN SAB VN VNM VN MSN VN HVN VN BVH VN PLX VN
Banks Materials Real EstateDiversifiedFinancials F&B Transportation
InsuranceEnergy

Mirae Asset Securities (Vietnam) Research24 | Vietnam focus: Strategy
• The daily average trading value in May plunged by more than 33% MoM to around VND13.8tr/day. That said, marketcash flow has improved slightly in recent weeks, since the VN-Index’s bottoming.
• According to our liquidity metric, Consumer Durables & Apparel, Insurance, Retailing, and Software & Services attractedthe most market cash flow during the market momentum resumption, while the liquidity scores of Utilities, Energy, andTransportation improved to Neutral. By contrast, many mainstays — such as Banks, Real Estate, Materials, andDiversified Financials — continued to trade at low levels.
Market cash flow has diverged during the bounceback
Market liquidity heatmap
II.4 – Market liquidity heatmap
Source: Mirae Asset Securities (Vietnam) Research. Red and green spots in graphs indicate the lowest and the highest value, respectively.Note: To rank liquidity levels, we use percentile scores that allow for comparing the current trading level to its historic trading levels over the trailing twelve-month period. The score ranges from 0% (the lowest) to 100% (the highest). For visualization, we use a heat map, with red signifying the lowest, green the highest, and yellow the middle.
Liquidity Trend4/29/2022 5/6/2022 5/13/2022 5/20/2022 5/27/2022 6/3/2022 score last 10 weeks
Consumer Durables & Apparel 75%Insurance 73%Retailing 69%Software & Services 65%Utilities 59%Transportation 45%Energy 43%F&B 27%Capital Goods 25%Health Care 20%Diversified Financials 12%Materials 4%Consumer Services 2%Real Estate 2%Automobiles & Components 0%Banks 0%Pharmaceuticals 0%VN-Index 2%
GICS Industry groupHeat map
Mirae Asset Securities (Vietnam) Research25 | Vietnam focus: Strategy
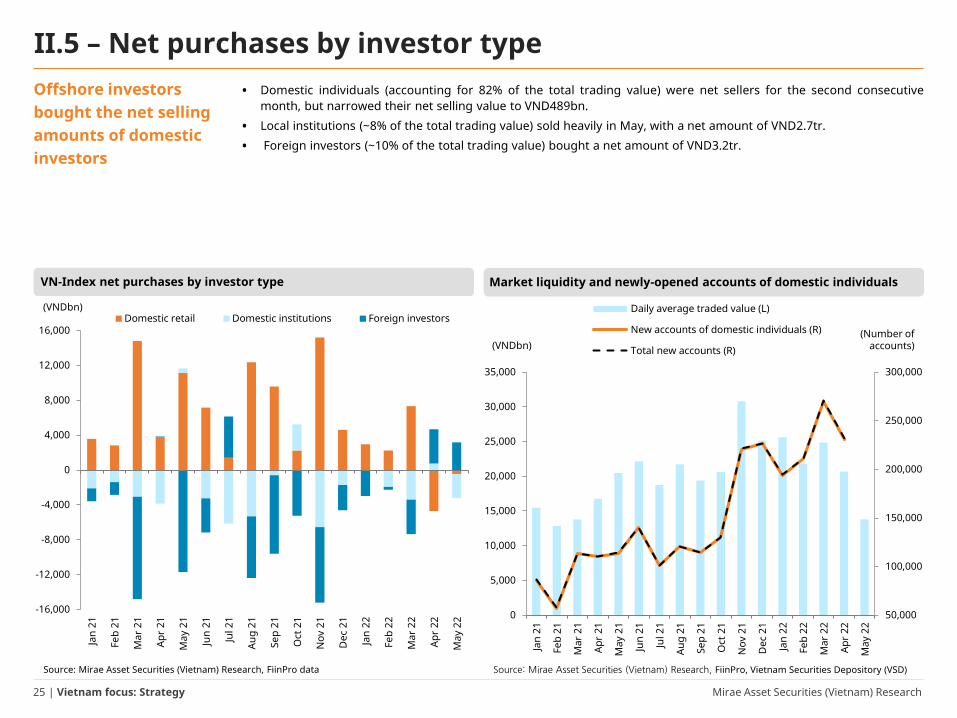
Offshore investors bought the net selling amounts of domestic investors
II.5 – Net purchases by investor type• Domestic individuals (accounting for 82% of the total trading value) were net sellers for the second consecutive
month, but narrowed their net selling value to VND489bn.
• Local institutions (~8% of the total trading value) sold heavily in May, with a net amount of VND2.7tr.
• Foreign investors (~10% of the total trading value) bought a net amount of VND3.2tr.
Source: Mirae Asset Securities (Vietnam) Research, FiinPro data
VN-Index net purchases by investor type Market liquidity and newly-opened accounts of domestic individuals
Source: Mirae Asset Securities (Vietnam) Research, FiinPro, Vietnam Securities Depository (VSD)
-16,000
-12,000
-8,000
-4,000
0
4,000
8,000
12,000
16,000
Jan
21
Feb
21
Mar
21
Apr
21
May
21
Jun
21
Jul 2
1
Aug
21
Sep
21
Oct
21
Nov
21
Dec
21
Jan
22
Feb
22
Mar
22
Apr
22
May
22
Domestic retail Domestic institutions Foreign investors(VNDbn)
50,000
100,000
150,000
200,000
250,000
300,000
0
5,000
10,000
15,000
20,000
25,000
30,000
35,000
Jan
21
Feb
21
Mar
21
Apr
21
May
21
Jun
21
Jul 2
1
Aug
21
Sep
21
Oct
21
Nov
21
Dec
21
Jan
22
Feb
22
Mar
22
Apr
22
May
22
Daily average traded value (L)
New accounts of domestic individuals (R)
Total new accounts (R)(Number of
accounts)(VNDbn)
Mirae Asset Securities (Vietnam) Research26 | Vietnam focus: Strategy
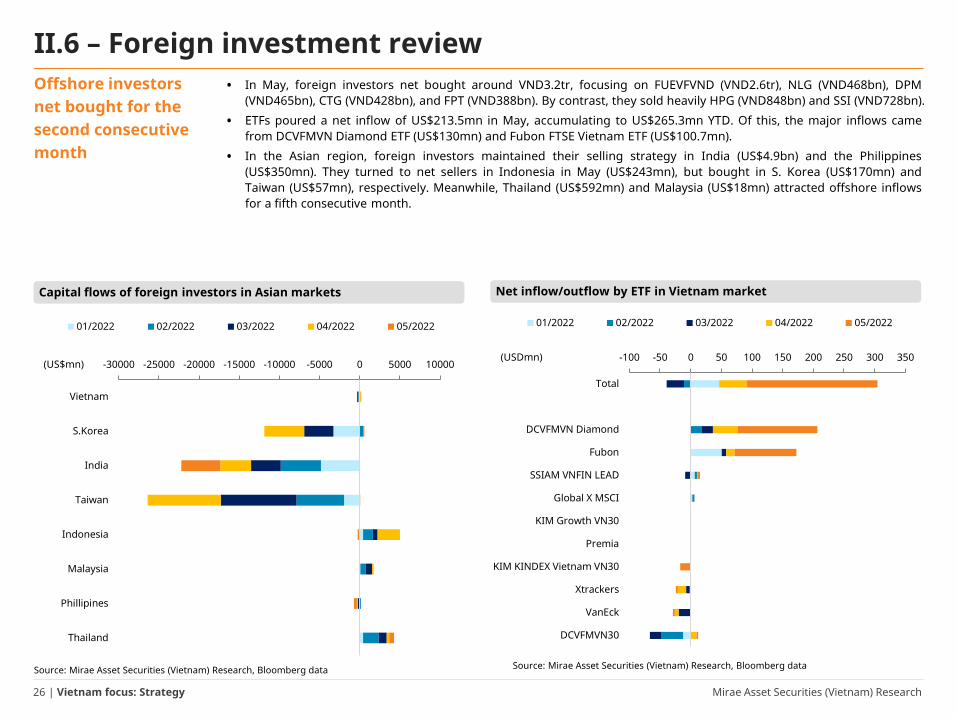
II.6 – Foreign investment reviewOffshore investors net bought for the second consecutive month
• In May, foreign investors net bought around VND3.2tr, focusing on FUEVFVND (VND2.6tr), NLG (VND468bn), DPM(VND465bn), CTG (VND428bn), and FPT (VND388bn). By contrast, they sold heavily HPG (VND848bn) and SSI (VND728bn).
• ETFs poured a net inflow of US$213.5mn in May, accumulating to US$265.3mn YTD. Of this, the major inflows camefrom DCVFMVN Diamond ETF (US$130mn) and Fubon FTSE Vietnam ETF (US$100.7mn).
• In the Asian region, foreign investors maintained their selling strategy in India (US$4.9bn) and the Philippines(US$350mn). They turned to net sellers in Indonesia in May (US$243mn), but bought in S. Korea (US$170mn) andTaiwan (US$57mn), respectively. Meanwhile, Thailand (US$592mn) and Malaysia (US$18mn) attracted offshore inflowsfor a fifth consecutive month.
Source: Mirae Asset Securities (Vietnam) Research, Bloomberg data Source: Mirae Asset Securities (Vietnam) Research, Bloomberg data
Capital flows of foreign investors in Asian markets Net inflow/outflow by ETF in Vietnam market
-30000 -25000 -20000 -15000 -10000 -5000 0 5000 10000
Vietnam
S.Korea
India
Taiwan
Indonesia
Malaysia
Phillipines
Thailand
01/2022 02/2022 03/2022 04/2022 05/2022
(US$mn)-100 -50 0 50 100 150 200 250 300 350
Total
DCVFMVN Diamond
Fubon
SSIAM VNFIN LEAD
Global X MSCI
KIM Growth VN30
Premia
KIM KINDEX Vietnam VN30
Xtrackers
VanEck
DCVFMVN30
01/2022 02/2022 03/2022 04/2022 05/2022
(USDmn)

Mirae Asset Securities (Vietnam) Research27 | Vietnam focus: Strategy
• VN-Index experienced a nasty sell-off, with its P/E plunging from a standard deviation (SD)above the 10-year average to one below the average. After bouncing back recently, the VN-Index is trading at 13.9x on a trailing P/E basis, below the 10-year average of 15x.Historically, the current valuation level of the VN-Index is attractive, offering buyingopportunities for strong fundamental stocks boasting long-term growth prospects atbargain prices.
• Despite having a relatively high ROE, the VN-Index is still trading at discount level, lowerthan peers, such as Indonesia (16.8x), Malaysia (15.8x), Thailand (18.5x), and thePhilippines (19.4x). Of note, the VN-Index has been trading at a discount compared withregional peers over the past 10 years. Furthermore, with its economic growth andcorporate earnings prospects (both of which are forecast to outperform those of othermarkets), Vietnam is likely to maintain a relatively attractive valuation. Meanwhile,emerging-market classification visibility in the foreseeable future, along with initiatives forimproving stock market transparency, is a plus in terms of the market attractiveness to FII.
• We priced in the increasing inflationary pressure on earnings in the coming quarters; thus,we cut our whole-year EPS growth projection for the VN-Index to 17.5% YoY (from 22% theprior forecast), lower than the Bloomberg consensus of 21% YoY. As a result, we expect theVN-Index to regain lost ground and return to the 1,300–1,530 range this year,corresponding to a fair P/E range from 12.8–15.1x.
III. Vietnam stock market prospects

Mirae Asset Securities (Vietnam) Research28 | Vietnam focus: Strategy
Attractive valuation at current discount level
III.1 – Relative valuations• VN-Index experienced a nasty sell-off, with its P/E plunging from a standard deviation (SD) above the 10-year average
to a SD under the average. After bouncing back recently, the VN-Index is trading at 13.9x on a trailing P/E basis, belowthe 10-year average of 15x.
• Correspondingly, the earning yield of the VN-Index also corrected from its 10-year average plus a SD before the maketentered the correction rout. On the other hand, domestic bond yields have soared since end of March, reflectingexternal risks (i.e., supply chain disruptions, China’s zero-Covid policy, the Russia-Ukraine war and sanctions on Russia,the Fed’s rate hikes and its balance sheet runoff, and global stagflation concerns), as well as domestic inflationarypressure. Currently, VN-Index is trading at 7.2x on a trailing earning yield, slightly above its 10-year average.
• Historically, the current valuation level of the VN-Index is attractive, offering buying opportunities for strongfundamental stocks boasting long-term growth prospects at bargain prices.
The VN-Index is currently trading below its 10-year P/E average
Source: Mirae Asset Securities (Vietnam) Research, Bloomberg data
Rising domestic bond yields reflected inflation risk
Source: Mirae Asset Securities (Vietnam) Research, Bloomberg data
10.5
12.8
15.1
17.3
19.6
10
12
14
16
18
20
22
May 12 May 13 May 14 May 15 May 16 May 17 May 18 May 19 May 20 May 21 May 22
P/E -2SD -1SD
10-year average +1SD +2SD
(x)
0
2
4
6
8
10
12
May 12 May 13 May 14 May 15 May 16 May 17 May 18 May 19 May 20 May 21 May 22
Earnings yield -1SD 10-year average+1SD 2-year yield 5-year yield10-year yield
(%pa)
Mirae Asset Securities (Vietnam) Research29 | Vietnam focus: Strategy
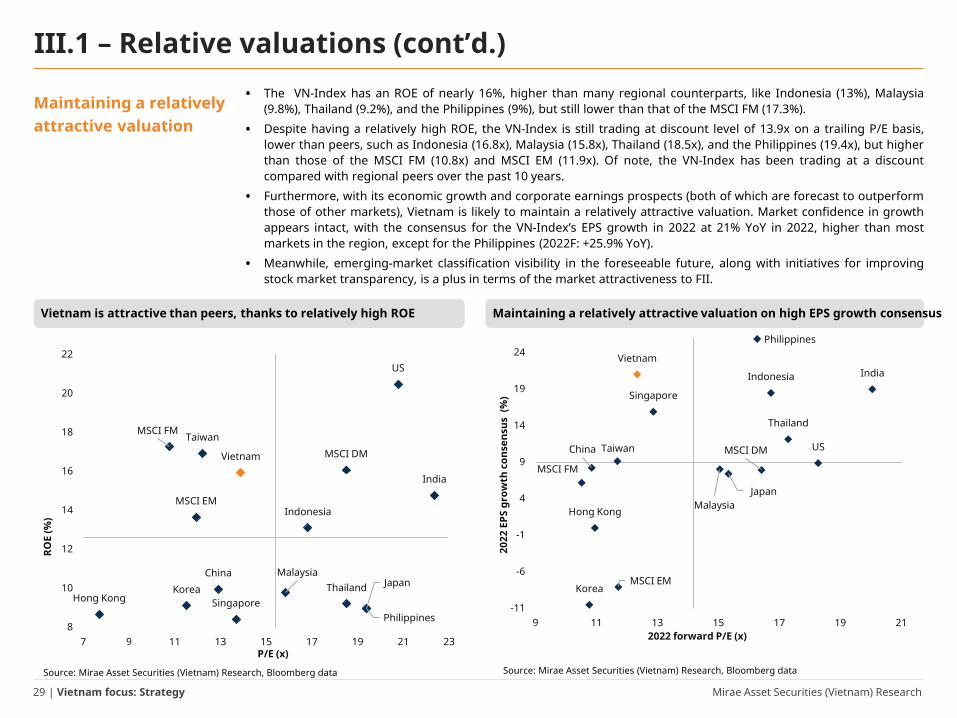
• The VN-Index has an ROE of nearly 16%, higher than many regional counterparts, like Indonesia (13%), Malaysia(9.8%), Thailand (9.2%), and the Philippines (9%), but still lower than that of the MSCI FM (17.3%).
• Despite having a relatively high ROE, the VN-Index is still trading at discount level of 13.9x on a trailing P/E basis,lower than peers, such as Indonesia (16.8x), Malaysia (15.8x), Thailand (18.5x), and the Philippines (19.4x), but higherthan those of the MSCI FM (10.8x) and MSCI EM (11.9x). Of note, the VN-Index has been trading at a discountcompared with regional peers over the past 10 years.
• Furthermore, with its economic growth and corporate earnings prospects (both of which are forecast to outperformthose of other markets), Vietnam is likely to maintain a relatively attractive valuation. Market confidence in growthappears intact, with the consensus for the VN-Index’s EPS growth in 2022 at 21% YoY in 2022, higher than mostmarkets in the region, except for the Philippines (2022F: +25.9% YoY).
• Meanwhile, emerging-market classification visibility in the foreseeable future, along with initiatives for improvingstock market transparency, is a plus in terms of the market attractiveness to FII.
Maintaining a relatively attractive valuation
III.1 – Relative valuations (cont’d.)
Source: Mirae Asset Securities (Vietnam) Research, Bloomberg data
Vietnam is attractive than peers, thanks to relatively high ROE Maintaining a relatively attractive valuation on high EPS growth consensus
Source: Mirae Asset Securities (Vietnam) Research, Bloomberg data
Vietnam
USMSCI DM
MSCI EM
MSCI FM
Korea
Japan
China
Hong Kong
Taiwan
India
Thailand
Malaysia
Indonesia
Philippines
Singapore
-11
-6
-1
4
9
14
19
24
9 11 13 15 17 19 21
2022
EPS
gro
wth
con
sens
us (
%)
2022 forward P/E (x)
Vietnam
US
MSCI DM
MSCI EM
MSCI FM
Korea JapanChina
Hong Kong
Taiwan
India
ThailandMalaysia
Indonesia
PhilippinesSingapore
8
10
12
14
16
18
20
22
7 9 11 13 15 17 19 21 23
ROE
(%)
P/E (x)

Mirae Asset Securities (Vietnam) Research30 | Vietnam focus: Strategy
• As Vietnam economy is still on road to a post-pandemic recovery, 1Q22 earnings growth is still robust, with the totalNPATMI of HOSE-listed firms increasing 34% YoY (2021: +37.6% YoY). However, companies have set conservativetargets for 2022, with the total PBT of 320 out of the 404 HOSE-listed firms (~92% of total market cap) set to grow by15.8% YoY.
• We priced in the rising inflationary pressure on earnings in the coming quarters; thus, we cut our full-year EPSgrowth projection for the VN-Index to 17.5% YoY (from 22% the prior forecast), lower than the Bloomberg consensusof 21% YoY.
o After a strong recovery in 2021, earnings growth is expected to be normalized in 2022.o As global inflation rises, profit margins are under pressure from surging transportation and material costs.o Due to increased inflationary pressure, along with the hawkish path of the Federal Reserve, local interest
rates are on the rise.o With a 2022 EPS growth expectation of 17.5%, we expect the VN-Index to regain lost ground to return to the 1,300–
1,530 range this year, corresponding to a fair P/E range from 12.8–15.1x.
We cut our 2022 EPS growth projection for the VN-Index to 17.5% YoY to reflect inflationary pressure
III.2 – Earnings review and 2022 outlook
Source: Mirae Asset Securities (Vietnam) Research, Bloomberg data Source: Mirae Asset Securities (Vietnam) Research
VN-Index’s EPS growth consensus for 2022 VN-Index forecast for 2022: Sensitivity analysis
2022
EPS
gro
wth
con
sens
us
10-year P/E band
-2SD -1SD Average +1SD +2SD
10.5 12.8 15.1 17.3 19.6
16.0% 1,050 1,281 1,512 1,742 1,973
16.5% 1,055 1,286 1,518 1,750 1,981
17.0% 1,059 1,292 1,525 1,757 1,990
17.5% 1,064 1,297 1,531 1,765 1,998
18.0% 1,068 1,303 1,538 1,772 2,007
18.5% 1,073 1,308 1,544 1,780 2,015
19.0% 1,077 1,314 1,551 1,787 2,024 19%
20%
21%
22%
23%
24%
25%
26%
Jan 22 Feb 22 Mar 22 Apr 22 May 22
Bloomberg consensus(% YoY)

Mirae Asset Securities (Vietnam) Research31 | Vietnam focus: Strategy
III.2 – Earnings review and 2022 outlook (cont’d.)
Source: Mirae Asset Securities (Vietnam) Research, FiinPro data (update as of May. 31, 2022)
Total earnings growth by industry for HOSE-listed firms: 1Q21 review and 2022 AGM stats
2020 2021 YoY growth% of totalmarket cap
PBT growth target
Automobiles & Components 9,501 13.2% 0.3% 11.9% 90% 13%Banks 1,563,909 16.4% 32.1% 31.9% 100% 33%Capital Goods 260,470 1.2% 19.9% 28.8% 93% 31%Commercial & Professional Services 5,435 -21.3% -4.2% 28.0% 95% 1%Consumer Durables & Apparel 54,544 37.0% 8.7% 37.6% 89% 32%Consumer Services 7,684 -89.2% 46.6% 168.2% 43% 13%Diversified Financials 129,453 38.4% 152.6% 29.0% 80% 14%Energy 78,314 -58.7% 92.1% -46.4% 15% -23%F&B 533,612 -12.1% 28.9% 44.4% 98% -3%Health Care 3,198 -37.0% 65.6% 873.9% 63% 5%Household & Personal Products 1,442 28.7% -27.3% -0.2% 100% 7%Insurance 52,870 28.5% 27.1% 5.8% 26% -8%Materials 432,161 56.9% 117.7% 45.8% 72% -16%Media & Entertainment 1,517 59.1% 140.5% 108.7%Pharmaceuticals 30,480 8.4% 8.0% 31.6% 93% 5.5%Real Estate 1,143,569 -1.6% 8.4% -11.9% 98% 12.4%Retailing 135,525 0.3% 41.3% 19.7% 100% 22.0%Software & Services 108,005 13.3% 23.8% 37.4% 93% 20.5%Telecommunication 2,131 -3.5% 38.9% 516.3% 82% 192.7%Transportation 195,221 -176.2% -10.9% 94.4% 75% 47.5%Utilities 361,450 -20.5% 12.0% 54.0% 85% -23.3%Total HOSE-listed firms 5,131,527 -0.5% 37.6% 34.0% 92% 15.8%
GICS Industry groupTotal market cap
(VNDbn)
2022 AGM statsEarnings growth (% YoY)

Mirae Asset Securities (Vietnam) Research32 | Vietnam focus: Strategy
III.3 – Upcoming eventsKey events in the last seven months of 2022
Source: Mirae Asset Securities (Vietnam) Research compilationNote: BoJ: Bank of Japan, FOMC: Federal Open Market Committee (US), BoE: Bank of England, ECB: European Central Bank
World events Vietnam’s events
Date Country Event Date Event
June
6/7/2022 AU RBA Interest Rate Decision 6/3/2022 Announcement of FTSE Vietnam ETF portfolio restructuring 6/8/2022 IN RBI Interest Rate Decision 6/10/2022 Announcement of VanEck Vectors Vietnam (VNM) ETF portfolio restructuring 6/9/2022 EA ECB Interest Rate Decision 6/16/2022 Expiry date of the VN30 futures contract
6/16/2022 US Fed Interest Rate Decision 6/17/2022 Restructuring of FTSE Vietnam Index ETF6/16/2022 GB BoE Interest Rate Decision 6/17/2022 Restructuring of VanEck Vectors Vietnam ETF6/17/2022 JP BoJ Interest Rate Decision 6/29/2022 Announcement of Vietnam economic data
July
7/5/2022 AU RBA Interest Rate Decision 7/18/2022Announcement of member change of VN30 and VNFINLEAD
Announcement of members’ information update of VN30, VNFIN LEAD, VNFIN SELECT, VNDIAMOND
7/7/2022 US FOMC Minutes 7/21/2022 Expiry date of the VN30 futures contract7/21/2022 JP BoJ Interest Rate Decision 7/29/2022 Announcement of Vietnam economic data7/28/2022 US Fed Interest Rate Decision
August8/2/2022 AU RBA Interest Rate Decision 08/01/2022 Changes in VN30, VNFINLEAD, VNFIN SELECT, and VNDIAMOND take effect8/4/2022 GB BoE Interest Rate Decision 8/18/2022 Expiry date of the VN30 futures contract
8/18/2022 US FOMC Minutes 8/29/2022 Announcement of Vietnam economic data
September
9/6/2022 AU RBA Interest Rate Decision 09/02/2022 Announcement of FTSE Vietnam ETF portfolio restructuring 9/8/2022 EA ECB Interest Rate Decision 09/09/2022 Announcement of VanEck Vectors Vietnam (VNM) ETF portfolio restructuring
9/15/2022 GB BoE Interest Rate Decision 9/15/2022 Expiry date of the VN30 futures contract9/22/2022 US Fed Interest Rate Decision 9/16/2022 Restructuring of FTSE Vietnam Index ETF and VanEck Vectors Vietnam ETF9/22/2022 JP BoJ Interest Rate Decision 9/29/2022 Announcement of Vietnam economic data
October10/13/2022 US FOMC Minutes 10/17/2022
Announcement of member change of VNFIN SELECT and VNDIAMONDAnnouncement of members’ information update of VN30, VNFIN LEAD, VNFIN SELECT,
VNDIAMOND10/27/2022 EA ECB Interest Rate Decision 10/29/2022 Expiry date of the VN30 futures contract10/28/2022 JP BoJ Interest Rate Decision 10/29/2022 Announcement of Vietnam economic data
November
11/1/2022 AU RBA Interest Rate Decision 11/07/2022 Changes in VN30, VNFINLEAD, VNFIN SELECT, and VNDIAMOND take effect11/3/2022 US Fed Interest Rate Decision 11/17/2022 Expiry date of the VN30 futures contract11/3/2022 GB BoE Interest Rate Decision 11/29/2022 Announcement of Vietnam economic data
11/24/2022 US FOMC Minutes
December
12/6/2022 AU RBA Interest Rate Decision 12/2/2022 Announcement of portfolio restructuring of FTSE Vietnam ETF and VanEck Vectors Vietnam ETF12/15/2022 US Fed Interest Rate Decision 12/15/2022 Expiry date of the VN30 futures contract12/15/2022 GB BoE Interest Rate Decision 12/16/2022 Restructuring of FTSE Vietnam Index ETF and VanEck Vectors Vietnam ETF12/15/2022 EA ECB Interest Rate Decision 12/29/2022 Announcement of Vietnam economic data12/20/2022 JP BoJ Interest Rate Decision

Mirae Asset Securities (Vietnam) Research33 | Vietnam focus: Strategy
• Industrial Real Estate: In general, the IP industry performance was strong in 1Q22. Total revenue of the eight leading enterprises increased by 13% YoY, whiletheir after-tax profit surged by 35% YoY. Some IP developers posted triple-digit growth rates in after-tax profit, such as IDC (+381% YoY) and VGC (+153%).
• Retail: We expect the retail industry to sustain double-digit growth in the long term. The recovery of non-essential sectors should be the key driver of the industry,thanks to depressed demand over the past two years. Total household spending maintained double-digit growth in 2021, and is expected to maintain thismomentum going forward.
• F&B: Seafood exporters are expected to have outstanding results in last-9M22. We believe that 2Q22 will see a boom in both the revenue and profit of seafoodexporters. However, it should be noted that this positive trend is likely to gradually fade in the last two quarters of 2022, as the 2021 low-priced inventory has beenexhausted and the new harvest, with higher prices, will arrive at end-3Q22. Beverages, food exports, and sugar production will see slight growth in 2022, with animproved performance for beverages expected, as domestic demand recovers from 2021’s low base.
• Utilities: According to Vietnam Electricity Corporation, electricity consumption increased by 6.3% YoY in 4M22. Wind power was the biggest beneficiary, with a500% YoY increase in April 2022 and a 369% YoY increase in 4M22, in terms of volume. Solar power output grew by 53% YoY in April 2022 and 6.6% YoY in 4M22. Themobilization of hydropower generators also improved by 27% YoY in April 2022 and 21% YoY in 4M22. According to the meteorological agencies, hot weather isforecast to arrive later than usual for the Northern and Central provinces, with lower-than-usual intensity and shorter duration. The water levels of some of themain rivers in the Northern region saw a slight recovery in 5M22.
• Oil & Gas: In total, O&G listed companies recorded growth rates of 46% in revenue and 74% in NPAT. Major oil and gas companies, namely GAS and PVS, deliveredstrong performances in the first quarter. GAS reported a surge of 52% YoY in revenue and and 69% YoY in NPAT. PVS also posted excellent results, with revenuegrowth of 44% YoY and after-tax profit growth of 50% YoY. It is estimated that O&G enterprises hold the largest cash balances among companies listed onVietnam’s stock market.
• Construction: In 4M22, government disbursement totaled VND85,712bn, achieving 14.86% of the Prime Minister’s FY22 target. Of this, domestic disbursementreached VND83,234bn, while foreign disbursement made up VND2,177bn. The Ministry of Finance estimated total capital disbursement at VND117,937VND by theend of May, achieving 20.45% of the FY22 plan. For 2022, the public investment capital allocated to the Ministry of Transport (MT) is expected to be VND50,000bn.By April 30, 2022, the total amount disbursed was VND10,096bn, while by the end of May, disbursement is expected to reach VND11,728bn.
• Steel: Coke prices remained high, reaching US$437/ton in May 2022 (+191% YoY), due to supply disruptions from Russia, as well as strong global demand frompower plants. Despite a 35% decrease in iron ore prices from the peak in May 2021, to US$137/ton in May 2022, steel plants are expected to see reduced profitmargins in 2022, due to rising logistics costs and other production costs. Construction steel prices reached VND18mn/ton in May 2022, down by VND1mn/ton MoM.
• Textiles: In May 2022 and 5M22, Vietnam's textile export value is estimated at US$3.1bn (+19.9% YoY) and US$14.9bn (+21.7% YoY), continuing the high growthrates seen since the beginning of the year. In key markets, the export value and market share of Vietnam garments recorded positive results. In 1Q22, the exportvalue of fashion goods to the US market reached US$4.7bn (+33% YoY, accounting for 14.7% of the market share). Vietnam’s textile exports to Canada reachedUS$392.2mn (+57.7% YoY), while fashion exports to the EU reached EU€761.2mn (+16.4% YoY). Textile and garment exports to Korea and Japan in 4M22 wereestimated at US$1bn (+8.4 YoY) and US$1.04bn (flat), respectively.
• Seaports: In 5M22, the volume of seaport clearance was estimated at 304.2mn tons (+2.9% YoY). Clearance container volume was estimated at 10.4mn TEU (+4.3%YoY). Container clearance activities maintained their growth for three consecutive months, after a slight decline of 1% in 2M22. Export-import value maintainedgood growth rates, with total export-import value estimated at US$306bn (+16.5% YoY, vs. +16.3% YoY in 4M22) in 5M22. The shipping price index of main routeswas on a downward trend, due to shipping activities declining amid the COVID-19 pandemic in China and the Ukraine crisis pushing up transport costs globally.
IV. Sector outlook and stock recommendations
Mirae Asset Securities (Vietnam) Research34 | Vietnam focus: Strategy
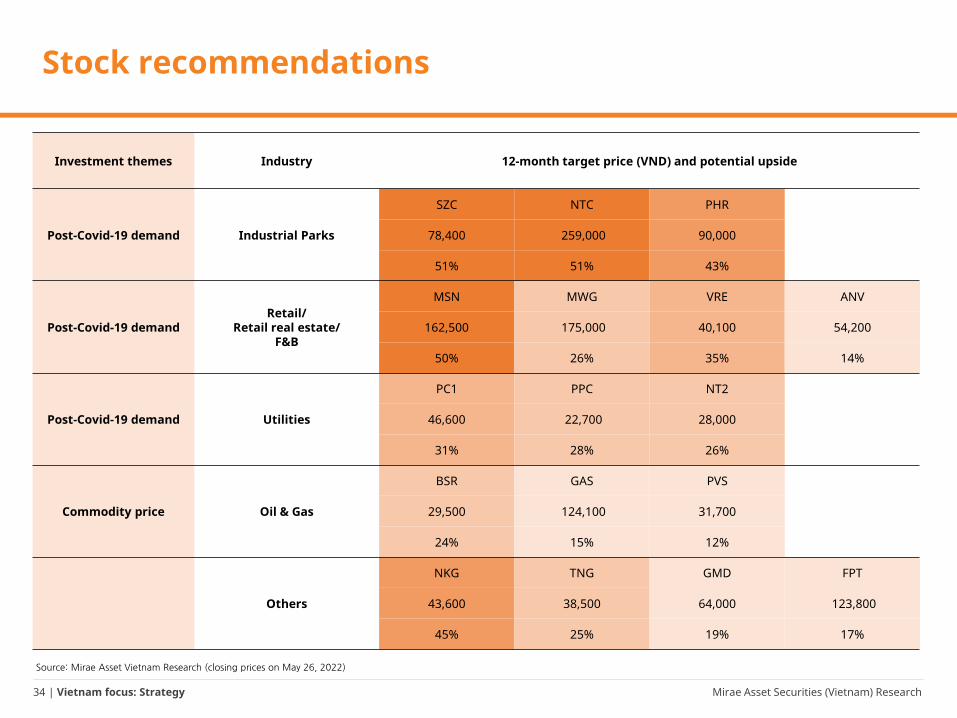
Stock recommendations
Source: Mirae Asset Vietnam Research (closing prices on May 26, 2022)
Investment themes Industry 12-month target price (VND) and potential upside
Post-Covid-19 demand Industrial Parks
SZC NTC PHR
78,400 259,000 90,000
51% 51% 43%
Post-Covid-19 demandRetail/
Retail real estate/F&B
MSN MWG VRE ANV
162,500 175,000 40,100 54,200
50% 26% 35% 14%
Post-Covid-19 demand Utilities
PC1 PPC NT2
46,600 22,700 28,000
31% 28% 26%
Commodity price Oil & Gas
BSR GAS PVS
29,500 124,100 31,700
24% 15% 12%
Others
NKG TNG GMD FPT
43,600 38,500 64,000 123,800
45% 25% 19% 17%
Mirae Asset Securities (Vietnam) Research35 | Vietnam focus: Strategy
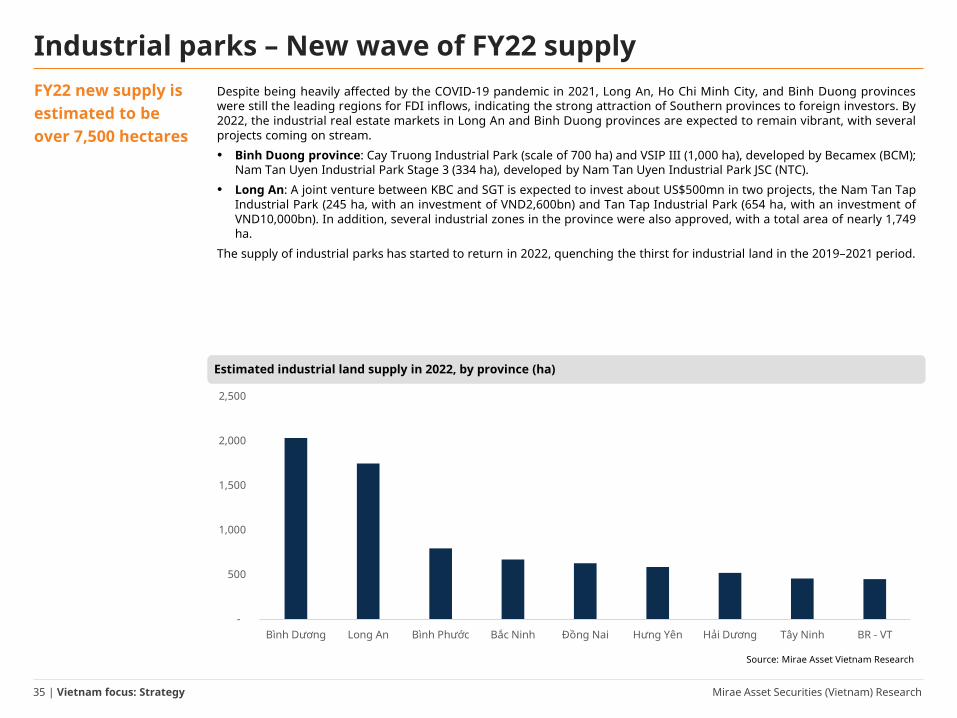
Industrial parks – New wave of FY22 supplyFY22 new supply is estimated to be over 7,500 hectares
Despite being heavily affected by the COVID-19 pandemic in 2021, Long An, Ho Chi Minh City, and Binh Duong provinceswere still the leading regions for FDI inflows, indicating the strong attraction of Southern provinces to foreign investors. By2022, the industrial real estate markets in Long An and Binh Duong provinces are expected to remain vibrant, with severalprojects coming on stream.
• Binh Duong province: Cay Truong Industrial Park (scale of 700 ha) and VSIP III (1,000 ha), developed by Becamex (BCM);Nam Tan Uyen Industrial Park Stage 3 (334 ha), developed by Nam Tan Uyen Industrial Park JSC (NTC).
• Long An: A joint venture between KBC and SGT is expected to invest about US$500mn in two projects, the Nam Tan TapIndustrial Park (245 ha, with an investment of VND2,600bn) and Tan Tap Industrial Park (654 ha, with an investment ofVND10,000bn). In addition, several industrial zones in the province were also approved, with a total area of nearly 1,749ha.
The supply of industrial parks has started to return in 2022, quenching the thirst for industrial land in the 2019–2021 period.
Estimated industrial land supply in 2022, by province (ha)
Source: Mirae Asset Vietnam Research
-
500
1,000
1,500
2,000
2,500
Bình Dương Long An Bình Phước Bắc Ninh Đồng Nai Hưng Yên Hải Dương Tây Ninh BR - VT
Mirae Asset Securities (Vietnam) Research36 | Vietnam focus: Strategy
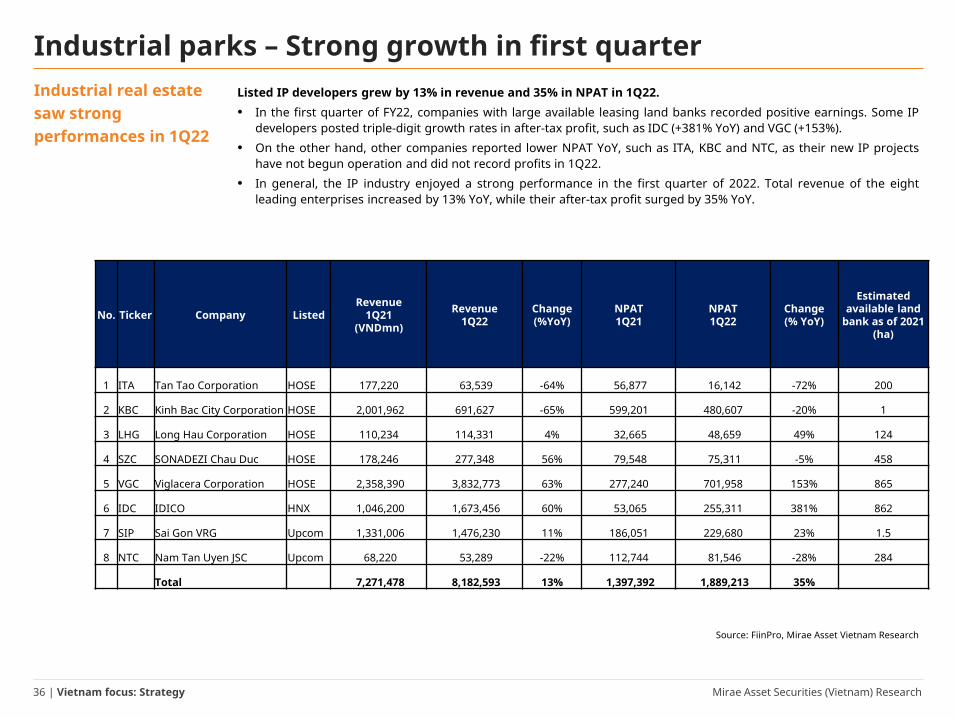
Industrial parks – Strong growth in first quarterIndustrial real estate saw strong performances in 1Q22
Listed IP developers grew by 13% in revenue and 35% in NPAT in 1Q22.
• In the first quarter of FY22, companies with large available leasing land banks recorded positive earnings. Some IPdevelopers posted triple-digit growth rates in after-tax profit, such as IDC (+381% YoY) and VGC (+153%).
• On the other hand, other companies reported lower NPAT YoY, such as ITA, KBC and NTC, as their new IP projectshave not begun operation and did not record profits in 1Q22.
• In general, the IP industry enjoyed a strong performance in the first quarter of 2022. Total revenue of the eightleading enterprises increased by 13% YoY, while their after-tax profit surged by 35% YoY.
Source: FiinPro, Mirae Asset Vietnam Research
No. Ticker Company Listed Revenue
1Q21(VNDmn)
Revenue1Q22
Change(%YoY)
NPAT1Q21
NPAT1Q22
Change(% YoY)
Estimated available land
bank as of 2021(ha)
1 ITA Tan Tao Corporation HOSE 177,220 63,539 -64% 56,877 16,142 -72% 200
2 KBC Kinh Bac City Corporation HOSE 2,001,962 691,627 -65% 599,201 480,607 -20% 1
3 LHG Long Hau Corporation HOSE 110,234 114,331 4% 32,665 48,659 49% 124
4 SZC SONADEZI Chau Duc HOSE 178,246 277,348 56% 79,548 75,311 -5% 458
5 VGC Viglacera Corporation HOSE 2,358,390 3,832,773 63% 277,240 701,958 153% 865
6 IDC IDICO HNX 1,046,200 1,673,456 60% 53,065 255,311 381% 862
7 SIP Sai Gon VRG Upcom 1,331,006 1,476,230 11% 186,051 229,680 23% 1.5
8 NTC Nam Tan Uyen JSC Upcom 68,220 53,289 -22% 112,744 81,546 -28% 284
Total 7,271,478 8,182,593 13% 1,397,392 1,889,213 35%

Mirae Asset Securities (Vietnam) Research37 | Vietnam focus: Strategy
Residential segment to enjoy strong earnings
SONADEZI Chau Duc Shareholding Company (SZC VN)
Investment points1Q22: Revenue up, but profit down
• In 1Q22, SZC announced revenue of VND277.3bn (+56% YoY), thanks to land leasing and managementrevenue. However, COGS/sales ratio increased sharply to 63.1%, compared with 39.3% in 1Q21, leading toNPAT of VND75.3bn (-5% YoY).
• The sharp increase in COGS/revenue ratio in 1Q22 came from the higher proportion of wholesale revenuefrom related parties. Wholesale revenue in 1Q22 reached VND192bn, accounting for 69.3% of total revenue,compared with 25.8% in 1Q21.
Strong earnings momentum starts from 2022In 2022, we expect earnings momentum to be maintained, with NPAT of VND601bn (+85% YoY), thanks to thefollowing:
• The launch 25.2 ha in the first phase of the Huu Phuoc project, which we expect to contribute about VND280–330bn to FY22 after-tax profit.
• SZC’s expected leasing of about 40 ha of industrial land, with revenue of VND670bn and NPAT of VND300bn.
(%) 1M 6M 12M
Absolute -33.3 -17.5 33.1
Relative -17.5 -1.0 35.5
NPAT (22F, VNDbn) 601
Market consensus (22F, VNDbn) n/a
EPS Growth (22F, %) 85
P/E (22F, x) 7.8
Marketcap (VND bn) 4,705
Outstanding (mn) 100
Freefloat (%) 89.2
Foreignownership(%) 2.6
52 week-high (VND) 31,550
52 week-low (VND) 83,400
(Maintain) BUY
Target price (VND, 12M) 78,400
Current price (05/26/22) 51,800
Expected return 51%
FY (31/12) 12/18 12/19 12/20 12/21 12/22F 12/23FRevenue (VNDbn) 290 329 433 713 1,269 1,396 Operating profit (VNDbn) 111 139 213 392 747 803 OP margin 38.2 42.2 49.2 55.0 58.9 57.5 NP (VNDbn) 97 134 186 324 601 646 EPS (VND) 779 1,140 1,860 3,236 6,012 6,462ROE (%) 6.8 9.7 15.3 23.7 35.9 30.7P/E (x) 15.5 21.2 22.8 7.8 7.2P/B (x) 1.5 3.1 5.0 3.9 3.2Source: Bloomberg, Mirae Asset Vietnam Research

Mirae Asset Securities (Vietnam) Research38 | Vietnam focus: Strategy
A step forward with NTC3 project
Nam Tan Uyen Joint Stock Company (NTC VN)
Investment pointsIn 1Q22, revenue for Nam Tan Uyen Joint Stock Company (NTC) reached VND53bn (-22% YoY), with financialrevenue of VND61bn (-29% YoY). Profit after tax was VND81.5bn (-27.7% YoY), with EPS of VND3,398. The NTC3project has completed total estimated investment of VND871bn, and is undergoing the final legal process tobegin official operations.NTC3 project to provide growth momentum: After receiving the land in the 2019–2020 period, NTC3'sinvestment and development process has been completed. The project is expected to be put into operation in2022.With a commercial land area of 288.52 ha and an estimated rental price in this area of around US$100–110/m2/lease cycle, we believe that NTC is capable of leasing its entire NTC3 land bank within five years andgenerating total revenue of nearly VND7,400bn. NTC has paid off most of the loan for the NTC3 project, which iscurrently the company’s only loan. Based on a change in the accounting— from annual allocation to one-timerecognition — for revenue from IP leasing activities, NTC's profit should show a dramatic increase in FY22.High dividend payout ratio: Cash dividend remains above 80% of charter capital (equivalent to 65–73% of NPAT),indicating NTC’s healthy business performance and strong cash flow.
(%) 1M 6M 12M
Absolute -13.0 -10.4 2.7
Relative 2.7 6.0 5.1
NPAT (22F, VNDbn) 846
Market consensus (22F, VNDbn) n/a
EPS Growth (22F, %) 187
P/E (22F, x) 5.1
Marketcap (VND bn) 4,320
Outstanding (mn) 24
Freefloat (%) 20.1
Foreignownership(%) 4.5
52 week-high (VND) 158,200
52 week-low (VND) 226,900
(Maintain) BUY
Target price (VND, 12M) 259,000
Current price (05/26/22) 172,000
Expected return 51%
FY (31/12) 12/18 12/19 12/20 12/21 12/22F 12/23F
Revenue (VNDbn) 532 194 264 271 1,220 1,247
Operating profit (VNDbn) 438 86 344 343 1,057 1,148
OP margin 82.3 44.5 130.5 126.6 86.7 92.0
NP (VNDbn) 470 237 291 294 846 918
EPS (VND) 19,357 9,855 12,123 12,274 35,248 38,253
ROE (%) 95.9 40.4 46.04 46.3 113.0 70.8
P/E (x) 2.7 11.2 16.3 15.8 5.1 4.7
P/B (x) 2.1 4.6 10.1 7.4 5.9 3.0
Source: Bloomberg, Mirae Asset Vietnam Research

Mirae Asset Securities (Vietnam) Research39 | Vietnam focus: Strategy
PHR looks to boost FY22 earnings from VSIP
Phuoc Hoa Rubber Joint Stock Company (PHR VN)
Investment points
• In 1Q22, PHR's revenue and net profit reached VND365bn (+30% YoY) and VND299bn (+239% YoY),respectively, mainly thanks to VND289bn in compensation from the transfer of 209 ha from VSIP.
• PHR received Decision No. 40/QD-TTg (dated January 10, 2022) on adjustment of the investment policy of theVietnam-Singapore Industrial Park III project as a basis for the People's Committee of Binh Duong province toapprove compensation for PHR. We expect PHR to be able to realize the compensatory profit from VSIP IIIfrom 2Q22. We forecast that PHR will book VND630bn in 2022 and VND368bn in 2023 in compensation fromVSIP III. We expect associated profit from VSIP to start from FY24 onward, with a profit of VND75bn in FY24.
• We believe that rubber prices will continue to increase in 2022 to an average of JPY240/ton, with a forecast ofworld supply of 13.8mn tons and demand of 14mn tons. PHR can increase its gross profit by VND150bn fromthis segment.
• Tan Lap and Hoi Nghia Industrial Parks (IP), with the advantage of low costs, as well as the lack of IP landbankin Binh Duong province, will be the key growth catalyst for PHR in the 2023–2025 period. The total area of IPsthat PHR plans to develop in the 2023–2027 period is 2,972ha, making PHR one of the largest industrial parkdevelopers in Vietnam.
Top pick
(%) 1M 6M 12M
Absolute -7.1 -11.3 21.0
Relative -1.8 1.6 23.1
NPAT (22F, VNDbn) 1,239
Market consensus (22F, VNDbn) NA
EPS Growth (22F, %) 128
P/E (22F, x) 7.1
Marketcap (VND bn) 8,807
Shareoutstanding (mn) 135
Free float (%) 32.3
Foreignownership (%) 14.0
52-week low (VND) 44,500
52-week high (VND) 87,500
(Maintain) BUY
Target price (VND, 12M) 90,000
Current price (05/26/22) 62,900
Expected return 43%
FY (31/12) 12/17 12/18 12/29 12/20 12/21 12/22F
Revenue (VNDbn) 1,654 1,561 1,640 1,632 1,947 2,140Operating profit (VNDbn) 233 362 373 391 513 556OP margin 14.1 23.2 22.8 23.2 32.4 26
Profit before tax (VNDbn) 412 770 607 1,382 597 1,387
NP (VNDbn) 330 644 488 1,125 577.7 1,239EPS (VND) 4,417 4,674 2,863 7,711 3,850 8,780ROE (%) 11.2 21.1 15.1 36.5 17.4 37.5P/E (x) 13.2 8.6 13.3 8.2 23.7 7.1P/B (x) 1.4 1.7 2 2.7 2.1 2.0Source: Bloomberg, Mirae Asset Vietnam Research

Mirae Asset Securities (Vietnam) Research40 | Vietnam focus: Strategy
Retail industry – Still-promising outlook
Retail sales growth
Sources: GSO, PwC, Mirae Asset Vietnam
Low base to serve as launch pad for high post-pandemic growth of retail industry
• V-Shaped recovery highly likely: We expect the retail industry to recover strongly in 2022, based on the followingassumptions: 1) Low likelihood of widespread social distancing mandates, thanks to high vaccination rates; 2) a lowbase, caused by depressed consumption over the past two years; 3) a rebound in tourist-related sectors; 4) a 2%preduction in VAT, valid until end-2022; 5) the government’s relief package, which should support domesticconsumption; and 6) temporary reductions in rental costs.
• High inflation risks: Prices of essential goods and services, as well as petroleum gas, are rising, which couldpressure the industry in the short term.
• Return to pre-pandemic growth levels: We expect the retail industry to sustain double-digit growth in the longterm. The recovery of non-essential sectors should be the key driver of the industry, thanks to depressed demandover the past two years.
• Unemployment rate to decline: Due to almost nationwide social distancing measures in 3Q21, Vietnam’sunemployment rate reached a new high of almost 4%, before gradually declining to 3.2% in 4Q21 and 2.6% in 1Q22.The economic recovery should stabilize the labor market in 2022.
• Vietnamese consumers remain optimistic: According to Nielsen, the consumer confidence index has recoveredfrom a low of 105 points in 3Q21 to 113 in 4Q21, which is high compared with regional peers.
Population
Sources: GSO, Mirae Asset Vietnam
1.5%
2.0%
2.5%
3.0%
3.5%
80
85
90
95
100
2013 2014 2015 2016 2017 2018 2019 2020 2021
Population (mn) Unemployment rates (%)
-4%
-2%
0%
2%
4%
6%
8%
10%
1Q15 1Q16 1Q17 1Q18 1Q19 1Q20 1Q21 1Q22
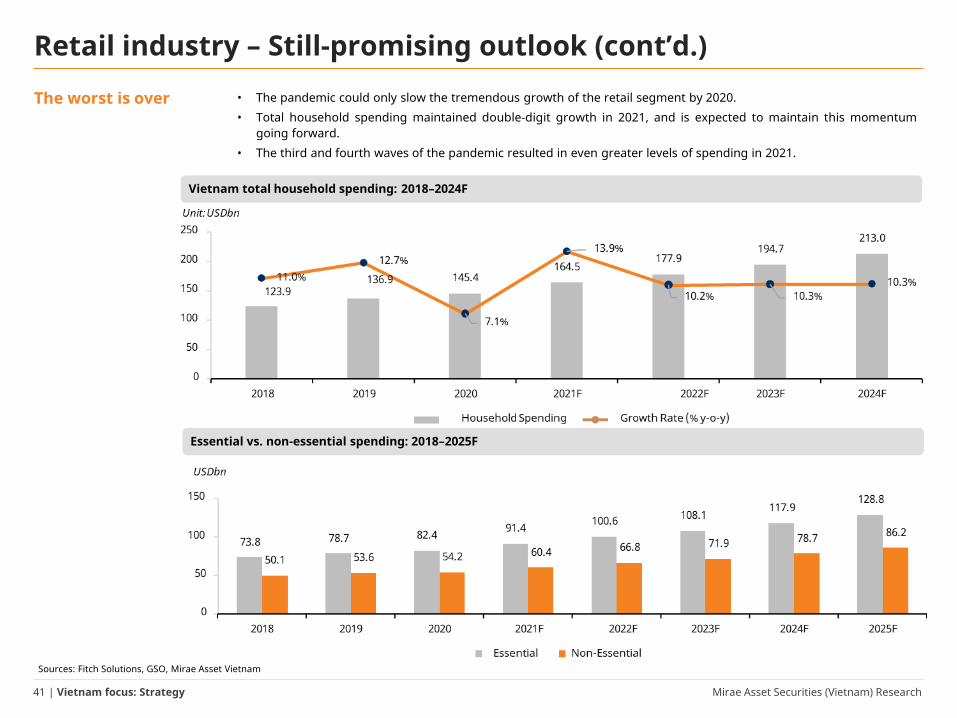
Mirae Asset Securities (Vietnam) Research41 | Vietnam focus: Strategy
Retail industry – Still-promising outlook (cont’d.)
Sources: Fitch Solutions, GSO, Mirae Asset Vietnam
The worst is over
400.0
Vietnam total household spending: 2018–2024F
• The pandemic could only slow the tremendous growth of the retail segment by 2020.• Total household spending maintained double-digit growth in 2021, and is expected to maintain this momentum
going forward.• The third and fourth waves of the pandemic resulted in even greater levels of spending in 2021.
Essential vs. non-essential spending: 2018–2025F

Mirae Asset Securities (Vietnam) Research42 | Vietnam focus: Strategy
Retail industry – Still-promising outlook (cont’d.)Vietnam’s mobile and internet retail growing fast; new retail business models take lead
• High growth rate expected: Total retail sales reached VND3,700tn (US$161bn) in 2021 and are forecast to record agrowth rate of 9–9.5% in the 2022–2025 period, according to projected growth figures from the Ministry of Industryand Trade.
• F&B, E-commerce, Grocery, Coffee Shops, and Clothing are the rising retail segments.
Sources: GSO, PwC, Mirae Asset Vietnam
> 41mnActive
mobile social users
> 43%Penetration
> 50mnInternet users
6.6%CAGR 2017–2022
47.19mnActive
mobile internet users
40%Of web traffic by
smartphones
15% 40%
Global Online Food Delivery MarketCAGR 2015-2020
Number of Online Food Transactionsto E-commerce transactions per day
in Vietnam
Food delivery growing fast, catching up to E-commerce delivery
Food & Clothing spending as percentage of income in Vietnam
44%
8%
CAGR2017 - 2020
17%
16%
63
144
24
98 100 151
24
109 161
206
27
133
$0
$100
$200
$300
$400
$500
Vietnam Indonesia Singapore Thailand
2012 2017 2022
1,569
2,158
2,990
China
Vietnam is the fastest-growing retail market in the region, and is expected to maintain ~9.3% CAGR growth until 2025 (US$bn)
Source: GSO, Euromonitor, BMI, Mirae Asset compiled

Mirae Asset Securities (Vietnam) Research43 | Vietnam focus: Strategy
43
Source: Mirae Asset compiled
Retail industry – Still-promising outlook (cont’d.)
Phase 1 – New and fragmented Phase 2 – Consolidating focus on consumer experience
Phase 3 – Integrated consumer ecosystems
2000–2020 2015–2025 2025 and beyond
▪ Products
▪ Distribution
▪ Brand recognition
▪ Golden population structure leads to consumer behavior shift: industrial lifestyle emerges
▪ Hygiene, quality + convenience + freshness ▪ Significant shift from wet markets to modern retail
(supermarkets)
▪ Digitalization starts to accelerate as technology investments become cheaper
▪ Young consumer base drives penetration of online▪ Discretionary spending becoming a bigger part of the
consumer budget
Drivers
▪ Standardized packaging with ISO quality
▪ Consumerbrands on the rise
▪ Value-added premium products that are clean,hygienic, and fresh
▪ Lifestyle and convenience: Ready-to-eat products
▪ One-stop shopping; loyalty + ecosystem▪ 100% traceable origins▪ Environmentally-friendly products▪ Personalization of services + products
Consumer demand
▪ Nationwide presence▪ Little demand for services▪ Cash transactions only
▪ From purely consumption-driven demand to demandfor experience and after-sales service
▪ Omni-channel network▪ Online payments accelerate
▪ Concept of channels eliminated ▪ Value-added services Consumer
experience
Source: Mirae Asset compiled
Retail sector is evolving, thanks to technology
• Rising demand: Retailers that can provide high-quality products, along with integrated consumer ecosystems and retail networks that offer convenience to customers, will see rising demand.
• MSN and MWG are well-positioned to fully embrace the opportunities in modern retail.

Mirae Asset Securities (Vietnam) Research44 | Vietnam focus: Strategy
Stock watchlists Based on our research, we recommend the stocks listed below as our top picks to potentially capitalize on opportunities in the retail industry. We selected these stocks based on the potential of their respective sectors, along with their fair market valuations, trading histories, and competitive advantages.
We classify those stocks into the following segments:• Convenience & Modern Retail: MSN (producer with an integrated retail platform), MWG (modern retailer focusing on
grocery and ICT products), FRT (the potential of pharmacy chain), VRE (shopping-mall, trading at premium)• E-Commerce: VTP (logistics services provider)• F&B & Traceable Products: MSN (Masan MEATLife & Masan Consumer)• Non-Essential Spending: VEA (automobiles sales recovery & abundant cash on hand)• New technologies and ICT products and other FMCG products: FPT, MWG, DGW (experimenting with FMCG
distribution)
Retail industry – Still-promising outlook (cont’d.)
Valuation snapshot (US$bn)
Sources: Bloomberg (05/26/2022), Mirae Asset Vietnam
Stock Market cap ROE ROA D/E (%) P/E P/B P/EBITDA P/SMSN VN EQUITY 6,628.5 44.7 8.1 159.1 15.4 5.6 13.7 1.8MWG VN EQUITY 4,382.9 25.8 8.9 112.3 19.8 4.5 10.8 0.8FPT VN EQUITY 4,159.4 26.1 9.3 98.9 20.5 5.0 12.9 2.5VRE VN EQUITY 2,897.9 2.9 2.3 10.2 73.8 2.2 25.1 13.4VEA VN EQUITY 2,507.6 23.7 22.0 1.0 10.1 2.5 154.5 14.5
DGW VN EQUITY 475.8 46.6 15.1 99.2 14.2 5.4 13.7 0.5FRT VN EQUITY 423.7 37.6 6.3 324.9 17.0 5.4 14.6 0.4VTP VN EQUITY 307.0 20.1 6.0 88.0 27.9 5.4 17.5 0.3

Mirae Asset Securities (Vietnam) Research45 | Vietnam focus: Strategy
Core profit to keep accelerating in 2022
Masan Group Corporation (MSN VN)
Investment points
• Despite divestment from the animal feed segment, we expect MSN revenue in FY22 to rise by a modest 2.6%YoY on positive results for all of its business lines, including: 1) Consumer Products: +14% YoY, thanks to rapidgrowth of the premium segment; 2) High-tech Materials: +7.4% YoY, on increasing global tungsten prices; and3) Grocery Retail segment: +27% in sales, thanks to 500–1,400 new stores and increasing “fresh portfolio.”Meat chain revenue is expected to drop 71% YoY in FY22, due to the end of animal feed sales. However, thechilled pork and poultry businesses are forecast to grow by 18% YoY and 35% YoY, respectively.
• In 2022, we expect the group’s consolidated operating profit to increase by 26.6% YoY. The operating profit ofthe consumer products and high-tech material segments are forecast to grow by 14.8% YoY and 40% YoY,respectively. Net profit after tax is projected to decline by 25% YoY to VND7,531bn, not including any one-offprofits.
• In 1Q22, MSN achieved a sudden increase in EAT of 452.9% YoY to VND1,895bn. The largest contribution toEAT was still consumer products (VND1,079bn, +42.7% YoY) and profit from associates (VND1,194bn, +26.1%YoY). The biggest contributor to EAT growth was high-tech materials with a profit of VND138bn, comparedwith a loss of VND272bn in 1Q21, thanks to a 33% YoY increase in global tungsten prices. Moreover, MSNrecorded a VND390bn YoY decrease in other losses, thanks to financial profit. Currently, MSN has completed25% of our full-year EAT forecast.
Top pick
(%) 1M 6M 12M
Abslolute -22.8 -21.8 11.1
Relative -7.0 -5.3 13.5
NPAT (22F, VNDbn) 6,300
Market consensus (22F, VNDbn) N/a
EPS Growth (22F, %) -38
P/E (22F, x) 21.7
Market cap (VND bn) 136,705
Shares outstanding (mn) 1,417
Free float (%) 45.2
Foreign ownership (%) 28.6
52-week low (VND) 85,100
52-week high (VND) 143,400
(Maintain) BUY
Target price (VND, 12M) 162,500
Current price (05/26/22) 108,600
Expected return 50%
FY (31/12) 2020 2021 2022F 2023FNet revenue (VNbn) 77,218 88,629 90,923 96,522 Operating profit (VNDbn) 1,682 6,283 7,953 9,238 Operating profit growth (% YoY) -65.3% 273.6% 26.6% 16.1%
Profit before tax (VNDbn) 2,325 11,489 8,565 11,578
Net profit (VNDbn) 1,234 8,563 6,300 8,795 EPS (VND) 1,045 7,253 5,337 7,450 ROE 8.8% 30.8% 19.9% 22.4%ROA 1.2% 8.0% 6.0% 7.8%
P/E (x) 84.37 23.53 21.7 20.1
P/B (x) 4.17 4.77 4.25 3.54Note: (*) Net profit = Net profit after tax excluding Minority interestSource: Company’s report, MiraeAsset Vietnam research

Mirae Asset Securities (Vietnam) Research46 | Vietnam focus: Strategy
Every challenge is an opportunity
Mobile World Corporation (MWG VN)
(%) 1M 6M 12M
Absolute -17.9 -5.3 39.5
Relative -2.1 11.1 41.9
NPAT (22F, VNDbn) 6,122
Market consensus (22F, VNDbn) NA
EPS Growth (22F, %) 23
P/E (22F, x) 15.3
Market cap (VND bn) 96,334
Shares outstanding (mn) 732
Free float (%) 74.8
Foreign ownership (%) 49.0
52-week low (VND) 89,900
52-week high (VND) 160,200
(Maintain) BUY
Target price (VND, 12M) 175,000
Current price (05/26/22) 138,500
Expected return 26%
Investment points
• For 4M22, net revenue surged by 18% YoY, reaching VND47.9tr, equivalent to 34.2% of annual target. In detail,sales growth of ICT and consumer electronic products was the key driver of MWG’s revenue growth, with a21.2% YoY increase, reaching VND30tr and accounting for 81.4% of the group’s revenue.
• Growing digitalization in the “new normal” and market consolidation will sustain double-digit growth. Asdemand for ICT products will serve both working and learning activities in the “new normal”, sales of thosegoods are expected to re-enter their growth stage. Although the epidemic affected MWG's sales of electronicproducts, it also accelerated the elimination of small and medium-sized retailers.
• Diversified product coverage will continue to serve as a growth engine. In addition to the ongoing expansionof its pharmacy retail chain, MWG plans to open new chains in the fashion and jewelry sectors.
Risks
• The key risk to our call is that MWG’s profit fails to meet its target. Due to product line expansion, the bottom-line growth of MWG may face pressure, which would cause P/E volatility in the short term.
FY (31/12) 2018 2019 2020 2021 2022F 2023F
Revenue (VNDbn) 86,516 102,174 108,546 122,958 140,824 149,876
OP (VNDbn) 3,870 4,977 5,216 5,888 7,874 8,807
OP margin (%) 4.5 4.9 4.8 4.8 5.6 5.9
NP (VNDbn) 2,879 3,836 3,920 4,901 6,122 6,810
EPS (VND) 6,641 8,916 8,838 7,008 8,585 9,272
ROE (%) 38.66 36.32 28.38 27.34 26.75 24.12
P/E (x) 20.92 15.58 15.72 19.82 15.32 14.19
P/B (x) 6.85 5.07 4.10 4.86 4.33 3.65
Source: Company data, Mirae Asset Vietnam Research

Mirae Asset Securities (Vietnam) Research47 | Vietnam focus: Strategy
Step-by-step recovery
Vincom Retail JSC (VRE VN)
Investment points• In 1Q22, VRE achieved VND1,369bn in revenue (equivalent to that of 4Q21, but -38% YoY) and VND377bn in
profit after tax (-52% YoY, but tripled QoQ). VRE's business results were affected by the spike in Covid cases, aswell as a VND464bn tenant support package in 1Q22 (4Q21: VND766bn).
• The number of visitors to shopping centers increased significantly, reaching an average of about 9mn in1Q22, improving from the mid-2021 bottom of only about 2–5mn visitors.
• On April 28, 2022, VRE inaugurated the Vincom Mega Mall Smart City in Hanoi, with a total area of 68,000 m2.In addition, VRE is expected to inaugurate Vincom Plaza Bac Lieu (Bac Lieu province), and Vincom Plaza MyTho (Tien Giang province) in 2Q22, bringing the total number of shopping centers to 83 and the totalcommercial floor area to 1.75mn m2.
• We expect VRE to open more six shopping centers in the FY23–FY24 period. By FY26, VRE targets a total of 129shopping centers, with floor area of 4.7mn m2.
• In the period of 2022–2023, we forecast that VRE will rebound strongly. Most of VRE's revenue in this periodwill come from leasing activities, while shophouse sales continue to decline, in terms of their proportion oftotal sales, averaging VND800–900bn in annual revenue. In FY22, VRE is forecast to reach VND8,348bn inrevenue (+42% YoY) and VND2,312bn in net profit (+76% YoY).
Risks
• While further lockdowns are unlikely, VRE will face a lot of competition from e-commerce platforms that are receiving significant levels of investment in Vietnam.
Top pick
(%) 1M 6M 12M
Absolute -13.0 -11.9 -10.7
Relative 2.8 4.5 -8.3
NP (22F, VND bn) 2,312
Consensus NP (22F, VND bn) Na
EPS Growth (22F, %) 75.8
P/E (22F, x) 27.6
Market cap (VND bn) 62,261
Shares outstanding (mn) 2,272
Free float (%) 28.3
Foreign ownership (%) 31.1
52-week low 25,300
52-week high 36,000
(Maintain) BUY
Target price (VND, 12M) 40,100
Current price (05/26/22) 29,700
Expected return 35%
FY (31/12) 12/19 12/20 12/21 12/22F 12/23F 12/24F
Revenue (VNDbn) 9,259 8,329 5,891 8,348 10,238 12,055OP (VNDbn) 3,583 3,093 1,757 2,838 3,431 4,021OP margin (%) 38.7 37.1 29.8 34.0 33.5 33.4NP (VNDbn) 2,851 2,382 1,315 2,312 2,797 3,277EPS (VND) 1,226 1,048 564 992 1,201 1,407ROE (%) 10.3 8.5 4.4 7.0 7.8 8.4P/E (x) 27.7 30.0 52.0 27.6 25.4 21.7P/B (x) 2.9 2.4 2.2 2.8 2.6 2.4
Note: All figures are based on consolidated VAS; NP refers to net profit attributable to controlling interests Source: Company data, MAS Vietnam Research estimates
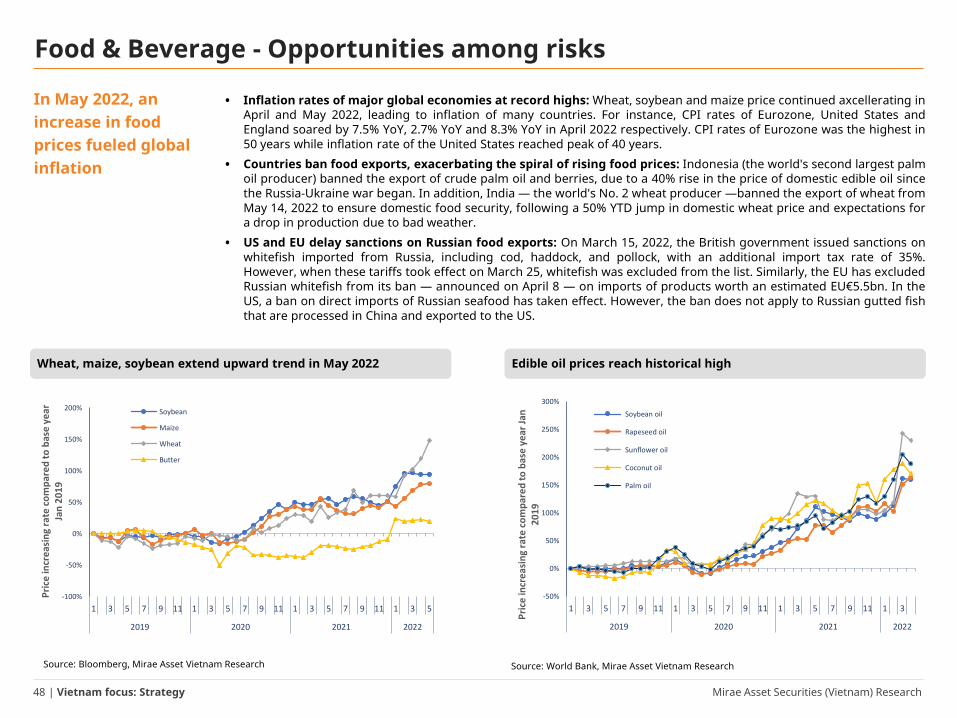
Mirae Asset Securities (Vietnam) Research48 | Vietnam focus: Strategy
In May 2022, an increase in food prices fueled global inflation
Food & Beverage - Opportunities among risks
• Inflation rates of major global economies at record highs: Wheat, soybean and maize price continued axcellerating inApril and May 2022, leading to inflation of many countries. For instance, CPI rates of Eurozone, United States andEngland soared by 7.5% YoY, 2.7% YoY and 8.3% YoY in April 2022 respectively. CPI rates of Eurozone was the highest in50 years while inflation rate of the United States reached peak of 40 years.
• Countries ban food exports, exacerbating the spiral of rising food prices: Indonesia (the world's second largest palmoil producer) banned the export of crude palm oil and berries, due to a 40% rise in the price of domestic edible oil sincethe Russia-Ukraine war began. In addition, India — the world's No. 2 wheat producer —banned the export of wheat fromMay 14, 2022 to ensure domestic food security, following a 50% YTD jump in domestic wheat price and expectations fora drop in production due to bad weather.
• US and EU delay sanctions on Russian food exports: On March 15, 2022, the British government issued sanctions onwhitefish imported from Russia, including cod, haddock, and pollock, with an additional import tax rate of 35%.However, when these tariffs took effect on March 25, whitefish was excluded from the list. Similarly, the EU has excludedRussian whitefish from its ban — announced on April 8 — on imports of products worth an estimated EU€5.5bn. In theUS, a ban on direct imports of Russian seafood has taken effect. However, the ban does not apply to Russian gutted fishthat are processed in China and exported to the US.
Source: World Bank, Mirae Asset Vietnam Research
Edible oil prices reach historical highWheat, maize, soybean extend upward trend in May 2022
Source: Bloomberg, Mirae Asset Vietnam Research
-100%
-50%
0%
50%
100%
150%
200%
1 3 5 7 9 11 1 3 5 7 9 11 1 3 5 7 9 11 1 3 5
2019 2020 2021 2022
Pri
ce in
cre
asin
g ra
te c
om
par
ed
to
bas
e y
ear
Ja
n 2
01
9
Soybean
Maize
Wheat
Butter
-50%
0%
50%
100%
150%
200%
250%
300%
1 3 5 7 9 11 1 3 5 7 9 11 1 3 5 7 9 11 1 3
2019 2020 2021 2022
Pri
ce in
cre
asin
g ra
te c
om
par
ed
to
bas
e y
ear
Jan
2
01
9
Soybean oil
Rapeseed oil
Sunflower oil
Coconut oil
Palm oil

Mirae Asset Securities (Vietnam) Research49 | Vietnam focus: Strategy
Exports of grain and other foods enjoying temporary benefits (except products exported to China)
• Seafood export price remain at historical highs: According to the Vietnam Association of Seafood Exporters andProducers (VASEP), the average price of pangasius exported to the US market increased sharply, reaching their highest-ever level of US$4.5/kg in May 2022, which surpasses the peak of 2019. The main products exported to the US are large-sized frozen pangasius fillets, with the market experiencing a shortage of small-sized products. The price of pangasius inthe EU market ranges in US$2.9–3.45/kg. Frozen pangasius fillet prices in the Netherlands, Germany, Belgium, and Spainalso increased, remaining stable compared with the same period in 2021. In China, the price of fish also increasedsignificantly, ranging in price from US$2.4/kg to US$3.25/kg.
• Export prices of Vietnamese rice show recovery: At the end of May 2022, the export price of Vietnamese rice recordedUS$420/ton, up 4.2% YTD. Despite the modest recovery in prices, the price of Vietnamese rice exports is still at a lowlevel compared with the peak of US$500/ton in February 2021.
• Vietnamese fruit stuck at China border, due to Zero-covid policy: Domestic prices of major exported fruit, such asdragon fruit, jackfruit, and bananas, bounced back after China temporary reopened its border with Vietnam on May 16,2022. However, export prices of these fruit remain at record lows, as China’s border with Vietnam has been closed formonths, driven by Zero-covid policy. China consumes 90% of Vietnam’s fresh fruit exports.
Export price of pangasius to EU has increased strongly since Sept. 2021
Source: Undercurrent News Source: World Bank, Mirae Asset Vietnam Research
Export price of Vietnamese rice shows recovery from Feb. 2022
Food & Beverage - Opportunities among risks (cont’d.)
0
100
200
300
400
500
600
1 3 5 7 9 11 1 3 5 7 9 11 1 3 5 7 9 11 1 3 5
2019 2020 2021 2022
USD
/Me
tric
to
n
Vietnamese Rice Thailand rice

Mirae Asset Securities (Vietnam) Research50 | Vietnam focus: Strategy
Domestic prices of several major foods stuck between inflation and oversupply
• Domestic sugar price lags compared with global recovery: The Vietnam Sugar Association recorded the end-Aprildomestic white sugar price at VND17,200/kg, down 4% YTD and -8.5% from the highest level recorded in 3Q21. Thedomestic sugar price trend was opposite to the world recovery supported by crude oil price. We believe that thedomestic sugar price decreased because the domestic supply was abundant after all the sugar mills in the countryfinished the 2021–2022 milling season. Not only that, the smuggling of sugar across the border also increaseddramatically, prompting the Ministry of Industry and Trade to decide to extend the investigation period for evasion oftrade defense measures for sugar until July 21, 2022.
• Live hog price move sideways, while industrial feed price increases: Live hog prices in North Vietnam reachedVND56,300/kg in end-May 2022, up 16% YTD, but down 21% YoY. In contrast, the price of animal feed has increasedstrongly under pressure from rising prices of raw materials, such as soybeans and corn. At current live hog sellingprices, only livestock farmers that take advantage of feed sources other than industrial feed can maintain a small profitor break even. The remaining livestock households that depend 100% on industrial feed have all suffered losses.
Domestic sugar price trend differs from global trend
Source: Vietnam Sugar Association Source: Anovafeed, Mirae Asset Research
Live hog prices move sideways, while industrial feed price increases
Food & Beverage - Opportunities among risks (cont’d.)
0.20
0.25
0.30
0.35
0.40
0.45
0
2,000
4,000
6,000
8,000
10,000
12,000
14,000
16,000
18,000
20,000
1 2 3 4 5 6 7 8 9 10 11 12 1 2 3 4
2021 2022
USD
/kg
VN
D/k
g
Domestic white sugar (Left) Global white sugar (right)
0
50,000
100,000
150,000
200,000
250,000
300,000
350,000
400,000
0
10,000
20,000
30,000
40,000
50,000
60,000
70,000
80,000
90,000
1 2 3 4 5 6 7 8 9 10 11 12 1 2 3 4 5
2021 2022
VN
D/2
5kg
VN
D/k
g
Industrial pig feed price (Right) Live hog price (Left)
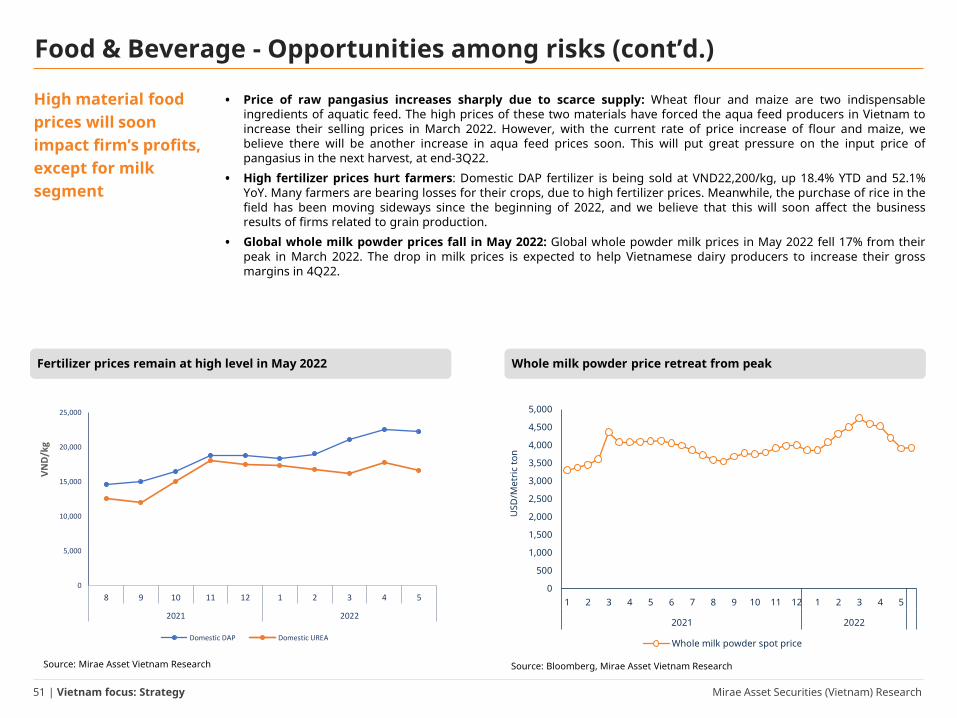
Mirae Asset Securities (Vietnam) Research51 | Vietnam focus: Strategy
High material food prices will soon impact firm’s profits, except for milk segment
• Price of raw pangasius increases sharply due to scarce supply: Wheat flour and maize are two indispensableingredients of aquatic feed. The high prices of these two materials have forced the aqua feed producers in Vietnam toincrease their selling prices in March 2022. However, with the current rate of price increase of flour and maize, webelieve there will be another increase in aqua feed prices soon. This will put great pressure on the input price ofpangasius in the next harvest, at end-3Q22.
• High fertilizer prices hurt farmers: Domestic DAP fertilizer is being sold at VND22,200/kg, up 18.4% YTD and 52.1%YoY. Many farmers are bearing losses for their crops, due to high fertilizer prices. Meanwhile, the purchase of rice in thefield has been moving sideways since the beginning of 2022, and we believe that this will soon affect the businessresults of firms related to grain production.
• Global whole milk powder prices fall in May 2022: Global whole powder milk prices in May 2022 fell 17% from theirpeak in March 2022. The drop in milk prices is expected to help Vietnamese dairy producers to increase their grossmargins in 4Q22.
Fertilizer prices remain at high level in May 2022
Source: Mirae Asset Vietnam Research Source: Bloomberg, Mirae Asset Vietnam Research
Whole milk powder price retreat from peak
Food & Beverage - Opportunities among risks (cont’d.)
0
5,000
10,000
15,000
20,000
25,000
8 9 10 11 12 1 2 3 4 5
2021 2022
VN
D/k
g
Domestic DAP Domestic UREA
0
500
1,000
1,500
2,000
2,500
3,000
3,500
4,000
4,500
5,000
1 2 3 4 5 6 7 8 9 10 11 12 1 2 3 4 5
2021 2022
USD
/Met
ric to
n
Whole milk powder spot price

Mirae Asset Securities (Vietnam) Research52 | Vietnam focus: Strategy
Potential for businesses for 2H22
• Seafood exporters expected to see outstanding results in last-9M22: We believe that 2Q22 will see a boom in boththe revenue and profit of seafood exporters. However, it should be noted that this positive trend is likely to graduallyfade in the last two quarters of 2022, as the 2021 low-priced inventory has been exhausted and the new harvest, withhigher prices, will arrive at end-3Q22.
• Beverages, food exports, and sugar production to see modest growth in 2022: In this group, an improvedperformance for beverages is expected, as domestic demand recovers from 2021’s low base.
• We expect dairy businesses to maintain profits in 2022: Although the price of powder milk is on a downward trend,the average price for whole powder milk in 5M22 was still 11.3% YoY higher. On the other hand, we have not seen ademand boom strong enough to ensure positive growth for dairy businesses in 2022.
Profit trend of major F&B groups – June 2022 review
GroupRevenue Expenses Profit
trendImpact Strength Impact Strength
Dairy products Recovery of domestic demand + Higher raw material price -- -
Seafood exports Strong increase in export price ++++ Material price increase - +++
Animal farm, slaughtering Drop in average price -Strong increase in animal feed price --- ----
Beverages Recovery of domestic demand ++ Material price increase - +
Sugar Price increase, due to oil price trend ++ Material price increase - +
Rice exportersExport price increase on impact of Russia-Ukraine war ++
Strong increase in fertilizer price - +
Packaged foodPost-Covid-19 domestic demand recovery +
Strong increase in material price -- -
Source: Mirae Asset Vietnam Research
Food & Beverage - Opportunities among risks (cont’d.)

Mirae Asset Securities (Vietnam) Research53 | Vietnam focus: Strategy
Selected listed companies’ 2022 guidance and 1Q22 results
2021 2022 plan 1Q22
Group Ticker Company nameNPAT
(VNDbn)% YoY
NPAT(VNDbn)
% YoYNPAT Post-MI
(VNDbn)% YoY
Seafood exporters
VHC Vinh Hoan Corp 1,110 54.3% 1,600 44.14% 547.5 318%
IDI International Development & Investment 143 33.8% 900 529.37% 198.6 949%
ANV Nam Viet Corp 128 -36.8% 720 462.50% 206.6 224%
ACL Cuu Long Fish JSC 43 51.0% 200 365.12% 62.6 473%
Rice exportersTAR Trung An Hi-Tech Farming Company 101 20.9% 600 494.06% 24.9 651%
LTG Loc Troi Group 422 14.4% 400 -5.21% 183.5 1%
Beverages SAB Sai Gon Beer – Alcoholi – Beverage Corp 3,929 -20.4% 4,581 16.59% 1,170.7 27.1%
Packaged food MCH Masan Consumer Holdings 5,526 20.2% 5,800~6,700 5.0%~21.2% 875.8 32.8%
Source: Company data
Food & Beverage - Opportunities among risks (cont’d.)

Mirae Asset Securities (Vietnam) Research54 | Vietnam focus: Strategy
2022: Dual booster
Nam Viet Corporation (ANV VN)
Investment points
• We recommend Buy and a target price of VND54,200 for Nam Viet Corporation (ANV), based on a target P/E of10.5x applied to 2022 EPS forward.
• ANV is among the top pangasius exporters in Vietnam, with a total capacity of 140,000 tons of fillet each year.The company is also Vietnam’s only pangasius producer, with 100% inhouse materials (from fingerling, feed,and farming). ANV has a total fish-pond area of 700 ha. In 2021, ANV posted net revenue of VND3,494bn(+1.5% YoY) and net profit of VND129bn (-36% YoY), due to the heavy impact of the Covid-19 pandemic.
• Vietnamese’s pangasius average price increased 60% YoY in 1Q22, due to the recent Russia-Ukraine war. Weexpect pangasius prices to be maintained at current levels for FY22.
• ANV is returning to the US market. ANV is one of Vietnam’s two pangasius exporters that enjoy a 0% anti-dumping tax in the US. The company announced that its first container exported to the US will be delivered inAugust 2022.
• We forecast ANV’s 2022 revenue will increase by 40% YoY to VND4,891bn, thanks to a 30% increase in averagepangasius export price and a 10% rise in export volume. Operating profit is expected to jump 269% YoY toVND798bn on the back of a 6.5%p improvement in gross margin and a 3.5%p reduction of SG&A/revenue ratio.Net profit after tax is projected to be at VND659bn (+411% YoY), with EPS of VND5,163. In 1Q22, ANV reachedNPAT of VND206bn (+223% YoY), fulfilling 28% of the company’s FY22 guidelines.
Top pick
(%) 1M 6M 12M
Abslolute -5.7 14.9 73.4
Relative 10.1 31.3 75.8
NPAT (22F, VNDbn) 659
Market consensus (22F, VNDbn) N/a
EPS Growth (22F, %) 411%
P/E (22F, x) 8.0
Market cap (VND bn) 5,256
Shares outstanding (mn) 127
Free float (%) 22.5
Foreign ownership (%) 2.4
52-week low (VND) 22,700
52-week high (VND) 48,800
(Maintain) TRADING BUY
Target price (VND, 12M) 54,200
Current price (05/26/22) 47,500
Expected return 14%
FY (31/12) 2020 2021 2022F 2023F
Net revenue (VNbn) 3,439 3,494 4,891 5,136
Operating profit (VNDbn) 243 216 798 786
Operating profit growth (% YoY) -69.8% -11.1% 269.6% -1.4%
Profit before tax (VNDbn) 240 151 775 764
Net profit (VNDbn) 202 129 659 650
EPS (VND) 1,585 1,009 5,163 5,095
ROE 8.7% 2.9% 13.3% 11.9%
ROA 3.1% 1.9% 8.2% 7.2%
P/E (x) 15.66 32.88 8.0 8.9
P/B (x) 1.36 1.81 2.14 1.70
Source: Company’s report, MiraeAsset Vietnam research

Mirae Asset Securities (Vietnam) Research55 | Vietnam focus: Strategy
1Q22: Strong earnings growth
Utilities - Strong earnings growth in 1Q22• According to the Vietnam Electricity Corporation (EVN), electricity consumption increased by 6.3% YoY in 4M22. Wind
power was the biggest beneficiary, with a 500% YoY increase in April 2022 and 369% YoY increase in 4M22, in terms ofvolume. Solar power output grew by 53% YoY in April 2022 and 6.6% YoY in 4M22. The mobilization of hydropowergenerators also improved by 27% YoY in April 2022 and 21% YoY in 4M22.
• According to the meteorological agencies, hot weather in the Northern and Central provinces is forecast to occur laterthan usual and to be less intense and of shorter duration. The water levels of some of the main rivers in the Northernregion recovered slightly in 5M22.
• Regarding the shortage of coal materials in 1Q22, EVN announced that TKV Group has signed contracts with EVN’s coal-fired thermal power plants to supply approximately 800,000 tons of undelivered coal from 1Q22 in the remainingquarters of 2022.
• Listed hydropower generators enjoyed strong performances in 1Q22 (+64% YoY in revenue, +119% YoY in net profit).Their growth was steeper than that of listed thermal power enterprises (+12% YoY in revenue, +50% YoY in net profit)and overall electricity generation (+18% YoY in revenue, +70% YoY in net profit).
Source: EVN, Mirae Asset Vietnam Research
QoQ growth of water levels in the Northern region Vietnam’s YoY electricity consumption growth
Source: EVN, Mirae Asset Vietnam Research
-48%
32%
4%
-14%
2% 2%
10%
4Q20 1Q21 2Q21 3Q21 4Q21 1Q22 22-May
11.3%
9.0% 9.2%8.7%
3.4%
1.4%
6.3%
FY16 FY17 FY18 FY19 FY20 FY21 4M22

Mirae Asset Securities (Vietnam) Research56 | Vietnam focus: Strategy
Draft Power Development Plan VIII: More “green” and more challenges
Utilities - Strong earnings growth in 1Q22 (cont’d.)
• The draft National Power Development Plan VIII (PDP VIII) submitted by the Ministry of Industry and Trade in April 2022was approved by the Appraisal Council, which will soon end the review process that has lasted more than a year. Thereare major changes to the capacity development plans for power sources in the latest draft, compared with the first draftof March 2021. The changes are intended to fulfill Vietnam's commitment made at the UN Climate Change Conference(COP26) to bring net CO2 emissions to "0" by 2050.
• The capacity of coal-fired thermal power in the latest draft declines by 8% in FY30 and 26% in FY45, compared with thelevels outlined in the first draft. Coal-fired power will gradually switch to using biomass and/or ammonia.
• LNG thermal power capacity in the latest draft increases sharply until FY30, to be gradually replaced by hydrogen byFY45. This change is due to the impact of COP26, as well as the Russia-Ukraine war, which has increased the urgency ofstrengthening energy security.
• By FY45, the installed capacity of renewable energy and hydro power will account for 68.5% of the overall power capacitymix. The reserve ratio (excluding solar power) also increases markedly in FY30 and FY45 in the latest draft.
• .Power capacity in draft PDP VIII
Source: Mirae Asset Vietnam Research, Vietnam Energy
FY30 FY45
Capacity (MW) March 2021 April 2022 % March 2021 April 2022 %
Pmax 93,343 93,343 0% 189,917 189,917 0%
Installed capacity 143,840 156,385 9% 329,610 416,254 26%
Reserve ratio (excluding solar power) 31% 47% 51% 40% 66% 65%
Coal-fired/biomass/ammoniac 40,899 37,467 -8% 50,949 37,467 -26%
New LNG/hydrogen thermal 17,150 23,900 39% 55,750 31,400 -44%
Flexible thermoelectric between natural gas and hydrogen 200 150 -25% 18,000 28,200 57%
Hydropower 25,498 28,946 14% 30,077 35,139 17%
Onshore wind power 12,470 16,121 29% 32,720 55,950 71%
Offshore wind power 2,000 7,000 250% 36,000 66,500 85%
Solar farm 13,635 8,736 -36% 63,640 75,987 19%
Pumped-storage hydroelectricity 2,400 2,450 2% 11,400 29,250 157%
Imported 5,742 5,000 -13% 11,042 11,042 0%
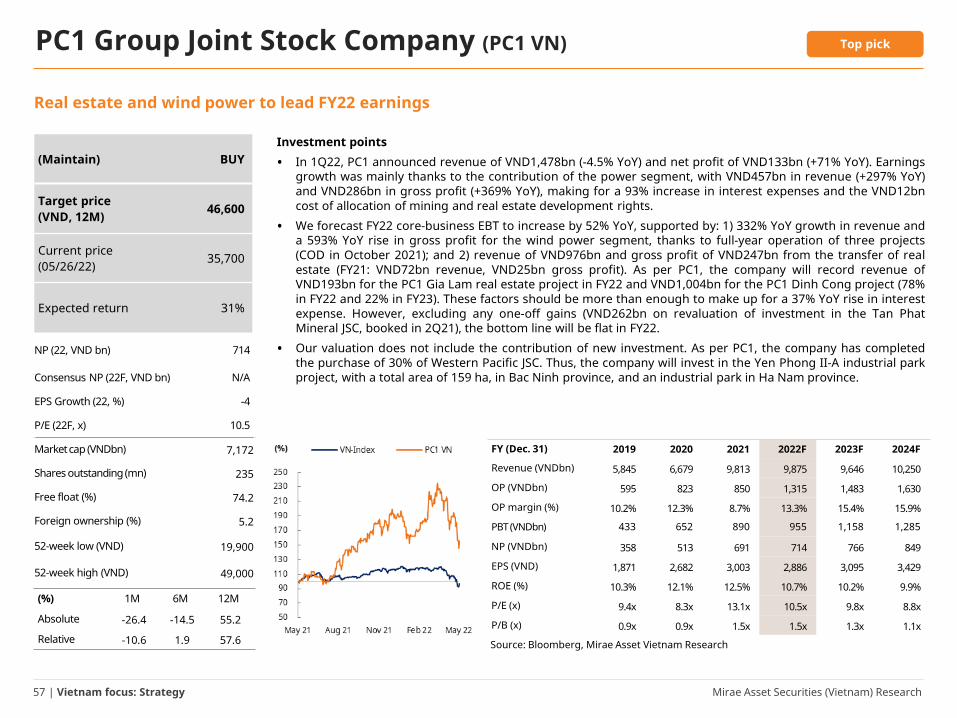
Mirae Asset Securities (Vietnam) Research57 | Vietnam focus: Strategy
Real estate and wind power to lead FY22 earnings
PC1 Group Joint Stock Company (PC1 VN)
Investment points
• In 1Q22, PC1 announced revenue of VND1,478bn (-4.5% YoY) and net profit of VND133bn (+71% YoY). Earningsgrowth was mainly thanks to the contribution of the power segment, with VND457bn in revenue (+297% YoY)and VND286bn in gross profit (+369% YoY), making for a 93% increase in interest expenses and the VND12bncost of allocation of mining and real estate development rights.
• We forecast FY22 core-business EBT to increase by 52% YoY, supported by: 1) 332% YoY growth in revenue anda 593% YoY rise in gross profit for the wind power segment, thanks to full-year operation of three projects(COD in October 2021); and 2) revenue of VND976bn and gross profit of VND247bn from the transfer of realestate (FY21: VND72bn revenue, VND25bn gross profit). As per PC1, the company will record revenue ofVND193bn for the PC1 Gia Lam real estate project in FY22 and VND1,004bn for the PC1 Dinh Cong project (78%in FY22 and 22% in FY23). These factors should be more than enough to make up for a 37% YoY rise in interestexpense. However, excluding any one-off gains (VND262bn on revaluation of investment in the Tan PhatMineral JSC, booked in 2Q21), the bottom line will be flat in FY22.
• Our valuation does not include the contribution of new investment. As per PC1, the company has completedthe purchase of 30% of Western Pacific JSC. Thus, the company will invest in the Yen Phong II-A industrial parkproject, with a total area of 159 ha, in Bac Ninh province, and an industrial park in Ha Nam province.
(%) 1M 6M 12M
Absolute -26.4 -14.5 55.2
Relative -10.6 1.9 57.6
NP (22, VND bn) 714
Consensus NP (22F, VND bn) N/A
EPS Growth (22, %) -4
P/E (22F, x) 10.5
Market cap (VNDbn) 7,172
Shares outstanding (mn) 235
Free float (%) 74.2
Foreign ownership (%) 5.2
52-week low (VND) 19,900
52-week high (VND) 49,000
(Maintain) BUY
Target price (VND, 12M) 46,600
Current price (05/26/22) 35,700
Expected return 31%
FY (Dec. 31) 2019 2020 2021 2022F 2023F 2024F
Revenue (VNDbn) 5,845 6,679 9,813 9,875 9,646 10,250
OP (VNDbn) 595 823 850 1,315 1,483 1,630
OP margin (%) 10.2% 12.3% 8.7% 13.3% 15.4% 15.9%
PBT (VNDbn) 433 652 890 955 1,158 1,285
NP (VNDbn) 358 513 691 714 766 849
EPS (VND) 1,871 2,682 3,003 2,886 3,095 3,429
ROE (%) 10.3% 12.1% 12.5% 10.7% 10.2% 9.9%
P/E (x) 9.4x 8.3x 13.1x 10.5x 9.8x 8.8x
P/B (x) 0.9x 0.9x 1.5x 1.5x 1.3x 1.1x
Source: Bloomberg, Mirae Asset Vietnam Research
Top pick

Mirae Asset Securities (Vietnam) Research58 | Vietnam focus: Strategy
Bottomed out
Pha Lai Thermal Power Joint Stock Company (PPC VN)
Investment points
• In 1Q22, PPC announced revenue of VND1,077bn (0% YoY) and net profit of VND80bn (-42% YoY). Gross profitreached VND42bn (+40% YoY); however, net financial income decreased by 52% YoY to VND68bn, due to: 1)interest income of VND9.6bn (-56% YoY); 2) received dividends of VND59bn (-39% YoY); and 3) lack of reversalsin investment provisioning (1Q21: reversal of VND22bn).
• Net profit is expected to rebound by 79% YoY in FY22. Technical issues at PL2 (a turbine engine failure at Unit6) are expected to be resolved by 2H22, and we forecast power generation to record production volume of4,346mn kWh (+47% YoY) and EBT of VND298bn in FY22 (FY21: VND-203bn). For net financial income, weexpect profit to cool in FY22 (-40% YoY), after booming in FY21, as HND will lower its cash dividend per shareto VND1,200 (-46% YoY), reflecting a downward adjustment to the fixed price in the power purchaseagreement from FY21.
• PPC will maintain a payout ratio of about 77%, resulting in a forecast cash dividend per share of VND1,200 inFY22 (dividend yield at 6%) and VND2,400 in FY23–FY24 (dividend yield at 12%).
(%) 1M 6M 12M
Absolute -12.9 -21.9 -28.0
Relative 2.8 -5.5 -25.6
NP (22, VND bn) 515
Consensus NP (22F, VND bn) N/A
EPS Growth (22, %) 69
P/E (22F, x) 11.7
Market cap (VNDbn) 5,674
Shares outstanding (mn) 321
Free float (%) 23.9
Foreign ownership (%) 13.5
52-week low (VND) 17,400
52-week high (VND) 25,100
(Maintain) BUY
Target price (VND, 12M) 22,700
Current price (05/26/22) 17,800
Expected return 28%
FY (Dec. 31) FY19 FY20 FY21 FY22F FY23F FY24F
Revenue (VNDbn) 8,183 7,929 3,885 6,006 8,217 7,865
OP (VNDbn) 1,203 928 (203) 298 721 689
OP margin (%) 15% 12% -5% 5% 9% 9%
PBT (VNDbn) 1,530 1,211 294 583 1,148 1,169
NP (VNDbn) 1,261 1,011 287 515 997 1,025
EPS (VND) 3,933 3,153 895 1,510 2,923 3,006
ROE (%) 22% 16% 5% 10% 20% 19%
P/E (x) 6.6x 7.8x 26.9x 11.7x 7.6x 7.4x
P/B (x) 1.4x 1.2x 1.6x 1.4x 1.4x 1.3x
Source: Bloomberg, Mirae Asset Vietnam Research
Top pick

Mirae Asset Securities (Vietnam) Research59 | Vietnam focus: Strategy
Improving cash flow
PetroVietnam Power Nhon Trach 2 JSC (NT2 VN)
Investment points
• NT2 announced 1Q22 business results, with revenue up 22% YoY (to VND2,007bn) and net profit up 39% YoY(to VND160bn), mainly thanks to the recovery of power output (+4.3% YoY, +21% QoQ). The results wereequivalent to 25% of total revenue and 29% of net profit in our FY22 forecast.
• We forecast flat net profit of VND544bn (+2% YoY) for NT2 in FY22. We expect selling volume to rise by 30%YoY, compared with FY21’s low-based output, and a surge in the volume of thermal power generators to makeup for a decline in hydropower volume in 2H22. The System Marginal Price (SMP) cap is VND1,602.3/kWh inFY22 (+VND98.8/kWh compared with that of FY21), according to Decision No. 98/QĐ-ĐTĐL, dated December31, 2021, which will ease the pessimistic forecast outcome of higher gas input price. Nevertheless, weanticipate no offsetting income incurred by lower mobilization than assigned Qc in last-9M22; thus, FY22gross profit will be maintained at VND678bn (+0.3% YoY).
• We expect a 59% drop in financial expenses in FY22. NT2 paid off its long-term loans by June 2021, which willhelp the company to save on financial expenses and improve cash flow. We estimate net cash flow ofVND670bn in FY22, versus VND-61bn in FY21.
• Risks: Mobilization of NT2 could be lower than our expectation, due to: 1) an increase in gas input price; and 2)higher output of renewable energy.
(%) 1M 6M 12M
Absolute -8.0 -8.8 9.0
Relative 7.8 7.7 11.4
NP (22, VND bn) 544
Consensus NP (22F, VND bn) N/A
EPS Growth (22, %) 2
P/E (22F, x) 11.5
Market cap (VNDbn) 6,059
Shares outstanding (mn) 288
Free float (%) 32.3
Foreign ownership (%) 13.9
52-week low (VND) 16,800
52-week high (VND) 25,900
(Maintain) BUY
Target price (VND, 12M) 28,000
Current price (05/26/22) 22,250
Expected return 26%
FY (Dec. 31) 2018 2019 2020 2021 2022F 2023F
Revenue (VNDbn) 7,670 7,654 6,082 6,150 7,907 6,897
OP (VNDbn) 915 887 810 593 591 511
OP margin (%) 11.9% 11.6% 13.3% 9.6% 7.5% 7.4%
NP (VNDbn) 782 754 625 534 544 491
EPS (VND) 2,618 2,540 2,095 1,778 1,815 1,639
ROE (%) 18.0% 19.3% 14.8% 12.5% 12.8% 11.4%
P/E (x) 8.4x 7.6x 11.3x 14.2x 11.5x 14.8x
P/B (x) 1.7x 1.3x 1.6x 1.8x 1.6x 1.6x
Source: Bloomberg, Mirae Asset Vietnam Research
Top pick

Mirae Asset Securities (Vietnam) Research60 | Vietnam focus: Strategy
Oil prices the fastest rising among popular commodities
Oil & Gas – Impact of oil price shock• Oil supply is forecast to increase slowly, as:
o The war between Russia and Ukraine has created a short-term oil price shock. In the long term, US andEuropean sanctions against Russia could limit Russia's oil and natural gas supplies.
o The US and China reached an agreement at COP26 to reduce the use of fossil fuels.o OPEC and its allies have not shown a desire to increase output.
• OPEC has a critical role in regulating supply and demand in the oil market, and increasing production output may bedifficult for this group. OPEC has consistently lowered production, even while oil prices were falling in 2018−2021,according to historical statistics. We anticipate that oil prices will remain high in 2022.
• According to the US Energy Information Administration (EIA), oil demand will reach 99.53mn barrels per day by end-FY22, resulting in a shortage of 500k barrels per day in 2022 and over 1mn barrels per day in 2023.
Brent oil price in 2013–2022 (US$/barrel)
Source: Bloomberg Source: OPEC, IEA
Global oil supply-and-demand in 2019–2030 (mn barrels/day)
85
90
95
100
105
110
2019 2020 2021 2022F 2023F 2024F 2025F 2026F 2027F 2028F 2029F 2030F
MbpdSupply Consumption
0
20
40
60
80
100
120
140
2-Ja
n-13
2-Ju
l-13
2-Ja
n-14
2-Ju
l-14
2-Ja
n-15
2-Ju
l-15
2-Ja
n-16
2-Ju
l-16
2-Ja
n-17
2-Ju
l-17
2-Ja
n-18
2-Ju
l-18
2-Ja
n-19
2-Ju
l-19
2-Ja
n-20
2-Ju
l-20
2-Ja
n-21
2-Ju
l-21
2-Ja
n-22

Mirae Asset Securities (Vietnam) Research61 | Vietnam focus: Strategy
O&G companies hold huge pile of cash
Oil & Gas – Excellent growth in 1Q22• Major oil and gas companies delivered strong performances in the first quarter, namely GAS and PVS. GAS reported a
surge of 52% YoY in revenue and 69% YoY in NPAT. PVS also posted excellent results, with revenue growth of 44% YoYand after-tax profit growth rate of 50% YoY.
• In total, listed O&G companies recorded growth rates of 46% in revenue and 74% in NPAT.
• It is estimated that O&G enterprises hold the largest cash balances among Vietnamese stocks. In May 25, 2022, the netcash/market cap ratio of some companies — namely PGD, PVB, PVS, and PVG — exceeded 50%. Notably, PVG's net cashbalance reached 184% of its market cap.
Source: Fiinpro
No, Ticker Company S/ENet cash
(cash – total loan)(VNDmn)
Market Cap Net cash/MarketCap
Revenue1Q/21
Revenue1Q/22 %YoY
NPAT1Q/21
NPAT1Q/22 %YoY
1ASP An Pha Petrol HOSE -554,131 306,558 -181% 800,689 1,159,399 45% 6,403 1,106 -83%
2CNG CNG Vietnam HOSE 250,522 915,289 27% 642,935 999,202 55% 14,913 36,093 142%
3GAS PV Gas HOSE 25,082,738 202,495,910 12% 17,570,498 26,689,145 52% 2,029,678 3,428,679 69%
4PGC Gas Petrolimex HOSE 40,582 1,206,786 3% 835,453 980,135 17% 33,372 30,694 -8%
5PGD PV GAS D HOSE 1,622,078 2,834,939 57% 2,047,381 2,662,359 30% 42,699 87,595 105%
6PVD PVDrilling HOSE -1,590,841 10,410,227 -15% 549,851 1,145,884 108% -103,762 -56,177 -46%
7PCG PetroVietnam Gas City HNX 30,947 116,994 26% 85,448 112,742 32% 1,205 -1,122 -193%
8PGS Southern Gas Trading HNX 369,629 1,224,970 30% 1,361,905 1,827,237 34% 13,411 33,944 153%
9PVB PetroViet Nam Coating HNX 194,975 332,640 59% 10,956 3,969 -64% -10,141 4,178 -141%
10PVC PVChem HNX 37,529 1,125,000 3% 302,306 478,238 58% 48 -3,152 NA
11PVG Petro VietNam LPG HNX 692,752 375,950 184% 1,237,454 1,214,115 -2% 4,965 3,007 -39%
12PVS PV Technical Services HNX 7,957,811 13,287,463 60% 2,613,675 3,769,373 44% 144,609 216,247 50%
Total 28,058,553 41,041,799 46% 2,177,399 3,781,092 74%

Mirae Asset Securities (Vietnam) Research62 | Vietnam focus: Strategy
Oil price scenarios and projected impact on industry players
Oil & Gas – Impact of oil price shock (cont’d.)
Crude oil price < US$60 US$60−85 US$85−100 > US$100 Comments
GASGAS buys gas at the wellhead price and distributes at the MFO price, whichfluctuates correspondingly with that of Brent oil. Thus, the higher the price of Brentoil, the greater the income GAS generates.
PLX Fluctuations in petrol prices suggest greater risks for PLX's petroleum retailing.
BSR Taking the US$72/barrel average price of Brent oil in 2021 as the threshold, anyincrease in oil price above this level will stimulate BSR’s profit growth.
PVD
The average cost of oil and gas production in East Asia is around US$55−60/barrel.Should the oil price remain above US$60, demand for exploration and exploitationactivities will enable PVD’s rigs to be leased at better prices and a longer rentalperiods.
PVS
Rental prices of FSO/FPSO floating storage could be lifted by the rise in oil prices.Upstream activities, such as the construction of the Block B - O Mon project, areexpected to be conducted during the high oil price period, thus encouraging theworkload for the construction segment to increase.
PVT
Most of PVT's transportation revenue comes from contracts with PVN. According tothese contracts, PVT will not have to bear the cost of raw materials, so the prices willnot be as flexible as those of outside transportation contracts. High oil prices canhelp PVT's outsourcing operations increase revenue.
Notes: NPAT remains unchanged 10% rise in NPAT 30% rise in NPAT
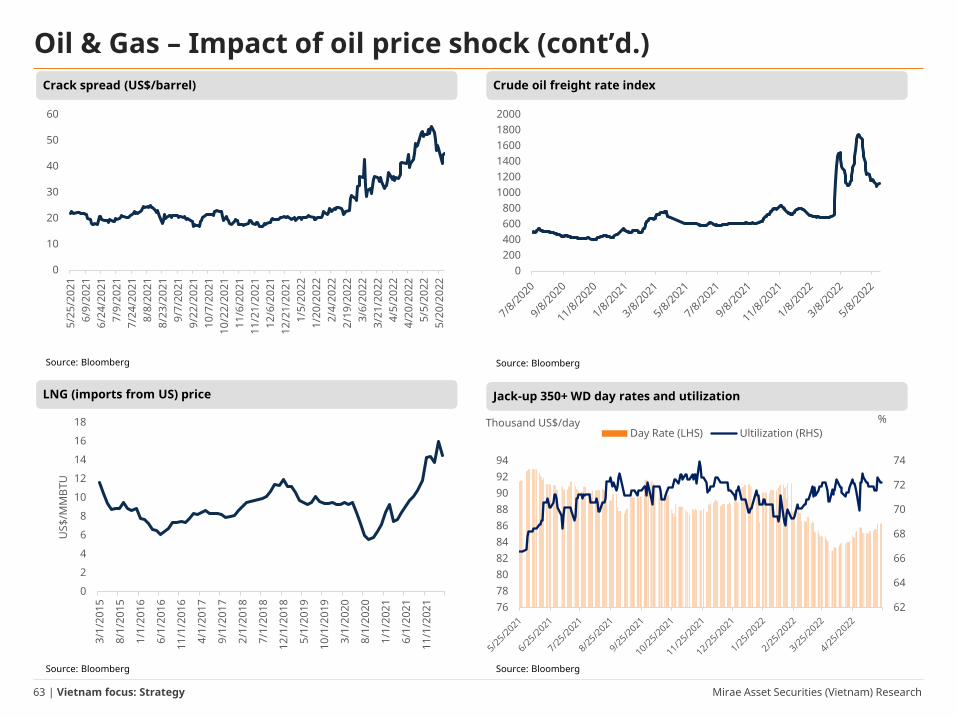
Mirae Asset Securities (Vietnam) Research63 | Vietnam focus: Strategy
Oil & Gas – Impact of oil price shock (cont’d.)
Source: Bloomberg
Source: BloombergSource: Bloomberg
Source: Bloomberg
Crack spread (US$/barrel) Crude oil freight rate index
LNG (imports from US) price Jack-up 350+ WD day rates and utilization
0
10
20
30
40
50
60
5/25
/202
16/
9/20
216/
24/2
021
7/9/
2021
7/24
/202
18/
8/20
218/
23/2
021
9/7/
2021
9/22
/202
110
/7/2
021
10/2
2/20
2111
/6/2
021
11/2
1/20
2112
/6/2
021
12/2
1/20
211/
5/20
221/
20/2
022
2/4/
2022
2/19
/202
23/
6/20
223/
21/2
022
4/5/
2022
4/20
/202
25/
5/20
225/
20/2
022
0
2
4
6
8
10
12
14
16
18
3/1/
2015
8/1/
2015
1/1/
2016
6/1/
2016
11/1
/201
6
4/1/
2017
9/1/
2017
2/1/
2018
7/1/
2018
12/1
/201
8
5/1/
2019
10/1
/201
9
3/1/
2020
8/1/
2020
1/1/
2021
6/1/
2021
11/1
/202
1
US$
/MM
BTU
0200400600800
100012001400160018002000
62
64
66
68
70
72
74
76788082848688909294
%Thousand US$/dayDay Rate (LHS) Ultilization (RHS)

Mirae Asset Securities (Vietnam) Research64 | Vietnam focus: Strategy
Turns positive
Binh Son Refining and Petrochemical JSC (BSR VN)
Investment points
• Current crack spread supports BSR's operations: Recently, Russia’s invasion of Ukraine has pushed oil pricesup sharply, with the crack spread sometimes hitting a peak of US$50/barrel. The index is expected to be aroundUS$25/barrel in FY22, supporting BSR's oil refining and petrochemical producing operations.
• Nghi Son factory reduced its production by 20%, forcing BSR to operate at 100% capacity: Nghi SonRefining and Petrochemical Company Limited (NSRP) reports a 20% cut in refinery output, due to financialissues. In order to make up for the supply shortage, BSR is operating at excess capacity.
• In 1Q22, BSR recorded revenue of VND34,783bn (+65% YoY), gross profit of VND2,612bn (+28% YoY), and profitafter tax of VND2,312bn (+25% YoY), equivalent to EPS of VND750.
• BSR's FY22 NPAT is expected to increase by 30% YoY to VND8,722bn, equivalent to an EPS of VND2,813/share.With an expected P/E of 10.5x (average level in the 2017–2019 period), we arrived at an expected share price ofVND29,500.
(%) 1M 6M 12M
Absolute -17.8 -8.2 38.6
Relative -2.0 8.2 41.0
NPAT (22F, VNDbn) 8,722
Market consensus (22F, VNDbn) NA
EPS Growth (22F, %) 30.1
P/E (22F, x) 7.6
Market Cap (VNDbn) 66,350
Outstanding shares (mn) 3,101
Free float (%) 7.9
Foreign Ownership (%) 41.1
52-week low (VND) 14,100
52-week high (VND) 29,900
(Maintain) BUY
Target price (VND, 12M) 29,500
Current price (05/26/22) 23,800
Expected return 24%
FY (31/12) 12/18 12/19 12/20 12/21 12/22F 12/23FRevenue (VNDbn) 111,952 102,824 57,959 101,079 149,244 164,169 OP (VNDbn) 3,950 2,869 (3,046) 6,943 10,843 11,943
OP margin (%) 3.5 2.8 (5.3) 6.9 7.3 7.6
NPAT (VNDbn) 3,606 2,914 (2,819) 6,705 8,722 9,558
EPS (VND) 1,163 898 (909) 2,162 2,813 3,083
ROE (%) 11.0 8.5 (8.7) 19.54 20.81 18.72
P/E (x) 13.82 8.73 11.88 7.60 6.42
P/B (x) 2.5 2.3 2.6 2.1 1.3 1.1
Source: Financial statements, Mirae Asset Securities Vietnam Research
Top pick

Mirae Asset Securities (Vietnam) Research65 | Vietnam focus: Strategy
Reaching 64.5% earnings guidance in 4M22
PetroVietnam Gas JSC (GAS VN)
Investment points• Gas hits 64.5% annual earnings guidance after only four months: PetroVietnam Gas JSC (GAS) reported
4M22 revenue of VND37,460bn and after-tax profit of VND4,544bn, equivalent to 28.3% of our FY22 estimates.• Development of LNG projects remain on track: Gas is focusing on construction of the Thi Vai LNG storage
tank, with the total capacity of 1mn tons of LNG/year, and due to start LNG imports in 2023. In 1Q22, GASestablished the Son My LNG terminal project company, preparing for implementation of the project in 2023.
• GAS to make capital contribution of 51% to the Block B - O Mon project: The information was announcedby the company's BOD at the 2022 Annual General Meeting of Shareholders. With a total investment ofVND28,788bn, a final investment decision on the Block B - O Mon gas pipeline project is expected to be madein July 2022, with operations to begin in 4Q25.
• Optimistic outlook: We forecast 2022 to be a positive year for GAS, thanks to high oil prices and recoveringgas consumption. We forecast the Brent oil price to average US$90/bbl (+32% YoY) and expect gasconsumption demand to recover after the pandemic has fully receded. We expect GAS to record VND95,738bnin revenue (+21.2% YoY) and NPAT of VND12,119bn (+39.7% YoY) for FY22.
• Valuation: The target price is based on the P/E comparison method, using the company’s past P/Eperformance as a reference. For 2022, we forecast NPAT to reach VND12,119bn, with EPS of VND6,332/share.With a P/E +1std of 19.61x, our target price for the stock is VND124,100.
(%) 1M 6M 12M
Absolute -12.3 -11.3 22.3
Relative 3.4 5.1 24.7
NPAT (22F, VNDbn) 12,119
Market consensus (22F, VNDbn) 11,221
EPS Growth (22F, %) 39.7
P/E (22F, x) 15.9
Market Cap (VNDbn) 193,308
Outstanding shares (mn) 1,914
Free float (%) 4.2
Foreign Ownership (%) 2.9
52-week low (VND) 77,600
52-week high (VND) 125,000
(Maintain) TRADING BUY
Target price (VND, 12M) 124,100
Current price (05/26/22) 107,600
Expected return 15%
FY (31/12) 12/18 12/19 12/20 12/21 12/22F 12/23FRevenue (VNDbn) 75,612 75,005 64,135 78,992 95,738 105,312Operating profit (VNDbn) 14,581 15,072 9,923 11,173 15,405 19,051Operating profit margin (%) 18.2 18.2 15.4 14.1 16.1 18.1NPAT (VNDbn) 11,454 11,902 7,855 8,673 12,119 14,979EPS (VND) 5,911 6,142 4,028 4,531 6,332 7,826ROE (%) 26.1 25.1 15.9 16.6 19.8 19.3P/E (x) 14.7 15.3 22.0 18.5 15.9 14.2P/B (x) 3.7 3.7 3.5 3.4 3.0 2.5Source: Bloomberg, Mirae Asset Vietnam Research

Mirae Asset Securities (Vietnam) Research66 | Vietnam focus: Strategy
Bright prospects driven by strong cash flow
PetroVietnam Technical Services Corporation (PVS VN)
Investment points• PVS is a subsidiary of Vietnam Oil and Gas Group (PVN), specializing in three business segments: 1) Floating
Storage Services (FSO/FPSO); 2) Mechanical & Construction; and 3) Supply Base Services. In addition, PVSconducts other activities, such as marine services, repair and maintenance services, and ROV.
• Positive signals: In 1Q22, revenue reached VND3,769bn (+44% YoY), profit after tax reached VND250bn (+53%YoY), and net profit was VND216bn (+50% YoY).
• Improved cash flow and strong cash balance: For 1Q22, PVS recorded an operating cash flow of VND667bn,a significant improvement over the loss of VND1,356bn in 1Q21. PVS has enjoyed plentiful cash reserves inrecent years; in 1Q22, PVS’s net cash (after deducting loans) reached VND7,957bn, amounting to roughly 60%of its market capitalization as of May 24, 2022. We highly value PVS's cash position and positive cash flow, asthese financial strengths enable the company to maintain stability in the current market environment.
• Positive outlook: As the Brent oil price remains above US$100/barrel, PVS is poised to benefit from surgingdemand for oil and gas exploration services, such as floating storage leasing, as well as contractor services forboth offshore and onshore oil and gas projects. In addition, PVS is also expanding its services to includeoffshore wind power construction and installation. Its notable projects include the Binh Dai - Ben Tre windpower project, Thang Long offshore wind power project, and Hai Long 2 and 3 offshore wind power projectsin Taiwan
• Valuation: We revised WACC upward to 10.89%, as 10-year government bond yields were increased from 2.5%to 3.3%. Accordingly, PVS's fair value per share is adjusted to VND31,700 (-11.7% compared with the previoustarget price).
Top pick
(%) 1M 6M 12M
Absolute 20.3 11.8 25.7
Relative 25.8 26.8 29.3
NPAT (22F, VNDbn) 1,072
Market consensus (22F, VNDbn) n/a
EPS Growth (22F, %) 60
P/E (22F, x) 14.4
Market Cap (VNDbn) 13,574
Outstanding shares (mn) 478
Free float (%) 48.6
Foreign Ownership (%) 9.0
52-week low (VND) 19,400
52-week high (VND) 41,200
(Maintain) TRADING BUY
Target price (VND, 12M) 31,700
Current price (05/26/22) 28,400
Expected return 12%
FY (31/12) 12/18 12/19 12/20 12/21 12/22F 12/23FRevenue (VNDbn) 14,638 16,789 20,180 14,237 14,651 21,976 Operating profit (VNDbn) 1,535 1,206 310 601 1,027 1,931Operating profit margin (%) 10.4 7.2 1.5 4.2 15.1 14.7 NPAT (VNDbn) 1,047 1,033 624 602 1,072 1,844 EPS (VND) 2,028 1,699 1,046 1,250 1,998 3,458ROE (%) 8.2 6.7 4.1 5.7 6.98 11.29P/E (x) 8.7 10.3 17.0 23.43 14.4 8.3P/B (x) 0.7 0.7 0.7 1.1 0.8 0.8Source: Bloomberg, Mirae Asset Vietnam Research
50
70
90
110
130
150
170
190
May 21 Aug 21 Nov 21 Feb 22 May 22
(%) VN-Index PVS VN

Mirae Asset Securities (Vietnam) Research67 | Vietnam focus: Strategy
Construction - Public investment for the recovery
Expected CAGR of 8.7% per year in 2021–2026 period
The construction market for Vietnam has an expected CAGR of 8.7% per year in the 2021–2026 period. Over the next3–to–5–year period, public investment’s highest priority will be the financing of major infrastructure, which will laythe foundations for economic growth.In 4M22, the government disbursement was VND85,712bn, achieving 14.86% of the Prime Minister’s FY22 target. Ofthis, domestic disbursement reached VND83,234bn, while foreign disbursement made up VND2,177bn. The Ministryof Finance estimated total capital disbursement at VND117,937 by end-May, achieving 20.45% of the FY22 plan.For 2022, the public investment capital allocated to the Ministry of Transport (MT) is expected to be VND50,000bn. ByApril 30, 2022, the total amount disbursed was VND10,096bn. By the end of May, the disbursement is expected toreach VND11,728bn. As detailed in the public investment plan of mid-term 2021–2025, MT will launch 67 new projects,including six national–scale projects, 10 A-scale projects, and 51 B&C–scale projects. The six national–scale projectsare as follows:
1. North–South Expressway (2021–2025)2. Chau Doc–Can Tho–Soc Trang Expressway3. Khanh Hoa–Buon Ma Thuot Expressway4. Hanoi Belt Road 45. Ho Chi Minh Belt Road 36. HCM–Long Thanh–Dau Giay Expressway expansion
According to Resolution No. 44/2022/QH15 of January 11, 2022, the National Congress approved the funding of 12projects for the North–South expressway in 2021–2025 (No. 1) from the central government’s budget. The projectswill stretch from Ha Tinh to Quang Tri, Khanh Hoa, Can Tho, and Ca Mau provinces.The government is considering investment policy approval for other four national-scale projects (No. 2–5) in the thirdsession of the National Assembly, which is taking place from May 23 to June 16, 2022.We believe that the Vietnamese government has taken drastic measures in prioritizing public investment as aneffective tool for stimulation, spreading the ripple effects to other sectors in both specific regions and across theentire nation. Nevertheless, the pace of disbursement as of end-May, however, is still behind schedule. The reasonsfor this are as follows:
• Subjective factors for departments, authorities, and provinces.
• Soaring prices of materials
• Scarcity of raw materials (sand, rock) for large-scale projects.
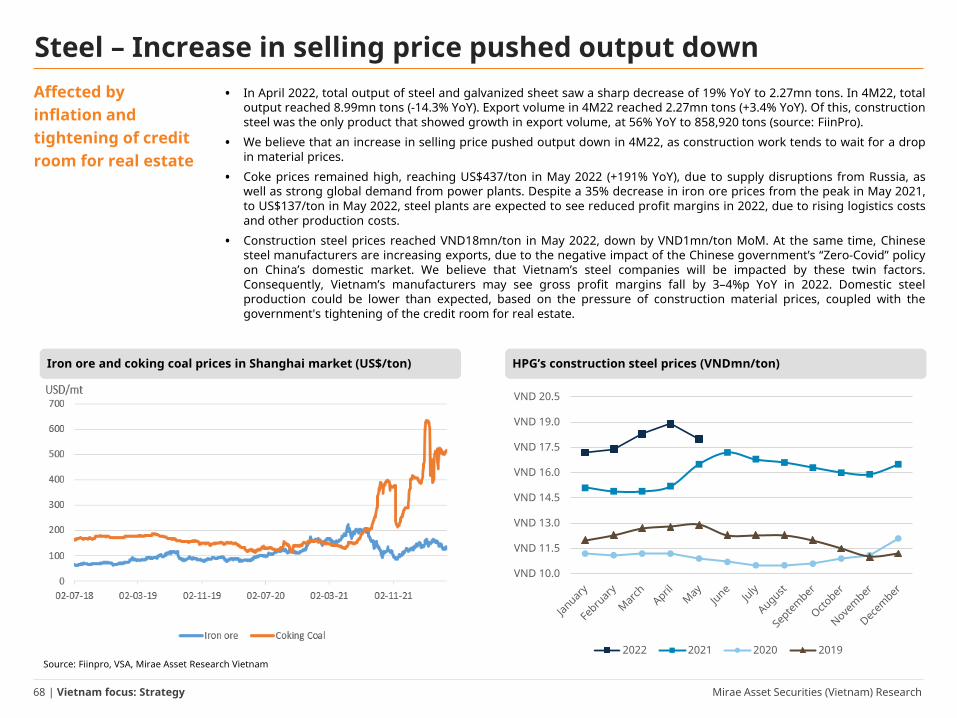
Mirae Asset Securities (Vietnam) Research68 | Vietnam focus: Strategy
Affected by inflation and tightening of credit room for real estate
Steel – Increase in selling price pushed output down• In April 2022, total output of steel and galvanized sheet saw a sharp decrease of 19% YoY to 2.27mn tons. In 4M22, total
output reached 8.99mn tons (-14.3% YoY). Export volume in 4M22 reached 2.27mn tons (+3.4% YoY). Of this, constructionsteel was the only product that showed growth in export volume, at 56% YoY to 858,920 tons (source: FiinPro).
• We believe that an increase in selling price pushed output down in 4M22, as construction work tends to wait for a dropin material prices.
• Coke prices remained high, reaching US$437/ton in May 2022 (+191% YoY), due to supply disruptions from Russia, aswell as strong global demand from power plants. Despite a 35% decrease in iron ore prices from the peak in May 2021,to US$137/ton in May 2022, steel plants are expected to see reduced profit margins in 2022, due to rising logistics costsand other production costs.
• Construction steel prices reached VND18mn/ton in May 2022, down by VND1mn/ton MoM. At the same time, Chinesesteel manufacturers are increasing exports, due to the negative impact of the Chinese government’s “Zero-Covid” policyon China’s domestic market. We believe that Vietnam’s steel companies will be impacted by these twin factors.Consequently, Vietnam’s manufacturers may see gross profit margins fall by 3–4%p YoY in 2022. Domestic steelproduction could be lower than expected, based on the pressure of construction material prices, coupled with thegovernment's tightening of the credit room for real estate.
HPG’s construction steel prices (VNDmn/ton)Iron ore and coking coal prices in Shanghai market (US$/ton)
Source: Fiinpro, VSA, Mirae Asset Research Vietnam
VND 10.0
VND 11.5
VND 13.0
VND 14.5
VND 16.0
VND 17.5
VND 19.0
VND 20.5
2022 2021 2020 2019

Mirae Asset Securities (Vietnam) Research69 | Vietnam focus: Strategy
Export growth • In 2021, the construction industry recorded growth of a mere 0.63%. We forecast total steel production of 29.9mn tons (-3% YoY) in 2022. The brightest point will come from the export market when Vietnam’s competitive prices will push theexport output in 2022. We forecast export output of 8mn tons (+6% YoY) in FY22.
• Risk of fluctuations in raw material prices: Raw material costs account for 65–75% of steel production costs. In thegalvanized steel industry, HRC cost accounts for more than 80% of total input material costs. However, leadingcompanies in the galvanized steel industry, such as NKG or HSG, have gradually switched to contracts with prices fixedthree months in advance; thus, we believe that the risk will not be significant in 1H22. High prices for construction steelmay cause the construction market to slow, thereby directly affecting output.
Price gap of HRC between China and US market
Source: Fiinpro, VSA, Mirae Asset Research Vietnam, Bloomberg
Steel – Increase in selling price pushed output down (cont’d.)
Freight Rate Index
0
100
200
300
400
500
600
700
800

Mirae Asset Securities (Vietnam) Research70 | Vietnam focus: Strategy
Leverage from export markets
Nam Kim Steel JSC (NKG VN)
Investment highlights
• Supply shortages in Europe offer great opportunities for NKG. The conflict between Russia and Ukraine hasled to supply shortages of nearly 40% for flat steel and more than 15% for HRC in the European market. Webelieve that NKG — with its high-quality GL or CRC product lines that have a foothold in high-value exportmarkets, such as Europe or the US — will be a beneficiary. We forecast NKG's export revenue to be VND20,135bn (+5% YoY), equivalent to 72% of total revenue in 2022.
• In contrast, NKG's domestic market suffered inflation pressure. The output of NKG in 4M22 began to decrease,to 324,788 tons (-7.4% YoY). Domestic galvanized steel capacity currently exceeds 30% of total demand; thus,we forecast the domestic revenue of NKG in 2022 at only VND7,803bn (-13% YoY).
• We revise our forecast net profit for NKG in 2022 downward to VND1,632bn (-26.7% YoY). In 2023, we forecastthat the domestic market will recover, with volume of 1.22mn tons (+9.7% YoY). We forecast NKG’s revenueand net profit in 2023 at VND29,144bn (+4.2% YoY) and VND1,784bn (+9% YoY), respectively.
• Nam Kim will build a new factory in the My Xuan B1 Industrial Park, with total estimated investment ofVND4,500bn and designed capacity of 1.2mn tons. According to NKG, the factory will operate commercially in2025, thereby helping the total capacity of NKG in 2025 to reach 2.5mn tons. New factory products will focuson cold-rolled steel sheet for export and products to produce high-quality household appliances.
Top piYoY
(%) 1M 6M 12M
Absolute -17.0 -28.4 17.4Relative -11.7 -15.5 19.4
NP (22F, VNDbn) 1,632
Consensus NP (22F, VNDbn) 1,765
EPS Growth (22F, %) -26
P/E (22F, x) 6
Market cap (VNDbn) 6,801
Shares outstanding (mn) 219
Free float (%) 66.3
Foreign ownership (%) 10.4
52-Week Low (VND) 24,500
52-Week High (VND) 55,900
(Maintain) BUY
Target price (VND, 12M) 43,600
Current price (05/26/22) 30,100
Expected return 45%
FY (31/12) FY18 FY19 FY20 FY21 FY22F FY23FRevenue (VNDbn) 14,812 12,177 11,560 28,173 27,966 29,144 OP (VNDbn) 390 63 509 2,739 1,902 2,011 OP margin (%) 2.6% 0.5% 4.4% 9.7% 6.8% 6.9%NP (VNDbn) 57 47 295 2,226 1,632 1,784 EPS (VND) 263 217 1,352 10,190 7,474 8,169ROE (%) 1.9% 1.6% 9.3% 38.9% 23.2% 21.0%P/E (x) 25.1x 26.5x 8.3x 3.8x 6.0x 5.5xP/B (x) 0.5x 0.5x 0.9x 1.5x 1.4x 1.2xSource: Company data, Bloomberg, Mirae Asset Vietnam Research
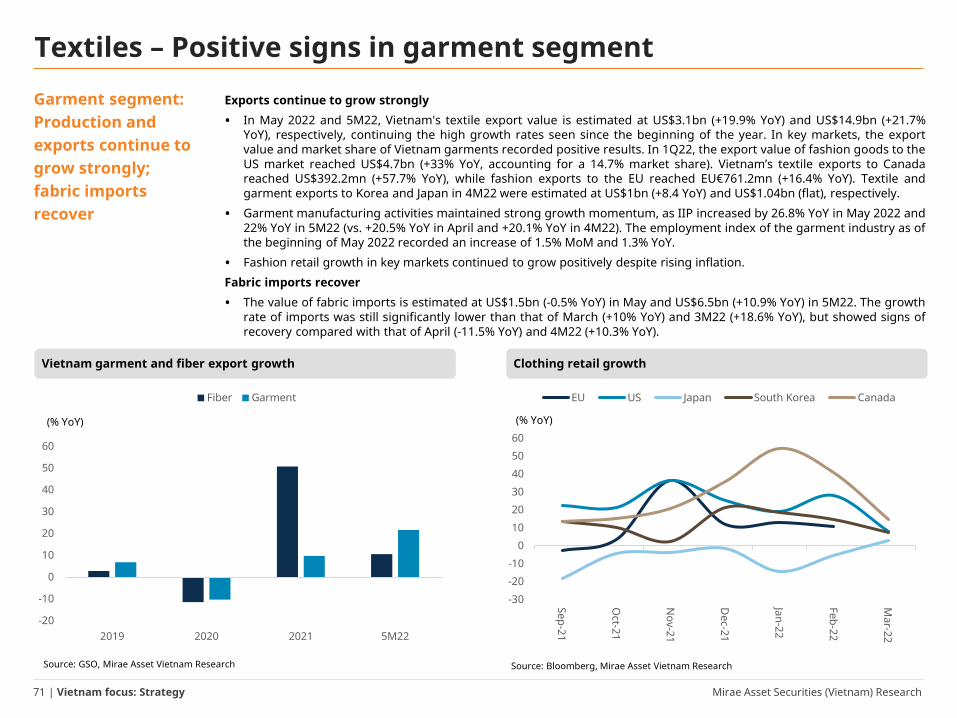
Mirae Asset Securities (Vietnam) Research71 | Vietnam focus: Strategy
Garment segment: Production and exports continue to grow strongly; fabric imports recover
Textiles – Positive signs in garment segment Exports continue to grow strongly
• In May 2022 and 5M22, Vietnam's textile export value is estimated at US$3.1bn (+19.9% YoY) and US$14.9bn (+21.7%YoY), respectively, continuing the high growth rates seen since the beginning of the year. In key markets, the exportvalue and market share of Vietnam garments recorded positive results. In 1Q22, the export value of fashion goods to theUS market reached US$4.7bn (+33% YoY, accounting for a 14.7% market share). Vietnam’s textile exports to Canadareached US$392.2mn (+57.7% YoY), while fashion exports to the EU reached EU€761.2mn (+16.4% YoY). Textile andgarment exports to Korea and Japan in 4M22 were estimated at US$1bn (+8.4 YoY) and US$1.04bn (flat), respectively.
• Garment manufacturing activities maintained strong growth momentum, as IIP increased by 26.8% YoY in May 2022 and22% YoY in 5M22 (vs. +20.5% YoY in April and +20.1% YoY in 4M22). The employment index of the garment industry as ofthe beginning of May 2022 recorded an increase of 1.5% MoM and 1.3% YoY.
• Fashion retail growth in key markets continued to grow positively despite rising inflation.Fabric imports recover
• The value of fabric imports is estimated at US$1.5bn (-0.5% YoY) in May and US$6.5bn (+10.9% YoY) in 5M22. The growthrate of imports was still significantly lower than that of March (+10% YoY) and 3M22 (+18.6% YoY), but showed signs ofrecovery compared with that of April (-11.5% YoY) and 4M22 (+10.3% YoY).
Source: Bloomberg, Mirae Asset Vietnam Research
Clothing retail growthVietnam garment and fiber export growth
Source: GSO, Mirae Asset Vietnam Research
-30-20-10
0102030405060
Sep-21
Oct-21
Nov-21
Dec-21
Jan-22
Feb-22
Mar-22
EU US Japan South Korea Canada
(% YoY)
-20
-10
0
10
20
30
40
50
60
2019 2020 2021 5M22
Fiber Garment
(% YoY)

Mirae Asset Securities (Vietnam) Research72 | Vietnam focus: Strategy
Fiber segment: Exports and consumption see negative results; slowdown in fiber manufacturing
Textiles - Positive signs in garment segment (cont’d.)
• Vietnam’s fiber exports were estimated at US$450mn (-4.7% YoY) in May and US$2.3bn (+10.6% YoY) in 5M22, comparedwith the results for April (-1.8% YoY) and 4M22 (+13.2% YoY). In terms of volume, fiber exports were estimated at 150,000tons (-10.2% YoY) in May and 737,000 tons (-9.7% YoY) in 5M22, declining at a slower pace compared with April (-14.9%YoY) and 4M22 (-10.5% YoY).
• Domestic textile production recorded a slowdown in growth rate, as the IIP of the textile segment increased by 4.7% YoYin 5M22 (down slightly from an increase of 6.0% YoY in 4M22).
• Risks: The textile segment in China recorded a decline of 6.3% YoY in April, the biggest drop since the outbreak of COVIDin 2020. With China’s persistent pursuit of the “Zero-COVID” policy, textile activity in that market is at risk, leading to adecline in demand for fiber.
Source: GSO, Mirae Asset Vietnam Research
Apparel IIPChina textile volume growth
Source: Bloomberg, Mirae Asset Vietnam Research
-8-6-4-202468
1012
Mar-18
Jun-18
Sep-18
Dec-18
Mar-19
Jun-19
Sep-19
Dec-19
Mar-20
Jun-20
Sep-20
Dec-20
Mar-21
Jun-21
Sep-21
Dec-21
Mar-22
(% YoY)
-30
-20
-10
0
10
20
30
40
Apparel 3-month average
(% YoY)
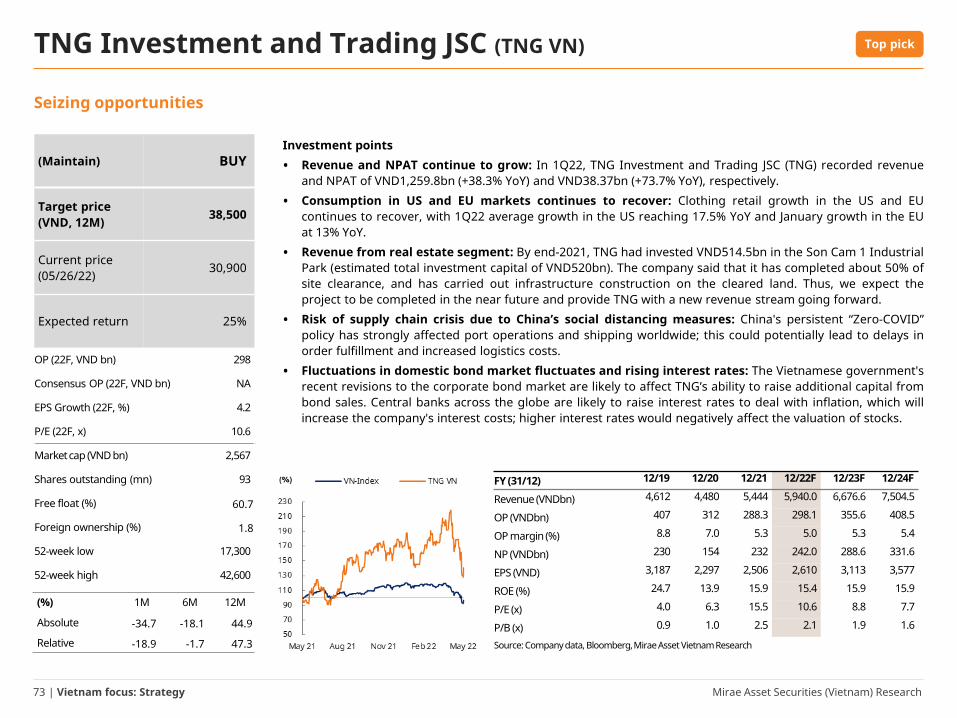
Mirae Asset Securities (Vietnam) Research73 | Vietnam focus: Strategy
Seizing opportunities
TNG Investment and Trading JSC (TNG VN)
Investment points
• Revenue and NPAT continue to grow: In 1Q22, TNG Investment and Trading JSC (TNG) recorded revenueand NPAT of VND1,259.8bn (+38.3% YoY) and VND38.37bn (+73.7% YoY), respectively.
• Consumption in US and EU markets continues to recover: Clothing retail growth in the US and EUcontinues to recover, with 1Q22 average growth in the US reaching 17.5% YoY and January growth in the EUat 13% YoY.
• Revenue from real estate segment: By end-2021, TNG had invested VND514.5bn in the Son Cam 1 IndustrialPark (estimated total investment capital of VND520bn). The company said that it has completed about 50% ofsite clearance, and has carried out infrastructure construction on the cleared land. Thus, we expect theproject to be completed in the near future and provide TNG with a new revenue stream going forward.
• Risk of supply chain crisis due to China’s social distancing measures: China's persistent “Zero-COVID”policy has strongly affected port operations and shipping worldwide; this could potentially lead to delays inorder fulfillment and increased logistics costs.
• Fluctuations in domestic bond market fluctuates and rising interest rates: The Vietnamese government'srecent revisions to the corporate bond market are likely to affect TNG’s ability to raise additional capital frombond sales. Central banks across the globe are likely to raise interest rates to deal with inflation, which willincrease the company's interest costs; higher interest rates would negatively affect the valuation of stocks.
Top pick
(%) 1M 6M 12M
Absolute -34.7 -18.1 44.9
Relative -18.9 -1.7 47.3
OP (22F, VND bn) 298
Consensus OP (22F, VND bn) NA
EPS Growth (22F, %) 4.2
P/E (22F, x) 10.6
Market cap (VND bn) 2,567
Shares outstanding (mn) 93
Free float (%) 60.7
Foreign ownership (%) 1.8
52-week low 17,300
52-week high 42,600
(Maintain) BUY
Target price (VND, 12M) 38,500
Current price (05/26/22) 30,900
Expected return 25%
FY (31/12) 12/19 12/20 12/21 12/22F 12/23F 12/24F
Revenue (VNDbn) 4,612 4,480 5,444 5,940.0 6,676.6 7,504.5
OP (VNDbn) 407 312 288.3 298.1 355.6 408.5
OP margin (%) 8.8 7.0 5.3 5.0 5.3 5.4
NP (VNDbn) 230 154 232 242.0 288.6 331.6
EPS (VND) 3,187 2,297 2,506 2,610 3,113 3,577
ROE (%) 24.7 13.9 15.9 15.4 15.9 15.9
P/E (x) 4.0 6.3 15.5 10.6 8.8 7.7
P/B (x) 0.9 1.0 2.5 2.1 1.9 1.6
Source: Company data, Bloomberg, Mirae Asset Vietnam Research

Mirae Asset Securities (Vietnam) Research74 | Vietnam focus: Strategy
Export-import value and clearance volume continue to grow
Seaports – Continued growth in clearance volume
• In 5M22, the volume of seaport clearance was estimated at 304.2mn tons (+2.9% YoY). Clearance container volume wasestimated at 10.4mn TEU (+4.3% YoY). Container clearance activities maintained growth for three consecutive months,after a slight decrease of 1% in 2M22. Meanwhile, export-import value maintained solid growth rates; in 5M22, the totalexport-import value was estimated at US$306bn (+16.5% YoY, vs. +16.3% YoY in 4M22).
• The shipping price index of main routes has been on a downward trend, supporting shipping activities amid the COVID-19 pandemic in China and the Ukraine crisis pushing up transport costs globally.
• Operations at key ports around the world continued to face difficulties, due to the impact of China’s “Zero-COVID” policy.Growth in the volume of customs clearance containers at the ports of Singapore (-1.6% YoY), Hong Kong (+0.2% YoY),Mainland China (+0.2% YoY), and the US (-5.8% YoY) remained at low levels from 1Q22.
Source: Vietnam Marine, Mirae Asset Vietnam Research
Container clearance volume growthShipping price index
Source: Bloomberg, Mirae Asset Vietnam Research
-10%
0%
10%
20%
30%
40%
50%
60%
70%
80%
90%
Total Exports Imports Domestics
2018 2019 2020 2021 5M22(% YoY)
0
50
100
150
200
250
300
350
Apr-20
Jun-20
Aug-20
Oct-20
Dec-20
Feb-21
Apr-21
Jun-21
Aug-21
Oct-21
Dec-21
Feb-22
Apr-22
Asia - North America Asia - Europe Asia - Asia

Mirae Asset Securities (Vietnam) Research75 | Vietnam focus: Strategy
Maintaining growths
Gemadept Corporation (GMD VN)
Investment points
• Clearance volume continues to grow: In 1Q22, the total output of Gemadept Corporation (GMD) through itsseaport system reached more than 785,000 TEUs (+51% YoY), accounting for nearly 12.5% of total customsclearance volume in Vietnam’s seaport system. The container capacity of Gemalink International Port reachedits first 1mn TEU after 12 months of operation (equivalent to an average of 83,000 TEU/month), approximately84% of the design capacity of Phase 1. Gemalink already contributes nearly VND38bn to GMD’s revenue andaccounts for nearly 11% of its profit before tax. The output of the Hai Phong Port group grew by 21% YoY.
• Growing profits from associates: In 1Q22, SCS recorded after-tax profit of VND187.5bn (+36.5% YoY), withGMD’s profit at about VND60bn. 1Q22 profits from other associated companies, such as CJ GMD LogisticsHoldings (VND9bn, +28.5% YoY) and CJ GMD Shipping Holdings (VND13.4bn, quadrupling YoY), grew strongly.
• Phuoc Long ICD Port will continue to operate until 2030, according to Decision 1829/QD-TTg, dated October31, 2021.
• Projected output and business results in 2022: We forecast container throughput through GMD's mainports (except Gemalink) to reach about 1.9mn TEUs (+4.2% YoY). The output of Gemalink Port is expected toreach a maximum capacity of 1.2mn TEUs. Dung Quat Port output is forecast to reach 2.7mn tons (+12.5%YoY). We exclude income from the rubber segment, as GMD will divest from this segment. We forecast GMD's2022 revenue and NPAT at VND3,457bn (+7.7% YoY) and VND1,069bn (+48.3% YoY), respectively. Profit forcontrolling shareholders will be about VND855bn (+39.7% YoY).
• Valuation: Using the discounted free cash flow (FCFF) method, we determined the fair price of GMD stock atVND64,000/share.
Top pick
(%) 1M 6M 12M
Absolute 4.4 14.5 50.7
Relative 10.1 27.7 53.1
OP (22F, VND bn) 1,342
Consensus OP (22F, VND bn) na
EPS Growth (22F, %) 62.6
P/E (22F, x) 20.5
Market cap (VND bn) 17,118
Shares outstanding (mn) 301
Free float (%) 95.9
Foreign ownership (%) 45.0
52-week low 36,800
52-week high 61,400
(Upgrade) TRADING BUY
Target price (VND, 12M) 64,000
Current price (05/26/22) 53,700
Expected return 19%
FY (31/12) 12/19 12/20 12/21F 12/22F 12/23F 12/24F
Revenue (VNDbn) 2,643 2,606 3,206 3,457 3,542 3,713
OP (VNDbn) 544 496.3 861.4 1,342.4 1,451.6 1,632.9
OP margin (%) 20.6 19.0 26.8 38.8 41.0 44.0
NP (VNDbn) 517 441 720 1,069 1,161 1,313
EPS (VND) 1,602 1,166 1,869 2,695 2,926 3,310
ROE (%) 8.1 6.7 10.2 14.3 14.4 15.1
P/E (x) 14.5 42.0 25.3 20.5 18.9 16.7
P/B (x) 1.2 2.2 2.3 2.2 2.1 1.9Source: Company data, Bloomberg, Mirae Asset Vietnam Research
50
70
90
110
130
150
170
May 21 Jul 21 Sep 21 Nov 21 Jan 22 Mar 22 May 22
(%) VN-Index GMD VN

Mirae Asset Securities (Vietnam) Research76 | Vietnam focus: Strategy
Sustaining solid growth
FPT Corporation (FPT VN)
Investment points• Technology segment to maintain double-digit growth: We expect FPT to enjoy continued growth, as: 1) FPT
can take advantage of synergies from M&A deals, helping sustain high growth rates in the US and domesticmarkets; 2) the Japanese market will rebound from a low base in 2021; and 3) demand for digitaltransformation in Asia-Pacific countries is expected to continue to grow.
• Telecommunications to maintain growth: FPT’s telecom segment should continue to flourish, thanks to: 1)growth in fixed broadband subscriptions, and a steady market share; and 2) FPT’s plans to increase its datacenter capacity.
• Risks to watch: 1) volatility of foreign currencies; 2) slower-than-expected recoveries in FPT’s foreign markets;and 3) intensified competition in the telecommunications segment.
• Raise TP to VND123,800: We raise our target price to VND123,800 (from VND111,900), based on: 1) raising our2022 earnings growth forecast to 24.7% YoY (from 23.2% YoY in our previous forecast); and 2) revising our PEtarget to 22x (+2STD) to reflect FPT’s top-tier domestic IT provider, sustainable earnings growth rate, and highROE, compared with its peers. On the downside adjustment, we increased our WACC assumption by 0.49%p to9.84% in the FCFF model.
• 4M22 review: In 4M22, FPT posted stronger-than-expected growth, with revenue of VND12,991bn (+24.5%YoY, 31% of its annual target), pre-tax profit of VND2,418bn (+25.9% YoY, 32% of its annual target), and profitafter tax and minority interests of VND1,682bn (+35.1% YoY). Revenue in Technology recorded VND7,376bn(+27.5% YoY), thanks to: 1) impressive growth in revenue from the US (+67% YoY) and APAC (+40% YoY)markets, on surging digital transformation demand (revenue from digital transformation grew 90.2% YoY in4M22); 2) continued recovery in global IT spending; and 3) an effective M&A strategy. In addition,Telecommunications revenue maintained its growth momentum, reaching VND4,649bn (+17.2% YoY) in 4M22.
Top pick
(%) 1M 6M 12M
Absolute -5.0 -0.7 20.4
Relative 0.9 16.7 26.1
NP (22, VND bn) 5,397
Consensus NP (22F, VND bn) 5,424
EPS Growth (22, %) 24.6
P/E (22F, x) 18.1
Market cap (VNDbn) 89,774
Shares outstanding (mn) 914
Free float (%) 84.3
Foreign ownership (%) 49.0
52-week low (VND) 79,000
52-week high (VND) 118,900
(Maintain) TRADING BUY
Target price (VND, 12M) 123,800
Current price (05/26/22) 105,600
Expected return 17%
FY (31/12) 12/18 12/19 12/20 12/21 12/22F 12/23F
Revenue (VNDbn) 23,214 27,717 29,830 35,657 43,181 52,681
OP (VNDbn) 3,122 4,147 4,605 5,415 7,128 8,748
OP margin (%) 13.4 15.0 15.4 15.2 16.5 16.6
NP (VNDbn) 2,620 3,135 3,538 4,337 5,397 6,589
EPS (VND) 2,683 3,191 3,579 4,349 5,414 6,610
ROE (%) 20.0 21.6 21.7 23.4 25.5 26.7
P/E (x) 10.8 13.8 14.4 21.4 18.1 14.9
P/B (x) 2.1 2.8 2.9 4.7 3.7 3.2Source: Company data, MiraeAsset Vietnam Research
70
80
90
100
110
120
130
140
150
May
21
Jun
21Ju
l 21
Aug
21Se
p 21
Oct
21
Nov
21
Dec
21
Jan
22Fe
b 22
Mar
22
Apr 2
2M
ay 2
2
(%) VN-Index FPT VN

Mirae Asset Securities (Vietnam) Research77 | Vietnam focus: Strategy
Net profit forecast (VNDbn)
Stock Industry 1Q21 1Q22 YoY Last 9M21 Last 9M22F YoY FY21 FY22F YoY
BID Banks 2,648 3,564 35% 7,925 10,234 29% 10,573 13,798 31%
CTG Banks 6,462 4,664 -28% 7,630 11,976 57% 14,092 16,640 18%
HDB Banks 1,563 1,918 23% 4,490 5,373 20% 6,054 7,291 20%
TCB Banks 4,397 5,505 25% 13,641 16,260 19% 18,038 21,765 21%
VCB Banks 6,903 7,962 15% 15,025 17,642 17% 21,928 25,604 17%
VIB Banks 1,446 1,823 26% 4,964 6,601 33% 6,410 8,424 31%
VPB Banks 3,202 8,672 171% 8,519 9,519 12% 11,721 18,191 55%
TCD Construction 63 105 67% 273 338 24% 336 443 32%
MSN F&B 187 1,596 753% 8,376 4,704 -44% 8,563 6,300 -26%
SAB F&B 921 1,171 27% 3,008 3,977 32% 3,929 5,148 31%
VNM F&B 2,576 2,266 -12% 8,057 9,004 12% 10,633 11,270 6%
ANV F&B 64 207 223% 65 452 595% 129 659 411%
Appendix – Earnings forecast
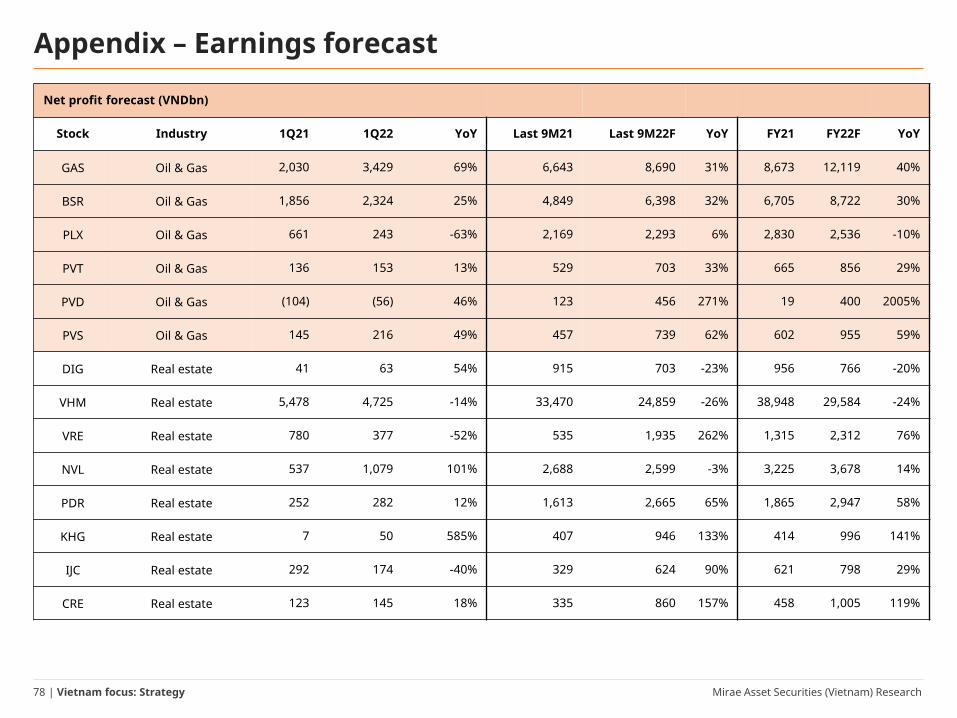
Mirae Asset Securities (Vietnam) Research78 | Vietnam focus: Strategy
Net profit forecast (VNDbn)
Stock Industry 1Q21 1Q22 YoY Last 9M21 Last 9M22F YoY FY21 FY22F YoY
GAS Oil & Gas 2,030 3,429 69% 6,643 8,690 31% 8,673 12,119 40%
BSR Oil & Gas 1,856 2,324 25% 4,849 6,398 32% 6,705 8,722 30%
PLX Oil & Gas 661 243 -63% 2,169 2,293 6% 2,830 2,536 -10%
PVT Oil & Gas 136 153 13% 529 703 33% 665 856 29%
PVD Oil & Gas (104) (56) 46% 123 456 271% 19 400 2005%
PVS Oil & Gas 145 216 49% 457 739 62% 602 955 59%
DIG Real estate 41 63 54% 915 703 -23% 956 766 -20%
VHM Real estate 5,478 4,725 -14% 33,470 24,859 -26% 38,948 29,584 -24%
VRE Real estate 780 377 -52% 535 1,935 262% 1,315 2,312 76%
NVL Real estate 537 1,079 101% 2,688 2,599 -3% 3,225 3,678 14%
PDR Real estate 252 282 12% 1,613 2,665 65% 1,865 2,947 58%
KHG Real estate 7 50 585% 407 946 133% 414 996 141%
IJC Real estate 292 174 -40% 329 624 90% 621 798 29%
CRE Real estate 123 145 18% 335 860 157% 458 1,005 119%
Appendix – Earnings forecast

Mirae Asset Securities (Vietnam) Research79 | Vietnam focus: Strategy
Net profit forecast (VNDbn)
Stock Industry 1Q21 1Q22 YoY Last 9M21 Last 9M22F YoY FY21 FY22F YoY
SZC Industrial parks 80 75 -6% 244 526 116% 324 601 85%
NTC Industrial parks 113 82 -27% 181 764 322% 294 846 188%
SIP Industrial parks 186 230 24% 647 610 -6% 833 840 1%
IDC Industrial parks 53 255 381% 400 2,048 412% 453 2,303 408%
PHR Industrial parks 88 299 240% 490 940 92% 578 1,239 114%
MWG Retail 1,338 1,444 8% 3,563 4,678 31% 4,901 6,122 25%
HPG Steel 7,006 8,206 17% 27,514 18,122 -34% 34,520 26,328 -24%
HSG Steel 1,035 234 -77% 3,278 2,778 -15% 4,313 3,012 -30%
NKG Steel 319 507 59% 1,906 1,125 -41% 2,225 1,632 -27%
FPT IT 906 1,239 37% 3,431 4,158 21% 4,337 5,397 24%
STK Textile 70 76 9% 208 216 4% 278 292 5%
TNG Textile 22 38 73% 211 204 -3% 233 242 4%
NT2 Utilities 115 160 39% 419 384 -8% 534 544 2%
PC1 Utilities 78 133 71% 613 581 -5% 691 714 3%
POW Utilities 508 721 42% 1,271 1,061 -17% 1,779 1,782 0%
PPC Utilities 138 80 -42% 149 435 192% 287 515 79%
REE Utilities 416 693 67% 1,439 1,302 -10% 1,855 1,995 8%
DVP Seaports 52 54 4% 225 250 11% 277 304 10%
GMD Seaports 172 319 85% 549 750 37% 721 1,069 48%
Source: Company data, Mirae Asset Vietnam Research (* HSG: FY end by September 30)
Appendix – Earnings forecast
Mirae Asset Securities (Vietnam) Research80 | Vietnam focus: Strategy
APPENDIX 1 Stock Ratings Industry Ratings
Buy : Relative performance of 20% or greater Overweight : Fundamentals are favorable or improving
Trading Buy : Relative performance of 10% or greater, but with volatility Neutral : Fundamentals are steady without any material changes
Hold : Relative performance of -10% and 10% Underweight : Fundamentals are unfavorable or worsening
Sell : Relative performance of -10%
Ratings and Target Price History (Share price (─), Target price (▬), Not covered (■), Buy (▲), Trading Buy (■), Hold (●), Sell (◆))* Our investment rating is a guide to the relative return of the stock versus the market over the next 12 months.* Although it is not part of the official ratings at Mirae Asset Securities (Vietnam) JSC, we may call a trading opportunity in case there is a technical or short-term material development.* The target price was determined by the research analyst through valuation methods discussed in this report, in part based on the analyst’s estimate of future earnings.* The achievement of the target price may be impeded by risks related to the subject securities and companies, as well as general market and economic conditions.
Analyst CertificationThe research analysts who prepared this report (the “Analysts”) are subject to Vietnamese securities regulations. They are neither registered as research analysts in any otherjurisdiction nor subject to the laws and regulations thereof. Opinions expressed in this publication about the subject securities and companies accurately reflect the personalviews of the Analysts primarily responsible for this report. Mirae Asset Securities (Vietnam) JSC (MAS) policy prohibits its Analysts and members of their households fromowning securities of any company in the Analyst’s area of coverage, and the Analysts do not serve as an officer, director or advisory board member of the subject companies.Except as otherwise specified herein, the Analysts have not received any compensation or any other benefits from the subject companies in the past 12 months and have notbeen promised the same in connection with this report. No part of the compensation of the Analysts was, is, or will be directly or indirectly related to the specificrecommendations or views contained in this report but, like all employees of MAS, the Analysts receive compensation that is determined by overall firm profitability, whichincludes revenues from, among other business units, the institutional equities, investment banking, proprietary trading and private client division. At the time of publication ofthis report, the Analysts do not know or have reason to know of any actual, material conflict of interest of the Analyst or MAS except as otherwise stated herein.
DisclaimersThis report is published by Mirae Asset Securities (Vietnam) JSC (MAS), a broker-dealer registered in the Socialist Republic of Vietnam and a member of the Vietnam StockExchanges. Information and opinions contained herein have been compiled in good faith and from sources believed to be reliable, but such information has not beenindependently verified and MAS makes no guarantee, representation or warranty, express or implied, as to the fairness, accuracy, completeness or correctness of theinformation and opinions contained herein or of any translation into English from the Vietnamese language. In case of an English translation of a report prepared in theVietnamese language, the original Vietnamese language report may have been made available to investors in advance of this report.The intended recipients of this report are sophisticated institutional investors who have substantial knowledge of the local business environment, its common practices, lawsand accounting principles and no person whose receipt or use of this report would violate any laws and regulations or subject MAS and its affiliates to registration or licensingrequirements in any jurisdiction shall receive or make any use hereof.This report is for general information purposes only and it is not and shall not be construed as an offer or a solicitation of an offer to effect transactions in any securities orother financial instruments. The report does not constitute investment advice to any person and such person shall not be treated as a client of MAS by virtue of receiving thisreport. This report does not take into account the particular investment objectives, financial situations, or needs of individual clients. The report is not to be relied upon insubstitution for the exercise of independent judgment. Information and opinions contained herein are as of the date hereof and are subject to change without notice. The priceand value of the investments referred to in this report and the income from them may depreciate or appreciate, and investors may incur losses on investments. Pastperformance is not a guide to future performance. Future returns are not guaranteed, and a loss of original capital may occur. MAS, its affiliates and their directors, officers,employees and agents do not accept any liability for any loss arising out of the use hereof.MAS may have issued other reports that are inconsistent with, and reach different conclusions from, the opinions presented in this report. The reports may reflect differentassumptions, views and analytical methods of the analysts who prepared them. MAS may make investment decisions that are inconsistent with the opinions and viewsexpressed in this research report. MAS, its affiliates and their directors, officers, employees and agents may have long or short positions in any of the subject securities at anytime and may make a purchase or sale, or offer to make a purchase or sale, of any such securities or other financial instruments from time to time in the open market orotherwise, in each case either as principals or agents. MAS and its affiliates may have had, or may be expecting to enter into, business relationships with the subject companiesto provide investment banking, market-making or other financial services as are permitted under applicable laws and regulations.No part of this document may be copied or reproduced in any manner or form or redistributed or published, in whole or in part, without the prior written consent of MAS.
Mirae Asset Securities (Vietnam) Research81 | Vietnam focus: Strategy
Mirae Asset Securities International Network Mirae Asset Securities Co., Ltd. (Seoul) Mirae Asset Securities (HK) Ltd. Mirae Asset Securities (UK) Ltd.One-Asia Equity Sales TeamMirae Asset Center 1 Building 26 Eulji-ro 5-gil, Jung-gu, Seoul 04539Korea
Units 8501, 8507-8508, 85/FInternational Commerce Centre1 Austin Road WestKowloonHong Kong
41st Floor, Tower 4225 Old Broad Street,London EC2N 1HQUnited Kingdom
Tel: 82-2-3774-2124 Tel: 852-2845-6332 Tel: 44-20-7982-8000
Mirae Asset Securities (USA) Inc. Mirae Asset Wealth Management (USA) Inc. Mirae Asset Wealth Management (Brazil) CCTVM
810 Seventh Avenue, 37th Floor New York, NY 10019USA
555 S. Flower Street, Suite 4410, Los Angeles, California 90071USA
Rua Funchal, 418, 18th Floor, E-Tower Building Vila OlimpiaSao Paulo - SP04551-060Brazil
Tel: 1-212-407-1000 Tel: 1-213-262-3807 Tel: 55-11-2789-2100
PT. Mirae Asset Sekuritas Indonesia Mirae Asset Securities (Singapore) Pte. Ltd. Mirae Asset Securities (Vietnam) JSCDistrict 8, Treasury Tower Building Lt. 50Sudirman Central Business DistrictJl. Jend. Sudirman, Kav. 52-54Jakarta Selatan 12190Indonesia
6 Battery Road, #11-01Singapore 049909Republic of Singapore
7F, Le Meridien Building3C Ton Duc Thang St.District 1, Ben Nghe Ward, Ho Chi Minh CityVietnam
Tel: 62-21-5088-7000 Tel: 65-6671-9845 Tel: 84-8-3911-0633 (ext.110)
Mirae Asset Securities Mongolia UTsK LLC Mirae Asset Investment Advisory (Beijing) Co., Ltd Beijing Representative Office
#406, Blue Sky Tower, Peace Avenue 171 Khoroo, Sukhbaatar DistrictUlaanbaatar 14240Mongolia
2401B, 24th Floor, East Tower, Twin TowersB12 Jianguomenwai Avenue, Chaoyang District Beijing 100022China
2401A, 24th Floor, East Tower, Twin TowersB12 Jianguomenwai Avenue, Chaoyang District Beijing 100022China
Tel: 976-7011-0806 Tel: 86-10-6567-9699 Tel: 86-10-6567-9699 (ext. 3300)
Shanghai Representative Office Ho Chi Minh Representative Office MiraeAsset Capital Markets (India) Private Limited38T31, 38F, Shanghai World Financial Center100 Century Avenue, Pudong New Area Shanghai 200120China
7F, Saigon Royal Building91 Pasteur St.District 1, Ben Nghe Ward, Ho Chi Minh CityVietnam
Unit No. 506, 5th Floor, Windsor Bldg., Off CST Road, Kalina, Santacruz (East), Mumbai – 400098India
Tel: 86-21-5013-6392 Tel: 84-8-3910-7715 Tel: 91-22-62661336
Copyright © 2022 FDOKUMEN