Emart - When will SSG.com turn a profit? - Mirae Asset ...
10
Emart ( 139480 KS) When will SSG.com turn a profit? Use of offline stores is key to shortening time to breakeven for SSG.com With the widespread adoption of fast delivery services, we believe SSG.com will continue to expand its core fulfillment center capabilities. In particular, we think the use of Emart stores to increase SSG.com’s core fulfillment capabilities could shorten the online platform’s time to breakeven. In our view, SSG.com, which has lower fixed costs than offline operations, needs to reduce variable costs. Aside from commissions that inevitably arise from sales, transportation costs account for the biggest percentage of SSG.com’s SG&A expenses. This is because, unlike Coupang or Market Kurly, SSG.com does not have an in-house delivery network. If SSG.com increases its delivery capacity by expanding picking & packing (PP) centers (e.g., the Cheonggyecheon Emart store) and setting up core fulfillment centers, this would allow the online platform to 1) save costs related to last-mile delivery (by reducing delivery distances) and 2) improve its transportation spending efficiency. The expansion of core fulfillment centers could also lower the need for spending on large distribution centers (core fulfillment centers cost W3-6bn vs. W80-180bn for large distribution centers). Transfer of fixed costs could improve offline profits If Emart uses some or all of its stores as core fulfillment centers for SSG.com (i.e., reducing sales floor space and using it instead for delivery), we think this could lead to fixed cost savings and thus improve profits. Emart’s same-store sales (SSS) growth was -0.6% in 2017, -2.8% in 2018, and -3.4% in 2019. Even if Emart’s floor space is partially used for fulfillment, the resulting revenue decline of the offline business should be fairly limited. For the offline business, the biggest source of costs (aside from commissions) are labor and depreciation. If Emart utilizes some of its stores to boost SSG.com’s delivery capabilities, this could help it transfer fixed costs to the online segment. SSG.com’s cost pressures could increase as a result, but the impact on SG&A expenses is likely to be partially offset by a decrease in transportation costs tied to sales. Maintain Buy and TP of W190,000 We maintain our Buy call and target price of W190,000 on Emart. We believe downside risks to 2020-21 EPS stemming from the spread of COVID-19 are limited, as a rise in average ticket caused by panic buying is likely to offset the impact of in-store traffic declines. SSG.com, meanwhile, is seeing 1) new customer inflows and 2) higher average ticket. We expect SSG.com to be able to retain these new customers, resulting in a quantum leap for its customer base and transaction value compared to pre- outbreak levels; this is a factor that justifies Emart’s valuation. Emart is currently trading at a 2020F P/E of 13.7x, higher than the level seen in 2018, when offline weakness and online expectations had not been priced in. Looking ahead, we believe the aggressive utilization of Emart’s stores will improve overall profits, supporting a valuation re-rating. We hence continue to recommend Buy on the stock and maintain it as our top pick in retail. FY (Dec.) 12/16 12/17 12/18 12/19 12/20F 12/21F Revenue (Wbn) 14,615 15,515 17,049 19,063 20,045 21,270 OP (Wbn) 569 585 463 151 232 312 OP Margin (%) 3.9 3.8 2.7 0.8 1.2 1.5 NP (Wbn) 376 616 450 234 219 288 EPS (W) 13,497 22,101 16,150 8,391 7,844 10,323 ROE (%) 5.1 7.7 5.5 2.8 2.5 3.2 P/E (x) 13.6 12.3 11.3 15.2 13.7 10.4 P/B (x) 0.7 0.9 0.6 0.4 0.3 0.3 Dividend Yield (%) 0.8 0.6 1.1 1.6 1.9 1.9 Note: All figures are based on consolidated K-IFRS; NP refers to net profit attributable to controlling interests Source: Company data, Mirae Asset Daewoo Research estimates Retail Company Report March 31, 2020 (Maintain) Buy Target Price (12M, W) 190,000 Share Price (03/30/20, W) 107,500 Expected Return 77% OP (20F, Wbn) 232 Consensus OP (20F, Wbn) 253 EPS Growth (20F, %) -6.5 Market EPS Growth (20F, %) 25.0 P/E (20F, x) 13.7 Market P/E (20F, x) 9.7 KOSPI 1,717.12 Market Cap (Wbn) 2,997 Shares Outstanding (mn) 28 Free Float (%) 68.2 Foreign Ownership (%) 32.7 Beta (12M) 0.51 52-Week Low 97,900 52-Week High 181,500 (%) 1M 6M 12M Absolute 2.4 -4.9 -37.5 Relative 18.5 14.3 -22.1 Mirae Asset Daewoo Co., Ltd. [ Retail ] Myoungjoo Kim +822-3774-1458 [email protected] Minjeong Kyeong +822-3774-1437 [email protected] 50 60 70 80 90 100 110 3.19 7.19 11.19 3.20 Emart KOSPI
-
Upload
khangminh22 -
Category
Documents
-
view
0 -
download
0
Transcript of Emart - When will SSG.com turn a profit? - Mirae Asset ...

Emart (139480 KS)
When will SSG.com turn a profit?
Use of offline stores is key to shortening time to breakeven for SSG.com
With the widespread adoption of fast delivery services, we believe SSG.com will
continue to expand its core fulfillment center capabilities. In particular, we think the
use of Emart stores to increase SSG.com’s core fulfillment capabilities could shorten
the online platform’s time to breakeven. In our view, SSG.com, which has lower fixed
costs than offline operations, needs to reduce variable costs.
Aside from commissions that inevitably arise from sales, transportation costs account
for the biggest percentage of SSG.com’s SG&A expenses. This is because, unlike
Coupang or Market Kurly, SSG.com does not have an in-house delivery network. If
SSG.com increases its delivery capacity by expanding picking & packing (PP) centers
(e.g., the Cheonggyecheon Emart store) and setting up core fulfillment centers, this
would allow the online platform to 1) save costs related to last-mile delivery (by
reducing delivery distances) and 2) improve its transportation spending efficiency. The
expansion of core fulfillment centers could also lower the need for spending on large
distribution centers (core fulfillment centers cost W3-6bn vs. W80-180bn for large
distribution centers).
Transfer of fixed costs could improve offline profits
If Emart uses some or all of its stores as core fulfillment centers for SSG.com (i.e.,
reducing sales floor space and using it instead for delivery), we think this could lead to
fixed cost savings and thus improve profits. Emart’s same-store sales (SSS) growth was
-0.6% in 2017, -2.8% in 2018, and -3.4% in 2019. Even if Emart’s floor space is partially
used for fulfillment, the resulting revenue decline of the offline business should be
fairly limited.
For the offline business, the biggest source of costs (aside from commissions) are labor
and depreciation. If Emart utilizes some of its stores to boost SSG.com’s delivery
capabilities, this could help it transfer fixed costs to the online segment. SSG.com’s cost
pressures could increase as a result, but the impact on SG&A expenses is likely to be
partially offset by a decrease in transportation costs tied to sales.
Maintain Buy and TP of W190,000
We maintain our Buy call and target price of W190,000 on Emart. We believe downside
risks to 2020-21 EPS stemming from the spread of COVID-19 are limited, as a rise in
average ticket caused by panic buying is likely to offset the impact of in-store traffic
declines. SSG.com, meanwhile, is seeing 1) new customer inflows and 2) higher
average ticket. We expect SSG.com to be able to retain these new customers, resulting
in a quantum leap for its customer base and transaction value compared to pre-
outbreak levels; this is a factor that justifies Emart’s valuation.
Emart is currently trading at a 2020F P/E of 13.7x, higher than the level seen in 2018,
when offline weakness and online expectations had not been priced in. Looking ahead,
we believe the aggressive utilization of Emart’s stores will improve overall profits,
supporting a valuation re-rating. We hence continue to recommend Buy on the stock
and maintain it as our top pick in retail.
FY (Dec.) 12/16 12/17 12/18 12/19 12/20F 12/21F
Revenue (Wbn) 14,615 15,515 17,049 19,063 20,045 21,270
OP (Wbn) 569 585 463 151 232 312
OP Margin (%) 3.9 3.8 2.7 0.8 1.2 1.5
NP (Wbn) 376 616 450 234 219 288
EPS (W) 13,497 22,101 16,150 8,391 7,844 10,323
ROE (%) 5.1 7.7 5.5 2.8 2.5 3.2
P/E (x) 13.6 12.3 11.3 15.2 13.7 10.4
P/B (x) 0.7 0.9 0.6 0.4 0.3 0.3
Dividend Yield (%) 0.8 0.6 1.1 1.6 1.9 1.9
Note: All figures are based on consolidated K-IFRS; NP refers to net profit attributable to controlling interests
Source: Company data, Mirae Asset Daewoo Research estimates
Retail
Company Report
March 31, 2020
(Maintain) Buy
Target Price (12M, W) 190,000
Share Price (03/30/20, W) 107,500
Expected Return 77%
OP (20F, Wbn) 232
Consensus OP (20F, Wbn) 253
EPS Growth (20F, %) -6.5
Market EPS Growth (20F, %) 25.0
P/E (20F, x) 13.7
Market P/E (20F, x) 9.7
KOSPI 1,717.12
Market Cap (Wbn) 2,997
Shares Outstanding (mn) 28
Free Float (%) 68.2
Foreign Ownership (%) 32.7
Beta (12M) 0.51
52-Week Low 97,900
52-Week High 181,500
(%) 1M 6M 12M
Absolute 2.4 -4.9 -37.5
Relative 18.5 14.3 -22.1
Mirae Asset Daewoo Co., Ltd.
[Retail]
Myoungjoo Kim +822-3774-1458 [email protected]
Minjeong Kyeong +822-3774-1437 [email protected]
50
60
70
80
90
100
110
3.19 7.19 11.19 3.20
Emart KOSPI
Emart
Mirae Asset Daewoo Research 2
March 31, 2020
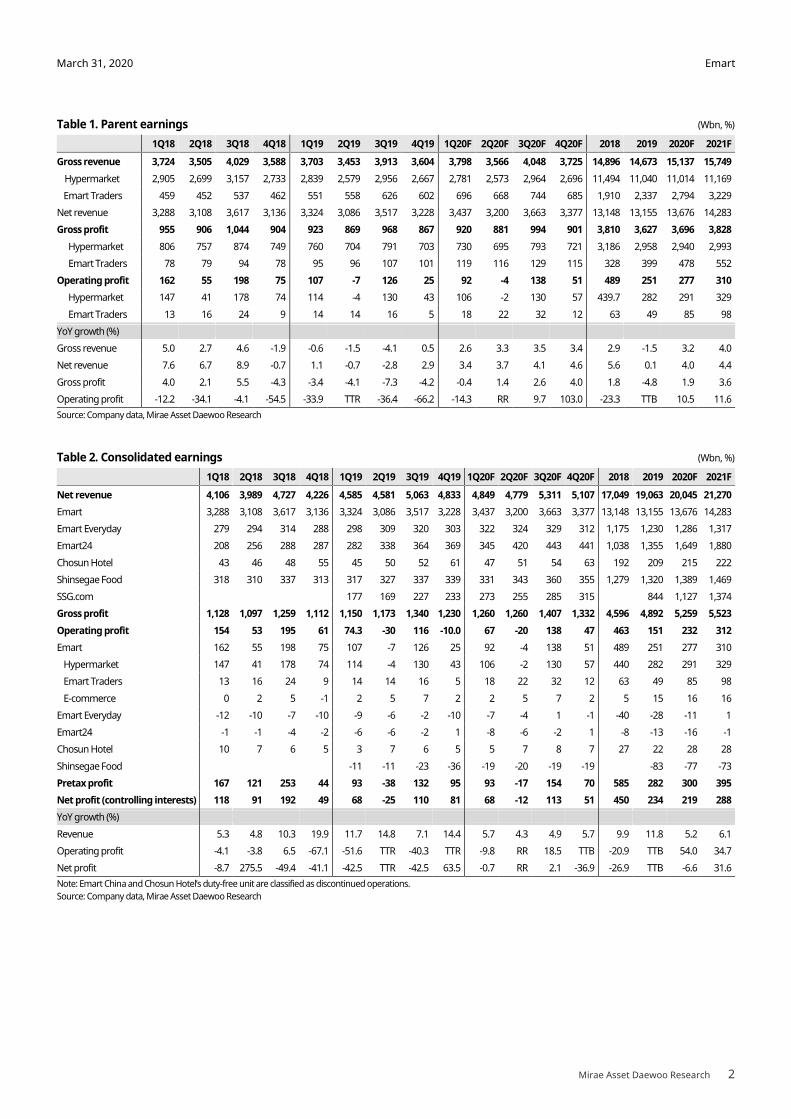
Table 1. Parent earnings (Wbn, %)
1Q18 2Q18 3Q18 4Q18 1Q19 2Q19 3Q19 4Q19 1Q20F 2Q20F 3Q20F 4Q20F 2018 2019 2020F 2021F
Gross revenue 3,724 3,505 4,029 3,588 3,703 3,453 3,913 3,604 3,798 3,566 4,048 3,725 14,896 14,673 15,137 15,749
Hypermarket 2,905 2,699 3,157 2,733 2,839 2,579 2,956 2,667 2,781 2,573 2,964 2,696 11,494 11,040 11,014 11,169
Emart Traders 459 452 537 462 551 558 626 602 696 668 744 685 1,910 2,337 2,794 3,229
Net revenue 3,288 3,108 3,617 3,136 3,324 3,086 3,517 3,228 3,437 3,200 3,663 3,377 13,148 13,155 13,676 14,283
Gross profit 955 906 1,044 904 923 869 968 867 920 881 994 901 3,810 3,627 3,696 3,828
Hypermarket 806 757 874 749 760 704 791 703 730 695 793 721 3,186 2,958 2,940 2,993
Emart Traders 78 79 94 78 95 96 107 101 119 116 129 115 328 399 478 552
Operating profit 162 55 198 75 107 -7 126 25 92 -4 138 51 489 251 277 310
Hypermarket 147 41 178 74 114 -4 130 43 106 -2 130 57 439.7 282 291 329
Emart Traders 13 16 24 9 14 14 16 5 18 22 32 12 63 49 85 98
YoY growth (%)
Gross revenue 5.0 2.7 4.6 -1.9 -0.6 -1.5 -4.1 0.5 2.6 3.3 3.5 3.4 2.9 -1.5 3.2 4.0
Net revenue 7.6 6.7 8.9 -0.7 1.1 -0.7 -2.8 2.9 3.4 3.7 4.1 4.6 5.6 0.1 4.0 4.4
Gross profit 4.0 2.1 5.5 -4.3 -3.4 -4.1 -7.3 -4.2 -0.4 1.4 2.6 4.0 1.8 -4.8 1.9 3.6
Operating profit -12.2 -34.1 -4.1 -54.5 -33.9 TTR -36.4 -66.2 -14.3 RR 9.7 103.0 -23.3 TTB 10.5 11.6
Source: Company data, Mirae Asset Daewoo Research
Table 2. Consolidated earnings (Wbn, %)
1Q18 2Q18 3Q18 4Q18 1Q19 2Q19 3Q19 4Q19 1Q20F 2Q20F 3Q20F 4Q20F 2018 2019 2020F 2021F
Net revenue 4,106 3,989 4,727 4,226 4,585 4,581 5,063 4,833 4,849 4,779 5,311 5,107 17,049 19,063 20,045 21,270
Emart 3,288 3,108 3,617 3,136 3,324 3,086 3,517 3,228 3,437 3,200 3,663 3,377 13,148 13,155 13,676 14,283
Emart Everyday 279 294 314 288 298 309 320 303 322 324 329 312 1,175 1,230 1,286 1,317
Emart24 208 256 288 287 282 338 364 369 345 420 443 441 1,038 1,355 1,649 1,880
Chosun Hotel 43 46 48 55 45 50 52 61 47 51 54 63 192 209 215 222
Shinsegae Food 318 310 337 313 317 327 337 339 331 343 360 355 1,279 1,320 1,389 1,469
SSG.com 177 169 227 233 273 255 285 315 844 1,127 1,374
Gross profit 1,128 1,097 1,259 1,112 1,150 1,173 1,340 1,230 1,260 1,260 1,407 1,332 4,596 4,892 5,259 5,523
Operating profit 154 53 195 61 74.3 -30 116 -10.0 67 -20 138 47 463 151 232 312
Emart 162 55 198 75 107 -7 126 25 92 -4 138 51 489 251 277 310
Hypermarket 147 41 178 74 114 -4 130 43 106 -2 130 57 440 282 291 329
Emart Traders 13 16 24 9 14 14 16 5 18 22 32 12 63 49 85 98
E-commerce 0 2 5 -1 2 5 7 2 2 5 7 2 5 15 16 16
Emart Everyday -12 -10 -7 -10 -9 -6 -2 -10 -7 -4 1 -1 -40 -28 -11 1
Emart24 -1 -1 -4 -2 -6 -6 -2 1 -8 -6 -2 1 -8 -13 -16 -1
Chosun Hotel 10 7 6 5 3 7 6 5 5 7 8 7 27 22 28 28
Shinsegae Food -11 -11 -23 -36 -19 -20 -19 -19 -83 -77 -73
Pretax profit 167 121 253 44 93 -38 132 95 93 -17 154 70 585 282 300 395
Net profit (controlling interests) 118 91 192 49 68 -25 110 81 68 -12 113 51 450 234 219 288
YoY growth (%)
Revenue 5.3 4.8 10.3 19.9 11.7 14.8 7.1 14.4 5.7 4.3 4.9 5.7 9.9 11.8 5.2 6.1
Operating profit -4.1 -3.8 6.5 -67.1 -51.6 TTR -40.3 TTR -9.8 RR 18.5 TTB -20.9 TTB 54.0 34.7
Net profit -8.7 275.5 -49.4 -41.1 -42.5 TTR -42.5 63.5 -0.7 RR 2.1 -36.9 -26.9 TTB -6.6 31.6
Note: Emart China and Chosun Hotel’s duty-free unit are classified as discontinued operations.
Source: Company data, Mirae Asset Daewoo Research
Emart
Mirae Asset Daewoo Research 3
March 31, 2020
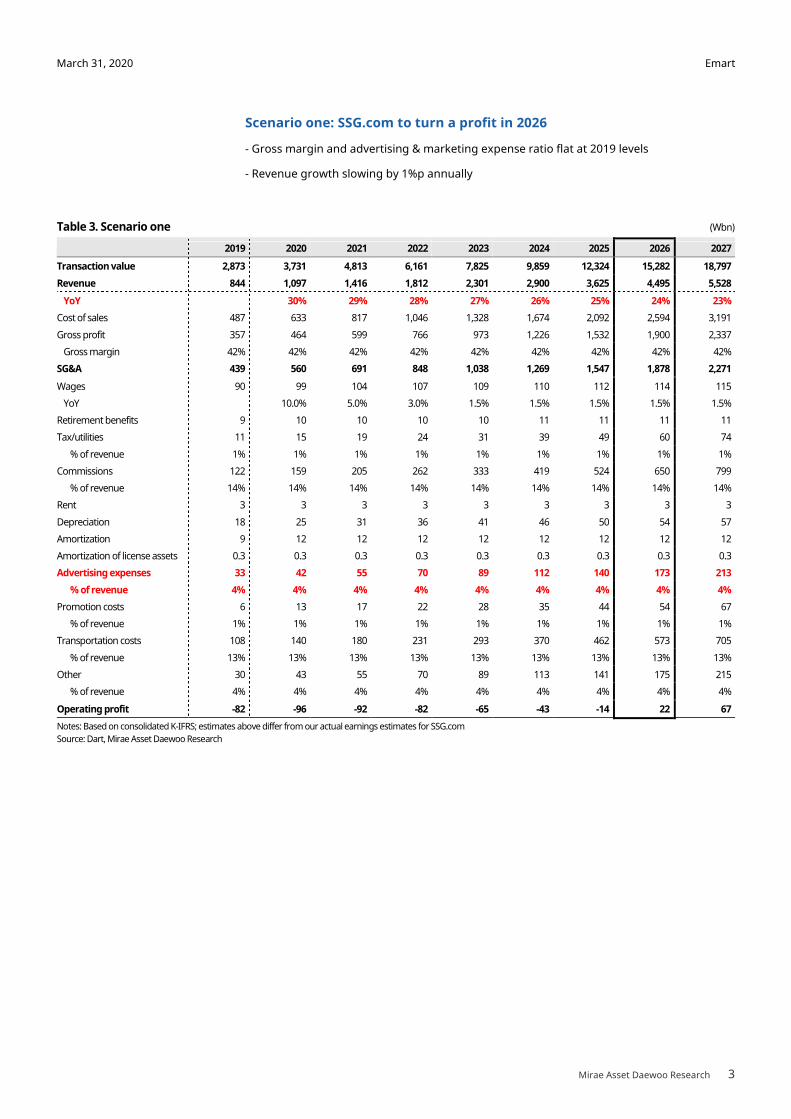
Scenario one: SSG.com to turn a profit in 2026
- Gross margin and advertising & marketing expense ratio flat at 2019 levels
- Revenue growth slowing by 1%p annually
Table 3. Scenario one (Wbn)
2019 2020 2021 2022 2023 2024 2025 2026 2027
Transaction value 2,873 3,731 4,813 6,161 7,825 9,859 12,324 15,282 18,797
Revenue 844 1,097 1,416 1,812 2,301 2,900 3,625 4,495 5,528
YoY
30% 29% 28% 27% 26% 25% 24% 23%
Cost of sales 487 633 817 1,046 1,328 1,674 2,092 2,594 3,191
Gross profit 357 464 599 766 973 1,226 1,532 1,900 2,337
Gross margin 42% 42% 42% 42% 42% 42% 42% 42% 42%
SG&A 439 560 691 848 1,038 1,269 1,547 1,878 2,271
Wages 90 99 104 107 109 110 112 114 115
YoY
10.0% 5.0% 3.0% 1.5% 1.5% 1.5% 1.5% 1.5%
Retirement benefits 9 10 10 10 10 11 11 11 11
Tax/utilities 11 15 19 24 31 39 49 60 74
% of revenue 1% 1% 1% 1% 1% 1% 1% 1% 1%
Commissions 122 159 205 262 333 419 524 650 799
% of revenue 14% 14% 14% 14% 14% 14% 14% 14% 14%
Rent 3 3 3 3 3 3 3 3 3
Depreciation 18 25 31 36 41 46 50 54 57
Amortization 9 12 12 12 12 12 12 12 12
Amortization of license assets 0.3 0.3 0.3 0.3 0.3 0.3 0.3 0.3 0.3
Advertising expenses 33 42 55 70 89 112 140 173 213
% of revenue 4% 4% 4% 4% 4% 4% 4% 4% 4%
Promotion costs 6 13 17 22 28 35 44 54 67
% of revenue 1% 1% 1% 1% 1% 1% 1% 1% 1%
Transportation costs 108 140 180 231 293 370 462 573 705
% of revenue 13% 13% 13% 13% 13% 13% 13% 13% 13%
Other 30 43 55 70 89 113 141 175 215
% of revenue 4% 4% 4% 4% 4% 4% 4% 4% 4%
Operating profit -82 -96 -92 -82 -65 -43 -14 22 67
Notes: Based on consolidated K-IFRS; estimates above differ from our actual earnings estimates for SSG.com
Source: Dart, Mirae Asset Daewoo Research

Emart
Mirae Asset Daewoo Research 4
March 31, 2020
Scenario two: SSG.com to turn a profit in 2025
- Gross margin expanding 0.1%p annually; advertising & marketing expense ratio falling
0.1%p annually
- Revenue growth slowing by 1%p annually
Table 4. Scenario two (Wbn)
2019 2020 2021 2022 2023 2024 2025 2026 2027
Transaction value 2,873 3,731 4,813 6,161 7,825 9,859 12,324 15,282 18,797
Revenue 844 1,097 1,416 1,812 2,301 2,900 3,625 4,495 5,528
YoY 30% 29% 28% 27% 26% 25% 24% 23%
Cost of sales 487 632 814 1,041 1,319 1,659 2,070 2,563 3,147
Gross profit 357 465 601 772 982 1,240 1,554 1,932 2,382
Gross margin 42% 42% 42% 43% 43% 43% 43% 43% 43%
SG&A 439 559 688 843 1,029 1,254 1,525 1,847 2,227
Wages 90 99 104 107 109 110 112 114 115
YoY 10.0% 5.0% 3.0% 1.5% 1.5% 1.5% 1.5% 1.5%
Retirement benefits 9 10 10 10 10 11 11 11 11
Tax/utilities 11 15 19 24 31 39 49 60 74
% of revenue 1% 1% 1% 1% 1% 1% 1% 1% 1%
Commissions 122 159 205 262 333 419 524 650 799
% of revenue 14% 14% 14% 14% 14% 14% 14% 14% 14%
Rent 3 3 3 3 3 3 3 3 3
Depreciation 18 25 31 36 41 46 50 54 57
Amortization 9 12 12 12 12 12 12 12 12
Amortization of license assets 0.3 0.3 0.3 0.3 0.3 0.3 0.3 0.3 0.3
Advertising expenses 33 41 52 64 79 97 118 142 169
% of revenue 4% 4% 4% 4% 3% 3% 3% 3% 3%
Promotion costs 6 13 17 22 28 35 44 54 67
% of revenue 1% 1% 1% 1% 1% 1% 1% 1% 1%
Transportation costs 108 140 180 231 293 370 462 573 705
% of revenue 13% 13% 13% 13% 13% 13% 13% 13% 13%
Other 30 43 55 70 89 113 141 175 215
% of revenue 4% 4% 4% 4% 4% 4% 4% 4% 4%
Operating profit -82 -93 -86 -71 -47 -14 29 85 155
Notes: Based on consolidated K-IFRS; estimates above differ from our actual earnings estimates for SSG.com
Source: Dart, Mirae Asset Daewoo Research

Emart
Mirae Asset Daewoo Research 5
March 31, 2020
Scenario three: SSG.com to turn a profit in 2026
- Gross margin remaining at 2019 level; advertising & marketing expense ratio expanding
by 0.1%p annually
- Revenue growth picking up 0.1%p annually
Table 5. Scenario three (Wbn)
2019 2020 2021 2022 2023 2024 2025 2026 2027
Transaction value 2,873 3,731 4,854 6,321 8,236 10,739 14,015 18,303 23,922
Revenue 844 1,097 1,428 1,859 2,422 3,159 4,122 5,383 7,036
YoY 30% 30% 30% 30% 30% 31% 31% 31%
Cost of sales 487 633 824 1,073 1,398 1,823 2,379 3,107 4,061
Gross profit 357 464 604 786 1,024 1,335 1,743 2,276 2,975
Gross margin 42% 42% 42% 42% 42% 42% 42% 42% 42%
SG&A 439 561 698 871 1,093 1,382 1,758 2,249 2,892
Wages 90 99 104 107 109 110 112 114 115
YoY 10.0% 5.0% 3.0% 1.5% 1.5% 1.5% 1.5% 1.5%
Retirement benefits 9 10 10 10 10 11 11 11 11
Tax/utilities 11 15 19 25 32 42 55 72 94
% of revenue 1% 1% 1% 1% 1% 1% 1% 1% 1%
Commission 122 159 206 269 350 457 596 778 1,017
% of revenue 14% 14% 14% 14% 14% 14% 14% 14% 14%
Rent 3 3 3 3 3 3 3 3 3
Depreciation 18 25 31 36 41 46 50 54 57
Amortization 9 12 12 12 12 12 12 12 12
Amortization of license assets 0.3 0.3 0.3 0.3 0.3 0.3 0.3 0.3 0.3
Advertising expenses 33 43 58 77 103 137 183 245 327
% of revenue 4% 4% 4% 4% 4% 4% 4% 5% 5%
Promotion costs 6 13 17 22 29 38 50 65 85
% of sales 1% 1% 1% 1% 1% 1% 1% 1% 1%
Transportation costs 108 140 182 237 309 403 525 686 897
% of revenue 13% 13% 13% 13% 13% 13% 13% 13% 13%
Other 30 43 55 72 94 123 160 209 273
% of revenue 4% 4% 4% 4% 4% 4% 4% 4% 4%
Operating profit -82 -97 -94 -85 -69 -46 -15 27 82
Notes: Based on consolidated K-IFRS; estimates above differ from our actual earnings estimates for SSG.com
Source: Dart, Mirae Asset Daewoo Research

Emart
Mirae Asset Daewoo Research 6
March 31, 2020
Scenario four: SSG.com to turn a profit in 2024
- Aggressive utilization of offline stores as online fulfillment centers
- Last-mile delivery cost reductions � Ratio of transportation costs to total revenue falling
0.5%p annually
- Use of offline stores � Higher labor and depreciation expenses vs. previous assumptions
- Revenue growth picking up 0.1%p annually
Table 6. Scenario four (Wbn)
2019 2020 2021 2022 2023 2024 2025 2026 2027
Transaction value 2,873 3,731 4,854 6,321 8,236 10,739 14,015 18,303 23,922
Revenue 844 1,097 1,428 1,859 2,422 3,159 4,122 5,383 7,036
YoY 30% 30% 30% 30% 30% 31% 31% 31%
Cost of sales 487 633 824 1,073 1,398 1,823 2,379 3,107 4,061
Gross profit 357 464 604 786 1,024 1,335 1,743 2,276 2,975
Gross margin 42% 42% 42% 42% 42% 42% 42% 42% 42%
SG&A 439 560 693 858 1,064 1,325 1,678 2,136 2,730
Wages 90 102 110 117 122 127 133 139 145
YoY 13.0% 8.0% 6.0% 4.5% 4.5% 4.5% 4.5% 4.5%
Retirement benefits 9 10 11 11 12 12 13 13 14
Tax/utilities 11 15 19 25 32 42 55 72 94
% of revenue 1% 1% 1% 1% 1% 1% 1% 1% 1%
Commissions 122 159 206 269 350 457 596 778 1,017
% of revenue 14% 14% 14% 14% 14% 14% 14% 14% 14%
Rent 3 3 3 3 3 3 3 3 3
Depreciation 18 27 37 46 56 66 75 85 94
Amortization 9 12 12 12 12 12 12 12 12
Amortization of license assets 0.3 0.3 0.3 0.3 0.3 0.3 0.3 0.3 0.3
Advertising expenses 33 42 55 72 93 122 159 207 271
% of revenue 4% 4% 4% 4% 4% 4% 4% 4% 4%
Promotion cost 6 13 17 22 29 38 50 65 85
% of revenue 1% 1% 1% 1% 1% 1% 1% 1% 1%
Transportation costs 108 134 168 209 260 324 422 552 721
% of revenue 13% 12% 12% 11% 11% 10% 10% 10% 10%
Other 30 43 55 72 94 123 160 209 273
% of revenue 4% 4% 4% 4% 4% 4% 4% 4% 4%
Operating profit -82 -96 -90 -72 -40 10 64 140 244
Notes: Based on consolidated K-IFRS; estimates above differ from our actual earnings estimates for SSG.com
Source: Dart, Mirae Asset Daewoo Research

Emart
Mirae Asset Daewoo Research 7
March 31, 2020
Emart (139480 KS/Buy/TP: W190,000)
Comprehensive Income Statement (Summarized) Statement of Financial Condition (Summarized)
(Wbn) 12/18 12/19 12/20F 12/21F (Wbn) 12/18 12/19 12/20F 12/21F
Revenue 17,049 19,063 20,045 21,270 Current Assets 2,286 3,650 3,742 3,914
Cost of Sales 12,453 14,170 14,786 15,747 Cash and Cash Equivalents 284 681 638 647
Gross Profit 4,596 4,893 5,259 5,523 AR & Other Receivables 584 668 706 752
SG&A Expenses 4,133 4,742 5,027 5,211 Inventories 1,123 1,279 1,352 1,439
Operating Profit (Adj) 463 151 232 312 Other Current Assets 295 1,022 1,046 1,076
Operating Profit 463 151 232 312 Non-Current Assets 14,468 17,445 16,693 16,089
Non-Operating Profit 122 131 68 83 Investments in Associates 718 836 884 941
Net Financial Income -54 -105 -144 -139 Property, Plant and Equipment 10,404 10,004 9,210 8,537
Net Gain from Inv in Associates 37 74 82 95 Intangible Assets 288 1,319 1,269 1,225
Pretax Profit 585 282 300 395 Total Assets 16,754 21,095 20,435 20,003
Income Tax 126 58 74 97 Current Liabilities 4,998 5,406 5,535 4,811
Profit from Continuing Operations 459 224 226 298 AP & Other Payables 1,560 1,779 1,880 2,001
Profit from Discontinued Operations 17 0 0 0 Short-Term Financial Liabilities 1,674 1,657 1,574 594
Net Profit 476 224 226 298 Other Current Liabilities 1,764 1,970 2,081 2,216
Controlling Interests 450 234 219 288 Non-Current Liabilities 2,898 5,482 4,521 4,568
Non-Controlling Interests 26 -10 8 10 Long-Term Financial Liabilities 2,165 4,789 3,789 3,789
Total Comprehensive Profit 19 108 226 298 Other Non-Current Liabilities 733 693 732 779
Controlling Interests -4 122 372 490 Total Liabilities 7,896 10,888 10,056 9,380
Non-Controlling Interests 23 -13 -146 -192 Controlling Interests 8,172 8,809 8,973 9,207
EBITDA 993 1,033 1,077 1,029 Capital Stock 139 139 139 139
FCF (Free Cash Flow) -125 -139 1,206 1,178 Capital Surplus 4,237 4,237 4,237 4,237
EBITDA Margin (%) 5.8 5.4 5.4 4.8 Retained Earnings 2,773 2,794 2,959 3,193
Operating Profit Margin (%) 2.7 0.8 1.2 1.5 Non-Controlling Interests 685 1,398 1,406 1,416
Net Profit Margin (%) 2.6 1.2 1.1 1.4 Stockholders' Equity 8,857 10,207 10,379 10,623
Cash Flows (Summarized) Forecasts/Valuations (Summarized)
(Wbn) 12/18 12/19 12/20F 12/21F 12/18 12/19 12/20F 12/21F
Cash Flows from Op Activities 770 816 1,206 1,178 P/E (x) 11.3 15.2 13.7 10.4
Net Profit 476 224 226 298 P/CF (x) 4.8 3.1 2.6 2.6
Non-Cash Income and Expense 579 931 940 836 P/B (x) 0.6 0.4 0.3 0.3
Depreciation 503 849 794 673 EV/EBITDA (x) 9.2 10.0 7.6 7.0
Amortization 27 33 50 44 EPS (W) 16,150 8,391 7,844 10,323
Others 49 49 96 119 CFPS (W) 37,841 41,426 41,839 40,694
Chg in Working Capital -296 -217 135 163 BPS (W) 293,262 319,802 325,712 334,100
Chg in AR & Other Receivables 60 -9 -30 -36 DPS (W) 2,000 2,000 2,000 2,000
Chg in Inventories -163 -157 -72 -87 Payout ratio (%) 11.7 24.1 23.8 18.1
Chg in AP & Other Payables 43 58 67 81 Dividend Yield (%) 1.1 1.6 1.9 1.9
Income Tax Paid -63 -126 -74 -97 Revenue Growth (%) 9.9 11.8 5.2 6.1
Cash Flows from Inv Activities -817 -1,005 -65 -78 EBITDA Growth (%) -6.9 4.0 4.3 -4.5
Chg in PP&E -692 128 0 0 Operating Profit Growth (%) -20.9 -67.4 53.6 34.5
Chg in Intangible Assets -20 -20 0 0 EPS Growth (%) -26.9 -48.0 -6.5 31.6
Chg in Financial Assets 1,334 -227 -65 -78 Accounts Receivable Turnover (x) 40.0 38.2 37.1 37.1
Others -1,439 -886 0 0 Inventory Turnover (x) 16.0 15.9 15.2 15.2
Cash Flows from Fin Activities 103 581 -1,137 -1,034 Accounts Payable Turnover (x) 12.1 12.3 12.1 12.1
Chg in Financial Liabilities 139 2,608 -1,083 -980 ROA (%) 2.9 1.2 1.1 1.5
Chg in Equity 0 0 0 0 ROE (%) 5.5 2.8 2.5 3.2
Dividends Paid -82 -104 -54 -54 ROIC (%) 3.9 1.1 1.7 2.5
Others 46 -1,923 0 0 Liability to Equity Ratio (%) 89.1 106.7 96.9 88.3
Increase (Decrease) in Cash 60 397 -43 9 Current Ratio (%) 45.7 67.5 67.6 81.3
Beginning Balance 224 284 681 638 Net Debt to Equity Ratio (%) 38.0 53.2 36.5 26.1
Ending Balance 284 681 638 647 Interest Coverage Ratio (x) 5.7 1.0 1.6 2.2
Source: Company data, Mirae Asset Daewoo Research estimates

Emart
Mirae Asset Daewoo Research 8
March 31, 2020
APPENDIX 1
Important Disclosures & Disclaimers
2-Year Rating and Target Price History
Company (Code) Date Rating Target Price
Emart (139480) 05/28/2019 Buy 190,000
05/15/2019 Buy 240,000
05/15/2019 Buy 190,000
02/06/2019 Buy 240,000
07/24/2018 Buy 320,000
02/25/2018 Buy 375,000
Equity Ratings Distribution & Investment Banking Services
Buy Trading Buy Hold Sell
Equity Ratings Distribution 84.05% 9.82% 6.13% 0.00%
Investment Banking Services 76.67% 13.33% 10.00% 0.00%
* Based on recommendations in the last 12-months (as of December 31, 2019)
Disclosures
As of the publication date, Mirae Asset Daewoo Co., Ltd. has acted as a liquidity provider for equity-linked warrants backed by shares of Emart as an underlying
asset; other than this, Mirae Asset Daewoo has no other special interests in the covered companies.
Analyst Certification
The research analysts who prepared this report (the “Analysts”) are registered with the Korea Financial Investment Association and are subject to Korean
securities regulations. They are neither registered as research analysts in any other jurisdiction nor subject to the laws or regulations thereof. Each Analyst
responsible for the preparation of this report certifies that (i) all views expressed in this report accurately reflect the personal views of the Analyst about
any and all of the issuers and securities named in this report and (ii) no part of the compensation of the Analyst was, is, or will be directly or indirectly
related to the specific recommendations or views contained in this report. Mirae Asset Daewoo Co., Ltd. (“Mirae Asset Daewoo”) policy prohibits its Analysts
and members of their households from owning securities of any company in the Analyst’s area of coverage, and the Analysts do not serve as an officer,
director or advisory board member of the subject companies. Except as otherwise specified herein, the Analysts have not received any compensation or
any other benefits from the subject companies in the past 12 months and have not been promised the same in connection with this report. Like all
employees of Mirae Asset Daewoo, the Analysts receive compensation that is determined by overall firm profitability, which includes revenues from,
among other business units, the institutional equities, investment banking, proprietary trading and private client division. At the time of publication of this
report, the Analysts do not know or have reason to know of any actual, material conflict of interest of the Analyst or Mirae Asset Daewoo except as
otherwise stated herein.
Disclaimers
This report was prepared by Mirae Asset Daewoo, a broker-dealer registered in the Republic of Korea and a member of the Korea Exchange. Information
and opinions contained herein have been compiled in good faith and from sources believed to be reliable, but such information has not been
independently verified and Mirae Asset Daewoo makes no guarantee, representation or warranty, express or implied, as to the fairness, accuracy,
completeness or correctness of the information and opinions contained herein or of any translation into English from the Korean language. In case of an
English translation of a report prepared in the Korean language, the original Korean language report may have been made available to investors in
advance of this report.
The intended recipients of this report are sophisticated institutional investors who have substantial knowledge of the local business environment, its
common practices, laws and accounting principles and no person whose receipt or use of this report would violate any laws or regulations or subject Mirae
Asset Daewoo or any of its affiliates to registration or licensing requirements in any jurisdiction shall receive or make any use hereof.
This report is for general information purposes only and it is not and shall not be construed as an offer or a solicitation of an offer to effect transactions in
any securities or other financial instruments. The report does not constitute investment advice to any person and such person shall not be treated as a
client of Mirae Asset Daewoo by virtue of receiving this report. This report does not take into account the particular investment objectives, financial
Stock Ratings Industry Ratings
Buy : Relative performance of 20% or greater Overweight : Fundamentals are favorable or improving
Trading Buy : Relative performance of 10% or greater, but with volatility Neutral : Fundamentals are steady without any material changes
Hold : Relative performance of -10% and 10% Underweight : Fundamentals are unfavorable or worsening
Sell : Relative performance of -10%
Ratings and Target Price History (Share price (─), Target price (▬), Not covered (■), Buy (▲), Trading Buy (■), Hold (●), Sell (◆))
* Our investment rating is a guide to the relative return of the stock versus the market over the next 12 months.
* Although it is not part of the official ratings at Mirae Asset Daewoo Co., Ltd., we may call a trading opportunity in case there is a technical or short-term material
development.
* The target price was determined by the research analyst through valuation methods discussed in this report, in part based on the analyst’s estimate of future
earnings.
* The achievement of the target price may be impeded by risks related to the subject securities and companies, as well as general market and economic
conditions.
0
100,000
200,000
300,000
400,000
Apr 18 Apr 19 Mar 20
(W) Emart

Emart
Mirae Asset Daewoo Research 9
March 31, 2020
situations, or needs of individual clients. The report is not to be relied upon in substitution for the exercise of independent judgment. Information and
opinions contained herein are as of the date hereof and are subject to change without notice. The price and value of the investments referred to in this
report and the income from them may depreciate or appreciate, and investors may incur losses on investments. Past performance is not a guide to future
performance. Future returns are not guaranteed, and a loss of original capital may occur. Mirae Asset Daewoo, its affiliates and their directors, officers,
employees and agents do not accept any liability for any loss arising out of the use hereof.
Mirae Asset Daewoo may have issued other reports that are inconsistent with, and reach different conclusions from, the opinions presented in this report.
The reports may reflect different assumptions, views and analytical methods of the analysts who prepared them. Mirae Asset Daewoo may make
investment decisions that are inconsistent with the opinions and views expressed in this research report. Mirae Asset Daewoo, its affiliates and their
directors, officers, employees and agents may have long or short positions in any of the subject securities at any time and may make a purchase or sale, or
offer to make a purchase or sale, of any such securities or other financial instruments from time to time in the open market or otherwise, in each case
either as principals or agents. Mirae Asset Daewoo and its affiliates may have had, or may be expecting to enter into, business relationships with the
subject companies to provide investment banking, market-making or other financial services as are permitted under applicable laws and regulations.
No part of this document may be copied or reproduced in any manner or form or redistributed or published, in whole or in part, without the prior written
consent of Mirae Asset Daewoo.
Distribution
United Kingdom: This report is being distributed by Mirae Asset Securities (UK) Ltd. in the United Kingdom only to (i) investment professionals falling within
Article 19(5) of the Financial Services and Markets Act 2000 (Financial Promotion) Order 2005 (the “Order”), and (ii) high net worth companies and other
persons to whom it may lawfully be communicated, falling within Article 49(2)(A) to (E) of the Order (all such persons together being referred to as
“Relevant Persons”). This report is directed only at Relevant Persons. Any person who is not a Relevant Person should not act or rely on this report or any of
its contents.
United States: Mirae Asset Daewoo is not a registered broker-dealer in the United States and, therefore, is not subject to U.S. rules regarding the
preparation of research reports and the independence of research analysts. This report is distributed in the U.S. by Mirae Asset Securities (USA) Inc., a
member of FINRA/SIPC, to “major U.S. institutional investors” in reliance on the exemption from registration provided by Rule 15a-6(b)(4) under the U.S.
Securities Exchange Act of 1934, as amended. All U.S. persons that receive this document by their acceptance hereof represent and warrant that they are a
major U.S. institutional investor and have not received this report under any express or implied understanding that they will direct commission income to
Mirae Asset Daewoo or its affiliates. Any U.S. recipient of this document wishing to effect a transaction in any securities discussed herein should contact
and place orders with Mirae Asset Securities (USA) Inc. Mirae Asset Securities (USA) Inc. accepts responsibility for the contents of this report in the U.S.,
subject to the terms hereof, to the extent that it is delivered to a U.S. person other than a major U.S. institutional investor. Under no circumstances should
any recipient of this research report effect any transaction to buy or sell securities or related financial instruments through Mirae Asset Daewoo. The
securities described in this report may not have been registered under the U.S. Securities Act of 1933, as amended, and, in such case, may not be offered
or sold in the U.S. or to U.S. persons absent registration or an applicable exemption from the registration requirements.
Hong Kong: This report is distributed in Hong Kong by Mirae Asset Securities (HK) Limited, which is regulated by the Hong Kong Securities and Futures
Commission. The contents of this report have not been reviewed by any regulatory authority in Hong Kong. This report is for distribution only to
professional investors within the meaning of Part I of Schedule 1 to the Securities and Futures Ordinance of Hong Kong (Cap. 571, Laws of Hong Kong) and
any rules made thereunder and may not be redistributed in whole or in part in Hong Kong to any person.
All Other Jurisdictions: Customers in all other countries who wish to effect a transaction in any securities referenced in this report should contact Mirae
Asset Daewoo or its affiliates only if distribution to or use by such customer of this report would not violate applicable laws and regulations and not subject
Mirae Asset Daewoo and its affiliates to any registration or licensing requirement within such jurisdiction.

Emart
Mirae Asset Daewoo Research 10
March 31, 2020
Mirae Asset Daewoo International Network
Mirae Asset Daewoo Co., Ltd. (Seoul) Mirae Asset Securities (HK) Ltd. Mirae Asset Securities (UK) Ltd.
Global Equity Sales Team
Mirae Asset Center 1 Building
26 Eulji-ro 5-gil, Jung-gu, Seoul 04539
Korea
Units 8501, 8507-8508, 85/F
International Commerce Centre
1 Austin Road West
Kowloon
Hong Kong
41st Floor, Tower 42
25 Old Broad Street,
London EC2N 1HQ
United Kingdom
Tel: 82-2-3774-2124 Tel: 852-2845-6332 Tel: 44-20-7982-8000
Mirae Asset Securities (USA) Inc. Mirae Asset Wealth Management (USA) Inc. Mirae Asset Wealth Management (Brazil) CCTVM
810 Seventh Avenue, 37th Floor
New York, NY 10019
USA
555 S. Flower Street, Suite 4410,
Los Angeles, California 90071
USA
Rua Funchal, 418, 18th Floor, E-Tower Building Vila
Olimpia
Sao Paulo - SP
04551-060
Brasil
Tel: 1-212-407-1000 Tel: 1-213-262-3807 Tel: 55-11-2789-2100
PT. Mirae Asset Sekuritas Indonesia Mirae Asset Securities (Singapore) Pte. Ltd. Mirae Asset Securities (Vietnam) LLC
Equity Tower Building Lt. 50
Sudirman Central Business District
Jl. Jend. Sudirman, Kav. 52-53 Jakarta Selatan
12190
Indonesia
6 Battery Road, #11-01
Singapore 049909
Republic of Singapore
7F, Saigon Royal Building
91 Pasteur St.
District 1, Ben Nghe Ward, Ho Chi Minh City
Vietnam
Tel: 62-21-515-3281 Tel: 65-6671-9845 Tel: 84-8-3911-0633 (ext.110)
Mirae Asset Securities Mongolia UTsK LLC Mirae Asset Investment Advisory (Beijing) Co., Ltd Beijing Representative Office
#406, Blue Sky Tower, Peace Avenue 17
1 Khoroo, Sukhbaatar District
Ulaanbaatar 14240
Mongolia
2401B, 24th Floor, East Tower, Twin Towers
B12 Jianguomenwai Avenue, Chaoyang District
Beijing 100022
China
2401A, 24th Floor, East Tower, Twin Towers
B12 Jianguomenwai Avenue, Chaoyang District
Beijing 100022
China
Tel: 976-7011-0806 Tel: 86-10-6567-9699 Tel: 86-10-6567-9699 (ext. 3300)
Shanghai Representative Office Ho Chi Minh Representative Office
38T31, 38F, Shanghai World Financial Center
100 Century Avenue, Pudong New Area Shanghai
200120
China
7F, Saigon Royal Building
91 Pasteur St.
District 1, Ben Nghe Ward, Ho Chi Minh City
Vietnam
Tel: 86-21-5013-6392 Tel: 84-8-3910-7715