Mirae Asset Global Discovery Fund - UK
67
Mirae Asset Global Discovery Fund Société d’Investissement à Capital Variable Annual Report and Audited Financial Statements for the Year Ended 31 March 2019 R.C.S Luxembourg B138.578 No subscription may be accepted on the basis of this report. Subscriptions are accepted only on the basis of the current prospectus and key investor information documents accompanied by the latest annual report and the latest semi-annual report if available.
-
Upload
khangminh22 -
Category
Documents
-
view
0 -
download
0
Transcript of Mirae Asset Global Discovery Fund - UK
Mirae Asset Global Discovery FundSociété d’Investissement à Capital Variable
Annual Report and Audited Financial Statements for the Year Ended 31 March 2019
R.C.S Luxembourg B138.578
No subscription may be accepted on the basis of this report. Subscriptions are accepted only on the basis of the current prospectus and key investor information documents accompanied by the latest annual report and the latest semi-annual report if available.
2
Mirae Asset Global Discovery FundSociété d’Investissement à Capital Variable
Annual Report and Audited Financial Statements for the year ended 31 March 2019
Table of Content
General Information ....................................................................................................................... 3
Principal Investment Manager’s Report............................................................................................ 5
Independent Auditor’s Report .......................................................................................................... 7
Financial Statements ....................................................................................................................10Statement of Net AssetsStatement of Operations and Changes in Net Assets
Statistical Information ..................................................................................................................17
Notes to the Financial Statements ...............................................................................................25
Schedule of Investments ..............................................................................................................31Mirae Asset Korea Equity Fund*Mirae Asset China Sector Leader Equity FundMirae Asset India Sector Leader Equity FundMirae Asset Asia Sector Leader Equity FundMirae Asset Asia Pacific Equity FundMirae Asset GEM Sector Leader Equity FundMirae Asset Islamic Asia Sector Leader Equity Fund*Mirae Asset Asia Great Consumer Equity FundMirae Asset Global Great Consumer Equity FundMirae Asset Asia Pacific Health Care Opportunities Equity Fund*Mirae Asset Asia Growth Equity Fund*Mirae Asset China Growth Equity Fund*Mirae Asset Next Asia Pacific Equity Fund*Mirae Asset India Mid Cap Equity Fund*Mirae Asset Global Dynamic Bond Fund*Mirae Asset Asia Bond Fund*
Industrial & Geographical Classification .....................................................................................51Mirae Asset Korea Equity Fund*Mirae Asset China Sector Leader Equity FundMirae Asset India Sector Leader Equity FundMirae Asset Asia Sector Leader Equity FundMirae Asset Asia Pacific Equity FundMirae Asset GEM Sector Leader Equity FundMirae Asset Islamic Asia Sector Leader Equity Fund*Mirae Asset Asia Great Consumer Equity FundMirae Asset Global Great Consumer Equity FundMirae Asset Asia Pacific Health Care Opportunities Equity Fund*Mirae Asset Asia Growth Equity Fund*Mirae Asset China Growth Equity Fund*Mirae Asset Next Asia Pacific Equity Fund*Mirae Asset India Mid Cap Equity Fund*Mirae Asset Global Dynamic Bond Fund*Mirae Asset Asia Bond Fund*
Unaudited Supplementary Information ........................................................................................67
* Not authorized in Hong Kong and not available to Hong Kong Residents
Mirae Asset Global Discovery Fund
3
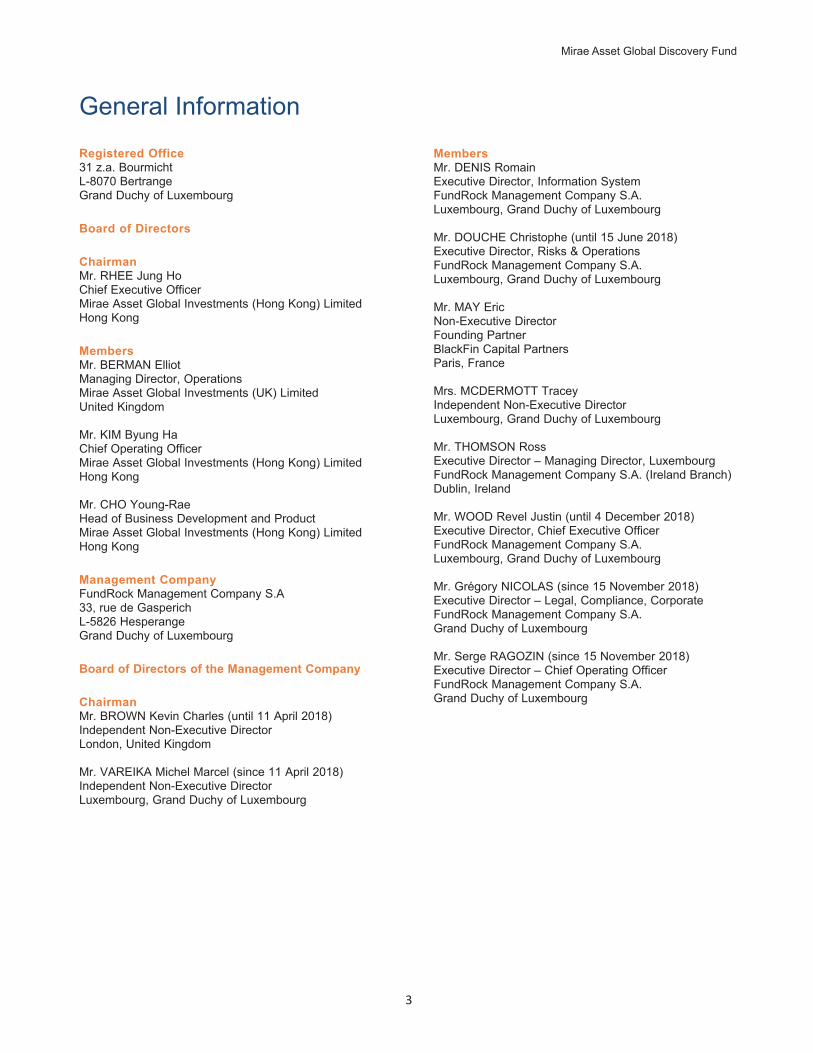
General Information Registered Office31 z.a. BourmichtL-8070 BertrangeGrand Duchy of Luxembourg
Board of Directors
ChairmanMr. RHEE Jung HoChief Executive OfficerMirae Asset Global Investments (Hong Kong) LimitedHong Kong
MembersMr. BERMAN ElliotManaging Director, OperationsMirae Asset Global Investments (UK) LimitedUnited Kingdom
Mr. KIM Byung HaChief Operating OfficerMirae Asset Global Investments (Hong Kong) LimitedHong Kong
Mr. CHO Young-RaeHead of Business Development and ProductMirae Asset Global Investments (Hong Kong) LimitedHong Kong
Management CompanyFundRock Management Company S.A33, rue de GasperichL-5826 HesperangeGrand Duchy of Luxembourg
Board of Directors of the Management Company
ChairmanMr. BROWN Kevin Charles (until 11 April 2018)Independent Non-Executive DirectorLondon, United Kingdom
Mr. VAREIKA Michel Marcel (since 11 April 2018)Independent Non-Executive DirectorLuxembourg, Grand Duchy of Luxembourg
MembersMr. DENIS RomainExecutive Director, Information SystemFundRock Management Company S.A.Luxembourg, Grand Duchy of Luxembourg
Mr. DOUCHE Christophe (until 15 June 2018)Executive Director, Risks & OperationsFundRock Management Company S.A.Luxembourg, Grand Duchy of Luxembourg
Mr. MAY EricNon-Executive DirectorFounding PartnerBlackFin Capital PartnersParis, France
Mrs. MCDERMOTT TraceyIndependent Non-Executive DirectorLuxembourg, Grand Duchy of Luxembourg
Mr. THOMSON RossExecutive Director – Managing Director, LuxembourgFundRock Management Company S.A. (Ireland Branch)Dublin, Ireland
Mr. WOOD Revel Justin (until 4 December 2018)Executive Director, Chief Executive OfficerFundRock Management Company S.A.Luxembourg, Grand Duchy of Luxembourg
Mr. Grégory NICOLAS (since 15 November 2018)Executive Director – Legal, Compliance, CorporateFundRock Management Company S.A.Grand Duchy of Luxembourg
Mr. Serge RAGOZIN (since 15 November 2018)Executive Director – Chief Operating OfficerFundRock Management Company S.A.Grand Duchy of Luxembourg
4
Conducting PersonsMr. DENIS RomainMr. DOUCHE Christophe (until 15 June 2018)Mr. FAHY EndaMr. NICOLAS GregoryMr. WOOD Revel Justin (until 4 December 2018)
Principal Investment Manager *Mirae Asset Global Investments (Hong Kong) LimitedLevel 15, Three Pacific Place1 Queen’s Road EastHong Kong
Investment Managers **Mirae Asset Global Investments Co Ltd13F, Tower 1, 33, Jong-roJongno-gu, Seoul, 03159,Republic of Korea
Mirae Asset Global Investments (USA) LLC625 Madison Avenue, 3rd FloorNew York, NY 10022United States of America
MAPS Capital Management LimitedLevel 15, Three Pacific Place1 Queen’s Road EastHong Kong
Daiwa Asset Management Co. Ltd.Gran Tokyo North Tower 9-1Marunouchi 1- ChomeChiyoda-ku, Tokyo100-6753 Japan
Global Distributor *Mirae Asset Global Investments (Hong Kong) LimitedLevel 15, Three Pacific Place1 Queen’s Road EastHong Kong
Depositary, Administrative Agent *, Registrar and Transfer Agent *, Paying Agent *Citibank Europe Plc, Luxembourg Branch31 z.a. BourmichtL-8070 BertrangeGrand Duchy of Luxembourg
Hong Kong RepresentativeMirae Asset Global Investments (Hong Kong) LimitedLevel 15, Three Pacific Place1 Queen’s Road EastHong Kong
Independent AuditorErnst & Young S.A.35E, avenue John F. KennedyL-1855 LuxembourgGrand Duchy of Luxembourg
Legal AdvisorsArendt & Medernach S.A.41A, avenue J.F. KennedyL-2082 LuxembourgGrand Duchy of Luxembourg
Information to ShareholdersCopies of the prospectus and any information relating thereto may be obtained from the registered office of the Company at 31 z.a. Bourmicht, L-8070 Bertrange, Grand Duchy of Luxembourg, from Mirae Asset Global Investments (Hong Kong) Limited and from the appointed fund distributors.
Corporate GovernanceFollowing its introduction in September 2009, the Board of Directors has adopted the ALFI Code of Conduct (the “Code”), which sets out the principles of good governance. The Board considers that the Company has been in compliance with the Code in all material respects throughout the year ended 31 March 2019.
* Delegated by the Management Company** Delegated by the Principal Investment Manager
Mirae Asset Global Discovery Fund
5
Principal Investment Manager’s ReportMarket Overview for the Year Ended 31 March 2019
Global financial markets have had a volatile year as macro and political events significantly affected investor sentiment. Emerging markets overall witnessed higher market volatility, particularly for second half of 2018 whilst the US performed well on the back of strengthening labor market and higher consumer spending and confidence. 2019 started off in a more optimistic mode as some of the concerns on rising interest rates, and a strong US Dollar have receded.
AsiaAsian ex-Japan equities witnessed a volatile period in the second half of 2019 as macro concerns about US-China trade, rising interest rates and a strong US Dollar significantly affected investor sentiment. As a result, Asian markets, particularly China, experienced high-selling pressure. As some of these macro headwinds receded at the beginning of 2019, investor sentiment rebounded and Asian markets became more attractive to investors.
In India, earlier concerns on inflation and the current account deficit have largely alleviated since oil prices have declined from October’s peak levels. The Reserve Bank of India has turned more dovish. This was mostly driven by a deceleration in high-frequency indicators this year as well as reduced inflation expectations. The first phase of India’s national elections began on April 11th. Opinion polls indicate that Prime Minister Narendra Modi’s Bharatiya Janata Party-led National Democratic Alliance is likely to retain power. The outcome will likely influence the market in the short-term; however, is important to note that India has maintained economic growth under various parties and coalitions over the past two decades, and we do not expect the election outcome to materially change the broader economic growth outlook.
Taiwan and South Korea’s trade data have trended weaker in since the second half of 2018. Domestic demand remains subdued as employment and wage growth continue to be sluggish. In the ASEAN region, recent inflation data has softened and combined with a more dovish US Fed, Asian central banks should have room to cut rates this year.
ChinaSince the second half of 2018, China’s macro data including GDP, manufacturing, and consumer spending point to signs that China’s economy is softening. This is partly due to the lingering effects of the governments’ earlier deleveraging efforts as well as regulatory changes that affected certain sectors. Since July 2018, when US-China trade tensions began, Chinese policymakers have shifted towards policy stimulus, including tax cuts, monetary easing, fiscal spending, as well as supportive policies to targeted industries including autos and home appliances. We expect policy support to continue as uncertainties surrounding US-China trade persists. Importantly, the Chinese government still has many levers it can utilize to stimulate the economy, particularly given that the stimulus, thus far, has been very measured.
Overall, the portfolios are positioned away from exporters and more geared toward domestic demand stories in China, including leading names in education, consumer staples and internet/e-commerce. We believe that these sectors will be more resilient in the current environment, particularly if policymakers target to further support domestic demand, which we have already seen via various tax cuts and spending policies.
A positive development was MSCI’s announcement in February that will raise the China A-Share inclusion factor from the current 5% to 20%, beginning from
6
May 2019 in three stages. Currently, the weight of A-shares in the MSCI EM Index is 0.8%. At 20% inclusion factor, the pro-forma weight of A-shares in MSCI EM Index will become approximately 3.3%. Foreign investors have been increasing their exposure to the onshore market. As at the end of 2018, foreign investors accounted for approximately 6.7% of the free-float market cap of the onshore equity market. This level is still low compared to other major markets in the region such as Taiwan, Korea and Japan, which are in the range of 20-35% foreign ownership.
GEMThe multi-year rally in EM equities saw a correction in 2018, but continued on a positive path into 2019. Last year’s volatility came from a combination of escalating trade tension between the US and China, continued US rate hikes, and fears over a hard “Brexit”. This combination led investors to fear slower global economic growth and move into more conservative asset classes. Additionally, emerging markets faced uncertain and polarizing elections in Brazil, Mexico, Colombia, and Turkey.
In EM ex-Asia, the US signed a new trade agreement with Mexico and Canada, erasing fears that President Trump would end the North American Free Trade Agreement (NAFTA) relationship. Brazil, for the first time in fourteen years, elected a market friendly President that supports fiscal responsibility and central bank autonomy. Russia’s Central Bank continued to keep inflation under control, which allowed for single digit interest rates, which stimulated borrowing and growth. Looking into the rest of 2019, the market will keep a close eye on elections in South Africa and Argentina.
Outlook for the next fiscal yearOur view is that US-China trade will be a key area to watch along with central bank and government policy going forward. US-China trade tensions remain the key downside risk, but our current base case is that the re-escalation in trade tensions is temporary and we see a more gradual growth recovery. Increased tariffs will likely negatively impact growth; however, we believe that further easing policies will be able to mitigate some of these effects.
We continue to focus on finding quality companies focused on building sustainable businesses that take advantage of rising incomes, financial inclusion, changing spending patterns, and consumption. Moreover, short term market dislocations can provide an opportunity to build larger positions in high conviction positions.
Mirae Asset Global Investments (Hong Kong) Limited
Principal Investment Manager
Jung Ho RHEE
17 June 2019
7
Independent auditor’s report
To the Shareholders of
Mirae Asset Global Discovery Fund
31 z.a. Bourmicht
L-8070 Bertrange
Grand Duchy of Luxembourg
Opinion
We have audited the financial statements of Mirae Asset Global Discovery Fund (the “Fund) and of each of
its sub-funds, which comprise the statement of net assets and the schedule of investments as at
31 March 2019 , and the statement of operations and changes in net assets for the year then ended , and
the notes to the financial statements, including a summary of significant accounting policies.
In our opinion, the accompanying financial statements give a true and fair view of the financial position of the
Fund and each of its sub-funds as at 31 March 2019, and of the results of their operations and changes in
their net assets for the year then ended in accordance with Luxembourg legal and regulatory requirements
relating to the preparation and presentation of the financial statements.
Basis for Opinion
We conducted our audit in accordance with the Law of 23 July 2016 on the audit profession (the “Law of
23 July 2016”) and with International Standards on Auditing (“ISAs”) as adopted for Luxembourg by the
“Commission de Surveillance du Secteur Financier” (“CSSF”). Our responsibilities under the Law of 23 July
2016 and ISAs are further described in the “responsibilities of the “réviseur d’entreprises agréé” for the audit
of the financial statements” section of our report. We are also independent of the Fund in accordance with
the International Ethics Standards Board for Accountants’ Code of Ethics for Professional Accountants
(“IESBA Code”) as adopted for Luxembourg by the CSSF together with the ethical requirements that are
relevant to our audit of the financial statements, and have fulfilled our other ethical responsibilities under
those ethical requirements. We believe that the audit evidence we have obtained is sufficient and
appropriate to provide a basis for our opinion.
Other information
The Board of Directors of the Fund is responsible for the other information. The other information comprises
the information included in the annual report but does not include the financial statements and our report of
the “réviseur d’entreprises agréé” thereon.
Our opinion on the financial statements does not cover the other information and we do not express any form
of assurance conclusion thereon.
Lucie.Grandjean
Tampon
4‘
EVBuilding a betterworking world
In connection with our audit of the financial statements, our responsibility is to read the other informationand. in doing so, consider whether the other information is materially inconsistent with the financialstatements or our knowledge obtained in the audit or othenrvise appears to be materially misstated. if, basedon the work we have performed. we conclude that there is a material misstatement of this other information,we are required to report this fact. We have nothing to report in this regard.
Responsibilities of the Board of Directors of the Fund and those charged with governance for thefinancial statements
The Board of Directors of the Fund is responsible for the preparation and fair presentation of these financialstatements in accordance with Luxembourg legal and regulatory requirements relating to the preparation andpresentation of the financial statements, and for such internal control as the Board of Directors of the Funddetermines is necessary to enable the preparation of financial statements that are free from materialmisstatement, whether due to fraud or error.In preparing the financial statements, the Board of Directors of the Fund is responsible for assessing theFund’s and each of its sub-funds’ ability to continue as a going concern. disclosing, as applicable. mattersrelated to going concern and using the going concern basis of accounting unless the Board of Directors ofthe Fund either intends to liquidate the Fund or any of its sub-funds or to cease operations, or has norealistic alternative but to do so.
Those charged with governance are responsible for overseeing the Fund’s financial reporting process.
Responsibilities of the “réviseur d'entreprises agréé” for the audit of the financial statements
Our objectives are to obtain reasonable assurance about whether the financial statements as a whole arefree from material misstatement, whether due to fraud or error. and to issue a report of the “réviseurd’entreprises agréé" that includes our opinion. Reasonable assurance is a high level of assurance. but is nota guarantee that an audit conducted in accordance with the Law of 23 July 2016 and with ISAs as adoptedfor Luxembourg by the CSSF will always detect a material misstatement when it exists. Misstatements canarise from fraud or error and are considered material if, individually or in the aggregate, they couldreasonably be expected to influence the economic decisions of users taken on the basis of these financialstatements.
As part of an audit in accordance with the Law of 23 July 2016 and with ISAs as adopted for Luxembourg bythe CSSF, we exercise professional judgment and maintain professional skepticism throughout the audit. Wealso:
- Identify and assess the risks of material misstatement of the financial statements, whether due to fraudor error. design and perform audit procedures responsive to those risks, and obtain audit evidence thatis sufficient and appropriate to provide a basis for our opinion. The risk of not detecting a materialmisstatement resulting from fraud is higher than for one resulting from error. as fraud may involvecollusion, forgery. intentional omissions, misrepresentations, or the override of internal control.
AmemberfirmnffimstaYowGiobalUmted
EYBuilding a betterworking world
- Obtain an understanding of internal control relevant to the audit in order to design audit procedures thatare appropriate in the circumstances. but not for the purpose of expressing an opinion on theeffectiveness of the Fund's internal control.
- Evaluate the appropriateness of accounting policies used and the reasonableness of accountingestimates and related disclosures made by the Board of Directors of the Fund.
- Conclude on the appropriateness of Board of Directors of the Fund use of the going concern basis ofaccounting and, based on the audit evidence obtained, whether a material uncertainty exists related toevents or conditions that may cast significant doubt on the Fund's or any of its sub-funds' ability tocontinue as a going concern. If we conclude that a material uncertainty exists, we are required to drawattention in our report of the “réviseur d’entreprises agréé" to the related disclosures in the financialstatements or, if such disclosures are inadequate, to modify our opinion. Our conclusions are based onthe audit evidence obtained up to the date of our report of the “réviseur d’entreprises agréé". However.future events or conditions may cause the Fund or any of its sub-funds‘ to cease to continue as a goingconcern.
- Evaluate the overall presentation, structure and content of the financial statements, including thedisclosures, and whether the financial statements represent the underlying transactions and events in amanner that achieves fair presentation.
We communicate with those charged with governance regarding, among other matters, the planned scopeand timing of the audit and significant audit findings, including any significant deficiencies in internal controlthat we identify during our audit.
Ernst & YoungSociété anonyme
Cabinet de révision agréé
//%Michael Ferguson
Luxembourg. 26 July 2019
Amember firm oft-Ernst & Voung Global Limited
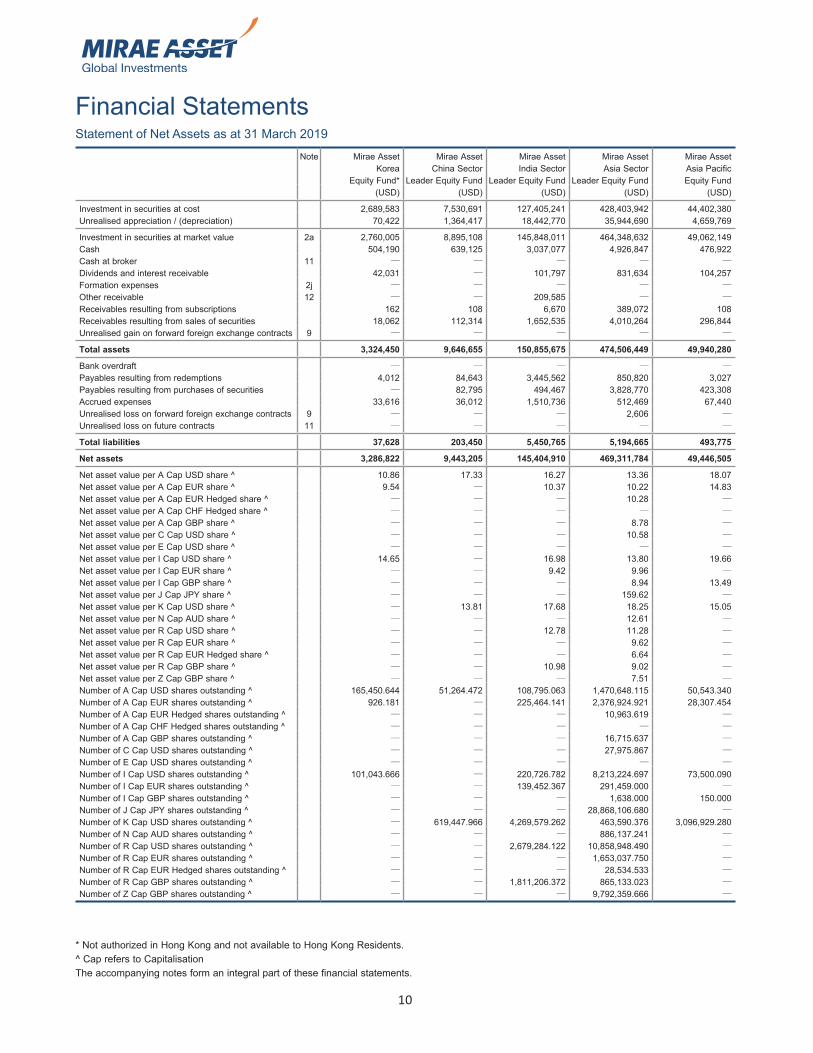
Financial StatementsStatement of Net Assets as at 31 March 2019
10
Note Mirae Asset Korea
Equity Fund*
Mirae Asset China Sector
Leader Equity Fund
Mirae Asset India Sector
Leader Equity Fund
Mirae Asset Asia Sector
Leader Equity Fund
Mirae Asset Asia Pacific Equity Fund
(USD) (USD) (USD) (USD) (USD)
Investment in securities at cost 2,689,583 7,530,691 127,405,241 428,403,942 44,402,380Unrealised appreciation / (depreciation) 70,422 1,364,417 18,442,770 35,944,690 4,659,769
Investment in securities at market value 2a 2,760,005 8,895,108 145,848,011 464,348,632 49,062,149Cash 504,190 639,125 3,037,077 4,926,847 476,922Cash at broker 11 — — — — —Dividends and interest receivable 42,031 — 101,797 831,634 104,257Formation expenses 2j — — — — —Other receivable 12 — — 209,585 — —Receivables resulting from subscriptions 162 108 6,670 389,072 108Receivables resulting from sales of securities 18,062 112,314 1,652,535 4,010,264 296,844Unrealised gain on forward foreign exchange contracts 9 — — — — —
Total assets 3,324,450 9,646,655 150,855,675 474,506,449 49,940,280
Bank overdraft — — — — —Payables resulting from redemptions 4,012 84,643 3,445,562 850,820 3,027Payables resulting from purchases of securities — 82,795 494,467 3,828,770 423,308Accrued expenses 33,616 36,012 1,510,736 512,469 67,440Unrealised loss on forward foreign exchange contracts 9 — — — 2,606 —Unrealised loss on future contracts 11 — — — — —
Total liabilities 37,628 203,450 5,450,765 5,194,665 493,775
Net assets 3,286,822 9,443,205 145,404,910 469,311,784 49,446,505
Net asset value per A Cap USD share ^ 10.86 17.33 16.27 13.36 18.07Net asset value per A Cap EUR share ^ 9.54 — 10.37 10.22 14.83Net asset value per A Cap EUR Hedged share ^ — — — 10.28 —Net asset value per A Cap CHF Hedged share ^ — — — — —Net asset value per A Cap GBP share ^ — — — 8.78 —Net asset value per C Cap USD share ^ — — — 10.58 —Net asset value per E Cap USD share ^ — — — — —Net asset value per I Cap USD share ^ 14.65 — 16.98 13.80 19.66Net asset value per I Cap EUR share ^ — — 9.42 9.96 —Net asset value per I Cap GBP share ^ — — — 8.94 13.49Net asset value per J Cap JPY share ^ — — — 159.62 —Net asset value per K Cap USD share ^ — 13.81 17.68 18.25 15.05Net asset value per N Cap AUD share ^ — — — 12.61 —Net asset value per R Cap USD share ^ — — 12.78 11.28 —Net asset value per R Cap EUR share ^ — — — 9.62 —Net asset value per R Cap EUR Hedged share ^ — — — 6.64 —Net asset value per R Cap GBP share ^ — — 10.98 9.02 —Net asset value per Z Cap GBP share ^ — — — 7.51 —Number of A Cap USD shares outstanding ^ 165,450.644 51,264.472 108,795.063 1,470,648.115 50,543.340Number of A Cap EUR shares outstanding ^ 926.181 — 225,464.141 2,376,924.921 28,307.454Number of A Cap EUR Hedged shares outstanding ^ — — — 10,963.619 —Number of A Cap CHF Hedged shares outstanding ^ — — — — —Number of A Cap GBP shares outstanding ^ — — — 16,715.637 —Number of C Cap USD shares outstanding ^ — — — 27,975.867 —Number of E Cap USD shares outstanding ^ — — — — —Number of I Cap USD shares outstanding ^ 101,043.666 — 220,726.782 8,213,224.697 73,500.090Number of I Cap EUR shares outstanding ^ — — 139,452.367 291,459.000 —Number of I Cap GBP shares outstanding ^ — — — 1,638.000 150.000Number of J Cap JPY shares outstanding ^ — — — 28,868,106.680 —Number of K Cap USD shares outstanding ^ — 619,447.966 4,269,579.262 463,590.376 3,096,929.280Number of N Cap AUD shares outstanding ^ — — — 886,137.241 —Number of R Cap USD shares outstanding ^ — — 2,679,284.122 10,858,948.490 —Number of R Cap EUR shares outstanding ^ — — — 1,653,037.750 —Number of R Cap EUR Hedged shares outstanding ^ — — — 28,534.533 —Number of R Cap GBP shares outstanding ^ — — 1,811,206.372 865,133.023 —Number of Z Cap GBP shares outstanding ^ — — — 9,792,359.666 —
* Not authorized in Hong Kong and not available to Hong Kong Residents.^ Cap refers to CapitalisationThe accompanying notes form an integral part of these financial statements.
Mirae Asset Global Discovery Fund
Financial Statements
11
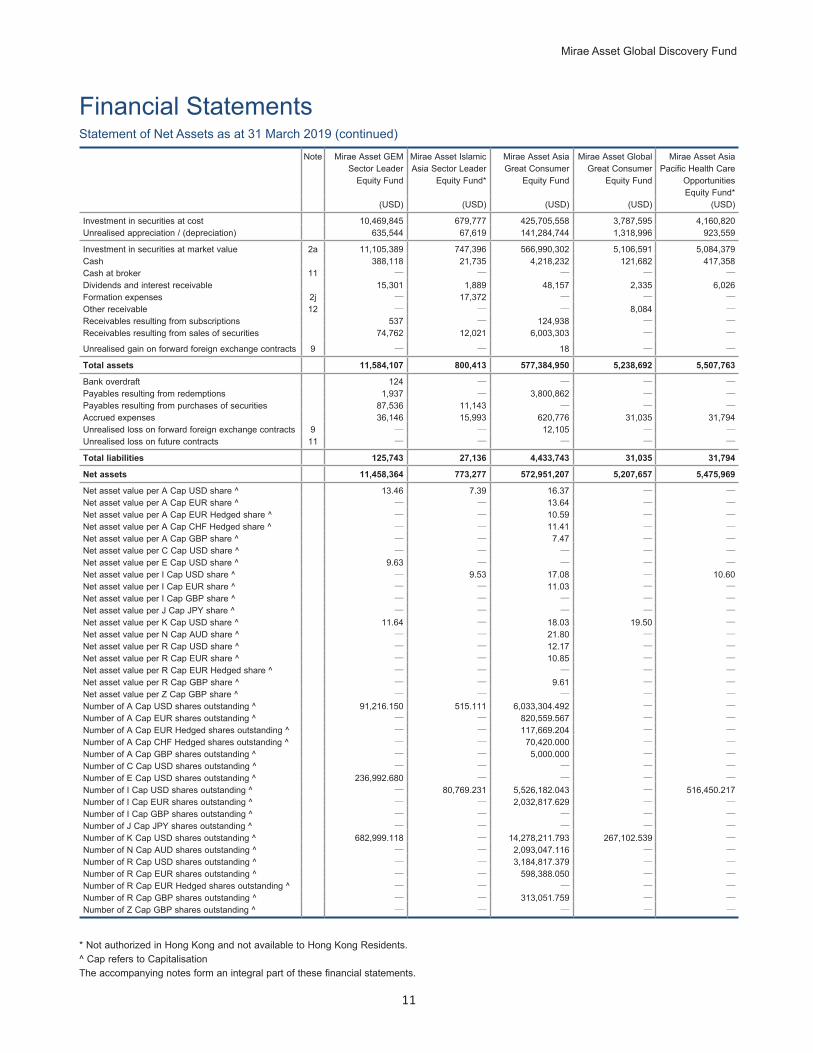
Statement of Net Assets as at 31 March 2019 (continued)
Note Mirae Asset GEM Sector Leader
Equity Fund
Mirae Asset Islamic Asia Sector Leader
Equity Fund*
Mirae Asset Asia Great Consumer
Equity Fund
Mirae Asset Global Great Consumer
Equity Fund
Mirae Asset Asia Pacific Health Care
Opportunities Equity Fund*
(USD) (USD) (USD) (USD) (USD)
Investment in securities at cost 10,469,845 679,777 425,705,558 3,787,595 4,160,820Unrealised appreciation / (depreciation) 635,544 67,619 141,284,744 1,318,996 923,559
Investment in securities at market value 2a 11,105,389 747,396 566,990,302 5,106,591 5,084,379Cash 388,118 21,735 4,218,232 121,682 417,358Cash at broker 11 — — — — —Dividends and interest receivable 15,301 1,889 48,157 2,335 6,026Formation expenses 2j — 17,372 — — —Other receivable 12 — — — 8,084 —Receivables resulting from subscriptions 537 — 124,938 — —Receivables resulting from sales of securities 74,762 12,021 6,003,303 — —
Unrealised gain on forward foreign exchange contracts 9 — — 18 — —
Total assets 11,584,107 800,413 577,384,950 5,238,692 5,507,763
Bank overdraft 124 — — — —Payables resulting from redemptions 1,937 — 3,800,862 — —Payables resulting from purchases of securities 87,536 11,143 — — —Accrued expenses 36,146 15,993 620,776 31,035 31,794Unrealised loss on forward foreign exchange contracts 9 — — 12,105 — —Unrealised loss on future contracts 11 — — — — —
Total liabilities 125,743 27,136 4,433,743 31,035 31,794
Net assets 11,458,364 773,277 572,951,207 5,207,657 5,475,969
Net asset value per A Cap USD share ^ 13.46 7.39 16.37 — —Net asset value per A Cap EUR share ^ — — 13.64 — —Net asset value per A Cap EUR Hedged share ^ — — 10.59 — —Net asset value per A Cap CHF Hedged share ^ — — 11.41 — —Net asset value per A Cap GBP share ^ — — 7.47 — —Net asset value per C Cap USD share ^ — — — — —Net asset value per E Cap USD share ^ 9.63 — — — —Net asset value per I Cap USD share ^ — 9.53 17.08 — 10.60Net asset value per I Cap EUR share ^ — — 11.03 — —Net asset value per I Cap GBP share ^ — — — — —Net asset value per J Cap JPY share ^ — — — — —Net asset value per K Cap USD share ^ 11.64 — 18.03 19.50 —Net asset value per N Cap AUD share ^ — — 21.80 — —Net asset value per R Cap USD share ^ — — 12.17 — —Net asset value per R Cap EUR share ^ — — 10.85 — —Net asset value per R Cap EUR Hedged share ^ — — — — —Net asset value per R Cap GBP share ^ — — 9.61 — —Net asset value per Z Cap GBP share ^ — — — — —Number of A Cap USD shares outstanding ^ 91,216.150 515.111 6,033,304.492 — —Number of A Cap EUR shares outstanding ^ — — 820,559.567 — —Number of A Cap EUR Hedged shares outstanding ^ — — 117,669.204 — —Number of A Cap CHF Hedged shares outstanding ^ — — 70,420.000 — —Number of A Cap GBP shares outstanding ^ — — 5,000.000 — —Number of C Cap USD shares outstanding ^ — — — — —Number of E Cap USD shares outstanding ^ 236,992.680 — — — —Number of I Cap USD shares outstanding ^ — 80,769.231 5,526,182.043 — 516,450.217Number of I Cap EUR shares outstanding ^ — — 2,032,817.629 — —Number of I Cap GBP shares outstanding ^ — — — — —Number of J Cap JPY shares outstanding ^ — — — — —Number of K Cap USD shares outstanding ^ 682,999.118 — 14,278,211.793 267,102.539 —Number of N Cap AUD shares outstanding ^ — — 2,093,047.116 — —Number of R Cap USD shares outstanding ^ — — 3,184,817.379 — —Number of R Cap EUR shares outstanding ^ — — 598,388.050 — —Number of R Cap EUR Hedged shares outstanding ^ — — — — —Number of R Cap GBP shares outstanding ^ — — 313,051.759 — —Number of Z Cap GBP shares outstanding ^ — — — — —
* Not authorized in Hong Kong and not available to Hong Kong Residents.^ Cap refers to CapitalisationThe accompanying notes form an integral part of these financial statements.
Financial Statements
12
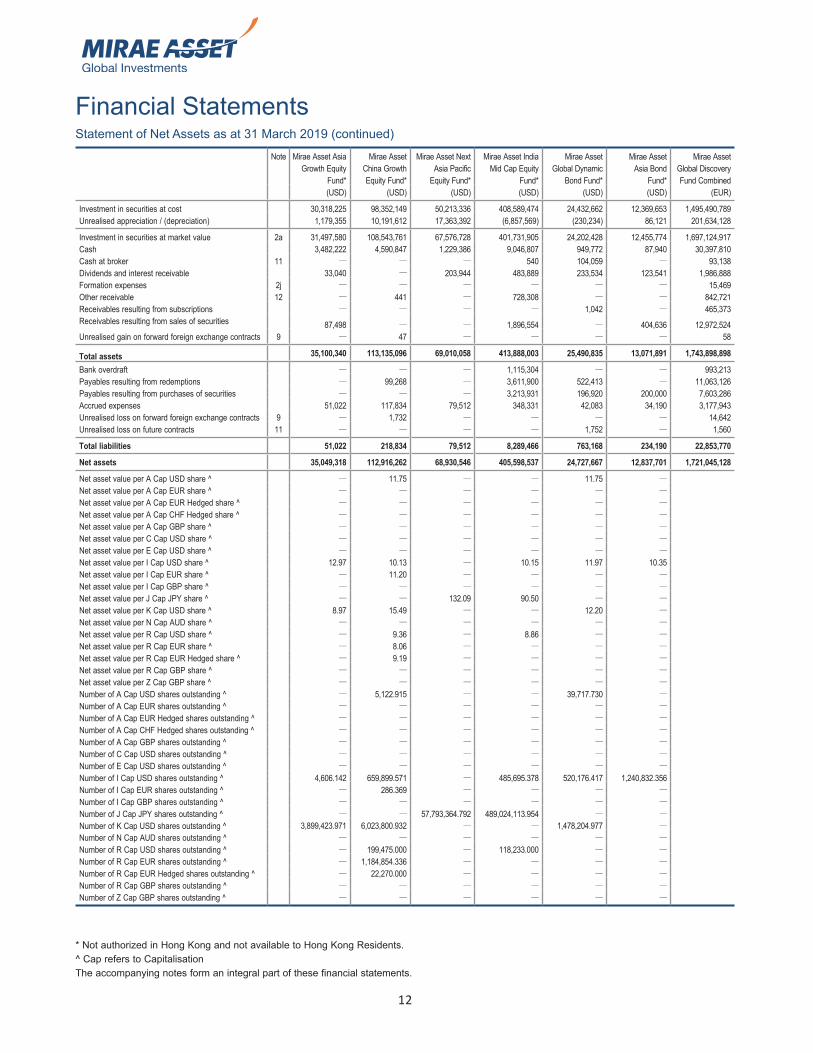
Statement of Net Assets as at 31 March 2019 (continued)
* Not authorized in Hong Kong and not available to Hong Kong Residents.^ Cap refers to CapitalisationThe accompanying notes form an integral part of these financial statements.
Note Mirae Asset Asia Growth Equity
Fund*
Mirae Asset China Growth Equity Fund*
Mirae Asset Next Asia Pacific
Equity Fund*
Mirae Asset India Mid Cap Equity
Fund*
Mirae Asset Global Dynamic
Bond Fund*
Mirae Asset Asia Bond
Fund*
Mirae Asset Global Discovery Fund Combined
(USD) (USD) (USD) (USD) (USD) (USD) (EUR)
Investment in securities at cost 30,318,225 98,352,149 50,213,336 408,589,474 24,432,662 12,369,653 1,495,490,789Unrealised appreciation / (depreciation) 1,179,355 10,191,612 17,363,392 (6,857,569) (230,234) 86,121 201,634,128
Investment in securities at market value 2a 31,497,580 108,543,761 67,576,728 401,731,905 24,202,428 12,455,774 1,697,124,917Cash 3,482,222 4,590,847 1,229,386 9,046,807 949,772 87,940 30,397,810Cash at broker 11 — — — 540 104,059 — 93,138Dividends and interest receivable 33,040 — 203,944 483,889 233,534 123,541 1,986,888Formation expenses 2j — — — — — — 15,469Other receivable 12 — 441 — 728,308 — — 842,721Receivables resulting from subscriptions — — — — 1,042 — 465,373Receivables resulting from sales of securities 87,498 — — 1,896,554 — 404,636 12,972,524Unrealised gain on forward foreign exchange contracts 9 — 47 — — — — 58
Total assets 35,100,340 113,135,096 69,010,058 413,888,003 25,490,835 13,071,891 1,743,898,898
Bank overdraft — — — 1,115,304 — — 993,213Payables resulting from redemptions — 99,268 — 3,611,900 522,413 — 11,063,126Payables resulting from purchases of securities — — — 3,213,931 196,920 200,000 7,603,286Accrued expenses 51,022 117,834 79,512 348,331 42,083 34,190 3,177,943Unrealised loss on forward foreign exchange contracts 9 — 1,732 — — — — 14,642Unrealised loss on future contracts 11 — — — — 1,752 — 1,560
Total liabilities 51,022 218,834 79,512 8,289,466 763,168 234,190 22,853,770
Net assets 35,049,318 112,916,262 68,930,546 405,598,537 24,727,667 12,837,701 1,721,045,128
Net asset value per A Cap USD share ^ — 11.75 — — 11.75 —Net asset value per A Cap EUR share ^ — — — — — —Net asset value per A Cap EUR Hedged share ^ — — — — — —Net asset value per A Cap CHF Hedged share ^ — — — — — —Net asset value per A Cap GBP share ^ — — — — — —Net asset value per C Cap USD share ^ — — — — — —Net asset value per E Cap USD share ^ — — — — — —Net asset value per I Cap USD share ^ 12.97 10.13 — 10.15 11.97 10.35Net asset value per I Cap EUR share ^ — 11.20 — — — —Net asset value per I Cap GBP share ^ — — — — — —Net asset value per J Cap JPY share ^ — — 132.09 90.50 — —Net asset value per K Cap USD share ^ 8.97 15.49 — — 12.20 —Net asset value per N Cap AUD share ^ — — — — — —Net asset value per R Cap USD share ^ — 9.36 — 8.86 — —Net asset value per R Cap EUR share ^ — 8.06 — — — —Net asset value per R Cap EUR Hedged share ^ — 9.19 — — — —Net asset value per R Cap GBP share ^ — — — — — —Net asset value per Z Cap GBP share ^ — — — — — —Number of A Cap USD shares outstanding ^ — 5,122.915 — — 39,717.730 —Number of A Cap EUR shares outstanding ^ — — — — — —Number of A Cap EUR Hedged shares outstanding ^ — — — — — —Number of A Cap CHF Hedged shares outstanding ^ — — — — — —Number of A Cap GBP shares outstanding ^ — — — — — —Number of C Cap USD shares outstanding ^ — — — — — —Number of E Cap USD shares outstanding ^ — — — — — —Number of I Cap USD shares outstanding ^ 4,606.142 659,899.571 — 485,695.378 520,176.417 1,240,832.356Number of I Cap EUR shares outstanding ^ — 286.369 — — — —Number of I Cap GBP shares outstanding ^ — — — — — —Number of J Cap JPY shares outstanding ^ — — 57,793,364.792 489,024,113.954 — —Number of K Cap USD shares outstanding ^ 3,899,423.971 6,023,800.932 — — 1,478,204.977 —Number of N Cap AUD shares outstanding ^ — — — — — —Number of R Cap USD shares outstanding ^ — 199,475.000 — 118,233.000 — —Number of R Cap EUR shares outstanding ^ — 1,184,854.336 — — — —Number of R Cap EUR Hedged shares outstanding ^ — 22,270.000 — — — —Number of R Cap GBP shares outstanding ^ — — — — — —Number of Z Cap GBP shares outstanding ^ — — — — — —
Mirae Asset Global Discovery Fund
Financial Statements
13
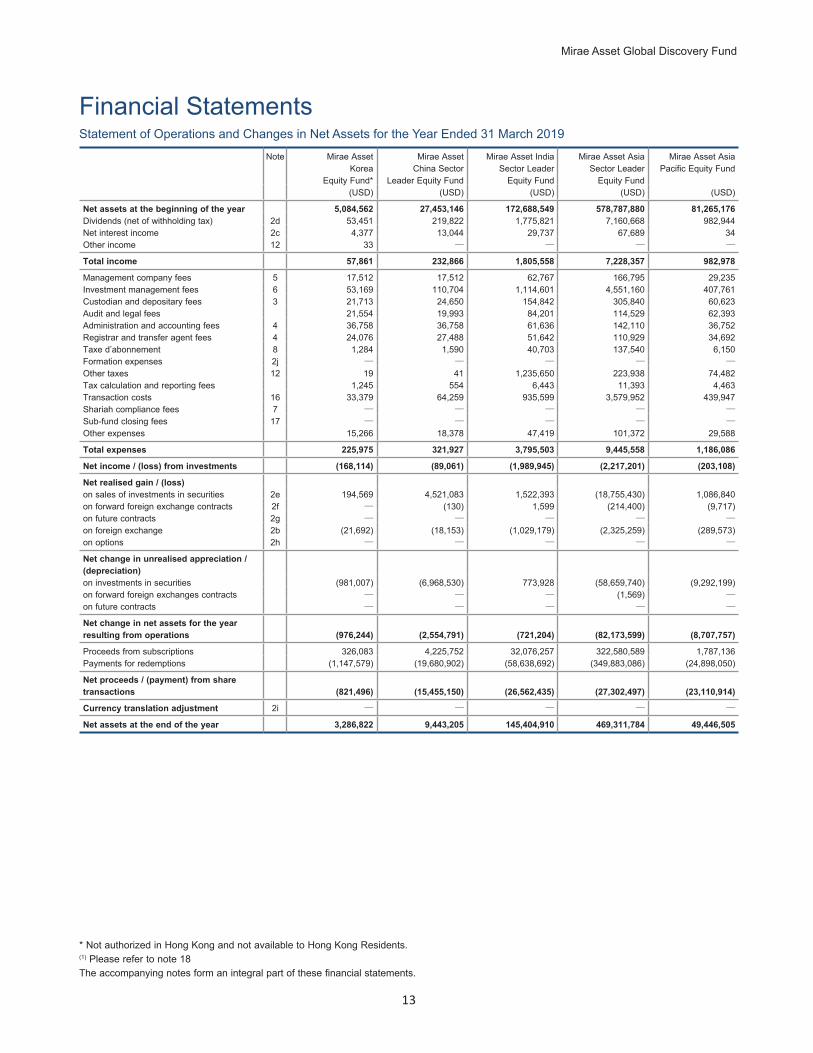
Statement of Operations and Changes in Net Assets for the Year Ended 31 March 2019
Note Mirae Asset Korea
Equity Fund*
Mirae Asset China Sector
Leader Equity Fund
Mirae Asset India Sector Leader
Equity Fund
Mirae Asset Asia Sector Leader
Equity Fund
Mirae Asset Asia Pacific Equity Fund
(USD) (USD) (USD) (USD) (USD)
Net assets at the beginning of the year 5,084,562 27,453,146 172,688,549 578,787,880 81,265,176Dividends (net of withholding tax) 2d 53,451 219,822 1,775,821 7,160,668 982,944Net interest income 2c 4,377 13,044 29,737 67,689 34Other income 12 33 — — — —
Total income 57,861 232,866 1,805,558 7,228,357 982,978
Management company fees 5 17,512 17,512 62,767 166,795 29,235Investment management fees 6 53,169 110,704 1,114,601 4,551,160 407,761Custodian and depositary fees 3 21,713 24,650 154,842 305,840 60,623Audit and legal fees 21,554 19,993 84,201 114,529 62,393Administration and accounting fees 4 36,758 36,758 61,636 142,110 36,752Registrar and transfer agent fees 4 24,076 27,488 51,642 110,929 34,692Taxe d’abonnement 8 1,284 1,590 40,703 137,540 6,150Formation expenses 2j — — — — —Other taxes 12 19 41 1,235,650 223,938 74,482Tax calculation and reporting fees 1,245 554 6,443 11,393 4,463Transaction costs 16 33,379 64,259 935,599 3,579,952 439,947Shariah compliance fees 7 — — — — —Sub-fund closing fees 17 — — — — —Other expenses 15,266 18,378 47,419 101,372 29,588
Total expenses 225,975 321,927 3,795,503 9,445,558 1,186,086
Net income / (loss) from investments (168,114) (89,061) (1,989,945) (2,217,201) (203,108)
Net realised gain / (loss)on sales of investments in securities 2e 194,569 4,521,083 1,522,393 (18,755,430) 1,086,840on forward foreign exchange contracts 2f — (130) 1,599 (214,400) (9,717)on future contracts 2g — — — — —on foreign exchange 2b (21,692) (18,153) (1,029,179) (2,325,259) (289,573)on options 2h — — — — —
Net change in unrealised appreciation / (depreciation)on investments in securities (981,007) (6,968,530) 773,928 (58,659,740) (9,292,199)on forward foreign exchanges contracts — — — (1,569) —on future contracts — — — — —
Net change in net assets for the year resulting from operations (976,244) (2,554,791) (721,204) (82,173,599) (8,707,757)
Proceeds from subscriptions 326,083 4,225,752 32,076,257 322,580,589 1,787,136Payments for redemptions (1,147,579) (19,680,902) (58,638,692) (349,883,086) (24,898,050)
Net proceeds / (payment) from share transactions (821,496) (15,455,150) (26,562,435) (27,302,497) (23,110,914)
Currency translation adjustment 2i — — — — —
Net assets at the end of the year 3,286,822 9,443,205 145,404,910 469,311,784 49,446,505
* Not authorized in Hong Kong and not available to Hong Kong Residents.(1) Please refer to note 18The accompanying notes form an integral part of these financial statements.
Financial Statements
14
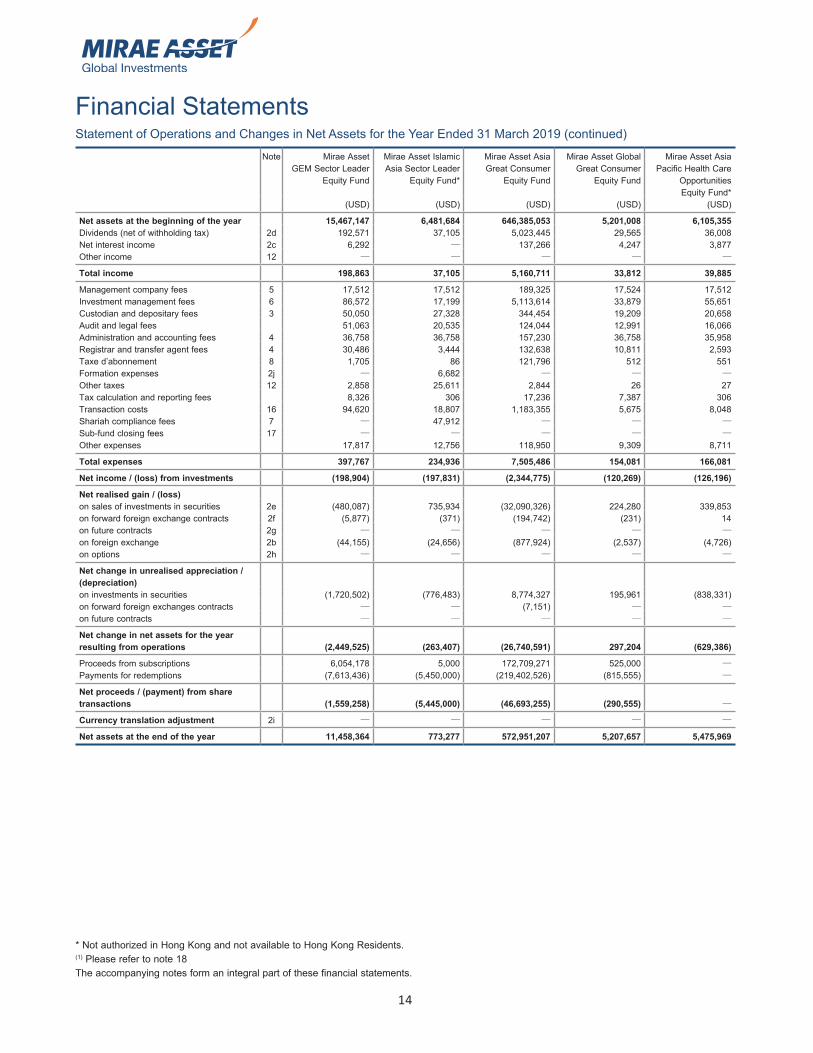
Statement of Operations and Changes in Net Assets for the Year Ended 31 March 2019 (continued)
* Not authorized in Hong Kong and not available to Hong Kong Residents.(1) Please refer to note 18The accompanying notes form an integral part of these financial statements.
Note Mirae Asset GEM Sector Leader
Equity Fund
Mirae Asset Islamic Asia Sector Leader
Equity Fund*
Mirae Asset Asia Great Consumer
Equity Fund
Mirae Asset Global Great Consumer
Equity Fund
Mirae Asset Asia Pacific Health Care
Opportunities Equity Fund*
(USD) (USD) (USD) (USD) (USD)
Net assets at the beginning of the year 15,467,147 6,481,684 646,385,053 5,201,008 6,105,355Dividends (net of withholding tax) 2d 192,571 37,105 5,023,445 29,565 36,008Net interest income 2c 6,292 — 137,266 4,247 3,877Other income 12 — — — — —
Total income 198,863 37,105 5,160,711 33,812 39,885
Management company fees 5 17,512 17,512 189,325 17,524 17,512Investment management fees 6 86,572 17,199 5,113,614 33,879 55,651Custodian and depositary fees 3 50,050 27,328 344,454 19,209 20,658Audit and legal fees 51,063 20,535 124,044 12,991 16,066Administration and accounting fees 4 36,758 36,758 157,230 36,758 35,958Registrar and transfer agent fees 4 30,486 3,444 132,638 10,811 2,593Taxe d’abonnement 8 1,705 86 121,796 512 551Formation expenses 2j — 6,682 — — —Other taxes 12 2,858 25,611 2,844 26 27Tax calculation and reporting fees 8,326 306 17,236 7,387 306Transaction costs 16 94,620 18,807 1,183,355 5,675 8,048Shariah compliance fees 7 — 47,912 — — —Sub-fund closing fees 17 — — — — —Other expenses 17,817 12,756 118,950 9,309 8,711
Total expenses 397,767 234,936 7,505,486 154,081 166,081
Net income / (loss) from investments (198,904) (197,831) (2,344,775) (120,269) (126,196)
Net realised gain / (loss)on sales of investments in securities 2e (480,087) 735,934 (32,090,326) 224,280 339,853on forward foreign exchange contracts 2f (5,877) (371) (194,742) (231) 14on future contracts 2g — — — — —on foreign exchange 2b (44,155) (24,656) (877,924) (2,537) (4,726)on options 2h — — — — —
Net change in unrealised appreciation / (depreciation)on investments in securities (1,720,502) (776,483) 8,774,327 195,961 (838,331)on forward foreign exchanges contracts — — (7,151) — —on future contracts — — — — —
Net change in net assets for the year resulting from operations (2,449,525) (263,407) (26,740,591) 297,204 (629,386)
Proceeds from subscriptions 6,054,178 5,000 172,709,271 525,000 —Payments for redemptions (7,613,436) (5,450,000) (219,402,526) (815,555) —
Net proceeds / (payment) from share transactions (1,559,258) (5,445,000) (46,693,255) (290,555) —
Currency translation adjustment 2i — — — — —
Net assets at the end of the year 11,458,364 773,277 572,951,207 5,207,657 5,475,969

Mirae Asset Global Discovery Fund
Financial Statements
15
Statement of Operations and Changes in Net Assets for the Year Ended 31 March 2019 (continued)
Note Mirae Asset Asia Growth Equity Fund*
Mirae Asset China Growth Equity Fund*
Mirae Asset Next Asia Pacific
Equity Fund*
Mirae Asset India Mid Cap Equity Fund*
Mirae Asset Asia Income
Balanced Fund*(1)
(USD) (USD) (USD) (USD) (USD)
Net assets at the beginning of the year 7,334,867 102,195,050 111,197,722 484,485,519 8,967,179Dividends (net of withholding tax) 2d 402,091 1,843,075 960,903 4,462,332 131,511Net interest income 2c 36,353 74,233 12,043 3 45,221Other income 12 — — — 711,255 —
Total income 438,444 1,917,308 972,946 5,173,590 176,732
Management company fees 5 20,313 56,388 39,295 157,413 8,188Investment management fees 6 243,515 893,611 548,499 2,764,592 23,517Custodian and depositary fees 3 52,326 58,138 58,535 454,807 12,146Audit and legal fees 28,775 30,329 30,142 108,172 6,960Administration and accounting fees 4 36,758 53,850 38,379 134,165 17,603Registrar and transfer agent fees 4 3,494 27,964 13,045 34,093 2,413Taxe d’abonnement 8 3,781 16,697 7,926 44,559 233Formation expenses 2j — — — — —Other taxes 12 234 487 — 2,575 3,615Tax calculation and reporting fees 306 306 306 605 —Transaction costs 16 385,149 478,963 95,607 1,849,399 22,634Shariah compliance fees 7 — — — — —Sub-fund closing fees 17 — — — — 50,000Other expenses 17,122 45,966 20,526 69,540 5,218
Total expenses 791,773 1,662,699 852,260 5,619,920 152,527
Net income / (loss) from investments (353,329) 254,609 120,686 (446,330) 24,205
Net realised gain / (loss)on sales of investments in securities 2e (5,701,923) (13,437,815) 4,813,543 (42,087,018) (454,289)on forward foreign exchange contracts 2f (171) (11,997) (33,884) (39,161) (2,381)on future contracts 2g — — — — (7,643)on foreign exchange 2b (278,785) (77,858) (64,251) (1,031,654) (23,935)on options 2h — — — — —
Net change in unrealised appreciation / (depreciation)on investments in securities (383,019) 1,124,540 (12,792,154) 39,766,077 (278,014)on forward foreign exchanges contracts — (1,685) — — —on future contracts — — — — —
Net change in net assets for the year resulting from operations (6,717,227) (12,150,206) (7,956,060) (3,838,086) (742,057)
Proceeds from subscriptions 54,259,000 129,962,307 1,353,230 44,091,816 —Payments for redemptions (19,827,322) (107,090,889) (35,664,346) (119,140,712) (8,225,122)
Net proceeds / (payment) from share transactions 34,431,678 22,871,418 (34,311,116) (75,048,896) (8,225,122)
Currency translation adjustment 2i — — — — —
Net assets at the end of the year 35,049,318 112,916,262 68,930,546 405,598,537 —
* Not authorized in Hong Kong and not available to Hong Kong Residents.(1) Please refer to note 18The accompanying notes form an integral part of these financial statements.

Financial Statements
16
Statement of Operations and Changes in Net Assets for the Year Ended 31 March 2019 (continued)
Note Mirae Asset Asia Pacific Multi-Asset
Income Fund*(1)
Mirae Asset Global Dynamic
Bond Fund*
Mirae Asset Asia Bond Fund*
Mirae Asset Global Discovery Fund
Combined(USD) (USD) (USD) (EUR)
Net assets at the beginning of the year 19,612,285 104,561,662 18,305,496 1,948,859,320Dividends (net of withholding tax) 2d 139,753 141,105 — 21,007,230Net interest income 2c 9,749 1,629,436 598,580 2,379,396Other income 12 72 — — 633,418
Total income 149,574 1,770,541 598,580 24,020,044
Management company fees 5 15,640 22,273 17,524 792,698Investment management fees 6 84,021 122,267 78,006 14,516,128Custodian and depositary fees 3 21,354 26,967 21,432 1,544,964Audit and legal fees 14,397 24,955 12,971 698,161Administration and accounting fees 4 33,103 36,836 36,758 894,820Registrar and transfer agent fees 4 2,681 32,631 2,670 487,770Taxe d’abonnement 8 222 3,782 1,390 347,720Formation expenses 2j — — — 5,950Other taxes 12 — 136 70 1,400,305Tax calculation and reporting fees 23 572 306 53,500Transaction costs 16 6,671 18,987 — 8,210,722Shariah compliance fees 7 — — — 42,662Sub-fund closing fees 17 70,000 — — 106,852Other expenses 10,128 21,154 7,907 513,893
Total expenses 258,240 310,560 179,034 29,616,145
Net income / (loss) from investments (108,666) 1,459,981 419,546 (5,596,101)
Net realised gain / (loss)on sales of investments in securities 2e (765,375) (2,637,184) (594,093) (92,217,662)on forward foreign exchange contracts 2f (87) (2,731) — (457,920)on future contracts 2g (19,821) (16,483) — (39,132)on foreign exchange 2b (20,964) (21,092) — (5,481,851)on options 2h 5,844 — — 5,204
Net change in unrealised appreciation / (depreciation)on investments in securities 187,011 865,676 521,727 (36,045,351)on forward foreign exchanges contracts — 724 — (8,620)on future contracts — 35,661 — 31,754
Net change in net assets for the year resulting from operations (722,058) (315,448) 347,180 (139,809,679)
Proceeds from subscriptions 2,052,000 6,231,640 2,879,240 695,533,145Payments for redemptions (20,942,227) (85,750,187) (8,694,215) (973,122,164)
Net proceeds / (payment) from share transactions (18,890,227) (79,518,547) (5,814,975) (277,589,019)
Currency translation adjustment 2i — — — 189,584,506
Net assets at the end of the year — 24,727,667 12,837,701 1,721,045,128
* Not authorized in Hong Kong and not available to Hong Kong Residents.(1) Please refer to note 18The accompanying notes form an integral part of these financial statements.
Mirae Asset Global Discovery Fund
Financial Statements
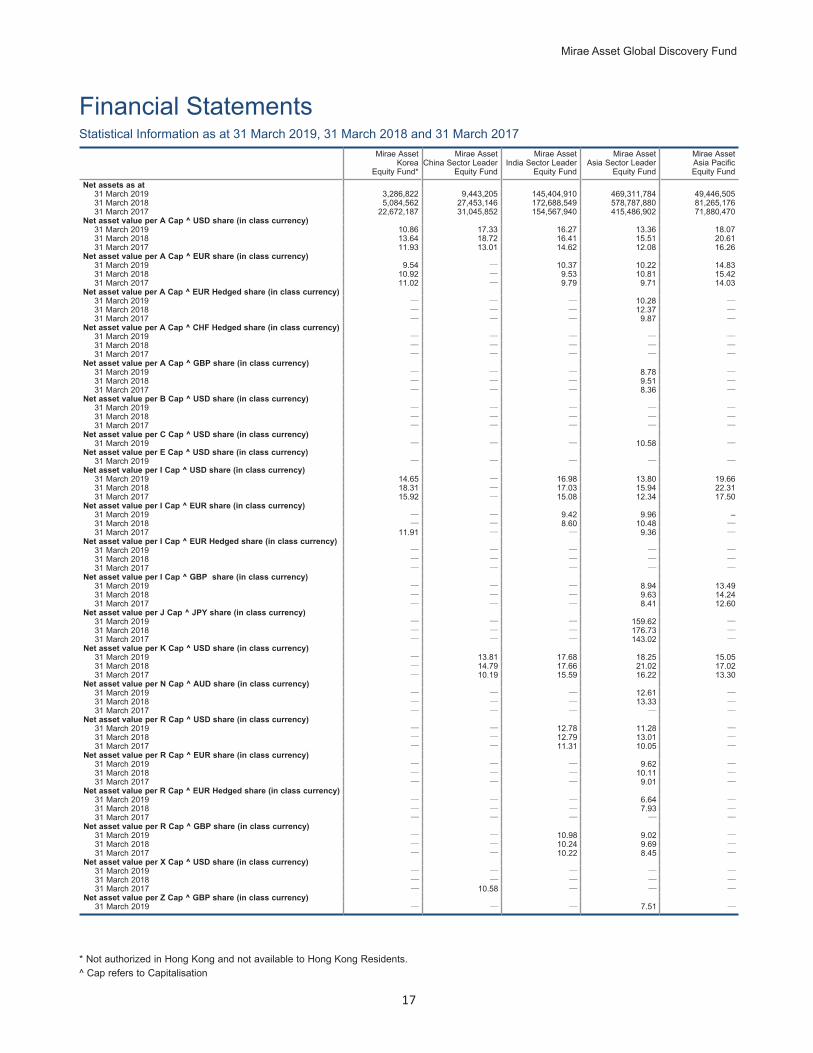
17
Statistical Information as at 31 March 2019, 31 March 2018 and 31 March 2017Mirae Asset
Korea Equity Fund*
Mirae Asset China Sector Leader
Equity Fund
Mirae Asset India Sector Leader
Equity Fund
Mirae Asset Asia Sector Leader
Equity Fund
Mirae Asset Asia Pacific Equity Fund
Net assets as at31 March 2019 3,286,822 9,443,205 145,404,910 469,311,784 49,446,50531 March 2018 5,084,562 27,453,146 172,688,549 578,787,880 81,265,17631 March 2017 22,672,187 31,045,852 154,567,940 415,486,902 71,880,470
Net asset value per A Cap ^ USD share (in class currency)31 March 2019 10.86 17.33 16.27 13.36 18.0731 March 2018 13.64 18.72 16.41 15.51 20.6131 March 2017 11.93 13.01 14.62 12.08 16.26
Net asset value per A Cap ^ EUR share (in class currency)31 March 2019 9.54 — 10.37 10.22 14.8331 March 2018 10.92 — 9.53 10.81 15.4231 March 2017 11.02 — 9.79 9.71 14.03
Net asset value per A Cap ^ EUR Hedged share (in class currency)31 March 2019 — — — 10.28 —31 March 2018 — — — 12.37 —31 March 2017 — — — 9.87 —
Net asset value per A Cap ^ CHF Hedged share (in class currency)31 March 2019 — — — — —31 March 2018 — — — — —31 March 2017 — — — — —
Net asset value per A Cap ^ GBP share (in class currency)31 March 2019 — — — 8.78 —31 March 2018 — — — 9.51 —31 March 2017 — — — 8.36 —
Net asset value per B Cap ^ USD share (in class currency)31 March 2019 — — — — —31 March 2018 — — — — —31 March 2017 — — — — —
Net asset value per C Cap ^ USD share (in class currency)31 March 2019 — — — 10.58 —
Net asset value per E Cap ^ USD share (in class currency)31 March 2019 — — — — —
Net asset value per I Cap ^ USD share (in class currency)31 March 2019 14.65 — 16.98 13.80 19.6631 March 2018 18.31 — 17.03 15.94 22.3131 March 2017 15.92 — 15.08 12.34 17.50
Net asset value per I Cap ^ EUR share (in class currency)31 March 2019 — — 9.42 9.96 –31 March 2018 — — 8.60 10.48 —31 March 2017 11.91 — — 9.36 —
Net asset value per I Cap ^ EUR Hedged share (in class currency)31 March 2019 — — — — —31 March 2018 — — — — —31 March 2017 — — — — —
Net asset value per I Cap ^ GBP share (in class currency)31 March 2019 — — — 8.94 13.4931 March 2018 — — — 9.63 14.2431 March 2017 — — — 8.41 12.60
Net asset value per J Cap ^ JPY share (in class currency)31 March 2019 — — — 159.62 —31 March 2018 — — — 176.73 —31 March 2017 — — — 143.02 —
Net asset value per K Cap ^ USD share (in class currency)31 March 2019 — 13.81 17.68 18.25 15.0531 March 2018 — 14.79 17.66 21.02 17.0231 March 2017 — 10.19 15.59 16.22 13.30
Net asset value per N Cap ^ AUD share (in class currency)31 March 2019 — — — 12.61 —31 March 2018 — — — 13.33 —31 March 2017 — — — — —
Net asset value per R Cap ^ USD share (in class currency)31 March 2019 — — 12.78 11.28 —31 March 2018 — — 12.79 13.01 —31 March 2017 — — 11.31 10.05 —
Net asset value per R Cap ^ EUR share (in class currency)31 March 2019 — — — 9.62 —31 March 2018 — — — 10.11 —31 March 2017 — — — 9.01 —
Net asset value per R Cap ^ EUR Hedged share (in class currency)31 March 2019 — — — 6.64 —31 March 2018 — — — 7.93 —31 March 2017 — — — — —
Net asset value per R Cap ^ GBP share (in class currency)31 March 2019 — — 10.98 9.02 —31 March 2018 — — 10.24 9.69 —31 March 2017 — — 10.22 8.45 —
Net asset value per X Cap ^ USD share (in class currency)31 March 2019 — — — — —31 March 2018 — — — — —31 March 2017 — 10.58 — — —
Net asset value per Z Cap ^ GBP share (in class currency)31 March 2019 — — — 7.51 —
* Not authorized in Hong Kong and not available to Hong Kong Residents.^ Cap refers to Capitalisation
Financial Statements
18
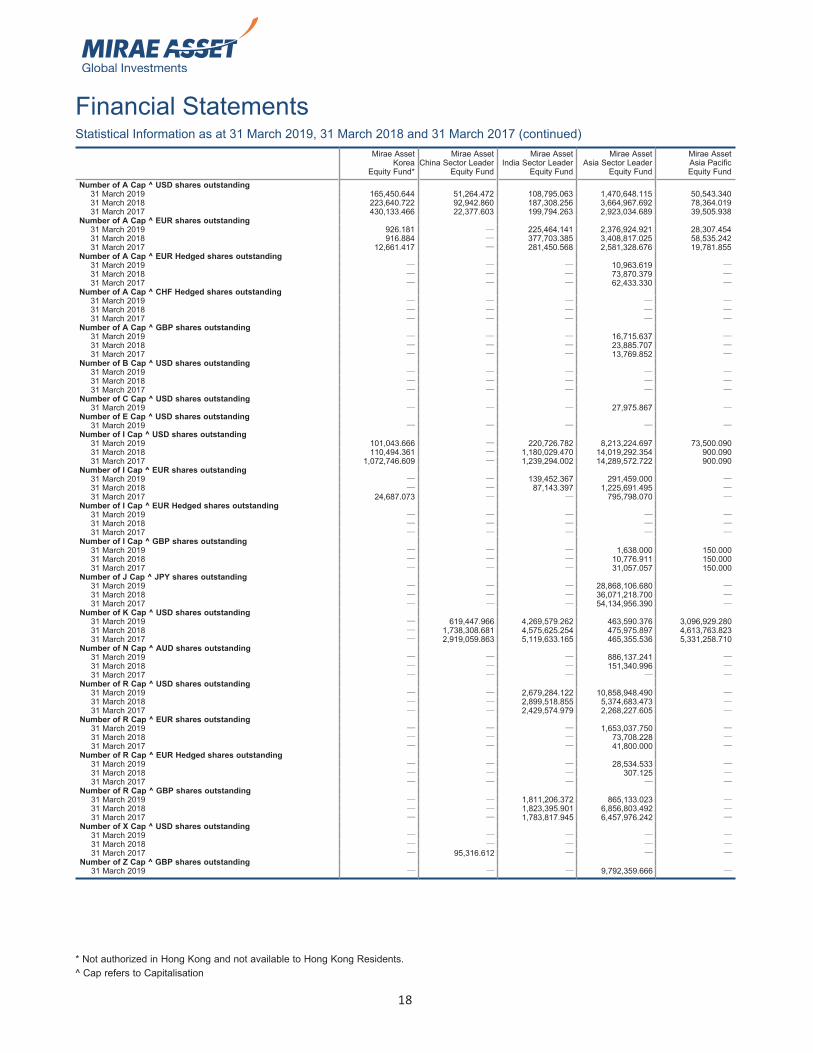
Statistical Information as at 31 March 2019, 31 March 2018 and 31 March 2017 (continued)
* Not authorized in Hong Kong and not available to Hong Kong Residents.^ Cap refers to Capitalisation
Mirae Asset Korea
Equity Fund*
Mirae Asset China Sector Leader
Equity Fund
Mirae Asset India Sector Leader
Equity Fund
Mirae Asset Asia Sector Leader
Equity Fund
Mirae Asset Asia Pacific Equity Fund
Number of A Cap ^ USD shares outstanding31 March 2019 165,450.644 51,264.472 108,795.063 1,470,648.115 50,543.34031 March 2018 223,640.722 92,942.860 187,308.256 3,664,967.692 78,364.01931 March 2017 430,133.466 22,377.603 199,794.263 2,923,034.689 39,505.938
Number of A Cap ^ EUR shares outstanding31 March 2019 926.181 — 225,464.141 2,376,924.921 28,307.45431 March 2018 916.884 — 377,703.385 3,408,817.025 58,535.24231 March 2017 12,661.417 — 281,450.568 2,581,328.676 19,781.855
Number of A Cap ^ EUR Hedged shares outstanding31 March 2019 — — — 10,963.619 —31 March 2018 — — — 73,870.379 —31 March 2017 — — — 62,433.330 —
Number of A Cap ^ CHF Hedged shares outstanding31 March 2019 — — — — —31 March 2018 — — — — —31 March 2017 — — — — —
Number of A Cap ^ GBP shares outstanding31 March 2019 — — — 16,715.637 —31 March 2018 — — — 23,885.707 —31 March 2017 — — — 13,769.852 —
Number of B Cap ^ USD shares outstanding31 March 2019 — — — — —31 March 2018 — — — — —31 March 2017 — — — — —
Number of C Cap ^ USD shares outstanding31 March 2019 — — — 27,975.867 —
Number of E Cap ^ USD shares outstanding31 March 2019 — — — — —
Number of I Cap ^ USD shares outstanding31 March 2019 101,043.666 — 220,726.782 8,213,224.697 73,500.09031 March 2018 110,494.361 — 1,180,029.470 14,019,292.354 900.09031 March 2017 1,072,746.609 — 1,239,294.002 14,289,572.722 900.090
Number of I Cap ^ EUR shares outstanding31 March 2019 — — 139,452.367 291,459.000 —31 March 2018 — — 87,143.397 1,225,691.495 —31 March 2017 24,687.073 — — 795,798.070 —
Number of I Cap ^ EUR Hedged shares outstanding31 March 2019 — — — — —31 March 2018 — — — — —31 March 2017 — — — — —
Number of I Cap ^ GBP shares outstanding31 March 2019 — — — 1,638.000 150.00031 March 2018 — — — 10,776.911 150.00031 March 2017 — — — 31,057.057 150.000
Number of J Cap ^ JPY shares outstanding31 March 2019 — — — 28,868,106.680 —31 March 2018 — — — 36,071,218.700 —31 March 2017 — — — 54,134,956.390 —
Number of K Cap ^ USD shares outstanding31 March 2019 — 619,447.966 4,269,579.262 463,590.376 3,096,929.28031 March 2018 — 1,738,308.681 4,575,625.254 475,975.897 4,613,763.82331 March 2017 — 2,919,059.863 5,119,633.165 465,355.536 5,331,258.710
Number of N Cap ^ AUD shares outstanding31 March 2019 — — — 886,137.241 —31 March 2018 — — — 151,340.996 —31 March 2017 — — — — —
Number of R Cap ^ USD shares outstanding31 March 2019 — — 2,679,284.122 10,858,948.490 —31 March 2018 — — 2,899,518.855 5,374,683.473 —31 March 2017 — — 2,429,574.979 2,268,227.605 —
Number of R Cap ^ EUR shares outstanding31 March 2019 — — — 1,653,037.750 —31 March 2018 — — — 73,708.228 —31 March 2017 — — — 41,800.000 —
Number of R Cap ^ EUR Hedged shares outstanding31 March 2019 — — — 28,534.533 —31 March 2018 — — — 307.125 —31 March 2017 — — — — —
Number of R Cap ^ GBP shares outstanding31 March 2019 — — 1,811,206.372 865,133.023 —31 March 2018 — — 1,823,395.901 6,856,803.492 —31 March 2017 — — 1,783,817.945 6,457,976.242 —
Number of X Cap ^ USD shares outstanding31 March 2019 — — — — —31 March 2018 — — — — —31 March 2017 — 95,316.612 — — —
Number of Z Cap ^ GBP shares outstanding31 March 2019 — — — 9,792,359.666 —
Mirae Asset Global Discovery Fund
Financial Statements
19
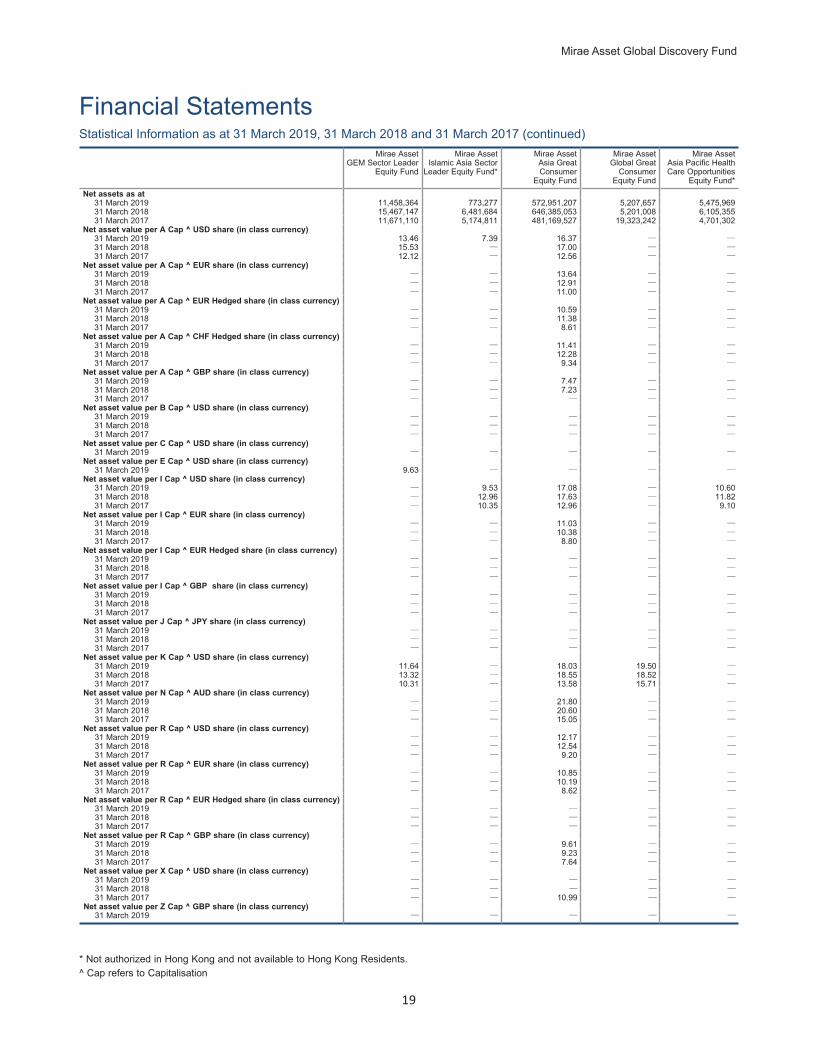
Statistical Information as at 31 March 2019, 31 March 2018 and 31 March 2017 (continued)
* Not authorized in Hong Kong and not available to Hong Kong Residents. ^ Cap refers to Capitalisation
Mirae Asset GEM Sector Leader
Equity Fund
Mirae Asset Islamic Asia Sector
Leader Equity Fund*
Mirae Asset Asia Great Consumer
Equity Fund
Mirae Asset Global Great
Consumer Equity Fund
Mirae Asset Asia Pacific Health Care Opportunities
Equity Fund*Net assets as at
31 March 2019 11,458,364 773,277 572,951,207 5,207,657 5,475,96931 March 2018 15,467,147 6,481,684 646,385,053 5,201,008 6,105,35531 March 2017 11,671,110 5,174,811 481,169,527 19,323,242 4,701,302
Net asset value per A Cap ^ USD share (in class currency)31 March 2019 13.46 7.39 16.37 — —31 March 2018 15.53 — 17.00 — —31 March 2017 12.12 — 12.56 — —
Net asset value per A Cap ^ EUR share (in class currency)31 March 2019 — — 13.64 — —31 March 2018 — — 12.91 — —31 March 2017 — — 11.00 — —
Net asset value per A Cap ^ EUR Hedged share (in class currency)31 March 2019 — — 10.59 — —31 March 2018 — — 11.38 — —31 March 2017 — — 8.61 — —
Net asset value per A Cap ^ CHF Hedged share (in class currency)31 March 2019 — — 11.41 — —31 March 2018 — — 12.28 — —31 March 2017 — — 9.34 — —
Net asset value per A Cap ^ GBP share (in class currency)31 March 2019 — — 7.47 — —31 March 2018 — — 7.23 — —31 March 2017 — — — — —
Net asset value per B Cap ^ USD share (in class currency)31 March 2019 — — — — —31 March 2018 — — — — —31 March 2017 — — — — —
Net asset value per C Cap ^ USD share (in class currency)31 March 2019 — — — — —
Net asset value per E Cap ^ USD share (in class currency)31 March 2019 9.63 — — — —
Net asset value per I Cap ^ USD share (in class currency)31 March 2019 — 9.53 17.08 — 10.6031 March 2018 — 12.96 17.63 — 11.8231 March 2017 — 10.35 12.96 — 9.10
Net asset value per I Cap ^ EUR share (in class currency)31 March 2019 — — 11.03 — —31 March 2018 — — 10.38 — —31 March 2017 — — 8.80 — —
Net asset value per I Cap ^ EUR Hedged share (in class currency)31 March 2019 — — — — —31 March 2018 — — — — —31 March 2017 — — — — —
Net asset value per I Cap ^ GBP share (in class currency)31 March 2019 — — — — —31 March 2018 — — — — —31 March 2017 — — — — —
Net asset value per J Cap ^ JPY share (in class currency)31 March 2019 — — — — —31 March 2018 — — — — —31 March 2017 — — — — —
Net asset value per K Cap ^ USD share (in class currency)31 March 2019 11.64 — 18.03 19.50 —31 March 2018 13.32 — 18.55 18.52 —31 March 2017 10.31 — 13.58 15.71 —
Net asset value per N Cap ^ AUD share (in class currency)31 March 2019 — — 21.80 — —31 March 2018 — — 20.60 — —31 March 2017 — — 15.05 — —
Net asset value per R Cap ^ USD share (in class currency)31 March 2019 — — 12.17 — —31 March 2018 — — 12.54 — —31 March 2017 — — 9.20 — —
Net asset value per R Cap ^ EUR share (in class currency)31 March 2019 — — 10.85 — —31 March 2018 — — 10.19 — —31 March 2017 — — 8.62 — —
Net asset value per R Cap ^ EUR Hedged share (in class currency)31 March 2019 — — — — —31 March 2018 — — — — —31 March 2017 — — — — —
Net asset value per R Cap ^ GBP share (in class currency)31 March 2019 — — 9.61 — —31 March 2018 — — 9.23 — —31 March 2017 — — 7.64 — —
Net asset value per X Cap ^ USD share (in class currency)31 March 2019 — — — — —31 March 2018 — — — — —31 March 2017 — — 10.99 — —
Net asset value per Z Cap ^ GBP share (in class currency)31 March 2019 — — — — —
Financial Statements
20
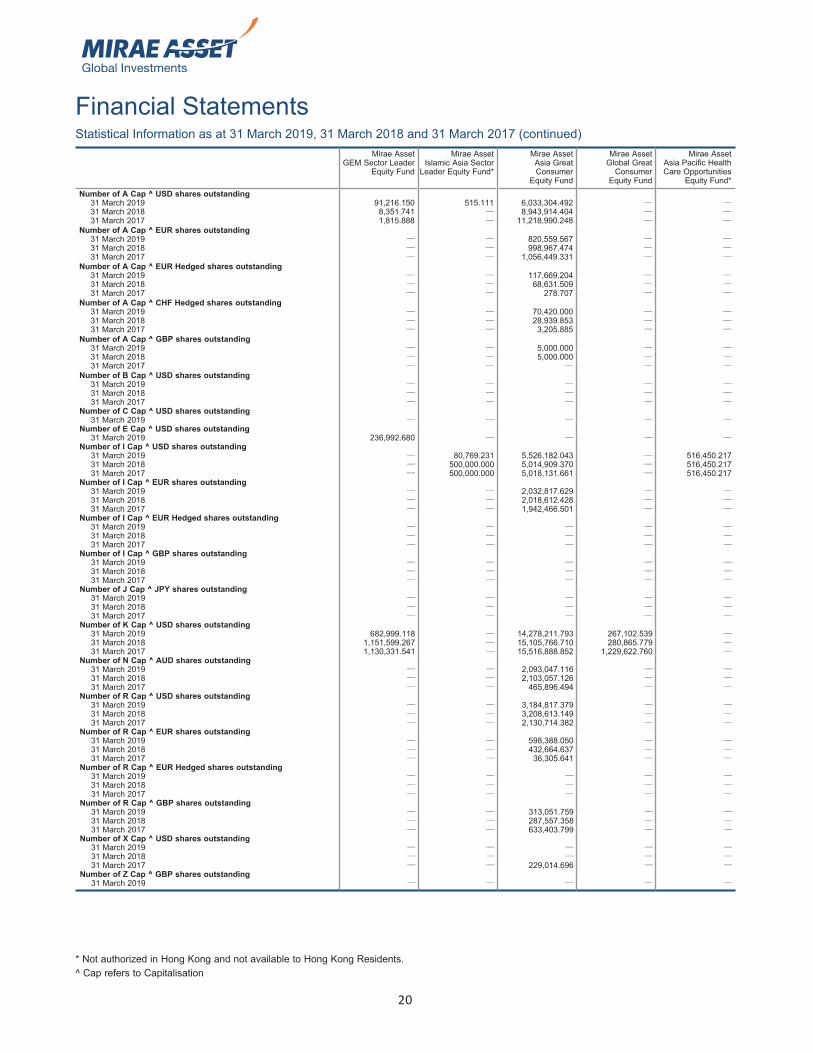
Statistical Information as at 31 March 2019, 31 March 2018 and 31 March 2017 (continued)
* Not authorized in Hong Kong and not available to Hong Kong Residents. ^ Cap refers to Capitalisation
Mirae Asset GEM Sector Leader
Equity Fund
Mirae Asset Islamic Asia Sector
Leader Equity Fund*
Mirae Asset Asia Great Consumer
Equity Fund
Mirae Asset Global Great
Consumer Equity Fund
Mirae Asset Asia Pacific Health Care Opportunities
Equity Fund*Number of A Cap ^ USD shares outstanding
31 March 2019 91,216.150 515.111 6,033,304.492 — —31 March 2018 8,351.741 — 8,943,914.404 — —31 March 2017 1,815.888 — 11,218,990.248 — —
Number of A Cap ^ EUR shares outstanding31 March 2019 — — 820,559.567 — —31 March 2018 — — 998,967.474 — —31 March 2017 — — 1,056,449.331 — —
Number of A Cap ^ EUR Hedged shares outstanding31 March 2019 — — 117,669.204 — —31 March 2018 — — 68,631.509 — —31 March 2017 — — 278.707 — —
Number of A Cap ^ CHF Hedged shares outstanding31 March 2019 — — 70,420.000 — —31 March 2018 — — 28,939.853 — —31 March 2017 — — 3,205.885 — —
Number of A Cap ^ GBP shares outstanding31 March 2019 — — 5,000.000 — —31 March 2018 — — 5,000.000 — —31 March 2017 — — — — —
Number of B Cap ^ USD shares outstanding31 March 2019 — — — — —31 March 2018 — — — — —31 March 2017 — — — — —
Number of C Cap ^ USD shares outstanding31 March 2019 — — — — —
Number of E Cap ^ USD shares outstanding31 March 2019 236,992.680 — — — —
Number of I Cap ^ USD shares outstanding31 March 2019 — 80,769.231 5,526,182.043 — 516,450.21731 March 2018 — 500,000.000 5,014,909.370 — 516,450.21731 March 2017 — 500,000.000 5,018,131.661 — 516,450.217
Number of I Cap ^ EUR shares outstanding31 March 2019 — — 2,032,817.629 — —31 March 2018 — — 2,018,612.428 — —31 March 2017 — — 1,942,466.501 — —
Number of I Cap ^ EUR Hedged shares outstanding31 March 2019 — — — — —31 March 2018 — — — — —31 March 2017 — — — — —
Number of I Cap ^ GBP shares outstanding31 March 2019 — — — — —31 March 2018 — — — — —31 March 2017 — — — — —
Number of J Cap ^ JPY shares outstanding31 March 2019 — — — — —31 March 2018 — — — — —31 March 2017 — — — — —
Number of K Cap ^ USD shares outstanding31 March 2019 682,999.118 — 14,278,211.793 267,102.539 —31 March 2018 1,151,599.267 — 15,105,766.710 280,865.779 —31 March 2017 1,130,331.541 — 15,516,888.852 1,229,622.760 —
Number of N Cap ^ AUD shares outstanding31 March 2019 — — 2,093,047.116 — —31 March 2018 — — 2,103,057.126 — —31 March 2017 — — 465,896.494 — —
Number of R Cap ^ USD shares outstanding31 March 2019 — — 3,184,817.379 — —31 March 2018 — — 3,208,613.149 — —31 March 2017 — — 2,130,714.382 — —
Number of R Cap ^ EUR shares outstanding31 March 2019 — — 598,388.050 — —31 March 2018 — — 432,664.637 — —31 March 2017 — — 36,305.641 — —
Number of R Cap ^ EUR Hedged shares outstanding31 March 2019 — — — — —31 March 2018 — — — — —31 March 2017 — — — — —
Number of R Cap ^ GBP shares outstanding31 March 2019 — — 313,051.759 — —31 March 2018 — — 287,557.358 — —31 March 2017 — — 633,403.799 — —
Number of X Cap ^ USD shares outstanding31 March 2019 — — — — —31 March 2018 — — — — —31 March 2017 — — 229,014.696 — —
Number of Z Cap ^ GBP shares outstanding31 March 2019 — — — — —
Mirae Asset Global Discovery Fund
Financial Statements
21
Statistical Information as at 31 March 2019, 31 March 2018 and 31 March 2017 (continued)
* Not authorized in Hong Kong and not available to Hong Kong Residents. ** The net assets, net asset values and number of shares disclosed are as at the last NAV date of 14 September 2018. (1) Please refer to note 18^ Cap refers to Capitalisation
Mirae Asset Asia Growth Equity Fund*
Mirae Asset China Growth Equity Fund*
Mirae Asset Next Asia Pacific
Equity Fund*
Mirae Asset India Mid Cap Equity Fund*
Mirae Asset Asia Income
Balanced Fund*(1)
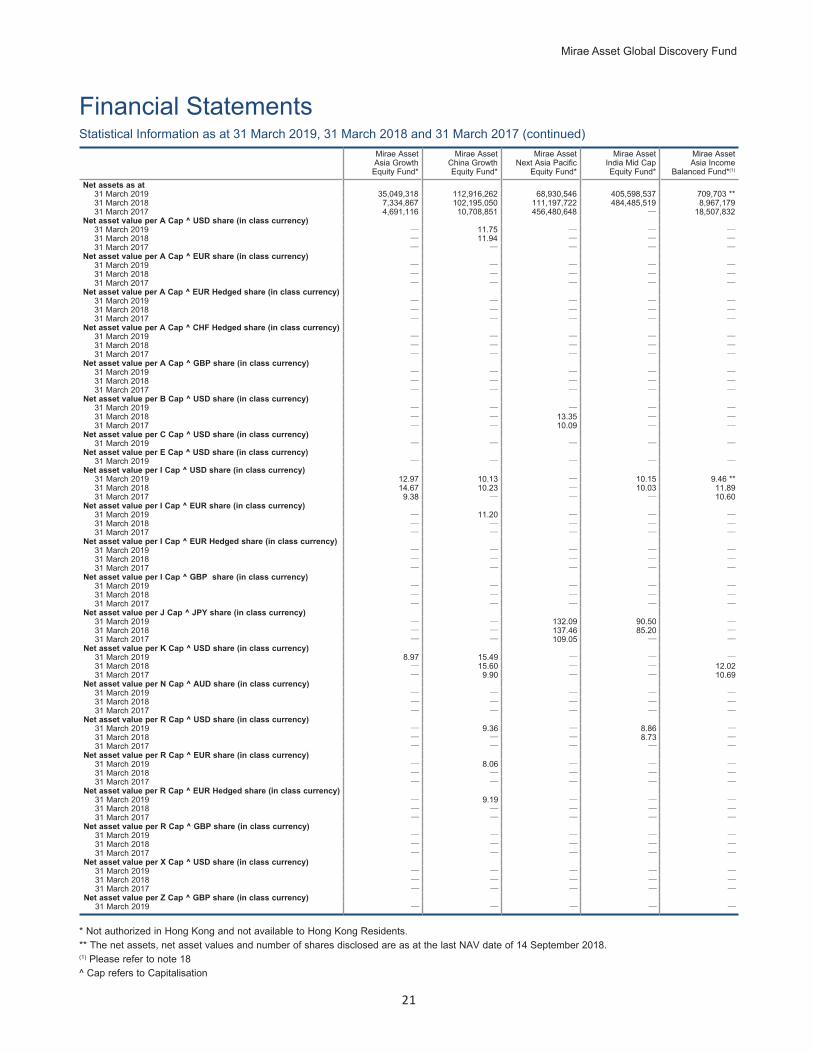
Net assets as at31 March 2019 35,049,318 112,916,262 68,930,546 405,598,537 709,703 **31 March 2018 7,334,867 102,195,050 111,197,722 484,485,519 8,967,17931 March 2017 4,691,116 10,708,851 456,480,648 — 18,507,832
Net asset value per A Cap ^ USD share (in class currency)31 March 2019 — 11.75 — — —31 March 2018 — 11.94 — — —31 March 2017 — — — — —
Net asset value per A Cap ^ EUR share (in class currency)31 March 2019 — — — — —31 March 2018 — — — — —31 March 2017 — — — — —
Net asset value per A Cap ^ EUR Hedged share (in class currency)31 March 2019 — — — — —31 March 2018 — — — — —31 March 2017 — — — — —
Net asset value per A Cap ^ CHF Hedged share (in class currency)31 March 2019 — — — — —31 March 2018 — — — — —31 March 2017 — — — — —
Net asset value per A Cap ^ GBP share (in class currency)31 March 2019 — — — — —31 March 2018 — — — — —31 March 2017 — — — — —
Net asset value per B Cap ^ USD share (in class currency)31 March 2019 — — — — —31 March 2018 — — 13.35 — —31 March 2017 — — 10.09 — —
Net asset value per C Cap ^ USD share (in class currency)31 March 2019 — — — — —
Net asset value per E Cap ^ USD share (in class currency)31 March 2019 — — — — —
Net asset value per I Cap ^ USD share (in class currency)31 March 2019 12.97 10.13 — 10.15 9.46 **31 March 2018 14.67 10.23 — 10.03 11.8931 March 2017 9.38 — — — 10.60
Net asset value per I Cap ^ EUR share (in class currency)31 March 2019 — 11.20 — — —31 March 2018 — — — — —31 March 2017 — — — — —
Net asset value per I Cap ^ EUR Hedged share (in class currency)31 March 2019 — — — — —31 March 2018 — — — — —31 March 2017 — — — — —
Net asset value per I Cap ^ GBP share (in class currency)31 March 2019 — — — — —31 March 2018 — — — — —31 March 2017 — — — — —
Net asset value per J Cap ^ JPY share (in class currency)31 March 2019 — — 132.09 90.50 —31 March 2018 — — 137.46 85.20 —31 March 2017 — — 109.05 — —
Net asset value per K Cap ^ USD share (in class currency)31 March 2019 8.97 15.49 — — —31 March 2018 — 15.60 — — 12.0231 March 2017 — 9.90 — — 10.69
Net asset value per N Cap ^ AUD share (in class currency)31 March 2019 — — — — —31 March 2018 — — — — —31 March 2017 — — — — —
Net asset value per R Cap ^ USD share (in class currency)31 March 2019 — 9.36 — 8.86 —31 March 2018 — — — 8.73 —31 March 2017 — — — — —
Net asset value per R Cap ^ EUR share (in class currency)31 March 2019 — 8.06 — — —31 March 2018 — — — — —31 March 2017 — — — — —
Net asset value per R Cap ^ EUR Hedged share (in class currency)31 March 2019 — 9.19 — — —31 March 2018 — — — — —31 March 2017 — — — — —
Net asset value per R Cap ^ GBP share (in class currency)31 March 2019 — — — — —31 March 2018 — — — — —31 March 2017 — — — — —
Net asset value per X Cap ^ USD share (in class currency)31 March 2019 — — — — —31 March 2018 — — — — —31 March 2017 — — — — —
Net asset value per Z Cap ^ GBP share (in class currency)31 March 2019 — — — — —
Financial Statements
22
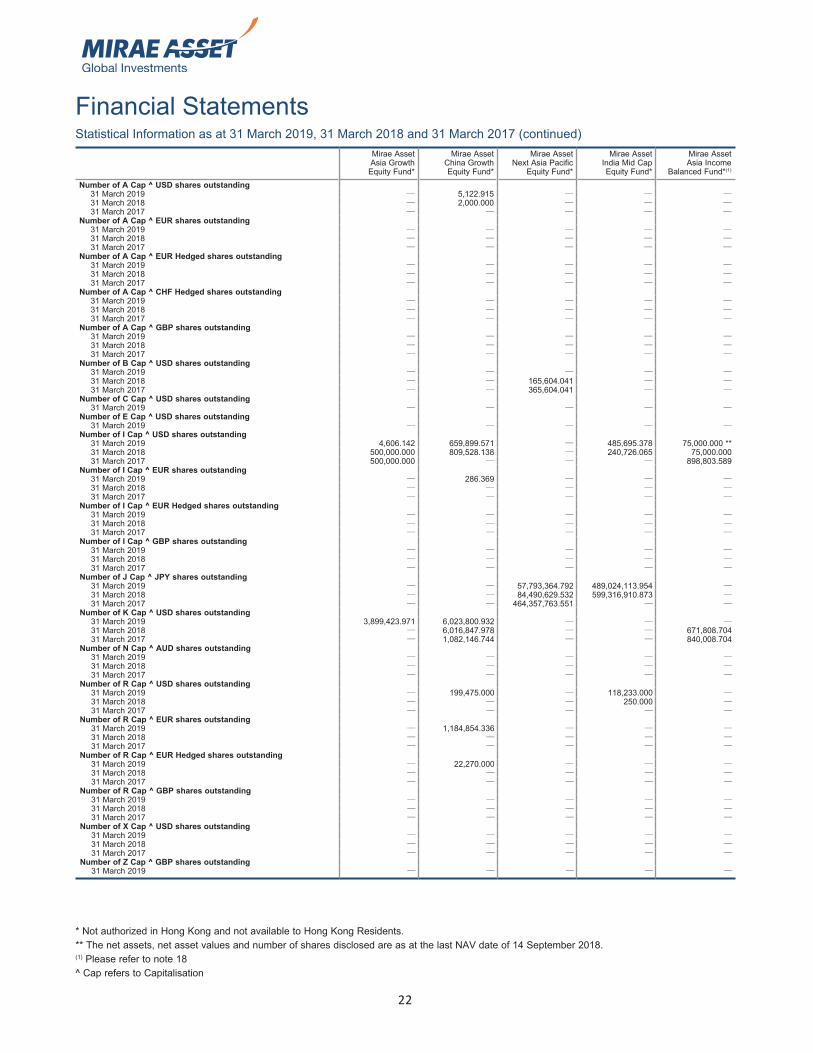
Statistical Information as at 31 March 2019, 31 March 2018 and 31 March 2017 (continued)
* Not authorized in Hong Kong and not available to Hong Kong Residents. ** The net assets, net asset values and number of shares disclosed are as at the last NAV date of 14 September 2018. (1) Please refer to note 18^ Cap refers to Capitalisation
Mirae Asset Asia Growth Equity Fund*
Mirae Asset China Growth Equity Fund*
Mirae Asset Next Asia Pacific
Equity Fund*
Mirae Asset India Mid Cap Equity Fund*
Mirae Asset Asia Income
Balanced Fund*(1)
Number of A Cap ^ USD shares outstanding31 March 2019 — 5,122.915 — — —31 March 2018 — 2,000.000 — — —31 March 2017 — — — — —
Number of A Cap ^ EUR shares outstanding31 March 2019 — — — — —31 March 2018 — — — — —31 March 2017 — — — — —
Number of A Cap ^ EUR Hedged shares outstanding31 March 2019 — — — — —31 March 2018 — — — — —31 March 2017 — — — — —
Number of A Cap ^ CHF Hedged shares outstanding31 March 2019 — — — — —31 March 2018 — — — — —31 March 2017 — — — — —
Number of A Cap ^ GBP shares outstanding31 March 2019 — — — — —31 March 2018 — — — — —31 March 2017 — — — — —
Number of B Cap ^ USD shares outstanding31 March 2019 — — — — —31 March 2018 — — 165,604.041 — —31 March 2017 — — 365,604.041 — —
Number of C Cap ^ USD shares outstanding31 March 2019 — — — — —
Number of E Cap ^ USD shares outstanding31 March 2019 — — — — —
Number of I Cap ^ USD shares outstanding31 March 2019 4,606.142 659,899.571 — 485,695.378 75,000.000 **31 March 2018 500,000.000 809,528.138 — 240,726.065 75,000.00031 March 2017 500,000.000 — — — 898,803.589
Number of I Cap ^ EUR shares outstanding31 March 2019 — 286.369 — — —31 March 2018 — — — — —31 March 2017 — — — — —
Number of I Cap ^ EUR Hedged shares outstanding31 March 2019 — — — — —31 March 2018 — — — — —31 March 2017 — — — — —
Number of I Cap ^ GBP shares outstanding31 March 2019 — — — — —31 March 2018 — — — — —31 March 2017 — — — — —
Number of J Cap ^ JPY shares outstanding31 March 2019 — — 57,793,364.792 489,024,113.954 —31 March 2018 — — 84,490,629.532 599,316,910.873 —31 March 2017 — — 464,357,763.551 — —
Number of K Cap ^ USD shares outstanding31 March 2019 3,899,423.971 6,023,800.932 — — —31 March 2018 — 6,016,847.978 — — 671,808.70431 March 2017 — 1,082,146.744 — — 840,008.704
Number of N Cap ^ AUD shares outstanding31 March 2019 — — — — —31 March 2018 — — — — —31 March 2017 — — — — —
Number of R Cap ^ USD shares outstanding31 March 2019 — 199,475.000 — 118,233.000 —31 March 2018 — — — 250.000 —31 March 2017 — — — — —
Number of R Cap ^ EUR shares outstanding31 March 2019 — 1,184,854.336 — — —31 March 2018 — — — — —31 March 2017 — — — — —
Number of R Cap ^ EUR Hedged shares outstanding31 March 2019 — 22,270.000 — — —31 March 2018 — — — — —31 March 2017 — — — — —
Number of R Cap ^ GBP shares outstanding31 March 2019 — — — — —31 March 2018 — — — — —31 March 2017 — — — — —
Number of X Cap ^ USD shares outstanding31 March 2019 — — — — —31 March 2018 — — — — —31 March 2017 — — — — —
Number of Z Cap ^ GBP shares outstanding31 March 2019 — — — — —
Mirae Asset Global Discovery Fund
Financial Statements
23
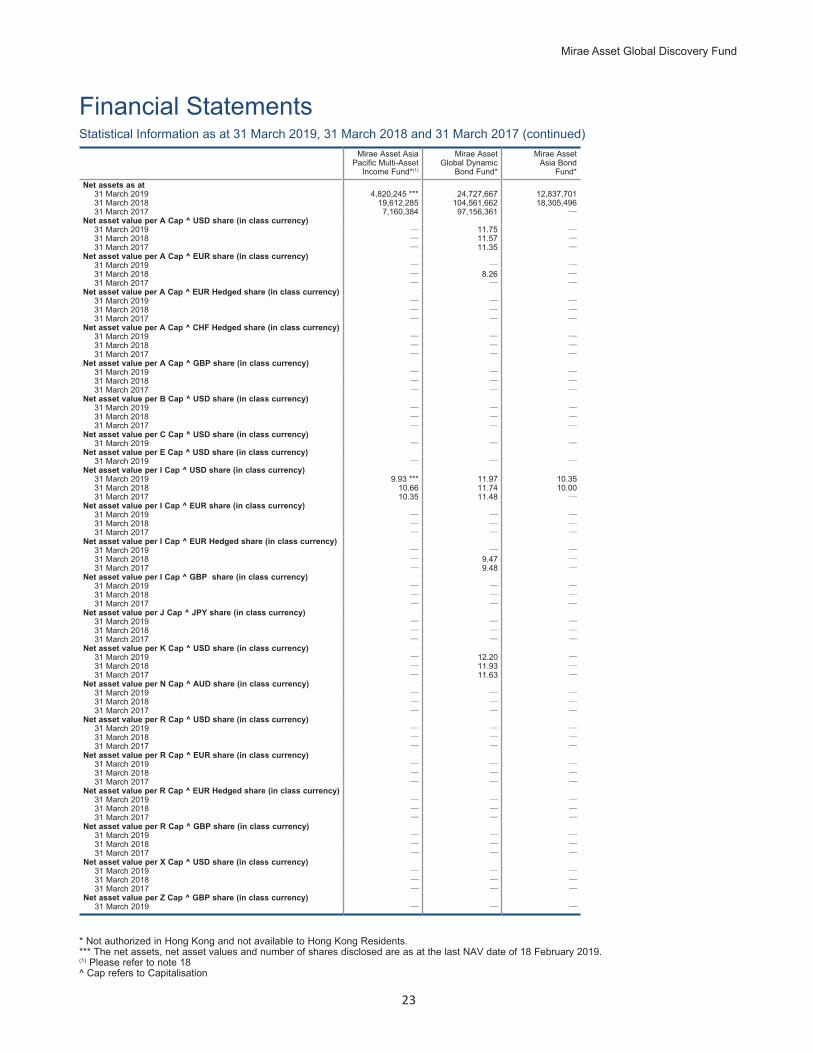
Statistical Information as at 31 March 2019, 31 March 2018 and 31 March 2017 (continued)
* Not authorized in Hong Kong and not available to Hong Kong Residents. *** The net assets, net asset values and number of shares disclosed are as at the last NAV date of 18 February 2019. (1) Please refer to note 18^ Cap refers to Capitalisation
Mirae Asset Asia Pacific Multi-Asset
Income Fund*(1)
Mirae Asset Global Dynamic
Bond Fund*
Mirae Asset Asia Bond
Fund*Net assets as at
31 March 2019 4,820,245 *** 24,727,667 12,837,70131 March 2018 19,612,285 104,561,662 18,305,49631 March 2017 7,160,384 97,156,361 —
Net asset value per A Cap ^ USD share (in class currency)31 March 2019 — 11.75 —31 March 2018 — 11.57 —31 March 2017 — 11.35 —
Net asset value per A Cap ^ EUR share (in class currency)31 March 2019 — — —31 March 2018 — 8.26 —31 March 2017 — — —
Net asset value per A Cap ^ EUR Hedged share (in class currency)31 March 2019 — — —31 March 2018 — — —31 March 2017 — — —
Net asset value per A Cap ^ CHF Hedged share (in class currency)31 March 2019 — — —31 March 2018 — — —31 March 2017 — — —
Net asset value per A Cap ^ GBP share (in class currency)31 March 2019 — — —31 March 2018 — — —31 March 2017 — — —
Net asset value per B Cap ^ USD share (in class currency)31 March 2019 — — —31 March 2018 — — —31 March 2017 — — —
Net asset value per C Cap ^ USD share (in class currency)31 March 2019 — — —
Net asset value per E Cap ^ USD share (in class currency)31 March 2019 — — —
Net asset value per I Cap ^ USD share (in class currency)31 March 2019 9.93 *** 11.97 10.3531 March 2018 10.66 11.74 10.0031 March 2017 10.35 11.48 —
Net asset value per I Cap ^ EUR share (in class currency)31 March 2019 — — —31 March 2018 — — —31 March 2017 — — —
Net asset value per I Cap ^ EUR Hedged share (in class currency)31 March 2019 — — —31 March 2018 — 9.47 —31 March 2017 — 9.48 —
Net asset value per I Cap ^ GBP share (in class currency)31 March 2019 — — —31 March 2018 — — —31 March 2017 — — —
Net asset value per J Cap ^ JPY share (in class currency)31 March 2019 — — —31 March 2018 — — —31 March 2017 — — —
Net asset value per K Cap ^ USD share (in class currency)31 March 2019 — 12.20 —31 March 2018 — 11.93 —31 March 2017 — 11.63 —
Net asset value per N Cap ^ AUD share (in class currency)31 March 2019 — — —31 March 2018 — — —31 March 2017 — — —
Net asset value per R Cap ^ USD share (in class currency)31 March 2019 — — —31 March 2018 — — —31 March 2017 — — —
Net asset value per R Cap ^ EUR share (in class currency)31 March 2019 — — —31 March 2018 — — —31 March 2017 — — —
Net asset value per R Cap ^ EUR Hedged share (in class currency)31 March 2019 — — —31 March 2018 — — —31 March 2017 — — —
Net asset value per R Cap ^ GBP share (in class currency)31 March 2019 — — —31 March 2018 — — —31 March 2017 — — —
Net asset value per X Cap ^ USD share (in class currency)31 March 2019 — — —31 March 2018 — — —31 March 2017 — — —
Net asset value per Z Cap ^ GBP share (in class currency)31 March 2019 — — —
Financial Statements
24
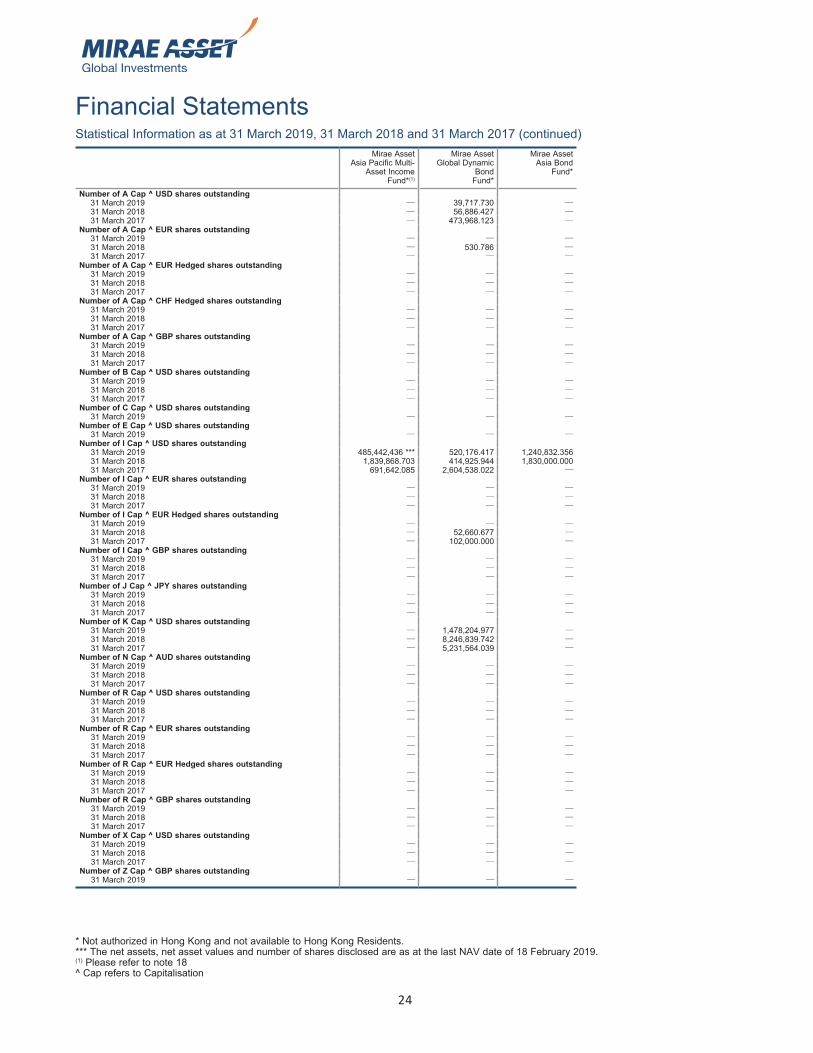
Statistical Information as at 31 March 2019, 31 March 2018 and 31 March 2017 (continued)
* Not authorized in Hong Kong and not available to Hong Kong Residents. *** The net assets, net asset values and number of shares disclosed are as at the last NAV date of 18 February 2019. (1) Please refer to note 18^ Cap refers to Capitalisation
Mirae Asset Asia Pacific Multi-
Asset Income Fund*(1)
Mirae Asset Global Dynamic
Bond Fund*
Mirae Asset Asia Bond
Fund*
Number of A Cap ^ USD shares outstanding31 March 2019 — 39,717.730 —31 March 2018 — 56,886.427 —31 March 2017 — 473,968.123 —
Number of A Cap ^ EUR shares outstanding31 March 2019 — — —31 March 2018 — 530.786 —31 March 2017 — — —
Number of A Cap ^ EUR Hedged shares outstanding31 March 2019 — — —31 March 2018 — — —31 March 2017 — — —
Number of A Cap ^ CHF Hedged shares outstanding31 March 2019 — — —31 March 2018 — — —31 March 2017 — — —
Number of A Cap ^ GBP shares outstanding31 March 2019 — — —31 March 2018 — — —31 March 2017 — — —
Number of B Cap ^ USD shares outstanding31 March 2019 — — —31 March 2018 — — —31 March 2017 — — —
Number of C Cap ^ USD shares outstanding31 March 2019 — — —
Number of E Cap ^ USD shares outstanding31 March 2019 — — —
Number of I Cap ^ USD shares outstanding31 March 2019 485,442,436 *** 520,176.417 1,240,832.35631 March 2018 1,839,868.703 414,925.944 1,830,000.00031 March 2017 691,642.085 2,604,538.022 —
Number of I Cap ^ EUR shares outstanding31 March 2019 — — —31 March 2018 — — —31 March 2017 — — —
Number of I Cap ^ EUR Hedged shares outstanding31 March 2019 — — —31 March 2018 — 52,660.677 —31 March 2017 — 102,000.000 —
Number of I Cap ^ GBP shares outstanding31 March 2019 — — —31 March 2018 — — —31 March 2017 — — —
Number of J Cap ^ JPY shares outstanding31 March 2019 — — —31 March 2018 — — —31 March 2017 — — —
Number of K Cap ^ USD shares outstanding31 March 2019 — 1,478,204.977 —31 March 2018 — 8,246,839.742 —31 March 2017 — 5,231,564.039 —
Number of N Cap ^ AUD shares outstanding31 March 2019 — — —31 March 2018 — — —31 March 2017 — — —
Number of R Cap ^ USD shares outstanding31 March 2019 — — —31 March 2018 — — —31 March 2017 — — —
Number of R Cap ^ EUR shares outstanding31 March 2019 — — —31 March 2018 — — —31 March 2017 — — —
Number of R Cap ^ EUR Hedged shares outstanding31 March 2019 — — —31 March 2018 — — —31 March 2017 — — —
Number of R Cap ^ GBP shares outstanding31 March 2019 — — —31 March 2018 — — —31 March 2017 — — —
Number of X Cap ^ USD shares outstanding31 March 2019 — — —31 March 2018 — — —31 March 2017 — — —
Number of Z Cap ^ GBP shares outstanding31 March 2019 — — —
Mirae Asset Global Discovery Fund
25
Notes to the Financial StatementsFor the year ended 31 March 2019
1. Description of the Company
Mirae Asset Global Discovery Fund (referred to hereafter as the “Company”) is an open-ended investment company with variable capital incorporated under the laws of the Grand Duchy of Luxembourg as a “Société d’Investissement à Capital Variable” (SICAV) under the form of a “société anonyme”. The Company is governed by the law of the Grand Duchy of Luxembourg of 10 August 1915 on commercial companies, as amended, and by Part I of the law of 17 December 2010, as amended.
The Company was incorporated for an unlimited period of time on 30 April 2008. The registered office of the Company is established at 31, z.a. Bourmicht, L-8070 Bertrange, Grand Duchy of Luxembourg.
The Articles have been deposited with the Chancery of the District Court of Luxembourg and published in the Memorial on 16 June 2008. The Articles have been last amended on 29 June 2012, with publication in the Memorial dated 24 August 2012.
As of 31 March 2019, the Company issued shares of the following 16 sub-funds for subscription:
– Mirae Asset Korea Equity Fund*– Mirae Asset China Sector Leader Equity Fund– Mirae Asset India Sector Leader Equity Fund– Mirae Asset Asia Sector Leader Equity Fund– Mirae Asset Asia Pacific Equity Fund– Mirae Asset GEM Sector Leader Equity Fund– Mirae Asset Islamic Asia Sector Leader Equity Fund*– Mirae Asset Asia Great Consumer Equity Fund– Mirae Asset Global Great Consumer Equity Fund– Mirae Asset Asia Pacific Health Care Opportunities Equity Fund*– Mirae Asset Asia Growth Equity Fund*– Mirae Asset China Growth Equity Fund*– Mirae Asset Next Asia Pacific Equity Fund*– Mirae Asset India Mid Cap Equity Fund*– Mirae Asset Global Dynamic Bond Fund*– Mirae Asset Asia Bond Fund*
As of 31 March 2019, 9 classes of shares are offered to investors: Class A Capitalisation, Class C Capitalisation, Class E Capitalisation, Class I Capitalisation, Class J Capitalisation, Class K Capitalisation, Class N Capitalisation, Class R Capitalisation and Class Z Capitalisation.
The Company may in the future create new sub-funds and new share classes.
2. Significant Accounting Policies
The financial statements have been prepared in accordance with Luxembourg legal and regulatory requirements applicable to investment funds. The following is a summary of significant accounting policies followed by the sub-funds.
a) Valuation of Investment in Securities
Securities which are listed or traded on any Regulated Market, stock exchange in an Other State or Other Regulated Market are valued at the closing price on such markets.
If a security is listed or traded on several markets, the closing price at the market which constitutes the main market for such securities is determined.
Securities not listed or traded on any Regulated Market, stock exchange in an Other State or Other Regulated Market are valued at their last available market price.
Securities for which no price quotation is available or for which the closing price at the market is not representative of the fair market value, are valued prudently, and in good faith by the Board of Directors on the basis of their reasonably foreseeable sales prices.
Units or shares of open-ended UCIs (undertakings for collective investment) are valued at their last official net asset values, excluding redemption fees, if any, as reported or provided by such UCIs or their agents, or at their last unofficial net asset values (i.e. estimates of net asset values) if more recent than their last official net asset values, provided that due diligence has been carried out by the Investment Manager, in accordance with instructions and under the overall control and responsibility of the Board of Directors, as to the reliability of such unofficial net asset values. The Net Asset Value calculated on the basis of unofficial net asset values of target UCIs may differ from the net asset value which would have been calculated, on the relevant Valuation Day, on the basis of the official net asset values determined by the administrative agents of the target UCIs. The Net Asset Value is final and binding notwithstanding any different later determination. Units or shares of quoted closed-ended UCIs are valued at their last available stock market value.
The Board of Directors has appointed a Pricing Committee which shall be entitled to approve the mechanisms of monitoring for significant events, along with decisions on whether a substantial proportion of the investments have been affected by the significant event and a fair value pricing of the portfolios is needed.
* Not authorized in Hong Kong and not available to Hong Kong Residents
26
Notes to the Financial StatementsFor the year ended 31 March 2019 (continued)
In a case where none of the members of the Pricing Committee is available for making a decision, it shall be the responsibility of the Board to decide how to proceed with the fair valuation of the assets in order to serve the best interests of shareholders.
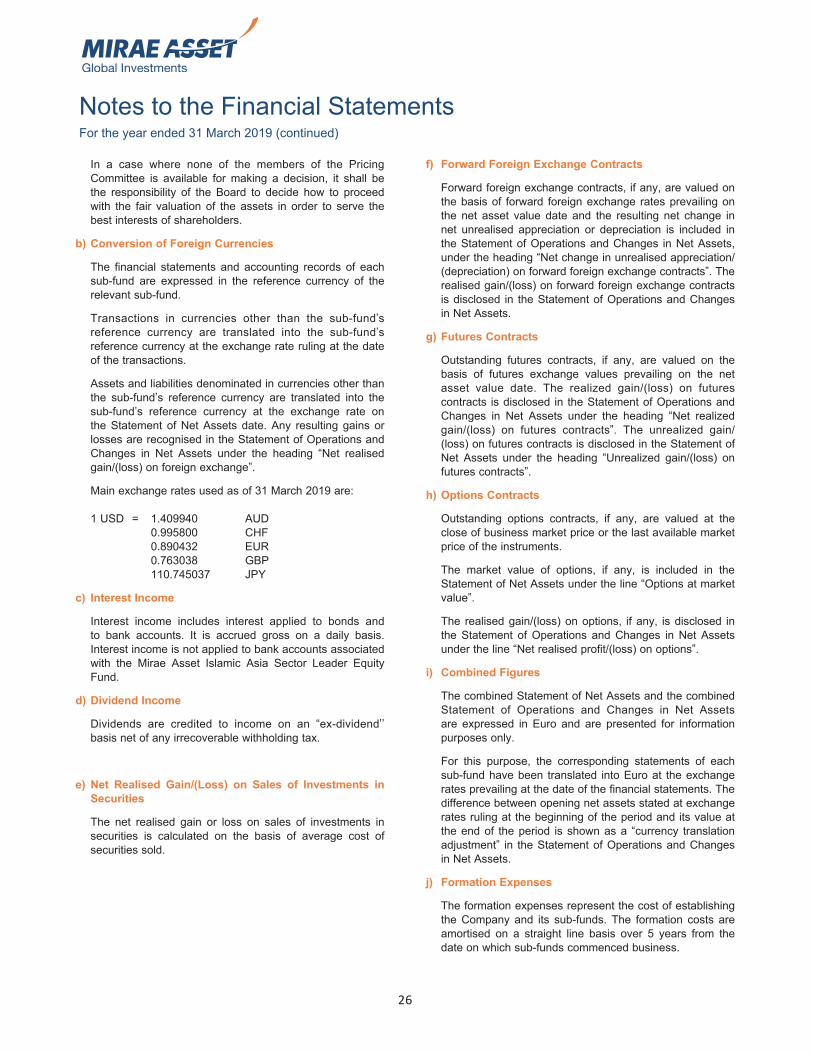
b) Conversion of Foreign Currencies
The financial statements and accounting records of each sub-fund are expressed in the reference currency of the relevant sub-fund.
Transactions in currencies other than the sub-fund’s reference currency are translated into the sub-fund’s reference currency at the exchange rate ruling at the date of the transactions.
Assets and liabilities denominated in currencies other than the sub-fund’s reference currency are translated into the sub-fund’s reference currency at the exchange rate on the Statement of Net Assets date. Any resulting gains or losses are recognised in the Statement of Operations and Changes in Net Assets under the heading “Net realised gain/(loss) on foreign exchange”.
Main exchange rates used as of 31 March 2019 are:
1 USD = 1.409940 AUD 0.995800 CHF 0.890432 EUR 0.763038 GBP 110.745037 JPY
c) Interest Income
Interest income includes interest applied to bonds and to bank accounts. It is accrued gross on a daily basis. Interest income is not applied to bank accounts associated with the Mirae Asset Islamic Asia Sector Leader Equity Fund.
d) Dividend Income
Dividends are credited to income on an “ex-dividend’’ basis net of any irrecoverable withholding tax.
e) Net Realised Gain/(Loss) on Sales of Investments in Securities
The net realised gain or loss on sales of investments in securities is calculated on the basis of average cost of securities sold.
f) Forward Foreign Exchange Contracts
Forward foreign exchange contracts, if any, are valued on the basis of forward foreign exchange rates prevailing on the net asset value date and the resulting net change in net unrealised appreciation or depreciation is included in the Statement of Operations and Changes in Net Assets, under the heading “Net change in unrealised appreciation/(depreciation) on forward foreign exchange contracts”. The realised gain/(loss) on forward foreign exchange contracts is disclosed in the Statement of Operations and Changes in Net Assets.
g) Futures Contracts
Outstanding futures contracts, if any, are valued on the basis of futures exchange values prevailing on the net asset value date. The realized gain/(loss) on futures contracts is disclosed in the Statement of Operations and Changes in Net Assets under the heading “Net realized gain/(loss) on futures contracts”. The unrealized gain/(loss) on futures contracts is disclosed in the Statement of Net Assets under the heading “Unrealized gain/(loss) on futures contracts”.
h) Options Contracts
Outstanding options contracts, if any, are valued at the close of business market price or the last available market price of the instruments.
The market value of options, if any, is included in the Statement of Net Assets under the line “Options at market value”.
The realised gain/(loss) on options, if any, is disclosed in the Statement of Operations and Changes in Net Assets under the line “Net realised profit/(loss) on options”.
i) Combined Figures
The combined Statement of Net Assets and the combined Statement of Operations and Changes in Net Assets are expressed in Euro and are presented for information purposes only.
For this purpose, the corresponding statements of each sub-fund have been translated into Euro at the exchange rates prevailing at the date of the financial statements. The difference between opening net assets stated at exchange rates ruling at the beginning of the period and its value at the end of the period is shown as a “currency translation adjustment” in the Statement of Operations and Changes in Net Assets.
j) Formation Expenses
The formation expenses represent the cost of establishing the Company and its sub-funds. The formation costs are amortised on a straight line basis over 5 years from the date on which sub-funds commenced business.
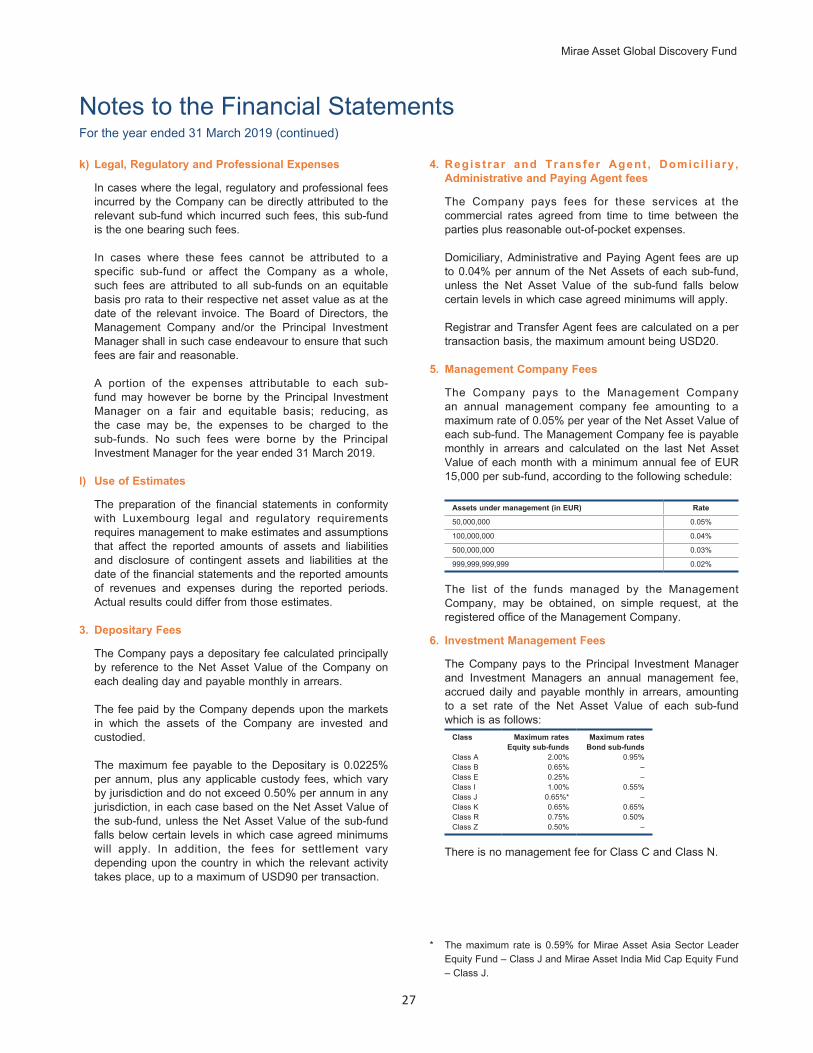
Mirae Asset Global Discovery Fund
27
Notes to the Financial StatementsFor the year ended 31 March 2019 (continued)
k) Legal, Regulatory and Professional Expenses
In cases where the legal, regulatory and professional fees incurred by the Company can be directly attributed to the relevant sub-fund which incurred such fees, this sub-fund is the one bearing such fees.
In cases where these fees cannot be attributed to a specific sub-fund or affect the Company as a whole, such fees are attributed to all sub-funds on an equitable basis pro rata to their respective net asset value as at the date of the relevant invoice. The Board of Directors, the Management Company and/or the Principal Investment Manager shall in such case endeavour to ensure that such fees are fair and reasonable.
A portion of the expenses attributable to each sub-fund may however be borne by the Principal Investment Manager on a fair and equitable basis; reducing, as the case may be, the expenses to be charged to the sub-funds. No such fees were borne by the Principal Investment Manager for the year ended 31 March 2019.
l) Use of Estimates
The preparation of the financial statements in conformity with Luxembourg legal and regulatory requirements requires management to make estimates and assumptions that affect the reported amounts of assets and liabilities and disclosure of contingent assets and liabilities at the date of the financial statements and the reported amounts of revenues and expenses during the reported periods. Actual results could differ from those estimates.
3. Depositary Fees
The Company pays a depositary fee calculated principally by reference to the Net Asset Value of the Company on each dealing day and payable monthly in arrears.
The fee paid by the Company depends upon the markets in which the assets of the Company are invested and custodied.
The maximum fee payable to the Depositary is 0.0225% per annum, plus any applicable custody fees, which vary by jurisdiction and do not exceed 0.50% per annum in any jurisdiction, in each case based on the Net Asset Value of the sub-fund, unless the Net Asset Value of the sub-fund falls below certain levels in which case agreed minimums will apply. In addition, the fees for settlement vary depending upon the country in which the relevant activity takes place, up to a maximum of USD90 per transaction.
4. Registrar and Transfer Agent , Domici l iary , Administrative and Paying Agent fees
The Company pays fees for these services at the commercial rates agreed from time to time between the parties plus reasonable out-of-pocket expenses.
Domiciliary, Administrative and Paying Agent fees are up to 0.04% per annum of the Net Assets of each sub-fund, unless the Net Asset Value of the sub-fund falls below certain levels in which case agreed minimums will apply.
Registrar and Transfer Agent fees are calculated on a per transaction basis, the maximum amount being USD20.
5. Management Company Fees
The Company pays to the Management Company an annual management company fee amounting to a maximum rate of 0.05% per year of the Net Asset Value of each sub-fund. The Management Company fee is payable monthly in arrears and calculated on the last Net Asset Value of each month with a minimum annual fee of EUR 15,000 per sub-fund, according to the following schedule:
Assets under management (in EUR) Rate
50,000,000 0.05%
100,000,000 0.04%
500,000,000 0.03%
999,999,999,999 0.02%
The list of the funds managed by the Management Company, may be obtained, on simple request, at the registered office of the Management Company.
6. Investment Management Fees
The Company pays to the Principal Investment Manager and Investment Managers an annual management fee, accrued daily and payable monthly in arrears, amounting to a set rate of the Net Asset Value of each sub-fund which is as follows:
Class Maximum rates Equity sub-funds
Maximum rates Bond sub-funds
Class A 2.00% 0.95%Class B 0.65% –Class E 0.25% –Class I 1.00% 0.55%Class J 0.65%* –Class K 0.65% 0.65%Class R 0.75% 0.50%Class Z 0.50% –
There is no management fee for Class C and Class N.
* The maximum rate is 0.59% for Mirae Asset Asia Sector Leader Equity Fund – Class J and Mirae Asset India Mid Cap Equity Fund – Class J.

28
Notes to the Financial StatementsFor the year ended 31 March 2019 (continued)
The effective rates respectively charged to the classes are as follows:
Class Effective rates Equity sub-funds
Effective rates Bond sub-funds
Class A 1.50% 0.95%Class B 0.65% –Class E 0.25% –Class I 1.00%** 0.55%Class J 0.59%*** –Class K 0.65% 0.65% ****Class R 0.75% –Class Z 0.50% –
The Principal Investment Manager is responsible for the payment of the fees of the Investment Managers.
In addition, the Company will pay management fees of the target UCITS in the case of investment in other UCITS. However, when the Sub-Fund invests in the shares or units of other UCITS and/or other UCIs that are managed, directly or by delegation, by the same management company or by any other company to which the management company is linked by common management or control or by a substantial direct or indirect holding, that management company or other company may not charge any subscription nor redemption fees on account of the Sub-Fund’ investment in the units of other UCITS and/or other UCI.
For Mirae Asset Asia Pacific Multi-Asset Income Fund, the maximum level of management fees that may be charged at the level of such target UCITS and/or UCIs may not exceed 1.5% of the relevant net assets under management.
** 0.80% for Mirae Asset Asia Pacific Multi-Asset Income Fund
*** 0.65% for Mirae Asset Next Asia Pacific Equity Fund
**** 0.25% for Mirae Asset Global Dynamic Bond Fund
7. Fees payable to the Shariah Service Providers
The Shariah Supervisory Board (“SSB”) was appointed to confirm Mirae Asset Islamic Asia Sector Leader Equity Fund’s compliance with Shariah principles and to ensure the Sub-Fund’s ongoing adherence to the Shariah Investment Guidelines.
The Shariah Stock Screening Provider (“SSSP”) was appointed by the Company to provide screening of the equities held by the Sub-Fund based on Shariah criteria. A different Shariah stock screening provider may be appointed by the Company from time to time.
With regards to the SSB, the Company shall pay to the SSB a maximum annual fee of USD50,000 out of the assets of the Sub-Fund.
With regards to the SSSP, the Company shall pay to the SSSP an annual fee of USD17,000 plus 0.01% of the Net Asset Value of the Sub-Fund, out of the assets of the Sub-Fund.
8. Taxation
Under current law and practice, the Company is not liable to any Luxembourg tax on income or capital gains, nor are dividends (if any) paid by the Company liable to any Luxembourg withholding tax.
The Company is, however, liable in Luxembourg to a taxe d’abonnement of 0.05% per annum of its Net Asset Value, such tax being payable quarterly and calculated on the Net Asset Value of the sub-funds at the end of the relevant calendar quarter. However, such rate is decreased to 0.01% per annum of their Net Asset Value for specific classes of shares or sub-funds which are restricted to Institutional Investors as specified in the Prospectus.
No Luxembourg tax is payable on the realised capital appreciation of the assets of the Company.
Dividends, capital gains and interest received by the Company on its investments may be subject to non-recoverable withholdings or other taxes in the countries of origin.
9. Forward Foreign Exchange Contracts
As of 31 March 2019, the following sub-funds are committed to outstanding forward foreign exchange contracts as follows:
Mirae Asset Asia Sector Leader Equity Fund
Purchase Sale Maturity Date Counterparty
Unrealised Result in
(USD)Currency Amount Currency Amount
EUR 185,746 USD 210,790 30-Apr-2019 Citibank (1,619)
EUR 113,246 USD 128,515 30-Apr-2019 Citibank (987)
Unrealised loss on forward foreign exchange contracts (2,606)
Mirae Asset Asia Great Consumer Equity Fund
Purchase Sale Maturity Date Counterparty
Unrealised Result in
(USD)Currency Amount Currency Amount
EUR 28,000 USD 31,513 30-Apr-2019 Citibank 18
Unrealised gain on forward foreign exchange contracts 18
Purchase Sale Maturity Date Counterparty
Unrealised Result in
(USD)Currency Amount Currency Amount
EUR 1,143,293 USD 1,297,441 30-Apr-2019 Citibank (9,966)
CHF 780,776 USD 788,435 30-Apr-2019 Citibank (1,974)
EUR 34,300 USD 38,791 30-Apr-2019 Citibank (165)
Unrealised loss on forward foreign exchange contracts (12,105)
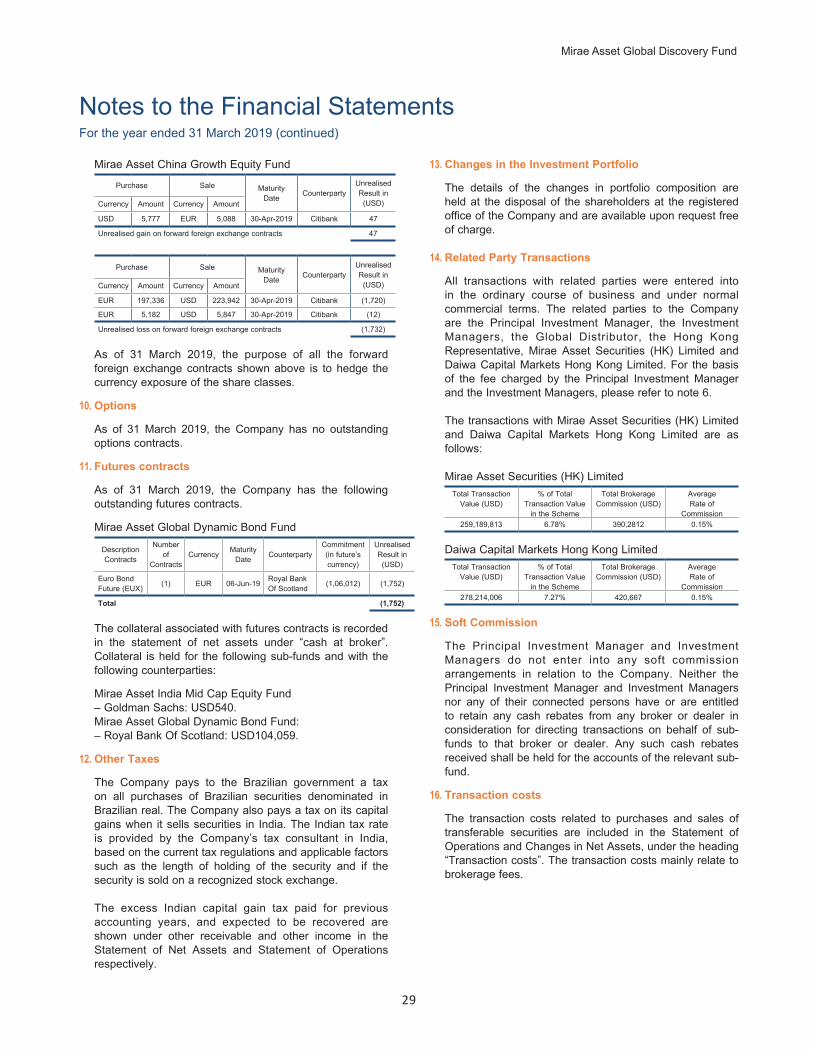
Mirae Asset Global Discovery Fund
29
Notes to the Financial StatementsFor the year ended 31 March 2019 (continued)
Mirae Asset China Growth Equity Fund
Purchase Sale Maturity Date Counterparty
Unrealised Result in
(USD)Currency Amount Currency Amount
USD 5,777 EUR 5,088 30-Apr-2019 Citibank 47
Unrealised gain on forward foreign exchange contracts 47
Purchase Sale Maturity Date Counterparty
Unrealised Result in
(USD)Currency Amount Currency Amount
EUR 197,336 USD 223,942 30-Apr-2019 Citibank (1,720)
EUR 5,182 USD 5,847 30-Apr-2019 Citibank (12)
Unrealised loss on forward foreign exchange contracts (1,732)
As of 31 March 2019, the purpose of all the forward foreign exchange contracts shown above is to hedge the currency exposure of the share classes.
10. Options
As of 31 March 2019, the Company has no outstanding options contracts.
11. Futures contracts
As of 31 March 2019, the Company has the following outstanding futures contracts.
Mirae Asset Global Dynamic Bond Fund
Description Contracts
Number of
ContractsCurrency Maturity
Date CounterpartyCommitment (in future’s currency)
Unrealised Result in
(USD)
Euro Bond Future (EUX) (1) EUR 06-Jun-19 Royal Bank
Of Scotland (1,06,012) (1,752)
Total (1,752)
The collateral associated with futures contracts is recorded in the statement of net assets under “cash at broker”. Collateral is held for the following sub-funds and with the following counterparties:
Mirae Asset India Mid Cap Equity Fund– Goldman Sachs: USD540.Mirae Asset Global Dynamic Bond Fund:– Royal Bank Of Scotland: USD104,059.
12. Other Taxes
The Company pays to the Brazilian government a tax on all purchases of Brazilian securities denominated in Brazilian real. The Company also pays a tax on its capital gains when it sells securities in India. The Indian tax rate is provided by the Company’s tax consultant in India, based on the current tax regulations and applicable factors such as the length of holding of the security and if the security is sold on a recognized stock exchange.
The excess Indian capital gain tax paid for previous accounting years, and expected to be recovered are shown under other receivable and other income in the Statement of Net Assets and Statement of Operations respectively.
13. Changes in the Investment Portfolio
The details of the changes in portfolio composition are held at the disposal of the shareholders at the registered office of the Company and are available upon request free of charge.
14. Related Party Transactions
All transactions with related parties were entered into in the ordinary course of business and under normal commercial terms. The related parties to the Company are the Principal Investment Manager, the Investment Managers, the Global Distributor, the Hong Kong Representative, Mirae Asset Securities (HK) Limited and Daiwa Capital Markets Hong Kong Limited. For the basis of the fee charged by the Principal Investment Manager and the Investment Managers, please refer to note 6.
The transactions with Mirae Asset Securities (HK) Limited and Daiwa Capital Markets Hong Kong Limited are as follows:
Mirae Asset Securities (HK) LimitedTotal Transaction
Value (USD)% of Total
Transaction Value in the Scheme
Total Brokerage Commission (USD)
Average Rate of
Commission259,189,813 6.78% 390,2812 0.15%
Daiwa Capital Markets Hong Kong LimitedTotal Transaction
Value (USD)% of Total
Transaction Value in the Scheme
Total Brokerage Commission (USD)
Average Rate of
Commission278,214,006 7.27% 420,667 0.15%
15. Soft Commission
The Principal Investment Manager and Investment Managers do not enter into any soft commission arrangements in relation to the Company. Neither the Principal Investment Manager and Investment Managers nor any of their connected persons have or are entitled to retain any cash rebates from any broker or dealer in consideration for directing transactions on behalf of sub-funds to that broker or dealer. Any such cash rebates received shall be held for the accounts of the relevant sub-fund.
16. Transaction costs
The transaction costs related to purchases and sales of transferable securities are included in the Statement of Operations and Changes in Net Assets, under the heading “Transaction costs”. The transaction costs mainly relate to brokerage fees.

30
Notes to the Financial StatementsFor the year ended 31 March 2019 (continued)
17. Sub-fund closing fees
The sub-fund Mirae Asset Asia Income Balanced Fund was closed as at 14 September 2018. Closing fees of USD50,000 were recorded.
The sub fund Mirae Asset Asia Pacific Multi Asset Income Fund was closed as at 18 February 2019. Closing fees of USD70,000 were recorded.
18. Important Events
The sub-fund Mirae Asset Asia Income Balanced Fund was closed as at 14 September 2018.
The sub fund Mirae Asset Asia Pacific Multi-Asset Income Fund was closed as at 18 February 2019.
19. Global Exposure
The global risk exposure is calculated for each sub-fund on a daily basis using the commitment approach.
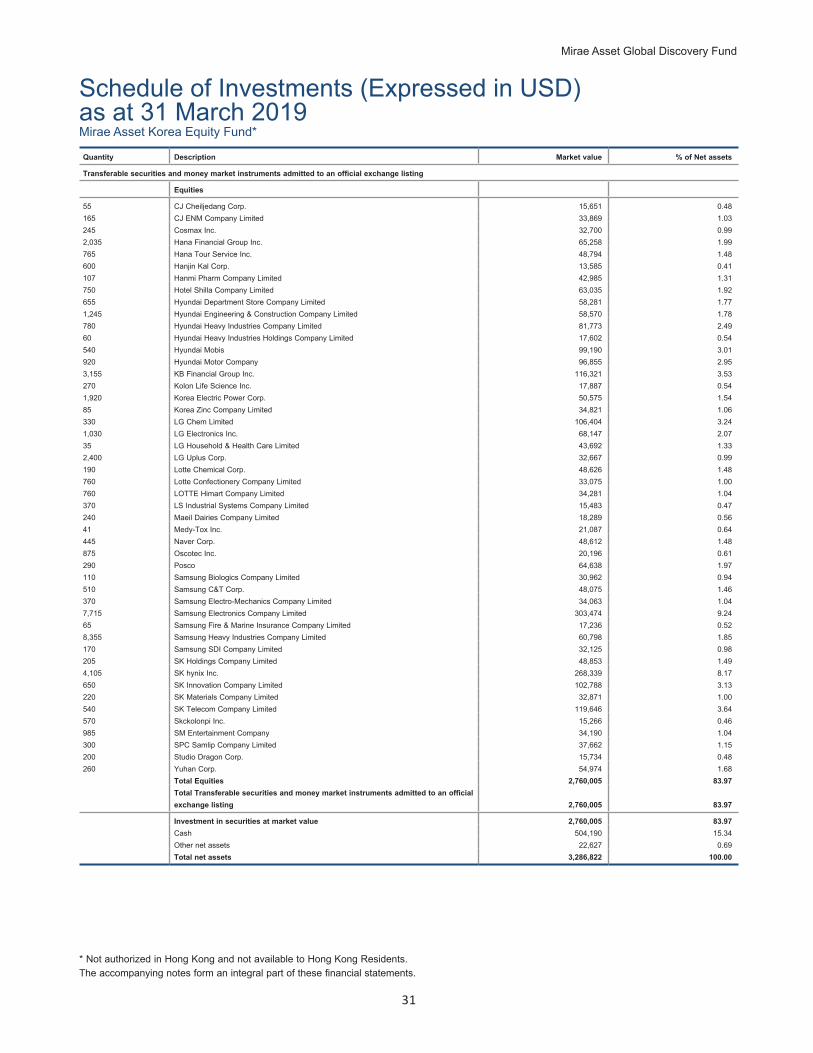
Mirae Asset Global Discovery Fund
31
Schedule of Investments (Expressed in USD)as at 31 March 2019
* Not authorized in Hong Kong and not available to Hong Kong Residents.The accompanying notes form an integral part of these financial statements.
Quantity Description Market value % of Net assets
Transferable securities and money market instruments admitted to an official exchange listing
Equities
55 CJ Cheiljedang Corp. 15,651 0.48165 CJ ENM Company Limited 33,869 1.03245 Cosmax Inc. 32,700 0.992,035 Hana Financial Group Inc. 65,258 1.99765 Hana Tour Service Inc. 48,794 1.48600 Hanjin Kal Corp. 13,585 0.41107 Hanmi Pharm Company Limited 42,985 1.31750 Hotel Shilla Company Limited 63,035 1.92655 Hyundai Department Store Company Limited 58,281 1.771,245 Hyundai Engineering & Construction Company Limited 58,570 1.78780 Hyundai Heavy Industries Company Limited 81,773 2.4960 Hyundai Heavy Industries Holdings Company Limited 17,602 0.54540 Hyundai Mobis 99,190 3.01920 Hyundai Motor Company 96,855 2.953,155 KB Financial Group Inc. 116,321 3.53270 Kolon Life Science Inc. 17,887 0.541,920 Korea Electric Power Corp. 50,575 1.5485 Korea Zinc Company Limited 34,821 1.06330 LG Chem Limited 106,404 3.241,030 LG Electronics Inc. 68,147 2.0735 LG Household & Health Care Limited 43,692 1.332,400 LG Uplus Corp. 32,667 0.99190 Lotte Chemical Corp. 48,626 1.48760 Lotte Confectionery Company Limited 33,075 1.00760 LOTTE Himart Company Limited 34,281 1.04370 LS Industrial Systems Company Limited 15,483 0.47240 Maeil Dairies Company Limited 18,289 0.5641 Medy-Tox Inc. 21,087 0.64445 Naver Corp. 48,612 1.48875 Oscotec Inc. 20,196 0.61290 Posco 64,638 1.97110 Samsung Biologics Company Limited 30,962 0.94510 Samsung C&T Corp. 48,075 1.46370 Samsung Electro-Mechanics Company Limited 34,063 1.047,715 Samsung Electronics Company Limited 303,474 9.2465 Samsung Fire & Marine Insurance Company Limited 17,236 0.528,355 Samsung Heavy Industries Company Limited 60,798 1.85170 Samsung SDI Company Limited 32,125 0.98205 SK Holdings Company Limited 48,853 1.494,105 SK hynix Inc. 268,339 8.17650 SK Innovation Company Limited 102,788 3.13220 SK Materials Company Limited 32,871 1.00540 SK Telecom Company Limited 119,646 3.64570 Skckolonpi Inc. 15,266 0.46985 SM Entertainment Company 34,190 1.04300 SPC Samlip Company Limited 37,662 1.15200 Studio Dragon Corp. 15,734 0.48260 Yuhan Corp. 54,974 1.68
Total Equities 2,760,005 83.97Total Transferable securities and money market instruments admitted to an official exchange listing 2,760,005 83.97
Investment in securities at market value 2,760,005 83.97Cash 504,190 15.34Other net assets 22,627 0.69Total net assets 3,286,822 100.00
Mirae Asset Korea Equity Fund*
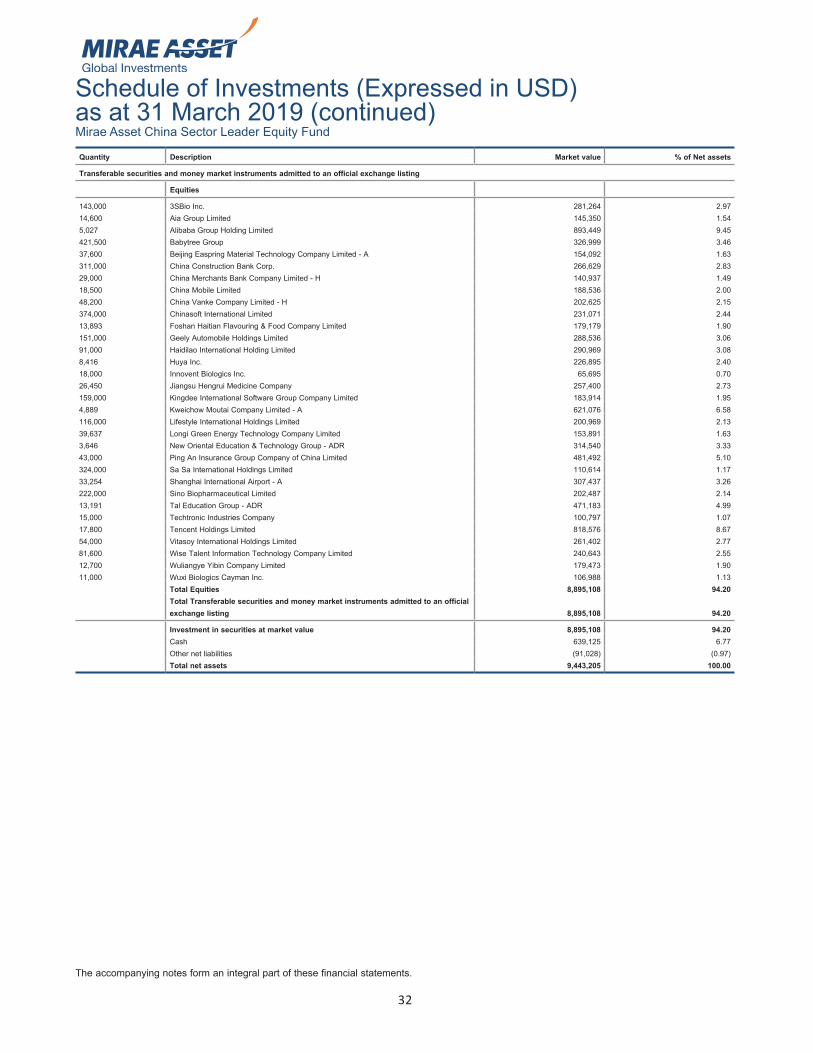
32
Schedule of Investments (Expressed in USD)as at 31 March 2019 (continued)
The accompanying notes form an integral part of these financial statements.
Quantity Description Market value % of Net assets
Transferable securities and money market instruments admitted to an official exchange listing
Equities
143,000 3SBio Inc. 281,264 2.9714,600 Aia Group Limited 145,350 1.545,027 Alibaba Group Holding Limited 893,449 9.45421,500 Babytree Group 326,999 3.4637,600 Beijing Easpring Material Technology Company Limited - A 154,092 1.63311,000 China Construction Bank Corp. 266,629 2.8329,000 China Merchants Bank Company Limited - H 140,937 1.4918,500 China Mobile Limited 188,536 2.0048,200 China Vanke Company Limited - H 202,625 2.15374,000 Chinasoft International Limited 231,071 2.4413,893 Foshan Haitian Flavouring & Food Company Limited 179,179 1.90151,000 Geely Automobile Holdings Limited 288,536 3.0691,000 Haidilao International Holding Limited 290,969 3.088,416 Huya Inc. 226,895 2.4018,000 Innovent Biologics Inc. 65,695 0.7026,450 Jiangsu Hengrui Medicine Company 257,400 2.73159,000 Kingdee International Software Group Company Limited 183,914 1.954,889 Kweichow Moutai Company Limited - A 621,076 6.58116,000 Lifestyle International Holdings Limited 200,969 2.1339,637 Longi Green Energy Technology Company Limited 153,891 1.633,646 New Oriental Education & Technology Group - ADR 314,540 3.3343,000 Ping An Insurance Group Company of China Limited 481,492 5.10324,000 Sa Sa International Holdings Limited 110,614 1.1733,254 Shanghai International Airport - A 307,437 3.26222,000 Sino Biopharmaceutical Limited 202,487 2.1413,191 Tal Education Group - ADR 471,183 4.9915,000 Techtronic Industries Company 100,797 1.0717,800 Tencent Holdings Limited 818,576 8.6754,000 Vitasoy International Holdings Limited 261,402 2.7781,600 Wise Talent Information Technology Company Limited 240,643 2.5512,700 Wuliangye Yibin Company Limited 179,473 1.9011,000 Wuxi Biologics Cayman Inc. 106,988 1.13
Total Equities 8,895,108 94.20Total Transferable securities and money market instruments admitted to an official exchange listing 8,895,108 94.20
Investment in securities at market value 8,895,108 94.20Cash 639,125 6.77Other net liabilities (91,028) (0.97)Total net assets 9,443,205 100.00
Mirae Asset China Sector Leader Equity Fund
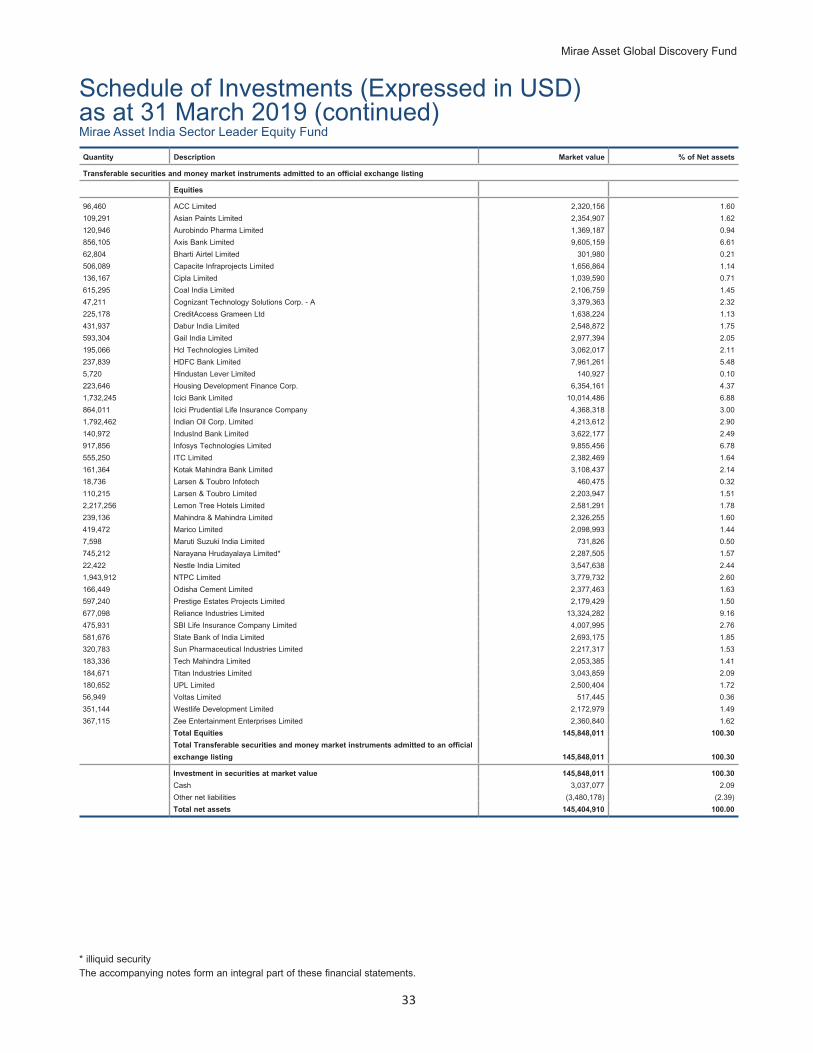
Mirae Asset Global Discovery Fund
33
Schedule of Investments (Expressed in USD)as at 31 March 2019 (continued)
* illiquid securityThe accompanying notes form an integral part of these financial statements.
Quantity Description Market value % of Net assets
Transferable securities and money market instruments admitted to an official exchange listing
Equities
96,460 ACC Limited 2,320,156 1.60109,291 Asian Paints Limited 2,354,907 1.62120,946 Aurobindo Pharma Limited 1,369,187 0.94856,105 Axis Bank Limited 9,605,159 6.6162,804 Bharti Airtel Limited 301,980 0.21506,089 Capacite Infraprojects Limited 1,656,864 1.14136,167 Cipla Limited 1,039,590 0.71615,295 Coal India Limited 2,106,759 1.4547,211 Cognizant Technology Solutions Corp. - A 3,379,363 2.32225,178 CreditAccess Grameen Ltd 1,638,224 1.13431,937 Dabur India Limited 2,548,872 1.75593,304 Gail India Limited 2,977,394 2.05195,066 Hcl Technologies Limited 3,062,017 2.11237,839 HDFC Bank Limited 7,961,261 5.485,720 Hindustan Lever Limited 140,927 0.10223,646 Housing Development Finance Corp. 6,354,161 4.371,732,245 Icici Bank Limited 10,014,486 6.88864,011 Icici Prudential Life Insurance Company 4,368,318 3.001,792,462 Indian Oil Corp. Limited 4,213,612 2.90140,972 IndusInd Bank Limited 3,622,177 2.49917,856 Infosys Technologies Limited 9,855,456 6.78555,250 ITC Limited 2,382,469 1.64161,364 Kotak Mahindra Bank Limited 3,108,437 2.1418,736 Larsen & Toubro Infotech 460,475 0.32110,215 Larsen & Toubro Limited 2,203,947 1.512,217,256 Lemon Tree Hotels Limited 2,581,291 1.78239,136 Mahindra & Mahindra Limited 2,326,255 1.60419,472 Marico Limited 2,098,993 1.447,598 Maruti Suzuki India Limited 731,826 0.50745,212 Narayana Hrudayalaya Limited* 2,287,505 1.5722,422 Nestle India Limited 3,547,638 2.441,943,912 NTPC Limited 3,779,732 2.60166,449 Odisha Cement Limited 2,377,463 1.63597,240 Prestige Estates Projects Limited 2,179,429 1.50677,098 Reliance Industries Limited 13,324,282 9.16475,931 SBI Life Insurance Company Limited 4,007,995 2.76581,676 State Bank of India Limited 2,693,175 1.85320,783 Sun Pharmaceutical Industries Limited 2,217,317 1.53183,336 Tech Mahindra Limited 2,053,385 1.41184,671 Titan Industries Limited 3,043,859 2.09180,652 UPL Limited 2,500,404 1.7256,949 Voltas Limited 517,445 0.36351,144 Westlife Development Limited 2,172,979 1.49367,115 Zee Entertainment Enterprises Limited 2,360,840 1.62
Total Equities 145,848,011 100.30Total Transferable securities and money market instruments admitted to an official exchange listing 145,848,011 100.30
Investment in securities at market value 145,848,011 100.30Cash 3,037,077 2.09Other net liabilities (3,480,178) (2.39)Total net assets 145,404,910 100.00
Mirae Asset India Sector Leader Equity Fund
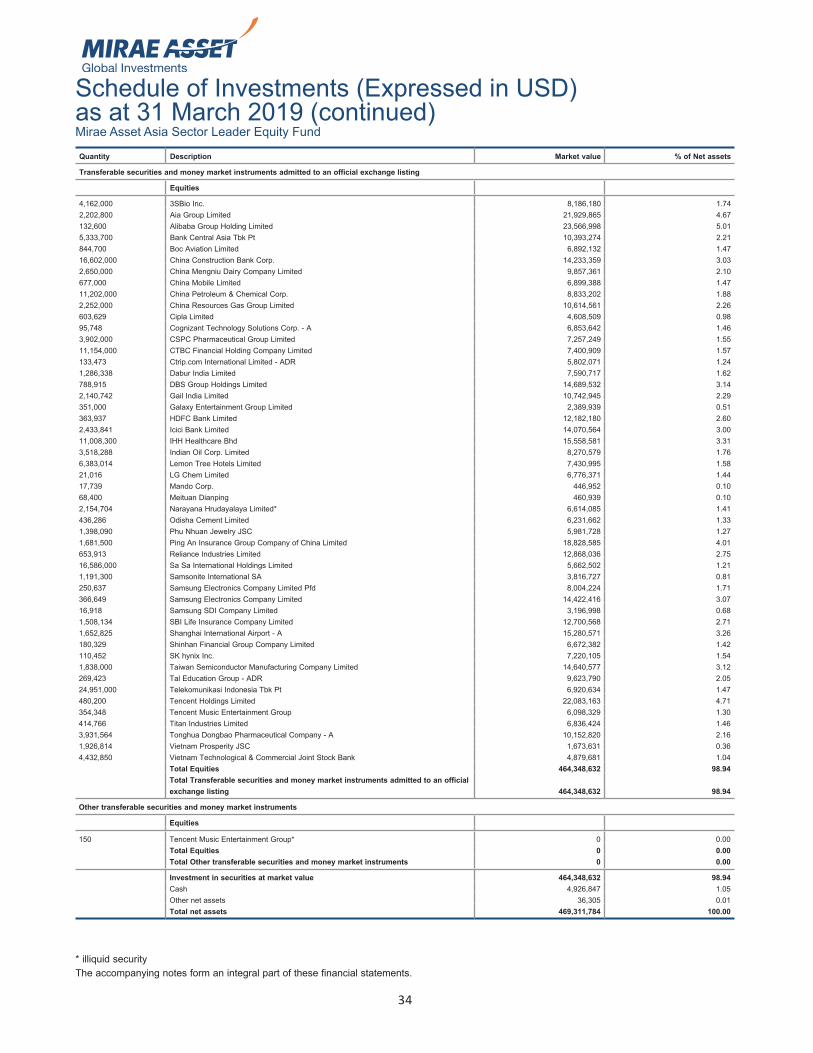
34
Schedule of Investments (Expressed in USD)as at 31 March 2019 (continued)
* illiquid security The accompanying notes form an integral part of these financial statements.
Quantity Description Market value % of Net assets
Transferable securities and money market instruments admitted to an official exchange listing
Equities
4,162,000 3SBio Inc. 8,186,180 1.742,202,800 Aia Group Limited 21,929,865 4.67132,600 Alibaba Group Holding Limited 23,566,998 5.015,333,700 Bank Central Asia Tbk Pt 10,393,274 2.21844,700 Boc Aviation Limited 6,892,132 1.4716,602,000 China Construction Bank Corp. 14,233,359 3.032,650,000 China Mengniu Dairy Company Limited 9,857,361 2.10677,000 China Mobile Limited 6,899,388 1.4711,202,000 China Petroleum & Chemical Corp. 8,833,202 1.882,252,000 China Resources Gas Group Limited 10,614,561 2.26603,629 Cipla Limited 4,608,509 0.9895,748 Cognizant Technology Solutions Corp. - A 6,853,642 1.463,902,000 CSPC Pharmaceutical Group Limited 7,257,249 1.5511,154,000 CTBC Financial Holding Company Limited 7,400,909 1.57133,473 Ctrip.com International Limited - ADR 5,802,071 1.241,286,338 Dabur India Limited 7,590,717 1.62788,915 DBS Group Holdings Limited 14,689,532 3.142,140,742 Gail India Limited 10,742,945 2.29351,000 Galaxy Entertainment Group Limited 2,389,939 0.51363,937 HDFC Bank Limited 12,182,180 2.602,433,841 Icici Bank Limited 14,070,564 3.0011,008,300 IHH Healthcare Bhd 15,558,581 3.313,518,288 Indian Oil Corp. Limited 8,270,579 1.766,383,014 Lemon Tree Hotels Limited 7,430,995 1.5821,016 LG Chem Limited 6,776,371 1.4417,739 Mando Corp. 446,952 0.1068,400 Meituan Dianping 460,939 0.102,154,704 Narayana Hrudayalaya Limited* 6,614,085 1.41436,286 Odisha Cement Limited 6,231,662 1.331,398,090 Phu Nhuan Jewelry JSC 5,981,728 1.271,681,500 Ping An Insurance Group Company of China Limited 18,828,585 4.01653,913 Reliance Industries Limited 12,868,036 2.7516,586,000 Sa Sa International Holdings Limited 5,662,502 1.211,191,300 Samsonite International SA 3,816,727 0.81250,637 Samsung Electronics Company Limited Pfd 8,004,224 1.71366,649 Samsung Electronics Company Limited 14,422,416 3.0716,918 Samsung SDI Company Limited 3,196,998 0.681,508,134 SBI Life Insurance Company Limited 12,700,568 2.711,652,825 Shanghai International Airport - A 15,280,571 3.26180,329 Shinhan Financial Group Company Limited 6,672,382 1.42110,452 SK hynix Inc. 7,220,105 1.541,838,000 Taiwan Semiconductor Manufacturing Company Limited 14,640,577 3.12269,423 Tal Education Group - ADR 9,623,790 2.0524,951,000 Telekomunikasi Indonesia Tbk Pt 6,920,634 1.47480,200 Tencent Holdings Limited 22,083,163 4.71354,348 Tencent Music Entertainment Group 6,098,329 1.30414,766 Titan Industries Limited 6,836,424 1.463,931,564 Tonghua Dongbao Pharmaceutical Company - A 10,152,820 2.161,926,814 Vietnam Prosperity JSC 1,673,631 0.364,432,850 Vietnam Technological & Commercial Joint Stock Bank 4,879,681 1.04
Total Equities 464,348,632 98.94Total Transferable securities and money market instruments admitted to an official exchange listing 464,348,632 98.94
Other transferable securities and money market instruments
Equities
150 Tencent Music Entertainment Group* 0 0.00Total Equities 0 0.00Total Other transferable securities and money market instruments 0 0.00
Investment in securities at market value 464,348,632 98.94Cash 4,926,847 1.05Other net assets 36,305 0.01Total net assets 469,311,784 100.00
Mirae Asset Asia Sector Leader Equity Fund
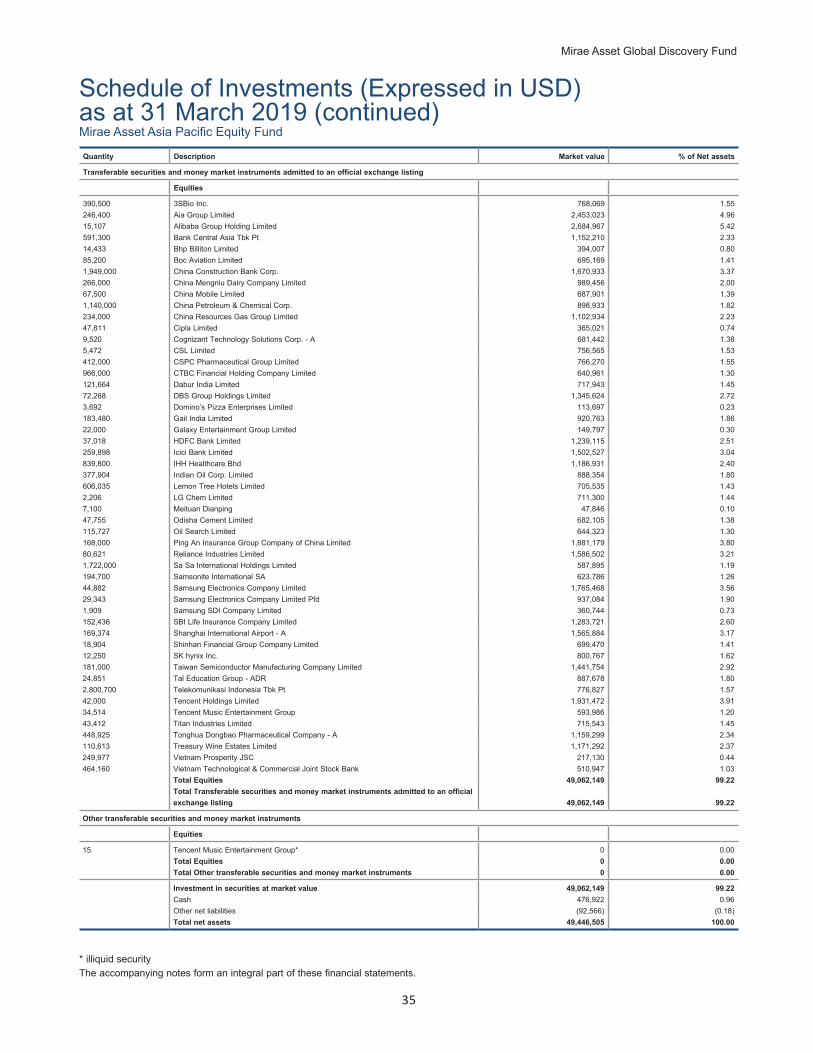
Mirae Asset Global Discovery Fund
35
Schedule of Investments (Expressed in USD)as at 31 March 2019 (continued)
* illiquid securityThe accompanying notes form an integral part of these financial statements.
Quantity Description Market value % of Net assets
Transferable securities and money market instruments admitted to an official exchange listing
Equities
390,500 3SBio Inc. 768,069 1.55246,400 Aia Group Limited 2,453,023 4.9615,107 Alibaba Group Holding Limited 2,684,967 5.42591,300 Bank Central Asia Tbk Pt 1,152,210 2.3314,433 Bhp Billiton Limited 394,007 0.8085,200 Boc Aviation Limited 695,169 1.411,949,000 China Construction Bank Corp. 1,670,933 3.37266,000 China Mengniu Dairy Company Limited 989,456 2.0067,500 China Mobile Limited 687,901 1.391,140,000 China Petroleum & Chemical Corp. 898,933 1.82234,000 China Resources Gas Group Limited 1,102,934 2.2347,811 Cipla Limited 365,021 0.749,520 Cognizant Technology Solutions Corp. - A 681,442 1.385,472 CSL Limited 756,565 1.53412,000 CSPC Pharmaceutical Group Limited 766,270 1.55966,000 CTBC Financial Holding Company Limited 640,961 1.30121,664 Dabur India Limited 717,943 1.4572,268 DBS Group Holdings Limited 1,345,624 2.723,692 Domino’s Pizza Enterprises Limited 113,697 0.23183,480 Gail India Limited 920,763 1.8622,000 Galaxy Entertainment Group Limited 149,797 0.3037,018 HDFC Bank Limited 1,239,115 2.51259,898 Icici Bank Limited 1,502,527 3.04839,800 IHH Healthcare Bhd 1,186,931 2.40377,904 Indian Oil Corp. Limited 888,354 1.80606,035 Lemon Tree Hotels Limited 705,535 1.432,206 LG Chem Limited 711,300 1.447,100 Meituan Dianping 47,846 0.1047,755 Odisha Cement Limited 682,105 1.38115,727 Oil Search Limited 644,323 1.30168,000 Ping An Insurance Group Company of China Limited 1,881,179 3.8080,621 Reliance Industries Limited 1,586,502 3.211,722,000 Sa Sa International Holdings Limited 587,895 1.19194,700 Samsonite International SA 623,786 1.2644,882 Samsung Electronics Company Limited 1,765,468 3.5629,343 Samsung Electronics Company Limited Pfd 937,084 1.901,909 Samsung SDI Company Limited 360,744 0.73152,436 SBI Life Insurance Company Limited 1,283,721 2.60169,374 Shanghai International Airport - A 1,565,884 3.1718,904 Shinhan Financial Group Company Limited 699,470 1.4112,250 SK hynix Inc. 800,767 1.62181,000 Taiwan Semiconductor Manufacturing Company Limited 1,441,754 2.9224,851 Tal Education Group - ADR 887,678 1.802,800,700 Telekomunikasi Indonesia Tbk Pt 776,827 1.5742,000 Tencent Holdings Limited 1,931,472 3.9134,514 Tencent Music Entertainment Group 593,986 1.2043,412 Titan Industries Limited 715,543 1.45448,925 Tonghua Dongbao Pharmaceutical Company - A 1,159,299 2.34110,613 Treasury Wine Estates Limited 1,171,292 2.37249,977 Vietnam Prosperity JSC 217,130 0.44464,160 Vietnam Technological & Commercial Joint Stock Bank 510,947 1.03
Total Equities 49,062,149 99.22Total Transferable securities and money market instruments admitted to an official exchange listing 49,062,149 99.22
Other transferable securities and money market instruments
Equities
15 Tencent Music Entertainment Group* 0 0.00Total Equities 0 0.00Total Other transferable securities and money market instruments 0 0.00
Investment in securities at market value 49,062,149 99.22Cash 476,922 0.96Other net liabilities (92,566) (0.18)Total net assets 49,446,505 100.00
Mirae Asset Asia Pacific Equity Fund
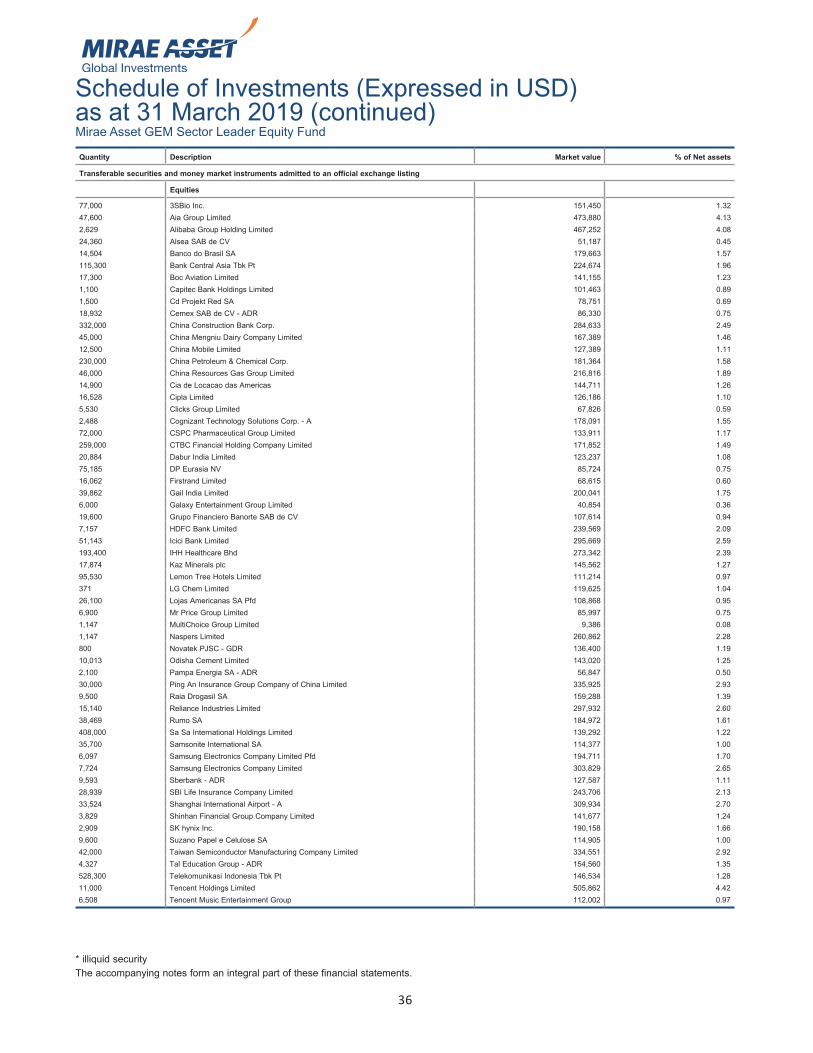
36
Schedule of Investments (Expressed in USD)as at 31 March 2019 (continued)
* illiquid securityThe accompanying notes form an integral part of these financial statements.
Quantity Description Market value % of Net assets
Transferable securities and money market instruments admitted to an official exchange listing
Equities
77,000 3SBio Inc. 151,450 1.3247,600 Aia Group Limited 473,880 4.132,629 Alibaba Group Holding Limited 467,252 4.0824,360 Alsea SAB de CV 51,187 0.4514,504 Banco do Brasil SA 179,663 1.57115,300 Bank Central Asia Tbk Pt 224,674 1.9617,300 Boc Aviation Limited 141,155 1.231,100 Capitec Bank Holdings Limited 101,463 0.891,500 Cd Projekt Red SA 78,751 0.6918,932 Cemex SAB de CV - ADR 86,330 0.75332,000 China Construction Bank Corp. 284,633 2.4945,000 China Mengniu Dairy Company Limited 167,389 1.4612,500 China Mobile Limited 127,389 1.11230,000 China Petroleum & Chemical Corp. 181,364 1.5846,000 China Resources Gas Group Limited 216,816 1.8914,900 Cia de Locacao das Americas 144,711 1.2616,528 Cipla Limited 126,186 1.105,530 Clicks Group Limited 67,826 0.592,488 Cognizant Technology Solutions Corp. - A 178,091 1.5572,000 CSPC Pharmaceutical Group Limited 133,911 1.17259,000 CTBC Financial Holding Company Limited 171,852 1.4920,884 Dabur India Limited 123,237 1.0875,185 DP Eurasia NV 85,724 0.7516,062 Firstrand Limited 68,615 0.6039,862 Gail India Limited 200,041 1.756,000 Galaxy Entertainment Group Limited 40,854 0.3619,600 Grupo Financiero Banorte SAB de CV 107,614 0.947,157 HDFC Bank Limited 239,569 2.0951,143 Icici Bank Limited 295,669 2.59193,400 IHH Healthcare Bhd 273,342 2.3917,874 Kaz Minerals plc 145,562 1.2795,530 Lemon Tree Hotels Limited 111,214 0.97371 LG Chem Limited 119,625 1.0426,100 Lojas Americanas SA Pfd 108,868 0.956,900 Mr Price Group Limited 85,997 0.751,147 MultiChoice Group Limited 9,386 0.081,147 Naspers Limited 260,862 2.28800 Novatek PJSC - GDR 136,400 1.1910,013 Odisha Cement Limited 143,020 1.252,100 Pampa Energia SA - ADR 56,847 0.5030,000 Ping An Insurance Group Company of China Limited 335,925 2.939,500 Raia Drogasil SA 159,288 1.3915,140 Reliance Industries Limited 297,932 2.6038,469 Rumo SA 184,972 1.61408,000 Sa Sa International Holdings Limited 139,292 1.2235,700 Samsonite International SA 114,377 1.006,097 Samsung Electronics Company Limited Pfd 194,711 1.707,724 Samsung Electronics Company Limited 303,829 2.659,593 Sberbank - ADR 127,587 1.1128,939 SBI Life Insurance Company Limited 243,706 2.1333,524 Shanghai International Airport - A 309,934 2.703,829 Shinhan Financial Group Company Limited 141,677 1.242,909 SK hynix Inc. 190,158 1.669,600 Suzano Papel e Celulose SA 114,905 1.0042,000 Taiwan Semiconductor Manufacturing Company Limited 334,551 2.924,327 Tal Education Group - ADR 154,560 1.35528,300 Telekomunikasi Indonesia Tbk Pt 146,534 1.2811,000 Tencent Holdings Limited 505,862 4.426,508 Tencent Music Entertainment Group 112,002 0.97
Mirae Asset GEM Sector Leader Equity Fund
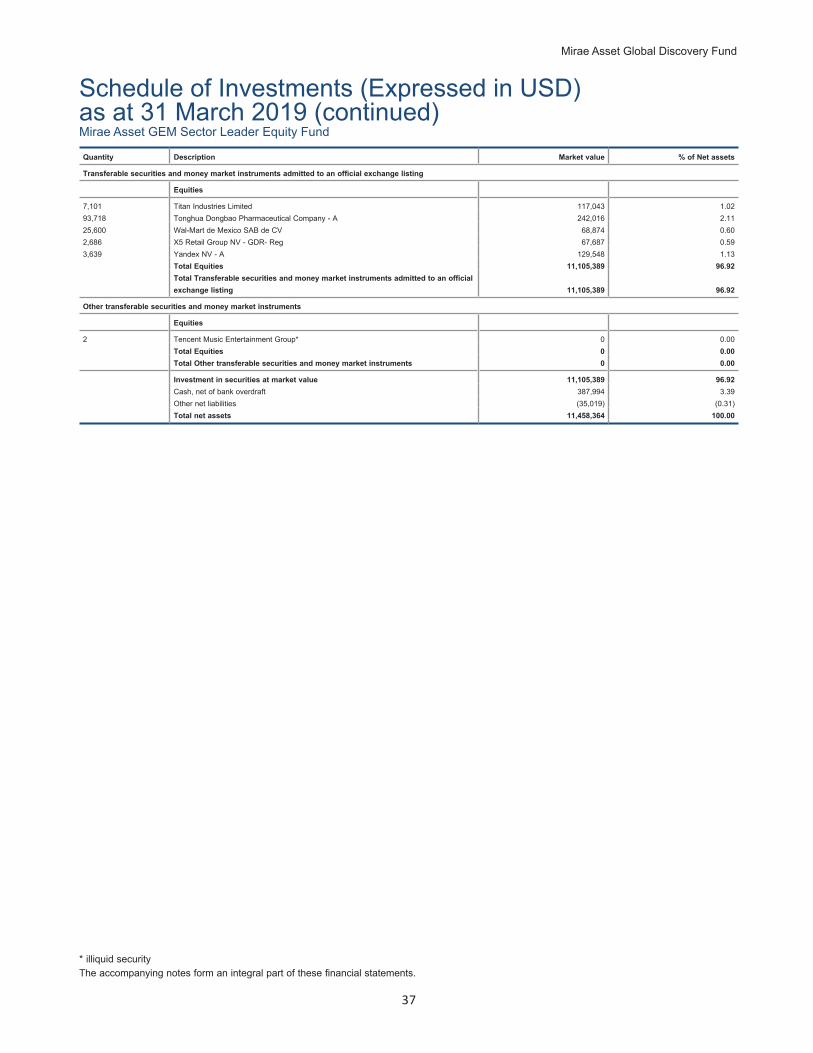
Mirae Asset Global Discovery Fund
37
Schedule of Investments (Expressed in USD)as at 31 March 2019 (continued)
* illiquid securityThe accompanying notes form an integral part of these financial statements.
Quantity Description Market value % of Net assets
Transferable securities and money market instruments admitted to an official exchange listing
Equities
7,101 Titan Industries Limited 117,043 1.0293,718 Tonghua Dongbao Pharmaceutical Company - A 242,016 2.1125,600 Wal-Mart de Mexico SAB de CV 68,874 0.602,686 X5 Retail Group NV - GDR- Reg 67,687 0.593,639 Yandex NV - A 129,548 1.13
Total Equities 11,105,389 96.92Total Transferable securities and money market instruments admitted to an official exchange listing 11,105,389 96.92
Other transferable securities and money market instruments
Equities
2 Tencent Music Entertainment Group* 0 0.00Total Equities 0 0.00Total Other transferable securities and money market instruments 0 0.00
Investment in securities at market value 11,105,389 96.92Cash, net of bank overdraft 387,994 3.39Other net liabilities (35,019) (0.31)Total net assets 11,458,364 100.00
Mirae Asset GEM Sector Leader Equity Fund
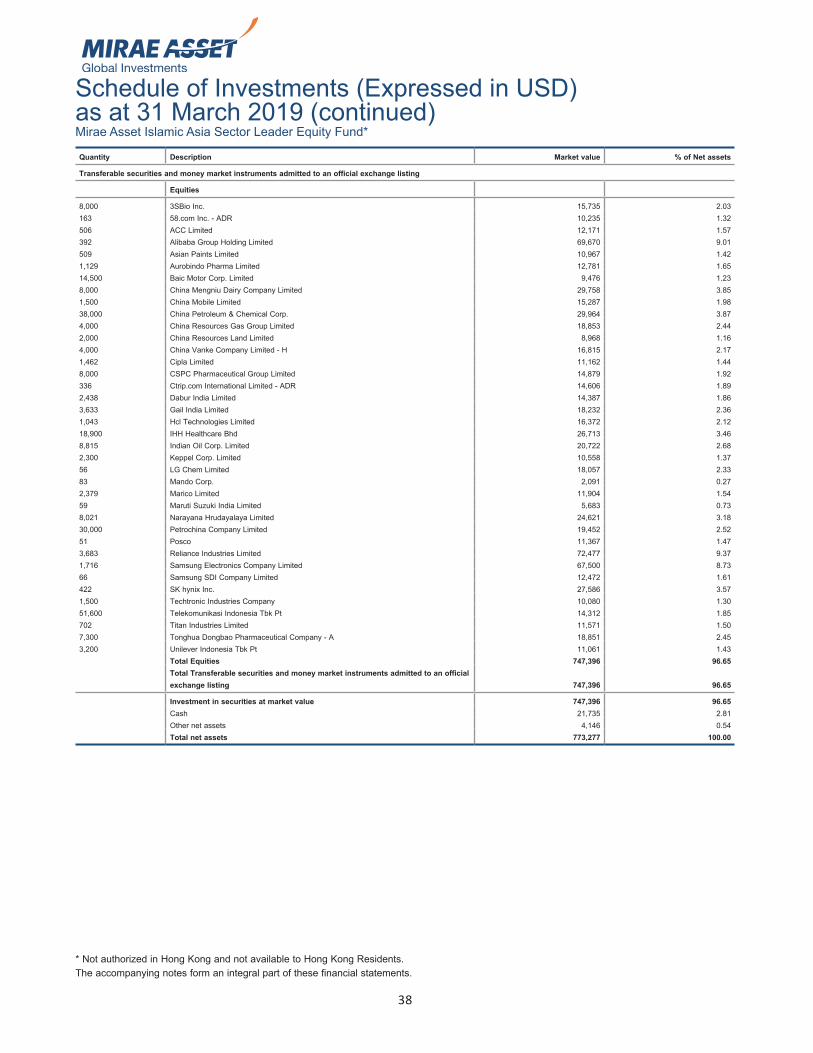
38
Schedule of Investments (Expressed in USD)as at 31 March 2019 (continued)
* Not authorized in Hong Kong and not available to Hong Kong Residents.The accompanying notes form an integral part of these financial statements.
Quantity Description Market value % of Net assets
Transferable securities and money market instruments admitted to an official exchange listing
Equities
8,000 3SBio Inc. 15,735 2.03163 58.com Inc. - ADR 10,235 1.32506 ACC Limited 12,171 1.57392 Alibaba Group Holding Limited 69,670 9.01509 Asian Paints Limited 10,967 1.421,129 Aurobindo Pharma Limited 12,781 1.6514,500 Baic Motor Corp. Limited 9,476 1.238,000 China Mengniu Dairy Company Limited 29,758 3.851,500 China Mobile Limited 15,287 1.9838,000 China Petroleum & Chemical Corp. 29,964 3.874,000 China Resources Gas Group Limited 18,853 2.442,000 China Resources Land Limited 8,968 1.164,000 China Vanke Company Limited - H 16,815 2.171,462 Cipla Limited 11,162 1.448,000 CSPC Pharmaceutical Group Limited 14,879 1.92336 Ctrip.com International Limited - ADR 14,606 1.892,438 Dabur India Limited 14,387 1.863,633 Gail India Limited 18,232 2.361,043 Hcl Technologies Limited 16,372 2.1218,900 IHH Healthcare Bhd 26,713 3.468,815 Indian Oil Corp. Limited 20,722 2.682,300 Keppel Corp. Limited 10,558 1.3756 LG Chem Limited 18,057 2.3383 Mando Corp. 2,091 0.272,379 Marico Limited 11,904 1.5459 Maruti Suzuki India Limited 5,683 0.738,021 Narayana Hrudayalaya Limited 24,621 3.1830,000 Petrochina Company Limited 19,452 2.5251 Posco 11,367 1.473,683 Reliance Industries Limited 72,477 9.371,716 Samsung Electronics Company Limited 67,500 8.7366 Samsung SDI Company Limited 12,472 1.61422 SK hynix Inc. 27,586 3.571,500 Techtronic Industries Company 10,080 1.3051,600 Telekomunikasi Indonesia Tbk Pt 14,312 1.85702 Titan Industries Limited 11,571 1.507,300 Tonghua Dongbao Pharmaceutical Company - A 18,851 2.453,200 Unilever Indonesia Tbk Pt 11,061 1.43
Total Equities 747,396 96.65Total Transferable securities and money market instruments admitted to an official exchange listing 747,396 96.65
Investment in securities at market value 747,396 96.65Cash 21,735 2.81Other net assets 4,146 0.54Total net assets 773,277 100.00
Mirae Asset Islamic Asia Sector Leader Equity Fund*
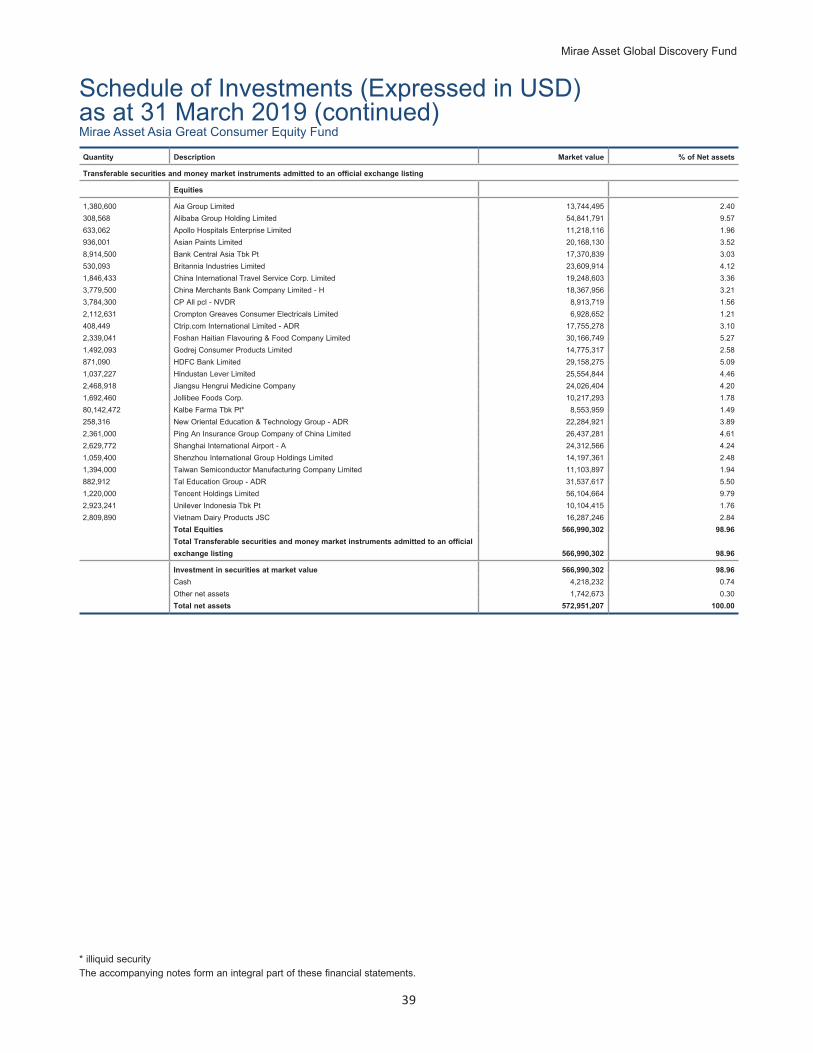
Mirae Asset Global Discovery Fund
39
Schedule of Investments (Expressed in USD)as at 31 March 2019 (continued)
* illiquid securityThe accompanying notes form an integral part of these financial statements.
Quantity Description Market value % of Net assets
Transferable securities and money market instruments admitted to an official exchange listing
Equities
1,380,600 Aia Group Limited 13,744,495 2.40308,568 Alibaba Group Holding Limited 54,841,791 9.57633,062 Apollo Hospitals Enterprise Limited 11,218,116 1.96936,001 Asian Paints Limited 20,168,130 3.528,914,500 Bank Central Asia Tbk Pt 17,370,839 3.03530,093 Britannia Industries Limited 23,609,914 4.121,846,433 China International Travel Service Corp. Limited 19,248,603 3.363,779,500 China Merchants Bank Company Limited - H 18,367,956 3.213,784,300 CP All pcl - NVDR 8,913,719 1.562,112,631 Crompton Greaves Consumer Electricals Limited 6,928,652 1.21408,449 Ctrip.com International Limited - ADR 17,755,278 3.102,339,041 Foshan Haitian Flavouring & Food Company Limited 30,166,749 5.271,492,093 Godrej Consumer Products Limited 14,775,317 2.58871,090 HDFC Bank Limited 29,158,275 5.091,037,227 Hindustan Lever Limited 25,554,844 4.462,468,918 Jiangsu Hengrui Medicine Company 24,026,404 4.201,692,460 Jollibee Foods Corp. 10,217,293 1.7880,142,472 Kalbe Farma Tbk Pt* 8,553,959 1.49258,316 New Oriental Education & Technology Group - ADR 22,284,921 3.892,361,000 Ping An Insurance Group Company of China Limited 26,437,281 4.612,629,772 Shanghai International Airport - A 24,312,566 4.241,059,400 Shenzhou International Group Holdings Limited 14,197,361 2.481,394,000 Taiwan Semiconductor Manufacturing Company Limited 11,103,897 1.94882,912 Tal Education Group - ADR 31,537,617 5.501,220,000 Tencent Holdings Limited 56,104,664 9.792,923,241 Unilever Indonesia Tbk Pt 10,104,415 1.762,809,890 Vietnam Dairy Products JSC 16,287,246 2.84
Total Equities 566,990,302 98.96Total Transferable securities and money market instruments admitted to an official exchange listing 566,990,302 98.96
Investment in securities at market value 566,990,302 98.96Cash 4,218,232 0.74Other net assets 1,742,673 0.30Total net assets 572,951,207 100.00
Mirae Asset Asia Great Consumer Equity Fund
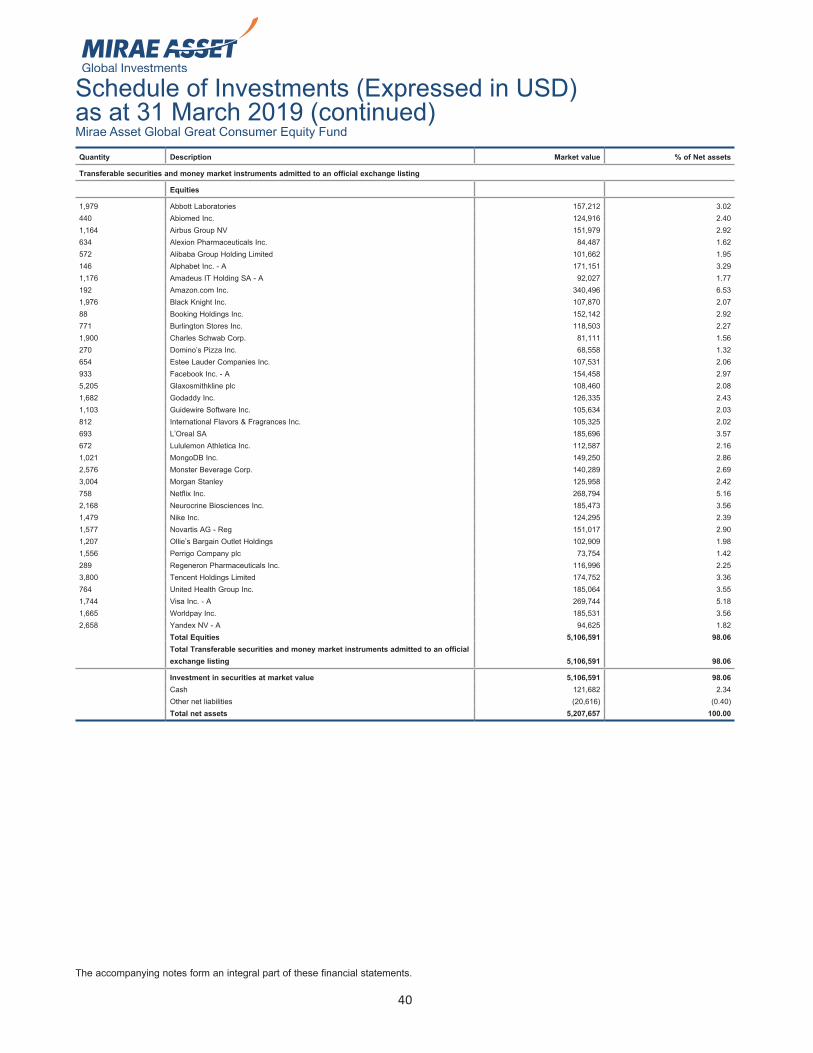
40
Schedule of Investments (Expressed in USD)as at 31 March 2019 (continued)
The accompanying notes form an integral part of these financial statements.
Quantity Description Market value % of Net assets
Transferable securities and money market instruments admitted to an official exchange listing
Equities
1,979 Abbott Laboratories 157,212 3.02440 Abiomed Inc. 124,916 2.401,164 Airbus Group NV 151,979 2.92634 Alexion Pharmaceuticals Inc. 84,487 1.62572 Alibaba Group Holding Limited 101,662 1.95146 Alphabet Inc. - A 171,151 3.291,176 Amadeus IT Holding SA - A 92,027 1.77192 Amazon.com Inc. 340,496 6.531,976 Black Knight Inc. 107,870 2.0788 Booking Holdings Inc. 152,142 2.92771 Burlington Stores Inc. 118,503 2.271,900 Charles Schwab Corp. 81,111 1.56270 Domino’s Pizza Inc. 68,558 1.32654 Estee Lauder Companies Inc. 107,531 2.06933 Facebook Inc. - A 154,458 2.975,205 Glaxosmithkline plc 108,460 2.081,682 Godaddy Inc. 126,335 2.431,103 Guidewire Software Inc. 105,634 2.03812 International Flavors & Fragrances Inc. 105,325 2.02693 L’Oreal SA 185,696 3.57672 Lululemon Athletica Inc. 112,587 2.161,021 MongoDB Inc. 149,250 2.862,576 Monster Beverage Corp. 140,289 2.693,004 Morgan Stanley 125,958 2.42758 Netflix Inc. 268,794 5.162,168 Neurocrine Biosciences Inc. 185,473 3.561,479 Nike Inc. 124,295 2.391,577 Novartis AG - Reg 151,017 2.901,207 Ollie’s Bargain Outlet Holdings 102,909 1.981,556 Perrigo Company plc 73,754 1.42289 Regeneron Pharmaceuticals Inc. 116,996 2.253,800 Tencent Holdings Limited 174,752 3.36764 United Health Group Inc. 185,064 3.551,744 Visa Inc. - A 269,744 5.181,665 Worldpay Inc. 185,531 3.562,658 Yandex NV - A 94,625 1.82
Total Equities 5,106,591 98.06Total Transferable securities and money market instruments admitted to an official exchange listing 5,106,591 98.06
Investment in securities at market value 5,106,591 98.06Cash 121,682 2.34Other net liabilities (20,616) (0.40)Total net assets 5,207,657 100.00
Mirae Asset Global Great Consumer Equity Fund
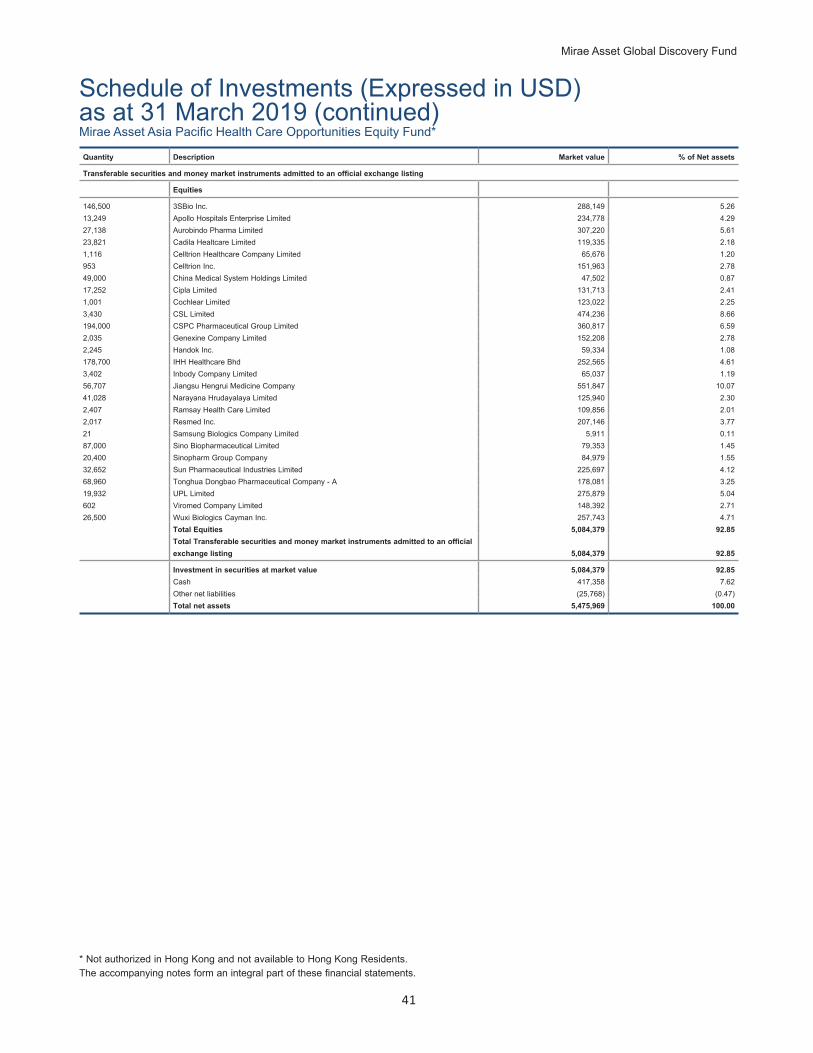
Mirae Asset Global Discovery Fund
41
Schedule of Investments (Expressed in USD)as at 31 March 2019 (continued)Quantity Description Market value % of Net assets
Transferable securities and money market instruments admitted to an official exchange listing
Equities
146,500 3SBio Inc. 288,149 5.2613,249 Apollo Hospitals Enterprise Limited 234,778 4.2927,138 Aurobindo Pharma Limited 307,220 5.6123,821 Cadila Healtcare Limited 119,335 2.181,116 Celltrion Healthcare Company Limited 65,676 1.20953 Celltrion Inc. 151,963 2.7849,000 China Medical System Holdings Limited 47,502 0.8717,252 Cipla Limited 131,713 2.411,001 Cochlear Limited 123,022 2.253,430 CSL Limited 474,236 8.66194,000 CSPC Pharmaceutical Group Limited 360,817 6.592,035 Genexine Company Limited 152,208 2.782,245 Handok Inc. 59,334 1.08178,700 IHH Healthcare Bhd 252,565 4.613,402 Inbody Company Limited 65,037 1.1956,707 Jiangsu Hengrui Medicine Company 551,847 10.0741,028 Narayana Hrudayalaya Limited 125,940 2.302,407 Ramsay Health Care Limited 109,856 2.012,017 Resmed Inc. 207,146 3.7721 Samsung Biologics Company Limited 5,911 0.1187,000 Sino Biopharmaceutical Limited 79,353 1.4520,400 Sinopharm Group Company 84,979 1.5532,652 Sun Pharmaceutical Industries Limited 225,697 4.1268,960 Tonghua Dongbao Pharmaceutical Company - A 178,081 3.2519,932 UPL Limited 275,879 5.04602 Viromed Company Limited 148,392 2.7126,500 Wuxi Biologics Cayman Inc. 257,743 4.71
Total Equities 5,084,379 92.85Total Transferable securities and money market instruments admitted to an official exchange listing 5,084,379 92.85
Investment in securities at market value 5,084,379 92.85Cash 417,358 7.62Other net liabilities (25,768) (0.47)Total net assets 5,475,969 100.00
* Not authorized in Hong Kong and not available to Hong Kong Residents.The accompanying notes form an integral part of these financial statements.
Mirae Asset Asia Pacific Health Care Opportunities Equity Fund*
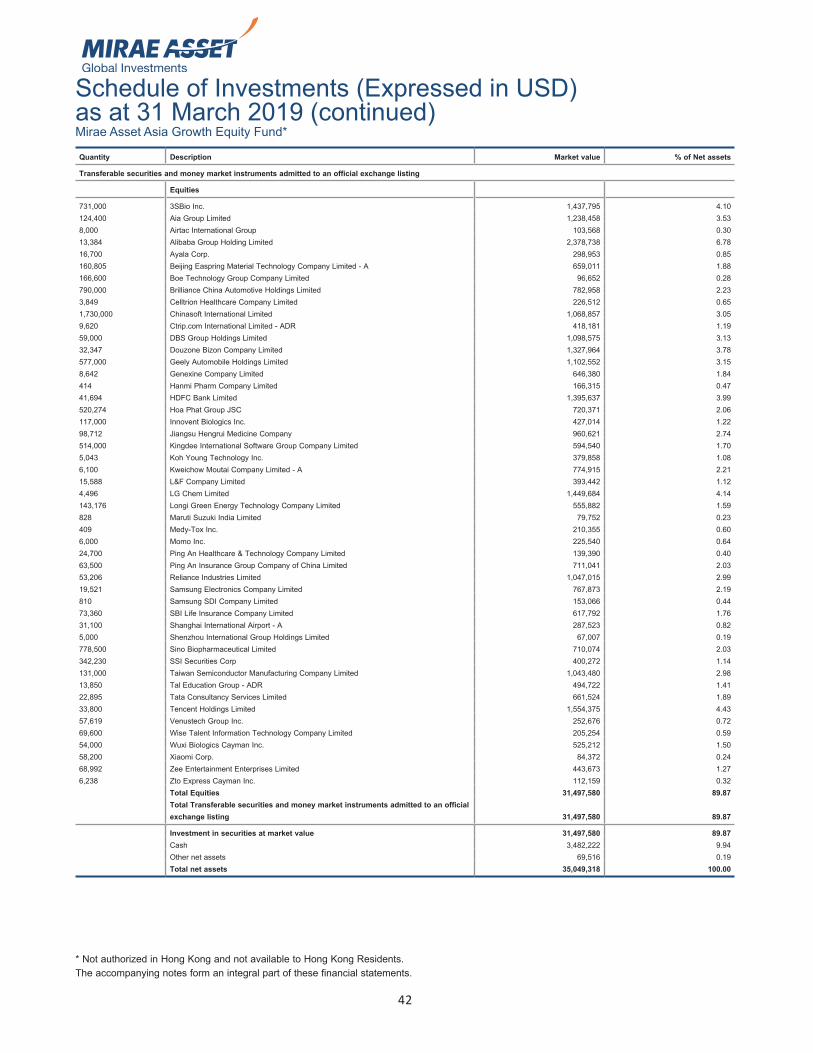
42
Schedule of Investments (Expressed in USD)as at 31 March 2019 (continued)
* Not authorized in Hong Kong and not available to Hong Kong Residents.The accompanying notes form an integral part of these financial statements.
Quantity Description Market value % of Net assets
Transferable securities and money market instruments admitted to an official exchange listing
Equities
731,000 3SBio Inc. 1,437,795 4.10124,400 Aia Group Limited 1,238,458 3.538,000 Airtac International Group 103,568 0.3013,384 Alibaba Group Holding Limited 2,378,738 6.7816,700 Ayala Corp. 298,953 0.85160,805 Beijing Easpring Material Technology Company Limited - A 659,011 1.88166,600 Boe Technology Group Company Limited 96,652 0.28790,000 Brilliance China Automotive Holdings Limited 782,958 2.233,849 Celltrion Healthcare Company Limited 226,512 0.651,730,000 Chinasoft International Limited 1,068,857 3.059,620 Ctrip.com International Limited - ADR 418,181 1.1959,000 DBS Group Holdings Limited 1,098,575 3.1332,347 Douzone Bizon Company Limited 1,327,964 3.78577,000 Geely Automobile Holdings Limited 1,102,552 3.158,642 Genexine Company Limited 646,380 1.84414 Hanmi Pharm Company Limited 166,315 0.4741,694 HDFC Bank Limited 1,395,637 3.99520,274 Hoa Phat Group JSC 720,371 2.06117,000 Innovent Biologics Inc. 427,014 1.2298,712 Jiangsu Hengrui Medicine Company 960,621 2.74514,000 Kingdee International Software Group Company Limited 594,540 1.705,043 Koh Young Technology Inc. 379,858 1.086,100 Kweichow Moutai Company Limited - A 774,915 2.2115,588 L&F Company Limited 393,442 1.124,496 LG Chem Limited 1,449,684 4.14143,176 Longi Green Energy Technology Company Limited 555,882 1.59828 Maruti Suzuki India Limited 79,752 0.23409 Medy-Tox Inc. 210,355 0.606,000 Momo Inc. 225,540 0.6424,700 Ping An Healthcare & Technology Company Limited 139,390 0.4063,500 Ping An Insurance Group Company of China Limited 711,041 2.0353,206 Reliance Industries Limited 1,047,015 2.9919,521 Samsung Electronics Company Limited 767,873 2.19810 Samsung SDI Company Limited 153,066 0.4473,360 SBI Life Insurance Company Limited 617,792 1.7631,100 Shanghai International Airport - A 287,523 0.825,000 Shenzhou International Group Holdings Limited 67,007 0.19778,500 Sino Biopharmaceutical Limited 710,074 2.03342,230 SSI Securities Corp 400,272 1.14131,000 Taiwan Semiconductor Manufacturing Company Limited 1,043,480 2.9813,850 Tal Education Group - ADR 494,722 1.4122,895 Tata Consultancy Services Limited 661,524 1.8933,800 Tencent Holdings Limited 1,554,375 4.4357,619 Venustech Group Inc. 252,676 0.7269,600 Wise Talent Information Technology Company Limited 205,254 0.5954,000 Wuxi Biologics Cayman Inc. 525,212 1.5058,200 Xiaomi Corp. 84,372 0.2468,992 Zee Entertainment Enterprises Limited 443,673 1.276,238 Zto Express Cayman Inc. 112,159 0.32
Total Equities 31,497,580 89.87Total Transferable securities and money market instruments admitted to an official exchange listing 31,497,580 89.87
Investment in securities at market value 31,497,580 89.87Cash 3,482,222 9.94Other net assets 69,516 0.19Total net assets 35,049,318 100.00
Mirae Asset Asia Growth Equity Fund*
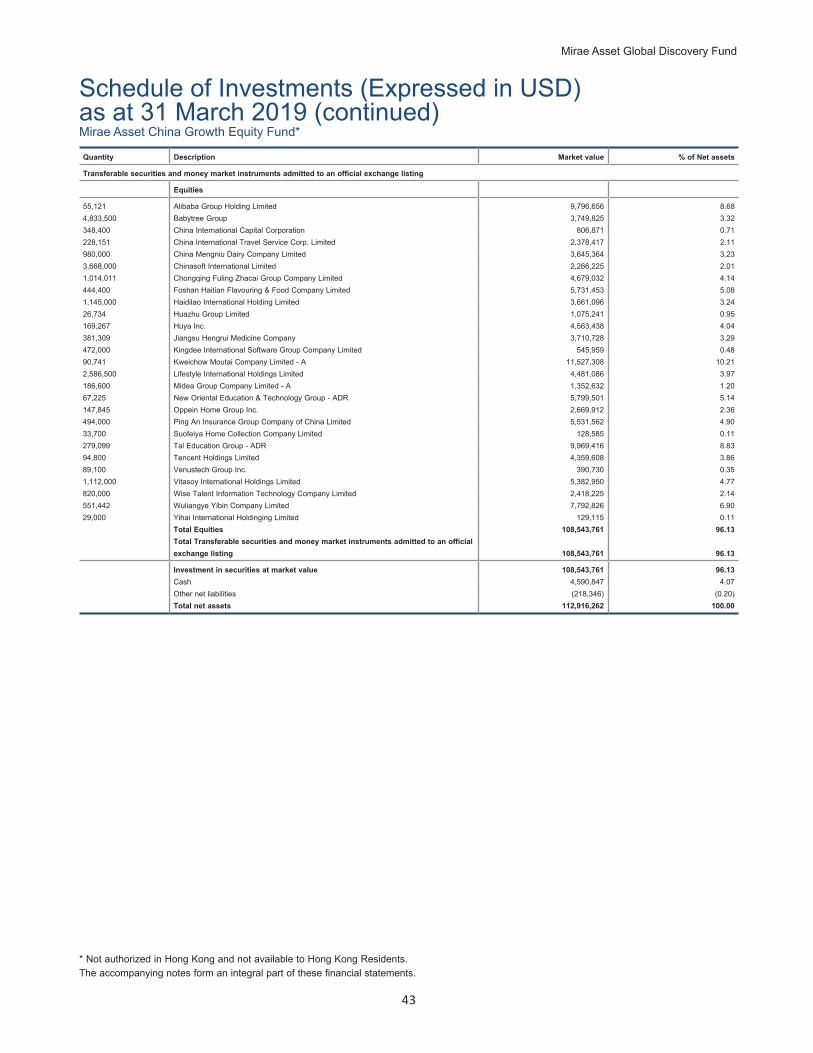
Mirae Asset Global Discovery Fund
43
Schedule of Investments (Expressed in USD)as at 31 March 2019 (continued)Quantity Description Market value % of Net assets
Transferable securities and money market instruments admitted to an official exchange listing
Equities
55,121 Alibaba Group Holding Limited 9,796,656 8.684,833,500 Babytree Group 3,749,825 3.32348,400 China International Capital Corporation 806,871 0.71228,151 China International Travel Service Corp. Limited 2,378,417 2.11980,000 China Mengniu Dairy Company Limited 3,645,364 3.233,668,000 Chinasoft International Limited 2,266,225 2.011,014,011 Chongqing Fuling Zhacai Group Company Limited 4,679,032 4.14444,400 Foshan Haitian Flavouring & Food Company Limited 5,731,453 5.081,145,000 Haidilao International Holding Limited 3,661,096 3.2426,734 Huazhu Group Limited 1,075,241 0.95169,267 Huya Inc. 4,563,438 4.04381,309 Jiangsu Hengrui Medicine Company 3,710,728 3.29472,000 Kingdee International Software Group Company Limited 545,959 0.4890,741 Kweichow Moutai Company Limited - A 11,527,308 10.212,586,500 Lifestyle International Holdings Limited 4,481,086 3.97186,600 Midea Group Company Limited - A 1,352,632 1.2067,225 New Oriental Education & Technology Group - ADR 5,799,501 5.14147,845 Oppein Home Group Inc. 2,669,912 2.36494,000 Ping An Insurance Group Company of China Limited 5,531,562 4.9033,700 Suofeiya Home Collection Company Limited 128,585 0.11279,099 Tal Education Group - ADR 9,969,416 8.8394,800 Tencent Holdings Limited 4,359,608 3.8689,100 Venustech Group Inc. 390,730 0.351,112,000 Vitasoy International Holdings Limited 5,382,950 4.77820,000 Wise Talent Information Technology Company Limited 2,418,225 2.14551,442 Wuliangye Yibin Company Limited 7,792,826 6.9029,000 Yihai International Holdinging Limited 129,115 0.11
Total Equities 108,543,761 96.13Total Transferable securities and money market instruments admitted to an official exchange listing 108,543,761 96.13
Investment in securities at market value 108,543,761 96.13Cash 4,590,847 4.07Other net liabilities (218,346) (0.20)Total net assets 112,916,262 100.00
Mirae Asset China Growth Equity Fund*
* Not authorized in Hong Kong and not available to Hong Kong Residents.The accompanying notes form an integral part of these financial statements.
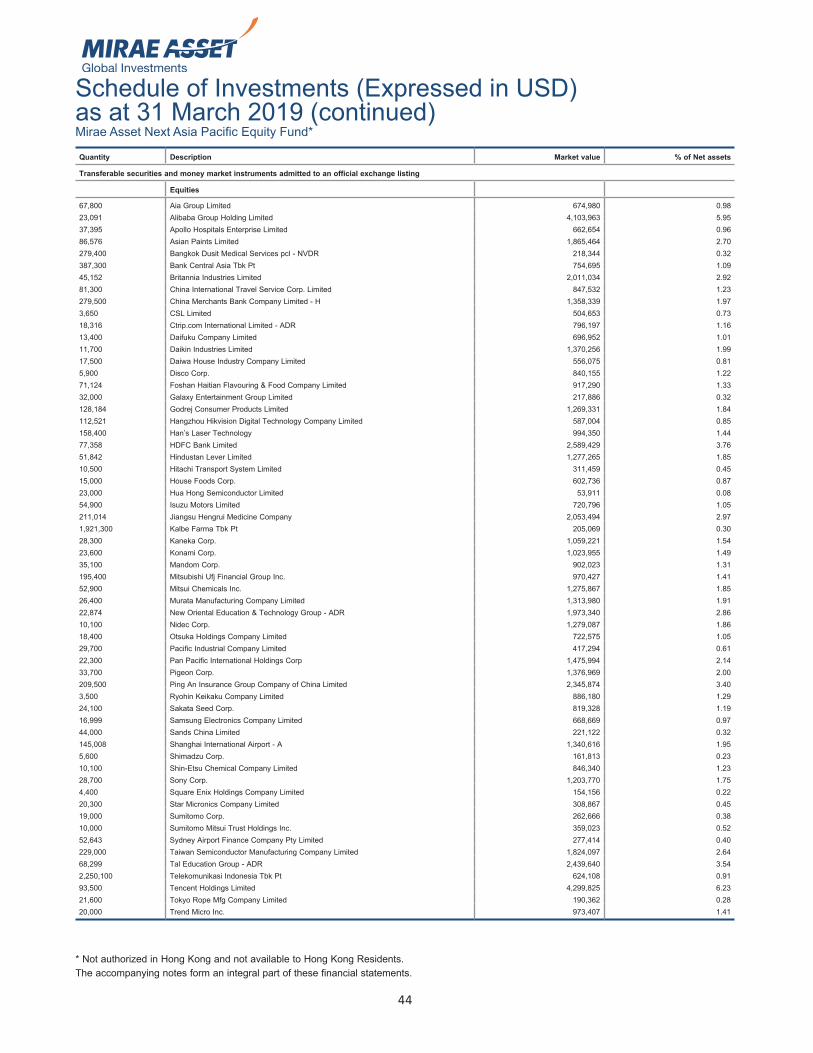
44
Schedule of Investments (Expressed in USD)as at 31 March 2019 (continued)
* Not authorized in Hong Kong and not available to Hong Kong Residents.The accompanying notes form an integral part of these financial statements.
Quantity Description Market value % of Net assets
Transferable securities and money market instruments admitted to an official exchange listing
Equities
67,800 Aia Group Limited 674,980 0.9823,091 Alibaba Group Holding Limited 4,103,963 5.9537,395 Apollo Hospitals Enterprise Limited 662,654 0.9686,576 Asian Paints Limited 1,865,464 2.70279,400 Bangkok Dusit Medical Services pcl - NVDR 218,344 0.32387,300 Bank Central Asia Tbk Pt 754,695 1.0945,152 Britannia Industries Limited 2,011,034 2.9281,300 China International Travel Service Corp. Limited 847,532 1.23279,500 China Merchants Bank Company Limited - H 1,358,339 1.973,650 CSL Limited 504,653 0.7318,316 Ctrip.com International Limited - ADR 796,197 1.1613,400 Daifuku Company Limited 696,952 1.0111,700 Daikin Industries Limited 1,370,256 1.9917,500 Daiwa House Industry Company Limited 556,075 0.815,900 Disco Corp. 840,155 1.2271,124 Foshan Haitian Flavouring & Food Company Limited 917,290 1.3332,000 Galaxy Entertainment Group Limited 217,886 0.32128,184 Godrej Consumer Products Limited 1,269,331 1.84112,521 Hangzhou Hikvision Digital Technology Company Limited 587,004 0.85158,400 Han’s Laser Technology 994,350 1.4477,358 HDFC Bank Limited 2,589,429 3.7651,842 Hindustan Lever Limited 1,277,265 1.8510,500 Hitachi Transport System Limited 311,459 0.4515,000 House Foods Corp. 602,736 0.8723,000 Hua Hong Semiconductor Limited 53,911 0.0854,900 Isuzu Motors Limited 720,796 1.05211,014 Jiangsu Hengrui Medicine Company 2,053,494 2.971,921,300 Kalbe Farma Tbk Pt 205,069 0.3028,300 Kaneka Corp. 1,059,221 1.5423,600 Konami Corp. 1,023,955 1.4935,100 Mandom Corp. 902,023 1.31195,400 Mitsubishi Ufj Financial Group Inc. 970,427 1.4152,900 Mitsui Chemicals Inc. 1,275,867 1.8526,400 Murata Manufacturing Company Limited 1,313,980 1.9122,874 New Oriental Education & Technology Group - ADR 1,973,340 2.8610,100 Nidec Corp. 1,279,087 1.8618,400 Otsuka Holdings Company Limited 722,575 1.0529,700 Pacific Industrial Company Limited 417,294 0.6122,300 Pan Pacific International Holdings Corp 1,475,994 2.1433,700 Pigeon Corp. 1,376,969 2.00209,500 Ping An Insurance Group Company of China Limited 2,345,874 3.403,500 Ryohin Keikaku Company Limited 886,180 1.2924,100 Sakata Seed Corp. 819,328 1.1916,999 Samsung Electronics Company Limited 668,669 0.9744,000 Sands China Limited 221,122 0.32145,008 Shanghai International Airport - A 1,340,616 1.955,600 Shimadzu Corp. 161,813 0.2310,100 Shin-Etsu Chemical Company Limited 846,340 1.2328,700 Sony Corp. 1,203,770 1.754,400 Square Enix Holdings Company Limited 154,156 0.2220,300 Star Micronics Company Limited 308,867 0.4519,000 Sumitomo Corp. 262,666 0.3810,000 Sumitomo Mitsui Trust Holdings Inc. 359,023 0.5252,643 Sydney Airport Finance Company Pty Limited 277,414 0.40229,000 Taiwan Semiconductor Manufacturing Company Limited 1,824,097 2.6468,299 Tal Education Group - ADR 2,439,640 3.542,250,100 Telekomunikasi Indonesia Tbk Pt 624,108 0.9193,500 Tencent Holdings Limited 4,299,825 6.2321,600 Tokyo Rope Mfg Company Limited 190,362 0.2820,000 Trend Micro Inc. 973,407 1.41
Mirae Asset Next Asia Pacific Equity Fund*
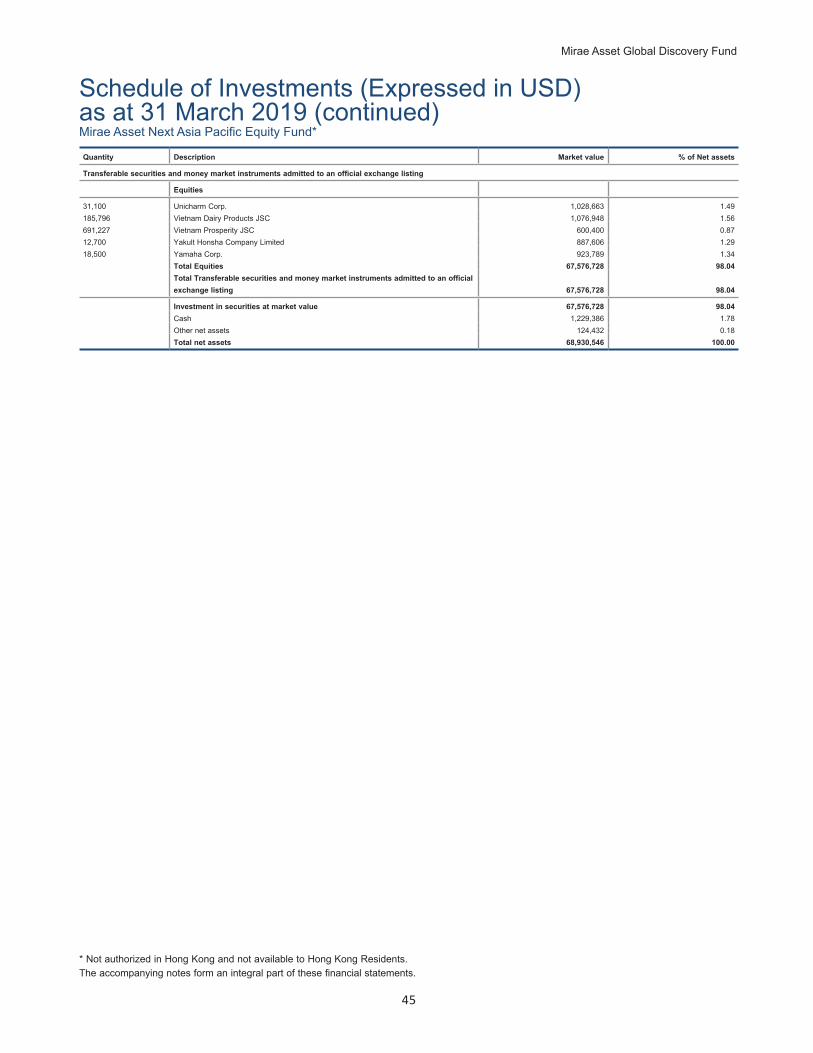
Mirae Asset Global Discovery Fund
45
Schedule of Investments (Expressed in USD)as at 31 March 2019 (continued)Quantity Description Market value % of Net assets
Transferable securities and money market instruments admitted to an official exchange listing
Equities
31,100 Unicharm Corp. 1,028,663 1.49185,796 Vietnam Dairy Products JSC 1,076,948 1.56691,227 Vietnam Prosperity JSC 600,400 0.8712,700 Yakult Honsha Company Limited 887,606 1.2918,500 Yamaha Corp. 923,789 1.34
Total Equities 67,576,728 98.04Total Transferable securities and money market instruments admitted to an official exchange listing 67,576,728 98.04
Investment in securities at market value 67,576,728 98.04Cash 1,229,386 1.78Other net assets 124,432 0.18Total net assets 68,930,546 100.00
* Not authorized in Hong Kong and not available to Hong Kong Residents.The accompanying notes form an integral part of these financial statements.
Mirae Asset Next Asia Pacific Equity Fund*

46
Schedule of Investments (Expressed in USD)as at 31 March 2019 (continued)
* illiquid security* Not authorized in Hong Kong and not available to Hong Kong Residents.The accompanying notes form an integral part of these financial statements.
Quantity Description Market value % of Net assets
Transferable securities and money market instruments admitted to an official exchange listing
Equities
2,713,586 Aditya Birla Fashion and Retail Limited 8,631,245 2.13493,766 Ajanta Pharma Limited 7,378,401 1.82250,879 Apollo Tyres Limited 806,675 0.201,165,530 Axis Bank Limited 13,076,785 3.23550,492 Balkrishna Industries Limited 7,910,593 1.951,732,186 Berger Paints India Limited 8,095,079 2.006,210,745 Bharat Electronics Limited 8,360,059 2.06807,186 Bharat Financial Inclusion Limited 13,168,786 3.26752,868 Bharat Forge Limited 5,568,584 1.37389,071 Biocon Limited 3,428,995 0.851,446,551 Capacite Infraprojects Limited* 4,735,803 1.17549,609 Ceat Limited 8,884,846 2.19307,341 Century Textile & Industries Limited 4,139,668 1.021,325,226 Dabur India Limited 7,820,196 1.93242,689 Divi’s Laboratories Limited 5,966,327 1.47407,688 Dr Lal Pathlabs Limited* 6,145,681 1.524,184,653 Equitas Holdings Limited 8,269,508 2.04552,269 Escorts Limited 6,346,113 1.562,567,635 Exide Industries Ltd 8,105,856 2.006,844,693 Federal Bank Limited 9,529,563 2.35571,145 Finolex Cables Limited 3,919,837 0.973,302,048 Gujarat Pipavav Port Limited 4,742,674 1.172,380,247 Gujarat State Petronet Limited 6,552,236 1.62906,921 Havell’s India Limited 10,113,110 2.491,275,260 Hindustan Petroleum Corp. 5,225,218 1.292,876,920 Icici Bank Limited 16,632,101 4.11103,795 Indian Hotels Company Limited 232,084 0.06325,368 Info Edge India Limited 8,653,881 2.13539,298 Ipca Laboratories Limited 7,643,473 1.881,555,117 Jindal Steel & Power Limited 4,033,926 0.9910,471 Jubilant Foodworks Limited 218,259 0.052,862,616 Jyothy Laboratories Limited* 7,561,901 1.86912,254 Kajaria Ceramics Limited 7,767,372 1.92520,877 Kotak Mahindra Bank Limited 10,033,918 2.47199,772 Larsen & Toubro Infotech 4,909,803 1.2169,892 Mahanagar Gas Limited 1,064,430 0.2621,866 Mahindra & Mahindra Limited 212,707 0.051,205,376 Max Financial Services Limited 7,572,307 1.87331,984 MindTree Limited 4,526,223 1.121,250,921 Muthoot Finance Limited 11,115,917 2.74351,384 Natco Pharma Limited 2,908,669 0.726,483,203 National Aluminium Company Limited 5,189,290 1.282,127,284 NTPC Limited 4,136,279 1.0211,926 Page Industries Limited 4,299,018 1.062,903,700 Petronet Lng Limited 10,543,695 2.59120,880 PI Industries Limited 1,800,652 0.444,334,329 Power Finance Corp. Limited 7,701,879 1.90731,170 Raymond Limited 8,564,927 2.111,306,454 RBL Bank Limited 12,830,492 3.1756,294 SRF Limited 1,952,687 0.481,431,249 State Bank of India Limited 6,626,720 1.63930,981 Tata Chemicals Limited 7,912,713 1.954,082,002 Tata Global Beverages Limited 12,017,488 2.961,277,455 Tata Steel Limited 9,607,273 2.37306,799 Torrent Pharmaceuticals Limited 8,634,747 2.13165,259 Trent Limited 863,317 0.211,166,412 TVS Motor Company Limited 7,928,617 1.951,180,994 Voltas Limited 10,730,642 2.642,279,112 Wipro Limited 8,382,660 2.06
Total Equities 401,731,905 99.05Total Transferable securities and money market instruments admitted to an official exchange listing 401,731,905 99.05
Investment in securities at market value 401,731,905 99.05Cash, net of bank overdraft 7,931,503 1.96Other net liabilities (4,064,871) (1.01)Total net assets 405,598,537 100.00
Mirae Asset India Mid Cap Equity Fund*
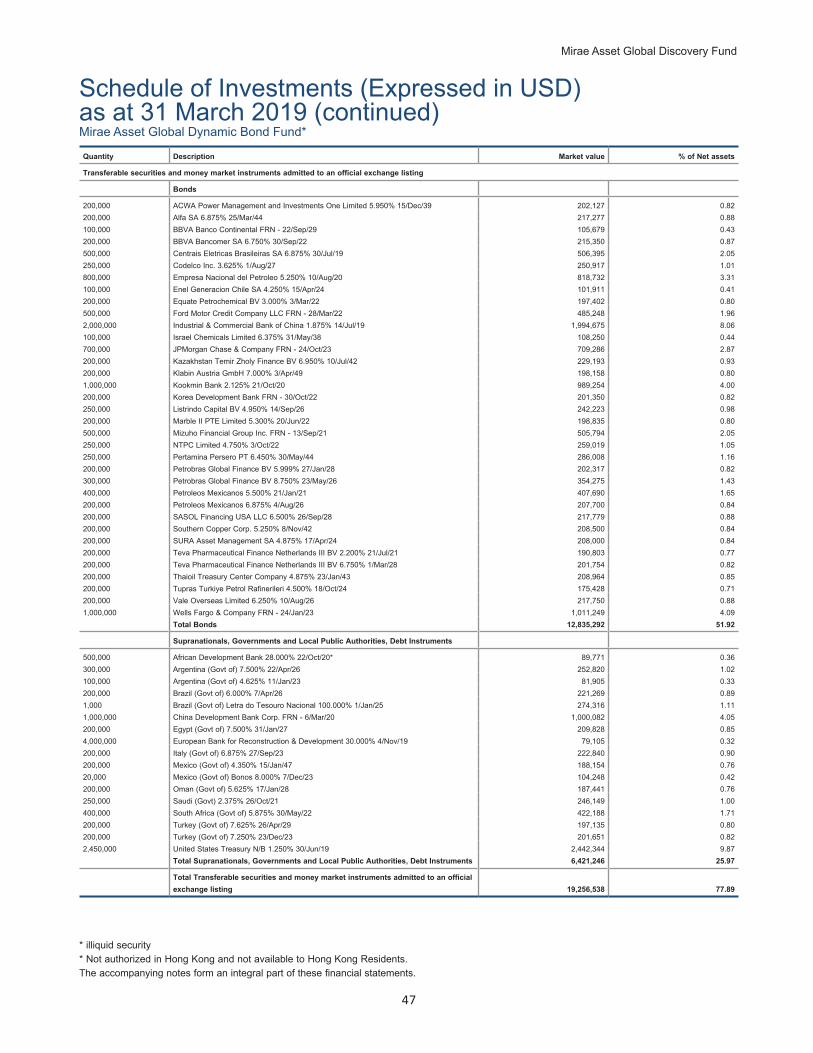
Mirae Asset Global Discovery Fund
47
Schedule of Investments (Expressed in USD)as at 31 March 2019 (continued)
* illiquid security* Not authorized in Hong Kong and not available to Hong Kong Residents.The accompanying notes form an integral part of these financial statements.
Quantity Description Market value % of Net assets
Transferable securities and money market instruments admitted to an official exchange listing
Bonds
200,000 ACWA Power Management and Investments One Limited 5.950% 15/Dec/39 202,127 0.82200,000 Alfa SA 6.875% 25/Mar/44 217,277 0.88100,000 BBVA Banco Continental FRN - 22/Sep/29 105,679 0.43200,000 BBVA Bancomer SA 6.750% 30/Sep/22 215,350 0.87500,000 Centrais Eletricas Brasileiras SA 6.875% 30/Jul/19 506,395 2.05250,000 Codelco Inc. 3.625% 1/Aug/27 250,917 1.01800,000 Empresa Nacional del Petroleo 5.250% 10/Aug/20 818,732 3.31100,000 Enel Generacion Chile SA 4.250% 15/Apr/24 101,911 0.41200,000 Equate Petrochemical BV 3.000% 3/Mar/22 197,402 0.80500,000 Ford Motor Credit Company LLC FRN - 28/Mar/22 485,248 1.962,000,000 Industrial & Commercial Bank of China 1.875% 14/Jul/19 1,994,675 8.06100,000 Israel Chemicals Limited 6.375% 31/May/38 108,250 0.44700,000 JPMorgan Chase & Company FRN - 24/Oct/23 709,286 2.87200,000 Kazakhstan Temir Zholy Finance BV 6.950% 10/Jul/42 229,193 0.93200,000 Klabin Austria GmbH 7.000% 3/Apr/49 198,158 0.801,000,000 Kookmin Bank 2.125% 21/Oct/20 989,254 4.00200,000 Korea Development Bank FRN - 30/Oct/22 201,350 0.82250,000 Listrindo Capital BV 4.950% 14/Sep/26 242,223 0.98200,000 Marble II PTE Limited 5.300% 20/Jun/22 198,835 0.80500,000 Mizuho Financial Group Inc. FRN - 13/Sep/21 505,794 2.05250,000 NTPC Limited 4.750% 3/Oct/22 259,019 1.05250,000 Pertamina Persero PT 6.450% 30/May/44 286,008 1.16200,000 Petrobras Global Finance BV 5.999% 27/Jan/28 202,317 0.82300,000 Petrobras Global Finance BV 8.750% 23/May/26 354,275 1.43400,000 Petroleos Mexicanos 5.500% 21/Jan/21 407,690 1.65200,000 Petroleos Mexicanos 6.875% 4/Aug/26 207,700 0.84200,000 SASOL Financing USA LLC 6.500% 26/Sep/28 217,779 0.88200,000 Southern Copper Corp. 5.250% 8/Nov/42 208,500 0.84200,000 SURA Asset Management SA 4.875% 17/Apr/24 208,000 0.84200,000 Teva Pharmaceutical Finance Netherlands III BV 2.200% 21/Jul/21 190,803 0.77200,000 Teva Pharmaceutical Finance Netherlands III BV 6.750% 1/Mar/28 201,754 0.82200,000 Thaioil Treasury Center Company 4.875% 23/Jan/43 208,964 0.85200,000 Tupras Turkiye Petrol Rafinerileri 4.500% 18/Oct/24 175,428 0.71200,000 Vale Overseas Limited 6.250% 10/Aug/26 217,750 0.881,000,000 Wells Fargo & Company FRN - 24/Jan/23 1,011,249 4.09
Total Bonds 12,835,292 51.92
Supranationals, Governments and Local Public Authorities, Debt Instruments
500,000 African Development Bank 28.000% 22/Oct/20* 89,771 0.36300,000 Argentina (Govt of) 7.500% 22/Apr/26 252,820 1.02100,000 Argentina (Govt of) 4.625% 11/Jan/23 81,905 0.33200,000 Brazil (Govt of) 6.000% 7/Apr/26 221,269 0.891,000 Brazil (Govt of) Letra do Tesouro Nacional 100.000% 1/Jan/25 274,316 1.111,000,000 China Development Bank Corp. FRN - 6/Mar/20 1,000,082 4.05200,000 Egypt (Govt of) 7.500% 31/Jan/27 209,828 0.854,000,000 European Bank for Reconstruction & Development 30.000% 4/Nov/19 79,105 0.32200,000 Italy (Govt of) 6.875% 27/Sep/23 222,840 0.90200,000 Mexico (Govt of) 4.350% 15/Jan/47 188,154 0.7620,000 Mexico (Govt of) Bonos 8.000% 7/Dec/23 104,248 0.42200,000 Oman (Govt of) 5.625% 17/Jan/28 187,441 0.76250,000 Saudi (Govt) 2.375% 26/Oct/21 246,149 1.00400,000 South Africa (Govt of) 5.875% 30/May/22 422,188 1.71200,000 Turkey (Govt of) 7.625% 26/Apr/29 197,135 0.80200,000 Turkey (Govt of) 7.250% 23/Dec/23 201,651 0.822,450,000 United States Treasury N/B 1.250% 30/Jun/19 2,442,344 9.87
Total Supranationals, Governments and Local Public Authorities, Debt Instruments 6,421,246 25.97
Total Transferable securities and money market instruments admitted to an official exchange listing 19,256,538 77.89
Mirae Asset Global Dynamic Bond Fund*
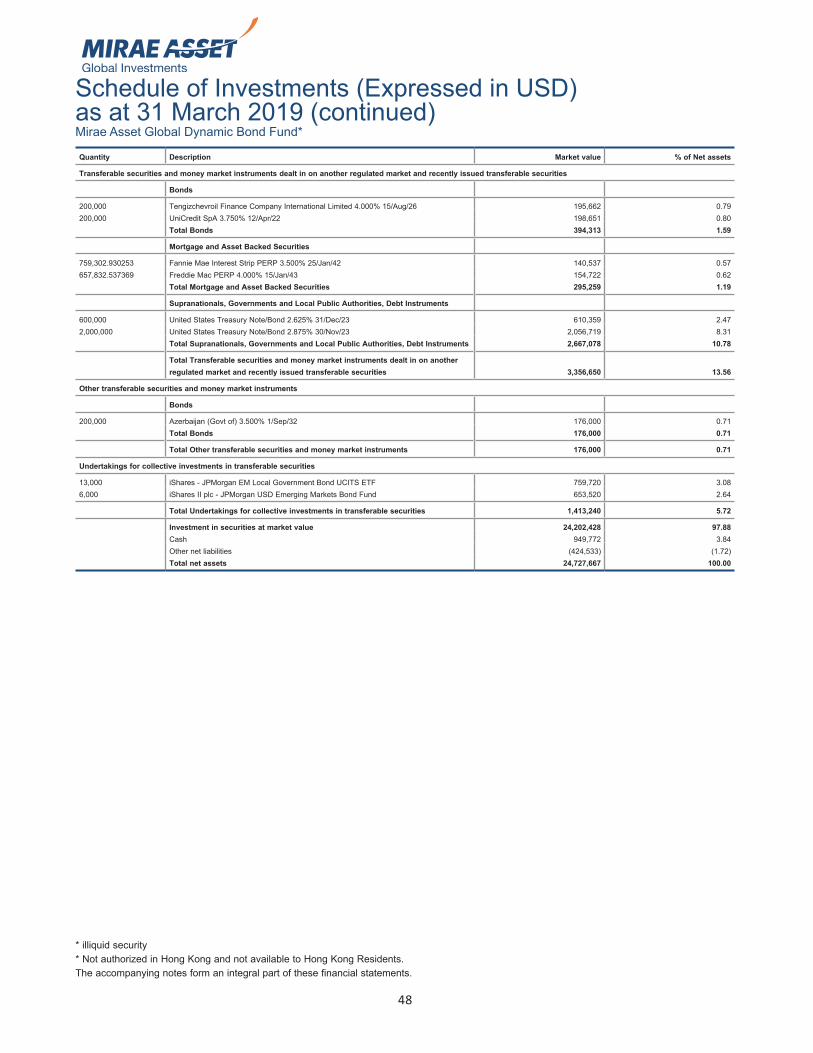
48
Schedule of Investments (Expressed in USD)as at 31 March 2019 (continued)
* illiquid security* Not authorized in Hong Kong and not available to Hong Kong Residents.The accompanying notes form an integral part of these financial statements.
Quantity Description Market value % of Net assets
Transferable securities and money market instruments dealt in on another regulated market and recently issued transferable securities
Bonds
200,000 Tengizchevroil Finance Company International Limited 4.000% 15/Aug/26 195,662 0.79200,000 UniCredit SpA 3.750% 12/Apr/22 198,651 0.80
Total Bonds 394,313 1.59
Mortgage and Asset Backed Securities
759,302.930253 Fannie Mae Interest Strip PERP 3.500% 25/Jan/42 140,537 0.57657,832.537369 Freddie Mac PERP 4.000% 15/Jan/43 154,722 0.62
Total Mortgage and Asset Backed Securities 295,259 1.19
Supranationals, Governments and Local Public Authorities, Debt Instruments
600,000 United States Treasury Note/Bond 2.625% 31/Dec/23 610,359 2.472,000,000 United States Treasury Note/Bond 2.875% 30/Nov/23 2,056,719 8.31
Total Supranationals, Governments and Local Public Authorities, Debt Instruments 2,667,078 10.78
Total Transferable securities and money market instruments dealt in on another regulated market and recently issued transferable securities 3,356,650 13.56
Other transferable securities and money market instruments
Bonds
200,000 Azerbaijan (Govt of) 3.500% 1/Sep/32 176,000 0.71Total Bonds 176,000 0.71
Total Other transferable securities and money market instruments 176,000 0.71
Undertakings for collective investments in transferable securities
13,000 iShares - JPMorgan EM Local Government Bond UCITS ETF 759,720 3.086,000 iShares II plc - JPMorgan USD Emerging Markets Bond Fund 653,520 2.64
Total Undertakings for collective investments in transferable securities 1,413,240 5.72
Investment in securities at market value 24,202,428 97.88Cash 949,772 3.84Other net liabilities (424,533) (1.72)Total net assets 24,727,667 100.00
Mirae Asset Global Dynamic Bond Fund*
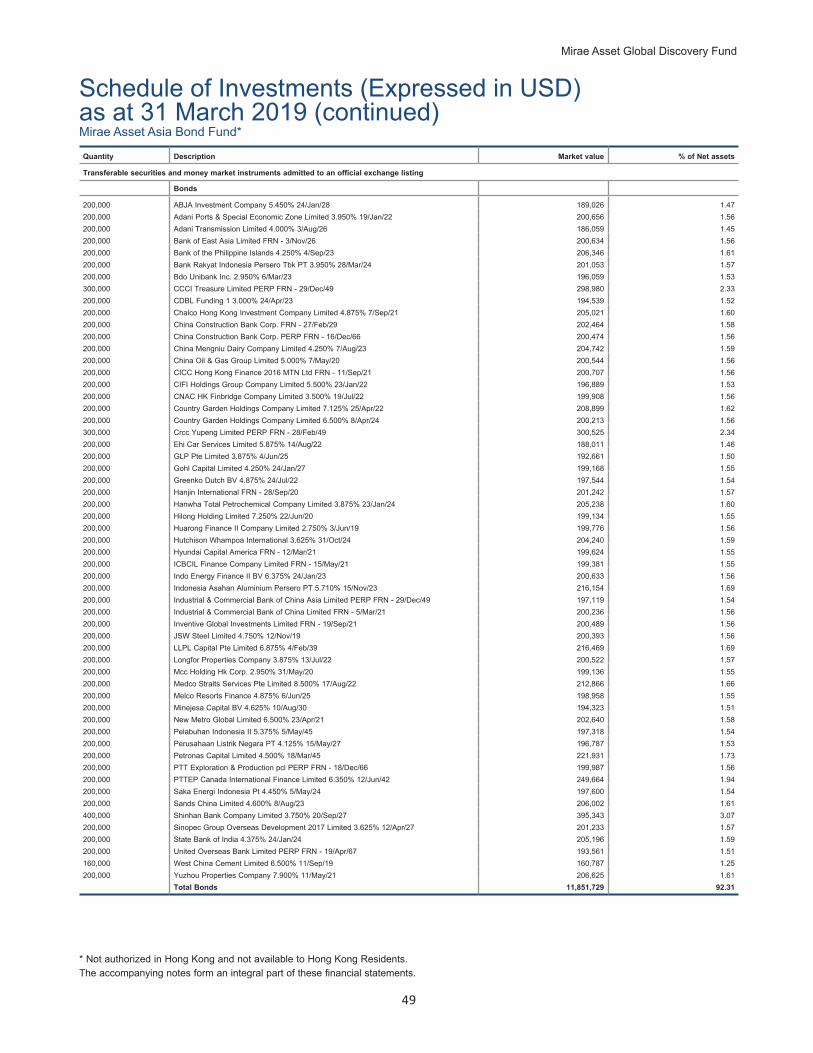
Mirae Asset Global Discovery Fund
49
Schedule of Investments (Expressed in USD)as at 31 March 2019 (continued)
* Not authorized in Hong Kong and not available to Hong Kong Residents.The accompanying notes form an integral part of these financial statements.
Quantity Description Market value % of Net assets
Transferable securities and money market instruments admitted to an official exchange listing
Bonds
200,000 ABJA Investment Company 5.450% 24/Jan/28 189,026 1.47200,000 Adani Ports & Special Economic Zone Limited 3.950% 19/Jan/22 200,656 1.56200,000 Adani Transmission Limited 4.000% 3/Aug/26 186,059 1.45200,000 Bank of East Asia Limited FRN - 3/Nov/26 200,634 1.56200,000 Bank of the Philippine Islands 4.250% 4/Sep/23 206,346 1.61200,000 Bank Rakyat Indonesia Persero Tbk PT 3.950% 28/Mar/24 201,053 1.57200,000 Bdo Unibank Inc. 2.950% 6/Mar/23 196,059 1.53300,000 CCCI Treasure Limited PERP FRN - 29/Dec/49 298,980 2.33200,000 CDBL Funding 1 3.000% 24/Apr/23 194,539 1.52200,000 Chalco Hong Kong Investment Company Limited 4.875% 7/Sep/21 205,021 1.60200,000 China Construction Bank Corp. FRN - 27/Feb/29 202,464 1.58200,000 China Construction Bank Corp. PERP FRN - 16/Dec/66 200,474 1.56200,000 China Mengniu Dairy Company Limited 4.250% 7/Aug/23 204,742 1.59200,000 China Oil & Gas Group Limited 5.000% 7/May/20 200,544 1.56200,000 CICC Hong Kong Finance 2016 MTN Ltd FRN - 11/Sep/21 200,707 1.56200,000 CIFI Holdings Group Company Limited 5.500% 23/Jan/22 196,889 1.53200,000 CNAC HK Finbridge Company Limited 3.500% 19/Jul/22 199,908 1.56200,000 Country Garden Holdings Company Limited 7.125% 25/Apr/22 208,899 1.62200,000 Country Garden Holdings Company Limited 6.500% 8/Apr/24 200,213 1.56300,000 Crcc Yupeng Limited PERP FRN - 28/Feb/49 300,525 2.34200,000 Ehi Car Services Limited 5.875% 14/Aug/22 188,011 1.46200,000 GLP Pte Limited 3.875% 4/Jun/25 192,661 1.50200,000 Gohl Capital Limited 4.250% 24/Jan/27 199,168 1.55200,000 Greenko Dutch BV 4.875% 24/Jul/22 197,544 1.54200,000 Hanjin International FRN - 28/Sep/20 201,242 1.57200,000 Hanwha Total Petrochemical Company Limited 3.875% 23/Jan/24 205,238 1.60200,000 Hilong Holding Limited 7.250% 22/Jun/20 199,134 1.55200,000 Huarong Finance II Company Limited 2.750% 3/Jun/19 199,776 1.56200,000 Hutchison Whampoa International 3.625% 31/Oct/24 204,240 1.59200,000 Hyundai Capital America FRN - 12/Mar/21 199,624 1.55200,000 ICBCIL Finance Company Limited FRN - 15/May/21 199,381 1.55200,000 Indo Energy Finance II BV 6.375% 24/Jan/23 200,633 1.56200,000 Indonesia Asahan Aluminium Persero PT 5.710% 15/Nov/23 216,154 1.69200,000 Industrial & Commercial Bank of China Asia Limited PERP FRN - 29/Dec/49 197,119 1.54200,000 Industrial & Commercial Bank of China Limited FRN - 5/Mar/21 200,236 1.56200,000 Inventive Global Investments Limited FRN - 19/Sep/21 200,489 1.56200,000 JSW Steel Limited 4.750% 12/Nov/19 200,393 1.56200,000 LLPL Capital Pte Limited 6.875% 4/Feb/39 216,469 1.69200,000 Longfor Properties Company 3.875% 13/Jul/22 200,522 1.57200,000 Mcc Holding Hk Corp. 2.950% 31/May/20 199,136 1.55200,000 Medco Straits Services Pte Limited 8.500% 17/Aug/22 212,866 1.66200,000 Melco Resorts Finance 4.875% 6/Jun/25 198,958 1.55200,000 Minejesa Capital BV 4.625% 10/Aug/30 194,323 1.51200,000 New Metro Global Limited 6.500% 23/Apr/21 202,640 1.58200,000 Pelabuhan Indonesia II 5.375% 5/May/45 197,318 1.54200,000 Perusahaan Listrik Negara PT 4.125% 15/May/27 196,787 1.53200,000 Petronas Capital Limited 4.500% 18/Mar/45 221,931 1.73200,000 PTT Exploration & Production pcl PERP FRN - 18/Dec/66 199,987 1.56200,000 PTTEP Canada International Finance Limited 6.350% 12/Jun/42 249,664 1.94200,000 Saka Energi Indonesia Pt 4.450% 5/May/24 197,600 1.54200,000 Sands China Limited 4.600% 8/Aug/23 206,002 1.61400,000 Shinhan Bank Company Limited 3.750% 20/Sep/27 395,343 3.07200,000 Sinopec Group Overseas Development 2017 Limited 3.625% 12/Apr/27 201,233 1.57200,000 State Bank of India 4.375% 24/Jan/24 205,196 1.59200,000 United Overseas Bank Limited PERP FRN - 19/Apr/67 193,561 1.51160,000 West China Cement Limited 6.500% 11/Sep/19 160,787 1.25200,000 Yuzhou Properties Company 7.900% 11/May/21 206,625 1.61
Total Bonds 11,851,729 92.31
Mirae Asset Asia Bond Fund*

50
Schedule of Investments (Expressed in USD)as at 31 March 2019 (continued)
* Not authorized in Hong Kong and not available to Hong Kong Residents.The accompanying notes form an integral part of these financial statements.
Quantity Description Market value % of Net assets
Transferable securities and money market instruments admitted to an official exchange listing
Supranationals, Governments and Local Public Authorities, Debt Instruments
200,000 Indian Railway Finance Corp. Limited 3.730% 29/Mar/24 200,294 1.56200,000 Sri Lanka (Govt of) 6.250% 4/Oct/20 203,024 1.59100,000 United States Treasury N/B 2.250% 15/Nov/27 98,930 0.77100,000 United States Treasury Note/Bond 2.625% 15/Feb/29 101,797 0.79
Total Supranationals, Governments and Local Public Authorities, Debt Instruments 604,045 4.71
Total Transferable securities and money market instruments admitted to an official exchange listing 12,455,774 97.02
Investment in securities at market value 12,455,774 97.02Cash 87,940 0.69Other net assets 293,987 2.29Total net assets 12,837,701 100.00
Mirae Asset Asia Bond Fund*
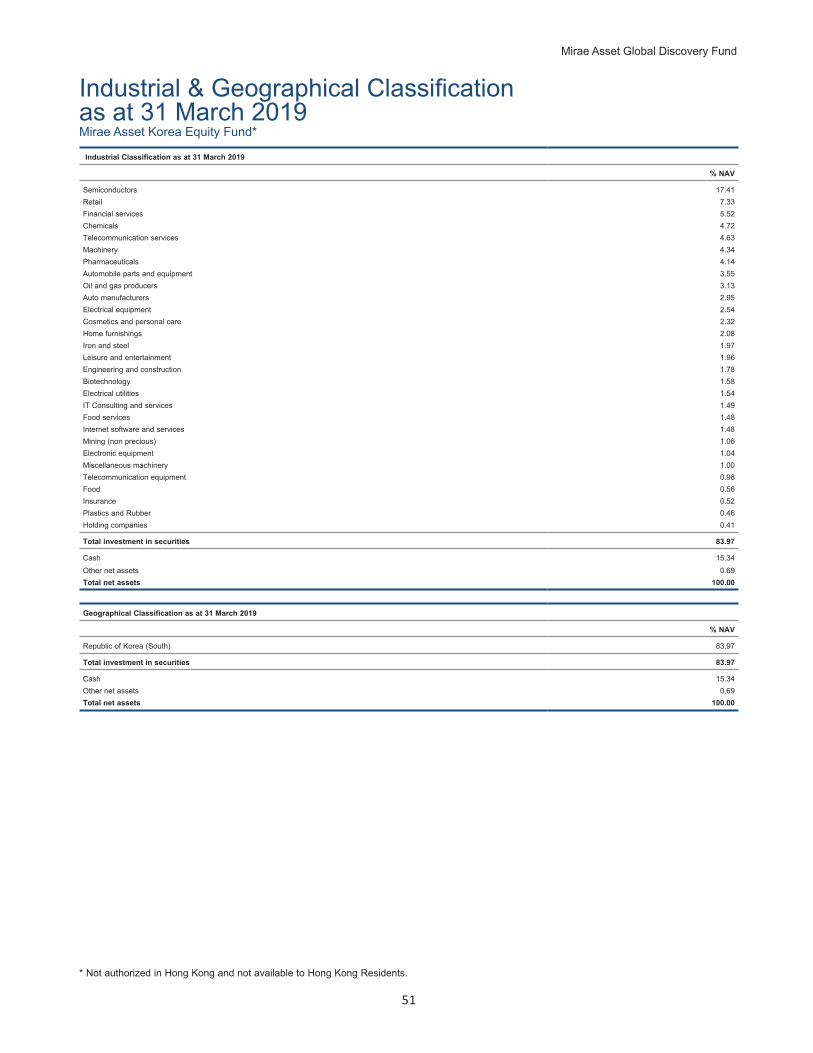
Mirae Asset Global Discovery Fund
51
Industrial & Geographical Classification as at 31 March 2019
* Not authorized in Hong Kong and not available to Hong Kong Residents.
Industrial Classification as at 31 March 2019
% NAV
Semiconductors 17.41Retail 7.33Financial services 5.52Chemicals 4.72Telecommunication services 4.63Machinery 4.34Pharmaceuticals 4.14Automobile parts and equipment 3.55Oil and gas producers 3.13Auto manufacturers 2.95Electrical equipment 2.54Cosmetics and personal care 2.32Home furnishings 2.08Iron and steel 1.97Leisure and entertainment 1.96Engineering and construction 1.78Biotechnology 1.58Electrical utilities 1.54IT Consulting and services 1.49Food services 1.48Internet software and services 1.48Mining (non precious) 1.06Electronic equipment 1.04Miscellaneous machinery 1.00Telecommunication equipment 0.98Food 0.56Insurance 0.52Plastics and Rubber 0.46Holding companies 0.41
Total investment in securities 83.97
Cash 15.34Other net assets 0.69Total net assets 100.00
Geographical Classification as at 31 March 2019
% NAV
Republic of Korea (South) 83.97
Total investment in securities 83.97
Cash 15.34Other net assets 0.69Total net assets 100.00
Mirae Asset Korea Equity Fund*

52
Industrial & Geographical Classification as at 31 March 2019 (continued)Industrial Classification as at 31 March 2019
% NAV
Internet software and services 24.13Beverages 11.25Commercial services 8.32Insurance 6.64Pharmaceuticals 6.00Software 4.39Banks 4.32Biotechnology 3.67Retail 3.30Transportation 3.26Restaurants 3.08Auto manufacturers 3.06Financial services 2.40Real estate investment trust 2.15Telecommunication services 2.00Food 1.90Electrical equipment 1.63Energy - alternate sources 1.63Machinery 1.07
Total investment in securities 94.20
Cash 6.77Other net liabilities (0.97)Total net assets 100.00
Geographical Classification as at 31 March 2019
% NAV
Cayman Islands 48.95China 33.64Hong Kong 11.61
Total investment in securities 94.20
Cash 6.77Other net liabilities (0.97)Total net assets 100.00
Mirae Asset China Sector Leader Equity Fund
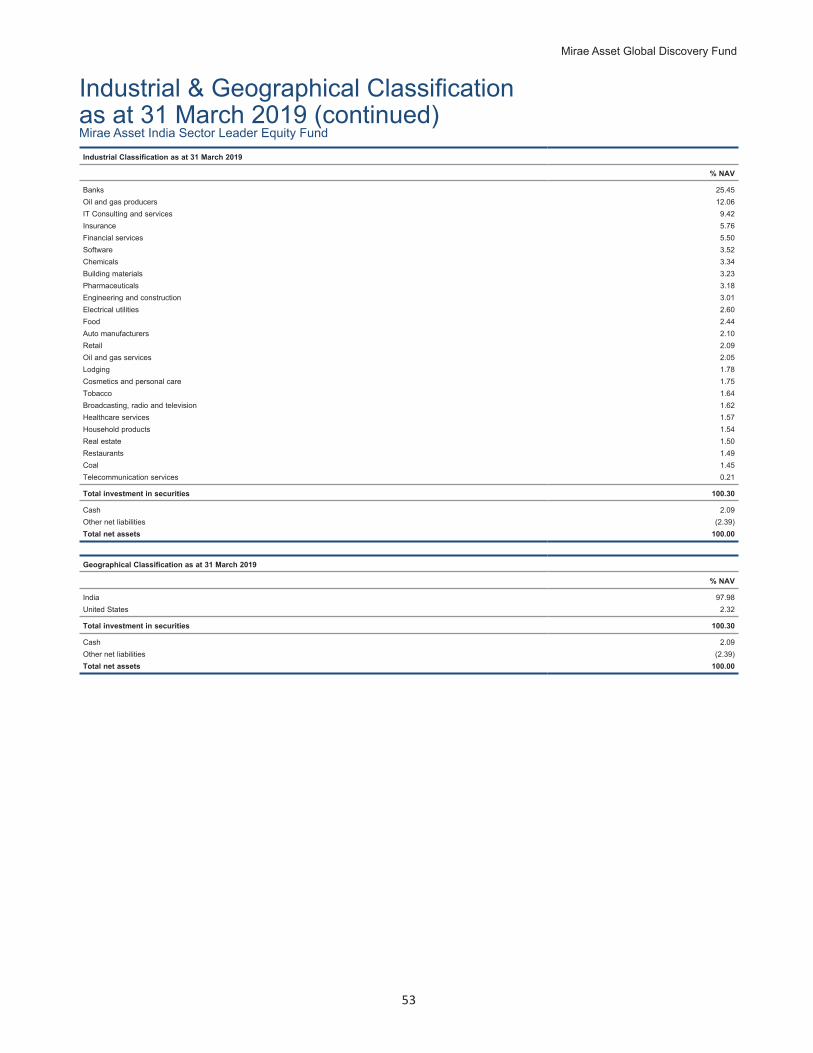
Mirae Asset Global Discovery Fund
53
Industrial & Geographical Classification as at 31 March 2019 (continued)Industrial Classification as at 31 March 2019
% NAV
Banks 25.45Oil and gas producers 12.06IT Consulting and services 9.42Insurance 5.76Financial services 5.50Software 3.52Chemicals 3.34Building materials 3.23Pharmaceuticals 3.18Engineering and construction 3.01Electrical utilities 2.60Food 2.44Auto manufacturers 2.10Retail 2.09Oil and gas services 2.05Lodging 1.78Cosmetics and personal care 1.75Tobacco 1.64Broadcasting, radio and television 1.62Healthcare services 1.57Household products 1.54Real estate 1.50Restaurants 1.49Coal 1.45Telecommunication services 0.21
Total investment in securities 100.30
Cash 2.09Other net liabilities (2.39)Total net assets 100.00
Geographical Classification as at 31 March 2019
% NAV
India 97.98United States 2.32
Total investment in securities 100.30
Cash 2.09Other net liabilities (2.39)Total net assets 100.00
Mirae Asset India Sector Leader Equity Fund

54
Industrial & Geographical Classification as at 31 March 2019 (continued)Industrial Classification as at 31 March 2019
% NAV
Banks 15.02Insurance 11.39Internet software and services 11.06Semiconductors 9.44Oil and gas producers 6.39Financial services 4.82Healthcare services 4.72Pharmaceuticals 4.69Oil and gas services 4.55Retail 3.94Transportation 3.26Telecommunication services 2.94Food 2.10Commercial services 2.05Biotechnology 1.74Cosmetics and personal care 1.62Lodging 1.58IT Consulting and services 1.46Chemicals 1.44Building materials 1.33Software 1.30Household products 0.81Telecommunication equipment 0.68Leisure and entertainment 0.51Automobile parts and equipment 0.10
Total investment in securities 98.94
Cash 1.05Other net assets 0.01Total net assets 100.00
Geographical Classification as at 31 March 2019
% NAV
India 23.49Cayman Islands 17.01China 15.58Republic of Korea (South) 9.96Hong Kong 9.41Taiwan 4.69Singapore 4.61Indonesia 3.68Malaysia 3.31Vietnam 2.67Bermuda 2.26United States 1.46Luxembourg 0.81
Total investment in securities 98.94
Cash 1.05Other net assets 0.01Total net assets 100.00
Mirae Asset Asia Sector Leader Equity Fund
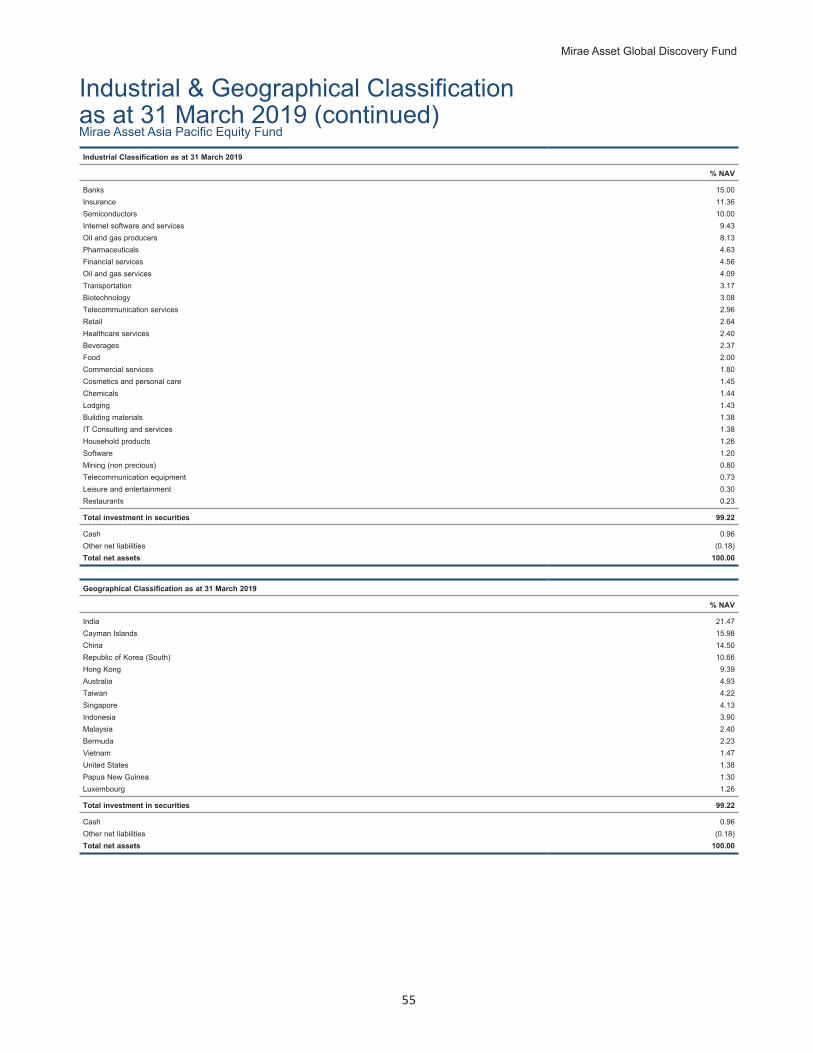
Mirae Asset Global Discovery Fund
55
Industrial & Geographical Classification as at 31 March 2019 (continued)Industrial Classification as at 31 March 2019
% NAV
Banks 15.00Insurance 11.36Semiconductors 10.00Internet software and services 9.43Oil and gas producers 8.13Pharmaceuticals 4.63Financial services 4.56Oil and gas services 4.09Transportation 3.17Biotechnology 3.08Telecommunication services 2.96Retail 2.64Healthcare services 2.40Beverages 2.37Food 2.00Commercial services 1.80Cosmetics and personal care 1.45Chemicals 1.44Lodging 1.43Building materials 1.38IT Consulting and services 1.38Household products 1.26Software 1.20Mining (non precious) 0.80Telecommunication equipment 0.73Leisure and entertainment 0.30Restaurants 0.23
Total investment in securities 99.22
Cash 0.96Other net liabilities (0.18)Total net assets 100.00
Geographical Classification as at 31 March 2019
% NAV
India 21.47Cayman Islands 15.98China 14.50Republic of Korea (South) 10.66Hong Kong 9.39Australia 4.93Taiwan 4.22Singapore 4.13Indonesia 3.90Malaysia 2.40Bermuda 2.23Vietnam 1.47United States 1.38Papua New Guinea 1.30Luxembourg 1.26
Total investment in securities 99.22
Cash 0.96Other net liabilities (0.18)Total net assets 100.00
Mirae Asset Asia Pacific Equity Fund

56
Industrial & Geographical Classification as at 31 March 2019 (continued)Industrial Classification as at 31 March 2019
% NAV
Banks 13.35Internet software and services 9.63Insurance 9.19Semiconductors 8.93Retail 6.97Oil and gas producers 5.37Financial services 4.85Pharmaceuticals 4.38Oil and gas services 3.64Transportation 2.70Commercial services 2.61Telecommunication services 2.47Healthcare services 2.39Broadcasting, radio and television 2.28Building materials 2.00Software 1.66Agriculture 1.61IT Consulting and services 1.55Food 1.46Biotechnology 1.32Mining (non precious) 1.27Cosmetics and personal care 1.08Chemicals 1.04Consumer goods 1.00Household products 1.00Lodging 0.97Restaurants 0.75Food services 0.59Electrical utilities 0.50Leisure and entertainment 0.36
Total investment in securities 96.92
Cash 3.39Other net liabilities (0.31)Total net assets 100.00
Geographical Classification as at 31 March 2019
% NAV
India 16.58Cayman Islands 13.60China 11.81Republic of Korea (South) 8.29Hong Kong 7.99Brazil 7.78South Africa 5.19Taiwan 4.41Indonesia 3.24Russian Federation 2.89Mexico 2.74Malaysia 2.39United Kingdom 2.02Bermuda 1.89United States 1.55Singapore 1.23Netherlands 1.13Luxembourg 1.00Poland 0.69Argentina 0.50
Total investment in securities 96.92
Cash, net of bank overdraft 3.39Other net liabilities (0.31)Total net assets 100.00
Mirae Asset GEM Sector Leader Equity Fund
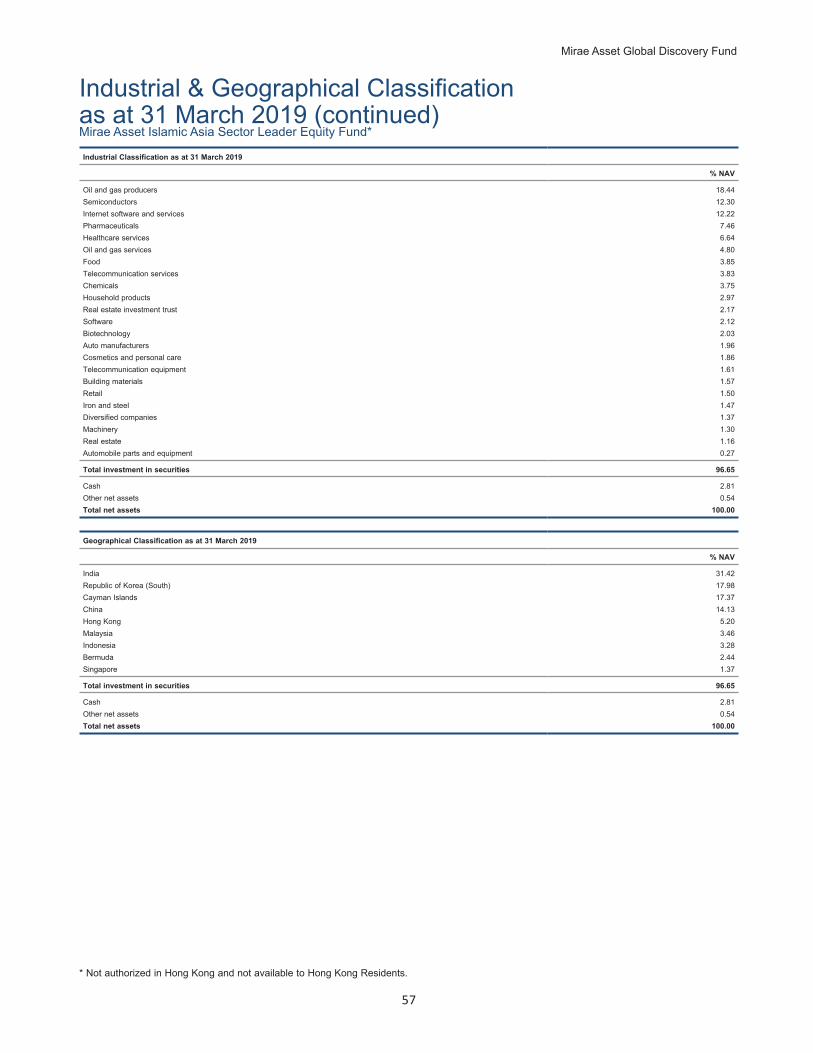
Mirae Asset Global Discovery Fund
57
Industrial & Geographical Classification as at 31 March 2019 (continued)Industrial Classification as at 31 March 2019
% NAV
Oil and gas producers 18.44Semiconductors 12.30Internet software and services 12.22Pharmaceuticals 7.46Healthcare services 6.64Oil and gas services 4.80Food 3.85Telecommunication services 3.83Chemicals 3.75Household products 2.97Real estate investment trust 2.17Software 2.12Biotechnology 2.03Auto manufacturers 1.96Cosmetics and personal care 1.86Telecommunication equipment 1.61Building materials 1.57Retail 1.50Iron and steel 1.47Diversified companies 1.37Machinery 1.30Real estate 1.16Automobile parts and equipment 0.27
Total investment in securities 96.65
Cash 2.81Other net assets 0.54Total net assets 100.00
Geographical Classification as at 31 March 2019
% NAV
India 31.42Republic of Korea (South) 17.98Cayman Islands 17.37China 14.13Hong Kong 5.20Malaysia 3.46Indonesia 3.28Bermuda 2.44Singapore 1.37
Total investment in securities 96.65
Cash 2.81Other net assets 0.54Total net assets 100.00
* Not authorized in Hong Kong and not available to Hong Kong Residents.
Mirae Asset Islamic Asia Sector Leader Equity Fund*
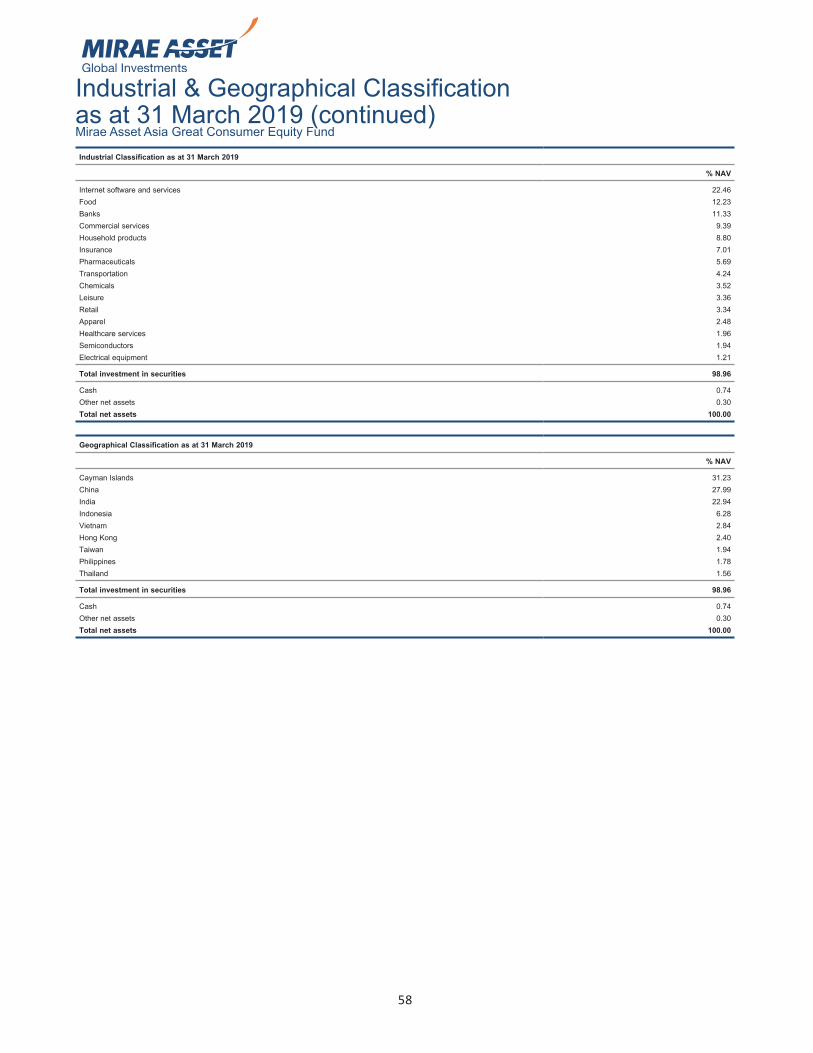
58
Industrial & Geographical Classification as at 31 March 2019 (continued)Industrial Classification as at 31 March 2019
% NAV
Internet software and services 22.46Food 12.23Banks 11.33Commercial services 9.39Household products 8.80Insurance 7.01Pharmaceuticals 5.69Transportation 4.24Chemicals 3.52Leisure 3.36Retail 3.34Apparel 2.48Healthcare services 1.96Semiconductors 1.94Electrical equipment 1.21
Total investment in securities 98.96
Cash 0.74Other net assets 0.30Total net assets 100.00
Geographical Classification as at 31 March 2019
% NAV
Cayman Islands 31.23China 27.99India 22.94Indonesia 6.28Vietnam 2.84Hong Kong 2.40Taiwan 1.94Philippines 1.78Thailand 1.56
Total investment in securities 98.96
Cash 0.74Other net assets 0.30Total net assets 100.00
Mirae Asset Asia Great Consumer Equity Fund

Mirae Asset Global Discovery Fund
59
Industrial & Geographical Classification as at 31 March 2019 (continued)Industrial Classification as at 31 March 2019
% NAV
Internet software and services 24.22Pharmaceuticals 12.98Financial services 10.30Software 8.73Retail 7.73Cosmetics and personal care 5.63Biotechnology 3.87Healthcare services 3.55Media 3.29Aerospace and defence 2.92Construction and Building materials 2.92Beverages 2.69Banks 2.42Healthcare supplies and equipment 2.40Apparel 2.39Chemicals 2.02
Total investment in securities 98.06
Cash 2.34Other net liabilities (0.40)Total net assets 100.00
Geographical Classification as at 31 March 2019
% NAV
United States 76.27Cayman Islands 5.31Netherlands 4.74France 3.57Switzerland 2.90United Kingdom 2.08Spain 1.77Ireland 1.42
Total investment in securities 98.06
Cash 2.34Other net liabilities (0.40)Total net assets 100.00
Mirae Asset Global Great Consumer Equity Fund
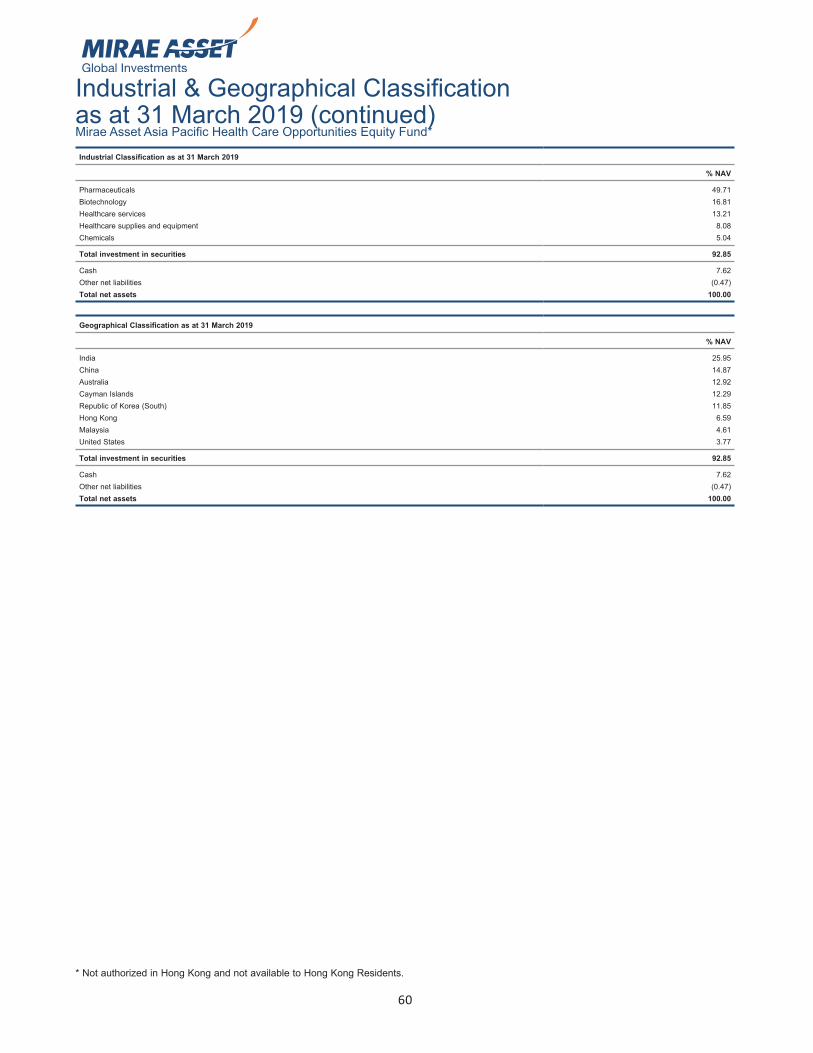
60
Industrial & Geographical Classification as at 31 March 2019 (continued)Industrial Classification as at 31 March 2019
% NAV
Pharmaceuticals 49.71Biotechnology 16.81Healthcare services 13.21Healthcare supplies and equipment 8.08Chemicals 5.04
Total investment in securities 92.85
Cash 7.62Other net liabilities (0.47)Total net assets 100.00
Geographical Classification as at 31 March 2019
% NAV
India 25.95China 14.87Australia 12.92Cayman Islands 12.29Republic of Korea (South) 11.85Hong Kong 6.59Malaysia 4.61United States 3.77
Total investment in securities 92.85
Cash 7.62Other net liabilities (0.47)Total net assets 100.00
* Not authorized in Hong Kong and not available to Hong Kong Residents.
Mirae Asset Asia Pacific Health Care Opportunities Equity Fund*
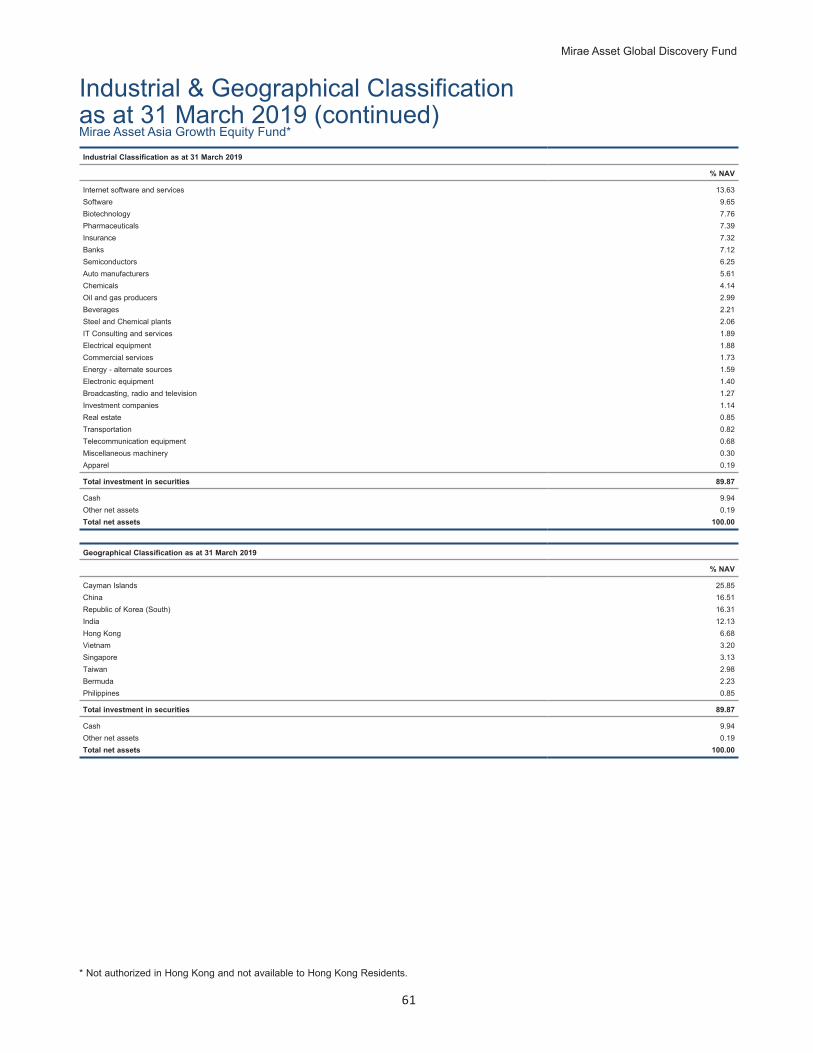
Mirae Asset Global Discovery Fund
61
Industrial & Geographical Classification as at 31 March 2019 (continued)
* Not authorized in Hong Kong and not available to Hong Kong Residents.
Industrial Classification as at 31 March 2019
% NAV
Internet software and services 13.63Software 9.65Biotechnology 7.76Pharmaceuticals 7.39Insurance 7.32Banks 7.12Semiconductors 6.25Auto manufacturers 5.61Chemicals 4.14Oil and gas producers 2.99Beverages 2.21Steel and Chemical plants 2.06IT Consulting and services 1.89Electrical equipment 1.88Commercial services 1.73Energy - alternate sources 1.59Electronic equipment 1.40Broadcasting, radio and television 1.27Investment companies 1.14Real estate 0.85Transportation 0.82Telecommunication equipment 0.68Miscellaneous machinery 0.30Apparel 0.19
Total investment in securities 89.87
Cash 9.94Other net assets 0.19Total net assets 100.00
Geographical Classification as at 31 March 2019
% NAV
Cayman Islands 25.85China 16.51Republic of Korea (South) 16.31India 12.13Hong Kong 6.68Vietnam 3.20Singapore 3.13Taiwan 2.98Bermuda 2.23Philippines 0.85
Total investment in securities 89.87
Cash 9.94Other net assets 0.19Total net assets 100.00
Mirae Asset Asia Growth Equity Fund*
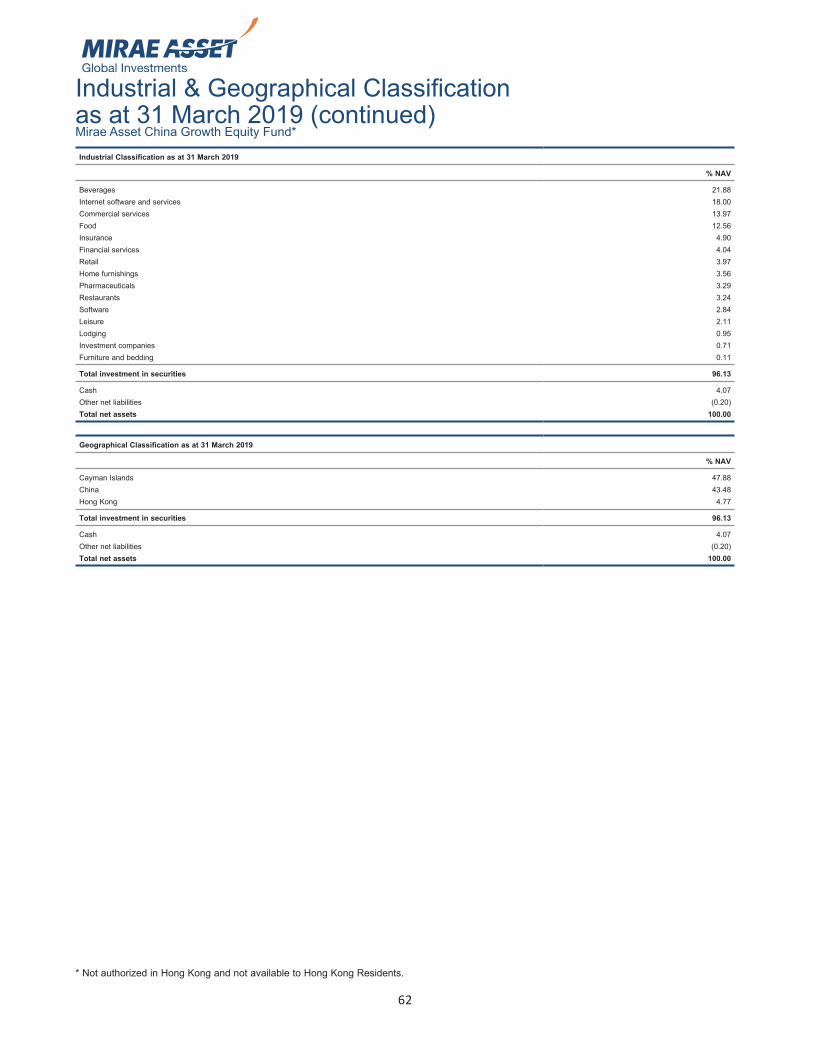
62
Industrial & Geographical Classification as at 31 March 2019 (continued)Industrial Classification as at 31 March 2019
% NAV
Beverages 21.88Internet software and services 18.00Commercial services 13.97Food 12.56Insurance 4.90Financial services 4.04Retail 3.97Home furnishings 3.56Pharmaceuticals 3.29Restaurants 3.24Software 2.84Leisure 2.11Lodging 0.95Investment companies 0.71Furniture and bedding 0.11
Total investment in securities 96.13
Cash 4.07Other net liabilities (0.20)Total net assets 100.00
Geographical Classification as at 31 March 2019
% NAV
Cayman Islands 47.88China 43.48Hong Kong 4.77
Total investment in securities 96.13
Cash 4.07Other net liabilities (0.20)Total net assets 100.00
* Not authorized in Hong Kong and not available to Hong Kong Residents.
Mirae Asset China Growth Equity Fund*
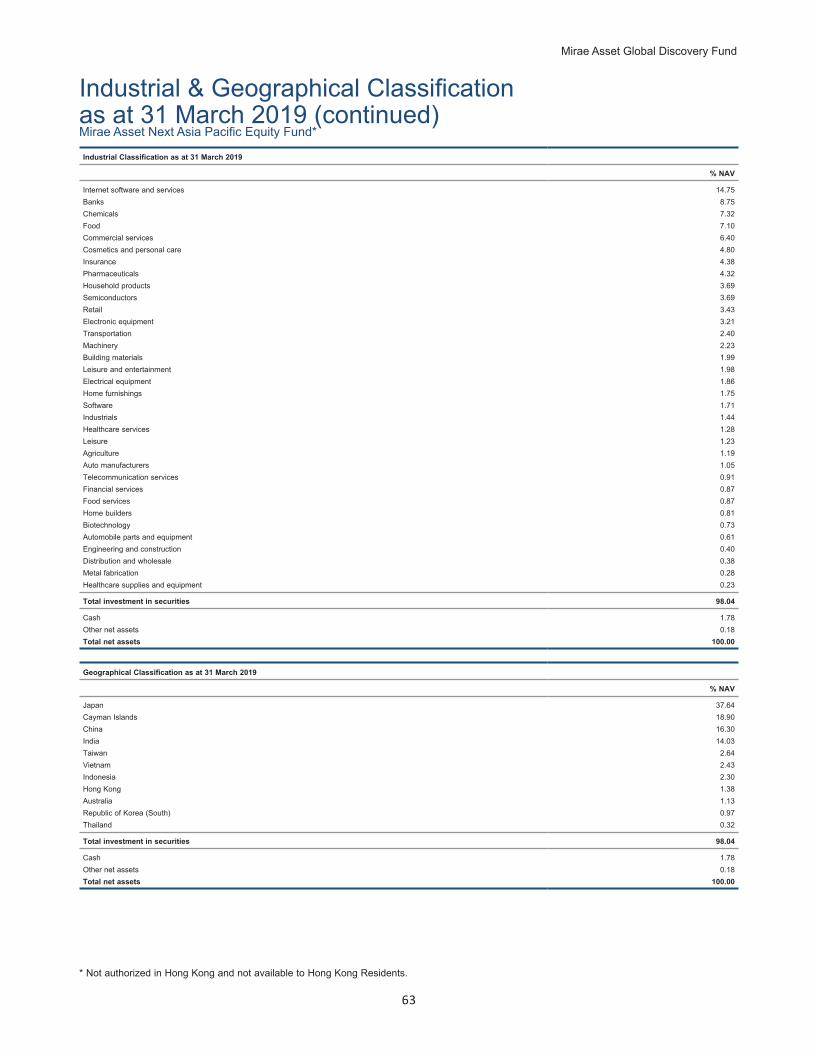
Mirae Asset Global Discovery Fund
63
Industrial & Geographical Classification as at 31 March 2019 (continued)Industrial Classification as at 31 March 2019
% NAV
Internet software and services 14.75Banks 8.75Chemicals 7.32Food 7.10Commercial services 6.40Cosmetics and personal care 4.80Insurance 4.38Pharmaceuticals 4.32Household products 3.69Semiconductors 3.69Retail 3.43Electronic equipment 3.21Transportation 2.40Machinery 2.23Building materials 1.99Leisure and entertainment 1.98Electrical equipment 1.86Home furnishings 1.75Software 1.71Industrials 1.44Healthcare services 1.28Leisure 1.23Agriculture 1.19Auto manufacturers 1.05Telecommunication services 0.91Financial services 0.87Food services 0.87Home builders 0.81Biotechnology 0.73Automobile parts and equipment 0.61Engineering and construction 0.40Distribution and wholesale 0.38Metal fabrication 0.28Healthcare supplies and equipment 0.23
Total investment in securities 98.04
Cash 1.78Other net assets 0.18Total net assets 100.00
Geographical Classification as at 31 March 2019
% NAV
Japan 37.64Cayman Islands 18.90China 16.30India 14.03Taiwan 2.64Vietnam 2.43Indonesia 2.30Hong Kong 1.38Australia 1.13Republic of Korea (South) 0.97Thailand 0.32
Total investment in securities 98.04
Cash 1.78Other net assets 0.18Total net assets 100.00
* Not authorized in Hong Kong and not available to Hong Kong Residents.
Mirae Asset Next Asia Pacific Equity Fund*
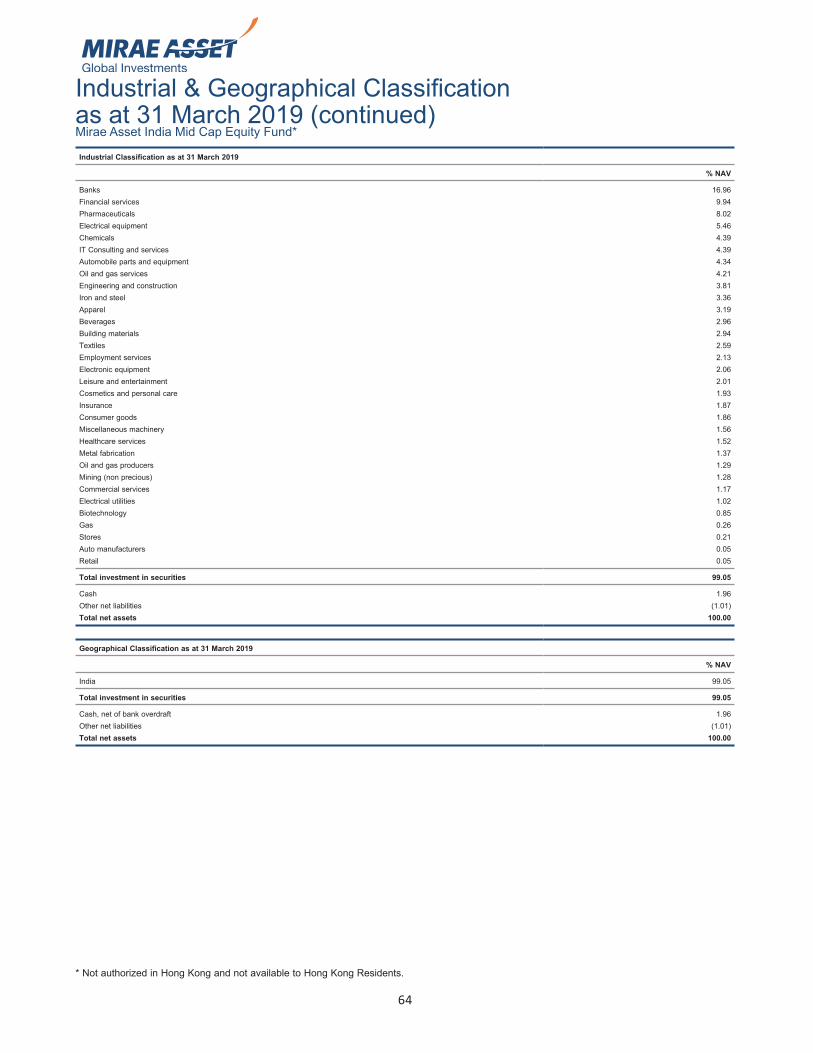
64
Industrial & Geographical Classification as at 31 March 2019 (continued)Industrial Classification as at 31 March 2019
% NAV
Banks 16.96Financial services 9.94Pharmaceuticals 8.02Electrical equipment 5.46Chemicals 4.39IT Consulting and services 4.39Automobile parts and equipment 4.34Oil and gas services 4.21Engineering and construction 3.81Iron and steel 3.36Apparel 3.19Beverages 2.96Building materials 2.94Textiles 2.59Employment services 2.13Electronic equipment 2.06Leisure and entertainment 2.01Cosmetics and personal care 1.93Insurance 1.87Consumer goods 1.86Miscellaneous machinery 1.56Healthcare services 1.52Metal fabrication 1.37Oil and gas producers 1.29Mining (non precious) 1.28Commercial services 1.17Electrical utilities 1.02Biotechnology 0.85Gas 0.26Stores 0.21Auto manufacturers 0.05Retail 0.05
Total investment in securities 99.05
Cash 1.96Other net liabilities (1.01)Total net assets 100.00
Geographical Classification as at 31 March 2019
% NAV
India 99.05
Total investment in securities 99.05
Cash, net of bank overdraft 1.96Other net liabilities (1.01)Total net assets 100.00
* Not authorized in Hong Kong and not available to Hong Kong Residents.
Mirae Asset India Mid Cap Equity Fund*
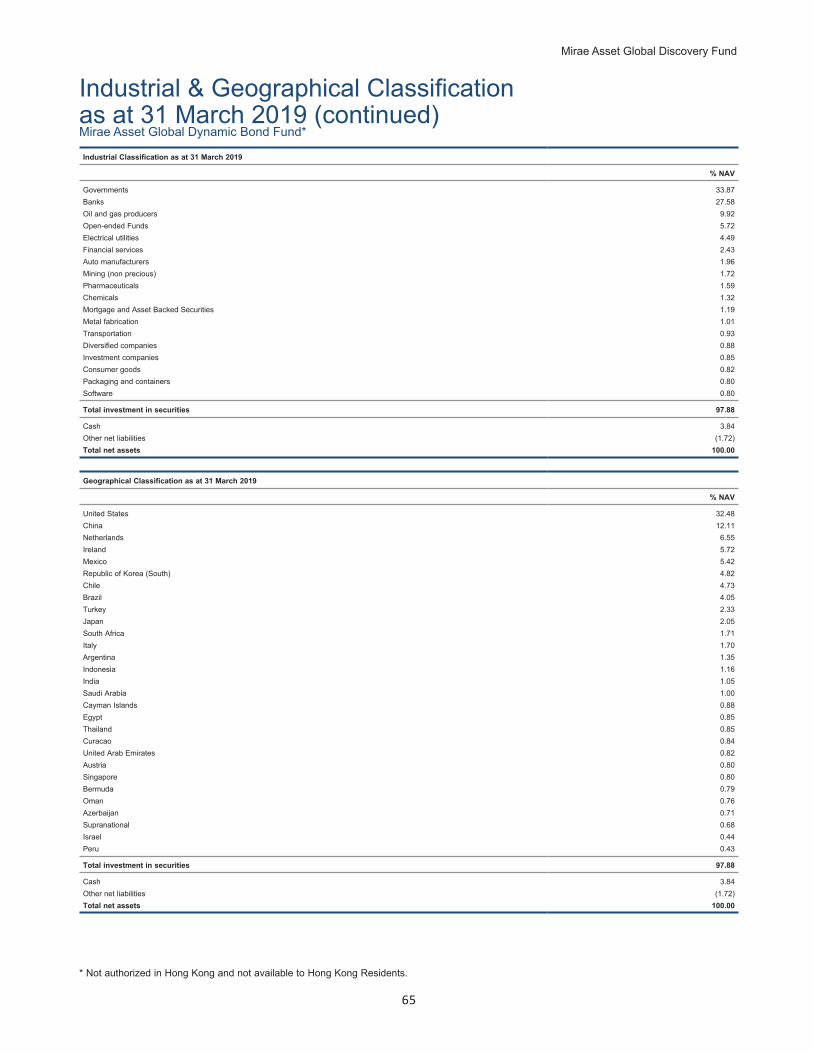
Mirae Asset Global Discovery Fund
65
Industrial & Geographical Classification as at 31 March 2019 (continued)Industrial Classification as at 31 March 2019
% NAV
Governments 33.87Banks 27.58Oil and gas producers 9.92Open-ended Funds 5.72Electrical utilities 4.49Financial services 2.43Auto manufacturers 1.96Mining (non precious) 1.72Pharmaceuticals 1.59Chemicals 1.32Mortgage and Asset Backed Securities 1.19Metal fabrication 1.01Transportation 0.93Diversified companies 0.88Investment companies 0.85Consumer goods 0.82Packaging and containers 0.80Software 0.80
Total investment in securities 97.88
Cash 3.84Other net liabilities (1.72)Total net assets 100.00
Geographical Classification as at 31 March 2019
% NAV
United States 32.48China 12.11Netherlands 6.55Ireland 5.72Mexico 5.42Republic of Korea (South) 4.82Chile 4.73Brazil 4.05Turkey 2.33Japan 2.05South Africa 1.71Italy 1.70Argentina 1.35Indonesia 1.16India 1.05Saudi Arabia 1.00Cayman Islands 0.88Egypt 0.85Thailand 0.85Curacao 0.84United Arab Emirates 0.82Austria 0.80Singapore 0.80Bermuda 0.79Oman 0.76Azerbaijan 0.71Supranational 0.68Israel 0.44Peru 0.43
Total investment in securities 97.88
Cash 3.84Other net liabilities (1.72)Total net assets 100.00
* Not authorized in Hong Kong and not available to Hong Kong Residents.
Mirae Asset Global Dynamic Bond Fund*
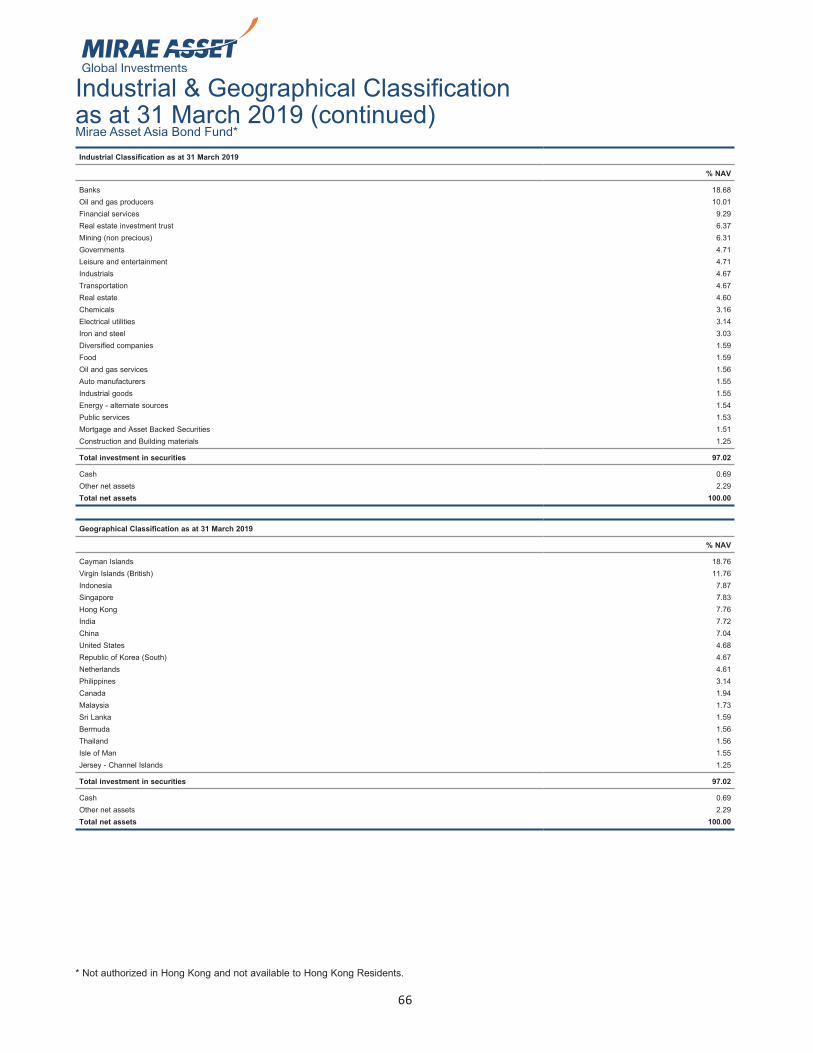
66
Industrial & Geographical Classification as at 31 March 2019 (continued)Industrial Classification as at 31 March 2019
% NAV
Banks 18.68Oil and gas producers 10.01Financial services 9.29Real estate investment trust 6.37Mining (non precious) 6.31Governments 4.71Leisure and entertainment 4.71Industrials 4.67Transportation 4.67Real estate 4.60Chemicals 3.16Electrical utilities 3.14Iron and steel 3.03Diversified companies 1.59Food 1.59Oil and gas services 1.56Auto manufacturers 1.55Industrial goods 1.55Energy - alternate sources 1.54Public services 1.53Mortgage and Asset Backed Securities 1.51Construction and Building materials 1.25
Total investment in securities 97.02
Cash 0.69Other net assets 2.29Total net assets 100.00
Geographical Classification as at 31 March 2019
% NAV
Cayman Islands 18.76Virgin Islands (British) 11.76Indonesia 7.87Singapore 7.83Hong Kong 7.76India 7.72China 7.04United States 4.68Republic of Korea (South) 4.67Netherlands 4.61Philippines 3.14Canada 1.94Malaysia 1.73Sri Lanka 1.59Bermuda 1.56Thailand 1.56Isle of Man 1.55Jersey - Channel Islands 1.25
Total investment in securities 97.02
Cash 0.69Other net assets 2.29Total net assets 100.00
* Not authorized in Hong Kong and not available to Hong Kong Residents.
Mirae Asset Asia Bond Fund*
Mirae Asset Global Discovery Fund
67
Unaudited Supplementary Information Information on Remuneration
FundRock Management Company S.A. (“FundRock”) has established and applies a remuneration policy in accordance with the principles laid out under the AIFMD and UCITS V directive, and any related legal & regulatory provisions applicable in Luxembourg. The remuneration policy is aligned with the business strategy, objectives, values and interests of the Management Company and the Funds that it manages and of the investors in such Funds, and which includes, inter alia, measures to avoid conflicts of interest; and it is consistent with and promotes sound and effective risk management and does not encourage risk taking which is inconsistent with the risk profiles, rules or instruments of incorporation of the Funds that the Management Company manages.
As an independent management company relying on a full-delegation model (i.e. delegation of the collective portfolio management function), FundRock ensures that its remuneration policy adequately reflects the predominance of its oversight activity within its core activities. As such, it should be noted that FundRock’s employees who are identified as risk-takers under UCITS V are not remunerated based on the performance of the funds under management.
A paper version of the remuneration policy is made available free of charge to investors at FundRock’s registered office.
The amount of remuneration, including social charges and benefits, for the financial year ending December 31, 2018 was:
EUR6,459,595.00
Fixed remuneration: EUR6,271,345.00
Variable remuneration: EUR188,250.00
This does not include the remuneration to SEB Fund Services/FundRock Nordics for the period from January 1, 2018 till December 21, 2018 prior to the merger of SEB Fund Services/FundRock Nordics with FundRock Management Company on December 21, 2018.
Number of beneficiaries: 64
The aggregated amount of remuneration for the financial year ending December 31, 2018 of Identified staff/risk takers is as follows:
Identified staff/risk takers: EUR1,069,358.00
Other risk takers: EUR Nil
The remuneration to SEB Fund Services/FundRock Nordics for the period from January 1, 2018 till December 21, 2018 prior to the merger of SEB Fund Services/FundRock Nordics with FundRock Management Company on December 21, 2018, including social charges and benefits was:
EUR2,286,192.83
Fixed remuneration: EUR2,245,970.33
Variable remuneration: EUR40,222.50
Number of beneficiaries: 19
The aggregated amount of remuneration for the period from January 1, 2018 till December 21, 2018 prior to the merger of SEB Fund Services/Fund Rock Nordics with Fund Rock Management Company of Identified staff/risk takers is as follows:
Identified staff/risk takers: EUR489,625.06
Other risk takers: EUR Nil
The total amount of remuneration is based on a combination of the assessment of the performance of the individual, the overall results of FundRock, and when assessing individual performance, financial as well as non-financial criteria are taken into account.
The total amount of remuneration is based on a combination of the assessment of the performance of the individual, the overall results of FundRock, and when assessing individual performance, financial as well as non-financial criteria are taken into account.
The Policy is subject to annual review by the Compliance Officer and the update is performed by HR department of FundRock and is presented for review to the Remuneration Committee and approval by the Board of FundRock.
The policy was last updated in February 2019, to reflect the additional requirements of the “UCITS V” Directive.
European Regulation (EU) 2015/2365 on the transparency of financial transactions in securities and reuse of collateral (Securities Financing Transactions or SFTR)
During the year ended 31 March 2019, the Company did not enter into securities financing transactions and total return swaps.