Optimal workload allocation model for scheduling divisible data grid applications

Optimal Asset Allocation:
Finding the optimal portfolio (that is the portfolio with
the highest utility) for
an investor means finding the best combination of the risk-
free asset and the
market portfolio. This is because we have seen that each
portfolio on the CML
(Which is the efficient frontier) is a combination of the
market portfolio and the
risk-free asset. The red point on the figure shows the
maximal utility. The red point is denoted with “θ” where
optimal asset is allocated. This point dominates all the
individual assets below itself. Above this point, investors
invest in risky assets borrowing from risk free assets.
Tangency portfolio: Because in the allocation formula of the
tangency port-
folio the factor C0 is linearly present, we can conclude
that also in this case,
the portfolio fractions are independent of C0. In other
words, the tangency
allocation and the invested capital C0 depend linearly on
each other.
Efficient frontier
The efficient frontier is the curve that shows all efficient
portfolios in a risk-return
Framework. An efficient portfolio is defined as the
portfolio that maximizes the
expected return for a given amount of risk (standard
deviation), or the portfolio
that minimizes the risk subject to a given expected return.
An investor will always invest in an efficient portfolio. If
he desires a certain
amount of risk, he would be crazy if he doesn't aim for the
highest possible

expected return. The other way the same holds. If he wants a
specific expected
return, he likes to achieve this with the minimum possible
amount of risk. This
is because the investor is risk averse.
So, to calculate the efficient frontier we have to minimize
the risk (standard
deviation) given some expected return. The objective
function is the function
that has to be minimized, which is the standard deviation.
However, we take
the variance (the squared standard deviation) as the
objective function.
Capital market line & market portfolio
The efficient frontier changes when a risk-free asset is
included. The theory of
Markowitz learns that the new efficient frontier is a
straight line, starting at the risk-free point and tangent
to the old efficient frontier. The new efficient frontier is
called the Capital Market Line (CML), and we still refer to
the old frontier as the efficient frontier. The tangency
point between the CML and the efficient frontier is called
the market

Portfolio. We will calculate the CML and show that the new
efficient frontier indeed is the Straight line from the
theory. Suppose that an amount if is invested in the risk-
Free asset and that the return on the risk-free asset is if.
Because the risk-free
asset is uncorrelated with the risky assets we have the
following relationships:
Market Portfolio:
Figure: The Capital Market Line. M is the market
portfolio and rf represents the risk free rate of
return. All portfolios other than those employing the market portfolio
and risk free borrowing or lending would lie below the CML.

The market portfolio is a portfolio consisting of all securities where the proportion invested in each security corresponds to its relative market value. The relative market value of a security is simply equal to the aggregate market value of the security divided by the sum of the aggregate market values of all securities. In equilibrium the proportions of the tangency portfolio
will correspond to the proportions of the market portfolio.
This tells us that the market portfolio plays a central role
in the CAPM, since the efficient set consists of an
investment in the market portfolio, coupled with a desired
amount of either risk free borrowing or lending.
Data: Suppose I as investor invest want to construct an
efficient portfolio with the 5 assets mentioned bellow-what
calculations and decisions I need to take that are being
shown step-by-step :-
1. First there are month end closing prices for 5 stock
for 5 years-
Date AB Bank Uttara Bank Dhaka Bank Padma Oil
Co.SquareTextile

30/12/ 2009 1176.5 1450.25 483.5 620.2 111.426/11/ 2009 1090.5 1483.75 443.25 1553.2 108.5
29/10/ 2009
895.00 1,188.25
353.50
1,304.50
111.40
30/09/ 2009
835.25 1,093.00
349.25
1,142.40
96.90
31/08/ 2009
881.75 1,077.25
346.75
1,125.10
91.20
30/07/ 2009
973.25 1,156.00
334.25
1,018.20
92.30
30/06/ 2009
1,032.50 1,223.75
332.00
868.10
95.90
31/05/ 2009 629.75 1056.5 309.5 768.8 93.930/04/ 2009 748.5 2132.5 308.5 681.1 11131/03/ 2009 430.75 1623 251.25 717.2 114.126/02/ 2009 593.75 2456 354.5 752.9 113.629/01/ 2009 694.75 2974 365.25 727.7 111.130/12/2008 822.25 3393.75 360.5 1436.6 117.330/11/2008 795 3090.75 362.25 1206.7 105.4
30/10/2008
812.25 2,710.25
369.50
1,761.10
118.90
25/09/2008 936.75 2803.25 431.00 1810.20 133.2031/08/2008 1000.5 2876.5 460 1734.9 13430/07/2008 940.5 2825.5 453.5 1661.3 136.930/06/2008 1324.25 2817.00 471.50 2047.40 118.5029/05/2008 3433.00 2878.75 487.75 1782.10 132.7030/04/2008 3993.25 2970.75 473.75 1591.90 135.8031/03/2008 3477.50 5461.25 596.50 1409.50 124.4028/02/2008 3169.50 4976.50 614.50 1243.50 118.2031/01/2008 2681 4600.75 664.5 1094.4 120.730/12/2007 2561.25 4854.75 706 1402.6 127.429/11/2007 2711 4726.25 609.75 1428.3 123.831/10/2007 2842.75 3868.25 616.5 1145.7 117.230/09/2007 2379.25 3570 602.25 921.1 106.729/08/2007 2170.25 3698.5 581 863 106.431/07/2007 2085.5 2574.5 601 833 109.828/06/2007 1468.75 2571.5 517.5 920 111.731/05/2007 1116.25 2111.5 501.5 920 109.630/04/2007 771.75 1854.25 436.5 1082.3 94.629/03/2007 804.25 1751.75 400 976.4 9528/02/2007 739 2235.5 468.5 615 97.231/01/2007 863.25 2323.75 451 632.1 99.728/12/2006 892.75 2312.25 465.75 601 74.930/11/2006 788.5 2085 401.75 600 7428/10/2006 835.50 2128.25 388.75 668.70 75.1028/09/2006 927.75 2103.25 391.25 668.70 77.2031/08/2006

797.50 1,938.75 407.75 623.90 76.20 31/07/2006 550.25 1864.50 371.75 650.00 65.30
29/06/2006
364.25 1,772.50
373.50
748.00
64.30
31/05/2006
351.50 1,518.75
379.00
680.00
66.00
30/04/2006 273.25 1522.75 379.75 599 76.130/03/2006 324.25 2681.5 383.75 600 79.828/02/2006 326.25 2603.25 407.75 599.40 77.2031/01/2006 370.25 2729.75 441.25 606.00 82.9029/12/2005 364.00 2811.00 469.00 606.30 82.0030/11/2005 349.25 2756.25 475.00 600.00 82.5031/10/2005 326.25 2849.00 502.75 597.50 80.0030/09/2005 358.25 2,603.00 530.25 500.00 81.2031/08/2005 283.75 2375.25 518.00 380.30 81.4031/07/2005 238.75 2023.75 438.00 378.00 76.8030/06/2005 278.25 2292.25 520.25 350.00 82.3031/05/2005 286.25 1724.25 496.75 327.00 80.8030/04/2005 285.25 1488.50 421.00 321.30 74.7031/03/2005 344.50 2428.50 632.50 340.00 95.9028/02/2005 327.75 2034.50 983.00 355.00 107.6031/01/2005 339.50 1957.25 831.25 340.00 116.90
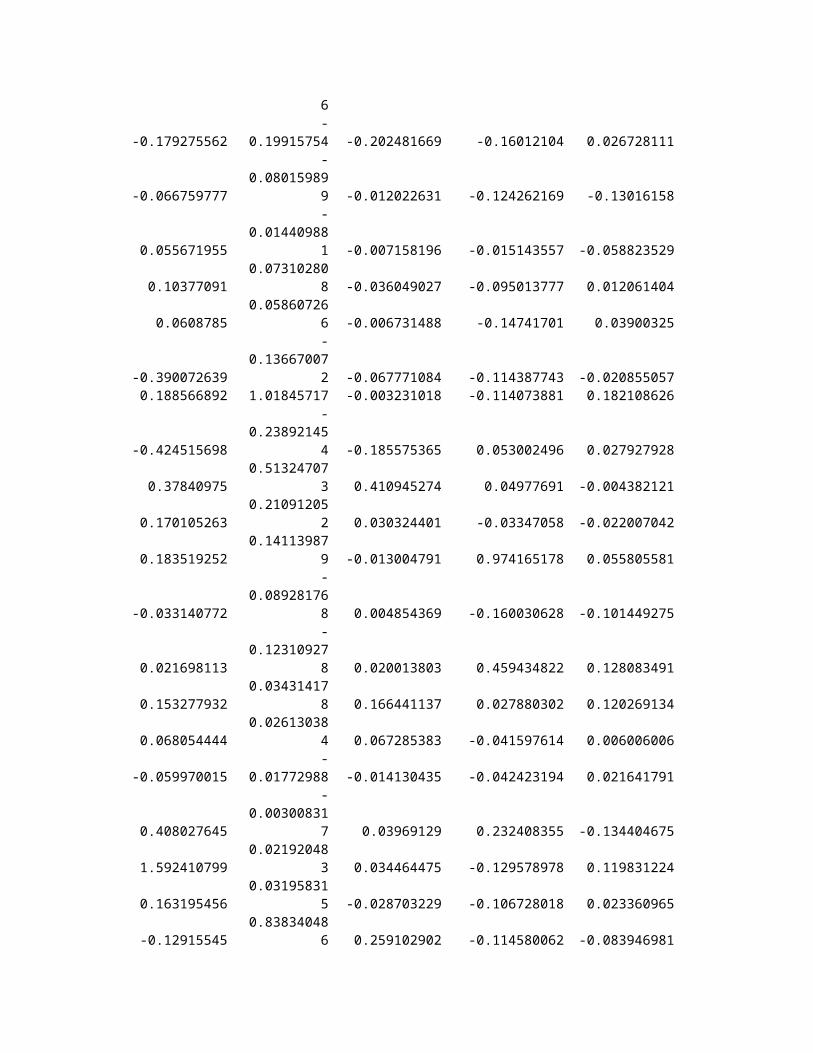
2. At first as an investor I should calculate the monthly
rate of return. It can be calculated by the formula
P1 - po
R= ----------------------
Po
The calculated monthly rate of return is given bellow throwwhich I have calculated the mean return of the 5 stocks:-
AB Bank UttaraBank Dhaka Bank Padma Oil Co.
SquareTextile
-0.073098173 0.02309946 -0.083247156 1.504353434 -0.026032316
6
-0.179275562-
0.19915754 -0.202481669 -0.16012104 0.026728111
-0.066759777
-0.08015989
9 -0.012022631 -0.124262169 -0.13016158
0.055671955
-0.01440988
1 -0.007158196 -0.015143557 -0.058823529
0.103770910.07310280
8 -0.036049027 -0.095013777 0.012061404
0.06087850.05860726
6 -0.006731488 -0.14741701 0.03900325
-0.390072639
-0.13667007
2 -0.067771084 -0.114387743 -0.0208550570.188566892 1.01845717 -0.003231018 -0.114073881 0.182108626
-0.424515698
-0.23892145
4 -0.185575365 0.053002496 0.027927928
0.378409750.51324707
3 0.410945274 0.04977691 -0.004382121
0.1701052630.21091205
2 0.030324401 -0.03347058 -0.022007042
0.1835192520.14113987
9 -0.013004791 0.974165178 0.055805581
-0.033140772
-0.08928176
8 0.004854369 -0.160030628 -0.101449275
0.021698113
-0.12310927
8 0.020013803 0.459434822 0.128083491
0.1532779320.03431417
8 0.166441137 0.027880302 0.120269134
0.0680544440.02613038
4 0.067285383 -0.041597614 0.006006006
-0.059970015-
0.01772988 -0.014130435 -0.042423194 0.021641791
0.408027645
-0.00300831
7 0.03969129 0.232408355 -0.134404675
1.5924107990.02192048
3 0.034464475 -0.129578978 0.119831224
0.1631954560.03195831
5 -0.028703229 -0.106728018 0.023360965
-0.129155450.83834048
6 0.259102902 -0.114580062 -0.083946981

-0.088569375-
0.08876173 0.030176027 -0.11777226 -0.049839228
-0.154125256
-0.07550487
3 0.081366965 -0.119903498 0.021150592-0.044666169 0.05520839 0.062452972 0.281615497 0.055509528
0.058467545
-0.02646892
2 -0.136331445 0.018323114 -0.028257457
0.048598303
-0.18153927
5 0.011070111 -0.197857593 -0.053311793
-0.163046346
-0.07710204
9 -0.023114355 -0.196037357 -0.089590444
-0.0878428080.03599439
8 -0.03528435 -0.063076756 -0.002811621
-0.039050801
-0.30390698
9 0.034423408 -0.034762457 0.031954887
-0.295732438
-0.00116527
5 -0.138935108 0.104441777 0.017304189
-0.24-
0.17888392 -0.030917874 0 -0.018800358
-0.30862262-
0.12183282 -0.129611167 0.176413043 -0.136861314
0.042112083
-0.05527841
4 -0.083619702 -0.097847177 0.00422833
-0.0811314890.27615241
9 0.17125 -0.37013519 0.023157895
0.1681326120.03947662
7 -0.037353255 0.027804878 0.025720165
0.034173183
-0.00494889
7 0.0327051 -0.049201076 -0.248746239
-0.116774013
-0.09828089
5 -0.137412775 -0.001663894 -0.012016021
0.0596068480.02074340
5 -0.032358432 0.1145 0.014864865
0.110412926-
0.01174674 0.006430868 0 0.027962716
-0.140393425
-0.07821229
1 0.042172524 -0.066995663 -0.012953368

-0.310031348
-0.03829787
2 -0.088289393 0.041833627 -0.143044619
-0.338028169
-0.04934298
7 0.004707465 0.150769231 -0.015313936
-0.035003432
-0.14315937
9 0.014725569 -0.090909091 0.026438569
-0.2226173540.00263374
5 0.001978892 -0.119117647 0.153030303
0.1866422690.76095879
2 0.010533246 0.001669449 0.048620237
0.00616808
-0.02918142
8 0.062540717 -0.001 -0.032581454
0.13486590.04859310
5 0.082158185 0.011011011 0.073834197-0.016880486 0.02976463 0.062889518 0.00049505 -0.010856454
-0.040521978
-0.01947705
4 0.012793177 -0.010390896 0.006097561
-0.0658554040.03365079
4 0.058421053 -0.004166667 -0.03030303
0.098084291
-0.08634608
6 0.054699155 -0.163179916 0.015
-0.207955338
-0.08749519
8 -0.02310231 -0.2394 0.002463054
-0.158590308
-0.14798442
3 -0.154440154 -0.006047857 -0.0565110570.165445026 0.13267449 0.187785388 -0.074074074 0.071614583
0.028751123
-0.24779147
1 -0.045170591 -0.065714286 -0.018226002
-0.00349345
-0.13672611
3 -0.152491193 -0.017431193 -0.075495050.207712533 0.63150823 0.502375297 0.058201058 0.283801874
-0.04862119
-0.16224006
6 0.554150198 0.044117647 0.122002086
0.035850496
-0.03797001
7 -0.154374364 -0.042253521 0.086431227

0.0062554040.02824568
3 0.017830785 0.013295772 0.004346311
Mean = 0.0062554040.02824568
3 0.017830785 0.013295772 0.004346311
Now I need to calculate the excess return.For which I need to subtract Risk-free rate of return from the mean return.Inour country the risk-free rate of return from 2005-2009 were:-
Risk Free Rate
2005 0.068
2006 0.078
2007 0.079
2008 0.079
2009 0.079
Average risk free rate= 0.012766667
Excess Returns:
Average monthlyreturn
Average riskfree rate=
ExcessReturn(Mean-RF)
AB Bank 0.006255404 0.012766667 -0.006511263Uttara Bank 0.028245683 0.012766667 0.015479017Dhaka Bank 0.017830785 0.012766667 0.005064118

Padma OilCo. 0.013295772 0.012766667 0.000529106
SquareTextile 0.004346311 0.012766667 -0.008420356
Copyright © 2022 FDOKUMEN