The Business Cycle Approach to Asset Allocation
12
Research The Business Cycle Approach to Asset Allocation FIDELITY INSTITUTIONAL INSIGHTS
-
Upload
khangminh22 -
Category
Documents
-
view
1 -
download
0
Transcript of The Business Cycle Approach to Asset Allocation

Research
The Business Cycle Approach to Asset Allocation
FIDELITY INSTITUTIONAL INSIGHTS

The Business Cycle Approach to Asset Allocation | 2
Although every business cycle is different, our historical analysis suggests that the rhythm of cyclical fluctuations in the economy has tended to follow similar patterns. Moreover, performance across asset categories typically rotates in line with different phases of the business cycle. As a result, a business cycle approach to asset allocation can add value as part of an intermediate-term investment strategy.
Asset allocation framework The Asset Allocation Research Team (AART) conducts economic, fundamental, and quantitative research to produce asset allocation recommendations for Fidelity’s portfolio managers and investment teams. Our framework begins with the premise that long-term historical averages provide reasonable baselines for portfolio allocations. However, over shorter time horizons—30 years or less—asset price fluctuations are driven by a confluence of various short-, intermediate-, and long-term factors that may cause performance to deviate significantly from historical averages. For this reason, incorporating a framework that analyzes underlying factors and trends among the following three temporal segments can be an effective asset allocation approach: tactical (one to 12 months), business cycle (one to 10 years), and secular (10 to 30 years). Exhibit 1 illustrates our duration-based asset allocation framework.
KEY TAKEAWAYS
• The business cycle reflects the aggregate fluctuations of economic activity, which can be a critical determinant of asset performance over the intermediate term.
• Changes in key economic indicators have historically provided a fairly reliable guide to recognizing the business cycle’s four distinct phases—early, mid, late, and recession.
• Our approach seeks to identify the shifting economic phases, providing a framework for making asset allocation decisions according to the probability that assets may outperform or underperform.
• For example, the early cycle phase is typically characterized by a sharp economic recovery and the outperformance of equities and other economically sensitive assets.
• This approach may be incorporated into an asset allocation framework to take advantage of cyclical performance that may deviate from longer-term asset returns.
Lisa Emsbo-Mattingly, CBEDirector, Asset Allocation Research
Dirk Hofschire, CFASenior Vice President, Asset Allocation Research
For illustrative purposes only. Source: Fidelity Investments (Asset Allocation Research Team).
Secular (10–30 Years)Business Cycle (1–10 Years)Tactical (1–12 Months)
DYNAMIC ASSET ALLOCATION TIMELINE
EXHIBIT 1: Asset performance is driven by a confluence of various short-, intermediate-, and long-term factors.
Multi-Time Horizon Asset Allocation Framework
Portfolio Construction• Asset Class• Country/Region• Sectors• Correlations
Jacob Weinstein, CFAResearch Analyst, Asset Allocation Research
Cait Dourney, CFAResearch Analyst, Asset Allocation Research

The Business Cycle Approach to Asset Allocation | 3
Over the intermediate term, asset performance is often driven largely by cyclical factors tied to the state of the economy—such as corporate earnings, interest rates, and inflation. The business cycle, which encompasses the cyclical fluctuations in an economy over many months or a few years, can therefore be a critical determinant of asset market returns and the relative performance of various asset classes.
Understanding the business cycle
Every business cycle is different in its own way, but certain patterns have tended to repeat themselves over time. Fluctuations in the business cycle are essentially distinct changes in the rate of growth in economic activity, particularly changes in three key cycles—the corporate profit cycle, the credit cycle, and the inventory cycle—as well as changes in monetary and fiscal policy. While unforeseen macroeconomic
events or shocks can sometimes disrupt a trend, changes in these key indicators historically have provided a relatively reliable guide to recognizing the different phases of an economic cycle. Our quantitatively backed, probabilistic approach helps in identifying, with a reasonable degree of confidence, the state of the business cycle at different points in time. Specifically, there are four distinct phases of a typical business cycle (Exhibit 2):
Early-cycle phase: Generally a sharp recovery from recession, marked by an inflection from negative to positive growth in economic activity (e.g., gross domestic product, industrial production), then an accelerating growth rate. Credit conditions stop tightening amid easy monetary policy, creating a healthy environment for rapid margin expansion and profit growth. Business inventories are low, while sales growth improves significantly.
EXHIBIT 2: The business cycle has four distinct phases, with the example of the U.S. experiencing a mix of early- and mid-cycle dynamics in the second quarter of 2021.
Business Cycle Framework
The diagram above is a hypothetical illustration of the business cycle, the pattern of cyclical fluctuations in an economy over a few years that can influence asset returns over an intermediate-term horizon. There is not always a chronological, linear progression among the phases of the business cycle, and there have been cycles when the economy has skipped a phase or retraced an earlier one. Source: Fidelity Investments (AART), as of April 30, 2021.
• Activity rebounds (GDP, IP, employment, incomes)
• Credit begins to grow• Profits grow rapidly• Policy still stimulative• Inventories low; sales improve
• Growth peaking• Credit growth strong• Profit growth peaks• Policy neutral • Inventories, sales grow;
equilibrium reached
• Growth moderating• Credit tightens• Earnings under pressure• Policy contractionary• Inventories grow; sales
growth falls
• Falling activity• Credit dries up• Profits decline• Policy eases• Inventories, sales fall
LATE RECESSIONEARLY MIDCycle Phases
Relative Performance of
Economically Sensitive Assets
+Economic Growth
–
U.S.

The Business Cycle Approach to Asset Allocation | 4
Mid-cycle phase: Typically the longest phase of the business cycle. The mid cycle is characterized by a positive but more moderate rate of growth than that experienced during the early-cycle phase. Economic activity gathers momentum, credit growth becomes strong, and profitability is healthy against an accommodative—though increasingly neutral—monetary policy backdrop. Inventories and sales grow, reaching equilibrium relative to each other.
Late-cycle phase: Often coincides with peak economic activity, implying that the rate of growth remains positive but slows. A typical late-cycle phase may be characterized as an overheating stage for the economy when capacity becomes constrained, which leads to rising inflationary pressures. While rates of inflation are not always high, rising inflationary pressures and a tight labor market tend to crimp profit margins and lead to tighter monetary policy.
Recession phase: Features a contraction in economic activity. Corporate profits decline and credit is scarce. Monetary policy becomes more accommodative and inventories gradually fall despite low sales levels, setting up for the next recovery.
Asset class performance patterns The U.S. has the longest history of economic and market data, and is thus a good use case to illustrate asset class return patterns across the business cycle. Looking at the performance of U.S. stocks, bonds, and cash from 1950 to 2020, we can see that shifts between business cycle phases create differentiation in asset price performance (Exhibit 3, page 5). In general, the performance of economically sensitive assets such as stocks tends to be the strongest when growth is rising at an accelerating rate during the early cycle, then moderates through the other phases until returns generally decline during recessions. By contrast, defensive assets such as investment-grade bonds and cash-like short-term debt have experienced the opposite pattern, with their highest returns during a recession and the weakest relative performance during the early cycle.
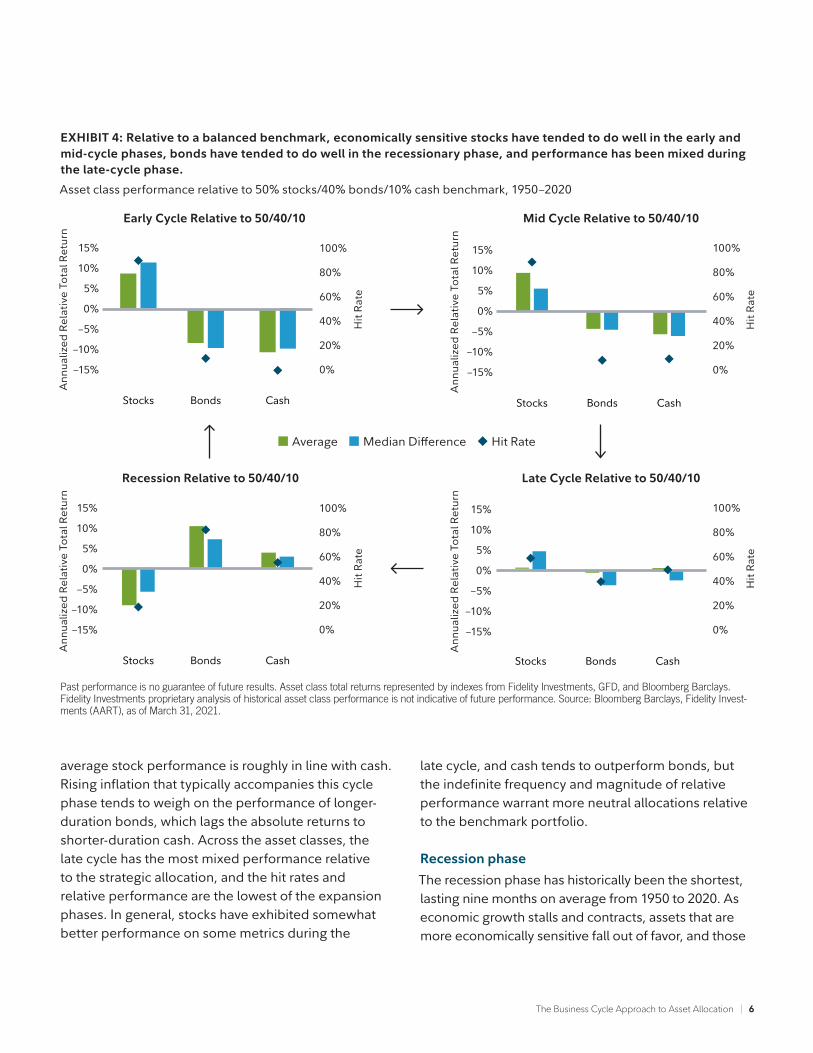
Analyzing relative asset class performance Certain metrics help us evaluate the historical performance of each asset class relative to the strategic allocation by revealing the potential magnitude of out- or underperformance during each phase, as well as the reliability of those historical performance patterns (see Exhibit 4, page 6).
• Full-phase average performance: Calculates the (geometric) average performance of an asset class in a particular phase of the business cycle and subtracts the performance of the benchmark portfolio. This method better captures the impact of compounding and performance that is experienced across full market cycles (i.e., longer holding periods). However, performance outliers carry greater weight and can skew results.
• Median monthly difference: Calculates the difference in the monthly performance of an asset class compared to the benchmark portfolio, and then takes the midpoint of those observations. This measure is indifferent to when a return period begins during a phase, which makes it a good measure for investors who may miss significant portions of each business cycle phase. This method mutes the extreme performance differences of outliers, and also underemphasizes the impact of compounding returns.
• Cycle hit rate: Calculates the frequency of an asset class outperforming the benchmark portfolio over each business cycle phase since 1950. This measure represents the consistency of asset class performance relative to the broader market over different cycles, removing the possibility that outsized gains during one period in history influence overall averages. This method suffers somewhat from small sample sizes, with only 11 full cycles during the period, but persistent out- or underperformance can still be observed.

The Business Cycle Approach to Asset Allocation | 5
Asset allocation decisions are rooted in relative asset class performance, and there is significant potential to enhance portfolio performance by tilting exposures to the major asset classes based on shifts in the business cycle. Investors can implement the business cycle approach to asset allocation by overweighting asset classes that tend to outperform during a given cycle phase, while underweighting those asset classes that tend to underperform. In the early cycle, for example, the investor using this approach would overweight stocks and underweight bonds and cash.
In the analysis that follows, we consider asset class performance patterns across the phases of the business cycle, both on an absolute basis and using several measures relative to a long-term strategic allocation to a balanced benchmark portfolio of 50% stocks, 40% bonds, and 10% cash (see “Analyzing relative asset class performance”). Business cycles since 1950 are represented, and all data is annualized for comparison purposes.
EXHIBIT 3: Historically, performance of stocks and bonds has been heavily influenced by the business cycle.
Asset Class Performance Across Business Cycle Phases 1950–2020
Past performance is no guarantee of future results. Asset class total returns represented by indexes from Fidelity Investments, GFD, and Bloomberg Barclays. Fidelity Investments proprietary analysis of historical asset class performance is not indicative of future performance. Source: Bloomberg Barclays, Fidelity Investments (AART), as of March 31, 2021.
Early-cycle phase
Lasting an average of about one year, the early phase of the business cycle has historically produced the most robust stock performance on an absolute basis (Exhibit 3). Stocks have typically benefited more than bonds and cash from the backdrop of low interest rates, the first signs of economic improvement, and the rebound in corporate earnings. Relative to the long-term strategic allocation, stocks have exhibited the greatest outperformance in the early cycle, while bonds and cash have experienced the deepest underperformance (Exhibit 4). A hallmark of this phase is that hit rates against the balanced benchmark are the most definitive, which may give investors greater conviction to overweight riskier assets and underweight more defensive asset classes during the early cycle.
Mid-cycle phase
Averaging nearly four years, the mid-cycle phase tends to be significantly longer than any other phase of the business cycle. As the economy moves beyond its initial stage of recovery and growth rates moderate during the mid cycle, the leadership of economically sensitive assets has typically tapered. On an absolute basis, stock market performance has tended to be fairly strong, though not as robust as in the early cycle phase, while bonds and cash have continued to post lower returns than equities in the mid cycle. This phase is also when most stock market corrections have taken place. Measured by average and median differences as well as hit rates, the mid-cycle pattern of performance relative to the strategic allocation is similar to that of the early cycle, with bonds and cash trailing stocks. However, since the magnitude of relative performance has been more muted, and more equity drawdowns occur in mid cycle, portfolio tilts should be more moderate than during the early cycle phase.
Late-cycle phase
The late-cycle phase has an average duration of roughly a year and a half. As the recovery matures, inflationary pressures build, monetary policy becomes restrictive, and investors start to shift away from economically sensitive areas. On an absolute basis,
Stocks Bonds Cash
Early Mid Late Recession
10%
5%
0%
–5%
–10%
15%
20%
25%
Ann
ual A
bsol
ute
Ret
urn
(Ave
rage
)
The Business Cycle Approach to Asset Allocation | 6
EXHIBIT 4: Relative to a balanced benchmark, economically sensitive stocks have tended to do well in the early and mid-cycle phases, bonds have tended to do well in the recessionary phase, and performance has been mixed during the late-cycle phase.
Asset class performance relative to 50% stocks/40% bonds/10% cash benchmark, 1950–2020
Past performance is no guarantee of future results. Asset class total returns represented by indexes from Fidelity Investments, GFD, and Bloomberg Barclays. Fidelity Investments proprietary analysis of historical asset class performance is not indicative of future performance. Source: Bloomberg Barclays, Fidelity Invest-ments (AART), as of March 31, 2021.
average stock performance is roughly in line with cash. Rising inflation that typically accompanies this cycle phase tends to weigh on the performance of longer-duration bonds, which lags the absolute returns to shorter-duration cash. Across the asset classes, the late cycle has the most mixed performance relative to the strategic allocation, and the hit rates and relative performance are the lowest of the expansion phases. In general, stocks have exhibited somewhat better performance on some metrics during the
late cycle, and cash tends to outperform bonds, but the indefinite frequency and magnitude of relative performance warrant more neutral allocations relative to the benchmark portfolio.
Recession phase
The recession phase has historically been the shortest, lasting nine months on average from 1950 to 2020. As economic growth stalls and contracts, assets that are more economically sensitive fall out of favor, and those
Early Cycle Relative to 50/40/10
Stocks Bonds Cash
10%
5%
0%
–5%
–10%
15%
Ann
ualiz
ed R
elat
ive
Tota
l Ret
urn
–15%H
it R
ate
20%
0%
40%
60%
80%
100%
Mid Cycle Relative to 50/40/10
Stocks Bonds Cash
10%
5%
0%
–5%
–10%
15%
Ann
ualiz
ed R
elat
ive
Tota
l Ret
urn
–15%
Hit
Rat
e
20%
0%
40%
60%
80%
100%
Recession Relative to 50/40/10
Stocks Bonds Cash
10%
5%
0%
–5%
–10%
15%
Ann
ualiz
ed R
elat
ive
Tota
l Ret
urn
–15%
Hit
Rat
e
20%
0%
40%
60%
80%
100%
Late Cycle Relative to 50/40/10
Stocks Bonds Cash
10%
5%
0%
–5%
–10%
15%
Ann
ualiz
ed R
elat
ive
Tota
l Ret
urn
–15%
Hit
Rat
e
20%
0%
40%
60%
80%
100%
Average Median Difference Hit Rate

The Business Cycle Approach to Asset Allocation | 7
that are defensively oriented move to the front of the performance line. The stock market has performed poorly during this phase. Cash has continued to play a defensive role, while the falling interest rate environment typically seen during recessions acts as a major tailwind for bonds. Performance patterns relative to the strategic allocation have been significantly different in recessions than in the other three phases, most notably in the high frequency of outperformance for bonds, and the opposite for stocks. Cash positions also enjoy their best performance relative to the balanced benchmark, albeit with only moderate hit rates. This phase of the business cycle tends to favor a high conviction in more defensive allocations.
Sector performance rotations within asset classes
Similar patterns of relative performance can be identified across sectors of the major asset classes, such as equity sectors or different credit qualities in the fixed income universe. Within equity markets, more economically sensitive sectors tend to do better in the
early and mid-cycle phases, while more defensively oriented sectors have historically exhibited better performance during the more sluggish economic growth in the late-cycle and recession phases (Exhibit 5, and Fidelity article “The Business Cycle Approach to Equity Sector Investing”).
Bond market sectors have also exhibited economic sensitivity. More credit-sensitive fixed income sectors (such as high-yield corporate bonds) have tended to do better in the early phase of the cycle, while less economically sensitive areas (such as government and other investment-grade bonds) have done relatively well in slowdowns and recessions. For instance, high-yield corporates have averaged strong annual gains during the early cycle but have been weaker in recessions, when interest rate-sensitive investment-grade bonds have exhibited solid positive returns. Many fixed income categories that are fairly new to the marketplace have limited history and hence smaller sample sizes that make historical performance analysis less useful. Nevertheless, comparing the performance of credit and interest
EXHIBIT 5: Equity sector relative performance has tended to be differentiated across business cycle phases.
Unshaded (white) portions above suggest no clear pattern of over- or under-performance vs. broader market. Double +/- signs indicate that the sector is showing a consistent signal across all three metrics: full-phase average performance, median monthly difference, and cycle hit rate. A single +/- indicates a mixed or less consistent signal. Annualized returns are from 1962 to 2020, represented by the performance of the largest 3,000 U.S. stocks measured by market capitalization. Sectors are defined by the Global Industry Classification Standard (GICS®). Source: Fidelity Investments (AART), updated as of March 31, 2021.
Sector EarlyRebounds
MidPeaks
LateModerates
RecessionContracts
Financials + − −Real Estate ++ – + − −Consumer Discretionary ++ − − +Technology + + − − −Industrials ++ − −Materials + − −Consumer Staples – + ++Health Care − − ++Energy − − ++Communication Services + −Utilities − − − + ++

The Business Cycle Approach to Asset Allocation | 8
rate-sensitive bonds across the phases illustrates that business cycle-based asset allocation within a fixed income portfolio has considerable potential to generate active returns (Exhibit 6).
Merits of the business cycle approachMany academics and market participants agree that economic factors influence asset prices. However, while academic research has shown that asset allocation decisions can be responsible for anywhere between 40% and 90% of return variability among portfolios, there is still debate over the best way to incorporate economic factors into asset allocation approaches.1
Other business cycle approaches
Some approaches feature economic indicators as important drivers. One of the most widely used paradigms for economically linked asset allocation decisions is to specify the economy as being in one of two states, expansion or contraction. The National Bureau of Economic Research (NBER) is generally considered to be the official arbiter of U.S. recessions, and its methodology tends to be either wholly or partly borrowed by market participants. Because recessions have generally experienced significant differentiation among asset class performance relative to the rest of the cycle, the NBER’s dating scheme has historically offered solid opportunities for active asset allocation.
However, many of these economic approaches have significant shortcomings. First, some may have a strong theoretical backing but cannot be practically applied, often relying on data that is revised frequently or not released on a timely basis. For instance, as of May 2021, the NBER had yet to announce the end of the 2020 recession despite a clear and robust economic recovery driven by reopening progress.Second, the binary approach is not granular enough to catch major shifts in asset price performance during the lengthy expansion phase, which reduces the potential for capturing active returns.
Other asset allocation paradigms also include market-based asset price signals. These tend to shift phase identifications more quickly than models based purely on the economy, likely due to the fast pace of asset
EXHIBIT 6: The economic sensitivity of high-yield bonds has caused them to behave more like equities than investment-grade bonds.
Bond Performance Across Business Cycle Phases 1950–2020
Past performance is no guarantee of future results. Asset class total returns represented by indexes from Fidelity Investments, GFD, and Bloomberg Barclays. Fidelity Investments proprietary analysis of historical asset class performance is not indicative of future performance. Source: Bloomberg Barclays, Fidelity Investments (AART), as of March 31, 2021.
market price movements. For example, one prominent strategy uses earnings yield—a function of corporate profits and stock prices—and recent stock market returns as primary inputs for an asset allocation model, which at times has shifted through all four phases in a one- or two-year period. While such strategies may capture more trading opportunities than the more economically based models, frequent portfolio composition changes often generate higher turnover and transaction costs.
Those strategies based more on asset price movements also have a greater likelihood of being whipsawed by price volatility, and they can be susceptible to false signals based on temporary investor optimism or pessimism.
Some alternative asset allocation approaches center on forecasting gross domestic product (GDP) and inferring asset market performance from those forecasts, but historical analysis has shown a relatively low correlation between GDP growth rates and stock or bond market investment rates of return over a cyclical time frame.
High-Yield Bonds Investment-Grade Bonds
Early Mid Late Recession
10%
5%
0%
–5%
15%
20%
Ann
ual A
bsol
ute
Ret
urn
(Ave
rage
)

The Business Cycle Approach to Asset Allocation | 9
Our approach to business cycle investing
Our quantitatively backed, probabilistic approach encompasses a number of key attributes:
First, the approach focuses on critical drivers of relative asset performance. As demonstrated above, there is a large differential in asset performance across the various phases of the business cycle. A key to identifying the phase of the cycle is to focus on the direction and rate of change of key indicators, rather than the overall level of activity. We focus on economic indicators that are most closely linked with asset market returns, such as corporate profitability, the provisioning of credit throughout the economy, and inventory buildups or drawdowns across various industries.
Second, we employ a practical and repeatable framework that provides a solid foundation and can be applied more consistently. Our business cycle dating scheme measures high-quality indicators that have a greater probability of representing economic reality and are not dependent on perfect hindsight. For instance, tangible measures such as inventory data are less likely to be revised or present false signals than other, broader indicators such as GDP growth. We use a disciplined, model-driven approach that helps minimize the behavioral tendency to pay too much attention to recent price movements and momentum, called the extrapolation bias, which is a common pitfall suffered by many investors.
Third, the cycle phases we employ are grounded in distinct, intermediate-term fundamental trends, typically only shifting over periods of several months or longer. This approach unfolds more slowly than tactical approaches, whose frequent shifts can whipsaw investors during periods of high volatility. Our approach is best suited to strategies with an intermediate-term time horizon and a lesser ability or willingness to trade into and out of positions quickly. On the other hand, this approach captures more frequent phases than the two-state NBER strategies, thus providing more scope for generating active returns.
Other considerations
Like any other approach, our business cycle approach has limitations and requires adept interpretation in order to use the framework appropriately as part of an investment strategy. For example, identifying the current phase of the business cycle determines the underlying trend of economic activity, but that trend can always be disrupted by exogenous shocks, such as pandemics, natural disasters, geopolitical events, or major policy actions. A number of factors, including a relatively slow pace of expansion and a heavy dependence on other economies or external drivers of growth, may make an economy more susceptible to such a shock. For example, Japan’s slow pace of growth since 1990 has made its economy more inclined to move quickly through the business cycle phases and more frequently into and out of recession. Meanwhile, Germany’s dependence on exports makes its business cycle more susceptible to changes in the global business cycle. The business cycles of China and other emerging economies are more policy driven, and thus shifts in monetary or fiscal stances have a more meaningful impact on their cycles.
It is also important to note that we draw a distinction between developed and developing economies when mapping their business cycles. For developed economies such as the U.S., we use the classic definition of recession, involving an outright contraction in economic activity. For developing economies we define a recession as a “growth recession.” A growth recession is a significant decline in activity relative to a country’s long-term economic potential. We adopt this definition because developing countries tend to exhibit strong trend performance driven by rapid factor accumulation and increases in productivity, and the deviation from the trend tends to matter the most for asset returns—even if there is no outright contraction in activity.

The Business Cycle Approach to Asset Allocation | 10
Investment implicationsAs a result, complementing the business cycle approach with additional strategies may further enhance the ability to generate active returns from asset allocation over time. For instance, tactical shifts in portfolio positioning may be used to mitigate the risks or opportunities presented either by the threat of external shocks or by major market moves that may be unrelated to changes in the business cycle. Another possibility is to analyze the domestic business cycle combined with the business cycles of major trading partners or the entire world, in order to capture more of the exogenous risks facing an economy.
Using additional complementary strategies may be particularly relevant during phases when the relative performance differential from the business cycle
framework tends to be more muted. For example, performance differences have been less pronounced during the late-cycle phase among stocks, bonds, and cash, or the mid cycle for equity sector relative performance. During these phases, it may make sense to make smaller active allocation tilts based on the business-cycle approach compared with other strategies.
Every business cycle is different, and so are the relative performance patterns among asset categories. However, by using a disciplined business cycle approach, it is possible to identify key phases in the economy’s natural ebb and flow. These signals can provide the potential to generate incremental returns over the intermediate term, and they can be incorporated into an asset allocation framework that analyzes underlying factors and trends across various time horizons.

The Business Cycle Approach to Asset Allocation | 11
Endnote 1 Ibbotson, Roger G., and Paul D. Kaplan. 2000. “Does Asset Allocation Policy Explain 40, 90, or 100 Percent of Performance?” Financial Analysts Journal, vol. 56, no. 1 (January/February): 26–33.
Index definitions The S&P 500® Index is a market capitalization-weighted index of 500 common stocks chosen for market size, liquidity, and industry group representation to represent U.S. equity performance. S&P 500 is a registered service mark of Standard & Poor’s Financial Services LLC. Sectors and industries are defined by the Global Industry Classification Standard (GICS®).
Sectors and industries are defined by the Global Industry Classification Standard (GICS®). The S&P 500 sector indexes include the 11 standard GICS sectors that make up the S&P 500® index. The market capitalization of all S&P 500® sector indexes together comprises the market capitalization of the parent S&P 500® index; each member of the S&P 500® index is assigned to one (and only one) sector.
Sectors are defined as follows: Communication Services: companies that facilitate communication or provide access to entertainment content and other information through various types of media. Consumer Discretionary: companies that provide goods and services that people want but don’t necessarily need, such as televisions, cars, and sporting goods; these businesses tend to be the most sensitive to economic cycles. Consumer Staples: companies that provide goods and services that people use on a daily basis, like food, household products, and personal-care products; these businesses tend to be less sensitive to economic cycles. Energy: companies whose businesses are dominated by either of the following activities: the construction or provision of oil rigs, drilling equipment, or other energy-related services and equipment, including seismic data collection; or the exploration, production, marketing, refining, and/or transportation of oil and gas products, coal, and consumable fuels. Financials: companies involved in activities such as banking, consumer finance, investment banking and brokerage, asset management, and insurance and investments. Health Care: companies in two main industry groups: health care equipment suppliers and manufacturers, and providers of health care services; and companies involved in the research, development, production, and marketing of pharmaceuticals and biotechnology products. Industrials: companies whose businesses manufacture and distribute capital goods, provide commercial services and supplies, or provide transportation services. Materials: companies that are engaged in a wide range of commodity-related manufacturing. Real Estate: companies in two main industry groups—real estate investment trusts (REITs), and real estate management and development companies. Technology: companies in technology software and services and technology hardware and equipment. Utilities: companies considered to be electric, gas, or water utilities, or companies that operate as independent producers and/or distributors of power.

Information provided in this document is for informational and educational purposes only. To the extent any investment information in this material is deemed to be a recommendation, it is not meant to be impartial investment advice or advice in a fiduciary capacity and is not intended to be used as a primary basis for you or your client’s investment decisions. Fidelity and its representatives may have a conflict of interest in the products or services mentioned in this material because they have a financial interest in them, and receive compensation, directly or indirectly, in connection with the management, distribution, and/or servicing of these products or services, including Fidelity funds, certain third-party funds and products, and certain investment services.
Information presented herein is for discussion and illustrative purposes only and is not a recommendation or an offer or solicitation to buy or sell any securities. Views expressed are as of May 2021, based on the information available at that time, and may change based on market and other conditions. Unless otherwise noted, the opinions provided are those of the author and not necessarily those of Fidelity Investments or its affiliates. Fidelity does not assume any duty to update any of the information.
Past performance is no guarantee of future results.
Neither asset allocation nor diversification ensures a profit or guarantees against loss.
Investing involves risk, including risk of loss.
Stock markets are volatile and can decline significantly in response to adverse issuer, political, regulatory, market, or economic developments.
In general the bond market is volatile, and fixed income securities carry interest rate risk. (As interest rates rise, bond prices usually fall, and vice versa. This effect is usually more pronounced for longer-term securities.) Fixed income securities also carry inflation, credit, and default risks for both issuers and counterparties.
Because of its narrow focus, sector investing tends to be more volatile than investments that diversify across many sectors and companies. Each sector investment is also subject to the additional risks associated with its particular industry.
References to specific investment themes are for illustrative purposes only and should not be construed as recommendations or investment advice. Investment decisions should be based on an individual’s own goals, time horizon, and tolerance for risk.
Indexes are unmanaged. It is not possible to invest directly in an index.
The typical business cycle depicts the general pattern of economic cycles throughout history, though each cycle is different. In general, the typical business cycle demonstrates the following: During the typical early cycle phase, the economy bottoms and picks up steam until it exits recession and then begins the recovery as activity accelerates. Inflationary pressures are typically low, monetary policy is accommodative, and the yield curve is steep. • During the typical mid-cycle phase, the economy exits recovery and enters into expansion, characterized by broader and more self-sustaining economic momentum but a more moderate pace of growth. Inflationary pressures typically begin to rise, monetary policy becomes tighter, and the yield curve experiences some flattening. • During the typical late-cycle phase, the economic expansion matures, inflationary pressures continue to rise, and the yield curve may eventually become flat or inverted. Eventually, the economy contracts and enters recession, with monetary policy shifting from tightening to easing.
Please note that there is no uniformity of time among phases, nor is there always a chronological progression in this order. For example, business cycles have varied between one and 10 years in the U.S., and there have been examples when the economy has skipped a phase or retraced an earlier one.
Third-party marks are the property of their respective owners; all other marks are the property of FMR LLC.
Fidelity InstitutionalSM provides investment products through Fidelity Distributors Company LLC; clearing, custody, or other brokerage services through National Financial Services LLC or Fidelity Brokerage Services LLC (Members NYSE, SIPC); and institutional advisory services through Fidelity Institutional Wealth Adviser LLC.
Personal and workplace investment products are provided by Fidelity Brokerage Services LLC, Member NYSE, SIPC.
Institutional asset management is provided by FIAM LLC and Fidelity Institutional Asset Management Trust Company.
© 2021 FMR LLC. All rights reserved.
632421.28.0
AuthorsLisa Emsbo-Mattingly, CBEDirector, Asset Allocation Research
Dirk Hofschire, CFASenior Vice President, Asset Allocation Research
Jacob Weinstein, CFAResearch Analyst, Asset Allocation Research
Cait Dourney, CFAResearch Analyst, Asset Allocation Research
The Asset Allocation Research Team (AART) conducts economic, fundamental, and quantitative research to develop asset allocation recommendations for Fidelity’s portfolio managers and investment teams. AART is responsible for analyzing and synthesizing investment perspectives across Fidelity’s asset management unit to generate insights on macroeconomic and financial market trends and their implications for asset allocation.