Knowledge Transfer Program - Module 2 – Asset Allocation ...
140
Marketing Material For professional / Institutional clients only Knowledge Transfer Program Module 2 – Asset Allocation and Capital Market Expectations Global Sovereign Markets April 2021
-
Upload
khangminh22 -
Category
Documents
-
view
2 -
download
0
Transcript of Knowledge Transfer Program - Module 2 – Asset Allocation ...

Marketing MaterialFor professional / Institutional clients only
Knowledge Transfer ProgramModule 2 – Asset Allocation and Capital Market ExpectationsGlobal Sovereign Markets
April 2021

1
UBS Asset Management: A centre of excellence for Sovereign institutions 35+ years' experience in partnering with Central Banks, SWFs, National Pension Funds, and other government agencies
Key strengths
Managing over USD 169bn AUM on behalf of public institutions
Global insight and expertise allows us to integrate our comprehensive range of investment capabilities in tailored solutions for you
A flexible range of advisory services to help you meet your long-term goals – including HF advisory experience
UBS AM is a member of the One Planet Sovereign Wealth Fund initiative
Knowledge partnerships and training with dedicated teams, tailored to sovereign clients
– Research papers and publications
– Financial Markets training courses
– Sovereign Trainee Programs
Dedicated Sovereign Client Solutions
Advisory services
Asset Management
Asset/Liability matching
Risk Management
Manager Selection
Knowledge Partnership
Training and development
Dedicated research team
Dedicated Global Sovereign Markets team
London
New York
Zurich
Singapore
Beijing
Taipei
Hong Kong
Dubai
Source: UBS Asset Management. Data as of 30 September 2020 unless otherwise stated.

2
UBS Knowledge transfer program UBS AM is an experienced long-term partner to sovereign clients
Key seminars offered to our Sovereign Clients:
Reserve Management Seminar, Switzerland: a forum for central bankers, multilateral organisations, finance ministries, frequent borrowers and representatives of SWFs to discuss and exchange ideas on best practices for managing reserves
Sovereign Investment Circle, Singapore: joint event between UBS AM and IMD, a leading business school, focusing long-term investing themes
Investment Training Seminar, Chicago: discussions on economic growth, fiscal and monetary policy and their impact on global markets
Greater China annual Conference, Shanghai: addressing latest investment trends/developments and providing access to China specialists
Topical research paper sand development opportunities that could be tailored to your needs
Greater ChinaConferenceChina
UBS AM Sovereign Investment Circle Singapore
Reserve Management SeminarSwitzerland
Investment Training SeminarUnited States
2x Reinvesting Bretton Woods SeminarUnited States
January June 28th-July 1st August 16th-18th October/November April & October
Client seminars: provide forum to discuss investment topics and an opportunity to meet peers

3
Knowledge transfer is one our key strengths Sharing industry know-how and investment expertise
The emphasis of an on-the-desk training program is to facilitate a knowledge-sharing environment whereby the participant is encouraged to openly engage with the investment professional and actively participate in the day-to-day activities of the team that they are seated with.
Ultimately, participants are equipped with the tools to learn and enhance practical skills for trading and investment and gain key industry insights into current developments across financial markets.
Examples of on-the-desk trainings:
Fixed Income Sovereign overview; Active global sovereign bond management; Introduction to passive fixed income Credit overview; Credit research with an analyst; Global credit investment process Foreign Exchange overview; Managing foreign exchange execution
Investment solutions
Strategic Asset Allocation Tactical Asset Allocation Currency exposure and hedging Scenario Analysis
Equities
Equity markets and the drivers Stocks and stock valuation, equity research Equity indices and passive investing Implementation of best execution
Risk Management Case studies demonstrating how to use the UBS AM's multi asset risk system in the context of the above scenarios

Table of contents
Asset allocation fundamentals – Michele Gambera Section 1 5
Capital Market Expectations, Portfolio optimization and risk management – Louis Finney Section 2 32
Integrating Alternatives and ESG into asset allocation frameworks – Michele Gambera, Louis Finney Section 3 57
Sample Portfolios, Capital Market Expectations and Advisory Services to Sovereign – Mohammad Ahmad, Massimiliano Castelli
Section 4 92
Biographies & important information Section 5 128

Asset allocation fundamentals –Michele Gambera
Section 1

Asset allocation basicsSection 1.1

7
Strategic asset allocationAn important workhorse of portfolio management
SAA generally based on long-term estimates of how asset classes are expected to behave
Asset allocation is important to determine the level of variability of a portfolio:
Brinson, Hood and Beebower (FAJ 1986) suggested over 90% of variability explained by AA
Xiong, Ibbotson, Idzorek, and Chen (FAJ 2010) suggest that it is more 50/50
Investors should establish risk and return guidelines for their portfolios.
This is important because of:
Suitability of the portfolio (risk capacity and risk tolerance)
Benchmarking and performance attribution
Choice of instruments, manager styles and asset classes
Liability driven investing
A strategic asset allocation (SAA) is a clear and intuitive way to express guidelines and quantify the 'ballpark' for managers

8
Assigning a strategic asset allocationEvolution of SAA approach
Prudent investors should have more prudent portfolios
Assessing personality is difficult, particularly when there are many people on a board
No relationship between goals, funding level and allocation
Risk aversion
Average return
Since risky asset classes have on average higher returns, investors that have low funding status should have riskier allocations
No relationship between horizon and allocation
This approach works about half the time!
Risk capacity
Quantify funding level and horizon and simulate future returns
Choose asset allocation that gives client highest probability of reaching goals
Use personal preferences as second-order variable

9
Advantages of the risk capacity approachThe more modern approach
Focus on probability and randomness of returns
Goals, funding status and time in the forefront
Help clients understand their funding status and whether their plan can be expected to succeed
Can be customized to take risk aversion and other preferences into account
10,000
100,000
1,000,000
10,000,000
0 5 10 15 20 25 30 35 40
Bala
nce
in a
ccou
nt
Years from today

10
Asset-Liability ManagementMaximizing the surplus instead of only assets
A portfolio of assets is geared towards a series of liabilities
The difference between assets and liabilities is the surplus (or deficit)
Liabilities are akin to a negative bond, with duration and all
We can use a portfolio of bonds among the assets to mimic duration, cash flows and credit quality so that changes in assets and in liabilities offset each other and keep the surplus stable

11
Core-Satellite approachThis may be implemented within an ALM framework
The core is the main part of the portfolio, close to the benchmark
Core often has low-cost, passive exposures
Satellite is the high-risk, high-return component
It has high tracking error and very active management with the objective of long-term growth
In an ALM framework, the core would offset the liabilities while the satellite would be geared toward growth to hopefully make the plan better funded over the long term

12
Risk parity approachEqual risk weights means high exposure to government bonds
Risk parity means that the decomposition of the portfolio variance yields the same contribution to risk for all asset classes
This asset allocation strategy is therefore based on risk only
No expected returns are involved
It worked particularly well during the great bull market in bonds from 1985 to 2020
It will have great difficulties if yields normalize
Risk weights
Gov. BondsStocks
CreditProperty

13
Investment Policy Statement (IPS)The clear agreement between portfolio managers and investor
Special situations
General investment objective
https://www.cfainstitute.org/-
/media/documents/article/position-
paper/investment-policy-statement-
institutional-investors.ashx
Risk objective, risk capacity
and risk aversion
Horizon
Return objective
Tax and legal constraints

Technical aspectsSection 1.2

15
Determining a strategic asset allocationThere are two main steps in determining an SAA
1. Quantify risk/return expectations for broad set of asset classes
Determine return, standard deviation, and covariance expectations for a broad set of asset classes based on relevant time horizon
Equilibrium: also known as Capital Market Expectations (CMEs); long-term (40+ year) expectations
Baseline: intermediate-term (5-10 years) expectations that consider current market conditions
2. Apply views to determine portfolio benchmark and SAA
Risk/Return expectations used in portfolio design depend upon the relevant time horizon.
In general:
– Utilize equilibrium assumptions for construction of portfolio benchmark
– Use baseline expectations to design target portfolio (Strategic Asset Allocation)
Client specific needs should also be considered:
liability hedging, liquidity constraints, risk preferences, income needs, etc.
US-I

16
It’s a matter of (time) perspectiveThree linked but different sets of asset class views: Equilibrium, Baseline and Tactical
Tactical views
Baseline expectations (the next 5–10 years)
Equilibrium expectations (an average over the next 40 or 50 years) Reflect our views for a
broad set of asset classes in a long-term, ideal equilibrium setting
Take equilibrium views and incorporate current market conditions with an intermediate time horizon
Set tactical asset allocation views in portfolios. Used to determine over- and under-weights around SAA.
US-I

17
Two different quantitative approachesBalancing both demand-side and supply-side approaches to modelling risk/return expectations lead to a more robust foundation for SAAs
Source: UBS Asset Management. For illustrative purpose only. A comparison of different supply- and demand-side approaches is summarized in Roger G. Ibbotson and Peng Chen (2003) "Long-Run Stock Returns: Participating in the Real Economy." Financial Analysts Journal, January/February. For ease of exposure, the analysis above excludes exchange rate adjustments as well as other adjustments we use in our methodology.
Demand-sideClassical approach
Investors demand ‘return premia’ for bearing risk
Determined by long-term historical risk premia, e.g. equity risk premium
Risk premia are time invariant but required returns influenced by starting values for interest rates and inflation
Supply-sideMore recent approach
Returns are supplied by the real economy & corporate earnings
Determined by forward-looking factors that drive asset class returns such as projected economic growth rates, current interest rates, etc.
Two different quantitative approaches provide more insight to consider when estimating returns
US-I

18
Example:Comparing supply and demand-side approach for US Equities
Source: UBS Asset Management. For illustrative purpose only. A comparison of different supply- and demand-side approaches is summarized in Roger G. Ibbotson and Peng Chen (2003) "Long-Run Stock Returns: Participating in the Real Economy." Financial Analysts Journal, January/February. For ease of exposure, the analysis above excludes exchange rate adjustments as well as other adjustments we use in our methodology.
US-I
Demand-sideBased on the investor’s required compensation for taking market risk
Supply-sideBased on the asset's capability to supply returns
Supply- and demand-side approaches to 5-year expected returns
Expected real cash 0.7%
+ Expected inflation 1.9%
+ Risk premium 3.8%
+ Δ Valuation -2.0%
TOTAL 4.4%
Current dividend yield 1.9%
+ Nominal earnings growth 4.8%
+ Δ Valuation -2.0%
TOTAL 4.7%

19
Low Real Rates
Low Real Rates
Low RealRates
Why have multiple sets of views? The result of an SAA optimization is only as good as its inputs
Static asset allocation based on equilibrium views works on average but only over long periods of time
Past performance is not necessarily indicative of future returns
Equilibrium views ignore current market conditions which can strongly influence intermediate return potential:
– Valuation at entry point
– Economic cycle
– Dramatic tail events may happen in the short term
– Changes in the structure of the economy or a market may affect expectations
– Ignores asymmetry of payoffs (tail risk, skewness)
Accordingly, we have baseline return expectations with an intermediate horizon (the next 5–10 years)
US-I
US Treasury Bill 1-Year Yield – US CPI All Urban Consumers
Source: UBS Asset Management views, Macrobond. Data as of December 2020.
-8
-6
-4
-2
0
2
4
6
8
10
1953 1958 1963 1968 1973 1978 1983 1988 1993 1998 2003 2008 2013 2018
Fight against Inflation
Followed by “Great Moderation”

20
How do we think about multi asset investing?Valuation tells you direction but not timing
Market behavior analysis
Macroeconomic analysis
Cyclical and structural themes
Risk should only be taken where compensated
– Crucial to better understand sources of risk and return
Pric
e
Time
Overvalued
Undervalued
Valuation
Intrinsicvalue
US-I

21
Example: Valuation is useful (but a poor timing tool)Historically, Shiller P/E is a solid predictor of equity returns over 5–10 years
Source: Prof. Shiller, Standard & Poor’s and Bureau of Labor Statistics via Macrobond; UBS Asset Management.Note: Indexes are not directly investable. Data as of December 2020.
US-I
0
5
10
15
20
25
30
35
40
45
50-5%
0%
5%
10%
15%
20%
25%
1959 1964 1969 1974 1979 1984 1989 1994 1999 2004 2009 2014 2019
Shiller Cyclically A
djusted P/E Ratio (inverted axis)A
nnua
lized
Tot
al R
etur
n in
nex
t 10
Yea
rs o
ver
Infla
tion
S&P500 Real Total Returns next 10 Years Ann. Equity Indices, S&P, 500, Index (Shiller), Cyclically Adjusted P/E Ratio (CAPE)

22
Example: Macro cycles separate returns distributionsStock returns have had more losses and higher volatility in past recessions
Histograms of S&P 500 Index total returns minus CPI inflation
Source: Bureau of Labor Statistics, NBER and Standard & Poor’s via Haver; UBS Asset Management. Sample period: January 1970–March 2015. Indexes are not directly investable. Past performance is no guarantee of future results.
US-I
0%
5%
10%
15%
20%
25%
-24% -18% -12% -6% 0% 6% 12%
Freq
uenc
y
Monthly total return in excess of inflation
Recession Expansion

23
Caveat: Parameter stabilityWe cannot use estimates as if they were the “true” number
Estimated parameters such as returns or correlations have large error margins
Changes in market or economic structure create discontinuities
Serial correlation in returns biases estimates
The “true” number may not exist if data have random walk or regime switches
20-quarter correlation between S&P 500 and Ibbotson Associates Long-term Treasury Index
US-I
Source: Ibbotson Associates; UBS Asset Management. Sample: 1926–2020.
-1
-0.8
-0.6
-0.4
-0.2
0
0.2
0.4
0.6
0.8
1931 1941 1951 1961 1971 1981 1991 2001 2011

24
Caveat: Illiquid asset classesAppraised vs. economic volatility
Illiquid asset classes are appraised because they do not trade every day like listed asset classes
Appraisals are rather smooth (today's appraisal is equal to last quarter's appraisal plus any new information that the appraiser deems important)
This means that volatility is underestimated
There are statistical unsmoothing techniques, but they do more harm than good to the data
Based on recent academic research, our approach compares illiquid assets to comparable listed assets (e.g., venture capital and micro-cap stocks)
We have therefore an appraised volatility (from appraisal returns and IRR) and an economic volatility (from comparisons with equivalent listed assets)

25
How does an optimizer work?Examples among the most used portfolio optimizers
Mean-Variance optimizer
Inputs: vector of expected returns; covariance matrix; constraints
Good: simple to use
Bad: tends to produce concentrated portfolios; users introduce too many constraints to increase diversification; very sensitive to input changes; does not consider fat tails
Mean-CVaR optimizer
Inputs: vector of expected returns; covariance matrix; co-skewness and co-kurtosis tensors; or historical returns of a series of assets
Good: takes fat tails into consideration
Bad: many parameters make it unstable; complicated

26
Resampling and other robust approachesSolving the input sensitivity problem
Richard Michaud invented resampling: creating a series of expected return vectors etc. that are slightly different from the initial one (using random numbers) and computing the respective efficient frontiers. The average weights across all these efficient frontiers is the resampled frontier
Advances in cloud computing and data science have led to the invention of new optimizers, such as for example the IBM CPLEX. These optimizers find solutions that are already robust to changes in inputs, particularly in cases where one has hundreds of variables and constraints
For illustration purposes only. These charts are based on sample data.

27
Does ESG affect risk and returns?Four dimensions of sustainability in asset allocation
For illustration purposes only. The chart is not to scale and is intended to exaggerate the point for ease of exposition.
Long term: Modern ESG approaches are not detrimental to the investment process by reducing returns or increasing risk
Intermediate-term: Early adopters of ESG approaches may see improved risk-reward outcomes during the transition period to a low-carbon economy, with outsized alpha opportunity also available
Preferences: Strong exclusionary preferences are likely to have a negative effect on risk-return outcomes as the universe gets constrained too far
Spillovers to the economy: The ESG transition phase may elicit broader, more lasting ramifications for the economy and financial markets that must be monitored over time. In particular, engagement by investors and asset manager can accelerate this transition

28
Investment styles, indices and benchmarkingMaking sure that your funds give you the desired exposures
Fundamental (Portfolio-based) style analysis
Costly to set up database
Accurate as long as portfolio data are recent
Impossible if there is no transparency
More complicated for portfolios with derivatives
Statistical (Returns-based) style analysis
Simple as one only needs returns
Average exposure during time frame (36 or 60 months, typically)
Can be confused by spurious correlations
Constrained regression has analytical issues

29
Performance measurementTrying to interpret historical returns to understand skill
Historical measures based on returns
Sharpe ratio: excess return / standard deviation (no fat tails)
Sortino ratio: excess return / left semi-standard-deviation (no clear utility function)
Jensen's alpha and Fama-French (3, 4 or 5 factor) alpha: result of regression on factors (alpha is the excess return not captured by average factor exposures)
Morningstar Rating™: power average that takes fat tails into account
Historical measures based on portfolios
Active share: distance between weights in benchmark and weights in fund; normally, funds that deviate more from benchmark and survive have best returns
'Go fish' (Kacperczyk, Sialm and Zeng (2008): benchmarks portfolio against previous portfolio positions. Did the manager create value?

30
Performance attributionUnderstanding the alpha and beta mechanism
Attribution is the decomposition of returns in the following components:
Share of returns explained by the benchmark
Share explained by asset allocation
Share explained by security selection
Residual (unexplained part of the returns)
0%
1%
2%
3%
4%
5%
SAA: assetclasses
SAA:country/style
TAA SecuritySelection
Residual

31
Conclusion
Asset allocation is an important choice for a portfolio
It needs to be based more on risk capacity than risk aversion
There are several methods in addition to traditional mean-variance
Style and performance measurement are key in this framework
Risk management is the main objective

Capital Market Expectations, Portfolio optimization and risk management –Louis Finney
Section 2

Capital Market ExpectationsSection 2.1

34
Setting capital market assumptionsTwo sets of numbers: Risk and Return
Returns:
Time frame
Risk parameters
Standard deviation of returns
Correlation across asset classes
In theory, we could look at 'higher moments'
Skewness: whether returns have a higher tail to the upside or downside
– Negative skewness is similar to 'downside' risk
Kurtosis: how 'heavy' are the tails
This requires much advanced techniques and is very data intensive.
Covariance matrix

35
UBS calculates two sets of capital market returnsEquilibrium and Baseline
Equilibrium Returns:
Two interpretations:
– Pure equilibrium would imply pure fair value = market value for all asset classes
– Long run average: what the market will fluctuate around
Very useful in setting strategic asset allocations, doing very long run projections (20+ years)
– Important for modeling viability of pension and savings schemes
Baseline returns:
What we expect over the next 5 or 10 years
Dependent on current market pricing and how quickly markets revert to equilibrium values
UBS uses its market valuation tools (ValMod) to establish which markets look attractive on a forward looking basis
– Overlay with judgments about growth, inflation and path of convergence to equilibrium

36
It’s a matter of (time) perspectiveThree linked but different sets of asset class views: Equilibrium, Baseline and Tactical
Tactical views
Baseline expectations (the next 5–10 years)
Equilibrium expectations (an average over the next 40 or 50 years) Reflect our views for a
broad set of asset classes in a long-term, ideal equilibrium setting
Take equilibrium views and incorporate current market conditions with an intermediate time horizon
Set tactical asset allocation views in portfolios. Used to determine over- and under-weights around SAA.
US-I

37
Long run return and riskHistory
Over long time periods, we see a clear relationship between return and risk.
This relationship holds for US data going back 25 for more years.
The relationship is less tight outside the US. (Currency effects and the relative underperformance of non-US equities.)
Historic return and risk of US market from 1996 to 2020 (25 years)
FTSE
Russell Bloomberg-Barclays Indices 1-Mo Inflation
S&P 500 2500 US Cred US Treas US HY T-Bills CPI-U
Geometric Return 9.4 10.6 5.9 4.7 7.1 2.0 1.6
Arithmetic Return 10.2 11.9 5.9 4.7 7.3 2.0 2.0
Standard Deviation 15.3 18.9 5.2 4.3 8.8 0.6 1.3
Sharpe ratio 0.54 0.52 0.75 0.63 0.60 0.00
Source: Morningstar Direct. Analysis by UBS Asset Management

38
Two different quantitative approachesBalancing both demand-side and supply-side approaches to modelling risk/return expectations lead to a more robust foundation for SAAs
Demand-sideClassical approach
Investors demand ‘return premia’ for bearing risk
Determined by long-term historicalrisk premia, e.g. equity risk premium
Risk premia are time invariant but required returns influenced by starting values for interest rates and inflation
Supply-sideMore recent approach
Returns are supplied by the real economy
Determined by forward-looking factors that drive asset class returns such as projected economic growth rates, current interest rates, etc.
Equities explained by income, earnings growth and valuation changes.
Fixed income determined by starting conditions (yields, duration, etc and changes in yields.)
Two different approaches provide more insight to consider when estimating returns
US-I
Source: UBS Asset Management. For illustrative purpose only. A comparison of different supply- and demand-side approaches is summarized in Roger G. Ibbotson and Peng Chen (2003) "Long-Run Stock Returns: Participating in the Real Economy." Financial Analysts Journal, January/February. For ease of exposure, the analysis above excludes exchange rate adjustments as well as other adjustments we use in our methodology.

39
Example:Comparing supply and demand-side approach for US Equities
Source: UBS Asset Management. For illustrative purpose only. A comparison of different supply- and demand-side approaches is summarized in Roger G. Ibbotson and Peng Chen (2003) "Long-Run Stock Returns: Participating in the Real Economy." Financial Analysts Journal, January/February. For ease of exposure, the analysis above excludes exchange rate adjustments as well as other adjustments we use in our methodology.
US-I
Demand-sideBased on the investor’s required compensation for taking market risk
Supply-sideBased on the asset's capability to supply returns
Supply- and demand-side approaches to Equilibrium returns
Expected real cash 1.2%
+ Expected inflation 2.0%
+ Risk premium 4.2%
TOTAL 7.4%
Real earnings growth 2.3%
+ Expected inflation 2.0%
+ Dividend yield 1.9%
+ Buyback yield 1.0%
+ Δ Valuation 0.0%
+ Compound Effect 0.2%
TOTAL 7.4%
40
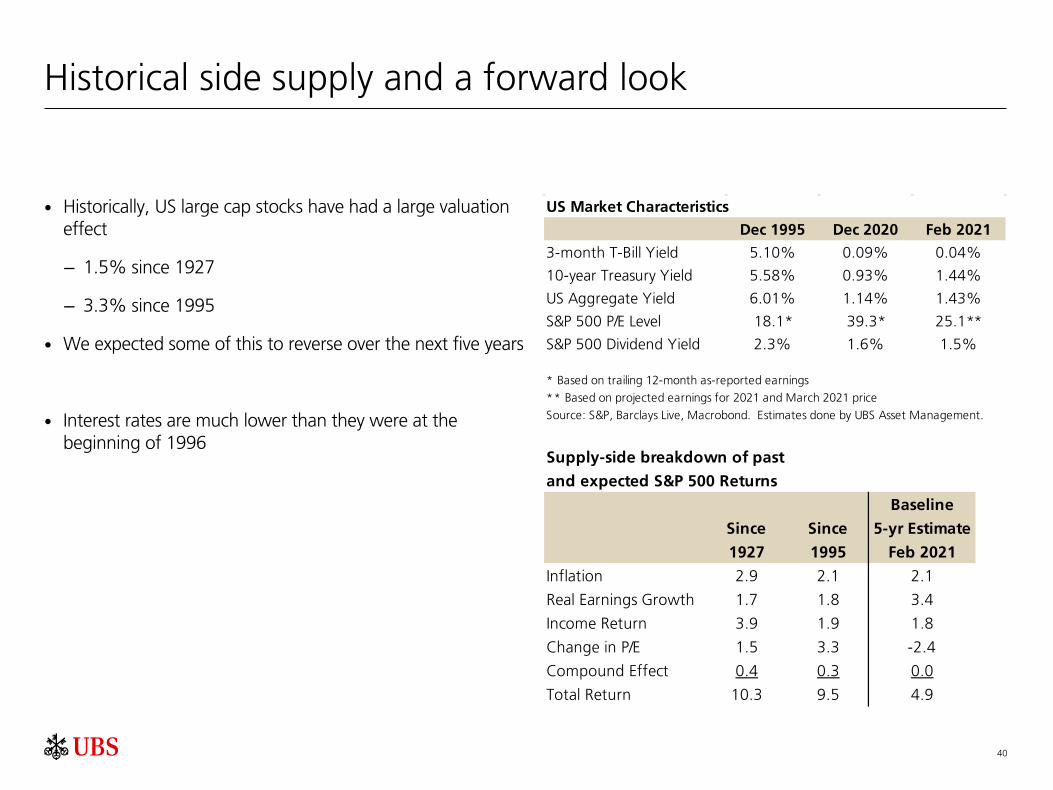
Historical side supply and a forward look
Historically, US large cap stocks have had a large valuation effect
– 1.5% since 1927
– 3.3% since 1995
We expected some of this to reverse over the next five years
Interest rates are much lower than they were at the beginning of 1996
US Market Characteristics
Dec 1995 Dec 2020 Feb 2021
3-month T-Bill Yield 5.10% 0.09% 0.04%
10-year Treasury Yield 5.58% 0.93% 1.44%
US Aggregate Yield 6.01% 1.14% 1.43%
S&P 500 P/E Level 18.1* 39.3* 25.1**
S&P 500 Dividend Yield 2.3% 1.6% 1.5%
* Based on trailing 12-month as-reported earnings
** Based on projected earnings for 2021 and March 2021 price
Source: S&P, Barclays Live, Macrobond. Estimates done by UBS Asset Management.
Supply-side breakdown of past
and expected S&P 500 Returns
Baseline
Since Since 5-yr Estimate
1927 1995 Feb 2021
Inflation 2.9 2.1 2.1
Real Earnings Growth 1.7 1.8 3.4
Income Return 3.9 1.9 1.8
Change in P/E 1.5 3.3 -2.4
Compound Effect 0.4 0.3 0.0
Total Return 10.3 9.5 4.9

41
Setting fixed income returnsStarting yields are good estimate
Adjust for:
Path of interest rates
– Use duration and convexity
Defaults effects
Inflation (for ILBs)
Income variability (prepayment, extension risk)
The closer the duration of the index is to the time horizon, the better the estimate:
For IG, you return very close to the starting yield over the duration horizon.
Expected Baseline Returns
February 2020
Yield-to-
Worst Duration 5-yr 10-yr
US Aggregate 1.4% 6.6 0.5% 1.3%
US 1-3 yr Treasury 0.2% 2.0 0.2% 0.5%
US 10+ yr Treasury 2.0% 18.9 -0.5% 0.8%
Source: Barclays Live. Analysis by UBS Asset Management
Expected Returns

42
Estimating risk from a top-down approach
Use a factor model to build consistent approach
Our group uses seven factors: growth, inflation, volatility, credit spreads, yield curve level, yield curve slope and illiquidity
Determine F1, the factor weighting matrix (also interpreted as a type of beta exposures) and set additional idiosyncratic risks 𝜎𝜎1𝑖𝑖 for each asset class
– Derive 𝐷𝐷1 the idiosyncratic covariance matrix from the 𝜎𝜎1𝑖𝑖's
Covariance matrix for these asset classes becomes:
Ω1 = 𝐹𝐹1′� Ω𝑓𝑓 � 𝐹𝐹1 + 𝐷𝐷1
The essential process can be repeated for additional levels of asset classes and complexity. From a relatively small set of assumptions, we can derive volatility and correlation for hundreds of asset classes.
Many practitioners just use historic data. (This means they are dependent on the historic regime.)

43
Demand side: applying the Black-Litterman process
Once the risk covariance for asset classes is formed, we can apply the Black-Litterman formula for determining equilibrium risk premium is:
𝑅𝑅𝑅𝑅 =𝑆𝑆𝑅𝑅𝑀𝑀𝜎𝜎𝑀𝑀
� Ω � 𝑊𝑊𝑀𝑀
where 𝑆𝑆𝑅𝑅𝑀𝑀 is the market Sharpe Ratio (a scalar), typically set between 0.25 and 0.5.
𝜎𝜎𝑀𝑀 is the market standard deviation (a scalar)
Ω is the covariance matrix for the market (assume N asset classes, so this matrix is NxN
𝑊𝑊𝑀𝑀 is the vector of market weights (nx1 array).
UBS's 2018 Equilibrium Covariance Matrix consists of 94 market asset classes (equities, fixed income and alternatives), 15 currencies, 4 commodity categories, 11 hedge fund categories, and cash (total of 125 asset classes).
Market weights are collected from a variety of sources: index providers (MSCI, Citigroup, JP Morgan, Bloomberg, S&P), Prequin). To smooth the weights, we use trailing 5-year averages.

44
Correlation
Most risk assets have some correlation with each other
Correlation and volatility spike in stress events: diversification benefits appear low
Most alternatives have correlation with risk, too.
Stock-bond correlation is quite variable
Currently in a negative correlation regime, but this could change if inflation takes off
This has kept volatility low on a total portfolio basis for portfolios with significant bond allocations
It may be a reason interest rates are low: the covariance property requites a low-risk premium for stocks and bonds. This is priced into both markets

45
A brief note on currencies
We add both hedged and unhedged currency factors to asset classes.
Cash differentials determine hedging costs/gains
We use a purchasing power parity approach to determine currency mispricing and then overlay a reversion to fair value
– This path also adjusts for inflation differentials
Currency perspective is important. Currency correlations with asset classes can vary widely across the countries.
– From US and Euro perspective, asset class returns are in general uncorrelated with domestic and foreign returns. Thus, hedging will reduce risk.
– However, for some countries—typically small countries with commodity exposure—foreign returns are negative correlated with currency returns.
– Thus, hedging will increase risk! Optimal strategy is not to hedge.
– Examples: Australia, Thailand

OptimizationSection 2.2

47
Types of optimization
Basic approaches:
Mean-variance optimization: maximize expected return at different levels of risk
Semi-variance: maximize expected return, but at different levels of downside variance
Conditional value-at-risk (Cvar): maximize expected return at different levels of downside tail events
– If a normal distribution, Cvar estimation will provide the same portfolios as mean-variance optimization. No additional insight is provided.
– Ideally, we would combine variance with skewness and kurtosis. But this is very demanding in setting assumptions (i.e.- lots more of them).
Run multiple frontiers:
Resampled frontier
Robust optimization
Other SAA techniques.
Stochastic modeling
Deterministic scenario analysis
Historic returns

48
Mean-variance modelling and optimization
Strengths
Math is well-understood. Economic foundation is solid.
Excellent first-order estimate of risk and return.
Demonstrates the advantages of diversification
Can be extended in many ways:
– Currency and currency hedging can be accommodated.
– Leverage and shorting: return and risk implications are very accurate
– Alpha and tracking error: active management is overlay on existing asset classes.
– Asset-liability management: liabilities are a negative asset class.
Consistent covariance matrix can be constructed with simple factor models
Weaknesses
Optimization can be very sensitive to inputs
Returns are assumed to be normally or log-normally distributed
– Tail events occur far more often than predicted by these distributions
No accommodation of serial correlation. This is a problem for cash assets and some alternatives
Assumption of rebalancing for each period
– Not possible with illiquid assets
Stationarity of distribution
Does not apply to option based strategies. These incorporate huge skewness and kurtosis effects.
Does not explicitly include cash flows
Mean-variance optimization (MVO) was proposed in the 1950s.
It is still the workhorse of SAA modeling.
US-I
Source: UBS Asset Management. For illustrative purpose only. A comparison of different supply- and demand-side approaches is summarized in Roger G. Ibbotson and Peng Chen (2003) "Long-Run Stock Returns: Participating in the Real Economy." Financial Analysts Journal, January/February. For ease of exposure, the analysis above excludes exchange rate adjustments as well as other adjustments we use in our methodology.

49
Mean-variance efficient frontierNominal equilibrium terms
Maximize the expected arithmetic return at each level of risk (equivalent to minimize risk for a given level of arithmetic return.
In practice, constraints are common
– Liquidity, regulatory, risk preference
– Relative constraints: e.g., small cap stocks cannot be over-weighted relative to market by 10%
The current portfolios for this client look very close to efficient in long run terms. Also notice how 'balanced' the portfolio look across the efficient frontier. All the asset classes appear on the efficient frontier at some point.

50
Mean-variance efficient frontierReal 5-yr Baseline terms
Now, we adjust for inflation and use our 5-yr Baseline assumptions.
From this perspective, the portfolios don't look so efficient.
– Tilt heavily away from fixed income and into cash
– But bonds still play an important roll in downside protection, even under current conditions of low yields.

51
Geometric and arithmetic returns
The geometric return is the compound return over time. It can be thought of as the median return (50% above and 50% below).
The arithmetic return is the average return in any one time period.
Simple example. You start with $1. In year 1, it doubles to $2; the return is 100%. In year 2, it drops by half, so back down to $1; the return is -50%. In this case the geometric return over two years is (1/1)^(1/2)-1 = 0%. The arithmetic return is (100% + -50%)/2 = 25%
The approximation formula is:
𝑔𝑔 = 𝑎𝑎 − 𝜎𝜎2
2
The exact formula used is
𝑔𝑔 =1 + 𝑎𝑎
1 + 𝜎𝜎2(1 + 𝑎𝑎)2
− 1
– Note: the higher the standard deviation, the larger the 'drag' in converting from arithmetic to geometric terms.
– Example of simple formula: arithmetic return of 10%, standard deviation is 20%. The approximate geometric return is 0.10 – ((0.2)^2)/2 = 0.10 – 0.04/2 = 0.10 – 0.02 = 0.08 = 8.0%. The exact formula gives 8.23%.
The process is: analyze in arithmetic terms, use standard deviation to convert to geometric terms

52
Stochastic modelingAlso called Monte Carlo modeling
Can allow for more complicated analysis and richer analysis
– Regime switching (rotating between different economic scenarios)
– Conditional investment strategies (derisking and rerisking depending on market conditions and levels of wealth)
– Deals with serial correlation better
– Sophisticated models can include yields, inflation, credit spreads, wages as modeled variables
Very useful when cash flow are involved
– Projecting pension contribution over time
– Analyzing defined contribution plans with cash flow in during employment and cash flows out
Run thousands of trials (10,000 trial over 50 years for example)
Downsides:
– Very time-consuming
– Results are not as intuitive to interpret. Often we are looking a dispersion, so risk is defined as a 95th percentile result and return is a median wealth ratio, funded status or replacement ratio at a point in time

53
Deterministic economic scenarios
While stochastic modeling runs thousands of trial, just a few can demonstrate the range (especially in the over a one to five year time horizon).
We often use economic scenarios to better understand the up-side and down-side cases:
Typically we offer four scenarios. They all start with current conditions.
Baseline, using our models of valuation
Recession:
– Slumping equity markets
– Declining inflation and government bond yields
Stagflation
– Slumping equity markets
– Rising yields and rising inflation:
– Stock-bond correlation is positive
An upside scenario: Productivity Boost
– Moderate/low inflation with modest rise in yields
– Strong equity returns

54
Managing risk at the SAA level
SAA defines a benchmark for CIOs to implement and be monitored against. It is a top-down process.
Many dimensions to risk at the SAA level to consider:
Volatility, downside, liquidity
Direct factor exposures: currencies, duration, credit, equity beta
As important are:
Operational risk management
Bottom-up portfolio analysis: Model individual securities and aggregate to total portfolio
– Very valuable in assessing risk against a benchmark
– Typically done based on daily data over trailing periods (90 days to seven years)
– Thus, can be biased by recent experience

55
Summary
Historical data show clear trade-off in risk and return
However, the starting point is important. History does not necessary repeat in return and correlation.
– Low interest rates mean lower expected returns
– High equity valuations indicate lower expected returns
Modeling the risk parameters is more difficult
– Simple factor models can greatly ease computation burdens
– Volatility is relative stable: equity in mid-teens, bonds in mid-single digits, cash around 1.0%
– Extrapolate/interpolate as appropriate to other asset classes (via Black-Litterman process, mean-variance math of leverage and shorting, etc.)
Correlation is highly dependent on regime
– We are currently in a negative stock-bond regime, but from early 1960s to late 1990s (over 30 years) we had positive stock-bond correlation

56
Break

Integrating Alternatives and ESG into asset allocation frameworks – Michele Gambera, Louis Finney
Section 3

Integrating AlternativesSection 3.1

59
Size of the alternatives market
We estimate the size of the total investable capital markets to be USD 155 trillion.
Equities 43.1%
Fixed Income 42.6%
Alternatives 7.2%
Cash 7.1%
This doesn't count:
Gold
Hedge funds
Commodity funds
Dry powder in the private asset arena

60
Two broad categories of alternatives
Private assets/private capital
Private equity: buy-out, venture, growth funds
Private real estate
– Typically invested through open-end or closed end funds
– Use of leverage: core, value-added and opportunistic funds
Private credit
Infrastructure
Other: energy, timber, farmland
Liquid/semi-liquid strategies
Hedge funds
Commodity funds
Gold
Not considered here:
Systematic strategies: risk parity, smart beta, etc
Art
Crypto-currencies

61
Characteristics of the alternative markets
Most private assets: cash flow oriented as opposed to price/income oriented.
Many investments are closed-end funds.
Different set of metrics: IRR, DPI, Capitalization Rate, etc.
Risk very difficult to assess
– Volatility based off of appraised values is biased downward. Valuations are sometimes months late.
High degree of active management. Constant spending/staff to maintain exposure.
Turnover of managers.
Distributions from closed-end funds need to be constantly recycled. There is a cycle of commitments, capital calls and distributions to manage.
Many transactions are negotiated
Requires a quick decision-making structure:
– A major complaint within large funds is the ability to make decisions on deals within days. Boards must design a structure that allows billions of USD to invested each year.
It's not buy-and-hold, but buy-and-continuously recycle.

62
Historic returnsAlternatives
Private Equity:
Historic data show a 1.8% to 4.1% premium over public equities
This would indicate a return in the high single digits, not low teens as seen over last two decades
Private credit:
Historically, private credit IRRs by vintage year are about 70 bps about the high yield yield-to-worst
Probably coming down closer to high yield

63
Historic returnsAlternatives
Real estate
For unlevered property, returns are between stocks and bonds
As leveraged is increased, returns become equity like in terms of return and risk
Hedge funds
Like real estate, performance is between stocks and bonds
Portfolios of hedge funds can range from highly aggressive (with equity-like features) to highly risk controlled with low volatility and low correlation to equities.

64
Setting returnsAlternatives
Private Equity: Historic data show a 2.0% to 3.0% premium over public equities This would indicate a premium in the high single digits, not low teens as seen over last two decades
Private credit: Historically, private credit IRRs by vintage year are about 70 bps about the high yield yield-to-worst Probably coming down closer to high yield
Real estate: On unlevered basis, treated between stocks and bonds Leverage increases returns, but increases risks as well Highly levered funds (Opportunistic, Value-added) approach equity like returns and risk
Infrastructure Difficult asset class to get a handle on Very long duration in cash flows: 10+ years
Hedge funds Typically modeled versus cash, but with an equity beta added (about 0.25 beta historically) Can vary widely, but well-constructed portfolios can achieve bond-like returns and bond-volatility but with low
correlation to other asset classes

65
Economic Risk and Appraised Volatiilty
Most alternatives have NAVs for funds, but few to no market transactions.
The appraised volatility underestimates actual risk.
Various methods can infer some higher volatilities.
For private equity, we use basic economic theory to determine the return and risks.
Private equity overall has a beta of 1.7
Summary Statistics: 1Q 1994-1Q2020
Private Real Hedge 10-yr S&P
Equity Estate Funds Commod T-Bills Treas 500
Estimates based on quarterly returns
Geometric Return 13.7 9.2 4.3 1.2 2.3 5.4 8.9
Arithmetic Return 13.6 8.9 4.5 2.7 2.3 5.6 9.9
Standard Deviation 10.1 4.1 7.0 16.7 1.0 8.2 16.1
Quarterly Serial Correlation 0.35 0.85 0.19 0.16 0.98 -0.01 0.01
Equity correlation 0.77 0.20 0.72 0.30 0.03 -0.48 1.00
Equity beta 0.48 0.05 0.31 0.31 0.00 -0.24 1.00
Skew -0.6 -2.9 -0.7 -0.9 0.3 0.7 -0.7
Kurtosis 2.4 11.8 3.2 2.0 -1.5 0.7 0.7
Estimates based on annual returns
Standard Deviation 14.8 7.5 8.3 18.0 2.0 7.2 17.3
Annual Serial Correlation 0.20 0.35 -0.12 -0.01 0.85 -0.21 0.20
Equity Correlation 0.80 0.28 0.65 0.29 0.10 -0.34 1.00
Equity Beta 0.68 0.13 0.31 0.29 0.01 -0.14 1.00
Skew -0.7 -2.4 -0.1 -0.4 0.3 0.0 -0.7
Data Private Equity Cambridge Associates US Private Equity
Real Estate NCREIF Property
Hedge Funds HFRI Fund of Funds Composite USD
Commod Bloomberg Commodity TR USD
T-Bills FTSE Treasury Bill 1 Mon USD
10-yr Treasury BBgBarc US Trsy Bellwethers 10Y TR USD
S&P 500 S&P 500 TR USD
66
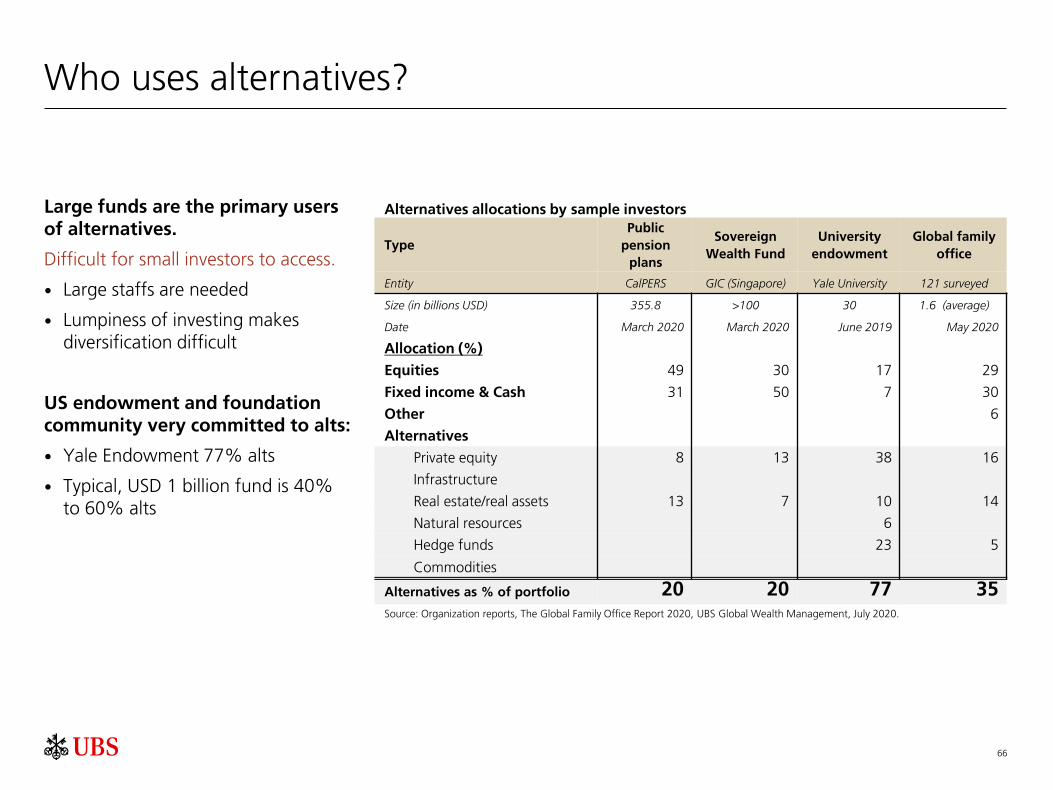
Who uses alternatives?
Large funds are the primary users of alternatives.
Difficult for small investors to access.
Large staffs are needed
Lumpiness of investing makes diversification difficult
US endowment and foundation community very committed to alts:
Yale Endowment 77% alts
Typical, USD 1 billion fund is 40% to 60% alts
Alternatives allocations by sample investors
TypePublic
pension plans
Sovereign Wealth Fund
University endowment
Global family office
Entity CalPERS GIC (Singapore) Yale University 121 surveyed
Size (in billions USD) 355.8 >100 30 1.6 (average)
Date March 2020 March 2020 June 2019 May 2020
Allocation (%)
Equities 49 30 17 29
Fixed income & Cash 31 50 7 30
Other 6
Alternatives
Private equity 8 13 38 16
Infrastructure
Real estate/real assets 13 7 10 14
Natural resources 6
Hedge funds 23 5
Commodities
Alternatives as % of portfolio 20 20 77 35Source: Organization reports, The Global Family Office Report 2020, UBS Global Wealth Management, July 2020.

67
Return and Risks of Portfolios
Alternatives can improve the return of portfolio, but offer more in diversification.
Note the higher Sharpe ratios for these portfolios over the 60/40 portfolio.
Appraised volatility makes these appear even more attractive, but this is misleading.
Endowments and foundations have run into liquidity crunches.
– Harvard in the GFC
– Several foundations procured loans in 2020 to avoid liquidity issues
Prospective 5-year Performance in USD Terms
September 2020
Public Sovereign Global
Pension Wealth University Family Standard
Plan Fund Endowment Office 60/40
5-yr Expected Geometric Return 5.3% 4.7% 7.2% 5.3% 4.5%
Economic Risk 11.3% 10.0% 14.1% 10.3% 10.5%
Sharpe Ratio 0.50 0.49 0.56 0.54 0.46
Appraised Volatility 10.0% 8.6% 9.9% 8.3% 10.5%

68
Summary
We see more and more acceptance of alternatives.
– Large efforts to figure out ways to bring them to the retail level
– The do offer substantial diversification benefits
Tremendous innovation in the field.
Returns should be lower, but returns are lower in the public markets, too.
Requires dedicated efforts to build portfolios:
– Either pay up in building staff expertise or in higher management fees

69
Assumptions
Return and risk assumptions: USD Terms
September 2020
5-yr
Expected Economic Appraised
Asset Class Return Risk Volatility
USD Cash 0.3% 1.3%
Intermediate Global IG Fixed Income 0.4% 2.6%
Global Investment Grade Fixed Income 0.0% 5.5%
Global Equities Unhedged 7.2% 16.0%
Global High Yield Hedged 3.0% 10.5%
Global Private Equity Unhedged 9.5% 24.5% 15.0%
Global Infrastructure (Equity) Unhedged 6.2% 14.0% 8.0%
Global Core Real Estate Unhedged 6.2% 12.6% 7.2%
Hedge Funds (Hedged) 4.0% 4.3%
Note: Expected returns are geometrc. We develop 5-year expected returns in the capital markets
based on current market markets and our expectations of inflation, growth and the path of interest
rates. We then overlay our assessment of fair value and the reversion and how quickly the market will
react. From here we extrapolate to the different sectors of the capital markets.
Global Equity, Private Equity, Infrastructure, and Core Real Estate are assumed to be unhedged. Cash,
fixed income and hedge funds are assumed to be hedged.

Integrating ESGSection 3.2

71
The Evolution of SustainabilityTraditional approach: Value-based Investing
From plain exclusion to overweighting good actors
Limited negative screening
Positive screening with multiple dimensions
– Environment
– Social issues
– Governance
Typical client: anyone
Modern approach: ESG
Negative screening (exclusion)
Focus on excluding "sin stocks"
– Tobacco
– Gambling
– Alcohol
Typical client: religious groups

72
The definition of ESG
Environment Pollution, global warming and use of sustainable practices
Social Responsibility
Diversity in the workforce, human rights and attention to work conditions including subcontractors
Governance Structure of the company and compensation levels, rights of shareholders and transparency
Together, these concepts incorporate the sustainability approach to investing

73
Engagement
Engagement is a special feature of ESG investing
Asset management firms are more active in encouraging firms to adhere to higher ESG standards and increase disclosure
This is unusual as traditionally asset management firms have been either voting with management or following consultant advice
UBS is part of the United Nations PRI initiative that helps investors and asset managers collaborate in engagements with firms

74
Impact Investing
Impact investing is a type of ESG investing
Objective is to help firms that are making a difference by doing business with underserved people or improving the environment
The function is not to maximize profits
Profits are not excluded but are a secondary objective
Impact investing is beyond the scope of this presentation

75
Is there a trade-off when using an ESG approach?
ProFocus on ESG may reduce negative skewness due to environmental damages or accounting scandals
ConNegative screening may reduce diversification and exclude profitable companies in fields such as tobacco or oil
PuzzleIf everyone prefers ESG, will I be able to buy sin stocks for a P/E of 1?

76
Is there an ESG factor, such as value or small cap?
No evidence of a priced ESG factor similar to, say, the Fama-French factors
Some evidence that top ESG grades are earned by mega-caps, quality firms. So there might be size and quality factor exposures while more firms disclose ESG variables
The most widely-used ESG indexes however are factor-neutral with respect to the equivalent traditional indexes

77
Academic findings
Most sustainable investors think only of E not S or G
Companies producing more carbon emissions have higher cost of capital
Stock prices outperform for firms that recently had a successful ESG engagement“ “ “
Hartzmark and Sussman2018
Bolton and Kacperczyk2019
Dimson, Karakas and Li2016

78
More academic findings
Philip Morris outpaced the S&P 500 by almost 9% a year in 1957—2003 (Sears, too, outperformed!)
[exclusion] ESG funds lag their traditional counterparts
ESG decreases value with simple exclusion, but increases it with positive ESG screening“ “ “
Siegel and Schwartz 2006
Renneboog, Ter Horst and Zhang 2008
Barnett and Salomon 2006

79
Is governance new?
Board of directors' quality is not a novel measure of corporate value
Many investment books, starting from Berle and Means (1932) and Graham and Dodd (1933), see management incentives as a key part of security analysis
Think of theory of the firm (e.g. Coase, Williamson, Marris) that started in the 1960’s, spelling out conflicts of interest between managers and shareholders

80
Does ESG Work?Sustainability and the client's interests
In theory
Pedersen, Fitzgibbons and Pomorski (2019): in a model with three types of investors (low/medium/high ESG enthusiasm), an abundance of ESG enthusiasts will lead “sin stocks” to outperform in the long run
Pastor, Stambaugh and Taylor (2020): a preference for sustainability will increase the ESG impact on firms because it will motivate firms to be better sustainability actors
In practice
Dunn, Fitzgibbons and Pomorski (2018): bottom ranked stocks (for ESG scores) have materially higher volatility during the 8 years examined
Auer and Schuhmacher (2016): in ESG ratings from Sustainalytics (2004–2012), companies with high ESG ratings provided superior risk-adjusted performance

81
Simple exclusion example (1/2)
Using world indexes, we see that both tobacco and oil & gas have similar risk and return to the aggregate
Individual companies may have huge runs, as seen in the US example above
Whole sample (1973–2020) S&P 500 Exxon Mobil AltriaArithmetic average 11.8% 12.8% 20.0%Geometric average 10.3% 10.9% 15.9%Standard deviation 16.7% 18.7% 27.3%Skewness -0.57 -0.81 0.14Kurtosis 0.94 3.05 1.31Min -25.2% -44.8% -33.6%Quartile 1 -1.5% -2.6% -4.2%Median 3.3% 3.4% 5.2%Quartile 3 8.0% 9.4% 13.3%Max 23.0% 26.9% 53.9%Observation # 190 190 190
Source: UBS AM. For illustrative purposes only.

82
Simple exclusion example (2/2)
The more we try to neutralize factor exposure, the more even the effect of negative screening fades
More modern positive screening approaches give about the same returns for traditional and ESG
Source: UBS AM. For illustrative purposes only.
2011-2020 S&P 500 S&P 500 ESGSimple
ExclusionFactor-Neutral
ExclusionArithmetic average 15.1% 15.3% 15.7% 15.6%Geometric average 13.9% 14.1% 14.5% 14.4%Standard deviation 16.7% 16.4% 16.5% 16.6%Skewness -0.98 -0.87 -0.96 -0.99Kurtosis 2.40 2.26 2.34 2.43Min -19.6% -18.60% -18.90% -19.1%Quartile 1 1.0% 1.1% 1.1% 1.1%Median 4.1% 4.3% 4.3% 4.4%Quartile 3 7.5% 7.5% 7.7% 7.7%Max 20.50% 21.2% 20.5% 20.5%Observation # 40 40 40 40Sharpe Ratio 0.87 0.89 0.91 0.90

83
Performance in Moments of Stress
March-April 2020
Conservative portfolio (30% global equity, 70% bonds), no rebalance
Traditional and ESG portfolio have the same returns
Same for 60/40 portfolio
$8,700.00
$8,900.00
$9,100.00
$9,300.00
$9,500.00
$9,700.00
$9,900.00
$10,100.00
18-Feb-20 03-Mar-20 17-Mar-20 31-Mar-20 14-Apr-20
30/70 esg no reb 30/70 trad no reb

84
Is there a trade-off in long-term risk-adjusted performance?Long-term expectations
A modern, multi-dimensional approach to sustainability (that is, not simply based on bare-bones exclusion) has no negative effects on investment performance
Therefore, as far as we can see, there is no trade off over the long term
Traditional and ESG portfolio can use the same capital market expectations
We saw in the previous page that performance is close even during times of stress
0.0%
2.0%
4.0%
6.0%
8.0%
10.0%
12.0%
14.0%
0% 5% 10% 15% 20% 25% 30%
Exce
ss R
etur
n
Standard Deviation
Base Case Conventional ESG Long Term

85
A trade-off in medium-term risk-adjusted performance?A possible reward for early adopters
The interest in ESG among retail and institutional investors has been growing steadily
It is possible that over the next 5–10 years, as more interest arises, highly-rated ESG names may be bid up due to scarcity
In this case, early ESG adopter will gain
Over the long term, more firms will adopt sound ESG practices and improve disclosure, so this outperformance will not last forever
0.0%
2.0%
4.0%
6.0%
8.0%
10.0%
12.0%
14.0%
16.0%
0% 5% 10% 15% 20% 25% 30%
Exce
ss R
etur
n
Standard Deviation
Base Case Conventional ESG Short Term

86
A trade-off in the preference levelConventional vs. high ESG preferences
Conventional ESG benchmarks are geared towards delivering high ESG ratings with low tracking error from traditional benchmarks
However, an investor with very strong ESG preferences may exclude a large amount of names and incur high risk, underperformance
Think for example of excluding all firms that are not carbon-neutral
0.0%
2.0%
4.0%
6.0%
8.0%
10.0%
12.0%
14.0%
0% 5% 10% 15% 20% 25% 30%
Exce
ss R
etur
n
Standard Deviation
Base Case Very Strong ESG

87
Special case: Loss-averse clients
We could use mean-CVaR optimization for clients that cannot bear losses
It is possible that firms with high ESG rating, by having good governance and low risk of environmental or social liabilities, may have a better "left tail" in the return distribution
If ESG portfolios have better left-tail characteristics, approaches like Rockafellar and Uryasev (2001) would prefer them
That approach uses historical returns for higher moments and VaR estimation

88
Security Selection
Intuitive suggestion: portfolio managers can provide better security selection if they know more about the likelihood of future legal and reputational liabilities from ESG violations
Possibility of rating arbitrage adding to alpha
We do not have enough data to support this finding, but it seems reasonable

89
Conclusion
ESG does not appear to affect risk-adjusted portfolio performance over the medium and long term
Asset allocations for traditional and ESG portfolios can be computed using the same capital market expectations
It is reasonable to expect highly-rated ESG firms to outperform as the world evolves towards sustainability
It is possible that ESG disclosures help active portfolio managers in security selection
We don't have enough data and will have a clearer view in the future
For illustration purposes only.The chart is not to scale and is intended to exaggerate the point for ease of exposition.

Sample Portfolios, Capital Market Expectations and Advisory Services to Sovereign –Mohammad Ahmad, Massimiliano Castelli
Section 4

91
Advisory service descriptions
Service Description Frequency Benefit
Strategy Advice and knowledge transfer
Deliver ValMod data and risk reports with market factors and indicators document
Quarterly You will gain access to our proprietary data/information.
Asset Allocation, Portfolio Construction
Review of target asset allocation and portfolio construction choices. Monitoring of risk and performance attribution and contribution
Quarterly Continuous oversight and assessment. Risk framework establishes appropriate portfolio construction choices and processes, Ensures alignment with strategic investment objectives.
Investment Oversight /Governance
Discuss asset class valuations, risk reviews, catalyst signals, market outlook
Semi-annual & Quarterly
You gain access to investment professionals to discuss in details the portfolio allocation, as well as gain access to the Risk and Investment Committees to discuss ad hoc topics as requested in advance.
Review of implementation choices
Cross asset investment oversight and implementation options. Assess mandate and pooled c
Quarterly Reviews funding levels of various strategies, accommodates subscription and redemption calendars across alternatives.
Reporting Formal review of portfolio risk. Conduct scenario analysis incorporating Client viewsPerformance reporting solutions
Monthly You will have a regular view of the risk profile of the portfolio. Optionality for having a risk review of the whole portfolio.
In times of extreme market stress clearly review meetings can be ad hoc and more frequent.
Training Training program tailored to Client Yearly We provide two weeks on-the-desk training per year with our asset allocation and/or risk management teams.
Conferences and Seminars Access to UBS scheduled yearly program of conferences
Throughout the year
Please refer to the separate discussion of our proposal here
Source: UBS Asset Management

Sovereign Sample Portfolios, Capital Market Expectations and Performance Monitoring
Section 4.1

93
Different setups for different objectivesWhen selecting the most suitable setup, the efficient frontiers differ based on constraints of each type of portfolio.
Risk vs. SDR cash basket1
Source IMF. Note: For illustrative purposes only. Current SDR mix is USD 41.73%, EUR 30.93%, CNY 10.92%, JPY 8.33%, GBP 8.09%1 SDR: Special Drawing Right currency basket is used as a proxy for the central bank risk free asset. This differs for each central bank
Risk
Pre
miu
m
Efficient frontiers
Stabilization PF
Savings PF
Reserve PF

94
Sovereign Portfolios: Different portfolios with different goalsLiquidity and investment tranche separation
Source: UBS AM. For illustrative purposes only.
CB Working CapitalObjective
• Liquidity management for market operations
Key considerations
• Preservation of capital and liquidity
• Currency mix/reference
• Import Coverage (3-6 months)
• Short term external debt coverage (100%)
Stabilization portfolioObjective
• Offset oil price movements to fill gap in revenues to fund public expenditure
Key considerations
• Preservation of capital and liquidity
• Precaution/buffer during national emergencies
• Explicit/implicit liabilities
• Diversify natural/structural endowment
Savings portfolioObjective
• Accumulate wealth for future generations
• Managing inflation impact
Key considerations
• Maximise (risk-adjusted) returns over longer time horizons
• Exploit illiquidity premium
• Return above relevant inflation target (reflecting import structure)
Liquidity Tranche Investment Tranche

95
Sample Portfolios (1) – Liquid Portfolios Sample portfolios have different levels of risk tolerance and diversification
Source: UBS AM. For illustrative purposes only.
Liquidity Fixed Income DiversificationEquity
DiversificationEquity and more
EMDMost liquid – CB working
capital managementDiversification across fixed income to improve risk-adjusted returns
Liquid equity to boost risk-adjusted returns
Equity and EMD to boostrisk-adjusted returns
CB1 CB2 CB3 CB4 CB5
Liquidity Cash 50 10 10 10 10
GGB 1 – 3 50 50 30 30 25
Division GGB 10 10 10 10
Spread Supranationals 10 10 8 5
Corporates 10 10 8 5
Securitised 10 10 8 5
Inflation hedge TIPS 10 8 5
Risk premium EMD 10 3 15
Equities 15 20
10
30
1088
8
8
81010
30
101010
10
1010
50
1010
10
1010
5050
10
25
10555
5
15
20

96
Sample Portfolios (2) – Stabilization FundsMajority of assets invested into liquid and high-grade government bonds but longer duration to boost returns and also investing in equity and real estate
Liquidity + Equity + Equity and RE50% in liquid GGB 1 – 3;
GGB/Corporates to boost returnsEquity to boost risk –
adjusted returnsEquity + RE to boost risk –
adjusted returns
Stab1 Stab2 Stab3
Liquidity GCB 1 – 3 50 45 40 Investment grade
Division GGB 40 35 35
Spread Corporates 10 10 10
Risk premium Equities 10 10
Real Estate 5
40
35
10
105
45
35
1010
5040
10 0
Source: UBS AM. For illustrative purposes only.

97
Sample Portfolios (3) – Saving FundsHigh risk tolerance but implementation can differ in terms of allocation to illiquid asset classes
Listed liquid Assets + AlternativesLarge allocation to illiquid assets
Norwegian model majority of assets in liquid public markets
Equity to boost risk –adjusted returns
Endowment modelLarge allocation to alternatives
Sav1 Sav2 Sav3
Duration GGB 22.5 22.5 15 Investment grade
Spread Corporates 10 10
Risk premium EMD 2.5 2.5
Equities 60 40 35
Real Estate 5 12 10
Private Equity 13 20
Hedge Funds 10
Infrastructure 5
Commodity 5
15
35
10
20
105 5
22.5
102.5
40
12
1322.5
102.560
5
Source: UBS AM. For illustrative purposes only.

98
Asset classes: high returns in fixed incomeIn risk-adjusted terms, fixed income assets performed strongly
Historical Returns and Standard Deviation, 2002 – 2021YTD
Source: UBS AM. Please note that past performance is not a guide to the future. Data as of end of February 2021.Note: Data for Private Equity and Real Estate for 2003 – 3Q 2020.
Sharpe Ratios, 2002 – 2021YTD
1.1
1.0
0.8
0.7
0.7
0.7
0.6
0.6
0.5
0.5
0.3
0.3
0.3
0.2
0.0
-0.1
-0.5 0.0 0.5 1.0 1.5
Securitised
Supra
EMD
Corp
GGB
GGB 1 3
TIPS
Hedge Funds
Real Estate
Private Equity
EMD Local
Global Equity
Infrastructure
EM Equity
Cash
Commodity
Cash
HF
GGBTIPSSupra
Securitized
EMD
EMDlocal
Global EQ
EM EQ
RE
Corporates
Infra
Commodities
PE
GGB 1-3
-2%
0%
2%
4%
6%
8%
10%
12%
14%
0% 5% 10% 15% 20% 25%

99
Diversification to improve returns (1)Diversification across fixed income and equity provided a substantial increase in returns while keeping risk/return relationships relatively stable
Historical Returns and Standard Deviation, 2002 – 2021YTD
Source: UBS AM. Please note that past performance is not a guide to the future. Data as of end of February 2021.
Return/Risk, 2002 – 2021YTD
3.0
1.7
1.5
1.5
0.0 1.0 2.0 3.0 4.0
CB1
CB2
CB3
CB4
CB1
CB2
CB3
CB4
0%
1%
2%
3%
4%
5%
6%
0% 1% 2% 3% 4% 5%
Retu
rns
Standard deviation
Worst 12 months, 2002 – 2021YTD
Higher returns
Less risk
0.2%
-1.1%
-1.9%
-7.5%
-10.0% -5.0% 0.0% 5.0%
CB1
CB2
CB3
CB4
15% EQ

100
Diversification to improve returns (2)Based on historical analysis, diversified portfolios provided higher returns; diversification into alternatives boosted returns in saving portfolios
Source: UBS AM. Please note that past performance is not a guide to the future. Data as of end of February 2021.
Historical Returns and Standard Deviation, 2002 – 2021YTD
GGB
Stab1
Stab2
Stab3
40/60
Sav1
Sav2
Sav3
0%
1%
2%
3%
4%
5%
6%
7%
8%
9%
10%
0% 2% 4% 6% 8% 10% 12% 14%
Retu
rns
Standard deviation
Returns, 2002 – 2021YTD
9.1%
8.8%
7.8%
5.8%
4.4%
4.0%
3.5%
4.4%
0.0% 5.0% 10.0%
Sav3
Sav2
Sav1
40/60 portfolio
Stab3
Stab2
Stab1
GGB
50% Alt
25% Alt
5% Alt

101
Central Bank portfolios: Recent market performance
Sample central bank portfolios tracking model output
Source: UBS AM model based on publicly available information, using broad indices and funds to replicate CBs and SWF portfolios.For illustrative purposes only. Please see appendix for more information on portfolios. Please note that past performance is not a guide to the future.
CB1 CB2 CB3 CB42021 January 0.01% -0.13% -0.33% -0.38%2021 February -0.05% -0.62% -1.09% -0.41%
Performance 2021 YTD -0.04% -0.75% -1.42% -0.79%Performance 2020 1.52% 4.28% 5.14% 6.81%
Performance 2019 2.76% 5.56% 7.10% 9.33%
Performance 2018 2.00% 1.04% 0.46% -0.47%
Performance 2017 0.90% 2.00% 3.07% 5.22%
Performance 2016 0.91% 2.29% 3.34% 3.50%
Performance 2015 0.51% 0.31% 0.39% 0.29%
Performance 2014 0.46% 2.84% 4.13% 3.89%
Performance 2013 0.29% -1.06% -1.86% 2.38%
Performance 2012 0.52% 3.10% 4.96% 5.63%
Performance 2011 0.95% 4.08% 5.41% 3.52%
Performance 2010 1.23% 3.60% 4.94% 5.61%
Performance 2009 1.19% 4.76% 7.04% 8.80%
Performance 2008 4.91% 4.19% 2.95% -3.70%
Performance 2007 6.03% 6.67% 6.70% 7.12%
Performance 2006 4.58% 3.80% 4.26% 6.23%
While portfolios that included spread products or equities suffered during the Coronavirus crisis, they more than offset these losses in the dramatic rally in risk assets that started in April 2020.
CB sample portfolio performance (indexed, 31.12.2015 = 100)

102
Post-COVID 19 Economic ScenariosUncertainties over the way out of the Coronavirus crisis and the fate of the global economy remain high
Source: UBS AM as of 3Q 2020. This does not constitute a guarantee by UBS AG, Asset Management.
Growth & Productivity upside (10%)Economic growth and productivity picks up significantly; secular P/E ratio rise to reflect lower risk premium
Inflation (US) at constant 1.8%
US T-Bills reaching 3.0% in five years
US 10-year yields rising to 3.8% in five years
Equities (S&P 500) with average P/E ratio of 22.0
Return to moderate growth (45%)Moderate rise in global rates and equity prices
Inflation (US) at 2% in 5 years
US T-Bills settling at 2.3% in 5 years
US 10-year yields rising only moderately to reach 3.2% in five years
Equities (S&P 500) with average P/E ratio of 17.4
Stagflation (20%)Recession followed by low growth and inflation; positive correlation for stocks & bonds
Inflation (US) ultimately reaching 4.0% in five years
US T-Bills reaching 3.8% in five years
US 10-year yields rising to 5.0% in five years
Equities (S&P 500) with average P/E ratio of 15.8
Long-lasting recession (25%)Long recession followed by low growth
Inflation (US) declining, reaching 1.5% in five years
US T-Bills declining, reaching 0.5% over five years
US 10-year yields settling at 2.3% over five years
Equities (S&P 500) with average P/E ratio of 15.8
Higher growth
Lower growth
Low
er r
ates
Hig
her
rate
s
• Quick and surprising breakthrough in the fight against the virus (e.g., discovery of antivirals)
• Return to higher productivity levels similar to the 1996-2004 period
• Inflation rates would be kept in check by productivity achievements
• Central banks would raise rates again
• Slow recovery from the virus marked by additional waves and setbacks, additional multi-trillion stimulus efforts globally
• Additional tariffs and trade wars, supply chain disruptions and shortages of food and medicine boost inflation
• Stock-bond correlation turns positive
• Global growth recovers over the next year with no major setbacks but enough uncertainty to keep rates at ultra-low levels
• Only gradual end of QE over the next 5 years
• Equity better than fixed income
• Setbacks in the fight against the virus, amplified by global tensions and trade wars
• High volatility for risky assets
• L-T yields approaching zero-bound. Negative stock-bond correlation protects diversified portfolios

103
Scenario A (Return to moderate growth)
Source: UBS AM. See Appendix for details about sources and details of asset class returns and calculations. Data as of end of December 2020. Past performance of investments is not necessarily an indicator of future results.
0.92
0.65
0.49
0.45
0.40
0.33
0.32
0.26
0.19
0.15
0.13
0.10
0.04
0.04
-0.04
-0.17
-0.5 0.0 0.5 1.0
Hedge Funds
Real Estate
EMD Hard Currency
Global Equity
Private Equity
Infrastructure
EMD Local Currency
Global Government…
Cash
Securitized
Supranational
Corporates
Gold
Commodity
Global Government…
TIPS
Return/Risk profileExpected Returns 5 years and Standard Deviation, %
Cash
GCB 1-3GGB
Corporates
TIPS
SecuritizedSupranational
EMD Hard Currency
EMD Local Currency
Global Equity
Real Estate
Private Equity
Hedge Funds
Infrastructure
Gold
Commodity
-2%
0%
2%
4%
6%
8%
10%
12%
0% 5% 10% 15% 20% 25% 30%
Retu
rns,
5ye
ars
Standard deviation
Fixed income with low real returns; equity/alternatives outperform

104
Scenario B (Recession)Equity underperform; fixed income assets and certain alternatives preserve capital
Expected Returns 5 years and Standard Deviation, % Return/Risk profile
CashGGB 1-3
GGB
Corporates
TIPS
SecuritizedSupranational
EMD Hard Currency
EMD Local Currency
Global Equity
Real Estate
Private Equity
Hedge Funds
Infrastructure
Gold
Commodity
-1%
0%
1%
2%
3%
4%
5%
6%
0% 5% 10% 15% 20% 25% 30% 35% 40%
Retu
rns,
5ye
ars
Standard deviation
0.61
0.40
0.25
0.25
0.24
0.20
0.17
0.14
0.13
0.12
0.06
0.05
0.04
0.03
0.01
-0.03
-0.2 0.0 0.2 0.4 0.6 0.8
EMD Hard Currency
Corporates
EMD Local Currency
Supranational
Hedge Funds
Securitized
Real Estate
Global Government…
Infrastructure
Gold
TIPS
Global Equity
Global Government…
Commodity
Private Equity
Cash
Source: UBS AM. See Appendix for details about sources and details of asset class returns and calculations. Data as of end of December 2020. Past performance of investments is not necessarily an indicator of future results.

105
Scenario C (Stagflation)Real assets perform well, but most asset classes show negative real returns
Expected Returns 5 years and Standard Deviation, % Return/Risk profile
Cash
GCB 1-3
GCB
Corporates
TIPS
Securitized
Supranational
EMD Hard Currency
EMD Local CurrencyGlobal Equity
Real Estate Private EquityHedge Funds
Infrastructure
Gold
Commodity
-4%
-2%
0%
2%
4%
6%
8%
0% 5% 10% 15% 20% 25% 30% 35% 40%
Retu
rns,
5ye
ars
Standard deviation
0.46
0.40
0.35
0.26
0.24
0.18
0.17
0.16
0.08
0.06
0.00
-0.04
-0.10
-0.28
-0.35
-0.65
-1.0 -0.5 0.0 0.5 1.0
EMD HC
Hedge Funds
Commodity
TIPS
Real Estate
Gold
Infrastructure
EMD Local
Global Equity
Private Equity
Cash
Securitized
Corporates
Supranational
GGB 1-3
GGB
Source: UBS AM. See Appendix for details about sources and details of asset class returns and calculations. Data as of end of December 2020. Past performance of investments is not necessarily an indicator of future results.

106
Scenario D (Growth and Productivity upside scenario)Risk assets do well, while government bonds perform poorly
Expected Returns 5 years and Standard Deviation, % Return/Risk profile
Cash
GCB 1-3
GCB
Corporates
TIPS
SecuritizedSupranational
EMD Hard CurrencyEMD Local Currency
Global Equity
Real Estate
Private Equity
Hedge Funds
Infrastructure
Gold Commodity
-4%
-2%
0%
2%
4%
6%
8%
10%
12%
14%
0% 5% 10% 15% 20% 25%
Retu
rns,
5ye
ars
Standard deviation
1.50
1.37
0.84
0.78
0.62
0.53
0.30
0.14
0.13
0.12
0.01
-0.02
-0.25
-0.34
-0.38
-0.71
-2.0 -1.0 0.0 1.0 2.0
Hedge Funds
Real Estate
Global Equity
EMD HC
Private Equity
Infrastructure
EMD Local
Gold
Commodity
Cash
Corporates
Securitized
Supranational
GGB 1-3
TIPS
GGB
Source: UBS AM. See Appendix for details about sources and details of asset class returns and calculations. Data as of end of December 2020. Past performance of investments is not necessarily an indicator of future results.

107
Sovereign portfolios – Scenario performancesComparison of Central Bank sample portfolio performance
Source: UBS AM. For illustrative purposes only. Data as of end of February 2021. Past performance of investments is not necessarily an indicator of future results.
3.24
%
5.47
%
1.10
%
-0.0
4%
0.39
%
4.00
%
5.43
%
2.72
%
-0.7
5%
0.47
%
5.21
%
4.81
%
3.64
%
-1.4
2%
0.74
%
5.42
%
1.57
%
4.50
%
-0.7
9%
1.64
%
-2.0%
-1.0%
0.0%
1.0%
2.0%
3.0%
4.0%
5.0%
6.0%
2002-2006 2007-2008 2009-2020 2021YTD 5-year expected
CB1 CB2 CB3 CB4
Equities still expected to enhance real
returns
0.03% 0.55%
1.2% 1.13%
0.0%
0.5%
1.0%
1.5%
Recession
0.25% 0.16%0.5%
0.61%
0.0%
0.2%
0.4%
0.6%
0.8%
Stagflation
0.7%
-1.16%-0.73%
0.3%
-1.5%-1.0%-0.5%0.0%0.5%1.0%
Productivity boost
5-year expected Alternative scenarios
Returns expected to be not adequate in a high inflation environment

108
0.54%0.83%
0.95%
0.0%0.2%0.4%0.6%0.8%1.0%
Recession
Sovereign portfolios – Scenario performancesComparison of Stabilization Fund sample portfolio performance
Source: UBS AM. For illustrative purposes only. Data as of end of February 2021. Past performance of investments is not necessarily an indicator of future results.
4.38
%
7.17
%
2.71
%
-1.6
4%
0.27
%
4.56
%
4.26
%
3.72
%
-1.3
2%
1.07
%
5.42
%
2.29
%
4.21
%
-1.1
6%
1.34
%
-3.0%
-2.0%
-1.0%
0.0%
1.0%
2.0%
3.0%
4.0%
5.0%
6.0%
7.0%
8.0%
2002-2006 2007-2008 2009-2020 2021YTD 5-year expected
Stab1 Stab2 Stab3
Golden era for fixed income: High
returns and negative
correlations to equities in times of
crisis
-1.31% -0.74% -0.56%
-2.0%
-1.0%
0.0%
1.0%
Stagflation
1.44%
-0.96%
0.17%
-2.0%-1.0%0.0%1.0%2.0%3.0%
Productivity boost
5-year expected Alternative scenarios
High allocations to L-T bonds beneficial
StDev16.5%
StDev17.3%
StDev9.2%
Nominal returns boosted by
inflation, but not enough to preserve value. High volatility impacting risk-
adjusted returns.

109
1.76%
1.87%
1.74%1.7%1.7%1.8%1.8%1.9%1.9%
Recession
Sovereign portfolios – Scenario performancesComparison saving fund sample portfolio performance
Source: UBS AM. For illustrative purposes only. Data as of end of February 2021. Past performance of investments is not necessarily an indicator of future results.
6.25
%
-11.
33%
9.27
%
-0.0
3%
4.96
%7.80
%
-16.
00%
9.90
%
0.81
%
5.29
%8.68
%
-20.
35%
9.97
%
2.32
%
6.12
%
-25.0%
-20.0%
-15.0%
-10.0%
-5.0%
0.0%
5.0%
10.0%
15.0%
2002-2006 2007-2008 2009-2020 2021YTD 5-year expected
Sav1 Sav2 Sav3
1.31% 1.56%
2.68%
0.0%
1.0%
2.0%
3.0%
Stagflation
7.16% 6.87% 7.30%
0.0%
3.0%
6.0%
9.0%
Productivity boost
5-year expected Alternative scenarios
High allocations to L-T bonds beneficial
StDev16.5%
StDev17.3%
StDev9.2%
Nominal returns boosted by
inflation, but not enough to preserve value. High volatility impacting risk-
adjusted returns.

110
Source: UBS AM model based on publicly available information, using broad indices and listed instruments to replicate monthly performance of SWF portfolios. For illustrative purposes only. Please note that past performance is not a guide to the future.
Peer analysis Our model portfolios replicating the SAAs of several key SWFs show that key saving funds performed well in 2020 due to a dramatic recovery in risk assets.
Replicated Sovereign portfolios tracking model output
Corona-Crash
Trump election
Vol shock
Trade War & FED worries
SWF sample portfolio performance (indexed, 31.12.2015 = 100)
Sofaz Norges GPFG ADIA CIC GIC2021 January -0.85% -0.81% -0.47% -0.25% -0.43%2021 February -0.73% 1.69% 1.65% 2.17% 1.40%
Performance 2021 YTD -1.57% 0.87% 1.17% 1.91% 0.96%Performance 2020 8.83% 13.48% 10.55% 9.06% 10.07%
Performance 2019 13.54% 22.23% 21.11% 23.18% 20.41%
Performance 2018 -1.61% -5.85% -4.50% -5.33% -3.76%
Performance 2017 7.43% 16.45% 14.03% 14.47% 12.19%
Performance 2016 5.08% 6.52% 6.48% 7.70% 6.38%
Performance 2015 -0.71% -0.32% -0.01% -1.44% 0.45%
Performance 2014 5.83% 5.83% 6.48% 5.99% 6.91%
Performance 2013 0.53% 17.33% 15.00% 15.96% 12.28%
Performance 2012 8.86% 13.32% 13.37% 14.22% 13.01%
Performance 2011 4.59% -1.48% -2.27% -4.30% -0.39%
Performance 2010 9.51% 10.96% 12.11% 14.03% 12.29%
Performance 2009 16.19% 23.10% 23.45% 26.51% 21.45%
Performance 2008 -8.19% -29.75% -30.13% -35.81% -27.12%
Performance 2007 7.06% 8.01% 6.18% 6.14% 5.43%
Performance 2006 9.61% 15.74% 16.51% 17.96% 14.13%

111
Simulations of changes to strategic asset allocations (1)Central bank portfolios including Equities and EMD for different levels of risk tolerance and diversification will allow to protect capital in real terms in the post-pandemic world.
Source: UBS AM. For illustrative purposes only. Past performance of investments is not necessarily an indicator of future results.
Diversified fixed income Adding Equity Equity and higher levels of EMD
+15% EQ and -7% EMD +5% EQ and +12% EMD
-5% S-T Bonds
-8% Spread products -12% Spread products
CB3 CB4 CB5Liquidity Cash 10 10 10
GGB 1 – 3 30 30 25
Division GGB 10 10 10
Spread Supranationals 10 8 5
Corporates 10 8 5
Securitised 10 8 5
Inflation hedge TIPS 10 8 5
Risk premium EMD 10 3 15
Equities 15 20
Return p.a. 2002-2020 3.94% 4.48% 5.29%
Standard Deviation 2002-2020 2.59% 3.05% 4.30%
Return/Standard Deviation 1.52 1.47 1.23
Minimum rolling yearly Return -1.86% -7.53% -11.63%
Base case 5y expected returns 0.74% 1.64% 2.41%
Recession 5y expected returns 1.16% 1.13% 1.75%
Stagflation 5y expected returns 0.45% 0.61% 1.45%
Upside scenario expected returns 0.31% 1.44% 2.56%
Typical FI-only central bank portfolio
Only portfolio expected to beat
inflation
20% equities and 15% EMD

112
Simulations of changes to strategic asset allocations (2)Real estate can provide an additional source of additional returns with a better risk profile. This could be the next step for reserve managers in their secular diversification trend.
Source: UBS AM. For illustrative purposes only. Past performance of investments is not necessarily an indicator of future results.
Fixed income diversified with Alternatives Equity diversified with Alternatives
+15% RE and +5% EMD +15% RE and +12% EMD
-10% ST Bonds -15% ST Bonds-10% Spread products -12% Spread products
CB3 CB3+ CB4 CB4+Liquidity Cash 10 10 10 10
GGB 1 – 3 30 20 30 15
Division GGB 10 8 10 10
Spread Supranationals 10 8 8 5
Corporates 10 8 8 5
Securitised 10 8 8 5
Inflation hedge TIPS 10 8 8 5
Risk premium EMD 10 15 3 15
Real Estate 15 15
Equities 15 15
Return p.a. 2002-2020 3.94% 5.14% 4.48% 5.96%
Standard Deviation 2002-2020 2.59% 3.94% 3.05% 6.15%
Return/Standard Deviation 1.52 1.30 1.47 0.97
Minimum rolling yearly Return -1.86% -9.38% -7.53% -12.34%
Base case 5y expected returns 0.74% 1.74% 1.64% 2.84%
Recession 5y expected returns 1.16% 1.68% 1.13% 1.93%
Stagflation 5y expected returns 0.45% 1.33% 0.61% 1.79%
Upside scenario expected returns 0.31% 2.84% 1.44% 4.40%
Adding EMD and Real Estate but
no Equities
Typical FI-only central bank portfolio

113
Asset classes Historical returns
Source: UBS Asset Management. Data as of end of February 2021. Infrastructure and Private Equity data since 2003. All other data since 2001.* Annualized Real Estate and Private Equity data based on quarterly time series. Maximum drawdown based on listed equivalents.
This document contains statements that constitute ”forward-looking statements”, including, but not limited to, statements relating to our future business development. While these forward-looking statements represent our judgments and future expectations concerning the development of our business, a number of risks, uncertainties and other important factors could cause actual developments and results to differ materially from our expectations.
Annual Return Annual Standard
Deviation Worst rolling 12m Return/Risk Sharpe Ratio
Cash 1.7% 0.46% 0.2% 3.68 0.00Corp 5.6% 5.83% -13.9% 0.95 0.67GGB 4.2% 3.92% -2.6% 1.07 0.64TIPS 5.1% 5.87% -9.3% 0.87 0.59Securitised 4.2% 2.31% -0.8% 1.83 1.11Supra 4.4% 2.75% -0.9% 1.60 0.99EMD 8.1% 8.64% -20.2% 0.93 0.74EMD Local 5.7% 11.64% -20.9% 0.49 0.35Global Equity 7.2% 15.34% -47.1% 0.47 0.36EM Equity 4.9% 16.36% -48.7% 0.30 0.20Real Estate 7.9% 11.78% -59.5% 0.67 0.53Hedge Funds 5.7% 6.24% -19.1% 0.91 0.64Infrastructure 7.1% 17.05% -51.5% 0.42 0.32Commodity 0.4% 16.06% -50.3% 0.02 -0.08Private Equity 13.0% 22.95% -71.4% 0.57 0.49GGB 1 3 2.5% 1.21% 0.1% 2.07 0.69

114
Annual Return Annual Standard
Deviation Worst 12 Month Return/Risk
Stab1 3.35% 2.37% -1.05% 1.41
Stab2 3.89% 2.34% -2.83% 1.66
Stab3 4.29% 2.96% -6.91% 1.45
Sav1 7.80% 10.12% -33.94% 0.77
Sav2 8.76% 9.18% -39.56% 0.95
Sav3 9.23% 11.11% -46.48% 0.83
60/40 portfolio 5.8% 5.8% -18.7% 1.00
Annual Return Annual Standard
Deviation Worst 12 Month Return/Risk
CB1 2.15% 0.7% 0.2% 2.94
CB2 3.05% 1.9% -1.1% 1.65
CB3 3.82% 2.6% -1.9% 1.46
CB3+ 5.29% 4.6% -9.4% 1.14
CB4 4.39% 3.0% -7.5% 1.44
CB4+ 5.88% 6.1% -12.3% 0.96
Portfolios Historical returns
Source: UBS Asset Management. Data as of end of February 2021. This does not constitute a guarantee by UBS AG, Asset Management. All other data since 2001.
This document contains statements that constitute ”forward-looking statements”, including, but not limited to, statements relating to our future business development. While these forward-looking statements represent our judgments and future expectations concerning the development of our business, a number of risks, uncertainties and other important factors could cause actual developments and results to differ materially from our expectations.
Liquid portfolios
Stabilization & Saving Funds

115
Asset classes
Source: UBS Asset Management. Data as of end of December 2020. See appendix for sources. This does not constitute a guarantee by UBS AG, Asset Management.
This document contains statements that constitute ”forward-looking statements”, including, but not limited to, statements relating to our future business development. While these forward-looking statements represent our judgments and future expectations concerning the development of our business, a number of risks, uncertainties and other important factors could cause actual developments and results to differ materially from our expectations.
Return Std Dev Risk/Return Sharpe Return Std Dev Risk/Return Sharpe Return Std Dev Risk/Return Sharpe Return Std Dev Risk/Return SharpeCash 0.26% 1.35% 0.19 0.00 -0.04% 1.34% -0.03 0.00 0.60% 1.36% 0.44 0.00 0.76% 1.34% 0.57 0.12
Global Government Bond 1-3 0.50% 1.96% 0.26 0.12 0.08% 1.96% 0.04 0.06 -0.12% 2.08% -0.06 -0.35 -0.05% 1.88% -0.03 -0.34
Global Government Bond -0.21% 5.58% -0.04 -0.08 0.61% 4.49% 0.14 0.14 -3.18% 5.85% -0.54 -0.65 -2.36% 4.18% -0.56 -0.71
Corporates 0.67% 6.44% 0.10 0.06 2.23% 5.57% 0.40 0.41 -0.30% 8.88% -0.03 -0.10 0.67% 4.85% 0.14 0.01
TIPS -0.90% 5.32% -0.17 -0.22 0.31% 5.21% 0.06 0.07 1.99% 5.38% 0.37 0.26 -1.24% 4.83% -0.26 -0.38
Securitized 0.94% 6.45% 0.15 0.11 1.02% 5.02% 0.20 0.21 0.31% 8.13% 0.04 -0.04 0.51% 5.23% 0.10 -0.02
Supranational 0.73% 5.77% 0.13 0.08 1.15% 4.62% 0.25 0.26 -1.15% 6.25% -0.18 -0.28 -0.55% 4.62% -0.12 -0.25
EMD Hard Currency 3.59% 7.38% 0.49 0.45 5.25% 8.65% 0.61 0.61 5.41% 10.47% 0.52 0.46 5.04% 5.69% 0.89 0.78
EMD Local Currency 4.28% 13.20% 0.32 0.30 3.56% 14.09% 0.25 0.26 2.90% 14.57% 0.20 0.16 4.38% 12.41% 0.35 0.30
Global Equity 7.16% 15.97% 0.45 0.43 1.03% 22.28% 0.05 0.05 2.43% 22.41% 0.11 0.08 11.53% 12.96% 0.89 0.84
Real Estate 5.66% 8.65% 0.65 0.62 1.88% 11.13% 0.17 0.17 3.29% 11.14% 0.30 0.24 10.38% 7.12% 1.46 1.37
Private Equity 9.53% 23.97% 0.40 0.39 0.17% 33.37% 0.01 0.01 2.73% 33.37% 0.08 0.06 12.76% 19.63% 0.65 0.62
Hedge Funds 3.98% 4.33% 0.92 0.86 1.29% 5.32% 0.24 0.25 2.72% 5.29% 0.51 0.40 6.38% 3.86% 1.65 1.50
Infrastructure 5.57% 16.65% 0.33 0.32 2.49% 19.03% 0.13 0.13 3.90% 19.03% 0.21 0.17 8.46% 14.81% 0.57 0.53
Gold 0.56% 12.54% 0.04 0.02 1.55% 12.42% 0.12 0.13 2.95% 12.92% 0.23 0.18 2.33% 12.45% 0.19 0.14
Commodity 0.56% 14.85% 0.04 0.02 0.39% 15.12% 0.03 0.03 6.24% 15.90% 0.39 0.35 2.54% 14.53% 0.17 0.13
5-year expected returns
Expected returns
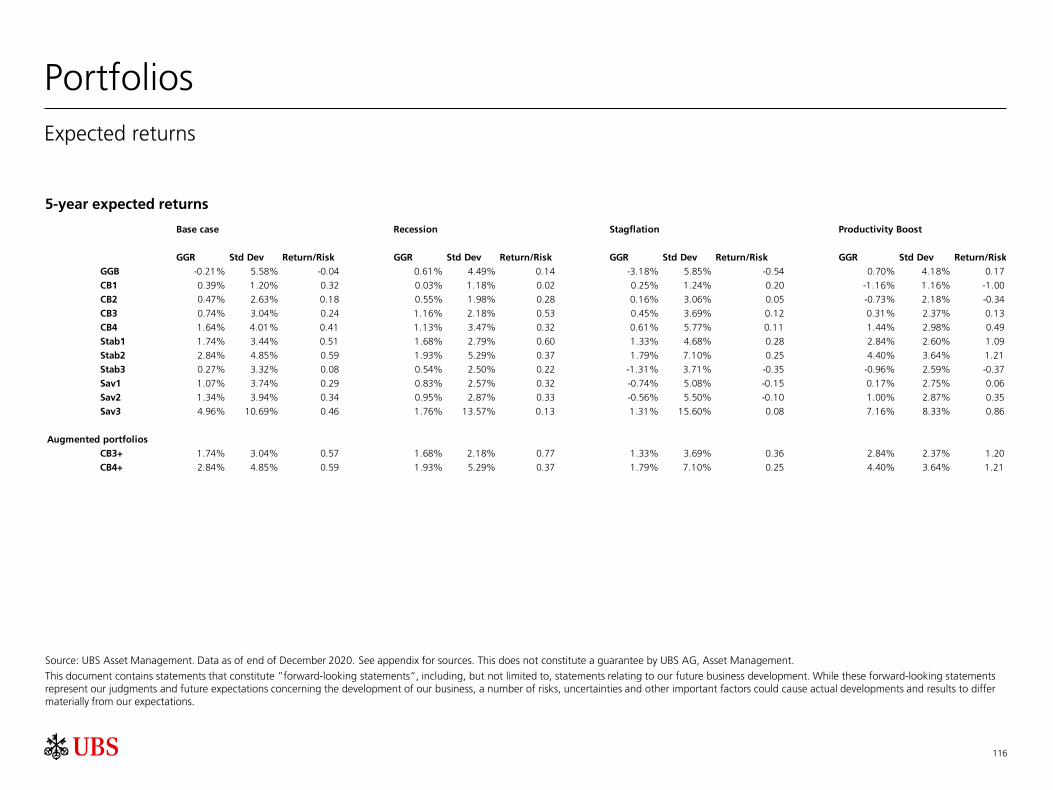
116
Portfolios Expected returns
Source: UBS Asset Management. Data as of end of December 2020. See appendix for sources. This does not constitute a guarantee by UBS AG, Asset Management.
This document contains statements that constitute ”forward-looking statements”, including, but not limited to, statements relating to our future business development. While these forward-looking statements represent our judgments and future expectations concerning the development of our business, a number of risks, uncertainties and other important factors could cause actual developments and results to differ materially from our expectations.
Base case Recession Stagflation Productivity Boost
GGR Std Dev Return/Risk GGR Std Dev Return/Risk GGR Std Dev Return/Risk GGR Std Dev Return/RiskGGB -0.21% 5.58% -0.04 0.61% 4.49% 0.14 -3.18% 5.85% -0.54 0.70% 4.18% 0.17
CB1 0.39% 1.20% 0.32 0.03% 1.18% 0.02 0.25% 1.24% 0.20 -1.16% 1.16% -1.00
CB2 0.47% 2.63% 0.18 0.55% 1.98% 0.28 0.16% 3.06% 0.05 -0.73% 2.18% -0.34
CB3 0.74% 3.04% 0.24 1.16% 2.18% 0.53 0.45% 3.69% 0.12 0.31% 2.37% 0.13
CB4 1.64% 4.01% 0.41 1.13% 3.47% 0.32 0.61% 5.77% 0.11 1.44% 2.98% 0.49
Stab1 1.74% 3.44% 0.51 1.68% 2.79% 0.60 1.33% 4.68% 0.28 2.84% 2.60% 1.09
Stab2 2.84% 4.85% 0.59 1.93% 5.29% 0.37 1.79% 7.10% 0.25 4.40% 3.64% 1.21
Stab3 0.27% 3.32% 0.08 0.54% 2.50% 0.22 -1.31% 3.71% -0.35 -0.96% 2.59% -0.37
Sav1 1.07% 3.74% 0.29 0.83% 2.57% 0.32 -0.74% 5.08% -0.15 0.17% 2.75% 0.06
Sav2 1.34% 3.94% 0.34 0.95% 2.87% 0.33 -0.56% 5.50% -0.10 1.00% 2.87% 0.35
Sav3 4.96% 10.69% 0.46 1.76% 13.57% 0.13 1.31% 15.60% 0.08 7.16% 8.33% 0.86
Augmented portfoliosCB3+ 1.74% 3.04% 0.57 1.68% 2.18% 0.77 1.33% 3.69% 0.36 2.84% 2.37% 1.20
CB4+ 2.84% 4.85% 0.59 1.93% 5.29% 0.37 1.79% 7.10% 0.25 4.40% 3.64% 1.21
5-year expected returns

Advisory Services to Sovereign InstitutionsSection 4.2

118
Key building blocks for an OCIO service
Multi –asset framework covering traditional and alternative, public and private
Asset Allocation Solutions
Review and refinement of investment policy and alignment to objectives and allocations
Valuation models, capital market research and assumptions, expected retruns and risk analytics
Risk premia, liquidity, alternatives and tactical views
Multi-Manager Solutions (MMS)
Research and selection management covers all asset markets incl. public & private markets and real estate
Consistent and coherent framework to ensure that capabilities are seamless with portfolio objectives
Views are continously refreshed in changing markets and scenarios
Knowledge Transfer
Access to UBS University for client staff
Ability to influence research and publications
Access to UBS Conferences and Seminars
Possibility to tailor development plans
Analytics
Our analytics suite provides capabilities in risk management, oversight and control alongside performance measurement and attribution
An Investment and risk governance framework helpskeep the investment programme aligned wit h objectives
Knowledge base and library
Custom Seminars
Tactical views and heat maps
UBS University
Glide path design
Strategic Objectives
Private label funds
Co-investments Pooled vehicles
Budgeting and Control
Decomposition and Attribution
Risk factors and styles

119
Key decision points and choices
Our comprehensive range of investment services tailored to client needs
Investment SelectionSelect suitable building blocks
Active, passive, and systematic
Traditional & alternative
Public & private markets
Internal & external managers
Derivative strategies
Asset AllocationNavigate financial markets
Long-term capital market assumptions across asset classes
Strategic asset allocation
Tactical views
Market research and insight
Portfolio ConstructionBuild the individual portfolio
Benchmark-relative
Based on risk budget
Absolute return
Public and private portfolios
AnalyticsAnalyze & manage investment risk
Risk analytics and modelling platform
Risk-mitigating strategies
Integrated risk analytics for asset allocation – strategic, tactical
Performance analytics
Partnership Design
Source: UBS Asset Management. For illustrative purposes only.

120
Sequencing and PrioritizingWe are focused on building a strategic partnership with our clients
Corporate Foundation
Return objectives
Risk tolerance/capacity
Investment horizon
Liquidity needs
Reference currency
Investment restrictions
Proactive, timely and tailored investment advice and proposals in a portfolio context
Systematic and comprehensive portfolio monitoring to identify risks
Access to experienced investment specialists and first-class execution
Exploiting full range of investment opportunities
Identify the Foundation’s overarching objective(s):
Determine tactical and strategic objectives
Define and meet investment policy objectives
Establish a policy portfolioEnhance investment and risk governance
Tailored investment proposalClient investment strategy Solution Design
Proactive investment recommendations, decisions and risk controlling, all assisted by investment specialist with access to research and a broad range of investment products in line with the client investment objective

121
Model economics of the client will determine appropriate investment strategy
Determining the Investment Policy Incorporating objectives, constraints and investments with capital market expectations to inform policy portfolios
Client-specific objectives
Return objectives (e.g. growth, income, preservation of real portfolio value)
Time horizon
Regulatory environment
Asset specification
Define universe of allowable investments
Current capital markets opportunities
Existing portfolio holdings, sensitivity to economic factors, liquidity needs
Cash flows
Expected contributions and withdrawals
Predictability and timing of cash flows
Funding ratios and volatility
Risk event models
Constraints
Regulatory
Risk tolerance/capacity
Time horizon
Fee sensitivity
Taxes
The Investment Policy Statement (IPS) identifies a target asset allocation aligned with your organization's return objective, risk tolerance, time horizon and other relevant investment considerations
Corporate Foundation Board

122
Sample Investment Engagement value chainDeliver expertise, investment services and content
For illustrative purposes only
Client objectivesRisk and return
analysisClient / UBS
viewsSAA and TAA
Advisory Solution Implementation
Evaluation AnalysisMarket Views
DesignPortfolio
Construction& Advisory
Client Engagement
Serv
ices
Client objectives Risk and return analysis
Client / UBS views
SAA and TAA
Solu
tions
Explanation and Articulation of market views
Feedback on SAA alignment to client needs
Ensuring client and IP restrictions
are upheld
Review and recommend active
allocation
Determine relevance of TAA
for client
Review implementation
guidelines
Synthesis of Objectives and
exposures
Synthesis of market views and
objectives
Portfolio building blocks
Scenarios and Outcomes
Fee structures and costs
Delivery and Maintenance

123
Project Management and deliverablesSample advisory pathway that can be tailored to client needs as the advisory engagement evolves
Definition phase Execution
Start
Rollout
1Preparatory work
2Strategic and Portfolio
review
4Define Strategic transformation
3Recommend
actions
5Transition
6Define Platform
7Board Approval and Implement
Analysis
1. Preparatory work Strategic review and adjustment Existing Manager review Strategy and Portfolio context review Risk review
2. Strategic & Portfolio review
Strategic recommendations Manager recommendations Bottom up analysis Portfolio recommendations – repositioning and changes Investment execution strategy review
3. Recommend course of action
• Reduce number of managers and realign strategy to sustainability objectives
• Reduce cost –review hedge fund allocation, consider passive ESG implementation in certain markets
• Refine core–satellite approach for Impact P.E.
4. Define Strategic Transformation
• Define profile in year 1 , 2 and 3 of programme• Define transformation for each asset class and capability• Establish key milestones to be achieved
5. Define transition plan to new strategy
• Remain invested in strategic allocation• Transform implementation vehicles to a format that
allows growth and tactical positioning• Establish tactical discretion parameters and applicability
6. Define platform & implementation
• Catalogue responsibilities across investment process• Determine if any areas of UBS discretion and where the
Investment Committee wants to retain control• Execute on plan maintaining invested status
7. Implementation • Establish investment platform and portfolio• Refine and expand , repeat
Managing change… leave the detail to us

124
Sample governance structure
We function as an extension of client staff, as client strategic partner
As part of a true strategic partnership, our services will include:
– Modelling asset / spending studies
– Tactical asset allocation advice on portfolio and manager weightings
– Monitor investment risk and performance of the portfolio and its external managers
– Assess risk of each manager and in the aggregate of the portfolio
– Tail risk hedging advice
– Advisory materials and publications
Sample governance structure
Discretionretained by
you
Discretion delegated to
UBS AM
Approve investment policy statement and strategic asset allocation
Approve dynamic asset allocation glide path for de-risking
Develop glide path for target returns
Implement de-risking asset allocation changes
Execute portfolio rebalancing
Implement tactical changes to asset allocation
Hire managers/funds
Terminate managers/funds
Determine size of allocations to managers/funds
Establish, interpret and approve investment guidelines for managers
Monitor compliance with investment policies and review performance in total and at the manager level
Carry out day-to-day administration of the investment function
Source: UBS Asset Management
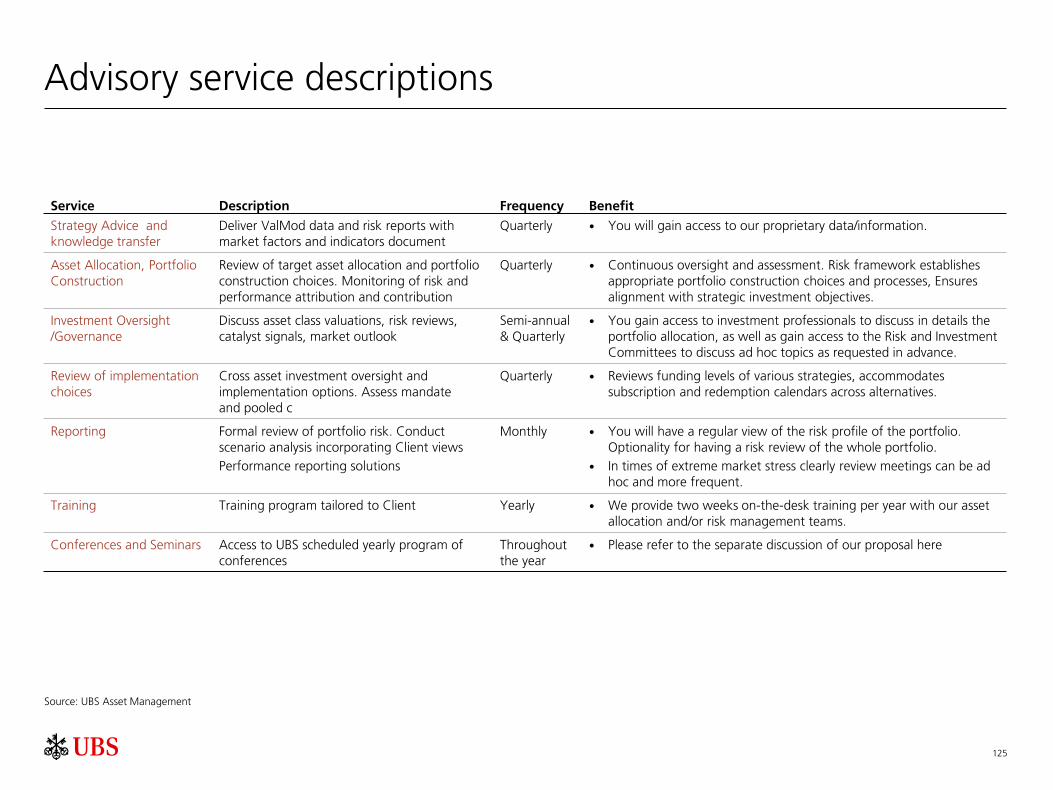
125
Advisory service descriptions
Service Description Frequency Benefit
Strategy Advice and knowledge transfer
Deliver ValMod data and risk reports with market factors and indicators document
Quarterly You will gain access to our proprietary data/information.
Asset Allocation, Portfolio Construction
Review of target asset allocation and portfolio construction choices. Monitoring of risk and performance attribution and contribution
Quarterly Continuous oversight and assessment. Risk framework establishes appropriate portfolio construction choices and processes, Ensures alignment with strategic investment objectives.
Investment Oversight /Governance
Discuss asset class valuations, risk reviews, catalyst signals, market outlook
Semi-annual & Quarterly
You gain access to investment professionals to discuss in details the portfolio allocation, as well as gain access to the Risk and Investment Committees to discuss ad hoc topics as requested in advance.
Review of implementation choices
Cross asset investment oversight and implementation options. Assess mandate and pooled c
Quarterly Reviews funding levels of various strategies, accommodates subscription and redemption calendars across alternatives.
Reporting Formal review of portfolio risk. Conduct scenario analysis incorporating Client viewsPerformance reporting solutions
Monthly You will have a regular view of the risk profile of the portfolio. Optionality for having a risk review of the whole portfolio.
In times of extreme market stress clearly review meetings can be ad hoc and more frequent.
Training Training program tailored to Client Yearly We provide two weeks on-the-desk training per year with our asset allocation and/or risk management teams.
Conferences and Seminars Access to UBS scheduled yearly program of conferences
Throughout the year
Please refer to the separate discussion of our proposal here
Source: UBS Asset Management

126
Our advisory and fiduciary service catalogueWe provide our investment value chain in a robust, transparent and independent format
Built from an integrated multi-asset value chain
Research Strategy design Active asset allocationRisk & Portfolio construction
Manager / Security selection and research Portfolio management
Macroeconomic research
Equilibrium Capital Market Assumptions
Baseline return expectations
Risk and Return Expectations
Sustainability and ESG
Confirm objectives and constraints
Risk budgeting and contribution
Building the neutral allocation
Identifying sources of alpha and beta
Macroeconomic research
Research groups Quantitative tools and
signals across valuation, behavioral, and macro
Idea generation and debate
Investment policy statement
Investment objectives Position scaling Trade interaction Portfolio risk analysis Risk Governance Scenario analysis
Active and passive considerations
Monitoring of in-house and / or external strategies
Derivative research Sustainability ratings Risk Assessment
Order generation Cash flow
management Portfolio monitoring
and rebalancing Sustainability and ESG
criteria Risk control and
Management
The advisory service catalogue allows the client to select the level of service and the underlying capabilities they need at the time and in the measure they need them.
UBS Asset Management research
Panorama
Themed White Papers
Portfolio Context research
Capital Market Expectations
Studies in Diversification and Correlation
Cross Asset risk modelling
Tactical Asset Market Views
Trade Views
Correlation Heat maps
Portfolio Context sensitive analysis
Investment Policy design and statements
Model Portfolios
Simulations and Stress tests
Cross asset risk modelling
Manager, Product and Strategy research papiers
Due diligence material
Asset market rankings and peer comparisons
Implementation choices
Direct / fund level – best execution
Formulation of a trading strategy
Guidance on trading and risk framework
Research & OpinionClient Outlook & Risk
AdvicePortfolio and
Investment DesignPortfolio Construction
& ImplementationPartial or Full Discretion Full OCIO

127
Thank youAny questions?

Biographies, appendix & important informationSection 5

129
Massimiliano Castelli, PhD, MSC
Years of financial industry experience: 20
Education: University of Rome (Italy), PhD; University of London (UK), MSc
As Head of Global Strategy he analyzes the market trends affecting the investment behavior of central banks, sovereign wealth funds and other state-controlled investment institutions and work closely with the investment teams in providing investment advice and developing tailored investment solutions for this client segment
Max established himself as a global thought leader on the macroeconomic, financial and political trends in sovereign wealth management. He has often been called in by leading institutions as an expert on global economic and financial matters. Max has recently published The New Economics of Sovereign Wealth Funds in the Wiley Finance Series, a book providing a thorough guide to sovereign wealth funds, covering the drivers of the industry, how it operates and grows, the interest from and in Western markets and the pivotal role that sovereign wealth funds play in the world economy
In his sixteen year long international professional career, Max has been Head of governmental affairs for UBS in Europe, Middle East and Africa, EMEA Senior Economist and consultant advising governments and corporates in emerging markets on behalf of international institutions
Max holds a PhD in Economics from the University of Rome where he lectured and a Msc in Economics from the University of London. He is a member of the Executive Committed of the Asset Management Investment Council (ICMA) and a Fellow at the Centre for International Markets, Money and Regulations at Bocconi University.
Head Global Strategy, Global Sovereign Markets Managing Director
Note: As at March 2021

130
Michele Gambera, PhD, CFACo-Head of Strategic Asset Allocation Modeling, Investment SolutionsExecutive Director
Years of investment industry experience: 22
Education: Università degliStudi di Trento (Italy), BS (Laurea); Pennsylvania State University (US), MA, PhD
Michele Gambera is Co-Head of Strategic Asset Allocation Modeling.
In this role he co-leads the team developing and maintaining quantitative models in asset allocation for both clients and the portfolio management teams in Investment Solutions.
Michele joined UBS Asset Management in 2010 from Ibbotson Associates, Morningstar’s asset allocation consultancy, where he had been Senior Research Consultant and Chief Economist since 2006. In his more than nine years at Morningstar, he was also a Senior Quantitative Analyst and then Chief Economist for Morningstar Associates LLC. Prior to joining Morningstar, he worked for the Federal Reserve Bank of Chicago for two years as an Economist in the Supervision and Regulation division.
Alongside his extensive economic and quantitative analysis experience, Michele has a strong academic background and has held various teaching roles, most recently on the Master of Quantitative Finance program at University of Illinois. He is often quoted by the press including the Wall Street Journal and the New York Times.
He is a member of the Chicago Quantitative Alliance and the CFA Society of Chicago.
Note: As at March 2021

131
Louis D. Finney, PhD Co-Head of Strategic Asset Allocation Modeling, Investment SolutionsExecutive Director
Years of investment industry experience: 35
Education: Johns Hopkins University (US), BA; University of Maryland (US), PhD
Louis Finney is Co-Head of the Strategic Asset Allocation Modeling group in the Investment Solutions team of UBS Asset Management.
In this role he co-leads the team in modeling portfolio returns, risks and characteristics for clients and the Investment Solutions platform.
Louis conducts research in the capital markets and researches tools and techniques in evaluating multi-asset portfolios. He develops the strategic asset allocation for defined benefit plans, sovereign wealth funds, endowments and foundations, target date funds, inflation protection and real return strategies He has done extensive work in strategies for implementing deferred annuities in defined contribution plans.
Before joining the firm in 2011, Louis was Chief Economist and Principal at Mercer Investment Consulting, where he focused on capital market research and strategic asset allocation. He set capital market assumptions, developed tools to model the capital markets and integrate them with asset/liability systems, and portfolio construction with multiple managers. He sat on several national and global committees.
Louis received his PhD in Economics from the University of Maryland in 1987. He graduated from Johns Hopkins University in 1978.
Note: As at March 2021

132
Mohammad AhmadHead Investment Solutions Specialists, EMEAExecutive Director
Years of investment industry experience: 30
Education: University of Edinburgh, Business School, MBA
Mohammad is part of the team for Investment Solutions and leads the Investment Solutions Specialists in EMEA
Mohammad was most recently Managing Director and Head of Risk, Analytics, and Regulation at the Enterprise division at Thomson Reuters. He joined Thomson Reuters as Head of Alternative Investment Solutions – catering to the analytic, platform (position and risk) and content needs of alternative investment firms.
Prior to that, he was Chief Risk and Chief Operating Officer and a co-founder at the hedge fund GMI Global Macro Investments AG.
Mohammad has worked in Japan and South Asia with Baring Securities Japan as head of quantitative analysis and later as the head of Baring Securities for South Asia.
Mohammad spent four years at Putnam Investments in Boston as part of the Risk and Portfolio construction team. Mohammad also worked with Crosby Capital Advisors – a private equity firm investing in fintech for alternatives . Mohammad has extensive experience in providing solution and consultative services to financial services firms in Europe, Asia, and the Middle East.
Mohammad's career spans sell side and buy side firms, vendors and consultant firms across APAC; EMEA and the North America over 28 years
Note: As at March 2021

133
Philipp Salman, Lic. oec. HSG Global Sovereign Markets – Strategy & AdviceDirector
Years of financial industry experience: 13
Education: University of St. Gallen (Switzerland), Lic. oec. HSG
Philipp Salman is a member of the Global Sovereign Markets team, working as a strategist and client advisor for the Head of Strategy, Max Castelli.
As part of that role, Philipp analyzes global economic and financial trends affecting the investment behavior of Central Banks, Sovereign Wealth Funds and other state-controlled investment institutions and contributes to their strategic and investment decision-making processes. He advises clients on strategic and tactical asset allocation and works with clients and portfolio managers in developing investment, advisory and training solutions tailored to the sovereign institutions client segment.
Philipp joined UBS Asset Management – Global Sovereign Markets in 2015. In his previous professional career at UBS, Philipp was an Equity Trader for US securities at UBS Investment Bank and a member of the UBS Investor Relations team located in Zurich.
Note: As at March 2021

134
Data sources
The following indices are used to represent historic returns of different asset classes
*) GGB and GGB1-3 represent fixed income portfolios based on short-term (GGB 1-3) and long-term (GGB) government bond indices of the respective country. Country weights: US 65%, Germany 15%, UK 5%, Japan 5%, France 5%, Netherlands 5%.
Cash Citigroup US 3m
GGB 1-3 Citigroup weighted index *)
GGB Citigroup weigted Index *)
Corporate Bond Bloomberg Barclays Corporate Investment Global - US Hedged
TIPS Bloomberg Barclays US Gov. Inflation-Linked All Mat.
Securitisied Bloomberg Barclays Global Aggregate Securitised
Supranationals Bloomberg Barclays Global Aggregate Government Related
EMD Hard Currency JP Morgan EMBI Global
EMD Local Currency JP Morgan GBI-EM Diversified (TR)
Global Equity MSCI World
Real Estate FTSE EPRA/NAREIT Developed (hedged USD)
Private Equity Cambridge Private Equity
Hedge Funds HFRI - Fund Weighted Composite Index
Infrastructure S&P Global Infrastructure Index (TR)
Gold London Gold Fixings AM
Commodity Bloomberg Commodity Index

135
Asset classes
Source: UBS Asset Management. Data as of end of December 2020. This does not constitute a guarantee by UBS AG, Asset Management.
This document contains statements that constitute ”forward-looking statements”, including, but not limited to, statements relating to our future business development. While these forward-looking statements represent our judgments and future expectations concerning the development of our business, a number of risks, uncertainties and other important factors could cause actual developments and results to differ materially from our expectations.
Return Std Dev Risk/Return Sharpe Return Std Dev Risk/Return Sharpe Return Std Dev Risk/Return Sharpe Return Std Dev Risk/Return SharpeCash 0.26% 1.35% 0.19 0.00 -0.04% 1.34% -0.03 0.00 0.60% 1.36% 0.44 0.00 0.76% 1.34% 0.57 0.12
Global Government Bond 1-3 0.50% 1.96% 0.26 0.12 0.08% 1.96% 0.04 0.06 -0.12% 2.08% -0.06 -0.35 -0.05% 1.88% -0.03 -0.34
Global Government Bond -0.21% 5.58% -0.04 -0.08 0.61% 4.49% 0.14 0.14 -3.18% 5.85% -0.54 -0.65 -2.36% 4.18% -0.56 -0.71
Corporates 0.67% 6.44% 0.10 0.06 2.23% 5.57% 0.40 0.41 -0.30% 8.88% -0.03 -0.10 0.67% 4.85% 0.14 0.01
TIPS -0.90% 5.32% -0.17 -0.22 0.31% 5.21% 0.06 0.07 1.99% 5.38% 0.37 0.26 -1.24% 4.83% -0.26 -0.38
Securitized 0.94% 6.45% 0.15 0.11 1.02% 5.02% 0.20 0.21 0.31% 8.13% 0.04 -0.04 0.51% 5.23% 0.10 -0.02
Supranational 0.73% 5.77% 0.13 0.08 1.15% 4.62% 0.25 0.26 -1.15% 6.25% -0.18 -0.28 -0.55% 4.62% -0.12 -0.25
EMD Hard Currency 3.59% 7.38% 0.49 0.45 5.25% 8.65% 0.61 0.61 5.41% 10.47% 0.52 0.46 5.04% 5.69% 0.89 0.78
EMD Local Currency 4.28% 13.20% 0.32 0.30 3.56% 14.09% 0.25 0.26 2.90% 14.57% 0.20 0.16 4.38% 12.41% 0.35 0.30
Global Equity 7.16% 15.97% 0.45 0.43 1.03% 22.28% 0.05 0.05 2.43% 22.41% 0.11 0.08 11.53% 12.96% 0.89 0.84
Real Estate 5.66% 8.65% 0.65 0.62 1.88% 11.13% 0.17 0.17 3.29% 11.14% 0.30 0.24 10.38% 7.12% 1.46 1.37
Private Equity 9.53% 23.97% 0.40 0.39 0.17% 33.37% 0.01 0.01 2.73% 33.37% 0.08 0.06 12.76% 19.63% 0.65 0.62
Hedge Funds 3.98% 4.33% 0.92 0.86 1.29% 5.32% 0.24 0.25 2.72% 5.29% 0.51 0.40 6.38% 3.86% 1.65 1.50
Infrastructure 5.57% 16.65% 0.33 0.32 2.49% 19.03% 0.13 0.13 3.90% 19.03% 0.21 0.17 8.46% 14.81% 0.57 0.53
Gold 0.56% 12.54% 0.04 0.02 1.55% 12.42% 0.12 0.13 2.95% 12.92% 0.23 0.18 2.33% 12.45% 0.19 0.14
Commodity 0.56% 14.85% 0.04 0.02 0.39% 15.12% 0.03 0.03 6.24% 15.90% 0.39 0.35 2.54% 14.53% 0.17 0.13
5-year expected returns
Expected returns

136
Portfolios Expected returns
Source: UBS Asset Management. Data as of end of December 2020. This does not constitute a guarantee by UBS AG, Asset Management.
This document contains statements that constitute ”forward-looking statements”, including, but not limited to, statements relating to our future business development. While these forward-looking statements represent our judgments and future expectations concerning the development of our business, a number of risks, uncertainties and other important factors could cause actual developments and results to differ materially from our expectations.
Base case Recession Stagflation Productivity Boost
GGR Std Dev Return/Risk GGR Std Dev Return/Risk GGR Std Dev Return/Risk GGR Std Dev Return/RiskGGB -0.21% 5.58% -0.04 0.61% 4.49% 0.14 -3.18% 5.85% -0.54 0.70% 4.18% 0.17
CB1 0.39% 1.20% 0.32 0.03% 1.18% 0.02 0.25% 1.24% 0.20 -1.16% 1.16% -1.00
CB2 0.47% 2.63% 0.18 0.55% 1.98% 0.28 0.16% 3.06% 0.05 -0.73% 2.18% -0.34
CB3 0.74% 3.04% 0.24 1.16% 2.18% 0.53 0.45% 3.69% 0.12 0.31% 2.37% 0.13
CB4 1.64% 4.01% 0.41 1.13% 3.47% 0.32 0.61% 5.77% 0.11 1.44% 2.98% 0.49
Stab1 1.74% 3.44% 0.51 1.68% 2.79% 0.60 1.33% 4.68% 0.28 2.84% 2.60% 1.09
Stab2 2.84% 4.85% 0.59 1.93% 5.29% 0.37 1.79% 7.10% 0.25 4.40% 3.64% 1.21
Stab3 0.27% 3.32% 0.08 0.54% 2.50% 0.22 -1.31% 3.71% -0.35 -0.96% 2.59% -0.37
Sav1 1.07% 3.74% 0.29 0.83% 2.57% 0.32 -0.74% 5.08% -0.15 0.17% 2.75% 0.06
Sav2 1.34% 3.94% 0.34 0.95% 2.87% 0.33 -0.56% 5.50% -0.10 1.00% 2.87% 0.35
Sav3 4.96% 10.69% 0.46 1.76% 13.57% 0.13 1.31% 15.60% 0.08 7.16% 8.33% 0.86
Augmented portfoliosCB3+ 1.74% 3.04% 0.57 1.68% 2.18% 0.77 1.33% 3.69% 0.36 2.84% 2.37% 1.20
CB4+ 2.84% 4.85% 0.59 1.93% 5.29% 0.37 1.79% 7.10% 0.25 4.40% 3.64% 1.21
5-year expected returns

137
DisclaimerThis document is for informational purposes only and is not intended to be construed as an invitation or offer of securities or to conclude a contract or to buy and sell any security or related financial instrument. Such an offer will only be made by means of a confidential offering memorandum. This material is confidential and intended solely for the information of the person to whom it has been delivered and may not be distributed in any jurisdiction where such distribution would constitute a violation of applicable law or regulations or to certain categories of investors. Recipients may not reproduce or transmit it, in whole or in part, to third parties. The program described herein is for sophisticated investors or professional clients as the program by its nature involves a substantial degree of risk. This document is not to be distributed to or relied upon by retail clients under any circumstances. The information in this document does not constitute advice and does not take into consideration your investment objectives, legal, financial or tax situation or particular needs in any other respect. Investors should seek professional advice as to the suitability of the program. If conflicts exist between this document and the applicable offering memorandum, the offering memorandum takes precedence. Any returns presented may or may not be indicative of the returns of the share class, series, and/or fund offered to you. Commissions and costs have a negative impact on performance. Should the currency of a financial product or service not match your reference currency, performance may rise or fall due to currency fluctuations. Your actual returns may be different and can be determined from the statements sent by the fund's administrator.
Unless otherwise noted, the information used to create information presented was based solely on information collected and retained by the investment manager and is believed to be reliable, but its accuracy cannot be guaranteed. Information used herein may have been obtained from third party sources including affiliates and as such the investment manager makes no representations as to the accuracy of such source or information which is subject to change without notice to the recipient. Notwithstanding the foregoing, third party funds and managers have neither reviewed nor approved any of the charts, graphs or other materials prepared by UBS Hedge Fund Solutions LLC based on information contributed by such third party funds and managers. If contained in a presentation, the information herein is not intended to be read in isolation and may not provide a full explanation of all of the topics that were presented and discussed. All such information and opinions are subject to change without notice. Neither this document nor the securities nor any other financial instruments referred to herein have been registered or filed with or approved or disapproved by any regulatory authority of any country or jurisdiction, and no regulatory authority has passed upon or endorsed upon the merits of this product or the accuracy or adequacy of this document. UBS may have a position in and may make a purchase and/or sale of any of the securities or other financial instruments mentioned in this document. This document may contain statements that constitute "forward-looking statements", including, but not limited to, statements relating to our future business development. While these forward-looking statements represent our judgments and future expectations concerning the development of our business, a number of risks, uncertainties and other important factors could cause actual developments and results to differ materially from our expectations. Any market or investment views expressed are not intended to be investment research. Source for all data and charts (if not indicated otherwise): UBS Asset Management, a business division of UBS AG.
The securities offered hereby (if this presentation concerns a Fund) are not deposits or other obligations of UBS or any other Bank, are not endorsed or guaranteed by UBS or any other Bank, are not insured by the Federal Deposit Insurance Corporation (FDIC) or any other Governmental Agency and involve investment risks, including loss of principal invested.
Any losses in the Fund presented herein will be borne solely by investors in the Fund and not by the Investment Manager or its affiliates; therefore, the Investment Manager and its affiliates' losses in the Fund will be limited to losses attributable to the ownership interests in the covered fund held by the investment Manager and its affiliates in their capacity as investors in the Fund.
As an investor, you should read the Fund Documentation Prior to investing in the Fund.
An affiliate of the Investment Manager may serve as the Administrator of the Fund, and the Investment Manager may engage affiliates as Prime Brokers for the Fund. None of these entities will bear any losses for the fund.
Past performance (whether simulated or actual) is not indicative of future results. Potential for profit is accompanied by possibility of loss.
For Switzerland: For marketing and information purposes. This document has been issued by UBS Asset Management Switzerland AG, a company registered under the Laws of Switzerland, and its affiliates. The following paragraph refers only to fund(s) mentioned in this document, which are distributed in or from Switzerland, which are managed by UBS and/or any of its affiliates and having UBS Fund Management (Switzerland) AG as Representative in Switzerland. Any such fund(s) referenced herein are intended only for Swiss qualified investors pursuant to Art 10 of the Collective Investment Schemes Act (CISA) and are not allowed to be distributed to the retail public (i.e. non-qualified investors).
Information for Swiss qualified Investors: Representative in Switzerland is UBS Fund Management (Switzerland) AG, Aeschenplatz 6, 4052 Basel. Paying Agent in Switzerland: UBS Switzerland AG, Bahnhofstrasse45, 8001 Zürich. The relevant Legal Fund Documents to this fund (s) are available free of charge from the Representative in Switzerland. Before any investment, please read the latest Legal Fund Documents. The information herein is not intended to be construed as a solicitation or an offer to invest in the fund(s). Past performance is not a reliable indicator of future results. The performance shown does not take account of any commissions and costs charged when subscribing and redeeming. If the currency of the fund(s) is different from your reference currency, the return can increase or decrease as a result of currency fluctuations. This information pays no regard to the specific or future investment objectives, financial or tax situation or particular needs of any specific recipient. The details and opinions contained in this document are provided by UBS Hedge Fund Solutions LLC without any guarantee or warranty and are for the recipient's personal use and information purposes only. This document and its contents have not been reviewed by any regulatory authority in Switzerland
For USA: This document has been issued by UBS Hedge Fund Solutions LLC for distribution to professional clients or sophisticated investors only. Funds are offered through UBS Asset Management (US) Inc./UBS Financial Services Inc. (a member of FINRA and SIPC). UBS Hedge Fund Solutions LLC (an investment adviser registered with the US Securities and Exchange Commission) and UBS Financial Services Inc./UBS Asset Management (US) Inc. are indirect wholly-owned subsidiaries of UBS AG.

138
DisclaimerFor UK/Jersey: UBS Asset Management (UK) Ltd is a subsidiary of UBS AG. Registered in England. UBS Asset Management (UK) Ltd and UBS Asset Management Funds Ltd are authorised and regulated by the Financial Conduct Authority. UBS Asset Management Life Ltd is authorised by the Prudential Regulation Authority and regulated by the Financial Conduct Authority and the Prudential Regulation Authority. Telephone calls may be recorded.
This document is for Professional Clients only. It is not to be distributed to or relied upon by Retail Clients under any circumstances. This material supports the presentation(s) given. It is not intended to be read in isolation and may not provide a full explanation of all the topics that were presented and discussed. Care has been taken to ensure the accuracy of the content, but no responsibility is accepted for any errors or omissions. This document is a marketing communication. Any market or investment views expressed are not intended to be investment research. The document has not been prepared in line with the FCA requirements designed to promote the independence of investment research and is not subject to any prohibition on dealing ahead of the dissemination of investment research. Source for all data and charts (unless otherwise stated): UBS Asset Management
This document does not create any legal or contractual obligation with UBS Asset Management. The recipient agrees that this information shall remain strictly confidential where it relates to the Investment Manager's business. The prior consent of UBS Asset Management (UK) Ltd should be obtained prior to the disclosure of commercially sensitive information to a third party (excluding the professional advisors of the recipient). Information reasonably deemed to be commercially sensitive and obtained from UBS Asset Management (UK) Ltd should not be disclosed. This information is supplied with a reasonable expectation that it will not be made public. If you receive a request under the Freedom of Information Act 2000 for information obtained from UBS Asset Management (UK) Ltd we ask that you consult with us. We also request that any information obtained from UBS Asset Management (UK) Ltd in your possession is destroyed as soon as it is no longer required.
For EMEA: This document has been issued by UBS AG, a company registered under the Laws of Switzerland, and its affiliates. In relation to each member state of the EEA which, at the date of this document, has implemented the Alternative Investment Fund Managers Directive (Directive (2011/61/EU), the "AIFMD"), this document may only be distributed, and shares in the Fund may only be offered or placed, in a member state to the extent that: (i) the Fund is permitted to be marketed to professional investors in the relevant member state (as implemented in the local law/regulation of that member state); or (ii) this document may otherwise be lawfully distributed and/or the Shares in the Fund may otherwise be lawfully offered or placed in that member state (including at the initiative of the investor). In relation to each member state of the EEA which, at the date of this document, has not implemented the AIFMD, this document may only be distributed, and shares in the Fund may only be offered or placed, to the extent that this document may be otherwise lawfully distributed and the shares in the Fund may be lawfully offered or placed in that member state (including at the initiative of the investor).
UBS AG and its affiliates, including, but not limited to UBS Asset Management (UK) Ltd, and any products or services mentioned in this document: (i) have not been approved by or registered with; and (ii) do not fall under the supervision of, the Securities and Commodities Authority of the United Arab Emirates.
For Japan: This document is sent to you, at your request, merely for information purposes only. No invitation or offer to subscribe or purchase securities is made except pursuant to the applicable laws and regulations of Japan, including but not limited to the Financial Instruments and Exchange Act and any other applicable laws, regulations or rules of Japan.
For Hong Kong: This document and its contents have not been reviewed by any regulatory authority in Hong Kong. No person may issue any invitation, advertisement or other document relating to the Interests whether in Hong Kong or elsewhere, which is directed at, or the contents of which are likely to be accessed or read by, the public in Hong Kong (except if permitted to do so under the securities laws of Hong Kong) other than with respect to the Interests which are or are intended to be disposed of only to persons outside Hong Kong or only to "professional investors" within the meaning of the Securities and Futures Ordinance (Cap. 571) and any rules made thereunder. The use of simulated past performance is not permitted in this jurisdiction.
For Singapore: This document has not been registered with the Monetary Authority of Singapore pursuant to the exemptions under Sections 304 and 305 of the SFA. Accordingly, this document may not be circulated or distributed, nor may the Securities be offered or sold, whether directly or indirectly, to any person in Singapore other than (i) to an institutional investor pursuant to Section 304 of the SFA, (ii) to an accredited investor or other relevant person, or any person pursuant to Section 305(2) of the SFA, and in accordance with the conditions specified in Section 305 of the SFA or (iii) otherwise pursuant to, and in accordance with the conditions of, any other applicable provision of the SFA.
For Vietnam: This document does not contemplate an offer to sell the securities in Vietnam and has not been approved by the State Securities Commission of Vietnam which takes no responsibility for its contents. No offer to purchase the securities will be made in Vietnam and this document is intended to be read by the addressees only. Investors should themselves carefully balance the risks and the level of those risks before they make any decision to invest in the securities. Investors are responsible for obtaining all approvals required by the laws of Vietnam.
For Korea: The securities may not be offered, sold and delivered directly or indirectly, or offered or sold to any person for re-offering or resale, directly or indirectly, in Korea or to any resident of Korea except pursuant to the applicable laws and regulations of Korea, including the Capital Market and Financial Investment Business Act and the Foreign Exchange Transaction Law of Korea, the presidential decrees and regulations thereunder and any other applicable laws, regulations or rules of Korea. The securities have not been registered with the Financial Services Commission of Korea (FSC) for a public offering in Korea nor has it been registered with the FSC for distribution to non-qualified investors in Korea.

139
DisclaimerFor People's Republic of China: This document and its contents have not been reviewed by, delivered to or registered with any regulatory or other relevant authority in the People's Republic of China (the "PRC"). This document is for informational purposes and should not be construed as an offer or invitation to the public, direct or indirect, to buy or sell securities. This document is intended for limited distribution and only to the extent permitted under applicable laws in the PRC. No representations are made with respect to the eligibility of any recipients of this document to acquire interests in securities under the laws of the PRC.
The securities may not be offered or sold directly or indirectly in the PRC. Neither this document or information contained or incorporated by reference herein relating to the securities, which have not been and will not be submitted to or approved/verified by or registered with the China Securities Regulatory Commission ("CSRC") or other relevant governmental authorities in the PRC pursuant to relevant laws and regulations, may be supplied to the public in the PRC or used in connection with any offer for the subscription or sale of the Securities in the PRC. The Securities may only be offered or sold to the PRC investors that are authorised to engage in the purchase of Securities of the type being offered or sold. PRC investors are responsible for obtaining all relevant government regulatory approvals/licences, verification and/or registrations themselves, including, but not limited to, any which may be required from the CSRC, the State Administration of Foreign Exchange and/or the China Banking Regulatory Commission, and complying with all relevant PRC regulations, including, but not limited to, all relevant foreign exchange regulations and/or foreign investment regulations.
For Taiwan: This document and its contents have not been reviewed by, delivered to or registered with any regulatory or other relevant authority in the Republic of China (R.O.C.). This document is for informational purposes and should not be construed as an offer or invitation to the public, direct or indirect, to buy or sell securities. This document is intended for limited distribution and only to the extent permitted under applicable laws in the Republic of China (R.O.C.). No representations are made with respect to the eligibility of any recipients of this document to acquire interests in securities under the laws of the Republic of China (R.O.C.).
For Australia: This document has been prepared and issued by UBS Hedge Fund Solutions LLC. UBS Hedge Fund Solutions LLC is an investment adviser registered with the US Securities and Exchange Commission and such is regulated under a regulatory regime that differs from the Australian regulatory regime. UBS O’Connor does not hold an Australian Financial Services Licence and is not authorised and regulated by the Australian Securities and Investments Commission (“ASIC”). UBS Hedge Fund Solutions LLC is permitted to provide financial services to wholesale clients in Australia in reliance on Class Order CO 03/1100 issued by ASIC. This document is intended for limited distribution to professional investors only. It is not to be distributed to or relied upon by retail clients. This document is general information only and does not take into account your objectives, financial situation or needs. Before investing you should seek professional advice. Any investment involves risk. UBS Hedge Fund Solutions LLC does not guarantee the performance of any investment.
For Brunei: This document has not been delivered to, licensed or permitted by the Authority as designated under the Brunei Darussalam Mutual Funds Order 2001. Nor has it been registered with the Registrar of Companies. This document is for informational purposes only and does not constitute an invitation or offer to the public. As such it must not be distributed or redistributed to and may not be relied upon or used by any person in Brunei other than the person to whom it is directly communicated, (i) in accordance with the conditions of section 21(3) of the International Business Companies Order 2000, or (ii) whose business or part of whose business is in the buying and selling of shares within the meaning of section 308(4) of the Companies Act Cap. 39.
For Malaysia: This document is sent to you, at your request, merely for information purposes only. No invitation or offer to subscribe or purchase securities is made by UBS Asset Management as the prior approval of the Securities Commission of Malaysia or other regulatory authorities of Malaysia have not been obtained. No prospectus has or will be filed or registered with the Securities Commission of Malaysia.
For Thailand: NOTICE TO RESIDENTS OF THAILAND – the securities will not be offered or sold, directly or indirectly, in Thailand. UBS Asset Management is not licenced to publically offer securities in Thailand. Thai investors must be authorised to engage in the purchase of Securities of the type being offered or sold. Thai investors are responsible for obtaining all relevant government regulatory approvals/licences, consents, verification and/or registrations from relevant Thai governmental and regulatory authorities required to invest in the securities and required for the purposes of remitting any amounts in foreign currencies for the investment.
For Brazil: UBS Hedge Fund Solutions LLC is not accredited with the Brazilian Securities Commission (" CVM") to perform Asset Management Services. The Asset Management Services may not be publicly offered or sold to the public in Brazil. Documents relating to the Asset Management Services as well as the information contained therein may not be supplied to the public in Brazil.
For Canada: Services to Canadian persons for any strategy herein are provided by UBS Asset Management (Canada) Inc., a Nova Scotia corporation and a member of the UBS Asset Management business division of UBS AG, a publicly traded Swiss bank (NYSE: UBS). UBS Asset Management (Canada) Inc. is an indirect wholly-owned subsidiary of UBS AG and is registered as a portfolio manager and exempt market dealer (in all provinces of Canada), commodity trading manager (Ontario), adviser – commodity futures (Manitoba) and investment fund manager (Ontario, Quebec and Newfoundland), all pursuant to Canadian securities law. This document can be distributed in Canada to Accredited Investors who qualify as Permitted Clients only. UBS Hedge Fund Solutions LLC may be considered a connected or related issuer of UBS Asset Management (Canada) Inc. in connection with a distribution of the strategy herein to investors in Canada.
© Copyright UBS 2021. The key symbol and UBS are among the registered and unregistered trademarks of UBS. All rights reserved.