E111 ASSET 7 Part3
50
101 Copyright 2011 AIRCOM International Status Fields in ENTERPRISE
-
Upload
independent -
Category
Documents
-
view
1 -
download
0
Transcript of E111 ASSET 7 Part3

101 Copyright 2011 AIRCOM International
Status Fields in ENTERPRISE

102 Copyright 2011 AIRCOM International
Filters in EnterpriseFilters provide a logical grouping of network elements according to their characteristics or functions. They enable you to sub-divide the network into more manageable sections for analysis, diagnosis and display.
• Static Filters• Static lists of objects specified by the user
• Dynamic Filters• The included objects will constantly update as the Network
evolves

103 Copyright 2011 AIRCOM International
Use of Filters• Limit the list of network elements displayed in the Site Database
• Determine which network elements appear in the Map View
• Allow customised appearance of different filters in the Map View
• Control which items are to be included in the various wizards
• Selects items to be included in any global edits in the Site DB
• Limit which items to include in the various reports
104 Copyright 2011 AIRCOM International
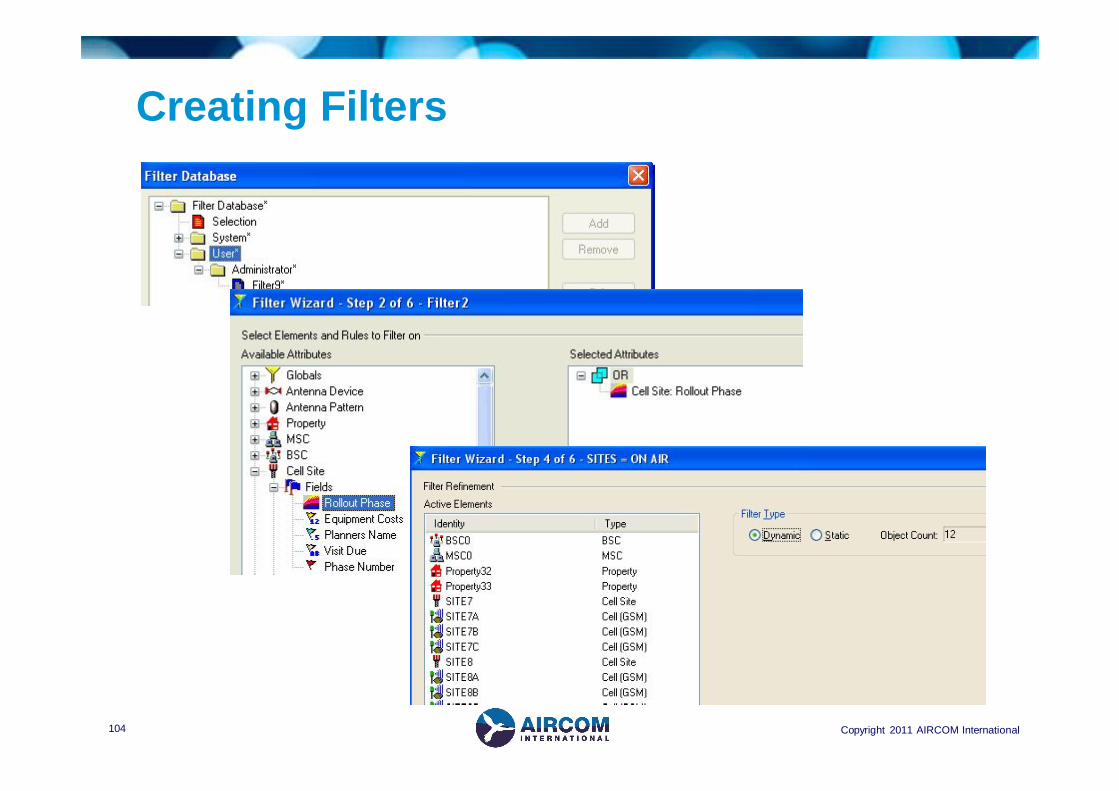
Creating Filters

105 Copyright 2011 AIRCOM International
Selection Filter and Selection Expert
Selection Filter• This is a static filter that exists only in memory. It is not stored in the
database and therefore cannot be Applied or Committed.
• It can be renamed and saved as a normal static filter.
Selection Expert• Allow populate selection filter by choosing elements individually in the Site
Database or Map View, or by creating in the Map View a polygonal, circular or rectangular area that contains the sites you want
• Acts as a handy clipboard - to easily allow you to cut and paste network elements between different parents cells between sites and so on
• Acts as a viewing window for all filters - you can quickly review all filters and edit the static and Selection filters

106 Copyright 2011 AIRCOM International
Exporting Filters using XML Export

107 Copyright 2011 AIRCOM International
Dynamic Filters and Efficiency
• Eliminate the largest number of unwanted objects first
• Use as few rules as possible
• Run the fastest rule first

108 Copyright 2011 AIRCOM International
Using Visualisers
• A visualiser is a way of creating multiple display settings for the same filter
• They are never saved to the Database and therefore have no impact on processing speed
• They do not affect other users

109 Copyright 2011 AIRCOM International
Display Properties

110 Copyright 2011 AIRCOM International
Customising Visualisers

111 Copyright 2011 AIRCOM International
Customising Visualisers

112 Copyright 2011 AIRCOM International
Customising Visualisers

113 Copyright 2011 AIRCOM International
Customising Visualisers

114 Copyright 2011 AIRCOM International
Session 9 - Predicting and Displaying Coverage

115 Copyright 2011 AIRCOM International
Session Objectives
In this session you will learn about:
• Predicting coverage (pathloss)
• Creating coverage arrays
• Displaying coverage
• Analysing coverage with statistical reports
• Managing arrays

116 Copyright 2011 AIRCOM International
Predicting Coverage• You can predict the pathloss of the signal from any cell to any point
and use this information as the basis of coverage and interference predictions for your planned network
• The arrays can be used to produce statistical reports• The coverage predictions are created or loaded automatically
whenever you create a coverage/interference array, or the Simulator• You do not need to explicitly create coverage predictions

117 Copyright 2011 AIRCOM International
Predicting Coverage

118 Copyright 2011 AIRCOM International
Primary and Secondary predictions• Dual prediction option, enables us to specify two 'sets' of resolution
and radius for the cells in your network
• Array Settings dialog box have a crucial impact on how dual predictions are used

119 Copyright 2011 AIRCOM International
Best RSRP Coverage Example

120 Copyright 2011 AIRCOM International
Array Display PropertiesTo customise the arrays displayed in the Map View window, Use theShow Data Types button

121 Copyright 2011 AIRCOM International
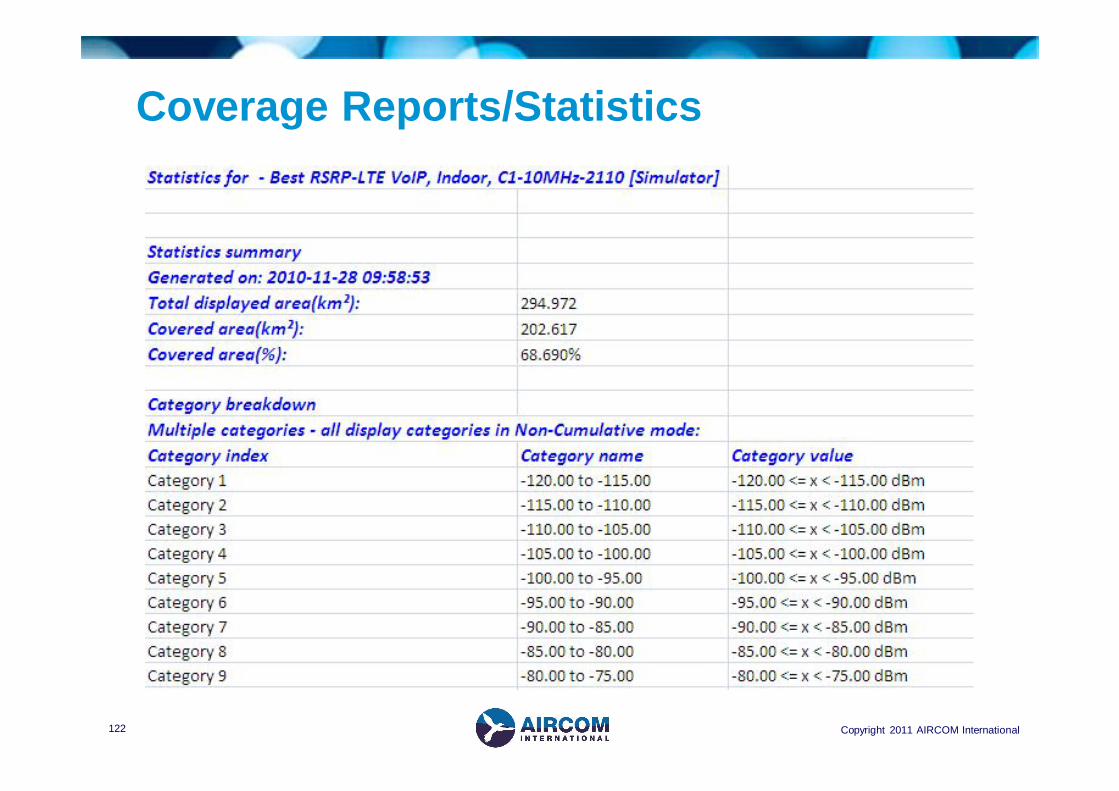
Coverage Reports/StatisticsOnce coverage arrays have been created, you can generate coverage statistics.
122 Copyright 2011 AIRCOM International
Coverage Reports/Statistics

123 Copyright 2011 AIRCOM International
Array Manager• Enables memory management on arrays and simulations
• Provides the ability to retrieve archived arrays, allowing for the benchmarking of statistical changes over time

124 Copyright 2011 AIRCOM International
Session 10 - Traffic Planning on a LTE Network

125 Copyright 2011 AIRCOM International
Session Objectives
In this session you will learn about:
• Configuring bearers
• Configuring services
• Configuring terminal types
• Setting clutter parameters
• Creating traffic rasters
126 Copyright 2011 AIRCOM International
Traffic Parameters for UMTS
When you are satisfied with your network's coverage performance, you are in a position to consider traffic modelling in your network.
In modern cellular networks, there are different types of subscribers with different profiles, and different types of mobile terminals with different properties. In addition, multiple services can be offered to the subscriber. These may include voice, data and multimedia services. When planning such a network, you must account for the different properties of these services, such as different costs, data rates and other requirements such as quality of service.
In ASSET, you can account for this by defining bearers, services, and terminal types

127 Copyright 2011 AIRCOM International
Default LTE BearersBearers represent the air interface connections, performing the task of transporting voice and data information between cells and terminal types.

128 Copyright 2011 AIRCOM International
Channel Quality Indicator TablesIndicates a combination of modulation and coding scheme that the NodeBshould use to ensure that the BLER experienced by the UE remains < 10%
eNB
UE1
UE2
UE3
UE4
UE5
64 QAM
16 QAM
QPSK
CQI Modulation Efficiency Actual coding rate
RequiredSINR
1 QPSK 0.1523 0.07618 -4.46
2 QPSK 0.2344 0.11719 -3.753 QPSK 0.3770 0.18848 -2.55
4 QPSK 0.6016 308/1024 -1.15
5 QPSK 0.8770 449/1024 1.75
6 QPSK 1.1758 602/1024 3.65
7 16QAM 1.4766 378/1024 5.28 16QAM 1.9141 490/1024 6.1
9 16QAM 2.4063 616/1024 7.55
10 64QAM 2.7305 466/1024 10.85
11 64QAM 3.3223 567/1024 11.5512 64QAM 3.9023 666/1024 12.75
13 64QAM 4.5234 772/1024 14.55
14 64QAM 5.1152 873/1024 18.1515 64QAM 5.5547 948/1024 19.25

129 Copyright 2011 AIRCOM International
LTE Services
The parameters that you specify will influence how the simulation behaves as well as enabling you to examine coverage and service quality for individual types of service.

130 Copyright 2011 AIRCOM International
LTE Services and QoS Parameters
Name QCI ResourceType
Priority Packet DelayBudget
Packet Error
Loss Rate
Example Services
VoIP 1 GBR 2 100 ms 10-2 Conversational VoiceVideo Call
2 GBR 4 150 ms 10-3 Conversational Video (Live Streaming)
Gaming 3 GBR 3 50 ms 10-3 Real Time GamingStreamin
g4 GBR 5 300 ms 10-6 Non-Convers.Video (Buff.
Streaming)Signalling 5 Non-GBR 1 100 ms 10-6 IMS Signalling
E-mail 6 Non-GBR 6 300 ms 10-6 Video (Buffered Streaming), TCP-based (www, e-mail,
chat, ftp, p2p sharing, Progressive video, etc.)
Voice, Video (Live Streaming) Interactive Gaming
Web browsing
7 Non-GBR 6 100 ms 10-3
P2P File Sharing
8 Non-GBR 8 300 ms 10-6
Chat 9 Non-GBR 9 300 ms 10-6

131 Copyright 2011 AIRCOM International
Clutter ParametersYou can define different shadow fading standard deviations for outdoor terminals and indoor terminals, per clutter type. If a building is in an urban area, it will encounter greater fading than in parkland.
You can also specify different indoor losses for each clutter type.

132 Copyright 2011 AIRCOM International
Terminal Types
ASSET models traffic demand by generating traffic density maps for the different types of terminal. These density maps define the amount of traffic offered to the network by each type of terminal on a pixel-by-pixel basis, corresponding to the available clutter map data resolutions.
A Terminal Type in ASSET defines these key characteristics:
• How much ‘traffic’ will the terminal type generate in total?
• How will the ‘traffic’ be spread geographically?
• What is the expected mobile speed distribution for this terminal type?
• Which service will the terminal type provide?
• What are the mobile equipment characteristics?
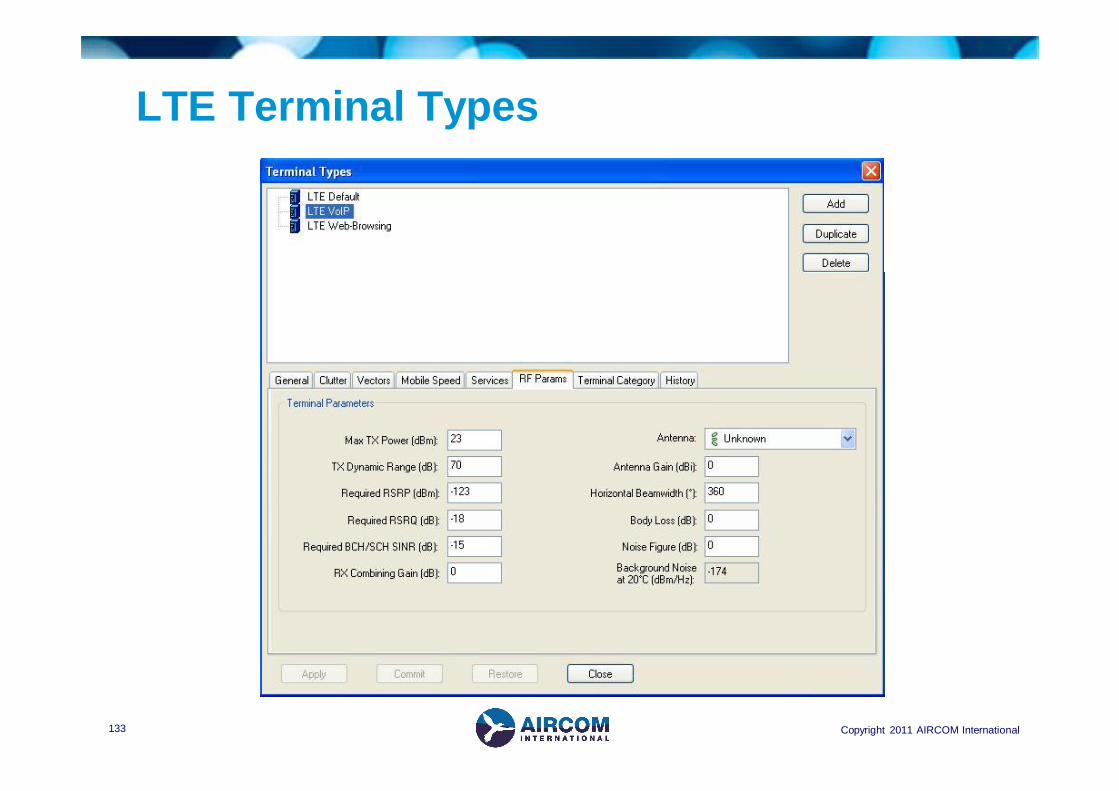
133 Copyright 2011 AIRCOM International
LTE Terminal Types

134 Copyright 2011 AIRCOM International
LTE User Equipment Categories
Parameters Category 1 Category 2 Category 3 Category 4 Category 5
Peak Data Rate (DL) 10 Mbps 50 Mbps 100 Mbps 150 Mbps 300 MbpsPeak Data Rate (UL) 5 Mbps 25 Mbps 50 Mbps 50 Mbps 75 Mbps
Block Size (DL) 10296 51024 102048 149776 299552Block Size (UL) 5160 25456 51024 51024 75376
Max. Modulation (DL) 64QAM 64QAM 64QAM 64QAM 64QAMMax. Modulation (UL) 16QAM 16QAM 16QAM 16QAM 64QAM
RF Bandwidth 20 MHz 20 MHz 20 MHz 20 MHz 20 MHzTransmit Diversity 1-4 Tx 1-4 Tx 1-4 Tx 1-4 Tx 1-4 TxReceive Diversity Yes Yes Yes Yes Yes
Spatial Multiplexing (DL) Optional 2 X 2 2 X 2 2 X 2 4 X 4Spatial Multiplexing (UL) No No No No No
MU-MIMO (DL) Optional Optional Optional Optional OptionalMU-MIMO (UL) Optional Optional Optional Optional Optional

135 Copyright 2011 AIRCOM International
Traffic Rasters
Traffic Rasters are arrays that store the distribution of traffic over an area. They can be created either from the information in the Terminal Types, or from imported Live Traffic values. The name of the created traffic raster will be the same as the name of the terminal type.
The Traffic Raster enables you to:
• Obtain initial estimates of the equipment and configuration needed for a nominal network. By visualising the array, you can gain a good idea of where to locate your sites.
• Can assess how your network performs in terms of capacity for a mature network. Can verify site configuration is sufficient to match the traffic spread over the network.

136 Copyright 2011 AIRCOM International
Creating Traffic Rasters

137 Copyright 2011 AIRCOM International
Traffic Rasters

138 Copyright 2011 AIRCOM International
Session 11 - Planning Neighbours

139 Copyright 2011 AIRCOM International
Session Objectives
In this session you will learn about:
• Creating neighbours manually
• Using simple file lists to add or remove neighbours
• Creating neighbours using the Neighbour Planning Wizard
• Amending the neighbour-related parameters
• Using the Neighbour Analysis
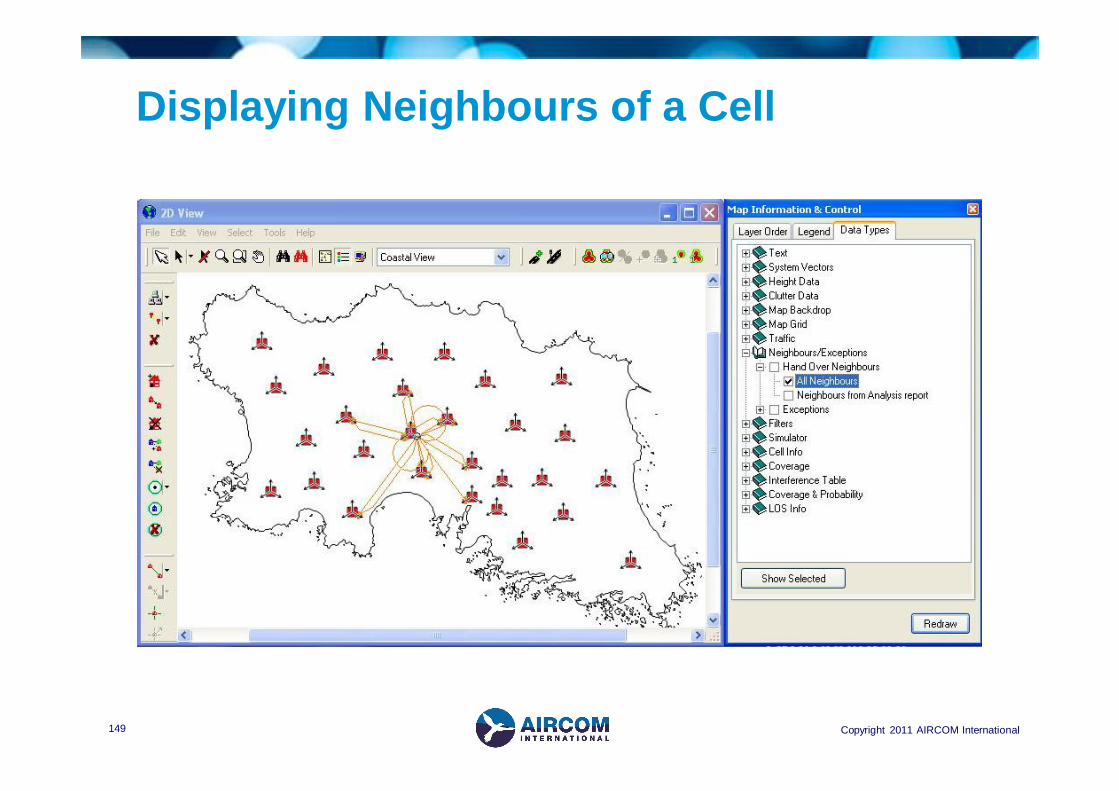
• Displaying neighbours in the Map View

140 Copyright 2011 AIRCOM International
Neighbours
A handover relationship from one cell to a neighbour cell, can be directional or mutual
Create Neighbours:
• Manually, in the Site Database or in the Map View
• By using a Comma Separated Value (*.csv) file
• By using automatic neighbour planning wizards
• By Importing/exporting via XML files

141 Copyright 2011 AIRCOM International
Creating Neighbours in the MAP View

142 Copyright 2011 AIRCOM International
Creating Neighbours in the Site Database

143 Copyright 2011 AIRCOM International
Creating Neighbours in the Site Database

144 Copyright 2011 AIRCOM International
Add/Remove Neighbours with a File List
• You can set up neighbours in ASSET by means of an XML import. Another way is use of a Comma Separated Value (*.csv) file.
• All neighbour relationships specified in the file must be outward
• Neighbour relationships which have been set to a protection state of 'Y' will be prevented from being removed

145 Copyright 2011 AIRCOM International
Auto Neighbour Planning Wizards
ASSET’s automatic Neighbour Planning Wizards enable you to generate neighbour relations between cells of the same (or different) technologies, and carriers according to a wide range of user-specified parameters.
There are two neighbour wizards available:
• Prediction-based
• Measurement-based (license based)

146 Copyright 2011 AIRCOM International
Auto Wizard Algorithm
• The algorithm takes place in two discrete stages:
• A 'search area' is established for each source cell, identifying the pixels to be included.
• The prediction-based wizard bases this on a combination of hysteresis margin and signal and/or quality thresholds.
• The measurement-based wizard bases this on a combination of measurement file information and signal and/or quality thresholds
• The calculation of potential target neighbour cells takes place, according to user-defined criteria. Within the search area, on a pixel-by-pixel basis, the neighbour wizards calculate a list of valid neighbours.

147 Copyright 2011 AIRCOM International
Prediction-Based Wizard Options

148 Copyright 2011 AIRCOM International
Neighbour Analysis
149 Copyright 2011 AIRCOM International
Displaying Neighbours of a Cell

150 Copyright 2011 AIRCOM International
Displaying Proposed Neighbours