UWS Asset Management - Co-UDlabs
22
Not all SuDS are created equal: Impact of different approaches on combined sewer overflows João P. Leitão Co-UDlabs online practice workshop on urban drainage 04 November 2021
-
Upload
khangminh22 -
Category
Documents
-
view
0 -
download
0
Transcript of UWS Asset Management - Co-UDlabs

Not all SuDS are created equal:
Impact of different approaches on combined sewer overflows
João P. Leitão
Co-UDlabs online practice workshop on urban drainage
04 November 2021

Traditional approach: to expand drainage systems
• Extremely expensive
• Unsustainable
• Impractical in dense urban areas
Other solutions are needed!
• Sustainable
• Multi-functional
• Decentralised
• …
Combined sewer overflows cause significant impacts on receiving
waters
https://sewerequipment.com/sanitary-vs-combined-sewer-systems/
Dry weather Wet weather

SuDS help attenuating runoff volume, increase time of concentration, …
SuDS may reduce CSO frequency and volume!
SuDS may reduce the pollution of
receiving water bodies ☺
Are Sustainable Urban Drainage Systems (SuDS) an option to reduce
CSOs?
Gra
ham
et al. (
2013)

A. Identifying the most suitable locations to install SuDS
B. Assessing the performance of SuDS for different storm events typical of Swiss rainfall
patterns
C. Comparing the implementation cost and efficiency of SuDS with the cost of grey
infrastructure (underground reservoirs)
Evaluating the effects of SuDS in reducing CSOs

• Rain barrels
• Green roofs
• Permeable pavements
• Bioretention cells
In this study we considered four types of SuDS…
Rain barrel
Permeable pavement
Green roof
Bioretention cell

SuDS type Dominant mechanism(s) Surface Pavement Soil Storage Drain
Bio-retention cell Evaporation, Infiltration ✓ ✓ ✓
Permeable pavement Infiltration, Storage ✓ ✓ ✓
Green roof Surface ✓ ✓
Rain Barrel Storage ✓ ✓
… with different working mechanisms

• 150 ha connected to the drainage system
• 6,500 inhabitants
• Mixed combined and separate system
• 7 CSO structures
• 35 year long rainfall time series
(1981 – 2016)
• Modelling: USA EPA’s SWMM 5.1
(Rossman, 2010, 2015)
The case study: Fehraltorf (Switzerland)
htt
ps:/
/ww
w.e
aw
ag.c
h/e
n/d
ep
art
ment/
sw
w/m
ain
-focus/u
rbanhydro
logis
ches-f
eld
labor/
Rossman, L.A. (2015). Storm Water Management Model User’s Manual Version 5.1. EPA/600/R-14/413b. United States Environ. Prot. Agency, Ohio
Rossman, L.A. (2010). Modeling low impact development alternatives with SWMM. J. Water Manag. Model. doi: 10.14796/JWMM.R236-11

A.Identifying the most suitable locations to install SuDS

Analytical Hierarchy Process (AHP)
Identification and ranking of criteria
Assignment of coefficients to criteria
using AHP
Identification and ranking of sub-criteria
Raster standardization
Raster overlay
Outcome: site suitability raster

Analytical Hierarchy Process (AHP)
Identification and ranking of criteria
Assignment of coefficients to criteria
using AHP
Identification and ranking of sub-criteria
Raster standardization
Raster overlay
Outcome: site suitability raster

14% of the area identified to be either “Most suitable” or “Suitable” for SuDS implementation
(this result does not include the location of the CSO structures criterion)
Some locations are better suited to install SuDS than others

B. Assessing the CSO reduction performance of SuDS
for different storm events typical of Swiss rainfall patterns
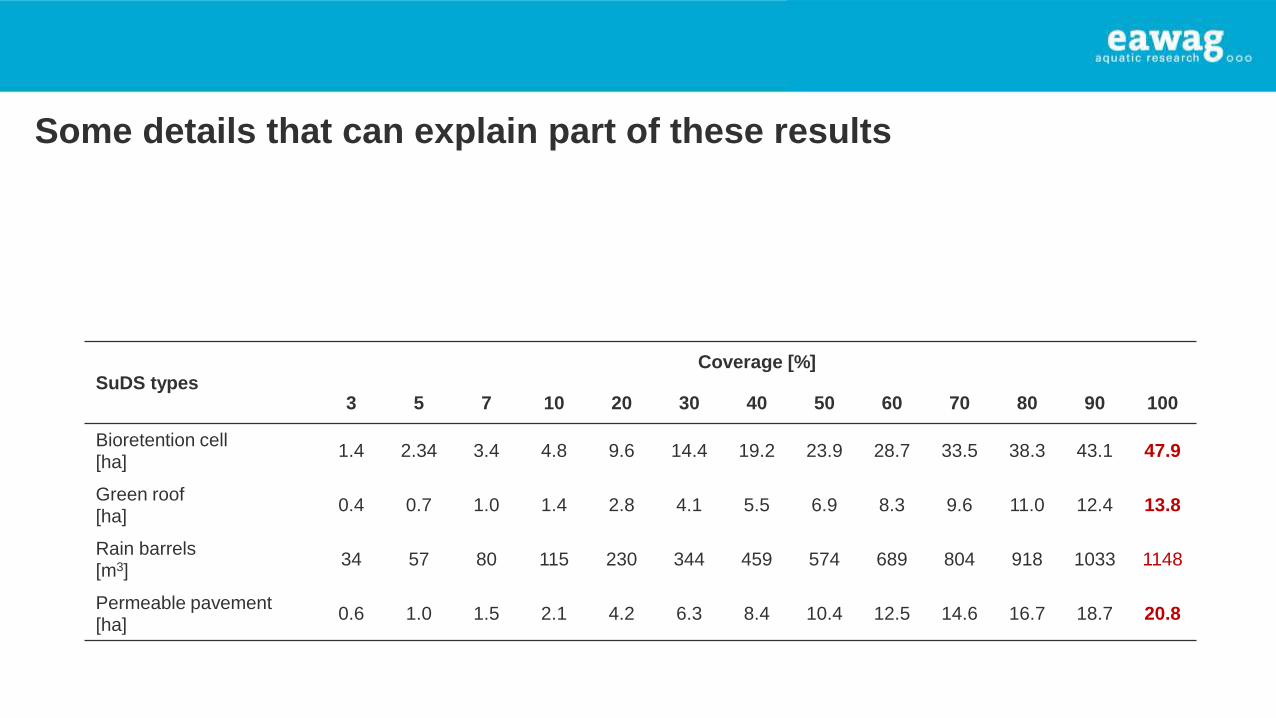
Some details that can explain part of these results
SuDS typesCoverage [%]
3 5 7 10 20 30 40 50 60 70 80 90 100
Bioretention cell[ha]
1.4 2.34 3.4 4.8 9.6 14.4 19.2 23.9 28.7 33.5 38.3 43.1 47.9
Green roof[ha]
0.4 0.7 1.0 1.4 2.8 4.1 5.5 6.9 8.3 9.6 11.0 12.4 13.8
Rain barrels[m3]
34 57 80 115 230 344 459 574 689 804 918 1033 1148
Permeable pavement[ha]
0.6 1.0 1.5 2.1 4.2 6.3 8.4 10.4 12.5 14.6 16.7 18.7 20.8

SuDS performance are different!

Longest rainfall event (41.1 mm, 5% SuDS coverage)
Different SuDS have different impact on CSOs...
0
2
4
6
8
10
12
14
16
18
200
50
100
150
200
250
300
350
400
450
500
Pre
cip
ita
tio
n [
mm
/h]
Dis
ch
arg
e a
t C
SO
[L
PS
]
Precipitation Reference Bioretention cell Green roof Pemeablepavement
Rain barrel
CSO threshold: 180 l s-1
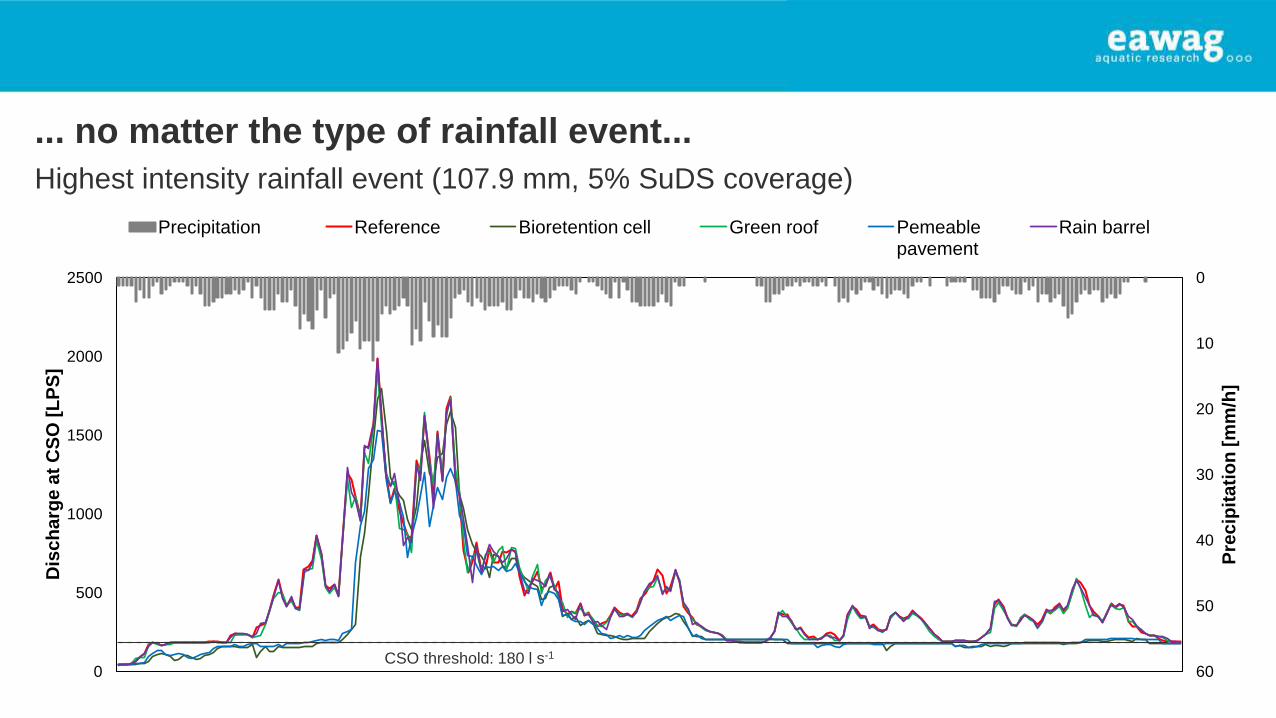
Highest intensity rainfall event (107.9 mm, 5% SuDS coverage)
... no matter the type of rainfall event...
0
10
20
30
40
50
600
500
1000
1500
2000
2500
Pre
cip
ita
tio
n [
mm
/h]
Dis
ch
arg
e a
t C
SO
[L
PS
]
Precipitation Reference Bioretention cell Green roof Pemeablepavement
Rain barrel
CSO threshold: 180 l s-1

... and as expected, the larger coverage the larger the reduction...
0
10
20
30
40
50
600
500
1000
1500
2000
2500
Pre
cip
ita
tio
n [
mm
/h]
Dis
ch
arg
e a
t C
SO
[L
PS
]
Precipitation Reference Bioretention cell
Green roof Pemeablepavement
Rain barrel
0
10
20
30
40
50
600
500
1000
1500
2000
2500
Pre
cip
ita
tio
n [
mm
/h]
Dis
ch
arg
e a
t C
SO
[L
PS
]
Precipitation Reference Bioretention cell
Green roof Pemeablepavement
Rain barrel
CSO threshold: 180 l s-1 CSO threshold: 180 l s-1
5% SuDS coverage 100% SuDS coverage

C.Comparing the implementation cost and efficiency of SuDS and
grey infrastructure (underground reservoirs)
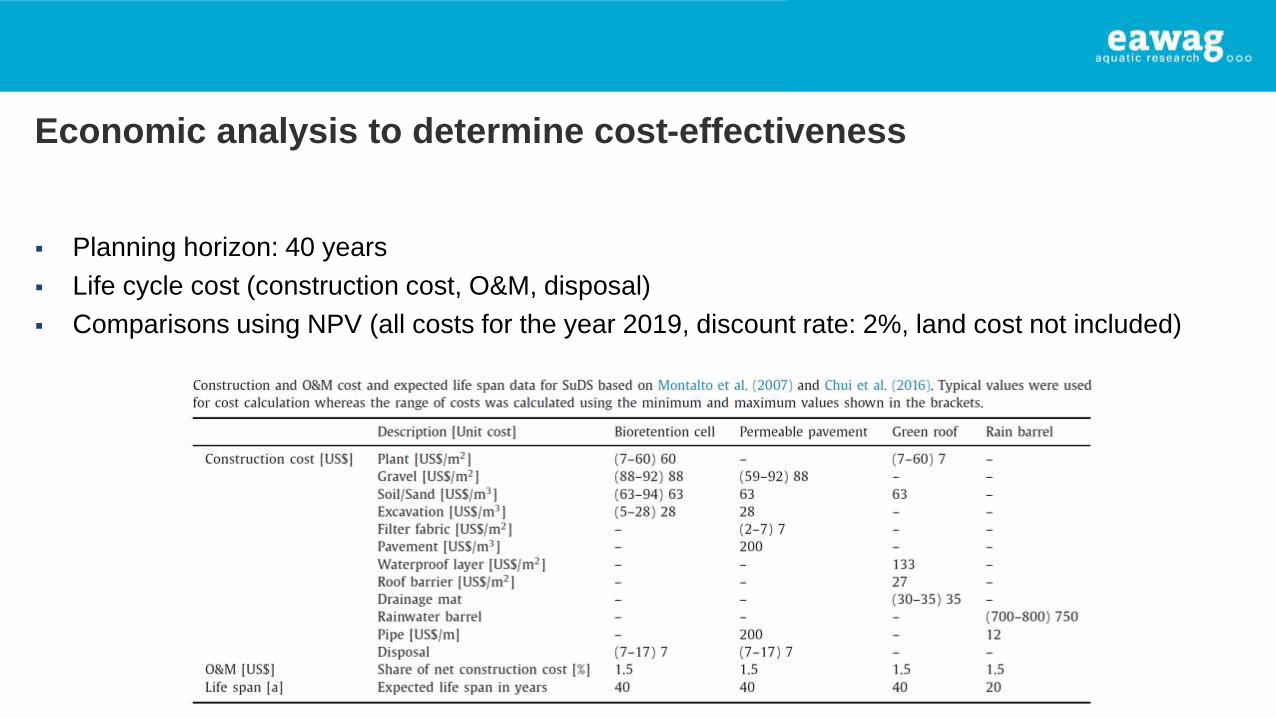
▪ Planning horizon: 40 years
▪ Life cycle cost (construction cost, O&M, disposal)
▪ Comparisons using NPV (all costs for the year 2019, discount rate: 2%, land cost not included)
Economic analysis to determine cost-effectiveness

... and SuDS showed to be interesting solutions compared to grey infrastructure!
Again, different SuDS showed different results

• Bio-retention cells showed highest CSO volume reduction (approx. 14%)
• Rain barrels and green roofs showed little impact on reducing CSOs (rain barrels have a very low
unit cost!)
• Location and distribution of SuDS are crucial in reducing CSOs
• Bio-retention cells were the most cost-effective option, despite their high unit cost
Follow-up steps: monitor the actual impact of SuDS, i.e., field experiments
• Challenging but Important!
Take home messages
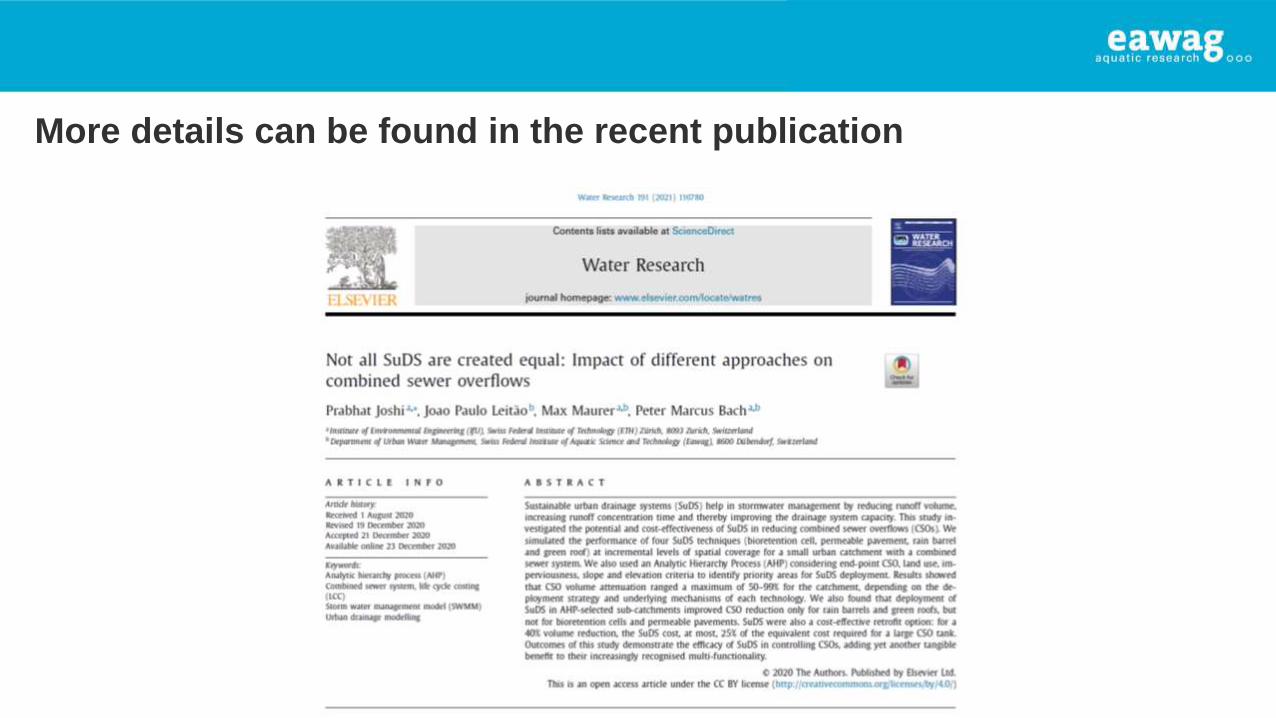
More details can be found in the recent publication