Asset Management Plan 2021 - Orion
332
Orion New Zealand Limited Asset Management Plan Asset Management Plan 2021
-
Upload
khangminh22 -
Category
Documents
-
view
0 -
download
0
Transcript of Asset Management Plan 2021 - Orion

i 10 Year Asset Management Plan Section 1 Summary
Orion New Zealand LimitedAsset Management Plan
Asset Management Plan 2021

ii Orion New Zealand Limited
Cover: Oxford Lane in Christchurch’s central city, powered by new infrastructure installed by Orion.
1 10 Year Asset Management Plan Section 1 Summary
It is an exhilarating period in our industry’s history. New technologies, changing customer expectations and local and international decarbonisation efforts are resulting in the energy sector facing more change than it has experienced over the last 50 years.
To give our customers confidence in how Orion is meeting the promise of this new era, we share our new Group Strategy and the challenges we have set ourselves to deliver on our Group Purpose, the touchstone for this AMP:
To power a cleaner and brighter future for our communities.These are exciting times at Orion. We are redefining our role in our communities, and taking a broader view of how the Orion Group can contribute to the future prosperity and sustainability of our region, and New Zealand.
This Asset Management Plan is our roadmap for delivering on our commitment to 210,000 customers in central Canterbury to provide one of the most safe, reliable and resilient electricity networks in New Zealand – one that’s ready for the future.
David Freeman-GreeneInterim Network Chief Executive

Liability disclaimerThis Asset Management Plan (AMP) has been prepared and publicly disclosed in accordance with the Electricity Distribution Information Disclosure Determination 2012.
Some of the information and statements contained in this AMP are comprised of, or are based on, assumptions, estimates, forecasts, predictions and projections made by Orion New Zealand Limited (Orion). In addition, some of the information and statements are based on actions that Orion currently intends to take in the future. Circumstances will change, assumptions and estimates may prove to be wrong, events may not occur as forecasted, predicted or projected, and Orion may at a later date decide to take different actions to those it currently intends to take.
Except for any statutory liability which cannot be excluded, Orion will not be liable, whether in contract, tort (including negligence), equity or otherwise, to compensate or indemnify any person for any loss, injury or damage arising directly or indirectly from any person using, or relying on any content of, this AMP.
When considering the content of this AMP, persons should take appropriate expert advice in relation to their own circumstances and must rely solely on their own judgement and expert advice obtained.
Orion New Zealand Limited
3 10 Year Asset Management Plan
Contents
2 About our business 19
1 Summary 9 1 Executive summary 9
3 Managing risk 41
4 Customer experience 63
3.1 Introduction 44 3.2 Our risk context 44 3.3 What our community wants from us 45 3.4 Our approach to risk management 45 3.5 Our risk management responsibilities 48 3.6 Our risk assessments and risk evaluations 50 3.7 Our key operational risks 52 3.8 Our resilience 60
4.1 Introduction 66 4.2 Customer engagement 66 4.3 What our customers have told us 68 4.4 Turning listening into action 71 4.5 Performance measures 72
2.1 Purpose of our AMP 22 2.2 Our business 22 2.3 Our local context 23 2.4 Our Group Strategy 25 2.5 Asset Management Plan development process 27 2.6 Asset management framework 29 2.7 Asset management policy 30 2.8 Asset management strategy 30 2.9 Management Maturity Assessment Tool (AMMAT) 31 2.10 Stakeholder interests 32 2.11 Accountabilities and responsibilities 34 2.12 Systems, processes and data management 36 2.13 Significant business assumptions 39
5 About our network 85
5.1 Introduction 88 5.2 Transpower Grid Exit Points (GXP) 88 5.3 Network architecture 90 5.4 Major customers 91 5.5 Network development approach 92 5.6 Asset lifecycle asset management approach 93 5.7 Investment and business case framework 102
6 Planning our network 103
6.1 Introduction 106 6.2 Evolving our network 107 6.3 Preparing for growth 111 6.4 Planning criteria 124 6.5 Network gap analysis 130 6.6 Network development proposals 132 6.7 Value of Distributed Energy Resource Management alternatives 150
4 Orion New Zealand Limited
Contents continued
7 Managing our assets 151
9 Financial forecasting 263
10 Ability to deliver 275
8 Supporting our business 249
Appendices 283
7.1 Introduction 156 7.2 How this section is structured 156 7.3 Network property 157 7.4 Overhead lines – subtransmission 163 7.5 Overhead lines – distribution 11kV 172 7.6 Overhead lines – distribution 400V 182 7.7 Underground cables – subtransmission 189 7.8 Underground cables – distribution 11kV 193 7.9 Underground cables – distribution 400V 197 7.10 Circuit breakers and switchgear 201 7.11 Power transformers and voltage regulations 212 7.12 Distribution transformers 218 7.13 Protection systems 222 7.14 Communication cables 226 7.15 Communication systems 228 7.16 Distribution Management System (DMS) 233 7.17 Load management systems 237 7.18 Information systems 240 7.19 Generators 242 7.20 Monitoring and power quality 246
8.1 Introduction 252 8.2 Gearing up for the future 252 8.3 System operations and network support 253 8.4 Future Capability Development 256 8.4 Business support 257 8.5 Corporate properties 259 8.6 Corporate information systems 260 8.7 Vehicles 261
9.1 Network expenditure forecasts 266 9.2 Non-network expenditure forecasts 271 9.3 Total captial and operations expenditure 272 9.4 Changes from our previous forecasts 273 9.5 Expenditure variation 274
10.1 Introduction 278 10.2 Service providers 278 10.3 Contract delivery 278
5
10 Year Asset Management Plan
Figures
Executive summary
1.1 Total network capex (real) forecast ($000) 131.2 Total network opex (real) forecast ($000) 14
About our business
2.4.1 Group Strategy framework 252.4.2 Orion Group Strategy strategic theme and 26 the related project drivers2.5.1 AMP development process 282.6.1 Orion’s asset management framework 292.9.1 AMMAT maturity levels 312.9.2 Orion’s maturity level scores 312.10.1 Stakeholders and their interests 322.10.2 Process for identifying stakeholder interests 332.11.1 Asset management structure 34
Managing risk
3.4.1 Our risk management process 453.4.2 Our risk management culture 463.5.1 Our HILP and crisis risk management 49 responsibilities3.6.1 Our five main risk evaluation options 51
Customer experience
4.2.1 Our customer engagement helps Orion 734.3.1 Key results from our Annual Residential 69 Customer Satisfaction survey, 2020, and Customer Calls research, 2020 4.5.1 SAIDI 10 year history and 10 year target, 75 including SAIDI forecast4.5.2 SAIFI 10 year history and 10 year target, 75 including SAIFI forecast4.5.3 FY20 SAIDI and SAIFI by asset class and 76 by cause4.5.4 5 year (FY15-FY19) SAIDI and SAIFI by asset 76 class and by cause4.5.5 Unplanned interruptions - % restored in 77 under three hours4.5.65 Comparing Capex per MWh and industry 80 performance4.5.7 Comparing Opex per MWh and industry 81 performance4.5.8 Comparing Opex per ICP and industry 82 Performance4.5.9 Forecast for SF6 circuit breakers 83
About our network
5.2.1 Region A and Region B 895.3.1 Network voltage level and asset relationships 905.5.1 Process for network development 925.6.1 Asset lifecycle management approach 935.6.2 Process for performance measurement 945.6.3 CBRM score conversion table 965.6.4 Replacement decision making process 985.6.5 Process to introduce new equipment 1005.6.6 Process for routine asset inspection 101 and maintenance
Planning our network
6.2.1 Projected residential distribution transformer 109 constraints 6.2.2 Projected residential LV network constraints 1106.3.1 Overall maximum demand trends on the 113 Orion network 6.3.2 Number and capacity of battery installations 1146.3.3 Electric vehicle uptakes in Canterbury 1156.3.4 Current level of solar PV uptake on our network 1166.3.5 Rolling 12 month increase in solar PV 116 connections 6.3.6 System energy throughput 1176.3.7 Region B maximum demand 1186.3.8 Zone substations – Region A (FY20 maximum 119 demand as a percentage of firm capacity) 6.3.9 Zone substations – Region B (FY20 maximum 120 demand as a percentage of firm capacity) 6.4.1 Example of a winter peak day demand profile 1296.6.1 Region A subtransmission 66kV and 33kV 133 – existing and proposed 6.6.2 Region B subtransmission 66kV and 33kV 134 – existing and proposed
Managing our assets
7.3.1 Substation buildings age profile by zone sub 159 and distribution substation7.3.2 Kiosk age profile 1597.4.1 Subtransmission support structure age profile 1647.4.2 Subtransmission conductor age profile 1657.4.3 Subtransmission pole condition profile 1657.4.4 Subtransmission conductor condition profile 1667.4.5 Subtransmission line faults per 100km 1667.4.6 Subtransmission pole risk matrix 1707.4.7 Subtransmission pole health scenarios 1707.5.1 11kV pole age profile 1737.5.2 11kV conductor age profile 1747.5.3 11kV pole condition profile 1747.5.4 11kV line faults per 100km 1757.5.5 Pole failure rate (all voltage classes) 1767.5.6 11kV pole risk matrix 1797.5.7 11kV pole risk scenarios 1807.5.8 11kV pole replacement plan 1807.6.1 400V pole age profile 1827.6.2 400V conductor age profile 1847.6.3 400V pole condition profile 1847.6.4 400V pole risk matrix 1867.6.5 400V pole risk scenarios 1877.6.6 400V pole replacement plan 1877.7.1 Subtransmission cable network age profile 1907.7.2 Subtransmission underground cable faults 191 per 100km7.8.1 11kV cable age profile 1937.8.2 Number of 11kV underground cable failures 194 and the corresponding SAIDI and SAIFI7.9.1 LV cable age profile 1977.9.2 LV enclosures age profile 1987.9.3 Cause of LV cable incidents 199
6 Orion New Zealand Limited
Figures continued
Tables
Summary
1.1 Top six Network Development programmes 15 for FY22 to FY311.2 Capital replacement programmes and their 16 drivers over the next 10 years1.3 Maintenance programmes and their drivers 17 over the next 10 years
Managing risk
3.6.1 Our risk assessment guidelines 503.6.2 Our risk treatment and escalation guidelines 513.7.1 Our key risks 523.7.2 Our overall key operational risk assessments 523.7.3 NZ Lifelines Council interdependency ratings 57 during/after HILP events – 20203.8.1 Orion’s key network resilience documents 61
Customer experience
4.5.1 Summary of performance against targets 734.5.2 Network reliability performance against targets 754.5.3 Network restoration performance against target 774.5.4 Network power quality performance 78 against target4.5.5 Safety performance against target 794.5.6 Sustainability performance against target 84
About our network
5.2.1 Customers by Grid Exit Point 885.4.1 Major customers by load size 915.6.1 Asset management approach for asset class 955.6.2 Our risk treatment and escalation guidelines 975.7.1 Assessment level decision table 102
Planning our network
6.3.1 GXP substations – load forecasts (MVA) 1216.3.2 Region A 66 and 33kV zone substations 122 – load forecasts (MVA) 6.3.3 Region B 66 and 33kV zone substations 123 – load forecasts (MVA) 6.4.1 Network supply HV Security Standard 1256.4.2 Standard network capacities 1276.5.1 Transpower GXP security gaps 1316.5.2 Subtransmission network security gaps 1316.6.1 Northern Christchurch network 136 – HV major projects 6.6.2 Northern Christchurch network 137 – HV minor projects 6.6.3 Region B 66kV subtransmission capacity 138 – GXP projects 6.6.4 Region B 66kV subtransmission capacity 139 – HV major projects 6.6.5 Region A 66kV subtransmission resilience 140 – HV major projects 6.6.6 Lincoln area capacity and resilience 143 improvement – HV major projects 6.6.7 Rolleston area capacity and resiliency 144 – HV major projects
7.10.1 Circuit breakers age profile 2027.10.2 Switchgear age profile 2047.10.3 33kV / 66kV circuit breaker condition profile 2057.10.4 11kV circuit breaker condition profile 2057.10.5 66kV / 33kV circuit breaker health scenarios 2097.10.6 11kV circuit breaker health scenarios 2107.11.1 Power transformer age profile 2137.11.2 11kV regulator age profile 2147.11.3 Power transformer condition profile 2147.11.4 Power transformer health scenarios 2177.12.1 Distribution transformer age profile 2187.12.2 Distribution transformer condition profile 2197.13.1 Health index profile of protection assets 2237.14.1 Communication cables age profile 226
Financial forecasting
9.5.1 FY20 opex variance 2749.5.2 FY20 capex variance 274
7 10 Year Asset Management Plan
6.6.8 Other network development proposals 146 – HV major projects 6.6.9 Other network development proposals 148 – HV minor projects 6.6.10 LV projects 1496.7.1 Distributed Energy Resources Management 150 value for network development alternatives
Managing our assets
7.3.1 Zone substation description and quantity 1577.3.2 Distribution substation type 1587.3.3 Network property issues/controls 1607.3.4 Network property maintenance plan 1617.3.5 Network property operational expenditure 162 (real) – $0007.3.6 Network property replacement capital 162 expenditure (real) – $0007.3.7 Procedures for disposal 1627.4.1 Subtransmission support structure type 1637.4.2 Subtransmission conductor type 1647.4.3 Subtransmission overhead line failure controls 1677.4.4 Subtransmission maintenance plan 1687.4.5 Subtransmission overhead operational 169 expenditure (real) – $0007.4.6 Subtransmission replacement capital 171 expenditure (real) – $0007.5.1 11kV pole quantities by type 1727.5.2 11kV conductor quantities by type 1737.5.3 11kV overhead line failure controls 1777.5.4 11kV overhead maintenance plan 1787.5.5 11kV overhead operational expenditure 178 (real) – $0007.5.6 11kV overhead replacement capital 181 expenditure (real) – $0007.6.1 400V pole quantities by type 1827.6.2 400V conductor quantities by type 1837.6.3 400V overhead operational expenditure 185 (real) – $0007.6.4 400V overhead replacement capital 188 expenditure (real) – $0007.7.1 Subtransmission cable length by type 1897.7.2 Subtransmission cable failure controls 1917.7.3 Subtransmission cable maintenance plan 1927.7.4 Subtransmission cable operational expenditure 192 (real) – $0007.7.5 Subtransmission cable replacement capital 192 expenditure (real) – $0007.8.1 11kV cable length by type 1937.8.2 11kV cable failure control 1957.8.3 11kV cable maintenance plan 1957.8.4 11kV cable operational expenditure (real) – $000 1967.8.5 11kV cable replacement capital expenditure 196 (real) – $0007.9.1 400V cable and street-lighting networks 197 cable type7.9.2 Distribution enclosure type 1987.9.3 LV cable network failure controls 1997.9.4 400V underground maintenance plan 200
7.9.5 400V underground operational expenditure 200 (real) – $0007.9.6 400V underground replacement capital 200 expenditure (real) – $0007.10.1 Circuit breaker description by type 2017.10.2 Circuit breaker quantities by type 2027.10.3 Switchgear description by type 2037.10.4 Switches quantities by type 2047.10.5 Performance of circuit breakers and switchgear 2067.10.6 Circuit breakers and switchgear failure controls 2077.10.7 Circuit breakers and switchgear 208 maintenance plan7.10.8 Circuit breakers and switchgear operational 208 expenditure (real) – $0007.10.9 Circuit breakers and switchgear replacement 211 capital expenditure (real) – $0007.11.1 Power transformer quantities by type 2127.11.2 Regulator quantities by type 2137.11.3 Power transformer and regulator issues and 215 control measures7.11.4 Power transformer maintenance plan 2167.11.5 Power transformer and regulator operational 216 expenditure (real) – $0007.11.6 Power transformer replacement plan 2177.11.7 Power transformer and regulator capital 217 expenditure (real) – $0007.12.1 Distribution transformer quantities by type 2187.12.2 Distribution transformers failure controls 2207.12.3 Distribution transformer maintenance plan 2207.12.4 Distribution transformer operational 221 expenditure (real) – $0007.12.5 Distribution transformer replacement capital 221 expenditure (real) – $0007.13.1 Relay types 2227.13.2 Protection system failure controls 2247.13.3 Protection maintenance plan 2257.13.4 Protection operational expenditure (real) – $000 2257.13.5 Protection replacement capital expenditure 225 (real) – $0007.14.1 Communication cables operational 227 expenditure (real) – $0007.14.2 Communication cables replacement capital 227 expenditure (real) – $0007.15.1 Data communication systems description 2297.15.2 Communication component quantities by type 2297.15.3 Communication systems failure controls 2307.15.4 Communication systems maintenance strategy 2317.15.5 Communication systems operational 231 expenditure (real) – $0007.15.6 Communication system replacement plan 2327.15.7 Communication system replacement capital 232 expenditure (real) – $0007.16.1 ADMS description 2347.16.2 ADMS failure controls 2357.16.3 ADMS operational expenditure (real) – $000 2367.16.4 ADMS replacement capital expenditure 236 (real) – $0007.17.1 Load management systems description 2377.17.2 Load management system condition 238
Tables continued

8 Orion New Zealand Limited
Tables continued
7.17.3 Load management failure controls 2387.17.4 Load management system maintenance plan 2397.17.5 Load management operational expenditure 239 (real) – $0007.17.6 Load management system replacement capital 239 expenditure (real) – $0007.18.1 Information system operational expenditure 241 (real) – $0007.18.2 Information systems replacement capital 241 expenditure (real) – $0007.19.1 Generator types 2427.19.2 Generator conditions by type 2437.19.3 Generator maintenance plan 2447.19.4 Generator operational expenditure (real) – $000 2447.19.5 Generator capital expenditure (real) – $000 2457.20.1 Monitoring quantities by type 2467.20.2 Monitoring maintenance plan 2477.20.3 Monitoring operational expenditure 247 (real) – $0007.20.4 Monitoring replacement capital expenditure 247 (real) – $000
Supporting our business
8.3.1 System operations and network support 256 (real) – $0008.5.1 Business support operational expenditure 258 (real) – $0008.5.2 Board of directors’ fees 2588.8.1 Vehicle quantities and type 261
Financial forecasting
9.1.1 Opex network – $000 2669.1.2 Opex – network (Commerce Commission’s 267 categories) – $0009.1.3 Opex contributions revenue – $000 2679.1.4 Capex summary – $000 2679.1.5 Capital contributions revenue – $000 2689.1.6 Capex customer connections / network 268 extension – $0009.1.7 Asset relocation /conversion capex – $000 2689.1.8 Capex – replacement – $000 2699.1.9 Capex –replacement (Commerce Commission’s 270 categories) – $0009.2.1 System operations and network support 271 – $0009.2.2 Board of directors’ fees and expenses – $000 2719.2.3 Business support – $000 2729.2.4 Capex non-network – $000 2729.3.1 Total capex and opex – $000 272
9 10 Year Asset Management Plan Section 1 Summary
1Executive summary

10 Orion New Zealand Limited
Photo: Janet and David McGimpsey in their warm Bryndwr home, insulated by Community Energy Action with Orion’s help.
11 10 Year Asset Management Plan Section 1 Summary
Introducing our 2021 Asset Management PlanThis Asset Management Plan sets out Orion’s asset management policy, strategy, practices and expenditure forecasts for the next 10 years from 1 April 2021.
We share who we are, changes in the environment we operate in, the risks we face in managing our assets, what our customers are telling us, the condition of our assets and distribution system, how we plan to care for and enhance them, and how we support the delivery of this plan.
We continue to operate our network in unprecedented times. Our community depends on us to maintain a safe, reliable and resilient service. Like most businesses, over the past 12 months we’ve learned to be more flexible and agile in how we operate to keep the power on. At the same time, we’ve been preparing for a very different future, and taking a fresh look at how we do things and where we can add additional value to our communities. While placing our feet firmly on the ground, the thrill of exploring new opportunities pervades this plan.
Our business is adapting to changeAt the heart of what we do is our desire to continue to deliver an electricity service that meets our customers’ expectations, at a cost our customers feel is fair and reasonable. To continue to do that well, we must adapt to rapidly evolving customer expectations fueled by new technology that is changing customer behaviour and market forces, and the increasing global realisation that we all need to radically reduce our carbon footprint to secure the future wellbeing of our planet.
We have challenged ourselves to think about what that changed future holds, and how the Orion Group needs to evolve and adapt to remain relevant and proactively harness opportunities in a fast changing energy landscape. Our re-defined Purpose and Group Strategy set a new, dynamic direction for our future contribution to our communities.
Changing demands on our infrastructure as a result of growth in our customer numbers continues to be strongly reflected in this AMP.
We continue to experience steady growth in our residential customer numbers as central Canterbury presents an attractive option for people to make their home, particularly in new housing developments in the Selwyn District and Halswell areas.
What’s new, what’s changed?Our Asset Management Plan for 2021 continues the direction we established in 2020. We have made some adjustments to project timings and budgets to reflect the realities of planning in a somewhat fluid environment, and fine-tuning that naturally occurs closer to the time of programme implementation. While our planning in respect of projects
and programmes is essentially unchanged, our approach to our future in a dynamically changing environment is significantly changing how we think about our work, and the opportunities presented to us.
Our Asset Management Strategy is underpinned by our Purpose to “Power a cleaner and brighter future for our communities”. It reflects how we see our future best serving our community, embodied in our Group Strategy’s strategic themes, which are:
Re-imagining the Future Network – ensuring we have intelligent network infrastructure that reflects changes in the energy marketplace and ensures customers can take advantage of future energy opportunities
Customer Inspired – enabling the choices customers make
Lead & Grow – growing our business through strategies and initiatives that leverage our expertise and knowledge within and in areas adjacent to our industry
Accelerating Capability – developing the capability we will need for the future: technical and leadership skills; partnerships with people and organisations inside and outside our industry to drive innovation; and redefining value to our community including our environmental and social impact
Powering the Low Carbon Economy – accelerating electrification, and helping others in our region decarbonise; powering the shift from fossil fuels to a low-carbon climate ready future
Managing new risksWe regularly evaluate our risks and mitigation strategies. COVID-19 brought the risk of a pandemic into sharp focus. As an essential service provider Orion has been acutely conscious of our responsibility to maintain vital power services to our community throughout this pandemic. As the situation evolved, our appreciation of the risks of pandemics on our ability to maintain our service to the community grew.
Consequently, our assessment of Orion’s key operational risks has now incorporated pandemics, rated at number five of seven. Throughout this pandemic Orion has implemented
Our re-defined Purpose and Group Strategy set a new, dynamic direction for our future contribution to our communities.
12 Orion New Zealand Limited
new ways of working to ensure we can continue to maintain essential power services to our community, and help in limiting the spread of COVID-19.
In this AMP we have also considered the risks and opportunities presented by climate change for the first time. Also reflecting our focus on this growing risk, in 2020 we published our first annual report in accordance with the guidelines published by the Task Force for Climate-related Disclosures, our Climate Change Opportunities and Risks for Orion report. We will continue to improve our understanding of climate effects on our network, and adapt and mitigate risks where appropriate, or reasonably practicable.
Ensuring customer experience and performance meet targetsSeeking out the views of our customers and giving them a voice in our decision making continues to be a focus. Being close to our customers is central to our asset investment decisions and asset management practices. We seek their views on a wide range of topics, reflecting our Group Strategy strategic themes.
We measure our customer’s assessment of our performance through a robust annual research programme. We are proud to report our customers continue to rate us highly and provide us with insights that help identify opportunities to improve our performance. See Figure 4.3.1.
We measure our performance in asset management through both independent assessment and against rigorous targets set by the Commerce Commission, and those we set ourselves.
Orion again engaged WSP Opus to undertake an independent assessment based on an Asset Management Maturity Assessment Tool (AMMAT) and Electricity Engineers’ Association guidelines. WSP Opus determined that Orion’s focus on asset management improvement initiatives, our attention to embedding the right organisational risk management culture, and our focus on continual improvement were reflected in our achievement of an outstanding score of Competent or Excellent in all categories. See Figure 2.9.2.
We also measure our performance against our service targets and for the first time, this year we have developed measures and targets for customer service.
Better informed decisions about our networkWe are increasingly using deeper levels of data analysis to inform our asset lifecycle management approach. Drawing data together from a range of sources, this year we introduced a risk matrix that enables us to identify the number of assets most at risk within an asset fleet, and identify what intervention strategy is required. The matrix means we can focus our efforts on those assets within
the class that most need replacing to provide the greatest reduction in the overall fleet risk profile.
Planning our network for growth and new technologyOur capital expenditure keeps pace with the growing demand on our network. This growth is both in the number of customers we serve, and energy demand.
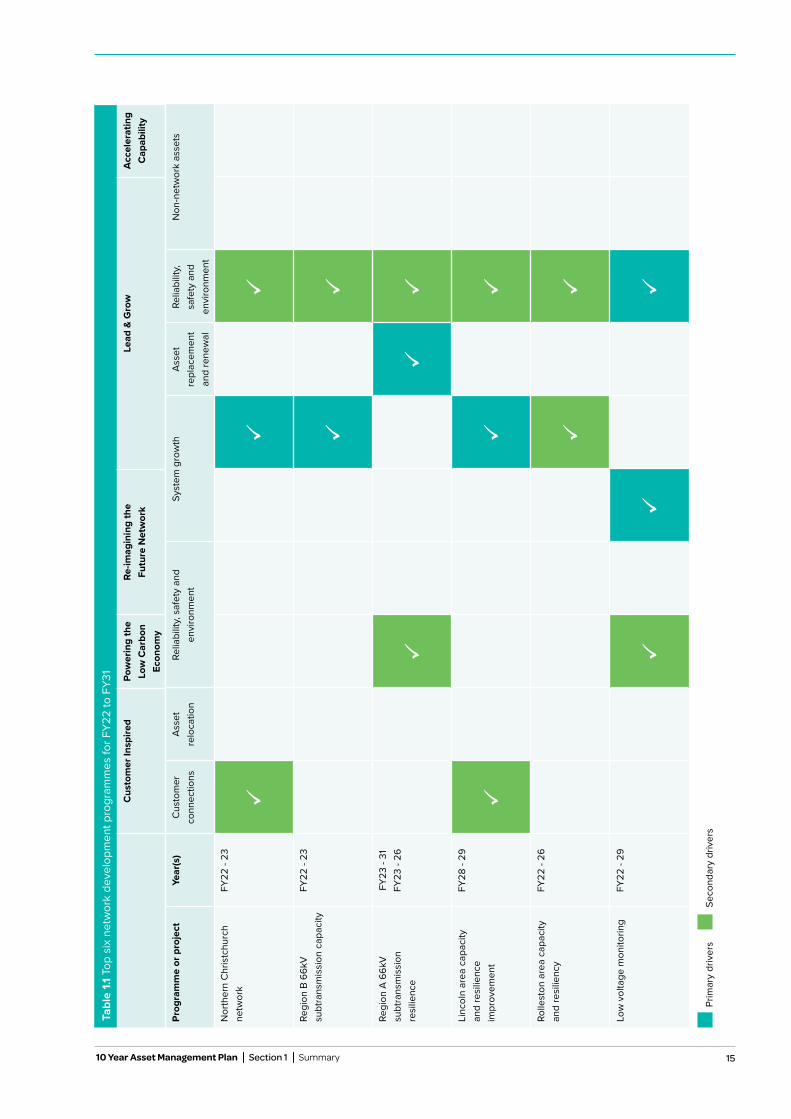
To support growth, we have planned six significant programmes of work, see Table 1.1.
We are also investing in readying our network to enable our customers to take advantage of new technologies. An increasing number of customers are thinking about installing solar PV, putting excess solar generation or power stored within a charged battery back into the grid, and considering a move to electric vehicles that are cleaner and cheaper to run. This energy transformation means our customers’ usage patterns are becoming more complicated as energy sources become embedded across our distribution network. Our low voltage monitoring programme, see Table 1.1, is an important step towards ensuring our network is ready to help power the future needs of the community.
In this AMP we have also considered the risks and opportunities presented by climate change for the first time.
This AMP builds on the planned maintenance and development of our network set down over the past two years, with minor adjustments to the relative timings of some individual projects.
13 10 Year Asset Management Plan Section 1 Summary
This AMP builds on the planned maintenance and development of our network set down over the past two years, with minor adjustments to the relative timings of some individual projects.
For a list of our key capital and maintenance projects and programmes, see Tables 1.1, 1.2 and 1.3 starting on page 15.
Managing our assetsOrion takes a proactive approach to managing our assets through extensive maintenance and replacement programmes. We believe a planned approach is in the long term interests of our customers as it minimises outages, addresses assets on a risk basis and is more cost effective. A secondary advantage is that a consistent flow of work maintains the competencies of our people and service providers.
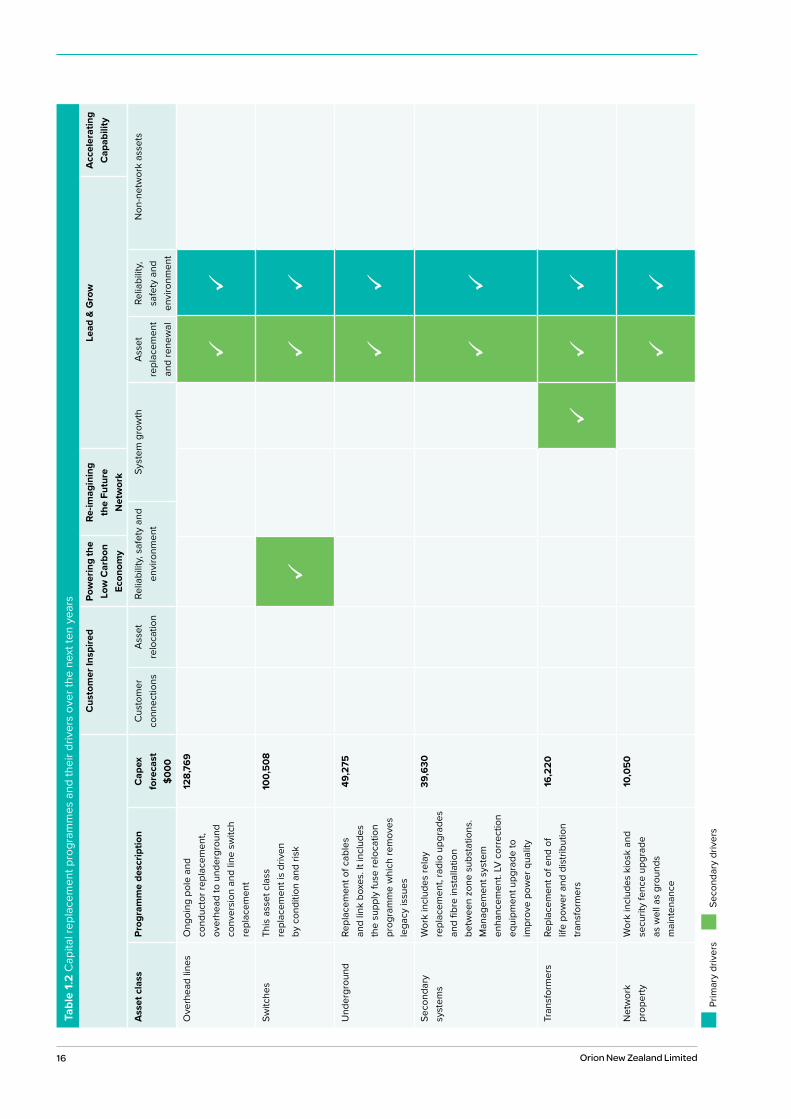
Replacement programmes for our poles and switchgear assets dominate our capital expenditure forecast. The driver for these programmes is to continue addressing the potential safety consequences of asset failure.
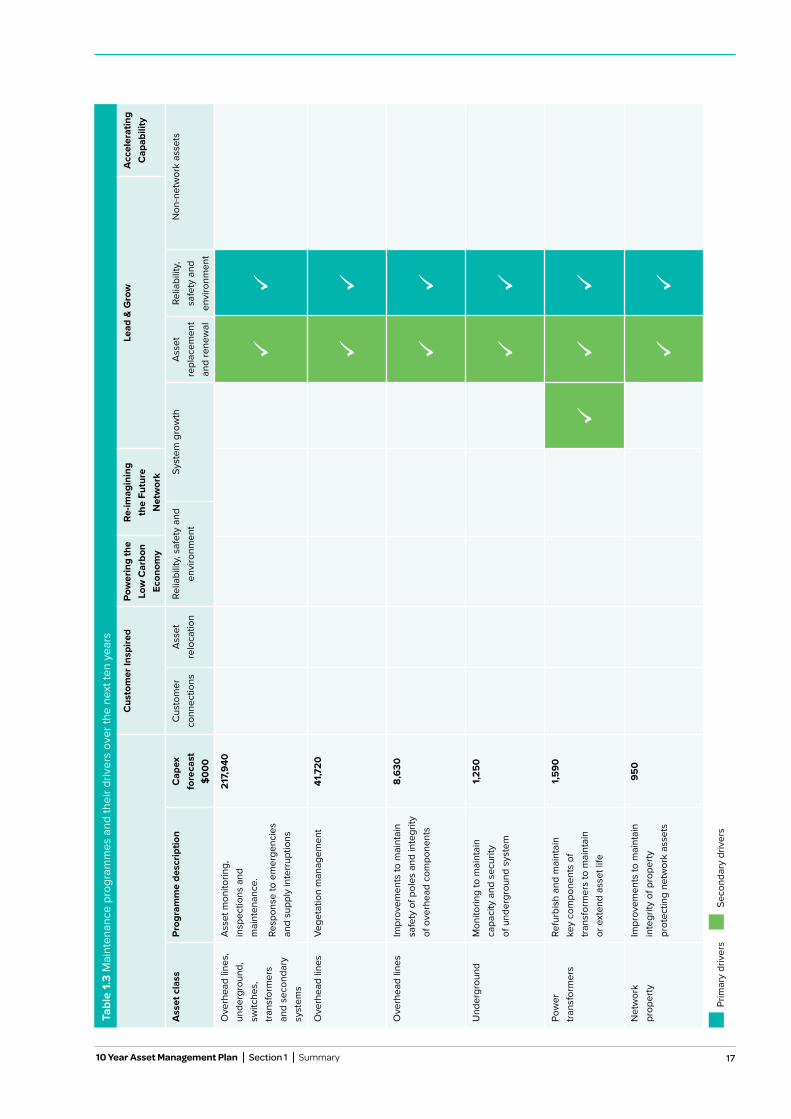
We reduce the impact of weather and plant failure events by conducting regular proactive programmes and approximately 70 per cent of our network operational expenditure is spent on inspections, testing and vegetation management. The remaining 30 per cent is spent on responding to service interruptions and emergencies, the majority of which occur on our overhead network and are largely weather related.
Gearing up for the futureAs our Group Strategy gains momentum, we are changing some of the ways we do things and introducing new roles to deliver on our strategic themes.
Our focus on continually developing our capability as effective asset managers means we are reshaping our approach to works delivery. These refinements will ensure we are able to deliver the projects in this AMP safely, efficiently and to the quality we expect into the future.
The Orion Group is also working with industry partners through an initiative called the Energy Academy to be part of the changes in capability development, to ensure our people are “match fit”.
These organisational changes and other initiatives to support our community’s evolving needs, delivery of the projects in this AMP and our increased focus on preparing for the future will result in a gradual increase in FTEs over the regulatory period.
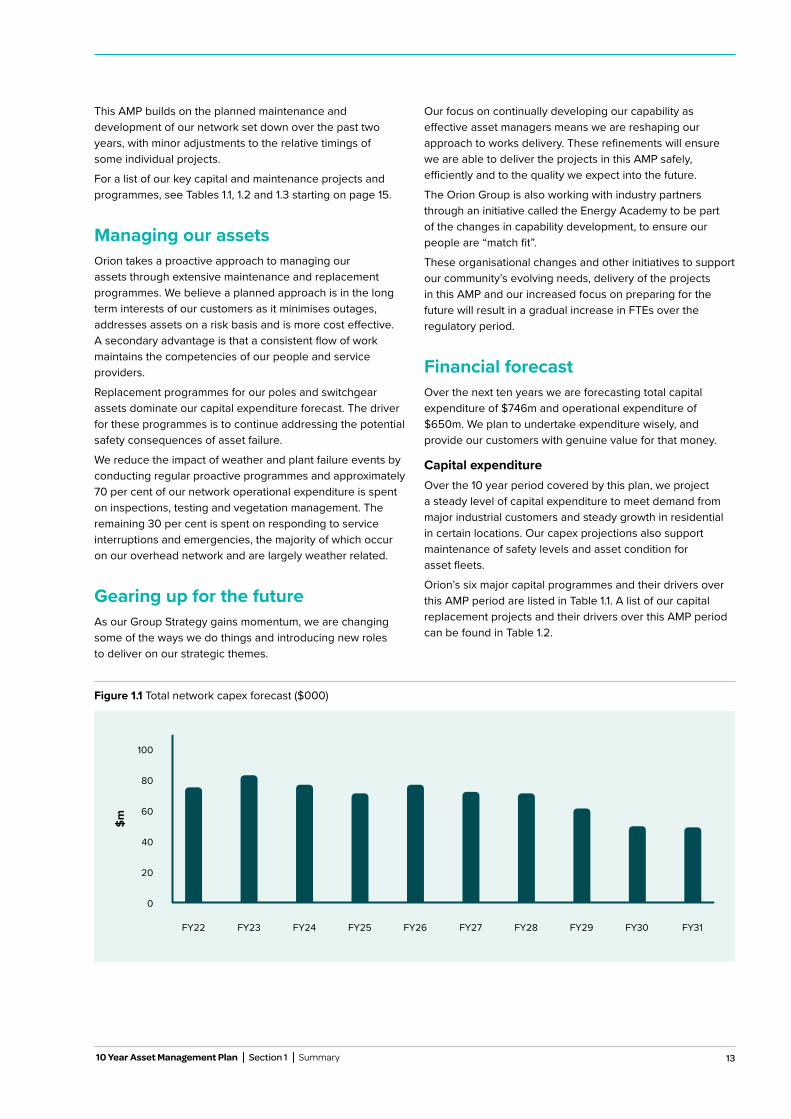
Financial forecastOver the next ten years we are forecasting total capital expenditure of $746m and operational expenditure of $650m. We plan to undertake expenditure wisely, and provide our customers with genuine value for that money.
Capital expenditureOver the 10 year period covered by this plan, we project a steady level of capital expenditure to meet demand from major industrial customers and steady growth in residential in certain locations. Our capex projections also support maintenance of safety levels and asset condition for asset fleets.
Orion’s six major capital programmes and their drivers over this AMP period are listed in Table 1.1. A list of our capital replacement projects and their drivers over this AMP period can be found in Table 1.2.
Figure 1.1 Total network capex forecast ($000)
0
40
100
80
60
FY22 FY23 FY24 FY25 FY26 FY27 FY28 FY29 FY30 FY31
20
$m
14 Orion New Zealand Limited
Expenditure changes from 2020 AMPCompared to last year’s AMP, the main changes in network expenditure over this AMP period are:
An increase of $45.7m network capital expenditure due to:
• $21.9m – an increase in major projects capex due to residential and industrial growth as well as changes in timing of projects to meet changes in customer needs
• $13.9m – an increase in asset replacement largely due to new programmes to upgrade LV conductors and replace LV panels. There’s also an increase due to refinement of circuit breaker unit cost per job based on recently completed projects
• $3.3m – an increase in connections capex largely due to refinement of cost for distribution transformers
• $6.6m – an increase in asset relocation due to new projects identified by road authorities
An increase of $13.4m network operational expenditure due to:
• $6.5m – an increase in maintenance of the overhead system due to improved pole inspection processes and targeted vegetation trimming projects
• $4.4m – an increase to reflect on more proactive work being carried out during maintenance rounds of our substation assets
• $2m – a slight increase in labour cost for emergency jobs. This increase also reflects provision for asset labelling
• $0.5m – an increase in Network Management Systems to cover maintenance for switching advisor, primary outage restoration tool and LV monitoring functions
Delivering our works programmeOur ability to deliver our AMP works programme relies on an appropriate level of capable, experienced and skilled people – both within the Orion team, and via our service providers.
We are developing and maturing our systems and processes to ensure transparency, rich data for decision making, consistency and adaptability for the future. We are extending our existing distribution management system to support further automation. Our asset management processes, standards, modelling, review and monitoring programmes are among New Zealand’s best, as attested to in the 2020 AMMAT assessment, see Figure 2.9.2.
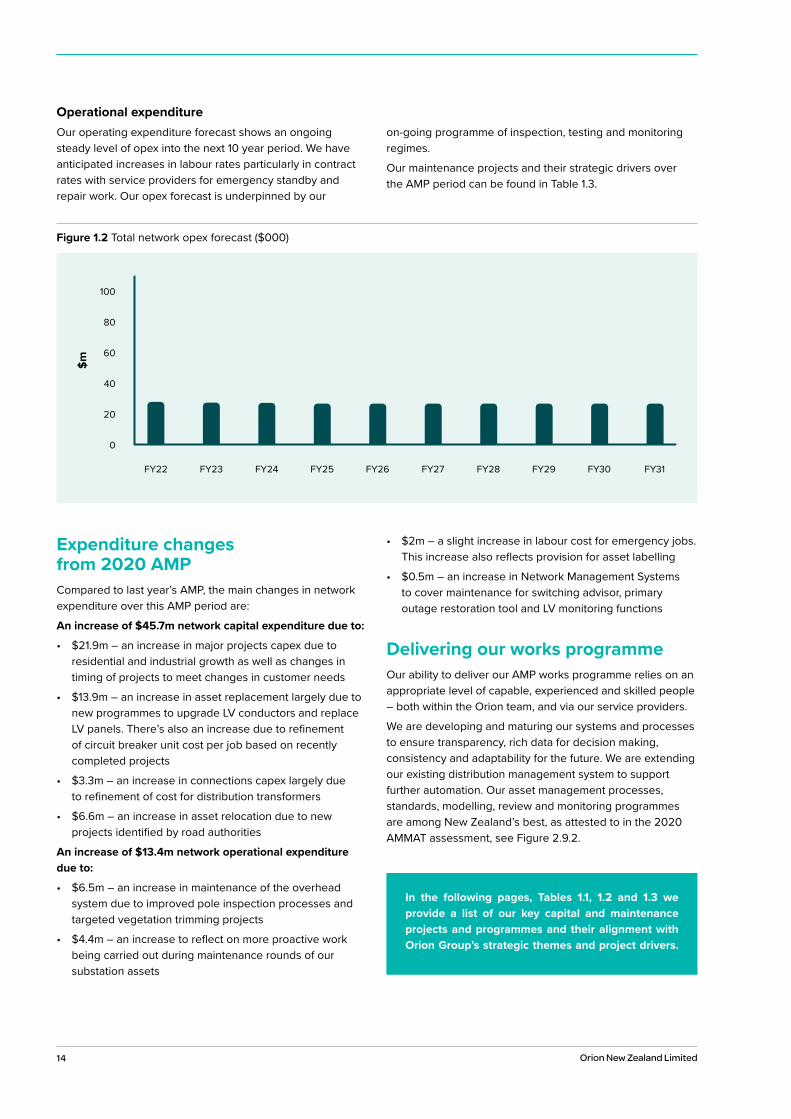
Figure 1.2 Total network opex forecast ($000)
0
40
100
80
60
FY22 FY23 FY24 FY25 FY26 FY27 FY28 FY29 FY30 FY31
20
$m
In the following pages, Tables 1.1, 1.2 and 1.3 we provide a list of our key capital and maintenance projects and programmes and their alignment with Orion Group’s strategic themes and project drivers.
Operational expenditure Our operating expenditure forecast shows an ongoing steady level of opex into the next 10 year period. We have anticipated increases in labour rates particularly in contract rates with service providers for emergency standby and repair work. Our opex forecast is underpinned by our
on-going programme of inspection, testing and monitoring regimes.
Our maintenance projects and their strategic drivers over the AMP period can be found in Table 1.3.
15 10 Year Asset Management Plan Section 1 Summary
Tabl
e 1.1
Top
six
net
wor
k de
velo
pmen
t pro
gram
mes
for F
Y22
to F
Y31
Cus
tom
er In
spire
dPo
wer
ing
the
Low
Car
bon
Econ
omy
Re-im
agin
ing
the
Fu
ture
Net
wor
kLe
ad &
Gro
wA
ccel
erat
ing
Cap
abili
ty
Prog
ram
me
or p
roje
ctYe
ar(s
)C
usto
mer
co
nnec
tions
Asse
t re
loca
tion
Relia
bilit
y, sa
fety
and
en
viro
nmen
tSy
stem
gro
wth
Asse
t re
plac
emen
t an
d re
new
al
Relia
bilit
y, sa
fety
and
en
viro
nmen
t
Non
-net
wor
k as
sets
Nor
ther
n C
hris
tchu
rch
netw
ork
FY22
- 23
Regi
on B
66k
V su
btra
nsm
issi
on c
apac
ityFY
22 -
23
Regi
on A
66k
V su
btra
nsm
issi
on
resi
lienc
e
FY23
- 31
FY
23 -
26
Linc
oln
area
cap
acity
an
d re
silie
nce
impr
ovem
ent
FY28
- 29
Rolle
ston
are
a ca
paci
ty
and
resi
lienc
yFY
22 -
26
Low
vol
tage
mon
itorin
gFY
22 -
29
Prim
ary
driv
ers
Seco
ndar
y dr
iver
s
16 Orion New Zealand Limited
Tabl
e 1.2
Cap
ital r
epla
cem
ent p
rogr
amm
es a
nd th
eir d
river
s ov
er th
e ne
xt te
n ye
ars
Cus
tom
er In
spire
dPo
wer
ing
the
Low
Car
bon
Econ
omy
Re-im
agin
ing
the
Futu
re
Net
wor
k
Lead
& G
row
Acc
eler
atin
g C
apab
ility
Ove
rhea
d lin
esO
ngoi
ng p
ole
and
cond
ucto
r rep
lace
men
t, ov
erhe
ad to
und
ergr
ound
co
nver
sion
and
line
sw
itch
repl
acem
ent
128,
769
Switc
hes
This
ass
et c
lass
re
plac
emen
t is
driv
en
by c
ondi
tion
and
risk
100,
508
Und
ergr
ound
Repl
acem
ent o
f cab
les
and
link
boxe
s. It
incl
udes
th
e su
pply
fuse
relo
catio
n pr
ogra
mm
e w
hich
rem
oves
le
gacy
issu
es
49,2
75
Seco
ndar
y sy
stem
sW
ork
incl
udes
rela
y re
plac
emen
t, ra
dio
upgr
ades
an
d fib
re in
stal
latio
n be
twee
n zo
ne s
ubst
atio
ns.
Man
agem
ent s
yste
m
enha
ncem
ent.
LV c
orre
ctio
n eq
uipm
ent u
pgra
de to
im
prov
e po
wer
qua
lity
39,6
30
Tran
sfor
mer
sRe
plac
emen
t of e
nd o
f lif
e po
wer
and
dis
tribu
tion
trans
form
ers
16,2
20
Net
wor
k pr
oper
tyW
ork
incl
udes
kio
sk a
nd
secu
rity
fenc
e up
grad
e as
wel
l as
grou
nds
mai
nten
ance
10,0
50
Prim
ary
driv
ers
Seco
ndar
y dr
iver
s
Ass
et c
lass
Prog
ram
me
desc
riptio
nC
apex
fo
reca
st
$000
Cus
tom
er
conn
ectio
nsAs
set
relo
catio
nRe
liabi
lity,
safe
ty a
nd
envi
ronm
ent
Syst
em g
row
thAs
set
repl
acem
ent
and
rene
wal
Relia
bilit
y, sa
fety
and
en
viro
nmen
t
Non
-net
wor
k as
sets
17 10 Year Asset Management Plan Section 1 Summary
Tabl
e 1.3
Mai
nten
ance
pro
gram
mes
and
thei
r driv
ers
over
the
next
ten
year
s
Cus
tom
er In
spire
dPo
wer
ing
the
Low
Car
bon
Econ
omy
Re-im
agin
ing
the
Futu
re
Net
wor
k
Lead
& G
row
Acc
eler
atin
g C
apab
ility
Ass
et c
lass
Prog
ram
me
desc
riptio
nC
apex
fo
reca
st
$000
Cus
tom
er
conn
ectio
nsAs
set
relo
catio
nRe
liabi
lity,
safe
ty a
nd
envi
ronm
ent
Syst
em g
row
thAs
set
repl
acem
ent
and
rene
wal
Relia
bilit
y, sa
fety
and
en
viro
nmen
t
Non
-net
wor
k as
sets
Ove
rhea
d lin
es,
unde
rgro
und,
sw
itche
s,
trans
form
ers
and
seco
ndar
y sy
stem
s
Asse
t mon
itorin
g,
insp
ectio
ns a
nd
mai
nten
ance
.
Resp
onse
to e
mer
genc
ies
and
supp
ly in
terru
ptio
ns
217,
940
Ove
rhea
d lin
esVe
geta
tion
man
agem
ent
41,7
20
Ove
rhea
d lin
esIm
prov
emen
ts to
mai
ntai
n sa
fety
of p
oles
and
inte
grity
of
ove
rhea
d co
mpo
nent
s
8,63
0
Und
ergr
ound
Mon
itorin
g to
mai
ntai
n ca
paci
ty a
nd s
ecur
ity
of u
nder
grou
nd s
yste
m
1,250
Pow
er
trans
form
ers
Refu
rbis
h an
d m
aint
ain
ke
y co
mpo
nent
s of
tra
nsfo
rmer
s to
mai
ntai
n
or e
xten
d as
set l
ife
1,59
0
Net
wor
k pr
oper
tyIm
prov
emen
ts to
mai
ntai
n in
tegr
ity o
f pro
perty
pr
otec
ting
netw
ork
asse
ts
950
Prim
ary
driv
ers
Seco
ndar
y dr
iver
s
18 Orion New Zealand Limited
If you would like to know more about our approach to managing our assets and our plans for the next ten years, please contact us on 0800 363 9898, or by email at [email protected].
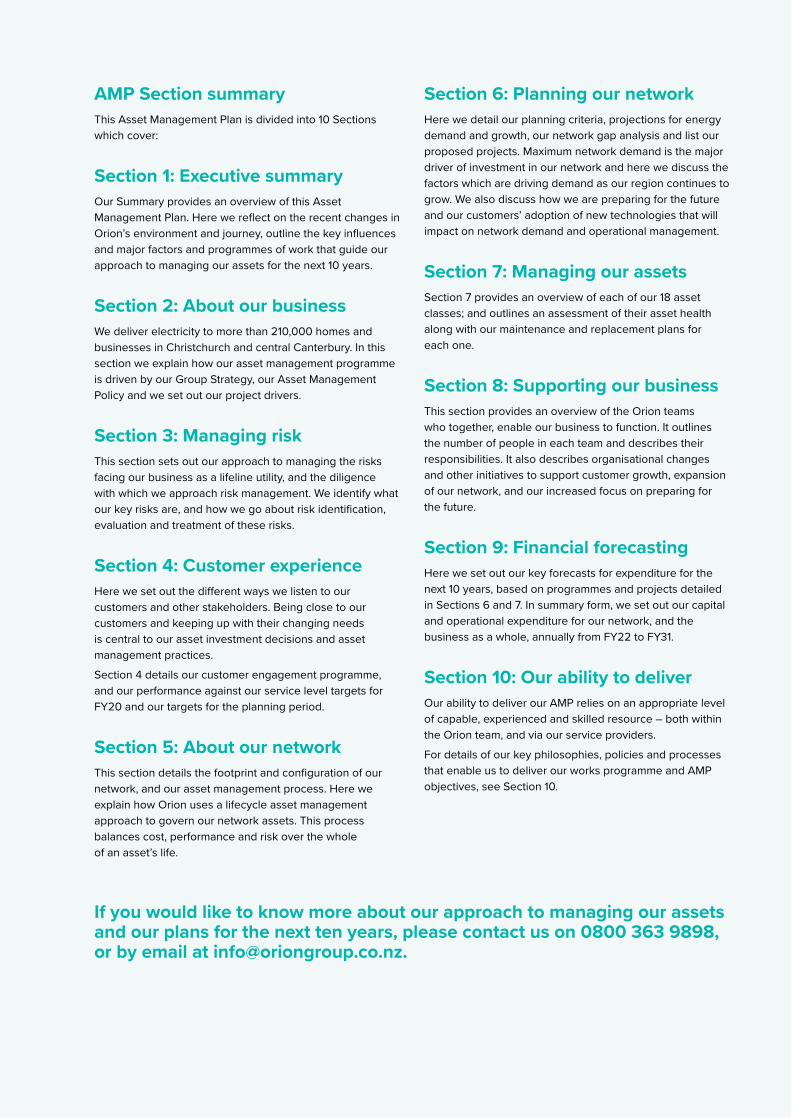
AMP Section summaryThis Asset Management Plan is divided into 10 Sections which cover:
Section 1: Executive summaryOur Summary provides an overview of this Asset Management Plan. Here we reflect on the recent changes in Orion’s environment and journey, outline the key influences and major factors and programmes of work that guide our approach to managing our assets for the next 10 years.
Section 2: About our business We deliver electricity to more than 210,000 homes and businesses in Christchurch and central Canterbury. In this section we explain how our asset management programme is driven by our Group Strategy, our Asset Management Policy and we set out our project drivers.
Section 3: Managing risk This section sets out our approach to managing the risks facing our business as a lifeline utility, and the diligence with which we approach risk management. We identify what our key risks are, and how we go about risk identification, evaluation and treatment of these risks.
Section 4: Customer experience Here we set out the different ways we listen to our customers and other stakeholders. Being close to our customers and keeping up with their changing needs is central to our asset investment decisions and asset management practices.
Section 4 details our customer engagement programme, and our performance against our service level targets for FY20 and our targets for the planning period.
Section 5: About our network This section details the footprint and configuration of our network, and our asset management process. Here we explain how Orion uses a lifecycle asset management approach to govern our network assets. This process balances cost, performance and risk over the whole of an asset’s life.
Section 6: Planning our network Here we detail our planning criteria, projections for energy demand and growth, our network gap analysis and list our proposed projects. Maximum network demand is the major driver of investment in our network and here we discuss the factors which are driving demand as our region continues to grow. We also discuss how we are preparing for the future and our customers’ adoption of new technologies that will impact on network demand and operational management.
Section 7: Managing our assets Section 7 provides an overview of each of our 18 asset classes; and outlines an assessment of their asset health along with our maintenance and replacement plans for each one.
Section 8: Supporting our business This section provides an overview of the Orion teams who together, enable our business to function. It outlines the number of people in each team and describes their responsibilities. It also describes organisational changes and other initiatives to support customer growth, expansion of our network, and our increased focus on preparing for the future.
Section 9: Financial forecasting Here we set out our key forecasts for expenditure for the next 10 years, based on programmes and projects detailed in Sections 6 and 7. In summary form, we set out our capital and operational expenditure for our network, and the business as a whole, annually from FY22 to FY31.
Section 10: Our ability to deliver Our ability to deliver our AMP relies on an appropriate level of capable, experienced and skilled resource – both within the Orion team, and via our service providers.
For details of our key philosophies, policies and processes that enable us to deliver our works programme and AMP objectives, see Section 10.

19 10 Year Asset Management Plan Section 1 Summary
2About our
business

20 Orion New Zealand Limited
Photo: Keeping the lights on for night training at Foster Park, Rolleston.
21 10 Year Asset Management Plan Section 1 Summary
2.4.1 Our Group Purpose 25 2.4.2 Group Strategy 25
2.4.3 Programme and project driver definitions 26
2.12.1 Systems 36 2.12.2 Asset data 38
2.12.3 Short term developments 38
2.5.1 Statement of Intent 27
2.4 Our Group Strategy 25
2.8 Asset management strategy 30
2.3 Our local context 23
2.2 Our business 22
2.7 Asset management policy 30
2.9 Asset Management Maturity Assessment Tool (AMMAT) 31
1 Summary 9
2.6 Asset management framework 29
2.1 Purpose of our AMP 22
Contents
2.13.1 Asset management processes 39 2.13.2 Changes to our business 39
2.13.3 Sources of uncertainty 39 2.13.4 Price inflation 40
2.13.5 Potential differences between our forecast and actual outcomes 40
2.12 Systems, processes and data management 36
2.13 Significant business assumptions 39
2.11 Accountabilities and responsibilities 34
2.10 Stakeholder interests 32
2.5 Asset Management Plan development process 27
21 10 Year Asset Management Plan Section 2 About our business
22 Orion New Zealand Limited
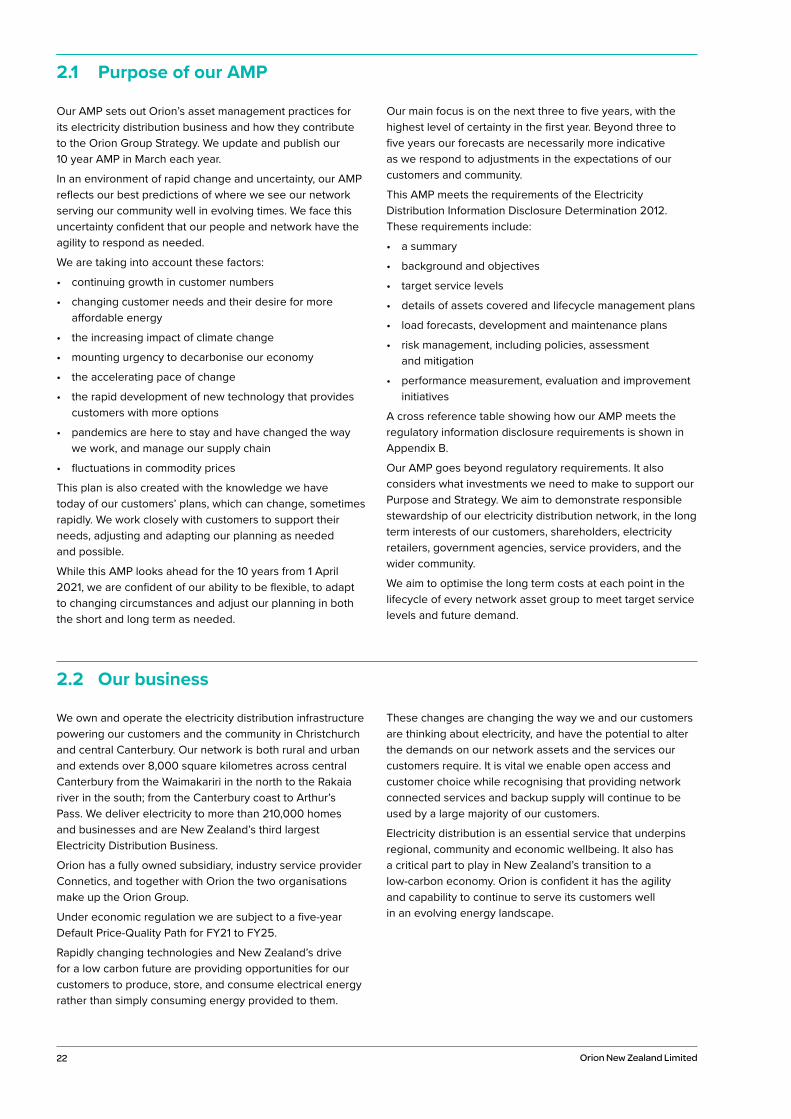
Our AMP sets out Orion’s asset management practices for its electricity distribution business and how they contribute to the Orion Group Strategy. We update and publish our 10 year AMP in March each year.
In an environment of rapid change and uncertainty, our AMP reflects our best predictions of where we see our network serving our community well in evolving times. We face this uncertainty confident that our people and network have the agility to respond as needed.
We are taking into account these factors:
• continuing growth in customer numbers
• changing customer needs and their desire for more affordable energy
• the increasing impact of climate change
• mounting urgency to decarbonise our economy
• the accelerating pace of change
• the rapid development of new technology that provides customers with more options
• pandemics are here to stay and have changed the way we work, and manage our supply chain
• fluctuations in commodity prices
This plan is also created with the knowledge we have today of our customers’ plans, which can change, sometimes rapidly. We work closely with customers to support their needs, adjusting and adapting our planning as needed and possible.
While this AMP looks ahead for the 10 years from 1 April 2021, we are confident of our ability to be flexible, to adapt to changing circumstances and adjust our planning in both the short and long term as needed.
Our main focus is on the next three to five years, with the highest level of certainty in the first year. Beyond three to five years our forecasts are necessarily more indicative as we respond to adjustments in the expectations of our customers and community.
This AMP meets the requirements of the Electricity Distribution Information Disclosure Determination 2012. These requirements include:
• a summary
• background and objectives
• target service levels
• details of assets covered and lifecycle management plans
• load forecasts, development and maintenance plans
• risk management, including policies, assessment and mitigation
• performance measurement, evaluation and improvement initiatives
A cross reference table showing how our AMP meets the regulatory information disclosure requirements is shown in Appendix B.
Our AMP goes beyond regulatory requirements. It also considers what investments we need to make to support our Purpose and Strategy. We aim to demonstrate responsible stewardship of our electricity distribution network, in the long term interests of our customers, shareholders, electricity retailers, government agencies, service providers, and the wider community.
We aim to optimise the long term costs at each point in the lifecycle of every network asset group to meet target service levels and future demand.
We own and operate the electricity distribution infrastructure powering our customers and the community in Christchurch and central Canterbury. Our network is both rural and urban and extends over 8,000 square kilometres across central Canterbury from the Waimakariri in the north to the Rakaia river in the south; from the Canterbury coast to Arthur’s Pass. We deliver electricity to more than 210,000 homes and businesses and are New Zealand’s third largest Electricity Distribution Business.
Orion has a fully owned subsidiary, industry service provider Connetics, and together with Orion the two organisations make up the Orion Group.
Under economic regulation we are subject to a five-year Default Price-Quality Path for FY21 to FY25.
Rapidly changing technologies and New Zealand’s drive for a low carbon future are providing opportunities for our customers to produce, store, and consume electrical energy rather than simply consuming energy provided to them.
These changes are changing the way we and our customers are thinking about electricity, and have the potential to alter the demands on our network assets and the services our customers require. It is vital we enable open access and customer choice while recognising that providing network connected services and backup supply will continue to be used by a large majority of our customers.
Electricity distribution is an essential service that underpins regional, community and economic wellbeing. It also has a critical part to play in New Zealand’s transition to a low-carbon economy. Orion is confident it has the agility and capability to continue to serve its customers well in an evolving energy landscape.
2.1 Purpose of our AMP
2.2 Our business
23
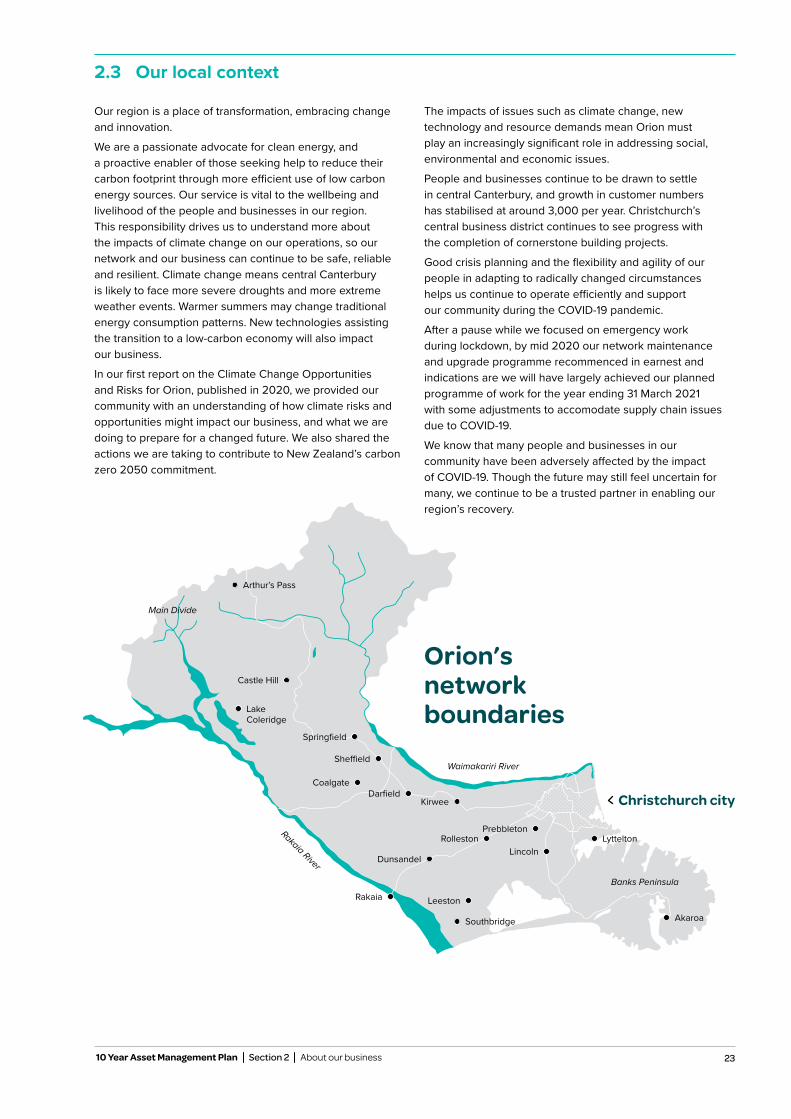
Our region is a place of transformation, embracing change and innovation.
We are a passionate advocate for clean energy, and a proactive enabler of those seeking help to reduce their carbon footprint through more efficient use of low carbon energy sources. Our service is vital to the wellbeing and livelihood of the people and businesses in our region. This responsibility drives us to understand more about the impacts of climate change on our operations, so our network and our business can continue to be safe, reliable and resilient. Climate change means central Canterbury is likely to face more severe droughts and more extreme weather events. Warmer summers may change traditional energy consumption patterns. New technologies assisting the transition to a low-carbon economy will also impact our business.
In our first report on the Climate Change Opportunities and Risks for Orion, published in 2020, we provided our community with an understanding of how climate risks and opportunities might impact our business, and what we are doing to prepare for a changed future. We also shared the actions we are taking to contribute to New Zealand’s carbon zero 2050 commitment.
The impacts of issues such as climate change, new technology and resource demands mean Orion must play an increasingly significant role in addressing social, environmental and economic issues.
People and businesses continue to be drawn to settle in central Canterbury, and growth in customer numbers has stabilised at around 3,000 per year. Christchurch’s central business district continues to see progress with the completion of cornerstone building projects.
Good crisis planning and the flexibility and agility of our people in adapting to radically changed circumstances helps us continue to operate efficiently and support our community during the COVID-19 pandemic.
After a pause while we focused on emergency work during lockdown, by mid 2020 our network maintenance and upgrade programme recommenced in earnest and indications are we will have largely achieved our planned programme of work for the year ending 31 March 2021 with some adjustments to accomodate supply chain issues due to COVID-19.
We know that many people and businesses in our community have been adversely affected by the impact of COVID-19. Though the future may still feel uncertain for many, we continue to be a trusted partner in enabling our region’s recovery.
2.3 Our local context
Arthur’s Pass
Castle Hill
Coalgate
Sheffield
Springfield
DarfieldKirwee
Leeston
Lincoln
Rakaia
Southbridge
Lyttelton
Dunsandel
Lake Coleridge
Christchurch city
Akaroa
Banks Peninsula
Rakaia River
Main Divide
RollestonPrebbleton
Waimakariri River
Orion’s network boundaries
10 Year Asset Management Plan Section 2 About our business

24 Orion New Zealand Limited
Our Purpose is to power a cleaner and brighter future for our communities.

25
2.4.1 Our Group PurposeOrion’s Group Purpose is central to all we do, and is the touch stone for this AMP.
As New Zealand transitions to a low-carbon economy, the energy sector has a critical part to play. Orion has established its Purpose to be a vital player in that transition for our community and our region. We are focussed on helping our community realise its dreams for a future that is new, better, and more sustainable over the long term. Our Group Strategy is changing the shape of Orion’s contribution - to use the skills and expertise of the Orion Group to meet the changing needs of our community today and tomorrow.
2.4.2 Group StrategyWhile it remains critical for Orion to provide our community with confidence in their energy supply, we have also challenged ourselves to think about what a changed future holds, and how the Orion Group needs to evolve and adapt to remain relevant and proactively harness opportunities in a fast changing energy landscape.
The outcome of this is our Group Strategy. See Figure 2.4.1.
Our Group Purpose is: Powering a cleaner and brighter future for our communities. It encapsulates the contribution we want to make to our community’s future wellbeing and prosperity.
• Powering – coveys our commitment to taking action and reinforces our focus on energy
• Cleaner – speaks to our commitment to assisting our region and New Zealand’s transition to a low carbon future and being environmentally sustainable
• Brighter – reflects our contribution to social and economic prosperity
• Our communities – reflects our holistic view that includes our people, our region and New Zealand
Sustainable Development Goals – are a subset of 17 United Nations goals that define global sustainable development priorities and aspirations. We consulted with a variety of our key stakeholders who helped us select the seven goals that were most relevant to Orion, and where we could have the
most impact. They provide a common language that enables us to collaborate and form partnerships with other like-minded organisations.
Impacts – we aim to make a clear, measurable impact in these three critical areas
Strategic themes – are the areas we are focussing on to fulfil our Purpose
Our foundation – underpins all that we do; it is critical we continue to perform our core network role exceptionally
Our enablers – the building blocks that will enable us to achieve our Group Strategy
This AMP delivers on our commitment to operate New Zealand’s most advanced electricity network and undertake our core network role to the high standard expected by our customers. It also outlines many new projects and initiatives aligned to our Group’s Strategic Themes, with more to come as the Group Strategy gains momentum.
2.4 Our Group Strategy
10 Year Asset Management Plan Section 2 About our business
Figure 2.4.1 Group Strategy framework
New Zealand’s most advanced electricity network
Re-imagining the Future Network
Lead & Grow
Customer Inspired
Accelerating Capability
Powering the Low Carbon Economy
Sector TransformationRegional ProsperityStrategic Leadership
Strategic Agility
Data & Digitisation
Re-defining Value
Leadership & Culture
Purpose
Foundation
Impacts
Enablers
Strategic themes
Sustainable Development Goals
Powering a cleaner and brighter future

26 Orion New Zealand Limited
2.4 Our Group Strategy continued
We have aligned our programmes and projects to our foundation and our five strategic themes. In Figure 2.4.2
we show the Commerce Commission’s project drivers and how they relate to each strategic theme.
Figure 2.4.2 Orion Group Strategy strategic theme and the related programme and project drivers
2.4.3 Programme and project driver definitionsSystem growthAdditional investment to maintain current security and/or quality of supply standards due to increased demand and/or generation. Includes SCADA and telecommunications assets.
Customer connectionsCustomer connection points established and alterations made to an existing customer connection point during the year, and includes both electricity injection and offtake points of connection.
Non-network sssetsExpenditure on non-network assets including: information and technology systems; asset management systems; office buildings and vehicles.
Asset relocationsExpenditure on assets where the primary driver is the need to relocate assets due to third party requests, for example, to allow for road widening. Includes undergrounding.
Reliability, safety and environment• Quality of supply - resilience – expenditure required
to meet improved security and/or quality of supply standards. E.g. reducing SAIDI, SAIFI etc.
• Legislative and regulatory – expenditure on assets where the primary driver is a new regulatory or legal requirement that results in the creation or modification of network assets.
• Other reliability, safety and environment – expenditure to improve network reliability or safety or to mitigate the environmental impacts of the network, but is not included in either of the quality of supply or legislative and regulatory categories.
Asset replacement and renewalReplacement or renewal of assets to maintain network asset integrity to maintain current security and/or quality of supply standards.
Customer connections
Asset relocations
Customer Inspired
Reliability, safety and environment
Other reliability, safety and
environment
Powering the Low Carbon Economy
Non-network assets
Accelerating Capability
Re-imagining the Future Network
System growth
Reliability, safety and environment
Quality of supply – resilience
Quality of supply – resilience
Legislative and regulatory
Other reliability, safety and
environment
Lead & Grow
Asset replacement and renewal
System growth
Reliability, safety and environment
Non-network assets
New Zealand’s most advanced electricity network
Re-imagining the Future Network
Lead & Grow
Customer Inspired
Accelerating Capability
Powering the Low Carbon Economy
Sector TransformationRegional ProsperityStrategic Leadership
Strategic Agility
Data & Digitisation
Re-defining Value
Leadership & Culture
Purpose
Foundation
Impacts
Enablers
Strategic themes
Sustainable Development Goals
Powering a cleaner and brighter future
27 10 Year Asset Management Plan Section 2 About our business
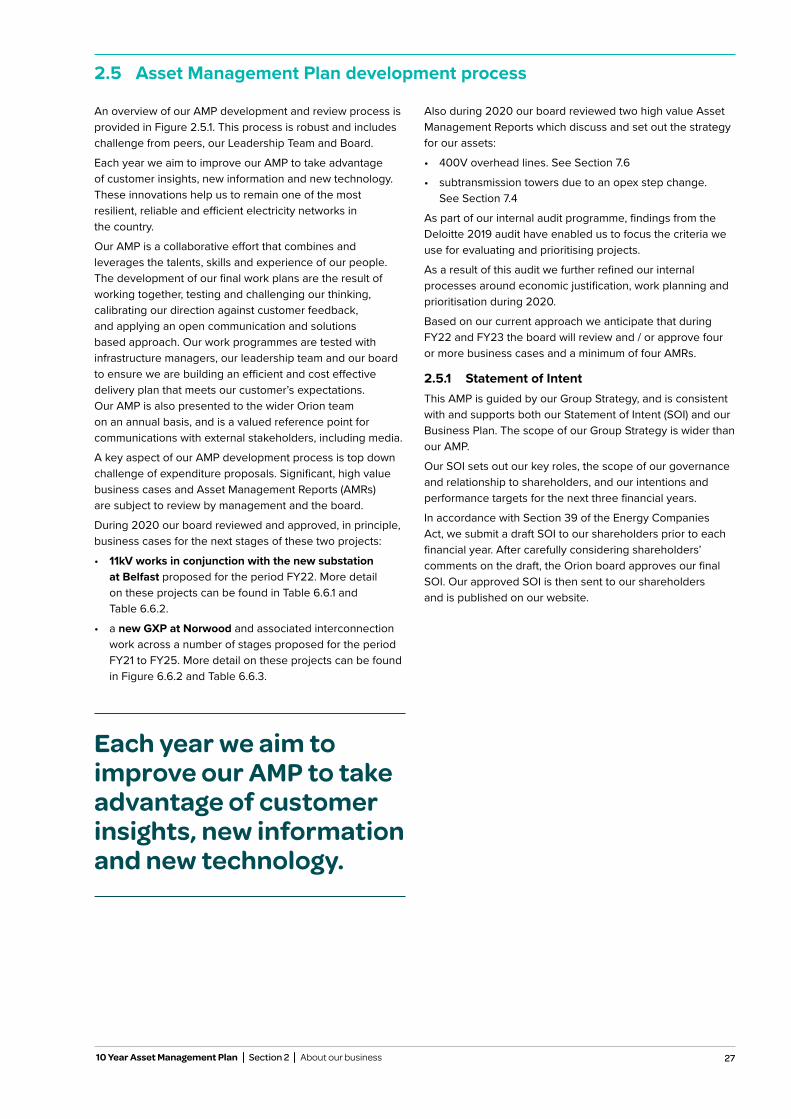
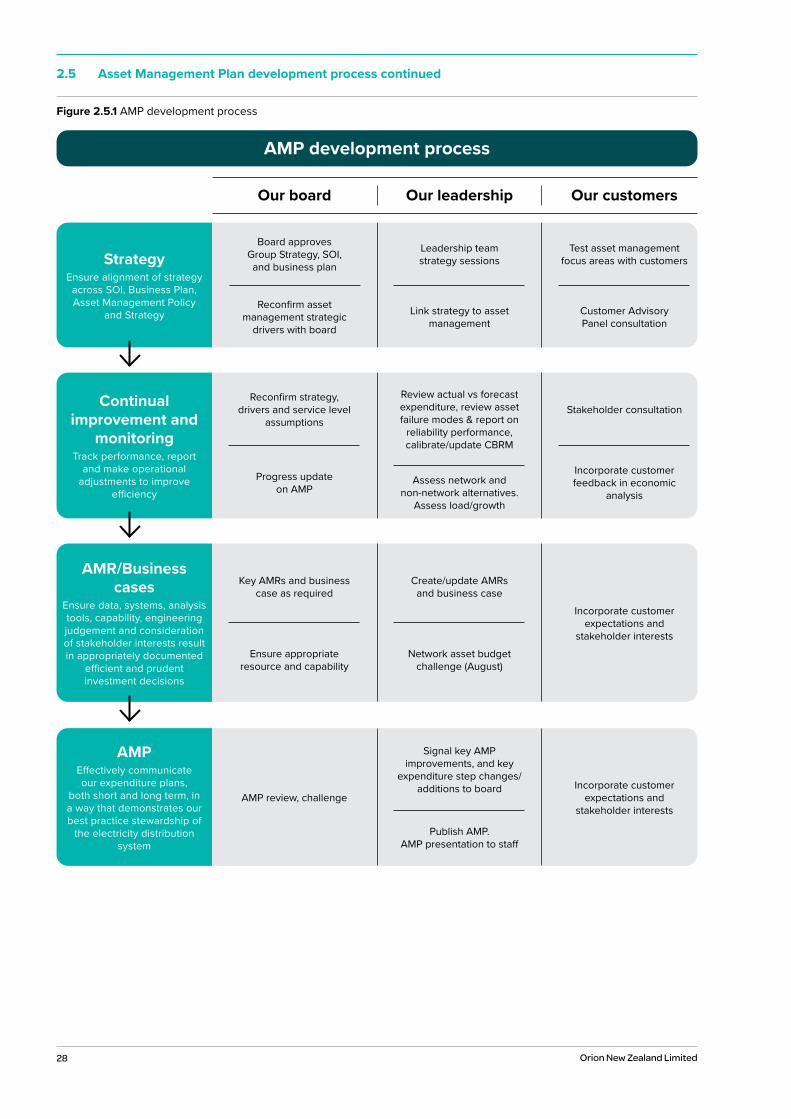
An overview of our AMP development and review process is provided in Figure 2.5.1. This process is robust and includes challenge from peers, our Leadership Team and Board.
Each year we aim to improve our AMP to take advantage of customer insights, new information and new technology. These innovations help us to remain one of the most resilient, reliable and efficient electricity networks in the country.
Our AMP is a collaborative effort that combines and leverages the talents, skills and experience of our people. The development of our final work plans are the result of working together, testing and challenging our thinking, calibrating our direction against customer feedback, and applying an open communication and solutions based approach. Our work programmes are tested with infrastructure managers, our leadership team and our board to ensure we are building an efficient and cost effective delivery plan that meets our customer’s expectations. Our AMP is also presented to the wider Orion team on an annual basis, and is a valued reference point for communications with external stakeholders, including media.
A key aspect of our AMP development process is top down challenge of expenditure proposals. Significant, high value business cases and Asset Management Reports (AMRs) are subject to review by management and the board.
During 2020 our board reviewed and approved, in principle, business cases for the next stages of these two projects:
• 11kV works in conjunction with the new substation at Belfast proposed for the period FY22. More detail on these projects can be found in Table 6.6.1 and Table 6.6.2.
• a new GXP at Norwood and associated interconnection work across a number of stages proposed for the period FY21 to FY25. More detail on these projects can be found in Figure 6.6.2 and Table 6.6.3.
Also during 2020 our board reviewed two high value Asset Management Reports which discuss and set out the strategy for our assets:
• 400V overhead lines. See Section 7.6
• subtransmission towers due to an opex step change. See Section 7.4
As part of our internal audit programme, findings from the Deloitte 2019 audit have enabled us to focus the criteria we use for evaluating and prioritising projects.
As a result of this audit we further refined our internal processes around economic justification, work planning and prioritisation during 2020.
Based on our current approach we anticipate that during FY22 and FY23 the board will review and / or approve four or more business cases and a minimum of four AMRs.
2.5.1 Statement of IntentThis AMP is guided by our Group Strategy, and is consistent with and supports both our Statement of Intent (SOI) and our Business Plan. The scope of our Group Strategy is wider than our AMP.
Our SOI sets out our key roles, the scope of our governance and relationship to shareholders, and our intentions and performance targets for the next three financial years.
In accordance with Section 39 of the Energy Companies Act, we submit a draft SOI to our shareholders prior to each financial year. After carefully considering shareholders’ comments on the draft, the Orion board approves our final SOI. Our approved SOI is then sent to our shareholders and is published on our website.
2.5 Asset Management Plan development process
Each year we aim to improve our AMP to take advantage of customer insights, new information and new technology.
28 Orion New Zealand Limited
2.5 Asset Management Plan development process continued
Figure 2.5.1 AMP development process
AMP development process
Our board Our leadership Our customers
AMPEffectively communicate our expenditure plans,
both short and long term, in a way that demonstrates our best practice stewardship of
the electricity distribution system
AMP review, challenge
Signal key AMP improvements, and key
expenditure step changes/additions to board
Publish AMP. AMP presentation to staff
Incorporate customer expectations and
stakeholder interests
StrategyEnsure alignment of strategy
across SOI, Business Plan, Asset Management Policy
and Strategy
Leadership team strategy sessions
Link strategy to asset management
Board approves Group Strategy, SOI, and business plan
Reconfirm asset management strategic
drivers with board
Test asset management focus areas with customers
Customer Advisory Panel consultation
Continual improvement and
monitoringTrack performance, report
and make operationaladjustments to improve
efficiency
Review actual vs forecast expenditure, review asset failure modes & report on
reliability performance, calibrate/update CBRM
Assess network and non-network alternatives.
Assess load/growth
Reconfirm strategy, drivers and service level
assumptions
Progress update on AMP
Stakeholder consultation
Incorporate customer feedback in economic
analysis
AMR/Business cases
Ensure data, systems, analysis tools, capability, engineering judgement and consideration of stakeholder interests result in appropriately documented
efficient and prudent investment decisions
Key AMRs and business case as required
Ensure appropriate resource and capability
Create/update AMRs and business case
Network asset budget challenge (August)
Incorporate customer expectations and
stakeholder interests
29
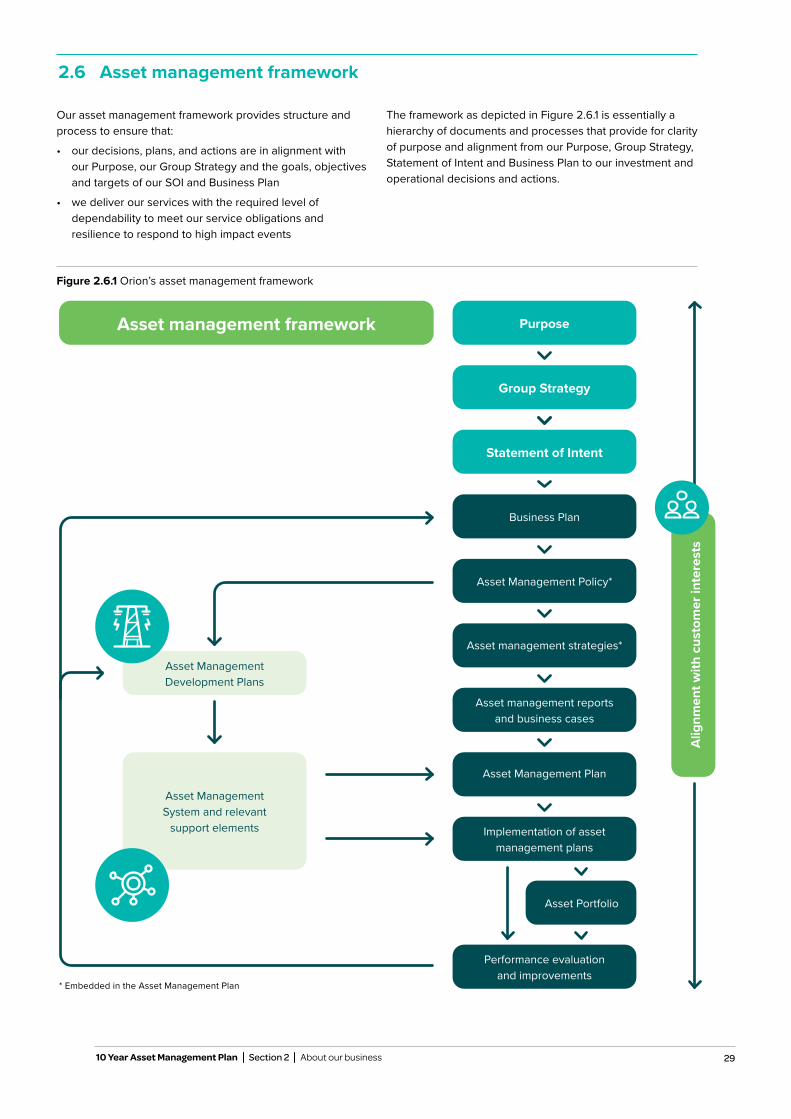
Our asset management framework provides structure and process to ensure that:
• our decisions, plans, and actions are in alignment with our Purpose, our Group Strategy and the goals, objectives and targets of our SOI and Business Plan
• we deliver our services with the required level of dependability to meet our service obligations and resilience to respond to high impact events
The framework as depicted in Figure 2.6.1 is essentially a hierarchy of documents and processes that provide for clarity of purpose and alignment from our Purpose, Group Strategy, Statement of Intent and Business Plan to our investment and operational decisions and actions.
2.6 Asset management framework
Figure 2.6.1 Orion’s asset management framework
Alig
nmen
t with
cus
tom
er in
tere
sts
Asset management framework Purpose
Group Strategy
Statement of Intent
Asset Management Development Plans
Asset Portfolio
Performance evaluation and improvements
Business Plan
Asset Management Policy*
Asset management strategies*
Asset Management Plan
Implementation of asset management plans
Asset management reports and business cases
Asset Management System and relevant
support elements
* Embedded in the Asset Management Plan
10 Year Asset Management Plan Section 2 About our business
30 Orion New Zealand Limited
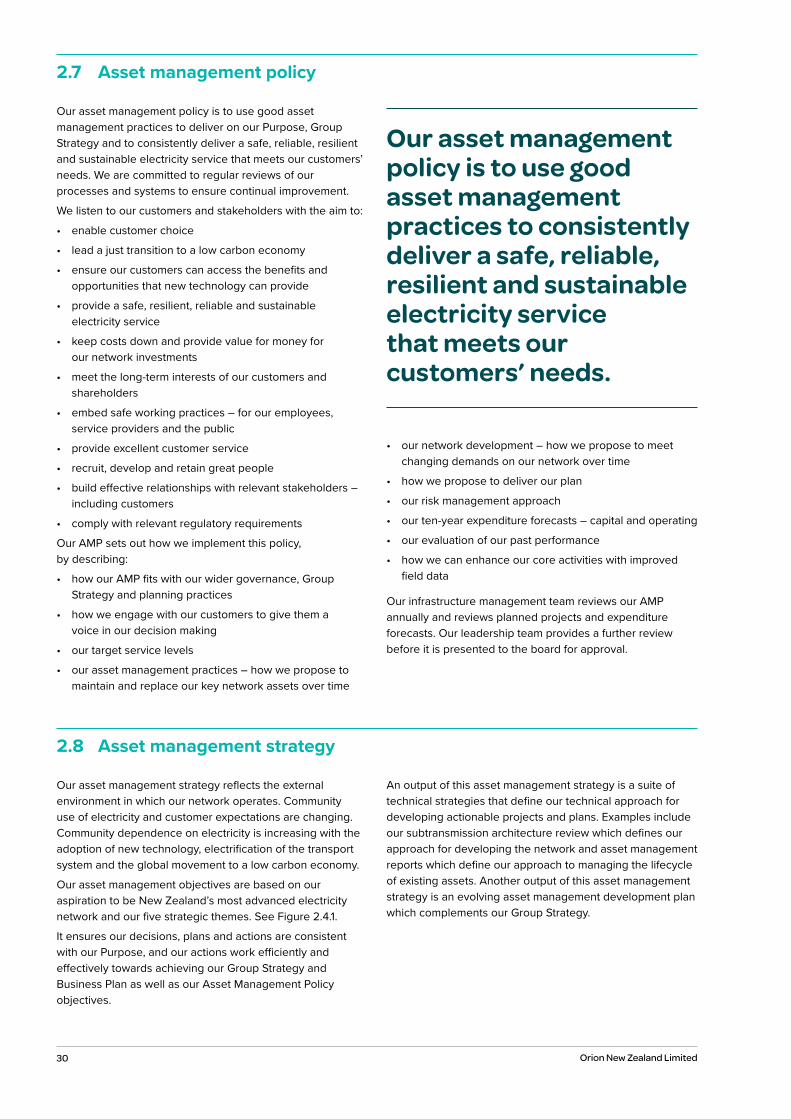
Our asset management policy is to use good asset management practices to deliver on our Purpose, Group Strategy and to consistently deliver a safe, reliable, resilient and sustainable electricity service that meets our customers’ needs. We are committed to regular reviews of our processes and systems to ensure continual improvement.
We listen to our customers and stakeholders with the aim to:
• enable customer choice
• lead a just transition to a low carbon economy
• ensure our customers can access the benefits and opportunities that new technology can provide
• provide a safe, resilient, reliable and sustainable electricity service
• keep costs down and provide value for money for our network investments
• meet the long-term interests of our customers and shareholders
• embed safe working practices – for our employees, service providers and the public
• provide excellent customer service
• recruit, develop and retain great people
• build effective relationships with relevant stakeholders – including customers
• comply with relevant regulatory requirements
Our AMP sets out how we implement this policy, by describing:
• how our AMP fits with our wider governance, Group Strategy and planning practices
• how we engage with our customers to give them a voice in our decision making
• our target service levels
• our asset management practices – how we propose to maintain and replace our key network assets over time
• our network development – how we propose to meet changing demands on our network over time
• how we propose to deliver our plan
• our risk management approach
• our ten-year expenditure forecasts – capital and operating
• our evaluation of our past performance
• how we can enhance our core activities with improved field data
Our infrastructure management team reviews our AMP annually and reviews planned projects and expenditure forecasts. Our leadership team provides a further review before it is presented to the board for approval.
2.7 Asset management policy
Our asset management policy is to use good asset management practices to consistently deliver a safe, reliable, resilient and sustainable electricity service that meets our customers’ needs.
Our asset management strategy reflects the external environment in which our network operates. Community use of electricity and customer expectations are changing. Community dependence on electricity is increasing with the adoption of new technology, electrification of the transport system and the global movement to a low carbon economy.
Our asset management objectives are based on our aspiration to be New Zealand’s most advanced electricity network and our five strategic themes. See Figure 2.4.1.
It ensures our decisions, plans and actions are consistent with our Purpose, and our actions work efficiently and effectively towards achieving our Group Strategy and Business Plan as well as our Asset Management Policy objectives.
An output of this asset management strategy is a suite of technical strategies that define our technical approach for developing actionable projects and plans. Examples include our subtransmission architecture review which defines our approach for developing the network and asset management reports which define our approach to managing the lifecycle of existing assets. Another output of this asset management strategy is an evolving asset management development plan which complements our Group Strategy.
2.8 Asset management strategy
31 10 Year Asset Management Plan Section 2 About our business
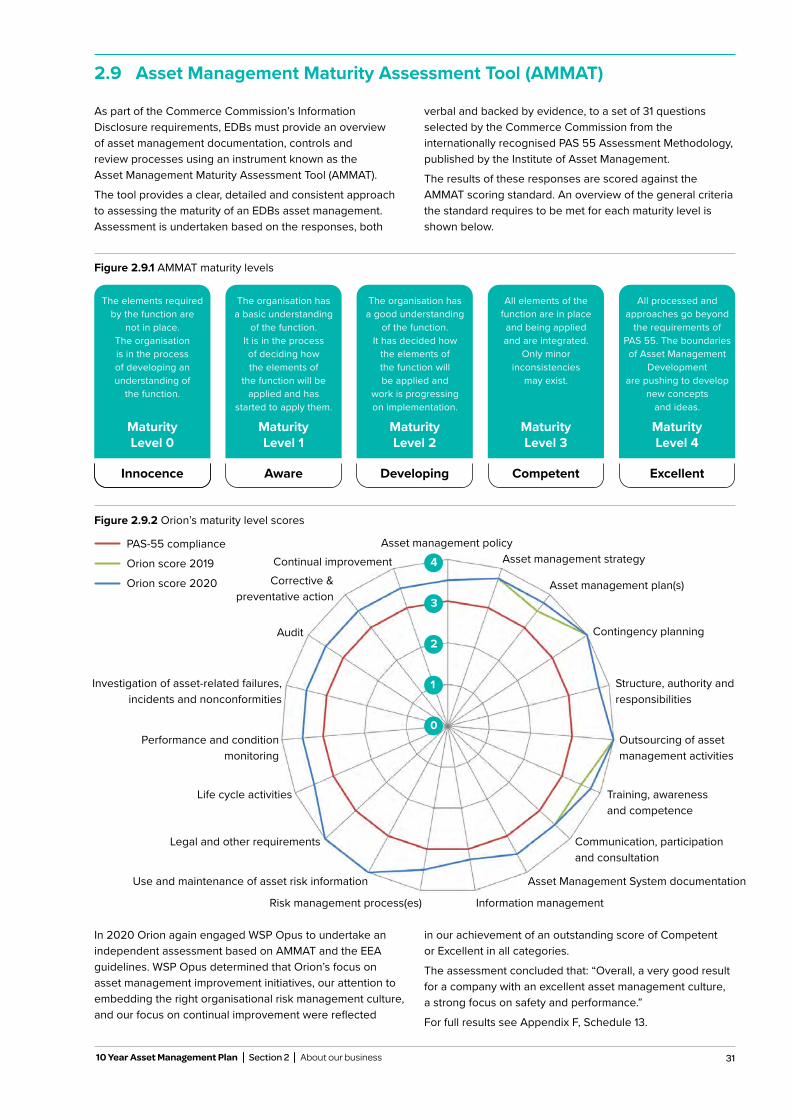
In 2020 Orion again engaged WSP Opus to undertake an independent assessment based on AMMAT and the EEA guidelines. WSP Opus determined that Orion’s focus on asset management improvement initiatives, our attention to embedding the right organisational risk management culture, and our focus on continual improvement were reflected
in our achievement of an outstanding score of Competent or Excellent in all categories.
The assessment concluded that: “Overall, a very good result for a company with an excellent asset management culture, a strong focus on safety and performance.”
For full results see Appendix F, Schedule 13.
Figure 2.9.2 Orion’s maturity level scores
As part of the Commerce Commission’s Information Disclosure requirements, EDBs must provide an overview of asset management documentation, controls and review processes using an instrument known as the Asset Management Maturity Assessment Tool (AMMAT).
The tool provides a clear, detailed and consistent approach to assessing the maturity of an EDBs asset management. Assessment is undertaken based on the responses, both
verbal and backed by evidence, to a set of 31 questions selected by the Commerce Commission from the internationally recognised PAS 55 Assessment Methodology, published by the Institute of Asset Management.
The results of these responses are scored against the AMMAT scoring standard. An overview of the general criteria the standard requires to be met for each maturity level is shown below.
Figure 2.9.1 AMMAT maturity levels
Maturity Level 0
Maturity Level 1
Maturity Level 3
Maturity Level 4
Maturity Level 2
Innocence Aware Developing Competent Excellent
The elements required by the function are
not in place. The organisation is in the process of developing an understanding of
the function.
The organisation has a basic understanding
of the function. It is in the process of deciding how the elements of
the function will be applied and has
started to apply them.
The organisation has a good understanding
of the function. It has decided how
the elements of the function will be applied and
work is progressing on implementation.
All elements of the function are in place and being applied and are integrated.
Only minor inconsistencies
may exist.
All processed and approaches go beyond
the requirements of PAS 55. The boundaries of Asset Management
Development are pushing to develop
new concepts and ideas.
Asset management policyAsset management strategyContinual improvement
Life cycle activities
Risk management process(es)
Corrective & preventative action
Audit
Asset management plan(s)
Contingency planning
Structure, authority and responsibilities
Outsourcing of asset management activities
Investigation of asset-related failures, incidents and nonconformities
Legal and other requirements
Use and maintenance of asset risk information
Performance and condition monitoring
Training, awareness and competence
Communication, participation and consultation
Asset Management System documentation
Information management
PAS-55 compliance
Orion score 2019
Orion score 2020
0
1
2
3
4
2.9 Asset Management Maturity Assessment Tool (AMMAT)
32 Orion New Zealand Limited
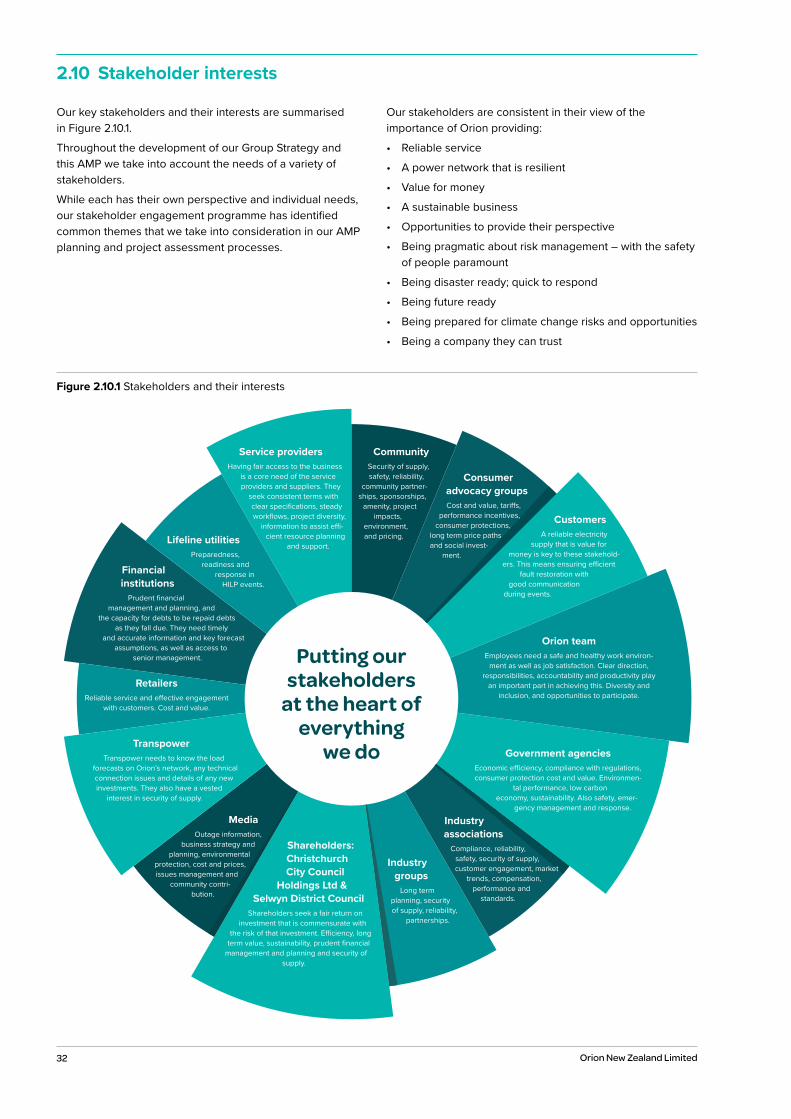
Our key stakeholders and their interests are summarised in Figure 2.10.1.
Throughout the development of our Group Strategy and this AMP we take into account the needs of a variety of stakeholders.
While each has their own perspective and individual needs, our stakeholder engagement programme has identified common themes that we take into consideration in our AMP planning and project assessment processes.
Our stakeholders are consistent in their view of the importance of Orion providing:
• Reliable service
• A power network that is resilient
• Value for money
• A sustainable business
• Opportunities to provide their perspective
• Being pragmatic about risk management – with the safety of people paramount
• Being disaster ready; quick to respond
• Being future ready
• Being prepared for climate change risks and opportunities
• Being a company they can trust
2.10 Stakeholder interests
Figure 2.10.1 Stakeholders and their interests
CommunitySecurity of supply, safety, reliability,
community partner-ships, sponsorships,
amenity, project impacts,
environment, and pricing.
Consumer advocacy groupsCost and value, tariffs,
performance incentives, consumer protections,
long term price paths and social invest-
ment.
CustomersA reliable electricity
supply that is value for money is key to these stakehold-
ers. This means ensuring efficient fault restoration with
good communication during events.
Orion teamEmployees need a safe and healthy work environ-
ment as well as job satisfaction. Clear direction, responsibilities, accountability and productivity play
an important part in achieving this. Diversity and inclusion, and opportunities to participate.
Government agenciesEconomic efficiency, compliance with regulations, consumer protection cost and value. Environmen-
tal performance, low carbon economy, sustainability. Also safety, emer-
gency management and response.
Industry associations
Compliance, reliability, safety, security of supply, customer engagement, market
trends, compensation, performance and
standards.
Shareholders: Christchurch City Council
Holdings Ltd & Selwyn District Council
Shareholders seek a fair return on investment that is commensurate with
the risk of that investment. Efficiency, long term value, sustainability, prudent financial
management and planning and security of supply.
Media
Outage information, business strategy and
planning, environmental protection, cost and prices, issues management and
community contri-bution.
TranspowerTranspower needs to know the load
forecasts on Orion’s network, any technical connection issues and details of any new investments. They also have a vested
interest in security of supply.
RetailersReliable service and effective engagement
with customers. Cost and value.
Financial institutions
Prudent financial management and planning, and
the capacity for debts to be repaid debts as they fall due. They need timely
and accurate information and key forecast assumptions, as well as access to
senior management.
Lifeline utilitiesPreparedness,
readiness and response in
HILP events.
Service providersHaving fair access to the business
is a core need of the service providers and suppliers. They
seek consistent terms with clear specifications, steady workflows, project diversity,
information to assist effi-cient resource planning
and support.
Putting our stakeholders
at the heart of everything
we do
Industry groups
Long term planning, security of supply, reliability,
partnerships.
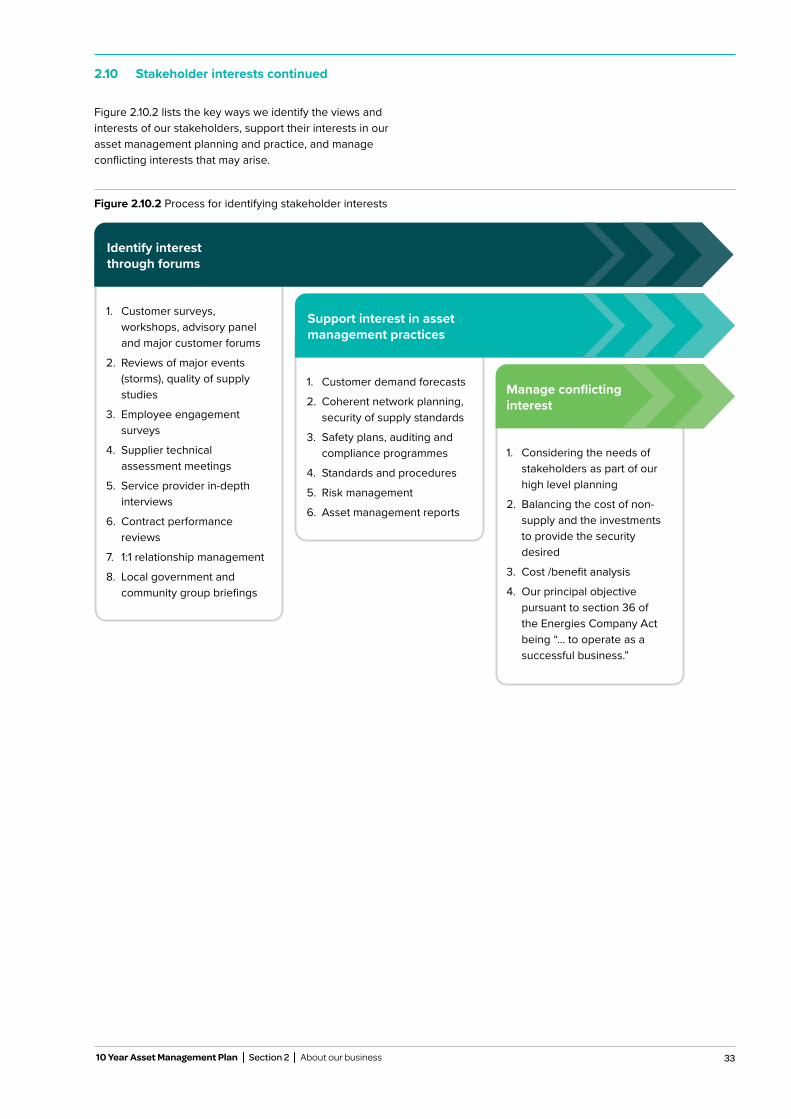
33
Figure 2.10.2 lists the key ways we identify the views and interests of our stakeholders, support their interests in our asset management planning and practice, and manage conflicting interests that may arise.
10 Year Asset Management Plan Section 2 About our business
Figure 2.10.2 Process for identifying stakeholder interests
2.10 Stakeholder interests continued
1. Customer surveys, workshops, advisory panel and major customer forums
2. Reviews of major events (storms), quality of supply studies
3. Employee engagement surveys
4. Supplier technical assessment meetings
5. Service provider in-depth interviews
6. Contract performance reviews
7. 1:1 relationship management
8. Local government and community group briefings
1. Customer demand forecasts
2. Coherent network planning, security of supply standards
3. Safety plans, auditing and compliance programmes
4. Standards and procedures
5. Risk management
6. Asset management reports
1. Considering the needs of stakeholders as part of our high level planning
2. Balancing the cost of non-supply and the investments to provide the security desired
3. Cost /benefit analysis
4. Our principal objective pursuant to section 36 of the Energies Company Act being “... to operate as a successful business.”
Manage conflicting interest
Identify interest through forums
Support interest in asset management practices
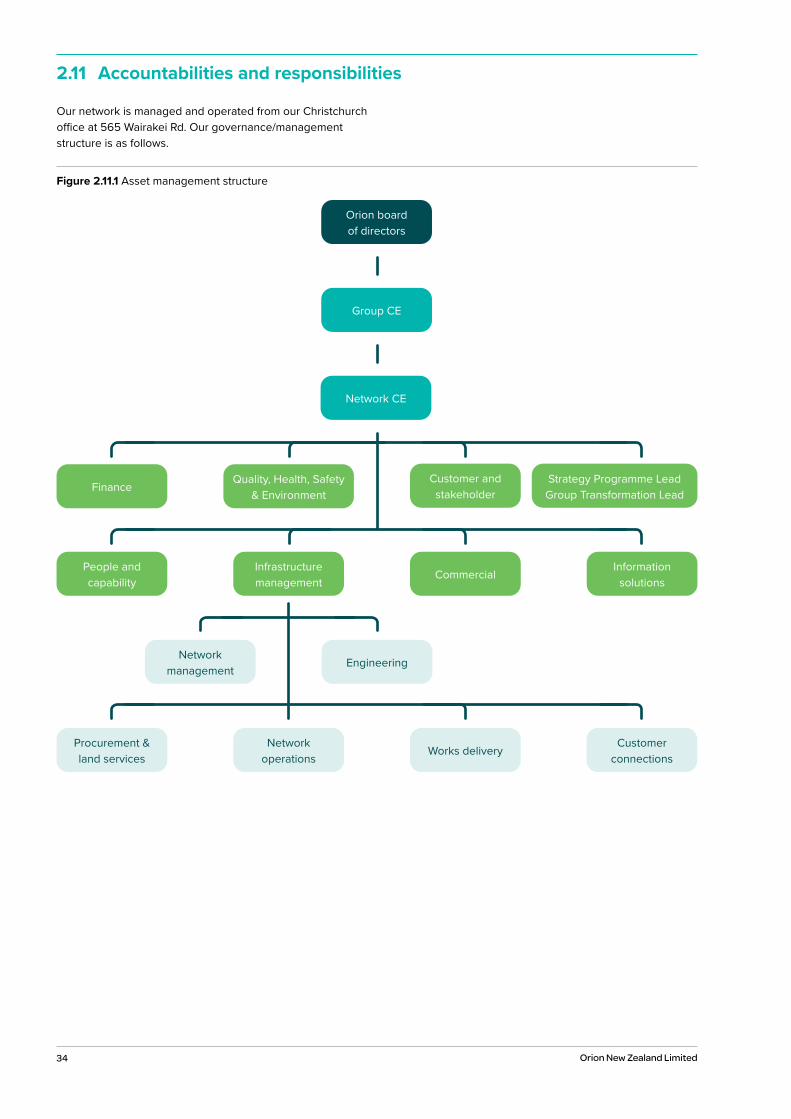
34 Orion New Zealand Limited
Our network is managed and operated from our Christchurch office at 565 Wairakei Rd. Our governance/management structure is as follows.
2.11 Accountabilities and responsibilities
Figure 2.11.1 Asset management structure
Orion board of directors
Group CE
Network CE
People and capability
Procurement & land services
Network operations
Network management
Works deliveryCustomer
connections
Engineering
Finance
Infrastructure management
Quality, Health, Safety & Environment
Commercial
Customer and stakeholder
Strategy Programme Lead Group Transformation Lead
Information solutions
35
Board and executive governance
Our directors are appointed by our shareholders to govern and direct our activities. The board usually meets monthly and receives formal updates from management of progress against objectives, legislative compliance, risk management and performance against targets.
Orion’s board of directors is the overall and final body responsible for all decision-making within the company. The board is responsible for the direction and control of the company including Group Strategy, commercial performance, business plans, policies, budgets and compliance with the law. The board reviews and approves our revised 10 year AMP prior to the start of each financial year (1 April).
The board also formally reviews and approves our key company policies each year, including delegated authorities and spending authorities. Each of the managers in the Leadership Team is responsible for their budget and operating within their delegated authorities.
Infrastructure responsibilities
The asset management framework is governed by the board, Leadership Team and the Infrastructure Team. Each infrastructure manager is responsible for their part of the network opex and capex. The expenditure for each asset class is also set out in the internal Asset Management Reports (AMRs), which then support this AMP. The AMRs are subjected to an internal approval process, whereby during the year, they go through several checkpoints including infrastructure managers and leadership team review and a selection will be reviewed by the directors.
For detailed responsibilities see Section 8 – Supporting our business.
10 Year Asset Management Plan Section 2 About our business
2.11 Accountabilities and responsibilities continued
36 Orion New Zealand Limited
2.12.1 SystemsOur information systems are used to record, develop, maintain and operate our business. The function of the main systems is detailed below:
2.12.1.1 Geographic asset information
Our Geospatial Information System (GIS) records the location of our network assets and their electrical connectivity. It is one of our integrated asset management systems.
Full access to the GIS is continuously available to the Orion team through locally connected and remote viewing tools.
Tailored views of GIS data are also available to authorised third parties via a secure web client. Information stored in our GIS includes:
• land-base
• aerial photography
• detailed plant locations for both cable and overheadsystems
• a model of our electricity network from the TranspowerGXPs to the customer connection
• conductor size and age
Our asset data team updates and maintains the GIS data. Data integrity checks between our asset register and the GIS are automatically run every week. Systems are in place to facilitate and manage GIS business development in-house.
2.12.1.2 Asset database
Our asset database is our central repository for details of the non-spatial network assets. Schedules extracted from this database are used for preventative maintenance contracts and network valuation purposes.
Information we hold includes:
• substation land (title/tenure etc.)
• transformers
• switchgear and ancillary equipment
• test/inspection results for site earths, poles andunderground distribution assets
• transformer maximum demand readings
• cables and pilot/communication cable lengths, joint andtermination details. This is linked to our GIS by a uniquecable reference number
• protection relays
• substation inspection/maintenance rounds
• poles and attached circuits
• valuation schedule codes and modern equivalent asset(MEA) class
• field SCADA and communication system
• links to documentation and photographs
See table in Appendix C for more specific detail of information held on each asset group.
2.12.1.3 Works Management system
All works activities are managed using an in house application. There is integration with our financial management system that allows works orders to be raised directly in Works Management.
Information held in Works Management includes:
• service provider/tendering details
• contract specifications and drawings
• management of customer connection requests
• auditing outcomes
• contract management documentation
• financial tracking
• job as-built documentation
2.12.1.4 Document management
We manage most of our key documents in Microsoft SharePoint.
Our engineering drawings and standard documents are controlled using a custom-built system. This system is used to process the release of CAD drawings to outsourced service providers and return them as “as-built” drawings at the completion of works contracts. Standards and policies maintained in-house are also controlled using this system. Standard drawings and documents are then posted directly on our ‘restricted’ website and the relevant service providers/designers are advised via an automated email process.
2.12.1.5 Connections Register
Our Connections Register, which links to the Industry Registry, holds details of all Installation Control Points (ICP) on our electrical network. There is an interface with our GIS systems that enables accurate derivation of GXP information by ICP and the association of ICP with an interruption. Interruptions are routinely traced within PowerOn for the high voltage network and the GIS for the low voltage network using the in-built connectivity model. Accurate information about the number of customers and interruption duration are recorded and posted overnight to the Electricity Authority’s registry.
2.12.1.6 Financial Management Information System (FMIS)
Our FMIS (Microsoft NAV) delivers our core accounting functions. It includes the general ledger, debtors, creditors, job costing, fixed assets and tax registers. Detailed network asset information is not held in the FMIS.
There is an interface between the Works Management system and the financial system to link project activities to jobs.
2.12.1.7 Cyber security management
We have a number of protection systems and processes in place to address the growing threat of cyber security breaches. See Section 3.7.5.
2.12 Systems, processes and data management
37 10 Year Asset Management Plan Section 2 About our business
2.12.1.8 Advanced Distribution Management System (ADMS)
We operate an integrated ADMS (PowerOn from GE) that includes the following modules:
Network monitoring system (SCADA) The electricity distribution system is monitored and controlled in real time by the SCADA system. SCADA is installed at all zone substations and an increasing number of switching equipment. We are also progressively installing SCADA at network substations throughout the urban area as old switchgear is replaced.
Network Management System (NMS) The NMS is a real-time software model of our high voltage distribution network that sits above the SCADA system. It allows interaction in real time with indication and control devices to provide better information on network configuration. This gives us the ability to decide on how to respond to network outages, especially big events such as storms, and manage planned maintenance outages to minimise the impact on customers. The system also allows us to automate some functions and improve response times in network emergencies.
Outage Management System (OMS) The OMS is the third component (along with the SCADA and NMS functions) of a comprehensive “Smart” Distribution Management System that drives much of our operational activity. Outages are inferred from SCADA ‘trippings’ or from customer call patterns and are tracked through their lifecycle. Key performance statistics are automatically calculated and an audit trail of HV switching activity is logged. Integrated into the NMS and OMS is a mobile extension which delivers switching instructions to field operators in real time and returns the actions they have taken. It also delivers fault jobs to field workers and tracks the progress of the job as it is worked on. Jobs requiring further work by an emergency service provider are automatically dispatched to the service providers’ administration centre. Service providers enter completion information directly into a web-based application, and the job details automatically flow through into the works database.
Mobile operating platform (Peek) Field Operators interact with our Control Systems in real time through an in-house developed mobile application called Peek. An Operator receives operating instructions in the field on a hand-held device and, as each operating step is undertaken, updates the system. The completed operating steps are available for the Control Room to see in real time. Safety documents related to the operating order are also provided directly to the hand-held device. A recent enhancement to this application will also check that an operator has the appropriate certifications for operating the equipment associated with the order before allowing them to proceed.
Distribution Power Flow Analysis (DPF) DPF is a decision support tool for our Network Controllers. It can perform network power analysis studies that compute electrical network statuses and provide power analysis
data to Controllers. DPF studies can run as simulations and include switching schedules and switching work/order and patches.
Service Request Register (SRR) SRR is a service provider online switching release request system. The online release request system manages requests from multiple service providers who wish to undertake planned work on network equipment. This replaces a largely manual, paper-based system for planned outages.
2.12.1.9 Load Management
A high-availability Load Management system is used to perform load shedding to reduce the magnitude of our peak load and to respond to Transpower constraints. We also run an “umbrella” Load Management system that co-ordinates the load management systems of each of the seven distributors in Transpower’s Upper South Island region. This co-operative venture provides a number of significant benefits both to Transpower and to each of the participating distributors.
2.12.1.10 Network analytics
A database of well over 100 million half-hour loading values is available for trend analysis at a wide range of monitoring points in our network. The database also includes Transpower grid injection point load history and major customer load history. Several tens of thousands of new data point observations are being added daily. Half hour network feeder loading data is retrieved from the SCADA historical storage system. This data is analysed to derive and maintain maximum demands for all feeders monitored by the SCADA system. Loading data is also archived for future analysis.
2.12.1.11 Data warehouse and BI
A data warehouse that hosts data from financial, asset management and control systems is in place to meet increasing demand for more sophisticated business reporting, analytics and dashboards. Microsoft’s Power BI is deployed throughout the business.
2.12.1.12 Interruption statistics
We automatically post outage information from the PowerOn OMS into a regulatory reporting database. After checking, the data is summarised along with cause and location in an interruption register. Reports from this register provide all relevant statistical information to calculate our network reliability statistics (such as SAIDI and SAIFI) and analyse individual feeder and asset performance.
2.12.1.13 Demolition tracking
Demolition jobs are dispatched to the field and demolition details returned electronically.
2.12.1.14 Condition Based Risk Management (CBRM)
CBRM is a spreadsheet-based modelling program that uses asset information, engineering knowledge and experience to define, justify and target asset renewals. For more information on CBRM see Section 5.6.2.1.
2.12 Systems, processes and data management continued
38 Orion New Zealand Limited
2.12 Systems, processes and data management continued
2.12.1.15 Health and Safety event management
Incidents are recorded, managed and reported in our safety management system. This enables incidents and injuries to be captured using a desktop client or in the field using a phone-based application. This system also manages non-staff related incidents, e.g. incidents affecting our network and customer complaints.
2.12.1.16 Delivery billing system
We have contracted NZX Energy, a leading data services and market place support company, to provide our delivery billing system. The system receives connection and loading information, calculates delivery charges and produces our monthly invoices to electricity retailers and directly contracted major customers.
2.12.1.17 Power system modelling software
An integral part of planning for existing and future power system alterations is the ability to analyse and simulate impact off-line using computer power-flow simulation.
We use a power-flow simulation software package called PSS/Sincal and can model our network from the Transpower connection points down to the customer LV terminals if required. An automated interface developed in-house is used to enable power-flow models to be systematically created for PSS/Sincal. These models are created by utilising spatial data from our GIS, and linkages to conductor information in our as-laid cables database and customer information in our connection database records.
2.12.1.18 Orion website
Our website is logically divided into two distinct areas. One focuses on the delivery of information to our customers and the other on interactions with third parties.
The customer facing portion of the web site provides the following information:
• Customer outage reporting - details of planned, currentand past outages on our web site are populatedautomatically by extracts from the PowerOn OutageManagement System. This provides accurate real-timereporting of customer numbers affected by an outage.Outages can be viewed as a list or on a map.
• Load management - we provide near real-time networkloadings, peak pricing periods and hot water control
• Electricity pricing
• Company publications, regulatory disclosures and mediareleases
• Public safety and tree trimming information
The interactive section of our website is a services portal that manages third party access to a range of services.
Services include:
• connections-related service requests for new andmodified network connections.
• annual work plan
• standard drawings, design standards, operatingstandards, specifications
• network location map requests
• close approach consents
• new and modified connection requests
• livening requests for action by livening agents
2.12.2 Asset dataMost of our primary asset information is held in our asset database, GIS system and cable database. We hold information about our network equipment from GXP connections down to individual LV poles with a high level of accuracy. The data has become more complete and more accurate over time.
Due to improved asset management plans, regulatory compliance and better risk identification and management, information accuracy has improved. This has ensured that we can locate, identify and confirm ownership of assets through our records.
Although there will inevitably be some minor errors and improved information will always be required, we believe our information for most of the network is accurate. Some information for older assets installed more than 25 years ago has been estimated based on best available data. Examples of this include:
• the conductor age for some lines older than circa 1990
• timber poles that went into service prior to the use ofidentification discs
• older 11kV air break switches and cut-out fuses
2.12.3 Short term developments We are engaged in several projects that will deliver improvements in key systems. This includes the increased automation of processes related to procurement and a review of voice communications systems.
Two key projects are:
Customer Relationship Management – we are in the early stage of defining requirements for a CRM system that will be delivered progressively over the next three years.
Low Voltage Data Model – as part of a wider strategic initiative associated with the future operation of our low voltage network we are developing a model for the collection, storage and consumption of data on the status and performance of LV assets.
39 10 Year Asset Management Plan Section 2 About our business
2.13.1 Asset management processes2.13.1.1 Business structure and management drivers
We assume no major changes in the regulatory framework, asset base through merger, changes of ownership and/or requirements of stakeholders.
2.13.1.2 Risk management
The assumptions regarding management of risk are largely discussed in Section 3. Although we have planned for processes and resources to ensure business continuity as a result of a major event or equipment failure, we have not included the actual consequences of a forecast/hypothetical major event in our AMP forecasts.
2.13.1.3 Service level targets
We have based our service level targets on customers’ views about the quality of service that they prefer. Extensive consultation over many years tells us that customers want us to deliver network reliability and resilience, and keep prices down. To meet this expectation we look for the right balance between costs for customers and network investment.
See Section 4 for a summary of our recent customer engagement.
2.13.1.4 Network development
Section 6 of this AMP outlines projects that will ensure that our network will continue to meet our customers’ expectations of service.
Our network pricing aims to promote active participation from customers, for example, many of our major customers respond to our price signals and reduce their demand when our network is running at peak demand. We maintain a watching brief on Transpower’s proposed changes to the Transmission Pricing Methodology, due to take effect in 2023. We envisage that the uptake of new technology such as electric vehicles, batteries and solar panels will accelerate but will have only modest low voltage network impacts in the 5-10 year time frame. We have assumed that industry rules will ensure that generation connections will not be subsidised by other industry participants, including Orion, or customers.
2.13.1.5 Lifecycle management of our assets
We have assumed no significant purchase/sale of network assets or forced disconnection of uneconomic supplies other than those discussed in the development of our network, see Section 6.
The planned maintenance and replacement of our assets is largely condition and risk based. This assumes prudent risk management practices associated with good industry practice to achieve the outcomes in line with our targeted service levels. Our risk assessments are based on the context of no significant changes to design standards, regulatory obligations and also our other business drivers and assumptions discussed in this section.
2.13.2 Changes to our businessAll forecasts in this AMP have been prepared consistent with the existing Orion business ownership and structure.
We are currently transitioning to a “Primary Service Delivery Partner” (PSDP) contracting model and moving away from our existing contracting model. It is proposed that Connetics will undertake the role as the PSDP.
This new contracting model is expected to be operational by October 2021 and will help us to more effectively and efficiently meet our objectives by enhancing service providers’ capability development, and ensure they have dedicated focus on health, safety, quality and the environment.
2.13.3 Sources of uncertaintyOur ability to operate in a climate of uncertainty is essential to our business’ sustainability and our ability to keep pace with our customers’ needs. We have identified a range of potential uncertainties that could impact our assumptions, and considered a range of scenarios. We face these sources of uncertainty confident in our ability to adjust our planning if needed.
Potential uncertainties in our key assumptions include:
• Regulation – future changes to regulation are unlikely to reduce our targeted service levels and are likely to continue the pressure for ensuring cost effective delivery of network services. We believe that the structure of our network pricing and our management processes encourage the economic development of the network and the chances of adverse significant changes in the regulatory framework in this regard are low.
• Government response to the Climate Commission’s draft advice – the Commission’s urging of the need for New Zealand to take bold and urgent climate action and any significant changes in Government policy could create transformational change in our industry and service provision.
• Changing customer demand – the uptake of new technologies such as electric vehicles, photovoltaic generation and battery storage is forecast to increase. These forecasts are uncertain and we have researched the impact of these technologies for different uptake scenarios to inform our thinking.
• The regeneration of Christchurch – the ongoing regeneration of Christchurch’s central city and the future of the ‘red zone’ are influenced by the Crown, Christchurch City Council and Ōtākaro Limited. It’s also influenced by private developers.
There is uncertainty regarding the timing and extent of some key projects as the rebuild continues.
• High growth scenario – growth scenarios form a relatively narrow range. Our peak demand forecasts include a range of scenarios to test the impact of new technologies. The high growth scenarios do not cause
2.13 Significant business assumptions
40 Orion New Zealand Limited
2.13 Significant business assumptions continued
a material uplift in network constraints and hence a material uplift in network investment or service provider resource requirements. Large capacity requests from major customers create manageable uncertainty.
• Resourcing of skilled service providers and employeesdue to demand – Powerco successfully applied tothe Commerce Commission for a CPP and other EBDsWellington Electricity and Aurora have followed.This will put further upward pressure on labour ratesand availability in the next period.
• COVID-19 – supply chain issues and uncertainty aroundthe frequency, extent and duration of a resurgence inCOVID-19 may impact the plans described in this AMP.
2.13.4 Price inflationIn this AMP our cost forecasts are stated in real dollars in FY21 terms. For some of our regulatory disclosures in Appendix F – the Report on Forecast Capital Expenditure (Schedule 11a) and the Report on Forecast Operational Expenditure (Schedule 11b) – we allow for price inflation and forecast in nominal dollars in certain components of the schedules.
We base our inflation assumptions on forecast information provided by PwC. PwC uses and extrapolates information provided by NZIER. We generally apply a labour cost index (LCI) to the estimated labour component of capital and opex, and a producer price index (PPI) to the other components of our capital expenditure and operational expenditure.
We adjust the LCI forecast provided by PwC to reflect our local view of wage and salary increases. This affects nominal information contained within the system operations and network support and business support forecasts contained in Appendx F, Schedule 11b.
2.13.5 Potential differences between our forecast and actual outcomes
Factors that may lead to material differences include:
• regulatory requirements may change
• customer demand may change and/or the requirementfor network resilience/reliability could change. This couldbe driven by national policy, economic and/or technologychanges. This could lead to different levels of networkinvestment
• changes in demand and/or connection growth couldlead us to change the timing of our network projects
• one or more large energy customers/generators mayconnect to our network requiring specific networkdevelopment projects
• Government measures to keep New Zealanders safefrom any escalation in COVID-19 or other pandemicsmay impact resource availability and delay our workprogramme
• major equipment failure, a major natural disaster or cyberattack may impact on our network requiring significantresponse and recovery work. This may delay someplanned projects during the period until the networkis fully restored
• input costs and exchange rates and the cost of borrowingmay vary influencing the economics associated with someprojects. If higher costs are anticipated, some projectsmay be abandoned, delayed or substituted
• changes to industry standards, inspection equipmenttechnologies and understanding of equipment failuremechanisms may lead to changing asset servicespecifications
• requirements for us to facilitate the rollout of a thirdparty communications network on our overhead networkcould lead to substantial preparatory work to ensure thenetwork is capable of meeting required regulatory andsafety standards. This could lead to resource issues andshort-medium term increases in labour costs
Government measures to keep New Zealanders safe from any escalation in COVID-19 or other pandemics may impact resource availability and delay our work programme

41 10 Year Asset Management Plan Section 2 About our business
3Managing
risk

42 Orion New Zealand Limited
Photo: Network Operator, Brad Nicholson checking an Orion kiosk in Burnside.
43 10 Year Asset Management Plan Section 1 Summary
3.1 Introduction 44
3.3 What our community wants from us 45
3.2 Our risk context 44
3.4 Our approach to risk management 45
Contents
43
3.4.1 Our risk management process 45
3.4.2 Our network risk management 47
3.4.3 Our people risk management 47
3.4.4 Our commercial and financial risk management 47
3.4.5 Our regulatory risk management 47
3.4.6 Our insurance 47
3.8 Our resilience 60
3.8.1 Introduction 60
3.8.2 Our key network vulnerabilities 60
3.8.3 Our conclusions on our resilience 60
3.5.1 Our everyday risk management 48
3.5.2 Our HILP/crisis risk management 48
3.6.1 Our risk assessments 50
3.6.2 Our risk evaluations 51
3.7.1 Health and safety 53
3.7.2 Major earthquake 53
3.7.3 Weather event 54
3.7.4 Pandemic 56
3.7.5 Cyber security breach 56
3.7.6 Major network asset failures 57
3.7.6 Other risks 58
3.5 Our risk management responsibilities 48
3.6 Our risk assessments and risk evaluations 50
3.7 Our key operational risks 52
10 Year Asset Management Plan Section 3 Managing risk
44 Orion New Zealand Limited
Prudent risk management strengthens our ability to provide a electricity delivery service that is safe, reliable, resilient and sustainable. Our risk management aims are to:
• support Orion’s Purpose and objectives
• support our community’s aspirations for a ‘liveable’ region that has strong connected communities, a healthy environment and a prosperous economy
• identify and manage our significant risks in proportionate, timely and cost-effective ways
• continuously improve
Our approach is grounded in our belief that:
• every person has a responsibility to identify and manage risks
• a healthy and collaborative culture is a vital part of our risk management
• good risk management relies on good judgment, supported by good evidence
• risk management is all about creating and protecting value for our customers, our community, our people and our key stakeholders
• we can always improve
Electricity is a fundamental necessity in the modern world particularly as our community shifts away from fossil fuels.We expect this reliance on our service to continue for the long-term.
Our community will increasingly depend on our electricity delivery service, so it’s essential we identify and manage our key risks. Our community especially depends on electricity during and after high impact low probability (HILP) events such as major earthquakes or storms.
Our lifelines responsibilities are set out in Section 60 of the Civil Defence Emergency Management (CDEM) Act. As a key lifelines utility, we ‘… must be able to function to the fullest possible extent, even though this may be at a reduced level, during and after an emergency.’.
As further context, our service region:
• is a significant earthquake zone. For example, GNS Science estimates that there is a 30% chance of a major Alpine Fault earthquake in the next 50 years
• has cold winters and is subject to weather extremes – including snow and/or wind storms
• has no reticulated natural gas
• has urban ‘clean air’ restrictions on the use of solid fuel heating
We also know that:
• climate change impacts and other environmental issues are increasingly important and urgent for our community and other stakeholders
• our customers will increasingly convert from carbon-based fuels to renewable electricity
• our customers will increasingly inject power back into our electricity distribution network
• global risk sources such as pandemics and cyber-crime are increasing in their likelihood and potential consequences
• the pace of technology change will continue to increase
• other lifelines utilities in our region depend on electricity, and this interdependency is important
• electricity distribution networks have specific hazards and risk sources by their very nature
• our industry is highly-regulated
• the Energy Companies Act requires that our principal objective shall be to operate as a successful business
• we are publicly accountable to our customers, our community, our shareholders and industry regulators
• our shareholders are also publicly accountable to our community
In summary, our risk context:
• is complex and dynamic
• has significant local, national and global downside risk factors
• also has significant upside opportunities – especially related to long-term customer demand growth for our electricity delivery service, as our community increasingly shifts from carbon fuels to renewable electricity.
3.2 Our risk context
3.1 Introduction
Our community will increasingly depend on our electricity delivery service, so it’s essential we identify and manage our key risks.
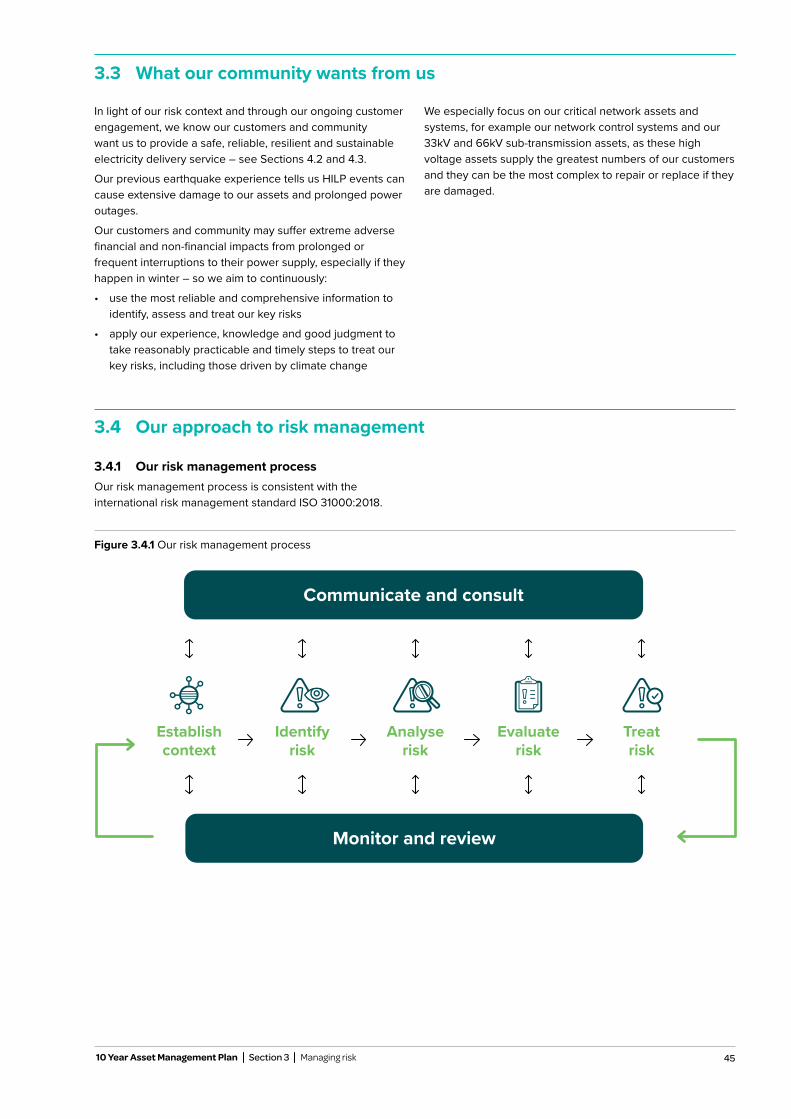
45
In light of our risk context and through our ongoing customer engagement, we know our customers and community want us to provide a safe, reliable, resilient and sustainable electricity delivery service – see Sections 4.2 and 4.3.
Our previous earthquake experience tells us HILP events can cause extensive damage to our assets and prolonged power outages.
Our customers and community may suffer extreme adverse financial and non-financial impacts from prolonged or frequent interruptions to their power supply, especially if they happen in winter – so we aim to continuously:
• use the most reliable and comprehensive information to identify, assess and treat our key risks
• apply our experience, knowledge and good judgment to take reasonably practicable and timely steps to treat our key risks, including those driven by climate change
We especially focus on our critical network assets and systems, for example our network control systems and our 33kV and 66kV sub-transmission assets, as these high voltage assets supply the greatest numbers of our customers and they can be the most complex to repair or replace if they are damaged.
3.3 What our community wants from us
3.4 Our approach to risk management
3.4.1 Our risk management processOur risk management process is consistent with the international risk management standard ISO 31000:2018.
Figure 3.4.1 Our risk management process
Establish context
Identify risk
Analyse risk
Evaluate risk
Treat risk
Communicate and consult
Monitor and review
10 Year Asset Management Plan Section 3 Managing risk
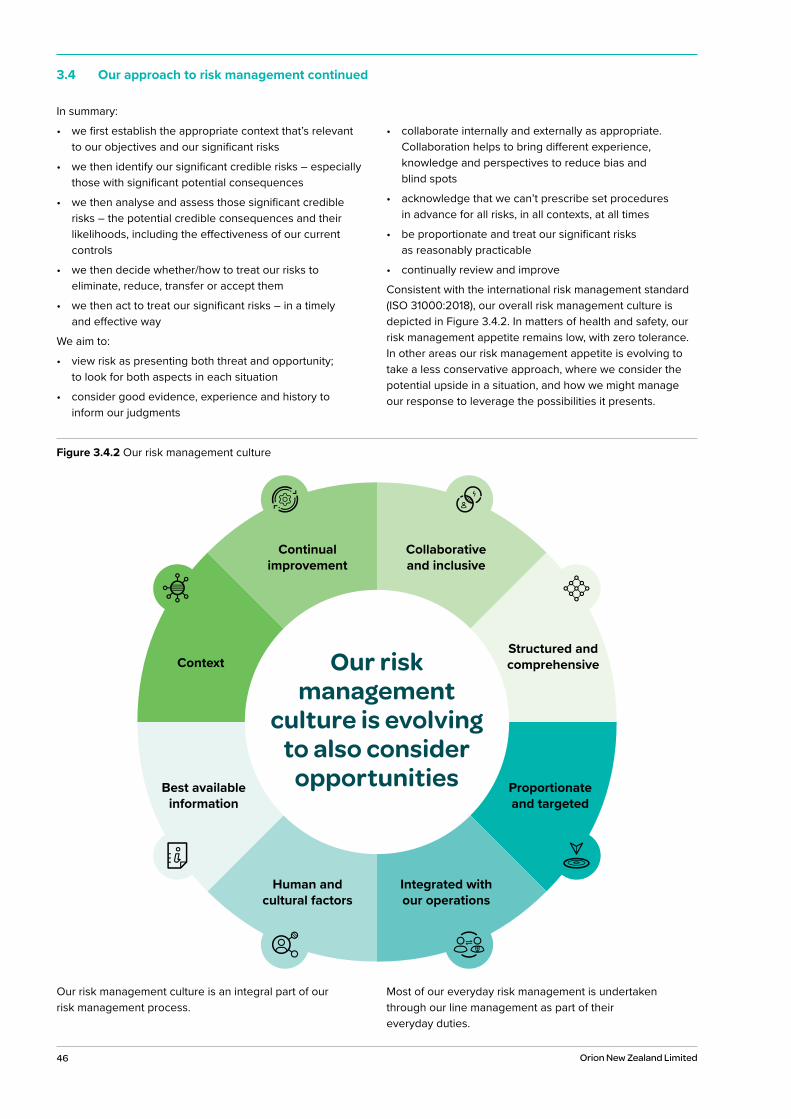
46 Orion New Zealand Limited
3.4 Our approach to risk management continued
Figure 3.4.2 Our risk management culture
Our risk management culture is an integral part of our risk management process.
Most of our everyday risk management is undertaken through our line management as part of their everyday duties.
In summary:
• we first establish the appropriate context that’s relevantto our objectives and our significant risks
• we then identify our significant credible risks – especiallythose with significant potential consequences
• we then analyse and assess those significant crediblerisks – the potential credible consequences and theirlikelihoods, including the effectiveness of our currentcontrols
• we then decide whether/how to treat our risks toeliminate, reduce, transfer or accept them
• we then act to treat our significant risks – in a timelyand effective way
We aim to:
• view risk as presenting both threat and opportunity;to look for both aspects in each situation
• consider good evidence, experience and history toinform our judgments
• collaborate internally and externally as appropriate.Collaboration helps to bring different experience,knowledge and perspectives to reduce bias andblind spots
• acknowledge that we can’t prescribe set proceduresin advance for all risks, in all contexts, at all times
• be proportionate and treat our significant risksas reasonably practicable
• continually review and improve
Consistent with the international risk management standard (ISO 31000:2018), our overall risk management culture is depicted in Figure 3.4.2. In matters of health and safety, our risk management appetite remains low, with zero tolerance. In other areas our risk management appetite is evolving to take a less conservative approach, where we consider the potential upside in a situation, and how we might manage our response to leverage the possibilities it presents.
Our risk management
culture is evolving to also consider
opportunities
Context
Continual improvement
Structured and comprehensive
Integrated with our operations
Proportionate and targeted
Best available information
Collaborative and inclusive
Human and cultural factors
47
3.4 Our approach to risk management continued
3.4.2 Our network risk managementWe aim to be proactive and prudent network managers, and we continuously improve how we:
• forecast customer demand for our services – includingthe potential impacts of new technologies, climateregulation and our changing environment
• plan and build for network safety, capacity, resilienceand reliability
• monitor, maintain and enhance the condition of our keyassets and systems via our ongoing lifecycle management
• operate, monitor and control access to our network
• maintain an appropriate level of redundancy andemergency spares
• maintain and develop competent employees and serviceproviders
• maintain an effective vegetation management programme
• otherwise identify, assess and manage our key risks
3.4.3 Our people risk managementWe achieve effective risk management via our people, and our aim is to have:
• a healthy and safe workplace
• a collaborative, diverse and inclusive culture
• effective employee recruitment and retention
• effective capability development and training
• effective long-term succession planning forkey competencies
We also support wider industry competency initiatives – for example:
• the Energy Academy
• the Ara Trades Innovation Centre, which has an electricitydistribution trades training centre
• the University of Canterbury’s Power EngineeringExcellence Trust
Our aspiration is to be an employer of choice. Our focus on the wellbeing of our people, flexible working practices and learning environment support us on this journey.
3.4.4 Our commercial and financial risk management
We aim to have sustainable revenues to support the ongoing investment required to meet the long-term interests of our shareholders, customers and community. We aim to manage our commercial and financial risks through:
• providing great service
• appropriate delivery service agreements and constructiveengagement with electricity retailers and major customers
• active engagement with regulatory agencies
• prudent financial policies and procedures
• sound internal controls
3.4.5 Our regulatory risk managementThe electricity industry is highly regulated, via multiple regulatory agencies. We aim to comply with our obligations and to constructively engage with agencies on key regulatory developments.
3.4.6 Our insuranceInsurance is the transfer of specified financial risks to insurance underwriters. We have the following insurances in place – consistent with good industry practice:
• our material damage insurance policy insures us againstphysical loss or damage to specified buildings, plant,equipment, zone and distribution substation buildings andcontents – and is based on assessed replacement values
• our business interruption insurance policy indemnifiesus for increased costs and reduced revenues as aconsequence of damage to insured assets – with anindemnity period of 18 months
• we have a number of liability policies — includingdirectors and officers, professional indemnity, publicliability and statutory liability
Our key uninsured risks, that are effectively uninsurable for all Electricity Distribution Businesses (EDBs), are:
• lost revenues – although the Commerce Commissionnow allows EDBs to recover uninsurable lower revenuesfrom customers in later years. This ability to recover iscapped at 20% of annual delivery revenues
• damage to overhead lines and underground cables
We also require our key network service providers and suppliers to have appropriate insurance for:
• third party liabilities
• contract works
• plant and equipment
• motor vehicle third party
• product liability
10 Year Asset Management Plan Section 3 Managing risk
We aim to have sustainable revenues to support the ongoing investment required to meet the long-term interests of our shareholders, customers and community.
48 Orion New Zealand Limited
3.5.1 Our everyday risk managementOrion’s board of directors oversees the risks that have the greatest potential to adversely affect the achievement of our objectives. Management regularly reports to the board on key issues and risks.
We also seek independent expert advice when appropriate.
Our everyday risk management is mostly handled by line management as part of their normal duties. We also have three teams that support line management to undertake risk management:
• Strategic programme lead – helps to coordinate our management and governance processes, our risk management framework and our insurance programme
The CDEM Act requires us to:
• function during and after an emergency, and have plans to support this
• participate in CDEM planning at national and regional level if requested
• provide technical advice on CDEM issues where required
• align our business continuity responsibilities using Civil Defence’s 4Rs approach to resilience planning – reduce, ready, respond and recover
• Quality, Health, Safety and Environment – six FTEs help our line management to continuously improve our processes in these areas
• Risk steering committee – this was established in 2020 as an ongoing cross-functional and diverse team of managers and employees that aims to provide support, guidance and oversight to the organisation’s identification and management of current and emerging risks.
The board audit committee also oversees an active assurance (internal audit) programme, that is facilitated by an independent chartered accounting firm.
3.5.2 Our HILP/crisis risk managementHigh impact low probability (HILP) events such as natural disasters, pandemics or cyber-attacks necessitate situation specific reporting and responsibility structures. Each HILP event is different, so we expect to plan-to-plan following such events.
3.5 Our risk management responsibilities
Orion’s board of directors oversees the risks that have the greatest potential to adversely affect the achievement of our objectives.
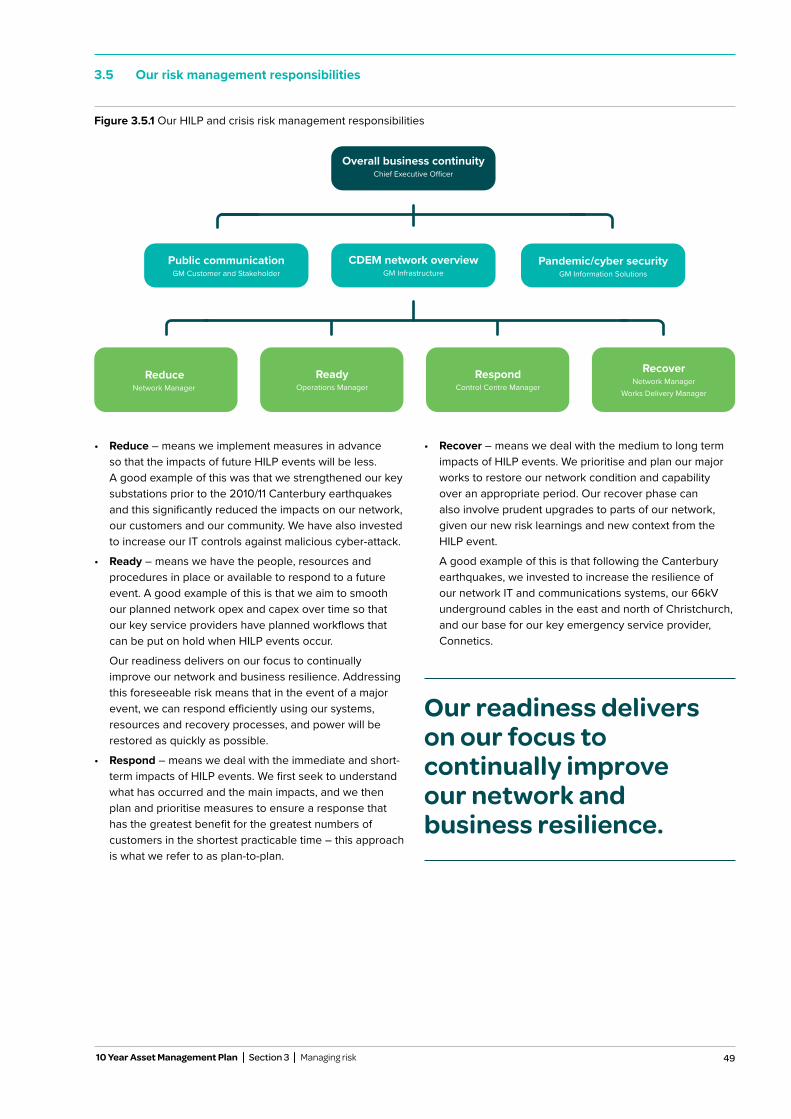
49
3.5 Our risk management responsibilities
Figure 3.5.1 Our HILP and crisis risk management responsibilities
• Reduce – means we implement measures in advance so that the impacts of future HILP events will be less. A good example of this was that we strengthened our key substations prior to the 2010/11 Canterbury earthquakes and this significantly reduced the impacts on our network, our customers and our community. We have also invested to increase our IT controls against malicious cyber-attack.
• Ready – means we have the people, resources and procedures in place or available to respond to a future event. A good example of this is that we aim to smooth our planned network opex and capex over time so that our key service providers have planned workflows that can be put on hold when HILP events occur.
Our readiness delivers on our focus to continually improve our network and business resilience. Addressing this foreseeable risk means that in the event of a major event, we can respond efficiently using our systems, resources and recovery processes, and power will be restored as quickly as possible.
• Respond – means we deal with the immediate and short-term impacts of HILP events. We first seek to understand what has occurred and the main impacts, and we then plan and prioritise measures to ensure a response that has the greatest benefit for the greatest numbers of customers in the shortest practicable time – this approach is what we refer to as plan-to-plan.
• Recover – means we deal with the medium to long term impacts of HILP events. We prioritise and plan our major works to restore our network condition and capability over an appropriate period. Our recover phase can also involve prudent upgrades to parts of our network, given our new risk learnings and new context from the HILP event.
A good example of this is that following the Canterbury earthquakes, we invested to increase the resilience of our network IT and communications systems, our 66kV underground cables in the east and north of Christchurch, and our base for our key emergency service provider, Connetics.
Our readiness delivers on our focus to continually improve our network and business resilience.
Pandemic/cyber securityGM Information Solutions
Public communicationGM Customer and Stakeholder
Overall business continuityChief Executive Officer
CDEM network overviewGM Infrastructure
RecoverNetwork Manager
Works Delivery Manager
ReadyOperations Manager
ReduceNetwork Manager
RespondControl Centre Manager
10 Year Asset Management Plan Section 3 Managing risk
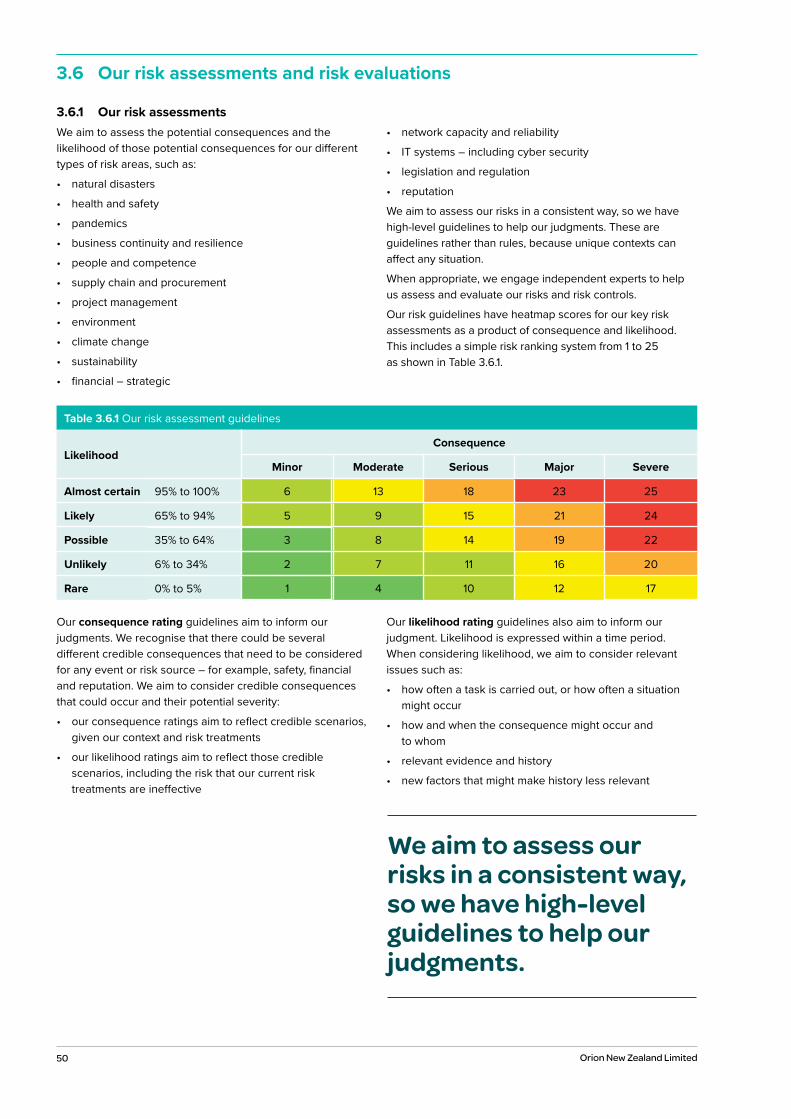
50 Orion New Zealand Limited
3.6 Our risk assessments and risk evaluations
3.6.1 Our risk assessmentsWe aim to assess the potential consequences and the likelihood of those potential consequences for our different types of risk areas, such as:
• natural disasters
• health and safety
• pandemics
• business continuity and resilience
• people and competence
• supply chain and procurement
• project management
• environment
• climate change
• sustainability
• financial – strategic
• network capacity and reliability
• IT systems – including cyber security
• legislation and regulation
• reputation
We aim to assess our risks in a consistent way, so we have high-level guidelines to help our judgments. These are guidelines rather than rules, because unique contexts can affect any situation.
When appropriate, we engage independent experts to help us assess and evaluate our risks and risk controls.
Our risk guidelines have heatmap scores for our key risk assessments as a product of consequence and likelihood. This includes a simple risk ranking system from 1 to 25 as shown in Table 3.6.1.
Our consequence rating guidelines aim to inform our judgments. We recognise that there could be several different credible consequences that need to be considered for any event or risk source – for example, safety, financial and reputation. We aim to consider credible consequences that could occur and their potential severity:
• our consequence ratings aim to reflect credible scenarios,given our context and risk treatments
• our likelihood ratings aim to reflect those crediblescenarios, including the risk that our current risktreatments are ineffective
Our likelihood rating guidelines also aim to inform our judgment. Likelihood is expressed within a time period. When considering likelihood, we aim to consider relevant issues such as:
• how often a task is carried out, or how often a situationmight occur
• how and when the consequence might occur andto whom
• relevant evidence and history
• new factors that might make history less relevant
We aim to assess our risks in a consistent way, so we have high-level guidelines to help our judgments.
Table 3.6.1 Our risk assessment guidelines
LikelihoodConsequence
Minor Moderate Serious Major Severe
Almost certain 6 13 18 23 25
Likely 5 9 15 21 24
Possible 3 8 14 19 22
Unlikely 2 7 11 16 20
Rare 1 4 10 12 17
95% to 100%
65% to 94%
35% to 64%
6% to 34%
0% to 5%
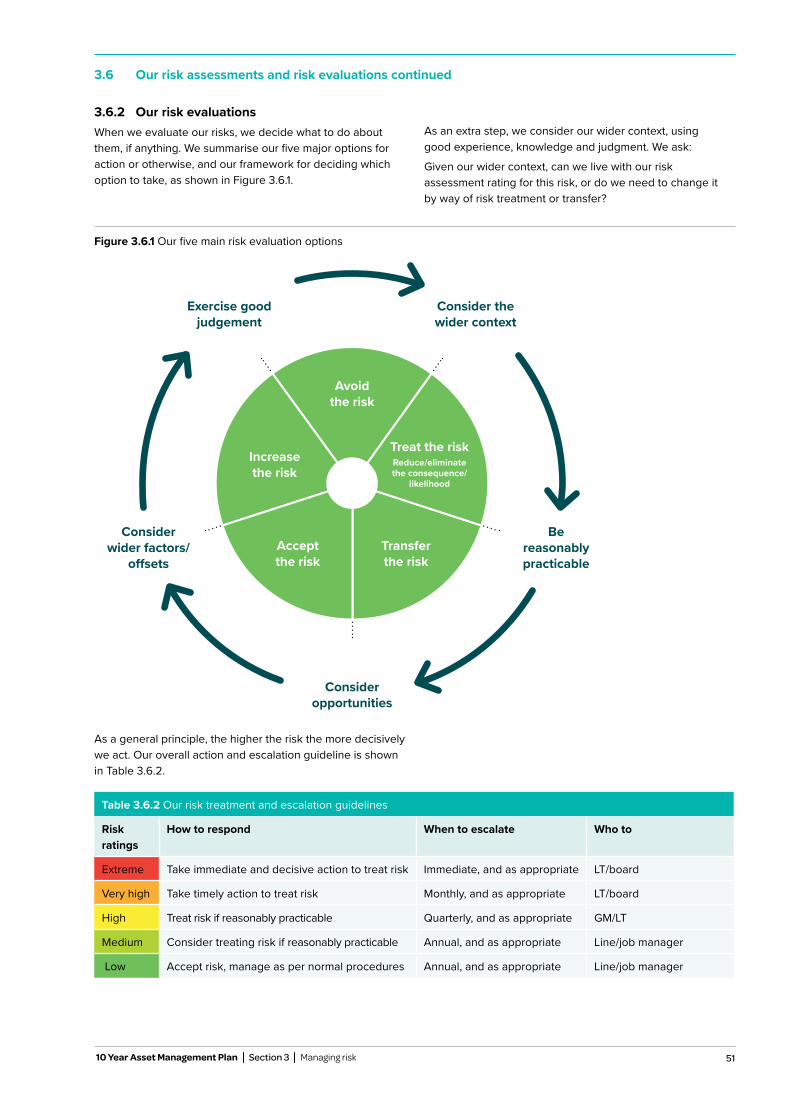
51
Figure 3.6.1 Our five main risk evaluation options
3.6 Our risk assessments and risk evaluations continued
3.6.2 Our risk evaluationsWhen we evaluate our risks, we decide what to do about them, if anything. We summarise our five major options for action or otherwise, and our framework for deciding which option to take, as shown in Figure 3.6.1.
As an extra step, we consider our wider context, using good experience, knowledge and judgment. We ask:
Given our wider context, can we live with our risk assessment rating for this risk, or do we need to change it by way of risk treatment or transfer?
Consider the wider context
Be reasonably practicable
Consider opportunities
Consider wider factors/
offsets
Exercise good judgement
Avoid the risk
Transfer the risk
Accept the risk
Increase the risk
Treat the riskReduce/eliminate the consequence/
likelihood
10 Year Asset Management Plan Section 3 Managing risk
As a general principle, the higher the risk the more decisively we act. Our overall action and escalation guideline is shown in Table 3.6.2.
Table 3.6.2 Our risk treatment and escalation guidelines
Risk ratings
How to respond When to escalate Who to
Extreme Take immediate and decisive action to treat risk Immediate, and as appropriate LT/board
Very high Take timely action to treat risk Monthly, and as appropriate LT/board
High Treat risk if reasonably practicable Quarterly, and as appropriate GM/LT
Medium Consider treating risk if reasonably practicable Annual, and as appropriate Line/job manager
Low Accept risk, manage as per normal procedures Annual, and as appropriate Line/job manager
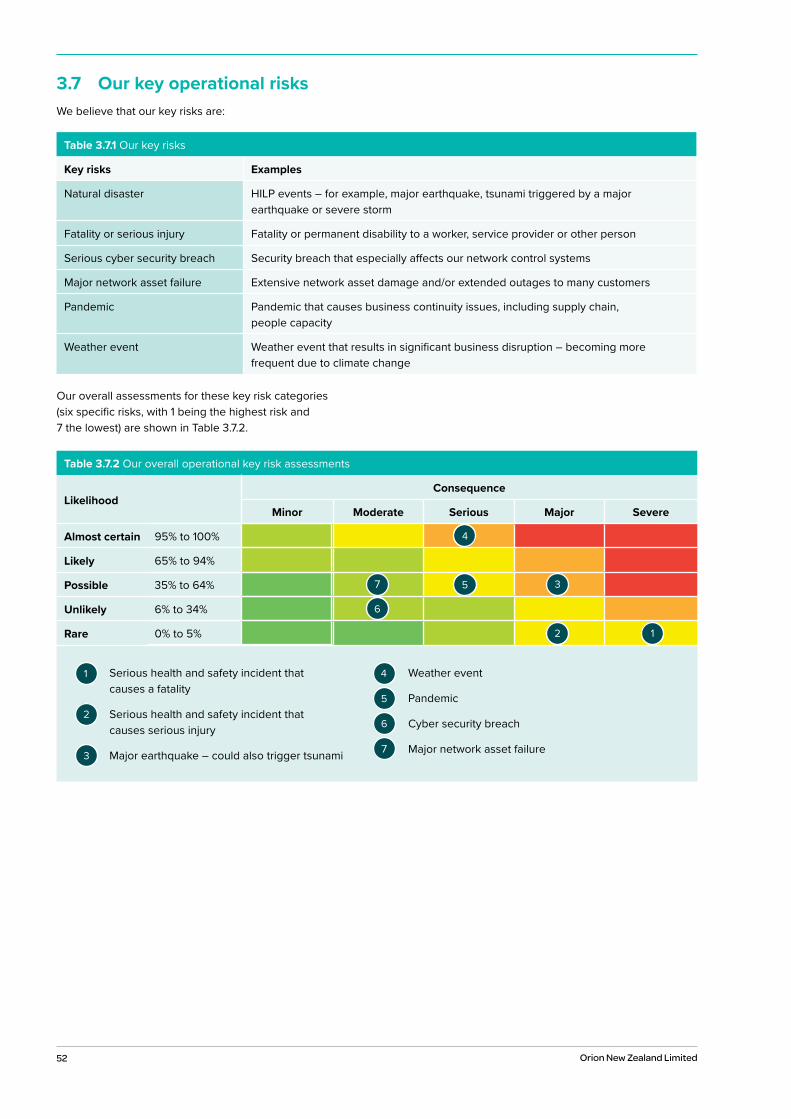
52 Orion New Zealand Limited
3.7 Our key operational risksWe believe that our key risks are:
Table 3.7.1 Our key risks
Key risks Examples
Natural disaster HILP events – for example, major earthquake, tsunami triggered by a major earthquake or severe storm
Fatality or serious injury Fatality or permanent disability to a worker, service provider or other person
Serious cyber security breach Security breach that especially affects our network control systems
Major network asset failure Extensive network asset damage and/or extended outages to many customers
Pandemic Pandemic that causes business continuity issues, including supply chain, people capacity
Weather event Weather event that results in significant business disruption – becoming more frequent due to climate change
Our overall assessments for these key risk categories (six specific risks, with 1 being the highest risk and 7 the lowest) are shown in Table 3.7.2.
Serious health and safety incident that causes a fatality
Serious health and safety incident that causes serious injury
Major earthquake – could also trigger tsunami
Weather event
Pandemic
Cyber security breach
Major network asset failure
Table 3.7.2 Our overall operational key risk assessments
LikelihoodConsequence
Minor Moderate Serious Major Severe
Almost certain
Likely
Possible
Unlikely
Rare
95% to 100%
65% to 94%
35% to 64%
6% to 34%
0% to 5%

53 10 Year Asset Management Plan Section 3 Managing risk
3.7 Our key operational risks continued
3.7.1 Health and safetyEnsuring our people can work safely and the community can go about its daily life in a healthy, sustainable environment is not simply a matter of compliance, it is embedded in our culture.
We continue to strengthen our health and safety focus. We’re vigilant in identifying risk, and continually improve our health and safety processes and outcomes.
Our management of health and safety is primarily achieved through our operational systems, utilising a ‘risk based’ approach, where we focus on situations which can result in negative impacts upon people and property – and on those which are more likely to occur.
We aim to actively identify and manage the risks typically associated with operating an electricity distribution network including by way of:
• a collaborative, learnings-based focus into our safetyincident investigations
• continuous improvement in our risk managementand reporting
• quality assurance oversight to provide a better overviewof interrelated factors
• follow-up for all reported incidents and formalinvestigations as appropriate
• well-developed and documented policies and procedures
• working with our service providers to encourage saferpractices when working around Orion infrastructure
• trained and competent field workers who can workin complex and dynamic environments
• remotely operated devices to monitor and operateaspects of our network
We have a dedicated team of people help us maintain a focus on the health, safety and wellbeing of our people, our service providers, and our community. Our Health and Safety Committee has employee representatives from across Orion who meet monthly to review incidents, opportunities for improvement in work practices and the work environment, and to assist in the education of our people.
We collaborate with our neighbouring and national networks, and industry associations such as the EEA and the ENA, to share knowledge and help us understand our industry risks and ‘good practice’ management of those risks.
We actively consider potential health and safety risks when we design and construct new network components, through our documented ‘safety in design’ process. We carefully document and regularly review our work policies and procedures to ensure they provide accurate guidance for those working on our infrastructure.
When considering our people, we recruit, train and equip our team members appropriately for their roles. Our team members are faced with challenging decisions each day, and we support them with a wellbeing programme aimed at ensuring our team members are fit to be at work and safely carry out their duties.
Much of the field work on our network is carried out by approved network service providers. We require our network service providers to have an equivalent health and safety management system to our own. We ensure our network service providers conform to our requirements through our formal contract management process and our auditing programme.
As with all distributors, the Electricity (Safety) Regulations require us to have an audited public safety management system, with the aim to prevent harm to the public or damage to third party property. To demonstrate our compliance with this requirement, we are independently audited at regular intervals against NZS7901 Electricity and Gas Industries – Safety Management Systems for Public Safety and have been assessed as compliant.
To protect our community from potential harm associated with our infrastructure, we have documented policies and procedures, and create physical barriers which restrict access to our electrical network infrastructure. We aim to:
• prevent access to restricted areas by the public andunauthorised personnel
• prevent inadvertent access to extremely hazardousareas by authorised personnel
• prevent entry by opportunist intruders withoutspecialised tools
• slow or impede determined intruders
Electricity is hazardous and regardless of our extensive programme of prudent, proactive measures our risk rating for health and safety is high. At all times, there is credible potential for a member of our team, a service provider or person in our community to suffer a serious injury or a tragic fatality.
This compels us to have effective health and safety performance and eternal vigilance by every team member.
3.7.2 Major earthquakeThe Canterbury and Kaikoura earthquakes of 2010, 2011 and 2016 indicate that our region’s greatest natural disaster risk is a major earthquake. A future major earthquake could be caused by the Alpine Fault or by other known or unknown faults.
GNS Science estimates that there is a 30% chance of a major Alpine Fault earthquake in the next 50 years and the risk of other local faults only increases that 30% chance for our region. It is important to note that none of the
Our region’s greatest natural disaster risk is a major earthquake.
54 Orion New Zealand Limited
3.7 Our key operational risks continued
earthquakes since 2010 were caused by a major rupture of the Alpine Fault.
An Alpine Fault earthquake would be centered further away from our urban network and would not be as sharp as the 22 February 2011 earthquake, but it would have a far longer duration – perhaps some minutes. This would test the resilience of our network in different ways to 2011. A major Alpine Fault earthquake may result in a major outage of up to seven days to significant parts of our network – and the impacts of that on our community would be more severe if it occurs in winter.
Fortunately, we were well-prepared for the Canterbury earthquakes in 2010 and 2011. We also completed our earthquake recovery projects in FY18, and as part of those initiatives we further enhanced our earthquake resilience.
Our next major planned resilience initiative is to replace the remaining 40km of oil-filled 66kV cables over ten years or so – starting in FY24. These cables represent old technology and the skills to maintain and replace them if they become damaged are increasingly rare internationally and locally. These were the type of sub-transmission cables that failed in the eastern suburbs in the 2011 earthquake and we had to abandon and replace them completely.
These cables may be susceptible to a series of prolonged tremors from a major Alpine Fault earthquake – including significant aftershocks. Christchurch has significantly developed to the west since 2011, so there is an increasing dependence on a resilient electricity supply in the west.
A major future earthquake will also have significant impacts on the ability of some of our team members to contribute to our response and recovery initiatives. We treat this risk in practicable ways – including via:
• well documented policies and procedures
• competent employees and service providers who can and do perform cross-over duties
• policies and practices that aim to support employee well-being
• flexible IT and communication systems that enable employees to work remotely for extended periods of time
• a policy and practice to plan-to-plan and adapt following a major event as necessary
In summary, we have implemented and continue to implement practical steps to address our earthquake risk exposures. Our most significant planned resilience project in this AMP is our replacement of the remaining 40km of oil-filled 66kV cables over the next 10 to 15 years.
3.7.2.1 Tsunami
Another major natural disaster risk is tsunami, most likely from a major earthquake off the coast of South America. This could result in an outage of up to three days in areas of our network near the east coast. Since 2011, we have significantly reduced the potential impacts of a major tsunami as our key service providers have moved their depots
significantly further inland. Our network assets near the east coast will inevitably be exposed to tsunami.
3.7.3 Weather eventSevere storms can and do result in outages to significant numbers of our customers of up to one hour in urban areas and up to three days in rural areas. Longer outages can especially affect customers in remote rural areas where access may be difficult and snow depth may be more severe.
We have continuously improved our network practices in light of past storms in our region – including significant learnings from a major wind storm in 1975, snow storm in 1992 and wind storm in 2013 – particularly for rural areas in our service region. We have implemented these improvements over time as part of our ongoing network asset lifecycle process and we have implemented strengthened asset loading standards for new network components. Examples of such changes for our rural service area include revised pole spans, revised pole and crossarm types – as appropriate for credible wind and/or snow loadings. Our credible snow loading forecasts recognise that local snow is relatively wet and heavy, in contrast to snow that falls in the middle of large continents.
Our urban network is largely underground – and so our weather risks mainly relate to our widely dispersed rural overhead lines.
An important element for this risk category is that the vast majority of the damage to our network in severe storms is due to tree branches, and even whole trees, coming into contact with our overhead lines – especially in rural areas. In the most severe storms, most of the trees and branches concerned are well outside regulatory cut zones. There is currently no scope for us to require private tree owners to remove such hazards if the trees and branches are outside a regulatory cut zone. In order to reduce this risk, we have an active vegetation management programme that aims to:
The vast majority of the damage to our network in severe storms is due to tree branches, and even whole trees, coming into contact with our overhead lines – especially in rural areas.
55
• ensure tree owners comply with the tree regulations
• enlist the long-term support of tree owners to reduce threats to our rural overhead network
Important risk assessment context includes:
• we have gradually improved the resilience of our rural overhead network over the last 25 years via our asset lifecycle programme
• we have also invested to improve our network switching capability in rural areas – in order to better isolate affected areas so that we can reduce the number of customers affected by network damage in many circumstances
• overhead networks are generally more susceptible to outages caused by trees, but they are faster and less expensive to repair than underground cables
We believe that flooding is a medium to low risk for our network. We expect that localised floods will occur from time to time near the Avon and Heathcote rivers. We have documented procedures to electrically isolate our network in areas affected to protect our network components before they are significantly damaged. Our head office, including our control room, is not at significant risk from flood.
3.7.3.1 Climate change
We group the opportunities and risks related to climate change into three categories:
• upside growth opportunities – demand for our electricity delivery service will continue to grow as our community continues to shift from burning fossil fuels to renewable electricity
• physical risks – these can be event-driven, such as more frequent and severe storms, or longer-term shifts such as gradual rising temperatures and sea levels
• transition risks – these can be wider changes – such as to the economy, regulation, technology, insurance markets or community preferences and behaviours
Overall, we assess that our upside growth opportunities from climate change will outweigh our physical and transition risks over the next ten years. In fact, we believe that we have an important role to help our community decarbonise – for example by encouraging the uptake of EVs and the conversion of process heat to electricity. This continued growth and reliance on electricity reinforces our asset management strategy to continue to invest to have a safe, resilient, reliable and sustainable electricity distribution network.
Our largest potential impacts relate to vegetation and more frequent and severe storms that will affect our largely-overhead rural network.
We already engineer and lifecycle-manage our network to be resilient to storms and have active vegetation management programmes in place. Our team will continue to improve our understanding of climate effects on our network, in order to adapt and mitigate risks where appropriate, or reasonably practicable.
We assess our transition risks as low to moderate over the next ten years, with the largest potential impacts relating to the pace of introduction of new technology. Because of the unknown nature of these changes and the technology that accompanies them, we prefer to view this risk as an opportunity. We believe our best management lies in promotion of an adaptable and agile business that can quickly adopt or accommodate new innovations. Adverse regulation could also potentially impact the level or structure of our delivery pricing, or could relate to operational aspects of our business.
In 2020, we published our first annual report in accordance with the guidelines published by the Task Force for Climate-related Disclosures (TFCD). Our Climate Change Opportunities and Risks for Orion report is available on our website.
3.7 Our key operational risks continued
10 Year Asset Management Plan Section 3 Managing risk
In 2020, we published our first annual report in accordance with the guidelines published by the Task Force for Climate-related Disclosures (TFCD). Our Climate Change Opportunities and Risks for Orion report is available on our website.
56 Orion New Zealand Limited
3.7.4 PandemicCOVID-19 brought the risk of a pandemic into sharp focus. As an essential service provider Orion has been acutely conscious of our responsibility to maintain vital power services to our community throughout this pandemic. As the situation evolved, our appreciation of the risks of pandemics on our ability to maintain our service to the community grew.
Skilled people are critical to Orion’s ability to operate, manage and maintain the electricity network safely. There was a risk of our people contracting COVID-19 and the need to limit any spread throughout our workforce. We took significant steps to ensure the safety and wellbeing of our staff, and especially those who worked in critical control centre and customer support roles, as well as our operators in the field.
We implemented processes to ensure our critical service providers were equally vigilant with their teams’ health and safety practices.
Orion’s focus during Alert Level 4 was on undertaking essential work and our crews and service providers remained on the road to ensure services were maintained. This minimised power outages for people at home and in workplaces that were an essential service and were still operating. It meant our annual work programme got off to a slow start in 2020, and placed pressure on us to catch up on planned work later in the year.
Supply chain issues are beginning to impact on delivery of components from overseas manufacturers for network maintenance and development projects, however increasing our advance purchase volumes for critical components has allowed us to minimise the impact of this situation. This risk may increase in future.
Many businesses felt the impacts of COVID-19 on their ability to operate. To date, we have not seen significant bad debt issues for Orion or retailers and have experienced less than forecast reduction in revenues. However, rising bad debts and reduced revenues remain risks to the sustainability of our business.
Throughout the COVID-19 pandemic Orion swiftly implemented a broad range of protocols that enabled us to keep our people safe while continuing to maintain essential power services to our community. We activated our Pandemic Response Plan which sets out how we undertake core business functions and provide a continuous supply of electricity to the community during a widespread health emergency. Risk management measures implemented included:
• isolating each member of our essential Control Roomand Customer Support team - reducing unnecessaryinteraction with the people who run our essential services
• ensuring as many of our people as possible worked athome - this supported minimising movements in ourcommunity and reduced the number of people workingin Orion’s building at any one time so that those whomust be there were safe
• splitting the Orion team into two teams - and ensuringmembers of one team did not have physical interactionwith members of the other
• no longer allowing visitors to our operationalheadquarters
• cancelling non-essential face to face meetings andnon-essential travel
• encouraging our people to practice physical distancing– or consider other options to face to face meetings e.g.Microsoft Teams meetings, phone conferences or email
• taking extra steps to ensure our workplaces were clean,hygienic environments - and distributed more handsanitising products throughout our headquarters andoperators’ vehicles
• asking our people to stay at home if they felt unwell
• supporting our people to self-isolate if required
• activating our alternative Control Centre and CustomerSupport Centre
Throughout all COVID-19 Alert levels, Orion continued to operate a safe and reliable network, and provide reassurance to the community that there was no heightened risk to the supply of power. While the future remains uncertain, we continue to monitor the situation closely and use what we have learned to prepare for other pandemics which global health experts predict are likely.
3.7.5 Cyber security breachAll businesses are now potentially susceptible to cyber-attacks from any part of the globe. We implement measures with the aim to prevent such attacks. Our information systems are vital to our ability to deliver a resilient, reliable, safe and sustainable service. We have two key categories of information systems risk:
• catastrophic failure of our systems, for any reason
• malicious third party attack on our systems
To prevent and reduce the potential impacts of attacks by malicious third parties, we employ layers of cyber security at server, network and device levels.
3.7 Our key operational risks continued
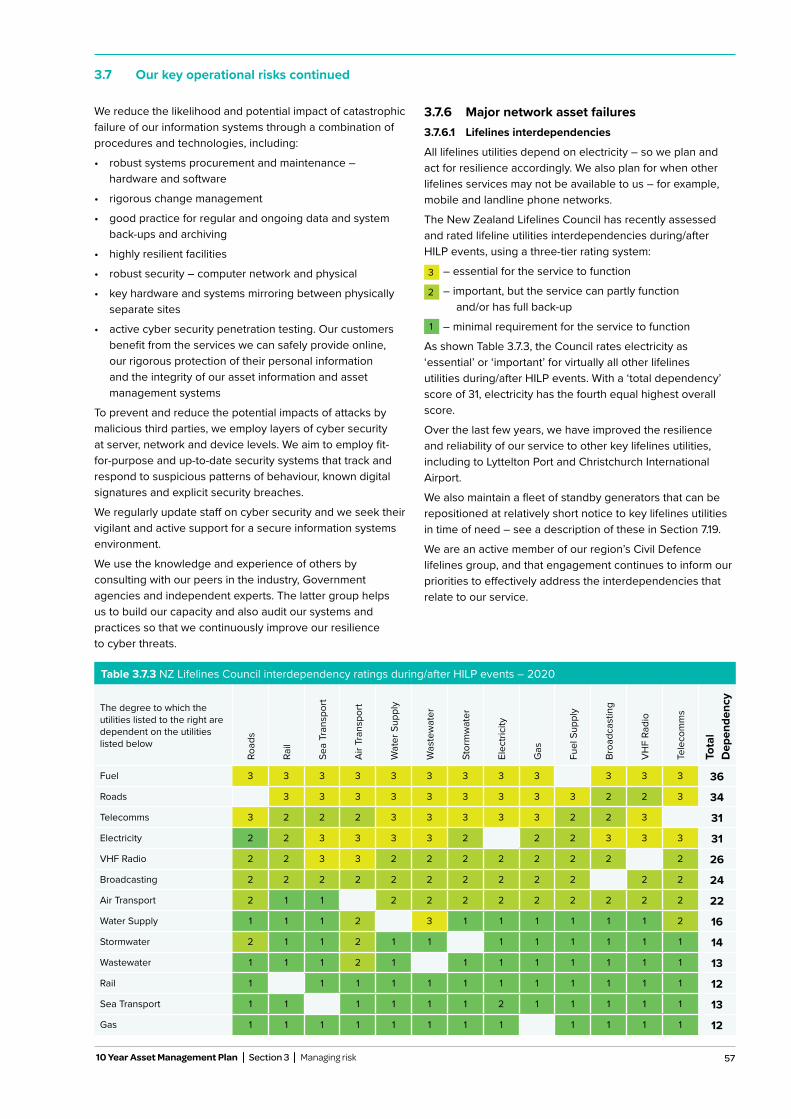
57 10 Year Asset Management Plan Section 3 Managing risk
We reduce the likelihood and potential impact of catastrophic failure of our information systems through a combination of procedures and technologies, including:
• robust systems procurement and maintenance – hardware and software
• rigorous change management
• good practice for regular and ongoing data and system back-ups and archiving
• highly resilient facilities
• robust security – computer network and physical
• key hardware and systems mirroring between physically separate sites
• active cyber security penetration testing. Our customers benefit from the services we can safely provide online, our rigorous protection of their personal information and the integrity of our asset information and asset management systems
To prevent and reduce the potential impacts of attacks by malicious third parties, we employ layers of cyber security at server, network and device levels. We aim to employ fit-for-purpose and up-to-date security systems that track and respond to suspicious patterns of behaviour, known digital signatures and explicit security breaches.
We regularly update staff on cyber security and we seek their vigilant and active support for a secure information systems environment.
We use the knowledge and experience of others by consulting with our peers in the industry, Government agencies and independent experts. The latter group helps us to build our capacity and also audit our systems and practices so that we continuously improve our resilience to cyber threats.
3.7.6 Major network asset failures3.7.6.1 Lifelines interdependencies
All lifelines utilities depend on electricity – so we plan and act for resilience accordingly. We also plan for when other lifelines services may not be available to us – for example, mobile and landline phone networks.
The New Zealand Lifelines Council has recently assessed and rated lifeline utilities interdependencies during/after HILP events, using a three-tier rating system:
– essential for the service to function
– important, but the service can partly function and/or has full back-up
– minimal requirement for the service to function
As shown Table 3.7.3, the Council rates electricity as ‘essential’ or ‘important’ for virtually all other lifelines utilities during/after HILP events. With a ‘total dependency’ score of 31, electricity has the fourth equal highest overall score.
Over the last few years, we have improved the resilience and reliability of our service to other key lifelines utilities, including to Lyttelton Port and Christchurch International Airport.
We also maintain a fleet of standby generators that can be repositioned at relatively short notice to key lifelines utilities in time of need – see a description of these in Section 7.19.
We are an active member of our region’s Civil Defence lifelines group, and that engagement continues to inform our priorities to effectively address the interdependencies that relate to our service.
3.7 Our key operational risks continued
Table 3.7.3 NZ Lifelines Council interdependency ratings during/after HILP events – 2020
The degree to which the utilities listed to the right are dependent on the utilities listed below
Road
s
Rail
Sea
Tran
spor
t
Air T
rans
port
Wat
er S
uppl
y
Was
tew
ater
Stor
mw
ater
Elec
trici
ty
Gas
Fuel
Sup
ply
Broa
dcas
ting
VHF
Radi
o
Tele
com
ms
Tota
l D
epen
denc
y
Fuel 3 3 3 3 3 3 3 3 3 3 3 3 36
Roads 3 3 3 3 3 3 3 3 3 2 2 3 34
Telecomms 3 2 2 2 3 3 3 3 3 2 2 3 31
Electricity 2 2 3 3 3 3 2 2 2 3 3 3 31
VHF Radio 2 2 3 3 2 2 2 2 2 2 2 2 26
Broadcasting 2 2 2 2 2 2 2 2 2 2 2 2 24
Air Transport 2 1 1 2 2 2 2 2 2 2 2 2 22
Water Supply 1 1 1 2 3 1 1 1 1 1 1 2 16
Stormwater 2 1 1 2 1 1 1 1 1 1 1 1 14
Wastewater 1 1 1 2 1 1 1 1 1 1 1 1 13
Rail 1 1 1 1 1 1 1 1 1 1 1 1 12
Sea Transport 1 1 1 1 1 1 2 1 1 1 1 1 13
Gas 1 1 1 1 1 1 1 1 1 1 1 1 12
58 Orion New Zealand Limited
3.7.6.2 Grid exit points (GXPs)
Asset failure at either of our two key GXPs at Bromley or Islington, or our own network equipment at those sites, could be caused by liquefaction. At Bromley, ground settlement of 20mm to 40mm is possible, but this is unlikely at Islington. We rate this risk as low to medium.
We have recently implemented several improvements to the spur assets we have purchased from Transpower at Bromley and we will continue to implement improvements over the next few years. Transpower has also implemented improvements at our GXPs, pursuant to new investment agreements with us. In FY19, we purchased 33kV spur assets at the Islington GXP and we have upgraded our equipment and converted the arrangement there to an indoor switch room.
Our 66kV sub-transmission ‘Northern Loop’, commissioned in June 2016, has created a more interconnected sub-transmission system which significantly reduces our risks to GXPs. This AMP also details planned capex projects to further improve the interconnected nature of our sub-transmission system.
3.7.6.3 Zone substations
Zone substation failures across our network could be caused by liquefaction or asset failure. This could result in local outages of up to one day for several thousand customers. For most of our 54 zone substations, we rate this event as a low to medium risk.
Since 1995, we have assessed and seismically strengthened our zone substations as appropriate, following detailed engineering studies. In the 2011 earthquake, we had two severely damaged urban zone substations and we subsequently:
• replaced Brighton zone sub on better ground 1.5km away at Rawhiti
• rebuilt Lancaster zone sub on the same site to be more resilient
We also have:
• targeted high voltage interconnectivity and diversity of supply
• contingency switching plans
• oil containment bunds at key sites
• simple and low-cost hold-down ties for transformers
• service providers who can cease planned work at short notice to respond to network incidents
3.7.6.4 Subtransmission overhead lines – 66kV and 33kV
Our overhead lines are widely dispersed and they are relatively easily repaired in an earthquake event. In the 2011 Canterbury earthquake, although there was damage to certain components for example, insulators, there was relatively little damage to our overhead lines when compared to an extreme weather event.
Our overhead lines in rural areas are exposed to extreme weather events. Subject to the ability of our repair teams
being able to access the affected areas, they are relatively easy and quick to repair, but there may be outages of up to three days in some remote areas of our network. We rate this event as a relatively low to medium risk.
We have rigorous engineering standards and systematic inspection processes in place for our overhead lines and towers. Also, we have an active vegetation management programme which aims to minimise the impacts of trees on our overhead lines, particularly during storm events.
3.7.6.5 66kV oil filled cables
We have 40km of oil-filled 66kV underground cables left in the urban area, and have a project to replace these with more easily repaired cables in the event of a major earthquake. A major Alpine Fault earthquake could damage these cables, resulting in extended outages for significant numbers of our customers of up to seven days or more.
We rate this event as a medium to high risk over the next 50 years. We plan to replace these cables with modern and resilient XLPE cable over the next 10 to 15 years.
For management of asset related risk, see Section 5.6.2.
3.7.7 Other risksIn Section 6 we identify where the load at risk exceeds our security standard and the mitigation we propose. Here we discuss two risks that are often raised, but which we rate as relatively low risk for our network.
3.7.7.1 Environmental risks
We take practical steps to prevent undue harm to the environment. Our environmental sustainability policy states our aim to be environmentally and socially responsible in our operations, and in support of this we maintain an environmental risk register.
Our environmental management system covers the sustainable use of natural resources, reduction and safe disposal of waste, the wise use of energy, restoring the environment following works, commitment of appropriate resources, stakeholder consultation, assessment, and annual audit. Our job specifications for our key service providers include requirements to identify and manage environmental risks in the work they do for us.
3.7 Our key operational risks continued
We have rigorous engineering standards and systematic inspection processes in place for our overhead lines and towers.
59 10 Year Asset Management Plan Section 3 Managing risk
We aim to reduce electrical losses on our network. We do this via our efficient network delivery pricing that signals system winter peaks – high loadings increase electrical losses – and via our network load management systems, especially our hot water cylinder control systems. It makes good environmental sense to reduce winter system peaks – in order to reduce electrical losses and to reduce the amount of network necessary to deliver electricity.
We have over the years invested to reduce the risks of ground contamination from oil-filled transformers. Our main substation transformers have now been fully bunded to contain any spill and we have fully documented management procedures and the necessary equipment to deal with any minor spills from smaller transformers – for example, those that are pole mounted in rural areas.
Most of our 66kV circuit breakers use sulphur hexafluoride gas (SF6) as the interruption medium. We have not found a viable alternative for this voltage. In our memorandum of understanding with the Ministry for the Environment, we commit to keeping annual SF6 gas losses below 1% of the total contained in our circuit breakers. Our environmental management procedure for SF6 gas aims to ensure we achieve that target.
We also require our key service providers to adhere to the discovery and handling protocols for:
• asbestos
• hazardous substances
• items of archaeological significance, complying withHeritage New Zealand Pouhere Taonga Act 2014
3.7.7.2 New technologies
New technologies have the potential to transform how our network operates and enable our community to thrive in a low carbon future. We manage any risk associated with them, by planning for their introduction as much as possible, so they can be integrated into a wider ‘energy ecosystem’ and used in the most effective way. Examples include:
• Increased use of electric vehicles in the region willincrease demand for electricity, but also introduce afleet of batteries that could enable innovative loadmanagement techniques
• conversion of industrial heat processes from fossil fuelsto low carbon energy, including electricity could alsoincrease demand on our network, but also provide
an opportunity to think about our energy system more widely and introduce a balanced approach to demand
• battery technology and energy management systemscan improve the resilience of our customers and enabledemand to be managed in a more nuanced way
• distributed generation, such as solar PV – this willpotentially create more complex two-way flows betweenour network and end-use customers. We need to ensureour network can enable this to occur and facilitatethe efficient and effective use and distribution of localgeneration wherever possible
Our risk management approach is to:
• keep up do date with technologies as they emerge
• assess the potential impacts and opportunities forour network
• understand more about our low voltage network –as this is where most two-way electrical flows will occur
• adhere to our business purpose and strategy –which is to be an ‘enabler’ for our customers
We are confident we can adapt our network to accommodate changing customer needs and preferences, and adopt new technologies that ensure our network is future-ready.
3.7 Our key operational risks continued
We take practical steps to prevent undue harm to the environment.
We are confident we can adapt our network to accommodate changing customer needs and preferences, and adopt new technologies that ensure our network is future-ready.
60 Orion New Zealand Limited
3.8 Our resilience
3.8.1 IntroductionClause 14 of the Commerce Commission’s Electricity Distribution Information Disclosure Determination 2012 (IDD) asks us to disclose:
• areas of our network that are vulnerable to HILP events
• our strategies and processes to identify and address those vulnerabilities
• our emergency and response plans
• our overall resilience
We define resilience as our ability to withstand, respond to and recover from significant, especially HILP, events.
As a lifelines utility, resilience is fundamental to our ability to provide a sustainable and fit-for-purpose service for the long- term benefit of our customers and our community.
We approach our network resilience from two main perspectives – we aim to:
• identify and reduce the impacts of future credible HILP events by how we design, construct and operate our network
• have a fit-for-purpose response and recovery capability
3.8.2 Our key network vulnerabilitiesThe lifelines section (Section 3.7.6) describes the HILP vulnerabilities for our network asset categories and our risk treatments and plans for them. For the purposes of this summary, our two significant vulnerabilities are:
• our outstanding risk treatments for spur assets we have purchased from Transpower since 2012. We have invested to substantially improve the safety, resilience and reliability of these assets since 2012 – and we plan to complete that investment programme over the next few years so that the spur assets meet our standards
• our remaining 40km of oil-filled 66kV underground cables. We plan to replace these cables with modern resilient XLPE cables over the next ten to fifteen years.
3.8.3 Our conclusions on our resilienceThere is no single measure of resilience. Assessing an EDB’s resilience requires a good understanding of the key quantitative and qualitative aspects of the appropriate context and where an EDB is at in relation to that context.
Our resilience is the result of all that we do to:
• reduce the potential impacts of future HILP events – for example, we have strengthened our key substations and we have prudently invested to create a more resilient urban 66kV network
• be ready to respond and recover – for example, we have prudent service provider practices, we have prudent levels of key network spares, we learn and improve from our experiences of quakes, storms and other significant events, and we foster a culture that encourages our people to identify and assess relevant context and risks – and we act as reasonably practicable to treat our resilience risks.
Overall, we believe we are achieving network resilience levels that are fit-for-purpose for our key lifelines responsibilities, in our local context and in the long-term interests of our customers and community. However, we can always improve and this AMP describes many of our initiatives that aim to do just that.
Overall, we believe we are achieving network resilience levels that are fit-for-purpose for our key lifelines responsibilities, in our local context and in the long-term interests of our customers and community.
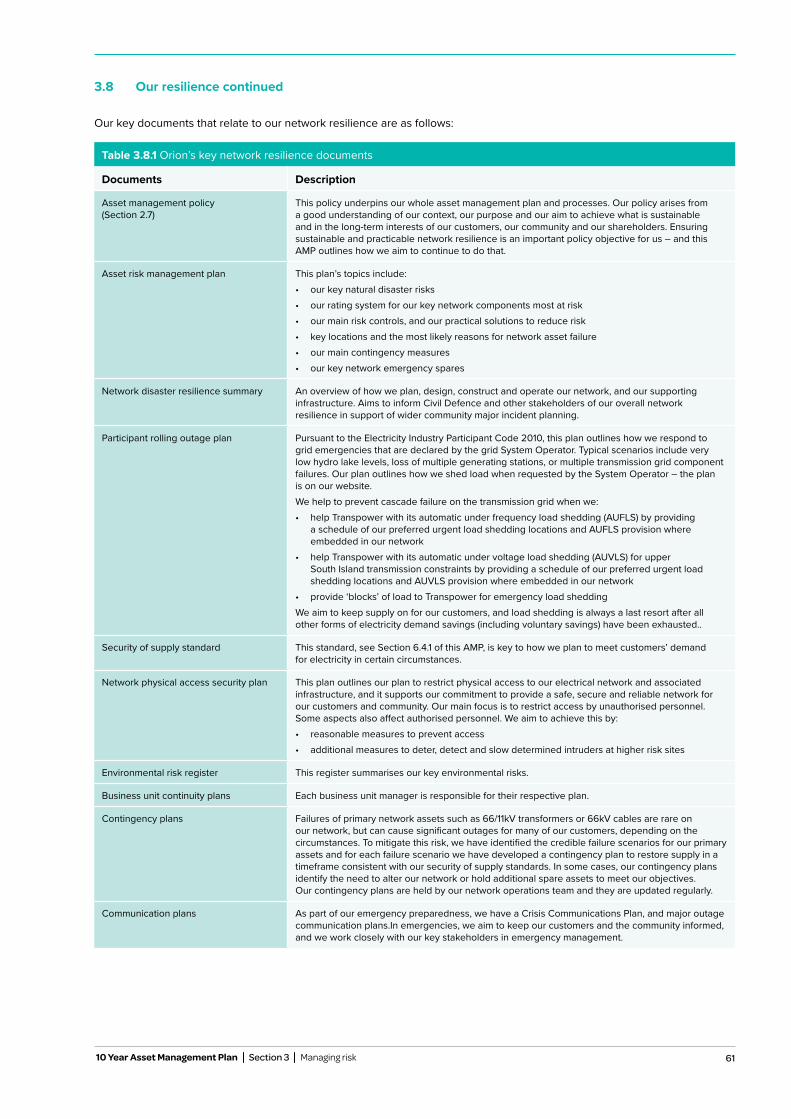
61 10 Year Asset Management Plan Section 3 Managing risk
3.8 Our resilience continued
Our key documents that relate to our network resilience are as follows:
Table 3.8.1 Orion’s key network resilience documents
Documents Description
Asset management policy (Section 2.7)
This policy underpins our whole asset management plan and processes. Our policy arises from a good understanding of our context, our purpose and our aim to achieve what is sustainable and in the long-term interests of our customers, our community and our shareholders. Ensuring sustainable and practicable network resilience is an important policy objective for us – and this AMP outlines how we aim to continue to do that.
Asset risk management plan This plan’s topics include:• our key natural disaster risks• our rating system for our key network components most at risk• our main risk controls, and our practical solutions to reduce risk• key locations and the most likely reasons for network asset failure • our main contingency measures• our key network emergency spares
Network disaster resilience summary An overview of how we plan, design, construct and operate our network, and our supporting infrastructure. Aims to inform Civil Defence and other stakeholders of our overall network resilience in support of wider community major incident planning.
Participant rolling outage plan Pursuant to the Electricity Industry Participant Code 2010, this plan outlines how we respond to grid emergencies that are declared by the grid System Operator. Typical scenarios include very low hydro lake levels, loss of multiple generating stations, or multiple transmission grid component failures. Our plan outlines how we shed load when requested by the System Operator – the plan is on our website.We help to prevent cascade failure on the transmission grid when we:• help Transpower with its automatic under frequency load shedding (AUFLS) by providing
a schedule of our preferred urgent load shedding locations and AUFLS provision where embedded in our network
• help Transpower with its automatic under voltage load shedding (AUVLS) for upper South Island transmission constraints by providing a schedule of our preferred urgent load shedding locations and AUVLS provision where embedded in our network
• provide ‘blocks’ of load to Transpower for emergency load sheddingWe aim to keep supply on for our customers, and load shedding is always a last resort after all other forms of electricity demand savings (including voluntary savings) have been exhausted..
Security of supply standard This standard, see Section 6.4.1 of this AMP, is key to how we plan to meet customers’ demand for electricity in certain circumstances.
Network physical access security plan This plan outlines our plan to restrict physical access to our electrical network and associated infrastructure, and it supports our commitment to provide a safe, secure and reliable network for our customers and community. Our main focus is to restrict access by unauthorised personnel. Some aspects also affect authorised personnel. We aim to achieve this by:• reasonable measures to prevent access • additional measures to deter, detect and slow determined intruders at higher risk sites
Environmental risk register This register summarises our key environmental risks.
Business unit continuity plans Each business unit manager is responsible for their respective plan.
Contingency plans Failures of primary network assets such as 66/11kV transformers or 66kV cables are rare on our network, but can cause significant outages for many of our customers, depending on the circumstances. To mitigate this risk, we have identified the credible failure scenarios for our primary assets and for each failure scenario we have developed a contingency plan to restore supply in a timeframe consistent with our security of supply standards. In some cases, our contingency plans identify the need to alter our network or hold additional spare assets to meet our objectives. Our contingency plans are held by our network operations team and they are updated regularly.
Communication plans As part of our emergency preparedness, we have a Crisis Communications Plan, and major outage communication plans.In emergencies, we aim to keep our customers and the community informed, and we work closely with our key stakeholders in emergency management.

62 Orion New Zealand Limited

63 10 Year Asset Management Plan Section 1 Summary
4Customer
experience

64 Orion New Zealand Limited
Photo: “Powerful Conversations” workshop participant telling us how she thinks Orion should approach encouraging people to trim their trees away from power lines.
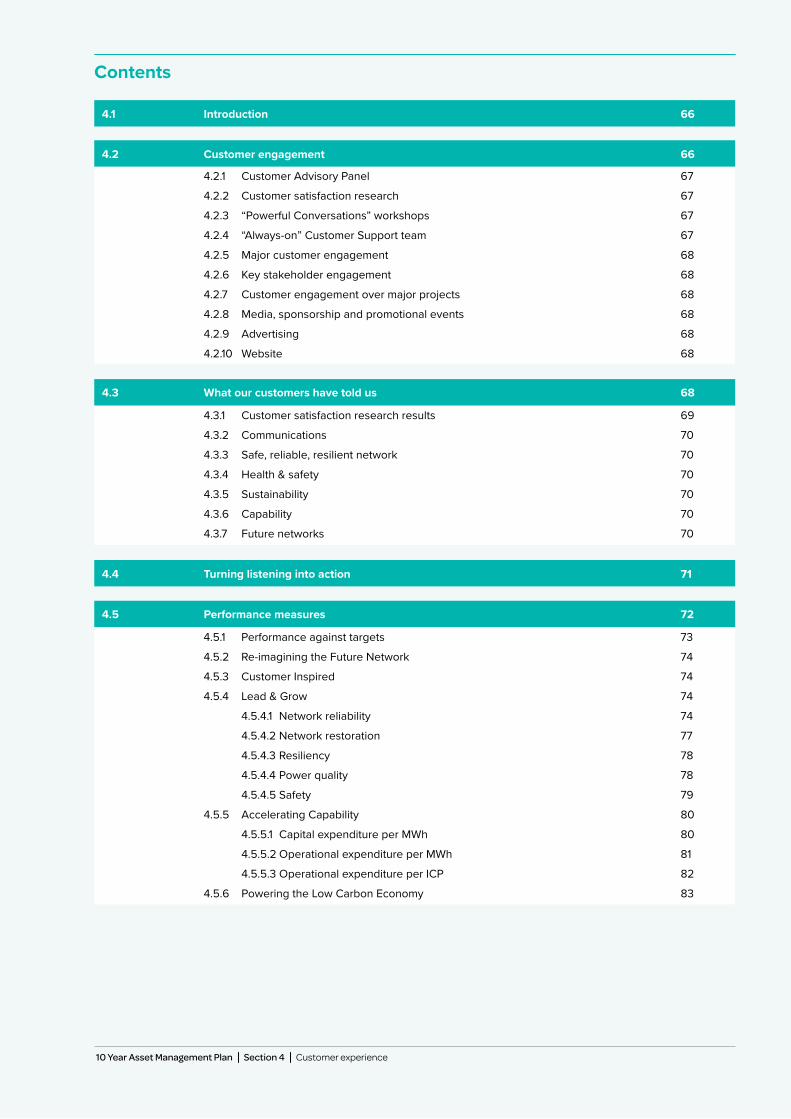
65 10 Year Asset Management Plan Section 4 Customer experience
4.5.1 Performance against targets 73
4.5.2 Re-imagining the Future Network 74
4.5.3 Customer Inspired 74
4.5.4 Lead & Grow 74
4.5.4.1 Network reliability 74
4.5.4.2 Network restoration 77
4.5.4.3 Resiliency 78
4.5.4.4 Power quality 78
4.5.4.5 Safety 79
4.5.5 Accelerating Capability 80
4.5.5.1 Capital expenditure per MWh 80
4.5.5.2 Operational expenditure per MWh 81
4.5.5.3 Operational expenditure per ICP 82
4.5.6 Powering the Low Carbon Economy 83
4.3.1 Customer satisfaction research results 69
4.3.2 Communications 70
4.3.3 Safe, reliable, resilient network 70
4.3.4 Health & safety 70
4.3.5 Sustainability 70
4.3.6 Capability 70
4.3.7 Future networks 70
4.2.1 Customer Advisory Panel 67
4.2.2 Customer satisfaction research 67
4.2.3 “Powerful Conversations” workshops 67
4.2.4 “Always-on” Customer Support team 67
4.2.5 Major customer engagement 68
4.2.6 Key stakeholder engagement 68
4.2.7 Customer engagement over major projects 68
4.2.8 Media, sponsorship and promotional events 68
4.2.9 Advertising 68
4.2.10 Website 68
4.1 Introduction 66
4.4 Turning listening into action 71
4.2 Customer engagement 66
4.5 Performance measures 72
4.3 What our customers have told us 68
Contents
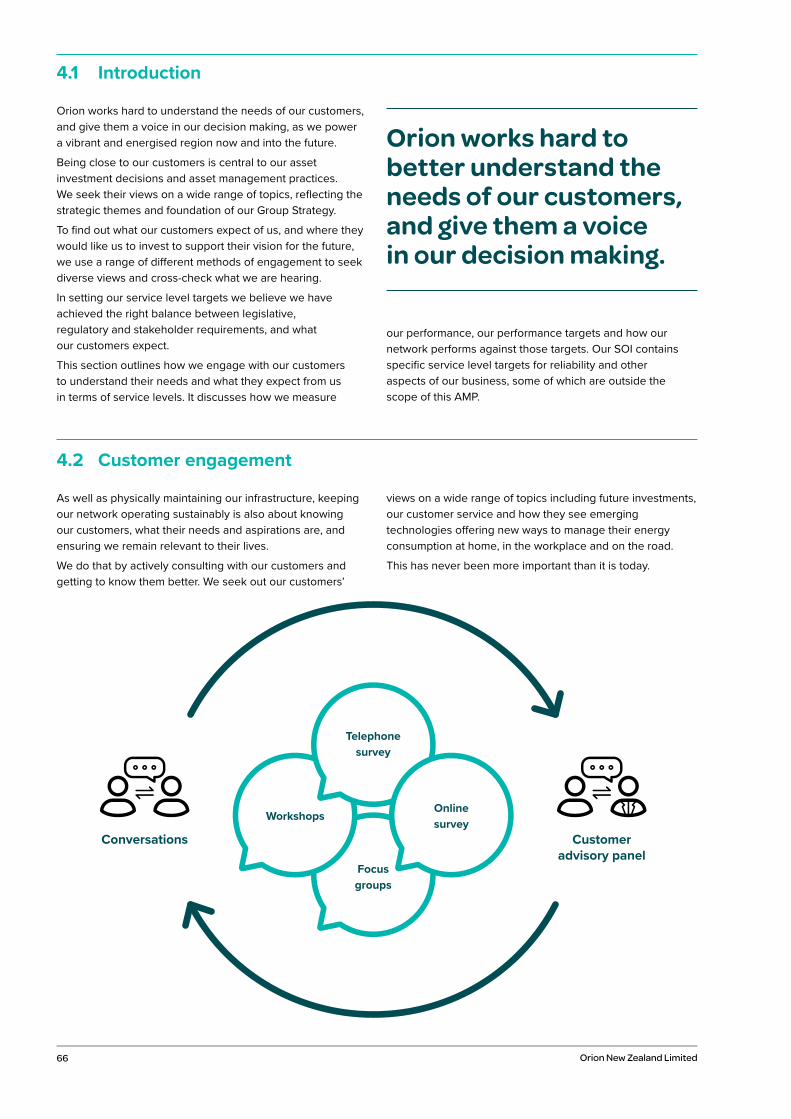
66 Orion New Zealand Limited
Orion works hard to understand the needs of our customers, and give them a voice in our decision making, as we power a vibrant and energised region now and into the future.
Being close to our customers is central to our asset investment decisions and asset management practices. We seek their views on a wide range of topics, reflecting the strategic themes and foundation of our Group Strategy.
To find out what our customers expect of us, and where they would like us to invest to support their vision for the future, we use a range of different methods of engagement to seek diverse views and cross-check what we are hearing.
In setting our service level targets we believe we have achieved the right balance between legislative, regulatory and stakeholder requirements, and what our customers expect.
This section outlines how we engage with our customers to understand their needs and what they expect from us in terms of service levels. It discusses how we measure
our performance, our performance targets and how our network performs against those targets. Our SOI contains specific service level targets for reliability and other aspects of our business, some of which are outside the scope of this AMP.
As well as physically maintaining our infrastructure, keeping our network operating sustainably is also about knowing our customers, what their needs and aspirations are, and ensuring we remain relevant to their lives.
We do that by actively consulting with our customers and getting to know them better. We seek out our customers’
views on a wide range of topics including future investments, our customer service and how they see emerging technologies offering new ways to manage their energy consumption at home, in the workplace and on the road.
This has never been more important than it is today.
4.2 Customer engagement
4.1 Introduction
Orion works hard to better understand the needs of our customers, and give them a voice in our decision making.
Conversations Customer advisory panel
Focus groups
WorkshopsOnline survey
Telephone survey
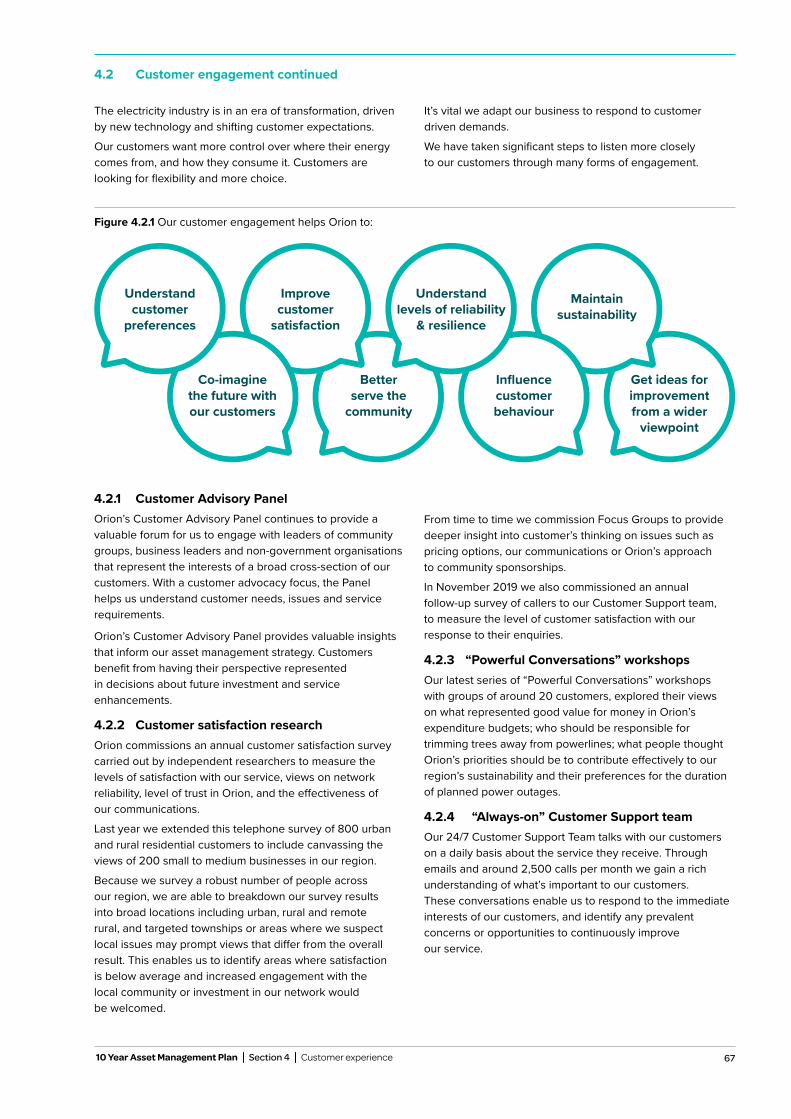
67 10 Year Asset Management Plan Section 4 Customer experience
4.2.1 Customer Advisory PanelOrion’s Customer Advisory Panel continues to provide a valuable forum for us to engage with leaders of community groups, business leaders and non-government organisations that represent the interests of a broad cross-section of our customers. With a customer advocacy focus, the Panel helps us understand customer needs, issues and service requirements.
Orion’s Customer Advisory Panel provides valuable insights that inform our asset management strategy. Customers benefit from having their perspective represented in decisions about future investment and service enhancements.
4.2.2 Customer satisfaction researchOrion commissions an annual customer satisfaction survey carried out by independent researchers to measure the levels of satisfaction with our service, views on network reliability, level of trust in Orion, and the effectiveness of our communications.
Last year we extended this telephone survey of 800 urban and rural residential customers to include canvassing the views of 200 small to medium businesses in our region.
Because we survey a robust number of people across our region, we are able to breakdown our survey results into broad locations including urban, rural and remote rural, and targeted townships or areas where we suspect local issues may prompt views that differ from the overall result. This enables us to identify areas where satisfaction is below average and increased engagement with the local community or investment in our network would be welcomed.
From time to time we commission Focus Groups to provide deeper insight into customer’s thinking on issues such as pricing options, our communications or Orion’s approach to community sponsorships.
In November 2019 we also commissioned an annual follow-up survey of callers to our Customer Support team, to measure the level of customer satisfaction with our response to their enquiries.
4.2.3 “Powerful Conversations” workshopsOur latest series of “Powerful Conversations” workshops with groups of around 20 customers, explored their views on what represented good value for money in Orion’s expenditure budgets; who should be responsible for trimming trees away from powerlines; what people thought Orion’s priorities should be to contribute effectively to our region’s sustainability and their preferences for the duration of planned power outages.
4.2.4 “Always-on” Customer Support teamOur 24/7 Customer Support Team talks with our customers on a daily basis about the service they receive. Through emails and around 2,500 calls per month we gain a rich understanding of what’s important to our customers. These conversations enable us to respond to the immediate interests of our customers, and identify any prevalent concerns or opportunities to continuously improve our service.
4.2 Customer engagement continued
The electricity industry is in an era of transformation, driven by new technology and shifting customer expectations.
Our customers want more control over where their energy comes from, and how they consume it. Customers are looking for flexibility and more choice.
It’s vital we adapt our business to respond to customer driven demands.
We have taken significant steps to listen more closely to our customers through many forms of engagement.
Better serve the
community
Co-imagine the future with our customers
Understand customer
preferences
Improve customer
satisfaction
Understand levels of reliability
& resilience
Maintain sustainability
Influence customer behaviour
Get ideas for improvement from a wider
viewpoint
Figure 4.2.1 Our customer engagement helps Orion to:

68 Orion New Zealand Limited
4.2 Customer engagement continued
4.2.5 Major customer engagementAll of our major customers are invited to seminars where we take the opportunity to engage with them on key matters. These are people who run intensive power dependent businesses, from schools, supermarkets and malls to dairy processing plants and printing machines.
4.2.6 Key stakeholder engagementWe regularly meet with key stakeholders and key influencers in the business community, our shareholders, Community Boards and local MPs to seek their views on our performance, future direction, and options we are considering.
In late 2019, we commissioned independent researchers to interview a range of our service providers to find out how we could further develop our relationship with people critical to the delivery of Orion’s service.
4.2.7 Customer engagement over major projectsWe have responded to increasing community expectations for more extensive communications about major projects affecting their service.
Where major projects have a significant impact on the community, we provide enhanced levels of communication directly with our customers and key community stakeholders. This can include Work Notices with details of the projects, the benefits and the impacts on their service during the work along with a point of contact, and updates via texts. We also provide presentations to local Community Boards, run local advertising and provide information via community social media channels.
4.2.8 Media, sponsorship and promotional events Media releases, sponsorships, trade shows, public exhibitions and social media are used to promote public safety messages, news about power outages and advice on future technologies, along with an invitation to provide us with feedback. These include:
• Media releases, briefings and interviews
• Twitter updates
• sponsorships and partnerships that enable us to engagewith our community on important power matters, suchas encouraging businesses to consider adding electricvehicles to their fleets through our “EV Experience”partnership with the Canterbury Employers’ Chamberof Commerce
• Displays at trade shows for the farming and generalcommunity
4.2.9 Advertising In the spirit of continuous improvement, In the past year we have overhauled our community advertising campaigns to improve their effectiveness and utilise increasingly popular online channels. Through online, newspaper, magazine and radio channels our new advertising campaigns focus on encouraging behaviours that have an impact on maintaining our network reliability and public safety:
• The need to trim trees away from power lines –metro and rural versions
• Farm safety around power lines
• DIY safety
• Encouraging people to come see us to discuss safetyaround power lines at local A&P shows
We also use advertising to provide the public with information and reassurance during crisis events, such as the 2020 COVID-19 lockdown periods.
4.2.10 WebsiteOur website provides up to date information, real-time details of power outages and online customer service functionality.
We recently enhanced the information provided on our power outages page to provide customers with updates on the cause of outages, and our progress with restoration.
Our customers have provided a useful picture of what is important to them, and where they would like us to concentrate our attention and investment. Consistently throughout our conversations, in research and Panel discussions customers are aligned with and have endorsed the strategic focus and guiding principles of our asset management strategy.
This section sets out the latest views of our customers gathered from our various customer engagement activities.
4.3 What our customers have told us

69 10 Year Asset Management Plan Section 4 Customer experience
4.3.1 Customer satisfaction research resultsWe gather a wealth of information on what our customers think of our service. In our annual customer surveys, they rate us highly on key service metrics including our Net Promoter Score, and our Customer Support team’s handling of their calls. As a reflection of our customer service and
network performance, there is a high level of community trust in Orion.
Figure 4.3.1 shows the key results from our latest customer research surveys.
4.3 What our customers have told us continued
Figure 4.3.1 Key results from our Annual Residential Customer Satisfaction survey, 2020; and Customer Calls research, 2020
Orion’s overall performance
NPS +60 8.8 AVG. 41%Orion’s Net Promoter Score of respondents rate performance
as a 10 on a 0—10 scale0—10 scale
Key perceptions of Orion
87% 84% 87% 82%agree Orion is capable and effective
agree Orion carries out its duties very well
agree Orion maintains the electricity network well
agree when the power goes out, Orion gets on to fixing it quickly
66% 45% 51% 41%agree Orion acts in the interest of local residents
agree Orion takes their customers’ views into account in its decisions
agree Orion is well-prepared for future natural disaster situations
agree Orion is prepared for a very different future for electricity
Awareness and perceptions of Orion
46% 96% 91% Awareness of Orion Satisfied with reliability
of power supplyLevel of trust in Orion
40% 36% 95%Aware of the Orion website Aware of the Orion Customer
Support serviceHad a good experience calling our Customer Support team
70 Orion New Zealand Limited
4.3.2 Communications
Our customers have also told us how they would like us to communicate with them about planned outages, and when. In general, residential customers would like personal direct communication about upcoming outages, a week or so before the event. They like to know what the outage is for, and how they will benefit. They prefer one big, all day outage over multiple shorter outages over an extended period.
Business customers tell us they need more notice to plan for interruptions to their operations, and they make greater use of Orion’s Customer Support team, and website.
4.3.3 Safe, reliable, resilient network
The key views of our customers on the safety, reliability and resilience of our network are:
• That our network can be safely accessed is “a given” for our customers. We recognise and respect the high level of public trust in the safe operation of our network.
• In all our conversations with customers, the importance of being provided with a reliable service is an abiding theme. Customers view reliability as a “hygiene factor” and tell us that focusing on providing a reliable service should be fundamental for Orion. They want us to continue to invest to maintain our standard of reliability, although not at any cost. Most customers are highly satisfied with Orion’s current levels of reliability, and do not support investment to increase reliability if that comes with increased prices.
Our 2020 annual survey of residential customers found 96% were satisfied with Orion’s service reliability. See Figure 4.3.1.
• Resilience is very important to our customers. Our customers tell us Orion’s investment in resilience represents good value for them. Customers have low tolerance for long outages, and want Orion to invest in resilience with this in mind.
On perceptions of our network resilience, while 82% of residential customers tells us they think we get on to fixing the network quickly when the power goes out, a significantly lower number, 51%, agree that we are well prepared for future natural disaster situations. We will be providing customers with increased reassurance around this point.
4.3.4 Health & safety
Customers have asked us to take a “common sense” approach to managing safety risks. They say protecting human life and avoiding injury is paramount. They believe Orion should balance the costs and risks associated with safety issues when addressing them.
The success of our public and business safety education campaigns is positively reflected in the number of occasions Orion is asked for a close approach consent from both residential and commercial customers. At consistently around 4,500 requests per year this is among the highest rates for EDBs in New Zealand. And in the most
important measure of the effectiveness of our public safety campaigning, there were no incidents of electrical harm in our region in FY20.
4.3.5 Sustainability
As we move forward on our sustainability journey, we are looking at how we are aligned to the United Nations Sustainable Development Goals. In our “Powerful Conversations” workshops and interviews with other key stakeholders, we talked with people about what sustainability means for Orion and where they think we should focus our efforts. The goals we found resonated most strongly for our customers and stakeholders are:
• working towards more sustainable communities and cities
• acting on climate change
• fostering good health and wellbeing in our community
• being responsible in the consumption and production of our business
These goals have been embraced in our Group Strategy, see Section 2.4.
4.3.6 Capability
As our industry goes through an era of unprecedented change, so too must our capability adapt to meet changing needs.
Our customer research shows people are very confident in Orion’s current capability and competence in management of the power network. As shown in Figure 4.3.1, among a range of strongly positive scores in our latest Customer Satisfaction survey, 87% agree that Orion is capable and effective in the management of our network, and 84% say we carry out our duties very well.
What surveyed customers are less sure of is whether we are prepared for the future. Customers tell us we need to be ahead of developments in the industry and ready to help customers and our service providers adapt to new ways of managing the community’s power needs. They encourage us to ensure we are developing the capability that will be needed.
4.3.7 Future networks
At both our “Powerful Conversations” workshops and Customer Advisory Panel sessions Orion has been encouraged to have a strong focus on the future – to make sure our network is ready for customers to take advantage of new technologies.
In our annual customer survey, we found customers are less confident in our preparedness for the future – only 41% agree that Orion is prepared for a very different future for electricity where customers have more choice about where they get their power from, how they use it and share it with others. We acknowledge we must do more to be ready for a changing future and accept the need to improve this perception.
4.3 What our customers have told us continued
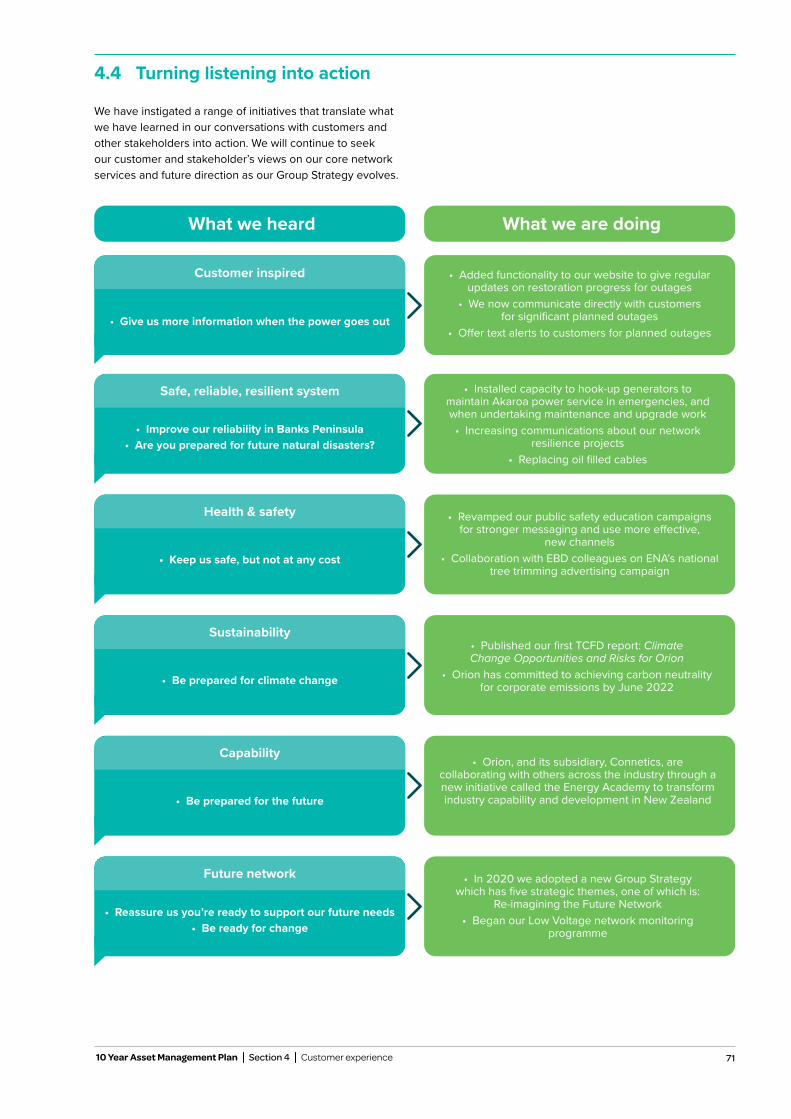
71 10 Year Asset Management Plan Section 4 Customer experience
We have instigated a range of initiatives that translate what we have learned in our conversations with customers and other stakeholders into action. We will continue to seek our customer and stakeholder’s views on our core network services and future direction as our Group Strategy evolves.
4.4 Turning listening into action
What we heard What we are doing
• Give us more information when the power goes out
Customer inspired
Safe, reliable, resilient system
Health & safety
Sustainability
Capability
Future network
• Improve our reliability in Banks Peninsula• Are you prepared for future natural disasters?
• Keep us safe, but not at any cost
• Be prepared for climate change
• Be prepared for the future
• Reassure us you’re ready to support our future needs• Be ready for change
• Orion, and its subsidiary, Connetics, arecollaborating with others across the industry through a new initiative called the Energy Academy to transform industry capability and development in New Zealand
• In 2020 we adopted a new Group Strategywhich has five strategic themes, one of which is:
Re-imagining the Future Network• Began our Low Voltage network monitoring
programme
• Added functionality to our website to give regularupdates on restoration progress for outages
• We now communicate directly with customersfor significant planned outages
• Offer text alerts to customers for planned outages
• Revamped our public safety education campaignsfor stronger messaging and use more effective,
new channels• Collaboration with EBD colleagues on ENA’s national
tree trimming advertising campaign
• Published our first TCFD report: ClimateChange Opportunities and Risks for Orion
• Orion has committed to achieving carbon neutralityfor corporate emissions by June 2022
• Installed capacity to hook-up generators tomaintain Akaroa power service in emergencies, and when undertaking maintenance and upgrade work• Increasing communications about our network
resilience projects• Replacing oil filled cables
72 Orion New Zealand Limited
This section sets out how we measure our performance. Throughout our engagement with customers they have told us that a reliable supply of electricity is a top priority. This is a key service measure. We also monitor our performance against a range of other service measures including customer service, power quality, safety and environmental impact. Table 4.5.1 shows how our measures align with the Orion Group Strategic Themes outlined in Section 2.4. Our Group Strategy is an evolving process, and further measures to reflect our commitment to our future focus are under development. Our current targets and our performance against those targets are set out in this section.
4.5 Performance measures
Figure 4.5.1 Performance Measures
Performance measures
Re-imagining the Future Network
Powering the Low Carbon
Economy
Customer Inspired
Lead & GrowAccelerating
Capability
Performance measures
Performance measures
Re-imagining the Future Network
Re-imagining the Future Network
Powering the Low Carbon
Economy
Powering the Low Carbon
Economy
Customer Inspired
Lead & Grow
Lead & Grow
Accelerating Capability
Accelerating Capability
Customer Inspired
Performance measures
Re-imagining the Future Network
Powering the Low Carbon
Economy
Customer Inspired
Accelerating Capability Lead & Grow
Re-imagining the Future Network
Performance measures
Re-imagining the Future Network
Powering the Low Carbon
Economy
Customer Inspired
Accelerating Capability Lead & Grow
Powering the Low Carbon
EconomyPerformance
measures
Re-imagining the Future Network
Powering the Low Carbon
Economy
Customer Inspired
Accelerating Capability Lead & Grow
Accelerating Capability
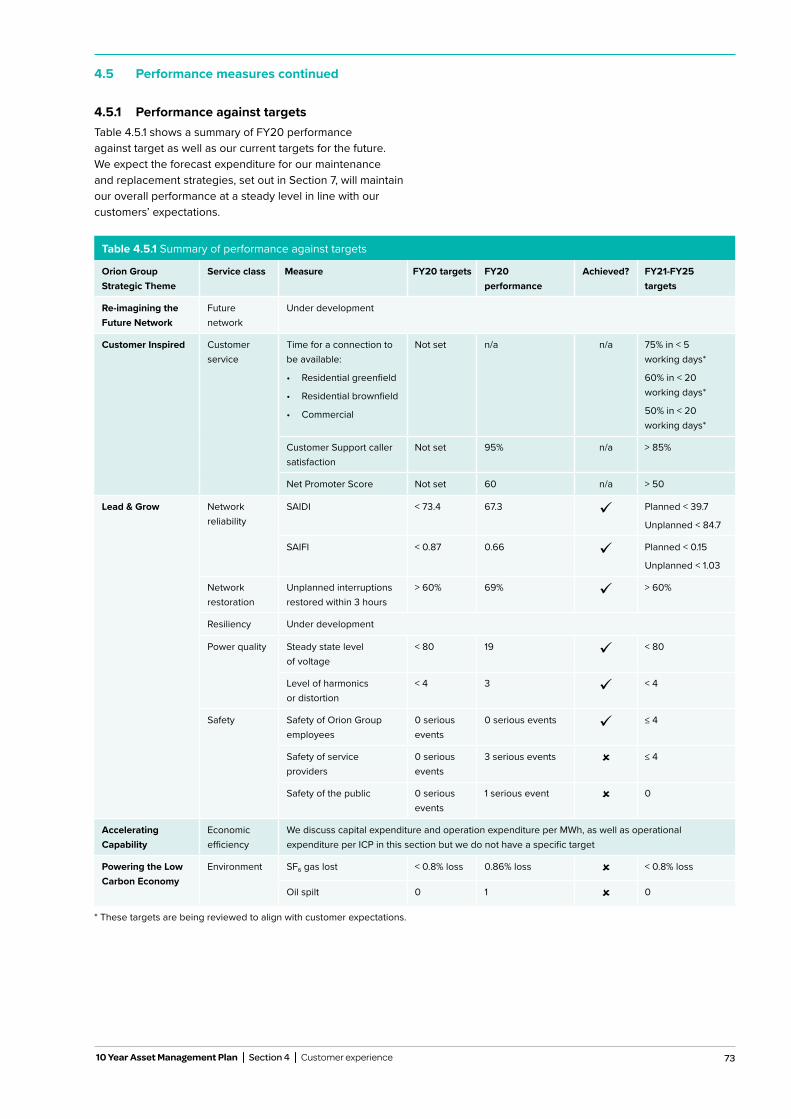
73 10 Year Asset Management Plan Section 4 Customer experience
4.5 Performance measures continued
4.5.1 Performance against targetsTable 4.5.1 shows a summary of FY20 performance against target as well as our current targets for the future. We expect the forecast expenditure for our maintenance and replacement strategies, set out in Section 7, will maintain our overall performance at a steady level in line with our customers’ expectations.
* These targets are being reviewed to align with customer expectations.
Table 4.5.1 Summary of performance against targets
Orion Group Strategic Theme
Service class Measure FY20 targets FY20 performance
Achieved? FY21-FY25 targets
Re-imagining the Future Network
Future network
Under development
Customer Inspired Customer service
Time for a connection to be available:
• Residential greenfield
• Residential brownfield
• Commercial
Not set n/a n/a 75% in < 5 working days*
60% in < 20 working days*
50% in < 20 working days*
Customer Support caller satisfaction
Not set 95% n/a > 85%
Net Promoter Score Not set 60 n/a > 50
Lead & Grow Network reliability
SAIDI < 73.4 67.3 Planned < 39.7
Unplanned < 84.7
SAIFI < 0.87 0.66 Planned < 0.15
Unplanned < 1.03
Network restoration
Unplanned interruptions restored within 3 hours
> 60% 69% > 60%
Resiliency Under development
Power quality Steady state level of voltage
< 80 19 < 80
Level of harmonics or distortion
< 4 3 < 4
Safety Safety of Orion Group employees
0 serious events
0 serious events ≤ 4
Safety of service providers
0 serious events
3 serious events ≤ 4
Safety of the public 0 serious events
1 serious event 0
Accelerating Capability
Economic efficiency
We discuss capital expenditure and operation expenditure per MWh, as well as operational expenditure per ICP in this section but we do not have a specific target
Powering the Low Carbon Economy
Environment SF6 gas lost < 0.8% loss 0.86% loss < 0.8% loss
Oil spilt 0 1 0
74 Orion New Zealand Limited
4.5 Performance measures continued
4.5.2 Re-imagining the Future Network
Figure 4.5.1 Performance Measures
Performancemeasures
Re-imagining the Future Network
Powering the Low Carbon
Economy
Customer Inspired
Lead & GrowAccelerating
Capability
Performancemeasures
Performancemeasures
Re-imagining the Future Network
Re-imagining the Future Network
Powering the Low Carbon
Economy
Powering the Low Carbon
Economy
Customer Inspired
Lead & Grow
Lead & Grow
Accelerating Capability
Accelerating Capability
Customer Inspired
Performance measures
Re-imagining the Future Network
Powering the Low Carbon
Economy
Customer Inspired
Accelerating Capability Lead & Grow
Re-imagining the Future Network
Performancemeasures
Re-imagining the Future Network
Powering the Low Carbon
Economy
Customer Inspired
Accelerating Capability Lead & Grow
Powering the Low Carbon
EconomyPerformance
measures
Re-imagining the Future Network
Powering the Low Carbon
Economy
Customer Inspired
Accelerating Capability Lead & Grow
Accelerating Capability
Our Low Voltage (LV) network will increasingly need to support new and more complex two-way power flows as customers progressively adopt new technologies. For this reason, we began our LV feeder monitoring project in FY20. The aim is to develop our ability
to monitor and centrally operate our LV network in real time. We are currently working on understanding the type of data we need to collect and why and how the data can be used. See Section 6.2 for more information.
Performance against targets
Targets are under development.
4.5.3 Customer Inspired
Figure 4.5.1 Performance Measures
Performancemeasures
Re-imagining the Future Network
Powering the Low Carbon
Economy
Customer Inspired
Lead & GrowAccelerating
Capability
Performancemeasures
Performance measures
Re-imagining the Future Network
Re-imagining the Future Network
Powering the Low Carbon
Economy
Powering the Low Carbon
Economy
Customer Inspired
Lead & Grow
Lead & Grow
Accelerating Capability
Accelerating Capability
Customer Inspired
Performancemeasures
Re-imagining the Future Network
Powering the Low Carbon
Economy
Customer Inspired
Accelerating Capability Lead & Grow
Re-imagining the Future Network
Performancemeasures
Re-imagining the Future Network
Powering the Low Carbon
Economy
Customer Inspired
Accelerating Capability Lead & Grow
Powering the Low Carbon
EconomyPerformance
measures
Re-imagining the Future Network
Powering the Low Carbon
Economy
Customer Inspired
Accelerating Capability Lead & Grow
Accelerating Capability
For the first time, we developed measures and targets for our performance in customer service, commencing FY21. They measure and set ambitious targets for our performance in three key areas:
• The length of time is takes us to connect a customerto our network – following their request, and theprovision of all necessary information. Customers havebeen expecting increasingly shorter timeframes forconnections, and expressing their frustration at thecurrent average turnaround time. We have provisionallyset our new targets to challenge our current performance,and we seek to reduce our connection times. We are reviewing these targets to ensure they meet our customers’ expectations.
• Customer satisfaction with their calls to our CustomerSupport team – around 2,500 customers call our Customer Support team each month and it is important they come away from the experience with the information they need, and feeling positive about the experience. Independent researchers follow up with calls to customers who have recently contacted us, and seek their feedback.
• Net Promoter Score – we use an adapted version of awidely recognised metric that is traditionally used forretail organisations, which remains relevant in a regulatedmonopoly context. We believe that after their experience with Orion, our customers should be left feeling positive about us, with good word of mouth to their friends. With the international average NPS of technology companies at +40, our target reflects our goal to have loyal customers who rate Orion in the “GREAT” NPS range.
4.5.4 Lead & Grow
Figure 4.5.1 Performance Measures
Performancemeasures
Re-imagining the Future Network
Powering the Low Carbon
Economy
Customer Inspired
Lead & GrowAccelerating
Capability
Performance measures
Performancemeasures
Re-imagining the Future Network
Re-imagining the Future Network
Powering the Low Carbon
Economy
Powering the Low Carbon
Economy
Customer Inspired
Lead & Grow
Lead & Grow
Accelerating Capability
Accelerating Capability
Customer Inspired
Performancemeasures
Re-imagining the Future Network
Powering the Low Carbon
Economy
Customer Inspired
Accelerating Capability Lead & Grow
Re-imagining the Future Network
Performancemeasures
Re-imagining the Future Network
Powering the Low Carbon
Economy
Customer Inspired
Accelerating Capability Lead & Grow
Powering the Low Carbon
EconomyPerformance
measures
Re-imagining the Future Network
Powering the Low Carbon
Economy
Customer Inspired
Accelerating Capability Lead & Grow
Accelerating Capability
4.5.4.1 Network reliability
Network reliability is measured by the frequency and duration of interruptions to the supply of electricity to our customers. Our goal is to ensure that our reliability performance meets our regulatory
requirements and our customers’ expectations, established through the various means of consultation discussed in the previous section.
Our network reliability measures are as required by the Commerce Commission’s Electricity Distribution Information Disclosure Determination 2012. These are:
• SAIDI – System Average Interruption Duration Index –measures the average number of minutes per annumthat a customer is without electricity
• SAIFI – System Average Interruption Frequency Index –measures the average number of times per annum thata customer is without electricity
Both the SAIDI and SAIFI measures consider planned and unplanned interruptions of a duration longer than one minute on our subtransmission and high voltage distribution system.
Performance against target
As shown in Figure 4.3.1, in our 2020 annual survey of residential customers, 96% were satisfied with our service reliability. Our customers also do not want us to continually improve network reliability if it is reflected in increased prices. There comes a point where the added costs outweigh the added benefits, particularly in a predominately overhead rural network. For example, a major improvement in rural reliability would require a large capital investment and a correspondingly large increase in line charges.
Our network reliability performance for FY20 is shown against our targets in Table 4.5.2. The annual network reliability limits were set by the Commerce Commission under CPP regime determined for Orion after the Christchurch earthquakes of 2010-2011. These limits have run from FY15 through to FY19 and our FY20 limits were the same as FY19.
Our new targets for SAIDI and SAIFI for FY21-FY25 are also shown in Table 4.5.2. There are now separate targets for planned and unplanned events, and a new extreme event measure that relates to identification and reporting of rare events. See Section 7 for more information on faults per 100km. Our historical performance and future targets are shown in Figures 4.5.1 and 4.5.2.
Our Low Voltage (LV) network will increasingly need to support new and more complex two-way power flows as customers progressively adopt new technologies.
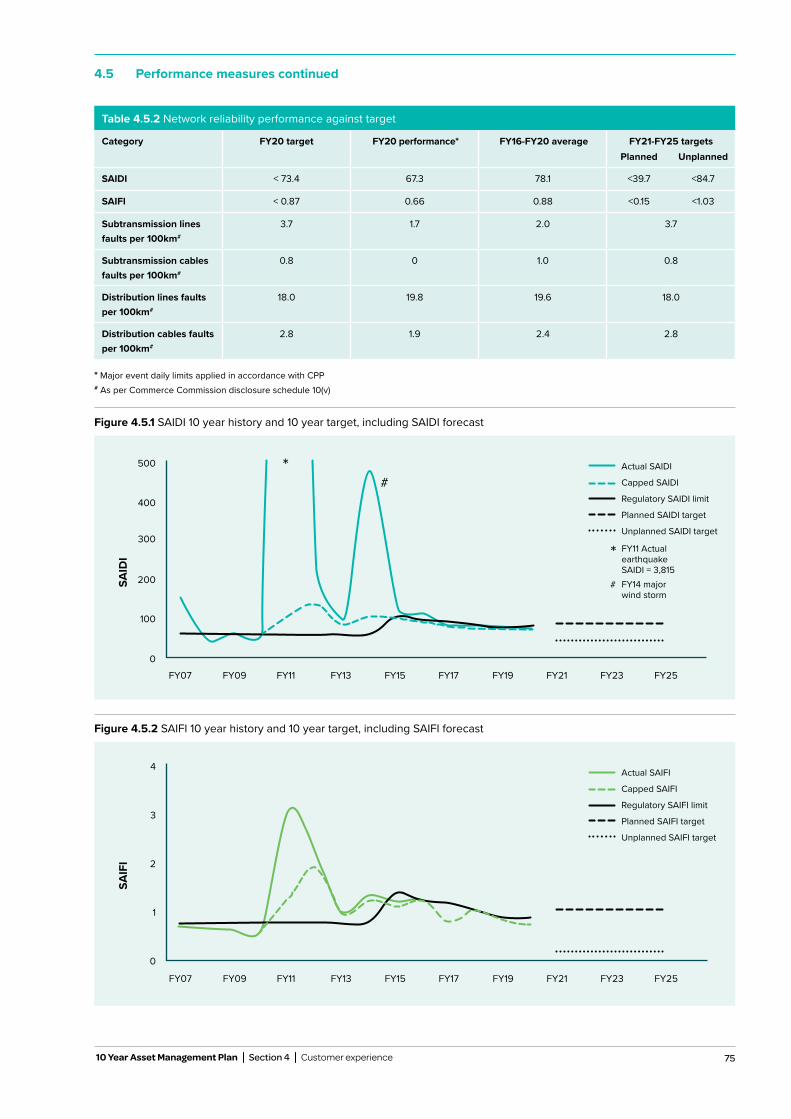
75 10 Year Asset Management Plan Section 4 Customer experience
4.5 Performance measures continued
Figure 4.5.1 SAIDI 10 year history and 10 year target, including SAIDI forecast
*#
* FY11 Actual earthquake SAIDI = 3,815
# FY14 major wind storm
Regulatory SAIDI limit
Unplanned SAIDI target
Planned SAIDI target
Actual SAIDI
Capped SAIDI
200
100
0
300
400
500
FY07 FY09 FY11 FY13 FY15 FY17 FY19 FY21 FY23 FY25
SAID
ITable 4.5.2 Network reliability performance against target
Category FY20 target FY20 performance* FY16-FY20 average FY21-FY25 targetsPlanned Unplanned
SAIDI < 73.4 67.3 78.1 <39.7 <84.7
SAIFI < 0.87 0.66 0.88 <0.15 <1.03
Subtransmission lines faults per 100km#
3.7 1.7 2.0 3.7
Subtransmission cables faults per 100km#
0.8 0 1.0 0.8
Distribution lines faults per 100km#
18.0 19.8 19.6 18.0
Distribution cables faults per 100km#
2.8 1.9 2.4 2.8
* Major event daily limits applied in accordance with CPP# As per Commerce Commission disclosure schedule 10(v)
Figure 4.5.2 SAIFI 10 year history and 10 year target, including SAIFI forecast
1
0
2
3
4
FY07 FY09 FY11 FY13 FY15 FY17 FY19 FY21 FY23 FY25
SAIF
I
Regulatory SAIFI limit
Unplanned SAIFI target
Planned SAIFI target
Actual SAIFI
Capped SAIFI
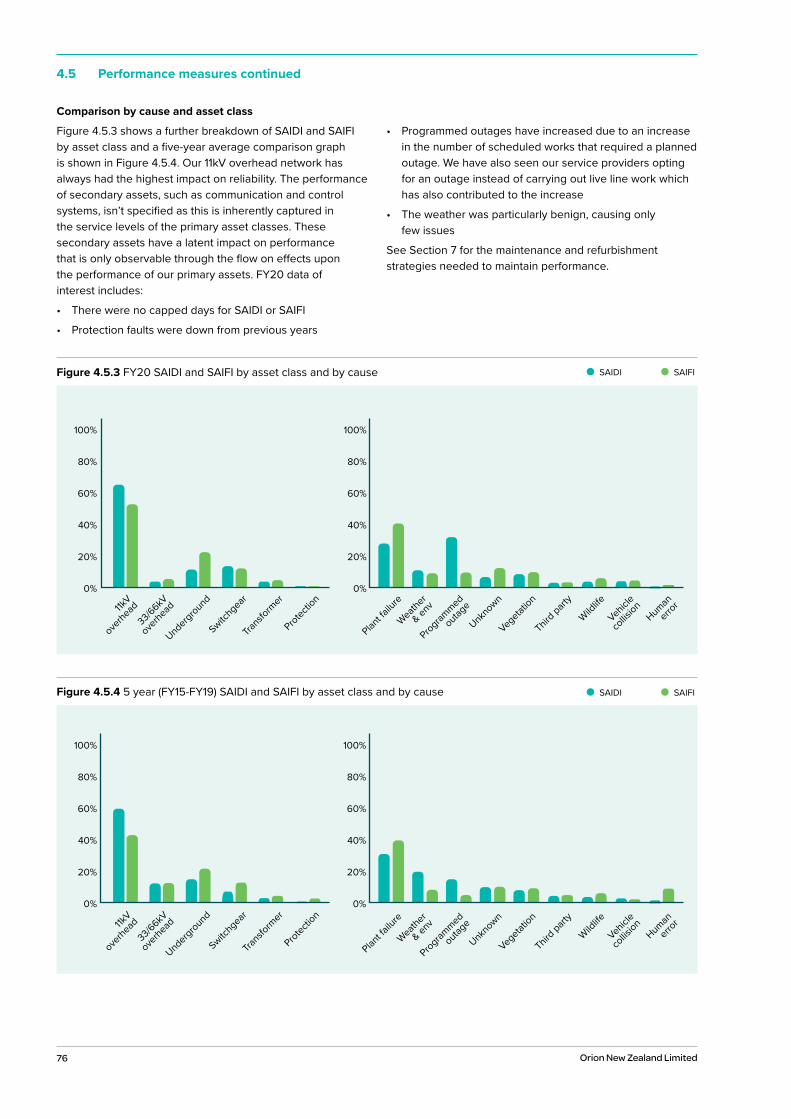
76 Orion New Zealand Limited
4.5 Performance measures continued
Comparison by cause and asset class
Figure 4.5.3 shows a further breakdown of SAIDI and SAIFI by asset class and a five-year average comparison graph is shown in Figure 4.5.4. Our 11kV overhead network has always had the highest impact on reliability. The performance of secondary assets, such as communication and control systems, isn’t specified as this is inherently captured in the service levels of the primary asset classes. These secondary assets have a latent impact on performance that is only observable through the flow on effects upon the performance of our primary assets. FY20 data of interest includes:
• There were no capped days for SAIDI or SAIFI
• Protection faults were down from previous years
• Programmed outages have increased due to an increase in the number of scheduled works that required a planned outage. We have also seen our service providers opting for an outage instead of carrying out live line work which has also contributed to the increase
• The weather was particularly benign, causing only few issues
See Section 7 for the maintenance and refurbishment strategies needed to maintain performance.
Figure 4.5.3 FY20 SAIDI and SAIFI by asset class and by cause SAIDI SAIFI
11kV
overhead
Weather
& env
Plant fa
ilure
Programmed
outage
Unknown
Vegetation
Third part
y
Wildlife
Vehicle
collis
ionHuman
error
33/66kV
overhead
Underground
Switchgear
Transfo
rmer
Protection
100%
80%
60%
40%
20%
0%
100%
80%
60%
40%
20%
0%
Figure 4.5.4 5 year (FY15-FY19) SAIDI and SAIFI by asset class and by cause SAIDI SAIFI
Weather
& env
Plant fa
ilure
Programmed
outage
Unknown
Vegetation
Third part
y
Wildlife
Vehicle
collis
ionHuman
error11k
V
overhead
33/66kV
overhead
Underground
Switchgear
Transfo
rmer
Protection
100%
80%
60%
40%
20%
0%
100%
80%
60%
40%
20%
0%
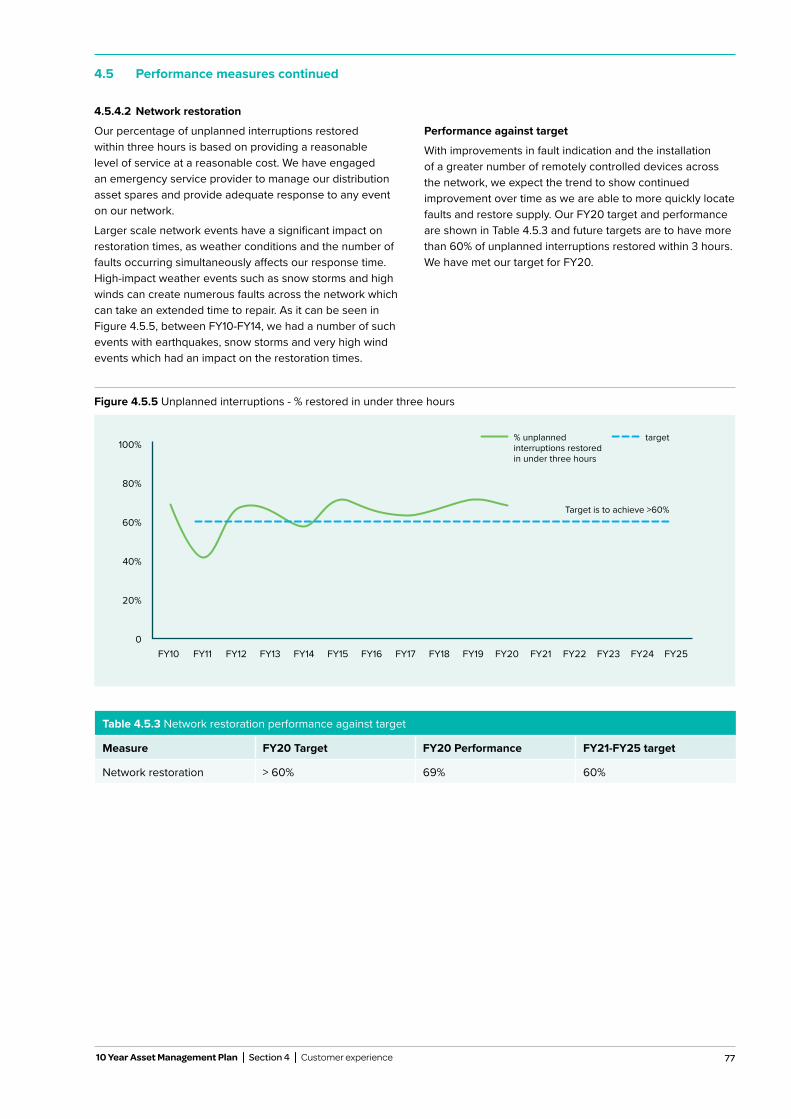
77 10 Year Asset Management Plan Section 4 Customer experience
4.5 Performance measures continued
4.5.4.2 Network restoration
Our percentage of unplanned interruptions restored within three hours is based on providing a reasonable level of service at a reasonable cost. We have engaged an emergency service provider to manage our distribution asset spares and provide adequate response to any event on our network.
Larger scale network events have a significant impact on restoration times, as weather conditions and the number of faults occurring simultaneously affects our response time. High-impact weather events such as snow storms and high winds can create numerous faults across the network which can take an extended time to repair. As it can be seen in Figure 4.5.5, between FY10-FY14, we had a number of such events with earthquakes, snow storms and very high wind events which had an impact on the restoration times.
Performance against target
With improvements in fault indication and the installation of a greater number of remotely controlled devices across the network, we expect the trend to show continued improvement over time as we are able to more quickly locate faults and restore supply. Our FY20 target and performance are shown in Table 4.5.3 and future targets are to have more than 60% of unplanned interruptions restored within 3 hours. We have met our target for FY20.
Figure 4.5.5 Unplanned interruptions - % restored in under three hours
0
20%
40%
60%
100%
80%
FY10 FY11 FY12 FY13 FY14 FY15 FY16 FY17 FY18 FY19 FY20 FY21 FY22 FY23 FY24 FY25
% unplanned interruptions restored in under three hours
target
Target is to achieve >60%
Table 4.5.3 Network restoration performance against target
Measure FY20 Target FY20 Performance FY21-FY25 target
Network restoration > 60% 69% 60%
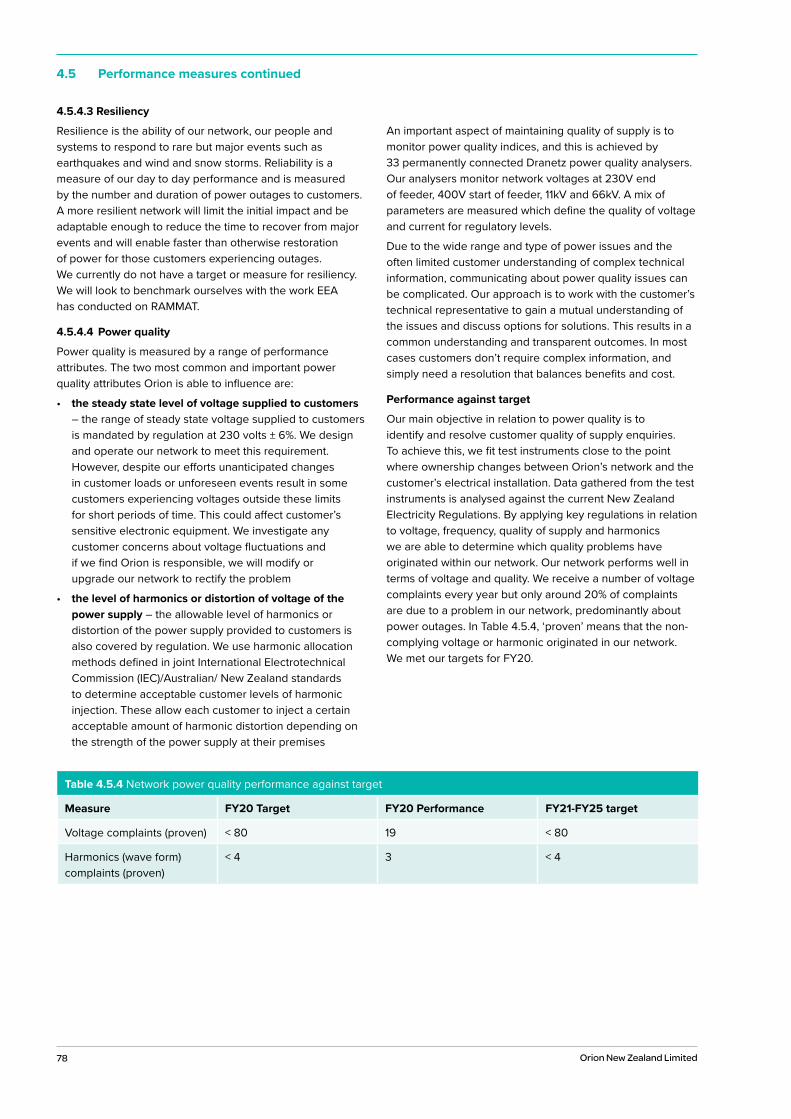
78 Orion New Zealand Limited
4.5 Performance measures continued
4.5.4.3 Resiliency
Resilience is the ability of our network, our people and systems to respond to rare but major events such as earthquakes and wind and snow storms. Reliability is a measure of our day to day performance and is measured by the number and duration of power outages to customers. A more resilient network will limit the initial impact and be adaptable enough to reduce the time to recover from major events and will enable faster than otherwise restoration of power for those customers experiencing outages. We currently do not have a target or measure for resiliency. We will look to benchmark ourselves with the work EEA has conducted on RAMMAT.
4.5.4.4 Power quality
Power quality is measured by a range of performance attributes. The two most common and important power quality attributes Orion is able to influence are:
• the steady state level of voltage supplied to customers – the range of steady state voltage supplied to customers is mandated by regulation at 230 volts ± 6%. We design and operate our network to meet this requirement. However, despite our efforts unanticipated changes in customer loads or unforeseen events result in some customers experiencing voltages outside these limits for short periods of time. This could affect customer’s sensitive electronic equipment. We investigate any customer concerns about voltage fluctuations and if we find Orion is responsible, we will modify or upgrade our network to rectify the problem
• the level of harmonics or distortion of voltage of the power supply – the allowable level of harmonics or distortion of the power supply provided to customers is also covered by regulation. We use harmonic allocation methods defined in joint International Electrotechnical Commission (IEC)/Australian/ New Zealand standards to determine acceptable customer levels of harmonic injection. These allow each customer to inject a certain acceptable amount of harmonic distortion depending on the strength of the power supply at their premises
An important aspect of maintaining quality of supply is to monitor power quality indices, and this is achieved by 33 permanently connected Dranetz power quality analysers. Our analysers monitor network voltages at 230V end of feeder, 400V start of feeder, 11kV and 66kV. A mix of parameters are measured which define the quality of voltage and current for regulatory levels.
Due to the wide range and type of power issues and the often limited customer understanding of complex technical information, communicating about power quality issues can be complicated. Our approach is to work with the customer’s technical representative to gain a mutual understanding of the issues and discuss options for solutions. This results in a common understanding and transparent outcomes. In most cases customers don’t require complex information, and simply need a resolution that balances benefits and cost.
Performance against target
Our main objective in relation to power quality is to identify and resolve customer quality of supply enquiries. To achieve this, we fit test instruments close to the point where ownership changes between Orion’s network and the customer’s electrical installation. Data gathered from the test instruments is analysed against the current New Zealand Electricity Regulations. By applying key regulations in relation to voltage, frequency, quality of supply and harmonics we are able to determine which quality problems have originated within our network. Our network performs well in terms of voltage and quality. We receive a number of voltage complaints every year but only around 20% of complaints are due to a problem in our network, predominantly about power outages. In Table 4.5.4, ‘proven’ means that the non-complying voltage or harmonic originated in our network. We met our targets for FY20.
Table 4.5.4 Network power quality performance against target
Measure FY20 Target FY20 Performance FY21-FY25 target
Voltage complaints (proven) < 80 19 < 80
Harmonics (wave form) complaints (proven)
< 4 3 < 4
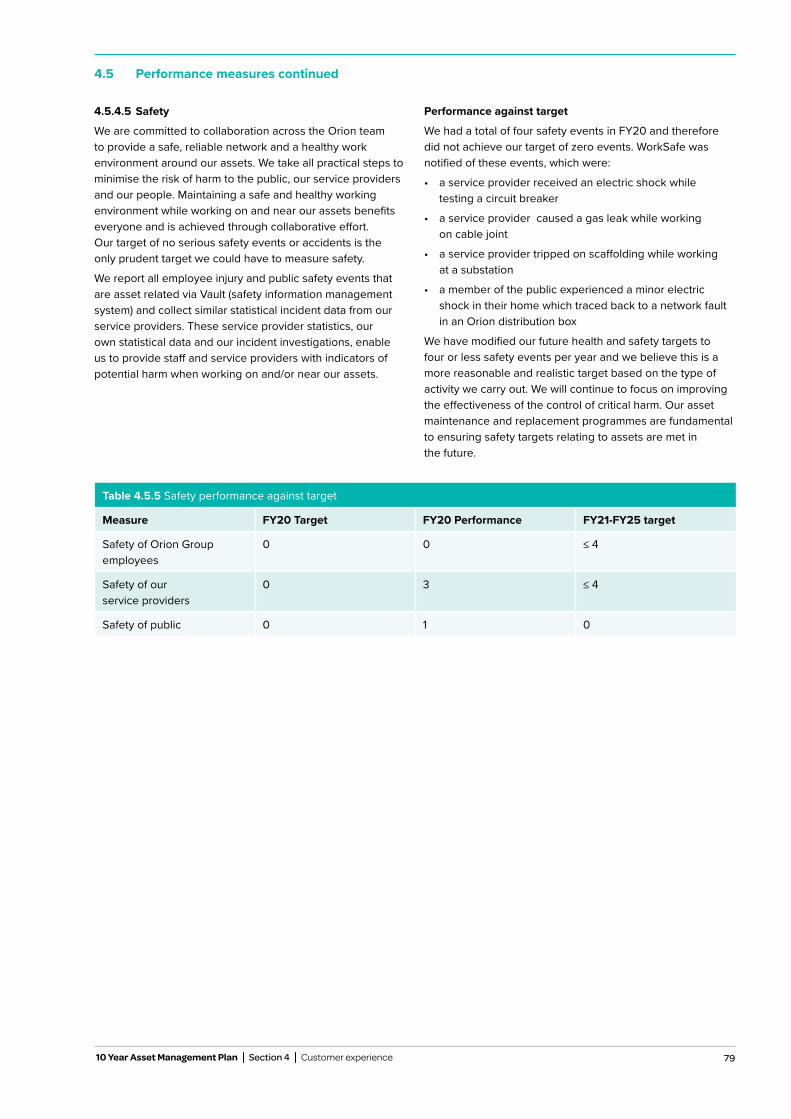
79 10 Year Asset Management Plan Section 4 Customer experience
4.5 Performance measures continued
Table 4.5.5 Safety performance against target
Measure FY20 Target FY20 Performance FY21-FY25 target
Safety of Orion Group employees
0 0 ≤ 4
Safety of our service providers
0 3 ≤ 4
Safety of public 0 1 0
4.5.4.5 Safety
We are committed to collaboration across the Orion team to provide a safe, reliable network and a healthy work environment around our assets. We take all practical steps to minimise the risk of harm to the public, our service providers and our people. Maintaining a safe and healthy working environment while working on and near our assets benefits everyone and is achieved through collaborative effort. Our target of no serious safety events or accidents is the only prudent target we could have to measure safety.
We report all employee injury and public safety events that are asset related via Vault (safety information management system) and collect similar statistical incident data from our service providers. These service provider statistics, our own statistical data and our incident investigations, enable us to provide staff and service providers with indicators of potential harm when working on and/or near our assets.
Performance against target
We had a total of four safety events in FY20 and therefore did not achieve our target of zero events. WorkSafe was notified of these events, which were:
• a service provider received an electric shock while testing a circuit breaker
• a service provider caused a gas leak while working on cable joint
• a service provider tripped on scaffolding while working at a substation
• a member of the public experienced a minor electric shock in their home which traced back to a network fault in an Orion distribution box
We have modified our future health and safety targets to four or less safety events per year and we believe this is a more reasonable and realistic target based on the type of activity we carry out. We will continue to focus on improving the effectiveness of the control of critical harm. Our asset maintenance and replacement programmes are fundamental to ensuring safety targets relating to assets are met in the future.
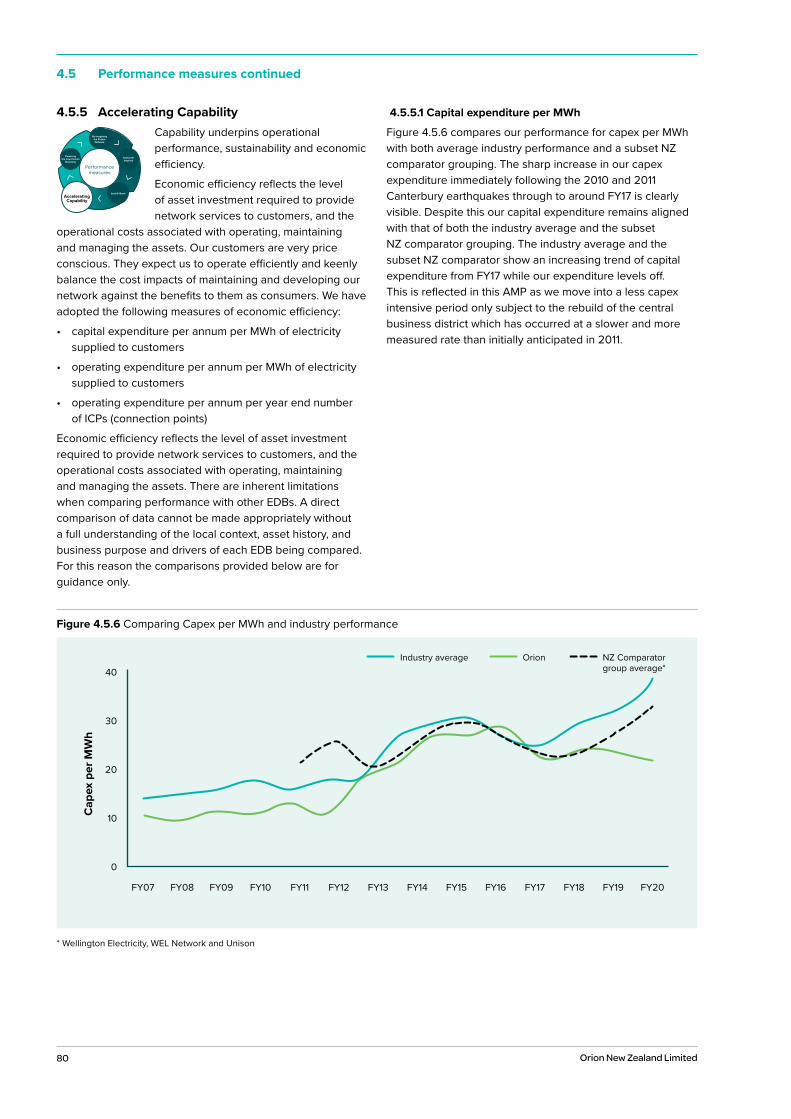
80 Orion New Zealand Limited
4.5 Performance measures continued
4.5.5 Accelerating Capability
Figure 4.5.1 Performance Measures
Performancemeasures
Re-imagining the Future Network
Powering the Low Carbon
Economy
Customer Inspired
Lead & GrowAccelerating
Capability
Performancemeasures
Performancemeasures
Re-imagining the Future Network
Re-imagining the Future Network
Powering the Low Carbon
Economy
Powering the Low Carbon
Economy
Customer Inspired
Lead & Grow
Lead & Grow
Accelerating Capability
Accelerating Capability
Customer Inspired
Performancemeasures
Re-imagining the Future Network
Powering the Low Carbon
Economy
Customer Inspired
Accelerating Capability Lead & Grow
Re-imagining the Future Network
Performancemeasures
Re-imagining the Future Network
Powering the Low Carbon
Economy
Customer Inspired
Accelerating Capability Lead & Grow
Powering the Low Carbon
EconomyPerformance
measures
Re-imagining the Future Network
Powering the Low Carbon
Economy
Customer Inspired
Accelerating Capability Lead & Grow
Accelerating Capability
Capability underpins operational performance, sustainability and economic efficiency.
Economic efficiency reflects the level of asset investment required to provide network services to customers, and the
operational costs associated with operating, maintaining and managing the assets. Our customers are very price conscious. They expect us to operate efficiently and keenly balance the cost impacts of maintaining and developing our network against the benefits to them as consumers. We have adopted the following measures of economic efficiency:
• capital expenditure per annum per MWh of electricitysupplied to customers
• operating expenditure per annum per MWh of electricitysupplied to customers
• operating expenditure per annum per year end numberof ICPs (connection points)
Economic efficiency reflects the level of asset investment required to provide network services to customers, and the operational costs associated with operating, maintaining and managing the assets. There are inherent limitations when comparing performance with other EDBs. A direct comparison of data cannot be made appropriately without a full understanding of the local context, asset history, and business purpose and drivers of each EDB being compared. For this reason the comparisons provided below are for guidance only.
4.5.5.1 Capital expenditure per MWh
Figure 4.5.6 compares our performance for capex per MWh with both average industry performance and a subset NZ comparator grouping. The sharp increase in our capex expenditure immediately following the 2010 and 2011 Canterbury earthquakes through to around FY17 is clearly visible. Despite this our capital expenditure remains aligned with that of both the industry average and the subset NZ comparator grouping. The industry average and the subset NZ comparator show an increasing trend of capital expenditure from FY17 while our expenditure levels off. This is reflected in this AMP as we move into a less capex intensive period only subject to the rebuild of the central business district which has occurred at a slower and more measured rate than initially anticipated in 2011.
Figure 4.5.6 Comparing Capex per MWh and industry performance
0
10
20
30
40
FY07 FY08 FY09 FY10 FY11 FY12 FY13 FY14 FY15 FY16 FY17 FY18 FY19 FY20
Industry average Orion NZ Comparator group average*
Cap
ex p
er M
Wh
* Wellington Electricity, WEL Network and Unison
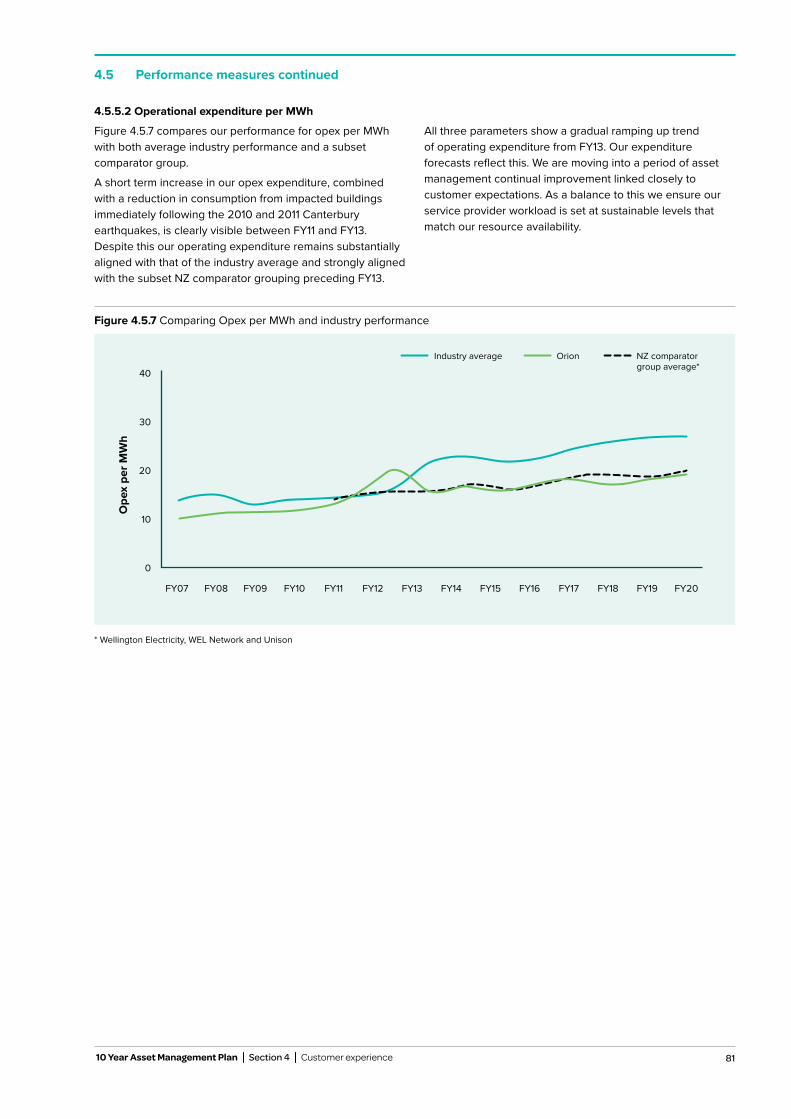
81 10 Year Asset Management Plan Section 4 Customer experience
4.5 Performance measures continued
4.5.5.2 Operational expenditure per MWh
Figure 4.5.7 compares our performance for opex per MWh with both average industry performance and a subset comparator group.
A short term increase in our opex expenditure, combined with a reduction in consumption from impacted buildings immediately following the 2010 and 2011 Canterbury earthquakes, is clearly visible between FY11 and FY13. Despite this our operating expenditure remains substantially aligned with that of the industry average and strongly aligned with the subset NZ comparator grouping preceding FY13.
All three parameters show a gradual ramping up trend of operating expenditure from FY13. Our expenditure forecasts reflect this. We are moving into a period of asset management continual improvement linked closely to customer expectations. As a balance to this we ensure our service provider workload is set at sustainable levels that match our resource availability.
Figure 4.5.7 Comparing Opex per MWh and industry performance
* Wellington Electricity, WEL Network and Unison
Industry average Orion NZ comparator group average*
0
10
20
30
40
Ope
x pe
r MW
h
FY07 FY08 FY09 FY10 FY11 FY12 FY13 FY14 FY15 FY16 FY17 FY18 FY19 FY20
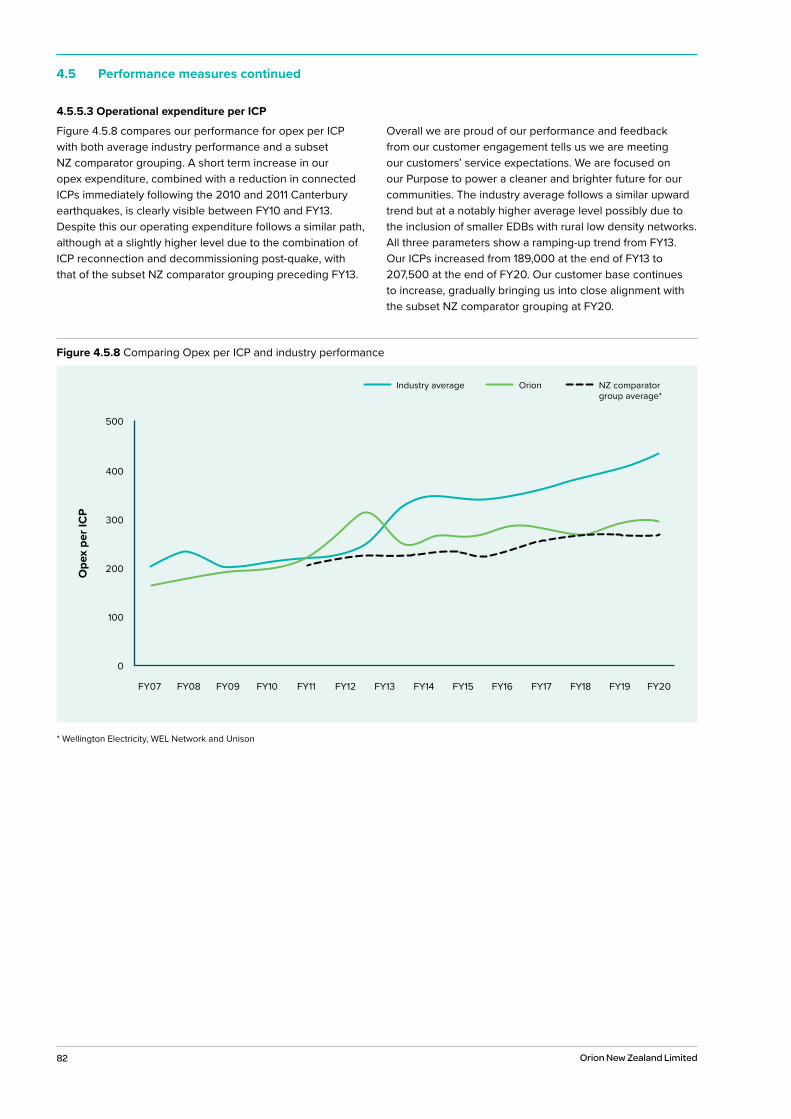
82 Orion New Zealand Limited
4.5 Performance measures continued
4.5.5.3 Operational expenditure per ICP
Figure 4.5.8 compares our performance for opex per ICP with both average industry performance and a subset NZ comparator grouping. A short term increase in our opex expenditure, combined with a reduction in connected ICPs immediately following the 2010 and 2011 Canterbury earthquakes, is clearly visible between FY10 and FY13. Despite this our operating expenditure follows a similar path, although at a slightly higher level due to the combination of ICP reconnection and decommissioning post-quake, with that of the subset NZ comparator grouping preceding FY13.
Overall we are proud of our performance and feedback from our customer engagement tells us we are meeting our customers’ service expectations. We are focused on our Purpose to power a cleaner and brighter future for our communities. The industry average follows a similar upward trend but at a notably higher average level possibly due to the inclusion of smaller EDBs with rural low density networks. All three parameters show a ramping-up trend from FY13. Our ICPs increased from 189,000 at the end of FY13 to 207,500 at the end of FY20. Our customer base continues to increase, gradually bringing us into close alignment with the subset NZ comparator grouping at FY20.
Figure 4.5.8 Comparing Opex per ICP and industry performance
* Wellington Electricity, WEL Network and Unison
Industry average Orion NZ comparator group average*
0
100
200
300
400
500
Ope
x pe
r IC
P
FY07 FY08 FY09 FY10 FY11 FY12 FY13 FY14 FY15 FY16 FY17 FY18 FY19 FY20
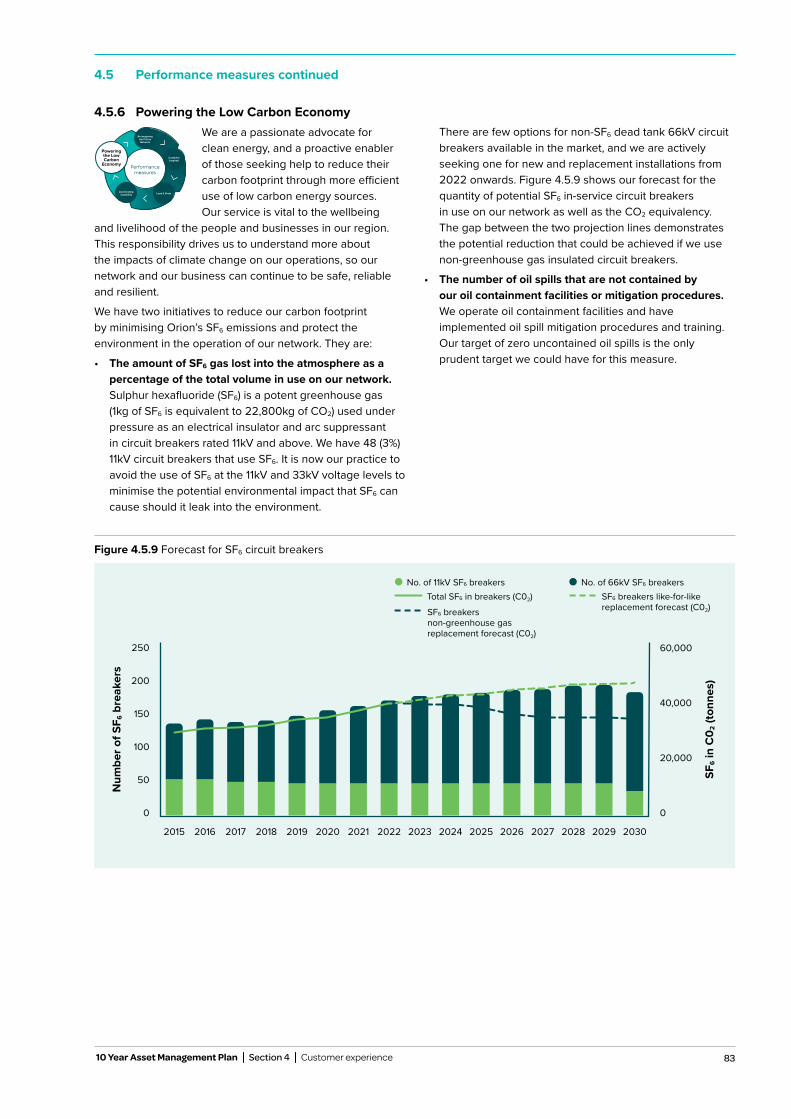
83 10 Year Asset Management Plan Section 4 Customer experience
4.5 Performance measures continued
4.5.6 Powering the Low Carbon Economy
Figure 4.5.1 Performance Measures
Performancemeasures
Re-imagining the Future Network
Powering the Low Carbon
Economy
Customer Inspired
Lead & GrowAccelerating
Capability
Performancemeasures
Performancemeasures
Re-imagining the Future Network
Re-imagining the Future Network
Powering the Low Carbon
Economy
Powering the Low Carbon
Economy
Customer Inspired
Lead & Grow
Lead & Grow
Accelerating Capability
Accelerating Capability
Customer Inspired
Performancemeasures
Re-imagining the Future Network
Powering the Low Carbon
Economy
Customer Inspired
Accelerating Capability Lead & Grow
Re-imagining the Future Network
Performance measures
Re-imagining the Future Network
Powering the Low Carbon
Economy
Customer Inspired
Accelerating Capability Lead & Grow
Powering the Low Carbon
EconomyPerformance
measures
Re-imagining the Future Network
Powering the Low Carbon
Economy
Customer Inspired
Accelerating Capability Lead & Grow
Accelerating Capability
We are a passionate advocate for clean energy, and a proactive enabler of those seeking help to reduce their carbon footprint through more efficient use of low carbon energy sources. Our service is vital to the wellbeing
and livelihood of the people and businesses in our region. This responsibility drives us to understand more about the impacts of climate change on our operations, so our network and our business can continue to be safe, reliable and resilient.
We have two initiatives to reduce our carbon footprint by minimising Orion’s SF6 emissions and protect the environment in the operation of our network. They are:
• The amount of SF6 gas lost into the atmosphere as apercentage of the total volume in use on our network.Sulphur hexafluoride (SF6) is a potent greenhouse gas(1kg of SF6 is equivalent to 22,800kg of CO2) used underpressure as an electrical insulator and arc suppressantin circuit breakers rated 11kV and above. We have 48 (3%)11kV circuit breakers that use SF6. It is now our practice toavoid the use of SF6 at the 11kV and 33kV voltage levels tominimise the potential environmental impact that SF6 cancause should it leak into the environment.
There are few options for non-SF6 dead tank 66kV circuit breakers available in the market, and we are actively seeking one for new and replacement installations from 2022 onwards. Figure 4.5.9 shows our forecast for the quantity of potential SF6 in-service circuit breakers in use on our network as well as the CO2 equivalency. The gap between the two projection lines demonstrates the potential reduction that could be achieved if we use non-greenhouse gas insulated circuit breakers.
• The number of oil spills that are not contained byour oil containment facilities or mitigation procedures.We operate oil containment facilities and haveimplemented oil spill mitigation procedures and training.Our target of zero uncontained oil spills is the onlyprudent target we could have for this measure.
Figure 4.5.9 Forecast for SF6 circuit breakers
No. of 11kV SF6 breakers No. of 66kV SF6 breakersTotal SF6 in breakers (C02) SF6 breakers like-for-like
replacement forecast (C02)SF6 breakers non-greenhouse gas replacement forecast (C02)
250
200
150
100
50
0
60,000
40,000
20,000
0
Num
ber o
f SF 6
bre
aker
s
SF6 i
n C
0 2 (t
onne
s)
2015 2016 2017 2018 2019 2020 2021 2022 2023 2024 2025 2026 2027 2028 2029 2030

84 Orion New Zealand Limited
Regarding oil spills, during FY20, we had an incident where the flooding of the Rakaia River washed away a transformer pole close to the bank. Oil was spilt as a result, and we did not meet our target of zero uncontained spills.
Performance against targets
We are committed to minimising Orion’s SF6 emissions and carefully monitor and report losses. We have a self-imposed target of less than 0.8% annual loss to the atmosphere of the insulating gas SF6, below the regulated target of 1%. In FY20 we engaged a service provider to assist us to manage and record our SF6 stocks. This has led to improved recording of our actual losses. For this reason, in FY20 we did not achieve our target loss figure as shown in Table 4.5.6.
Due to our reporting obligation to the Ministry for the Environment, our current target is measured as a percentage of SF6 loss. In the future we will set a quantity based target that will provide a clearer representation of our commitment to reduce SF6 over out network.
Table 4.5.6 Sustainability performance against target
Measure FY20 Target FY20 Performance FY21-FY25 target
SF6 gas lost < 0.8% loss 0.86% loss* < 0.8% loss
Oil spills (uncontained) 0 1 0
* Calendar year performance for 1 Jan 2019 to 31 Dec 2019
4.5 Performance measures continued
85 10 Year Asset Management Plan Section 1 Summary
5About our
network
8,000Square kilometres network coverage
50Zone substations
390Major customers with loads from 0.2MVA
90,000Orion power poles
11,700Distribution substations
11,500Kilometres of lines and cables

86 Orion New Zealand Limited
Photo: Akaroa harbour, seen from a farm above Duvauchelle Bay.
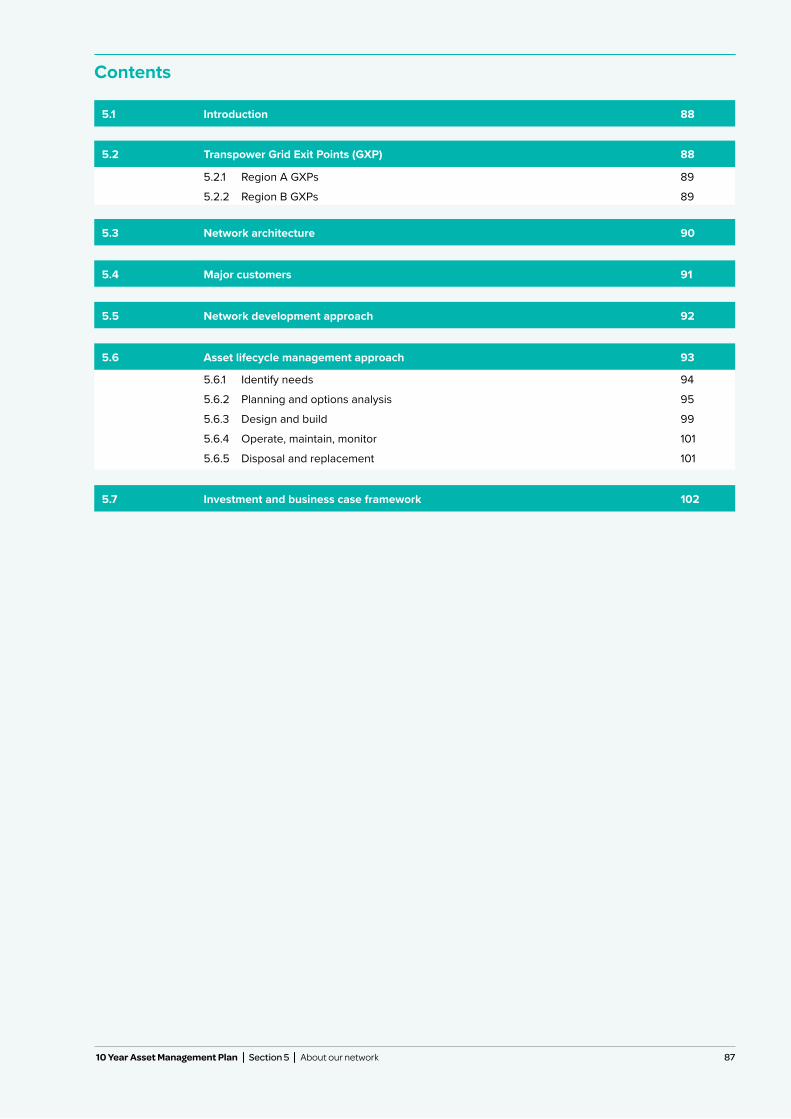
87 10 Year Asset Management Plan Section 1 Summary
5.1 Introduction 88
Contents
5.2.1 Region A GXPs 89
5.2.2 Region B GXPs 89
5.3 Network architecture 90
5.4 Major customers 91
5.5 Network development approach 92
5.2 Transpower Grid Exit Points (GXP) 88
5.6.1 Identify needs 94
5.6.2 Planning and options analysis 95
5.6.3 Design and build 99
5.6.4 Operate, maintain, monitor 101
5.6.5 Disposal and replacement 101
5.6 Asset lifecycle management approach 93
10 Year Asset Management Plan Section 5 About our network 87
5.7 Investment and business case framework 102
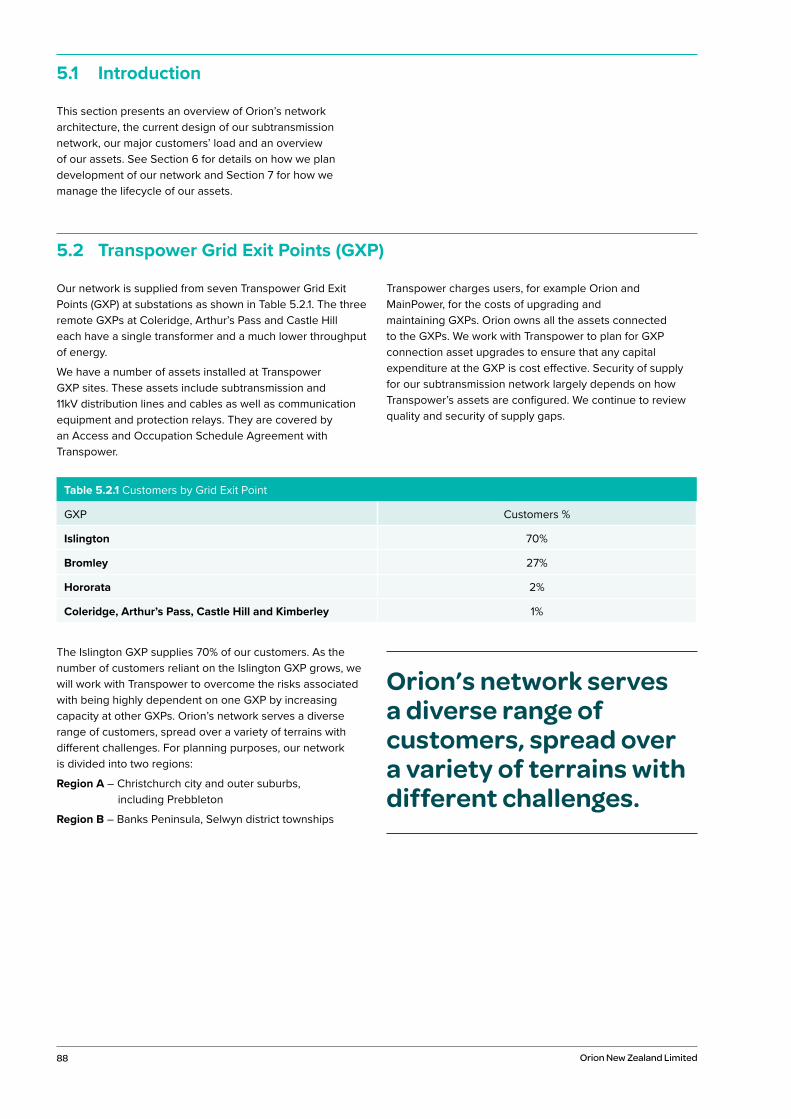
88 Orion New Zealand Limited
This section presents an overview of Orion’s network architecture, the current design of our subtransmission network, our major customers’ load and an overview of our assets. See Section 6 for details on how we plan development of our network and Section 7 for how we manage the lifecycle of our assets.
Our network is supplied from seven Transpower Grid Exit Points (GXP) at substations as shown in Table 5.2.1. The three remote GXPs at Coleridge, Arthur’s Pass and Castle Hill each have a single transformer and a much lower throughput of energy.
We have a number of assets installed at Transpower GXP sites. These assets include subtransmission and 11kV distribution lines and cables as well as communication equipment and protection relays. They are covered by an Access and Occupation Schedule Agreement with Transpower.
Transpower charges users, for example Orion and MainPower, for the costs of upgrading and maintaining GXPs. Orion owns all the assets connected to the GXPs. We work with Transpower to plan for GXP connection asset upgrades to ensure that any capital expenditure at the GXP is cost effective. Security of supply for our subtransmission network largely depends on how Transpower’s assets are configured. We continue to review quality and security of supply gaps.
The Islington GXP supplies 70% of our customers. As the number of customers reliant on the Islington GXP grows, we will work with Transpower to overcome the risks associated with being highly dependent on one GXP by increasing capacity at other GXPs. Orion’s network serves a diverse range of customers, spread over a variety of terrains with different challenges. For planning purposes, our network is divided into two regions:
Region A – Christchurch city and outer suburbs, including Prebbleton
Region B – Banks Peninsula, Selwyn district townships
5.1 Introduction
Orion’s network serves a diverse range of customers, spread over a variety of terrains with different challenges.
Table 5.2.1 Customers by Grid Exit Point
GXP Customers %
Islington 70%
Bromley 27%
Hororata 2%
Coleridge, Arthur’s Pass, Castle Hill and Kimberley 1%
5.2 Transpower Grid Exit Points (GXP)
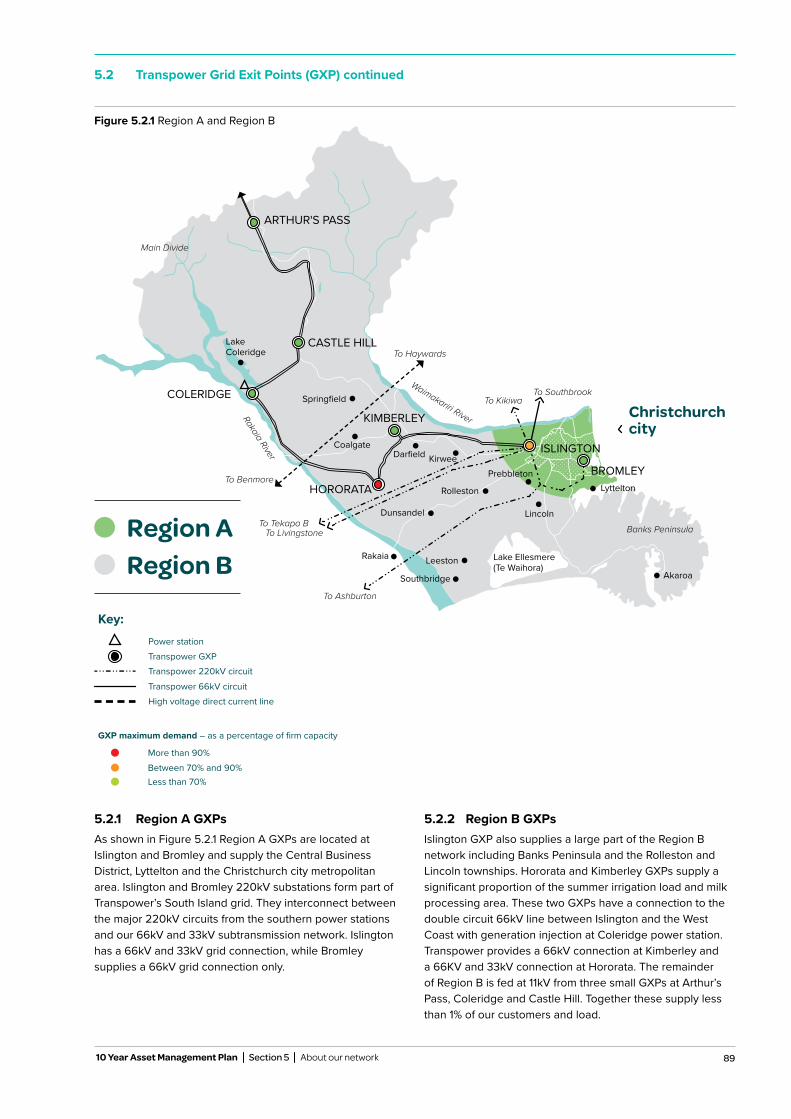
89
5.2.1 Region A GXPsAs shown in Figure 5.2.1 Region A GXPs are located at Islington and Bromley and supply the Central Business District, Lyttelton and the Christchurch city metropolitan area. Islington and Bromley 220kV substations form part of Transpower’s South Island grid. They interconnect between the major 220kV circuits from the southern power stations and our 66kV and 33kV subtransmission network. Islington has a 66kV and 33kV grid connection, while Bromley supplies a 66kV grid connection only.
5.2.2 Region B GXPsIslington GXP also supplies a large part of the Region B network including Banks Peninsula and the Rolleston and Lincoln townships. Hororata and Kimberley GXPs supply a significant proportion of the summer irrigation load and milk processing area. These two GXPs have a connection to the double circuit 66kV line between Islington and the West Coast with generation injection at Coleridge power station. Transpower provides a 66kV connection at Kimberley and a 66KV and 33kV connection at Hororata. The remainder of Region B is fed at 11kV from three small GXPs at Arthur’s Pass, Coleridge and Castle Hill. Together these supply less than 1% of our customers and load.
5.2 Transpower Grid Exit Points (GXP) continued
Figure 5.2.1 Region A and Region B
Region ARegion B
Power station
Transpower 220kV circuit
More than 90%
Transpower 66kV circuitHigh voltage direct current line
Between 70% and 90%Less than 70%
Transpower GXP
GXP maximum demand – as a percentage of firm capacity
Key:
Banks Peninsula
Rolleston
Prebbleton
Coalgate
Springfield
Darfield Kirwee
Leeston
Lincoln
Rakaia
Southbridge
Dunsandel
Lake Coleridge
Main Divide
Waimakariri River
ARTHUR'S PASS
CASTLE HILL
COLERIDGE
ISLINGTON
To Benmore
To Southbrook
To Haywards
To Ashburton
To Kikiwa
Lake Ellesmere (Te Waihora)
HORORATA
KIMBERLEYRakaia River
Akaroa
Lyttelton
BROMLEY
To Tekapo BTo Livingstone
Christchurch city
10 Year Asset Management Plan Section 5 About our network
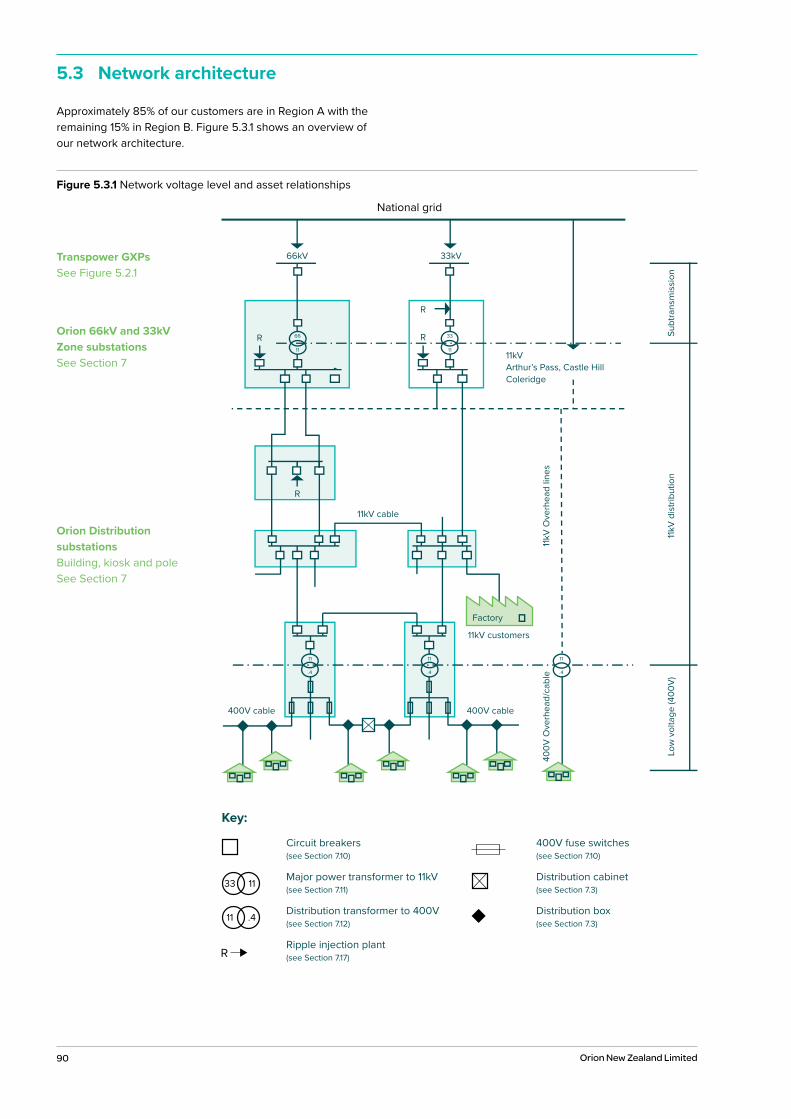
90 Orion New Zealand Limited
5.3 Network architecture
Figure 5.3.1 Network voltage level and asset relationships
Approximately 85% of our customers are in Region A with the remaining 15% in Region B. Figure 5.3.1 shows an overview of our network architecture.
Circuit breakers (see Section 7.10)
Major power transformer to 11kV (see Section 7.11)
Distribution transformer to 400V (see Section 7.12)
Ripple injection plant (see Section 7.17)
400V fuse switches (see Section 7.10)
Distribution cabinet (see Section 7.3)
Distribution box (see Section 7.3)
Key:
Transpower GXPs See Figure 5.2.1
Orion 66kV and 33kV Zone substations See Section 7
Orion Distribution substations Building, kiosk and pole See Section 7
66kV 33kV
11kV cable
11kV customers
400V cable 400V cable
11kV
Ove
rhea
d lin
es40
0V O
verh
ead/
cabl
e
R
3366
1111
11 11
.4 .4
11
.4
R
R
Subt
rans
mis
sion
11kV
dis
tribu
tion
Low
vol
tage
(400
V)
11kV Arthur’s Pass, Castle Hill Coleridge
Factory
National grid
R
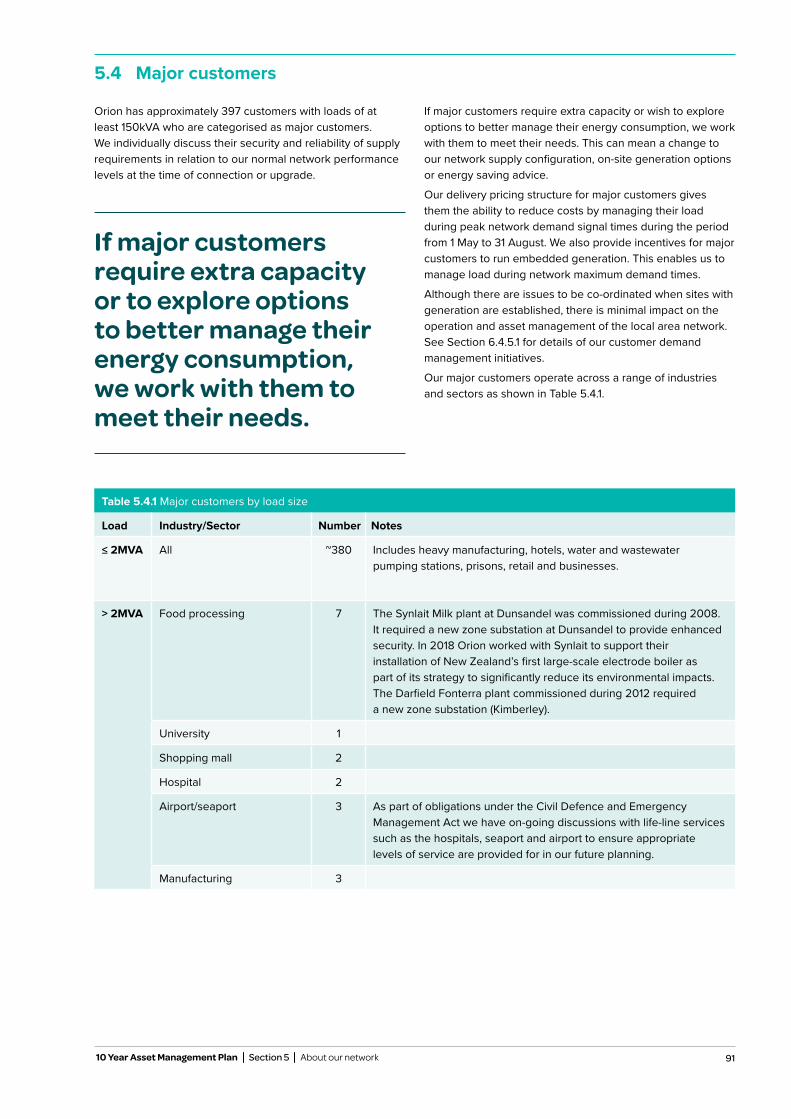
91 10 Year Asset Management Plan Section 5 About our network
Table 5.4.1 Major customers by load size
Load Industry/Sector Number Notes
≤ 2MVA All ~380 Includes heavy manufacturing, hotels, water and wastewater pumping stations, prisons, retail and businesses.
> 2MVA Food processing 7 The Synlait Milk plant at Dunsandel was commissioned during 2008. It required a new zone substation at Dunsandel to provide enhanced security. In 2018 Orion worked with Synlait to support their installation of New Zealand’s first large-scale electrode boiler as part of its strategy to significantly reduce its environmental impacts. The Darfield Fonterra plant commissioned during 2012 required a new zone substation (Kimberley).
University 1
Shopping mall 2
Hospital 2
Airport/seaport 3 As part of obligations under the Civil Defence and Emergency Management Act we have on-going discussions with life-line services such as the hospitals, seaport and airport to ensure appropriate levels of service are provided for in our future planning.
Manufacturing 3
Orion has approximately 397 customers with loads of at least 150kVA who are categorised as major customers. We individually discuss their security and reliability of supply requirements in relation to our normal network performance levels at the time of connection or upgrade.
If major customers require extra capacity or wish to explore options to better manage their energy consumption, we work with them to meet their needs. This can mean a change to our network supply configuration, on-site generation options or energy saving advice.
Our delivery pricing structure for major customers gives them the ability to reduce costs by managing their load during peak network demand signal times during the period from 1 May to 31 August. We also provide incentives for major customers to run embedded generation. This enables us to manage load during network maximum demand times.
Although there are issues to be co-ordinated when sites with generation are established, there is minimal impact on the operation and asset management of the local area network. See Section 6.4.5.1 for details of our customer demand management initiatives.
Our major customers operate across a range of industries and sectors as shown in Table 5.4.1.
5.4 Major customers
If major customers require extra capacity or to explore options to better manage their energy consumption, we work with them to meet their needs.
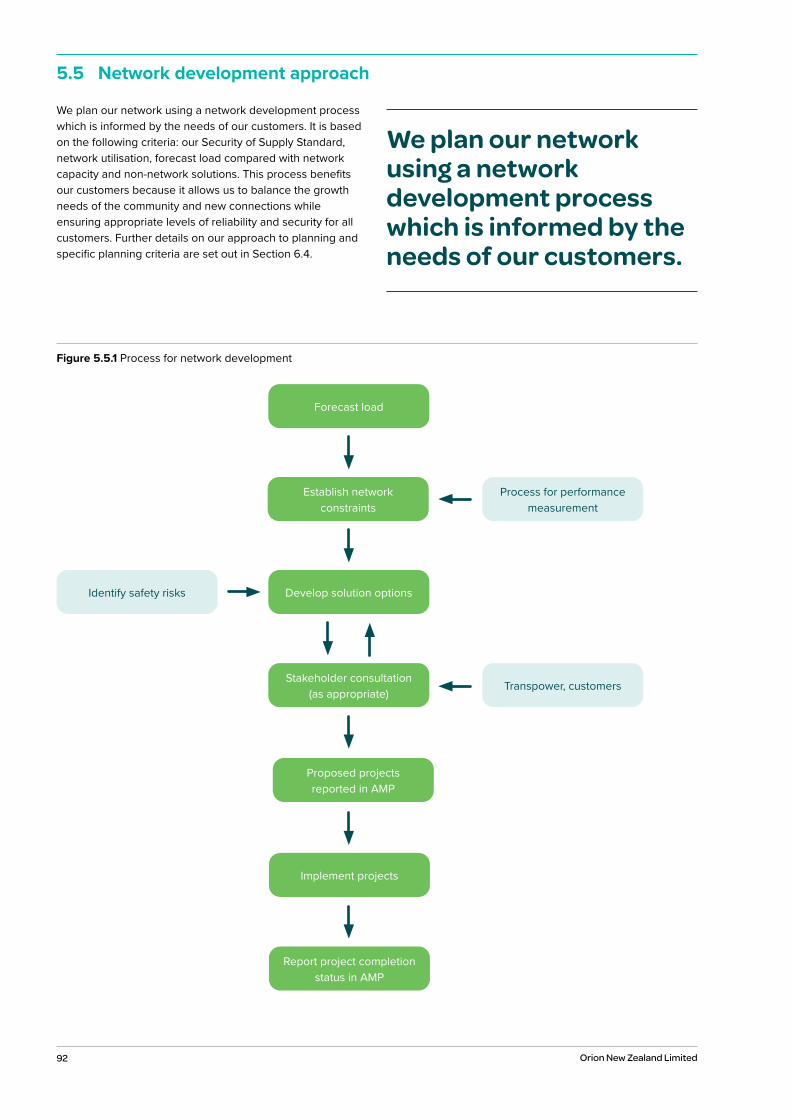
92 Orion New Zealand Limited
We plan our network using a network development process which is informed by the needs of our customers. It is based on the following criteria: our Security of Supply Standard, network utilisation, forecast load compared with network capacity and non-network solutions. This process benefits our customers because it allows us to balance the growth needs of the community and new connections while ensuring appropriate levels of reliability and security for all customers. Further details on our approach to planning and specific planning criteria are set out in Section 6.4.
5.5 Network development approach
Figure 5.5.1 Process for network development
Report project completion status in AMP
Process for performance measurement
Forecast load
Proposed projects reported in AMP
Establish network constraints
Implement projects
Develop solution options
Stakeholder consultation (as appropriate)
Identify safety risks
Transpower, customers
We plan our network using a network development process which is informed by the needs of our customers.
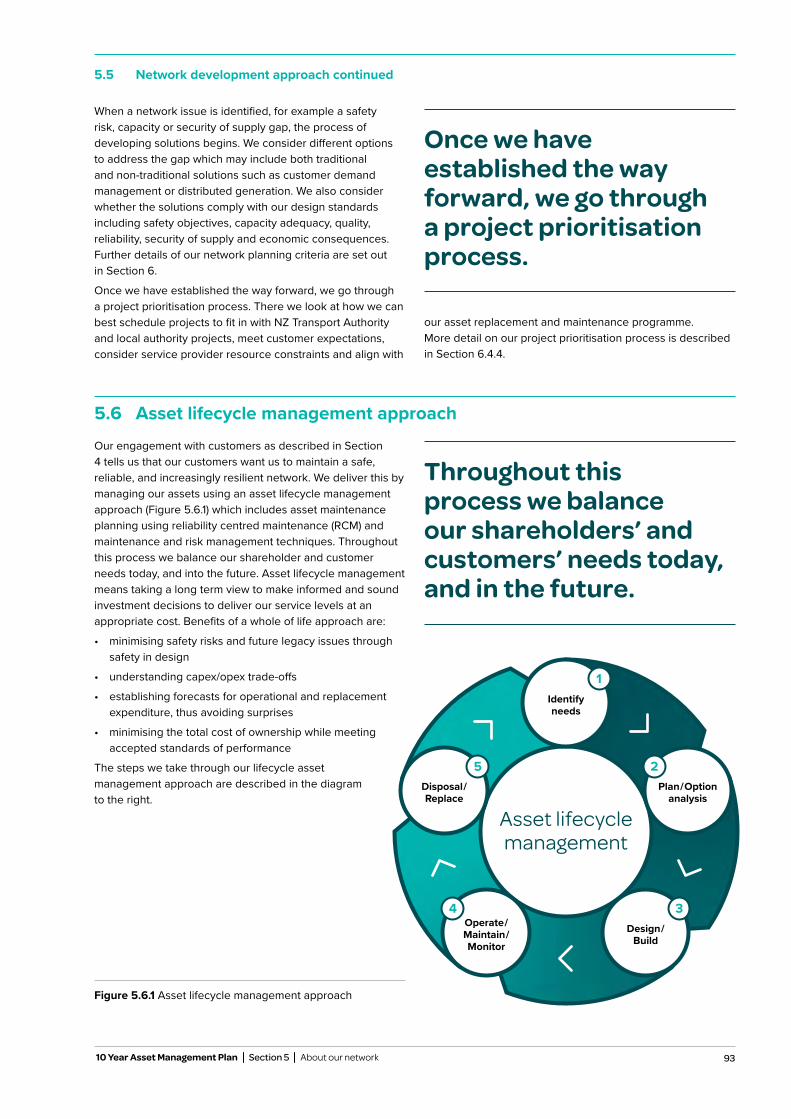
93 10 Year Asset Management Plan Section 5 About our network
When a network issue is identified, for example a safety risk, capacity or security of supply gap, the process of developing solutions begins. We consider different options to address the gap which may include both traditional and non-traditional solutions such as customer demand management or distributed generation. We also consider whether the solutions comply with our design standards including safety objectives, capacity adequacy, quality, reliability, security of supply and economic consequences. Further details of our network planning criteria are set out in Section 6.
Once we have established the way forward, we go through a project prioritisation process. There we look at how we can best schedule projects to fit in with NZ Transport Authority and local authority projects, meet customer expectations, consider service provider resource constraints and align with
our asset replacement and maintenance programme. More detail on our project prioritisation process is described in Section 6.4.4.
Once we have established the way forward, we go through a project prioritisation process.
Our engagement with customers as described in Section 4 tells us that our customers want us to maintain a safe, reliable, and increasingly resilient network. We deliver this by managing our assets using an asset lifecycle management approach (Figure 5.6.1) which includes asset maintenance planning using reliability centred maintenance (RCM) and maintenance and risk management techniques. Throughout this process we balance our shareholder and customer needs today, and into the future. Asset lifecycle management means taking a long term view to make informed and sound investment decisions to deliver our service levels at an appropriate cost. Benefits of a whole of life approach are:
• minimising safety risks and future legacy issues through safety in design
• understanding capex/opex trade-offs
• establishing forecasts for operational and replacement expenditure, thus avoiding surprises
• minimising the total cost of ownership while meeting accepted standards of performance
The steps we take through our lifecycle asset management approach are described in the diagram to the right.
5.6 Asset lifecycle management approach
5.5 Network development approach continued
Throughout this process we balance our shareholders’ and customers’ needs today, and in the future.
Asset lifecycle management
1Identify needs
Disposal/ Replace
Plan/Option analysis
Design/ Build
Operate/ Maintain/ Monitor
2
34
5
Figure 5.6.1 Asset lifecycle management approach

94 Orion New Zealand Limited
5.6.1 Identify needsThe first step in the asset lifecycle management process is to identify needs. This is based around two main areas – setting service levels and measuring service levels.
5.6.1.1 Setting service levels
Service level requirements are largely informed through customer consultation, health and safety considerations and regulatory requirements. Further details on how our service levels are set and the levels we are currently working to are detailed in Section 4.
5.6.1.2 Measuring service levels
In this step, we review how we measure service levels for SF6 and SAIDI and SAIFI.
A small amount of our circuit breakers use SF6, a greenhouse gas, as the interruption medium. We measure the loss of SF6 to the atmosphere on an annual basis. Our SF6 loss measurement is based on the quantity of top up gas that is added to the breakers or discharged from storage. Top up gas bottles are weighed pre and post top up. All gas movements are recorded and sent to us for logging.
We are obligated to report and surrender a payment based on the unit of emission. For service level performance against targets, see Section 4.5.
We collect network performance data on duration and frequency of all network outages (SAIDI and SAIFI) logged in our control centre. The data collection process has been automated with the introduction of our network management system that utilises Supervisory Control and Data Acquisition (SCADA) information and a real-time network model.
This process is independently audited on an annual basis. SAIDI and SAIFI figures are monitored and reported on a monthly basis to allow appropriate management of the network.
A more detailed internal review of network reliability is undertaken on an annual basis. This review is documented and includes root-cause analysis of asset downtime and failure modes. This includes analysis of asset failure trends. Our assessment of service level performance is used to inform our standards and asset management policies, our network development, replace, maintain and disposal plans, and asset inspection regime. Figure 5.6.2 gives an overview of our process for performance measurement.
5.6 Asset lifecycle management approach continued
Asset lifecycle management
1
2
34
5
Figure 5.6.2 Process for performance measurement
Establish/review measures and targets
Implement monitoring/measurement techniques
Analyse failure modesAnalyse maintenance/ inspection reports
Collect fault data
Process for network development
Review standards/asset management policies
Review performance
Asset inspections and maintenance
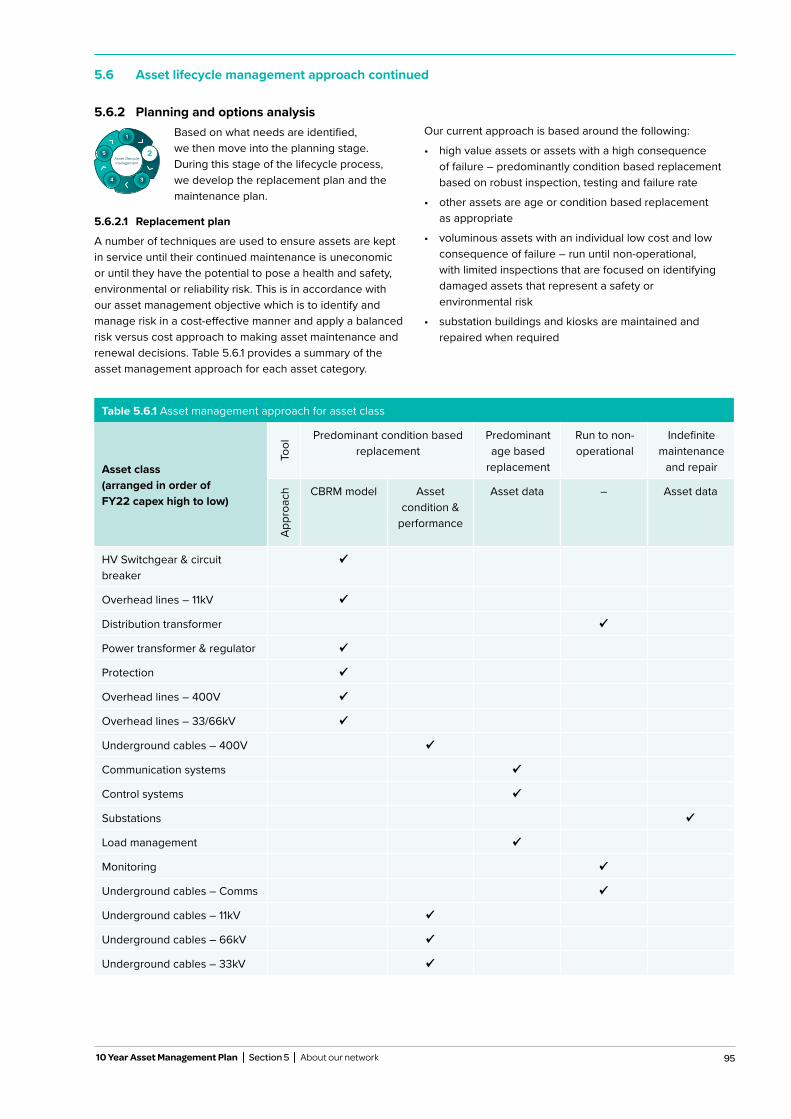
95 10 Year Asset Management Plan Section 5 About our network
5.6.2 Planning and options analysisBased on what needs are identified, we then move into the planning stage. During this stage of the lifecycle process, we develop the replacement plan and the maintenance plan.
5.6.2.1 Replacement plan
A number of techniques are used to ensure assets are kept in service until their continued maintenance is uneconomic or until they have the potential to pose a health and safety, environmental or reliability risk. This is in accordance with our asset management objective which is to identify and manage risk in a cost-effective manner and apply a balanced risk versus cost approach to making asset maintenance and renewal decisions. Table 5.6.1 provides a summary of the asset management approach for each asset category.
Our current approach is based around the following:
• high value assets or assets with a high consequence of failure – predominantly condition based replacement based on robust inspection, testing and failure rate
• other assets are age or condition based replacement as appropriate
• voluminous assets with an individual low cost and low consequence of failure – run until non-operational, with limited inspections that are focused on identifying damaged assets that represent a safety or environmental risk
• substation buildings and kiosks are maintained and repaired when required
Table 5.6.1 Asset management approach for asset class
Asset class (arranged in order of FY22 capex high to low)
Tool
Predominant condition based replacement
Predominant age based
replacement
Run to non-operational
Indefinite maintenance
and repair
Appr
oach CBRM model Asset
condition & performance
Asset data – Asset data
HV Switchgear & circuit breaker
Overhead lines – 11kV
Distribution transformer
Power transformer & regulator
Protection
Overhead lines – 400V
Overhead lines – 33/66kV
Underground cables – 400V
Communication systems
Control systems
Substations
Load management
Monitoring
Underground cables – Comms
Underground cables – 11kV
Underground cables – 66kV
Underground cables – 33kV
5.6 Asset lifecycle management approach continued
Asset lifecycle management
1
2
34
5
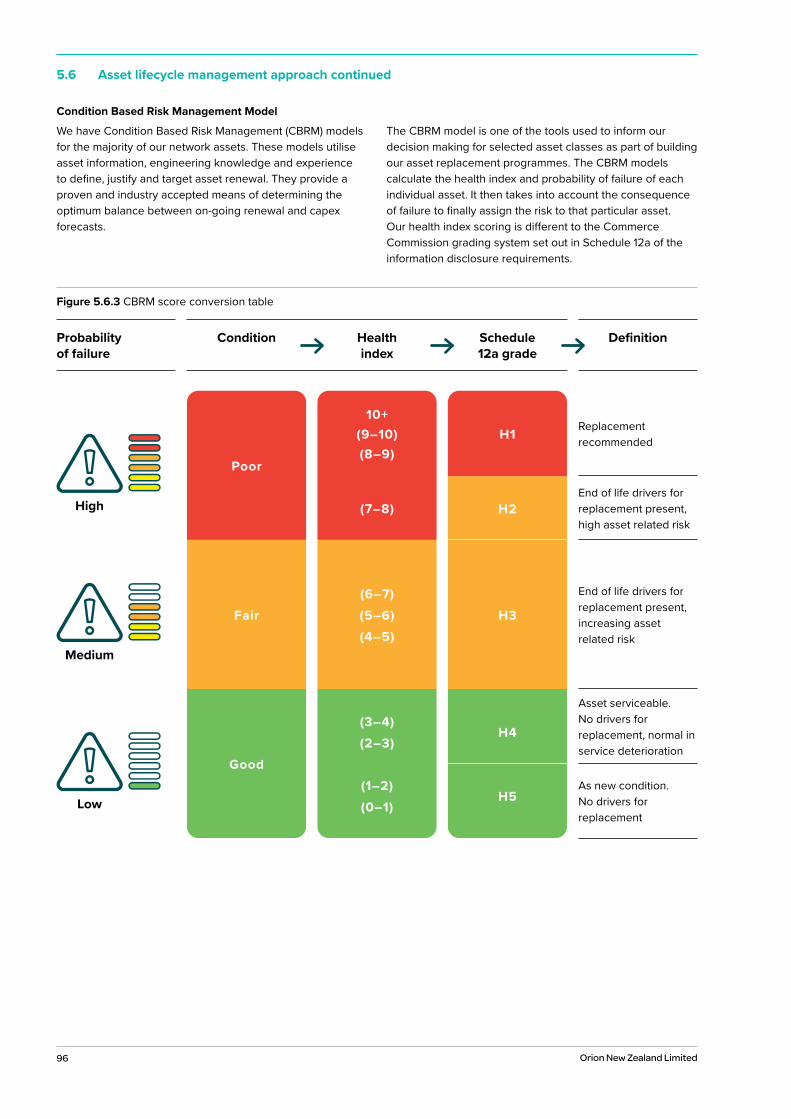
96 Orion New Zealand Limited
5.6 Asset lifecycle management approach continued
Condition Based Risk Management Model
We have Condition Based Risk Management (CBRM) models for the majority of our network assets. These models utilise asset information, engineering knowledge and experience to define, justify and target asset renewal. They provide a proven and industry accepted means of determining the optimum balance between on-going renewal and capex forecasts.
The CBRM model is one of the tools used to inform our decision making for selected asset classes as part of building our asset replacement programmes. The CBRM models calculate the health index and probability of failure of each individual asset. It then takes into account the consequence of failure to finally assign the risk to that particular asset. Our health index scoring is different to the Commerce Commission grading system set out in Schedule 12a of the information disclosure requirements.
Figure 5.6.3 CBRM score conversion table
Condition Health index
Schedule 12a grade
Probability of failure
Definition
Medium
Low
High H2
H3(6–7)(5–6)(4–5)
10+(9–10)(8–9)
(7–8)
Poor
H1 Replacement recommended
End of life drivers for replacement present, high asset related risk
End of life drivers for replacement present, increasing asset related risk
Asset serviceable. No drivers for replacement, normal in service deterioration
As new condition. No drivers for replacement
Fair
Good
(3–4)(2–3)
(1–2)(0–1)
H4
H5
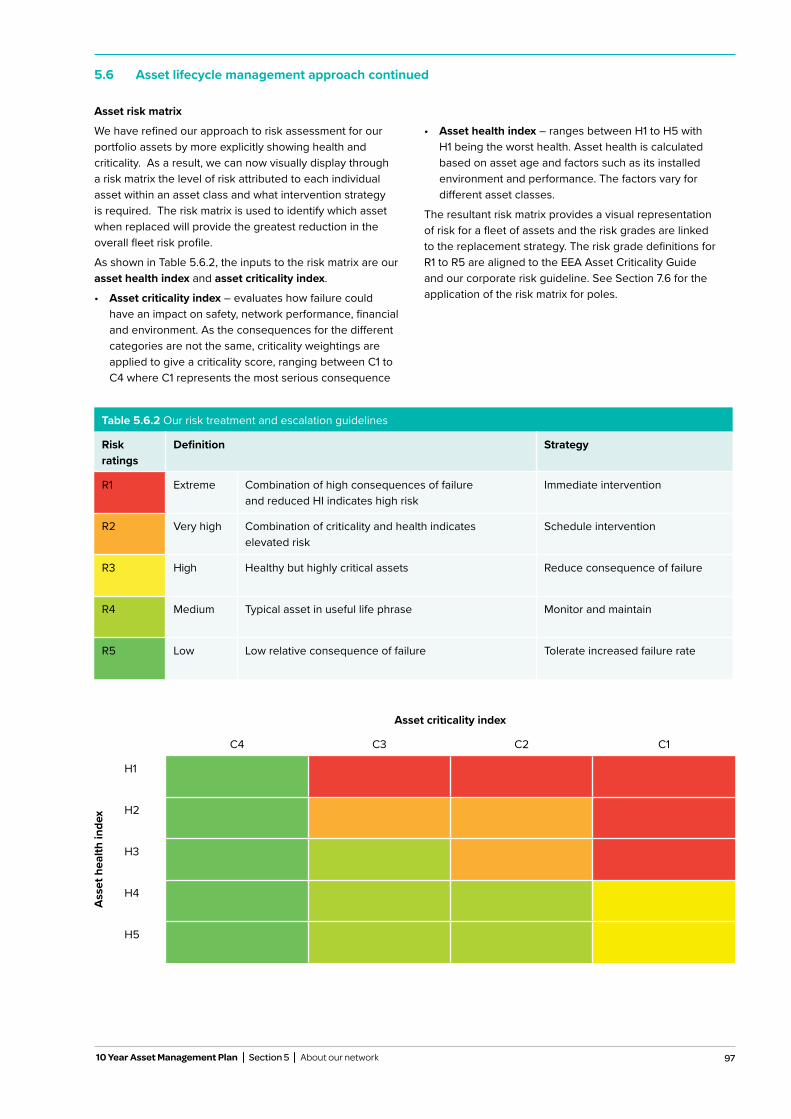
97
Table 5.6.2 Our risk treatment and escalation guidelines
Risk ratings
Definition Strategy
R1 Extreme Combination of high consequences of failure and reduced HI indicates high risk
Immediate intervention
R2 Very high Combination of criticality and health indicates elevated risk
Schedule intervention
R3 High Healthy but highly critical assets Reduce consequence of failure
R4 Medium Typical asset in useful life phrase Monitor and maintain
R5 Low Low relative consequence of failure Tolerate increased failure rate
Asset criticality index
C4 C3 C2 C1
Ass
et h
ealth
inde
x
H1
H2
H3
H4
H5
5.6 Asset lifecycle management approach continued
Asset risk matrix
We have refined our approach to risk assessment for our portfolio assets by more explicitly showing health and criticality. As a result, we can now visually display through a risk matrix the level of risk attributed to each individual asset within an asset class and what intervention strategy is required. The risk matrix is used to identify which asset when replaced will provide the greatest reduction in the overall fleet risk profile.
As shown in Table 5.6.2, the inputs to the risk matrix are our asset health index and asset criticality index.
• Asset criticality index – evaluates how failure could have an impact on safety, network performance, financial and environment. As the consequences for the different categories are not the same, criticality weightings are applied to give a criticality score, ranging between C1 to C4 where C1 represents the most serious consequence
• Asset health index – ranges between H1 to H5 with H1 being the worst health. Asset health is calculated based on asset age and factors such as its installed environment and performance. The factors vary for different asset classes.
The resultant risk matrix provides a visual representation of risk for a fleet of assets and the risk grades are linked to the replacement strategy. The risk grade definitions for R1 to R5 are aligned to the EEA Asset Criticality Guide and our corporate risk guideline. See Section 7.6 for the application of the risk matrix for poles.
10 Year Asset Management Plan Section 5 About our network
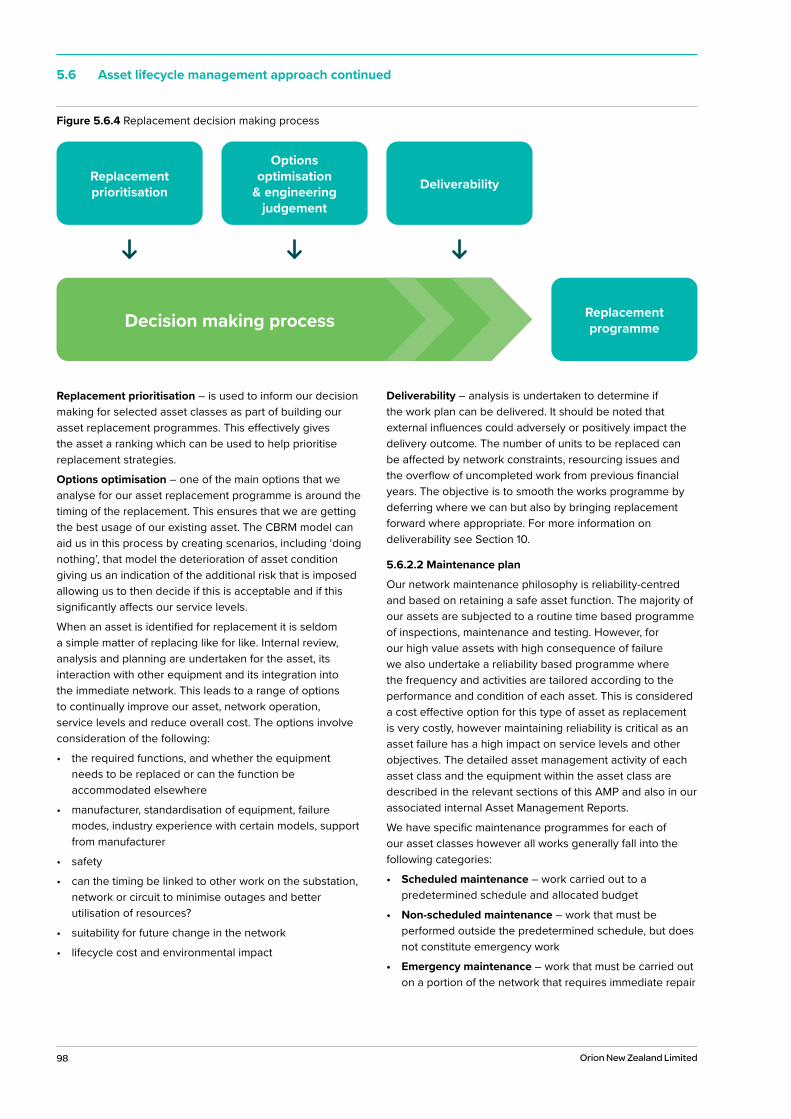
98 Orion New Zealand Limited
5.6 Asset lifecycle management approach continued
Replacement prioritisation – is used to inform our decision making for selected asset classes as part of building our asset replacement programmes. This effectively gives the asset a ranking which can be used to help prioritise replacement strategies.
Options optimisation – one of the main options that we analyse for our asset replacement programme is around the timing of the replacement. This ensures that we are getting the best usage of our existing asset. The CBRM model can aid us in this process by creating scenarios, including ‘doing nothing’, that model the deterioration of asset condition giving us an indication of the additional risk that is imposed allowing us to then decide if this is acceptable and if this significantly affects our service levels.
When an asset is identified for replacement it is seldom a simple matter of replacing like for like. Internal review, analysis and planning are undertaken for the asset, its interaction with other equipment and its integration into the immediate network. This leads to a range of options to continually improve our asset, network operation, service levels and reduce overall cost. The options involve consideration of the following:
• the required functions, and whether the equipmentneeds to be replaced or can the function beaccommodated elsewhere
• manufacturer, standardisation of equipment, failuremodes, industry experience with certain models, supportfrom manufacturer
• safety
• can the timing be linked to other work on the substation,network or circuit to minimise outages and betterutilisation of resources?
• suitability for future change in the network
• lifecycle cost and environmental impact
Deliverability – analysis is undertaken to determine if the work plan can be delivered. It should be noted that external influences could adversely or positively impact the delivery outcome. The number of units to be replaced can be affected by network constraints, resourcing issues and the overflow of uncompleted work from previous financial years. The objective is to smooth the works programme by deferring where we can but also by bringing replacement forward where appropriate. For more information on deliverability see Section 10.
5.6.2.2 Maintenance plan
Our network maintenance philosophy is reliability-centred and based on retaining a safe asset function. The majority of our assets are subjected to a routine time based programme of inspections, maintenance and testing. However, for our high value assets with high consequence of failure we also undertake a reliability based programme where the frequency and activities are tailored according to the performance and condition of each asset. This is considered a cost effective option for this type of asset as replacement is very costly, however maintaining reliability is critical as an asset failure has a high impact on service levels and other objectives. The detailed asset management activity of each asset class and the equipment within the asset class are described in the relevant sections of this AMP and also in our associated internal Asset Management Reports.
We have specific maintenance programmes for each of our asset classes however all works generally fall into the following categories:
• Scheduled maintenance – work carried out to apredetermined schedule and allocated budget
• Non-scheduled maintenance – work that must beperformed outside the predetermined schedule, but doesnot constitute emergency work
• Emergency maintenance – work that must be carried outon a portion of the network that requires immediate repair
Figure 5.6.4 Replacement decision making process
Replacement prioritisation
Options optimisation
& engineering judgement
Deliverability
Replacement programmeDecision making process
99
5.6 Asset lifecycle management approach continued
10 Year Asset Management Plan Section 5 About our network
5.6.3 Design and buildWe use service providers for the design and build of projects identified in the AMP. Through this process, we use a number of key standards and specifications that are set out below.
5.6.3.1 Safety in Design
We have developed a Safety in Design process that can be applied at any stage of asset lifecycle and can also be applied to non-network assets such as vehicles, tools and innovation. The Safety in Design standard is used by us and approved service providers to identify hazards that could exist throughout the complete lifecycle of assets from concept to disposal via construction, operation and maintenance. The standard includes a hazard identification and risk assessment process which, when applied by designers and other key participants such as those who construct and operate the assets, proposes elimination and control measures for each identified hazard to a level so far as is reasonably practicable. The Safety in Design process aligns with industry best practice and ensures designers carry out their duties in line with the Health and Safety at Work Act 2015.
This innovation delivers on two areas of focus in our asset management strategy:
• continually improving to provide a safe, reliable, resilient system
• maintaining our health and safety focus
Customers benefit as a result of the equipment we install being designed in a way that protects public safety, minimises customer outages and enhances system resilience in adverse events.
5.6.3.2 Design standards
To manage the health and safety, cost, efficiency and quality aspects of our network we standardise network design and work practices where possible. To achieve this standardisation we have developed design standards and drawings that are available to approved service providers. Normally we only accept designs that conform to these standards, however this does not limit innovation. Design proposals that differ from the standard are considered if they offer significant economic, environmental and operational advantages. Design standards are listed in Appendix D against the asset group they relate to.
5.6.3.3 Technical specifications
Technical specifications are intended for authorised service providers working on the construction and maintenance of our network and refer to the relevant codes of practice and industry standards as appropriate. Specifications are listed in Appendix D against the asset group they relate to.
5.6.3.4 Equipment specifications
We also seek to standardise equipment used to construct components of our network. To this end we have developed specifications that detail accepted performance criteria for significant equipment in our network. New equipment must conform to these specifications. However, without limiting innovation, equipment that differs from specification is considered if it offers significant economic, environmental and operational advantages.
New equipment types are reviewed to carefully establish any benefits they may provide. Introduction is carried out to a plan to ensure that the equipment meets our technical requirements and provides cost benefits. It must be able to be maintained and operated to provide safe, cost effective utilisation to support our supply security requirements.
To manage the health and safety, cost, efficiency and quality aspects of our network we standardise network design and work practices where possible.
Asset lifecycle management
1
2
34
5
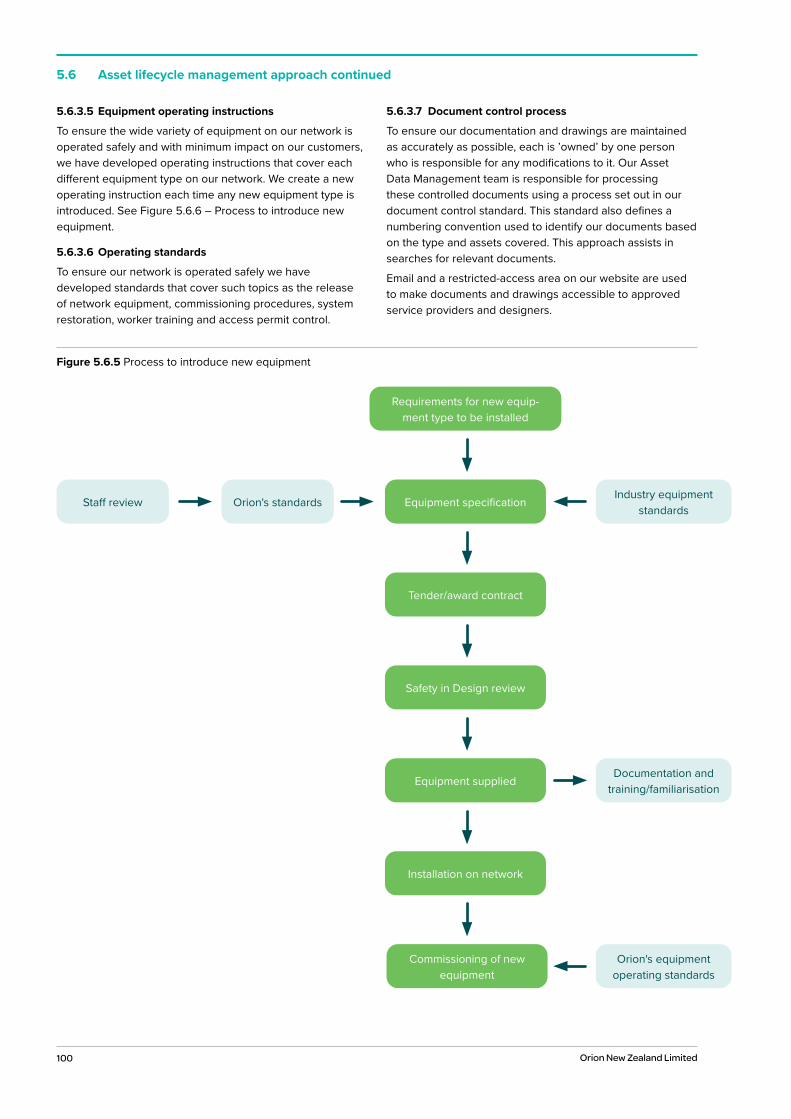
100 Orion New Zealand Limited
5.6.3.5 Equipment operating instructions
To ensure the wide variety of equipment on our network is operated safely and with minimum impact on our customers, we have developed operating instructions that cover each different equipment type on our network. We create a new operating instruction each time any new equipment type is introduced. See Figure 5.6.6 – Process to introduce new equipment.
5.6.3.6 Operating standards
To ensure our network is operated safely we have developed standards that cover such topics as the release of network equipment, commissioning procedures, system restoration, worker training and access permit control.
5.6.3.7 Document control process
To ensure our documentation and drawings are maintained as accurately as possible, each is ’owned’ by one person who is responsible for any modifications to it. Our Asset Data Management team is responsible for processing these controlled documents using a process set out in our document control standard. This standard also defines a numbering convention used to identify our documents based on the type and assets covered. This approach assists in searches for relevant documents.
Email and a restricted-access area on our website are used to make documents and drawings accessible to approved service providers and designers.
5.6 Asset lifecycle management approach continued
Figure 5.6.5 Process to introduce new equipment
Commissioning of new equipment
Industry equipment standards
Requirements for new equip-ment type to be installed
Equipment supplied
Equipment specification
Installation on network
Tender/award contract
Safety in Design review
Orion's standards
Documentation and training/familiarisation
Staff review
Orion's equipment operating standards
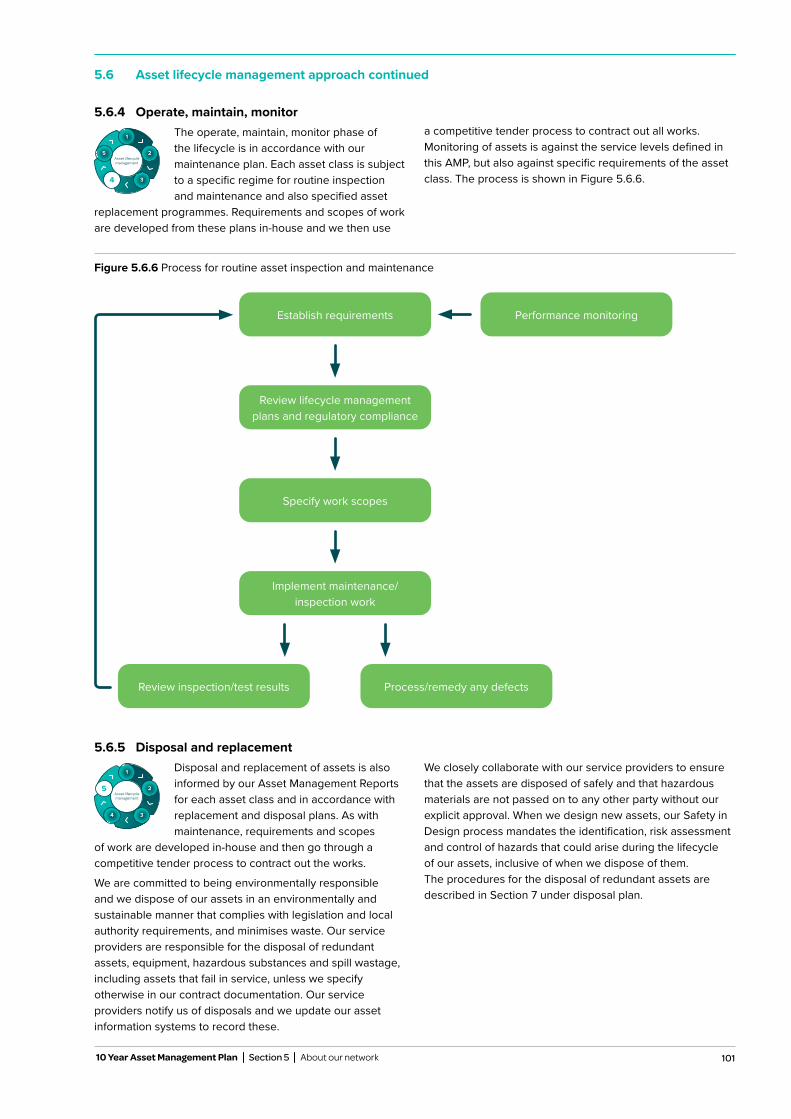
101
5.6 Asset lifecycle management approach continued
10 Year Asset Management Plan Section 5 About our network
Figure 5.6.6 Process for routine asset inspection and maintenance
5.6.5 Disposal and replacementDisposal and replacement of assets is also informed by our Asset Management Reports for each asset class and in accordance with replacement and disposal plans. As with maintenance, requirements and scopes
of work are developed in-house and then go through a competitive tender process to contract out the works.
We are committed to being environmentally responsible and we dispose of our assets in an environmentally and sustainable manner that complies with legislation and local authority requirements, and minimises waste. Our service providers are responsible for the disposal of redundant assets, equipment, hazardous substances and spill wastage, including assets that fail in service, unless we specify otherwise in our contract documentation. Our service providers notify us of disposals and we update our asset information systems to record these.
We closely collaborate with our service providers to ensure that the assets are disposed of safely and that hazardous materials are not passed on to any other party without our explicit approval. When we design new assets, our Safety in Design process mandates the identification, risk assessment and control of hazards that could arise during the lifecycle of our assets, inclusive of when we dispose of them. The procedures for the disposal of redundant assets are described in Section 7 under disposal plan.
Asset lifecycle management
1
2
34
5
Establish requirements
Review lifecycle management plans and regulatory compliance
Specify work scopes
Implement maintenance/ inspection work
Process/remedy any defectsReview inspection/test results
Performance monitoring
5.6.4 Operate, maintain, monitorThe operate, maintain, monitor phase of the lifecycle is in accordance with our maintenance plan. Each asset class is subject to a specific regime for routine inspection and maintenance and also specified asset
replacement programmes. Requirements and scopes of work are developed from these plans in-house and we then use
a competitive tender process to contract out all works. Monitoring of assets is against the service levels defined in this AMP, but also against specific requirements of the asset class. The process is shown in Figure 5.6.6.
Asset lifecycle management
1
2
34
5
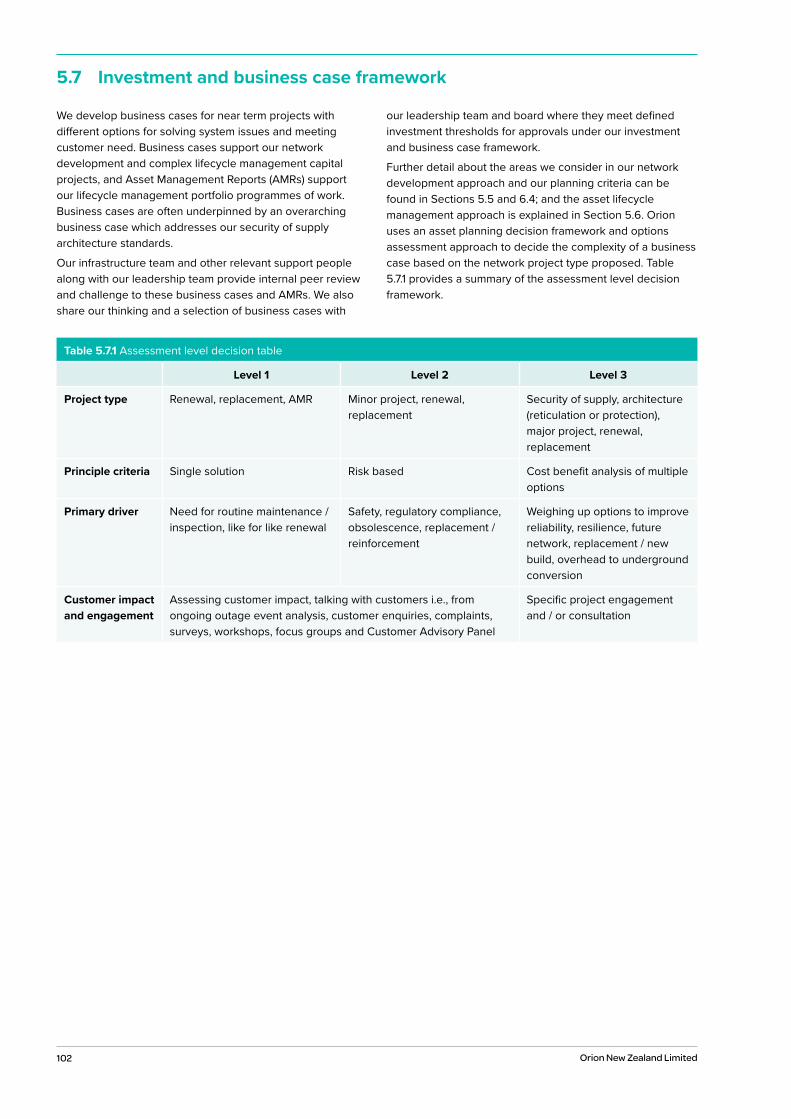
102 Orion New Zealand Limited
We develop business cases for near term projects with different options for solving system issues and meeting customer need. Business cases support our network development and complex lifecycle management capital projects, and Asset Management Reports (AMRs) support our lifecycle management portfolio programmes of work. Business cases are often underpinned by an overarching business case which addresses our security of supply architecture standards.
Our infrastructure team and other relevant support people along with our leadership team provide internal peer review and challenge to these business cases and AMRs. We also share our thinking and a selection of business cases with
our leadership team and board where they meet defined investment thresholds for approvals under our investment and business case framework.
Further detail about the areas we consider in our network development approach and our planning criteria can be found in Sections 5.5 and 6.4; and the asset lifecycle management approach is explained in Section 5.6. Orion uses an asset planning decision framework and options assessment approach to decide the complexity of a business case based on the network project type proposed. Table 5.7.1 provides a summary of the assessment level decision framework.
5.7 Investment and business case framework
Table 5.7.1 Assessment level decision table
Level 1 Level 2 Level 3
Project type Renewal, replacement, AMR Minor project, renewal, replacement
Security of supply, architecture (reticulation or protection), major project, renewal, replacement
Principle criteria Single solution Risk based Cost benefit analysis of multiple options
Primary driver Need for routine maintenance / inspection, like for like renewal
Safety, regulatory compliance, obsolescence, replacement / reinforcement
Weighing up options to improve reliability, resilience, future network, replacement / new build, overhead to underground conversion
Customer impact and engagement
Assessing customer impact, talking with customers i.e., from ongoing outage event analysis, customer enquiries, complaints, surveys, workshops, focus groups and Customer Advisory Panel
Specific project engagement and / or consultation

103 10 Year Asset Management Plan Section 5 About our network
6Planning
our network

104 Orion New Zealand Limited
Photo: View to Christchurch city at dusk, taken from Sumner.
105 10 Year Asset Management Plan Section 1 Summary
6.1 Introduction 106
6.2 Evolving our network 107
6.3 Preparing for growth 111
Contents
6.4 Planning criteria 124
6.2.1 Developing our LV capability 107
6.2.2 Improving our systems 110
6.4.1 HV security of supply standard 124
6.4.2 Network utilisation thresholds 126
6.4.3 Capacity determination for new projects 126
6.4.4 Project prioritisation 127
6.4.5 Non-network solutions 128
6.6 Network development proposals 132
6.5 Network gap analysis 130
6.7 Value of Distributed Energy Resource Management alternatives 150
6.6.1 HV programmes of work and other projects 132
6.6.2 LV projects 149
6.3.1 How we forecast demand growth 111
6.3.2 Our network’s energy throughput 117
6.3.3 Territorial authority growth 117
6.3.4 Present loading 119
6.3.5 Load forecast 121
105 10 Year Asset Management Plan Section 6 Planning our network
106 Orion New Zealand Limited
In this section we set out how we plan our network to prepare for the future. We discuss the changing demands on our infrastructure as we respond to the growing needs of our region, and the challenges and opportunities posed by an era of rapid technology change in our industry.
Towards the end of this section we detail the proposed projects our planning process has identified are needed to maintain and increase the safety, reliability, resilience and sustainability of our network over the coming ten years.
Our capital expenditure keeps pace with the growing demand on our network. This growth is both in terms of the number of customers we serve, and energy demand.
We continue to experience steady growth in the number of residential customers moving into new housing developments in the Selwyn District and Halswell area. For example, at present the population of Rolleston sits at around 17,000 and is predicted to jump to more than 27,000 within a decade. Growth in industrial parks also continues as businesses take advantage of new energy efficient premises with easy access to road and rail.
To support this growth, we have planned significant projects. Some examples of these are:
• a new Region B GXP at Norwood to support growth in Selwyn District and western Christchurch
• a new Region B zone substation near Rolleston to support load growth in Rolleston and shift load from Islington GXP to Norwood GXP
• an upgrade of the Halswell zone substation capacity to support residential load growth in the southwest of Christchurch
At Orion, we are committed to powering a cleaner and brighter future for our communities. Key to this is ensuring our customers can take advantage of new low-carbon technologies and providing them greater freedom to manage their energy use to achieve their decarbonisation goals.
We will continue to lead and encourage our customers to adopt low-carbon technology, particularly for process-heating and transportation, where the biggest emission-reduction gains can be made. We aim to provide a safe, reliable open-access network where customers can connect any compliant load, storage or generating device and use our network as a platform for services to other connected customers.
In addition to this, we are seeing increased interest in new types of Distributed Energy Resources (DER) such as solar panels, wind-turbines, battery storage and electric vehicles. DERs are technologies that can generate or store energy at a customer level. They challenge the traditional approach to network operation and planning which assumes larger centralised power supplies which feed one-way to our customers. In contrast, DERs can change power flows from single to multi-directional which places additional demands on our low voltage networks which were not originally designed for this type of operation.
To meet these challenges, we are implementing initiatives that increase our knowledge of the network and systems that can fully utilise the data sources at our disposal to optimise the planning and operation of our network. Thus, enabling us to distribute clean, reliable and affordable power for the benefit of our customers and our region through our open-access network.
6.1 Introduction
At Orion, we are committed to powering a cleaner and brighter future for our communities.
107
The existing electricity business model is largely uni-directional. Large generators sell their production in the wholesale market, and the electricity is then distributed to end user customers, via the transmission network and lines companies such as Orion. This traditional one-way model is undergoing change for several reasons. These include:
• Distributed Energy Resources (DER) – the capacity for customers to generate and store their own energy from sources including solar and wind will see electricity fed into grids locally, from households and businesses
• advanced digital technology – will enable greater information access and management options at household and business levels
• new consumption patterns – adoption of EVs, other low carbon initiatives and other new technologies will create new challenges due to their increased demand for energy with less predictable behaviour
With these developments, and others that will emerge, our customers may increasingly wish to:
• sell surplus power to the grid
• store own-produced electricity for their future consumption and cost savings
• sell power on a peer-to-peer (P2P) basis to others
• develop virtual storage in neighbourhood networks
• charge their electric vehicles, and other flexible usage devices, at times when electricity pricing is lowest
• ramp back power usage at times when New Zealand’s generation is operating from non-renewable sources
Customers will have many choices for investment and how to make the best use of the options open to them. We will continue to develop our understanding of what our customers want from us and how this translates to services they need. Regardless of the direction our customers and the market take, we will invest in new systems and technologies to deliver future customer benefits over our AMP planning period.
6.2.1 Developing our LV capabilityHistorically, LV networks were planned for reasonably stable passive household loads with one-way power flow. However, more customers are adopting technologies such as EVs which can place significant additional demand on a street’s LV system. Given Orion’s LV networks supply most of our residential customers, developing the visibility and capability of these networks is becoming increasingly important to efficiently manage our networks and facilitate customer choice.
We have four LV initiatives currently ongoing:
• LV feeder monitoring
• Smart meter information gathering
• LV network reinforcement, when identified as necessary
• LV research
These initiatives will develop our LV networks and help us to:
• provide information to guide our operational, planning and investment activities
• develop improved forecasting and modelling techniques for the future
• facilitate customer choice by better enabling customers to charge batteries during off-peak times and potentially export power into our network at peak times – thereby lowering their net cost of electricity
• improve customer service through real-time identification and location of faults
• identify poor performing feeders and quality of service to individual customers, which will then allow us to target actions to improve customer experience
• reduce capital and operational costs by early warning of power quality problems, such as phase imbalance
• enhance safety as real- or near-time monitoring provides measurements which will better inform us of what is live, de-energised, and outside of regulatory limits
6.2 Evolving our network
We will continue to develop our understanding of what our customers want from us and how this translates to services they need.
10 Year Asset Management Plan Section 6 Planning our network
108 Orion New Zealand Limited
6.2 Evolving our network continued
6.2.1.1 LV feeder monitoring
In FY20, we began a 10-year programme to install monitoring at around 35% of our distribution transformers. Sites were prioritised based on a wide range of criteria such as those with high customer numbers, long overhead feeders and solar connections, as well as those which fell under our existing renewal programmes. Analysing the data from these monitors will enable us to develop a better understanding of LV demand as new technologies and customer behaviours become more prevalent. In the long-term, we aim to use this data to monitor trends and demand profiles at the LV level to inform our investment decisions.
In FY20, we completed 100 LV monitor installations and our LV monitoring program will continue to ramp up gradually over the 10-year AMP period. This rate of installation may vary depending on changing customer requirements, internal system capability and speed of adoption of new technologies.
In collaboration with the Electric Power Engineering Centre (EPECentre) at the University of Canterbury, we commissioned a high-level analysis to identify potential LV issues down at the distribution substation level. See Section 6.2.1.4. Our site selection for future LV monitoring installations will be informed by the outcomes of this research and our existing renewal programmes.
As more information is gathered and analysed, we will gain a fuller understanding of the community’s adoption of new technologies and their impact on customer energy use. For example, in the UK, clustering of solar PV connections has been observed where 70% of solar penetration at household level occurs on just 30% of UK streets. This clustering effect is one of the reasons we need to increase our visibility and understanding of our low voltage network.
We can also leverage our LV monitoring programme to gain greater visibility of our HV network by using the live LV monitor data in conjunction with the state-estimation capabilities of our Advanced Distribution Management System (ADMS).
6.2.1.2 Smart meter information gathering
While the LV feeder monitoring programme will provide us with excellent information on our network’s performance at the start of a feeder, information from further downstream is required to fully assess the performance of our LV network.
The quality of electricity supply varies depending on where a home is located along the length of a feeder – for example the last few houses on a line may be more susceptible to voltage performance issues.
To monitor performance of this aspect of our service, we’ll require information from one of two sources:
• LV monitors installed further down the feeder on our sideof the customer’s point of supply, for example on the lastpower pole or in the distribution box, or
• existing smart meters installed on the meter board at thecustomer’s home
Our preference is to use smart meters already installed on homes as this is likely to be the most cost-effective and efficient option for our customers, compared to Orion installing new standalone monitors.
We are currently working with meter providers to obtain access to smart meter information and are hopeful this is achievable. An allowance for sourcing additional smart meter information has been incorporated in our operational expenditure.
6.2.1.3 LV network reinforcement
Based on LV modelling undertaken to date, we believe the majority of our low voltage network has sufficient capacity to meet demand in the short to medium term. However, as new technologies are adopted by more households and businesses, and as we receive more data on our low voltage network utilisation, it is expected reinforcement above historic levels will be required. We have revised our LV reinforcement budget to reflect this, based on results from our high-level modelling.
As more information is gathered and analysed, we will gain a fuller understanding of the community’s adoption of new technologies and their impact on customer energy use.
Based on LV modelling undertaken to date, we believe the majority of our low voltage network has sufficient capacity to meet demand in the short to medium term.
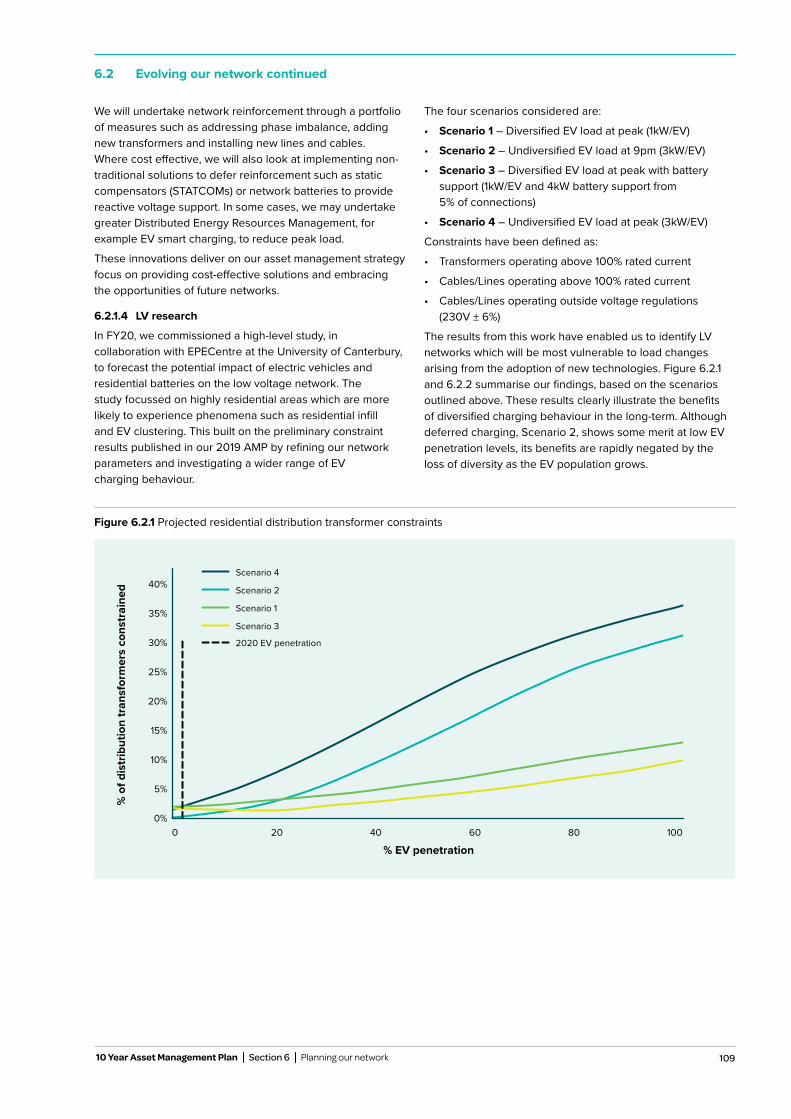
109
6.2 Evolving our network continued
We will undertake network reinforcement through a portfolio of measures such as addressing phase imbalance, adding new transformers and installing new lines and cables. Where cost effective, we will also look at implementing non-traditional solutions to defer reinforcement such as static compensators (STATCOMs) or network batteries to provide reactive voltage support. In some cases, we may undertake greater Distributed Energy Resources Management, for example EV smart charging, to reduce peak load.
These innovations deliver on our asset management strategy focus on providing cost-effective solutions and embracing the opportunities of future networks.
6.2.1.4 LV research
In FY20, we commissioned a high-level study, in collaboration with EPECentre at the University of Canterbury, to forecast the potential impact of electric vehicles and residential batteries on the low voltage network. The study focussed on highly residential areas which are more likely to experience phenomena such as residential infill and EV clustering. This built on the preliminary constraint results published in our 2019 AMP by refining our network parameters and investigating a wider range of EV charging behaviour.
The four scenarios considered are:
• Scenario 1 – Diversified EV load at peak (1kW/EV)
• Scenario 2 – Undiversified EV load at 9pm (3kW/EV)
• Scenario 3 – Diversified EV load at peak with batterysupport (1kW/EV and 4kW battery support from5% of connections)
• Scenario 4 – Undiversified EV load at peak (3kW/EV)
Constraints have been defined as:
• Transformers operating above 100% rated current
• Cables/Lines operating above 100% rated current
• Cables/Lines operating outside voltage regulations(230V ± 6%)
The results from this work have enabled us to identify LV networks which will be most vulnerable to load changes arising from the adoption of new technologies. Figure 6.2.1 and 6.2.2 summarise our findings, based on the scenarios outlined above. These results clearly illustrate the benefits of diversified charging behaviour in the long-term. Although deferred charging, Scenario 2, shows some merit at low EV penetration levels, its benefits are rapidly negated by the loss of diversity as the EV population grows.
10 Year Asset Management Plan Section 6 Planning our network
Figure 6.2.1 Projected residential distribution transformer constraints
% o
f dis
trib
utio
n tr
ansf
orm
ers
cons
trai
ned
% EV penetration
Scenario 4
Scenario 2
Scenario 1
Scenario 3
2020 EV penetration
0 20 40 60 80 100
40%
35%
30%
25%
20%
15%
10%
5%
0%
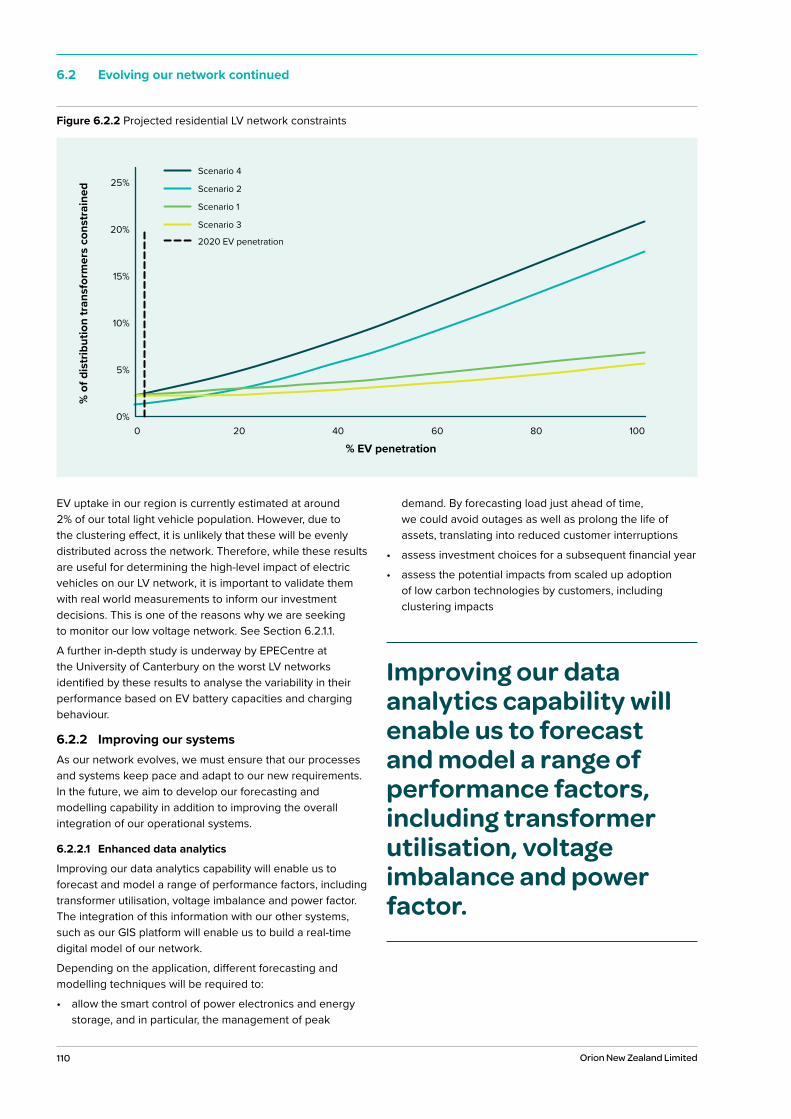
110 Orion New Zealand Limited
6.2 Evolving our network continued
EV uptake in our region is currently estimated at around 2% of our total light vehicle population. However, due to the clustering effect, it is unlikely that these will be evenly distributed across the network. Therefore, while these results are useful for determining the high-level impact of electric vehicles on our LV network, it is important to validate them with real world measurements to inform our investment decisions. This is one of the reasons why we are seeking to monitor our low voltage network. See Section 6.2.1.1.
A further in-depth study is underway by EPECentre at the University of Canterbury on the worst LV networks identified by these results to analyse the variability in their performance based on EV battery capacities and charging behaviour.
6.2.2 Improving our systemsAs our network evolves, we must ensure that our processes and systems keep pace and adapt to our new requirements. In the future, we aim to develop our forecasting and modelling capability in addition to improving the overall integration of our operational systems.
6.2.2.1 Enhanced data analytics
Improving our data analytics capability will enable us to forecast and model a range of performance factors, including transformer utilisation, voltage imbalance and power factor. The integration of this information with our other systems, such as our GIS platform will enable us to build a real-time digital model of our network.
Depending on the application, different forecasting and modelling techniques will be required to:
• allow the smart control of power electronics and energy storage, and in particular, the management of peak
demand. By forecasting load just ahead of time, we could avoid outages as well as prolong the life of assets, translating into reduced customer interruptions
• assess investment choices for a subsequent financial year
• assess the potential impacts from scaled up adoption of low carbon technologies by customers, including clustering impacts
Improving our data analytics capability will enable us to forecast and model a range of performance factors, including transformer utilisation, voltage imbalance and power factor.
Figure 6.2.2 Projected residential LV network constraints
% o
f dis
trib
utio
n tr
ansf
orm
ers
cons
trai
ned
Scenario 4
Scenario 2
Scenario 1
Scenario 3
2020 EV penetration
0 20 40 60 80 100
25%
20%
15%
10%
5%
0%
% EV penetration
111
Network development is driven by growth in peak demand, not energy. The peak demand capability of our network is defined by network component capacities. For this reason, we concentrate on forecasting peak demand across all levels of our network, rather than energy usage.
The network development projects listed in this 10-year AMP ensure we can maintain capacity, quality and security of supply to support the forecast growth rates. Actual growth rates are monitored on an annual basis and any change will be reflected in next year’s development plan.
The factors and methodologies we use to estimate the quantity and location of load growth is described in our document: Long-term load forecasting methodology for subtransmission and zone substations. In summary, our method is to forecast growth at the zone substation level and translate this up to Transpower GXPs and finally to a total network demand forecast.
Our forecasts have a range of scenarios from uptake of electric vehicles, battery storage, solar photovoltaics and customer actions.
Our GXP and zone substation forecasts take account of our electric vehicle forecast, continued improvements in energy efficiency and growth in households and business associated with population growth. We have insufficient information to include any meaningful battery storage forecasts at this level but have included a possible scenario in the overall network total.
6.3.1 How we forecast demand growthOur network feeds both high density Christchurch city loads and diverse rural loads on the Canterbury Plains and Banks Peninsula.
Growth in electricity consumption in Christchurch and on Banks Peninsula has historically matched growth in population, including the holiday population for Banks Peninsula. Electricity consumption growth on the Canterbury Plains has been driven by changes in land use rather than population growth.
10 Year Asset Management Plan Section 6 Planning our network
6.2 Evolving our network continued
An enhanced digital network model will also enable improved:
• detection of electrical safety concerns both on ournetwork and in customer premises which may beidentified from smart meter information and ourLV monitors
• power flow outputs which can allow us to identify voltagefluctuations, violation limits, fault currents etc., as a toolin the operation of our network
6.2.2.2 Integration with operational systems and business processes
We plan for our advanced distribution management system to be incrementally upgraded to support the anticipated future requirements, thereby avoiding the need to purchase and implement an entirely new management system, see Section 7.16. Our view is improvements will build on our existing load management and upper South Island coordination expertise.
It is also our desire to develop our systems to allow non-discriminatory secure data access and transfer to eligible market parties and customers. To help ensure this occurs in an efficient manner for our customers we will continue collaboration with retailers and other industry players on technology development, process and communications platforms.
Current examples of this are:
• installing low voltage monitoring systems on ourLV feeders
• discussions with smart meter providers arounddata access
Our GXP and zone substation forecasts take account of our electric vehicle forecast, continued improvements in energy efficiency and growth in households and business associated with population growth.
6.3 Preparing for growth
112 Orion New Zealand Limited
This pattern reflects that, besides weather, two factors influence load growth:
• population increases
• changes in population behaviour
At a national level, it is reasonably easy to forecast population growth. When the national forecast is broken down to a regional level, the accuracy is less reliable but still useful in predicting future demand growth. At a regional level, we derive our load forecast from a combination of bottom-up inputs, such as household growth forecasts by Christchurch City Council and Selwyn District Council using Statistics NZ 2016 projections and historical trends in growth.
6.3.1.1 Our network maximum demand
Maximum demand is the major driver of investment in our network so it’s important for us to forecast it as accurately as we can. This measure is very volatile and normally varies by up to 10% depending on winter weather. Our network maximum half hour demand, based on load through the Transpower GXPs, for FY20 was 604MW during the peak that occurred on 6 June 2019, up 24MW from the previous year.
In the medium-term maximum network demand is influenced by factors such as underlying population trends, new customers joining the network, growth in the commercial/ industrial sector, changes in rural land use, climate changes and changes in customer behaviour.
Many things influence changes in customer energy behaviour. It’s these factors that are hard to predict in an era of rapid technology change. Some of the issues we need to consider are:
• Electric vehicles – EV uptake rates are uncertain, whatproportion of EV drivers will charge at home and when,the diversity of home charging and what size chargerwill be used are all current unknowns.
• Customer actions – how customers will respond tosignals of high cost power or high CO2 generation areunknown. A focus on decarbonisation could lead toimproved house insulation, greater appliance efficiency,and customers responding to reduce peak load. We couldalso see a shift from polluting generation in industrialboilers, to renewable electricity usage.
• Solar photovoltaics – the future uptake rate, and sizeof solar installations is uncertain.
• Batteries – battery uptake rates remain uncertain, asdoes knowledge of how our customers will use batteries.Customers may discharge batteries at expensive eveningpeak times, and recharge the batteries at cheaper times,or may discharge their batteries when they get up inthe morning and through the day – meaning eveningelectricity usage may still be from the grid.
Given the range of impacts new technology brings, we can no longer rely on maximum demand forecasts based primarily on historical growth. Instead we’ve moved to scenario based maximum demand forecasting as shown in Figure 6.3.1.
All our maximum demand scenario planning assumes solar photovoltaics have no effect on the peak, which occurs on a winter evening after sunset – i.e. at a time when the sun isn’t shining.
Our total network forecast is higher than the linear history due to the forecast population increase in our region, industrial development in Rolleston, and ongoing regeneration in the central city. Winter peak demand on our network is anticipated to increase by approximately 80MW (14%) over the next 10 years. This is based on the mid scenario shown in Figure 6.3.1. Significant volatility can be expected in annual actual maximum demands, with 10% variation depending on winter weather. Capital investment plans will be modified as load growth is observed.
Our maximum demand is linked with cold weather. The extra growth in forecast maximum demand for the next few years is due to the Convention Centre, the Canterbury Multi-Use Arena and Lincoln University moving from coal to electricity for heating.
6.3 Preparing for growth
Maximum demand is the major driver of investment in our network so it’s important for us to forecast it as accurately as we can.
Given the range of impacts new technology brings, we can no longer rely on maximum demand forecasts based primarily on historical growth.
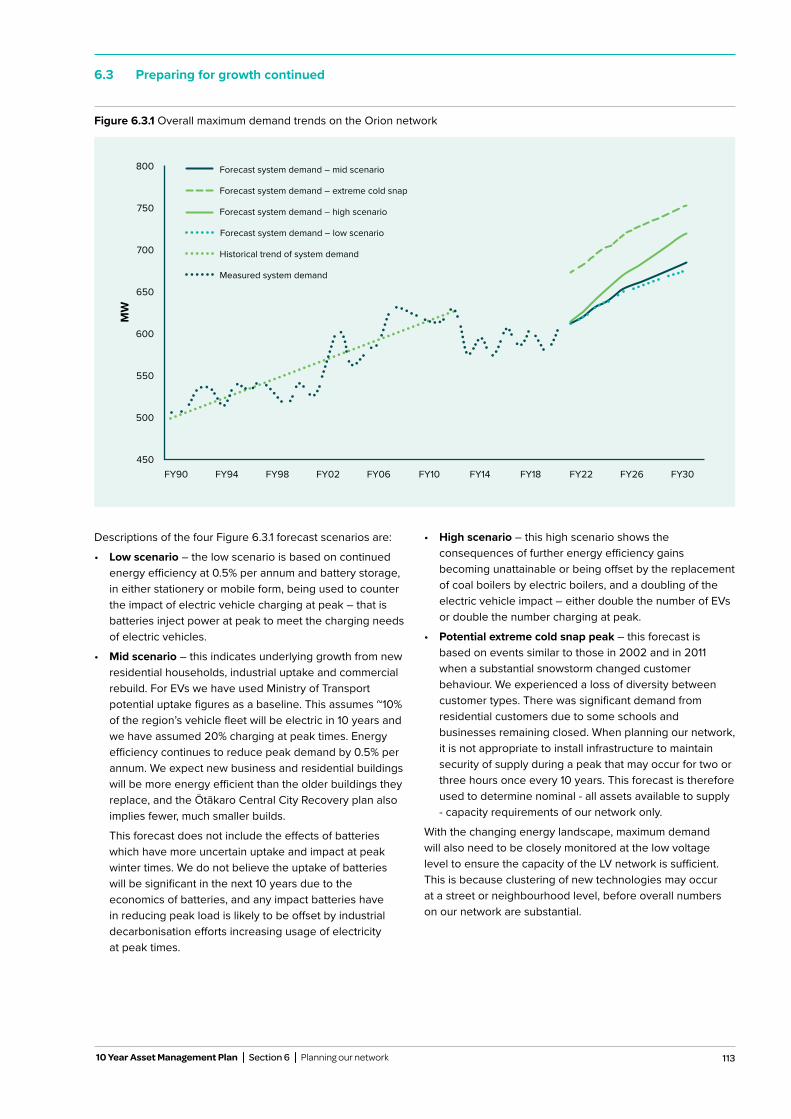
113
Descriptions of the four Figure 6.3.1 forecast scenarios are:
• Low scenario – the low scenario is based on continuedenergy efficiency at 0.5% per annum and battery storage,in either stationery or mobile form, being used to counterthe impact of electric vehicle charging at peak – that isbatteries inject power at peak to meet the charging needsof electric vehicles.
• Mid scenario – this indicates underlying growth from newresidential households, industrial uptake and commercialrebuild. For EVs we have used Ministry of Transportpotential uptake figures as a baseline. This assumes ~10%of the region’s vehicle fleet will be electric in 10 years andwe have assumed 20% charging at peak times. Energyefficiency continues to reduce peak demand by 0.5% perannum. We expect new business and residential buildingswill be more energy efficient than the older buildings theyreplace, and the Ōtākaro Central City Recovery plan alsoimplies fewer, much smaller builds.
This forecast does not include the effects of batterieswhich have more uncertain uptake and impact at peakwinter times. We do not believe the uptake of batterieswill be significant in the next 10 years due to theeconomics of batteries, and any impact batteries havein reducing peak load is likely to be offset by industrialdecarbonisation efforts increasing usage of electricityat peak times.
• High scenario – this high scenario shows theconsequences of further energy efficiency gainsbecoming unattainable or being offset by the replacementof coal boilers by electric boilers, and a doubling of theelectric vehicle impact – either double the number of EVsor double the number charging at peak.
• Potential extreme cold snap peak – this forecast isbased on events similar to those in 2002 and in 2011when a substantial snowstorm changed customerbehaviour. We experienced a loss of diversity betweencustomer types. There was significant demand fromresidential customers due to some schools andbusinesses remaining closed. When planning our network,it is not appropriate to install infrastructure to maintainsecurity of supply during a peak that may occur for two orthree hours once every 10 years. This forecast is thereforeused to determine nominal - all assets available to supply- capacity requirements of our network only.
With the changing energy landscape, maximum demand will also need to be closely monitored at the low voltage level to ensure the capacity of the LV network is sufficient. This is because clustering of new technologies may occur at a street or neighbourhood level, before overall numbers on our network are substantial.
6.3 Preparing for growth continued
Figure 6.3.1 Overall maximum demand trends on the Orion network
450
550
700
650
600
750
800
FY90 FY94 FY98 FY02 FY06 FY10 FY14 FY18 FY22 FY26 FY30
500
Forecast system demand – mid scenario
Forecast system demand – extreme cold snap
Forecast system demand – high scenario
Forecast system demand – low scenario
Historical trend of system demand
Measured system demand
MW
10 Year Asset Management Plan Section 6 Planning our network
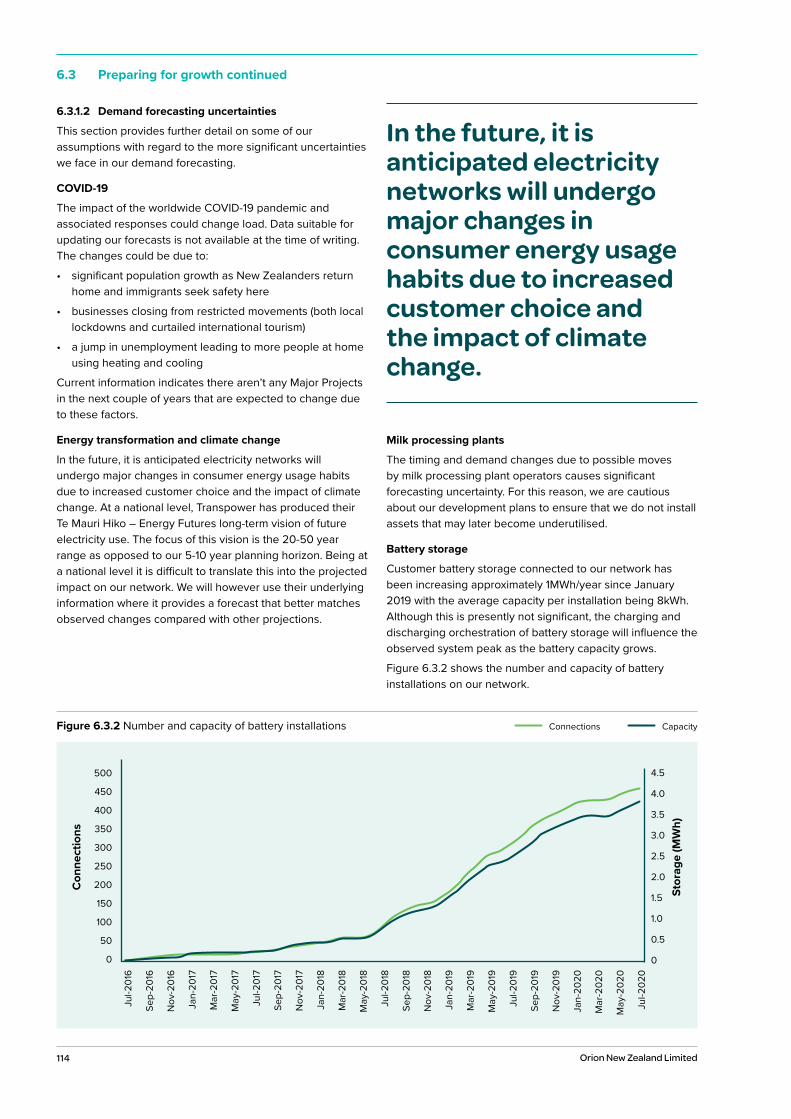
114 Orion New Zealand Limited
6.3 Preparing for growth continued
6.3.1.2 Demand forecasting uncertainties
This section provides further detail on some of our assumptions with regard to the more significant uncertainties we face in our demand forecasting.
COVID-19
The impact of the worldwide COVID-19 pandemic and associated responses could change load. Data suitable for updating our forecasts is not available at the time of writing. The changes could be due to:
• significant population growth as New Zealanders return home and immigrants seek safety here
• businesses closing from restricted movements (both local lockdowns and curtailed international tourism)
• a jump in unemployment leading to more people at home using heating and cooling
Current information indicates there aren’t any Major Projects in the next couple of years that are expected to change due to these factors.
Energy transformation and climate change
In the future, it is anticipated electricity networks will undergo major changes in consumer energy usage habits due to increased customer choice and the impact of climate change. At a national level, Transpower has produced their Te Mauri Hiko – Energy Futures long-term vision of future electricity use. The focus of this vision is the 20-50 year range as opposed to our 5-10 year planning horizon. Being at a national level it is difficult to translate this into the projected impact on our network. We will however use their underlying information where it provides a forecast that better matches observed changes compared with other projections.
Milk processing plants
The timing and demand changes due to possible moves by milk processing plant operators causes significant forecasting uncertainty. For this reason, we are cautious about our development plans to ensure that we do not install assets that may later become underutilised.
Battery storage
Customer battery storage connected to our network has been increasing approximately 1MWh/year since January 2019 with the average capacity per installation being 8kWh. Although this is presently not significant, the charging and discharging orchestration of battery storage will influence the observed system peak as the battery capacity grows.
Figure 6.3.2 shows the number and capacity of battery installations on our network.
In the future, it is anticipated electricity networks will undergo major changes in consumer energy usage habits due to increased customer choice and the impact of climate change.
Figure 6.3.2 Number and capacity of battery installations Connections Capacity
500
450
400
350
300
250
200
150
100
50
0
Jul-2
016
Sep-
2016
Nov
-201
6
Jan-
2017
Mar
-201
7
May
-201
7
Jul-2
017
Sep-
2017
Nov
-201
7
Jan-
2018
Mar
-201
8
May
-201
8
Jul-2
018
Sep-
2018
Nov
-201
8
Jan-
2019
Mar
-201
9
May
-201
9
Jul-2
019
Sep-
2019
Nov
-201
9
Jan-
2020
Mar
-202
0
May
-202
0
Jul-2
020
4.5
4.0
3.5
3.0
2.5
2.0
1.5
1.0
0.5
0
Stor
age
(MW
h)
Con
nect
ions
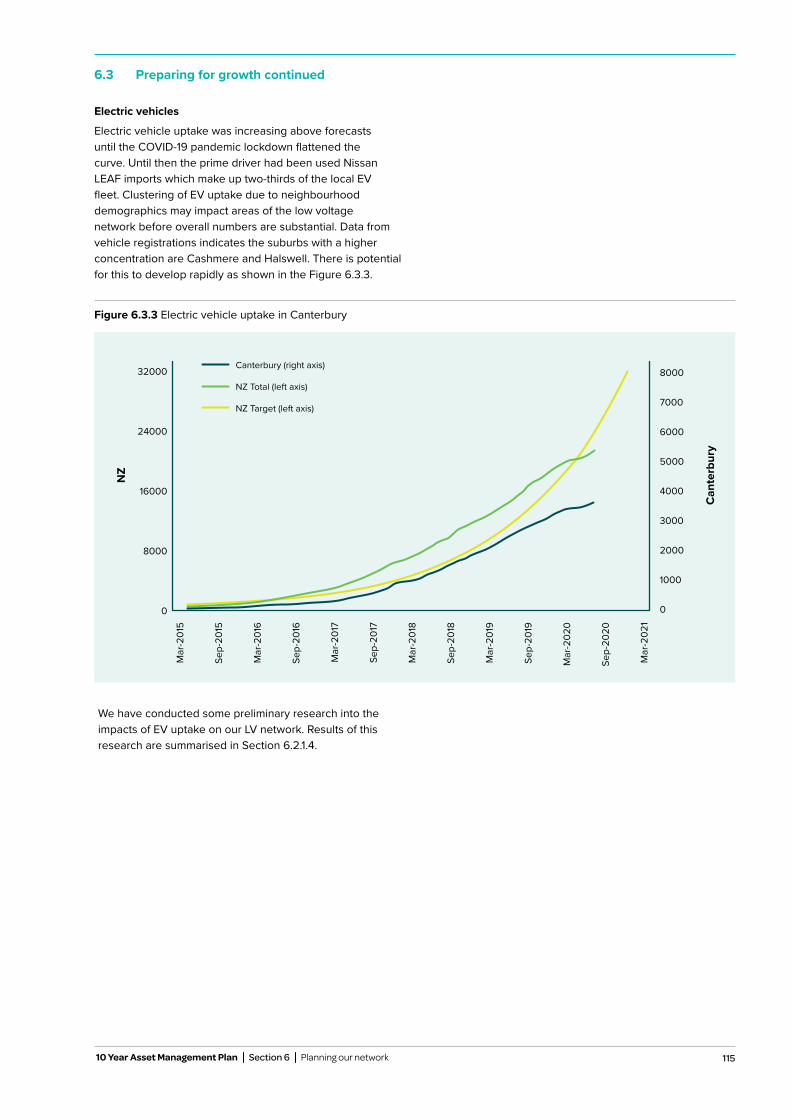
115
Electric vehicles
Electric vehicle uptake was increasing above forecasts until the COVID-19 pandemic lockdown flattened the curve. Until then the prime driver had been used Nissan LEAF imports which make up two-thirds of the local EV fleet. Clustering of EV uptake due to neighbourhood demographics may impact areas of the low voltage network before overall numbers are substantial. Data from vehicle registrations indicates the suburbs with a higher concentration are Cashmere and Halswell. There is potential for this to develop rapidly as shown in the Figure 6.3.3.
We have conducted some preliminary research into the impacts of EV uptake on our LV network. Results of this research are summarised in Section 6.2.1.4.
6.3 Preparing for growth continued
10 Year Asset Management Plan Section 6 Planning our network
Figure 6.3.3 Electric vehicle uptake in Canterbury
NZ
Can
terb
ury
Canterbury (right axis)
NZ Total (left axis)
NZ Target (left axis)
8000
7000
6000
5000
4000
3000
2000
1000
0
32000
24000
16000
8000
0
Mar
-201
5
Sep-
2015
Mar
-201
6
Sep-
2016
Mar
-201
7
Sep-
2017
Mar
-201
8
Sep-
2018
Mar
-201
9
Sep-
2019
Mar
-202
0
Sep-
2020
Mar
-202
1
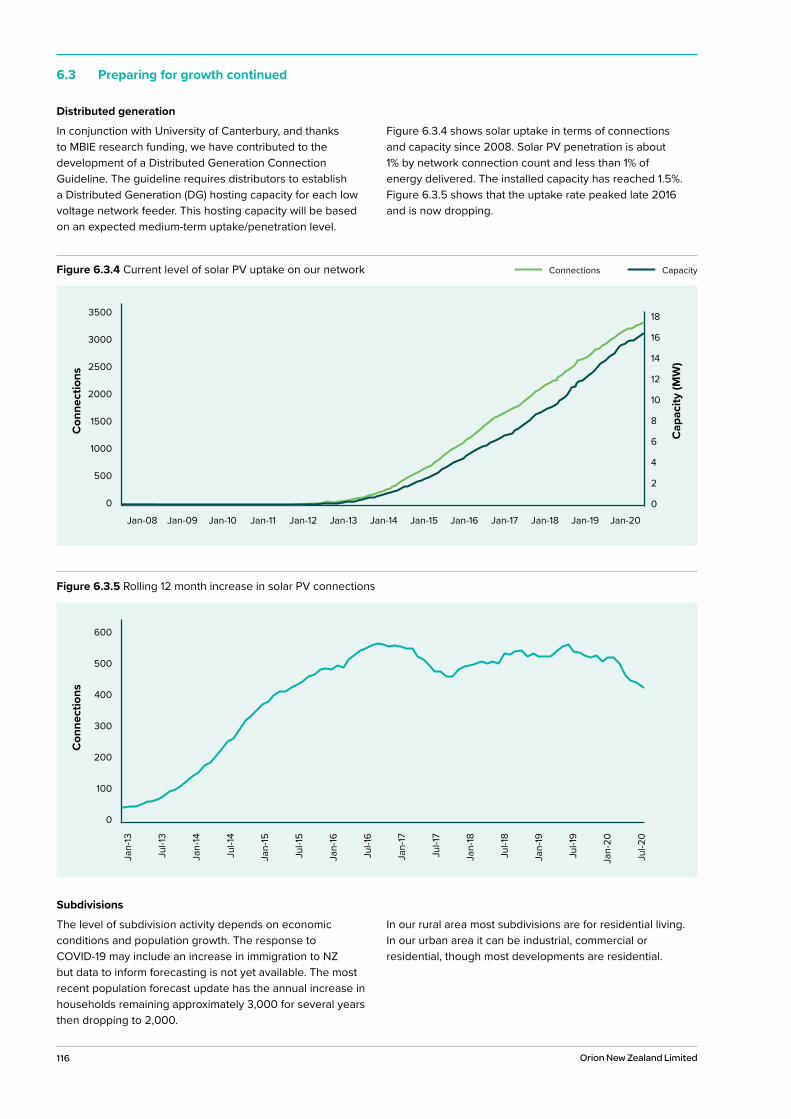
116 Orion New Zealand Limited
6.3 Preparing for growth continued
Distributed generation
In conjunction with University of Canterbury, and thanks to MBIE research funding, we have contributed to the development of a Distributed Generation Connection Guideline. The guideline requires distributors to establish a Distributed Generation (DG) hosting capacity for each low voltage network feeder. This hosting capacity will be based on an expected medium-term uptake/penetration level.
Figure 6.3.4 shows solar uptake in terms of connections and capacity since 2008. Solar PV penetration is about 1% by network connection count and less than 1% of energy delivered. The installed capacity has reached 1.5%. Figure 6.3.5 shows that the uptake rate peaked late 2016 and is now dropping.
Subdivisions
The level of subdivision activity depends on economic conditions and population growth. The response to COVID-19 may include an increase in immigration to NZ but data to inform forecasting is not yet available. The most recent population forecast update has the annual increase in households remaining approximately 3,000 for several years then dropping to 2,000.
In our rural area most subdivisions are for residential living. In our urban area it can be industrial, commercial or residential, though most developments are residential.
Figure 6.3.4 Current level of solar PV uptake on our network Connections Capacity
3500
3000
2500
2000
1500
1000
500
0
18
16
14
12
10
8
6
4
2
0
Cap
acity
(MW
)
Con
nect
ions
Jan-08 Jan-09 Jan-10 Jan-11 Jan-12 Jan-13 Jan-14 Jan-15 Jan-16 Jan-17 Jan-18 Jan-19 Jan-20
Figure 6.3.5 Rolling 12 month increase in solar PV connections
600
500
400
300
200
100
0
Jan-
13
Jul-1
3
Jan-
14
Jul-1
4
Jan-
15
Jul-1
5
Jan-
16
Jul-1
6
Jan-
17
Jul-1
7
Jan-
18
Jul-1
8
Jan-
19
Jul-1
9
Jan-
20
Jul-2
0
Con
nect
ions
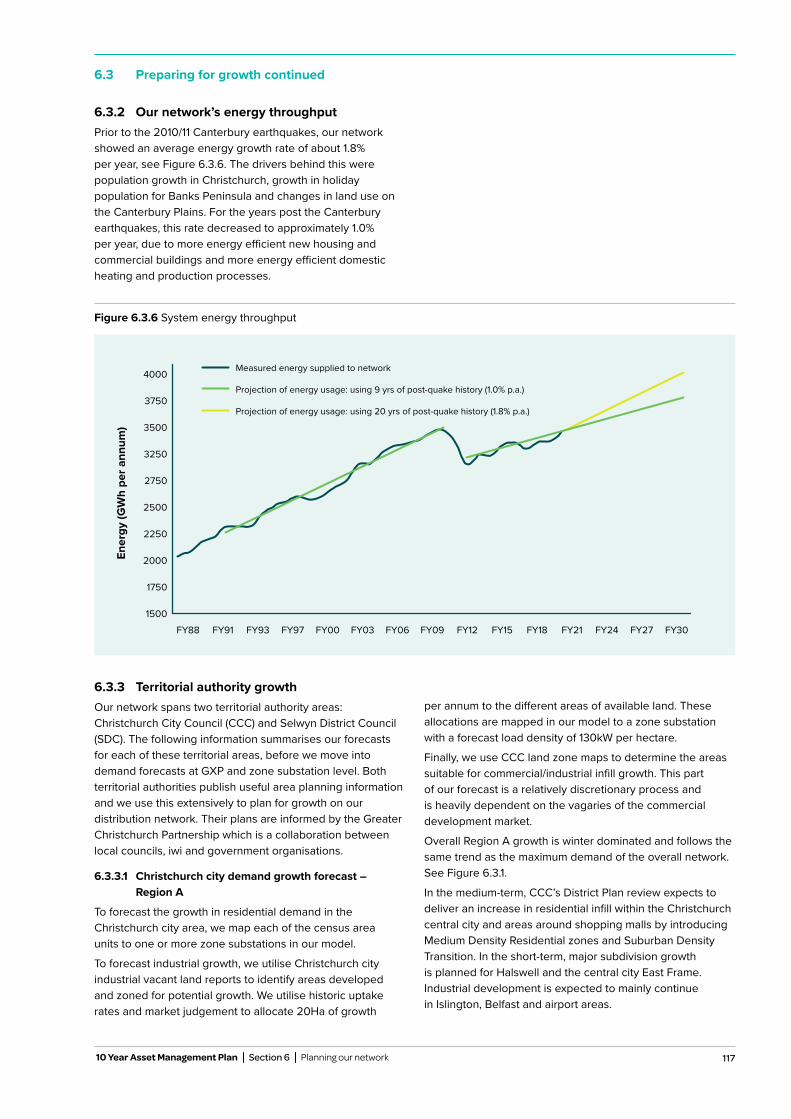
117
6.3.2 Our network’s energy throughputPrior to the 2010/11 Canterbury earthquakes, our network showed an average energy growth rate of about 1.8% per year, see Figure 6.3.6. The drivers behind this were population growth in Christchurch, growth in holiday population for Banks Peninsula and changes in land use on the Canterbury Plains. For the years post the Canterbury earthquakes, this rate decreased to approximately 1.0% per year, due to more energy efficient new housing and commercial buildings and more energy efficient domestic heating and production processes.
6.3.3 Territorial authority growthOur network spans two territorial authority areas: Christchurch City Council (CCC) and Selwyn District Council (SDC). The following information summarises our forecasts for each of these territorial areas, before we move into demand forecasts at GXP and zone substation level. Both territorial authorities publish useful area planning information and we use this extensively to plan for growth on our distribution network. Their plans are informed by the Greater Christchurch Partnership which is a collaboration between local councils, iwi and government organisations.
6.3.3.1 Christchurch city demand growth forecast – Region A
To forecast the growth in residential demand in the Christchurch city area, we map each of the census area units to one or more zone substations in our model.
To forecast industrial growth, we utilise Christchurch city industrial vacant land reports to identify areas developed and zoned for potential growth. We utilise historic uptake rates and market judgement to allocate 20Ha of growth
per annum to the different areas of available land. These allocations are mapped in our model to a zone substation with a forecast load density of 130kW per hectare.
Finally, we use CCC land zone maps to determine the areas suitable for commercial/industrial infill growth. This part of our forecast is a relatively discretionary process and is heavily dependent on the vagaries of the commercial development market.
Overall Region A growth is winter dominated and follows the same trend as the maximum demand of the overall network. See Figure 6.3.1.
In the medium-term, CCC’s District Plan review expects to deliver an increase in residential infill within the Christchurch central city and areas around shopping malls by introducing Medium Density Residential zones and Suburban Density Transition. In the short-term, major subdivision growth is planned for Halswell and the central city East Frame. Industrial development is expected to mainly continue in Islington, Belfast and airport areas.
6.3 Preparing for growth continued
10 Year Asset Management Plan Section 6 Planning our network
Figure 6.3.6 System energy throughput
Ener
gy (G
Wh
per a
nnum
)
Measured energy supplied to network
Projection of energy usage: using 9 yrs of post-quake history (1.0% p.a.)
Projection of energy usage: using 20 yrs of post-quake history (1.8% p.a.)
4000
3750
3500
3250
2750
2500
2250
2000
1750
1500FY88 FY91 FY93 FY97 FY00 FY03 FY06 FY09 FY12 FY15 FY18 FY21 FY24 FY27 FY30
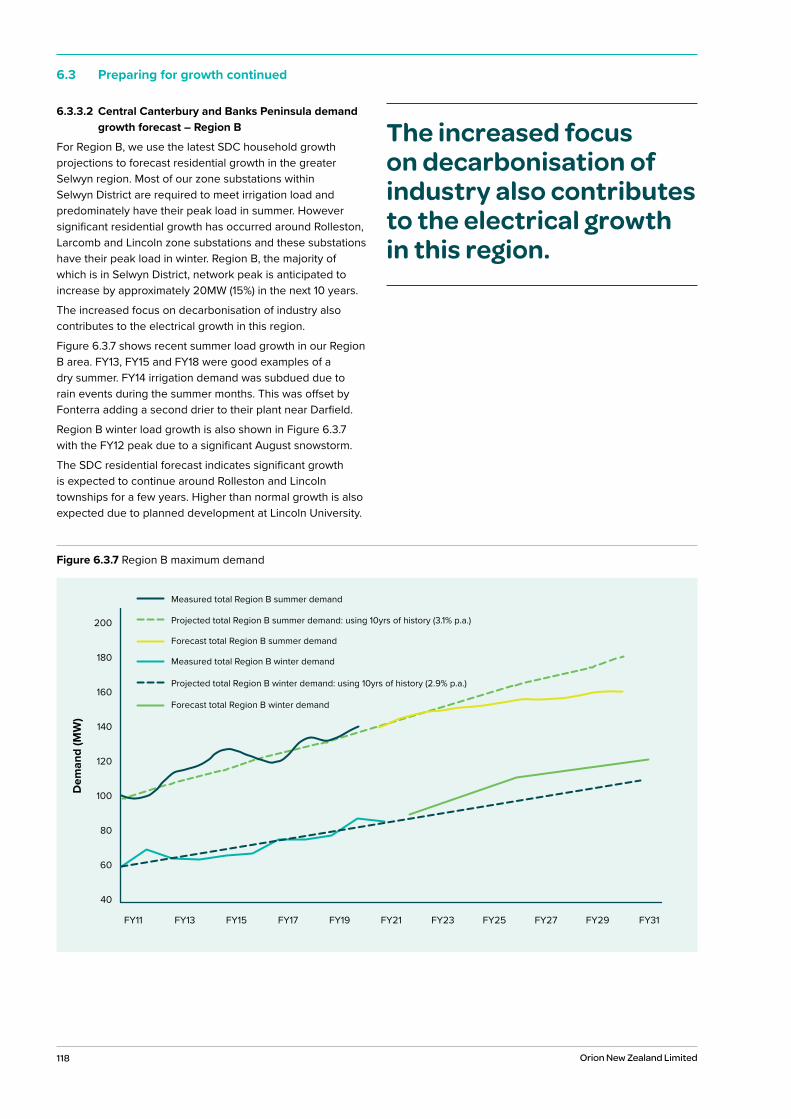
118 Orion New Zealand Limited
6.3 Preparing for growth continued
6.3.3.2 Central Canterbury and Banks Peninsula demand growth forecast – Region B
For Region B, we use the latest SDC household growth projections to forecast residential growth in the greater Selwyn region. Most of our zone substations within Selwyn District are required to meet irrigation load and predominately have their peak load in summer. However significant residential growth has occurred around Rolleston, Larcomb and Lincoln zone substations and these substations have their peak load in winter. Region B, the majority of which is in Selwyn District, network peak is anticipated to increase by approximately 20MW (15%) in the next 10 years.
The increased focus on decarbonisation of industry also contributes to the electrical growth in this region.
Figure 6.3.7 shows recent summer load growth in our Region B area. FY13, FY15 and FY18 were good examples of a dry summer. FY14 irrigation demand was subdued due to rain events during the summer months. This was offset by Fonterra adding a second drier to their plant near Darfield.
Region B winter load growth is also shown in Figure 6.3.7 with the FY12 peak due to a significant August snowstorm.
The SDC residential forecast indicates significant growth is expected to continue around Rolleston and Lincoln townships for a few years. Higher than normal growth is also expected due to planned development at Lincoln University.
The increased focus on decarbonisation of industry also contributes to the electrical growth in this region.
Figure 6.3.7 Region B maximum demand
FY11 FY13 FY15 FY17 FY19 FY21 FY23 FY25 FY27 FY29 FY31
Measured total Region B summer demand
Forecast total Region B summer demand
Forecast total Region B winter demand
Measured total Region B winter demand
Projected total Region B summer demand: using 10yrs of history (3.1% p.a.)
Projected total Region B winter demand: using 10yrs of history (2.9% p.a.)
Dem
and
(MW
)
200
180
160
140
120
100
80
60
40
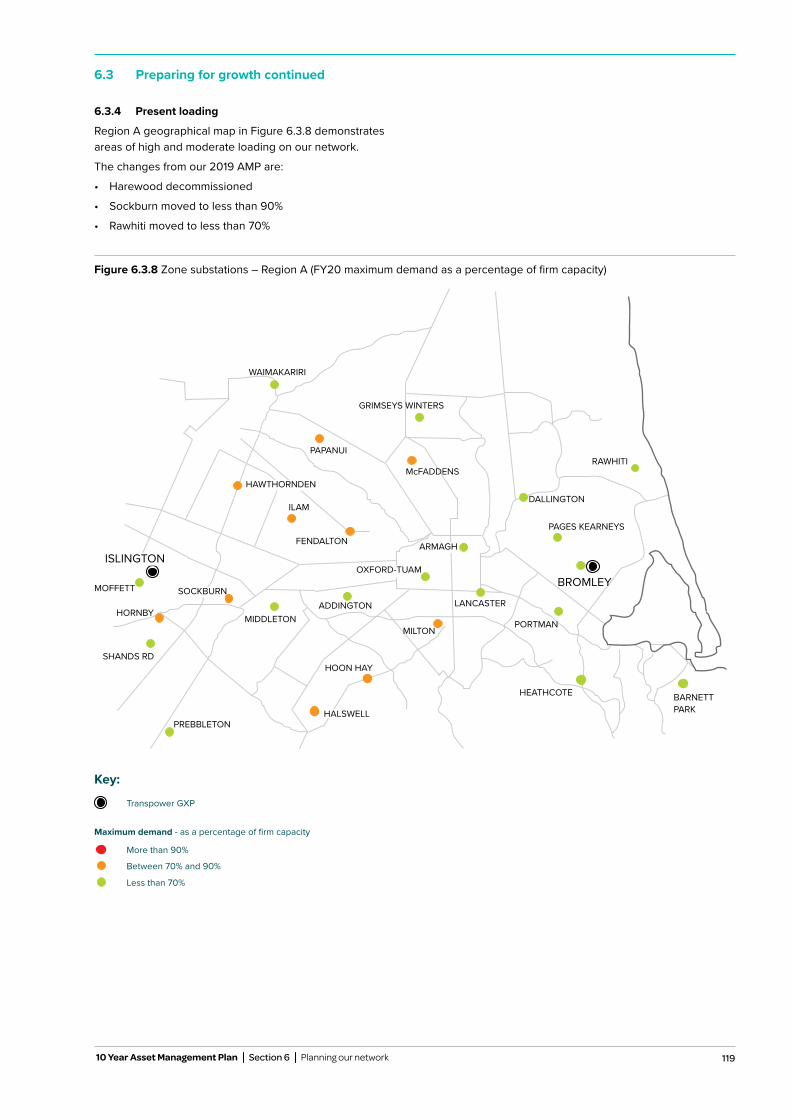
119 10 Year Asset Management Plan Section 6 Planning our network
6.3 Preparing for growth continued
6.3.4 Present loading
Region A geographical map in Figure 6.3.8 demonstrates areas of high and moderate loading on our network.
The changes from our 2019 AMP are:
• Harewood decommissioned
• Sockburn moved to less than 90%
• Rawhiti moved to less than 70%
Figure 6.3.8 Zone substations – Region A (FY20 maximum demand as a percentage of firm capacity)
BROMLEY
GRIMSEYS WINTERS
FENDALTON
PREBBLETON
SHANDS RD
ILAM
MIDDLETON
PAGES KEARNEYS
DALLINGTON
RAWHITI
LANCASTER
WAIMAKARIRI
HAWTHORNDEN
HALSWELL
HOON HAY
ARMAGH
MILTON
HEATHCOTE BARNETT PARK
OXFORD-TUAM
SOCKBURNADDINGTON
PORTMAN
PAPANUI
McFADDENS
HORNBY
ISLINGTON
MOFFETT
Transpower GXP
Key:
Less than 70%
Between 70% and 90%
More than 90%
Maximum demand - as a percentage of firm capacity
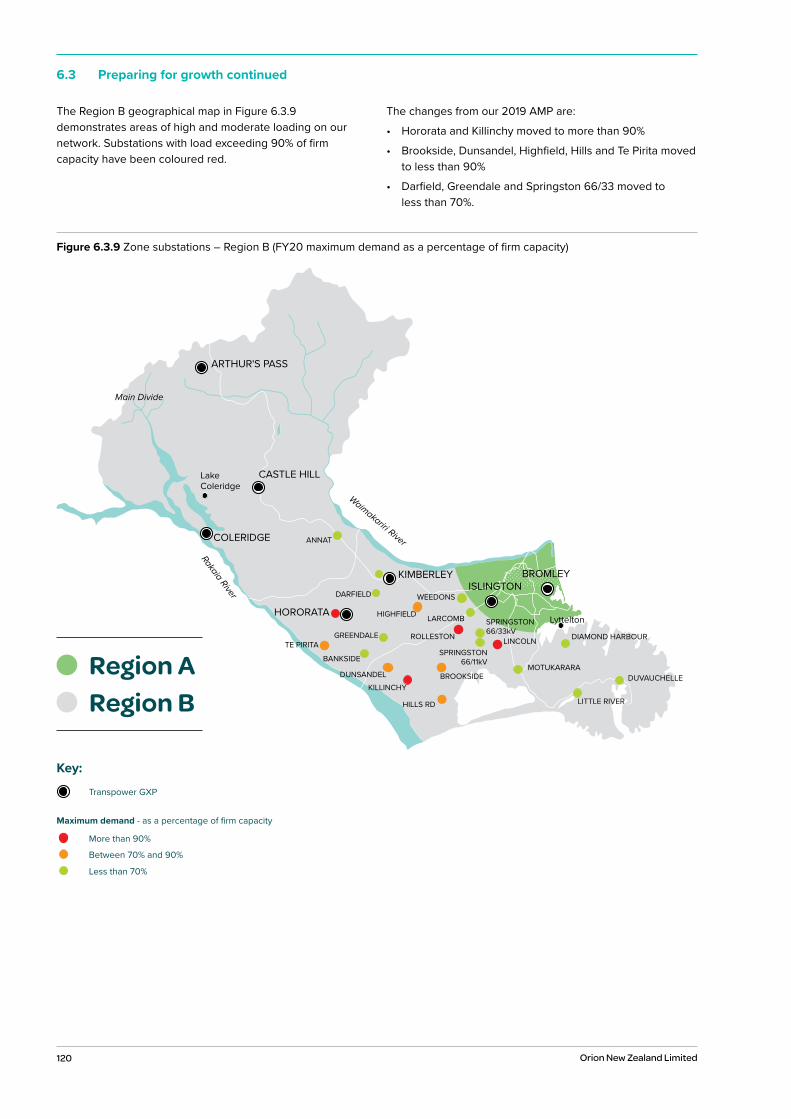
120 Orion New Zealand Limited
6.3 Preparing for growth continued
The Region B geographical map in Figure 6.3.9 demonstrates areas of high and moderate loading on our network. Substations with load exceeding 90% of firm capacity have been coloured red.
The changes from our 2019 AMP are:
• Hororata and Killinchy moved to more than 90%
• Brookside, Dunsandel, Highfield, Hills and Te Pirita movedto less than 90%
• Darfield, Greendale and Springston 66/33 moved toless than 70%.
Figure 6.3.9 Zone substations – Region B (FY20 maximum demand as a percentage of firm capacity)
Transpower GXP
Key:
Less than 70%
Between 70% and 90%
More than 90%
Maximum demand - as a percentage of firm capacity
Region ARegion B
Lyttelton
Lake Coleridge
Main Divide
ARTHUR'S PASS
CASTLE HILL
COLERIDGE
ISLINGTONBROMLEY
TE PIRITA
KILLINCHY
MOTUKARARA
HILLS RD
ANNAT
LITTLE RIVER
BANKSIDE
BROOKSIDE DUVAUCHELLEDUNSANDEL
DIAMOND HARBOUR
KIMBERLEY
HORORATA
DARFIELD
GREENDALE
HIGHFIELD
Waimakariri River
Rakaia River WEEDONS
LARCOMB
ROLLESTON
SPRINGSTON 66/11kV
SPRINGSTON 66/33kV
LINCOLN
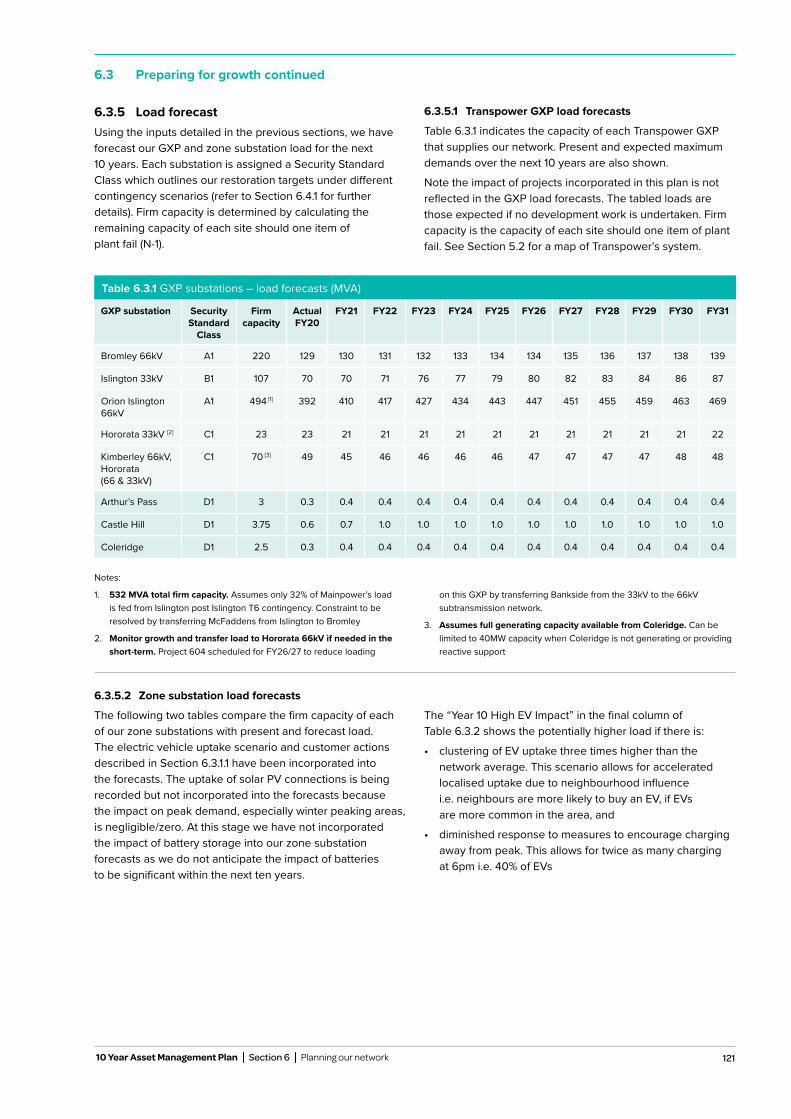
121
6.3 Preparing for growth continued
10 Year Asset Management Plan Section 6 Planning our network
6.3.5.2 Zone substation load forecasts
The following two tables compare the firm capacity of each of our zone substations with present and forecast load. The electric vehicle uptake scenario and customer actions described in Section 6.3.1.1 have been incorporated into the forecasts. The uptake of solar PV connections is being recorded but not incorporated into the forecasts because the impact on peak demand, especially winter peaking areas, is negligible/zero. At this stage we have not incorporated the impact of battery storage into our zone substation forecasts as we do not anticipate the impact of batteries to be significant within the next ten years.
The “Year 10 High EV Impact” in the final column of Table 6.3.2 shows the potentially higher load if there is:
• clustering of EV uptake three times higher than thenetwork average. This scenario allows for acceleratedlocalised uptake due to neighbourhood influencei.e. neighbours are more likely to buy an EV, if EVsare more common in the area, and
• diminished response to measures to encourage chargingaway from peak. This allows for twice as many chargingat 6pm i.e. 40% of EVs
Table 6.3.1 GXP substations – load forecasts (MVA)
GXP substation Security Standard
Class
Firm capacity
Actual FY20
FY21 FY22 FY23 FY24 FY25 FY26 FY27 FY28 FY29 FY30 FY31
Bromley 66kV A1 220 129 130 131 132 133 134 134 135 136 137 138 139
Islington 33kV B1 107 70 70 71 76 77 79 80 82 83 84 86 87
Orion Islington 66kV
A1 494 [1] 392 410 417 427 434 443 447 451 455 459 463 469
Hororata 33kV [2] C1 23 23 21 21 21 21 21 21 21 21 21 21 22
Kimberley 66kV, Hororata (66 & 33kV)
C1 70 [3] 49 45 46 46 46 46 47 47 47 47 48 48
Arthur’s Pass D1 3 0.3 0.4 0.4 0.4 0.4 0.4 0.4 0.4 0.4 0.4 0.4 0.4
Castle Hill D1 3.75 0.6 0.7 1.0 1.0 1.0 1.0 1.0 1.0 1.0 1.0 1.0 1.0
Coleridge D1 2.5 0.3 0.4 0.4 0.4 0.4 0.4 0.4 0.4 0.4 0.4 0.4 0.4
Notes:
1. 532 MVA total firm capacity. Assumes only 32% of Mainpower’s load is fed from Islington post Islington T6 contingency. Constraint to be resolved by transferring McFaddens from Islington to Bromley
2. Monitor growth and transfer load to Hororata 66kV if needed in the short-term. Project 604 scheduled for FY26/27 to reduce loading
on this GXP by transferring Bankside from the 33kV to the 66kV subtransmission network.
3. Assumes full generating capacity available from Coleridge. Can be limited to 40MW capacity when Coleridge is not generating or providing reactive support
6.3.5 Load forecastUsing the inputs detailed in the previous sections, we have forecast our GXP and zone substation load for the next 10 years. Each substation is assigned a Security Standard Class which outlines our restoration targets under different contingency scenarios (refer to Section 6.4.1 for further details). Firm capacity is determined by calculating the remaining capacity of each site should one item of plant fail (N-1).
6.3.5.1 Transpower GXP load forecasts
Table 6.3.1 indicates the capacity of each Transpower GXP that supplies our network. Present and expected maximum demands over the next 10 years are also shown.
Note the impact of projects incorporated in this plan is not reflected in the GXP load forecasts. The tabled loads are those expected if no development work is undertaken. Firm capacity is the capacity of each site should one item of plant fail. See Section 5.2 for a map of Transpower’s system.
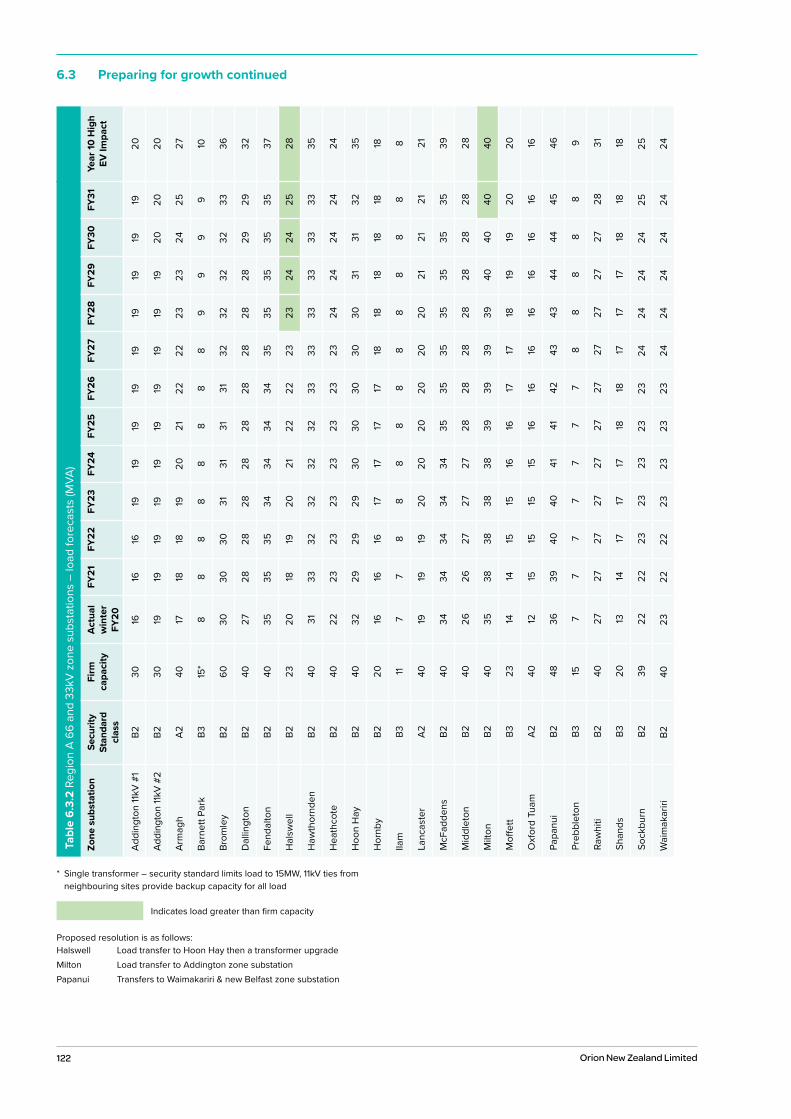
122 Orion New Zealand Limited
6.3 Preparing for growth continuedTa
ble
6.3.
2 Re
gion
A 6
6 an
d 33
kV z
one
subs
tatio
ns –
load
fore
cast
s (M
VA)
Zone
sub
stat
ion
Secu
rity
Stan
dard
cl
ass
Firm
ca
paci
tyA
ctua
l w
inte
r FY
20
FY21
FY22
FY23
FY24
FY25
FY26
FY27
FY28
FY29
FY30
FY31
Year
10 H
igh
EV Im
pact
Addi
ngto
n 11
kV #
1B2
3016
1616
1919
1919
1919
1919
1920
Addi
ngto
n 11k
V #2
B230
1919
1919
1919
1919
1919
2020
20
Arm
agh
A240
1718
1819
2021
2222
2323
2425
27
Barn
ett P
ark
B315
*8
88
88
88
89
99
910
Brom
ley
B260
3030
3031
3131
3132
3232
3233
36
Dal
lingt
onB2
4027
2828
2828
2828
2828
2829
2932
Fend
alto
nB2
4035
3535
3434
3434
3535
3535
3537
Hal
swel
lB2
2320
1819
2021
2222
2323
2424
2528
Haw
thor
nden
B240
3133
3232
3232
3333
3333
3333
35
Hea
thco
teB2
4022
2323
2323
2323
2324
2424
2424
Hoo
n H
ayB2
4032
2929
2930
3030
3030
3131
3235
Hor
nby
B220
1616
1617
1717
1718
1818
1818
18
Ilam
B311
77
88
88
88
88
88
8
Lanc
aste
rA2
4019
1919
2020
2020
2020
2121
2121
McF
adde
nsB2
4034
3434
3434
3535
3535
3535
3539
Mid
dlet
onB2
4026
2627
2727
2828
2828
2828
2828
Milt
onB2
4035
3838
3838
3939
3939
4040
4040
Moff
ett
B323
1414
1515
1616
1717
1819
1920
20
Oxf
ord
Tuam
A240
1215
1515
1516
1616
1616
1616
16
Papa
nui
B248
3639
4040
4141
4243
4344
4445
46
Preb
blet
onB3
157
77
77
77
88
88
89
Raw
hiti
B240
2727
2727
2727
2727
2727
2728
31
Shan
dsB3
2013
1417
1717
1818
1717
1718
1818
Sock
burn
B239
2222
2323
2323
2324
2424
2425
25
Wai
mak
ariri
B240
2322
2223
2323
2324
2424
2424
24
* Single transformer – security standard limits load to 15MW, 11kV ties from neighbouring sites provide backup capacity for all load
Proposed resolution is as follows:Halswell Load transfer to Hoon Hay then a transformer upgradeMilton Load transfer to Addington zone substationPapanui Transfers to Waimakariri & new Belfast zone substation
Indicates load greater than firm capacity
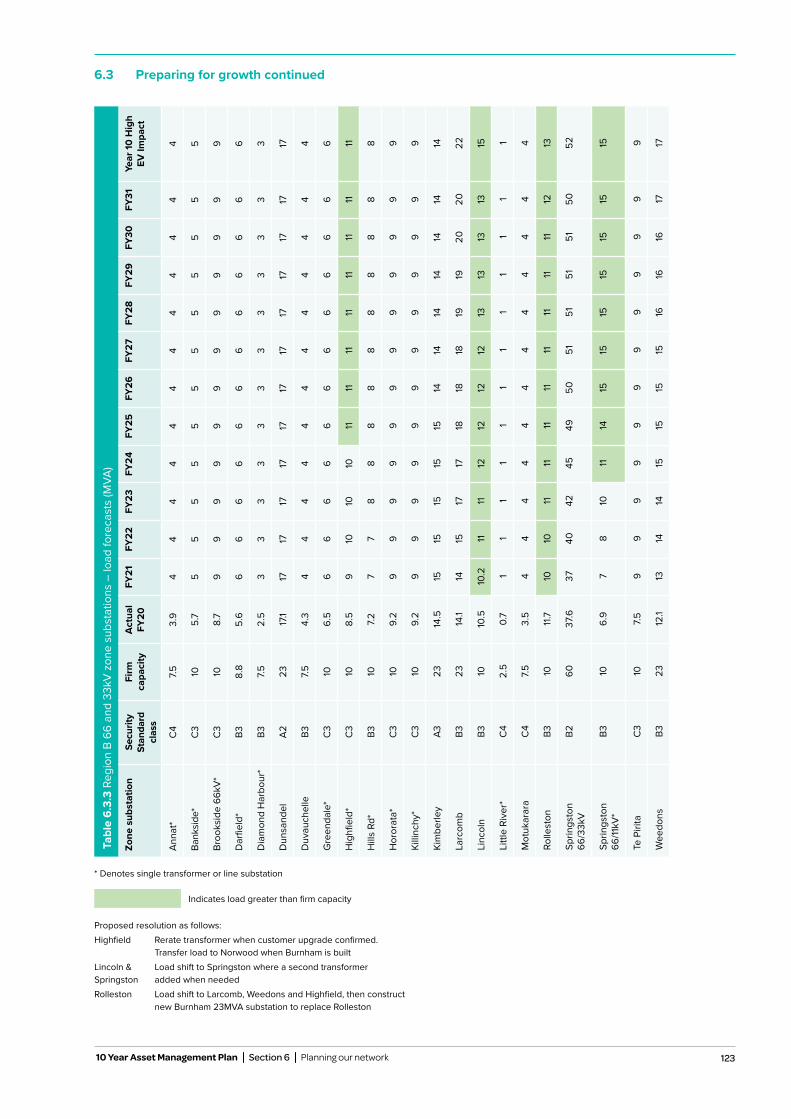
123
6.3 Preparing for growth continued
10 Year Asset Management Plan Section 6 Planning our network
Indicates load greater than firm capacity
* Denotes single transformer or line substation
Proposed resolution as follows:Highfield Rerate transformer when customer upgrade confirmed.
Transfer load to Norwood when Burnham is builtLincoln & Load shift to Springston where a second transformer Springston added when neededRolleston Load shift to Larcomb, Weedons and Highfield, then construct
new Burnham 23MVA substation to replace Rolleston
Tabl
e 6.
3.3
Regi
on B
66
and
33kV
zon
e su
bsta
tions
– lo
ad fo
reca
sts
(MVA
)
Zone
sub
stat
ion
Secu
rity
Stan
dard
cl
ass
Firm
ca
paci
tyA
ctua
l FY
20FY
21FY
22FY
23FY
24FY
25FY
26FY
27FY
28FY
29FY
30FY
31Ye
ar 10
Hig
h EV
Impa
ct
Anna
t*C
47.5
3.9
44
44
44
44
44
44
Bank
side
*C
310
5.7
55
55
55
55
55
55
Broo
ksid
e 66
kV*
C3
108.
79
99
99
99
99
99
9
Dar
field
*B3
8.8
5.6
66
66
66
66
66
66
Dia
mon
d H
arbo
ur*
B37.5
2.5
33
33
33
33
33
33
Dun
sand
elA2
2317
.117
1717
1717
1717
1717
1717
17
Duv
auch
elle
B37.5
4.3
44
44
44
44
44
44
Gre
enda
le*
C3
106.
56
66
66
66
66
66
6
Hig
hfiel
d*C
310
8.5
910
1010
1111
1111
1111
1111
Hill
s Rd
*B3
107.2
77
88
88
88
88
88
Hor
orat
a*C
310
9.2
99
99
99
99
99
99
Killi
nchy
*C
310
9.2
99
99
99
99
99
99
Kim
berle
yA3
2314
.515
1515
1515
1414
1414
1414
14
Larc
omb
B323
14.1
1415
1717
1818
1819
1920
2022
Linc
oln
B310
10.5
10.2
1111
1212
1212
1313
1313
15
Littl
e Ri
ver*
C4
2.5
0.7
11
11
11
11
11
11
Mot
ukar
ara
C4
7.53.
54
44
44
44
44
44
4
Rolle
ston
B310
11.7
1010
1111
1111
1111
1111
1213
Sprin
gsto
n 66
/33k
VB2
6037
.637
4042
4549
5051
5151
5150
52
Sprin
gsto
n 66
/11kV
*B3
106.
97
810
1114
1515
1515
1515
15
Te P
irita
C3
107.5
99
99
99
99
99
99
Wee
dons
B323
12.1
1314
1415
1515
1516
1616
1717
124 Orion New Zealand Limited
6.4 Planning criteria
When planning our network, we:
• take account of customer feedback to determine thevalue they put on reducing interruption times. This givesan upper threshold of how much reliability investmentis justified
• preserve our HV security of supply standard, which is theability of our network to meet the demand for electricitywhen electrical equipment fails
• monitor our network utilisation thresholds to preparean annual reinforcement programme for our network
• compare our current network capacity with load forecastscenarios. The resulting projects are based on our designstandards
• projects are based on our design standards. The projectsare then prioritised taking account of the ability to deliverthe work each year
• consider, especially as the network becomes constrained,non-network solutions to relieve these constraints as analternative to or to delay network investment
6.4.1 HV security of supply standardSecurity of supply is the ability of a network to meet the demand for electricity in certain circumstances when electrical equipment fails. The more secure an electricity network, the greater its ability to continue to perform or the quicker it can recover from a fault or a series of faults.
Security of supply underpins our HV network resilience. It is grounded in the flexibility of our network to be reconfigured to provide power from alternative sources when needed. Security of supply differs from reliability, which is how the network performs, measured by the frequency and duration of power outages per customer.
In addition to our security of supply standard, customers are given the opportunity at the time of initial connection to discuss their individual security of supply requirements. We will also make changes to individual security of supply arrangements for existing customers.
Our security of supply standard caters for connections of sizes that meet our major customer’s needs and individual security arrangements on our network are minimal. They are mainly limited to high profile services such as hospitals, ports, Christchurch International Airport and public sports venues. We also have in place individual security of supply agreements with milk processing plants at Darfield and Dunsandel.
We take account of customer feedback to determine the value they put on reducing interruption times. This gives an upper threshold of how much reliability investment is justified.
Security of supply underpins our HV network resilience.
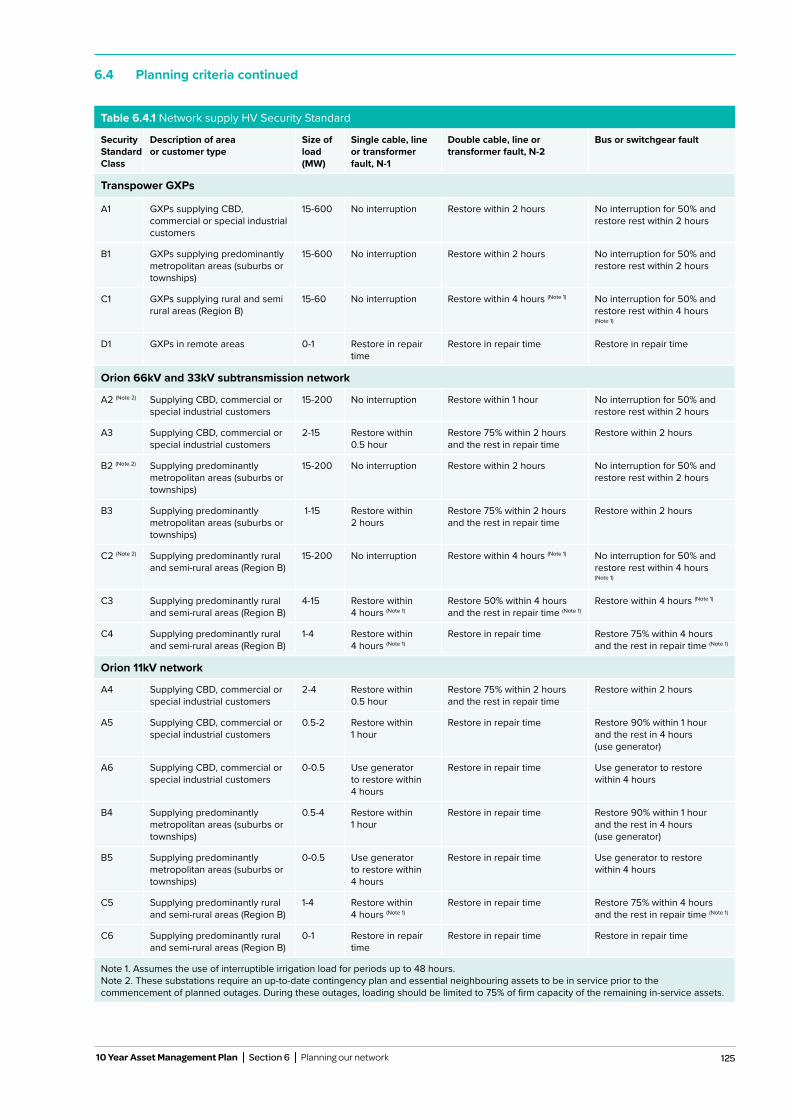
125
6.4 Planning criteria continued
10 Year Asset Management Plan Section 6 Planning our network
Table 6.4.1 Network supply HV Security Standard
Security Standard Class
Description of area or customer type
Size of load (MW)
Single cable, line or transformer fault, N-1
Double cable, line or transformer fault, N-2
Bus or switchgear fault
Transpower GXPs
A1 GXPs supplying CBD, commercial or special industrial customers
15-600 No interruption Restore within 2 hours No interruption for 50% and restore rest within 2 hours
B1 GXPs supplying predominantly metropolitan areas (suburbs or townships)
15-600 No interruption Restore within 2 hours No interruption for 50% and restore rest within 2 hours
C1 GXPs supplying rural and semi rural areas (Region B)
15-60 No interruption Restore within 4 hours (Note 1) No interruption for 50% and restore rest within 4 hours (Note 1)
D1 GXPs in remote areas 0-1 Restore in repair time
Restore in repair time Restore in repair time
Orion 66kV and 33kV subtransmission network
A2 (Note 2) Supplying CBD, commercial or special industrial customers
15-200 No interruption Restore within 1 hour No interruption for 50% and restore rest within 2 hours
A3 Supplying CBD, commercial or special industrial customers
2-15 Restore within 0.5 hour
Restore 75% within 2 hours and the rest in repair time
Restore within 2 hours
B2 (Note 2) Supplying predominantly metropolitan areas (suburbs or townships)
15-200 No interruption Restore within 2 hours No interruption for 50% and restore rest within 2 hours
B3 Supplying predominantly metropolitan areas (suburbs or townships)
1-15 Restore within 2 hours
Restore 75% within 2 hours and the rest in repair time
Restore within 2 hours
C2 (Note 2) Supplying predominantly rural and semi-rural areas (Region B)
15-200 No interruption Restore within 4 hours (Note 1) No interruption for 50% and restore rest within 4 hours (Note 1)
C3 Supplying predominantly rural and semi-rural areas (Region B)
4-15 Restore within 4 hours (Note 1)
Restore 50% within 4 hours and the rest in repair time (Note 1)
Restore within 4 hours (Note 1)
C4 Supplying predominantly rural and semi-rural areas (Region B)
1-4 Restore within 4 hours (Note 1)
Restore in repair time Restore 75% within 4 hours and the rest in repair time (Note 1)
Orion 11kV network
A4 Supplying CBD, commercial or special industrial customers
2-4 Restore within 0.5 hour
Restore 75% within 2 hours and the rest in repair time
Restore within 2 hours
A5 Supplying CBD, commercial or special industrial customers
0.5-2 Restore within 1 hour
Restore in repair time Restore 90% within 1 hour and the rest in 4 hours (use generator)
A6 Supplying CBD, commercial or special industrial customers
0-0.5 Use generator to restore within 4 hours
Restore in repair time Use generator to restore within 4 hours
B4 Supplying predominantly metropolitan areas (suburbs or townships)
0.5-4 Restore within 1 hour
Restore in repair time Restore 90% within 1 hour and the rest in 4 hours (use generator)
B5 Supplying predominantly metropolitan areas (suburbs or townships)
0-0.5 Use generator to restore within 4 hours
Restore in repair time Use generator to restore within 4 hours
C5 Supplying predominantly rural and semi-rural areas (Region B)
1-4 Restore within 4 hours (Note 1)
Restore in repair time Restore 75% within 4 hours and the rest in repair time (Note 1)
C6 Supplying predominantly rural and semi-rural areas (Region B)
0-1 Restore in repair time
Restore in repair time Restore in repair time
Note 1. Assumes the use of interruptible irrigation load for periods up to 48 hours. Note 2. These substations require an up-to-date contingency plan and essential neighbouring assets to be in service prior to the commencement of planned outages. During these outages, loading should be limited to 75% of firm capacity of the remaining in-service assets.
126 Orion New Zealand Limited
6.4 Planning criteria continued
6.4.2 Network utilisation thresholdsHistoric loading data from our DMS and forecast zone substation and subtransmission utilisation figures are used to prepare our 10-year programme of works for our network.
Growth at the 11kV distribution level is largely dependent on individual subdivision development and customer connection upgrades. Growth in excess of the system average is not uncommon and localised growth rates are applied as necessary. Zone substations, subtransmission and distribution feeder cables are subject to four distinct types of peak load:
1) Nominal load – the maximum load seen on a given asset when all of the surrounding network is available for service.
2) N-1 load – the load that a given asset would be subjected to if one piece of the network was removed from service due to a fault or maintenance.
3) N-2 load – the load that a given asset would be subjected to if two pieces of the network were removed due to a fault or maintenance.
4) Bus fault load – the load that a given asset would be subjected to if a single bus was removed from service due to a fault or maintenance. A bus is part of the configuration of equipment in a substation. The operational flexibility and reliability of a substation greatly depends upon the bus design.
As defined in our security of supply standard, the location and quantity of load supplied by a feeder has a bearing on whether all or only some of the four load categories described above should be applied to an asset for analysis.
If the peak load reaches 70% or the N-1, N-2 or bus fault load reaches 90% of the asset capacity then a more detailed review of the surrounding network is instigated.
6.4.3 Capacity determination for new projectsWhen a capacity or security gap is identified on the network we consider different capacity options as solutions. For example, a constrained 11kV feeder can be relieved by installing an additional 11kV feeder to the area. But if the zone substation supplying the area is near full capacity then it may be more cost effective to bring forward the new zone substation investment and avoid the 11kV feeder expense altogether.
When comparing different capacity solutions, we use the Net Present Value (NPV) test. The NPV test is an economic tool that analyses the profitability of a projected investment or project, converting the value of future projects to present day dollars. NPV analysis generally supports the staged implementation of a number of smaller reinforcements. This approach also reduces the risk of over-capitalisation that can ultimately result in stranded assets.
The capacity of a new zone substation and 11kV feeders is generally dictated by the desire to standardise network equipment. The capacity of a zone substation and transformer/s is based mainly on the load density of the
area to be supplied and the level of the available subtransmission voltage. Developing a network based on standardised capacities provides additional benefit when considering future maintenance and repair. Transformers and switchgear are more readily interchangeable, and the range of spares required for emergencies can be minimised.
When underground cable capacities are exceeded, it is normally most effective to lay new cables. When overhead line capacities are exceeded, an upgrade of the current carrying conductor may be feasible. However, the increased weight of a larger conductor may require that the line be rebuilt with different pole spans and stronger hardware. In this case it may be preferable to build another line in a different location that addresses several capacity issues. In Region A the installation of a new line will require a Resource Consent under the Christchurch District Plan.
New upper network capacity is installed only once new load growth has or is certain to occur. In the short term, unexpected or accelerated load growth is met by utilising security of supply capacity. We discuss our approach to increased capacity in our architecture and network design document.
Table 6.4.2 provides a summary of our standard network capacities.
Developing a network based on standardised capacities provides additional benefit when considering future maintenance and repair.
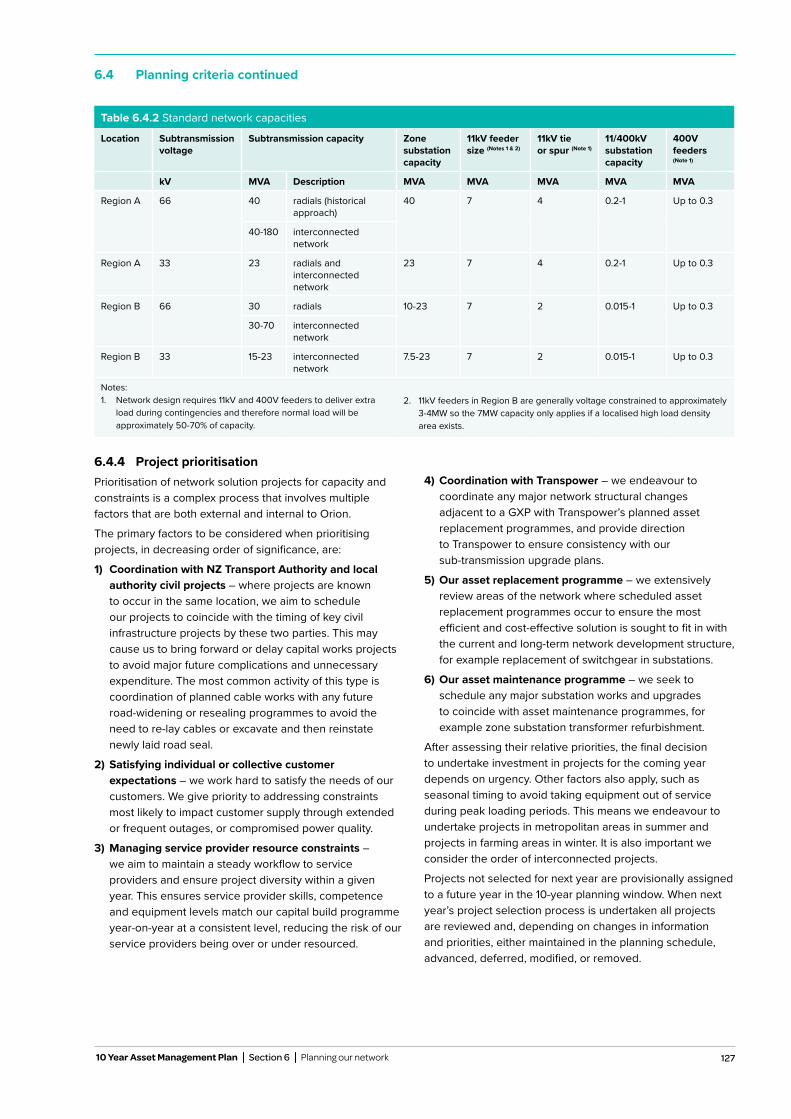
127
6.4 Planning criteria continued
10 Year Asset Management Plan Section 6 Planning our network
6.4.4 Project prioritisationPrioritisation of network solution projects for capacity and constraints is a complex process that involves multiple factors that are both external and internal to Orion.
The primary factors to be considered when prioritising projects, in decreasing order of significance, are:
1) Coordination with NZ Transport Authority and local authority civil projects – where projects are known to occur in the same location, we aim to schedule our projects to coincide with the timing of key civil infrastructure projects by these two parties. This may cause us to bring forward or delay capital works projects to avoid major future complications and unnecessary expenditure. The most common activity of this type is coordination of planned cable works with any future road-widening or resealing programmes to avoid the need to re-lay cables or excavate and then reinstate newly laid road seal.
2) Satisfying individual or collective customer expectations – we work hard to satisfy the needs of our customers. We give priority to addressing constraints most likely to impact customer supply through extended or frequent outages, or compromised power quality.
3) Managing service provider resource constraints – we aim to maintain a steady workflow to service providers and ensure project diversity within a given year. This ensures service provider skills, competence and equipment levels match our capital build programme year-on-year at a consistent level, reducing the risk of our service providers being over or under resourced.
4) Coordination with Transpower – we endeavour to coordinate any major network structural changes adjacent to a GXP with Transpower’s planned asset replacement programmes, and provide direction to Transpower to ensure consistency with our sub-transmission upgrade plans.
5) Our asset replacement programme – we extensively review areas of the network where scheduled asset replacement programmes occur to ensure the most efficient and cost-effective solution is sought to fit in with the current and long-term network development structure, for example replacement of switchgear in substations.
6) Our asset maintenance programme – we seek to schedule any major substation works and upgrades to coincide with asset maintenance programmes, for example zone substation transformer refurbishment.
After assessing their relative priorities, the final decision to undertake investment in projects for the coming year depends on urgency. Other factors also apply, such as seasonal timing to avoid taking equipment out of service during peak loading periods. This means we endeavour to undertake projects in metropolitan areas in summer and projects in farming areas in winter. It is also important we consider the order of interconnected projects.
Projects not selected for next year are provisionally assigned to a future year in the 10-year planning window. When next year’s project selection process is undertaken all projects are reviewed and, depending on changes in information and priorities, either maintained in the planning schedule, advanced, deferred, modified, or removed.
Table 6.4.2 Standard network capacities
Location Subtransmission voltage
Subtransmission capacity Zone substation capacity
11kV feeder size (Notes 1 & 2)
11kV tie or spur (Note 1)
11/400kV substation capacity
400V feeders (Note 1)
kV MVA Description MVA MVA MVA MVA MVA
Region A 66 40 radials (historical approach)
40 7 4 0.2-1 Up to 0.3
40-180 interconnected network
Region A 33 23 radials and interconnected network
23 7 4 0.2-1 Up to 0.3
Region B 66 30 radials 10-23 7 2 0.015-1 Up to 0.3
30-70 interconnected network
Region B 33 15-23 interconnected network
7.5-23 7 2 0.015-1 Up to 0.3
Notes: 1. Network design requires 11kV and 400V feeders to deliver extra
load during contingencies and therefore normal load will be approximately 50-70% of capacity.
2. 11kV feeders in Region B are generally voltage constrained to approximately 3-4MW so the 7MW capacity only applies if a localised high load density area exists.
128 Orion New Zealand Limited
6.4 Planning criteria continued
The recent and forecast improvement in battery technology and forecast drop in price is likely to create new Distributed Energy Resources Management opportunities in the short to medium-term. We will continue to monitor and investigate opportunities.
For some major projects, we would consider paying for Distributed Energy Resources Management to avoid or defer network development. These projects, and an indication of the value possible are detailed in Section 6.7.
6.4.5 Non-network solutionsWhen the network becomes constrained it is not always necessary to relieve that constraint by investing in new zone substations, 11kV feeders and 400V reinforcement. Before implementing network investment solutions, we look for network switching options and then consider the following alternatives:
• Distributed Energy Resources Management
• Distributed Generation
• Uneconomic connections
6.4.5.1 Distributed Energy Resources Management
Distributed Energy Resources Management provides an alternative to transmission and distribution network development.
We are open to exploring projects with customers or third parties in the DER space and are keen to partner where there are mutual benefits.
This promotes efficient operation of the network.
Some of the gains from Distributed Energy Resources Management are:
• increased utilisation of the network
• improved utilisation of Transpower’s transmission capacity
• customers benefit by becoming more efficient in the utilisation of energy and network capacity
• customer relations improve through less upward pressure on prices
The following Distributed Energy Resources Management strategies are applied by Orion:
• ripple system – anytime hot water cylinder control
• ripple system – night rate price options
• ripple system – major customer price signalling
• ripple system – interruptible irrigation
• coordinated upper South Island load management
• power factor correction rebate
• diesel-fueled generation
Ripple control
Ripple control is one of the most effective tools available for implementing Distributed Energy Resources Management. Committed utilisation of our ripple control system has been the driver for approximately 150MW of the 200MW gap between demand and energy.
Ripple control has facilitated the implementation of the following Distributed Energy Resource Management:
• hot water cylinder control – 50MW of peak load deferment
• night store heating – 190MW of night load providing an estimated 75MW peak reduction
• peak price signalling mainly major customers – 25MW, includes embedded generation
• interruptible irrigation load groups (summer only) – 15MW during contingencies
We will continue to work with retailers, customers and meter owners to ensure that the benefits of ripple control are retained during any transition to new technology options.
Winter load management
We design our network to meet peak demand, which we manage through hot water cylinder peak control and night rate price signalling. As network development costs and the transmission grid usage charges are driven by peak demand, the growth in the cost to our customers has been kept much lower than growth in overall annual demand.
A demonstration of the effectiveness of our winter load management, via hot water cylinder control and peak price signalling, in reducing the overall network load is shown in Figure 6.4.1 below.
Distributed Energy Resources Management is shaping the overall customer load profile to obtain maximum mutual benefit to the customer and the grid and network operator.
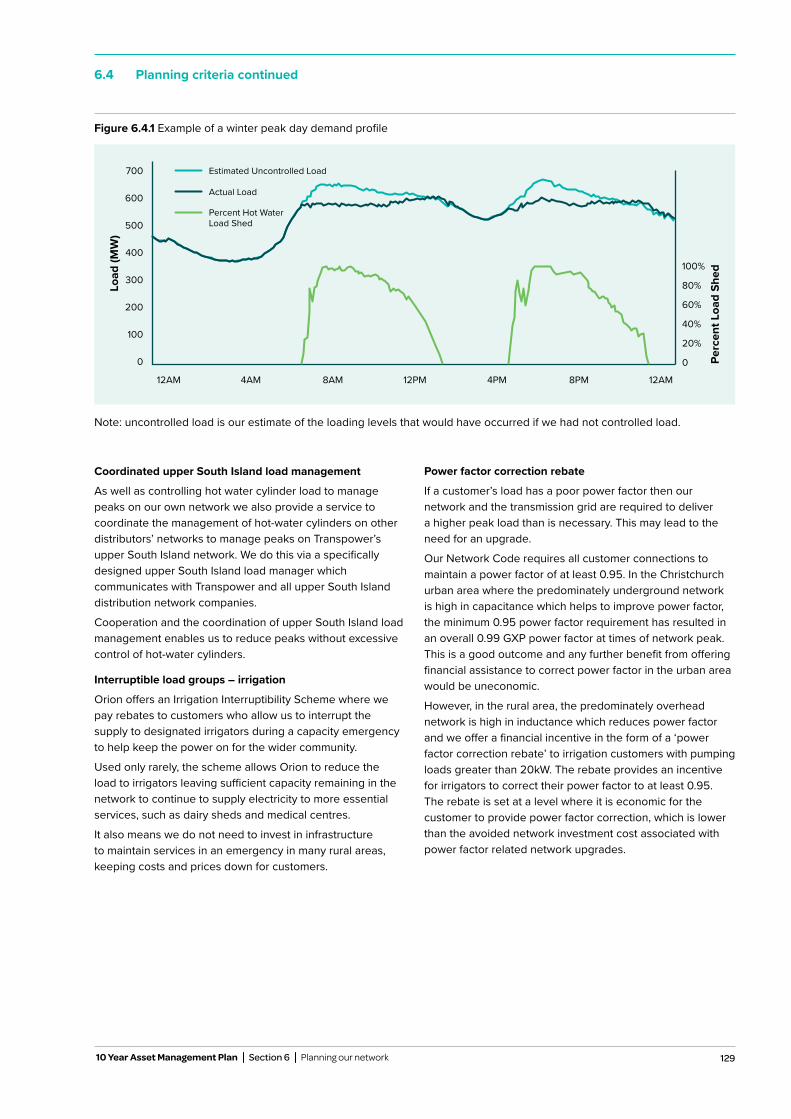
129
Note: uncontrolled load is our estimate of the loading levels that would have occurred if we had not controlled load.
Coordinated upper South Island load management
As well as controlling hot water cylinder load to manage peaks on our own network we also provide a service to coordinate the management of hot-water cylinders on other distributors’ networks to manage peaks on Transpower’s upper South Island network. We do this via a specifically designed upper South Island load manager which communicates with Transpower and all upper South Island distribution network companies.
Cooperation and the coordination of upper South Island load management enables us to reduce peaks without excessive control of hot-water cylinders.
Interruptible load groups – irrigation
Orion offers an Irrigation Interruptibility Scheme where we pay rebates to customers who allow us to interrupt the supply to designated irrigators during a capacity emergency to help keep the power on for the wider community.
Used only rarely, the scheme allows Orion to reduce the load to irrigators leaving sufficient capacity remaining in the network to continue to supply electricity to more essential services, such as dairy sheds and medical centres.
It also means we do not need to invest in infrastructure to maintain services in an emergency in many rural areas, keeping costs and prices down for customers.
Power factor correction rebate
If a customer’s load has a poor power factor then our network and the transmission grid are required to deliver a higher peak load than is necessary. This may lead to the need for an upgrade.
Our Network Code requires all customer connections to maintain a power factor of at least 0.95. In the Christchurch urban area where the predominately underground network is high in capacitance which helps to improve power factor, the minimum 0.95 power factor requirement has resulted in an overall 0.99 GXP power factor at times of network peak. This is a good outcome and any further benefit from offering financial assistance to correct power factor in the urban area would be uneconomic.
However, in the rural area, the predominately overhead network is high in inductance which reduces power factor and we offer a financial incentive in the form of a ‘power factor correction rebate’ to irrigation customers with pumping loads greater than 20kW. The rebate provides an incentive for irrigators to correct their power factor to at least 0.95. The rebate is set at a level where it is economic for the customer to provide power factor correction, which is lower than the avoided network investment cost associated with power factor related network upgrades.
6.4 Planning criteria continued
10 Year Asset Management Plan Section 6 Planning our network
Figure 6.4.1 Example of a winter peak day demand profile
700
600
500
400
300
200
100
0
100%
80%
60%
40%
20%
0 Perc
ent L
oad
Shed
Load
(MW
)
12AM 4AM 8AM 12PM 4PM 8PM 12AM
Estimated Uncontrolled Load
Percent Hot Water Load Shed
Actual Load
130 Orion New Zealand Limited
6.4 Planning criteria continued
6.4.5.2 Distributed Generation
The purpose of our distribution network has been to deliver bulk energy from Transpower GXPs to customers. In certain circumstances it can be more economic for the customer to provide a source of energy themselves in the form of Distributed Generation. Distributed Generation may also reduce the need to extend our network capacity.
We approach Distributed Generation in different ways, depending on the size of the system. For Distributed Generation above 750kW we consider the following issues:
• coincidence of Distributed Generation with Transpower interconnection charges
• benefits of avoided or delayed network investment
• security of supply provided by generators as opposed to network solutions
• hours of operation permitted by resource consents
• priority order for calling on peak lopping alternatives, such as hot-water control versus Distributed Generation
Region A load peaks on a winter evening when there is no solar PV generation. Diesel generation can reduce peak loads so is included in our peak forecast. Solar PV may offer a reduction to peak demand on our Region B network which is driven by summer irrigation load.
For diesel generation to be effective we require a contract to ensure peak lopping is reliably achieved. This is done through pricing structures that encourage users to control load at peak times. An incentive for major customers to generate electricity is provided through our pricing structure which includes an avoidable control period demand charge.
6.4.5.3 Uneconomic connections policy
When an application for a new or upgraded larger connection is requested, we undertake an economic assessment of the connection. This assessment determines whether our standard pricing arrangements will cover the cost of utilising existing or new assets associated with the connection. If the connection is uneconomic, and existing customers would be subsidising the new connection, then a connection contribution is required from the new customer. This policy ensures that the true cost of providing supply is passed on to the appropriate customer and allows them to make the right financial trade-offs.
We analyse the network for gaps using our Security of Supply Standard. It is a guide to the level of capital investment required in future network expansion to deliver the desired level of reliability performance expected by connected customers. The standard provides a sound basis for balancing the cost of providing the service with the value placed on that service by the customer.
Our Security of Supply Standard:
• provides a ‘table of rules’ that describes our desired level of service after different types of asset failure. The failure could be intrinsic or due to external influence, e.g. weather, or third-party damage
• defines whether an interruption will, or will not, occur following an asset failure and if so the length of time that customers can expect to be without power
• sets the guidelines by which we build our network. It is one of the key factors behind our reliability performance
The standard does not provide exhaustive detail and has been developed as a first pass guideline for the network planning team. It errs on the side of caution by providing a high level of security for customers who place a high value on the supply of electricity. If our network security does not match the level of security required by the security standard, then a gap in security is listed in Table 6.5.2. Before implementing a major solution to eliminate a security gap,
our network planning team ensures that the solution can be justified with economic analysis and a risk assessment.
In general, network security gaps fall into the following categories:
• solution is currently uneconomic, and an economic solution is not anticipated in the foreseeable future
• solution is currently uneconomic but is expected to become economic as load grows in the area under study
• local solution is uneconomic but network expansion in adjacent areas is expected to provide a security improvement in the future
• solution requires co-ordination with Transpower’s asset replacement programme and/or is subject to Transpower/ Commerce Commission approval
The economic analysis we undertake when considering investments to improve network security take into account the High Impact Low Probability (HILP) nature of the risks involved.
Transpower is required to maintain an N-1 level of security for the core grid as stated in the Electricity Industry Participation Code which includes a national transmission grid reliability standard. The GXP gaps identified in Table 6.5.1 are based on the application of our Security of Supply Standard to Transpower’s core-grid, spur or GXP assets.
6.5 Network gap analysis
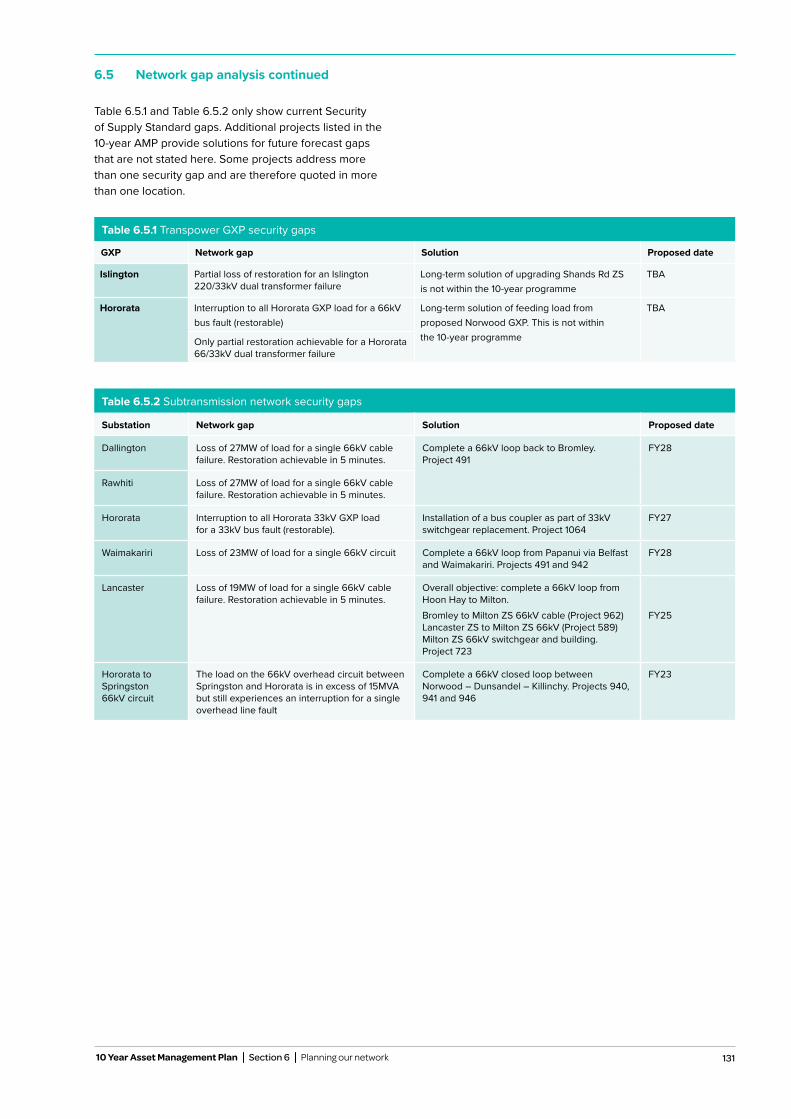
131
6.5 Network gap analysis continued
10 Year Asset Management Plan Section 6 Planning our network
Table 6.5.1 and Table 6.5.2 only show current Security of Supply Standard gaps. Additional projects listed in the 10-year AMP provide solutions for future forecast gapsthat are not stated here. Some projects address morethan one security gap and are therefore quoted in morethan one location.
Table 6.5.1 Transpower GXP security gaps
GXP Network gap Solution Proposed date
Islington Partial loss of restoration for an Islington 220/33kV dual transformer failure
Long-term solution of upgrading Shands Rd ZS is not within the 10-year programme
TBA
Hororata Interruption to all Hororata GXP load for a 66kV bus fault (restorable)
Long-term solution of feeding load from proposed Norwood GXP. This is not within the 10-year programme
TBA
Only partial restoration achievable for a Hororata 66/33kV dual transformer failure
Table 6.5.2 Subtransmission network security gaps
Substation Network gap Solution Proposed date
Dallington Loss of 27MW of load for a single 66kV cable failure. Restoration achievable in 5 minutes.
Complete a 66kV loop back to Bromley. Project 491
FY28
Rawhiti Loss of 27MW of load for a single 66kV cable failure. Restoration achievable in 5 minutes.
Hororata Interruption to all Hororata 33kV GXP load for a 33kV bus fault (restorable).
Installation of a bus coupler as part of 33kV switchgear replacement. Project 1064
FY27
Waimakariri Loss of 23MW of load for a single 66kV circuit Complete a 66kV loop from Papanui via Belfast and Waimakariri. Projects 491 and 942
FY28
Lancaster Loss of 19MW of load for a single 66kV cable failure. Restoration achievable in 5 minutes.
Overall objective: complete a 66kV loop from Hoon Hay to Milton.Bromley to Milton ZS 66kV cable (Project 962) Lancaster ZS to Milton ZS 66kV (Project 589) Milton ZS 66kV switchgear and building. Project 723
FY25
Hororata to Springston 66kV circuit
The load on the 66kV overhead circuit between Springston and Hororata is in excess of 15MVA but still experiences an interruption for a single overhead line fault
Complete a 66kV closed loop between Norwood – Dunsandel – Killinchy. Projects 940, 941 and 946
FY23
132 Orion New Zealand Limited
6.6 Network development proposals
This section lists our project proposals to address capacity and security constraints on our network. Our network development projects are driven by a variety of factors such as customer need, load growth, environmental considerations and increasing overall network resilience. Where economic, projects have been designed to meet our Security of Supply Standard requirements. See Section 6.4.1.
We account for the time it takes to plan and undertake the proposed projects for network improvements. This includes:
• the time required to procure zone substation land and/ornegotiate circuit routes – typically one or two years
• the time required for detailed design – typically one year
• management of service provider resources by providinga consistent work-flow
A major 66kV or 33kV network development project takes approximately three years to plan, design and build, while smaller 11kV projects take around 18 months. A 400V solution can take several months. In this context, it is prudent to be flexible in how we implement our network development proposals, rather than rigidly adhere to a project schedule based on an outdated forecast.
6.6.1 HV programmes of work and other projectsThe following section outlines our Network Development HV projects and programmes of work planned for the next 10 years. Projects in the first two years of the plan are considered firm. Projects scheduled in the first five years of the plan have programme overviews and brief descriptions for each. In contrast, projects in the latter five years are only outlined by project name, an indicative construction year, and their strategic driver(s).
There are five main programmes of work scheduled in the 10-year period:
• Northern Christchurch network, Section 6.6.1.1
• Region B 66kV subtransmission capacity, Section 6.6.1.2
• Region A 66kV subtransmission resilience, Section 6.6.1.3
• Lincoln area capacity and resilience improvement,Section 6.6.1.4
• Rolleston area capacity and resiliency, Section 6.6.1.5
The following Region A and Region B maps indicate the location and timing of individual forecast projects in this 10-year period, and the details of each project follow.
Our network development projects are driven by a variety of factors such as customer need, load growth, environmental considerations and increasing overall network resilience.
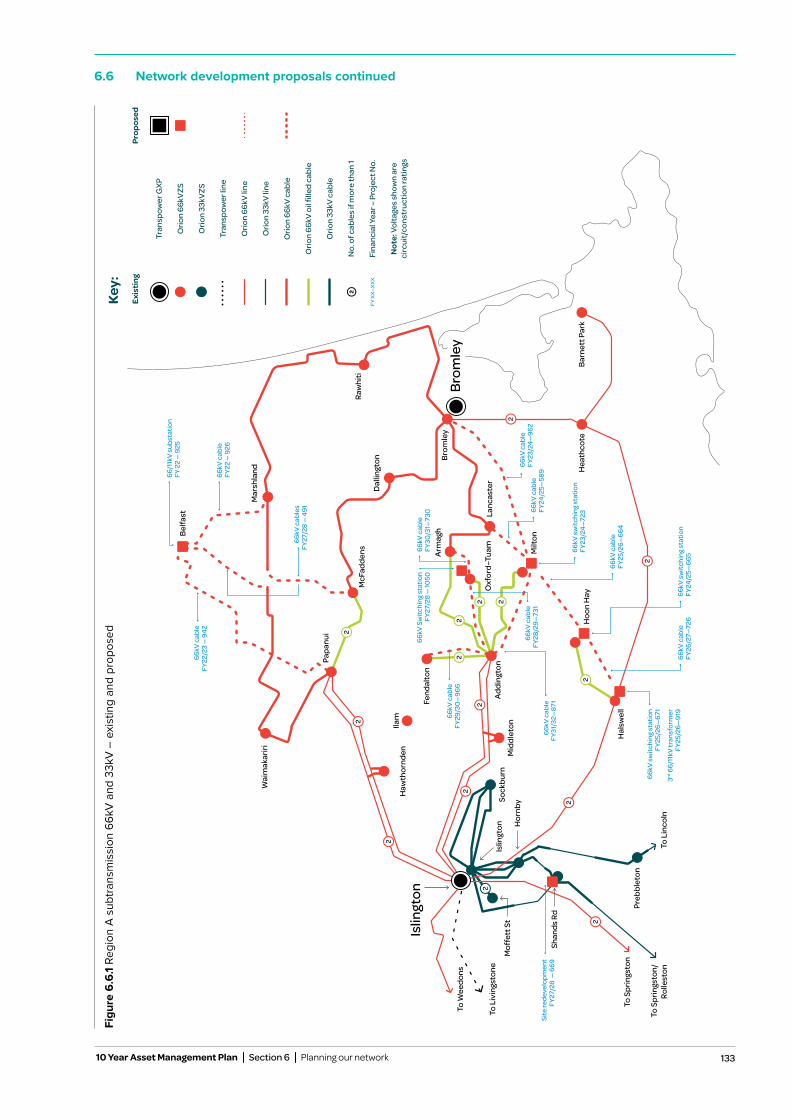
133
2
2
2
2
2
2
22
2
2 2
2
2
2
2
Tran
spow
er G
XP
Orio
n 66
kVZS
Orio
n 33
kVZS
Tran
spow
er li
ne
Orio
n 66
kV li
ne
Orio
n 33
kV li
ne
Orio
n 66
kV c
able
Orio
n 66
kV o
il fil
led
cabl
e
Orio
n 33
kV c
able
No.
of c
able
s if
mor
e th
an 1
Fina
ncia
l Yea
r – P
roje
ct N
o.
Not
e: V
olta
ges
show
n ar
e ci
rcui
t/co
nstr
uctio
n ra
tings
Key:
Exis
ting
Prop
osed
FY X
X—XX
X
Islin
gton
Brom
ley
Barn
ett P
ark
Hea
thco
te
Brom
ley
Lanc
aste
r
Arm
agh
Fend
alto
n
Add
ingt
onM
iddl
eton
Sock
burn
Oxf
ord–
Tuam
Haw
thor
nden
Ilam
Milt
on
Hoo
n H
ay
Hal
swel
l
Preb
blet
on
Wai
mak
ariri
Papa
nui
McF
adde
ns
Belfa
st
Mar
shla
nd
Dal
lingt
on
Raw
hiti
Mof
fett
St
To L
inco
lnTo
Spr
ings
ton/
Rolle
ston
To S
prin
gsto
n
To W
eedo
ns
To L
ivin
gsto
ne
Shan
ds R
d
Hor
nby
Islin
gton
Regi
on A
6.
2
66kV
sw
itchi
ng s
tatio
nFY
25/2
6—67
1
3rd 6
6/11
kV tr
ansf
orm
erFY
25/2
6—91
9
66kV
cab
leFY
28/2
9—73
166
kV c
able
FY31
/32—
871
66kV
cab
leFY
29/3
0—
966
Site
rede
velo
pmen
tFY
27/2
8 —
669
66kV
cab
les
FY27
/28
— 4
91
66kV
cab
leFY
22/2
3 —
942
66kV
cab
leFY
26/2
7—72
6
66kV
cab
leFY
25/2
6—66
4
66kV
sw
itchi
ng s
tatio
nFY
23/2
4—72
3
66kV
cab
leFY
23/2
4—96
266
kV c
able
FY24
/25—
589
66kV
sw
itchi
ng s
tatio
nFY
24/2
5—66
5
66kV
cab
leFY
30/3
1—73
066
kV S
witc
hing
sta
tion
FY27
/28
— 10
50
66/1
1kV
subs
tatio
nFY
22
— 9
25
66kV
cab
leFY
22 —
926 2
2
2
2
2
2
22
2
2 2
2
2
2
2
Tran
spow
er G
XP
Orio
n 66
kVZS
Orio
n 33
kVZS
Tran
spow
er li
ne
Orio
n 66
kV li
ne
Orio
n 33
kV li
ne
Orio
n 66
kV c
able
Orio
n 66
kV o
il fil
led
cabl
e
Orio
n 33
kV c
able
No.
of c
able
s if
mor
e th
an 1
Fina
ncia
l Yea
r – P
roje
ct N
o.
Not
e: V
olta
ges
show
n ar
e ci
rcui
t/co
nstr
uctio
n ra
tings
Key:
Exis
ting
Prop
osed
FY X
X—XX
X
Islin
gton
Brom
ley
Barn
ett P
ark
Hea
thco
te
Brom
ley
Lanc
aste
r
Arm
agh
Fend
alto
n
Add
ingt
onM
iddl
eton
Sock
burn
Oxf
ord–
Tuam
Haw
thor
nden
Ilam
Milt
on
Hoo
n H
ay
Hal
swel
l
Preb
blet
on
Wai
mak
ariri
Papa
nui
McF
adde
ns
Belfa
st
Mar
shla
nd
Dal
lingt
on
Raw
hiti
Mof
fett
St
To L
inco
lnTo
Spr
ings
ton/
Rolle
ston
To S
prin
gsto
n
To W
eedo
ns
To L
ivin
gsto
ne
Shan
ds R
d
Hor
nby
Islin
gton
Regi
on A
6.
2
66kV
sw
itchi
ng s
tatio
nFY
25/2
6—67
1
3rd 6
6/11
kV tr
ansf
orm
erFY
25/2
6—91
9
66kV
cab
leFY
28/2
9—73
166
kV c
able
FY31
/32—
871
66kV
cab
leFY
29/3
0—
966
Site
rede
velo
pmen
tFY
27/2
8 —
669
66kV
cab
les
FY27
/28
— 4
91
66kV
cab
leFY
22/2
3 —
942
66kV
cab
leFY
26/2
7—72
6
66kV
cab
leFY
25/2
6—66
4
66kV
sw
itchi
ng s
tatio
nFY
23/2
4—72
3
66kV
cab
leFY
23/2
4—96
266
kV c
able
FY24
/25—
589
66kV
sw
itchi
ng s
tatio
nFY
24/2
5—66
5
66kV
cab
leFY
30/3
1—73
066
kV S
witc
hing
sta
tion
FY27
/28
— 10
50
66/1
1kV
subs
tatio
nFY
22
— 9
25
66kV
cab
leFY
22 —
926
6.6 Network development proposals continued
10 Year Asset Management Plan Section 6 Planning our network
Figu
re 6
.6.1
Regi
on A
sub
trans
mis
sion
66k
V an
d 33
kV –
exi
stin
g an
d pr
opos
ed
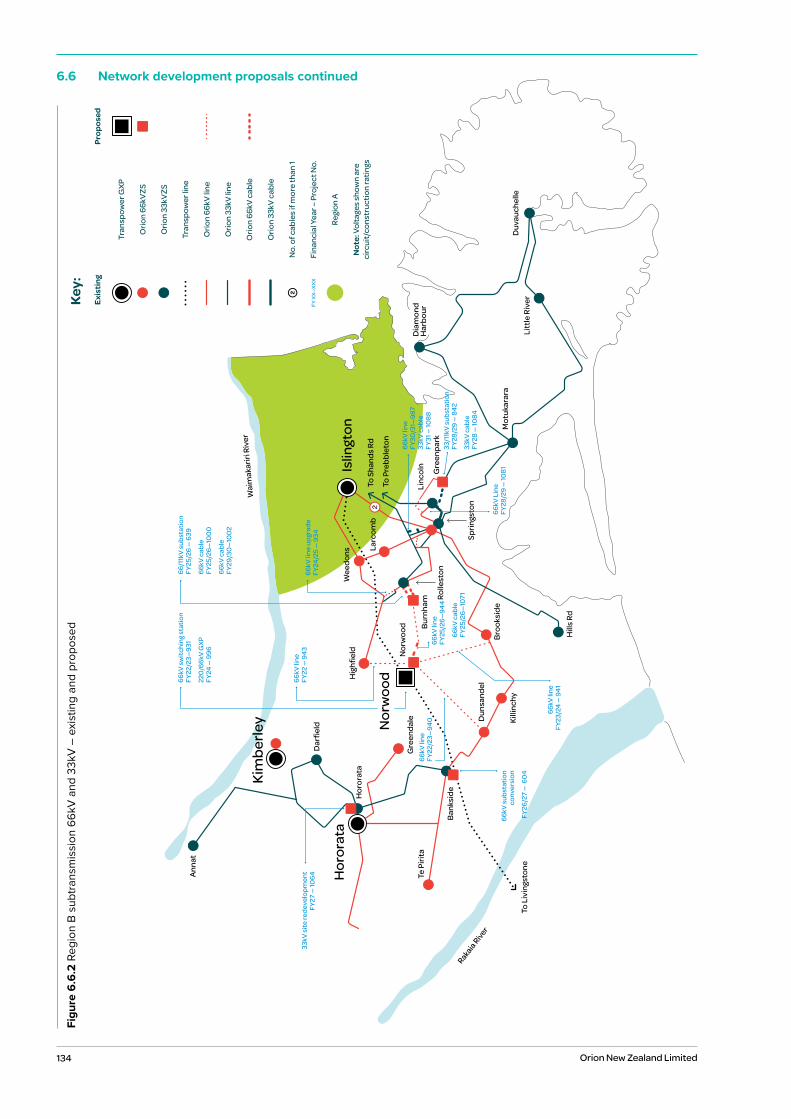
134 Orion New Zealand Limited
2
Tran
spow
er G
XP
Orio
n 66
kVZS
Orio
n 33
kVZS
Tran
spow
er li
ne
Orio
n 66
kV li
ne
Orio
n 33
kV li
ne
Orio
n 66
kV c
able
Orio
n 33
kV c
able
No.
of c
able
s if
mor
e th
an 1
Fina
ncia
l Yea
r – P
roje
ct N
o.
Regi
on A
Not
e: V
olta
ges
show
n ar
e ci
rcui
t/co
nstr
uctio
n ra
tings
FY X
X—XX
X
Key:
Exis
ting
Prop
osed
Litt
le R
iver
Mot
ukar
ara
Dia
mon
d H
arbo
ur
To S
hand
s Rd
To P
rebb
leto
n
Linc
oln
Gre
enpa
rk
Islin
gton
Kim
berle
y
Hor
orat
a
Nor
woo
d
Duv
auch
elle
Rolle
ston
Hill
s Rd
Broo
ksid
e
Dun
sand
el
Killi
nchy
Bank
side
Gre
enda
le
Hor
orat
a
Dar
field
Ann
at
Regi
on B
6.3
Hig
hfiel
d Nor
woo
d
Larc
omb
Wee
dons
Wai
mak
ariri
Riv
er
Rakaia River
Burn
ham
Te P
irita
To L
ivin
gsto
ne
Sprin
gsto
n
66/1
1kV
subs
tatio
nFY
25/2
6 —
639
66kV
cab
leFY
25/2
6—10
00
66kV
cab
leFY
29/3
0—
100
2
66kV
line
upg
rade
FY24
/25
— 9
34
66kV
sw
itchi
ng s
tatio
nFY
22/2
3—93
1
220
/66k
V G
XPFY
24 —
996
66kV
line
FY22
— 9
43
33/1
1kV
subs
tatio
nFY
28/2
9 —
842
33kV
cab
leFY
28 —
1084
66kV
line
FY
25/2
6—94
4
66kV
line
FY
22/2
3—94
0
66kV
cab
leFY
25/2
6—10
71
66kV
line
FY
30/3
1—98
733
kV c
able
FY31
— 10
88
66kV
sub
stat
ion
conv
ersi
on
FY26
/27
— 6
04
33kV
site
rede
velo
pmen
t FY
27 —
1064
66kV
line
FY
23/2
4 —
941
66kV
Lin
eFY
28/2
9 —
1081
2
Tran
spow
er G
XP
Orio
n 66
kVZS
Orio
n 33
kVZS
Tran
spow
er li
ne
Orio
n 66
kV li
ne
Orio
n 33
kV li
ne
Orio
n 66
kV c
able
Orio
n 33
kV c
able
No.
of c
able
s if
mor
e th
an 1
Fina
ncia
l Yea
r – P
roje
ct N
o.
Regi
on A
Not
e: V
olta
ges
show
n ar
e ci
rcui
t/co
nstr
uctio
n ra
tings
FY X
X—XX
X
Key:
Exis
ting
Prop
osed
Litt
le R
iver
Mot
ukar
ara
Dia
mon
d H
arbo
ur
To S
hand
s Rd
To P
rebb
leto
n
Linc
oln
Gre
enpa
rk
Islin
gton
Kim
berle
y
Hor
orat
a
Nor
woo
d
Duv
auch
elle
Rolle
ston
Hill
s Rd
Broo
ksid
e
Dun
sand
el
Killi
nchy
Bank
side
Gre
enda
le
Hor
orat
a
Dar
field
Ann
at
Regi
on B
6.3
Hig
hfiel
d Nor
woo
d
Larc
omb
Wee
dons
Wai
mak
ariri
Riv
er
Rakaia River
Burn
ham
Te P
irita
To L
ivin
gsto
ne
Sprin
gsto
n
66/1
1kV
subs
tatio
nFY
25/2
6 —
639
66kV
cab
leFY
25/2
6—10
00
66kV
cab
leFY
29/3
0—
100
2
66kV
line
upg
rade
FY24
/25
— 9
34
66kV
sw
itchi
ng s
tatio
nFY
22/2
3—93
1
220
/66k
V G
XPFY
24 —
996
66kV
line
FY22
— 9
43
33/1
1kV
subs
tatio
nFY
28/2
9 —
842
33kV
cab
leFY
28 —
1084
66kV
line
FY
25/2
6—94
4
66kV
line
FY
22/2
3—94
0
66kV
cab
leFY
25/2
6—10
71
66kV
line
FY
30/3
1—98
733
kV c
able
FY31
— 10
88
66kV
sub
stat
ion
conv
ersi
on
FY26
/27
— 6
04
33kV
site
rede
velo
pmen
t FY
27 —
1064
66kV
line
FY
23/2
4 —
941
66kV
Lin
eFY
28/2
9 —
1081
Figu
re 6
.6.2
Reg
ion
B su
btra
nsm
issi
on 6
6kV
and
33kV
– e
xist
ing
and
prop
osed
6.6 Network development proposals continued
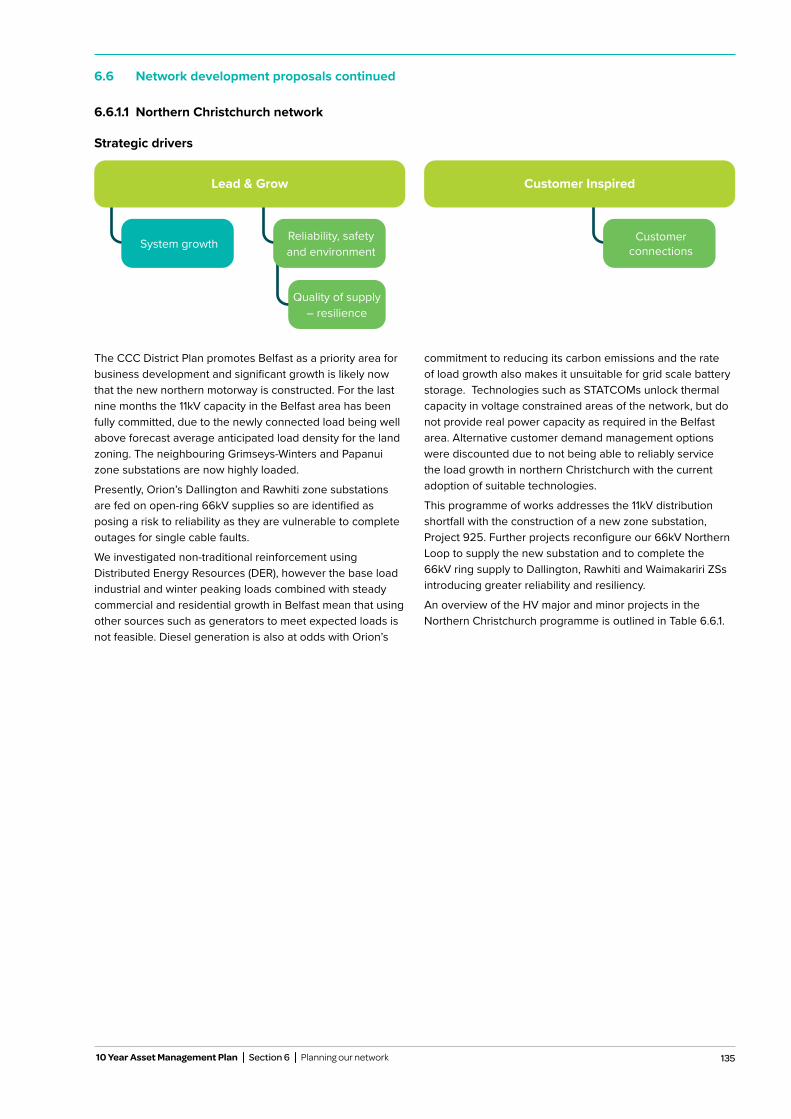
135 10 Year Asset Management Plan Section 6 Planning our network
6.6 Network development proposals continued
The CCC District Plan promotes Belfast as a priority area for business development and significant growth is likely now that the new northern motorway is constructed. For the last nine months the 11kV capacity in the Belfast area has been fully committed, due to the newly connected load being well above forecast average anticipated load density for the land zoning. The neighbouring Grimseys-Winters and Papanui zone substations are now highly loaded.
Presently, Orion’s Dallington and Rawhiti zone substations are fed on open-ring 66kV supplies so are identified as posing a risk to reliability as they are vulnerable to complete outages for single cable faults.
We investigated non-traditional reinforcement using Distributed Energy Resources (DER), however the base load industrial and winter peaking loads combined with steady commercial and residential growth in Belfast mean that using other sources such as generators to meet expected loads is not feasible. Diesel generation is also at odds with Orion’s
commitment to reducing its carbon emissions and the rate of load growth also makes it unsuitable for grid scale battery storage. Technologies such as STATCOMs unlock thermal capacity in voltage constrained areas of the network, but do not provide real power capacity as required in the Belfast area. Alternative customer demand management options were discounted due to not being able to reliably service the load growth in northern Christchurch with the current adoption of suitable technologies.
This programme of works addresses the 11kV distribution shortfall with the construction of a new zone substation, Project 925. Further projects reconfigure our 66kV Northern Loop to supply the new substation and to complete the 66kV ring supply to Dallington, Rawhiti and Waimakariri ZSs introducing greater reliability and resiliency.
An overview of the HV major and minor projects in the Northern Christchurch programme is outlined in Table 6.6.1.
6.6.1.1 Northern Christchurch network
Strategic drivers
Customer Inspired
Customer connections
Lead & Grow
Quality of supply – resilience
System growth Reliability, safety and environment
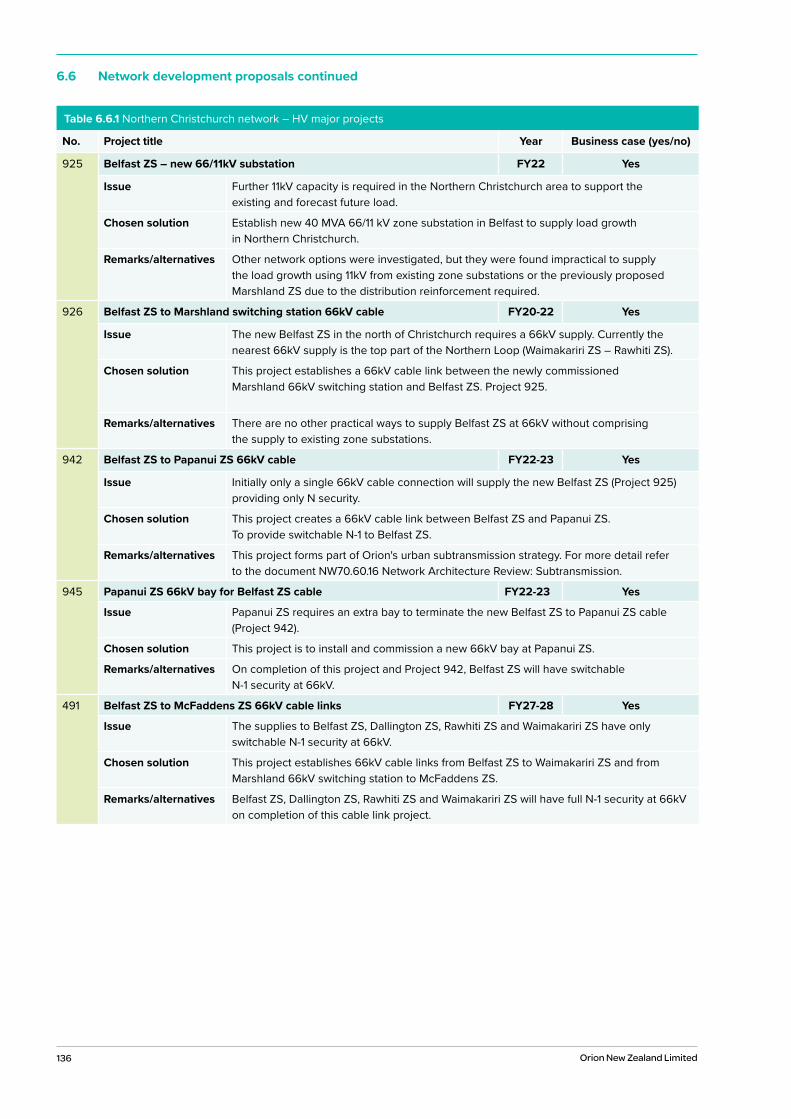
136 Orion New Zealand Limited
6.6 Network development proposals continued
Table 6.6.1 Northern Christchurch network – HV major projects
No. Project title Year Business case (yes/no)
925 Belfast ZS – new 66/11kV substation FY22 Yes
Issue Further 11kV capacity is required in the Northern Christchurch area to support the existing and forecast future load.
Chosen solution Establish new 40 MVA 66/11 kV zone substation in Belfast to supply load growth in Northern Christchurch.
Remarks/alternatives Other network options were investigated, but they were found impractical to supply the load growth using 11kV from existing zone substations or the previously proposed Marshland ZS due to the distribution reinforcement required.
926 Belfast ZS to Marshland switching station 66kV cable FY20-22 Yes
Issue The new Belfast ZS in the north of Christchurch requires a 66kV supply. Currently the nearest 66kV supply is the top part of the Northern Loop (Waimakariri ZS – Rawhiti ZS).
Chosen solution This project establishes a 66kV cable link between the newly commissioned Marshland 66kV switching station and Belfast ZS. Project 925.
Remarks/alternatives There are no other practical ways to supply Belfast ZS at 66kV without comprising the supply to existing zone substations.
942 Belfast ZS to Papanui ZS 66kV cable FY22-23 Yes
Issue Initially only a single 66kV cable connection will supply the new Belfast ZS (Project 925) providing only N security.
Chosen solution This project creates a 66kV cable link between Belfast ZS and Papanui ZS. To provide switchable N-1 to Belfast ZS.
Remarks/alternatives This project forms part of Orion's urban subtransmission strategy. For more detail refer to the document NW70.60.16 Network Architecture Review: Subtransmission.
945 Papanui ZS 66kV bay for Belfast ZS cable FY22-23 Yes
Issue Papanui ZS requires an extra bay to terminate the new Belfast ZS to Papanui ZS cable (Project 942).
Chosen solution This project is to install and commission a new 66kV bay at Papanui ZS.
Remarks/alternatives On completion of this project and Project 942, Belfast ZS will have switchable N-1 security at 66kV.
491 Belfast ZS to McFaddens ZS 66kV cable links FY27-28 Yes
Issue The supplies to Belfast ZS, Dallington ZS, Rawhiti ZS and Waimakariri ZS have only switchable N-1 security at 66kV.
Chosen solution This project establishes 66kV cable links from Belfast ZS to Waimakariri ZS and from Marshland 66kV switching station to McFaddens ZS.
Remarks/alternatives Belfast ZS, Dallington ZS, Rawhiti ZS and Waimakariri ZS will have full N-1 security at 66kV on completion of this cable link project.
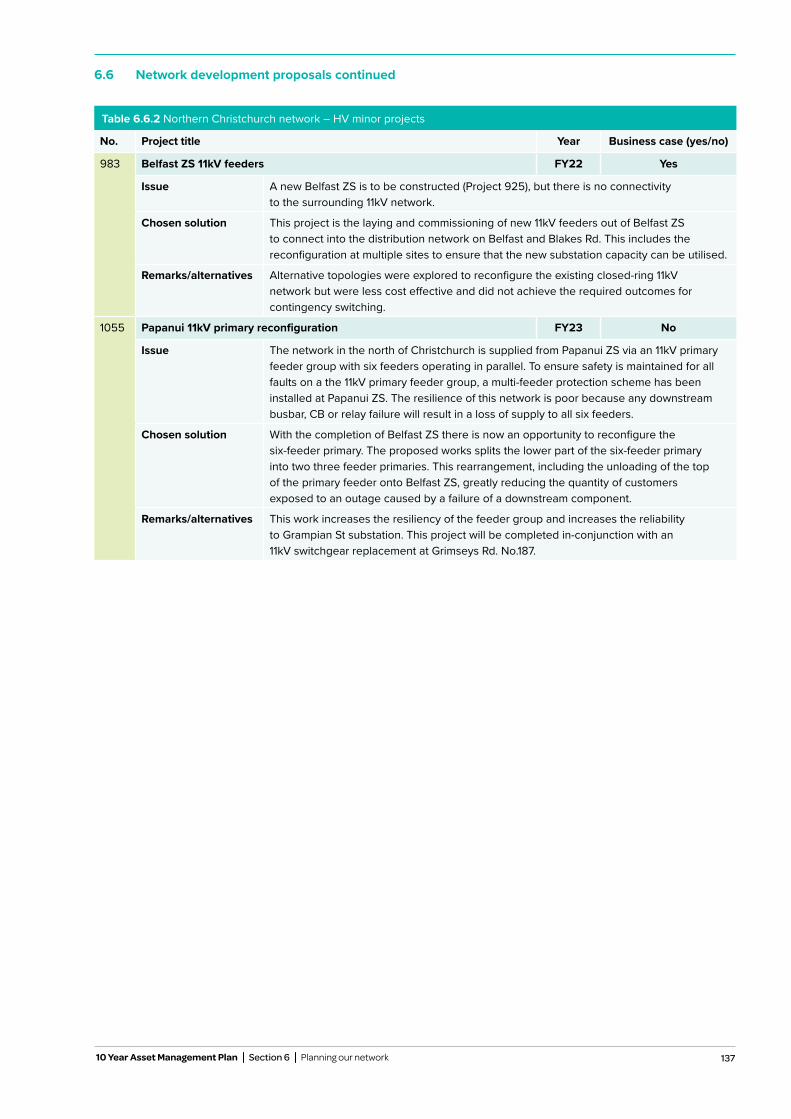
137
Table 6.6.2 Northern Christchurch network – HV minor projects
No. Project title Year Business case (yes/no)
983 Belfast ZS 11kV feeders FY22 Yes
Issue A new Belfast ZS is to be constructed (Project 925), but there is no connectivity to the surrounding 11kV network.
Chosen solution This project is the laying and commissioning of new 11kV feeders out of Belfast ZS to connect into the distribution network on Belfast and Blakes Rd. This includes the reconfiguration at multiple sites to ensure that the new substation capacity can be utilised.
Remarks/alternatives Alternative topologies were explored to reconfigure the existing closed-ring 11kV network but were less cost effective and did not achieve the required outcomes for contingency switching.
1055 Papanui 11kV primary reconfiguration FY23 No
Issue The network in the north of Christchurch is supplied from Papanui ZS via an 11kV primary feeder group with six feeders operating in parallel. To ensure safety is maintained for all faults on a the 11kV primary feeder group, a multi-feeder protection scheme has been installed at Papanui ZS. The resilience of this network is poor because any downstream busbar, CB or relay failure will result in a loss of supply to all six feeders.
Chosen solution With the completion of Belfast ZS there is now an opportunity to reconfigure the six-feeder primary. The proposed works splits the lower part of the six-feeder primary into two three feeder primaries. This rearrangement, including the unloading of the top of the primary feeder onto Belfast ZS, greatly reducing the quantity of customers exposed to an outage caused by a failure of a downstream component.
Remarks/alternatives This work increases the resiliency of the feeder group and increases the reliability to Grampian St substation. This project will be completed in-conjunction with an 11kV switchgear replacement at Grimseys Rd. No.187.
6.6 Network development proposals continued
10 Year Asset Management Plan Section 6 Planning our network
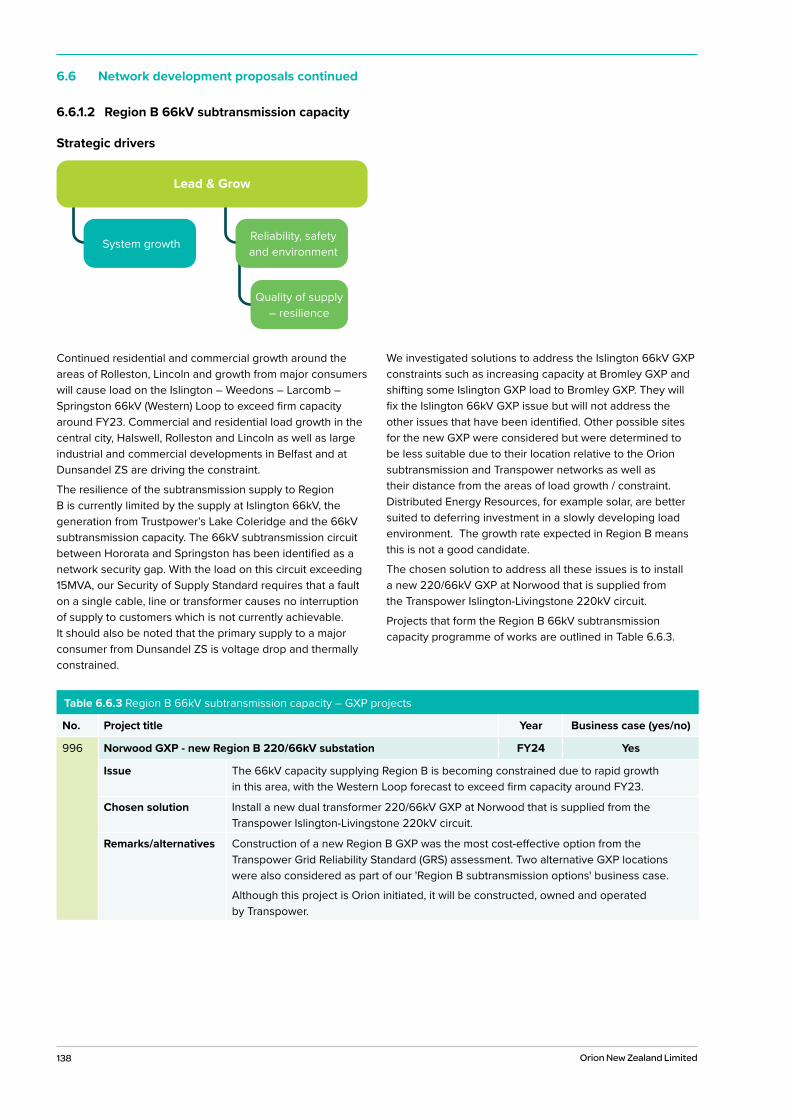
138 Orion New Zealand Limited
6.6 Network development proposals continued
Continued residential and commercial growth around the areas of Rolleston, Lincoln and growth from major consumers will cause load on the Islington – Weedons – Larcomb – Springston 66kV (Western) Loop to exceed firm capacity around FY23. Commercial and residential load growth in the central city, Halswell, Rolleston and Lincoln as well as large industrial and commercial developments in Belfast and at Dunsandel ZS are driving the constraint.
The resilience of the subtransmission supply to Region B is currently limited by the supply at Islington 66kV, the generation from Trustpower’s Lake Coleridge and the 66kV subtransmission capacity. The 66kV subtransmission circuit between Hororata and Springston has been identified as a network security gap. With the load on this circuit exceeding 15MVA, our Security of Supply Standard requires that a fault on a single cable, line or transformer causes no interruption of supply to customers which is not currently achievable. It should also be noted that the primary supply to a major consumer from Dunsandel ZS is voltage drop and thermally constrained.
We investigated solutions to address the Islington 66kV GXP constraints such as increasing capacity at Bromley GXP and shifting some Islington GXP load to Bromley GXP. They will fix the Islington 66kV GXP issue but will not address the other issues that have been identified. Other possible sites for the new GXP were considered but were determined to be less suitable due to their location relative to the Orion subtransmission and Transpower networks as well as their distance from the areas of load growth / constraint. Distributed Energy Resources, for example solar, are better suited to deferring investment in a slowly developing load environment. The growth rate expected in Region B means this is not a good candidate.
The chosen solution to address all these issues is to install a new 220/66kV GXP at Norwood that is supplied from the Transpower Islington-Livingstone 220kV circuit.
Projects that form the Region B 66kV subtransmission capacity programme of works are outlined in Table 6.6.3.
6.6.1.2 Region B 66kV subtransmission capacity
Strategic drivers
Table 6.6.3 Region B 66kV subtransmission capacity – GXP projects
No. Project title Year Business case (yes/no)
996 Norwood GXP - new Region B 220/66kV substation FY24 Yes
Issue The 66kV capacity supplying Region B is becoming constrained due to rapid growth in this area, with the Western Loop forecast to exceed firm capacity around FY23.
Chosen solution Install a new dual transformer 220/66kV GXP at Norwood that is supplied from the Transpower Islington-Livingstone 220kV circuit.
Remarks/alternatives Construction of a new Region B GXP was the most cost-effective option from the Transpower Grid Reliability Standard (GRS) assessment. Two alternative GXP locations were also considered as part of our 'Region B subtransmission options' business case.
Although this project is Orion initiated, it will be constructed, owned and operated by Transpower.
Lead & Grow
Quality of supply – resilience
System growth Reliability, safety and environment
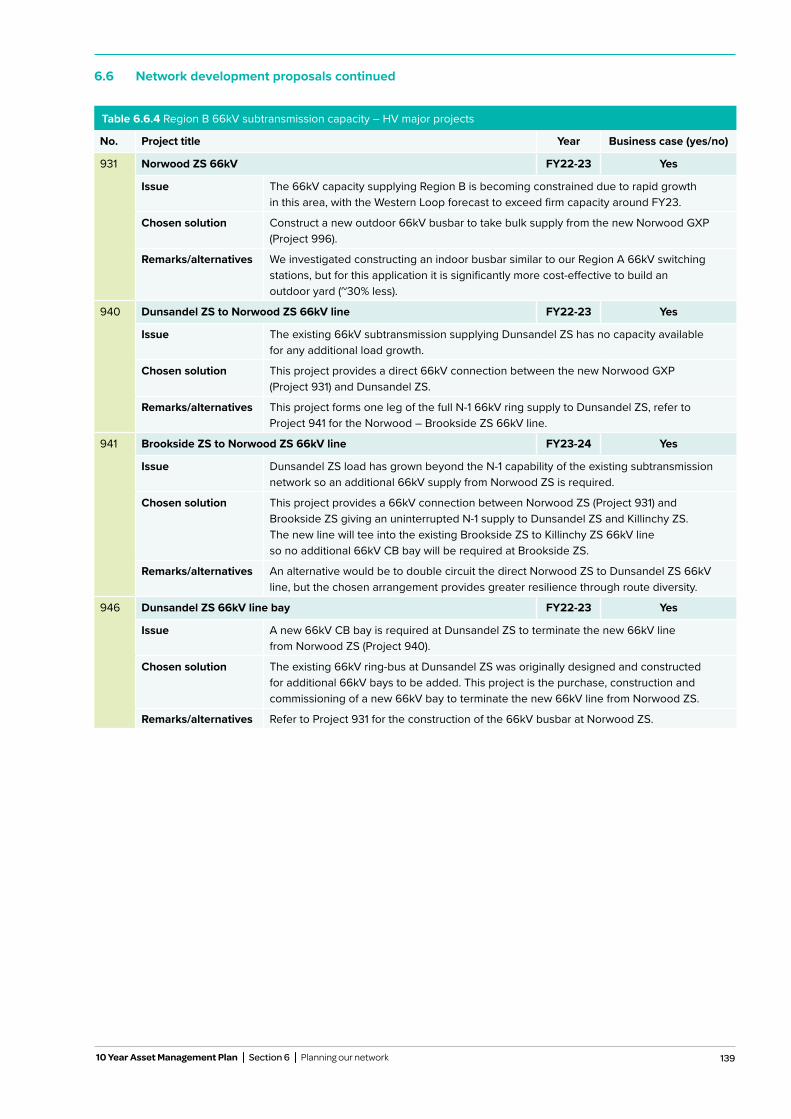
139
6.6 Network development proposals continued
10 Year Asset Management Plan Section 6 Planning our network
Table 6.6.4 Region B 66kV subtransmission capacity – HV major projects
No. Project title Year Business case (yes/no)
931 Norwood ZS 66kV FY22-23 Yes
Issue The 66kV capacity supplying Region B is becoming constrained due to rapid growth in this area, with the Western Loop forecast to exceed firm capacity around FY23.
Chosen solution Construct a new outdoor 66kV busbar to take bulk supply from the new Norwood GXP (Project 996).
Remarks/alternatives We investigated constructing an indoor busbar similar to our Region A 66kV switching stations, but for this application it is significantly more cost-effective to build an outdoor yard (~30% less).
940 Dunsandel ZS to Norwood ZS 66kV line FY22-23 Yes
Issue The existing 66kV subtransmission supplying Dunsandel ZS has no capacity available for any additional load growth.
Chosen solution This project provides a direct 66kV connection between the new Norwood GXP (Project 931) and Dunsandel ZS.
Remarks/alternatives This project forms one leg of the full N-1 66kV ring supply to Dunsandel ZS, refer to Project 941 for the Norwood – Brookside ZS 66kV line.
941 Brookside ZS to Norwood ZS 66kV line FY23-24 Yes
Issue Dunsandel ZS load has grown beyond the N-1 capability of the existing subtransmission network so an additional 66kV supply from Norwood ZS is required.
Chosen solution This project provides a 66kV connection between Norwood ZS (Project 931) and Brookside ZS giving an uninterrupted N-1 supply to Dunsandel ZS and Killinchy ZS. The new line will tee into the existing Brookside ZS to Killinchy ZS 66kV line so no additional 66kV CB bay will be required at Brookside ZS.
Remarks/alternatives An alternative would be to double circuit the direct Norwood ZS to Dunsandel ZS 66kV line, but the chosen arrangement provides greater resilience through route diversity.
946 Dunsandel ZS 66kV line bay FY22-23 Yes
Issue A new 66kV CB bay is required at Dunsandel ZS to terminate the new 66kV line from Norwood ZS (Project 940).
Chosen solution The existing 66kV ring-bus at Dunsandel ZS was originally designed and constructed for additional 66kV bays to be added. This project is the purchase, construction and commissioning of a new 66kV bay to terminate the new 66kV line from Norwood ZS.
Remarks/alternatives Refer to Project 931 for the construction of the 66kV busbar at Norwood ZS.
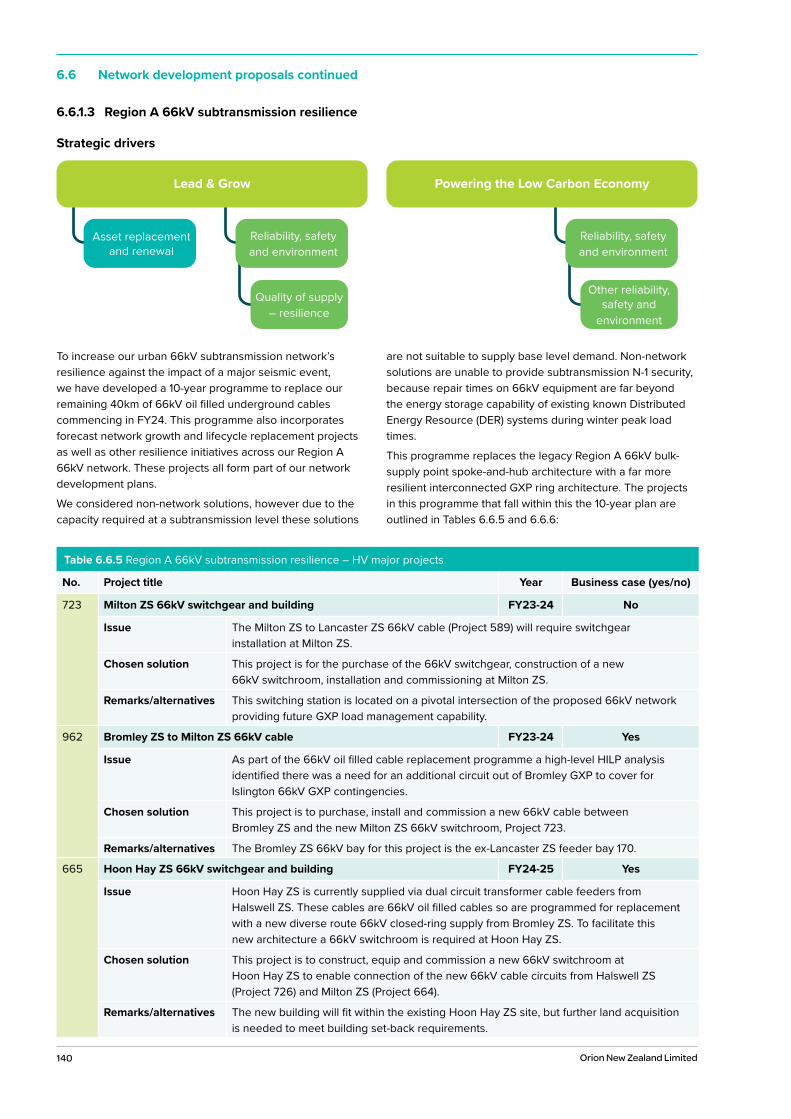
140 Orion New Zealand Limited
6.6 Network development proposals continued
To increase our urban 66kV subtransmission network’s resilience against the impact of a major seismic event, we have developed a 10-year programme to replace our remaining 40km of 66kV oil filled underground cables commencing in FY24. This programme also incorporates forecast network growth and lifecycle replacement projects as well as other resilience initiatives across our Region A 66kV network. These projects all form part of our network development plans.
We considered non-network solutions, however due to the capacity required at a subtransmission level these solutions
are not suitable to supply base level demand. Non-network solutions are unable to provide subtransmission N-1 security, because repair times on 66kV equipment are far beyond the energy storage capability of existing known Distributed Energy Resource (DER) systems during winter peak load times.
This programme replaces the legacy Region A 66kV bulk-supply point spoke-and-hub architecture with a far more resilient interconnected GXP ring architecture. The projects in this programme that fall within this the 10-year plan are outlined in Tables 6.6.5 and 6.6.6:
6.6.1.3 Region A 66kV subtransmission resilience
Strategic drivers
Table 6.6.5 Region A 66kV subtransmission resilience – HV major projects
No. Project title Year Business case (yes/no)
723 Milton ZS 66kV switchgear and building FY23-24 No
Issue The Milton ZS to Lancaster ZS 66kV cable (Project 589) will require switchgear installation at Milton ZS.
Chosen solution This project is for the purchase of the 66kV switchgear, construction of a new 66kV switchroom, installation and commissioning at Milton ZS.
Remarks/alternatives This switching station is located on a pivotal intersection of the proposed 66kV network providing future GXP load management capability.
962 Bromley ZS to Milton ZS 66kV cable FY23-24 Yes
Issue As part of the 66kV oil filled cable replacement programme a high-level HILP analysis identified there was a need for an additional circuit out of Bromley GXP to cover for Islington 66kV GXP contingencies.
Chosen solution This project is to purchase, install and commission a new 66kV cable between Bromley ZS and the new Milton ZS 66kV switchroom, Project 723.
Remarks/alternatives The Bromley ZS 66kV bay for this project is the ex-Lancaster ZS feeder bay 170.
665 Hoon Hay ZS 66kV switchgear and building FY24-25 Yes
Issue Hoon Hay ZS is currently supplied via dual circuit transformer cable feeders from Halswell ZS. These cables are 66kV oil filled cables so are programmed for replacement with a new diverse route 66kV closed-ring supply from Bromley ZS. To facilitate this new architecture a 66kV switchroom is required at Hoon Hay ZS.
Chosen solution This project is to construct, equip and commission a new 66kV switchroom at Hoon Hay ZS to enable connection of the new 66kV cable circuits from Halswell ZS (Project 726) and Milton ZS (Project 664).
Remarks/alternatives The new building will fit within the existing Hoon Hay ZS site, but further land acquisition is needed to meet building set-back requirements.
Lead & Grow
Quality of supply – resilience
Asset replacement and renewal
Reliability, safety and environment
Powering the Low Carbon Economy
Other reliability, safety and
environment
Reliability, safety and environment
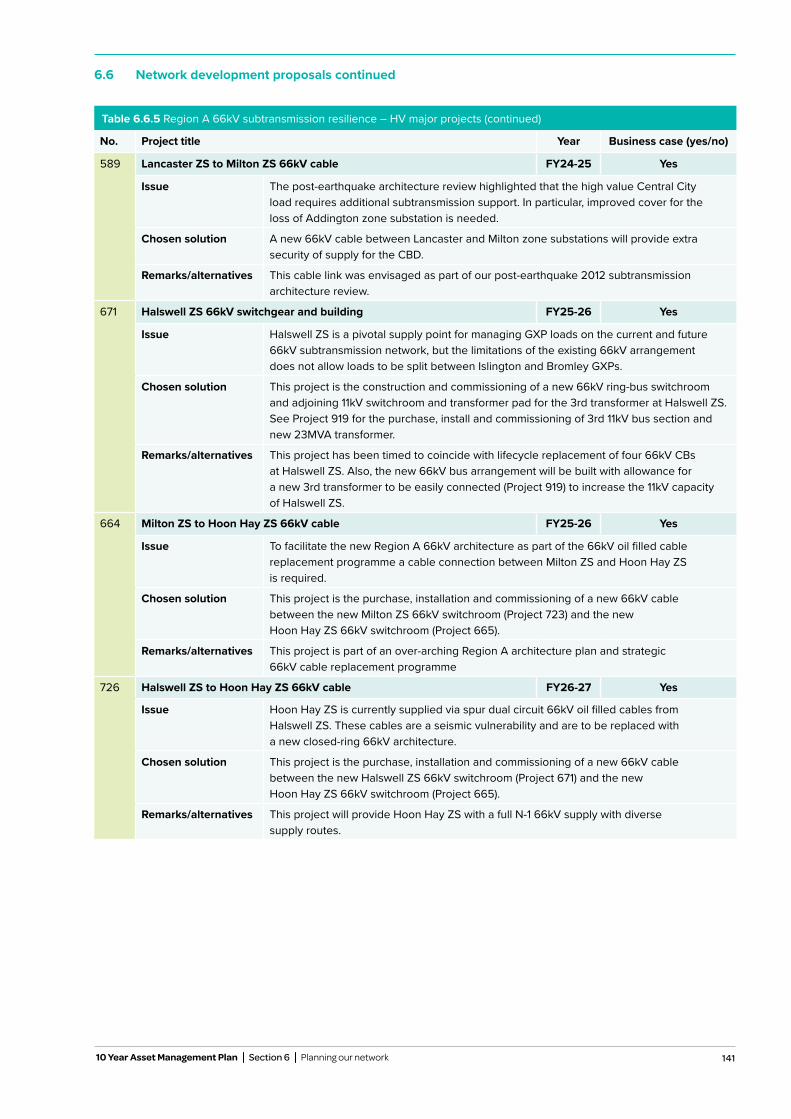
141
6.6 Network development proposals continued
10 Year Asset Management Plan Section 6 Planning our network
Table 6.6.5 Region A 66kV subtransmission resilience – HV major projects (continued)
No. Project title Year Business case (yes/no)
589 Lancaster ZS to Milton ZS 66kV cable FY24-25 Yes
Issue The post-earthquake architecture review highlighted that the high value Central City load requires additional subtransmission support. In particular, improved cover for the loss of Addington zone substation is needed.
Chosen solution A new 66kV cable between Lancaster and Milton zone substations will provide extra security of supply for the CBD.
Remarks/alternatives This cable link was envisaged as part of our post-earthquake 2012 subtransmission architecture review.
671 Halswell ZS 66kV switchgear and building FY25-26 Yes
Issue Halswell ZS is a pivotal supply point for managing GXP loads on the current and future 66kV subtransmission network, but the limitations of the existing 66kV arrangement does not allow loads to be split between Islington and Bromley GXPs.
Chosen solution This project is the construction and commissioning of a new 66kV ring-bus switchroom and adjoining 11kV switchroom and transformer pad for the 3rd transformer at Halswell ZS. See Project 919 for the purchase, install and commissioning of 3rd 11kV bus section and new 23MVA transformer.
Remarks/alternatives This project has been timed to coincide with lifecycle replacement of four 66kV CBs at Halswell ZS. Also, the new 66kV bus arrangement will be built with allowance for a new 3rd transformer to be easily connected (Project 919) to increase the 11kV capacity of Halswell ZS.
664 Milton ZS to Hoon Hay ZS 66kV cable FY25-26 Yes
Issue To facilitate the new Region A 66kV architecture as part of the 66kV oil filled cable replacement programme a cable connection between Milton ZS and Hoon Hay ZS is required.
Chosen solution This project is the purchase, installation and commissioning of a new 66kV cable between the new Milton ZS 66kV switchroom (Project 723) and the new Hoon Hay ZS 66kV switchroom (Project 665).
Remarks/alternatives This project is part of an over-arching Region A architecture plan and strategic 66kV cable replacement programme
726 Halswell ZS to Hoon Hay ZS 66kV cable FY26-27 Yes
Issue Hoon Hay ZS is currently supplied via spur dual circuit 66kV oil filled cables from Halswell ZS. These cables are a seismic vulnerability and are to be replaced with a new closed-ring 66kV architecture.
Chosen solution This project is the purchase, installation and commissioning of a new 66kV cable between the new Halswell ZS 66kV switchroom (Project 671) and the new Hoon Hay ZS 66kV switchroom (Project 665).
Remarks/alternatives This project will provide Hoon Hay ZS with a full N-1 66kV supply with diverse supply routes.
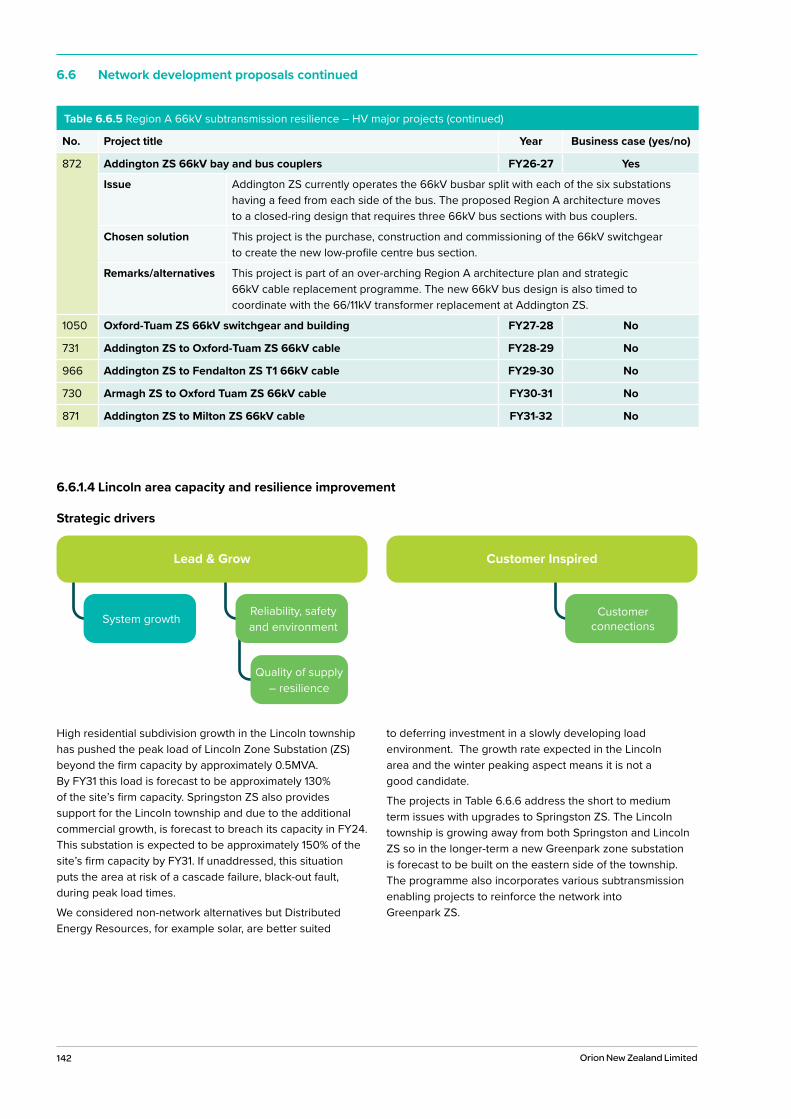
142 Orion New Zealand Limited
6.6 Network development proposals continued
High residential subdivision growth in the Lincoln township has pushed the peak load of Lincoln Zone Substation (ZS) beyond the firm capacity by approximately 0.5MVA. By FY31 this load is forecast to be approximately 130% of the site’s firm capacity. Springston ZS also provides support for the Lincoln township and due to the additional commercial growth, is forecast to breach its capacity in FY24. This substation is expected to be approximately 150% of the site’s firm capacity by FY31. If unaddressed, this situation puts the area at risk of a cascade failure, black-out fault, during peak load times.
We considered non-network alternatives but Distributed Energy Resources, for example solar, are better suited
to deferring investment in a slowly developing load environment. The growth rate expected in the Lincoln area and the winter peaking aspect means it is not a good candidate.
The projects in Table 6.6.6 address the short to medium term issues with upgrades to Springston ZS. The Lincoln township is growing away from both Springston and Lincoln ZS so in the longer-term a new Greenpark zone substation is forecast to be built on the eastern side of the township. The programme also incorporates various subtransmission enabling projects to reinforce the network into Greenpark ZS.
6.6.1.4 Lincoln area capacity and resilience improvement
Strategic drivers
Table 6.6.5 Region A 66kV subtransmission resilience – HV major projects (continued)
No. Project title Year Business case (yes/no)
872 Addington ZS 66kV bay and bus couplers FY26-27 Yes
Issue Addington ZS currently operates the 66kV busbar split with each of the six substations having a feed from each side of the bus. The proposed Region A architecture moves to a closed-ring design that requires three 66kV bus sections with bus couplers.
Chosen solution This project is the purchase, construction and commissioning of the 66kV switchgear to create the new low-profile centre bus section.
Remarks/alternatives This project is part of an over-arching Region A architecture plan and strategic 66kV cable replacement programme. The new 66kV bus design is also timed to coordinate with the 66/11kV transformer replacement at Addington ZS.
1050 Oxford-Tuam ZS 66kV switchgear and building FY27-28 No
731 Addington ZS to Oxford-Tuam ZS 66kV cable FY28-29 No
966 Addington ZS to Fendalton ZS T1 66kV cable FY29-30 No
730 Armagh ZS to Oxford Tuam ZS 66kV cable FY30-31 No
871 Addington ZS to Milton ZS 66kV cable FY31-32 No
Customer Inspired
Customer connections
Lead & Grow
Quality of supply – resilience
System growth Reliability, safety and environment
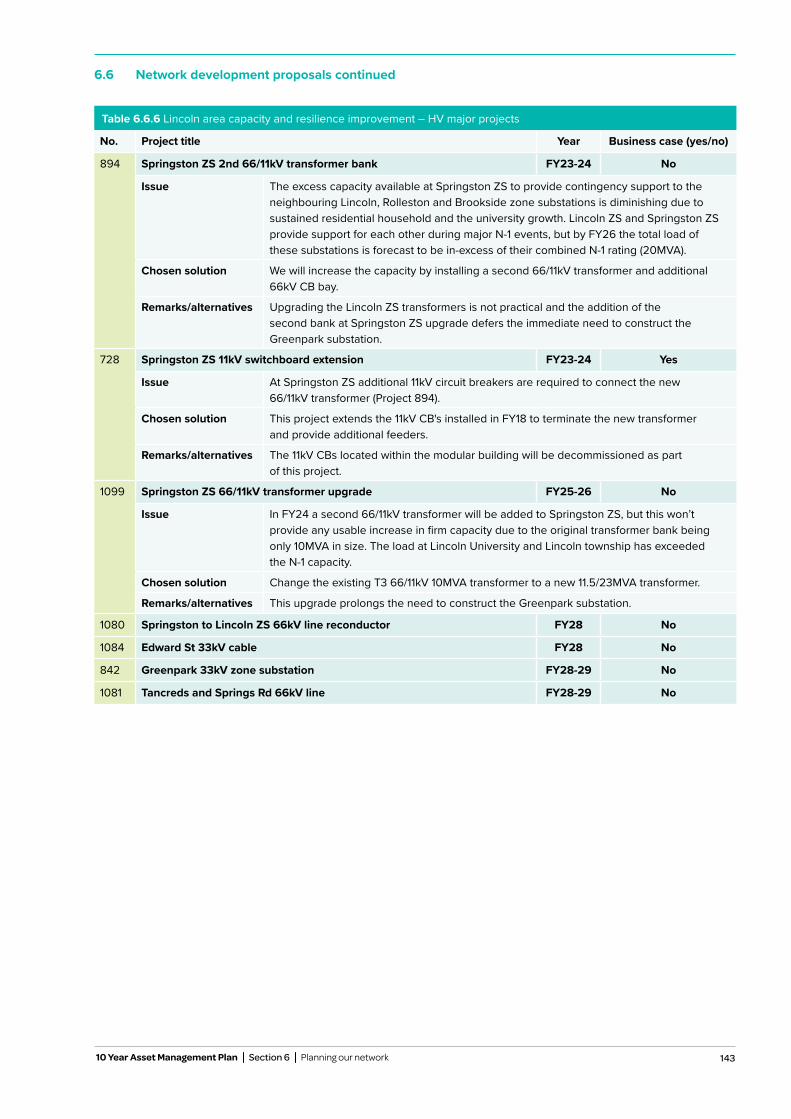
143
6.6 Network development proposals continued
10 Year Asset Management Plan Section 6 Planning our network
Table 6.6.6 Lincoln area capacity and resilience improvement – HV major projects
No. Project title Year Business case (yes/no)
894 Springston ZS 2nd 66/11kV transformer bank FY23-24 No
Issue The excess capacity available at Springston ZS to provide contingency support to the neighbouring Lincoln, Rolleston and Brookside zone substations is diminishing due to sustained residential household and the university growth. Lincoln ZS and Springston ZS provide support for each other during major N-1 events, but by FY26 the total load of these substations is forecast to be in-excess of their combined N-1 rating (20MVA).
Chosen solution We will increase the capacity by installing a second 66/11kV transformer and additional 66kV CB bay.
Remarks/alternatives Upgrading the Lincoln ZS transformers is not practical and the addition of the second bank at Springston ZS upgrade defers the immediate need to construct the Greenpark substation.
728 Springston ZS 11kV switchboard extension FY23-24 Yes
Issue At Springston ZS additional 11kV circuit breakers are required to connect the new 66/11kV transformer (Project 894).
Chosen solution This project extends the 11kV CB's installed in FY18 to terminate the new transformer and provide additional feeders.
Remarks/alternatives The 11kV CBs located within the modular building will be decommissioned as part of this project.
1099 Springston ZS 66/11kV transformer upgrade FY25-26 No
Issue In FY24 a second 66/11kV transformer will be added to Springston ZS, but this won’t provide any usable increase in firm capacity due to the original transformer bank being only 10MVA in size. The load at Lincoln University and Lincoln township has exceeded the N-1 capacity.
Chosen solution Change the existing T3 66/11kV 10MVA transformer to a new 11.5/23MVA transformer.
Remarks/alternatives This upgrade prolongs the need to construct the Greenpark substation.
1080 Springston to Lincoln ZS 66kV line reconductor FY28 No
1084 Edward St 33kV cable FY28 No
842 Greenpark 33kV zone substation FY28-29 No
1081 Tancreds and Springs Rd 66kV line FY28-29 No
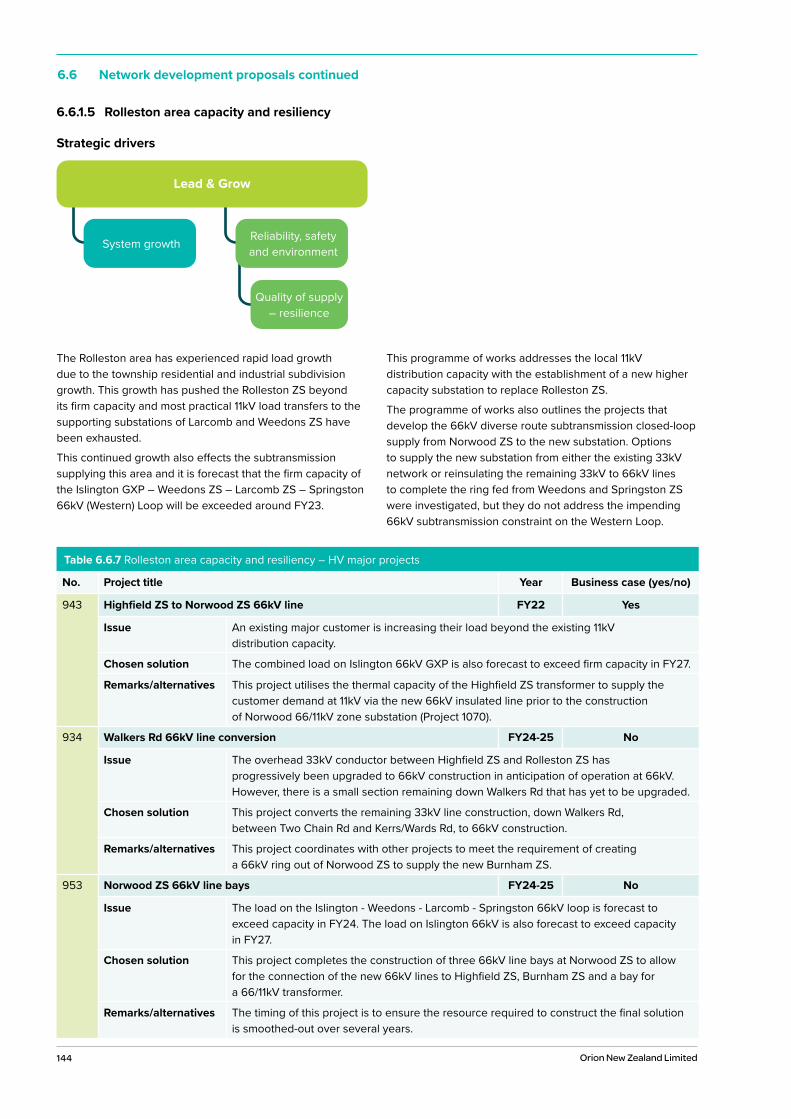
144 Orion New Zealand Limited
6.6 Network development proposals continued
The Rolleston area has experienced rapid load growth due to the township residential and industrial subdivision growth. This growth has pushed the Rolleston ZS beyond its firm capacity and most practical 11kV load transfers to the supporting substations of Larcomb and Weedons ZS have been exhausted.
This continued growth also effects the subtransmission supplying this area and it is forecast that the firm capacity of the Islington GXP – Weedons ZS – Larcomb ZS – Springston 66kV (Western) Loop will be exceeded around FY23.
This programme of works addresses the local 11kV distribution capacity with the establishment of a new higher capacity substation to replace Rolleston ZS.
The programme of works also outlines the projects that develop the 66kV diverse route subtransmission closed-loop supply from Norwood ZS to the new substation. Options to supply the new substation from either the existing 33kV network or reinsulating the remaining 33kV to 66kV lines to complete the ring fed from Weedons and Springston ZS were investigated, but they do not address the impending 66kV subtransmission constraint on the Western Loop.
6.6.1.5 Rolleston area capacity and resiliency
Strategic drivers
Table 6.6.7 Rolleston area capacity and resiliency – HV major projects
No. Project title Year Business case (yes/no)
943 Highfield ZS to Norwood ZS 66kV line FY22 Yes
Issue An existing major customer is increasing their load beyond the existing 11kV distribution capacity.
Chosen solution The combined load on Islington 66kV GXP is also forecast to exceed firm capacity in FY27.
Remarks/alternatives This project utilises the thermal capacity of the Highfield ZS transformer to supply the customer demand at 11kV via the new 66kV insulated line prior to the construction of Norwood 66/11kV zone substation (Project 1070).
934 Walkers Rd 66kV line conversion FY24-25 No
Issue The overhead 33kV conductor between Highfield ZS and Rolleston ZS has progressively been upgraded to 66kV construction in anticipation of operation at 66kV. However, there is a small section remaining down Walkers Rd that has yet to be upgraded.
Chosen solution This project converts the remaining 33kV line construction, down Walkers Rd, between Two Chain Rd and Kerrs/Wards Rd, to 66kV construction.
Remarks/alternatives This project coordinates with other projects to meet the requirement of creating a 66kV ring out of Norwood ZS to supply the new Burnham ZS.
953 Norwood ZS 66kV line bays FY24-25 No
Issue The load on the Islington - Weedons - Larcomb - Springston 66kV loop is forecast to exceed capacity in FY24. The load on Islington 66kV is also forecast to exceed capacity in FY27.
Chosen solution This project completes the construction of three 66kV line bays at Norwood ZS to allow for the connection of the new 66kV lines to Highfield ZS, Burnham ZS and a bay for a 66/11kV transformer.
Remarks/alternatives The timing of this project is to ensure the resource required to construct the final solution is smoothed-out over several years.
Lead & Grow
Quality of supply – resilience
System growth Reliability, safety and environment
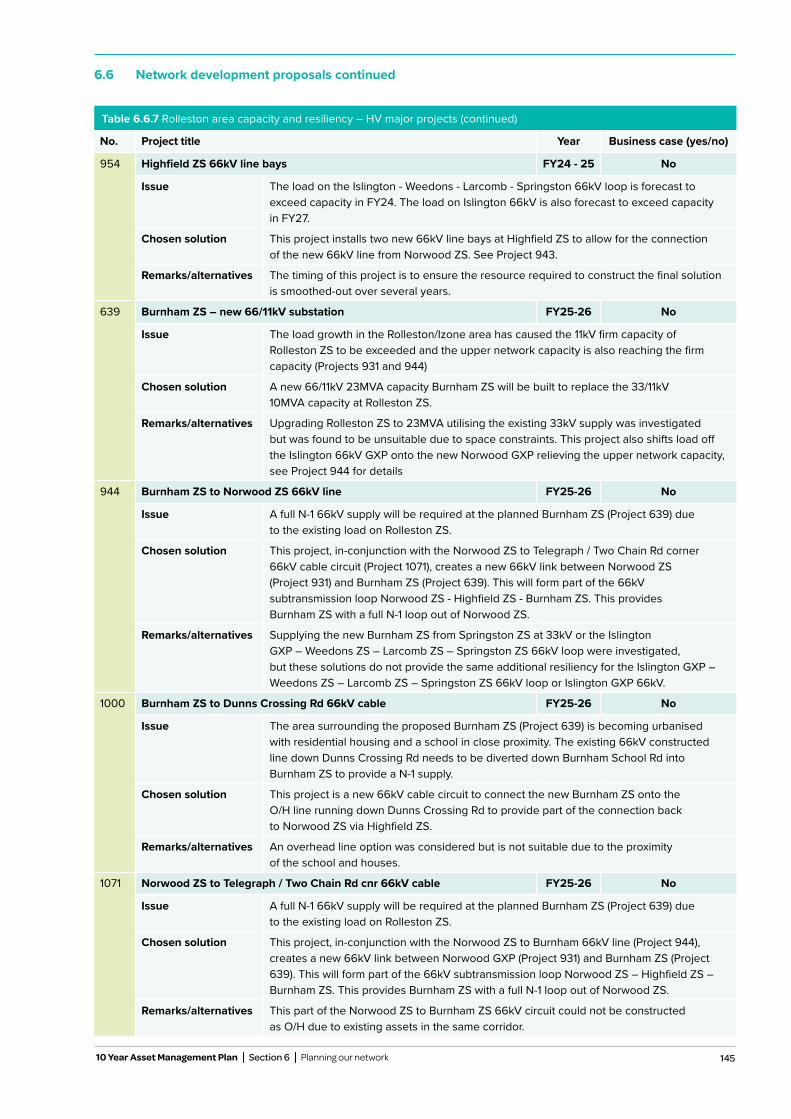
145
6.6 Network development proposals continued
10 Year Asset Management Plan Section 6 Planning our network
Table 6.6.7 Rolleston area capacity and resiliency – HV major projects (continued)
No. Project title Year Business case (yes/no)
954 Highfield ZS 66kV line bays FY24 - 25 No
Issue The load on the Islington - Weedons - Larcomb - Springston 66kV loop is forecast to exceed capacity in FY24. The load on Islington 66kV is also forecast to exceed capacity in FY27.
Chosen solution This project installs two new 66kV line bays at Highfield ZS to allow for the connection of the new 66kV line from Norwood ZS. See Project 943.
Remarks/alternatives The timing of this project is to ensure the resource required to construct the final solution is smoothed-out over several years.
639 Burnham ZS – new 66/11kV substation FY25-26 No
Issue The load growth in the Rolleston/Izone area has caused the 11kV firm capacity of Rolleston ZS to be exceeded and the upper network capacity is also reaching the firm capacity (Projects 931 and 944)
Chosen solution A new 66/11kV 23MVA capacity Burnham ZS will be built to replace the 33/11kV 10MVA capacity at Rolleston ZS.
Remarks/alternatives Upgrading Rolleston ZS to 23MVA utilising the existing 33kV supply was investigated but was found to be unsuitable due to space constraints. This project also shifts load off the Islington 66kV GXP onto the new Norwood GXP relieving the upper network capacity, see Project 944 for details
944 Burnham ZS to Norwood ZS 66kV line FY25-26 No
Issue A full N-1 66kV supply will be required at the planned Burnham ZS (Project 639) due to the existing load on Rolleston ZS.
Chosen solution This project, in-conjunction with the Norwood ZS to Telegraph / Two Chain Rd corner 66kV cable circuit (Project 1071), creates a new 66kV link between Norwood ZS (Project 931) and Burnham ZS (Project 639). This will form part of the 66kV subtransmission loop Norwood ZS - Highfield ZS - Burnham ZS. This provides Burnham ZS with a full N-1 loop out of Norwood ZS.
Remarks/alternatives Supplying the new Burnham ZS from Springston ZS at 33kV or the Islington GXP – Weedons ZS – Larcomb ZS – Springston ZS 66kV loop were investigated, but these solutions do not provide the same additional resiliency for the Islington GXP – Weedons ZS – Larcomb ZS – Springston ZS 66kV loop or Islington GXP 66kV.
1000 Burnham ZS to Dunns Crossing Rd 66kV cable FY25-26 No
Issue The area surrounding the proposed Burnham ZS (Project 639) is becoming urbanised with residential housing and a school in close proximity. The existing 66kV constructed line down Dunns Crossing Rd needs to be diverted down Burnham School Rd into Burnham ZS to provide a N-1 supply.
Chosen solution This project is a new 66kV cable circuit to connect the new Burnham ZS onto the O/H line running down Dunns Crossing Rd to provide part of the connection back to Norwood ZS via Highfield ZS.
Remarks/alternatives An overhead line option was considered but is not suitable due to the proximity of the school and houses.
1071 Norwood ZS to Telegraph / Two Chain Rd cnr 66kV cable FY25-26 No
Issue A full N-1 66kV supply will be required at the planned Burnham ZS (Project 639) due to the existing load on Rolleston ZS.
Chosen solution This project, in-conjunction with the Norwood ZS to Burnham 66kV line (Project 944), creates a new 66kV link between Norwood GXP (Project 931) and Burnham ZS (Project 639). This will form part of the 66kV subtransmission loop Norwood ZS – Highfield ZS – Burnham ZS. This provides Burnham ZS with a full N-1 loop out of Norwood ZS.
Remarks/alternatives This part of the Norwood ZS to Burnham ZS 66kV circuit could not be constructed as O/H due to existing assets in the same corridor.
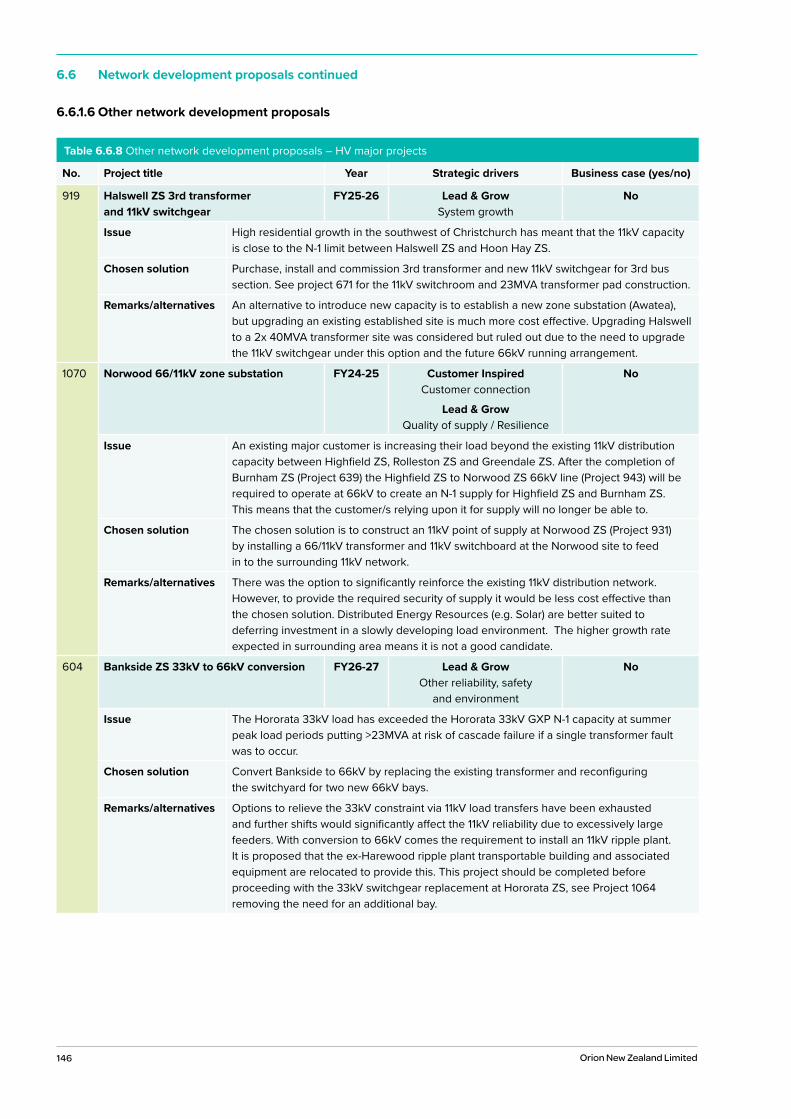
146 Orion New Zealand Limited
6.6 Network development proposals continued
Table 6.6.8 Other network development proposals – HV major projects
No. Project title Year Strategic drivers Business case (yes/no)
919 Halswell ZS 3rd transformer and 11kV switchgear
FY25-26 Lead & Grow System growth
No
Issue High residential growth in the southwest of Christchurch has meant that the 11kV capacity is close to the N-1 limit between Halswell ZS and Hoon Hay ZS.
Chosen solution Purchase, install and commission 3rd transformer and new 11kV switchgear for 3rd bus section. See project 671 for the 11kV switchroom and 23MVA transformer pad construction.
Remarks/alternatives An alternative to introduce new capacity is to establish a new zone substation (Awatea), but upgrading an existing established site is much more cost effective. Upgrading Halswell to a 2x 40MVA transformer site was considered but ruled out due to the need to upgrade the 11kV switchgear under this option and the future 66kV running arrangement.
1070 Norwood 66/11kV zone substation FY24-25 Customer Inspired Customer connection
Lead & Grow Quality of supply / Resilience
No
Issue An existing major customer is increasing their load beyond the existing 11kV distribution capacity between Highfield ZS, Rolleston ZS and Greendale ZS. After the completion of Burnham ZS (Project 639) the Highfield ZS to Norwood ZS 66kV line (Project 943) will be required to operate at 66kV to create an N-1 supply for Highfield ZS and Burnham ZS. This means that the customer/s relying upon it for supply will no longer be able to.
Chosen solution The chosen solution is to construct an 11kV point of supply at Norwood ZS (Project 931) by installing a 66/11kV transformer and 11kV switchboard at the Norwood site to feed in to the surrounding 11kV network.
Remarks/alternatives There was the option to significantly reinforce the existing 11kV distribution network. However, to provide the required security of supply it would be less cost effective than the chosen solution. Distributed Energy Resources (e.g. Solar) are better suited to deferring investment in a slowly developing load environment. The higher growth rate expected in surrounding area means it is not a good candidate.
604 Bankside ZS 33kV to 66kV conversion FY26-27 Lead & Grow Other reliability, safety
and environment
No
Issue The Hororata 33kV load has exceeded the Hororata 33kV GXP N-1 capacity at summer peak load periods putting >23MVA at risk of cascade failure if a single transformer fault was to occur.
Chosen solution Convert Bankside to 66kV by replacing the existing transformer and reconfiguring the switchyard for two new 66kV bays.
Remarks/alternatives Options to relieve the 33kV constraint via 11kV load transfers have been exhausted and further shifts would significantly affect the 11kV reliability due to excessively large feeders. With conversion to 66kV comes the requirement to install an 11kV ripple plant. It is proposed that the ex-Harewood ripple plant transportable building and associated equipment are relocated to provide this. This project should be completed before proceeding with the 33kV switchgear replacement at Hororata ZS, see Project 1064 removing the need for an additional bay.
6.6.1.6 Other network development proposals
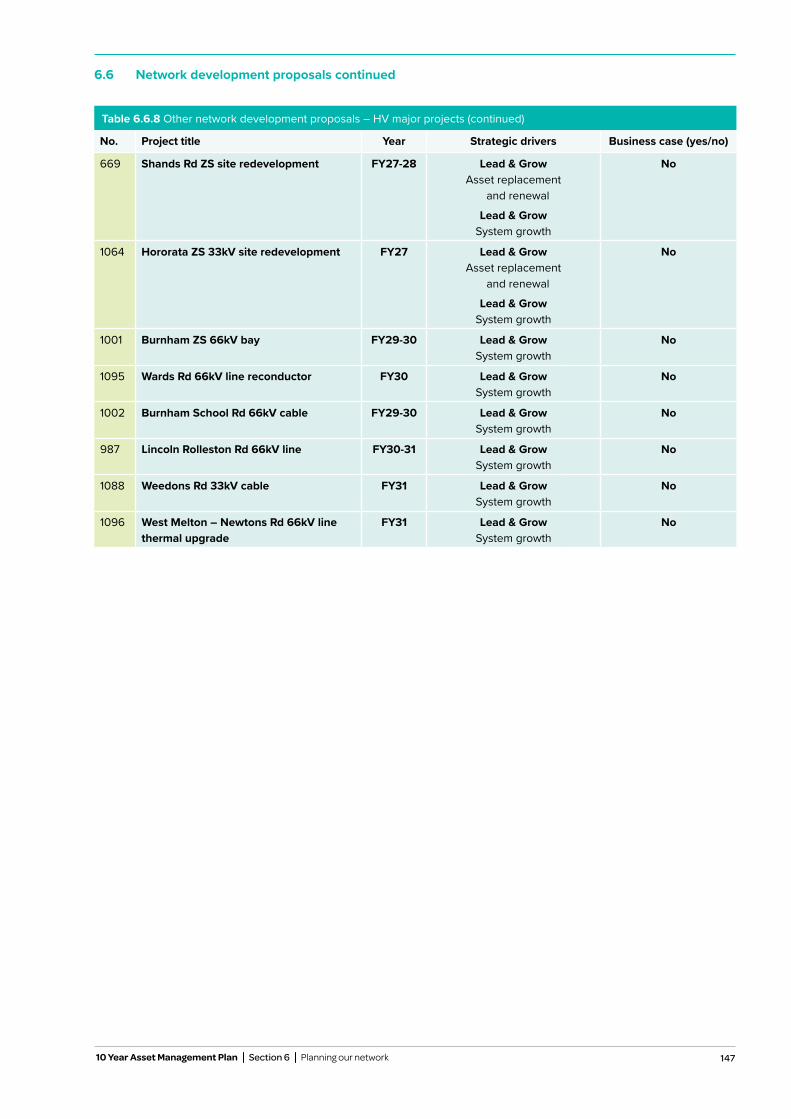
147
6.6 Network development proposals continued
10 Year Asset Management Plan Section 6 Planning our network
Table 6.6.8 Other network development proposals – HV major projects (continued)
No. Project title Year Strategic drivers Business case (yes/no)
669 Shands Rd ZS site redevelopment FY27-28 Lead & Grow Asset replacement
and renewal
Lead & Grow System growth
No
1064 Hororata ZS 33kV site redevelopment FY27 Lead & Grow Asset replacement
and renewal
Lead & Grow System growth
No
1001 Burnham ZS 66kV bay FY29-30 Lead & Grow System growth
No
1095 Wards Rd 66kV line reconductor FY30 Lead & Grow System growth
No
1002 Burnham School Rd 66kV cable FY29-30 Lead & Grow System growth
No
987 Lincoln Rolleston Rd 66kV line FY30-31 Lead & Grow System growth
No
1088 Weedons Rd 33kV cable FY31 Lead & Grow System growth
No
1096 West Melton – Newtons Rd 66kV line thermal upgrade
FY31 Lead & Grow System growth
No
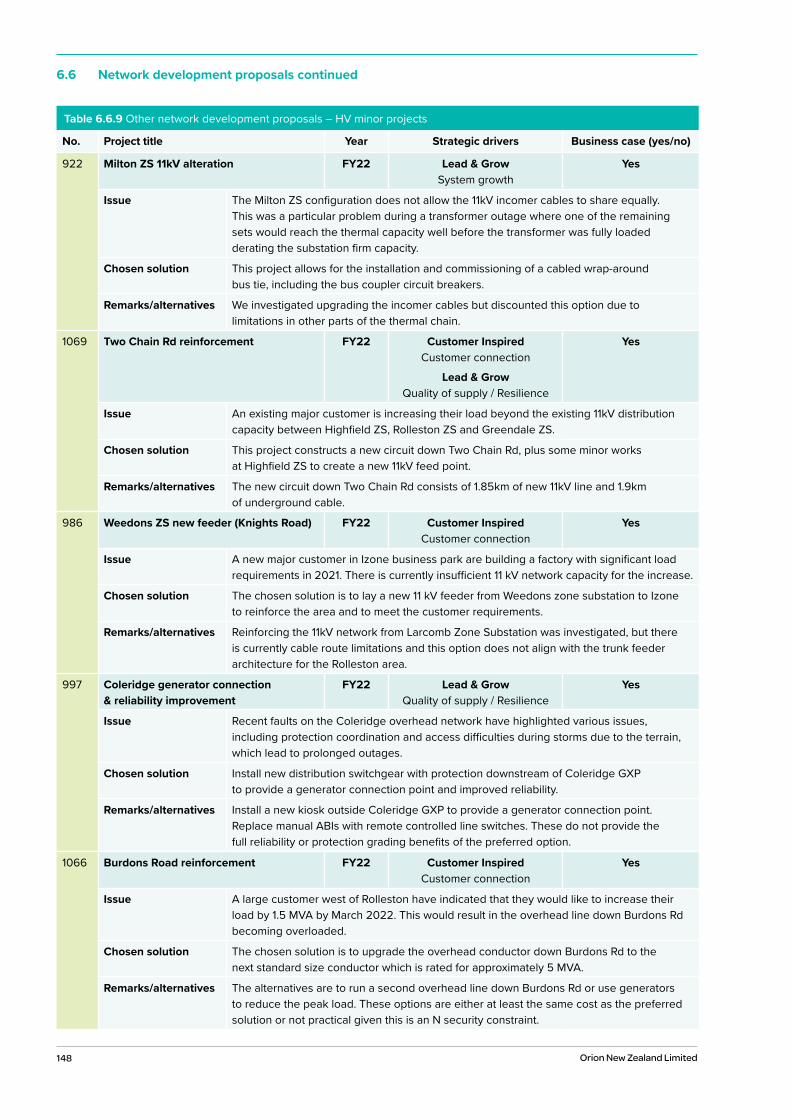
148 Orion New Zealand Limited
6.6 Network development proposals continued
Table 6.6.9 Other network development proposals – HV minor projects
No. Project title Year Strategic drivers Business case (yes/no)
922 Milton ZS 11kV alteration FY22 Lead & Grow System growth
Yes
Issue The Milton ZS configuration does not allow the 11kV incomer cables to share equally. This was a particular problem during a transformer outage where one of the remaining sets would reach the thermal capacity well before the transformer was fully loaded derating the substation firm capacity.
Chosen solution This project allows for the installation and commissioning of a cabled wrap-around bus tie, including the bus coupler circuit breakers.
Remarks/alternatives We investigated upgrading the incomer cables but discounted this option due to limitations in other parts of the thermal chain.
1069 Two Chain Rd reinforcement FY22 Customer Inspired Customer connection
Lead & Grow Quality of supply / Resilience
Yes
Issue An existing major customer is increasing their load beyond the existing 11kV distribution capacity between Highfield ZS, Rolleston ZS and Greendale ZS.
Chosen solution This project constructs a new circuit down Two Chain Rd, plus some minor works at Highfield ZS to create a new 11kV feed point.
Remarks/alternatives The new circuit down Two Chain Rd consists of 1.85km of new 11kV line and 1.9km of underground cable.
986 Weedons ZS new feeder (Knights Road) FY22 Customer Inspired Customer connection
Yes
Issue A new major customer in Izone business park are building a factory with significant load requirements in 2021. There is currently insufficient 11 kV network capacity for the increase.
Chosen solution The chosen solution is to lay a new 11 kV feeder from Weedons zone substation to Izone to reinforce the area and to meet the customer requirements.
Remarks/alternatives Reinforcing the 11kV network from Larcomb Zone Substation was investigated, but there is currently cable route limitations and this option does not align with the trunk feeder architecture for the Rolleston area.
997 Coleridge generator connection & reliability improvement
FY22 Lead & Grow Quality of supply / Resilience
Yes
Issue Recent faults on the Coleridge overhead network have highlighted various issues, including protection coordination and access difficulties during storms due to the terrain, which lead to prolonged outages.
Chosen solution Install new distribution switchgear with protection downstream of Coleridge GXP to provide a generator connection point and improved reliability.
Remarks/alternatives Install a new kiosk outside Coleridge GXP to provide a generator connection point. Replace manual ABIs with remote controlled line switches. These do not provide the full reliability or protection grading benefits of the preferred option.
1066 Burdons Road reinforcement FY22 Customer Inspired Customer connection
Yes
Issue A large customer west of Rolleston have indicated that they would like to increase their load by 1.5 MVA by March 2022. This would result in the overhead line down Burdons Rd becoming overloaded.
Chosen solution The chosen solution is to upgrade the overhead conductor down Burdons Rd to the next standard size conductor which is rated for approximately 5 MVA.
Remarks/alternatives The alternatives are to run a second overhead line down Burdons Rd or use generators to reduce the peak load. These options are either at least the same cost as the preferred solution or not practical given this is an N security constraint.
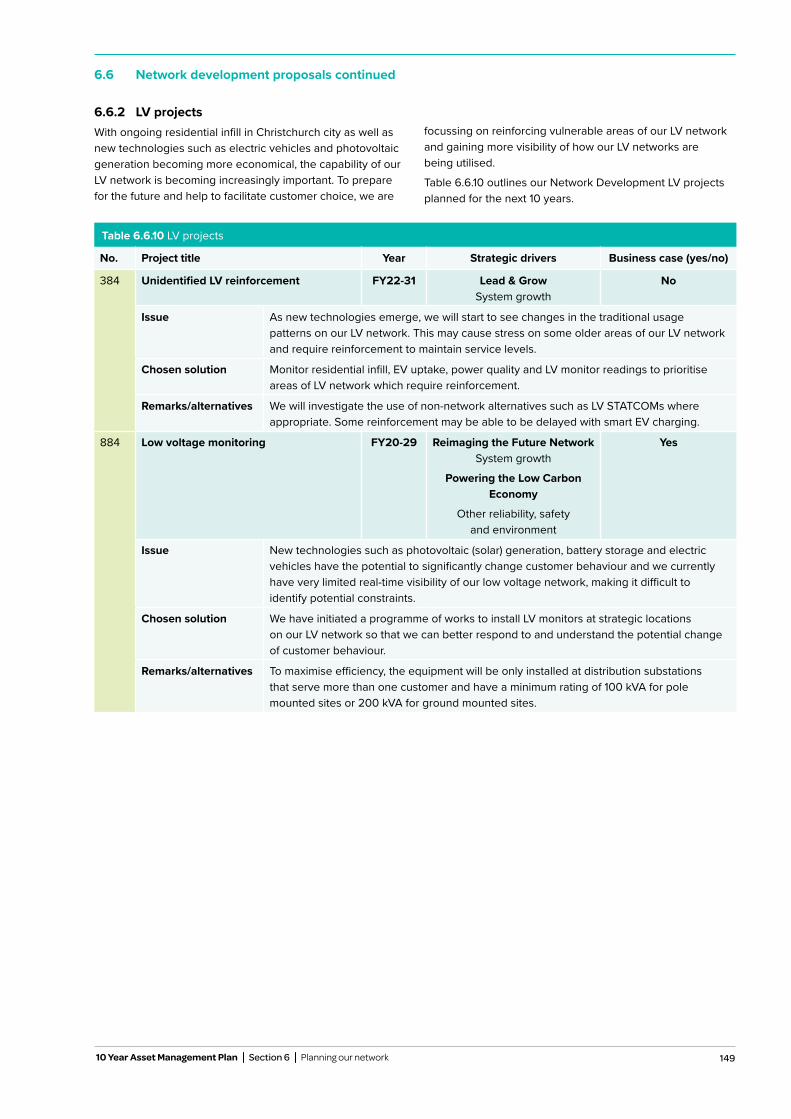
149 10 Year Asset Management Plan Section 6 Planning our network
6.6 Network development proposals continued
Table 6.6.10 LV projects
No. Project title Year Strategic drivers Business case (yes/no)
384 Unidentified LV reinforcement FY22-31 Lead & Grow System growth
No
Issue As new technologies emerge, we will start to see changes in the traditional usage patterns on our LV network. This may cause stress on some older areas of our LV network and require reinforcement to maintain service levels.
Chosen solution Monitor residential infill, EV uptake, power quality and LV monitor readings to prioritise areas of LV network which require reinforcement.
Remarks/alternatives We will investigate the use of non-network alternatives such as LV STATCOMs where appropriate. Some reinforcement may be able to be delayed with smart EV charging.
884 Low voltage monitoring FY20-29 Reimaging the Future Network System growth
Powering the Low Carbon Economy
Other reliability, safety and environment
Yes
Issue New technologies such as photovoltaic (solar) generation, battery storage and electric vehicles have the potential to significantly change customer behaviour and we currently have very limited real-time visibility of our low voltage network, making it difficult to identify potential constraints.
Chosen solution We have initiated a programme of works to install LV monitors at strategic locations on our LV network so that we can better respond to and understand the potential change of customer behaviour.
Remarks/alternatives To maximise efficiency, the equipment will be only installed at distribution substations that serve more than one customer and have a minimum rating of 100 kVA for pole mounted sites or 200 kVA for ground mounted sites.
6.6.2 LV projectsWith ongoing residential infill in Christchurch city as well as new technologies such as electric vehicles and photovoltaic generation becoming more economical, the capability of our LV network is becoming increasingly important. To prepare for the future and help to facilitate customer choice, we are
focussing on reinforcing vulnerable areas of our LV network and gaining more visibility of how our LV networks are being utilised.
Table 6.6.10 outlines our Network Development LV projects planned for the next 10 years.
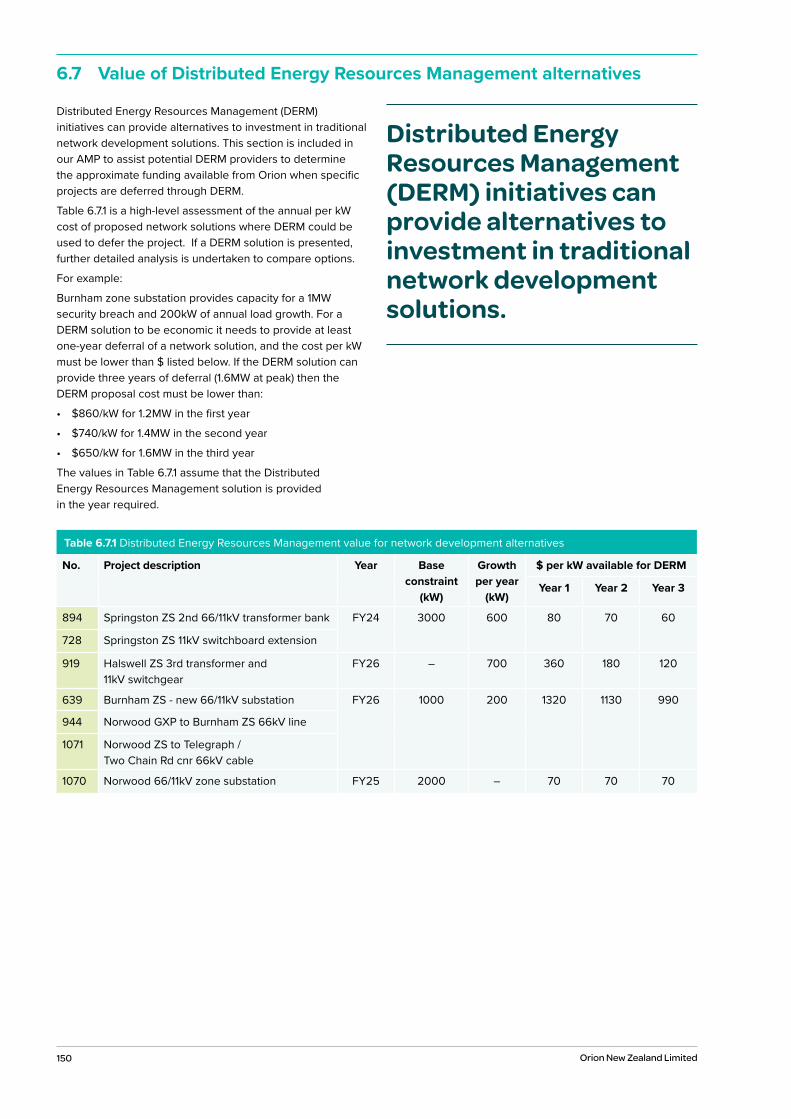
150 Orion New Zealand Limited
Distributed Energy Resources Management (DERM) initiatives can provide alternatives to investment in traditional network development solutions. This section is included in our AMP to assist potential DERM providers to determine the approximate funding available from Orion when specific projects are deferred through DERM.
Table 6.7.1 is a high-level assessment of the annual per kW cost of proposed network solutions where DERM could be used to defer the project. If a DERM solution is presented, further detailed analysis is undertaken to compare options.
For example:
Burnham zone substation provides capacity for a 1MW security breach and 200kW of annual load growth. For a DERM solution to be economic it needs to provide at least one-year deferral of a network solution, and the cost per kW must be lower than $ listed below. If the DERM solution can provide three years of deferral (1.6MW at peak) then the DERM proposal cost must be lower than:
• $860/kW for 1.2MW in the first year
• $740/kW for 1.4MW in the second year
• $650/kW for 1.6MW in the third year
The values in Table 6.7.1 assume that the Distributed Energy Resources Management solution is provided in the year required.
Table 6.7.1 Distributed Energy Resources Management value for network development alternatives
No. Project description Year Base constraint
(kW)
Growth per year
(kW)
$ per kW available for DERM
Year 1 Year 2 Year 3
894 Springston ZS 2nd 66/11kV transformer bank FY24 3000 600 80 70 60
728 Springston ZS 11kV switchboard extension
919 Halswell ZS 3rd transformer and 11kV switchgear
FY26 – 700 360 180 120
639 Burnham ZS - new 66/11kV substation FY26 1000 200 1320 1130 990
944 Norwood GXP to Burnham ZS 66kV line
1071 Norwood ZS to Telegraph / Two Chain Rd cnr 66kV cable
1070 Norwood 66/11kV zone substation FY25 2000 – 70 70 70
6.7 Value of Distributed Energy Resources Management alternatives
Distributed Energy Resources Management (DERM) initiatives can provide alternatives to investment in traditional network development solutions.

151 10 Year Asset Management Plan Section 1 Summary
7Managing
our assets

152 Orion New Zealand Limited
Photo: Top of 66kV circuit breaker at our Heathcote zone substation.
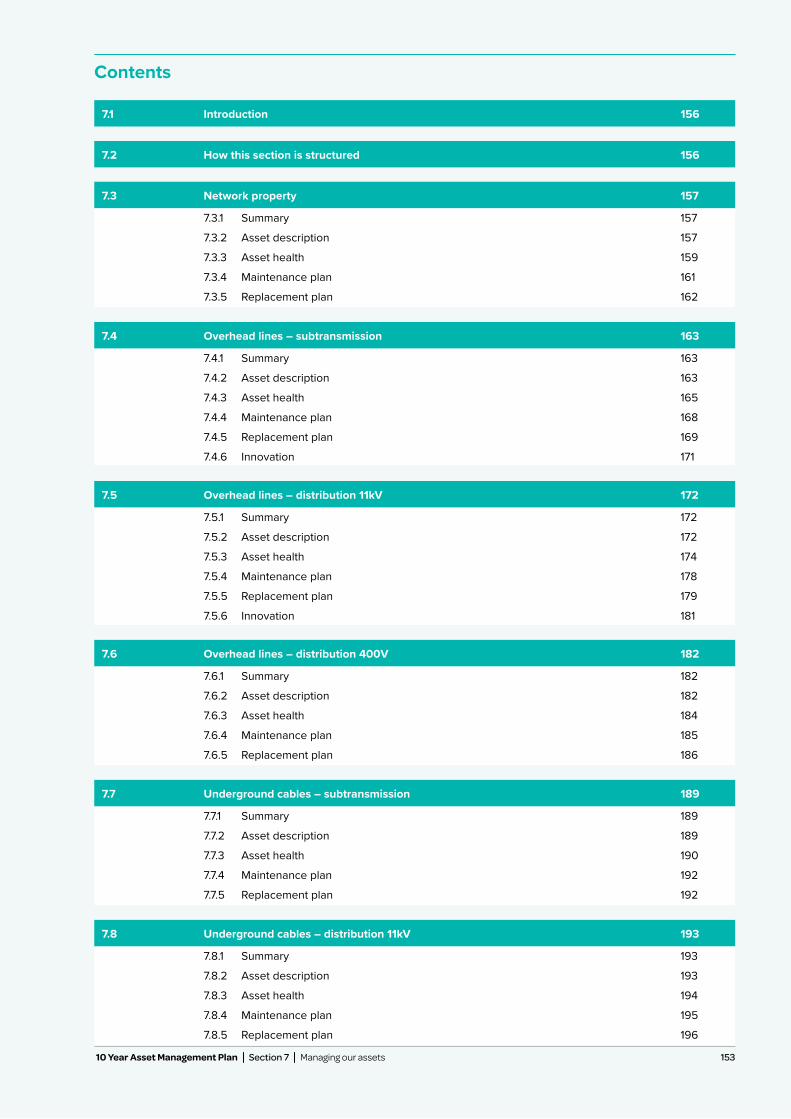
153 10 Year Asset Management Plan Section 1 Summary
7.3.1 Summary 157
7.3.2 Asset description 157
7.3.3 Asset health 159
7.3.4 Maintenance plan 161
7.3.5 Replacement plan 162
7.4.1 Summary 163
7.4.2 Asset description 163
7.4.3 Asset health 165
7.4.4 Maintenance plan 168
7.4.5 Replacement plan 169
7.4.6 Innovation 171
7.5.1 Summary 172
7.5.2 Asset description 172
7.5.3 Asset health 174
7.5.4 Maintenance plan 178
7.5.5 Replacement plan 179
7.5.6 Innovation 181
7.6.1 Summary 182
7.6.2 Asset description 182
7.6.3 Asset health 184
7.6.4 Maintenance plan 185
7.6.5 Replacement plan 186
7.7.1 Summary 189
7.7.2 Asset description 189
7.7.3 Asset health 190
7.7.4 Maintenance plan 192
7.7.5 Replacement plan 192
7.8.1 Summary 193
7.8.2 Asset description 193
7.8.3 Asset health 194
7.8.4 Maintenance plan 195
7.8.5 Replacement plan 196
7.1 Introduction 156
7.2 How this section is structured 156
7.3 Network property 157
7.4 Overhead lines – subtransmission 163
7.5 Overhead lines – distribution 11kV 172
7.6 Overhead lines – distribution 400V 182
7.7 Underground cables – subtransmission 189
7.8 Underground cables – distribution 11kV 193
Contents
153 10 Year Asset Management Plan Section 7 Managing our assets
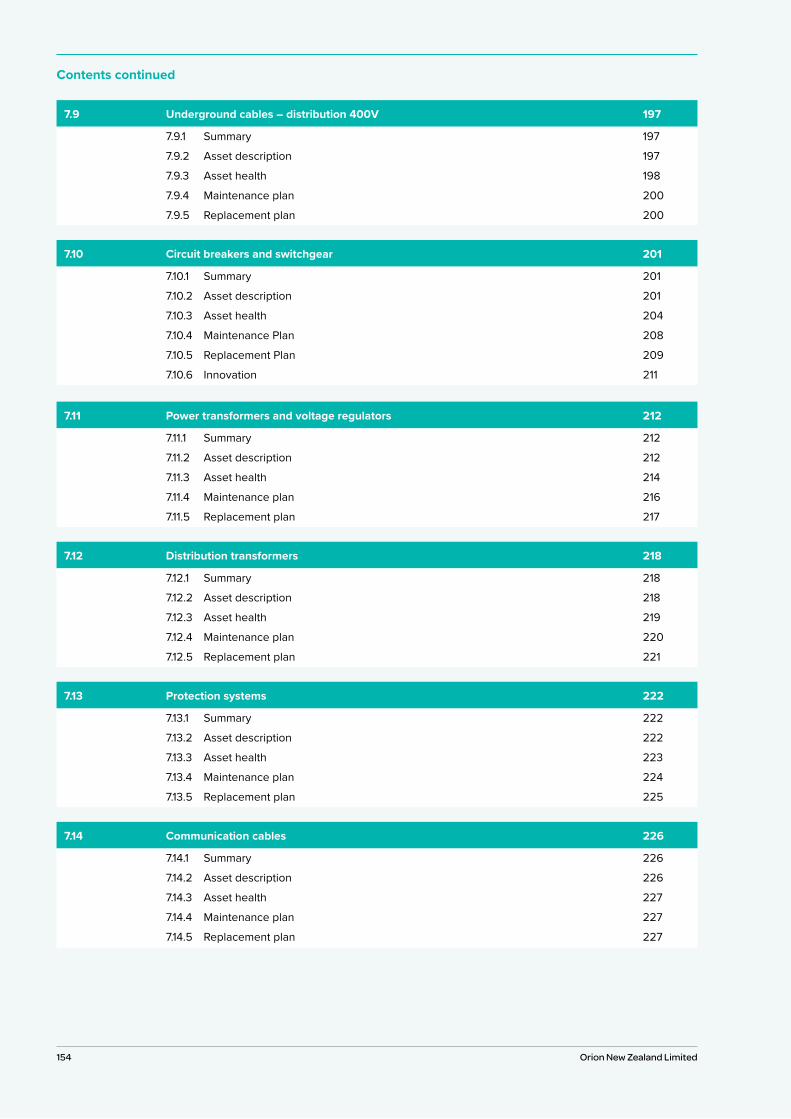
154 Orion New Zealand Limited Orion New Zealand Limited
7.10.1 Summary 201
7.10.2 Asset description 201
7.10.3 Asset health 204
7.10.4 Maintenance Plan 208
7.10.5 Replacement Plan 209
7.10.6 Innovation 211
7.11.1 Summary 212
7.11.2 Asset description 212
7.11.3 Asset health 214
7.11.4 Maintenance plan 216
7.11.5 Replacement plan 217
7.12.1 Summary 218
7.12.2 Asset description 218
7.12.3 Asset health 219
7.12.4 Maintenance plan 220
7.12.5 Replacement plan 221
7.13.1 Summary 222
7.13.2 Asset description 222
7.13.3 Asset health 223
7.13.4 Maintenance plan 224
7.13.5 Replacement plan 225
7.14.1 Summary 226
7.14.2 Asset description 226
7.14.3 Asset health 227
7.14.4 Maintenance plan 227
7.14.5 Replacement plan 227
7.10 Circuit breakers and switchgear 201
7.11 Power transformers and voltage regulators 212
7.12 Distribution transformers 218
7.13 Protection systems 222
7.14 Communication cables 226
Contents continued
7.9.1 Summary 197
7.9.2 Asset description 197
7.9.3 Asset health 198
7.9.4 Maintenance plan 200
7.9.5 Replacement plan 200
7.9 Underground cables – distribution 400V 197
154
155 10 Year Asset Management Plan Section 1 Summary
7.16.1 Summary 233
7.16.2 Asset description 233
7.16.3 Asset health 235
7.16.4 Maintenance plan 236
7.16.5 Replacement plan 236
7.16.6 Innovation 236
7.17.1 Summary 237
7.17.2 Asset description 237
7.17.3 Asset health 238
7.17.4 Maintenance plan 239
7.17.5 Replacement plan 239
7.18.1 Summary 240
7.18.2 Asset description 240
7.18.3 Asset health 240
7.18.4 Maintenance plan 241
7.18.5 Replacement plan 241
7.19.1 Summary 242
7.19.2 Asset description 242
7.19.3 Asset health 243
7.19.4 Maintenance plan 244
7.19.5 Replacement plan 245
7.19.6 Innovation 245
7.20.1 Summary 246
7.20.2 Asset description 246
7.20.3 Asset health 247
7.20.4 Maintenance plan 247
7.20.5 Replacement plan 247
7.16 Distribution Management System (DMS) 233
7.17 Load management systems 237
7.18 Information systems 240
7.19 Generators 242
7.20 Monitoring and power quality 246
155 10 Year Asset Management Plan Section 7 Managing our assets
7.15.1 Summary 228
7.15.2 Asset description 228
7.15.3 Asset health 230
7.15.4 Maintenance plan 231
7.15.5 Replacement plan 232
7.15 Communication systems 228
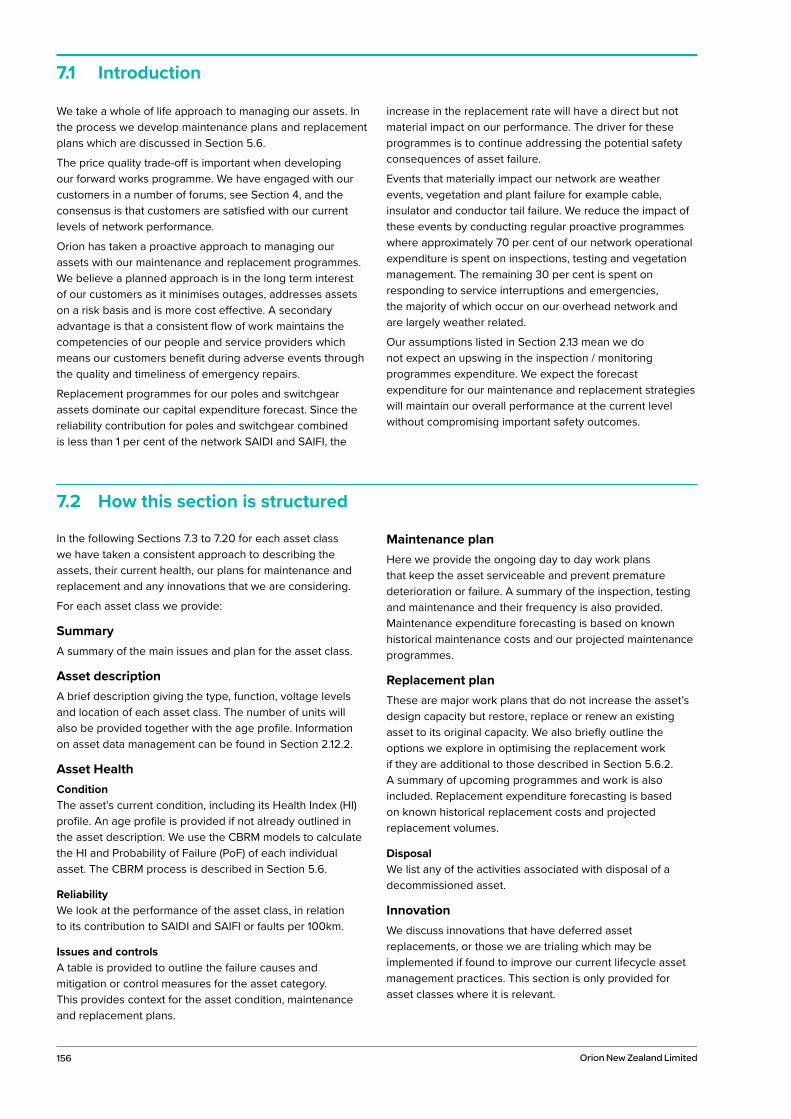
156 Orion New Zealand Limited
We take a whole of life approach to managing our assets. In the process we develop maintenance plans and replacement plans which are discussed in Section 5.6.
The price quality trade-off is important when developing our forward works programme. We have engaged with our customers in a number of forums, see Section 4, and the consensus is that customers are satisfied with our current levels of network performance.
Orion has taken a proactive approach to managing our assets with our maintenance and replacement programmes. We believe a planned approach is in the long term interest of our customers as it minimises outages, addresses assets on a risk basis and is more cost effective. A secondary advantage is that a consistent flow of work maintains the competencies of our people and service providers which means our customers benefit during adverse events through the quality and timeliness of emergency repairs.
Replacement programmes for our poles and switchgear assets dominate our capital expenditure forecast. Since the reliability contribution for poles and switchgear combined is less than 1 per cent of the network SAIDI and SAIFI, the
increase in the replacement rate will have a direct but not material impact on our performance. The driver for these programmes is to continue addressing the potential safety consequences of asset failure.
Events that materially impact our network are weather events, vegetation and plant failure for example cable, insulator and conductor tail failure. We reduce the impact of these events by conducting regular proactive programmes where approximately 70 per cent of our network operational expenditure is spent on inspections, testing and vegetation management. The remaining 30 per cent is spent on responding to service interruptions and emergencies, the majority of which occur on our overhead network and are largely weather related.
Our assumptions listed in Section 2.13 mean we do not expect an upswing in the inspection / monitoring programmes expenditure. We expect the forecast expenditure for our maintenance and replacement strategies will maintain our overall performance at the current level without compromising important safety outcomes.
7.1 Introduction
7.2 How this section is structured
In the following Sections 7.3 to 7.20 for each asset class we have taken a consistent approach to describing the assets, their current health, our plans for maintenance and replacement and any innovations that we are considering.
For each asset class we provide:
SummaryA summary of the main issues and plan for the asset class.
Asset descriptionA brief description giving the type, function, voltage levels and location of each asset class. The number of units will also be provided together with the age profile. Information on asset data management can be found in Section 2.12.2.
Asset HealthConditionThe asset’s current condition, including its Health Index (HI) profile. An age profile is provided if not already outlined in the asset description. We use the CBRM models to calculate the HI and Probability of Failure (PoF) of each individual asset. The CBRM process is described in Section 5.6.
ReliabilityWe look at the performance of the asset class, in relation to its contribution to SAIDI and SAIFI or faults per 100km.
Issues and controlsA table is provided to outline the failure causes and mitigation or control measures for the asset category. This provides context for the asset condition, maintenance and replacement plans.
Maintenance planHere we provide the ongoing day to day work plans that keep the asset serviceable and prevent premature deterioration or failure. A summary of the inspection, testing and maintenance and their frequency is also provided. Maintenance expenditure forecasting is based on known historical maintenance costs and our projected maintenance programmes.
Replacement planThese are major work plans that do not increase the asset’s design capacity but restore, replace or renew an existing asset to its original capacity. We also briefly outline the options we explore in optimising the replacement work if they are additional to those described in Section 5.6.2. A summary of upcoming programmes and work is also included. Replacement expenditure forecasting is based on known historical replacement costs and projected replacement volumes.
DisposalWe list any of the activities associated with disposal of a decommissioned asset.
InnovationWe discuss innovations that have deferred asset replacements, or those we are trialing which may be implemented if found to improve our current lifecycle asset management practices. This section is only provided for asset classes where it is relevant.
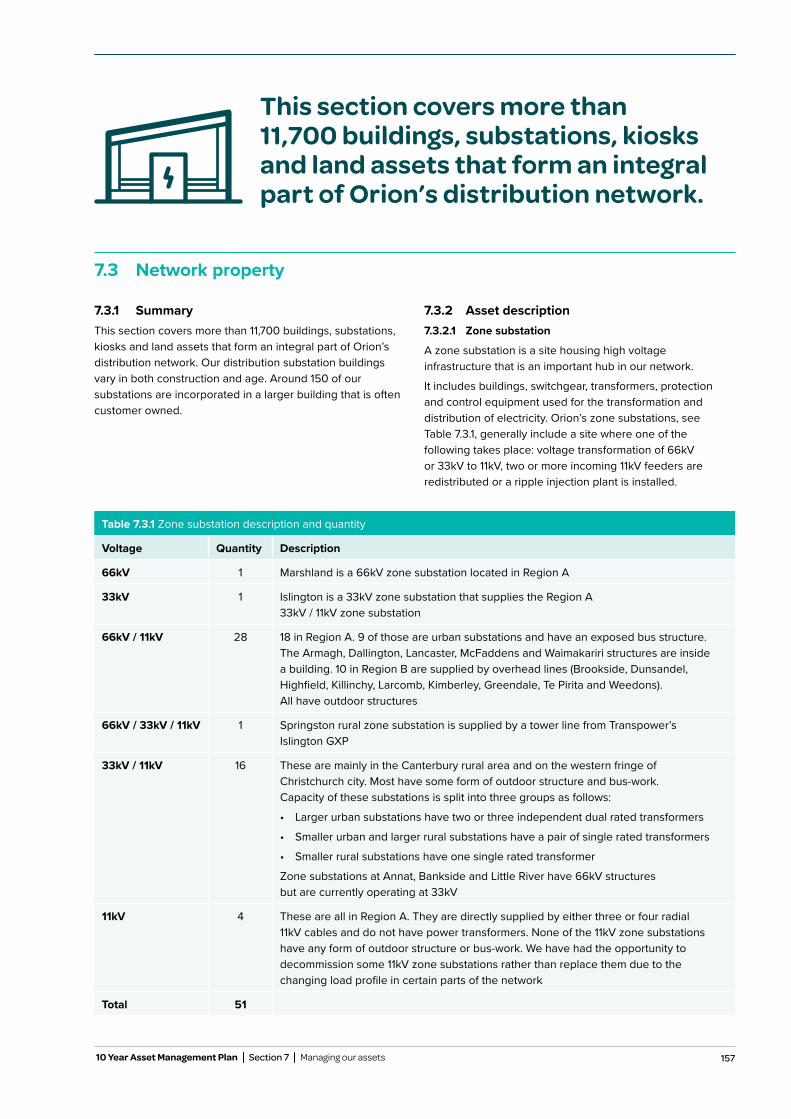
157
7.3 Network property
7.3.1 SummaryThis section covers more than 11,700 buildings, substations, kiosks and land assets that form an integral part of Orion’s distribution network. Our distribution substation buildings vary in both construction and age. Around 150 of our substations are incorporated in a larger building that is often customer owned.
7.3.2 Asset description7.3.2.1 Zone substation
A zone substation is a site housing high voltage infrastructure that is an important hub in our network.
It includes buildings, switchgear, transformers, protection and control equipment used for the transformation and distribution of electricity. Orion’s zone substations, see Table 7.3.1, generally include a site where one of the following takes place: voltage transformation of 66kV or 33kV to 11kV, two or more incoming 11kV feeders are redistributed or a ripple injection plant is installed.
Table 7.3.1 Zone substation description and quantity
Voltage Quantity Description
66kV 1 Marshland is a 66kV zone substation located in Region A
33kV 1 Islington is a 33kV zone substation that supplies the Region A 33kV / 11kV zone substation
66kV / 11kV 28 18 in Region A. 9 of those are urban substations and have an exposed bus structure. The Armagh, Dallington, Lancaster, McFaddens and Waimakariri structures are inside a building. 10 in Region B are supplied by overhead lines (Brookside, Dunsandel, Highfield, Killinchy, Larcomb, Kimberley, Greendale, Te Pirita and Weedons). All have outdoor structures
66kV / 33kV / 11kV 1 Springston rural zone substation is supplied by a tower line from Transpower’s Islington GXP
33kV / 11kV 16 These are mainly in the Canterbury rural area and on the western fringe of Christchurch city. Most have some form of outdoor structure and bus-work. Capacity of these substations is split into three groups as follows:
• Larger urban substations have two or three independent dual rated transformers
• Smaller urban and larger rural substations have a pair of single rated transformers
• Smaller rural substations have one single rated transformer
Zone substations at Annat, Bankside and Little River have 66kV structures but are currently operating at 33kV
11kV 4 These are all in Region A. They are directly supplied by either three or four radial 11kV cables and do not have power transformers. None of the 11kV zone substations have any form of outdoor structure or bus-work. We have had the opportunity to decommission some 11kV zone substations rather than replace them due to the changing load profile in certain parts of the network
Total 51
This section covers more than 11,700 buildings, substations, kiosks and land assets that form an integral part of Orion’s distribution network.
10 Year Asset Management Plan Section 7 Managing our assets
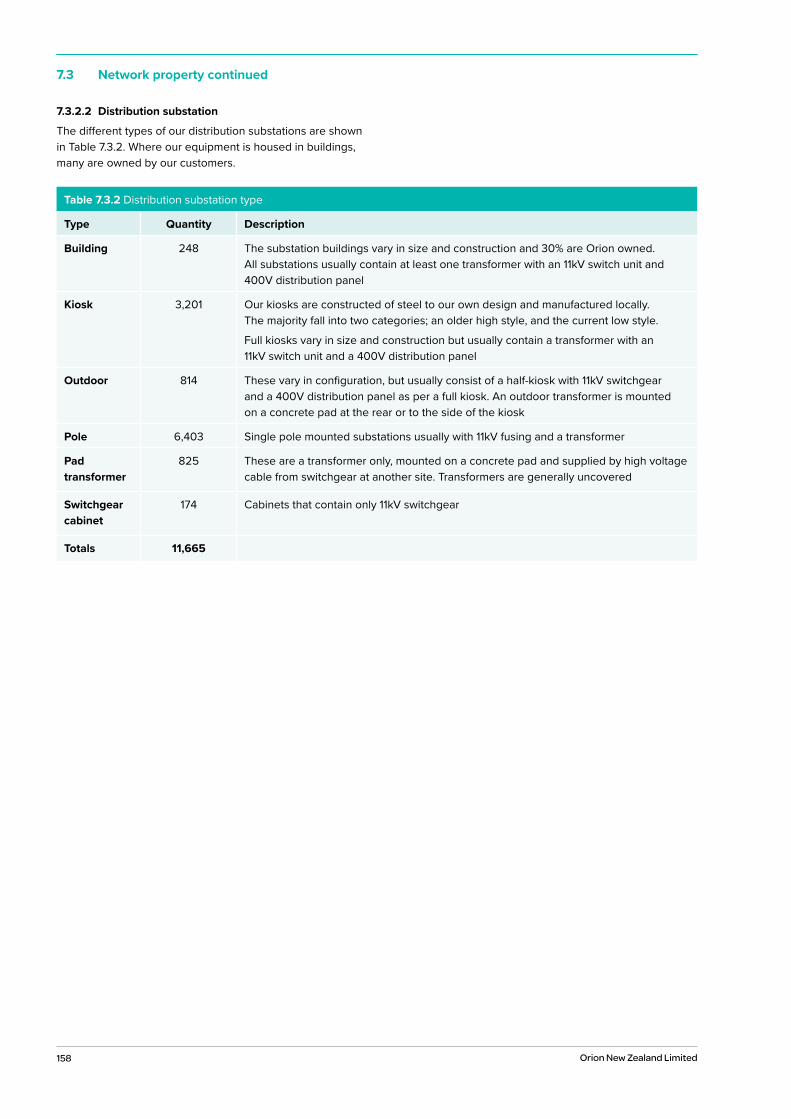
158 Orion New Zealand Limited
7.3 Network property continued
7.3.2.2 Distribution substation
The different types of our distribution substations are shown in Table 7.3.2. Where our equipment is housed in buildings, many are owned by our customers.
Table 7.3.2 Distribution substation type
Type Quantity Description
Building 248 The substation buildings vary in size and construction and 30% are Orion owned. All substations usually contain at least one transformer with an 11kV switch unit and 400V distribution panel
Kiosk 3,201 Our kiosks are constructed of steel to our own design and manufactured locally. The majority fall into two categories; an older high style, and the current low style.
Full kiosks vary in size and construction but usually contain a transformer with an 11kV switch unit and a 400V distribution panel
Outdoor 814 These vary in configuration, but usually consist of a half-kiosk with 11kV switchgear and a 400V distribution panel as per a full kiosk. An outdoor transformer is mounted on a concrete pad at the rear or to the side of the kiosk
Pole 6,403 Single pole mounted substations usually with 11kV fusing and a transformer
Pad transformer
825 These are a transformer only, mounted on a concrete pad and supplied by high voltage cable from switchgear at another site. Transformers are generally uncovered
Switchgear cabinet
174 Cabinets that contain only 11kV switchgear
Totals 11,665
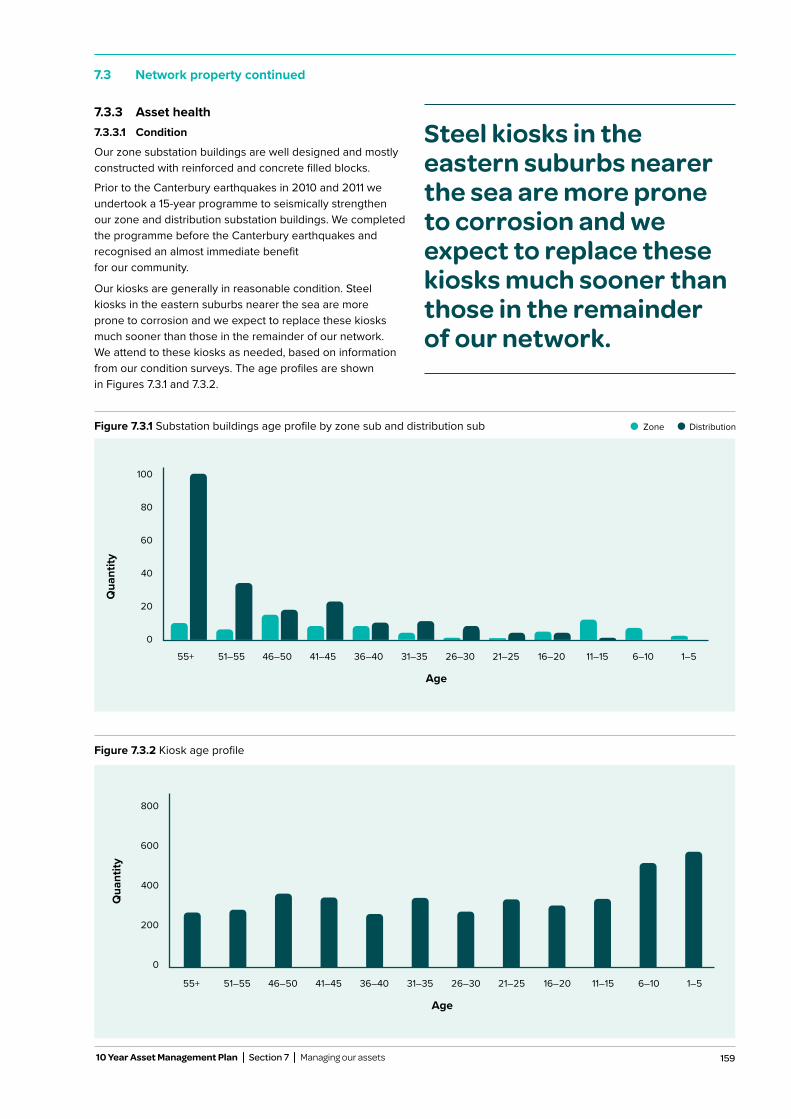
159
7.3 Network property continued
10 Year Asset Management Plan Section 7 Managing our assets
7.3.3 Asset health7.3.3.1 Condition
Our zone substation buildings are well designed and mostly constructed with reinforced and concrete filled blocks.
Prior to the Canterbury earthquakes in 2010 and 2011 we undertook a 15-year programme to seismically strengthen our zone and distribution substation buildings. We completed the programme before the Canterbury earthquakes and recognised an almost immediate benefit for our community.
Our kiosks are generally in reasonable condition. Steel kiosks in the eastern suburbs nearer the sea are more prone to corrosion and we expect to replace these kiosks much sooner than those in the remainder of our network. We attend to these kiosks as needed, based on information from our condition surveys. The age profiles are shown in Figures 7.3.1 and 7.3.2.
Steel kiosks in the eastern suburbs nearer the sea are more prone to corrosion and we expect to replace these kiosks much sooner than those in the remainder of our network.
Figure 7.3.2 Kiosk age profile
Age
800
600
400
200
0
Qua
ntity
55+ 51–55 46–50 41–45 36–40 31–35 26–30 21–25 16–20 11–15 6–10 1–5
Qua
ntity
Age
55+ 51–55 46–50 41–45 36–40 31–35 26–30 21–25 16–20 11–15 6–10 1–5
100
80
60
40
20
0
Figure 7.3.1 Substation buildings age profile by zone sub and distribution sub Zone Distribution
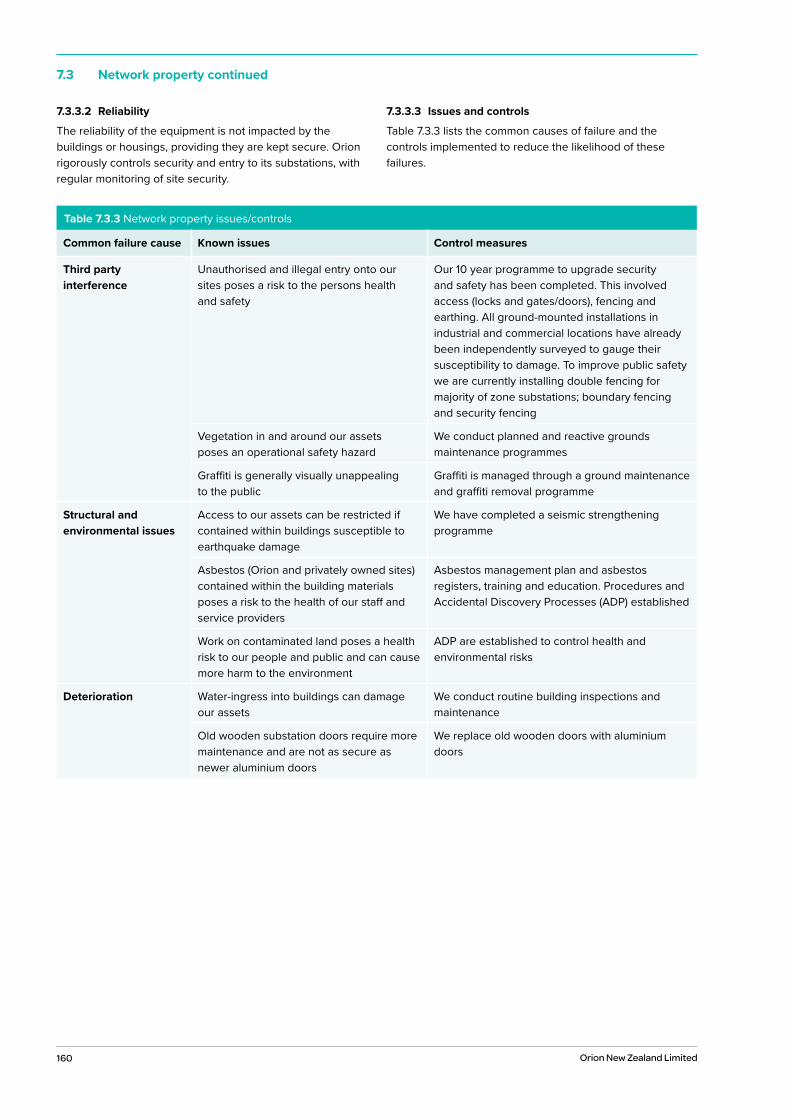
160 Orion New Zealand Limited
7.3 Network property continued
7.3.3.2 Reliability
The reliability of the equipment is not impacted by the buildings or housings, providing they are kept secure. Orion rigorously controls security and entry to its substations, with regular monitoring of site security.
7.3.3.3 Issues and controls
Table 7.3.3 lists the common causes of failure and the controls implemented to reduce the likelihood of these failures.
Table 7.3.3 Network property issues/controls
Common failure cause Known issues Control measures
Third party interference
Unauthorised and illegal entry onto our sites poses a risk to the persons health and safety
Our 10 year programme to upgrade security and safety has been completed. This involved access (locks and gates/doors), fencing and earthing. All ground-mounted installations in industrial and commercial locations have already been independently surveyed to gauge their susceptibility to damage. To improve public safety we are currently installing double fencing for majority of zone substations; boundary fencing and security fencing
Vegetation in and around our assets poses an operational safety hazard
We conduct planned and reactive grounds maintenance programmes
Graffiti is generally visually unappealing to the public
Graffiti is managed through a ground maintenance and graffiti removal programme
Structural and environmental issues
Access to our assets can be restricted if contained within buildings susceptible to earthquake damage
We have completed a seismic strengthening programme
Asbestos (Orion and privately owned sites) contained within the building materials poses a risk to the health of our staff and service providers
Asbestos management plan and asbestos registers, training and education. Procedures and Accidental Discovery Processes (ADP) established
Work on contaminated land poses a health risk to our people and public and can cause more harm to the environment
ADP are established to control health and environmental risks
Deterioration Water-ingress into buildings can damage our assets
We conduct routine building inspections and maintenance
Old wooden substation doors require more maintenance and are not as secure as newer aluminium doors
We replace old wooden doors with aluminium doors

161
7.3 Network property continued
10 Year Asset Management Plan Section 7 Managing our assets
7.3.4 Maintenance planThe substation monitoring and inspection programmes are listed in Table 7.3.4. Our forecast operational expenditure, Table 7.3.5, is in the Commerce Commission categories.
Table 7.3.4 Network property maintenance plan
Maintenance activity Strategy Frequency
Zone substation Maintenance
Substation Building Condition Assessments are carried to identify the substation maintenance requirements
2 years
Zone substation grounds maintenance
Grounds are adequately maintained, switchyard is free of vegetation and gutters and downpipes are free of any blockages
Each site is visited once every 3 weeks
Distribution substations
Visual inspection of all the components and includes recording any transformer loading (MDI) value. Vegetation issues are also reported and cleared
6 months
Graffiti removal We liaise with the local authorities and community groups in our area to assist us with this problem. We also now have in place a proactive graffiti removal plan where our service providers survey allocated areas of the city and remove graffiti as they find it
The sites which go through the reporting process are attended usually within 48 hours
Kiosks Inspection rounds identify any maintenance requirements
Grounds maintenance ensuring clear and free access to kiosks is undertaken on urban sites
Grounds maintenance on rural sites is undertaken as required
We maintain and repaint our kiosks as required with more focus to deter rust on the coastal areas
6 months
2 years
As required
Substation earthing A risk based approach has been taken for the inspecting and testing of our site earths. In general, earth systems in our rural area are subject to deterioration because of highly resistive soils, stony sub-layers of earth and corroded earthing systems
Between 2,000 and 2,600 sites are tested in any year and those sites requiring repairs are scheduled for remedial work in the following year
Roof refurbishment programme
A number of our substation buildings were constructed with a flat concrete roof with a tar-based membrane covering. These have been prone to leaking when cracks develop in the concrete. Over the past few years we have begun to upgrade these buildings by constructing a new pitched colour steel roof over the top
Roof replacement is scheduled and prioritised as required, based on survey data
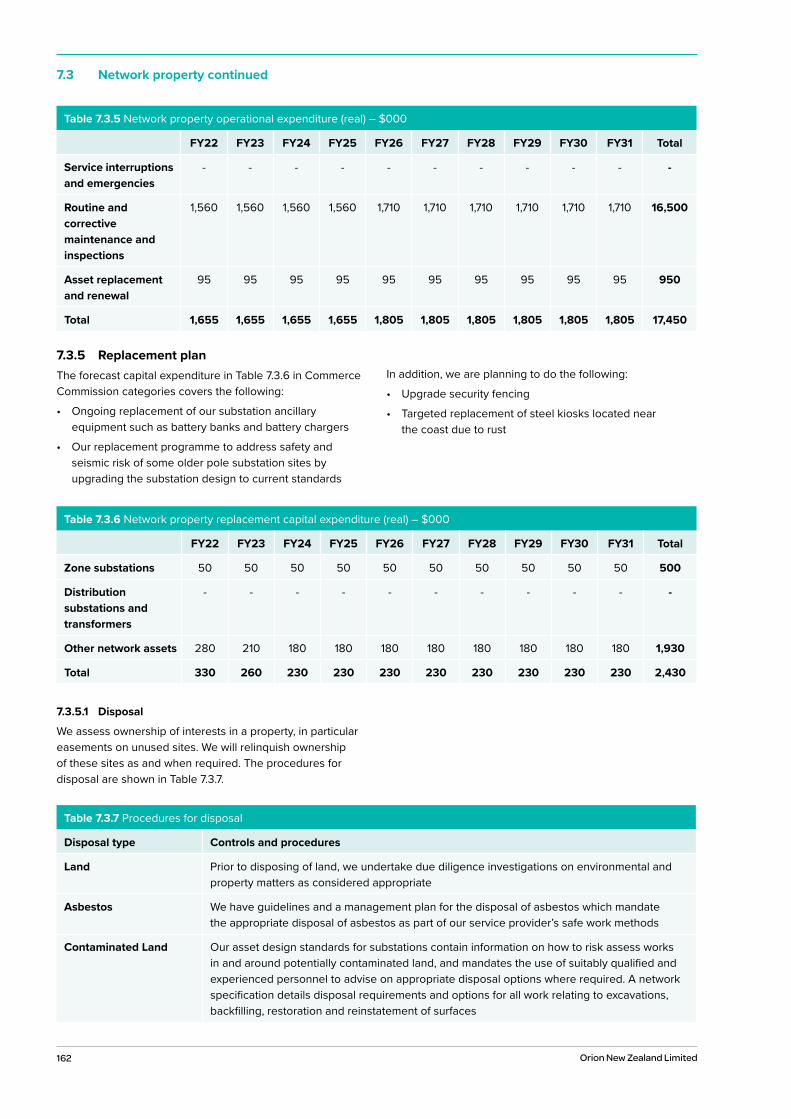
162 Orion New Zealand Limited
7.3 Network property continued
Table 7.3.5 Network property operational expenditure (real) – $000
FY22 FY23 FY24 FY25 FY26 FY27 FY28 FY29 FY30 FY31 Total
Service interruptions and emergencies
- - - - - - - - - - -
Routine and corrective maintenance and inspections
1,560 1,560 1,560 1,560 1,710 1,710 1,710 1,710 1,710 1,710 16,500
Asset replacement and renewal
95 95 95 95 95 95 95 95 95 95 950
Total 1,655 1,655 1,655 1,655 1,805 1,805 1,805 1,805 1,805 1,805 17,450
Table 7.3.6 Network property replacement capital expenditure (real) – $000
FY22 FY23 FY24 FY25 FY26 FY27 FY28 FY29 FY30 FY31 Total
Zone substations 50 50 50 50 50 50 50 50 50 50 500
Distribution substations and transformers
- - - - - - - - - - -
Other network assets 280 210 180 180 180 180 180 180 180 180 1,930
Total 330 260 230 230 230 230 230 230 230 230 2,430
Table 7.3.7 Procedures for disposal
Disposal type Controls and procedures
Land Prior to disposing of land, we undertake due diligence investigations on environmental and property matters as considered appropriate
Asbestos We have guidelines and a management plan for the disposal of asbestos which mandate the appropriate disposal of asbestos as part of our service provider’s safe work methods
Contaminated Land Our asset design standards for substations contain information on how to risk assess works in and around potentially contaminated land, and mandates the use of suitably qualified and experienced personnel to advise on appropriate disposal options where required. A network specification details disposal requirements and options for all work relating to excavations, backfilling, restoration and reinstatement of surfaces
7.3.5 Replacement planThe forecast capital expenditure in Table 7.3.6 in Commerce Commission categories covers the following:
• Ongoing replacement of our substation ancillaryequipment such as battery banks and battery chargers
• Our replacement programme to address safety andseismic risk of some older pole substation sites byupgrading the substation design to current standards
In addition, we are planning to do the following:
• Upgrade security fencing
• Targeted replacement of steel kiosks located nearthe coast due to rust
7.3.5.1 Disposal
We assess ownership of interests in a property, in particular easements on unused sites. We will relinquish ownership of these sites as and when required. The procedures for disposal are shown in Table 7.3.7.
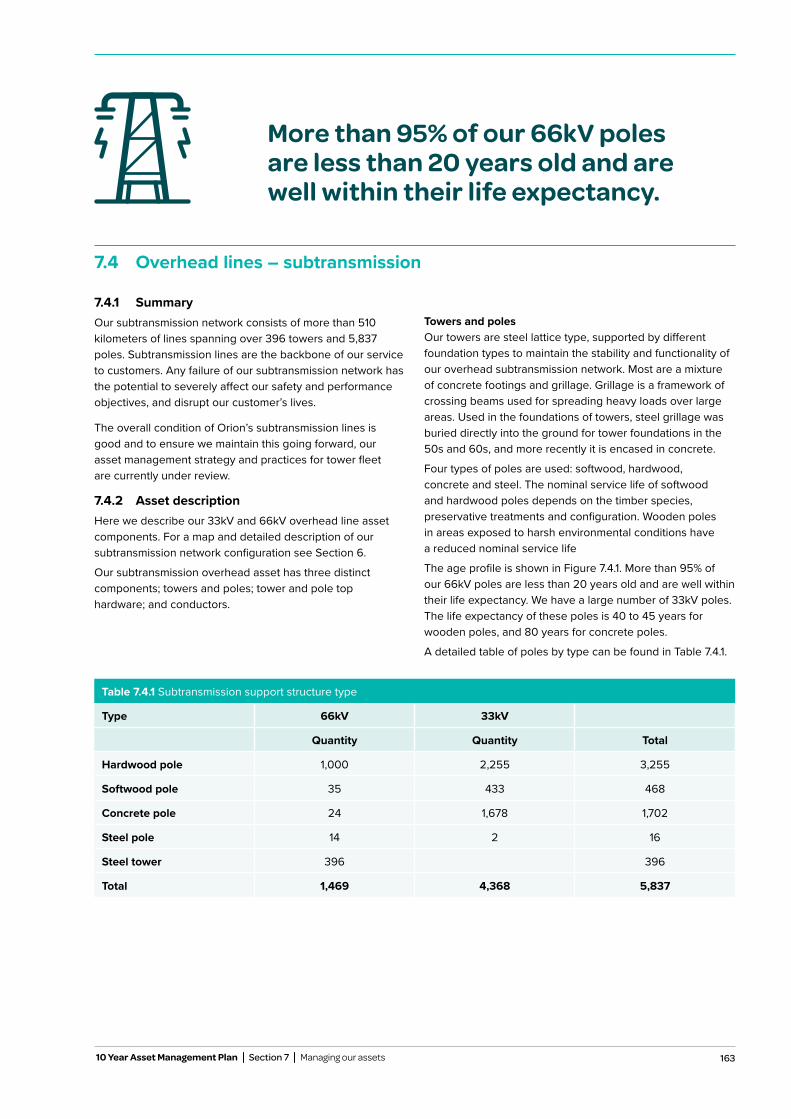
163 10 Year Asset Management Plan Section 7 Managing our assets
7.4 Overhead lines – subtransmission
Table 7.4.1 Subtransmission support structure type
Type 66kV 33kV
Quantity Quantity Total
Hardwood pole 1,000 2,255 3,255
Softwood pole 35 433 468
Concrete pole 24 1,678 1,702
Steel pole 14 2 16
Steel tower 396 396
Total 1,469 4,368 5,837
7.4.1 SummaryOur subtransmission network consists of more than 510 kilometers of lines spanning over 396 towers and 5,837 poles. Subtransmission lines are the backbone of our service to customers. Any failure of our subtransmission network has the potential to severely affect our safety and performance objectives, and disrupt our customer’s lives.
The overall condition of Orion’s subtransmission lines is good and to ensure we maintain this going forward, our asset management strategy and practices for tower fleet are currently under review.
7.4.2 Asset descriptionHere we describe our 33kV and 66kV overhead line asset components. For a map and detailed description of our subtransmission network configuration see Section 6.
Our subtransmission overhead asset has three distinct components; towers and poles; tower and pole top hardware; and conductors.
Towers and polesOur towers are steel lattice type, supported by different foundation types to maintain the stability and functionality of our overhead subtransmission network. Most are a mixture of concrete footings and grillage. Grillage is a framework of crossing beams used for spreading heavy loads over large areas. Used in the foundations of towers, steel grillage was buried directly into the ground for tower foundations in the 50s and 60s, and more recently it is encased in concrete.
Four types of poles are used: softwood, hardwood, concrete and steel. The nominal service life of softwood and hardwood poles depends on the timber species, preservative treatments and configuration. Wooden poles in areas exposed to harsh environmental conditions have a reduced nominal service life
The age profile is shown in Figure 7.4.1. More than 95% of our 66kV poles are less than 20 years old and are well within their life expectancy. We have a large number of 33kV poles. The life expectancy of these poles is 40 to 45 years for wooden poles, and 80 years for concrete poles.
A detailed table of poles by type can be found in Table 7.4.1.
More than 95% of our 66kV poles are less than 20 years old and are well within their life expectancy.
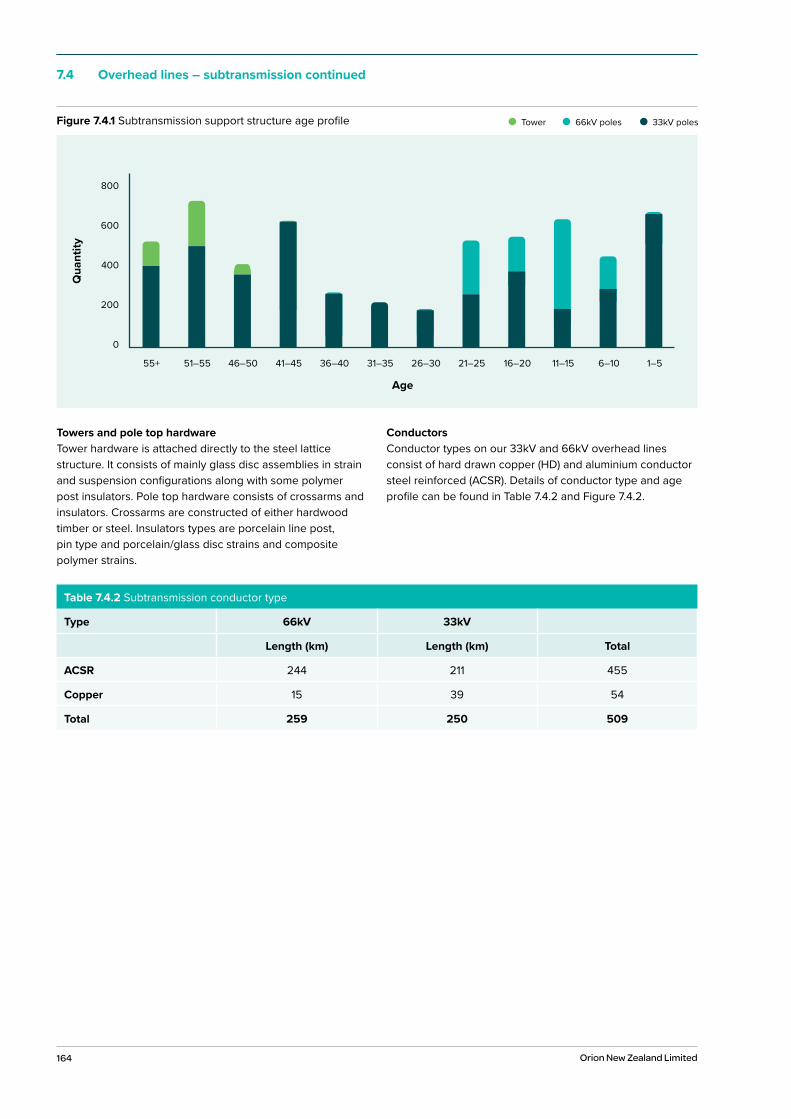
164 Orion New Zealand Limited
7.4 Overhead lines – subtransmission continued
Towers and pole top hardwareTower hardware is attached directly to the steel lattice structure. It consists of mainly glass disc assemblies in strain and suspension configurations along with some polymer post insulators. Pole top hardware consists of crossarms and insulators. Crossarms are constructed of either hardwood timber or steel. Insulators types are porcelain line post, pin type and porcelain/glass disc strains and composite polymer strains.
ConductorsConductor types on our 33kV and 66kV overhead lines consist of hard drawn copper (HD) and aluminium conductor steel reinforced (ACSR). Details of conductor type and age profile can be found in Table 7.4.2 and Figure 7.4.2.
Table 7.4.2 Subtransmission conductor type
Type 66kV 33kV
Length (km) Length (km) Total
ACSR 244 211 455
Copper 15 39 54
Total 259 250 509
Figure 7.4.1 Subtransmission support structure age profile Tower 66kV poles 33kV poles
Age
800
600
400
200
0
Qua
ntity
55+ 51–55 46–50 41–45 36–40 31–35 26–30 21–25 16–20 11–15 6–10 1–5

165 10 Year Asset Management Plan Section 7 Managing our assets
7.4 Overhead lines – subtransmission continued
7.4.3 Asset health7.4.3.1 Condition
TowersThe overall condition of our steel towers is good. The towers between Addington and Islington came with no additional paint protection which we are addressing with our painting programme. The condition of most tower grillage foundations below ground level is good. A few are in fair condition due to corrosion. We have a foundation refurbishment and concrete encasement programme to address the condition of these towers.
PolesAs shown in Figure 7.4.3 the overall condition of the subtransmission poles is good. Some 33kV mainly wood poles are in fair condition and are showing signs of age-related deterioration. These are being prioritised for replacement
The overall condition of our steel towers is good.
Figure 7.4.2 Subtransmission conductor age profile 66kV 33kV
Age
100
80
60
40
20
0
Leng
th (k
m)
55+ 51–55 46–50 41–45 36–40 31–35 26–30 21–25 16–20 11–15 6–10 1–5
Figure 7.4.3 Subtransmission pole condition profile Poor Fair Good
Age
800
600
400
200
0
Pole
s
55+ 51–55 46–50 41–45 36–40 31–35 26–30 21–25 16–20 11–15 6–10 1–5
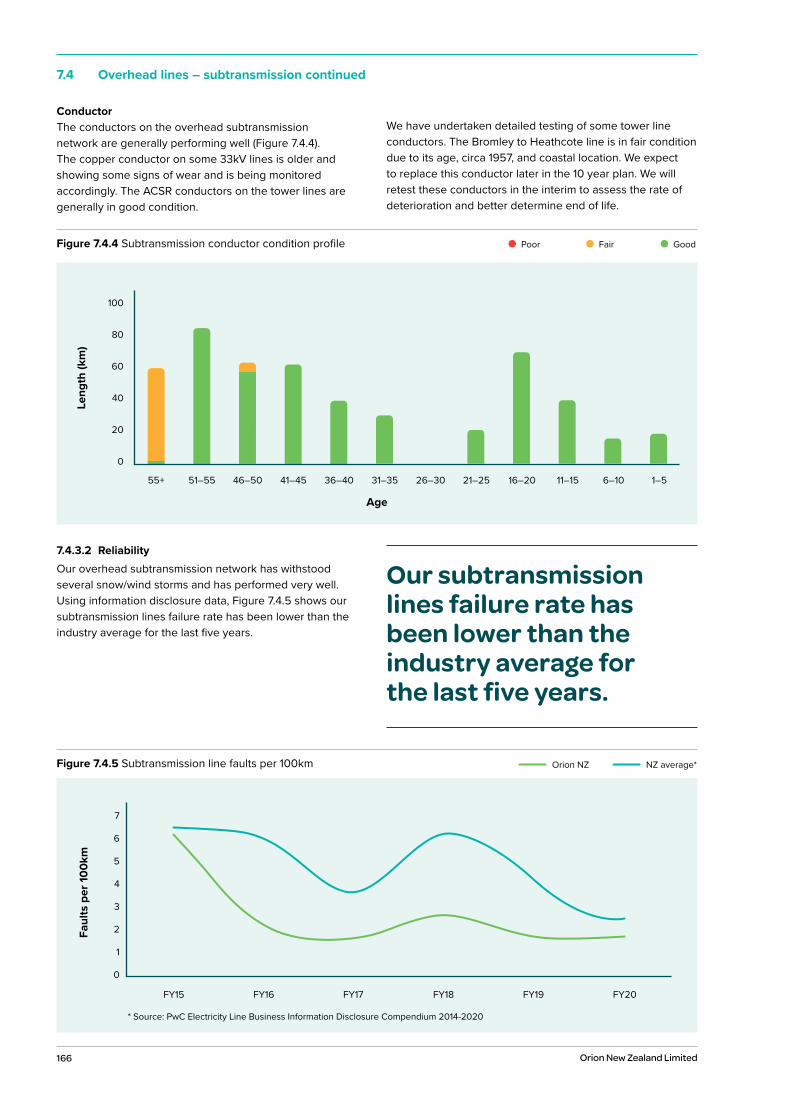
166 Orion New Zealand Limited
Figure 7.4.5 Subtransmission line faults per 100km Orion NZ NZ average*
FY15 FY16 FY17 FY18 FY19 FY20
Faul
ts p
er 1
00km
7
6
5
4
3
2
1
0
* Source: PwC Electricity Line Business Information Disclosure Compendium 2014-2020
7.4 Overhead lines – subtransmission continued
ConductorThe conductors on the overhead subtransmission network are generally performing well (Figure 7.4.4). The copper conductor on some 33kV lines is older and showing some signs of wear and is being monitored accordingly. The ACSR conductors on the tower lines are generally in good condition.
We have undertaken detailed testing of some tower line conductors. The Bromley to Heathcote line is in fair condition due to its age, circa 1957, and coastal location. We expect to replace this conductor later in the 10 year plan. We will retest these conductors in the interim to assess the rate of deterioration and better determine end of life.
7.4.3.2 ReliabilityOur overhead subtransmission network has withstood several snow/wind storms and has performed very well. Using information disclosure data, Figure 7.4.5 shows our subtransmission lines failure rate has been lower than the industry average for the last five years.
Figure 7.4.4 Subtransmission conductor condition profile Poor Fair Good
Age
100
80
60
40
20
0
Leng
th (k
m)
55+ 51–55 46–50 41–45 36–40 31–35 26–30 21–25 16–20 11–15 6–10 1–5
Our subtransmission lines failure rate has been lower than the industry average for the last five years.
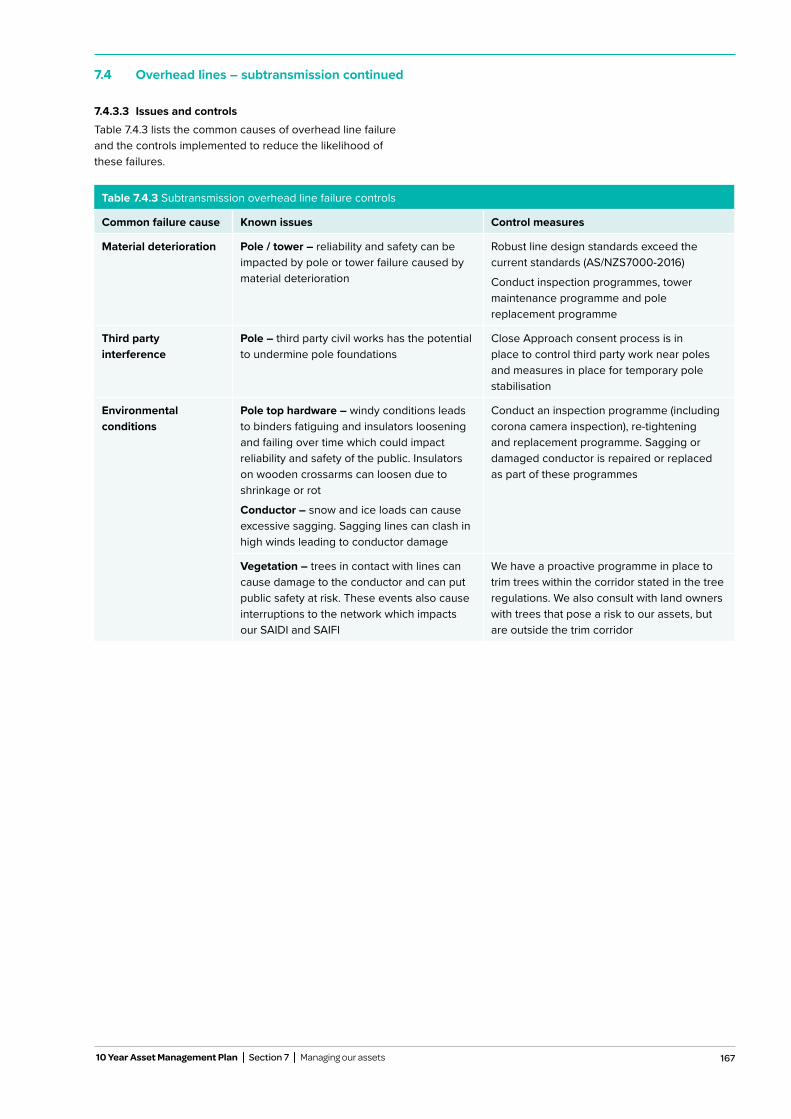
167 10 Year Asset Management Plan Section 7 Managing our assets
7.4 Overhead lines – subtransmission continued
7.4.3.3 Issues and controlsTable 7.4.3 lists the common causes of overhead line failure and the controls implemented to reduce the likelihood of these failures.
Table 7.4.3 Subtransmission overhead line failure controls
Common failure cause Known issues Control measures
Material deterioration Pole / tower – reliability and safety can be impacted by pole or tower failure caused by material deterioration
Robust line design standards exceed the current standards (AS/NZS7000-2016)
Conduct inspection programmes, tower maintenance programme and pole replacement programme
Third party interference
Pole – third party civil works has the potential to undermine pole foundations
Close Approach consent process is in place to control third party work near poles and measures in place for temporary pole stabilisation
Environmental conditions
Pole top hardware – windy conditions leads to binders fatiguing and insulators loosening and failing over time which could impact reliability and safety of the public. Insulators on wooden crossarms can loosen due to shrinkage or rot
Conductor – snow and ice loads can cause excessive sagging. Sagging lines can clash in high winds leading to conductor damage
Conduct an inspection programme (including corona camera inspection), re-tightening and replacement programme. Sagging or damaged conductor is repaired or replaced as part of these programmes
Vegetation – trees in contact with lines can cause damage to the conductor and can put public safety at risk. These events also cause interruptions to the network which impacts our SAIDI and SAIFI
We have a proactive programme in place to trim trees within the corridor stated in the tree regulations. We also consult with land owners with trees that pose a risk to our assets, but are outside the trim corridor
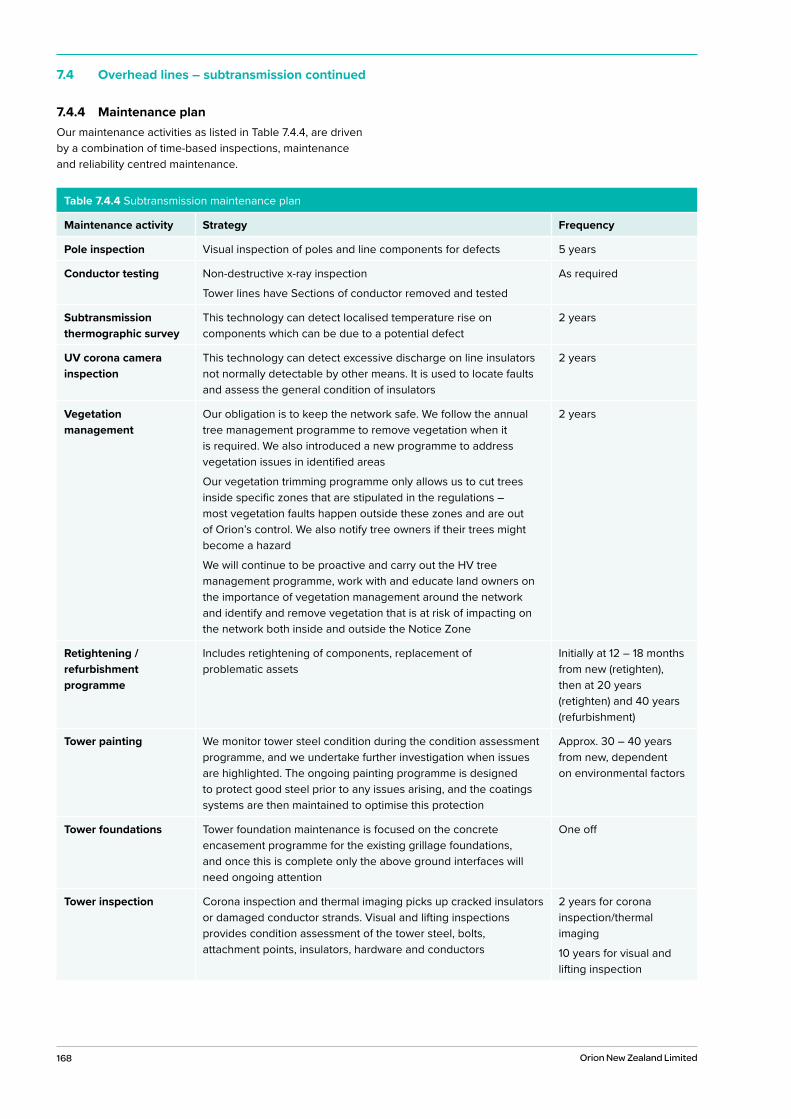
168 Orion New Zealand Limited
7.4 Overhead lines – subtransmission continued
7.4.4 Maintenance planOur maintenance activities as listed in Table 7.4.4, are driven by a combination of time-based inspections, maintenance and reliability centred maintenance.
Table 7.4.4 Subtransmission maintenance plan
Maintenance activity Strategy Frequency
Pole inspection Visual inspection of poles and line components for defects 5 years
Conductor testing Non-destructive x-ray inspection
Tower lines have Sections of conductor removed and tested
As required
Subtransmission thermographic survey
This technology can detect localised temperature rise on components which can be due to a potential defect
2 years
UV corona camera inspection
This technology can detect excessive discharge on line insulators not normally detectable by other means. It is used to locate faults and assess the general condition of insulators
2 years
Vegetation management
Our obligation is to keep the network safe. We follow the annual tree management programme to remove vegetation when it is required. We also introduced a new programme to address vegetation issues in identified areas
Our vegetation trimming programme only allows us to cut trees inside specific zones that are stipulated in the regulations – most vegetation faults happen outside these zones and are out of Orion’s control. We also notify tree owners if their trees might become a hazard
We will continue to be proactive and carry out the HV tree management programme, work with and educate land owners on the importance of vegetation management around the network and identify and remove vegetation that is at risk of impacting on the network both inside and outside the Notice Zone
2 years
Retightening / refurbishment programme
Includes retightening of components, replacement of problematic assets
Initially at 12 – 18 months from new (retighten), then at 20 years (retighten) and 40 years (refurbishment)
Tower painting We monitor tower steel condition during the condition assessment programme, and we undertake further investigation when issues are highlighted. The ongoing painting programme is designed to protect good steel prior to any issues arising, and the coatings systems are then maintained to optimise this protection
Approx. 30 – 40 years from new, dependent on environmental factors
Tower foundations Tower foundation maintenance is focused on the concrete encasement programme for the existing grillage foundations, and once this is complete only the above ground interfaces will need ongoing attention
One off
Tower inspection Corona inspection and thermal imaging picks up cracked insulators or damaged conductor strands. Visual and lifting inspections provides condition assessment of the tower steel, bolts, attachment points, insulators, hardware and conductors
2 years for corona inspection/thermal imaging
10 years for visual and lifting inspection
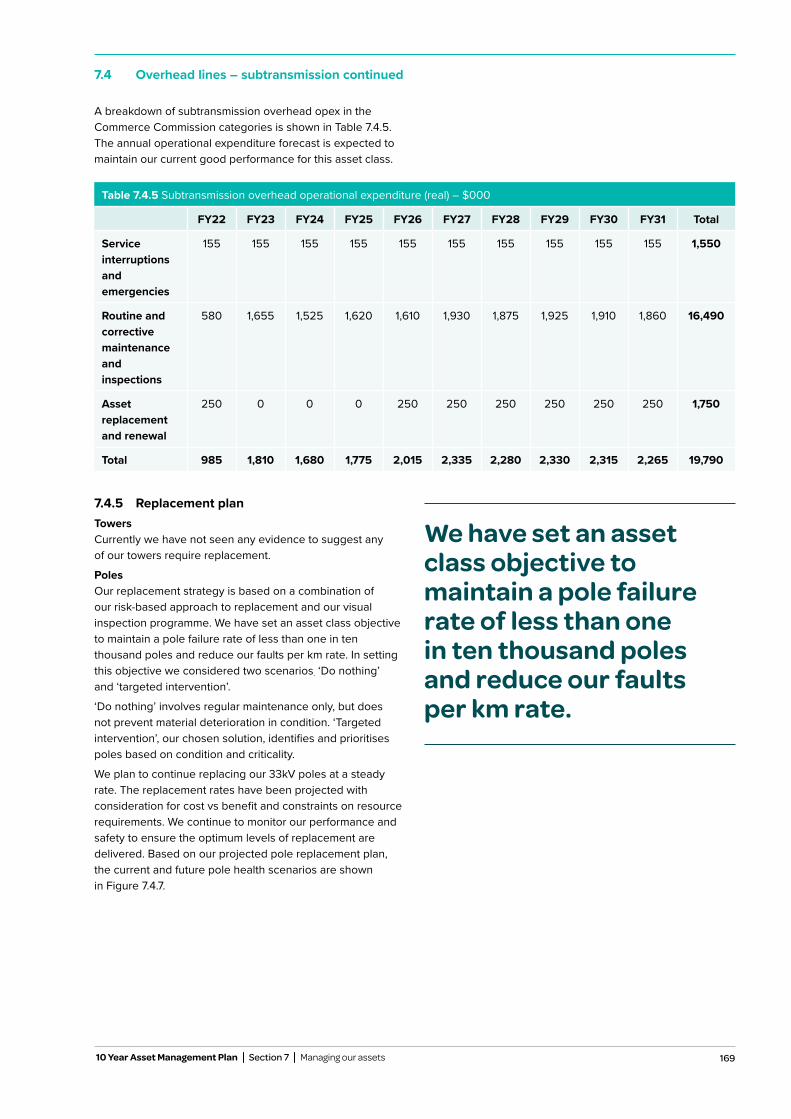
169
A breakdown of subtransmission overhead opex in the Commerce Commission categories is shown in Table 7.4.5. The annual operational expenditure forecast is expected to maintain our current good performance for this asset class.
10 Year Asset Management Plan Section 7 Managing our assets
7.4 Overhead lines – subtransmission continued
7.4.5 Replacement planTowersCurrently we have not seen any evidence to suggest any of our towers require replacement.
PolesOur replacement strategy is based on a combination of our risk-based approach to replacement and our visual inspection programme. We have set an asset class objective to maintain a pole failure rate of less than one in ten thousand poles and reduce our faults per km rate. In setting this objective we considered two scenarios. ‘Do nothing’ and ‘targeted intervention’.
‘Do nothing’ involves regular maintenance only, but does not prevent material deterioration in condition. ‘Targeted intervention’, our chosen solution, identifies and prioritises poles based on condition and criticality.
We plan to continue replacing our 33kV poles at a steady rate. The replacement rates have been projected with consideration for cost vs benefit and constraints on resource requirements. We continue to monitor our performance and safety to ensure the optimum levels of replacement are delivered. Based on our projected pole replacement plan, the current and future pole health scenarios are shown in Figure 7.4.7.
Table 7.4.5 Subtransmission overhead operational expenditure (real) – $000
FY22 FY23 FY24 FY25 FY26 FY27 FY28 FY29 FY30 FY31 Total
Service interruptions and emergencies
155 155 155 155 155 155 155 155 155 155 1,550
Routine and corrective maintenance and inspections
580 1,655 1,525 1,620 1,610 1,930 1,875 1,925 1,910 1,860 16,490
Asset replacement and renewal
250 0 0 0 250 250 250 250 250 250 1,750
Total 985 1,810 1,680 1,775 2,015 2,335 2,280 2,330 2,315 2,265 19,790
We have set an asset class objective to maintain a pole failure rate of less than one in ten thousand poles and reduce our faults per km rate.
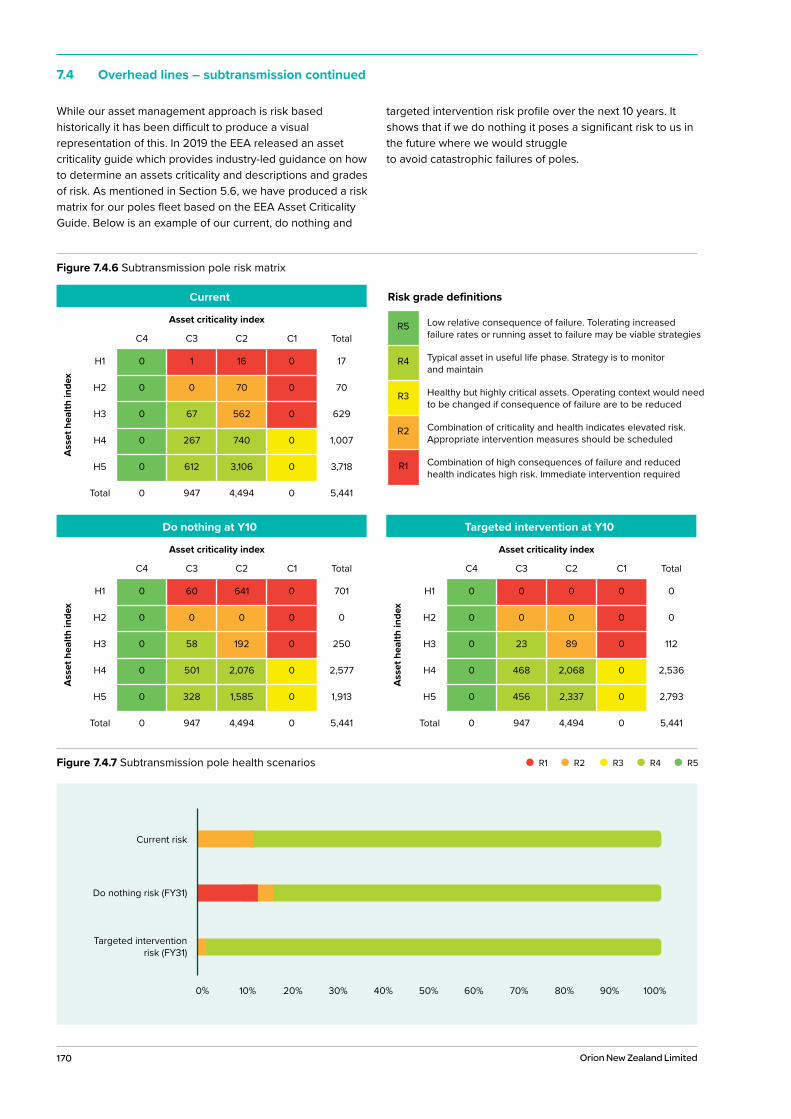
170 Orion New Zealand Limited
7.4 Overhead lines – subtransmission continued
While our asset management approach is risk based historically it has been difficult to produce a visual representation of this. In 2019 the EEA released an asset criticality guide which provides industry-led guidance on how to determine an assets criticality and descriptions and grades of risk. As mentioned in Section 5.6, we have produced a risk matrix for our poles fleet based on the EEA Asset Criticality Guide. Below is an example of our current, do nothing and
targeted intervention risk profile over the next 10 years. It shows that if we do nothing it poses a significant risk to us in the future where we would struggle to avoid catastrophic failures of poles.
Figure 7.4.6 Subtransmission pole risk matrix
Current
Asset criticality index
C4 C3 C2 C1 Total
Ass
et h
ealth
inde
x
H1 0 1 16 0 17
H2 0 0 70 0 70
H3 0 67 562 0 629
H4 0 267 740 0 1,007
H5 0 612 3,106 0 3,718
Total 0 947 4,494 0 5,441
Risk grade definitions
R5 Low relative consequence of failure. Tolerating increased failure rates or running asset to failure may be viable strategies
R4 Typical asset in useful life phase. Strategy is to monitor and maintain
R3 Healthy but highly critical assets. Operating context would need to be changed if consequence of failure are to be reduced
R2 Combination of criticality and health indicates elevated risk. Appropriate intervention measures should be scheduled
R1 Combination of high consequences of failure and reduced health indicates high risk. Immediate intervention required
Do nothing at Y10
Asset criticality index
C4 C3 C2 C1 Total
Ass
et h
ealth
inde
x
H1 0 60 641 0 701
H2 0 0 0 0 0
H3 0 58 192 0 250
H4 0 501 2,076 0 2,577
H5 0 328 1,585 0 1,913
Total 0 947 4,494 0 5,441
Targeted intervention at Y10
Asset criticality index
C4 C3 C2 C1 Total
Ass
et h
ealth
inde
x
H1 0 0 0 0 0
H2 0 0 0 0 0
H3 0 23 89 0 112
H4 0 468 2,068 0 2,536
H5 0 456 2,337 0 2,793
Total 0 947 4,494 0 5,441
Figure 7.4.7 Subtransmission pole health scenarios R1 R3R2 R4 R5
Current risk
Do nothing risk (FY31)
Targeted intervention risk (FY31)
0% 10% 20% 30% 40% 50% 60% 70% 80% 90% 100%
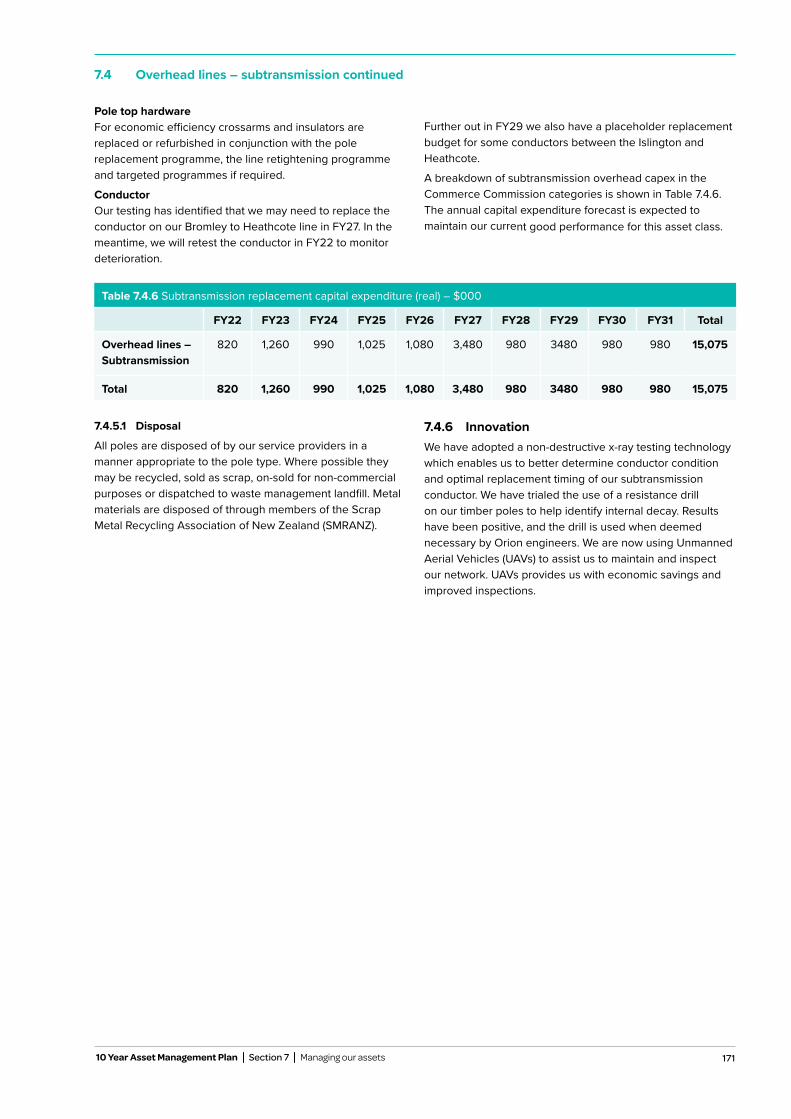
171
7.4 Overhead lines – subtransmission continued
Pole top hardwareFor economic efficiency crossarms and insulators are replaced or refurbished in conjunction with the pole replacement programme, the line retightening programme and targeted programmes if required.
ConductorOur testing has identified that we may need to replace the conductor on our Bromley to Heathcote line in FY27. In the meantime, we will retest the conductor in FY22 to monitor deterioration.
Further out in FY29 we also have a placeholder replacement budget for some conductors between the Islington and Heathcote.
A breakdown of subtransmission overhead capex in the Commerce Commission categories is shown in Table 7.4.6. The annual capital expenditure forecast is expected to maintain our current good performance for this asset class.
7.4.5.1 Disposal
All poles are disposed of by our service providers in a manner appropriate to the pole type. Where possible they may be recycled, sold as scrap, on-sold for non-commercial purposes or dispatched to waste management landfill. Metal materials are disposed of through members of the Scrap Metal Recycling Association of New Zealand (SMRANZ).
7.4.6 InnovationWe have adopted a non-destructive x-ray testing technology which enables us to better determine conductor condition and optimal replacement timing of our subtransmission conductor. We have trialed the use of a resistance drill on our timber poles to help identify internal decay. Results have been positive, and the drill is used when deemed necessary by Orion engineers. We are now using Unmanned Aerial Vehicles (UAVs) to assist us to maintain and inspect our network. UAVs provides us with economic savings and improved inspections.
Table 7.4.6 Subtransmission replacement capital expenditure (real) – $000
FY22 FY23 FY24 FY25 FY26 FY27 FY28 FY29 FY30 FY31 Total
Overhead lines – Subtransmission
820 1,260 990 1,025 1,080 3,480 980 3480 980 980 15,075
Total 820 1,260 990 1,025 1,080 3,480 980 3480 980 980 15,075
10 Year Asset Management Plan Section 7 Managing our assets
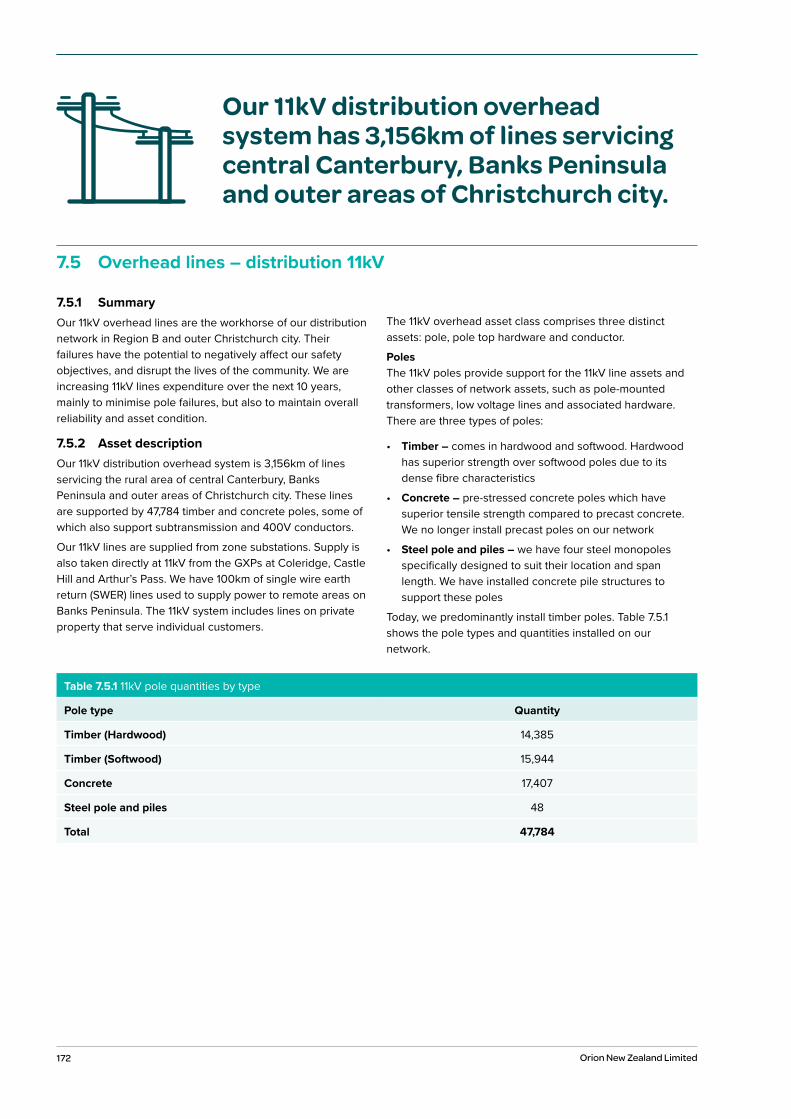
172 Orion New Zealand Limited
7.5 Overhead lines – distribution 11kV
7.5.1 SummaryOur 11kV overhead lines are the workhorse of our distribution network in Region B and outer Christchurch city. Their failures have the potential to negatively affect our safety objectives, and disrupt the lives of the community. We are increasing 11kV lines expenditure over the next 10 years, mainly to minimise pole failures, but also to maintain overall reliability and asset condition.
7.5.2 Asset descriptionOur 11kV distribution overhead system is 3,156km of lines servicing the rural area of central Canterbury, Banks Peninsula and outer areas of Christchurch city. These lines are supported by 47,784 timber and concrete poles, some of which also support subtransmission and 400V conductors.
Our 11kV lines are supplied from zone substations. Supply is also taken directly at 11kV from the GXPs at Coleridge, Castle Hill and Arthur’s Pass. We have 100km of single wire earth return (SWER) lines used to supply power to remote areas on Banks Peninsula. The 11kV system includes lines on private property that serve individual customers.
The 11kV overhead asset class comprises three distinct assets: pole, pole top hardware and conductor.
PolesThe 11kV poles provide support for the 11kV line assets and other classes of network assets, such as pole-mounted transformers, low voltage lines and associated hardware. There are three types of poles:
• Timber – comes in hardwood and softwood. Hardwoodhas superior strength over softwood poles due to itsdense fibre characteristics
• Concrete – pre-stressed concrete poles which havesuperior tensile strength compared to precast concrete.We no longer install precast poles on our network
• Steel pole and piles – we have four steel monopolesspecifically designed to suit their location and spanlength. We have installed concrete pile structures tosupport these poles
Today, we predominantly install timber poles. Table 7.5.1 shows the pole types and quantities installed on our network.
Our 11kV distribution overhead system has 3,156km of lines servicing central Canterbury, Banks Peninsula and outer areas of Christchurch city.
Table 7.5.1 11kV pole quantities by type
Pole type Quantity
Timber (Hardwood) 14,385
Timber (Softwood) 15,944
Concrete 17,407
Steel pole and piles 48
Total 47,784
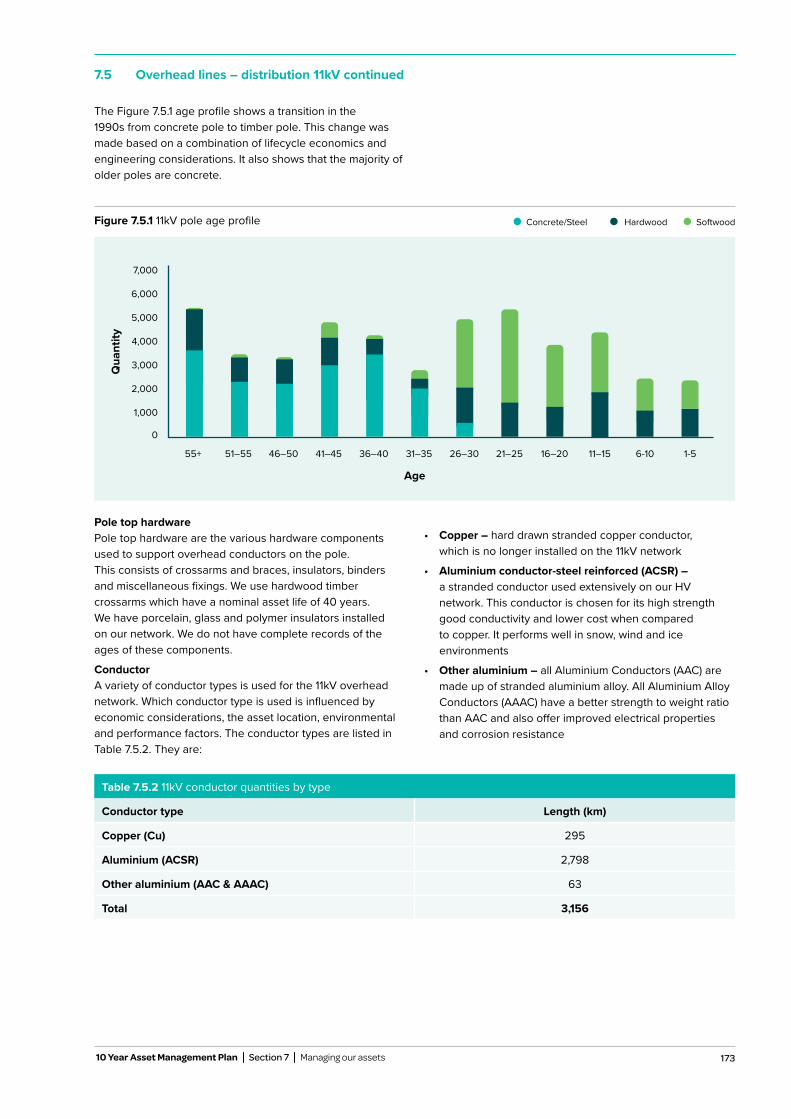
173
Pole top hardwarePole top hardware are the various hardware components used to support overhead conductors on the pole. This consists of crossarms and braces, insulators, binders and miscellaneous fixings. We use hardwood timber crossarms which have a nominal asset life of 40 years. We have porcelain, glass and polymer insulators installed on our network. We do not have complete records of the ages of these components.
ConductorA variety of conductor types is used for the 11kV overhead network. Which conductor type is used is influenced by economic considerations, the asset location, environmental and performance factors. The conductor types are listed in Table 7.5.2. They are:
• Copper – hard drawn stranded copper conductor, which is no longer installed on the 11kV network
• Aluminium conductor-steel reinforced (ACSR) – a stranded conductor used extensively on our HV network. This conductor is chosen for its high strength good conductivity and lower cost when compared to copper. It performs well in snow, wind and ice environments
• Other aluminium – all Aluminium Conductors (AAC) are made up of stranded aluminium alloy. All Aluminium Alloy Conductors (AAAC) have a better strength to weight ratio than AAC and also offer improved electrical properties and corrosion resistance
7.5 Overhead lines – distribution 11kV continued
The Figure 7.5.1 age profile shows a transition in the 1990s from concrete pole to timber pole. This change was made based on a combination of lifecycle economics and engineering considerations. It also shows that the majority of older poles are concrete.
Table 7.5.2 11kV conductor quantities by type
Conductor type Length (km)
Copper (Cu) 295
Aluminium (ACSR) 2,798
Other aluminium (AAC & AAAC) 63
Total 3,156
10 Year Asset Management Plan Section 7 Managing our assets
Figure 7.5.1 11kV pole age profile HardwoodConcrete/Steel Softwood
Age
7,000
6,000
5,000
4,000
3,000
2,000
1,000
0
Qua
ntity
55+ 51–55 46–50 41–45 36–40 31–35 26–30 21–25 16–20 11–15 6-10 1-5
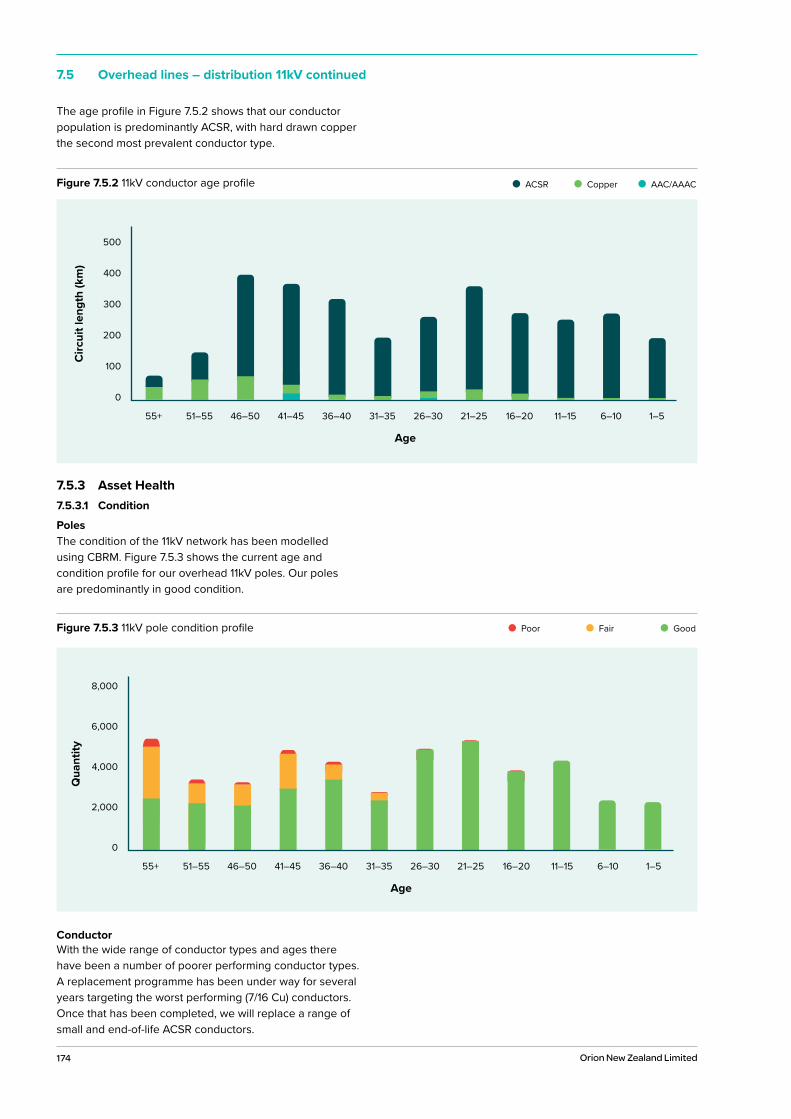
174 Orion New Zealand Limited
Figure 7.5.2 11kV conductor age profile ACSR Copper AAC/AAAC
7.5 Overhead lines – distribution 11kV continued
The age profile in Figure 7.5.2 shows that our conductor population is predominantly ACSR, with hard drawn copper the second most prevalent conductor type.
7.5.3 Asset Health7.5.3.1 Condition
PolesThe condition of the 11kV network has been modelled using CBRM. Figure 7.5.3 shows the current age and condition profile for our overhead 11kV poles. Our poles are predominantly in good condition.
ConductorWith the wide range of conductor types and ages there have been a number of poorer performing conductor types. A replacement programme has been under way for several years targeting the worst performing (7/16 Cu) conductors. Once that has been completed, we will replace a range of small and end-of-life ACSR conductors.
Figure 7.5.3 11kV pole condition profile Poor Fair Good
Age
500
400
300
200
100
0
Circ
uit l
engt
h (k
m)
55+ 51–55 46–50 41–45 36–40 31–35 26–30 21–25 16–20 11–15 6–10 1–5
Age
8,000
6,000
4,000
2,000
0
Qua
ntity
55+ 51–55 46–50 41–45 36–40 31–35 26–30 21–25 16–20 11–15 6–10 1–5
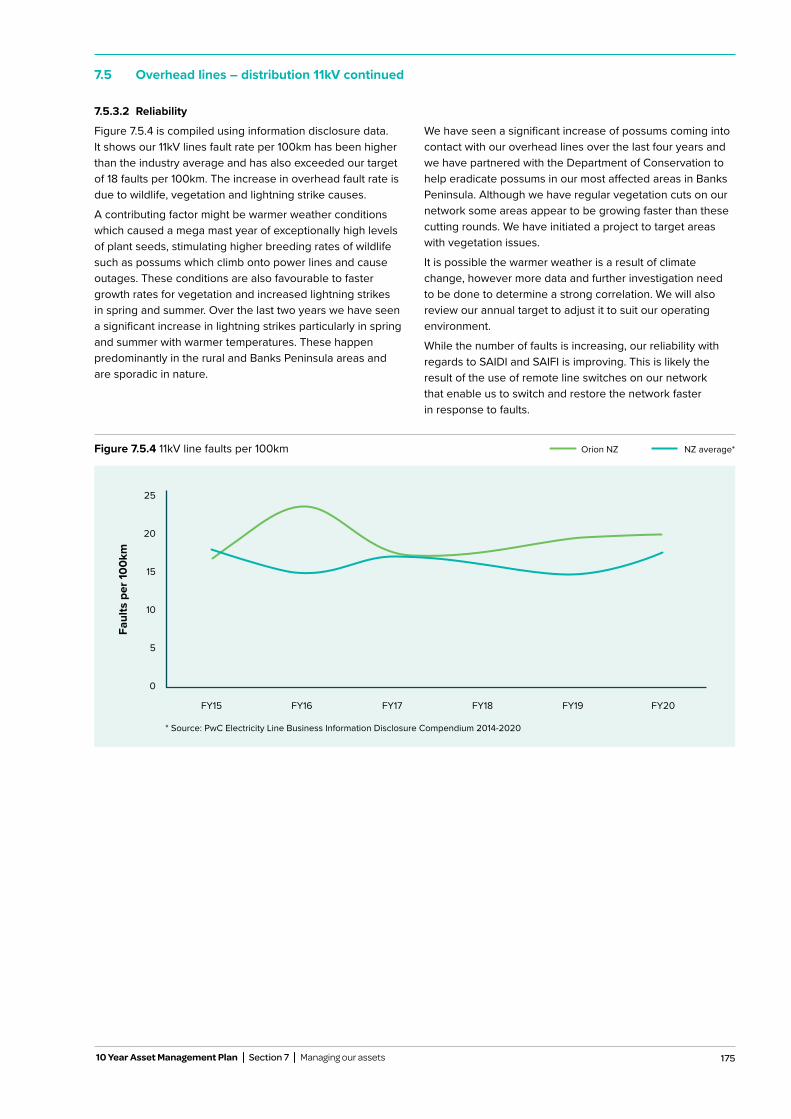
175
7.5.3.2 Reliability
Figure 7.5.4 is compiled using information disclosure data. It shows our 11kV lines fault rate per 100km has been higher than the industry average and has also exceeded our target of 18 faults per 100km. The increase in overhead fault rate is due to wildlife, vegetation and lightning strike causes.
A contributing factor might be warmer weather conditions which caused a mega mast year of exceptionally high levels of plant seeds, stimulating higher breeding rates of wildlife such as possums which climb onto power lines and cause outages. These conditions are also favourable to faster growth rates for vegetation and increased lightning strikes in spring and summer. Over the last two years we have seen a significant increase in lightning strikes particularly in spring and summer with warmer temperatures. These happen predominantly in the rural and Banks Peninsula areas and are sporadic in nature.
We have seen a significant increase of possums coming into contact with our overhead lines over the last four years and we have partnered with the Department of Conservation to help eradicate possums in our most affected areas in Banks Peninsula. Although we have regular vegetation cuts on our network some areas appear to be growing faster than these cutting rounds. We have initiated a project to target areas with vegetation issues.
It is possible the warmer weather is a result of climate change, however more data and further investigation need to be done to determine a strong correlation. We will also review our annual target to adjust it to suit our operating environment.
While the number of faults is increasing, our reliability with regards to SAIDI and SAIFI is improving. This is likely the result of the use of remote line switches on our network that enable us to switch and restore the network faster in response to faults.
7.5 Overhead lines – distribution 11kV continued
10 Year Asset Management Plan Section 7 Managing our assets
0
10
5
15
20
25
FY15 FY16 FY17 FY18 FY19 FY20
Faul
ts p
er 10
0km
* Source: PwC Electricity Line Business Information Disclosure Compendium 2014-2020
Figure 7.5.4 11kV line faults per 100km Orion NZ NZ average*
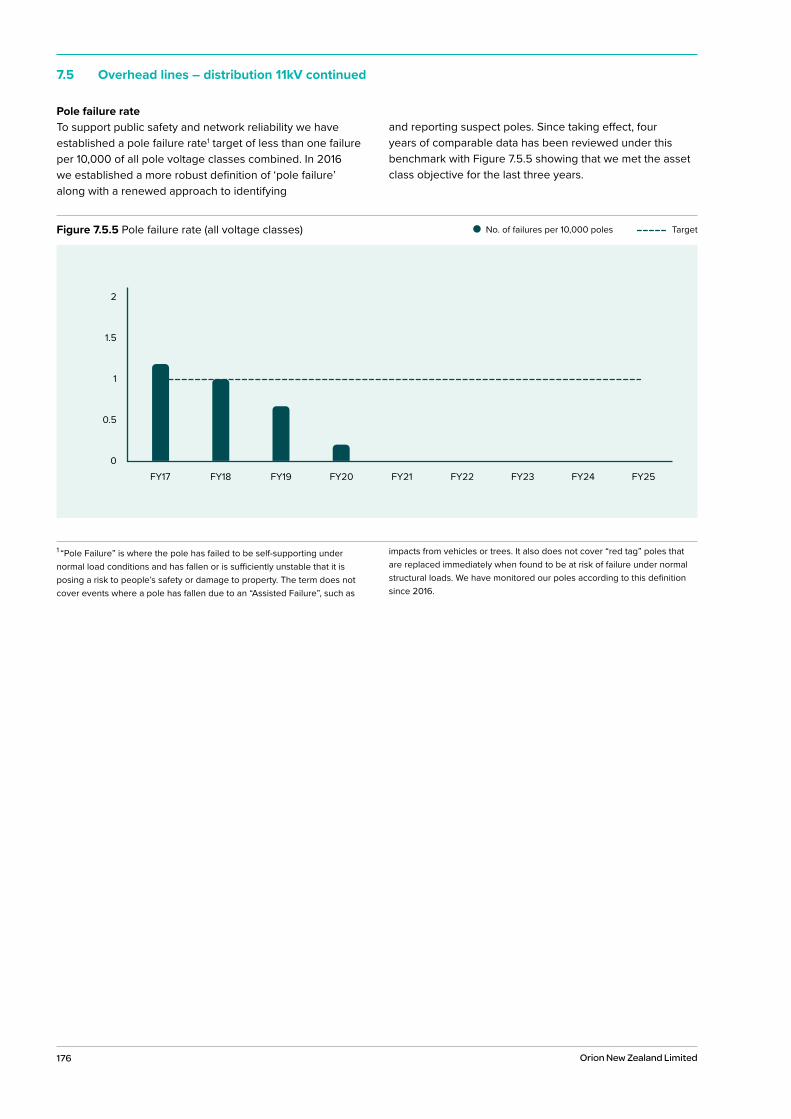
176 Orion New Zealand Limited
Pole failure rate To support public safety and network reliability we have established a pole failure rate1 target of less than one failure per 10,000 of all pole voltage classes combined. In 2016 we established a more robust definition of ‘pole failure’ along with a renewed approach to identifying
and reporting suspect poles. Since taking effect, four years of comparable data has been reviewed under this benchmark with Figure 7.5.5 showing that we met the asset class objective for the last three years.
1 “Pole Failure” is where the pole has failed to be self-supporting under normal load conditions and has fallen or is sufficiently unstable that it is posing a risk to people’s safety or damage to property. The term does not cover events where a pole has fallen due to an “Assisted Failure”, such as
impacts from vehicles or trees. It also does not cover “red tag” poles that are replaced immediately when found to be at risk of failure under normal structural loads. We have monitored our poles according to this definition since 2016.
7.5 Overhead lines – distribution 11kV continued
Figure 7.5.5 Pole failure rate (all voltage classes) No. of failures per 10,000 poles Target
2
1.5
1
0.5
0FY17 FY18 FY19 FY20 FY21 FY22 FY23 FY24 FY25
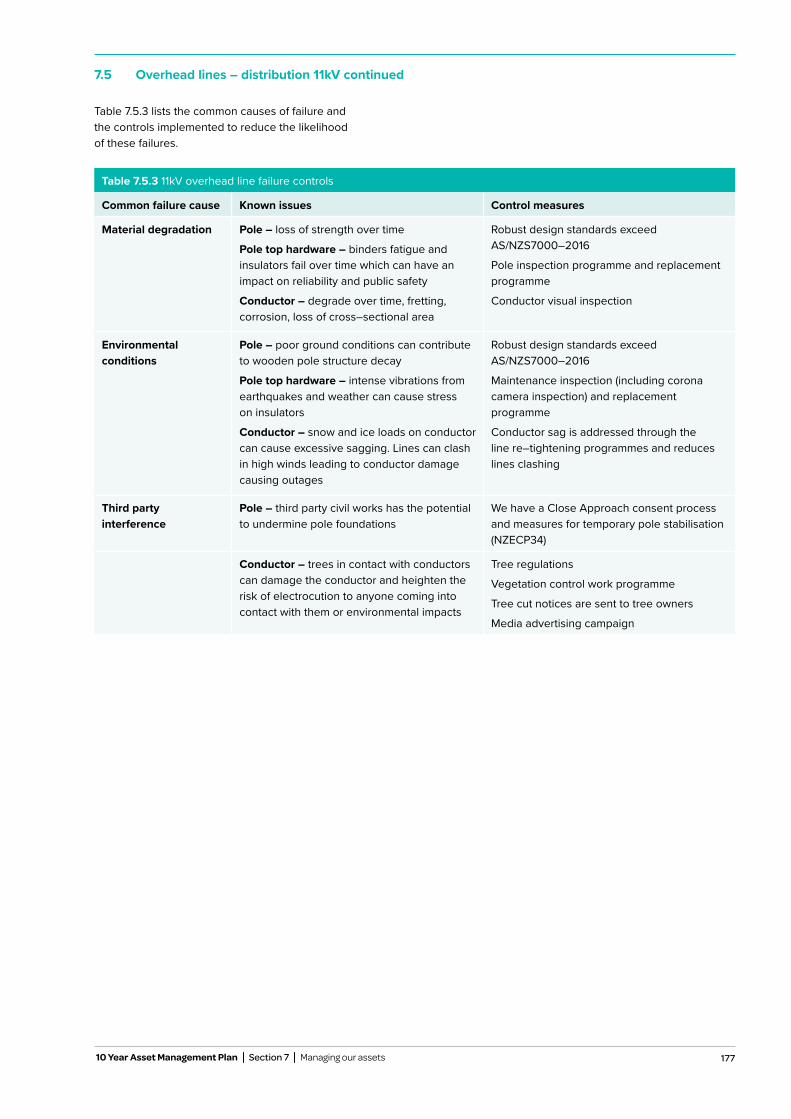
177 10 Year Asset Management Plan Section 7 Managing our assets
Table 7.5.3 lists the common causes of failure and the controls implemented to reduce the likelihood of these failures.
7.5 Overhead lines – distribution 11kV continued
Table 7.5.3 11kV overhead line failure controls
Common failure cause Known issues Control measures
Material degradation Pole – loss of strength over time
Pole top hardware – binders fatigue and insulators fail over time which can have an impact on reliability and public safety
Conductor – degrade over time, fretting, corrosion, loss of cross–sectional area
Robust design standards exceed AS/NZS7000–2016
Pole inspection programme and replacement programme
Conductor visual inspection
Environmental conditions
Pole – poor ground conditions can contribute to wooden pole structure decay
Pole top hardware – intense vibrations from earthquakes and weather can cause stress on insulators
Conductor – snow and ice loads on conductor can cause excessive sagging. Lines can clash in high winds leading to conductor damage causing outages
Robust design standards exceed AS/NZS7000–2016
Maintenance inspection (including corona camera inspection) and replacement programme
Conductor sag is addressed through the line re–tightening programmes and reduces lines clashing
Third party interference
Pole – third party civil works has the potential to undermine pole foundations
We have a Close Approach consent process and measures for temporary pole stabilisation (NZECP34)
Conductor – trees in contact with conductors can damage the conductor and heighten the risk of electrocution to anyone coming into contact with them or environmental impacts
Tree regulations
Vegetation control work programme
Tree cut notices are sent to tree owners
Media advertising campaign
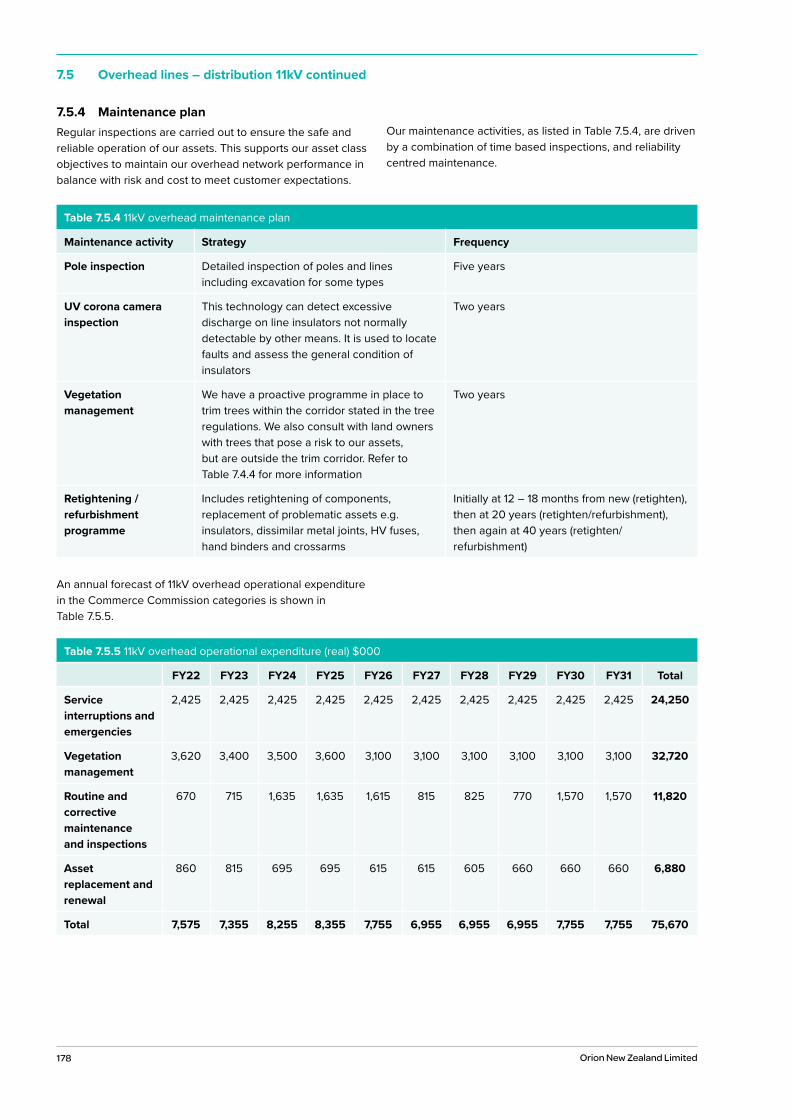
178 Orion New Zealand Limited
Table 7.5.4 11kV overhead maintenance plan
Maintenance activity Strategy Frequency
Pole inspection Detailed inspection of poles and lines including excavation for some types
Five years
UV corona camera inspection
This technology can detect excessive discharge on line insulators not normally detectable by other means. It is used to locate faults and assess the general condition of insulators
Two years
Vegetation management
We have a proactive programme in place to trim trees within the corridor stated in the tree regulations. We also consult with land owners with trees that pose a risk to our assets, but are outside the trim corridor. Refer to Table 7.4.4 for more information
Two years
Retightening / refurbishment programme
Includes retightening of components, replacement of problematic assets e.g. insulators, dissimilar metal joints, HV fuses, hand binders and crossarms
Initially at 12 – 18 months from new (retighten), then at 20 years (retighten/refurbishment), then again at 40 years (retighten/refurbishment)
7.5.4 Maintenance planRegular inspections are carried out to ensure the safe and reliable operation of our assets. This supports our asset class objectives to maintain our overhead network performance in balance with risk and cost to meet customer expectations.
Our maintenance activities, as listed in Table 7.5.4, are driven by a combination of time based inspections, and reliability centred maintenance.
An annual forecast of 11kV overhead operational expenditure in the Commerce Commission categories is shown in Table 7.5.5.
7.5 Overhead lines – distribution 11kV continued
Table 7.5.5 11kV overhead operational expenditure (real) $000
FY22 FY23 FY24 FY25 FY26 FY27 FY28 FY29 FY30 FY31 Total
Service interruptions and emergencies
2,425 2,425 2,425 2,425 2,425 2,425 2,425 2,425 2,425 2,425 24,250
Vegetation management
3,620 3,400 3,500 3,600 3,100 3,100 3,100 3,100 3,100 3,100 32,720
Routine and corrective maintenance and inspections
670 715 1,635 1,635 1,615 815 825 770 1,570 1,570 11,820
Asset replacement and renewal
860 815 695 695 615 615 605 660 660 660 6,880
Total 7,575 7,355 8,255 8,355 7,755 6,955 6,955 6,955 7,755 7,755 75,670
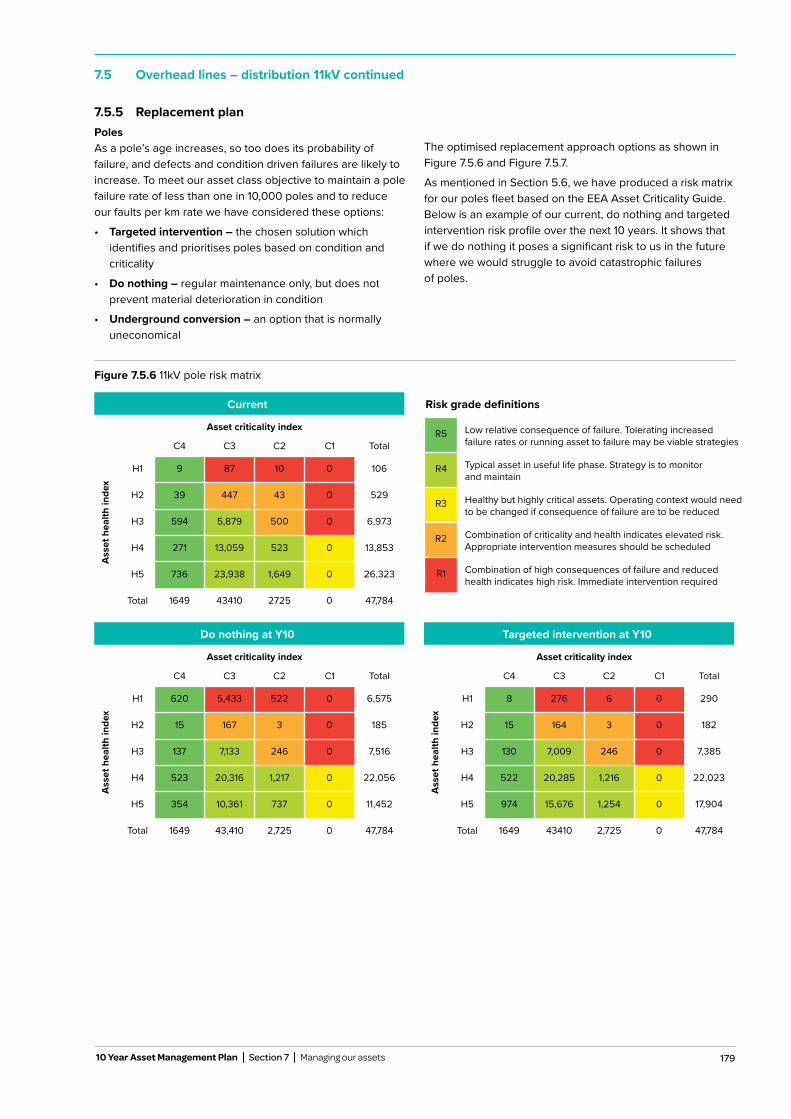
179
7.5.5 Replacement planPolesAs a pole’s age increases, so too does its probability of failure, and defects and condition driven failures are likely to increase. To meet our asset class objective to maintain a pole failure rate of less than one in 10,000 poles and to reduce our faults per km rate we have considered these options:
• Targeted intervention – the chosen solution whichidentifies and prioritises poles based on condition andcriticality
• Do nothing – regular maintenance only, but does notprevent material deterioration in condition
• Underground conversion – an option that is normallyuneconomical
The optimised replacement approach options as shown in Figure 7.5.6 and Figure 7.5.7.
As mentioned in Section 5.6, we have produced a risk matrix for our poles fleet based on the EEA Asset Criticality Guide. Below is an example of our current, do nothing and targeted intervention risk profile over the next 10 years. It shows that if we do nothing it poses a significant risk to us in the future where we would struggle to avoid catastrophic failures of poles.
7.5 Overhead lines – distribution 11kV continued
10 Year Asset Management Plan Section 7 Managing our assets
Figure 7.5.6 11kV pole risk matrix
Current
Asset criticality index
C4 C3 C2 C1 Total
Ass
et h
ealth
inde
x
H1 9 87 10 0 106
H2 39 447 43 0 529
H3 594 5,879 500 0 6,973
H4 271 13,059 523 0 13,853
H5 736 23,938 1,649 0 26,323
Total 1649 43410 2725 0 47,784
Risk grade definitions
R5 Low relative consequence of failure. Tolerating increased failure rates or running asset to failure may be viable strategies
R4 Typical asset in useful life phase. Strategy is to monitor and maintain
R3 Healthy but highly critical assets. Operating context would need to be changed if consequence of failure are to be reduced
R2 Combination of criticality and health indicates elevated risk. Appropriate intervention measures should be scheduled
R1 Combination of high consequences of failure and reduced health indicates high risk. Immediate intervention required
Do nothing at Y10
Asset criticality index
C4 C3 C2 C1 Total
Ass
et h
ealth
inde
x
H1 620 5,433 522 0 6,575
H2 15 167 3 0 185
H3 137 7,133 246 0 7,516
H4 523 20,316 1,217 0 22,056
H5 354 10,361 737 0 11,452
Total 1649 43,410 2,725 0 47,784
Targeted intervention at Y10
Asset criticality index
C4 C3 C2 C1 Total
Ass
et h
ealth
inde
x
H1 8 276 6 0 290
H2 15 164 3 0 182
H3 130 7,009 246 0 7,385
H4 522 20,285 1,216 0 22,023
H5 974 15,676 1,254 0 17,904
Total 1649 43410 2,725 0 47,784
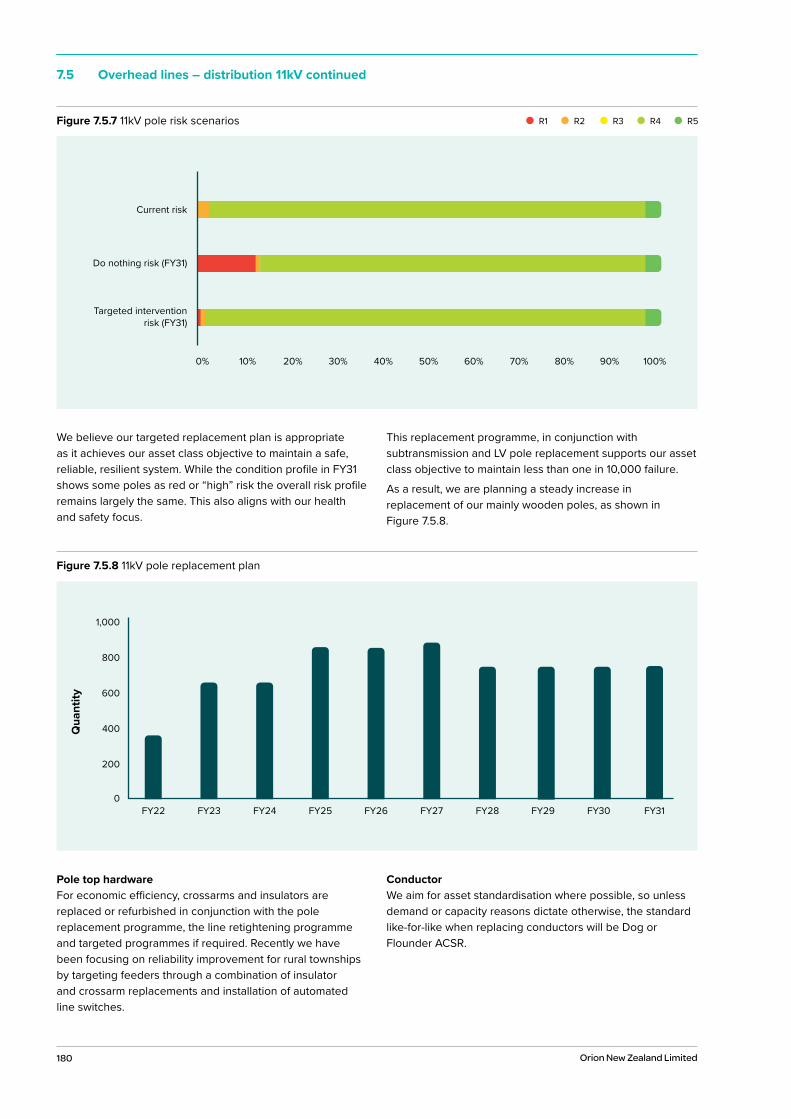
180 Orion New Zealand Limited
Pole top hardwareFor economic efficiency, crossarms and insulators are replaced or refurbished in conjunction with the pole replacement programme, the line retightening programme and targeted programmes if required. Recently we have been focusing on reliability improvement for rural townships by targeting feeders through a combination of insulator and crossarm replacements and installation of automated line switches.
ConductorWe aim for asset standardisation where possible, so unless demand or capacity reasons dictate otherwise, the standard like-for-like when replacing conductors will be Dog or Flounder ACSR.
7.5 Overhead lines – distribution 11kV continued
We believe our targeted replacement plan is appropriate as it achieves our asset class objective to maintain a safe, reliable, resilient system. While the condition profile in FY31 shows some poles as red or “high” risk the overall risk profile remains largely the same. This also aligns with our health and safety focus.
This replacement programme, in conjunction with subtransmission and LV pole replacement supports our asset class objective to maintain less than one in 10,000 failure.
As a result, we are planning a steady increase in replacement of our mainly wooden poles, as shown in Figure 7.5.8.
Figure 7.5.8 11kV pole replacement plan
1,000
800
600
400
200
0FY22 FY23 FY24 FY25 FY26 FY27 FY28 FY29 FY30 FY31
Qua
ntity
Figure 7.5.7 11kV pole risk scenarios R1 R3R2 R4 R5
0% 10% 20% 30% 40% 50% 60% 70% 80% 90% 100%
Current risk
Do nothing risk (FY31)
Targeted intervention risk (FY31)
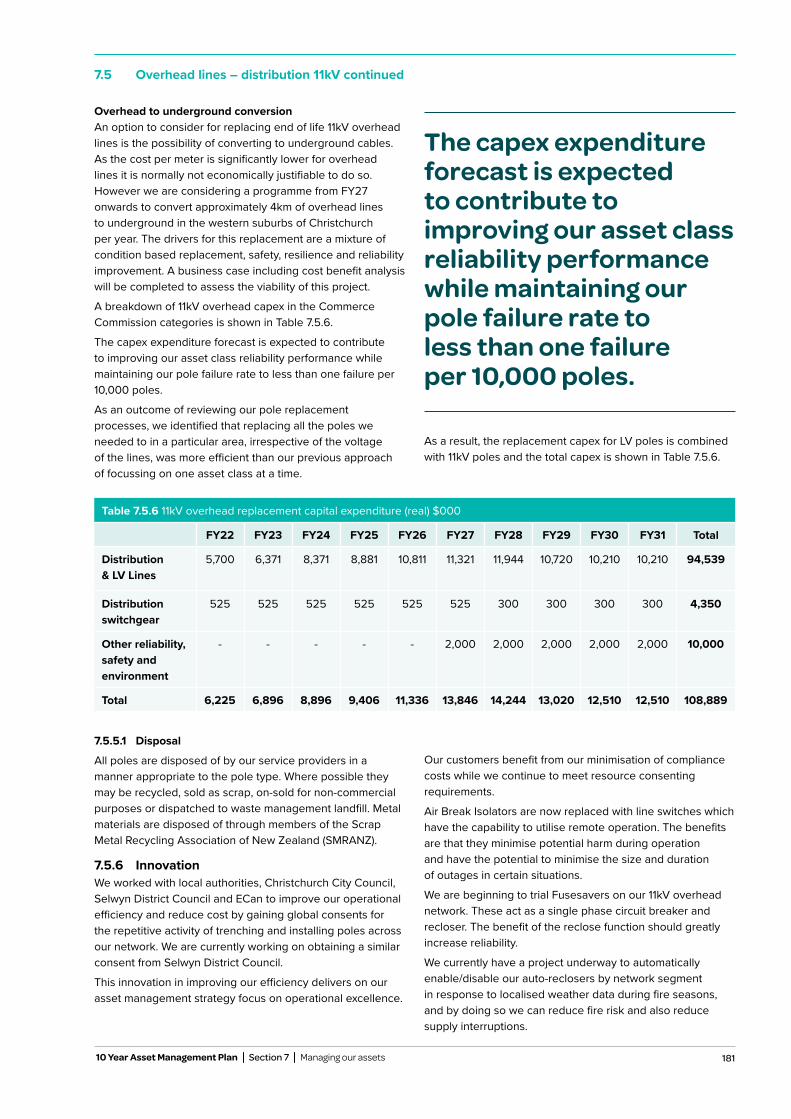
181
Overhead to underground conversionAn option to consider for replacing end of life 11kV overhead lines is the possibility of converting to underground cables. As the cost per meter is significantly lower for overhead lines it is normally not economically justifiable to do so. However we are considering a programme from FY27 onwards to convert approximately 4km of overhead lines to underground in the western suburbs of Christchurch per year. The drivers for this replacement are a mixture of condition based replacement, safety, resilience and reliability improvement. A business case including cost benefit analysis will be completed to assess the viability of this project.
A breakdown of 11kV overhead capex in the Commerce Commission categories is shown in Table 7.5.6.
The capex expenditure forecast is expected to contribute to improving our asset class reliability performance while maintaining our pole failure rate to less than one failure per 10,000 poles.
As an outcome of reviewing our pole replacement processes, we identified that replacing all the poles we needed to in a particular area, irrespective of the voltage of the lines, was more efficient than our previous approach of focussing on one asset class at a time.
As a result, the replacement capex for LV poles is combined with 11kV poles and the total capex is shown in Table 7.5.6.
The capex expenditure forecast is expected to contribute to improving our asset class reliability performance while maintaining our pole failure rate to less than one failure per 10,000 poles.
Table 7.5.6 11kV overhead replacement capital expenditure (real) $000
FY22 FY23 FY24 FY25 FY26 FY27 FY28 FY29 FY30 FY31 Total
Distribution & LV Lines
5,700 6,371 8,371 8,881 10,811 11,321 11,944 10,720 10,210 10,210 94,539
Distribution switchgear
525 525 525 525 525 525 300 300 300 300 4,350
Other reliability, safety and environment
- - - - - 2,000 2,000 2,000 2,000 2,000 10,000
Total 6,225 6,896 8,896 9,406 11,336 13,846 14,244 13,020 12,510 12,510 108,889
7.5 Overhead lines – distribution 11kV continued
7.5.5.1 Disposal
All poles are disposed of by our service providers in a manner appropriate to the pole type. Where possible they may be recycled, sold as scrap, on-sold for non-commercial purposes or dispatched to waste management landfill. Metal materials are disposed of through members of the Scrap Metal Recycling Association of New Zealand (SMRANZ).
7.5.6 InnovationWe worked with local authorities, Christchurch City Council, Selwyn District Council and ECan to improve our operational efficiency and reduce cost by gaining global consents for the repetitive activity of trenching and installing poles across our network. We are currently working on obtaining a similar consent from Selwyn District Council.
This innovation in improving our efficiency delivers on our asset management strategy focus on operational excellence.
Our customers benefit from our minimisation of compliance costs while we continue to meet resource consenting requirements.
Air Break Isolators are now replaced with line switches which have the capability to utilise remote operation. The benefits are that they minimise potential harm during operation and have the potential to minimise the size and duration of outages in certain situations.
We are beginning to trial Fusesavers on our 11kV overhead network. These act as a single phase circuit breaker and recloser. The benefit of the reclose function should greatly increase reliability.
We currently have a project underway to automatically enable/disable our auto-reclosers by network segment in response to localised weather data during fire seasons, and by doing so we can reduce fire risk and also reduce supply interruptions.
10 Year Asset Management Plan Section 7 Managing our assets
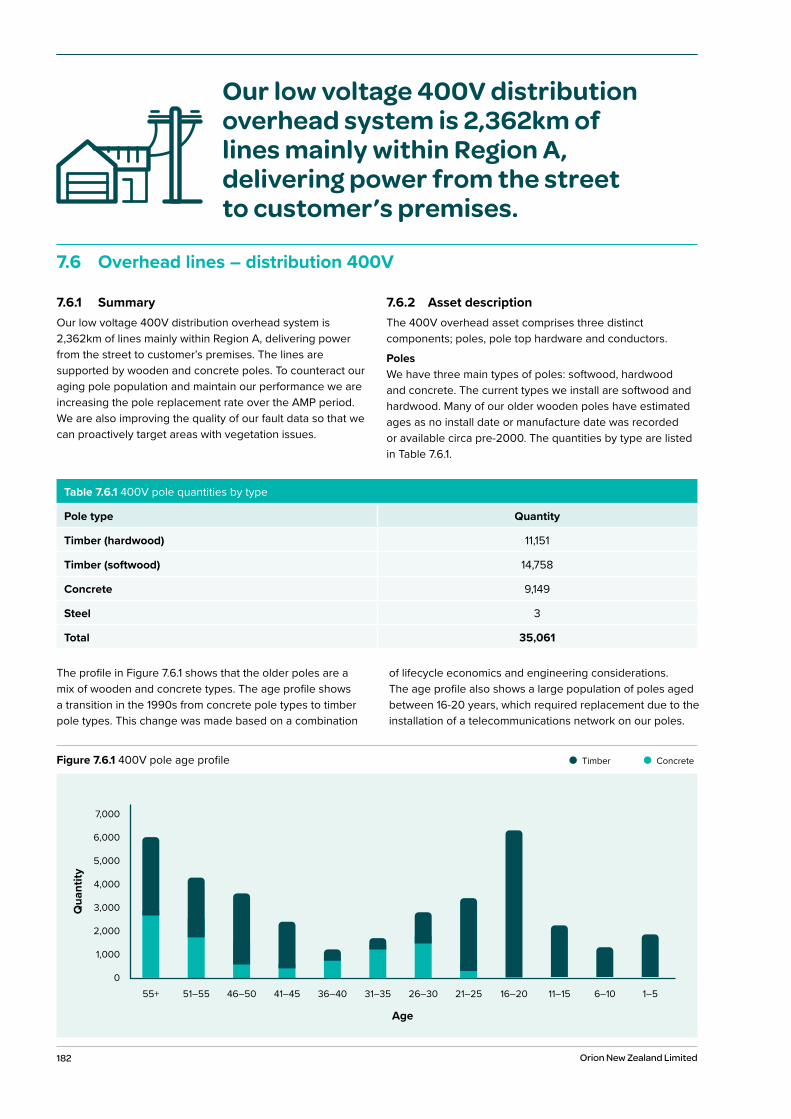
182 Orion New Zealand Limited
Table 7.6.1 400V pole quantities by type
Pole type Quantity
Timber (hardwood) 11,151
Timber (softwood) 14,758
Concrete 9,149
Steel 3
Total 35,061
7.6 Overhead lines – distribution 400V
Our low voltage 400V distribution overhead system is 2,362km of lines mainly within Region A, delivering power from the street to customer’s premises.
7.6.1 SummaryOur low voltage 400V distribution overhead system is 2,362km of lines mainly within Region A, delivering power from the street to customer’s premises. The lines are supported by wooden and concrete poles. To counteract our aging pole population and maintain our performance we are increasing the pole replacement rate over the AMP period. We are also improving the quality of our fault data so that we can proactively target areas with vegetation issues.
7.6.2 Asset descriptionThe 400V overhead asset comprises three distinct components; poles, pole top hardware and conductors.
PolesWe have three main types of poles: softwood, hardwood and concrete. The current types we install are softwood and hardwood. Many of our older wooden poles have estimated ages as no install date or manufacture date was recorded or available circa pre-2000. The quantities by type are listed in Table 7.6.1.
The profile in Figure 7.6.1 shows that the older poles are a mix of wooden and concrete types. The age profile shows a transition in the 1990s from concrete pole types to timber pole types. This change was made based on a combination
of lifecycle economics and engineering considerations. The age profile also shows a large population of poles aged between 16-20 years, which required replacement due to the installation of a telecommunications network on our poles.
Figure 7.6.1 400V pole age profile Timber Concrete
7,000
6,000
5,000
4,000
3,000
2,000
1,000
0
Qua
ntity
55+ 51–55 46–50 41–45 36–40 31–35 26–30 21–25 16–20 11–15 6–10 1–5
Age
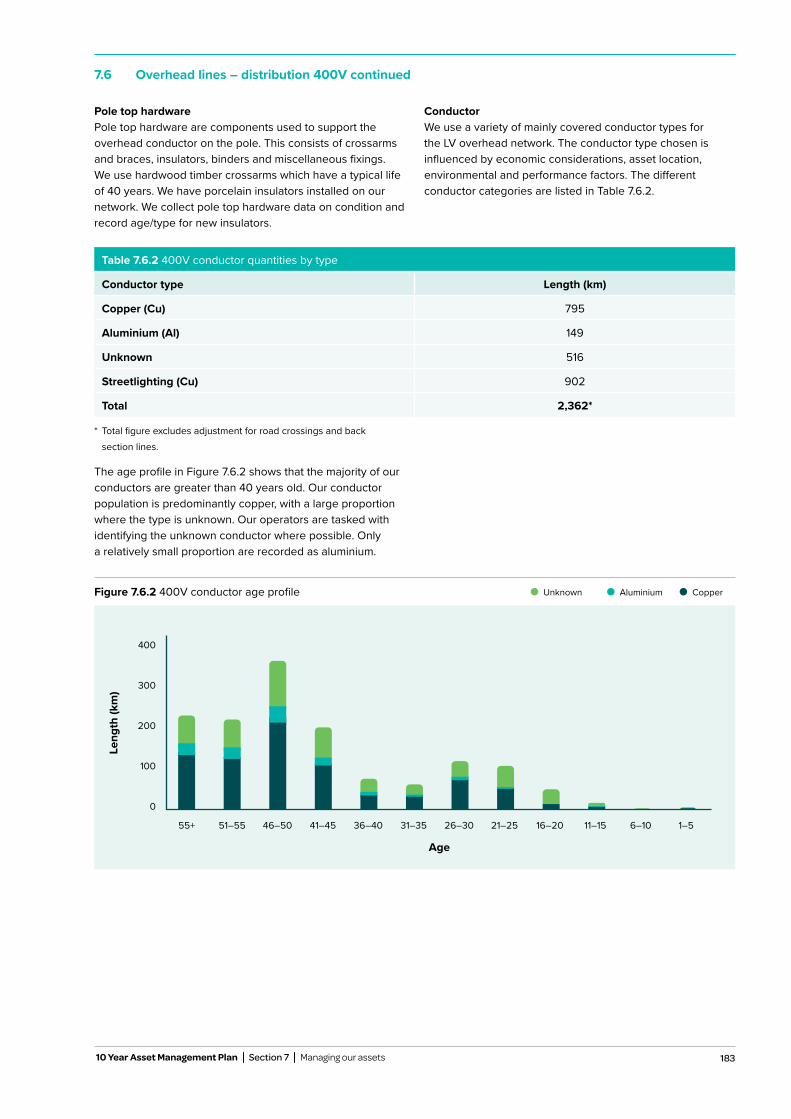
183
Pole top hardwarePole top hardware are components used to support the overhead conductor on the pole. This consists of crossarms and braces, insulators, binders and miscellaneous fixings. We use hardwood timber crossarms which have a typical life of 40 years. We have porcelain insulators installed on our network. We collect pole top hardware data on condition and record age/type for new insulators.
ConductorWe use a variety of mainly covered conductor types for the LV overhead network. The conductor type chosen is influenced by economic considerations, asset location, environmental and performance factors. The different conductor categories are listed in Table 7.6.2.
* Total figure excludes adjustment for road crossings and back section lines.
The age profile in Figure 7.6.2 shows that the majority of our conductors are greater than 40 years old. Our conductor population is predominantly copper, with a large proportion where the type is unknown. Our operators are tasked with identifying the unknown conductor where possible. Only a relatively small proportion are recorded as aluminium.
Table 7.6.2 400V conductor quantities by type
Conductor type Length (km)
Copper (Cu) 795
Aluminium (Al) 149
Unknown 516
Streetlighting (Cu) 902
Total 2,362*
7.6 Overhead lines – distribution 400V continued
10 Year Asset Management Plan Section 7 Managing our assets
Figure 7.6.2 400V conductor age profile AluminiumUnknown Copper
400
300
200
100
0
Leng
th (k
m)
55+ 51–55 46–50 41–45 36–40 31–35 26–30 21–25 16–20 11–15 6–10 1–5
Age
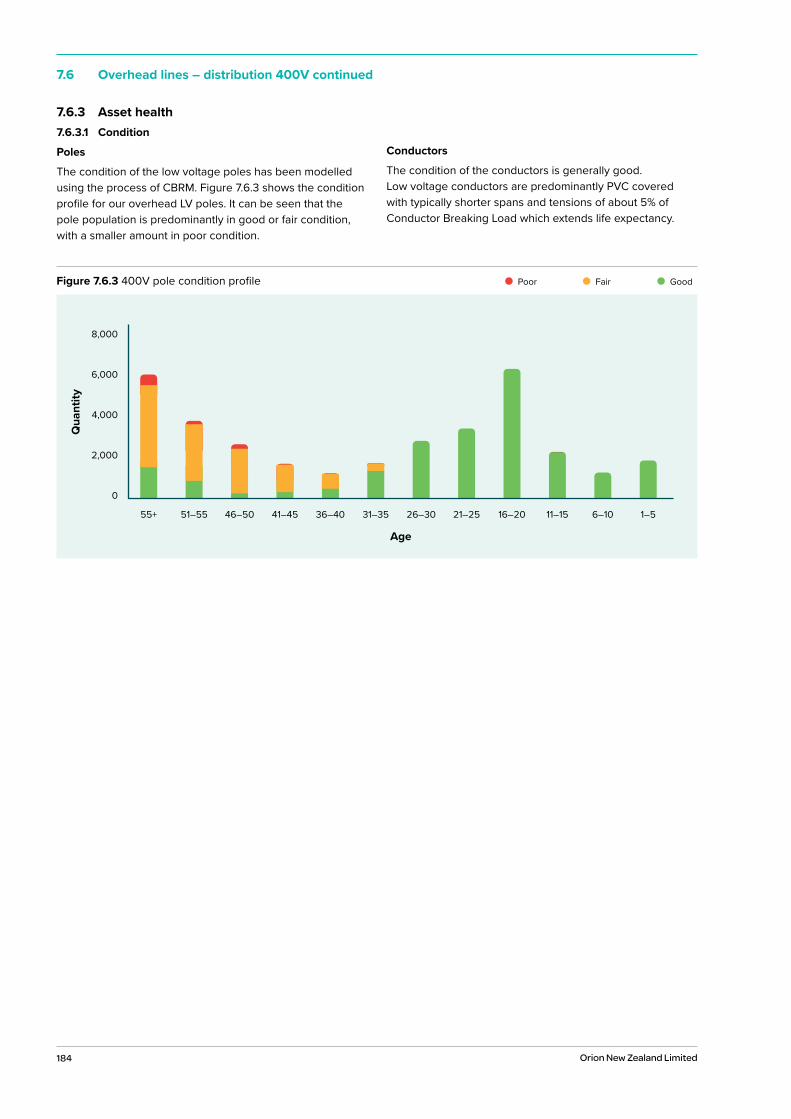
184 Orion New Zealand Limited
7.6.3 Asset health7.6.3.1 Condition
Poles
The condition of the low voltage poles has been modelled using the process of CBRM. Figure 7.6.3 shows the condition profile for our overhead LV poles. It can be seen that the pole population is predominantly in good or fair condition, with a smaller amount in poor condition.
Conductors
The condition of the conductors is generally good. Low voltage conductors are predominantly PVC covered with typically shorter spans and tensions of about 5% of Conductor Breaking Load which extends life expectancy.
7.6 Overhead lines – distribution 400V continued
Figure 7.6.3 400V pole condition profile Poor Fair Good
8,000
6,000
4,000
2,000
0
Qua
ntity
55+ 51–55 46–50 41–45 36–40 31–35 26–30 21–25 16–20 11–15 6–10 1–5
Age
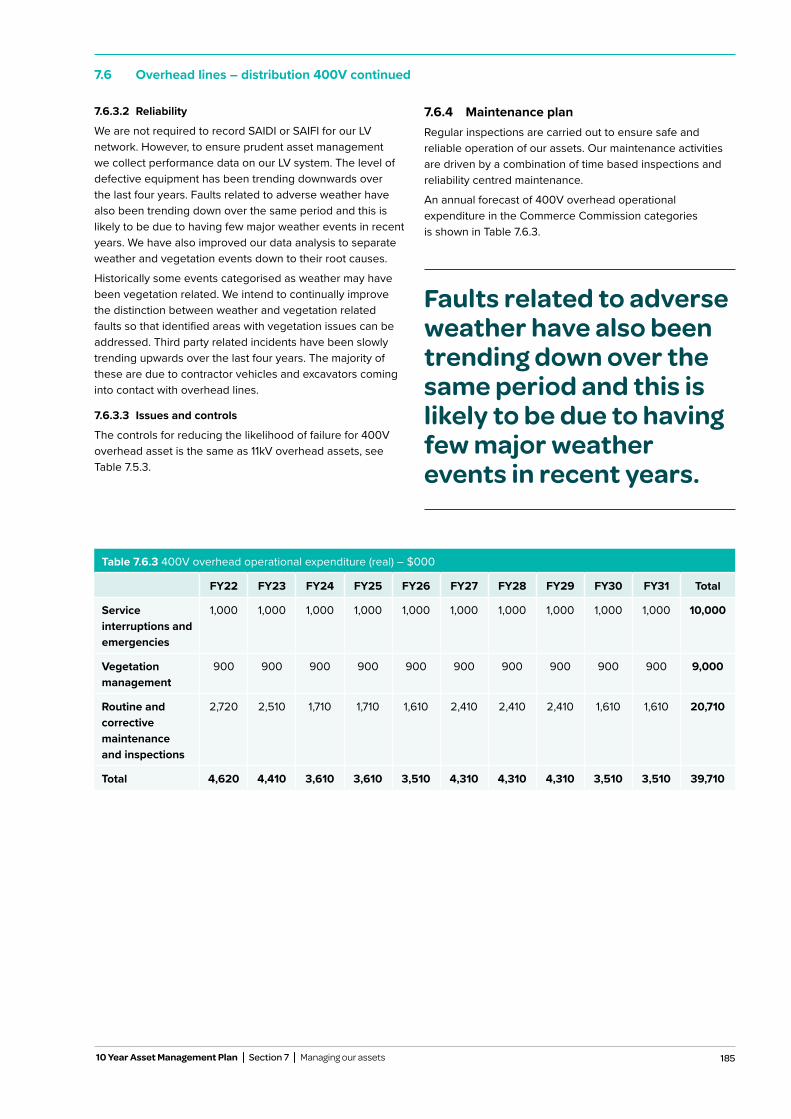
185
7.6.3.2 Reliability
We are not required to record SAIDI or SAIFI for our LV network. However, to ensure prudent asset management we collect performance data on our LV system. The level of defective equipment has been trending downwards over the last four years. Faults related to adverse weather have also been trending down over the same period and this is likely to be due to having few major weather events in recent years. We have also improved our data analysis to separate weather and vegetation events down to their root causes.
Historically some events categorised as weather may have been vegetation related. We intend to continually improve the distinction between weather and vegetation related faults so that identified areas with vegetation issues can be addressed. Third party related incidents have been slowly trending upwards over the last four years. The majority of these are due to contractor vehicles and excavators coming into contact with overhead lines.
7.6.3.3 Issues and controls
The controls for reducing the likelihood of failure for 400V overhead asset is the same as 11kV overhead assets, see Table 7.5.3.
7.6.4 Maintenance planRegular inspections are carried out to ensure safe and reliable operation of our assets. Our maintenance activities are driven by a combination of time based inspections and reliability centred maintenance.
An annual forecast of 400V overhead operational expenditure in the Commerce Commission categories is shown in Table 7.6.3.
Table 7.6.3 400V overhead operational expenditure (real) – $000
FY22 FY23 FY24 FY25 FY26 FY27 FY28 FY29 FY30 FY31 Total
Service interruptions and emergencies
1,000 1,000 1,000 1,000 1,000 1,000 1,000 1,000 1,000 1,000 10,000
Vegetation management
900 900 900 900 900 900 900 900 900 900 9,000
Routine and corrective maintenance and inspections
2,720 2,510 1,710 1,710 1,610 2,410 2,410 2,410 1,610 1,610 20,710
Total 4,620 4,410 3,610 3,610 3,510 4,310 4,310 4,310 3,510 3,510 39,710
7.6 Overhead lines – distribution 400V continued
10 Year Asset Management Plan Section 7 Managing our assets
Faults related to adverse weather have also been trending down over the same period and this is likely to be due to having few major weather events in recent years.
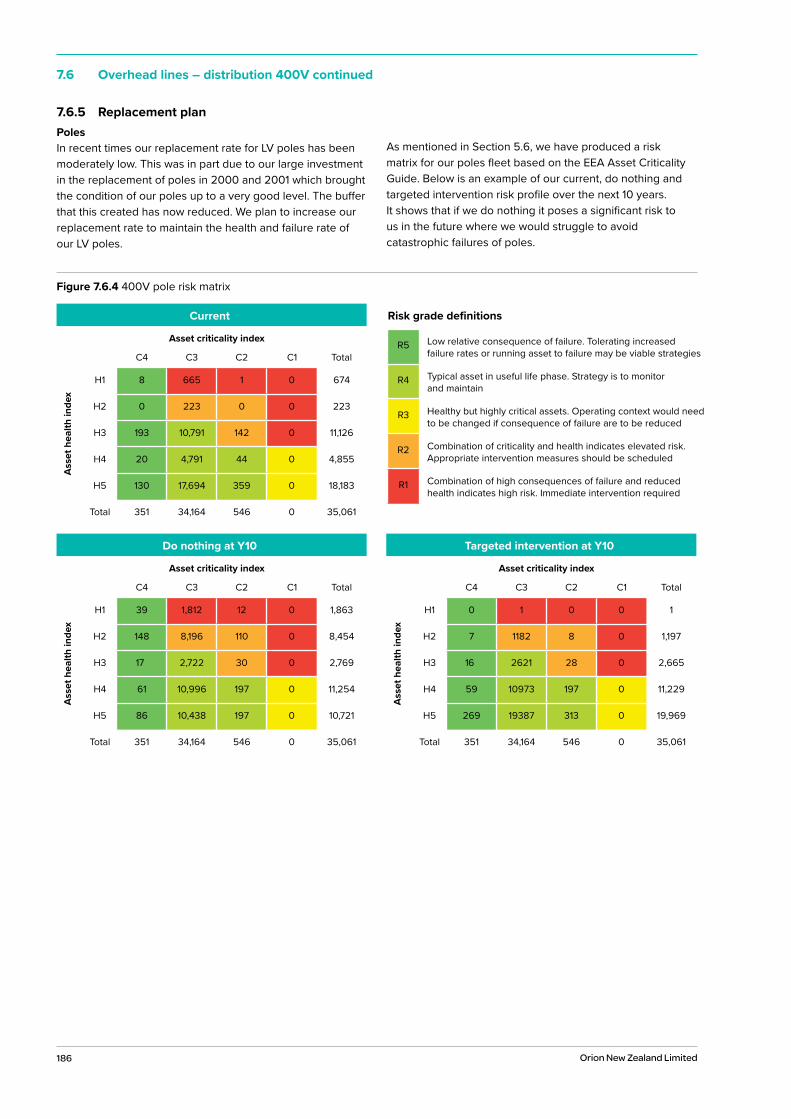
186 Orion New Zealand Limited
7.6.5 Replacement planPolesIn recent times our replacement rate for LV poles has been moderately low. This was in part due to our large investment in the replacement of poles in 2000 and 2001 which brought the condition of our poles up to a very good level. The buffer that this created has now reduced. We plan to increase our replacement rate to maintain the health and failure rate of our LV poles.
As mentioned in Section 5.6, we have produced a risk matrix for our poles fleet based on the EEA Asset Criticality Guide. Below is an example of our current, do nothing and targeted intervention risk profile over the next 10 years. It shows that if we do nothing it poses a significant risk to us in the future where we would struggle to avoid catastrophic failures of poles.
7.6 Overhead lines – distribution 400V continued
Figure 7.6.4 400V pole risk matrix
Current
Asset criticality index
C4 C3 C2 C1 Total
Ass
et h
ealth
inde
x
H1 8 665 1 0 674
H2 0 223 0 0 223
H3 193 10,791 142 0 11,126
H4 20 4,791 44 0 4,855
H5 130 17,694 359 0 18,183
Total 351 34,164 546 0 35,061
Risk grade definitions
R5 Low relative consequence of failure. Tolerating increased failure rates or running asset to failure may be viable strategies
R4 Typical asset in useful life phase. Strategy is to monitor and maintain
R3 Healthy but highly critical assets. Operating context would need to be changed if consequence of failure are to be reduced
R2 Combination of criticality and health indicates elevated risk. Appropriate intervention measures should be scheduled
R1 Combination of high consequences of failure and reduced health indicates high risk. Immediate intervention required
Do nothing at Y10
Asset criticality index
C4 C3 C2 C1 Total
Ass
et h
ealth
inde
x
H1 39 1,812 12 0 1,863
H2 148 8,196 110 0 8,454
H3 17 2,722 30 0 2,769
H4 61 10,996 197 0 11,254
H5 86 10,438 197 0 10,721
Total 351 34,164 546 0 35,061
Targeted intervention at Y10
Asset criticality index
C4 C3 C2 C1 Total
Ass
et h
ealth
inde
x
H1 0 1 0 0 1
H2 7 1182 8 0 1,197
H3 16 2621 28 0 2,665
H4 59 10973 197 0 11,229
H5 269 19387 313 0 19,969
Total 351 34,164 546 0 35,061
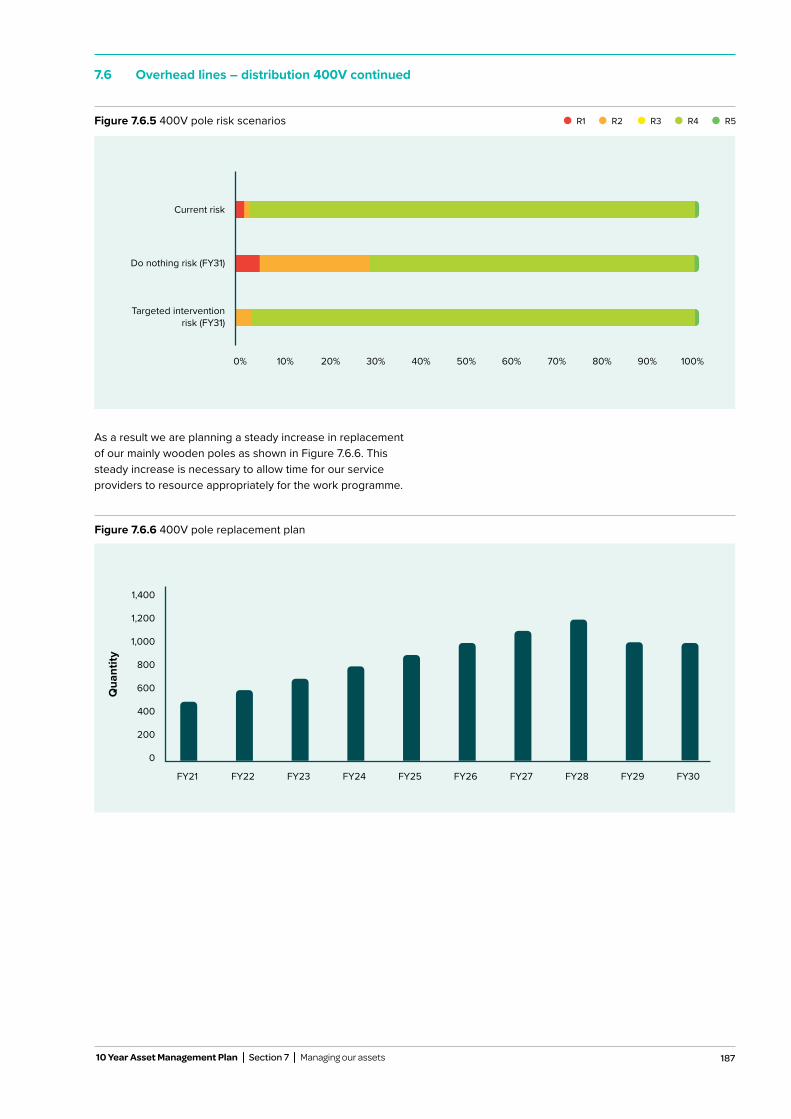
187
As a result we are planning a steady increase in replacement of our mainly wooden poles as shown in Figure 7.6.6. This steady increase is necessary to allow time for our service providers to resource appropriately for the work programme.
7.6 Overhead lines – distribution 400V continued
10 Year Asset Management Plan Section 7 Managing our assets
Figure 7.6.6 400V pole replacement plan
1,400
1,200
1,000
800
600
400
200
0
Qua
ntity
FY21 FY22 FY23 FY24 FY25 FY26 FY27 FY28 FY29 FY30
Figure 7.6.5 400V pole risk scenarios R1 R3R2 R4 R5
0% 10% 20% 30% 40% 50% 60% 70% 80% 90% 100%
Current risk
Do nothing risk (FY31)
Targeted intervention risk (FY31)
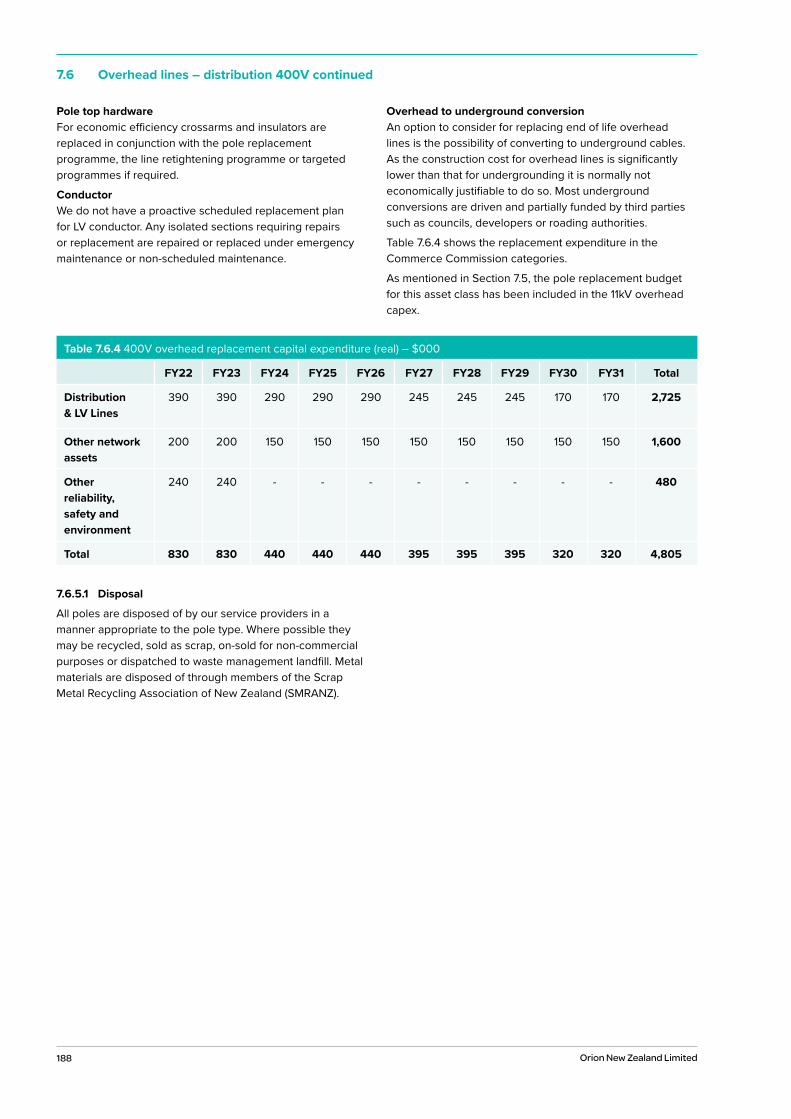
188 Orion New Zealand Limited
Pole top hardwareFor economic efficiency crossarms and insulators are replaced in conjunction with the pole replacement programme, the line retightening programme or targeted programmes if required.
ConductorWe do not have a proactive scheduled replacement plan for LV conductor. Any isolated sections requiring repairs or replacement are repaired or replaced under emergency maintenance or non-scheduled maintenance.
Overhead to underground conversionAn option to consider for replacing end of life overhead lines is the possibility of converting to underground cables. As the construction cost for overhead lines is significantly lower than that for undergrounding it is normally not economically justifiable to do so. Most underground conversions are driven and partially funded by third parties such as councils, developers or roading authorities.
Table 7.6.4 shows the replacement expenditure in the Commerce Commission categories.
As mentioned in Section 7.5, the pole replacement budget for this asset class has been included in the 11kV overhead capex.
Table 7.6.4 400V overhead replacement capital expenditure (real) – $000
FY22 FY23 FY24 FY25 FY26 FY27 FY28 FY29 FY30 FY31 Total
Distribution & LV Lines
390 390 290 290 290 245 245 245 170 170 2,725
Other network assets
200 200 150 150 150 150 150 150 150 150 1,600
Other reliability, safety and environment
240 240 - - - - - - - - 480
Total 830 830 440 440 440 395 395 395 320 320 4,805
7.6.5.1 Disposal
All poles are disposed of by our service providers in a manner appropriate to the pole type. Where possible they may be recycled, sold as scrap, on-sold for non-commercial purposes or dispatched to waste management landfill. Metal materials are disposed of through members of the Scrap Metal Recycling Association of New Zealand (SMRANZ).
7.6 Overhead lines – distribution 400V continued
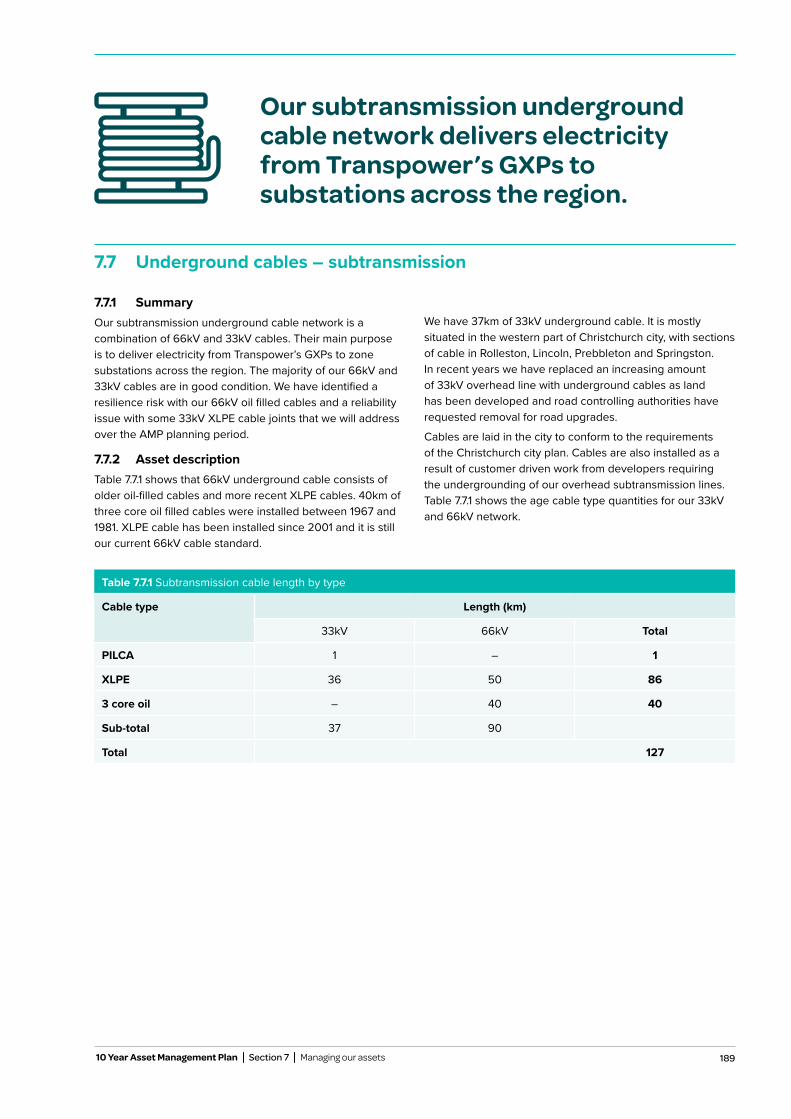
189 10 Year Asset Management Plan Section 7 Managing our assets
7.7 Underground cables – subtransmission
7.7.1 SummaryOur subtransmission underground cable network is a combination of 66kV and 33kV cables. Their main purpose is to deliver electricity from Transpower’s GXPs to zone substations across the region. The majority of our 66kV and 33kV cables are in good condition. We have identified a resilience risk with our 66kV oil filled cables and a reliability issue with some 33kV XLPE cable joints that we will address over the AMP planning period.
7.7.2 Asset descriptionTable 7.7.1 shows that 66kV underground cable consists of older oil-filled cables and more recent XLPE cables. 40km of three core oil filled cables were installed between 1967 and 1981. XLPE cable has been installed since 2001 and it is still our current 66kV cable standard.
We have 37km of 33kV underground cable. It is mostly situated in the western part of Christchurch city, with sections of cable in Rolleston, Lincoln, Prebbleton and Springston. In recent years we have replaced an increasing amount of 33kV overhead line with underground cables as land has been developed and road controlling authorities have requested removal for road upgrades.
Cables are laid in the city to conform to the requirements of the Christchurch city plan. Cables are also installed as a result of customer driven work from developers requiring the undergrounding of our overhead subtransmission lines. Table 7.7.1 shows the age cable type quantities for our 33kV and 66kV network.
Table 7.7.1 Subtransmission cable length by type
Cable type Length (km)
33kV 66kV Total
PILCA 1 – 1
XLPE 36 50 86
3 core oil – 40 40
Sub-total 37 90
Total 127
Our subtransmission underground cable network delivers electricity from Transpower’s GXPs to substations across the region.
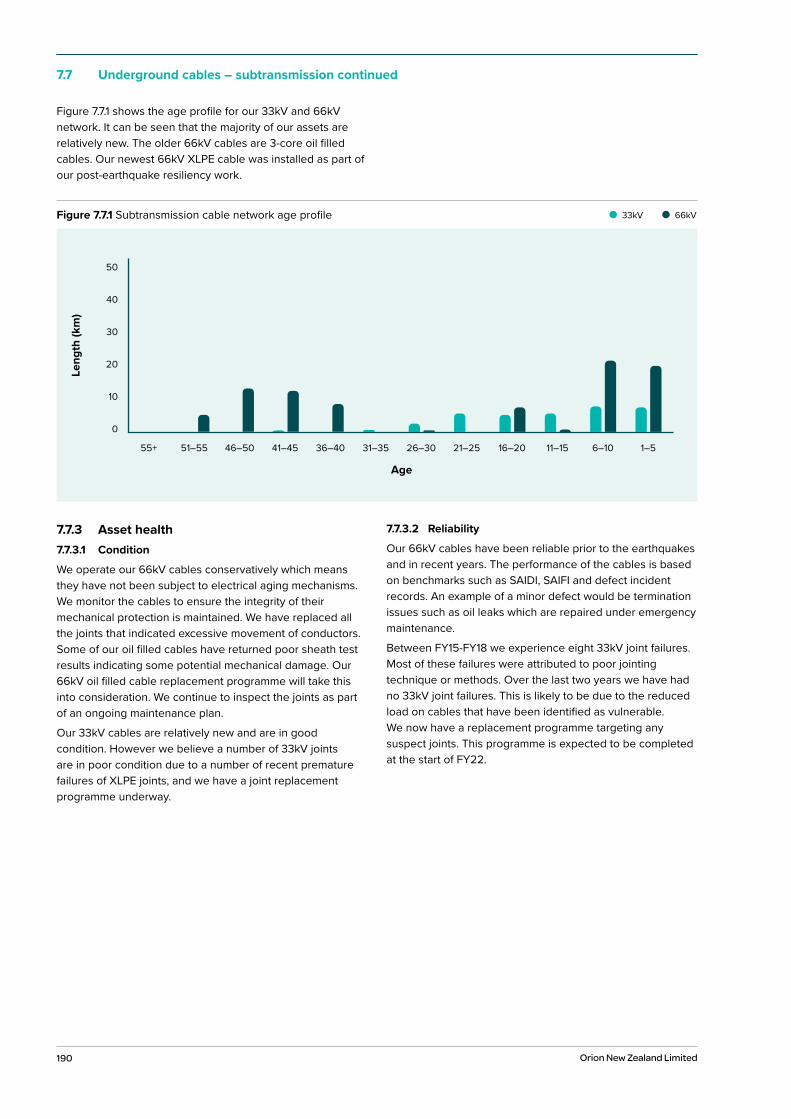
190 Orion New Zealand Limited
7.7 Underground cables – subtransmission continued
Figure 7.7.1 shows the age profile for our 33kV and 66kV network. It can be seen that the majority of our assets are relatively new. The older 66kV cables are 3-core oil filled cables. Our newest 66kV XLPE cable was installed as part of our post-earthquake resiliency work.
7.7.3 Asset health7.7.3.1 Condition
We operate our 66kV cables conservatively which means they have not been subject to electrical aging mechanisms. We monitor the cables to ensure the integrity of their mechanical protection is maintained. We have replaced all the joints that indicated excessive movement of conductors. Some of our oil filled cables have returned poor sheath test results indicating some potential mechanical damage. Our 66kV oil filled cable replacement programme will take this into consideration. We continue to inspect the joints as part of an ongoing maintenance plan.
Our 33kV cables are relatively new and are in good condition. However we believe a number of 33kV joints are in poor condition due to a number of recent premature failures of XLPE joints, and we have a joint replacement programme underway.
7.7.3.2 Reliability
Our 66kV cables have been reliable prior to the earthquakes and in recent years. The performance of the cables is based on benchmarks such as SAIDI, SAIFI and defect incident records. An example of a minor defect would be termination issues such as oil leaks which are repaired under emergency maintenance.
Between FY15-FY18 we experience eight 33kV joint failures. Most of these failures were attributed to poor jointing technique or methods. Over the last two years we have had no 33kV joint failures. This is likely to be due to the reduced load on cables that have been identified as vulnerable. We now have a replacement programme targeting any suspect joints. This programme is expected to be completed at the start of FY22.
50
40
30
20
10
0
Leng
th (k
m)
55+ 51–55 46–50 41–45 36–40 31–35 26–30 21–25 16–20 11–15 6–10 1–5
Age
Figure 7.7.1 Subtransmission cable network age profile 33kV 66kV

191
7.7 Underground cables – subtransmission continued
10 Year Asset Management Plan Section 7 Managing our assets
0
2
1
3
4
6
5
FY15 FY16 FY17 FY18 FY19 FY20
Faul
ts p
er 10
0km
* Source: PwC Electricity Line Business Information Disclosure Compendium 2014-2020
Figure 7.7.2 Subtransmission underground cable faults per 100km Orion NZ NZ average*
7.7.3.3 Issues and controls
Subtransmission cable failures are rare, but when they do occur, they can significantly impact our customers through loss of supply. Table 7.7.2 lists the common causes of failure and the controls implemented to reduce the likelihood of these failures.
Table 7.7.2 Subtransmission cable failure controls
Common failure cause Known issues Control measures
Material degradation Partial discharge degrades the cable insulation which can result in complete failure leading to an outage
Ultrasonic and partial discharge monitoring of terminations in zone substations
Quality of installation Poor quality of workmanship while installing cable joints can lead to premature failure impacting reliability further down the track
Poorly compacted fill material or naturally soft ground – for example organic clays and peat
Cable jointers are qualified, competent and trained to install specific products. We require them to be certified by the supplier
Replacement programme for affected 33kV joints. Minimise high current loads to prevent thermal runaway of suspect joints
Inspection of service providers during the laying of cables
Third party interference Third parties dig up and damage our cables during road reconstruction
33kV and 66kV cables require standover process and consent application for any work
Extensive safety advertising in the media. Free training on working safely around cables, including map reading and a DVD
New 33kV cable is now required to be installed with an orange coloured sheath to allow easier identification
Proactive promotion to service providers of cable maps and locating services
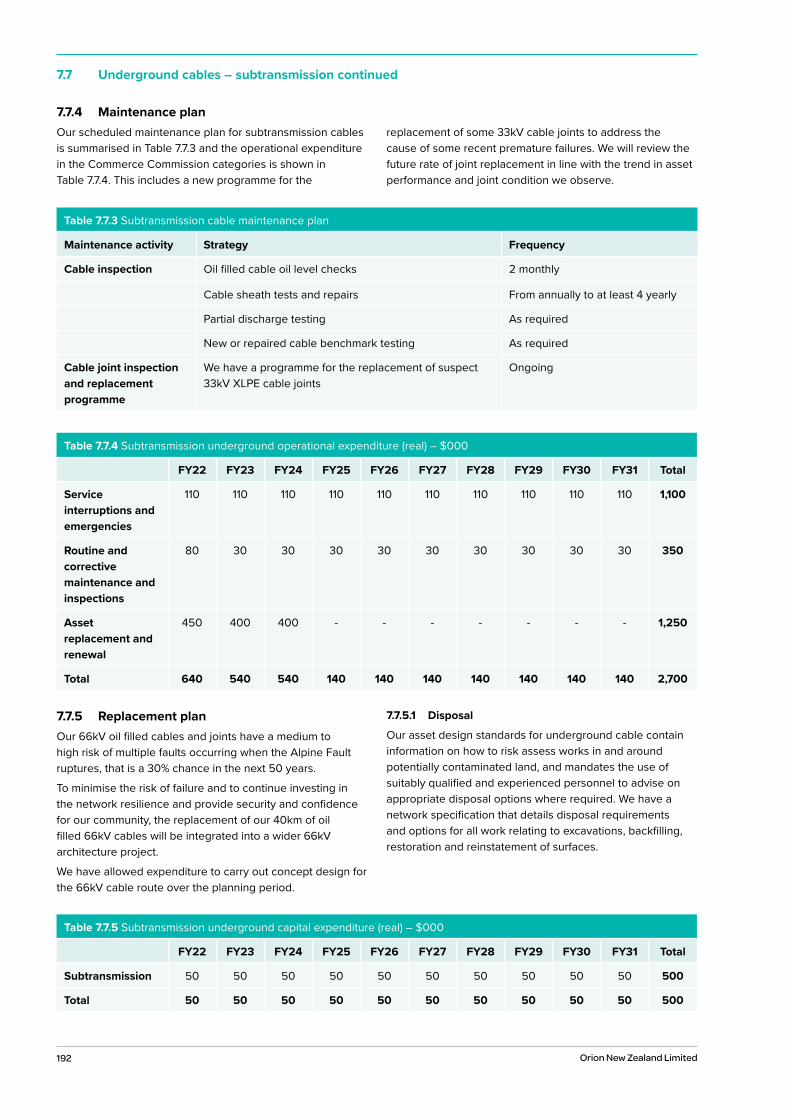
192 Orion New Zealand Limited
7.7 Underground cables – subtransmission continued
Table 7.7.3 Subtransmission cable maintenance plan
Maintenance activity Strategy Frequency
Cable inspection Oil filled cable oil level checks 2 monthly
Cable sheath tests and repairs From annually to at least 4 yearly
Partial discharge testing As required
New or repaired cable benchmark testing As required
Cable joint inspection and replacement programme
We have a programme for the replacement of suspect 33kV XLPE cable joints
Ongoing
Table 7.7.4 Subtransmission underground operational expenditure (real) – $000
FY22 FY23 FY24 FY25 FY26 FY27 FY28 FY29 FY30 FY31 Total
Service interruptions and emergencies
110 110 110 110 110 110 110 110 110 110 1,100
Routine and corrective maintenance and inspections
80 30 30 30 30 30 30 30 30 30 350
Asset replacement and renewal
450 400 400 - - - - - - - 1,250
Total 640 540 540 140 140 140 140 140 140 140 2,700
Table 7.7.5 Subtransmission underground capital expenditure (real) – $000
FY22 FY23 FY24 FY25 FY26 FY27 FY28 FY29 FY30 FY31 Total
Subtransmission 50 50 50 50 50 50 50 50 50 50 500
Total 50 50 50 50 50 50 50 50 50 50 500
7.7.5 Replacement planOur 66kV oil filled cables and joints have a medium to high risk of multiple faults occurring when the Alpine Fault ruptures, that is a 30% chance in the next 50 years.
To minimise the risk of failure and to continue investing in the network resilience and provide security and confidence for our community, the replacement of our 40km of oil filled 66kV cables will be integrated into a wider 66kV architecture project.
We have allowed expenditure to carry out concept design for the 66kV cable route over the planning period.
7.7.5.1 Disposal
Our asset design standards for underground cable contain information on how to risk assess works in and around potentially contaminated land, and mandates the use of suitably qualified and experienced personnel to advise on appropriate disposal options where required. We have a network specification that details disposal requirements and options for all work relating to excavations, backfilling, restoration and reinstatement of surfaces.
7.7.4 Maintenance planOur scheduled maintenance plan for subtransmission cables is summarised in Table 7.7.3 and the operational expenditure in the Commerce Commission categories is shown in Table 7.7.4. This includes a new programme for the
replacement of some 33kV cable joints to address the cause of some recent premature failures. We will review the future rate of joint replacement in line with the trend in asset performance and joint condition we observe.
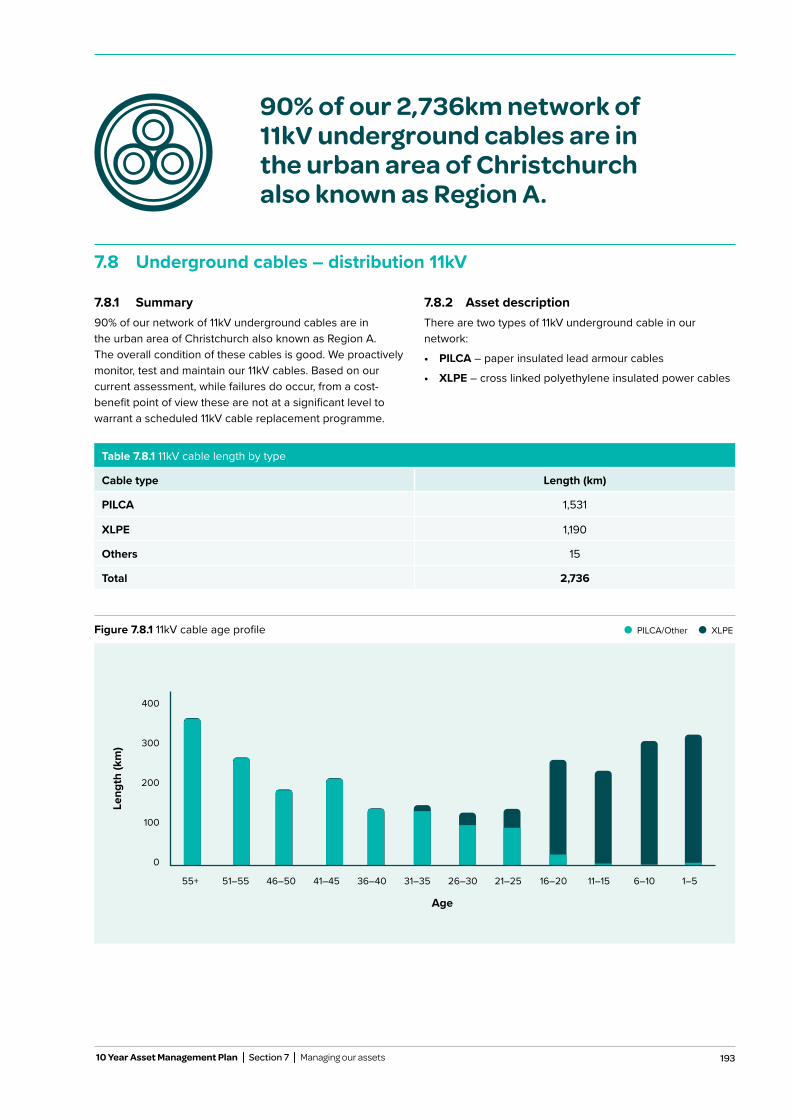
193 10 Year Asset Management Plan Section 7 Managing our assets
90% of our 2,736km network of 11kV underground cables are in the urban area of Christchurch also known as Region A.
7.8 Underground cables – distribution 11kV
7.8.1 Summary90% of our network of 11kV underground cables are in the urban area of Christchurch also known as Region A. The overall condition of these cables is good. We proactively monitor, test and maintain our 11kV cables. Based on our current assessment, while failures do occur, from a cost-benefit point of view these are not at a significant level to warrant a scheduled 11kV cable replacement programme.
7.8.2 Asset descriptionThere are two types of 11kV underground cable in our network:
• PILCA – paper insulated lead armour cables
• XLPE – cross linked polyethylene insulated power cables
Table 7.8.1 11kV cable length by type
Cable type Length (km)
PILCA 1,531
XLPE 1,190
Others 15
Total 2,736
400
300
200
100
0
Leng
th (k
m)
55+ 51–55 46–50 41–45 36–40 31–35 26–30 21–25 16–20 11–15 6–10 1–5
Age
Figure 7.8.1 11kV cable age profile PILCA/Other XLPE
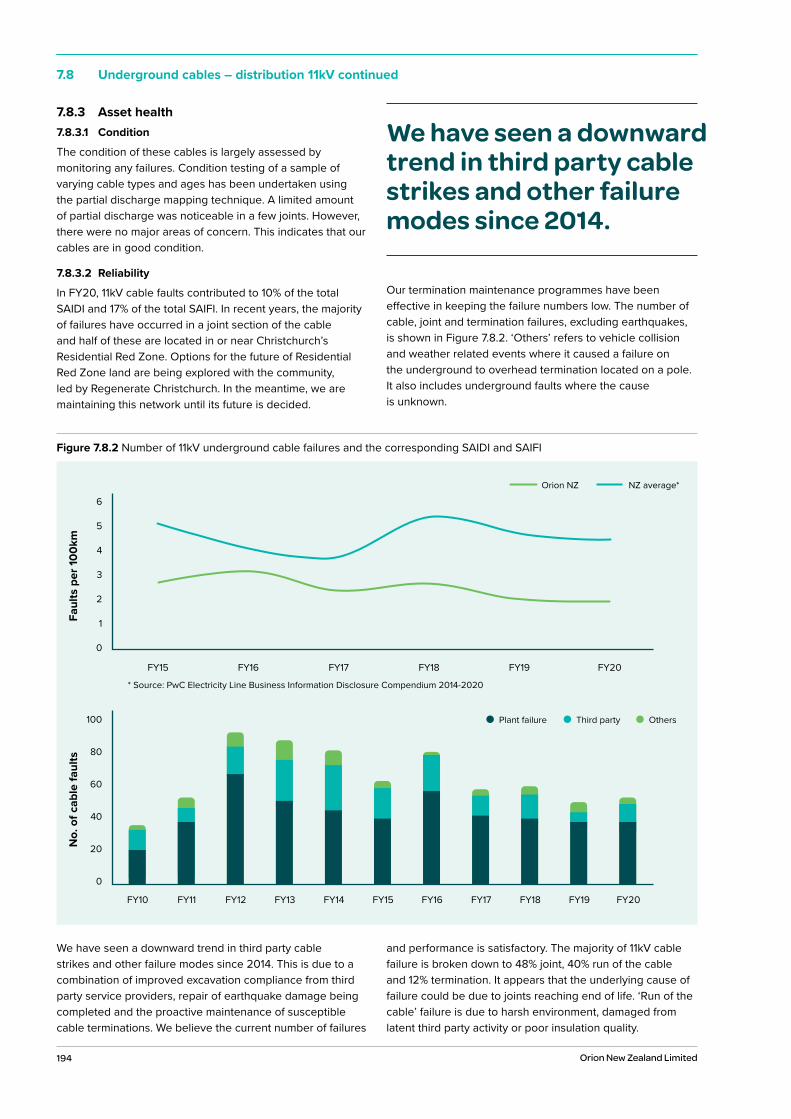
194 Orion New Zealand Limited
100
80
60
40
20
0
FY10 FY11 FY12 FY13 FY14 FY15 FY16 FY17 FY18 FY19 FY20
Third partyPlant failure Others
No.
of c
able
faul
ts
0
2
1
3
4
6
5
FY15 FY16 FY17 FY18 FY19 FY20
Faul
ts p
er 10
0km
Orion NZ NZ average*
* Source: PwC Electricity Line Business Information Disclosure Compendium 2014-2020
7.8 Underground cables – distribution 11kV continued
7.8.3 Asset health7.8.3.1 Condition
The condition of these cables is largely assessed by monitoring any failures. Condition testing of a sample of varying cable types and ages has been undertaken using the partial discharge mapping technique. A limited amount of partial discharge was noticeable in a few joints. However, there were no major areas of concern. This indicates that our cables are in good condition.
7.8.3.2 Reliability
In FY20, 11kV cable faults contributed to 10% of the total SAIDI and 17% of the total SAIFI. In recent years, the majority of failures have occurred in a joint section of the cable and half of these are located in or near Christchurch’s Residential Red Zone. Options for the future of Residential Red Zone land are being explored with the community, led by Regenerate Christchurch. In the meantime, we are maintaining this network until its future is decided.
Our termination maintenance programmes have been effective in keeping the failure numbers low. The number of cable, joint and termination failures, excluding earthquakes, is shown in Figure 7.8.2. ‘Others’ refers to vehicle collision and weather related events where it caused a failure on the underground to overhead termination located on a pole. It also includes underground faults where the cause is unknown.
We have seen a downward trend in third party cable strikes and other failure modes since 2014. This is due to a combination of improved excavation compliance from third party service providers, repair of earthquake damage being completed and the proactive maintenance of susceptible cable terminations. We believe the current number of failures
and performance is satisfactory. The majority of 11kV cable failure is broken down to 48% joint, 40% run of the cable and 12% termination. It appears that the underlying cause of failure could be due to joints reaching end of life. ‘Run of the cable’ failure is due to harsh environment, damaged from latent third party activity or poor insulation quality.
We have seen a downward trend in third party cable strikes and other failure modes since 2014.
Figure 7.8.2 Number of 11kV underground cable failures and the corresponding SAIDI and SAIFI
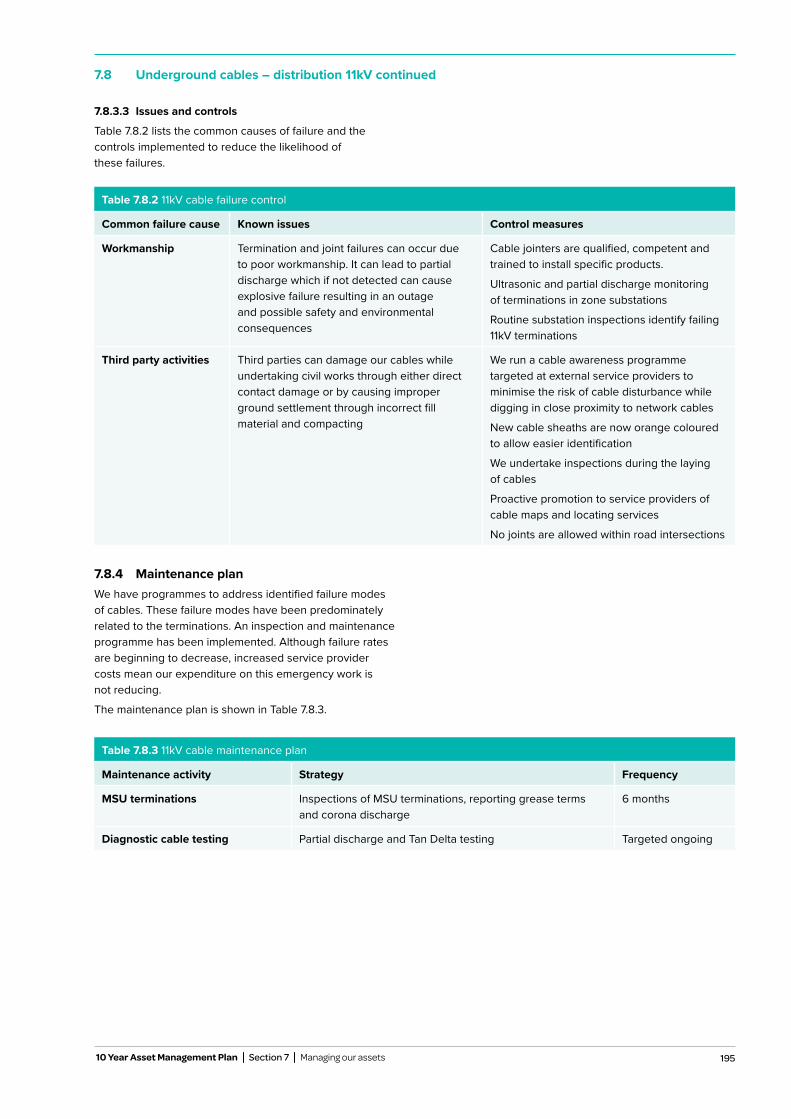
195
7.8 Underground cables – distribution 11kV continued
7.8.3.3 Issues and controls
Table 7.8.2 lists the common causes of failure and the controls implemented to reduce the likelihood of these failures.
Table 7.8.2 11kV cable failure control
Common failure cause Known issues Control measures
Workmanship Termination and joint failures can occur due to poor workmanship. It can lead to partial discharge which if not detected can cause explosive failure resulting in an outage and possible safety and environmental consequences
Cable jointers are qualified, competent and trained to install specific products.
Ultrasonic and partial discharge monitoring of terminations in zone substations
Routine substation inspections identify failing 11kV terminations
Third party activities Third parties can damage our cables while undertaking civil works through either direct contact damage or by causing improper ground settlement through incorrect fill material and compacting
We run a cable awareness programme targeted at external service providers to minimise the risk of cable disturbance while digging in close proximity to network cables
New cable sheaths are now orange coloured to allow easier identification
We undertake inspections during the laying of cables
Proactive promotion to service providers of cable maps and locating services
No joints are allowed within road intersections
Table 7.8.3 11kV cable maintenance plan
Maintenance activity Strategy Frequency
MSU terminations Inspections of MSU terminations, reporting grease terms and corona discharge
6 months
Diagnostic cable testing Partial discharge and Tan Delta testing Targeted ongoing
7.8.4 Maintenance planWe have programmes to address identified failure modes of cables. These failure modes have been predominately related to the terminations. An inspection and maintenance programme has been implemented. Although failure rates are beginning to decrease, increased service provider costs mean our expenditure on this emergency work is not reducing.
The maintenance plan is shown in Table 7.8.3.
10 Year Asset Management Plan Section 7 Managing our assets
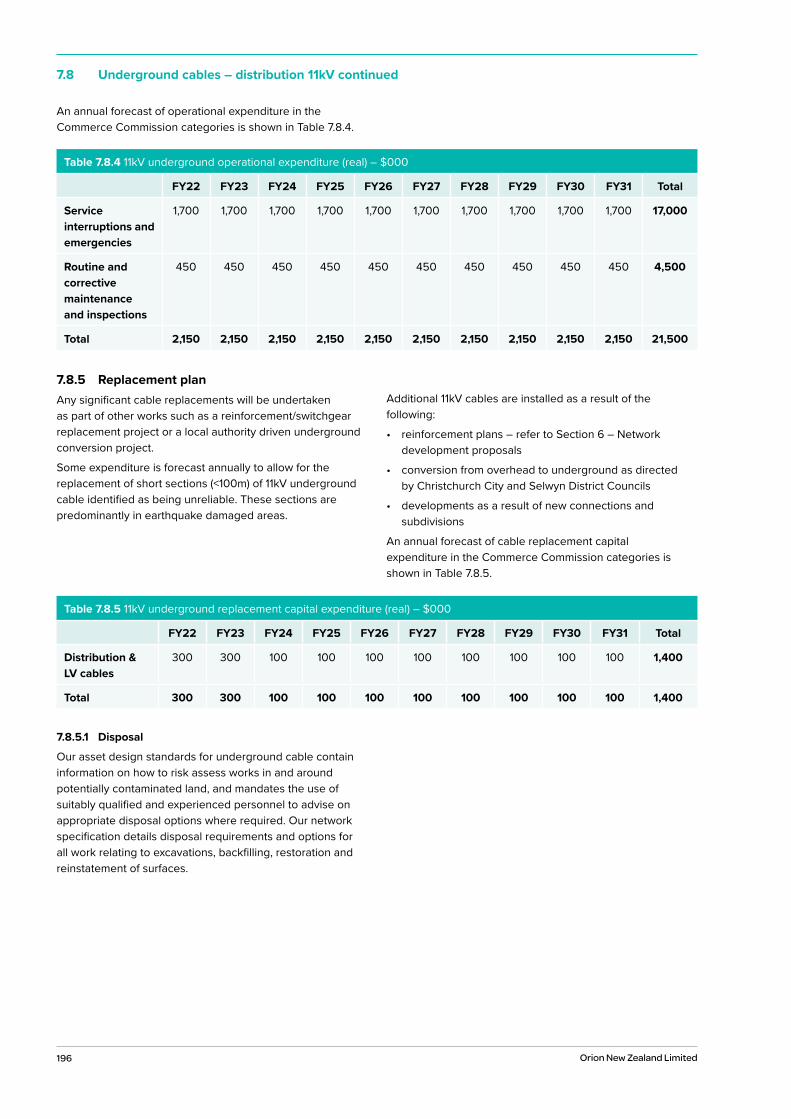
196 Orion New Zealand Limited
Table 7.8.4 11kV underground operational expenditure (real) – $000
FY22 FY23 FY24 FY25 FY26 FY27 FY28 FY29 FY30 FY31 Total
Service interruptions and emergencies
1,700 1,700 1,700 1,700 1,700 1,700 1,700 1,700 1,700 1,700 17,000
Routine and corrective maintenance and inspections
450 450 450 450 450 450 450 450 450 450 4,500
Total 2,150 2,150 2,150 2,150 2,150 2,150 2,150 2,150 2,150 2,150 21,500
Table 7.8.5 11kV underground replacement capital expenditure (real) – $000
FY22 FY23 FY24 FY25 FY26 FY27 FY28 FY29 FY30 FY31 Total
Distribution & LV cables
300 300 100 100 100 100 100 100 100 100 1,400
Total 300 300 100 100 100 100 100 100 100 100 1,400
7.8.5 Replacement planAny significant cable replacements will be undertaken as part of other works such as a reinforcement/switchgear replacement project or a local authority driven underground conversion project.
Some expenditure is forecast annually to allow for the replacement of short sections (<100m) of 11kV underground cable identified as being unreliable. These sections are predominantly in earthquake damaged areas.
Additional 11kV cables are installed as a result of the following:
• reinforcement plans – refer to Section 6 – Network development proposals
• conversion from overhead to underground as directed by Christchurch City and Selwyn District Councils
• developments as a result of new connections and subdivisions
An annual forecast of cable replacement capital expenditure in the Commerce Commission categories is shown in Table 7.8.5.
7.8.5.1 Disposal
Our asset design standards for underground cable contain information on how to risk assess works in and around potentially contaminated land, and mandates the use of suitably qualified and experienced personnel to advise on appropriate disposal options where required. Our network specification details disposal requirements and options for all work relating to excavations, backfilling, restoration and reinstatement of surfaces.
7.8 Underground cables – distribution 11kV continued
An annual forecast of operational expenditure in the Commerce Commission categories is shown in Table 7.8.4.
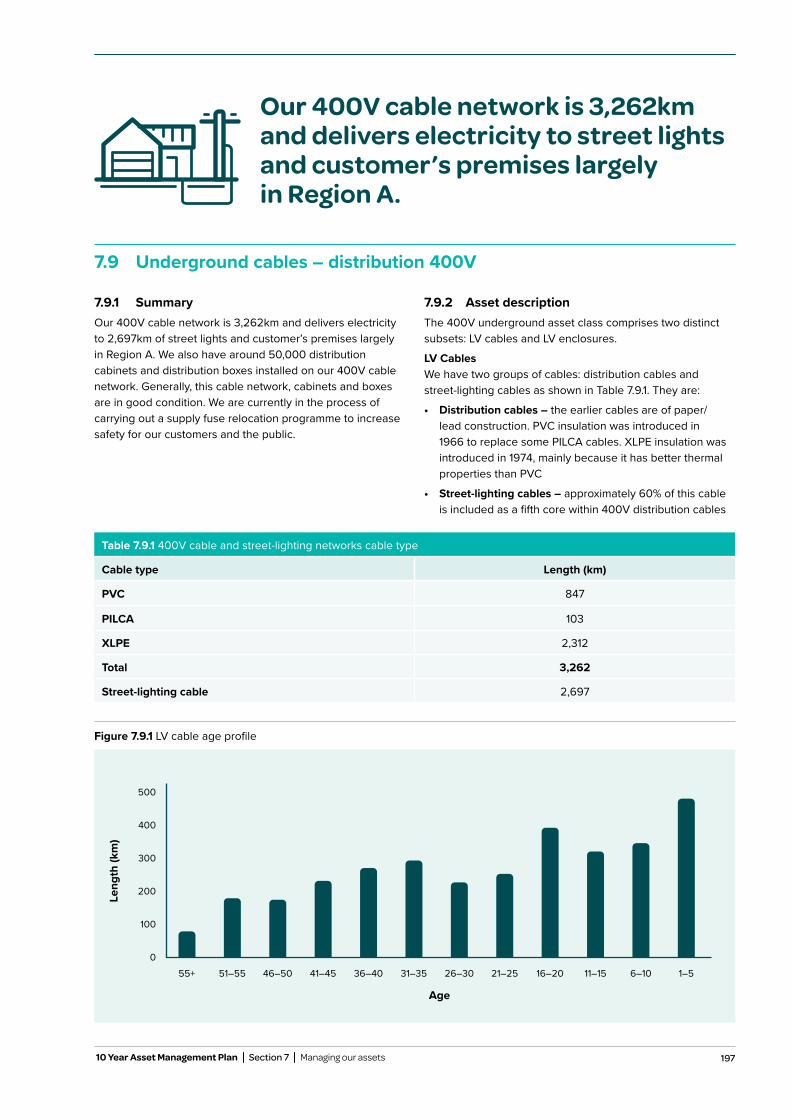
197
Our 400V cable network is 3,262km and delivers electricity to street lights and customer’s premises largely in Region A.
7.9 Underground cables – distribution 400V
7.9.1 SummaryOur 400V cable network is 3,262km and delivers electricity to 2,697km of street lights and customer’s premises largely in Region A. We also have around 50,000 distribution cabinets and distribution boxes installed on our 400V cable network. Generally, this cable network, cabinets and boxes are in good condition. We are currently in the process of carrying out a supply fuse relocation programme to increase safety for our customers and the public.
7.9.2 Asset descriptionThe 400V underground asset class comprises two distinct subsets: LV cables and LV enclosures.
LV CablesWe have two groups of cables: distribution cables and street-lighting cables as shown in Table 7.9.1. They are:
• Distribution cables – the earlier cables are of paper/lead construction. PVC insulation was introduced in 1966 to replace some PILCA cables. XLPE insulation was introduced in 1974, mainly because it has better thermal properties than PVC
• Street-lighting cables – approximately 60% of this cable is included as a fifth core within 400V distribution cables
Table 7.9.1 400V cable and street-lighting networks cable type
Cable type Length (km)
PVC 847
PILCA 103
XLPE 2,312
Total 3,262
Street-lighting cable 2,697
Figure 7.9.1 LV cable age profile
500
400
300
200
100
0
Leng
th (k
m)
55+ 51–55 46–50 41–45 36–40 31–35 26–30 21–25 16–20 11–15 6–10 1–5
Age
10 Year Asset Management Plan Section 7 Managing our assets
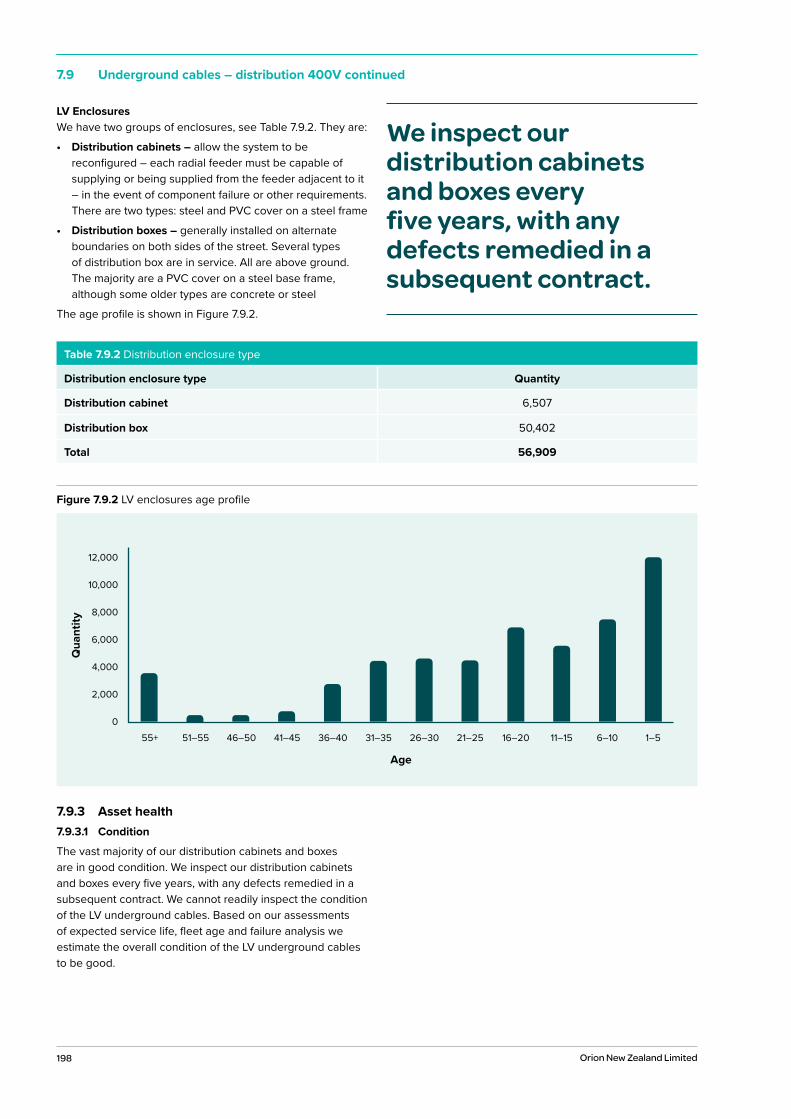
198 Orion New Zealand Limited
7.9 Underground cables – distribution 400V continued
LV EnclosuresWe have two groups of enclosures, see Table 7.9.2. They are:
• Distribution cabinets – allow the system to be reconfigured – each radial feeder must be capable of supplying or being supplied from the feeder adjacent to it – in the event of component failure or other requirements. There are two types: steel and PVC cover on a steel frame
• Distribution boxes – generally installed on alternate boundaries on both sides of the street. Several types of distribution box are in service. All are above ground. The majority are a PVC cover on a steel base frame, although some older types are concrete or steel
The age profile is shown in Figure 7.9.2.
Table 7.9.2 Distribution enclosure type
Distribution enclosure type Quantity
Distribution cabinet 6,507
Distribution box 50,402
Total 56,909
We inspect our distribution cabinets and boxes every five years, with any defects remedied in a subsequent contract.
Figure 7.9.2 LV enclosures age profile
12,000
10,000
8,000
6,000
4,000
2,000
0
Qua
ntity
55+ 51–55 46–50 41–45 36–40 31–35 26–30 21–25 16–20 11–15 6–10 1–5
Age
7.9.3 Asset health7.9.3.1 Condition
The vast majority of our distribution cabinets and boxes are in good condition. We inspect our distribution cabinets and boxes every five years, with any defects remedied in a subsequent contract. We cannot readily inspect the condition of the LV underground cables. Based on our assessments of expected service life, fleet age and failure analysis we estimate the overall condition of the LV underground cables to be good.
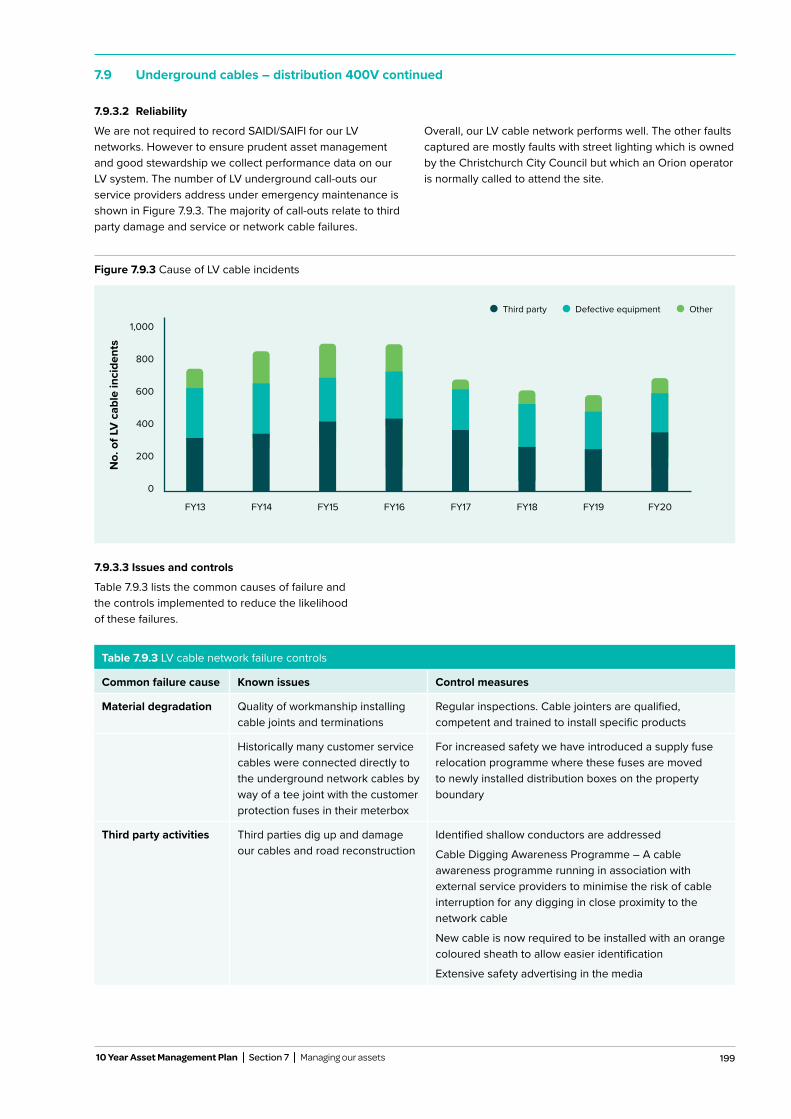
199
7.9 Underground cables – distribution 400V continued
7.9.3.2 Reliability
We are not required to record SAIDI/SAIFI for our LV networks. However to ensure prudent asset management and good stewardship we collect performance data on our LV system. The number of LV underground call-outs our service providers address under emergency maintenance is shown in Figure 7.9.3. The majority of call-outs relate to third party damage and service or network cable failures.
Overall, our LV cable network performs well. The other faults captured are mostly faults with street lighting which is owned by the Christchurch City Council but which an Orion operator is normally called to attend the site.
7.9.3.3 Issues and controls
Table 7.9.3 lists the common causes of failure and the controls implemented to reduce the likelihood of these failures.
Table 7.9.3 LV cable network failure controls
Common failure cause Known issues Control measures
Material degradation Quality of workmanship installing cable joints and terminations
Regular inspections. Cable jointers are qualified, competent and trained to install specific products
Historically many customer service cables were connected directly to the underground network cables by way of a tee joint with the customer protection fuses in their meterbox
For increased safety we have introduced a supply fuse relocation programme where these fuses are moved to newly installed distribution boxes on the property boundary
Third party activities Third parties dig up and damage our cables and road reconstruction
Identified shallow conductors are addressed
Cable Digging Awareness Programme – A cable awareness programme running in association with external service providers to minimise the risk of cable interruption for any digging in close proximity to the network cable
New cable is now required to be installed with an orange coloured sheath to allow easier identification
Extensive safety advertising in the media
10 Year Asset Management Plan Section 7 Managing our assets
Figure 7.9.3 Cause of LV cable incidents
1,000
800
600
400
200
0
Third party Defective equipment Other
FY13 FY14 FY15 FY16 FY17 FY18 FY19 FY20
No.
of L
V c
able
inci
dent
s
200 Orion New Zealand Limited
7.9 Underground cables – distribution 400V continued
7.9.5 Replacement planWe have developed a programme to install distribution boxes complete with fusing on the supply. This project is programmed to be complete in 2028. We are also upgrading
our existing distribution cabinets to a more secure design. A detailed breakdown of replacement in the Commerce Commission categories is shown in Table 7.9.6.
7.9.5.1 Disposal plan
Our asset design standards for underground cable contain information on how to risk assess works in and around potentially contaminated land, and mandates the use of suitably qualified and experienced personnel to advise on
appropriate disposal options where required. Our network specification details disposal requirements and options for all work relating to excavations, backfilling, restoration and reinstatement of surfaces.
Table 7.9.5 400V underground operational expenditure (real) – $000
FY22 FY23 FY24 FY25 FY26 FY27 FY28 FY29 FY30 FY31 Total
Service interruptions and emergencies
1,600 1,600 1,600 1,600 1,600 1,600 1,600 1,600 1,600 1,600 16,000
Routine and corrective maintenance and inspections
1,295 1,295 1,295 1,295 1,295 1,295 1,295 1,295 1,295 1,295 12,950
Total 2,895 2,895 2,895 2,895 2,895 2,895 2,895 2,895 2,895 2,895 28,950
Table 7.9.6 400V underground replacement capital expenditure (real) – $000
FY22 FY23 FY24 FY25 FY26 FY27 FY28 FY29 FY30 FY31 Total
Distribution and LV cables
415 470 470 470 470 570 570 570 570 570 5,145
Other reliability, safety and environment
6,750 6,750 6,750 6,750 6,750 6,750 930 - - - 41,430
Total 7,165 7,220 7,220 7,220 7,220 7,320 1,500 570 570 570 46,575
7.9.4 Maintenance planOur scheduled maintenance plan is summarised in Table 7.9.4 and the associated expenditure in the Commerce Commission categories is shown in Table 7.9.5.
Table 7.9.4 400V underground maintenance plan
Asset Maintenance Description Frequency
Distribution cables Visual inspection of insulation on cable to overhead terminations. Where insulation is degraded due to the effects of UV light it is scheduled for rectification
5 years
Distribution enclosures Visual inspection programme of the above-ground equipment and terminations. Major defects identified and scheduled for rectification
5 years
201
7.10 Circuit breakers and switchgear
7.10.1 SummaryCircuit breakers and switchgear contribute to our asset management objectives by providing capability to control, protect and configure the electricity network. Most of our circuit breakers and switchgear are in good condition overall, and meeting our service level targets. However, there are some older oil-filled breakers and 66kV and 33kV switchgear that have a poor health index.
We also have an ageing 11kV switchgear group that require a steadily rising replacement programme to maintain current health profile and performance.
7.10.2 Asset descriptionIn this section we discuss the types of circuit breaker and switchgear we install on Orion’s network.
Circuit breakers
Circuit breakers are installed to provide safe interruption of both fault and load currents, for example, during power system abnormalities. They are strategically placed in the network for line/cable, transformer and ripple plant protection.
Circuit breakers and switchgear contribute to our asset management objectives by providing capability to control, protect and configure the electricity network.
Table 7.10.1 Circuit breaker description by type
Voltage Type Description
66kV Circuit breaker (zone substation)
These are installed at zone substations predominately in outdoor switchyards. The exceptions being Armagh, Dallington, Marshland, McFaddens, Lancaster and Waimakariri zone substations where the ‘outdoor design’ circuit breakers have been installed indoors in specially designed buildings. The majority of our 66kV circuit breakers use SF6 gas as the interruption medium.
33kV Circuit breaker (zone substation)
A mix of outdoor and indoor. Those installed pre-circa 2001 are mainly outdoor minimum oil interruption type. We are now moving from outdoor to indoor switchgear.
This has the advantage of improved security and public safety.
The newer circuit breakers at a number of our zone substations are an indoor metal-clad vacuum interruption type. We also have a number of oil filled and SF6 units.
11kV Circuit breaker These substation circuit breakers are installed indoors and used for the protection of primary equipment and the distribution network. The older units use oil or SF6 gas as an interruption medium, while those installed since 1992 are a vacuum interruption type.
11kV Line circuit breaker (pole mounted)
These have reclose capability. They are installed in selected locations to improve feeder reliability by isolating a portion of the overall substation feeder.
10 Year Asset Management Plan Section 7 Managing our assets
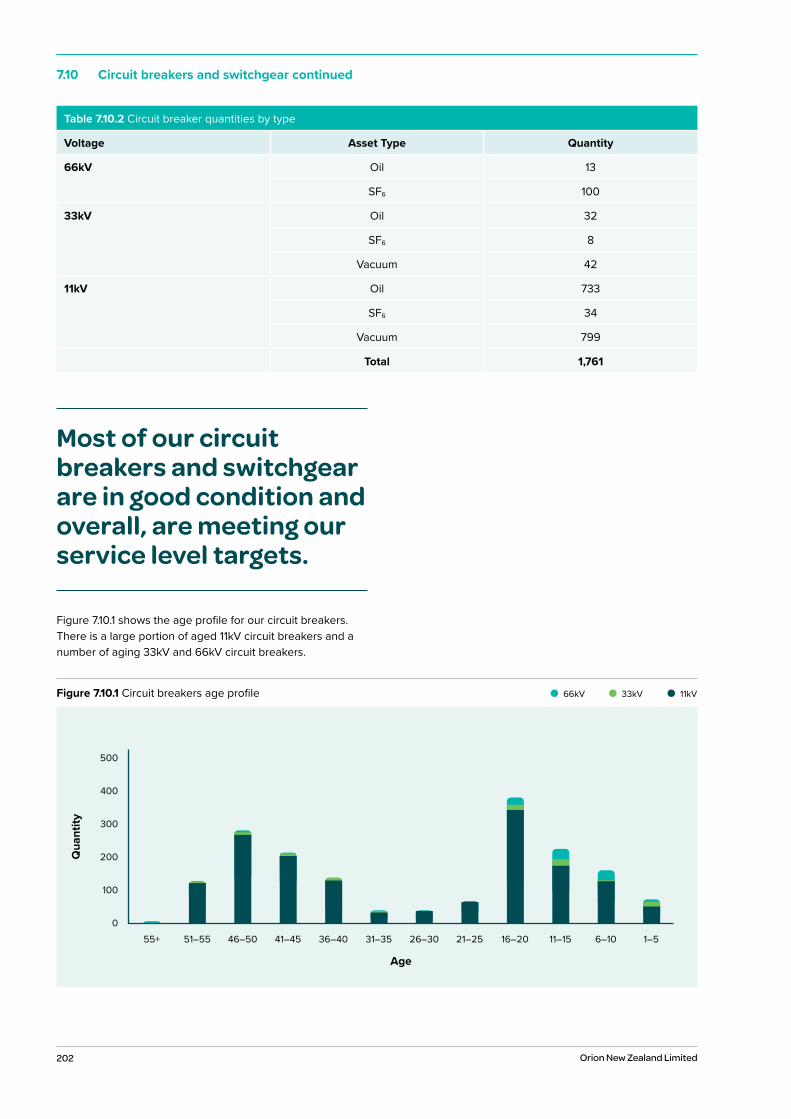
202 Orion New Zealand Limited
7.10 Circuit breakers and switchgear continued
Most of our circuit breakers and switchgear are in good condition and overall, are meeting our service level targets.
Table 7.10.2 Circuit breaker quantities by type
Voltage Asset Type Quantity
66kV Oil 13
SF6 100
33kV Oil 32
SF6 8
Vacuum 42
11kV Oil 733
SF6 34
Vacuum 799
Total 1,761
Figure 7.10.1 shows the age profile for our circuit breakers. There is a large portion of aged 11kV circuit breakers and a number of aging 33kV and 66kV circuit breakers.
Figure 7.10.1 Circuit breakers age profile 33kV 11kV66kV
500
400
300
200
100
0
Qua
ntity
55+ 51–55 46–50 41–45 36–40 31–35 26–30 21–25 16–20 11–15 6–10 1–5
Age
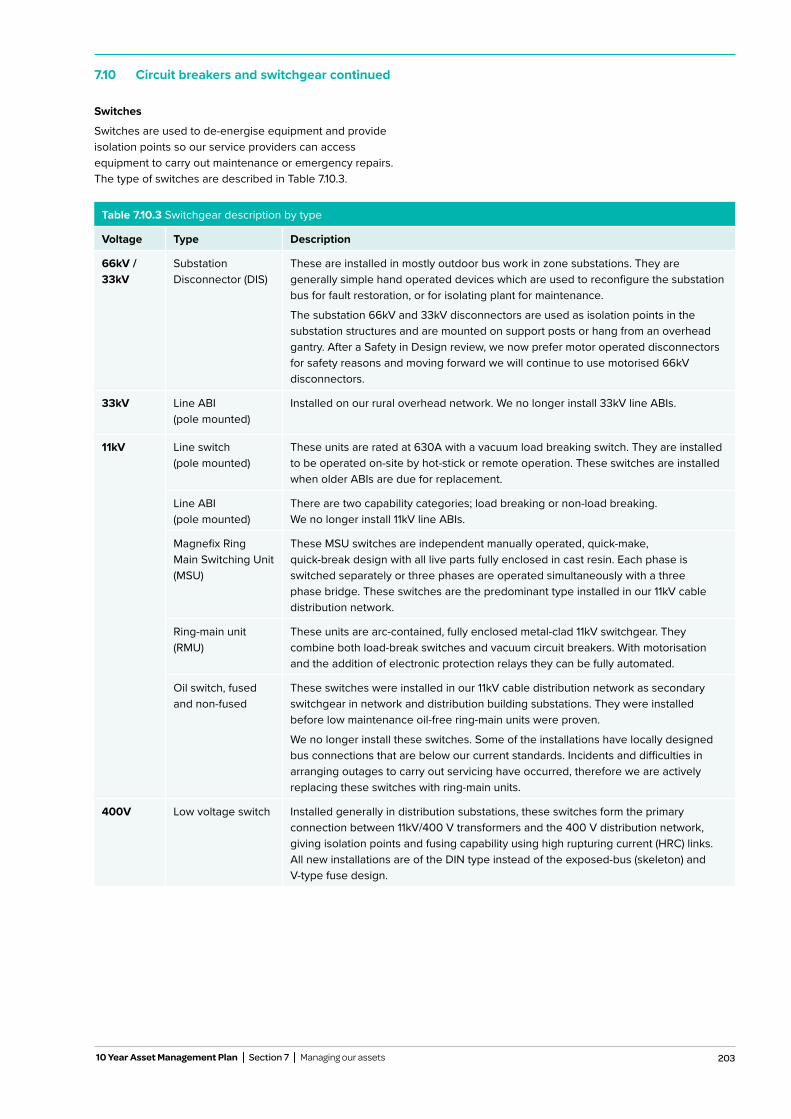
203
7.10 Circuit breakers and switchgear continued
Switches
Switches are used to de-energise equipment and provide isolation points so our service providers can access equipment to carry out maintenance or emergency repairs. The type of switches are described in Table 7.10.3.
Table 7.10.3 Switchgear description by type
Voltage Type Description
66kV / 33kV
Substation Disconnector (DIS)
These are installed in mostly outdoor bus work in zone substations. They are generally simple hand operated devices which are used to reconfigure the substation bus for fault restoration, or for isolating plant for maintenance.
The substation 66kV and 33kV disconnectors are used as isolation points in the substation structures and are mounted on support posts or hang from an overhead gantry. After a Safety in Design review, we now prefer motor operated disconnectors for safety reasons and moving forward we will continue to use motorised 66kV disconnectors.
33kV Line ABI (pole mounted)
Installed on our rural overhead network. We no longer install 33kV line ABIs.
11kV Line switch (pole mounted)
These units are rated at 630A with a vacuum load breaking switch. They are installed to be operated on-site by hot-stick or remote operation. These switches are installed when older ABIs are due for replacement.
Line ABI (pole mounted)
There are two capability categories; load breaking or non-load breaking. We no longer install 11kV line ABIs.
Magnefix Ring Main Switching Unit (MSU)
These MSU switches are independent manually operated, quick-make, quick-break design with all live parts fully enclosed in cast resin. Each phase is switched separately or three phases are operated simultaneously with a three phase bridge. These switches are the predominant type installed in our 11kV cable distribution network.
Ring-main unit (RMU)
These units are arc-contained, fully enclosed metal-clad 11kV switchgear. They combine both load-break switches and vacuum circuit breakers. With motorisation and the addition of electronic protection relays they can be fully automated.
Oil switch, fused and non-fused
These switches were installed in our 11kV cable distribution network as secondary switchgear in network and distribution building substations. They were installed before low maintenance oil-free ring-main units were proven.
We no longer install these switches. Some of the installations have locally designed bus connections that are below our current standards. Incidents and difficulties in arranging outages to carry out servicing have occurred, therefore we are actively replacing these switches with ring-main units.
400V Low voltage switch Installed generally in distribution substations, these switches form the primary connection between 11kV/400 V transformers and the 400 V distribution network, giving isolation points and fusing capability using high rupturing current (HRC) links. All new installations are of the DIN type instead of the exposed-bus (skeleton) and V-type fuse design.
10 Year Asset Management Plan Section 7 Managing our assets
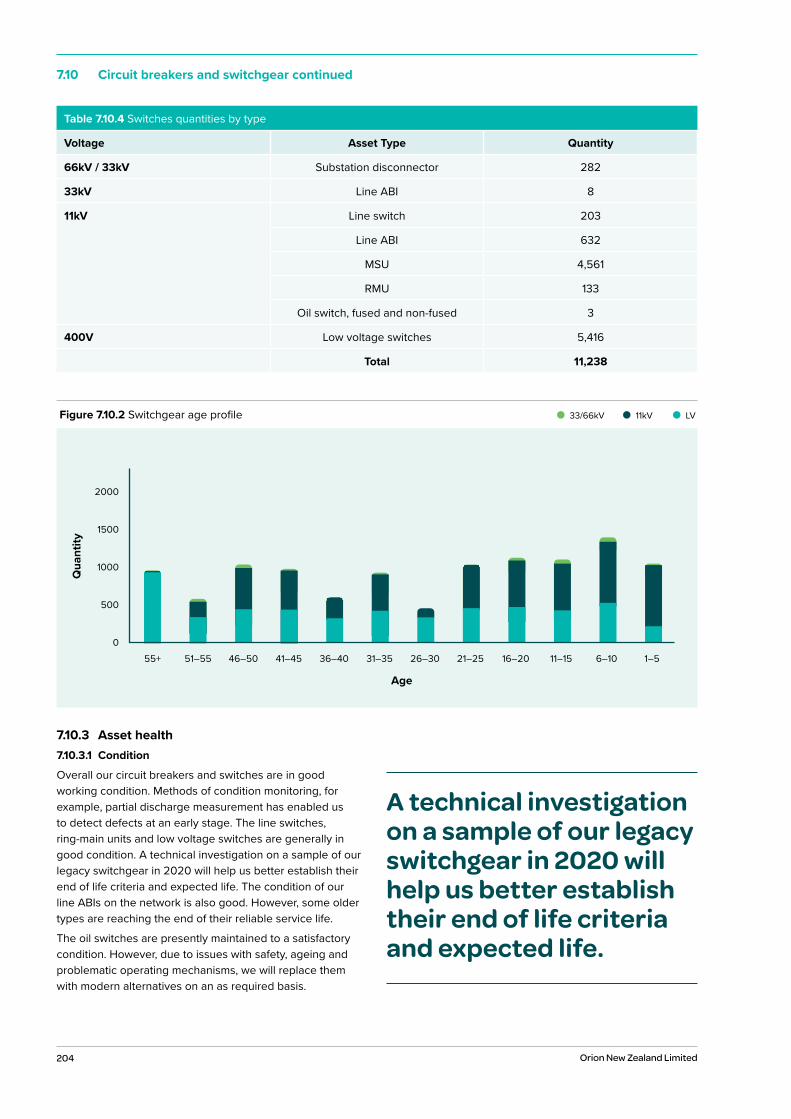
204 Orion New Zealand Limited
Table 7.10.4 Switches quantities by type
Voltage Asset Type Quantity
66kV / 33kV Substation disconnector 282
33kV Line ABI 8
11kV Line switch 203
Line ABI 632
MSU 4,561
RMU 133
Oil switch, fused and non-fused 3
400V Low voltage switches 5,416
Total 11,238
Figure 7.10.2 Switchgear age profile 11kV LV33/66kV
2000
1500
1000
500
0
Qua
ntity
55+ 51–55 46–50 41–45 36–40 31–35 26–30 21–25 16–20 11–15 6–10 1–5
Age
7.10 Circuit breakers and switchgear continued
7.10.3 Asset health7.10.3.1 Condition
Overall our circuit breakers and switches are in good working condition. Methods of condition monitoring, for example, partial discharge measurement has enabled us to detect defects at an early stage. The line switches, ring-main units and low voltage switches are generally in good condition. A technical investigation on a sample of our legacy switchgear in 2020 will help us better establish their end of life criteria and expected life. The condition of our line ABIs on the network is also good. However, some older types are reaching the end of their reliable service life.
The oil switches are presently maintained to a satisfactory condition. However, due to issues with safety, ageing and problematic operating mechanisms, we will replace them with modern alternatives on an as required basis.
A technical investigation on a sample of our legacy switchgear in 2020 will help us better establish their end of life criteria and expected life.

205 10 Year Asset Management Plan Section 7 Managing our assets
Figure 7.10.4 11kV circuit breaker condition profile Poor Fair Good
400
300
200
100
0
Qua
ntity
55+ 51–55 46–50 41–45 36–40 31–35 26–30 21–25 16–20 11–15 6–10 1–5
Age
Figure 7.10.3 33kV / 66kV circuit breaker condition profile Poor Fair GoodQ
uant
ity
55+ 51–55 46–50 41–45 36–40 31–35 26–30 21–25 16–20 11–15 6–10 1–5
Age
50
40
30
20
10
0
7.10 Circuit breakers and switchgear continued
7.10.3.2 Reliability
Switchgear contributes to our asset management objectives by providing capability to control, protect and configure the electricity network. Therefore, we strive for a good performance due to the potentially serious consequences of asset failure.
Our approach for this asset class is to achieve a high level of reliability, mitigate safety and environmental hazards, and to avoid major failures. A summary of switchgear performance by type is shown in Table 7.10.5.
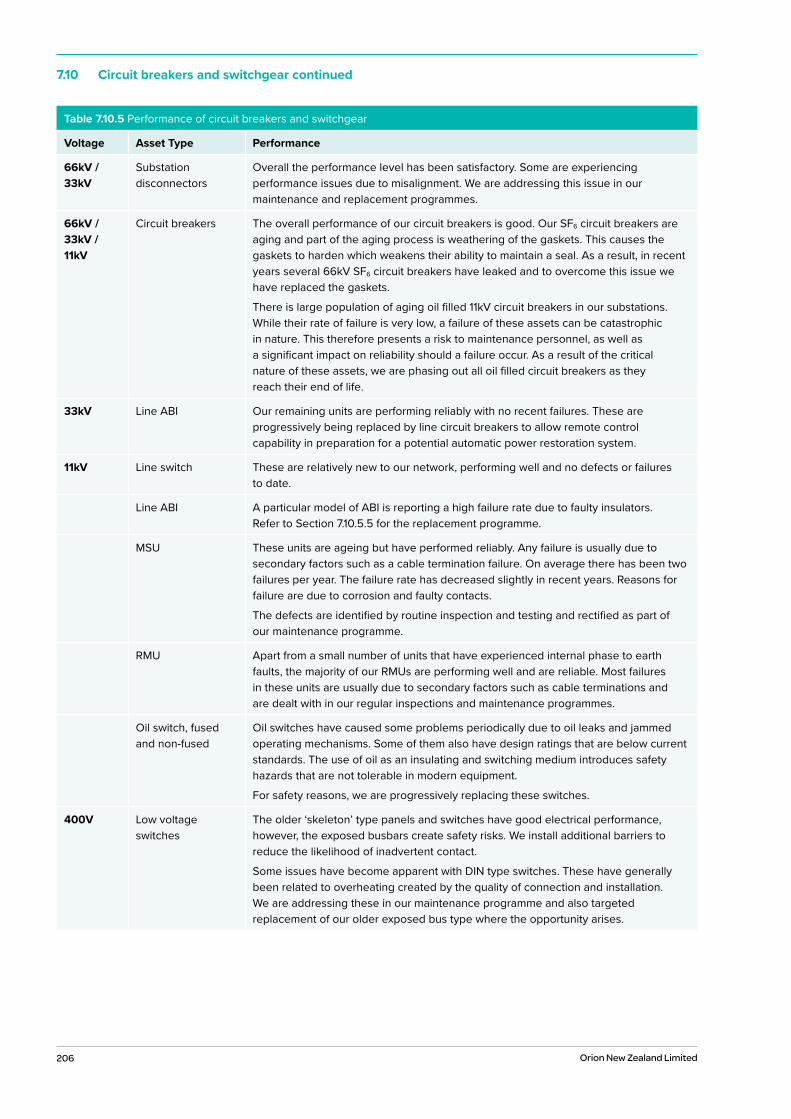
206 Orion New Zealand Limited
7.10 Circuit breakers and switchgear continued
Table 7.10.5 Performance of circuit breakers and switchgear
Voltage Asset Type Performance
66kV / 33kV
Substation disconnectors
Overall the performance level has been satisfactory. Some are experiencing performance issues due to misalignment. We are addressing this issue in our maintenance and replacement programmes.
66kV / 33kV / 11kV
Circuit breakers The overall performance of our circuit breakers is good. Our SF6 circuit breakers are aging and part of the aging process is weathering of the gaskets. This causes the gaskets to harden which weakens their ability to maintain a seal. As a result, in recent years several 66kV SF6 circuit breakers have leaked and to overcome this issue we have replaced the gaskets.
There is large population of aging oil filled 11kV circuit breakers in our substations. While their rate of failure is very low, a failure of these assets can be catastrophic in nature. This therefore presents a risk to maintenance personnel, as well as a significant impact on reliability should a failure occur. As a result of the critical nature of these assets, we are phasing out all oil filled circuit breakers as they reach their end of life.
33kV Line ABI Our remaining units are performing reliably with no recent failures. These are progressively being replaced by line circuit breakers to allow remote control capability in preparation for a potential automatic power restoration system.
11kV Line switch These are relatively new to our network, performing well and no defects or failures to date.
Line ABI A particular model of ABI is reporting a high failure rate due to faulty insulators. Refer to Section 7.10.5.5 for the replacement programme.
MSU These units are ageing but have performed reliably. Any failure is usually due to secondary factors such as a cable termination failure. On average there has been two failures per year. The failure rate has decreased slightly in recent years. Reasons for failure are due to corrosion and faulty contacts.
The defects are identified by routine inspection and testing and rectified as part of our maintenance programme.
RMU Apart from a small number of units that have experienced internal phase to earth faults, the majority of our RMUs are performing well and are reliable. Most failures in these units are usually due to secondary factors such as cable terminations and are dealt with in our regular inspections and maintenance programmes.
Oil switch, fused and non-fused
Oil switches have caused some problems periodically due to oil leaks and jammed operating mechanisms. Some of them also have design ratings that are below current standards. The use of oil as an insulating and switching medium introduces safety hazards that are not tolerable in modern equipment.
For safety reasons, we are progressively replacing these switches.
400V Low voltage switches
The older ‘skeleton’ type panels and switches have good electrical performance, however, the exposed busbars create safety risks. We install additional barriers to reduce the likelihood of inadvertent contact.
Some issues have become apparent with DIN type switches. These have generally been related to overheating created by the quality of connection and installation. We are addressing these in our maintenance programme and also targeted replacement of our older exposed bus type where the opportunity arises.
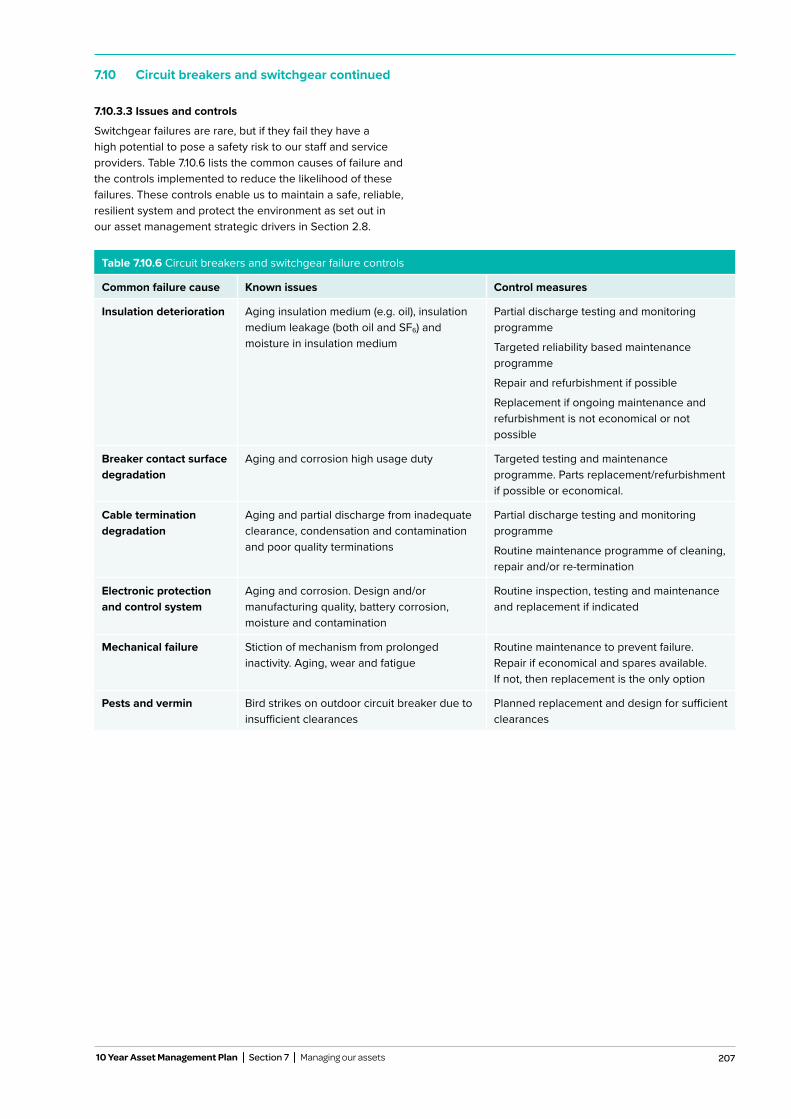
207
7.10 Circuit breakers and switchgear continued
10 Year Asset Management Plan Section 7 Managing our assets
Table 7.10.6 Circuit breakers and switchgear failure controls
Common failure cause Known issues Control measures
Insulation deterioration Aging insulation medium (e.g. oil), insulation medium leakage (both oil and SF6) and moisture in insulation medium
Partial discharge testing and monitoring programme
Targeted reliability based maintenance programme
Repair and refurbishment if possible
Replacement if ongoing maintenance and refurbishment is not economical or not possible
Breaker contact surface degradation
Aging and corrosion high usage duty Targeted testing and maintenance programme. Parts replacement/refurbishment if possible or economical.
Cable termination degradation
Aging and partial discharge from inadequate clearance, condensation and contamination and poor quality terminations
Partial discharge testing and monitoring programme
Routine maintenance programme of cleaning, repair and/or re-termination
Electronic protection and control system
Aging and corrosion. Design and/or manufacturing quality, battery corrosion, moisture and contamination
Routine inspection, testing and maintenance and replacement if indicated
Mechanical failure Stiction of mechanism from prolonged inactivity. Aging, wear and fatigue
Routine maintenance to prevent failure. Repair if economical and spares available. If not, then replacement is the only option
Pests and vermin Bird strikes on outdoor circuit breaker due to insufficient clearances
Planned replacement and design for sufficient clearances
7.10.3.3 Issues and controls
Switchgear failures are rare, but if they fail they have a high potential to pose a safety risk to our staff and service providers. Table 7.10.6 lists the common causes of failure and the controls implemented to reduce the likelihood of these failures. These controls enable us to maintain a safe, reliable, resilient system and protect the environment as set out in our asset management strategic drivers in Section 2.8.
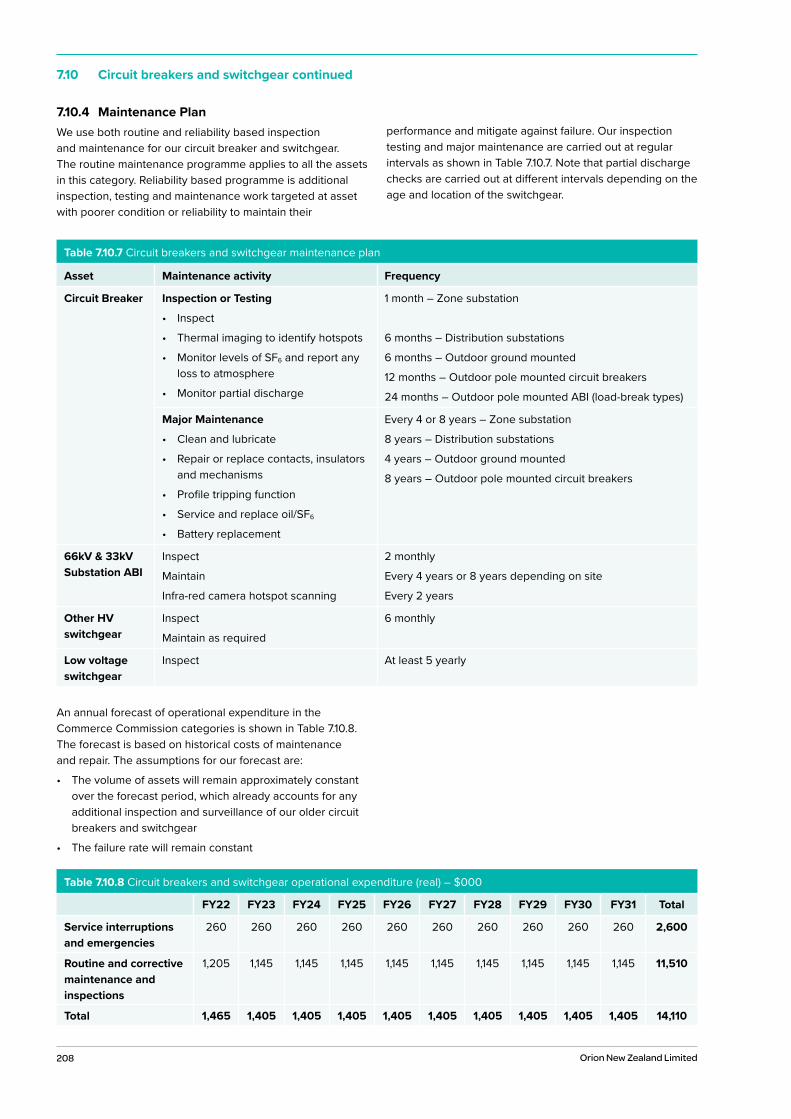
208 Orion New Zealand Limited
7.10 Circuit breakers and switchgear continued
7.10.4 Maintenance PlanWe use both routine and reliability based inspection and maintenance for our circuit breaker and switchgear. The routine maintenance programme applies to all the assets in this category. Reliability based programme is additional inspection, testing and maintenance work targeted at asset with poorer condition or reliability to maintain their
performance and mitigate against failure. Our inspection testing and major maintenance are carried out at regular intervals as shown in Table 7.10.7. Note that partial discharge checks are carried out at different intervals depending on the age and location of the switchgear.
An annual forecast of operational expenditure in the Commerce Commission categories is shown in Table 7.10.8. The forecast is based on historical costs of maintenance and repair. The assumptions for our forecast are:
• The volume of assets will remain approximately constantover the forecast period, which already accounts for anyadditional inspection and surveillance of our older circuitbreakers and switchgear
• The failure rate will remain constant
Table 7.10.7 Circuit breakers and switchgear maintenance plan
Asset Maintenance activity Frequency
Circuit Breaker Inspection or Testing
• Inspect
• Thermal imaging to identify hotspots
• Monitor levels of SF6 and report anyloss to atmosphere
• Monitor partial discharge
1 month – Zone substation
6 months – Distribution substations
6 months – Outdoor ground mounted
12 months – Outdoor pole mounted circuit breakers
24 months – Outdoor pole mounted ABI (load-break types)
Major Maintenance
• Clean and lubricate
• Repair or replace contacts, insulatorsand mechanisms
• Profile tripping function
• Service and replace oil/SF6
• Battery replacement
Every 4 or 8 years – Zone substation
8 years – Distribution substations
4 years – Outdoor ground mounted
8 years – Outdoor pole mounted circuit breakers
66kV & 33kV Substation ABI
Inspect
Maintain
Infra-red camera hotspot scanning
2 monthly
Every 4 years or 8 years depending on site
Every 2 years
Other HV switchgear
Inspect
Maintain as required
6 monthly
Low voltage switchgear
Inspect At least 5 yearly
Table 7.10.8 Circuit breakers and switchgear operational expenditure (real) – $000
FY22 FY23 FY24 FY25 FY26 FY27 FY28 FY29 FY30 FY31 Total
Service interruptions and emergencies
260 260 260 260 260 260 260 260 260 260 2,600
Routine and corrective maintenance and inspections
1,205 1,145 1,145 1,145 1,145 1,145 1,145 1,145 1,145 1,145 11,510
Total 1,465 1,405 1,405 1,405 1,405 1,405 1,405 1,405 1,405 1,405 14,110
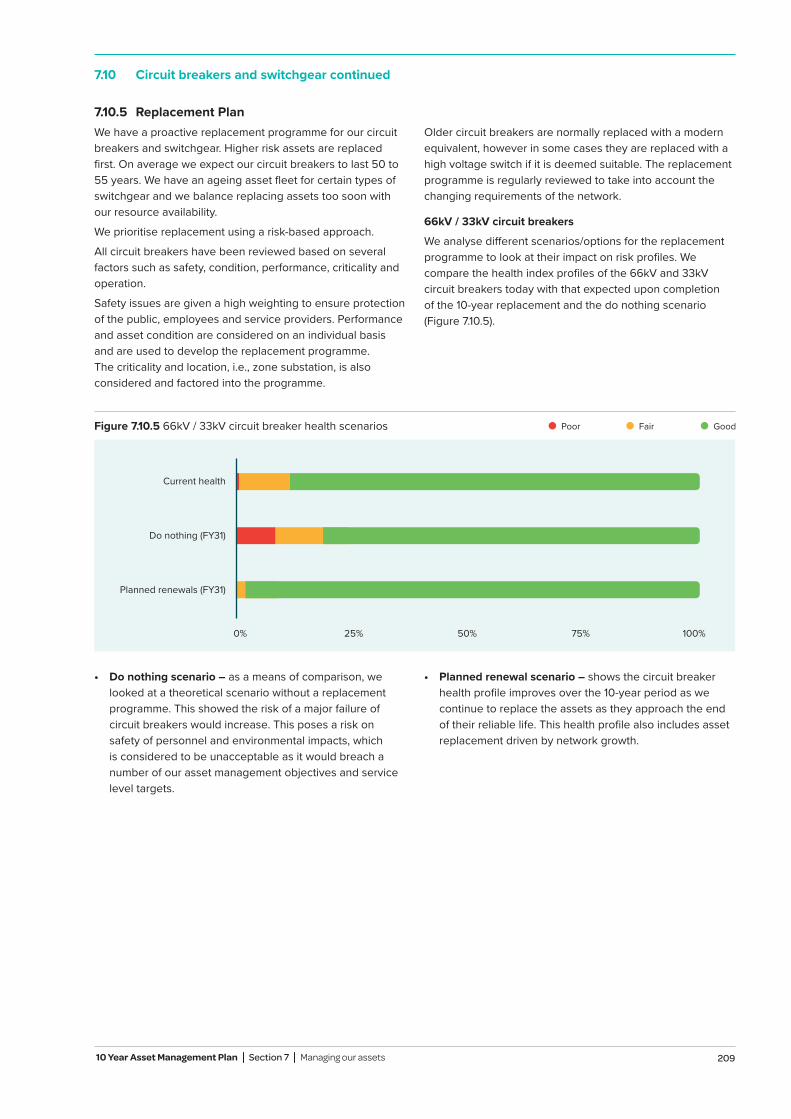
209
7.10 Circuit breakers and switchgear continued
10 Year Asset Management Plan Section 7 Managing our assets
• Do nothing scenario – as a means of comparison, we looked at a theoretical scenario without a replacement programme. This showed the risk of a major failure of circuit breakers would increase. This poses a risk on safety of personnel and environmental impacts, which is considered to be unacceptable as it would breach a number of our asset management objectives and service level targets.
• Planned renewal scenario – shows the circuit breaker health profile improves over the 10-year period as we continue to replace the assets as they approach the end of their reliable life. This health profile also includes asset replacement driven by network growth.
7.10.5 Replacement PlanWe have a proactive replacement programme for our circuit breakers and switchgear. Higher risk assets are replaced first. On average we expect our circuit breakers to last 50 to 55 years. We have an ageing asset fleet for certain types of switchgear and we balance replacing assets too soon with our resource availability.
We prioritise replacement using a risk-based approach.
All circuit breakers have been reviewed based on several factors such as safety, condition, performance, criticality and operation.
Safety issues are given a high weighting to ensure protection of the public, employees and service providers. Performance and asset condition are considered on an individual basis and are used to develop the replacement programme. The criticality and location, i.e., zone substation, is also considered and factored into the programme.
Older circuit breakers are normally replaced with a modern equivalent, however in some cases they are replaced with a high voltage switch if it is deemed suitable. The replacement programme is regularly reviewed to take into account the changing requirements of the network.
66kV / 33kV circuit breakers
We analyse different scenarios/options for the replacement programme to look at their impact on risk profiles. We compare the health index profiles of the 66kV and 33kV circuit breakers today with that expected upon completion of the 10-year replacement and the do nothing scenario (Figure 7.10.5).
Figure 7.10.5 66kV / 33kV circuit breaker health scenarios Poor Fair Good
Current health
Do nothing (FY31)
Planned renewals (FY31)
0% 25% 50% 75% 100%
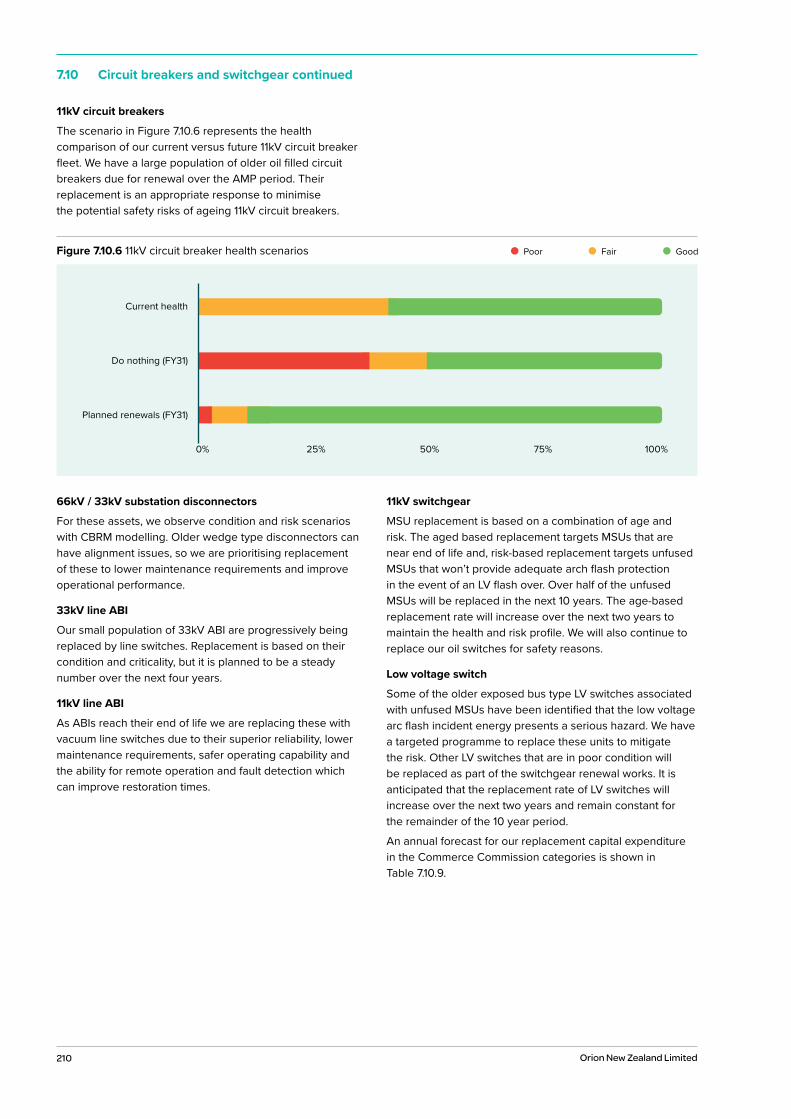
210 Orion New Zealand Limited
7.10 Circuit breakers and switchgear continued
11kV circuit breakers
The scenario in Figure 7.10.6 represents the health comparison of our current versus future 11kV circuit breaker fleet. We have a large population of older oil filled circuit breakers due for renewal over the AMP period. Their replacement is an appropriate response to minimise the potential safety risks of ageing 11kV circuit breakers.
66kV / 33kV substation disconnectors
For these assets, we observe condition and risk scenarios with CBRM modelling. Older wedge type disconnectors can have alignment issues, so we are prioritising replacement of these to lower maintenance requirements and improve operational performance.
33kV line ABI
Our small population of 33kV ABI are progressively being replaced by line switches. Replacement is based on their condition and criticality, but it is planned to be a steady number over the next four years.
11kV line ABI
As ABIs reach their end of life we are replacing these with vacuum line switches due to their superior reliability, lower maintenance requirements, safer operating capability and the ability for remote operation and fault detection which can improve restoration times.
11kV switchgear
MSU replacement is based on a combination of age and risk. The aged based replacement targets MSUs that are near end of life and, risk-based replacement targets unfused MSUs that won’t provide adequate arch flash protection in the event of an LV flash over. Over half of the unfused MSUs will be replaced in the next 10 years. The age-based replacement rate will increase over the next two years to maintain the health and risk profile. We will also continue to replace our oil switches for safety reasons.
Low voltage switch
Some of the older exposed bus type LV switches associated with unfused MSUs have been identified that the low voltage arc flash incident energy presents a serious hazard. We have a targeted programme to replace these units to mitigate the risk. Other LV switches that are in poor condition will be replaced as part of the switchgear renewal works. It is anticipated that the replacement rate of LV switches will increase over the next two years and remain constant for the remainder of the 10 year period.
An annual forecast for our replacement capital expenditure in the Commerce Commission categories is shown in Table 7.10.9.
Figure 7.10.6 11kV circuit breaker health scenarios Poor Fair Good
Current health
Do nothing (FY31)
Planned renewals (FY31)
0% 25% 50% 75% 100%
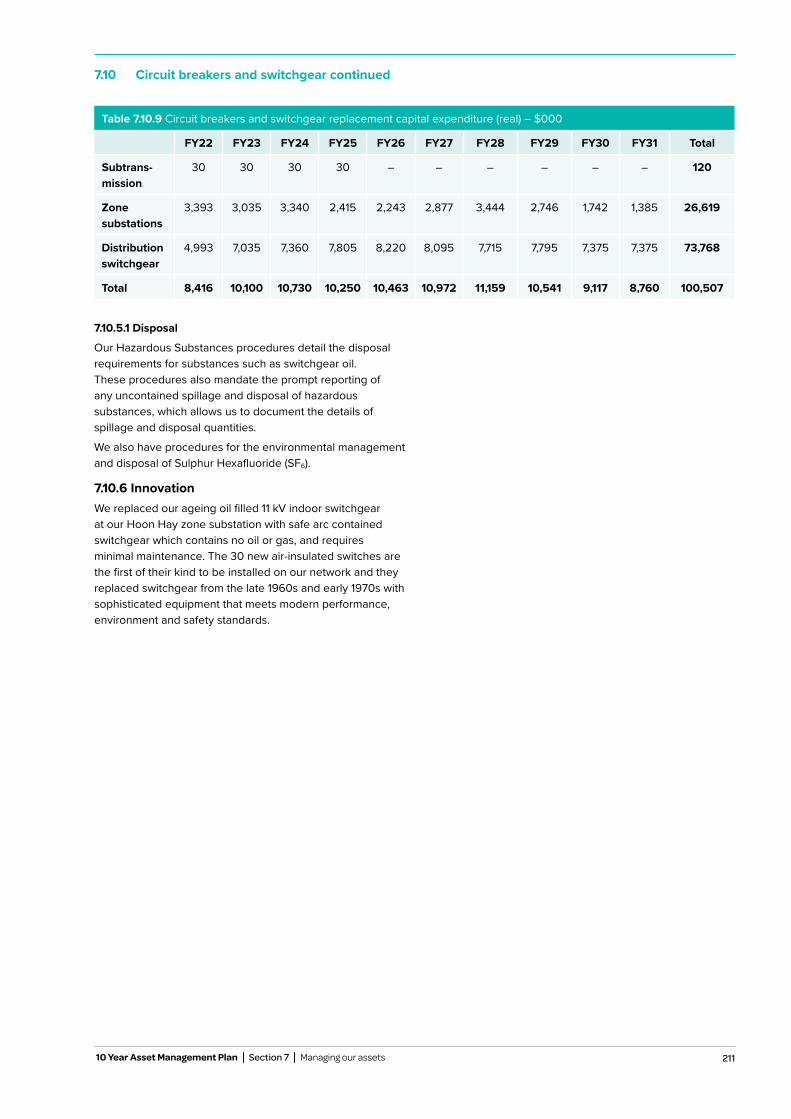
211
7.10 Circuit breakers and switchgear continued
10 Year Asset Management Plan Section 7 Managing our assets
Table 7.10.9 Circuit breakers and switchgear replacement capital expenditure (real) – $000
FY22 FY23 FY24 FY25 FY26 FY27 FY28 FY29 FY30 FY31 Total
Subtrans- mission
30 30 30 30 – – – – – – 120
Zone substations
3,393 3,035 3,340 2,415 2,243 2,877 3,444 2,746 1,742 1,385 26,619
Distribution switchgear
4,993 7,035 7,360 7,805 8,220 8,095 7,715 7,795 7,375 7,375 73,768
Total 8,416 10,100 10,730 10,250 10,463 10,972 11,159 10,541 9,117 8,760 100,507
7.10.5.1 Disposal
Our Hazardous Substances procedures detail the disposal requirements for substances such as switchgear oil. These procedures also mandate the prompt reporting of any uncontained spillage and disposal of hazardous substances, which allows us to document the details of spillage and disposal quantities.
We also have procedures for the environmental management and disposal of Sulphur Hexafluoride (SF6).
7.10.6 InnovationWe replaced our ageing oil filled 11 kV indoor switchgear at our Hoon Hay zone substation with safe arc contained switchgear which contains no oil or gas, and requires minimal maintenance. The 30 new air-insulated switches are the first of their kind to be installed on our network and they replaced switchgear from the late 1960s and early 1970s with sophisticated equipment that meets modern performance, environment and safety standards.
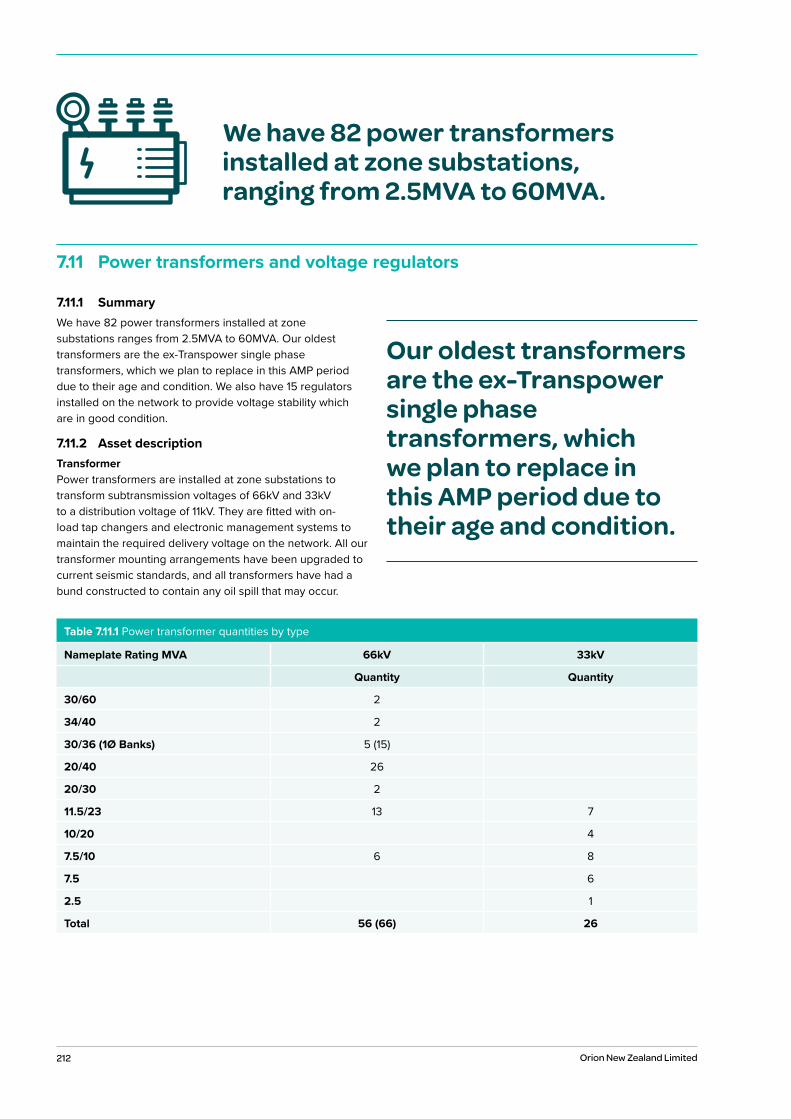
212 Orion New Zealand Limited
7.11 Power transformers and voltage regulators
7.11.1 SummaryWe have 82 power transformers installed at zone substations ranges from 2.5MVA to 60MVA. Our oldest transformers are the ex-Transpower single phase transformers, which we plan to replace in this AMP period due to their age and condition. We also have 15 regulators installed on the network to provide voltage stability which are in good condition.
7.11.2 Asset descriptionTransformerPower transformers are installed at zone substations to transform subtransmission voltages of 66kV and 33kV to a distribution voltage of 11kV. They are fitted with on-load tap changers and electronic management systems to maintain the required delivery voltage on the network. All our transformer mounting arrangements have been upgraded to current seismic standards, and all transformers have had a bund constructed to contain any oil spill that may occur.
We have 82 power transformers installed at zone substations, ranging from 2.5MVA to 60MVA.
Our oldest transformers are the ex-Transpower single phase transformers, which we plan to replace in this AMP period due to their age and condition.
Table 7.11.1 Power transformer quantities by type
Nameplate Rating MVA 66kV 33kV
Quantity Quantity
30/60 2
34/40 2
30/36 (1Ø Banks) 5 (15)
20/40 26
20/30 2
11.5/23 13 7
10/20 4
7.5/10 6 8
7.5 6
2.5 1
Total 56 (66) 26
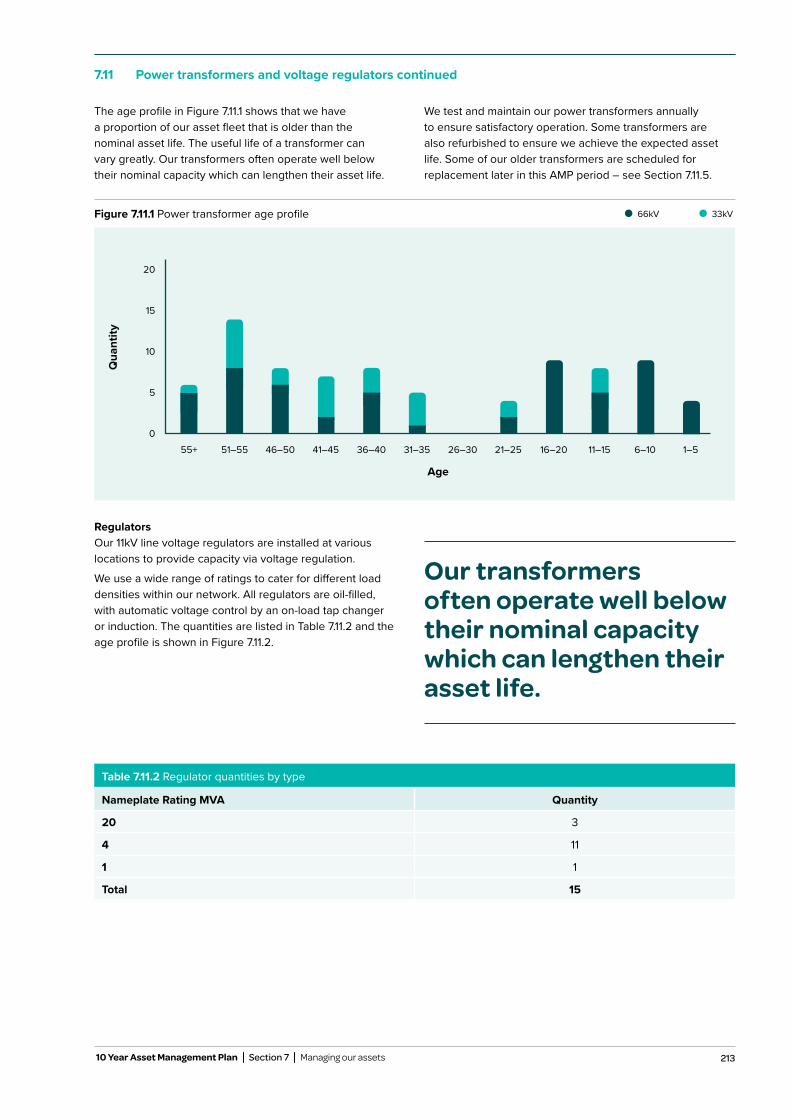
213
7.11 Power transformers and voltage regulators continued
10 Year Asset Management Plan Section 7 Managing our assets
Table 7.11.2 Regulator quantities by type
Nameplate Rating MVA Quantity
20 3
4 11
1 1
Total 15
The age profile in Figure 7.11.1 shows that we have a proportion of our asset fleet that is older than the nominal asset life. The useful life of a transformer can vary greatly. Our transformers often operate well below their nominal capacity which can lengthen their asset life.
We test and maintain our power transformers annually to ensure satisfactory operation. Some transformers are also refurbished to ensure we achieve the expected asset life. Some of our older transformers are scheduled for replacement later in this AMP period – see Section 7.11.5.
RegulatorsOur 11kV line voltage regulators are installed at various locations to provide capacity via voltage regulation.
We use a wide range of ratings to cater for different load densities within our network. All regulators are oil-filled, with automatic voltage control by an on-load tap changer or induction. The quantities are listed in Table 7.11.2 and the age profile is shown in Figure 7.11.2.
Figure 7.11.1 Power transformer age profile 66kV 33kV
20
15
10
5
0
Qua
ntity
55+ 51–55 46–50 41–45 36–40 31–35 26–30 21–25 16–20 11–15 6–10 1–5
Age
Our transformers often operate well below their nominal capacity which can lengthen their asset life.

214 Orion New Zealand Limited
7.11 Power transformers and voltage regulators continued
7.11.3 Asset health7.11.3.1 Condition
Power transformerThe condition profile in Figure 7.11.3 shows that most of our transformers are in good condition. This is in part due to a number of refurbishments we have completed on many of our older power transformers. There are a small number in poor condition. These are single phase bank transformers at Addington substation. Our strategy to address these transformers is discussed further in this section.
Figure 7.11.2 11kV regulator age profile
55+ 51–55 46–50 41–45 36–40 31–35 26–30 21–25 16–20 11–15 6–10 1–5
Age
6
5
4
3
2
1
0
Qua
ntity
Figure 7.11.3 Power transformer condition profile Poor Fair Good
15
10
5
0
Qua
ntity
55+ 51–55 46–50 41–45 36–40 31–35 26–30 21–25 16–20 11–15 6–10 1–5
Age
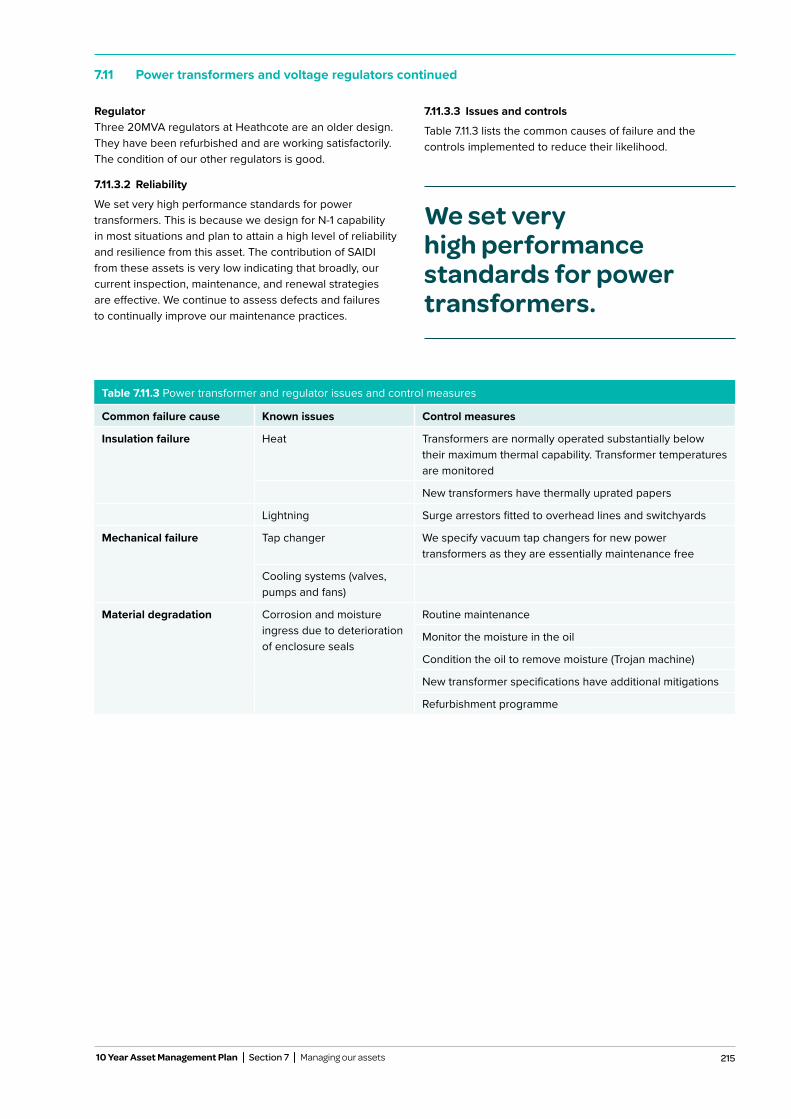
215
7.11 Power transformers and voltage regulators continued
10 Year Asset Management Plan Section 7 Managing our assets
RegulatorThree 20MVA regulators at Heathcote are an older design. They have been refurbished and are working satisfactorily. The condition of our other regulators is good.
7.11.3.2 Reliability
We set very high performance standards for power transformers. This is because we design for N-1 capability in most situations and plan to attain a high level of reliability and resilience from this asset. The contribution of SAIDI from these assets is very low indicating that broadly, our current inspection, maintenance, and renewal strategies are effective. We continue to assess defects and failures to continually improve our maintenance practices.
7.11.3.3 Issues and controls
Table 7.11.3 lists the common causes of failure and the controls implemented to reduce their likelihood.
We set very high performance standards for power transformers.
Table 7.11.3 Power transformer and regulator issues and control measures
Common failure cause Known issues Control measures
Insulation failure Heat Transformers are normally operated substantially below their maximum thermal capability. Transformer temperatures are monitored
New transformers have thermally uprated papers
Lightning Surge arrestors fitted to overhead lines and switchyards
Mechanical failure Tap changer We specify vacuum tap changers for new power transformers as they are essentially maintenance free
Cooling systems (valves, pumps and fans)
Material degradation Corrosion and moisture ingress due to deterioration of enclosure seals
Routine maintenance
Monitor the moisture in the oil
Condition the oil to remove moisture (Trojan machine)
New transformer specifications have additional mitigations
Refurbishment programme
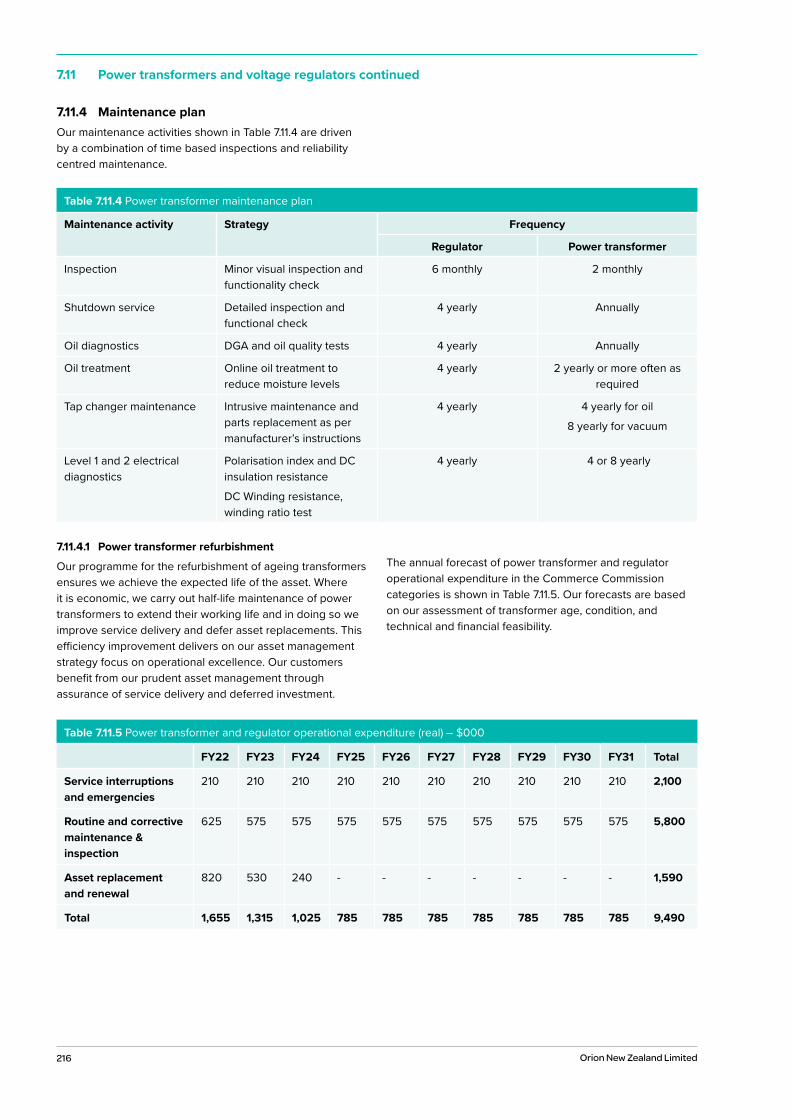
216 Orion New Zealand Limited
7.11 Power transformers and voltage regulators continued
7.11.4 Maintenance planOur maintenance activities shown in Table 7.11.4 are driven by a combination of time based inspections and reliability centred maintenance.
7.11.4.1 Power transformer refurbishment
Our programme for the refurbishment of ageing transformers ensures we achieve the expected life of the asset. Where it is economic, we carry out half-life maintenance of power transformers to extend their working life and in doing so we improve service delivery and defer asset replacements. This efficiency improvement delivers on our asset management strategy focus on operational excellence. Our customers benefit from our prudent asset management through assurance of service delivery and deferred investment.
The annual forecast of power transformer and regulator operational expenditure in the Commerce Commission categories is shown in Table 7.11.5. Our forecasts are based on our assessment of transformer age, condition, and technical and financial feasibility.
Table 7.11.4 Power transformer maintenance plan
Maintenance activity Strategy Frequency
Regulator Power transformer
Inspection Minor visual inspection and functionality check
6 monthly 2 monthly
Shutdown service Detailed inspection and functional check
4 yearly Annually
Oil diagnostics DGA and oil quality tests 4 yearly Annually
Oil treatment Online oil treatment to reduce moisture levels
4 yearly 2 yearly or more often as required
Tap changer maintenance Intrusive maintenance and parts replacement as per manufacturer’s instructions
4 yearly 4 yearly for oil
8 yearly for vacuum
Level 1 and 2 electrical diagnostics
Polarisation index and DC insulation resistance
DC Winding resistance, winding ratio test
4 yearly 4 or 8 yearly
Table 7.11.5 Power transformer and regulator operational expenditure (real) – $000
FY22 FY23 FY24 FY25 FY26 FY27 FY28 FY29 FY30 FY31 Total
Service interruptions and emergencies
210 210 210 210 210 210 210 210 210 210 2,100
Routine and corrective maintenance & inspection
625 575 575 575 575 575 575 575 575 575 5,800
Asset replacement and renewal
820 530 240 - - - - - - - 1,590
Total 1,655 1,315 1,025 785 785 785 785 785 785 785 9,490

217
7.11 Power transformers and voltage regulators continued
10 Year Asset Management Plan Section 7 Managing our assets
Table 7.11.6 Power transformer replacement plan
Zone substation Details Financial year planned
Spare A new spare 33kV will be purchased which is intended for replacement of Shands Zone Sub T1 in FY27. By procuring this earlier we will have a contingency spare in case we find any problems during our refurbishment programme for our 33kV transformer fleet
FY23
Addington Replace T6 and T7 transformer banks with one transformer. This transformer replacement timing is dependent on a wider network and site strategy to rationalise assets at the substation
FY28
Table 7.11.7 Power transformer and regulator replacement capital expenditure (real) – $000
FY22 FY23 FY24 FY25 FY26 FY27 FY28 FY29 FY30 FY31 Total
Zone substation 600 1,270 300 - - - 2,600 - - - 4,770
Total 600 1,270 300 - - - 2,600 - - - 4,770
7.11.5 Replacement planOur current replacement programme targets end of life zone substation power transformers. The programme as shown in Table 7.11.6 prevents failure rates and risk from materially increasing above current levels.
Figure 7.11.4 shows the current condition and 10-year condition projection for the two scenarios. ‘Do nothing’ is a hypothetical scenario where no transformers are proactively replaced or refurbished. This unrealistic scenario is provided as a benchmark to assist in visualising the benefits of the
proposed programmes. The ‘planned renewals’ is a targeted intervention that takes into account the asset’s condition and the timing of other related works to produce efficient and economic outcomes.
Figure 7.11.4 shows that the planned renewal scenario improves the overall condition scores of our transformer fleet. This is due to our ongoing refurbishment programme and replacement of our end of life single phase transformers. Comparing with the ‘do-nothing’ scenario shows that the
proposed programme mitigates a substantial deterioration in asset condition. An annual summary of power transformer and regulator capital expenditure in the Commerce Commission categories is shown in Table 7.11.7.
Current health
Do nothing (FY31)
Planned renewals (FY31)
0% 25% 50% 75% 100%
Figure 7.11.4 Power transformer health scenarios Poor Fair Good

218 Orion New Zealand Limited
7.12 Distribution transformers
7.12.1 SummaryWe have more than 11,000 distribution transformers installed on our network to transform the voltage from 11kV to 400V for customer connections. They range in capacity from 5kVA to 1,500kVA. The performance of our distribution transformer fleet is good. We continue to maintain and replace our distribution transformers in accordance with our standard asset management practices.
7.12.2 Asset descriptionDistribution transformers fall into two main categories: pole mounted or ground mounted. Pole mounted transformers range in rating from 15kVA – 300kVA. With new installations we limit pole-mount transformers to no bigger than 200kVA for safety reasons. Ground mounted transformers range in rating from 5kVA to 1,500kVA. These are installed either outdoors or inside a building/kiosk. Table 7.12.1 shows the transformer quantities categorized by rating, and an age profile can be found in Figure 7.12.1.
We have more than 11,000 distribution transformers installed on our network to transform the voltage from 11kV to 400V for customer connections.
Table 7.12.1 Distribution transformer quantities by type
Rating kVA Ground mount Pole mount
Quantity Quantity
5-100 398 6,081
150-500 4,289 363
600-1000 590
1250-1500 31
Total 5,308 6,444
1500
1000
500
0
Qua
ntity
55+ 51–55 46–50 41–45 36–40 31–35 26–30 21–25 16–20 11–15 6–10 1–5
Age
Figure 7.12.1 Distribution transformer age profile Pole mountedGround mounted
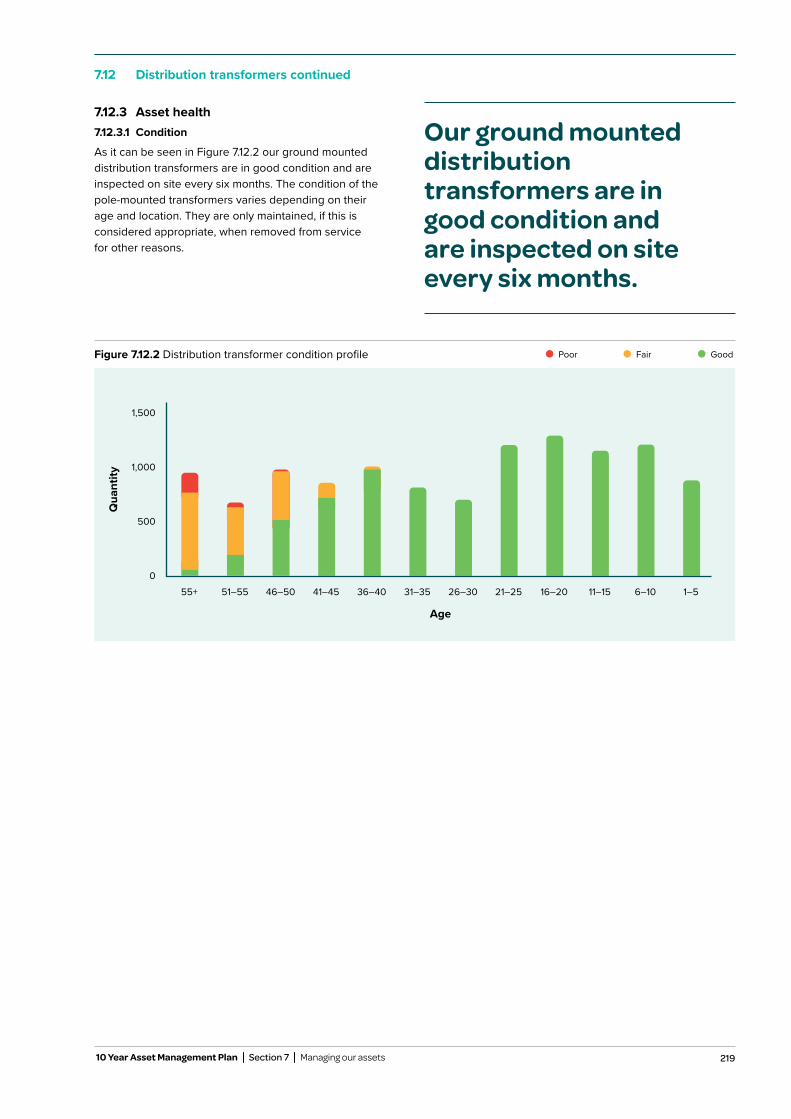
219
7.12 Distribution transformers continued
10 Year Asset Management Plan Section 7 Managing our assets
7.12.3 Asset health7.12.3.1 Condition
As it can be seen in Figure 7.12.2 our ground mounted distribution transformers are in good condition and are inspected on site every six months. The condition of the pole-mounted transformers varies depending on their age and location. They are only maintained, if this is considered appropriate, when removed from service for other reasons.
Our ground mounted distribution transformers are in good condition and are inspected on site every six months.
Figure 7.12.2 Distribution transformer condition profile Poor Fair Good
1,500
1,000
500
0
Qua
ntity
55+ 51–55 46–50 41–45 36–40 31–35 26–30 21–25 16–20 11–15 6–10 1–5
Age
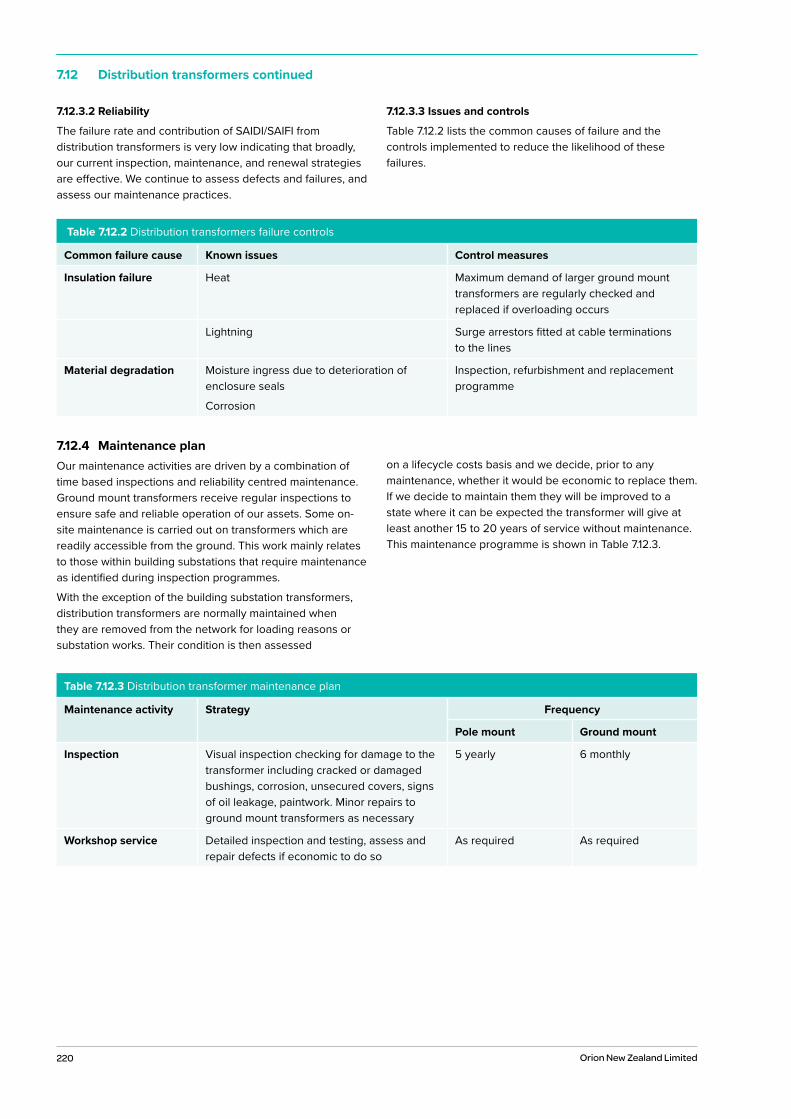
220 Orion New Zealand Limited
7.12 Distribution transformers continued
7.12.3.2 Reliability
The failure rate and contribution of SAIDI/SAIFI from distribution transformers is very low indicating that broadly, our current inspection, maintenance, and renewal strategies are effective. We continue to assess defects and failures, and assess our maintenance practices.
7.12.3.3 Issues and controls
Table 7.12.2 lists the common causes of failure and the controls implemented to reduce the likelihood of these failures.
7.12.4 Maintenance planOur maintenance activities are driven by a combination of time based inspections and reliability centred maintenance. Ground mount transformers receive regular inspections to ensure safe and reliable operation of our assets. Some on-site maintenance is carried out on transformers which are readily accessible from the ground. This work mainly relates to those within building substations that require maintenance as identified during inspection programmes.
With the exception of the building substation transformers, distribution transformers are normally maintained when they are removed from the network for loading reasons or substation works. Their condition is then assessed
on a lifecycle costs basis and we decide, prior to any maintenance, whether it would be economic to replace them. If we decide to maintain them they will be improved to a state where it can be expected the transformer will give at least another 15 to 20 years of service without maintenance. This maintenance programme is shown in Table 7.12.3.
Table 7.12.2 Distribution transformers failure controls
Common failure cause Known issues Control measures
Insulation failure Heat Maximum demand of larger ground mount transformers are regularly checked and replaced if overloading occurs
Lightning Surge arrestors fitted at cable terminations to the lines
Material degradation Moisture ingress due to deterioration of enclosure seals
Corrosion
Inspection, refurbishment and replacement programme
Table 7.12.3 Distribution transformer maintenance plan
Maintenance activity Strategy Frequency
Pole mount Ground mount
Inspection Visual inspection checking for damage to the transformer including cracked or damaged bushings, corrosion, unsecured covers, signs of oil leakage, paintwork. Minor repairs to ground mount transformers as necessary
5 yearly 6 monthly
Workshop service Detailed inspection and testing, assess and repair defects if economic to do so
As required As required
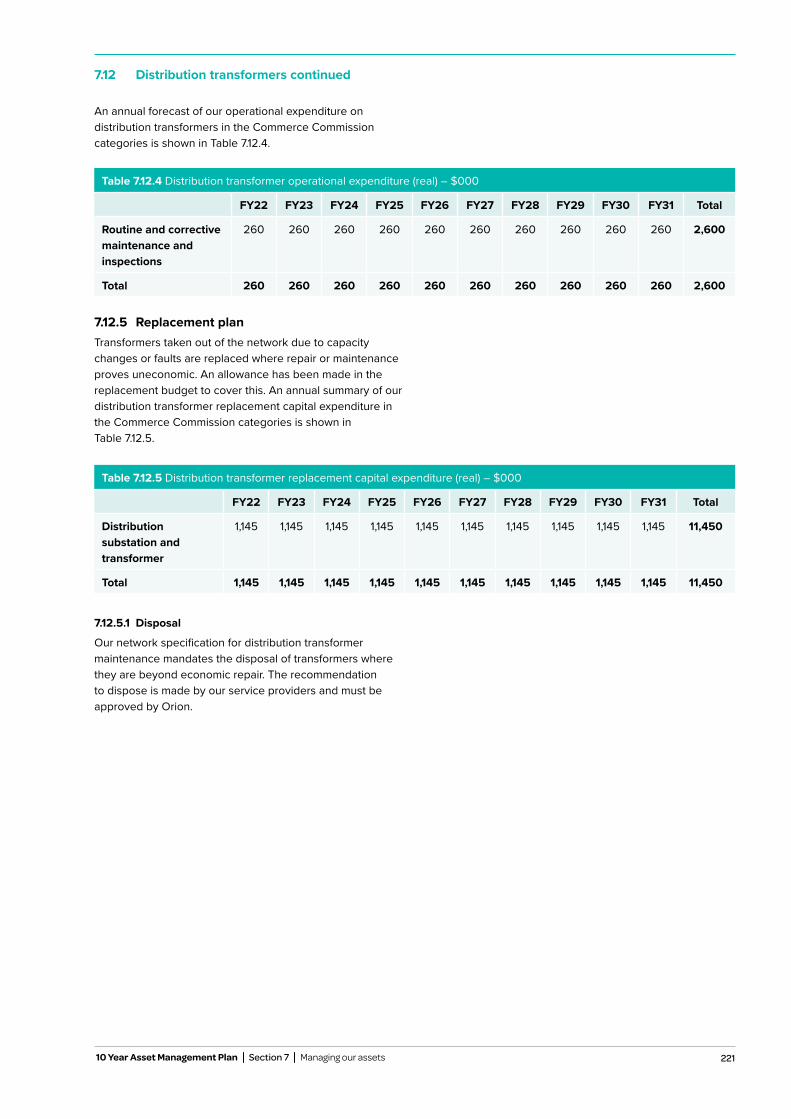
221
7.12 Distribution transformers continued
10 Year Asset Management Plan Section 7 Managing our assets
An annual forecast of our operational expenditure on distribution transformers in the Commerce Commission categories is shown in Table 7.12.4.
Table 7.12.4 Distribution transformer operational expenditure (real) – $000
FY22 FY23 FY24 FY25 FY26 FY27 FY28 FY29 FY30 FY31 Total
Routine and corrective maintenance and inspections
260 260 260 260 260 260 260 260 260 260 2,600
Total 260 260 260 260 260 260 260 260 260 260 2,600
Table 7.12.5 Distribution transformer replacement capital expenditure (real) – $000
FY22 FY23 FY24 FY25 FY26 FY27 FY28 FY29 FY30 FY31 Total
Distribution substation and transformer
1,145 1,145 1,145 1,145 1,145 1,145 1,145 1,145 1,145 1,145 11,450
Total 1,145 1,145 1,145 1,145 1,145 1,145 1,145 1,145 1,145 1,145 11,450
7.12.5 Replacement planTransformers taken out of the network due to capacity changes or faults are replaced where repair or maintenance proves uneconomic. An allowance has been made in the replacement budget to cover this. An annual summary of our distribution transformer replacement capital expenditure in the Commerce Commission categories is shown in Table 7.12.5.
7.12.5.1 Disposal
Our network specification for distribution transformer maintenance mandates the disposal of transformers where they are beyond economic repair. The recommendation to dispose is made by our service providers and must be approved by Orion.
222 Orion New Zealand Limited
7.13 Protection systems
7.13.1 SummaryOur protection system consists predominately of digital Intelligent Electronic Devices (IED), a moderate quantity of electromechanical relays and a small number of analogue electronic devices. Overall our protection system equipment is performing well and meeting our service target levels. The main issues are due to asset ageing or obsolescence in equipment support, parts and function.
The reliability of the protection system is inherent in fulfilling our objectives of maintaining personnel safety and system reliability.
Protection system upgrades/replacement is most cost effective if linked to the associated switchgear replacement. For this reason our protection system replacement programme is influenced by the volume and schedule of our switchgear replacement.
7.13.2 Asset descriptionProtection systems are installed to provide automatic control to elements of our network and to protect it during power system faults. These systems protect all levels of the network including the low voltage system where fuses are used.
The digital electronic equipment that provides protection, control and metering functions is integrated into a single device. The functions performed by these micro-processor based devices are so wide they have been labelled IEDs.
The introduction of IEDs has allowed us to reduce costs by improving productivity and increasing system reliability and efficiency. The introduction of remote indication and control reduces labour requirements, engineering design, installation and commissioning. Operation of the system is based on existing skill sets and does not require any significant changes in the organisation.
Protection systems are installed to provide automatic control to elements of our network and to protect it during power system faults.
Table 7.13.1 Relay types
Relay type Quantity
Electro-mechanical 1,074
Micro-processor based (IED) 1,643
Total 2,717
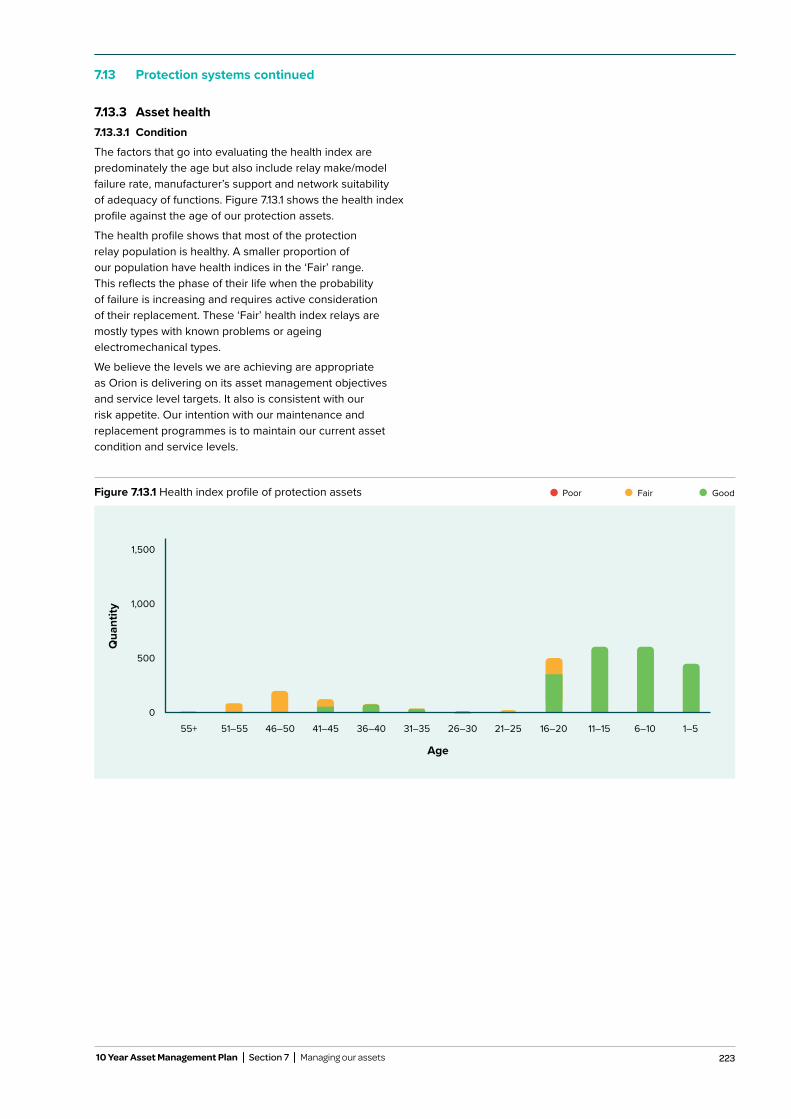
223
7.13 Protection systems continued
10 Year Asset Management Plan Section 7 Managing our assets
7.13.3 Asset health7.13.3.1 Condition
The factors that go into evaluating the health index are predominately the age but also include relay make/model failure rate, manufacturer’s support and network suitability of adequacy of functions. Figure 7.13.1 shows the health index profile against the age of our protection assets.
The health profile shows that most of the protection relay population is healthy. A smaller proportion of our population have health indices in the ‘Fair’ range. This reflects the phase of their life when the probability of failure is increasing and requires active consideration of their replacement. These ‘Fair’ health index relays are mostly types with known problems or ageing electromechanical types.
We believe the levels we are achieving are appropriate as Orion is delivering on its asset management objectives and service level targets. It also is consistent with our risk appetite. Our intention with our maintenance and replacement programmes is to maintain our current asset condition and service levels.
1,500
1,000
500
0
Qua
ntity
55+ 51–55 46–50 41–45 36–40 31–35 26–30 21–25 16–20 11–15 6–10 1–5
Age
Figure 7.13.1 Health index profile of protection assets Fair GoodPoor
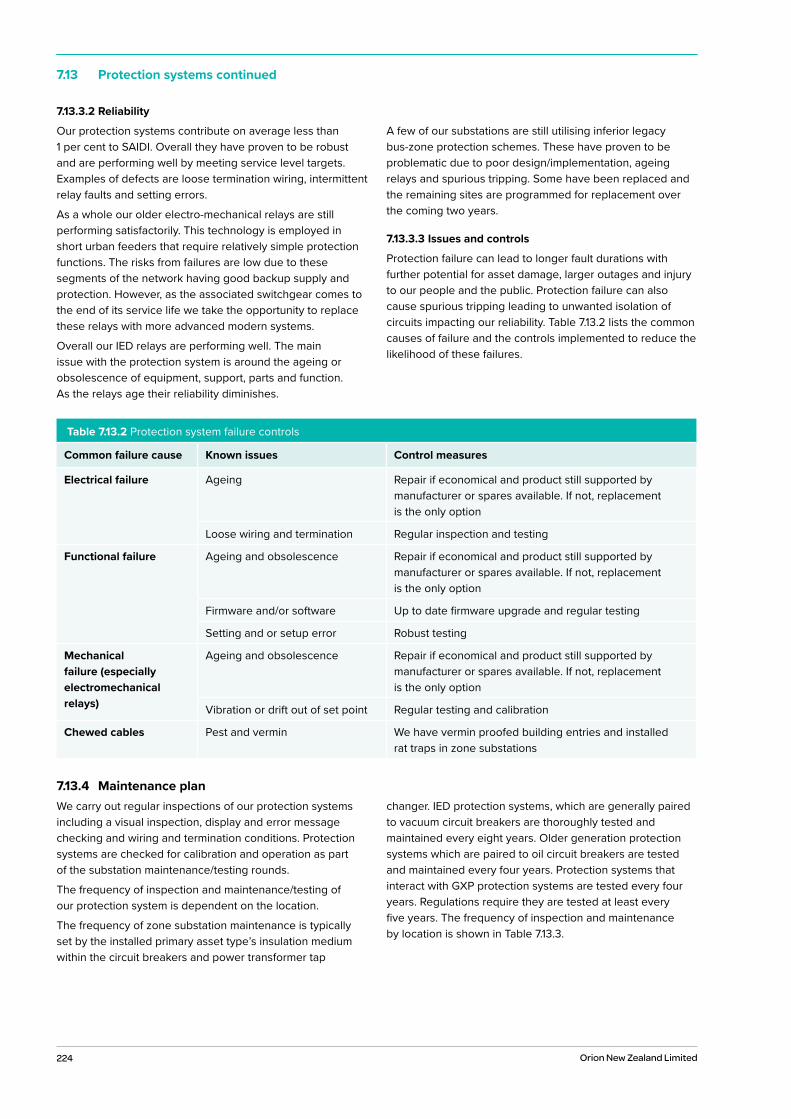
224 Orion New Zealand Limited
7.13 Protection systems continued
7.13.3.2 Reliability
Our protection systems contribute on average less than 1 per cent to SAIDI. Overall they have proven to be robust and are performing well by meeting service level targets. Examples of defects are loose termination wiring, intermittent relay faults and setting errors.
As a whole our older electro-mechanical relays are still performing satisfactorily. This technology is employed in short urban feeders that require relatively simple protection functions. The risks from failures are low due to these segments of the network having good backup supply and protection. However, as the associated switchgear comes to the end of its service life we take the opportunity to replace these relays with more advanced modern systems.
Overall our IED relays are performing well. The main issue with the protection system is around the ageing or obsolescence of equipment, support, parts and function. As the relays age their reliability diminishes.
A few of our substations are still utilising inferior legacy bus-zone protection schemes. These have proven to be problematic due to poor design/implementation, ageing relays and spurious tripping. Some have been replaced and the remaining sites are programmed for replacement over the coming two years.
7.13.3.3 Issues and controls
Protection failure can lead to longer fault durations with further potential for asset damage, larger outages and injury to our people and the public. Protection failure can also cause spurious tripping leading to unwanted isolation of circuits impacting our reliability. Table 7.13.2 lists the common causes of failure and the controls implemented to reduce the likelihood of these failures.
Table 7.13.2 Protection system failure controls
Common failure cause Known issues Control measures
Electrical failure Ageing Repair if economical and product still supported by manufacturer or spares available. If not, replacement is the only option
Loose wiring and termination Regular inspection and testing
Functional failure Ageing and obsolescence Repair if economical and product still supported by manufacturer or spares available. If not, replacement is the only option
Firmware and/or software Up to date firmware upgrade and regular testing
Setting and or setup error Robust testing
Mechanical failure (especially electromechanical relays)
Ageing and obsolescence Repair if economical and product still supported by manufacturer or spares available. If not, replacement is the only option
Vibration or drift out of set point Regular testing and calibration
Chewed cables Pest and vermin We have vermin proofed building entries and installed rat traps in zone substations
7.13.4 Maintenance planWe carry out regular inspections of our protection systems including a visual inspection, display and error message checking and wiring and termination conditions. Protection systems are checked for calibration and operation as part of the substation maintenance/testing rounds.
The frequency of inspection and maintenance/testing of our protection system is dependent on the location.
The frequency of zone substation maintenance is typically set by the installed primary asset type’s insulation medium within the circuit breakers and power transformer tap
changer. IED protection systems, which are generally paired to vacuum circuit breakers are thoroughly tested and maintained every eight years. Older generation protection systems which are paired to oil circuit breakers are tested and maintained every four years. Protection systems that interact with GXP protection systems are tested every four years. Regulations require they are tested at least every five years. The frequency of inspection and maintenance by location is shown in Table 7.13.3.
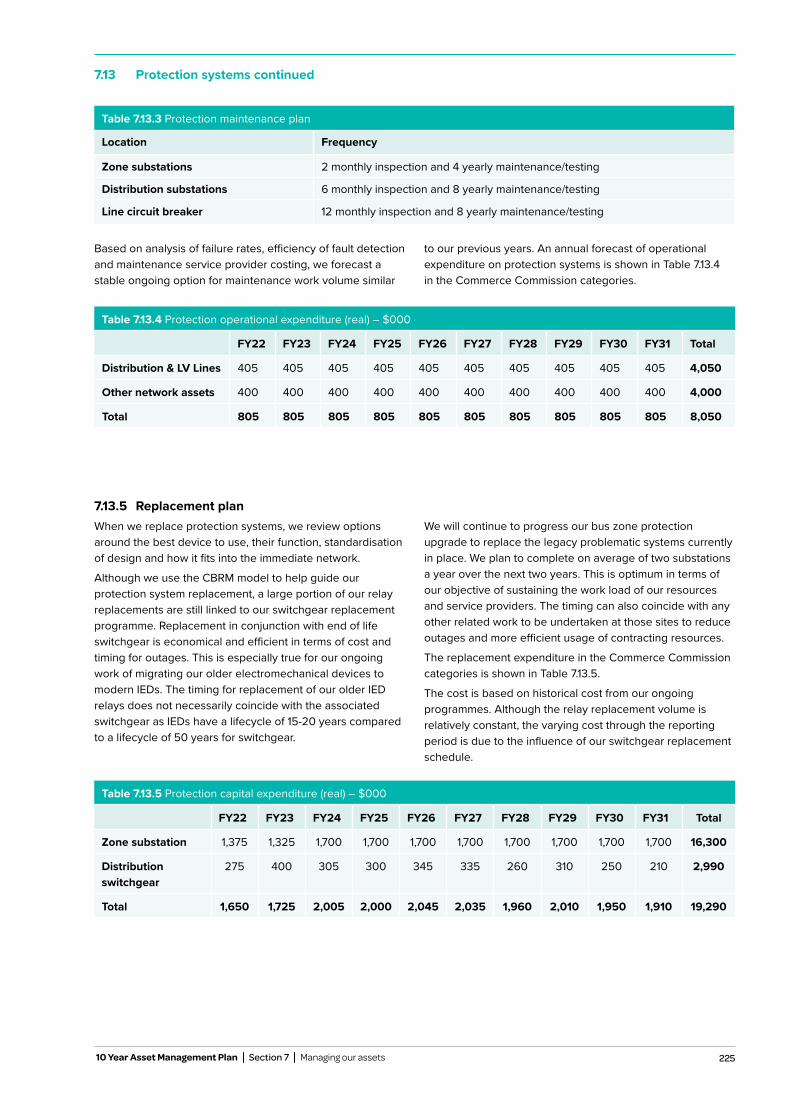
225
7.13 Protection systems continued
10 Year Asset Management Plan Section 7 Managing our assets
Table 7.13.3 Protection maintenance plan
Location Frequency
Zone substations 2 monthly inspection and 4 yearly maintenance/testing
Distribution substations 6 monthly inspection and 8 yearly maintenance/testing
Line circuit breaker 12 monthly inspection and 8 yearly maintenance/testing
Based on analysis of failure rates, efficiency of fault detection and maintenance service provider costing, we forecast a stable ongoing option for maintenance work volume similar
to our previous years. An annual forecast of operational expenditure on protection systems is shown in Table 7.13.4 in the Commerce Commission categories.
Table 7.13.4 Protection operational expenditure (real) – $000
FY22 FY23 FY24 FY25 FY26 FY27 FY28 FY29 FY30 FY31 Total
Distribution & LV Lines 405 405 405 405 405 405 405 405 405 405 4,050
Other network assets 400 400 400 400 400 400 400 400 400 400 4,000
Total 805 805 805 805 805 805 805 805 805 805 8,050
Table 7.13.5 Protection capital expenditure (real) – $000
FY22 FY23 FY24 FY25 FY26 FY27 FY28 FY29 FY30 FY31 Total
Zone substation 1,375 1,325 1,700 1,700 1,700 1,700 1,700 1,700 1,700 1,700 16,300
Distribution switchgear
275 400 305 300 345 335 260 310 250 210 2,990
Total 1,650 1,725 2,005 2,000 2,045 2,035 1,960 2,010 1,950 1,910 19,290
7.13.5 Replacement planWhen we replace protection systems, we review options around the best device to use, their function, standardisation of design and how it fits into the immediate network.
Although we use the CBRM model to help guide our protection system replacement, a large portion of our relay replacements are still linked to our switchgear replacement programme. Replacement in conjunction with end of life switchgear is economical and efficient in terms of cost and timing for outages. This is especially true for our ongoing work of migrating our older electromechanical devices to modern IEDs. The timing for replacement of our older IED relays does not necessarily coincide with the associated switchgear as IEDs have a lifecycle of 15-20 years compared to a lifecycle of 50 years for switchgear.
We will continue to progress our bus zone protection upgrade to replace the legacy problematic systems currently in place. We plan to complete on average of two substations a year over the next two years. This is optimum in terms of our objective of sustaining the work load of our resources and service providers. The timing can also coincide with any other related work to be undertaken at those sites to reduce outages and more efficient usage of contracting resources.
The replacement expenditure in the Commerce Commission categories is shown in Table 7.13.5.
The cost is based on historical cost from our ongoing programmes. Although the relay replacement volume is relatively constant, the varying cost through the reporting period is due to the influence of our switchgear replacement schedule.
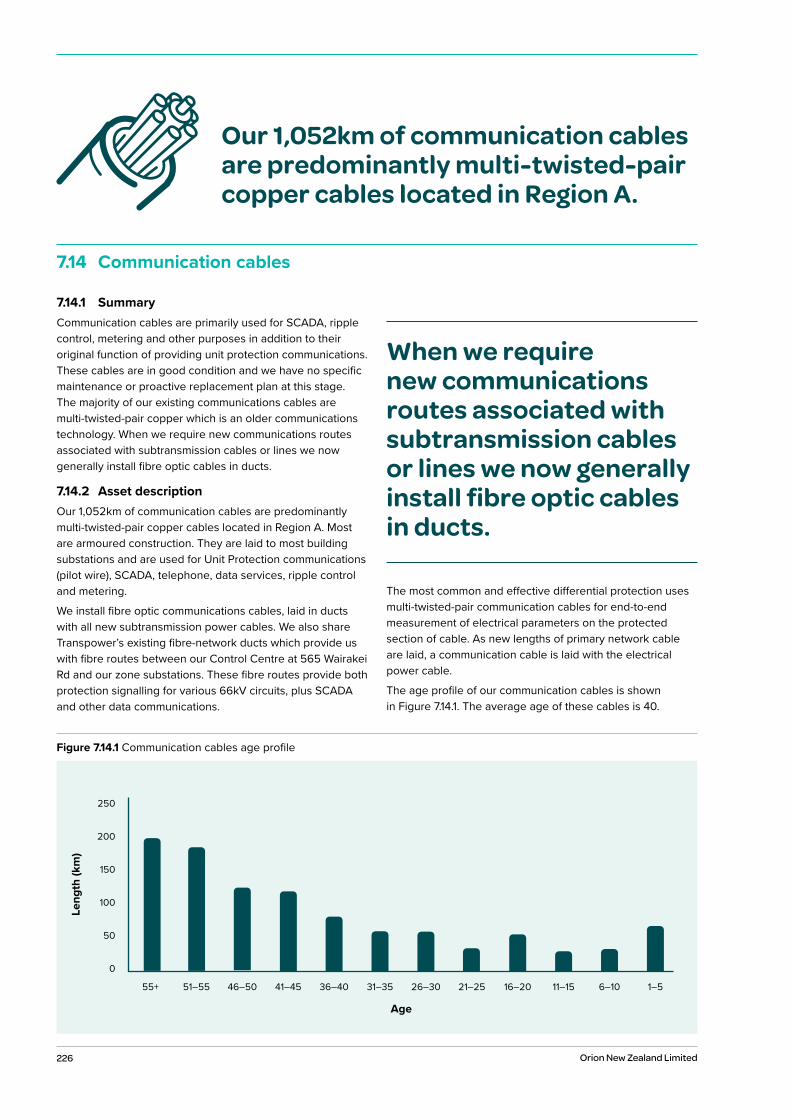
226 Orion New Zealand Limited
7.14 Communication cables
7.14.1 SummaryCommunication cables are primarily used for SCADA, ripple control, metering and other purposes in addition to their original function of providing unit protection communications. These cables are in good condition and we have no specific maintenance or proactive replacement plan at this stage. The majority of our existing communications cables are multi-twisted-pair copper which is an older communications technology. When we require new communications routes associated with subtransmission cables or lines we now generally install fibre optic cables in ducts.
7.14.2 Asset descriptionOur 1,052km of communication cables are predominantly multi-twisted-pair copper cables located in Region A. Most are armoured construction. They are laid to most building substations and are used for Unit Protection communications (pilot wire), SCADA, telephone, data services, ripple control and metering.
We install fibre optic communications cables, laid in ducts with all new subtransmission power cables. We also share Transpower’s existing fibre-network ducts which provide us with fibre routes between our Control Centre at 565 Wairakei Rd and our zone substations. These fibre routes provide both protection signalling for various 66kV circuits, plus SCADA and other data communications.
The most common and effective differential protection uses multi-twisted-pair communication cables for end-to-end measurement of electrical parameters on the protected section of cable. As new lengths of primary network cable are laid, a communication cable is laid with the electrical power cable.
The age profile of our communication cables is shown in Figure 7.14.1. The average age of these cables is 40.
Our 1,052km of communication cables are predominantly multi-twisted-pair copper cables located in Region A.
When we require new communications routes associated with subtransmission cables or lines we now generally install fibre optic cables in ducts.
Figure 7.14.1 Communication cables age profile
Leng
th (k
m)
55+ 51–55 46–50 41–45 36–40 31–35 26–30 21–25 16–20 11–15 6–10 1–5
Age
250
200
150
100
50
0
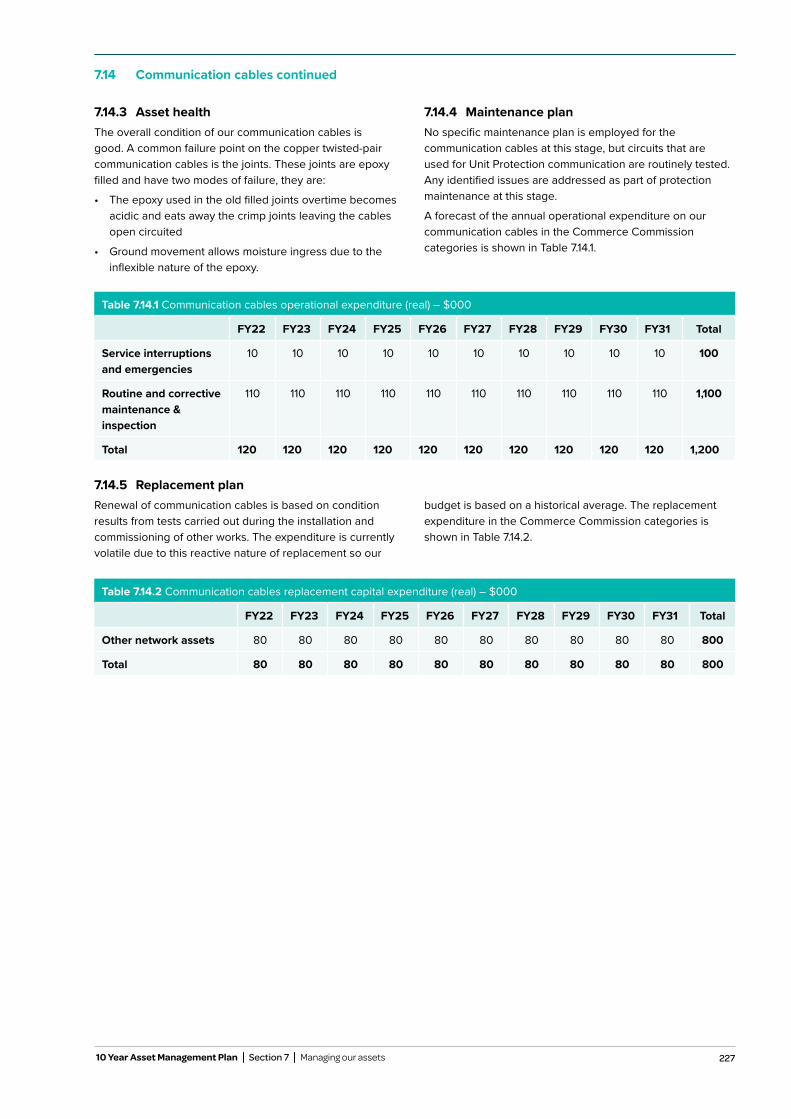
227 10 Year Asset Management Plan Section 7 Managing our assets
7.14 Communication cables continued
7.14.3 Asset healthThe overall condition of our communication cables is good. A common failure point on the copper twisted-pair communication cables is the joints. These joints are epoxy filled and have two modes of failure, they are:
• The epoxy used in the old filled joints overtime becomes acidic and eats away the crimp joints leaving the cables open circuited
• Ground movement allows moisture ingress due to the inflexible nature of the epoxy.
7.14.4 Maintenance planNo specific maintenance plan is employed for the communication cables at this stage, but circuits that are used for Unit Protection communication are routinely tested. Any identified issues are addressed as part of protection maintenance at this stage.
A forecast of the annual operational expenditure on our communication cables in the Commerce Commission categories is shown in Table 7.14.1.
7.14.5 Replacement planRenewal of communication cables is based on condition results from tests carried out during the installation and commissioning of other works. The expenditure is currently volatile due to this reactive nature of replacement so our
budget is based on a historical average. The replacement expenditure in the Commerce Commission categories is shown in Table 7.14.2.
Table 7.14.1 Communication cables operational expenditure (real) – $000
FY22 FY23 FY24 FY25 FY26 FY27 FY28 FY29 FY30 FY31 Total
Service interruptions and emergencies
10 10 10 10 10 10 10 10 10 10 100
Routine and corrective maintenance & inspection
110 110 110 110 110 110 110 110 110 110 1,100
Total 120 120 120 120 120 120 120 120 120 120 1,200
Table 7.14.2 Communication cables replacement capital expenditure (real) – $000
FY22 FY23 FY24 FY25 FY26 FY27 FY28 FY29 FY30 FY31 Total
Other network assets 80 80 80 80 80 80 80 80 80 80 800
Total 80 80 80 80 80 80 80 80 80 80 800
228 Orion New Zealand Limited
7.15 Communication systems
7.15.1 SummaryOur communication network is made up of voice and data systems which provide an essential ancillary service assisting with the operation of our distribution network, and communication with our customers. These systems provide contact between our Control Room and operating staff and service providers in the field, and remote indication and control of network equipment. Our communication systems enable us to operate our network and deploy our people efficiently, and help us to reduce the impact of faults on customers.
These systems are in good condition and performing well. Additional control of the high voltage network and monitoring of the low voltage network is taking place. We are planning to upgrade our analog radios to digital. This will provide us with significantly increased signal strength on remote areas of the network.
7.15.2 Asset description7.15.2.1 Voice communication system
Our voice communication system is made up of three different sub-systems:
• VHF analogue radio – installed in vehicles and hand held portable units. These operate via Linked VHF hilltop radio repeaters.
• Private telephone switch – a telephone network split between the transportable data centres, connecting to the main telco network from both locations.
• Public cellular networks – not owned by Orion, we use these public networks for mobile voice and data communications.
Our communication systems enable us to operate our network and deploy our people efficiently, and help us to reduce the impact of faults on customers.
We are planning to upgrade our analog radios to digital. This will provide us with significantly increased signal strength on remote areas of the network.
229 10 Year Asset Management Plan Section 7 Managing our assets
7.15 Communication systems continued
Table 7.15.2 Communication component quantities by type
Asset Quantity
Cable modems 160
Voice radios 650 (includes service providers’)
Cellular modems/HH PDA’s 276
IP data radios 292
Radio antennae 550
Antenna cable 35
Communication masts 55
Routers/switches 2
Telephone switch 2
Table 7.15.1 Data communication systems description
Asset Nominal asset life
SCADA analogue communication copper cable network
Used for serial communication to a small number of urban substations. Installed in dedicated pairs with one modem at the remote site connected to a remote terminal unit (RTU) and its pair at a zone substation connected to the Internet Protocol (IP) network via terminal servers. This system is due for replacement due to obsolescence.
SHDSL IP system Used for point-to-point IP links between substations utilising copper communications where available. Various urban links are arranged in four rings to provide full communication redundancy to each substation. This system is fully protected against Earth Potential Rise (EPR) voltages.
UHF IP and protection radio system Utilise high spectral efficiency radios operating in licensed UHF bands. These radios are used for point-to-point and point- to-multipoint where they utilise base stations located at hilltop sites.
Fibre communications system Provide IP and protection signalling. Fibre is typically laid with all new sub-transmission cables and provides high speed communications paths between our SCADA, engineering network IP and corporate office.
Public cellular network Operated with in a private access point name (APN) gateway provided by commercial providers. A number of our 11kV regulators, diesel generators and various power quality monitors are connected to this system. This network also supports all our mobile devices and data connectivity to our vehicles.
7.15.2.2 Data communication system
Our data communication system is made up of five different network or sub-systems providing data communications to network field assets, protection for main power feeds and general data communications to business mobile devices. These systems along with a description of each can be found in Table 7.15.1.
Table 7.15.2 shows the quantities of these assets by type.
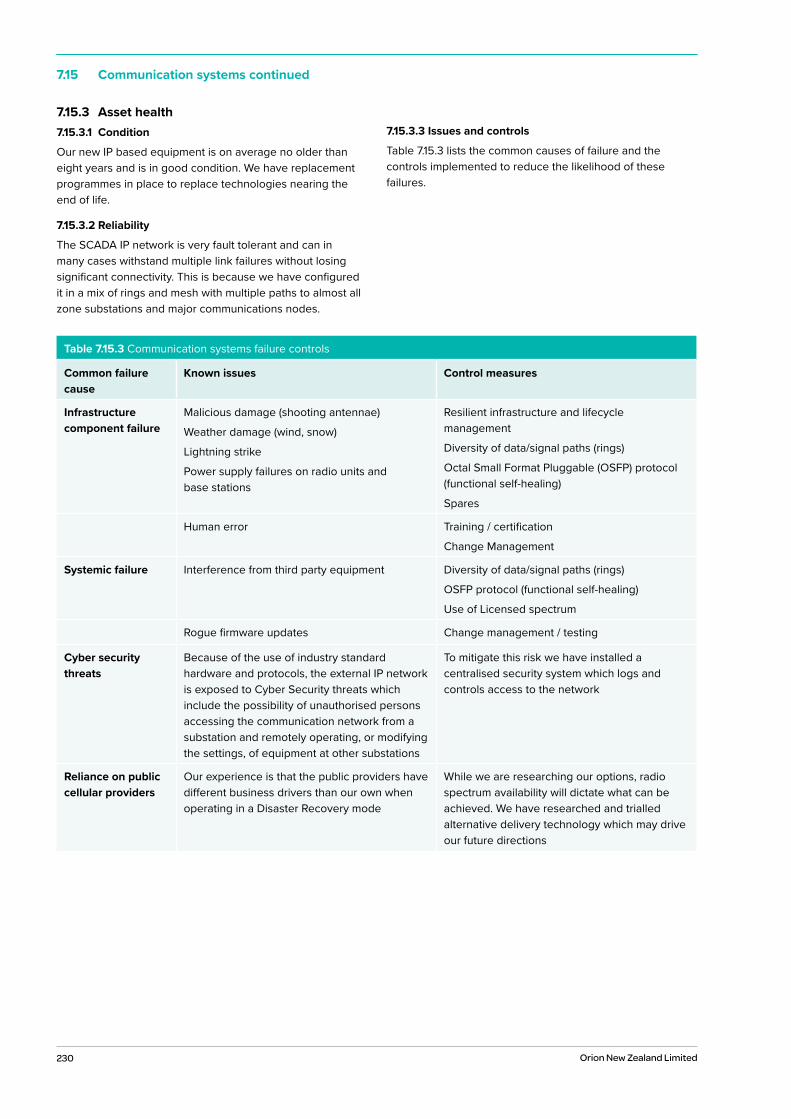
230 Orion New Zealand Limited
7.15 Communication systems continued
Table 7.15.3 Communication systems failure controls
Common failure cause
Known issues Control measures
Infrastructure component failure
Malicious damage (shooting antennae)
Weather damage (wind, snow)
Lightning strike
Power supply failures on radio units and base stations
Resilient infrastructure and lifecycle management
Diversity of data/signal paths (rings)
Octal Small Format Pluggable (OSFP) protocol (functional self-healing)
Spares
Human error Training / certification
Change Management
Systemic failure Interference from third party equipment Diversity of data/signal paths (rings)
OSFP protocol (functional self-healing)
Use of Licensed spectrum
Rogue firmware updates Change management / testing
Cyber security threats
Because of the use of industry standard hardware and protocols, the external IP network is exposed to Cyber Security threats which include the possibility of unauthorised persons accessing the communication network from a substation and remotely operating, or modifying the settings, of equipment at other substations
To mitigate this risk we have installed a centralised security system which logs and controls access to the network
Reliance on public cellular providers
Our experience is that the public providers have different business drivers than our own when operating in a Disaster Recovery mode
While we are researching our options, radio spectrum availability will dictate what can be achieved. We have researched and trialled alternative delivery technology which may drive our future directions
7.15.3 Asset health7.15.3.1 Condition
Our new IP based equipment is on average no older than eight years and is in good condition. We have replacement programmes in place to replace technologies nearing the end of life.
7.15.3.2 Reliability
The SCADA IP network is very fault tolerant and can in many cases withstand multiple link failures without losing significant connectivity. This is because we have configured it in a mix of rings and mesh with multiple paths to almost all zone substations and major communications nodes.
7.15.3.3 Issues and controls
Table 7.15.3 lists the common causes of failure and the controls implemented to reduce the likelihood of these failures.
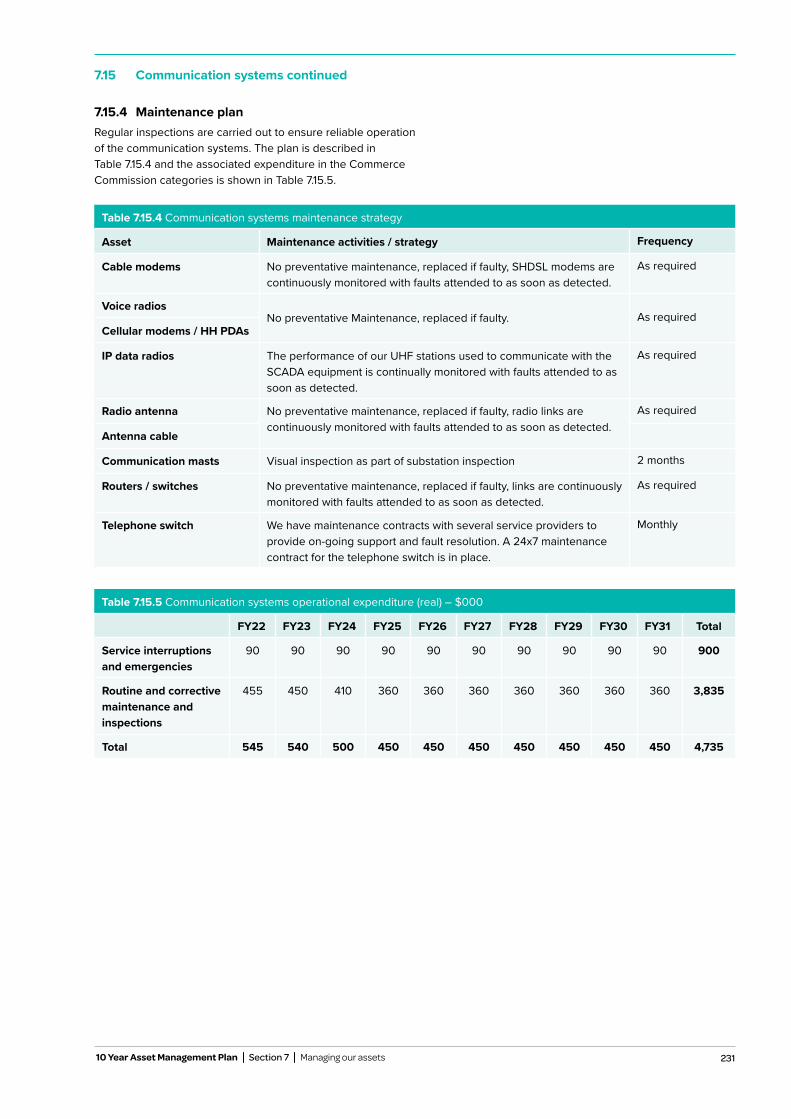
231 10 Year Asset Management Plan Section 7 Managing our assets
Table 7.15.4 Communication systems maintenance strategy
Asset Maintenance activities / strategy Frequency
Cable modems No preventative maintenance, replaced if faulty, SHDSL modems are continuously monitored with faults attended to as soon as detected.
As required
Voice radiosNo preventative Maintenance, replaced if faulty. As required
Cellular modems / HH PDAs
IP data radios The performance of our UHF stations used to communicate with the SCADA equipment is continually monitored with faults attended to as soon as detected.
As required
Radio antenna No preventative maintenance, replaced if faulty, radio links are continuously monitored with faults attended to as soon as detected.
As required
Antenna cable
Communication masts Visual inspection as part of substation inspection 2 months
Routers / switches No preventative maintenance, replaced if faulty, links are continuously monitored with faults attended to as soon as detected.
As required
Telephone switch We have maintenance contracts with several service providers to provide on-going support and fault resolution. A 24x7 maintenance contract for the telephone switch is in place.
Monthly
7.15.4 Maintenance planRegular inspections are carried out to ensure reliable operation of the communication systems. The plan is described in Table 7.15.4 and the associated expenditure in the Commerce Commission categories is shown in Table 7.15.5.
Table 7.15.5 Communication systems operational expenditure (real) – $000
FY22 FY23 FY24 FY25 FY26 FY27 FY28 FY29 FY30 FY31 Total
Service interruptions and emergencies
90 90 90 90 90 90 90 90 90 90 900
Routine and corrective maintenance and inspections
455 450 410 360 360 360 360 360 360 360 3,835
Total 545 540 500 450 450 450 450 450 450 450 4,735
7.15 Communication systems continued

232 Orion New Zealand Limited
7.15 Communication systems continued
Table 7.15.6 Communication system replacement plan
System Replacement plan
Completion of IP Network We are progressively upgrading older analogue links when the associated network primary equipment is replaced. Additional IP radios were installed as part of protection improvements on the Banks Peninsula 33kV ring to provide alternative communication links to the peninsula.
Hill top radio facility Because of the expansion of both UHF radio protection linking and additional UHF PowerOn communications requirements, this facility is no longer fit for purpose.
We will replace the facility with a self-supported support structure with antenna expansion capability and weather tight equipment housing structure.
Voice radios After the successful trial of a digital radio system on the Banks Peninsula in FY20, we are now looking to upgrade our existing analog system over the next 3 years. The upgrade will significantly increase our signal strength in remote areas and offer more features such as user identification and user location.
Comms architecture projects
As we introduce new assets on our network the need for communications increases.
Expenditure is kept aside for such projects, with the majority going towards fibre installations. Currently there is no long-term plan for our comms architecture projects but going forward this is something we hope to develop.
Pole investigation A number of our radio sites sit on top of steel octagonal poles. Recently, there have been reports of significant movement/vibration of these poles in windy conditions. After consultation with a specialist, we have decided that the best action is to replace these problematic poles before they start to fail.
7.15.5 Replacement planBecause of the rapid improvement in technology, communications equipment has a relatively short life and equipment is not normally renewed but is replaced with more modern technologies. Our replacement plan over the
AMP period is shown in Table 7.15.6 and the forecast expenditure in the Commerce Commission’s categories can be found in Table 7.15.7.
Table 7.15.7 Communication system replacement capital expenditure (real) – $000
FY22 FY23 FY24 FY25 FY26 FY27 FY28 FY29 FY30 FY31 Total
Zone substation 100 100 - - - - - - - - 200
Other network assets 980 970 270 270 270 270 270 270 270 270 4,110
Quality of supply 110 110 110 110 105 105 70 70 70 70 930
Total 1,190 1,180 380 380 375 375 340 340 340 340 5,240
Because of the rapid improvement in technology, communications equipment has a relatively short life and equipment is not normally renewed but is replaced with more modern technologies.
233 10 Year Asset Management Plan Section 7 Managing our assets
7.16 Advanced Distribution Management System (ADMS)
7.16.1 SummaryOur Advanced Distribution Management System (ADMS) is built on a digital model of our high voltage network and supports a range of activities related to the operation, planning and configuration of the electricity network. Safety is a core driver for the use and development of our advanced distribution management system. It is an essential element in our efforts to ensure the safe and effective operation of the network.
Our ADMS enables automated control and management of our electricity network and directly supports SAIDI key measures.
The network model used by PowerOn and the SCADA data that it relies on are currently limited to high voltage assets 11kV or more. Our expectation is that over the next five years we will extend the model to include low voltage assets. We also intend to introduce technology that will enable the ADMS to automatically operate network equipment or self-heal to restore supply to customers following an outage. Work underway includes a Switching Request Register (SRR) to improve service provider workflows.
7.16.2 Asset descriptionA ADMS is a suite of applications designed to monitor and control the distribution network and also to support decision making in the Control Room. ADMS comes in two systems: core system and ancillary system. See Table 7.16.1 for system descriptions.
Our future planning for the ADMS includes the installation of more remotely controlled switchgear and the use of the existing on-line load-flow analysis within the ADMS enables the implementation of an Adaptive Power Restoration Scheme (APRS). APRS is a ADMS application module that allows the ADMS to autonomously operate remote switching devices to isolate faults and reconfigure the network to restore supply. We will implement the SRR to improve service providers workflow.
We install new network remote terminal units when we build new sites with telemetry control. A move to implement low voltage monitoring and control will require substantial new investment.
Safety is a core driver for the use and development of our data management systems.
The network model used by PowerOn and the SCADA data that it relies on are currently limited to high voltage assets 11kV or more. Our expectation is that over the next five years we will extend the model to include low voltage assets.
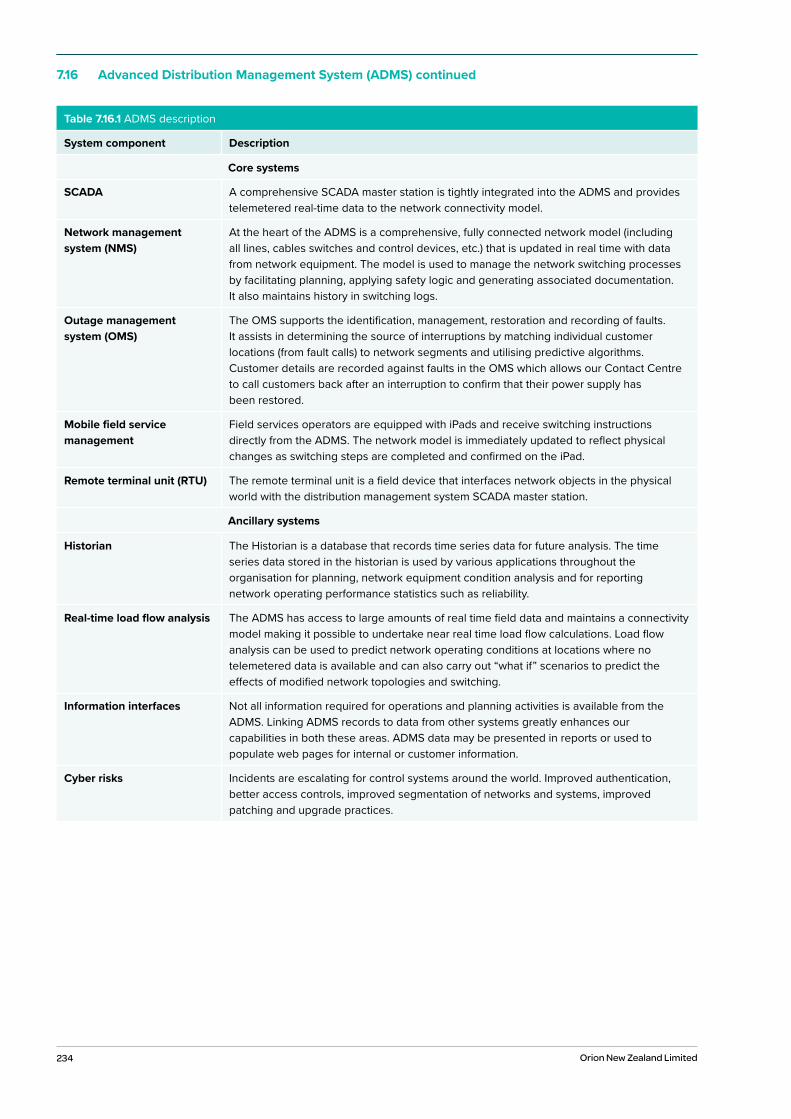
234 Orion New Zealand Limited
7.16 Advanced Distribution Management System (ADMS) continued
Table 7.16.1 ADMS description
System component Description
Core systems
SCADA A comprehensive SCADA master station is tightly integrated into the ADMS and provides telemetered real-time data to the network connectivity model.
Network management system (NMS)
At the heart of the ADMS is a comprehensive, fully connected network model (including all lines, cables switches and control devices, etc.) that is updated in real time with data from network equipment. The model is used to manage the network switching processes by facilitating planning, applying safety logic and generating associated documentation. It also maintains history in switching logs.
Outage management system (OMS)
The OMS supports the identification, management, restoration and recording of faults. It assists in determining the source of interruptions by matching individual customer locations (from fault calls) to network segments and utilising predictive algorithms. Customer details are recorded against faults in the OMS which allows our Contact Centre to call customers back after an interruption to confirm that their power supply has been restored.
Mobile field service management
Field services operators are equipped with iPads and receive switching instructions directly from the ADMS. The network model is immediately updated to reflect physical changes as switching steps are completed and confirmed on the iPad.
Remote terminal unit (RTU) The remote terminal unit is a field device that interfaces network objects in the physical world with the distribution management system SCADA master station.
Ancillary systems
Historian The Historian is a database that records time series data for future analysis. The time series data stored in the historian is used by various applications throughout the organisation for planning, network equipment condition analysis and for reporting network operating performance statistics such as reliability.
Real-time load flow analysis The ADMS has access to large amounts of real time field data and maintains a connectivity model making it possible to undertake near real time load flow calculations. Load flow analysis can be used to predict network operating conditions at locations where no telemetered data is available and can also carry out “what if” scenarios to predict the effects of modified network topologies and switching.
Information interfaces Not all information required for operations and planning activities is available from the ADMS. Linking ADMS records to data from other systems greatly enhances our capabilities in both these areas. ADMS data may be presented in reports or used to populate web pages for internal or customer information.
Cyber risks Incidents are escalating for control systems around the world. Improved authentication, better access controls, improved segmentation of networks and systems, improved patching and upgrade practices.
235 10 Year Asset Management Plan Section 7 Managing our assets
7.16.3 Asset health7.16.3.1 Condition
We have a number of older RTUs in our network that are no longer supported by their manufacturer. We hold enough spares to cover these units for maintenance purposes and they are performing adequately. These units are progressively being replaced as we undertake other upgrades at their locations. The major RTU used is at end of life, and spares for some communication components and other parts are becoming very scarce. It is now important to provide a replacement strategy and delivery path for the older units.
7.16.3.2 Reliability
Generally the ADMS system runs at or near 100% reliability. There are some recent performance issues with the capacity, performance and/or availability of the ADMS and these are being addressed within our operational budgets to improve DMS operations, for example: user training, computer and network infrastructure, computer systems monitoring, settling-in time for new functionality, alarms reviews, commissioning practices.
7.16.3.3 Issues and controls
Our maintenance and replacement programmes are developed to ensure the continuous availability of the ADMS. This includes building highly resilient systems, upgrading core software and infrastructure on a lifecycle basis and undertaking regular reviews of system capacity and performance. Table 7.16.2 describes the potential failure cause and mitigation controls.
Table 7.16.2 ADMS failure controls
Common failure cause Known issues Control measures
Infrastructure component failure
Server hardware and platform failure
Real time monitoring, diversity, resilient infrastructure, lifecycle management
RTU failure Spares available
Emergency contract
Information System (application/database) failure
Software failure / flaw System monitoring, diversity, resilient platforms, maintenance contracts
Unexpected usage errors Unexpected use cases Training, testing, small systems change, upgrades
7.16 Advanced Distribution Management System (ADMS) continued
Generally the ADMS system runs at or near 100% reliability.
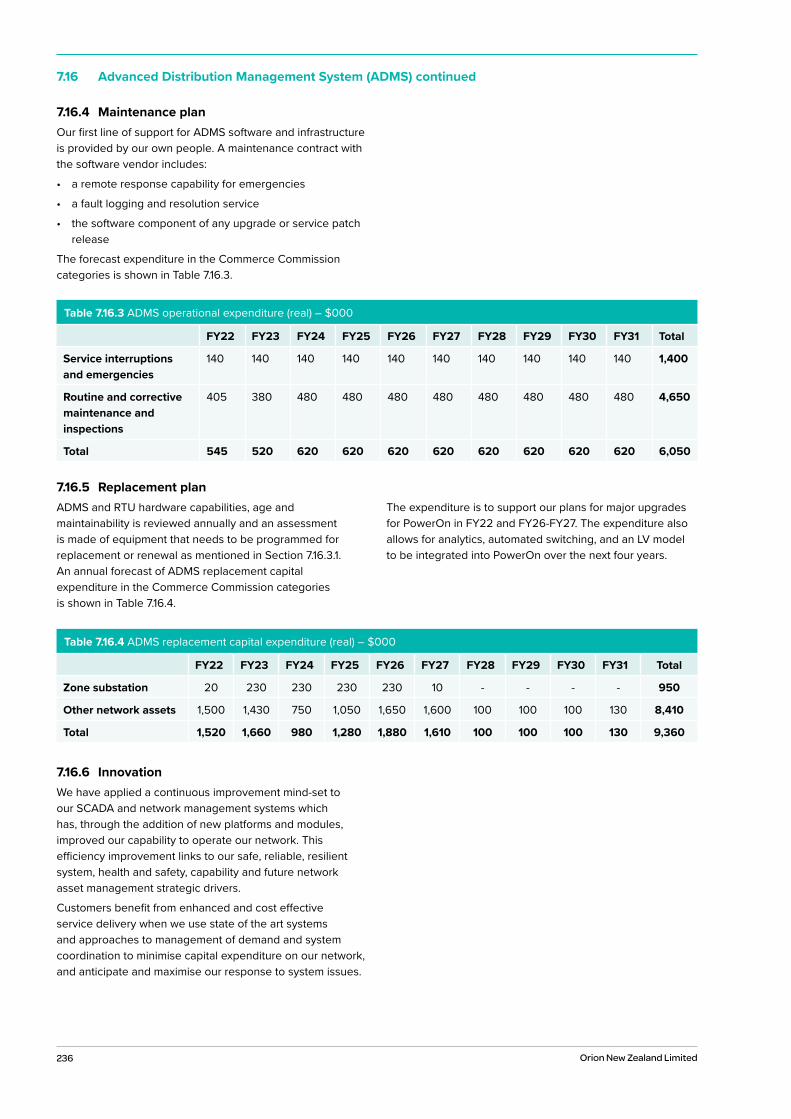
236 Orion New Zealand Limited
7.16 Advanced Distribution Management System (ADMS) continued
7.16.5 Replacement planADMS and RTU hardware capabilities, age and maintainability is reviewed annually and an assessment is made of equipment that needs to be programmed for replacement or renewal as mentioned in Section 7.16.3.1. An annual forecast of ADMS replacement capital expenditure in the Commerce Commission categories is shown in Table 7.16.4.
The expenditure is to support our plans for major upgrades for PowerOn in FY22 and FY26-FY27. The expenditure also allows for analytics, automated switching, and an LV model to be integrated into PowerOn over the next four years.
Table 7.16.4 ADMS replacement capital expenditure (real) – $000
FY22 FY23 FY24 FY25 FY26 FY27 FY28 FY29 FY30 FY31 Total
Zone substation 20 230 230 230 230 10 - - - - 950
Other network assets 1,500 1,430 750 1,050 1,650 1,600 100 100 100 130 8,410
Total 1,520 1,660 980 1,280 1,880 1,610 100 100 100 130 9,360
7.16.4 Maintenance planOur first line of support for ADMS software and infrastructure is provided by our own people. A maintenance contract with the software vendor includes:
• a remote response capability for emergencies
• a fault logging and resolution service
• the software component of any upgrade or service patchrelease
The forecast expenditure in the Commerce Commission categories is shown in Table 7.16.3.
Table 7.16.3 ADMS operational expenditure (real) – $000
FY22 FY23 FY24 FY25 FY26 FY27 FY28 FY29 FY30 FY31 Total
Service interruptions and emergencies
140 140 140 140 140 140 140 140 140 140 1,400
Routine and corrective maintenance and inspections
405 380 480 480 480 480 480 480 480 480 4,650
Total 545 520 620 620 620 620 620 620 620 620 6,050
7.16.6 InnovationWe have applied a continuous improvement mind-set to our SCADA and network management systems which has, through the addition of new platforms and modules, improved our capability to operate our network. This efficiency improvement links to our safe, reliable, resilient system, health and safety, capability and future network asset management strategic drivers.
Customers benefit from enhanced and cost effective service delivery when we use state of the art systems and approaches to management of demand and system coordination to minimise capital expenditure on our network, and anticipate and maximise our response to system issues.
237 10 Year Asset Management Plan Section 7 Managing our assets
7.17 Load management systems
7.17.1 SummaryOur load management systems control electrical loads predominantly by injecting frequency signals over the electricity network. The system is made up of various electrical plant and hardware/software platforms.
We will soon be undertaking a review of our current load management system architecture. This will look at how we control future Distributed Energy Resource Management (DERM) and consider integration of alternative metering sources further down the network including our protection relays, LV monitors and possibly LV smart meters. It is envisaged that any future change will transfer the load management functionality into our DMS system.
We are also actively involved in industry groups that are researching alternative technologies for DERM control.
7.17.2 Asset descriptionOur load management consists of two separate systems: Orion’s load management system and the Upper South Island (USI) load management system, which Orion operates in collaboration with the seven other electricity distributers in the upper South Island. These systems are described in Table 7.17.1.
The primary use of both systems is to defer energy consumption and minimise peak load. This is achieved in two ways. Customer demand management load reduction and/or generation and by distributor controlled load management through hot-water cylinder and interruptible irrigation control.
Orion’s load management system signals to our customer’s premises by injecting a carrier frequency with a digital signal into the power network that is acted upon by relays installed at the customer’s connection point. There are two ripple carrier frequencies used on our system. The ripple relays are owned by the retailers, apart from approximately 2,000 that are owned by Orion, used for controlling streetlights. Alternative signal means are also used to prepare and initiate some major customer load management methods.
We install new 11kV ripple injection plants in conjunction with new zone substations or rural zone substations that are converted from 33kV to 66kV. For example, in 2018 we converted Springston substation with a new 66/11kV transformer, 11kV switchgear and 11kV 317Hz decabit ripple plant. The existing 33kV plants remain in service to provide ripple control to the remaining 33kV substations.
Our load management systems control electrical loads predominantly by injecting frequency signals over the electricity network.
Table 7.17.1 Load management systems description
System Description Quantity
Load management master station and RTUs
The load management master station is a SCADA system that runs independently of the network management system. The master station consists of two redundant servers on dedicated hardware.
2 plus 1 spare
Upper South Island load management system (USI)
The USI load management system is a dedicated SCADA system run independently of our load management and network management systems. Two redundant servers take information from Orion, Transpower and seven other USI distributors’ SCADA systems, monitor the total USI system load and send targets to the various distributors’ ripple control systems to control USI total load to an overall target.
2 plus 1 historian
Ripple injection system Telenerg 175 Hz
This system operates mainly within our Region A network and is the major ripple injecting system controlling the load of approximately 160,000 customers. It is made up of multiple small injection plants connected to the zone substation feeders.
27
Ripple injection system Zellweger Decabit 317Hz
The Decabit system operates predominately within our Region B network. A number of ripple plants provide injection at zone substation feeders. The main reason for separate systems is the historical merger between distribution authorities and their separate ripple plant types.
17
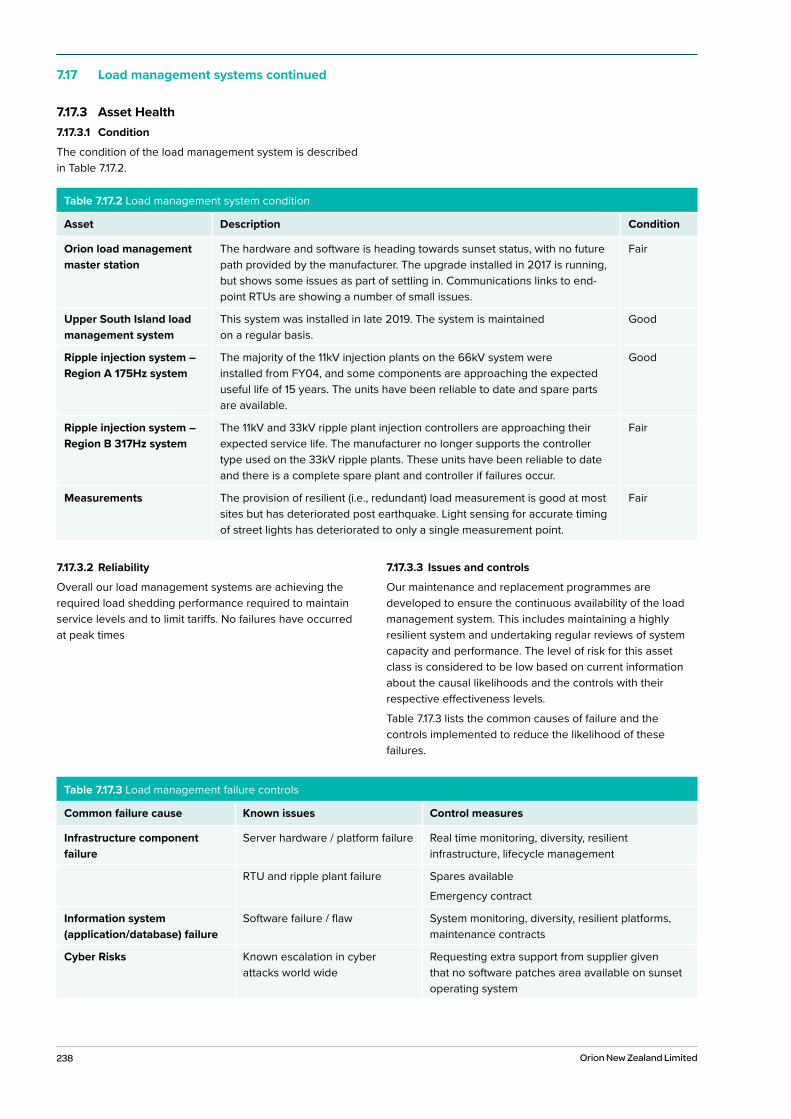
238 Orion New Zealand Limited
7.17 Load management systems continued
7.17.3 Asset Health7.17.3.1 Condition
The condition of the load management system is described in Table 7.17.2.
Table 7.17.2 Load management system condition
Asset Description Condition
Orion load management master station
The hardware and software is heading towards sunset status, with no future path provided by the manufacturer. The upgrade installed in 2017 is running, but shows some issues as part of settling in. Communications links to end-point RTUs are showing a number of small issues.
Fair
Upper South Island load management system
This system was installed in late 2019. The system is maintained on a regular basis.
Good
Ripple injection system – Region A 175Hz system
The majority of the 11kV injection plants on the 66kV system were installed from FY04, and some components are approaching the expected useful life of 15 years. The units have been reliable to date and spare parts are available.
Good
Ripple injection system – Region B 317Hz system
The 11kV and 33kV ripple plant injection controllers are approaching their expected service life. The manufacturer no longer supports the controller type used on the 33kV ripple plants. These units have been reliable to date and there is a complete spare plant and controller if failures occur.
Fair
Measurements The provision of resilient (i.e., redundant) load measurement is good at most sites but has deteriorated post earthquake. Light sensing for accurate timing of street lights has deteriorated to only a single measurement point.
Fair
Table 7.17.3 Load management failure controls
Common failure cause Known issues Control measures
Infrastructure component failure
Server hardware / platform failure Real time monitoring, diversity, resilient infrastructure, lifecycle management
RTU and ripple plant failure Spares available
Emergency contract
Information system (application/database) failure
Software failure / flaw System monitoring, diversity, resilient platforms, maintenance contracts
Cyber Risks Known escalation in cyber attacks world wide
Requesting extra support from supplier given that no software patches area available on sunset operating system
7.17.3.2 Reliability
Overall our load management systems are achieving the required load shedding performance required to maintain service levels and to limit tariffs. No failures have occurred at peak times
7.17.3.3 Issues and controls
Our maintenance and replacement programmes are developed to ensure the continuous availability of the load management system. This includes maintaining a highly resilient system and undertaking regular reviews of system capacity and performance. The level of risk for this asset class is considered to be low based on current information about the causal likelihoods and the controls with their respective effectiveness levels.
Table 7.17.3 lists the common causes of failure and the controls implemented to reduce the likelihood of these failures.
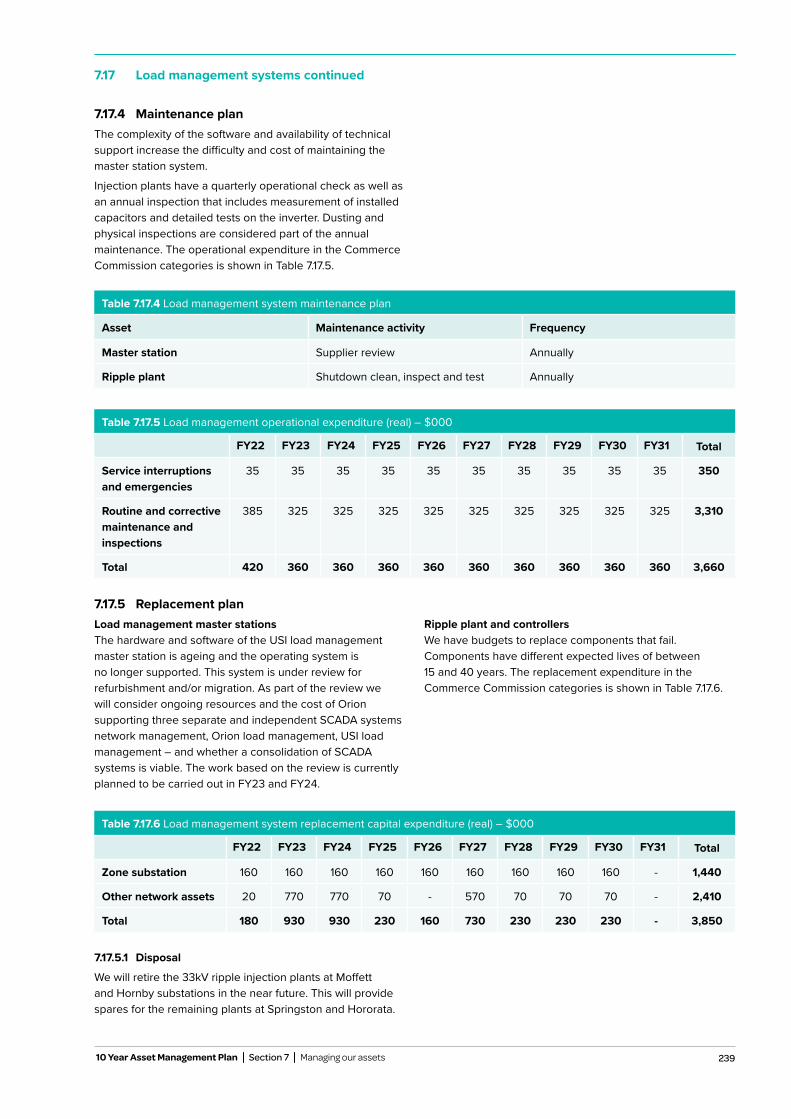
239 10 Year Asset Management Plan Section 7 Managing our assets
Table 7.17.4 Load management system maintenance plan
Asset Maintenance activity Frequency
Master station Supplier review Annually
Ripple plant Shutdown clean, inspect and test Annually
7.17.4 Maintenance planThe complexity of the software and availability of technical support increase the difficulty and cost of maintaining the master station system.
Injection plants have a quarterly operational check as well as an annual inspection that includes measurement of installed capacitors and detailed tests on the inverter. Dusting and physical inspections are considered part of the annual maintenance. The operational expenditure in the Commerce Commission categories is shown in Table 7.17.5.
Table 7.17.5 Load management operational expenditure (real) – $000
FY22 FY23 FY24 FY25 FY26 FY27 FY28 FY29 FY30 FY31 Total
Service interruptions and emergencies
35 35 35 35 35 35 35 35 35 35 350
Routine and corrective maintenance and inspections
385 325 325 325 325 325 325 325 325 325 3,310
Total 420 360 360 360 360 360 360 360 360 360 3,660
7.17 Load management systems continued
7.17.5 Replacement planLoad management master stationsThe hardware and software of the USI load management master station is ageing and the operating system is no longer supported. This system is under review for refurbishment and/or migration. As part of the review we will consider ongoing resources and the cost of Orion supporting three separate and independent SCADA systems network management, Orion load management, USI load management – and whether a consolidation of SCADA systems is viable. The work based on the review is currently planned to be carried out in FY23 and FY24.
Ripple plant and controllersWe have budgets to replace components that fail. Components have different expected lives of between 15 and 40 years. The replacement expenditure in the Commerce Commission categories is shown in Table 7.17.6.
7.17.5.1 Disposal
We will retire the 33kV ripple injection plants at Moffett and Hornby substations in the near future. This will provide spares for the remaining plants at Springston and Hororata.
Table 7.17.6 Load management system replacement capital expenditure (real) – $000
FY22 FY23 FY24 FY25 FY26 FY27 FY28 FY29 FY30 FY31 Total
Zone substation 160 160 160 160 160 160 160 160 160 - 1,440
Other network assets 20 770 770 70 - 570 70 70 70 - 2,410
Total 180 930 930 230 160 730 230 230 230 - 3,850
240 Orion New Zealand Limited
7.18 Information systems
7.18.1 SummaryOur Asset Management Information Systems (AMIS) hold information about our electricity network assets and support our business processes in managing assets. Our AMIS are performing well as they are regularly maintained and frequently upgraded.
7.18.2 Asset descriptionThe majority of our primary asset information is held in our asset database and Geographic Information System (GIS). We hold information about our network equipment from GXP connections down to individual LV pole level with a high level of accuracy. In addition to these asset registers we also hold detailed information regarding customer connections in our Connections Register and track the process of asset creation and maintenance in our Works Management system.
Geographic Information System (GIS) – Orion’s GIS records our network assets according to their location, type and electrical connectivity. It interfaces with other information systems such as substation asset attribute data stored in our asset register. GeoMedia specialises in reporting and analysing geographic data. In particular, GeoMedia easily combines core GIS and third party datasets such as aerial imagery for both Orion and service provider and consultant use.
Various GIS viewer technologies enable Orion to deliver ‘fit for purpose’ geographic asset information within Orion premises, or off site via a secure website. In areas where internet coverage is limited, GIS datasets may be stored directly on a laptop device.
Asset database – EMS Basix, provides a central resource management application that holds details of key asset types with their current location/status. The assets covered include land, substations and all our major equipment including HV cables with less strategic types being added over time. Schedules extracted from this database are used for preventative maintenance contracts and it archives any inspection/test data gathered during the contract.
Works Management – We manage all types of works activity using purpose-built in-house developed applications which populate a single works data repository.
The applications are optimised for different types of work including new connections management, general network jobs and emergency works. When a job is created in Works Management a companion job is also automatically created in the financial system (NAV) to track job related invoices.
Connections Register – Our in-house developed Connections Register holds details of all installation control points (ICP) on our network. This is linked with the industry registry. Links with our GIS systems enable accurate derivation of GXP information by ICP and the association of ICP with an interruption. Interruptions are now routinely traced within the GIS using the in-built connectivity model, and accurate information about the number of customers and interruption duration are recorded.
7.18.3 Asset healthGIS – Our GIS has adequate capacity and performance for the time frame of this plan.
Asset database – We use the most current available version of EMS Basix. We use only a subset of the capabilities of the EMS Basix database which can be applied to Works Management as well as asset tracking. The performance and capacity of the upgraded system is adequate for the time frame of this plan.
Works Management – This application was subject to a review in FY17. We found the underlying database to be sound from both an architecture and overall performance perspective. The user facing components of this system however, which are based on aging technology, are rapidly becoming unsupportable and will be refreshed over the next 12 months. The performance and capacity of the database is adequate for the time frame of this plan.
Connections Register – Its capacity and performance are adequate for the period of this plan if there are no further major changes required. The Connections Register has been modified significantly since its establishment in FY00, to support a range of new business processes. This system has however reached a “tipping point” and without a change to its underlying architecture, there is a high degree of risk in developing it further.
We manage all types of works activity using purpose-built in-house developed applications which populate a single works data repository.
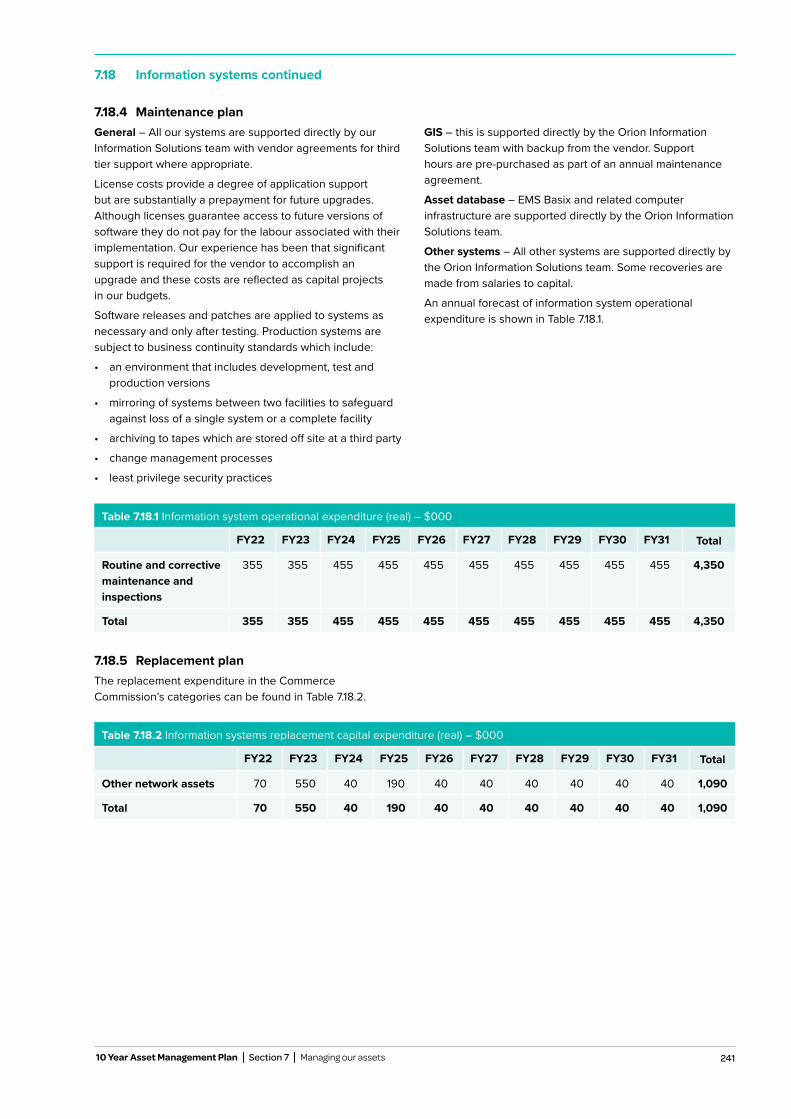
241 10 Year Asset Management Plan Section 7 Managing our assets
7.18.4 Maintenance planGeneral – All our systems are supported directly by our Information Solutions team with vendor agreements for third tier support where appropriate.
License costs provide a degree of application support but are substantially a prepayment for future upgrades. Although licenses guarantee access to future versions of software they do not pay for the labour associated with their implementation. Our experience has been that significant support is required for the vendor to accomplish an upgrade and these costs are reflected as capital projects in our budgets.
Software releases and patches are applied to systems as necessary and only after testing. Production systems are subject to business continuity standards which include:
• an environment that includes development, test andproduction versions
• mirroring of systems between two facilities to safeguardagainst loss of a single system or a complete facility
• archiving to tapes which are stored off site at a third party
• change management processes
• least privilege security practices
GIS – this is supported directly by the Orion Information Solutions team with backup from the vendor. Support hours are pre-purchased as part of an annual maintenance agreement.
Asset database – EMS Basix and related computer infrastructure are supported directly by the Orion Information Solutions team.
Other systems – All other systems are supported directly by the Orion Information Solutions team. Some recoveries are made from salaries to capital.
An annual forecast of information system operational expenditure is shown in Table 7.18.1.
Table 7.18.1 Information system operational expenditure (real) – $000
FY22 FY23 FY24 FY25 FY26 FY27 FY28 FY29 FY30 FY31 Total
Routine and corrective maintenance and inspections
355 355 455 455 455 455 455 455 455 455 4,350
Total 355 355 455 455 455 455 455 455 455 455 4,350
Table 7.18.2 Information systems replacement capital expenditure (real) – $000
FY22 FY23 FY24 FY25 FY26 FY27 FY28 FY29 FY30 FY31 Total
Other network assets 70 550 40 190 40 40 40 40 40 40 1,090
Total 70 550 40 190 40 40 40 40 40 40 1,090
7.18.5 Replacement planThe replacement expenditure in the Commerce Commission’s categories can be found in Table 7.18.2.
7.18 Information systems continued
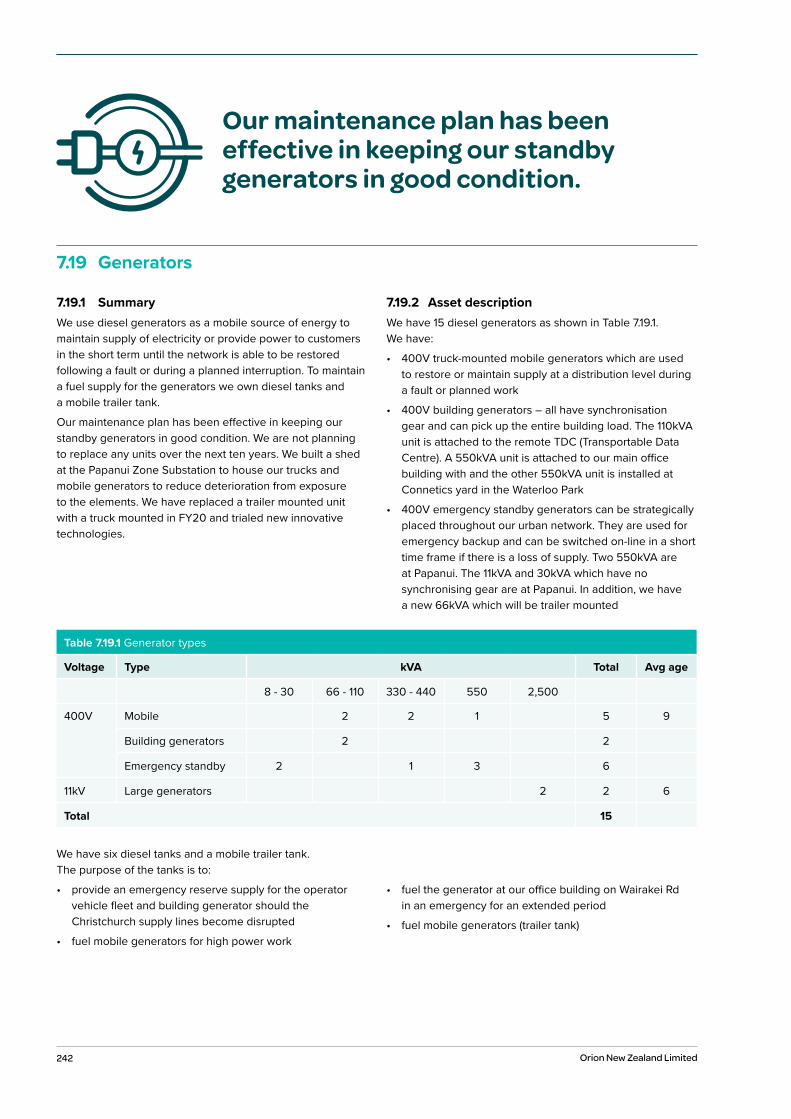
242 Orion New Zealand Limited
7.19 Generators
7.19.1 SummaryWe use diesel generators as a mobile source of energy to maintain supply of electricity or provide power to customers in the short term until the network is able to be restored following a fault or during a planned interruption. To maintain a fuel supply for the generators we own diesel tanks and a mobile trailer tank.
Our maintenance plan has been effective in keeping our standby generators in good condition. We are not planning to replace any units over the next ten years. We built a shed at the Papanui Zone Substation to house our trucks and mobile generators to reduce deterioration from exposure to the elements. We have replaced a trailer mounted unit with a truck mounted in FY20 and trialed new innovative technologies.
7.19.2 Asset descriptionWe have 15 diesel generators as shown in Table 7.19.1. We have:
• 400V truck-mounted mobile generators which are usedto restore or maintain supply at a distribution level duringa fault or planned work
• 400V building generators – all have synchronisationgear and can pick up the entire building load. The 110kVAunit is attached to the remote TDC (Transportable DataCentre). A 550kVA unit is attached to our main officebuilding with and the other 550kVA unit is installed atConnetics yard in the Waterloo Park
• 400V emergency standby generators can be strategicallyplaced throughout our urban network. They are used foremergency backup and can be switched on-line in a shorttime frame if there is a loss of supply. Two 550kVA areat Papanui. The 11kVA and 30kVA which have nosynchronising gear are at Papanui. In addition, we havea new 66kVA which will be trailer mounted
Our maintenance plan has been effective in keeping our standby generators in good condition.
Table 7.19.1 Generator types
Voltage Type kVA Total Avg age
8 - 30 66 - 110 330 - 440 550 2,500
400V Mobile 2 2 1 5 9
Building generators 2 2
Emergency standby 2 1 3 6
11kV Large generators 2 2 6
Total 15
We have six diesel tanks and a mobile trailer tank. The purpose of the tanks is to:
• provide an emergency reserve supply for the operatorvehicle fleet and building generator should theChristchurch supply lines become disrupted
• fuel mobile generators for high power work
• fuel the generator at our office building on Wairakei Rdin an emergency for an extended period
• fuel mobile generators (trailer tank)
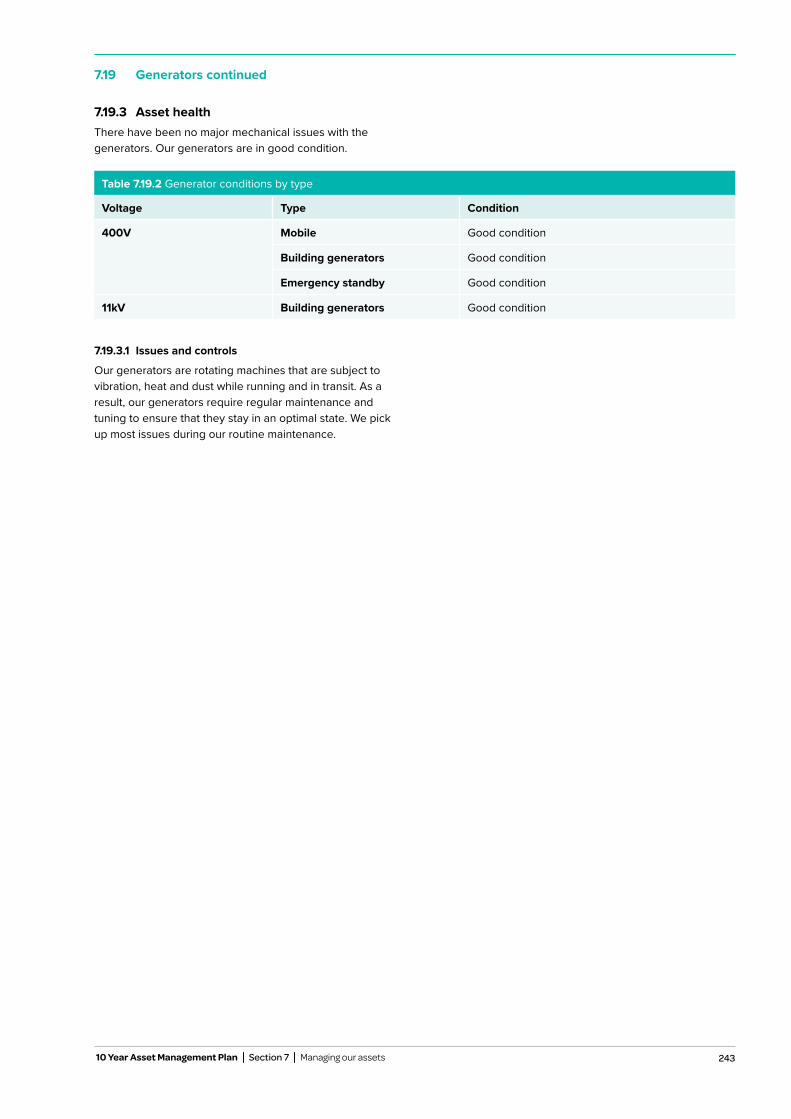
243 10 Year Asset Management Plan Section 7 Managing our assets
7.19 Generators continued
7.19.3 Asset healthThere have been no major mechanical issues with the generators. Our generators are in good condition.
7.19.3.1 Issues and controls
Our generators are rotating machines that are subject to vibration, heat and dust while running and in transit. As a result, our generators require regular maintenance and tuning to ensure that they stay in an optimal state. We pick up most issues during our routine maintenance.
Table 7.19.2 Generator conditions by type
Voltage Type Condition
400V Mobile Good condition
Building generators Good condition
Emergency standby Good condition
11kV Building generators Good condition
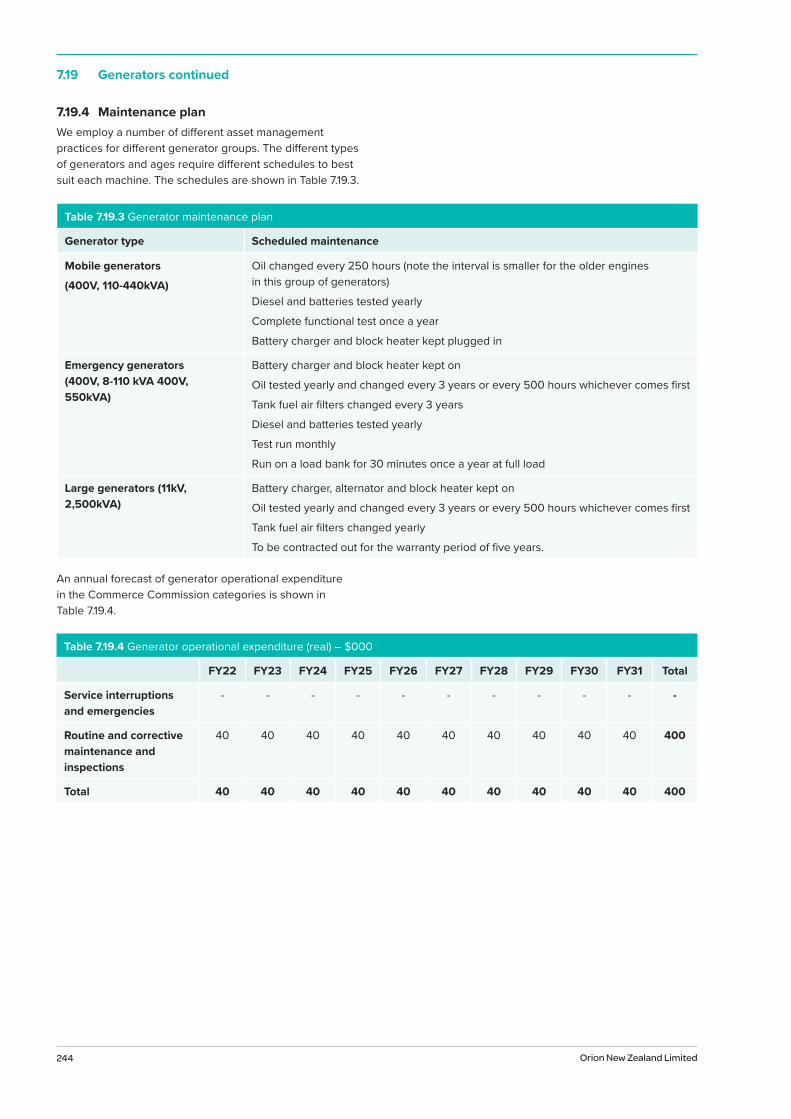
244 Orion New Zealand Limited
7.19 Generators continued
Table 7.19.3 Generator maintenance plan
Generator type Scheduled maintenance
Mobile generators
(400V, 110-440kVA)
Oil changed every 250 hours (note the interval is smaller for the older engines in this group of generators)
Diesel and batteries tested yearly
Complete functional test once a year
Battery charger and block heater kept plugged in
Emergency generators (400V, 8-110 kVA 400V, 550kVA)
Battery charger and block heater kept on
Oil tested yearly and changed every 3 years or every 500 hours whichever comes first
Tank fuel air filters changed every 3 years
Diesel and batteries tested yearly
Test run monthly
Run on a load bank for 30 minutes once a year at full load
Large generators (11kV, 2,500kVA)
Battery charger, alternator and block heater kept on
Oil tested yearly and changed every 3 years or every 500 hours whichever comes first
Tank fuel air filters changed yearly
To be contracted out for the warranty period of five years.
7.19.4 Maintenance planWe employ a number of different asset management practices for different generator groups. The different types of generators and ages require different schedules to best suit each machine. The schedules are shown in Table 7.19.3.
An annual forecast of generator operational expenditure in the Commerce Commission categories is shown in Table 7.19.4.
Table 7.19.4 Generator operational expenditure (real) – $000
FY22 FY23 FY24 FY25 FY26 FY27 FY28 FY29 FY30 FY31 Total
Service interruptions and emergencies
- - - - - - - - - - -
Routine and corrective maintenance and inspections
40 40 40 40 40 40 40 40 40 40 400
Total 40 40 40 40 40 40 40 40 40 40 400
245
Table 7.19.5 Generators capital expenditure (real) - $,000
FY22 FY23 FY24 FY25 FY26 FY27 FY28 FY29 FY30 FY31 Total
Other network assets 20 20 20 20 20 20 - - - - 120
Total 20 20 20 20 20 20 - - - - 120
10 Year Asset Management Plan Section 7 Managing our assets
7.19.5 Replacement planWhen a generator gets to the end of its economic life, analysis will be done to see if it will be replaced. The 440kVA generator has done 6,600 hours and is 13 years old. When it gets to 10,000 hrs we will assess whether it is more economic to do major maintenance or replace it with a new unit. We are planning to replace trailer mounted units to truck mounted. The replacement expenditure is covered in Section 8.7 – vehicles. Expenditure has been allocated for controller and AVR replacement from FY22 – FY27.
7.19.5.1 Disposal
Generators are disposed of by auction when they become surplus to our requirements or they become uneconomic to continue to operate.
Our network procedures detail the disposal requirements for substances such as fuels that have the potential to spill from generators or any other form of holding or transport tank. These procedures also mandate the prompt reporting of any uncontained spillage and disposal of hazardous substances, which allows us to document the details of spillage and disposal quantities.
7.19.6 InnovationMost of our generators have been fitted with SCADA which provides alarming and monitoring. Reverse synchronising has been fitted which allows the generator to be returned from an islanded state with connected load, avoiding an outage to the customer.
Our mobile generators have been fitted with equipment to allow the generator to operate in a voltage support mode.
This is where the generator is operated in parallel with the network and as the load drops the voltage increases, allowing the generator to shut down, saving fuel.
We have now fitted control relays that allow the generator to start large loads or areas of islanded network after a fault. This has drastically improved customer service by reducing restoration times.
We have also fitted a Statcom to one truck and are planning on fitting to others. These allow the generators to shutdown at low load while paralleled, reducing engine wear and fuel use.
7.19 Generators continued
We have now fitted control relays that allow the generator to start large loads or areas of islanded network after a fault. This has drastically improved customer service by reducing restoration times.
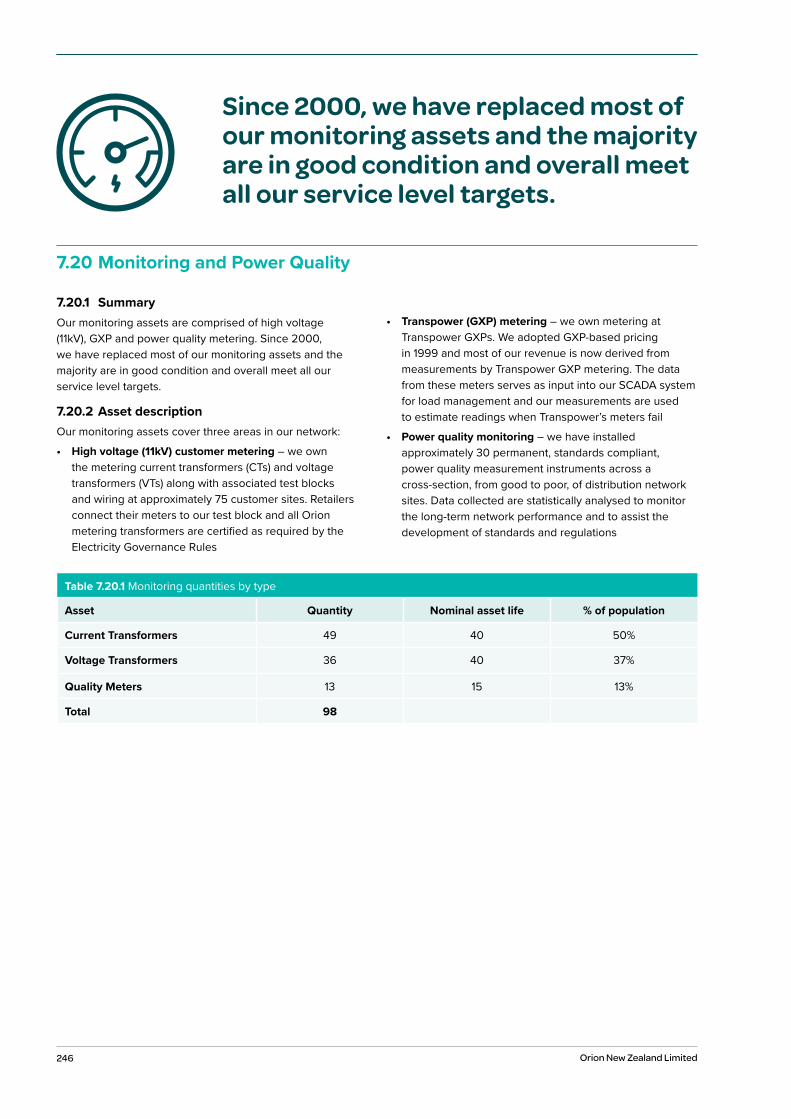
246 Orion New Zealand Limited
7.20 Monitoring and Power Quality
7.20.1 SummaryOur monitoring assets are comprised of high voltage (11kV), GXP and power quality metering. Since 2000, we have replaced most of our monitoring assets and the majority are in good condition and overall meet all our service level targets.
7.20.2 Asset descriptionOur monitoring assets cover three areas in our network:
• High voltage (11kV) customer metering – we ownthe metering current transformers (CTs) and voltagetransformers (VTs) along with associated test blocksand wiring at approximately 75 customer sites. Retailersconnect their meters to our test block and all Orionmetering transformers are certified as required by theElectricity Governance Rules
• Transpower (GXP) metering – we own metering atTranspower GXPs. We adopted GXP-based pricingin 1999 and most of our revenue is now derived frommeasurements by Transpower GXP metering. The datafrom these meters serves as input into our SCADA systemfor load management and our measurements are usedto estimate readings when Transpower’s meters fail
• Power quality monitoring – we have installedapproximately 30 permanent, standards compliant,power quality measurement instruments across across-section, from good to poor, of distribution networksites. Data collected are statistically analysed to monitorthe long-term network performance and to assist thedevelopment of standards and regulations
Since 2000, we have replaced most of our monitoring assets and the majority are in good condition and overall meet all our service level targets.
Table 7.20.1 Monitoring quantities by type
Asset Quantity Nominal asset life % of population
Current Transformers 49 40 50%
Voltage Transformers 36 40 37%
Quality Meters 13 15 13%
Total 98
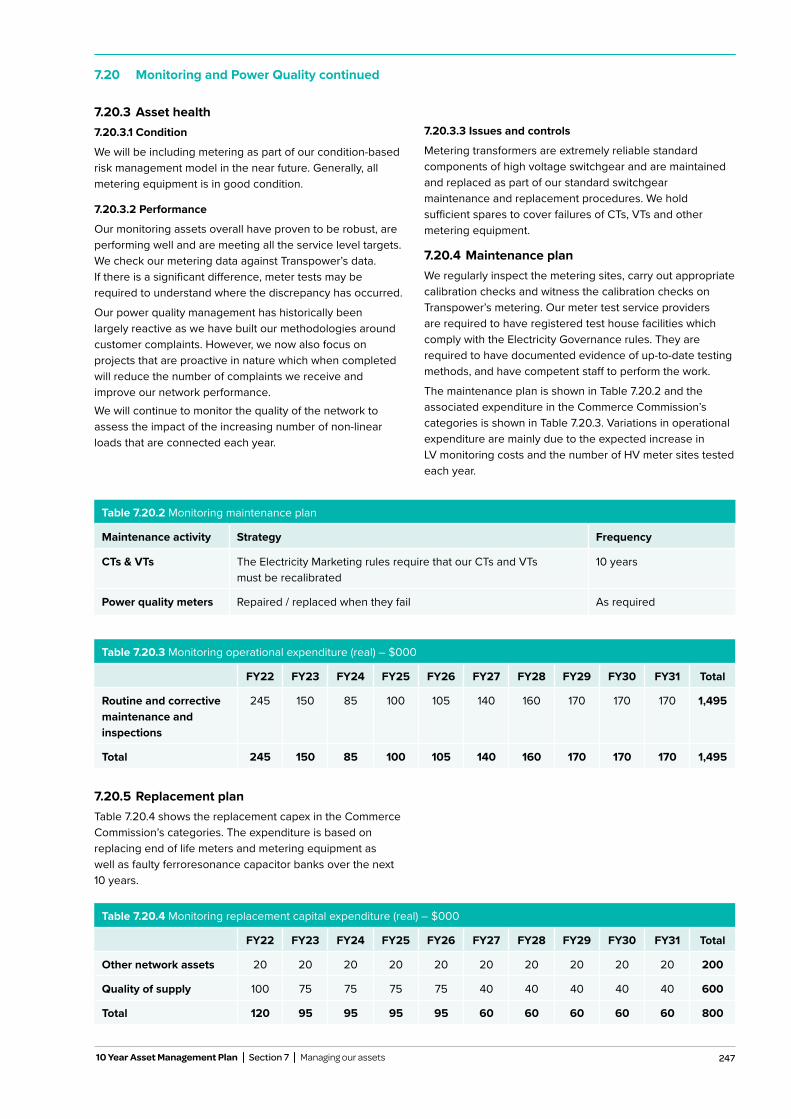
247 10 Year Asset Management Plan Section 7 Managing our assets
7.20 Monitoring and Power Quality continued
7.20.3 Asset health7.20.3.1 Condition
We will be including metering as part of our condition-based risk management model in the near future. Generally, all metering equipment is in good condition.
7.20.3.2 Performance
Our monitoring assets overall have proven to be robust, are performing well and are meeting all the service level targets. We check our metering data against Transpower’s data. If there is a significant difference, meter tests may be required to understand where the discrepancy has occurred.
Our power quality management has historically been largely reactive as we have built our methodologies around customer complaints. However, we now also focus on projects that are proactive in nature which when completed will reduce the number of complaints we receive and improve our network performance.We will continue to monitor the quality of the network to assess the impact of the increasing number of non-linear loads that are connected each year.
7.20.3.3 Issues and controls
Metering transformers are extremely reliable standard components of high voltage switchgear and are maintained and replaced as part of our standard switchgear maintenance and replacement procedures. We hold sufficient spares to cover failures of CTs, VTs and other metering equipment.
7.20.4 Maintenance planWe regularly inspect the metering sites, carry out appropriate calibration checks and witness the calibration checks on Transpower’s metering. Our meter test service providers are required to have registered test house facilities which comply with the Electricity Governance rules. They are required to have documented evidence of up-to-date testing methods, and have competent staff to perform the work.
The maintenance plan is shown in Table 7.20.2 and the associated expenditure in the Commerce Commission’s categories is shown in Table 7.20.3. Variations in operational expenditure are mainly due to the expected increase in LV monitoring costs and the number of HV meter sites tested each year.
Table 7.20.2 Monitoring maintenance plan
Maintenance activity Strategy Frequency
CTs & VTs The Electricity Marketing rules require that our CTs and VTs must be recalibrated
10 years
Power quality meters Repaired / replaced when they fail As required
Table 7.20.3 Monitoring operational expenditure (real) – $000
FY22 FY23 FY24 FY25 FY26 FY27 FY28 FY29 FY30 FY31 Total
Routine and corrective maintenance and inspections
245 150 85 100 105 140 160 170 170 170 1,495
Total 245 150 85 100 105 140 160 170 170 170 1,495
Table 7.20.4 Monitoring replacement capital expenditure (real) – $000
FY22 FY23 FY24 FY25 FY26 FY27 FY28 FY29 FY30 FY31 Total
Other network assets 20 20 20 20 20 20 20 20 20 20 200
Quality of supply 100 75 75 75 75 40 40 40 40 40 600
Total 120 95 95 95 95 60 60 60 60 60 800
7.20.5 Replacement planTable 7.20.4 shows the replacement capex in the Commerce Commission’s categories. The expenditure is based on replacing end of life meters and metering equipment as well as faulty ferroresonance capacitor banks over the next 10 years.

248 Orion New Zealand Limited

249 10 Year Asset Management Plan Section 1 Summary
8Supporting our
business

250 Orion New Zealand Limited
Photo: Sina Rollo, Customer Support team member.
251 10 Year Asset Management Plan Section 1 Summary
8.3.1 Infrastructure management 253
8.3.2 Network management 253
8.3.3 Network operations 253
8.3.4 Customer and stakeholder – customer support team 254
8.3.5 Engineering team 254
8.3.6 Works delivery 254
8.3.7 Customer connections team 254
8.3.8 Procurement and property services team 254
8.3.9 Quality, health, safety and environment (QHSE) team 255
8.3.10 System operations and network support expenditure forecast 255
8.5.1 Leadership team 257
8.5.2 People and capability 257
8.5.3 Strategic services 257
8.5.4 Finance 257
8.5.5 Information solutions 257
8.5.6 Commercial 257
8.5.7 Customer and stakeholder 257
8.5.8 Board 257
8.5.9 Insurance 257
8.5.10 Business support operational expenditure forecast 257
8.5.11 Business support capital expenditure forecast 258
8.3 System operations and network support 253
8.5 Business support 257
8.4.1 Orion Development Programme, Technical 2568.4.2 Orion Development Programme, Graduate 256
8.4.3 Energy Academy 256
8.4 Future Capability Development 256
8.2 Gearing up for the future 252
1 Summary 9 8.1 Introduction 252
Contents
251 10 Year Asset Management Plan Section 8 Supporting our business
8.6.1 Asset description 2598.6.2 Maintenance plan 259
8.6.3 Replacement plan 259
8.7.1 Asset description 2608.7.2 Maintenance plan 260
8.7.3 Replacement plan 260
8.8.1 Asset description 2618.8.2 Maintenance plan 261
8.8.3 Replacement plan 261
8.6 Corporate properties 259
8.7 Corporate information systems 260
8.8 Vehicles 261
252 Orion New Zealand Limited
In this section we describe the work of the teams in Orion that together, enable our business to function. We set out what each team does, the number of people involved, and our operational and capital expenditure forecast for each team. We also describe the business information systems that support our administrative functions, and the fleet of vehicles we use to do our work and engage with the community.
Our engagement with customers, as described in Section 4, has informed how we need to prepare for their future needs. Our customers want a safe, reliable, resilient network and one that is built ready for them to take advantage of new technologies. To deliver this, we have increased resources in our information solutions team to support business process and systems development, and position Orion appropriately to meet our customers’ present and future expectations.
Our strategic focus on long term capability means we have reviewed and begun to reshape our approach to works delivery. These refinements will ensure we are able to deliver the initiatives and projects in this AMP and into the future.
Business model and capability evolution complements our ability to support a future that calls for us to have more knowledge of our network and the ability to operate with greater agility, be more customer responsive, and plan with flexibility for new technology that’s opening up a world of options for us and our customers. These changes will enable us to efficiently and cost effectively build the solutions for a more connected and interactive future.
In early 2020 we appointed a Group Transformation Lead and a Strategy Programme Lead to deliver on our Purpose and progress our strategic objectives at pace. In mid 2020, we appointed a Future Network Strategic Lead to bring momentum to this key strategic driver of our AMP.
These organisational changes and other initiatives to support our community’s evolving needs, delivery of the projects in this AMP and our increased focus on preparing for the future will result in a gradual increase in FTEs over the regulatory period.
The additional roles that will contribute to improvements to better meet our operational needs and our customers’ expectations are in the following work streams:
• Customer and stakeholder – we are adding specialist dedicated resources to open up new channels to engage with our customers and progress our customer centred service design
• Works delivery – we have instigated an alliance project management office with our primary service delivery partner, Connetics, to support our ability to efficiently deliver as described in Section 10, and ensure a safe and quality outcome for our customers and the wider community
8.1 Introduction
8.2 Gearing up for the future
These changes will enable us to efficiently and cost effectively build the solutions for a more connected and interactive future.
253
The systems operations and network support functional area covers the teams managing our network, including our Customer Support team and office-based system operations teams. Around three quarters of our people are in this functional area.
8.3.1 Infrastructure managementThis team is responsible for the overall direction and management of our infrastructure group.
8.3.2 Network managementOur network team is responsible for planning our network, managing our assets and packaging network programmes. This group also consists of the asset data systems team and the Orion Development Programme, Technical.
There are four teams in the group:
Network lifecycle & development team:
• develops appropriate whole of life strategies for our network assets
• monitors, analyses and reports on network performance, network failure analysis and condition of assets
• develops appropriate maintenance and replacement programmes, based on the above analysis
• develops an annual work plan and ensures progress against the plan is updated regularly
• forecasts changes in customer behaviour and demand
• identifies network constraints and develops network and non-network solutions
• provides the planning interface with Transpower
• documents our network development plans and forecasts
• monitors and analyses the impact of emerging technology
• responsible for production of the Asset Management Plan
Network programme team:
• identifies required works and develops scopes, works specifications and designs that meet our network standards and specifications
• ensures the work packages are suitable for delivery
• monitors the completion of works to our budget as set out in the AMP
Asset information team:
• manages and develops our network asset register and geospatial systems to ensure our network asset data is accurate and available for the effective management of our network
• manages the content, review and dissemination of certain controlled business documents, internally and externally
• manages and develops systems and procedures to ensure accurate network reliability statistics
Orion Development Programme, Technical:
• this programme mentors and develops our people as they progress through their focussed training – see 8.4.1
8.3.3 Network operationsOur network operations team includes our control centre, operations improvement, field response, and network access teams.
Control centre team:
• monitors and controls our electricity network in real time, 24/7
• provides safe network switching and fault restoration
• utilises load management to minimise peak load and maintain security
• provides load management assistance for all upper South Island EDBs
Operations improvement team:
• provides strategic direction in the operations area from identification, business case through to delivery of processes and projects that will deliver customer or safety enhancements
• delivers customer centric solutions and planning relating to how we operate the network
• coordinates the release of network equipment to service providers, while maintaining network security
• liaises with all parties to minimise planned outage frequency, size and duration
• allocates operators and generators to planned works
• notifies retailers to inform customers of planned power outages
Field response team:
• operates high and low voltage switchgear
• provides a first response to network and customer faults
• makes safe network equipment and customer premises for emergency services
• repairs minor faults
Network access team:
• coordinates and approves access to our network, including setting standards and writing training and assessment material for both employees and authorised service providers
• trains and assesses the competency of employees and service providers to enter and work in restricted areas, and to operate our network
• maintains a database of competencies held by every person accessing and working on our network
• develops operating manuals for equipment used on our network, and support material for our network operators
• reviews applications and issues, as appropriate, close approach permits to Orion-authorised service providers, third party service providers and members of the public who need to work closer than four meters from our overhead lines and support structures
8.3 System operations and network support
10 Year Asset Management Plan Section 8 Supporting our business
254 Orion New Zealand Limited
8.3 System operations and network support continued
• provides service providers and public safety advice and education for others who are working close to or around Orion assets
• provides stand-overs for safety on excavations or other work conducted by third parties on Orion’s sub-transmission asset
8.3.4 Customer and stakeholder – customer support team
Our customer support team is a key point of contact for our customers. The team:
• operates 24/7 and responds to approximately 2,500 calls from customers each month
• provides a point of contact for our customers seeking the help and reassurance of a real person
• provides customers with information about power outages, resolves complaints and assists with the supply of our services
8.3.5 Engineering teamOur engineering team provides support with engineering or technical issues and explores new opportunities to improve our network management. The team:
• focuses on ensuring a safe, reliable and effective network
• sets and maintains standards for materials and applications and maintains documentation associated with establishing, maintaining and developing our network assets
• researches and reviews new products and alternative options with a view to maximising network safety and reliability and minimising lifetime cost
• researches and evaluates latest trends in maintenance and replacement of assets
• investigates plant failure, manages protection setting data and keeps the integrity of control and protection systems at high levels
• works with our service providers when developing commissioning plans and the introduction of new standards and equipment
• analyses technical data and acts on the information to minimise the risk of loss of supply to network
8.3.6 Works delivery teamWe are currently transitioning to a Primary Service Delivery Partner (PSDP) model where the majority of the current delivery functions for Orion projects and programmes of work will be undertaken by the project management office within the PSDP. It is proposed that Connetics will undertake the role as the PSDP.
Orion will continue to be directly responsible for functions including:
• management of Orion’s property assets, from kiosks to substations to office buildings
• our vegetation management programme that has a key role in customer education and interaction
8.3.7 Customer connections teamThe customer connections team welcomes new customers to our network. The team:
• ensures customers are connected to the electricity network in a safe and cost effective way
• manages power quality – investigates complex Orion and customer network issues. Analyses voltage disturbance and deviation problems, predominantly in industrial and commercial customer groups, while offering support and education
• manages distributed generation –reviews and approves customer connected generation. Ensures safe connections
• manages street lighting and new technology connection management. Develops and maintains Distributed Unmetered Load Data Base for major customers. Ensures accuracy and integrity of SL data on GIS
• provides low voltage management – enables safe switching operations to be carried out on Orion’s network through accurate schematics and site identification
• creates and supports business processes to enable accurate updating of GIS
• manages HV labelling – enables safe switching operations to be carried out on Orion’s network through site and network circuit identification
• manages Orion-owned generators to ensure safe operation. During disaster recovery, provides a specialised team to work independently from the network to enable generator power restoration to communities
• undertakes technical surveys and provides concise and simple reporting
8.3.8 Procurement and land services teamThis team ensures Orion gets value for money and the level of service we expect from the services we contract in as well as securing Orion’s property and consenting interests. The team consists of our procurement and land services teams.
Procurement team:
• ensures appropriate contracts are in place for timely delivery of network services
• recommends appropriate contract models and frameworks
• ensures clear and unambiguous contract documentation for contract implementation
• ensures fair and reasonable contract management processes are implemented and maintained
• provides independent support for contract implementation, including:
• contract tendering
• support, monitoring and auditing of contract systems – including safety, quality assurance, service provider performance etc.
255
8.3 System operations and network support continued
• approving correct service provider payments and appropriate delegated authorities
• third party recovery where appropriate
Land services team:
• provides land and legal services for property acquisitions and disposals and the registration of interests, for example electrical easements
• provides services for the preparation and execution of property access agreements
• provides guidance on the Resource Management Act and local government compliance
• provides environmental and compliance advice related to land functions
• provides investigation services for third party damage
8.3.9 Quality, health, safety and environment (QHSE) team
The QHSE team ensures we work safely and our community can be confident Orion contributes to a safe and healthy environment. The team:
• provides governance over and continuous improvement of the Orion QHSE systems
• provides general QHSE advice to business and other stakeholders as required
• administers Vault, our safety information management system
• leads the QHSE audit program and delivers process assurance
• leads significant investigations
• coaches our Incident Cause Analysis Method (ICAM) investigation team and builds competency
• coordinates QHSE training initiatives
• provides QHSE assurance to Orion, board and management and the Electricity Engineer’s Association
8.3.10 System operations and network support expenditure forecast
The forecast for our operational expenditure for the activities of each of these teams in FY22 dollar terms is shown in Table 8.3.1.
Notes to expenditure:
• our most significant operational expenditure in these teams is remuneration for our employees.
• this chart does not include operational expenditure on our network assets
• it also does not include the following, consistent with the operational expend forecasts that are shown in non-network operational expenditure schedule 11b in Appendix F:
• pass-through costs, such as local authority rates and industry levies
• depreciation
• transmission purchases
10 Year Asset Management Plan Section 8 Supporting our business
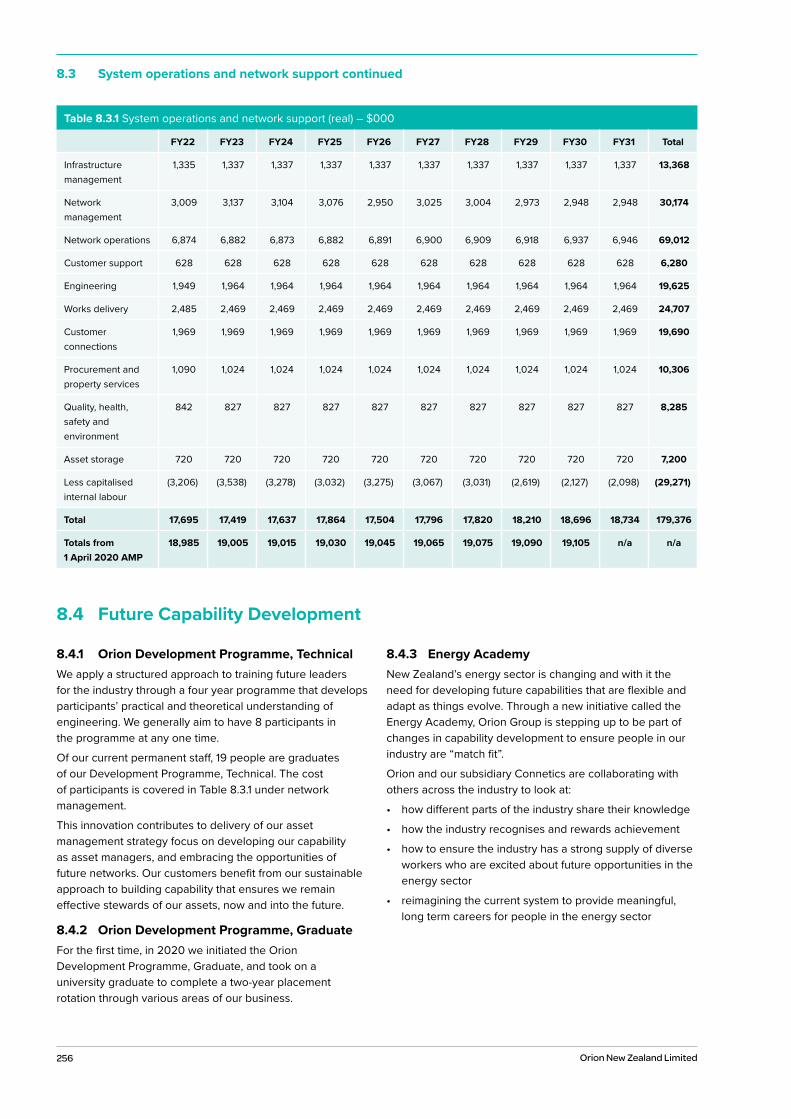
256 Orion New Zealand Limited
8.3 System operations and network support continued
Table 8.3.1 System operations and network support (real) – $000
FY22 FY23 FY24 FY25 FY26 FY27 FY28 FY29 FY30 FY31 Total
Infrastructure management
1,335 1,337 1,337 1,337 1,337 1,337 1,337 1,337 1,337 1,337 13,368
Network management
3,009 3,137 3,104 3,076 2,950 3,025 3,004 2,973 2,948 2,948 30,174
Network operations 6,874 6,882 6,873 6,882 6,891 6,900 6,909 6,918 6,937 6,946 69,012
Customer support 628 628 628 628 628 628 628 628 628 628 6,280
Engineering 1,949 1,964 1,964 1,964 1,964 1,964 1,964 1,964 1,964 1,964 19,625
Works delivery 2,485 2,469 2,469 2,469 2,469 2,469 2,469 2,469 2,469 2,469 24,707
Customer connections
1,969 1,969 1,969 1,969 1,969 1,969 1,969 1,969 1,969 1,969 19,690
Procurement and property services
1,090 1,024 1,024 1,024 1,024 1,024 1,024 1,024 1,024 1,024 10,306
Quality, health, safety and environment
842 827 827 827 827 827 827 827 827 827 8,285
Asset storage 720 720 720 720 720 720 720 720 720 720 7,200
Less capitalised internal labour
(3,206) (3,538) (3,278) (3,032) (3,275) (3,067) (3,031) (2,619) (2,127) (2,098) (29,271)
Total 17,695 17,419 17,637 17,864 17,504 17,796 17,820 18,210 18,696 18,734 179,376
Totals from 1 April 2020 AMP
18,985 19,005 19,015 19,030 19,045 19,065 19,075 19,090 19,105 n/a n/a
8.4.1 Orion Development Programme, TechnicalWe apply a structured approach to training future leaders for the industry through a four year programme that develops participants’ practical and theoretical understanding of engineering. We generally aim to have 8 participants in the programme at any one time.
Of our current permanent staff, 19 people are graduates of our Development Programme, Technical. The cost of participants is covered in Table 8.3.1 under network management.
This innovation contributes to delivery of our asset management strategy focus on developing our capability as asset managers, and embracing the opportunities of future networks. Our customers benefit from our sustainable approach to building capability that ensures we remain effective stewards of our assets, now and into the future.
8.4.2 Orion Development Programme, GraduateFor the first time, in 2020 we initiated the Orion Development Programme, Graduate, and took on a university graduate to complete a two-year placement rotation through various areas of our business.
8.4.3 Energy AcademyNew Zealand’s energy sector is changing and with it the need for developing future capabilities that are flexible and adapt as things evolve. Through a new initiative called the Energy Academy, Orion Group is stepping up to be part of changes in capability development to ensure people in our industry are “match fit”.
Orion and our subsidiary Connetics are collaborating with others across the industry to look at:
• how different parts of the industry share their knowledge
• how the industry recognises and rewards achievement
• how to ensure the industry has a strong supply of diverse workers who are excited about future opportunities in the energy sector
• reimagining the current system to provide meaningful, long term careers for people in the energy sector
8.4 Future Capability Development
257
Around one quarter of our people work in this functional area.
8.5.1 Leadership teamThe leadership team sets the direction of the company, provides overall company leadership and oversees key stakeholder interaction.
This team also leads the Group strategy development, transformation strategy and implementation.
8.5.2 People and capabilityThis team provides strategic, tactical and operational support and advice to the business in the people/HR space, including payroll and wellbeing.
By supporting our leaders and managers to build capability we seek to achieve the best organisational results through our people
8.5.3 Strategic servicesStrategic services ensures we have the operating model and processes in place to deliver on our Group Strategy. This includes providing the people and systems capability to ensure we have a network fit for the future. This team works across the organisation to ensure we can efficiently and effectively meet our customer’s needs and expectations now and into the future.
8.5.4 FinanceThis team is responsible for financial reporting and administering Orion’s internal audit programme. It is also responsible for treasury, tax and tax compliance, regulatory reporting, budgets, accounts payable and receivable, financial forecasting, job management, financial tax and regulatory fixed asset registers and support for financial systems. Our Privacy officer is a member of this team.
8.5.5 Information solutionsThis team is responsible for delivering our information systems, including all information technology infrastructure.
We operate maintenance agreements for larger corporate systems, financials, document management, payroll, and productivity software. Our agreements cover on-premise systems that are normally supported directly by our own people as well as off-premise, cloud based systems.
We review all software agreements annually.
Our information solutions team is in-sourced and salaries are the largest single component of its operational expenditure. Team members are divided evenly among IT services and infrastructure, system development and business change, and the administration of the real time systems which are used to operate Orion’s electricity network.
Led by the Future Networks Strategic Lead the team is also is responsible for the design and delivery of Orion’s future network operating model and for leading the business in understanding Distribution System Operation (DSO) and the opportunities it presents.
The Future Networks Strategic Lead also directs the work of cross functional teams that investigate, prototype and recommend solutions that affect the operation of the future network.
8.5.6 CommercialThis team’s responsibilities include pricing, regulation, billing and future development. This team leads:
• our engagement with and submissions to the CommerceCommission, Electricity Authority and other industryregulators
• our network delivery pricing approach and billing toretailers and major customers
8.5.7 Customer and stakeholderThis team is responsible for engaging with our community and key stakeholders, to:
• identify their needs and work with our business to ensurewe can best meet these needs
• build key community relationships to enable us to deliveron our strategic community objectives
• lead internal and external communications includingpublic relations and social media
This team leads Orion’s focus on sustainability:
• understanding our carbon footprint
• directs our sustainability activity on both our networkand in the wider community in support of addressingclimate change opportunities and issues
• builds sustainability partnerships in the community
The team also focuses on improving our customer service:
• understands our customers’ needs
• co-creates service offerings with our customers andpartners
• facilitates customer inspired conversations aboutfuture power options
8.5.8 BoardWe have a board of six non-executive directors, with extensive governance and commercial experience.
8.5.9 InsuranceWe purchase insurance to transfer specified financial risks to insurers. The fees forecast are shown in Table 8.5.1.
8.5.10 Business support operational expenditure forecast
The forecast for the activities of each of these teams in FY22 dollar terms can be found in Table 8.5.1.
8.5 Business support
10 Year Asset Management Plan Section 8 Supporting our business
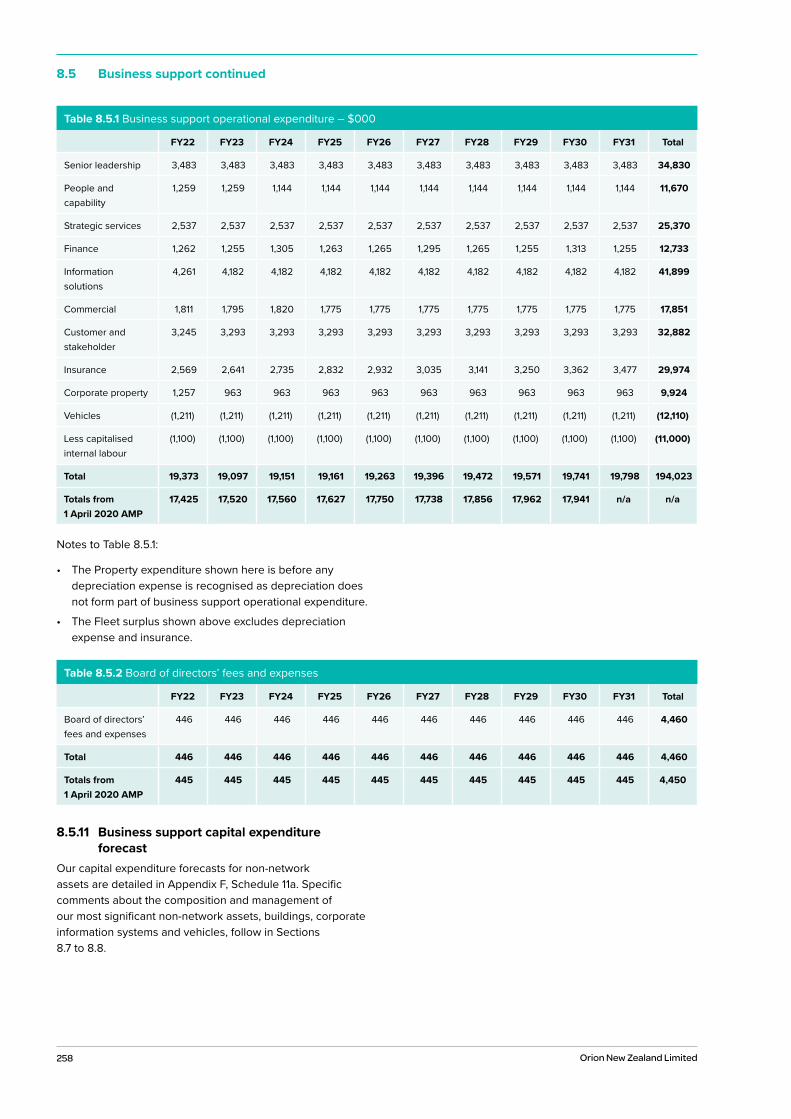
258 Orion New Zealand Limited
8.5 Business support continued
Notes to Table 8.5.1:
• The Property expenditure shown here is before any depreciation expense is recognised as depreciation does not form part of business support operational expenditure.
• The Fleet surplus shown above excludes depreciation expense and insurance.
Table 8.5.1 Business support operational expenditure – $000
FY22 FY23 FY24 FY25 FY26 FY27 FY28 FY29 FY30 FY31 Total
Senior leadership 3,483 3,483 3,483 3,483 3,483 3,483 3,483 3,483 3,483 3,483 34,830
People and capability
1,259 1,259 1,144 1,144 1,144 1,144 1,144 1,144 1,144 1,144 11,670
Strategic services 2,537 2,537 2,537 2,537 2,537 2,537 2,537 2,537 2,537 2,537 25,370
Finance 1,262 1,255 1,305 1,263 1,265 1,295 1,265 1,255 1,313 1,255 12,733
Information solutions
4,261 4,182 4,182 4,182 4,182 4,182 4,182 4,182 4,182 4,182 41,899
Commercial 1,811 1,795 1,820 1,775 1,775 1,775 1,775 1,775 1,775 1,775 17,851
Customer and stakeholder
3,245 3,293 3,293 3,293 3,293 3,293 3,293 3,293 3,293 3,293 32,882
Insurance 2,569 2,641 2,735 2,832 2,932 3,035 3,141 3,250 3,362 3,477 29,974
Corporate property 1,257 963 963 963 963 963 963 963 963 963 9,924
Vehicles (1,211) (1,211) (1,211) (1,211) (1,211) (1,211) (1,211) (1,211) (1,211) (1,211) (12,110)
Less capitalised internal labour
(1,100) (1,100) (1,100) (1,100) (1,100) (1,100) (1,100) (1,100) (1,100) (1,100) (11,000)
Total 19,373 19,097 19,151 19,161 19,263 19,396 19,472 19,571 19,741 19,798 194,023
Totals from 1 April 2020 AMP
17,425 17,520 17,560 17,627 17,750 17,738 17,856 17,962 17,941 n/a n/a
Table 8.5.2 Board of directors’ fees and expenses
FY22 FY23 FY24 FY25 FY26 FY27 FY28 FY29 FY30 FY31 Total
Board of directors’ fees and expenses
446 446 446 446 446 446 446 446 446 446 4,460
Total 446 446 446 446 446 446 446 446 446 446 4,460
Totals from 1 April 2020 AMP
445 445 445 445 445 445 445 445 445 445 4,450
8.5.11 Business support capital expenditure forecast
Our capital expenditure forecasts for non-network assets are detailed in Appendix F, Schedule 11a. Specific comments about the composition and management of our most significant non-network assets, buildings, corporate information systems and vehicles, follow in Sections 8.7 to 8.8.
259
8.6.1 Asset descriptionOur corporate property portfolio covers our administration building at 565 Wairakei Road, Connetics’ Waterloo base and rental properties throughout the Canterbury region. Our corporate properties vary in both construction and age.
• Administration building – our Wairakei Rd administrationbuilding was built in FY14.
• Connetics’ Waterloo base – Connetics moved to a new,purpose-built facility in Waterloo Business Park in FY18to provide a more operationally efficient and resilient basefor its operations. Orion owns the depot with Conneticsentering a long-term ‘arms-length’ lease.
• Rental properties – we own nine rental properties fourof which are residential properties adjacent to zonesubstations. Some of these were acquired as part of apackage when substation land was purchased. Othershave been strategically purchased to allow the substationto expand if necessary. We receive income from theseproperties, provided they are tenanted, and this rentalincome is in line with the rental market in theChristchurch area.
We are a lifelines utility under the Civil Defence Emergency Management Act 2002, providing essential services to the community. This means we are required to be operational after a significant event. Our administration building was built to Importance Level 4 (IL4). This means that the building is designed to remain operational following a 1 in 500 year seismic event. The building is also equipped with a standby generator, with 500 litre diesel tank, which is able to provide back-up power.
As part of our Pandemic Response Plan, and to support protocols we put in place during COVID-19 we established a permanent emergency operational centre for our Controllers and Customer Support team at our Papanui Zone Substation.
Our property assets must meet the following criteria:
• they must be fit for purpose and maintained in areasonable condition so the occupier can fully utilisethe premises
• they shall comply with all building, health and safetystandards that may apply
• they must be visually acceptable
8.6.2 Maintenance planWe have no assigned ‘end of life’ for our corporate properties. Our property asset management programme ensures our corporate property is managed in a manner that is consistent with Orion’s corporate obligations to deliver an effective and efficient service.
We carry out regular inspections of our buildings to ensure they remain in good condition and any need for maintenance is identified. Several databases are used to assist us with the management process such as our asset register and our works management system. The risks that our corporate buildings are exposed to are listed below, in no particular order of importance:
• seismic damage
• liquefaction and subsidence
• defective drainage and guttering
• roof leaks
• vegetation/tree roots
• vandalism – repairs carried out as soon as reported
• rust and rot
• extreme weather conditions
• fire
• graffiti
Minor repairs are undertaken as they are identified in the inspection process. Major repair and maintenance work is scheduled, budgeted for and undertaken on an annual basis. Vandalism and graffiti is fixed as soon as we are notified. We have maintenance contracts in place with several service providers to ensure that all aspects of our property and land maintenance are covered. These include:
Our property assets must meet the following criteria:
• grounds maintenance
• building services maintenance
• graffiti removal
Our budgeted maintenance costs are in Section 9.2.1.
8.6.3 Replacement planWe have no replacement plan for our corporate properties. These assets are maintained to ensure they provide the required levels of performance. Our budgeted replacement costs are in Section 9.2.4 — Capex — Non network.
8.6 Corporate properties
We are a lifelines utility under the Civil Defence Emergency Management Act 2002, providing essential services to the community.
10 Year Asset Management Plan Section 8 Supporting our business
260 Orion New Zealand Limited
8.7.1 Asset descriptionOur corporate business information systems and productivity software support processes that run across Orion. They include financial systems, employee management systems, for example human resources, payroll, health and safety and personal productivity software such as desktop applications, email, web and document management.
Our supporting computing infrastructure hosts, connects and provides access to our information systems. In most cases we manage our computing infrastructure in house because of the critical nature of some of our information systems and the need for them to be continuously connected in real time to equipment on the electricity network.
We deliver services on a system hosted by a third party where appropriate, such as our PayGlobal payroll system and parts of our website. This category includes:
• HR/payroll – as a cloud based application the performance and availability of this system is subject to a service level agreement.
• Email system – the capacity and performance of our Email system is adequate for the period of this plan if there are no major changes required. Our email system is a mature and well established application. It will be integrated with document management as part of the current implementation.
• Desktop/laptop clients and operating systems – our choice of operating system and desktop software capacity/performance are adequate for the period of this plan. The desktop operating system is current and subject to regular security and performance updates from Microsoft. Changes may be forced on us in the future as new equipment becomes unsupported on the current version.
• Replicated computer room – we operate two Transportable Data Centres linked by diverse fibre networks which are both performing to expectations.
• VM and SAN – our VMware Virtual Server and Storage Area Network infrastructure is managed through a life cycle and regularly upgraded before performance issues arise or warranties expire. Capacity and performance are adequate for the period of this plan.
• Physical servers – we still occasionally use individual physical service for specific applications. As with all our infrastructure we manage these servers through a lifecycle. The health of these servers are monitored and we typically replace servers of this type in three to five years.
• Desktops, laptops, tablets – we typically upgrade our desktops and laptops on a three-yearly cycle. We expect that the capacity and performance of this equipment will not be adequate for the period of this plan.
• Financial Management Information System (FMIS) – our FMIS (Microsoft Nav) delivers our core accounting functions which includes general ledger, debtors, creditors, job costing, fixed assets and tax registers.
8.7.2 Maintenance planAll corporate systems are supported directly by our Information Solutions group with vendor agreements for third tier support where appropriate.
We employ a strict change management regime and software releases and patches are applied to systems as necessary and only after testing.
Production systems are subject to business continuity standards which include:
• an environment that includes development, test and production versions
• mirroring of systems between two facilities to safeguard against loss of a single system or a complete facility
• archiving to tapes which are stored off site at a third party
• change management processes
• least privilege security practices
Our budgeted maintenance costs are shown in Section 9.2.1.
8.7.3 Replacement planWe employ a rigorous change management approach to all software and hardware systems. Major changes to all corporate business information systems will follow a project proposal, business case approval, business requirements.
All project costs are capitalised, including around $0.3m of software development labour per annum.
Our budgeted replacement costs are shown in Section 9.2.4.
8.7 Corporate information systems
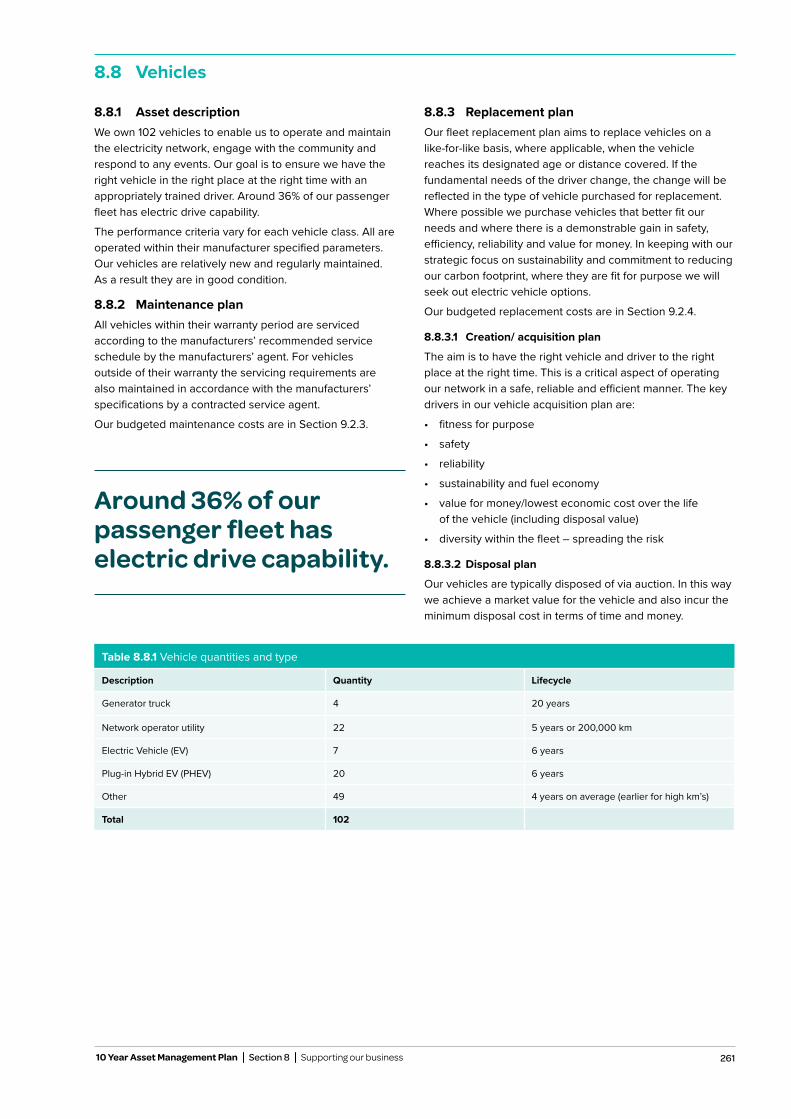
261
8.8.1 Asset descriptionWe own 102 vehicles to enable us to operate and maintain the electricity network, engage with the community and respond to any events. Our goal is to ensure we have the right vehicle in the right place at the right time with an appropriately trained driver. Around 36% of our passenger fleet has electric drive capability.
The performance criteria vary for each vehicle class. All are operated within their manufacturer specified parameters. Our vehicles are relatively new and regularly maintained. As a result they are in good condition.
8.8.2 Maintenance planAll vehicles within their warranty period are serviced according to the manufacturers’ recommended service schedule by the manufacturers’ agent. For vehicles outside of their warranty the servicing requirements are also maintained in accordance with the manufacturers’ specifications by a contracted service agent.
Our budgeted maintenance costs are in Section 9.2.3.
8.8.3 Replacement planOur fleet replacement plan aims to replace vehicles on a like-for-like basis, where applicable, when the vehicle reaches its designated age or distance covered. If the fundamental needs of the driver change, the change will be reflected in the type of vehicle purchased for replacement. Where possible we purchase vehicles that better fit our needs and where there is a demonstrable gain in safety, efficiency, reliability and value for money. In keeping with our strategic focus on sustainability and commitment to reducing our carbon footprint, where they are fit for purpose we will seek out electric vehicle options.
Our budgeted replacement costs are in Section 9.2.4.
8.8.3.1 Creation/ acquisition plan
The aim is to have the right vehicle and driver to the right place at the right time. This is a critical aspect of operating our network in a safe, reliable and efficient manner. The key drivers in our vehicle acquisition plan are:
• fitness for purpose
• safety
• reliability
• sustainability and fuel economy
• value for money/lowest economic cost over the life of the vehicle (including disposal value)
• diversity within the fleet – spreading the risk
8.8.3.2 Disposal plan
Our vehicles are typically disposed of via auction. In this way we achieve a market value for the vehicle and also incur the minimum disposal cost in terms of time and money.
8.8 Vehicles
Around 36% of our passenger fleet has electric drive capability.
Table 8.8.1 Vehicle quantities and type
Description Quantity Lifecycle
Generator truck 4 20 years
Network operator utility 22 5 years or 200,000 km
Electric Vehicle (EV) 7 6 years
Plug-in Hybrid EV (PHEV) 20 6 years
Other 49 4 years on average (earlier for high km’s)
Total 102
10 Year Asset Management Plan Section 8 Supporting our business

262 Orion New Zealand Limited

263 10 Year Asset Management Plan Section 1 Summary
9Financial
forecasting
$272m
$378m
$746m
Network operating expenditure
Non-network operating expenditure
Capital expenditure

264 Orion New Zealand Limited
Photo: Orion’s network extends out to sea, lighting up New Brighton Pier.
265 10 Year Asset Management Plan Section 1 Summary
9.2.1 Opex non-network 271
9.2.2 Board of directors’ fees and expenses 271
9.2.3 Business support 272
9.2.4 Capex non-network 272
9.4.1 Opex – network 273
9.4.2 Capex – network 273
9.4.3 Connections / extensions 273
9.4.4 Asset relocations 273
9.4.5 HV minor projects 273
9.4.6 LV projects 273
9.4.7 Major projects 273
9.5.1 Network opex variation 274
9.5.2 Network capex variation 274
9.1 Network expenditure forecasts 266
9.2 Non-network expenditure forecasts 271
9.3 Total capital and operations expenditure 272
9.4 Changes from our previous forecasts 273
9.5 Expenditure variation 274
Contents
265 10 Year Asset Management Plan Section 9 Financial forecasting
9.1.1 Opex – network 266
9.1.2 Opex – network (Commerce Commission’s categories) 267
9.1.3 Opex contributions revenue 267
9.1.4 Capex summary 267
9.1.5 Capital contributions revenue 268
9.1.6 Capex – customer connections / network extensions 268
9.1.7 Asset relocations / conversions 268
9.1.8 Capex – replacement 269
9.1.9 Capex – replacement (Commerce Commission’s categories) 270
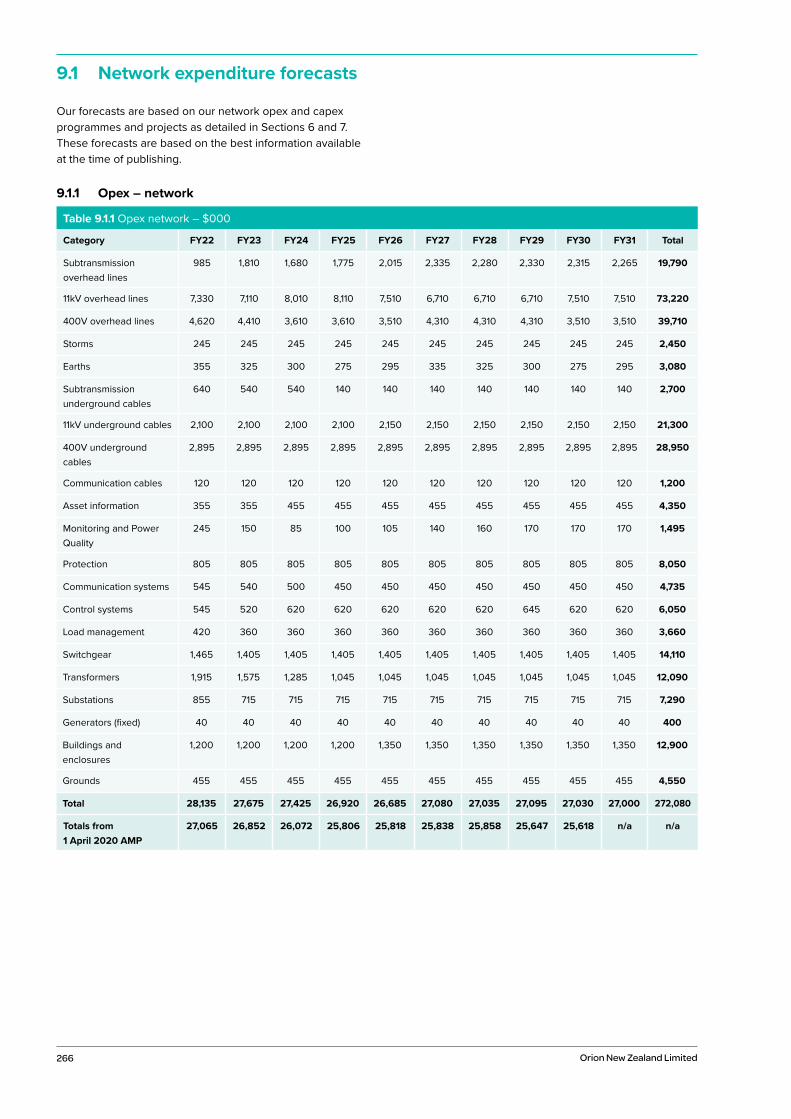
266 Orion New Zealand Limited
Our forecasts are based on our network opex and capex programmes and projects as detailed in Sections 6 and 7. These forecasts are based on the best information available at the time of publishing.
9.1 Network expenditure forecasts
9.1.1 Opex – network
Table 9.1.1 Opex network – $000
Category FY22 FY23 FY24 FY25 FY26 FY27 FY28 FY29 FY30 FY31 Total
Subtransmission overhead lines
985 1,810 1,680 1,775 2,015 2,335 2,280 2,330 2,315 2,265 19,790
11kV overhead lines 7,330 7,110 8,010 8,110 7,510 6,710 6,710 6,710 7,510 7,510 73,220
400V overhead lines 4,620 4,410 3,610 3,610 3,510 4,310 4,310 4,310 3,510 3,510 39,710
Storms 245 245 245 245 245 245 245 245 245 245 2,450
Earths 355 325 300 275 295 335 325 300 275 295 3,080
Subtransmission underground cables
640 540 540 140 140 140 140 140 140 140 2,700
11kV underground cables 2,100 2,100 2,100 2,100 2,150 2,150 2,150 2,150 2,150 2,150 21,300
400V underground cables
2,895 2,895 2,895 2,895 2,895 2,895 2,895 2,895 2,895 2,895 28,950
Communication cables 120 120 120 120 120 120 120 120 120 120 1,200
Asset information 355 355 455 455 455 455 455 455 455 455 4,350
Monitoring and Power Quality
245 150 85 100 105 140 160 170 170 170 1,495
Protection 805 805 805 805 805 805 805 805 805 805 8,050
Communication systems 545 540 500 450 450 450 450 450 450 450 4,735
Control systems 545 520 620 620 620 620 620 645 620 620 6,050
Load management 420 360 360 360 360 360 360 360 360 360 3,660
Switchgear 1,465 1,405 1,405 1,405 1,405 1,405 1,405 1,405 1,405 1,405 14,110
Transformers 1,915 1,575 1,285 1,045 1,045 1,045 1,045 1,045 1,045 1,045 12,090
Substations 855 715 715 715 715 715 715 715 715 715 7,290
Generators (fixed) 40 40 40 40 40 40 40 40 40 40 400
Buildings and enclosures
1,200 1,200 1,200 1,200 1,350 1,350 1,350 1,350 1,350 1,350 12,900
Grounds 455 455 455 455 455 455 455 455 455 455 4,550
Total 28,135 27,675 27,425 26,920 26,685 27,080 27,035 27,095 27,030 27,000 272,080
Totals from 1 April 2020 AMP
27,065 26,852 26,072 25,806 25,818 25,838 25,858 25,647 25,618 n/a n/a
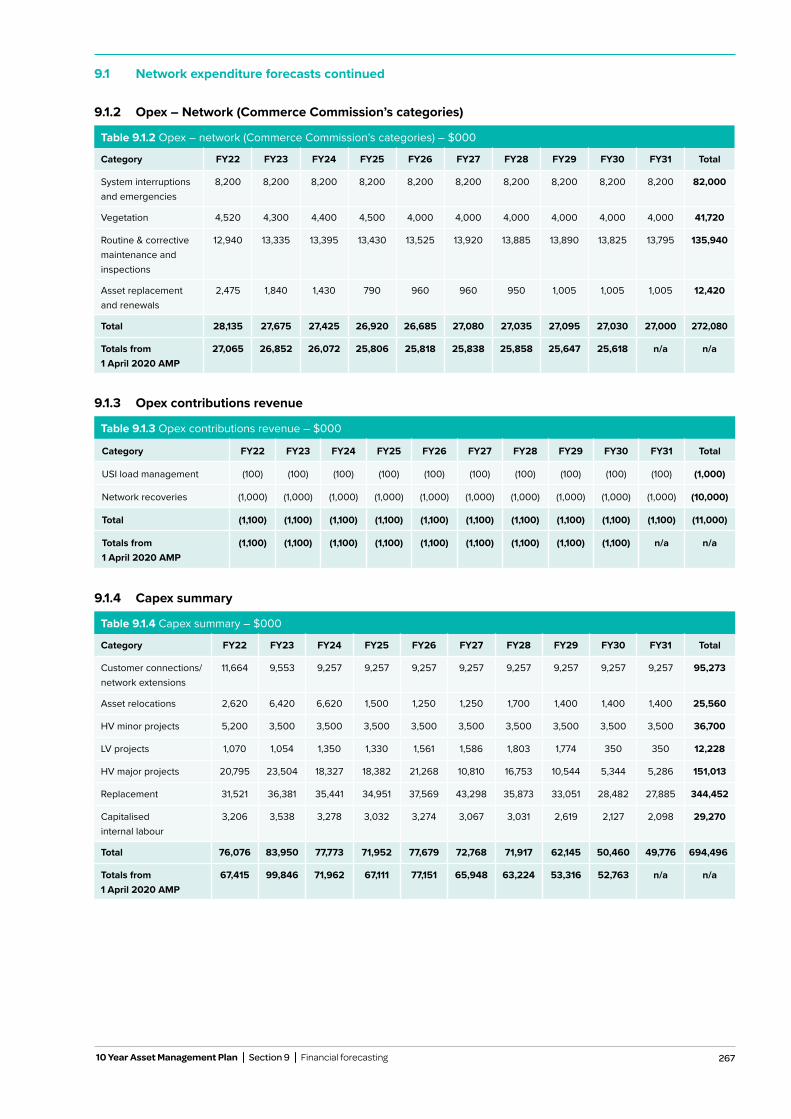
267
9.1.2 Opex – Network (Commerce Commission’s categories)
Table 9.1.2 Opex – network (Commerce Commission’s categories) – $000
Category FY22 FY23 FY24 FY25 FY26 FY27 FY28 FY29 FY30 FY31 Total
System interruptions and emergencies
8,200 8,200 8,200 8,200 8,200 8,200 8,200 8,200 8,200 8,200 82,000
Vegetation 4,520 4,300 4,400 4,500 4,000 4,000 4,000 4,000 4,000 4,000 41,720
Routine & corrective maintenance and inspections
12,940 13,335 13,395 13,430 13,525 13,920 13,885 13,890 13,825 13,795 135,940
Asset replacement and renewals
2,475 1,840 1,430 790 960 960 950 1,005 1,005 1,005 12,420
Total 28,135 27,675 27,425 26,920 26,685 27,080 27,035 27,095 27,030 27,000 272,080
Totals from 1 April 2020 AMP
27,065 26,852 26,072 25,806 25,818 25,838 25,858 25,647 25,618 n/a n/a
9.1.3 Opex contributions revenue
Table 9.1.3 Opex contributions revenue – $000
Category FY22 FY23 FY24 FY25 FY26 FY27 FY28 FY29 FY30 FY31 Total
USI load management (100) (100) (100) (100) (100) (100) (100) (100) (100) (100) (1,000)
Network recoveries (1,000) (1,000) (1,000) (1,000) (1,000) (1,000) (1,000) (1,000) (1,000) (1,000) (10,000)
Total (1,100) (1,100) (1,100) (1,100) (1,100) (1,100) (1,100) (1,100) (1,100) (1,100) (11,000)
Totals from 1 April 2020 AMP
(1,100) (1,100) (1,100) (1,100) (1,100) (1,100) (1,100) (1,100) (1,100) n/a n/a
9.1.4 Capex summary
Table 9.1.4 Capex summary – $000
Category FY22 FY23 FY24 FY25 FY26 FY27 FY28 FY29 FY30 FY31 Total
Customer connections/ network extensions
11,664 9,553 9,257 9,257 9,257 9,257 9,257 9,257 9,257 9,257 95,273
Asset relocations 2,620 6,420 6,620 1,500 1,250 1,250 1,700 1,400 1,400 1,400 25,560
HV minor projects 5,200 3,500 3,500 3,500 3,500 3,500 3,500 3,500 3,500 3,500 36,700
LV projects 1,070 1,054 1,350 1,330 1,561 1,586 1,803 1,774 350 350 12,228
HV major projects 20,795 23,504 18,327 18,382 21,268 10,810 16,753 10,544 5,344 5,286 151,013
Replacement 31,521 36,381 35,441 34,951 37,569 43,298 35,873 33,051 28,482 27,885 344,452
Capitalised internal labour
3,206 3,538 3,278 3,032 3,274 3,067 3,031 2,619 2,127 2,098 29,270
Total 76,076 83,950 77,773 71,952 77,679 72,768 71,917 62,145 50,460 49,776 694,496
Totals from 1 April 2020 AMP
67,415 99,846 71,962 67,111 77,151 65,948 63,224 53,316 52,763 n/a n/a
9.1 Network expenditure forecasts continued
10 Year Asset Management Plan Section 9 Financial forecasting
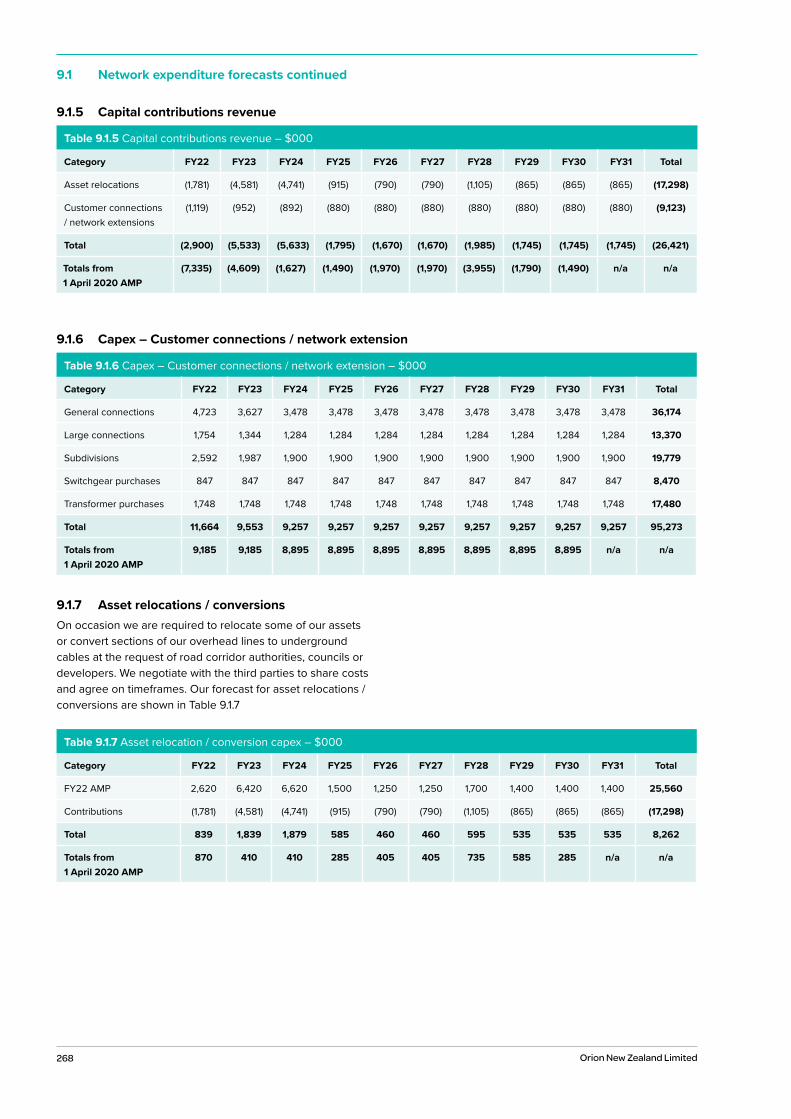
268 Orion New Zealand Limited
9.1.5 Capital contributions revenue
Table 9.1.5 Capital contributions revenue – $000
Category FY22 FY23 FY24 FY25 FY26 FY27 FY28 FY29 FY30 FY31 Total
Asset relocations (1,781) (4,581) (4,741) (915) (790) (790) (1,105) (865) (865) (865) (17,298)
Customer connections / network extensions
(1,119) (952) (892) (880) (880) (880) (880) (880) (880) (880) (9,123)
Total (2,900) (5,533) (5,633) (1,795) (1,670) (1,670) (1,985) (1,745) (1,745) (1,745) (26,421)
Totals from 1 April 2020 AMP
(7,335) (4,609) (1,627) (1,490) (1,970) (1,970) (3,955) (1,790) (1,490) n/a n/a
Table 9.1.6 Capex – Customer connections / network extension – $000
Category FY22 FY23 FY24 FY25 FY26 FY27 FY28 FY29 FY30 FY31 Total
General connections 4,723 3,627 3,478 3,478 3,478 3,478 3,478 3,478 3,478 3,478 36,174
Large connections 1,754 1,344 1,284 1,284 1,284 1,284 1,284 1,284 1,284 1,284 13,370
Subdivisions 2,592 1,987 1,900 1,900 1,900 1,900 1,900 1,900 1,900 1,900 19,779
Switchgear purchases 847 847 847 847 847 847 847 847 847 847 8,470
Transformer purchases 1,748 1,748 1,748 1,748 1,748 1,748 1,748 1,748 1,748 1,748 17,480
Total 11,664 9,553 9,257 9,257 9,257 9,257 9,257 9,257 9,257 9,257 95,273
Totals from 1 April 2020 AMP
9,185 9,185 8,895 8,895 8,895 8,895 8,895 8,895 8,895 n/a n/a
9.1.7 Asset relocations / conversions On occasion we are required to relocate some of our assets or convert sections of our overhead lines to underground cables at the request of road corridor authorities, councils or developers. We negotiate with the third parties to share costs and agree on timeframes. Our forecast for asset relocations / conversions are shown in Table 9.1.7
Table 9.1.7 Asset relocation / conversion capex – $000
Category FY22 FY23 FY24 FY25 FY26 FY27 FY28 FY29 FY30 FY31 Total
FY22 AMP 2,620 6,420 6,620 1,500 1,250 1,250 1,700 1,400 1,400 1,400 25,560
Contributions (1,781) (4,581) (4,741) (915) (790) (790) (1,105) (865) (865) (865) (17,298)
Total 839 1,839 1,879 585 460 460 595 535 535 535 8,262
Totals from 1 April 2020 AMP
870 410 410 285 405 405 735 585 285 n/a n/a
9.1 Network expenditure forecasts continued
9.1.6 Capex – Customer connections / network extension
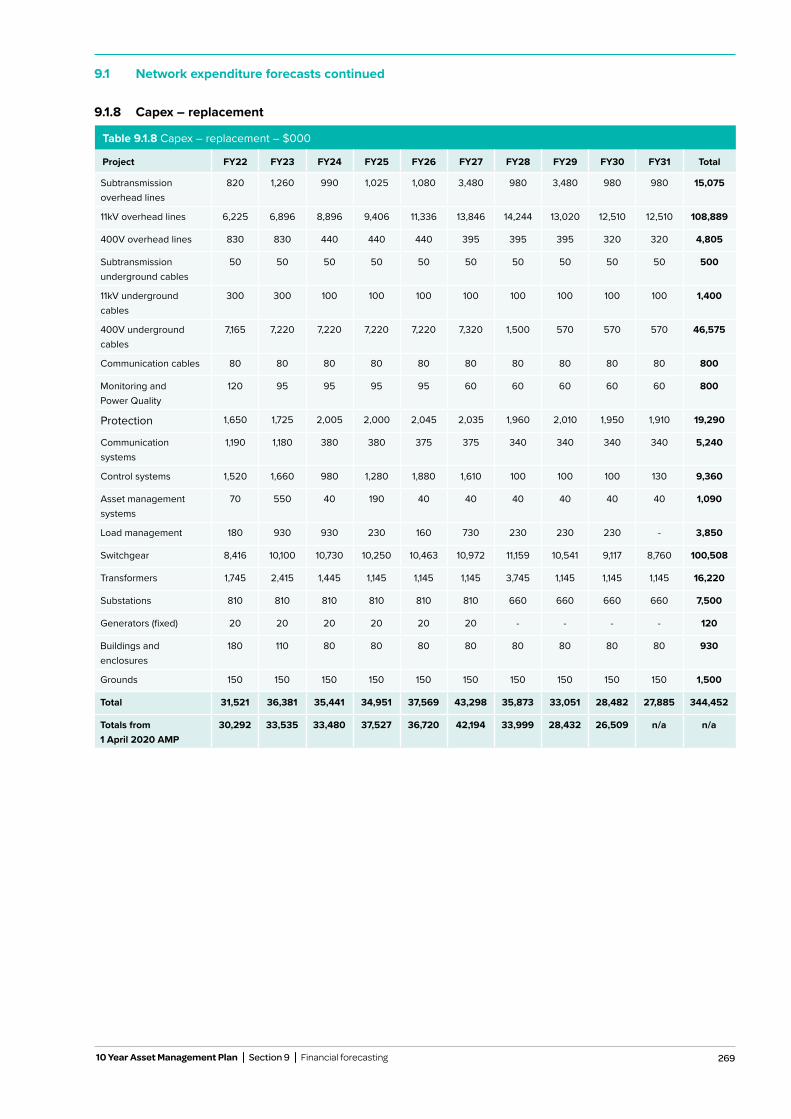
269
9.1.8 Capex – replacement
Table 9.1.8 Capex – replacement – $000
Project FY22 FY23 FY24 FY25 FY26 FY27 FY28 FY29 FY30 FY31 Total
Subtransmission overhead lines
820 1,260 990 1,025 1,080 3,480 980 3,480 980 980 15,075
11kV overhead lines 6,225 6,896 8,896 9,406 11,336 13,846 14,244 13,020 12,510 12,510 108,889
400V overhead lines 830 830 440 440 440 395 395 395 320 320 4,805
Subtransmission underground cables
50 50 50 50 50 50 50 50 50 50 500
11kV underground cables
300 300 100 100 100 100 100 100 100 100 1,400
400V underground cables
7,165 7,220 7,220 7,220 7,220 7,320 1,500 570 570 570 46,575
Communication cables 80 80 80 80 80 80 80 80 80 80 800
Monitoring and Power Quality
120 95 95 95 95 60 60 60 60 60 800
Protection 1,650 1,725 2,005 2,000 2,045 2,035 1,960 2,010 1,950 1,910 19,290
Communication systems
1,190 1,180 380 380 375 375 340 340 340 340 5,240
Control systems 1,520 1,660 980 1,280 1,880 1,610 100 100 100 130 9,360
Asset management systems
70 550 40 190 40 40 40 40 40 40 1,090
Load management 180 930 930 230 160 730 230 230 230 - 3,850
Switchgear 8,416 10,100 10,730 10,250 10,463 10,972 11,159 10,541 9,117 8,760 100,508
Transformers 1,745 2,415 1,445 1,145 1,145 1,145 3,745 1,145 1,145 1,145 16,220
Substations 810 810 810 810 810 810 660 660 660 660 7,500
Generators (fixed) 20 20 20 20 20 20 - - - - 120
Buildings and enclosures
180 110 80 80 80 80 80 80 80 80 930
Grounds 150 150 150 150 150 150 150 150 150 150 1,500
Total 31,521 36,381 35,441 34,951 37,569 43,298 35,873 33,051 28,482 27,885 344,452
Totals from 1 April 2020 AMP
30,292 33,535 33,480 37,527 36,720 42,194 33,999 28,432 26,509 n/a n/a
9.1 Network expenditure forecasts continued
10 Year Asset Management Plan Section 9 Financial forecasting
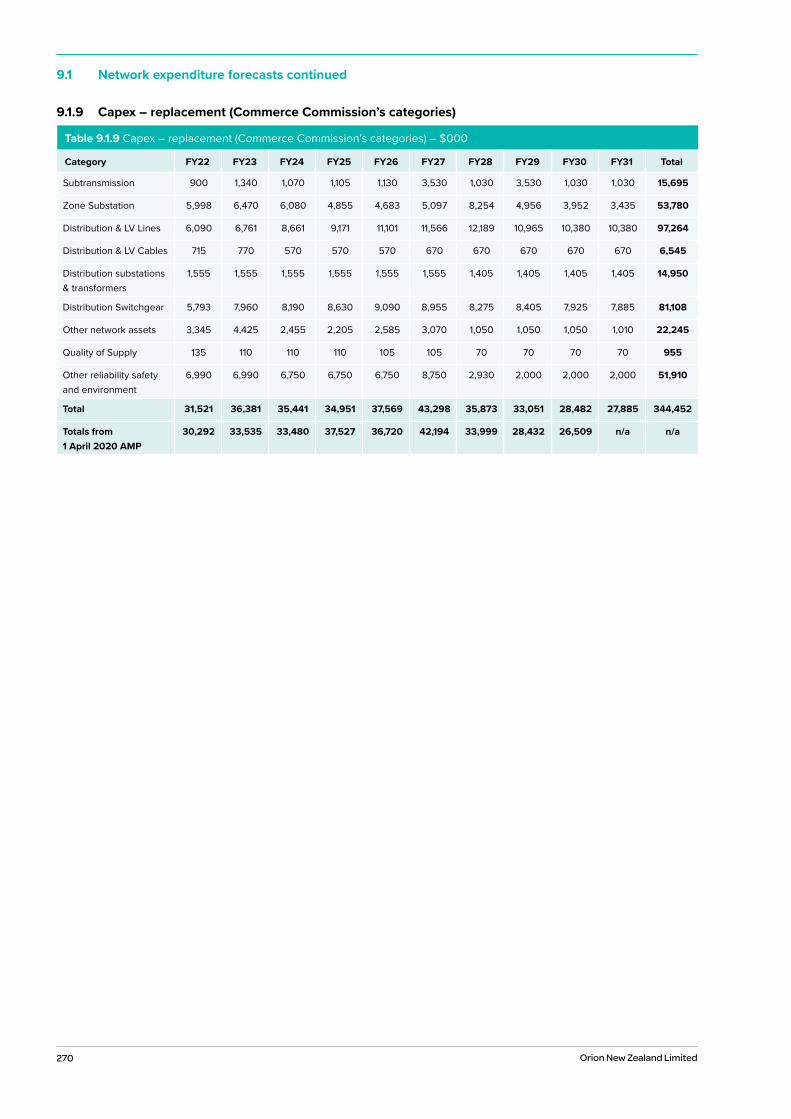
270 Orion New Zealand Limited
9.1 Network expenditure forecasts continued
9.1.9 Capex – replacement (Commerce Commission’s categories)
Table 9.1.9 Capex – replacement (Commerce Commission’s categories) – $000
Category FY22 FY23 FY24 FY25 FY26 FY27 FY28 FY29 FY30 FY31 Total
Subtransmission 900 1,340 1,070 1,105 1,130 3,530 1,030 3,530 1,030 1,030 15,695
Zone Substation 5,998 6,470 6,080 4,855 4,683 5,097 8,254 4,956 3,952 3,435 53,780
Distribution & LV Lines 6,090 6,761 8,661 9,171 11,101 11,566 12,189 10,965 10,380 10,380 97,264
Distribution & LV Cables 715 770 570 570 570 670 670 670 670 670 6,545
Distribution substations & transformers
1,555 1,555 1,555 1,555 1,555 1,555 1,405 1,405 1,405 1,405 14,950
Distribution Switchgear 5,793 7,960 8,190 8,630 9,090 8,955 8,275 8,405 7,925 7,885 81,108
Other network assets 3,345 4,425 2,455 2,205 2,585 3,070 1,050 1,050 1,050 1,010 22,245
Quality of Supply 135 110 110 110 105 105 70 70 70 70 955
Other reliability safety and environment
6,990 6,990 6,750 6,750 6,750 8,750 2,930 2,000 2,000 2,000 51,910
Total 31,521 36,381 35,441 34,951 37,569 43,298 35,873 33,051 28,482 27,885 344,452
Totals from 1 April 2020 AMP
30,292 33,535 33,480 37,527 36,720 42,194 33,999 28,432 26,509 n/a n/a
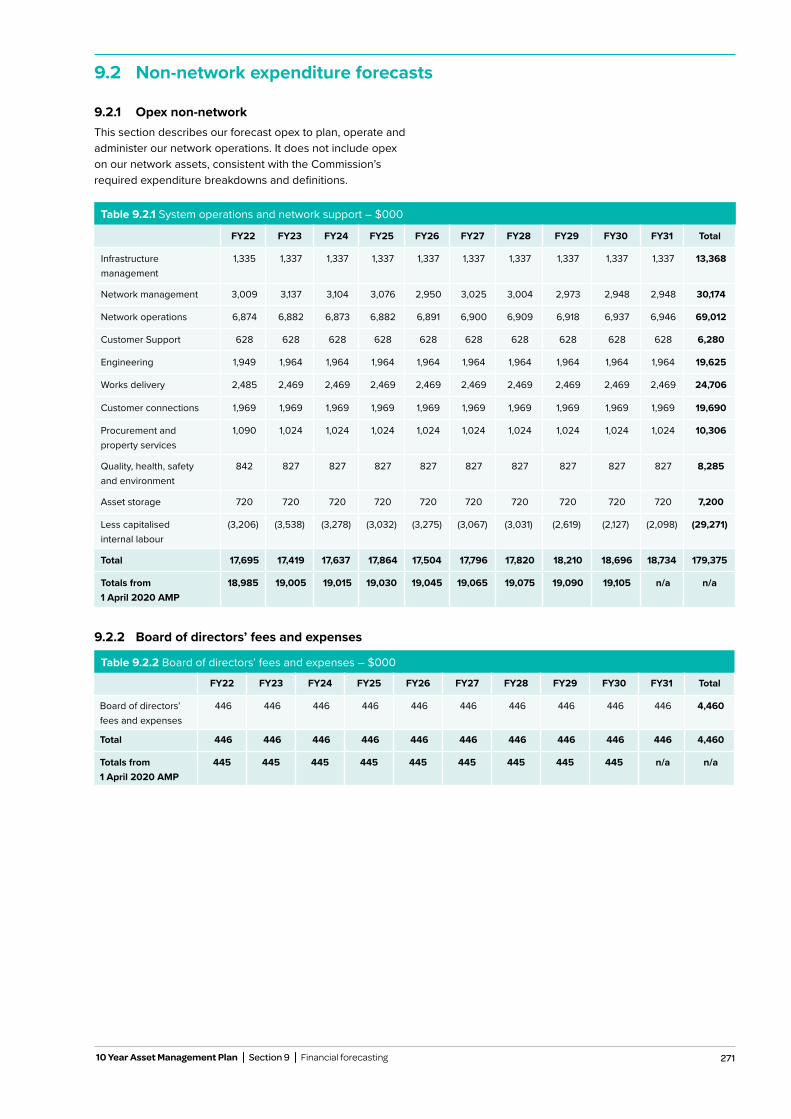
271
9.2 Non-network expenditure forecasts
Table 9.2.1 System operations and network support – $000
FY22 FY23 FY24 FY25 FY26 FY27 FY28 FY29 FY30 FY31 Total
Infrastructure management
1,335 1,337 1,337 1,337 1,337 1,337 1,337 1,337 1,337 1,337 13,368
Network management 3,009 3,137 3,104 3,076 2,950 3,025 3,004 2,973 2,948 2,948 30,174
Network operations 6,874 6,882 6,873 6,882 6,891 6,900 6,909 6,918 6,937 6,946 69,012
Customer Support 628 628 628 628 628 628 628 628 628 628 6,280
Engineering 1,949 1,964 1,964 1,964 1,964 1,964 1,964 1,964 1,964 1,964 19,625
Works delivery 2,485 2,469 2,469 2,469 2,469 2,469 2,469 2,469 2,469 2,469 24,706
Customer connections 1,969 1,969 1,969 1,969 1,969 1,969 1,969 1,969 1,969 1,969 19,690
Procurement and property services
1,090 1,024 1,024 1,024 1,024 1,024 1,024 1,024 1,024 1,024 10,306
Quality, health, safety and environment
842 827 827 827 827 827 827 827 827 827 8,285
Asset storage 720 720 720 720 720 720 720 720 720 720 7,200
Less capitalised internal labour
(3,206) (3,538) (3,278) (3,032) (3,275) (3,067) (3,031) (2,619) (2,127) (2,098) (29,271)
Total 17,695 17,419 17,637 17,864 17,504 17,796 17,820 18,210 18,696 18,734 179,375
Totals from 1 April 2020 AMP
18,985 19,005 19,015 19,030 19,045 19,065 19,075 19,090 19,105 n/a n/a
9.2.2 Board of directors’ fees and expenses
Table 9.2.2 Board of directors’ fees and expenses – $000
FY22 FY23 FY24 FY25 FY26 FY27 FY28 FY29 FY30 FY31 Total
Board of directors’ fees and expenses
446 446 446 446 446 446 446 446 446 446 4,460
Total 446 446 446 446 446 446 446 446 446 446 4,460
Totals from 1 April 2020 AMP
445 445 445 445 445 445 445 445 445 n/a n/a
9.2.1 Opex non-networkThis section describes our forecast opex to plan, operate and administer our network operations. It does not include opex on our network assets, consistent with the Commission’s required expenditure breakdowns and definitions.
10 Year Asset Management Plan Section 9 Financial forecasting
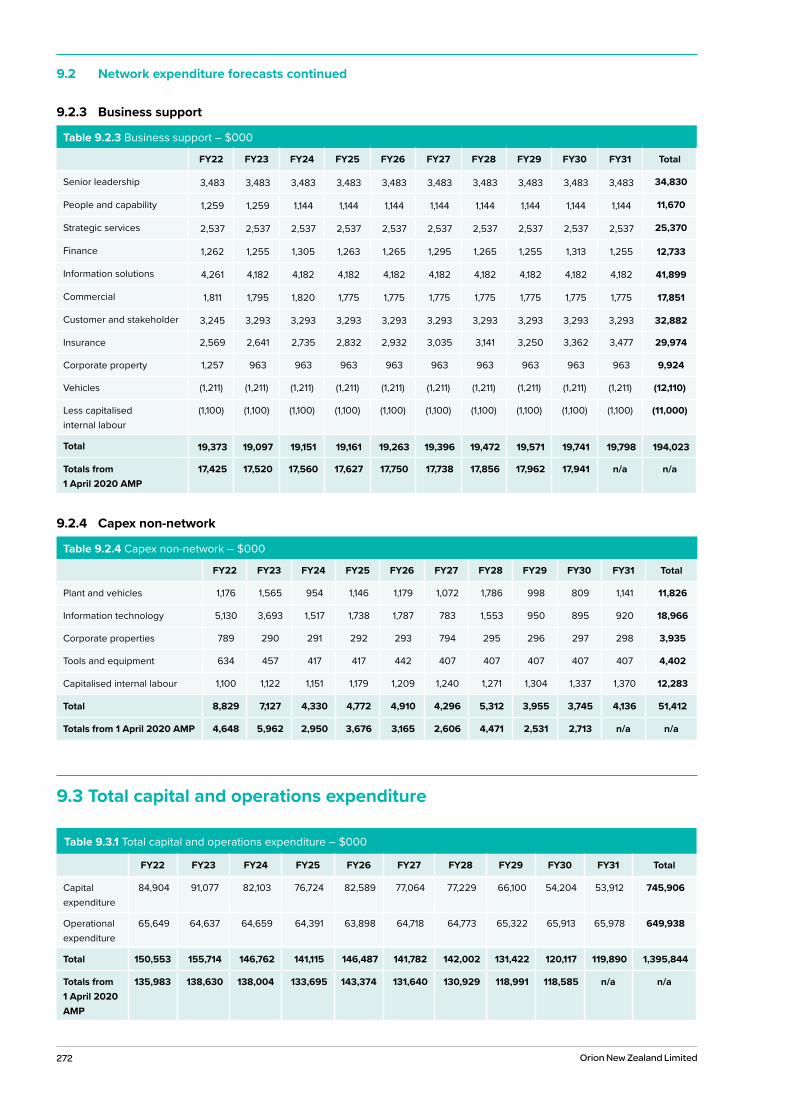
272 Orion New Zealand Limited
9.2 Network expenditure forecasts continued
9.2.3 Business support
Table 9.2.3 Business support – $000
FY22 FY23 FY24 FY25 FY26 FY27 FY28 FY29 FY30 FY31 Total
Senior leadership 3,483 3,483 3,483 3,483 3,483 3,483 3,483 3,483 3,483 3,483 34,830
People and capability 1,259 1,259 1,144 1,144 1,144 1,144 1,144 1,144 1,144 1,144 11,670
Strategic services 2,537 2,537 2,537 2,537 2,537 2,537 2,537 2,537 2,537 2,537 25,370
Finance 1,262 1,255 1,305 1,263 1,265 1,295 1,265 1,255 1,313 1,255 12,733
Information solutions 4,261 4,182 4,182 4,182 4,182 4,182 4,182 4,182 4,182 4,182 41,899
Commercial 1,811 1,795 1,820 1,775 1,775 1,775 1,775 1,775 1,775 1,775 17,851
Customer and stakeholder 3,245 3,293 3,293 3,293 3,293 3,293 3,293 3,293 3,293 3,293 32,882
Insurance 2,569 2,641 2,735 2,832 2,932 3,035 3,141 3,250 3,362 3,477 29,974
Corporate property 1,257 963 963 963 963 963 963 963 963 963 9,924
Vehicles (1,211) (1,211) (1,211) (1,211) (1,211) (1,211) (1,211) (1,211) (1,211) (1,211) (12,110)
Less capitalised internal labour
(1,100) (1,100) (1,100) (1,100) (1,100) (1,100) (1,100) (1,100) (1,100) (1,100) (11,000)
Total 19,373 19,097 19,151 19,161 19,263 19,396 19,472 19,571 19,741 19,798 194,023
Totals from 1 April 2020 AMP
17,425 17,520 17,560 17,627 17,750 17,738 17,856 17,962 17,941 n/a n/a
9.2.4 Capex non-network
Table 9.2.4 Capex non-network – $000
FY22 FY23 FY24 FY25 FY26 FY27 FY28 FY29 FY30 FY31 Total
Plant and vehicles 1,176 1,565 954 1,146 1,179 1,072 1,786 998 809 1,141 11,826
Information technology 5,130 3,693 1,517 1,738 1,787 783 1,553 950 895 920 18,966
Corporate properties 789 290 291 292 293 794 295 296 297 298 3,935
Tools and equipment 634 457 417 417 442 407 407 407 407 407 4,402
Capitalised internal labour 1,100 1,122 1,151 1,179 1,209 1,240 1,271 1,304 1,337 1,370 12,283
Total 8,829 7,127 4,330 4,772 4,910 4,296 5,312 3,955 3,745 4,136 51,412
Totals from 1 April 2020 AMP 4,648 5,962 2,950 3,676 3,165 2,606 4,471 2,531 2,713 n/a n/a
9.3 Total capital and operations expenditure
Table 9.3.1 Total capital and operations expenditure – $000
FY22 FY23 FY24 FY25 FY26 FY27 FY28 FY29 FY30 FY31 Total
Capital expenditure
84,904 91,077 82,103 76,724 82,589 77,064 77,229 66,100 54,204 53,912 745,906
Operational expenditure
65,649 64,637 64,659 64,391 63,898 64,718 64,773 65,322 65,913 65,978 649,938
Total 150,553 155,714 146,762 141,115 146,487 141,782 142,002 131,422 120,117 119,890 1,395,844
Totals from 1 April 2020 AMP
135,983 138,630 138,004 133,695 143,374 131,640 130,929 118,991 118,585 n/a n/a
273
9.4 Changes from our previous forecasts
Overall, there has been a small increase of $5m in the cost of labour to maintain and replace our overhead and substation assets. This is less than 1% of the total network opex and capex forecast.
9.4.1 Opex – networkOur opex forecast is broadly consistent with last year’s forecasts with the exceptions of:
• Overhead system – increase of $6.5m due to our improved pole inspection process and targeted vegetation trimming projects
• Switchgear, transformers and substations – adjustment of $2m to reflect more proactive work being carried out doing the maintenance rounds of these asset classes
9.4.2 Capex – asset replacement Our replacement programme is also broadly consistent with last year’s forecast with these significant exceptions:
• Overhead system – increase of $4.7m due to new programme to upgrade LV conductors and expected increase in the number of proactively replacing defective poles due to the improved pole inspection process
• Switchgear – increase of $3m due to our new LV panel replacement programme and $7m due to refinement of circuit breaker unit cost per job based on recently completed jobs
• Secondary system – decrease of $4.6m due to our identification of opportunities to align protection projects
9.4.3 Connections / extensionsWe anticipate that the surge in new residential housing will continue into next year, so we have increased our FY22 forecast connection budget by $2.1m.
9.4.4 Asset relocationsUnderground conversions are carried out predominantly in conjunction with road works undertaken at the direction of Selwyn District Council, Christchurch City Council and/or the NZ Transport Agency. The increase this year is due to new projects identified by road authorities and our desire to make economical use of these opportunities.
9.4.5 HV minor projectsDue to two large customer driven reinforcement projects we have increased the FY22 HV minor project budget to $5.2m, while the FY23 – 31 years remain at a constant $3.5m.
9.4.6 LV projectsNo change from the 2020 AMP forecast.
9.4.7 Major projects Although the network connections and extensions budget has remained relatively stationary due to no forecast increases in the connection numbers, we have observed that the underlying growth in existing as well as large scale commercial and industrial connections has eroded our capacity at a subtransmission level. This has triggered the need to include the extension of our subtransmission network and the construction of new zone substations into our forecast expenditure.
Other alterations from the last year’s 2020 AMP Update are driven by the requirement to coordinate projects around Christchurch City Council and Waka Kotahi (NZ Transport Agency) works as well as balancing contractor resource.
The changes include:
• Construction of the Belfast ZS to Papanui ZS 66kV cable in FY22 – 23 (Project 942) instead of the Belfast ZS to McFaddens ZS cable 66kV links (Project 491) due to the timing of the Christchurch Northern Motorway completion. Project 491 is now forecast for construction in FY27 – 28
• A large industrial customer capacity upgrade requiring the addition of a 66/11kV transformer at Norwood ZS in FY24 – 25 (Project 1070)
• Upgrade of the 66/11kV transformer at Springston ZS to meet the growth of Lincoln township and the University (Project 1099)
• Construction of the 23MVA rated Greenpark ZS to replace the 10MVA Lincoln ZS in FY28 – 29 to support the growing Lincoln township from the east (Project 842). There are also several enabling projects to reinforce the subtransmission supply to the new ZS
• Redevelopment of the Shands Rd ZS site as part of the enveloping industrial subdivision. This project is timed to coincide with the 11kV and 33kV switchgear replacement at Shands Rd ZS
10 Year Asset Management Plan Section 9 Financial forecasting
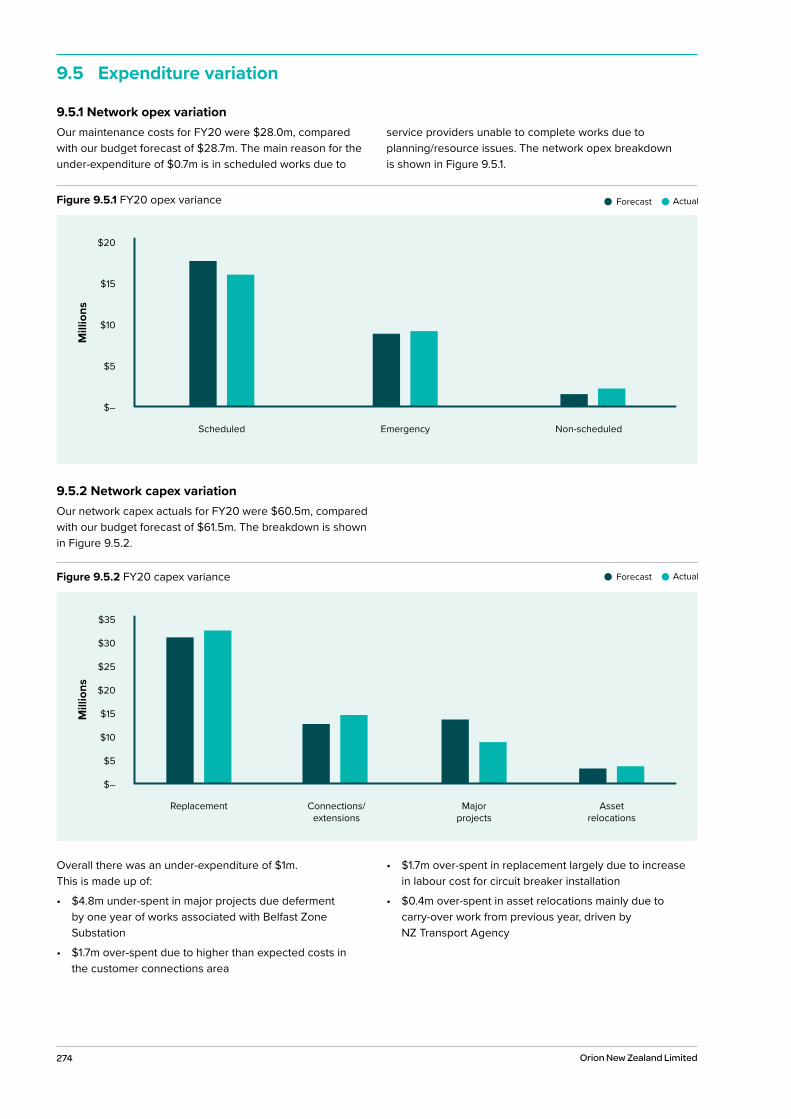
274 Orion New Zealand Limited
9.5.1 Network opex variationOur maintenance costs for FY20 were $28.0m, compared with our budget forecast of $28.7m. The main reason for the under-expenditure of $0.7m is in scheduled works due to
service providers unable to complete works due to planning/resource issues. The network opex breakdown is shown in Figure 9.5.1.
9.5.2 Network capex variationOur network capex actuals for FY20 were $60.5m, compared with our budget forecast of $61.5m. The breakdown is shown in Figure 9.5.2.
Overall there was an under-expenditure of $1m. This is made up of:
• $4.8m under-spent in major projects due defermentby one year of works associated with Belfast ZoneSubstation
• $1.7m over-spent due to higher than expected costs inthe customer connections area
• $1.7m over-spent in replacement largely due to increasein labour cost for circuit breaker installation
• $0.4m over-spent in asset relocations mainly due tocarry-over work from previous year, driven byNZ Transport Agency
9.5 Expenditure variation
Figure 9.5.1 FY20 opex variance ActualForecast
$–
$10
$20
$15
Scheduled Emergency Non-scheduled
$5
Mill
ions
ActualForecastFigure 9.5.2 FY20 capex variance
$–
$10
$35
$30
$15
$20
$25
$5
Mill
ions
Replacement Connections/ extensions
Major projects
Asset relocations

275 10 Year Asset Management Plan Section 1 Summary
10Our ability
to deliver

276 Orion New Zealand Limited
Photo: Connetics’ Tony Williamson and Ventia crew working at Hawthornden substation to reconfigure the power supply from our Islington Zone substation.

277 10 Year Asset Management Plan Section 1 Summary
10.3.1 Works programme 279
10.3.2 Procurement 279
10.3.3 Tenders 279
10.3.4 Resourcing 279
10.3.5 Delivery 280
10.3.6 Audit and performance monitoring 280
10.3.7 Conclusions on our ability to deliver our forecast work programme 281
10.3 Contract delivery 278
10.2 Service providers 278
1 Summary 9 10.1 Introduction 278
Contents
10 Year Asset Management Plan Section 10 Our ability to deliver 277
278 Orion New Zealand Limited
This section describes our:
• key philosophies, policies and processes that enable us to deliver our works programme and AMP objectives
• contract delivery process and how it enables us to consistently deliver our work safely, cost effectively and on time
• approach to works prioritisation and optimising resources
Orion engages contractors and consultants, who we call service providers, to design, construct, maintain and dispose of our network assets.
Our service providers don’t have direct network management responsibilities for our service – we engage them for specified scopes of work or for contracts over specific periods to meet the needs of our AMP objectives.
The key objective of our contractual relationships is to actively specify, monitor and control the contract to ensure that services and materials are delivered on time, at an agreed cost and to specified requirements. Our contracts are founded on AS/NZS standard conditions for capital, maintenance, and emergency works contracts.
Our Service Providers Specification (NW73.10.15) sets the procurement framework for authorised service providers to meet our AMP objectives. Authorisation to undertake works on our network is subject to a formal contractual agreement which specifies the work categories that each service provider can undertake for us. Service providers
become responsible and accountable for the requirements of the base contract, and the specific conditions attached to specific projects or works orders.
When special circumstances arise, for example, a project that requires specialist skills, we may invite other suitably experienced and competent suppliers to tender for the work.
We welcome expressions of interest from suppliers who wish to become authorised service providers for our network, and we have a process that allows for this. We maintain a service provider register which details the work categories that can be undertaken by each provider – and we audit those providers at appropriate intervals and times to ensure they still comply with our requirements and specifications.
We monitor our service providers by work types on an ongoing basis to ensure our overall service provider competence, capability and health and safety objectives are being met.
We are transitioning away from a lowest conforming tender model to a Primary Service Delivery Partner (PSDP) contracting model. Connetics will undertake the role of the PSDP and will contract for services from other contracting companies to ensure that we can deliver on our AMP and maintain the resilience in our service providers.
The new contracting model will be operational by October 2021 and will position Orion to more effectively and efficiently meet the following outcomes:
• support and enhance safety
• drive increased quality and efficiency
• develop people within the Orion Group and across the industry
• deliver the resilience that Orion requires
• comply with our legal and regulatory framework
• serve the Orion Group purpose of powering a cleaner and brighter future for our communities
This model will ensure a suitable platform to achieve future sustainability, continued investment in people, capability and competence and ensure that our service providers have a dedicated focus on health, safety, quality and the environment.
Our Procurement and Land Services team will maintain the contract and service level measures that are in place with Connetics.
Our Works Programming team are responsible for ensuring that our works are being delivered in a way that achieves long term value for our customers. They will do this by monitoring and approving pricing as well as the service levels being achieved. They are supported as appropriate by our operational and engineering teams.
Our Works Management information management system supports the above processes – including tenders, contracts, audit information and financial tracking.
10.1 Introduction
10.2 Service providers
10.3 Contract delivery
279
10.3.1 Works programmeOur customer initiated projects are prioritised by our project prioritisation process, set out in Section 6. Our replacement and maintenance programmes are set out in Section 7.
10.3.2 ProcurementWe adopt a risk based approach to our key procurement decisions, while ensuring levels of authority that allow for the efficient delivery of our AMP objectives. Our Procurement Policy outlines our strategic approach to procurement. Our key network risks and our proposed procurement priorities for the next period are outlined elsewhere in this AMP.
Our contract delivery process recommends formal procurement contracts with suppliers and service providers where the value and risk is considered high, complex, novel or likely to attract media attention, or come under significant public scrutiny. We have a variety of procurement options within our contract delivery framework which allow for flexible contract options and conditions.
We aim to have fair and transparent procurement processes that are free from fraud and impropriety, and which are sustainable from economic, risk, legal, society, and environmental perspectives. We do this by:
• procuring fit-for-purpose goods and services
• considering whole-of-life costs of goods and services when procuring
• being cost conscious and considering value for money
• identifying, assessing and managing our procurement risks – financial and non-financial
• managing and mitigating any potential conflicts of interest in an open and collaborative manner
• complying with our legal and contractual obligations
• following good procurement practice
• continuous improvement
• ensuring sustainable value-add
Key policies which also provide procurement guidelines include our Delegations of Authority and Fraud and Theft policies. Our Delegations of Authority policy outlines our general expenditure and approval rules and details the expenditure authorities that allow our staff to expediently deliver our AMP plan and objectives, including budgeted and unbudgeted expenditure. It also details authority limits for asset disposals, and research and development.
10.3.3 TendersTenders are our preferred method of engagement for the supply of equipment and specialist services.
We assess tenders for equipment supply following a robust assessment of process using weighted attributes such as price, technical support, experience and reputation.
For the delivery of our planned and unplanned works we will utilise our Primary Service Delivery Partner (PSDP), Connetics, to plan and procure the delivery of work from
Connetics or a number of other service providers through a dedicated arms-length Project Management Office (PMO).
The PMO will use a fair price methodology for assessing and awarding works and apply unit rates where work is repeatable.
We aim to maintain the relationships we have with our service providers and seek to deliver our works at a whole of life cost that is in the long term interest of our customers.
10.3.4 ResourcingOur ability to deliver our AMP objectives relies on an appropriate level of competent, experienced and skilled resource – both within the Orion team, our PSDP and their service providers. The availability of sufficient and competent resources is essential to the delivery of our planned capital and operational expenditure, our response to customer initiated upgrades, and our ability to respond to network faults, emergencies and natural disasters.
We will proactively work with our PSDP to assess the levels of resources necessary to deliver our objectives, to the extent that is practical, while investing in competence and capability. This provides for a base level of ongoing planned work and resource that can be quickly redirected to areas of greater need following High Impact Low Probability events.
10.3 Contract delivery continued
The availability of sufficient and competent resources is essential to the delivery of our planned capital and operational expenditure, our response to customer initiated upgrades, and our ability to respond to network faults, emergencies and natural disasters.
10 Year Asset Management Plan Section 10 Our ability to deliver
280 Orion New Zealand Limited
Our Works General Requirements places certain overarching requirements on our service providers:
• work shall be carried out safely, time mannerly andcost efficiently, while ensuring customer satisfaction
• only authorised personnel may undertake work onour network
• service providers shall have appropriate managementsystems in place to deliver contractual obligations
• the preferred methods and controls to plan, execute,monitor, control and close out works
Our Emergency Works Requirements covers our requirements for urgent work – for example, due to weather events, network failure or safety reasons. In this document, we mandate and describe:
• the up-front resources and contingency measures werequire service providers to have at all times
• how to prioritise emergency works
• the requirement for service providers to redeploy theirresources to us in a major emergency
• the use of authorised personnel for emergency work
• the methods and controls for network access duringemergency work
• the requirements for regular response and restorationtime assessments
• the levels and controls for emergency spares
Where economically justified, we plan our activities to incentivise our service providers to grow and maintain the delivery resources we need:
• internal resources – the Orion team and its structureare described in Section 8 of this AMP. Section 8 of thisAMP also provides comprehensive overviews and theresponsibilities of each business support area and howtheir capabilities help deliver our AMP objectives
• service providers – we manage our service providerresources by ‘smoothing’ our opex and capex worksas much as practical to avoid unnecessary resourcepeaks and troughs. This has two key benefits. First,our service providers avoid the need to substantially‘gear-up’ or ‘gear-down’ their resources for short termpeaks. Second, it provides our service providers withmore certainty
10.3.5 DeliveryWe deliver our programme of scheduled and emergency works using our PDSP framework, our service providers, and our in-house team based in our Christchurch office.
Our infrastructure management team is responsible for works planning and delivery of our annual work plan, supported as appropriate by our other teams. They use our robust contract delivery processes to safely construct, maintain and renew our network to achieve our expected service levels. Our other in-house teams, as shown in Section 8 of this AMP, provide and administer the vital business and
information support functions which enable the successful delivery of our works programme.
We provide a highly responsive service to our customers and community in terms of managing situations where our network capacity in localised areas may be constrained or compromised by other parties, and by providing the ability for customers to connect to our network, or alter their connection type or capacity, in a timely manner.
10.3.6 Audit and performance monitoring We audit our contract delivery process using an audit management guide based on an AS/NZS standard, and we have a dedicated team, supported by external experts as appropriate, for this. Our audit process allows for the identification of health and safety hazards, conflicts of interest and contractual or technical non-conformances.
We review longer term contracts for continual performance improvement and to enable new initiatives as they arise.
We monitor our contract performance against our conditions of contract as per NW72.20.05 (Contract Performance).
Our key objective when monitoring contract performance is continuous improvement including:
• enhanced collaborative and positive relationships withservice providers
• consistent reporting and tracking of contract performanceindicators
• the provision of information that allows for reporting,benchmarking and trend analysis
• enhancing our customer experience by ensuring ourservice providers are focussed on customer satisfaction
Our historic approach to contract delivery was a successful model for Orion for a number of years. However, the extraordinary time following the Canterbury earthquakes masked some issues with this model. Our focus has always been on continuous improvement, and our PSDP model will deliver long term value to our customers and our stakeholders.
10.3 Contract delivery continued
Our focus on continuous improvement means we are always looking for ways to refine and improve our delivery processes for the benefit of all stakeholders.
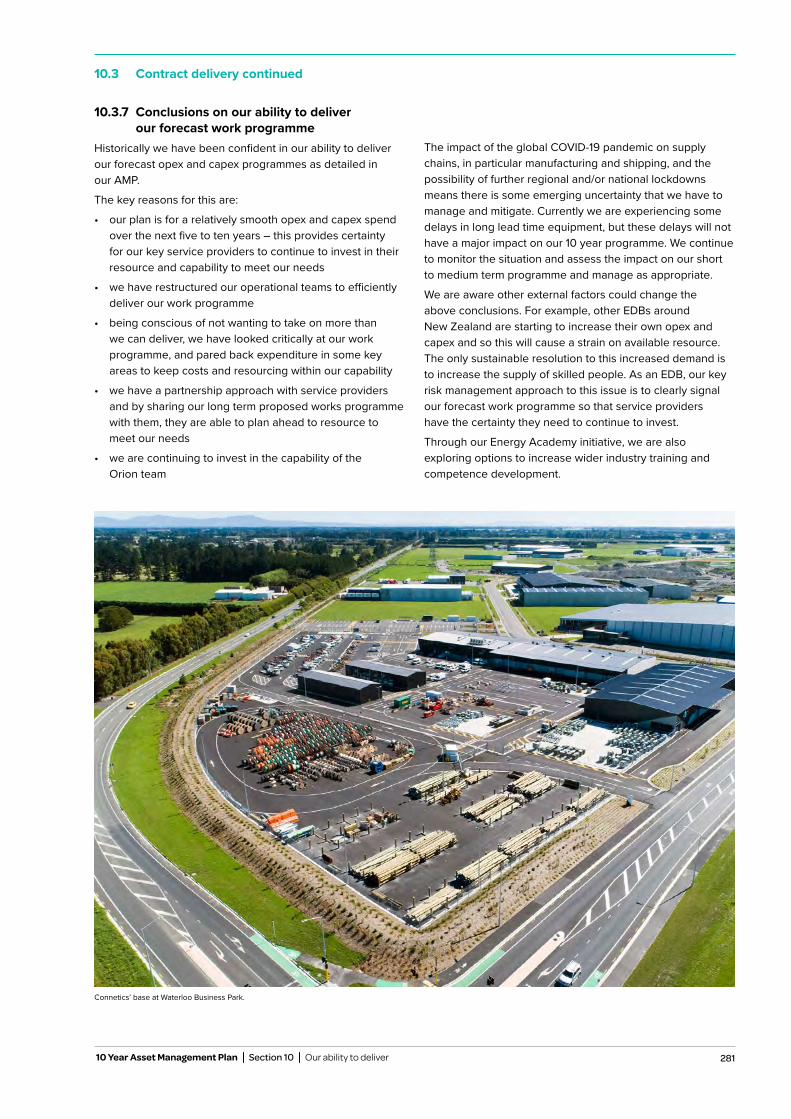
281
10.3 Contract delivery continued
10.3.7 Conclusions on our ability to deliver our forecast work programme
Historically we have been confident in our ability to deliver our forecast opex and capex programmes as detailed in our AMP.
The key reasons for this are:
• our plan is for a relatively smooth opex and capex spend over the next five to ten years – this provides certainty for our key service providers to continue to invest in their resource and capability to meet our needs
• we have restructured our operational teams to efficiently deliver our work programme
• being conscious of not wanting to take on more than we can deliver, we have looked critically at our work programme, and pared back expenditure in some key areas to keep costs and resourcing within our capability
• we have a partnership approach with service providers and by sharing our long term proposed works programme with them, they are able to plan ahead to resource to meet our needs
• we are continuing to invest in the capability of the Orion team
The impact of the global COVID-19 pandemic on supply chains, in particular manufacturing and shipping, and the possibility of further regional and/or national lockdowns means there is some emerging uncertainty that we have to manage and mitigate. Currently we are experiencing some delays in long lead time equipment, but these delays will not have a major impact on our 10 year programme. We continue to monitor the situation and assess the impact on our short to medium term programme and manage as appropriate.
We are aware other external factors could change the above conclusions. For example, other EDBs around New Zealand are starting to increase their own opex and capex and so this will cause a strain on available resource. The only sustainable resolution to this increased demand is to increase the supply of skilled people. As an EDB, our key risk management approach to this issue is to clearly signal our forecast work programme so that service providers have the certainty they need to continue to invest.
Through our Energy Academy initiative, we are also exploring options to increase wider industry training and competence development.
Connetics’ base at Waterloo Business Park.
10 Year Asset Management Plan Section 10 Our ability to deliver

282 Orion New Zealand Limited

283 10 Year Asset Management Plan Section 1 Summary
Appendices

284 Orion New Zealand Limited
Photo: Orion and Connetics team members reviewing infrastructure maps.
285 10 Year Asset Management Plan Section 1 Summary
Schedule 11a Report on forecast capital expenditure 296
Schedule 11b Report on forecast operational expenditure 300
Schedule 12a Report on asset condition 301
Schedule 12b Report on forecast capacity 303
Schedule 12c Report on forecast network demand 305
Schedule 12d Report forecast interruptions and duration 306
Schedule 13 Report on asset management maturity 306
Appendix F Disclosure schedules 11-13 295
Appendix C Asset data 289
Appendix E Specification and standards (network planning) 294
Appendix B Cross reference table 288
Appendix H Certificate for year-beginning disclosures 327
Appendix D Specifications and standards (assets) 290
1 Summary 9
1 Summary 9
Appendix A Glossary of terms 286
Appendix G Mandatory explanatory notes on forecast information 326
Contents
285 10 Year Asset Management Plan Appendices
286 Orion New Zealand Limited
ABI: Air Break Isolator, a pole mounted isolation switch. Usually manually operated.
Alpine Fault: a geological fault, specifically a right-lateral strike-slip fault that runs almost the entire length of New Zealand’s South Island. It has an average interval for a major earthquake at every 290 years, plus or minus 23 years. The last major Alpine Fault earthquake occurred in 1717. The longest known major Alpine Fault earthquake return rate is believed to be around 350 years and the shortest around 160 years.
Alternating current (AC): a flow of electricity which reaches maximum in one direction, decreases to zero, then reverses itself and reaches maximum in the opposite direction. The cycle is repeated continuously.
Ampere (A): unit of electrical current flow, or rate of flow of electrons.
Bushing: an electrical component that insulates a high voltage conductor passing through a metal enclosure.
Capacity utilisation: a ratio which measures the utilisation of transformers in the network. Calculated as the maximum demand experienced on an electricity network in a year, divided by the transformer capacity on that network.
Capacitance: the ability of a body to store an electrical charge.
CBRM (condition based risk management): CBRM is a modelling programme which combines asset information, observations of condition and engineering knowledge and experience to produce a measure of asset health, the CBRM Health Index. The model also produces forecasts of asset probability of failure, and a measure of asset related risk in future years which can be used for developing optimised asset renewal plans.
Circuit breaker (CB): a device which detects excessive power demands in a circuit and cuts off power when they occur. Nearly all of these excessive demands are caused by a fault on the network. In the urban network, where most of these CBs are, they do not attempt a reclose after a fault as line circuit breakers may do on the rural overhead network.
Continuous rating: the constant load which a device can carry at rated primary voltage and frequency without damaging and/or adversely effecting it characteristics.
Conductor: the ‘wire’ that carries the electricity and includes overhead lines which can be covered (insulated) or bare (not insulated) and underground cables which are insulated.
CPP: the Commerce Act (Orion New Zealand Limited Customised Price-Quality Path Determination 2013) in effect for FY15 to FY19. This determination applies to Orion, and replaces all terms of the Orion DPP Determination as they apply to Orion.
Current: the movement of electricity through a conductor, measured in amperes (A).
Customer Demand Management: shaping the overall customer load profile to obtain maximum mutual benefit to the customer and the network operator.
DIN: Deutsches Institut für Normung, the German Institute for Standardisation. Equipment manufactured to these standards is often called ‘DIN Equipment’.
Distributed/embedded generation (DG): a privately owned generating station connected to our network.
Distribution substation: is either a building, a kiosk, an outdoor substation or pole substation taking its supply at 11kV and distributing at 400V
EA Technology Ltd: is an international consultancy based in the UK. They were appointed as peer reviewers to the Auckland CBD cable failure ministerial enquiry and subsequently engaged by us to review our 66kV cable network.
Fault current: the current from the connected power system that flows in a short circuit caused by a fault. Feeder: a physical grouping of conductors that originate from a zone substation circuit breaker.
Flashover: a disruptive discharge around or over the surface of an insulator.
Frequency: on alternating current circuits, the designated number of times per second that polarity alternates from positive to negative and back again, expressed in Hertz (Hz)
Fuse: a device that will heat up, melt and electrically open the circuit after a period of prolonged abnormally high current flow. Gradient, voltage: the voltage drop, or electrical difference, between two given points.
Grid exit point (GXP): a point where Orion’s network is connected to Transpower’s transmission network.
Harmonics (wave form distortion): changes an ac voltage waveform from sinusoidal to complex and can be caused by network equipment and equipment owned by customers including electric motors or computer equipment.
High voltage (HV): voltage exceeding 1,000 volts (1kV), in Orion’s case generally 11kV, 33kV or 66kV.
ICP: installation control point, a uniquely numbered point on our network where a customer(s) is connected.
Inductance: is the property of a conductor by which current flowing through it creates a voltage (electromotive force) in both the conductor itself (self-inductance) and in any nearby conductors.
Insulator: supports live conductors and is made from material which does not allow electricity to flow through it.
Interrupted N-1: a network is said to have ‘Interrupted N-1’ security or capability if following the failure of ‘one’ overhead line, cable or transformer the network can be switched to restore electricity supply to customers.
Interrupted N-2: a network is said to have ‘Interrupted N-2’ security or capability if following the failure of ‘two’ overhead line, cable or transformer the network can be switched to restore electricity supply to customers.
ISO 55000: International Standards for Asset Management.
kVA: the kVA, or Kilovolt-ampere, output rating designates the output which a transformer can deliver for a specified time at rated secondary voltage and rated frequency.
Appendix A Glossary of terms
287
Legacy assets: assets installed to meet appropriate standards of the time, but are not compliant with current day safety standards.
Lifelines groups: local collaborations between lifeline utilities. They aim to reduce infrastructure outages, especially if HILP events occur. It was this collaboration that lead us to invest to strengthen our key substations before the Canterbury earthquakes.
Lifelines project: an engineering study into the effects of a natural disaster on Christchurch city undertaken in the mid 1990s.
Line circuit breaker (LCB): a circuit breaker mounted on an overhead line pole which quickly cuts off power after a fault so no permanent damage is caused to any equipment. It switches power back on after a few seconds and, if the cause of the fault has gone, (e.g. a branch has blown off a line) then the power will stay on. If the offending item still exists then power will be cut again. This can happen up to three times before power will stay off until the fault is repaired. Sometimes an LCB is known as a ‘recloser’.
Low voltage (LV): a voltage not exceeding 1,000 volts, generally 230 or 400 volts.
Maximum demand: the maximum demand for electricity, at any one time, during the course of a year.
N: a network is said to have ‘N’ security or capability if the network cannot deliver electricity after the failure of ‘one’ overhead line, cable or transformer.
N-1: a network is said to have ‘N-1’ security or capability if the network continues to deliver electricity
N-2: a network is said to have ‘N-2’ security or capability if the network continues to deliver electricity after the failure of ‘two’ overhead lines, cables or transformers.
Network deliveries: total energy supplied to our network through Transpower’s grid exit points, usually measured as energy supplied over the course of a year.
Network substations: are part of Orion’s primary 11kV network all within the Christchurch urban area. Ohm: a measure of the opposition to electrical flow, measured in ohms.
ORDC: optimised depreciated replacement cost, prepared in accordance with New Zealand International Financial Reporting Standards (NZ IFRS) under International Accounting Standard NZ IAS 16 – Property, Plant and Equipment as at 31 March 2007
Outage: an interruption to electricity supply.
PCB: Polychlorinated biphenyls (PCBs) were used as dielectric fluids in transformers and capacitors, coolants, lubricants, stabilising additives in flexible PVC coatings of electrical wiring and electronic components. PCB production was banned in the 1970s due to the high toxicity of most PCB congeners and mixtures. PCBs are classified as persistent organic pollutants which bio-accumulate in animals.
PMO: Project Management Office.
Proven voltage complaint: a complaint from a customer concerning a disturbance to the voltage of their supply which has proven to be caused by the network company.
PSDP: Primary Service Delivery Partner.
Ripple control system: a system used to control the electrical load on the network by, for example, switching domestic water heaters, or by signaling large users of a high price period. Also used to control streetlights.
RTU: Remote Terminal Unit. Part of the SCADA system usually installed at the remote substation.
SAIDI: System Average Interruption Duration Index; an international index which measures the average duration of interruptions to supply that a customer experiences in a given period.
SAIFI: System Average Interruption Frequency Index; an international index which measures the average number of interruptions that a customer experiences in a given period.
SCADA: System Control and Data Acquisition
Transformer: a device that changes voltage up to a higher voltage or down to a lower voltage.
Transpower: the state owned enterprise that operates New Zealand’s transmission network. Transpower delivers electricity from generators to grid exit points (GXPs) on distribution networks throughout the country.
Voltage: electric pressure; the force which causes current to flow through an electrical conductor. Voltage drop: is the reduction in voltage in an electrical circuit between the source and load.
Voltage regulator: an electrical device that keeps the voltage at which electricity is supplied to customers at a constant level, regardless of load fluctuations.
Zone substation: a major substation where either; voltage is transformed from 66 or 33kV to 11kV, two or more incoming 11kV.
Appendix A Glossary of terms continued
10 Year Asset Management Plan Appendices

288 Orion New Zealand Limited
As our AMP has been structured as a practical planning tool, it does not strictly follow the order laid out in the Electricity Distribution Information Disclosure Determination 2012. We have prepared the cross reference table below to help the reader find specific sections.
Appendix B Cross reference table
Sections as per the Electricity Distribution Information Determination 2012
Orion AMP SECTION
1. Summary of the plan 1 Executive summary
2. Background and objectives 2 About our business
5 About our network
8 Supporting our business
3. Assets covered 5 About our network
7 Managing our assets
4. Service levels 4 Customer experience
5. Network development plans 6 Planning our network
9 Financial forecasting
10 Our ability to deliver
6. Lifecycle asset management planning (maintenance and renewal)
7 Managing our assets
9 Financial forecasting
10 Our ability to deliver
7. Risk management 3 Managing risk
8. Evaluation of performance 2 About our business
4 Customer experience
9 Financial forecasting
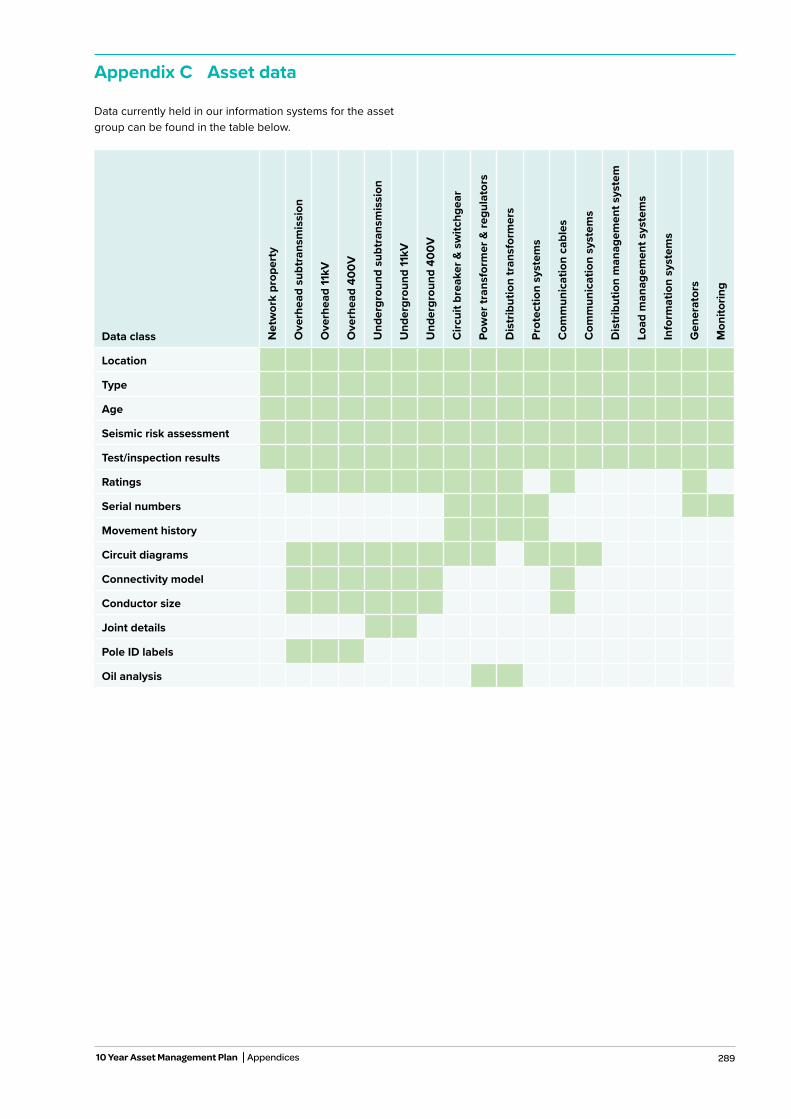
289
Data currently held in our information systems for the asset group can be found in the table below.
Data class Net
wor
k pr
oper
ty
Ove
rhea
d su
btra
nsm
issi
on
Ove
rhea
d 11
kV
Ove
rhea
d 40
0V
Und
ergr
ound
sub
tran
smis
sion
Und
ergr
ound
11kV
Und
ergr
ound
400
V
Circ
uit b
reak
er &
sw
itchg
ear
Pow
er tr
ansf
orm
er &
regu
lato
rs
Dis
trib
utio
n tr
ansf
orm
ers
Prot
ectio
n sy
stem
s
Com
mun
icat
ion
cabl
es
Com
mun
icat
ion
syst
ems
Dis
trib
utio
n m
anag
emen
t sys
tem
Load
man
agem
ent s
yste
ms
Info
rmat
ion
syst
ems
Gen
erat
ors
Mon
itorin
g
Location
Type
Age
Seismic risk assessment
Test/inspection results
Ratings
Serial numbers
Movement history
Circuit diagrams
Connectivity model
Conductor size
Joint details
Pole ID labels
Oil analysis
Appendix C Asset data
10 Year Asset Management Plan Appendices
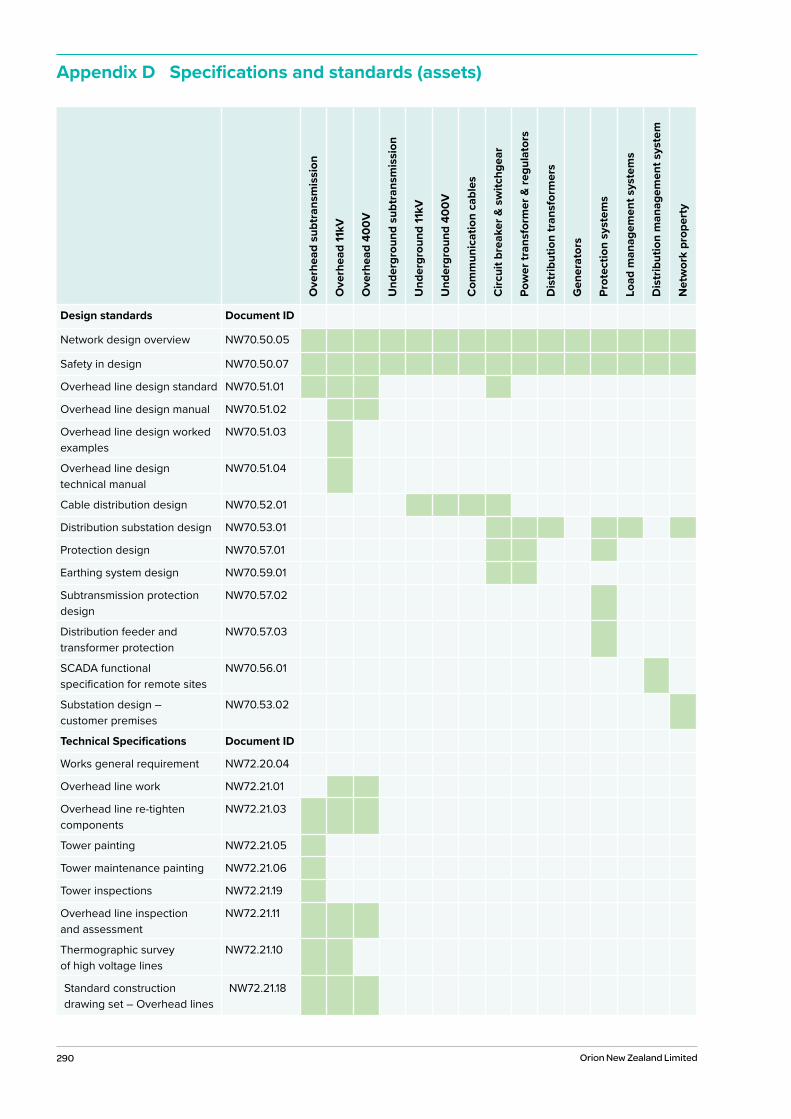
290 Orion New Zealand Limited
Appendix D Specifications and standards (assets)
Ove
rhea
d su
btra
nsm
issi
on
Ove
rhea
d 11
kV
Ove
rhea
d 40
0V
Und
ergr
ound
sub
tran
smis
sion
Und
ergr
ound
11kV
Und
ergr
ound
400
V
Com
mun
icat
ion
cabl
es
Circ
uit b
reak
er &
sw
itchg
ear
Pow
er tr
ansf
orm
er &
regu
lato
rs
Dis
trib
utio
n tr
ansf
orm
ers
Gen
erat
ors
Prot
ectio
n sy
stem
s
Load
man
agem
ent s
yste
ms
Dis
trib
utio
n m
anag
emen
t sys
tem
Net
wor
k pr
oper
ty
Design standards Document ID
Network design overview NW70.50.05
Safety in design NW70.50.07
Overhead line design standard NW70.51.01
Overhead line design manual NW70.51.02
Overhead line design worked examples
NW70.51.03
Overhead line design technical manual
NW70.51.04
Cable distribution design NW70.52.01
Distribution substation design NW70.53.01
Protection design NW70.57.01
Earthing system design NW70.59.01
Subtransmission protection design
NW70.57.02
Distribution feeder and transformer protection
NW70.57.03
SCADA functional specification for remote sites
NW70.56.01
Substation design – customer premises
NW70.53.02
Technical Specifications Document ID
Works general requirement NW72.20.04
Overhead line work NW72.21.01
Overhead line re-tighten components
NW72.21.03
Tower painting NW72.21.05
Tower maintenance painting NW72.21.06
Tower inspections NW72.21.19
Overhead line inspection and assessment
NW72.21.11
Thermographic survey of high voltage lines
NW72.21.10
Standard construction drawing set – Overhead lines
NW72.21.18
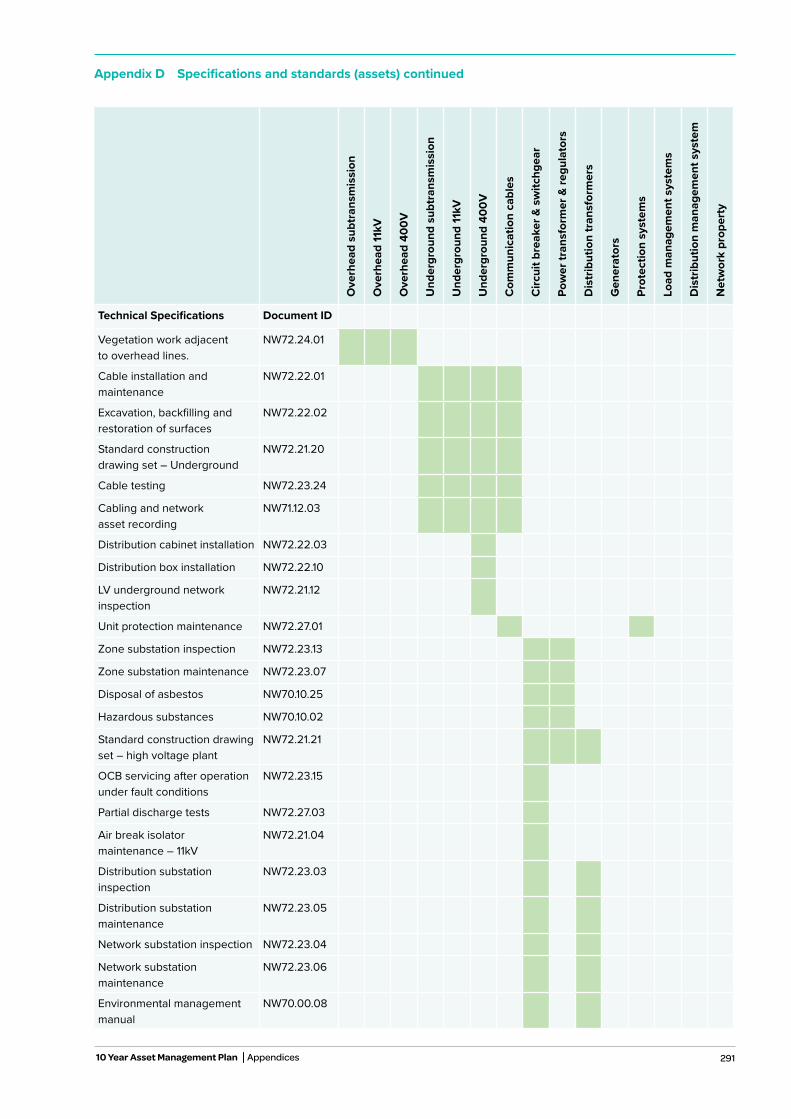
291
Appendix D Specifications and standards (assets) continued
Ove
rhea
d su
btra
nsm
issi
on
Ove
rhea
d 11
kV
Ove
rhea
d 40
0V
Und
ergr
ound
sub
tran
smis
sion
Und
ergr
ound
11kV
Und
ergr
ound
400
V
Com
mun
icat
ion
cabl
es
Circ
uit b
reak
er &
sw
itchg
ear
Pow
er tr
ansf
orm
er &
regu
lato
rs
Dis
trib
utio
n tr
ansf
orm
ers
Gen
erat
ors
Prot
ectio
n sy
stem
s
Load
man
agem
ent s
yste
ms
Dis
trib
utio
n m
anag
emen
t sys
tem
Net
wor
k pr
oper
ty
Technical Specifications Document ID
Vegetation work adjacent to overhead lines.
NW72.24.01
Cable installation and maintenance
NW72.22.01
Excavation, backfilling and restoration of surfaces
NW72.22.02
Standard construction drawing set – Underground
NW72.21.20
Cable testing NW72.23.24
Cabling and network asset recording
NW71.12.03
Distribution cabinet installation NW72.22.03
Distribution box installation NW72.22.10
LV underground network inspection
NW72.21.12
Unit protection maintenance NW72.27.01
Zone substation inspection NW72.23.13
Zone substation maintenance NW72.23.07
Disposal of asbestos NW70.10.25
Hazardous substances NW70.10.02
Standard construction drawing set – high voltage plant
NW72.21.21
OCB servicing after operation under fault conditions
NW72.23.15
Partial discharge tests NW72.27.03
Air break isolator maintenance – 11kV
NW72.21.04
Distribution substation inspection
NW72.23.03
Distribution substation maintenance
NW72.23.05
Network substation inspection NW72.23.04
Network substation maintenance
NW72.23.06
Environmental management manual
NW70.00.08
10 Year Asset Management Plan Appendices
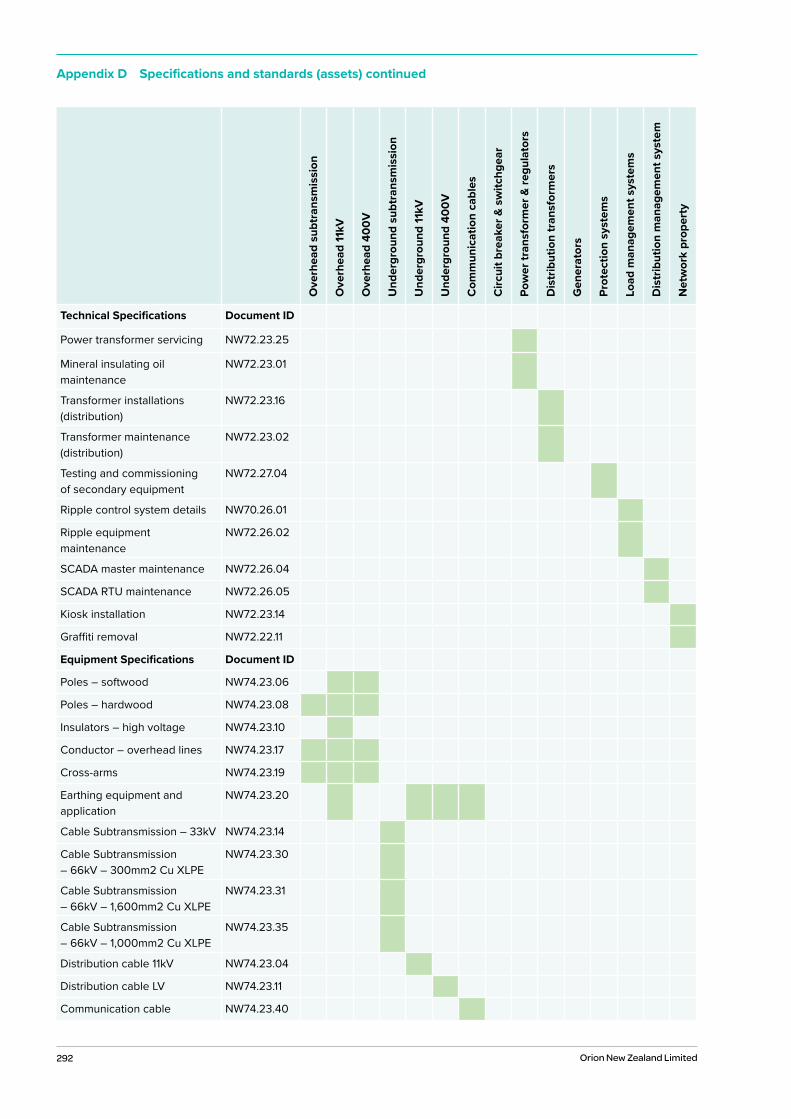
292 Orion New Zealand Limited
Appendix D Specifications and standards (assets) continued
Ove
rhea
d su
btra
nsm
issi
on
Ove
rhea
d 11
kV
Ove
rhea
d 40
0V
Und
ergr
ound
sub
tran
smis
sion
Und
ergr
ound
11kV
Und
ergr
ound
400
V
Com
mun
icat
ion
cabl
es
Circ
uit b
reak
er &
sw
itchg
ear
Pow
er tr
ansf
orm
er &
regu
lato
rs
Dis
trib
utio
n tr
ansf
orm
ers
Gen
erat
ors
Prot
ectio
n sy
stem
s
Load
man
agem
ent s
yste
ms
Dis
trib
utio
n m
anag
emen
t sys
tem
Net
wor
k pr
oper
ty
Technical Specifications Document ID
Power transformer servicing NW72.23.25
Mineral insulating oil maintenance
NW72.23.01
Transformer installations (distribution)
NW72.23.16
Transformer maintenance (distribution)
NW72.23.02
Testing and commissioning of secondary equipment
NW72.27.04
Ripple control system details NW70.26.01
Ripple equipment maintenance
NW72.26.02
SCADA master maintenance NW72.26.04
SCADA RTU maintenance NW72.26.05
Kiosk installation NW72.23.14
Graffiti removal NW72.22.11
Equipment Specifications Document ID
Poles – softwood NW74.23.06
Poles – hardwood NW74.23.08
Insulators – high voltage NW74.23.10
Conductor – overhead lines NW74.23.17
Cross-arms NW74.23.19
Earthing equipment and application
NW74.23.20
Cable Subtransmission – 33kV NW74.23.14
Cable Subtransmission – 66kV – 300mm2 Cu XLPE
NW74.23.30
Cable Subtransmission – 66kV – 1,600mm2 Cu XLPE
NW74.23.31
Cable Subtransmission – 66kV – 1,000mm2 Cu XLPE
NW74.23.35
Distribution cable 11kV NW74.23.04
Distribution cable LV NW74.23.11
Communication cable NW74.23.40

293
Appendix D Specifications and standards (assets) continued
Ove
rhea
d su
btra
nsm
issi
on
Ove
rhea
d 11
kV
Ove
rhea
d 40
0V
Und
ergr
ound
sub
tran
smis
sion
Und
ergr
ound
11kV
Und
ergr
ound
400
V
Com
mun
icat
ion
cabl
es
Circ
uit b
reak
er &
sw
itchg
ear
Pow
er tr
ansf
orm
er &
regu
lato
rs
Dis
trib
utio
n tr
ansf
orm
ers
Gen
erat
ors
Prot
ectio
n sy
stem
s
Load
man
agem
ent s
yste
ms
Dis
trib
utio
n m
anag
emen
t sys
tem
Net
wor
k pr
oper
ty
Equipment Specifications Document ID
Switchgear – 400V indoor NW74.23.23
Circuit breaker – 66kV NW74.23.25
Circuit breaker – 33kV indoor NW74.23.28
Major power transformer 7.5/10MVA 66/11kV
NW74.23.07
Voltage regulator 11kV NW74.23.15
Major power transformer 11.5/23MVA 66/11kV
NW74.23.16
Major power transformer 2.5MVA 33/11kV
NW74.23.22
Major power transformer 20/40MVA 66/11kV
NW74.23.24
Transformers – distribution NW74.23.05
Ripple control system NW74.23.09
Kiosk shell – full NW74.23.01
Kiosk shell – half NW74.23.02
Kiosk shell – quarter NW74.23.03
Asset management reports Document ID
AMR – Protection Systems NW70.00.22
AMR – Power Transformers NW70.00.23
AMR – Switchgear HV and LV NW70.00.24
AMR – Overhead Lines – LV NW70.00.25
AMR – Overhead Lines – Subtransmission
NW70.00.26
AMR – Overhead Lines – 11kV NW70.00.27
AMR – Cables – Communication
NW70.00.28
AMR – Cables – LV and Hardware
NW70.00.29
AMR – Cables – 11kV NW70.00.30
AMR – Cables – 33kV NW70.00.31
AMR – Cables – 66kV NW70.00.32
AMR – Circuit Breakers NW70.00.33
10 Year Asset Management Plan Appendices

294 Orion New Zealand Limited
Appendix D Specifications and standards (assets) continued
Ove
rhea
d su
btra
nsm
issi
on
Ove
rhea
d 11
kV
Ove
rhea
d 40
0V
Und
ergr
ound
sub
tran
smis
sion
Und
ergr
ound
11kV
Und
ergr
ound
400
V
Com
mun
icat
ion
cabl
es
Circ
uit b
reak
er &
sw
itchg
ear
Pow
er tr
ansf
orm
er &
regu
lato
rs
Dis
trib
utio
n tr
ansf
orm
ers
Gen
erat
ors
Prot
ectio
n sy
stem
s
Load
man
agem
ent s
yste
ms
Dis
trib
utio
n m
anag
emen
t sys
tem
Net
wor
k pr
oper
ty
Asset management reports Document ID
AMR – Communication Systems
NW70.00.34
AMR – Distribution Management
NW70.00.36
AMR – Load Management NW70.00.37
AMR – Monitoring NW70.00.38
AMR – Generators NW70.00.39
AMR – Transformers – Distribution
NW70.00.40
AMR – Voltage Regulators NW70.00.41
AMR – Property – Corporate NW70.00.42
AMR – Property – Network NW70.00.43
AMR – Substations NW70.00.44
AMR – Vehicles NW70.00.47
AMR – Information Systems (Asset Management)
NW70.00.48
AMR – Information Systems (Corporate)
NW70.00.49
Design standards Document ID
Network architecture review: subtransmission NW70.60.16
Urban 11kV network architecture review NW70.60.06
Network design overview NW70.50.05
Project prioritisation and deliverability process NW70.60.14
Long term load forecasting methodology for subtransmission and zone substation NW70.60.12
Demand side management stage 1 – issues and opportunities NW70.60.10
Demand side management stage 2 – potential initiatives NW70.60.11
Appendix E Specification and standards (network planning)
295
This section contains the Information disclosure asset management plan schedules.
Schedule Schedule name
11a Report on forecast capital expenditure
11b Report on forecast operational expenditure
12a Report on asset condition
12b Report on forecast capacity
12c Report on forecast network demand
12d Report forecast interruptions and duration
13 Report on asset management maturity
Appendix F Disclosure schedules 11-13
10 Year Asset Management Plan Appendices
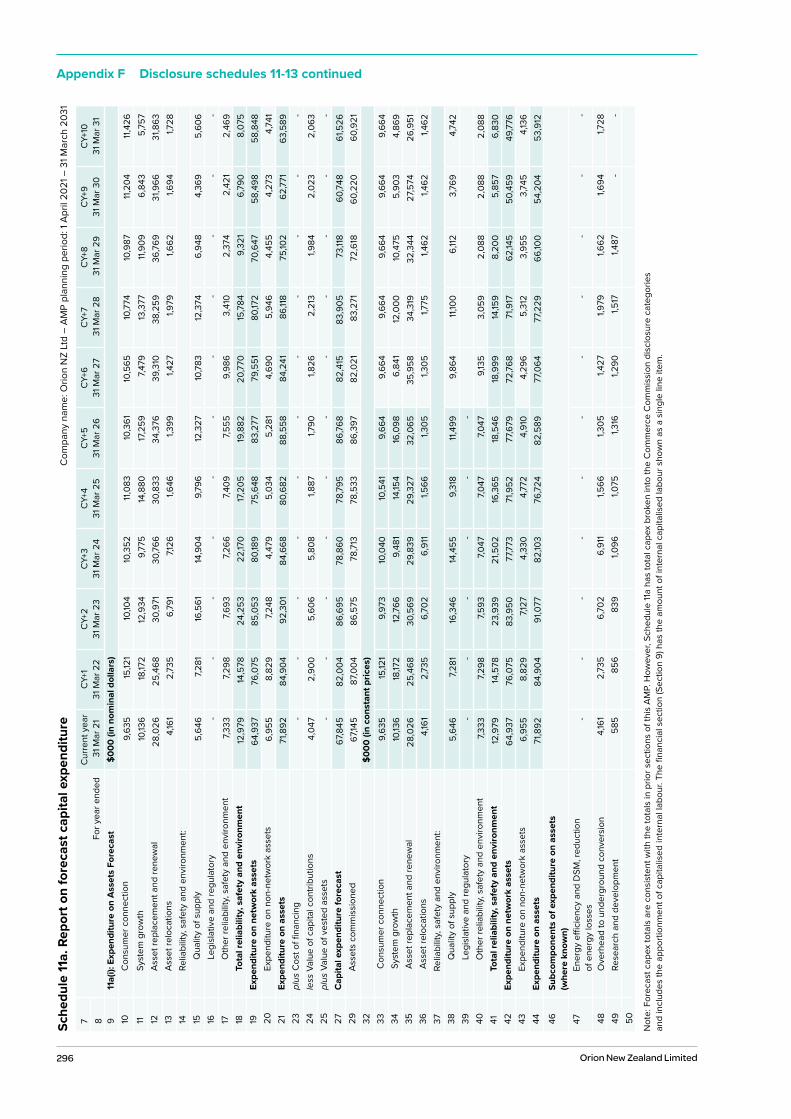
296 Orion New Zealand Limited
Appendix F Disclosure schedules 11-13 continuedSc
hedu
le 11
a. R
epor
t on
fore
cast
cap
ital e
xpen
ditu
re
C
ompa
ny n
ame:
Orio
n N
Z Lt
d –
AMP
plan
ning
per
iod:
1 Ap
ril 2
021 –
31 M
arch
203
1
7Fo
r yea
r end
edC
urre
nt y
ear
31 M
ar 2
1CY
+131
Mar
22
CY+2
31 M
ar 2
3 CY
+331
Mar
24
CY+4
31 M
ar 2
5 CY
+531
Mar
26
CY+6
31 M
ar 2
7 CY
+7 3
1 Mar
28
CY+8
31 M
ar 2
9CY
+931
Mar
30
CY+1
031
Mar
31
8 911
a(i):
Exp
endi
ture
on
Ass
ets
Fore
cast
$000
(in
nom
inal
dol
lars
) 10
Con
sum
er c
onne
ctio
n9,
635
15,12
1 10
,104
10,3
52
11,0
83
10,3
61
10,5
65
10,7
74
10,9
87
11,2
04
11,4
26
11Sy
stem
gro
wth
10,13
6 18
,172
12,9
34
9,77
5 14
,880
17
,259
7,4
79
13,3
77
11,9
09
6,84
3 5,
757
12As
set r
epla
cem
ent a
nd re
new
al28
,026
25
,468
30
,971
30
,766
30
,833
34
,376
39
,310
38
,259
36
,769
31
,966
31
,863
13
Asse
t rel
ocat
ions
4,16
1 2,
735
6,79
1 7,1
26
1,646
1,3
99
1,427
1,9
79
1,662
1,6
94
1,728
14
Relia
bilit
y, sa
fety
and
env
ironm
ent:
15Q
ualit
y of
sup
ply
5,64
6 7,2
81
16,5
61
14,9
04
9,79
6 12
,327
10
,783
12
,374
6,
948
4,36
9 5,
606
16Le
gisl
ativ
e an
d re
gula
tory
--
--
--
--
--
-17
Oth
er re
liabi
lity,
safe
ty a
nd e
nviro
nmen
t7,3
33
7,298
7,6
93
7,266
7,4
09
7,555
9,
986
3,41
0 2,
374
2,42
1 2,
469
18To
tal r
elia
bilit
y, s
afet
y an
d en
viro
nmen
t12
,979
14
,578
24
,253
22
,170
17,2
05
19,8
82
20,7
70
15,7
84
9,32
1 6,
790
8,07
5 19
Expe
nditu
re o
n ne
twor
k as
sets
64,9
37
76,0
75
85,0
53
80,18
9 75
,648
83
,277
79
,551
80
,172
70,6
47
58,4
98
58,8
48
20Ex
pend
iture
on
non-
netw
ork
asse
ts6,
955
8,82
9 7,2
48
4,47
9 5,
034
5,28
1 4,
690
5,94
6 4,
455
4,27
3 4,
741
21Ex
pend
iture
on
asse
ts71
,892
84
,904
92
,301
84
,668
80
,682
88
,558
84
,241
86
,118
75,10
2 62
,771
63
,589
23
plus
Cos
t of fi
nanc
ing
--
--
--
--
--
-24
less
Val
ue o
f cap
ital c
ontri
butio
ns4,
047
2,90
0 5,
606
5,80
8 1,8
87
1,790
1,8
26
2,21
3 1,9
84
2,02
3 2,
063
25pl
us V
alue
of v
este
d as
sets
--
--
--
--
--
-27
Cap
ital e
xpen
ditu
re fo
reca
st67
,845
82
,004
86
,695
78
,860
78
,795
86
,768
82
,415
83
,905
73
,118
60,7
48
61,5
26
29As
sets
com
mis
sion
ed67
,145
87,0
04
86,5
75
78,7
13
78,5
33
86,3
97
82,0
21
83,2
71
72,6
18
60,2
20
60,9
21
32$0
00 (i
n co
nsta
nt p
rices
) 33
Con
sum
er c
onne
ctio
n9,
635
15,12
1 9,
973
10,0
40
10,5
41
9,66
4 9,
664
9,66
4 9,
664
9,66
4 9,
664
34 S
yste
m g
row
th10
,136
18,17
2 12
,766
9,
481
14,15
4 16
,098
6,
841
12,0
00
10,4
75
5,90
3 4,
869
35 A
sset
repl
acem
ent a
nd re
new
al28
,026
25
,468
30
,569
29
,839
29
,327
32
,065
35
,958
34
,319
32
,344
27
,574
26
,951
36
Ass
et re
loca
tions
4,16
1 2,
735
6,70
2 6,
911
1,566
1,3
05
1,305
1,7
75
1,462
1,4
62
1,462
37
Relia
bilit
y, sa
fety
and
env
ironm
ent:
38Q
ualit
y of
sup
ply
5,64
67,2
81
16,3
46
14,4
55
9,31
8 11
,499
9,
864
11,10
0 6,
112
3,76
9 4,
742
39Le
gisl
ativ
e an
d re
gula
tory
--
--
--
40O
ther
relia
bilit
y, sa
fety
and
env
ironm
ent
7,333
7,2
98
7,593
7,0
47
7,047
7,0
47
9,13
5 3,
059
2,08
8 2,
088
2,08
8 41
Tota
l rel
iabi
lity,
saf
ety
and
envi
ronm
ent
12,9
79
14,5
78
23,9
39
21,5
02
16,3
65
18,5
46
18,9
99
14,15
9 8,
200
5,85
7 6,
830
42Ex
pend
iture
on
netw
ork
asse
ts64
,937
76
,075
83
,950
77
,773
71
,952
77
,679
72
,768
71
,917
62
,145
50,4
59
49,7
76
43Ex
pend
iture
on
non-
netw
ork
asse
ts6,
955
8,82
9 7,1
27
4,33
0 4,
772
4,91
0 4,
296
5,31
2 3,
955
3,74
5 4,
136
44Ex
pend
iture
on
asse
ts71
,892
84
,904
91
,077
82
,103
76,7
24
82,5
89
77,0
64
77,2
29
66,10
0 54
,204
53
,912
46
Subc
ompo
nent
s of
exp
endi
ture
on
asse
ts
(whe
re k
now
n)47
Ener
gy e
ffici
ency
and
DSM
, red
uctio
n
of e
nerg
y lo
sses
--
--
--
--
--
-
48O
verh
ead
to u
nder
grou
nd c
onve
rsio
n4,
161
2,73
5 6,
702
6,91
1 1,5
66
1,305
1,4
27
1,979
1,6
62
1,694
1,7
28
49Re
sear
ch a
nd d
evel
opm
ent
585
856
839
1,096
1,0
75
1,316
1,2
90
1,517
1,4
87
--
50
Not
e: F
orec
ast c
apex
tota
ls a
re c
onsi
sten
t with
the
tota
ls in
prio
r sec
tions
of t
his
AMP.
How
ever
, Sch
edul
e 11
a ha
s to
tal c
apex
bro
ken
into
the
Com
mer
ce C
omm
issi
on d
iscl
osur
e ca
tego
ries
an
d in
clud
es th
e ap
porti
onm
ent o
f cap
italis
ed in
tern
al la
bour
. The
fina
ncia
l sec
tion
(Sec
tion
9) h
as th
e am
ount
of i
nter
nal c
apita
lised
labo
ur s
how
n as
a s
ingl
e lin
e ite
m.

297
Appendix F Disclosure schedules 11-13 continued
Sche
dule
11a.
Rep
ort o
n fo
reca
st c
apita
l exp
endi
ture
con
tinue
d
C
ompa
ny n
ame:
Orio
n N
Z Lt
d –
AMP
plan
ning
per
iod:
1 Ap
ril 2
021 –
31 M
arch
203
1
51Fo
r yea
r end
edC
urre
nt y
ear
31 M
ar 2
1CY
+131
Mar
22
CY+2
31 M
ar 2
3 CY
+331
Mar
24
CY+4
31 M
ar 2
5 CY
+531
Mar
26
CY+6
31 M
ar 2
7 CY
+7 3
1 Mar
28
CY+8
31 M
ar 2
9CY
+931
Mar
30
CY+1
031
Mar
31
52 53D
iffer
ence
bet
wee
n no
min
al a
nd
cons
tant
pric
e fo
reca
sts
$000
54C
onsu
mer
con
nect
ion
--
131
312
541
697
901
1,109
1,3
22
1,540
1,7
61
55Sy
stem
gro
wth
--
168
295
727
1,160
63
8 1,3
77
1,433
94
0 88
7 56
Asse
t rep
lace
men
t and
rene
wal
--
402
927
1,506
2,
311
3,35
2 3,
939
4,42
5 4,
393
4,91
2 57
Asse
t rel
ocat
ions
--
88
215
80
94
122
204
200
233
266
58Re
liabi
lity,
safe
ty a
nd e
nviro
nmen
t:59
Qua
lity
of s
uppl
y-
-21
5 44
9 47
9 82
9 91
9 1,2
74
836
600
864
60Le
gisl
ativ
e an
d re
gula
tory
--
--
--
--
--
-61
Oth
er re
liabi
lity,
safe
ty a
nd e
nviro
nmen
t-
-10
0 21
9 36
2 50
8 85
1 35
1 28
6 33
3 38
1 62
Tota
l rel
iabi
lity,
saf
ety
and
envi
ronm
ent
- -
314
668
841
1,337
1,7
71
1,625
1,1
22
933
1,245
63
Expe
nditu
re o
n ne
twor
k as
sets
- -
1,103
2,
417
3,69
6 5,
598
6,78
3 8,
255
8,50
3 8,
038
9,07
2 64
Expe
nditu
re o
n no
n-ne
twor
k as
sets
--
121
149
262
371
394
634
500
528
605
65Ex
pend
iture
on
asse
ts-
-1,2
24
2,56
6 3,
958
5,96
9 7,1
77
8,88
9 9,
003
8,56
6 9,
677
6811
a(ii)
: Con
sum
er C
onne
ctio
n69
Con
sum
er ty
pes
defin
ed b
y ED
B (s
ee n
ote)
$000
(in
cons
tant
pric
es)
70G
ener
al C
onne
ctio
ns3,
792
4,93
1 3,
787
3,63
1 3,
631
3,63
1 71
Larg
e C
usto
mer
s1,3
32
4,77
5 1,4
03
1,716
2,
217
1,340
72
Subd
ivis
ions
2,09
8 2,
706
2,07
4 1,9
84
1,984
1,9
84
73Sw
itchg
ear
839
884
884
884
884
884
74Tr
ansf
orm
ers
1,574
1,8
25
1,825
1,8
25
1,825
1,8
25
76C
onsu
mer
con
nect
ion
expe
nditu
re9,
635
15,12
1 9,
973
10,0
40
10,5
41
9,66
4 77
less
Cap
ital c
ontri
butio
ns fu
ndin
g co
nsum
er
con
nect
ions
995
1,119
95
2 89
2 88
0 88
0
78C
onsu
mer
con
nect
ion
less
cap
ital
cont
ribut
ions
8,64
0 14
,002
9,
021
9,14
8 9,
661
8,78
4
7911
a(iii
): Sy
stem
Gro
wth
80Su
btra
nsm
issi
on12
1 6,
231
7,716
3,
977
3,65
2 4,
546
81Zo
ne s
ubst
atio
ns7,0
37
9,87
3 2,
143
1,537
6,
534
7,586
82
Dis
tribu
tion
and
LV li
nes
--
--
--
83D
istri
butio
n an
d LV
cab
les
2,02
5 1,5
91
494
313
313
313
84D
istri
butio
n su
bsta
tions
and
tran
sfor
mer
s-
--
--
-85
Dis
tribu
tion
switc
hgea
r-
-25
3 -
--
86O
ther
net
wor
k as
sets
954
477
2,16
0 3,
654
3,65
4 3,
654
87Sy
stem
gro
wth
exp
endi
ture
10,13
6 18
,172
12,7
66
9,48
1 14
,154
16,0
98
88le
ss C
apita
l con
tribu
tions
fund
ing
s
yste
m g
row
th-
--
--
-
89Sy
stem
gro
wth
less
cap
ital c
ontr
ibut
ions
10,13
6 18
,172
12,7
66
9,48
1 14
,154
16,0
98
90
Not
e: O
ur c
apex
bud
gets
for n
ew c
onne
ctio
ns a
re b
roke
n do
wn
into
ass
et ty
pes
rath
er th
an c
onsu
mer
type
s an
d th
eref
ore
the
cons
umer
type
defi
nitio
ns in
this
sch
edul
e di
ffer f
rom
Sch
edul
e 12
c(i).
10 Year Asset Management Plan Appendices
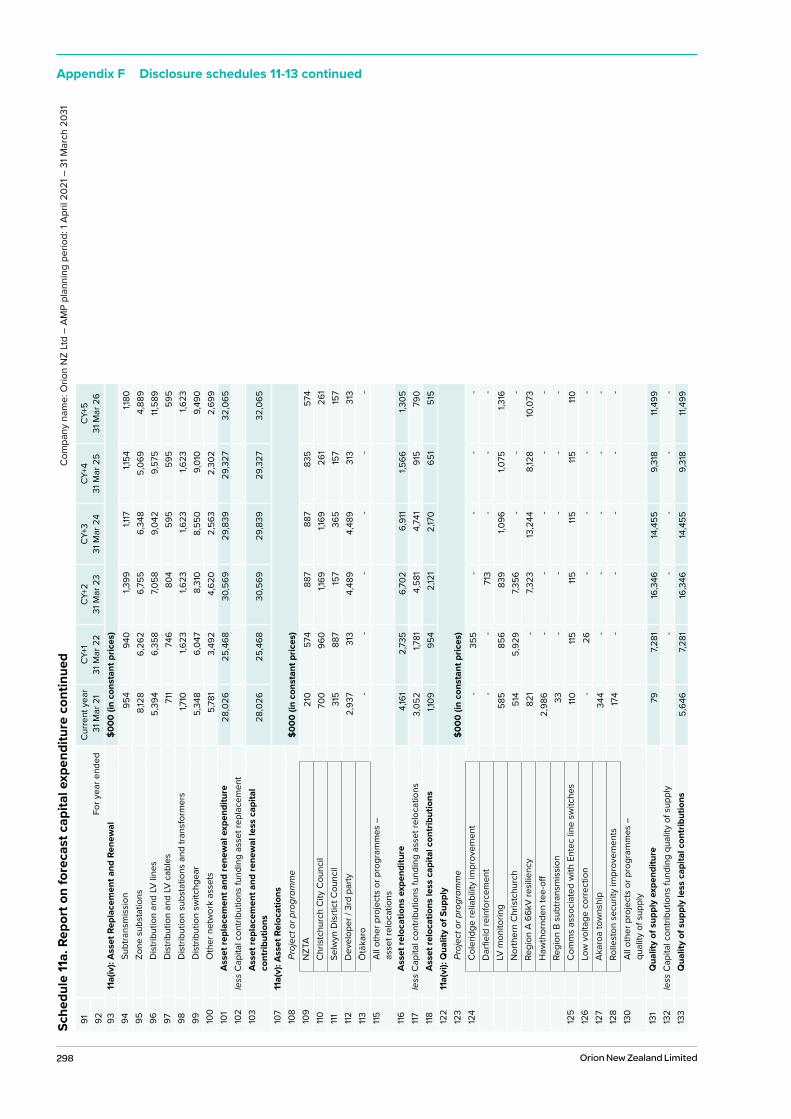
298 Orion New Zealand Limited
Appendix F Disclosure schedules 11-13 continuedSc
hedu
le 11
a. R
epor
t on
fore
cast
cap
ital e
xpen
ditu
re c
ontin
ued
Com
pany
nam
e: O
rion
NZ
Ltd
– AM
P pl
anni
ng p
erio
d: 1
April
202
1 – 3
1 Mar
ch 2
031
91Fo
r yea
r end
edC
urre
nt y
ear
31 M
ar 2
1CY
+131
Mar
22
CY+2
31 M
ar 2
3 CY
+331
Mar
24
CY+4
31 M
ar 2
5 CY
+531
Mar
26
92 9311
a(iv
): A
sset
Rep
lace
men
t and
Ren
ewal
$000
(in
cons
tant
pric
es)
94Su
btra
nsm
issi
on95
4 94
0 1,3
99
1,117
1,1
54
1,180
95
Zone
sub
stat
ions
8,12
8 6,
262
6,75
5 6,
348
5,06
9 4,
889
96D
istri
butio
n an
d LV
line
s5,
394
6,35
8 7,0
58
9,04
2 9,
575
11,5
89
97D
istri
butio
n an
d LV
cab
les
711
746
804
595
595
595
98D
istri
butio
n su
bsta
tions
and
tran
sfor
mer
s1,7
10
1,623
1,6
23
1,623
1,6
23
1,623
99
Dis
tribu
tion
switc
hgea
r5,
348
6,04
7 8,
310
8,55
0 9,
010
9,49
0 10
0O
ther
net
wor
k as
sets
5,78
1 3,
492
4,62
0 2,
563
2,30
2 2,
699
101
Ass
et re
plac
emen
t and
rene
wal
exp
endi
ture
28,0
26
25,4
68
30,5
69
29,8
39
29,3
27
32,0
65
102
less
Cap
ital c
ontri
butio
ns fu
ndin
g as
set r
epla
cem
ent
103
Ass
et re
plac
emen
t and
rene
wal
less
cap
ital
cont
ribut
ions
28,0
26
25,4
68
30,5
69
29,8
39
29,3
27
32,0
65
107
11a(
v): A
sset
Rel
ocat
ions
$000
(in
cons
tant
pric
es)
108
Proj
ect o
r pro
gram
me
109
NZT
A21
0 57
4 88
7 88
7 83
5 57
4 11
0C
hris
tchu
rch
City
Cou
ncil
700
960
1,169
1,1
69
261
261
111
Selw
yn D
isrti
ct C
ounc
il31
5 88
7 15
7 36
5 15
7 15
7 11
2D
evel
oper
/ 3r
d pa
rty2,
937
313
4,48
9 4,
489
313
313
113
Ōtā
karo
--
--
--
115
All o
ther
pro
ject
s or
pro
gram
mes
–
asse
t rel
ocat
ions
116
Ass
et re
loca
tions
exp
endi
ture
4,16
1 2,
735
6,70
2 6,
911
1,566
1,3
05
117
less
Cap
ital c
ontri
butio
ns fu
ndin
g as
set r
eloc
atio
ns3,
052
1,781
4,
581
4,74
1 91
5 79
0 11
8A
sset
relo
catio
ns le
ss c
apita
l con
trib
utio
ns1,1
09
954
2,12
1 2,
170
651
515
122
11a(
vi):
Qua
lity
of S
uppl
y$0
00 (i
n co
nsta
nt p
rices
) 12
3Pr
ojec
t or p
rogr
amm
e12
4C
oler
idge
relia
bilit
y im
prov
emen
t-
355
--
--
Dar
field
rein
forc
emen
t-
-71
3 -
--
LV m
onito
ring
585
856
839
1,096
1,0
75
1,316
N
orth
ern
Chr
istc
hurc
h51
45,
929
7,356
-
--
Regi
on A
66k
V re
silie
ncy
821
-7,3
23
13,2
44
8,12
8 10
,073
H
awth
ornd
en te
e-off
2,98
6-
--
--
Regi
on B
sub
trans
mis
sion
33-
--
--
125
Com
ms
asso
ciat
ed w
ith E
ntec
line
sw
itche
s11
011
5 11
5 11
5 11
5 11
0 12
6Lo
w v
olta
ge c
orre
ctio
n-
26
--
--
127
Akar
oa to
wns
hip
344
--
--
-12
8Ro
llest
on s
ecur
ity im
prov
emen
ts17
4-
--
--
130
All o
ther
pro
ject
s or
pro
gram
mes
–
qual
ity o
f sup
ply
131
Qua
lity
of s
uppl
y ex
pend
iture
797,2
81
16,3
46
14,4
55
9,31
8 11
,499
13
2le
ss C
apita
l con
tribu
tions
fund
ing
qual
ity o
f sup
ply
--
--
-13
3Q
ualit
y of
sup
ply
less
cap
ital c
ontr
ibut
ions
5,64
67,2
81
16,3
46
14,4
55
9,31
8 11
,499
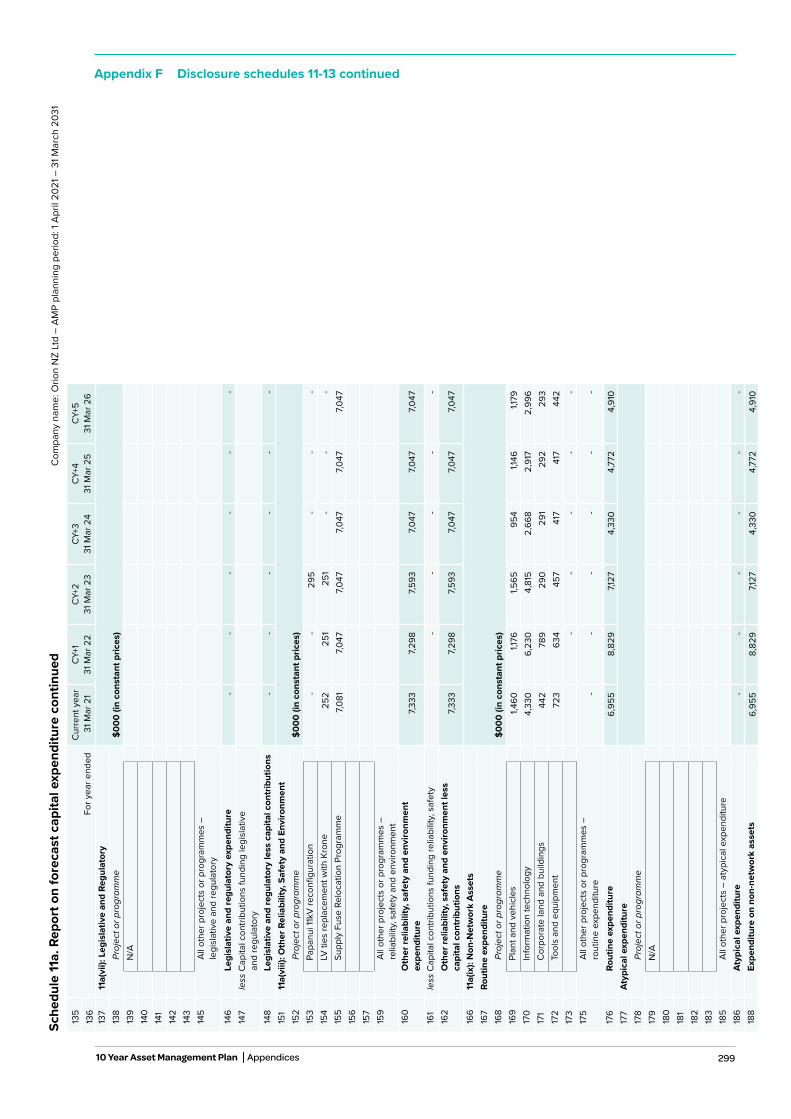
299
Appendix F Disclosure schedules 11-13 continuedSc
hedu
le 11
a. R
epor
t on
fore
cast
cap
ital e
xpen
ditu
re c
ontin
ued
Com
pany
nam
e: O
rion
NZ
Ltd
– AM
P pl
anni
ng p
erio
d: 1
April
202
1 – 3
1 Mar
ch 2
031
135
For y
ear e
nded
Cur
rent
yea
r 3
1 Mar
21
CY+1
31 M
ar 2
2 CY
+231
Mar
23
CY+3
31 M
ar 2
4 CY
+431
Mar
25
CY+5
31 M
ar 2
6 13
613
711
a(vi
i): L
egis
lativ
e an
d Re
gula
tory
$000
(in
cons
tant
pric
es)
138
Proj
ect o
r pro
gram
me
139
N/A
140
141
142
143
145
All o
ther
pro
ject
s or
pro
gram
mes
–
legi
slat
ive
and
regu
lato
ry
146
Legi
slat
ive
and
regu
lato
ry e
xpen
ditu
re-
--
--
-14
7le
ss C
apita
l con
tribu
tions
fund
ing
legi
slat
ive
a
nd re
gula
tory
148
Legi
slat
ive
and
regu
lato
ry le
ss c
apita
l con
trib
utio
ns-
--
--
-15
111
a(vi
ii): O
ther
Rel
iabi
lity,
Saf
ety
and
Envi
ronm
ent
$000
(in
cons
tant
pric
es)
152
Proj
ect o
r pro
gram
me
153
Papa
nui 1
1kV
reco
nfigu
ratio
n-
-29
5 -
--
154
LV ti
es re
plac
emen
t with
Kro
ne25
2 25
1 25
1 -
--
155
Supp
ly F
use
Relo
catio
n Pr
ogra
mm
e7,0
81
7,047
7,0
47
7,047
7,0
47
7,047
15
615
715
9Al
l oth
er p
roje
cts
or p
rogr
amm
es –
re
liabi
lity,
safe
ty a
nd e
nviro
nmen
t16
0O
ther
relia
bilit
y, s
afet
y an
d en
viro
nmen
t ex
pend
iture
7,333
7,2
98
7,593
7,0
47
7,047
7,0
47
161
less
Cap
ital c
ontri
butio
ns fu
ndin
g re
liabi
lity,
safe
ty-
--
--
162
Oth
er re
liabi
lity,
saf
ety
and
envi
ronm
ent l
ess
ca
pita
l con
trib
utio
ns7,3
33
7,298
7,5
93
7,047
7,0
47
7,047
166
11a(
ix):
Non
-Net
wor
k A
sset
s
$000
(in
cons
tant
pric
es)
167
Rout
ine
expe
nditu
re16
8Pr
ojec
t or p
rogr
amm
e16
9Pl
ant a
nd v
ehic
les
1,460
1,1
76
1,565
95
4 1,1
46
1,179
17
0In
form
atio
n te
chno
logy
4,33
0 6,
230
4,81
5 2,
668
2,91
7 2,
996
171
Cor
pora
te la
nd a
nd b
uild
ings
442
789
290
291
292
293
172
Tool
s an
d eq
uipm
ent
723
634
457
417
417
442
173
--
--
-17
5Al
l oth
er p
roje
cts
or p
rogr
amm
es –
ro
utin
e ex
pend
iture
--
--
--
176
Rout
ine
expe
nditu
re6,
955
8,82
9 7,1
27
4,33
0 4,
772
4,91
0 17
7At
ypic
al e
xpen
ditu
re17
8Pr
ojec
t or p
rogr
amm
e17
9N
/A18
018
118
218
318
5Al
l oth
er p
roje
cts
– at
ypic
al e
xpen
ditu
re
18
6At
ypic
al e
xpen
ditu
re-
--
--
-18
8Ex
pend
iture
on
non-
netw
ork
asse
ts6,
955
8,82
9 7,1
27
4,33
0 4,
772
4,91
0
10 Year Asset Management Plan Appendices
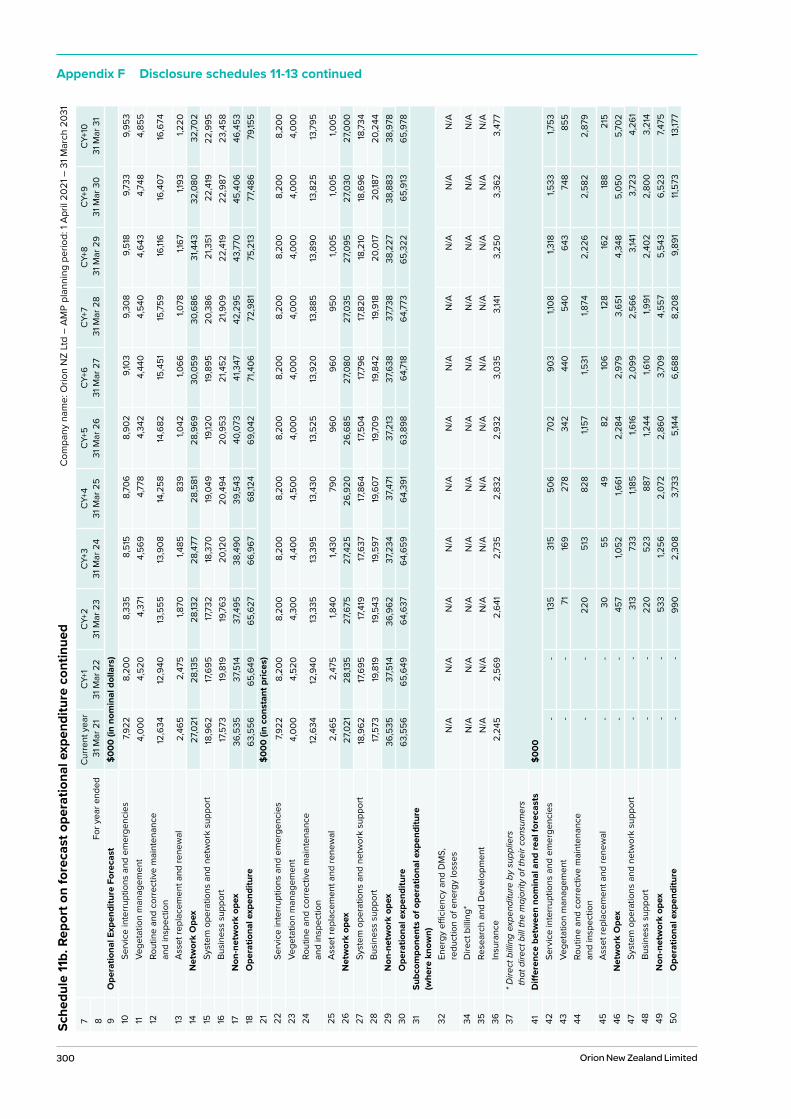
300 Orion New Zealand Limited
Sche
dule
11b.
Rep
ort o
n fo
reca
st o
pera
tiona
l exp
endi
ture
con
tinue
d
Com
pany
nam
e: O
rion
NZ
Ltd
– AM
P pl
anni
ng p
erio
d: 1
April
202
1 – 3
1 Mar
ch 2
031
7Fo
r yea
r end
edC
urre
nt y
ear
31 M
ar 2
1CY
+131
Mar
22
CY+2
31 M
ar 2
3 CY
+331
Mar
24
CY+4
31 M
ar 2
5 CY
+531
Mar
26
CY+6
31 M
ar 2
7 CY
+7 3
1 Mar
28
CY+8
31 M
ar 2
9CY
+931
Mar
30
CY+1
031
Mar
31
8 9O
pera
tiona
l Exp
endi
ture
For
ecas
t$0
00 (i
n no
min
al d
olla
rs)
10Se
rvic
e in
terru
ptio
ns a
nd e
mer
genc
ies
7,922
8,
200
8,33
5 8,
515
8,70
6 8,
902
9,10
3 9,
308
9,51
8 9,
733
9,95
3 11
Vege
tatio
n m
anag
emen
t4,
000
4,52
0 4,
371
4,56
9 4,
778
4,34
2 4,
440
4,54
0 4,
643
4,74
8 4,
855
12Ro
utin
e an
d co
rrect
ive
mai
nten
ance
an
d in
spec
tion
12,6
34
12,9
40
13,5
55
13,9
08
14,2
58
14,6
82
15,4
51
15,7
59
16,11
6 16
,407
16
,674
13As
set r
epla
cem
ent a
nd re
new
al2,
465
2,47
5 1,8
70
1,485
83
9 1,0
42
1,066
1,0
78
1,167
1,1
93
1,220
14
Net
wor
k O
pex
27,0
21
28,13
5 28
,132
28,4
77
28,5
81
28,9
69
30,0
59
30,6
86
31,4
43
32,0
80
32,7
02
15Sy
stem
ope
ratio
ns a
nd n
etw
ork
supp
ort
18,9
62
17,6
95
17,7
32
18,3
70
19,0
49
19,12
0 19
,895
20
,386
21
,351
22
,419
22
,995
16
Busi
ness
sup
port
17,5
73
19,8
19
19,7
63
20,12
0 20
,494
20
,953
21
,452
21
,909
22
,419
22
,987
23
,458
17
Non
-net
wor
k op
ex36
,535
37
,514
37
,495
38
,490
39
,543
40
,073
41
,347
42
,295
43
,770
45
,406
46
,453
18
Ope
ratio
nal e
xpen
ditu
re63
,556
65
,649
65
,627
66
,967
68
,124
69,0
42
71,4
06
72,9
81
75,2
13
77,4
86
79,15
5 21
$000
(in
cons
tant
pric
es)
22Se
rvic
e in
terru
ptio
ns a
nd e
mer
genc
ies
7,922
8,
200
8,20
0 8,
200
8,20
0 8,
200
8,20
0 8,
200
8,20
0 8,
200
8,20
0 23
Vege
tatio
n m
anag
emen
t4,
000
4,52
0 4,
300
4,40
0 4,
500
4,00
0 4,
000
4,00
0 4,
000
4,00
0 4,
000
24Ro
utin
e an
d co
rrect
ive
mai
nten
ance
an
d in
spec
tion
12,6
34
12,9
40
13,3
35
13,3
95
13,4
30
13,5
25
13,9
20
13,8
85
13,8
90
13,8
25
13,7
95
25As
set r
epla
cem
ent a
nd re
new
al2,
465
2,47
5 1,8
40
1,430
79
0 96
0 96
0 95
0 1,0
05
1,005
1,0
05
26N
etw
ork
opex
27,0
21
28,13
5 27
,675
27
,425
26
,920
26
,685
27
,080
27
,035
27
,095
27
,030
27
,000
27
Syst
em o
pera
tions
and
net
wor
k su
ppor
t18
,962
17
,695
17
,419
17
,637
17
,864
17
,504
17
,796
17
,820
18
,210
18
,696
18
,734
28
Busi
ness
sup
port
17,5
73
19,8
19
19,5
43
19,5
97
19,6
07
19,7
09
19,8
42
19,9
18
20,0
17
20,18
7 20
,244
29
Non
-net
wor
k op
ex36
,535
37
,514
36
,962
37
,234
37
,471
37
,213
37
,638
37
,738
38
,227
38
,883
38
,978
30
Ope
ratio
nal e
xpen
ditu
re63
,556
65
,649
64
,637
64
,659
64
,391
63
,898
64
,718
64
,773
65
,322
65
,913
65
,978
31
Subc
ompo
nent
s of
ope
ratio
nal e
xpen
ditu
re
(whe
re k
now
n)32
Ener
gy e
ffici
ency
and
DM
S,
redu
ctio
n of
ene
rgy
loss
esN
/AN
/AN
/AN
/AN
/AN
/AN
/AN
/AN
/AN
/AN
/A
34D
irect
bill
ing*
N/A
N/A
N/A
N/A
N/A
N/A
N/A
N/A
N/A
N/A
N/A
35Re
sear
ch a
nd D
evel
opm
ent
N/A
N/A
N/A
N/A
N/A
N/A
N/A
N/A
N/A
N/A
N/A
36In
sura
nce
2,24
5 2,
569
2,64
1 2,
735
2,83
2 2,
932
3,03
5 3,
141
3,25
0 3,
362
3,47
7 37
* Dire
ct b
illin
g ex
pend
iture
by
supp
liers
t
hat d
irect
bill
the
maj
ority
of t
heir
cons
umer
s$0
0041
Diff
eren
ce b
etw
een
nom
inal
and
real
fore
cast
s42
Serv
ice
inte
rrupt
ions
and
em
erge
ncie
s-
-13
5 31
5 50
6 70
2 90
3 1,1
08
1,318
1,5
33
1,753
43
Vege
tatio
n m
anag
emen
t-
-71
16
9 27
8 34
2 44
0 54
0 64
3 74
8 85
5 44
Rout
ine
and
corre
ctiv
e m
aint
enan
ce
and
insp
ectio
n-
-22
0 51
3 82
8 1,1
57
1,531
1,8
74
2,22
6 2,
582
2,87
9
45As
set r
epla
cem
ent a
nd re
new
al-
-30
55
49
82
10
6 12
8 16
2 18
8 21
5 46
Net
wor
k O
pex
--
457
1,052
1,6
61
2,28
4 2,
979
3,65
1 4,
348
5,05
0 5,
702
47Sy
stem
ope
ratio
ns a
nd n
etw
ork
supp
ort
--
313
733
1,185
1,6
16
2,09
9 2,
566
3,14
1 3,
723
4,26
1 48
Busi
ness
sup
port
--
220
523
887
1,244
1,6
10
1,991
2,
402
2,80
0 3,
214
49N
on-n
etw
ork
opex
--
533
1,256
2,
072
2,86
0 3,
709
4,55
7 5,
543
6,52
3 7,4
75
50O
pera
tiona
l exp
endi
ture
--
990
2,30
8 3,
733
5,14
4 6,
688
8,20
8 9,
891
11,5
73
13,17
7
Appendix F Disclosure schedules 11-13 continued
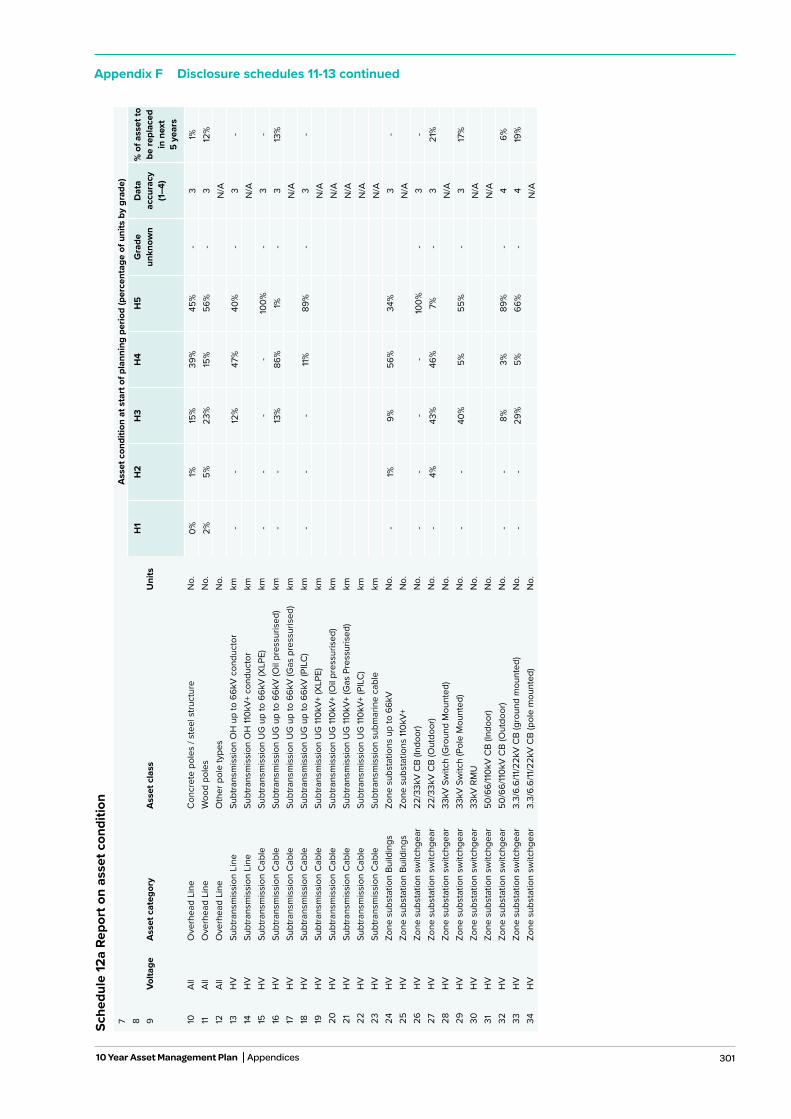
301
Sche
dule
12a
Repo
rt o
n as
set c
ondi
tion
7A
sset
con
ditio
n at
sta
rt o
f pla
nnin
g pe
riod
(per
cent
age
of u
nits
by
grad
e)8 9
Volta
geA
sset
cat
egor
yA
sset
cla
ssU
nits
H1
H2
H3
H4
H5
Gra
de
unkn
own
Dat
aac
cura
cy(1
–4)
% o
f ass
et to
be
repl
aced
in
nex
t 5
year
s
10Al
lO
verh
ead
Line
Con
cret
e po
les
/ ste
el s
truct
ure
No.
0%
1%
15%
39
%
45%
-
31%
11
All
Ove
rhea
d Li
neW
ood
pole
sN
o.2%
5%
23
%
15%
56
%
-3
12%
12
All
Ove
rhea
d Li
neO
ther
pol
e ty
pes
No.
N/A
13H
VSu
btra
nsm
issi
on L
ine
Subt
rans
mis
sion
OH
up
to 6
6kV
cond
ucto
rkm
--
12%
47
%
40%
-
3-
14H
VSu
btra
nsm
issi
on L
ine
Subt
rans
mis
sion
OH
110k
V+ c
ondu
ctor
kmN
/A15
HV
Subt
rans
mis
sion
Cab
leSu
btra
nsm
issi
on U
G u
p to
66k
V (X
LPE)
km-
--
-10
0%
-3
-16
HV
Subt
rans
mis
sion
Cab
leSu
btra
nsm
issi
on U
G u
p to
66k
V (O
il pr
essu
rised
)km
--
13%
86
%
1%
-3
13%
17
HV
Subt
rans
mis
sion
Cab
leSu
btra
nsm
issi
on U
G u
p to
66k
V (G
as p
ress
uris
ed)
kmN
/A18
HV
Subt
rans
mis
sion
Cab
leSu
btra
nsm
issi
on U
G u
p to
66k
V (P
ILC
)km
--
-11
%
89%
-
3-
19H
VSu
btra
nsm
issi
on C
able
Subt
rans
mis
sion
UG
110k
V+ (X
LPE)
kmN
/A20
HV
Subt
rans
mis
sion
Cab
leSu
btra
nsm
issi
on U
G 11
0kV+
(Oil
pres
suris
ed)
kmN
/A21
HV
Subt
rans
mis
sion
Cab
leSu
btra
nsm
issi
on U
G 11
0kV+
(Gas
Pre
ssur
ised
)km
N/A
22H
VSu
btra
nsm
issi
on C
able
Subt
rans
mis
sion
UG
110k
V+ (P
ILC
)km
N/A
23H
VSu
btra
nsm
issi
on C
able
Subt
rans
mis
sion
sub
mar
ine
cabl
ekm
N/A
24H
VZo
ne s
ubst
atio
n Bu
ildin
gs
Zone
sub
stat
ions
up
to 6
6kV
No.
-1%
9%
56
%
34%
3
-25
HV
Zone
sub
stat
ion
Build
ings
Zo
ne s
ubst
atio
ns 11
0kV+
No.
N/A
26H
VZo
ne s
ubst
atio
n sw
itchg
ear
22/3
3kV
CB
(Indo
or)
No.
--
--
100%
-
3-
27H
VZo
ne s
ubst
atio
n sw
itchg
ear
22/3
3kV
CB
(Out
door
)N
o.-
4%
43%
46
%
7%
-3
21%
28
HV
Zone
sub
stat
ion
switc
hgea
r 33
kV S
witc
h (G
roun
d M
ount
ed)
No.
N/A
29H
VZo
ne s
ubst
atio
n sw
itchg
ear
33kV
Sw
itch
(Pol
e M
ount
ed)
No.
--
40%
5%
55
%
-3
17%
30
HV
Zone
sub
stat
ion
switc
hgea
r 33
kV R
MU
No.
N/A
31H
VZo
ne s
ubst
atio
n sw
itchg
ear
50/6
6/11
0kV
CB
(Indo
or)
No.
N/A
32H
VZo
ne s
ubst
atio
n sw
itchg
ear
50/6
6/11
0kV
CB
(Out
door
)N
o.-
-8%
3%
89
%
-4
6%
33H
VZo
ne s
ubst
atio
n sw
itchg
ear
3.3/
6.6/
11/2
2kV
CB
(gro
und
mou
nted
) N
o.-
-29
%
5%
66%
-
419
%
34H
VZo
ne s
ubst
atio
n sw
itchg
ear
3.3/
6.6/
11/2
2kV
CB
(pol
e m
ount
ed)
No.
N/A
Appendix F Disclosure schedules 11-13 continued
10 Year Asset Management Plan Appendices
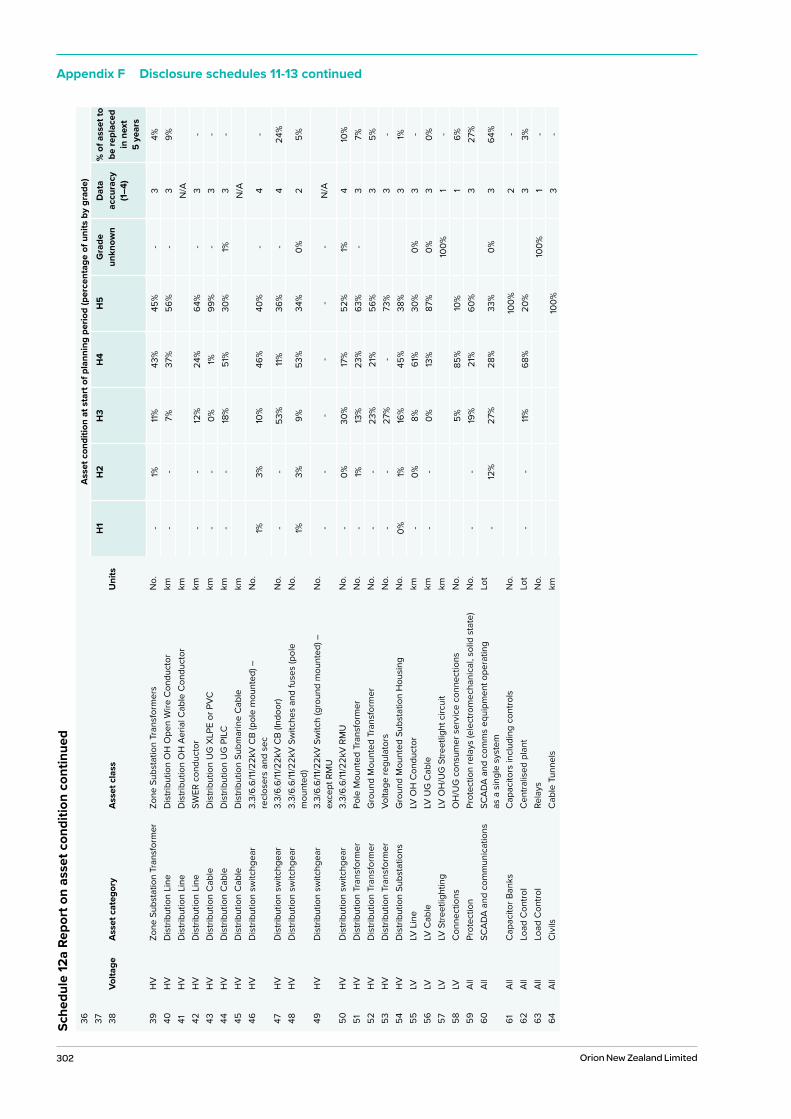
302 Orion New Zealand Limited
Sche
dule
12a
Repo
rt o
n as
set c
ondi
tion
cont
inue
d36
Ass
et c
ondi
tion
at s
tart
of p
lann
ing
perio
d (p
erce
ntag
e of
uni
ts b
y gr
ade)
37 38Vo
ltage
Ass
et c
ateg
ory
Ass
et c
lass
Uni
tsH
1H
2H
3H
4H
5G
rade
un
know
nD
ata
accu
racy
(1–4
)
% o
f ass
et to
be
repl
aced
in
nex
t 5
year
s
39H
VZo
ne S
ubst
atio
n Tr
ansf
orm
er
Zone
Sub
stat
ion
Tran
sfor
mer
sN
o.-
1%
11%
43
%
45%
-
34%
40
HV
Dis
tribu
tion
Line
Dis
tribu
tion
OH
Ope
n W
ire C
ondu
ctor
km-
-7%
37
%
56%
-
39%
41
HV
Dis
tribu
tion
Line
Dis
tribu
tion
OH
Aer
ial C
able
Con
duct
orkm
N/A
42H
VD
istri
butio
n Li
neSW
ER c
ondu
ctor
km-
-12
%
24%
64
%
-3
-43
HV
Dis
tribu
tion
Cab
leD
istri
butio
n U
G X
LPE
or P
VCkm
--
0%
1%
99%
-
3-
44H
VD
istri
butio
n C
able
Dis
tribu
tion
UG
PIL
Ckm
--
18%
51
%
30%
1%
3
-45
HV
Dis
tribu
tion
Cab
leD
istri
butio
n Su
bmar
ine
Cab
lekm
N/A
46H
VD
istri
butio
n sw
itchg
ear
3.3/
6.6/
11/2
2kV
CB
(pol
e m
ount
ed) –
re
clos
ers
and
sec
No.
1%
3%
10%
46
%
40%
-
4-
47H
VD
istri
butio
n sw
itchg
ear
3.3/
6.6/
11/2
2kV
CB
(Indo
or)
No.
--
53%
11
%
36%
-
424
%
48H
VD
istri
butio
n sw
itchg
ear
3.3/
6.6/
11/2
2kV
Switc
hes
and
fuse
s (p
ole
mou
nted
)N
o.1%
3%
9%
53
%
34%
0%
2
5%
49H
VD
istri
butio
n sw
itchg
ear
3.3/
6.6/
11/2
2kV
Switc
h (g
roun
d m
ount
ed) –
ex
cept
RM
UN
o.-
--
--
-N
/A
50H
VD
istri
butio
n sw
itchg
ear
3.3/
6.6/
11/2
2kV
RMU
No.
-0%
30
%
17%
52
%
1%
410
%
51H
VD
istri
butio
n Tr
ansf
orm
erPo
le M
ount
ed T
rans
form
erN
o.-
1%
13%
23
%
63%
-
37%
52
HV
Dis
tribu
tion
Tran
sfor
mer
Gro
und
Mou
nted
Tra
nsfo
rmer
No.
--
23%
21
%
56%
3
5%
53H
VD
istri
butio
n Tr
ansf
orm
er
Volta
ge re
gula
tors
No.
--
27%
-
73%
3
-54
HV
Dis
tribu
tion
Subs
tatio
nsG
roun
d M
ount
ed S
ubst
atio
n H
ousi
ngN
o.0%
1%
16
%
45%
38
%
31%
55
LVLV
Lin
eLV
OH
Con
duct
orkm
-0%
8%
61
%
30%
0%
3
-56
LVLV
Cab
leLV
UG
Cab
lekm
--
0%
13%
87
%
0%
30%
57
LVLV
Stre
etlig
htin
gLV
OH
/UG
Stre
etlig
ht c
ircui
tkm
100%
1
-58
LVC
onne
ctio
nsO
H/U
G c
onsu
mer
ser
vice
con
nect
ions
No.
5%
85%
10
%
16%
59
All
Prot
ectio
nPr
otec
tion
rela
ys (e
lect
rom
echa
nica
l, so
lid s
tate
)N
o.-
-19
%
21%
60
%
327
%
60Al
lSC
ADA
and
com
mun
icat
ions
SCAD
A an
d co
mm
s eq
uipm
ent o
pera
ting
as
a s
ingl
e sy
stem
Lot
-12
%
27%
28
%
33%
0%
3
64%
61Al
lC
apac
itor B
anks
Cap
acito
rs in
clud
ing
cont
rols
No.
100%
2
-62
All
Load
Con
trol
Cen
tralis
ed p
lant
Lot
--
11%
68
%
20%
3
3%
63Al
lLo
ad C
ontro
lRe
lays
No.
100%
1
-64
All
Civ
ilsC
able
Tun
nels
km10
0%
3-
Appendix F Disclosure schedules 11-13 continued

303
Sche
dule
12b
Repo
rt o
n fo
reca
st c
apac
ity7
12b(
i): S
yste
m G
row
th –
Zon
e Su
bsta
tions
8
Exis
ting
Zone
Su
bsta
tions
Cur
rent
Pe
ak L
oad
(MVA
)
Inst
alle
d Fi
rm
Cap
acity
(MVA
)
Secu
rity
of S
uppl
y C
lass
ifica
tion
(type
)
Tran
sfer
C
apac
ity(M
VA)
Util
isat
ion
of In
stal
led
Firm
C
apac
ity%
Inst
alle
d Fi
rm
Cap
acity
+5
yea
rs(M
VA)
Util
isat
ion
of In
stal
led
Firm
C
apac
ity
+ 5y
rs%
Inst
alle
d Fi
rm C
apac
ity
Con
stra
int +
5 ye
ars
(cau
se)
Expl
anat
ion
9Ad
ding
ton
11kV
#1
16
30
N-1
16
54%
30
63
%
No
cons
train
t with
in +
5 ye
ars
10Ad
ding
ton
11kV
#2
19
30
N-1
19
63%
30
64
%
No
cons
train
t with
in +
5 ye
ars
11Ar
mag
h17
40
N
-117
43
%
40
53%
N
o co
nstra
int w
ithin
+5
year
sC
entra
l City
Reb
uild
exp
ecte
d to
giv
e la
rge
load
incr
ease
ov
er n
ext f
ew y
ears
12Ba
rnet
t Par
k8
15
N8
55%
15
56
%
No
cons
train
t with
in +
5 ye
ars
Sing
le 6
6kV
line
and
23M
VA tr
ansf
orm
er b
acke
d up
by
11kV
but
lim
ited
to 15
MVA
by
com
plia
nce
with
sec
urity
of
sup
ply
stan
dard
13Br
omle
y30
60
N
-130
50
%
60
52%
N
o co
nstra
int w
ithin
+5
year
s14
Dal
lingt
on27
40
N
-127
69
%
40
70%
N
o co
nstra
int w
ithin
+5
year
s15
Fend
alto
n35
40
N
-135
87
%
40
86%
N
o co
nstra
int w
ithin
+5
year
s16
Hal
swel
l20
23
N
-120
87
%
23
94%
N
o co
nstra
int w
ithin
+5
year
sIn
stal
l 3rd
tran
sfor
mer
whe
n ne
eded
17H
awth
ornd
en31
40
N
-131
78
%
40
81%
N
o co
nstra
int w
ithin
+5
year
s18
Hea
thco
te22
40
N
-122
56
%
40
58%
N
o co
nstra
int w
ithin
+5
year
s19
Hoo
n H
ay32
40
N
-132
79
%
40
74%
N
o co
nstra
int w
ithin
+5
year
s20
Hor
nby
16
20
N-1
16
80%
20
85
%
No
cons
train
t with
in +
5 ye
ars
21Ila
m7
11
N-1
7 66
%
11
69%
N
o co
nstra
int w
ithin
+5
year
s22
Lanc
aste
r19
40
N
-119
48
%
40
50%
N
o co
nstra
int w
ithin
+5
year
s23
McF
adde
ns34
40
N
-134
84
%
40
86%
N
o co
nstra
int w
ithin
+5
year
s24
Mid
dlet
on26
40
N
-126
66
%
40
70%
N
o co
nstra
int w
ithin
+5
year
s25
Milt
on35
40
N
-135
87
%
40
96%
N
o co
nstra
int w
ithin
+5
year
sLo
ad tr
ansf
er to
Add
ingt
on w
hen
need
ed26
Moff
ett
14
23
N-1
14
59%
23
71
%
No
cons
train
t with
in +
5 ye
ars
27O
xfor
d Tu
am12
40
N
-112
31
%
40
39%
N
o co
nstra
int w
ithin
+5
year
s28
Papa
nui
36
48
N-1
36
74%
48
86
%
Oth
erIn
stal
l new
Bel
fast
zon
e su
bsta
tion
to a
llevi
ate
11kV
con
stra
int
whi
ch a
lso
avoi
ds e
mer
ging
tran
sfor
mer
con
stra
int
29Pr
ebbl
eton
7 15
N
7 47
%
15
49%
N
o co
nstra
int w
ithin
+5
year
s30
Raw
hiti
27
40
N-1
27
67%
40
67
%
No
cons
train
t with
in +
5 ye
ars
31Sh
ands
13
20
N-1
13
66%
20
88
%
No
cons
train
t with
in +
5 ye
ars
32So
ckbu
rn22
29
N
-122
77
%
29
81%
N
o co
nstra
int w
ithin
+5
year
s33
Wai
mak
ariri
23
40
N-1
23
57%
40
58
%
No
cons
train
t with
in +
5 ye
ars
34An
nat
4 -
N3
--
-N
o co
nstra
int w
ithin
+5
year
s35
Bank
side
6 -
N4
--
-N
o co
nstra
int w
ithin
+5
year
s36
Broo
ksid
e 66
kV9
-N
6 -
--
No
cons
train
t with
in +
5 ye
ars
37D
arfie
ld6
-N
4 -
--
No
cons
train
t with
in +
5 ye
ars
38D
iam
ond
Har
bour
2 -
N2
--
-N
o co
nstra
int w
ithin
+5
year
s39
Dun
sand
el17
23
N
-112
74
%
23
74%
N
o co
nstra
int w
ithin
+5
year
s40
Duv
auch
elle
4 8
N-1
4 57
%
8 56
%
No
cons
train
t with
in +
5 ye
ars
41G
reen
dale
6 -
N5
--
-N
o co
nstra
int w
ithin
+5
year
s42
Hig
hfiel
d9
-N
6 -
--
No
cons
train
t with
in +
5 ye
ars
43H
ills
7 -
N5
--
-N
o co
nstra
int w
ithin
+5
year
s44
Hor
orat
a9
-N
6 -
--
No
cons
train
t with
in +
5 ye
ars
Appendix F Disclosure schedules 11-13 continued
10 Year Asset Management Plan Appendices

304 Orion New Zealand Limited
Sche
dule
12b
Repo
rt o
n fo
reca
st c
apac
ity c
ontin
ued
12b(
i): S
yste
m G
row
th –
Zon
e Su
bsta
tions
Exis
ting
Zone
Su
bsta
tions
Cur
rent
Pe
ak L
oad
(MVA
)
Inst
alle
d Fi
rm
Cap
acity
(MVA
)
Secu
rity
of S
uppl
y C
lass
ifica
tion
(type
)
Tran
sfer
C
apac
ity(M
VA)
Util
isat
ion
of In
stal
led
Firm
C
apac
ity%
Inst
alle
d Fi
rm
Cap
acity
+5
yea
rs(M
VA)
Util
isat
ion
of In
stal
led
Firm
C
apac
ity
+ 5y
rs%
Inst
alle
d Fi
rm C
apac
ity
Con
stra
int +
5 ye
ars
(cau
se)
Expl
anat
ion
45Ki
llinc
hy9
-N
6 -
--
No
cons
train
t with
in +
5 ye
ars
46Ki
mbe
rley
15
23
N-1
10
63%
23
63
%
No
cons
train
t with
in +
5 ye
ars
47La
rcom
b14
23
N
-110
61
%
23
75%
N
o co
nstra
int w
ithin
+5
year
s48
Linc
oln
10
10
N-1
7 10
5%
10
115%
Tr
ansf
orm
erC
onst
rain
t to
be re
solv
ed b
y tra
nsfe
rs to
Spr
ings
ton
zo
ne s
ubst
atio
n49
Littl
e Ri
ver
1 -
N1
--
-N
o co
nstra
int w
ithin
+5
year
s50
Mot
ukar
ara
4 8
N-1
4 47
%
8 47
%
No
cons
train
t with
in +
5 ye
ars
51Ro
llest
on12
10
N
-18
117%
10
10
7%
Tran
sfor
mer
Con
stra
int t
o be
reso
lved
by
trans
fers
to W
eedo
ns &
Hig
hfiel
d 52
Sprin
gsto
n 66
/11kV
7 -
N5
-10
11
4%
No
cons
train
t with
in +
5 ye
ars
Stag
ed u
pgra
de to
2 x
10M
VA tr
ansf
orm
ers
53Te
Piri
ta7
-N
5 -
--
No
cons
train
t with
in +
5 ye
ars
54W
eedo
ns12
23
N
-18
52%
23
63
%
No
cons
train
t with
in +
5 ye
ars
Appendix F Disclosure schedules 11-13 continued
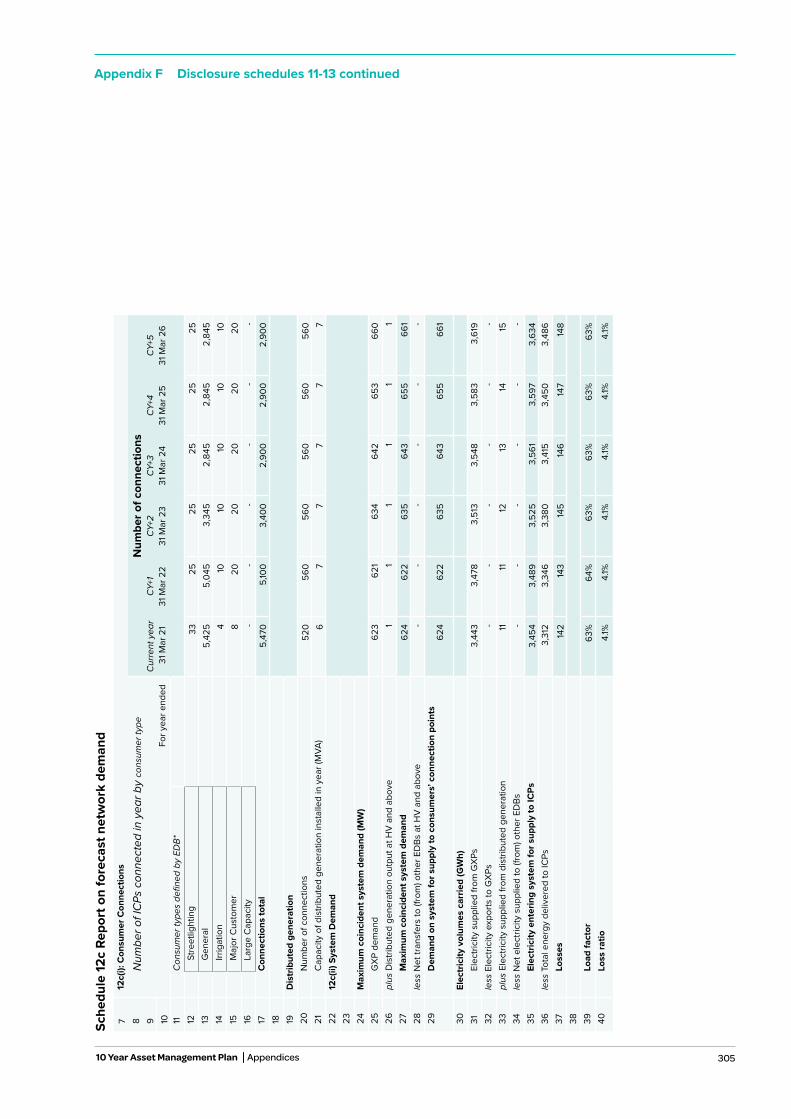
305
Appendix F Disclosure schedules 11-13 continued
Sche
dule
12c
Repo
rt o
n fo
reca
st n
etw
ork
dem
and
712
c(i):
Con
sum
er C
onne
ctio
ns8
Num
ber o
f IC
Ps c
onne
cted
in y
ear b
y co
nsum
er ty
peN
umbe
r of c
onne
ctio
ns9
For y
ear e
nded
Cur
rent
yea
r 3
1 Mar
21
CY+1
31 M
ar 2
2 CY
+231
Mar
23
CY+3
31 M
ar 2
4 CY
+431
Mar
25
CY+5
31 M
ar 2
6 10 11
Con
sum
er ty
pes
defin
ed b
y ED
B*12
Stre
etlig
htin
g33
25
25
25
25
25
13
Gen
eral
5,42
5 5,
045
3,34
5 2,
845
2,84
5 2,
845
14Irr
igat
ion
4 10
10
10
10
10
15
Maj
or C
usto
mer
8 20
20
20
20
20
16
Larg
e C
apac
ity-
--
--
-17
Con
nect
ions
tota
l5,
470
5,10
0 3,
400
2,90
0 2,
900
2,90
0 18 19
Dis
trib
uted
gen
erat
ion
20N
umbe
r of c
onne
ctio
ns52
0 56
0 56
0 56
0 56
0 56
0 21
Cap
acity
of d
istri
bute
d ge
nera
tion
inst
alle
d in
yea
r (M
VA)
6 7
7 7
7 7
2212
c(ii)
Sys
tem
Dem
and
23 24M
axim
um c
oinc
iden
t sys
tem
dem
and
(MW
)25
GXP
dem
and
623
621
634
642
653
660
26pl
us D
istri
bute
d ge
nera
tion
outp
ut a
t HV
and
abov
e1
1 1
1 1
1 27
Max
imum
coi
ncid
ent s
yste
m d
eman
d62
4 62
2 63
5 64
3 65
5 66
1 28
less
Net
tran
sfer
s to
(fro
m) o
ther
ED
Bs a
t HV
and
abov
e-
--
--
-29
Dem
and
on s
yste
m fo
r sup
ply
to c
onsu
mer
s’ c
onne
ctio
n po
ints
624
622
635
643
655
661
30El
ectr
icity
vol
umes
car
ried
(GW
h)31
Elec
trici
ty s
uppl
ied
from
GXP
s3,
443
3,47
8 3,
513
3,54
8 3,
583
3,61
9 32
less
Ele
ctric
ity e
xpor
ts to
GXP
s-
--
--
-33
plus
Ele
ctric
ity s
uppl
ied
from
dis
tribu
ted
gene
ratio
n11
11
12
13
14
15
34
less
Net
ele
ctric
ity s
uppl
ied
to (f
rom
) oth
er E
DBs
--
--
--
35El
ectr
icity
ent
erin
g sy
stem
for s
uppl
y to
ICPs
3,45
4 3,
489
3,52
5 3,
561
3,59
7 3,
634
36le
ss T
otal
ene
rgy
deliv
ered
to IC
Ps3,
312
3,34
6 3,
380
3,41
5 3,
450
3,48
6 37
Loss
es14
2 14
3 14
5 14
6 14
7 14
8 38 39
Load
fact
or63
%
64%
63
%
63%
63
%
63%
40
Loss
ratio
4.1%
4.
1%
4.1%
4.
1%
4.1%
4.
1%
10 Year Asset Management Plan Appendices
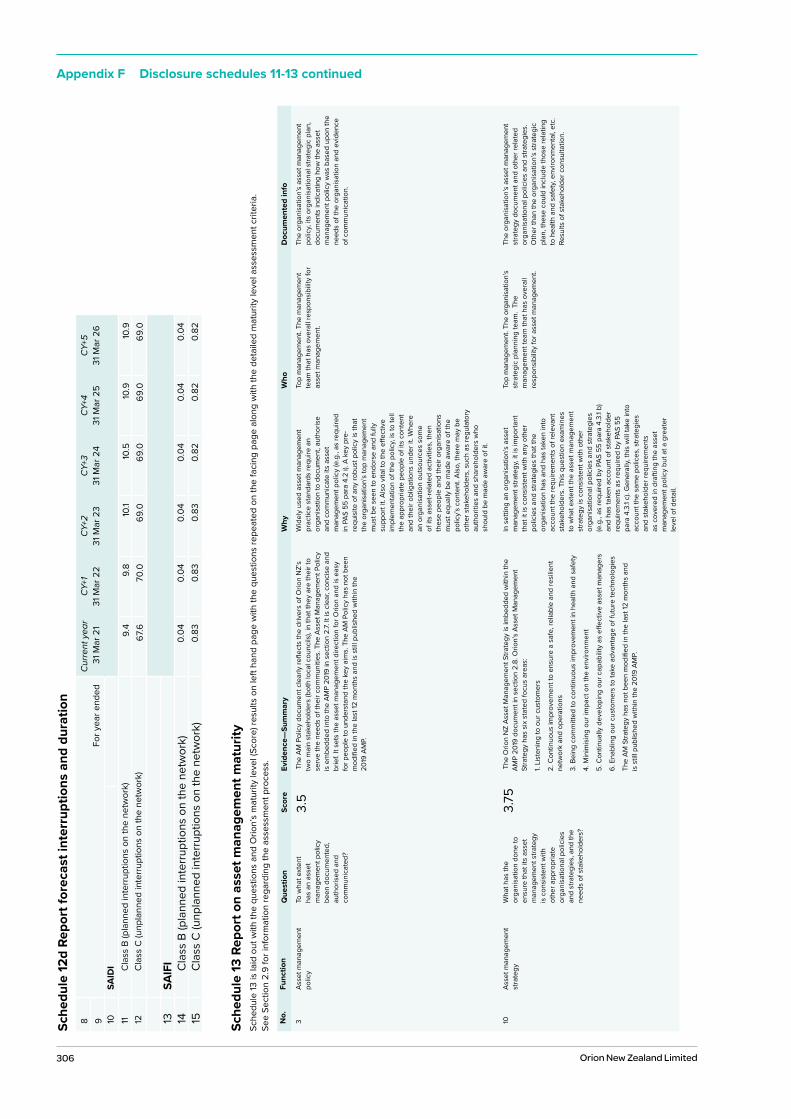
306 Orion New Zealand Limited
Appendix F Disclosure schedules 11-13 continuedSc
hedu
le 12
d Re
port
fore
cast
inte
rrup
tions
and
dur
atio
n 8
For y
ear e
nded
Cur
rent
yea
r 3
1 Mar
21
CY+1
31 M
ar 2
2 CY
+231
Mar
23
CY+3
31 M
ar 2
4 CY
+431
Mar
25
CY+5
31 M
ar 2
6 9 10
SAID
I11
Cla
ss B
(pla
nned
inte
rrupt
ions
on
the
netw
ork)
9.4
9.8
10.1
10.5
10
.9
10.9
12
Cla
ss C
(unp
lann
ed in
terru
ptio
ns o
n th
e ne
twor
k)67
.6
70.0
69
.0
69.0
69
.0
69.0
13SA
IFI
14C
lass
B (p
lann
ed in
terru
ptio
ns o
n th
e ne
twor
k)0.
04
0.04
0.
04
0.04
0.
04
0.04
15C
lass
C (u
npla
nned
inte
rrupt
ions
on
the
netw
ork)
0.83
0.
83
0.83
0.
82
0.82
0.
82
Sche
dule
13 R
epor
t on
asse
t man
agem
ent m
atur
itySc
hedu
le 13
is la
id o
ut w
ith th
e qu
estio
ns a
nd O
rion’
s m
atur
ity le
vel (
Scor
e) re
sults
on
left
hand
pag
e w
ith th
e qu
estio
ns re
peat
ed o
n th
e fa
cing
pag
e al
ong
with
the
deta
iled
mat
urity
leve
l ass
essm
ent c
riter
ia.
See
Sect
ion
2.9
for i
nfor
mat
ion
rega
rdin
g th
e as
sess
men
t pro
cess
.
No.
Func
tion
Que
stio
nSc
ore
Evid
ence
—Su
mm
ary
Why
Who
Doc
umen
ted
info
3As
set m
anag
emen
t po
licy
To w
hat e
xten
t ha
s an
ass
et
man
agem
ent p
olic
y be
en d
ocum
ente
d,
auth
oris
ed a
nd
com
mun
icat
ed?
3.5
The
AM
Pol
icy
docu
men
t cle
arly
refle
cts
the
driv
ers
of O
rion
NZ’
s tw
o m
ain
stak
ehol
ders
(bot
h lo
cal c
ounc
ils),
in th
at th
ey a
re th
eir t
o se
rve
the
need
s of
thei
r com
mun
ities
. The
Ass
et M
anag
emen
t Pol
icy
is e
mbe
dded
into
the
AMP
2019
in s
ectio
n 2.
7. It
is c
lear
, con
cise
and
br
ief.
It se
ts th
e as
set m
anag
emen
t dire
ctio
n fo
r Orio
n an
d is
eas
y fo
r peo
ple
to u
nder
stan
d th
e ke
y ai
ms.
The
AM
Pol
icy
has
not b
een
mod
ified
in th
e la
st 12
mon
ths
and
is s
till p
ublis
hed
with
in th
e
2019
AM
P.
Wid
ely
used
ass
et m
anag
emen
t pr
actic
e st
anda
rds
requ
ire a
n or
gani
satio
n to
doc
umen
t, au
thor
ise
and
com
mun
icat
e its
ass
et
man
agem
ent p
olic
y (e
.g.,
as re
quire
d in
PAS
55
para
4.2
i). A
key
pre
-re
quis
ite o
f any
robu
st p
olic
y is
that
th
e or
gani
satio
n’s
top
man
agem
ent
mus
t be
seen
to e
ndor
se a
nd fu
lly
supp
ort i
t. Al
so v
ital t
o th
e eff
ectiv
e im
plem
enta
tion
of th
e po
licy,
is to
tell
the
appr
opria
te p
eopl
e of
its
cont
ent
and
thei
r obl
igat
ions
und
er it
. Whe
re
an o
rgan
isat
ion
outs
ourc
es s
ome
of it
s as
set-r
elat
ed a
ctiv
ities
, the
n th
ese
peop
le a
nd th
eir o
rgan
isat
ions
m
ust e
qual
ly b
e m
ade
awar
e of
the
polic
y’s
cont
ent.
Also
, the
re m
ay b
e ot
her s
take
hold
ers,
suc
h as
regu
lato
ry
auth
oriti
es a
nd s
hare
hold
ers
who
sh
ould
be
mad
e aw
are
of it
.
Top
man
agem
ent.
The
man
agem
ent
team
that
has
ove
rall
resp
onsi
bilit
y fo
r as
set m
anag
emen
t.
The
orga
nisa
tion’
s as
set m
anag
emen
t po
licy,
its o
rgan
isat
iona
l stra
tegi
c pl
an,
docu
men
ts in
dica
ting
how
the
asse
t m
anag
emen
t pol
icy
was
bas
ed u
pon
the
need
s of
the
orga
nisa
tion
and
evid
ence
of
com
mun
icat
ion.
10As
set m
anag
emen
t st
rate
gyW
hat h
as th
e or
gani
satio
n do
ne to
en
sure
that
its
asse
t m
anag
emen
t stra
tegy
is
con
sist
ent w
ith
othe
r app
ropr
iate
or
gani
satio
nal p
olic
ies
and
stra
tegi
es, a
nd th
e ne
eds
of s
take
hold
ers?
3.75
The
Orio
n N
Z As
set M
anag
emen
t Stra
tegy
is im
bedd
ed w
ithin
the
AMP
2019
doc
umen
t in
sect
ion
2.8.
Orio
n’s
Asse
t Man
agem
ent
Stra
tegy
has
six
sta
ted
focu
s ar
eas:
1. Li
sten
ing
to o
ur c
usto
mer
s
2. C
ontin
uous
impr
ovem
ent t
o en
sure
a s
afe,
relia
ble
and
resi
lient
ne
twor
k an
d op
erat
ions
3. B
eing
com
mitt
ed to
con
tinuo
us im
prov
emen
t in
heal
th a
nd s
afet
y
4. M
inim
isin
g ou
r im
pact
on
the
envi
ronm
ent
5. C
ontin
ually
dev
elop
ing
our c
apab
ility
as
effec
tive
asse
t man
ager
s
6. E
nabl
ing
our c
usto
mer
s to
take
adv
anta
ge o
f fut
ure
tech
nolo
gies
The
AM S
trate
gy h
as n
ot b
een
mod
ified
in th
e la
st 12
mon
ths
and
is
stil
l pub
lishe
d w
ithin
the
2019
AM
P.
In s
ettin
g an
org
anis
atio
n’s
asse
t m
anag
emen
t stra
tegy
, it i
s im
porta
nt
that
it is
con
sist
ent w
ith a
ny o
ther
po
licie
s an
d st
rate
gies
that
the
orga
nisa
tion
has
and
has
take
n in
to
acco
unt t
he re
quire
men
ts o
f rel
evan
t st
akeh
olde
rs. T
his
ques
tion
exam
ines
to
wha
t ext
ent t
he a
sset
man
agem
ent
stra
tegy
is c
onsi
sten
t with
oth
er
orga
nisa
tiona
l pol
icie
s an
d st
rate
gies
(e
.g.,
as re
quire
d by
PAS
55
para
4.3
.1 b)
an
d ha
s ta
ken
acco
unt o
f sta
keho
lder
re
quire
men
ts a
s re
quire
d by
PAS
55
para
4.3
.1 c)
. Gen
eral
ly, th
is w
ill ta
ke in
to
acco
unt t
he s
ame
polic
es, s
trate
gies
an
d st
akeh
olde
r req
uire
men
ts
as c
over
ed in
dra
fting
the
asse
t m
anag
emen
t pol
icy
but a
t a g
reat
er
leve
l of d
etai
l.
Top
man
agem
ent.
The
orga
nisa
tion’
s st
rate
gic
plan
ning
team
. Th
e m
anag
emen
t tea
m th
at h
as o
vera
ll re
spon
sibi
lity
for a
sset
man
agem
ent.
The
orga
nisa
tion’
s as
set m
anag
emen
t st
rate
gy d
ocum
ent a
nd o
ther
rela
ted
orga
nisa
tiona
l pol
icie
s an
d st
rate
gies
. O
ther
than
the
orga
nisa
tion’
s st
rate
gic
plan
, the
se c
ould
incl
ude
thos
e re
latin
g to
hea
lth a
nd s
afet
y, en
viro
nmen
tal,
etc.
Re
sults
of s
take
hold
er c
onsu
ltatio
n.
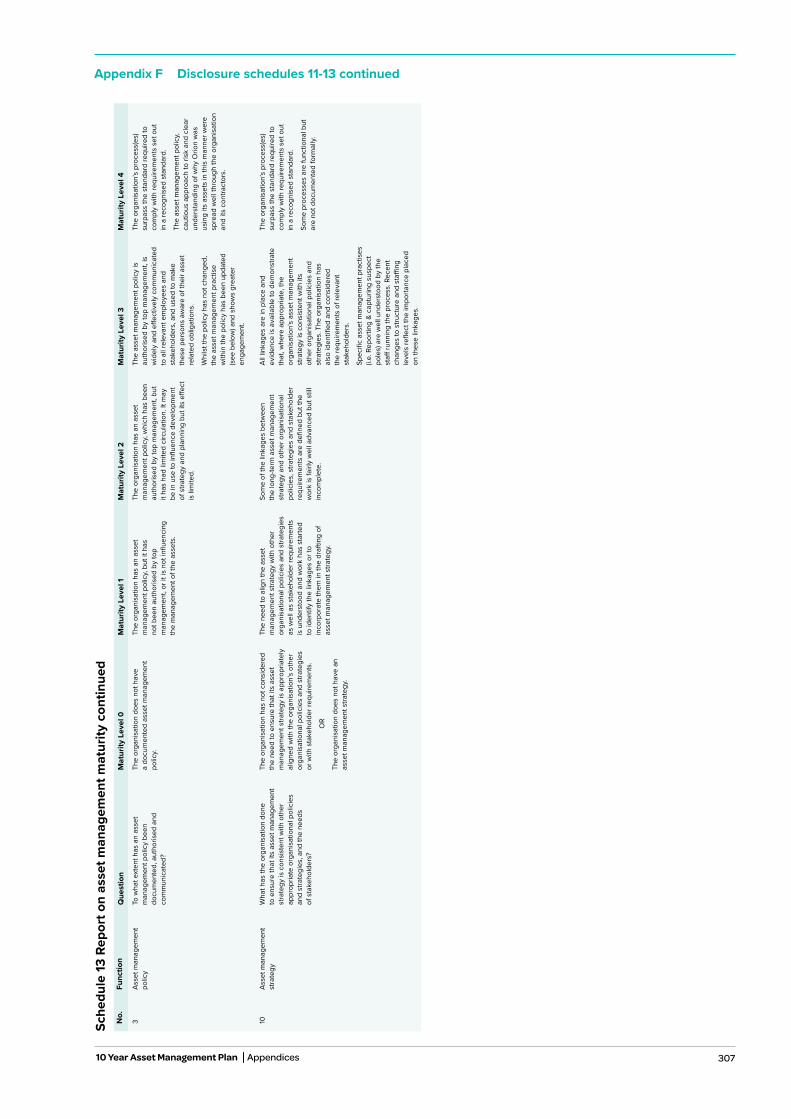
307
Appendix F Disclosure schedules 11-13 continued
Sche
dule
13 R
epor
t on
asse
t man
agem
ent m
atur
ity c
ontin
ued
No.
Func
tion
Que
stio
nM
atur
ity L
evel
0M
atur
ity L
evel
1M
atur
ity L
evel
2M
atur
ity L
evel
3M
atur
ity L
evel
4
3As
set m
anag
emen
t po
licy
To w
hat e
xten
t has
an
asse
t m
anag
emen
t pol
icy
been
do
cum
ente
d, a
utho
rised
and
co
mm
unic
ated
?
The
orga
nisa
tion
does
not
hav
e
a do
cum
ente
d as
set m
anag
emen
t po
licy.
The
orga
nisa
tion
has
an a
sset
m
anag
emen
t pol
icy,
but i
t has
no
t bee
n au
thor
ised
by
top
man
agem
ent,
or it
is n
ot in
fluen
cing
th
e m
anag
emen
t of t
he a
sset
s.
The
orga
nisa
tion
has
an a
sset
m
anag
emen
t pol
icy,
whi
ch h
as b
een
auth
oris
ed b
y to
p m
anag
emen
t, bu
t it
has
had
limite
d ci
rcul
atio
n. It
may
be
in u
se to
influ
ence
dev
elop
men
t of
stra
tegy
and
pla
nnin
g bu
t its
effe
ct
is li
mite
d.
The
asse
t man
agem
ent p
olic
y is
au
thor
ised
by
top
man
agem
ent,
is
wid
ely
and
effec
tivel
y co
mm
unic
ated
to
all
rele
vant
em
ploy
ees
and
stak
ehol
ders
, and
use
d to
mak
e th
ese
pers
ons
awar
e of
thei
r ass
et
rela
ted
oblig
atio
ns.
Whi
lst t
he p
olic
y ha
s no
t cha
nged
, th
e as
set m
anag
emen
t pra
ctis
e w
ithin
the
polic
y ha
s be
en u
pdat
ed
(see
bel
ow) a
nd s
how
s gr
eate
r en
gage
men
t.
The
orga
nisa
tion’
s pr
oces
s(es
) su
rpas
s th
e st
anda
rd re
quire
d to
co
mpl
y w
ith re
quire
men
ts s
et o
ut
in a
reco
gnis
ed s
tand
ard.
The
asse
t man
agem
ent p
olic
y, ca
utio
us a
ppro
ach
to ri
sk a
nd c
lear
un
ders
tand
ing
of w
hy O
rion
was
us
ing
its a
sset
s in
this
man
ner w
ere
spre
ad w
ell t
hrou
gh th
e or
gani
satio
n an
d its
con
tract
ors.
10As
set m
anag
emen
t st
rate
gyW
hat h
as th
e or
gani
satio
n do
ne
to e
nsur
e th
at it
s as
set m
anag
emen
t st
rate
gy is
con
sist
ent w
ith o
ther
ap
prop
riate
org
anis
atio
nal p
olic
ies
and
stra
tegi
es, a
nd th
e ne
eds
of
sta
keho
lder
s?
The
orga
nisa
tion
has
not c
onsi
dere
d th
e ne
ed to
ens
ure
that
its
asse
t m
anag
emen
t stra
tegy
is a
ppro
pria
tely
al
igne
d w
ith th
e or
gani
satio
n’s
othe
r or
gani
satio
nal p
olic
ies
and
stra
tegi
es
or w
ith s
take
hold
er re
quire
men
ts.
O
R
The
orga
nisa
tion
does
not
hav
e an
as
set m
anag
emen
t stra
tegy
.
The
need
to a
lign
the
asse
t m
anag
emen
t stra
tegy
with
oth
er
orga
nisa
tiona
l pol
icie
s an
d st
rate
gies
as
wel
l as
stak
ehol
der r
equi
rem
ents
is
und
erst
ood
and
wor
k ha
s st
arte
d to
iden
tify
the
linka
ges
or to
in
corp
orat
e th
em in
the
draf
ting
of
asse
t man
agem
ent s
trate
gy.
Som
e of
the
linka
ges
betw
een
the
long
-term
ass
et m
anag
emen
t st
rate
gy a
nd o
ther
org
anis
atio
nal
polic
ies,
stra
tegi
es a
nd s
take
hold
er
requ
irem
ents
are
defi
ned
but t
he
wor
k is
fairl
y w
ell a
dvan
ced
but s
till
inco
mpl
ete.
All l
inka
ges
are
in p
lace
and
ev
iden
ce is
ava
ilabl
e to
dem
onst
rate
th
at, w
here
app
ropr
iate
, the
or
gani
satio
n’s
asse
t man
agem
ent
stra
tegy
is c
onsi
sten
t with
its
othe
r org
anis
atio
nal p
olic
ies
and
stra
tegi
es. T
he o
rgan
isat
ion
has
also
iden
tified
and
con
side
red
the
requ
irem
ents
of r
elev
ant
stak
ehol
ders
.
Spec
ific
asse
t man
agem
ent p
ract
ises
(i.
e. R
epor
ting
& ca
ptur
ing
susp
ect
pole
s) a
re w
ell u
nder
stoo
d by
the
staff
runn
ing
the
proc
ess.
Rec
ent
chan
ges
to s
truct
ure
and
staffi
ng
leve
ls re
flect
the
impo
rtanc
e pl
aced
on
thes
e lin
kage
s.
The
orga
nisa
tion’
s pr
oces
s(es
) su
rpas
s th
e st
anda
rd re
quire
d to
co
mpl
y w
ith re
quire
men
ts s
et o
ut
in a
reco
gnis
ed s
tand
ard.
Som
e pr
oces
ses
are
func
tiona
l but
ar
e no
t doc
umen
ted
form
ally.
10 Year Asset Management Plan Appendices

308 Orion New Zealand Limited
Appendix F Disclosure schedules 11-13 continuedSc
hedu
le 13
Rep
ort o
n as
set m
anag
emen
t mat
urity
con
tinue
dN
o.Fu
nctio
nQ
uest
ion
Scor
eEv
iden
ce—
Sum
mar
yW
hyW
hoD
ocum
ente
d in
fo
11As
set m
anag
emen
t st
rate
gyIn
wha
t way
doe
s th
e or
gani
satio
n’s
asse
t m
anag
emen
t stra
tegy
ta
ke a
ccou
nt o
f the
lif
ecyc
le o
f the
ass
ets,
as
set t
ypes
and
ass
et
syst
ems
over
whi
ch
the
orga
nisa
tion
has
stew
ards
hip?
3.75
For
eac
h of
thes
e fo
cus
area
s, a
det
aile
d ex
plan
atio
n is
pro
vide
d w
ithin
sec
tion
2.8
of A
MP
2019
. Eac
h fo
cus
area
topi
c ha
s th
e fo
llow
ing
spec
ific
deta
ils d
ocum
ente
d:
• Pur
pose
;
• Foc
us a
rea
obje
ctiv
es, a
nd;
• Ini
tiativ
es;
AM S
trate
gy re
mai
ned
the
sam
e in
202
0
Goo
d as
set s
tew
ards
hip
is th
e ha
llmar
k of
an
orga
nisa
tion
com
plia
nt w
ith
wid
ely
used
AM
sta
ndar
ds. A
key
co
mpo
nent
of t
his
is th
e ne
ed to
take
ac
coun
t of t
he li
fecy
cle
of th
e as
sets
, as
set t
ypes
and
ass
et s
yste
ms.
(F
or e
xam
ple,
this
requ
irem
ent i
s re
cogn
ised
in 4
.3.1
d) o
f PAS
55)
. Th
is q
uest
ion
expl
ores
wha
t an
orga
nisa
tion
has
done
to ta
ke li
fecy
cle
into
acc
ount
in it
s as
set m
anag
emen
t
Top
man
agem
ent.
Peo
ple
in th
e or
gani
satio
n w
ith e
xper
t kno
wle
dge
of
the
asse
ts, a
sset
type
s, a
sset
sys
tem
s an
d th
eir a
ssoc
iate
d lif
e-cy
cles
. Th
e m
anag
emen
t tea
m th
at h
as o
vera
ll re
spon
sibi
lity
for a
sset
man
agem
ent.
Thos
e re
spon
sibl
e fo
r dev
elop
ing
and
adop
ting
met
hods
and
pro
cess
es u
sed
in a
sset
man
agem
ent.
The
orga
nisa
tion’
s do
cum
ente
d as
set
man
agem
ent s
trate
gy a
nd s
uppo
rting
w
orki
ng d
ocum
ents
.
26As
set m
anag
emen
t pl
an(s
)H
ow d
oes
the
orga
nisa
tion
esta
blis
h an
d do
cum
ent i
ts a
sset
m
anag
emen
t pla
n(s)
ac
ross
the
life
cycl
e ac
tiviti
es o
f its
ass
ets
and
asse
t sys
tem
s?
3.75
The
2019
AM
P se
ts o
ut O
rion’
s as
set m
anag
emen
t pol
icy,
stra
tegy
, pr
actic
es a
nd e
xpen
ditu
re fo
reca
sts
for t
he n
ext 1
0 ye
ars
from
1 A
pril
2019
. Thi
s cu
rrent
372
pag
e do
cum
ent h
as b
een
subs
tant
ially
up
date
d fro
m th
e la
st A
MP
and
is o
f ver
y hi
gh q
ualit
y. Th
e cu
rrent
AM
P is
a c
onde
nsed
78-
page
202
0 AM
P U
pdat
e w
hich
cov
ers
the
Orio
n N
Z up
date
d st
rate
gy, p
ract
ices
, pro
gram
me
of w
ork
and
expe
nditu
re fo
reca
sts
for t
he n
ext 1
0 ye
ars
from
1 Ap
ril 2
020
to
31 M
arch
203
0. T
he 2
020
AMP
Upd
ate
is to
be
read
in c
onju
nctio
n w
ith th
e pr
evio
us m
ore
deta
iled
2019
AM
P.
The
asse
t man
agem
ent s
trate
gy n
eed
to b
e tra
nsla
ted
into
pra
ctic
al p
lan(
s) s
o th
at a
ll pa
rties
kno
w h
ow th
e ob
ject
ives
w
ill b
e ac
hiev
ed. T
he d
evel
opm
ent o
f pl
an(s
) will
nee
d to
iden
tify
the
spec
ific
task
s an
d ac
tiviti
es re
quire
d to
opt
imiz
e co
sts,
risk
s an
d pe
rform
ance
of t
he
asse
ts a
nd/o
r ass
et s
yste
m(s
), w
hen
they
are
to b
e ca
rried
out
and
the
reso
urce
s re
quire
d.
The
man
agem
ent t
eam
with
ove
rall
resp
onsi
bilit
y fo
r the
ass
et m
anag
emen
t sy
stem
. O
pera
tions
, mai
nten
ance
and
en
gine
erin
g m
anag
ers.
The
orga
nisa
tion'
s as
set
man
agem
ent p
lan(
s).
27As
set m
anag
emen
t pl
an(s
) H
ow h
as th
e or
gani
satio
n co
mm
unic
ated
its
plan
(s) t
o al
l rel
evan
t pa
rties
to a
leve
l of
deta
il ap
prop
riate
to
the
rece
iver
’s ro
le in
th
eir d
eliv
ery?
3.75
The
curre
nt 2
020
AMP
Upd
ate
whi
ch c
over
s th
e O
rion
NZ
upda
ted
stra
tegy
, pra
ctic
es, p
rogr
amm
e of
wor
k an
d ex
pend
iture
fore
cast
s fo
r th
e ne
xt 10
yea
rs fr
om 1
April
202
0 to
31 M
arch
203
0. T
he 2
020
AMP
Upd
ate
is to
be
read
in c
onju
nctio
n w
ith th
e pr
evio
us m
ore
deta
iled
2019
AM
P. B
oth
AMP’
s ar
e av
aila
ble
thro
ugho
ut th
e or
gani
satio
n an
d vi
a th
eir o
nlin
e in
trane
t site
.
Plan
s w
ill b
e in
effec
tive
unle
ss th
ey a
re
com
mun
icat
ed to
all
thos
e, in
clud
ing
cont
ract
ed s
uppl
iers
and
thos
e w
ho
unde
rtake
ena
blin
g fu
nctio
n(s)
. Th
e pl
an(s
) nee
d to
be
com
mun
icat
ed in
a
way
that
is re
leva
nt to
thos
e w
ho n
eed
to u
se th
em.
The
man
agem
ent t
eam
with
ove
rall
resp
onsi
bilit
y fo
r the
ass
et m
anag
emen
t sy
stem
. D
eliv
ery
func
tions
and
su
pplie
rs.
Dis
tribu
tion
lists
for p
lan(
s).
Doc
umen
ts d
eriv
ed fr
om p
lan(
s) w
hich
de
tail
the
rece
iver
s ro
le in
pla
n de
liver
y.
Evid
ence
of c
omm
unic
atio
n.
29As
set m
anag
emen
t pl
an(s
) H
ow a
re d
esig
nate
d re
spon
sibi
litie
s fo
r de
liver
y of
ass
et p
lan
actio
ns d
ocum
ente
d?
3.75
Resp
onsi
bilit
y fo
r AM
P ac
tions
and
focu
s is
now
incl
uded
in in
sta
ff
Job
Des
crip
tions
and
Con
tract
ors
scop
es o
f wor
k. O
ngoi
ng tr
aini
ng
and
awar
enes
s of
the
driv
ers
with
in th
e la
test
AM
P’s
cont
inue
s.
The
impl
emen
tatio
n of
ass
et
man
agem
ent p
lan(
s) re
lies
on (1
) act
ions
be
ing
clea
rly id
entifi
ed, (
2) a
n ow
ner
allo
cate
d an
d (3
) tha
t ow
ner h
avin
g su
ffici
ent d
eleg
ated
resp
onsi
bilit
y an
d au
thor
ity to
car
ry o
ut th
e w
ork
requ
ired.
It
also
requ
ires
alig
nmen
t of a
ctio
ns
acro
ss th
e or
gani
satio
n. T
his
ques
tion
expl
ores
how
wel
l the
pla
n(s)
set
out
re
spon
sibi
lity
for d
eliv
ery
of a
sset
pl
an a
ctio
ns.
The
man
agem
ent t
eam
with
ove
rall
resp
onsi
bilit
y fo
r the
ass
et m
anag
emen
t sy
stem
. O
pera
tions
, mai
nten
ance
and
en
gine
erin
g m
anag
ers.
If a
ppro
pria
te,
the
perfo
rman
ce m
anag
emen
t tea
m.
The
orga
nisa
tion’
s as
set m
anag
emen
t pl
an(s
). D
ocum
enta
tion
defin
ing
role
s an
d re
spon
sibi
litie
s of
indi
vidu
als
and
orga
nisa
tiona
l dep
artm
ents
.
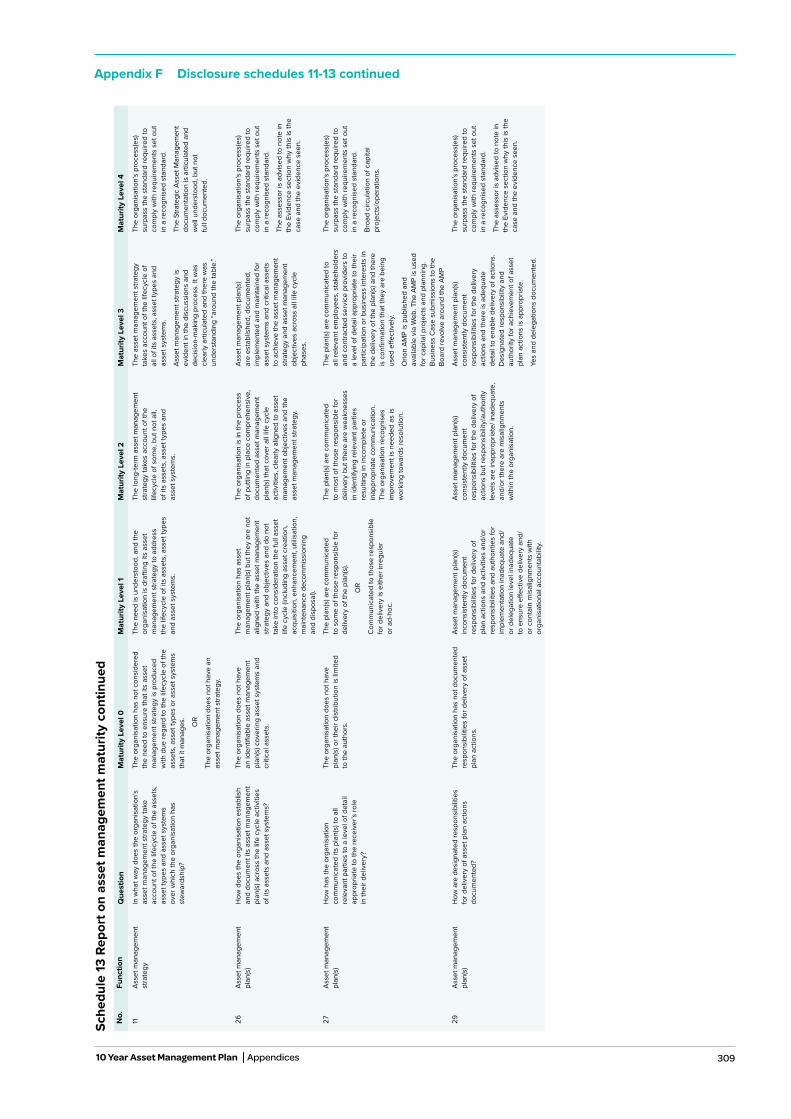
309
Appendix F Disclosure schedules 11-13 continued
Sche
dule
13 R
epor
t on
asse
t man
agem
ent m
atur
ity c
ontin
ued
No.
Func
tion
Que
stio
nM
atur
ity L
evel
0M
atur
ity L
evel
1M
atur
ity L
evel
2M
atur
ity L
evel
3M
atur
ity L
evel
4
11As
set m
anag
emen
t st
rate
gyIn
wha
t way
doe
s th
e or
gani
satio
n’s
asse
t man
agem
ent s
trate
gy ta
ke
acco
unt o
f the
life
cycl
e of
the
asse
ts,
asse
t typ
es a
nd a
sset
sys
tem
s ov
er w
hich
the
orga
nisa
tion
has
stew
ards
hip?
The
orga
nisa
tion
has
not c
onsi
dere
d th
e ne
ed to
ens
ure
that
its
asse
t m
anag
emen
t stra
tegy
is p
rodu
ced
with
due
rega
rd to
the
lifec
ycle
of t
he
asse
ts, a
sset
type
s or
ass
et s
yste
ms
that
it m
anag
es.
O
R
The
orga
nisa
tion
does
not
hav
e an
as
set m
anag
emen
t stra
tegy
.
The
need
is u
nder
stoo
d, a
nd th
e or
gani
satio
n is
dra
fting
its
asse
t m
anag
emen
t stra
tegy
to a
ddre
ss
the
lifec
ycle
of i
ts a
sset
s, a
sset
type
s an
d as
set s
yste
ms.
The
long
-term
ass
et m
anag
emen
t st
rate
gy ta
kes
acco
unt o
f the
lif
ecyc
le o
f som
e, b
ut n
ot a
ll,
of it
s as
sets
, ass
et ty
pes
and
as
set s
yste
ms.
The
asse
t man
agem
ent s
trate
gy
take
s ac
coun
t of t
he li
fecy
cle
of
all o
f its
ass
ets,
ass
et ty
pes
and
asse
t sys
tem
s.
Asse
t man
agem
ent s
trate
gy is
ev
iden
t in
the
disc
ussi
ons
and
deci
sion
-mak
ing
proc
ess.
It w
as
clea
rly a
rticu
late
d an
d th
ere
was
un
ders
tand
ing
“aro
und
the
tabl
e.”
The
orga
nisa
tion’
s pr
oces
s(es
) su
rpas
s th
e st
anda
rd re
quire
d to
co
mpl
y w
ith re
quire
men
ts s
et o
ut
in a
reco
gnis
ed s
tand
ard.
The
Stra
tegi
c As
set M
anag
emen
t do
cum
enta
tion
is a
rticu
late
d an
d w
ell u
nder
stoo
d, b
ut n
ot
full
docu
men
ted.
26As
set m
anag
emen
t pl
an(s
)H
ow d
oes
the
orga
nisa
tion
esta
blis
h an
d do
cum
ent i
ts a
sset
man
agem
ent
plan
(s) a
cros
s th
e lif
e cy
cle
activ
ities
of
its
asse
ts a
nd a
sset
sys
tem
s?
The
orga
nisa
tion
does
not
hav
e
an id
entifi
able
ass
et m
anag
emen
t pl
an(s
) cov
erin
g as
set s
yste
ms
and
criti
cal a
sset
s.
The
orga
nisa
tion
has
asse
t m
anag
emen
t pla
n(s)
but
they
are
not
al
igne
d w
ith th
e as
set m
anag
emen
t st
rate
gy a
nd o
bjec
tives
and
do
not
take
into
con
side
ratio
n th
e fu
ll as
set
life
cycl
e (in
clud
ing
asse
t cre
atio
n,
acqu
isiti
on, e
nhan
cem
ent,
utili
satio
n,
mai
nten
ance
dec
omm
issi
onin
g
and
disp
osal
).
The
orga
nisa
tion
is in
the
proc
ess
of p
uttin
g in
pla
ce c
ompr
ehen
sive
, do
cum
ente
d as
set m
anag
emen
t pl
an(s
) tha
t cov
er a
ll lif
e cy
cle
activ
ities
, cle
arly
alig
ned
to a
sset
m
anag
emen
t obj
ectiv
es a
nd th
e as
set m
anag
emen
t stra
tegy
.
Asse
t man
agem
ent p
lan(
s)
are
esta
blis
hed,
doc
umen
ted,
im
plem
ente
d an
d m
aint
aine
d fo
r as
set s
yste
ms
and
criti
cal a
sset
s to
ach
ieve
the
asse
t man
agem
ent
stra
tegy
and
ass
et m
anag
emen
t ob
ject
ives
acr
oss
all l
ife c
ycle
ph
ases
.
The
orga
nisa
tion’
s pr
oces
s(es
) su
rpas
s th
e st
anda
rd re
quire
d to
co
mpl
y w
ith re
quire
men
ts s
et o
ut
in a
reco
gnis
ed s
tand
ard.
The
asse
ssor
is a
dvis
ed to
not
e in
th
e Ev
iden
ce s
ectio
n w
hy th
is is
the
case
and
the
evid
ence
see
n.
27As
set m
anag
emen
t pl
an(s
)H
ow h
as th
e or
gani
satio
n co
mm
unic
ated
its
plan
(s) t
o al
l re
leva
nt p
artie
s to
a le
vel o
f det
ail
appr
opria
te to
the
rece
iver
’s ro
le
in th
eir d
eliv
ery?
The
orga
nisa
tion
does
not
hav
e pl
an(s
) or t
heir
dist
ribut
ion
is li
mite
d
to th
e au
thor
s.
The
plan
(s) a
re c
omm
unic
ated
to
som
e of
thos
e re
spon
sibl
e fo
r de
liver
y of
the
plan
(s).
O
R
Com
mun
icat
ed to
thos
e re
spon
sibl
e fo
r del
iver
y is
eith
er ir
regu
lar
or a
d-ho
c.
The
plan
(s) a
re c
omm
unic
ated
to
mos
t of t
hose
resp
onsi
ble
for
deliv
ery
but t
here
are
wea
knes
ses
in
iden
tifyi
ng re
leva
nt p
artie
s re
sulti
ng in
inco
mpl
ete
or
inap
prop
riate
com
mun
icat
ion.
Th
e or
gani
satio
n re
cogn
ises
im
prov
emen
t is
need
ed a
s is
w
orki
ng to
war
ds re
solu
tion.
The
plan
(s) a
re c
omm
unic
ated
to
all r
elev
ant e
mpl
oyee
s, s
take
hold
ers
and
cont
ract
ed s
ervi
ce p
rovi
ders
to
a le
vel o
f det
ail a
ppro
pria
te to
thei
r pa
rtici
patio
n or
bus
ines
s in
tere
sts
in
the
deliv
ery
of th
e pl
an(s
) and
ther
e is
con
firm
atio
n th
at th
ey a
re b
eing
us
ed e
ffect
ivel
y.
Orio
n AM
P is
pub
lishe
d an
d av
aila
ble
via
Web
. The
AM
P is
use
d fo
r cap
ital p
roje
cts
and
plan
ning
. Bu
sine
ss C
ase
subm
issi
ons
to th
e Bo
ard
revo
lve
arou
nd th
e AM
P
The
orga
nisa
tion’
s pr
oces
s(es
) su
rpas
s th
e st
anda
rd re
quire
d to
co
mpl
y w
ith re
quire
men
ts s
et o
ut
in a
reco
gnis
ed s
tand
ard.
Broa
d ci
rcul
atio
n of
cap
ital
proj
ects
/ope
ratio
ns.
29As
set m
anag
emen
t pl
an(s
)H
ow a
re d
esig
nate
d re
spon
sibi
litie
s fo
r del
iver
y of
ass
et p
lan
actio
ns
docu
men
ted?
The
orga
nisa
tion
has
not d
ocum
ente
d re
spon
sibi
litie
s fo
r del
iver
y of
ass
et
plan
act
ions
.
Asse
t man
agem
ent p
lan(
s)
inco
nsis
tent
ly d
ocum
ent
resp
onsi
bilit
ies
for d
eliv
ery
of
plan
act
ions
and
act
iviti
es a
nd/o
r re
spon
sibi
litie
s an
d au
thor
ities
for
impl
emen
tatio
n in
adeq
uate
and
/or
del
egat
ion
leve
l ina
dequ
ate
to e
nsur
e eff
ectiv
e de
liver
y an
d/or
con
tain
mis
alig
nmen
ts w
ith
orga
nisa
tiona
l acc
ount
abili
ty.
Asse
t man
agem
ent p
lan(
s)
cons
iste
ntly
doc
umen
t re
spon
sibi
litie
s fo
r the
del
iver
y of
ac
tions
but
resp
onsi
bilit
y/au
thor
ity
leve
ls a
re in
appr
opria
te/ i
nade
quat
e,
and/
or th
ere
are
mis
alig
nmen
ts
with
in th
e or
gani
satio
n.
Asse
t man
agem
ent p
lan(
s)
cons
iste
ntly
doc
umen
t re
spon
sibi
litie
s fo
r the
del
iver
y ac
tions
and
ther
e is
ade
quat
e de
tail
to e
nabl
e de
liver
y of
act
ions
. D
esig
nate
d re
spon
sibi
lity
and
auth
ority
for a
chie
vem
ent o
f ass
et
plan
act
ions
is a
ppro
pria
te.
Yes
and
dele
gatio
ns d
ocum
ente
d.
The
orga
nisa
tion’
s pr
oces
s(es
) su
rpas
s th
e st
anda
rd re
quire
d to
co
mpl
y w
ith re
quire
men
ts s
et o
ut
in a
reco
gnis
ed s
tand
ard.
The
asse
ssor
is a
dvis
ed to
not
e in
th
e Ev
iden
ce s
ectio
n w
hy th
is is
the
case
and
the
evid
ence
see
n.
10 Year Asset Management Plan Appendices

310 Orion New Zealand Limited
Appendix F Disclosure schedules 11-13 continuedSc
hedu
le 13
Rep
ort o
n as
set m
anag
emen
t mat
urity
con
tinue
dN
o.Fu
nctio
nQ
uest
ion
Scor
eEv
iden
ce—
Sum
mar
yW
hyW
hoD
ocum
ente
d in
fo
31As
set m
anag
emen
t pl
an(s
)W
hat h
as th
e or
gani
satio
n do
ne to
en
sure
that
app
ropr
iate
ar
rang
emen
ts a
re
mad
e av
aila
ble
for t
he e
ffici
ent
and
cost
effe
ctiv
e im
plem
enta
tion
of
the
plan
(s)?
(Not
e th
is is
abo
ut
reso
urce
s an
d en
ablin
g su
ppor
t)
3.75
The
cond
ense
d ve
rsio
n of
the
2020
AM
P U
pdat
e ha
s en
able
a m
ore
cost
effe
ctiv
e re
view
pro
cess
, whi
ch h
as fo
cuse
d on
upc
omin
g an
d fu
ture
ass
et im
prov
emen
t are
as.
It is
ess
entia
l tha
t the
pla
n(s)
are
re
alis
tic a
nd c
an b
e im
plem
ente
d,
whi
ch re
quire
s ap
prop
riate
reso
urce
s to
be
ava
ilabl
e an
d en
ablin
g m
echa
nism
s in
pla
ce.
This
que
stio
n ex
plor
es h
ow
wel
l thi
s is
ach
ieve
d. T
he p
lan(
s) n
ot
only
nee
d to
con
side
r the
reso
urce
s di
rect
ly re
quire
d an
d tim
esca
les,
but
al
so th
e en
ablin
g ac
tiviti
es, i
nclu
ding
for
exam
ple,
trai
ning
requ
irem
ents
, sup
ply
chai
n ca
pabi
lity
and
proc
urem
ent
times
cale
s.
The
man
agem
ent t
eam
with
ove
rall
resp
onsi
bilit
y fo
r the
ass
et m
anag
emen
t sy
stem
. O
pera
tions
, mai
nten
ance
and
en
gine
erin
g m
anag
ers.
If a
ppro
pria
te,
the
perfo
rman
ce m
anag
emen
t tea
m.
If ap
prop
riate
, the
per
form
ance
m
anag
emen
t tea
m.
Whe
re a
ppro
pria
te
the
proc
urem
ent t
eam
and
ser
vice
pr
ovid
ers
wor
king
on
the
orga
nisa
tion’
s as
set-r
elat
ed a
ctiv
ities
.
The
orga
nisa
tion’
s as
set m
anag
emen
t pl
an(s
). D
ocum
ente
d pr
oces
ses
and
proc
edur
es fo
r the
del
iver
y of
the
asse
t m
anag
emen
t pla
n.
33C
ontin
genc
y pl
anni
ngW
hat p
lan(
s) a
nd
proc
edur
e(s)
doe
s th
e or
gani
satio
n ha
ve
for i
dent
ifyin
g an
d re
spon
ding
to in
cide
nts
and
emer
genc
y si
tuat
ions
and
ens
urin
g co
ntin
uity
of c
ritic
al
asse
t man
agem
ent
activ
ities
?
4" O
rion
are
cont
inui
ng to
dev
elop
and
impr
ove
thei
r con
tinge
ncy
plan
ning
and
resi
lienc
e ca
pabi
litie
s. D
urin
g th
e re
cent
per
iod
of th
e C
OVI
D-19
Loc
kdow
n Re
stric
tions
(Lev
el 4
and
3),
Orio
n N
Z m
anag
ed
thei
r res
pons
e to
this
situ
atio
n vi
a th
eir C
risis
Man
agem
ent T
eam
(C
MT)
stru
ctur
e. T
his
enab
led
the
orga
nisa
tion
to e
ffect
ivel
y m
anag
e an
d su
ppor
t all
of th
eir s
taff
and
key
cont
ract
ors
thou
gh th
is u
niqu
e si
tuat
ion
in N
ew Z
eala
nd. T
he n
etw
ork
load
dem
ands
dro
pped
co
nsid
erab
ly d
urin
g th
e le
vel 3
and
4 p
erio
ds (a
ppro
xim
atel
y by
15%
) an
d th
ere
was
a la
rge
redu
ctio
n in
inci
dent
due
to th
e lo
wer
vo
lum
es o
f veh
icle
s on
the
road
. Man
y ot
her i
mpr
ovem
ent a
reas
ha
ve b
een
note
d.
Wid
ely
used
AM
pra
ctic
e st
anda
rds
requ
ire th
at a
n or
gani
satio
n ha
s pl
an(s
) to
iden
tify
and
resp
ond
to e
mer
genc
y si
tuat
ions
. Em
erge
ncy
plan
(s) s
houl
d ou
tline
the
actio
ns to
be
take
n to
re
spon
d to
spe
cifie
d em
erge
ncy
situ
atio
ns a
nd e
nsur
e co
ntin
uity
of
criti
cal a
sset
man
agem
ent a
ctiv
ities
in
clud
ing
the
com
mun
icat
ion
to, a
nd
invo
lvem
ent o
f, ex
tern
al a
genc
ies.
Th
is q
uest
ion
asse
sses
if, a
nd h
ow w
ell,
thes
e pl
an(s
) trig
gere
d, im
plem
ente
d an
d re
solv
ed in
the
even
t of a
n in
cide
nt.
The
plan
(s) s
houl
d be
app
ropr
iate
to
the
leve
l of r
isk
as d
eter
min
ed b
y th
e or
gani
satio
n's
risk
asse
ssm
ent
met
hodo
logy
. It
is a
lso
a re
quire
men
t th
at re
leva
nt p
erso
nnel
are
com
pete
nt
and
train
ed.
The
man
ager
with
resp
onsi
bilit
y fo
r de
velo
ping
em
erge
ncy
plan
(s).
Th
e or
gani
satio
n's
risk
asse
ssm
ent
team
. Pe
ople
with
des
igna
ted
dutie
s w
ithin
the
plan
(s) a
nd p
roce
dure
(s) f
or
deal
ing
with
inci
dent
s an
d em
erge
ncy
situ
atio
ns.
The
orga
nisa
tion'
s pl
an(s
) and
pr
oced
ure(
s) fo
r dea
ling
with
em
erge
ncie
s. T
he o
rgan
isat
ion'
s ris
k as
sess
men
ts a
nd ri
sk re
gist
ers.
37St
ruct
ure,
aut
horit
y an
d re
spon
sibi
litie
sW
hat h
as th
e or
gani
satio
n do
ne to
ap
poin
t mem
ber(s
) of
its m
anag
emen
t tea
m
to b
e re
spon
sibl
e fo
r ens
urin
g th
at
the
orga
nisa
tion'
s as
sets
del
iver
the
requ
irem
ents
of t
he
asse
t man
agem
ent
stra
tegy
, obj
ectiv
es
and
plan
(s)?
3.75
"The
follo
win
g as
pect
s of
Stru
ctur
e an
d Le
ader
ship
hav
e be
en n
oted
th
is y
ear.
Gro
wth
of t
he te
am s
truct
ure
Cla
rity
of ro
les
and
lear
ning
s be
ing
embe
dded
– i.
e. o
n po
les.
Gar
ry H
eyes
– P
rocu
rem
ent &
Pro
perty
Ser
vice
s M
anag
er N
etw
ork
Infra
stru
ctur
e, n
ow s
ettli
ng in
to h
is n
ew ro
le a
nd u
sing
his
pas
t ex
perie
nce
to d
rive
impr
ovem
ent w
ithin
his
por
tfolio
.
Alas
dair
Reid
– E
ngin
eerin
g M
anag
er is
now
spr
eadi
ng h
is in
fluen
ce,
both
in a
n en
gine
erin
g an
d a
asse
t man
agem
ent f
ocus
.
New
peo
ple
in k
ey ro
les
whe
re g
aps
wer
e pr
evio
usly
not
ed,
or in
puts
requ
ired
Incr
ease
d le
ader
ship
invo
lvem
ent i
n in
dust
ry w
ide
initi
ativ
es.
In o
rder
to e
nsur
e th
at th
e or
gani
satio
n's
asse
ts a
nd a
sset
sys
tem
s de
liver
the
requ
irem
ents
of t
he a
sset
m
anag
emen
t pol
icy,
stra
tegy
and
ob
ject
ives
resp
onsi
bilit
ies
need
to b
e al
loca
ted
to a
ppro
pria
te p
eopl
e w
ho
have
the
nece
ssar
y au
thor
ity to
fulfi
l th
eir r
espo
nsib
ilitie
s. (T
his
ques
tion,
re
late
s to
the
orga
nisa
tion'
s as
sets
e.g
., pa
ra b
), s
4.4
.1 of
PAS
55,
mak
ing
it th
eref
ore
dist
inct
from
the
requ
irem
ent
cont
aine
d in
par
a a)
, s 4
.4.1
of P
AS 5
5).
Top
man
agem
ent.
Peo
ple
with
m
anag
emen
t res
pons
ibili
ty fo
r the
de
liver
y of
ass
et m
anag
emen
t pol
icy,
stra
tegy
, obj
ectiv
es a
nd p
lan(
s).
Peop
le
wor
king
on
asse
t-rel
ated
act
iviti
es.
Evid
ence
that
man
ager
s w
ith
resp
onsi
bilit
y fo
r the
del
iver
y of
ass
et
man
agem
ent p
olic
y, st
rate
gy, o
bjec
tives
an
d pl
an(s
) hav
e be
en a
ppoi
nted
and
ha
ve a
ssum
ed th
eir r
espo
nsib
ilitie
s.
Evid
ence
may
incl
ude
the
orga
nisa
tion'
s do
cum
ents
rela
ting
to it
s as
set
man
agem
ent s
yste
m, o
rgan
isat
iona
l ch
arts
, job
des
crip
tions
of p
ost-h
olde
rs,
annu
al ta
rget
s/ob
ject
ives
and
per
sona
l de
velo
pmen
t pla
n(s)
of p
ost-h
olde
rs
as a
ppro
pria
te.
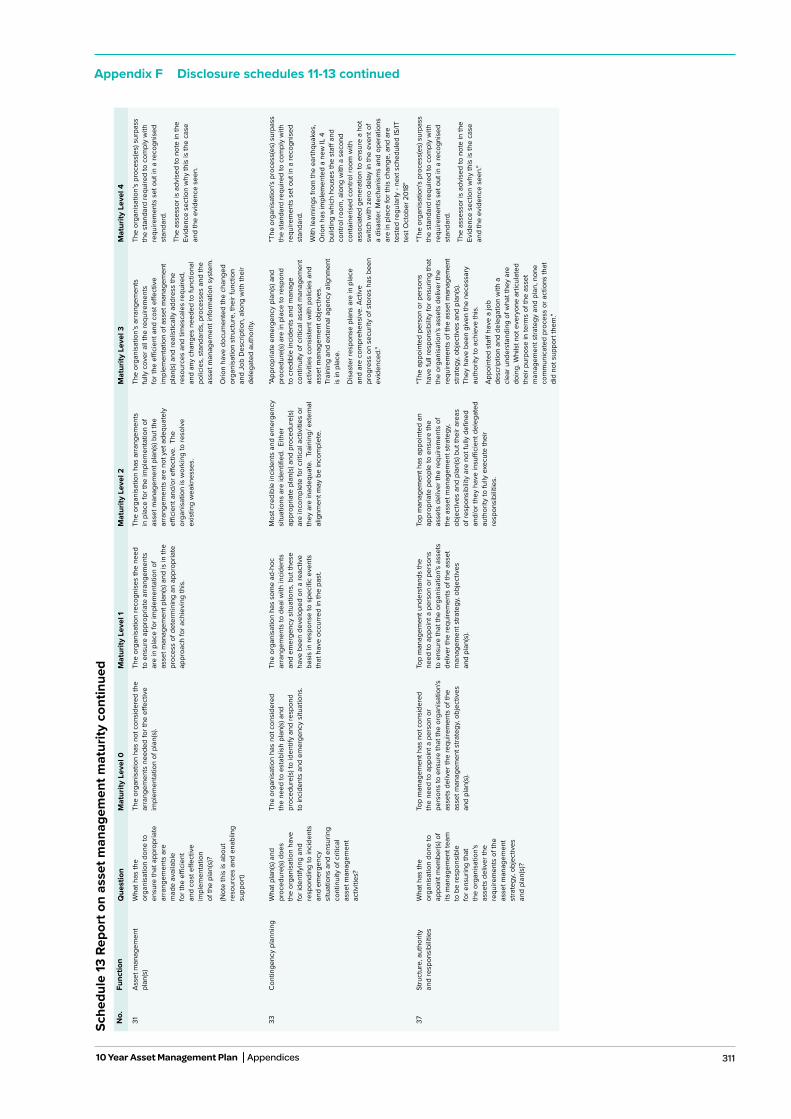
311
Appendix F Disclosure schedules 11-13 continued
Sche
dule
13 R
epor
t on
asse
t man
agem
ent m
atur
ity c
ontin
ued
No.
Func
tion
Que
stio
nM
atur
ity L
evel
0M
atur
ity L
evel
1M
atur
ity L
evel
2M
atur
ity L
evel
3M
atur
ity L
evel
4
31As
set m
anag
emen
t pl
an(s
)W
hat h
as th
e or
gani
satio
n do
ne to
en
sure
that
app
ropr
iate
ar
rang
emen
ts a
re
mad
e av
aila
ble
for t
he e
ffici
ent
and
cost
effe
ctiv
e im
plem
enta
tion
of
the
plan
(s)?
(Not
e th
is is
abo
ut
reso
urce
s an
d en
ablin
g su
ppor
t)
The
orga
nisa
tion
has
not c
onsi
dere
d th
e ar
rang
emen
ts n
eede
d fo
r the
effe
ctiv
e im
plem
enta
tion
of p
lan(
s).
The
orga
nisa
tion
reco
gnis
es th
e ne
ed
to e
nsur
e ap
prop
riate
arra
ngem
ents
ar
e in
pla
ce fo
r im
plem
enta
tion
of
asse
t man
agem
ent p
lan(
s) a
nd is
in th
e pr
oces
s of
det
erm
inin
g an
app
ropr
iate
ap
proa
ch fo
r ach
ievi
ng th
is.
The
orga
nisa
tion
has
arra
ngem
ents
in
pla
ce fo
r the
impl
emen
tatio
n of
as
set m
anag
emen
t pla
n(s)
but
the
arra
ngem
ents
are
not
yet
ade
quat
ely
effici
ent a
nd/o
r effe
ctiv
e. T
he
orga
nisa
tion
is w
orki
ng to
reso
lve
exis
ting
wea
knes
ses.
The
orga
nisa
tion’
s ar
rang
emen
ts
fully
cov
er a
ll th
e re
quire
men
ts
for t
he e
ffici
ent a
nd c
ost e
ffect
ive
impl
emen
tatio
n of
ass
et m
anag
emen
t pl
an(s
) and
real
istic
ally
add
ress
the
reso
urce
s an
d tim
esca
les
requ
ired,
an
d an
y ch
ange
s ne
eded
to fu
nctio
nal
polic
ies,
sta
ndar
ds, p
roce
sses
and
the
asse
t man
agem
ent i
nfor
mat
ion
syst
em.
Orio
n ha
ve d
ocum
ente
d th
e ch
ange
d or
gani
satio
n st
ruct
ure,
thei
r fun
ctio
n an
d Jo
b D
escr
iptio
n, a
long
with
thei
r de
lega
ted
auth
ority
.
The
orga
nisa
tion’
s pr
oces
s(es
) sur
pass
th
e st
anda
rd re
quire
d to
com
ply
with
re
quire
men
ts s
et o
ut in
a re
cogn
ised
st
anda
rd.
The
asse
ssor
is a
dvis
ed to
not
e in
the
Evid
ence
sec
tion
why
this
is th
e ca
se
and
the
evid
ence
see
n.
33C
ontin
genc
y pl
anni
ngW
hat p
lan(
s) a
nd
proc
edur
e(s)
doe
s th
e or
gani
satio
n ha
ve
for i
dent
ifyin
g an
d re
spon
ding
to in
cide
nts
and
emer
genc
y si
tuat
ions
and
ens
urin
g co
ntin
uity
of c
ritic
al
asse
t man
agem
ent
activ
ities
?
The
orga
nisa
tion
has
not c
onsi
dere
d th
e ne
ed to
est
ablis
h pl
an(s
) and
pr
oced
ure(
s) to
iden
tify
and
resp
ond
to
inci
dent
s an
d em
erge
ncy
situ
atio
ns.
The
orga
nisa
tion
has
som
e ad
-hoc
ar
rang
emen
ts to
dea
l with
inci
dent
s an
d em
erge
ncy
situ
atio
ns, b
ut th
ese
have
bee
n de
velo
ped
on a
reac
tive
basi
s in
resp
onse
to s
peci
fic e
vent
s th
at h
ave
occu
rred
in th
e pa
st.
Mos
t cre
dibl
e in
cide
nts
and
emer
genc
y si
tuat
ions
are
iden
tified
. Ei
ther
ap
prop
riate
pla
n(s)
and
pro
cedu
re(s
) ar
e in
com
plet
e fo
r crit
ical
act
iviti
es o
r th
ey a
re in
adeq
uate
. Tr
aini
ng/ e
xter
nal
alig
nmen
t may
be
inco
mpl
ete.
"App
ropr
iate
em
erge
ncy
plan
(s) a
nd
proc
edur
e(s)
are
in p
lace
to re
spon
d to
cre
dibl
e in
cide
nts
and
man
age
cont
inui
ty o
f crit
ical
ass
et m
anag
emen
t ac
tiviti
es c
onsi
sten
t with
pol
icie
s an
d as
set m
anag
emen
t obj
ectiv
es.
Trai
ning
and
ext
erna
l age
ncy
alig
nmen
t is
in p
lace
.
Dis
aste
r res
pons
e pl
ans
are
in p
lace
an
d ar
e co
mpr
ehen
sive
. Act
ive
prog
ress
on
secu
rity
of s
tore
s ha
s be
en
evid
ence
d."
"The
org
anis
atio
n's
proc
ess(
es) s
urpa
ss
the
stan
dard
requ
ired
to c
ompl
y w
ith
requ
irem
ents
set
out
in a
reco
gnis
ed
stan
dard
.
With
lear
ning
s fro
m th
e ea
rthqu
akes
, O
rion
has
impl
emen
ted
a ne
w IL
4
build
ing
whi
ch h
ouse
s th
e st
aff a
nd
cont
rol r
oom
, alo
ng w
ith a
sec
ond
cont
aine
rised
con
trol r
oom
with
as
soci
ated
gen
erat
ion
to e
nsur
e a
hot
switc
h w
ith z
ero
dela
y in
the
even
t of
a di
sast
er. M
echa
nism
s an
d op
erat
ions
ar
e in
pla
ce fo
r thi
s ch
ange
, and
are
te
sted
regu
larly
- ne
xt s
ched
uled
IS/IT
te
st O
ctob
er 2
018"
37St
ruct
ure,
aut
horit
y an
d re
spon
sibi
litie
sW
hat h
as th
e or
gani
satio
n do
ne to
ap
poin
t mem
ber(s
) of
its m
anag
emen
t tea
m
to b
e re
spon
sibl
e fo
r ens
urin
g th
at
the
orga
nisa
tion'
s as
sets
del
iver
the
requ
irem
ents
of t
he
asse
t man
agem
ent
stra
tegy
, obj
ectiv
es
and
plan
(s)?
Top
man
agem
ent h
as n
ot c
onsi
dere
d th
e ne
ed to
app
oint
a p
erso
n or
pe
rson
s to
ens
ure
that
the
orga
nisa
tion'
s as
sets
del
iver
the
requ
irem
ents
of t
he
asse
t man
agem
ent s
trate
gy, o
bjec
tives
an
d pl
an(s
).
Top
man
agem
ent u
nder
stan
ds th
e ne
ed to
app
oint
a p
erso
n or
per
sons
to
ens
ure
that
the
orga
nisa
tion'
s as
sets
de
liver
the
requ
irem
ents
of t
he a
sset
m
anag
emen
t stra
tegy
, obj
ectiv
es
and
plan
(s).
Top
man
agem
ent h
as a
ppoi
nted
an
appr
opria
te p
eopl
e to
ens
ure
the
asse
ts d
eliv
er th
e re
quire
men
ts o
f th
e as
set m
anag
emen
t stra
tegy
, ob
ject
ives
and
pla
n(s)
but
thei
r are
as
of re
spon
sibi
lity
are
not f
ully
defi
ned
and/
or th
ey h
ave
insu
ffici
ent d
eleg
ated
au
thor
ity to
fully
exe
cute
thei
r re
spon
sibi
litie
s.
"The
app
oint
ed p
erso
n or
per
sons
ha
ve fu
ll re
spon
sibi
lity
for e
nsur
ing
that
th
e or
gani
satio
n's
asse
ts d
eliv
er th
e re
quire
men
ts o
f the
ass
et m
anag
emen
t st
rate
gy, o
bjec
tives
and
pla
n(s)
. Th
ey h
ave
been
giv
en th
e ne
cess
ary
auth
ority
to a
chie
ve th
is.
Appo
inte
d st
aff h
ave
a jo
b de
scrip
tion
and
dele
gatio
n w
ith a
cl
ear u
nder
stan
ding
of w
hat t
hey
are
doin
g. W
hils
t not
eve
ryon
e ar
ticul
ated
th
eir p
urpo
se in
term
s of
the
asse
t m
anag
emen
t stra
tegy
and
pla
n, n
one
com
mun
icat
ed p
roce
ss o
r act
ions
that
di
d no
t sup
port
them
."
"The
org
anis
atio
n's
proc
ess(
es) s
urpa
ss
the
stan
dard
requ
ired
to c
ompl
y w
ith
requ
irem
ents
set
out
in a
reco
gnis
ed
stan
dard
.
The
asse
ssor
is a
dvis
ed to
not
e in
the
Evid
ence
sec
tion
why
this
is th
e ca
se
and
the
evid
ence
see
n."
10 Year Asset Management Plan Appendices
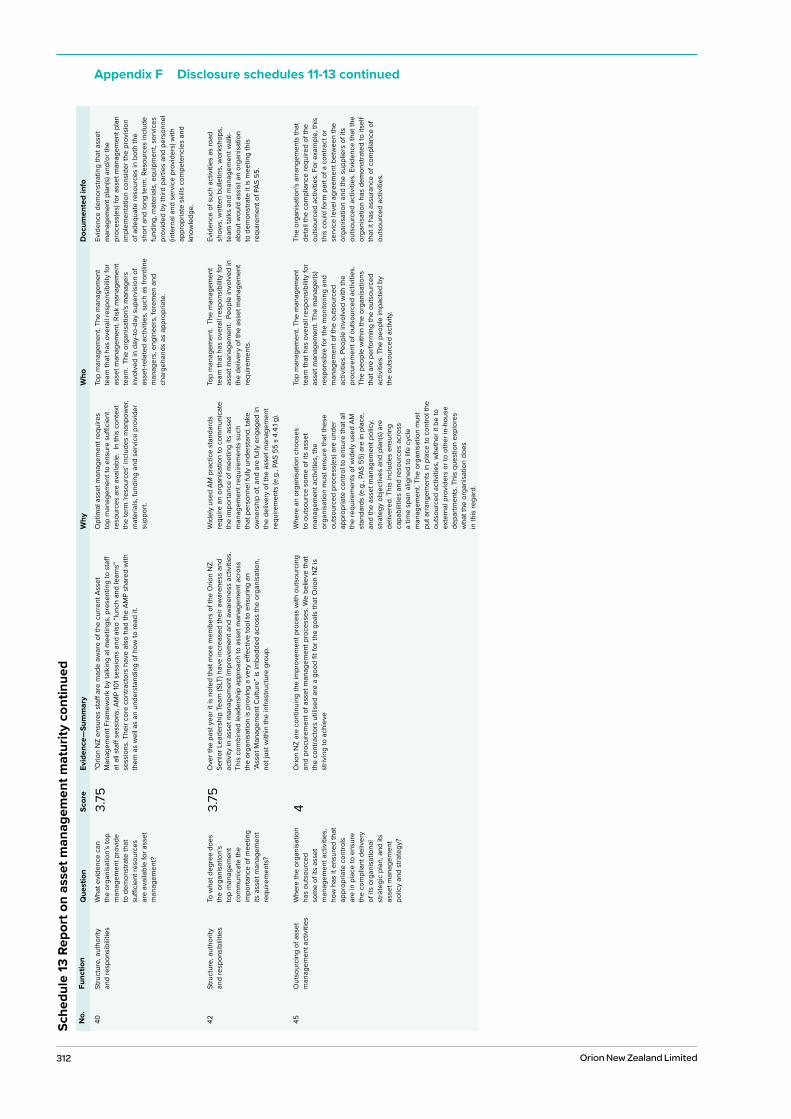
312 Orion New Zealand Limited
Sche
dule
13 R
epor
t on
asse
t man
agem
ent m
atur
ity c
ontin
ued
No.
Func
tion
Que
stio
nSc
ore
Evid
ence
—Su
mm
ary
Why
Who
Doc
umen
ted
info
40St
ruct
ure,
aut
horit
y an
d re
spon
sibi
litie
sW
hat e
vide
nce
can
the
orga
nisa
tion’
s to
p m
anag
emen
t pro
vide
to
dem
onst
rate
that
su
ffici
ent r
esou
rces
ar
e av
aila
ble
for a
sset
m
anag
emen
t?
3.75
"Orio
n N
Z en
sure
s st
aff a
re m
ade
awar
e of
the
curre
nt A
sset
M
anag
emen
t Fra
mew
ork
by ta
lkin
g at
mee
tings
, pre
sent
ing
to s
taff
at a
ll st
aff s
essi
ons,
AM
P 10
1 ses
sion
s an
d al
so “l
unch
and
lear
ns”
sess
ions
. The
ir co
re c
ontra
ctor
s ha
ve a
lso
had
the
AMP
shar
ed w
ith
them
as
wel
l as
an u
nder
stan
ding
of h
ow to
read
it.
Opt
imal
ass
et m
anag
emen
t req
uire
s to
p m
anag
emen
t to
ensu
re s
uffici
ent
reso
urce
s ar
e av
aila
ble.
In
this
con
text
th
e te
rm 'r
esou
rces
' inc
lude
s m
anpo
wer
, m
ater
ials
, fun
ding
and
ser
vice
pro
vide
r su
ppor
t.
Top
man
agem
ent.
The
man
agem
ent
team
that
has
ove
rall
resp
onsi
bilit
y fo
r as
set m
anag
emen
t. Ri
sk m
anag
emen
t te
am.
The
orga
nisa
tion'
s m
anag
ers
invo
lved
in d
ay-to
-day
sup
ervi
sion
of
asse
t-rel
ated
act
iviti
es, s
uch
as fr
ontli
ne
man
ager
s, e
ngin
eers
, for
emen
and
ch
arge
hand
s as
app
ropr
iate
.
Evid
ence
dem
onst
ratin
g th
at a
sset
m
anag
emen
t pla
n(s)
and
/or t
he
proc
ess(
es) f
or a
sset
man
agem
ent p
lan
impl
emen
tatio
n co
nsid
er th
e pr
ovis
ion
of a
dequ
ate
reso
urce
s in
bot
h th
e sh
ort a
nd lo
ng te
rm. R
esou
rces
incl
ude
fund
ing,
mat
eria
ls, e
quip
men
t, se
rvic
es
prov
ided
by
third
par
ties
and
pers
onne
l (in
tern
al a
nd s
ervi
ce p
rovi
ders
) with
ap
prop
riate
ski
lls c
ompe
tenc
ies
and
know
ledg
e.
42St
ruct
ure,
aut
horit
y an
d re
spon
sibi
litie
sTo
wha
t deg
ree
does
th
e or
gani
satio
n’s
top
man
agem
ent
com
mun
icat
e th
e im
porta
nce
of m
eetin
g its
ass
et m
anag
emen
t re
quire
men
ts?
3.75
Ove
r the
pas
t yea
r it i
s no
ted
that
mor
e m
embe
rs o
f the
Orio
n N
Z Se
nior
Lea
ders
hip
Team
(SLT
) hav
e in
crea
sed
thei
r aw
aren
ess
and
activ
ity in
ass
et m
anag
emen
t im
prov
emen
t and
aw
aren
ess
activ
ities
. Th
is c
ombi
ned
lead
ersh
ip a
ppro
ach
to a
sset
man
agem
ent a
cros
s
the
orga
nisa
tion
is p
rovi
ng a
ver
y eff
ectiv
e to
ol to
ens
urin
g an
“A
sset
Man
agem
ent C
ultu
re” i
s im
bedd
ed a
cros
s th
e or
gani
satio
n,
not j
ust w
ithin
the
infra
stru
ctur
e gr
oup.
Wid
ely
used
AM
pra
ctic
e st
anda
rds
requ
ire a
n or
gani
satio
n to
com
mun
icat
e th
e im
porta
nce
of m
eetin
g its
ass
et
man
agem
ent r
equi
rem
ents
suc
h th
at p
erso
nnel
fully
und
erst
and,
take
ow
ners
hip
of, a
nd a
re fu
lly e
ngag
ed in
th
e de
liver
y of
the
asse
t man
agem
ent
requ
irem
ents
(e.g
., PA
S 55
s 4
.4.1
g).
Top
man
agem
ent.
The
man
agem
ent
team
that
has
ove
rall
resp
onsi
bilit
y fo
r as
set m
anag
emen
t. P
eopl
e in
volv
ed in
th
e de
liver
y of
the
asse
t man
agem
ent
requ
irem
ents
.
Evid
ence
of s
uch
activ
ities
as
road
sh
ows,
writ
ten
bulle
tins,
wor
ksho
ps,
team
talk
s an
d m
anag
emen
t wal
k-ab
out w
ould
ass
ist a
n or
gani
satio
n to
dem
onst
rate
it is
mee
ting
this
re
quire
men
t of P
AS 5
5.
45O
utso
urci
ng o
f ass
et
man
agem
ent a
ctiv
ities
Whe
re th
e or
gani
satio
n ha
s ou
tsou
rced
so
me
of it
s as
set
man
agem
ent a
ctiv
ities
, ho
w h
as it
ens
ured
that
ap
prop
riate
con
trols
ar
e in
pla
ce to
ens
ure
the
com
plia
nt d
eliv
ery
of it
s or
gani
satio
nal
stra
tegi
c pl
an, a
nd it
s as
set m
anag
emen
t po
licy
and
stra
tegy
?
4O
rion
NZ
are
cont
inui
ng th
e im
prov
emen
t pro
cess
with
out
sour
cing
an
d pr
ocur
emen
t of a
sset
man
agem
ent p
roce
sses
. We
belie
ve th
at
the
cont
ract
ors
utili
sed
are
a go
od fi
t for
the
goal
s th
at O
rion
NZ
is
striv
ing
to a
chie
ve
Whe
re a
n or
gani
satio
n ch
oose
s to
out
sour
ce s
ome
of it
s as
set
man
agem
ent a
ctiv
ities
, the
or
gani
satio
n m
ust e
nsur
e th
at th
ese
outs
ourc
ed p
roce
ss(e
s) a
re u
nder
ap
prop
riate
con
trol t
o en
sure
that
all
the
requ
irem
ents
of w
idel
y us
ed A
M
stan
dard
s (e
.g.,
PAS
55) a
re in
pla
ce,
and
the
asse
t man
agem
ent p
olic
y, st
rate
gy o
bjec
tives
and
pla
n(s)
are
de
liver
ed. T
his
incl
udes
ens
urin
g ca
pabi
litie
s an
d re
sour
ces
acro
ss
a tim
e sp
an a
ligne
d to
life
cyc
le
man
agem
ent.
The
orga
nisa
tion
mus
t pu
t arra
ngem
ents
in p
lace
to c
ontro
l the
ou
tsou
rced
act
iviti
es, w
heth
er it
be
to
exte
rnal
pro
vide
rs o
r to
othe
r in-
hous
e de
partm
ents
. Thi
s qu
estio
n ex
plor
es
wha
t the
org
anis
atio
n do
es
in th
is re
gard
.
Top
man
agem
ent.
The
man
agem
ent
team
that
has
ove
rall
resp
onsi
bilit
y fo
r as
set m
anag
emen
t. Th
e m
anag
er(s
) re
spon
sibl
e fo
r the
mon
itorin
g an
d m
anag
emen
t of t
he o
utso
urce
d ac
tiviti
es. P
eopl
e in
volv
ed w
ith th
e pr
ocur
emen
t of o
utso
urce
d ac
tiviti
es.
The
peop
le w
ithin
the
orga
nisa
tions
th
at a
re p
erfo
rmin
g th
e ou
tsou
rced
ac
tiviti
es. T
he p
eopl
e im
pact
ed b
y
the
outs
ourc
ed a
ctiv
ity.
The
orga
nisa
tion'
s ar
rang
emen
ts th
at
deta
il th
e co
mpl
ianc
e re
quire
d of
the
outs
ourc
ed a
ctiv
ities
. For
exa
mpl
e, th
is
this
cou
ld fo
rm p
art o
f a c
ontra
ct o
r se
rvic
e le
vel a
gree
men
t bet
wee
n th
e or
gani
satio
n an
d th
e su
pplie
rs o
f its
ou
tsou
rced
act
iviti
es. E
vide
nce
that
the
orga
nisa
tion
has
dem
onst
rate
d to
itse
lf th
at it
has
ass
uran
ce o
f com
plia
nce
of
outs
ourc
ed a
ctiv
ities
.
Appendix F Disclosure schedules 11-13 continued
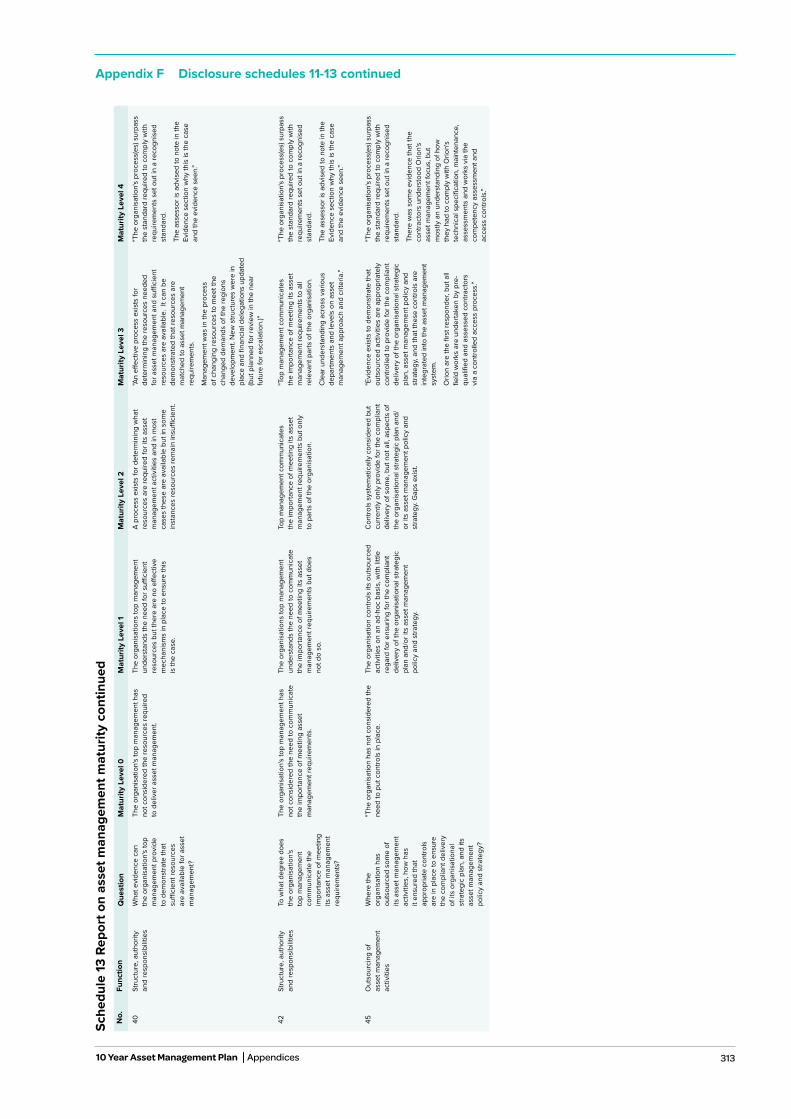
313
Appendix F Disclosure schedules 11-13 continued
Sche
dule
13 R
epor
t on
asse
t man
agem
ent m
atur
ity c
ontin
ued
No.
Func
tion
Que
stio
nM
atur
ity L
evel
0M
atur
ity L
evel
1M
atur
ity L
evel
2M
atur
ity L
evel
3M
atur
ity L
evel
4
40St
ruct
ure,
aut
horit
y an
d re
spon
sibi
litie
sW
hat e
vide
nce
can
the
orga
nisa
tion'
s to
p m
anag
emen
t pro
vide
to
dem
onst
rate
that
su
ffici
ent r
esou
rces
ar
e av
aila
ble
for a
sset
m
anag
emen
t?
The
orga
nisa
tion'
s to
p m
anag
emen
t has
no
t con
side
red
the
reso
urce
s re
quire
d
to d
eliv
er a
sset
man
agem
ent.
The
orga
nisa
tions
top
man
agem
ent
unde
rsta
nds
the
need
for s
uffici
ent
reso
urce
s bu
t the
re a
re n
o eff
ectiv
e m
echa
nism
s in
pla
ce to
ens
ure
this
is
the
case
.
A pr
oces
s ex
ists
for d
eter
min
ing
wha
t re
sour
ces
are
requ
ired
for i
ts a
sset
m
anag
emen
t act
iviti
es a
nd in
mos
t ca
ses
thes
e ar
e av
aila
ble
but i
n so
me
inst
ance
s re
sour
ces
rem
ain
insu
ffici
ent.
"An
effec
tive
proc
ess
exis
ts fo
r de
term
inin
g th
e re
sour
ces
need
ed
for a
sset
man
agem
ent a
nd s
uffici
ent
reso
urce
s ar
e av
aila
ble.
It c
an b
e de
mon
stra
ted
that
reso
urce
s ar
e m
atch
ed to
ass
et m
anag
emen
t re
quire
men
ts.
Man
agem
ent w
as in
the
proc
ess
of c
hang
ing
reso
urce
s to
mee
t the
ch
ange
d de
man
ds o
f the
regi
ons
deve
lopm
ent.
New
stru
ctur
es w
ere
in
plac
e an
d fin
anci
al d
eleg
atio
ns u
pdat
ed
(but
pla
nned
for r
evie
w in
the
near
fu
ture
for e
scal
atio
n.)"
"The
org
anis
atio
n's
proc
ess(
es) s
urpa
ss
the
stan
dard
requ
ired
to c
ompl
y w
ith
requ
irem
ents
set
out
in a
reco
gnis
ed
stan
dard
.
The
asse
ssor
is a
dvis
ed to
not
e in
the
Evid
ence
sec
tion
why
this
is th
e ca
se
and
the
evid
ence
see
n."
42St
ruct
ure,
aut
horit
y an
d re
spon
sibi
litie
sTo
wha
t deg
ree
does
th
e or
gani
satio
n's
top
man
agem
ent
com
mun
icat
e th
e im
porta
nce
of m
eetin
g its
ass
et m
anag
emen
t re
quire
men
ts?
The
orga
nisa
tion'
s to
p m
anag
emen
t has
no
t con
side
red
the
need
to c
omm
unic
ate
the
impo
rtanc
e of
mee
ting
asse
t m
anag
emen
t req
uire
men
ts.
The
orga
nisa
tions
top
man
agem
ent
unde
rsta
nds
the
need
to c
omm
unic
ate
the
impo
rtanc
e of
mee
ting
its a
sset
m
anag
emen
t req
uire
men
ts b
ut d
oes
not d
o so
.
Top
man
agem
ent c
omm
unic
ates
th
e im
porta
nce
of m
eetin
g its
ass
et
man
agem
ent r
equi
rem
ents
but
onl
y
to p
arts
of t
he o
rgan
isat
ion.
"Top
man
agem
ent c
omm
unic
ates
th
e im
porta
nce
of m
eetin
g its
ass
et
man
agem
ent r
equi
rem
ents
to a
ll re
leva
nt p
arts
of t
he o
rgan
isat
ion.
Cle
ar u
nder
stan
ding
acr
oss
vario
us
depa
rtmen
ts a
nd le
vels
on
asse
t m
anag
emen
t app
roac
h an
d cr
iteria
."
"The
org
anis
atio
n's
proc
ess(
es) s
urpa
ss
the
stan
dard
requ
ired
to c
ompl
y w
ith
requ
irem
ents
set
out
in a
reco
gnis
ed
stan
dard
.
The
asse
ssor
is a
dvis
ed to
not
e in
the
Evid
ence
sec
tion
why
this
is th
e ca
se
and
the
evid
ence
see
n."
45O
utso
urci
ng o
f as
set m
anag
emen
t ac
tiviti
es
Whe
re th
e or
gani
satio
n ha
s ou
tsou
rced
som
e of
its
ass
et m
anag
emen
t ac
tiviti
es, h
ow h
as
it en
sure
d th
at
appr
opria
te c
ontro
ls
are
in p
lace
to e
nsur
e th
e co
mpl
iant
del
iver
y of
its
orga
nisa
tiona
l st
rate
gic
plan
, and
its
asse
t man
agem
ent
polic
y an
d st
rate
gy?
"The
org
anis
atio
n ha
s no
t con
side
red
the
need
to p
ut c
ontro
ls in
pla
ce.
The
orga
nisa
tion
cont
rols
its
outs
ourc
ed
activ
ities
on
an a
d-ho
c ba
sis,
with
littl
e re
gard
for e
nsur
ing
for t
he c
ompl
iant
de
liver
y of
the
orga
nisa
tiona
l stra
tegi
c pl
an a
nd/o
r its
ass
et m
anag
emen
t po
licy
and
stra
tegy
.
Con
trols
sys
tem
atic
ally
con
side
red
but
curre
ntly
onl
y pr
ovid
e fo
r the
com
plia
nt
deliv
ery
of s
ome,
but
not
all,
asp
ects
of
the
orga
nisa
tiona
l stra
tegi
c pl
an a
nd/
or it
s as
set m
anag
emen
t pol
icy
and
stra
tegy
. Gap
s ex
ist.
"Evi
denc
e ex
ists
to d
emon
stra
te th
at
outs
ourc
ed a
ctiv
ities
are
app
ropr
iate
ly
cont
rolle
d to
pro
vide
for t
he c
ompl
iant
de
liver
y of
the
orga
nisa
tiona
l stra
tegi
c pl
an, a
sset
man
agem
ent p
olic
y an
d st
rate
gy, a
nd th
at th
ese
cont
rols
are
in
tegr
ated
into
the
asse
t man
agem
ent
syst
em.
Orio
n ar
e th
e fir
st re
spon
der,
but a
ll
field
wor
ks a
re u
nder
take
n by
pre
-qu
alifi
ed a
nd a
sses
sed
cont
ract
ors
vi
a a
cont
rolle
d ac
cess
pro
cess
."
"The
org
anis
atio
n's
proc
ess(
es) s
urpa
ss
the
stan
dard
requ
ired
to c
ompl
y w
ith
requ
irem
ents
set
out
in a
reco
gnis
ed
stan
dard
.
Ther
e w
as s
ome
evid
ence
that
the
cont
ract
ors
unde
rsto
od O
rion'
s as
set m
anag
emen
t foc
us, b
ut
mos
tly a
n un
ders
tand
ing
of h
ow
they
had
to c
ompl
y w
ith O
rion'
s te
chni
cal s
peci
ficat
ion,
mai
nten
ance
, as
sess
men
ts a
nd w
orks
via
the
com
pete
ncy
asse
ssm
ent a
nd
acce
ss c
ontro
ls."
10 Year Asset Management Plan Appendices
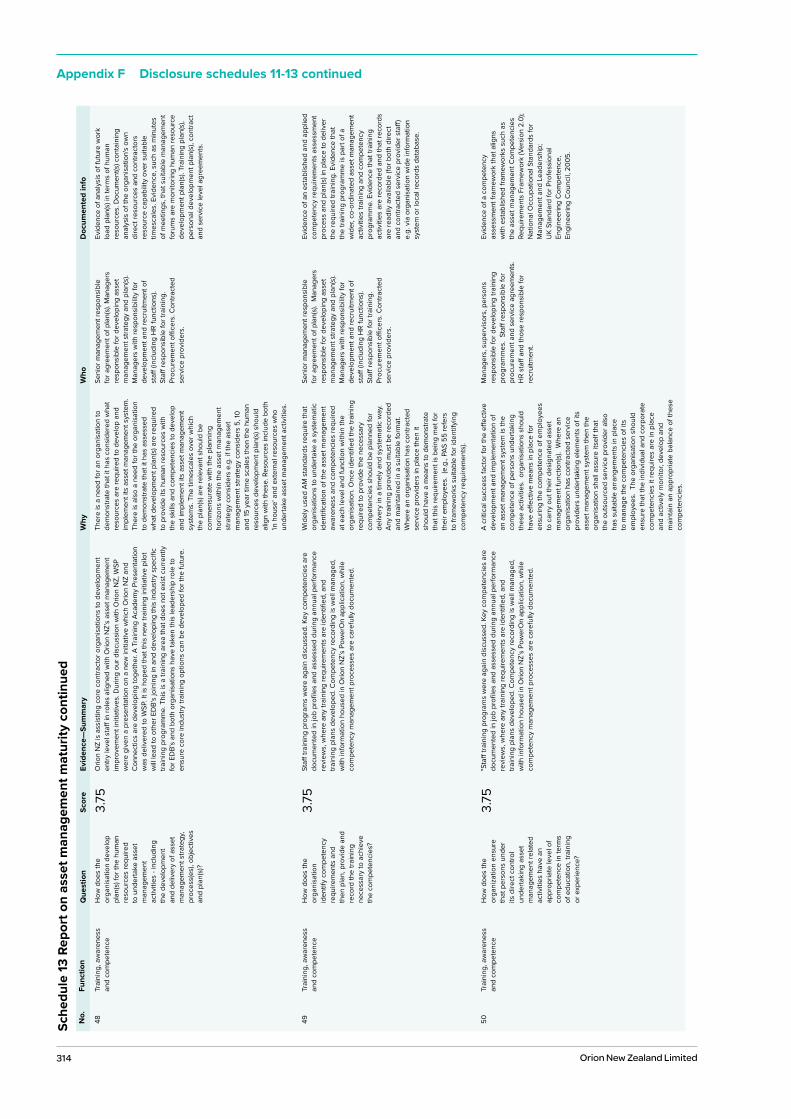
314 Orion New Zealand Limited
Appendix F Disclosure schedules 11-13 continuedSc
hedu
le 13
Rep
ort o
n as
set m
anag
emen
t mat
urity
con
tinue
dN
o.Fu
nctio
nQ
uest
ion
Scor
eEv
iden
ce—
Sum
mar
yW
hyW
hoD
ocum
ente
d in
fo
48Tr
aini
ng, a
war
enes
s an
d co
mpe
tenc
eH
ow d
oes
the
orga
nisa
tion
deve
lop
plan
(s) f
or th
e hu
man
re
sour
ces
requ
ired
to u
nder
take
ass
et
man
agem
ent
activ
ities
- in
clud
ing
the
deve
lopm
ent
and
deliv
ery
of a
sset
m
anag
emen
t stra
tegy
, pr
oces
s(es
), ob
ject
ives
an
d pl
an(s
)?
3.75
Orio
n N
Z is
ass
istin
g co
re c
ontra
ctor
org
anis
atio
ns to
dev
elop
men
t en
try le
vel s
taff
in ro
les
alig
ned
with
Orio
n N
Z’s
asse
t man
agem
ent
impr
ovem
ent i
nitia
tives
. Dur
ing
our d
iscu
ssio
n w
ith O
rion
NZ,
WSP
w
ere
give
n a
pres
enta
tion
on a
new
initi
ativ
e w
hich
Orio
n N
Z an
d C
onne
ctic
s ar
e de
velo
ping
toge
ther
. A T
rain
ing
Acad
emy
Pres
enta
tion
was
del
iver
ed to
WSP
. It i
s ho
ped
that
this
new
trai
ning
initi
ativ
e pi
lot
will
lead
to o
ther
ED
B’s
join
ing
in a
nd d
evel
opin
g th
is in
dust
ry s
peci
fic
train
ing
prog
ram
me.
Thi
s is
a tr
aini
ng a
rea
that
doe
s no
t exi
st c
urre
ntly
fo
r ED
B’s
and
both
org
anis
atio
ns h
ave
take
n th
is le
ader
ship
role
to
ensu
re c
ore
indu
stry
trai
ning
opt
ions
can
be
deve
lope
d fo
r the
futu
re.
Ther
e is
a n
eed
for a
n or
gani
satio
n to
de
mon
stra
te th
at it
has
con
side
red
wha
t re
sour
ces
are
requ
ired
to d
evel
op a
nd
impl
emen
t its
ass
et m
anag
emen
t sys
tem
. Th
ere
is a
lso
a ne
ed fo
r the
org
anis
atio
n to
dem
onst
rate
that
it h
as a
sses
sed
wha
t dev
elop
men
t pla
n(s)
are
requ
ired
to p
rovi
de it
s hu
man
reso
urce
s w
ith
the
skill
s an
d co
mpe
tenc
ies
to d
evel
op
and
impl
emen
t its
ass
et m
anag
emen
t sy
stem
s. T
he ti
mes
cale
s ov
er w
hich
th
e pl
an(s
) are
rele
vant
sho
uld
be
com
men
sura
te w
ith th
e pl
anni
ng
horiz
ons
with
in th
e as
set m
anag
emen
t st
rate
gy c
onsi
ders
e.g
. if t
he a
sset
m
anag
emen
t stra
tegy
con
side
rs 5
, 10
and
15 y
ear t
ime
scal
es th
en th
e hu
man
re
sour
ces
deve
lopm
ent p
lan(
s) s
houl
d al
ign
with
thes
e. R
esou
rces
incl
ude
both
'in
hou
se' a
nd e
xter
nal r
esou
rces
who
un
derta
ke a
sset
man
agem
ent a
ctiv
ities
.
Seni
or m
anag
emen
t res
pons
ible
fo
r agr
eem
ent o
f pla
n(s)
. Man
ager
s re
spon
sibl
e fo
r dev
elop
ing
asse
t m
anag
emen
t stra
tegy
and
pla
n(s)
. M
anag
ers
with
resp
onsi
bilit
y fo
r de
velo
pmen
t and
recr
uitm
ent o
f st
aff (i
nclu
ding
HR
func
tions
).
Staff
resp
onsi
ble
for t
rain
ing.
Pr
ocur
emen
t offi
cers
. Con
tract
ed
serv
ice
prov
ider
s.
Evid
ence
of a
naly
sis
of fu
ture
wor
k lo
ad p
lan(
s) in
term
s of
hum
an
reso
urce
s. D
ocum
ent(s
) con
tain
ing
anal
ysis
of t
he o
rgan
isat
ion'
s ow
n di
rect
reso
urce
s an
d co
ntra
ctor
s re
sour
ce c
apab
ility
ove
r sui
tabl
e tim
esca
les.
Evi
denc
e, s
uch
as m
inut
es
of m
eetin
gs, t
hat s
uita
ble
man
agem
ent
foru
ms
are
mon
itorin
g hu
man
reso
urce
de
velo
pmen
t pla
n(s)
. Tra
inin
g pl
an(s
), pe
rson
al d
evel
opm
ent p
lan(
s), c
ontra
ct
and
serv
ice
leve
l agr
eem
ents
.
49Tr
aini
ng, a
war
enes
s an
d co
mpe
tenc
eH
ow d
oes
the
orga
nisa
tion
iden
tify
com
pete
ncy
requ
irem
ents
and
th
en p
lan,
pro
vide
and
re
cord
the
train
ing
nece
ssar
y to
ach
ieve
th
e co
mpe
tenc
ies?
3.75
Staff
trai
ning
pro
gram
s w
ere
agai
n di
scus
sed.
Key
com
pete
ncie
s ar
e do
cum
ente
d in
job
profi
les
and
asse
ssed
dur
ing
annu
al p
erfo
rman
ce
revi
ews,
whe
re a
ny tr
aini
ng re
quire
men
ts a
re id
entifi
ed, a
nd
train
ing
plan
s de
velo
ped.
Com
pete
ncy
reco
rdin
g is
wel
l man
aged
, w
ith in
form
atio
n ho
used
in O
rion
NZ’
s Po
wer
On
appl
icat
ion,
whi
le
com
pete
ncy
man
agem
ent p
roce
sses
are
car
eful
ly d
ocum
ente
d.
Wid
ely
used
AM
sta
ndar
ds re
quire
that
or
gani
satio
ns to
und
erta
ke a
sys
tem
atic
id
entifi
catio
n of
the
asse
t man
agem
ent
awar
enes
s an
d co
mpe
tenc
ies
requ
ired
at e
ach
leve
l and
func
tion
with
in th
e or
gani
satio
n. O
nce
iden
tified
the
train
ing
requ
ired
to p
rovi
de th
e ne
cess
ary
com
pete
ncie
s sh
ould
be
plan
ned
for
deliv
ery
in a
tim
ely
and
syst
emat
ic w
ay.
Any
train
ing
prov
ided
mus
t be
reco
rded
an
d m
aint
aine
d in
a s
uita
ble
form
at.
Whe
re a
n or
gani
satio
n ha
s co
ntra
cted
se
rvic
e pr
ovid
ers
in p
lace
then
it
shou
ld h
ave
a m
eans
to d
emon
stra
te
that
this
requ
irem
ent i
s be
ing
met
for
thei
r em
ploy
ees.
(e.
g., P
AS 5
5 re
fers
to
fram
ewor
ks s
uita
ble
for i
dent
ifyin
g co
mpe
tenc
y re
quire
men
ts).
Seni
or m
anag
emen
t res
pons
ible
fo
r agr
eem
ent o
f pla
n(s)
. M
anag
ers
resp
onsi
ble
for d
evel
opin
g as
set
man
agem
ent s
trate
gy a
nd p
lan(
s).
Man
ager
s w
ith re
spon
sibi
lity
for
deve
lopm
ent a
nd re
crui
tmen
t of
staff
(inc
ludi
ng H
R fu
nctio
ns).
St
aff re
spon
sibl
e fo
r tra
inin
g.
Proc
urem
ent o
ffice
rs. C
ontra
cted
se
rvic
e pr
ovid
ers.
Evid
ence
of a
n es
tabl
ishe
d an
d ap
plie
d co
mpe
tenc
y re
quire
men
ts a
sses
smen
t pr
oces
s an
d pl
an(s
) in
plac
e to
del
iver
th
e re
quire
d tra
inin
g. E
vide
nce
that
th
e tra
inin
g pr
ogra
mm
e is
par
t of a
w
ider
, co-
ordi
nate
d as
set m
anag
emen
t ac
tiviti
es tr
aini
ng a
nd c
ompe
tenc
y pr
ogra
mm
e. E
vide
nce
that
trai
ning
ac
tiviti
es a
re re
cord
ed a
nd th
at re
cord
s ar
e re
adily
ava
ilabl
e (fo
r bot
h di
rect
an
d co
ntra
cted
ser
vice
pro
vide
r sta
ff)
e.g.
via
org
anis
atio
n w
ide
info
rmat
ion
syst
em o
r loc
al re
cord
s da
taba
se.
50Tr
aini
ng, a
war
enes
s an
d co
mpe
tenc
eH
ow d
oes
the
orga
niza
tion
ensu
re
that
per
sons
und
er
its d
irect
con
trol
unde
rtaki
ng a
sset
m
anag
emen
t rel
ated
ac
tiviti
es h
ave
an
appr
opria
te le
vel o
f co
mpe
tenc
e in
term
s of
edu
catio
n, tr
aini
ng
or e
xper
ienc
e?
3.75
"Sta
ff tra
inin
g pr
ogra
ms
wer
e ag
ain
disc
usse
d. K
ey c
ompe
tenc
ies
are
docu
men
ted
in jo
b pr
ofile
s an
d as
sess
ed d
urin
g an
nual
per
form
ance
re
view
s, w
here
any
trai
ning
requ
irem
ents
are
iden
tified
, and
tra
inin
g pl
ans
deve
lope
d. C
ompe
tenc
y re
cord
ing
is w
ell m
anag
ed,
with
info
rmat
ion
hous
ed in
Orio
n N
Z’s
Pow
erO
n ap
plic
atio
n, w
hile
co
mpe
tenc
y m
anag
emen
t pro
cess
es a
re c
aref
ully
doc
umen
ted.
A cr
itica
l suc
cess
fact
or fo
r the
effe
ctiv
e de
velo
pmen
t and
impl
emen
tatio
n of
an
ass
et m
anag
emen
t sys
tem
is th
e co
mpe
tenc
e of
per
sons
und
erta
king
th
ese
activ
ities
. or
gani
satio
ns s
houl
d ha
ve e
ffect
ive
mea
ns in
pla
ce fo
r en
surin
g th
e co
mpe
tenc
e of
em
ploy
ees
to c
arry
out
thei
r des
igna
ted
asse
t m
anag
emen
t fun
ctio
n(s)
. W
here
an
orga
nisa
tion
has
cont
ract
ed s
ervi
ce
prov
ider
s un
derta
king
ele
men
ts o
f its
as
set m
anag
emen
t sys
tem
then
the
orga
nisa
tion
shal
l ass
ure
itsel
f tha
t th
e ou
tsou
rced
ser
vice
pro
vide
r als
o ha
s su
itabl
e ar
rang
emen
ts in
pla
ce
to m
anag
e th
e co
mpe
tenc
ies
of it
s em
ploy
ees.
The
org
anis
atio
n sh
ould
en
sure
that
the
indi
vidu
al a
nd c
orpo
rate
co
mpe
tenc
ies
it re
quire
s ar
e in
pla
ce
and
activ
ely
mon
itor,
deve
lop
and
mai
ntai
n an
app
ropr
iate
bal
ance
of t
hese
co
mpe
tenc
ies.
Man
ager
s, s
uper
viso
rs, p
erso
ns
resp
onsi
ble
for d
evel
opin
g tra
inin
g pr
ogra
mm
es.
Staff
resp
onsi
ble
for
proc
urem
ent a
nd s
ervi
ce a
gree
men
ts.
HR
staff
and
thos
e re
spon
sibl
e fo
r re
crui
tmen
t.
Evid
ence
of a
com
pete
ncy
asse
ssm
ent f
ram
ewor
k th
at a
ligns
w
ith e
stab
lishe
d fra
mew
orks
suc
h as
th
e as
set m
anag
emen
t Com
pete
ncie
s Re
quire
men
ts F
ram
ewor
k (V
ersi
on 2
.0);
Nat
iona
l Occ
upat
iona
l Sta
ndar
ds fo
r M
anag
emen
t and
Lea
ders
hip;
U
K St
anda
rd fo
r Pro
fess
iona
l En
gine
erin
g C
ompe
tenc
e,
Engi
neer
ing
Cou
ncil,
200
5.

315
Appendix F Disclosure schedules 11-13 continued
Sche
dule
13 R
epor
t on
asse
t man
agem
ent m
atur
ity c
ontin
ued
No.
Func
tion
Que
stio
nM
atur
ity L
evel
0M
atur
ity L
evel
1M
atur
ity L
evel
2M
atur
ity L
evel
3M
atur
ity L
evel
4
48Tr
aini
ng, a
war
enes
s an
d co
mpe
tenc
eH
ow d
oes
the
orga
nisa
tion
deve
lop
plan
(s) f
or th
e hu
man
re
sour
ces
requ
ired
to u
nder
take
ass
et
man
agem
ent
activ
ities
- in
clud
ing
the
deve
lopm
ent
and
deliv
ery
of a
sset
m
anag
emen
t stra
tegy
, pr
oces
s(es
), ob
ject
ives
an
d pl
an(s
)?
The
orga
nisa
tion
has
not r
ecog
nise
d th
e ne
ed fo
r ass
essi
ng h
uman
reso
urce
s re
quire
men
ts to
dev
elop
and
impl
emen
t its
ass
et m
anag
emen
t sys
tem
.
The
orga
nisa
tion
has
reco
gnis
ed th
e ne
ed to
ass
ess
its h
uman
reso
urce
s re
quire
men
ts a
nd to
dev
elop
a p
lan(
s).
Ther
e is
lim
ited
reco
gniti
on o
f the
nee
d to
alig
n th
ese
with
the
deve
lopm
ent
and
impl
emen
tatio
n of
its
asse
t m
anag
emen
t sys
tem
.
The
orga
nisa
tion
has
deve
lope
d a
stra
tegi
c ap
proa
ch to
alig
ning
co
mpe
tenc
ies
and
hum
an re
sour
ces
to th
e as
set m
anag
emen
t sys
tem
in
clud
ing
the
asse
t man
agem
ent p
lan
but t
he w
ork
is in
com
plet
e or
has
not
be
en c
onsi
sten
tly im
plem
ente
d.
"The
org
anis
atio
n ca
n de
mon
stra
te
that
pla
n(s)
are
in p
lace
and
effe
ctiv
e in
mat
chin
g co
mpe
tenc
ies
and
capa
bilit
ies
to th
e as
set m
anag
emen
t sy
stem
incl
udin
g th
e pl
an fo
r bot
h in
tern
al a
nd c
ontra
cted
act
iviti
es.
Plan
s ar
e re
view
ed in
tegr
al to
ass
et
man
agem
ent s
yste
m p
roce
ss(e
s).
Staff
trai
ning
was
cle
arly
dem
onst
rate
d an
d EA
C/P
HC
wer
e tra
cked
and
re
cord
ed, b
oth
for s
taff
and
appr
oved
co
ntra
ctor
s w
ith s
ubst
atio
n/as
set
acce
ss."
"The
org
anis
atio
n's
proc
ess(
es) s
urpa
ss
the
stan
dard
requ
ired
to c
ompl
y w
ith
requ
irem
ents
set
out
in a
reco
gnis
ed
stan
dard
.
The
asse
ssor
is a
dvis
ed to
not
e in
the
Evid
ence
sec
tion
why
this
is th
e ca
se
and
the
evid
ence
see
n."
49Tr
aini
ng, a
war
enes
s an
d co
mpe
tenc
eH
ow d
oes
the
orga
nisa
tion
iden
tify
com
pete
ncy
requ
irem
ents
and
th
en p
lan,
pro
vide
and
re
cord
the
train
ing
nece
ssar
y to
ach
ieve
th
e co
mpe
tenc
ies?
The
orga
nisa
tion
does
not
hav
e an
y m
eans
in p
lace
to id
entif
y co
mpe
tenc
y re
quire
men
ts.
The
orga
nisa
tion
has
reco
gnis
ed
the
need
to id
entif
y co
mpe
tenc
y re
quire
men
ts a
nd th
en p
lan,
pro
vide
an
d re
cord
the
train
ing
nece
ssar
y to
ac
hiev
e th
e co
mpe
tenc
ies.
The
orga
nisa
tion
is th
e pr
oces
s of
id
entif
ying
com
pete
ncy
requ
irem
ents
al
igne
d to
the
asse
t man
agem
ent
plan
(s) a
nd th
en p
lan,
pro
vide
and
re
cord
app
ropr
iate
trai
ning
. It i
s in
com
plet
e or
inco
nsis
tent
ly a
pplie
d.
"Com
pete
ncy
requ
irem
ents
are
in p
lace
an
d al
igne
d w
ith a
sset
man
agem
ent
plan
(s).
Pla
ns a
re in
pla
ce a
nd e
ffect
ive
in p
rovi
ding
the
train
ing
nece
ssar
y to
ac
hiev
e th
e co
mpe
tenc
ies.
A s
truct
ured
m
eans
of r
ecor
ding
the
com
pete
ncie
s ac
hiev
ed is
in p
lace
.
Com
pete
ncy
agai
nst j
ob d
escr
iptio
ns
are
reco
rded
and
revi
ewed
alo
ng w
ith
dele
gatio
ns w
hen
prom
otio
ns o
r re
-org
anis
atio
ns a
re u
nder
take
n,"
"The
org
anis
atio
n's
proc
ess(
es) s
urpa
ss
the
stan
dard
requ
ired
to c
ompl
y w
ith
requ
irem
ents
set
out
in a
reco
gnis
ed
stan
dard
.
The
asse
ssor
is a
dvis
ed to
not
e in
the
Evid
ence
sec
tion
why
this
is th
e ca
se
and
the
evid
ence
see
n."
50Tr
aini
ng, a
war
enes
s an
d co
mpe
tenc
eH
ow d
oes
the
orga
niza
tion
ensu
re
that
per
sons
und
er
its d
irect
con
trol
unde
rtaki
ng a
sset
m
anag
emen
t rel
ated
ac
tiviti
es h
ave
an
appr
opria
te le
vel o
f co
mpe
tenc
e in
term
s
of e
duca
tion,
trai
ning
or
exp
erie
nce?
The
orga
niza
tion
has
not r
ecog
nise
d th
e ne
ed to
ass
ess
the
com
pete
nce
of p
erso
n(s)
und
erta
king
ass
et
man
agem
ent r
elat
ed a
ctiv
ities
.
Com
pete
ncy
of s
taff
unde
rtaki
ng a
sset
m
anag
emen
t rel
ated
act
iviti
es is
not
m
anag
ed o
r ass
esse
d in
a s
truct
ured
w
ay, o
ther
than
form
al re
quire
men
ts
for l
egal
com
plia
nce
and
safe
ty
man
agem
ent.
The
orga
niza
tion
is in
the
proc
ess
of
putti
ng in
pla
ce a
mea
ns fo
r ass
essi
ng
the
com
pete
nce
of p
erso
n(s)
invo
lved
in
ass
et m
anag
emen
t act
iviti
es
incl
udin
g co
ntra
ctor
s. T
here
are
gap
s an
d in
cons
iste
ncie
s.
"Com
pete
ncy
requ
irem
ents
are
id
entifi
ed a
nd a
sses
sed
for a
ll pe
rson
s ca
rryin
g ou
t ass
et m
anag
emen
t rel
ated
ac
tiviti
es -
inte
rnal
and
con
tract
ed.
Requ
irem
ents
are
revi
ewed
and
sta
ff re
asse
ssed
at a
ppro
pria
te in
terv
als
alig
ned
to a
sset
man
agem
ent
requ
irem
ents
.
Com
pete
ncy
agai
nst j
ob d
escr
iptio
ns
are
reco
rded
and
revi
ewed
alo
ng w
ith
dele
gatio
ns w
hen
prom
otio
ns o
r re
-org
anis
atio
ns a
re u
nder
take
n."
"The
org
anis
atio
n's
proc
ess(
es) s
urpa
ss
the
stan
dard
requ
ired
to c
ompl
y w
ith
requ
irem
ents
set
out
in a
reco
gnis
ed
stan
dard
.
The
asse
ssor
is a
dvis
ed to
not
e in
the
Evid
ence
sec
tion
why
this
is th
e ca
se
and
the
evid
ence
see
n."
10 Year Asset Management Plan Appendices
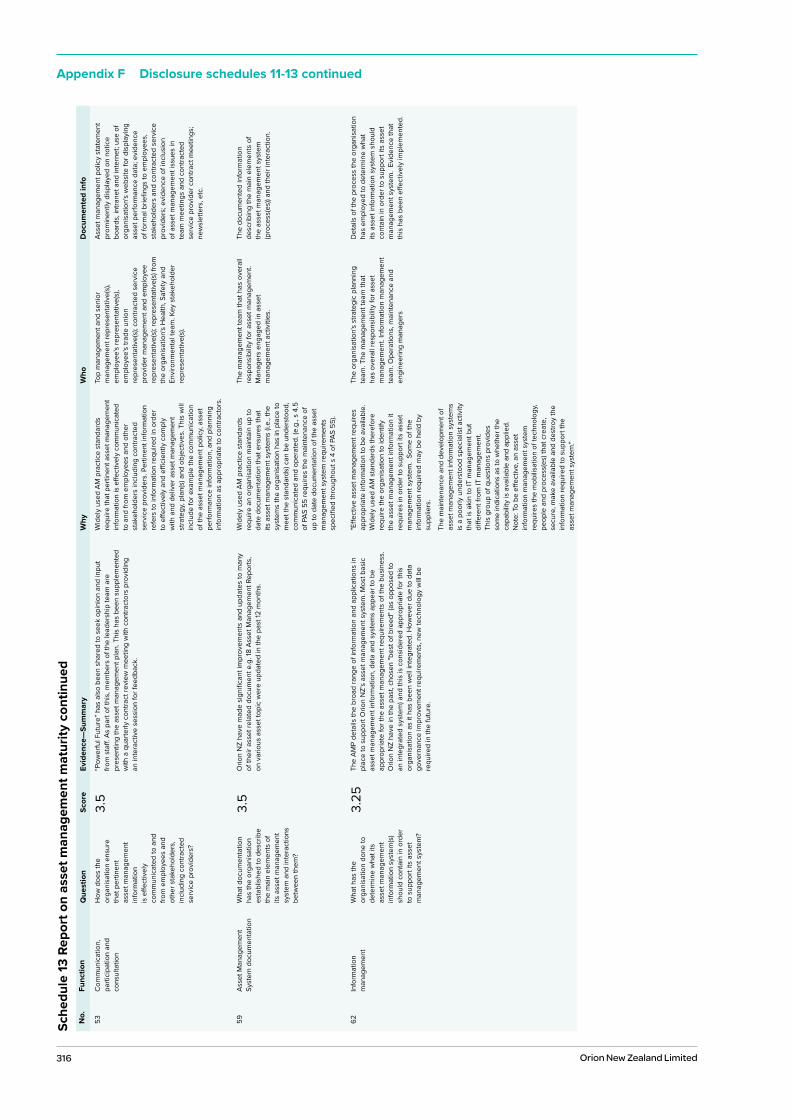
316 Orion New Zealand Limited
Appendix F Disclosure schedules 11-13 continuedSc
hedu
le 13
Rep
ort o
n as
set m
anag
emen
t mat
urity
con
tinue
dN
o.Fu
nctio
nQ
uest
ion
Scor
eEv
iden
ce—
Sum
mar
yW
hyW
hoD
ocum
ente
d in
fo
53C
omm
unic
atio
n,
parti
cipa
tion
and
cons
ulta
tion
How
doe
s th
e or
gani
satio
n en
sure
th
at p
ertin
ent
asse
t man
agem
ent
info
rmat
ion
is e
ffect
ivel
y co
mm
unic
ated
to a
nd
from
em
ploy
ees
and
othe
r sta
keho
lder
s,
incl
udin
g co
ntra
cted
se
rvic
e pr
ovid
ers?
3.5
“Pow
erfu
l Fut
ure”
has
als
o be
en s
hare
d to
see
k op
inio
n an
d in
put
from
sta
ff. A
s pa
rt of
this
, mem
bers
of t
he le
ader
ship
team
are
pr
esen
ting
the
asse
t man
agem
ent p
lan.
Thi
s ha
s be
en s
uppl
emen
ted
with
a q
uarte
rly c
ontra
ct re
view
mee
ting
with
con
tract
ors
prov
idin
g
an in
tera
ctiv
e se
ssio
n fo
r fee
dbac
k.
Wid
ely
used
AM
pra
ctic
e st
anda
rds
requ
ire th
at p
ertin
ent a
sset
man
agem
ent
info
rmat
ion
is e
ffect
ivel
y co
mm
unic
ated
to
and
from
em
ploy
ees
and
othe
r st
akeh
olde
rs in
clud
ing
cont
ract
ed
serv
ice
prov
ider
s. P
ertin
ent i
nfor
mat
ion
refe
rs to
info
rmat
ion
requ
ired
in o
rder
to
effe
ctiv
ely
and
effici
ently
com
ply
with
and
del
iver
ass
et m
anag
emen
t st
rate
gy, p
lan(
s) a
nd o
bjec
tives
. Thi
s w
ill
incl
ude
for e
xam
ple
the
com
mun
icat
ion
of th
e as
set m
anag
emen
t pol
icy,
asse
t pe
rform
ance
info
rmat
ion,
and
pla
nnin
g in
form
atio
n as
app
ropr
iate
to c
ontra
ctor
s.
Top
man
agem
ent a
nd s
enio
r m
anag
emen
t rep
rese
ntat
ive(
s),
empl
oyee
's re
pres
enta
tive(
s),
empl
oyee
's tra
de u
nion
re
pres
enta
tive(
s); c
ontra
cted
ser
vice
pr
ovid
er m
anag
emen
t and
em
ploy
ee
repr
esen
tativ
e(s)
; rep
rese
ntat
ive(
s) fr
om
the
orga
nisa
tion'
s H
ealth
, Saf
ety
and
Envi
ronm
enta
l tea
m. K
ey s
take
hold
er
repr
esen
tativ
e(s)
.
Asse
t man
agem
ent p
olic
y st
atem
ent
prom
inen
tly d
ispl
ayed
on
notic
e bo
ards
, int
rane
t and
inte
rnet
; use
of
orga
nisa
tion'
s w
ebsi
te fo
r dis
play
ing
asse
t per
form
ance
dat
a; e
vide
nce
of fo
rmal
brie
fings
to e
mpl
oyee
s,
stak
ehol
ders
and
con
tract
ed s
ervi
ce
prov
ider
s; e
vide
nce
of in
clus
ion
of a
sset
man
agem
ent i
ssue
s in
te
am m
eetin
gs a
nd c
ontra
cted
se
rvic
e pr
ovid
er c
ontra
ct m
eetin
gs;
new
slet
ters
, etc
.
59As
set M
anag
emen
t Sy
stem
doc
umen
tatio
nW
hat d
ocum
enta
tion
has
the
orga
nisa
tion
esta
blis
hed
to d
escr
ibe
the
mai
n el
emen
ts o
f its
ass
et m
anag
emen
t sy
stem
and
inte
ract
ions
be
twee
n th
em?
3.5
Orio
n N
Z ha
ve m
ade
sign
ifica
nt im
prov
emen
ts a
nd u
pdat
es to
man
y of
thei
r ass
et re
late
d do
cum
ent e
.g. 1
8 As
set M
anag
emen
t Rep
orts
, on
var
ious
ass
et to
pic
wer
e up
date
d in
the
past
12 m
onth
s.
Wid
ely
used
AM
pra
ctic
e st
anda
rds
requ
ire a
n or
gani
satio
n m
aint
ain
up to
da
te d
ocum
enta
tion
that
ens
ures
that
its
ass
et m
anag
emen
t sys
tem
s (i.
e., t
he
syst
ems
the
orga
nisa
tion
has
in p
lace
to
mee
t the
sta
ndar
ds) c
an b
e un
ders
tood
, co
mm
unic
ated
and
ope
rate
d. (e
.g.,
s 4.
5 of
PAS
55
requ
ires
the
mai
nten
ance
of
up to
dat
e do
cum
enta
tion
of th
e as
set
man
agem
ent s
yste
m re
quire
men
ts
spec
ified
thro
ugho
ut s
4 o
f PAS
55)
.
The
man
agem
ent t
eam
that
has
ove
rall
resp
onsi
bilit
y fo
r ass
et m
anag
emen
t.
Man
ager
s en
gage
d in
ass
et
man
agem
ent a
ctiv
ities
.
The
docu
men
ted
info
rmat
ion
desc
ribin
g th
e m
ain
elem
ents
of
the
asse
t man
agem
ent s
yste
m
(pro
cess
(es)
) and
thei
r int
erac
tion.
62In
form
atio
n m
anag
emen
tW
hat h
as th
e or
gani
satio
n do
ne to
de
term
ine
wha
t its
as
set m
anag
emen
t in
form
atio
n sy
stem
(s)
shou
ld c
onta
in in
ord
er
to s
uppo
rt its
ass
et
man
agem
ent s
yste
m?
3.25
The
AMP
deta
ils th
e br
oad
rang
e of
info
rmat
ion
and
appl
icat
ions
in
plac
e to
sup
port
Orio
n N
Z’s
asse
t man
agem
ent s
yste
m. M
ost b
asic
as
set m
anag
emen
t inf
orm
atio
n, d
ata
and
syst
ems
appe
ar to
be
appr
opria
te fo
r the
ass
et m
anag
emen
t req
uire
men
ts o
f the
bus
ines
s.
Orio
n N
Z ha
ve in
the
past
, cho
sen
"bes
t of b
reed
" (as
opp
osed
to
an in
tegr
ated
sys
tem
) and
this
is c
onsi
dere
d ap
prop
riate
for t
his
orga
nisa
tion
as it
has
bee
n w
ell i
nteg
rate
d. H
owev
er d
ue to
dat
a go
vern
ance
impr
ovem
ent r
equi
rem
ents
, new
tech
nolo
gy w
ill b
e re
quire
d in
the
futu
re.
"Effe
ctiv
e as
set m
anag
emen
t req
uire
s ap
prop
riate
info
rmat
ion
to b
e av
aila
ble.
W
idel
y us
ed A
M s
tand
ards
ther
efor
e re
quire
the
orga
nisa
tion
to id
entif
y th
e as
set m
anag
emen
t inf
orm
atio
n it
requ
ires
in o
rder
to s
uppo
rt its
ass
et
man
agem
ent s
yste
m.
Som
e of
the
info
rmat
ion
requ
ired
may
be
held
by
supp
liers
.
The
mai
nten
ance
and
dev
elop
men
t of
asse
t man
agem
ent i
nfor
mat
ion
syst
ems
is a
poo
rly u
nder
stoo
d sp
ecia
list a
ctiv
ity
that
is a
kin
to IT
man
agem
ent b
ut
diffe
rent
from
IT m
anag
emen
t.
This
gro
up o
f que
stio
ns p
rovi
des
so
me
indi
catio
ns a
s to
whe
ther
the
capa
bilit
y is
ava
ilabl
e an
d ap
plie
d.
Not
e: T
o be
effe
ctiv
e, a
n as
set
info
rmat
ion
man
agem
ent s
yste
m
requ
ires
the
mob
ilisa
tion
of te
chno
logy
, pe
ople
and
pro
cess
(es)
that
cre
ate,
se
cure
, mak
e av
aila
ble
and
dest
roy
the
info
rmat
ion
requ
ired
to s
uppo
rt th
e
asse
t man
agem
ent s
yste
m."
The
orga
nisa
tion'
s st
rate
gic
plan
ning
te
am. T
he m
anag
emen
t tea
m th
at
has
over
all r
espo
nsib
ility
for a
sset
m
anag
emen
t. In
form
atio
n m
anag
emen
t te
am. O
pera
tions
, mai
nten
ance
and
en
gine
erin
g m
anag
ers
Det
ails
of t
he p
roce
ss th
e or
gani
satio
n ha
s em
ploy
ed to
det
erm
ine
wha
t its
ass
et in
form
atio
n sy
stem
sho
uld
cont
ain
in o
rder
to s
uppo
rt its
ass
et
man
agem
ent s
yste
m.
Evid
ence
that
th
is h
as b
een
effec
tivel
y im
plem
ente
d.
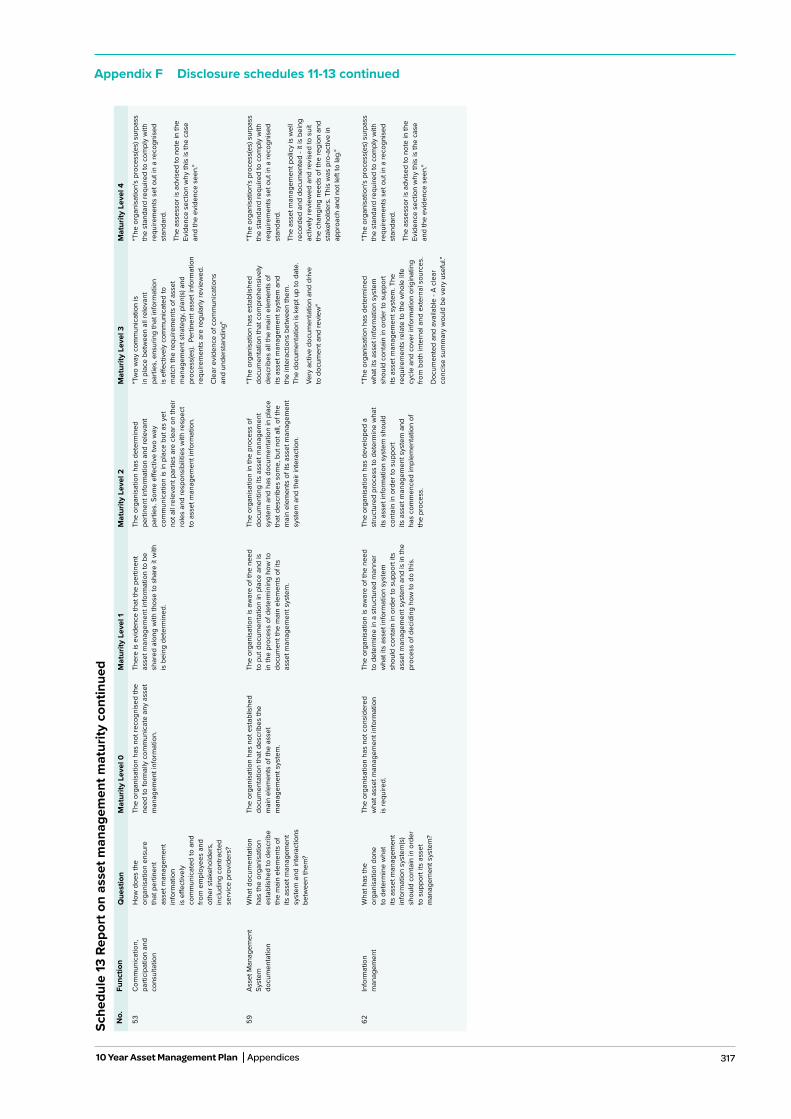
317
Appendix F Disclosure schedules 11-13 continued
Sche
dule
13 R
epor
t on
asse
t man
agem
ent m
atur
ity c
ontin
ued
No.
Func
tion
Que
stio
nM
atur
ity L
evel
0M
atur
ity L
evel
1M
atur
ity L
evel
2M
atur
ity L
evel
3M
atur
ity L
evel
4
53C
omm
unic
atio
n,
parti
cipa
tion
and
cons
ulta
tion
How
doe
s th
e or
gani
satio
n en
sure
th
at p
ertin
ent
asse
t man
agem
ent
info
rmat
ion
is e
ffect
ivel
y co
mm
unic
ated
to a
nd
from
em
ploy
ees
and
othe
r sta
keho
lder
s,
incl
udin
g co
ntra
cted
se
rvic
e pr
ovid
ers?
The
orga
nisa
tion
has
not r
ecog
nise
d th
e ne
ed to
form
ally
com
mun
icat
e an
y as
set
man
agem
ent i
nfor
mat
ion.
Ther
e is
evi
denc
e th
at th
e pe
rtine
nt
asse
t man
agem
ent i
nfor
mat
ion
to b
e sh
ared
alo
ng w
ith th
ose
to s
hare
it w
ith
is b
eing
det
erm
ined
.
The
orga
nisa
tion
has
dete
rmin
ed
perti
nent
info
rmat
ion
and
rele
vant
pa
rties
. Som
e eff
ectiv
e tw
o w
ay
com
mun
icat
ion
is in
pla
ce b
ut a
s ye
t no
t all
rele
vant
par
ties
are
clea
r on
thei
r ro
les
and
resp
onsi
bilit
ies
with
resp
ect
to a
sset
man
agem
ent i
nfor
mat
ion.
"Tw
o w
ay c
omm
unic
atio
n is
in
pla
ce b
etw
een
all r
elev
ant
parti
es, e
nsur
ing
that
info
rmat
ion
is e
ffect
ivel
y co
mm
unic
ated
to
mat
ch th
e re
quire
men
ts o
f ass
et
man
agem
ent s
trate
gy, p
lan(
s) a
nd
proc
ess(
es).
Per
tinen
t ass
et in
form
atio
n re
quire
men
ts a
re re
gula
rly re
view
ed.
Cle
ar e
vide
nce
of c
omm
unic
atio
ns
and
unde
rsta
ndin
g"
"The
org
anis
atio
n's
proc
ess(
es) s
urpa
ss
the
stan
dard
requ
ired
to c
ompl
y w
ith
requ
irem
ents
set
out
in a
reco
gnis
ed
stan
dard
.
The
asse
ssor
is a
dvis
ed to
not
e in
the
Evid
ence
sec
tion
why
this
is th
e ca
se
and
the
evid
ence
see
n."
59As
set M
anag
emen
t Sy
stem
do
cum
enta
tion
Wha
t doc
umen
tatio
n ha
s th
e or
gani
satio
n es
tabl
ishe
d to
des
crib
e th
e m
ain
elem
ents
of
its a
sset
man
agem
ent
syst
em a
nd in
tera
ctio
ns
betw
een
them
?
The
orga
nisa
tion
has
not e
stab
lishe
d do
cum
enta
tion
that
des
crib
es th
e
mai
n el
emen
ts o
f the
ass
et
man
agem
ent s
yste
m.
The
orga
nisa
tion
is a
war
e of
the
need
to
put
doc
umen
tatio
n in
pla
ce a
nd is
in
the
proc
ess
of d
eter
min
ing
how
to
docu
men
t the
mai
n el
emen
ts o
f its
as
set m
anag
emen
t sys
tem
.
The
orga
nisa
tion
in th
e pr
oces
s of
do
cum
entin
g its
ass
et m
anag
emen
t sy
stem
and
has
doc
umen
tatio
n in
pla
ce
that
des
crib
es s
ome,
but
not
all,
of t
he
mai
n el
emen
ts o
f its
ass
et m
anag
emen
t sy
stem
and
thei
r int
erac
tion.
"The
org
anis
atio
n ha
s es
tabl
ishe
d do
cum
enta
tion
that
com
preh
ensi
vely
de
scrib
es a
ll th
e m
ain
elem
ents
of
its a
sset
man
agem
ent s
yste
m a
nd
the
inte
ract
ions
bet
wee
n th
em.
The
docu
men
tatio
n is
kep
t up
to d
ate.
Very
act
ive
docu
men
tatio
n an
d dr
ive
to
doc
umen
t and
revi
ew"
"The
org
anis
atio
n's
proc
ess(
es) s
urpa
ss
the
stan
dard
requ
ired
to c
ompl
y w
ith
requ
irem
ents
set
out
in a
reco
gnis
ed
stan
dard
.
The
asse
t man
agem
ent p
olic
y is
wel
l re
cord
ed a
nd d
ocum
ente
d - i
t is
bein
g ac
tivel
y re
view
ed a
nd re
vise
d to
sui
t th
e ch
angi
ng n
eeds
of t
he re
gion
and
st
akeh
olde
rs. T
his
was
pro
-act
ive
in
appr
oach
and
not
left
to la
g."
62In
form
atio
n m
anag
emen
tW
hat h
as th
e or
gani
satio
n do
ne
to d
eter
min
e w
hat
its a
sset
man
agem
ent
info
rmat
ion
syst
em(s
) sh
ould
con
tain
in o
rder
to
sup
port
its a
sset
m
anag
emen
t sys
tem
?
The
orga
nisa
tion
has
not c
onsi
dere
d w
hat a
sset
man
agem
ent i
nfor
mat
ion
is
requ
ired.
The
orga
nisa
tion
is a
war
e of
the
need
to
det
erm
ine
in a
stru
ctur
ed m
anne
r w
hat i
ts a
sset
info
rmat
ion
syst
em
shou
ld c
onta
in in
ord
er to
sup
port
its
asse
t man
agem
ent s
yste
m a
nd is
in th
e pr
oces
s of
dec
idin
g ho
w to
do
this
.
The
orga
nisa
tion
has
deve
lope
d a
stru
ctur
ed p
roce
ss to
det
erm
ine
wha
t its
ass
et in
form
atio
n sy
stem
sho
uld
cont
ain
in o
rder
to s
uppo
rt
its a
sset
man
agem
ent s
yste
m a
nd
has
com
men
ced
impl
emen
tatio
n of
th
e pr
oces
s.
"The
org
anis
atio
n ha
s de
term
ined
w
hat i
ts a
sset
info
rmat
ion
syst
em
shou
ld c
onta
in in
ord
er to
sup
port
its a
sset
man
agem
ent s
yste
m. T
he
requ
irem
ents
rela
te to
the
who
le li
fe
cycl
e an
d co
ver i
nfor
mat
ion
orig
inat
ing
from
bot
h in
tern
al a
nd e
xter
nal s
ourc
es.
Doc
umen
ted
and
avai
labl
e - A
cle
ar
conc
ise
sum
mar
y w
ould
be
very
use
ful."
"The
org
anis
atio
n's
proc
ess(
es) s
urpa
ss
the
stan
dard
requ
ired
to c
ompl
y w
ith
requ
irem
ents
set
out
in a
reco
gnis
ed
stan
dard
.
The
asse
ssor
is a
dvis
ed to
not
e in
the
Evid
ence
sec
tion
why
this
is th
e ca
se
and
the
evid
ence
see
n."
10 Year Asset Management Plan Appendices
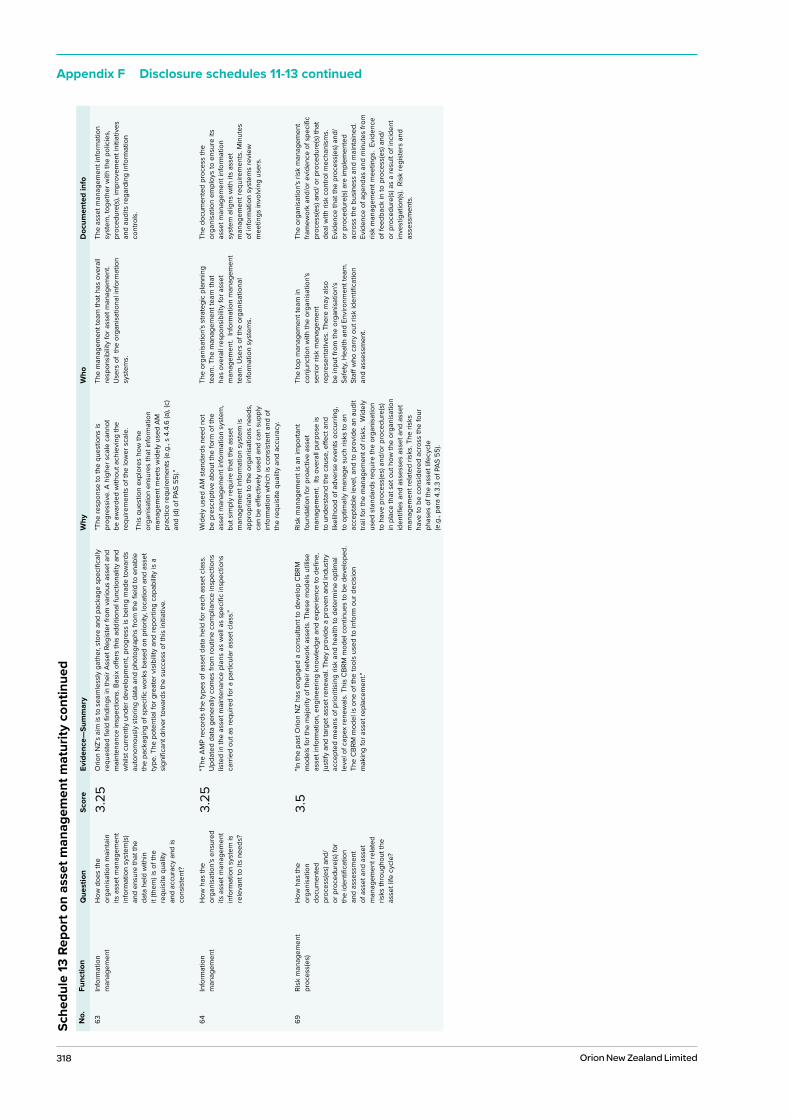
318 Orion New Zealand Limited
Appendix F Disclosure schedules 11-13 continuedSc
hedu
le 13
Rep
ort o
n as
set m
anag
emen
t mat
urity
con
tinue
dN
o.Fu
nctio
nQ
uest
ion
Scor
eEv
iden
ce—
Sum
mar
yW
hyW
hoD
ocum
ente
d in
fo
63In
form
atio
n m
anag
emen
tH
ow d
oes
the
orga
nisa
tion
mai
ntai
n its
ass
et m
anag
emen
t in
form
atio
n sy
stem
(s)
and
ensu
re th
at th
e da
ta h
eld
with
in
it (th
em) i
s of
the
requ
isite
qua
lity
and
accu
racy
and
is
cons
iste
nt?
3.25
Orio
n N
Z’s
aim
is to
sea
mle
ssly
gat
her,
stor
e an
d pa
ckag
e sp
ecifi
cally
re
ques
ted
field
find
ings
in th
eir A
sset
Reg
iste
r fro
m v
ario
us a
sset
and
m
aint
enan
ce in
spec
tions
. Bas
ix o
ffers
this
add
ition
al fu
nctio
nalit
y an
d w
hils
t cur
rent
ly u
nder
dev
elop
men
t, pr
ogre
ss is
bei
ng m
ade
tow
ards
au
tono
mou
sly
stor
ing
data
and
pho
togr
aphs
from
the
field
to e
nabl
e th
e pa
ckag
ing
of s
peci
fic w
orks
bas
ed o
n pr
iorit
y, lo
catio
n an
d as
set
type
. The
pot
entia
l for
gre
ater
vis
ibili
ty a
nd re
porti
ng c
apab
ility
is a
si
gnifi
cant
driv
er to
war
ds th
e su
cces
s of
this
initi
ativ
e.
"The
resp
onse
to th
e qu
estio
ns is
pr
ogre
ssiv
e. A
hig
her s
cale
can
not
be a
war
ded
with
out a
chie
ving
the
requ
irem
ents
of t
he lo
wer
sca
le.
This
que
stio
n ex
plor
es h
ow th
e or
gani
satio
n en
sure
s th
at in
form
atio
n m
anag
emen
t mee
ts w
idel
y us
ed A
M
prac
tice
requ
irem
ents
(e.g
., s
4.4.
6 (a
), (c
) an
d (d
) of P
AS 5
5)."
The
man
agem
ent t
eam
that
has
ove
rall
resp
onsi
bilit
y fo
r ass
et m
anag
emen
t.
Use
rs o
f th
e or
gani
satio
nal i
nfor
mat
ion
syst
ems.
The
asse
t man
agem
ent i
nfor
mat
ion
syst
em, t
oget
her w
ith th
e po
licie
s,
proc
edur
e(s)
, im
prov
emen
t ini
tiativ
es
and
audi
ts re
gard
ing
info
rmat
ion
cont
rols
.
64In
form
atio
n m
anag
emen
tH
ow h
as th
e or
gani
satio
n’s
ensu
red
its a
sset
man
agem
ent
info
rmat
ion
syst
em is
re
leva
nt to
its
need
s?
3.25
"The
AM
P re
cord
s th
e ty
pes
of a
sset
dat
a he
ld fo
r eac
h as
set c
lass
. U
pdat
ed d
ata
gene
rally
com
es fr
om ro
utin
e co
mpl
ianc
e in
spec
tions
lis
ted
in th
e as
set m
aint
enan
ce p
lans
as
wel
l as
spec
ific
insp
ectio
ns
carri
ed o
ut a
s re
quire
d fo
r a p
artic
ular
ass
et c
lass
."
Wid
ely
used
AM
sta
ndar
ds n
eed
not
be p
resc
riptiv
e ab
out t
he fo
rm o
f the
as
set m
anag
emen
t inf
orm
atio
n sy
stem
, bu
t sim
ply
requ
ire th
at th
e as
set
man
agem
ent i
nfor
mat
ion
syst
em is
ap
prop
riate
to th
e or
gani
satio
ns n
eeds
, ca
n be
effe
ctiv
ely
used
and
can
sup
ply
info
rmat
ion
whi
ch is
con
sist
ent a
nd o
f th
e re
quis
ite q
ualit
y an
d ac
cura
cy.
The
orga
nisa
tion'
s st
rate
gic
plan
ning
te
am. T
he m
anag
emen
t tea
m th
at
has
over
all r
espo
nsib
ility
for a
sset
m
anag
emen
t. In
form
atio
n m
anag
emen
t te
am. U
sers
of t
he o
rgan
isat
iona
l in
form
atio
n sy
stem
s.
The
docu
men
ted
proc
ess
the
orga
nisa
tion
empl
oys
to e
nsur
e its
as
set m
anag
emen
t inf
orm
atio
n
syst
em a
ligns
with
its
asse
t m
anag
emen
t req
uire
men
ts. M
inut
es
of in
form
atio
n sy
stem
s re
view
m
eetin
gs in
volv
ing
user
s.
69Ri
sk m
anag
emen
t pr
oces
s(es
)H
ow h
as th
e or
gani
satio
n do
cum
ente
d pr
oces
s(es
) and
/or
pro
cedu
re(s
) for
th
e id
entifi
catio
n an
d as
sess
men
t of
ass
et a
nd a
sset
m
anag
emen
t rel
ated
ris
ks th
roug
hout
the
asse
t life
cyc
le?
3.5
"In th
e pa
st O
rion
NZ
has
enga
ged
a co
nsul
tant
to d
evel
op C
BRM
m
odel
s fo
r the
maj
ority
of t
heir
netw
ork
asse
ts. T
hese
mod
els
utili
se
asse
t inf
orm
atio
n, e
ngin
eerin
g kn
owle
dge
and
expe
rienc
e to
defi
ne,
just
ify a
nd ta
rget
ass
et re
new
al. T
hey
prov
ide
a pr
oven
and
indu
stry
ac
cept
ed m
eans
of p
riorit
isin
g ris
k an
d he
alth
to d
eter
min
e op
timal
le
vel o
f cap
ex re
new
als.
Thi
s C
BRM
mod
el c
ontin
ues
to b
e de
velo
ped.
Th
e C
BRM
mod
el is
one
of t
he to
ols
used
to in
form
our
dec
isio
n m
akin
g fo
r ass
et re
plac
emen
t."
Risk
man
agem
ent i
s an
impo
rtant
fo
unda
tion
for p
roac
tive
asse
t m
anag
emen
t. It
s ov
eral
l pur
pose
is
to u
nder
stan
d th
e ca
use,
effe
ct a
nd
likel
ihoo
d of
adv
erse
eve
nts
occu
rring
, to
opt
imal
ly m
anag
e su
ch ri
sks
to a
n ac
cept
able
leve
l, an
d to
pro
vide
an
audi
t tra
il fo
r the
man
agem
ent o
f ris
ks.
Wid
ely
used
sta
ndar
ds re
quire
the
orga
nisa
tion
to h
ave
proc
ess(
es) a
nd/o
r pro
cedu
re(s
) in
pla
ce th
at s
et o
ut h
ow th
e or
gani
satio
n id
entifi
es a
nd a
sses
ses
asse
t and
ass
et
man
agem
ent r
elat
ed ri
sks.
The
risk
s ha
ve to
be
cons
ider
ed a
cros
s th
e fo
ur
phas
es o
f the
ass
et li
fecy
cle
(e
.g.,
para
4.3
.3 o
f PAS
55)
.
The
top
man
agem
ent t
eam
in
conj
unct
ion
with
the
orga
nisa
tion'
s se
nior
risk
man
agem
ent
repr
esen
tativ
es. T
here
may
als
o
be in
put f
rom
the
orga
nisa
tion'
s
Safe
ty, H
ealth
and
Env
ironm
ent t
eam
. St
aff w
ho c
arry
out
risk
iden
tifica
tion
and
asse
ssm
ent.
The
orga
nisa
tion'
s ris
k m
anag
emen
t fra
mew
ork
and/
or e
vide
nce
of s
peci
fic
proc
ess(
es) a
nd/ o
r pro
cedu
re(s
) tha
t de
al w
ith ri
sk c
ontro
l mec
hani
sms.
Ev
iden
ce th
at th
e pr
oces
s(es
) and
/or
pro
cedu
re(s
) are
impl
emen
ted
acro
ss th
e bu
sine
ss a
nd m
aint
aine
d.
Evid
ence
of a
gend
as a
nd m
inut
es fr
om
risk
man
agem
ent m
eetin
gs.
Evid
ence
of
feed
back
in to
pro
cess
(es)
and
/or
pro
cedu
re(s
) as
a re
sult
of in
cide
nt
inve
stig
atio
n(s)
. Ri
sk re
gist
ers
and
asse
ssm
ents
.
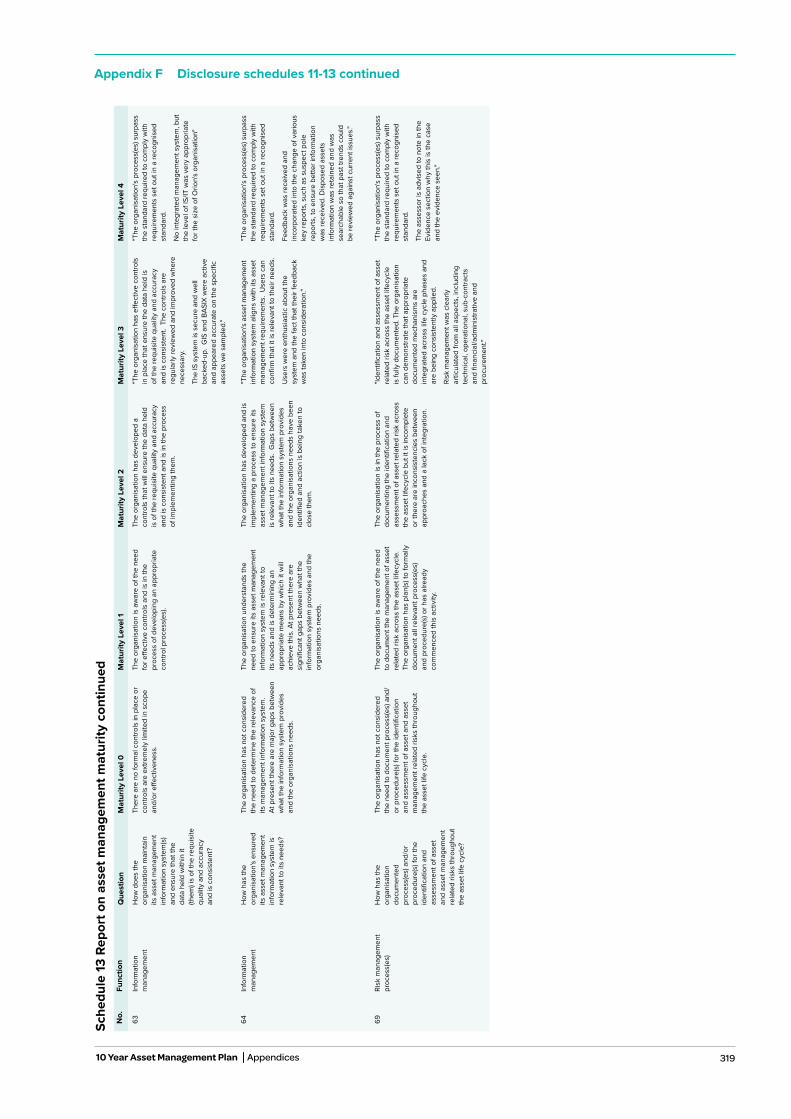
319
Appendix F Disclosure schedules 11-13 continued
Sche
dule
13 R
epor
t on
asse
t man
agem
ent m
atur
ity c
ontin
ued
No.
Func
tion
Que
stio
nM
atur
ity L
evel
0M
atur
ity L
evel
1M
atur
ity L
evel
2M
atur
ity L
evel
3M
atur
ity L
evel
4
63In
form
atio
n m
anag
emen
tH
ow d
oes
the
orga
nisa
tion
mai
ntai
n its
ass
et m
anag
emen
t in
form
atio
n sy
stem
(s)
and
ensu
re th
at th
e da
ta h
eld
with
in it
(th
em) i
s of
the
requ
isite
qu
ality
and
acc
urac
y an
d is
con
sist
ent?
Ther
e ar
e no
form
al c
ontro
ls in
pla
ce o
r co
ntro
ls a
re e
xtre
mel
y lim
ited
in s
cope
an
d/or
effe
ctiv
enes
s.
The
orga
nisa
tion
is a
war
e of
the
need
fo
r effe
ctiv
e co
ntro
ls a
nd is
in th
e pr
oces
s of
dev
elop
ing
an a
ppro
pria
te
cont
rol p
roce
ss(e
s).
The
orga
nisa
tion
has
deve
lope
d a
cont
rols
that
will
ens
ure
the
data
hel
d is
of t
he re
quis
ite q
ualit
y an
d ac
cura
cy
and
is c
onsi
sten
t and
is in
the
proc
ess
of im
plem
entin
g th
em.
"The
org
anis
atio
n ha
s eff
ectiv
e co
ntro
ls
in p
lace
that
ens
ure
the
data
hel
d is
of
the
requ
isite
qua
lity
and
accu
racy
an
d is
con
sist
ent.
The
con
trols
are
re
gula
rly re
view
ed a
nd im
prov
ed w
here
ne
cess
ary.
The
IS s
yste
m is
sec
ure
and
wel
l ba
cked
-up.
GIS
and
BAS
IX w
ere
activ
e an
d ap
pear
ed a
ccur
ate
on th
e sp
ecifi
c as
sets
we
sam
pled
."
"The
org
anis
atio
n's
proc
ess(
es) s
urpa
ss
the
stan
dard
requ
ired
to c
ompl
y w
ith
requ
irem
ents
set
out
in a
reco
gnis
ed
stan
dard
.
No
inte
grat
ed m
anag
emen
t sys
tem
, but
th
e le
vel o
f IS/
IT w
as v
ery
appr
opria
te
for t
he s
ize
of O
rion'
s or
gani
satio
n"
64In
form
atio
n m
anag
emen
tH
ow h
as th
e or
gani
satio
n's
ensu
red
its a
sset
man
agem
ent
info
rmat
ion
syst
em is
re
leva
nt to
its
need
s?
The
orga
nisa
tion
has
not c
onsi
dere
d
the
need
to d
eter
min
e th
e re
leva
nce
of
its m
anag
emen
t inf
orm
atio
n sy
stem
. At
pre
sent
ther
e ar
e m
ajor
gap
s be
twee
n w
hat t
he in
form
atio
n sy
stem
pro
vide
s an
d th
e or
gani
satio
ns n
eeds
.
The
orga
nisa
tion
unde
rsta
nds
the
need
to e
nsur
e its
ass
et m
anag
emen
t in
form
atio
n sy
stem
is re
leva
nt to
its
nee
ds a
nd is
det
erm
inin
g an
ap
prop
riate
mea
ns b
y w
hich
it w
ill
achi
eve
this
. At p
rese
nt th
ere
are
sign
ifica
nt g
aps
betw
een
wha
t the
in
form
atio
n sy
stem
pro
vide
s an
d th
e or
gani
satio
ns n
eeds
.
The
orga
nisa
tion
has
deve
lope
d an
d is
im
plem
entin
g a
proc
ess
to e
nsur
e its
as
set m
anag
emen
t inf
orm
atio
n sy
stem
is
rele
vant
to it
s ne
eds.
Gap
s be
twee
n w
hat t
he in
form
atio
n sy
stem
pro
vide
s an
d th
e or
gani
satio
ns n
eeds
hav
e be
en
iden
tified
and
act
ion
is b
eing
take
n to
cl
ose
them
.
"The
org
anis
atio
n's
asse
t man
agem
ent
info
rmat
ion
syst
em a
ligns
with
its
asse
t m
anag
emen
t req
uire
men
ts.
Use
rs c
an
confi
rm th
at it
is re
leva
nt to
thei
r nee
ds.
Use
rs w
ere
enth
usia
stic
abo
ut th
e sy
stem
and
the
fact
that
thei
r fee
dbac
k w
as ta
ken
into
con
side
ratio
n."
"The
org
anis
atio
n's
proc
ess(
es) s
urpa
ss
the
stan
dard
requ
ired
to c
ompl
y w
ith
requ
irem
ents
set
out
in a
reco
gnis
ed
stan
dard
.
Feed
back
was
rece
ived
and
in
corp
orat
ed in
to th
e ch
ange
of v
ario
us
key
repo
rts, s
uch
as s
uspe
ct p
ole
repo
rts, t
o en
sure
bet
ter i
nfor
mat
ion
was
rece
ived
. Dis
pose
d as
sets
in
form
atio
n w
as re
tain
ed a
nd w
as
sear
chab
le s
o th
at p
ast t
rend
s co
uld
be
revi
ewed
aga
inst
cur
rent
issu
es."
69Ri
sk m
anag
emen
t pr
oces
s(es
)H
ow h
as th
e or
gani
satio
n do
cum
ente
d pr
oces
s(es
) and
/or
proc
edur
e(s)
for t
he
iden
tifica
tion
and
asse
ssm
ent o
f ass
et
and
asse
t man
agem
ent
rela
ted
risks
thro
ugho
ut
the
asse
t life
cyc
le?
The
orga
nisa
tion
has
not c
onsi
dere
d th
e ne
ed to
doc
umen
t pro
cess
(es)
and
/or
pro
cedu
re(s
) for
the
iden
tifica
tion
and
asse
ssm
ent o
f ass
et a
nd a
sset
m
anag
emen
t rel
ated
risk
s th
roug
hout
th
e as
set l
ife c
ycle
.
The
orga
nisa
tion
is a
war
e of
the
need
to
doc
umen
t the
man
agem
ent o
f ass
et
rela
ted
risk
acro
ss th
e as
set l
ifecy
cle.
Th
e or
gani
satio
n ha
s pl
an(s
) to
form
ally
do
cum
ent a
ll re
leva
nt p
roce
ss(e
s)
and
proc
edur
e(s)
or h
as a
lread
y co
mm
ence
d th
is a
ctiv
ity.
The
orga
nisa
tion
is in
the
proc
ess
of
docu
men
ting
the
iden
tifica
tion
and
asse
ssm
ent o
f ass
et re
late
d ris
k ac
ross
th
e as
set l
ifecy
cle
but i
t is
inco
mpl
ete
or th
ere
are
inco
nsis
tenc
ies
betw
een
appr
oach
es a
nd a
lack
of i
nteg
ratio
n.
"Iden
tifica
tion
and
asse
ssm
ent o
f ass
et
rela
ted
risk
acro
ss th
e as
set l
ifecy
cle
is fu
lly d
ocum
ente
d. T
he o
rgan
isat
ion
can
dem
onst
rate
that
app
ropr
iate
do
cum
ente
d m
echa
nism
s ar
e in
tegr
ated
acr
oss
life
cycl
e ph
ases
and
ar
e be
ing
cons
iste
ntly
app
lied.
Risk
man
agem
ent w
as c
lear
ly
artic
ulat
ed fr
om a
ll as
pect
s, in
clud
ing
tech
nica
l, op
erat
iona
l, su
b-co
ntra
cts
and
finan
cial
/adm
inis
trativ
e an
d pr
ocur
emen
t."
"The
org
anis
atio
n's
proc
ess(
es) s
urpa
ss
the
stan
dard
requ
ired
to c
ompl
y w
ith
requ
irem
ents
set
out
in a
reco
gnis
ed
stan
dard
.
The
asse
ssor
is a
dvis
ed to
not
e in
the
Evid
ence
sec
tion
why
this
is th
e ca
se
and
the
evid
ence
see
n."
10 Year Asset Management Plan Appendices
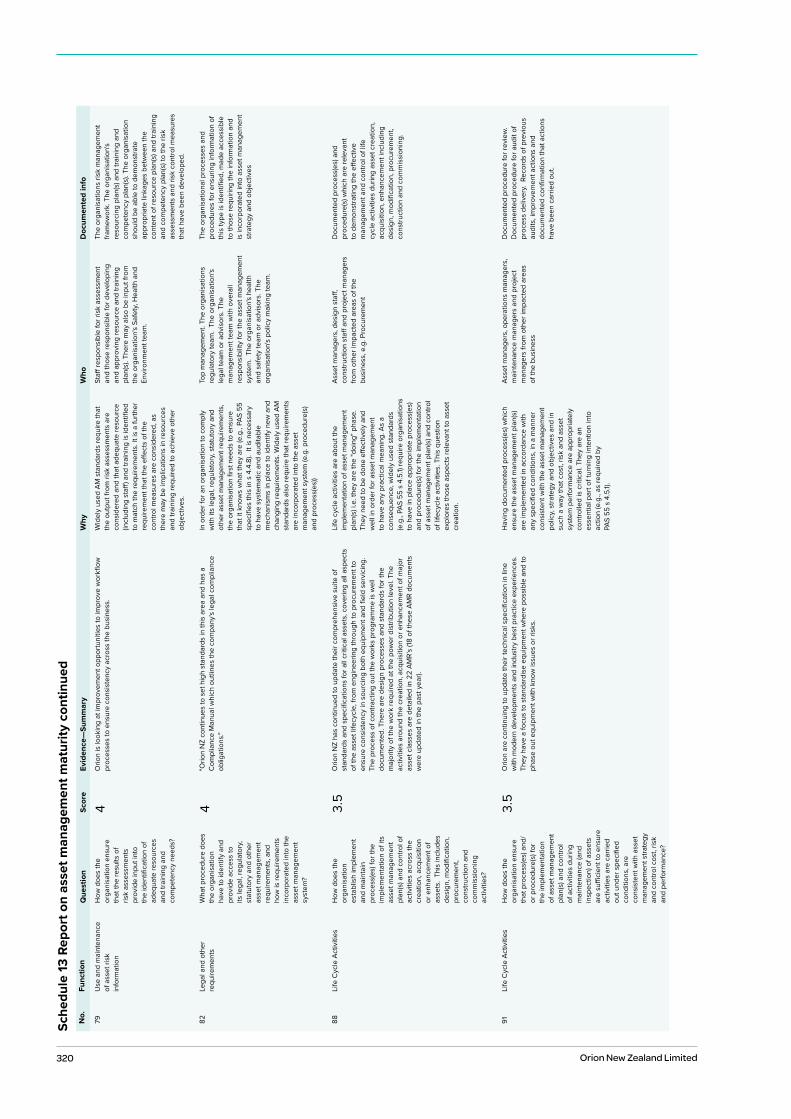
320 Orion New Zealand Limited
Sche
dule
13 R
epor
t on
asse
t man
agem
ent m
atur
ity c
ontin
ued
No.
Func
tion
Que
stio
nSc
ore
Evid
ence
—Su
mm
ary
Why
Who
Doc
umen
ted
info
79U
se a
nd m
aint
enan
ce
of a
sset
risk
in
form
atio
n
How
doe
s th
e or
gani
satio
n en
sure
th
at th
e re
sults
of
risk
asse
ssm
ents
pr
ovid
e in
put i
nto
the
iden
tifica
tion
of
adeq
uate
reso
urce
s an
d tra
inin
g an
d co
mpe
tenc
y ne
eds?
4O
rion
is lo
okin
g at
impr
ovem
ent o
ppor
tuni
ties
to im
prov
e w
orkfl
ow
proc
esse
s to
ens
ure
cons
iste
ncy
acro
ss th
e bu
sine
ss.
Wid
ely
used
AM
sta
ndar
ds re
quire
that
th
e ou
tput
from
risk
ass
essm
ents
are
co
nsid
ered
and
that
ade
quat
e re
sour
ce
(incl
udin
g st
aff) a
nd tr
aini
ng is
iden
tified
to
mat
ch th
e re
quire
men
ts. I
t is
a fu
rther
re
quire
men
t tha
t the
effe
cts
of th
e co
ntro
l mea
sure
s ar
e co
nsid
ered
, as
ther
e m
ay b
e im
plic
atio
ns in
reso
urce
s an
d tra
inin
g re
quire
d to
ach
ieve
oth
er
obje
ctiv
es.
Staff
resp
onsi
ble
for r
isk
asse
ssm
ent
and
thos
e re
spon
sibl
e fo
r dev
elop
ing
and
appr
ovin
g re
sour
ce a
nd tr
aini
ng
plan
(s).
Ther
e m
ay a
lso
be in
put f
rom
th
e or
gani
satio
n's
Safe
ty, H
ealth
and
En
viro
nmen
t tea
m.
The
orga
nisa
tions
risk
man
agem
ent
fram
ewor
k. T
he o
rgan
isat
ion'
s re
sour
cing
pla
n(s)
and
trai
ning
and
co
mpe
tenc
y pl
an(s
). Th
e or
gani
satio
n sh
ould
be
able
to d
emon
stra
te
appr
opria
te li
nkag
es b
etw
een
the
cont
ent o
f res
ourc
e pl
an(s
) and
trai
ning
an
d co
mpe
tenc
y pl
an(s
) to
the
risk
asse
ssm
ents
and
risk
con
trol m
easu
res
that
hav
e be
en d
evel
oped
.
82Le
gal a
nd o
ther
re
quire
men
tsW
hat p
roce
dure
doe
s th
e or
gani
satio
n ha
ve to
iden
tify
and
prov
ide
acce
ss to
its
lega
l, re
gula
tory
, st
atut
ory
and
othe
r as
set m
anag
emen
t re
quire
men
ts, a
nd
how
is re
quire
men
ts
inco
rpor
ated
into
the
asse
t man
agem
ent
syst
em?
4"O
rion
NZ
cont
inue
s to
set
hig
h st
anda
rds
in th
is a
rea
and
has
a C
ompl
ianc
e M
anua
l whi
ch o
utlin
es th
e co
mpa
ny's
lega
l com
plia
nce
oblig
atio
ns."
In o
rder
for a
n or
gani
satio
n to
com
ply
with
its
lega
l, re
gula
tory
, sta
tuto
ry a
nd
othe
r ass
et m
anag
emen
t req
uire
men
ts,
the
orga
nisa
tion
first
nee
ds to
ens
ure
that
it k
now
s w
hat t
hey
are
(e.g
., PA
S 55
sp
ecifi
es th
is in
s 4
.4.8
). It
is n
eces
sary
to
hav
e sy
stem
atic
and
aud
itabl
e m
echa
nism
s in
pla
ce to
iden
tify
new
and
ch
angi
ng re
quire
men
ts. W
idel
y us
ed A
M
stan
dard
s al
so re
quire
that
requ
irem
ents
ar
e in
corp
orat
ed in
to th
e as
set
man
agem
ent s
yste
m (e
.g. p
roce
dure
(s)
and
proc
ess(
es))
Top
man
agem
ent.
The
orga
nisa
tions
re
gula
tory
team
. Th
e or
gani
satio
n's
lega
l tea
m o
r adv
isor
s. T
he
man
agem
ent t
eam
with
ove
rall
resp
onsi
bilit
y fo
r the
ass
et m
anag
emen
t sy
stem
. Th
e or
gani
satio
n's
heal
th
and
safe
ty te
am o
r adv
isor
s. T
he
orga
nisa
tion'
s po
licy
mak
ing
team
.
The
orga
nisa
tiona
l pro
cess
es a
nd
proc
edur
es fo
r ens
urin
g in
form
atio
n of
th
is ty
pe is
iden
tified
, mad
e ac
cess
ible
to
thos
e re
quiri
ng th
e in
form
atio
n an
d is
inco
rpor
ated
into
ass
et m
anag
emen
t st
rate
gy a
nd o
bjec
tives
88Li
fe C
ycle
Act
iviti
esH
ow d
oes
the
orga
nisa
tion
esta
blis
h im
plem
ent
and
mai
ntai
n pr
oces
s(es
) for
the
impl
emen
tatio
n of
its
asse
t man
agem
ent
plan
(s) a
nd c
ontro
l of
activ
ities
acr
oss
the
crea
tion,
acq
uisi
tion
or e
nhan
cem
ent o
f as
sets
. Th
is in
clud
es
desi
gn, m
odifi
catio
n,
proc
urem
ent,
cons
truct
ion
and
com
mis
sion
ing
activ
ities
?
3.5
Orio
n N
Z ha
s co
ntin
ued
to u
pdat
e th
eir c
ompr
ehen
sive
sui
te o
f st
anda
rds
and
spec
ifica
tions
for a
ll cr
itica
l ass
ets,
cov
erin
g al
l asp
ects
of
the
asse
t life
cycl
e, fr
om e
ngin
eerin
g th
roug
h to
pro
cure
men
t to
ensu
re c
onsi
sten
cy in
sou
rcin
g bo
th e
quip
men
t and
fiel
d se
rvic
ing.
Th
e pr
oces
s of
con
tract
ing
out t
he w
orks
pro
gram
me
is w
ell
docu
men
ted.
The
re a
re d
esig
n pr
oces
ses
and
stan
dard
s fo
r the
m
ajor
ity o
f the
wor
k re
quire
d at
the
pow
er d
istri
butio
n le
vel.
The
activ
ities
aro
und
the
crea
tion,
acq
uisi
tion
or e
nhan
cem
ent o
f maj
or
asse
t cla
sses
are
det
aile
d in
22
AMR’
s (18
of t
hese
AM
R do
cum
ents
w
ere
upda
ted
in th
e pa
st y
ear).
Life
cyc
le a
ctiv
ities
are
abo
ut th
e im
plem
enta
tion
of a
sset
man
agem
ent
plan
(s) i
.e. t
hey
are
the
"doi
ng" p
hase
. Th
ey n
eed
to b
e do
ne e
ffect
ivel
y an
d w
ell i
n or
der f
or a
sset
man
agem
ent
to h
ave
any
prac
tical
mea
ning
. As
a co
nseq
uenc
e, w
idel
y us
ed s
tand
ards
(e
.g.,
PAS
55 s
4.5
.1) re
quire
org
anis
atio
ns
to h
ave
in p
lace
app
ropr
iate
pro
cess
(es)
an
d pr
oced
ure(
s) fo
r the
impl
emen
tatio
n of
ass
et m
anag
emen
t pla
n(s)
and
con
trol
of li
fecy
cle
activ
ities
. Thi
s qu
estio
n ex
plor
es th
ose
aspe
cts
rele
vant
to a
sset
cr
eatio
n.
Asse
t man
ager
s, d
esig
n st
aff,
cons
truct
ion
staff
and
pro
ject
man
ager
s fro
m o
ther
impa
cted
are
as o
f the
bu
sine
ss, e
.g. P
rocu
rem
ent
Doc
umen
ted
proc
ess(
es) a
nd
proc
edur
e(s)
whi
ch a
re re
leva
nt
to d
emon
stra
ting
the
effec
tive
man
agem
ent a
nd c
ontro
l of l
ife
cycl
e ac
tiviti
es d
urin
g as
set c
reat
ion,
ac
quis
ition
, enh
ance
men
t inc
ludi
ng
desi
gn, m
odifi
catio
n, p
rocu
rem
ent,
cons
truct
ion
and
com
mis
sion
ing.
91Li
fe C
ycle
Act
iviti
esH
ow d
oes
the
orga
nisa
tion
ensu
re
that
pro
cess
(es)
and
/or
pro
cedu
re(s
) for
th
e im
plem
enta
tion
of a
sset
man
agem
ent
plan
(s) a
nd c
ontro
l of
act
iviti
es d
urin
g m
aint
enan
ce (a
nd
insp
ectio
n) o
f ass
ets
are
suffi
cien
t to
ensu
re
activ
ities
are
car
ried
out u
nder
spe
cifie
d co
nditi
ons,
are
co
nsis
tent
with
ass
et
man
agem
ent s
trate
gy
and
cont
rol c
ost,
risk
and
perfo
rman
ce?
3.5
Orio
n ar
e co
ntin
uing
to u
pdat
e th
eir t
echn
ical
spe
cific
atio
n in
line
w
ith m
oder
n de
velo
pmen
ts a
nd in
dust
ry b
est p
ract
ice
expe
rienc
es.
They
hav
e a
focu
s to
sta
ndar
dise
equ
ipm
ent w
here
pos
sibl
e an
d to
ph
ase
out e
quip
men
t with
kno
w is
sues
or r
isks
.
Hav
ing
docu
men
ted
proc
ess(
es) w
hich
en
sure
the
asse
t man
agem
ent p
lan(
s)
are
impl
emen
ted
in a
ccor
danc
e w
ith
any
spec
ified
con
ditio
ns, i
n a
man
ner
cons
iste
nt w
ith th
e as
set m
anag
emen
t po
licy,
stra
tegy
and
obj
ectiv
es a
nd in
su
ch a
way
that
cos
t, ris
k an
d as
set
syst
em p
erfo
rman
ce a
re a
ppro
pria
tely
co
ntro
lled
is c
ritic
al. T
hey
are
an
esse
ntia
l par
t of t
urni
ng in
tent
ion
into
ac
tion
(e.g
., as
requ
ired
by
PAS
55 s
4.5
.1).
Asse
t man
ager
s, o
pera
tions
man
ager
s,
mai
nten
ance
man
ager
s an
d pr
ojec
t m
anag
ers
from
oth
er im
pact
ed a
reas
of
the
busi
ness
Doc
umen
ted
proc
edur
e fo
r rev
iew
. D
ocum
ente
d pr
oced
ure
for a
udit
of
proc
ess
deliv
ery.
Rec
ords
of p
revi
ous
audi
ts, i
mpr
ovem
ent a
ctio
ns a
nd
docu
men
ted
confi
rmat
ion
that
act
ions
ha
ve b
een
carri
ed o
ut.
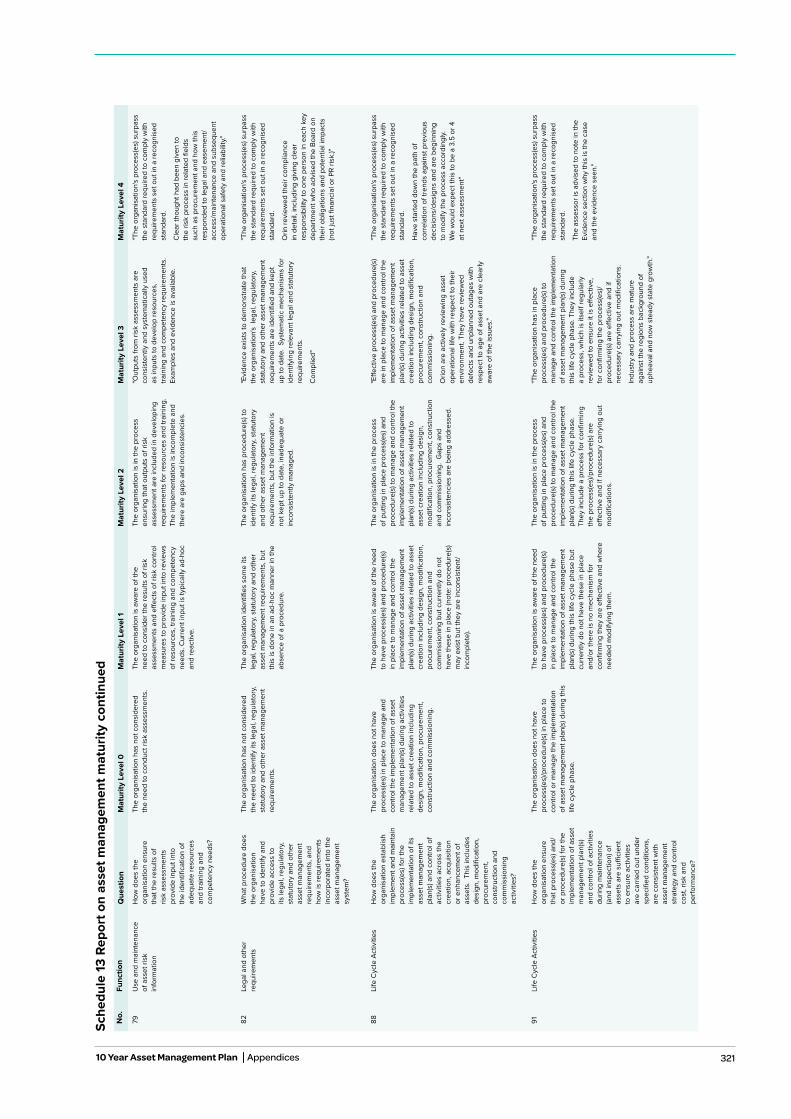
321
Sche
dule
13 R
epor
t on
asse
t man
agem
ent m
atur
ity c
ontin
ued
No.
Func
tion
Que
stio
nM
atur
ity L
evel
0M
atur
ity L
evel
1M
atur
ity L
evel
2M
atur
ity L
evel
3M
atur
ity L
evel
4
79U
se a
nd m
aint
enan
ce
of a
sset
risk
in
form
atio
n
How
doe
s th
e or
gani
satio
n en
sure
th
at th
e re
sults
of
risk
asse
ssm
ents
pr
ovid
e in
put i
nto
the
iden
tifica
tion
of
adeq
uate
reso
urce
s an
d tra
inin
g an
d co
mpe
tenc
y ne
eds?
The
orga
nisa
tion
has
not c
onsi
dere
d
the
need
to c
ondu
ct ri
sk a
sses
smen
ts.
The
orga
nisa
tion
is a
war
e of
the
need
to c
onsi
der t
he re
sults
of r
isk
asse
ssm
ents
and
effe
cts
of ri
sk c
ontro
l m
easu
res
to p
rovi
de in
put i
nto
revi
ews
of re
sour
ces,
trai
ning
and
com
pete
ncy
need
s. C
urre
nt in
put i
s ty
pica
lly a
d-ho
c an
d re
activ
e.
The
orga
nisa
tion
is in
the
proc
ess
ensu
ring
that
out
puts
of r
isk
asse
ssm
ent a
re in
clud
ed in
dev
elop
ing
requ
irem
ents
for r
esou
rces
and
trai
ning
. Th
e im
plem
enta
tion
is in
com
plet
e an
d th
ere
are
gaps
and
inco
nsis
tenc
ies.
"Out
puts
from
risk
ass
essm
ents
are
co
nsis
tent
ly a
nd s
yste
mat
ical
ly u
sed
as in
puts
to d
evel
op re
sour
ces,
tra
inin
g an
d co
mpe
tenc
y re
quire
men
ts.
Exam
ples
and
evi
denc
e is
ava
ilabl
e.
"The
org
anis
atio
n's
proc
ess(
es) s
urpa
ss
the
stan
dard
requ
ired
to c
ompl
y w
ith
requ
irem
ents
set
out
in a
reco
gnis
ed
stan
dard
.
Cle
ar th
ough
t had
bee
n gi
ven
to
the
risk
proc
ess
in re
late
d fie
lds
such
as
proc
urem
ent a
nd h
ow th
is
resp
onde
d to
lega
l and
eas
emen
t/ac
cess
/mai
nten
ance
and
sub
sequ
ent
oper
atio
nal s
afet
y an
d re
liabi
lity."
82Le
gal a
nd o
ther
re
quire
men
tsW
hat p
roce
dure
doe
s th
e or
gani
satio
n ha
ve to
iden
tify
and
prov
ide
acce
ss to
its
lega
l, re
gula
tory
, st
atut
ory
and
othe
r as
set m
anag
emen
t re
quire
men
ts, a
nd
how
is re
quire
men
ts
inco
rpor
ated
into
the
asse
t man
agem
ent
syst
em?
The
orga
nisa
tion
has
not c
onsi
dere
d th
e ne
ed to
iden
tify
its le
gal,
regu
lato
ry,
stat
utor
y an
d ot
her a
sset
man
agem
ent
requ
irem
ents
.
The
orga
nisa
tion
iden
tifies
som
e its
le
gal,
regu
lato
ry, s
tatu
tory
and
oth
er
asse
t man
agem
ent r
equi
rem
ents
, but
th
is is
don
e in
an
ad-h
oc m
anne
r in
the
abse
nce
of a
pro
cedu
re.
The
orga
nisa
tion
has
proc
edur
e(s)
to
iden
tify
its le
gal,
regu
lato
ry, s
tatu
tory
an
d ot
her a
sset
man
agem
ent
requ
irem
ents
, but
the
info
rmat
ion
is
not k
ept u
p to
dat
e, in
adeq
uate
or
inco
nsis
tent
ly m
anag
ed.
"Evi
denc
e ex
ists
to d
emon
stra
te th
at
the
orga
nisa
tion'
s le
gal,
regu
lato
ry,
stat
utor
y an
d ot
her a
sset
man
agem
ent
requ
irem
ents
are
iden
tified
and
kep
t up
to d
ate.
Sys
tem
atic
mec
hani
sms
for
iden
tifyi
ng re
leva
nt le
gal a
nd s
tatu
tory
re
quire
men
ts.
Com
plie
d"
"The
org
anis
atio
n's
proc
ess(
es) s
urpa
ss
the
stan
dard
requ
ired
to c
ompl
y w
ith
requ
irem
ents
set
out
in a
reco
gnis
ed
stan
dard
.
Orin
revi
ewed
thei
r com
plia
nce
in d
etai
l, in
clud
ing
givi
ng c
lear
re
spon
sibi
lity
to o
ne p
erso
n in
eac
h ke
y de
partm
ent w
ho a
dvis
ed th
e Bo
ard
on
thei
r obl
igat
ions
and
pot
entia
l im
pact
s (n
ot ju
st fi
nanc
ial o
r PR
risk.
)"
88Li
fe C
ycle
Act
iviti
esH
ow d
oes
the
orga
nisa
tion
esta
blis
h im
plem
ent a
nd m
aint
ain
proc
ess(
es) f
or th
e im
plem
enta
tion
of it
s as
set m
anag
emen
t pl
an(s
) and
con
trol o
f ac
tiviti
es a
cros
s th
e cr
eatio
n, a
cqui
sitio
n or
enh
ance
men
t of
asse
ts.
This
incl
udes
de
sign
, mod
ifica
tion,
pr
ocur
emen
t, co
nstru
ctio
n an
d co
mm
issi
onin
g ac
tiviti
es?
The
orga
nisa
tion
does
not
hav
e pr
oces
s(es
) in
plac
e to
man
age
and
cont
rol t
he im
plem
enta
tion
of a
sset
m
anag
emen
t pla
n(s)
dur
ing
activ
ities
re
late
d to
ass
et c
reat
ion
incl
udin
g de
sign
, mod
ifica
tion,
pro
cure
men
t, co
nstru
ctio
n an
d co
mm
issi
onin
g.
The
orga
nisa
tion
is a
war
e of
the
need
to
hav
e pr
oces
s(es
) and
pro
cedu
re(s
) in
pla
ce to
man
age
and
cont
rol t
he
impl
emen
tatio
n of
ass
et m
anag
emen
t pl
an(s
) dur
ing
activ
ities
rela
ted
to a
sset
cr
eatio
n in
clud
ing
desi
gn, m
odifi
catio
n,
proc
urem
ent,
cons
truct
ion
and
com
mis
sion
ing
but c
urre
ntly
do
not
have
thes
e in
pla
ce (n
ote:
pro
cedu
re(s
) m
ay e
xist
but
they
are
inco
nsis
tent
/in
com
plet
e).
The
orga
nisa
tion
is in
the
proc
ess
of p
uttin
g in
pla
ce p
roce
ss(e
s) a
nd
proc
edur
e(s)
to m
anag
e an
d co
ntro
l the
im
plem
enta
tion
of a
sset
man
agem
ent
plan
(s) d
urin
g ac
tiviti
es re
late
d to
as
set c
reat
ion
incl
udin
g de
sign
, m
odifi
catio
n, p
rocu
rem
ent,
cons
truct
ion
and
com
mis
sion
ing.
Gap
s an
d in
cons
iste
ncie
s ar
e be
ing
addr
esse
d.
"Effe
ctiv
e pr
oces
s(es
) and
pro
cedu
re(s
) ar
e in
pla
ce to
man
age
and
cont
rol t
he
impl
emen
tatio
n of
ass
et m
anag
emen
t pl
an(s
) dur
ing
activ
ities
rela
ted
to a
sset
cr
eatio
n in
clud
ing
desi
gn, m
odifi
catio
n,
proc
urem
ent,
cons
truct
ion
and
com
mis
sion
ing.
Orio
n ar
e ac
tivel
y re
view
ing
asse
t op
erat
iona
l life
with
resp
ect t
o th
eir
envi
ronm
ent.
They
hav
e re
view
ed
defe
cts
and
unpl
anne
d ou
tage
s w
ith
resp
ect t
o ag
e of
ass
et a
nd a
re c
lear
ly
awar
e of
the
issu
es."
"The
org
anis
atio
n's
proc
ess(
es) s
urpa
ss
the
stan
dard
requ
ired
to c
ompl
y w
ith
requ
irem
ents
set
out
in a
reco
gnis
ed
stan
dard
.
Hav
e st
arte
d do
wn
the
path
of
corre
latio
n of
tren
ds a
gain
st p
revi
ous
deci
sion
s/de
sign
s an
d ar
e be
ginn
ing
to
mod
ify th
e pr
oces
s ac
cord
ingl
y.
We
wou
ld e
xpec
t thi
s to
be
a 3.
5 or
4
at n
ext a
sses
smen
t"
91Li
fe C
ycle
Act
iviti
esH
ow d
oes
the
orga
nisa
tion
ensu
re
that
pro
cess
(es)
and
/or
pro
cedu
re(s
) for
the
impl
emen
tatio
n of
ass
et
man
agem
ent p
lan(
s)
and
cont
rol o
f act
iviti
es
durin
g m
aint
enan
ce
(and
insp
ectio
n) o
f as
sets
are
suffi
cien
t to
ens
ure
activ
ities
ar
e ca
rried
out
und
er
spec
ified
con
ditio
ns,
are
cons
iste
nt w
ith
asse
t man
agem
ent
stra
tegy
and
con
trol
cost
, ris
k an
d pe
rform
ance
?
The
orga
nisa
tion
does
not
hav
e pr
oces
s(es
)/pro
cedu
re(s
) in
plac
e to
co
ntro
l or m
anag
e th
e im
plem
enta
tion
of
ass
et m
anag
emen
t pla
n(s)
dur
ing
this
lif
e cy
cle
phas
e.
The
orga
nisa
tion
is a
war
e of
the
need
to
hav
e pr
oces
s(es
) and
pro
cedu
re(s
) in
pla
ce to
man
age
and
cont
rol t
he
impl
emen
tatio
n of
ass
et m
anag
emen
t pl
an(s
) dur
ing
this
life
cyc
le p
hase
but
cu
rrent
ly d
o no
t hav
e th
ese
in p
lace
an
d/or
ther
e is
no
mec
hani
sm fo
r co
nfirm
ing
they
are
effe
ctiv
e an
d w
here
ne
eded
mod
ifyin
g th
em.
The
orga
nisa
tion
is in
the
proc
ess
of p
uttin
g in
pla
ce p
roce
ss(e
s) a
nd
proc
edur
e(s)
to m
anag
e an
d co
ntro
l the
im
plem
enta
tion
of a
sset
man
agem
ent
plan
(s) d
urin
g th
is li
fe c
ycle
pha
se.
They
incl
ude
a pr
oces
s fo
r con
firm
ing
the
proc
ess(
es)/p
roce
dure
(s) a
re
effec
tive
and
if ne
cess
ary
carry
ing
out
mod
ifica
tions
.
"The
org
anis
atio
n ha
s in
pla
ce
proc
ess(
es) a
nd p
roce
dure
(s) t
o m
anag
e an
d co
ntro
l the
impl
emen
tatio
n of
ass
et m
anag
emen
t pla
n(s)
dur
ing
this
life
cyc
le p
hase
. The
y in
clud
e a
proc
ess,
whi
ch is
itse
lf re
gula
rly
revi
ewed
to e
nsur
e it
is e
ffect
ive,
fo
r con
firm
ing
the
proc
ess(
es)/
proc
edur
e(s)
are
effe
ctiv
e an
d if
nece
ssar
y ca
rryin
g ou
t mod
ifica
tions
.
Indu
stry
and
pro
cess
are
mat
ure
agai
nst t
he re
gion
s ba
ckgr
ound
of
uphe
aval
and
now
ste
ady
stat
e gr
owth
."
"The
org
anis
atio
n's
proc
ess(
es) s
urpa
ss
the
stan
dard
requ
ired
to c
ompl
y w
ith
requ
irem
ents
set
out
in a
reco
gnis
ed
stan
dard
.
The
asse
ssor
is a
dvis
ed to
not
e in
the
Evid
ence
sec
tion
why
this
is th
e ca
se
and
the
evid
ence
see
n."
10 Year Asset Management Plan Appendices
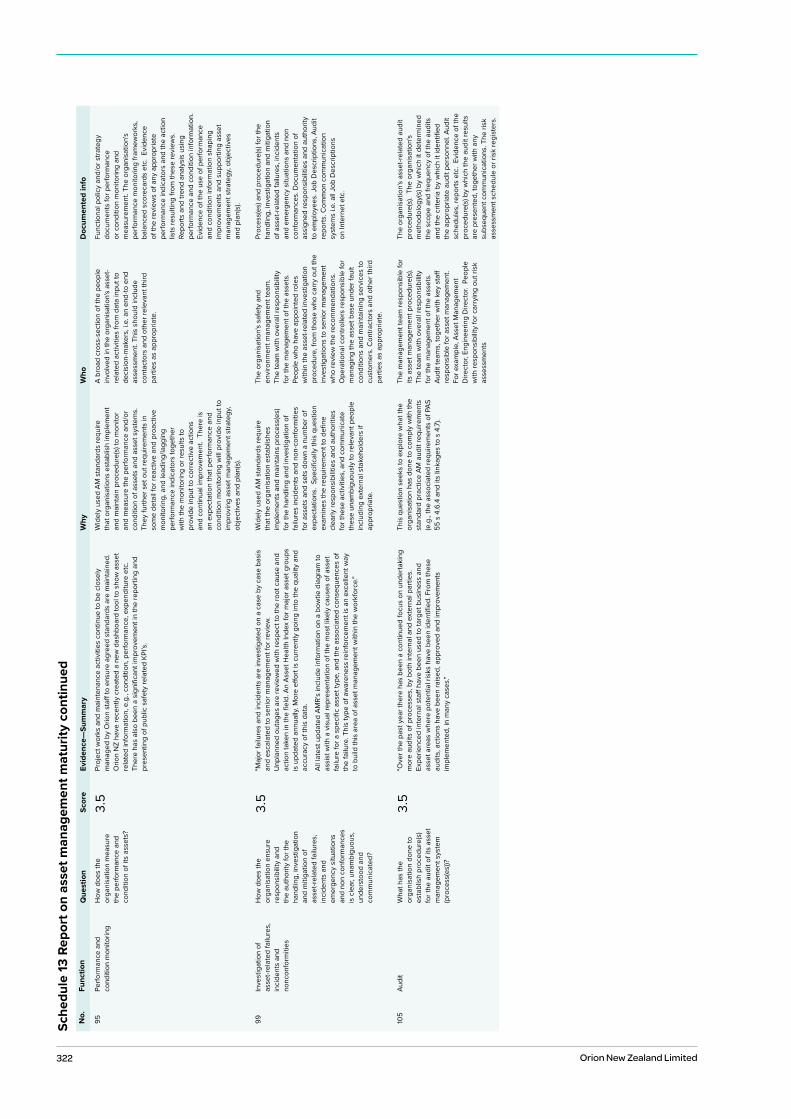
322 Orion New Zealand Limited
Sche
dule
13 R
epor
t on
asse
t man
agem
ent m
atur
ity c
ontin
ued
No.
Func
tion
Que
stio
nSc
ore
Evid
ence
—Su
mm
ary
Why
Who
Doc
umen
ted
info
95Pe
rform
ance
and
co
nditi
on m
onito
ring
How
doe
s th
e or
gani
satio
n m
easu
re
the
perfo
rman
ce a
nd
cond
ition
of i
ts a
sset
s?
3.5
Proj
ect w
orks
and
mai
nten
ance
act
iviti
es c
ontin
ue to
be
clos
ely
man
aged
by
Orio
n st
aff to
ens
ure
agre
ed s
tand
ards
are
mai
ntai
ned.
O
rion
NZ
have
rece
ntly
cre
ated
a n
ew d
ashb
oard
tool
to s
how
ass
et
rela
ted
info
rmat
ion,
e.g
., co
nditi
on, p
erfo
rman
ce, e
xpen
ditu
re e
tc.
Ther
e ha
s al
so b
een
a si
gnifi
cant
impr
ovem
ent i
n th
e re
porti
ng a
nd
pres
entin
g of
pub
lic s
afet
y re
late
d KP
I’s.
Wid
ely
used
AM
sta
ndar
ds re
quire
th
at o
rgan
isat
ions
est
ablis
h im
plem
ent
and
mai
ntai
n pr
oced
ure(
s) to
mon
itor
and
mea
sure
the
perfo
rman
ce a
nd/o
r co
nditi
on o
f ass
ets
and
asse
t sys
tem
s.
They
furth
er s
et o
ut re
quire
men
ts in
so
me
deta
il fo
r rea
ctiv
e an
d pr
oact
ive
mon
itorin
g, a
nd le
adin
g/la
ggin
g pe
rform
ance
indi
cato
rs to
geth
er
with
the
mon
itorin
g or
resu
lts to
pr
ovid
e in
put t
o co
rrect
ive
actio
ns
and
cont
inua
l im
prov
emen
t. T
here
is
an e
xpec
tatio
n th
at p
erfo
rman
ce a
nd
cond
ition
mon
itorin
g w
ill p
rovi
de in
put t
o im
prov
ing
asse
t man
agem
ent s
trate
gy,
obje
ctiv
es a
nd p
lan(
s).
A br
oad
cros
s-se
ctio
n of
the
peop
le
invo
lved
in th
e or
gani
satio
n's
asse
t-re
late
d ac
tiviti
es fr
om d
ata
inpu
t to
deci
sion
-mak
ers,
i.e.
an
end-
to e
nd
asse
ssm
ent.
This
sho
uld
incl
ude
cont
acto
rs a
nd o
ther
rele
vant
third
pa
rties
as
appr
opria
te.
Func
tiona
l pol
icy
and/
or s
trate
gy
docu
men
ts fo
r per
form
ance
or
con
ditio
n m
onito
ring
and
mea
sure
men
t. Th
e or
gani
satio
n's
perfo
rman
ce m
onito
ring
fram
ewor
ks,
bala
nced
sco
reca
rds
etc.
Evi
denc
e of
the
revi
ews
of a
ny a
ppro
pria
te
perfo
rman
ce in
dica
tors
and
the
actio
n lis
ts re
sulti
ng fr
om th
ese
revi
ews.
Re
ports
and
tren
d an
alys
is u
sing
pe
rform
ance
and
con
ditio
n in
form
atio
n.
Evid
ence
of t
he u
se o
f per
form
ance
an
d co
nditi
on in
form
atio
n sh
apin
g im
prov
emen
ts a
nd s
uppo
rting
ass
et
man
agem
ent s
trate
gy, o
bjec
tives
an
d pl
an(s
).
99In
vest
igat
ion
of
asse
t-rel
ated
failu
res,
in
cide
nts
and
nonc
onfo
rmiti
es
How
doe
s th
e or
gani
satio
n en
sure
re
spon
sibi
lity
and
the
auth
ority
for t
he
hand
ling,
inve
stig
atio
n an
d m
itiga
tion
of
asse
t-rel
ated
failu
res,
in
cide
nts
and
emer
genc
y si
tuat
ions
an
d no
n co
nfor
man
ces
is c
lear
, una
mbi
guou
s,
unde
rsto
od a
nd
com
mun
icat
ed?
3.5
"Maj
or fa
ilure
s an
d in
cide
nts
are
inve
stig
ated
on
a ca
se b
y ca
se b
asis
an
d es
cala
ted
to s
enio
r man
agem
ent f
or re
view
. U
npla
nned
out
ages
are
revi
ewed
with
resp
ect t
o th
e ro
ot c
ause
and
ac
tion
take
n in
the
field
. An
Asse
t Hea
lth In
dex
for m
ajor
ass
et g
roup
s is
upd
ated
ann
ually
. Mor
e eff
ort i
s cu
rrent
ly g
oing
into
the
qual
ity a
nd
accu
racy
of t
his
data
.
All l
ates
t upd
ated
AM
R’s
incl
ude
info
rmat
ion
on a
bow
tie d
iagr
am to
as
sist
with
a v
isua
l rep
rese
ntat
ion
of th
e m
ost l
ikel
y ca
uses
of a
sset
fa
ilure
for a
spe
cific
ass
et ty
pe, a
nd th
e as
soci
ated
con
sequ
ence
s of
th
e fa
ilure
. Thi
s ty
pe o
f aw
aren
ess
rein
forc
emen
t is
an e
xcel
lent
way
to
bui
ld th
is a
rea
of a
sset
man
agem
ent w
ithin
the
wor
kfor
ce."
Wid
ely
used
AM
sta
ndar
ds re
quire
th
at th
e or
gani
satio
n es
tabl
ishe
s im
plem
ents
and
mai
ntai
ns p
roce
ss(e
s)
for t
he h
andl
ing
and
inve
stig
atio
n of
fa
ilure
s in
cide
nts
and
non-
conf
orm
ities
fo
r ass
ets
and
sets
dow
n a
num
ber o
f ex
pect
atio
ns.
Spec
ifica
lly th
is q
uest
ion
exam
ines
the
requ
irem
ent t
o de
fine
clea
rly re
spon
sibi
litie
s an
d au
thor
ities
fo
r the
se a
ctiv
ities
, and
com
mun
icat
e th
ese
unam
bigu
ousl
y to
rele
vant
peo
ple
incl
udin
g ex
tern
al s
take
hold
ers
if ap
prop
riate
.
The
orga
nisa
tion'
s sa
fety
and
en
viro
nmen
t man
agem
ent t
eam
. Th
e te
am w
ith o
vera
ll re
spon
sibi
lity
for t
he m
anag
emen
t of t
he a
sset
s.
Peop
le w
ho h
ave
appo
inte
d ro
les
with
in th
e as
set-r
elat
ed in
vest
igat
ion
proc
edur
e, fr
om th
ose
who
car
ry o
ut th
e in
vest
igat
ions
to s
enio
r man
agem
ent
who
revi
ew th
e re
com
men
datio
ns.
Ope
ratio
nal c
ontro
llers
resp
onsi
ble
for
man
agin
g th
e as
set b
ase
unde
r fau
lt co
nditi
ons
and
mai
ntai
ning
ser
vice
s to
cu
stom
ers.
Con
tract
ors
and
othe
r thi
rd
parti
es a
s ap
prop
riate
.
Proc
ess(
es) a
nd p
roce
dure
(s) f
or th
e ha
ndlin
g, in
vest
igat
ion
and
miti
gatio
n of
ass
et-re
late
d fa
ilure
s, in
cide
nts
and
emer
genc
y si
tuat
ions
and
non
co
nfor
man
ces.
Doc
umen
tatio
n of
as
sign
ed re
spon
sibi
litie
s an
d au
thor
ity
to e
mpl
oyee
s. J
ob D
escr
iptio
ns, A
udit
repo
rts. C
omm
on c
omm
unic
atio
n sy
stem
s i.e
. all
Job
Des
crip
tions
on
Inte
rnet
etc
.
105
Audi
tW
hat h
as th
e or
gani
satio
n do
ne to
es
tabl
ish
proc
edur
e(s)
fo
r the
aud
it of
its
asse
t m
anag
emen
t sys
tem
(p
roce
ss(e
s))?
3.5
"Ove
r the
pas
t yea
r the
re h
as b
een
a co
ntin
ued
focu
s on
und
erta
king
m
ore
audi
ts o
f pro
cess
es, b
y bo
th in
tern
al a
nd e
xter
nal p
artie
s.
Expe
rienc
ed in
tern
al s
taff
have
bee
n us
ed to
targ
et b
usin
ess
and
asse
t are
as w
here
pot
entia
l ris
ks h
ave
been
iden
tified
. Fro
m th
ese
audi
ts, a
ctio
ns h
ave
been
rais
ed, a
ppro
ved
and
impr
ovem
ents
im
plem
ente
d, in
man
y ca
ses."
This
que
stio
n se
eks
to e
xplo
re w
hat t
he
orga
nisa
tion
has
done
to c
ompl
y w
ith th
e st
anda
rd p
ract
ice
AM a
udit
requ
irem
ents
(e
.g.,
the
asso
ciat
ed re
quire
men
ts o
f PAS
55
s 4
.6.4
and
its
linka
ges
to s
4.7
).
The
man
agem
ent t
eam
resp
onsi
ble
for
its a
sset
man
agem
ent p
roce
dure
(s).
Th
e te
am w
ith o
vera
ll re
spon
sibi
lity
for t
he m
anag
emen
t of t
he a
sset
s.
Audi
t tea
ms,
toge
ther
with
key
sta
ff re
spon
sibl
e fo
r ass
et m
anag
emen
t.
For e
xam
ple,
Ass
et M
anag
emen
t D
irect
or, E
ngin
eerin
g D
irect
or.
Peop
le
with
resp
onsi
bilit
y fo
r car
ryin
g ou
t ris
k as
sess
men
ts
The
orga
nisa
tion'
s as
set-r
elat
ed a
udit
proc
edur
e(s)
. Th
e or
gani
satio
n's
met
hodo
logy
(s) b
y w
hich
it d
eter
min
ed
the
scop
e an
d fre
quen
cy o
f the
aud
its
and
the
crite
ria b
y w
hich
it id
entifi
ed
the
appr
opria
te a
udit
pers
onne
l. Au
dit
sche
dule
s, re
ports
etc
. Ev
iden
ce o
f the
pr
oced
ure(
s) b
y w
hich
the
audi
t res
ults
ar
e pr
esen
ted,
toge
ther
with
any
su
bseq
uent
com
mun
icat
ions
. The
risk
as
sess
men
t sch
edul
e or
risk
regi
ster
s.
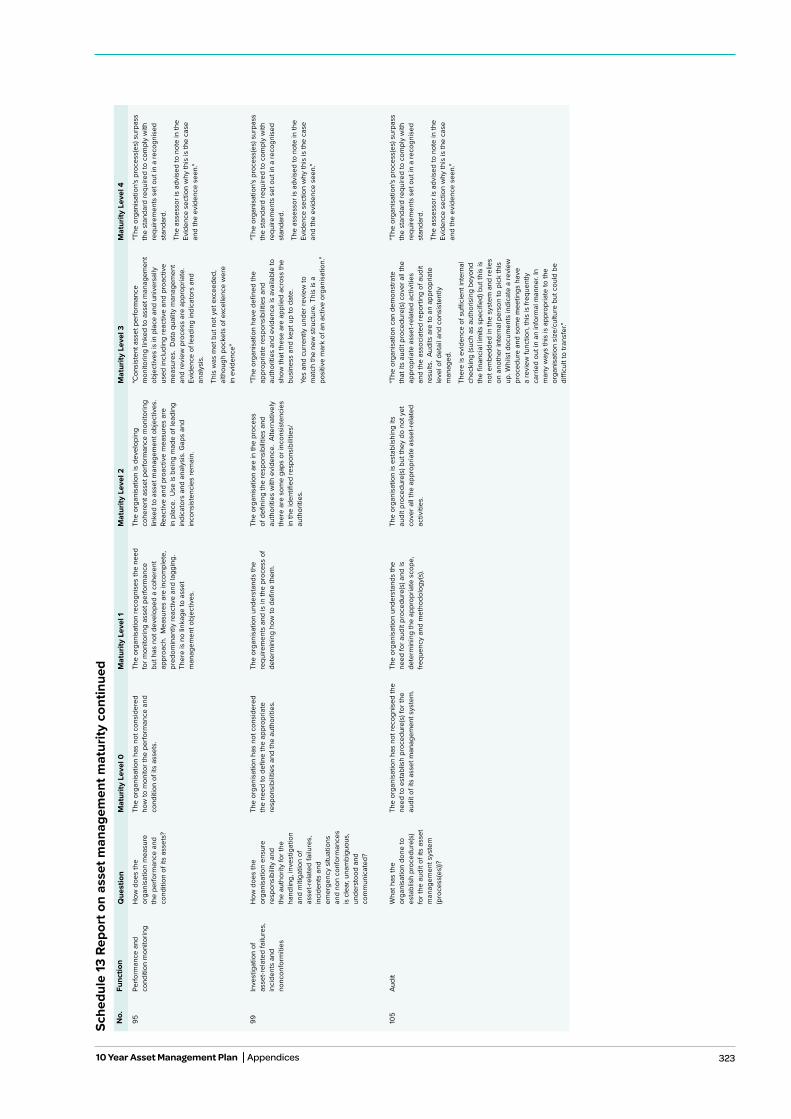
323
Sche
dule
13 R
epor
t on
asse
t man
agem
ent m
atur
ity c
ontin
ued
No.
Func
tion
Que
stio
nM
atur
ity L
evel
0M
atur
ity L
evel
1M
atur
ity L
evel
2M
atur
ity L
evel
3M
atur
ity L
evel
4
95Pe
rform
ance
and
co
nditi
on m
onito
ring
How
doe
s th
e or
gani
satio
n m
easu
re
the
perfo
rman
ce a
nd
cond
ition
of i
ts a
sset
s?
The
orga
nisa
tion
has
not c
onsi
dere
d ho
w to
mon
itor t
he p
erfo
rman
ce a
nd
cond
ition
of i
ts a
sset
s.
The
orga
nisa
tion
reco
gnis
es th
e ne
ed
for m
onito
ring
asse
t per
form
ance
bu
t has
not
dev
elop
ed a
coh
eren
t ap
proa
ch.
Mea
sure
s ar
e in
com
plet
e,
pred
omin
antly
reac
tive
and
lagg
ing.
Th
ere
is n
o lin
kage
to a
sset
m
anag
emen
t obj
ectiv
es.
The
orga
nisa
tion
is d
evel
opin
g co
here
nt a
sset
per
form
ance
mon
itorin
g lin
ked
to a
sset
man
agem
ent o
bjec
tives
. Re
activ
e an
d pr
oact
ive
mea
sure
s ar
e in
pla
ce.
Use
is b
eing
mad
e of
lead
ing
indi
cato
rs a
nd a
naly
sis.
Gap
s an
d in
cons
iste
ncie
s re
mai
n.
"Con
sist
ent a
sset
per
form
ance
m
onito
ring
linke
d to
ass
et m
anag
emen
t ob
ject
ives
is in
pla
ce a
nd u
nive
rsal
ly
used
incl
udin
g re
activ
e an
d pr
oact
ive
mea
sure
s. D
ata
qual
ity m
anag
emen
t an
d re
view
pro
cess
are
app
ropr
iate
. Ev
iden
ce o
f lea
ding
indi
cato
rs a
nd
anal
ysis
.
This
was
met
but
not
yet
exc
eede
d,
alth
ough
poc
kets
of e
xcel
lenc
e w
ere
in e
vide
nce"
"The
org
anis
atio
n's
proc
ess(
es) s
urpa
ss
the
stan
dard
requ
ired
to c
ompl
y w
ith
requ
irem
ents
set
out
in a
reco
gnis
ed
stan
dard
.
The
asse
ssor
is a
dvis
ed to
not
e in
the
Evid
ence
sec
tion
why
this
is th
e ca
se
and
the
evid
ence
see
n."
99In
vest
igat
ion
of
asse
t-rel
ated
failu
res,
in
cide
nts
and
nonc
onfo
rmiti
es
How
doe
s th
e or
gani
satio
n en
sure
re
spon
sibi
lity
and
the
auth
ority
for t
he
hand
ling,
inve
stig
atio
n an
d m
itiga
tion
of
asse
t-rel
ated
failu
res,
in
cide
nts
and
emer
genc
y si
tuat
ions
an
d no
n co
nfor
man
ces
is c
lear
, una
mbi
guou
s,
unde
rsto
od a
nd
com
mun
icat
ed?
The
orga
nisa
tion
has
not c
onsi
dere
d th
e ne
ed to
defi
ne th
e ap
prop
riate
re
spon
sibi
litie
s an
d th
e au
thor
ities
.
The
orga
nisa
tion
unde
rsta
nds
the
requ
irem
ents
and
is in
the
proc
ess
of
dete
rmin
ing
how
to d
efine
them
.
The
orga
nisa
tion
are
in th
e pr
oces
s of
defi
ning
the
resp
onsi
bilit
ies
and
auth
oriti
es w
ith e
vide
nce.
Alte
rnat
ivel
y th
ere
are
som
e ga
ps o
r inc
onsi
sten
cies
in
the
iden
tified
resp
onsi
bilit
ies/
auth
oriti
es.
"The
org
anis
atio
n ha
ve d
efine
d th
e ap
prop
riate
resp
onsi
bilit
ies
and
auth
oriti
es a
nd e
vide
nce
is a
vaila
ble
to
show
that
thes
e ar
e ap
plie
d ac
ross
the
busi
ness
and
kep
t up
to d
ate.
Yes
and
curre
ntly
und
er re
view
to
mat
ch th
e ne
w s
truct
ure.
Thi
s is
a
posi
tive
mar
k of
an
activ
e or
gani
satio
n."
"The
org
anis
atio
n's
proc
ess(
es) s
urpa
ss
the
stan
dard
requ
ired
to c
ompl
y w
ith
requ
irem
ents
set
out
in a
reco
gnis
ed
stan
dard
.
The
asse
ssor
is a
dvis
ed to
not
e in
the
Evid
ence
sec
tion
why
this
is th
e ca
se
and
the
evid
ence
see
n."
105
Audi
tW
hat h
as th
e or
gani
satio
n do
ne to
es
tabl
ish
proc
edur
e(s)
fo
r the
aud
it of
its
asse
t m
anag
emen
t sys
tem
(p
roce
ss(e
s))?
The
orga
nisa
tion
has
not r
ecog
nise
d th
e ne
ed to
est
ablis
h pr
oced
ure(
s) fo
r the
au
dit o
f its
ass
et m
anag
emen
t sys
tem
.
The
orga
nisa
tion
unde
rsta
nds
the
need
for a
udit
proc
edur
e(s)
and
is
dete
rmin
ing
the
appr
opria
te s
cope
, fre
quen
cy a
nd m
etho
dolo
gy(s
).
The
orga
nisa
tion
is e
stab
lishi
ng it
s au
dit p
roce
dure
(s) b
ut th
ey d
o no
t yet
co
ver a
ll th
e ap
prop
riate
ass
et-re
late
d ac
tiviti
es.
"The
org
anis
atio
n ca
n de
mon
stra
te
that
its
audi
t pro
cedu
re(s
) cov
er a
ll th
e ap
prop
riate
ass
et-re
late
d ac
tiviti
es
and
the
asso
ciat
ed re
porti
ng o
f aud
it re
sults
. Au
dits
are
to a
n ap
prop
riate
le
vel o
f det
ail a
nd c
onsi
sten
tly
man
aged
.
Ther
e is
evi
denc
e of
suffi
cien
t int
erna
l ch
ecki
ng (s
uch
as a
utho
risin
g be
yond
th
e fin
anci
al li
mits
spe
cifie
d) b
ut th
is is
no
t em
bedd
ed in
the
syst
em a
nd re
lies
on a
noth
er in
tern
al p
erso
n to
pic
k th
is
up. W
hils
t doc
umen
ts in
dica
te a
revi
ew
proc
edur
e an
d so
me
mee
tings
hav
e a
revi
ew fu
nctio
n, th
is is
freq
uent
ly
carri
ed o
ut in
an
info
rmal
man
ner.
In
man
y w
ays
this
is a
ppro
pria
te to
the
orga
nisa
tion
size
/cul
ture
but
cou
ld b
e di
fficu
lt to
tran
sfer
."
"The
org
anis
atio
n's
proc
ess(
es) s
urpa
ss
the
stan
dard
requ
ired
to c
ompl
y w
ith
requ
irem
ents
set
out
in a
reco
gnis
ed
stan
dard
.
The
asse
ssor
is a
dvis
ed to
not
e in
the
Evid
ence
sec
tion
why
this
is th
e ca
se
and
the
evid
ence
see
n."
10 Year Asset Management Plan Appendices
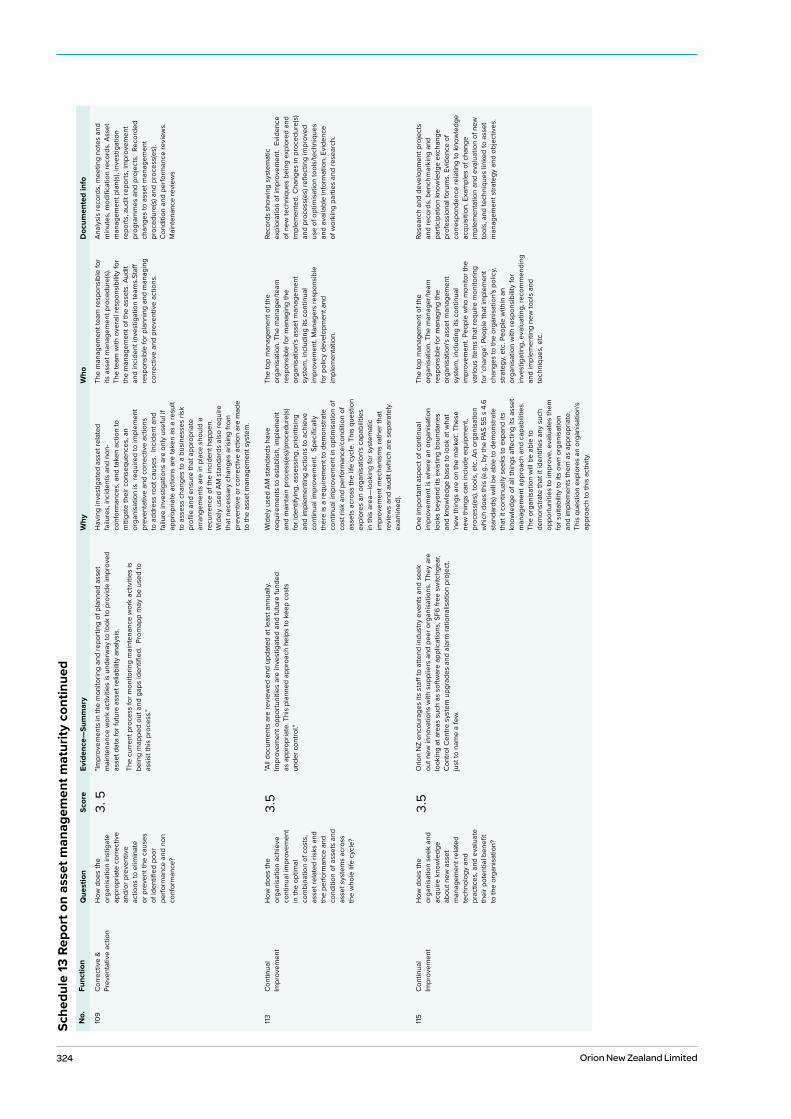
324 Orion New Zealand Limited
Sche
dule
13 R
epor
t on
asse
t man
agem
ent m
atur
ity c
ontin
ued
No.
Func
tion
Que
stio
nSc
ore
Evid
ence
—Su
mm
ary
Why
Who
Doc
umen
ted
info
109
Cor
rect
ive
& Pr
even
tativ
e ac
tion
How
doe
s th
e or
gani
satio
n in
stig
ate
appr
opria
te c
orre
ctiv
e an
d/or
pre
vent
ive
actio
ns to
elim
inat
e or
pre
vent
the
caus
es
of id
entifi
ed p
oor
perfo
rman
ce a
nd n
on
conf
orm
ance
?
3. 5
"Impr
ovem
ents
in th
e m
onito
ring
and
repo
rting
of p
lann
ed a
sset
m
aint
enan
ce w
ork
activ
ities
is u
nder
way
to lo
ok to
pro
vide
impr
oved
as
set d
ata
for f
utur
e as
set r
elia
bilit
y an
alys
is.
The
curre
nt p
roce
ss fo
r mon
itorin
g m
aint
enan
ce w
ork
activ
ities
is
bein
g m
appe
d ou
t and
gap
s id
entifi
ed.
Prom
app
may
be
used
to
assi
st th
is p
roce
ss."
Hav
ing
inve
stig
ated
ass
et re
late
d fa
ilure
s, in
cide
nts
and
non-
conf
orm
ance
s, a
nd ta
ken
actio
n to
m
itiga
te th
eir c
onse
quen
ces,
an
orga
nisa
tion
is r
equi
red
to im
plem
ent
prev
enta
tive
and
corre
ctiv
e ac
tions
to
add
ress
root
cau
ses.
Inc
iden
t and
fa
ilure
inve
stig
atio
ns a
re o
nly
usef
ul if
ap
prop
riate
act
ions
are
take
n as
a re
sult
to a
sses
s ch
ange
s to
a b
usin
esse
s ris
k pr
ofile
and
ens
ure
that
app
ropr
iate
ar
rang
emen
ts a
re in
pla
ce s
houl
d a
recu
rrenc
e of
the
inci
dent
hap
pen.
W
idel
y us
ed A
M s
tand
ards
als
o re
quire
th
at n
eces
sary
cha
nges
aris
ing
from
pr
even
tive
or c
orre
ctiv
e ac
tion
are
mad
e to
the
asse
t man
agem
ent s
yste
m.
The
man
agem
ent t
eam
resp
onsi
ble
for
its a
sset
man
agem
ent p
roce
dure
(s).
Th
e te
am w
ith o
vera
ll re
spon
sibi
lity
for
the
man
agem
ent o
f the
ass
ets.
Aud
it an
d in
cide
nt in
vest
igat
ion
team
s.St
aff
resp
onsi
ble
for p
lann
ing
and
man
agin
g co
rrect
ive
and
prev
entiv
e ac
tions
.
Anal
ysis
reco
rds,
mee
ting
note
s an
d m
inut
es, m
odifi
catio
n re
cord
s. A
sset
m
anag
emen
t pla
n(s)
, inv
estig
atio
n re
ports
, aud
it re
ports
, im
prov
emen
t pr
ogra
mm
es a
nd p
roje
cts.
Rec
orde
d ch
ange
s to
ass
et m
anag
emen
t pr
oced
ure(
s) a
nd p
roce
ss(e
s).
Con
ditio
n an
d pe
rform
ance
revi
ews.
M
aint
enan
ce re
view
s
113
Con
tinua
l Im
prov
emen
tH
ow d
oes
the
orga
nisa
tion
achi
eve
cont
inua
l im
prov
emen
t in
the
optim
al
com
bina
tion
of c
osts
, as
set r
elat
ed ri
sks
and
the
perfo
rman
ce a
nd
cond
ition
of a
sset
s an
d as
set s
yste
ms
acro
ss
the
who
le li
fe c
ycle
?
3.5
"All
docu
men
ts a
re re
view
ed a
nd u
pdat
ed a
t lea
st a
nnua
lly.
Impr
ovem
ent o
ppor
tuni
ties
are
inve
stig
ated
and
futu
re fu
nded
as
app
ropr
iate
. Thi
s pl
anne
d ap
proa
ch h
elps
to k
eep
cost
s
unde
r con
trol."
Wid
ely
used
AM
sta
ndar
ds h
ave
requ
irem
ents
to e
stab
lish,
impl
emen
t an
d m
aint
ain
proc
ess(
es)/p
roce
dure
(s)
for i
dent
ifyin
g, a
sses
sing
, prio
ritis
ing
and
impl
emen
ting
actio
ns to
ach
ieve
co
ntin
ual i
mpr
ovem
ent.
Spe
cific
ally
th
ere
is a
requ
irem
ent t
o de
mon
stra
te
cont
inua
l im
prov
emen
t in
optim
isat
ion
of
cost
risk
and
per
form
ance
/con
ditio
n of
as
sets
acr
oss
the
life
cycl
e. T
his
ques
tion
expl
ores
an
orga
nisa
tion'
s ca
pabi
litie
s in
this
are
a—lo
okin
g fo
r sys
tem
atic
im
prov
emen
t mec
hani
sms
rath
er th
at
revi
ews
and
audi
t (w
hich
are
sep
arat
ely
exam
ined
).
The
top
man
agem
ent o
f the
or
gani
satio
n. T
he m
anag
er/te
am
resp
onsi
ble
for m
anag
ing
the
orga
nisa
tion'
s as
set m
anag
emen
t sy
stem
, inc
ludi
ng it
s co
ntin
ual
impr
ovem
ent.
Man
ager
s re
spon
sibl
e fo
r pol
icy
deve
lopm
ent a
nd
impl
emen
tatio
n.
Reco
rds
show
ing
syst
emat
ic
expl
orat
ion
of im
prov
emen
t. E
vide
nce
of n
ew te
chni
ques
bei
ng e
xplo
red
and
impl
emen
ted.
Cha
nges
in p
roce
dure
(s)
and
proc
ess(
es) r
eflec
ting
impr
oved
us
e of
opt
imis
atio
n to
ols/
tech
niqu
es
and
avai
labl
e in
form
atio
n. E
vide
nce
of
wor
king
par
ties
and
rese
arch
.
115
Con
tinua
l Im
prov
emen
tH
ow d
oes
the
orga
nisa
tion
seek
and
ac
quire
kno
wle
dge
abou
t new
ass
et
man
agem
ent r
elat
ed
tech
nolo
gy a
nd
prac
tices
, and
eva
luat
e th
eir p
oten
tial b
enefi
t to
the
orga
nisa
tion?
3.5
Orio
n N
Z en
cour
ages
its
staff
to a
ttend
indu
stry
eve
nts
and
seek
ou
t new
inno
vatio
ns w
ith s
uppl
iers
and
pee
r org
anis
atio
ns. T
hey
are
look
ing
at a
reas
suc
h as
sof
twar
e ap
plic
atio
ns, S
F6 fr
ee s
witc
hgea
r, C
ontro
l Cen
tre s
yste
m u
pgra
des
and
alar
m ra
tiona
lisat
ion
proj
ect,
ju
st to
nam
e a
few
.
One
impo
rtant
asp
ect o
f con
tinua
l im
prov
emen
t is
whe
re a
n or
gani
satio
n lo
oks
beyo
nd it
s ex
istin
g bo
unda
ries
and
know
ledg
e ba
se to
look
at w
hat
'new
thin
gs a
re o
n th
e m
arke
t'. Th
ese
new
thin
gs c
an in
clud
e eq
uipm
ent,
proc
ess(
es),
tool
s, e
tc. A
n or
gani
satio
n w
hich
doe
s th
is (e
.g.,
by th
e PA
S 55
s 4
.6
stan
dard
s) w
ill b
e ab
le to
dem
onst
rate
th
at it
con
tinua
lly s
eeks
to e
xpan
d its
kn
owle
dge
of a
ll th
ings
affe
ctin
g its
ass
et
man
agem
ent a
ppro
ach
and
capa
bilit
ies.
Th
e or
gani
satio
n w
ill b
e ab
le to
de
mon
stra
te th
at it
iden
tifies
any
suc
h op
portu
nitie
s to
impr
ove,
eva
luat
es th
em
for s
uita
bilit
y to
its
own
orga
nisa
tion
and
impl
emen
ts th
em a
s ap
prop
riate
. Th
is q
uest
ion
expl
ores
an
orga
nisa
tion'
s ap
proa
ch to
this
act
ivity
.
The
top
man
agem
ent o
f the
or
gani
satio
n. T
he m
anag
er/te
am
resp
onsi
ble
for m
anag
ing
the
orga
nisa
tion'
s as
set m
anag
emen
t sy
stem
, inc
ludi
ng it
s co
ntin
ual
impr
ovem
ent.
Peop
le w
ho m
onito
r the
va
rious
item
s th
at re
quire
mon
itorin
g fo
r 'ch
ange
'. Peo
ple
that
impl
emen
t ch
ange
s to
the
orga
nisa
tion'
s po
licy,
stra
tegy
, etc
. Peo
ple
with
in a
n or
gani
satio
n w
ith re
spon
sibi
lity
for
inve
stig
atin
g, e
valu
atin
g, re
com
men
ding
an
d im
plem
entin
g ne
w to
ols
and
tech
niqu
es, e
tc.
Rese
arch
and
dev
elop
men
t pro
ject
s an
d re
cord
s, b
ench
mar
king
and
pa
rtici
patio
n kn
owle
dge
exch
ange
pr
ofes
sion
al fo
rum
s. E
vide
nce
of
corre
spon
denc
e re
latin
g to
kno
wle
dge
acqu
isiti
on. E
xam
ples
of c
hang
e im
plem
enta
tion
and
eval
uatio
n of
new
to
ols,
and
tech
niqu
es li
nked
to a
sset
m
anag
emen
t stra
tegy
and
obj
ectiv
es.
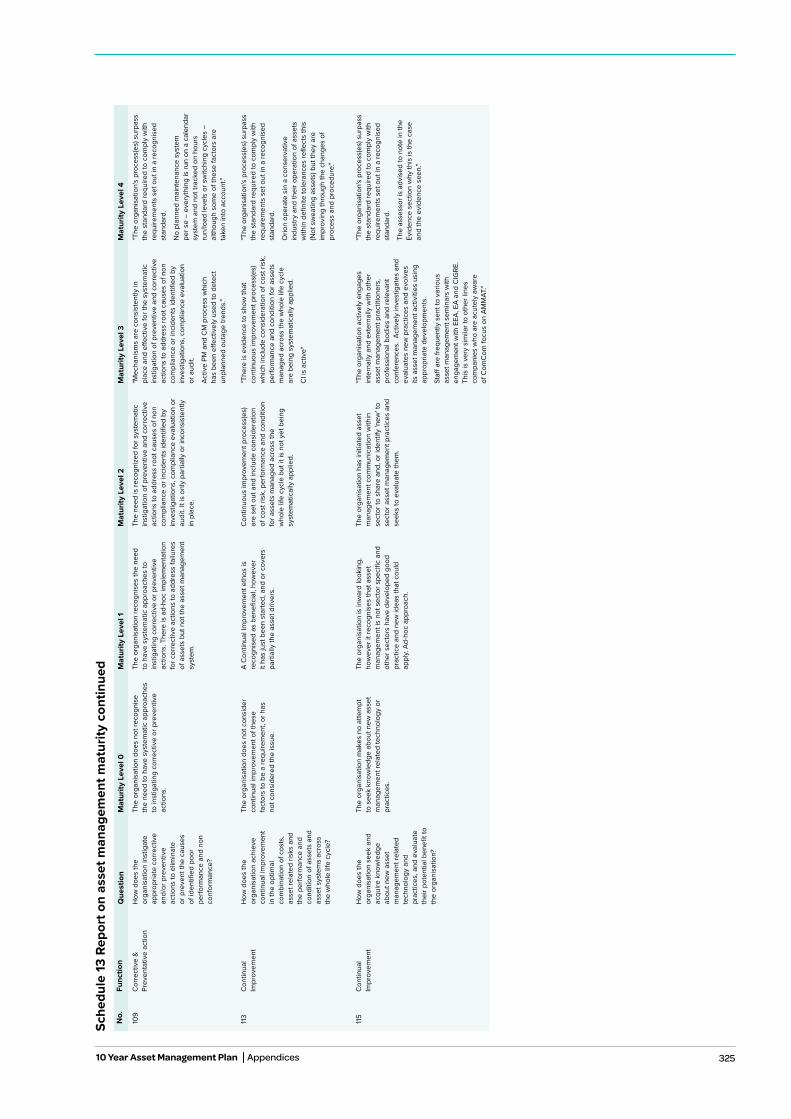
325
Sche
dule
13 R
epor
t on
asse
t man
agem
ent m
atur
ity c
ontin
ued
No.
Func
tion
Que
stio
nM
atur
ity L
evel
0M
atur
ity L
evel
1M
atur
ity L
evel
2M
atur
ity L
evel
3M
atur
ity L
evel
4
109
Cor
rect
ive
& Pr
even
tativ
e ac
tion
How
doe
s th
e or
gani
satio
n in
stig
ate
appr
opria
te c
orre
ctiv
e an
d/or
pre
vent
ive
actio
ns to
elim
inat
e or
pre
vent
the
caus
es
of id
entifi
ed p
oor
perfo
rman
ce a
nd n
on
conf
orm
ance
?
The
orga
nisa
tion
does
not
reco
gnis
e
the
need
to h
ave
syst
emat
ic a
ppro
ache
s to
inst
igat
ing
corre
ctiv
e or
pre
vent
ive
actio
ns.
The
orga
nisa
tion
reco
gnis
es th
e ne
ed
to h
ave
syst
emat
ic a
ppro
ache
s to
in
stig
atin
g co
rrect
ive
or p
reve
ntiv
e ac
tions
. The
re is
ad-
hoc
impl
emen
tatio
n fo
r cor
rect
ive
actio
ns to
add
ress
failu
res
of a
sset
s bu
t not
the
asse
t man
agem
ent
syst
em.
The
need
is re
cogn
ized
for s
yste
mat
ic
inst
igat
ion
of p
reve
ntiv
e an
d co
rrect
ive
actio
ns to
add
ress
root
cau
ses
of n
on
com
plia
nce
or in
cide
nts
iden
tified
by
inve
stig
atio
ns, c
ompl
ianc
e ev
alua
tion
or
audi
t. It
is o
nly
parti
ally
or i
ncon
sist
ently
in
pla
ce.
"Mec
hani
sms
are
cons
iste
ntly
in
plac
e an
d eff
ectiv
e fo
r the
sys
tem
atic
in
stig
atio
n of
pre
vent
ive
and
corre
ctiv
e ac
tions
to a
ddre
ss ro
ot c
ause
s of
non
co
mpl
ianc
e or
inci
dent
s id
entifi
ed b
y in
vest
igat
ions
, com
plia
nce
eval
uatio
n or
aud
it.
Activ
e PM
and
CM
pro
cess
whi
ch
has
been
effe
ctiv
ely
used
to d
etec
t un
plan
ned
outa
ge tr
ends
."
"The
org
anis
atio
n's
proc
ess(
es) s
urpa
ss
the
stan
dard
requ
ired
to c
ompl
y w
ith
requ
irem
ents
set
out
in a
reco
gnis
ed
stan
dard
.
No
plan
ned
mai
nten
ance
sys
tem
pe
r se
– ev
eryt
hing
is ru
n on
a c
alen
dar
syst
em a
nd n
ot tr
acke
d on
hou
rs
run/
load
leve
ls o
r sw
itchi
ng c
ycle
s –
alth
ough
som
e of
thes
e fa
ctor
s ar
e ta
ken
into
acc
ount
."
113
Con
tinua
l Im
prov
emen
tH
ow d
oes
the
orga
nisa
tion
achi
eve
cont
inua
l im
prov
emen
t in
the
optim
al
com
bina
tion
of c
osts
, as
set r
elat
ed ri
sks
and
the
perfo
rman
ce a
nd
cond
ition
of a
sset
s an
d as
set s
yste
ms
acro
ss
the
who
le li
fe c
ycle
?
The
orga
nisa
tion
does
not
con
side
r co
ntin
ual i
mpr
ovem
ent o
f the
se
fact
ors
to b
e a
requ
irem
ent,
or h
as
not c
onsi
dere
d th
e is
sue.
A C
ontin
ual I
mpr
ovem
ent e
thos
is
reco
gnis
ed a
s be
nefic
ial,
how
ever
it
has
just
bee
n st
arte
d, a
nd o
r cov
ers
parti
ally
the
asse
t driv
ers.
Con
tinuo
us im
prov
emen
t pro
cess
(es)
ar
e se
t out
and
incl
ude
cons
ider
atio
n of
cos
t ris
k, p
erfo
rman
ce a
nd c
ondi
tion
for a
sset
s m
anag
ed a
cros
s th
e w
hole
life
cyc
le b
ut it
is n
ot y
et b
eing
sy
stem
atic
ally
app
lied.
"The
re is
evi
denc
e to
sho
w th
at
cont
inuo
us im
prov
emen
t pro
cess
(es)
w
hich
incl
ude
cons
ider
atio
n of
cos
t ris
k,
perfo
rman
ce a
nd c
ondi
tion
for a
sset
s m
anag
ed a
cros
s th
e w
hole
life
cyc
le
are
bein
g sy
stem
atic
ally
app
lied.
CI i
s ac
tive"
"The
org
anis
atio
n's
proc
ess(
es) s
urpa
ss
the
stan
dard
requ
ired
to c
ompl
y w
ith
requ
irem
ents
set
out
in a
reco
gnis
ed
stan
dard
.
Orio
n op
erat
e si
n a
cons
erva
tive
indu
stry
and
thei
r ope
ratio
n of
ass
ets
with
in d
efini
te to
lera
nces
refle
cts
this
(N
ot s
wea
ting
asse
ts) b
ut th
ey a
re
impr
ovin
g th
roug
h th
e ch
ange
s of
pr
oces
s an
d pr
oced
ure.
"
115
Con
tinua
l Im
prov
emen
tH
ow d
oes
the
orga
nisa
tion
seek
and
ac
quire
kno
wle
dge
abou
t new
ass
et
man
agem
ent r
elat
ed
tech
nolo
gy a
nd
prac
tices
, and
eva
luat
e th
eir p
oten
tial b
enefi
t to
the
orga
nisa
tion?
The
orga
nisa
tion
mak
es n
o at
tem
pt
to s
eek
know
ledg
e ab
out n
ew a
sset
m
anag
emen
t rel
ated
tech
nolo
gy o
r pr
actic
es.
The
orga
nisa
tion
is in
war
d lo
okin
g,
how
ever
it re
cogn
ises
that
ass
et
man
agem
ent i
s no
t sec
tor s
peci
fic a
nd
othe
r sec
tors
hav
e de
velo
ped
good
pr
actic
e an
d ne
w id
eas
that
cou
ld
appl
y. Ad
-hoc
app
roac
h.
The
orga
nisa
tion
has
initi
ated
ass
et
man
agem
ent c
omm
unic
atio
n w
ithin
se
ctor
to s
hare
and
, or i
dent
ify 'n
ew' t
o se
ctor
ass
et m
anag
emen
t pra
ctic
es a
nd
seek
s to
eva
luat
e th
em.
"The
org
anis
atio
n ac
tivel
y en
gage
s in
tern
ally
and
ext
erna
lly w
ith o
ther
as
set m
anag
emen
t pra
ctiti
oner
s,
prof
essi
onal
bod
ies
and
rele
vant
co
nfer
ence
s. A
ctiv
ely
inve
stig
ates
and
ev
alua
tes
new
pra
ctic
es a
nd e
volv
es
its a
sset
man
agem
ent a
ctiv
ities
usi
ng
appr
opria
te d
evel
opm
ents
.
Staff
are
freq
uent
ly s
ent t
o va
rious
as
set m
anag
emen
t sem
inar
s w
ith
enga
gem
ent w
ith E
EA, E
A an
d C
IGRE
. Th
is is
ver
y si
mila
r to
othe
r lin
es
com
pani
es w
ho a
re a
cute
ly a
war
e
of C
omC
om fo
cus
on A
MM
AT."
"The
org
anis
atio
n's
proc
ess(
es) s
urpa
ss
the
stan
dard
requ
ired
to c
ompl
y w
ith
requ
irem
ents
set
out
in a
reco
gnis
ed
stan
dard
.
The
asse
ssor
is a
dvis
ed to
not
e in
the
Evid
ence
sec
tion
why
this
is th
e ca
se
and
the
evid
ence
see
n."
10 Year Asset Management Plan Appendices

326 Orion New Zealand Limited
Schedule 14a Mandatory explanatory notes on forecast informationBox 1: Comment on the difference between nominal and constant price capital expenditure forecasts
In our AMP we have disclosed our:
• constant price (real) opex and capex forecasts
• nominal opex and capex forecasts for the ten years FY22 to FY31 inclusive.
In escalating our real forecasts to nominal forecasts, we have:
• split our forecast opex and capex into a number of groups
• forecast an escalation index for each group that represents a reasonable proxy for forecast movements in unit costs for each group
• applied the forecast escalation indices for the ten-year forecast period.
We applied forecast opex and capex escalators as follows:
• network labour – NZIER labour index forecasts to FY24, extrapolated by PwC to FY31
• non-network labour – NZIER forecasts to FY24, extrapolated by PwC to FY31
• other – NZIER producer price index (PPI) forecasts to FY25, extrapolated by PwC to FY31.
Box 2: Comment on the difference between nominal and constant price operational expenditure forecasts
• Please refer to Box 1 above.
Company name: Orion NZ Ltd
For year ended: 31 March 2022
Appendix G Mandatory explanatory notes on forecast information
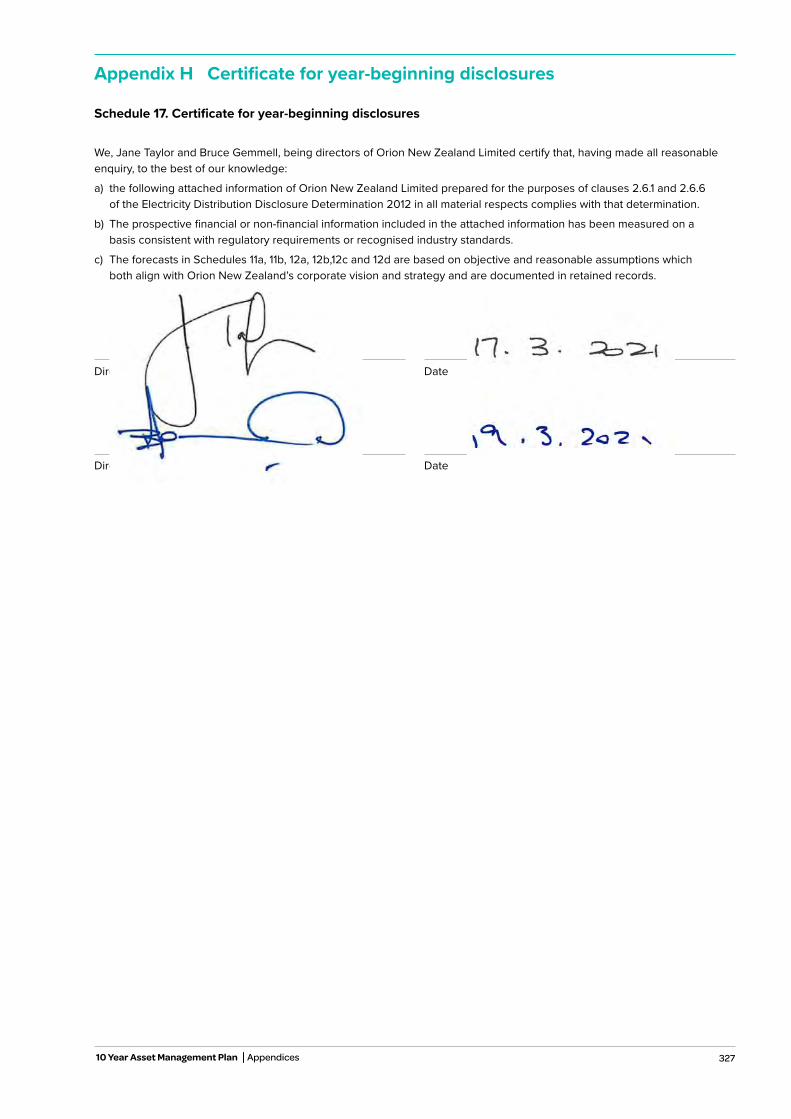
327
Schedule 17. Certificate for year-beginning disclosures
We, Jane Taylor and Bruce Gemmell, being directors of Orion New Zealand Limited certify that, having made all reasonable enquiry, to the best of our knowledge:
a) the following attached information of Orion New Zealand Limited prepared for the purposes of clauses 2.6.1 and 2.6.6 of the Electricity Distribution Disclosure Determination 2012 in all material respects complies with that determination.
b) The prospective financial or non-financial information included in the attached information has been measured on a basis consistent with regulatory requirements or recognised industry standards.
c) The forecasts in Schedules 11a, 11b, 12a, 12b,12c and 12d are based on objective and reasonable assumptions which both align with Orion New Zealand’s corporate vision and strategy and are documented in retained records.
Appendix H Certificate for year-beginning disclosures
10 Year Asset Management Plan Appendices
Director Date
Director Date


329 10 Year Asset Management Plan Section 1 Summary

Orion New Zealand Limited 565 Wairakei Road
PO Box 13896 Christchurch 8141
+64 3 363 9898 oriongroup.co.nz