THE DISTRIBUTION OF DEUTERATED FORMALDEHYDE WITHIN ORION-KL
9
THE DISTRIBUTION OF DEUTERATED FORMALDEHYDE WITHIN ORION-KL Cécile Favre 1 , Edwin A. Bergin 1 , Justin L. Neill 1 , Nathan R. Crockett 2 , Qizhou Zhang 3 , and Dariusz C. Lis 4,5 1 Department of Astronomy, University of Michigan, 500 Church Street, Ann Arbor, MI 48109, USA; [email protected] 2 California Institute of Technology, Division of Geological and Planetary Sciences, MS 150-21, Pasadena, CA 91125, USA 3 Harvard-Smithsonian Center for Astrophysics, 60 Garden Street, Cambridge, MA 02138, USA 4 LERMA, Observatoire de Paris, PSL Research University, CNRS, Sorbonne Universités, UPMC Univ. Paris 06, F-75014, Paris, France 5 Cahill Center for Astronomy and Astrophysics 301-17, California Institute of Technology, Pasadena, CA 91125, USA Received 2015 January 5; accepted 2015 June 19; published 2015 July 29 ABSTRACT We report the first high angular resolution imaging (3 ″ .4 × 3 ″ .0) of deuterated formaldehyde (HDCO) toward Orion-KL, carried out with the Submillimeter Array. We find that the spatial distribution of the formaldehyde emission systematically differs from that of methanol: while methanol is found toward the inner part of the region, HDCO is found in colder gas that wraps around the methanol emission on four sides. The HDCO/H 2 CO ratios are determined to be 0.003–0.009 within the region, up to an order of magnitude higher than the D/H measured for methanol. These findings strengthen the previously suggested hypothesis that there are differences in the chemical pathways leading to HDCO (via deuterated gas-phase chemistry) and deuterated methanol (through conversion of formaldehyde into methanol on the surface of icy grain mantles). Key words: astrochemistry – ISM: abundances – ISM: individual objects (Orion-KL) – ISM: molecules – line: identification 1. INTRODUCTION The Orion-KL nebula, which lies at a distance of 414 ± 7 pc (Menten et al. 2007), is a focal source for studies of the physics and chemistry of high-mass star forming regions. Its rich molecular diversity and complex physical structure have been revealed by a number of spectral line surveys and interfero- metric studies of the region (e.g., Blake et al. 1987; Schilke et al. 1997, 2001; Beuther et al. 2005, 2006; Comito et al. 2005; Persson et al. 2007; Friedel & Snyder 2008; Guélin et al. 2008; Tercero et al. 2010, 2011; Favre et al. 2011a, 2011b, 2014; Friedel & Widicus Weaver 2012; Widicus Weaver & Friedel 2012; Brouillet et al. 2013; Esplugues et al. 2013; Peng et al. 2013). Recently, a broadband spectral line survey of Orion-KL carried out with the Herschel/HIFI spectrometer (Bergin et al. 2010; Crockett et al. 2010, 2014) has been obtained as part of the HEXOS key program. 6 The unprece- dented 1.2 THz wide frequency coverage of this survey has allowed for strong constraints on physical parameters and molecular abundances due to the detection of many transitions for each molecule with a wide range of excitation conditions, revealing the presence of thermal gradients (e.g., Wang et al. 2011). Among the molecular components associated with Orion-KL lie the so-called Hot Core and Compact Ridge. Although the precise nature of these regions remains enigmatic, evidence has been recently provided that they may have originated from the interaction of the remnants of a recent explosion with ice grains mantles (⩽720 years ago, e.g., Gómez et al. 2005, 2008; Rodríguez et al. 2005; Bally et al. 2011; Nissen et al. 2012), leading to the evaporation and the heating of organic material (Favre et al. 2011a; Zapata et al. 2011). Deuterium fractionation is intrinsically a low-temperature process. Therefore, deuterated molecules in warm (T ⩾ 100 K) regions, such as Orion-KL, offer a window into its physical conditions at the earlier, colder stage (T ∼ 10–30 K) when this material likely formed (Blake et al. 1987; Pagani et al. 1992; Charnley et al. 1997). Numerous deuterated species have been observed toward Orion-KL: deuterated water (Turner et al. 1975; Jacq et al. 1990; Neill et al. 2013b), deuterated ammonia (Rodriguez Kuiper et al. 1978; Walmsley et al. 1987), deuterated formaldehyde (Loren & Wootten 1985; Turner 1990), and deuterated methanol (Mauersberger et al. 1988; Jacq et al. 1993; Peng et al. 2012). Recently, Neill et al. (2013a) used the HIFI survey and tens of transitions to set strong constraints in the D/H ratio of organics associated with Orion-KL. Their finding strongly suggests that D/H fractiona- tion is inhomogenuous in this source. In this study, we extend the HIFI study of deuterated species performed by Neill et al. (2013a, 2013b); especially since the Herschel observations are spatially unresolved, even with well- determined column densities within the beam, there can be large deviations in the deuterium fractionation as a function of spatial position. In Section 2, we present the Submillimeter Array (SMA) observations to complement the HIFI analysis. In particular, we focus on formaldehyde (H 2 CO and HDCO). The D/H ratios of this molecule is key to obtaining a full picture of the oxygen chemistry in this region, as formaldehyde is believed to be an intermediate in the grain-surface synthesis of methanol through sequential reactions of H or D atoms with CO (see Watanabe & Kouchi 2002; Cazaux et al. 2011; Taquet et al. 2012). Alternatively, gas-phase chemistry might independently lead to the formation of formaldehyde via reactions involving CH 2 D + products under warmer conditions (typically T > 50 K, see Loren & Wootten 1985; Wootten 1987). Incidentally, the tentative detection of the CH 2 D + ion toward Orion-KL by Roueff et al. (2013) suggests that gas- phase chemistry might be efficient for the HDCO formation. In this analysis, we present the first high angular resolution image of the spatial distribution of (deuterated) formaldehyde in Orion-KL and discuss the different chemical pathways that can be involved in its formation. More specifically, results and analysis are presented in Section 3 and discussed in Section 4, with conclusions set out in Section 5. The Astrophysical Journal, 808:155 (9pp), 2015 August 1 doi:10.1088/0004-637X/808/2/155 © 2015. The American Astronomical Society. All rights reserved. 6 www.hexos.org 1
-
Upload
univ-grenoble-alpes -
Category
Documents
-
view
0 -
download
0
Transcript of THE DISTRIBUTION OF DEUTERATED FORMALDEHYDE WITHIN ORION-KL

THE DISTRIBUTION OF DEUTERATED FORMALDEHYDE WITHIN ORION-KL
Cécile Favre1, Edwin A. Bergin1, Justin L. Neill1, Nathan R. Crockett2, Qizhou Zhang3, and Dariusz C. Lis4,51 Department of Astronomy, University of Michigan, 500 Church Street, Ann Arbor, MI 48109, USA; [email protected]
2 California Institute of Technology, Division of Geological and Planetary Sciences, MS 150-21, Pasadena, CA 91125, USA3 Harvard-Smithsonian Center for Astrophysics, 60 Garden Street, Cambridge, MA 02138, USA
4 LERMA, Observatoire de Paris, PSL Research University, CNRS, Sorbonne Universités, UPMC Univ. Paris 06, F-75014, Paris, France5 Cahill Center for Astronomy and Astrophysics 301-17, California Institute of Technology, Pasadena, CA 91125, USA
Received 2015 January 5; accepted 2015 June 19; published 2015 July 29
ABSTRACT
We report the first high angular resolution imaging (3″. 4 × 3″. 0) of deuterated formaldehyde (HDCO) towardOrion-KL, carried out with the Submillimeter Array. We find that the spatial distribution of the formaldehydeemission systematically differs from that of methanol: while methanol is found toward the inner part of the region,HDCO is found in colder gas that wraps around the methanol emission on four sides. The HDCO/H2CO ratios aredetermined to be 0.003–0.009 within the region, up to an order of magnitude higher than the D/H measured formethanol. These findings strengthen the previously suggested hypothesis that there are differences in the chemicalpathways leading to HDCO (via deuterated gas-phase chemistry) and deuterated methanol (through conversion offormaldehyde into methanol on the surface of icy grain mantles).Key words: astrochemistry – ISM: abundances – ISM: individual objects (Orion-KL) – ISM: molecules –line: identification
1. INTRODUCTION
The Orion-KL nebula, which lies at a distance of 414 ± 7 pc(Menten et al. 2007), is a focal source for studies of the physicsand chemistry of high-mass star forming regions. Its richmolecular diversity and complex physical structure have beenrevealed by a number of spectral line surveys and interfero-metric studies of the region (e.g., Blake et al. 1987; Schilkeet al. 1997, 2001; Beuther et al. 2005, 2006; Comito et al.2005; Persson et al. 2007; Friedel & Snyder 2008; Guélin et al.2008; Tercero et al. 2010, 2011; Favre et al. 2011a, 2011b,2014; Friedel & Widicus Weaver 2012; Widicus Weaver &Friedel 2012; Brouillet et al. 2013; Esplugues et al. 2013; Penget al. 2013). Recently, a broadband spectral line survey ofOrion-KL carried out with the Herschel/HIFI spectrometer(Bergin et al. 2010; Crockett et al. 2010, 2014) has beenobtained as part of the HEXOS key program.6 The unprece-dented 1.2 THz wide frequency coverage of this survey hasallowed for strong constraints on physical parameters andmolecular abundances due to the detection of many transitionsfor each molecule with a wide range of excitation conditions,revealing the presence of thermal gradients (e.g., Wanget al. 2011). Among the molecular components associatedwith Orion-KL lie the so-called Hot Core and Compact Ridge.Although the precise nature of these regions remains enigmatic,evidence has been recently provided that they may haveoriginated from the interaction of the remnants of a recentexplosion with ice grains mantles (⩽720 years ago, e.g.,Gómez et al. 2005, 2008; Rodríguez et al. 2005; Bally et al.2011; Nissen et al. 2012), leading to the evaporation and theheating of organic material (Favre et al. 2011a; Zapataet al. 2011).
Deuterium fractionation is intrinsically a low-temperatureprocess. Therefore, deuterated molecules in warm (T ⩾ 100 K)regions, such as Orion-KL, offer a window into its physicalconditions at the earlier, colder stage (T ∼ 10–30 K) when this
material likely formed (Blake et al. 1987; Pagani et al. 1992;Charnley et al. 1997). Numerous deuterated species have beenobserved toward Orion-KL: deuterated water (Turneret al. 1975; Jacq et al. 1990; Neill et al. 2013b), deuteratedammonia (Rodriguez Kuiper et al. 1978; Walmsleyet al. 1987), deuterated formaldehyde (Loren & Wootten 1985;Turner 1990), and deuterated methanol (Mauersbergeret al. 1988; Jacq et al. 1993; Peng et al. 2012). Recently, Neillet al. (2013a) used the HIFI survey and tens of transitions to setstrong constraints in the D/H ratio of organics associated withOrion-KL. Their finding strongly suggests that D/H fractiona-tion is inhomogenuous in this source.In this study, we extend the HIFI study of deuterated species
performed by Neill et al. (2013a, 2013b); especially since theHerschel observations are spatially unresolved, even with well-determined column densities within the beam, there can belarge deviations in the deuterium fractionation as a function ofspatial position. In Section 2, we present the SubmillimeterArray (SMA) observations to complement the HIFI analysis. Inparticular, we focus on formaldehyde (H2CO and HDCO). TheD/H ratios of this molecule is key to obtaining a full picture ofthe oxygen chemistry in this region, as formaldehyde isbelieved to be an intermediate in the grain-surface synthesis ofmethanol through sequential reactions of H or D atoms withCO (see Watanabe & Kouchi 2002; Cazaux et al. 2011; Taquetet al. 2012). Alternatively, gas-phase chemistry mightindependently lead to the formation of formaldehyde viareactions involving CH2D
+ products under warmer conditions(typically T > 50 K, see Loren & Wootten 1985; Wootten1987). Incidentally, the tentative detection of the CH2D
+ iontoward Orion-KL by Roueff et al. (2013) suggests that gas-phase chemistry might be efficient for the HDCO formation. Inthis analysis, we present the first high angular resolution imageof the spatial distribution of (deuterated) formaldehyde inOrion-KL and discuss the different chemical pathways that canbe involved in its formation. More specifically, results andanalysis are presented in Section 3 and discussed in Section 4,with conclusions set out in Section 5.
The Astrophysical Journal, 808:155 (9pp), 2015 August 1 doi:10.1088/0004-637X/808/2/155© 2015. The American Astronomical Society. All rights reserved.
6 www.hexos.org
1

Tab
le1
SpectroscopicandObservatio
nalLineParametersforFo
rmaldehy
dea,b
HDCO
Frequency
Transition
Eup
ASy
nthesized
dF1
dF2
×10−
4Beam
Tdv
mb
¨v L
SRv L
SR%
T ex
NT
dvm
b¨
v LSR
v LSR
%T e
xN
(MHz)
(K)
(s−1 )
(″×″)
PA(°)
(Kkm
s−1 )
(km
s−1 )
(km
s−1 )
(K)
(101
4cm
−2 )
(Kkm
s−1 )
(km
s−1 )
(km
s−1 )
(K)
(101
4cm
−2 )
1928
93.26c
,d
3 0,3–2 0
,218
.51.94
LL
LL
LL
LL
LL
LL
1939
07.46
3 2,1–2 2
,050
.41.10
3.44
×3.01
308.50
(1.54)
9.84(0.14)
1.80(0.46)
89(16)
4.65(0.86)
7.38(0.43)
7.75(0.10)
2.20(0.18)
56(7)
2.92(0.22)
1933
91.61
3 2,2–2 2
,150
.41.09
3.47
×3.02
309.05
(0.63)
9.65(0.10)
1.69(0.16)
89(16)
4.96(0.37)
7.07(0.35)
7.57(0.07)
2.40(0.15)
56(7)
2.80(0.18)
dF3
dF4
Tdv
mb
¨v L
SRv L
SR%
T ex
NT
dvm
b¨
v LSR
v LSR
%T e
xN
(Kkm
s−1 )
(km
s−1 )
(km
s−1 )
(K)
(101
4cm
−2 )
(Kkm
s−1 )
(km
s−1 )
(km
s−1 )
(K)
(101
4cm
−2 )
1928
93.26c
,d
3 0,3–2 0
,218
.51.94
LL
LL
LL
LL
LL
LL
1939
07.46
3 2,1–2 2
,050
.41.10
3.44
×3.01
307.13
(0.98)
7.80(0.10)
1.71(0.32)
57(8)
2.77(0.42)
11.25(1.45)
8.61(0.05)
1.13(0.14)
52(8)
4.26(0.62)
1933
91.61
3 2,2–2 2
,150
.41.09
3.47
×3.02
308.00
(2.29)
8.00(0.03)
1.39(0.44)
57(8)
3.12(0.93)
9.79(1.02)
8.30(0.10)
1.66(0.24)
52(8)
3.71(0.45)
(para–)H
CO
213
Frequency
Transition
Eup
ASy
nthesized
dF1
dF2
×10−
4beam
Tdv
mb
¨v L
SRv L
SR%
T ex
NT
dvm
b¨
v LSR
v LSR
%T e
xN
(MHz)
(K)
(s−1 )
(″×″)
PA(°)
(Kkm
s−1 )
(km
s−1 )
(km
s−1 )
(K)
(101
4cm
−2 )
(Kkm
s−1 )
(km
s−1 )
(km
s−1 )
(K)
(101
4cm
−2 )
2128
11.18
3 0,3–2 0
,220
.42.64
3.17
×2.75
3017
.99(1.73)
9.88(0.09)
1.83(0.24)
89(16)
5.44(0.53)
16.04(1.37)
7.44(0.11)
2.54(0.29)
56(7)
2.83(0.26)
2130
37.34d
3 2,2–2 2
,167
.71.46
LL
LL
LL
LL
LL
LL
2132
93.57
3 2,1–2 2
,067
.71.46
3.15
×2.75
305.87
(0.85)
9.89(0.19)
2.21(0.42)
89(16)
5.43(0.82)
3.84(0.40)
7.43(0.13)
2.16(0.30)
56(7)
2.83(0.35)
dF3
dF4
Tdv
mb
¨v L
SRv L
SR%
T ex
NT
dvm
b¨
v LSR
v LSR
%T e
xN
(Kkm
s−1 )
(km
s−1 )
(km
s−1 )
(K)
(101
4cm
−2 )
(Kkm
s−1 )
(km
s−1 )
(km
s−1 )
(K)
(101
4cm
−2 )
2128
11.18
3 0,3–2 0
,220
.42.64
3.17
×2.75
3012
.93(0.28)
7.94(0.03)
1.55(0.04)
57(8)
2.27(0.64)
9.70(1.16)
8.44(0.03)
1.58(0.25)
52(8)
1.58(0.20)
2130
37.34d
3 2,2–2 2
,167
.71.46
LL
LL
LL
LL
LL
LL
2132
93.57
3 2,1–2 2
,067
.71.46
3.15
×2.75
303.14
(0.55)
8.03(0.08)
1.56(0.37)
57(8)
2.27(0.44)
2.16(0.26)
8.63(0.17)
1.30(0.23)
52(8)
1.58(0.23)
Notes.The
HDCO
emission
peakslie
atthefollo
wingpo
sitio
ns:dF
1(α
J200
0=
05h 35m
14s .601
,δ J
2000
=−05
°22′34
″.18),dF
2(α
J200
0=
05h 35m
14s .054
,δ J
2000
=−05
°22′27
″.82),dF
3(α
J200
0=
05h 35m
14s .210
,δ J
2000
=−05
°22′42
″.88),and
dF4(α
J200
0=
05h 35m
13s .861
,δJ200
0=
−05°22′41
″.92).T
heexcitatio
ntemperature
ofHDCO
towardthosepeaksisfixedandtakenequaltothat
ofH
CO
213as
describedin
Section3.2.
aMeasuredandpredictedtransitio
nsareavailablefrom
theCDMS(http
://www.astro.uni-koeln.de/cdms/;M
ülleretal.2
005)
database
andatSp
latalogu
e(w
ww.splatalog
ue.net;R
emijanetal.2
007).M
orespecifically
andas
previously
repo
rted
byNeillet
al.(20
13a),weused
thespectroscopicdata
parametersfrom
Mülleret
al.(20
00)for
HC
O213
andfrom
Bocqu
etet
al.(199
9)andJohn
s&
McK
ellar(197
7)forHDCO.
bThe
numbers
inbracketsreferto
the1σ
levelun
certainty.
c,dThese
twolin
eshave
been
exclud
edfrom
ouranalysissincetheirem
ission
iscontam
inated
bytheem
ission
from
HCOOCH3and
33SO
,respectiv
ely.
2
The Astrophysical Journal, 808:155 (9pp), 2015 August 1 Favre et al.

2. OBSERVATIONS AND DATA REDUCTION
Observations of Orion-KL were carried out with the SMA7
(Ho et al. 2004) in its compact configuration on 2013December 12 for about 6.75 hr. The phase-tracking center was
J2000B = 05h35m14s.20, δJ2000 = −05°22′33″. 00. The newbroader-bandwidth SMA capability of the 230 GHz band wasused to cover the following frequency ranges:192.6–194.6 GHz and 197.6–199.6 GHz in LSB band, and207.6–209.6 GHz and 212.6–214.6 GHz in the USB band. Anenormous advantage of this broadband capability is thepossibility to observe transitions of both HDCO and H CO2
13
in a single tuning (see Table 1). The correlator was configuredwith a uniform spectral resolution over 4 GHz bandwidth ineach sideband. Each 4 GHz bandwidth is divided into 48“chunks” and each chunk is further divided into 128 channelswith a channel width of 0.812MHz. The weather conditionswere good and stable with an atmospheric opacity of about0.14 at 225 GHz. The SMA data were calibrated using theMIR/IDL package8 (Qi 2007). The nearby quasars 0423–013and 0510+180 were used as complex gain (phase andamplitude) calibrators.
Continuum subtraction and data imaging were performedusing the MIRIAD software package. The final continuumemission maps obtained at 198 and 213 GHz are shown in
Figure 1. They were restored using a robust weighting of 0.0,resulting in a synthesized beam size of 3″. 5 × 3″. 01 (P.A. =32 ◦. 7) at 198 GHz and of 3″. 2 × 2″. 8 (P.A. = 26 ◦. 7) at213 GHz. Positions of the four main continuum sources derivedfrom Gaussian fits in the (u, v) LSB data set image plane aregiven in Figure 1. The positions of these continuum sources arecommensurate between the LSB and USB data sets and, inagreement, within the synthesized beam size, with previousPdBI observations (Favre et al. 2011a).In this analysis, we only focus on two emission lines of
HDCO and two of para—H CO213 (see spectroscopic para-
meters listed in Table 1). The spectral resolution is 1.14 km s−1
for H CO213 at 212/213 GHz and 1.26 km s−1 for the HDCO
lines at 193 GHz. The resulting synthesized beam sizes( 3 3_ ´ q ´, P.A. = 30°) are given in Table 1 at the differentfrequencies.
3. RESULTS AND ANALYSIS
3.1. Emission Maps and Velocity Structure
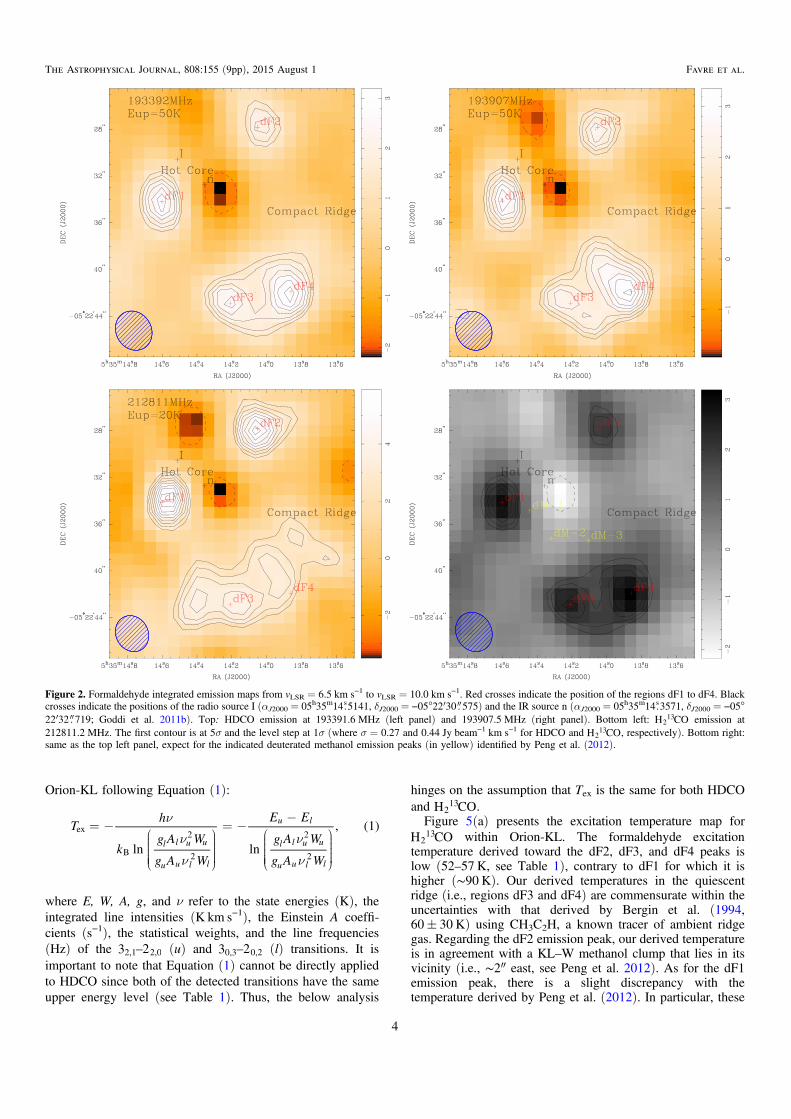
The HDCO and H CO213 emission maps integrated over the
line profile are shown in Figure 2. Four main molecularemission peaks, labeled dF1 to dF4, are associated with theHDCO emission. More specifically, they are located toward theleft of the Hot Core component (dF1), north of the CompactRidge (dF2), and in the quiescent ridge (dF3 and dF4) locatedsouth of the Compact Ridge. Their coordinates are given inTable 1. The regions dF1, dF2, and dF3 are also associatedwith the H CO2
13 emission, but dF4 is not. Incidentally, it isimportant to note that the integrated emission map of theH CO2
13 transition at 213293.57MHz is strongly contaminatedby the emission from an unidentified species toward the HotCore region. This is shown in Figure 3, which displays theintegrated emission map along with the spectrum of thisH CO2
13 line; the latter being taken at the position of thecontaminated emission peak.The spectra of the formaldehyde transitions observed toward
regions dF1 to dF4 are shown in Figure 4 and the observed lineparameters are summarized in Table 1. The bulk of theformaldehyde emission toward those peaks appears to liebetween vLSR = 7.5 km s−1 and vLSR = 9.8 km s−1. This resultis consistent with the HDCO LSR velocity derived by Loren &Wootten (1985) toward the quiescent ridge (∼8.5 km s−1,single-dish Millimeter Wave Observatory observations) and byNeill et al. (2013a) toward the region (∼8 and 10.4 km s−1,Herschel/HIFI observations). It is important to note that Neillet al. (2013a) associated the HDCO emission with two velocitycomponents in the Compact Ridge. This difference results fromthe fact that (i) some complex molecules, such as methylformate or dimethyl ether, are seen with two distinct velocitycomponents emitting at ∼7.5 and 9.2 km s−1 in the CompactRidge (e.g., Favre et al. 2011a; Brouillet et al. 2013), and that(ii) the Herschel observations are spatially unresolved. Weinfer that the two HDCO velocity components seen by Neillet al. (2013a) actually correspond to our HDCO emissionobserved toward dF3 and dF1, respectively.
3.2. Excitation Temperature
Assuming optically thin emission, we use the integrated lineintensity measurements of the observed H CO2
13 transitions toderive the formaldehyde excitation temperature (Tex) within
Figure 1. Continuum emission maps obtained at 213 GHz (grayscale, USBband) and at 198 GHz (black, LSB band) toward Orion-KL as measured withthe SMA. The first contour and the level step are at 3σ (where1σ = 0.132 Jy beam−1). The synthesized beams are 3″. 2 × 2″. 8 (P.A. =26 ◦. 7) and 3″. 5 × 3″. 01 (P.A. = 32 ◦. 7) at 207 and 198 GHz, respectively. Bluecrosses mark the positions of the four main continuum sources derived fromGaussian fits in the (u,v) plane (198 GHz data set, LSB band). These sourcesare the Hot core (αJ2000 = 05h35m14s.537, δJ2000 = −05°22′31″. 600), theCompact Ridge (αJ2000 = 05h35m14s.132, δJ2000 = −05°22′36″. 462), the NorthCompact Ridge (αJ2000 = 05h35m14s.144, δJ2000 = −05°22′29″. 295), and theSouth Compact Ridge (αJ2000 = 05h35m14s.019, δJ2000 = −05°22′44″. 212).
7 The SMA is a joint project between the Smithsonian AstrophysicalObservatory and the Academia Sinica Institute of Astronomy and Astro-physics, and is funded by the Smithsonian Institution and the Academia Sinica.8 https://www.cfa.harvard.edu/∼cqi/mircook.html
3
The Astrophysical Journal, 808:155 (9pp), 2015 August 1 Favre et al.
Orion-KL following Equation (1):
Th
kg A W
g A W
E E
g A W
g A Wln ln
, (1)l l u u
u u l l
u l
l l u u
u u l l
ex
B
2
2
2
2
O
O
O
O
O
� ��
�
�����
¬
®
� ��
�
�
�����
¬
®
where E, W, A, g, and ν refer to the state energies (K), theintegrated line intensities (K km s−1), the Einstein A coeffi-cients (s−1), the statistical weights, and the line frequencies(Hz) of the 32,1–22,0 (u) and 30,3–20,2 (l) transitions. It isimportant to note that Equation (1) cannot be directly appliedto HDCO since both of the detected transitions have the sameupper energy level (see Table 1). Thus, the below analysis
hinges on the assumption that Tex is the same for both HDCOand H CO2
13 .Figure 5(a) presents the excitation temperature map for
H CO213 within Orion-KL. The formaldehyde excitation
temperature derived toward the dF2, dF3, and dF4 peaks islow (52–57 K, see Table 1), contrary to dF1 for which it ishigher (∼90 K). Our derived temperatures in the quiescentridge (i.e., regions dF3 and dF4) are commensurate within theuncertainties with that derived by Bergin et al. (1994,60± 30 K) using CH3C2H, a known tracer of ambient ridgegas. Regarding the dF2 emission peak, our derived temperatureis in agreement with a KL–W methanol clump that lies in itsvicinity (i.e., ∼2″ east, see Peng et al. 2012). As for the dF1emission peak, there is a slight discrepancy with thetemperature derived by Peng et al. (2012). In particular, these
Figure 2. Formaldehyde integrated emission maps from vLSR = 6.5 km s−1 to vLSR = 10.0 km s−1. Red crosses indicate the position of the regions dF1 to dF4. Blackcrosses indicate the positions of the radio source I (αJ2000 = 05h35m14s.5141, δJ2000 = −05°22′30″. 575) and the IR source n (αJ2000 = 05h35m14s.3571, δJ2000 = −05°22′32″. 719; Goddi et al. 2011b). Top: HDCO emission at 193391.6 MHz (left panel) and 193907.5 MHz (right panel). Bottom left: H CO2
13 emission at212811.2 MHz. The first contour is at 5σ and the level step at 1σ (where σ = 0.27 and 0.44 Jy beam−1 km s−1 for HDCO and H CO2
13 , respectively). Bottom right:same as the top left panel, expect for the indicated deuterated methanol emission peaks (in yellow) identified by Peng et al. (2012).
4
The Astrophysical Journal, 808:155 (9pp), 2015 August 1 Favre et al.

authors report a temperature that is lower than the typicaltemperature derived in the vicinity of this region (∼100–300 K,e.g., Friedel & Snyder 2008; Favre et al. 2011a; Goddiet al. 2011a). However, looking at their Figure B.4., a 130 Ktemperature seems to be consistent with their data, suggestingthat their error bars might have been underestimated. Overallthe temperatures derived here are lower than the typicaltemperatures derived for organic species toward the Hot Coreand Compact Ridge components associated with the inner partof Orion-KL (e.g., Crockett et al. 2014).
3.3. Column Density
Assuming that (i) LTE is reached, which implies that theexcitation temperature is equal to the rotational temperature,
and (ii) the rotational temperature is the same for both HDCOand H CO2
13 , we derive the total column density, N, by usingthe following equation (Goldsmith & Langer 1999):
k W
g hc A
NQ
E
Tln
8ln , (2)
u ul
uB2
3
Q O�
�
�����
¬
®
�
�
����
¬
®�
where
W is the integrated line intensity (K cm s−1),ν is the line frequency (Hz),Aul is the Einstein coefficient (s−1),gu is the statistical weight,N is the total column density (cm−2),Q is the partition function,Eup is the upper state energy (K),h is the Planck constant (erg s),kB is the Boltzmann constant (erg K−1),c is the speed of light (cm s−1), andT is the excitation temperature derived above
(in K, Section 3.2).
The column densities derived toward regions dF1 to dF4 forboth HDCO and para–H CO2
13 are listed in Table 1. In addition,Table 2 gives the total column densities for HDCO, H CO2
13 ,and H2CO toward the dF1 to dF4 peaks. The total columndensities have been calculated as follow: (i) the columndensities derived for the two HDCO transitions, which arelisted in Table 1, have been averaged. The same applies to thetwo para–H CO2
13 transitions. (ii) Regarding H CO213 and
HDCO, we assume an ortho:para ratio of 3:1, which iscommensurate with measurements performed toward Orion-KLby Kahane et al. (1984) and Crockett et al. (2014), anda 12C/13C isotopic ratio of 70 (see Favre et al. 2014 andreference therein), which is in agreement within the error barswith previous studies (e.g., Persson et al. 2007; Stahlet al. 2008).
3.4. D/H Ratios for Formaldehyde
Using the total column densities for HDCO and H CO213 (see
Section 3.3 and Table 2), we derive the D/H ratio for regionsdF1 to dF4. The resulting D/H ratios are given in Table 2.Figure 5(b) shows the distribution map of the D/H ratio forformaldehyde in Orion-KL. The HDCO/H2CO ratio is found tobe 0.009± 0.002 toward dF4, 0.003± 0.001 toward dF1, and0.004± 0.001 and 0.005± 0.002 toward dF2 and dF3,respectively. Our results are commensurate within the uncer-tainties from previous D/H ratio measurements in the region(e.g., Loren & Wootten 1985; Neill et al. 2013a) and suggest apossible gradient in the HDCO/H CO2
13 ratio at the 3σ level.
4. DISCUSSION
4.1. Anticorrelation between Formaldehydeand Methanol Emission
A recent study by Peng et al. (2012) using the Plateau deBure interferometer derived the D/H ratios of methanol(CH2DOH and CH3OD) at comparable resolution to our
Figure 3. Top: H CO213 integrated emission map at 213293.6 MHz from
vLSR = 6.5 km s−1 to vLSR = 10.0 km s−1. Red crosses indicate the position ofthe regions dF1 to dF4 while black crosses indicate the positions of the radiosource I and the IR source n (see Figure 2). The first contour is at 3σ and thelevel step is at 2σ (where σ = 0.27 Jy beam−1 km s−1). The emission of thisH CO2
13 transition is strongly contaminated by the emission from anunidentified species toward the Hot Core region marked by a blue cross andlabeled “Blended Peak.” Bottom: H CO2
13 spectrum observed toward the“Blended Peak” position (blue cross). The red dashed line indicates an LSRvelocity of 9.0 km s−1.
5
The Astrophysical Journal, 808:155 (9pp), 2015 August 1 Favre et al.

SMA observations. A notable result is that the spatialdistribution of formaldehyde emission (HDCO and H CO2
13 ,see Figure 2) clearly differs from that of (deuterated) methanol(see Figure 3 of Peng et al. 2012). The methanol distributionfollows a V-shaped structure linking the Hot Core componentto the Compact Ridge (Peng et al. 2012) while formaldehydeexhibits a spatial structure which appears to surround thismolecular V-shaped structure on four sides. This difference isillustrated in Figure 2 (bottom right panel) in which thedeuterated methanol emission peaks identified by Peng et al.(2012) are indicated on the HDCO integrated emission map atat 193391.6 MHz. Furthermore, the D/H ratio for methanolderived by Peng et al. (2012) lies in the range (0.8–1.3) × 10−3,which is up to an order of magnitude (within the uncertainties)lower than the D/H ratio for formaldehyde derived in this study(see Table 2).
4.2. Origin of Formaldehyde Emission
All the nearby well-characterized sources (i.e., Hot Core andCompact Ridge) are not coincident with formaldehydeemission. In fact, it is possible and even likely that we areseeing quiescent material surrounding the hotter sources, suchas the well-known quiescent ridge in Orion-KL. Incidentally,the spatial difference between the formaldehyde and methanolemission has already been observed toward others sources,such as the Horsehead Photon-dominated Region (PDR) andits associated dense core (Guzmán et al. 2013) and the OrionBar PDR (Leurini et al. 2006, 2010). In their respectiveanalyses, the authors have shown that the UV radiation fieldaffects the gas-phase abundance of formaldehyde and metha-nol. More specifically, the H2CO/CH3OH abundance ratio is
expected to be higher in high-FUV illuminated environmentscompared with denser and less illuminated regions. In thislight, the entire Orion-KL quiescent ridge gas is a face-on PDR(see Irvine et al. 1987; Persson et al. 2007; Lerate et al. 2008),and therefore the photodissociation of gas-phase methanol intoformaldehyde might occur (e.g., see, Le Teuff et al. 2000;Leurini et al. 2006, 2010). In this context, we determine theabundance ratio of H2CO/CH3OH in the formaldehyde clumps.Comparison to ratios measured toward other PDRs would thenilluminate whether the Orion PDR is influencing the localchemistry of dense material surrounding the hot embeddedcores.The determination of the methanol column density (see
Equation (2)) relies on the assumptions that the CH3OH-Etransitions listed in Table 3 are optically thin and that therotational temperature is the same as that of H CO2
13 . It isimportant to note that toward the dF1 and dF2 emission peaks,the CH3OH-E lines are strongly blended (see Figure 6),preventing us from deriving the column density of methanol atthose positions. Regarding the dF3 and dF4 regions, theresulting H2CO/CH3OH abundance ratio lies in the range3.5–4.5, which might suggest a slight decrease in the methanolabundance in the quiescent ridge. However, our derived ratio islower by at least a factor of 3–400 compared with thatestimated by Leurini et al. (2010) toward the Orion Bar,suggesting that the production of formaldehyde in Orion-KLthrough the photodissociation of gas-phase methanol is not themain formation route. Finally, it is noteable that our estimatedH2CO/CH3OH abundance ratio is more consistent with thatfound in hot-corino regions (see Maret et al. 2004, 2005 andGuzmán et al. 2013 for a review). This finding leads us to
Figure 4. HDCO and H CO213 spectra observed toward dF1, dF2, dF3, and dF4. The red dashed line indicates the vLSR toward each peak (i.e., 9.8, 7.5, 8.0, and
8.4 km s−1, respectively).
6
The Astrophysical Journal, 808:155 (9pp), 2015 August 1 Favre et al.

argue that formaldehyde emission in Orion-KL is more likelyprobing the edge of the hot gas.
4.3. Implications: On the Formaldehyde Formation
Formaldehyde and methanol are believed to be formed onice grain mantles during the pre-stellar cold phase (T < 50 K)from successive hydrogenation reactions of H or D atoms withCO (see, e.g., Charnley et al. 1997; Watanabe & Kouchi 2002;Cazaux et al. 2011; Taquet et al. 2012):
CO HCO H CO CH O CH OH (3)2 3 3l l l l
and
CO DCO HDCO CH DO CH DOH. (4)2 2l l l l
Laboratory experiments have shown that the sequential COhydrogenation process (i.e., Reaction (3)) efficiently formsboth formaldehyde and methanol at low temperatures (⩽20 K,see Hidaka et al. 2004; Watanabe et al. 2004; Fuchs et al.2009). Thus, if methanol and formaldehyde both purelyoriginate from ice grain mantles, the measured D/H ratioshould be similar (within a factor of two) for both molecules,and, in particular, these molecules should trace similarenvironments while desorbed as they share a common origin.This is inconsistent with our observations (see Section 4.1),and thus strongly argues in favor of differences in the chemicalformation pathways of these deuterated molecules. Thus,CH3OH and H2CO emission is probing different spatialregions within the central region of Orion-KL that may notbe coeval. We infer that a likely scenario is HDCO productionthrough hot gas-phase deuterium chemistry in the colder gasassociated with Orion-KL, as suggested by Loren & Wootten(1985). More specifically, at relatively high temperatures (T ∼70–100 K, Wootten 1987; Öberg et al. 2012), such as thatderived in this study (see Figure 5), reaction (5) is active due toits high exothermicity (ΔE of 654 K, see Roueff et al. 2013)and favors deuterium fractionation through reactions involvingCH2D
+ as a parent molecule (Favre et al. 2015):
CH HD CH D H E. (5)3 2 2� � � %� �p
In that context, reaction (5) can then lead to the formation ofHDCO and H2CO (see further details in Loren & Woot-ten 1985). Incidentally, the temperature of this colder regionassociated with Orion-KL is not sufficient to desorb CH3OHfrom the surface of icy grain mantles (T ⩾ 120–160 K; see
Figure 5. Top: H CO213 excitation temperature map toward Orion-KL. Bottom:
D/H ratio for formaldehyde within Orion-KL.
Table 2Total Formaldehyde Column Densities and D/H Ratios
Position N(HDCO) N(H213CO) N(H2CO) D/H Ratio
(×1014 cm−2) (×1014 cm−2) (×1016 cm−2)
dF1 4.81(0.62) 21.70(2.72) 15.20(1.90) 0.0032(0.0008)dF2 2.86(0.20) 11.30(1.22) 7.92(0.86) 0.0036(0.0006)dF3 2.94(0.67) 9.06(1.00) 6.34(0.70) 0.0046(0.0016)dF4 3.99(0.54) 6.34(0.85) 4.44(0.60) 0.0090(0.0024)
Note. The total H213CO and H2CO column densities have been derived assuming an ortho:para ratio of 3:1 (e.g., see Kahane et al. 1984; Crockett et al. 2014) and a
12C/13C isotopic ratio of 70 (e.g., see, Favre et al. 2014).
Table 3Spectroscopic Parameters of the CH3OH-E Methanol Transitions Observed
with the SMA Towards the dF3 and dF4 Emission Peaksa
Frequency Transition Eup A(MHz) (K) (×10−5 s−1)
193415.37 40,4–30,3vt = 0 36.3 3.03
193441.61 41,4–31,3vt = 0 28.8 2.84
193474.33 43,1–33,0vt = 0 70.9 1.33
193488.99 43,2–33,1vt = 0 85.9 1.33
193506.60 41,3–31,2vt = 0 44.3 2.91
Note.a Measured and predicted transitions are available from the CDMS database(Müller et al. 2005) and at Splatalogue (www.splatalogue.net, Remijanet al. 2007).
7
The Astrophysical Journal, 808:155 (9pp), 2015 August 1 Favre et al.

Collings et al. 2004; Green et al. 2009). However, in the innerhottest part of Orion-KL where methanol emits, most of theformaldehyde might have been converted into methanol bygrain-surface reactions (Watanabe & Kouchi 2002) during acolder phase prior to the explosive event. Then, upon heating,methanol is released from grain surfaces into the gas phasealong with little formaldehyde. We stress that the release ofmethanol into gas phase in this region is mainly due to internalradiation heating (i.e., outflow, shock, IR sources) but not heatfrom the PDR (see Section 4.2). In this instance, the D/H ratioand the spatial distribution of methanol should differ from thatof formaldehyde.
5. CONCLUSIONS
We have characterized, for the first time, the spatialdistribution of deuterated formaldehyde (HDCO) towardOrion-KL with an angular resolution of 3″. 4 × 3″. 0 using theSMA. The new SMA broadband capability of the 230 GHzband allowed simultaneous observation of both HDCO andH CO2
13 within relatively sparse spectra. Four main emissionpeaks, labeled in this study dF1 to dF4, are identified in theformaldehyde emission image. An important result is that thespatial distribution the emission of the HDCO and H CO2
13
emission differ from that of CH3OH and its deuteratedisotopologues. The emission maps show that methanol emitsin the inner part of Orion-KL, while formaldehyde is found inthe colder gas enveloping the CH3OH emission on four sides:one located left of the Hot Core (dF1), one toward the north ofthe Compact Ridge (dF2), and two in the quiescent ridge (dF3and dF4). In addition, we derive a HDCO/H2CO ratio whichlies in the range 0.003–0.009 within the region; this value is an
order of magnitude higher than the D/H measured formethanol. We suggest that the high measured D/H ratio forformaldehyde and its spatial distribution in Orion-KL are acombination of gas-phase chemistry in the cooler gasassociated with Orion-KL, and a conversion of formaldehydeinto methanol on ice grain mantles in the earlier history of theinner part.
Support for this work was provided by NASA (Herschel OTfunding) through an award issued by JPL/Caltech. This papermakes use of SMA data. C.F. thanks Tzu-Cheng Peng forhelpful discussions.Facility: SMA.
REFERENCES
Bally, J., Cunningham, N. J., Moeckel, N., et al. 2011, ApJ, 727, 113Bergin, E. A., Goldsmith, P. F., Snell, R. L., & Ungerechts, H. 1994, ApJ,
431, 674Bergin, E. A., Phillips, T. G., Comito, C., et al. 2010, A&A, 521, L20Beuther, H., Zhang, Q., Greenhill, L. J., et al. 2005, ApJ, 632, 355Beuther, H., Zhang, Q., Reid, M. J., et al. 2006, ApJ, 636, 323Blake, G. A., Sutton, E. C., Masson, C. R., & Phillips, T. G. 1987, ApJ,
315, 621Bocquet, R., Demaison, J., Cosléou, J., et al. 1999, JMoSp, 195, 345Brouillet, N., Despois, D., Baudry, A., et al. 2013, A&A, 550, A46Cazaux, S., Caselli, P., & Spaans, M. 2011, ApJL, 741, L34Charnley, S. B., Tielens, A. G. G. M., & Rodgers, S. D. 1997, ApJL, 482, L203Collings, M. P., Anderson, M. A., Chen, R., et al. 2004, MNRAS, 354, 1133Comito, C., Schilke, P., Phillips, T. G., et al. 2005, ApJS, 156, 127Crockett, N. R., Bergin, E. A., Neill, J. L., et al. 2014, ApJ, 787, 112Crockett, N. R., Bergin, E. A., Wang, S., et al. 2010, A&A, 521, L21+Esplugues, G. B., Tercero, B., Cernicharo, J., et al. 2013, A&A, 556, A143Favre, C., Bergin, E. A., Cleeves, L. I., et al. 2015, ApJL, 802, L23Favre, C., Carvajal, M., Field, D., et al. 2014, ApJS, 215, 25Favre, C., Despois, D., Brouillet, N., et al. 2011a, A&A, 532, A32
Figure 6. CH3OH-E spectra observed toward dF1, dF2, dF3, and dF4.
8
The Astrophysical Journal, 808:155 (9pp), 2015 August 1 Favre et al.
Favre, C., Wootten, H. A., Remijan, A. J., et al. 2011b, ApJL, 739, L12Friedel, D. N., & Snyder, L. E. 2008, ApJ, 672, 962Friedel, D. N., & Widicus Weaver, S. L. 2012, ApJS, 201, 17Fuchs, G. W., Cuppen, H. M., Ioppolo, S., et al. 2009, A&A, 505, 629Goddi, C., Greenhill, L. J., Humphreys, E. M. L., Chandler, C. J., &
Matthews, L. D. 2011a, ApJL, 739, L13Goddi, C., Humphreys, E. M. L., Greenhill, L. J., Chandler, C. J., &
Matthews, L. D. 2011b, ApJ, 728, 15Goldsmith, P. F., & Langer, W. D. 1999, ApJ, 517, 209Gómez, L., Rodríguez, L. F., Loinard, L., et al. 2005, ApJ, 635, 1166Gómez, L., Rodríguez, L. F., Loinard, L., et al. 2008, ApJ, 685, 333Green, S. D., Bolina, A. S., Chen, R., et al. 2009, MNRAS, 398, 357Guélin, M., Brouillet, N., Cernicharo, J., Combes, F., & Wooten, A. 2008,
Ap&SS, 313, 45Guzmán, V. V., Goicoechea, J. R., Pety, J., et al. 2013, A&A, 560, A73Hidaka, H., Watanabe, N., Shiraki, T., Nagaoka, A., & Kouchi, A. 2004, ApJ,
614, 1124Ho, P. T. P., Moran, J. M., & Lo, K. Y. 2004, ApJL, 616, L1Irvine, W. M., Goldsmith, P. F., & Hjalmarson, A. 1987, in Chemical
Abundances in Molecular Clouds, ed. D. J. Hollenbach &H. A. Thronson, Jr. (Astrophysics and Space Science Library, Vol. 134;Dordrecht: D. Reidel), 56
Jacq, T., Walmsley, C. M., Henkel, C., et al. 1990, A&A, 228, 447Jacq, T., Walmsley, C. M., Mauersberger, R., et al. 1993, A&A, 271, 276Johns, J. W. C., & McKellar, A. R. W. 1977, JMoSp, 64, 327Kahane, C., Lucas, R., Frerking, M. A., Langer, W. D., & Encrenaz, P. 1984,
A&A, 137, 211Le Teuff, Y. H., Millar, T. J., & Markwick, A. J. 2000, A&AS, 146, 157Lerate, M. R., Yates, J., Viti, S., et al. 2008, MNRAS, 387, 1660Leurini, S., Parise, B., Schilke, P., Pety, J., & Rolffs, R. 2010, A&A, 511, A82Leurini, S., Rolffs, R., Thorwirth, S., et al. 2006, A&A, 454, L47Loren, R. B., & Wootten, A. 1985, ApJ, 299, 947Maret, S., Ceccarelli, C., Caux, E., et al. 2004, A&A, 416, 577Maret, S., Ceccarelli, C., Tielens, A. G. G. M., et al. 2005, A&A, 442, 527Mauersberger, R., Henkel, C., Jacq, T., & Walmsley, C. M. 1988, A&A,
194, L1Menten, K. M., Reid, M. J., Forbrich, J., & Brunthaler, A. 2007, A&A,
474, 515Müller, H. S. P., Gendriesch, R., Margulès, L., et al. 2000, PCCP, 2, 3401Müller, H. S. P., Schlöder, F., Stutzki, J., & Winnewisser, G. 2005, JMoSt,
742, 215
Neill, J. L., Crockett, N. R., Bergin, E. A., Pearson, J. C., & Xu, L.-H. 2013a,ApJ, 777, 85
Neill, J. L., Wang, S., Bergin, E. A., et al. 2013b, ApJ, 770, 142Nissen, H. D., Cunningham, N. J., Gustafsson, M., et al. 2012, A&A,
540, A119Öberg, K. I., Qi, C., Wilner, D. J., & Hogerheijde, M. R. 2012, ApJ, 749, 162Pagani, L., Salez, M., & Wannier, P. G. 1992, A&A, 258, 479Peng, T.-C., Despois, D., Brouillet, N., Parise, B., & Baudry, A. 2012, A&A,
543, A152Peng, T.-C., Despois, D., Brouillet, N., et al. 2013, A&A, 554, A78Persson, C. M., Olofsson, A. O. H., Koning, N., et al. 2007, A&A,
476, 807Qi, C. 2007, AdSpR, 40, 639Remijan, A. J., Markwick-Kemper, A., & ALMA Working Group on Spectral
Line Frequencies 2007, BAAS, 38, 963Rodríguez, L. F., Poveda, A., Lizano, S., & Allen, C. 2005, ApJL, 627, L65Rodriguez Kuiper, E. N., Kuiper, T. B. H., & Zuckerman, B. 1978, ApJL,
219, L49Roueff, E., Gerin, M., Lis, D. C., et al. 2013, JPCA, 117, 9959Schilke, P., Benford, D. J., Hunter, T. R., Lis, D. C., & Phillips, T. G. 2001,
ApJS, 132, 281Schilke, P., Groesbeck, T. D., Blake, G. A., & Phillips, T. G. 1997, ApJS,
108, 301Stahl, O., Casassus, S., & Wilson, T. 2008, A&A, 477, 865Taquet, V., Ceccarelli, C., & Kahane, C. 2012, ApJL, 748, L3Tercero, B., Cernicharo, J., Pardo, J. R., & Goicoechea, J. R. 2010, A&A,
517, A96Tercero, B., Vincent, L., Cernicharo, J., Viti, S., & Marcelino, N. 2011, A&A,
528, A26Turner, B. E. 1990, ApJL, 362, L29Turner, B. E., Fourikis, N., Morris, M., Palmer, P., & Zuckerman, B. 1975,
ApJL, 198, L125Walmsley, C. M., Hermsen, W., Henkel, C., Mauersberger, R., & Wilson, T. L.
1987, A&A, 172, 311Wang, S., Bergin, E. A., Crockett, N. R., et al. 2011, A&A, 527, A95+Watanabe, N., & Kouchi, A. 2002, ApJL, 571, L173Watanabe, N., Nagaoka, A., Shiraki, T., & Kouchi, A. 2004, ApJ, 616, 638Widicus Weaver, S. L., & Friedel, D. N. 2012, ApJS, 201, 16Wootten, A. 1987, in IAU Symp. 120, Astrochemistry, ed. M. S. Vardya &
S. P. Tarafdar (Dordrecht: D. Reidel), 311Zapata, L. A., Schmid-Burgk, J., & Menten, K. M. 2011, A&A, 529, A24
9
The Astrophysical Journal, 808:155 (9pp), 2015 August 1 Favre et al.