
Strange Hadron Spectroscopy with Secondary KL Beam at ...
136
Date: May 30, 2018 Proposal for JLab PAC46 Strange Hadron Spectroscopy with Secondary K L Beam at GlueX A. Ali 18 , M. B. Ali 47 , M. J. Amaryan 45,*,† , E. G. Anassontzis 2 , A. V. Anisovich 4,48 , A. Austregesilo 30 , M. Baalouch 45 , F. Barbosa 30 , J. Barlow 13 , A. Barnes 7 , E. Barriga 13 , M. Bashkanov 10,† , A. Bazavov 39 , T. D. Beattie 50 , R. Bellwied 20 , V. V. Berdnikov 8 , V. Bernard 46 , T. Black 42 , W. Boeglin 12 , M. Boer 8 , W. J. Briscoe 14 , T. Britton 30 , W. K. Brooks 53 , B. E. Cannon 13 , N. Cao 22 , E. Chudakov 30 , G. Colangelo 3 , P. L. Cole 21 , S. Cole 1 , O. Cortes-Becerra 14 , V. Crede 13 , M. M. Dalton 30 , T. Daniels 42 , D. Day 58 , P. Degtyarenko 30 , A. Deur 30 , S. Dobbs 13 , G. Dodge 45 , A. G. Dolgolenko 27 , M. Döring 14,30 , M. Dugger 1 , R. Dzhygadlo 18 , S. Eidelman 5,44 , R. Edwards 30 , H. Egiyan 30 , A. Ernst 13 , A. Eskandarian 14 , P. Eugenio 13 , C. Fanelli 36 , S. Fegan 14 , A. Filippi 25 , A. M. Foda 50 , J. Frye 23 , S. Furletov 30 , L. Gan 42 , A. Gasparyan 41 , G. Gavalian 30 , M. Gauzshtein 54,55 , N. Gevorgyan 61 , C. Gleason 23 , D. I. Glazier 17 , J. Goity 30,19 , V. S. Goryachev 27 , K. Götzen 18 , A. Goncalves 13 , L. Guo 12 , H. Haberzettl 14 , M. Hadžimehmedovi´ c 57 , H. Hakobyan 53 , A. Hamdi 18 , S. Han 60 , J. Hardin 36 , A. Hayrapetyan 16 , G. M. Huber 50 , A. Hurley 59 , C. E. Hyde 45 , T. Horn 8 , D. G. Ireland 17 , M. Ito 30 , R. Jaffe 36 , N. Jarvis 7 , R. T. Jones 9 , V. Kakoyan 61 , G. Kalicy 8 , M. Kamel 12 , C. D. Keith 30 , C. W. Kim 14 , F. J. Klein 14 , B. Z. Kopeliovich 53 , C. Kourkoumeli 2 , G. Krafft 30 , S. Kuleshov 53 , I. Kuznetsov 54,55 , A. B. Laptev 33 , I. Larin 35 , D. Lawrence 30 , D. I. Lersch 13 , H. Leutwyler 3 , M. Levillain 41 , H. Li 7 , W. Li 59 , K. Livingston 17 , B. Liu 22 , G. J. Lolos 50 , V. E. Lyubovitskij 56,54,55,53 , D. Mack 30 , M. Mai 14 , D. M. Manley 31 , M. Mazouz 47 , H. Marukyan 61 , V. Mathieu 30 , M. Matveev 48 , V. Matveev 27 , M. McCaughan 30 , W. McGinley 7 , M. McCracken 7 , J. McIntyre 9 , U.-G. Meißner 4,29 , C. A. Meyer 7 , R. Miskimen 35 , R. E. Mitchell 23 , F. Mokaya 9 , V. Mokeev 30 , C. Morningstar 7 , B. Moussallam 46 , F. Nerling 18 , K. Nakayama 15 , Y. Oh 32 , R. Omerovi´ c 57 , H. Osmanovi´ c 57 , A. Ostrovidov 13 , Z. Papandreou 50 , K. Park 30 , E. Pasyuk 30 , M. Patsyuk 36 , P. Pauli 17 , R. Pedroni 41 , J. R. Pelaez 34 , L. Pentchev 30 , K. J. Peters 18 , W. Phelps 14 , A. Pilloni 30 , E. Pooser 30 , J. W. Price 6 , N. Qin 43 , J. Reinhold 12 , D. Richards 30 , D.-O. Riska 11 , B. Ritchie 1 , J. Ritman 51,28,† , L. Robison 43 , A. Rodas 34 , D. Romanov 37 , C. Romero 53 , J. Ruiz de Elvira 3 , H-Y. Ryu 49 , C. Salgado 40 , E. Santopinto 24 , A. V. Sarantsev 4,48 , T. Satogata 30 , A. M. Schertz 59 , R. A. Schumacher 7 , C. Schwarz 18 , J. Schwiening 18 , A. Yu. Semenov 50 , I. A. Semenova 50 , K. K. Seth 43 , X. Shen 22 , M. R. Shepherd 23 , E. S. Smith 30 , D. I. Sober 8 , D. Sokhan 17 , A. Somov 30 , S. Somov 37 , O. Soto 53 , M. Staib 7 , J. Stahov 57 , J. R. Stevens 59,† , I. I. Strakovsky 14,† , A. Švarc 52 , A. Szczepaniak 23,30 , V. Tarasov 27 , S. Taylor 30 , A. Teymurazyan 50 , A. Trabelsi 47 , G. Vasileiadis 2 , D. Watts 10 , D. Werthmüller 17 , T. Whitlatch 30 , N. Wickramaarachchi 45 , M. Williams 36 , B. Wojtsekhowski 30 , R. L. Workman 14 , T. Xiao 43 , Y. Yang 36 , N. Zachariou 10 , J. Zarling 23 , J. Zhang 58 , Z. Zhang 60 , G. Zhao 22 , B. Zou 26 , Q. Zhou 22 , X. Zhou 60 , B. Zihlmann 30 i
-
Upload
khangminh22 -
Category
Documents
-
view
2 -
download
0
Transcript of Strange Hadron Spectroscopy with Secondary KL Beam at ...

Date: May 30, 2018
Proposal for JLab PAC46
Strange Hadron Spectroscopy with Secondary KL Beam at GlueX
A. Ali18, M. B. Ali47, M. J. Amaryan45,∗,†, E. G. Anassontzis2, A. V. Anisovich4,48,A. Austregesilo30, M. Baalouch45, F. Barbosa30, J. Barlow13, A. Barnes7, E. Barriga13,
M. Bashkanov10,†, A. Bazavov39, T. D. Beattie50, R. Bellwied20, V. V. Berdnikov8, V. Bernard46,T. Black42, W. Boeglin12, M. Boer8, W. J. Briscoe14, T. Britton30, W. K. Brooks53, B. E. Cannon13,N. Cao22, E. Chudakov30, G. Colangelo3, P. L. Cole21, S. Cole1, O. Cortes-Becerra14, V. Crede13,M. M. Dalton30, T. Daniels42, D. Day58, P. Degtyarenko30, A. Deur30, S. Dobbs13, G. Dodge45,
A. G. Dolgolenko27, M. Döring14,30, M. Dugger1, R. Dzhygadlo18, S. Eidelman5,44, R. Edwards30,H. Egiyan30, A. Ernst13, A. Eskandarian14, P. Eugenio13, C. Fanelli36, S. Fegan14, A. Filippi25,
A. M. Foda50, J. Frye23, S. Furletov30, L. Gan42, A. Gasparyan41, G. Gavalian30,M. Gauzshtein54,55, N. Gevorgyan61, C. Gleason23, D. I. Glazier17, J. Goity30,19,
V. S. Goryachev27, K. Götzen18, A. Goncalves13, L. Guo12, H. Haberzettl14,M. Hadžimehmedovic57, H. Hakobyan53, A. Hamdi18, S. Han60, J. Hardin36, A. Hayrapetyan16,
G. M. Huber50, A. Hurley59, C. E. Hyde45, T. Horn8, D. G. Ireland17, M. Ito30, R. Jaffe36,N. Jarvis7, R. T. Jones9, V. Kakoyan61, G. Kalicy8, M. Kamel12, C. D. Keith30, C. W. Kim14,
F. J. Klein14, B. Z. Kopeliovich53, C. Kourkoumeli2, G. Krafft30, S. Kuleshov53, I. Kuznetsov54,55,A. B. Laptev33, I. Larin35, D. Lawrence30, D. I. Lersch13, H. Leutwyler3, M. Levillain41, H. Li7,
W. Li59, K. Livingston17, B. Liu22, G. J. Lolos50, V. E. Lyubovitskij56,54,55,53, D. Mack30,M. Mai14, D. M. Manley31, M. Mazouz47, H. Marukyan61, V. Mathieu30, M. Matveev48,
V. Matveev27, M. McCaughan30, W. McGinley7, M. McCracken7, J. McIntyre9,U.-G. Meißner4,29, C. A. Meyer7, R. Miskimen35, R. E. Mitchell23, F. Mokaya9, V. Mokeev30,
C. Morningstar7, B. Moussallam46, F. Nerling18, K. Nakayama15, Y. Oh32, R. Omerovic57,H. Osmanovic57, A. Ostrovidov13, Z. Papandreou50, K. Park30, E. Pasyuk30, M. Patsyuk36,
P. Pauli17, R. Pedroni41, J. R. Pelaez34, L. Pentchev30, K. J. Peters18, W. Phelps14, A. Pilloni30,E. Pooser30, J. W. Price6, N. Qin43, J. Reinhold12, D. Richards30, D.-O. Riska11, B. Ritchie1,J. Ritman51,28,†, L. Robison43, A. Rodas34, D. Romanov37, C. Romero53, J. Ruiz de Elvira3,
H-Y. Ryu49, C. Salgado40, E. Santopinto24, A. V. Sarantsev4,48, T. Satogata30, A. M. Schertz59,R. A. Schumacher7, C. Schwarz18, J. Schwiening18, A. Yu. Semenov50, I. A. Semenova50,
K. K. Seth43, X. Shen22, M. R. Shepherd23, E. S. Smith30, D. I. Sober8, D. Sokhan17, A. Somov30,S. Somov37, O. Soto53, M. Staib7, J. Stahov57, J. R. Stevens59,†, I. I. Strakovsky14,†, A. Švarc52,
A. Szczepaniak23,30, V. Tarasov27, S. Taylor30, A. Teymurazyan50, A. Trabelsi47, G. Vasileiadis2,D. Watts10, D. Werthmüller17, T. Whitlatch30, N. Wickramaarachchi45, M. Williams36,
B. Wojtsekhowski30, R. L. Workman14, T. Xiao43, Y. Yang36, N. Zachariou10, J. Zarling23,J. Zhang58, Z. Zhang60, G. Zhao22, B. Zou26, Q. Zhou22, X. Zhou60, B. Zihlmann30
i

1 Arizona State University (ASU), Tempe, AZ 85287, USA2 National and Kapodistrian University of Athens, Athens 15771, Greece3 University of Bern, CH-3012 Bern, Switzerland4 Helmholtz-Institut für Strahlen- und Kernphysik, Universität Bonn, Bonn 53115, Germany5 Budker Institute of Nuclear Physics SB RAS, Novosibirsk 630090, Russia6 California State University, Dominguez Hills, Carson, CA 90747, USA7 Carnegie Mellon University (CMU), Pittsburgh, PA 15213, USA8 The Catholic University of America (CUA), Washington, DC 20064, USA9 University of Connecticut, Storrs, CO 06269, USA10 University of Edinburgh, Edinburgh EH9 3FD, United Kingdom11 Finnish Society of Science and Letters, Helsinki 00130, Finland12 Florida International University (FIU), Miami, FL 33199, USA13 Florida State University (FSU), Tallahassee, FL 32306, USA14 The George Washington University (GW), Washington, DC 20052, USA15 University of Georgia (UGA), Athens, GA 30602, USA16 Justus Liebig-University of Giessen, Giessen 35392, Germany17 University of Glasgow, Glasgow G12 8QQ, United Kingdom18 GSI Helmholtzzentrum für Schwerionenforschung GmbH, Darmstadt 64291, Germany19 Hampton University, Hampton, VA 23668, USA20 University of Houston, Houston, TX 77204, USA21 Lamar University, Beaumont, TX 77710, USA22 Institute of High Energy Physics, CAS, Beijing Shi, 100049, People’s Republic of China23 Indiana University (IU), Bloomington, IN 47403, USA24 I.N.F.N. Sezione di Genova, Genova 16146, Italy25 I.N.F.N. Sezione di Torino, Torino 10125, Italy26 Institute of Theoretical Physics, CAS, Beijing 100190, People’s Republic of China27 National Research Centre “Kurchatov Institute", Institute for Theoretical and ExperimentalPhysics (ITEP), Moscow 117218, Russia28 Institute für Kernphysik & Jülich Center für Hadron Physics, Jülich 52425, Germany29 Institute for Advanced Simulation, Institut für Kernphysik and Jülich Center for Hadron Physics,Jülich 52425, Germany30 Thomas Jefferson National Accelerator Facility (JLab), Newport News, VA 23606, USA31 Kent State University (KSU), Kent, OH 44242, USA32 Kyungpook National University, Daegu 702-701, Republic of Korea33 Los Alamos National Laboratory (LANL), Los Alamos, NM 87545, USA34 Universidad Complutense de Madrid, 28040 Madrid, Spain35 University of Massachusetts, Amherst, MA 01003, USA36 Massachusetts Institute of Technology (MIT), Cambridge, MA 02139, USA37 National Research Nuclear University Moscow Engineering Physics Institute (MEPhI), Moscow115409, Russia38 Instituto de Ciencias Nucleares, Universidad Nacional Autonoma de Mexico, Ciudad de Mexico04510, Mexico39 Michigan State University (MSU), East Lansing, MI 48824, USA40 Norfolk State University, Norfolk, VA 23504, USA41 North Carolina A&T State University (N.C.A&T), Greensboro, NC 27411, USA
ii

42 University of North Carolina at Wilmington (UNCW), Wilmington, NC 28403, USA43 Northwestern University, Evanston, IL 60208, USA44 Novosibirsk State University, Novosibirsk 630090, Russia45 Old Dominion University (ODU), Norfolk, VA 23529, USA46 Universite Paris-Sud 11, 91400 Orsay, France47 University of Tunis El-Manar, Tunis 1068, Tunisia48 National Research Centre “Kurchatov Institute", Petersburg Nuclear Physics Institute (PNPI),Gatchina 188300, Russia49 Pusan National University, Busan 46241, Republic of Korea50 University of Regina (UR), Regina, SA S4S 0A2, Canada51 Institut für Experimentalphysik I - Ruhr-Universität, Bochum 44780, Germany52 Rudjer Boškovic Institute, Zagreb 10002, Croatia53 Universidad Técnica Federico Santa María, Casilla 110-V Valparaíso, Chile54 Tomsk State University, Tomsk 634050, Russia55 Tomsk Polytechnic University, Tomsk 634050, Russia56 Institute of Theoretical Physics, University of Tübingen, Tübingen 72076, Germany57 University of Tuzla, Tuzla 75000, Bosnia and Herzegovina58 University of Virginia (UVa), Charlottesville, VA 22904, USA59 College of William and Mary (W&M), Williamsburg, VA 23185, USA60 Wuhan University, Wuhan, Hubei 430072, People’s Republic of China61 A. I. Alikhanian National Science Laboratory (Yerevan Physics Institute (YerPhi)), Yerevan0036, Armenia∗ Contact Person: [email protected]† Spokesperson
(The GLUEX Collaboration)
iii

Abstract
We propose to create a secondary beam of neutral kaons at Hall D at Jefferson Lab to be used withthe GlueX experimental setup for strange hadron spectroscopy. The superior CEBAF electronbeam will enable a flux on the order of 1 × 10⁴ KL/s, which exceeds the flux of that previouslyattained at SLAC by three orders of magnitude. This will allow a broad range of measurements thatwill correspondingly improve the statistics of earlier data obtained on a hydrogen target likewiseby three orders of magnitude. The use of a deuteron target will provide first measurements everwith neutral kaons on neutrons.
The experiment will measure both differential cross sections and self-analyzed polarizations of theproduced Λ, Σ, Ξ, and Ω hyperons using the GlueX detector at the Jefferson Lab Hall D. The mea-surements will span CM cos θ from −0.95 to 0.95 in the range W = 1490 MeV to 2500 MeV. Thenew data will significantly constrain the partial wave analyses and reduce model-dependent uncer-tainties in the extraction of the properties and pole positions of the strange hyperon resonances,and establish the orbitally excited multiplets in the spectra of the Ξ and Ω hyperons. Comparisonwith the corresponding multiplets in the spectra of the charm and bottom hyperons will illuminatethe approach to heavy flavor symmetry and the accuracy of QCD based calculations.
The proposed facility will have a defining impact in the strange meson sector trough measurementsof the final state Kπ system up to 2 GeV invariant mass. This will allow the determination ofpole positions and widths of all K∗(Kπ) P-wave resonances and finaly settle the question of theexistence or nonexistence of scaler meson κ(800) and subsequently of the low-lying scalar nonetin general.
iv

Contents
1 Executive Summary 1
2 Scope of the Proposal 2
3 The Case for Strange Hyperon Spectroscopy 4
3.1 Heavy Quark Symmetry and the Hyperons . . . . . . . . . . . . . . . . . . . . . . 4
3.2 The Λ(1405)1/2− − Λ(1520)3/2− Doublet . . . . . . . . . . . . . . . . . . . . . 5
3.3 The Low-Lying Positive-Parity Resonances . . . . . . . . . . . . . . . . . . . . . 6
3.4 The Negative-Parity Hyperon Resonances . . . . . . . . . . . . . . . . . . . . . . 6
3.5 Summary for the Case . . . . . . . . . . . . . . . . . . . . . . . . . . . . . . . . 7
4 Strange Hadrons from the Lattice 8
5 The Interest of the RHIC/LHC Community in Excited Hyperon Measurements 10
6 Previous Measurements for Hyperons 13
7 Phenomenology / Partial-Wave Analysis 14
7.1 KN and KN Final States . . . . . . . . . . . . . . . . . . . . . . . . . . . . . . 15
7.2 πΛ Final States . . . . . . . . . . . . . . . . . . . . . . . . . . . . . . . . . . . . 16
7.3 πΣ Final States . . . . . . . . . . . . . . . . . . . . . . . . . . . . . . . . . . . . 18
7.4 KΞ Final States . . . . . . . . . . . . . . . . . . . . . . . . . . . . . . . . . . . . 18
7.5 Excited S = −2 and S = −3 baryons . . . . . . . . . . . . . . . . . . . . . . . . 19
7.6 Summary for PWA . . . . . . . . . . . . . . . . . . . . . . . . . . . . . . . . . . 20
8 Theory for “Neutron" Target Measurements 21
9 πK Scattering Amplitudes and Strange Meson Resonances 24
9.1 Note on the Strange Meson Spectrum . . . . . . . . . . . . . . . . . . . . . . . . 24
9.2 Strange Exotics . . . . . . . . . . . . . . . . . . . . . . . . . . . . . . . . . . . . 24
9.3 Status of πK Scattering Measurements . . . . . . . . . . . . . . . . . . . . . . . . 26
v

9.4 Theory . . . . . . . . . . . . . . . . . . . . . . . . . . . . . . . . . . . . . . . . . 28
10 Proposed KL Beam Facility 29
10.1 KL Beam at Hall D . . . . . . . . . . . . . . . . . . . . . . . . . . . . . . . . . . 29
10.1.1 Beamline Delivery for Secondary KL Beam . . . . . . . . . . . . . . . . . 31
10.1.2 Compact Photon Source: Conceptual Design . . . . . . . . . . . . . . . . 33
10.1.3 Be Target Assembly: Conceptual Design . . . . . . . . . . . . . . . . . . 35
10.1.4 KL Flux Monitor . . . . . . . . . . . . . . . . . . . . . . . . . . . . . . . 36
10.1.5 KL Beam Parameters . . . . . . . . . . . . . . . . . . . . . . . . . . . . . 39
10.2 LH2/LD2 Cryogenic Target for Neutral Kaon Beam at Hall D . . . . . . . . . . . . 47
11 Expected Results and Beam Time Requirements 49
11.1 Simulations and Reconstruction of Various Channels using GlueX Detector . . . . 49
11.2 Expected results in Hyperon Spectroscopy . . . . . . . . . . . . . . . . . . . . . . 50
11.2.1 KLp→ KSp Reaction . . . . . . . . . . . . . . . . . . . . . . . . . . . . 50
11.2.2 KLp→ π+Λ Reaction . . . . . . . . . . . . . . . . . . . . . . . . . . . . 51
11.2.3 Cascade Reactions on Proton and Neutron Targets: KLp → K+Ξ0 andKLn→ K+Ξ− . . . . . . . . . . . . . . . . . . . . . . . . . . . . . . . . 52
11.2.4 KLp→ K+n Reaction . . . . . . . . . . . . . . . . . . . . . . . . . . . . 59
11.2.5 Expectations for Λ∗ and Σ∗ Spectroscopy via a π+p PWA . . . . . . . . . 61
11.3 Expected results in Strange Meson Spectroscopy . . . . . . . . . . . . . . . . . . 64
11.3.1 Reaction KLp→ K−π+p . . . . . . . . . . . . . . . . . . . . . . . . . . 64
11.3.2 Simulation Study of KLp→ K∗0(892)p→ K+π−p . . . . . . . . . . . . 65
11.3.3 K∗(892) Production in KLF . . . . . . . . . . . . . . . . . . . . . . . . . 68
11.3.4 Impact on P -Wave Phase-Shift Study . . . . . . . . . . . . . . . . . . . . 68
11.3.5 Kπ S-Wave and Kappa Investigation . . . . . . . . . . . . . . . . . . . . 70
11.4 Expected Statistical Accuracy . . . . . . . . . . . . . . . . . . . . . . . . . . . . 77
12 Summary and Beam Time Request 78
13 Appendix A1: Analysis of Three-Body Final States 81
vi

14 Appendix A2: Determination of Pole Positions 82
15 Appendix A3: Statistics Tools for Spectroscopy of Strange Resonances 85
15.1 Minimizing Resonance Content . . . . . . . . . . . . . . . . . . . . . . . . . . . 85
15.2 Goodness-of-Fit Tests . . . . . . . . . . . . . . . . . . . . . . . . . . . . . . . . . 87
15.3 Representation of Results . . . . . . . . . . . . . . . . . . . . . . . . . . . . . . . 87
16 Appendix A4: Neutron and Gamma Background 87
17 Appendix A5: Details of Monte Carlo Study 92
17.1 Particle Identification . . . . . . . . . . . . . . . . . . . . . . . . . . . . . . . . . 92
17.1.1 Details of MC study for KLp→ KSp . . . . . . . . . . . . . . . . . . . . 93
17.1.2 Details of MC study for KLp→ π+Λ . . . . . . . . . . . . . . . . . . . . 95
17.1.3 Details of MC study for KLp→ K+Ξ0 . . . . . . . . . . . . . . . . . . . 97
17.1.4 Details of MC study for KLp→ K+n . . . . . . . . . . . . . . . . . . . . 101
18 Appendix A6: Details of Monte Carlo Study for KLp→ K∗0(892)p→ K+π−p 105
19 Appendix A7: Current Hadronic Projects 110
19.1 Hyperon Projects . . . . . . . . . . . . . . . . . . . . . . . . . . . . . . . . . . . 110
19.1.1 Project X, USA . . . . . . . . . . . . . . . . . . . . . . . . . . . . . . . . 110
19.1.2 J-PARC, Japan . . . . . . . . . . . . . . . . . . . . . . . . . . . . . . . . 111
19.1.3 Belle, Japan . . . . . . . . . . . . . . . . . . . . . . . . . . . . . . . . . . 112
19.1.4 BaBar, USA . . . . . . . . . . . . . . . . . . . . . . . . . . . . . . . . . 112
19.1.5 PANDA, Germany . . . . . . . . . . . . . . . . . . . . . . . . . . . . . . 112
19.1.6 COMPASS, CERN . . . . . . . . . . . . . . . . . . . . . . . . . . . . . . 112
20 Appendix A8: Additional Physics Potential with a KL Beam 113
vii
1 Executive Summary
We propose to establish a secondary KL beamline at JLab Hall D for scattering experiments onboth proton and neutron (for the first time) targets in order to determine the differential crosssections and the self-polarization of strange hyperons with the GlueX detector to enable precisepartial wave analysis (PWA) in order to determine all the resonances up to 2500 MeV in the spectraof the Λ, Σ, Ξ, and Ω hyperons.
In addition, this facility provides a unique envornement to study strange meson spectroscopythrough the Kπ interaction, to locate the pole positions in the S- and P -waves for the I = 1/2 and3/2 channels. The experiment will settle the still open issue of the existence or non-existence ofthe low lying strange scalar meson κ(800).
The KL beam will be generated by directing a high energy, high intensity photon beam onto aBe-target upstream of the GlueX detector. The flux of the KL beam will be ∼1×10⁴ KL/s ona liquid hydrogen/deuterium (LH2/LD2) cryogenic target within the GlueX detector, which has alarge acceptance with coverage of both charged and neutral particles. This flux will allow statisticsin the case of the hydrogen target to exceed that of earlier experiments by almost three orders ofmagnitude. The main components of the experimental setup are the Compact Photon Source, theBe-target assembly with a beam plug, and sweeping magnet.
The physics case for the experiments is aligned with the 2015 Long Range Plan for Nuclear Sci-ence [1]: “...a better understanding of the role of strange quarks became an important priority".Knowledge of the hyperon spectra is an important component for this. The empirical knowledge ofthe low lying spectra of the Λ and Σ hyperons remains very poor in comparison with that of the nu-cleon, and in the case of the Ξ hyperons extremely poor. The structure of these hyperon resonancescannot be understood without empirical determination of their pole positions and decays, which isone of the goals of the proposed experiments. The determination of the strange hyperon spectrain combination with the current measurements of the spectra of the charm and beauty hyperonsat the LHCb experiment at CERN should allow a clear understanding of soft QCD matter and theapproach to heavy quark symmetry.
As the first stage of the GlueX program the focus will be on two-body and quasi-two-body re-actions: elastic KLp → KSp and charge-exchange KLp → K+n reactions, then on two-bodyreactions producing S = −1(S = −2) hyperons as KLp → π+Λ, KLp → π+Σ0, and KLp →π0Σ+(KLp→ K+Ξ0), as well as three body KLp→ K+K+Ω−.
A coupled channel PWA of the GlueX data will be performed in parallel with an analysis of thedata from the J-PARC K− measurements, when available. The best fit will determine the partialwave amplitudes and the resonance pole positions, residues and Breit-Wigner (BW) parameters.These will provide a benchmark for results of forthcoming QCD lattice calculations and lead tothe desired understanding of the structure of the strange hyperons.
Our timeline is to begin KL beam experiments at the completion of the current GlueX physicsprogram.
1

2 Scope of the Proposal
The nature of QCD confinement continues to provide a challenge to our understanding of softQCD. Experimental investigation of the baryon spectrum provides the obvious avenue to under-stand QCD in this region since the location and properties of the excited states depend on theconfining interaction and the relevant degrees of freedom of hadrons.
Through analyses of decades worth of data, from both hadronic and electromagnetic (EM) scatter-ing experiments, numerous baryon resonances have been observed, many of which with masses,widths, and quantum numbers fully determined. There are 109 baryons in the PDG2016 listings,but only 58 of them with 4∗ or 3∗ quality [2]. Many more states are predicted by quark models(QMs). For example, in the case of SU(6)F ×O(3) symmetry, 434 resonances would be required,if all partly revealed multiplets were completed (three 70-plets and four 56-plets).
The light and strange quarks can be arranged in six baryonic families, N∗, ∆∗, Λ∗, Σ∗, Ξ∗, and Ω∗.The possible number of members in a family is not arbitrary [3]. Under the SU(3)F symmetrythese are the octet: N∗, Λ∗, and Σ∗, and the decuplet: ∆∗, Σ∗, Ξ∗, and Ω∗. The number ofexperimentally identified resonances in each baryon family in PDG2016 summary tables is 17 N∗,24 ∆∗, 14 Λ∗, 12 Σ∗, 7 Ξ∗, and 2 Ω∗. Constituent QMs, for instance, predict the existence of nofewer than 64 N∗ and 22 ∆∗ states with masses less than 3 GeV. The “missing-states" problem [4]is obvious from these numbers. To complete SU(3)F multiplets, one needs no fewer than 17 Λ∗s,41 Σ∗s, 41 Ξ∗s, and 24 Ω∗s.
If these “missing resonances" exist, they have either eluded detection or have produced only weaksignals in the existing data sets. The search for those resonances provides a most natural motivationfor future measurements at Jefferson Lab. As stated in the 2015 Long Range Plan for Nuclear Sci-ence [1]: For many years, there were both theoretical and experimental reasons to believe that thestrange sea-quarks might play a significant role in the nucleon’s structure; a better understandingof the role of strange quarks became an important priority.
The JLab 12 GeV energy upgrade, with the new Hall D, provides an ideal tool for extensive studiesof both non-strange and, specifically, strange baryon resonances [5, 6]. Our plan is to take advan-tage of the existing high-quality photon beamline and the experimental area in the Hall D complexat Jefferson Lab to deliver a beam of KL particles onto a LH2/LD2 within the GlueX detector.The recently constructed GlueX detector is a large-acceptance spectrometer with good coveragefor both charged and neutral particles that can be adapted to this purpose. Obviously, a KL beamfacility with good momentum resolution is crucial for providing the data needed to identify andcharacterize the properties of hyperon resonances. The masses and widths of the lowest Λ andΣ baryons were determined mainly with kaon beam experiments in the 1970s [2]. The first de-terminations of the pole position in the complex-energy plane for a hyperon, for instance, for theΛ(1520)3/2−, have been made only recently [7]. An intense KL beam would open a new windowof opportunity, not only to locate “missing resonances", but also to establish their properties bystudying different decay channels systematically.
A recent white paper, dedicated to the physics with meson beams and endorsed by a broad physicscommunity, summarized unresolved issues in hadron physics, and outlined the vast opportuni-
2

ties and advances that only become possible with a “secondary beam facility" [8]. The Hall DGlueX K-long Facility (KLF) measurements will allow studies of very poorly known multiplets ofΛ∗, Σ∗, Ξ∗, and even Ω∗ hyperons with unprecedented statistical precision. These measurementsalso have the potential to observe dozens of predicted (but heretofore unobserved) states and toestablish the quantum numbers of already observed hyperon resonances listed in PDG2016 [2].Interesting puzzles exist for PDG-listed excited hyperons that do not fit into any of the low-lyingexcited multiplets, and these need to be further revisited and investigated. Excited Ξs, for instance,are very poorly known. Establishing and discovering new states is important, in particular, fordetermination of the multiplet structure of excited baryons.
We have organized four Workshops: Physics with Neutral Kaon Beam at JLab (KL2016) (Febru-ary 2016) [9], Excited Hyperons in QCD Thermodynamics at Freeze-Out (YSTAR2016) (Novem-ber 2016) [10], New Opportunities with High-Intensity Photon Sources (HIPS2017) (February2017) [11], and Pion-Kaon Interactions (PKI2018) (February 2018) [12]. They were dedicatedto the physics of hyperons produced by the neutral kaon beam. The KL2016 Workshop [13] fol-lowed our LoI–12–15–001 [14] to help address the comments made by PAC43 and to prepare thefull proposal for PAC45 [15]. The proposed GlueX KLF program is complementary, for instance,to the CLAS12 baryon spectroscopy experiments [16, 17] and would operate at Hall D for sev-eral years. The YSTAR2016 Workshop [18] was a successor to the recent KL2016 Workshopand considered the influence of possible “missing" hyperon resonances on QCD thermodynamics,on freeze-out in heavy ion collisions and in the early universe, and in spectroscopy. Then, theHIPS2017 Workshop [19] aimed at producing an optimized photon source concept with potentialincrease of scientific output at Jefferson Lab, and at refining the science for hadron physics exper-iments benefitting from such a high-intensity photon source. Finally, the PKI2018 Workshop isdedicated to the physics of strange mesons produced by the neutral kaon beam [20].
Additionally, the proposed facility will also have great impact in the strange meson sector by mea-surements of the final-state Kπ system from threshold up to 2 GeV in invariant mass to establishand improve on pole positions and widths of all K∗(Kπ) P -wave states and the S-wave scalarmesons K∗0(800) or κ(800). In particular, the κ(800) meson has been under discussion for decadesand still remains to be unequivocally confirmed with corresponding quantum numbers by detailedphase-shift analysis with high statistics data [21,22]. A detailed study of theKπ system is requiredto extract the so-called Kπ vector and scalar form factors that are to be compared with τ → Kπντdecay and can be used to constrain the Vus Cabibbo-Kobayashi-Maskawa (CKM) matrix elementas well as to be used in testing CP violation in decays of heavy B and D mesons into Kππ finalstates.
The proposal is organized in the following manner. We give an executive summary in Sec. 1 andthe scope of the proposal in Sec. 2. Then the case of hyperon spectroscopy is given in Sec. 3 whilehyperons in lattice studies are presented in Sec. 4. An overview of the interest of the RHIC/LHCcommunity in hyperon measurements is summarized in Sec. 5. The short overview of previousbubble chamber measurements is given in Sec. 6. Partial-wave phenomenology is considered, inSec. 7 and theory for the “neutron" target in Sec. 8. A short overview for strange meson spec-troscopy is given in Sec. 9. Our proposed KL beam facility is reported in Sec. 10. It describesa beam delivery for secondary KL beam, compact photon source, KL production and KL beamproperties, start counter resolution, measurements of KL flux, and cryogenic target description.
3

Expected results and beam time requirements are described in Sec. 11 while summary and a beamtime request is given in Sec. 12. The Appendices contain many technical details for our proposal:Analysis of three-body final states in Appendix A1 13, determination of pole positions in Ap-pendix A2 14, statistics tools for spectroscopy of strange resonances in Appendix A3 15, neutronand gamma background in Appendix A4 16, details of Monte Carlo study in Appendix A5 17 andin Appendix A6 18, current hadronic projects in Appendix A7 19, and additional physics potentialwith a KL Beam Appendix in A8 20.
3 The Case for Strange Hyperon Spectroscopy
The present experimental knowledge of the spectra of the strange hyperons remains remarkablyincomplete, despite the fact that the ground states of the strange hyperons have been known sincethe 1960s. In the case of the Λ hyperon resonance spectrum, only the lowest negative-parity doubletand the positive parity singlet are well established, even though the structure of these resonancesremains under discussion. In the case of the Σ and Ξ hyperons, only the lowest decuplet resonancestates Σ(1385) and Ξ(1530) are well established.
The masses of the lowest positive-parity resonances in the spectrum of the Λ and Σ hyperons, theΛ(1600) and Σ(1660) are experimentally known, but their structure is not. In the case of the Ξhyperon, the lowest positive-parity resonance remains unobserved.
To settle the nature of the hyperon resonances, their main decay modes have to be determined byexperiment. A clear example of how the decay modes can settle the structure of the resonancesis provided by the decay widths of the decuplets ∆(1232), Σ(1385), and Ξ(1530). The ratio ofthese decay widths is 13:4:1, whereas if they were simple three-quark states, with 3, 2, and 1 lightquarks each, the ratio should be 9:4:1. A comparison of these ratios indicates that the Σ(1385)and Ξ(1530) appear to be three-quark states, while the ∆(1232) is more complex and formedby a three-quark core with a surrounding meson (or multiquark) cloud. This conclusion is wellsupported by extensive theoretical calculations [23, 24].
3.1 Heavy Quark Symmetry and the Hyperons
Heavy quark symmetry [25] provides a powerful tool for analyzing the structure of hyperons withheavy flavor quarks to those with strange quarks. Heavy quark symmetry follows from the factthat the strength of quark spin-orbit couplings scale with the inverse of the constituent mass. In thecase of the hyperons this implies that the spin-orbit splittings in the hyperon spectra decrease withincreasing quark mass. In the case of hyperons with light and heavy quarks this implies that theheavy quark spin decouples from those of the light quarks. Heavy quark symmetry suggests, thatthe ratio of the sizes of such spin-orbit splittings in the corresponding multiplets in the spectra of thestrange, charm and beauty hyperons should approximately correspond to the ratio of the inversesof the corresponding constituent quark (or approximately) meson (K, D, B) masses: 10.7:2.8:1.Where the spin-orbit splittings conform to this scaling law the implication is that the structure ofthe corresponding hyperon resonances in the different flavor sectors are very similar, and where
4

not, their structures are anomalous and more complex.
This tool will be the more accurate, the heavier the constituent masses and for those hyperons,which have less light-flavor quarks. Given this it shall be exceptionally interesting to comparethe spin-orbit splittings between the Cascade hyperons in the different flavor sectors, once theseare determined experimentally. Hitherto the comparable splittings are only known for the lowestnegative parity doublets in the strange, charm and beauty hyperon spectra, with two light-flavorand only one single heavy quark, however. This argument is strongest in the case of the resonancespectrum of the Ξ and Ω hyperons, once better known, and when corresponding resonances can bedetected for the corresponding charm and beauty hyperons.
In the case of those lowest energy flavor-singlet 1/2− – 3/2− parity doublets in the strange, charmand bottom hyperon spectra: Λ(1405)–Λ(1520), Λc(2595)–Λc(2625), Ξc(2790)–Ξc(2815), andΛb(5912)–Λb(5920) [2] the ratio between the splittings in these three doublets are 14.4:3.7:3.1:1.These ratios agree qualitatively and within 30 % with the corresponding inverse ratios of the K,D, and B meson masses: 10.7:2.8:1. As these resonances all contain one light quark pair the latteris what one should expect from the gradual approach to heavy-quark symmetry with increasingmeson (or constituent quark) mass if the quark structure of these three multiplets is similar. Thispattern is also consistent with the large NC limit of QCD.
The determination of the energies and quantum numbers of the S = −2 Cascade resonancesbeyond the Ξ(1530) should have high priority, especially when the LHCb experiment at CERN [26]may be expected do similar determination for double charm resonances. This is a fortiori the casefor the spectrum of the Ω hyperons.
3.2 The Λ(1405)1/2− − Λ(1520)3/2− Doublet
In the simplest constituent quark model, the most natural − and the oldest − interpretation, isthat the Λ(1405)1/2− − Λ(1520)3/2− doublet is a low-lying flavor singlet of three quarks (uds).Dynamical versions of this model, with two-body interactions between the quarks can describe thelow mean energy of this multiplet, but not the 115 MeV splitting between them. This has led tosuggestions that there may even be two different 1/2− states − one dynamical low KN resonanceat 1405 MeV, and an unresolved higher state close to 1520 MeV [27]. If so, it is high time thatthe “missing" 1/2− higher-energy state be empirically identified. This problem may indicate thatthe Λ(1405) has a more complex multiquark structure. This issue is tested in modern theoreti-cal approaches, including constraints from unitarity and chiral symmetry. A two pole structure ofΛ(1405) was indeed found in Ref. [28]. The narrow pole lies slightly below KN threshold, andis fixed by the scattering data rather well, see Ref. [29] for the comparison of different moderncoupled-channel approaches. However, the position of the second pole is determined less pre-cisely, and may lie much further below KN threshold and deeper in the complex plane. Recentphotoproduction data on πΣ by CLAS [30] may be used to reduce the theoretical ambiguity on this(second) pole of Λ(1405) as demonstrated in Ref. [31]. Modern lattice QCD (LQCD) calculationsalso support the view that its structure is a KN state [32, 33]. In Skyrme’s topological solitonmodel for the baryons, the low-lying Λ(1405) state also appears naturally as a mainly 5-quarkstate [34, 35]. That model is consistent with QCD in the large color number (NC) limit. Lattice
5

calculations based on the sequential Bayesian do however indicate that the multiplet may have amainly 3-quark structure [36].
3.3 The Low-Lying Positive-Parity Resonances
In the spectra of the nucleon and the Λ and Σ hyperons, the lowest positive-parity resonances alllie below the lowest negative-parity multiplets except for the flavor singlet doublet Λ(1405)1/2−−Λ(1520)3/2−. This reversal of normal ordering cannot be achieved in the constituent quark modelwith purely color-spin dependent quark interactions. These low-lying positive-parity resonancesare the N(1440), Λ(1600), and the Σ(1660) 1/2+ states. Their low masses do however appearnaturally, if the interactions between the quarks are flavor dependent [37].
Present day LQCD calculations have not yet converged on whether these low-lying states can bedescribed as having a mainly three-quark structure [36, 38]. This may reflect that there is a collec-tive nature in the quark content of these resonances. As an example Skyrme’s topological solitonmodel for the baryons, which represents one version of the large NC limit of QCD, describes theselow-lying states as collective vibrational states.
In the spectrum of the Ξ, the Ξ(1690) may be such a 1/2+ state as well, although the quantumnumbers of that state are yet to be determined.
In the corresponding decuplet spectra, a similar low-lying positive-parity state has so far onlybeen definitely identified in the ∆(1232) spectrum: namely, the ∆(1600)3/2+. The Σ(1840)3/2+
resonance very likely represents the corresponding positive-parity Σ∗ state. It should be importantto identify the corresponding 3/2+ state in the spectrum of the Ξ∗.
It is of course very probable that corresponding low-lying positive-parity states will be found inthe spectra of the Λc and Λb hyperons, given the fact that they have low-lying negative-parity statesakin to those of the Λ hyperon as described above. The experimental identification of those is animportant task. Even if the still tentative resonance Λc(2765) turns out to be a 1/2+ state, its energyappears to be too high for being the equivalent of the Λ(1600) in the charm hyperon spectrum.
In the spectrum of the Σc, the decuplet state Σc(2520) is well established. The tentative resonanceΣc(2800) may, should it turn out to be a 1/2+ state, correspond to the Σ(1660) in the strangehyperon spectrum.
3.4 The Negative-Parity Hyperon Resonances
In the spectrum of the nucleon, two well-separated groups of negative-parity resonances appearabove the 1/2+ state N(1440). In the three-quark model, the symmetry of the lowest energy groupis [21]FS[21]F [21]S; i.e., it has mixed flavor (F) and spin (S) symmetry as well as mixed flavor-spin (FS) symmetry [37, 39]. This group consists of the N(1535)1/2− and the N(1520)3/2−
resonances. There is a direct correspondence in the Λ(1670)1/2− and the Λ(1690)3/2− reso-nances. There is also a repeat of this group in the spectrum of the Σ hyperon in the two resonancesΣ(1620)1/2− (tentative) and Σ(1670)3/2−.
6

These spin 1/2− and 3/2− states in the spectrum of the nucleon have intriguing decay patterns.The N(1535) resonance has a large (32–52 %) decay branch to ηN , even though its energy liesvery close to the ηN threshold. This pattern repeats in the case of the Λ(1670), which also has asubstantial (10–25 %) decay branch to the corresponding ηΛ state, even though it lies even closerto the threshold for that decay. As the still uncertain Σ(1620)1/2− resonance is located almostexactly at the threshold for ηΣ, there is naturally no signal for an ηΣ decay from it. The ratioof the η decay widths of the N(1535) and the Λ(1670) is about 6:1, which suggests that the ηdecay might involve a pair of quarks rather than a single constituent quark as in the π decay of thedecuplet resonances.
In the spectrum of the Ξ hyperon, none of the hitherto determined negative-parity multiplets iscomplete. The state Ξ(1820)3/2− may be the analog in the Ξ spectrum of the states N(1520),Λ(1670), and Σ(1670). It should be important to identify the lowest 1/2− resonance in the Ξspectrum. If that resonance lacks an η decay branch, it would demonstrate that the η decay of the1/2− resonances in the spectra of the nucleon, Λ and Σ involves two quarks.
It should also be important to determine whether the uncertain “bumps" referred to in the ParticleData Tables labelled Σ(1480), Σ(1560), and Ξ(1620) represent true resonances [2].
About 120 MeV above the 1/2−−3/2− pair of nucleon resonancesN(1535) andN(1520), the nu-cleon spectrum has three negative-parity resonances close in energy to one another. This multipletis formed of the N(1650)1/2−, N(1700)3/2−, and N(1675)5/2− resonances. In the three-quarkmodel the symmetry configuration of these states are [21]FS[21]F [21]S; i.e., their spin configura-tion is completely symmetric.
The analogs in the spectrum of the Λ of the first and last of these nucleon resonances are theΛ(1800)1/2− and the Λ(1830)5/2− resonances. This correspondence remains uncertain, however,because the missing 3/2− state in this Λ resonance multiplet has not yet been identified.
A common feature of all the 1/2− resonances in these multiplets is their substantial η decay branch.
Our present knowledge of the spectrum of the Ξ hyperons remains too incomplete to identify anymember of the negative-parity multiplet with the symmetry structure [21]FS[21]F [21]S .
3.5 Summary for the Case
This overview shows that the present empirical knowledge of the spectrum of the strange hyperonsremains remarkably incomplete. As a consequence, the quark structure of even the lowest-energyresonances remains uncertain. Only an experimental determination of the lowest-energy positive-and negative-parity hyperon resonances and their decay branches would settle the main open issues.
In the spectrum of the Λ hyperon, there remains a question of the existence of a 1/2− partner tothe Λ(1520)3/2− resonance. In addition, it should be important to search for the missing Λ3/2−
resonance near 1700 MeV. Equally important would be the search for the apparently “missing"3/2− state near 1750 MeV in the spectrum of the Σ hyperon.
The present knowledge of the spectrum of the Σ hyperons remains too incomplete to identify any
7

member of the corresponding negative-parity multiplet formed of 1/2−, 3/2−, and 5/2− resonances.
It should also be important to determine, whether the uncertain “bumps" referred to in the ParticleData Tables labelled Σ(1480), Σ(1560), and Σ(1620) represent true resonances [2].
Finally the determination of the spectrum of the strange cascade hyperon should be given highpriority. This spectrum remains very poorly known. As these hyperon resonances contain only onelight-flavor quark the scalings implied by heavy quark symmetry would provide a tool to predictthe splittings in the corresponding spectra of the double charm and beauty hyperons.
4 Strange Hadrons from the Lattice
Our knowledge of the excited-state spectrum of QCD through the solution of the theory on aEuclidean-space lattice has undergone tremendous advances over the past several year. What wecharacterize as excited states are resonances that are unstable under the strong interaction, and theirproperties are encapsulated in momentum-dependent scattering amplitudes.
The methodology for obtaining momentum-dependent phase shifts for elastic scattering from theshifts in energy levels on a Euclidean lattice at finite volume was provided many years ago [40]and extended to systems in motion [41], but its implementation for QCD remained computationallyelusive until recently. A combination of theoretical, algorithmic, and computational advances haschanged this situation dramatically, notably in the case of mesons. There have been several latticecalculations of the momentum-dependent phase shift of the ρ mesons [42–48]. This has now beenextended to Kπ scattering [49] in both P - and S-wave.
The formulation to extract amplitude information has been extended to the coupled-channel case [50–58], and applied to the case of the coupled KK − ππ [61] system describing the ρ resonance tothe ηK − ηπ system [62, 63], and to the emblematic isoscalar sector [64, 65]. Most recently, acalculation of coupled isoscalar ππ, KK, and ηη scattering for both S and D wave has been per-formed [64], revealing a qualitative interpretation of σ, f0, and f2 mesons similar to that seen inexperiment. Collectively, these papers provide a comprehensive picture of SU(3) nonets both inthe tensor and scalar sectors, albeit at unphysically large pion mass.
The application to baryons is far more limited but, nonetheless, important insights have beengained. In an approach in which the excited-state hadrons are treated as stable particles, a spectrumof baryons at least as rich as that of the quark model is revealed [66, 67], and evidence has beenpresented for “hybrid" baryon states, beyond those of the quark model, in which gluon degreesof freedom are essential [68]. Notably, this picture extends to the spectrum of Λ, Σ, Ξ, and Ωstates where the counting of states relects SU(6)×O(3) symmetry, and the presence of hybrids iscommon across the spectrum. In Fig. 1, baryon spectra from [69] are presented in units of Ω massfrom LQCD calculations with ensemble mπ = 391 MeV (not yet at physical mπ).
The calculations for the baryon sector are incomplete, in that the momentum-dependent scatteringamplitudes characterizing multi-hadron states have not been extracted. In comparison with thecalculations for mesons cited above, the challenges are more computational than theoretical orconceptual. Nonetheless, the first direct calculation of the I = 3/2 Nπ system in P -wave has now
8

Figure 1: Results for baryon excited states using an ensemble with mπ = 391 MeVare shown versus JP [69]. Colors are used to display the flavor symmetry of dominantoperators as follows: blue for 8F in N , Λ, Σ, and Ξ; beige for 1F for Λ; yellow for10F in ∆, Σ, Ξ, and Ω. The lowest bands of positive- and negative-parity states arehighlighted within slanted boxes. Hybrid states, in which the gluons play a substantiverole, are shown for positive parity by symbols with thick borders.
9

been performed [59], revealing a Breit-Wigner description of the amplitude commensurate witha phenomenological description of the ∆ resonance. Thus we can be confident that the progressmade in the meson sector will be reflected for the case of baryons in the coming years. Indeed,many of the algorithmic and computational challenges, notably the need to perform calculationsat physical quark masses, and the increasing complexity of the Wick contractions as the numberof hadrons, and therefore quarks, is increased, are being addressed with the recently launchedExascale Computing Project of the DOE and NNSA, whose application to lattice QCD is describedin Ref. [60].
5 The Interest of the RHIC/LHC Community in Excited Hy-peron Measurements
The relativistic heavy-ion community at RHIC and the LHC has recently embarked on specificanalyses to address the issue of strangeness hadronization. LQCD calculations in the QCD crossovertransition region between a deconfined phase of quark and gluons and a hadronic resonance gashave revealed a potentially interesting sub-structure related to the hadronization process. Studiesof flavor-dependent susceptibilities, which can be equated to experimental measurements of con-served quantum-number fluctuations, seem to indicate a slight flavor hierarchy in the three-quarksector (u,d,s) in thermalized systems. Specifically, the ratios of higher-order susceptibilities in thestrange sector show a higher transition temperature than in the light sector [70]. Both pseudo-critical temperatures are still within the error bars of the quoted transition temperature based on allLQCD order parameters [71,72], which is 154±9 MeV, but the difference of the specific suscepti-bilities is around 18 MeV and well outside their individual uncertainties.
This difference seems to be confirmed by statistical thermal-model calculations that try to describethe yields of emitted hadrons from a QGP based on a common chemical freeze-out temperature.Although the yields measured by ALICE at the LHC in 2.76 TeV PbPb collisions can be describedby a common temperature of 156±2 MeV, with a reasonable χ2, the fit improves markedly if oneallows the light quark baryons to have a lower temperature than the strange quark baryons [73]. Asimilar result has been found when the thermal fluctuations of particle yields as measured by theSTAR Collaboration [74, 75], which can be related to the light quark dominated susceptibilities ofthe electric charge and the baryon number on the lattice, have been compared to statistical modelcalculations [76].
If one assumes that strange and light quarks indeed prefer different freeze-out temperatures, thenthe question arises how this could impact the hadronization mechanism and abundance of specifichadronic species. In other words, is the production of strange particles, in particular excited res-onant states, enhanced in a particular temperature range in the crossover region? Strange ground-state particle production shows evidence of enhancement, but the most likely scenario is that theincreased strange quark abundance will populate excited states; therefore, the emphasis of anyfuture experimental program trying to understand hadron production is shifting towards strangebaryonic resonance production. Furthermore, recent LHC measurements in small systems, downto elementary proton-proton collisions, have revealed that even in these small systems there is ev-
10

Figure 2: Upper plot: Comparison of predicted and measured excited strange hadronic states inPDG2016, PDG2016+ (including one star states), QM, and hQM. Lower plot: Lattice QCD calcu-lation of the temperature dependence of the leading order susceptibility ratio (µs/µB) compared toresults from HRG model calculations with varying number of hadronic states.
idence for deconfinement, if the achieved energy density, documented by the measured chargedparticle multiplicity is large enough [77]. Therefore, future measurements of elementary collisionsin the K-Long Facility experiment at JLab might well provide the necessary link to future analysis
11

of strange resonance enhancements in heavy-ion collisions at RHIC and the LHC and a deeperunderstanding of the hadronization process.
This statement is also supported by comparisons between the aforementioned LQCD calculationsand model predictions based on a non-interacting hadronic resonance gas. The Hadron Reso-nance Gas (HRG) model [78–81] yields a good description of most thermodynamic quantitiesin the hadronic phase up to the pseudo-critical temperature. The idea that strongly interactingmatter in the ground state can be described in terms of a non-interacting gas of hadrons and res-onances, which effectively mimics the interactions of hadrons by simply increasing the numberof possible resonant states exponentially as a function of temperature, was proposed early on byHagedorn [82]. The only input to the model is the hadronic spectrum: usually it includes all well-known hadrons in the Review of Particle Physics (RPP), namely the ones rated with at least twostars. Recently, it has been noticed that some more differential observables present a discrepancybetween lattice and HRG model results. The inclusion of not-yet-detected states, such as the onespredicted by the original Quark Model (QM) [83, 84] has been proposed to improve the agree-ment [85, 86]. A systematic study based on a breakdown of contributions to the thermodynamicpressure given by particles grouped according to their quantum numbers (in particular baryon num-ber and strangeness) enables us to infer in which hadron sector more states are needed compared tothe well-known ones from the RPP [87]. In case of a flavor hierarchy in the transition region, onewould expect the number of strange resonances to increase, due to a higher freeze-out temperature,compared to the number of light-quark resonances. Figure 2 shows the effect of different strangehadron input spectra to the HRG model in comparison to LQCD. Figure 2 (Upper plot) shows thenumber of states in PDG2016 [2], PDG2016+ (including one star states), the standard QM, anda Quark Model with enhanced quark interactions in the hadron (hyper-central model hQM [88]).Fig. 2 (Lower plot) shows a comparison of the HRG results to a leading-order LQCD calculationof µs/µB; i.e., the ratio to strange to baryon number susceptibility [87].
An interesting conclusion that arises from these studies is that the improvement in the listing ofstrange resonances between PDG2008 [89] and PDG2016 definitely brought the HRG calcula-tions closer to the LQCD data. By looking at details in the remaining discrepancy, which is inpart remedied by including one-star rated resonances in PDG2016, it seems that the effect is morecarried by singly strange resonances rather than multi-strange resonances, also in light of com-parisons to quark models that include di-quark structures [90] or enhanced quark interactions inthe baryon (hypercentral models [88]). This is good news for the experiments since the Λ and Σresonances below 2 GeV are well within reach of the KLF experiment and, to a lesser significance,the RHIC/LHC experiments. In this context it is also important to point out that the use of bothhydrogen and deuterium targets in KLF is crucial since it will enable the measurement of chargedand neutral hyperons. A complete spectrum of singly strange hyperon states is necessary to makea solid comparison to first-principle calculations.
To summarize: Any comparisons between experimentally verified strange quark-model states fromYSTAR and LQCD will shed light on a multitude of interesting questions relating to hadroniza-tion in the non-perturbative regime, exotic particle production, the interaction between quarks inbaryons and a possible flavor hierarchy in the creation of confined matter.
12

6 Previous Measurements for Hyperons
While a formally complete experiment requires the measurement, at each energy, W , and angle,θ, of at least three independent observables, the current database for KLp → πY and KY ispopulated mainly by unpolarized cross sections. Figure 3 illustrates this quite clearly.
Figure 3: Experimental data available for KLp → K+n, KLp → KLp, KLp → KSp, KLp →π+Λ, KLp → π+Σ0, and KLp → π0Σ+ as a function of CM energy W [91]. The number of datapoints (dp) is given in the upper righthand side of each subplot [blue (red) shows the amount ofunpolarized (polarized) observables]. Total cross sections are plotted at zero degrees.
The initial studies of the KLF program at GlueX will likely focus on two-body and quasi-two-body processes: elastic KLp→ KSp and charge-exchange KLp→ K+n reactions, then two-bodyreactions producing S = −1 (S = −2) hyperons as KLp → π+Λ, KLp → π+Σ0, and KLp →
13

π0Σ+ (KLp→ K+Ξ0). Most of the previous measurements induced by aKL beam, were collectedfor W = 1454 MeV and with some data up to W = 5054 MeV. Experiments were performed between1961 and 1982 with mostly hydrogen bubble chambers at ANL, BNL, CERN, DESY, KEK, LRL,NIMROD, NINA, PPA, and SLAC. Note that some of data were taken at EM facilities at NINA [92](a short overview about NINA experiments is given by Albrow recently [93]) and SLAC [94]. Thegoal of the Manchester University group that worked at the Daresbury 5-GeV electron synchrotronNINA was CP-violation, which was a hot topic back to the mid 1960s. The main physics topicsthat the SLAC group addressed were studies of the systematics for particle/anti-particle processesthrough the intrinsic properties of the K-longs.
The first paper that discussed the possibility of creating a practical neutral kaon beam at an electronsynchrotron through photoproduction was an optimistic prediction for SLAC by Drell and Jacobin 1965 [95]. With significant developments in technology, high-quality EM facilities, such asJLab [14], are now able to realize a complete hyperon spectroscopy program.
The overall systematics of previous KLp experiments varies between 15 % and 35 %, and theenergy binning is much broader than hyperon widths. The previous number of KL-induced mea-surements (2426 dσ/dΩ, 348 σtot, and 115 P observables) [91] was very limited. Additionally, weare not aware of any measurements on a “neutron" target.
Our knowledge about the non-strange sector is more advanced vs. the strange one [2]. For thenon-strange case, for instance, phenomenology has access to 51k data of πN → πN and 39k dataof γN → πN below W = 2. 5 GeV [96].
7 Phenomenology / Partial-Wave Analysis
Here, we summarize some of the physics issues involved with such processes. Following Ref. [97],the differential cross section and polarization for KLp scattering are given by
dσ
dΩ= λ-2(|f |2 + |g|2), (1)
Pdσ
dΩ= 2λ-2Im(fg∗), (2)
where λ- = ~/k, with k the magnitude of CM momentum for the incoming meson. Here f =f(W, θ) and g = g(W, θ) are the usual spin-nonflip and spin-flip amplitudes at CM energy W andmeson CM scattering angle θ. In terms of partial waves, f and g can be expanded as
f(W, θ) =∞∑l=0
[(l + 1)Tl+ + lTl−]Pl(cos θ), (3)
g(W, θ) =∞∑l=1
[Tl+ − Tl−]P 1l (cos θ), (4)
where l is the initial orbital angular momentum, Pl(cos θ) is a Legendre polynomial, and P 1l (cos θ)
is an associated Legendre function. The total angular momentum for the amplitude Tl+ is J = l+ 12,
14

while that for the amplitude Tl− is J = l − 12. For hadronic scattering reactions, we may ignore
small CP-violating terms and write
KL =1√2
(K0 −K0), (5)
KS =1√2
(K0 +K0). (6)
We may generally have both I = 0 and I = 1 amplitudes for KN and KN scattering, so that theamplitudes Tl± can be expanded in terms of isospin amplitudes as
Tl± = C0T0l± + C1T
1l±, (7)
where T Il± are partial-wave amplitudes with isospin I and total angular momentum J = l± 12, with
CI the appropriate isospin Clebsch-Gordan coefficients.
We plan to do a coupled-channel PWA with new GlueX data in combination with available newJ-PARC K− measurements when they will come. Then the best fit will allow to determine model-independent (data-driven) partial-wave amplitudes and associated resonance parameters (pole po-sitions, residues, BW parameters, etc.) as the SAID group does, for instance, for the analysis ofπN -elastic, charge-exchange, and π−p→ ηn data [98].
7.1 KN and KN Final States
The amplitudes for reactions leading to KN and KN final states are
T (K−p→ K−p) =1
2T 1(KN → KN) +
1
2T 0(KN → KN), (8)
T (K−p→ K0n) =1
2T 1(KN → KN)− 1
2T 0(KN → KN), (9)
T (K+p→ K+p) = T 1(KN → KN), (10)
T (K+n→ K+n) =1
2T 1(KN → KN) +
1
2T 0(KN → KN), (11)
T (KLp→ KSp) =1
2
(1
2T 1(KN → KN) +
1
2T 0(KN → KN)
)− 1
2T 1(KN → KN), (12)
T (KLp→ KLp) =1
2
(1
2T 1(KN → KN) +
1
2T 0(KN → KN)
)+
1
2T 1(KN → KN), (13)
T (KLp→ K+n) =1√2
(1
2T 1(KN → KN)− 1
2T 0(KN → KN)
). (14)
15

Figure 4: Selected differential cross section data for KLp→ KSp at W = 1660 MeV,1720 MeV, 1750 MeV, and 1840 MeV from Ref. [101]. The plotted data from pre-viously published experimental data are those data points within 20 MeV of the kaonCM energy indicated on each panel [96]. Plotted uncertainties are statistical only.The curves are predictions using amplitudes from a recent PWA of KN → KNdata [99, 100], combined with KN → KN amplitudes from the SAID database [96].
A fair amount of data are available for the reaction, K+n→ K0p, measured on a deuterium target.Figure 4 shows a sample of available differential cross sections for KLp → KSp compared withpredictions determined from a recent PWA of KN → KN data [99, 100], combined with KN →KN amplitudes from the SAID database [96]. The predictions at lower and higher energies tendto agree less well with the data.
7.2 πΛ Final States
The amplitudes for reactions leading to πΛ final states are
T (K−p→ π0Λ) =1√2T 1(KN → πΛ), (15)
T (KLp→ π+Λ) = − 1√2T 1(KN → πΛ). (16)
The K−p → π0Λ and KLp → π+Λ amplitudes imply that observables for these reactions mea-sured at the same energy should be the same except for small differences due to the isospin-
16

Figure 5: Comparison of selected differential cross section data for K−p → π0Λand KLp → π+Λ at W = 1540 MeV, 1620 MeV, 1760 MeV, and 1840 MeV fromRef. [101]. The plotted data from previously published experimental data are thosedata points within 20 MeV of the kaon CM energy indicated on each panel [96].Plotted uncertainties are statistical only. The curves are from a recent PWA ofK−p→ π0Λ data [99, 100].
Figure 6: Comparison of selected polarization data for K−p → π0Λ and KLp →π+Λ at W = 1760 MeV and 1880 MeV, from Ref. [101]. The plotted data frompreviously published experimental data are those data points within 20 MeV of thekaon CM energy indicated on each panel [96]. The curves are from a recent PWA ofK−p→ π0Λ data [99, 100].
17

violating mass differences in the hadrons. No differential cross section data for K−p → π0Λare available at CM energies W < 1540 MeV, although data for KLp→ π+Λ are available at suchenergies. At 1540 MeV and higher energies, differential cross section and polarization data for thetwo reactions are in fair agreement, as shown in Figs. 5 and 6. It should be stressed that polarizedmeasurements are tolerable for any PWA solutions (Fig. 6).
7.3 πΣ Final States
The amplitudes for reactions leading to πΣ final states are
T (K−p→ π−Σ+) = −1
2T 1(KN → πΣ)− 1√
6T 0(KN → πΣ), (17)
T (K−p→ π+Σ−) =1
2T 1(KN → πΣ)− 1√
6T 0(KN → πΣ), (18)
T (K−p→ π0Σ0) =1√6T 0(KN → πΣ), (19)
T (K0Lp→ π+Σ0) = −1
2T 1(KN → πΣ), (20)
T (K0Lp→ π0Σ+) =
1
2T 1(KN → πΣ). (21)
Figure 7 shows a comparison of differential cross section data for K−p and KLp reactions leadingto πΣ final states at W = 1660 MeV (or Plab = 716 MeV/c). The curves are based on energy-dependent isospin amplitudes from a recent PWA [99, 100]. No differential cross section data areavailable for KLp → π0Σ+. As this example shows, the quality of the KLp data is comparableto that for the K−p data. It would, therefore, be advantageous to combine the KLp data in anew coupled-channel PWA with available K−p data. Note that the reactions KLp → π+Σ0 andKLp → π0Σ+ are isospin selective (only I = 1 amplitudes are involved) whereas the reactionsK−p → π−Σ+ and K−p → π+Σ− are not. New measurements with a KL beam would lead to abetter understanding of Σ∗ states and would help constrain the amplitudes for K−p scattering toπΣ final states
7.4 KΞ Final States
The amplitudes for reactions leading to KΞ final states are
T (K−p→ K0Ξ0) =1
2T 1(KN → KΞ) +
1
2T 0(KN → KΞ), (22)
T (K−p→ K+Ξ−) =1
2T 1(KN → KΞ)− 1
2T 0(KN → KΞ), (23)
T (KLp→ K+Ξ0) = − 1√2T 1(KN → KΞ). (24)
18

Figure 7: Comparison of selected differential cross section data for K−p → π−Σ+,K−p → π+Σ−, K−p → π0Σ0, and KLp → π0Σ+ at W = 1660 MeV, fromRef. [101]. The plotted data from previously published experimental data are thosedata points within 20 MeV of the kaon CM energy indicated on each panel [96] Thecurves are from a recent PWA of K−p→ πΣ data [99, 100].
The threshold for K−p and KLp reactions leading to KΞ final states is fairly high (Wthresh =1816 MeV). In Fig. 8 (left), we present the cross section for Ξ production using a K−-beam [102].There are no differential cross section data available for KLp→ K+Ξ0 and very few (none recent)for K−p → K0Ξ0 or K−p → K+Ξ−. Measurements for these reactions would be very helpful,especially for comparing with predictions from dynamical coupled-channel (DCC) models [103,104] and other effective Lagrangian approaches [105]. The Review of Particle Physics [2] listsonly two states with branching fractions (BF) to KΞ, namely, Λ(2100)7/2− (BF < 3 %) andΣ(2030)7/2+ (BF < 2 %)
7.5 Excited S = −2 and S = −3 baryons
SU(3) flavor symmetry allows as many S = −2 baryon resonances as there are N and ∆ reso-nances combined (∼27); however, until now only three states, Ξ(1322)1/2+, Ξ(1530)3/2+, andΞ(1820)3/2−, have their quantum numbers assigned and only a few more states have been ob-served [2]. For the discovery of excited cascade baryons, we envision a PWA similar to theS = −1 sector but more complicated as one is dealing with a three-body final state. See also
19

Figure 8: Left panel: Cross section of Ξ− production, K−p → Ξ−X , as a function of K− mo-mentum [102]. Right panel: Cross section of Ω− production, K−p → Ω−K+K0, as a function ofK−-momentum [102]. The curve is a fit by eye to the data.
.
Appendix A1 (Sec. 13) for a related discussion.
The experimental situation with Ω−∗s is even worse than for the Ξ∗ case – there are very few datafor excited states. The main reason for such a scarce dataset is the very low cross section for theirindirect production with pion or photon beams. In Fig. 8 (right), we present the cross section forΩ production using a K− beam [102].
A major effort in LQCD calculations involves the determination of inelastic and multi-hadronscattering amplitudes, and the first calculation to study an inelastic channel was recently per-formed [62,63]. For lattice calculations involving baryons that contain one or more strange quarksan advantage is that the number of open decay channels is generally smaller than for baryonscomprised only of the light u and d quarks.
7.6 Summary for PWA
The pole positions have been determined (no uncertainties) for several Λ∗s and Σ∗s but the infor-mation about the pole positions have not been determined for Ξ or Ω hyperons [2]. Our plan isto do a coupled-channel PWA with new GlueX KLF data in combination with available and newJ-PARC K−p measurements when they will be available. Then the best fit will allow the deter-mination of data-driven (model independent) partial-wave amplitudes and associated resonanceparameters (pole positions, residues, BW parameters, and so on). See Appendix A2 (Sec. 14) for amore detailed discussion. In Appendix A3 (Sec. 15), statistical tools for the reliable determinationof the resonance spectrum are highlighted. Additionally, PWAs with new GlueX data will allow asearch for “missing" hyperons via looking for new poles in complex plane positions. It will providea new benchmark for comparisons with QCD-inspired models and LQCD calculations.
20

8 Theory for “Neutron" Target Measurements
Figure 9: Pole positions of Λ(1405) in chiral unitary approaches - KM from Ref. [106], B fromRef. [31], M from Ref. [107], and P from Ref. [108] as compared in Ref. [29]. Each symbolrepresents the position of the first (black) and second (red) pole in each model.
KLn→ K−p KLn→ K0n KLn→ π0Λ KLn→ π0Σ0 KLn→ π−Σ+ KLn→ π+Σ−
0.2
0.4
0.6
dσ/dΩ
[mb]
KLn → K-p
2.5
5.
7.5
KLn → K0n
0.2
0.4
0.6
KLn → π0Λ
0.2
0.4
KLn → π0Σ0
0.2
0.4
0.6
KLn → π+Σ-
0.2
0.4
0.6
pL
AB=
30
0M
eV
KLn → π-Σ+
0.2
0.4
0.6
dσ/dΩ
[mb]
2.5
5.
7.5
0.2
0.4
0.6
0.2
0.4
0.2
0.4
0.6
0.2
0.4
0.6
pL
AB=
70
0M
eV
-0.5 0. 0.5
0.2
0.4
0.6
cos θ
dσ/dΩ
[mb]
-0.5 0. 0.5
2.5
5.
7.5
cos θ
-0.5 0. 0.5
0.2
0.4
0.6
cos θ
-0.5 0. 0.5
0.2
0.4
cos θ
-0.5 0. 0.5
0.2
0.4
0.6
cos θ
-0.5 0. 0.5
0.2
0.4
0.6
cos θp
LA
B=
11
00
Me
V
Figure 10: Theoretical predictions for differential cross sections, dσ/dΩ inmb as a function of CMcos of a meson production angle, θ. Each row associated with kaon lab-momentum of 300, 700,and 1000 MeV/c of initial neutral kaon beam. Orange dashed and blue solid lines show predictionswithin Model-B2 and Model-B4, respectively (see text for details).
The only systematic ways to address hadronic interactions at low energies are Chiral PerturbationTheory (ChPT) and numerical calculations of Lattice QCD. The first one is an Effective The-ory to QCD at low energies, which relies on the expansion of QCD Green’s functions in smallmomenta and quark masses. Over the years this approach has become a benchmark for a largevariety of examples of hadronic systems. However, in the perturbative sense ChPT breaks downin the resonance region, and also exhibits slow convergence in three-flavor formulation or when
21

KLn→ K−p KLn→ K0n KLn→ π0Λ KLn→ π0Σ0 KLn→ π−Σ+ KLn→ π+Σ−
-0.2
0.
0.2
Pdσ/dΩ
[mb]
KLn → K-p
-0.5
0.
0.5
KLn → K0n
-0.1
0.
0.1
KLn → π0Λ
-0.2
0.
0.2
KLn → π0Σ0
-0.2
0.
0.2
0.4
KLn → π+Σ-
-0.2
0.
0.2
pLA
B=
30
0M
eV
KLn → π-Σ+
-0.2
0.
0.2
Pdσ/dΩ
[mb]
-0.5
0.
0.5
-0.1
0.
0.1
-0.2
0.
0.2
-0.2
0.
0.2
0.4
-0.2
0.
0.2
pLA
B=
70
0M
eV
-0.5 0. 0.5
-0.2
0.
0.2
cos θ
Pdσ/dΩ
[mb]
-0.5 0. 0.5
-0.5
0.
0.5
cos θ
-0.5 0. 0.5
-0.1
0.
0.1
cos θ
-0.5 0. 0.5
-0.2
0.
0.2
cos θ
-0.5 0. 0.5
-0.2
0.
0.2
0.4
cos θ
-0.5 0. 0.5
-0.2
0.
0.2
cos θ
pLA
B=
11
00
Me
V
Figure 11: Theoretical predictions for polarized differential cross sections, Pdσ/dΩ. The notationis the same as in Fig. 10.
0.000
0.005
0.010
0.015
dσ/dΩ
[mb]
W=1.82 MeV
0.000
0.001
0.002
0.003
0.004
W=2.32 MeV
0.000
0.001
0.002
0.003
0.004
0.005
W=2.82 MeV
-0.5 0. 0.5
-0.010
-0.008
-0.006
-0.004
-0.002
0.000
0.002
cos θ
Pdσ/dΩ
[mb]
-0.5 0. 0.5
-0.0005
0.0000
0.0005
0.0010
0.0015
0.0020
0.0025
cos θ
-0.5 0. 0.5
0.0000
0.0005
0.0010
cos θ
Figure 12: Theoretical predictions for differential cross sections, dσ/dΩ, [mb] and polarized dif-ferential cross sections, Pdσ/dΩ as a function of CM cos of a meson production angle, θ, for thereaction KLn → K+Ξ−. Each column associated with kaon lab-momentum of 300, 700, and1000 MeV/c of initial neutral kaon beam. Orange (dashed) and blue lines show predictions withinModel-B2 and Model-B4, respectively (see text for details)
large momenta are involved. In fact, all these obstacles are present in the antikaon-nucleon sys-tem, due to the large kaon mass, widely separated two particle thresholds and the presence ofthe Λ(1405)1/2−. An extension of ChPT is required to address these issues namely the so-calledcoupled-channel Chiral Unitary approaches (UChPT).
These models implement unitarity exactly via a re-summation of a chiral potential to a certainchiral order. They successfully describe all available antikaon-nucleon scattering data and predictthe mass and width of the sub-threshold resonance in the Isospin I = 0 channel, the Λ(1405)1/2−.Furthermore, such models lead to the prediction of the second pole in the complex energy planewith the same quantum numbers as Λ(1405)1/2−. This is usually referred to as the two-polestructure of the Λ(1405), see the current review by the Particle Data Group [2] for more details.
22

In the most advanced and recent formulation, the UChPT approach relies on a chiral amplitudefor meson-baryon scattering up to next-to-leading chiral order. Whereas the unitarity constraintis imposed via the Bethe-Salpeter equation either in the full off-shell formulation [109, 110] or inthe so-called on-shell approximation, e.g., [31, 106]. For the analysis of data the former is quiteintricate, while as it was shown in Ref. [109] the off-shell effects are rather small. Recently, adirect quantitative comparison of the on-shell models [31,106–108] was performed in Ref. [29]. Itwas found there that various models, which typically have many free parameters, adjusted to thesame experimental data, predict very different behavior of the scattering amplitude on and off thereal energy-axis. This systematic uncertainty becomes evident, when comparing the pole positionsof the Λ(1405) in these models (see Fig. 9). The position of the narrow (first) pole seems to beconstraint at least in the real part rather well, while the predictions for the position broad (second)pole cover a very wide region of the complex energy-plane. This uncertainty is present even withinmodels of the same type. This ambiguity can be traced back to the fact that the experimental dataused to fix the parameters of the models is rather old and imprecise.
The KL beam can be scattered on a neutron target, while measuring the strangeness S = −1final meson-baryon states, see, e.g., Sec. 7. In such a setup, the proposed experiment will becomea new and very strongly desired source of experimental data to pinpoint the properties of theantikaon-nucleon scattering amplitude. To make this statement more quantitative, we comparepredictions of both solutions of the model 1 from Ref. [31]. These solutions agree with all presentlyavailable scattering, threshold as well as the photoproduction data for the Σπ line shapes by theCLAS Collaboration [30]. The predicted differential cross sections (dσ/dΩ) as well as polarizedones (Pdσ/dΩ) for the KLn scattering with the final states K−p, K0n, π0Λ, π0/+/−Σ0/−/+ arepresented in Figs. 10 and 11, respectively. There is no clear agreement on the prediction of theseobservables in the energy range aimed to study in the proposed KL experiment. The latter isvery encouraging in the sense that the actual data can sort out one (or maybe both) solutions asunphysical, which was not possible by the present experimental data. As for the KΞ final statesbeing measured at KLF, both solutions of the here presented model can be used for a theoreticalestimate. The reason of being able to do so is that K+Ξ− and K0Ξ0 channels are part of thechannel space of ground state octet mesons-baryon channels dynamically implemented into thepresent model. The result of such a prediction is depicted and addressed further in Fig. 12.
To summarize: The proposed experiment has the potential to shrink the available parameter spaceof the theoretical models for the antikaon-nucleon scattering. Undoubtedly, this will sharpen ourunderstanding of the SU(3) dynamics, which besides hadronic physics also has important impli-cation for the mass-to-radius relation of neutron stars.
1The choice of this model for the present analysis is justified by the fact that it includes the p-wave interaction inthe interaction-kernel of the Bethe-Salpeter equation explicitly.
23
9 πK Scattering Amplitudes and Strange Meson Resonances
9.1 Note on the Strange Meson Spectrum
As in the case of the strange hyperons, it is instructive to compare the spectrum of the kaons tothe corresponding spectra of the D and the Ds mesons (see Ref. [111]). With exception of the stilluncertain spin 0 state κ or K∗0(800) the known parts of the kaon, the D and the Ds mesons arequalitatively very similar, but with somewhat different orderings [2].
The established part of the strange meson spectrum [2, 111] begins with the 0− ground state,followed by the 1− K∗(892) vector meson meson state, which is followed by the two 1+ statesK1(1270), K1(1400), and then the recurrence K∗(1410) of the 1− vector meson state and thescalar meson state K∗0(1430). The spectrum of the D meson differs only in that the correspond-ing scalar meson state D∗0(2400) lies slighly below, rather than slightly above the two 1+ statesD1(2420) and D1(2430), and in that the analog of the second recurrence of the vector meson statein the D meson state has yet to be identified.
In the case of the charm-strange meson spectrum, the two 1+ statesDs1(2460) andDs1(2536) bothlie above the scalar meson state D∗s0(2317), and the recurrence of the vector meson state D∗s(2112)also has yet to be found.
This comparison of the spectra of the K, D and Ds mesons reveals the key importance of settlingthe issue of the existence of the low lying scalar meson state κ or K∗0(800), as its existence wouldsettle the debate on the existence of a light scalar nonet below 1 GeV, which is a controversy thatexists for more than 50 years. In turn, this would imply the existence of corresponding low lyingscalar meson states in the spectra of the charm and charm-strange mesons. It is remarkable thatin all these spectra, the first recurrence of that low scalar meson is well established by the statesK∗0(1430), D∗0(2400), and D∗s0(2317). Given the very large width of the non-strange scalar mesonf0(500) (or σ), and its proximity to the threshold of its main decay channel, it may be expected thatthe lowest scalar strange state, the κ, but also the lowest charm strange, charm and charm-strangemesons will have similar large widths and threshold effects, which would be the main reason forthe absence of clear signals for their pole positions. Moreover, establishing firmly the existence ofthe κ/K∗0(800), with similar characteristics to the σ/f0(500), but with strangeness, would also killthe glueball interpretations of the latter [112] or the recent resurrection of its dilatonic interpreta-tion [113].
9.2 Strange Exotics
Two important motivations for performing new measurements of πK scattering amplitudes, fromthe attention received by Chiral Perturbation Theory [114–117], resonance and unitarized mod-els [118–122], and from the need to confirm the existence of the exotic κ meson (or K∗0(800)) inthe I = 1/2 S-wave. This state would be the strange counterpart of the σ (or f0(500)) mesonwhich is now rather well established from ππ scattering (see the review [123]).
For Chiral Perturbation Theory the interest is on the very low energy and the threshold parameters,
24

particularly the scalar scattering lengths. In the Theory section below, we will discuss the existingtension between dispersive analyses of experimental data [124, 125], theoretical predictions fromChiral Perturbation Theory [116,117], and lattice calculations [127–130]. One of the main difficul-ties for extracting reliable values form experiment is that the existing πK data starts at 750 MeV,and one needs an extrapolation down to the threshold at ∼635 MeV. Thus, the new KLF input atlow energies, together with the general improvement in statisics, will be determinant to settle thisissue.
For spectroscopy, the relevance of this state, which according to the Review of Particle Physics [2]still “needs confirmation”, is twofold: First, as commented before, because establishing firmly itsexistence will settle the longstading debate on whether there is a low-lying scalar nonet, with theσ/f0(500), the f0(980) and a0(980) as partners. But, second, because there is mounting evidencethat such a nonet is actually exotic, i.e., not an ordinary quark-antiquark state [131–140]. Knowingwith precision the κ features, particularly its pole position, mass, width, and Kπ coupling willsupport, or not, such scenario.
At this point, it is worth remarking the decisive role that the precise low-energy data from NA48/2experiment [141] played a dramatic revision of the σ/f0(500) in the RPP. In this regard, improvedmeasurements of the S-wave πK phase-shifts at low energy (E <∼ 1 GeV) would be highly desir-able in order to play a similar role for the κ/K∗0(800). On the one hand, the existence of this typeof resonance is linked to the fact that the phase-shift passes through 45 sufficiently close to thethreshold. This, of course is in contrast with the case of an ordinary resonance which correspondsto a fast increase of the phase-shift passing through 90. Fig. 13 illustrates how these phase be-haviors on the real axis are related to the presence of a zero of the S matrix on the first Riemannsheet (corresponding to a resonance pole on the second Riemann sheet). The figure, which is basedon amplitudes generated from the Roy-Steiner equations (to be discussed below) suggests that theI = 1/2 S-wave displays both an exotic resonance and an ordinary one. On a more quantitativeside precision measurements of the S-wave phase-shifts would allow application of the Padé ap-proximant method for determining the positions of the resonances (see, e.g., [142]. This methodhas been recently applied to πK scattering, and a κ pole has been found in Ref. [143] using as aninput the fit to data constrained with Forward Dispersion Relations obtained in Ref. [125].
Alternatively, the most rigorous way to determine this resonance pole is from Roy-Steiner (RS)type equations [144, 145]. These equations rely on the first principles like analyticity, crossing aswell as data. They provide a suitable framework for performing extrapolations in the low energyregion, E < 1 GeV, of the S and P partial waves given sufficiently precise inputs at higher energies,essentially in the range (1 – 2) GeV. Extrapolations for complex values of the energies can beperformed with the same accuracy as on the real axis. Unlike the Padé approximant approach,the extrapolation of the I = 1/2 S-wave from the RS equations requires inputs from other partialwaves as well since the equations form a coupled system. Based on the existing data set, anestimate of the κ pole position from the RS equations was performed in Ref. [22]. Note that noinput on πK scattering in the scalar partial waves below 1 GeV was used for this estimate. Usingthis Roy-Steiner equations with the data produced in KLF would produce an actual experimentaland rigorous determination of the κ pole.
In the P -wave, finally, the studies by the LASS Collaboration [146, 147] have identified besides
25

Figure 13: Zeros of the S-matrix, for the I = 1/2, J = 0 πK partial-wave on the first Riemann sheet.The figure shows the lines which correspond to Re[S] = 0 and Im[S] = 0 (intersection of the two lines,obviously, corresponds to a zero of S) and some important phase-shift values on the real axis.
the well known K∗(892) a new meson, the K∗(1410). This meson has an unexpectedly low massas it appears to be essentially degenerate with the non-strange ρ(1450) or ω(1420) vector mesons.Its properties are not very precisely known at present.
9.3 Status of πK Scattering Measurements
Figure 14: Illustration of the contribution from one-pion exchange, which is dominant at small momentumtransfer, to the production amplitude KLp→ K+π−p.
The traditional method for measuring πK → πK amplitudes is from production measurements
Kp→ Kπp, Kp→ Kπn, Kp→ Kπ∆ (25)
26

focusing on the region of small momentum transfers |t| < 0.1−0.2 GeV2, which is accessible withkaon beams of a few GeV. In this region, the amplitude is dominated by the one pion exchangecontribution, see Fig. 14. The same method was used for measuring ππ → ππ amplitudes, detailscan be found in the book [148]. The two experiments performed at SLAC [147, 149] have thelargest statistics and provide the best determinations of the πK scattering amplitudes at present.They cover the energy ranges 0.73 ≤ E ≤ 1.85 GeV (Ref. [149]) and 0.83 ≤ E ≤ 2.52 GeV(Ref. [147]), respectively. References to earlier work can be found in the review [150].
Figure 15: Phase of the πK vector form factor as determined in Ref. [153] and compared with the P-wavephase shifts from Refs. [147, 149]. The two phases should be identical, by Watson’s theorem, in the elasticscattering energy region.
A completely different approach to measuring the πK phase-shifts makes use of Watson’s theoremfor weak decay form factors. In this manner, the phase-shift difference δS − δP was determinedfrom analyzing the D+ → K−π+e+ν by the BaBar Collaboration [151]. The results are in agree-ment with the LASS determination but more statistics are needed before one reaches a comparableprecision. Similarly, from the measurement of the energy distribution in the decay τ− → KSπ
−νby the Belle Collaboration [152] the P -wave phase has been determined [153], relying on the an-alyticity properties of the form factor. Their result is shown in Fig. 15. Since Watson’s theorem isvalid in the energy region of elastic scattering, these alternative phase determinations provide im-portant information on the effective onset of inelastic scattering in the various partial waves. Thefigure also shows that the determination of the phase shift in the region of the K∗(1410) resonanceis not very precise and could be improved.
The same form factors which appear in the τ → Kπν decays are also involved in the Kl3 decayamplitudes: K → πeν, K → πµν. A series of new Kl3 experiments were undertaken recentlyin order to improve the determination of Vus (see Ref. [154]). As shown in Ref. [154], an optimalanalysis of the Kl3 data is achieved by using a description of the two form factors involved basedon phase dispersive representations rather than phenomenological polynomial or pole forms asdone previously.
27

πK scattering also plays an important role in a number of three-body decays, like D → Kππ.Recently, a method was developped [155] which allows to compute the effect of the three-bodyrescattering in terms of the known two-body ππ and πK T -matrices. This could be useful foridentifying small CP violating effects in the charm sector.
9.4 Theory
Figure 16: Results for the S-wave phase shifts extrapolated below 1 GeV based on the Roy-Steiner disper-sive equations (from Ref. [124]) compared with the experimental data from Ref. [149].
Pions and kaons are QCD pseudo-Goldstone bosons, therefore the πK amplitudes at low energycan be expressed as a chiral expansion. The NLO calculation was performed in Ref. [116] whopredict the following results for the scattering lengths,
a1/20 = 0.19± 0.02, a
3/20 = −0.05± 0.02 (26)
(in units of m−1π ). Verifying these predictions would provide an important check of the three-flavor
chiral expansion. Based on experimental phase-shift measurements this is possible, in principle,using dispersion relations for extrapolating down to the threshold. The Roy-Steiner equationsprovide a suitable framework for that. This is illustrated in Fig. 16 which shows the extrapolatedresults for the S-waves in the region E ≤ 1 GeV, based on experimental inputs from Refs. [147,149] in the region E > 1 GeV. It is clear that the availability of more precise data in the range E ≤1 GeV would greatly strengthen the efficiency of this method. We note that a direct experimentalestimate of the scattering length difference was performed recently [156] based on the lifetime ofthe π+K− atom at the DIRAC experiment at CERN. Unfortunately, the experimental errors arestill too large and do not provide really precise information about the pion-kaon scattering lengths.
28

Alternatively, scattering phase shifts can be computed in lattice QCD using Lüscher’s method [40].Results for πK phase shifts were first obtained in Refs. [157,158] and in Ref. [62]. In this last work,the influence of one inelastic scattering two-body channel is accounted for and mπ = 391 MeV. Veryrecently, results for mπ = 230 MeV have been presented [49]. Once physical values for mπ arereached, these lattice QCD results can be compared directly to experimental measurements of theπK phase shifts which provides a direct probe of the quality of the numerical QCD solution.
Finally, let us note that there is a sizable tension between the values of scattering lengths obtainedfrom dispersive analyses of data [124, 125], on one side, and the predictions from Chiral Pertur-bation Theory [116, 117] and lattice calculations [127–130], on the other side. The values of thisthreshold parameters are related to two important questions. On the one hand, for phenomenology,establishing the convergence and reliability of SU(3) Chiral Perturbation Theory. On the otherhand, for the foundations of QCD, the size of the strange versus the non-strange chiral condensate,i.e., the detailed pattern of the QCD spontaneous chiral symmetry breaking is very important.
As previously noticed and as shown in Fig. 16, the existing πK data starts at 750 MeV, and oneneeds an extrapolation down to the threshold at ∼635 MeV. Hence, the new KLF data at lowenergies, together with the general improvement in statisics, will be determinant to resolve thistension.
10 Proposed KL Beam Facility
We propose to use the KL Facility with the GlueX spectrometer, in JLab Hall D, to perform pre-cision measurements of KLN → KY ∗ and KLN → Y ∗ → πY,KN,KΞ from liquid hydrogenand deuterium cryogenic targets (LH2/LD2) in the resonance region, W = 1490 – 2500 MeV, andCM cos θ from −0.95 to 0.95. It will operate at a neutral kaon flux of 1 × 10⁴ KL/s (that is by afactor of three order of magnitude higher than SLAC had in the past [159]). The ability of GlueXto measure over wide ranges in θ and φ with good coverage for both charged and neutral particles,together with the KL energy information from the KL Facility, provide an ideal environment forthese measurements.
10.1 KL Beam at Hall D
Schematic view of the Hall D beamline for KLF is presented in Figure 17. At the first stage, 12 GeVelectrons will scatter in the copper radiator (10 % R.L.) inside the Compact Photon Source (CPS)generating an intense beam of untagged bremsstrahlung photons. The CPS will be located down-stream of the tagger magnet. The tagger alcove has more space than that available in Halls C/A.So the positioning of the CPS and the placement of shielding are simplified. The Hall D taggermagnet and detectors will not be used. More details about the CPS are in Section 10.1.2. At thesecond stage, bremsstrahlung photons, created by electrons will hit the Be target assembly locatedat the beginning of the collimator cave (Fig. 28), and produce neutral kaons along with neutrons,photons, and charged particles which will be thrown away by the magnetic field (see below). Moredetails about a Be target assembly are in Section 10.1.3. The GlueX wiki [160] is a source of
29

75 m
Collimator select < 25 r
polarized photons Hall-D
Diamond Radiator "↑− "%→&"↑− %
Tagger Area
Photon Tagger Pair Spectrometer
GlueX Spectrometer
Photon Beam Dump
Electron Beam Dump East ARC
North LINAC KL
Compact Photon Source
ɣ beame- beam
Be Target
75 m
Collimator select < 25 r
polarized photons Hall-D
Diamond Radiator "↑− "%→&"↑− %
Tagger Area
Photon Tagger Pair Spectrometer
GlueX Spectrometer
Photon Beam Dump
Electron Beam Dump East ARC
North LINAC
Sweep Magnet
Tagger Area
GlueX Spectrometer
Flux Monitor
Figure 17: Schematic view of Hall D beamline on the way e → γ → KL. Electrons first hit thecopper radiator inside of CPS, then photons hit the Be target, and finally, neutral kaons hit theLH2/LD2 cryogenic target. The main components are the CPS, Be target assembly, sweep magnet,and neutral kaons FM (see the text for details).
..
Photons Kaons
Soil
Hall D
AirBe-targetAssembly
Labyrinth LabyrinthSweep Magnet
Lead
Concrete
Cryogenic TargetFlux Monitor
Pair Spectrometer
SEG-blocks
VacuumCollimator
Figure 18: Schematic view of the collimator cave with the Be-target assembly (more details inFig. 21) concrete walls, and sweeping magnet. Beam goes from left to right.
the collimator cave geometry. Additional shielding inside the collimator cave was optimized tominimaize the neutron and gamma background in the experimental hall and to satisfy the RadConrequirement establishing the radiation dose rate limit in the experimental hall (1 mrem/h).
Two concrete walls (a labyrinth) inside the collimator cave will reduce neutron and photon back-ground and allow access to the Be-target from the experimental hall are both 1.21 m thick and have0.5 m gap between them (Fig. 18). The first concrete wall has additional 0.10 m lead shielding.The permanent sweeping magnet (3.83 m in length) is placed right after the second concrete wall.It cleans up the charged component of the beam and has a field integral of 0.8 Tm, which is enough
30

to remove all charged background coming out of the Be-target assembly.
Table 1: Expected electron/photon/kaon beam conditions at the KL experiment.
Property ValueElectron beam current (µA) 5Electron flux at CPS (s−1) 3.1× 10¹³
Photon flux at Be-target Eγ > 1500 MeV (s−1) 2.6× 10¹¹
KL beam flux at cryogenic target (s−1) 1× 10⁴
KL beam σp/p @ 1 GeV/c (%) ∼1.5KL beam σp/p @ 2 GeV/c (%) ∼5KL beam nonuniformity (%) < 2KL beam divergence () < 0.15
K0/K0 ratio at cryogenic target 2:1Background gamma flux at cryogenic target, Eγ > 50 MeV (s−1) ∼105
Background gamma flux at cryogenic target, Eγ > 500 MeV (s−1) ∼103
Background neutron flux at cryogenic target (s−1) 6× 10⁴
Table 2: Expected targets properties at the KL experiment.
Property ValueCopper radiator in CPS (%R.L.) 10∅Be-target (m) 0.06Be-target length (m) 0.40∅LH2/LD2 cryogenic target (m) 0.06LH2/LD2 cryogenic target length (m) 0.40Photon beamline length (m) 67Kaon beamline length (m) 24
The vacuum beam pipe has a ∅0.07 m and prevents neutron rescattering in air. Finally, KL mesonswill reach the LH2/LD2 cryogenic target located inside the GlueX spectrometer. The distancebetween the primary Be and cryogenic targets is 24 m. The flux of KL mesons will be measuredby a Flux Monitor (FM) [161] (1.2 m in length) located in the experimental hall in just 2 m (itwould utilize the KL in-flight decays) behind the Pair Spectrometer [162]. More details about theFM are in Section 10.1.4.
Our MC calculations have been performed for the JLab Hall D beamline geometry. Tables 1 and 2summarize beam properties and dimensions of targets, respectively.
10.1.1 Beamline Delivery for Secondary KL Beam
The proposed secondary KL experiment requires time of flight measurements, which in turnrequires substantially lower bunch repetition rates in CEBAF than the nominal 249.5 MHz or
31

499 MHz. Gun laser hardware lends itself to powers of two reductions in repetition rates, so thisproposal includes beam delivery at either the 32nd (15.59 MHz) or 64th (7.80 MHz) harmonic ofthe nominal 499 MHz.
An average dump power limit of 30-60 kW for 12 GeV electrons in the CPS translates to aver-age beam currents of 2.5-5.0 µA. Combining these beam requirements leads to individual bunchcharges shown in Table 3.
Table 3: CEBAF injector bunch currents and repetition rates for Secondary KL experiment.
Current Rep Rate Harmonic of 499 MHz Bunch Charge Equivalent 499 MHz Current(µA) (MHz) (pC) (µA)2.5 15.59 32nd 0.16 802.5 7.80 64th 0.32 1605.0 15.59 32nd 0.32 1605.0 7.80 64th 0.64 320
Experience shows that operating at 0.16 – 0.32 pC bunch charge has been shown to be challeng-ing in the 12 GeV era. Injector setup time of up to a week is required to limit bunch tails thatcause beam trips and background, and intervention on the order of every few days is currently re-quired to maintain a reasonable accelerator availability. The G0 experiment ran 1.6 pC/bunch, butonly at 3 GeV with the 6 GeV machine and in a dedicated configuration that required substantialinterception to trim beam tails [163].
These concerns may be mitigated somewhat by completion of the injector upgrade program, in-cluding operations of a 200 keV gun, in the 2021 timeframe. The HV gun is scheduled for instal-lation in summer 2018, and may be available for early tests in FY19 [164].
Low frequency, high power amplifier use has been attempted at CEBAF in recent years, resultingin substantial damage and high amplifier failure rates even near 30 MHz because of high peakpower required as repetition rate is lowered. The low bunch repetition rate therefore also requiresconsiderable investment.
With the existing and planned gun confiration, laser development is required to achieve any ofthe planned bunch repetition rates. This requires construction of a pulse picker that would passa sub-harmonic of the 249.5 MHz system (for example, 15.6 MHz) to avoid major impact tothe existing 249.5/499 MHz laser systems. Amplification is then required before doubling to theproper wavelength to achieve useful power, even for 10 µA beam. Additional power amplificationis necessary for the higher beam currents required here.
In order to build up a beamline delivery system for the secondary KL beam, it requires the pulsepicking system and the laser amplifier. The lead time on amplifiers can be long so ideally ayear of advance funding would be necessary to design, build and demonstrate the system per-formance [163].
The G0 experiment [165] used a commercial Ti:Al2SO3 laser with a very long (∼5 m) opticalcavity that was very difficult to keep on and locked to the accelerator RF. This solution is not
32

practical for the 12 GeV era.
10.1.2 Compact Photon Source: Conceptual Design
An intense high-energy gamma source is a prerequisite for the production of the KL beam neededfor the new experiments described in this proposal. In 2014, the Neutral Particle SpectrometerCollaboration started the development of a novel concept of a Compact Photon Source (CPS) [166].It was originally developed for a Wide-Angle Compton Experiment proposed to PAC43 [167], butadditional science possibilities have been discussed since.
Figure 19: Plane cut of the Tagger vault model built using the GEANT3 detector simulation pack-age. Black areas correspond to the concrete walls. Red hatch style is used for iron shielding blocks.Yellow areas correspond to the beam vacuum. Top panel: The simulation of 2000 beam electronsat 12 GeV for the current Hall D setup. Red tracks show charged particles, mostly electrons, bluetracks are gammas, and neutrons are tracked in black. Bottom panel: The CPS assembly and thesimulation of 2000 beam electrons at 12 GeV. This Figures are taken from Ref. [169] (Figures 3and 6).
The details of the CPS can be found in a document by the CPS Collaboration Working Group [168].We present here a part of the document to illustrate the main aspects of the conceptual design. The
33

CPS design combines in a single properly shielded assembly all elements necessary for the pro-duction of the intense photon beam, such that the overall dimensions of the setup are limited andthe operational radiation dose rates around it are acceptable. Compared to the alternative, the pro-posed CPS solution presents several advantages: much lower radiation levels, both prompt andpost-operational due to the beamline elements radio-activation at the vault. The new design pro-vides much less disturbance of the available infrastructure at the Tagger Area, and better flexibilityin achieving high-intensity photon beam delivery to Hall D. The new CPS solution will satisfythe proposed KL beam production parameters; we do not envision any significant technical ororganizational difficulties in the implementation of the conceptual design.
Figure 20: A comparison of dose rate estimates in the Tagger Area in the two conditions:Left panel: Nominal Hall D operation with the standard amorphous radiator at 0.05 % R.L. andRight panel: Radiator at 10 % R.L., used as part of the CPS setup. This Figure is taken fromRef. [169] (Figure 7).
The new setup utilizes the Hall D Tagger vault, properly shielded by design to accomodate themedium power beam dump capable of accepting up to 60 kW of 12 GeV electron beam, assumingthat proper local shielding is set around the dump. The presently installed dump is placed behindthe iron labyrinth walls, and is surrounded by a massive iron shielding, made of iron blocks avail-able at the time of construction. The standard GlueX setup is optimized for operations using verythin radiators producing relatively low intensity photon beam such that the beam electrons losingenergy to photon production in the radiator may be detected and counted in the tagger hodoscopecounters. The present setup is not suitable for production of massively more intense photon beamsneeded for the KL production, due to the expected overwhelming radiation and activation levels inthe vault.
The CPS will be located downstream of the tagger magnet. The tagger alcove has more space thanthat available in Halls C/A, so positioning and shielding placement are simpler. Indeed, the CPSimplementation in Hall D may have a different length and magnet field, as well as shielding. A totalfloor loading of the implementation up to 100 t is acceptable. Hall D would require implementationof the rastering system in the beam line leading to the vault, that should be optimized.
For the Hall-D adaptation, the 5 µA beam current is limited by the design of the Hall D TaggerMagnet alcove. This corresponds to a 60 kW power limit. Note that the ceiling shielding ofthe Tagger hall above the CPS position is the same as it is above the existing 60 kW dump. No
34
Igor
Highlight
Igor
Highlight

radiation increase at the site boundary is thus expected with respect to 60 kW operations usingthe existing dump. Figs. 19 and 20 illustrate how the CPS stops the electron beam and absorbsalmost all beam energy inside, and therefore provides excellent shielding. Running the CPS at fullbeam power produces radiation fields in the Hall D tagger area, comparable with running regularHall D experiment utilizing a very thin radiator upstream of the tagger magnet. A 30 kW CPShas been designed for Halls C/A. For Hall D, the dose rates in the vault during full 60 kW beamoperations are comparable to the nominal running conditions in the vault, as shown in Fig. 20. Thelatter device has to be somewhat larger, but the Tagger hall provides more available space than theHall C location.
10.1.3 Be Target Assembly: Conceptual Design
..
50 cm
70 cm
40 cm
100 cm
120 cm
76 cm
6 cm
Borated Polyethylene
Be
Lead
Tungsten
Air
Photons KaonsVacuum
Concrete
150 cm
Figure 21: Schematic view of the Be-target (KL production target) assembly. Concrete, boratedpolyethylene, lead, tungsten, beryllium, vacuum beam pipe, and air shown by grey, pink, brown,light blue, blue, violet, and white color, respectively. Beam goes from left to right.
A conceptual design of the Be target assembly for neutral kaon experiments to be used with theGlueX experimental setup is given in Ref. [170] (See Appendix A4 (Sec. 16) for further details ofelements of the Be-target assembly). Schematic view of the Be-target assembly is given in Fig. 21.Lighter elements provide higher photoproduction yield for a unit of radiation length. Berylliumtargets were used for KL production at SLAC [94] and NINA [92]. Then the beam tungsten plugof a 0.10 m thick (30 % R.L.) is connected to the beryllium (Fig. 21).
Elements of the Be-target assembly are presented in Table 7 (Appendix A4 (Sec. 16)). The weightof the Be-target assembly is 14.5 t. Changeover from the photon to the KL beamline and fromthe KL to the photon beamline requires further evaluation. However, initial conservative estimatesare that this changeover could be completed approximately in 6 months. Therefore, the majorityof this changeover could be completed during a typical summer shutdown period in the CEBAFaccelerator schedule. It has to be mentioned that the collimator cave has enough space (with the4.52 m width) for the Be-target assembly to remain far enough from the beamline.
Water cooling would be required around the beryllium and tungsten plug. Cooling water is avail-able in the experimental hall that can be used to dissipate 6 kW of power delivered by the photon
35
Igor
Highlight
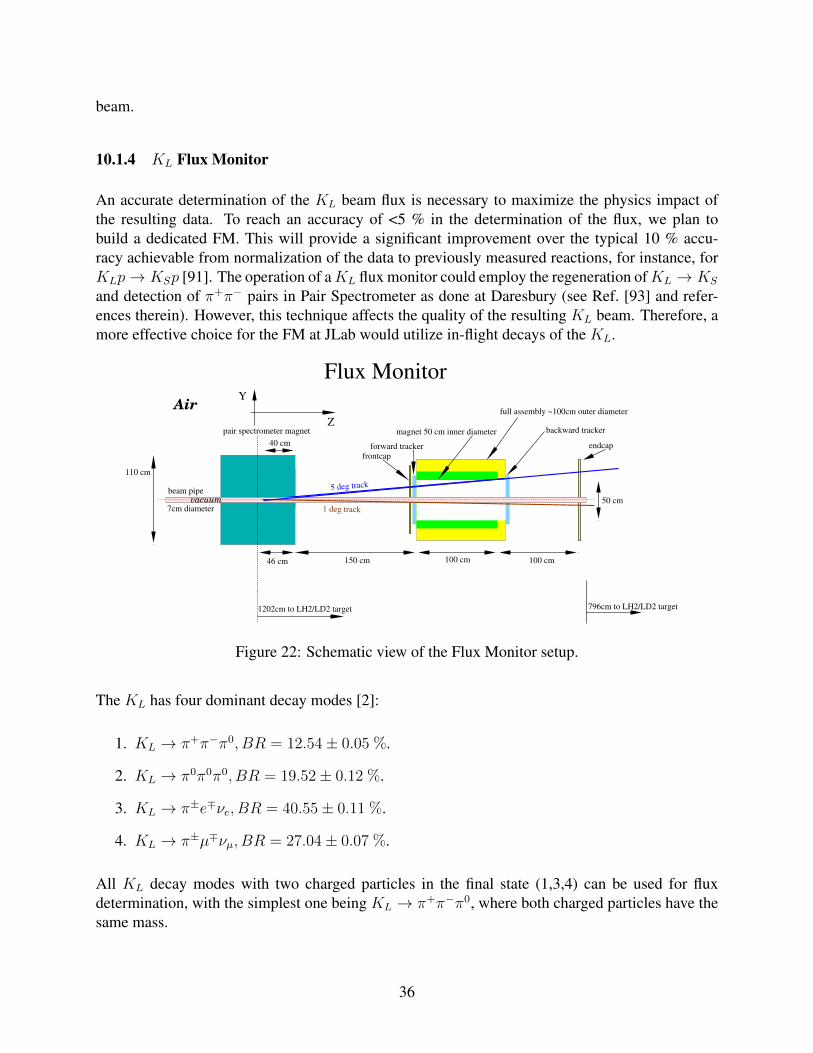
beam.
10.1.4 KL Flux Monitor
An accurate determination of the KL beam flux is necessary to maximize the physics impact ofthe resulting data. To reach an accuracy of <5 % in the determination of the flux, we plan tobuild a dedicated FM. This will provide a significant improvement over the typical 10 % accu-racy achievable from normalization of the data to previously measured reactions, for instance, forKLp→ KSp [91]. The operation of aKL flux monitor could employ the regeneration ofKL → KS
and detection of π+π− pairs in Pair Spectrometer as done at Daresbury (see Ref. [93] and refer-ences therein). However, this technique affects the quality of the resulting KL beam. Therefore, amore effective choice for the FM at JLab would utilize in-flight decays of the KL.
Y
Zpair spectrometer magnet
1 deg track
5 deg track
magnet 50 cm inner diameter backward tracker
1202cm to LH2/LD2 target
150 cm 100 cm 100 cm
beam pipe
7cm diameter
110 cm
50 cm
full assembly ~100cm outer diameter
forward tracker
796cm to LH2/LD2 target
Flux Monitor
46 cm
40 cm endcap
frontcap
Air
vacuum
Figure 22: Schematic view of the Flux Monitor setup.
The KL has four dominant decay modes [2]:
1. KL → π+π−π0, BR = 12.54± 0.05 %.
2. KL → π0π0π0, BR = 19.52± 0.12 %.
3. KL → π±e∓νe, BR = 40.55± 0.11 %.
4. KL → π±µ∓νµ, BR = 27.04± 0.07 %.
All KL decay modes with two charged particles in the final state (1,3,4) can be used for fluxdetermination, with the simplest one being KL → π+π−π0, where both charged particles have thesame mass.
36

[GeV/c]LKP
2 4 6
]-1 s
-1flu
x [M
eV
0
0.1
0.2
0.3
0.4
0.5
0π-π+π
νµπ
νeπ
Flux Monitor countrate
[GeV/c]LKP
2 4 6 8 10
erro
r [%
]
0
2
4
6
8
10FM 1 day stat. accuracy (bin=20 MeV/c)
Figure 23: The Flux Monitor performance. Left panel: Visible KL flux for various decay channelswithin the FM acceptance. Solid lines correspond to a system with front/end-caps only. Dashedlines show the improvement one can obtain with the additional barrel part extension to the FM.Right panel: Expected statistical accuracy for 1 day FM measurement (π+π−π0 branch only) in20 MeV/c momentum bin.
To account for various possible acceptance effects during KL beam propagation from the Be-target, we plan to measure the KL flux upstream of the GlueX detector, utilizing the Hall D PairSpectrometer [162] as shielding against KL which have decayed further upstream.
Momentum [GeV/c]LK0 2 4 6 8 10 12
s⋅M
eV/c
ka
ons
0
1
2
3
2/LD2LH
flux monitor X 10
fluxLK
Figure 24: KL-momentum spectra originating from all sources simulated using the Pythia gener-ator [171] for the kaons reached cryotarget (red) and decayed within the Flux Monitor acceptance(blue).
The FM design proposed and described in this section will measure a small fraction of decayedKL’s, concentrating on the portion decaying within a distance of 2 m downstream of the PairSpectrometer magnet center (see Fig. 22). The FM consists of the following major parts: the front
37

]2)2 [(GeV/c2Missing Mass-0.1 -0.05 0 0.05 0.1
coun
ts [a
rb]
0
20
40
60
0π-π+π
νµπ
νeπ
]2)2 [(GeV/c2Missing Mass-0.1 -0.05 0 0.05 0.1
coun
ts [a
rb]
0
50
100
0π-π+π
νµπνeπ
Figure 25: The Flux Monitor missing mass resolution (all charged particles in all decay channelsare assumed to have mass of pion). Left panel: based on ToF system. Right panel: based onmagnetic system.
cap, forward tracker, backward tracker, endcap, and solenoidal magnet. The FM can be furtherequipped with a plastic scintillator barrel, covering inner part of a magnet and a start counter(FMSC), comprising plastic scintillator bars covering the beampipe, from the location of the PairSpectrometer magnet to the FM magnet.
The front- and end-caps are pizza-piece shaped segmented plastic scintillators used to providestart and stop timing signals for time-of-flight (ToF) as well as signals for the trigger electronics.Each cap is proposed to have double-layer design to improve the time resolution and equippedwith Hamamatsu R4998 PMTs (H6533 assemblies). The endcap would be located around 1 mdownstream of the FM magnet to improve the achievable ToF resolution. Two trackers will beinstalled outside the magnetic field covering the downstream and upstream needs of the FM.
To be measured by the FM, both charged particles from the kaon decay need to be incident withinthe FM acceptance. Taking into account the different branching ratios, we expect to reconstructthe following number of KL from various decay channels (see Fig. 23 (left)). One can quantify theexpected rate in terms of the achievable statistical error within a one day measurement (see Fig. 23(right)).
For the kaon beam momenta range appropriate for the hyperon program a 1 % statistical error ofthe KL flux determination is achievable in less than a day.
An accurate flux monitoring requires determination of the kaon flux as both a function of transver-sal position within the beampipe and kaon energy. The most inner 3 cm of the transverse beamprofile at the position of the FM would correspond to a 6 cm profile at the cryogenic target. A∅7 cm beam pipe allows sufficient margins and the clean definition of a fiducial regions of thetransverse beam profile at the FM position. All in all we expect to measure about 1.1k kaon/s inthe FM. In Fig. 24, one can see the kaon flux experienced by the FM and by the cryogenic target,
38
respectively. The increased low momentum yield of kaons observed in the FM compared to thetarget position arises because these low momenta particles have a larger probability of decaying inthe region between the FM and cryogenic target.
An achievable FM resolution/performance for various case scenarios can be illustrated in Fig. 25.Correct mass assignment for the KL → π+π−π0 branch give a much narrower missing massdistribution.
The ratio between different branches is fixed. As expected, the magnetic field provides moreprecise event reconstruction.
We do not expect any influence of a neutron background on the FM. A similar system of ToFscintillators with trackers was working at the WASA detector for a decade under several ordersof magnitude higher neutron fluxes without showing signal deterioration. Conventional PMT’sproved to be very tolerable to a neutron flux. We also do not expect any neutron flux mediateddisturbances in kaon flux measureemnrs. At the position of the FM assembly the neutron fluxis more or less confined within the beam pipe. However, the divergence of a neutron beam willcause some charge particle background, which would be seen by the FM. In some cases, like two-proton knockout or nn→ npπ− reactions in the beam pipe material these events might mimic kaondecays. Fortunately, all these events would originate from the beampipe with a vertex displacementof a 35 mm in transversal direction, allowing a fair separation from useful kaon decays limitedby 15 mm transverse displacement. The FM tracker system will provide sufficient accuracy todisentangle these cases with simple fiducial cuts.
To summarize: The flux determination with proposed FM and accuracy better than 5 % over thefull range of energies seems to be feasible. Additional neutron flux monitoring with neutron-beampipe scattering is possible. The FM construction is straightforward and can be completed within1 year. No prototyping is necessary. No interference with existing Hall-D equipment is expected.For further details about the FM design and performance, see Ref. [161].
10.1.5 KL Beam Parameters
1. Simulations Study of KL Beam ProductionNeutral kaon production was simulated for a photon bremsstrahlung beam produced by the12 GeV electron beam in the Hall D CPS. The main mechanism of KL production in ourenergy range is via φ-meson photoproduction, which yields the same number of K0 and K0.We have taken as a model the Pythia generator [171], which includes hyperon production.Total and differential cross sections for the φ-meson photoproduction on proton and complexnuclei (coherent and incoherent) data were taken from Refs. [172, 173]. The angular distri-butions that we used for φ→ KLKS decay are from Refs. [172, 174, 175]. Our calculationsshow that the φ decay in its rest frame is mostly perpendicular to the axis of φ-momentum.Since KLs need to stay along the original photon beam direction to get to the LH2/LD2 cryo-genic target, this condition requires that the φ production and decay angles in the laboratoryframe be about the same. That means that we will have only KLs from φ-mesons producedat relatively high momentum transfer t at the Be target. It suppresses the number of “use-ful" KLs by a factor of ∼3 or more (in comparison with the case if KL and KS momenta
39

are parallel to the φ-momentum). The KL absorption, used in our calculations, was studiedextensively in Ref. [176]. More than 80 % of the produced KLs will be absorbed in theBe target and following tungsten beam plug.
Figure 26: KL and neutron momentum spectra on the cryogenic target. Left panel: The rate of KL
(red) and neutrons (blue) on the LH2/LD2 cryogenic target of Hall D as a function of their generatedmomentum, with a total rate of 1× 10⁴ KL/s and 6× 10⁴ n/s. Kaon calculations were performedusing Pythia generator [171] while neutron calculations were performed using the MCNP transportcode [178]. Right panel: Experimental data from SLAC measurements using a 16 GeV/c electronbeam were taken from Ref. [94] (Figure 2). The rate of KL (red filled circles) and neutrons (blackfilled squares) is shown.
One of the mainKL-beam parameters is the momentum distribution (momentum spectrum asa function of the distance and angle) [177]. Results of our simulations for theKL momentumspectrum for those KL reaching the LH2/LD2 cryogenic target is shown in Fig. 24. Thespectrum first increases with KL momentum up to ∼4 GeV/c since the φ decay cone angledecreases at higher γ-beam and KL-momenta. This selects lower φ production t values,which are more favorable according to the φ differential cross section. At a certain point, thehighest possible γ-beam momentum is reached and the KL-momentum spectrum decreasesto the endpoint. Pythia calculations show that φ decays yield roughly 70 % of the KL fluxwith the rest originating from hyperon photoproduction. The number of K0 exceeds thenumber of K0 by 30 % points according to this generator for our conditions.
To estimate the expected rate of KLs at the LH2/LD2 cryogenic target, we used the condi-tions listed in Tables 1 and 2 which results in a beam flux of about 1× 10⁴ KL/s from allproduction mechanisms at the cryogenic target (Fig. 26). We simulated the KL and neutronproduction from 12-GeV electrons under these conditions for the GlueX KL Facility and the
40
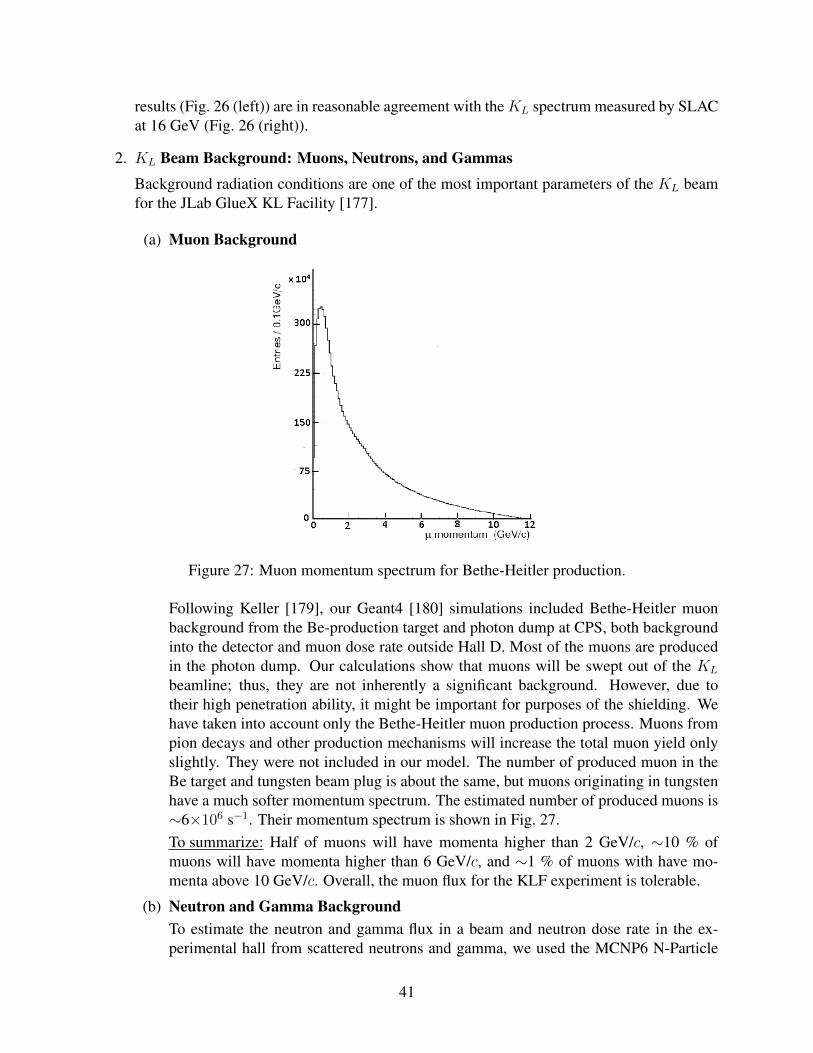
results (Fig. 26 (left)) are in reasonable agreement with theKL spectrum measured by SLACat 16 GeV (Fig. 26 (right)).
2. KL Beam Background: Muons, Neutrons, and GammasBackground radiation conditions are one of the most important parameters of the KL beamfor the JLab GlueX KL Facility [177].
(a) Muon Background
Figure 27: Muon momentum spectrum for Bethe-Heitler production.
Following Keller [179], our Geant4 [180] simulations included Bethe-Heitler muonbackground from the Be-production target and photon dump at CPS, both backgroundinto the detector and muon dose rate outside Hall D. Most of the muons are producedin the photon dump. Our calculations show that muons will be swept out of the KL
beamline; thus, they are not inherently a significant background. However, due totheir high penetration ability, it might be important for purposes of the shielding. Wehave taken into account only the Bethe-Heitler muon production process. Muons frompion decays and other production mechanisms will increase the total muon yield onlyslightly. They were not included in our model. The number of produced muon in theBe target and tungsten beam plug is about the same, but muons originating in tungstenhave a much softer momentum spectrum. The estimated number of produced muons is∼6×10⁶ s−1. Their momentum spectrum is shown in Fig. 27.To summarize: Half of muons will have momenta higher than 2 GeV/c, ∼10 % ofmuons will have momenta higher than 6 GeV/c, and ∼1 % of muons with have mo-menta above 10 GeV/c. Overall, the muon flux for the KLF experiment is tolerable.
(b) Neutron and Gamma BackgroundTo estimate the neutron and gamma flux in a beam and neutron dose rate in the ex-perimental hall from scattered neutrons and gamma, we used the MCNP6 N-Particle
41

(MCNP) Transport code [178]. The realism of MCNP simulations is based on the ad-vanced nuclear cross section libraries created and maintained in national laboratoriesof DOE complex. The physical models implemented in the MCNP6 code take intoaccount bremsstrahlung photon production, photonuclear reactions, neutron and pho-ton multiple scattering processes. The experimental hall, collimator cave, and photonbeam resulted from copper radiator were modeled using the specifications from thelayout presented in Figure 28 shown as a 3D graphic model of the experimental setup.
..
#5
#9#8
#7
#1#3
#6
LH2/LD2
Labyrinth
LabyrinthSweep Magnet
Be-targetAssembly
Key Area for RadConon ceiling
Figure 28: Schematic view of Hall D setting for MCNP transport code [178] calculations. Beamgoes from left to right. The model is presented as semi-transparent for demonstration purposes.This 3D plot is a part of Hall D beamline as Fig. 17 and some tallies are shown.
The MCNP model simulates a 12 GeV 5µA electron beam hitting the copper radiatorinside the CPS. Electron transport was traced in copper radiator, vacuum beam pipefor bremsstrahlung photons, and Be-target. Neutrons and photons were traced in allcomponents of the used MCNP model. The media outside concrete walls of the colli-mator cave and bremsstrahlung photon beam pipe was excluded from consideration tofacilitate the calculations.For MCNP calculations (in terms of flux [part/s/cm2] or biological dose rate [mrem/h]),several tallies (as Tables 8 and 9 will show below) were placed along the beam and atthe experimental hall for neutron and gamma fluence estimation Tally descriptions aregiven in Appendix A4 (Sec. 16). Fluence-to-Effective Dose conversion factors fromICRP 116 [181] were implemented to convert neutron fluence to effective dose rate.The tally #5 (Table 9) was selected by the RadCon to estimate neutron fluence at theexperimental hall ceiling just above the GlueX detector. That is the Key Area forRadCon shown in Fig. 28. The neutron dose rate calculated for the layouts from Fig. 71on tally #5 is 0.11±0.04 mrem/h which is acceptable by RadCon.
42

Figure 29: Neutron energy spectrum at the beam and face of the cryogenic target, tally #3.
The neutron flux on the face of the LH2/LD2 cryogenic target (tally #3) is 1.7 ×10⁴ n/(s·cm2). The spectrum of neutrons at the face of the cryogenic target is shownin Fig. 29. The neutron energy on the cryogenic target varied between 0.1 – 1 GeVwith an exponentially dropping tail extending up to 10 GeV. The flux is not sufficientto provide a significant background in the case of np or nd interactions in the cryogenictarget, see Appendix 16 for details.The neutron dose rate for the silicon photomultipliers (SiPM) of the start counter [182–184] and BCAL [184, 185] is given in Fig. 30 (left). There is an issue for SiPM andlow level of BCAL. Previous studies stand that the dose rate of 30 mreh/h increases adark current at SiPM by a factor of 5 after 75 days of running period [186].In our initial calculations (Fig. 30), we ignored Pair Spectrometer and FM magnets.In new calcluations (Table 9), we took them into account as well as 4 SEG-blocks(132 × 132 × 66 cm3) shildings around the beam pipe and a concrete block (132 ×132 × 20 cm3) with a steel collimator for the beam pipe (outer ∅13 cm and inner∅8 cm). We are confident that the additional steel collimator between SEG-blocksreduces a neutron radiation dose for BCAL up to <0.1 mrem/h (tallies #10 – #19)(Table 9) which is negligible. While there is still an issue for SiPMs of the start counterwhich is 632±145 mrem/h (tally #6). SiPMs can be replaced with regular PMTs, butwe have to worry about shielding the magnetic field. Another option is MCP-PMTswhich are rad hard and resistant to magnetic fields.To estimate the photon flux in a beam and gamma dose rate in the experimental hallfrom scattered neutrons, we used the same MCNP Transport code [178]. After pass-ing through a 30 % R.L. tungsten beam plug and the charged background componentremoved by the sweep magnet, we will have some residual γ background producedby EM showers. The energy spectrum of residual gammas is shown in Fig. 31. It de-creases exponentially with increasing energy of photons and vanishes above 30 MeV.
43
Igor
Highlight
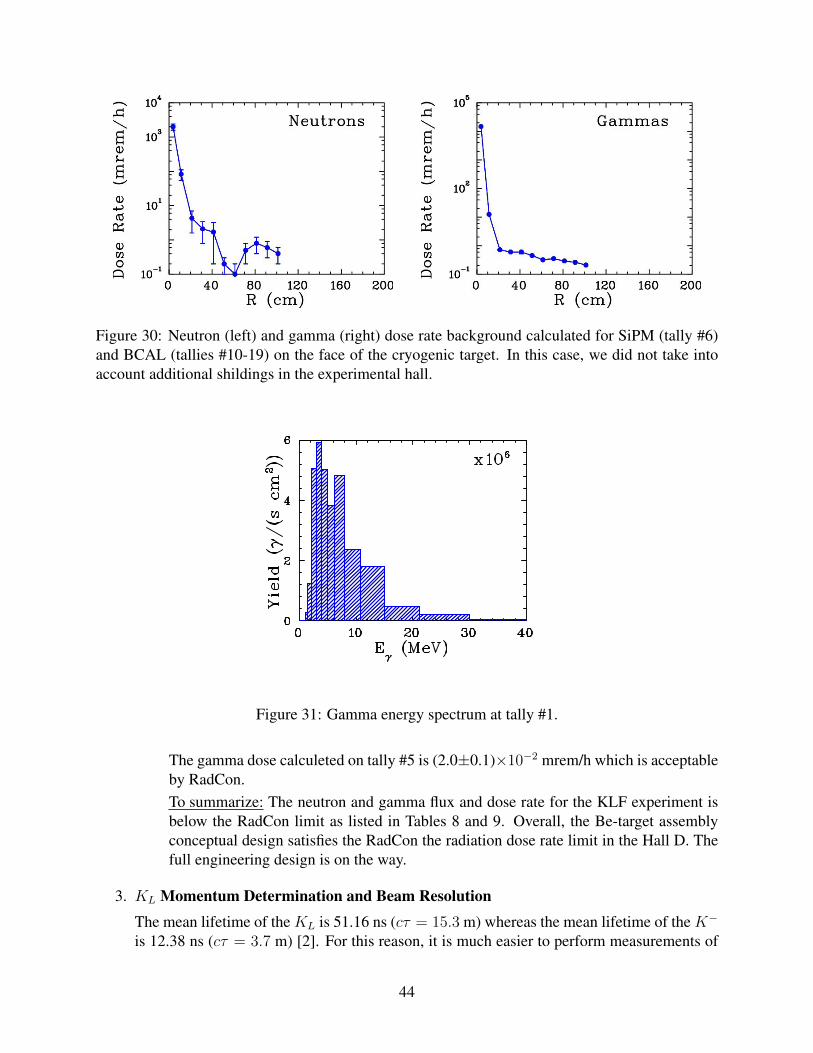
Figure 30: Neutron (left) and gamma (right) dose rate background calculated for SiPM (tally #6)and BCAL (tallies #10-19) on the face of the cryogenic target. In this case, we did not take intoaccount additional shildings in the experimental hall.
Figure 31: Gamma energy spectrum at tally #1.
The gamma dose calculeted on tally #5 is (2.0±0.1)×10−2 mrem/h which is acceptableby RadCon.To summarize: The neutron and gamma flux and dose rate for the KLF experiment isbelow the RadCon limit as listed in Tables 8 and 9. Overall, the Be-target assemblyconceptual design satisfies the RadCon the radiation dose rate limit in the Hall D. Thefull engineering design is on the way.
3. KL Momentum Determination and Beam ResolutionThe mean lifetime of the KL is 51.16 ns (cτ = 15.3 m) whereas the mean lifetime of the K−
is 12.38 ns (cτ = 3.7 m) [2]. For this reason, it is much easier to perform measurements of
44

KLp scattering at low beam energies compared with K−p scattering.
Figure 32: Left panel: Time resolution (σt) for KL beam as a function of KL-momentum.Right panel: Momentum resolution (σp/p) as a function of momentum (note, log scale).
The momentum of aKL beam can be measured using time-of-flight (TOF) - the time betweenthe accelerator bunch (RF signal from CEBAF) and the reaction in the LH2/LD2 target asdetected by the GlueX spectrometer. Thus the TOF resolution is a quadratic sum of acceler-ator time and GlueX spectrometer time resolutions. Since the accelerator signal has a verygood time resolution on the order of few picoseconds, the TOF resolution will be definedmainly by the GlueX detector. The time resolution of the GlueX detector is discussed inSec. 4. The details of time reconstruction for the TOF is discussed in Sec. 11.1. In ourcalculations, we used currently achieved Start Counter time resolution of 250 ps to show thetime and beam momentum resolution vs. kaon momentum (Fig. 32). All hyperon productionreactions have very similar TOF and final state reconstructed W-resolution, see Sec. 11 andAppendix A5 (Sec. 17). While the W resolution vs. W shows on (Fig. 33).
To get precise TOF information, the electron beam needs to have a narrow bunch time struc-ture. As discussed in Sec. 10.1.1, the electron beam can be delivered with predeterminedrepetition rate. For the KL experiment, the 64 ns bunch spacing structure is an optimalchoice. It allows no cross-bunch overlap for the full range of kaon beam momentum frompKL
>320 MeV/c.
The uncertainty in a neutral kaon production position at lower momenta (p < 0.5 GeV/c)affects timing resolution caused by the TOF difference between the photon and kaon timetraversing the Be target, however, as ∆p/p = γ2∆t/t momentum resolution is below 1 %at lower momenta. The TOF resolution is flat for momenta higher than 1 GeV/c. Themomentum resolution decreases with momentum: for 1 GeV/c it is ∼1.5 % and for 2 GeV/cit is ∼5 %. For fully reconstructed final states W can be reconstructed directly, providing abetter resolution in the region where the TOF method deteriorates, W > 2.2 GeV (see dashedcurve in Fig. 33).
45

[GeV]trueW
1.6 1.8 2 2.2 2.4
, [M
eV]
Wσ
0
20
40
60
80
100W resolution
Figure 33: The energy resolution (σW ) as a function of energy. The dashed line shows approximateW resolution from reconstruction of the final-state particles.
4. GlueX Detector Time Resolution
Figure 34: Time difference between the measured and expected ST time from the Spring 2017GlueX run period. The data were fitted with a Gaussian to determine the current time resolution of∼250 ps.
The KL beam momentum and time resolution are governed by the time resolution providedby the GlueX detector from the reconstruction of charged particles produced in the LH2/LD2
target. There are three detector systems that can provide precision timing information forreconstructed charged particles in GlueX: the Start Counter (ST) [183], Barrel Calorimeter(BCAL) [185], and Time of Flight (TOF) detectors. The aforementioned detectors and thecharged particle time resolutions they provide are discussed in this section.
The GlueX ST is a cylindrical plastic scintillator detector surrounding the LH2/LD2 target,with 3 mm thick scintillator bars and a tapered nose region that bends toward the beamline at
46

the downstream end. The scintillation light from each of the 30 scintillator bars is detectedby an array of four 3 × 3 mm2 Hamamatsu S10931-050P surface mount silicon photomul-tipliers (SiPMs) [187]. The time resolution of the ST was determined to be 250 ps duringthe 2016 and 2017 GlueX run periods (as shown in Fig. 34) and thus provided adequate sep-aration of the 250 MHz photon beam bunch structure delivered to Hall D during that time.This performance was achieved using the recommended operating gain and bias voltagessupplied by Hamamatsu to provide both the FADC 250 analog signals and precision F1TDCdiscriminator signals used in the GlueX reconstruction.
To summarize: The simulation studies in this proposal (see Sec. 11) have assumed a timeresolution of 250 ps, which is adequate for the proposed physics program. With the currentdetector, the overall KL-momentum resolution will be determined by utilizing the timinginformation from the ST, BCAL, and TOF detectors and will probably overshoot a veryconservative 250 ps specification. Finally, we are exploring potential upgrades to improvethe ST time resolution significantly; however, such improvements would not influence muchon the resonance parameters extracted by the PWA, hence they have low priority for theproposed hyperon spectroscopy program.
10.2 LH2/LD2 Cryogenic Target for Neutral Kaon Beam at Hall D
The proposed experiment will utilize the existing GlueX liquid hydrogen cryogenic target (Fig. 35)modified to accept a larger diameter target cell [188]. The GlueX target is comprised of a kaptoncell containing liquid hydrogen at a temperature and pressure of about 20 K and 19 psia, respec-tively The 100 ml cell is filled through a pair of 1.5 m long stainless steel tubes (fill and return)connected to a small container where hydrogen gas is condensed from two room-temperature stor-age tanks. This condenser is cooled by a pulse tube refrigerator with a base temperature of 3 K andcooling power of about 20 W at 20 K. A 100 W temperature controller regulates the condenser at18 K.
Figure 35: The GlueX liquid hydrogen target.
47

The entire target assembly is contained within an “L"-shaped stainless steel and aluminum vacuumchamber with a Rohacell extension surrounding the target cell. The ST for the GlueX experimentfits snugly over this extension. The vacuum chamber, along with the hydrogen storage tanks, gashandling system, and control electronics, is mounted on a custom-built beamline cart for easyinsertion into the Hall D solenoid. A compact I/O system monitors and controls the performanceof the target, while hardware interlocks on the target temperature and pressure and on the chambervacuum ensure the system’s safety and integrity. The target can be cooled from room temperatureand filled with liquid hydrogen in about 5 hours. For empty target runs, the liquid can be boiledfrom the cell in about 20 minutes (the cell remains filled with cold hydrogen gas), and then refilledwith liquid in about 40 minutes.
Figure 36: Left: Kapton target cell for the GlueX LH2/LD2 cryogenic target. Right: Conceptualdesign for a larger target cell for the proposed KL beam at Hall D experiment.
The GlueX cell (Fig. 36 (left)) is closely modeled on those utilized at Hall B for more than a decadeand is a horizontal, tapered cylinder about 0.38 m long with a mean diameter of 0.02 m. The cellwalls are 130 µm kapton glued to an aluminum base. A ∅0.02 m reentrant beam window definesthe length of LH2/LD2 in the beam to be about 0.30 m. Both entrance and exit windows on the cellare 75 µm kapton. In normal operation, the cell, the condenser, and the pipes between them are allfilled with liquid hydrogen. In this manner, the liquid can be subcooled a few degrees below thevapor pressure curve, greatly suppressing bubble formation in the cell. In total, about 0.4 liter ofLH2 is condensed from the storage tanks, and the system is engineered to recover this quantity ofhydrogen safely back into the tanks during a sudden loss of insulating vacuum, with a maximumallowed cell pressure of 49 psia [189].
A conceptual design for the neutral kaon beam target is also shown in Fig. 36 (right). The proposedtarget cell has a ∅0.06 m and a 0.40 m length from entrance to exit windows, correspondingto a volume of about 1.1 liter, which will require filling the existing tanks on the target cart toabout 50 psia. The Collaboration will work with the JLab Target Group to investigate alternativematerials and construction techniques to increase the strength of the cell. As an example, the LH2
target cell recently developed for Hall A is ∅0.063 m, 0.18 m long and has a wall thickness ofapproximately 0.2 mm. The cell is machined from a high-strength aluminum alloy, AL7075-T6,and has a maximum allowed pressure of about 100 psia. It is expected that minor modificationsto the cryogenic target’s piping systems will also be required to satisfy the increased volume ofcondensed hydrogen.
The proposed system is expected to work equally well with liquid deuterium, which condensesat a slightly higher temperature than hydrogen (23.3 K versus 20.3 K at atmospheric pressure).The expansion ratio of LD2 is 13 % higher, which implies a storage pressure of about 60 psia.
48

Therefore, the new target cell must be engineered and constructed to work with both LH2 and LD2.
11 Expected Results and Beam Time Requirements
11.1 Simulations and Reconstruction of Various Channels using GlueX De-tector
The KL beam is generated by sampling the momentum distribution of KL particles produced byinteractions of a photon beam with a beryllium target 24 m upstream of the LH2/LD2 cryogenictarget. The KL beam profile was simulated to be uniform within a ∅0.06 m at the LH2/LD2 cryo-genic target. The expected KL beam nonuniformity is below 2 % with a beam divergence < 0.15
(see Table 1). Due to the very strong t-dependence in the φ photoproduction cross section [190]and the P -wave origin of the φ → KLKS decay, the majority of kaons will be produced at verysmall angles. In the simulation studies discussed in this section, 1 × 10⁴ KL/s are impinged on a0.40 m long LH2 target for a beamtime of 100 PAC days.
Figure 37: Schematic view of the GlueX detector.
The GlueX detector is a large acceptance detector based on a solenoid design with good coveragefor both neutral and charged particles. The detector consists of a solenoid magnet enclosing devicesfor tracking charged particles and detecting neutral particles, and a forward region consisting oftwo layers of scintillators (TOF) and a lead-glass EM calorimeter (FCAL). A schematic viewof the GlueX detector is shown in Fig. 37. The magnetic field at the center of the bore of themagnet for standard running conditions is about 2 T. The trajectories of charged particles produced
49

by interactions of the beam with the 0.40-m LH2/LD2 cryogenic target at the center of the boreof the magnet are measured using the Central Drift Chamber (CDC) for angles greater than ≈20 with respect to the beamline Forward-going tracks are reconstructed using the Forward DriftChambers (FDC). The timing of the interaction of the kaon beam with the LH2 cryogenic target isdetermined using signals from the ST, an array of 30 mm thin (3 mm thick) scintillators enclosingthe target region. Photons are registered in the central region by the BCAL. Detector performanceand reconstructions techniques were evaluated during the main GlueX program. Details can befound elsewhere [191].
This section describes some simulations of events generated by KL beam particles interacting witha LH2/LD2 cryogenic target at the center of the solenoid [192]. All simulations assumed standardbeam/target conditions listed in Tables 1 and 2. The GlueX detector is used to detect one or allof the final-state particles. For hyperon spectroscopy, we will be focusing on a few of simpletwo-body reactions, namely
1. KLp→ KSp,
2. KLp→ π+Λ,
3. KLp→ K+Ξ0
4. KLd→ K+Ξ−pspectator
5. KLp→ K+n.
For each topology, one particle (the proton for the KSp channel, the π+ for the π+Λ channel andthe K+ for the K+Ξ/K+n channels) provides a rough determination of the position of the primaryvertex along the beamline that is used in conjunction with the ST to determine the flight time of theKL from the Be target to the hydrogen target. Protons, pions, and kaons are distinguished usinga combination of dE/dx in the chambers and time-of-flight to the outer detectors (the BCAL andtwo layers of scintillators (TOF)). See Appendix A4 (Sec. 16) for further details.
11.2 Expected results in Hyperon Spectroscopy
11.2.1 KLp→ KSp Reaction
The total production cross section, shown in Fig. 38, is reasonably large; however, for the dif-ferential cross section there is a fair amount of tension in the existing data sets between differentmeasurements, and the angular coverage in some bins is sparse. Figure 39 shows the existing dif-ferential cross section data for several bins in W . The cross section as a function of CM cos θ wasparametrized using a set of Legendre polynomials (blue curves in Fig. 39); the weights of eachpolynomial in the set depended on W . This parametrization was used to generate KLp → KSpevents that were passed through a full Geant3-based Monte Carlo (MC) of the GlueX detector.The final-state particles were constructed using the standard GlueX reconstruction code. We re-constructed the KS in its π+π− channel. More details about the reconstruction of this channel
50

Figure 38: Total cross section for KLp → KSp as a function of W . The measured data arefrom [193] and references therein.
can be found in Appendix A5 (Sec. 17.1.1). Estimates for statistical uncertainties in the measuredcross section for 100 days of running as a function of CM cos θ for several values of W are shownin Fig. 40. We estimate that for W < 3 GeV, we will detect on the order of 2.7M KSp events in theπ+π− channel.
11.2.2 KLp→ π+Λ Reaction
The KLp→ π+Λ and KLp→ π+Σ0 reactions are key to studying hyperon resonances – an analogof Nπ reactions for the N∗ spectra. They are also the key reaction to disentangling the weakexchange degeneracy of the K∗(892) and K∗(1420) trajectories. (A general discussion is given inAppendix A1 (Sec. 13) and Sec. 9). The first measurement of this reaction was performed at SLACin 1974 [159] for K0 beam momentum range between 1 GeV/c to 12 GeV/c. The total number ofπ+Λ events was about 2500 events, which statistically limits the measurement.
Through the MC simulation, we show our estimate of the statistical uncertainty of the π+Λ totalcross section as a functionKL beam momentum with GlueX detector in Hall-D as shown in Fig. 41(left). We kept the same momentum bin size as the one from the SLAC data. The box-shaped errorbars in the MC points (red triangles) were increased by a factor of 10 for comparison with the SLACdata. The proposed measurements will provide unprecedented statistical accuracy to determine thecross section for a wide range of KL-momentum. In Fig. 41 (right), the t-dependent cross sectionswere shown in three beam momentum bins same as SLAC data sets: pK0 = 1.5 – 2.5 GeV/c (solidbullets), pK0 = 2.5 – 3.5 GeV/c (solid rectangles)and pK0 = 3.5 – 5.0 GeV/c (solid triangles). As
51

Figure 39: Differential cross section plots for KLp → KSp as a function of W . The blue curvesare the result of a parametrization of the cross section in terms of Legendre polynomials. Themeasured data are from [193].
it shows, a strong forward peaking in t-channel for all momenta was observed, which appears tomove out 〈−t〉 = 0.4 - 0.5 GeV2 at higher momenta.
Parity violation in the weak decay of Λ makes it possible to measure the induced polarization. Theinduced Λ polarization (PΛ) can be observed by measuring the angular distribution of the protonwith respect to the normal vector to the production plane. As one can see in Section 6 the recoilpolarization is extremely sensitive and valuable tool to constrain PWA amplitudes. Our simulationsshow that existing SLAC data can be improved a lot by KL facility at JLab (see Fig. 42).
11.2.3 Cascade Reactions on Proton and Neutron Targets: KLp → K+Ξ0 and KLn →K+Ξ−
The study of cascade data will allow us to place stringent constraints on dynamical coupled-channelmodels. It was recently found in N∗ spectroscopy that many N∗ resonances do not couple stronglyto a Nπ channel, but are nicely seen in KΛ and KΣ channels. The corresponding situation inhyperon spectroscopy leads to many Λ∗ and Σ∗ resonances decaying preferably to a KΞ channel
52

Figure 40: Reconstructed KLp → KSp differential cross sections for various values of W for100 days of running.
(see Appendix A1 (Sec. 13) for details). In addition, cascade data will provide us with long-soughtinformation on missing excited Ξ states and the possibility to measure the quantum numbers of thealready established Ξ(1690) and Ξ(1820) from a double-moments analysis. The expected largedata sample will allow us to determine the induced polarization transfer of the cascade with un-precedented precision, which will place stringent constraints on the underlying dynamics of thereaction. Polarization measurements of hyperons shed light on the contribution from individualquarks to the overall polarization of these states. The polarization of the ground-state cascade canbe measured from its weak decay in a straightforward way. With a KL beam, the study of the reac-tions KLp → K+Ξ0 and KLn → K+Ξ− is quite simple and an unprecedented statistical samplecan be easily obtained. The statistical uncertainty obtained for two-fold differential polarizationobservables with 100 days of beam time (∼1×10⁵ reconstructed events) is of the order of 0.05–0.1,which will allow precision tests on the underlying dynamics to be performed. It also will be a firstmeasurement of this kind.
1. KLp→ K+Ξ0 Reaction
Several topologies can be used to reconstruct KLp → K+Ξ0 events, thereby enhancing theavailable statistics. The biggest contribution results from requiring the reconstruction of onlythe K+ in the final state and reconstructing the reaction using the missing-mass technique.The Ξ0 decays almost 100 % of the time to π0Λ. By utilizing the large branching ratiosfor Λ → π−p and π0 → γγ decays, we can also fully reconstruct the Ξ0s in the final stateusing the four-momenta of the detected final-state particles. Figure 43 shows the expectedW resolution for this reaction with the ToF-method (black) and when W is determined fromall detected final-state particles (blue).
In 100 days of beamtime, we expect 3 × 10⁶ KLp → K+Ξ0 events. Out of which, one
53

Figure 41: Left panel: The total cross section uncertainty estimate (statistical uncertainty only) forKLp→ π+Λ reaction as a function of KL beam momentum in comparison with SLAC data [159].The experimental uncertainties have tick marks at the end of the error bars. The box-shaped errorbars in the MC points from KL beam at GlueX were increased by a factor of 5. Right panel: Thet-dependent cross sections in three beam momentum bins (same as SLAC data sets): pK0 = 1.5– 2.5 GeV/c (solid bullets), pK0 = 2.5 – 3.5 GeV/c (solid rectangles)and pK0 = 3.5 – 5.0 GeV/c(solid triangles). The box-shaped error bars in the MC points from KL beam at GlueX detectorwere increased by a factor of 2.
can reconstruct 2 × 10⁶ events for Topology 1 (KLp → K+X); 1 × 10⁵ for Topology 2(KLp → K+ΛX); and 2 × 10⁴ for Topology 3 (KLp → K+Ξ0). Figure 44 compares thestatistical uncertainties of the total and differential cross sections for the reaction KLp →K+Ξ0 with existing data taken from [194] for the three different topologies (column 1: onlyK+ reconstructed, column 2: K+Λ reconstructed, and column 3: K+Ξ0 reconstructed).
These statistics also allow us to determine the cascade-induced polarization by utilizing thefact that the cascade is self-analyzing with an analyzing power of −0.406 [2]. Figure 45shows the statistical uncertainty estimates of the induced polarization of the cascade by sim-ple fits to the acceptance-corrected yields of the pion angular distribution in the Ξ0 rest frame.
The main background for this reaction would come from the reactions KLp → K+n andKLp → π+Λ, where the π+ is misidentified as a kaon. The former reaction has an order-of-magnitude higher cross section than KLp → K+Ξ0; however, the W resolution below2.5 GeV allows a clean separation of these two reactions. Detection and reconstruction ofthe Λ places additional constraints that reduce any background contributions significantly.Neutron-induced reactions are not expected to contribute significantly to background andwith missing-mass, invariant-mass, and time-of-flight cuts, such background contributions
54

Figure 42: Left panel: The averaged polarization, 〈αPΛ〉 as a function of the beam momentumfrom Ref. [159], pK0 > 2.5 GeV/c (red boxes), pK0 = 2.5 − 3.8 GeV/c (blue triangles) andpK0 > 3.8 GeV/c (purple bullets). The experimental uncertainties have tick marks at the end ofthe error bars. The box-shaped error bars from the MC for the KL beam at GlueX, assuming100 days beamtime. α = 0.645 is the Λ analysing power. Right panel: Estimates of the statisticaluncertainties of the Λ polarization as a function of CM cos Θπ+ for the W = 2.4 – 2.5 GeV energybin.
Figure 43: W resolution of σW/W , for the time-of-flight method (black) and when W is deter-mined from all detected final-state particles (blue).
can be eliminated.
The KL Facility can be utilized to study excited cascade states KLp → K+Ξ∗ with Ξ∗ →
55
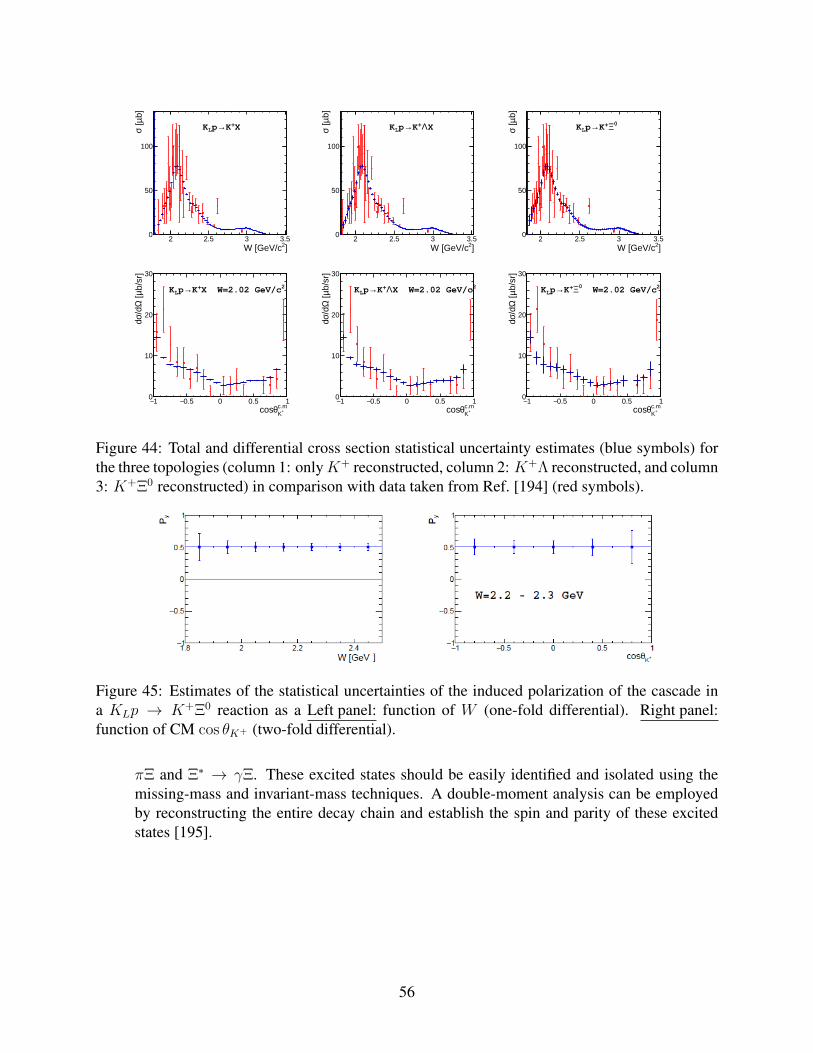
]2W [GeV/c2 2.5 3 3.5
b]µ [σ
0
50
100
X+K→pLK
]2W [GeV/c2 2.5 3 3.5
b]µ [σ
0
50
100
XΛ+K→pLK
]2W [GeV/c2 2.5 3 3.5
b]µ [σ
0
50
100
0Ξ+K→pLK
+Kc.mθcos
1− 0.5− 0 0.5 1
b/sr
]µ [
Ω/dσd
0
10
20
30
2X W=2.02 GeV/c+K→pLK
+Kc.mθcos
1− 0.5− 0 0.5 1
b/sr
]µ [
Ω/dσd
0
10
20
30
2X W=2.02 GeV/cΛ+K→pLK
+Kc.mθcos
1− 0.5− 0 0.5 1
b/sr
]µ [
Ω/dσd
0
10
20
30
2 W=2.02 GeV/c0Ξ+K→pLK
Figure 44: Total and differential cross section statistical uncertainty estimates (blue symbols) forthe three topologies (column 1: onlyK+ reconstructed, column 2: K+Λ reconstructed, and column3: K+Ξ0 reconstructed) in comparison with data taken from Ref. [194] (red symbols).
Figure 45: Estimates of the statistical uncertainties of the induced polarization of the cascade ina KLp → K+Ξ0 reaction as a Left panel: function of W (one-fold differential). Right panel:function of CM cos θK+ (two-fold differential).
πΞ and Ξ∗ → γΞ. These excited states should be easily identified and isolated using themissing-mass and invariant-mass techniques. A double-moment analysis can be employedby reconstructing the entire decay chain and establish the spin and parity of these excitedstates [195].
56

2. KLn→ K+Ξ− Reaction
The analysis of this reaction on the neutron is based on the same approach as the one de-scribed above for KLp → K+Ξ0. The main difference comes from the momentum distri-bution of the target nucleon. This issue can be easily addressed by selecting semi-exclusiveevents having only the spectator proton undetected. The analysis requires the detection of allfinal-state particles besides spectator, namely theK+, the π− from the cascade decay and theproton and π− from the Λ decay. Even though this condition reduces the available statistics,the W resolution can be kept high.
Based on the models described in Sec. 8, polarized data on the reaction KLn → K+Ξ−
were generated. In 100 days of beamtime, we expect to produce several million events(between 3 and 10) depending on the two available solutions, which give very differentpredictions. From this, the reconstruction of 7 × 10⁴ or 3 × 10⁵ events is expected forthe fully exclusive reaction selection. In the same manner as the reaction on the proton(KLp→ K+Ξ0), we will utilize the fact the the cascade is self-analyzing with an analyzingpower of −0.458 [2]. The statistical uncertainties obtained over a period of 100 days for theinduced cascade polarization are illustrated in Fig. 46 (left). Expected statistical significancefor the model separation at the same W-bin as a function of experiment duration is shown inFig. 46 (right). In this particular case, a 100 days experiment would reach a decisive level of7.6 σ separation power, compared to only a 3.5 σ separation after 20 days.
0 50 100 150 200Number of Days
0
2
4
6
8
10
Sta
tistic
al S
igni
fican
ce
2W =2.2 - 2.3 GeV/c
Figure 46: Left panel: Estimated statistical uncertainties of the induced polarization of the Ξ− ina KLn → K+Ξ− reaction as a function of CM cos θK+ (two-fold differential). The curves showthe theoretical predictions based on two solutions as described in Sec. 8. Right panel: Expectedstatistical significance, in units of σs, to distinguish two models as a function of the running time.Two benchmark cases of 20 and 100 days are highlighted by the dashed green and blue curves,respectively.
It is evident that the determination of Py will place very stringent constraints on the availablemodels. The statistical uncertainties obtained over a period of 100 days are sufficient toinvestigate the underlying dynamics and cleanly differentiate between leading theoreticalpredictions.
The exclusivity of the reaction allows us to obtain a much cleaner sample of events withminimal background contributions. This will be done by requiring the invariant mass of
57
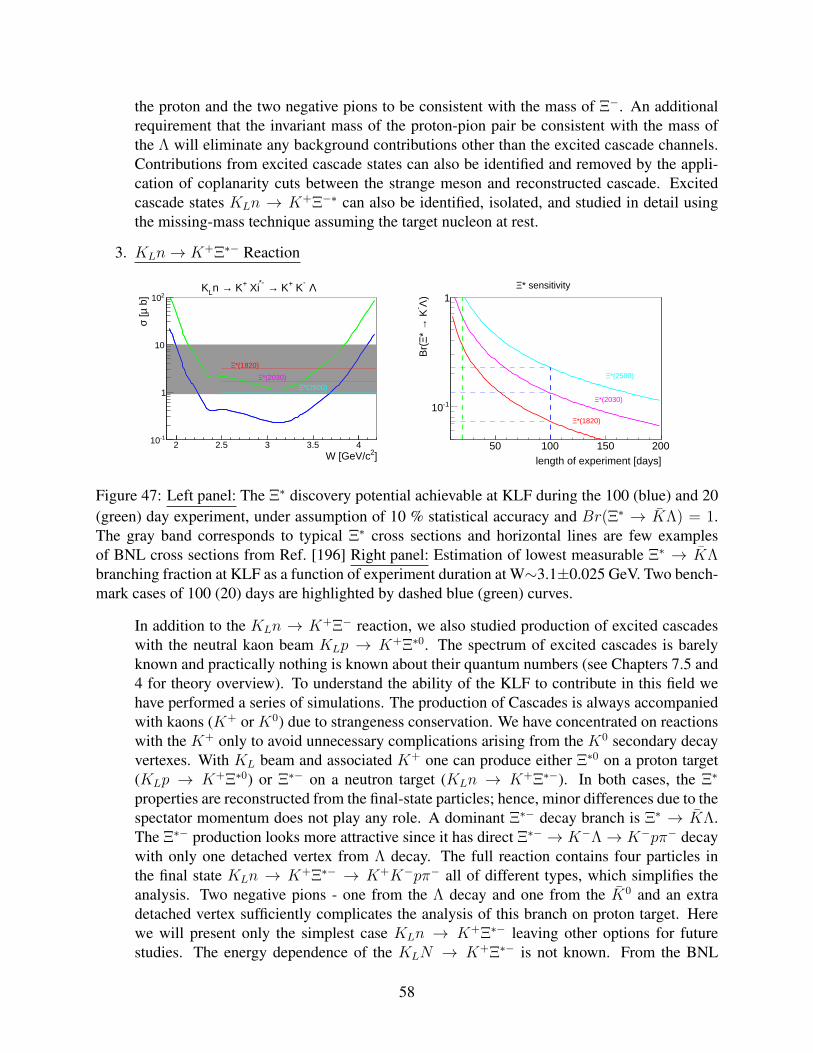
the proton and the two negative pions to be consistent with the mass of Ξ−. An additionalrequirement that the invariant mass of the proton-pion pair be consistent with the mass ofthe Λ will eliminate any background contributions other than the excited cascade channels.Contributions from excited cascade states can also be identified and removed by the appli-cation of coplanarity cuts between the strange meson and reconstructed cascade. Excitedcascade states KLn → K+Ξ−∗ can also be identified, isolated, and studied in detail usingthe missing-mass technique assuming the target nucleon at rest.
3. KLn→ K+Ξ∗− Reaction
]2W [GeV/c2 2.5 3 3.5 4
b]
µ [σ
-110
1
10
210
*(1820)Ξ
*(2030)Ξ*(2500)Ξ
Λ - K+ K→ *- Xi+ K→n LK
length of experiment [days]50 100 150 200
)Λ-
K→
* ΞB
r(
-110
1
*(1820)Ξ
*(2030)Ξ
*(2500)Ξ
* sensitivityΞ
Figure 47: Left panel: The Ξ∗ discovery potential achievable at KLF during the 100 (blue) and 20(green) day experiment, under assumption of 10 % statistical accuracy and Br(Ξ∗ → KΛ) = 1.The gray band corresponds to typical Ξ∗ cross sections and horizontal lines are few examplesof BNL cross sections from Ref. [196] Right panel: Estimation of lowest measurable Ξ∗ → KΛbranching fraction at KLF as a function of experiment duration at W∼3.1±0.025 GeV. Two bench-mark cases of 100 (20) days are highlighted by dashed blue (green) curves.
In addition to the KLn → K+Ξ− reaction, we also studied production of excited cascadeswith the neutral kaon beam KLp → K+Ξ∗0. The spectrum of excited cascades is barelyknown and practically nothing is known about their quantum numbers (see Chapters 7.5 and4 for theory overview). To understand the ability of the KLF to contribute in this field wehave performed a series of simulations. The production of Cascades is always accompaniedwith kaons (K+ or K0) due to strangeness conservation. We have concentrated on reactionswith the K+ only to avoid unnecessary complications arising from the K0 secondary decayvertexes. With KL beam and associated K+ one can produce either Ξ∗0 on a proton target(KLp → K+Ξ∗0) or Ξ∗− on a neutron target (KLn → K+Ξ∗−). In both cases, the Ξ∗
properties are reconstructed from the final-state particles; hence, minor differences due to thespectator momentum does not play any role. A dominant Ξ∗− decay branch is Ξ∗ → KΛ.The Ξ∗− production looks more attractive since it has direct Ξ∗− → K−Λ→ K−pπ− decaywith only one detached vertex from Λ decay. The full reaction contains four particles inthe final state KLn → K+Ξ∗− → K+K−pπ− all of different types, which simplifies theanalysis. Two negative pions - one from the Λ decay and one from the K0 and an extradetached vertex sufficiently complicates the analysis of this branch on proton target. Herewe will present only the simplest case KLn → K+Ξ∗− leaving other options for futurestudies. The energy dependence of the KLN → K+Ξ∗− is not known. From the BNL
58

measurements given in Ref. [196], we know that the Ξ∗− production cross section should beon the order of 1 − 10 µb – the higher the Ξ∗ mass the lower the cross section, from 3.7µbfor the Ξ∗(1820) to 1µb for the Ξ∗(2500). Some exotic cascades might have even lowerproduction cross sections. We have tried to evaluate what Ξ∗ production cross sections thatmight be measurable at KL-facility within 20 and 100 days. We consider a lower boundof 10 % statistical uncertainty for the Ξ∗ states to be identified. The results of our analysiscan be seen in Fig. 47 in comparison with typical Ξ∗ cross sections from Ref. [196]. FromN∗ → πN studies, it is known that for the high mass N∗ states the N∗ → πN branch getsuppressed in favour of multi-pion ladder decays. A similar effect is expected to be seenfor the high-mass Ξ∗. According to PDG, the Ξ∗ → KΛ is “dominant" for many Ξ∗ states,however we need to be prepared to measure somewhat suppressed Ξ∗ → KΛ decay of heavyΞ∗’s. A W -variation of the Ξ∗ production cross-section provide and important informationon Ξ∗ → KΛ∗ and Ξ∗ → KΣ∗ couplings as an inverse process allowing further insight intoΞ∗ internal structure.
To summarize: With 20 days beamtime one can barely touch the lowest-lying Ξ∗ reso-nances keeping quantum numbers determinations, which requires precise measurements ofthe differential observables and Λ recoil polarization, out of considerations. With 100 daysbeamtime, all Ξ∗ resonances could be measured with a statistical significance sufficient notonly for the determination of mass and width parameters but also for spin-parity assignmentsas well.
11.2.4 KLp→ K+n Reaction
The K0Lp → K+n reaction is a very special case in kaon-nucleon scattering. Due to strangeness
conservation, formation of intermediate resonances is forbidden for this reaction. The main contri-bution comes from various non-resonant processes, which can be studied in a clean and controlledway. Similar non-resonant processes can be seen in other reactions where they can interfere withhyperon production amplitudes, causing distortion of the hyperon signals. That is why knowledgeof the non-resonant physical background is important not only for the kaon-induced reactions butfor all reactions with strangeness. The non-resonant nature of the reaction does not guarantee theabsence of bumps in the total cross section: kaons and/or nucleons can be excited in the interme-diate stage, producing bumps in the total cross section.
The reaction K0Lp → K+n is simple and has a very high production cross section (see Fig. 48);
nevertheless, data on this reaction are scarce. It is a bit simpler to perform a positive kaon beamscattering for the inverse reaction however the reaction on a neutron target involves final-stateinteractions that may complicate the analysis. That is why the inverse reaction is also not so wellknown. A fair amount of differential cross-section data are available in the range 0.5 < pKL
<1.5 GeV/c, predominantly from bubble chambers, see Ref. [197], and there are a few measurementsat high momenta: pK = 5.5 GeV/c [198], pK = 10 GeV/c [199]. In the energy range 2 < W <3.5 GeV, which can be covered by the KLF experiment with very high statistics, there are no dataon this reaction at all.
Detection of the charged kaon is enough to reconstruct the reaction fully via the missing-mass
59

Figure 48: The total cross section for KLp→ K+n reaction as a function of KL-momentum fromRef. [197]
technique. If the beam energy is determined by TOF method utilizing the 24 m flight path betweenthe kaon production Be target and the reaction hydrogen target, the beam resolution is driven bythe ST time resolution (Sec. 10.1.5.3).
In addition to a kaon, one could also detect a neutron; however, due to poor neutron detectionefficiency and the large systematic uncertainties associated with neutron detection an improvementin the reconstruction of the reaction may be problematic.
In 100 days of a beamtime, we expect to detect around 60M KLp → K+n events. A typicalexample of the expected statistics in comparison to previous data are shown in Fig. 49 (left). Thehighest flux is expected around W = 3 GeV, where we had to increase statistical uncertainties by afactor of 10 to make them visible (see Fig. 49, right).
Figure 49: Left panel: The cross-section uncertainty estimates (statistical only) for KLp → K+nreaction for the W = 2 GeV in comparison with data from Ref. [197]. Right panel: same distribu-tion for the W = 3 GeV. The error bars for the right plot were increased by factor of 10 to makethem visible.
60

There are three major sources of background: np → K+nn, np → π+nn, and KLp → K+Ξ0.Neutron flux drops exponentially with energy (see Appendix A4 (Sec. 16) for details) and generallythe high-energy neutron flux is tiny. A detailed description of various backgrounds can be foundin Appendix A5 (Sec. 17).
11.2.5 Expectations for Λ∗ and Σ∗ Spectroscopy via a π+p PWA
The observation of Λ∗ and Σ∗ hyperons at KLF will require a coupled-channel PWA using themeasured differential cross sections and recoil observables, which have been simulated in Sec. 7.The resonance poles in the complex energy plane will be used to confirm previously observed statesand identify new Λ∗ and Σ∗ resonances in the hyperon spectrum (see Appendix A2 (Sec. 14)).
Figure 50: Ratios of uncertainties of partial-wave amplitudes of the proposed data individually forthe two settings 20 days (green) and 100 days (blue) (SES for 20 and 100 days) vs. SES associatedwith WI14 [201] (a fit of the world πN database) [96].
The existing KLp database is so poor that PWAs of individual KLp-induced reactions may notbe possible based on currently available data (Sec. 6). In particular, there are no KLp → K+Ξ0
polarization data available and there is only one energy for the KLp → π+Λ reaction with bothdσ/dΩ and polarization data. Our proposal does not consider the use of a polarized target at thisstage and, for that reason, we will be able to measure polarization data for recoil observables only.Overall, one certainly cannot perform a reliable PWA for reactions in which only dσ/dΩ data areavailable. The existing KLn database is nonexistent.
61

Figure 51: Uncertainties of real (left) and imaginary (right) parts of partial wave amplitudes at W= 1743 MeV. The green (blue) filled circles correspond to the SES for 20 (100) days of runningtime.
Figure 52: Amplitudes S31 (left) andD33 (right) Comparison with SAID WI14 [201]. Real (imagi-nary) part shown by black solid (dashed) curves along with 100 days SES (blue circles) and 20 daysSES (green circles).
Figure 53: Two examples (W = 1743 MeV) showing the impact of the proposed data on the SAIDSES. The green (blue) hatched band indicates the present uncertainties in the SES for 20 (100)days of running time. The yellow solid curve corresponds to the SAID WI14 solution [201].
62

Figure 54: Two more examples (θ = 70) showing the impact of the proposed data on the SAIDSES. The green (blue) hatched band indicates the present uncertainties in the SES for 20 (100)days of running time. The yellow solid curve corresponds to the SAID WI14 solution [201].
To estimate the impact that new KL measurements will have on fits, we have carried out a studybased on an analogous PWA of π+p elastic scattering. This reaction was chosen in part becauseit is isospin selective as are most of the KLp reactions that we propose to measure. Our methodis similar to that used by the GW group in the FROST proposal for pion photoproduction [200].Using the recent SAID WI14 solution [201], we generated pseudodata for the π+p→ π+p reaction:dσ/dΩ and recoil polarization P . The pseudodata were generated for our worse case of statisticsfor a KLp → K+Ξ0 binning of 20 MeV in CM energy W in the second resonance region W =1400 - 1800 MeV and θ = 5 (10) 175 for dσ/dΩ and cos θ = −0.8 (0.4) 0.8 for P . A seriesof single-energy solutions (SES) were then obtained using settings associated with 100 days ofrunning time: σ(dσ/dΩ) = 1 % with σ(P ) = 0.1. We also carried out a series of SES usingsettings associated with 20 days of running time: σ(dσ/dΩ) = 5 % with σ(P ) = 0.5. Only thegenerated π+p → π+p pseudodata were included in these fits so that the precision of the partial-wave amplitudes corresponds to what we expect to obtain with the proposed KLp measurements.
To facilitate the comparisons, we have summarized the effect on individual partial-wave ampli-tudes by computing the ratio of uncertainties for 20 and 100 days data vs. SES associated withWI14 [201]. A plot of ratios for SES for 20 and 100 days vs. SES associated with WI14 (a fit ofthe world πN database [96]) is presented in Fig. 50. Uncertainties of real and imaginary parts ofpartial wave amplitudes at W = 1743 MeV are shown in Fig. 51. Here we see an improvementthrough the inclusion statistics from 20 to 100 days of running time. The greatest effect naturallyrequires a measurement of all available quantities, but 100 days provides a great benefit for partialwaves with l > 1.
We employed single-energy (SES) solutions over a variety of energy ranges to estimate uncertain-ties. In Fig. 52, we present a specific example for the S31 and D33 partial waves that show how theproposed measurements can reduce uncertainties. The proposed measurements will clearly havea greater sensitivity to structures that might be missed by lower statistics data. Figures 53 and 54show the impact of the proposed data on the SAID SES. The new measurements, specifically the100 days of running time case will significantly reduce the uncertainties of the observables. Thetotal angular resolution will therefore be greatly improved, which will enhance the possibility of
63

Table 4: ∆(1620)1/2− (S31) and ∆(1700)3/2− (D33) Breit-Wigner (BW) parameters fromPDG2016 [2] and SAID WI14 [201] compared with corresponding results of the SES fits for 20and 100 days of running time.
determining the number of amplitudes that are involved. With this greater understanding of theseobservables, effects of higher-spin resonances can be investigated.
From the PWA of π+p→ π+p, we extracted Breit-Wigner resonance parameters for two examplestates in the ∆∗ spectrum, ∆(1620)1/2− and ∆(1700)3/2−. The mass and width parameters areshown in Table 4 under the 20- and 100-day scenarios. The precision of the resonance parameterssignificantly deteriorates in a 20-day scenario for the higher-mass ∆(1700)3/2+. With 100 daysof running time we could reach a precision level comparable to modern results of the SAID πNPWA [201].
To summarize: With 100 days of running time, we can provide a reliable solution for all the res-onances having elastic branching ratios larger than 4 %, at least up to l = 4. With 20 days ofbeamtime, we could only carry out simple “bump-hunting" - an identification of well-defined andwell-separated resonances with regular shapes. All irregular cases (e.g., molecular states withskewed shapes and complex energy-dependent-widths, threshold-effects, multiple interferences,etc.) and all the exotic states that are predicted to populate the hyperon spectrum will requirehigh-precision polarization observables on the order of 0.1 or better to be identified. From our π+pPWA study, we can infer that the precision of resonance parameters extracted from PWA of KLFdata for the higher-mass Λ∗ and Σ∗ states we propose to measure will deteriorate without sufficientrunning time. The spectrum of excited Λ∗ and Σ∗ states is expected to be densely populated withtypical mass differences of about 100 MeV for states with the same quantum numbers [2]. There-fore to disentangle the spectrum of observed hyperon states, we require sufficient precision for theextracted mass and width parameters, provided by the proposed 100 days of running time.
11.3 Expected results in Strange Meson Spectroscopy
11.3.1 Reaction KLp→ K−π+p
TheKπ scattering has two possible isospin channels, I = 1/2 and I = 3/2. For S-wave scattering,both are significant below 2 GeV, whereas the P -wave I = 3/2 is almost negligible. Below1 GeV the P -wave is basically a narrow elastic wave peaking at 892 MeV, interpreted as theK∗(892) resonance, whereas a second resonance, the K∗1(1410) exists above 1 GeV, although itsproperties are less precisely known. The I = 3/2 S-wave is elastic and repulsive up to 1.7 GeVand contains no known resonances. The P -wave I = 3/2 has been measured in Ref. [149] and is
64

also repulsive but very small. However, the I = 1/2 S-wave has a peaking broad resonance above1350 MeV, interpreted asK∗0(1430). In addition, some phenomenological [118–122,202–207] andexperimental [208,209] studies require the presence of a resonance with a very large width, calledκ (kappa), or K∗0(800), in the region close to the Kπ threshold.
Most of the experimental studies of the Kπ system have been performed by experiments withkaon scattering beam off nucleons. This is related to the high cross section of the Kπ systemproduction with this processes. For example, the cross section of theK∗(892) resonance, producedin the reaction K−p → K0π−p at 2.1 GeV/c [210], is 1.34±0.08 mb. In case of a neutral kaonbeam, the equivalent reaction to the process K−p → K∗−(892)p is the kaon beam scatteringKLp → K∗0(892)p. Therefore, the production of the Kπ system, using the KL facility, canprovide an adequate environment for studying the strange meson states.
More details about a simulation study are in Appendix A6 18.
11.3.2 Simulation Study of KLp→ K∗0(892)p→ K+π−p
To understand the behaviour of the P -wave Kπ system at the proposed KL facility we have per-formed a comprehensive simulation study, utilizing the Regge Model from Refs. [211, 212] byadapting it to the neutral kaon beam. The theoretical model showed a good agreement with existingcharged kaon data produced with beam momenta between 2.1 and 10 GeV/c and four momentumtransfer up to 1 GeV2. In our studies, we have assumed that the neutral exchange with chargedkaon beam is similar to neutral kaon beam. We have simulated the following reactions:
1. KLp→ K∗0(892)p→ K+π−p,
2. KLp→ K∗0(892)p→ K−π+p,
3. KLp→ K∗0(892)p→ KSπ0p,
4. KLp→ K∗0(892)p→ KSπ0p.
Fig. 55 (top left) shows the total cross section of K∗(892) produced in reaction (a), and Figs. 55(top right) and 55 (bottom) show the differential cross section dσ/dt at pKL
= 5.5 GeV/c.
The two physical variables, beam momentum and four momentum transfer are essential for thestudy of the Kπ production mechanism. Therefore we have performed a dedicated resolution andefficiency study to quantify the improvement that KLF facility can provide. The Fig. 56 (left)represents the relative resolution of the negative four momentum transfer −t and the Kπ invariantmass mK+π− (right). The relative resolution of −t is very high, varying between 3 % and 5 %above 0.3 GeV2 with slight increases close to the threshold. This behavior originates from thereconstruction of the slow recoil proton with momentum below 300 MeV/c at GlueX. However,comparing to the experimental results and the binning resolution of t given in the studies [210,213–216], a binning width of 0.02 GeV at low −t is sufficient to increase the number of the datapoints and improve the precision for the study of the production mechanism. The Kπ invariant
65

Figure 55: Top left panel: The total cross section in mb function of the beam momentum us-ing Regge model in Ref. [211]. Top right panel: Differential cross section dσ/dt for the processKLp → K∗0(892)p → K+π−p at beam momentum p = 5.5 GeV/c using the production model inRef. [211]. Bottom panel: Beam momentum versus the differential cross section for the processKLp→ K∗0(892)p→ K+π−p using Regge model in Ref. [211].
66

mass resolution is very high - below 1.5 % over the full range of interest, see Fig. 56 (right) for thedetails. This resolution is similar to the mass resolution of LASS Experiment [149].
An efficiency studies on the variables pKL, t and mKπ were made to evaluate the improvement on
the study of the Kπ system with KLF. According to this simulation, the total integrated efficiencyfor the reaction KLp→ K+π−p is found to be 14 %. Above −t = 0.15 GeV2 the four momentumefficiency remains uniform around 16 %. The efficiency of K+π− invariant mass is uniform overthe entire mass range [0.64, 1.2] GeV, see Fig. 57.
Figure 56: Left panel: Four momentum transfer relative resolution (σt/t) as a function of −t.Right panel: Invariant mass relative resolution (σm/m) as a function of M(Kπ).
Figure 57: Reconstruction en selection efficiency of four momentum transfer (left plot) and K+π−
invariant mass (right plot).
67

11.3.3 K∗(892) Production in KLF
Knowing the total acceptance with the cross section and expected luminosity, we can estimate theexpected number of events for the K∗(892) production in KLF. Almost 50 % of the neutral KπP -wave are produced as KLp → K∗0(892)p → K+π−p and the rest as KLp → K∗0(892)p →K−π+p.
Fig. 58 (left) shows the expected number of K∗(892) events produced in KLF during 100 days runwith standard conditions (Tables 1 and 2), as a function of beam momentum p.
momentum [GeV/c]LK2 4 6
reco
nstr
ucte
d ev
ents
1
10
210
310
410
510
610
KLF
previous
-π+ K→ 0πLK
Figure 58: Left panel: Expected number of events of the reaction KLp → K∗0(892)p functionof beam momentum. Right panel: Events number of K∗(892) production in former kaon beamexperiment (only charged kaon) compared to the expected number of K∗(892) produced by KL
facility with the same t- and W - cuts. Significant improvement of number of events expected inKLF specifically at low beam momenta. Previous data are from Refs. [210, 213, 214, 217–219](Table 10).
The study of the strange mesons using kaon beam were performed in several experiments andmainly between the 1960s and 1980s. We expect three to four orders of magnitude improvementin K∗(892) statistics in comparison to previously collected data [210, 213, 214, 216–218] (Fig. 58(right)).
11.3.4 Impact on P -Wave Phase-Shift Study
The pion exchange in the hadro-production mechanism of K∗0(892) occurs mostly at low−t, thuswe can have access to the amplitude scattering of K0π0 → K+π−, as illustrated in Fig. 14. Usingthe resolutions and efficiencies from our simulations, we can estimate the improvement that canbe made on the scattering amplitude analysis of Kπ → Kπ. The range of −t that will be used inthis comparison will be [0.14, 0.2] GeV2 to ensure that the t efficiency is uniform. The efficiencyof this t range selection is επ = 17.85 %. The expected number of events in this case is 2× 10⁶.
The study of theKπ P -wave phase-shift is mainly used to extract the vector form factor f±(t) [220],where t is the four-momentum transfer. The vector form factor, at the optical point f+(0), has animpact on the measurement of the CKM matrix element Vus [153, 220], where the precision on
68
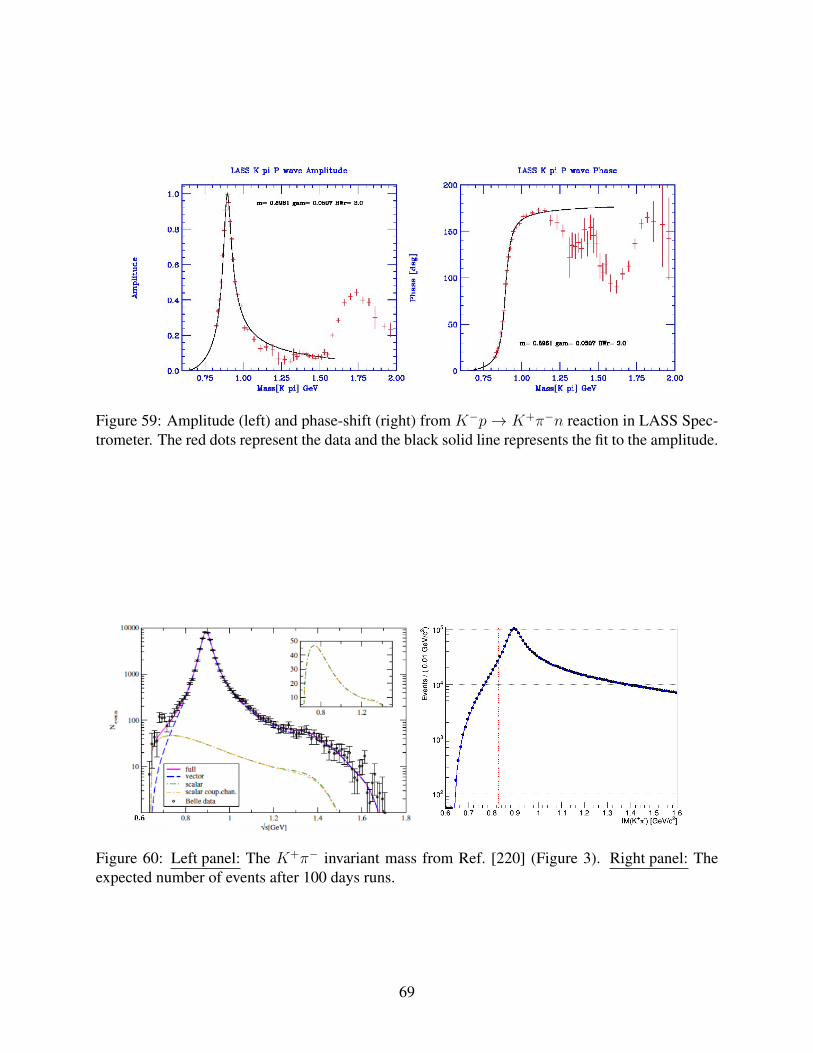
Figure 59: Amplitude (left) and phase-shift (right) from K−p→ K+π−n reaction in LASS Spec-trometer. The red dots represent the data and the black solid line represents the fit to the amplitude.
Figure 60: Left panel: The K+π− invariant mass from Ref. [220] (Figure 3). Right panel: Theexpected number of events after 100 days runs.
69

this measurement plays an important role on probing the physics beyond the Standard Model. Thephenomenological studies [153, 220] analyzed the Kπ P -wave phase-shift produced by Belle Ex-periment [152] using the decay τ → Kπντ and LASS data [147,149] using the scattering reactionK−p → K+π−n. We can evaluate the improvement that can be performed by KLF in these typeof studies. The comparison is made to the LASS results [147] which is a similar scattering reac-tion study but with charged kaon beam. Fig. 59 shows the amplitude and the phase-shift of theLASS study [147]. The resulting model from the fit to LASS amplitude is used to simulate thedistribution of the invariant mass of K+π− P -wave with KLF.
Fig. 60 (left) shows the Belle data from Ref. [220]. Fig. 60 (right) shows the expected statistics ofthe K+π− invariant mass for the 100 days KLF run. A significant improvement can be made onthe study of the P -wave in term of precision, especially in the low mass region (below M(Kπ) =0.825 GeV), where no amplitudes were reconstructed from the LASS results [147, 149].
11.3.5 Kπ S-Wave and Kappa Investigation
1. S-wave and D-wave Production in KLp→ K+π−p
Figure 61: The cross section of K−p → K+π−n function of the invariant mass from LASSresult [147] results. The blue line is the fit to the cross section using composite model containingtwo RBW, spin-1 and spin-2, and S-wave LASS parameterisation.
TheKπ S-wave scattering, below 2 GeV, has two possible isospin channels. The 1/2 isospinS-wave contains two resonances, κ and K∗0(1430), both of them are not well defined. In 3/2S-wave no resonance is found. So far, the available data used to study the dynamics of theS-wave are LASS data [147, 149]. The Kπ P -wave and D-wave are well defined with oneresonance K∗(892) as vector meson and one resonance K∗2(1430) as tensor meson. Thesimulation of the reaction KLp → K∗0(892)p → K+π−p in KLF can be used to estimatethe total production rate of the different Kπ waves. For this estimation, we need the relativemodulus of the S and D waves to the P -wave, which is extracted from the fit to the cross
70

section function of the invariant mass measured by the LASS. The fit function is a compos-ite model containing spin-1 and spin-2 Relativistic Breit-Wigner functions and the S-waveLASS parameterisation [149]. Fig. 61 shows the fit to the cross section of LASS results.The relative modulus of the S-wave is found to be 1.77 and the D-wave is found to be 0.62.Thus, we expect NS = 3.5× 10⁶ events, after 100 days KFL-run, for the S-wave productionand ND = 1.2× 10⁶ for the D-wave. The total 100 days production statistics for the K+π−
system is expected to be ≈ 7 × 10⁶ events for the S, P , and D-waves combined. This pro-duction includes 1/2 and 3/2 isospin and represent about 50 times the dataset collected byLASS experiment [147]. Fig. 62 shows the expected K+π− invariant mass distribution pro-duced by the reaction KLp → K∗0(892)p → K+π−p in KLF. In the right pannel, we zoomon the very low-energy region, where we expect to have a drammatic improvement, not onlydue to the much better statistics, but also because LASS did not provide any data below0.75 GeV. These data are therefore very relevant for the extraction of the scalar scatteringlengths that, as explained in previous sections, will test the predictions and convergence ofSU(3) Chiral Perturbation Theory. Moreover, the rigorous variable for analytic continuationto the complex plane is s, and due to the large width of the κ, the real part of the κ poleposition in the s-plane is Re(Mκ − iΓ/2)2 ' (M2
κ − Γ2/4) ' 0.39 Gev2, much closer tothreshold sth ' 0.40 GeV2 than to its nominal mass M2
κ ' (0.682)2 GeV2 ' 0.465 GeV2,which makes the determination of the pole especially sensitive to the threshold region andthe KLF low-energy results of even greater relevance.
Figure 62: Left panel: Expected distribution of theK+π− invariant mass below 1.6 GeV from KLFafter 100 days of run. The dark magenta function represents the K+π− P -wave, light brown theS-wave and green the D-wave. The dashed line represents the threshold of Kπ invariant mass inLASS results [147]. Right panel: Zoomed-in view ofK+π− invariant mass below 0.85 GeV wherethe pole of κ is expected to exist.
2. Kappa InvestigationAs already commented in previous sections the κ orK∗0(800) meson has been the subject of adebate lasting for more than 40 years and its relevance is twofold. First, because confirmingits existence (“Needs confirmation" according to the PDG [2]) would finally settle the dis-cussion about the existence of a full light scalar meson nonet below 1 GeV. These would be
71
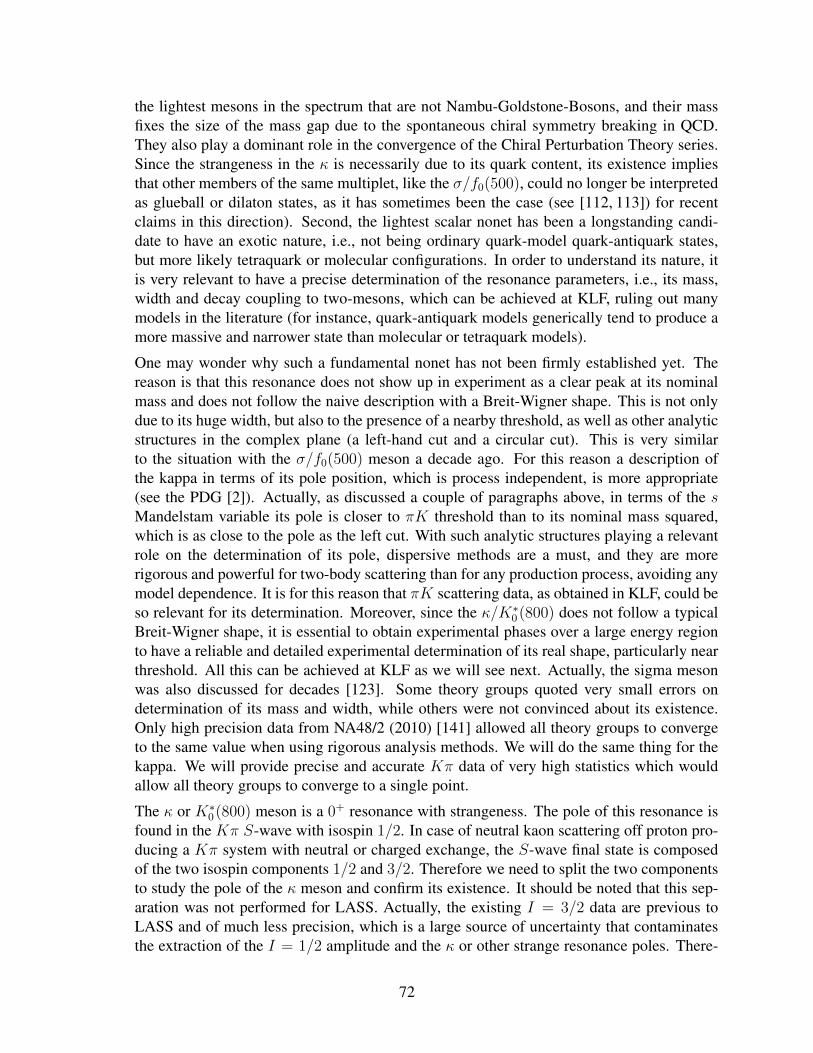
the lightest mesons in the spectrum that are not Nambu-Goldstone-Bosons, and their massfixes the size of the mass gap due to the spontaneous chiral symmetry breaking in QCD.They also play a dominant role in the convergence of the Chiral Perturbation Theory series.Since the strangeness in the κ is necessarily due to its quark content, its existence impliesthat other members of the same multiplet, like the σ/f0(500), could no longer be interpretedas glueball or dilaton states, as it has sometimes been the case (see [112, 113]) for recentclaims in this direction). Second, the lightest scalar nonet has been a longstanding candi-date to have an exotic nature, i.e., not being ordinary quark-model quark-antiquark states,but more likely tetraquark or molecular configurations. In order to understand its nature, itis very relevant to have a precise determination of the resonance parameters, i.e., its mass,width and decay coupling to two-mesons, which can be achieved at KLF, ruling out manymodels in the literature (for instance, quark-antiquark models generically tend to produce amore massive and narrower state than molecular or tetraquark models).
One may wonder why such a fundamental nonet has not been firmly established yet. Thereason is that this resonance does not show up in experiment as a clear peak at its nominalmass and does not follow the naive description with a Breit-Wigner shape. This is not onlydue to its huge width, but also to the presence of a nearby threshold, as well as other analyticstructures in the complex plane (a left-hand cut and a circular cut). This is very similarto the situation with the σ/f0(500) meson a decade ago. For this reason a description ofthe kappa in terms of its pole position, which is process independent, is more appropriate(see the PDG [2]). Actually, as discussed a couple of paragraphs above, in terms of the sMandelstam variable its pole is closer to πK threshold than to its nominal mass squared,which is as close to the pole as the left cut. With such analytic structures playing a relevantrole on the determination of its pole, dispersive methods are a must, and they are morerigorous and powerful for two-body scattering than for any production process, avoiding anymodel dependence. It is for this reason that πK scattering data, as obtained in KLF, could beso relevant for its determination. Moreover, since the κ/K∗0(800) does not follow a typicalBreit-Wigner shape, it is essential to obtain experimental phases over a large energy regionto have a reliable and detailed experimental determination of its real shape, particularly nearthreshold. All this can be achieved at KLF as we will see next. Actually, the sigma mesonwas also discussed for decades [123]. Some theory groups quoted very small errors ondetermination of its mass and width, while others were not convinced about its existence.Only high precision data from NA48/2 (2010) [141] allowed all theory groups to convergeto the same value when using rigorous analysis methods. We will do the same thing for thekappa. We will provide precise and accurate Kπ data of very high statistics which wouldallow all theory groups to converge to a single point.
The κ or K∗0(800) meson is a 0+ resonance with strangeness. The pole of this resonance isfound in the Kπ S-wave with isospin 1/2. In case of neutral kaon scattering off proton pro-ducing a Kπ system with neutral or charged exchange, the S-wave final state is composedof the two isospin components 1/2 and 3/2. Therefore we need to split the two componentsto study the pole of the κ meson and confirm its existence. It should be noted that this sep-aration was not performed for LASS. Actually, the existing I = 3/2 data are previous toLASS and of much less precision, which is a large source of uncertainty that contaminatesthe extraction of the I = 1/2 amplitude and the κ or other strange resonance poles. There-
72

fore, the data that will be obtained from KLF will be relevant, not only due to the expectedhigh production rate of the Kπ system in KLF, but also because it will produce data in theregion well below 0.85 GeV, and also because it will allow for a separation of both isospinchannels.
Figure 63: Left panel: Plot produced by the authors of Ref. [125]. Data from LASS re-sults [147, 149]. The upper panel shows the S-wave Kπ amplitude in the (SI=1/2 + SI=3/2)/2combination of isospin that was actually measured, whereas the lower one shows the phase-shift,which was measured independently. The continuous line is the unconstrained fit from Pelaez andRodas dispersion relation study [125], whose uncertainties are covered by the gray band. Forcomparison, the red lines represent the fit to the amplitude of LASS scaled by the expected KLFproduction during 100 days of run, whose corresponding uncertainties are delimited by the redband. Right: Zoom of the left plots to the elastic region. Note that there are no LASS data below0.750 GeV.
As a matter of fact, simultaneous analysis of the neutral exchange reactions can offer thepossibility to separate I = 1/2 and I = 3/2 amplitudes. This separation can be performedby neglecting CP violations, and assuming the factorization of the nucleon vertex at the pionpole. The reactions that will be used for the simultaneous analysis are:
(a) KLp→ K0π0p→ K+π−p,
(b) KLp→ K0π0p→ K−π+p,
(c) KLp→ K0(K0)π0p→ KSπ0p.
Let’s note A(i), A(ii), and A(iii), the total amplitude of the reaction (i), (ii), and (iii). Theseamplitudes can be expressed in term of linear combination of 1/2 and 3/2 isospin amplitude
73
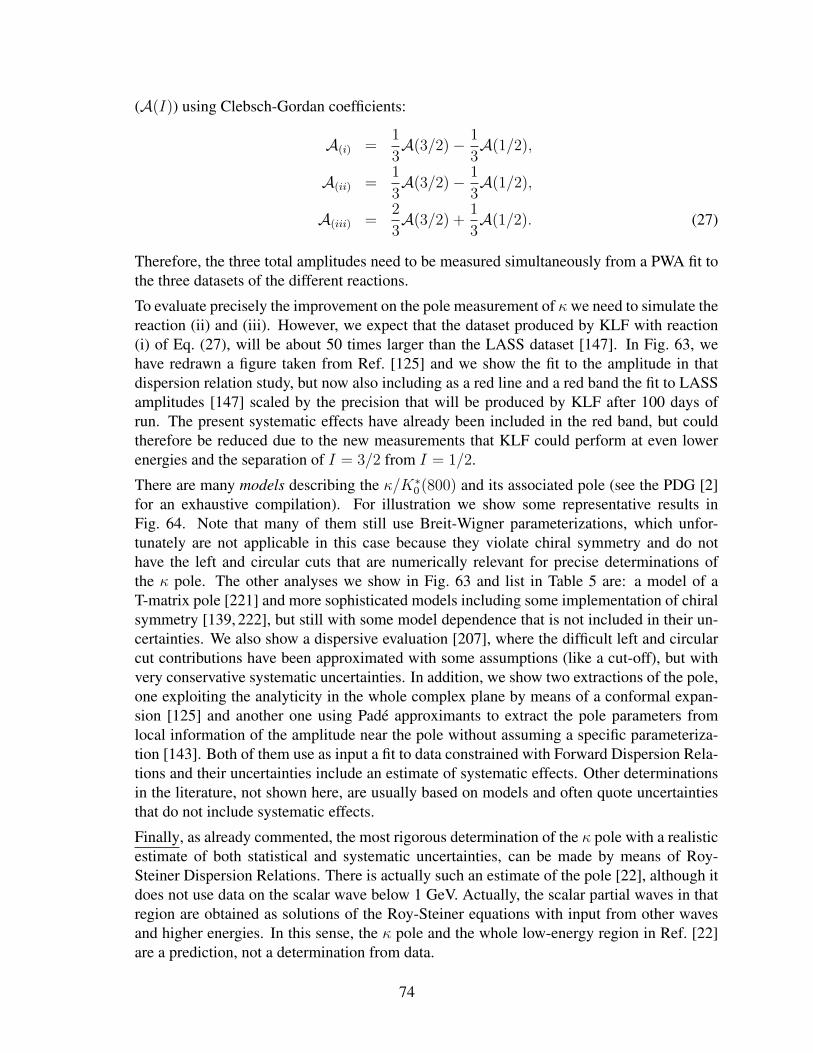
(A(I)) using Clebsch-Gordan coefficients:
A(i) =1
3A(3/2)− 1
3A(1/2),
A(ii) =1
3A(3/2)− 1
3A(1/2),
A(iii) =2
3A(3/2) +
1
3A(1/2). (27)
Therefore, the three total amplitudes need to be measured simultaneously from a PWA fit tothe three datasets of the different reactions.
To evaluate precisely the improvement on the pole measurement of κwe need to simulate thereaction (ii) and (iii). However, we expect that the dataset produced by KLF with reaction(i) of Eq. (27), will be about 50 times larger than the LASS dataset [147]. In Fig. 63, wehave redrawn a figure taken from Ref. [125] and we show the fit to the amplitude in thatdispersion relation study, but now also including as a red line and a red band the fit to LASSamplitudes [147] scaled by the precision that will be produced by KLF after 100 days ofrun. The present systematic effects have already been included in the red band, but couldtherefore be reduced due to the new measurements that KLF could perform at even lowerenergies and the separation of I = 3/2 from I = 1/2.
There are many models describing the κ/K∗0(800) and its associated pole (see the PDG [2]for an exhaustive compilation). For illustration we show some representative results inFig. 64. Note that many of them still use Breit-Wigner parameterizations, which unfor-tunately are not applicable in this case because they violate chiral symmetry and do nothave the left and circular cuts that are numerically relevant for precise determinations ofthe κ pole. The other analyses we show in Fig. 63 and list in Table 5 are: a model of aT-matrix pole [221] and more sophisticated models including some implementation of chiralsymmetry [139, 222], but still with some model dependence that is not included in their un-certainties. We also show a dispersive evaluation [207], where the difficult left and circularcut contributions have been approximated with some assumptions (like a cut-off), but withvery conservative systematic uncertainties. In addition, we show two extractions of the pole,one exploiting the analyticity in the whole complex plane by means of a conformal expan-sion [125] and another one using Padé approximants to extract the pole parameters fromlocal information of the amplitude near the pole without assuming a specific parameteriza-tion [143]. Both of them use as input a fit to data constrained with Forward Dispersion Rela-tions and their uncertainties include an estimate of systematic effects. Other determinationsin the literature, not shown here, are usually based on models and often quote uncertaintiesthat do not include systematic effects.
Finally, as already commented, the most rigorous determination of the κ pole with a realisticestimate of both statistical and systematic uncertainties, can be made by means of Roy-Steiner Dispersion Relations. There is actually such an estimate of the pole [22], although itdoes not use data on the scalar wave below 1 GeV. Actually, the scalar partial waves in thatregion are obtained as solutions of the Roy-Steiner equations with input from other wavesand higher energies. In this sense, the κ pole and the whole low-energy region in Ref. [22]are a prediction, not a determination from data.
74
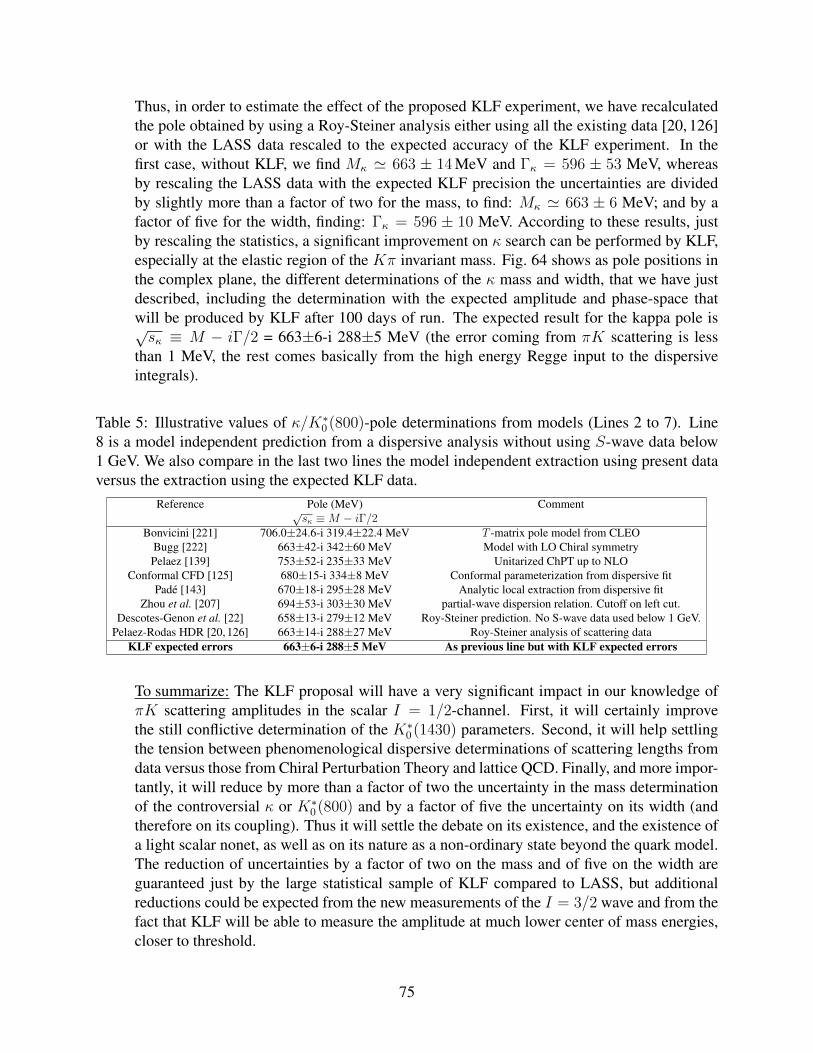
Thus, in order to estimate the effect of the proposed KLF experiment, we have recalculatedthe pole obtained by using a Roy-Steiner analysis either using all the existing data [20, 126]or with the LASS data rescaled to the expected accuracy of the KLF experiment. In thefirst case, without KLF, we find Mκ ' 663 ± 14 MeV and Γκ = 596 ± 53 MeV, whereasby rescaling the LASS data with the expected KLF precision the uncertainties are dividedby slightly more than a factor of two for the mass, to find: Mκ ' 663 ± 6 MeV; and by afactor of five for the width, finding: Γκ = 596 ± 10 MeV. According to these results, justby rescaling the statistics, a significant improvement on κ search can be performed by KLF,especially at the elastic region of the Kπ invariant mass. Fig. 64 shows as pole positions inthe complex plane, the different determinations of the κ mass and width, that we have justdescribed, including the determination with the expected amplitude and phase-space thatwill be produced by KLF after 100 days of run. The expected result for the kappa pole is√sκ ≡ M − iΓ/2 = 663±6-i 288±5 MeV (the error coming from πK scattering is less
than 1 MeV, the rest comes basically from the high energy Regge input to the dispersiveintegrals).
Table 5: Illustrative values of κ/K∗0(800)-pole determinations from models (Lines 2 to 7). Line8 is a model independent prediction from a dispersive analysis without using S-wave data below1 GeV. We also compare in the last two lines the model independent extraction using present dataversus the extraction using the expected KLF data.
Reference Pole (MeV) Comment√sκ ≡M − iΓ/2
Bonvicini [221] 706.0±24.6-i 319.4±22.4 MeV T -matrix pole model from CLEOBugg [222] 663±42-i 342±60 MeV Model with LO Chiral symmetryPelaez [139] 753±52-i 235±33 MeV Unitarized ChPT up to NLO
Conformal CFD [125] 680±15-i 334±8 MeV Conformal parameterization from dispersive fitPadé [143] 670±18-i 295±28 MeV Analytic local extraction from dispersive fit
Zhou et al. [207] 694±53-i 303±30 MeV partial-wave dispersion relation. Cutoff on left cut.Descotes-Genon et al. [22] 658±13-i 279±12 MeV Roy-Steiner prediction. No S-wave data used below 1 GeV.
Pelaez-Rodas HDR [20, 126] 663±14-i 288±27 MeV Roy-Steiner analysis of scattering dataKLF expected errors 663±6-i 288±5 MeV As previous line but with KLF expected errors
To summarize: The KLF proposal will have a very significant impact in our knowledge ofπK scattering amplitudes in the scalar I = 1/2-channel. First, it will certainly improvethe still conflictive determination of the K∗0(1430) parameters. Second, it will help settlingthe tension between phenomenological dispersive determinations of scattering lengths fromdata versus those from Chiral Perturbation Theory and lattice QCD. Finally, and more impor-tantly, it will reduce by more than a factor of two the uncertainty in the mass determinationof the controversial κ or K∗0(800) and by a factor of five the uncertainty on its width (andtherefore on its coupling). Thus it will settle the debate on its existence, and the existence ofa light scalar nonet, as well as on its nature as a non-ordinary state beyond the quark model.The reduction of uncertainties by a factor of two on the mass and of five on the width areguaranteed just by the large statistical sample of KLF compared to LASS, but additionalreductions could be expected from the new measurements of the I = 3/2 wave and from thefact that KLF will be able to measure the amplitude at much lower center of mass energies,closer to threshold.
75

Figure 64: Present situation of the determinations of the κ pole. The figure is from Ref. [20, 126]but we have added as a red point with uncertainties, the simulation of the pole position that wouldbe obtained by means of a Roy-Steiner analysis when fitting to the amplitude and phase-shift ofLASS, but scaled by the precision that will produced by KLF experiment after 100 days of run.This calculation also include estimates of systematic effects. Note that the other points are eitherpredictions [22] or illustrative models that may have additional systematic uncertainties due totheir model dependence, like Breit-Wigner determinations.
76

It has to be mentioned that in the LASS experiment with charged kaon beam, with fixedstrangeness, and charged final state K−π+ only one isospin state could be produced, whilein the proposed experiment with KL Facility, the neutral kaon beam scattering on both protonand neutron targets at low t-Mandelstam will allow to produce and identify all four isospinpartners of K∗0(800).
11.4 Expected Statistical Accuracy
A coupled-channel PWA is the most direct and least model-dependent way to extract resonanceproperties. However, as shown in Sec. 11.2.5, it requires knowledge of both the differential andpolarization observables at the same CM energy. In order to ensure that the duration of the ex-periment would be adequate to extract all observables with sufficient accuracy, dedicated studieswere performed. One can determine the recoil polarization utilizing large self-analysing powersof hyperon decays. In this case, the errors on the polarization measurement are essentially of sta-tistical nature, hence one can infer desired accuracy in the polarization measurement to a requiredbeam time of experiment in a straightforward way. From theoretical perspective, the polarizationerror on the order of 0.1 looks essential in getting unambiguous PWA solution (see Sec. 11.2.5).Polarization errors larger than 0.5 would have no influence on convergence of the PWA fit, hencewill be discarded. This tight theoretical constrains impose strict requirement for the duration ofexperiment to collect sufficient statistics in each channel. Fig. 65 shows the expected error in mea-surement of polarization observable as a function of CM energies (left) and experiment duration(right) for the key reaction KLp→ K+Ξ0. The expected error is a complex three-fold function ofkaon flux (Fig. 24 with maximum at W = 3 GeV), cross section (Ref. [194]) and detector accep-tance (Fig. 85). In case of KLp→ K+Ξ0 reaction it lead to a maximum statistics reachable in therange of 2.2< W <2.7 GeV.
Figure 65: Required a beam time of the experiment for the KLp → K+Ξ reaction. Left panel:to reach 10 % polarization uncertainty as a function of W . Right panel: Reachable polarizationuncertainty at W = 2.2 GeV and θK+ = 90.
A similar study can be performed for the another reaction channel, KLp→ π+Λ, see Fig. 66.
77

Figure 66: Required a beam time of the experiment for the KLp → π+Λ reaction. Left panel:to reach 10 % polarization uncertainty as a function of W . Right panel: Reachable polarizationuncertainty at W = 2.525 GeV and θπ+ = 90.
This reaction requires finer binning to disentangle various Λ−Σ mixing effects leading to a similarexperiment durations as in KΞ case, despite larger production cross sections.
Systematic uncertainties with KL beam will be reaction and kinematics dependent. The totalsystematic errors include three major sources: detector related, induced by the reconstruction al-gorithms and overall flux estimation. The first two sources can be linked to the current GlueXprogram. Indeed after several years of running our understanding of the GlueX detector perfor-mance is in quite advanced state. The KL program will utilize this knowledge. Hence, we expectthe detector related systematical errors to be of the similar size to that of the photon program andbelow ≈3 % [5]. The only source of uncertainty which cannot be estimated from ongoing GlueXprogram is KL flux related ambiguity. A dedicated KL Flux Monitor will be able to provide aflux determination with an accuracy better than 5 %, see Section 10.1.4, leading to an overallsystematical error on the order of 6 %.
To summarize: All channels we have considered so far require about 100 days beamtime for anominal flux of 104 KL/s to exhibit the beauty of strangeness physics in details and maximize thediscovery potential of the KL Facility.
12 Summary and Beam Time Request
We propose to perform strange hadron spectroscopy with a secondaryKL beam in the GlueX setupat JLab. Precise new experimental data (both differential cross sections and recoil polarization ofhyperons) for KLp scattering with good kinematic coverage will be obtained. This will allow
78

predictions from the CQM and LQCD to be checked for all families of excited Λ∗, Σ∗, Ξ∗, and Ω∗
hyperon resonances for the first time. In addition, it will permit a search for the possible existenceof hybrids in the hyperon sector as predicted by the lattice calculations [68].
A complete understanding of three-quark bound states requires accurate measurements of the fullspectra of hyperons with their spin-parity assignments, pole positions, and branching ratios. Animportant impact of these strange hyperon spectroscopy measurements is their significance for thethermodynamic properties of the early universe at freeze-out, which is one of the main physicstopics at heavy-ion colliders.
Besides hyperon spectroscopy, the experimental data obtained in the strange meson sector in thereactions KLp→ K±π∓p and KLp→ KSπ
±n(p) will provide precise and statistically significantdata for experimental studies of the Kπ system. This will allow a determination of quantum num-bers of strange meson resonances in S- (including κ(800)), P-, D-, and higher-wave states. It willalso allow a determination of phase shifts to account for final-stateKπ interactions. Measurementsof Kπ form factors will be important input for Dalitz-plot analyses of D-meson and charmless Bmesons with Kπ in final state.
The KL facility at JLab will be unique in the world. The high-intensity secondary beam of KL
(1 × 10⁴ KL/s) would be produced in EM interactions using the high-intensity and high-duty-factor CEBAF electron beam with very low neutron contamination as was done at SLAC in the1970s; but now, with three orders of magnitude higher intensity [159]. The possibility to performsimilar studies with charged kaon beams is under discussion at J-PARC with intensities similar tothose proposed for the KL beam at JLab. If these proposals are approved, the experimental datafrom J-PARC will be complementary to those of the proposed KL measurements.
Table 6: Expected statistics for differential cross sections of different reactions with LH2 and belowW = 3.0 GeV for 100 days of beam time.
Reaction Statistics(events)
KLp→ KSp 2.7MKLp→ π+Λ 7MKLp→ K+Ξ0 2MKLp→ K+n 60MKLp→ K−π+p 7M
In Table 6, we present the expected statistics for 100 days of running with a LH2 target in theGlueX setup at JLab. The expected statistics for the 5 major reactions are very large. There arehowever, two words of cautions at this stage. These numbers correspond to an inclusive reactionreconstruction, which is enough to identify the resonance, but might not be enough to uncover itsnature. The need for exclusive reconstruction is essential to extract polarization observables washighlighted in Sections 11.2.5 and 11.4. It further decrease the expected statistics, e.g., from 2Mto 200k events in the KΞ case. These statistics, however, would allow a precise measurement ofthe double-differential polarization observables with statistical uncertainties on the order of 10 %.Secondly, kaon flux has a maximum around W = 3 GeV, which decreases rapidly towards high/low
79

W ’s. Thus, the 100 days of beam time on the LH2 are essential to maximize the discovery potentialof the KL Facility and uncover the densely populated hyperon states at low-W .
There are no data on “neutron" targets and, for this reason, it is hard to make a realistic estimateof the statistics for KLn reactions. If we assume similar statistics as on a proton target, the fullprogram will be completed after running 100 days with LH2 and 100 days with LD2 targets.
80

13 Appendix A1: Analysis of Three-Body Final States
The understanding of baryon properties is hardly possible without an analysis of reactions withtwo mesons in the final state. Already in the mass region above 1600 MeV, the excited Λ hyperonsdecay strongly into the πΣ(1385) [223, 224] final state while the Σ-hyperons decay strongly intothe πΣ(1385) [223] and πΛ(1405) [225] channels. Above 1800 MeV almost all known Λ and Σhyperons have a dominant decay mode defined by production of the vector meson K∗(892) [224].In the Σ-sector, a number of resonances were seen in an analysis of the K∆(1230) final state. It isnatural to expect the decay of JP = 3/2+ states into the πΛ(1520) channel [226].
Reactions with two-meson final states provide vital information for the analysis of single-mesonproduction reactions. The singularities that correspond to the opening of the resonance-mesonthreshold (branching points) can produce structures in other channels that can simulate a resonance-like signal [227,228]. The situation is notably more severe in the hyperon sector than in the sectorof non-strange baryons. Due to the rather small widths of low-mass excited hyperons and mesonresonances with an s-quark, such singularities are situated much closer to the physical region andcan notably influence the data. Therefore, a combined analysis of the channels with single and twomesons in the final state is a must in the search for the missing resonances.
Two- and three-body channel approach for the strangeness sector have already been formulatedby the Jülich [229] and ANL-Osaka [103, 104] groups. Note the recent progress in the under-standing of three-body unitarity that can be used to formulate conceptually improved partial-waveamplitudes [230].
The combined analysis should help us to understand the structure of resonances with masses up to2.5 GeV and their decay properties. One of the important tasks is to find nonet partners of the nu-cleon states observed in the photo-production reactions in the mass region around 1900 MeV [231].These states have strong couplings to the ρ(770)N final state and it is natural to expect that theirhyperon partners can be found in an analysis of the K∗(892)N channel.
The analysis of the three-body final state should be done in the framework of the event-by-eventmaximum likelihood method, which allows us to take into account all amplitude correlations inthe multidimensional phase space. It is very important to extract the polarization observables fromthe decay of the final hyperons in the KN → ππΛ and KN → ππΣ reactions. One possiblesimplification is connected with an extraction of the K∗(892)N state from the KN → KπN data,where the analysis can be performed in the framework of the density-matrix-elements approach.However, the analysis should take into account the rescattering of the particles in the final state;e.g., triangle diagrams that lead to logarithmic singularities in the scattering amplitude. Due to thesmall widths of intermediate states, such singularities can play a more important role than in thecase of nucleon and ∆ excitations. It would be also very important to include in the analysis theCLAS photoproduction data with KπΛ and KπΣ final states because there is a chance that stateswith a small KN coupling could be observed in these reactions.
81

14 Appendix A2: Determination of Pole Positions
In spite of their model dependence, partial-wave BW parameters have for quite some time beenthe preferred connection between experiment and QCD in hadronic spectroscopy. More recently,however, pole parameters (e.g., pole positions and residues) have justifiably become the preferredconnection, and this fact has also been recognized by the Particle Data Group in recent editions ofthe Review of Particle Physics [2]. Therefore, the extraction of pole parameters from experimentaldata becomes a procedure of utmost importance.
Extraction of pole parameters is usually performed in two ways: (a) in an energy-dependent way(ED) or (b) in an energy-independent procedure through SES PWAs. In an ED procedure, onemeasures as many observables as possible to be close to the complete set and then fits the observ-ables with parameters of a well-founded theoretical model that describes the reaction in question.Continuity in energy is enforced by the features of the theoretical model. In a SE procedure,one again measures as many observables as possible but attempts to extract partial waves by fit-ting energy-binned data independently, therefore, reducing the theoretical input. A discrete setof partial waves is obtained, and the issues of achieving continuity in energy have recently beenextensively discussed either by introducing the constraints in analyticity [232] or through angle-and energy-dependent phase ambiguity [233, 234].
In energy-dependent models, pole parameters have been extracted in various ways. The mostnatural way is the analytic continuation of theoretical model solutions into the complex-energyplane. Simpler single-channel pole extraction methods have been developed such as the speedplot [235], time delay [236], the N/D method [237], regularization procedures [238], and Padeapproximants [142], but their success has been limited. In single-energy analyses, the situationis even worse: until recently no adequate method has been available for the extraction of poleparameters. All single-channel methods involve first- or higher-order derivatives, so partial-wavedata had to be either interpolated or fitted with an unknown function, and that introduced additionaland, very often, uncontrolled model dependencies.
That situation has been recently overcome when a new Laurent+Pietarinen (L+P) method appli-cable to both, ED and SES models, has been introduced [239–243]. The driving concept behindthe single-channel (and later multichannel) L+P approach was to replace solving an elaborate the-oretical model and analytically continuing its solution into the full complex-energy plane, withan approximation actualized by local power-series representation of partial-wave amplitudes hav-ing well-defined analytic properties on the real energy axis, and fitting it to the given input. Insuch a way, the global complexity of a model is replaced by a much simpler, and almost model-independent expansion, limited to the regions near the real energy axis. And this is sufficient toobtain poles and their residues. This procedure gives the simplest function with known analyticstructure that fits the data. Formally, the introduced L+P method is based on the Mittag-Lefflerexpansion 2 of partial-wave amplitudes near the real-energy axis, where we represented the regu-lar background term by a conformal-mapping-generated, fastly converging power series called a
2Mittag-Leffler expansion [244] is the generalization of a Laurent expansion to a more-than-one pole situation. Forsimplicity, we call it Laurent expansion.
82
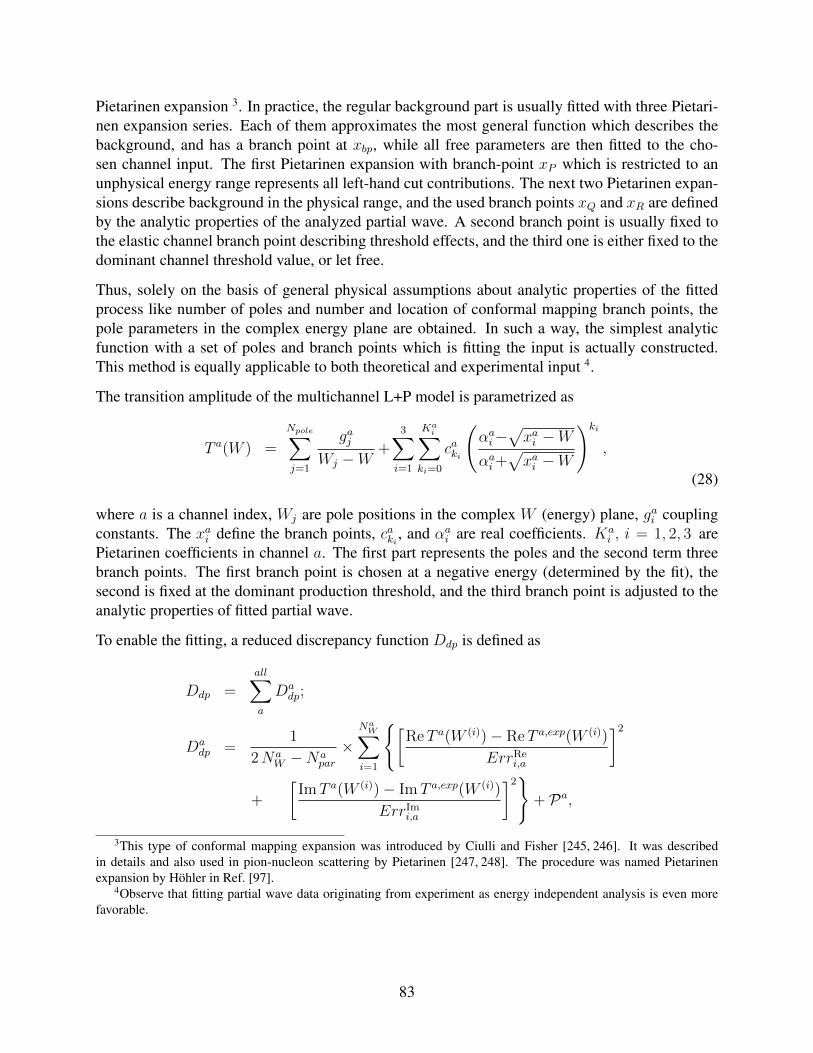
Pietarinen expansion 3. In practice, the regular background part is usually fitted with three Pietari-nen expansion series. Each of them approximates the most general function which describes thebackground, and has a branch point at xbp, while all free parameters are then fitted to the cho-sen channel input. The first Pietarinen expansion with branch-point xP which is restricted to anunphysical energy range represents all left-hand cut contributions. The next two Pietarinen expan-sions describe background in the physical range, and the used branch points xQ and xR are definedby the analytic properties of the analyzed partial wave. A second branch point is usually fixed tothe elastic channel branch point describing threshold effects, and the third one is either fixed to thedominant channel threshold value, or let free.
Thus, solely on the basis of general physical assumptions about analytic properties of the fittedprocess like number of poles and number and location of conformal mapping branch points, thepole parameters in the complex energy plane are obtained. In such a way, the simplest analyticfunction with a set of poles and branch points which is fitting the input is actually constructed.This method is equally applicable to both theoretical and experimental input 4.
The transition amplitude of the multichannel L+P model is parametrized as
T a(W ) =
Npole∑j=1
gajWj −W
+3∑i=1
Kai∑
ki=0
caki
(αai−
√xai −W
αai+√xai −W
)ki
,
(28)
where a is a channel index, Wj are pole positions in the complex W (energy) plane, gai couplingconstants. The xai define the branch points, caki , and αai are real coefficients. Ka
i , i = 1, 2, 3 arePietarinen coefficients in channel a. The first part represents the poles and the second term threebranch points. The first branch point is chosen at a negative energy (determined by the fit), thesecond is fixed at the dominant production threshold, and the third branch point is adjusted to theanalytic properties of fitted partial wave.
To enable the fitting, a reduced discrepancy function Ddp is defined as
Ddp =all∑a
Dadp;
Dadp =
1
2NaW −Na
par
×Na
W∑i=1
[ReT a(W (i))− ReT a,exp(W (i))
ErrRei,a
]2
+
[ImT a(W (i))− ImT a,exp(W (i))
ErrImi,a
]2
+ Pa,
3This type of conformal mapping expansion was introduced by Ciulli and Fisher [245, 246]. It was describedin details and also used in pion-nucleon scattering by Pietarinen [247, 248]. The procedure was named Pietarinenexpansion by Höhler in Ref. [97].
4Observe that fitting partial wave data originating from experiment as energy independent analysis is even morefavorable.
83

where
Pa = λak1
Ka∑k1=1
(cak1)2 k1
3 + λak2
La∑k2=1
(cak2)2 k2
3 + +λak3
Ma∑m=1
(cak3)2 k3
3
is the Pietarinen penalty function, which ensures fast and optimal convergence. NaW is the number
of energies in channel a, Napar the number of fit parameters in channel a, λac , λ
ad, λ
ae are Pietarinen
weighting factors, ErrRe, Imi,a . . . errors of the real and imaginary part, and cak1
, cak2, cak3
real couplingconstants.
Figure 67: L+P fit to CM12 GW/SAID pion photoproduction pE0+ ED and SESs [249].
In order to obtain reliable answers in the L+P model we have to build knowledge about the analyticstructure of the fitted partial wave into the fitting procedure. Because we are looking for poles, weonly have to define which branch points to include. Their analytic form will be determined by thenumber of Pietarinen coefficients. As we have only three branch points at our disposal we expectthat the first branch-point will describe all subthreshold and left-hand cut processes, the secondone is usually fixed to the dominant channel opening, and the third one is to represent backgroundcontributions of all channel openings in the physical range. So, in addition to choosing the numberof relevant poles, our anticipation of the analytic structure of the observed partial wave is of greatimportance for the stability of the fit.
The L+P model has been successfully applied to both theoretical models and discreet partial-wavedata. As an example, in Fig. 67, we give the achieved quality of the fit for the CM12 GW/SAIDpion photoproduction amplitudes [249].
To summarize: Methods of the described L+P model will be used to extract pole parameters forboth ED solutions, obtained by the method described in Section 7, and SESs developed indepen-dently.
84

15 Appendix A3: Statistics Tools for Spectroscopy of StrangeResonances
Several statistical aspects concerning the analysis of KL data are discussed in the following. Theproposed experiment will be capable of producing a large body of consistent data, which is a pre-requisite to carry out statistical analyses. So far, the data in the strangeness S = −1 sector wereproduced in many different experiments, often from the 1980s or earlier, with different systematicuncertainties that are, moreover, unknown in many cases. The problems resemble the situation inpion-induced inelastic reactions [250, 251]. This makes any kind of analysis difficult but statis-tical tests, e.g., on the significance of a claimed resonance signal, are indispensable to carry outmeaningful baryon spectroscopy. Indeed, the search for missing resonances is not only a problemof implementing physical principles such as unitarity in the amplitude but also, to a large extent,a statistical one. This becomes especially relevant once one searches for states beyond the mostprominent resonances.
15.1 Minimizing Resonance Content
The PWA, discussed in Section 7 is needed to extract the physically relevant information fromdata. For resonance spectroscopy, one needs the energy dependence of the amplitude to deter-mine resonance positions and widths. Therefore, energy dependent parametrizations of the partialwaves are fitted either to data or to SESs, generated by conducting PWA in narrow energy bins.The resonance content is usually determined by speed-plot techniques or analytic continuation ofthe ED parametrization to complex scattering energies, where resonances manifest themselves aspoles [252].
Yet, the ED parametrization itself contains, almost always, resonance plus background terms inone implementation or another. A problem arises if resonance terms are needed to model missingbackground dynamics such as triangle singularities or threshold openings in the complex plane.Then, false positive resonance signals could be obtained [227]. Adding resonance terms will al-ways lower the χ2 in a given fit, but the question is how significant this change is.
We plan to address this well-known, yet poorly addressed problem by applying several statisticalanalysis tools to the amplitude parametrization. Some techniques have been used, so far, to addressthis problem. For example, in so-called mass scans, the χ2 dependence on the mass of an additionalresonance is studied [253–255]. If χ2 drops by a certain amount at a given energy, potentially inseveral reaction channels at once, then a resonance might be responsible.
Beyond mass scans, there exist model selection techniques referring to the process of selecting thesimplest model with the most conventional explanation. Here, the conventional/simple explanationis an (energy-dependent) background and/or threshold cusps, while the algorithm should penalizeunconventional explanations such as resonances.
Minimizing the resonance content in a systematic way is thus a goal within PWA. For this, the LeastAbsolute Shrinkage and Selection Operator (LASSO) technique for model selection can be applied
85

(which provides a Bayesian posterior-mode estimate), in combination with cross validation and/orinformation theory to control the size of the penalty parameter λ [256–258]. The combinationof these techniques effectively suppresses the emergence of resonances except for those reallyneeded by the data. The numerical implementation is especially simple because it affects only thecalculation of the χ2. Trial-and-error techniques, sometimes still applied to check for resonancesin different partial waves, will become obsolete. Here, one simply starts with an over-completeresonance set plus flexible backgrounds, and the algorithm will remove all those resonances notneeded by data, without manual intervention. Apart from cross validation, we will also considerinformation theory to regulate λ as proposed in Ref. [259]. In particular, the Akaike and Bayesianinformation criteria provide easy-to-use model selection. Results should be independent of thechoice of the criterion.
In 2017, the LASSO technique was, for the first time, used in pion photoproduction at low energiesfor the “blindfolded" selection of the relevant multipoles and their simplest parametrization todescribe the available data [260]. The analysis of kaon-induced reactions is closely related. Fora recent application in a different but related context see Ref. [261]. Once the model selectionprocess is finished, uncertainties on resonance parameters can be obtained by the usual re-samplingtechniques.
The existing and proposed PWA tools use different construction principles: resonances are in-cluded in the form of bare states, K-matrix poles, or generated from hadron dynamics itself. Forthe first two classes of approaches, one has at one’s disposal the coupling constants that tune theinteraction of a bare singularity with the meson-baryon continuum. Those are fit parameters thatcan be explicitly included in the penalty term. If resonances are generated from the meson-baryondynamics itself, the case is a bit more complicated, because there are no directly accessible tuningparameters. This parametrization, practiced by the GW/SAID group for many years (see, e.g.,Ref. [249]), is, in principle, the cleanest analysis tool, because resonance generation does not re-quire manual intervention. Yet, even here the emergence of resonance terms can be penalized, e.g.,through the value of contour integrals on the second Riemann sheet where resonance poles arelocated (a value of zero corresponds then to the absence of poles).
It should be stressed that the information theory criteria do not require a good fit in a frequentist’ssense because they merely compare the relative quality of models. This is especially relevant whenit comes to the analysis of many different data sets (such as kaon-induced reactions) in which, e.g.,the systematic errors might be underestimated such that a χ2/d.o.f. ≈ 1 is difficult to achieve.
Systematic uncertainties can be treated as in the GW/SAID approach [98] in which the χ2 is definedas
χ2 =∑i
(NΘi −Θexp
i
εi
)2
+
(N − 1
εN
)2
, (29)
where Θexpi is an experimental point in an angular distribution and Θi is the fit value. Here the
overall systematic error, εN , is used to weight an additional χ2 penalty term due to renormalizatonof the fit by the factor N . The statistical error is given by εi. Note that the fit function is penalized,rather than the data, to avoid the bias discussed in Ref. [262]. See also Ref. [263] for furtherdiscussion of this topic.
86

15.2 Goodness-of-Fit Tests
The χ2 per degree of freedom, χ2d.o.f., is usually considered as a criterion for a good fit, but be-
comes meaningless if thousands of data are fitted (and should be replaced by Pearson’s χ2 test).Statistical χ2 tests will become possible through the new data, putting resonance analysis on afirmer ground. While χ2 tests are sensitive to under-fitting, they are insensitive to over-fitting.Here, the F -test [264] is suitable to test the significance of new fit parameters. That test, can, thus,be applied to reduce the number of internal parameters in a partial-wave parametrization, which re-sults in more reliable estimates of uncertainties for extracted resonance parameters such as masses,widths, and branching ratios.
With increased consistency of data through the KLF experiment, other goodness-of-fit criteria canalso be applied, such as Smirnov-Kolmogorov or Anderson-Darling tests for normality [265, 266]or run tests from non-parametric statistics. For pion photoproduction, these tests are applied andextensively discussed in Ref. [260].
A prerequisite to carry out classical statistical tests is data consistency. As discussed before, thisis unfortunately not always the case in the S = −1 sector. The proposed KLF measurements willproduce, for the first time, a body of data large enough to enable such tests reliably.
15.3 Representation of Results
As mentioned, ED parametrizations are needed to extract resonance parameters, but SES fits areuseful to search for narrow structures, or for other groups to test theoretical models of hadron dy-namics. The question arises how the partial waves can be presented to allow the theory communityto carry out their fits. As recently demonstrated [267], SESs alone carry incomplete statistical in-formation, mainly because they are correlated quantities. We plan to provide the analysis resultsin a similar form as recently done in Ref. [267] for elastic πN scattering. With this, the theorycommunity can fit partial waves through so-called correlated χ2 fits obtaining a χ2 close to theone obtained in a fit directly to data (see Ref. [267] for an extended discussion). This format en-sures that the maximal information from experiment is transmitted to theory, allowing to addressthe missing resonance problem in the wider context of questions related to confinement and massgeneration, that have been paramount problems in hadronic physics for decades.
To summarize: With a large consistent data set from the KLF experiment, an entire class of sta-tistical tools will become applicable that is needed to conduct rigorous baryon spectroscopy. Withthe new data, the quantitative significance of resonance signals and the quantitative uncertaintiesof resonance parameters can be determined.
16 Appendix A4: Neutron and Gamma Background
1. Elements of the Be-target AssemblySchematic view of the Be-target assembly (KL production target) is given in Fig. 21. The el-
87

Table 7: Elements of the Be-target assembly.
Element Outer ∅/Inner ∅ Thickness Volume Density Mass(m) (m) (m3) (kg/m3) (kg)
Borated polyethylen (front) 1.20/0.16 0.10 0.111 1000 111.1Borated polyethylen (side) 1.20/1.00 1.30 0.449 1000 449.2Borated polyethylen (back) 1.20/0.08 0.10 0.113 1000 112.6
Lead (front) 1.00/0.16 0.30 0.230 11350 2605.8Lead (side) 1.00/0.76 0.70 0.232 11350 2635.8Lead (back) 1.00/0.08 0.30 0.234 11350 2657.2
Tungsten (front) 0.76/0.16 0.40 0.173 19300 3346.9Tungsten (center) 0.76/0.00 0.10 0.045 19300 875.5Tungsten (back) 0.76/0.08 0.20 0.090 19300 1731.7
Beryllium 0.06/0.00 0.40 0.001 1848 2.1
ements of the Be-target assembly are presented in Table 7. The weight of the construction is14.5 ton. Changeover from the photon to KL beamline and from the KL beamline to photonneeds to be further evaluated and in the most conservative scenario may take approximately6 months or less. This maximal break period may fit the current CEBAF Accelerator sched-ule. It has to be mentioned that the collimator cave has enough space (with the 4.52 m width)for the Be-target assembly to remain far enough from the beamline.
2. Neutron and Gamma BackgroundThe schematic view of the collimator cave with the Be-target assembly is given in Fig. 18.
Several tallies were placed along the beam and at the experimental hall for neutron andgamma fluence estimation. Tally descriptions are:
• #1: spot for flux (∅0.07 m) on the beam in the experimental hall right behind of theconcrete wall;
• #2: spot for flux (∅0.07 m) outside the beam in the experimental hall right behind ofthe concrete wall;
• #3: spot for flux (∅0.07 m) on the beam in the experimental hall right on the face ofthe cryogenic target;
• #4: spot for flux (∅0.07 m) outside the beam in the experimental hall right on the faceof the cryogenic target;
• #5: area for dose rate (6×6 m2) on ceiling of the experimental hall centered at theGlueX detector - key area for the RadCon;
• #6: ring for dose rate (outer ∅0.08 m and inner ∅0.07 m) on the face of the cryogenictarget - to evaluate a radiation damage for the SiPMs;
• #7-9: area for dose rate (1×1 m2) hallway in the experimental hall following the GlueXdetector;
88

• #10-19: rings for dose rate (outer ∅0.25, 0.45, 0.65, 0.85, 1.05, 1.25, 1.45, 1.65, 1.85,2.05 m and inner ∅0.20, 0.40, 0.60, 0.80, 1.00, 1.20, 1.40, 1.60, 1.80, 2.00 m, respec-tively) on the face of the cryogenic target - to evaluate a radiation damage for the frontof the BCAL;
• #20: spot for flux (∅0.07 m) on the beam right behind beryllium;
• #21: spot for flux (∅0.07 m) on the beam right behind tungsten.
(a) Neutron BackgroundCalculations were performed for different shielding configurations in the collimatorcave to minimize the neutron and gamma dose rate.The KLs, produced by the Be-target and survived after the beam tungsten or lead plug,are presented in Fig. 68. This figure shows that there is a small effect in the materialdifference in the beam plug. There are 10 % of KLs, produced by the Be-target, sur-vived after the beam tungsten plug. The neutron yield integral from the berilium is2.4×1010 n/(s · cm2) and then from tunsten is 4.2×10⁹ n/(s · cm2) (Figs. 69 and 70).So, the tungsten plug reduced the neutron flux by the same amount as the neutral kaonflux.
Figure 68: Fraction of survivrd kaons after the tungsten (left) or lead (right) plugs are installedwith 15 or 30 R.L.
Calculations were performed for different shielding cofigurations in the collimator caveto minimaize the neutron and gamma dose rate. The vertical (horizontal) cross sectionof the neutron flux is given in Fig. 71 (Fig. 72).
89
Igor
Highlight

Figure 69: Number of neutrons that will not pass through the tungsten plug. Calculations wereperformed using the MCNP Transport code [178].
Figure 70: Number of neutrons that will pass through the tungsten plug. Calculations were per-formed using the MCNP Transport code [178].
Figure 71: Vertical cross section of the neutron flux calculated for the model. Beam goes from leftto right.
90

Figure 72: Horizontal cross section of the neutron flux calculated for the model. Beam goes fromleft to right.
Figure 73: Vertical cross section of the gamma flux calculated for the model.
Table 8: Neutron (2nd column) and gamma (3rd column) background flux calculated for differenttallies (1st column). Percentage in brackets shows statistical uncertainties of MC simulations.
Tally Neutron flux (n/(s·cm2)) Photon flux (γ/(s·cm2))#1 (8.0±0.5)×104 (6.7 %) (31.1±0.1)×106 (0.3 %)#2 (2.2±1.7)×103 (75 %) (3.3±1.0)×103 (31 %)#3 (1.7±0.2)×104 (11 %) (27.2±0.1)×106 (0.3 %)#4 > 1.7× 10² (9.9±1.6)×103 (16 %)
#20 (236.0±0.1)×108(0.1 %) (223.0±0.5)×106 (0.02 %)#21 (41.7±0.1)×108(0.1 %) (10.7±0.1)×106 (0.2 %)
(b) Gamma BackgroundThe vertical cross section of the gamma flux is given in Fig. 73.
91
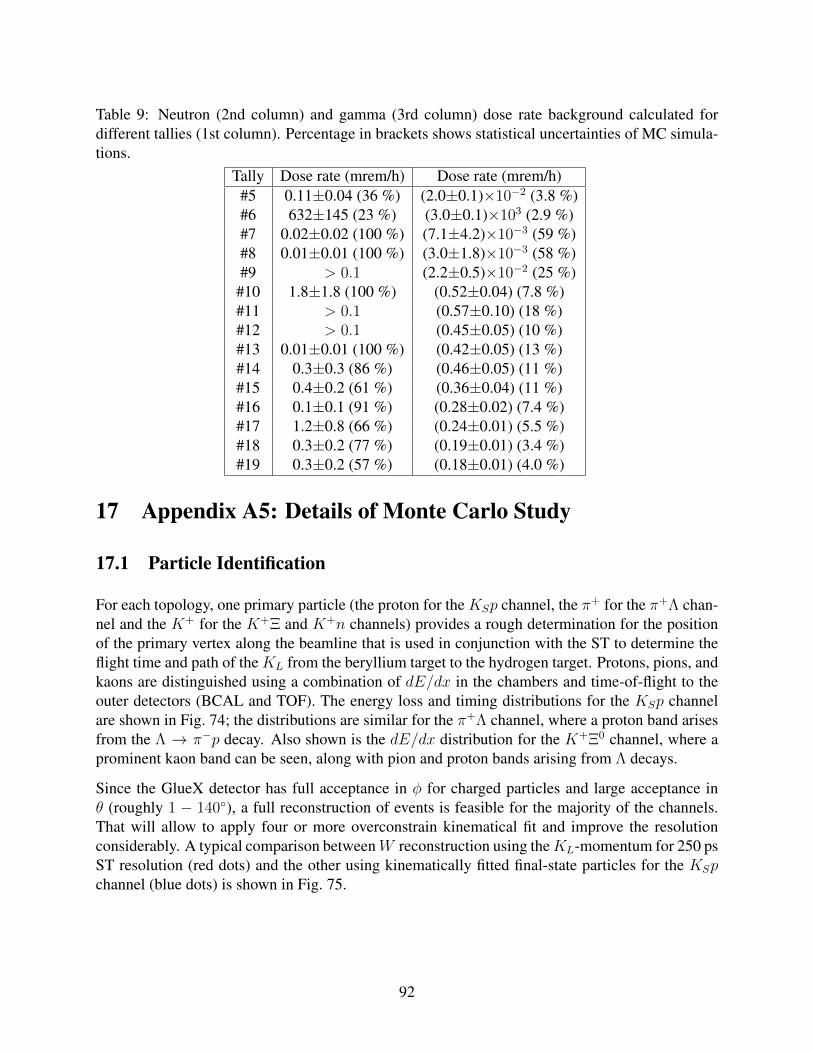
Table 9: Neutron (2nd column) and gamma (3rd column) dose rate background calculated fordifferent tallies (1st column). Percentage in brackets shows statistical uncertainties of MC simula-tions.
Tally Dose rate (mrem/h) Dose rate (mrem/h)#5 0.11±0.04 (36 %) (2.0±0.1)×10−2 (3.8 %)#6 632±145 (23 %) (3.0±0.1)×103 (2.9 %)#7 0.02±0.02 (100 %) (7.1±4.2)×10−3 (59 %)#8 0.01±0.01 (100 %) (3.0±1.8)×10−3 (58 %)#9 > 0.1 (2.2±0.5)×10−2 (25 %)
#10 1.8±1.8 (100 %) (0.52±0.04) (7.8 %)#11 > 0.1 (0.57±0.10) (18 %)#12 > 0.1 (0.45±0.05) (10 %)#13 0.01±0.01 (100 %) (0.42±0.05) (13 %)#14 0.3±0.3 (86 %) (0.46±0.05) (11 %)#15 0.4±0.2 (61 %) (0.36±0.04) (11 %)#16 0.1±0.1 (91 %) (0.28±0.02) (7.4 %)#17 1.2±0.8 (66 %) (0.24±0.01) (5.5 %)#18 0.3±0.2 (77 %) (0.19±0.01) (3.4 %)#19 0.3±0.2 (57 %) (0.18±0.01) (4.0 %)
17 Appendix A5: Details of Monte Carlo Study
17.1 Particle Identification
For each topology, one primary particle (the proton for the KSp channel, the π+ for the π+Λ chan-nel and the K+ for the K+Ξ and K+n channels) provides a rough determination for the positionof the primary vertex along the beamline that is used in conjunction with the ST to determine theflight time and path of the KL from the beryllium target to the hydrogen target. Protons, pions, andkaons are distinguished using a combination of dE/dx in the chambers and time-of-flight to theouter detectors (BCAL and TOF). The energy loss and timing distributions for the KSp channelare shown in Fig. 74; the distributions are similar for the π+Λ channel, where a proton band arisesfrom the Λ → π−p decay. Also shown is the dE/dx distribution for the K+Ξ0 channel, where aprominent kaon band can be seen, along with pion and proton bands arising from Λ decays.
Since the GlueX detector has full acceptance in φ for charged particles and large acceptance inθ (roughly 1 − 140), a full reconstruction of events is feasible for the majority of the channels.That will allow to apply four or more overconstrain kinematical fit and improve the resolutionconsiderably. A typical comparison betweenW reconstruction using theKL-momentum for 250 psST resolution (red dots) and the other using kinematically fitted final-state particles for the KSpchannel (blue dots) is shown in Fig. 75.
92

Figure 74: Particle identification. Top left panel: dE/dx for the KSp channel. Top right panel:time difference at the primary “vertex" for the proton hypothesis for the KSp channel using theTOF. Bottom panel: dE/dx for the K+Ξ channel. The proton and pion bands arise from the decayof the Λ.
Figure 75: The W resolution for the KSp channel, (blue dots) using kinematic fitting after recon-struction of all final state particles; (red dots) using KL time-of-flight.
17.1.1 Details of MC study for KLp→ KSp
For the KSp channel, we take advantage of the BR of 69.2 % for KS → π+π− [2]: the invariantmass of the π+π− pair and W as computed from the four-momenta of the proton and the two pionsis shown in Fig. 76.
After combining the four-momenta of the final-state particles with the four-momenta of the beamand the target, the missing-mass squared for the full reaction should be zero, which is also shown
93

Figure 76: Full reconstruction for KLp → KSp and KS → π+π−. Top left panel: π+π− invariantmass. Top right panel: W computed from π+π−p invariant mass. Bottom panel: Missing-masssquared for the full reaction.
in Fig. 76. Finally, one requires conservation of energy and momentum in the reaction by applyinga kinematic fit to the data. After applying a 0.1 cut on the confidence level of the fit, one computedan estimate for the reconstruction efficiency has been calculated and is shown as a function of Win Fig. 77. Here the efficiency includes the BR for KS → π+π−. The average reconstructionefficiency is about 7 %.
Figure 77: Estimate the efficiency for full reconstruction of the KLp → KSp and KS → π+π−
reaction chain as a function of W .
94

17.1.2 Details of MC study for KLp→ π+Λ
For our proposed KL Facility at Hall-D, we expect good statistics of KLp→ π+Λ for a very widerange of KL beam momentum. Figure 78 shows the KL beam momentum distributions from thegenerated counts (left) and reconstructed counts (right) when requiring βKL
> 0.95 in time-of-flight.
Figure 78: Beam particle (KL) momentum distribution in MC simulation, Left panel: Generated.Right panel: Reconstructed.
We have generated the KLp → π+Λ reaction in phase space taking into account the realistic KL
beam momentum distribution in the event generator. This momentum spectrum is a function ofthe distance and angle. Then events were pased through the standard Hall-D GEANT simulationwith GlueX detector and momentum smearing and utilized JANA for particle reconstruction thatwe simulated. Figure 79 shows a sample plot for polar angle versus momentum distribution of π+,π−, and protons from the generated event (left) and reconstructed event (right).
Figure 80 shows an example of the reconstructed the Λ invariant mass (left) and missing mass(right). We obtained a 5 MeV invariant-mass resolution and a 150 MeV missing-mass resolutionand estimateed the expected total number of π+Λ events as final-state particle within topology of1π+, 1π−, and 1 proton. In 100 days of beam time with 1×10⁴ KL/s on the liquid hydrogen target,we expect to detect around 5.3M KLp → π+Λ events for W < 3 GeV. Such an unprecedentedstatistics will improve our knowledge of these states through PWA.
Moreover, Fig. 81 (left) shows the correlation between Λ invariant mass from its decay particles (p,π−) and missing mass of π+X . The right plot in Fig. 81 shows the Λ invariant mass as a functionof pion angular distribution (θπ+). All these plots are based on the 250 ps time resolution of theST.
The KLp → π+Λ reaction has a relatively high production cross section the order of a few mb inour proposed KL-momentum range (1 – 6 GeV/c). The beam resolution has been calculated at thetime-of-flight vertex time resolution (250 ps) of the start counter (TOF-ST).
The major source of systematic uncertainty for this reaction would be mistaken particle identifi-
95

Figure 79: Momentum and angular distributions. Top row panel: π+, Middle row panel: π−,Bottom row panel: proton. Left column panels: Generated and Right column panels: Recon-structed events.
Figure 80: The Λ invariant-mass distribution reconstructed. Left panel: From its π−p decayparticles. Right panel: The missing mass of π+X (right).
cation among π+, K+, and proton in the final state. However, requiring the reconstructed Λ andside-band subtraction technique for background will improve this uncertainty substantially.
96

Figure 81: Left panel: The Λ invariant mass versus missing mass of π+X . Right panel: The θπ+
angle distribution versus Λ invariant mass (right).
17.1.3 Details of MC study for KLp→ K+Ξ0
The section here focuses on the reconstruction of KLp → K+Ξ0 but the initial procedure forparticle identification and reaction reconstruction is almost identical to the reaction on the neutron(KLn→ K+Ξ−). Three topologies can be used to reconstruct the reaction KLp→ K+Ξ0 on freeproton targets. Topology 1 requires the detection of a K+, topology 2 requires the detection of aK+ and a Λ by utilizing its high branching ratio to a π−p pair (63.9 %), and Topology 3 requiresthe detection of the two-photon decay of the π0 from Ξ → π0Λ. In the case of KLn → K+Ξ−,features from having a target nucleon with a non-zero momentum are removed from the analysis bydetecting all final state particles (one K+, one proton, and two π−). Particle identification is donevia a probabilistic approach involving dE/dX , time-of-flight, and track curvature informationas described in Appendix A5 (Sec. 17.1). The dE/dX distributions for kaon, proton, and π−
candidates are shown in Fig. 82.
Figure 82: dE/dX distributions used in kaon proton and π− identification for the reconstructionof KLp→ K+Ξ0.
97

At low particle momenta, kaons and protons can be well separated, but high-energy particles can-not be unambiguously differentiated by dE/dX or by ToF information, which leads to particlemisidentification. The higher the W , the higher ejectile energy and the more misidentificationcontributions we have. In this analysis (specifically Topology 2 and 3), these events were largelyremoved by making an invariant-mass cut on the π−p pair.
Figure 83 shows the missing mass of KLp → K+X for simulated data for the reaction KLp →K+Ξ0 used in the reconstruction of all topologies, the invariant-mass distribution of the π−p pairused to reconstruct Topology 2 (KLp→ K+ΛX) and 3, and the invariant-mass of the two-photonpair used to reconstruct Topology 3 (KLp → K+Λπ0). A 3σ cut on these distributions allows usto reconstruct the reaction fully. Fig. 83 (left) shows the 3σ W -dependent cut applied to selectthe missing Ξ0 as well as the W -dependent 3σ cut to reconstruct the reaction KLp → K+n. (SeeAppendix A5 (Sec. 17.1.4) for more details on the sources of resolution effects on the missingmass.) The latter is one of the major sources of background for our reaction for Topology 1;however, the missing-mass resolution (obtained with a vertex-time resolution of 250 ps) allows aclean separation of these two reactions up to W = 2.3 GeV Above this value, special treatment of theKLp→ K+n background is required as discussed in greater detail in Appendix A5 (Sec. 17.1.3).
Figure 83: The missing mass of the reactionKLp→ K+X used to reconstruct the reactionKLp→K+Ξ0 (Topology 1), and the invariant mass of pπ− pair (Topology 2), and the invariant mass ofthe two-photon pair (Topology 3).
Similarly, the reconstruction of KLn→ K+Ξ− is done by first identifying the pion that originatesfrom the Λ decay. Fig. 84 (left) shows the invariant mass of the proton and the one of the twodetected pions. It is clear from this that the pion that originates from the Λ is easily identified withminimal combinatorial background.
The invariant mass of two pions and the proton is shown in Fig. 84 (right).
The detection efficiency as a function of the trueW for each topology for the reaction on the protonis shown in Fig. 85. As expected, the efficiency is highest for Topology 1 reaching a maximumat 60 % for W = 2.05 GeV. The efficiency for Topology 2 is about an order of magnitude lessthan Topology 1, and Topology 3 detection efficiency is on average 0.8 %. The efficiency for thereaction on the neutron for a fully exclusive reaction is of the order of a few percent.
98

Figure 84: Left panel: Invariant mass of detected proton and π−1 as a function of Invariant mass ofdetected proton and π−2 . Right panel: Invariant mass of detected proton and two π−.
Figure 85: The detection efficiency for the reaction KLp→ K+Ξ0 for each topology.
KLp → K+Ξ0 background suppression: Different sources of background will contribute inthe three topologies used to study this reaction. Disentangling our signal KLp → K+Ξ0 from thereaction KLp → K+n (for Topology 1), which has two orders of magnitude larger cross sectionis expected to be relatively straightforward. As mentioned before, a simple missing-mass cut issufficient to remove any contributions from this reaction for W < 2.3 GeV. For W > 2.3 GeV, ans-weight approach (or neuralNets, etc.) can be utilized to remove these contribution as the shapeof the background under any cascade events can be well established from simulations. Figure 86shows the W -dependence of the missing-mass distribution of KLp → K+X for the simulatedreactions KLp → K+Ξ0 and KLp → K+n (left panel). The right panel shows the missing-massprojection at W = 1.9 GeV. In addition to KLp → K+n, the reaction KLp → π+Λ is also asource of background events for Topology 1 (KLp → K+X) and 2 (KLp → K+ΛX). Thischannel contributes when the final-state π+ is misidentified as a K+. This shifts the missing massof KLp → π+X to values lower than the ones expected, which leads to a good separation of thissource of background below W < 2.2 GeV. Figure 87 shows the missing-mass distribution of thesemisidentified events. Contributions from these events for Topology 3 is completely removed bythe requirement of two photons in the final state that reconstruct the mass of π0. For Topology 2,
99

Figure 86: The missing mass of the reaction KLp → K+X used to reconstruct the reactionsKLp → K+Ξ0 (Topology 1) and KLp → K+n (which has about 2 orders of magnitude largercross section). Right panel shows the missing mass at W = 1.9 GeV.
coplanarity cuts between the reconstructed (misidentified) K+ and Λ can reduce contributions,where as a background subtraction approach using the missing-mass information can be used toremove any contribution at W > 2.2 GeV.
Figure 87: The missing mass of the reaction KLp→ K+X for simulated events from the reactionKLp→ π+Λ. The reconstructed events here results from a pion misidentified as a kaon.
Ξ0 induced polarization: In terms of four-vectors, conservation of energy and momentum forthis reaction is written as follows:
PKL+ Pp = PK+ + PΞ0 . (30)
The production plane is then defined by
y =~PΞ × ~PKL
|~PΞ × ~PKL|. (31)
100

The z axis lies along the beam direction
z =~PKL
|~PKL|, (32)
and thus the x axis is defined to give a right-handed coordinate system:
x = y × z. (33)
The determination of P yΞ can be established by linear fits to the acceptance-corrected pion angular
(cos θyπ) yields. Fitting these distributions with a first-degree polynomial,
y = a0(1 + a1 cos θyπ), (34)
allows the determination of a1, which gives us the the induced polarization
a1 = P yΞα. (35)
Alternatively, one can determine the induced polarization transfer from determining the forward-backward asymmetry, Ay, of the pion angular distribution. This asymmetry is defined as
Ay =Ny
+ −Ny−
Ny+ +Ny
−, (36)
where Ny+ and Ny
− are the acceptance-corrected yields with cos θyπ positive and negative, respec-tively. The asymmetry is related to the induced polarization by
P yΞ =−2Ay
α. (37)
The statistical uncertainty in the asymmetry measurement of P yΞ is related to the Poisson uncer-
tainty in Ny+ and Ny
−. Propagating this uncertainty to the uncertainty of Ay gives
σAy =2
(Ny+ +Ny
−)2
√Ny
+Ny−(Ny
+ +Ny−). (38)
The uncertainty in P yΞ is then found by propagating σAy and σα:
σP yΞ
P yΞ
=
√(σAy
Ay)2 + (
σαα
)2. (39)
17.1.4 Details of MC study for KLp→ K+n
As described in Section 11.2.4 we used only K+ detection to reconstruct this reaction. Kaonidentification is done with a probabilistic approach involving dE/dX , time-of-flight, and trackcurvature information; see Appendix A5 (Sec. 17.1) for further details. Even in pure KLp→ K+nMC case one can have more than one charged particle track reconstructed due to various reactions
101

in the detector volume. That is why in addition to the pronounced K+ banana in Fig. 88 (left)we see some traces of pion and proton bands. At low K+-momenta, kaons can be well separatedfrom pions and protons, but high-energy particles cannot be differentiated by dE/dX or by ToFinformation leading to particle misidentification. The higher W (the higher the ejectile energy),we have and the more kaons we lose due to misidentification; see Fig. 88 (right, green). In ouranalysis, we restricted ourselves to one and only one reconstructed charged-particle track. Thiscondition helps to suppress the background, but does not reduce the reconstruction efficiency; seeFig. 88 (right, black).
Figure 88: Left panel: dE/dx for the KLp → K+n channel Right panel: single charged-particletrack detection efficiency as a function of W for the KLp → K+n channel. Any charged particle(black), kaon (green), proton (red), and pion (blue).
Charged-particle track detection efficiency stays flat over the full range of W , but kaon recon-struction efficiency drops from about 60 % at low W to 20 % at W∼3.5 GeV. Since the GlueXacceptance is large and essentially hole-less, kaon reconstruction efficiency does not depend on yetunknown angular distributions. For the final selection of the KLp→ K+n reaction, we used a 3σmissing-mass cut around the neutron’s mass; see Fig. 89.
Figure 89 was plotted under the assumption of a 250 ps vertex time resolution. Both W (Fig. 48)and missing-mass resolutions are driven by the KL-momentum resolution.
Below W = 2.4 GeV, the KLp → K+n and KLp → K+Ξ reactions can be disentangled byK+ missing mass alone. Above this value, special treatment of the KLp → K+Ξ backgroundis required. One may notice that a 3σ cut for the KLp → K+n reaction rises faster than forKLp → K+Ξ0. This effect has a purely kinematical explanation - due to the higher mass of theΞ0 baryon, the K+ produced in KLp → K+Ξ reaction has a lower energy for the same value ofW . The lower the K+ energy we have, the better missing-mass resolution we get, and the morenarrow the missing-mass cut one needs to apply.
KLp → K+n background suppression: Due to its very high cross section, the KLp → K+nreaction is essentially background free. Due to the extremely high statistics expected for thisreaction our uncertainties will be dominated by systematics. We have identified three major sourcesof physical background: np→ K+nn, np→ π+nn, and KLp→ K+Ξ reactions.
102

Figure 89: Left panel: Full (red) and detector related (blue) K+ missing-mass resolution in termsof σ. In second case, the true KL-momentum was used to calculate the missing mass. Right panel:K+ missing-mass resolution as a function of W . 3σ missing-mass cuts for the KLp → K+n(red) and KLp→ K+Ξ (gray) reactions are indicated by solid lines. Horizontal dashed lines shownominal masses of the neutron and Ξ baryon. The vertical gray dashed line indicates the range ofpure missing-mass separation between these two reactions.
Details on KLp → K+n and KLp → K+Ξ separation can be found in Appendix A5 (Sec-tion 17.1.3). For W < 2.3 GeV, these two reactions can be separated by a 3σ K+ missing-masscut. Above W = 2.4 GeV, one can use standard background suppression techniques - S-weights,Q-weights, NeuralNets, etc. . . .. The main decay branch of Ξ is Ξ0 → π0Λ → π0π−p, whichleads to several charged particles in the final state besides K+; hence filtered out by a “one-charge-track-only" selection criterion. Another decay branch Ξ0 → π0Λ → π0π0n cannot be filtered outthat easily; however, due to its smaller branching ratio combined with the small KLp → K+Ξproduction cross section, this channel only contributes at the level of 10−3 even without anybackground suppression techniques. Further suppression vetoing multiple neutral tracks and/orQ-weight should push this background far below 10−4.
Neutron flux drops exponentially with energy (see Appendix A4 16 for details) and generally thehigh-energy neutron flux is small, but nonvanishing. If neutrons and KLs have the same velocity,they cannot be separated by time of flight. Neutron-induced reactions have high cross sections,which is why one needs to consider them as a possible source of background. In Fig. 90, onecan see a comparison of kaon and neutron fluxes for the worse-case scenario when no neutronsuppression is employed, similar to Fig. 26 (right) in terms of β. Particles with the same β cannotbe separated by time of flight. At β = 0.95 neutron and kaon fluxes become equal. This velocitycorresponds to a neutron momentum of pn = 2.9 GeV/c and kaon momentum of pK =1.5 GeV/c.
To evaluate the amount of background, we need to fold this flux with production cross section andreconstruction efficiency. Let’s first consider the np → K+Λn background. Unfortunately, thisreaction is not very well measured, so we would use the pp→ K+Λp cross section parametrizationtogether with the knowledge of σ(pp→K+Λp)
σ(np→K+Λn)= 2 from Ref. [268]. In Fig. 91, one can see the flux of
K+s from kaon-induced KLp→ K+n reaction in comparison to a neutron-induced np→ K+Λnas a function of projectile velocities.
103

Figure 90: Neutron and KL fluxes as a function of velocity β.
Figure 91: Left panel: pp→ K+Λp total cross section from Ref. [268]. Right panel: K+ flux as afunction of projectile velocity β for neutron-induced (green) and kaon-induced (red) reactions.
As one can see in Fig. 91, neutron-induced K+ production contributes only in a very narrow rangeof energies. The contribution is also very small. One can further suppress this type of backgroundby vetoing charged particles from Λ decay and performing aK+ missing-mass cut. Altogether onecan suppress this type of background below 10−4.
The most dangerous type of neutron-induced background originates from the np→ π+nn reactionwith fast π+ misidentification as K+. There are no measurements of np→ π+nn reaction but dueto isospin symmetry one can relate this reaction to an isospin symmetric case np → π−pp. Thelater reaction is known, see Ref. [269]. The total cross section for this reaction is about 2 mb. Thenp → π+nn reaction has a much lower threshold compared to np → K+Λn, so it can utilizean enormous flux of low-energy neutrons. However, low-energy neutrons predominately producelow-energy pions, which can be separated from kaons. The background needs to be consideredonly for β > 0.8; see Fig. 92. The background level looks much higher compared to Fig. 91,but it can be severely suppressed with the “K+" missing-mass cut since pion kinematics of the
104

three-body np→ π+nn reaction is very different from the KLp→ K+n.
Figure 92: K+ flux as a function of projectile velocity for the np → π+nn (green) and KLp →K+n (red) reactions. Pion misidentification efficiency for the neutron-induced reaction is extractedfrom the full MC Geant simulation.
To summarize: Kaon particle identification together with a simple 3σ missing-mass cut and as-sumption of KL beam can efficiently suppress all physical backgrounds of the KLp → K+nreaction.
18 Appendix A6: Details of Monte Carlo Study for KLp →K∗0(892)p→ K+π−p
A MC simulation is made to study the Kπ P -wave in the proposed KL facility. The model usedfor the MC generation is the Regge Model describing the neutral exchange production [211, 212]with charged kaon beam, and we adapted for the neutral kaon beam. The theoretical model showeda good agreement with the data produced with beam momenta between 2.1 and 10 GeV/c and fourmomentum transfer up to 1 GeV2. In this simulation study, we assume that the neutral exchangewith charged kaon beam is similar to neutral kaon beam, and we used to simulate the followingreaction
1. KLp→ K∗0(892)p→ K+π−p,
2. KLp→ K∗0(892)p→ K−π+p,
3. KLp→ K∗0(892)p→ KSπ0p,
4. KLp→ K∗0(892)p→ KSπ0p.
105

The number of MC events generated in this study was 500 kevent, weighted by the beam profiledescribed in Sec. 10.1.5.3. A relativistic Breit-Wigner is used to simulate the K∗(892) resonance,and the kinematics of the decay daughters K+ and π− are simulated uniform in the phase-spaceof K∗0(892)→ K+π−. Next, these generated events sample is simulated through GlueX detectorusing HDGeant package, the GlueX software developed by the GlueX Collaboration to simulatethe detector response. Finally, The reconstruction of the simulation is made by the JLab Recon-struction Framework JANA. The selection of the reconstructed MC events is performed using theParticle Identification (PID) variables dE/dx, the deposit energy from the Central Drift Chamber(CDC) and Forward Drift Chamber (FDC) of GlueX spectrometer. In addition, the time differencefrom the Time-Of-Flight (TOF) was used to identify the forward pion and kaon in the final state.The number of the reconstructed and selected MC events is 70 kevents, which represents an inte-grated efficiency of the reconstruction and selection equal to 13.7 %. Fig. 93 shows the generatedand reconstructed/selected MC events and Fig. 94 shows the same variables but integrated over theentire range of beam momentum.
Figure 93: MC events projected on the plane beam momentum VS four momentum on the leftplots and beam momentum vs K+π− invariant mass on the right plots. Top plots represent thegenerated MC events and bottom plots the reconstructed and selected MC events.
An efficiency studies on the variables pKL, t and mKπ is made to evaluate the improvement on
the study of Kπ system with KLF. Fig. 95 shows the reconstruction and selection efficiency ofthe beam momentum versus four momentum transfer and Kπ invariant mass. According to thissimulation, the total integrated efficiency for the reaction KLp → K+π−p is found to be 13.7 %.The relative efficiency of the four momentum transfer increases when the beam momentum ishigher, and is zero below−t = 0.088 GeV2 because of the poor reconstruction of the recoil protonbelow 300 MeV/c. Above −t = 0.15 GeV2 the four momentum efficiency remains uniform around
106

Figure 94: MC events plotted on the variables four momentum (left) and K+π− invariant mass(right). Top plots represent the generated MC events and bottom plots the reconstructed and se-lected MC events.
15.75 %. In the other hand, the efficiency of K+π− invariant mass is uniform on the entire massrange [0.64, 1.2] GeV.
1. K∗(892) Production in KLFKnowing the total acceptance with the cross section and expected luminosity, we can esti-mate the expected number of events of the K∗(892) production in KLF. Almost 50 % ofthe neutral Kπ P -wave are produced as KLp → K∗0(892)(→ K+π−)p and the rest asKLp → K∗0(892)p → K+π−p. Assuming that the reconstruction and selection efficiencyof the finale state K+π−p is the same as K−π+p, we can estimate the total number of eventsof the neutral K∗(892) that can produced in KLF during for a given period of time. Theexpected number of events is estimated as follows
N(~p) = σK∗(~p)× BR(K∗ → K+π−)×∫Ldt× εtot(~p) , (40)
where ~p is the beam momentum, σ is the total cross section ofK∗(892) production, BR(K∗ →K+π−) is the branching ratio (≈ 100 %), εtot(p) is the total efficiency function of beam mo-mentum and
∫Ldt is the integrated luminosity over the time, and given as∫
Ldt = nKntT, (41)
where nK is the rate of incident KL on target per second, nt is the number of scatteringcenters per unit area and T is the integrated live time of the detector. For a 40 cm LH2 target,the number of scattering centers per unit area is nt = 1.69 b−1.
107
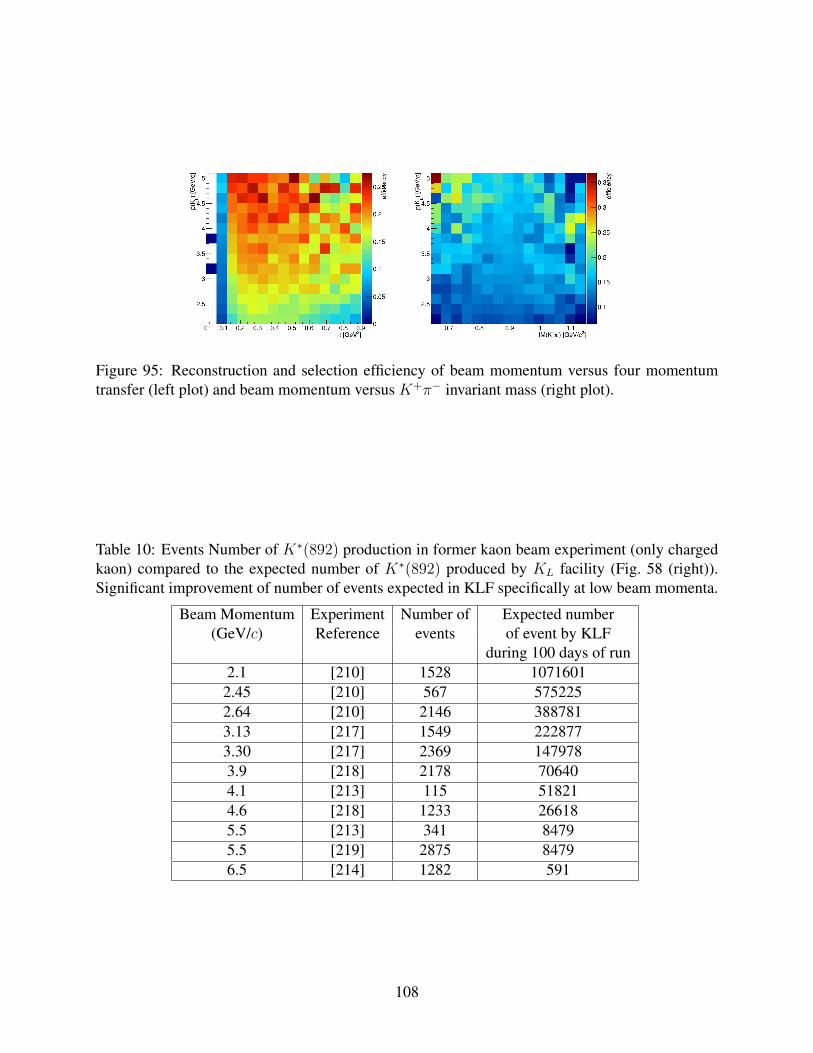
Figure 95: Reconstruction and selection efficiency of beam momentum versus four momentumtransfer (left plot) and beam momentum versus K+π− invariant mass (right plot).
Table 10: Events Number of K∗(892) production in former kaon beam experiment (only chargedkaon) compared to the expected number of K∗(892) produced by KL facility (Fig. 58 (right)).Significant improvement of number of events expected in KLF specifically at low beam momenta.
Beam Momentum Experiment Number of Expected number(GeV/c) Reference events of event by KLF
during 100 days of run2.1 [210] 1528 1071601
2.45 [210] 567 5752252.64 [210] 2146 3887813.13 [217] 1549 2228773.30 [217] 2369 1479783.9 [218] 2178 706404.1 [213] 115 518214.6 [218] 1233 266185.5 [213] 341 84795.5 [219] 2875 84796.5 [214] 1282 591
108
The study of the strange mesons using kaon beam were performed in several experimentsand mainly between the 1960s and 1980s. The events number of K∗(892) production withneutral exchange in some of these analyses [210,213,214,216–218] are gathered in Table 10to evaluate the improvement that KLF can provide in terms of K∗ production.
2. Impact on P -Wave Phase-Shift StudyThe pion exchange in the hadro-production mechanism of K∗0(892) occurs mostly at low−t, thus we can have access to the amplitude scattering of K0π0 → K+π−, as illustrated inFig. 14. Using the resolutions and efficiencies given in the previous section, we can estimatethe improvement that can be made on the scattering amplitude analysis of Kπ → Kπ. Therange of −t that will be used in this comparison will be [0.14, 0.2] GeV2. The lower valueis different from zero to ensure that the t efficiency is uniform and avoid the sharp decrease.The efficiency of this t range selection is επ = 17.85 %. The expected number of events inthis case
N = σ(KLp→ K∗p)× BR(K∗ → K+π−)×∫Ldt× εtotεπ , (42)
where σ is the total cross section ofK∗(892) production, BR(K∗ → K+π−) is the branchingratio of the decay of K∗(892) to K+π−, εtot is the integrated total efficiency and
∫Ldt is
the integrated luminosity. For 100 days of run the expected number of events for the reactionKLp→ K∗0(892)p is N = 2× 10⁶ events.
The study of the Kπ P -wave phase-shift is mainly used to extract the vector form factorf±(t) [220], where t is the four-momentum transfer. The vector form factor, at the opticalpoint f+(0), has an impact on the measurement of the CKM matrix element Vus [153, 220],where the precision on this measurement plays an important role on probing the physicsbeyond Standard Model. The phenomenological studies [153, 220] analyzed the Kπ P -wave phase-shift produced by Belle Experiment [152] using the decay τ → Kπντ andLASS data [147, 149] using the scattering reaction K−p → K+π−n. Using the simulationmade in this section we can evaluate the improvement that can performed by KLF in thesetype of studies. The comparison is made to LASS results [147] since is scattering reactionstudy with charged kaon beam. The resulting model from the fit to LASS amplitude is usedto simulate the distribution of the invariant mass of K+π− P -wave with KLF.
Fig. 60 shows the toy MC data, generated with LASS model, of theK+π− invariant mass for100 days of run. According to the generated toy MC, a significant improvement can be madeon the study of the P -wave in term of precision, especially in the low mass region where inLASS results [147, 149] no amplitudes were reconstructed below M(Kπ) = 0.825 GeV2.
3. S-wave and D-wave Production in KLp→ K+π−p
TheKπ S-wave scattering, below 2 GeV, has two possible isospin channels. The 1/2 isospinS-wave contains two resonances, κ and K∗0(1430), both of them are not well defined. In 3/2S-wave no resonance is found. So far, the available data used to study the dynamics of theS-wave is LASS data [147,149]. TheKπ P -wave andD-wave are well defined with one res-onanceK∗(892) as vector meson and one resonanceK∗2(1430) as tensor meson. The simula-tion of the reaction KLp→ K∗0(892)(→ K+π−)p in KLF can be used to estimate the total
109

production of the different Kπ waves. For this estimation we need the relative amplitudes ofthe S andD waves to the P -wave, which is extracted from the fit to the cross section functionof the invariant mass measured by LASS. The fit function is a composite model containingspin-1 and spin-2 Relativistic Breit-Wigner functions and the S-wave LASS parameterisa-tion [149]. Fig 61 shows the fit to the cross section of LASS results, the relative amplitude ofthe S-wave is found to be 1.77 and theD-wave is found to be 0.62, thus the expected numberof event, after 100 days of run, of the S-wave production is NS = 3.5 × 10⁶ events and forthe D-wave is ND = 1.2 × 10⁶ events. The expected total production of 100 days of runwith KLF of the K+π− system, assuming the same production mechanism for the S, P andD-wave, is≈ 7×10⁶ events. This production includes 1/2 and 3/2 isospin and represent 50times the dataset collected by LASS experiment [147]. Fig. 62 shows the expected K+π−
invariant mass distribution produced by the reaction KLp→ K∗0(892)(→ K+π−)p in KLF.
19 Appendix A7: Current Hadronic Projects
Past measurements involving kaon scattering measurements were made at a variety of laboratories,mainly in the 1960s and 1980s when experimental techniques were far inferior to the standards oftoday (short summary is given in Sec. 6). It is important to recognize that current projects arelargely complementary to the proposed Jlab KL hadron beam facility. We summarize the status ofthe FNAL, J-PARC, Belle, BaBar, PANDA, and COMPASS efforts here.
19.1 Hyperon Projects
19.1.1 Project X, USA
The status of Project X at FNAL [270–273] is as follows: First stage of Project X aims for neu-trinos. Proposed KL beam can be used to study rare decays and CP-violation [274]. It may beimpossible to use the FNAL KL beam for hyperon spectroscopy because of momentum range andn/KL ratio (columns 4 and 6 at Table 11). In particular, the 8-yr old FNAL LoI addressed to theCP-violation study proposed to have a neutral kaon beam rate of 1010/hr for high energies and verybroad energy binning [275].
Table 11: Comparison of the KL production yield. The BNL AGS kaon and neutron yields aretaken from RSVP reviews in 2004 and 2005. The Project X yields are for a thick target, fullysimulated with LAQGSM/MARS15 into the KOPIO beam solid angle and momentum acceptancefrom Ref. [271].
Project Beam energy Target p(KL) KL/s n/KL
(GeV) (λI) (MeV/c) (into 0.5 msr) (En >10 MeV)BNL AGS 24 1.1 Pt 300–1200 60× 106 ∼1:1000Project X 3 1.0 C 300–1200 450× 106 ∼1:2700
110

19.1.2 J-PARC, Japan
While J-PARC has a whole program of charged strange particle and hypernuclear reactions, thephoton beam at GlueX KLF allows unique access to other channels. J-PARC provides separatedsecondary beam lines up to 2 GeV/c (Table 12). The operation of the Hadron Experimental Facilityresumed in April of 2015 following a two-year suspension to renovate the facility after the accidentthat occurred in May 2013 [276]. The primary beam intensity is currently 50 kW, and can beupgraded to 85 kW. This will correspond to ∼109 ppp (particles per pulse) for pion beam intensityand to ∼106 ppp for negative kaon beam flux. The K/π ratio is expected to be close to 10,which is realized with double-stage electrostatic separators. One of the main problems in the K/πseparation is a high duty-factor of the J-PARC Complex.
Table 12: J-PARC beamlines in the Hadron Experimental Facility from Ref. [277]. Top part ofTable gives information about beamlines in the present hall, while bottom part information is aboutnew beamlines in the extended area.
Beamline Particle Momentum Number of particles Characteristics(GeV/c) per spill
K1.8 K±, π± <2.0 106 K− separatedK1.8BR K±, π± <1.1 105 K− separated
KL KL 2.1 in ave. 107 KL to 16
High-p p 1010 p primary protonsπ± <31 107 π
K1.1 K±, π± <1.2 106 K− separated0.7∼0.8 lower momentum
[K1.1BR]HIHR π± <2.0 2.8× 10⁸ π− separated
×10 better ∆p/pK10 K±, π±, p <10 107 K− separated
new KL KL 5.2 in ave. 108 KL to 5
n/KL optimized
With K− beams, currently there is no proposal specific for S = −1 hyperons, but the cascadeswill be studied in the early stage of E50 [278], hopefully in a few years. The beam momentumbite, ∆p/p, is strongly depending on the configuration of the beam line spectrometer, but one candetermine beam momentum with the resolution of ∆p/p ∼ 10−3 or 10−4. One can think that thesystematic study for S = −1 hyperons even with charged kaons is desirable and J-PARC folksthink that such a study is definitely needed but currently there is no room to accept a new proposalto require a long beamline. J-PARC is focusing on hypernuclei physics [279].
There is no KL beamline for hyperon physics at J-PARC. It is 100 % dedicated to the study ofCP-violation. The momentum is spread out from 1 to 4 GeV/c, there is no concept of ∆p/p sincethe beam cannot be focused with EM devices.
111

19.1.3 Belle, Japan
The Belle Collaboration at KEK has plenty of e+e− data, and people in Belle [Belle NuclearPhysics Consortium (Belle NPC)] are now extracting various charm-baryon decay processes, whichcan be used for cascade resonance spectroscopy, from those “raw" e+e− data [280, 281].
19.1.4 BaBar, USA
The BaBar Collaboration at SLAC studied, for instance, properties of the Ξ(1530)0 in the decay ofΛ+C → (π+Ξ−)K+ and Ξ(1690)0 in the decay of Λ+
C → (K0Λ)K+ [282–284] (see, for instance, arecent overview by Ziegler [285]).
19.1.5 PANDA, Germany
The PANDA experiment [286] will measure annihilation reactions of antiprotons with nucleonsand nuclei in order to provide complementary and in part uniquely decisive information on a widerange of QCD aspects. The scientific scope of PANDA is ordered into several pillars: hadronspectroscopy, properties of hadrons in matter, nucleon structure and hypernuclei. Antiprotonsare produced with a primary proton beam, collected and phase-space cooled in the CR (Collec-tor Ring), and then transferred to the HESR (High Energy Storage Ring) where they are stacked,further phase-space cooled, and then directed onto an internal target located at the center of thePANDA detector. The facility will start with a luminosity of 1031 cm2/s and a momentum resolu-tion of ∆p/p = 10−4, and later improve to 2 × 1032 and 4 × 10⁻⁵, respectively. The large crosssection into baryon-antibaryon final states (e.g., ∼1 µb for ΞΞ or 0.1 µb for ΩΩ) make spectro-scopic studies of excited multi-strange hyperons a very compelling part of the initial program ofPANDA, which is expected to commence by 2025 [287].
19.1.6 COMPASS, CERN
COMPASS is thinking of the physics using an RF-separated beam of charged kaons. It is still inthe discussion stage. The rates, which were presented as a very first guess by the CERN beamlinegroup were very interesting for a strangeness physics program via diffractive production of strangeresonances [288]. The cost of a RF-separated beam is high; however, something like this had beenbuilt in the past.
Charged kaons could be used to extend the χPT investigations into the strangeness sector, e.g., tomeasure the polarizability of the kaon and for a spectroscopy program. At present, COMPASSfilters out kaons in the COMPASS charged hadron beam via Cherenkov detectors but they makeup only about 2.6 % of all beam particles. With an RF-separated kaon beam, they would aim fora more than 20x larger dataset compared to what has been measured so far. This would allowthem to perform an analysis, similar to their analysis of pion-beam diffraction: π−p→ π−π−π+ +precoil [289]. The energy of the kaon beam would probably be below 100 GeV but above 40 –
112

50 GeV. The latter number is defined by the stability of the power supplies for the beamline, whichafter all is about 1 km long.
At these high energies, diffractive production via Pomeron exchange is the dominant process andbeam excitations can be well separated from target excitations. This would allow them to collect aclean data sample of kaon-beam diffraction.
20 Appendix A8: Additional Physics Potential with aKL Beam
As stated in the summary of Mini-Proceedings of the Workshop on Excited Hyperons in QCDThermodynamics at Freeze-Out (YSTAR2016) [290]: a very interesting further opportunity forthe KL Facility is to investigate KL reactions on complex nuclei. By selecting events with theappropriate beam momentum together with a fast forward-going pion, events can be identified, inwhich a hyperon is produced at low relative momentum to the target nucleus or even into a boundstate. Baryons with strangeness embedded in the nuclear environment, hypernuclei or hyperatoms,are the only available tool to approach the many-body aspect of the three-flavor strong interaction.Furthermore, appropriate events with a forward-going K+ could deposit a double-strange hyperoninto the remaining nucleus, potentially enabling searches for and studies of double-Λ hypernuclei.
Similarly, the scattering of kaons from nuclear targets could be a favorable method to measure thematter form factor (and, therefore, neutron skin) of heavy nuclei, with different and potentiallysmaller systematics than other probes. The character of the neutron skin, therefore, has a wideimpact and the potential to give important new information on neutron star structure and coolingmechanisms [291–295], searches for physics beyond the standard model [296, 297], the nature of3-body forces in nuclei [298,299], collective nuclear excitations [300–303] and flows in heavy-ioncollisions [304, 305]. Theoretical developments and investigations will be required to underpinsuch a program, but the science impact of such measurements is high.
Further potential exists to search for – or exclude – possible exotic baryonic states that cannoteasily be described by the usual three-valence-quark structure. Recent results from LHCb providetantalizing hints for the existence of so-called pentaquarks that include a charm valence quark;however, the interpretation of those results is under discussion. In contrast, elastic scattering ofKL
with a hydrogen target gives unambiguous information on the potential existence of such states inthe strange sector. With the given flux of KL at the proposed facility, a clear proof of existence orproof of absence will be obtained within the integrated luminosity required for the excited hyperonspectroscopy program that forms the basis of this proposal.
There are two particles in the reaction KLp → πY and KY that can carry polarization: the targetand recoil baryons. Hence, there are two possible double-polarization experiments: target/recoil.The total number of observables is three. The formalism and definitions of observables commonlyused to describe the reaction KLp→ KY is given in Sec. 7. Although one cannot easily measurerecoil polarization with GlueX, the self-analyzing decay of hyperons makes this possible. Double-polarization experiments, using, e.g., a polarized target like FROST [188], will however be left forfuture proposal(s).
113

The physics potential connected with studies of CP-violating decays of the KL is very appealing;however, that topic is not currently the focus of this proposal, since a detailed comparison withthe competition from existing and upcoming experiments is needed in order to identify the mostattractive measurements that could be done at the proposed KL Facility at JLab.
114

References
[1] A. Aprahamian et al., Reaching for the Horizon: The 2015 Long Range Plan for NuclearScience; http://science.energy.gov/np/nsac/ .
[2] C. Patrignani et al. [Particle Data Group], Chin. Phys. C 40, no. 10, 100001 (2016).
[3] B. M. K. Nefkens, πN Newslett. 14, 150 (1998).
[4] R. Koniuk and N. Isgur, Phys. Rev. Lett. 44, 845 (1980).
[5] H. Al Ghoul et al. [GlueX Collaboration], Phys. Rev. C 95, no. 4, 042201 (2017).
[6] A. AlekSejevs et al. [GlueX Collaboration], arXiv:1305.1523 [nucl-ex].
[7] Y. Qiang, Y. I. Azimov, I. I. Strakovsky, W. J. Briscoe, H. Gao, D. W. Higinbotham, andV. V. Nelyubin, Phys. Lett. B 694, 123 (2011).
[8] W. J. Briscoe, M. Döring, H. Haberzettl, D. M. Manley, M. Naruki, I. I. Strakovsky, andE. S. Swanson, Eur. Phys. J. A 51, no. 10, 129 (2015).
[9] Web page of the Workshop on Physics with Neutral Kaon Beam at JLab (KL2016), JLab,Newport News, VA, USA, Feb. 2016: https://www.jlab.org/conferences/kl2016/ contains pre-sentations.
[10] Web page of the Workshop on Excited Hyperons in QCD Thermodynam-ics at Freeze-Out (YSTAR2016), JLab, Newport News, VA, USA, Nov. 2016:https://www.jlab.org/conferences/YSTAR2016/ contains presentations.
[11] Web page of the Workshop on New Opportunities with High-IntensityPhoton Sources (HISP2017), CUA, Washington, DC, USA, Feb. 2017:https://www.jlab.org/conferences/HIPS2017/ contains presentations.
[12] Web page of the Workshop on Pion-Kaon Interactions (PKI2018), JLab, Newport News, VA,USA, Feb. 2018: https://www.jlab.org/conferences/pki2018/ contains presentations.
[13] M. Amaryan, U.-G. Meißner, C. Meyer, J. Ritman, and I. Strakovsky, eds., Mini-Proceedings,Workshop on Physics with Neutral Kaon Beam at JLab (KL2016); arXiv:1604.02141 [hep–ph].
[14] Physics opportunities with secondary KL beam at JLab, Spokesperson: M. Amaryan [GlueXCollaborations], JLab LoI12–15–001, Newport News, VA, USA, 2015.
[15] Strange hadron spectroscopy with a secondary KL beam at GlueX, Spokespersons:M. J. Amaryan, M. Bashkanov, J. Ritman, J. R. Stevens, and I. I. Strakovsky [GlueX Collab-oration], JLab Proposal PR12–17–001, Newport News, VA, USA, 2017; arXiv:1707.05284[hep–ex].
115

[16] Photoproduction of the very strangest baryons on the proton target in CLAS12, Spokesper-sons: L. Guo, M. Dugger, J. Goetz, E. Pasyuk, I.I. Strakovsky, D.P. Watts, N. Zachariou,and V. Ziegler [Very Strange Collaboration for CLAS Collaboration], JLab Proposal E12–11–005A, Newport News, VA, USA, 2013.
[17] Nucleon resonance structure studies via exclusive KY electroproduction at 6.6 GeV and8.8 GeV, Spokespersons: D.S. Carman, R. Gothe, and V. Mokeev [CLAS Collaboration],JLab E12–16–010A, Newport News, VA, USA, 2016.
[18] M. Amaryan, E. Chudakov, K. Rajagopal, C. Ratti, J. Ritman, and I. Strakovsky, eds., Mini-Proceedings, Workshop on Excited Hyperons in QCD Thermodynamics at Freeze-Out (YS-TAR2016); arXiv:1701.07346 [hep–ph].
[19] T. Horn, C. Keppel, C. Munoz-Camacho, and I. Strakovsky, eds., Mini-Proceedings, Work-shop on High-Intensity Photon Sources (HIPS2017); arXiv:1704.00816 [nucl–ex].
[20] M. Amaryan, C. Meyer, U.-G. Meißner, J. Ritman, and I. Strakovsky, eds., Mini-Proceedings,Workshop on Pion-Kaon Interactions (PKI2018); arXiv:1804.06528 [hep–ph].
[21] C. Amsler, S. Eidelman, T. Gutsche, C. Hanhart, S. Spanier, and N. A. Törnqvist, in: Ref. [2];
[22] S. Descotes-Genon and B. Moussallam, Eur. Phys. J. C 48, 553 (2006).
[23] B. Julia-Diaz, T.-S. H. Lee, T. Sato, and L. C. Smith, Phys. Rev. C 75, 015205 (2007).
[24] T. Sato and T.-S. H. Lee, J. Phys. G 36, 073001 (2009).
[25] N. Isgur and M. B. Wise, Phys. Rev. Lett. 66, 1130 (1991).
[26] R. Aaij et al. [LHCb Collaboration], Phys. Rev. Lett. 119, no. 11, 112001 (2017).
[27] Z. W. Liu, J. M. M. Hall, D. B. Leinweber, A. W. Thomas, and J. J. Wu, Phys. Rev. D 95, no.1, 014506 (2017).
[28] J. A. Oller and U.-G. Meißner, Phys. Lett. B 500, 263 (2001).
[29] A. Cieplý, M. Mai, U.-G. Meißner, and J. Smejkal, Nucl. Phys. A 954, 17 (2016).
[30] K. Moriya et al. [CLAS Collaboration], Phys. Rev. C 87, no. 3, 035206 (2013).
[31] M. Mai and U.-G. Meißner, Eur. Phys. J. A 51, no. 3, 30 (2015).
[32] W. Kamleh, J. M. M. Hall, D. B. Leinweber, B. J. Menadue, B. J. Owen, A. W. Thomas, andR. D. Young, PoS CD 15, 037 (2016).
[33] R. Molina and M. Döring, Phys. Rev. D 94, no. 5, 056010 (2016); Addendum: [Phys. Rev. D94, no. 7, 079901 (2016)].
[34] N. N. Scoccola, H. Nadeau, M. A. Nowak, and M. Rho, Phys. Lett. B 201, 425 (1988);Erratum: [Phys. Lett. B 220, 658 (1989)].
116

[35] C. G. Callan, Jr., K. Hornbostel, and I. R. Klebanov, Phys. Lett. B 202, 269 (1988).
[36] K. F. Liu, Int. J. Mod. Phys. E 26, no. 01n02, 1740016 (2017).
[37] L. Y. Glozman and D. O. Riska, Phys. Rept. 268, 263 (1996).
[38] K. F. Liu, Y. Chen, M. Gong, R. Sufian, M. Sun, and A. Li, PoS LATTICE 2013, 507 (2014).
[39] F. Coester, K. Dannbom, and D. O. Riska, Nucl. Phys. A 634, 335 (1998).
[40] M. Luscher, Nucl. Phys. B 354, 531 (1991).
[41] K. Rummukainen and S. A. Gottlieb, Nucl. Phys. B 450, 397 (1995).
[42] S. Aoki et al. [CP-PACS Collaboration], Phys. Rev. D 76, 094506 (2007).
[43] X. Feng, K. Jansen, and D. B. Renner, Phys. Rev. D 83, 094505 (2011).
[44] J. J. Dudek et al. [Hadron Spectrum Collaboration], Phys. Rev. D 87, no. 3, 034505 (2013);Erratum: [Phys. Rev. D 90, no. 9, 099902 (2014)].
[45] D. Guo, A. Alexandru, R. Molina, and M. Döring, Phys. Rev. D 94, no. 3, 034501 (2016).
[46] C. Alexandrou et al., Phys. Rev. D 96, no. 3, 034525 (2017).
[47] J. Bulava, B. Fahy, B. Hz, K. J. Juge, C. Morningstar, and C. H. Wong, Nucl. Phys. B 910,842 (2016).
[48] C. B. Lang, D. Mohler, S. Prelovsek, and M. Vidmar, Phys. Rev. D 84, no. 5, 054503 (2011);Erratum: [Phys. Rev. D 89, no. 5, 059903 (2014)].
[49] R. Brett, J. Bulava, J. Fallica, A. Hanlon, B. Hz, and C. Morningstar, arXiv:1802.03100[hep-lat].
[50] P. Guo, J. Dudek, R. Edwards, and A. P. Szczepaniak, Phys. Rev. D 88, no. 1, 014501 (2013).
[51] R. A. Briceno and Z. Davoudi, Phys. Rev. D 88, no. 9, 094507 (2013).
[52] U.-G. Meißner, G. Rios, and A. Rusetsky, Phys. Rev. Lett. 114, no. 9, 091602 (2015); Erra-tum: [Phys. Rev. Lett. 117, no. 6, 069902 (2016)].
[53] C. Liu, X. Feng, and S. He, Int. J. Mod. Phys. A 21, 847 (2006).
[54] M. Lage, U.-G. Meißner, and A. Rusetsky, Phys. Lett. B 681, 439 (2009).
[55] C. Morningstar, J. Bulava, B. Singha, R. Brett, J. Fallica, A. Hanlon, and B. Hz, Nucl. Phys.B 924, 477 (2017).
[56] M. Döring, U. G. Meißner, E. Oset, and A. Rusetsky, Eur. Phys. J. A 47, 139 (2011).
[57] M. Döring and U. G. Meißner, JHEP 1201, 009 (2012).
117

[58] M. Döring, U. G. Meißner, E. Oset, and A. Rusetsky, Eur. Phys. J. A 48, 114 (2012).
[59] C. W. Andersen, J. Bulava, B. Hz, and C. Morningstar, Phys. Rev. D 97, no. 1, 014506 (2018).
[60] R. Brower, N. Christ, C. DeTar, R. Edwards, and P. Mackenzie, EPJ Web Conf. 175, 09010(2018).
[61] D. J. Wilson, R. A. Briceno, J. J. Dudek, R. G. Edwards, and C. E. Thomas, Phys. Rev. D 92,no. 9, 094502 (2015).
[62] D. J. Wilson, J. J. Dudek, R. G. Edwards, and C. E. Thomas, Phys. Rev. D 91, no. 5, 054008(2015).
[63] J. J. Dudek et al. [Hadron Spectrum Collaboration], Phys. Rev. Lett. 113, no. 18, 182001(2014).
[64] R. A. Briceno, J. J. Dudek, R. G. Edwards, and D. J. Wilson, Phys. Rev. D 97, no. 5, 054513(2018).
[65] R. A. Briceno, J. J. Dudek, R. G. Edwards, and D. J. Wilson, Phys. Rev. Lett. 118, no. 2,022002 (2017).
[66] R. G. Edwards, J. J. Dudek, D. G. Richards, and S. J. Wallace, Phys. Rev. D 84, 074508(2011).
[67] G. P. Engel et al. [BGR Collaboration], Phys. Rev. D 87, no. 7, 074504 (2013).
[68] J. J. Dudek and R. G. Edwards, Phys. Rev. D 85, 054016 (2012).
[69] R. G. Edwards et al. [Hadron Spectrum Collaboration], Phys. Rev. D 87, no. 5, 054506(2013).
[70] R. Bellwied, S. Borsanyi, Z. Fodor, S. D. Katz, and C. Ratti, Phys. Rev. Lett. 111, 202302(2013).
[71] S. Borsanyi et al. [Wuppertal-Budapest Collaboration], JHEP 1009, 073 (2010).
[72] A. Bazavov et al. [HotQCD Collaboration], Phys. Rev. D 90, 094503 (2014).
[73] M. Floris, Nucl. Phys. A 931, 103 (2014).
[74] L. Adamczyk et al. [STAR Collaboration], Phys. Rev. Lett. 112, 032302 (2014).
[75] L. Adamczyk et al. [STAR Collaboration], Phys. Rev. Lett. 113, 092301 (2014).
[76] P. Alba, W. Alberico, R. Bellwied, M. Bluhm, V. Mantovani Sarti, M. Nahrgang, and C. Ratti,Phys. Lett. B 738, 305 (2014).
[77] J. Adam et al. [ALICE Collaboration], Nature Phys. 13, 535 (2017).
[78] R. Dashen, S. K. Ma, and H. J. Bernstein, Phys. Rev. 187, 345 (1969).
118
[79] R. Venugopalan and M. Prakash, Nucl. Phys. A 546, 718 (1992).
[80] F. Karsch, K. Redlich, and A. Tawfik, Phys. Lett. B 571, 67 (2003).
[81] A. Tawfik, Phys. Rev. D 71, 054502 (2005).
[82] R. Hagedorn, Prog. Sci. Culture 1, 395 (1976).
[83] S. Capstick and N. Isgur, Phys. Rev. D 34, 2809 (1986).
[84] D. Ebert, R. N. Faustov, and V. O. Galkin, Phys. Rev. D 79, 114029 (2009).
[85] A. Majumder and B. Muller, Phys. Rev. Lett. 105, 252002 (2010).
[86] A. Bazavov et al., Phys. Rev. Lett. 113, no. 7, 072001 (2014).
[87] P. Alba et al., Phys. Rev. D 96, no. 3, 034517 (2017).
[88] M. M. Giannini and E. Santopinto, Chin. J. Phys. 53, 020301 (2015).
[89] C. Amsler et al. [Particle Data Group], Phys. Lett. B 667, 1 (2008).
[90] E. Santopinto and J. Ferretti, Phys. Rev. C 92, no. 2, 025202 (2015).
[91] The Durham HEP Reaction Data Databases (UK) (Durham HepData):http://durpdg.dur.ac.uk/hepdata/reac.html .
[92] M. G. Albrow et al., Nucl. Phys. B 23, 509 (1970).
[93] M. Albrow, in: Workshop on Physics with Neutral Kaon Beam at JLab: mini-Proceedings,arXiv:1604.02141 [hep–ph] (February, 2016), p. 5.
[94] A. D. Brody et al., Phys. Rev. Lett. 22, 966 (1969).
[95] S. D. Drell and M. Jacob, Phys. Rev. 138, B1313 (1965).
[96] W. J. Briscoe, I. I. Strakovsky, and R. L. Workman, Institute of Nuclear Studies of The GeorgeWashington University Database; http://gwdac.phys.gwu.edu.
[97] G. Höhler and H. Schopper, Numerical Data And Functional Relationships In ScienceAnd Technology. Group I: Nuclear And Particle Physics. Vol. 9: Elastic And ChargeExchange Scattering Of Elementary Particles. B: Pion Nucleon Scattering. Pt. 2: MethodsAnd Results Of Phenomenologic, (Landolt-Börnstein. New Series, I/9B2) (Springer, Berlin,Germany, 1983) 601 P.
[98] R. A. Arndt, W. J. Briscoe, I. I. Strakovsky, and R. L. Workman, Phys. Rev. C 74, 045205(2006).
[99] H. Zhang, J. Tulpan, M. Shrestha, and D. M. Manley, Phys. Rev. C 88, no. 3, 035204 (2013).
[100] H. Zhang, J. Tulpan, M. Shrestha, and D. M. Manley, Phys. Rev. C 88, no. 3, 035205 (2013).
119

[101] D. M. Manley, in: Workshop on Physics with Neutral Kaon Beam at JLab: mini-Proceedings, arXiv:1604.02141 [hep–ph] (February, 2016), p. 42.
[102] J. K. Hassall et al., Nucl. Phys. B 189, 397 (1981).
[103] H. Kamano, S. X. Nakamura, T.-S. H. Lee, and T. Sato, Phys. Rev. C 90, no. 6, 065204(2014).
[104] H. Kamano, S. X. Nakamura, T.-S. H. Lee, and T. Sato, Phys. Rev. C 92, no. 2, 025205(2015); Erratum: [Phys. Rev. C 95, no. 4, 049903 (2017)].
[105] B. C. Jackson, Y. Oh, H. Haberzettl, and K. Nakayama, Phys. Rev. C 91, no. 6, 065208(2015).
[106] Y. Ikeda, T. Hyodo, and W. Weise, Nucl. Phys. A 881, 98 (2012).
[107] Z. H. Guo and J. A. Oller, Phys. Rev. C 87, no. 3, 035202 (2013).
[108] A. Cieplý and J. Smejkal, Nucl. Phys. A 881, 115 (2012).
[109] M. Mai and U.-G. Meißner, Nucl. Phys. A 900, 51 (2013).
[110] P. C. Bruns, M. Mai, and U.-G. Meißner, Phys. Lett. B 697, 254 (2011).
[111] S. Godfrey and J. Napolitano, Rev. Mod. Phys. 71, 1411 (1999).
[112] S. Narison, Nucl. Phys. Proc. Suppl. 96, 244 (2001).
[113] R. J. Crewther and L. C. Tunstall, Phys. Rev. D 91, no. 3, 034016 (2015).
[114] V. Bernard, N. Kaiser, and U. G. Meißner, Nucl. Phys. B 357, 129 (1991).
[115] V. Bernard, N. Kaiser, and U. G. Meißner, Nucl. Phys. B 364, 283 (1991).
[116] V. Bernard, N. Kaiser, and U. G. Meißner, Phys. Rev. D 43, 2757 (1991).
[117] J. Bijnens, P. Dhonte, and P. Talavera, JHEP 0405, 036 (2004).
[118] Z. H. Guo and J. A. Oller, Phys. Rev. D 84, 034005 (2011).
[119] A. Dobado and J. R. Pelaez, Phys. Rev. D 47, 4883 (1993).
[120] A. Gomez Nicola and J. R. Pelaez, Phys. Rev. D 65, 054009 (2002).
[121] M. Jamin, J. A. Oller, and A. Pich, Nucl. Phys. B 587, 331 (2000).
[122] J. Nebreda and J. R. Pelaez., Phys. Rev. D 81, 054035 (2010).
[123] J. R. Pelaez, Phys. Rept. 658, 1 (2016).
[124] P. Büttiker, S. Descotes-Genon, and B. Moussallam, Eur. Phys. J. C 33, 409 (2004).
[125] J. R. Pelaez and A. Rodas, Phys. Rev. D 93, no. 7, 074025 (2016).
120

[126] J. R. Pelaez and A. Rodas, in preparation.
[127] S. R. Beane et al., Phys. Rev. D 74, 114503 (2006).
[128] J. M. Flynn and J. Nieves, Phys. Rev. D 75, 074024 (2007).
[129] Z. Fu, Phys. Rev. D 85, 074501 (2012).
[130] K. Sasaki et al. [PACS-CS Collaboration], Phys. Rev. D 89, no. 5, 054502 (2014).
[131] R. L. Jaffe, Phys. Rev. D 15, 267 (1977).
[132] T. Barnes, Phys. Lett. 165B, 434 (1985).
[133] E. van Beveren, T. A. Rijken, K. Metzger, C. Dullemond, G. Rupp, and J. E. Ribeiro, Z.Phys. C 30, 615 (1986).
[134] J. A. Oller, E. Oset, and J. R. Pelaez, Phys. Rev. Lett. 80, 3452 (1998); Phys. Rev. D 59,074001 (1999); Erratum: [Phys. Rev. D 60, 099906 (1999)]; Erratum: [Phys. Rev. D 75,099903 (2007)].
[135] D. Black, A. H. Fariborz, F. Sannino, and J. Schechter, Phys. Rev. D 58, 054012 (1998);Phys. Rev. D 59, 074026 (1999).
[136] J. A. Oller and E. Oset, Phys. Rev. D 60, 074023 (1999).
[137] F. E. Close and N. A. Tornqvist, J. Phys. G 28, R249 (2002).
[138] J. R. Pelaez, Phys. Rev. Lett. 92, 102001 (2004).
[139] J. R. Pelaez, Mod. Phys. Lett. A 19, 2879 (2004).
[140] R. Jaffe and F. Wilczek, Eur. Phys. J. C 33, S38 (2004).
[141] J. R. Batley et al. [NA48-2 Collaboration], Eur. Phys. J. C70, 635-657 (2010).
[142] P. Masjuan, J. Ruiz de Elvira, and J. J. Sanz-Cillero, Phys. Rev. D 90, no. 9, 097901 (2014).
[143] J. R. Pelaez, A. Rodas, and J. Ruiz de Elvira, Eur. Phys. J. C 77, no. 2, 91 (2017).
[144] S. M. Roy, Phys. Lett. 36B, 353 (1971).
[145] F. Steiner, Fortsch. Phys. 19, 115 (1971).
[146] D. Aston et al., Nucl. Phys. B 292, 693 (1987).
[147] D. Aston et al., Nucl. Phys. B 296, 493 (1988).
[148] B. R. Martin, D. Morgan, and G. Shaw, Pion Pion Interactions in Particle Physics (Aca-demic press, London, 1976).
121

[149] P. Estabrooks, R. K. Carnegie, A. D. Martin, W. M. Dunwoodie, T. A. Lasinski, andD. W. G. S. Leith, Nucl. Phys. B 133, 490 (1978).
[150] C. B. Lang, Fortsch. Phys. 26, 509 (1978).
[151] P. del Amo Sanchez et al. [BaBar Collaboration], Phys. Rev. D 83, 072001 (2011).
[152] D. Epifanov et al. [Belle Collaboration], Phys. Lett. B 654, 65 (2007).
[153] D. R. Boito, R. Escribano, and M. Jamin, JHEP 1009, 031 (2010).
[154] M. Antonelli et al. [FlaviaNet Working Group on Kaon Decays], Eur. Phys. J. C 69, 399(2010).
[155] F. Niecknig and B. Kubis, JHEP 1510, 142 (2015).
[156] B. Adeva et al. [DIRAC Collaboration], Phys. Rev. D 96, 052002 (2017).
[157] C. B. Lang, L. Leskovec, D. Mohler, and S. Prelovsek, Phys. Rev. D 86, 054508 (2012).
[158] S. Prelovsek, L. Leskovec, C. B. Lang, and D. Mohler, Phys. Rev. D 88, no. 5, 054508(2013).
[159] R. Yamartino et al., Phys. Rev. D10, 9 (1974); Ph. D Thesis, SLAC Standford University,1974; SLAC-R-0177, SLAC-R-177, SLAC-0177, SLAC-177.
[160] GlueX wiki: https://halldweb.jlab.org/wiki/images/d/df/CollimatorElevationSept08.png ;S. Worthington, private communication, 2018.
[161] M. Bashkanov, D. P. Watts, N. Zachariou, E. Chudakov, M. Amaryan, J. Ritman, J. Stevens,and I.Strakovsky, Preprint GlueX-doc-3603, 2018.
[162] F. Barbosa, C. Hutton, A. Sitnikov, A. Somov, S. Somov, and I. Tolstukhin, Nucl. Instrum.Meth. A 795, 376 (2015).
[163] J. Grames, private communication, April 2018.
[164] R. Kazimi, private communication, April 2018.
[165] D. Androic et al. [G0 Collaboration], Nucl. Instrum. Meth. A 646, 59 (2011).
[166] https://wiki.jlab.org/cuawiki/images/3/32/Sergey−Abrahamyan−WACS−NPS−2014−update.pdf
[167] Polarization observables in wide-angle Compton scattering at photon energies up to 8 GeV,Spokespersons: B. Wojtsekhowski, S. Abrahamyan, and G. Niculescu [Neutral Particle Spec-trometer Collaboration], JLab Proposal PR12–15–003, Newport News, VA, USA, 2015.
[168] T. Horn, D. Day, P. Degtiarenko, R. Ent, D. Hamilton, D. Keller, C. Keppel, G. Niculescu,P. Reid, I. Strakovsky, B. Wojtsekhowski, and J. Zhang, Preprint GlueX-doc-36xx, 2018.
[169] P. Degtyarenko and B. Wojtsekhowski, in: Workshop on Physics with Neutral Kaon Beamat JLab: mini-Proceedings, arXiv:1604.02141 [hep–ph] (February, 2016), p. 214.
122

[170] I. I. Strakovsky, M. J. Amaryan, W. J. Briscoe, P. Degtyarenko, A. Somov, J. R. Stevens,and T. Whitlatch, Preprint GlueX-doc-3601, 2018.
[171] We used a modified version of the Pythia package for the GlueX Collaboration at JLabHall D, http://home.thep.lu.se/torbjorn/Pythia.html .
[172] A. I. Titov and T. S. H. Lee, Phys. Rev. C 67, 065205 (2003).
[173] G. Mcclellan, N. B. Mistry, P. Mostek, H. Ogren, A. Osborne, J. Swartz, R. Talman, andG. Diambrini-Palazzi, Phys. Rev. Lett. 26, 1593 (1971).
[174] A. I. Titov and B. Kampfer, Phys. Rev. C 76, 035202 (2007).
[175] T. Mibe et al. [CLAS Collaboration], Phys. Rev. C 76, 052202 (2007).
[176] G. W. Brandenburg et al., Phys. Rev. D 7, 708 (1973).
[177] I. Larin, in: Workshop on Physics with Neutral Kaon Beam at JLab: mini-Proceedings,arXiv:1604.02141 [hep–ph] (February, 2016), p. 198.
[178] T. Goorley et al., Nucl. Tech. 180, 298. (2012); https://mcnp.lanl.gov/ .
[179] L. Keller, private communication, 2015.
[180] J. Allison et al., Nucl. Instrum. Meth. A 835, 186 (2016).
[181] ICRP 116 Publication, Conversion Coefficients for Radiological Protection Quantities forExternal Radiation Exposures, Annals of the ICRP, 40, No 2-5 (2010).
[182] Y. Qiang, C. Zorn, F. Barbosa, and E. Smith, Nucl. Instrum. Meth. A 698, 234 (2013).
[183] E. Pooser, F. Barbosa, W. Boeglin, C. Hutton, M. Ito, M. Kamel, P. Khetarpal, A. LLo-dra, N. Sandoval, S. Taylor, C. Yero, T. Whitlatch, S. Worthington, and B. Zihlmann, to besubmitted to Nucl. Instrum. Meth. A.
[184] P. Degtiarenko, A. Fass, G. Kharashvili, and A. Somov, Preprint JLAB-TN-11-005, 2011.
[185] T. D. Beattie et al., Nucl. Instrum. Meth. A 896, 24 (2018).
[186] A. Somov, Preprint GlueX–doc–1646, 2011.
[187] E. Pooser, Ph.D. Thesis, Florida International University (2016).
[188] C. Keith, in: Workshop on Physics with Neutral Kaon Beam at JLab: mini-Proceedings,arXiv:1604.02141 [hep–ph] (February, 2016), p. 223.
[189] D. Meekins, TGT-CALC-401-007: Hall D Cryogenic Target: General calculations for reliefof the LH2 target.
[190] H. Seraydaryan et al. [CLAS Collaboration], Phys. Rev. C 89, no. 5, 055206 (2014).
[191] H. Al Ghoul et al. [GlueX Collaboration], AIP Conf. Proc. 1735, 020001 (2016).
123

[192] S. Taylor, in: Workshop on Physics with Neutral Kaon Beam at JLab: mini-Proceedings,arXiv:1604.02141 [hep–ph] (February, 2016), p. 205.
[193] P. Capiluppi, G. Giacomelli, G. Mandrioli, A. M. Rossi, P. Serra-Lugaresi, and L. Zitelli,IFUB-81-25.
[194] D. A. Sharov, V. L. Korotkikh, and D. E. Lanskoy, Eur. Phys. J. A 47, 109 (2011).
[195] S. F. Biagi et al., Z. Phys. C 34, 175 (1987).
[196] C. M. Jenkins et al., Phys. Rev. Lett. 51, 951 (1983).
[197] J. C. M. Armitage et al., Nucl. Phys. B 123, 11 (1977).
[198] D. Cline, J. Penn, and D. D. Reeder, Nucl. Phys. B 22, 247 (1970).
[199] P. Bajllon et al., Nucl. Phys. B 134, 31 (1978).
[200] Pion photoproduction from a polarized target, Spokespersons: N. Benmouna, W. J. Briscoe,I. I. Strakovsky, S. Strauch, and G. V. O’Rially [CLAS Collaborations], JLab Proposal E-03-105, Newport News, VA, USA, 2003.
[201] I. G. Alekseev et al. [EPECUR Collaboration], Phys. Rev. C 91, no. 2, 025205 (2015).
[202] A. V. Anisovich and A. V. Sarantsev, Phys. Lett. B 413, 137 (1997).
[203] J. A. Oller and E. Oset, Nucl. Phys. A 620, 438 (1997); Erratum: [Nucl. Phys. A 652, 407(1999)].
[204] C. Cawlfield et al. [CLEO Collaboration], Phys. Rev. D 74, 031108 (2006).
[205] R. Delbourgo and M. D. Scadron, Int. J. Mod. Phys. A 13, 657 (1998).
[206] M. D. Scadron, F. Kleefeld, G. Rupp, and E. van Beveren, Nucl. Phys. A 724, 391 (2003).
[207] Z. Y. Zhou and H. Q. Zheng, Nucl. Phys. A 775, 212 (2006).
[208] E. M. Aitala et al. [E791 Collaboration], Phys. Rev. Lett. 89, 121801 (2002).
[209] J. Z. Bai et al. [BES Collaboration], hep-ex/0304001.
[210] J. H. Friedman and R. R. Ross, Phys. Rev. Lett. 16, 485 (1966).
[211] G. V. Dass and C. D. Froggatt, Nucl. Phys. B 10, 151 (1969).
[212] G. V. Dass and C. D. Froggatt, Nucl. Phys. B 19, 611 (1970).
[213] F. Schweingruber et al., Phys. Rev. 166, 1317 (1968).
[214] S. Toaff et al., Phys. Rev. D 23, 1500 (1981).
[215] M. Aderholz et al., Nucl. Phys. B 5, 567 (1968).
124

[216] S. Goldhaber et al. Phys. Rev. Lett. 15 737 (1965).
[217] A. G. Clark, L. Lyons, and D. Radojicic, Nucl. Phys. B 54, 432 (1973).
[218] M. Aguilar-Benitez, R. L. Eisner, and J. B. Kinson, Phys. Rev. D 4, 2583 (1971).
[219] R. Engelmann, B. Musgrave, F. Schweingruber, H. Yuta, B. Forman, N. Gelfand, andH. Schulz, Phys. Rev. D 5, 2162 (1972).
[220] V. Bernard, JHEP 1406, 082 (2014).
[221] G. Bonvicini et al. [CLEO Collaboration], Phys. Rev. D 78, 052001 (2008).
[222] D. V. Bugg, Phys. Lett. B 572, 1 (2003); Erratum: [Phys. Lett. B 595, 556 (2004)]; Phys.Rev. D 81, 014002 (2010).
[223] J. Prevost et al. [Cern-Heidelberg-Saclay Collaboration], Nucl. Phys. B 69, 246 (1974).
[224] W. Cameron et al. [Rutherford-London Collaboration], Nucl. Phys. B 143, 189 (1978).
[225] J. Timmermans et al. [Amsterdam-CERN-Nijmegen-Oxford Collaboration], Nucl. Phys. B112, 77 (1976).
[226] W. Cameron et al. [Rutherford-London Collaboration], Nucl. Phys. B 131, 399 (1977).
[227] S. Ceci, M. Döring, C. Hanhart, S. Krewald, U.-G. Meißner, and A. Švarc, Phys. Rev. C 84,015205 (2011).
[228] V. D. Burkert et al., arXiv:1412.0241 [nucl-ex].
[229] A. Mueller- Groeling, K. Holinde, and J. Speth, Nucl. Phys. A 513, 557 (1990).
[230] M. Mai, B. Hu, M. Döring, A. Pilloni, and A. Szczepaniak, Eur. Phys. J. A 53, no. 9, 177(2017).
[231] A. V. Anisovich, R. Beck, E. Klempt, V. A. Nikonov, A. V. Sarantsev, and U. Thoma, Eur.Phys. J. A 48, 15 (2012).
[232] H. Osmanovic et al., Phys. Rev. C 97, no. 1, 015207 (2018).
[233] Y. Wunderlich, A. Švarc, R. L. Workman, L. Tiator, and R. Beck, Phys. Rev. C 96, no. 6,065202 (2017).
[234] A. Švarc, Y. Wunderlich, H. Osmanovic, M. Hadžimehmedovic, R. Omerovic, J. Stahov,V. Kashevarov, K. Nikonov, M. Ostrick, L. Tiator, and R. Workman, Phys. Rev. C 97, no. 5,054611 (2018).
[235] G. Höhler, PiN Newslett. 1993, no. 9, 1 (1993).
[236] N. G. Kelkar and M. Nowakowski, Phys. Rev. A 78, 012709 (2008); and references therein.
[237] G. F. Chew and S. Mandelstam, Phys. Rev. 119, 467 (1960).
125

[238] S. Ceci, J. Stahov, A. Švarc, S. Watson, and B. Zauner, Phys. Rev. D 77, 116007 (2008).
[239] A. Švarc, M. Hadžimehmedovic, H. Osmanovic, J. Stahov, L. Tiator, and R. L. Workman,Phys. Rev. C 88, no. 3, 035206 (2013).
[240] A. Švarc, M. Hadžimehmedovic, R. Omerovic, H. Osmanovic, and J. Stahov, Phys. Rev. C89, no. 4, 045205 (2014).
[241] A. Švarc, M. Hadžimehmedovic, H. Osmanovic, J. Stahov, L. Tiator, and R. L. Workman,Phys. Rev. C 89, no. 6, 065208 (2014).
[242] A. Švarc, M. Hadžimehmedovic, H. Osmanovic, J. Stahov, and R. L. Workman, Phys. Rev.C 91, no. 1, 015207 (2015).
[243] A. Švarc, M. Hadžimehmedovic, H. Osmanovic, J. Stahov, L. Tiator, and R. L. Workman,Phys. Lett. B 755, 452 (2016).
[244] M. Hazewinkel: Encyclopaedia of Mathematics (Springer, 31. 8. 1990) Vol.6, pg. 251.
[245] S. Ciulli and J. Fischer, Nucl. Phys. 24, 465 (1961).
[246] I. Ciulli, S. Ciulli, and J. Fisher, Nuovo Cimento 23, 1129 (1962).
[247] E. Pietarinen, Nuovo Cim. A 12, 522 (1972).
[248] E. Pietarinen, Nucl. Phys. B 107, 21 (1976).
[249] R. L. Workman, M. W. Paris, W. J. Briscoe, and I. I. Strakovsky, Phys. Rev. C 86, 015202(2012).
[250] D. Rönchen et al., Eur. Phys. J. A 49, 44 (2013).
[251] M. Döring, C. Hanhart, F. Huang, S. Krewald, U.-G. Meißner, and D. Rönchen, Nucl. Phys.A 851, 58 (2011).
[252] M. Döring, C. Hanhart, F. Huang, S. Krewald, and U.-G. Meißner, Nucl. Phys. A 829, 170(2009).
[253] R. A. Arndt, I. I. Strakovsky, and R. L. Workman, Phys. Rev. C 68, 042201 (2003); Erratum:[Phys. Rev. C 69, 019901 (2004)];
[254] Y. I. Azimov, R. A. Arndt, I. I. Strakovsky, and R. L. Workman, Phys. Rev. C 68, 045204(2003).
[255] A. V. Anisovich, E. Klempt, V. A. Nikonov, A. V. Sarantsev, H. Schmieden, and U. Thoma,Phys. Lett. B 711, 162 (2012).
[256] R. Tibshirani, J.R. Statist. Soc. B 58, 267 (1996).
[257] T. Hasti, R. Tibshirani, and J. Friedman, The Elements of Statistical Learning: Data Mining,Inference, and Prediction, (Springer, 2009) 2nd ed.; E-book available athttp://statweb.stanford.edu/ tibs/ElemStatLearn/index.html .
126

[258] T. Hastie, and R. Tibshiran, An Introduction to Statistical Learning, (Springer, 2015) 6thed.; E-book available at http://www-bcf.usc.edu/ gareth/ISL/ .
[259] B. Guegan, J. Hardin, J. Stevens, and M. Williams, JINST 10, no. 09, P09002 (2015).
[260] J. Landay, M. Döring, C. Fernández-Ramírez, B. Hu, and R. Molina, Phys. Rev. C 95, no.1, 015203 (2017).
[261] D. Agadjanov, M. Döring, M. Mai, U.-G. Meißner, and A. Rusetsky, JHEP 1606, 043(2016).
[262] G. D’Agostini, Nucl. Instrum. Meth. A 346, 306 (1994).
[263] R. D. Ball et al. [NNPDF Collaboration], JHEP 1005, 075 (2010).
[264] L. Wilkinson and G.E. Dallal, Technometrics 23, 377 (1981).
[265] T. W. Anderson and D. A. Darling, Annals of Mathematical Statistics 23, 193 (1952).
[266] M. A. Stephens, Journal of the American Statistical Association 69, 730 (1974).
[267] M. Döring, J. Revier, D. Rönchen, and R. L. Workman, Phys. Rev. C 93, no. 6, 065205(2016).
[268] Y. Valdau et al., Phys. Rev. C 84, 055207 (2011).
[269] P. Adlarson et al. [WASA-at-COSY Collaboration], Phys. Lett. B 774, 599 (2017).
[270] Project X Physics Study, https://indico.fnal.gov/event/projectxps12 .
[271] S. D. Holmes et al., arXiv:1306.5022 [physics.acc-ph].
[272] A. S. Kronfeld et al., arXiv:1306.5009 [hep-ex].
[273] D. M. Asner et al., arXiv:1306.5024 [physics.acc-ph].
[274] C. Quigg, private communication, 2015.
[275] B. Winstein et al., High precision, high intensitivity K0 physics at the main injector, FNALLoI 0804, 1988.
[276] Summary of the Report from the Working Group for The External Expert Panel on the Ra-dioactive Material Leak Accident at the Hadron Experimental Facility of J-PARC; http://j-parc.jp/en/topics/HDAccident20130827 02.p
[277] H. Fujioka et al., arXiv:1706.07916 [nucl-ex].
[278] H. Noumi et al., Charmed baryon spectroscopy experiment at J-PARC, J-PARC ProposalE50, 2012.
[279] M. Naruki, private communication, 2015.
127

[280] K. Abe et al. [Belle Collaboration], Phys. Lett. B 524, 33 (2002).
[281] T. Lesiak et al. [Belle Collaboration], Phys. Lett. B 605, 237 (2005); Erratum: [Phys. Lett.B 617, 198 (2005)].
[282] B. Aubert et al. [BaBar Collaboration], Phys. Rev. D 78, 034008 (2008).
[283] B. Aubert et al. [BaBar Collaboration], Phys. Rev. Lett. 97, 112001 (2006).
[284] B. Aubert et al. [BaBar Collaboration], Phys. Rev. Lett. 95, 142003 (2005).
[285] V. Ziegler, in: Workshop on Physics with Neutral Kaon Beam at JLab: mini-Proceedings,arXiv:1604.02141 [hep–ph] (February, 2016), p. 113.
[286] M. F. M. Lutz et al. [PANDA Collaboration], arXiv:0903.3905 [hep-ex].
[287] J. Ritman, invited talk at Excited Hyperons in QCD Thermodynamics at Freeze-Out Work-shop, see Ref. [10].
[288] S. Paul, private communication, 2016.
[289] C. Adolph et al. [COMPASS Collaboration], Phys. Rev. D 95, no. 3, 032004 (2017).
[290] J. Goity, P. Huovinen, J. Ritman, and A, Tang, in: Workshop on Excited Hyperons in QCDThermodynamics at Freeze-Out: mini-Proceedings, arXiv:1701.07346 [hep–ph], (November,2016) p. 158.
[291] A. W. Steiner, M. Prakash, J. M. Lattimer, and P. J. Ellis, Phys. Rept. 411, 325 (2005).
[292] C. J. Horowitz and J. Piekarewicz, Phys. Rev. Lett. 86, 5647 (2001).
[293] J. Xu, L. W. Chen, B. A. Li, and H. R. Ma, Astrophys. J. 697, 1549 (2009).
[294] A. W. Steiner, J. M. Lattimer, and E. F. Brown, Astrophys. J. 722, 33 (2010).
[295] B. G. Todd-Rutel and J. Piekarewicz, Phys. Rev. Lett. 95, 122501 (2005).
[296] D. H. Wen, B. A. Li, and L. W. Chen, Phys. Rev. Lett. 103, 211102 (2009).
[297] S. J. Pollock and M. C. Welliver, Phys. Lett. B 464, 177 (1999).
[298] M. B. Tsang et al., Phys. Rev. C 86, 015803 (2012).
[299] K. Hebeler, J. M. Lattimer, C. J. Pethick, and A. Schwenk, Phys. Rev. Lett. 105, 161102(2010).
[300] M. Centelles, X. Roca-Maza, X. Vinas, and M. Warda, Phys. Rev. Lett. 102, 122502 (2009).
[301] A. Carbone, G. Colo, A. Bracco, L. G. Cao, P. F. Bortignon, F. Camera, and O. Wieland,Phys. Rev. C 81, 041301 (2010).
[302] L. W. Chen, C. M. Ko, B. A. Li, and J. Xu, Phys. Rev. C 82, 024321 (2010).
128
[303] A. Tamii et al., Phys. Rev. Lett. 107, 062502 (2011).
[304] B. A. Li, L. W. Chen, and C. M. Ko, Phys. Rept. 464, 113 (2008).
[305] M. B. Tsang, Y. Zhang, P. Danielewicz, M. Famiano, Z. Li, W. G. Lynch, and A. W. Steiner,Phys. Rev. Lett. 102, 122701 (2009).
129