Integral field spectroscopy of selected areas of the Bright bar and Orion-S cloud in the Orion...
15
Mon. Not. R. Astron. Soc. 000, 1–15 (2010) Printed 21 June 2011 (MN L A T E X style file v2.2) Integral field spectroscopy of selected areas of the Bright Bar and Orion-S cloud in the Orion Nebula ? A. Mesa-Delgado† 1,2,3 , M. N´ u˜ nez-D´ ıaz 2,3 , C. Esteban 2,3 , L. L´ opez-Mart´ ın 2,3 and J. Garc´ ıa-Rojas 2,3 1 Institute for Astronomy, 2680 Woodlawn Drive, Honolulu, HI 96822, USA 2 Instituto de Astrof´ ısica de Canarias, E-38200 La Laguna, Tenerife, Spain 3 Departamento de Astrof´ ısica, Universidad de La Laguna, E-38205 La Laguna, Tenerife, Spain Accepted 2011 June 16. Received 2011 June 13; in original form 2011 May 12 ABSTRACT We present integral field spectroscopy of two selected zones in the Orion Nebula ob- tained with the Potsdam Multi-Aperture Spectrophotometer (PMAS), covering the optical spectral range from 3500 to 7200 ˚ A and with a spatial resolution of 1 00 . The observed zones are located on the prominent Bright Bar and on the brightest area at the northeast of the Orion South cloud, both containing remarkable ionization fronts. We obtain maps of emission line fluxes and ratios, electron density and temperatures, and chemical abundances. We study the ionization structure and morphology of both fields, which ionization fronts show different inclination angles with respect to the plane of the sky. We find that the maps of electron density, O + /H + and O/H ratios show a rather similar structure. We interpret this as produced by the strong depen- dence on density of the [O ii] lines used to derive the O + abundance, and that our nominal values of electron density –derived from the [S ii] line ratio– may be slightly higher than the appropriate value for the O + zone. We measure the faint recombina- tion lines of O ii in the field at the northeast of the Orion South cloud allowing us to explore the so-called abundance discrepancy problem. We find a rather constant abundance discrepancy across the field and a mean value similar to that determined in other areas of the Orion Nebula, indicating that the particular physical conditions of this ionization front do not contribute to this discrepancy. Key words: ISM: abundances, H ii regions – ISM: individual objects: Orion Nebula 1 INTRODUCTION The analysis of H ii regions is currently our best tool to study the physical conditions and chemical abundances of the in- terstellar medium. Because of its proximity and high surface brightness, the Orion Nebula (M42) is one of the best stud- ied H ii regions of our galaxy. Although the Orion Nebula has a large extension for more than one half degree, most of the radiation comes from the inner part, the so-called Huy- gens region. This is an active star-formation region ionized by a group of four massive stars known as the Trapezium cluster, where θ 1 Ori C (O7 V; Sim´ on-D´ ıaz et al. 2006) is the main ionizing source and, therefore, responsible of the bulk ? Based on observations collected at the Centro Astron´omico His- pano Alem´an (CAHA) at Calar Alto, operated jointly by the Max-Planck Institut f¨ ur Astronomie and the Instituto de As- trof´ ısica de Andaluc´ ıa (CSIC). † E-mail: [email protected]/adalfi[email protected] of nebular emission from the main ionization front (MIF). Physical, chemical, kinematical and structural properties for this H ii region have been studied in depth using different ob- servational techniques (e.g. Hester et al. 1991; Pogge et al. 1992; Walter et al. 1992; Esteban et al. 1998; Bally et al. 2000; O’Dell 2001; O’Dell et al. 2003; Doi et al. 2004; Es- teban et al. 2004; Garc´ ıa-D´ ıaz & Henney 2007; Garc´ ıa-D´ ıaz et al. 2008; O’Dell & Henney 2008; O’Dell et al. 2009) as well as photoionization models (e.g. Zuckerman 1973; Bal- ick et al. 1974; Rubin et al. 1991; Baldwin et al. 1991; Wen & O’Dell 1995; O’Dell 2001). The presence of many different morphological features such as protoplanetary discs, Herbig- Haro objects or bright bars makes the Orion Nebula the best laboratory for analysing photoionization phenomena. They study of ionization fronts is one of these phenom- ena of special interest because they are transitions between the fully ionized gas and its neutral surroundings, where we expect density and temperature gradients. Probably, there arXiv:1106.3602v1 [astro-ph.GA] 18 Jun 2011
-
Upload
independent -
Category
Documents
-
view
6 -
download
0
Transcript of Integral field spectroscopy of selected areas of the Bright bar and Orion-S cloud in the Orion...

Mon. Not. R. Astron. Soc. 000, 1–15 (2010) Printed 21 June 2011 (MN LATEX style file v2.2)
Integral field spectroscopy of selected areas of the BrightBar and Orion-S cloud in the Orion Nebula?
A. Mesa-Delgado†1,2,3, M. Nunez-Dıaz2,3, C. Esteban2,3, L. Lopez-Martın2,3 andJ. Garcıa-Rojas2,31Institute for Astronomy, 2680 Woodlawn Drive, Honolulu, HI 96822, USA2Instituto de Astrofısica de Canarias, E-38200 La Laguna, Tenerife, Spain3Departamento de Astrofısica, Universidad de La Laguna, E-38205 La Laguna, Tenerife, Spain
Accepted 2011 June 16. Received 2011 June 13; in original form 2011 May 12
ABSTRACTWe present integral field spectroscopy of two selected zones in the Orion Nebula ob-tained with the Potsdam Multi-Aperture Spectrophotometer (PMAS), covering theoptical spectral range from 3500 to 7200 A and with a spatial resolution of 1′′. Theobserved zones are located on the prominent Bright Bar and on the brightest area atthe northeast of the Orion South cloud, both containing remarkable ionization fronts.We obtain maps of emission line fluxes and ratios, electron density and temperatures,and chemical abundances. We study the ionization structure and morphology of bothfields, which ionization fronts show different inclination angles with respect to theplane of the sky. We find that the maps of electron density, O+/H+ and O/H ratiosshow a rather similar structure. We interpret this as produced by the strong depen-dence on density of the [O ii] lines used to derive the O+ abundance, and that ournominal values of electron density –derived from the [S ii] line ratio– may be slightlyhigher than the appropriate value for the O+ zone. We measure the faint recombina-tion lines of O ii in the field at the northeast of the Orion South cloud allowing usto explore the so-called abundance discrepancy problem. We find a rather constantabundance discrepancy across the field and a mean value similar to that determinedin other areas of the Orion Nebula, indicating that the particular physical conditionsof this ionization front do not contribute to this discrepancy.
Key words: ISM: abundances, H ii regions – ISM: individual objects: Orion Nebula
1 INTRODUCTION
The analysis of H ii regions is currently our best tool to studythe physical conditions and chemical abundances of the in-terstellar medium. Because of its proximity and high surfacebrightness, the Orion Nebula (M42) is one of the best stud-ied H ii regions of our galaxy. Although the Orion Nebulahas a large extension for more than one half degree, most ofthe radiation comes from the inner part, the so-called Huy-gens region. This is an active star-formation region ionizedby a group of four massive stars known as the Trapeziumcluster, where θ1Ori C (O7 V; Simon-Dıaz et al. 2006) is themain ionizing source and, therefore, responsible of the bulk
? Based on observations collected at the Centro Astronomico His-
pano Aleman (CAHA) at Calar Alto, operated jointly by the
Max-Planck Institut fur Astronomie and the Instituto de As-trofısica de Andalucıa (CSIC).† E-mail: [email protected]/[email protected]
of nebular emission from the main ionization front (MIF).Physical, chemical, kinematical and structural properties forthis H ii region have been studied in depth using different ob-servational techniques (e.g. Hester et al. 1991; Pogge et al.1992; Walter et al. 1992; Esteban et al. 1998; Bally et al.2000; O’Dell 2001; O’Dell et al. 2003; Doi et al. 2004; Es-teban et al. 2004; Garcıa-Dıaz & Henney 2007; Garcıa-Dıazet al. 2008; O’Dell & Henney 2008; O’Dell et al. 2009) aswell as photoionization models (e.g. Zuckerman 1973; Bal-ick et al. 1974; Rubin et al. 1991; Baldwin et al. 1991; Wen& O’Dell 1995; O’Dell 2001). The presence of many differentmorphological features such as protoplanetary discs, Herbig-Haro objects or bright bars makes the Orion Nebula the bestlaboratory for analysing photoionization phenomena.
They study of ionization fronts is one of these phenom-ena of special interest because they are transitions betweenthe fully ionized gas and its neutral surroundings, where weexpect density and temperature gradients. Probably, there
c© 2010 RAS
arX
iv:1
106.
3602
v1 [
astr
o-ph
.GA
] 1
8 Ju
n 20
11

2 A. Mesa-Delgado et al.
Figure 1. HST image of the central part of the Orion Nebula, which combines WFPC2 images taken in different narrow-band filters
(O’Dell & Wong 1996). The white squares correspond to the fields of view of PMAS IFU used, covering the Bright Bar and the northeastedge of the Orion-S cloud (NE-Orion-S). The black and white images show enlargements of the Hα emission in our PMAS fields, rebinned
to 160×160 pixels and smoothed using a Gaussian filter.
is an ionization front in almost every direction towards theOrion Nebula, though only certain geometries allow us toexplore the ionization structure of these features. The clear-est example in the Orion Nebula is the well-known BrightBar (hereinafter, BB). It is one of the most conspicuous fea-tures of the Orion Nebula, which is seen as an elongatedstructure in both ionized gas and molecular emission. It islocated at about 111′′ to the southeast of θ1Ori C. The BBappears specially bright in emission lines of low ionizationspecies such as [N ii] or [S ii] (e.g. Hester 1991; Pogge et al.1992; Walter et al. 1993; Garcıa-Dıaz & Henney 2007). Onthe basis of this fact, Balick et al. (1974) proposed that theBB is an escarpment in the MIF. Multi-wavelength studiesfrom infrared to radio spectral domains as well as theoreticalmodeling (e.g. Tielens et al. 1993; Tauber et al. 1994; vander Werf et al. 1996; Marconi et al. 1998; Young Owl et al.2000; Kassis et al. 2006; van der Wiel et al. 2009; Pellegriniet al. 2009, and references therein) support this proposal,where the MIF changes from a face-on to an edge-on geom-etry. Pellegrini et al. (2009) modeled the emission spectraalong the transition from H+ to H0 and H2 regions. Theyadopt a thin slab geometry for the BB, which extends 0.115pc and is inclined 7◦ with respect to the line of sight, findinga good agreement between the computed optical spectrumand that observed by Baldwin et al. (1991).
Besides the BB, there are other remarkable areas inthe Orion Nebula. Recently, Garcıa-Dıaz & Henney (2007)
have identified several examples of compact bars toward thecore of the Huygens region, in addition to the brighter barspreviously reported in the literature (O’Dell & Yusef-Zadeh2000). This is the case of the brightest zone of the Huygensregion (see Fig. 1), located at the northeast at the north-east edge of the Orion South (Orion-S) cloud (hereinafter,NE-Orion-S). This region is located about 30′′ to the south-west of θ1Ori C. In several observational studies (e.g. Poggeet al. 1992; Walter et al. 1993; Garcıa-Dıaz & Henney 2007)the NE-Orion-S appears as an extended structure, which isvery bright in [N ii] and [S ii] emission lines as in the caseof the BB. Recently, O’Dell et al. (2009) have studied in-depth the three dimensional structure of the whole Orion-Sconcluding that it is a cloud ionized from one side facing toθ1Ori C and suspended within the main body of the OrionNebula in front of the MIF. Therefore, this cloud as well asits NE-Orion-S edge are ionization fronts with a given un-known inclination, though it should not be as tilted as theBB (O’Dell et al. 2009).
As we will see in the next paragraphs, there have beena number of works devoted to study the spatial distribu-tions of physical conditions and chemical abundances in theOrion Nebula, but this is the first one specifically dedicatedto these ionization fronts –BB and NE-Orion-S– making useof integral field spectroscopy in the optical spectral range atspatial scales of about 1′′. Walter et al. (1992) determined ra-dial gradients of the physical conditions from the analysis of
c© 2010 RAS, MNRAS 000, 1–15
Integral field spectroscopy in the Orion Nebula 3
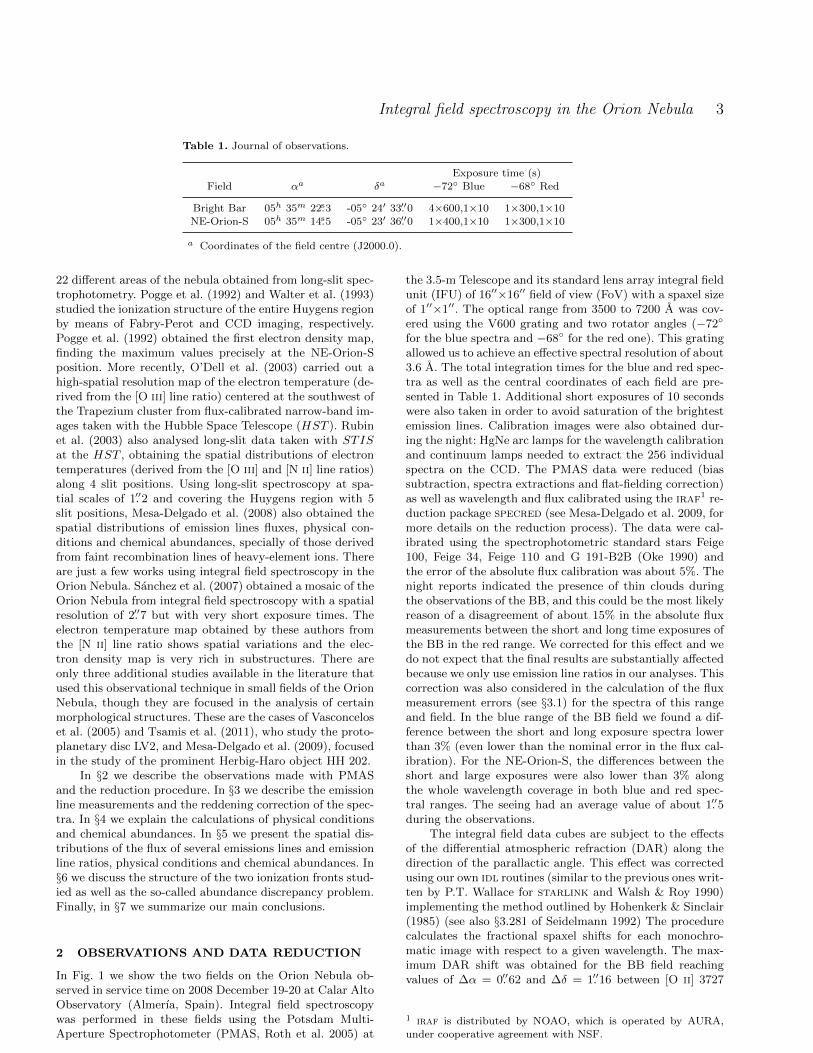
Table 1. Journal of observations.
Exposure time (s)
Field αa δa −72◦ Blue −68◦ Red
Bright Bar 05h 35m 22.s3 -05◦ 24′ 33.′′0 4×600,1×10 1×300,1×10
NE-Orion-S 05h 35m 14.s5 -05◦ 23′ 36.′′0 1×400,1×10 1×300,1×10
a Coordinates of the field centre (J2000.0).
22 different areas of the nebula obtained from long-slit spec-trophotometry. Pogge et al. (1992) and Walter et al. (1993)studied the ionization structure of the entire Huygens regionby means of Fabry-Perot and CCD imaging, respectively.Pogge et al. (1992) obtained the first electron density map,finding the maximum values precisely at the NE-Orion-Sposition. More recently, O’Dell et al. (2003) carried out ahigh-spatial resolution map of the electron temperature (de-rived from the [O iii] line ratio) centered at the southwest ofthe Trapezium cluster from flux-calibrated narrow-band im-ages taken with the Hubble Space Telescope (HST ). Rubinet al. (2003) also analysed long-slit data taken with STISat the HST , obtaining the spatial distributions of electrontemperatures (derived from the [O iii] and [N ii] line ratios)along 4 slit positions. Using long-slit spectroscopy at spa-tial scales of 1.′′2 and covering the Huygens region with 5slit positions, Mesa-Delgado et al. (2008) also obtained thespatial distributions of emission lines fluxes, physical con-ditions and chemical abundances, specially of those derivedfrom faint recombination lines of heavy-element ions. Thereare just a few works using integral field spectroscopy in theOrion Nebula. Sanchez et al. (2007) obtained a mosaic of theOrion Nebula from integral field spectroscopy with a spatialresolution of 2.′′7 but with very short exposure times. Theelectron temperature map obtained by these authors fromthe [N ii] line ratio shows spatial variations and the elec-tron density map is very rich in substructures. There areonly three additional studies available in the literature thatused this observational technique in small fields of the OrionNebula, though they are focused in the analysis of certainmorphological structures. These are the cases of Vasconceloset al. (2005) and Tsamis et al. (2011), who study the proto-planetary disc LV2, and Mesa-Delgado et al. (2009), focusedin the study of the prominent Herbig-Haro object HH 202.
In §2 we describe the observations made with PMASand the reduction procedure. In §3 we describe the emissionline measurements and the reddening correction of the spec-tra. In §4 we explain the calculations of physical conditionsand chemical abundances. In §5 we present the spatial dis-tributions of the flux of several emissions lines and emissionline ratios, physical conditions and chemical abundances. In§6 we discuss the structure of the two ionization fronts stud-ied as well as the so-called abundance discrepancy problem.Finally, in §7 we summarize our main conclusions.
2 OBSERVATIONS AND DATA REDUCTION
In Fig. 1 we show the two fields on the Orion Nebula ob-served in service time on 2008 December 19-20 at Calar AltoObservatory (Almerıa, Spain). Integral field spectroscopywas performed in these fields using the Potsdam Multi-Aperture Spectrophotometer (PMAS, Roth et al. 2005) at
the 3.5-m Telescope and its standard lens array integral fieldunit (IFU) of 16′′×16′′ field of view (FoV) with a spaxel sizeof 1′′×1′′. The optical range from 3500 to 7200 A was cov-ered using the V600 grating and two rotator angles (−72◦
for the blue spectra and −68◦ for the red one). This gratingallowed us to achieve an effective spectral resolution of about3.6 A. The total integration times for the blue and red spec-tra as well as the central coordinates of each field are pre-sented in Table 1. Additional short exposures of 10 secondswere also taken in order to avoid saturation of the brightestemission lines. Calibration images were also obtained dur-ing the night: HgNe arc lamps for the wavelength calibrationand continuum lamps needed to extract the 256 individualspectra on the CCD. The PMAS data were reduced (biassubtraction, spectra extractions and flat-fielding correction)as well as wavelength and flux calibrated using the iraf1 re-duction package specred (see Mesa-Delgado et al. 2009, formore details on the reduction process). The data were cal-ibrated using the spectrophotometric standard stars Feige100, Feige 34, Feige 110 and G 191-B2B (Oke 1990) andthe error of the absolute flux calibration was about 5%. Thenight reports indicated the presence of thin clouds duringthe observations of the BB, and this could be the most likelyreason of a disagreement of about 15% in the absolute fluxmeasurements between the short and long time exposures ofthe BB in the red range. We corrected for this effect and wedo not expect that the final results are substantially affectedbecause we only use emission line ratios in our analyses. Thiscorrection was also considered in the calculation of the fluxmeasurement errors (see §3.1) for the spectra of this rangeand field. In the blue range of the BB field we found a dif-ference between the short and long exposure spectra lowerthan 3% (even lower than the nominal error in the flux cal-ibration). For the NE-Orion-S, the differences between theshort and large exposures were also lower than 3% alongthe whole wavelength coverage in both blue and red spec-tral ranges. The seeing had an average value of about 1.′′5during the observations.
The integral field data cubes are subject to the effectsof the differential atmospheric refraction (DAR) along thedirection of the parallactic angle. This effect was correctedusing our own idl routines (similar to the previous ones writ-ten by P.T. Wallace for starlink and Walsh & Roy 1990)implementing the method outlined by Hohenkerk & Sinclair(1985) (see also §3.281 of Seidelmann 1992) The procedurecalculates the fractional spaxel shifts for each monochro-matic image with respect to a given wavelength. The max-imum DAR shift was obtained for the BB field reachingvalues of ∆α = 0.′′62 and ∆δ = 1.′′16 between [O ii] 3727
1 iraf is distributed by NOAO, which is operated by AURA,
under cooperative agreement with NSF.
c© 2010 RAS, MNRAS 000, 1–15
4 A. Mesa-Delgado et al.
A and Hβ. The reference wavelengths were Hβ and Hα forthe blue and red data cube, respectively. These emissionlines were also used to align the blue and red data cubescalculating the right spaxel offsets that produce the maxi-mum correlation between both Hβ and Hα emission maps.For the two fields, these offsets reached values lower than0.′′3 in α and δ. Finally, the data cubes are corrected usingthe bilinear function of idl, the calculated fractional shiftsand the alignment offsets. As result of all this process, themaximum coincident FoV resulting in the whole wavelengthrange is reduced to 14′′×14′′. We tested the DAR correctionobserving the alignment of localized features at different H ilines finding good agreement in all cases.
3 LINE MEASUREMENTS AND REDDENINGCORRECTION
3.1 Line intensity measurements
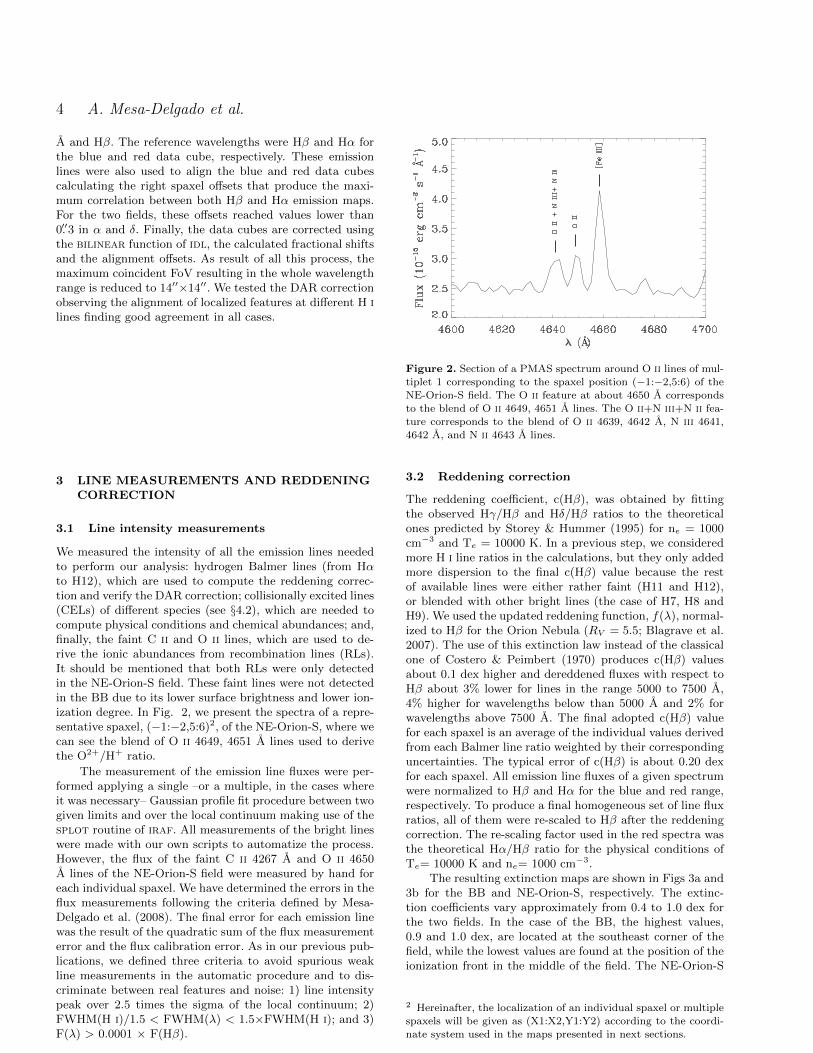
We measured the intensity of all the emission lines neededto perform our analysis: hydrogen Balmer lines (from Hαto H12), which are used to compute the reddening correc-tion and verify the DAR correction; collisionally excited lines(CELs) of different species (see §4.2), which are needed tocompute physical conditions and chemical abundances; and,finally, the faint C ii and O ii lines, which are used to de-rive the ionic abundances from recombination lines (RLs).It should be mentioned that both RLs were only detectedin the NE-Orion-S field. These faint lines were not detectedin the BB due to its lower surface brightness and lower ion-ization degree. In Fig. 2, we present the spectra of a repre-sentative spaxel, (−1:−2,5:6)2, of the NE-Orion-S, where wecan see the blend of O ii 4649, 4651 A lines used to derivethe O2+/H+ ratio.
The measurement of the emission line fluxes were per-formed applying a single –or a multiple, in the cases whereit was necessary– Gaussian profile fit procedure between twogiven limits and over the local continuum making use of thesplot routine of iraf. All measurements of the bright lineswere made with our own scripts to automatize the process.However, the flux of the faint C ii 4267 A and O ii 4650A lines of the NE-Orion-S field were measured by hand foreach individual spaxel. We have determined the errors in theflux measurements following the criteria defined by Mesa-Delgado et al. (2008). The final error for each emission linewas the result of the quadratic sum of the flux measurementerror and the flux calibration error. As in our previous pub-lications, we defined three criteria to avoid spurious weakline measurements in the automatic procedure and to dis-criminate between real features and noise: 1) line intensitypeak over 2.5 times the sigma of the local continuum; 2)FWHM(H i)/1.5 < FWHM(λ) < 1.5×FWHM(H i); and 3)F(λ) > 0.0001 × F(Hβ).
Figure 2. Section of a PMAS spectrum around O ii lines of mul-
tiplet 1 corresponding to the spaxel position (−1:−2,5:6) of theNE-Orion-S field. The O ii feature at about 4650 A corresponds
to the blend of O ii 4649, 4651 A lines. The O ii+N iii+N ii fea-ture corresponds to the blend of O ii 4639, 4642 A, N iii 4641,
4642 A, and N ii 4643 A lines.
3.2 Reddening correction
The reddening coefficient, c(Hβ), was obtained by fittingthe observed Hγ/Hβ and Hδ/Hβ ratios to the theoreticalones predicted by Storey & Hummer (1995) for ne = 1000cm−3 and Te = 10000 K. In a previous step, we consideredmore H i line ratios in the calculations, but they only addedmore dispersion to the final c(Hβ) value because the restof available lines were either rather faint (H11 and H12),or blended with other bright lines (the case of H7, H8 andH9). We used the updated reddening function, f(λ), normal-ized to Hβ for the Orion Nebula (RV = 5.5; Blagrave et al.2007). The use of this extinction law instead of the classicalone of Costero & Peimbert (1970) produces c(Hβ) valuesabout 0.1 dex higher and dereddened fluxes with respect toHβ about 3% lower for lines in the range 5000 to 7500 A,4% higher for wavelengths below than 5000 A and 2% forwavelengths above 7500 A. The final adopted c(Hβ) valuefor each spaxel is an average of the individual values derivedfrom each Balmer line ratio weighted by their correspondinguncertainties. The typical error of c(Hβ) is about 0.20 dexfor each spaxel. All emission line fluxes of a given spectrumwere normalized to Hβ and Hα for the blue and red range,respectively. To produce a final homogeneous set of line fluxratios, all of them were re-scaled to Hβ after the reddeningcorrection. The re-scaling factor used in the red spectra wasthe theoretical Hα/Hβ ratio for the physical conditions ofTe= 10000 K and ne= 1000 cm−3.
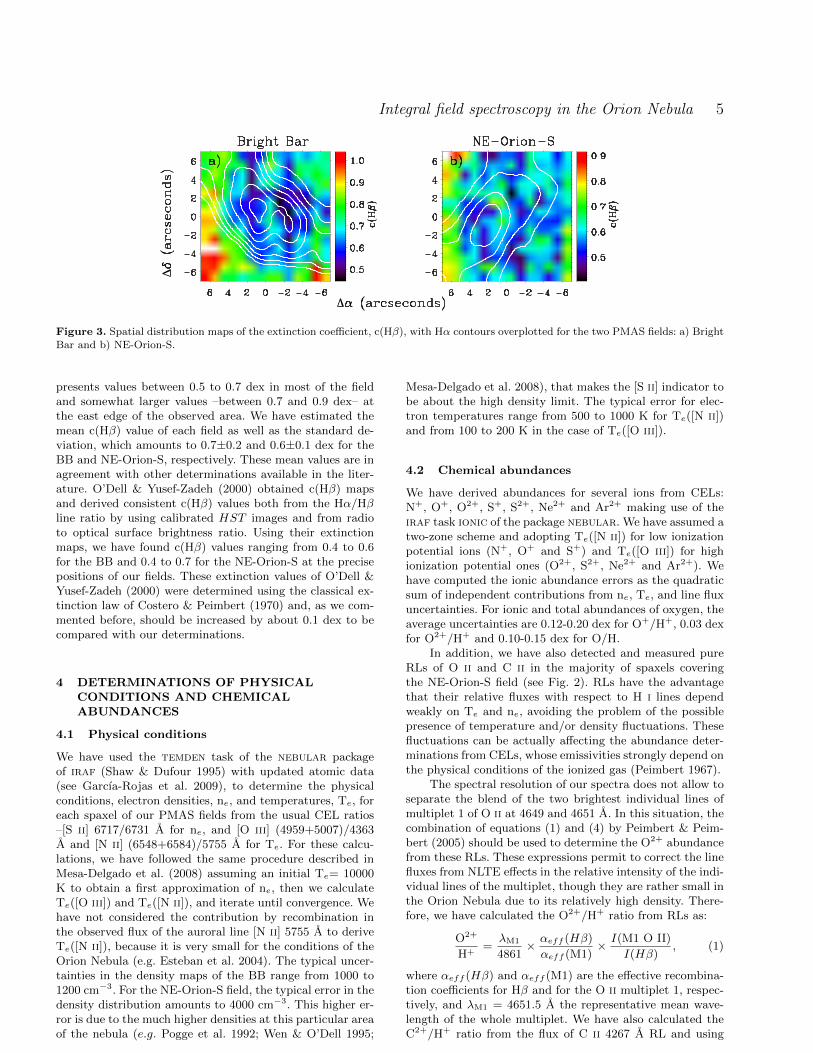
The resulting extinction maps are shown in Figs 3a and3b for the BB and NE-Orion-S, respectively. The extinc-tion coefficients vary approximately from 0.4 to 1.0 dex forthe two fields. In the case of the BB, the highest values,0.9 and 1.0 dex, are located at the southeast corner of thefield, while the lowest values are found at the position of theionization front in the middle of the field. The NE-Orion-S
2 Hereinafter, the localization of an individual spaxel or multiple
spaxels will be given as (X1:X2,Y1:Y2) according to the coordi-
nate system used in the maps presented in next sections.
c© 2010 RAS, MNRAS 000, 1–15
Integral field spectroscopy in the Orion Nebula 5
Figure 3. Spatial distribution maps of the extinction coefficient, c(Hβ), with Hα contours overplotted for the two PMAS fields: a) BrightBar and b) NE-Orion-S.
presents values between 0.5 to 0.7 dex in most of the fieldand somewhat larger values –between 0.7 and 0.9 dex– atthe east edge of the observed area. We have estimated themean c(Hβ) value of each field as well as the standard de-viation, which amounts to 0.7±0.2 and 0.6±0.1 dex for theBB and NE-Orion-S, respectively. These mean values are inagreement with other determinations available in the liter-ature. O’Dell & Yusef-Zadeh (2000) obtained c(Hβ) mapsand derived consistent c(Hβ) values both from the Hα/Hβline ratio by using calibrated HST images and from radioto optical surface brightness ratio. Using their extinctionmaps, we have found c(Hβ) values ranging from 0.4 to 0.6for the BB and 0.4 to 0.7 for the NE-Orion-S at the precisepositions of our fields. These extinction values of O’Dell &Yusef-Zadeh (2000) were determined using the classical ex-tinction law of Costero & Peimbert (1970) and, as we com-mented before, should be increased by about 0.1 dex to becompared with our determinations.
4 DETERMINATIONS OF PHYSICALCONDITIONS AND CHEMICALABUNDANCES
4.1 Physical conditions
We have used the temden task of the nebular packageof iraf (Shaw & Dufour 1995) with updated atomic data(see Garcıa-Rojas et al. 2009), to determine the physicalconditions, electron densities, ne, and temperatures, Te, foreach spaxel of our PMAS fields from the usual CEL ratios–[S ii] 6717/6731 A for ne, and [O iii] (4959+5007)/4363A and [N ii] (6548+6584)/5755 A for Te. For these calcu-lations, we have followed the same procedure described inMesa-Delgado et al. (2008) assuming an initial Te= 10000K to obtain a first approximation of ne, then we calculateTe([O iii]) and Te([N ii]), and iterate until convergence. Wehave not considered the contribution by recombination inthe observed flux of the auroral line [N ii] 5755 A to deriveTe([N ii]), because it is very small for the conditions of theOrion Nebula (e.g. Esteban et al. 2004). The typical uncer-tainties in the density maps of the BB range from 1000 to1200 cm−3. For the NE-Orion-S field, the typical error in thedensity distribution amounts to 4000 cm−3. This higher er-ror is due to the much higher densities at this particular areaof the nebula (e.g. Pogge et al. 1992; Wen & O’Dell 1995;
Mesa-Delgado et al. 2008), that makes the [S ii] indicator tobe about the high density limit. The typical error for elec-tron temperatures range from 500 to 1000 K for Te([N ii])and from 100 to 200 K in the case of Te([O iii]).
4.2 Chemical abundances
We have derived abundances for several ions from CELs:N+, O+, O2+, S+, S2+, Ne2+ and Ar2+ making use of theiraf task ionic of the package nebular. We have assumed atwo-zone scheme and adopting Te([N ii]) for low ionizationpotential ions (N+, O+ and S+) and Te([O iii]) for highionization potential ones (O2+, S2+, Ne2+ and Ar2+). Wehave computed the ionic abundance errors as the quadraticsum of independent contributions from ne, Te, and line fluxuncertainties. For ionic and total abundances of oxygen, theaverage uncertainties are 0.12-0.20 dex for O+/H+, 0.03 dexfor O2+/H+ and 0.10-0.15 dex for O/H.
In addition, we have also detected and measured pureRLs of O ii and C ii in the majority of spaxels coveringthe NE-Orion-S field (see Fig. 2). RLs have the advantagethat their relative fluxes with respect to H i lines dependweakly on Te and ne, avoiding the problem of the possiblepresence of temperature and/or density fluctuations. Thesefluctuations can be actually affecting the abundance deter-minations from CELs, whose emissivities strongly depend onthe physical conditions of the ionized gas (Peimbert 1967).
The spectral resolution of our spectra does not allow toseparate the blend of the two brightest individual lines ofmultiplet 1 of O ii at 4649 and 4651 A. In this situation, thecombination of equations (1) and (4) by Peimbert & Peim-bert (2005) should be used to determine the O2+ abundancefrom these RLs. These expressions permit to correct the linefluxes from NLTE effects in the relative intensity of the indi-vidual lines of the multiplet, though they are rather small inthe Orion Nebula due to its relatively high density. There-fore, we have calculated the O2+/H+ ratio from RLs as:
O2+
H+=
λM1
4861× αeff (Hβ)
αeff (M1)× I(M1 O II)
I(Hβ), (1)
where αeff (Hβ) and αeff (M1) are the effective recombina-tion coefficients for Hβ and for the O ii multiplet 1, respec-tively, and λM1 = 4651.5 A the representative mean wave-length of the whole multiplet. We have also calculated theC2+/H+ ratio from the flux of C ii 4267 A RL and using
c© 2010 RAS, MNRAS 000, 1–15
6 A. Mesa-Delgado et al.
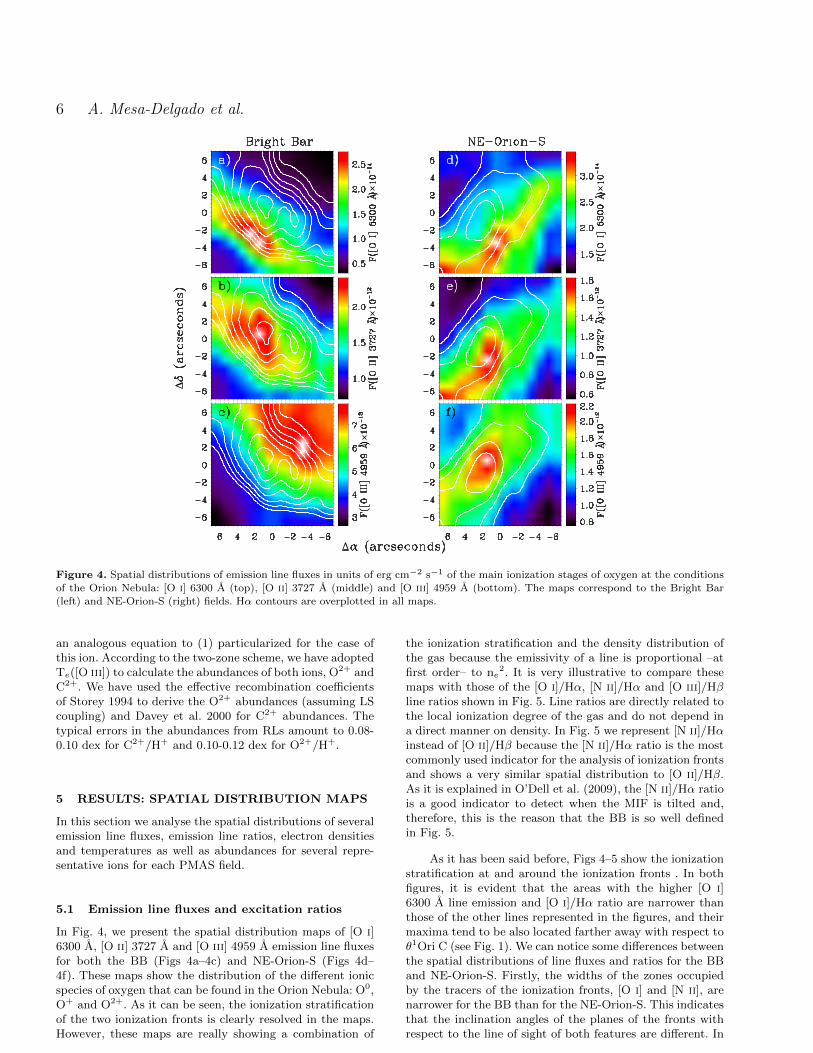
Figure 4. Spatial distributions of emission line fluxes in units of erg cm−2 s−1 of the main ionization stages of oxygen at the conditions
of the Orion Nebula: [O i] 6300 A (top), [O ii] 3727 A (middle) and [O iii] 4959 A (bottom). The maps correspond to the Bright Bar(left) and NE-Orion-S (right) fields. Hα contours are overplotted in all maps.
an analogous equation to (1) particularized for the case ofthis ion. According to the two-zone scheme, we have adoptedTe([O iii]) to calculate the abundances of both ions, O2+ andC2+. We have used the effective recombination coefficientsof Storey 1994 to derive the O2+ abundances (assuming LScoupling) and Davey et al. 2000 for C2+ abundances. Thetypical errors in the abundances from RLs amount to 0.08-0.10 dex for C2+/H+ and 0.10-0.12 dex for O2+/H+.
5 RESULTS: SPATIAL DISTRIBUTION MAPS
In this section we analyse the spatial distributions of severalemission line fluxes, emission line ratios, electron densitiesand temperatures as well as abundances for several repre-sentative ions for each PMAS field.
5.1 Emission line fluxes and excitation ratios
In Fig. 4, we present the spatial distribution maps of [O i]6300 A, [O ii] 3727 A and [O iii] 4959 A emission line fluxesfor both the BB (Figs 4a–4c) and NE-Orion-S (Figs 4d–4f). These maps show the distribution of the different ionicspecies of oxygen that can be found in the Orion Nebula: O0,O+ and O2+. As it can be seen, the ionization stratificationof the two ionization fronts is clearly resolved in the maps.However, these maps are really showing a combination of
the ionization stratification and the density distribution ofthe gas because the emissivity of a line is proportional –atfirst order– to ne
2. It is very illustrative to compare thesemaps with those of the [O i]/Hα, [N ii]/Hα and [O iii]/Hβline ratios shown in Fig. 5. Line ratios are directly related tothe local ionization degree of the gas and do not depend ina direct manner on density. In Fig. 5 we represent [N ii]/Hαinstead of [O ii]/Hβ because the [N ii]/Hα ratio is the mostcommonly used indicator for the analysis of ionization frontsand shows a very similar spatial distribution to [O ii]/Hβ.As it is explained in O’Dell et al. (2009), the [N ii]/Hα ratiois a good indicator to detect when the MIF is tilted and,therefore, this is the reason that the BB is so well definedin Fig. 5.
As it has been said before, Figs 4–5 show the ionizationstratification at and around the ionization fronts . In bothfigures, it is evident that the areas with the higher [O i]6300 A line emission and [O i]/Hα ratio are narrower thanthose of the other lines represented in the figures, and theirmaxima tend to be also located farther away with respect toθ1Ori C (see Fig. 1). We can notice some differences betweenthe spatial distributions of line fluxes and ratios for the BBand NE-Orion-S. Firstly, the widths of the zones occupiedby the tracers of the ionization fronts, [O i] and [N ii], arenarrower for the BB than for the NE-Orion-S. This indicatesthat the inclination angles of the planes of the fronts withrespect to the line of sight of both features are different. In
c© 2010 RAS, MNRAS 000, 1–15

Integral field spectroscopy in the Orion Nebula 7
Figure 5. Spatial distribution maps of selected emission line ratios for the Bright Bar (left) and NE-Orion-S (right). The sum of [N ii]6548, 6584 A and [O iii] 4959, 5007 A nebular lines have been used to derive the [N ii]/Hα (middle) and [O iii]/Hβ (bottom) ratios,
respectively. Hα contours are overplotted in all maps.
fact, as we commented in §1, this was already suggested byO’Dell et al. (2009). The BB is located at a border of theHuygens region where the MIF is an edge-on escarpment,where its plane is tilted about 7◦ with respectto our line ofsight (Pellegrini et al. 2009). The situation is not so clearin the case of the NE-Orion-S. It is a portion the Orion-S cloud, which is suspended in front of the MIF with anunknown inclination and can be interpreted as a bump in theotherwise concave surface of the MIF at the Huygens region(O’Dell et al. 2009). Secondly, another difference betweenthe BB and NE-Orion-S can be seen comparing the mapsshown in Figs 4 and 5. In the case of the BB, Fig. 4b) showsthat the maxima of [O ii] 3727 A and Hα emission coincide.However, in the case of the NE-Orion-S, Fig. 4f) indicatesthat the maximum of Hα emission coincides with [O iii]4959 A. This difference is due to the NE-Orion-S area isnearer to θ1Ori C than the BB and that while few photonscapable of producing O2+ are reaching the BB, NE-Orion-Sis illuminated by a significant fraction of such high-energyphotons. This is clearly confirmed in Fig. 5c), where themaximum of the [O iii]/Hβ line ratio is well outside the BBand towards the ionizing source of the nebula. Interestingly,Fig. 5f) indicates that in the case of the NE-Orion-S, thezone of the highest [O iii]/Hβ line ratio is just at the northedge of the field. This area coincides with a filament, whichseems to be out of Orion-S cloud itself. Its higher excitation
suggests that this filament should be nearer to θ1Ori C andperhaps belongs to the MIF.
5.2 Physical conditions
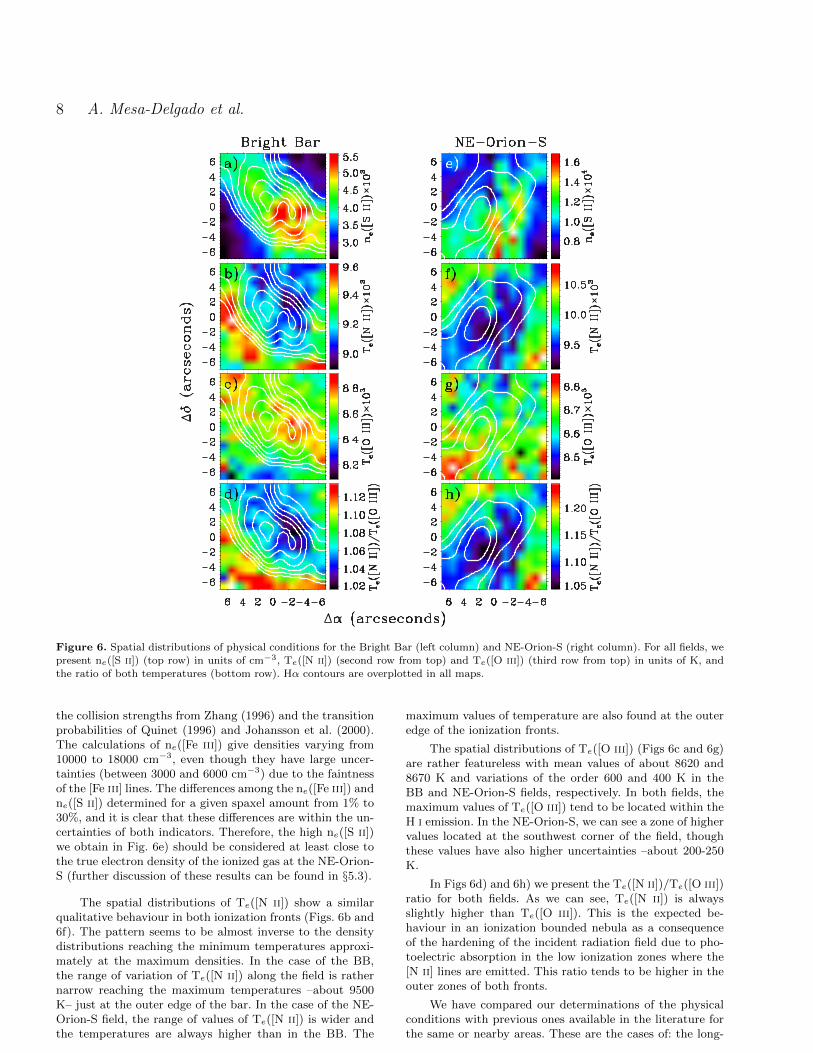
In Fig. 6 we present the physical conditions for the two ob-served fields: ne([S ii]), Te([N ii]), Te([O iii]) and the tem-perature ratio Te([N ii])/Te([O iii]).
Both fields show ne spatial variations of the order of afactor 2. The densities in the BB range from 3000 to 5500cm−3, but larger values are found in the NE-Orion-S, from8000 to 16000 cm−3. In the BB field, maximum densities arefound within the Hα contours, while in the NE-Orion-S theseare displaced with respect to the maximum of H i emission.The average densities of the ionization fronts are 4370±580cm−3 for the BB and 10900±1900 cm−3 for the NE-Orion-S.In the case of the NE-Orion-S field, the highest density val-ues are about the high density limit of the [S ii] line ratio in-dicator and, therefore, they may not correspond to the truedensities. Fortunately, we have detected at least 5 [Fe iii]lines of the 3F multiplet ([Fe iii] 4607, 4658, 4702, 4734 and4755 A) and one line of the 2F multiplet ([Fe iii] 4881 A) atthose spaxels of the NE-Orion-S field showing the ne([S ii])maxima. These lines permit to get an additional determina-tion of the density, ne([Fe iii]), which range of validity hasan upper limit above that of the [S ii] indicator. To carryout these calculations we have used a 34-level atom using
c© 2010 RAS, MNRAS 000, 1–15
8 A. Mesa-Delgado et al.
Figure 6. Spatial distributions of physical conditions for the Bright Bar (left column) and NE-Orion-S (right column). For all fields, we
present ne([S ii]) (top row) in units of cm−3, Te([N ii]) (second row from top) and Te([O iii]) (third row from top) in units of K, andthe ratio of both temperatures (bottom row). Hα contours are overplotted in all maps.
the collision strengths from Zhang (1996) and the transitionprobabilities of Quinet (1996) and Johansson et al. (2000).The calculations of ne([Fe iii]) give densities varying from10000 to 18000 cm−3, even though they have large uncer-tainties (between 3000 and 6000 cm−3) due to the faintnessof the [Fe iii] lines. The differences among the ne([Fe iii]) andne([S ii]) determined for a given spaxel amount from 1% to30%, and it is clear that these differences are within the un-certainties of both indicators. Therefore, the high ne([S ii])we obtain in Fig. 6e) should be considered at least close tothe true electron density of the ionized gas at the NE-Orion-S (further discussion of these results can be found in §5.3).
The spatial distributions of Te([N ii]) show a similarqualitative behaviour in both ionization fronts (Figs. 6b and6f). The pattern seems to be almost inverse to the densitydistributions reaching the minimum temperatures approxi-mately at the maximum densities. In the case of the BB,the range of variation of Te([N ii]) along the field is rathernarrow reaching the maximum temperatures –about 9500K– just at the outer edge of the bar. In the case of the NE-Orion-S field, the range of values of Te([N ii]) is wider andthe temperatures are always higher than in the BB. The
maximum values of temperature are also found at the outeredge of the ionization fronts.
The spatial distributions of Te([O iii]) (Figs 6c and 6g)are rather featureless with mean values of about 8620 and8670 K and variations of the order 600 and 400 K in theBB and NE-Orion-S fields, respectively. In both fields, themaximum values of Te([O iii]) tend to be located within theH i emission. In the NE-Orion-S, we can see a zone of highervalues located at the southwest corner of the field, thoughthese values have also higher uncertainties –about 200-250K.
In Figs 6d) and 6h) we present the Te([N ii])/Te([O iii])ratio for both fields. As we can see, Te([N ii]) is alwaysslightly higher than Te([O iii]). This is the expected be-haviour in an ionization bounded nebula as a consequenceof the hardening of the incident radiation field due to pho-toelectric absorption in the low ionization zones where the[N ii] lines are emitted. This ratio tends to be higher in theouter zones of both fronts.
We have compared our determinations of the physicalconditions with previous ones available in the literature forthe same or nearby areas. These are the cases of: the long-
c© 2010 RAS, MNRAS 000, 1–15
Integral field spectroscopy in the Orion Nebula 9
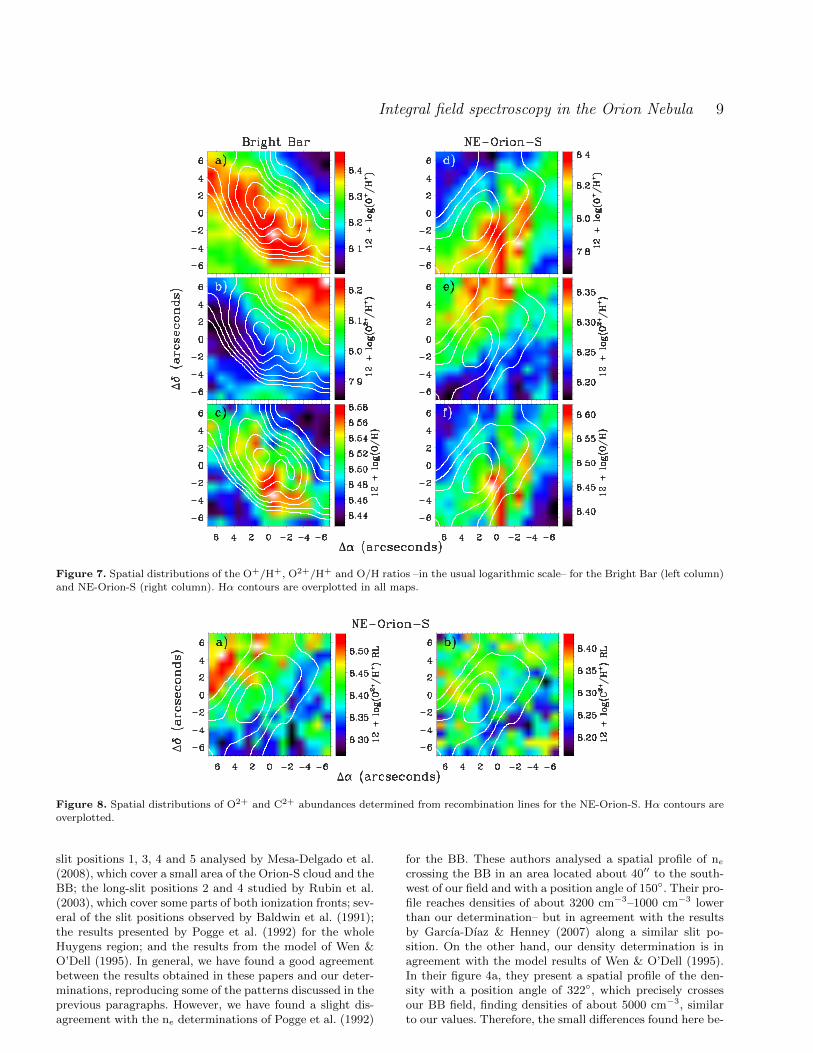
Figure 7. Spatial distributions of the O+/H+, O2+/H+ and O/H ratios –in the usual logarithmic scale– for the Bright Bar (left column)
and NE-Orion-S (right column). Hα contours are overplotted in all maps.
Figure 8. Spatial distributions of O2+ and C2+ abundances determined from recombination lines for the NE-Orion-S. Hα contours areoverplotted.
slit positions 1, 3, 4 and 5 analysed by Mesa-Delgado et al.(2008), which cover a small area of the Orion-S cloud and theBB; the long-slit positions 2 and 4 studied by Rubin et al.(2003), which cover some parts of both ionization fronts; sev-eral of the slit positions observed by Baldwin et al. (1991);the results presented by Pogge et al. (1992) for the wholeHuygens region; and the results from the model of Wen &O’Dell (1995). In general, we have found a good agreementbetween the results obtained in these papers and our deter-minations, reproducing some of the patterns discussed in theprevious paragraphs. However, we have found a slight dis-agreement with the ne determinations of Pogge et al. (1992)
for the BB. These authors analysed a spatial profile of ne
crossing the BB in an area located about 40′′ to the south-west of our field and with a position angle of 150◦. Their pro-file reaches densities of about 3200 cm−3–1000 cm−3 lowerthan our determination– but in agreement with the resultsby Garcıa-Dıaz & Henney (2007) along a similar slit po-sition. On the other hand, our density determination is inagreement with the model results of Wen & O’Dell (1995).In their figure 4a, they present a spatial profile of the den-sity with a position angle of 322◦, which precisely crossesour BB field, finding densities of about 5000 cm−3, similarto our values. Therefore, the small differences found here be-
c© 2010 RAS, MNRAS 000, 1–15
10 A. Mesa-Delgado et al.
tween our physical conditions and those reported by otherauthors seem to be related to the presence of local varia-tions of the physical conditions in the BB. Wen & O’Dell(1995), in their figure 5a, also presented a spatial profile ofthe density with a position angle of 226◦ covering the NE-Orion-S field, which passes close to the southeast corner ofour field. They found densities no higher than 12000 cm−3,slightly lower than our determinations but consistent withinthe uncertainties.
5.3 Chemical abundances
In Fig. 7 we present the spatial distributions of ionic and to-tal oxygen abundances derived from CELs for the two fields.As expected, the O+ and O2+ abundance distributions arerather similar to those of the [N ii]/Hα and [O iii]/Hβ lineratios shown in Fig. 5. However, unexpectedly, we find struc-tures in the spatial distributions of the total O abundance ofboth fields as we can see in Figs 7c) and 7f). The mean val-ues of the O/H ratio at the BB and NE-Orion-S amountto 8.49±0.03 dex and 8.48±0.05 dex, respectively, whichare in complete agreement with the typical oxygen abun-dances –8.50 dex– obtained by previous works in differentparts of the Orion Nebula (Esteban et al. 1998, 2004; Bla-grave et al. 2006; Mesa-Delgado et al. 2009; Simon-Dıaz &Stasinska 2011). In the BB field, the O abundance variationsare within the typical error of about 0.10-0.15 dex, whilein the NE-Orion-S the range is slightly wider, finding thelowest values at the southwest corner of the field, preciselywhere the O2+ abundances are lower and Te([O iii]) has alarger uncertainty, as we mentioned in §5.2. In Fig. 7, wecan see that the areas with the highest total O abundancecoincide in general with those showing higher O+/H+ ra-tio. Moreover, the structure of the spatial variations of theO/H ratio shown in Figs 7c) and 7f) is remarkably similarto that of the ne maps of Figs 6a) and 6e). To understandthis behaviour we have to consider that ionic abundance de-terminations derived from CELs depend very much on thephysical conditions of the gas. O+/H+ and O2+/H+ ratiosare both strongly dependent on Te, but not on ne at thesame level. In particular, the O+/H+ ratio derived from the[O ii] 3727 A doublet is much more dependent on ne thanthe O2+ abundance calculated from the nebular [O iii] 4959,5007 A lines at least at the densities measured in our PMASfields. Therefore, the striking similar structure of the O/Hand ne maps may be produced by the strong dependence ofthe O+ abundance on ne. The simpler explanation is thatthe ne([S ii]) we obtain for the ionization fronts is not indi-cating the true density of the O+ zone and, therefore, notappropriate for determining the O+ abundances. A possibleway to check this solution could be to obtain high-spectralresolution spectra to measure and separate the [O ii] 3726,3729, 7319 and 7330 A lines and derive the precise physi-cal conditions of the O+ zone. Another explanation is that,even in the case that the physical conditions are the samefor S+ and O+, ne([S ii]) could not be the true one becausethe reported densities are about –specially in the case ofNE-Orion-S– the critical densities of the [S ii] 6717, 6731 Alines –2000-3000 cm−3 and 10000 cm−3, respectively. In fact,considering densities somewhat higher than the true valuesproduce higher O+/H+ ratios. This is because we overes-timate the collisional de-excitation affecting the [O ii] line
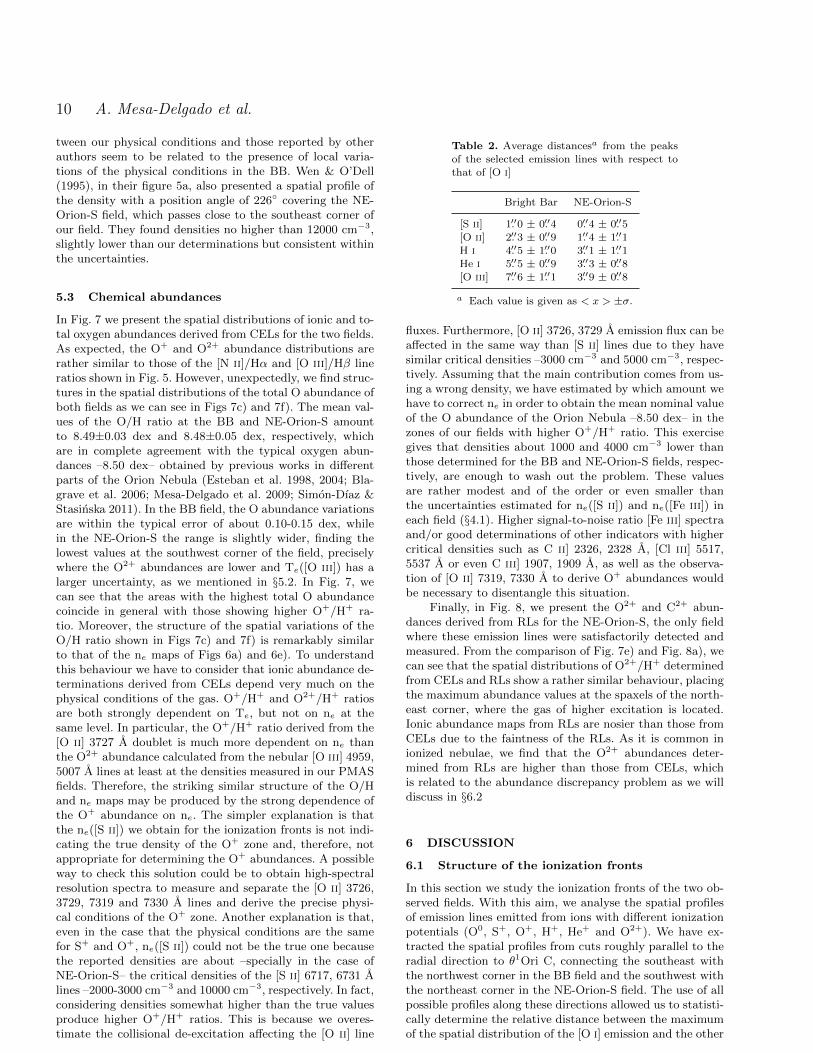
Table 2. Average distancesa from the peaks
of the selected emission lines with respect tothat of [O i]
Bright Bar NE-Orion-S
[S ii] 1.′′0 ± 0.′′4 0.′′4 ± 0.′′5[O ii] 2.′′3 ± 0.′′9 1.′′4 ± 1.′′1H i 4.′′5 ± 1.′′0 3.′′1 ± 1.′′1He i 5.′′5 ± 0.′′9 3.′′3 ± 0.′′8[O iii] 7.′′6 ± 1.′′1 3.′′9 ± 0.′′8
a Each value is given as < x > ±σ.
fluxes. Furthermore, [O ii] 3726, 3729 A emission flux can beaffected in the same way than [S ii] lines due to they havesimilar critical densities –3000 cm−3 and 5000 cm−3, respec-tively. Assuming that the main contribution comes from us-ing a wrong density, we have estimated by which amount wehave to correct ne in order to obtain the mean nominal valueof the O abundance of the Orion Nebula –8.50 dex– in thezones of our fields with higher O+/H+ ratio. This exercisegives that densities about 1000 and 4000 cm−3 lower thanthose determined for the BB and NE-Orion-S fields, respec-tively, are enough to wash out the problem. These valuesare rather modest and of the order or even smaller thanthe uncertainties estimated for ne([S ii]) and ne([Fe iii]) ineach field (§4.1). Higher signal-to-noise ratio [Fe iii] spectraand/or good determinations of other indicators with highercritical densities such as C ii] 2326, 2328 A, [Cl iii] 5517,5537 A or even C iii] 1907, 1909 A, as well as the observa-tion of [O ii] 7319, 7330 A to derive O+ abundances wouldbe necessary to disentangle this situation.
Finally, in Fig. 8, we present the O2+ and C2+ abun-dances derived from RLs for the NE-Orion-S, the only fieldwhere these emission lines were satisfactorily detected andmeasured. From the comparison of Fig. 7e) and Fig. 8a), wecan see that the spatial distributions of O2+/H+ determinedfrom CELs and RLs show a rather similar behaviour, placingthe maximum abundance values at the spaxels of the north-east corner, where the gas of higher excitation is located.Ionic abundance maps from RLs are nosier than those fromCELs due to the faintness of the RLs. As it is common inionized nebulae, we find that the O2+ abundances deter-mined from RLs are higher than those from CELs, whichis related to the abundance discrepancy problem as we willdiscuss in §6.2
6 DISCUSSION
6.1 Structure of the ionization fronts
In this section we study the ionization fronts of the two ob-served fields. With this aim, we analyse the spatial profilesof emission lines emitted from ions with different ionizationpotentials (O0, S+, O+, H+, He+ and O2+). We have ex-tracted the spatial profiles from cuts roughly parallel to theradial direction to θ1Ori C, connecting the southeast withthe northwest corner in the BB field and the southwest withthe northeast corner in the NE-Orion-S field. The use of allpossible profiles along these directions allowed us to statisti-cally determine the relative distance between the maximumof the spatial distribution of the [O i] emission and the other
c© 2010 RAS, MNRAS 000, 1–15

Integral field spectroscopy in the Orion Nebula 11
Figure 9. Spatial profiles of several emission lines traced along the main diagonal from the southeast to the northwest corner of the
Bright Bar (top left) and along the third line below (to the southeast) of the main diagonal from the southwest to the northeast corner
of the NE-Orion-S (top right). The zero point is located at the maximum of [O i] line emission and the offsets are given in arcseconds onthe plane of the sky. Positive values in abscissae indicate decreasing distance with respect to θ1Ori C. The plotted lines are: [O i] (dotted
line), [S i] (black solid line), [O ii] (dashed-dotted line), H i (thinner solid line), He i (three dotted-dashed line) and [O iii] (dashed line).
The emission line fluxes are normalized to their maximum emission. In the middle and bottom panels, the spatial profiles of Te([N ii])(solid line) and Te([O iii]) (dashed line), as well as ne([S ii]) are presented. Te([N ii]) and ne([S ii]) are normalized to their respective
maxima: 9480 K and 4760 cm−3 for the Bright Bar and 10390 K and 14200 cm−3 for the NE-Orion-S.
emission lines across the fields. To estimate these distances,we have used the rebinned maps without applying any Gaus-sian smoothing filter as we did for the Hα images presentedin Fig. 1. The rebinned maps do not change the relative po-sitions of the maxima and allow us to explore the changesin the profiles interpolating at subarcsecond scales. Further-more, these maps allow to use a total of 29 spatial profilesto calculate statistically significant averages. In Table 2 wepresent the average values of these distances and their stan-dard deviations. In Fig. 9 we present spatial profiles of theemission lines only for one representative cut: along the maindiagonal in the case of the BB; and along the third diagonalline towards the southeast of the main diagonal in the caseof the NE-Orion-S. In Fig. 9 we also show the temperatureand density distributions along the same cuts. For all pro-files, we have located the zero point at the position of themaximum of [O i] emission, which is the farthest one fromθ1Ori C, as we saw in Fig. 4 and see now in Fig. 9.
Theory about the ionization structure of nebulae can befound in Osterbrock & Ferland (2006). In our discussion be-low, we state that the stratification should be driven by theionization energy of the atom. This is approximately true,
but it should also be mentioned that the local ionizing radi-ation field in a nebula, which control the distribution of theionic states of heavy elements, is determined by the opacityof the two most abundant elements, hydrogen and helium.In terms of the emission lines fluxes presented in Fig. 9, thisimplies that both [O i] and [S ii] arise near the zone wherehydrogen becomes optically thick and the presence of theseions is combined with thermalized electrons coming fromhydrogen photoionizations. [O ii] as well as [N ii] emissionsarise from the zone where hydrogen is ionized and helium isstill neutral. Finally, [O iii] emission comes from the near-est zone to θ1Ori C, where hydrogen remains ionized andhelium is once ionized. In the spatial profiles presented inFig. 9, the small differences with respect to that expectedstratification are probably a combined effect of the geometryof each ionization front and the density dependence of theobserved flux.
The ionization structure of the BB has been well stud-ied in the literature (e.g. Hester 1991; Tielens et al. 1993;Walmsley et al. 2000; Pellegrini et al. 2009; van der Wielet al. 2009). This bar is basically edge-on and its plane hasan inclination of 7◦ with respect to the line of sight (Pel-
c© 2010 RAS, MNRAS 000, 1–15
12 A. Mesa-Delgado et al.
legrini et al. 2009), allowing to resolve its ionization struc-ture as we see in Fig. 9. The MIF is a thin layer locatedbetween the maximum emission peaks of [O i] and [S ii].Pellegrini et al. (2009) indicate that the maxima of H2 and12CO line emissions are detected at about 12′′ and 20′′ be-hind the MIF position, respectively. As we see in Table 2, wefound that the peak of the [S ii] emission is located about1′′ ahead [O i], which corresponds to a physical separationof 2.1×10⁻³ pc assuming a distance to the Orion Nebulaof 436±20 pc (O’Dell & Henney 2008). The maximum of[O ii] emission, which also coincides with the maxima of[N ii] (14.5 eV) and [Fe iii] (16.2 eV), is found about 2.′′3–4.9×10⁻³ pc– with a standard deviation of 0.′′9, implyingthat this zone is spatially less defined than that of [S ii]emission. The spatial profiles of the H i and He i emissionlines are more extended. The mean distance of the peak ofH i emission is 4.′′5 (9.5×10⁻³ pc) with a standard deviationof 1′′. In the case of He i emission, its maximum is locatedbetween the H i and [O iii] zones –as it is expected con-sidering the ionization potential of this ion (24.6 eV)– at5.′′5 (11.6×10⁻³ pc) with respect to the peak of [O i] emis-sion. The He i emission distribution represented in Fig. 9corresponds to the line at 6678 A, which permits to avoidproblems related to self-absorption due to it comes from asinglet state. Finally, the [O iii] zone reaches its maximumvalue at 7.′′6 (16.1×10⁻³ pc).
In contrast to the BB, the ionization structure of NE-Orion-S has not been described in the literature. Taking intoaccount the distances estimated in Table 2, the distributionof the spatial profiles shown in Fig. 9 and comparing withthe results for the BB, it is clear that we can not resolve theionization structure of the NE-Orion-S as well as of the BBbecause this front is much tilted with respect to the line ofsight. In their figure 5b, Wen & O’Dell (1995) present thegeometry of their Orion Nebula model along a cut with aposition angle of 226◦, which passes close to the southeastcorner of our NE-Orion-S field. At a distance of 30′′ fromthe center of our field, the model by Wen & O’Dell (1995)indicates that the MIF has an inclination of about 60◦ withrespect to the line of sight and after that the MIF remainsrather parallel to the plane of the sky. The properties of thenebular structure to whom NE-Orion-S belongs, the Orion-S cloud, have been recently reviewed by O’Dell et al. (2009)showing that it should be located in the foreground with anunknown inclination as well as an uncertain placement inthe three-dimensional space, but at a similar distance withrespect to θ1Ori C as that of the MIF in the background(0.182 pc). The inclination angle of the NE-Orion-S haveto be such to produce the observed distances between lineemission maxima given in Table 2, where, on the one hand,the emission of [S ii] and [O ii] and, on the other hand, theemissions of H i, He i and [O iii] are not well separatedat our spatial resolution. We can compare the data of Ta-ble 2 for the BB and NE-Orion-S to obtain a first orderestimation of the NE-Orion-S inclination. Assuming a pro-portional relation between the bar inclination with respectto the plane of the sky and the average distances with re-spect to the [O i] maximum emission of Table 2, we haveestimated that the plane of the NE-Orion-S should be tiltedabout 48◦±13◦ with respect to the line of sight. This an-gle was calculated as a weighted average of the individualestimations for each emitting zone. In addition, it is impor-
tant to note that the NE-Orion-S has a complex structureof shadowed regions and other features as we see in Fig. 1as well as in the new combined image of the Huygens re-gion obtained by J.R. Walsh using a drizzle technique toproduce a mosaic with a resolution of 0.′′1 over the wholefield3. Furthermore, the proximity and unknown exact po-sition with respect to the Trapezium cluster is also playinga role on the geometry of what we observe as we mentionin §5.1. Therefore, it can be difficult to interpret this ion-ization front as a simple slab with a given inclination. Inthis sense, our analysis of the individual spatial profiles ex-tracted parallel to the main diagonal of the NE-Orion-S fieldcan give further information about the complex structure ofthe NE-Orion-S. We have noted that the emission of [S ii]and [O ii] are much separated in the profiles extracted be-low –to the southeast of– the main diagonal than above it.In fact, we have estimated that the average distances be-tween the emission peaks of [S ii] and [O ii] and that of [O i]are of about 0.′′7±0.′′4 and 1.′′9±0.′′9 below the main diago-nal, and 0.′′1±0.′′3 and 0.′′6±0.′′3 above it. This fact suggeststhat the inclination of the NE-Orion-S is not constant alongthe observed field. Below the main diagonal, the plane ofthe NE-Orion-S seems to be less inclined with respect tothe line of sight –more edge-on. But, above the main diago-nal, the inclination angle is larger and the peaks of the lineemission of the different ionic species can not be resolved.The variation of the inclination of the NE-Orion-S along thefield may also explain the change of the width of the area ofhigh [N ii]/Hα ratio –a good indicator of the inclination ofan ionization front, as it is commented in §5.1– across thefield (see Fig. 5), which seems to be wider below the maindiagonal.
In Fig. 9 we have also plotted the spatial profiles ofphysical conditions of the BB and NE-Orion-S along thesame diagonals as in the case of upper panels. Here, someof the results commented in §5.2 are more clearly seen:Te([N ii]) is always higher than Te([O iii]), but they tend tobe more similar inside te bars. For the NE-Orion-S we cannote a correlation between the ne and Te([N ii]) profiles,where lower temperatures are reached where the densitiesare higher. At the BB, this effect is not as clear as in thecase of NE-Orion-S, this can be due to the lower densitiesof the BB.
6.2 Abundance discrepancy problem
The Orion Nebula is an unique object to analyse and exploreparticular problems in common with other H ii regions. Thisis the case of the well known abundance discrepancy (AD)problem, i.e. the disagreement between the abundances ofthe same heavy-element ion derived from CELs and RLs.The AD problem is quantified making use of the AD factor,ADF, which can be defined for a given ion as
ADF(Xi+) = log(Xi+
H+
)RL− log
(Xi+
H+
)CEL
. (2)
From intermediate and high resolution spectroscopy,several works have found that the ADF(O2+) is always be-tween 0.1 and 0.3 dex in Galactic and extragalactic H ii
3 J.R. Walsh webpage: http://www.stecf.org/ jwalsh/
c© 2010 RAS, MNRAS 000, 1–15
Integral field spectroscopy in the Orion Nebula 13
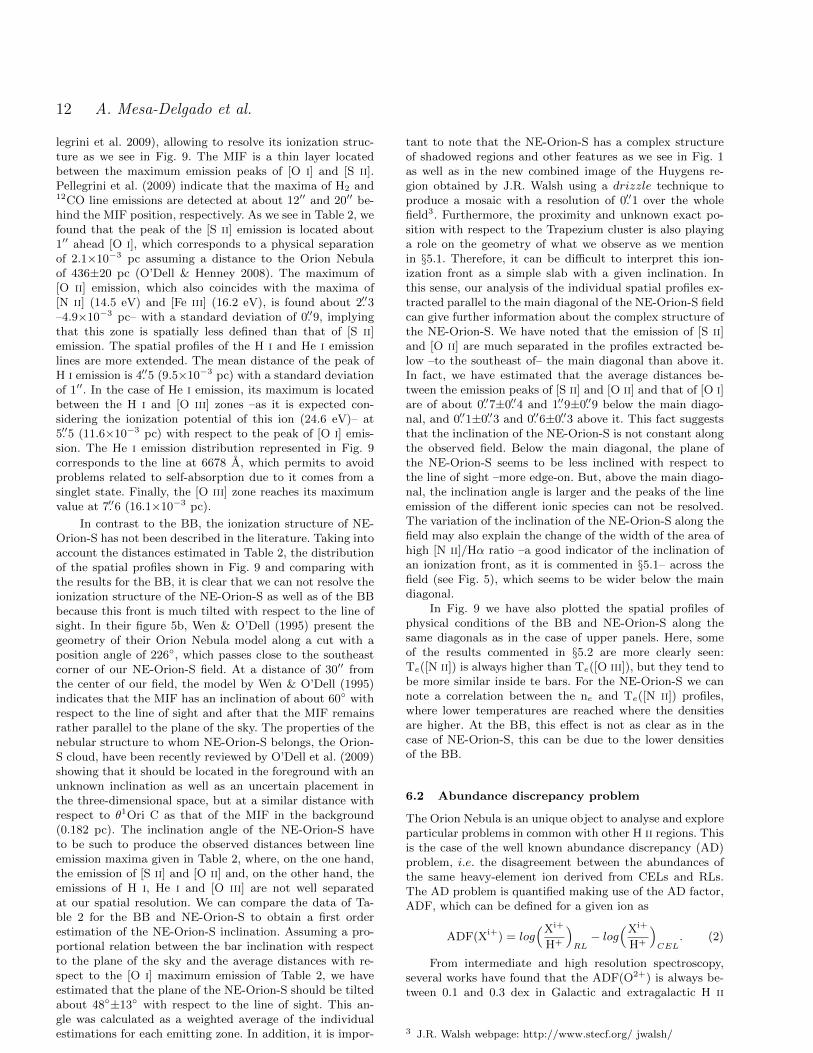
Figure 10. Spatial distribution of ADF(O2+) for the NE-Orion-Swith Hα contours overplotted.
regions (see e.g. Esteban et al. 2002; Tsamis et al. 2003;Esteban et al. 2004; Garcıa-Rojas & Esteban 2007; Lopez-Sanchez et al. 2007; Mesa-Delgado et al. 2008; Esteban et al.2009; Mesa-Delgado & Esteban 2010). Garcıa-Rojas & Es-teban (2007) argued that the AD problem in H ii regionsseems to be consistent with the predictions of the tempera-ture fluctuation paradigm proposed by Peimbert (1967) andparametrized by the mean square of the spatial variationsof temperature, the so-called t2 parameter. Under this hy-pothesis, the AD would be produced by the very differenttemperature dependence of the emissivities of both kinds oflines and the abundances from RLs would be the represen-tative ones of the ionized gas. However, the existence andorigin of such temperature fluctuations are still controver-sial and the AD problem remains open. Other authors asTsamis & Pequignot (2005) and Stasinska et al. (2007) haveproposed a different hypothesis to explain the AD problemin H ii regions. Based on the model for heavy-element mix-ing of Tenorio-Tagle (1996), Stasinska et al. (2007) proposethat the presence of cold metal-rich droplets of supernovaejecta still not mixed with the ambient gas of the H ii regionswould produce most of the RL emission, while CEL emissionwould be produced by the ambient gas, which would havethe expected composition of the local interstellar medium.In such case, the abundances from CELs would be the trulyrepresentative ones of the nebula. Recently, the studies per-formed in the Orion Nebula by Mesa-Delgado et al. (2009),Tsamis et al. (2011) and Simon-Dıaz & Stasinska (2011)have provided new observational clues to address this puz-zling issue. Mesa-Delgado et al. (2009) obtained echelle spec-troscopy of the HH 202-S separating the kinematic com-ponent of the background emission from that of the gasflow finding clearly higher ADF(O2+) values at the high-velocity component. This result suggests a possible relationbetween the ADF(O2+) and the gas flow velocity. Tsamiset al. (2011) carried out a high-spectral resolution analysisof the protoplanetary disc LV2 with FLAMES. Their studyof LV2 emission with the nebular background subtractedshows ADF(O2+) values which are basically zero. This sur-prising result seems to be related to the high electron densi-ties expected in these kind of objects, which affect the ionicabundances derived from CELs. Therefore, it is necessary toexplore the behaviour of the ADF(O2+) in other morpholog-
ical structures of the Orion Nebula –as stratified ionizationfronts– in order to better understand and constrain the ADproblem. Finally, we consider important to comment the re-cent remarkable result by Simon-Dıaz & Stasinska (2011),who find that the nebular oxygen total abundances derivedfrom RLs agrees better with the stellar abundances of B-typestars of the Orion Association than those determined fromCELs. This result is an indication that nebular abundancesobtained from RLs may be more reliable than those derivedfrom the standard method based on CELs and thereforestressing the importance of investigating the AD problem.
As we pointed out in §5.3 we derived O2+ abundancesfrom RLs in the NE-Orion-S field. Subtracting these abun-dances from those obtained from CELs (Fig. 7) we find thespatial distribution of the ADF(O2+), which is presented inFig. 10. As we can see, the ADF(O2+) seems to be slightlyhigher at the northeast corner of the field, but the mapdoes not show any remarkable structure inside the ioniza-tion front. The range of the variations goes from 0.05 to0.25 dex with a typical error of about 0.12 dex for eachspaxel. However, we have checked that the extreme valuesof the ADF(O2+) correspond typically with spaxels with lowsignal-to-noise ratio in the O ii RLs of their spectra. There-fore, not particular variations of the ADF(O2+) are relatedto the presence of stratified ionization fronts, at least withthe properties and physical conditions of the NE-Orion-Sand the spatial resolution of our observations. The meanvalue of the ADF(O2+) in the field is about 0.14 dex with astandard deviation of about 0.05 dex. Therefore, there is areal difference between the O2+ abundances from RLs andCELs, which is in the range between 21% and 44%. Thisis precisely the value found in our previous studies of theOrion Nebula (e.g. Esteban et al. 2004; Mesa-Delgado et al.2008).
7 CONCLUSIONS
In this paper we analyse integral field optical spectroscopyof two two remarkable structures related to ionization frontsof the Orion Nebula: the Bright Bar (BB) and the northeastedge of the Orion South cloud (NE-Orion-S). In both fields,we have mapped emission line fluxes and ratios, physicalconditions and chemical abundances at spatial scales of 1′′.
The maps clearly show the ionization stratification ofboth ionization fronts, which present rather different incli-nation angles as well as different distances with respect toθ1Ori C, the main exciting source of the nebula. The ioniza-tion structure of the BB is well resolved because the ioniza-tion front is almost edge-on –inclination angle of 7◦ with re-spect to the line of sight–, while the NE-Orion-S is a portionof the Orion-S cloud suspended within the main body of thenebula, which is more tilted and presents a more complexstructure. We have analysed spatial profiles of selected emis-sion lines of ions with different ionization potential and esti-mated the average distances of the peaks of the emission ofthese lines with respect to the maximum of [O i]. Comparingthose distances in both fronts, we have estimated that theplane of the NE-Orion-S field could be tilted about 48◦±13◦
with respect to the line of sight. However, the distances be-tween the peaks of the lines with respect to [O i] change inthe different spatial profiles extracted for the NE-Orion-S,
c© 2010 RAS, MNRAS 000, 1–15
14 A. Mesa-Delgado et al.
indicating that the inclination angle of this ionization frontshould vary across the observed field.
The maps of electron density, ne(S ii]), show that NE-Orion-S is much denser than the BB. The NE-Orion-S has amean density of about 10900 cm−3, while the BB has 4370cm−3. In both cases, the [S ii] lines may be somewhat af-fected by collisional de-excitation because the nominal val-ues of ne we find are of the order of their critical densities.In any case, this de-excitation should not be severe due tothe rather similar ne we determine from [Fe iii] lines. Thestructure of the temperature maps are rather featureless andTe([N ii]) is usually higher than Te([O iii]), specially outsidethe bars. The maps of total O abundance show mean valuesconsistent with previous determinations of the literature forthe Orion Nebula, but they show a pattern very similar tothe maps of O+/H+ ratio and ne([S ii]). The spaxels withhigher ne values also show higher O+ and O abundances. Wefind that considering values of ne slightly lower than thosedetermined from the [S ii] line ratio –but of the order ofthe quoted uncertainties– the problem can be satisfactorilysolved.
Finally, the higher signal-to-noise ratio of the spectrain the NE-Orion-S field allows us to detect, measure andmap the faint RLs of O ii and C ii. We explore the abun-dance discrepancy problem in this field comparing the O2+
abundance maps derived from CELs and RLs, finding a fea-tureless spatial distribution for the abundance discrepancyfactor of O2+, ADF(O2+), which shows values ranging be-tween 0.05 and 0.25 dex with a typical error of about 0.12dex. The mean ADF(O2+) is 0.14±0.05 dex, in excellentagreement with other previous determinations in other areasof the Orion Nebula –except at Herbig-Haro objects (Mesa-Delgado et al. 2008, 2009) and the LV2 protoplanetary disc(Tsamis et al. 2011). This result implies that the O2+ abun-dances from RLs are between 21% and 44% larger than thosefrom CELs and that there is not any particular variation ofthe ADF(O2+) related to the presence of stratified ionizationfronts, at least for the properties and physical conditions ofthe NE-Orion-S and the spatial resolution of our observa-tions
ACKNOWLEDGMENTS
We are very grateful to the referee of this paper, C.R. O’Dell,for his useful comments and suggestions. We also thankW. Henney, C. Morriset and Y. Tsamis their helpful com-ments and correspondence. This work has been funded bythe Ministerio de Educacion y Ciencia (MEC) under projectAYA2007-63030.
REFERENCES
Baldwin J. A., Ferland G. J., Martin P. G., Corbin M. R.,Cota S. A., Peterson B. M., Slettebak A., 1991, ApJ, 374,580
Balick B., Gammon R. H., Hjellming R. M., 1974, PASP,86, 616
Bally J., O’Dell C. R., McCaughrean M. J., 2000, AJ, 119,2919
Blagrave K. P. M., Martin P. G., Baldwin J. A., 2006, ApJ,644, 1006
Blagrave K. P. M., Martin P. G., Rubin R. H., Dufour R. J.,Baldwin J. A., Hester J. J., Walter D. K., 2007, ApJ, 655,299
Costero R., Peimbert M., 1970, Boletın de los Observato-rios Tonantzintla y Tacubaya, 5, 229
Davey A. R., Storey P. J., Kisielius R., 2000, A&AS, 142,85
Doi T., O’Dell C. R., Hartigan P., 2004, AJ, 127, 3456Esteban C., Bresolin F., Peimbert M., Garcıa-Rojas J., Pe-imbert A., Mesa-Delgado A., 2009, ApJ, 700, 654
Esteban C., Peimbert M., Garcıa-Rojas J., Ruiz M. T.,Peimbert A., Rodrıguez M., 2004, MNRAS, 355, 229
Esteban C., Peimbert M., Torres-Peimbert S., EscalanteV., 1998, MNRAS, 295, 401
Esteban C., Peimbert M., Torres-Peimbert S., RodrıguezM., 2002, ApJ, 581, 241
Garcıa-Dıaz M. T., Henney W. J., 2007, AJ, 133, 952Garcıa-Dıaz M. T., Henney W. J., Lopez J. A., Doi T.,2008, Rev. Mexicana Astron. Astrofis., 44, 181
Garcıa-Rojas J., Esteban C., 2007, ApJ, 670, 457Garcıa-Rojas J., Pena M., Peimbert A., 2009, A&A, 496,139
Hester J. J., 1991, PASP, 103, 853Hester J. J., Gilmozzi R., O’dell C. R., Faber S. M., Camp-bell B., Code A., Currie D. G., Danielson G. E., EwaldS. P., Groth E. J., Holtzman J. A., Kelsall T., Lauer T. R.,Light R. M., Lynds R., O’Neil Jr. E. J., Shaya E. J., West-phal J. A., 1991, ApJ, 369, L75
Hohenkerk C. Y., Sinclair A. T., 1985, The Computation ofAngular Atmospheric Refraction at Large Zenith Angles.Royal Greenwich Observatory
Johansson S., Zethson T., Hartman H., Ekberg J. O.,Ishibashi K., Davidson K., Gull T., 2000, A&A, 361, 977
Kassis M., Adams J. D., Campbell M. F., Deutsch L. K.,Hora J. L., Jackson J. M., Tollestrup E. V., 2006, ApJ,637, 823
Lopez-Sanchez A. R., Esteban C., Garcıa-Rojas J., Peim-bert M., Rodrıguez M., 2007, ApJ, 656, 168
Marconi A., Testi L., Natta A., Walmsley C. M., 1998,A&A, 330, 696
Mesa-Delgado A., Esteban C., 2010, MNRAS, 405, 2651Mesa-Delgado A., Esteban C., Garcıa-Rojas J., 2008, ApJ,675, 389
Mesa-Delgado A., Esteban C., Garcıa-Rojas J., LuridianaV., Bautista M., Rodrıguez M., Lopez-Martın L., Peim-bert M., 2009, MNRAS, 395, 855
Mesa-Delgado A., Lopez-Martın L., Esteban C., Garcıa-Rojas J., Luridiana V., 2009, MNRAS, 394, 693
O’Dell C. R., 2001, PASP, 113, 29O’Dell C. R., Henney W. J., 2008, AJ, 136, 1566O’Dell C. R., Henney W. J., Abel N. P., Ferland G. J.,Arthur S. J., 2009, AJ, 137, 367
O’Dell C. R., Peimbert M., Peimbert A., 2003, AJ, 125,2590
O’Dell C. R., Wong K., 1996, AJ, 111, 846O’Dell C. R., Yusef-Zadeh F., 2000, AJ, 120, 382Oke J. B., 1990, AJ, 99, 1621Osterbrock D. E., Ferland G. J., 2006, Astrophysicsof gaseous nebulae and active galactic nuclei.2nd. ed. Sausalito, CA: University Science Books
c© 2010 RAS, MNRAS 000, 1–15
Integral field spectroscopy in the Orion Nebula 15
Peimbert A., Peimbert M., 2005, in Torres-Peimbert D.,MacAlpine G., eds, Rev. Mexicana Astron. Astrofis. Conf.Ser. Vol. 23, Oxygen Recombination Line Abundances inGaseous Nebulae. p. 9
Peimbert M., 1967, ApJ, 150, 825Pellegrini E. W., Baldwin J. A., Ferland G. J., Shaw G.,Heathcote S., 2009, ApJ, 693, 285
Pogge R. W., Owen J. M., Atwood B., 1992, ApJ, 399, 147Quinet P., 1996, A&AS, 116, 573Roth M. M., Kelz A., Fechner T., Hahn T., Bauer S.-M.,Becker T., Bohm P., Christensen L., Dionies F., PaschkeJ., Popow E., Wolter D., Schmoll J., Laux U., AltmannW., 2005, PASP, 117, 620
Rubin R. H., Martin P. G., Dufour R. J., Ferland G. J.,Blagrave K. P. M., Liu X.-W., Nguyen J. F., BaldwinJ. A., 2003, MNRAS, 340, 362
Rubin R. H., Simpson J. P., Haas M. R., Erickson E. F.,1991, ApJ, 374, 564
Sanchez S. F., Cardiel N., Verheijen M. A. W., Martın-Gordon D., Vilchez J. M., Alves J., 2007, A&A, 465, 207
Seidelmann P. K., 1992, Explanatory Supplement to theAstronomical Almanac. University Science Books
Shaw R. A., Dufour R. J., 1995, PASP, 107, 896Simon-Dıaz S., Herrero A., Esteban C., Najarro F., 2006,A&A, 448, 351
Simon-Dıaz S., Stasinska G., 2011, A&A, 526, A48Stasinska G., Tenorio-Tagle G., Rodrıguez M., HenneyW. J., 2007, A&A, 471, 193
Storey P. J., 1994, A&A, 282, 999Storey P. J., Hummer D. G., 1995, MNRAS, 272, 41Tauber J. A., Tielens A. G. G. M., Meixner M., FoldsmithP. F., 1994, ApJ, 422, 136
Tenorio-Tagle G., 1996, AJ, 111, 1641Tielens A. G. G. M., Meixner M. M., van der Werf P. P.,Bregman J., Tauber J. A., Stutzki J., Rank D., 1993, Sci-ence, 262, 86
Tsamis Y. G., Barlow M. J., Liu X.-W., Danziger I. J.,Storey P. J., 2003, MNRAS, 338, 687
Tsamis Y. G., Pequignot D., 2005, MNRAS, 364, 687Tsamis Y. G., Walsh J. R., Vılchez J. M., Pequignot D.,2011, MNRAS, 412, 1367
van der Werf P. P., Stutzki J., Sternberg A., Krabbe A.,1996, A&A, 313, 633
van der Wiel M. H. D., van der Tak F. F. S., OssenkopfV., Spaans M., Roberts H., Fuller G. A., Plume R., 2009,A&A, 498, 161
Vasconcelos M. J., Cerqueira A. H., Plana H., Raga A. C.,Morisset C., 2005, AJ, 130, 1707
Walmsley C. M., Natta A., Oliva E., Testi L., 2000, A&A,364, 301
Walsh J. R., Roy J. R., 1990, in D. Baade & P. J. Gros-bol ed., European Southern Observatory Conference andWorkshop Proceedings Vol. 34, Area Spectroscopy andCorrection for Differential Atmospheric Refraction. p. 95
Walter D. K., Dufour R. J., Hester J. J., 1992, ApJ, 397,196
Walter D. K., Dufour R. J., Hester J. J., 1993, Rev. Mexi-cana Astron. Astrofis., 27, 207
Wen Z., O’Dell C. R., 1995, ApJ, 438, 784Young Owl R. C., Meixner M. M., Wolfire M., TielensA. G. G. M., Tauber J., 2000, ApJ, 540, 886
Zhang H., 1996, A&AS, 119, 523
Zuckerman B., 1973, ApJ, 183, 863
c© 2010 RAS, MNRAS 000, 1–15