Appendices for CPP Proposal - Orion
505
Appendices for CPP Proposal 1 PwC Report on Catastrophic Event Cost Recovery 2 James Mellsop and Will Taylor of NERA Expert Report 3 Linetech Consulting Report on Proposed Reliability Standards 4 Satisfaction of CPP IM information requirements 5 Modifications to Schedule E templates 6 Sub-transmission network architecture review 7 11kV urban network architecture review 8 Wire Scan’s Cable Testing Report 9 Detailed data tables for proposed quality standards 10 Regulatory decisions regarding catastrophic events 11 Marsh’s Report on Orion’s Network Catastrophe Insurance 12 Quantity growth trends 13 Detailed calculations for weighted average growth in quantities 14 SKM’s Report on Initial RAB Adjustments 15 Depreciation by asset type 16 Engineer’s Report on Non Standard Asset Lives 17 Recoverable costs – verifier 18 Recoverable costs – auditor 19 Recoverable costs – engineer 20 Project and programme schedule summary 21 Summary of policies 22 Consultants’ reports 23 References to AMP 24 Asset Management Policy 25 DSA (extract) 26 Detailed schedule of asset values 27 Construction cost benchmarks 28 EDB opex benchmarks
-
Upload
khangminh22 -
Category
Documents
-
view
2 -
download
0
Transcript of Appendices for CPP Proposal - Orion

Appendices for CPP Proposal
1 PwC Report on Catastrophic Event Cost Recovery
2 James Mellsop and Will Taylor of NERA Expert Report
3 Linetech Consulting Report on Proposed Reliability Standards
4 Satisfaction of CPP IM information requirements
5 Modifications to Schedule E templates
6 Sub-transmission network architecture review
7 11kV urban network architecture review
8 Wire Scan’s Cable Testing Report
9 Detailed data tables for proposed quality standards
10 Regulatory decisions regarding catastrophic events
11 Marsh’s Report on Orion’s Network Catastrophe Insurance
12 Quantity growth trends
13 Detailed calculations for weighted average growth in quantities
14 SKM’s Report on Initial RAB Adjustments
15 Depreciation by asset type
16 Engineer’s Report on Non Standard Asset Lives
17 Recoverable costs – verifier
18 Recoverable costs – auditor
19 Recoverable costs – engineer
20 Project and programme schedule summary
21 Summary of policies
22 Consultants’ reports
23 References to AMP
24 Asset Management Policy
25 DSA (extract)
26 Detailed schedule of asset values
27 Construction cost benchmarks
28 EDB opex benchmarks

29 Network security gap
30 Letter from CCC on undergrounding
31 Emergency maintenance contract terms (extract)
32 Contract procedures and policies
33 Rider Levett Bucknall estimates
34 Davis Langdon estimates
35 Ian Harrison and Associates estimates
36 Project summary documents for identified projects
37 Asset management reports supporting identified projects

Appendix 1 PwC Report on Catastrophic Event Cost Recovery

PricewaterhouseCoopers, ABN 52 780 433 757Freshwater Place, 2 Southbank Boulevard, SOUTHBANK VIC 3006, GPO Box 1331, MELBOURNE VIC 3001T: 61 3 8603 1000, F: 61 3 8603 1999, www.pwc.com.au
Liability limited by a scheme approved under Professional Standards Legislation.
Mr. David Freeman-GreeneGeneral Manager CommercialOrionPO Box 13896Christchurch 2141 New Zealand
17 December 2012
Dear Mr Freeman-Greene
Long-term incidence of cost recovery following acatastrophic event
1. Summary and implications of findingsTerms of reference
The purpose of this report is to respond to Orion’s request for an expert report in the contextof the costs it incurred with respect to recent earthquakes in the Canterbury region. Orion’srequest, dated 4 October 2012, specifically asked as follows:
We seek an expert report from you which addresses the fundamental question as to“who should pay” for these uninsurable costs and losses following a catastrophic event,in the context of our CPP proposal. We consider specific consideration of theclaw-back (ie: ex post) and forecast (ex ante) nature of our CPP proposal is required.
In particular we require a report which considers the following:
i. The role of the Commerce Act, Part 4 Purpose Statement, including the tensionbetween each of the subparts of the Purpose Statement and the asymmetricrisks of under investment by EDBs
ii. The role of the Part 4 IMs, including the approach to asset valuation and cost ofcapital and CPP specific processes and rules
iii. The Part 4 and IM provisions for claw-back (section 52D and 53V) - includingrecoverable cost mechanisms (including the option for price smoothing beyondthe CPP period),and the requirements to consider financial hardship and priceshock
iv. Whether claw-back should compensate for uninsurable and unanticipated lostrevenue and extra costs caused by catastrophic events relative to DPPassumptions
v. The respective role of DPPs and CPPs in meeting the Part 4 Purpose

2
vi. The Energy Companies Act, which requires Orion to operate as a successfulbusiness
vii. Orion’s approach to insurance (in light of the Marsh expert report)
viii. Orion’s ability to manage its financial flexibility and resiliency through acombination of revenue, borrowings and its shareholder distribution policy
ix. The nature of Orion’s unanticipated costs and losses – for example there is not aone to one relationship between Orion’s extra costs and improvements inSAIDI/SAIFI performance and many of the unanticipated costs relate to securityof supply rather than short term reliability performance.
x. Orion’s obligation to consult with its consumers and other stakeholders (forexample ratepayers) about its CPP proposal.
xi. The relevance of other determinations to Orion’s CPP, including the proposedEDB DPP reset and Transpower’s price resets
xii. The relevance of the Commission’s CPP determination for Orion, to theoperation of Part 4 and the signals that will be sent to other regulated suppliers.
I have interpreted the request as requiring me to address two questions:
Where, considered over the long term, should the incidence of cost recovery laybetween Orion and its consumers?
Where costs are recovered from consumers, how should cost-recovery be spread overtime?
My conclusions on each of these matters are as follows. It has been convenient to addressthe above matters in a different order to those discussed above; however, Appendix Aindicates where each of these matters has been addressed in the report.
Long term incidence of cost recovery
A key objective of price regulation is to protect consumers from the misuse ofmonopoly power, while ensuring the continued and reliable provision of the service.These apparently competing objectives are almost universally settled by setting pricesthat permit the recovery of prudent and efficient costs, including a commercial return oninvestment. These tensions are reflected directly in the Purpose Statement for Part 4 ofthe Commerce Act.
Catastrophic events raise the cost of providing a service and, equivalently, leadto a loss of revenue. Accordingly, my answer to the first question set out above isthat, consistent with the treatment of costs in general, the efficient and prudentcosts caused by catastrophic events should be recovered from consumers.

3
The key choice that exists with respect to the recovery of the costs caused bycatastrophic events lies in how the compensation for these costs (including lowerrevenues) should best be provided, with the options being:
An allowance (akin to self insurance) under which the regulated business gets anallowance every year based on a forecast about the frequency andconsequences of such an event (but the supplier bears any windfall gain or lossassociated with these forecasts being incorrect), or
Compensation for the actual costs incurred after the event has occurred.
My view is that the latter regime (compensation after the event occurred) hassubstantial practical advantages over the former. It is also consistent with theassumptions built into the current price controls, and is clearly the approach that isassumed in the new Part 4 of the Commerce Act and in the Commerce Commission’sInput Methodologies.
I also note that:
Orion could expect to be asked to demonstrate the prudence and efficiency of itsdecisions prior to and after the event (although I note that this should focus onthe prudence of decisions in the light of the information available at the time andso avoid applying undue hindsight). However, from the information I havereviewed, Orion would appear to be well placed to demonstrate that it wasprudent in its preparations for, and response to, this event. For example, I aminformed that Orion factored the prospect of earthquakes in to its networkdecisions, which it says delivered substantial, quantifiable benefits to itself andconsumers after the earthquakes. I have also reviewed an expert report fromMarsh that concluded that Orion’s insurance decisions prior to the event wereprudent and in line with good industry practice.
The fact that Orion is community owned does not alter these conclusions. TheEnergy Companies Act requires it to operate as a successful business, andresource efficiency generally is advanced if it sets prices that recover the full costof service (which is the outcome achieved if prices are set as if it is privatelyowned). Moreover, the effect of the earthquake has been to raise the cost ofproviding electricity distribution services (through requiring repair andreplacement of assets, loss of revenue, etc.), which would have been unaffectedby who owns the assets.
Timing of cost recovery
When considering the recovery of costs associated with a catastrophic event, there is atension between ensuring prices provide a sufficient cash flow to fund the costs for thebusiness and the risks of distorting the consumption decisions of consumers (i.e.,discouraging otherwise efficient consumption).
For the avoidance of doubt, the full cost caused by the catastrophic event shouldbe recovered from consumers. The issue considered in this section is how that
4
cost recovery should be spread over time in a NPV neutral manner so as to helpmitigate the impact on consumers.
The risk of reduced revenue from changes in consumer behaviour can be mitigated byextending, or delaying, the recovery of costs associated with a catastrophic event, andso seeking to avoid any short term “spike” in prices. There is, however, a natural limit tothe extent cost recovery can be delayed or extended. This is because the businessrequires cash flow in order to fund its costs and to maintain the deepest and lowestforms of debt finance.
I recommend that Orion and the Commerce Commission give explicit consideration tothe need to minimise distorting customer consumption decisions while meeting thegenuine cash flow needs of the business when setting a price path to recover thesecosts. In this regard, I note that:
While decisions will be made about the recovery period for each cost item (i.e.,the various elements of claw-back, the recovery of the residual cost of damagedassets, recovery of new expenditure), it is the aggregate impact of the separaterecoveries that matters for consumers as well as cash flow. The reasonablenessof each separate recovery option should be tested against the impact on theoverall result on consumers.
If the recovery of claw-back is to be spread over multiple regulatory periods (i.e.,more than 5 years), the Commission should provide sufficient clarity about whatapproach it will take and the mechanisms it will use to do so in order to minimiseany risk to Orion as to how amounts that remain unrecovered after the initial CPPwill be treated in future controls.
Some implications of our conclusions
This section summarises the implications of the findings above for some of the questions thatinterested parties may have with Orion’s proposals. This is in recognition of Orion’sobligations when preparing a CPP application to consult with its stakeholders.
IS ORION PROPOSING A DIFFERENT TREATMENT TO FIRMS OPERATING IN COMPETITIVE MARKETS?
A pre-requisite for investment in any market – including the most vigorously competitive – isthat the investor expects to make a commercial return on that investment after recoveringefficient costs. These costs include those incurred as a result of catastrophic events, likemajor earthquakes. Against this objective, Orion’s proposal is wholly consistent with theoutcome expected in any form of competitive market.
Where Orion’s proposed approach is different to the outcome expected in some forms ofcompetitive market is in when those costs are recovered. Firms in the most vigorouslycompetitive markets would not be able to pass on some of the additional costs caused by acatastrophic event after the event has occurred – specifically, only costs that are borne by anew competitor would be expected to be reflected in the market price, whereas theincumbent would bear additional costs (for example, the repair of damage to existing

5
assets).1 As a result, firms in competitive markets insure against such losses and, whereinsurance is too costly or unavailable, add an increment to prices based on the “best guess”of the cost caused by such events (in turn reflecting the “best guesses” of the likelihood andconsequence of future catastrophic events). In contrast, Orion is proposing to recover thecost after the event has occurred.
However, there are a number of reasons for treating Orion in this manner.
First, the proportion of Orion’s exposure to such events that cannot be economicallyinsured is much greater than for the typical firm in a competitive market, which theMarsh report discussed above notes is common to electricity distribution businesses inNZ and globally. Thus, while Orion insures just like firms in competitive markets, theuninsured “gap” is much more significant.
Secondly, the fact that Orion is a monopoly and has its prices regulated means thatthere is the flexibility to include a much more accurate recovery of cost in its regulatedcharges than would occur in the competitive market discussed above. That is, ratherthan making the “best guess” about the effect of a future event – which brings with itthe risk of overcharging as well as undercharging consumers – the actual cost can berecovered.
Thirdly, a fair interpretation of history suggests that Orion (like other EDBs) had notbeen recovering through their charges the anticipated, uninsured “gap” in cost recoveryprior to the earthquakes.
Moreover, in an alternative form of competitive market, such costs could be passed on toconsumers after the event. The Commission has identified a market where competition existsat the time that long term contracts for infrastructure-like services are written. It would bepossible and logical for such a contract to include a more certain treatment of the recovery ofsuch costs.
However, if Orion expected to recover the actual cost caused by such an event after theevent, then this could have dampened its incentive to be efficient. Thus, it is reasonable forconsumers to expect Orion to demonstrate the prudence of its expenditure prior to and afterthe event.
SHOULD ORION EARN A COMMERCIAL RETURN FROM THE SUPPLY OF DISTRIBUTION SERVICES?
Orion’s regulated charges have been set such that a reasonable, commercial return wouldbe expected to be earned on investment after efficient costs have been recovered. Theallowable rate of return has been determined (by the Commission) on the basis of the returnthat would be available from an alternative investment and an adjustment for risk (electricitydistributors are treated as a low risk business).
While Orion is a council-owned business, it is reasonable for it generate a commercial returnfrom its investments. The reasons for this include the following.
1A catastrophic event will raise some costs for all competitors, which will be passed on toconsumers after the event. As an example, the cost of insurance generally increases after suchan event (and/or the coverage decreases).

6
First, Orion is required by the Energy Companies Act to operate as successfulbusiness. A critical requirement for the success of any business – and for a capitalintensive business in particular – is to make a commercial return.
Secondly, Orion is an important investment of its owner-councils. The option hasexisted (in principle at least) for its owners to sell Orion to private interests and investthe proceeds in alternative investments, in which case a reasonable commercial returnwould have been earned. Allowing Orion to generate a commercial return provides fora neutral outcome for its owners against this alternative.
Thirdly, including a commercial return in Orion’s regulated prices results in those pricesrecovering the full cost of providing the service (the return that is foregone by not beingable to invest in alternative, commercial activities is a key component of this cost).Setting cost-reflective prices encourages broader resource efficiency by encouragingconsumers to consider the cost that society bears for the provision of the service whendeciding whether and how to consume electricity.
Fourthly, as Orion’s owners are the councils whose areas are broadly, but not exactly,coincident with Orion’s territory, the local population could be expected to ultimatelypay for the additional costs borne by Orion, with the choice being whether this is direct(through electricity charges) or indirect (through higher council rates, being aconsequence of reduced earnings for the councils from their investment in Orion). Theformer could be seen to be a fairer means of spreading the cost burden as it wouldmean that an individual’s share would reflect its proportionate use of the electricityinfrastructure.
I consider that Orion’s proposed recovery of the costs caused by the earthquakes would bereasonable if Orion was privately owned. If Orion was privately owned, the character of thelosses caused by the earthquakes would be the same.
2. Overview and backgroundThis section sets out my understanding of the Terms of Reference provided to me by Orion.In addition, in order to inform the analysis of the issues, I set out some contextualinformation; namely relevant background information about Orion, and my understanding ofsome of the relevant consequences from recent earthquakes.
2.1. Scope of advice
The Terms of Reference from Orion has been provided in the context that it has incurredmaterial costs associated with recent earthquakes and that it is planning to submit acustomised price-quality path (CPP) associated with these costs. On this basis, I haveinterpreted the Terms of References as requiring me to address two key questions:
Where, considered over the long term, should the incidence of cost recovery laybetween Orion and its consumers?
Where costs are recovered from consumers, how should cost-recovery be spread overtime?

7
Orion has also identified a number of matters that I should have regard to when answeringthese questions. These relate predominately to the consideration of the regulatory frameworkOrion operates within, relevant statements by the Commerce Commission, the nature of thecosts and losses it has incurred, and relevant actions of Orion prior to, and following, thecatastrophic event. I have also been provided with a report from Marsh that assesses theprudence of Orion’s insurance purchases prior to the earthquakes occurring.
2.2. About Orion
Orion owns and operates the electricity distribution network in central Canterbury betweenthe Waimakariri and Rakaia rivers, and from the Canterbury coast to Arthur’s Pass.
Orion is a community owned company. The Christchurch City Council owns 89 per cent ofOrion and the Selwyn District Council owns the remaining 11 percent. This means that theconsumers of Orion’s services are effectively its shareholders.
While Orion is community owned, an important assumption in this report is that, forregulatory purposes, Orion should be treated the same as any other commercial entity. Thatis, it is assumed that it faces the same disciplines and pressures on returns as privatelyowned and financed entities. This assumption is based on my understanding that Orion isintended to operate as a fully commercial entity, and also based on my view that this wouldenhance the efficiency of service provision, which is addressed further in section 3.2.2.
2.3. Recent experience from earthquakes
Earthquakes on 4 September 2010 and 22 February 2011, in particular, caused extensivedamage to the Orion distribution network. The damage and losses for Orion from the 22February 2011 earthquake were an order of magnitude greater than for the previousearthquake.
There are three predominant impacts from the earthquakes for Orion:
It damaged electricity network assets needed to supply electricity to consumers. Someof the assets could be repaired while others required replacement. I am advised byOrion that the cost of repairing these assets is expected to exceed NZ$70 million.
Energy consumption has fallen and, as a consequence, revenue has fallen, and usageis expected to remain at levels lower than it would have been without the earthquakefor some time. The fall in energy consumption is largely due to residential, commercialand industrial consumers either moving away from the area or damage to their ownpremises and equipment constraining their capacity to consume electricity.
It has changed the location of the customer base within the region and therefore theexpected locations of growth. As a consequence, future capital expenditure is likely tobe higher to meet demand than it otherwise would have been.
3. Allocation of the long-term incidence of costsIn this section I consider the question of where the long-term incidence of costs should layfollowing a catastrophic event. Principally, the decision is whether these costs should beborne by Orion or consumers.

8
I first set out the economic principles that are relevant to considering the long-term incidenceof cost for a regulated electricity network business. I then consider the regulatory precedentand statements of the Commerce Commission as guidance on the approach that hasactually applied for Orion. Having regard to Orion’s actual behaviour prior to and followingthe earthquakes, I draw conclusions on where the incidence of costs should lay following acatastrophic event.
3.1. Relevant economic principles for the incidence of costrecovery
3.1.1. Importance of long term cost recovery
The purpose of economic regulation is to constrain the impact of the misuse of marketpower, but subject to the constraint that consumers place a high value on continued andreliable service provision, and therefore the simultaneous achievement of this outcome. Thistension between investment (and service provision) while not allowing undue monopoly rentsis reflected directly in the purpose statement for Part 4 of the Commerce Act,2 most notablyin factors (a) (incentive to innovate and invest) and (d) (suppliers limited in their ability toextract excessive profits).
The universal response by regulators (or at least those who deal with commercial entities inmarket economies) to these competing objectives is to set prices with reference to cost – thatis, to ensure that businesses can expect to recover operating costs and at least make acommercial return on investment, thus eliminating monopoly rents and generating prices thatare as low as is compatible with continued and reliable service provision. Indeed, it iscommon for a “safety margin” to be included in estimates of important inputs like the allowedreturn on investment in recognition that consumers would value additional confidence that areliable and secure service will be provided.
I observe for completeness that the outcome whereby regulated businesses have areasonable expectation that they will recover costs is not something that is unique to theregulated sector, but rather is an essential element for the long term sustainability of anybusiness. Absent an expectation of cost recovery it is not possible for a business to remain inoperation over the medium to longer term.
The expectation of future cost recovery is particularly important in the context of electricitynetworks. This reflects the essential service nature of electricity and that its provisioninvolves significant sunk assets with costs recovered over an extended period of time;sometimes up to 40 years or more. If investors perceived there were risks that they would notbe able to recover at least their efficient costs of service provision over time, there would bea diminished incentive to make future investments to the detriment of reliable supply forconsumers. I note that the Commission has endorsed strongly the importance of the regimeproviding firms with the expectation of recovering efficient cost, noting the following forexample:3
2 Commerce Act, section 52A.3 Commerce Commission, 2010, Input Methodologies Reasons Paper, December, p.36.

9
Investment (s 52A(1)(a)). In workably competitive markets, there is pressure on firms toundertake investments at an efficient level and at the socially optimal time. Superiorinvestment decisions are rewarded by greater than normal returns (i.e. normal profits)in the short to medium term, and it is this prospect of earning above-normal returns fora period that provides incentives for efficient investment (and efficiency moregenerally). If a regulated firm does not expect to make at least a normal return on itsefficient incremental investments going forward, it would be unable to maintain thequality of its services and would have no incentive to invest further in order to meet thegrowth in consumer demand.
3.1.2. Relevance of uncertain events
This also means that firms should be compensated, through prices to consumers, for anyone-sided costs and risks they may face, such as those that arise from a catastrophic event.
It is also important to be clear about what costs are relevant. It is not just the easily observedcosts of doing business that are important, such as recurrent operating expenditures andreasonably foreseeable capital expenditures. Cost recovery should also includecompensation for the less easily observed and/or uncertain costs associated with theservice. It is noted that all costs have a degree of uncertainty attached to them – and the onlydifferentiating factor of those that are the subject of this report is the fact that (prior to theearthquake) they were less certain than normal expenses.
I note for completeness that there is no conceptual difference from a regulatory perspectivebetween adverse events that cause a reduction in revenue (through reducing demand) andthose that occur to cost. An unexpected (and uncompensated) event that leads to areduction in anticipated revenue (arising from a reduction in demand) for a firm with largelyfixed costs will result in costs being unrecovered, just like an unexpected (anduncompensated) increase in costs. In this report I refer a reduction in energy usage andconsequent impact on anticipated revenue as an “expense” in order to keep the discussionas simple as possible; however, it is emphasised here that a proper treatment of changes todemand is equally important to a proper treatment of expenditure items.4
It is important here to appreciate the difference in what the regulatory WACC compensatesfor, the role of diversification in this regard, and how this relates to uncertain events.
The cost of capital is the return that investors need to expect on average in order to beinduced to hold a particular asset. A return equal to the cost of capital will compensateinvestors for the volatility of returns around this expected or average level. We know,however, that not all volatility affects the cost of capital – as a large portion of the riskcan be eliminated at no cost merely by holding an asset as part of a diversifiedportfolio. Financial models like the Capital Asset Pricing Model are directed towardsestimating the return required from a particular asset after taking account of suchmatters as the ability to diversify risk.
4 The reduction in revenue caused by the earthquake can be interpreted as akin to bad debts,which are typically recorded as expenditure items even though they relate to the non-receipt ofanticipated revenue.
10
A corollary of the above statement is that, when a regulator applies the regulatoryWACC to derive regulated revenues, the resulting cash flows need to deliver anexpected or average return equal to the WACC. This reference to expected or averagereturns means that the return needs to equate to the regulatory WACC after takingaccount of all of the possible future events that may occur, weighted by their probabilityof occurrence. If classes of costs are missed or ignored when setting regulatedrevenues, then the expected return will fall short of the regulatory WACC and the costrecovery discussed above will not occur.
Importantly, diversification by investors cannot reduce the effects of asymmetric events.Diversification is a technique that enables investors to reduce the risk premium required toinvest in a particular asset, it cannot reduce the cost of physically running a business (that is,operating, maintaining and investing in an asset).5 It follows that the ability for investors todiversify cannot reduce the cost associated with uncertain events any more than it canreduce operating and maintenance costs.
When discussing uncertain events, it is common to distinguish between symmetric andasymmetric events. The former events bring with them the prospect of downsideconsequences, but also upside potential.6 The effect of these sorts of events can be ignoredif it is reasonable to assume that the value of the downside and upside consequences arelikely to offset approximately (which is the definition of symmetry). However, the effects of acatastrophic event like an earthquake provide a clear example of a one-sided liability. That is,an event that, if it occurs, would cause damage and cost, but not deliver a correspondingprospect of an upside reward.
The above principles have been well accepted in Australia for some time, being succinctlydescribed in a regulatory decision over a decade ago:7
the Office noted investors should not expect to earn a return for risk that isassociated with events that are unique to a particular firm, given that this risk can beeliminated costlessly by holding a widely diversified portfolio of assets. However, itwas accepted that the price controls should be designed such that investors canexpect to earn the WACC on average, taking into account all potential events.
In addition, the Expert Panel that the Commission engaged to advise upon matters related tothe cost of capital also endorsed the observations above that asymmetric events are not
5 The discussion above assumes that the appropriate compensation in respect of an uncertainevent is to receive an allowance equal to the expected cost (also referred to as the actuariallyfair cost) associated with the event. This allowance does not include a risk premium (the latterbeing the amount that is provided in addition to the actuarially fair cost) and so implicitlyassumes that the required risk premium is already captured in the regulatory WACC.
6 An example may be the weather, with deviations from the average delivering either more or lessrevenue than would occur under average weather conditions.
7 Office of the Regulator-General, 2000, Electricity Distribution Price Review – Final Decision,September, pp.317-318.

11
naturally compensated through the regulatory WACC and that an additional compensationfor these matters should be considered. The Panel commented that:8
All three Panel members agree that asymmetric risks are real, potentially have largeimpacts on the firm, and therefore should not be ignored by the Commission.
3.1.3. Options for ensuring long run cost recovery in the presence ofuncertain events
There are two polar options for ensuring that the objective of long run cost recovery ismaintained in the face of uncertain (and asymmetric) events, which are to:
Polar option 1: Compensate the regulated business for the expected (actuarially fair)annual cost associated with such events (with this allowance occurring in advance ofand subsequent to, such events),9 or
Polar option 2: Wait for the relevant event to occur and then compensate the businessfor the costs that are caused.
Within these two options are the two key questions that arise with respect to these events,namely:
Who takes the risk associated with the consequences of the event – that is, if the risk issmaller or larger than expected, or if the ex ante compensation has been insufficient orhas been excessive, who bears the shortfall or keeps the surplus?
Under either option, consumers will bear the cost, but when will this cost be incurred?Will the cost recovery be smoothed over time, with this recovery commencing beforethe event, or just commence after the event has occurred?
For the two polar cases, the answers to these questions are clear, namely that:
Polar option 1: risk is transferred to the regulated business and cost recovery at leastcommences in advance of the event, as discussed above, and
Polar option 2: risk is borne by consumers and recovery occurs after the event.
The outworking of the two options is illustrated in the stylised example below. In thisexample, it is assumed that:
The business has an opening regulatory asset base (RAB) of 1000, which is fullyrecovered over the 5 year life of the asset
The regulatory WACC is 10 per cent (pre tax)
8 Franks, J., Lally, M., Myers, S., Recommendations to the New Zealand Commerce Commissionon an appropriate Cost of Capital Methodology, 18 December 2008, p. 37.
9 That is, if an event was expected to occur once every 40 years and have a cost of 100, then 2.5would need to be provided per annum (= 1/40 x 100). If the event did in fact only occur once in40 years, then the regulated business would recover 100 per event and be properlycompensated, ignoring the time value of money. If the event occurred in year 20, then thebusiness would have recovered half of the cost prior to the event, and then the remaindersubsequent to the event.

12
The business occurs “certain” ongoing costs of 10 per annum, and
There is a 5 per cent chance of an adverse event occurring in any one year that wouldcause a cost of 175, implying an actuarially fair cost associated with the uncertainevent of 8.75 per annum.
The messages from this example are as follows:
If uncertain costs are ignored when setting regulated revenues, but these exist, thenthe regulated business will be undercompensated (rows 9 to 13). While the regulator
[1] Year PV 1 2 3 4 5
[2] Regulated revenues if only "certain" costs are considered
[3] Regulated Revenues - capital 263.80 263.80 263.80 263.80 263.80
[4] Costs (certain) 10.00 10.00 10.00 10.00 10.00
[5] Regulated revenues - total 273.80 273.80 273.80 273.80 273.80
[6] Costs (certain) 10.00 10.00 10.00 10.00 10.00
[7] Expected cash flow 1,000.00 263.80 263.80 263.80 263.80 263.80
[8]
[9] But if there are uncertain (one-sided) costs
[10] Regulated Revenues - total 273.80 273.80 273.80 273.80 273.80
[11] Costs (certain) 10.00 10.00 10.00 10.00 10.00
[12] Costs (uncertain) 8.75 8.75 8.75 8.75 8.75
[13] Expected cash flow 966.83 255.05 255.05 255.05 255.05 255.05
[14]
[15] Response 1: Compensate for expected cost
[16] Ex ante position
[17] Regulated revenues - capital 263.80 263.80 263.80 263.80 263.80
[18] Costs (certain) 10.00 10.00 10.00 10.00 10.00
[19] Costs (expected cost of uncertain events) 8.75 8.75 8.75 8.75 8.75
[20] Regulated revenues - total 282.55 282.55 282.55 282.55 282.55
[21] Certain cost 10.00 10.00 10.00 10.00 10.00
[22] Uncertain cost 8.75 8.75 8.75 8.75 8.75
[23] Expected cash flow 1,000.00 263.80 263.80 263.80 263.80 263.80
[24]
[25] Ex post position if event occurs
[26] Regulated revenues - total 282.55 282.55 282.55 282.55 282.55
[27] Certain costs 10.00 10.00 10.00 10.00 10.00
[28] Uncertain cost - - 175.00 - -
[29] Actual cash flow 901.69 272.55 272.55 97.55 272.55 272.55
[30]
[31] Ex post position if event does not occur
[32] Regulated revenues - total 282.55 282.55 282.55 282.55 282.55
[33] Certain costs 10.00 10.00 10.00 10.00 10.00
[34] Uncertain cost - - - - -
[35] Actual cash flow 1,033.17 272.55 272.55 272.55 272.55 272.55
[36]
[37] Response 2: Take away risk and compensate if the uncertain event occurs
[38] Regulated revenues - capital 263.80 263.80 263.80 263.80 263.80
[39] Costs (certain) 10.00 10.00 10.00 10.00 10.00
[40] Costs (uncertain) - - 175.00 - -
[41] Regulated revenues - total 273.80 273.80 448.80 273.80 273.80
[42] Costs (certain) 10.00 10.00 10.00 10.00 10.00
[43] Costs (after uncertain event occurs) - - 175.00 - -
[44] Expected cash flow 1,000.00 263.80 263.80 263.80 263.80 263.80

13
will think it is providing cash flows with a present value of 1000 (and so NPV = 0, row7), the cash flow in fact has a present value of 966.83 (NPV = -33.17, row 13).
The two options for remedying this issue are either to compensate in advance for theexpected cost (rows 15 to 23) or compensate if the event occurs (rows 37 to 44).However, this example also points to potential issues with the options, namely that:
with ex ante compensation, the prospect exists that the regulated business will beundercompensated for the risk (rows 25 to 29) or overcompensated (rows 31 to35), depending upon the accuracy of the forecasts that fed into the ex anteallowance, and
with ex post recovery, a material cost will be incurred (and recoverable fromconsumers) if the event occurs – raising the question of how this should bespread over time.
A further implication of the last point is that both options will deliver the same outcomesfor the regulated business and consumers if the ex ante allowance is calculated usingthe “true” frequency and consequences of the catastrophic event. That is, the expectedor average payoff to the business and consumers should be the same under eitherapproach – where they differ is in who bears the risk if the ex ante allowance isincorrect.10
The relative merits of the alternative options are addressed in more length in Section 3.2.2.
It is noted here that a myriad of options exist between the two polar options discussed abovefor how the two questions posed above could be answered. Two that will be mentioned hereare that:
there could be cost recovery from consumers in advance of an event occurring, but atrue-up at the time of the event to account for the difference between the actual costand the amount recovered – in effect, advance recovery without the risk transfer, or
a risk transfer for some of the consequences associated with an event, but not all.
As implied by the last point, a key requirement for a model based on risk transfer to result incost recovery but without inappropriate monopoly rents being earned is for the bounds of thattransfer of risk to be clearly established up front (that is, prior to an event occurring), togetherwith the provision of the appropriate compensation. Once an event has occurred, theregulated business will have a strong incentive to argue for its exposure to be read narrowly,while consumers will have the incentive to advocate the opposite. Indeed, this is one of thekey shortcomings of a model that incorporates risk transfer, which is discussed further inSection 3.2.2.
3.1.4. Relevant questions in relation to Orion
As the earthquakes have now occurred, the most directly relevant question is what wasassumed about the allocation of risk associated with natural disasters in the current regime
10 The difficulties of getting an ex ante allowance correct – reflecting the difficulties of accuratelypredicting the frequency and consequences of such events – are immense, however.

14
and, related to this, whether there has been some form of pre-recovery from consumers thatshould now be taken into account. This is a factual question, requiring an analysis of how thecurrent price controls have been determined and the reasonable inferences from the contextin which that occurred. Some of the indicators that are most relevant would include whether:
There have been clear statements about the intended allocation of risk, and
Whether the revenues underpinning current prices could be said to include anallowance in respect of a risk that is absorbed (and, in that case, what allocation of riskthe particular allowance indicates).
Notwithstanding our view that the key question is a factual inquiry as to what risk allocationhas been factored into current prices, we also address the question from first principles – thatis, asking whether, of the risk allocations that could have been implemented, is the currentapproach appropriate? Anticipating the conclusions that are reached below, it is envisagedthat this will assist in Orion’s broader communications of the merits of its CPP application.
These two matters are addressed in the following section.
3.2. Assumptions of the current regulatory regime
3.2.1. “First principles” analysis of risk allocation
As discussed above, any option for dealing with the cost consequences of catastrophicevents must result in consumers bearing the cost of those events, at least in an “expectation”sense.11 The key question is whether the regulated business should be compensated inadvance of the event through an allowance that is akin to a self insurance premium, and thenbears the risk of the event, or whether the compensation to the regulated business is basedon the actual costs of the event. A second and related question is when consumers shouldpay these costs – should there be an effort to smooth them over time, including throughpayments being made in advance of the event, or should this await the occurrence of theevent. The smoothing naturally occurs if the regulated business is compensated through anannualised allowance akin to an insurance premium, but could be incorporated into a modelwhereby the compensation to regulated businesses is based ultimately upon on the cost ofthe event.
Implications of workably competitive markets
The starting point for analysis under the purpose statement is to address the question ofwhat would be expected to occur in workably competitive markets. The response of thisdepends in part on the form of workable competition that is taken as the hypothetical case.Two alternative formulations – and the implications – are as follows.
In a market where there are repeated transactions and continual entry and exit from themarket, firms will be limited in their ability to recover costs after the event, beingrestricted to only recovering the costs that new entrants would incur. Thus, to theextent that the event caused forward-looking costs to be higher, then these costs would
11 That is, to pay an annual amount equal to the actuarially fair cost of the event. This will recoverthe cost of the event over the average duration between events if all assumptions about the costof the event and frequency are correct.

15
be recovered after the event; however, other costs (such as the premature replacementof assets) could not be passed through into prices, which would be expected toaccount for the vast majority of the costs. However, it is also clear that firms would onlychoose to enter the market where it was able to set prices to compensate it for the risksand costs it expected to incur. The consequence is that, for the majority of the risksassociated with a catastrophic event, the cost associated with catastrophic eventswould be factored into prices in advance.
However, the Commission and its advisers during the Input Methodologies reviewreferred to different formulations of workable competition, with an apparently preferredformulation being one where users of a service were assumed to enter into long termcontracts for the service, with the competition taking place at the time of awarding thecontract. In such a market, it would be feasible for a different risk allocation to beagreed between the parties, with the risk associated with catastrophic events eitherbeing shared or borne by the user of the service.
Accordingly, I would conclude that an analysis of the more standard formulations of workablycompetitive markets would direct attention towards an ex ante compensation for the costconsequences of these events. This implies that consumers bear the cost of catastrophicevents through ex-ante compensation and “true up” would occur in light of the actualfrequency and consequences of such events. As well as being a product of competition (andthereby a constraint), the reliance upon ex ante recovery is more feasible in competitivemarkets given the greater ability for firms in such markets to insure against such events. Asnoted in the Marsh report, this is not the case for electricity network businesses.
In contrast, however, I note that the formulations of workably competitive markets that havebeen considered by the Commission as more relevant for infrastructure services are muchless definitive and encourage an inquiry into the merits of a particular risk allocation.
Allocating the risk of catastrophic events – the regulatory context
The specific nature of catastrophic events and their potential effect on electricityinfrastructure pose a number of challenges for the design of regulation where firms areregulated. In particular, such events:
May have a substantial effect on cost, but
Cause a range of costs, some of which are subtle and difficult to clearly separate out(for example, in the case of Orion, the effect of the earthquakes on the cost of futureaugmentation expenditure in view of the changed location of demand),
Be very difficult to predict the cost and the frequency of such events in advance, and
Lack access to complete insurance from external provides at a reasonable price, inparticular with respect to lines and cables.
This creates a number of important implications where firms are regulated and prices aredetermined with reference to cost.
First, it would be impracticable to apply an ex ante regime to all of the consequences of acatastrophic event. In particular, this would require the regulator to identify and separate out

16
costs that are considered incremental to the event. Some components to the incrementalcost may be obvious (such as the premature replacement of damaged assets) whereasothers may be more difficult to identify (such as the additional cost of maintaining a securesystem in view of the changed location of demand). Moreover, if the incremental costs wereto be separated out, this would require such a separation to be performed (in principle atleast) at all future reviews of prices. Moreover, even for those cases where it appears at firstsight to be obvious as to what additional cost has been caused by the event, the dividing linemay turn out to be much less clear in practice.
Secondly, the fact that the scope of external insurance (at least for a reasonable price) islimited has two further implications:
A substantial part of the ex ante allowance would be in the nature of a self insurancepremium that could not be determined with reference to observed market prices. This,in turn, would require the regulator to form a view upon the frequency of catastrophicevents and their expected consequences. This is an extremely complex and possiblyimpossible task – after all, a key reason as to why external insurance is not availablefor the full range of consequences of a catastrophic event is because of the difficulty ofpredicting the frequency and consequences of such events. This task then is likely tobecome extremely contentious because if the assumed frequency and/orconsequences of the event are incorrect then windfall gains (loss to consumers) orlosses (gain to consumers) will accrue.
The regulated business would bear a substantial share of the risk associated with suchevents. Depending upon the size of the event, this could expose the business to a riskthat could affect its viability and ability to raise finance, and arising at the very timewhen substantial work would be required to restore service to consumers.
It follows that, viewed through the lens of regulation and absent access to comprehensiveexternal insurance at a reasonable price, an ex ante regime for catastrophic events has anumber of undesirable characteristics. The regime is likely to invoke substantial controversy,both when deriving the ex ante allowances and, after the event has occurred, distinguishingthe costs that are caused by the event (or intended to be borne by the regulated business)from those that are not. Moreover, depending upon how much risk is intended to be borne bythe regulated business, the occurrence of an event may adversely affect the ability for thefirm to raise finance. This would either put at risk or slow down the recovery from the event,or cause the regulator to allow some or all of the risks to be passed on to consumers(notwithstanding previous commitments).
In view of these matters, I conclude that an ex ante approach for compensating for the costof catastrophic events is inappropriate and that an ex post approach is most justified from afirst principles analysis. It is noted here that the most in depth discussion of this matter inAustralia – in a decision of over a decade ago – made similar observations to those above:12
Subsequent to the receipt of the submissions, the Office convened a workshop todiscuss a number of issues related to the cost of capital, one of which was how the
12 Office of the Regulator-General, 2000, Electricity Distribution Price Review – Final Decision,September, p.320.

17
Office should treat high cost, low probability events. The Office noted that there are(conceptually) two means of treating such events, which are:
• to provide a self-insurance premium, and impose the risk on the distributors;or
• not to make an explicit allowance, but to deal with such events when theyarise (implicitly passing the risk onto customers).
The Office noted that neither approach is perfect. The former approach assumes anaccurate quantification of the expected cost from such events is necessary, and thatthe businesses are in a position to bear such a risk at the time. However, it involves amoral hazard risk for customers in that they would pay the self-insurance premium inadvance, and the distributor could be unable to carry the risk in practice when theevent occurs. It also requires there to be a distinction drawn between these specialevents, and routine events. The latter approach, however, would require thecommitment (for the regulatory period) to pass the risk onto customers to bemaintained. [footnotes omitted]
I observe that the Commission and the Commission’s advisers reached the sameconclusions about the merits of an ex ante regime (or, more specifically, on the merits of atransfer of risk to the regulated businesses):13
Professor Myers argues that ideally compensation for regulated firms should alsooccur ex ante. But in practice the size of the premium will be hard to justify toregulators, so some combination of ex post and ex ante compensation will beunavoidable. The form of compensation should depend on the nature of the risk.
Professor Myers recommends that type I risks could be handled by allowing regulatedfirms to charge an ‘insurance premium’ that is invested in a reserve fund, which wouldpay out in the event of a type I occurrence (effectively, a form of self-insurance thatmimics what might otherwise occur, absent regulation). If the fund turns out to beinadequate, the Commission could allow some ex post compensation. If the fundaccumulates too much money, part of the fund could be returned to consumers.
I interpret these remarks as expressing a desire for commencing recovery of the cost of suchevents in advance of them occurring (a matter that is addressed next) but not leaving theregulated business bearing the risk (which would include retaining the benefit) flowing frominaccuracies of the cost or frequency of such events.
A factor that needs to be managed where recovery is permitted of the actual costs ofresponding to a catastrophic event is the potential for a “guarantee” of cost recovery todiminish the business’s incentives for prudent behaviour. It would not be unusual in thiscircumstance for a regulator to test the prudence of expenditure prior to permitting itsrecovery – the intention of the review being to provide a substitute incentive for performancerather than necessarily expecting to find costs to disallow. It is noted that two sets ofdecisions could be tested, namely:
13 Franks, J., Lally, M., Myers, S., Recommendations to the New Zealand Commerce Commissionon an appropriate Cost of Capital Methodology, 18 December 2008, p. 38.

18
whether actions prior to the event efficiently minimised the consequences toconsumers of the event, most relevantly whether the business had a prudent level ofinsurance and whether the network had an efficient level of resilience to potentialcatastrophic events, and
whether the response to the event was prudent, noting, however, that a properapplication of a test of prudence would take account of the constraints on decisionmaking that were caused by the event.
We observe, however, that the threat of an ex-post prudence test of expenditure brings withit the risk of the regulator incorrectly disallowing appropriate expenditure. The chances of theinappropriate disallowance of prudent expenditure can be managed by putting clear boundson the application of the ex-post prudence test, and the key elements of a well designed ex-post prudence test include:
the regulator not applying hindsight to its decisions, including that regard is had only toinformation that was available to the business, and would have appeared relevant, atthe time it made its decision
the review should be based on whether expenditures were the result of prudentdecision making and not whether they reflect “best practice” or some measure of“frontier” expenditure, and
the regulator should accept the onus of proving that expenditure was imprudent, ratherthan for the business to prove prudency.
Should there be advance recovery of the cost caused by catastrophic events?
Insurance programs are widespread amongst utility firms and provide a means of shifting therisk associated with the frequency and occurrence of catastrophic events away from both theconsumers and regulated business to a wider pool of parties. It will be in the interests ofconsumers for this insurance to be taken out by regulated businesses provided that it isavailable at a cost that does not exceed the value that consumers would place uponremoving this risk.
However, it was observed above that there are limitations to the insurance coverage that isavailable from external sources. It was also observed above that regulation should providean expectation that firms be able to recover operating costs and at least make a commercialreturn on investment. In combination, the implication is that consumers will be required tobear those costs that cannot be insured externally.
One of the issues addressed by the Commission’s expert advisers on the cost of capital waswhether the recovery of the cost caused by natural disaster (assumed here to be theuninsured portion) should commence in advance of an event occurring. In practice, thiswould imply adding an increment to prices and quarantining the funds raised, to be used todefray the cost of responding to a future catastrophic event. The intended purpose of such ameasure would be to spread the costs of responding to a catastrophic event to the periodboth prior to and after the event in question.
Notwithstanding the Commission’s expert’s support for such a measure, in my view themerits of the measure would depend upon the specific facts surrounding the company in

19
question. I note further that there are two polar options that would deliver broadly similarresults for consumers in the long term, namely to:
seek to recover the costs associated with catastrophic events at a constant rate overtime, irrespective of the timing of such an event, or
recover the costs after the event occurred.
These options would both involve consumers at all times paying for the consequences of onecatastrophic event, the only difference being whether consumers are paying for the cost ofresponding to what is likely to be a mix of the last and next event, or are paying to remedythe consequences of the last event.14
I observe, however, that where a catastrophic event has just occurred and consumers hadnot pre-paid for the cost of the event, then they would be paying for the costs of one event. Inthis case, if consumers were asked also to make provision for the next event then they wouldbe contributing more than would be reasonable. Clearly this is the case for Orion’sconsumers, which I return to below.
3.2.2. Application to Orion
Assumptions in the current regulatory regime with respect to the allocation of risk
In my view, the context within which the current price controls were determined conveyed areasonably clear assumption that regulated businesses were not assumed to bear the risk ofcatastrophic events,15 but would pass the costs through to consumers if such an eventoccurred. I also think it is reasonably clear (or as clear as is possible within the context of theNew Zealand regime) that no allowance was provided to Orion (apart from the recovery ofthe cost of external insurance) for bearing any such risk. Moreover, I note that theCommission’s subsequent decisions on this issue – including the Input MethodologiesDetermination and its informal discussions with Orion – have put these assumptions intoeffect and that there is no disagreement with the Commission on how these costs should betreated.
Turning first to the context within which the current price controls were determined, the NewZealand regulatory regime for electricity distribution businesses is somewhat unique in thatthere is an intention that default price controls be established based upon a fairly high-levelanalysis and without an analysis of firm-specific issues, with the businesses then able topropose a customised approach if the default price controls materially understate cost. Inaddition, where customised price controls are put in place, the Commission has thediscretion to retrospectively adjust for any shortfall (or surplus) that occurred prior to the
14 The other obvious difference is that where costs are recovered after an event occurs, there isno need to predict the cost or frequency of an event – the event would have occurred and thecosts are measurable.
15 The current price controls for Orion were determined on 30 November 2009, and therefore Ihave focussed on the context as at that date, although the Commission’s subsequent decisionsalso provide evidence of what was expected earlier in the process of developing the InputMethodologies.

20
customised price controls coming into effect.16 In such a regime, it is difficult (albeit notimpossible) for compensation for catastrophic events to be addressed through an ex anteallowance, given that this would require analysis of the specific environment faced by eachbusiness. Thus, I consider it reasonable to assume that the structure of the regime at leastcreates a presumption that the costs associated with such events would be treated after theyoccur.
In addition, the matter of how catastrophic events should be treated in the regime – includinga recognition that compensation is warranted and the broad options available – had alreadybeen canvassed at the time that the current price controls were determined, with the adviceto the Commission (and its own view) being a preference for not transferring this risk to theregulated businesses. The Commission’s statement – which adopted the advice of itsadvisers – was as follows:17
With these issues in mind, Franks et al (2008) have proposed a hybrid scheme thatmixes ex ante and ex post allowances. In particular, they recommend that theCommission handle Type I risks by allowing regulated firms to charge an ‘insurancepremium’ that is invested in a reserve fund, which would pay out in the event of aType I occurrence (effectively, a form of self-insurance that simulates what mightotherwise occur, absent regulation). Ex post adjustments could be made if the fundproves inadequate or too generous.
The key point from this paragraph is the reference to ex post adjustments if the settings forthe fund were incorrect – this adjustment means that the fund would not transfer the risk ofsuch events to the regulated business, but rather seek to smooth the recovery of this costover time.
Moreover, in my view, the Commission’s subsequent decisions in relation to the InputMethodologies are clear as to how the cost-consequences of catastrophic events were to betreated, namely that the costs would be recovered if and when such an event occurs. Whilethese decisions were made after the current price controls were determined, they provideevidence of the expectations of parties during the discussion.18 The Commission endorsedthe reasoning above that it is difficult to make an ex ante allowance for asymmetric risks (ofwhich the exposure to catastrophic events is one) in the context of a DPP regime in view ofthe intention that such controls be determined without a detailed analysis of firm-specificissues:19
The IM applies a ‘benchmark’ or service-specific cost of capital for all suppliers of aregulated service. If the Commission were to apply an ad-hoc adjustment to the
16 Commerce Act, section 53V(2), although the Commission has noted its intention to apply thisdiscretion more narrowly – albeit carving out catastrophic events as a case where claw-back ispermitted back to the date of the event (Input Methodologies, clause 5.3.4(4)(b)).
17 Commerce Commission, 2009, Revised Draft Guidelines for the Cost of Capital, June, p.54. TheCommission’s discussion on this matter was directed towards the feasibility of creating such afund.
18 I note that this is not an issue where parties to the Commission’s consultations expressedsurprise as to the Commission’s final position.
19 Commerce Commission, 2010, Input Methodologies Reasons Paper, December, p.571.

21
service-wide cost of capital it would imply that all suppliers of a particular service areexposed to the same level of asymmetric risk. However, suppliers of a regulatedservice are exposed to different levels of asymmetric risks and at possibly differenttime periods. If the IMs were to make an ad-hoc adjustment for asymmetric risks inthe service-wide cost of capital, it may over-compensate some suppliers and possibleunder-compensate other suppliers.
The decision not to specify in the Input Methodologies that regulated prices shouldcompensate for the expected cost of catastrophic events is consistent with an intention toallow the costs caused by such events to be recovered after the fact. Moreover, this intentionis reflected clearly in the specific and general provisions in the Input Methodologies, that is:
Where an electricity distribution business seeks a customised price path after acatastrophic event, there is a requirement for claw-back to apply covering the periodafter that event,20 implying an intention that these events be address throughapplication of a customised price path. There are also detailed provisions directing theCommission to identify (and thereby allow recovery of) all of the incremental costscaused by the event.21
As a general matter, the regulatory asset base is calculated by including all past capitalexpenditure,22 which would naturally allow recovery of the financing cost associatedwith all incremental capital expenditure (and continued recovery of the cost of assetsthat may have been replaced prior to the expiry of their lives).
I observe that the Commission in responding to Orion’s proposal would remove anyremaining doubt as to how costs caused by catastrophic events would be treated, therebyfurther reducing risk in the sector and thus enhancing further the incentive for investment.
Turning to whether as a matter of fact Orion’s price controls include an allowance in respectof catastrophic events, I acknowledge that it is difficult to be definitive about which particularcosts are reflected in Orion’s price controls because Orion has not had price controls settransparently with reference to cost. However, I observe that costs have featured in theprevious regime in a number of ways, including:
in the calculation of profitability that was used in the derivation of the “thresholds” forthe 2004 to 2009 period
the reported outturn return on assets under the disclosure regime that also operatedover the 2004 to 2009 period, and
were expected by all parties to be a key input into the setting of the starting pricesunder the default price path, which has transpired as a correct expectation.
None of these uses of the concept of “cost” has included an allowance in respect ofcatastrophic events, apart from the recognition of insurance premiums paid to externalinsurers.
20 EDB Input Methodologies, clause 5.3.4.21 EDB Input Methodologies, clause 5.6.22 EDB Input Methodologies, clause 5.3.6.

22
I reiterate the point made in section 3.2.1, however, that the outcomes for consumers neednot be materially different depending upon whether Orion was assumed to bear the riskassociated with catastrophic events, or whether this was intended to be recovered directlyfrom consumers. In particular, if Orion was intended to assume this risk (or, more accurately,bear the expected cost), then it would need to be compensated for this, and thatcompensation, with that compensation continuing into the future. The difference in outcomesfor consumers (at least over the long term) between the two approaches would arise due tothe assumptions about the frequency and consequences of such events being incorrect, inwhich case consumers could face a windfall gain or loss.
Price cap regimes and demand risk
In the previous discussion I have emphasised that the loss of anticipated revenue arisingfrom a reduction in demand is no different conceptually to the requirement to incur additionalexpenditures, meaning that a failure to compensate properly for either will lead to costs notbeing recovered.23
It could be observed, however, that price caps are intended to shift some demand risk tosuppliers. In turn, the question could be asked whether compensation is required for thedemand risk associated with catastrophic events and, if so, why this form of demand risk isdifferent to “normal” demand risk, for which specific compensation is not provided.
The answer to this question is that whether or not specific compensation is required inrespect of a particular source of demand risk depends upon whether that risk is expected tohave a symmetric or asymmetric effect on returns.
Most of the demand risk to which suppliers are subject can be assumed to have anapproximately symmetric effect on returns. This means that the supplier has a roughlyeven chance of demand being higher than expected (and delivering commensuratelyhigher returns) than it is being lower than expected (and delivering commensuratelylower returns). If the relevant source of demand risk is expected to have a symmetriceffect on returns, the supplier would expect to earn the WACC on average, and nofurther compensation is required. The assumption of a symmetric effect on returns isreasonable for many of the sources of demand risk, for example, economic growth andpopulation growth.
In contrast, an adverse shock to demand arising from a catastrophic event isasymmetric – there is no offsetting positive event that would cancel out the downside.Thus, specific compensation is required to ensure that the supplier expects to earn theWACC on average.
As with expenditure items, the specific compensation referred to above could be provided exante or ex post, although I argue that the latter is more appropriate from a first principlesanalysis. I note further that, in parallel with expenditure items, there is no evidence that the
23 As implied in the discussion above, an additional fact that is relevant is that most of Orion’scosts are fixed (amongst other things, comprising investments in irreversible investments). Thismeans that the reduction in demand would not have led to a material (let alone a proportionate)reduction in cost.

23
Commission has provided ex ante compensation for the demand risk associated withcatastrophic events when undertaking its various duties.
In parallel with the discussion above, recognition of this element of demand risk wouldhave required the Commission to revise down measured profit to make an allowancefor the actuarially fair consequences for revenue of a catastrophic event. This hasnever occurred.
Similarly, the Commission’s proposed method for setting the default price paths wouldnot result in compensation being provided for the demand risk associated withcatastrophic events. Providing this compensation would have required the Commissioneither to (i) include an allowance for the actuarially fair consequences of such an eventfor revenue as an expense item, or (ii) adjust its demand forecasts to remove theactuarially fair loss of demand associated with the prospect of such an event, neither ofwhich has been proposed by the Commission.
As discussed above, the observation that the Commission has not provided ex anterecognition or compensation for these risks is not intended as a criticism. This approach isconsistent with the expectation that these events would be addressed ex post, which I haveconcluded to be the most appropriate means of addressing these risks.
Prudence of Orion’s expenditures
A noted above, it is not uncommon for a regulator to foreshadow an ex post review of theefficiency of capital expenditure in circumstances where that expenditure was undertaken inan environment where the incentives for efficiency were weak.24 This could be argued to bethe case under a regime where a full pass through of costs associated with a catastrophicincurred were assumed, although I note that the uncertainty in the current regulatory regimeand the visibility to the community of the response to such an event are mitigating factors.
I have not undertaken a comprehensive review of Orion’s actions to determine whether ittook prudent actions prior to the earthquake to ameliorate the consequences of such anevent. However, from the information I have reviewed, Orion would appear to be well placedto demonstrate that it was prudent in its preparations for, and response to, this event. Inparticular, I note the following:
I have been informed that an objective of Orion’s network design and investmentstrategy was focussed on the resiliency and diversity of its electricity distributionnetwork in order to minimise the impact of such an event on network infrastructure andsupply continuity. For example, I am aware that Orion favours using multiple networkrouts and interconnections into each area in Christchurch. In addition, Orion recentlycompleted a 15 year and $6 million major program of strengthening key substationsagainst such risks. I am further informed that without such strategies or works, therepair bill would have been materially higher and the length of the power outages in thearea would have extended for much longer than was realised.
24 I note that such a test is not factored into the Input Methodologies, but is addressed here forcompleteness.

24
I have also been provided a report from Marsh on Orion’s approach to insurance priorto the earthquakes occurring. The key finding from the Marsh report is that, given thenature of Orion’s business and the market for insurance, its approach was consistentwith good industry practice.
Issues flowing from Orion’s ownership
As discussed earlier, while Orion is community owned, we have assumed that it operates asa commercial entity so that, like privately owned entities, its incentive to invest is conditionalon recovering efficient cost and making a commercial return.
I observe that this assumption is consistent with Orion’s obligations under the EnergyCompanies Act. Section 36(1) of the Energy Companies Act states that the principalobjective of an energy company shall be to operate a successful business. I note that criticalrequirement for the success of any business – and for a capital intensive business inparticular – is to make a commercial return after recovering efficient costs. The assumptionthat Orion operate as a commercial entity is also consistent with the assumptions implicit inthe regulatory regime applicable to Orion and other like community owned entities.
In addition, I note that the efficiency of electricity use – and the efficiency of the allocation ofresources in New Zealand more generally – is also enhanced by treating Orion like a privateentity when setting regulated prices. This is because such an approach ensures that theprices reflect cost, including a risk-adjusted return on capital. Such prices discourageconsumers from using electricity where they value it less than its cost, which in turn ensuresthat supply capacity is built for efficient use and resources otherwise flow to producingdifferent goods and services.
Moreover, as Orion’s owners are the councils whose areas were most affected by theearthquakes, the local population is expected to ultimately pay for the costs caused for Orion,with the choice being whether this is direct (through electricity charges) or indirect (throughhigher council rates, being a consequence of reduced earnings from their investment inOrion). However, the former could be seen to be a fairer means of spreading the cost burdenas it would mean that an individual’s share would reflect its proportionate use of theelectricity infrastructure.
I am also aware that concerns have been expressed about whether Orion (through itscommunity ownership) may not have sufficiently “diversified” its exposure to the risk of sucha catastrophic event, and that as a consequence some of the cost it incurred is inefficientand should be disallowed.
This was a matter that was discussed above, and the conclusions are summarised below. Inshort, this argument mistakes the role and effect of diversification – the same costs wouldhave been suffered irrespective of who was the owner of the assets.
Diversification is undertaken by investors to reduce the risk premium that they requirefor holding an asset that generates volatile returns. The regulatory WACC for Orion (asdetermined by the Commerce Commission) assumes that the owner of Orion holds thatasset as part of a diversified portfolio – that is, the risk premium is the minimum thatany investor would require.

25
The key effect of a catastrophic event as argued in this report is not to increase thevolatility of Orion’s returns (and thereby possible create an argument that investorsrequire a greater risk premium), but rather to increase the costs that it faces (i.e., theneed to repair assets, loss of revenue, etc.). This is a cost that would have been borneirrespective of who owned the assets – it is a function of the fact that electricityinfrastructure needs to be constructed in the location of consumers, and this is wherethe earthquake occurred.
4. Cost recovery over timeThe purpose of this section is to consider the second key question Orion has asked me toaddress, namely, how should cost recovery be spread over time.
Consistent with the previous section, I first consider the relevant economic principles that areapplicable to the question of the timing of cost recovery, followed by a consideration of thecurrent regulatory framework. I then make some concluding comments with respect to thecircumstances for Orion.
4.1. Relevant economic principles for cost recovery over time
Prices are the means of signalling to consumers the costs of providing services, and as such,when and how much they should consume at a particular point in time. Prices are also thesource of providing revenue to regulated businesses so they can fund their activities. Pricestherefore, are also the mechanism for providing a regulated business with the necessaryrevenue to compensate it for the costs incurred in responding to the earthquake. There is atension, however, between ensuring that prices provide a sufficient cash flow to fund costsfor the business following such an event while also avoiding creating distortions to theconsumption decisions of consumers.
It is important to understand at the outset that while it was the earthquake that causedadditional costs to be incurred, these costs were, nevertheless, incurred for the benefit ofconsumers. As an extreme example, had consumers decided they no longer wished to useelectricity following the earthquakes it may not have been necessary for Orion to incur muchof the expenditure it did in order to restore supply. The point of making this clear is that it isappropriate that the costs of the response are passed onto consumers.
A real rise in prices in order to recover the costs of a catastrophe might change theconsumption behaviour of consumers. Most significantly, some consumers may choose todisconnect from the network altogether. This is more likely from industrial and commercialconsumers who have more alternative options, including self supply, relocation of theirpremises or complete shut-down. Residential consumers, however, might seek to reduceconsumption in order to reduce the overall impact of the price rise on their budgets(irrespective of whether costs are recovered through the fixed or variable component ofprices).
The risks of disconnection or reduced sales occurring are dependent on the price sensitivityfor each consumer type. Given a catastrophic event might be expected to also have costimplications for consumers in a region, there is a chance that the price sensitivity ofconsumers might increase following such an event.

26
There is good reason why it might be desirable to seek to avoid consumers eitherdisconnecting or reducing overall sales. The reduction in either consumers or sales wouldmean that overall revenue to the electricity network business is reduced. This in turn wouldrisk the ability for the network business to earn sufficient revenue to cover its costs. In orderto earn sufficient revenue to cover costs in this circumstance prices would need to risefurther again to those remaining consumers. This would risk a further round of consumerdisconnections or reduced sales.
The circular problem of increasing prices leading to reduced revenue and further rises inprices can be mitigated by extending the period over which costs are recovered. That is,rather than recovering the costs associated with the claw-back of costs over one regulatoryperiod, these costs could be recovered over multiple periods. The intent would be to keepprices level in real terms over the long term so to avoid consumers disconnecting or reducingconsumption. Indeed, it may also be possible to delay, or back-end, any recovery of costsuntil future periods. This would be in recognition of any short-term heightened pricesensitivity of consumers affected by the catastrophic event.
For completeness, I note that there are a number of different categories of incremental costcaused by the earthquakes. These include the short term loss of revenue and repair relatedcosts, as well as longer term costs caused by the changed location of demand and reducelevel of consumption. Importantly, however, the decisions of consumers are affected byprices, which in turn reflect the aggregate impact of the recovery of all categories of thesecosts, in combination with the aggregate impact of the recovery of Orion’s underlying costs(that is, those costs that would have existed absent the earthquake). Thus, thereasonableness of the proposed method for recovering any single category of costs needs tobe assessed against its impact on the overall time profile of prices in combination with theproposed method for the recovery of all other costs.
There is a natural limit, however, to how far cost recovery can be delayed or extended. Thisis because a delay or extension of cost recovery has impacts on the cash flow of thebusiness. If the pattern of cash flow is not consistent with the efficient financing of assets thiscan impact on the financial viability of the business as well as the overall costs of serviceprovision.
It is in society’s interest that asset owners are able to access the deepest and lowest costforms of debt finance. Securing debt finance of this type requires certain minimum measuresof debt servicing capacity to be met in all periods. Changes to the pattern of cash flow canenhance or deteriorate a business’s credit metrics if the strength of the cash flow differsacross periods. Ensuring cost recovery is not unduly delayed or extended can minimise therisks of impacts on the debt servicing ability of the business and hence the overall costs ofservice provision.
4.2. Commerce Commission approach
While the Electricity Authority has responsibility for the price methodology for electricitydistribution businesses, it is the Commerce Commission that sets the price control. It is theprice control that determines the level and timing of cost recovery over time. Therefore, Ifocus here on the Commerce Commission’s approach rather than the pricing methodology ofthe Electricity Authority.

27
Statements by the Commerce Commission indicate that it acknowledges the interactionbetween the need for prices to ensure sufficient revenue while also recognising that pricelevels have an impact on consumption behaviour:25
Prices and quality (s 52A(1)(b) and (c)). Price and quality are inextricably linkedbecause they are the two key aspects of goods and services that are often of mostinterest to consumers. In workably competitive markets, consumer demand isresponsive to changes in price and quality. Prices provide appropriate signals forallocating resources efficiently within the economy, and provide a level of profits justsufficient to reward investment, innovation and efficiency. In the case of regulatedsuppliers, ensuring prices result in revenues that provide a normal rate of return is onlyone of the necessary conditions for allocative efficiency. Allocative efficiency is not onlydependent on overall revenue, but is also dependent on individual price levels andstructure, because consumers respond to the prices that they face, rather than to therevenues that firms make. Similarly, service quality is more important to consumers atan individual service level than on a whole-of business basis.
In the context of setting the P0 and X-factor under a CPP, the Commerce Commission hasalso specifically acknowledged there is a trade-off between avoiding price shocks forconsumers and maintaining the cash flow needs of a regulated business:26
However, the appropriate balance between P0/X will be situation-specific and depend,among other things, upon the cash flow needs of the CPP applicant and the extent ofpossible price-shocks to its consumers.
There remains a question, however, about whether the current formation of the InputMethodologies facilitates the delayed or extended recovery of some of the incremental costscaused by a catastrophic event and the principles are applied to maintain an appropriatecash flow for the business.
In relation to new capital expenditure, I note that the Input Methodologies provide substantialflexibility over depreciation methods applied under a CPP, and provide certainty that thedepreciation method adopted under a CPP will be applied to update the regulatory assetbase when the control is reset (either as a new CPP or a DPP). The implication of this is thatthe Input Methodologies provide substantial flexibility (together with certainty) over how theincremental costs associated with capital expenditure are spread over future regulatoryperiods.
However, in relation to the claw-back component of costs the situation is less clear. Inparticular, what is less certain is whether any costs that have not been recovered over thefive year period of the CPP can be recovered in future periods (either under a new CPP or aDPP). On the question of whether the amount of the claw-back that is unrecovered at theend of the initial CPP period can be recovered in future periods under the InputMethodologies as currently drafted, I provide the following observations:
If the next control is a new CPP, the question comes down to the meaning ofclause 5.3.4 of the Input Methodologies, and in particular the meaning of “any value of
25 Commerce Commission, 2010, Input Methodologies Reasons Paper, December, p.36.26 Commerce Commission, 2010, Input Methodologies Reasons Paper, December, para.9.1.17.
28
claw-back for the CPP regulatory period” as this clause defines the extent to whichregulated charges are able to recover something more than the building blockallowable revenue.
In my view, this clause can be read to allow the recovery in one CPP period aclaw-back amount that has emanated (and was first recovered) in a previousCPP period. In particular, the clause refers to the value of claw-back for the CPPregulatory period, rather than the value of claw-back emanating from a particularperiod. Thus, if there was a large claw-back amount determined now, and thiswas spread mechanistically over several future regulatory periods, my view isthat this clause would require the Commission to permit the recovery ofclaw-back in those future periods in line with the original intention.
I observe, however, that the Commission would need to be clear in the originalCPP determination (i.e., 2014-2019) about the aggregate claw-back amount thathad been determined and the value (or a formula for determining the value) thatis intended to be recovered in future periods. Creating such a formula is astraightforward task.
If a distributor moved to a DPP, which would appear likely at least at some point in thefuture, the Commerce Commission would appear to have the discretion to permitcontinued recovery given its wide discretion when determining starting prices. This,however, would not be a requirement on the Commerce Commission. Again, clarity inthe original CPP determination about the formula for cost recovery into the future maylargely overcome any uncertainty of future approaches.
Alternatively, if more certainty is to be sought about the recovery of the claw-back amountwhile remaining within the current regulatory framework, an option is to recover the costsassociated with the claw-back over the five year period, but delay the recovery of any newcapital costs by extending (or back-ending) depreciation schedules. This could be done so asto achieve the desired certainty of the claw-back amount while ensuring a desirable overallimpact on consumers.
4.3. Application of economic principles and existing framework toOrion
I recommend that the Commerce Commission should apply the following principles for therecovery of costs associated with the earthquakes:
the timing of cost recovery should be spread over time in a manner that providesefficient use of the network, and
the timing of cost recovery should also be consistent with maintaining the financialstability of the network business.
Both of these principles should be applied having regard to the aggregate impact of theseparate recoveries on the time profile of prices and cash flow.
While the current framework appears to provide some flexibility to spread the recovery of theclaw-back amount beyond the term of the initial CPP, over multiple periods, the Commission

29
should provide sufficient clarity about what approach it will take and the mechanisms it willuse to do so in order to minimise any risk as to how amounts that remain unrecovered afterthe initial CPP will be treated in future controls.
* * *
Yours sincerely,
Jeff BalchinPrincipalAdvisory

30
Appendix A
Index of Terms of Reference RequirementsTable 1: Terms of Reference Index
Terms of Reference Requirement Section addressed inreport
Specific consideration of the claw-back (ie: ex post) and forecast(ex ante) nature of our CPP proposal is required.
3.2.1 and 3.2.2
The role of the Commerce Act, Part 4 Purpose Statement,including the tension between each of the subparts of thePurpose Statement and the asymmetric risks of under investmentby EDBs
3.1.1
The role of the Part 4 IMs, including the approach to assetvaluation and cost of capital and CPP specific processes andrules
3.2.2, 4.2
The Part 4 and IM provisions for claw-back (section 52D and53V) - including recoverable cost mechanisms (including theoption for price smoothing beyond the CPP period),and therequirements to consider financial hardship and price shock
3.2.2, 4.2
Whether claw-back should compensate for uninsurable andunanticipated lost revenue and extra costs caused bycatastrophic events relative to DPP assumptions
3.2.1
The respective role of DPPs and CPPs in meeting the Part 4Purpose
3.2.2 and 4.2
The Energy Companies Act, which requires Orion to operate as asuccessful business
3.2.2
Orion’s approach to insurance (in light of the Marsh expert report) 3.2.2
Orion’s ability to manage its financial flexibility and resiliencythrough a combination of revenue, borrowings and itsshareholder distribution policy
2.2 and 4.1

31
The nature of Orion’s unanticipated costs and losses – forexample there is not a one to one relationship between Orion’sextra costs and improvements in SAIDI/SAIFI performance andmany of the unanticipated costs relate to security of supply ratherthan short term reliability performance.
2.3
Orion’s obligation to consult with its consumers and otherstakeholders (for example ratepayers) about its CPP proposal.
1
The relevance of other determinations to Orion’s CPP, includingthe proposed EDB DPP reset and Transpower’s price resets.
3.2.2
The relevance of the Commission’s CPP determination for Orion,to the operation of Part 4 and the signals that will be sent to otherregulated suppliers.
3.2.2

Appendix 2 James Mellsop and Will Taylor of NERA Expert Report

NERA Economic Consulting Level 18, 151 Queen Street Auckland 1010 New Zealand Tel: +64 9 928 3290 Fax: +64 9 928 3289 Mobile: +64 21 549 905 [email protected] www.nera.com
MEMO TO: David Freeman-Greene, Orion DATE: February 6, 2013 FROM: James Mellsop and Will Taylor SUBJECT: Peer review of PwC report on cost recovery following a catastrophic event
1. Introduction Orion has been regulated under the Commerce Act Part 4A thresholds regime and more recently a Commerce Act Part 4 default price path. As a result of the 4 September 2010 and 22 February 2011 Christchurch earthquakes Orion:
• Has incurred and will incur extra costs; and
• Has received lower and will receive lower revenues.
These extra costs and lower revenues (which we will refer to jointly as “losses”) are not insured, and indeed (we understand) are not (economically) insurable. Accordingly there is an “insurance gap” which must somehow be funded.
Orion is now applying for a customized price path (“CPP”), and a relevant issue is whether Orion’s consumers (as opposed to Orion’s shareholders) should bear the losses, both historic and forecast. Orion engaged Jeff Balchin of PWC to consider these and related issues – Mr Balchin’s report is dated 17 December 2012. Orion has now engaged us to undertake a peer review of Mr Balchin’s report.
At page 2 of his report, Mr Balchin decomposes the Orion terms of reference into two related questions:
• “Where, considered over the long term, should the incidence of cost recovery lay between Orion and its consumers?
• Where costs are recovered from consumers, how should cost-recovery be spread over time?”
We address Mr Balchin’s analysis of each of these questions in turn. We agree with the conclusions reached by Mr Balchin, although in certain cases we would reach them through a slightly different chain of logic. In summary, we think the uninsurable losses arising from the Christchurch earthquakes, and any future catastrophic events, should be recovered from customers on an ex post basis.

Page 2 February 6, 2013 Peer review of PwC report on cost recovery following a catastrophic event
NERA Economic Consulting
2. Who should pay?
2.1. Summary of Balchin analysis
Mr Balchin’s answer to the first question is that all “efficient and prudent” costs should be recovered from consumers. The chain of logic leading to this conclusion is as follows:
• Price regulation balances the competing tensions of ensuring continued and reliable service provision and the protection from market power abuse by setting cost reflective prices;
• The costs associated with catastrophic events are no different from other costs, they are just less certain;
• Demand reductions associated with catastrophic events are conceptually the same as a cost increase;
• If costs are not expected to be recovered in the long term, the sustainability of the industry will be jeopardized;
• Therefore firms should be able to recover the costs associated with catastrophic events from their customers.
Mr Balchin then analyses the secondary question of whether recovery should occur on an ex ante or ex post basis, or some hybrid of the two. Under a (pure) ex ante approach, the firm (shareholders) would bear the risk of inaccurate forecasting of the magnitude and frequency of catastrophic events.1 Mr Balchin argues that in the case of electricity distribution businesses (“EDBs”), an ex post method is preferred for the following key reasons: • A pure ex ante approach risks under- or over- compensating the regulated firm;
• Forecasting the frequency and costs of catastrophic events is very difficult, making an ex ante approach impractical;
• An ex post approach is implicit in the input methodologies and the regime in place when the current price controls were determined;2
• There is no evidence that EDBs have included a self-insurance premium in their prices so double counting is not a concern; and
• While a typical analysis of competitive markets would suggest an ex ante approach, the long term contract formulation of workable competition allows for other risk allocations.
Mr Balchin notes that an ex post approach may create a perverse incentive to incur inefficient costs and therefore a prudence test may be desirable. 1 As noted by Mr Balchin on page 13, if the frequency and magnitude of catastrophic events are forecast accurately then the two
approaches deliver the same outcome. 2 E.g. page 19-20

Page 3 February 6, 2013 Peer review of PwC report on cost recovery following a catastrophic event
NERA Economic Consulting
2.2. NERA comment
2.2.1. Who should pay: consumers or the firm?
Mr Balchin rationalizes his key conclusion by referring to regulatory principle. We think the point can be made even more generically.
A firm will only enter a market if the firm believes it will recover its expected costs, including those arising from asymmetric risks (e.g., earthquakes). Some of those risks may be insurable, turning them into a (relatively) certain cost. Others may not be insurable, and so the expected cost would be a function of the probability of the event occurring.
Expected costs are recovered through the prices paid by consumers. It is a necessary condition of economic activity that consumers pay (the efficient) costs of production, which include those arising from asymmetric risks. So, at least as a matter of principle, we agree with one of Mr Balchin’s key conclusions, being that “the efficient and prudent costs caused by catastrophic events should be recovered from consumers” (page 2).
Recovery of expected costs will be a function of expected revenues, which will in turn be a function of asymmetric risks (e.g., an earthquake that reduces demand). A firm will only enter a market if it expects revenues from its customers, taking into account asymmetric risks, to be sufficient to recover expected costs. In other words, expected prices would need to be high enough to account for the asymmetric risk of demand falling following a catastrophic event.
Therefore we also agree with Mr Balchin that demand reductions due to catastrophic events can be considered in the same way as cost increases.
To apply these principles to Orion’s CPP further questions must be asked to determine whether the costs are “efficient and prudent”, e.g.:
• Does the insurance gap exist because losses are uninsurable as opposed to Orion being negligent in its insurance practices?
• Did Orion take sufficient care prior to the earthquakes occurring?
• Are the costs being incurred now the most efficient way of repairing the network?
Mr Balchin defers to Marsh (an insurance brokerage firm) on the question of Orion’s insurance practices and Orion itself on the efficiency of its decisions prior to and after the earthquakes. These are largely factual questions which the Commission is likely to test as part of the CPP process.
2.2.2. Ex ante or ex post compensation?
Assuming that the costs are efficient, the second question is whether losses should be funded on an ex ante or ex post basis, and who bears the risks of funding imbalances. Mr Balchin emphasises the

Page 4 February 6, 2013 Peer review of PwC report on cost recovery following a catastrophic event
NERA Economic Consulting
impracticality of an ex ante regime relative to an ex post regime, and the consistency of an ex post regime with the regulatory framework:3
My view is that the latter regime (compensation after the event occurred) has substantial practical advantages over the former. It is also consistent with the assumptions built into the current price controls, and is clearly the approach that is assumed in the new Part 4 of the Commerce Act and the Commerce Commission’s Input Methodologies.
We agree with Mr Balchin’s conclusion, although we reach that conclusion in a slightly different way. We think the analysis can be usefully separated into two (related) questions:
1. How should the known and/or estimated losses associated with the earthquakes that have already occurred be recovered?
2. How should losses associated with future unknown events be recovered?
Regarding the first question, because the event has already occurred and the losses are known or can be estimated, the (policy) question of ex ante or ex post recovery is less relevant than the question of what (if any) “agreement” was in place for recovering these losses prior to the event occurring. Mr Balchin recognizes the importance of this analysis at page 14, although he also conducts a first principles analysis of ex post vs ex ante recovery before returning to the regulatory bargain in place when the earthquakes struck at page 19. In our view, and as canvassed by Mr Balchin, the “regulatory bargain” (defined by legislation and the Commission’s approach to regulating EDBs) implies an ex post approach to the uninsurable risks: • Under the Part 4A regime that preceded the present regime, there was no inclusion during profit
assessments of any allowance for the cost of non-insurable catastrophic events (see page 21 of Mr Balchin’s report);4, 5
• The historic non-firm-specific approach to price control of EDBs in New Zealand (both under the repealed Part 4A and the new Part 4) means that there has never been a specific identification and quantification of ex ante compensation for uninsurable risks; and
• The claw-back mechanism is sections 52D and 53V of the Commerce Act, inserted into the Commerce Act in October 2008, i.e., approximately two years prior to the first earthquake. As
3 Page 3. 4 Costs were included in the “relative profitability” component of the price path thresholds, based on operating expenditures and
asset values as disclosed by EDBs (see Commerce Commission, “Regulation of Electricity Lines Businesses Targeted Control Regime Threshold Decisions (Regulatory Period Beginning 2004)”, 1 April 2004, paragraph 251), and there is no mention in the Commission’s report (or in the related analysis of profitability undertaken by Meyrick Associates) of these costs including an allowance for non-insurable catastrophic events. Likewise costs were included in some measures of returns in the information disclosure requirements, but again there is no mention in the Commission’s report that these costs include an allowance for non-insurable catastrophic events (see Commerce Commission, “Electricity Information Disclosure Requirements issued 31 March 2004”, Consolidating all amendments to 31 October 2008).
5 This is particularly important as it ensures that ex post compensation now would not result in “double counting”.

Page 5 February 6, 2013 Peer review of PwC report on cost recovery following a catastrophic event
NERA Economic Consulting
we understand this mechanism, it means the Commission can permit an EDB to recover historic losses under a CPP. This implies that the relevant risks are allocated to consumers, not the EDB.
In other words, Orion has not historically been charging an ex ante premium for uninsurable catastrophic events on the basis of a regulatory bargain that these costs would be recovered in full ex post. As Mr Balchin notes, this might be different from what would be observed in workably competitive markets. To analyse what would occur in workably competitive markets, it is useful to categorise losses due to a catastrophic event into:
• Losses that are borne by all firms, including potential entrants; and
• Firm-specific losses. Regarding the first category, if the catastrophe causes a cost increase for all firms in the market (e.g. insurance premiums or other input costs), market prices would simply adjust to reflect these costs. Regarding the second category, if for example, firm A’s factory burns down, consumers would simply switch to firm B,6 and firm A would find it difficult to raise prices to recover its losses (e.g., rebuild costs). Therefore, we would expect firms to recover this category of losses in an ex ante way via prices.7, 8
For EDBs, risk allocation and compensation are controlled by the Commission and the regulatory framework, not by competitive market forces.
Regarding the second question of how future catastrophic events should be dealt with, a number of points must be considered:
• What method would be most consistent with workably competitive markets?
• What is the “regulatory bargain” going forward? • Which allowable method is the most practical?
• What are the implications of the fact that Orion would be recovering losses resulting from a previous event on an ex post basis?
This is effectively what Mr Balchin’s analysis (section 3.2.1) does. We agree that an ex post method would likely be the most practical. The fact the risks are “uninsurable” illustrates the difficulty for the Commission in trying to estimate an ex ante premium.
6 Or a new entrant. 7 This is the same point made by Mr Balchin at pages 4-5 of his report. 8 This is a general statement, and we do observe some markets where ex post responsibility for uninsurable events might be
allocated to the customer, e.g., a price increase for unexpected soil conditions in fixed price construction contracts.

Page 6 February 6, 2013 Peer review of PwC report on cost recovery following a catastrophic event
NERA Economic Consulting
Regarding compatibility with workably competitive markets, for the “category one” costs discussed above, it would be consistent with a workably competitive market to adjust the price cap for changes in generic costs when an event occurs. For “category two”, as discussed above, ex post recovery might not be consistent with a typical workably competitive market. However it would appear to be more practical and also likely consistent with the regulatory bargain. On a related note, while the input methodologies appear to permit either an ex ante or an ex post9 approach under a CPP, paragraph K3.26 of the EDB Reasons Paper appears to rule out a hybrid approach for CPPs:10
For the purpose of a CPP, the Commission will allow a supplier to recover an allowance for self-insurance as long as it is clear: what risks are being insured; that these risks are credibly self-insured (as opposed to being recoverable ex post through reconsideration of the price-quality path); and the self-insurance premium has been independently verified as appropriate by an actuary with the necessary expertise. A supplier must provide the information specified in clause D15 of the IM Determinations. Should a self-insured risk eventuate during the CPP period, then the supplier will not receive ex post compensation for that event via a reconsideration of the price-quality path. [emphasis added]
Mr Balchin briefly touches on the fact that if an ex ante approach is used going forward while an ex post approach is used for the historic earthquakes, consumers would be paying for multiple events at the same time and that this would be “unreasonable”.11 Paying for multiple events at the same time could result in quite high prices over the next regulatory period(s) and distortions to consumption decisions, as we discuss in section 3.2 below. This is another argument for maintaining the ex post approach for future events.
Furthermore, an ex post approach would result in lower risk for the firm than an ex ante approach. In theory the extra risk to the firm under an ex ante approach could be compensated for through a premium paid by customers, but the fact that these risks are uninsurable highlights the difficulty of setting an appropriate premium. Therefore an ex post approach is more likely to facilitate investment by the firm than an ex ante approach.12
Of course, regulatory commitment will be crucial to achieving efficient investment, particularly given the long-lived nature of electricity distribution assets. For example, Orion will need confidence about the treatment of investments made during the CPP period in subsequent regulatory periods.
9 Through a claw back under section 52D and 53V as mentioned above. 10 Commerce Commission, Input Methodologies (Electricity Distribution and Gas Pipeline Services) Reasons Paper, December
2010. 11 Page 19. 12 As Mr Balchin points out, the downside of an ex post approach is a possible incentive to incur inefficient costs, which could be
managed by a prudence test (see page 5 of Mr Balchin’s report).

Page 7 February 6, 2013 Peer review of PwC report on cost recovery following a catastrophic event
NERA Economic Consulting
3. Time profile of recovery
3.1. Summary of Balchin analysis
Mr Balchin’s recommendations on this issue are:
• Cost recovery should be spread over time in a manner that provides efficient use of the network; and
• The timing of cost recovery should also be consistent with maintaining the financial stability of the network business.
Mr Balchin argues that “there is a tension, however, between ensuring prices provide sufficient cash flow to fund costs for the business following such an event while also avoiding creating distortions to the consumption decision of consumers.”13
The “distortion” is argued to arise from a short term increase in the price elasticity of demand due to the earthquake and the circularity of the EDB raising prices to recover its costs, which causes a reduction in volume which causes the EBD to raise its prices further.
The cash flow issue arises if there is a significant mismatch between the profile of the costs and the recovery of those costs.
3.2. NERA comment
On this issue, our main comment is that it would be helpful to distinguish between two types of losses related to the 4 September 2010 and 22 February 2011 earthquakes:
• The forward-looking losses; and
• Claw-back of historic losses. In terms of distorting consumption, there is nothing wrong with consumers paying higher prices to reflect higher forward-looking costs that are spread over time in the normal manner – in fact, allowing these costs to be spread over time in the normal manner would incentivize efficient consumption decisions.14 The trickier issues arise when considering recovery of past (sunk) losses.
In our view it is the claw-back of losses for which there might be a concern about distorting consumption decisions. Clawing-back historic losses may raise the price above forward-looking costs, which could distort consumption. There might be customers whose willingness to pay exceeds forward-looking costs, but who do not consume as the claw-back inclusive price exceeds
13 Page 25. 14 Recognising that the economies of scale and scope in infrastructure mean that pricing is unlikely to be perfectly efficient.

Page 8 February 6, 2013 Peer review of PwC report on cost recovery following a catastrophic event
NERA Economic Consulting
their willingness to pay. This would certainly suggest spreading the recovery out over time, as Mr Balchin suggests.
It is possible that the consumption distortion issue is not a material problem. Mr Balchin argues that elasticity may have increased following the earthquake, and we agree that this could be the case as customers needing to rebuild might have the option of relocating. However, even if this is correct the elasticity of final demand with respect to lines charges is still likely to be relatively inelastic, given the “essentiality” of electricity and the fact that line charges are just one component of final electricity charges.15 Ultimately though this is an empirical question. Finally, we think Mr Balchin is correct to raise a concern about cash flows and financing, particularly in light of the extraordinary losses that Orion faces as a result of the earthquakes. We think it is good practice for regulators to check the implication of proposed price controls for cash flows and financeability.
15 For example, for residential consumers distribution charges make up on average 29% of electricity charges in New Zealand -
http://www.powerswitch.org.nz/powerswitch/site-info/powerswitch-faqs/where-does-your-money-go.

Appendix 3 LineTech Consulting Report on Proposed Reliability Standards

Independent Engineer’s Report
Standard Variation
Independent Engineer’s Report –
Standard Variation
Client: Orion New Zealand Ltd.
Final
OCTOBER 2012
Quality
Orion New Zealand Ltd.
Final Report
OCTOBER 2012

QUALITY STANDARD VARIATION
Prepared for
ORION NZ Ltd
Prepared by
LineTech Consulting Ltd
� Administration Office
23b Mandeville Street
Christchurch.
Report Author Office
14 Tui Crescent
Waiatarua
Waitakere City
� +64 9 814 9623
� +64 9 814 9623
� www.linetech.co.nz
© Linetech Consulting 2012 The information contained in this document is produced by LineTech Consulting and is solely for the use of the Client identified on the cover sheet for the purpose for which it has been prepared and Consulting undertakes no duty to or accepts anydocument.
FINAL REPORT ORION NZ LTD
QUALITY STANDARD VARIATION OCTOBER 2012
LineTech Consulting Ltd
Street, Riccarton
The information contained in this document is produced by LineTech Consulting and is solely for the use of the Client identified on the cover sheet for the purpose for which it has been prepared and
nsulting undertakes no duty to or accepts any responsibility to any third party who may rely upon this
ORION NZ LTD
P a g e | i
The information contained in this document is produced by LineTech Consulting and is solely for the use of the Client identified on the cover sheet for the purpose for which it has been prepared and LineTech
responsibility to any third party who may rely upon this

QUALITY STANDARD VARIATION
Quality Information
Document Independent Engineer’s Report
Reference: LTC
Date: 19th
Prepared by: Ir G. Richard Gibbons
BSc.
Int PE;
General Manager LineTech Consulting Ltd
Mobile: +
Revision History
Revision
Revision
Date
Draft V1 27/10/12
Draft V2 30/10/12
Draft V3 31/10/12
Draft V3a 02/11/12
Draft V4 07/11/12
Final 16/11/12
FINAL REPORT ORION NZ LTD
QUALITY STANDARD VARIATION OCTOBER 2012
Quality Information
Independent Engineer’s Report – Quality Standard Variation
LTC
th October 2012
Ir G. Richard Gibbons
BSc. (Hons), Dip BA, Cert Co Dir; FIET, C.Eng (UK); FIPENZ, CPEng (NZ);
Int PE; Life M.EEA; FNZIM; Acc.MInstD
General Manager LineTech Consulting Ltd
Mobile: + 64 27 22 88 160
Details
Authorised
Name/Position Signature
Partial Draft for
comment
R Gibbons/GM
Completed Draft for
comment
R Gibbons/GM
Revised draft post
client clarifications
R Gibbons/GM
Minor corrections to
text
R Gibbons/GM
Minor corrections to
text
R Gibbons/GM
Finalised R Gibbons/GM
ORION NZ LTD
P a g e | ii
Quality Standard Variation
C.Eng (UK); FIPENZ, CPEng (NZ);
Signature

QUALITY STANDARD VARIATION
Executive Summary
Orion New Zealand Ltd (Orion) is preparing a “customised price
submitted to the Commerce Commission (Commission). This follows
infrastructure caused by the series of earthquakes affecting
4 September 2010. This document is submitted under the catastrophic event provisions of the
Commerce Act Electricity Distribution Input Methodology Determination, December 2010.
The Input Methodology Determination re
provide reports on certain aspects of that application. In particular a report is required on a quality
standard variation from the default standards set by the Commission in accordance with clause
5.4.5(c) of the Input Methodology Determination.
This report has been prepared to meet the requirements for the variation in quality standards in
accordance with clause 5.4.5(c) of the Input Methodology Determination
The approach adopted for this report has bee
the Independent Engineer. This established that for the situation faced by Orion it is not considered
realistic to apply the requirements for this Independent Engineer’s review strictly as written. Th
the approach adopted has been an examination of the Orion proposals to identify if they provide an
appropriate trade-off between the proposed expenditure and resultant improvement in network
performance from its present damaged state within the realisti
The proposals by Orion contained in the supplied draft Chapter 6 submission and associated
documents were then reviewed in the light of the above.
It is the reviewer’s opinion that Orion has demonstrated appropriate trade
limitations set by the lack of clarity around aspects of the rebuild on the CBD; Long term population
trends; the unknown state of parts of the existing network asset and the associated impact on
failure rates and the level of risk of further
The approaches adopted of reviewing theoretical optimum network architecture arrangements for
both the sub-transmission and distribution networks is considered most appropriate as is the
intention to check the application of these over
review and ensure an optimal solution is found
lifecycle considerations at the time of the decision being required.
The proposed set of targets set by
considered to be an appropriate way of addressing targeted performance as projects are carried out
to repair/replace the severe damage suffered. Whilst noting the Determination will set fixed
it is understood Orion will internally review them each year to reflect the improved knowledge on
the effects of the earthquakes on plant and equipment.
This review concludes that the proposals and targets provide an appropriate trade
proposed expenditure and resultant improvement in network performance from its present
damaged state within the realistic availability of resources. In comparison to the application of the
DPP methodology the quality standard variation
FINAL REPORT ORION NZ LTD
QUALITY STANDARD VARIATION OCTOBER 2012
Orion New Zealand Ltd (Orion) is preparing a “customised price-quality path” (CPP) application to be
submitted to the Commerce Commission (Commission). This follows the significant damage to its
infrastructure caused by the series of earthquakes affecting the Christchurch area that started on
2010. This document is submitted under the catastrophic event provisions of the
Commerce Act Electricity Distribution Input Methodology Determination, December 2010.
The Input Methodology Determination requires Orion to engage an independent engineer, to
provide reports on certain aspects of that application. In particular a report is required on a quality
standard variation from the default standards set by the Commission in accordance with clause
) of the Input Methodology Determination.
This report has been prepared to meet the requirements for the variation in quality standards in
accordance with clause 5.4.5(c) of the Input Methodology Determination
The approach adopted for this report has been to firstly review the set requirements for review by
the Independent Engineer. This established that for the situation faced by Orion it is not considered
realistic to apply the requirements for this Independent Engineer’s review strictly as written. Th
the approach adopted has been an examination of the Orion proposals to identify if they provide an
off between the proposed expenditure and resultant improvement in network
performance from its present damaged state within the realistic availability of resources.
The proposals by Orion contained in the supplied draft Chapter 6 submission and associated
documents were then reviewed in the light of the above.
It is the reviewer’s opinion that Orion has demonstrated appropriate trade-of
limitations set by the lack of clarity around aspects of the rebuild on the CBD; Long term population
trends; the unknown state of parts of the existing network asset and the associated impact on
failure rates and the level of risk of further earthquake damage.
The approaches adopted of reviewing theoretical optimum network architecture arrangements for
transmission and distribution networks is considered most appropriate as is the
intention to check the application of these overall proposals when individual projects are analysed to
solution is found that balances economics, performance, safety and
at the time of the decision being required.
The proposed set of targets set by year for SAIDI and SAIFI – including their boundary values
considered to be an appropriate way of addressing targeted performance as projects are carried out
to repair/replace the severe damage suffered. Whilst noting the Determination will set fixed
it is understood Orion will internally review them each year to reflect the improved knowledge on
the effects of the earthquakes on plant and equipment.
This review concludes that the proposals and targets provide an appropriate trade-off between
proposed expenditure and resultant improvement in network performance from its present
damaged state within the realistic availability of resources. In comparison to the application of the
quality standard variation as proposed by Orion is considered to be notably
ORION NZ LTD
P a g e | iii
quality path” (CPP) application to be
the significant damage to its
the Christchurch area that started on
2010. This document is submitted under the catastrophic event provisions of the
Commerce Act Electricity Distribution Input Methodology Determination, December 2010.
quires Orion to engage an independent engineer, to
provide reports on certain aspects of that application. In particular a report is required on a quality
standard variation from the default standards set by the Commission in accordance with clause
This report has been prepared to meet the requirements for the variation in quality standards in
n to firstly review the set requirements for review by
the Independent Engineer. This established that for the situation faced by Orion it is not considered
realistic to apply the requirements for this Independent Engineer’s review strictly as written. Thus
the approach adopted has been an examination of the Orion proposals to identify if they provide an
off between the proposed expenditure and resultant improvement in network
c availability of resources.
The proposals by Orion contained in the supplied draft Chapter 6 submission and associated
offs within the
limitations set by the lack of clarity around aspects of the rebuild on the CBD; Long term population
trends; the unknown state of parts of the existing network asset and the associated impact on
The approaches adopted of reviewing theoretical optimum network architecture arrangements for
transmission and distribution networks is considered most appropriate as is the
all proposals when individual projects are analysed to
that balances economics, performance, safety and
including their boundary values - are
considered to be an appropriate way of addressing targeted performance as projects are carried out
to repair/replace the severe damage suffered. Whilst noting the Determination will set fixed targets
it is understood Orion will internally review them each year to reflect the improved knowledge on
off between the
proposed expenditure and resultant improvement in network performance from its present
damaged state within the realistic availability of resources. In comparison to the application of the
is considered to be notably

QUALITY STANDARD VARIATION
better in reflecting the realistically achievable performance of the
regulatory period.
FINAL REPORT ORION NZ LTD
QUALITY STANDARD VARIATION OCTOBER 2012
better in reflecting the realistically achievable performance of the EDB (Orion)
ORION NZ LTD
P a g e | iv
(Orion) over the CPP

QUALITY STANDARD VARIATION
Contents
Executive Summary ................................
1.0 Background/Introduction ................................
2.0 Requirements ................................
3.0 Review of Requirements ................................
3.1Context ................................................................
3.2 Consideration and Comparison of Catastrophic Events
3.2.1 Failure Rates ................................
3.2.2 Loading Patterns ................................
3.3.3 Network Configuration
3.3.4 Major Earthquake Risk
3.3.5 Data Homogeneity ................................
4.0 Review of Chapter 6 ................................
4.1 Targets ................................
4.2 Synthesising of Data ................................
4.3 Moving Targets ................................
5.0 Review of Supporting Data ................................
5.1 Network Architecture Review
5.2 Network Architecture Review
5.3 Asset Management Plan.
6.0 Conclusions ................................
Appendix A: List of Documents Provided for Review
FINAL REPORT ORION NZ LTD
QUALITY STANDARD VARIATION OCTOBER 2012
................................................................................................................................
................................................................................................
................................................................................................................................
................................................................................................
................................................................................................
3.2 Consideration and Comparison of Catastrophic Events ...............................................................
................................................................................................
................................................................................................
Network Configuration ................................................................................................
Major Earthquake Risk ................................................................................................
................................................................................................
........................................................................................................................
................................................................................................................................
................................................................................................
.....................................................................................................................
................................................................................................
Network Architecture Review – Subtransmission ................................................................
Network Architecture Review – Urban 11kV ................................................................
................................................................................................
...............................................................................................................................
List of Documents Provided for Review ................................................................
ORION NZ LTD
P a g e | v
................................ iii
................................................. 6
.................................... 6
................................................... 7
........................................... 7
............................... 8
.................................................... 8
............................................. 8
................................... 9
.................................... 9
.......................................... 9
........................ 10
.................................. 10
.............................................. 10
..................... 11
....................................... 12
................................ 12
........................................ 13
...................................... 14
............................... 14
....................................... 16

QUALITY STANDARD VARIATION
1.0 Background/Introduction
Orion New Zealand Ltd (Orion) is preparing
submitted to the Commerce Commission (Commission).
This application is under section 53Q of the Act, which allows for a supplier of electricity distribution
services, such as Orion, to make a proposal to the Commission for a CPP which effectively permits
the supplier to follow a different price
otherwise apply. A CPP proposal must be made in accordance with the methodologies and
processes set out in the Input Methodology Determination
Following the significant damage to its infrastructure caused
the Christchurch area that started on 4
to the Commission under the catastrophic event provisions of the
Determination.
The Input Methodology Determination
provide reports on certain aspects of that application. The reports are to be included in the CPP
application to the Commerce Commission. In particular, a report is required on
variation from the default standards set by the Commission in accordance with clause 5.4.5(c) of the
Input Methodology Determination.
This report has been prepared to meet the requirements for the variation in
accordance with clause 5.4.5(c) of the
2.0 Requirements
Clause 5.4.5 specifies the Information on
Where a CPP applicant seeks a quality standard variation
following information:
(a) different values of either or both of
(i) μSAIDI and μSAIFI; and
(ii) σ SAIDI and σ SAIFI,
to those which would be determined in accordance with the methodology for calculating reliability
limits specified in the DPP determination
(b) an explanation of the reasons for the proposed
(c) an engineer's report on the extent to which the
realistically achievable performance of th
both of-
(i) statistical analysis of past SAIDI and SAIFI performance; and
FINAL REPORT
OCTOBER 2012
und/Introduction
Orion New Zealand Ltd (Orion) is preparing a “customised price-quality path” (CPP) application to be
submitted to the Commerce Commission (Commission).
This application is under section 53Q of the Act, which allows for a supplier of electricity distribution
services, such as Orion, to make a proposal to the Commission for a CPP which effectively permits
the supplier to follow a different price-quality path from the default price-quality path that would
otherwise apply. A CPP proposal must be made in accordance with the methodologies and
Input Methodology Determination.
Following the significant damage to its infrastructure caused by the series of earthquakes affecting
the Christchurch area that started on 4 September 2010, Orion proposes to submit a CPP application
to the Commission under the catastrophic event provisions of the Input Methodology
Methodology Determination requires Orion to engage an independent engineer, to
provide reports on certain aspects of that application. The reports are to be included in the CPP
application to the Commerce Commission. In particular, a report is required on a quality standard
variation from the default standards set by the Commission in accordance with clause 5.4.5(c) of the
.
This report has been prepared to meet the requirements for the variation in quality standards in
rdance with clause 5.4.5(c) of the Input Methodology Determination
Information on the proposed quality standard variations as follows.
quality standard variation, the CPP proposal must contain the
(a) different values of either or both of-
to those which would be determined in accordance with the methodology for calculating reliability
DPP determination;
(b) an explanation of the reasons for the proposed quality standard variation;
report on the extent to which the quality standard variation better reflects the
realistically achievable performance of the EDB over the CPP regulatory period based on either or
(i) statistical analysis of past SAIDI and SAIFI performance; and
ORION NZ LTD
P a g e | 6
quality path” (CPP) application to be
This application is under section 53Q of the Act, which allows for a supplier of electricity distribution
services, such as Orion, to make a proposal to the Commission for a CPP which effectively permits
quality path that would
otherwise apply. A CPP proposal must be made in accordance with the methodologies and
by the series of earthquakes affecting
2010, Orion proposes to submit a CPP application
Input Methodology
requires Orion to engage an independent engineer, to
provide reports on certain aspects of that application. The reports are to be included in the CPP
a quality standard
variation from the default standards set by the Commission in accordance with clause 5.4.5(c) of the
quality standards in
follows.
must contain the
to those which would be determined in accordance with the methodology for calculating reliability
better reflects the
based on either or

QUALITY STANDARD VARIATION
(ii) the level of investment provided for in proposed
3.0 Review of Requirements
3.1Context
Before reviewing the documentation provided by Orion it is appropriate to review the requirements
noted in section 2.0 above in relation to the events that have lead to the request for a CPP.
The definition of a Catastrophic Event is found in sub
DISTRIBUTION SERVICES INPUT METHODOLOGIES) DETERMINATION 2010 as follows:
5.6.1 Catastrophic event
Catastrophic event means an event
(a) beyond the reasonable control of the EDB;
(b) in relation to which expenditure
(i) was neither sought in a CPP proposal; nor
(ii) is explicitly or implicitly provided for in the DPP or CPP, as the case may be;
(c) that could not have been reasonably foreseen at the time the CPP or DPP was
determined; and
(d) in respect of which-
(i) action required to rectify its adverse consequences cannot be delayed
until a future regulatory period without quality standards being
breached;
(ii) remediation requires either or both of capital expenditure or operating
expenditure during the regulatory period;
(iii) the full remediation costs are not provided for in the DPP or CPP; and
(iv) in respect of an EDB subject to a CPP, the cost of remediation net of any
insurance or compensatory entitlements would have an impact on the
price path over the disclosure years of the CPP remaining on and after
the first date at which a remediation cost is proposed to be or has been
incurred, by an amount at least equivalent
allowable notional revenue for the disclosure years of the CPP in
which the cost was or will be incurred.
It is understood that the events that impacted on the Orion network clearly fall into the above
category, however it is not necessarily clear that the requirements of clause 5.4.5
section 2.0, necessarily reflect the event and its effects.
If consideration is given to a more common catastrophic event of a 30 year return snow fall/storm
would appear reasonable to be able
FINAL REPORT
OCTOBER 2012
(ii) the level of investment provided for in proposed maximum allowable revenue before tax
3.0 Review of Requirements
Before reviewing the documentation provided by Orion it is appropriate to review the requirements
noted in section 2.0 above in relation to the events that have lead to the request for a CPP.
The definition of a Catastrophic Event is found in sub Part 6 of COMMERCE ACT (ELECTRICITY
DISTRIBUTION SERVICES INPUT METHODOLOGIES) DETERMINATION 2010 as follows: -
Catastrophic event means an event-
(a) beyond the reasonable control of the EDB;
iture-
(i) was neither sought in a CPP proposal; nor
(ii) is explicitly or implicitly provided for in the DPP or CPP, as the case may be;
(c) that could not have been reasonably foreseen at the time the CPP or DPP was
(i) action required to rectify its adverse consequences cannot be delayed
until a future regulatory period without quality standards being
(ii) remediation requires either or both of capital expenditure or operating
expenditure during the regulatory period;
(iii) the full remediation costs are not provided for in the DPP or CPP; and
(iv) in respect of an EDB subject to a CPP, the cost of remediation net of any
insurance or compensatory entitlements would have an impact on the
price path over the disclosure years of the CPP remaining on and after
the first date at which a remediation cost is proposed to be or has been
incurred, by an amount at least equivalent to 1% of the aggregated
allowable notional revenue for the disclosure years of the CPP in
which the cost was or will be incurred.
It is understood that the events that impacted on the Orion network clearly fall into the above
t necessarily clear that the requirements of clause 5.4.5
necessarily reflect the event and its effects.
If consideration is given to a more common catastrophic event of a 30 year return snow fall/storm
e to be able fully follow the requirements specified of: -
ORION NZ LTD
P a g e | 7
maximum allowable revenue before tax; …
Before reviewing the documentation provided by Orion it is appropriate to review the requirements
noted in section 2.0 above in relation to the events that have lead to the request for a CPP.
Part 6 of COMMERCE ACT (ELECTRICITY
(ii) is explicitly or implicitly provided for in the DPP or CPP, as the case may be;
It is understood that the events that impacted on the Orion network clearly fall into the above
t necessarily clear that the requirements of clause 5.4.5, as noted in
If consideration is given to a more common catastrophic event of a 30 year return snow fall/storm it

QUALITY STANDARD VARIATION
“quality standard variation better reflects
(i) statistical analysis of past SAIDI and SAIFI performance; and
(ii) the level of investment provided for in proposed
tax; …”
3.2 Consideration and Comparison
In the case of a snowstorm it is relatively straightforward to determine the exact level of damage to
network components and to then develop the repair path line and
reasonably accurately look at the historic SAIDI
overall network performance over the “clean
For the major earthquake events suffered by the Orion network
as identified in the following sections:
3.2.1 Failure Rates
The extent of the damage to plant and equipment is not
compared to the snowstorm which affects a limited number of overhead components, the
earthquakes are known to have damaged both overhead lines and cables, as well as
transformers, switchgear and associated control and protection system
many components will have a higher failure rate
damage will have weakened items such that
ingress) will occur in places that would not normally be fo
than previously. Similarly it is likely that insulation or other components inside transformers,
switchgear and controls may have suffered stress or even fractures that will cause future
failures that would not otherwise b
However, it is now 20 months since the major earthquake and the network has now been
subjected to two winters including extensive periods of rain and also snow storms. It is
reasonable to expect that the majority of the major incipient faults
and that this, in association with ongoing works, will lead to a reduction in the incidents of
faults causing large SAIDI outages
3.2.2 Loading Patterns
In the snowstorm case it can reasonably be assumed that
customers) will remain and
to continue. Conversely the actual network that will be required in several areas for Orion in
future is not known and any previous load growth patterns a
as before. The redevelopment of the CBD is at present yet to be confirmed and the type, size
and expected loading of the buildings in the redeveloped areas can only be a matter of
conjecture at this stage. Further the long
growth) is unlikely to follow traditional historic trends with short term effects from
additional people coming to Christchurch to assist in the re
longer term reduction as existi
earthquake risk. This latter trend has already been identified, but the duration and size of
the departure in the longer term is unknown.
FINAL REPORT
OCTOBER 2012
better reflects ………….either or both of-
(i) statistical analysis of past SAIDI and SAIFI performance; and
(ii) the level of investment provided for in proposed maximum allowable revenue before
and Comparison of Catastrophic Events
In the case of a snowstorm it is relatively straightforward to determine the exact level of damage to
network components and to then develop the repair path line and thus it should be possible to
reasonably accurately look at the historic SAIDI and SAIFI performance and use this to predict the
overall network performance over the “clean-up” years.
suffered by the Orion network the situation is significantly different
as identified in the following sections: -
The extent of the damage to plant and equipment is not fully known, further, when
compared to the snowstorm which affects a limited number of overhead components, the
earthquakes are known to have damaged both overhead lines and cables, as well as
transformers, switchgear and associated control and protection systems. It is likely that
many components will have a higher failure rate in future years as some of the earthquake
damage will have weakened items such that normal failure mechanisms (such as moisture
ingress) will occur in places that would not normally be found or may occur at a faster rate
. Similarly it is likely that insulation or other components inside transformers,
switchgear and controls may have suffered stress or even fractures that will cause future
failures that would not otherwise be expected.
However, it is now 20 months since the major earthquake and the network has now been
subjected to two winters including extensive periods of rain and also snow storms. It is
reasonable to expect that the majority of the major incipient faults have now been triggered
and that this, in association with ongoing works, will lead to a reduction in the incidents of
faults causing large SAIDI outages
the snowstorm case it can reasonably be assumed that the pre-existing ne
and the underlying changes in loading patterns can also be expected
Conversely the actual network that will be required in several areas for Orion in
future is not known and any previous load growth patterns are similarly unlikely to continue
as before. The redevelopment of the CBD is at present yet to be confirmed and the type, size
and expected loading of the buildings in the redeveloped areas can only be a matter of
Further the longer term population growth (and associated load
growth) is unlikely to follow traditional historic trends with short term effects from
additional people coming to Christchurch to assist in the re-building work, but a possible
existing residents opt to move to areas with a perceived lower
This latter trend has already been identified, but the duration and size of
the departure in the longer term is unknown.
ORION NZ LTD
P a g e | 8
allowable revenue before
In the case of a snowstorm it is relatively straightforward to determine the exact level of damage to
thus it should be possible to
SAIFI performance and use this to predict the
ation is significantly different
known, further, when
compared to the snowstorm which affects a limited number of overhead components, the
earthquakes are known to have damaged both overhead lines and cables, as well as
s. It is likely that
as some of the earthquake
failure mechanisms (such as moisture
or may occur at a faster rate
. Similarly it is likely that insulation or other components inside transformers,
switchgear and controls may have suffered stress or even fractures that will cause future
However, it is now 20 months since the major earthquake and the network has now been
subjected to two winters including extensive periods of rain and also snow storms. It is
have now been triggered
and that this, in association with ongoing works, will lead to a reduction in the incidents of
existing network (and
the underlying changes in loading patterns can also be expected
Conversely the actual network that will be required in several areas for Orion in
re similarly unlikely to continue
as before. The redevelopment of the CBD is at present yet to be confirmed and the type, size
and expected loading of the buildings in the redeveloped areas can only be a matter of
er term population growth (and associated load
growth) is unlikely to follow traditional historic trends with short term effects from
building work, but a possible
opt to move to areas with a perceived lower
This latter trend has already been identified, but the duration and size of

QUALITY STANDARD VARIATION
3.3.3 Network Configuration
For the snowstorm case it is e
effectively identical to the pre
that a simple rebuild of the existing network is not necessarily the most cost effective
approach and has carried out studies to identify the theoretically most economically
appropriate design approaches to take for network architecture.
3.3.4 Major Earthquake Risk
For the snowstorm case a one in thirty year return period may mean the impact of a similar
storm the next year, but on average it is not expected for some 30 years and there is a
relatively low risk of a snowstorm
Christchurch the current views on the risk of a further severe earthquake are still
for debate with quite divergent view
3.3.5 Data Homogeneity
For the case of the snowstorm
it should be possible to develop an accurate assessment of the damage to the ne
is reasonable to expect that a forward path for SAIDI and SAIFI can be predicted. In the
present case the first earthquake caused a clear break point from historic trends, which were
further distorted by the second
network not yet restored at the request of the authorities the recent SAIDI and SAIFI figures
are distorted by these ongoing forced outages and the date chosen to close of
generation of data from them.
It is therefore my view that the proposals put forward by Orion cannot be reviewed by a
application of the requirements and that it is necessary to examine them from the perspective of the
underlying philosophy of the requirements.
judgements made through the process to ensure they achieve the required result of better reflecting
the realistically achievable performance.
Thus, for the review that follows, the approach taken has been to
from Orion provide an appropriate trade
improvement in network performance from its present damaged state
approach taken to develop statistically valid
A further limiting factor when the comparison with a snowstorm event is considered is that of the
physical ability to carry out works. It has already been noted that repair/replacement of much of the
presently isolated CBD network is outside of Orion’s control. However the wider issue is that of the
repair/replacement of the rest of the network. For the snowstorm case it is reasonable to expect
that additional resources can be applied over a relatively short time to bring the dam
the network back to pre-storm condition. Orion currently faces such a large amount of
repair/replacement work that it is not realistic to complete it in a short space of time
were available. This is due to the level of resources
FINAL REPORT
OCTOBER 2012
For the snowstorm case it is expected that the network will be repaired so that that it is
effectively identical to the pre-damage situation. For the present case Orion ha
a simple rebuild of the existing network is not necessarily the most cost effective
carried out studies to identify the theoretically most economically
appropriate design approaches to take for network architecture.
For the snowstorm case a one in thirty year return period may mean the impact of a similar
storm the next year, but on average it is not expected for some 30 years and there is a
snowstorm occurring during the CPP period. In the case of
views on the risk of a further severe earthquake are still
for debate with quite divergent views on the topic.
For the case of the snowstorm the SAIDI and SAIFI in the years have been homogeneous and
it should be possible to develop an accurate assessment of the damage to the ne
is reasonable to expect that a forward path for SAIDI and SAIFI can be predicted. In the
present case the first earthquake caused a clear break point from historic trends, which were
further distorted by the second and more damaging earthquake. With some areas of the
network not yet restored at the request of the authorities the recent SAIDI and SAIFI figures
are distorted by these ongoing forced outages and the date chosen to close of
generation of data from them.
It is therefore my view that the proposals put forward by Orion cannot be reviewed by a
application of the requirements and that it is necessary to examine them from the perspective of the
underlying philosophy of the requirements. This requires consideration of the engineering
judgements made through the process to ensure they achieve the required result of better reflecting
the realistically achievable performance.
Thus, for the review that follows, the approach taken has been to primarily consider if the proposals
from Orion provide an appropriate trade-off between the proposed expenditure and resultant
improvement in network performance from its present damaged state whilst also considering the
approach taken to develop statistically valid data for SAIDI and SAIFI.
A further limiting factor when the comparison with a snowstorm event is considered is that of the
physical ability to carry out works. It has already been noted that repair/replacement of much of the
rk is outside of Orion’s control. However the wider issue is that of the
repair/replacement of the rest of the network. For the snowstorm case it is reasonable to expect
that additional resources can be applied over a relatively short time to bring the dam
storm condition. Orion currently faces such a large amount of
repair/replacement work that it is not realistic to complete it in a short space of time
due to the level of resources (human, plant and materials) and also due to the
ORION NZ LTD
P a g e | 9
xpected that the network will be repaired so that that it is
damage situation. For the present case Orion has identified
a simple rebuild of the existing network is not necessarily the most cost effective
carried out studies to identify the theoretically most economically
For the snowstorm case a one in thirty year return period may mean the impact of a similar
storm the next year, but on average it is not expected for some 30 years and there is a
PP period. In the case of
views on the risk of a further severe earthquake are still a matter
have been homogeneous and
it should be possible to develop an accurate assessment of the damage to the network so it
is reasonable to expect that a forward path for SAIDI and SAIFI can be predicted. In the
present case the first earthquake caused a clear break point from historic trends, which were
With some areas of the
network not yet restored at the request of the authorities the recent SAIDI and SAIFI figures
are distorted by these ongoing forced outages and the date chosen to close off the
It is therefore my view that the proposals put forward by Orion cannot be reviewed by a literal
application of the requirements and that it is necessary to examine them from the perspective of the
nsideration of the engineering
judgements made through the process to ensure they achieve the required result of better reflecting
consider if the proposals
off between the proposed expenditure and resultant
whilst also considering the
A further limiting factor when the comparison with a snowstorm event is considered is that of the
physical ability to carry out works. It has already been noted that repair/replacement of much of the
rk is outside of Orion’s control. However the wider issue is that of the
repair/replacement of the rest of the network. For the snowstorm case it is reasonable to expect
that additional resources can be applied over a relatively short time to bring the damaged part of
storm condition. Orion currently faces such a large amount of
repair/replacement work that it is not realistic to complete it in a short space of time, even if funds
(human, plant and materials) and also due to the
QUALITY STANDARD VARIATION
operational restrictions on the network which limit how many items of plant can be worked on at
any given time.
Thus the Orion proposals must take account of what can physically be achieved in each year
assuming it were possible to decide what was to be done when still awaiting major decisions on the
future network needs. This issue also creates problems when trying to estimate the SAIDI
contributions to the total figures resulting from “organis
down a part of the network so as to permit the connection of new
So this review becomes an examination of the Orion proposals to identify if they provide an
appropriate trade-off between the proposed expenditure and resultant improvement in network
performance from its present damaged state within the realistic availability of resources.
4.0 Review of Chapter 6
4.1 Targets
Orion proposes to return the overall network perform
although this is not targeted to be achieved within the
carried out extensive studies and consultations over past years that
targeted level of performance. It is of note that the network performance has been in the upper
levels of that compared with other networks and both SAIDI and SAIFI have shown a long term
steady improvement trend over the 10 years pre
maintaining a position in the lowest
Considering the levels of expenditure it is considered reasonable to adopt the previous performance
targets as a long term goal and to work towards these during this
variables and unknowns this goal should be monitored in the light of actual costs and the achieved
performance improvements to ensure they remain valid
sufficiently long for a noticeable improveme
4.2 Synthesising of Data
The overall approach adopted by Orion can be classified as synthesising the expected overall
network SAIDI and SAIFI performance data from consideration of the expected contributions
the various components that make up the network. This approach recognises that the various
components of the network will have various capital projects carried out that will improve their
performance from the present, post earthquake, situation.
This approach allows for the economically sound decision to review the theoretically optimum
network architectures and to use these as the basis of analysis for the overall repair/reinforcement
proposals, but allowing for flexibility in individual cases where
appear able to continue to provide appropriate levels of service whilst not necessarily matching the
theoretical ideal. In other words the approach looks to
FINAL REPORT
OCTOBER 2012
operational restrictions on the network which limit how many items of plant can be worked on at
Thus the Orion proposals must take account of what can physically be achieved in each year
assuming it were possible to decide what was to be done when still awaiting major decisions on the
This issue also creates problems when trying to estimate the SAIDI
contributions to the total figures resulting from “organised shutdowns” – i.e. the necessity to close
down a part of the network so as to permit the connection of new cables and plant to the network.
review becomes an examination of the Orion proposals to identify if they provide an
f between the proposed expenditure and resultant improvement in network
performance from its present damaged state within the realistic availability of resources.
4.0 Review of Chapter 6
Orion proposes to return the overall network performance to that existing prior to the earthquakes,
although this is not targeted to be achieved within the CPP period under consideration. Orion has
carried out extensive studies and consultations over past years that have shown support for
. It is of note that the network performance has been in the upper
levels of that compared with other networks and both SAIDI and SAIFI have shown a long term
steady improvement trend over the 10 years pre-earthquake. These results were achieved whil
a position in the lowest price group of networks.
Considering the levels of expenditure it is considered reasonable to adopt the previous performance
targets as a long term goal and to work towards these during this CPP period. With so many
variables and unknowns this goal should be monitored in the light of actual costs and the achieved
performance improvements to ensure they remain valid. The interval for review will need to be
sufficiently long for a noticeable improvement in performance from the present situation
Synthesising of Data
The overall approach adopted by Orion can be classified as synthesising the expected overall
network SAIDI and SAIFI performance data from consideration of the expected contributions
the various components that make up the network. This approach recognises that the various
components of the network will have various capital projects carried out that will improve their
m the present, post earthquake, situation.
s approach allows for the economically sound decision to review the theoretically optimum
network architectures and to use these as the basis of analysis for the overall repair/reinforcement
proposals, but allowing for flexibility in individual cases where the existing network components
appear able to continue to provide appropriate levels of service whilst not necessarily matching the
theoretical ideal. In other words the approach looks to work towards the theoretical optimal designs
ORION NZ LTD
P a g e | 10
operational restrictions on the network which limit how many items of plant can be worked on at
Thus the Orion proposals must take account of what can physically be achieved in each year –
assuming it were possible to decide what was to be done when still awaiting major decisions on the
This issue also creates problems when trying to estimate the SAIDI and SAIFI
i.e. the necessity to close
cables and plant to the network.
review becomes an examination of the Orion proposals to identify if they provide an
f between the proposed expenditure and resultant improvement in network
performance from its present damaged state within the realistic availability of resources.
ance to that existing prior to the earthquakes,
PP period under consideration. Orion has
have shown support for Orion’s
. It is of note that the network performance has been in the upper
levels of that compared with other networks and both SAIDI and SAIFI have shown a long term
achieved while also
Considering the levels of expenditure it is considered reasonable to adopt the previous performance
riod. With so many
variables and unknowns this goal should be monitored in the light of actual costs and the achieved
he interval for review will need to be
nt in performance from the present situation.
The overall approach adopted by Orion can be classified as synthesising the expected overall
network SAIDI and SAIFI performance data from consideration of the expected contributions from
the various components that make up the network. This approach recognises that the various
components of the network will have various capital projects carried out that will improve their
s approach allows for the economically sound decision to review the theoretically optimum
network architectures and to use these as the basis of analysis for the overall repair/reinforcement
the existing network components
appear able to continue to provide appropriate levels of service whilst not necessarily matching the
the theoretical optimal designs

QUALITY STANDARD VARIATION
but adopting a pragmatic approach with existing network assets to ensure the best overall
economic results.
The analysis has been carried out by considering the historic performance of network items broken
down by voltage levels and identifying the various causes of outages
analysis varies with sub-section under consideration, but in each case looks to distil out “clean” data
for the analysis.
The data presented has been considered by outage cause and voltage class and appears to be
realistic.
The improvement impact predicted on the performance figures from the planned projects
appears to be realistic and achievable for “normal” conditions each year. i.e. excluding the effects of
a further major earthquake or other major event.
One aspect correctly identified by Orion regarding all of the rebuilding/replacement/reinforcement
works is that of the increased risk of outages such activity is likely to cause. There are two sources of
outages associated with the works, firstly the incr
party cable or line hits) but also the requirement to shut down supply to customers in order to carry
out the new works.
This latter issue is particularly difficult in relation to the presently un
as the condition of existing cables and plant is unclear, the new requirements are unknown and thus
the process of establishing the replacement network is not known. If the building development plans
allow, it may be possible to minimise the organised shutdowns, conversely it may result in additional
interruptions. Orion is not able to control this situation as the decisions will be made by third parties
including Christchurch Earthquake Recovery Authority (CERA), and the Stronger Ch
Infrastructure Rebuild Team (SCIRT).
It is noted that the allowances for SAIDI are put at 11.7 minutes for the rural network and 1.8
minutes for the urban network, which, in the absence of any other suitable methodology are both
based on historic performance levels
appropriate in that operations remain similar post earthquakes to pre
case for the urban network including the presently disconnected CBD areas. It is
SAIDI and SAIFI “allowance” should be increased for urban areas, in the absence of any other
guidance or data it is suggested that the historic figures should be doubled.
4.3 Moving Targets
One specific deviation from the defined
SAIFI as opposed to proposing a single value for the reset period.
improvement in network performance as it is rebuilt/replaced which will occur in an incremental
way.
1 Note that the urban figure may also be distorted by the change in work patterns after the first earthquake in
the period up to the second earthquake.
FINAL REPORT
OCTOBER 2012
tic approach with existing network assets to ensure the best overall
The analysis has been carried out by considering the historic performance of network items broken
down by voltage levels and identifying the various causes of outages. The historic data used for this
section under consideration, but in each case looks to distil out “clean” data
The data presented has been considered by outage cause and voltage class and appears to be
impact predicted on the performance figures from the planned projects
appears to be realistic and achievable for “normal” conditions each year. i.e. excluding the effects of
a further major earthquake or other major event.
One aspect correctly identified by Orion regarding all of the rebuilding/replacement/reinforcement
works is that of the increased risk of outages such activity is likely to cause. There are two sources of
associated with the works, firstly the increased risk of outage due to error (such as an
) but also the requirement to shut down supply to customers in order to carry
This latter issue is particularly difficult in relation to the presently un-energised sections of the CBD
as the condition of existing cables and plant is unclear, the new requirements are unknown and thus
the process of establishing the replacement network is not known. If the building development plans
imise the organised shutdowns, conversely it may result in additional
not able to control this situation as the decisions will be made by third parties
including Christchurch Earthquake Recovery Authority (CERA), and the Stronger Ch
Infrastructure Rebuild Team (SCIRT).
It is noted that the allowances for SAIDI are put at 11.7 minutes for the rural network and 1.8
minutes for the urban network, which, in the absence of any other suitable methodology are both
ic performance levels1. Whilst the rural network figure is considered to be
appropriate in that operations remain similar post earthquakes to pre-earthquakes, this is not the
case for the urban network including the presently disconnected CBD areas. It is considered that the
SAIDI and SAIFI “allowance” should be increased for urban areas, in the absence of any other
guidance or data it is suggested that the historic figures should be doubled.
Moving Targets
One specific deviation from the defined approach is that of proposing yearly values for SAIDI and
as opposed to proposing a single value for the reset period. This reflects the planned gradual
improvement in network performance as it is rebuilt/replaced which will occur in an incremental
Note that the urban figure may also be distorted by the change in work patterns after the first earthquake in
the period up to the second earthquake.
ORION NZ LTD
P a g e | 11
tic approach with existing network assets to ensure the best overall
The analysis has been carried out by considering the historic performance of network items broken
. The historic data used for this
section under consideration, but in each case looks to distil out “clean” data
The data presented has been considered by outage cause and voltage class and appears to be
impact predicted on the performance figures from the planned projects similarly
appears to be realistic and achievable for “normal” conditions each year. i.e. excluding the effects of
One aspect correctly identified by Orion regarding all of the rebuilding/replacement/reinforcement
works is that of the increased risk of outages such activity is likely to cause. There are two sources of
eased risk of outage due to error (such as an third
) but also the requirement to shut down supply to customers in order to carry
sed sections of the CBD
as the condition of existing cables and plant is unclear, the new requirements are unknown and thus
the process of establishing the replacement network is not known. If the building development plans
imise the organised shutdowns, conversely it may result in additional
not able to control this situation as the decisions will be made by third parties
including Christchurch Earthquake Recovery Authority (CERA), and the Stronger Christchurch
It is noted that the allowances for SAIDI are put at 11.7 minutes for the rural network and 1.8
minutes for the urban network, which, in the absence of any other suitable methodology are both
. Whilst the rural network figure is considered to be
earthquakes, this is not the
considered that the
SAIDI and SAIFI “allowance” should be increased for urban areas, in the absence of any other
approach is that of proposing yearly values for SAIDI and
This reflects the planned gradual
improvement in network performance as it is rebuilt/replaced which will occur in an incremental
Note that the urban figure may also be distorted by the change in work patterns after the first earthquake in

QUALITY STANDARD VARIATION
By proposing such an approach Orion are setting a tougher target than if they had chosen to strictly
follow the requirements for the DP
section 6.5.1 of their report. The performanc
customers continuing to receive a level of performance significantly below that proposed under the
gradually improving targets.
Based on a review of the components that build the synthesised targets it
to set year by year targets as supported by the data, this will provide all parties with a clearer picture
of progress over the CPP period.
5.0 Review of Supporting Data
It was necessary to review several documents in addition
decision making process used by Orion in reaching their proposals. This section considers each of
these items in turn.
5.1 Network Architecture Review
This paper sets out a theoretical analysis of the options for the architecture of the subtransmission
system (mainly 66kV) and seeks to establish the
established as required to support the achievement
It should be noted that Orion carried out a detailed Security Standard review in 2007 which generally
endorsed the past design practices for most of the network. These standards considered the
of High Impact Low Probability (HILP) events and reviewing the performance of the network after
the first major earthquake confirmed the appropriateness of the level of resilience adopted. This
was further tested by the second earthquake and also supported the resilience so
A purely theoretical “Greenfield” situation was developed and the various component costs
introduced to develop the lowest cost topography. (Note
common components between topologies were not included).
Having developed a theoretical approach to identifying the optimum architecture Orion ha
sought to analyse how this can be applied to the existing system considering the expected re
development of the city. The options considered show that the proposed
security appear to be achievable and to provide the most appropriate overall economic solution.
The recommendation is to adopt closed ring (N
between the 66kV GXP’s to provide full support in the event of the total loss of a GXP
11 kV tie capacity between adjacent zone substations to allow a substation’s complete load to be
carried by two neighbouring zone substations as a general princi
The ongoing development proposals as presented are therefore supported, noting that revisions will
take place as better information becomes avai
location.
FINAL REPORT
OCTOBER 2012
By proposing such an approach Orion are setting a tougher target than if they had chosen to strictly
PP to an updated historical dataset, this being clearly illustrated in
The performance measures calculated by this method would see their
customers continuing to receive a level of performance significantly below that proposed under the
Based on a review of the components that build the synthesised targets it is considered reasonable
to set year by year targets as supported by the data, this will provide all parties with a clearer picture
Review of Supporting Data
It was necessary to review several documents in addition to Chapter 6 as these detail aspects of the
decision making process used by Orion in reaching their proposals. This section considers each of
Network Architecture Review – Subtransmission
This paper sets out a theoretical analysis of the options for the architecture of the subtransmission
to establish the optimal solution which will provide the security level
established as required to support the achievement of the overall performance figures.
It should be noted that Orion carried out a detailed Security Standard review in 2007 which generally
endorsed the past design practices for most of the network. These standards considered the
Probability (HILP) events and reviewing the performance of the network after
the first major earthquake confirmed the appropriateness of the level of resilience adopted. This
was further tested by the second earthquake and also supported the resilience sought.
A purely theoretical “Greenfield” situation was developed and the various component costs
introduced to develop the lowest cost topography. (Note that only variable costs were considered,
common components between topologies were not included).
ing developed a theoretical approach to identifying the optimum architecture Orion ha
sought to analyse how this can be applied to the existing system considering the expected re
development of the city. The options considered show that the proposed underlying levels of
security appear to be achievable and to provide the most appropriate overall economic solution.
The recommendation is to adopt closed ring (N-1) topology with sufficient 66kV interconnection
the 66kV GXP’s to provide full support in the event of the total loss of a GXP
11 kV tie capacity between adjacent zone substations to allow a substation’s complete load to be
carried by two neighbouring zone substations as a general principle.
proposals as presented are therefore supported, noting that revisions will
take place as better information becomes available, such as the actual load growth on an individual
ORION NZ LTD
P a g e | 12
By proposing such an approach Orion are setting a tougher target than if they had chosen to strictly
, this being clearly illustrated in
e measures calculated by this method would see their
customers continuing to receive a level of performance significantly below that proposed under the
is considered reasonable
to set year by year targets as supported by the data, this will provide all parties with a clearer picture
to Chapter 6 as these detail aspects of the
decision making process used by Orion in reaching their proposals. This section considers each of
This paper sets out a theoretical analysis of the options for the architecture of the subtransmission
solution which will provide the security level
of the overall performance figures.
It should be noted that Orion carried out a detailed Security Standard review in 2007 which generally
endorsed the past design practices for most of the network. These standards considered the effect
Probability (HILP) events and reviewing the performance of the network after
the first major earthquake confirmed the appropriateness of the level of resilience adopted. This
ught.
A purely theoretical “Greenfield” situation was developed and the various component costs
only variable costs were considered,
ing developed a theoretical approach to identifying the optimum architecture Orion has then
sought to analyse how this can be applied to the existing system considering the expected re-
underlying levels of
security appear to be achievable and to provide the most appropriate overall economic solution.
interconnection
the 66kV GXP’s to provide full support in the event of the total loss of a GXP and sufficient
11 kV tie capacity between adjacent zone substations to allow a substation’s complete load to be
proposals as presented are therefore supported, noting that revisions will
ble, such as the actual load growth on an individual

QUALITY STANDARD VARIATION
It is noted, however, that all such anal
not supplied during an outage – the Value of Lost Load (VoLL). Whilst much work has been carried
out around the world on this topic the current view, as supported by Orion, is that for accuracy i
calculating the impact of an outage event a series of values for VoLL are required to reflect not only
the difference in load types (Residential, Commercial, etc) but also the duration of the event. They
propose to work with the Electricity Authority to
This proposal is fully supported as it should lead to improved decision making on individual projects
by more accurately reflecting the economic cost to network customers of failures of supply. This will
then help identify the optimum project and its timing to manage such events.
5.2 Network Architecture Review
This paper sets out a theoretical analysis of the options for the architecture of the Urban 11kV
system. Factors taken into considerat
distribution system to distribution transformers and thus customers;
supplies via the 11kV network to maintain supply to customers in the event of the loss of b
circuits into a zone substation (as it did in multiple places during the earthquake)
also forms part of the overall philosophy for security.
The report drew on the detailed work carried out in 2007
economic analysis of the various theoretical topologies. It is noted that in addition to establishment
costs the costs of energy losses were also considered and this is considered appropriate.
One specific aspect that Orion has considered in detail i
switchgear to be used in future. Traditionally Orion has used Magnefix Switching Units (MSU),
however these have been in manufacture for some 40 years and safety standards for operators and
the general public have changed, particularly in relation to Arc
grown they are being required to switch higher currents than in the past.
In summary this switchgear does not provide arc flash hazard protection that is now considered
appropriate and whilst procedures and protective clothing etc can be used to allow existing
equipment to remain in service no further units should be installed. (This is in agreement with
decisions taken by other users of the equipment).
Orion are in the process of reviewing the range of options currently available, but the total cost of
new options, including the installation costs, have not been fully established. The work in progress
will establish these total costs which will then need to be used to re
carried out on the 11kV architecture options. However, it is considered unlikely that there will be
any major changes identified to the current proposals.
The overall proposals for Greenfield developments confirmed the presen
configuration and local substation (kiosks) arrangements, subject to checking new 11kV switchgear
costs. The ability to improve the network performance by the use of additional remote control
equipment is noted for further analysi
benefit of adding remote indication of switchgear operation. Finally Orion notes that whilst the
theoretical green fields approach should guide redevelopment of brown field areas
for conversions should be assessed on an area by area basis.
FINAL REPORT
OCTOBER 2012
It is noted, however, that all such analysis is dependent on the value applied to the cost of energy
the Value of Lost Load (VoLL). Whilst much work has been carried
out around the world on this topic the current view, as supported by Orion, is that for accuracy i
calculating the impact of an outage event a series of values for VoLL are required to reflect not only
the difference in load types (Residential, Commercial, etc) but also the duration of the event. They
propose to work with the Electricity Authority to develop a matrix approach to cover these items.
This proposal is fully supported as it should lead to improved decision making on individual projects
by more accurately reflecting the economic cost to network customers of failures of supply. This will
n help identify the optimum project and its timing to manage such events.
Network Architecture Review – Urban 11kV
This paper sets out a theoretical analysis of the options for the architecture of the Urban 11kV
. Factors taken into consideration include the initial purpose of 11kV feeders as the primary
distribution system to distribution transformers and thus customers; and the provision of alternative
supplies via the 11kV network to maintain supply to customers in the event of the loss of b
(as it did in multiple places during the earthquake)and
also forms part of the overall philosophy for security.
The report drew on the detailed work carried out in 2007 and effectively provides an upd
economic analysis of the various theoretical topologies. It is noted that in addition to establishment
costs the costs of energy losses were also considered and this is considered appropriate.
One specific aspect that Orion has considered in detail is that of the type of 11kV distribution
switchgear to be used in future. Traditionally Orion has used Magnefix Switching Units (MSU),
however these have been in manufacture for some 40 years and safety standards for operators and
anged, particularly in relation to Arc-Flash hazard. Further, as loads have
grown they are being required to switch higher currents than in the past.
In summary this switchgear does not provide arc flash hazard protection that is now considered
appropriate and whilst procedures and protective clothing etc can be used to allow existing
no further units should be installed. (This is in agreement with
decisions taken by other users of the equipment).
process of reviewing the range of options currently available, but the total cost of
new options, including the installation costs, have not been fully established. The work in progress
will establish these total costs which will then need to be used to re-check the economic analysis
carried out on the 11kV architecture options. However, it is considered unlikely that there will be
any major changes identified to the current proposals.
for Greenfield developments confirmed the present approach for the feeder
configuration and local substation (kiosks) arrangements, subject to checking new 11kV switchgear
costs. The ability to improve the network performance by the use of additional remote control
equipment is noted for further analysis once the new switchgear costs are developed as is the
benefit of adding remote indication of switchgear operation. Finally Orion notes that whilst the
theoretical green fields approach should guide redevelopment of brown field areas the economics
versions should be assessed on an area by area basis.
ORION NZ LTD
P a g e | 13
ysis is dependent on the value applied to the cost of energy
the Value of Lost Load (VoLL). Whilst much work has been carried
out around the world on this topic the current view, as supported by Orion, is that for accuracy in
calculating the impact of an outage event a series of values for VoLL are required to reflect not only
the difference in load types (Residential, Commercial, etc) but also the duration of the event. They
develop a matrix approach to cover these items.
This proposal is fully supported as it should lead to improved decision making on individual projects
by more accurately reflecting the economic cost to network customers of failures of supply. This will
This paper sets out a theoretical analysis of the options for the architecture of the Urban 11kV
11kV feeders as the primary
the provision of alternative
supplies via the 11kV network to maintain supply to customers in the event of the loss of both 66kV
and notes that it
and effectively provides an updated
economic analysis of the various theoretical topologies. It is noted that in addition to establishment
costs the costs of energy losses were also considered and this is considered appropriate.
s that of the type of 11kV distribution
switchgear to be used in future. Traditionally Orion has used Magnefix Switching Units (MSU),
however these have been in manufacture for some 40 years and safety standards for operators and
Flash hazard. Further, as loads have
In summary this switchgear does not provide arc flash hazard protection that is now considered
appropriate and whilst procedures and protective clothing etc can be used to allow existing
no further units should be installed. (This is in agreement with
process of reviewing the range of options currently available, but the total cost of
new options, including the installation costs, have not been fully established. The work in progress
check the economic analysis
carried out on the 11kV architecture options. However, it is considered unlikely that there will be
t approach for the feeder
configuration and local substation (kiosks) arrangements, subject to checking new 11kV switchgear
costs. The ability to improve the network performance by the use of additional remote control
are developed as is the
benefit of adding remote indication of switchgear operation. Finally Orion notes that whilst the
the economics

QUALITY STANDARD VARIATION
It is considered that the approach taken by Orion is fundamentally sound and pragmatic and the
approach of continued review and individual economic analysis is fully supported.
5.3 Asset Management Pl
The 2012 AMP summarises the overall plans by Orion for the restoration and development of its
network taking into account the various reviews, etc covered above. The AMP sets the planned
expenditure on both Capital and Maintenance, noting the interrelated nature of
The proposed levels of both expenditures has been provided and reviewed and it is considered they
reflect an overall achievable set of targets based on current knowledge. It must be recognised that
Orion faces a much greater level of u
a result of the extensive damage to both the city and its network.
The proposed levels of expenditure appear to
including the past two years of emergency expenditure. Thus it is considered that
adequate numbers of appropriately qualified and trained staff
proposals. Further, the present proposals appear to reflect the expected renewa
infrastructure in the areas that suffered major damage
This is considered to further support the approach adopted of looking at annual incremental
improvements and it must be expected that revisions to targets are likely to be required
unknowns are addressed and more accurate data becomes available for review.
6.0 Conclusions
As established in section 3.0 of this report, for the situation faced by Orion it is not considered
possible to apply the requirements for this Indepe
thus the approach adopted was an examination of the Orion proposals to identify if they provide an
appropriate trade-off between the proposed expenditure and resultant improvement in network
performance from its present damaged state within the realistic availability of resources.
It is the reviewer’s opinion that Orion ha
clarity around aspects of the rebuild on the CBD; Long term population trends
parts of the existing network asset and the associated impact on failure rates and the level of risk of
further earthquake damage.
The approach adopted of reviewing theoretical optimum network architecture arrangements for
both the sub-transmission and distribution networks
intention to check the application of these overall proposals when individual projects are analysed to
review and ensure the most economic solution is found at the time of
Whilst not being possible to strictly follow the specified statistical analysis, Orion have adopted an
approach to synthesise the projected data from realistic expectations of the performance of
FINAL REPORT
OCTOBER 2012
It is considered that the approach taken by Orion is fundamentally sound and pragmatic and the
approach of continued review and individual economic analysis is fully supported.
Asset Management Plan.
AMP summarises the overall plans by Orion for the restoration and development of its
network taking into account the various reviews, etc covered above. The AMP sets the planned
expenditure on both Capital and Maintenance, noting the interrelated nature of some expenditure.
The proposed levels of both expenditures has been provided and reviewed and it is considered they
reflect an overall achievable set of targets based on current knowledge. It must be recognised that
Orion faces a much greater level of uncertainty with many significant factors outside of its control as
a result of the extensive damage to both the city and its network.
The proposed levels of expenditure appear to be realistically achievable, based on historic spending,
years of emergency expenditure. Thus it is considered that
adequate numbers of appropriately qualified and trained staff are available to Orion to achieve the
proposals. Further, the present proposals appear to reflect the expected renewal of property and
infrastructure in the areas that suffered major damage
This is considered to further support the approach adopted of looking at annual incremental
improvements and it must be expected that revisions to targets are likely to be required
unknowns are addressed and more accurate data becomes available for review.
As established in section 3.0 of this report, for the situation faced by Orion it is not considered
possible to apply the requirements for this Independent Engineer’s review strictly as written and
as an examination of the Orion proposals to identify if they provide an
off between the proposed expenditure and resultant improvement in network
its present damaged state within the realistic availability of resources.
s opinion that Orion has demonstrated this within the limitations set by the lack of
clarity around aspects of the rebuild on the CBD; Long term population trends; the unknown state of
parts of the existing network asset and the associated impact on failure rates and the level of risk of
The approach adopted of reviewing theoretical optimum network architecture arrangements for
transmission and distribution networks is considered most appropriate as is the
intention to check the application of these overall proposals when individual projects are analysed to
review and ensure the most economic solution is found at the time of the decision being required.
Whilst not being possible to strictly follow the specified statistical analysis, Orion have adopted an
ach to synthesise the projected data from realistic expectations of the performance of
ORION NZ LTD
P a g e | 14
It is considered that the approach taken by Orion is fundamentally sound and pragmatic and the
AMP summarises the overall plans by Orion for the restoration and development of its
network taking into account the various reviews, etc covered above. The AMP sets the planned
some expenditure.
The proposed levels of both expenditures has been provided and reviewed and it is considered they
reflect an overall achievable set of targets based on current knowledge. It must be recognised that
many significant factors outside of its control as
based on historic spending,
years of emergency expenditure. Thus it is considered that materials and
are available to Orion to achieve the
l of property and
This is considered to further support the approach adopted of looking at annual incremental
improvements and it must be expected that revisions to targets are likely to be required as the
As established in section 3.0 of this report, for the situation faced by Orion it is not considered
ndent Engineer’s review strictly as written and
as an examination of the Orion proposals to identify if they provide an
off between the proposed expenditure and resultant improvement in network
its present damaged state within the realistic availability of resources.
demonstrated this within the limitations set by the lack of
; the unknown state of
parts of the existing network asset and the associated impact on failure rates and the level of risk of
The approach adopted of reviewing theoretical optimum network architecture arrangements for
is considered most appropriate as is the
intention to check the application of these overall proposals when individual projects are analysed to
the decision being required.
Whilst not being possible to strictly follow the specified statistical analysis, Orion have adopted an
ach to synthesise the projected data from realistic expectations of the performance of

QUALITY STANDARD VARIATION
individual sections of the overall network which appears to be carefully considered, and then the
required approach to develop boundary values has been followed.
The proposed set of targets set by year for SAIDI and SAIFI
considered to be an appropriate way of addressing targeted performance as projects are carried out
to repair/replace the severe damage suffered
the determination period it is understood that Orion will review their plann
actual performance compared to target as well as
of the earthquakes on plant and equipment.
This review concludes that the proposals and targets provide an appropriate trade
proposed expenditure and resultant improvement in network performance from its present
damaged state within the realistic availability of resources. In comparison to the application of the
DPP methodology the quality standard variation
better in reflecting the realistically achievable performance of
regulatory period.
In summary, it is the reviewers opinion that Orion has chosen an appropriate balance between
expenditure on the network and the expected improvement in performance. This recognises the
present damaged state of parts of the network as well as the availability of resources for the work.
The proposals are considered to better reflect the realistically achievable improvement in network
performance than the standard methodology.
FINAL REPORT
OCTOBER 2012
overall network which appears to be carefully considered, and then the
required approach to develop boundary values has been followed.
The proposed set of targets set by year for SAIDI and SAIFI – including their boundary values
appropriate way of addressing targeted performance as projects are carried out
to repair/replace the severe damage suffered. Whilst recognising that the targets will be fixed for
the determination period it is understood that Orion will review their planned projects in the light of
actual performance compared to target as well as reflecting the improved knowledge on the effects
of the earthquakes on plant and equipment.
This review concludes that the proposals and targets provide an appropriate trade-off
proposed expenditure and resultant improvement in network performance from its present
damaged state within the realistic availability of resources. In comparison to the application of the
quality standard variation as proposed by Orion is considered to be notably
the realistically achievable performance of the EDB (Orion)
opinion that Orion has chosen an appropriate balance between
expenditure on the network and the expected improvement in performance. This recognises the
present damaged state of parts of the network as well as the availability of resources for the work.
he proposals are considered to better reflect the realistically achievable improvement in network
performance than the standard methodology.
ORION NZ LTD
P a g e | 15
overall network which appears to be carefully considered, and then the
including their boundary values - are
appropriate way of addressing targeted performance as projects are carried out
Whilst recognising that the targets will be fixed for
ed projects in the light of
the improved knowledge on the effects
off between the
proposed expenditure and resultant improvement in network performance from its present
damaged state within the realistic availability of resources. In comparison to the application of the
is considered to be notably
(Orion) over the CPP
opinion that Orion has chosen an appropriate balance between
expenditure on the network and the expected improvement in performance. This recognises the
present damaged state of parts of the network as well as the availability of resources for the work.
he proposals are considered to better reflect the realistically achievable improvement in network

QUALITY STANDARD VARIATION
Appendix A: List of Documents Provided for Review
The following Documents were supplied to support the review:
CPP Proposal Chapter 6 – Quality Standard Variation
Orion AMP 2012
Network Architecture Review – Subtransmission
Network Architecture Review – Urban 11kV Network
Spreadsheets analysing expected performance of netwo
Paper presented to Orion Board on proposed quality standards for CPP application
Annual Budgets for proposed CAPEX and OPEX
FINAL REPORT
OCTOBER 2012
List of Documents Provided for Review
supplied to support the review: -
Quality Standard Variation
Subtransmission
Urban 11kV Network – including Ring Main Unit Paper
Spreadsheets analysing expected performance of network sections
Paper presented to Orion Board on proposed quality standards for CPP application
Annual Budgets for proposed CAPEX and OPEX
ORION NZ LTD
P a g e | 16
List of Documents Provided for Review

Appendix 4 Satisfaction of CPP IM Information requirements

CPP Proposal Information Compliance Summary
CPP IM Information Requirements CPP Proposal Reference
5.4.1 Application of this subpart
(1) Subject to subclause (2), a CPP proposal must contain at least the information specified in this subpart. (2) For the purpose of subclause (1)-
(a) where a CPP applicant seeks only a quality standard variation, its CPP proposal need only contain the information specified in clauses 5.4.2, 5.4.3, 5.4.4 and 5.4.5; and (b) where a CPP proposal is made in accordance with provisions in a DPP determination relating to the submission of CPP proposals in response to a catastrophic event, the information specified in clause 5.4.3 is not required.
n/a 4.1
5.4.2 Reasons for the proposal
A CPP proposal must contain a-
(a) detailed description of the CPP applicant's rationale for seeking a CPP; and (b) summary of the key evidence in the proposal supporting that rationale.
3.1 – 3.6, Appendix 1, Appendix 2, Appendix 3 3.8, Appendix 4
5.4.3 Information regarding priority of proposal
(Not required – refer 5.4.1 (2)(b) above)
4.1
5.4.4 Duration of regulatory period
Where a CPP applicant seeks a CPP of 3 years' or 4 years' duration-
(a) the duration of the CPP sought must be stated in the CPP proposal; and
(b) the CPP proposal must contain an explanation as to why that duration better meets the purpose of Part 4 of the Act than 5 years.
5.1 – 5.2
5.4.5 Information on proposed quality standard variation
Where a CPP applicant seeks a quality standard variation, the CPP proposal must contain the following information:
(a) different values of either or both of-
(i) μSAIDI and μSAIFI; and (ii) σ SAIDI and σ SAIFI,
to those which would be determined in accordance with the methodology for calculating reliability limits specified in the DPP determination; (b) an explanation of the reasons for the proposed quality standard variation; (c) an engineer's report on the extent to which the quality standard variation better reflects the realistically achievable performance of the EDB over the
6.1, 6.4, Appendix 9 6.2, 6.3, 6.4, Appendix 6, Appendix 7, Appendix 8 6.6, Appendix 3

CPP Proposal Information Compliance Summary
CPP IM Information Requirements CPP Proposal Reference
CPP regulatory period based on either or both of- (i) statistical analysis of past SAIDI and SAIFI performance; and (ii) the level of investment provided for in proposed maximum allowable revenue before tax; and
(d) an estimation and evaluation of the effect of the proposed quality standard variation, had it applied in an earlier period of 5 years by use of historic data, by contrast with the quality standards specified in the DPP determination.
6.5
5.4.6 Interpretation
(2) Any values and amounts used by a CPP applicant to determine the quantum of allowances, amounts, sums or values required by this section must be consistent with other information provided in accordance with this part.
Addressed through model and audit procedures
5.4.7 Proposed building blocks allowable revenue
(1) A CPP proposal must contain amounts for
(a) building blocks allowable revenue before tax for each disclosure year of the next period; and (b) building blocks allowable revenue after tax for each disclosure year of the next period.
(2) A CPP proposal must contain all data, information, calculations and assumptions used to determine the amounts required by subclause (1), including but not limited to-
(a) amounts or forecasts of-
(i) regulatory investment value; (ii) total value of commissioned assets determined in accordance with clause 5.3.2(3) (iii) total depreciation; (iv) total revaluation; and (v) other regulated income;
(b) all data, information, calculations and assumptions used to derive amounts or forecasts of TFVCA, PVVCA, TF, and TFrev determined in accordance with clause 5.3.2(4); (c) all data, information, calculations and assumptions used to derive the forecasts other regulated income provided pursuant to paragraph (a); (c) forecast operating expenditure; and (d) any proposed term credit spread differential allowance.
(3) A CPP proposal must contain the following information:
(a) actual other regulated income for each disclosure year of the current period; and
7.3.1 7.3.1 7.3.2 7.3.3 7.3.4 7.3.5 7.3.7 7.3.6 7.3.7 7.3.8 7.3.9 7.3.7

CPP Proposal Information Compliance Summary
CPP IM Information Requirements CPP Proposal Reference
(b) data, calculations and assumptions demonstrating how the forecast of other regulated income provided pursuant to subclause (2)(a)(iv) is consistent with information provided in accordance with paragraph (a).
(4) All calculations, values and amounts required by this clause must be presented in a spreadsheet format which –
(a) clearly demonstrates how building blocks allowable revenue before tax and building blocks allowable revenue after tax for each disclosure year of the next period have been derived using the formulae specified in clauses 5.3.2 and 5.3.3; and (b) where data has been computed or derived from other values on the spreadsheet through the use of formulae, makes the underlying formulae accessible.
7.3.7 A list of the relevant spreadsheets which accompany this proposal is included in Section 7.10
5.4.8 Maximum Allowable Revenues
(1) A CPP proposal must contain amounts for-
(a) maximum allowable revenue before tax for each disclosure year of the CPP regulatory period; and (b) maximum allowable revenue after tax for each disclosure year of the CPP regulatory period.
(2) For the purpose of subclauses (1)(a) and (1)(b), the CPP applicant must -
(a) apply an X factor; and (b) state the value of the X factor.
(3) For the purpose of subclause (2) the X factor is that defined in the CPP applicant's DPP determination, subject to subclause (4). (4) For the purpose of subclause (3), a different X factor may be used provided that the CPP proposal contains an explanation and supporting evidence as to why it would better meet the purpose of Part 4 of the Act. (5) A CPP proposal must contain all data, calculations and assumptions used to derive the forecast weighted average growth in quantities in accordance with clause 5.3.4(7), including-
(a) a description of each demand group; (b) the rationale for the selection of demand groups; (c) the forecast growth in demand for each demand group; (d) the basis for the forecast growth in demand for each demand group; (e) evidence that the forecast growth in demand for each demand group is consistent with all other relevant demand forecasts included in the CPP
7.2.1 7.2.1 7.2.4 7.2.4 7.2.4 7.2.4 7.2.5, Appendix 9 and 10 7.2.5 7.2.5 7.2.5 7.2.5 7.2.5
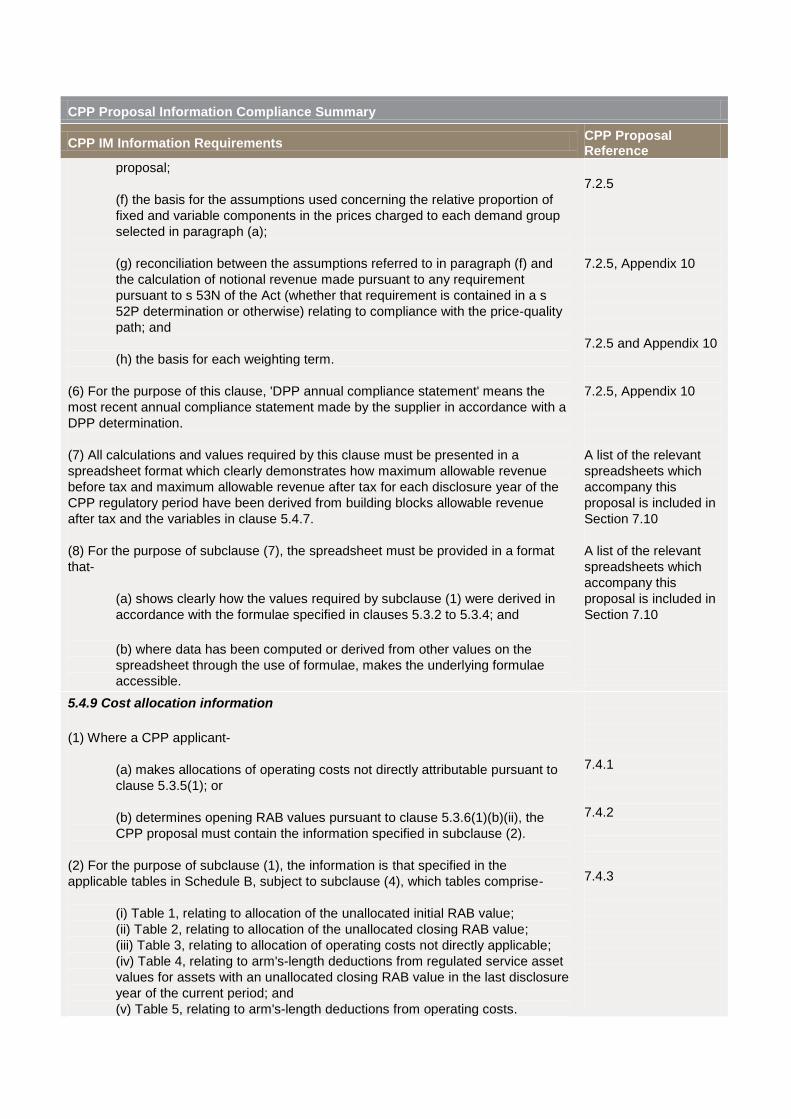
CPP Proposal Information Compliance Summary
CPP IM Information Requirements CPP Proposal Reference
proposal; (f) the basis for the assumptions used concerning the relative proportion of fixed and variable components in the prices charged to each demand group selected in paragraph (a); (g) reconciliation between the assumptions referred to in paragraph (f) and the calculation of notional revenue made pursuant to any requirement pursuant to s 53N of the Act (whether that requirement is contained in a s 52P determination or otherwise) relating to compliance with the price-quality path; and (h) the basis for each weighting term.
(6) For the purpose of this clause, 'DPP annual compliance statement' means the most recent annual compliance statement made by the supplier in accordance with a DPP determination. (7) All calculations and values required by this clause must be presented in a spreadsheet format which clearly demonstrates how maximum allowable revenue before tax and maximum allowable revenue after tax for each disclosure year of the CPP regulatory period have been derived from building blocks allowable revenue after tax and the variables in clause 5.4.7. (8) For the purpose of subclause (7), the spreadsheet must be provided in a format that-
(a) shows clearly how the values required by subclause (1) were derived in accordance with the formulae specified in clauses 5.3.2 to 5.3.4; and
(b) where data has been computed or derived from other values on the spreadsheet through the use of formulae, makes the underlying formulae accessible.
7.2.5 7.2.5, Appendix 10 7.2.5 and Appendix 10 7.2.5, Appendix 10 A list of the relevant spreadsheets which accompany this proposal is included in Section 7.10 A list of the relevant spreadsheets which accompany this proposal is included in Section 7.10
5.4.9 Cost allocation information
(1) Where a CPP applicant-
(a) makes allocations of operating costs not directly attributable pursuant to clause 5.3.5(1); or (b) determines opening RAB values pursuant to clause 5.3.6(1)(b)(ii), the CPP proposal must contain the information specified in subclause (2).
(2) For the purpose of subclause (1), the information is that specified in the applicable tables in Schedule B, subject to subclause (4), which tables comprise-
(i) Table 1, relating to allocation of the unallocated initial RAB value; (ii) Table 2, relating to allocation of the unallocated closing RAB value; (iii) Table 3, relating to allocation of operating costs not directly applicable; (iv) Table 4, relating to arm's-length deductions from regulated service asset values for assets with an unallocated closing RAB value in the last disclosure year of the current period; and (v) Table 5, relating to arm's-length deductions from operating costs.
7.4.1 7.4.2 7.4.3

CPP Proposal Information Compliance Summary
CPP IM Information Requirements CPP Proposal Reference
(3) In respect of-
(a) operating costs not directly attributable allocated to electricity distribution services in accordance with clause 5.3.5(2); or (b) closing RAB values determined in accordance with clause 5.3.6(4), the CPP proposal must contain the information specified in Schedule C, subject to subclause (4), which tables comprise- (c) Table 1, relating to allocation of the unallocated closing RAB value; (d) Table 2 relating to allocation of operating costs not directly applicable; (e) Table 3, relating to arm's-length deductions from regulated service asset values for assets with an unallocated closing RAB value at the end of the last year of the assessment period; and (f) Table 4, relating to arm's-length deductions from operating costs.
(4) For the purpose of this clause-
(a) the information specified in the tables of the schedules referred to must be provided on spreadsheets; and (b) where data has been computed or derived from other values on the spreadsheet through the use of formulae, all underlying formulae must be accessible.
7.4.3 7.4.3
5.4.10 Certification requirements
(1) Where any arm's-length deduction was applied for the purpose of this Section, the CPP proposal must contain certification by no fewer than 2 of the EDB's directors in the following terms, where words in bold bear the meanings specified in this determination:
"I, [insert name], director of [insert name of Supplier of services regulated under Part 4 of the Commerce Act] certify that, having made all reasonable enquiry, my belief is that having had regard to the attached information [information required by clause 5.4.9(2)] for the purpose of the supplier's CPP proposal, it was appropriate to make the arm's-length deductions the amount and nature of which are detailed in the tables below, namely: Table 4 of Schedule B / Table 5 of Schedule B / Table 3 of Schedule C / Table 4 of Schedule C [delete as appropriate]."
(2) Where, in relation to regulated service asset values, OVABAA was applied for the purpose of this clause in accordance with Subpart 3 Section 2, the CPP proposal must contain certification by no fewer than 2 of the EDB's directors in respect of its application in the following terms, where words in bold bear the meanings specified in this determination: "
I, [insert name], director of [insert name of Supplier of services regulated under Part 4 of the Commerce Act] certify that, having made all reasonable enquiry, my belief is that having had regard to the attached information
7.4.1 and 7.4.2 (no arms length deduction has been made) 7.4.1 and 7.4.2 (no arms length deduction has been made)

CPP Proposal Information Compliance Summary
CPP IM Information Requirements CPP Proposal Reference
(being information required by clause 5.4.9(2)) for the purpose of the supplier's CPP proposal-
(a) the attached information is accurate; (b) the OVABAA was applicable in accordance with clause 2.1.2; and (c) the following unregulated services would be unduly deterred had adjustments to allocations of regulated service asset values ( in accordance with clause 2.1.5) not been made: [list relevant unregulated services]."
(3) Where, in relation to operating costs provided in a CPP proposal in accordance with subclause 5.4.8(1) and Schedule C, the OVABAA was applied, the CPP proposal must contain certification by no fewer than 2 of the EDB's directors in respect of application of the OVABAA in the following terms:
"I, [insert name], director of [insert name of Supplier of services regulated under Part 4 of the Commerce Act] certify that, having made all reasonable enquiry, my belief is that having had regard to the attached information (being information required by clause 5.4.9(2)) for the purpose of the supplier's CPP proposal-
(a) the attached information is accurate; (b) the OVABAA was applicable in accordance with clause 2.1.2; and (c) the following unregulated services would be unduly deterred had adjustments to allocations of operating costs ( in accordance with clause 2.1.5) not been made: [list relevant unregulated services]."
7.4.1 and 7.4.2 (OVABAA has not been applied)
5.4.11 RAB roll forward information In respect of each disclosure year commencing after-
(a) where disclosure has been made pursuant to an ID determination, the last disclosure so made; or (b) where disclosure has not been made pursuant to an ID determination, the disclosure year 2009, to the last disclosure year of the next period, provide values, in accordance with Subpart 3 Section 2, for the- (c) total opening RAB value; and (d) sum of each of the following things:
(i) forecast value of commissioned assets; and (ii) closing RAB values.
7.5.1 7.5.1 7.5.1 7.5.1 7.5.1
5.4.12 Depreciation information
(1) In respect of each disclosure year of the CPP regulatory period, provide the information specified in this clause.
7.5.3

CPP Proposal Information Compliance Summary
CPP IM Information Requirements CPP Proposal Reference
(2) The sum of depreciation for each type of asset-
(a) for which the proposed method of determining depreciation is the standard depreciation method; and (b) for which the proposed method of determining depreciation is something other than the standard depreciation method.
(3) For each type of asset to which subclause (2)(b) applies-
(a) a description of the type of asset; (b) a description of the proposed depreciation method; (c) where the proposed asset life is different to the physical asset life, the proposed asset for the type of asset; (d) where the proposed asset life for the type of asset is different to the physical asset life, the proposed remaining asset life; (e) forecast depreciation over the asset life for the type of asset, including details of all assumptions made; (f) forecast depreciation over the asset life for the type of asset determined in accordance with the standard depreciation method; (g) evidence to demonstrate that the proposed depreciation method including, where applicable, any proposed asset life different to the physical asset life, better meets the purpose of Part 4 of the Act than the standard depreciation method; and (h) a description of any consultation undertaken with consumers on the proposed depreciation method, including-
(i) the extent of any consumer disagreement; and (ii) the EDB's view in response.
(4) For each asset or type of asset for which a different physical asset life to the standard physical asset life is proposed-
(a) a description of the assets or types of asset; (b) to which clauses 2.2.8(1)(c)and 2.2.8(1)(e)(v) apply, an engineer's report addressing the suitability of the proposed physical asset life; and (c) any other evidence to demonstrate that the requirements of clause 2.2.8 in respect of the particular type of asset are met.
7.5.3, Appendix 15 7.5.3 7.5.3 7.5.3 n/a n/a 7.5.3 7.5.3 7.5.3 7.5.3, CPP application n/a n/a n/a Appendix 16
5.4.13 Revaluation information
(1) In respect of each disclosure year commencing after-
(a) where disclosure has been made pursuant to an ID determination, the last disclosure so made; or
7.5.4

CPP Proposal Information Compliance Summary
CPP IM Information Requirements CPP Proposal Reference
(b) where disclosure has not been made pursuant to an ID determination, the disclosure year 2009, to the last disclosure year of the next period provide the following things: (c) sum of opening RAB values; (d) forecast CPI for the last quarter of the disclosure year; (e) forecast CPI for the last quarter of the preceding disclosure year; and
(f) revaluation rate.
7.5.4 7.5.4 7.5.4 7.5.4 7.5.4
5.4.14 Commissioned assets information
(1) In respect of each disclosure year commencing after-
(a) where disclosure has been made pursuant to an ID determination, the last disclosure so made; or (b) where disclosure has not been made pursuant to an ID determination, the disclosure year 2009, to the last disclosure year of the next period, provide the- (c) sum of value of commissioned assets; and (d) sum of forecast value of commissioned assets, in respect of each of the following groups of assets: (e) assets-
(i) acquired or intended to be acquired from a related company; or (ii) transferred from a part of the EDB that supplies unregulated services;
(f) assets-
(i) acquired or intended to be acquired from another regulated supplier and used by that regulated supplier in the supply of regulated services; or (ii) transferred or intended to be transferred from a part of the EDB that supplies other regulated services;
(g) network spares; and (h) all other assets having a commissioning date or forecast to have a commissioning date in that period.
(2) In respect of each value provided in accordance with subclause (1) provide-
(a) all data, information, calculations and assumptions used to derive it from
7.5.5 7.5.5 7.5.5 7.5.5 7.5.5 7.5.5 n/a 7.5.5 n/a 7.5.5 7.5.5 7.5.5

CPP Proposal Information Compliance Summary
CPP IM Information Requirements CPP Proposal Reference
relevant data provided in the capex forecast; and (b) where capital contributions are taken into account in any value disclosed pursuant to subclause (1)-
(i) the amount of such capital contributions, with respect to asset types and quantities; and (ii) policies relevant to such capital contributions.
(3) In respect of each asset to which subclause (1)(e) applies, provide—
(a) the name of the relevant person or other part of the EDB, as the case may be; and (b) where the acquisition was or is intended to be from a related company, a description of the relationship between the EDB and that person.
(4) In respect of the likely vendor of each asset to which subclause (1)(f) applies, provide—
(a) the name of the vendor; (b) a description of each asset likely to be acquired from that vendor; and (c) the forecast closing RAB value of each asset in the vendor's regulatory asset base for the disclosure year in which the acquisition is intended.
7.5.5 Available as supporting information 7.5.5 7.5.5 n/a
5.4.15 Asset disposals information
(1) In respect of each disclosure year commencing after-
(a) where disclosure has been made pursuant to an ID determination, the last disclosure so made; or (b) where disclosure has not been made pursuant to an ID determination, the disclosure year 2009, to the last disclosure year of the next period, in respect of each of the following groups of assets: (c) assets likely to be-
(i) sold to a related company; or (ii) transferred to another part of the EDB; and
(d) all other disposed assets, provide the- (e) sum of unallocated opening RAB values; and (f) sum of opening RAB values.
7.5.6 7.5.6 7.5.6 7.5.6 7.5.6, 7.5.6 7.5.6 7.5.6

CPP Proposal Information Compliance Summary
CPP IM Information Requirements CPP Proposal Reference
(2) In respect of each asset to which the values provided pursuant to subclause (1) relate, provide—
(a) the name of the relevant person or other part of the EDB, as the case may be; and (b) where the disposal is proposed to be to a related company, a description of the relationship between the EDB and that person.
n/a n/a
5.4.16 Works under construction information
In respect of each disclosure year commencing after-
(a) where disclosure has been made pursuant to an ID determination, the last disclosure so made; or (b) where disclosure has not been made pursuant to an ID determination, the disclosure year 2009, to the last disclosure year of the next period, provide- (c) opening works under construction; (d) sum of capital expenditure; (e) sum of value of commissioned assets but only to the extent that values are included in closing RAB values disclosed pursuant to an ID determination; (f) sum of forecast value of commissioned assets but only to the extent that values are included in the sum of closing RAB values provided pursuant to clause 5.4.11(d)(ii); and
(g) sum of closing works under construction.
7.5.7 7.5.7 7.5.7 7.5.7 7.5.7 7.5.7 7.5.7
5.4.18 Period in respect of which tax information to be provided A CPP proposal must contain the information specified in this section in respect of each disclosure year commencing after- (a) where disclosure has been made pursuant to an ID determination, the last disclosure so made; or (b) where disclosure has not been made pursuant to an ID determination, the disclosure year 2009, to the last disclosure year of the next period, in accordance with Subpart 3 Section 3.
7.6.1 7.6.1 7.6.1
5.4.19 Regulatory tax allowance information
(1) forecast regulatory tax allowance and particulars of how it was calculated (2) other regulated income (3) sum of discretionary discounts and customer rebates;
7.6.1 7.6.1 7.6.1
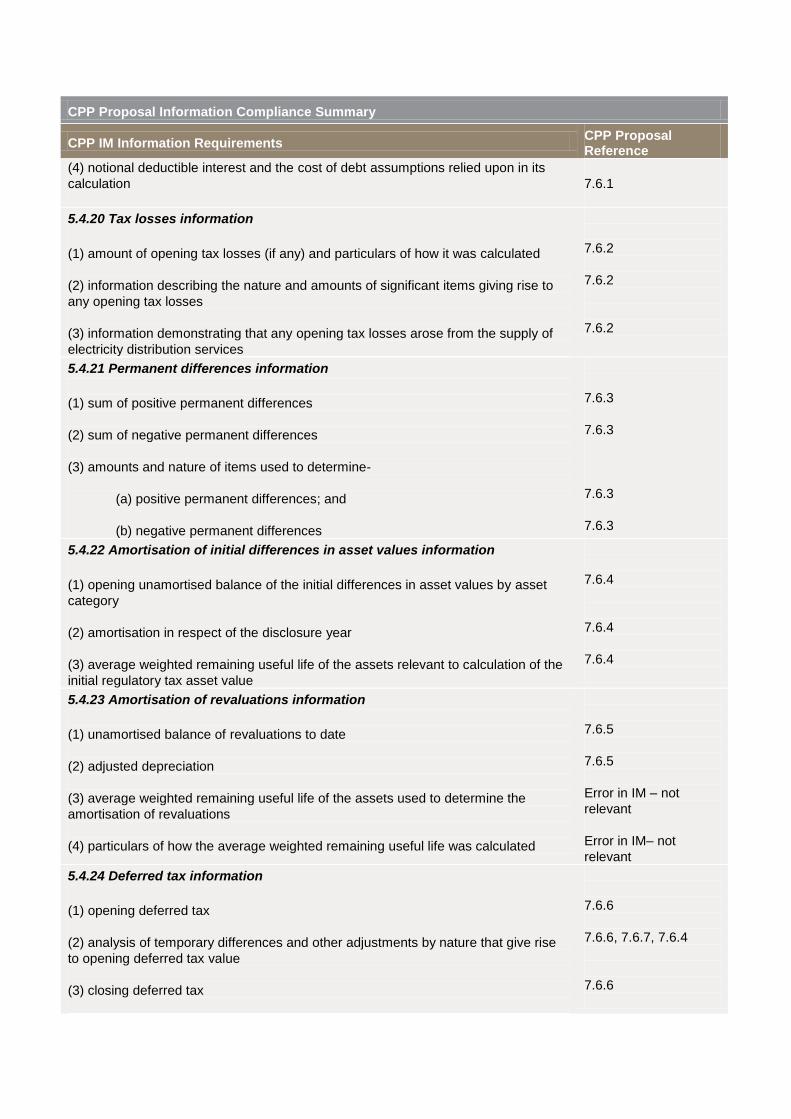
CPP Proposal Information Compliance Summary
CPP IM Information Requirements CPP Proposal Reference
(4) notional deductible interest and the cost of debt assumptions relied upon in its calculation
7.6.1
5.4.20 Tax losses information
(1) amount of opening tax losses (if any) and particulars of how it was calculated (2) information describing the nature and amounts of significant items giving rise to any opening tax losses (3) information demonstrating that any opening tax losses arose from the supply of electricity distribution services
7.6.2 7.6.2 7.6.2
5.4.21 Permanent differences information
(1) sum of positive permanent differences (2) sum of negative permanent differences (3) amounts and nature of items used to determine-
(a) positive permanent differences; and (b) negative permanent differences
7.6.3 7.6.3 7.6.3 7.6.3
5.4.22 Amortisation of initial differences in asset values information
(1) opening unamortised balance of the initial differences in asset values by asset category (2) amortisation in respect of the disclosure year (3) average weighted remaining useful life of the assets relevant to calculation of the initial regulatory tax asset value
7.6.4 7.6.4 7.6.4
5.4.23 Amortisation of revaluations information
(1) unamortised balance of revaluations to date (2) adjusted depreciation (3) average weighted remaining useful life of the assets used to determine the amortisation of revaluations (4) particulars of how the average weighted remaining useful life was calculated
7.6.5 7.6.5 Error in IM – not relevant Error in IM– not relevant
5.4.24 Deferred tax information
(1) opening deferred tax (2) analysis of temporary differences and other adjustments by nature that give rise to opening deferred tax value (3) closing deferred tax
7.6.6 7.6.6, 7.6.7, 7.6.4 7.6.6

CPP Proposal Information Compliance Summary
CPP IM Information Requirements CPP Proposal Reference
(4) reconciliation of opening deferred tax to closing deferred tax by nature of temporary differences and other adjustments
7.6.6
5.4.25 Temporary differences information
(1) description of the methodology and depreciation rates by asset category used to determine the forecast tax depreciation (2) amounts and nature of other forecast temporary differences (3) particulars of the calculation of the tax effect of temporary differences showing tax rates used
7.6.8 7.6.7 7.6.7
5.4.26 Regulatory tax asset value information
(1) sum of tax asset values at the start of the disclosure year (2) sum of tax asset values by asset category at the start of the disclosure year (3) sum of regulatory tax asset values at the start of the disclosure year (4) sum of regulatory tax asset values by asset category at the start of the disclosure year (5) weighted average remaining tax life of assets and tax depreciation methodology employed, by asset category ( 6) particulars of the calculation used to derive the regulatory tax asset values at the start of the disclosure year from the tax asset values at the start of the disclosure year (7) sum of regulatory tax asset values at the end of the disclosure year (8) reconciliation between the sum of regulatory tax asset values at the start of the disclosure year and the sum of regulatory tax asset values at the end of the disclosure year, by asset category, showing the values of capital additions, disposals, tax depreciation and other asset adjustments including cost allocation adjustments
7.6.8 7.6.8 7.6.8 7.6.8 7.6.8 7.6.8 7.6.8 7.6.8
5.4.27 Information regarding WACC
(1) A CPP proposal must identify the 75th percentile estimate of WACC used for the purpose of clause 5.4.7(1). (2) For the purpose of subclause (1), the identified 75th percentile estimate of WACC must be the amount most recently published by the Commission in accordance with clause 5.3.29 prior to submission of the CPP proposal corresponding to the EDB's proposed duration of the CPP regulatory period. (3) Where a term credit spread differential allowance is proposed, a CPP proposal must contain all data, information, calculations, Bloomberg print-outs and assumptions used to determine any proposed term credit spread differential.
7.7.1 7.7.1 7.7.2
5.4.28 Capex, opex, demand and network qualitative information

CPP Proposal Information Compliance Summary
CPP IM Information Requirements CPP Proposal Reference
The information specified in Schedule D must be- (a) contained in a CPP proposal; and (b) provided in accordance with the requirements of that schedule.
Section 9 Section 9
5.4.29 Capex, opex, demand and network quantitative information
(1) A CPP proposal must contain the information specified in the regulatory templates and that information must be- (a) in spreadsheet format whereby each item of data is linked between all cells to which it is relevant, irrespective of whether such cells are on the same or different tabs; and (b) provided in accordance with the instructions specified in clause 5.4.30. (2) Regulatory templates means the tables included in Schedule E named-
(a) Table 1: Top 5; (b) Table 2: Capex Summary; (c) Table 3: Opex Summary; (d) Table 4: Capex Project Programme; (e) Table 5: Opex Project Programme; (f) Table 6: Overheads; (g) Table 7: Unit rate escalators; (h) Table 8: Cost allocation A; and (i) Table 9: Cost allocation B.
(3) Where data provided in accordance with subclause (1) has been computed or derived from other amounts or values on the spreadsheet through the use of formulae, the underlying formulae for the cells containing the data must be accessible. (4) For the purpose of subclause (1), terms used in the regulatory templates must be interpreted in the same way as those terms are defined for the purpose of Schedule D.
8.2, 8.6, Schedule E, Tables 1-9 A list of the relevant Schedule E spreadsheets which accompany this proposal is included in Section 8.7 A list of the relevant Schedule E spreadsheets which accompany this proposal is included in Section 8.7
5.4.30 Instructions for completion of the regulatory templates
(1) Provide the information specified in the Capex Project Programme and Opex Project Programme tables of the regulatory templates for each project and for each programme. (2) For the purpose of specifying the relevant capex category or opex category in accordance with subclause (1), where expenditure within each project or programme is relevant to more than one capex category or opex category-
(a) select the capex category or opex category that is most relevant based on the nature of the expenditure; or (b) redefine the project or programme into two or more new projects or programmes and reallocate the expenditure so as to resolve the overlap.
(3) For the purpose of specifying the relevant service category in accordance with subclause (1), where expenditure within each project or programme is relevant to
8.5.1, Tables 4 (capex) and 5 (opex), Appendix 20 8.5.3 8.5.2

CPP Proposal Information Compliance Summary
CPP IM Information Requirements CPP Proposal Reference
more than one service category (a) select the service category that is most relevant based on the nature of the expenditure; or
(b) redefine the project or programme into two or more new projects or programmes and reallocate the expenditure so as to resolve the overlap.
(4) For the purpose of subclause (1), the total Project/Programme amounts provided in the Asset Category sub-table must reconcile to the total Project/Programme amounts provided in the Project Costs by Source sub-table. (5) Provide the information specified in the Overheads table of the regulatory templates in respect of general management, administration and overheads opex. (6) Provide the information specified in the Unit rate escalators table of the regulatory templates for each unit rate for which an escalator has been applied. (7) Provide the information specified in the Top 5 table of the regulatory templates-
(a) in respect of projects or programmes meeting paragraph (a) or (b) of the definition in clause D1 of Schedule D of identified programme; and (b) using the information provided in accordance with subclause (1).
(8) Provide the information specified in the Capex Summary and Opex Summary tables of the regulatory templates using the information provided in accordance with subclause (1). (9) Where clause 5.3.5(2) applies, provide the information specified in the Cost allocation B table of the regulatory templates.
8.5.1 - 8.5.5, Tables 4 and 5 8.5.3, Table 6 8.5.6, Table 7 (for each escalator) 8.5.1, Table 1 8.3, Tables 2, 3a), b) and c) 5.3.5(2) does not apply
5.4.31 Transitional information format provisions
(1) For CPP proposals made on or before 31 March 2016, the CPP proposal may contain actual and forecast expenditure information-
(a) relating to the current period and next period using the opex categories and capex categories; or (b) in accordance with the -
(i) CPP applicant’s own opex categories and capex categories in respect of the current period and next period; and (ii) opex categories and capex categories in respect of the next period.
(2) For the avoidance of doubt, where information is provided in accordance with subclause (1)(b), project or programme total expenditures in each disclosure year of the next period must be consistent between the forecasts.
8.5.3 8.5.3 8.5.3 8.5.3
D2 Instructions relating to provision of information
(1) A CPP proposal must-

CPP Proposal Information Compliance Summary
CPP IM Information Requirements CPP Proposal Reference
(a) assemble all information that this Schedule requires in a section of the CPP proposal entitled ―Capex/Opex/Demand Qualitative Information‖; and (b) contain a table that, in respect of each clause of this schedule-
(i) provides a reference to the place where, in the Capex/Opex/Demand Qualitative Information section of the CPP proposal, a response is provided; and (ii) gives the title and page reference to any separate document identified in response, including in the case where the document in question is provided in the CPP proposal.
(2) Where information provided in accordance with these requirements differs from the most recent information provided by the EDB to the Commission in accordance with any obligation under Part 4 of the Act, a CPP proposal must-
(i) identify the differences; and (ii) give reasons for such differences.
(3) Where information required by this Schedule is omitted from a CPP proposal, the CPP proposal must contain an explanation for each such omission. (4) A CPP applicant may, without provision of additional information, reproduce information from its asset management plan in response to a requirement of this Schedule, subject to subclause (5). (5) For the purpose of subclause (4), reproduction of such material is only permitted where the relevant section of the asset management plan clearly and succinctly provides the required information, without the need for analysis or interpretation on the part of the verifier or the Commission. (6) For the avoidance of doubt-
(a) the content of the CPP proposal as initially provided to the verifier will not include information required by this schedule in relation to projects or programmes falling under paragraph (c) of the definition in this schedule of identified programme; and (b) such information-
(i) need only be provided to the verifier upon the verifier's request; and (ii) is required to be included in the CPP proposal as provided to the Commission.
Section 9 9.2.1 9.2.1 9.2.2 9.2.3 Appendix 23 Appendix 23 provides references and explanations Noted Noted Throughout sections 8 and 9
D3 Qualitative Information
(1) Provide-
(a) all policies relied upon in whole or in part in preparing the response to-
(i) this schedule; and
Table included in section 9.2.1 provides the compliance references 9.4, 9.3.1, 9.5.1, 9.5.2, 9.5.3, 9.5.6, Appendix

CPP Proposal Information Compliance Summary
CPP IM Information Requirements CPP Proposal Reference
(ii) any other requirement of Subpart 4 Section 8 of Part 5; and (b) where the rationale is not already included in the policies themselves, the rationale for the policies provided in accordance with paragraph (a), including any consultants’ reports relied upon in preparing the policies.
(2) Identify all consultants’ reports commissioned for the purpose of preparing the capex forecast or opex forecast. (3) Where information from the CPP applicant’s asset management plan has been included in the CPP proposal in response to a requirement of this clause, provide an index of explicit references to the sections and paragraphs of the asset management plan relied upon.
21 9.4.1, 9.4.2, 9.4.3, 9.5, Appendix 21, Appendix 24 9.3.1, Appendix 22 9.4.1, 9.5.1 - 9.5.6, 9.3.2, Appendix 23
D4 Categorisation of services
For each service category relevant to the electricity distribution services provided by the EDB, provide-
(a) a description of the EDB’s services that fall within it, including- (i) its key service features and specifications; (ii) the identity of the intended consumers of the services; (iii) the processes used to determine the features and specifications of each service; and (iv) any material changes to the services proposed for the next period;
(b) the service measures, including a description as to how these have been defined, relating to-
(i) categories of consumers; (ii) asset performance, asset efficiency and effectiveness; (iii) efficiency of the EDB’s business activities; and (iv) the EDB’s obligations;
(c) a corresponding target service level for each service measure; (d) a description as to how each target service level-
(i) was determined, including a description of any consumer consultation used to specify it; and (ii) relates to the EDB’s relevant policies;
(e) a comparison and evaluation of each actual service level achieved for each disclosure year in the current period against each relevant target service level for each relevant service measure, including explanations for all significant variances and, for each significant variance, an explanation of the action being taken or proposed to improve performance; and (f) details of all proposed changes to the target service levels for each service measure, including-
(i) the rationale for all proposed changes with reference to relevant
9.6.1 – 9.6.10, Appendix 25 9.6.1-9.6.10 9.6.11 9.6.11 9.6.12 9.6.1-9.6.11

CPP Proposal Information Compliance Summary
CPP IM Information Requirements CPP Proposal Reference
consumer demands and the EDB’s obligations; and (ii) a description of how the proposed changes were taken into account in preparing the CPP proposal.
D5 Network asset information 1) Provide details of the EDB’s existing network assets including- (a) a high-level description of the distribution area that includes- (i) identification of the distribution area(s) covered; (ii) identification of large consumers that have a significant impact on network operations or asset management priorities; (iii) a description of the load characteristics for different parts of the network; and (iv) the peak demand and total electricity delivered in each disclosure year of the current period, broken down by geographically non-contiguous network, if any; (b) a description of the existing network configuration, including- (i) identification of bulk electricity supply points and any embedded generation with a capacity greater than 1 MW; (ii) existing firm supply capacity and current peak load of each bulk supply point; (iii) a description of the sub-transmission system fed from the bulk supply points, including identification and capacity of zone substations and the voltage of the sub-transmission network; (iv) identification of the sub-transmission security levels of individual zone substations , eg, n, n-1, n-2, and the rationale for the use of each level used; and (v) a description of the distribution system, including the extent to which it is underground (c) a brief description of the network’s distribution substation arrangements; (d) a description of the low voltage network, including the extent to which it is underground; (e) an overview of secondary assets such as ripple injection systems, SCADA and telecommunications systems; (f) a description of the existing network assets by asset category, including- (i) voltage levels; (ii) a description and quantity of assets; (iii) age profiles; (iv) a discussion of the condition of the assets, further broken down as appropriate, including historic failure rates; and (v) identification of any relevant systemic issues that may lead to the need to prematurely replace assets or parts of assets; (g) the sum of regulated service asset values by asset category consistent with those most recently disclosed by the EDB prior to making the CPP application pursuant to the Electricity Disclosure (Information Requirements) 2008 or an ID determination; and (h) at the EDB's option, a sum of regulated service asset values by any asset
9.7.2 9.7.3 9.7.4 9.7.5 9.7.6, 9.5.4 9.7.3, 9.7.7, Asset Management Reports (NW70.00.22 – NW70.00.44) 9.7.8 Appendix 26

CPP Proposal Information Compliance Summary
CPP IM Information Requirements CPP Proposal Reference
category sub-category (as 'sub-category' is defined by the EDB); (2) For the purpose of subclause (1)- (a) where information is based on estimates, this must be explicitly stated; (b) quantities of assets must be presented in a way that clearly describes the size of the regulatory asset base, but need not include detailed lists or schedules as would be included in a complete asset register or inventory; and (c) 'geographically non-contiguous network' means a network that is physically separate from another network except where- (i) its total circuit length capable of conveying electricity at a voltage equal to or greater than 3.3 kilovolts is shorter than 25 kilometres; (ii) it conveyed fewer than 20 gigawatt hours of electricity in the most recent disclosure year prior to submission of the CPP application; (iii) its lines are not connected, whether directly or indirectly, to the national grid (as 'national grid' is defined in s 5 of the Electricity Industry Act 2010); or (iv) it conveys electricity to fewer than 2000 ICPs (as 'ICP' is defined in s 54D(2) of the Act).
9.5.4, 9.5.5 refer above sections 9.7.2
D6 Demand, consumer numbers and generation forecasts (1) For each key assumption relating to maximum demand, electricity supplied, consumer numbers, embedded generation and distributed generation- (a) explain how it was relied upon in the CPP proposal; (b) provide, describe and explain the methodology used to prepare the relevant forecasts (to at least zone substation level) relating to demand forecasts for each disclosure year in the next period, including details of- (i) any sensitivity analysis undertaken; (ii) any weather normalisation methodology used and how weather data has been used; and (iii) the models used (including each model’s key inputs and assumptions); and (c) provide- (i) an outline of the treatment of very large loads, uncertain loads and significant loads transferred, or expected to be transferred, between different parts of the network (e.g. between zone substations and/or between feeders); (ii) assumptions of consumer numbers in total and by the consumer categories used by the EDB; (iii) assumptions of energy volumes supplied to consumers by each category referred to in sub-paragraph (ii); (iv) assumptions relating to average consumer energy usage by each category referred to in sub-paragraph (ii); (v) details of the location, type and size of any embedded generators and assumptions relating to the impact they may have on network forecasts; (vi) details of the location, types and aggregate levels of any distributed generation and assumptions relating to the impact they may have on network forecasts; and (vii) details of the effect that any demand management systems or initiatives may
9.8.6 9.8.1, 9.8.2, 9.8.3, 9.8.4, 9.8.5 9.8.6 9.8.2, 9.8.3 9.8.6 9.8.6 9.8.6 9.8.6 9.8.2

CPP Proposal Information Compliance Summary
CPP IM Information Requirements CPP Proposal Reference
have on network forecasts. (2) Explain- (a) the extent to which the forecasting methodology used is consistent with and has taken into account historical observations; (b) whether forecast data is internally consistent at and between each level of aggregation down to at least the zone substation level; and (c) the extent to which the forecasting methodology used is consistent with the methodology used to derive the forecast quantities as required by clause 5.3.4(7).
9.8.6 9.8.6 9.8.6 and 7.2.3
D7 Capital expenditure
(1) For each capex category included in the capex forecast-
(a) provide an overall description including the aims and objectives of the capex category; (b) provide an explanation as to its deliverability, with reference to factors likely to affect the capex category as a whole; and (c) identify all relevant documents, policies and consultant's reports that were taken into account in preparing the capex forecast.
(2) For each identified programme included in the capex forecast- (a) provide an overall description including the aims and objectives of the identified programme; (b) provide an explanation as to its deliverability, with reference to factors likely to specifically affect that identified programme; (c) provide details of all contingency factors provided for, including how they were calculated and what uncertainties they account for; (d) state-
(i) each relevant key assumption; (ii) each relevant obligation; and (iii) any step change and its effect on the capex forecast for the identified programme;
(e) explain all departures from any conclusions and recommendations contained in each consultant’s report identified in accordance with subclause (1)(c); and (f) explain the methodology used to generate the capex forecast for the identified programme, including but not limited to details regarding-
(i) any cost benchmarking undertaken by or for the EDB; (ii) internal historical cost trends (for specific asset categories) relied upon; (iii) material changes to work backlogs;
9.11.1, 9.11.2, 9.11.3, 9.12, 9.13-9.17 9.13-9.17, 9.11.2, 9.11.3 9.13-9.17 9.13.1, 9.15.1, 9.16.1, Appendix 36 and 37
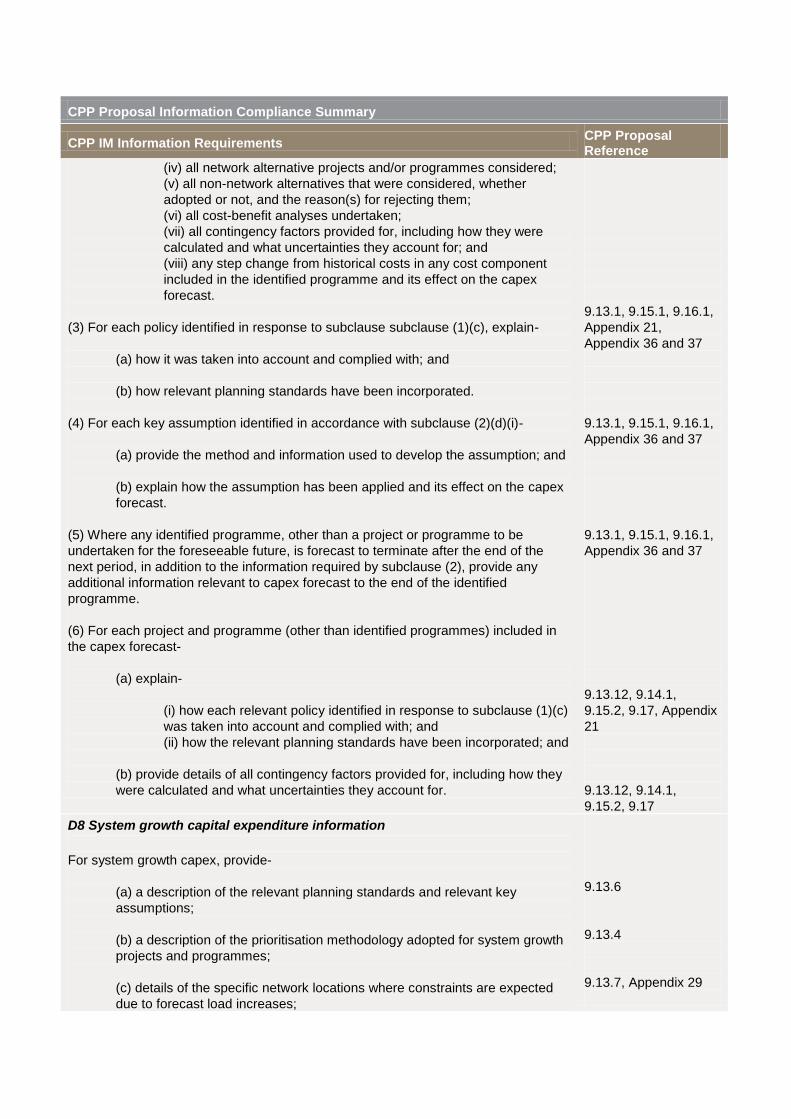
CPP Proposal Information Compliance Summary
CPP IM Information Requirements CPP Proposal Reference
(iv) all network alternative projects and/or programmes considered; (v) all non-network alternatives that were considered, whether adopted or not, and the reason(s) for rejecting them; (vi) all cost-benefit analyses undertaken; (vii) all contingency factors provided for, including how they were calculated and what uncertainties they account for; and (viii) any step change from historical costs in any cost component included in the identified programme and its effect on the capex forecast.
(3) For each policy identified in response to subclause subclause (1)(c), explain-
(a) how it was taken into account and complied with; and (b) how relevant planning standards have been incorporated.
(4) For each key assumption identified in accordance with subclause (2)(d)(i)-
(a) provide the method and information used to develop the assumption; and (b) explain how the assumption has been applied and its effect on the capex forecast.
(5) Where any identified programme, other than a project or programme to be undertaken for the foreseeable future, is forecast to terminate after the end of the next period, in addition to the information required by subclause (2), provide any additional information relevant to capex forecast to the end of the identified programme. (6) For each project and programme (other than identified programmes) included in the capex forecast-
(a) explain-
(i) how each relevant policy identified in response to subclause (1)(c) was taken into account and complied with; and (ii) how the relevant planning standards have been incorporated; and
(b) provide details of all contingency factors provided for, including how they were calculated and what uncertainties they account for.
9.13.1, 9.15.1, 9.16.1, Appendix 21, Appendix 36 and 37 9.13.1, 9.15.1, 9.16.1, Appendix 36 and 37 9.13.1, 9.15.1, 9.16.1, Appendix 36 and 37 9.13.12, 9.14.1, 9.15.2, 9.17, Appendix 21 9.13.12, 9.14.1, 9.15.2, 9.17
D8 System growth capital expenditure information
For system growth capex, provide-
(a) a description of the relevant planning standards and relevant key assumptions; (b) a description of the prioritisation methodology adopted for system growth projects and programmes; (c) details of the specific network locations where constraints are expected due to forecast load increases;
9.13.6 9.13.4 9.13.7, Appendix 29

CPP Proposal Information Compliance Summary
CPP IM Information Requirements CPP Proposal Reference
(d) relevant policies for purchasing land and easements for future use; (e) relevant policies on embedded and distributed generation; (f) relevant policies on non-network solutions; (g) where rationale is not already included in the policy documents, rationale for the policies provided in accordance with paragraphs (d) to (f); (h) an analysis of the network and non-network development options available; (i) details of the planning decisions made to meet each relevant target service level; and (j) a description and identification of the system growth programme including-
(i) provisions made in respect of embedded and distributed generation and non-network solutions; (ii) actions to be taken, including clear linkages to the forecast expenditures in each of the associated projects and programmes; (iii) a detailed description of each project in the capex forecast that has commenced or is committed; and (iv) a description of each project or programme that is not committed but is planned to commence in the next period, the information being provided to be commensurate with the project's or programme's current status in the planning process.
9.13.5 9.13.9 9.13.10 Appendix 21 9.13.9 9.13.6 9.13 9.13.9 9.13.11, 9.13.12 9.13.11, 9.13.12 9.13.11, 9.13.12
D9 Asset replacement and renewal capital expenditure information
(1) For asset replacement and renewal capex provide-
(a) a description of the relevant policies and key assumptions relating to the circumstances in which capex should be incurred based on-
(i) the age or reliability profile of an asset by comparison with the condition of an asset and vice versa; and (ii) replacement of an asset rather than renewing it and vice versa;
(b) where rationale is not already included in the policy documents, the rationale for the policies and key assumptions provided in accordance with paragraph (a); (c) any asset replacement models developed by or for the EDB to determine asset replacement and renewal capex, including-
(i) all supporting documentation for the models used; and (ii) any other relevant considerations; and
(d) a description and identification of replacement and renewal programmes or actions to be taken for each asset category.
(2) Explain whether and how the matters provided and identified in accordance with subclause (1)-
9.7.1, 9.15 Appendix 21 9.15 9.15.1, 9.15.2 9.15
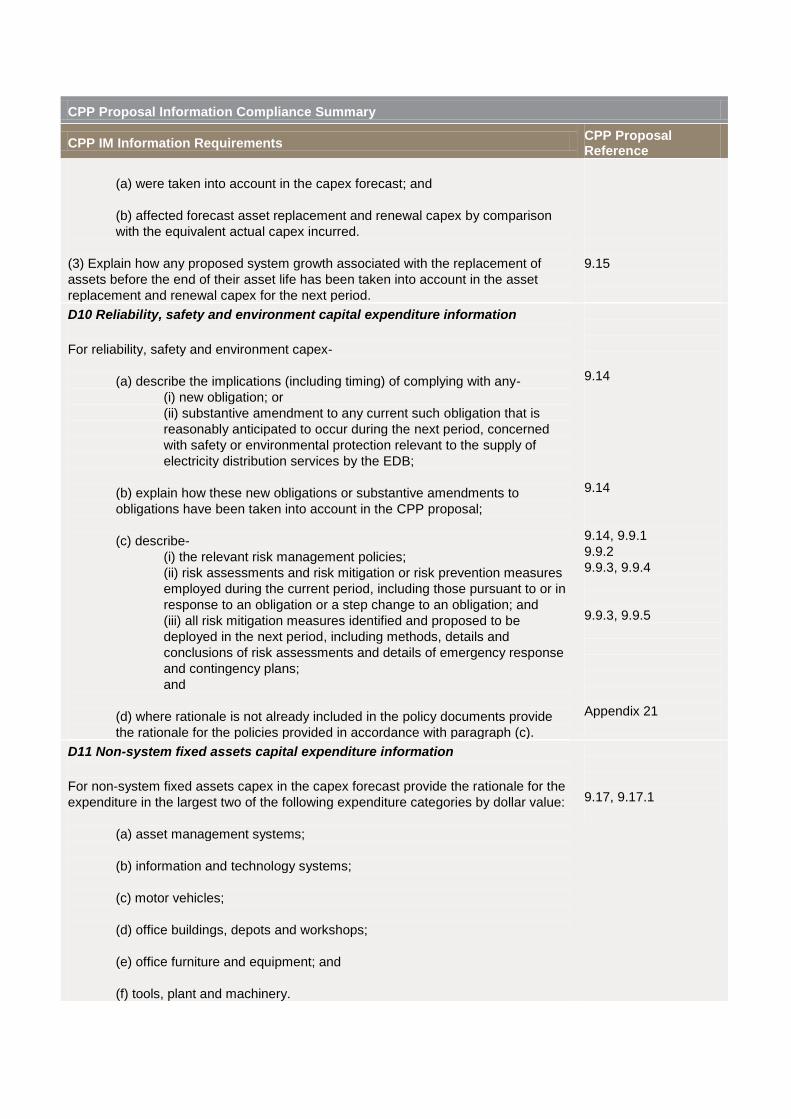
CPP Proposal Information Compliance Summary
CPP IM Information Requirements CPP Proposal Reference
(a) were taken into account in the capex forecast; and (b) affected forecast asset replacement and renewal capex by comparison with the equivalent actual capex incurred.
(3) Explain how any proposed system growth associated with the replacement of assets before the end of their asset life has been taken into account in the asset replacement and renewal capex for the next period.
9.15
D10 Reliability, safety and environment capital expenditure information
For reliability, safety and environment capex-
(a) describe the implications (including timing) of complying with any-
(i) new obligation; or (ii) substantive amendment to any current such obligation that is reasonably anticipated to occur during the next period, concerned with safety or environmental protection relevant to the supply of electricity distribution services by the EDB;
(b) explain how these new obligations or substantive amendments to obligations have been taken into account in the CPP proposal; (c) describe-
(i) the relevant risk management policies; (ii) risk assessments and risk mitigation or risk prevention measures employed during the current period, including those pursuant to or in response to an obligation or a step change to an obligation; and (iii) all risk mitigation measures identified and proposed to be deployed in the next period, including methods, details and conclusions of risk assessments and details of emergency response and contingency plans; and
(d) where rationale is not already included in the policy documents provide the rationale for the policies provided in accordance with paragraph (c).
9.14 9.14 9.14, 9.9.1 9.9.2 9.9.3, 9.9.4 9.9.3, 9.9.5 Appendix 21
D11 Non-system fixed assets capital expenditure information
For non-system fixed assets capex in the capex forecast provide the rationale for the expenditure in the largest two of the following expenditure categories by dollar value:
(a) asset management systems; (b) information and technology systems; (c) motor vehicles; (d) office buildings, depots and workshops; (e) office furniture and equipment; and (f) tools, plant and machinery.
9.17, 9.17.1

CPP Proposal Information Compliance Summary
CPP IM Information Requirements CPP Proposal Reference
D12 Operating and maintenance expenditure
(1) For each opex category included in the opex forecast-
(a) provide an overall description including the aims and objectives of the opex category; (b) provide an explanation as to its deliverability, with reference to factors likely to affect the opex category as a whole; and (c) identify all relevant documents, policies and consultants' reports that were taken into account in preparing the opex forecast.
(2) For each identified programme included in the opex forecast-
(a) provide-
(i) an overall description including the aims and objectives of the identified programme; (ii) an explanation as to its deliverability, with reference to factors likely to affect that identified programme specifically; and (iii) details of all contingency factors provided for, including how they were calculated and what uncertainties they account for;
(b) identify-
(i) each relevant key assumption; (ii) each relevant obligation; and (iii) any step change and its effect on the opex forecast for the identified programme; and
(c) explain-
(i) whether a base year approach was used in forecasting, and if so, identify the base year used and, if it is not a year in the current period (for which data will have been provided), provide the relevant data from that base year; (ii) all departures from any conclusions and recommendations contained in each consultant’s report identified in accordance with
subclause (1)(c); and (iii) the methodology used to generate the opex forecast for the identified programme.
(3) For the purpose of subclause (2)(c)(iii), such methodology must include, as a minimum, details regarding-
(a) any cost benchmarking undertaken by or for the EDB; (b) internal historical cost trends (for specific asset categories) relied upon; (c) descriptions of inspections, tests and condition monitoring carried out and the intervals at which they were done;
9.11.1, 9.11.2, 9.11.3, 9.18, 9.19 – 9.23 Appendix 21 9.19.5, 9.20.6, 9.22.1, 9.23.5, Appendix 36 and 37 9.19.5, 9.20.7, 9.21.6, 9.22.1, 9.23.5, Appendix 27 and 28

CPP Proposal Information Compliance Summary
CPP IM Information Requirements CPP Proposal Reference
(d) material changes to work backlogs; (e) alternative programmes considered; (f) all cost-benefit analyses undertaken; (g) all contingency factors provided for, including how they were calculated and the uncertainties they account for; (h) any step change from historical costs in any cost component included in the identified programme and its effect on the opex forecast; and (i) how the service measures identified in accordance with clause D4(b) were taken into account.
(4) For each relevant policy identified in response to subclause (1)(c), explain-
(a) how it was taken into account and complied with; and (b) how the relevant planning standards were incorporated in it.
(5) For each key assumption identified in accordance with subclause (2)(b)(i), explain-
(a) the method and information used to develop the assumption; and (b) how the assumption has been applied and its effect on the opex forecast.
9.19 - 9.23, Appendix 21 9.19.5, 9.20.7, 9.21.6, 9.22.1, 9.23.5
D13 General management, administration and overheads operating expenditure category
(1) For the general management, administration and overheads opex category-
(a) identify-
(i) each relevant key assumption; (ii) each relevant obligation; and (iii) any step change and its effect on the opex forecast for this category; and
(b) explain-
(i) whether a base year approach was used in forecasting, and if so, identify the base year used and, if it is not a year in the current period (for which data is required to be provided in a CPP proposal), provide the relevant data from that base year; (ii) all departures from any conclusions and recommendations contained in each consultant’s report identified in accordance with clause D12(1)(c); and (iii) the methodology used to generate the opex forecast for this category.
(2) For the purpose of subclause (1)(b)(iii), such methodology must include, as a
9.23, Appendix 28 9.23

CPP Proposal Information Compliance Summary
CPP IM Information Requirements CPP Proposal Reference
minimum, details regarding-
(a) any cost benchmarking undertaken by or for the EDB; (b) internal historical cost trends relied upon; (c) all contingency factors provided for, including how they were calculated and the uncertainties they account for; and (d) the effect of any step change on the costs in the general management, administration and overheads opex category.
(3) For each relevant policy identified in the response to clause D12(1)(c) explain how it was taken into account and complied with. (4) For each key assumption identified in accordance with subclause (1)(a)(i), explain-
(a) the method and information used to develop the assumption; and (b) how the assumption has been applied and its effect on the opex forecast for this opex category.
9.23.4, Appendix 21 9.23
D14 Operating expenditure projects and programmes
For each project and programme (other than identified programmes) included in the opex forecast -
(a) explain how each of the relevant policies identified in the response to clause D12(1)(c) was taken into account and complied with; (b) explain how the relevant planning standards have been incorporated; and (c) provide details of all contingency factors provided for, including how they were calculated and what uncertainties they account for.
9.23, Appendix 21
D15 Self-insurance
(1) For any proposed self-insurance allowance-
(a) provide- (i) a description of the uncertainties covered by the allowance; (ii) the methodology used to calculate the self-insurance risk premium (e.g. probability multiplied by consequence); (iii) a report on the calculation of each self-insurance risk premium from an actuary who is qualified to provide such advice; and (iv) any quotes obtained from external insurers; and
(b) explain why compensation should be provided for the uncertainty.
(2) In respect of each quote provided in accordance with subclause (1)(a)(iv)-
(a) state-
(i) the amount insured for which the quote related (if not included in
9.23.7, Appendix 11 n/a n/a

CPP Proposal Information Compliance Summary
CPP IM Information Requirements CPP Proposal Reference
the quote itself); (ii) the annual premium payable or paid by the EDB; (iii) the size of any deductible; (iv) the terms and conditions of the insurance; and (v) why it is not considered suitable.
(3) Explain whether and, if so, how the costs of remediating the effects of each uncertainty for which the allowance is sought may be recovered through any other mechanism.
n/a
D16 Controllable opex
For each disclosure year of the next period provide-
(a) a description of the types of opex comprised in the forecast for controllable opex; and (b) justification for why the opex referred to in paragraph (a) should be determined as controllable opex, including a description of how the EDB is able to control the amount of opex over the CPP regulatory period.
9.24
D17 Related parties
(1) Identify and describe all related parties in respect of whom costs are disclosed in accordance with the regulatory templates. (2) For each person to whom subclause (1) applies identify each project or programme with which he, she or it is associated. (3) For each person to whom subclause (1) applies, describe, in respect of each relevant project and programme the-
(a) nature of the services undertaken by that person; and (b) the date and term of the contract in respect of that service.
(4) For each service identified in accordance with subclause (3)(a)-
(a) provide a description of the tendering process used to procure the service; (b) identify all relevant documents used to tender for its provision, including but not limited to requests for tender and tender submissions; and (c) explain-
(i) why that service is outsourced instead of being undertaken by the EDB itself; (ii) whether the services procured are provided under a discrete contract or provided as part of a broader operational contract (or similar); (iii) whether the service was procured on a genuinely competitive basis and if not, why not; and (iv) whether the service (or any component thereof) was sub-contracted to another provider.
9.25.1 9.25.2 9.25.2, Appendix 31 9.19.3, 9.25.3, Appendix 32 9.25.3 9.11.2, 9.19.3, 9.25.3

CPP Proposal Information Compliance Summary
CPP IM Information Requirements CPP Proposal Reference
(5) For each contract identified in accordance with subclause (3)(b), identify methodologies, consultants’ reports, or assumptions used to determine components of the costs included in the contract price.
9.11.2, 9.19.3, 9.25.1
D18 Unit costs and expenditure escalators
(1) For each key assumption that is a unit rate-
(a) identify-
(i) source material from which it was derived; (ii) the date it was developed; and (iii) the historical unit rates adopted for key items of plant and equipment for the capex forecast and the opex forecast; and
(b) explain-
(i) how it was developed with reference to the responses to paragraph (a); and (ii) whether, and if so an explanation as to why, its quantum is reasonable.
(2) For each key assumption that is a labour or materials escalator-
(a) provide the class of labour and materials to which each escalator relates; (b) provide-
(i) the base year and the labour and materials unit rates for that year; (ii) the escalator used in percentage terms for each year from the base year to the end of the next period; (iii) the quantum of the labour costs in the capex forecast and the opex forecast which is the result of application of the labour escalator; (iv) the quantum of the materials costs in the capex forecast and the opex forecast which is the result of application of the materials escalator; and (v) confirmation of whether the escalator used is expressed in real or nominal terms and, if real, the indexation assumptions used; and
(c) explain-
(i) the methodology underlying the calculation of each escalator, including sources, data conversions and the use of any assumptions, including lags; (ii) the weightings given to each escalator and how these weightings were developed, including any assumptions; (iii) whether the same expenditure escalators have been used in the capex forecast and opex forecast; (iv) where the response to sub-paragraph (iii) is no, why different expenditure escalators were applied, using supporting evidence; and
(v) whether, in applying the relevant labour or material escalator,
additional contingency factors have been applied and, if so, what
9.26.1, 9.26.2 9.26 9.26.3 n/a 9.26.3 – 9.26.5 9.26.6 9.26.6 9.26.5 9.26.3 – 9.26.5, Appendices 33 - 35

CPP Proposal Information Compliance Summary
CPP IM Information Requirements CPP Proposal Reference
uncertainties they account for and how they were calculated.
SECTION 9 Information relevant to prices
5.4.32 Information on proposed new pass-through costs
A CPP proposal must contain details of any cost not specified in clause 3.1.2(2) that is sought to be specified as a new pass-through cost in accordance with clause 3.1.2(1)(b), including information on-
(a) how the cost is likely to arise; (b) who the cost would be payable to; (c) how the cost would be calculated; (d) any good or service the EDB would receive in exchange; and
(e) how the cost meets the criteria specified in clause 3.1.2(3).
7.9
5.4.33 Information on proposed recoverable costs relating to costs of making CPP application
Where a CPP applicant seeks specification in the CPP determination of a recoverable cost to which clause 3.1.3(1)(j), 3.1.3(1)(k), or 3.1.3(1)(l) applies, it must provide, in relation to each auditor, verifier or engineer who was engaged to provided an opinion on some aspect of the CPP proposal in accordance with a requirement of this Part-
(a) any document making a public or limited circulation request for proposals to carry out the work; (b) the terms of reference for the work; (c) invoices for services undertaken in respect of the work; and
(d) receipts for payment by the CPP applicant.
7.10

CPP Application Information Compliance Summary
CPP IM Information Requirements CPP Application Reference
5.1.2 Evidence of consumer consultation
For the purpose of clause 5.1.1(2)(a), in respect of consumer consultation, the specified information is-
(a) a description as to how the requirements of clause 5.5.1 were met; (b) a list of respondents to the consultation required by that clause; (c) a description of all issues raised by consumers in response to the CPP applicant's intended CPP proposal; (d) a summary of the arguments raised in respect of each issue described in accordance with paragraph (c); and (e) in respect of the issues described in accordance with paragraph (c), an explanation as to whether its CPP proposal accommodates the arguments referred to in (d); and
(i) if so, how; and (ii) if not, why not.
2.3 2.4, Appendix 6 2.5 2.5 2.5
5.5.1 Consumer consultation
(1) By no later than 40 working days prior to submission of the CPP proposal, the CPP applicant must have adequately notified its consumers-
(a) that it intends to make a CPP proposal; (b) of the expected effect on the revenue and quality of its electricity distribution services were the Commission to determine a CPP entirely in accordance with the intended CPP proposal; (c) of the process for making submissions to the EDB in respect of the intended CPP proposal; (d) where and how further information in respect of the intended CPP proposal may be obtained; and (e) of their opportunity to participate in the consultation process required of the Commission by s 53T of the Act after any CPP proposal is received and considered compliant by the Commission.
(2) For the purpose of subclause (1)(d), where further information is available in hard copy only, the applicant must have ensured that any further information was readily available for inspection at the stated location. (3) For the purpose of subclause (1), the CPP applicant must-
(a) provide all relevant information;
2.3.1, 2.3.2 2.3.3, Appendices 1-5 2.3.3, 2.3.4, Appendices 1-5 2.3.4 2.3.3, 2.3.4 2.3.3. 2.3.4 2.3.2 2.3.2

(b) provide information in a manner that promotes consumer engagement; (c) make best endeavours to express information clearly, including by use of plain language and the avoidance of jargon; and (d) provide consumers with (or notified them where to obtain) the information through a medium or media appropriate to the natures of the consumer base.
Examples: (i) by placing the information on the EDB's website; (ii) by providing the information to groups or organisations that represent the consumers’ relevant interests; (iii) by including the information in consumers' or electricity retailers’
bills; and/or (iv) by placing advertisements in local newspapers.
5.1.3 Verification-related material
(1) For the purpose of clause 5.1.1(2)(a), in respect of verification, the specified information is-
(a) in the case of a CPP proposal seeking only a quality standard variation, nil; and (b) in the case of any other CPP proposal-
(i) a verification report; and (ii) any information relating to the CPP proposal, other than information required to be included in a CPP proposal by Subpart 4, provided to the verifier by or on behalf of the CPP applicant, pursuant to clause 5.5.2(3);
Examples: instructions as to how to interpret information provided to the verifier; details as to the source of the information; and
(iii) subject to subclause (2), a certificate signed by the verifier stating that the relevant parts of the CPP proposal were verified and verification report was prepared in accordance with Schedule G.
(2) For the purpose of subclause (1)(b)(iii), the CPP applicant must ensure that the certificate described in subclause (1)(b)(iii) relates to verification of the relevant parts of the CPP proposal as submitted to the Commission.
3.1, Appendix 7
5.5.2 Verification
(1) A CPP proposal, other than one made by a CPP applicant seeking only a quality standard variation, must be verified by a verifier. (2) The verifier must be engaged in accordance with Schedule F. (3) The CPP applicant must provide the verifier with-
(a) the materials-
(i) required by the verifier to verify the CPP proposal in accordance with the terms of his, her or its engagement and Schedule G; and (ii) that it intends to submit to the Commission as a CPP proposal;
(b) subject to paragraph (c), the materials referred to in paragraph (a) prior to
3.1, Appendix 7

the verifier commencing verification in accordance with Schedule G; ( c) the information required by Schedule D pertaining to projects or programmes meeting paragraph (c) of the definition in Schedule D of identified programme after the verifier has notified the CPP applicant of his, her or its selection of projects or programmes meeting paragraph (c) of the definition of identified programme to the CPP applicant; (d) any information requested by the verifier pursuant to the verifier's right to ask for such information pursuant to his, her or its deed of engagement, as specified in clause F5(2)(d).
5.1.4 Audit report
(1) For the purpose of clause 5.1.1(2)(a), in respect of audit, the specified information is a report written by an auditor and signed by that auditor (either in an individual's name or that of a firm) in respect of an audit undertaken of the matters specified in clause 5.5.3, stating-
(a) the work done by the auditor; (b) the scope and limitations of the audit; (c) the existence of any relationships (other than that of auditor) which the auditor has with, or any interests which the auditor has in, the CPP applicant or any of its subsidiaries; (d) whether the auditor obtained all information and explanations that he or she required to undertake the audit, and, if not-
(i) details of the information and explanations not obtained; and (ii) any reasons provided by the CPP applicant for its or their nonprovision;
(e) the auditor's opinion of the matters in respect of which the audit was undertaken.
(2) For the avoidance of doubt, an audit report of an audit undertaken other than expressly for the purpose of clause 5.5.3 is an audit report complying with subclause (1) if the report relates to an audit fulfilling the requirements of clause 5.5.3. (3) The CPP applicant must ensure that the audit report required by this clause relates to the CPP proposal as submitted to the Commission. (4) For the avoidance of doubt, the audit report required by this clause need not be-
(a) prepared in advance of the verifier undertaking verification of the CPP proposal; nor (b) provided to the verifier.
(5) If, notwithstanding subclause (4), an audit report prepared in accordance with this clause is provided to the verifier, subclause (3) continues to apply.
4.1, Appendix 8
5.5.3 Audit
A CPP proposal must be audited by an auditor as to whether or not-
(a) as far as appears from an examination of them, proper records to enable the complete and accurate compilation of information required by Subpart 4
4.1, Appendix 8

have been kept by the CPP applicant; (b) in the case of actual financial information relating to the current period, that information has been prepared in all material respects in accordance with this determination; (c) in the case of forecast financial information relating to the next period, that information has been compiled in all material respects in accordance with this determination and the records examined pursuant to paragraph (a); and (d) in the case of quantitative information provided in spreadsheets, that information is accurately presented.
5.1.5 Certification
(1) For the purpose of clause 5.1.1(2)(a), in respect of certification, the specified information is the certificates recording the certifications specified in clause 5.5.4. (2) For the avoidance of doubt, one physical document may contain more than one of the certifications specified in clause 5.5.4.
5.1 – 5.3, Appendix 9
5.5.4 Certification
(1) In the case of all information of a quantitative nature, other than forecast information, provided in accordance with this Part, no fewer than 2 directors of the CPP applicant must certify in writing his or her belief that-
(a) the information was derived and is provided in accordance with the relevant requirements; and (b) it properly represents the results of financial or non-financial operations as the case may be. In the case of all information of a qualitative nature, other than forecast information, provided in accordance with this Part, no fewer than 2 directors of the CPP applicant must certify in writing his or her belief that-
(a) the information is provided in accordance with the relevant requirements; and (b) it properly represents the events that occurred during the current period.
(3) In the case of all forecast information provided in accordance with this Part, no fewer than 2 directors of the CPP applicant must certify in writing his or her belief that-
(a) the information was derived and is provided in accordance with the relevant requirements; and (b) the assumptions made are reasonable.
(4) No fewer than 2 directors of the CPP applicant must certify in writing-
(a) that, to the best of his or her knowledge, the verifier was engaged by the CPP applicant in accordance with Schedule F; (b) that, to the best of his or her knowledge, the CPP applicant provided the verifier with all the information specified in Part 5, including its schedules, relevant to Schedule F;
5.1-5.3, Appendix 9

(c) that, to the best of his or her knowledge, the information referred to in paragraph (b), save that relating to projects or programmes meeting paragraph (c) of the definition in Schedule D of identified programme, was provided to the verifier in advance of the verifier's selection of projects or programmes meeting paragraph (c) of the definition in Schedule D of identified programme, in accordance with clause G3; (d) a description of any information not provided to the verifier following the verifier's request; (e) reasons, which, in his or her opinion, justified any non-provision of such information; (f) that, to the best of his or her knowledge, the-
(i) matters the auditor was engaged to audit included the matters specified in clause 5.5.3; and (ii) auditor was instructed to report on at least the matters described in clause 5.1.4; and
(g) that the-
(i) audit report provided pursuant to clause 5.1.4; (ii) verification report; and (iii) other certifications required by this clause, all relate to the same CPP proposal.
(5) Where-
(a) a director has certified a matter of opinion in accordance with this clause; and (b) his or her opinion has changed before the Commission's determination of the CPP in question, that director must notify the Commission as soon as reasonably practicable.
(6) Where- (a) a director has certified a matter of fact in accordance with this clause; and (b) before the Commission's determination of the CPP in question he or she-
(i) becomes aware that the fact is untrue; or (ii) has significant cause to doubt the accuracy of that fact, that director must notify the Commission as soon as reasonably practicable.
(7) For the avoidance of doubt, the certifications required by the different subclauses of this clause may be made by the same or different directors.

Appendix 5 Modifications to Schedule E templates

Modifications to Schedule E Templates
Table Modification Explanation
Tables 2, 3, 4, 5
Orion’s own expenditure categories rather
than the CPP IM ones are included, which is permitted under clause 5.4.31. We have also restated the forecast using the IM categories, consistent with 5.4.31(1)(b)(ii
We note that the IM categories are not consistent with the way in which the forecasts are prepared. Also since the IMs were determined, the October 2012 ID Determination requires different categories to be applied for the purpose of AMP forecasts, to apply for the first time to the 2013 AMP. Accordingly, we are currently seeking to comply with the new ID requirements. Duplicate templates are not required in order to comply with 5.4.31(1)(b)
Table 2 Table 2 requires capex to be allocated across services. However corporate capex does not support any specific service, together it provides the support infrastructure to deliver all services. We have added a new row in the Table for corporate capex, directly above the total capex row, and independent of the service categories
This mirrors Tables 3(a), (b) and (c) for opex which has corporate opex not assigned to service categories, and included as a separate line item above the total.
We believe this is a reasonable adjustment which is consistent with the corporate opex requirements in the IM and the support nature of the capex concerned
Tables 3(a), (b) and (c)
Tables 3 (a) – (c) requires system management and operations opex to be allocated across services categories. However system management and operations opex does not support any specific service, as it provides the support necessary to deliver all services. This is consistent with general management, administration and overheads opex which is not allocated to services in these tables. We have added a new row in the Tables for system management and operations opex, directly next to the general management row, and independent of the service categories
This mirrors the treatment of corporate opex which is not assigned to service categories, and included as a separate line item above the total
We believe this is a reasonable adjustment which is consistent with the corporate opex requirements in the IM and the support nature of the office based network management opex concerned
Tables 4 and 5
For each capex and opex project/programme costs by source are required. These are available for actual expenditure to date, but not for most categories of forecast expenditure. We have added a “to be tendered” source for
the forecast period
We are unable to assign future network capex and opex to source before it is tendered. Note this excludes corporate costs which are not required to be allocated by source
Table 6 incomplete
Table 6 includes general management, administration and overheads opex. It is not included in tables 4 and 5 as it is not directly attributed against assets. However network management and operations expenditure is also not directly attributed to assets. We have added additional rows in 6 to accommodate this
Required to ensure the full opex programme is included in the schedules. Table 5 and 6 are intended to capture all opex. Table 5 by asset category and Table 6 for overheads opex which is not allocated to network assets (general management, administration and overheads). However system management and operations opex does not fit into either of these tables – ie: it

category of expenditure is not undertaken in the field so can’t be allocated
to network assets and is not included in general management etc.
Table Missing
There is no Table provided for non network capex projects/programmes. We have created a Table 6b for Non system fixed asset capex, similar to Table 6 for Overheads opex (which we have called 6a)
Expenditure data is otherwise incomplete. This is required to ensure our full capex/opex programme is included in the Schedule E templates
Table 7 Table 7 requires information regarding cost escalators. We have not included information pertaining to unit rates and volumes as is anticipated by this Schedule. We have provided information in this Schedule pertaining to yearly escalators and quantum of costs.
Table 7 assumes that escalators are applied to unit costs and that these unit costs are applied to volumes to derive capex and opex costs. We do not propose to escalate costs this way. Real input costs are to be converted to nominal terms by applying escalators (indices) to project costs which are broken down by inputs. This method is explained in Section 9.26
Tables 8 and 9
Tables 8 and 9 address cost allocation. They use opex categories consistent with IM, but we are using slightly different opex categories in accordance with 5.4.31
We have modified Tables 8 and 9 to reflect our expenditure categories
Table 9: Clause 5.4.29 of the IM refers to Table 9: Cost Allocation B. There is no Table 9 included in Schedule E in CPP IM Determination. It is in the spreadsheet versions of the tables provided which suggests it may have been omitted in error from the Determination itself.
Table 9 included in our CPP proposal consistent with the spreadsheet version of Schedule E we have obtained from the Commission

Appendix 6 Sub-transmission network architecture review

1
Network Architecture Review: Subtransmission
2012

Architecture Review 2012 2
Table of Contents 1 Executive Summary ................................................................................................... 3 2 Introduction ................................................................................................................ 4 3 Assumptions ............................................................................................................... 4 4 Architecture design .................................................................................................... 7 5 Economics ................................................................................................................ 13 6 Applying the findings ............................................................................................... 18 7 Orion networks 2060 ................................................................................................ 20 8 Sub-transmission switchyard layout options ........................................................ 28 9 Modelling tool ........................................................................................................... 38 10 Recommendations ................................................................................................... 39 11 Appendix A Network topologies ............................................................................ 40 12 Appendix B Model Inputs ....................................................................................... 46 13 Appendix C Bus Coupler Analysis ........................................................................ 51 14 Appendix D Switchyard development options ..................................................... 52 15 Appendix E Economic Analysis of bus configurations ....................................... 59 16 Appendix F Bus Protection .................................................................................... 60 17 Appendix G Comparison of Ring Layout Options 1A & 1B for Network Faults 62
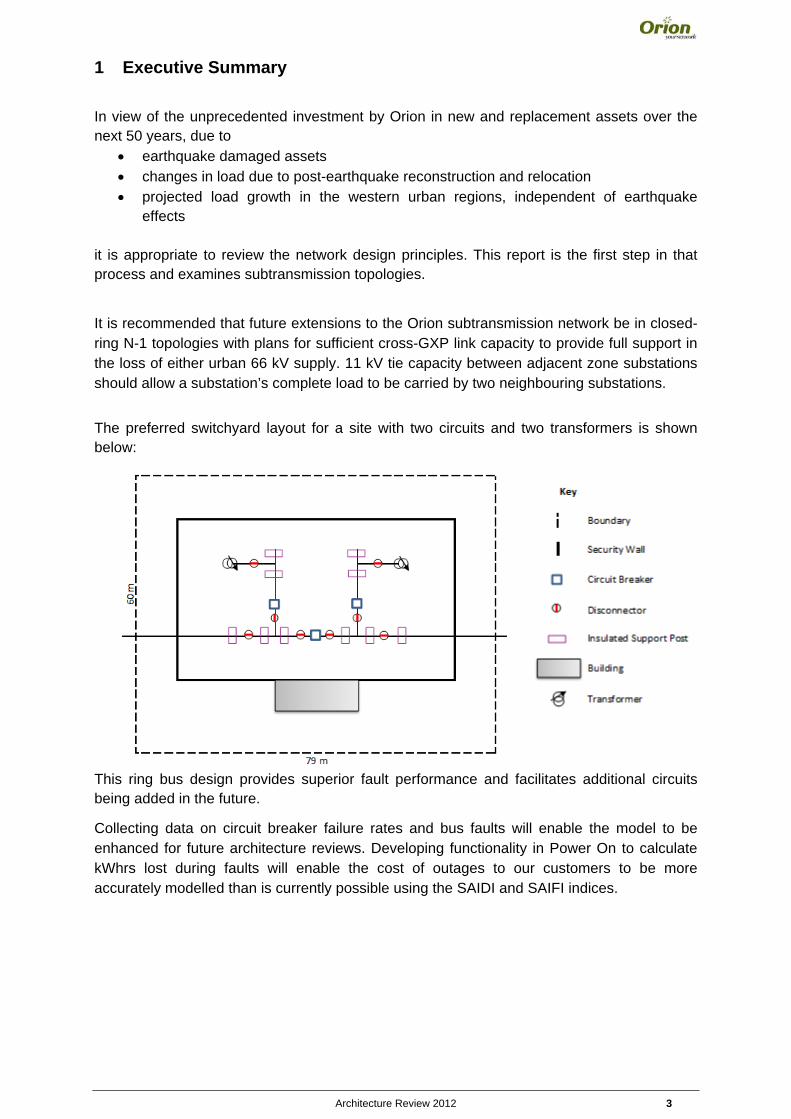
Architecture Review 2012 3
1 Executive Summary
In view of the unprecedented investment by Orion in new and replacement assets over the next 50 years, due to
• earthquake damaged assets • changes in load due to post-earthquake reconstruction and relocation • projected load growth in the western urban regions, independent of earthquake
effects it is appropriate to review the network design principles. This report is the first step in that process and examines subtransmission topologies.
It is recommended that future extensions to the Orion subtransmission network be in closed-ring N-1 topologies with plans for sufficient cross-GXP link capacity to provide full support in the loss of either urban 66 kV supply. 11 kV tie capacity between adjacent zone substations should allow a substation’s complete load to be carried by two neighbouring substations.
The preferred switchyard layout for a site with two circuits and two transformers is shown below:
This ring bus design provides superior fault performance and facilitates additional circuits being added in the future.
Collecting data on circuit breaker failure rates and bus faults will enable the model to be enhanced for future architecture reviews. Developing functionality in Power On to calculate kWhrs lost during faults will enable the cost of outages to our customers to be more accurately modelled than is currently possible using the SAIDI and SAIFI indices.

Architecture Review 2012 4
2 Introduction In 2010 Orion was entering a phase of increased investment in the urban upper network, with up to 10 zone substations in planning and the acquisition of Transpower spur assets in prospect. The earthquakes of 2010-11 resulted in significant damage to subtransmission assets plus load shifts due to abandonment of some areas and relocation of residential and commercial customers. The company now faces a period of unprecedented construction, with decisions which will shape the network for several decades to come.
It is therefore an appropriate time to review the design principles which determine the architecture of our network at all voltages. The first stage of this architecture review covers the 66 kV/33 kV subtransmission network.
The drivers for the new assets are:
to provide capacity for projected load growth (particularly in the urban north, north-west, west, and south-west)
to improve security of supply for some of the 10 zone substations1 which are currently on single 66 kV feeds or a pair of radial cables/lines in a common trench/tower
to develop resilience to major events, and reduce exposure to serious outages at Islington, Addington or Bromley by increasing cross-GXP transfer capability
3 Assumptions In a comprehensive review a balance must be struck between starting from an empty page and challenging all assumptions, and achieving a pragmatic result in a reasonable timeframe. The following assumptions, resulting from other planning exercises, are made:
1. Orion urban load is forecast to be nearly 900 MW in 20602
2. Bromley 66 kV, Islington 66 kV and Islington 33 kV will remain the only urban GXPs, with firm (N-1) capacities of 420 MW3, 540 MW and 106 MW respectively
3. New 220/66 kV GXPs will be required to the southwest of Christchurch to provide for growth in the Selwyn district and to support Islington contingencies
4. the optimum zone substation capacities are 40 MW4 (66/11 kV) and 23 MW (33/11 kV).
5. subtransmission at 33 kV does not provide sufficient capacity to economically allow full load transfer between GXPs, so if these links are deemed necessary no expansion of the 33 kV network will take place5 and all new investment will be at 66 kV
1 Hoon Hay, Milton, Middleton, Hawthornden, Ilam, Fendalton, McFaddens, Barnett Park, Dallington and Rawhiti. 2 There is significant uncertainty in this forecast and the chosen architecture must allow for a staged approach as load growth eventuates. 3 The increase in Bromley capacity from 210 MW in 2013 to 420 MW will take place when load growth requires. 4 40 MW is close to the limit of our standard 11 kV switchgear. Also, it is more cost-effective to add a new site on an interconnected network than to deal with the congestion of 11 kV feeder cables installed around a substation of more than 40 MW. 5 New substations on the existing 33 kV cable network may be appropriate where back up can be provided by neighbouring and interconnected 66kV substations e.g. the proposed Main South Road site.

Architecture Review 2012 5
6. where N-1 subtransmission security applies, an N-2 event should not result in the loss of more than one zone substation. If a substation is lost for any reason, the neighboring substations must be able to pick up the lost load on the 11 kV network. This implies there must be enough redundant capacity in the 66 kV network to feed the extra load to those sites
7. GXP’s cannot be permanently operated in parallel. Parallel operation opens up operational issues with Transpower and the electricity market, and the cost to rectify these constraints is prohibitive
8. The review is mainly focused on the urban network and all costs assume underground 66 kV installation except where noted
Assumptions 1 and 4 imply the need for 22 40 MW urban zone substations. Given that the Islington 33 kV interconnectors are early in their life cycle and there is substantial sunk cost in Orion’s urban 33 kV assets, there is no proposal for an early withdrawal from 33 kV. Also due to their location some 66 kV substations are unlikely to reach 40 MW load. This complicates the number of sites required for the model. As a starting point the high-level models (see section 4.2) are based on a scheme of 20 66 kV zone substations, with 10 on each GXP (including a zone substation at or very near the GXP site).
Assumption 6 has a major effect on network design. A subtransmission branch which provides N-1 security can be vulnerable to the loss of all zone substations in an N-2 event (see Figure1). If we assume that for N-1 systems an N-2 event should be recovered in switching time rather than repair time, then assumption 6 means only one zone sub will require 11kV support in an N-2 66 kV event. This limits the amount of switching to avoid long outages, and limits the redundant capacity required in the adjacent zone substations, and the 11kV ties needed between them.
However, Assumption 6 requires an N-1 system to be “almost N-2” and will be more expensive than an N-1 design which allows potential loss of all load in an N-2 event, with restoration in repair time. Simple probabilistic analysis shows that this extra cost is justified.
Standard 66 kV XLPE conductor sizes are employed in the design options (see Table 1). The listed capacities are best-case and may require de-rating after installation, depending on ground conditions, ducting, cable congestion etc.
To manage inventory costs it is likely that only a subset of these cable sizes will be chosen for use, but to make the best decision about which sizes are suitable all were treated as available in the various design options.
Figure 1

Architecture Review 2012 6
It is worth noting that the smallest cable (300Cu) has a capacity of around 60 MVA, which is 50% more than the standard zone substation capacity. This means that a substation may be carried by two of its neighbours without increasing the minimum cable cost (provided 11 kV ties are adequate).
The cable cost per MVA decreases as cable size increases, so as a general rule fewer larger cables are cheaper than more smaller cables, and also require less switchgear. However fewer larger cables means that more load is at risk from planned and unplanned outages and providing security against this can be expensive.
Costs are the best available at December 2011 and include installation and jointing. Termination costs are included in the installed switchgear or transformer cost.
Installation costs for 2 circuits together save $60/m.
Other cost data may be found in Appendix B Model Inputs.
size lay MVA $/m
installed
300Cu ∴ 58
728 … 61
630Cu ∴ 87
887 … 95
800Cu ∴ 97
962 … 106
1000Cu ∴ 107
1088 … 119
1200Cu ∴ 120
1167 … 137
1600Cu ∴ 141
1354 … 166
Table 1: 66kV cable sizes

Architecture Review 2012 7
4 Architecture design 4.1 Security of supply
The optimum network topology depends on the relative costs and benefits of:
• security levels (N vs. N-1 vs. N-2) • interrupted vs. non- interrupted supply after contingencies • radial vs. ring topologies (plus hybrids) • provision for HILP6 events (in particular, subtransmission links between GXPs)
Orion’s Security Standard Review in 2007 addressed load thresholds and restoration times for zone substation security levels. It is not proposed to review the methodology of this study but updated VOLL values will be taken into account. HILP events were not explicitly covered, but post-quake learnings and the likelihood of continuing seismic activity now bring this into focus, despite the difficulty in quantising the risks.
The occurrence of a “one in X year” event should not be a cause for complacency (the common fallacy being that the “law of averages” means another disaster is unlikely to occur for a long time). The earthquakes triggered many aftershock sequences to the surprise of experts, who now warn of elevated risk for the indefinite future, decades of heightened seismic activity and significant probability of further >7.0 tremors. The success of the 1980s-1990s substation civil reinforcement programme repaid the investment many times over. Given the increasing dependence on electricity of modern society, and the distress of customers left without power for days in February 2011, it would seem clear that Orion’s responsibility to shareholders and customers alike is to provide a network with increased resilience to major events, provided the HILP investment premium is appropriate.
4.2 Generic topologies
Future development takes place on an existing asset base of nearly $1b, with a complex history of separate Electricity Board architectures and different eras of design philosophy. A theoretical green-fields approach to optimal network design may give a useful steer on future expansion but in the end, must also make the best use of existing assets for the remainder of their life cycle.
Estimating the cost of various options is difficult, as they depend on actual cable routes, switchgear arrangements etc. and to comprehensively cost out all the permutations would take years of work. So, very high-level generic models were used to compare the approximate costs of the different approaches, allowing the elimination of some, and the selection of the most promising candidates for more detailed analysis.
Six architectures were considered (Table 2).
Since these have many possible variants, the initial comparison was done on generic high-level models (see Appendix A) consisting of 2 GXPs with 9 zone substations each at equal distances from the GXP. Once the more promising schemes were identified, these were laid out on a map of Christchurch to obtain more realistic cable route lengths.
6 High Impact Low Probability events, also known as MOCHED (Major Outages Causing Huge Economic Damage). While this could cover a variety of situations involving the loss of multiple zone substations, the worst-case scenario is typically the loss of an entire GXP. Since the number of affected customers is very large and the repair times for interconnecting transformers very long, a high value is placed on cross-GXP subtransmission links.

Architecture Review 2012 8
Architecture 1 has zone substations with one 66 kV cable and one transformer. Variant 1a has 40 MVA transformers which provide no redundancy or spare capacity, so 11 kV ties between substations are not needed – outages will be restored in repair time.
There are two ways to introduce redundant capacity into such a network – increase the number of substations so that each 40 MW transformer supplies a normal load of 26MW, or increasing the transformer size to 60 MW for a normal load of 40 MW. Both these schemes allow a zone substation to be supported over 11kV by two neighbours.
The first option violates Assumption 4 regarding optimum 66/11 kV substation capacity. The second option is certainly cheaper and given that the smallest cable is ~60 MW is a natural fit. This is variant 1b.
Architectures 2-5 have zone substations with 2x40 MVA transformers providing redundancy, and also spare capacity to support neighbouring substations via 11 kV ties.
Architecture 6 has 2 variants – 6a has N-2 cable security but 2 transformers per site. 6b has 3 transformers per site providing full N-2 security for both cable and transformer outages.
11 kV ties (which provide interrupted N-2 security in an N-1 subtransmission scheme) may be considered unnecessary in Architecture 6, which provides N-2 security at 66 kV. Analysis was done for 6a and 6b with and without 11 kV ties.
Architecture 66 kV contingency result Load restoration
1a N radial, no 11 kV ties
no GXP links
restore 66 kV in repair time for single fault
restore load in 66 kV repair time
1b N radial, 11 kV ties
no GXP links
restore 66 kV in repair time for single fault
restore load by switching 11 kV (max. 1 sub) for single 66 kV fault
2 N‐1 radial, 11 kV ties
no GXP links
no break in 66 kV for single fault restore load by switching 11 kV (max. 1 sub) for 2 66 kV faults
3 N‐1 rings, 11 kV ties
no GXP links
no break in 66 kV for single fault restore load by switching 11 kV (max. 1 sub) for 2 66 kV faults
4 N‐1 radial, 11 kV ties
GXP links restore 66 kV in switching time for single fault (possibly fast automated switching)
restore load by switching 11 kV (max. 1 sub) for 2 66 kV faults
5 N‐1 rings, 11 kV ties
GXP links no break in 66 kV for single fault restore load by switching 11 kV (max. 1 sub) for 2 66 kV faults
6 N‐2 rings GXP links no break in 66 kV for 1 or 2 faults restore load by switching 11 kV (max. 1 sub) for 3 66 kV faults
Table 2

Architecture Review 2012 9
4.3 Topologies specific to Christchurch
Once the most economic networks in each category were identified in a generic analysis with unit link lengths, they were laid out on a map of Christchurch to provide a more realistic estimate of cable lengths. Identifying and comparing actual cable routes was considered too time-consuming at this stage, so direct distances were measured and a scaling factor applied to allow for the extra length of a practical installation.
A factor of 1.4 was chosen (from the worst-case extra
length required to join 2 points by orthogonal straight links.
This factor can be varied for sensitivity analysis.
Historically the CBD was an area of high load concentration but will probably be less so after earthquake reconstruction. As a first approximation the urban area was divided into 20 cells of equal density (Figure 2 overleaf). Existing and planned7 zone substations are shown for reference (existing 66kV red, planned 66kV red italic, existing 33kV purple, planned 33kV purple italic).
Figure 3 shows an example of a network laid out to estimate link lengths. Layouts were optimised iteratively by measurement, trial and error.
7 As in the 2012 AMP
1
√2
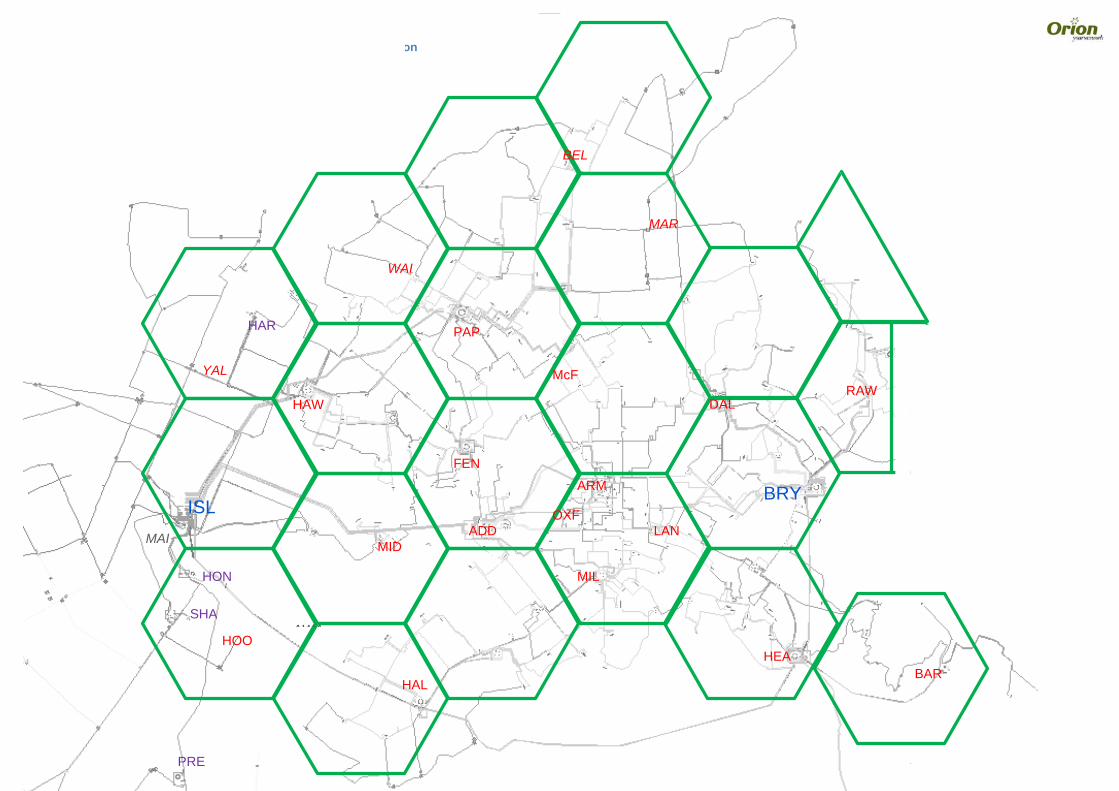
SH
PRE
MAI
IS
Figure 2: ide
HA
HOO
HON
HA
E
HAR
YAL
AW
SL
eal urban zone sub
AW
H
WA
MIDSO
WA
bstation distributio
A
PAP
HAL
ADD
FEN
AI
on
Architecture Review 20
McF
MIL
OXF
ARM
BEL
012
MAR
LAN
DAL
HEA
BRY
10
RAW
BAR

Architecture Review 2012 11
Figure 3: example of network layout
137
95
9595
137
137
95 95
137
1379595
13795
1379595
137137
95 95
137
137
95
95
95
137

Architecture Review 2012 12
Table 3
4.4 Comparison of topologies
The high-level estimated cost for building a 20-substation 66 kV subtransmission network according to the various security schemes is shown in Table 3. The zone substations at the GXPs are assumed to be on a 2-cable radial feed.
Low voltage and 11 kV assets are not included except for the incremental cost of providing tie support between zone substations8. GXP assets are not considered except for one bay per cable. A fixed cost of $1m per 66 kV switchyard is included.
Key findings:
• The cost of laying cable is the dominant component of the network value • The premium for N-1 subtransmission over N is around $140m (93% of the N cost) or
$6.9m per zone substation • The premium for N-2 subtransmission over N-1 with GXP ties is around $31m (10%
of the N-1 cost) or $1.6m per zone substation • The premium for full N-2 security (3 cables, 3 transformers per substation) over N-2
subtransmission (3 cables, 2 transformers) is around $38m (12%) or $1.9m per zone substation
• The premium for a ringed network with full inter-GXP connection over a ringed network with no connection is around $16m (6% of the no connection cost) or $0.8m per zone substation
Note that some subtransmission rings and limited cross-GXP ties already exist in Orion’s network, so the purely radial architectures or those with no GXP ties are not a practical option. Nonetheless this study assists in the decision as to whether to reinforce these ties in the future.
8 The cost per substation was identified in the Orion Security of Supply Standard Review of 2005 as $292k (inflation adjusted to 2012).
N radial, 1x40MVA transformer with no CB, no GXP links, no 11kV ties1a A1 112 7 0 31 0 150
N radial, 1x60MVA transformer with no CB, no GXP links, 11kV ties1b A1 112 7 0 36 6 161
N‐1 radial, 2x40 transformers with no CB, no GXP links, no 11kV ties2 A2 213 14 0 62 0 289
N‐1 radial, 2x40 transformers with no CB, no GXP links, 11kV ties2 A2 213 14 0 62 6 295
N‐1 rings, 2x40 transformers, no GXP links, 11kV ties3 A3c 173 30 18 62 6 288
N‐1 radial, 2x40 transformers, GXP links, 11kV ties4 A4 198 25 18 62 6 309
N‐1 rings, 2x40 transformers, GXP links, 11kV ties5 A5b 192 27 18 62 6 305
N‐2 rings, 2x40 transformers, GXP links6a A6 216 34 18 62 0/6 330/336
N‐2 rings, 3x40 transformers, GXP links6b A6 216 41 18 93 0/6 368/374
Figuretransformer cost $m
total $mswitchyard cost $m
cable cost $m
breaker cost $m
11kV ties cost $m
Arch.

Architecture Review 2012 13
5 Economics 5.1 Value of Lost Load (VOLL) and Value of Interruption (VOI)
An official VOLL figure was last published by the Electricity Commission in 2004 as $20,000/MWh (Electricity Industry Participation Code). When this is CPI-adjusted to 2012 it becomes $24,967.
A VOLL review9 was initiated in 2008 and as part of this process the Electricity Authority commissioned a set of customer surveys in 2011. The collated data from these surveys has been released10 but the industry consultation stage is not scheduled to begin until mid-2012, so officially published values are not available at the time of writing. Producing a useful VOLL figure (or better, a matrix of values for different customer types and seasons etc.) from this data is problematic.
The VOLL used in the Orion 2012 AMP is $16,260/MWhr. We also apply a Value of Interruption (VOI) component of $6970/MW, so the total VOLL for the first hour of interruption is $16,260 + $6,970 = $23,230/MW which is in good agreement with the adjusted EC figure. VOLL decreases after the first hour to $16,260/MWhr. Until the EA publish their findings we will continue to use these values.
5.2 66 kV economics (ideal architectures)
The costs of building the various architectures are laid out in Table 4. The benefits have been identified as follows.
VOLL
This is the expected average cost of unserved load due to subtransmission contingencies which are predictable (in a probabilistic sense), based on the frequency and consequence of various failure modes. Transmission and GXP outages which are rare and unpredictable in nature are addressed separately from the VOLL analysis.
Loss effects
The different architectures have different cable lengths and sizes, and so the power losses will be different for each and were modeled in powerflow software. Three different cost effects of losses were considered.
Losses at peak load mean extra power is required to be supplied by generators through the grid. The long-run marginal cost (LRMC) of generation capacity at network peak loading times is set by the cost of peaking generators and is taken as $125/kW. This is a cost to New Zealand in general, rather than to Orion; nonetheless, any investment made by Orion which reduces losses will provide a regulated return, and is a valid component of the analysis.
The Transpower grid interconnection charges payable by Orion are set by the Orion peak load contribution to the upper South Island peak load and whilst the Transpower grid interconnection charge may not reflect the immediate short-run marginal cost (SRMC) of
9 G:\Network Development\Network planning\Electricity Commission or Authority\VOLL survey\Value-of-use-final-report 2008.pdf 10 G:\Network Development\Network planning\Electricity Commission or Authority\VOLL survey\100727 Electricity commission VOLL surveys.pdf

Architecture Review 2012 14
extra upper South Island capacity, it is assumed to be a reasonable proxy of the LRMC. The 2012-13 grid interconnection charges are $91/kW.
There is also the annual cost of energy wasted in losses. This is an aggregate of energy losses over all load levels over the year. The commonly used formula for estimating the loss load factor for average losses is LLF = 0.3*LF + (0.7*LF)2, where Orion’s load factor LF is taken as 0.6. The wholesale cost of energy in 2012 is around $90/MWhr.
Both the wholesale cost of energy and the grid interconnection charges are expected to rise faster than general inflation for the forseeable future.
Value of network capacitance
The Transmission Pricing Advisory Group has recommended the introduction of a charge on reactive power drawn from the grid. This will place a value on the capacitance embedded in networks, which offsets the investment required in power factor correction and voltage support equipment on the grid. The different architectures comprise different levels of capacitance in the installed 66kV cable.
The extra cable involved in 11kV tie support is also significant. The review of the 11kV architecture has not been undertaken at the time of writing this report, so the amount of extra cable required for ties has been taken from the 2005 supply security analysis.
The suggested charge11 is $4-5/kVAr. A figure of $4.50 was used in the following table.
There is significant value in cable capacitance to Orion as well, for reducing reactive power flows and maximizing the real power able to be delivered by the cable network. This value has not been quantized but will favour interconnected architectures.
Table 4 summarises the costs (network construction, VOLL, and loss effects) and offsetting benefits (value of network capacitance) for the various architectures.
Notes:
The rate of return normally used to find the annual cost of an Orion investment is about 14%. The operational cost of the upper network is considerably less than that of the 11/0.4kV assets, so a reduced figure of 11% was used to derive the annualised network construction cost.
The VOLL for the N-1 radial architectures without GXP links (Arch. 2) is based on cable fault probabilities assuming independent cable routes. Since the pair of cables to each zone substation are laid together in a shared trench, this does not take into account the common-mode risk (for events such as excavation accidents or earthquake damage happening to both cables). This added risk is significant and is borne out by double cable outages for Orion in recent years. Because the total cost of N-1 ringed architectures without GXP links (Arch. 3) is less than that of Arch. 2 even without taking common-mode risk onto account, no attempt was made to include it and it is taken that for N-1 networks without GXP links, radial connections are inferior to rings.
11 Table 2 of Draft TPAG paper – Static Reactive Compensation section on http://www.ea.govt.nz/our-work/advisory-working-groups/tpag/22Aug11/

Architecture Review 2012 15
Table 4
*66 kV contingencies only **additional capacitance due to 11 kV ties
Notes continued
The VOLL for architectures 3-6 assume the provision of rapid automatic switching following contingencies, to close open points and/or relieve temporary cable overload. The VOLL for these topologies is overstated as equal cable lengths were assumed in the outage calculations12. In parallel systems equal lengths provide higher outage rates than unequal lengths (which occur in the actual network model). Due to the relative insignificance of VOLL compared to loss effects in these architectures, a correction has not been made for this.
Architecture 1b requires 11 kV switching to cover all planned and unplanned outages. This is an opex burden which would increase the total annual network cost by an amount which is difficult to specify.
Due to the requirement that no more than one zone substation is at risk from a double fault, the N-1 radial network with GXP ties (Figure A4) is almost a ringed network and is similar in overall cost.
12 To consider different cable lengths for each link would make the probability analysis prohibitively complex, without the use of reliability modelling software.
N radial, 1x40MVA transformer with no CB, no GXP links, no 11kV ties1a A1 150 16.5 294,364 3,653 ‐193 0 314.3
N radial, 1x60MVA transformer with no CB, no GXP links, 11kV ties1b A1 161 17.7 5893 3,653 ‐193 ‐2,392 24.6
N‐1 radial, 2x40 transformers with no CB, no GXP links, no 11kV ties2 A2 289 31.8 759 2,371 ‐385 0 34.5
N‐1 radial, 2x40 transformers with no CB, no GXP links, 11kV ties2 A2 295 32.5 9.90 2,371 ‐385 ‐2,392 32.1
N‐1 rings, 2x40 transformers, no GXP links, 11kV ties3 A3c 288 31.7 0.343 2,615 ‐314 ‐2,392 31.6
N‐1 radial, 2x40 transformers, GXP links, 11kV ties4 A4 309 33.9 0.287 2,228 ‐376 ‐2,392 33.4
N‐1 rings, 2x40 transformers, GXP links, 11kV ties5 A5b 305 33.5 0.122 2,425 ‐366 ‐2,392 33.2
N‐2 rings, 2x40 transformers, GXP links, no 11kV ties6a A6 330 36.3 9.88 2,655 ‐395 0 38.6
N‐2 rings, 2x40 transformers, GXP links, 11kV ties6a A6 336 36.9 0.0108 2,655 ‐395 ‐2,392 36.8
N‐2 rings, 3x40 transformers, GXP links, no 11kV ties6b A6 368 40.5 0.677 2,655 ‐395 0 42.8
N‐2 rings, 3x40 transformers, GXP links, 11kV ties6b A6 374 41.1 0.00273 2,655 ‐395 ‐2,392 41.0
loss effects $k p.a.
total cost pa $m
reduction in Var charges (66kV) $k p.a.
Arch. Figurenetwork cost $m
annualised cost $m
VOLL* $k p.a.
reduction in Var charges (11kV**)
$k p.a.

Architecture Review 2012 16
Table 5
Key findings:
• The N radial network without 11 kV ties (1a) is totally uneconomic • N-1 radial networks have the same or higher total cost than N-1 ringed networks
(given the requirement that no more than one zone substation is at risk from two concurrent faults)
• In each case it is economic to include 11 kV tie support between zone substations • The N-2 network with 3 transformers per site is uneconomic
After eliminating the least promising candidates, we have:
Bearing in mind the additional opex for 1b as discussed above which will increase its overall cost and reduce the cost premium for the interconnected models, the following conclusions may be drawn:
• Architecture 3 has significantly more total cost than Architecture 1, for no extra benefit.
• Architecture 6 has significantly more total cost than Architecture 5, for no extra benefit.
• The economics of architectures 4 and 5 depend on the value of cross-GXP links.
5.3 HILP economics (ideal architectures)
The probabilistic analysis used for the average expected cost of 66 kV subtransmission outages cannot be readily applied to HILP events on the transmission grid or GXP, due to speculative probability of occurrence and the high concentration of load through key sites. This results in significant uncertainty around common-mode risks for multiple assets with large load at risk and long repair times.
Rather than attempt to estimate outage frequencies and durations, it may be more useful to examine what type of event will justify the added cost of building cross-GXP ties ($8.6m p.a.).
The Islington GXP is located close to Christchurch International Airport Limited (CIAL), and in the Waimakariri river flood plain. Events such as major fires/explosions, floods, tsunamis,
Arch. Figure total cost $m p.a. additional cost over Arch. 1b $m p.a.
N radial, 1x60MVA transformer with no CB, no GXP links, 11kV ties1b A1 25
N‐1 rings, 2x40 transformers, no GXP links, 11kV ties3 A3c 32 7.0
N‐1 radial, 2x40 transformers, GXP links, 11kV ties4 A4 33 8.8
N‐1 rings, 2x40 transformers, GXP links, 11kV ties5 A5b 33 8.6
N‐2 rings, 2x40 transformers, GXP links, 11kV ties6a A6 37 12.2

Architecture Review 2012 17
earthquakes, plane crashes or sabotage could result in complete or partial destruction of a GXP site, with repair times on the scale of months.
In the Islington Disaster Recovery Plan13 prepared for Transpower by Tesla LineTech Mitton Consulting, it is suggested that following a catastrophe at Islington it would take 24 hours to restore 220 kV supply to Bromley and any other 220 kV GXPs in the region, and 3 months to restore Islington supply through emergency measures14.
For the generic network of 800 MW supplied from two 400 MW GXPs the following VOLL values apply to the total loss of either GXP, with no 66 kV supporting link capacity. A load factor of 0.6 is applied.
• One 3-day outage (or three 1-day outages) have a VOLL of $283m. If this occurred once in 33 years, this represents an average annual VOLL of $8.6m
• One 7-day outage has a VOLL of $657m. If this occurred once in 76 years, this represents an average annual VOLL of $8.6m
• One 3-month outage has a VOLL of $8.5b. If this occurred once in 1000 years, this represents an average annual VOLL of $8.5m
The only HILP event considered above is a catastrophe at a GXP site. A highly interconnected network with 11kV ties and cross-GXP links provides resilience to many foreseeable and unforeseeable situations, such as the recent earthquakes which did not cause much damage to GXPs but to many other parts of the network. VOLL is improved by reducing switching times and providing multiple options for re-routing supply.
As interconnection charges and the wholesale cost of energy rise, Architecture 1 becomes relatively more expensive compared to the other options. Given the remarks in section 4.1, and the fact that the $8.6m premium for GXP ties is overstated due to the additional opex costs (quantify) of Architecture 1, it is appropriate to build a network with resilience against HILP events.
We can conclude that from a greenfields perspective, a ringed N-1 architecture with cross-GXP links is preferred.
13 Document MEL-R452 Rev 01, June 2009 14 Some load could be restored earlier than this due to existing cross-GXP ties, but at this point we are considering the value of having no ties vs. full tie capacity.

Architecture Review 2012 18
6 Applying the findings 6.1 Orion 2012-2060
Sections 1-5 of this report considered the best greenfields architectures; Sections 6-7 consider the best way to incrementally build on the existing Orion network, informed by the findings above. The following points are important.
6.2 33 kV network
The Islington 33 kV GXP is in early lifecycle and will be retained for at least 50 years. But the Springston 33 kV GXP is likely to be removed in the next 20 years with that network converted to 66 kV. This will leave ISL33 islanded; support must be at 11 kV from 66 kV substations. Some 33 kV zone substations will need to convert to 66 kV to manage this - probably Moffet and Shands due to their proximity to 66 kV supply.
6.3 Number of zone substations
Orion already has 22 urban substations, and growth in the north means another 3-4 will be required. Given that the 33 kV stations are 23 MVA capacity and the location of some 66 kV stations means they will probably never exceed 23 MVA, when the urban demand reaches ~900MW all 26 sites should be close to nominal capacity.
New 220/66 kV GXPs at Springston and/or West Melton are a preferred option over increasing load on Islington, and will cover growth in Selwyn District to the southwest of the city. The new GXP(s) will support Islington in a 66 kV outage and allow Bromley GXP to remain at no more than 420 MVA firm capacity.
6.4 Existing network
Orion’s existing and planned urban substations (as in the 2012 AMP) are shown in Figure 4.
There are 10 substations on N-1 radial feeds. Limited cross-GXP ties already exist in the Halswell-Heathcote tower lines and the Lancaster-Armagh cable.
There are two other likely routes for GXP links – by connecting McFaddens to Dallington, and from Hawthornden to Rawhiti via the future Waimakariri and Marshland sites.

Architecture Review 2012 19
Existing 66kV
Planned 66kV
Existing 33kV
Planned 33kV
linecable
Figure 4: existing and planned urban substations (2011)
2x40
2x40
3x243x27
27
24
17
2x40
2x40
2x40
2x40
2x53 2x53
166
2x53
2x53 2x53
166
HOO
HAL BARHEA
HAW
2x1742x168
PAP
4x174
McF
FEN
MIL
OXF
ARM
LAN
3434
RAW
DAL
ADD
WAI MAR
BEL
AWA
KNO
SOC
YAL
HONSHA
PRE
TEM
MAI2x40
MID
MOF
BRY

Architecture Review 2012 20
It has been established that ringed networks are more advantageous than radial networks, and although the Orion urban network is largely N-1 radial at present the following work assumes that further construction will incorporate closed rings where feasible.
With regard to GXP ties, two approaches are considered – building towards full tie capacity (section 7.1), and not adding to the existing ties (section 7.2). Existing ties are provided by the 2x40MVA Addington-Armagh cables and the 2x53MVA Halswell-Heathcote lines. Once GXP(s) in the Selwyn district are installed, the Islington-Springston and Islington-Weedons circuits will provide further GXP support for Islington.
7 Orion networks 2060 7.1 N-1 ringed network with full GXP ties
The existing layout does not match any of the idealised architectures discussed in sections 4 and 5 very well.
Given the current and planned site locations, and their natural grouping into 4 cross-GXP branches, the N-1 ringed arrangement in Figure 5 is a good fit and can be adapted to existing plans. It did not initially attract interest in the generic high-level study as it is not symmetrical (more load on Islington than Bromley, and Bromley cannot cover all of Islington load). However this suits the actual GXP capacities and the fact that Islington outages will be partially supported by new GXPs to the west.
Figure 5
The network in Figure 5 is a more expensive greenfields option than the optimum N-1 ring plan in Figure A5b (see Table 6). However the fact that the 8x174 MW Islington-Papanui and Islington-Addington tower lines, and the Halswell-Heathcote tower lines, are already in service changes the economics. The existing 1600Cu Bromley-Lancaster cable also matches the requirements.
166
166
2x10⁶
2x10⁶
95
137
137
137
137 166
166
2x10⁶
2x10⁶
137
137
137
137
166
166
166
166
61
95
95
6195

Architecture Review 2012 21
Table 6
The diagrams on the next pages show the proposed network with full GXP links around 2060, assuming all zone substations are at capacity or their expected maximum load. All urban stations are no-break N-1. Some rural stations are switched N-1 or N.
Figure 7 shows existing and planned assets, Figure 8 has the normal operating state, Figure 9 shows the loss of Bromley GXP, and Figure 10 shows the loss of Islington 66 kV GXP. Red rings indicate the links at or near capacity.
The main point to emerge from this design apart from cable sizing, is that the Armagh-McFaddens cable in the 2012 AMP (which provides for Bromley a ring with 3 feeders and an open branch, Figure 6 left) is less useful than a Milton-Hoon Hay link (which provides for two 2-feeder rings, Figure 6 right).
N‐1 radial, 2x40 transformers, GXP links, 11kV ties4 A4 198 25 18 62 6 309
N‐1 rings, 2x40 transformers, GXP links, 11kV tiesA5b 192 27 18 62 6 3055 246 30 18 62 6 361
N‐2 rings, 2x40 transformers, GXP links, no 11kV ties6a A6 216 34 18 62 6 336
total $mFigurecable cost
$mbreaker cost $m
switchyard cost $m
transformer cost $m
Arch.11kV ties cost $m
5
Figure 6
LAN
HOO HAL
HEAMIL
DAL
McFMAR
LAN
HAL
HEA
DAL
McFMAR
ARM

Architecture Review 2012 22
145
160
104
81
81
123
103
132
34
34
3434
34
119
119
123
34
34
34
58
87
87
2x40
56
56
2x40
24
2x40
83
83
58
58
3x24
3x2758
58
2x40
2x174
2x40
2x40
2x90
166166
2x40
2x1742x168
2x60 2x53
58
2x60
104
58
3x24
3x27
58
58
132
2x40
2x174
2x40
145
2x90
2x53
2x53
166
103
166
2x40
2x1742x168
2x60 2x53
2x60
27
27
2x174
2x174
2x70
2717
27
27
2x70
27
26
24
26
40
40
58
58
58
58
58
58
2x53
2x53
34
34
17
58
58
2x40
3458
2x40
34
3434
34
34
40
40
40
40 160
ADD
ARM
LAN
HOO
HEA
MIL
FEN
DAL
OXF
McFPAP
MARWAI 23MWHAW
BEL
Substations - existing 66kV, planned 66kV, existing 33kV, planned 33kV
ADD 40MW
ARM 34MW
LAN 40MW
HOO 40MW
HAL* 22MW
BAR 13MW
HEA 40MW
MIL 40MW
FEN 40MW
RAW 25MW
DAL 40MW
OXF 40MW
McF 40MW
PAP 40MW
MAR 35MW
WAI 20MW
BEL 35MW
BAR 23MW
AWA 10MW
TEM 23MW
LAR 23MW
HON 23MW
PRE 23MW
WEE 20MW
LAR 20MW
TEM 15MW
Normal supply arrangement – 2060 winter loads
SOC 35MW
SOC 35MW
BRY
BRY 40MW
SPN 13MW
MOF 30MVA
MOF
SHA 23MW
HON 23MW
PRE 23MW
SHA 20MW
ISL 33kV 110MVA (212 max, 106 firm)
MAI 23MW
MAI 23MW
BUR 20MW
WEE 23MW
BUR 23MW
AWA 23MW
HAL 23MW
ROS 10MW
ROS 10MW
LIN 23MW
HIG 10MW
HIG 10MW
BP 13MW
MID 40MW
MOT +BP
SPN 23MW
LIN 23MW
*requires bus redesign
MID
(undiversified)
Darfield, Kimberley, Hororata
Dunsandel, Bankside, Hororata
BRS 10MW
KIL 10MW
DOY 10MW
SBG 10MW
BRS 5MW
KIL 5MW
DOY 5MW
SBG 5MW N
Wolf upgrade
1000Cu flat
1200Cu flat or 1600Cu trefoil
630Cu trefoil
300Cu flat or trefoilYAL
23MW
YAL 10MW
HAW 40MW
RAW
switched N-1
N
switched N-1
switched N-1
BRY 66kV(630 max, 420 firm)360MVA undiversified
ISL 66kV (841 max, 620 firm)443MVA undiversified + Mainpower
SPN/ROS 66kV 153MVA
Winter peak loads rural urban
193MVA 850MVA
Substation capacities 40MVA except where noted
1600Cu flat
Wolf upgrade
1200Cu flat or 1600Cu trefoil
800Cu flat or 1000Cu trefoil
800Cu flat or 1000Cu trefoil
300Cu flat or trefoil
630Cu flat or trefoil
630Cu flat or trefoil
1600Cu flat
Figure 1: network with full GXP links
Figure 8: network with full GXP links

Architecture Review 2012 23
81
81
40
119
119
123
40
24
58
87
2x53
2x53
57
2x40
2x40
83
58
104
58
3x24
3x27
132
2x40
2x174
2x40
145
2x90
166
103
166
2x40
2x168
2x60 2x53
2x60
2x174
2717
27
27
2x70
26
58
58
58
58
34
34
34
58
58
2x174
2x40
123
40
24
58
87
2x53
2x53
57
40
40
83
58
104
58
3x24
3x27
132
40
2x174
2x174
40
145
2x90
166
103
166
2x40
2x168
2x60 2x53
2x60
2717
27
27
2x70
26
58
58
58
58
34
34
34
58
58
2x174
2x4040
40
4040
40
40
40
160
160
ADD 40MW
ARM 34MW
LAN 40MW
HOO 40MW
HAL 23MW
BAR 15MW
HEA 40MW
MIL 40MW
FEN 40MW
DAL 40MW
OXF 40MW
McF 40MW
PAP 40MW
MAR 35MW
WAI 20MW
HAW 40MW
BEL 35MW
AWA 10MW
TEM 15MW
SOC 35MW
BRY 40MW
MOF 30MW
HON 23MW
PRE 23MW
SHA 20MW
MAI 23MW
BRY GXP outage
WEE 20MW
LAR 20MW
SPN 13MW
BUR 20MW
ISL 33kV 95MW (212 max, 106 firm)
ROS 10MW
HIG 10MW
LIN 23MW
BP 13MW
ISL 66kV 787MVA + Mainpower (841 max, 620 firm)
SPN/ROS 66kV 193MVA
MID 40MW
ADD 40MW
ARM 34MW
LAN 40MW
HOO 40MW
HAL 23MW
BAR 15MW
HEA 40MW
MIL 40MW
FEN 40MW
DAL 40MW
OXF 40MW
McF 40MW
PAP 40MW
MAR 35MW
WAI 20MW
HAW 40MW
BEL 35MW
AWA 10MW
TEM 15MW
SOC 35MW
BRY 40MW
MOF 30MW
HON 23MW
PRE 23MW
SHA 20MW
MAI 23MW
WEE 20MW
LAR 20MW
SPN 13MW
BUR 20MW
ISL 33kV 95MW (212 max, 106 firm)
ROS 10MW
HIG 10MW
LIN 23MW
BP 13MW
MID 40MW
BRY 66kV 630MW (630 max, 420 firm)
ISL 66kV GXP outage
SPN/ROS 66kV 253MVA
YAL 10MW
YAL 23MW
RAW 25MW
RAW 25MW
Figure 9: network with full GXP links
Figure 10: network with full GXP links

Architecture Review 2012 24
The supply to Rawhiti zone substation deserves mention. As a result of the earthquake it is served by a temporary single radial line; the Security Standard requires an N-1 supply. Retaining a single Bromley-Rawhiti circuit would mean an early commitment to the expensive Rawhiti-Marshland link plus either the Marshland-Waimakariri or the Marshland-McFaddens circuits to provide a second independent feed. In addition, space constraints do not permit the construction of a 4-bay bus at Rawhiti for the preferred arrangement of a 2-cable feed through substation.
The economic analysis which follows (for both full and partial GXP links) assumes a single large cable from Bromley to Rawhiti. A number of schemes to provide two feeds to Rawhiti before the provision of supply from the north are under investigation and will take into account the NPV of delaying the links north of Rawhiti.
7.2 N-1 ringed network with partial GXP ties
The approach here is to add zone substations in rings to the existing network, without constructing new cross-GXP links. One new ring is created to the north of each GXP; the rest of the urban network remains largely N-1 radial. McFaddens zone substation sits more naturally in the new Bromley ring and thus the existing Papanui-McFaddens 2x40MVA links become an extra GXP tie.
The diagrams on the next pages show the proposed network with partial GXP links around 2060, assuming all zone substations are at capacity or their expected maximum load. All urban stations are no-break N-1. Some rural stations are switched N-1 or N.
Figure 11 shows existing and planned assets and Figure 12 has the normal operating state.

Architecture Review 2012 25
147
145
104
83
119
34
34
3434
34
34
34
34
58
24
58
58
3x24
3x2758
58
2x174
2x1742x16858
2x60
58
3x24
3x27
58
58
2x174
2x53
2x53
2x1742x168
2x60
27
27
2x174
2x174
2x70
2717
27
27
2x70
27
26
24
26
58
58
58
58
58
58
2x53
2x53
34
34
17
58
58
34
58
58
34
3434
34
34
Substations - existing 66kV, planned 66kV, existing 33kV, planned 33kV
Winter peak loads rural urban
193MVA 850MVA
AWA 10MW
TEM 23MW
LAR 23MW
HON 23MW
PRE 23MW
WEE 20MW
LAR 20MW
TEM 15MW
Normal supply arrangement – 2060 winter loads
BRY 66kV(630 max, 420 firm)320MVA undiversified
ISL 66kV (841 max, 620 firm)492MVA undiversified + Mainpower
SOC 35MW
SPN/ROS 66kV 153MVA
SPN 13MW
MOF 30MVA
MOF
SHA 23MW
HON 23MW
PRE 23MW
SHA 20MW
ISL 33kV 110MVA (212 max, 106 firm)
MAI 23MW
MAI 23MW
BUR 20MW
WEE 23MW
BUR 23MW
AWA 23MW
ROS 10MW
ROS 10MW
LIN 23MW
HIG 10MW
HIG 10MW
BP 13MW
MOT +BP
SPN 23MW
LIN 23MW
(undiversified)
Darfield, Kimberley, Hororata
Dunsandel, Bankside, Hororata
BRS 10MW
KIL 10MW
DOY 10MW
SBG 10MW
BRS 5MW
KIL 5MW
DOY 5MW
SBG 5MW N
switched N-1
N
switched N-1
switched N-1
147
56
104
119
2x40
56
2x40
83
2x40
2x40
145
2x40
2x53
166166
2x40
2x53 2x53
40
2x40
40
40
ADD
ARM
LAN
HOO
HEA
MIL
FEN
DAL
OXF
McFPAP
MARWAI 23MWHAW
BEL
BAR 23MW
SOC 35MW
BRY
HAL 23MW
MID
300Cu flat or trefoil
300Cu flatYAL
23MW
RAW
300Cu flat
56
2x40
56
2x40 2x40
2x40
2x40
2x53
166166
2x40
2x53 2x53
40
2x40
40
40
HAL 22MW
YAL 10MW
MAR 35MW
RAW 25MW
BRY 40MW
BAR 13MW
HEA 40MW
DAL 40MW
LAN 40MW
McF 40MW
ARM 40MW
BEL 35MW
WAI 20MW
HAW 40MW
MID 40MW
MIL 40MW
HOO 40MW
FEN 40MW
PAP 40MW
OXF 40MW
ADD 40MW
1600Cu flat or trefoil
Substation capacities 40MVA except where noted
800Cu flat or 1000Cu trefoil
1600Cu flat or trefoil
1000Cu flat or 1200Cu trefoil
630Cu flat or trefoil
Figure 11: network with partial GXP links
Figure 12: network with partial GXP links

Architecture Review 2012 26
Table 7
7.3 Comparing the options The build costs in the following table refer to those assets to be constructed in the future. This includes the cable network and differences in switchgear. Investments common to both plans (substation sites, transformers etc.) are not included.
Note that an NPV analysis has not been undertaken, as the timing of investment depends on the outcome of the Architecture Review and the unfolding of load growth. Much of the two options consist of equivalent projects (e.g. a Dallington-McFaddens cable) which would be installed at the same time in either option, but with different cost due to different cable size. In this case the project cost is a reasonable basis for comparison as the timing would be the same. There are projects in the full-link option which have no equivalent in the partial-link option (such as uprating the Bromley-Heathcote and Islington-Springston circuits) but these would take place later in the time frame as the load nears network capacity; as such their effect on NPV will be less than earlier projects. Thus an NPV analysis is likely to reduce the cost difference between the options from the absolute build costs listed below.
Cable lengths are derived from realistic measures of practical routes. The loss and capacitance effects are modelled in powerflow software and represent the entire 66kV network in each case (not just the planned extensions).
The 66 kV VOLL of the options is not analysed – both are N-1 schemes with 11kV ties between zones substations and as can be seen from Table 4 the difference in VOLL of interconnected systems is insignificant when compared to other factors.
The annualised difference in total costs is around $3.8m, before considering the value of the complete vs. partial GXP links.
The increased capacity of the Islington-Springston GXP links (uprating the twin Wolf circuits) would improve Islington support in a Springston/Rossendale contingency. This adds further benefit to the increased link model but this case has not yet been analysed in detail and the following applies to Islington and Bromley outages only.
The partial GXP links will provide full cross-GXP support for a proportion of the time (when the load on the failed GXP is less than the tie support capacity). Loss of load only occurs when the tie capacity is exceeded, so the average annualised VOLL of GXP outages is much lower than when there are no GXP ties.
For the 2060 network with existing (partial) GXP links an estimated 133 MVA peak load would remain unserved following an Islington GXP failure and an estimated 115 MVA following a Bromley GXP failure. This assumes new Selwyn district GXP(s) can supply Islington to the full capacity of the existing Islington-Springston and Islington-Weedons lines.
Both Islington and Bromley load is expected to exceed existing tie capacity 25% of the time, assuming load duration profiles are similar to those of today.
Full GXP ties71 7,849 10,115 ‐340 17.6
Partial GXP ties36 3,940 10,188 ‐303 13.8
loss effects $k p.a.
total cost $m p.a.
reduction in Var charges $k p.a.
network cost $m
cost $k p.a.
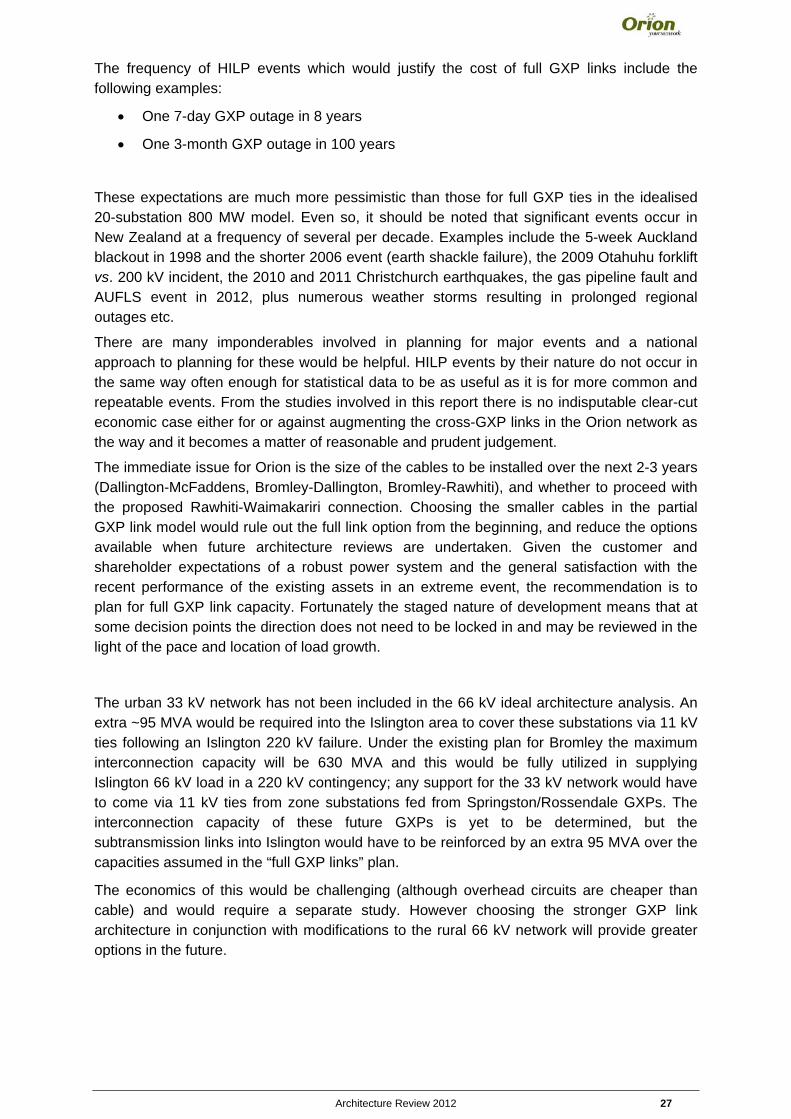
Architecture Review 2012 27
The frequency of HILP events which would justify the cost of full GXP links include the following examples:
• One 7-day GXP outage in 8 years
• One 3-month GXP outage in 100 years
These expectations are much more pessimistic than those for full GXP ties in the idealised 20-substation 800 MW model. Even so, it should be noted that significant events occur in New Zealand at a frequency of several per decade. Examples include the 5-week Auckland blackout in 1998 and the shorter 2006 event (earth shackle failure), the 2009 Otahuhu forklift vs. 200 kV incident, the 2010 and 2011 Christchurch earthquakes, the gas pipeline fault and AUFLS event in 2012, plus numerous weather storms resulting in prolonged regional outages etc.
There are many imponderables involved in planning for major events and a national approach to planning for these would be helpful. HILP events by their nature do not occur in the same way often enough for statistical data to be as useful as it is for more common and repeatable events. From the studies involved in this report there is no indisputable clear-cut economic case either for or against augmenting the cross-GXP links in the Orion network as the way and it becomes a matter of reasonable and prudent judgement.
The immediate issue for Orion is the size of the cables to be installed over the next 2-3 years (Dallington-McFaddens, Bromley-Dallington, Bromley-Rawhiti), and whether to proceed with the proposed Rawhiti-Waimakariri connection. Choosing the smaller cables in the partial GXP link model would rule out the full link option from the beginning, and reduce the options available when future architecture reviews are undertaken. Given the customer and shareholder expectations of a robust power system and the general satisfaction with the recent performance of the existing assets in an extreme event, the recommendation is to plan for full GXP link capacity. Fortunately the staged nature of development means that at some decision points the direction does not need to be locked in and may be reviewed in the light of the pace and location of load growth.
The urban 33 kV network has not been included in the 66 kV ideal architecture analysis. An extra ~95 MVA would be required into the Islington area to cover these substations via 11 kV ties following an Islington 220 kV failure. Under the existing plan for Bromley the maximum interconnection capacity will be 630 MVA and this would be fully utilized in supplying Islington 66 kV load in a 220 kV contingency; any support for the 33 kV network would have to come via 11 kV ties from zone substations fed from Springston/Rossendale GXPs. The interconnection capacity of these future GXPs is yet to be determined, but the subtransmission links into Islington would have to be reinforced by an extra 95 MVA over the capacities assumed in the “full GXP links” plan.
The economics of this would be challenging (although overhead circuits are cheaper than cable) and would require a separate study. However choosing the stronger GXP link architecture in conjunction with modifications to the rural 66 kV network will provide greater options in the future.

Architecture Review 2012 28
8 Sub-transmission switchyard layout options Process
Numerous conceptually possible layouts were considered and existing Orion substations were reviewed to give a set of layouts to examine. These included conventional bus layouts as typically used by Transpower and ring bus layouts as used by Orion in recent years.
Starting with 6 circuits and 2 transformers, the options were drawn up and worked backwards to 1 circuit and 1 transformer to eliminate options that didn’t provide an incremental transition path.
The value of a having a bus coupler was determined for various configurations.
Resilience to a range of faults was checked (including considering the interaction with neighbouring switchyards for dual circuit failures) and land area needs were reviewed.
When considering switchyard layouts note there are external variables to the substation that could alter its layout:
• 3 circuit terminal. Circuits that are Tee’d together outside of a substation without the use of any switchgear. This mainly occurs in the rural overhead network, but examples can be found in the urban network i.e. Middleton.
• Layout of neighboring substations. A substation with 2 circuits will require a neighboring substation with 3 circuits to ensure switchable N-2 (this is shown later in this section).
• Future expansion. Extra circuit breaker bays require extra space and integration into the existing layout.

Architecture Review 2012 29
6 Circuits, 2 Transformers – Options
All options have disconnectors enabling a CB or transformer to be removed from service without affecting the operation of the remaining plant.
Ring Bus 1A
This option has the circuits connected between the transformers. It allows for 2 rings to operate and is robust for Circuit, Tx, CB and Bus faults.
Ring Bus 1B
Transformers are adjacent without a circuit connected between them. If a CB fails between the 2 transformers, both Transformers will be lost.
2 – Conventional
With a bus coupler it has 1 more circuit breaker than a ring bus.
Note that a bus coupler fault causes a complete bus/station shutdown and may also affect neighbouring substations.
3 –Conventional Bus Ringed
More equipment, cost and no advantage over ring bus. Therefore not considered further.
4 - Conventional double bus-bar.
Any circuit is able to operate on either bus. However this layout does require many ABI’s and an extra CB than a ring bus. Therefore not considered further.
Appendix G compares the performance of Ring Bus 1A and 1B for network faults. It shows that 1A gives better performance for Transformer and Circuit Breaker faults.

Architecture Review 2012 30
Conventional Bus
The transition from 6 circuits, 2 transformers to just one circuit and transformer is shown here:
Site fully developed with 6 circuits, two transformers and a bus coupler*
Site with 4 circuits and 2 transformers, without bus coupler*. There are 2 disconnectors on the middle of the bus to enable one to be taken out for maintenance without isolating the whole bus which would cut of supply to both transformers
Site with 2 transformers and 2 circuits can readily be extended to incorporate a 3rd circuit
Simple 2 circuit, 1 transformer site with ability to feed through between adjacent sites. Vulnerable to bus fault.
Alternative 2 circuit option
Single source with a radial tee so no need for a CB on the source side
Alternative 2 circuit option
2 circuit with single tee to transformer. Fault on either circuit prevents load being supplied therefore not preferred
1 circuit, 1 transformer

Architecture Review 2012 31
• *Appendix C gives the analysis of the value of having a bus coupler. It shows that it is not economic to have a bus coupler for 40 MW substations with less than 6 CB (4 circuits and 2 transformers). At this point the economics are close to breaking even using a pessimistic CB failure probability, therefore a bus coupler is not justified unless there are more than 4 circuits and 2 transformers. This conclusion holds true with the proposed design of the 66kV subtransmission network which for the loss of two 66kV circuits during a bus fault the 66kV supply to surrounding substations is still live. For sites with three or more 66kV circuits the economics of a bus coupler on a conventional bus need to be checked on a case by case basis.
Ring Bus
For a CB fault only 1 Transformer or 1 circuit is lost. No load lost.
Added security with 4th CB, however 2 Transformers or both circuits could be lost for a CB fault. Therefore not preferred.
Only 3 CB’s used. No load lost for a circuit fault or a Transformer fault.
Single Transformer will stay live if either circuit is lost. If
Transformer trips then circuit not fed through until ABI switched. Fits in well with above layout going forward.
Single Transformer will stay live if either circuit is lost.
Design doesn’t fit in with more circuits going
forward. Simple.

Architecture Review 2012 32
Switching between GXP rings
The proposed 66kV network design and regulatory requirements (which can be overcome but are not economically justified) prevent permanent connection between 66kV GXPs.
The following shows how Ring Bus 1A layout has the flexibility to allow a substation to be switched between an Islington GXP ring and a Bromley GXP ring. If a conventional bus was used, 2 busses (or 4 to avoid outages for bus faults) would be required.
Transformers connected to right hand-side . Ring operating on both-sides.
Transformers connected to left hand-side. Ring operating on both-sides.

Architecture Review 2012 33
Site Development
To understand 66 kV zone substation site development options the analysis now changes from Single Line Diagrams to site layouts. Appendix D shows how a site develops from 1 circuit, 1 transformer up to 4 circuits, 2 transformers for each bus option. Dimensions/spacings are based on recent substations constructed in Orion’s network.
It is considered prudent to allow sufficient land to develop up to at least 2 circuits and 2 transformers (or in some cases 4 circuits – depending on the location within the network). For the 2 circuit case the conventional bus arrangement is shown in the following figure:
Of the options covered this has the smallest footprint of ~3700 m2, but requires four circuit breakers.

Architecture Review 2012 34
The Ring Bus A option (with transformers opposite) is:
Although this has a larger footprint of ~4700 m2 it requires only three circuit breakers. The extra land cost is more than compensated for by the reduction of a circuit breaker. Reliability is also improved through having less circuit breakers. See Appendix E for economic analysis.
The Ring Bus B option (with transformers adjacent) is:
This has a slightly smaller footprint than Ring Bus A option at ~4300 m2. However unless land is extremely tight and expansion to a third circuit is never going to be required, Ring Bus A option is preferred as it has better fault performance as shown in Appendix G.

Architecture Review 2012 35
If the zone substation is connected to other zone substations in such a way that through connectivity between the two circuits needs to be maintained with the middle circuit breaker out, then Ring Bus A option can be extended as shown below:
This layout facilitates the addition of further circuits, eg 4 circuits, 2 transformers as shown here:
For all 3 options (Conventional, Ring Bus A, Ring Bus B), the development up to 4 circuits and 2 transformers requires 6 circuit breakers in all options, and the land difference reduces. Hence there is no sufficient reason to choose an alternative bus configuration going beyond 2 circuits. The analysis in appendix E shows that Ring Bus A is the most economic for 3 or 4 circuit substation.

Architecture Review 2012 36
A variation of Ring Bus A with a transverse bus crossing over a bus to give adjacent transformers was considered as shown below.
However this requires more land at each stage of development, and would need both transverse buses to be isolated for safety if work is carried out on either of them.
Therefore Ring Bus A option (transformers opposite) is the preferred option, providing a suitable development path as the number of circuits and transformers increases. This option also has the advantage of greater separation between transformers which reduces the risk from an explosion in one transformer damaging the other transformer. Ring Bus B (transformers adjacent) provides an alternative for an area constrained site that will require no more than 2 circuits, and the ability to feed through to an adjacent substation is not required.

Architecture Review 2012 37
Implications of bus design on the subtransmission system
For High Impact Low Probability (HILP) events, the requirement that two 66kV cable/line faults must not affect any more than one zone substation means that every other substation will require a third circuit.
This ensures neighbouring substations have sufficient capacity to provide support for the effected zone substation.
The network shown to the left shows:
• 2 subs with 3 circuits and • 2 with 2 circuits.
2 cables faults shown result in loss of 2 transformers at 2 different sites and no loss of load. The 3rd cable would have sufficient to keep the load going to both.
2 cables faults shown result in loss of a whole substation. The substations either side still have enough capacity left to meet their own load of 40 MVA plus another 20 MVA each making up for the 40 MVA lost.

Architecture Review 2012 38
Comparison of Ring Bus Verse Conventional
Ring
• Better fault performance eg Only 1 feeder tripped for a Bus fault, 2 CB’s & 2 feeders tripped for a CB fail
• Can provide switching for 2 separate GXP rings
• Bus protection is simple as each section is small (see Appendix E for details)
Conventional (No Bus Coupler)
• Requires extra CB for 2 transformer, 2 circuit configuration
• Easier to extend
• Can be more compact in size
• Whole bus section lost for a CB fault
• Additional CB bays need to be added into the bus protection. More complex than for a ring bus.
9 Modelling tool We have developed a network investment and reliability performance modelling tool which essentially allows a variety of network architectures to be analysed in terms of their construction costs and reliability performance. In this way capital investment and operations costs can be compared to the value that customers put on the reliability benefits.
The model and the data input assumptions (construction costs, fault rates, value of unserved energy, etc.) have been developed internally and have been subject to an internal review involving network development, asset management, operational and commercial staff members. This process has enabled the quality of input data assumptions and also the output calculation accuracy to be thoroughly challenged and checked.
Participants include GM Development, Network Planning Manager, GM Infrastructure, Operations Manager, Engineering Manager and the Commercial Analyst.
The model input values that have been used are shown in Appendix B.

Architecture Review 2012 39
10 Recommendations
It is recommended that future extensions to the Orion subtransmission network be in closed-ring N-1 topologies with plans for sufficient cross-GXP link capacity15 to provide full support in the loss of either urban 66 kV supply.
The recommendation for Dallington and Rawhiti will be written following feedback on this draft of the report.
11 kV tie capacity between adjacent zone substations should allow a substation’s complete load to be carried by two neighbouring substations as a general principle (exact tie support details will depend on the number and location of adjacent substations and specifics of existing 11kV assets).
Ring bus A design be incorporated into Orion design standards for 66 kV switchyard design. This requires land area of ~60 m * ~79 m for a two circuit, two transformer site with a 10 m landscaping/noise buffer. For the development of sites with potential for three to four circuits in the future, the land area required is ~76 m * ~79 m. Deviations from this design may be appropriate where supported by documentation outlining the engineering or economic reasons.
To facilitate further analysis in the future it is recommended that Orion starts capturing data on circuit breaker failures and bus faults.
To improve knowledge of the extent of outages it is recommended that Orion develops functionality in Power On to calculate kWhrs lost during faults. This will enable the cost of outages to our customers to be more accurately modelled than is currently possible using the SAIDI and SAIFI indices.
To formalise a new value for VOLL it is recommended that we continue to work with the Electricity Authority to produce updated VOLL values in the following format.
Outage duration Discount factor (1)
Customer Category 10 min (2) 1 hour 3 hour 8 hours 2 days (3)
Small industrial
Commercial
Agricultural
Residential
1. Assuming that the values in the above table would be VOLL at the worst possible time it would be useful if a typical discount value (%) to take account of season, day of week and time of day
2. In the absence of a 5-10 second value, we would use the 10 minute value to assess the impact of momentary outages caused by auto reclose operations or auto switching schemes which shift load post contingency
3. Supporting discussion about direct and indirect costs and the treatment of asymmetric risk for high impact low probability events is just as important as a VOLL value
15 It is understood that while the complete plan consists of rings with full GXP link capacity, the development stages may involve radial spurs or less than full GXP link capacity while load grows to justify more timely and economic upgrade capacity, as permitted under the Security of Supply Standard and supporting economic analysis.

Architecture Review 2012 40
11 Appendix A Network topologies In the following diagrams, the numbers on the links refer to cable capacity as in Table 1.
1 N radial
no GXP links
restore 66kV in repair time for single fault restore load by switching 11kV for single 66kV fault
Single cable to each substation (one transformer); no breakers at substations.
2 N‐1 radial
no GXP links
no break in 66kV for single fault restore load by switching 11kV (max. 1 sub) for 2 66kV faults
Two cables to each substation (two transformers); no breakers at substations.
Figure A2: N-2 radial without GXP links
Figure A1: N radial without GXP links

Architecture Review 2012 41
3 N‐1 rings
no GXP links
no break in 66kV for single fault restore load by switching 11kV (max. 1 sub) for 2 66kV faults
These designs have two transformers and at least two cables per substation, with a 66kV bus and breakers.
Cable sizes are chosen to ensure that for the loss of any 2 cables all the load may still be supplied (if a zone sub loses 66kV, neighbouring subs carry the load via 11kV ties).
All substations operate in closed rings providing continuous supply in the event of a single 66kV fault.
There is a number of possible ring arrangements of 18 zone substations, such as
• 2 rings of 9 subs • 3 rings of 6 subs • 2 rings of 4 subs + 2 rings of 5 subs • 6 rings of 3 subs • 9 rings of 2 subs
In addition, each arrangement has different permutations – for example, a ring of 6 substations could take the following forms and more:
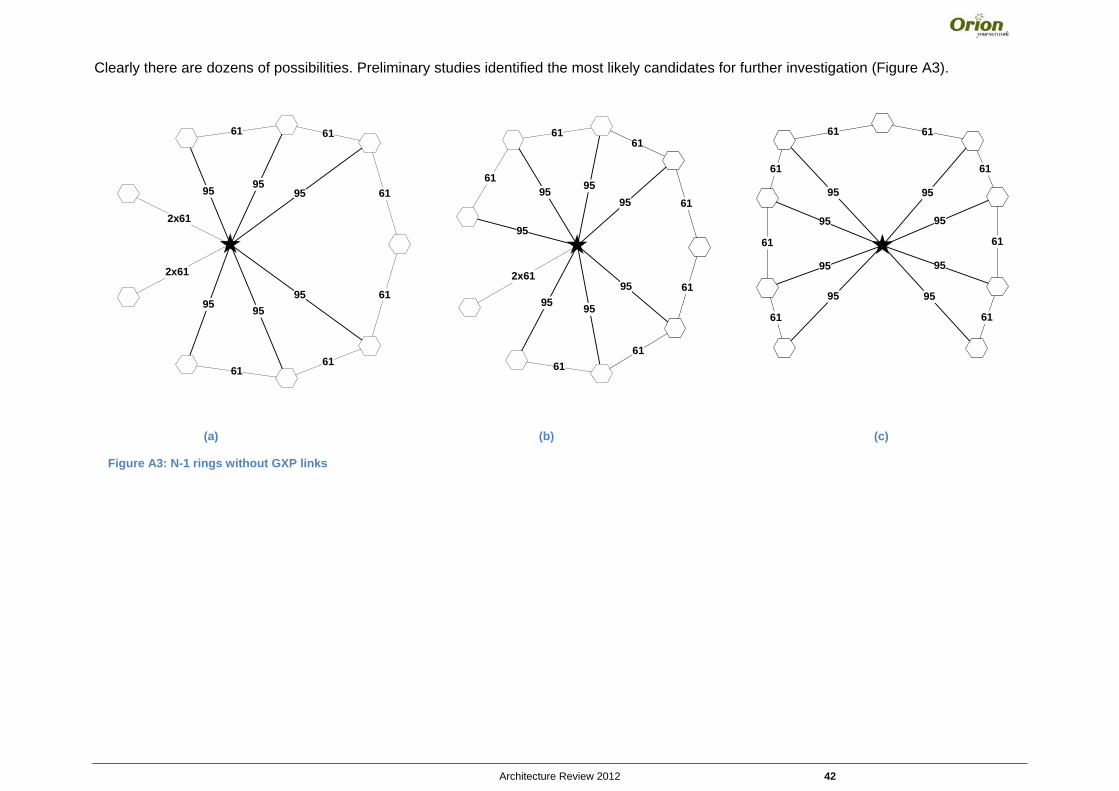
Architecture Review 2012 42
Clearly there are dozens of possibilities. Preliminary studies identified the most likely candidates for further investigation (Figure A3).
(a) (b) (c)
Figure A3: N-1 rings without GXP links
95
95
61
61
61
61
9595
95
61
61
95
2x61
2x61
95
95
61
61
61
61
9595
95
61
61
95
95
61
61
61
95
61
95
61
6161
95
95
95
95
61 61
95
95
2x61

Architecture Review 2012 43
4 N‐1 radial
GXP links restore 66kV in switching time for single fault (possibly fast automated switching)
restore load by switching 11kV (max. 1 sub) for 2 66kV faults
These designs have two transformers and at least two cables per substation, with a 66kV bus and breakers.
Cable sizes are chosen to ensure that for the loss of any 2 cables all the load may still be supplied (if a zone sub loses 66kV, neighbouring subs carry the load via 11kV ties).
Radial networks with GXP links consist of branches of substations connecting the GXPs with an open point. Because of Assumption 6 the designs are “nearly N-2;” rather than strictly radial there are extra links allowing groups of substations to be operated as closed rings. Not all substations are in closed rings, and a cable fault can result in outages which are restored by switching open points. Intelligent protection and control systems could provide for rapid sensing of fault conditions and automated switching (~300ms).
There is a number of possible radial arrangements of 18 zone substations, such as
• 2 branches of 9 subs • 3 branches of 6 subs • 2 branches of 4 subs + 2 branches of 5 subs • 6 branches of 3 subs • 9 branches of 2 subs
Each arrangement has different permutations and preliminary studies identified the most likely candidate for further investigation (Figure A4).
Figure A4: N-1 radial with GXP links

Architecture Review 2012 44
5 N‐1 rings
GXP links no break in 66kV for single fault restore load by switching 11kV (max. 1 sub) for 2 66kV faults
These designs have two transformers and at least two cables per substation, with a 66kV bus and breakers.
Cable sizes are chosen to ensure that for the loss of any 2 cables all the load may still be supplied (if a zone sub loses 66kV, neighbouring subs carry the load via 11kV ties).
All substations operate in closed rings providing continuous supply in the event of a single 66kV fault.
Numerous arrangements are possible. The networks in Figure A5 were chosen for further analysis:
Figure A5: N-1 rings with GXP links
(a)
(b)

Architecture Review 2012 45
61
61
61
61
106
61
61
61
61
95
61
61
61
61
6161
61 61
95 119
61
95 106
119
106
11995119
106 95
61
61
61
61 61
61
95
95
61
61
9595
10695
95
95
61
61
9595
106 9595
95
95
95
95
95
61 61
6161
106
95 95
95
61
61
61
106
95
6 N‐2 rings GXP links no break in 66kV for 1 or 2 faults
These designs have two transformers and at least three cables per substation, with a 66kV bus and breakers.
Cable sizes are chosen to ensure that for the loss of any 3 cables all the load may still be supplied (if a zone sub loses 66kV, neighbouring subs carry the load via 11kV ties).
All substations operate in closed rings providing continuous supply in the event of a single or double 66kV fault. This arrangement provides N-2 security for cable or switchgear faults but N-1 for transformer (or transformer breaker) faults. Given the lower incidence of transformer failures, this is a reasonable option. In the economic analysis, a variant with 3 transformers per substation (full N-2) is included for comparison.
Numerous arrangements are possible. The networks in Figure A6 were chosen for further analysis (the top one relies on the GXP bus being usable in a contingency):
Figure A6: N-2 rings with GXP links
(a)
(b)

Architecture Review 2012 46
12 Appendix B Model Inputs The equipment failure rates in the last column of the following table have been applied to the reliability and economic analysis model.
Asset Reliability Assumptions 2006 Review
EEA Guide Rate
IEEE Standard
493
Orion Risk Management
Plan
Orion 2006 - 2011 Urban Avg
Orion 2006 - 2011 Rural Avg
Proposed2011
Faults per item or km pa
Faults per item or km pa
66kV cable 0.02 0.01 0.02 0.011 0.005 - 0.0133kV cable 0.02 0.011 0.014 0.032 0.0266kV line 0.03 0.03 0.003 0.015 0.0333kV line 0.03 0.04 0.022 0.039 0.0466/11kV Xfmr 0.02 0.02 0.015 0.012 0.011 0.000 0.0233/11kV Xfmr 0.012 0.000 0.030 0.0266kV Bus 0.002 - 0.002 0.00233kV Bus 0.002 0.00266kV CB 0.025 - 0.018 0.002 0.0233kV CB 0.025 0.002 0.0211kV Bus 0.015 0.015 0.0036 0.01511kV CB 0.02 0.015 0.0036 0.002 0.00211kV cable & kiosks 0.035 0.04 0.03 0.024 0.026 0.035 0.03
The 66 kV/33 kV CB proposed faults rate may be high, but we have no evidence to support lowering these. This data is used for assessing the economics of a bus coupler in a conventional switchyard. Using 0.02 indicates the bus coupler is not justified and lower rates would further reduce the economics for a bus coupler. This review recommends a ring bus rather than a conventional bus arrangement so lower fault rates would not change this.
The 2006 – 2011 Orion data points come from a statistically small dataset for all but 11 kV data so provide a limited reality check.
Repair times have been updated and refined to reflect various failure modes as shown in the following table.

Architecture Review 2012 47
Asset
2006 Repair
time hrs
2011 Proposed
Repair time hrs Notes
66kV cable - cable 240 330 XLPE 240, Oil filled 336 (14 days) - delay getting jointer onsite. 66kV cable - protection 6 33kV cable - cable 240 72 33kV cable - protection 6 66kV or 33kV line 12 12 66/11kV or 33/11kV Xfmr - urban
72 72 Urban Xfrm has more complex configuration requiring 4 days for swap, or 2 days for onsite repair
66/11kV or 33/11kV Xfmr - rural 48 Rural Xfrm takes 2 to 3 days for swap, or 2 days for onsite repair 66kV Bus 48 48 eg Transpower dropper fails 33kV Bus 48 48 Indoor could be weeks 66kV CB 48 48 Indoor would be longer 33kV CB 48 48 11kV Bus 96 96 11kV CB 24 24 11kV cable & kiosks 8 10 Ranges from 8 to 12 (faults at night take longer)
Had 1 cable repair truck/crew, looking to get 2nd one Line faults - bring in resources as needed to repair all within 5 days

Architecture Review 2012 48
Capital Costs have been updated with the following:

Architecture Review 2012 49
Alternative Ring Main Unit options are being investigated. It is anticipated that there will be an option at lower cost than the XIRIA, and that MSUs will be phased out.

Architecture Review 2012 50
Operations and maintenance costs have been determined based on a years worth of records. This showed the average cost is $28 for onsite manual switching compared with $4 for remote switching via SCADA.
Regarding remote indication and control:
• SCADA system cost is a separate consideration as SCADA justified for overall business operation
• Indication much more valuable than Control
• Consider use of ‘smart meter’ at kiosk (comms cost to be included in Opex)

Architecture Review 2012 51
13 Appendix C Bus Coupler Analysis
Input Information:
• Probability of a bus fault is 0.002 or once in 500 years. Likely hood is very low.
• Probability of a circuit breaker fault is 0.02 or once in 50 years.
• The more circuit breakers there are on a bus, the higher the probabilities of a CB fault occurring which will affect the bus.
• Adding a bus coupler also adds another CB increasing the probability of failure.
• Assumes the cost of a bus-coupler is $360,000
• If a conventional bus failed without a bus-coupler (including CB failure), either of the two ABI’s in the middle of the bus could be switched for half the site to be restored.
• The existing and proposed design of the 66kV subtransmission network means that the loss of two 66kV circuits for a bus fault will not effect the 66kV supply to surrounding substations. For sites with three or more 66kV circuits the economics of a bus coupler on a conventional bus need to be checked on a case by case basis.
Summary:
• The gray column in the table above shows that for a CB probability of 0.02 it is not economic for a substation with 4 circuit breakers (2 circuits, 2 transformers) or 5 circuit breakers (3 circuits, 2 transformers) to have a bus-coupler installed.
• The economics are close to even with 6 circuit breakers (4 circuits, 2 transformers). However sensitivity analysis shows that is highly dependent on the CB failure probability. It becomes uneconomic if the fault rate moves from 0.02 to 0.018 (once in 50 years moves to once in 55 years).

Architecture Review 2012 52
14 Appendix D Switchyard development options
Conventional Bus

Architecture Review 2012 53

Architecture Review 2012 54
Ring Bus A (Transformers Opposite)

Architecture Review 2012 55
Ring Bus A (continued)

Architecture Review 2012 56
Ring Bus B (Transformers Adjacent)

Architecture Review 2012 57
Ring Bus B (continued)

Architecture Review 2012 58
Ring Bus A (Transverse Bus)
Transverse bus option requires greater land area and requires extra isolation for work on transverse bus so not considered further.
Summary Comparison
Stage Conventional Ring Bus A Ring Bus B
2 transformers,
2 circuits
4 Circuit Breakers
3700 m2 Land
3 Circuit Breakers
4700 m2 Land
3 Circuit Breakers
4300 m2 Land
2 transformers,
4 circuits
6 Circuit Breakers
5350 m2 Land
6 Circuit Breakers
6000 m2 Land
6 Circuit Breakers
6000 m2 Land

Architecture Review 2012 59
15 Appendix E Economic Analysis of bus configurations

Architecture Review 2012 60
16 Appendix F Bus Protection Busbar Protection – Ring Bus
One of the advantages of a ring bus design is that for each feeder, 2 CT’s are used and these overlap the adjacent feeder. The dead-tank circuit breakers provide CT’s on both sides so that the furthest side from the feeder can be used for 2 adjacent feeders creating the overlap. Typically Orion use line differential protection on sub-transmission circuits so that each section of the ring bus is protected by overlapping differential zones using multiple relays i.e. 1 zone per feeder. Differential or distance protection would operate quickly to clear faults in zone.
If the primary protection on a circuit fails, backup over-current protection would operate via the protection at the far end and then the 2 adjacent relays. For bigger schemes backup protection can be provided via duplicate relays.

Architecture Review 2012 61
Busbar Protection – Conventional Bus
Two diagrams are shown below. One with a bus coupler and one without.
Historically bus protection was achieved using High Impedance Differential relays. The CT’s from each phase are connected together in parallel. Resistors and MOV’s are used to provide security against mal-operation from CT saturation. All CT’s are required to be the same type and ratio. Bigger schemes typically have 1 relay for each bus and an additional relay covering all busses as an overall bus check. Both the local and overall bus relay must operate together for the circuit breakers to trip. To take a circuit out of service for testing, the CT’s for the circuit must be shorted out.
With the advent of modern multifunction relays the typical approach is to use a differential bus relay. The main difference is each individual CT is wired to the relay. Relays of this type generally allow for up to 18 CT’s or 6 circuits. Multiple relays can be ganged together for larger schemes. The big advantage with this scheme over the high impedance is that every set of CT’s can be different, the stability is better and they are easier to alter at a later date. The bus relay can also provide backup over-current protection for the each circuit. A circuit can be taken out of service for testing internally using the logic settings of the relay. Orion uses this type of protection for its 11 kV zone substations.
Both conventional bus schemes would be more expensive than a ring bus. However if backup protection was required then they might be closer in cost.
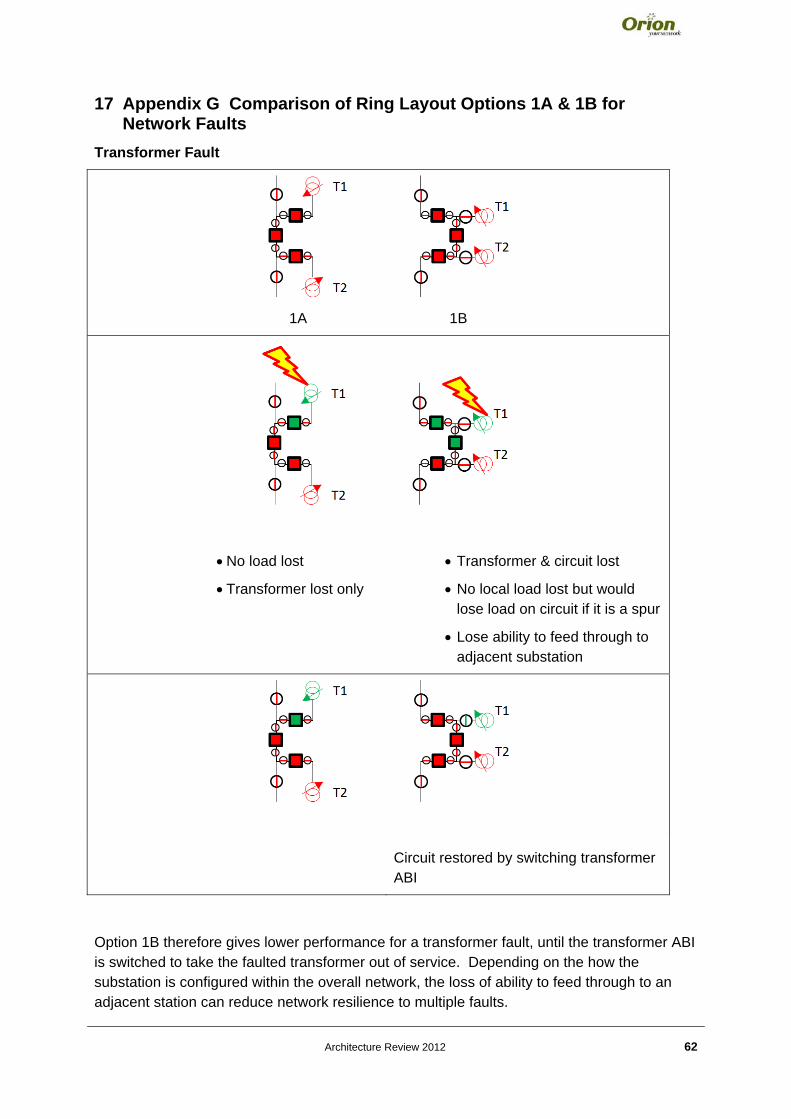
Architecture Review 2012 62
17 Appendix G Comparison of Ring Layout Options 1A & 1B for Network Faults
Transformer Fault
1A 1B
• No load lost
• Transformer lost only
• Transformer & circuit lost
• No local load lost but would lose load on circuit if it is a spur
• Lose ability to feed through to adjacent substation
Circuit restored by switching transformer ABI
Option 1B therefore gives lower performance for a transformer fault, until the transformer ABI is switched to take the faulted transformer out of service. Depending on the how the substation is configured within the overall network, the loss of ability to feed through to an adjacent station can reduce network resilience to multiple faults.

Architecture Review 2012 63
Circuit Fault
1A 1B
• Transformer & circuit lost
• No load lost
• Circuit lost
• No load lost
• 2nd Transformer restored with switching of ABI
Both Ring Bus 1A and 1B options give effectively the same performance for a circuit fault.

Architecture Review 2012 64
Circuit Breaker fault
1A 1B
• No load lost
• Through capability lost
• ALL local load lost
• Through capability retained
• Through capability restored with switching of ABIs
• Load restored with switching of ABIs
The impact of losing through capability depends on interconnections with neighbouring substations. Ring Bus 1B option is considered to have weaker fault performance as it is vulnerable to losing all local load for a circuit breaker fault (regardless of interconnections with neighbouring substations).

Appendix 7 11kV urban network architecture review

Page 1 of 20
Urban 11 kV Network Architecture Review
... Draft: 28 September 2012 NW 70.60.06
Page 2 of 20
Table of Contents Executive Summary ........................................................................................................... 3 Process ............................................................................................................................... 4 Key Findings for Greenfields .......................................................................................... 10 Recommendations ........................................................................................................... 11 Appendix A Model & Inputs ........................................................................................... 12 Appendix B Ring Main Unit Paper for 11kV Architecture review ............................... 17
1.1 Background .................................................................................................................... 18
1.2 Arc Flash ........................................................................................................................ 18
1.3 Use of the Magnefix Switching Units in our 11kV architecture ...................................... 19
1.4 Conclusion ...................................................................................................................... 20

Page 3 of 20
Executive Summary
In view of the unprecedented investment by Orion in new and replacement assets over the next 50 years, due to:
• earthquake damaged assets • changes in load due to post-earthquake reconstruction and relocation • projected load growth in the western urban regions, independent of earthquake
effects
it is appropriate to review the network design principles. The subtransmission topologies have been examined and this report is the next step in that process and covers 11 kV configurations. To conclude this process it is proposed that the 400 V system will be assessed and then the subtransmission and 11 kV reports will be reviewed in light of this.
It is recommended that the current radial architecture continues to be used as the design for urban feeders. Twelve of these feeders deliver electricity from a 40 MW zone substation to serve ~12,000 customers. The recommended cable design gives capacity to transfer load between zone substations should one zone substation be out of service ie supports N-2 at subtransmission level.
The use of intermediate circuit breakers, Remote Indication from kiosks, and kiosks with Remote Control & Indication was considered. The latter two give better options for future development as technology is developed which facilitates improved customer service. A decision to change to a new type of 11 kV RMU switchgear now requires a trial to confirm the as built costs for kiosks. This will enable refinement of the analysis to give the best permutation of Remote Indication and Control functionality.
Current information shows the best configuration is:
The kiosks shown with Remote Control also have Remote Indication. The addition of Remote Indication only to a number of the other kiosks will be reviewed as part of the 400V architecture review to be carried out next.

Page 4 of 20
Process The Orion 2007 Security Standard review recommended the introduction of a radial 11 kV architecture design with N-2 subtransmission capability. That is, the 11 kV feeder cables shall be configured and have capacity to provide restoration of power for a complete failure (N-2) of a zone substation. The current review builds on that piece of work to include consideration of 11 kV losses, capacitance, safety, latest pricing and reliability data, and considers the use of remote control and/or monitoring. The 2007 architecture review included an economic assessment of many different 11kV networks. It was not considered necessary to revisit the economics of all the 2007 architecture options. A review of the 2007 work concluded that an update of the economic analysis for the following 4 layouts would provide sufficient results for us to conclude whether our current practice is still appropriate and what refinements would deliver additional benefit. Each option assumes the use of a 40 MW zone substation with each kiosk placed at 300m intervals unless otherwise stated.
• Option 1: 12 feeders N-2 Inter zone substation capacity (current Orion practice for new build).
• Option 2: 12 feeders N-2 inter zone substation capacity with 3 intermediate circuit breakers (minimising outage costs by reducing number of customers losing supply for a fault on the feeder).

Page 5 of 20
• Option 3: A primary ring architecture with 8 Network Substations (NWS) and 18 secondary feeders. This design does not provide N-2 inter zone substation capacity but is similar to the 11kV network architecture used by Orion prior to the 2007 architecture review.
• Option 4: 12 feeders N-1 inter zone substation capacity (to assess the difference
between N-2 and N-1)
The analysis showed the following results (Appendix A gives the inputs for this assessment):
Annual cost ($m)/zone substation .
See definitions in following paragraph

Page 6 of 20
The annual 11kV network cost is the total cost of providing the 11kV network including the required return on capital, administration, maintenance and operations over the expected life of the assets. The annual cost of outages represents the estimated economic cost of outages to our customers. This cost is calculated by adding the Value Of Interruption (VOI- $/kW interrupted) and the Value Of Lost Load (VOLL - $/kWh interrupted). The load and duration used to determine VOI and VOLL was calculated by considering the probability and impact of each 11 kV cable and feeder CB fault on each kiosk on the feeder. The loss cost is dependent on the length and size of cable and the amount of load distributed on each cable section. Energy losses are calculated by multiplying peak losses by a load loss factor and a $/kWh value. The reduction of losses at peak also has a value to the transmission and generation sector of the electricity industry. We assume that peak load loss reduction has a per annum value of $91/kW transmission1 and $125/kW generation2. The Var cost is calculated by multiplying the peak MVar consumption by a $/MVar value3. This approach is in line with proposed changes to the Transpower Transmission Pricing Methodology (TPM) which is to include a $/MVar charge at regional transmission peak. Option 3 - the Network Substation/primary ring design - has a significantly higher capital cost due to the extra cost of cable and CBs (ie much longer green bar) and the benefits of this design for decreasing outage costs are an order of magnitude smaller (the reduction in height of the orange bar). This layout has the benefit of reducing the operations costs of planned outages, but this would need to exceed $1M/zone substation per year before it would be a competitive option – this is clearly not the case. The graph shows that all three radial options (1, 2 and 4) are relatively similar in overall cost. Although option 4 has a slightly lower total cost than option 1, it is fundamentally a weaker network design and does not provide:
• the strong 11kV network connections between zone substations of option 1&2 to provide for planned and unplanned 11kV ripple plant shutdowns.
• the same level of resiliency for zone substation shutdowns – the economic cost of N-2 zone substation shutdowns is included in the analysis for each architecture but the benefit of the inherent extra capacity in the option 1&2 design is not captured for other rare but severe events that involve more than just one zone substation failure.
• the same level of spare capacity as option 1&2 to shift open points for unexpected load growth or defer new subtransmission investment in the short term
For the above reasons, option 3 & 4 were discarded from further analysis. Further analysis is focussed on refining options 1&2. Comparing the first two options shows that introducing three intermediate circuit breakers gives a reduction in the outage cost. However it is very difficult to implement in practise. Subdivision enquiries from developers tend to be staged with changes in roading design occurring and poor coordination with other developers/developments in the area. These
1 Transpower interconnection charge 2 \\Verdi\Groups$\Network Development\Network planning\Demand Side Management\Presentations and Reports\111010 Demand Side Management Stage 2.pdf 3 \\Verdi\Groups$\Network Development\Network planning\Demand Side Management\Presentations and Reports\110824 Demand Side Management review Stage 1.pdf

Page 7 of 20
practical issues make the placement of the three limbs and associated circuit breakers difficult on a regular basis. The reduction in outage costs by using intermediate breakers to reduce the number of customers losing power for an 11 kV fault is desirable. Therefore a 5th configuration was considered with just one intermediate breaker as shown in the diagram below.
This gave an increase in total annual cost (2%, $87k/yr/zone substation), but with the benefit of improved SAIDI (12 minutes → 9 minutes) and SAIFI values (0.19 → 0.14) for the 11 kV components. As with all intermediate circuit breaker options, this configuration introduces a potential issue with ensuring reliable discrimination (with fast clearance times for safety and power quality) between the zone substation feeder breaker and the intermediate breaker. This may be addressed by adding communications (eg pilot cable) to enable blocking of feeder breaker protection when the intermediate breaker intends to clear the fault. To further reduce the outage cost, remote indication was added to the original option 1 (Inter zone capacity No intermediate breaker configuration):
This enables quicker fault location and eliminates unnecessary temporary switching (which is used to get lots of customers back on sooner whilst fault locating continues). The cost is slightly higher (0.2%, $9k/yr/zone substation), but with significantly less outage time for the last customer to be restored (~100 mins → ~60 mins). The option analysed in detail used remote indication at every 2nd kiosk which enables an Operator to be sent directly to a kiosk that is at one end of the faulted cable. The number of indicating kiosks could be reduced from the option shown here to reduce capital cost, however this would be small (~$130/kiosk/yr), and the outage cost would increase. Having remote indicators at every 2nd site has the advantage of minimising the outage cost regardless of multiple faults ie most resilient option. Trying to reduce the number of remote indicating sites leaves the feeder vulnerable to a sub optimum configuration of indicating sites when a fault has led to it being supplied from a neighbouring feeder. Remote indication also provides other benefits - power quality monitoring, metering information including maximum demand and time of use and real time monitoring such as

Page 8 of 20
kiosk door security switches. These other benefits are to be quantified as part of a review of our low voltage network architecture. Another way to reduce outage times is to have Remote Control & Indication to save travelling time (the single largest delay in power restoration switching). The lowest cost addition of remote control is two kiosks as shown in the following diagram. This enables half the kiosks to be restored remotely giving a significant decrease in Customer Average Interruption Duration Index (CAIDI) minutes from over 63 to under 33. At this point, a report was received recommending that new 11 kV switchgear should not be based on the Magnefix MSU (Appendix B). Alternatives are significantly more expensive, so the analysis was extended to show the implications for all the options considered for this review. The results are shown below, with light green for the options using Magnefix MSU, and dark green for the same options but with a new type of replacement RMU.
Annual Cost/Zone Substation

Page 9 of 20
A workshop of Orion staff took the recommendation to cease using MSUs and agreed to focus on permutations using a new RMU, with an intermediate circuit breaker, and a number of kiosks having remote control & indication. The results of this are shown in the next picture.
In August the Corporate Group accepted the proposed change from Magnefix MSU → RMU 11kV switchgear. Over the next 50 years this will lead to increased charges of $13 to 19M/yr. Engineering staff will now proceed to trial new RMUs over the following year which will confirm the cost input for 11 kV switchgear in the model. Analysis can then also be done on the option of using Remote Controlled Circuit Breakers instead of Remote Controlled Switches. All this will enable refinement of the Total cost, which together with a subjective HILP benefit consideration will determine the appropriate 11 kV architecture. The chart above indicates the preferred option is likely to include one intermediate circuit breaker as this reduces SAIFI. Note this option alone has a small disadvantage for customers past this breaker as the Controller is not aware of any outage until someone calls in (ie no remote indication of an outage). Adding Remote Control and Indication to at least 2 kiosks/feeder removes this disadvantage and reduces SAIDI. Both these gains come for a Total Cost of around $40k/zone substation/year (<1%). An intermediate circuit breaker increases resilience by reducing the number of customers affected by some faults. This is particularly valuable as the probability of a damaging Canterbury based fault is now higher than the probability of an Alpine based fault (27% probability of a Canterbury quake over the next 20 years exceeding magnitude 6.5, this is equivalent to the energy release of 1 mega tonne of TNT).4
4 Supplied by GNS through CERA Utility Transport and Network Providers Forum on 13 February 2012: Probability (Canterbury wide) of 6 – 6.4 quake: 13% (1 year), 34% (5 yr), 64% (20 yr); 6.5 -6.9 quake: 4% (1 yr), 11% (5 yr), 27% (20 yr)

Page 10 of 20
Consideration of having Remote Indication at every 2nd kiosk (or more) is to be revisited when the 400 V review is carried out (currently planned for 2013). Note when it comes to confirming the design for a specific feeder it may be worth slightly refining the placement of remote control depending on the location of major customer load ie remote control is at load centroid rather than kiosk centroid eg if major customer is at kiosk 5 then add remote control at kiosk 4 towards 7 & 6 towards 19 so Controller can isolate cable faults on 7,8,9 and turn 5 (& 6) back on remotely. The remote indication and control enhancements give flexibility to build on as more product/service options develop in the power supply arena. They give the possibility of interfacing with sophisticated controllers, Home Area Networks or smart phones, which the sectionaliser option does not have. Full Remote Control and Indication reduces the number of Operators required. If all urban 11kV switchgear was remote switchable (except for site earthing, etc), this could save $625k/year (based on 5 Operators at $125k/yr). The ~$30k/zone substation saving has been taken off the total for the last option shown in the previous chart.
Key Findings for Greenfields
1) Optimum feeder layout & cable sizing is the same as current radial practice:
2) N-2 subtransmission capacity is appropriate when considering HILP events
3) Adding Remote Indication is low cost and significantly reduces the time for the last customer to be restored (from ~100 mins down to ~60 mins)
4) Adding Remote Control gives the lowest SAIDI (6.1 mins), and significantly reduces CAIDI (~60 mins to ~30 mins).
5) Adding an Intermediate Circuit Breaker is the only way to reduce SAIFI, lowering 0.19 down to 0.14
6) Details of best use of partial Remote Control & Indication along feeder to be confirmed once as built costs of new RMU switchgear to replace Magnefix MSU are established (expected in 2013)
7) Long term Capital cost increase of ~ 25% due to ceasing use of MSU, with Remote Control & Indication options adding another 2% to 3%
8) The four lowest Total cost options are similar (< 2% variance)

Page 11 of 20
Recommendations
1) For 40 MW zone substation development, continue using 12 feeder N-2 Inter zone capacity feeder configurations:
2) Trial new 11 kV RMU switchgear in 2013 to confirm as built costs
3) Use these costs to analyze permutations with an intermediate circuit breaker and
Remote Control switches/circuit breakers at some kiosks eg at kiosks 4, 12 and 13:
4) Review Remote Indication options as part of LV review
5) Let greenfields conclusions guide brownfields approach but assess economics for conversion on an area by area basis.

Page 12 of 20
Appendix A Model & Inputs
Modelling Tool
We have developed a network investment and reliability performance modelling tool which essentially allows a variety of network architectures to be analysed in terms of their construction costs and reliability performance. In this way capital investment and operations costs can be compared to the value that customers put on the reliability benefits.
The model and the data input assumptions (construction costs, fault rates, value of unserved energy, etc.) have been developed internally and have been subject to an internal review involving network development, asset management, operational and commercial staff members. This process has enabled the quality of input data assumptions and also the output calculation accuracy to be thoroughly challenged and checked.
Participants include GM Development, Strategic Planning Manager, GM Infrastructure, Operations Manager, Engineering Manager, Infrastructure Lifecycle Manager, Engineering Support Manager, Technical Support Manager and the Commercial Analyst.

Page 13 of 20
Inputs
Ref: \\Verdi\Groups$\Network Development\Network planning\Architecture review 2011\11kV\120926 Economics and Reliability Model.xlsx

Page 14 of 20
11 kV Inputs including Switchgear WITHOUT Remote Control or Indication

Page 15 of 20
11 kV Switchgear WITH Remote Control ($4/switching Operations cost):

Page 16 of 20
11 kV Switchgear READY for Remote Control and Indication to be fitted AND Remote Indication OPTION:
Reference: \\Verdi\Groups$\Network Development\Network planning\Architecture review 2011\11kV\120926 Economics and Reliability Model.xlsx, Sheet:11 kV Costs July 2012”

Appendix B Ring Main Unit Paper for 11kV Architecture review
Author: Steve Macdonald
Date: 18 July 2012
Version: Draft
Approved:
Date:

Architecture Review 2012 18
Table of Contents 8.1 Background .............................................................................................................. 18 8.2 Arc Flash ................................................................................................................... 18 8.3 Use of the Magnefix Switching Units in our 11kV architecture............................ 19 8.4 Conclusion ................................................................................................................ 20
1.1 Background
Within the Orion network and other networks throughout New Zealand, distribution companies use a ring main unit (RMU) to distribute the HV network around the area. The supplier and types of these vary greatly between companies.
Our current ring main unit, the Magnefix Switching Unit (MSU) has been in manufacture for over 40 years. There has been no significant development of the product recently that would align to safety requirements (arc containment) of IEC standard 62271 Part 200. We consider the product to be a “twilight” product in that while its performance does not warrant removal from our network; it is not suitable for new installations to be introduced into the network. New products are now becoming available to the market that deliver a much improved safety and operational outcome. We are actively looking for suitable switchgear that will meet our safety, environment, technical and network operational requirements.
1.2 Arc Flash
The EEA Guide for Arc Flash Hazards says that “If the potential employee exposure to an incident energy of greater than 1.2 cal/cm2 exists the asset owner shall take all practicable steps to
• Eliminate the exposure, i.e. reduce it to no more than 1.2cal/cm2, or • If elimination is not practicable, isolate the exposure from employees, or
If elimination or isolation is not practicable, minimise the exposure and provide protective equipment to employees
The Electricity Safety Regulations require “... the effect of the safety management system is that all practicable steps are taken to prevent the works from presenting a significant risk of—
• (i) serious harm to any member of the public; or • (ii) significant damage to property owned by a person other than the
safety management system operator
The EEA “Guide for the Management of Arc Flash Hazards (Oct 11)” states that:
“An arc flash protection boundary shall also be established for work in public areas, and all persons not wearing appropriate PPE shall remain beyond the boundary. Note: Arc flash protection boundaries cannot be used where the public has uncontrolled access to the vicinity of the equipment, e.g. on roadsides and other public areas, except when a workparty is at the site. For protection of the public when work is not taking place, controls need to be inherently safe, e.g. barriers, safety by design etc.”
The IEEE standard 1584 has rapidly become the definitive authority for the analysing of arc flash and it is now widely adopted.

Architecture Review 2012 19
This standard has been used to develop strategies that have the goal of minimising burn injuries.
The Orion PPE standard NW21.07.03 was developed using the calculation method of the model formed from IEEE 1584.
The model not only determines the required level of PPE gear to sustain a flash without suffering burns, but also determines the Arc Flash Boundary were everyone inside that boundary must be dressed in the specified protective equipment or specifically excluded from the area.
If we use the IEEE 1584 model with a 14 Ka fault level, then a clearance delay of 100 milliseconds results in requiring PPE equipment that can withstand 2.69 cal/cm2. Our PPE standard is set to 16.0 cal/cm2 and the Arc Flash boundary required is 1.32 metres. An operator should be able to ensure no one else is inside this boundary, particularly members of the public.
If we model the slower clearance time of 510 milliseconds, as is required with one of the network architecture options involving intermediate switchgear, the PPE gear must withstand 13.7 cal/cm2. This is close to the maximum rating of NW21.07.03 and the ARC Flash boundary has increased to 7.13 metres, meaning we would need to close the footpath and or road?
The requirement to prevent access to the public inside the Arc Flash area is present even when workers are not on site so barriers are required to exclude access.
Orion’s ongoing strategy around managing arc flash is:
• By using the safety by design criteria, ensure new switchgear installations being installed contain arc containment appropriate for the environment, i.e. IEC standard 62271 Part 200. We are currently investigating suitable equipment for installation in the network.
• Ensure existing installations with arc flash risk are appropriately risk managed by minimising exposure levels, use of procedures and PPE
1.3 Use of the Magnefix Switching Units in our 11kV architecture
The greatest risk for Orion around the continuation of the installation of MSUs in both new and existing substations is the level of safety from Arc Flash Prevention that it affords.
As the MSU switchgear is a cast resin switching unit, it does not provide for Arc Flash protection to either the worker, adjacent property or the public.
Although it has proven to be a reliable product in the past, the changing nature of the network means the Magnefix is being subjected to different operating criteria, including switching of higher currents than in the past. So is it a operator safety switching issue - not a public issue.
Discussions with two other NZ companies who had a large number of MSU’s has shown that due to safety concerns, they are no longer installing MSUs into their network. There are no proposals from the manufacturer to install Magnefix in an arc contained environment. Therefore to remove or limit future exposure we must look to install new switchgear to standard 62271 Part 200. This is in line with current international practise.

Architecture Review 2012 20
The move from our traditional primary based 11kV network to some of the radial network options being considered has brought a concern that protection clearance times are becoming longer and poses a greater safety risk to the public and workers. However, these radial network options are not proposed feasible/acceptable without additional communication signalling to achieve fast clearance times and therefore this is not a justified concern.
When switching at kiosks that have MSU’s fitted protective clothing conforming to NW21.07.03 is required to be worn which only addresses the risk to the worker and not the public.
Management of risk associated with existing installations will need to be addressed. This will include, monitoring of incidents, reviews of levels of site risk exposure levels, possible targeted risk mitigation procedures, and ensuring appropriate maintenance and operating programmes and procedures are in place
1.4 Conclusion
Orion’s network requirements in the future will require new purchases of ring main units that meet IEC 62271 Part 200. This will mean that new Magnefix switchgear will not be purchased when a suitable alternative that meets the safety, quality and operational objectives of the business is available.
We propose to risk manage existing live front MSU’s to ensure safety to workers and public safety.
Any future planning and budget modelling should allow for a change in switchgear type and costings. Our review of the current suitable switchgear available on the market means that we will change our RMU purchasing during 2013.

Appendix 8 Wire Scan’s Cable Testing Report

Orion Christchurch Via Siemens New Zealand Att: Darran Mumford Your reference: Our reference: rev1 Sarpsborg 06.04.2011 Summary measurements in Christchurch March 2011 Measurements preformed 24 and 25 March 2011. The uncertainty in the measurements is ±20 meter from the given length unless otherwise stated. Armagh – Lancaster 2363m XLPE (186‐146), measured from Armagh Very strong indications of impedance changes at 4 locations that were not in area of joints: 568 (±3m), 1150 (±3m), 1750 (±15m) and 2060 meter Armagh – Addington no 2 4416 m oil (ADD126‐ARM136), measured from Armagh Strong indications of impedance changes at 5 locations not in area of joints: 350, 1355, 2085, 2764 and 3460 meter. Armagh – Addington no 1 4282 m oil (ADD66B‐ARM116), measured from Armagh to joint at 1461 Indications of impedance changes at 1 locations: 350 meter Knox – Addington (Addington unit 11 – Knox unit 17) 3177 m oil measured from Knox Only indications of impedance chances in the regions of known joints. Addington – Milton 66 kV 3990 m oil measured from Addington Only indications of impedance chances in the regions of known joints. In area around 3100 meter there is indications in one of the phases (blue). Addington ‐ Oxford Tuam No 2 measured from Addington Only indications of impedance chances in the regions of known joints. Papanui – McFadden 66kV Oil measured from Papanui Only indications of impedance chances in the regions of known joints. The impedance change in the joint at 2651 meter is however significant larger than in the other observed joints. Papanui – McFadden 66kV Oil measured from Papanui Only indications of impedance chances in the regions of known joints. There is however a significant impedance change in the area of 250 meter. This is probably caused by several joints close together in this area. Sincerely yours / Best regards Jon Ivar Juvik Senior Engineer Wirescan AS Mobile: +47 48 13 86 01 E‐mail: [email protected]
Wirescan AS Sundløkkaveien 75
1659 Torp
Norway
E‐mail: [email protected]
Web: www.wirescan.no
Org No : 988777102 MVA

Appendix 9 Detailed data tables for proposed quality standards

Appendix 9 Supporting SAIDI and SAIFI Data
SAIDI YTDPost EQ
Part Year
2012 Calendar
YTD
05 - 09 Average
08 - 12 Average
Post Quake
AverageRural 2005 2006 2007 2008 2009 2008 2009 2010 2011 2012 2013 2011 Jan-12 2014 2015 2016 2017 2018 2019
11kV Aug-123rd Party Damage 1.130 2.277 2.044 1.125 0.857 1.125 0.857 1.855 1.770 1.477 1.345 1.238 2.247 1.487 1.417 2.030 1.417 1.417 1.417 1.417 1.417 1.417External Factors 12.051 14.726 21.997 10.863 13.012 10.863 13.012 8.822 15.987 22.898 16.096 12.980 24.087 14.530 14.316 25.987 14.316 14.316 14.316 14.316 14.316 14.316System Failure 6.133 9.570 6.893 5.811 9.596 5.827 9.596 9.062 10.947 11.624 5.704 7.406 10.084 7.601 9.411 12.367 12.367 11.414 10.461 9.507 8.554 7.601Planned Outage 6.691 4.669 6.025 8.719 17.916 8.728 17.916 19.464 4.974 7.772 2.020 2.609 6.660 8.804 11.771 6.201 11.771 11.771 11.771 11.771 11.771 11.771Sub Total 26.006 31.242 36.959 26.518 41.381 26.543 41.381 39.202 33.678 43.772 25.165 24.233 43.078 32.421 36.915 46.585 39.871 38.918 37.965 37.011 36.058 35.105
33kV3rd Party Damage 0.000 0.000 0.111 0.000 0.167 0.000 0.167 0.000 0.000 0.000 0.000 0.000 0.000 0.056 0.033 0.000 0.033 0.033 0.033 0.033 0.033 0.033External Factors 3.839 2.737 1.105 3.007 1.851 3.007 1.851 1.453 8.043 1.540 0.120 5.524 1.264 2.508 3.179 3.592 3.179 3.179 3.179 3.179 3.179 3.179System Failure 0.237 1.611 0.888 3.684 3.342 3.684 3.342 2.205 1.155 0.250 0.739 1.155 1.005 1.953 2.127 1.072 2.127 2.127 2.127 2.127 2.127 2.127Planned Outage 0.000 0.000 0.000 0.000 0.000 0.000 0.000 0.000 0.000 0.000 0.000 0.000 0.000 0.000 0.000 0.000 0.000 0.000 0.000 0.000 0.000 0.000Sub Total 4.076 4.348 2.105 6.691 5.361 6.691 5.361 3.657 9.198 1.790 0.859 6.679 2.270 4.516 5.340 4.664 5.340 5.340 5.340 5.340 5.340 5.340
66kV3rd Party Damage 0.000 0.000 0.000 0.000 0.000 0.000 0.000 0.000 0.000 0.000 0.000 0.000 1.430 0.000 0.000 0.000 0.000 0.000 0.000 0.000 0.000 0.000External Factors 0.000 0.766 0.054 0.000 0.106 0.000 0.106 0.000 0.243 0.067 0.000 0.243 0.000 0.185 0.083 0.155 0.083 0.083 0.083 0.083 0.083 0.083System Failure 0.108 0.000 0.000 0.000 0.021 0.000 0.021 0.000 0.086 0.000 0.041 0.000 0.041 0.026 0.021 0.020 0.021 0.021 0.021 0.021 0.021 0.021Planned Outage 0.000 0.000 0.000 0.000 0.000 0.000 0.000 0.000 0.000 0.000 0.000 0.000 0.000 0.000 0.000 0.000 0.000 0.000 0.000 0.000 0.000 0.000Sub Total 0.108 0.766 0.054 0.000 0.127 0.000 0.127 0.000 0.329 0.067 0.041 0.243 1.471 0.211 0.105 0.175 0.105 0.105 0.105 0.105 0.105 0.105
Rural Total 30.190 36.357 39.118 33.210 46.869 33.235 46.869 42.860 43.205 45.629 26.065 31.155 46.819 37.149 42.359 51.425 45.316 44.362 43.409 42.456 41.502 40.549
SAIDI YTDPost EQ
Part Year
2012 Calendar
YTD
05 - 09 Average
08 - 12 Average
Post Quake
AverageUrban 2005 2006 2007 2008 2009 2008 2009 2010 2011 2012 2013 2011 Jan-12 2014 2015 2016 2017 2018 2019
11kV Nov-123rd Party Damage 1.047 0.895 2.251 0.930 2.003 0.930 2.003 1.274 0.747 1.602 1.081 0.147 1.729 1.425 1.311 1.415 1.889 1.889 1.889 1.889 1.889 1.889External Factors 5.941 4.706 4.672 3.857 4.171 3.857 4.171 5.292 7.056 13.105 4.669 5.536 10.315 4.670 6.696 11.655 6.696 6.696 6.696 6.696 6.696 6.696System Failure 12.806 7.792 4.542 5.057 5.398 5.057 5.398 6.241 12.324 26.468 4.770 8.494 12.860 7.119 11.097 19.866 19.866 17.316 14.767 12.218 9.668 7.119Planned Outage 0.989 1.312 2.755 1.459 3.271 1.459 3.271 1.253 1.170 2.154 0.221 0.840 1.247 1.957 1.861 1.607 3.723 3.723 3.723 3.723 3.723 3.723Sub Total 20.783 14.706 14.220 11.303 14.843 11.303 14.843 14.059 21.298 43.328 10.740 15.017 26.151 15.171 20.966 34.543 32.173 29.624 27.075 24.525 21.976 19.427
33kV3rd Party Damage 0.000 0.000 0.000 0.000 0.000 0.000 0.000 0.000 0.000 0.000 0.000 0.000 0.000 0.000 0.000 0.000 0.000 0.000 0.000 0.000 0.000 0.000External Factors 0.000 0.000 0.008 0.000 0.000 0.000 0.000 0.000 0.000 0.000 0.135 0.000 0.135 0.002 0.000 0.067 0.000 0.000 0.000 0.000 0.000 0.000System Failure 0.109 0.577 1.430 0.005 0.016 0.005 0.016 0.000 0.001 0.000 0.000 0.001 0.000 0.428 0.004 0.000 0.004 0.004 0.004 0.004 0.004 0.004Planned Outage 0.000 0.000 0.000 0.000 0.000 0.000 0.000 0.000 0.000 0.000 0.000 0.000 0.000 0.000 0.000 0.000 0.000 0.000 0.000 0.000 0.000 0.000Sub Total 0.109 0.577 1.438 0.005 0.016 0.005 0.016 0.000 0.001 0.000 0.135 0.001 0.135 0.429 0.004 0.068 0.004 0.004 0.004 0.004 0.004 0.004
66kVBaseline 66kV Urban 0.569 0.451 0.000 0.303 0.000 0.303 0.000 4.225 0.000 7.070 0.000 0.000 6.794 0.265 2.320 3.535 0.265 0.265 0.265 0.265 0.265 0.265Not Subject to 66kV Urban Upgrades 8.883 8.992 4.383 4.370 0.000 0.000Subject to 66kV Urban Upgrades 8.883 8.992 8.765 8.741 8.738 4.084Sub Total 0.569 0.451 0.000 0.303 0.000 0.303 0.000 4.225 0.000 7.070 0.000 0.000 6.794 0.265 2.320 3.535 18.032 18.249 13.413 13.376 9.002 4.349
Urban Total 21.461 15.735 15.657 11.612 14.859 11.612 14.859 18.283 21.299 50.398 10.874 15.018 33.080 15.865 23.290 38.145 50.210 47.877 40.492 37.905 30.983 23.780
Reference Dataset 1 Reference Dataset 2 µSAIDI
Reference Dataset 1 Reference Dataset 2 µSAIDI

SAIDI YTDPost EQ
Part Year
2012 Calendar
YTD
05 - 09 Average
08 - 12 Average
Post Quake
AverageTranspower 2005 2006 2007 2008 2009 2008 2009 2010 2011 2012 2013 2011 Jan-12 2014 2015 2016 2017 2018 2019
Addington 31/03/15Transpower Unplanned 0.000 0.000 0.883 0.000 0.000 0.000 0.000 0.000 0.000 0.000 0.000 0.000 0.000 0.177 0.000 0.000 0.000 0.000 0.000 0.000 0.000 0.000Transpower Planned 0.000 0.000 0.000 0.000 0.000 0.000 0.000 0.000 0.000 0.000 0.000 0.000 0.000 0.000 0.000 0.000 0.000 0.000 0.000 0.000 0.000 0.000Sub Total 0.000 0.000 0.883 0.000 0.000 0.000 0.000 0.000 0.000 0.000 0.000 0.000 0.000 0.177 0.000 0.000 0.000 0.000 0.000 0.000 0.000 0.000
Arthurs 31/03/15Transpower Unplanned 0.000 0.000 0.024 0.061 0.003 0.061 0.003 0.000 0.000 0.000 0.000 0.000 0.239 0.018 0.013 0.000 0.000 0.000 0.013 0.013 0.013 0.013Transpower Planned 0.000 0.000 0.000 0.000 0.000 0.000 0.000 0.000 0.000 0.000 0.000 0.000 0.000 0.000 0.000 0.000 0.000 0.000 0.000 0.000 0.000 0.000Sub Total 0.000 0.000 0.024 0.061 0.003 0.061 0.003 0.000 0.000 0.000 0.000 0.000 0.239 0.018 0.013 0.000 0.000 0.000 0.013 0.013 0.013 0.013
Bromley 31/03/16Transpower Unplanned 0.532 0.000 0.000 0.000 0.406 0.000 0.406 0.000 0.000 0.000 0.000 0.000 0.000 0.188 0.081 0.000 0.000 0.000 0.000 0.081 0.081 0.081Transpower Planned 0.000 0.000 0.000 0.000 0.000 0.000 0.000 0.000 0.000 0.000 0.000 0.000 0.000 0.000 0.000 0.000 0.000 0.000 0.000 0.000 0.000 0.000Sub Total 0.532 0.000 0.000 0.000 0.406 0.000 0.406 0.000 0.000 0.000 0.000 0.000 0.000 0.188 0.081 0.000 0.000 0.000 0.000 0.081 0.081 0.081
Castle 31/03/15Transpower Unplanned 0.000 0.000 0.028 0.054 0.003 0.054 0.003 0.000 0.282 0.000 0.000 0.000 0.254 0.017 0.068 0.000 0.000 0.000 0.068 0.068 0.068 0.068Transpower Planned 0.253 0.000 0.000 0.000 0.000 0.000 0.000 0.000 0.000 0.000 0.000 0.000 0.000 0.051 0.000 0.000 0.000 0.000 0.000 0.000 0.000 0.000Sub Total 0.253 0.000 0.028 0.054 0.003 0.054 0.003 0.000 0.282 0.000 0.000 0.000 0.254 0.068 0.068 0.000 0.000 0.000 0.068 0.068 0.068 0.068
Hororata 31/03/16Transpower Unplanned 0.000 0.000 0.000 0.000 0.311 0.000 0.311 0.000 0.000 0.000 0.000 0.000 0.000 0.062 0.062 0.000 0.000 0.000 0.000 0.062 0.062 0.062Transpower Planned 0.000 0.000 0.000 0.000 0.000 0.000 0.000 0.000 0.000 0.000 0.000 0.000 0.000 0.000 0.000 0.000 0.000 0.000 0.000 0.000 0.000 0.000Sub Total 0.000 0.000 0.000 0.000 0.311 0.000 0.311 0.000 0.000 0.000 0.000 0.000 0.000 0.062 0.062 0.000 0.000 0.000 0.000 0.062 0.062 0.062
Islington 31/03/17Transpower Unplanned 0.000 0.561 0.000 0.000 0.000 0.000 0.000 0.000 0.000 0.000 0.000 0.000 0.000 0.112 0.000 0.000 0.000 0.000 0.000 0.000 0.000 0.000Transpower Planned 0.000 0.000 0.000 0.000 0.000 0.000 0.000 0.000 0.000 0.000 0.000 0.000 0.000 0.000 0.000 0.000 0.000 0.000 0.000 0.000 0.000 0.000Sub Total 0.000 0.561 0.000 0.000 0.000 0.000 0.000 0.000 0.000 0.000 0.000 0.000 0.000 0.112 0.000 0.000 0.000 0.000 0.000 0.000 0.000 0.000
Middleton 31/03/15Transpower Unplanned 0.000 0.000 0.000 0.000 0.000 0.000 0.000 0.000 0.000 0.000 0.000 0.000 0.000 0.000 0.000 0.000 0.000 0.000 0.000 0.000 0.000 0.000Transpower Planned 0.000 0.000 0.000 0.000 0.000 0.000 0.000 0.000 0.000 0.000 0.000 0.000 0.000 0.000 0.000 0.000 0.000 0.000 0.000 0.000 0.000 0.000Sub Total 0.000 0.000 0.000 0.000 0.000 0.000 0.000 0.000 0.000 0.000 0.000 0.000 0.000 0.000 0.000 0.000 0.000 0.000 0.000 0.000 0.000 0.000
Papanui 01/08/12Transpower Unplanned 0.000 0.000 0.000 0.000 0.000 0.000 0.000 0.000 0.000 0.000 0.000 0.000 0.000 0.000 0.000 0.000 0.000 0.000 0.000 0.000 0.000 0.000Transpower Planned 0.000 0.000 0.000 0.000 0.000 0.000 0.000 0.000 0.000 0.000 0.000 0.000 0.000 0.000 0.000 0.000 0.000 0.000 0.000 0.000 0.000 0.000Sub Total 0.000 0.000 0.000 0.000 0.000 0.000 0.000 0.000 0.000 0.000 0.000 0.000 0.000 0.000 0.000 0.000 0.000 0.000 0.000 0.000 0.000 0.000
Springston 01/08/13Transpower Unplanned 0.000 1.993 0.000 4.840 0.000 5.926 0.000 6.333 0.085 0.067 0.000 0.000 0.000 1.367 2.482 0.034 1.646 2.482 2.482 2.482 2.482 2.482Transpower Planned 0.000 0.000 0.000 0.000 0.000 0.000 0.000 0.000 0.000 0.000 0.000 0.000 0.000 0.000 0.000 0.000 0.000 0.000 0.000 0.000 0.000 0.000Sub Total 0.000 1.993 0.000 4.840 0.000 5.926 0.000 6.333 0.085 0.067 0.000 0.000 0.000 1.367 2.482 0.034 1.646 2.482 2.482 2.482 2.482 2.482
Transpower Total 0.785 2.555 0.935 4.956 0.723 6.041 0.723 6.333 0.367 0.067 0.000 0.000 0.493 1.991 2.706 0.034 1.646 2.482 2.563 2.706 2.706 2.706
Grand Total 52.437 54.646 55.710 49.778 62.451 50.888 62.451 67.476 64.870 96.094 36.939 46.173 80.391 55.004 68.356 89.603 97.171 94.722 86.464 83.067 75.191 67.035Check 0.000 0.000 0.000 0.000 0.000 0.000 0.000 0.000 0.000 0.000 -21.932 0.000 0.000
2014 2015 2016 2017 2018 2019
45.316 44.362 43.409 42.456 41.502 40.54950.210 47.877 40.492 37.905 30.983 23.7801.646 2.482 2.563 2.706 2.706 2.706
97.171 94.722 86.464 83.067 75.191 67.035
µSAIDI
µSAIDI
Rural TotalUrban TotalTranspower Total
Grand Total
Reference Dataset 1 Reference Dataset 2

SAIFI YTDPost EQ
Part Year
2012 Calendar
YTD
05 - 09 Average
08 - 12 Average
Post Quake
AverageRural 2005 2006 2007 2008 2009 2008 2009 2010 2011 2012 2013 2011 Jan-12 2014 2015 2016 2017 2018 2019
11kV Aug-123rd Party Damage 0.008 0.029 0.029 0.019 0.015 0.019 0.015 0.022 0.033 0.009 0.011 0.024 0.020 0.020 0.019 0.022 0.019 0.019 0.019 0.019 0.019 0.019External Factors 0.153 0.165 0.237 0.110 0.119 0.110 0.119 0.113 0.145 0.204 0.118 0.110 0.202 0.157 0.138 0.216 0.138 0.138 0.138 0.138 0.138 0.138System Failure 0.078 0.098 0.089 0.077 0.133 0.078 0.133 0.098 0.091 0.157 0.059 0.060 0.116 0.095 0.111 0.137 0.137 0.129 0.121 0.112 0.104 0.095Planned Outage 0.022 0.018 0.022 0.033 0.061 0.033 0.061 0.077 0.028 0.028 0.011 0.009 0.025 0.031 0.046 0.024 0.046 0.046 0.046 0.046 0.046 0.046Sub Total 0.260 0.310 0.378 0.239 0.328 0.240 0.328 0.310 0.297 0.398 0.198 0.202 0.364 0.303 0.315 0.399 0.341 0.332 0.324 0.315 0.307 0.298
33kV3rd Party Damage 0.000 0.000 0.002 0.000 0.002 0.000 0.002 0.000 0.000 0.000 0.000 0.000 0.000 0.001 0.000 0.000 0.000 0.000 0.000 0.000 0.000 0.000External Factors 0.055 0.050 0.044 0.063 0.028 0.063 0.028 0.019 0.061 0.015 0.004 0.026 0.023 0.048 0.037 0.023 0.037 0.037 0.037 0.037 0.037 0.037System Failure 0.031 0.038 0.018 0.100 0.058 0.100 0.058 0.038 0.033 0.002 0.015 0.033 0.019 0.049 0.046 0.025 0.046 0.046 0.046 0.046 0.046 0.046Planned Outage 0.000 0.000 0.000 0.000 0.000 0.000 0.000 0.000 0.000 0.000 0.000 0.000 0.000 0.000 0.000 0.000 0.000 0.000 0.000 0.000 0.000 0.000Sub Total 0.085 0.088 0.063 0.163 0.088 0.163 0.088 0.057 0.094 0.017 0.019 0.060 0.042 0.098 0.084 0.048 0.084 0.084 0.084 0.084 0.084 0.084
66kV3rd Party Damage 0.000 0.000 0.000 0.000 0.000 0.000 0.000 0.000 0.000 0.000 0.000 0.000 0.074 0.000 0.000 0.000 0.000 0.000 0.000 0.000 0.000 0.000External Factors 0.000 0.011 0.001 0.000 0.001 0.000 0.001 0.000 0.002 0.005 0.000 0.002 0.000 0.003 0.002 0.003 0.002 0.002 0.002 0.002 0.002 0.002System Failure 0.002 0.000 0.000 0.000 0.004 0.000 0.004 0.000 0.001 0.000 0.001 0.000 0.001 0.001 0.001 0.001 0.001 0.001 0.001 0.001 0.001 0.001Planned Outage 0.000 0.000 0.000 0.000 0.000 0.000 0.000 0.000 0.000 0.000 0.000 0.000 0.000 0.000 0.000 0.000 0.000 0.000 0.000 0.000 0.000 0.000Sub Total 0.002 0.011 0.001 0.000 0.006 0.000 0.006 0.000 0.003 0.005 0.001 0.002 0.075 0.004 0.003 0.004 0.003 0.003 0.003 0.003 0.003 0.003
Rural Total 0.348 0.409 0.442 0.403 0.422 0.403 0.422 0.366 0.394 0.419 0.219 0.264 0.481 0.405 0.401 0.451 0.427 0.419 0.410 0.402 0.393 0.385
SAIFI YTDPost EQ
Part Year
2012 Calendar
YTD
05 - 09 Average
08 - 12 Average
Post Quake
AverageUrban 2005 2006 2007 2008 2009 2008 2009 2010 2011 2012 2013 2011 Jan-12 2014 2015 2016 2017 2018 2019
11kV Nov-123rd Party Damage 0.024 0.020 0.043 0.016 0.032 0.016 0.032 0.024 0.019 0.034 0.024 0.003 0.038 0.027 0.025 0.030 0.042 0.042 0.042 0.042 0.042 0.042External Factors 0.101 0.063 0.065 0.057 0.054 0.057 0.054 0.060 0.084 0.097 0.048 0.067 0.090 0.068 0.070 0.106 0.070 0.070 0.070 0.070 0.070 0.070System Failure 0.225 0.162 0.070 0.098 0.077 0.098 0.077 0.087 0.155 0.544 0.115 0.104 0.278 0.126 0.192 0.382 0.382 0.331 0.280 0.229 0.177 0.126Planned Outage 0.005 0.008 0.010 0.007 0.016 0.007 0.016 0.007 0.005 0.015 0.001 0.004 0.003 0.009 0.010 0.010 0.020 0.020 0.020 0.020 0.020 0.020Sub Total 0.356 0.253 0.188 0.177 0.179 0.177 0.179 0.178 0.263 0.690 0.188 0.178 0.409 0.231 0.298 0.528 0.514 0.463 0.412 0.361 0.310 0.259
33kV3rd Party Damage 0.000 0.000 0.000 0.000 0.000 0.000 0.000 0.000 0.000 0.000 0.000 0.000 0.000 0.000 0.000 0.000 0.000 0.000 0.000 0.000 0.000 0.000External Factors 0.000 0.000 0.000 0.000 0.000 0.000 0.000 0.000 0.000 0.000 0.002 0.000 0.002 0.000 0.000 0.001 0.000 0.000 0.000 0.000 0.000 0.000System Failure 0.002 0.011 0.046 0.005 0.000 0.005 0.000 0.000 0.000 0.000 0.000 0.000 0.000 0.013 0.001 0.000 0.001 0.001 0.001 0.001 0.001 0.001Planned Outage 0.000 0.000 0.000 0.000 0.000 0.000 0.000 0.000 0.000 0.000 0.000 0.000 0.000 0.000 0.000 0.000 0.000 0.000 0.000 0.000 0.000 0.000Sub Total 0.002 0.011 0.047 0.005 0.000 0.005 0.000 0.000 0.000 0.000 0.002 0.000 0.002 0.013 0.001 0.001 0.001 0.001 0.001 0.001 0.001 0.001
66kVBaseline 66kV Urban 0.032 0.068 0.000 0.040 0.000 0.040 0.000 0.032 0.000 0.167 0.000 0.000 0.121 0.028 0.048 0.084 0.028 0.028 0.028 0.028 0.028 0.028Not Subject to 66kV Urban Upgrades 0.148 0.150 0.073 0.073 0.000 0.000Subject to 66kV Urban Upgrades 0.148 0.150 0.146 0.146 0.146 0.068Sub Total 0.032 0.068 0.000 0.040 0.000 0.040 0.000 0.032 0.000 0.167 0.000 0.000 0.121 0.028 0.048 0.084 0.324 0.328 0.247 0.246 0.173 0.096
Urban Total 0.390 0.332 0.235 0.223 0.179 0.223 0.179 0.210 0.263 0.858 0.190 0.178 0.533 0.272 0.347 0.613 0.839 0.792 0.660 0.608 0.484 0.356
Reference Dataset 1 Reference Dataset 2 µSAIFI
Reference Dataset 1 Reference Dataset 2 µSAIFI

SAIFI YTDPost EQ
Part Year
2012 Calendar
YTD
05 - 09 Average
08 - 12 Average
Post Quake
AverageTranspower 2005 2006 2007 2008 2009 2008 2009 2010 2011 2012 2013 2011 Jan-12 2014 2015 2016 2017 2018 2019
Addington 31/03/15Transpower Unplanned 0.000 0.000 0.029 0.000 0.000 0.000 0.000 0.000 0.000 0.000 0.000 0.000 0.000 0.006 0.000 0.000 0.000 0.000 0.000 0.000 0.000 0.000Transpower Planned 0.000 0.000 0.000 0.000 0.000 0.000 0.000 0.000 0.000 0.000 0.000 0.000 0.000 0.000 0.000 0.000 0.000 0.000 0.000 0.000 0.000 0.000Sub Total 0.000 0.000 0.029 0.000 0.000 0.000 0.000 0.000 0.000 0.000 0.000 0.000 0.000 0.006 0.000 0.000 0.000 0.000 0.000 0.000 0.000 0.000
Arthurs 31/03/15Transpower Unplanned 0.000 0.000 0.003 0.005 0.001 0.005 0.001 0.000 0.000 0.000 0.000 0.000 0.001 0.002 0.001 0.000 0.000 0.000 0.001 0.001 0.001 0.001Transpower Planned 0.000 0.000 0.000 0.000 0.000 0.000 0.000 0.000 0.000 0.000 0.000 0.000 0.000 0.000 0.000 0.000 0.000 0.000 0.000 0.000 0.000 0.000Sub Total 0.000 0.000 0.003 0.005 0.001 0.005 0.001 0.000 0.000 0.000 0.000 0.000 0.001 0.002 0.001 0.000 0.000 0.000 0.001 0.001 0.001 0.001
Bromley 31/03/16Transpower Unplanned 0.018 0.000 0.000 0.000 0.068 0.000 0.068 0.000 0.000 0.000 0.000 0.000 0.000 0.017 0.014 0.000 0.000 0.000 0.000 0.014 0.014 0.014Transpower Planned 0.000 0.000 0.000 0.000 0.000 0.000 0.000 0.000 0.000 0.000 0.000 0.000 0.000 0.000 0.000 0.000 0.000 0.000 0.000 0.000 0.000 0.000Sub Total 0.018 0.000 0.000 0.000 0.068 0.000 0.068 0.000 0.000 0.000 0.000 0.000 0.000 0.017 0.014 0.000 0.000 0.000 0.000 0.014 0.014 0.014
Castle 31/03/15Transpower Unplanned 0.000 0.000 0.002 0.006 0.001 0.006 0.001 0.000 0.002 0.000 0.000 0.000 0.001 0.002 0.002 0.000 0.000 0.000 0.002 0.002 0.002 0.002Transpower Planned 0.001 0.000 0.000 0.000 0.000 0.000 0.000 0.000 0.000 0.000 0.000 0.000 0.000 0.000 0.000 0.000 0.000 0.000 0.000 0.000 0.000 0.000Sub Total 0.001 0.000 0.002 0.006 0.001 0.006 0.001 0.000 0.002 0.000 0.000 0.000 0.001 0.002 0.002 0.000 0.000 0.000 0.002 0.002 0.002 0.002
Hororata 31/03/16Transpower Unplanned 0.000 0.000 0.000 0.000 0.010 0.000 0.010 0.000 0.000 0.000 0.000 0.000 0.000 0.002 0.002 0.000 0.000 0.000 0.000 0.002 0.002 0.002Transpower Planned 0.000 0.000 0.000 0.000 0.000 0.000 0.000 0.000 0.000 0.000 0.000 0.000 0.000 0.000 0.000 0.000 0.000 0.000 0.000 0.000 0.000 0.000Sub Total 0.000 0.000 0.000 0.000 0.010 0.000 0.010 0.000 0.000 0.000 0.000 0.000 0.000 0.002 0.002 0.000 0.000 0.000 0.000 0.002 0.002 0.002
Islington 31/03/17Transpower Unplanned 0.000 0.033 0.000 0.000 0.000 0.000 0.000 0.000 0.000 0.000 0.000 0.000 0.000 0.007 0.000 0.000 0.000 0.000 0.000 0.000 0.000 0.000Transpower Planned 0.000 0.000 0.000 0.000 0.000 0.000 0.000 0.000 0.000 0.000 0.000 0.000 0.000 0.000 0.000 0.000 0.000 0.000 0.000 0.000 0.000 0.000Sub Total 0.000 0.033 0.000 0.000 0.000 0.000 0.000 0.000 0.000 0.000 0.000 0.000 0.000 0.007 0.000 0.000 0.000 0.000 0.000 0.000 0.000 0.000
Papanui 31/03/15Transpower Unplanned 0.000 0.000 0.000 0.000 0.000 0.000 0.000 0.000 0.000 0.000 0.000 0.000 0.000 0.000 0.000 0.000 0.000 0.000 0.000 0.000 0.000 0.000Transpower Planned 0.000 0.000 0.000 0.000 0.000 0.000 0.000 0.000 0.000 0.000 0.000 0.000 0.000 0.000 0.000 0.000 0.000 0.000 0.000 0.000 0.000 0.000Sub Total 0.000 0.000 0.000 0.000 0.000 0.000 0.000 0.000 0.000 0.000 0.000 0.000 0.000 0.000 0.000 0.000 0.000 0.000 0.000 0.000 0.000 0.000
Middleton 01/08/12Transpower Unplanned 0.000 0.000 0.000 0.000 0.000 0.000 0.000 0.000 0.000 0.000 0.000 0.000 0.000 0.000 0.000 0.000 0.000 0.000 0.000 0.000 0.000 0.000Transpower Planned 0.000 0.000 0.000 0.000 0.000 0.000 0.000 0.000 0.000 0.000 0.000 0.000 0.000 0.000 0.000 0.000 0.000 0.000 0.000 0.000 0.000 0.000Sub Total 0.000 0.000 0.000 0.000 0.000 0.000 0.000 0.000 0.000 0.000 0.000 0.000 0.000 0.000 0.000 0.000 0.000 0.000 0.000 0.000 0.000 0.000
Springston 01/08/13Transpower Unplanned 0.000 0.080 0.000 0.073 0.000 0.092 0.000 0.086 0.009 0.010 0.000 0.000 0.000 0.030 0.039 0.005 0.026 0.039 0.039 0.039 0.039 0.039Transpower Planned 0.000 0.000 0.000 0.000 0.000 0.000 0.000 0.000 0.000 0.000 0.000 0.000 0.000 0.000 0.000 0.000 0.000 0.000 0.000 0.000 0.000 0.000Sub Total 0.000 0.080 0.000 0.073 0.000 0.092 0.000 0.086 0.009 0.010 0.000 0.000 0.000 0.030 0.039 0.005 0.026 0.039 0.039 0.039 0.039 0.039
Transpower Total 0.019 0.113 0.034 0.083 0.079 0.103 0.079 0.086 0.011 0.010 0.000 0.000 0.002 0.066 0.058 0.005 0.026 0.039 0.042 0.058 0.058 0.058
Grand Total 0.757 0.853 0.712 0.709 0.680 0.729 0.680 0.662 0.668 1.287 0.409 0.442 1.015 0.742 0.805 1.068 1.292 1.250 1.113 1.068 0.935 0.798Check 0.000 0.000 0.000 0.000 0.000 0.000 0.000 0.000 0.000 0.000 -0.295 0.000 0.000
2014 2015 2016 2017 2018 2019
0.427 0.419 0.410 0.402 0.393 0.3850.839 0.792 0.660 0.608 0.484 0.3560.026 0.039 0.042 0.058 0.058 0.058
1.292 1.250 1.113 1.068 0.935 0.798
µSAIFI
µSAIFI
Rural TotalUrban TotalTranspower Total
Grand Total
Reference Dataset 1 Reference Dataset 2

Appendix 10 Regulatory decisions regarding catastrophic events

Regulatory decisions regarding catastrophic events
This appendix details how selected international regulators respond to catastrophic events.
For each jurisdiction, we detail the regulatory mechanism for responding to the event, the speed at which any price changes occur, whether ‘claw-back’ is allowed to be recovered, and whether suppliers are compensated
for revenue reductions in addition to cost increases.
Essential Services Commission – regulation of Victorian (Australia) water and wastewater suppliers
Mechanism for adjusting regulatory settings in response to a natural disaster
The current price determinations for each supplier (they each have a separate one) include a mechanism where suppliers can apply for an adjustment to price in response to events which were unforeseen or uncertain at the time of the decision (including catastrophic events).
1
Timing of adjustment to prices
Prices can be adjusted within the regulatory period, from the year after the event.
Recovery of claw-back
Suppliers can be compensated for all financial effects of the event in NPV terms. This is equivalent to the application of claw-back.
Compensation for revenue reductions
Prices can be adjusted in response to higher than expected costs or lower than expected demand.
In 2010, Coliban Water applied for a price adjustment on the basis of lower than expected demand (and revenue). Its prices were adjusted.
2
Ofgem – regulation of UK electricity distributors
Mechanism for adjusting regulatory settings in response to a natural disaster
Distributors have a clause in their licences which allow them to apply to re-open a price control for any reason (‘disapplication’).
3 The licence conditions are non-specific, and Ofgem has substantial discretion to decide
whether price adjustments are appropriate.
Timing of adjustment to prices
Revised prices are typically applied around 2 years after an application.
Recovery of claw-back
This is at Ofgem’s discretion.
1 See for example: Essential Services Commission (June 2008), 2008 Water price review: Coliban Water
determination 1 July 2008 – 30 June 2013, Section 4. 2 Essential Services Commission (June 2010), Coliban Water application for tariff adjustment: Determination
under clause 4 of the 2008 water price review final decision; Coliban Water determination. 3 See for example: Ofgem, issued by the Secretary of State (2001), SP Distribution Limited – Electricity
Distribution Licence, Special Conditions E4 and F2.

Compensation for revenue reductions
Distributors can apply for a price control disapplication on the grounds of both higher costs and lower demand. However the final determination is at Ofgem’s discretion.
Ofwat – regulation of UK water and wastewater suppliers
Mechanism for adjusting regulatory settings in response to a natural disaster
Each supplier has a clause in its licence which allows it to apply for an interim determination of prices in response to a ‘substantial effect’.
4 A supplier can apply for an interim determination in response to any event
which has a financial impact on the supplier above a specified threshold.
Timing of adjustment to prices
Revised prices are applied from the year after application. This may be the year after the event, but possibly later (since the application must be made by a certain date each year, and it may take a period of time after the event to gather sufficient evidence of the effects).
Recovery of claw-back
The financial impact on the supplier is calculated from the date of the event. The revised prices are set so that the supplier is fully compensated for the financial effects in NPV terms. This is equivalent to the application of claw-back.
Compensation for revenue reductions
The substantial effect can relate to higher costs, lower demand, or both.
4 See for example: Department of the Environment (August 1989), Instrument of Appointment by the Secretary
of State for the Environment of Thames Water Utilities Limited as a water and sewerage undertaker under the Water Act 1989, Part IV, clauses 13.1 and 13.2.

Appendix 11Marsh’s Report on Orion’s Network Catastrophe Insurance

ORION’S NETWORK CATASTROPHE INSURANCE • Material Damage Insurance • Business Interruption Insurance
AN EXPERT REPORT FOR ORION AND THE COMMERCE COMMISSION
Paul Casey – Executive Director – Marsh Limited 8 October 2012

COMMERCE COMMISSION AND ORION NZ LTD
MARSH
i
CONTENTS
1 Introduction .............................................................................................................. 1
2 The insurance market .............................................................................................. 2
3 The availability of MD and BI insurance ................................................................... 4
4 The relationship between MD and BI insurance cover.............................................. 7
5 The evolution of insurance markets.......................................................................... 8
6 The forecast evolution of relevant insurance markets............................................. 10
7 Strategies to manage risk transfer.......................................................................... 11
8 Captive insurance and mutual group funding ......................................................... 12
9 Orion’s approach to MD and BI insurance.............................................................. 14
10 Network owners’ future approach........................................................................... 16
11 Catastrophe insurance claims can be complex ...................................................... 17
12 Marsh credentials................................................................................................... 18

COMMERCE COMMISSION AND ORION NZ LTD
MARSH
1
1 Introduction The purpose of this report is to respond to Orion’s request for an expert report on material damage (MD) and business interruption (BI) insurance matters – especially as they relate to Orion. Orion’s request was dated 20 August 2012 and specifically asked as follows: “We seek an expert report which addresses the prudency of Orion’s past and projected approach to insurance. In particular we require a report which:
• describes the characteristics of the insurance market (in New Zealand and globally) for long life infrastructure, with particular emphasis on electricity distribution networks
• describes the historical and forecast insurance availability and terms (including premium rates) of the major categories of assets within electricity distribution networks – for example substations, underground cables and overhead lines – and whether these are considered economic
• describes the relationship between material damage cover and business interruption cover
• explains how these markets have evolved to date, particularly in the last decade • considers how insurance markets are likely to evolve over the next decade, with
particular emphasis on potential changes to the management of catastrophic damage, and the associated costs of insurance
• sets out the strategies currently employed by network owners in Australasia and globally to manage the risks of damage to their networks, with examples, including consideration of the costs and terms of insurance and the levels of real risk transfer that have been or can be achieved (transfer to a 100% owned captive alone is not considered to be real risk transfer) – where practicable this should be categorised by major asset category (substations, line, cables)
• considers whether network owners are changing, or are expected to change, their approach to insurance over the next decade, in response to changing market conditions
• assesses the prudency of Orion’s past and planned insurance approach, with particular emphasis on the policies in place at the time of the Christchurch earthquakes, and the reasonableness or otherwise of continuing with that approach to 2019 (the end of the CPP period).
The report should also include a summary of your credentials relevant to the scope of work set out above. We require a draft report by 27 September and a final report by 15 October. The report will be included in Orion’s CPP proposal, and will become publicly available before or during the Commerce Commission’s assessment of the proposal.”

COMMERCE COMMISSION AND ORION NZ LTD
MARSH
2
2 The insurance market The major areas Marsh Ltd has been asked to address are insurance for long life infrastructure for electricity distribution businesses (EDBs):
• substations • underground cables and overhead lines.
EDBs’ key substations are normally insured under an MD insurance policy. Underground cables and overhead lines, are referred to as transmission and distribution (T&D) risks and are normally uninsured. Marsh does not act for all EDBs and transmission companies in Australasia, however to the best of my knowledge and belief no EDBs or transmission companies in Australasia, with the exception of those noted below, insure their T&D (overhead lines and underground cables) risks. The one exception that I can confirm is Powerlink in Queensland, a transmission company that purchases T&D Insurance. Premiums are lower for Transmission companies because the plant is more robust than for EDB’s and the risk is spread over wider geographical areas. Insurance companies are not typically able to provide MD and BI insurance cover for T&D because T&D is specifically excluded from their reinsurance treaty arrangements. This is a global position due to the major T&D risks posed by natural disasters and catastrophes, which insurers and reinsurers globally require to be addressed on a case-by-case basis. The major risks to T&D for transmission companies and EDBs depend on their location but they normally include:
• fire • lightning • explosion • windstorm • flood • hail • snow • ice • frost • typhoon • hurricane • tornado • tsunami • cyclone • aircraft and other aerial devices • other impacts • volcanic eruption • subterranean fire • thermal activity • terrorism/vandalism • earthquake • negligence/incorrect operation.

COMMERCE COMMISSION AND ORION NZ LTD
MARSH
3
Currently all of these risks for Orion are uninsurable as T&D insurance is not available for risks in Christchurch. If insurance was available it would at a minimum exclude cover for terrorism, damage from wilful neglect and failure from internal causes. Insurers believe that insurable risks can be aggregated in limited geographic areas. They believe that this can concentrate the risks from a single natural disaster, which adds to the aggregate exposures that insurers face in that region, from all the other risks they insure. If a catastrophic event occurs, it has potential to cause a significant single event exposure for insurers, which adversely affects their reinsurance and their retained aggregate exposure to natural disasters. All insurers carry retentions to their own account, whether by virtue of a reinsurance deductible or because their exposures aren’t fully reinsured.

COMMERCE COMMISSION AND ORION NZ LTD
MARSH
4
3 The availability of MD and BI insurance MD and BI insurance has been difficult to purchase for EDBs globally. From circa 1980 until 2001, New Zealand EDBs purchased T&D insurance cover through a scheme called “TRIP” (transmission reticulation insurance programme). TRIP was MD cover only. It did not cover BI risks. TRIP provided New Zealand EDBs with adequate amounts of MD catastrophe cover for their respective electricity distribution networks, with relatively low deductibles. TRIP covered all EDB distribution network assets – this included overhead lines and underground cables. Up until 1998 TRIP was arranged through the Electricity Networks Association. From 1999 to 2001 the scheme was managed directly by Marsh. The lead insurer for TRIP was HIH Australia and when HIH Australia failed in March 2001 it triggered the reason the TRIP cover ceased to operate. HIH was reinsured by Swiss Reinsurance, headquartered in Zurich. The balance of the insurance capacity was made up with support from a number of Lloyd’s syndicates from London (each Lloyd’s syndicate participated in small percentages). TRIP cover was in two layers. The first $15m layer was enough to cover the majority of the (smaller) EDBs. A few (larger) EDBs purchased higher limits and it made sense economically to purchase this in the form of additional separate layers. Only three EDBs purchased cover above the $15m primary layer in the year 2000. They were Hawkes Bay Networks, United Networks and Orion. The primary $15m layer cost Orion approximately $0.14m - a rate of 0.9%. Orion’s second layer of $29m cost approximately $0.05m at a rate of 0.19%. The average combined rate on Orion’s $44m of MD cover was approximately 0.45%.

COMMERCE COMMISSION AND ORION NZ LTD
MARSH
5
Orion made a number of claims under TRIP: • 1968 windstorm $1.30m • 1973 snow damage $1.25m • 1974 windstorm $3.75m • 1975 windstorm $0.10m • 1993 snow damage $1.20m • 1995 snow damage $0.10m. The TRIP underwriters significantly increased Orion’s deductible to $1.25m in the year 2000. This increased deductible was the second highest deductible for participating EDBs. This increase was a reflection of Orion’s past claims record. TRIP ceased in April 2001 from a combination of factors. In 1999 the fire and general insurance industry experienced deteriorating profitability and there were a number of significant (at that time) natural disasters. 1999 was a bad year for insured natural disasters – this included significant insurance losses from major storms in Europe in December 1999. These factors all resulted in:
• substantial increases in TRIP’s reinsurance rates and • less capacity for “difficult to place” risks – risks such as T&D.
TRIP had different renewal dates for different EDBs. EDBs that renewed at the end of 1999 saw reduced participation from London based insurers (such as Lloyd’s), which resulted in only 70% coverage for loss above the primary $15m layer. This triggered the move to a common renewal date of 1 April. All underwriters other than HIH reduced their capacity from 1 April 2000 and premiums increased by more than 10%. Then TRIP experienced a large loss/claim – approximately $5m. Amalgamation of a number of EDBs with ability to retain risk (which reduced the premium pool for insurers) contributed to the difficulties for insurers. HIH Australia itself faced major legal and financial pressures and reinsurers became less willing to continue to support HIH. So TRIP collapsed in 2001. TRIP had been attractive for New Zealand EDBs – it had relatively low deductibles, it covered most of the network assets of EDBs to specified limits and the premiums were affordable. There have been a couple of attempts since TRIP’s collapse to launch a replacement scheme for EDBs. However these attempts have not been successful (even before the Canterbury earthquakes) because:
• the minimum deductibles offered have been in the region of $5m and
• the (even before the Canterbury earthquakes) premiums required by insurers have been in the region of 7.5% to 10% of the policy limit. This level of premium rate is considerably greater than the TRIP scheme – around 20 times more expensive.
For example, a premium cost of 10% would mean that an EDB would have to have a total loss of its electricity network at least every ten years in order to be “in the money” on its T&D insurance cover. On this basis, EDBs (including Orion), have reasonably concluded that this cover for overhead lines and underground cables is not economic, even if it is available.

COMMERCE COMMISSION AND ORION NZ LTD
MARSH
6
Insurers are clearly reluctant to offer cover to EDBs for T&D risks in earthquake zones. Insurers believe that:
• EDBs have the majority of their assets in relatively concentrated geographic locations. The potential for large “single event” losses for lines, cables and substations is significant
• transmission companies (for example Transpower) have wide geographic spreads and depending on the natural disaster risk in their geography are generally less exposed to large “single event” losses
• transmission companies have more robust transmission and distribution plant, generally
designed to withstand specific types and levels of natural disaster with proportionally lower values below ground
• the T&D “single event” risk profile for EDBs is therefore higher than for transmission companies.

COMMERCE COMMISSION AND ORION NZ LTD
MARSH
7
4 The relationship between MD and BI insurance cover BI insurance covers specified loss of revenues and specified increased costs of working. BI is only very rarely offered by insurers on a stand-alone basis. The insured must first purchase MD insurance. With limited exceptions, BI claims are only triggered by BI losses caused by damage to physical assets which are specifically insured under an associated MD policy. In our opinion, EDBs have no MD insurance cover for T&D because EDBs have reasonably concluded that this cover is not economically available. So there is no BI (loss of profits or revenue, or increased costs of working) insurance available for T&D. Despite the fact that the large majority of EDBs’ assets are T&D, and despite the catastrophe risk they face to those T&D assets, EDBs such as Orion therefore have no T&D insurance cover for:
• MD or
• BI. EDBs are therefore not covered (that is, they are uninsured) for BI type losses (increased costs of working and lower revenues) caused by:
• physical damage to T&D (for example Orion had over ten kilometres of 11kV underground cable faults following the 22 February 2011 quake)
• general depopulation, reduced consumption, reduced customer numbers

COMMERCE COMMISSION AND ORION NZ LTD
MARSH
8
5 The evolution of insurance markets The global insurance market has historically segmented itself into various categories such as marine, aviation, casualty (general liability, professional negligence, directors and officers liability etc), energy, and property. The property market is split into two areas - one being general property, which largely excludes the risk of mechanical and electrical breakdown, and there is a specific market within the property market that addresses power utilities business. The property risks for EDBs can fall within the general property market and the specialist power utilities market. All onshore (land-based) property risks in New Zealand are dominated by the natural disaster exposure. New Zealand insurers have historically been the most competitive at providing insurance for these risks and as a result since around 2002 New Zealand EDBs (including Orion) have bought their property insurance (excluding overhead lines and underground cables) within the New Zealand property insurance market. During the decade up until 2001 the property insurance markets in New Zealand became very competitive and additionally there was a broadening of the cover that was offered under MD policies. The power utilities market became strained and hardened in 2002 following a number of industry lossses, including a number of large business interruption claims . Wider policy coverages and lower pricing became much more dificult to place after the World Trade Centre event in September 2001. Coverage became more restricted as underwriters sought to gain more control over the risks they were insuring and prices increased markedly - in a number of cases by as much as 300%. Underwriting of insurance is different for each insurance company, which can result in different pricing of risk. Rating and pricing is not linear or necessarily mathematical. Insurers have different overheads, and their costs and structure of catastrophe (natural disaster) insurance varies - this means an actual “market” exists for insurance. These comments apply globally. Capacity and pricing in the insurance market is generally impacted by losses, increases or reductions in natural disasters, increases or reductions in profitability, an ability or otherwise to make investment profits on loss reserves and fee capital, and the availability of capital. In recent years insurance underwriters generally, with influence from credit rating agencies, have put a lot more effort into identifying all the risks they are actually insuring under policy wordings and it is now fair to say they have a much better understanding of those risks. The effect of this is that the larger natural disasters after 2001 (for example - the 2004 and 2005 hurricanes in the Gulf of Mexico, the Canterbury and Japan earthquakes and floods in Thailand) (with a few exceptions, like AMI) did not impact the capital base of the insurance industry, even if they did certainly impact the industry’s profitability. The New Zealand insurance market became very “hard” (ie more expensive) in 2011/2012. On the other hand, the World Trade Centre disaster did impact the capital base of a number of insurers and this resulted in some credit rating downgrades. In summary, the insurance industry is now better able to withstand cumulative natural disasters in any one calendar year. This does not mean there will be no price increases but the capital security of the insurers is generally speaking better founded than has been in the past.

COMMERCE COMMISSION AND ORION NZ LTD
MARSH
9
In the context of T&D insurance, it is still difficult to find insurers who are prepared to provide insurance for EDBs with acceptable terms and conditions – including reasonable deductibles and price. T&D insurance is possibly available for some transmission companies who have a large spread of risk and a record of low or no losses, at deductibles that these larger enterprises can tolerate, but this does not translate into similar acceptable insurance being available to EDBs.

COMMERCE COMMISSION AND ORION NZ LTD
MARSH
10
6 The forecast evolution of relevant insurance markets Marsh expects there to be little change in the next few years to insurers’ views of natural disaster risks in New Zealand, the availability of such insurance and the pricing of the insurance if it is offered. Generally Marsh expects there to be some softening (lowering) of pricing over time for attractive risks but insurers’ current pricing for natural disaster risks will continue for the next few years. Marsh expects EDBs to continue to look at alternative ways of financing the exposure to their T&D risks from natural disaster losses and insurance brokers will continue to monitor the situation to look for opportunities to develop innovative solutions for this in New Zealand. Clearly, the Canterbury earthquakes have worsened the MD/BI insurance situation for all New Zealand EDBs – and Orion in particular. They have also worsened the insurance situation for all buyers of property and loss of revenue insurance in New Zealand.

COMMERCE COMMISSION AND ORION NZ LTD
MARSH
11
7 Strategies to manage risk transfer As shown in the credentials section later in this report, Marsh represents many if not most of the significant energy businesses in Australia and New Zealand region. We are not aware of any EDB in Australasia that has achieved any effective and material risk transfer for the bulk of its T&D assets. This view is in respect of all Marsh clients in the region. We are aware of only one transmission company in Australia, Powerlink in Queensland, that purchases such insurance. EDBs’ substations, other buildings and contents can be and are insured under standard MD insurance policies at rates that reflect the individual risks of the properties in the geographies in which they are located.

COMMERCE COMMISSION AND ORION NZ LTD
MARSH
12
8 Captive insurance and mutual group funding From time to time over the past eleven years captive insurance companies have been raised as a possible option or vehicle for entities to fund and/or insure their risks. Captive insurance companies generally work as follows:
• a captive is an insurance subsidiary company - wholly owned by the parent company • the captive insures specified risks of the parent and/or group and charges a premium for
that service • capital is paid by the parent to establish the captive, interest may be charged and a level
of return may be expected • risk is capped at predetermined levels and is funded by the premiums charged and by
the paid-up capital • as reserves increase, the risk carried by the captive can be increased • the first years are critical as the risk is generally funded more by capital than premium
until the retained earnings and annual premium are adequate to fund the exposure carried by the captive. There are also solvency considerations in the context of the domicile in which the captive is located which will impact the level of capital required - some countries have specific captive enabling legislation and regulation and as a result some domiciles (countries) are easier to work in than others. Compliance with New Zealand insurance legislation and regulation makes New Zealand a challenging environment in which to establish a captive.
Captives’ main cited advantages versus just purchasing insurance are usually:
• where a company’s risk profile is better than its industry average and/or it expects that its risk management practices will result in improved loss experience
• where a company believes it can reduce its cost of insurance • the ability to access reinsurance markets directly and thus gain wholesale reinsurance
prices • to provide a cash buffer in the captive to reduce premiums paid to the insurance market • a captive can be used as a tailor made risk management tool.
Their main disadvantages are usually:
• establishment costs • ongoing costs such as consultants • compliance in New Zealand • corporate governance • executive time.
In the context of Orion and EDBs generally, we do not believe that captives are appropriate for the following reasons:
• captives are generally not suited to carry catastrophe risks because such risks are difficult to manage and can “limit” losses up to the maximum amount of the insurance provided
• building a cash fund in the captive over time to firstly fund a deductible and then to fund higher proportion of natural disaster risks is a legitimate strategy, albeit with considerable

COMMERCE COMMISSION AND ORION NZ LTD
MARSH
13
administrative cost, but without T&D reinsurance support it is not economically feasible because of the large amounts exposed.
• captives can be complex and costly – economies of scale count and Orion is arguably not large enough to justify this complexity and cost
• catastrophe insurance for T&D is not available in the market anyway (especially post the Canterbury earthquakes) and so Orion would not achieve material risk transfer, the whole point of insurance.
The concept of a mutual insurance group involving several or all 29 EDBs in New Zealand has also been considered on more than one occasion over the past eleven years. These considerations have not developed beyond discussion for a number of reasons:
• the different risk profiles of EDBs’ networks creates significant issues for individuals EDBs’ premiums, deductibles and loss sharing. Urban networks have different risk profiles to rural (largely overhead) networks. Some have greater underground exposure and some greater overhead.
• Orion and some others have spent considerable amounts to improve the resiliency and
risk profiles of their networks over the past decade (which paid dividends for Orion and its customers in the recent earthquakes) – some EDBs haven’t
• different networks present different exposures to natural disasters such as earthquakes.
Natural disaster insurance for T&D risks is not available for networks in Wellington and Christchurch nor probably elsewhere in New Zealand.
• different EDBs have different risk appetites. Most EDBs want lower deductibles than the
minimum (circa $5m) that was available before the Canterbury earthquakes
• the mutual insurance group would still need to be able to purchase natural disaster insurance for all participating members to achieve risk transfer
• the members would have to identify an equitable mechanism for funding losses under
the attachment point of any available T&D insurance. Issues of cross subsidisation and replenishing the uninsured part of the “insured” risk were issues for some network companies in the past.
All in all – we believe that if EDBs were to consider a mutual (possibly captive) group to arrange T&D catastrophe cover there would be a significant risk that:
• the interests of EDB members would not be aligned – for example how would Orion’s risks (Christchurch’s seismicity is greater than average) be priced within the group?
• the costs and complexities (and potential for conflict) would be considerable
• effective and material risk transfer would not be achieved.
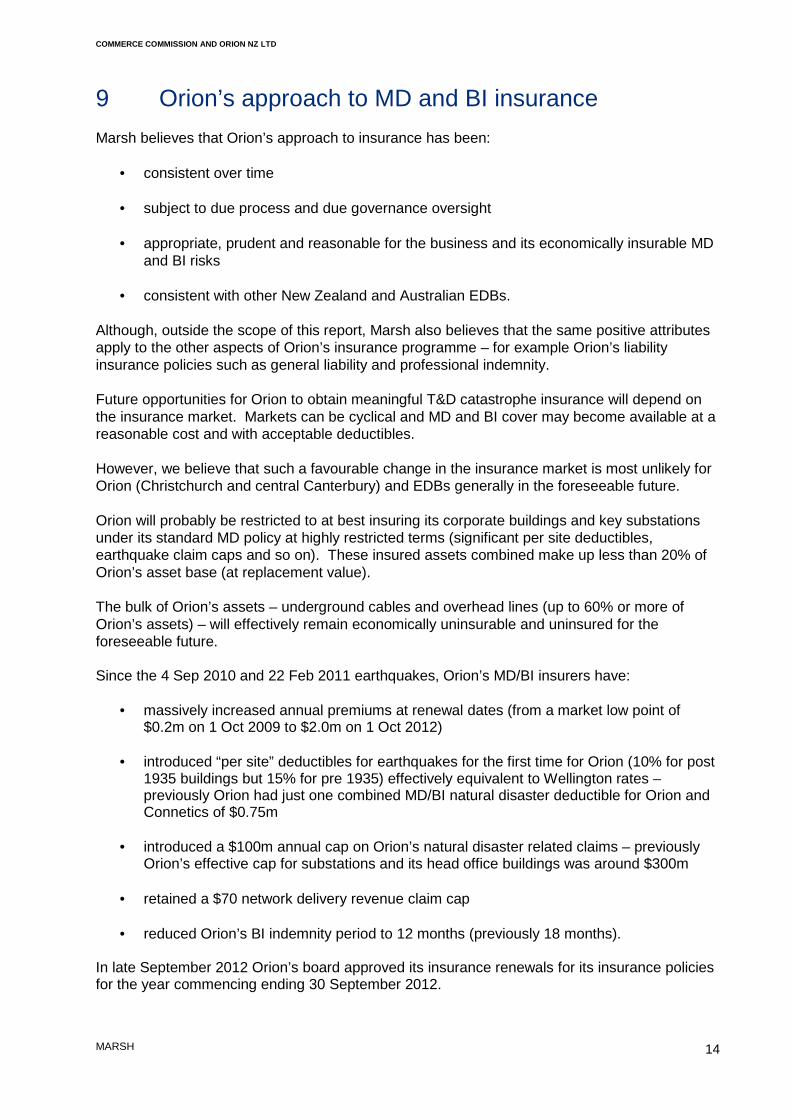
COMMERCE COMMISSION AND ORION NZ LTD
MARSH
14
9 Orion’s approach to MD and BI insurance Marsh believes that Orion’s approach to insurance has been:
• consistent over time
• subject to due process and due governance oversight
• appropriate, prudent and reasonable for the business and its economically insurable MD and BI risks
• consistent with other New Zealand and Australian EDBs.
Although, outside the scope of this report, Marsh also believes that the same positive attributes apply to the other aspects of Orion’s insurance programme – for example Orion’s liability insurance policies such as general liability and professional indemnity. Future opportunities for Orion to obtain meaningful T&D catastrophe insurance will depend on the insurance market. Markets can be cyclical and MD and BI cover may become available at a reasonable cost and with acceptable deductibles. However, we believe that such a favourable change in the insurance market is most unlikely for Orion (Christchurch and central Canterbury) and EDBs generally in the foreseeable future. Orion will probably be restricted to at best insuring its corporate buildings and key substations under its standard MD policy at highly restricted terms (significant per site deductibles, earthquake claim caps and so on). These insured assets combined make up less than 20% of Orion’s asset base (at replacement value). The bulk of Orion’s assets – underground cables and overhead lines (up to 60% or more of Orion’s assets) – will effectively remain economically uninsurable and uninsured for the foreseeable future. Since the 4 Sep 2010 and 22 Feb 2011 earthquakes, Orion’s MD/BI insurers have:
• massively increased annual premiums at renewal dates (from a market low point of
$0.2m on 1 Oct 2009 to $2.0m on 1 Oct 2012) • introduced “per site” deductibles for earthquakes for the first time for Orion (10% for post
1935 buildings but 15% for pre 1935) effectively equivalent to Wellington rates – previously Orion had just one combined MD/BI natural disaster deductible for Orion and Connetics of $0.75m
• introduced a $100m annual cap on Orion’s natural disaster related claims – previously
Orion’s effective cap for substations and its head office buildings was around $300m
• retained a $70 network delivery revenue claim cap
• reduced Orion’s BI indemnity period to 12 months (previously 18 months). In late September 2012 Orion’s board approved its insurance renewals for its insurance policies for the year commencing ending 30 September 2012.

COMMERCE COMMISSION AND ORION NZ LTD
MARSH
15
In the current market, it was not feasible for Orion to seek competitive quotes. Virtually no insurer is offering new MD/BI business in Canterbury right now – and certainly not for T&D risks. A chart of Orion’s MD/BI premiums over the last decade is as follows (annualised, years ending 30 September):
Orion MDBI Premium History
0
0.2
0.4
0.6
0.8
1
1.2
1.4
1.6
1.8
2
2003 2004 2005 2006 2007 2008 2009 2010 2011 2012 2013 2014
Year
Pre
miu
m (
mil
lio
ns)
This chart clearly shows the cyclical nature of the insurance market (for example, premiums halved between 2006 and 2008) and the impact of the Canterbury earthquakes. Orion has insured its key substations and its corporate properties throughout this period.

COMMERCE COMMISSION AND ORION NZ LTD
MARSH
16
10 Network owners’ future approach The current approach in our region (insured key substations under MD/BI) has been the norm for over a decade. Marsh does not expect any material softening or change in the insurance market that will trigger a material change to this approach in the future.

COMMERCE COMMISSION AND ORION NZ LTD
MARSH
17
11 Catastrophe insurance claims can be complex It’s useful to understand Orion’s earthquake claims experience so far. Catastrophe claims, and especially Canterbury earthquake claims are time consuming and complex for all concerned. However we believe that Orion is managing its claims process in a very professional manner and that Orion and its insurers are making good progress in resolving those claims. Orion’s largest MD/BI claims relate to:
• Orion’s CBD offices and ancillary buildings on its CBD site and their respective contents – Orion has cash settled with insurers for over $20m for these and the offices and one of the ancillary buildings have been demolished
• Orion’s Brighton zone substation – this substation in the eastern suburbs was damaged but the actual equipment largely survived; it and another smaller substation needed to be relocated 1.5km away at Rawhiti Domain. This is a very complex MD and BI claim, which is currently in discussion with insurers.
• Orion’s other damaged substations • Orion’s increased costs of working – capped at $5m and they need to be due to physical
damage to Orion’s insured property. We understand that Orion has experienced a significant drop in its network delivery revenues. The majority of that reduction in revenue has been caused by uninsured events such as:
• depopulation • damage to Orion’s underground 11kV cables in the eastern suburbs.
The BI insurance that Orion was able to purchase will provide very little contribution to the total reduction in revenue suffered by Orion.. We expect that Orion’s earthquake MD and BI claims process will continue well into next year.
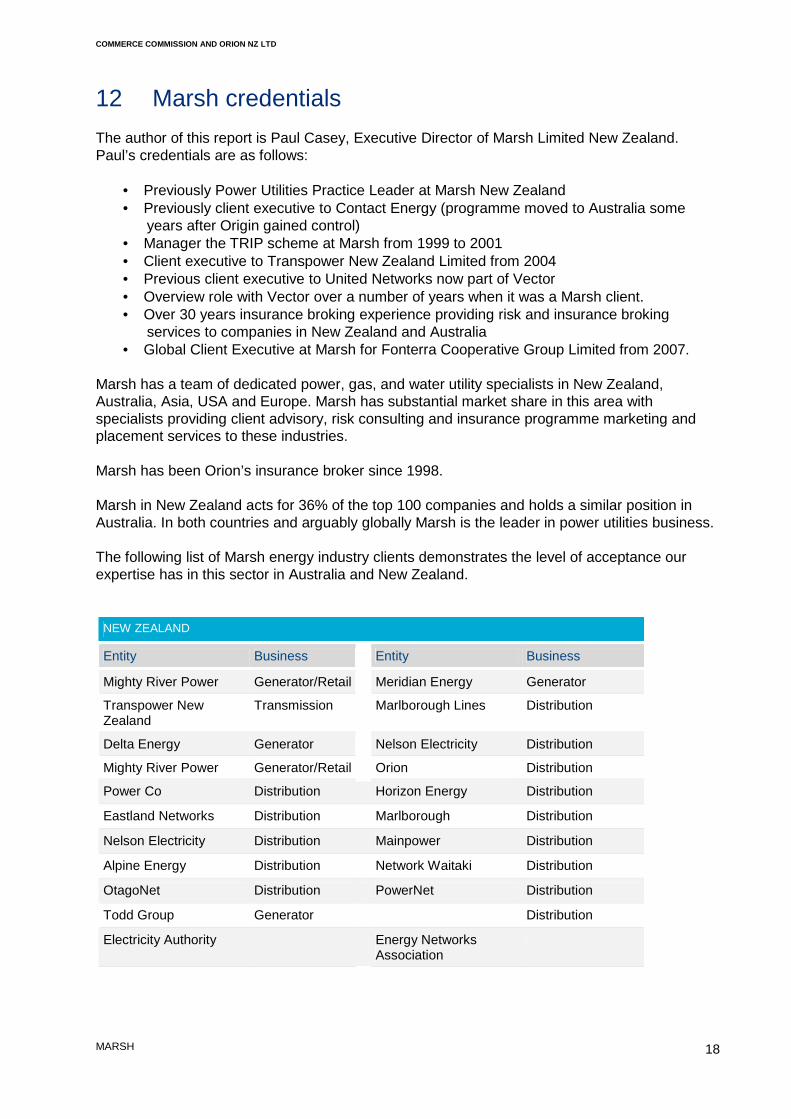
COMMERCE COMMISSION AND ORION NZ LTD
MARSH
18
12 Marsh credentials The author of this report is Paul Casey, Executive Director of Marsh Limited New Zealand. Paul’s credentials are as follows:
• Previously Power Utilities Practice Leader at Marsh New Zealand • Previously client executive to Contact Energy (programme moved to Australia some
years after Origin gained control) • Manager the TRIP scheme at Marsh from 1999 to 2001 • Client executive to Transpower New Zealand Limited from 2004 • Previous client executive to United Networks now part of Vector • Overview role with Vector over a number of years when it was a Marsh client. • Over 30 years insurance broking experience providing risk and insurance broking
services to companies in New Zealand and Australia • Global Client Executive at Marsh for Fonterra Cooperative Group Limited from 2007.
Marsh has a team of dedicated power, gas, and water utility specialists in New Zealand, Australia, Asia, USA and Europe. Marsh has substantial market share in this area with specialists providing client advisory, risk consulting and insurance programme marketing and placement services to these industries. Marsh has been Orion’s insurance broker since 1998. Marsh in New Zealand acts for 36% of the top 100 companies and holds a similar position in Australia. In both countries and arguably globally Marsh is the leader in power utilities business. The following list of Marsh energy industry clients demonstrates the level of acceptance our expertise has in this sector in Australia and New Zealand.
NEW ZEALAND
Entity Business Entity Business
Mighty River Power Generator/Retail Meridian Energy Generator
Transpower New Zealand
Transmission Marlborough Lines Distribution
Delta Energy Generator Nelson Electricity Distribution
Mighty River Power Generator/Retail
Orion Distribution
Power Co Distribution Horizon Energy Distribution
Eastland Networks Distribution Marlborough Distribution
Nelson Electricity Distribution Mainpower Distribution
Alpine Energy Distribution Network Waitaki Distribution
OtagoNet Distribution PowerNet Distribution
Todd Group Generator Distribution
Electricity Authority Energy Networks Association

COMMERCE COMMISSION AND ORION NZ LTD
MARSH
19
VICTORIA
Entity Business Entity Business
TRUenergy Generator IPower Retailer
Hazelwood Power Generator Vemco Vegetation Mgt
Loy Yang B Generator Basslink Transmission
Loy Yang Power Generator Toora Wind Farm
Gas Pipelines Victoria Transmission Oaklands Hill Wind Farm
United Energy Distribution
Distributor Macarthur Wind Farm
MultiNet Group – Gas Distributor
NEW SOUTH WALES
Entity Business Entity Business
Country Energy Distributor DirectLink Transmission
Delta Electricity Generator AGL Generator
Eraring Energy Generator Murubeni Power Development
Co-Generator Plant
Smithfield Generator APT Gas Transmission
Actew/AGL Distributor/ Retail
Capital Wind Wind Farm
QUEENSLAND WESTERN AUSTRALIA
Entity Business Entity Business
Stanwell Corporation Generator
Condamine Power Station
Generator
Newgen Power Kwinana Partnership
Generator
Powerlink Queensland Transmission
Oakey Power Generator
NewGen Neerabup Power Station
Generator
Collinsville Power Station
Generator Kemerton Power Station
Generator
Townsville Power Station
Generator Collgar Wind Farm
Windy Hill Wind Farm
Alinta Wind Farm
SOUTH AUSTRALIA TASMANIA
Entity Business Entity Business
International Power (Australia)
Generator Hydro Generator
ElectraNet Transmission Transend Transmission
Infratil Generator
Aurora Energy Retail/Distribution

Marsh Ltd Level 18, 151 Queen Street PO Box 2221, Shortland Street Auckland 1140, New Zealand +64 9 379 6640

Appendix 12 Quantity growth trends

General connections
350,000
360,000
370,000
380,000
390,000
400,000
410,000
420,000
430,000
440,000
450,000
460,000
470,000
480,000
490,000
500,000
2005 2006 2007 2008 2009 2010 2011 2012 2013
Ch
arg
eab
le p
eak p
eri
od
(kW
)
Year to 31 March
General peak
Prior values
Original projection
Projection
Linear (Trend Line (5 years))
900
925
950
975
1,000
1,025
1,050
1,075
1,100
1,125
1,150
1,175
1,200
1,225
1,250
1,275
1,300
2005 2006 2007 2008 2009 2010 2011 2012 2013
Ch
arg
ea
ble
vo
lum
e (
GW
h)
Year to 31 March
General volume
Day prior valuesOriginal projection DayNight/Weekend prior valuesOriginal projection Night/Weekend projectionProjection DayProjection NightLinear (Night/Weekend trend line (5 years))Linear (Night/Weekend trend line (5 years))

Irrigation connections
40,000
45,000
50,000
55,000
60,000
65,000
70,000
75,000
2005 2006 2007 2008 2009 2010 2011 2012 2013
Ch
arg
eab
le c
ap
acit
y (
kW
)
Year to 31 March
Irrigation capacity
Prior values
Projection (same as current year)
Inflated by addition of discretionary small irrigators many of which have/will opt-out
0
20,000
40,000
60,000
80,000
100,000
120,000
140,000
2005 2006 2007 2008 2009 2010 2011 2012 2013
Ch
arg
ea
ble
vo
lum
e (
GW
h)
Year to 31 March
Irrigation volume
Day prior values
Day trend line (5 year)
Day projection
Night/Weekend prior values
Night/Weekend trend line (5 year)
Night/Weekend projection

Street lighting connections
10,000
15,000
20,000
25,000
30,000
35,000
40,000
45,000
2005 2006 2007 2008 2009 2010 2011 2012 2013
Cre
dit
ab
le r
eb
ate
s (k
VA
r a
nd
kW
)
Year to 31 March
Irrigation rebates
Interruptibility prior values
Interruptibility projection
PF Correction prior values
PF Correction trend line (5 year trend)
PF Correction projection
Interruptibility trend line (5 year trend)
30,000
32,000
34,000
36,000
38,000
40,000
42,000
44,000
2005 2006 2007 2008 2009 2010 2011 2012 2013
Ch
arg
ea
ble
co
nn
ec
tio
ns
Year to 31 March
Streetlighting fixed chargeable quantity
Prior values
Trend line (5 year SL)
Projection

0
500
1,000
1,500
2,000
2,500
3,000
3,500
2005 2006 2007 2008 2009 2010 2011 2012 2013
Ch
arg
eab
le p
eak p
eri
od
(kW
)
Year to 31 March
Streetlighting peak
Prior values
Projection (5 year average)
Volatility results from the proportion of peak periods that occur in the evening, rather than in the morning.
0
5,000
10,000
15,000
20,000
25,000
2005 2006 2007 2008 2009 2010 2011 2012 2013
Ch
arg
ea
ble
vo
lum
e (
MW
h)
Year to 31 March
Streetlighting volume
Day prior values
Day trend line (5 year)
Day projection
Night/Weekend prior values
Night/Weekend trend line (5 year)
Night/Weekend projection

Appendix 13 Detailed calculations for weighted average growth in quantities

Detailed calculations for weighted average growth in quantities
IM 5.4.8(5)
This appendix contains additional information related to the forecast weighted average growth in quantities, as discussed in Section 7.2.5 of the proposal.
Historical quantities for FY05 to FY12
The table below shows historical quantities, from FY05 to FY12, for each charge.
Historical quantities for each consumer group by charge type
FY05 FY06 FY07 FY08 FY09 FY10 FY11 FY12
General connections
Peak charge (kW) 414,626 437,684 466,538 479,290 471,481 469,853 484,724 446,363
Volume charge: working weekdays (MWh) 982,940 999,562 1,031,331 1,021,961 1,056,117 1,082,974 1,033,761 974,117
Volume charge: nights, weekends, holidays (MWh) 1,195,614 1,192,348 1,229,876 1,228,087 1,252,408 1,275,326 1,207,887 1,139,712
Low power factor charge (kVAr) 101 101 101 101 101 0 0 0
Major customer connections
Fixed charge: standard connections (connections) 390 395 395 395 410 408 416 366
Fixed charge: secondary connections (connections) 18 18 17 17 17 17 16 14
Fixed charge: dedicated equipment (by item $000) 1,287,000 1,301,000 1,298,421 1,298,820 1,719,374 1,748,476 1,819,638 1,654,000
Peak charge (kVA) 112,189 122,361 122,589 118,251 115,943 124,192 116,648 107,898
Capacity charge (kVA) 204,723 212,142 212,413 209,390 211,683 212,797 210,496 201,250
Irrigation connections
Capacity charge (kW) 55,033 56,493 59,549 61,278 62,766 68,609 69,213 70,446
Volume charge: working weekdays (MWh) 43,087 50,481 37,627 56,049 63,920 58,440 66,719 54,359
Volume charge: nights, weekends, holidays (MWh) 73,941 89,879 72,377 104,020 109,647 103,755 117,920 95,063
Rebate: power factor correction (kVAr) 20,124 23,105 24,296 25,029 26,094 27,293 27,387 27,530
Rebate: interruptibility (kW) 25,129 27,220 39,299 36,083 37,785 38,763 39,510 40,964
Street lighting connections
Fixed charge (connections) 38,399 39,245 40,135 40,896 41,500 42,016 42,375 42,707
Peak charge (kW) 2,730 3,000 2,271 2,787 1,990 2,736 1,971 2,274
Volume charge: working weekdays (MWh) 3,241 3,328 3,889 3,390 3,290 3,301 3,309 3,279
Volume charge: nights, weekends, holidays (MWh) 22,173 22,405 22,926 23,731 22,532 22,757 22,900 22,810
Large Capacity - Fonterra
Administration charge (kVA) - - - - - - - -
Use of distribution assets (kVA) - - - - - - - -
Lareg capacity - Synlait
Administration charge (kVA) - - - - 4,800 3,058 3,445 5,800
Asset charge (kVA) - - - - - - - 5,800
Export and generation
Real power distribution component (kW) 3,171 2,277 3,747 4,036 3,241 3,130 2,649 2,104
Reactive power distribution component (kVAr) 1,681 2,251 2,517 2,545 2,217 1,937 1,710 1,127
Generation credits (kWh) - - 8,262 40,721 65,423 357,450 307,554 422,808

Reconciliation between DPP revenue quantities and CPP quantities
The two tables below reconcile the FY10 quantities used in this CPP proposal and those from our current DPP. The first table shows the quantities in FY10 for each charge. These are used to help derive our forecast quantities for each charge. The second table shows the assessed DPP quantities for FY10.
CPP Quantities
Components Units Actual 09/10 References
Streetlighting connections
Fixed charge Connections 42,016 a
Peak charge (peak period demand) kW 2,736 to b
Volume charge
Working weekdays (7am - 9pm) MWh 3,301 to c
Nights, weekends and holidays MWh 22,757 to d
General connections
Peak charge (peak period demand) kW 469,853 to b
Volume charge
Working weekdays (7am - 9pm) MWh 1,082,974 to c
Nights, weekends and holidays MWh 1,275,326 to d
Low power factor charge kVAr - e
Irrigation connections
Capacity charge kW 68,609 f
Volume charge
Working weekdays (7am - 9pm) MWh 58,440 to c
Nights, weekends and holidays MWh 103,755 to d
Rebates
Power factor correction rebate kVAr 27,293 g
Interruptibility rebate kW 38,763 h
Major customer connections & Embedded networks
Fixed charge
Fixed (Standard connections) Connections 408 i
Fixed (Secondary connections) Connections 17 j
Dedicated Equipment By item ($000) 1,748,476
Peak charge (control period demand) kVA 124,192 k
Capacity charge
Assessed capacity distribution kVA 212,797 l
Assessed capacity transmission kVA 227,952 n/a
Large capacity connections (Synlait)
Distribution charge
Administration kVA 3,058 m
Asset Charge 35% n
Transmission charge
Interconnection charge (winter) kVA 607 n/a
Interconnection charge (summer) kVA 3,058 n/a
Use of transmission connection assets 4% n/a
Large capacity connections (Fonterra) - no charge in 2010 and hence there are no quantities
Distribution charge
Administration kVA
Use of distribution assets kVA
Transmission charge
Interconnection charge (winter) kVA
Interconnection charge (summer) kVA
Use of transmission connection assets kVA
Export and generation
Real power distribution component kW 3,130 p
Reactive power distribution component kVAr 1,923 q
Real power transmission component kW 3,130 n/a
Generation credits kWh 357,450 r
Grouping streetlight, general and irrigation Units Actual 09/10 References
Peak charge (peak period demand)
Streetlighting connections kW 2,736
General connections kW 469,853
kW 472,589 b
Volume charge
Working weekdays (7am - 9pm)
Streetlighting connections MWh 3,301
General connections MWh 1,082,974
Irrigation connections MWh 58,440
1,144,715 c
Nights, weekends and holidays
Streetlighting connections MWh 22,757
General connections MWh 1,275,326
Irrigation connections MWh 103,755
MWh 1,401,838 d

DPP Quantities - price path assessment as at 31 March 2012
Components Units Quantities (Qi,2010) References
Streetlighting, general and irrigation connections
Streetlighting fixed charge Connections 42,016 a
Streetlighting and general connections
Peak charge (peak period demand) kW 472,589 b
Streetlighting, general and irrigation connections volume charge
Working weekdays (7am - 9pm) MWh 1,144,715 c
Nights, weekends and holidays MWh 1,401,838 d
General connections
Low power factor charge kVAr - e
Irrigation connections
Capacity charge kW 68,609 f
Power factor correction rebate kVAr 27,293 g
Interruptibility rebate kW 38,763 h
Major customer connections
Fixed charge
Fixed (Standard connections) Connections 408 i
Fixed (Secondary connections) Connections 17 j
Peak charge (control period demand) kVA 124,192 k
Capacity charge
Assessed capacity distribution kVA 212,797 l
Assessed capacity transmission kVA 227,653 n/a
Large capacity connections (Synlait)
Distribution charge
Administration kVA 3,058 m
Use of distribution assets 35 n
Transmission charge
Interconnection charge (winter) kVA 607 n/a
Interconnection charge (summer) kVA 3,058 n/a
Use of transmission connection assets 4 n/a
Export and generation
Real power credit kW 3,130 p
Reactive power credit kVAr 1,923 q
Generation credit kWh 357,450 r

Appendix 14SKM’s Report on Initial RAB Adjustments

Independent Engineer’s Report on the Asset Adjustment Process of: Orion NZ Ltd
9 October 2012

The SKM logo trade mark is a registered trade mark of Sinclair Knight Merz Pty Ltd.
Independent Engineer’s Report on the Asset Adjustment Process of: Orion NZ Ltd
9 October 2012
Level 2 Carlaw Park 12-16 Nicholls Lane Parnell 1149 PO Box 9806 Auckland Tel: +64 9 928 5500 Fax: +64 9 928 5501 Web: www.skmconsulting.com COPYRIGHT: The concepts and information contained in this document are the property of Sinclair Knight Merz Pty Ltd. Use or copying of this document in whole or in part without the written permission of Sinclair Knight Merz constitutes an infringement of copyright.
LIMITATION: This report has been prepared on behalf of and for the exclusive use of Sinclair Knight Merz Pty Ltd’s Client, and is subject to and issued in connection with the provisions of the agreement between Sinclair Knight Merz and its Client. Sinclair Knight Merz accepts no liability or responsibility whatsoever for or in respect of any use of or reliance upon this report by any third party.

Orion Asset Adjustment Process
Contents Executive Summary 1 1. Introduction 2
1.1. Background 2 1.2. Processes 2
2. Information Provided by Orion 3 3. Consideration of RAB Adjustments 4
3.1. Load Control Relays 4 3.2. Correct Asset Register Errors 4 3.3. Reapplication of Asset Multipliers 4 3.4. Reapplication of Existing or Modified Multiplier Types 4 3.5. Re-apply Optimisation and/or Economic Value Test 5 3.6. Re-categorisation of Assets 5
4. Roll-forward 2005-2009 6 4.1. Asset Re-categorisation Adjustment 6
5. Summary 8 Appendix A Table Summary of Asset Value Adjustments: Schedule A4 9 Appendix B Orion Instructions to Engineer 10 Appendix C Signed Statement by Engineer 11 Appendix D Initial Regulatory Asset Base as at 31 March 2009 12
SINCLAIR KNIGHT MERZ
PAGE i

Orion Asset Adjustment Process
Document history and status Revision Date issued Reviewed by Approved by Date approved Revision type
0 8 October 2012
C Parker S Wightman 1 October 2012 Draft for client comment
1 9 October 2012 S Wightman S Wightman 9 October 2012 Final
Distribution of copies Revision Copy no Quantity Issued to
0 Electronic 1 Bruce Rogers (Orion – Pricing Manager)
1 Electronic 1 Bruce Rogers (Orion – Pricing Manager)
Printed: 9 October 2012
9 October 2012 12:11 PM Last saved:
I:\ZPINA\Projects\ZP01286\Deliverables\Reports\ZP01286 - Orion NZ Ltd Engineering Report (Draft) rev 1 9-10-2012.docx
File name:
Richard Fairbairn Author:
Richard Fairbairn Project manager:
Orion New Zealand Limited Name of organisation:
Orion - Certification of RAB (2012) Name of project:
Independent Engineer’s Report on the Asset Adjustment Process of Orion NZ Ltd Name of document:
Version 1 Document version:
ZP01286 Project number:
SINCLAIR KNIGHT MERZ PAGE ii

Orion Asset Adjustment Process
SINCLAIR KNIGHT MERZ PAGE iii
GLOSSARY
EDB Electricity Distribution Business
DRC Depreciated Replacement Cost
EDB IM Electricity Distribution Services Input Methodologies GIS Geographic Information System
ODRC Optimised Depreciated Replacement Cost ODV Optimised Deprival Valuation
ORC Optimised Replacement Cost
RAB Regulatory Asset Base
RC Replacement Cost
SKM Sinclair Knight Merz

Orion Asset Adjustment Process
SINCLAIR KNIGHT MERZ PAGE 1
Executive Summary On 22 December 2010 the Commerce Commission (Commission) released a document entitled “Commerce Act (Electricity Distribution Input Methodologies) Determination 2010” (EDB IM). The EDB IM outlines a set of modifications (referred to as the “asset adjustment process”) that Electricity Distribution Businesses (EDBs) may choose to undertake to their disclosed 2004 ODVs as part of the process to establish an Initial Regulatory Asset Base (Initial RAB) as defined in clause 2.2.2 of the EDB IM.
On 27 August 2012 Orion New Zealand Limited received, from the Commission, a “Notice to supply information to the Commerce Commission Section - 53ZD of the Commerce Act 1986” (Section 53ZD Notice). Associated with this Section 53ZD Notice was the requirement that Orion supply an independent Engineer’s Report in respect of the asset adjustment process used for setting its Initial RAB. The exact requirements of this report are contained in “Schedule E: Information Requirements for Engineer’s Report” of the Section 53ZD Notice.
Sinclair Knight Merz (SKM) was requested by Orion to review changes made to the initial RAB and confirm that they meet with the requirements of the asset adjustment process outlined in Clause 2.2.1 of the Commerce Commission’s EDB IM. In particular, to review adjustments Orion has made that relate to clause 2.2.1(2)(b) where post 1 April 2004 additions have been re-categorised for the purpose of calculating depreciation by assigning the appropriate standard physical asset lives. These adjustments have been made in order to comply with the asset classes outlined in Schedule A of the EDB IM.
SKM has reviewed the re-categorisation of asset additions for the period 2005-2009 and deems the judgements and assumptions applied to be reasonable. SKM has not undertaken a detailed audit of the value assigned to each sub-category, as this is the responsibility of Orion’s auditors (Audit NZ).
No adjustments to assets existing at 2004 were made by Orion.
The following table summarises the adjustments arising from Orion’s proposed additions and deletions relating to the period 2005 through 2009 (year ending 31 March).
Year 2004 2005 2006 2007 2008 2009
Value of Adjustments (ODV) $0.0k $0.2k ($65.7k) ($134.4k) ($194.7k) ($357.8k)

Orion Asset Adjustment Process
SINCLAIR KNIGHT MERZ PAGE 2
1. Introduction 1.1. Background
Sinclair Knight Merz Ltd (SKM) was requested by Orion New Zealand Limited (Orion) to undertake an independent review of its asset adjustment process. SKM’s review was undertaken to determine the appropriateness of the proposed adjustments in respect of the asset adjustment process as set out in clause 2.2.1 of the “Commerce Act (Electricity Distribution Services Input Methodologies) Determination 2010”, 22 December 2010 (EDB IM).
This report details the findings of the independent review and has been prepared to comply with the requirements for the independent Engineer’s Report in Schedule E of the Commerce Commission’s “Notice to supply information to the Commerce Commission Section 53ZD of the Commerce Act 1986 (Section 53ZD Notice), dated 27 August 2012. A copy of the signed statement required by the Section 53ZD Notice is provided in Appendix C.
SKM notes that Orion does not propose to make any adjustments to the 2004 ODV, which typically comprises of the following items: the inclusion of load control relays; corrections for asset errors; the reapplication of asset multipliers; and the reapplication of optimisation or economic value.
The EDB IM also allows for changes to be made under the asset adjustment process to those assets allocated to the incorrect asset category, or given an estimation of quantity, age, category or locations now know to be incorrect, which assets are designated as of “value modified” type.
Orion has proposed to correct the classification of some of its assets in its valuation database with the result that some small adjustments are required to the RAB particularly in relation to depreciation over the 2005-2009 period.
SKM has focused principally on the methodology that Orion has used to its re-categorise assets.
1.2. Processes
The preparation of this report has been the responsibility of SKM. SKM has relied upon information and data prepared by Orion. Wherever possible we have sought to verify this data to check its validity including liaising with Orion’s staff. SKM has not conducted field /site visits to confirm the accuracy of Orion’s asset management systems. In the interests of accuracy and completeness, there has been interaction between SKM and Orion during the review. This has been undertaken via telephone discussions and email correspondence.

Orion Asset Adjustment Process
SINCLAIR KNIGHT MERZ PAGE 3
2. Information Provided by Orion Orion supplied SKM with a number of documents and files to support the review, as follows:
“Initial Regulatory Asset Base as at 31 March 2009”, Orion report issued 9 October 2012. [see Appendix D]
“Regulatory Valuation Register”, MS-Access database populated from the company’s asset management systems/databases.
“Orion 2004 ODV Asset Schedules report”
“Orion Report on Optimised Deprival Valuation of System Fixed Assets as at 31 March 2004”, dated 7 December 2004.
“53ZD Notice Schedule A4 (30 August 2012).xls”, MS-Excel file containing breakdown of inputs to Appendix A4 of EDB IM.

Orion Asset Adjustment Process
SINCLAIR KNIGHT MERZ PAGE 4
3. Consideration of RAB Adjustments This section considers the basis for adjustments to the Orion 2004 RAB, made under the asset adjustment process.
3.1. Load Control Relays
Reference EDB IM cl 2.2.1(2)(a). An EDB may designate a load control relay asset owned by an EDB, except a 2009 disclosed asset, as of ‘included’ type. Clause 2.2.1(3) goes on to say that assets to which sub-clause (2)(a) applies may be valued as:
its depreciated historic cost as at 31 March 2009; or
if there are insufficient records, then its depreciated carrying value from the general purpose financial statements.
Orion has not included load control relays in its 2004 RAB.
3.2. Correct Asset Register Errors
Reference EDB IM cl 2.2.1(2)(b). EDBs may correct asset related errors in the light of new information. The allowable corrections being due to:
assets being omitted in error;
assets being included in error;
assets being incorrectly categorised; and
asset ages, quantity, category or locations being incorrectly recorded.
Orion has not identified any errors or omissions in its 2004 RAB requiring correction.
3.3. Reapplication of Asset Multipliers
Reference EDB IM cl 2.2.1(2)(c). EDBs may reapply multipliers where more accurate information has become available.
Orion has not proposed to make any adjustments to its application of multipliers used in its 2004 RAB.
3.4. Reapplication of Existing or Modified Multiplier Types
Reference EDB IM cl 2.2.1(2)(d). EDBs may reapply the multiplier types (rugged terrain multiplier; business district multiplier; rocky ground multiplier) within the ranges and circumstances specified in the ODV handbook.
Orion has not proposed to make any adjustments to its application of multipliers used in its 2004 RAB.

Orion Asset Adjustment Process
SINCLAIR KNIGHT MERZ PAGE 5
3.5. Re-apply Optimisation and/or Economic Value Test
Reference EDB IM cl 2.2.1(2)(e). EDBs may reconsider the application of optimisation or economic value testing based on the network conditions during 2009.
Orion has not proposed any optimisation or EV adjustments to its 2004 RAB.
3.6. Re-categorisation of Assets
Orion’s report “Initial Regulatory Asset Base as at 31 March 2009, issued 9 October 2012” (a copy of this report is included in Appendix D) sets out the methodology adopted by Orion to correct the allocation of asset additions since 2004 (categorisation corrections) in accordance with Schedule A of the EDB IM and the subsequent changes to the calculation of depreciation from those given in Orion’s Electricity Distribution (Information Disclosure) from 2005 to 2009.

Orion Asset Adjustment Process
SINCLAIR KNIGHT MERZ PAGE 6
4. Roll-forward 2005-2009 4.1. Asset Re-categorisation Adjustment
Over the period 2005 through 2009 Orion recorded asset additions in approximately fifteen different high level asset classes and while these were in accordance with disclosure requirements at the time, they were not necessarily in the form required by Schedule A of the EDB IM.
Orion proposes to re-categorise the additions and deletions, over the period 2005 through 2009, into asset categories that align with Schedule A of the EDB IM. This, in turn, has impacted on the depreciation that Orion disclosed over the period 2005 through 2009.
Orion’s process of re-categorisation has required estimation and engineering judgement. SKM has reviewed Orion’s re-categorisation process and specifically notes the following:
1) Five of the original Orion general ledger asset classes (“Ripple Injection”, “SCADA Equip”, “SCADA & ripple software”, “Building Kiosks” and “Buildings Pole”) have been allocated directly to three of the EDB IM asset classes ((i) Ripple injection plant, (ii) SCADA and communications, (iii) Distribution substations.
2) Seven of the original Orion general ledger building & easement asset classes have been allocated into three EDB IM asset classes ((i) Zone substation; site development and buildings, (ii) Distribution substations and (ii) Easements).
3) Six of the original Orion general ledger asset classes (“Transformer”, “Underground cables”, “Overhead lines”, “LC Switchgear & misc equip”, “HV Switchgear & misc equip” and “Land substations & Kiosk land”) have been allocated to align with the EDB IM asset classes. Orion has estimated the proportion of the split by considering historical information that it has access to, for example, Orion’s capital expenditure prior to 2004.
4) Overhead line additions, over the period 2005-2009, have been based on a wood pole 45 year standard life, whereas overhead lines had previously been depreciated over 49.9 years based on the weighted average of wood and concrete pole used up until 2004). This change is based on the fact that Orion has reassessed its additions/standards and identified that wood pole installations have predominated over the 2005-2009 period.
5) XLPE cable additions have been depreciated based on a cable life of 45 years (previously depreciated over 46.7 years) based on the standard life in Appendix A of the ODV handbook and using the 2008 Information Disclosure Requirements.
SKM is of the view that methodology used by Orion to align the asset categorisation of additions / deletions from 2005 to 2009 is reasonable and further that the additions over the period 2005-2009 are assigned the appropriate standard asset lives in Schedule A of the EDB IM. A consequence of the adjustment process is a greater depreciation charge associated with asset additions over the 2005-2009 period (when compared to that previously disclosed).

Orion Asset Adjustment Process
SINCLAIR KNIGHT MERZ PAGE 7
SKM has not audited the re-categorisation data provided by Orion and has relied on the documentation that has been supplied. Furthermore, SKM understands that the historical costs provided in the roll forward have been reviewed by an accountant and that the roll forward has been subject to an audit by Orion’s auditors.
The annual adjustments over the period 2005-2009 are outlined in Table 1.
Table 1 : Additions, Disposals, Depreciation & Revaluation: 2005-2009 period
Year Original disclosed New roll-forward Annual Difference
2005 $28,646,000 $28,646,227 $227 2006 $29,543,000 $29,477,259 ($65,741) 2007 $22,737,000 $22,602,568 ($134,432) 2008 $39,397,000 $39,202,350 ($194,650) 2009 $35,219,000 $34,861,230 ($357,770)
The total closing values over the 2005-2009 period are outlined in Table 2.
Table 2 : Closing values: 2005-2009 period and cumulative difference
Year Original disclosed New roll-forward Cumulative Difference
2005 $608,870,000 $608,870,227 $227 2006 $638,413,000 $638,347,486 ($65,514) 2007 $661,150,000 $660,950,054 ($199,946)
2008 $700,547,000 $700,152,403 ($394,597)
2009 $735,765,000 $735,013,633 ($751,367)

Orion Asset Adjustment Process
SINCLAIR KNIGHT MERZ PAGE 8
5. Summary Orion proposes to make no changes to its 2004 RAB. Orion has proposed to re-categorise some of the asset additions over the period 2005 to 2009 to correctly identify with Schedule A of the EDB IM. The proposed changes are outlined in Schedule A4 in Appendix A.

Orion Asset Adjustment Process
Appendix A Table Summary of Asset Value Adjustments: Schedule A4
EDB NameDisclosure Year Ended
SCHEDULE A4: ASSET ADJUSTMENT PROCESSrow
6 Summary of Engineer's Valuation Adjustments (at time asset enters regulatory asset register)
7 2004 * 2005 2006 2007 2008 20098 Asset adjustment process - adjustments ($000) ($000) ($000) ($000) ($000) ($000) Ref9
10 Include load control relays nil 2.2.1(2)(a)
11 Correct asset register errors for 2004 ODV assets
12 No asset register errors corrected nil13
14
15 nil 2.2.1(2)(b)
16 Correct asset register errors for 2005 – 2009 assets
17 Depreciation and resulting revaluation differences from recategorisation of 05 to 09 additions18 Lines 0 (13) (26) (40) (59)19 Cables 0 (24) (51) (84) (132)20 Transformers 0 12 14 (27) (30)21 Other assets 0 (42) (72) (43) (135)22 Other rounding differences 0 1 (0) (2) (2)23 0.227 (65.741) (134.432) (194.650) (357.770) 2.2.1(2)(b)
24 Re-apply an existing multiplier to 2004 ODV assets
25 No changes to multipliers nil262728 nil 2.2.1(2)(c)
29 Re-apply a modified multiplier to 2004 ODV assets30 No changes to multipliers nil313233 nil 2.2.1(2)(d)
34 Re-apply optimisation or EV tests to 2004 ODV assets35 No change to optimisation or EV tests363738 nil 2.2.1(2)(e)3940 Total value of adjustments by disclosure year nil 0.227 (65.741) (134.432) (194.650) (357.770)
4142 Page 6
Orion New Zealand Limited31 March 2010
* Includes assets which first entered the regulatory asset register in a disclosure year prior to 2004.
SINCLAIR KNIGHT MERZ PAGE 9

Orion Asset Adjustment Process
SINCLAIR KNIGHT MERZ PAGE 10
Appendix B Orion Instructions to Engineer

Orion Asset Adjustment Process
SINCLAIR KNIGHT MERZ PAGE 11
Appendix C Signed Statement by Engineer

Sinclair Knight Merz PO Box 9806 Newmarket 1023 Auckland New Zealand
Tel: +64 9 928 5500 Fax: +64 9 928 5501 Web: www.skmconsulting.com
Bruce Rogers Pricing Manager (Commercial) Orion New Zealand Limited PO Box 13896 Christchurch 8141 New Zealand
9 October 2012 ZP01286
Sinclair Knight Merz Limited The SKM logo trade mark is a registered trade mark of Sinclair Knight Merz Pty Ltd. Offices across Australia, New Zealand, UK, South East Asia, Middle East, the Pacific and Americas
Dear Sir
Statement Regarding Independent Engineer's Report on the Asset Adjustment Process of Orion New Zealand Limited
Introduction
Sinclair Knight Merz Ltd (SKM) was requested by Orion NZ Ltd (Orion) to undertake an independent review of proposed adjustments to its regulatory asset base as at 31st March 2004. This review was undertaken to determine the appropriateness of the proposed adjustments in respect of the process set out in clause 2.2.1 of the “Commerce Act (Electricity Distribution Input Methodologies) Determination 2010”, 22 December 2010 (EDB IM).
SKM’s findings are set out in the enclosed report which has been prepared to comply with the requirements for the Independent Engineer’s report in Schedule C of the Commerce Commission’s “Notice to supply information to the Commerce Commission Section 53ZD of the Commerce Act 1986 (Section 53ZD Notice) dated 27 August 2012. This letter incorporates the signed statement required by the Section 53ZD Notice.
Confirmation of Independence and Qualifications
I, as a chartered professional engineer (as defined in section 6 of the Chartered Professional Engineers Act 2002), can confirm that:
1) SKM has acted independently with respect to Orion and its subsidiaries and affiliates;
2) SKM has significant experience in New Zealand, Australia and the United Kingdom in relation to the valuation of electricity networks for both regulatory and financial reporting purposes. SKM’s review and the preparation of the report have been undertaken by Dr Richard Fairbairn and Mr Stephen Wightman. Dr Fairbairn and Mr Wightman are professionally qualified and experienced in the type of work concerned and are familiar with the Orion network;
3) the report is in writing and accessible in electronic (PDF file-type) format and includes a copy of the written instructions provided to SKM by Orion (included as Appendix B to the enclosed report), including any subsequent variations or modifications;

Orion New Zealand Limited Statement Regarding Independent Engineer's Report on the Asset Adjustment Process of Orion NZ Ltd 09 October 2012
The SKM logo trade mark is a registered trade mark of Sinclair Knight Merz Pty Ltd. page 2
4) the report includes a table summarising the various asset value adjustments corresponding to Schedule A4 of the Information Disclosure Notice Templates (please see Appendix A to the enclosed report);
5) the report provides the minimum information for each category of asset adjustment outlined in Table 1 of the Section 53ZD Notice, together with such additional information sufficient to allow a reader:
i. to understand the data, information, calculations and assumptions employed in respect of each category of asset adjustment;
ii. to understand the extent to which professional judgement was exercised by SKM and the effect of that judgement in deriving the resultant asset values;
iii. to verify the arithmetical accuracy of the asset adjustment calculations; and 6) the report may be publicly disclosed by Orion pursuant to an information disclosure
determination in relation to Orion made by the Commission under section 52P of the Commerce Act (1986).
I can confirm that SKM is satisfied that:
i. the Orion’s rules have been properly applied for assets which had not had an Orion valuation calculated originally, as required by clause 2.2.1 of the EDB IM;
ii. where values under Generally Accepted Accounting Practice have been relied on, those values have been supplied or reviewed by an appropriately qualified party (e.g. accounting practitioner); and
iii. the report meets the requirements of Schedule C of the Section 53ZD Notice. SIGNED on behalf of Sinclair Knight Merz Limited by:
R. Fairbairn, MIET, MIPENZ, CPEng S. Wightman, MIPENZ Sinclair Knight Merz Sinclair Knight Merz

Orion Asset Adjustment Process
SINCLAIR KNIGHT MERZ PAGE 12
Appendix D Initial Regulatory Asset Base as at 31 March 2009

Regulatory valuation of system fixed assets pursuant to the
Commerce Act
(Electricity Distribution Services Input Methodologies) Determination 2010
Initial Regulatory Asset Base
as at 31 March 2009
Issued 9 October 2012

ORION NEW ZEALAND LIMITED INITIAL REGULATORY ASSET BASE 2009
2
Contents
Introduction ................................................................................................................ 3
Overview ..................................................................................................................... 4
Valuation register database ...................................................................................... 5
Adjustments to the 2004 ODV Valuation ................................................................. 8
Mapping of ODV Entries to Standard Categories ................................................... 9 Value as at 31 March 2004 ................................................................................................................ 9
Roll-forward 2005 to 2009 ....................................................................................... 11 Additions .......................................................................................................................................... 11
Disposals .......................................................................................................................................... 11
Revaluation ...................................................................................................................................... 13
Depreciation ..................................................................................................................................... 13
Finance During Construction allowance ........................................................................................... 13
Roll forward summary ...................................................................................................................... 14
Reconciliation with information disclosure requirements .................................................................. 15
Value as at 31 March 2009 – the Initial RAB .................................................................................... 16
Appendix A: Mapping of ODV values to new categories ..................................... 18
Appendix B: Mapping of Additions values to new categories ............................ 26

ORION NEW ZEALAND LIMITED INITIAL REGULATORY ASSET BASE 2009
3
INTRODUCTION
1 Orion New Zealand Limited (Orion) owns and operates the electricity distribution network in central Canterbury between the Waimakariri and Rakaia rivers, and from the Canterbury coast to Arthur’s Pass. Our network covers 8,000 square kilometres of diverse geography, including Christchurch city, Banks Peninsula, farming communities and high country regions. We receive electricity from Transpower’s national grid at 9 separate locations and we distribute this electricity to more than 192,000 homes and businesses.
2 As a natural monopoly service provider, we are subject to government regulation under the Commerce Act 1986 (the Act). Pursuant to the requirements of this Act, the Commerce Commission has set a regulatory framework that includes information disclosure (ID) regulation, default price-quality paths (DPP) and the option for electricity distribution businesses (EDBs) to apply for a customised price-quality path (CPP).
3 In accordance with the Act, the Commerce Commission has gazetted input methodologies (IMs) to be used in all forms of regulation applying to EDBs. These are embodied in the Commerce Act (Electricity Distribution Services Input Methodologies) Determination 2010 (the Determination) which, among other things, sets out how the regulatory asset base (RAB) value is to be established. ID, DPPs and CPPs require asset values which are established consistent with the IMs.
4 In accordance with the IMs, Orion must establish the value of its initial regulatory asset base, the Initial RAB (as at 31 March 2009). The methods to be applied for the Initial RAB are set out in Subpart 2 of Part 2 of the IMs.
5 Orion is currently applying for a CPP. In addition, we will shortly be subject to a new ID Determination, which will require us to disclose our Initial RAB (at 31 March 2009).
6 In order to facilitate our CPP application, which must be prepared before the ID information has been submitted, the Commerce Commission has issued a “Notice to Supply Information to the Commerce Commission” under section 53ZD of the Act (dated 27 August 2012), which requires us to provide a range of information including the Initial RAB value and supporting information.
7 This valuation report documents Orion’s establishment of its Initial RAB as at 31 March 2009 consistent with the Determination.

ORION NEW ZEALAND LIMITED INITIAL REGULATORY ASSET BASE 2009
4
OVERVIEW
8 The Determination effectively sets out a valuation method that starts with our 2004 published Optimised Deprival Valuation and rolls it forward. The Determination provides for:
8.1 a set scope of adjustments to the 2004 ODV valuation,
8.2 new asset values (added between 1 April 2004 and 31 March 2009) rolled in at capital cost,
8.3 an allocation methodology for assets that are used to provide services outside the scope of this regulation,
8.4 depreciation based on the remaining life of assets,
8.5 annual revaluation linked to CPI, and
8.6 a finance during construction (FDC) allowance of 2.45% applied to the 31 March 2009 closing value.
9 This valuation report sets out our approach for System Fixed Assets (those assets previously represented in our ODV). Other assets are dealt with separately, including head office land and buildings, works under construction, vehicles, IT, sundry plant and equipment, and truck mounted generators.

ORION NEW ZEALAND LIMITED INITIAL REGULATORY ASSET BASE 2009
5
VALUATION REGISTER DATABASE
10 To support the calculation of the Initial RAB, we have established a Microsoft Access database, called the “Regulatory Valuation Register”. The database is structured around a central table into which value entries are loaded. Each entry is linked to a standard reporting category (in the form of IM schedule A) and the database includes functionality to load sequential roll-forward transactions against each valuation entry.
Valuation entry information 2004 ODV assets 2004 – 2009 roll forward Valuation ID Incremental database ID Regulatory value category (Mandatory)
RV number Link to IM categorisation for reporting
Description (Mandatory)
Free form, description of the group of assets represented)
Origin (Mandatory)
Mandatory, set to 2004 ODV
Either 2004‐2009 additions, 2004‐2009 disposals
Designation
Either Included, Modified value
Null
Valuation date (Mandatory, effective date the asset is loaded to the valuation register)
31 March 2004 30 September of relevant year
Starting Value (Mandatory, the initial value of the entry)
the ODV value Either - the gross capital cost of assets (incl
vested assets paid for by a customer), - the disposal ODRC (as a negative
amount) (cash capital contributions are not entered)
Starting Remaining Life (the remaining life of the asset on entry to the valuation register)
The remaining life for the group of assets from the ODV model
Either - The TL consistent with the ODV
Handbook, or - 3 years for disposals
Notes Freeform memo field to document explanatory notes where relevant

ORION NEW ZEALAND LIMITED INITIAL REGULATORY ASSET BASE 2009
6
Roll forward transaction information
11 The annual roll forward calculation is carried out valuation-entry by valuation-entry. Each result is explicitly recorded as a transaction and value entries are rounded to the nearest cent. Calculations are as follows:
2004 – 2009 roll forward Transaction ID Incremental database IDParent Valuation ID Link to the valuation entry to which the transaction relates Opening value Set to
- ODV for valuation entry from ODV, else - nil if valuation entry was not present at end of previous year, else - closing value from previous year’s transaction.
Revaluation (CPI adjustment, positive increases a positive value entry, negative reduces a negative value asset)
Nil for additions and disposals during the year, otherwise calculate based on disclosure CPI (see below), against opening value.
Depreciation (negative reduces a positive value entry, positive increases a negative valuation entry toward nil)
Calculated as (Opening value + Revaluation) x min(max(prev closing RL‐3,0),1) prev closing remaining life (ie no depreciation in first part year, calculated against CPI adjusted opening value)
Closing remaining life Calculate as If first transaction for valuation entry then set to total life (consistent with ODV), else Prev closing remaining life ‐ min(max(prev closing remaining life ‐3,0),1)
Closing value Calculated as opening value plus additions/disposals plus CPI adjustment plus depreciation

ORION NEW ZEALAND LIMITED INITIAL REGULATORY ASSET BASE 2009
7
Valuation register example
12 The following screen shot shows an example of an entry in the valuation register – 66kV overhead lines (wood) additions during 2005, with transactions rolled-forward to 2009:
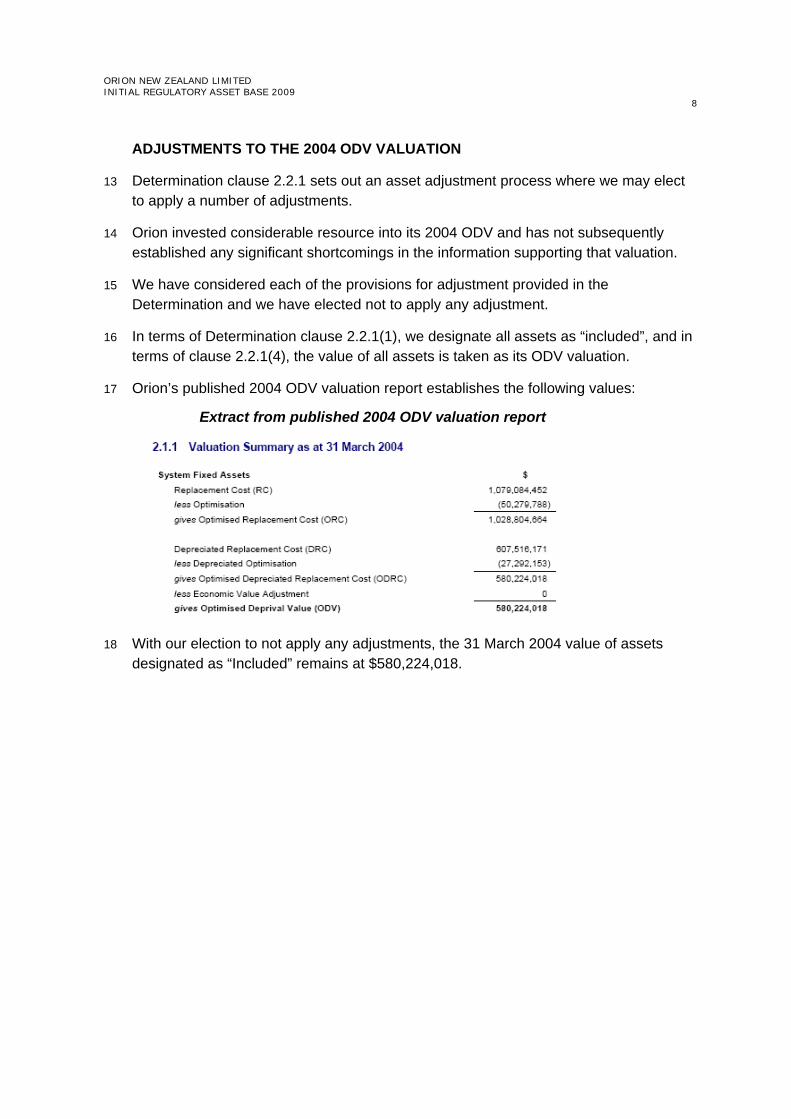
ORION NEW ZEALAND LIMITED INITIAL REGULATORY ASSET BASE 2009
8
ADJUSTMENTS TO THE 2004 ODV VALUATION
13 Determination clause 2.2.1 sets out an asset adjustment process where we may elect to apply a number of adjustments.
14 Orion invested considerable resource into its 2004 ODV and has not subsequently established any significant shortcomings in the information supporting that valuation.
15 We have considered each of the provisions for adjustment provided in the Determination and we have elected not to apply any adjustment.
16 In terms of Determination clause 2.2.1(1), we designate all assets as “included”, and in terms of clause 2.2.1(4), the value of all assets is taken as its ODV valuation.
17 Orion’s published 2004 ODV valuation report establishes the following values:
Extract from published 2004 ODV valuation report
18 With our election to not apply any adjustments, the 31 March 2004 value of assets designated as “Included” remains at $580,224,018.

ORION NEW ZEALAND LIMITED INITIAL REGULATORY ASSET BASE 2009
9
MAPPING OF ODV ENTRIES TO STANDARD CATEGORIES
19 Determination Schedule A sets out a table which provides a basis for standard reporting categories. We have augmented this table to accommodate our range of assets. Appendix A to this report sets out how we have aligned our ODV assets with the new categories.
20 The appendix shows that the total value mapped into the new categories matches the published ODV (see section above) of $580,224,018.
21 Of note, we have created a new category for our overhead lines which are recorded as having a mix of wood and concrete pole construction within each segment. It is not possible to split these between the new separate wood and concrete categories. New additions are assigned to the respective wood or concrete pole categories as appropriate.
22 ODV valuation entries are mapped and transferred to the new valuation register with their optimised depreciated replacement cost (and remaining life is also carried over). This mapping merely represents a different grouping of valuation entries to better match the format of IM schedule A. It does not represent a recategorisation to adjust total lives or remaining lives, as no such change has been made. The new categories are not comparable with the categories in the 2004 ODV report - even where the category heading is the same, the definition of the items included in each category is different.
Value as at 31 March 2004
23 After loading in the new valuation register, the 31 March 2004 value totals by IM Schedule A category heading are:
Schedule A Section Heading* Total Starting Value
Subtransmission $55,536,066
Zone substations $85,507,051
HV Distribution conductors $163,972,019
HV Distribution switchgear $41,950,406
Distribution Substations $82,913,961
LV Distribution $145,039,433
Other system fixed assets $5,305,082
$580,224,018
*augmented as noted above

ORION NEW ZEALAND LIMITED INITIAL REGULATORY ASSET BASE 2009
10
24 And the values by category are: Section Heading Standard
Cat Code Cat Name Total Starting
Value
Subtransmission RV010 66kV Overhead lines (wood pole) $3,010,670Subtransmission RV015 66kV Overhead lines (steel tower and steel pole) $723,539Subtransmission RV020 66kV Underground cables (PILC & Oil filled) $23,236,758Subtransmission RV025 66kV Underground cables (XLPE) $9,521,316Subtransmission RV045 33kV Overhead lines (mixed construction) $8,181,590Subtransmission RV050 33kV Underground cables (PILC & Oil filled) $1,046,645Subtransmission RV055 33kV Underground cables (XLPE) $2,215,233Subtransmission RV065 Pilot / Communications Circuits $5,676,390Subtransmission RV070 Air break isolators & surge diverters (66/33kV) $1,923,924Zone substations RV100 Zone sub land $6,129,423Zone substations RV105 Zone sub site development and buildings $13,418,124Zone substations RV110 Power transformers $21,437,535Zone substations RV115 Indoor circuit breakers (sealed & unsealed, 66/33/11kV) $22,939,410Zone substations RV125 Outdoor circuit breakers and switchgear (66/33/11kV) $636,188Zone substations RV135 Protection (mixed digital & electromechanical) $8,995,803Zone substations RV140 Outdoor structure (concrete pole) $3,816,903Zone substations RV150 Zone sub SCADA, communications, metering $2,112,159Zone substations RV155 Ripple injection $4,840,303Zone substations RV160 DC Supplies, batteries and inverters $139,462Zone substations RV165 Other items $1,041,741HV Distribution RV220 11kV Overhead lines (mixed construction) $49,674,008HV Distribution RV240 11kV Underground cables (PILC) $88,317,987HV Distribution RV250 11kV Underground cables (XLPE) $25,980,024HV Distribution RV300 11kV Disconnectors & dropout fuses, Surge diverters (3ph) $13,224,686HV Distribution RV320 11kV Circuit breaker/recloser & sectionalisers $1,106,100HV Distribution RV330 11kV Voltage regulators $1,572,789HV Distribution RV340 11kV MSU and oil switches $23,616,709HV Distribution RV350 Distribution SCADA, communications, metering $2,291,145HV Distribution RV360 Switchgear cabinet $138,978Distribution RV400 Distribution sub land $19,141,050Distribution RV410 Distribution transformers (pole) $17,510,750Distribution RV420 Distribution transformers (pad) $35,740,123Distribution RV430 Distribution substations mount (pole) $3,101,300Distribution RV440 Distribution substations mount (pad) $6,981,247Distribution RV450 Distribution substation mount (building) $439,491LV Distribution RV520 LV Overhead lines (mixed construction) $31,551,573LV Distribution RV530 LV Underground cables (PILC) $4,697,654LV Distribution RV540 LV Underground cables (XLPE) $80,623,584LV Distribution RV550 LV Customer service connections and link pillars $28,166,621Other system RV600 SCADA and communications, UHF masters and repeaters $1,415,318Other system RV610 Network spares $3,889,764 $580,224,018

ORION NEW ZEALAND LIMITED INITIAL REGULATORY ASSET BASE 2009
11
ROLL-FORWARD 2005 TO 2009
25 The roll-forward from 1 April 2004 to 31 March 2009 takes account of additions, disposals, depreciation, revaluations, and a one-off finance during construction (FDC) allowance using the 2008 Information Disclosure Requirements (2008 IDRs) asset valuation methodology.
26 The 2008 IDRs provide for asset register corrections identified in our annual regulatory accounts to be included in the roll forward. We did not identify any lost or found assets in our regulatory reporting, so no amounts are included.
Additions
27 During the period, additions were rolled in to our regulatory accounts based on capital cost. Assets that were constructed by others and vested to Orion are included and were valued using the 2004 ODV unit replacement cost indexed with a CPI factor (consistent with our approach in our audited annual regulatory disclosures).
28 For regulatory accounting purposes, assets were grouped into approximately 15 general ledger categories, and values were assigned between these categories based on job closure forms.
29 The new valuation register sets out a much greater disaggregation of asset categories, with approximately 46 categories. We have therefore taken the opportunity to improve the asset categorisation in the roll forward of additions to correct the inherent errors in the previous grouped approach, consistent with provisions of 2.2.1(2)(b)(iii) of the Determination. To this end, we allocated the regulatory account general ledger categories between the new categories using the methodology and assumptions set out in Appendix B to this report.
30 All additions are assumed to have occurred mid-way through the relevant period (30 September), consistent with the approach previously adopted for regulatory reporting purposes.
Disposals
31 During the period we captured actual disposals and valued them according to the ODV methodology, resulting in a total disposals amount in each of 4 categories: cables, lines, transformers, and “other”. The actual assets removed were not identified in, or linked to, our 2004 valuation register (which is essentially a snapshot of assets as at 31 March 2004).
32 As we cannot identify the individual assets removed, we have instead loaded the disposals values previously disclosed as negative additions to offset the total value. We have assigned a 3 year minimum remaining life to these disposals to offset the depreciation of the value entries that would otherwise have been removed (effectively assuming that all removed assets are at or close to the end of their lives).

ORION NEW ZEALAND LIMITED INITIAL REGULATORY ASSET BASE 2009
12
33 Consistent with the provisions of clause 2.2.1(2)(b)(iii) of the Determination we have corrected the asset categorisation of the disposal amounts by splitting them between the new more disaggregated and hence more accurate categories. We have done this in proportion to the 2004 ODV value of assets for each relevant category , as follows:
Cables disposal value Split between LV and 11kV in proportion to 2004 asset values:
Standard Cat Code
Cat Name Total Starting
Value Proportion
RV240 11kV Underground cables (PILC) $88,317,987 44.2% RV250 11kV Underground cables (XLPE) $25,980,024 13.0% RV530 LV Underground cables (PILC) $4,697,654 2.4% RV540 LV Underground cables (XLPE) $80,623,585 40.4%
100.0%
Lines disposal value Split between LV and 11kV mixed construction in proportion to 2004 asset values
Standard Cat Code
Cat Name Total Starting
Value Proportion
RV220 11kV Overhead lines (mixed construction) $49,603,069 61.1% RV520 LV Overhead lines (mixed construction) $31,551,573 38.9%
100.0%
Transformers disposal value Split between pole and pad in proportion to 2004 asset values
Standard Cat Code
Cat Name Total Starting
Value Proportion
RV410 Distribution transformers (pole) $17,510,750 32.9% RV420 Distribution transformers (pad) $35,740,123 67.1%
100.0%
Other disposal value Split between all other assets (excl land/buildings/spares) in proportion to 2004 ODV value
Standard Cat Code
Cat Name Total Starting
Value Proportion
RV070 Air break isolators & surge diverters (66/33kV) $1,923,924 1.7% RV115 Indoor circuit breakers (66/33/11kV) $12,052,955 10.4% RV120 Indoor circuit breakers sealed (66/33/11kV) $10,886,454 9.4% RV125 Outdoor circuit breakers and switchgear (66/33/11kV) $636,188 0.5% RV135 Protection (mixed digital & electromechanical) $8,995,803 7.8% RV300 11kV Disconnectors & dropout fuses $12,495,793 10.8% RV310 Surge diverters (3ph, 66/33kV) $728,893 0.6% RV320 11kV Circuit breaker/recloser & sectionalisers $1,106,100 1.0% RV330 11kV Voltage regulators $1,572,789 1.4% RV340 11kV MSU and oil switches $23,616,709 20.4% RV350 Distribution SCADA, communications, metering $2,291,145 2.0% RV430 Distribution substations mount (pole) $3,101,300 2.7% RV440 Distribution substations mount (pad) $6,981,247 6.0% RV550 LV Customer service connections and link pillars $28,166,621 24.3% RV600 SCADA and communications, UHF masters and
repeaters $1,415,318 1.2%
100.0%

ORION NEW ZEALAND LIMITED INITIAL REGULATORY ASSET BASE 2009
13
34 As disposals run through the asset register as negative assets, it is important that their category groupings are as consistent with the asset groupings as possible to ensure the disposal profile matches the asset profile.
Revaluation
35 The revaluation amount for each year is calculated against the opening value for each valuation entry multiplied by the revaluation rate. It reflects the CPI movement in the value of those assets over the year. Additions during the year in question do not attract a revaluation.
36 The revaluation rate is the rate used in our audited regulatory disclosures as set out in Determination clause 2.2.9. It is based on 31 March CPI figures as follows:
Year to 31 March
CPI (All groups index
SEA9)
Revaluation rate (rounded to 3 decimal places)
2004 928
2005 953 2.694%
2006 985 3.358%
2007 1010 2.538%
2008 1044 3.366%
2009 1075 2.969%
Depreciation
37 The depreciation for each year is calculated against by adding the revaluation amount (calculated above) to the opening value for each valuation entry and then dividing this by the remaining life. Additions during the year in question do not attract depreciation. A minimum remaining life of 3 years is maintained (ie assets are not depreciated beyond a 3 year remaining life).
38 A closing remaining life is also calculated as the opening remaining life minus 1, subject to the 3 year minimum remaining life.
Finance During Construction allowance
39 Determination clause 2.2.3(1) and (2) provides for the 2009 value of system fixed assets to be multiplied by 1.0245 to account for the cost of finance during construction which is not provided for in previous values.
40 This addition equates to $18,007,834 as noted in the roll forward summary below. Within the database, the revaluation amount has been added into the revaluation part of the 2009 roll-forward transaction.
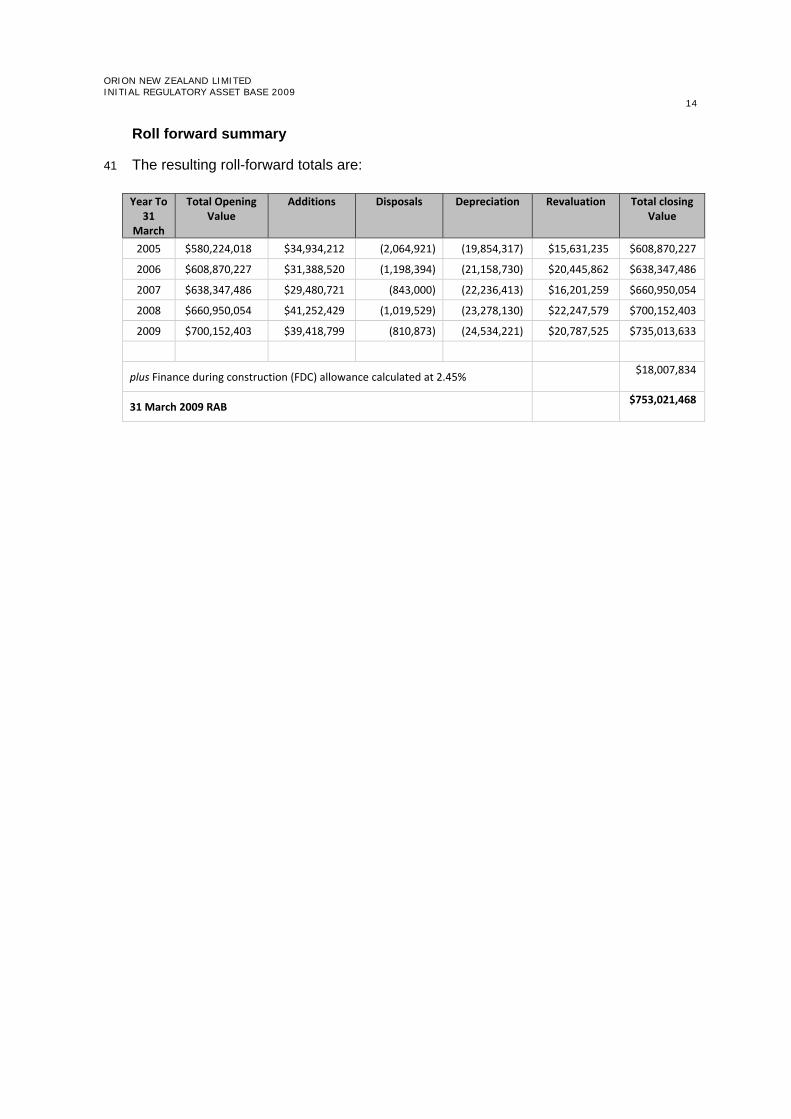
ORION NEW ZEALAND LIMITED INITIAL REGULATORY ASSET BASE 2009
14
Roll forward summary
41 The resulting roll-forward totals are:
Year To 31
March
Total Opening Value
Additions Disposals Depreciation Revaluation Total closing Value
2005 $580,224,018 $34,934,212 (2,064,921) (19,854,317) $15,631,235 $608,870,227
2006 $608,870,227 $31,388,520 (1,198,394) (21,158,730) $20,445,862 $638,347,486
2007 $638,347,486 $29,480,721 (843,000) (22,236,413) $16,201,259 $660,950,054
2008 $660,950,054 $41,252,429 (1,019,529) (23,278,130) $22,247,579 $700,152,403
2009 $700,152,403 $39,418,799 (810,873) (24,534,221) $20,787,525 $735,013,633
plus Finance during construction (FDC) allowance calculated at 2.45% $18,007,834
31 March 2009 RAB $753,021,468

ORION NEW ZEALAND LIMITED INITIAL REGULATORY ASSET BASE 2009
15
Reconciliation with information disclosure requirements
42 The following table provides a comparison with the annual regulatory valuation roll-forward report disclosed in report AV1 of our Electricity Distribution (Information Disclosure) Requirements as published for the year ending 31 March 2010:
Financial year ending 31 March
Original disclosure
Revised amount
Difference Cumulative difference
2005 Opening value $580,224,000 $580,224,018 $18 Additions $34,934,000 $34,934,212 $212 Disposals ($2,065,000) (2,064,921) $79 Depreciation ($19,854,000) (19,854,317) (317) Revaluation $15,631,000 $15,631,235 $235 Total closing value $608,870,000 $608,870,227 $227 $227
2006 Additions $31,388,000 $31,388,520 $520
Disposals ($1,198,000) (1,198,394) (394)
Depreciation ($21,092,000) (21,158,730) (66,730)
Revaluation $20,445,000 $20,445,862 $862
Total closing value $638,413,000 $638,347,486 (65,741) (65,514)
2007 Additions $29,481,000 $29,480,721 (279)
Disposals ($843,000) (843,000) $0
Depreciation ($22,104,000) (22,236,413) (132,413)
Revaluation $16,203,000 $16,201,259 (1,741)
Total closing value $661,150,000 $660,950,054 (134,432) (199,946)
2008 Additions $41,252,000 $41,252,429 $429
Disposals ($1,020,000) (1,019,529) $471
Depreciation ($23,092,000) (23,278,130) (186,130)
Revaluation $22,257,000 $22,247,579 (9,421)
Total closing value $700,547,000 $700,152,403 (194,650) (394,597)
2009 Additions $39,419,000 $39,418,799 (201)
Disposals ($811,000) (810,873) $127
Depreciation ($24,191,000) (24,534,221) (343,221)
Revaluation $20,802,000 $20,787,525 (14,475)
Total closing value $735,765,000 $735,013,633 (357,770) (751,367)
Finance During Construction allowance
$18,026,000 $18,007,834 (18,166) (769,533)
43 The revised roll-forward carries a greater depreciation charge which occurs as a result of the categorisation corrections of additions provided for under clause 2.2.1(2)(b)(iii) of the Determination. Asset additions are now more correctly allocated to separate categories and depreciation is accordingly calculated using a total life for each asset category consistent with that used in the 2004 ODV valuation. In the original disclosure values, asset additions were grouped into approximately 15 categories and weighted-average total lives (derived from the 2004 ODV valuation) were used to calculate depreciation. Of note:

ORION NEW ZEALAND LIMITED INITIAL REGULATORY ASSET BASE 2009
16
43.1 Overhead line additions are now separated and depreciated over the wood-pole 45 year life, whereas they were previously depreciated over 49.9 years based on the weighted average of wood and concrete pole additions in the period prior to 2004.
43.2 Underground cable additions are now depreciated over the XLPE 45 year life, whereas they were previously depreciated over 46.7 years based on the weighted average of XLPE and PILC cable additions in the period prior to 2004.
43.3 Additions previously grouped as “other” assets and depreciated using the weighted average 38.6 year total life are now allocated into separate categories with specific total lives – the resulting average total life is 35.2 years.
44 The smaller revaluation differences result from the cumulative effect of the depreciation differences, and all other differences reflect rounding in the original disclosure.
Value as at 31 March 2009 – the Initial RAB
45 Following the 2005 to 2009 roll-forward described above, our valuation totals by category heading are:
Schedule A Section Heading Total Closing
Value
Subtransmission $58,749,224
Zone substations $116,066,465
HV Distribution conductors $198,847,737
HV Distribution switchgear $55,482,723
Distribution Substations $101,111,147
LV Distribution $212,351,547
Other system fixed assets $10,412,625 $753,021,468

ORION NEW ZEALAND LIMITED INITIAL REGULATORY ASSET BASE 2009
17
46 The valuation totals by category are:
Section Heading Standard Cat Code
Cat Name Total Closing
Value Subtransmission RV010 66kV Overhead lines (wood pole) $3,746,828 Subtransmission RV015 66kV Overhead lines (steel tower and steel pole) $462,256 Subtransmission RV020 66kV Underground cables (PILC & Oil filled) $24,166,552 Subtransmission RV025 66kV Underground cables (XLPE) $10,045,266 Subtransmission RV040 33kV Overhead lines (wood pole) $1,445,585 Subtransmission RV045 33kV Overhead lines (mixed construction) $8,009,803 Subtransmission RV050 33kV Underground cables (PILC & Oil filled) $1,094,524 Subtransmission RV055 33kV Underground cables (XLPE) $2,746,420 Subtransmission RV065 Pilot / Communications Circuits $5,125,825 Subtransmission RV070 Air break isolators & surge diverters (66/33kV) $1,906,165 Zone substations RV100 Zone sub land $8,110,071 Zone substations RV105 Zone sub site development and buildings $19,222,599 Zone substations RV110 Power transformers $26,223,902 Zone substations RV115 Indoor circuit breakers (sealed & unsealed, 66/33/11kV) $31,183,427 Zone substations RV125 Outdoor circuit breakers and switchgear (66/33/11kV) $648,245 Zone substations RV130 Protection (digital) $4,735,182 Zone substations RV135 Protection (mixed digital & electromechanical) $8,230,780 Zone substations RV140 Outdoor structure (concrete pole) $3,859,164 Zone substations RV150 Zone sub SCADA, communications, metering $6,548,929 Zone substations RV155 Ripple injection $6,155,497 Zone substations RV160 DC Supplies, batteries and inverters $123,831 Zone substations RV165 Other items $1,024,838 HV Distribution conductors RV210 11kV Overhead lines (wood pole) $15,116,542 HV Distribution conductors RV220 11kV Overhead lines (mixed construction) $47,997,251 HV Distribution conductors RV240 11kV Underground cables (PILC) $92,076,466 HV Distribution conductors RV250 11kV Underground cables (XLPE) $43,657,478 HV Distribution switchgear RV300 11kV Disconnectors & dropout fuses, Surge diverters (3p $19,510,769 HV Distribution switchgear RV320 11kV Circuit breaker/recloser & sectionalisers $1,828,345 HV Distribution switchgear RV330 11kV Voltage regulators $1,571,147 HV Distribution switchgear RV340 11kV MSU and oil switches $30,092,012 HV Distribution switchgear RV350 Distribution SCADA, communications, metering $2,274,016 HV Distribution switchgear RV360 Switchgear cabinet $206,434 Distribution Substations RV400 Distribution sub land $24,599,444 Distribution Substations RV405 Easements $377,798 Distribution Substations RV410 Distribution transformers (pole) $21,933,219 Distribution Substations RV420 Distribution transformers (pad) $42,154,528 Distribution Substations RV430 Distribution substations mount (pole) $2,852,025 Distribution Substations RV440 Distribution substations mount (pad) $8,173,389 Distribution Substations RV450 Distribution substation mount (building) $1,020,744 LV Distribution RV510 LV Overhead lines (wood pole) $14,196,811 LV Distribution RV520 LV Overhead lines (mixed construction) $29,025,714 LV Distribution RV530 LV Underground cables (PILC) $4,763,889 LV Distribution RV540 LV Underground cables (XLPE) $132,982,812 LV Distribution RV550 LV Customer service connections and link pillars $31,382,321 Other system fixed assets RV600 SCADA and communications, UHF masters and repeaters $827,157 Other system fixed assets RV610 Network spares $4,616,293 Other system fixed assets RV615 Finance leases $4,969,175 $753,021,468

ORION NEW ZEALAND LIMITED INITIAL REGULATORY ASSET BASE 2009
18
APPENDIX A: MAPPING OF ODV VALUES TO NEW CATEGORIES
Asset Code
Asset Name IM Standard Life1
ODV Standard
Life
MEA Code
Orion asset name Mapped ODV
amount
Subtransmission
RV005 66kV Overhead lines (concrete pole)
60 60 No concrete in ODV, but some since
RV010 66kV Overhead lines (wood pole) 45 45 MEA0030 66kV OH Medium (single circuit wooden pole)
3,010,670
RV015 66kV Overhead lines (steel tower and steel pole)
55 55 MEA0020 66kV OH Heavy (Dcst wolf) 625,757
MEA0025 66kV OH Heavy (Dcst hyena) 97,782
RV020 66kV Underground cables (PILC) 70 70 MEA0010 66kV UG Heavy Dcct 23,166,254
RV025 66kV Underground cables (XLPE) 55 45 MEA0005 66kV UG Extra heavy 9,521,316
RV030 66kV Underground cables (Oil filled)
NA 70 MEA0015 66kV UG Heavy 70,505
RV035 33kV Overhead lines (concrete pole)
60 60
RV040 33kV Overhead lines (wood pole) 45 45
RV045 33kV Overhead lines (mixed construction)
NA 51.6 MEA0035 33kV OH Heavy 269,716
MEA0040 33kV OH Light 7,911,874
RV050 33kV Underground cables (PILC & Oil)
70 70 MEA0055 33kV UG Heavy 1,006,615
MEA0060 33kV UG Medium 40,030
RV055 33kV Underground cables (XLPE) 55 45 MEA0055 33kV UG Heavy 2,215,233
RV065 Pilot / Communications Circuits 45 45 MEA0155 Comms UG 5,676,390
RV070 Air break isolators & surge diverters (66/33kV)
35 35 MEA0070 33kV Isolation 79,843
MEA0075 33kV Surge arresters (3ph) 49,371
MEA0275 66kV AB isolator 251,702
MEA0280 66kV AB isolator with E/Sw 176,586
MEA0300 33kV A B Isolator 196,501
Regulatory asset value categories in the form of the Commerce Commission's Input Methodologies Determination 2010 with additional entries to cater for ODV assets.
ODV Assets included
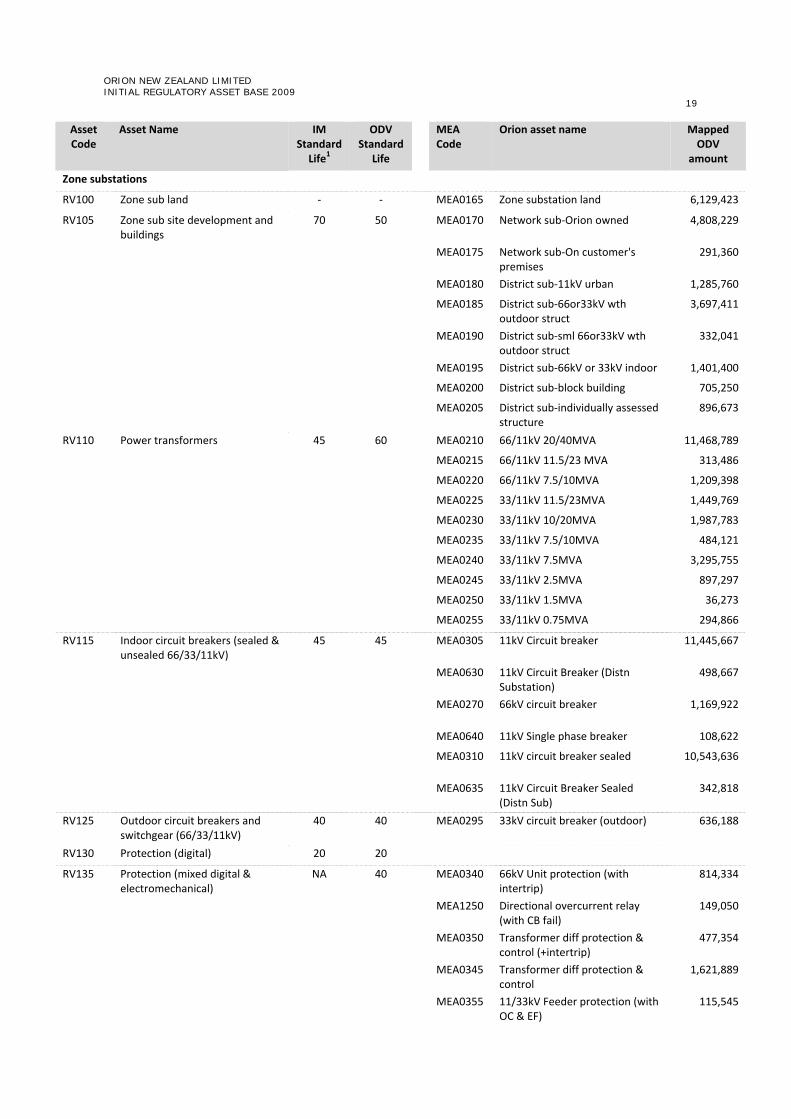
ORION NEW ZEALAND LIMITED INITIAL REGULATORY ASSET BASE 2009
19
Asset Code
Asset Name IM Standard Life1
ODV Standard
Life
MEA Code
Orion asset name Mapped ODV
amount
Zone substations
RV100 Zone sub land ‐ ‐ MEA0165 Zone substation land 6,129,423
RV105 Zone sub site development and buildings
70 50 MEA0170 Network sub‐Orion owned 4,808,229
MEA0175 Network sub‐On customer's premises
291,360
MEA0180 District sub‐11kV urban 1,285,760
MEA0185 District sub‐66or33kV wth outdoor struct
3,697,411
MEA0190 District sub‐sml 66or33kV wth outdoor struct
332,041
MEA0195 District sub‐66kV or 33kV indoor 1,401,400
MEA0200 District sub‐block building 705,250
MEA0205 District sub‐individually assessed structure
896,673
RV110 Power transformers 45 60 MEA0210 66/11kV 20/40MVA 11,468,789
MEA0215 66/11kV 11.5/23 MVA 313,486
MEA0220 66/11kV 7.5/10MVA 1,209,398
MEA0225 33/11kV 11.5/23MVA 1,449,769
MEA0230 33/11kV 10/20MVA 1,987,783
MEA0235 33/11kV 7.5/10MVA 484,121
MEA0240 33/11kV 7.5MVA 3,295,755
MEA0245 33/11kV 2.5MVA 897,297
MEA0250 33/11kV 1.5MVA 36,273
MEA0255 33/11kV 0.75MVA 294,866
RV115 Indoor circuit breakers (sealed & unsealed 66/33/11kV)
45 45 MEA0305 11kV Circuit breaker 11,445,667
MEA0630 11kV Circuit Breaker (Distn Substation)
498,667
MEA0270 66kV circuit breaker 1,169,922
MEA0640 11kV Single phase breaker 108,622
MEA0310 11kV circuit breaker sealed 10,543,636
MEA0635 11kV Circuit Breaker Sealed (Distn Sub)
342,818
RV125 Outdoor circuit breakers and switchgear (66/33/11kV)
40 40 MEA0295 33kV circuit breaker (outdoor) 636,188
RV130 Protection (digital) 20 20
RV135 Protection (mixed digital & electromechanical)
NA 40 MEA0340 66kV Unit protection (with intertrip)
814,334
MEA1250 Directional overcurrent relay (with CB fail)
149,050
MEA0350 Transformer diff protection & control (+intertrip)
477,354
MEA0345 Transformer diff protection & control
1,621,889
MEA0355 11/33kV Feeder protection (with OC & EF)
115,545

ORION NEW ZEALAND LIMITED INITIAL REGULATORY ASSET BASE 2009
20
Asset Code
Asset Name IM Standard Life1
ODV Standard
Life
MEA Code
Orion asset name Mapped ODV
amount
MEA0365 11/33kV Unit protection (with OC)
1,375,350
MEA0360 11/33kV Unit protection 1,594,098
MEA0370 11kV Protection (with OC & EF) 1,790,036
MEA1255 11kV Protection (with OC, EF, reclose & CB fail)
567,991
MEA0375 Bus bar protection relay 490,157
RV140 Outdoor structure (concrete pole)
60 60 MEA0380 Structure 66kV ‐ incomer 374,524
MEA0385 Structure 66kV ‐ bus section 475,737
MEA0390 Structure 66kV ‐ isolator section 146,624
MEA0395 Structure 66kV ‐ feeder 533,305
MEA0400 Structure 33kV ‐ incomer 256,921
MEA0405 Structure 33kV ‐ bus section 829,134
MEA0410 Structure 33kV ‐isolator section 120,257
MEA0415 Structure 33kV ‐ feeder 1,080,401
RV145 Outdoor structure (wood pole) 45 45
RV150 Zone sub SCADA, communications, metering
15 15 (40 for metering
)
MEA0160 GXP check metering 204,069
MEA0420 RTU (large urban district sub) 225,923
MEA1155 RTU (medium urban district sub) 385,633
MEA1160 RTU (small urban district sub) 248,721
MEA1165 RTU (small rural district sub) 466,513
MEA1170 RTU (medium network sub) 35,001
MEA1175 RTU (small network sub) 457,700
MEA0425 Pilot box 140 way 8,405
MEA0430 Pilot box 280 way 80,196
RV155 Ripple injection 20 20 MEA0435 Ripple injection plant (11kV, 175Hz)
4,090,776
MEA1125 Ripple injection plant (11kV, 317Hz)
433,228
MEA0440 Ripple injection plant (33kV, 317 Hz)
275,800
MEA0445 Ripple wave trap (66kV 175Hz) 40,500
RV160 DC Supplies, batteries and inverters
20 20 MEA0450 Battery (50/100AH), charger (110V) & stand
118,892
MEA0455 Battery (50/100AH), charger (50V) & stand
20,570
RV165 Other items 40 40 MEA0460 11kV AT (15kVA) 49,098
MEA0465 11kV Incomer Cable 40MVA 409,568
MEA0470 11kV Incomer Cable 20MVA 44,291
MEA0475 11kV Incomer Cable 10MVA 103,239
MEA0480 11kV Bus coupler cable 20MVA 78,246
MEA0485 11kV Bus coupler cable 10MVA 7,252
MEA0490 66kV VT (3ph) 35,803

ORION NEW ZEALAND LIMITED INITIAL REGULATORY ASSET BASE 2009
21
Asset Code
Asset Name IM Standard Life1
ODV Standard
Life
MEA Code
Orion asset name Mapped ODV
amount
MEA0495 66kV Surge diverter (3ph) 30,742
MEA0500 33kV VT (3ph) 7,668
MEA0505 33kV Surge diverter (3ph) 7,508
MEA0510 11kV VT (3ph) 184,772
MEA0515 11kV Neutral earthing resistor 83,554
HV Distribution conductors
RV200 11kV Overhead lines (concrete pole)
60 60
RV210 11kV Overhead lines (wood pole)
45 45
RV220 11kV Overhead lines (mixed construction)
NA 52.2 (49.4 for traffic mgmt)
MEA0520 11kV OH Heavy 287,403
MEA0525 11kV OH Medium 15,023,327
MEA0530 11kV OH Light 21,667,928
MEA1270 11kV OH Two phase 8,736,624
MEA0535 11kV OH SWER 1,895,052
MEA0540 11kV OH Heavy underbuilt 423
MEA0545 11kV OH Medium underbuilt 1,608,277
MEA0550 11kV OH Light underbuilt 344,554
MEA1280 11kV OH Two phase underbuilt 39,483
MEA1130 Traffic mgmt (OH Level 1) 46,346 MEA1135 Traffic mgmt (OH Level 2) 24,593
RV240 11kV Underground cables (PILC) 70 70 MEA0555 11kV UG Extra heavy 462,138
MEA0560 11kV UG Heavy 2,599,491
MEA0565 11kV UG Medium 18,458,140
MEA0570 11kV UG Light 13,186,187
MEA0575 11kV UG Extra heavy Dcct 7,201,907
MEA0580 11kV UG Heavy Dcct 14,371,604
MEA0585 11kV UG Medium Dcct 19,454,442
MEA0590 11kV UG Light Dcct 10,751,469
MEA1140 Traffic mgmt (UG level 1) 488,917
MEA1145 Traffic mgmt (UG level 2) 981,458
MEA1150 Traffic mgmt (UG level 2‐in road) 362,234
RV250 11kV Underground cables (XLPE) 55 45 MEA0555 11kV UG Extra heavy 26,919
MEA0560 11kV UG Heavy 315,101
MEA0565 11kV UG Medium 5,425,839
MEA0570 11kV UG Light 4,483,781
MEA0575 11kV UG Extra heavy Dcct 12,476
MEA0580 11kV UG Heavy Dcct 2,906,060
MEA0585 11kV UG Medium Dcct 5,289,292
MEA0590 11kV UG Light Dcct 3,504,752
MEA1140 Traffic mgmt (UG level 1) 1,071,367

ORION NEW ZEALAND LIMITED INITIAL REGULATORY ASSET BASE 2009
22
Asset Code
Asset Name IM Standard Life1
ODV Standard
Life
MEA Code
Orion asset name Mapped ODV
amount
MEA1145 Traffic mgmt (UG level 2) 2,150,674
MEA1150 Traffic mgmt (UG level 2‐in road) 793,764
HV Distribution switchgear
RV300 11kV Disconnectors & dropout fuses, Surge diverters (3ph)
35 35 MEA0595 11kV Disconnector (3ph) 1,076,100
MEA0610 11kV Dropout fuse (3ph set) 9,179,464
MEA1265 11kV Dropout fuse (1ph) 78,029
MEA0615 11kV Dropout fuse (2ph set) 2,162,200
MEA0645 11kV Surge arresters (3ph) 728,893
RV320 11kV Circuit breaker/recloser & sectionalisers
40 40 MEA0625 11kV Circuit breaker / recloser (pole‐mounted)
1,041,525
MEA0620 11kV Sectionaliser 64,575
RV330 11kV Voltage regulators 55 55 MEA0260 11kV Regulator (20MVA) 136,827
MEA0265 11kV Regulator (4MVA) 1,435,962
RV340 11kV MSU and oil switches 40 40 MEA0655 11kV Magnefix type UT 482,213
MEA0660 11kV Magnefix type 1K2T 333,771
MEA0665 11kV Magnefix type 1K3T 18,842
MEA0670 11kV Magnefix type 2K1T 3,932,239
MEA0675 11kV Magnefix type 2K2T 421,595
MEA0680 11kV Magnefix type 2K3T 14,615
MEA0685 11kV Magnefix type 2KB2K 3,629,217
MEA0690 11kV Magnefix type 2KBK 3,262,210
MEA0695 11kV Magnefix type 3K 3,629,319
MEA0700 11kV Magnefix type 3K1T 2,552,982
MEA0705 11kV Magnefix type 3K2T 39,347
MEA0710 11kV Magnefix type 3KX 4,999
MEA0715 11kV Magnefix type 4K 5,170
MEA0720 11kV Magnefix type 4K1T 166,760
MEA0725 11kV Magnefix type 5K 118,061
MEA0730 11kV Magnefix type KB2K 233,853
MEA0735 11kV Magnefix type KB2KBK 1,523,511
MEA0740 11kV Magnefix type KBX 2,734,321
MEA0745 11kV Magnefix type KTB 317,836
MEA0755 11kV Oil switch (not fused) 63,450
MEA0760 11kV Oil switch (fused) 132,400
RV350 Distribution SCADA, communications, metering
15 15 (40 for metering
)
MEA0765 UHF remote Unit 179,722
MEA1180 RTU Aux equip (pole mount on LCB)
252,461
MEA0930 Distn Sub ‐ LV MDI metering (800A)
1,578,638
MEA0935 Distn Sub ‐ LV MDI metering (1500A)
280,324

ORION NEW ZEALAND LIMITED INITIAL REGULATORY ASSET BASE 2009
23
Asset Code
Asset Name IM Standard Life1
ODV Standard
Life
MEA Code
Orion asset name Mapped ODV
amount
RV360 Switchgear cabinet 45 45 MEA0750 11kV Switchgear cabinet (1/4 Kiosk)
138,978
Distribution Substations
RV400 Distribution sub land ‐ ‐ MEA0885 Distn Sub ‐ Land 19,141,050
RV410 Distribution transformers (pole) 45 45 MEA0770 1ph Pole mount ≤ 15 kVA 1,747,430
MEA0775 1ph Pole mount 30 kVA 113,777
MEA0790 1ph Pole mount 100 kVA 2,878
MEA0815 3ph Pole mount ≤ 30 kVA 6,431,720
MEA0820 3ph Pole mount 50 kVA 3,943,411
MEA0825 3ph Pole mount 100 kVA 3,692,200
MEA0830 3ph Pole mount 200 kVA 1,543,245
MEA0835 3ph Pole mount 300 kVA 36,089
RV420 Distribution transformers (pad) 45 55 MEA0795 1ph Pad mount ≤ 15 kVA 20,445
MEA0800 1ph Pad mount 30 kVA 12,660
MEA0805 1ph Pad mount 50 kVA 0
MEA0810 1ph Pad mount 75 kVA 0
MEA0845 3ph Pad mount 100 kVA 408,764
MEA0850 3ph Pad mount 200 kVA 8,841,763
MEA0855 3ph Pad mount 300 kVA 12,282,327
MEA0860 3ph Pad mount 500 kVA 8,669,800
MEA0865 3ph Pad mount 750 kVA 3,424,672
MEA0870 3ph Pad mount 1000 kVA 1,957,236
MEA0875 3ph Pad mount 1250 kVA 36,727
MEA0880 3ph Pad mount 1500 kVA 85,727
RV430 Distribution substations mount (pole)
45 45 MEA0890 Distn Sub ‐ Pole mount (≤50 kVA) 2,184,834
MEA0895 Distn Sub ‐ Pole mount (>50 kVA, <100 kVA)
112,800
MEA0900 Distn Sub ‐ Pole mount (≥100 kVA)
803,666
RV440 Distribution substations mount (pad)
45 55 MEA0905 Distn Sub ‐ Pad mount (Orion full kiosk)
5,621,491
MEA0910 Distn Sub ‐ Pad mount (Orion 1/2 kiosk)
1,359,756
RV450 Distribution substation mount (building)
45 55 MEA0920 Distn Sub ‐ Building (Orion owned)
220,400
MEA0925 Distn Sub ‐ Building (customer owned)
219,091
LV Distribution
RV500 LV Overhead lines (concrete pole)
60 60
RV510 LV Overhead lines (wood pole) 45 45
RV520 LV Overhead lines (mixed construction)
NA 49.35 MEA0940 LV OH Heavy 4 wire 699,913
MEA0945 LV OH Medium 4 wire 15,620,013

ORION NEW ZEALAND LIMITED INITIAL REGULATORY ASSET BASE 2009
24
Asset Code
Asset Name IM Standard Life1
ODV Standard
Life
MEA Code
Orion asset name Mapped ODV
amount
MEA0950 LV OH Light 4 wire 422,985
MEA0955 LV OH Medium 2 wire 540,019
MEA0960 LV OH Light 2 wire 19,678
MEA0965 LV OH Heavy 4 wire underbuilt 14,327
MEA0970 LV OH Medium 4 wire underbuilt 2,110,652
MEA1105 LV OH Light 4 wire underbuilt 149,316
MEA0975 LV OH Medium 2 wire underbuilt 432,688
MEA0980 LV OH Light 2 wire underbuilt 7,226
MEA0985 LV OH Urban Road Crossings & Back Sections
4,319,784
MEA0990 LV OH Rural Road Crossings & Back Sections
5,500,437
MEA0995 LV OH Lighting (on own) 1,372,207
MEA1115 LV OH Lighting (with LV) 0
MEA1120 LV OH Lighting (with HV) 342,330
RV530 LV Underground cables (PILC) 70 70 MEA1000 LV UG Heavy 6,821,900
MEA1005 LV UG Medium 49,955,092
MEA1010 LV UG Service Main (16mm2 NS) 5,978,991
MEA1015 LV UG Heavy shared trench 1,269,118
MEA1020 LV UG Medium shared trench 9,948,165
MEA1025 LV UG Lighting 2 core (on own) 6,650,318
MEA1110 LV UG Lighting 2 core (with LV) 0
MEA1035 LV UG Lighting 5th core (with LV) 0
RV540 LV Underground cables (XLPE) 55 45 MEA1000 LV UG Heavy 1,545,520
MEA1005 LV UG Medium 2,071,334
MEA1010 LV UG Service Main (16mm2 NS) 213,999
MEA1015 LV UG Heavy shared trench 381,348
MEA1020 LV UG Medium shared trench 441,588
MEA1025 LV UG Lighting 2 core (on own) 43,865
MEA1110 LV UG Lighting 2 core (with LV) 0
MEA1035 LV UG Lighting 5th core (with LV) 0
RV550 LV Customer service connections and link pillars
45 45 MEA1040 LV 2 way linkbox / multibox 3,507,133
MEA1045 LV 3 way linkbox / multibox 2,077,067
MEA1050 LV 4 way linkbox / multibox 1,968,311
MEA1055 LV connection OH 1ph 1,966,058
MEA1060 LV connection OH 3ph 577,652
MEA1065 LV connection UG 1ph (fuse only) 890,172
MEA1100 LV connection UG 3ph (fuse only) 142,218
MEA1070 LV connection UG 1ph (shared bndry box)
9,668,958
MEA1075 LV connection UG 1ph (dedicated bndry box)
1,417,661
MEA1080 LV connection UG 3ph (shared bndry box)
4,969,329

ORION NEW ZEALAND LIMITED INITIAL REGULATORY ASSET BASE 2009
25
Asset Code
Asset Name IM Standard Life1
ODV Standard
Life
MEA Code
Orion asset name Mapped ODV
amount
MEA1085 LV connection UG 3ph (dedicated bndry box)
982,062
Other system fixed assets
RV600 SCADA and communications, UHF masters and repeaters
15 15 MEA1090 SCADA master station 1,290,218
MEA1095 UHF masters 61,600
MEA1245 UHF repeaters 63,500
RV610 Network spares NA NA MEA1195 66kV UG Spares 806,965
MEA1185 66kV OH Spares 22,696
MEA1200 33kV OH spares 8,629
MEA1205 33kV UG Spares 85,780
MEA1240 11kV circuit breaker spares 1,039,662
MEA1215 Subtransmission spares 1,071,376
MEA1225 11kV OH Spares 9,074
MEA1235 Distribution transformer spares 263,622
MEA1220 Distribution spares 70,087
MEA1260 Distribution switchgear spares 93,048
MEA1230 11kV UG Spares 2,801
MEA1210 Ripple spares 416,024
580,224,018

ORION NEW ZEALAND LIMITED INITIAL REGULATORY ASSET BASE 2009
26
APPENDIX B: MAPPING OF ADDITIONS VALUES TO NEW CATEGORIES

Appendix 15 Depreciation by asset type

Depreciation by asset type (standard depreciation)
IM 5.4.12 (2)(a)
Standard depreciation ($000)
FY10 FY11 FY12 FY13 FY14 FY15 FY16 FY17 FY18 FY19
Sub-transmission network
66 kV Overhead lines (concrete pole) - - - 5 5 5 5 5 5 5
66 kV Overhead lines (wood pole) 98 103 118 154 222 226 231 236 242 247
66 kV Overhead lines (towers) 100 103 108 13 68 97 235 197 193 196
66 kV Underground cables (PILC) 682 696 714 725 739 752 770 788 806 824
66 kV Underground cables (XLPE) 272 278 285 290 414 422 432 441 451 461
33 kV Overhead lines (wood pole) 34 40 47 52 63 65 66 68 69 71
33 kV Overhead lines (mixed construction) 362 370 381 363 359 351 360 368 377 387
33 kV Underground cables (PILC) 30 30 31 31 32 33 33 34 35 36
33 kV Underground cables (XLPE) 79 86 92 96 109 111 113 116 119 121
Pilot / Communications Circuits 414 424 439 289 287 255 378 424 545 508
Substations
Zone sub land - - - - - - - - - -
Zone sub site development and buildings 988 1,044 1,094 924 968 924 1,083 1,150 1,155 1,167
Power Transformers 854 903 926 932 989 1,028 1,207 1,299 1,322 1,337
Protection (electromechanical) 543 556 574 430 414 372 381 391 400 411
Protection (digital) 262 315 393 494 739 775 838 879 897 913
Outdoor Structure (concrete pole) 134 137 140 143 158 167 207 233 237 237
DC Supplies, batteries and inverters 22 23 24 8 18 21 40 51 51 50
Other items 90 93 97 59 59 51 52 53 55 56
Distribution network
11 kV Overhead lines (wood pole) 351 422 493 552 682 694 711 727 743 759
11 kV Overhead lines (mixed construction) 1,491 1,519 1,548 2,023 2,051 2,048 2,099 2,148 2,199 2,253
11 kV Underground cables (PILC) 2,491 2,543 2,605 2,733 2,783 2,815 2,884 2,949 3,017 3,087
11 kV Underground cables (XLPE) 1,170 1,253 1,426 1,655 1,817 1,840 1,884 1,926 1,969 2,014
Distribution sub land - - - - - - - - - -
Distribution transformers (pole,
1ph/2ph/3ph)788 824 861 986 1,030 988 1,012 1,036 1,061 1,087
Distribution transformers (pad) 1,137 1,185 1,231 1,676 1,772 1,717 1,760 1,801 1,844 1,889
Distribution substations mount (pole) 168 174 180 158 154 134 137 141 144 148
Distribution substations mount (pad) 253 265 279 318 364 361 370 378 387 396
Distribution substation mount (building &
in customer building)36 37 39 36 44 41 42 43 44 45
Switchgear cabinet 6 7 7 8 8 8 8 8 9 9
Switchgear
Surge Diverters (3ph, 66/33kV) / Air break
isolators (66/33kV)88 97 110 106 103 99 102 104 107 109
Indoor circuit breakers and switchgear
(66/33/11kV)1,559 1,635 1,743 1,516 1,651 1,441 1,513 1,583 1,619 1,656
Outdoor circuit breakers and switchgear
(66/33/11kV)59 61 63 44 86 87 143 208 211 210
11kV Disconnectors & Dropout fuses 940 1,000 1,087 1,031 1,075 1,058 1,084 1,109 1,135 1,163
11kV voltage regulators 53 54 55 55 57 51 52 53 54 56
11kV Circuit breaker/recloser &
sectionalisers57 62 69 82 83 85 87 89 91 93
11kV MSU and oil switches 1,523 1,599 1,706 1,618 1,610 1,490 1,527 1,563 1,601 1,643
CPP PeriodCurrent Period Assessment Period

Standard depreciation ($000)
FY10 FY11 FY12 FY13 FY14 FY15 FY16 FY17 FY18 FY19
Low voltage distribution network
LV Overhead lines (wood pole) 330 396 462 518 582 593 607 620 634 648
LV Overhead lines (mixed construction) 1,265 1,291 1,322 1,530 1,506 1,337 1,372 1,405 1,440 1,479
LV Underground cables (PILC) 152 155 159 163 167 168 172 176 180 185
LV Underground cables (XLPE) 4,606 4,795 4,993 5,136 5,318 5,200 5,327 5,450 5,577 5,710
Link Pillars & LV customer service
connections1,323 1,408 1,475 1,519 1,616 1,545 1,583 1,620 1,658 1,699
Supporting or secondary systems
Ripple Injection Plant 489 501 516 439 497 507 519 532 545 559
SCADA and communications 1,129 1,283 1,379 963 1,121 1,047 1,113 1,153 1,219 1,236
Peak load generator - - - 38 39 40 41 42 43 44
Metering systems - - - - 5 5 6 6 6 6
Easements - - - - - - - - - -
Network Spares - - - - - - - - - -
Finance leases 177 191 196 214 218 213 219 224 229 235
Capital Contributions - (60) (111) (186) (228) (231) (236) (241) (245) (250)
Power factor correction plant - - - - - - - - - -
EDB-owned mobile substations and
generators- - - - 206 210 215 220 225 230
Non system fixed assets
Office Buildings 95 106 101 103 105 31 32 33 33 34
Information and Technology Systems 1,453 1,992 2,034 2,456 2,655 945 970 997 1,029 1,073
Office Furniture and Equipment 62 64 71 75 117 85 87 90 92 96
Tools, Plant and Machinery 257 170 208 295 307 227 232 238 245 254
Vehicles 543 588 579 613 643 384 394 404 418 435
Total 29,014 30,817 32,348 33,480 35,886 32,914 34,499 35,568 36,524 37,314
Current Period Assessment Period CPP Period

Depreciation by asset type (alternative depreciation)
IM 5.4.12 (2)(b)
Alternative depreciation ($000)
FY10 FY11 FY12 FY13 FY14 FY15 FY16 FY17 FY18 FY19
Sub-transmission network
66 kV Overhead lines (concrete pole) - - - - - - - - - -
66 kV Overhead lines (wood pole) - - - - - 0 3 3 6 15
66 kV Overhead lines (towers) - - - - - 0 0 4 4 4
66 kV Underground cables (PILC) - - - - - - - - - -
66 kV Underground cables (XLPE) - - - - - 41 56 103 114 120
33 kV Overhead lines (wood pole) - - - - - 1 2 3 4 6
33 kV Overhead lines (mixed construction) - - - - - - - - - -
33 kV Underground cables (PILC) - - - - - - - - - -
33 kV Underground cables (XLPE) - - - - - - - - 0 0
Pilot / Communications Circuits - - - - - 1 1 2 3 3
Substations
Zone sub land - - - - - - - - - -
Zone sub site development and buildings - - - - - 3 9 13 16 25
Power Transformers - - - - - 10 21 22 36 54
Protection (electromechanical) - - - - - - - 0 0 0
Protection (digital) - - - - - 36 62 93 129 176
Outdoor Structure (concrete pole) - - - - - 0 0 0 0 0
DC Supplies, batteries and inverters - - - - - 1 2 2 3 5
Other items - - - - - 0 0 0 0 0
Distribution network
11 kV Overhead lines (wood pole) - - - - - 9 16 26 37 48
11 kV Overhead lines (mixed construction) - - - - - - - - - -
11 kV Underground cables (PILC) - - - - - - - - - -
11 kV Underground cables (XLPE) - - - - - 19 40 60 80 100
Distribution sub land - - - - - - - - - -
Distribution transformers (pole,
1ph/2ph/3ph)- - - - - 6 12 19 25 32
Distribution transformers (pad) - - - - - 5 11 16 22 28
Distribution substations mount (pole) - - - - - 0 1 2 3 4
Distribution substations mount (pad) - - - - - 3 6 9 12 16
Distribution substation mount (building &
in customer building)- - - - - 0 1 1 2 2
Switchgear cabinet - - - - - - - - - -
Switchgear
Surge Diverters (3ph, 66/33kV) / Air break
isolators (66/33kV)- - - - - - - - - 0
Indoor circuit breakers and switchgear
(66/33/11kV)- - - - - 15 38 59 81 108
Outdoor circuit breakers and switchgear
(66/33/11kV)- - - - - 7 18 33 51 72
11kV Disconnectors & Dropout fuses - - - - - 2 5 8 11 14
11kV voltage regulators - - - - - 1 1 2 2 2
11kV Circuit breaker/recloser &
sectionalisers- - - - - - - - - -
11kV MSU and oil switches - - - - - - - - - -
Current Period Assessment Period CPP Period

Alternative depreciation ($000)
FY10 FY11 FY12 FY13 FY14 FY15 FY16 FY17 FY18 FY19
Low voltage distribution network
LV Overhead lines (wood pole) - - - - - 2 3 6 8 11
LV Overhead lines (mixed construction) - - - - - - - - - -
LV Underground cables (PILC) - - - - - - - - - -
LV Underground cables (XLPE) - - - - - 9 20 31 43 55
Link Pillars & LV customer service
connections- - - - - 11 18 29 40 49
Supporting or secondary systems
Ripple Injection Plant - - - - - 7 12 27 39 57
SCADA and communications - - - - - 34 73 114 159 214
Peak load generator - - - - - - - - - -
Metering systems - - - - - 1 2 3 4 5
Easements - - - - - - - - - -
Network Spares - - - - - - - - - -
Finance leases - - - - - - - - - -
Capital Contributions - - - - - (11) (17) (27) (35) (40)
Power factor correction plant - - - - - 1 1 2 3 3
EDB-owned mobile substations and
generators- - - - - - - 12 14 15
Non system fixed assets
Office Buildings - - - - - 28 31 33 36 39
Information and Technology Systems - - - - - 148 429 837 1,475 2,990
Office Furniture and Equipment - - - - - 169 234 324 461 694
Tools, Plant and Machinery - - - - - 10 24 41 66 101
Vehicles - - - - - 51 82 158 275 483
Total - - - - - 621 1,221 2,073 3,232 5,512
Current Period Assessment Period CPP Period

Appendix 16Engineer’s Report on Non Standard Asset Lives

Independent Engineer’s Report
Asset life for ‘peak load and mobile generation’
and ‘power factor correction’ assets
Independent Engineer’s Report –
Asset life for ‘peak load and mobile generation’
and ‘power factor correction’ assets
Client: Orion New Zealand Ltd.
FINAL
DECEMBER
Asset life for ‘peak load and mobile generation’
Orion New Zealand Ltd.
FINAL Report
DECEMBER 2012
ASSET LIFE
Prepared for
ORION NZ Ltd
Prepared by
LineTech Consulting Ltd
� Administration Office
23b Mandeville Street
Christchurch.
Report Author Office
14 Tui Crescent
Waiatarua
Waitakere City
� +64 9 814 9623
� +64 9 814 9623
� www.linetech.co.nz
© Linetech Consulting 2012 The information contained in this document is produced by LineTech Consulting and is solely for the use of the Client identified on the cover sheet for the purpose for which it has been prepared and Consulting undertakes no duty to or accepts any responsibility to any third party who may rely upon this document.
FINAL REPORT ORION NZ LTD
DECEMBER 2012
LineTech Consulting Ltd
Street, Riccarton
The information contained in this document is produced by LineTech Consulting and is solely for the use of the Client identified on the cover sheet for the purpose for which it has been prepared and
duty to or accepts any responsibility to any third party who may rely upon this
ORION NZ LTD
P a g e | i
The information contained in this document is produced by LineTech Consulting and is solely for the use of the Client identified on the cover sheet for the purpose for which it has been prepared and LineTech
duty to or accepts any responsibility to any third party who may rely upon this

ASSET LIFE
Quality Information
Document Independent Engineer’s Report
Reference: LTC
Date: 13th
Prepared by: Ir G. Richard Gibbons
BSc. (Hons), Dip BA, Cert Co Dir; FIET,
Int PE;
General Manager LineTech Consulting Ltd
Mobile: +
Revision History
Revision
Revision Date
Draft V1 13/12/12
Final
20/12/12
FINAL REPORT ORION NZ LTD
DECEMBER 2012
Quality Information
Independent Engineer’s Report – Quality Standard Variation
LTC
th December 2012
Ir G. Richard Gibbons
BSc. (Hons), Dip BA, Cert Co Dir; FIET, C.Eng (UK); FIPENZ, CPEng (NZ);
Int PE; Life M.EEA; FNZIM; Acc.MInstD
General Manager LineTech Consulting Ltd
Mobile: + 64 27 22 88 160
Revision Date Details
Authorised
Name/Position
Initial Draft for
comment
R Gibbons/GM
Final version R Gibbons/GM
ORION NZ LTD
P a g e | ii
Quality Standard Variation
C.Eng (UK); FIPENZ, CPEng (NZ);
Authorised
Signature

ASSET LIFE
Executive Summary
Orion New Zealand Ltd (Orion) is preparing a “customised price
submitted to the Commerce Commission (Commission). This follows
infrastructure caused by the series of earthquakes affecting the Christchurch area that started on
4 September 2010. This document is submitted under the catastrophic event provisions of the
Commerce Act Electricity Distribution Input Methodo
One aspect where an independent engineers view is required relates to the service lives that should
be allocated to components for which an exist
where there are no existing standard lives
factor correction’.
This report considered the approaches adopted and the values prop
these assets classes.
On the basis of the analysis undertaken this review supports the service lives proposed by Orion
‘peak load and mobile generation’ and ‘power factor correction’ assets
respectively.
FINAL REPORT ORION NZ LTD
DECEMBER 2012
Orion New Zealand Ltd (Orion) is preparing a “customised price-quality path” (CPP) application to be
submitted to the Commerce Commission (Commission). This follows the significant
infrastructure caused by the series of earthquakes affecting the Christchurch area that started on
2010. This document is submitted under the catastrophic event provisions of the
Commerce Act Electricity Distribution Input Methodology Determination, December 2010.
One aspect where an independent engineers view is required relates to the service lives that should
or which an existing standard life does not exist. Orion has two cases
isting standard lives being ‘peak load and mobile generation’ and ‘power
This report considered the approaches adopted and the values proposed for adoption for each of
On the basis of the analysis undertaken this review supports the service lives proposed by Orion
‘peak load and mobile generation’ and ‘power factor correction’ assets of 15 years and 35 years
ORION NZ LTD
P a g e | iii
quality path” (CPP) application to be
the significant damage to its
infrastructure caused by the series of earthquakes affecting the Christchurch area that started on
2010. This document is submitted under the catastrophic event provisions of the
logy Determination, December 2010.
One aspect where an independent engineers view is required relates to the service lives that should
Orion has two cases
‘peak load and mobile generation’ and ‘power
sed for adoption for each of
On the basis of the analysis undertaken this review supports the service lives proposed by Orion for
of 15 years and 35 years

ASSET LIFE
Contents
Executive Summary ................................
1.0 Background/Introduction ................................
2.0 Requirements ................................
3.0 Generators ................................
4.0 Power Factor Correction Capacitors
6.0 Conclusions ................................
Appendix A: List of Documents Provided for Review
FINAL REPORT ORION NZ LTD
DECEMBER 2012
................................................................................................................................
................................................................................................
................................................................................................................................
................................................................................................................................
4.0 Power Factor Correction Capacitors ................................................................................................
................................................................................................................................
List of Documents Provided for Review ................................................................
ORION NZ LTD
P a g e | iv
................................ iii
................................................. 5
.................................... 5
........................................ 5
................................. 6
....................................... 7
......................................... 8

ASSSET LIFE
1.0 Background/Introduction
Orion New Zealand Ltd (Orion) is preparing
submitted to the Commerce Commission (Commission).
This application is under section 53Q of the Act, which allows for a supplier of electricity distribution
services, such as Orion, to make a propo
the supplier to follow a different price
otherwise apply. A CPP proposal must be made in accordance with the methodologies and
processes set out in the Input Methodology Determination
Following the significant damage to its infrastructure caused by the series of earthquakes affecting
the Christchurch area that started on 4
to the Commission under the catastrophic event provisions of the
Determination.
The Input Methodology Determination
provide reports on certain aspects of that application.
alternative depreciation methodologies
in accordance with 5.3.8 must be independently reviewed.
an independent verifier to provide an opinion as to whether the proposed asset life and proposed
alternative depreciation method in the CPP application better meets the purposes of Part 4 of the
Act than if the standard depreciation method set by the Commission was applied.
The alternative depreciation proposed by Orion does not involve
life thus it does not require verification or an engineer’s report.
independent engineer to provide a report on
of ‘peak load and mobile’ generators and power factor correction plants
between FY10 and FY 19 as they do not have a standard physical asset life
This report has been prepared to review the proposed physical service lives for the identified plant
2.0 Requirements
The issue to be addressed is “are the
and mobile’ generators and power factor correction plants
3.0 Generators
Orion propose to use an asset life of 15 years for these assets as
in the initial RAB, and had previously
scheduled life for these assets. Since
frequently than the standby generators,
FINAL REPORT
DECEMEBR 2012
und/Introduction
Orion New Zealand Ltd (Orion) is preparing a “customised price-quality path” (CPP) application to be
submitted to the Commerce Commission (Commission).
This application is under section 53Q of the Act, which allows for a supplier of electricity distribution
services, such as Orion, to make a proposal to the Commission for a CPP which effectively permits
the supplier to follow a different price-quality path from the default price-quality path that would
otherwise apply. A CPP proposal must be made in accordance with the methodologies and
Input Methodology Determination.
Following the significant damage to its infrastructure caused by the series of earthquakes affecting
the Christchurch area that started on 4 September 2010, Orion proposes to submit a CPP application
Commission under the catastrophic event provisions of the Input Methodology
Input Methodology Determination requires Orion to engage an independent engineer, to
provide reports on certain aspects of that application. One aspect relates to the option of selecting
alternative depreciation methodologies where clause 7.2 states an alternative depreciation method
in accordance with 5.3.8 must be independently reviewed. Clause G9 of the Determination requires
provide an opinion as to whether the proposed asset life and proposed
alternative depreciation method in the CPP application better meets the purposes of Part 4 of the
Act than if the standard depreciation method set by the Commission was applied.
sed by Orion does not involve them proposing alternative asset
it does not require verification or an engineer’s report. However Orion do require an
to provide a report on their proposed assessment of the physical service life
of ‘peak load and mobile’ generators and power factor correction plants which they will commission
do not have a standard physical asset life.
review the proposed physical service lives for the identified plant
Requirements
“are the proposed assessment of the physical service life of ‘peak load
and mobile’ generators and power factor correction plants reasonable”
fe of 15 years for these assets as they had some standby generators
previously adopted an asset life of 16 years consistent with the IRD
scheduled life for these assets. Since they expect to use the new mobile generation assets more
frequently than the standby generators, they considered a shorter life to be appropriate.
ORION NZ LTD
P a g e | 5
quality path” (CPP) application to be
This application is under section 53Q of the Act, which allows for a supplier of electricity distribution
sal to the Commission for a CPP which effectively permits
quality path that would
otherwise apply. A CPP proposal must be made in accordance with the methodologies and
Following the significant damage to its infrastructure caused by the series of earthquakes affecting
2010, Orion proposes to submit a CPP application
Input Methodology
requires Orion to engage an independent engineer, to
to the option of selecting
an alternative depreciation method
Clause G9 of the Determination requires
provide an opinion as to whether the proposed asset life and proposed
alternative depreciation method in the CPP application better meets the purposes of Part 4 of the
proposing alternative asset
do require an
proposed assessment of the physical service life
which they will commission
review the proposed physical service lives for the identified plant
proposed assessment of the physical service life of ‘peak load
some standby generators
an asset life of 16 years consistent with the IRD
new mobile generation assets more
a shorter life to be appropriate.

ASSSET LIFE
To determine if this is reasonable the list of proposed assets was reviewed
unites rated at 2.0MVA (primarily used for peak lopping duties)
than 300kVA, mainly mobile (Truck or trailer mounted) units. The expected operating hours was also
provided for each set.
From an engineering perspective the lives of such plant are norm
operation, not the age of the machine.
such generators including their
maintenance, availability of parts, etc
base load can have an almost indefinite life
had lives reported as low as 600hrs.
The IRD depreciation life represents a typical
use.
After considering the machines identified and their intended use as well as their expected annual
hours of operation it is considered t
standard IRD life of 16 years, is reasonable and
4.0 Power Factor Correction Capacitors
Orion has proposed to use an asset life of 35 years for these assets.
arrangements of 11kV capacitors, switchgear and cables, protection and control relays and c
pad enclosures. Orion propose to make the asset life for power factor correction assets a weighted
average of the lives used for each of the components.
There already exist IM standard lives for each of these components
the 11kV capacitors. For the 11kV capacitors Orion have proposed to use the standard life for Ripple
injection plant, of which one major component
Considering firstly the proposal to use the weighted average of the lives of the individual
components, this is a totally logical approach to the issue and is supported by this review. It is noted
that the calculated average value for the life of the assem
to 35years which in view of the averaged
appropriate.
The second issue to consider is that of the appropriate life allocated to the capacitors
by Orion to adopt the standard IM life for ripple injection plant is logical f
is the main other location where such items are used, however the ripple plant life reflects the
average values for several components in addition to the ca
coupling transformer as well as the signal gen
latter item does not operate at 11kV and thus may distort the average life of the assem
A review of manufacturers literature for 11kV capacitors has identified that they are typically quoted
as having a service life of 20years, which is in
injection plant as proposed by Orion.
FINAL REPORT
DECEMEBR 2012
To determine if this is reasonable the list of proposed assets was reviewed which identified some
y used for peak lopping duties) but the majority of units being less
mobile (Truck or trailer mounted) units. The expected operating hours was also
From an engineering perspective the lives of such plant are normally measured by the hours of
operation, not the age of the machine. There are many factors which impact on the service life of
design, their operational speed, loading patterns, levels of
etc. larger slow speed machines that are carefully serviced
base load can have an almost indefinite life, whereas very small high speed portable machines have
lives reported as low as 600hrs.
The IRD depreciation life represents a typical medium size generator in regular, but not continuous
After considering the machines identified and their intended use as well as their expected annual
hours of operation it is considered that the proposed service life of 15 years, slight
life of 16 years, is reasonable and appropriate.
Power Factor Correction Capacitors
to use an asset life of 35 years for these assets. The assets consist of
11kV capacitors, switchgear and cables, protection and control relays and c
Orion propose to make the asset life for power factor correction assets a weighted
average of the lives used for each of the components.
IM standard lives for each of these components on an individual basis, except for
For the 11kV capacitors Orion have proposed to use the standard life for Ripple
of which one major component is such 11kV capacitors.
Considering firstly the proposal to use the weighted average of the lives of the individual
this is a totally logical approach to the issue and is supported by this review. It is noted
average value for the life of the assembly was 32.9 yrs which has been rounded
to 35years which in view of the averaged values for individual component lives is considered
The second issue to consider is that of the appropriate life allocated to the capacitors
on to adopt the standard IM life for ripple injection plant is logical from the viewpoint that
is the main other location where such items are used, however the ripple plant life reflects the
average values for several components in addition to the capacitors such as inductors, switches, the
the signal generation plant which is normally an electronic unit. This
latter item does not operate at 11kV and thus may distort the average life of the assem
manufacturers literature for 11kV capacitors has identified that they are typically quoted
as having a service life of 20years, which is in fact the same as the IM life for the complete ripple
injection plant as proposed by Orion.
ORION NZ LTD
P a g e | 6
which identified some
but the majority of units being less
mobile (Truck or trailer mounted) units. The expected operating hours was also
ally measured by the hours of
actors which impact on the service life of
loading patterns, levels of
fully serviced run on
speed portable machines have
in regular, but not continuous,
After considering the machines identified and their intended use as well as their expected annual
service life of 15 years, slightly under the
The assets consist of
11kV capacitors, switchgear and cables, protection and control relays and concrete
Orion propose to make the asset life for power factor correction assets a weighted
on an individual basis, except for
For the 11kV capacitors Orion have proposed to use the standard life for Ripple
Considering firstly the proposal to use the weighted average of the lives of the individual
this is a totally logical approach to the issue and is supported by this review. It is noted
bly was 32.9 yrs which has been rounded
for individual component lives is considered
The second issue to consider is that of the appropriate life allocated to the capacitors. The proposal
the viewpoint that this
is the main other location where such items are used, however the ripple plant life reflects the
such as inductors, switches, the
normally an electronic unit. This
latter item does not operate at 11kV and thus may distort the average life of the assembly.
manufacturers literature for 11kV capacitors has identified that they are typically quoted
for the complete ripple

ASSSET LIFE
Thus the proposed composite life for 11kV Power factor correction capacitors of 35 years is
considered to be a reasonable and appropriate life.
5.0 Conclusions
On the basis of the analysis undertaken this review supports the
‘peak load and mobile generation’ and ‘power
respectively.
FINAL REPORT
DECEMEBR 2012
ite life for 11kV Power factor correction capacitors of 35 years is
appropriate life.
On the basis of the analysis undertaken this review supports the service lives proposed
‘peak load and mobile generation’ and ‘power factor correction’ assets of 15 years and 35 years
ORION NZ LTD
P a g e | 7
ite life for 11kV Power factor correction capacitors of 35 years is
proposed by Orion for
of 15 years and 35 years

ASSSET LIFE
Appendix A: List of Documents Provided for Review
The following Documents were supplied to sup
• Spreadsheet of generation assets, including estimates of the number of operation
hours each year.
FINAL REPORT
DECEMEBR 2012
List of Documents Provided for Review
supplied to support the review: -
Spreadsheet of generation assets, including estimates of the number of operation
ORION NZ LTD
P a g e | 8
List of Documents Provided for Review
Spreadsheet of generation assets, including estimates of the number of operation

Appendix 17 Recoverable costs - verifier
1. Verifier RFP 2. Verifier ToE 3. Verifier Tripartite Deed 4. Verifier Invoice 1 – to 31 November 2012 5. Verifier Invoice 2 – to 31 December 2012

Direct dial: 03 363 9848 Email: [email protected]
by email
12 June 2012
Geoff Brown 77 Taylors Road Mount Albert Auckland
Dear Geoff
Request for proposal relating to verification services
Introduction
1 Orion New Zealand Limited (Orion) wishes to engage an appropriate expert to act as “verifier” of a potential “customised price-quality path” (CPP) to be submitted to the Commerce Commission (Commission). This letter invites you to submit a proposal to act as that verifier.
Background
2 Orion owns and operates the electricity distribution network in central Canterbury between the Waimakariri and Rakaia rivers, and from the Canterbury coast to Arthur's Pass. Orion also owns the electrical contracting business Connectics.
3 Orion is a New Zealand electricity distribution services company. Under Part 4 of the Commerce Act 1986 (Act) 1, the Commission may impose regulation of the price and/or quality of goods or services supplied in markets where there is little or no likelihood of a substantial increase of competition. The Commission produces input methodologies in respect of such markets, which set out rules, requirements and processes applying to the regulation of those services.
4 The Commission has made a final determination as to the input methodologies applicable to electricity distribution services - the Commerce Act (Electricity Distribution Services Input Methodologies) Determination 2010 (Determination). The Determination sets out methodologies which must be applied by the Commission in order to regulate the price and quality of electricity distribution services Orion provides. A copy of the Determination (and the related “Reasons Paper”) can be found here: http://www.comcom.govt.nz/electricity-distribution/ .
1http://www.legislation.co.nz/act/public/1986/0005/latest/DLM87623.html?search=ta_act_C_ac%40acur%40anif_
an%40bn%40rn_25_a&p=4

2
5 Under section 53Q of the Act, a supplier of electricity distribution services such as Orion may make a proposal to the Commission for a CPP which effectively permits the supplier to follow a different price-quality path from the default price-quality path that would otherwise apply. A CPP proposal must be made in accordance with the methodologies and processes set out in the Determination.
6 Following the significant damage to its infrastructure caused by the series of earthquakes affecting the Christchurch area that started on the 4th September 2010, Orion proposes to submit a CPP application to the Commission under the catastrophic event provisions of the Determination.
7 For the purposes of that application, the Determination requires Orion to engage a verifier, that the Commission has approved, to “verify” certain aspects of that
application. The role of, and requirements for appointment of, a verifier are set out in clause 5.5.2 and Schedules F and G of the Determination. In particular, once the Commission has approved a proposed verifier, the approved person may not undertake any service in relation to the Orion’s CPP proposal until Orion, the
Commission and the verifier have entered into a tripartite deed addressing the matters referred to in clause F5 of Schedule F. The form of tripartite deed proposed by Orion is accordingly enclosed. This has yet to be approved by the Commission and is subject to such amendments as may be required by the Commission.
8 Orion has not yet completed preparation of its draft CPP proposal. It anticipates doing so by Friday 16th November 2012. The final date for submission of the CPP application, which must be accompanied by a finalised verification report, is 11 February 2013. The timeframe for verification is accordingly short.
9 Further the Commission will require the verifier to be available following submission of the CPP proposal, to answer any questions it may have.
Request for proposal
10 You have indicated that you are interested in being appointed as verifier for Orion’s
CPP proposal. Orion accordingly now requests, on and subject to the terms of this letter, that you submit to it your proposal to act in that role.
11 Your proposal should address at least the following matters:
11.1 Your name and contact details.
11.2 Confirmation of your willingness to act as verifier.
11.3 Confirmation that you have read and understood, and agree to, the terms and conditions of this letter.
11.4 Reasons why you are sufficiently qualified and experienced to carry out the role of verifier in accordance with the Determination, and an explanation of the

3
nature and extent of your qualifications and experience (and those of your relevant personnel) relevant to carrying out that role, including:
(a) details of the key personnel who you anticipate would be involved (including details of their relevant experience);
(b) the other resources available to you to conduct the work, including other personnel that can cover for the key personnel identified above;
(c) other relevant recent work (including reasonable details of the work performed (including as to complexity and timing) and the names and contact details of at least 3 referees with whom you worked);
(d) conformation of the applicable standards issued and the applicable standards body that you will conduct your assignment as Verifier in accordance with; and
(e) confirmation that you can meet the requirements for independence set out in the determination.
11.5 Confirmation of your (and your relevant personnel’s) availability to act as verifier
and ability to meet the tight timing requirements noted above.
11.6 Confirmation that key personnel will not change without the approval of Orion, such approval not to be unreasonably withheld.
11.7 Confirmation that you can complete the following tasks in the timeframes stated:
(a) notify Orion of the outcome of your selection, in accordance with clause G3 of Schedule G of the Determination, of Projects or Programmes meeting paragraph (c) of the definition in clause D1 of Schedule D of the Determination of “Identified Programme”; by 21 November 2012
(b) prepare a draft verification report in accordance with Schedule G of the Determination and provide it to Orion; by 21 December 2012
(c) prepare a verification report in accordance in accordance with Schedule G of the Determination that takes account of any modifications to the information originally provided to the Verifier under clause 2, in light of Orion’s consideration of the draft verification report provided to it in
accordance with clause 4.1(c); by 31 January 2103
(d) provide a certificate as described in clause 5.1.3(1)(b)(iii) of the Determination; by 31 January 2013
11.8 Include a written statement signed by you that can be supplied by Orion to the Commission that confirming that you are, and will be, independent (in the sense required by clause F2 of the Schedule F of the Determination), including:

4
(a) a confirmation of the matters referred to in clause F2(2)(a); and
(b) any explanation required by clause F2(2)(b).
11.9 Include written statement signed by you that can be supplied by Orion to the Commission (as required by clause F3(2)) explaining the nature and extent of your qualifications and experience relevant to assessing and reporting on the CPP proposal in accordance with the tasks and duties specified in Schedule G.
11.10 Any potential impediments to your completing verification within the required timeframe.
11.11 Confirmation of your willingness to enter into the tripartite deed in the form enclosed, subject to reasonable amendments required by the Commission.
11.12 The fee basis upon which you would propose to charge for this work, including:
(a) an estimate of the probable total fee (if expressed as a range then with no greater variance between the upper and lower bounds than 25% of the lower bound); and
(b) the key assumptions on which that estimate is based, including but not limited to:
(i) Schedule of hourly rates for individuals proposed
(ii) Other fees/charges
(iii) Estimates of the time inputs for key tasks.
11.13 The other terms and conditions you propose for the engagement. (Please note that such terms of engagement may supplement, but may not be inconsistent with, the tripartite deed.)
11.14 How you would expect to carry out your role, addressing in particular the following matters:
(a) What assessment techniques are expected to be used when undertaking analysis and reviews of information and considering the matters required by Schedule G of the Determination for each for the following topics:
(i) Service categories, measures and levels
(ii) Forecast capex projects and programmes, including the techniques which are expected to be used for identified programmes
(iii) Forecast opex projects and programmes, including the techniques which are expected to be used for identified programmes
5
(iv) Unit rates and contingencies included in project and programme forecasts
(v) Demand forecasts.
12 Your proposal should be:
12.1 signed by you (or by your duly authorised agent) and include appropriate contact details, including postal and email addresses and telephone numbers;
12.2 delivered prior to 4pm on Friday 29th June 2012 (the Closing Date) by email (with subject line “Verifier Proposal”) to: [email protected].
13 Submission of your proposal will constitute your agreement to the terms of this letter. Please ensure you have read and familiarised yourself with these provisions.
Submission of proposal
14 You may request additional information from Orion which you require for the preparation of a proposal. Any such material will or may, at Orion’s option, be provided
to one or more other persons from whom Orion has requested a proposal to act as verifier. However, you are and shall be responsible for the accuracy and sufficiency of your proposal (including the pricing and other information contained in it). You shall meet all costs you incur in considering this request and in preparing and submitting any proposal. You acknowledge that Orion may rely on the information in your proposal in relation to decisions it makes in relation to its CPP proposal and (in particular) verification of it, and you will accordingly exercise reasonable care in the preparation of any proposal and ensure that it is not misleading.
15 Any proposal submitted by you will be the property of and will be retained by Orion, and may be used by it for any purpose. Submission of a proposal by you will constitute your irrevocable confirmation that no intellectual property rights of any person will be infringed by:
15.1 receipt of that proposal by Orion, and use or disclosure of it by Orion for the purposes of assessing your proposal and/or obtaining the approval of the Commission to your appointment as verifier; or
15.2 use and disclosure by Orion for any other purpose of any part of that proposal (other than any part specifically identified in the proposal as the intellectual property of a third party which may not be used or disclosed by Orion for any purpose other than that in the immediately preceding sub-paragraph).
16 Notwithstanding the immediately preceding paragraph, Orion will not disclose your pricing proposal or your proposed terms of engagement to any person without your prior written consent, except to the extent (if any) that:

6
16.1 it reasonably requires to do so for the purposes of assessing your proposal and/or obtaining the approval of the Commission to your appointment as verifier;
16.2 it is required to do so by law; or
16.3 that information is already in or subsequently enters the public domain (otherwise than as a result of a breach by Orion of any obligation of confidentiality, including under the foregoing provisions of this clause).
Proposal acceptance period
17 Once submitted, your proposal will remain open for acceptance by Orion for a period of 40 working days from the Closing Date. Your proposal will be irrevocable and may not be withdrawn or amended during that period without Orion’s written consent.
Subject to contract
18 Orion will have no legal or other obligations to you in relation to the conduct or outcome of this proposal process. Such obligations will only arise (if ever) upon acceptance of a proposal by Orion pursuant to paragraphs 21 to 24 of this letter and subsequent entry by you and Orion into a binding agreement.
Orion’s rights
19 Orion may at any time, in each case without giving any reasons:
19.1 invite one or more other parties to submit proposals relating to verification of Orion’s CPP proposal and/or any other matter, without notice to you;
19.2 accept, not accept or reject your proposal, whether in whole or in part and whether received before or after the Closing Date;
19.3 consider any non-conforming or partially completed proposal submitted by you or any other person;
19.4 enter into discussions and/or negotiations with any other person in relation to the verification of its CPP proposal and/or any other matters (on any terms) to the exclusion of, and without notice to, you and without the need to consider any resubmitted altered proposal documents (or any other material) from you;
19.5 enter into any agreement or arrangement with any other person in relation to the verification of its CPP proposal and/or any other matters on any terms and conditions to the exclusion of, and without notice to, you and without the need to consider any resubmitted altered proposal documents (or any other material) from you;
19.6 amend, suspend or cancel (in whole or in part) this request for proposal or any process relating to Orion’s CPP proposal (including, to avoid doubt, elect not to
proceed with a CPP application); and/or

7
19.7 act in any other manner it wishes in relation to its intended CPP proposal without any requirement to notify you or obtain your consent or approval.
Evaluation Process
20 Orion may take into consideration any matters that it considers relevant to the evaluation of a proposal from you and/or any other person (each a “tenderer”),
including:
20.1 the Commission’s approval of the tenderer as a verifier
20.2 the tenderer’s apparent capability to meet the desired outcomes.
20.3 the experience and expertise of the tenderer.
20.4 the quality of the tenderer’s response on all or any matters set out in the
Proposal Documents.
20.5 the completeness of the tenderer’s proposal.
20.6 interviews with the tenderer.
20.7 any other factors Orion considers relevant or appropriate.
Acceptance of proposal
21 Orion’s acceptance of your proposal is conditional on the Commission’s approval of
you as a verifier and preparedness to enter into a tripartite deed with you and Orion in a form acceptable to Orion. If Orion accepts your proposal, it will give you notice of such acceptance in writing signed by an authorised signatory of Orion. Such notice will be sent to the address provided in your proposal. Acceptance will be deemed to have been communicated on the dispatch of that notice.
22 If Orion encloses with or attaches to that notice your proposed terms of engagement (or such amended terms of engagement as may have been agreed between you and Orion subsequent to receipt by Orion of your proposal) duly executed by Orion, and the tripartite deed in the form agreed with you, you will immediately execute those terms and that deed and return them to Orion.
23 If Orion does not do so, you will immediately negotiate in good faith with Orion in an endeavour to agree the terms and conditions of your engagement and/or the deed (as applicable) as soon as possible.
24 If your proposal is unsuccessful, Orion will notify you of that fact.
No liability
25 Orion makes no representation and gives no warranty (and you will not allege that Orion has made any representation or given any warranty), and will have no liability, in relation to the accuracy or sufficiency of, or for any errors or misdescriptions in, this

8
letter, its accompanying documentation or any other information provided by Orion in relation to your possible appointment as verifier.
26 You agree that Orion has no liability whatsoever to you at law, by statute, in equity, in tort (including negligence) or otherwise, in connection with this letter, its accompanying documentation or the process relating to the possible appointment of a verifier by Orion, except to the extent (if any) expressly agreed in writing by Orion.
27 If, despite the other provisions of this letter, Orion is found to be liable to you then its liability is limited to NZ$100.
Confidentiality
28 You must keep confidential (and your receipt and acceptance of this letter shall constitute your agreement to keep confidential) all information contained in this letter and its accompanying documents, except to the extent that:
28.1 Orion agrees otherwise in writing;
28.2 you are required by law to disclose that information; or
28.3 the information is already in or subsequently enters the public domain other than through a breach by you of any obligation of confidence (whether in this letter or otherwise).
Yours faithfully
David Freeman-Greene
General Manager Commercial


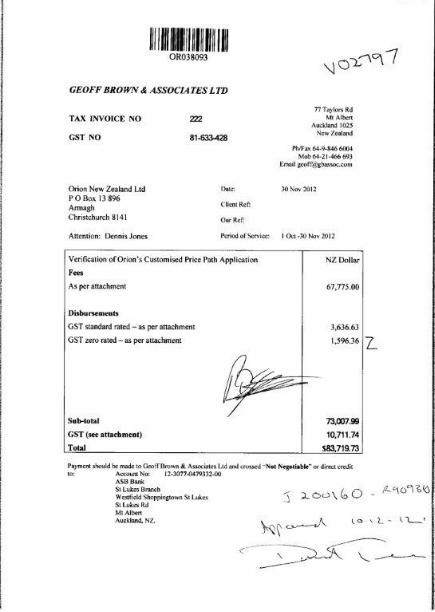


Appendix 18Recoverable costs - auditor
1. Arrangements for assurance engagement 2. Audit Invoice 1 to 30 November 2012 3. Audit Invoice 2 to 31 December 2012


Appendix 19 Recoverable costs - engineer
1. Richard Gibbons Engineer RFP 2. LineTech Consulting Offer 3. Letter of acceptance 4. Engineer invoice to 11 November 2012 5. Engineer final invoice, 21 January 2013
Direct dial: 03 363 9848 Email: [email protected]
by email
10 September 2004
Richard Gibbons General Manager LineTech Consulting Limited 14 Tui Crescent Waiatarua Waitakere City, Auckland 0604
Dear Richard
Request for proposal relating to engineering services
Introduction 1 Orion New Zealand Limited (Orion) wishes to engage an independent engineer to
assist with a “customised price-quality path” (CPP) application to be submitted to the Commerce Commission (Commission). This letter invites you to submit a proposal to act as that engineer.
Background 2 Orion owns and operates the electricity distribution network in central Canterbury
between the Waimakariri and Rakaia rivers, and from the Canterbury coast to Arthur's Pass. Orion also owns the electrical contracting business Connectics.
3 Orion is a New Zealand electricity distribution services company. Under Part 4 of the Commerce Act 1986 (Act)1, the Commission may impose regulation of the price and/or quality of goods or services supplied in markets where there is little or no competition or likelihood of a substantial increase in competition. The Commission produces input methodologies in respect of such markets, which set out rules, requirements and processes applying to the regulation of those services.
4 The Commission has made a final determination as to the input methodologies applicable to electricity distribution services - the Commerce Act (Electricity
1
http://www.legislation.co.nz/act/public/1986/0005/latest/DLM87623.html?search=ta_act_C_ac%40acur%40anif_an%40bn%40rn_25_a&p=4

2
Distribution Services Input Methodologies) Determination 2010 (Determination). The Determination sets out methodologies which must be applied by the Commission in order to regulate the price and quality of electricity distribution services Orion provides. A copy of the Determination (and the related “Reasons Paper”) can be found here: http://www.comcom.govt.nz/electricity-distribution/.
5 Under section 53Q of the Act, a supplier of electricity distribution services such as Orion may make a proposal to the Commission for a CPP which effectively permits the supplier to follow a different price-quality path from the default price-quality path that would otherwise apply. A CPP proposal must be made in accordance with the methodologies and processes set out in the Determination.
6 Following the significant damage to its infrastructure caused by the series of earthquakes affecting the Christchurch area that started on 4 September 2010, Orion proposes to submit a CPP application to the Commission under the catastrophic event provisions of the Determination.
7 For the purposes of that application, the Determination requires Orion to engage an independent engineer, to provide reports on certain aspects of that application. The reports are to be included in the CPP application to the Commerce Commission. In particular, we will require reports on:
7.1 a quality standard variation from the default standards set by the Commission must include an engineer’s report in accordance with clause 5.4.5(c) of the Determination; and
7.2 an alternative depreciation method in accordance with 5.3.8 must be independently reviewed. Clause G9 of the Determination requires an independent verifier to provide an opinion as to whether the proposed asset life and proposed alternative depreciation method in the CPP application better meets the purposes of Part 4 of the Act than if the standard depreciation method set by the Commission was applied. Orion requires an engineer to provide a report on the substance of clause G9, to be included in Orion’s CPP proposal, and to assist the independent verifier fulfil its obligations under clause G9
8 Orion has not yet completed preparation of its draft CPP proposal. We anticipate having the quality standard variation and any alternative depreciation method completed to a stage suitable for review by 30 September 2012. We would require the draft engineering reports outlined in paragraphs 7.1, 7.2 above to be completed by Friday 19 October 2012 with final reports due by 30 October 2012. The timeframe for engineering services is accordingly short.
9 Orion may require the engineer to be available following submission of the CPP proposal, to answer any questions the Commission may have.
Request for proposal

3
10 You have indicated that you are interested in being appointed as the independent engineer for Orion’s CPP proposal. Orion accordingly now requests, on and subject to the terms of this letter, that you submit to it your proposal to act in that role.
11 Your proposal should address at least the following matters:
11.1 Your name and contact details.
11.2 Confirmation of your willingness to act as the engineer.
11.3 Confirmation that you have read and understood, and agree to, the terms and conditions of this letter.
11.4 Reasons why you are sufficiently qualified and experienced to carry out the role of the engineer in accordance with the Determination, and an explanation of the nature and extent of your qualifications and experience (and those of your relevant personnel) relevant to carrying out that role.
11.5 Confirmation of your (and your relevant personnel’s) availability to act as the engineer and ability to meet the tight timing requirements noted above.
11.6 Confirmation that key personnel will not change without the approval of Orion, such approval not to be unreasonably withheld.
11.7 Any potential impediments to you completing the engineering services within the required timeframe.
11.8 Your terms of engagement which should include the fee basis upon which you would propose to charge for this work, including:
(a) an estimate of the probable total fee (if expressed as a range then with no greater variance between the upper and lower bounds than 25% of the lower bound); and
(b) the key assumptions on which that estimate is based, including but not limited to:
(i) schedule of hourly rates for individuals proposed;
(ii) other fees/charges; and
(iii) estimates of the time inputs for key tasks.
11.9 How you would expect to carry out your role, addressing in particular
the assessment techniques that you expect to use when undertaking analysis and reviews of information and considering the matters required by clauses 5.4.5(c), and G9 of the Determination.

4
12 Your proposal should be:
12.1 signed by you (or by your duly authorised agent) and include appropriate contact details, including postal and email addresses and telephone numbers;
12.2 delivered prior to 5pm on Tuesday 11 September 2012 (the Closing Date) by email (with subject line “Engineer Proposal”) to: [email protected].
13 Submission of your proposal will constitute your agreement to the terms of this letter. Please ensure you have read and familiarised yourself with these provisions.
Acceptance of proposal
14 If Orion accepts your proposal, it will give you notice of such acceptance in writing
signed by an authorised signatory of Orion. Orion will enclose with that notice the terms of engagement (or such amended terms of engagement as may have been agreed between you and Orion subsequent to receipt by Orion of your proposal) duly executed by Orion. You will immediately execute those terms and return them to Orion.
15 If your proposal is unsuccessful, Orion will notify you of that fact.
Yours faithfully
David Freeman-Greene
General Manager Commercial

To: David Freeman-Greene
General Manager Commercial
Orion New Zealand Ltd
Dear David:
Independent engineer to assist with a “customised price
Thank you for the opportunity to put forward a proposal to assist
customised price path to reflect the effects of the recent
We understand that for the purposes of that application, the Determination requires Orion to engage
an independent engineer, to provide reports on certain aspects of that application. The
to be included in the CPP application to the Commerce Commission. In par
on:
a) a quality standard variation from the default standards set by the Commission must include
an engineer’s report in accordance with clause 5.4.5(c) of the Determination; and
b) an alternative depreciation method in
reviewed. Clause G9 of the Determination requires an independent verifier to provide an
opinion as to whether the proposed asset life and proposed alternative depreciation method in
the CPP application better me
depreciation method set by the Commission was applied. Orion requires an engineer to
provide a report on the substance of clause G9, to be included in Orion’s CPP proposal, and
to assist the independent verifier fulfil its obligations under clause G9
LineTech Consulting Ltd puts forward the following
1. Proposed Independent Engineer:
Ir G. Richard Gibbons BSc. (Hons), Dip BA, Cert Co Dir; FIET, C.Eng (UK); FIPENZ, CPEng (NZ); Int PE;
2. Confirmation of willingness to act as the engineer
I confirm I am willing to act as the independent Engineer
3. Confirmation that I have read and understood, and agree to, the terms and conditions
of this letter
I confirm that I have read and understood, and agree to, the terms and conditions of this letter
LineTech Consulting Administration OfficeLineTech Consulting Administration OfficeLineTech Consulting Administration OfficeLineTech Consulting Administration Office23B
PO. Box 8373, Riccarton, Christchurch
Mail from: Richard GibbonsMail from: Richard GibbonsMail from: Richard GibbonsMail from: Richard Gibbons
Email: richard.gibbons@linetech
General Manager Commercial
ndependent engineer to assist with a “customised price-quality path” (CPP) application
put forward a proposal to assist Orion with their application for a
customised price path to reflect the effects of the recent earthquakes on the Orion netwo
or the purposes of that application, the Determination requires Orion to engage
an independent engineer, to provide reports on certain aspects of that application. These
to be included in the CPP application to the Commerce Commission. In particular, reports
a quality standard variation from the default standards set by the Commission must include
an engineer’s report in accordance with clause 5.4.5(c) of the Determination; and
an alternative depreciation method in accordance with 5.3.8 must be independently
reviewed. Clause G9 of the Determination requires an independent verifier to provide an
opinion as to whether the proposed asset life and proposed alternative depreciation method in
the CPP application better meets the purposes of Part 4 of the Act than if the standard
depreciation method set by the Commission was applied. Orion requires an engineer to
provide a report on the substance of clause G9, to be included in Orion’s CPP proposal, and
endent verifier fulfil its obligations under clause G9
puts forward the following proposal for your consideration:-
dent Engineer:
BSc. (Hons), Dip BA, Cert Co Dir; FIET, C.Eng (UK); FIPENZ, CPEng (NZ); Int PE; Life M.EEA; FNZIM ; Ac.MInstD
willingness to act as the engineer.
ing to act as the independent Engineer
have read and understood, and agree to, the terms and conditions
read and understood, and agree to, the terms and conditions of this letter
LineTech Consulting Administration OfficeLineTech Consulting Administration OfficeLineTech Consulting Administration OfficeLineTech Consulting Administration Office 23B Mandeville Street,
Riccarton, Christchurch8440 Fax (03) 377 2874 Ph (03) 377 1546
Mail from: Richard GibbonsMail from: Richard GibbonsMail from: Richard GibbonsMail from: Richard Gibbons General Manager 14 Tui Crescent
Waiatarua Waitakere City Auckland 0604
ail: [email protected]
By E-Mail
quality path” (CPP) application
Orion with their application for a
network
or the purposes of that application, the Determination requires Orion to engage
se reports are
reports are required
a quality standard variation from the default standards set by the Commission must include
an engineer’s report in accordance with clause 5.4.5(c) of the Determination; and
accordance with 5.3.8 must be independently
reviewed. Clause G9 of the Determination requires an independent verifier to provide an
opinion as to whether the proposed asset life and proposed alternative depreciation method in
ets the purposes of Part 4 of the Act than if the standard
depreciation method set by the Commission was applied. Orion requires an engineer to
provide a report on the substance of clause G9, to be included in Orion’s CPP proposal, and
MInstD
have read and understood, and agree to, the terms and conditions
read and understood, and agree to, the terms and conditions of this letter.

LineTech Proposal 11th September 2012
I note that the commercial terms of agreement are to be agreed. Linetech has a current Consultancy
Services Agreement with Orion which would be fully acceptable; alternatively we would propose the
use of an IPENZ short form agreement
4. Qualifications and experience
I attach my current CV providing details of my qualifications and experience which totals over 40 years
in the electrical supply industry.
In relation to this work I would specifically identify the following: -
• I have been involved in the specific topics of quality, including security of supply issues and
customer expectations since 1985 when I carried out the first studies in NZ on customer
expectations of network performance and price sensitivities as reported in the EEA paper
“Keeping the Customer Satisfied - Consumer Based Engineering Standards”.
• This work developed further and was reported in the EEA paper “What Price Security” in 1990
which won the Best Paper Award that year. This lead through to a significant involvement with
the CAE study which resulted in the publication of their book "Reliability of Electricity Supply"
in 1993 for which I was a Section Author.
• Following experience gained during the Auckland CBD crisis in 1998 I was involved in various
studies and presentations in NZ and overseas on the issues of security of supply and failure
modes.
• I was co-author of the current EEA publication “Guidelines for Security of Supply in New
Zealand Electricity Networks” in 2000 and I am currently Consultant to the EEA carrying out a
review and update of this publication.
• I have previously reviewed aspects of Orion’s approach to network security and overall design
as well as providing an independent review of Orion’s exposure to a major Grid Exit Point
failure following the “D Clamp” failure that resulted in a major outage to the Auckland Region.
• More recently I provided services to Aurora Ltd (Delta Utility Services), for their review of their
quality and security standards. Other networks have included WEL, United and Aurora
(Tasmania).
5. Confirmation of availability to act as the engineer and ability to meet the tight timing
requirements
I confirm that I am available act as the engineer and to meet the proposed timetable.
6. Confirmation that key personnel will not change without the approval of Orion, such
approval not to be unreasonably withheld
I confirm that the key personnel will not change without Orion’s approval.
7. Potential impediments to you completing the engineering services within the required
timeframe
I do not know of any potential impediments to completing the engineering services within the potential
timeframe, noting that at the time of making this offer no material has been viewed.
8. Terms of engagement
Without being able to view any material at this time it is very difficult to provide an estimate of the
costs involved in the work requested. The following is therefore proposed: -
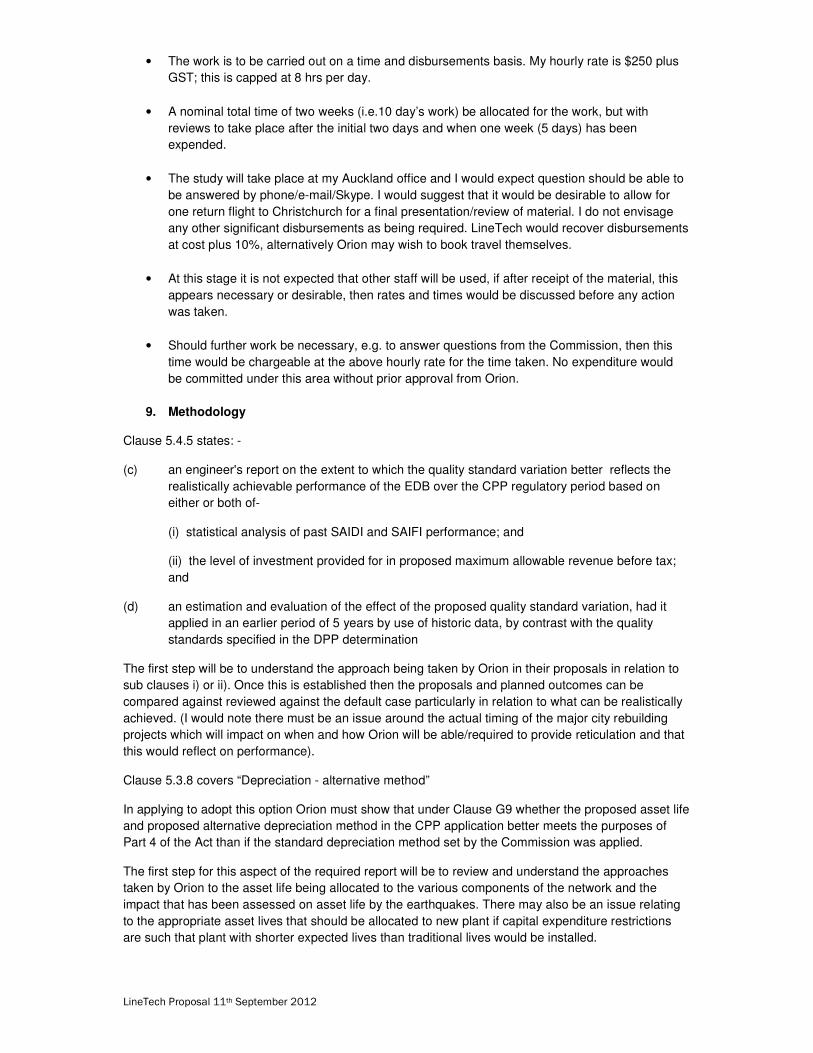
LineTech Proposal 11th September 2012
• The work is to be carried out on a time and disbursements basis. My hourly rate is $250 plus
GST; this is capped at 8 hrs per day.
• A nominal total time of two weeks (i.e.10 day’s work) be allocated for the work, but with
reviews to take place after the initial two days and when one week (5 days) has been
expended.
• The study will take place at my Auckland office and I would expect question should be able to
be answered by phone/e-mail/Skype. I would suggest that it would be desirable to allow for
one return flight to Christchurch for a final presentation/review of material. I do not envisage
any other significant disbursements as being required. LineTech would recover disbursements
at cost plus 10%, alternatively Orion may wish to book travel themselves.
• At this stage it is not expected that other staff will be used, if after receipt of the material, this
appears necessary or desirable, then rates and times would be discussed before any action
was taken.
• Should further work be necessary, e.g. to answer questions from the Commission, then this
time would be chargeable at the above hourly rate for the time taken. No expenditure would
be committed under this area without prior approval from Orion.
9. Methodology
Clause 5.4.5 states: -
(c) an engineer's report on the extent to which the quality standard variation better reflects the
realistically achievable performance of the EDB over the CPP regulatory period based on
either or both of-
(i) statistical analysis of past SAIDI and SAIFI performance; and
(ii) the level of investment provided for in proposed maximum allowable revenue before tax;
and
(d) an estimation and evaluation of the effect of the proposed quality standard variation, had it
applied in an earlier period of 5 years by use of historic data, by contrast with the quality
standards specified in the DPP determination
The first step will be to understand the approach being taken by Orion in their proposals in relation to
sub clauses i) or ii). Once this is established then the proposals and planned outcomes can be
compared against reviewed against the default case particularly in relation to what can be realistically
achieved. (I would note there must be an issue around the actual timing of the major city rebuilding
projects which will impact on when and how Orion will be able/required to provide reticulation and that
this would reflect on performance).
Clause 5.3.8 covers “Depreciation - alternative method”
In applying to adopt this option Orion must show that under Clause G9 whether the proposed asset life
and proposed alternative depreciation method in the CPP application better meets the purposes of
Part 4 of the Act than if the standard depreciation method set by the Commission was applied.
The first step for this aspect of the required report will be to review and understand the approaches
taken by Orion to the asset life being allocated to the various components of the network and the
impact that has been assessed on asset life by the earthquakes. There may also be an issue relating
to the appropriate asset lives that should be allocated to new plant if capital expenditure restrictions
are such that plant with shorter expected lives than traditional lives would be installed.

LineTech Proposal 11th September 2012
In each case I would expect that an initial review would be undertaken of the material followed by a
discussion (phone/Skype) to clarify initial queries or understandings. The next step would be to carry
out any specific investigations required to clarify or refine any issues or to establish any useful
standards or similar used elsewhere.
This would be followed by the preparation of a report outline/index to allow for agreement on content
before a draft report was written and forwarded for your review. Depending on the issues, etc, at that
stage a face to face meeting/presentation may be desirable. Once issues are resolved the final report
will be provided.
I would expect to review the approach as part of the proposed check points at 2 and 5 days of work.
10. Other Matters
I note that the primary reviews of Orion’s application are to be reviewed by Geoff Brown and
Associates. I would confirm that I have previously worked with Geoff on other projects and would be
pleased to do so, on this project.
Should there be any aspect of this proposal that you wish to discuss please contact me, office 09 814
9642, cell 027 22 88 160, Skype “irgrgibbons”.
Yours faithfully
Ir. G. Richard Gibbons General Manager LineTech Consulting Ltd.

Direct dial: 03 363 9848 Email: [email protected]
by email
14 September 2012
Richard Gibbons General Manager LineTech Consulting Limited 14 Tui Crescent Waiatarua Waitakere City, Auckland 0604
Dear Richard
Acceptance of proposal relating to independent engineering services
Orion New Zealand Limited (Orion) is pleased to advise acceptance of your proposal of 11 September 2012 to provide independent engineering services in relation to our CPP application.
We would also like to advise that the current Consultancy Services Agreement that LineTech has with Orion is acceptable to us.
As discussed in our RFP we anticipate having a draft of our quality standard variation completed to a stage suitable for review by 30 September 2012.
Yours faithfully
David Freeman-Greene
General Manager Commercial


Appendix 20 Project and programme schedule summary

Capex by project ($000 Nominal)
Project name CPP reference Capex category FY10 FY11 FY12 FY13 FY14 FY15 FY16 FY17 FY18 FY19Total
(CPP period)
Urban Major North CPP1 Major Projects - - - 2,899 12,133 25,656 14,236 - 11,091 - 50,984
Urban Major Dallington CPP2 Major Projects - - 0 9,984 10,240 - - - - - -
Urban Major West CPP3 Major Projects - - - - - 106 110 7,156 - - 7,372
Major Urban Southeast CPP4 Major Projects - - - - - 532 6,320 3,277 - - 10,129
Major Urban South CPP5 Major Projects - - - - 258 - - - - - -
Urban Major CBD CPP6 Major Projects - - - - - 532 - - - - 532
Rural Major Rolleston CPP7 Major Projects 397 11 - 508 7,782 3,872 - 1,947 858 - 6,677
Rural Major Hororata/Creyke 66kV CPP8 Major Projects - - - - - 1,623 - 285 4,221 918 7,047
Major Rural Central Plains CPP9 Major Projects - - - - 1,386 - - - 4,608 - 4,608
Rural Major Springston CPP10 Major Projects - - - 100 - 1,321 - - - - 1,321
Rural Major Norwood CPP11 Major Projects - - - - - - - - 294 7,270 7,564
Rural Major Power Factor CPP12 Major Projects - - - - 128 136 145 152 159 166 757
Rural Major Annat CPP13 Major Projects - - - - - - - - 538 - 538
Rural Banks Peninsula CPP14 Major Projects - - - - 405 874 - - - - 874
Rural Major Southbridge CPP15 Major Projects - - - - - - - 114 5,192 - 5,306
Rural Major Dunsandel CPP16 Major Projects - - - - - - - 2,694 - - 2,694
Rural Major Porter Heights CPP17 Major Projects - - - - - 4,790 - - - - 4,790
Rural Major Kimberley CPP18 Major Projects - - - - 2,779 - - - - - -
Rural Major Alpine CPP19 Major Projects - - - - - - 257 - - - 257
Major Rural GFN CPP20 Major Projects - - - 856 1,219 - - - - - -
Load management software Current Period Major Projects 603 - - - - - - - - - -
Urban & rural major projects - 66kV Current Period Major Projects 1,721 1,355 3,272 - - - - - - - -
Urban major projects - Earthquake emergency Current Period Major Projects - 855 774 - - - - - - - -
Urban major projects - Hornby Current Period Major Projects 208 - - - - - - - - - -
Urban major projects - Bromley Current Period Major Projects - - 222 - - - - - - - -
Rural major projects - Weedons Current Period Major Projects - - 8 - - - - - - - -
Urban & rural major projects - Substations Current Period Major Projects 5,190 5,634 16,946 - - - - - - - -
Urban major projects - QEII Current Period Major Projects - - 14 - - - - - - - -
Subtotal 8,119 7,855 21,236 14,346 36,329 39,442 21,068 15,623 26,961 8,354 111,449
Other Projects
Underground conversions CPP50 Underground Conversions 2,588 2,475 3,627 2,300 6,570 1,768 6,862 4,460 1,758 1,096 15,945
Urban reinforcement CPP51 Reinforcement 3,996 4,949 2,466 1,673 4,249 4,563 2,954 3,973 4,225 3,316 19,031
Rural reinforcement CPP52 Reinforcement 1,308 369 2,014 2,477 690 785 2,771 2,161 2,085 3,228 11,031
Connections and extensions CPP53Customer Connection/Network
Extension5,113 6,058 6,898 9,650 12,829 14,523 15,616 14,612 13,100 12,703 70,554
Spur asset acquisitions CPP54 Asset Acquisitions - - - 4,188 2,700 16,784 9,419 1,198 - - 27,401
Subtotal 13,004 13,851 15,004 20,288 27,038 38,423 37,623 26,405 21,167 20,344 143,963
Current Period Assessment Period CPP Period
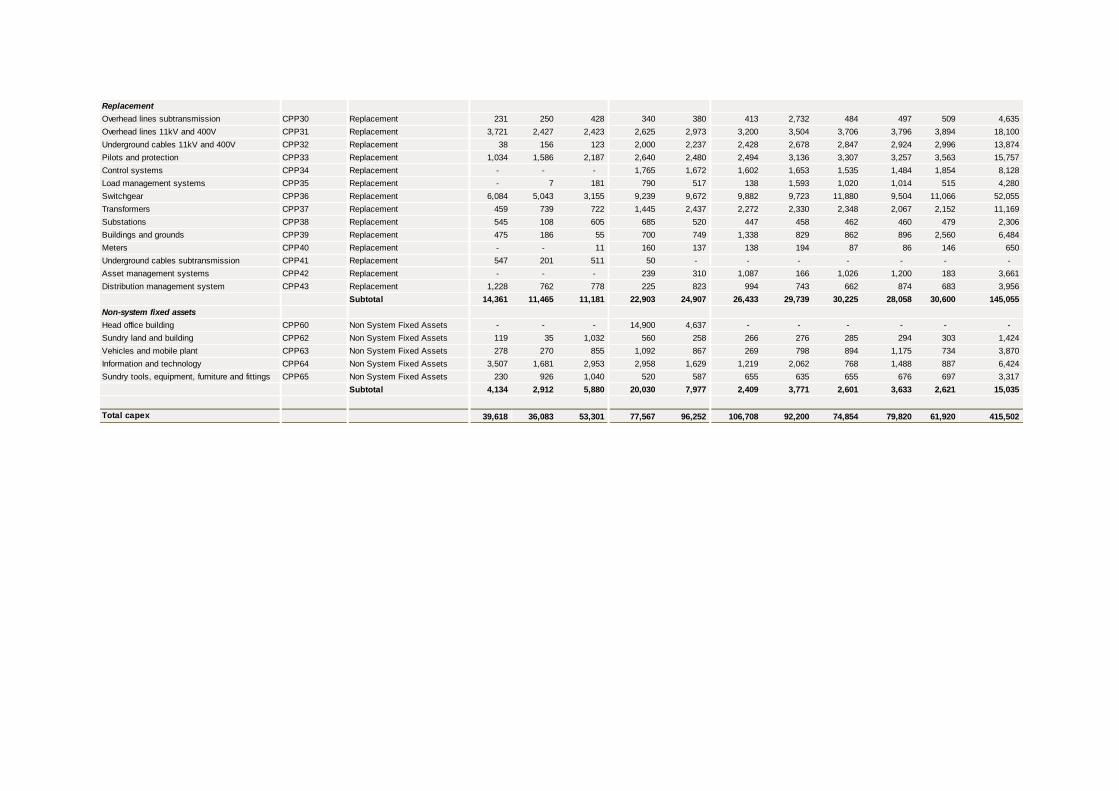
Replacement
Overhead lines subtransmission CPP30 Replacement 231 250 428 340 380 413 2,732 484 497 509 4,635
Overhead lines 11kV and 400V CPP31 Replacement 3,721 2,427 2,423 2,625 2,973 3,200 3,504 3,706 3,796 3,894 18,100
Underground cables 11kV and 400V CPP32 Replacement 38 156 123 2,000 2,237 2,428 2,678 2,847 2,924 2,996 13,874
Pilots and protection CPP33 Replacement 1,034 1,586 2,187 2,640 2,480 2,494 3,136 3,307 3,257 3,563 15,757
Control systems CPP34 Replacement - - - 1,765 1,672 1,602 1,653 1,535 1,484 1,854 8,128
Load management systems CPP35 Replacement - 7 181 790 517 138 1,593 1,020 1,014 515 4,280
Switchgear CPP36 Replacement 6,084 5,043 3,155 9,239 9,672 9,882 9,723 11,880 9,504 11,066 52,055
Transformers CPP37 Replacement 459 739 722 1,445 2,437 2,272 2,330 2,348 2,067 2,152 11,169
Substations CPP38 Replacement 545 108 605 685 520 447 458 462 460 479 2,306
Buildings and grounds CPP39 Replacement 475 186 55 700 749 1,338 829 862 896 2,560 6,484
Meters CPP40 Replacement - - 11 160 137 138 194 87 86 146 650
Underground cables subtransmission CPP41 Replacement 547 201 511 50 - - - - - - -
Asset management systems CPP42 Replacement - - - 239 310 1,087 166 1,026 1,200 183 3,661
Distribution management system CPP43 Replacement 1,228 762 778 225 823 994 743 662 874 683 3,956
Subtotal 14,361 11,465 11,181 22,903 24,907 26,433 29,739 30,225 28,058 30,600 145,055
Non-system fixed assets
Head office building CPP60 Non System Fixed Assets - - - 14,900 4,637 - - - - - -
Sundry land and building CPP62 Non System Fixed Assets 119 35 1,032 560 258 266 276 285 294 303 1,424
Vehicles and mobile plant CPP63 Non System Fixed Assets 278 270 855 1,092 867 269 798 894 1,175 734 3,870
Information and technology CPP64 Non System Fixed Assets 3,507 1,681 2,953 2,958 1,629 1,219 2,062 768 1,488 887 6,424
Sundry tools, equipment, furniture and fittings CPP65 Non System Fixed Assets 230 926 1,040 520 587 655 635 655 676 697 3,317
Subtotal 4,134 2,912 5,880 20,030 7,977 2,409 3,771 2,601 3,633 2,621 15,035
Total capex 39,618 36,083 53,301 77,567 96,252 106,708 92,200 74,854 79,820 61,920 415,502

Opex by project ($000 Nominal)
Project name CPP reference Opex category FY08 FY09 FY10 FY11 FY12 FY13 FY14 FY15 FY16 FY17 FY18 FY19Total
(CPP period)
Network Opex
Overhead lines CPP117 Emergency Maintenance 1,422 1,327 1,340 2,225 2,718 1,475 2,123 2,257 2,876 2,509 2,623 2,741 13,006
Underground cables CPP118 Emergency Maintenance 1,274 960 1,261 6,141 14,588 2,340 3,365 3,577 4,574 3,978 4,157 4,345 20,630
Network assets CPP119 Emergency Maintenance 913 835 895 6,168 3,297 1,110 1,414 1,478 1,747 1,605 1,664 1,724 8,218
Subtotal 3,608 3,122 3,495 14,534 20,603 4,925 6,903 7,311 9,197 8,092 8,443 8,810 41,854
Overhead lines subtransmission CPP100 Scheduled Maintenance 295 163 381 126 249 920 1,014 1,061 1,177 1,230 1,285 1,343 6,095
Overhead lines 11kV and 400V CPP101 Scheduled Maintenance 3,268 3,684 4,429 3,123 3,201 4,545 5,759 6,059 6,448 5,590 5,842 6,161 30,099
Earths CPP102 Scheduled Maintenance 256 126 190 113 145 270 287 305 324 339 354 370 1,692
Underground cables subtransmission CPP103 Scheduled Maintenance 2,264 2,745 1,954 1,020 27 825 982 1,044 1,111 1,161 1,213 1,268 5,796
Underground cables 11kV and 400V CPP104 Scheduled Maintenance 484 589 857 637 416 1,430 1,306 1,388 1,477 1,543 1,613 1,686 7,707
Mapping and asset storage CPP105 Scheduled Maintenance 335 316 300 335 299 508 519 532 547 561 575 589 2,804
Control systems CPP106 Scheduled Maintenance - - - - - 665 705 754 797 829 863 898 4,141
Protection and pilots CPP107 Scheduled Maintenance 201 330 261 154 102 610 653 705 750 784 806 843 3,889
Transformers CPP108 Scheduled Maintenance 872 938 1,148 957 1,141 1,165 1,157 1,219 1,297 1,355 1,416 1,480 6,767
Buildings, grounds and substations CPP109 Scheduled Maintenance 1,345 1,697 1,959 1,641 1,088 3,350 3,434 3,436 3,152 3,294 3,049 3,187 16,117
Meters CPP110 Scheduled Maintenance 0 4 21 27 73 155 165 175 186 194 203 212 971
Generators CPP111 Scheduled Maintenance 5 7 - - 323 100 234 248 528 201 210 233 1,420
Switchgear CPP112 Scheduled Maintenance 681 787 759 584 486 1,177 1,300 1,314 1,231 1,286 1,344 1,405 6,580
Contingency maintenance CPP120 Scheduled Maintenance - - - - - - - 1,570 1,616 1,656 1,697 1,740 8,280
Load management systems CPP121 Scheduled Maintenance 180 114 152 112 89 355 244 260 276 289 302 315 1,441
Distribution management systems CPP123 Scheduled Maintenance 258 387 168 216 271 135 249 254 222 307 269 336 1,388
Subtotal 10,443 11,887 12,577 9,045 7,910 16,210 18,009 20,323 21,138 20,619 21,042 22,065 105,187
Overhead lines CPP113 Non-scheduled Maintenance 764 946 1,112 933 753 790 839 891 949 991 1,036 1,083 4,950
Network assets CPP114 Non-scheduled Maintenance 428 509 716 606 490 565 599 637 677 707 739 772 3,533
Uunderground cables CPP115 Non-scheduled Maintenance 345 611 375 262 284 290 308 327 348 364 380 397 1,817
Buildings, grounds and substations CPP116 Non-scheduled Maintenance 351 360 482 693 302 350 372 395 420 439 459 480 2,193
Subtotal 1,888 2,426 2,684 2,494 1,829 1,995 2,118 2,250 2,394 2,502 2,614 2,732 12,492
Non-Network Opex
Corporate CPP160 General Mgmt and Admin 3,008 3,008 3,105 3,119 3,151 3,607 3,660 3,741 3,863 3,967 4,072 4,167 19,809
Finance CPP161 General Mgmt and Admin 1,000 1,000 987 1,027 955 1,089 1,215 1,243 1,279 1,311 1,343 1,376 6,552
Information solutions - corporate systems CPP164 General Mgmt and Admin 1,210 1,374 1,590 1,741 1,908 2,634 2,159 2,065 2,116 2,621 2,357 2,416 11,574
Commercial and regulatory CPP165 General Mgmt and Admin 1,943 2,050 2,310 2,484 1,917 1,461 2,011 2,065 2,163 2,189 2,249 2,310 10,975
Communications and engagement CPP166 General Mgmt and Admin - - - - - 1,094 1,126 1,162 1,204 1,242 1,280 1,320 6,209
Property maintenance CPP168 General Mgmt and Admin 201 527 606 545 397 1,672 1,433 848 882 913 945 980 4,569
Insurance CPP169 General Mgmt and Admin 598 635 709 842 1,610 1,972 2,463 2,749 2,966 3,155 3,322 3,498 15,689
Earthquakes - overheads and head office CPP170 General Mgmt and Admin - - - 1,545 2,164 2,300 124 - - - - - -
Special projects CPP171 General Mgmt and Admin 78 334 177 111 79 2,000 1,546 532 552 569 588 1,516 3,757
Subtotal 8,038 8,928 9,484 11,414 12,181 17,829 15,736 14,406 15,025 15,965 16,154 17,584 79,134
Infrastructure management CPP167 Network Mgmt and Ops 8,410 8,712 9,498 10,122 11,795 13,681 15,989 16,916 17,487 17,706 18,166 18,661 88,935
Subtotal 8,410 8,712 9,498 10,122 11,795 13,681 15,989 16,916 17,487 17,706 18,166 18,661 88,935
Total opex 32,387 35,076 37,738 47,609 54,319 54,640 58,753 61,205 65,242 64,884 66,419 69,852 327,603
Assessment Period CPP PeriodCurrent Period

Appendix 21 Summary of policies

Summary of relevant policies
IM D3(1) and (2)
9.1 Corporate policies and plans
Reference Title Description/Rationale Relevance to capex/opex projects and programmes
OR00.10.17 Building Emergency Plan - 200-210 Armagh St Describes how staff should act if there is an
emergency and they are situated in 200-210
Armagh Street
These corporate policies support our entire business
operation, and thus are relevant to all projects and
programmes. They ensure we operate consistent with
good industry practice to achieve efficient, effective and
safe outcomes for our staff, consumers, contractors
and other stakeholders. However the responsibility for
delivering them lies predominantly within our corporate
and infrastructure teams. Their activities are included
in the following CPP projects:
CPP160, CPP161, CPP165, CPP166 and CPP171
General management, administration and
overheads
CPP167 Network management and operations
OR00.00.14 Credit Card - Policy Prescribes how and when credit cards should be
used.
OR00.00.11 Delegations of Authority - Policy Sets out what employees are permitted to do as
part of the day-to-day running of Orion. This is
intended to:
Establish clear responsibility, authority,
scope and involvement in all operational
decision making
Maintain adequate levels of control while
empowering employees
Provide managers and employees with
appropriate levels of delegation.
OR00.00.03 Environmental - Sustainability Policy This is intended to provide guidance as we work
towards our goal of environmental sustainability in
our operations.
OR00.00.08 Fraud and Theft - Policy Sets out our policy towards fraud and theft. We
are committed to the prevention, deterrence,
detection and investigation of all fraud and theft.
OR00.00.06 Hazard Management Plan The purpose of this management plan is to
identify and control hazards that may exist or
arise as a result of work undertaken by Orion.
OR00.00.02 Health and Safety - Committee Constitution Sets out our policy towards health and safety for
all staff. This is intended to help protect our
employees, contractors and the public. OR00.00.01 Health and Safety - Policy
OR00.00.18 Housekeeping - Policy There is a correlation between the state of
housekeeping and the number of safety incidents.
To enable us to monitor our housekeeping

performance we have introduced this standard.
OR00.00.05 Human Resources - Policy This sets out all procedures to be followed for the
hiring, management and discipline of employees.
OR00.00.13 Information Systems This policy provides a general overview of the
computing environment and the rules associated
with access to it.
OR00.00.07 Major Outage Communication Plan Outlines staff responsibilities and define the type
of communication that will be carried out in the
event of a major outage.
OR00.00.22 Media Policy Sets out the principles which underpin Orion’s
approach to media relations and the procedures
for coordinating and managing media relations. OR00.00.21 Media Policy - Social
OR00.00.09 Motor Vehicle - Policy Ensures that Orion provides and operates motor
vehicles to achieve the best possible company
outcomes.
OR00.00.12 Orion Sponsorship Sets out the process for selecting who is eligible
to receive sponsorship from Orion.
OR00.00.15 Police Reference Checks - Policy This sets out our requirement for all prospective
employees to undergo a police reference check.
OR00.00.10 Privacy – Policy Sets out 12 information privacy principles to
ensure we comply with the Privacy Act.
OR00.00.19 Procurement (Equipment Purchasing) - Policy Ensures the following good practice principles are
incorporated in all purchasing/procurement
decisions made by Orion employees:
To reflect accountability to the board
To ensure best value for money
To encourage and maintain effective and
sustainable competitive markets among
our suppliers
To ensure lawfulness, fairness and
integrity at all times.
OR00.00.16 Protected Disclosures Policy To facilitate the disclosure and investigation of
matters of “serious wrongdoing” within or by Orion
and to protect employees who, in accordance

with the provisions of the Act, make disclosures of
information about “serious wrongdoing” within or
by Orion.
OR00.00.04 Staff Travel - Policy Sets out what restrictions on travel and costs
incurred while travelling.
Code of Conduct for the Board of Directors Sets out the code of conduct for the board of
directors
Treasury Policy Outlines the objectives and approach that Orion
will adopt in the treasury management process.
Tax Risk Management Policy Documents Orion’s approach to the management
of tax risk.
9.2.1 Infrastructure management policies and plans
Reference Title Description/Rationale Relevance to capex/opex projects and programmes
NW70.60.01 Asset Management Plan To optimise the lifecycle costs for each network
asset group to meet agreed service levels and
future demand. These policies provide an overall
picture of how our assets should be managed and
the current condition of the assets.
CPP1 – CPP20 Major Projects
CPP51 and CPP52 Reinforcement
CPP50 Underground conversions
CPP53 Connections and extensions
CPP30 – CPP43 Replacement
CPP100 – CPP120 Emergency maintenance,
scheduled maintenance and non scheduled
maintenance
CPP60 – CPP65 Non-system fixed assets
CPP164 and CPP168 General management,
administration and overheads
NW71.01.02 Asset Performance Report
NW70.00.46 Asset Management Policy
NW70.60.04 Business Continuity Plan - Infrastructure
Management
This identifies our key risks and strategies to
manage these for each area of the business.
This plan supports our entire business operation, and
thus is relevant to all projects and programmes.
NW70.20.00 Business Plan - Network The mission of this policy is to:
Retain and improve network value
Cost effectively manage the network
asset and improve its performance to a
level which meets or exceeds customer
service level expectations
To manage work on network assets to
achieve or exceed expectations of
CPP1 – CPP20 Major Projects
CPP51 and CPP52 Reinforcement
CPP50 Underground conversions
CPP53 Connections and extensions
CPP30 – CPP43 Replacement
CPP100 – CPP120 Emergency maintenance,
scheduled maintenance and non scheduled
maintenance

contactors and other customer groups. CPP167 Network management and operations
NW70.00.00 Document Index Provides a list of all infrastructure management
controlled documents.
CPP167 Network management and operations
NW70.00.13 Easements - Agreement to Grant This is the contract which Orion and the owner of
the land on which an easement is being granted
sign.
All network capex and maintenance projects which
involve easements
NW70.00.08 Environmental - Management Manual The manuals set out specific responsibilities and
procedures to be followed in order to comply with
the policies.
These manuals support our entire business operation,
and thus are relevant to all projects and programmes.
NW70.00.16 Health and Safety - Management Manual
NW72.00.00 Over-Boundary Maintenance Policy Addresses maintenance responsibilities where
third party premises are involved
CPP100 – CPP123 Scheduled, non-scheduled and
emergency maintenance
NW72.01.01 Overhead Line - Maintenance Costs Sets out whether expenditure should be
considered capex or opex.
CPP30 and CPP31 Replacement
CPP100 and CPP101 Scheduled maintenance
CPP113 Non-scheduled maintenance
CPP117 Emergency maintenance
NW70.00.21 Safety Management System Manual This manuals set out specific responsibilities and
procedures to be followed in order to comply with
our safety policies and procedures
These manuals support our entire business operation,
and thus are relevant to all projects and programmes.
NW70.00.10 Underground Conversion Describes how underground conversion costs are
apportioned between the parties involved
CPP50 Underground conversions
NW70.01.17 Work Plan - Annual Sets out the scheduled work plan for the
upcoming years. This allows our contractors to
better plan their workflow and ensure availability.
All network projects and programmes:
CPP1 – CPP20 Major Projects
CPP51 and CPP52 Reinforcement
CPP50 Underground conversions
CPP53 Connections and extensions
CPP30 – CPP43 Replacement
CPP100 – CPP120 Emergency maintenance,
scheduled maintenance and non scheduled
maintenance
Also relevant to CPP167 Network management and
operations which is responsible for co-ordinating and
ultimate delivery of the annual works plan

9.2.2 Asset lifecycle management reports
Reference Title Description/Rationale Relevance to capex/opex projects and programmes
NW70.00.33 Circuit Breakers – HV These reports describe our approach to life cycle
maintenance and replacement of each asset
category. They include:
a detailed description of the assets installed
on our network
a description of the condition of those assets
and known failures or issues
CBRM HI index (where available)
lifecycle strategy including planned
replacement programme and emergency,
scheduled and non scheduled maintenance
plans
These are updated each year in conjunction with
the AMP update and annual works planning
CPP36 Replacement
CPP112 Scheduled maintenance
CPP114 Non scheduled maintenance
CPP119 Emergency maintenance
NW70.00.34 Communication Systems CPP34 Replacement
CPP106 Scheduled maintenance
CPP114 Non scheduled maintenance
CPP119 Emergency maintenance
NW70.00.36 Distribution Management Systems CPP34 Replacement
CPP106 Scheduled maintenance
CPP114 Non scheduled maintenance
CPP119 Emergency maintenance
NW70.00.39 Generators CPP111 Scheduled maintenance
CPP114 Non scheduled maintenance
CPP119 Emergency maintenance
NW70.00.37 Load Management Systems CPP35 Replacement
CPP121 Scheduled maintenance
CPP114 Non scheduled maintenance
CPP119 Emergency maintenance
NW70.00.38 Metering CPP40 Replacement
CPP110 Scheduled maintenance
CPP114 Non scheduled maintenance
CPP119 Emergency maintenance
NW70.00.27 Overhead Lines - 11kV CPP31 Replacement
CPP101 Scheduled maintenance
CPP113 Non scheduled maintenance
CPP117 Emergency maintenance
NW70.00.25 Overhead Lines – LV CPP31 Replacement
CPP101 Scheduled maintenance
CPP113 Non scheduled maintenance
CPP117 Emergency maintenance
NW70.00.26 Overhead Lines - Subtransmission CPP30 Replacement
CPP100 Scheduled maintenance
CPP113 Non scheduled maintenance
CPP117 Emergency maintenance

NW70.00.42 Property – Corporate CPP60, and CPP62 Non System Fixed Assets
CPP168 General management, administration and
overheads
NW70.00.43 Property – Network CPP39 Replacement
CPP109 Scheduled maintenance
CPP116 Non scheduled maintenance
CPP119 Emergency maintenance
NW70.00.44 Property – Substations CPP38 Replacement
CPP109 Scheduled maintenance
CPP116 Non scheduled maintenance
CPP119 Emergency maintenance
NW70.00.22 Protection Systems CPP33 Replacement
CPP107 Scheduled maintenance
CPP114 Non scheduled maintenance
CPP119 Emergency maintenance
NW70.00.41 Regulators CPP36 Replacement
CPP112 Scheduled maintenance
CPP114 Non scheduled maintenance
CPP119 Emergency maintenance
NW70.00.24 Switchgear - HV and LV CPP36 Replacement
CPP112 Scheduled maintenance
CPP114 Non scheduled maintenance
CPP119 Emergency maintenance
NW70.00.40 Transformers - Distribution CPP37 Replacement
CPP108 Scheduled maintenance
CPP114 Non scheduled maintenance
CPP119 Emergency maintenance
NW70.00.23 Transformers - Power CPP37 Replacement
CPP108 Scheduled maintenance
CPP114 Non scheduled maintenance
CPP119 Emergency maintenance
NW70.00.30 Underground Cables - 11kV
CPP32 Replacement
CPP104 Scheduled maintenance
CPP115 Non scheduled maintenance
CPP118 Emergency maintenance

9.2.3 Design standards
Reference Title Description/Rationale Relevance to capex/opex projects and programmes
NW70.52.01 Cables - Underground Cable Design These set out the minimum requirements and
design specifications for assets on our network.
The rationale is to ensure that all of our assets
are capable of completing the job we require of
them. They also help ensure our network
performance and customer performance targets
are met.
They are relevant to all network capex projects (as part
of asset design), to the extent that each project includes
the relevant equipment:
CPP1 – CPP20 Major Projects
CPP51 and CPP52 Reinforcement
CPP50 Underground conversions
CPP53 Connections and extensions
They are also relevant to all network maintenance
programmes to ensure assets perform as intended
throughout their life
CPP30 – CPP43 Replacement
CPP100 – CPP120 Emergency maintenance,
scheduled maintenance and non scheduled
maintenance
NW70.57.03 Design Application Guide - Distribution Feeder
and Transformer Protection
NW70.50.02 Draughting & Records
NW70.59.01 Earthing - Design
NW70.57.06 Ground Fault Neutraliser - Design Application
Guide
NW70.55.01 Metering Design
NW70.00.12 Network Asset Identification
NW70.50.05 Network Design Overview
NW70.51.02 Overhead Line - Design Manual
NW70.51.01 Overhead Line - Design Standard
NW70.51.04 Overhead Line - Technical Manual
NW70.51.03 Overhead Line - Worked Examples
NW70.57.01 Protection - Design
NW70.50.06 Railway Crossing Application Form (KiwiRail)
NW70.56.01 SCADA Functional Specification for Remote
Sites
NW70.53.02 Substation - Customer Premises

NW70.53.01 Substation - Design
NW70.57.02 Subtransmission Protection - Design
NW70.50.03 Document Control
Provides a list of all controlled documents
These controlled documents support our entire business
operation, and thus are relevant to all projects and
programmes.
9.2.4 Technical specifications
Reference Title Description/Rationale Relevance to capex/opex projects and programmes
Overhead network
NW72.21.04 ABI maintenance The technical specifications set out the
procedures for the maintenance and replacement
for our network assets. This includes the
procedures to be followed when testing and
working on the assets.
The rationale is to ensure the equipment on our
network is operated:
safely to ensure our health and safety
standards are met
prudently to ensure our network performance
and consumer performance standards and
targets are met
CPP30 and CPP31 Replacement
CPP100 and CPP101 Scheduled maintenance
CPP113 Non-scheduled maintenance
CPP117 Emergency maintenance NW72.21.23 Excavation Protocols - Near
Electrical/Telecommunication Lines
NW72.31.01 Overhead Line - Construction Checklist
NW72.21.11 Overhead Line - Inspection & Assessment
NW72.31.02 Overhead Line - Inspection Sheet
NW72.21.03 Overhead Line - Retighten Components
NW72.21.05 Overhead Line - Tower Painting
NW72.21.09 Overhead Line - Visual Inspection of HV
NW72.21.01 Overhead Line - Work
NW72.21.16 Poles - Attachment Engineering Agreement -
Between Orion & Telecom

NW72.21.22 Poles - Ownership Agreement - Between Orion
& Telecom
NW72.21.17 Poles - Shared Use - Attachment Guideline
NW72.21.14 Poles - Shared Use - Engineering Practice
NW72.21.15 Poles - Shared Use - Engineering Practice -
Telecomm Service Drops (Telstra)
NW72.21.18 Standard Construction Drawing Set -
Overhead
NW72.21.10 Thermographic Survey of HV Network
NW72.21.19 Tower Foundation Inspections
NW72.14.01 Tree Cutting Notification
NW72.24.01 Vegetation Work Adjacent to Overhead Lines
NW72.21.13 Vibration Damper Installation
Underground network
NW72.22.04 Cables - 66kV Civil Construction - McFaddens
to Dallington
The technical specifications set out the
procedures for the maintenance and replacement
for our network assets. This includes the
procedures to be followed when testing and
working on the assets.
The rationale is to ensure the equipment on our
network is operated:
safely to ensure our health and safety
standards are met
prudently to ensure our network performance
CPP32, CPP33 and CPP41 Replacement
CPP103, CPP104 and CPP107 Scheduled maintenance
CPP114 and CPP115 Non-scheduled maintenance
CPP118 and CPP119 Emergency maintenance NW72.22.05
Cables - 66kV Installation - McFaddens to
Dallington
NW72.22.02 Cables - Excavation & Backfilling
NW72.22.01 Cables - Installation & Maintenance
NW71.12.03 Cables - Recording Cables & Associated plant

NW72.23.24 Cables - Testing and consumer performance standards and
targets are met
NW72.22.03 Distribution Enclosure Installation
NW72.12.01 Duct Installation For Future Use
NW72.21.12 Low Voltage UG Network Inspection
NW72.21.20 Standard Construction Drawing Set -
Underground
Substations
NW72.23.18 Building Sub - Install Equipment The technical specifications set out the
procedures for the maintenance and replacement
for our network assets. This includes the
procedures to be followed when testing and
working on the assets.
The rationale is to ensure the equipment on our
network is operated:
safely to ensure our health and safety
standards are met
prudently to ensure our network performance
and consumer performance standards and
targets are met
CPP37, CPP38 and CPP39 Replacement
CPP102, CPP108 and CPP109 Scheduled maintenance
CPP114 and CPP116 Non-scheduled maintenance
CPP119 Emergency maintenance NW72.23.03 Distribution Sub - Inspection
NW72.23.05 Distribution Sub - Maintenance
NW72.23.02 Distribution Transformer - Maintenance
NW72.28.01 Earthing - Installation
NW72.28.02 Earthing - Testing
NW72.23.26 Jointing instruction - Prysmian 72.5kV Outdoor
Sealing End
NW72.23.14 Kiosk Sub - Installation
NW72.23.01 Mineral Insulating Oil - Maintenance
NW72.23.04 Network Sub - Inspection
NW72.23.06 Network Sub - Maintenance

NW72.23.19 Network Substation - Seismic Strengthening
NW72.23.15 OCB - Servicing After Fault Operation
NW72.27.03 Partial Discharge Tests
NW72.23.20 Pole Mounted Sub - Fuse Maintenance
NW72.23.25 Power Transformer - Maintenance
NW72.27.02 Protection
NW72.23.22 Regulators - Install or Change on O/D Pad
Mounted Sites
NW72.21.21 Standard Construction Drawing Set -
Substations
NW72.27.04 Testing and Commissioning of Secondary
Equipment
NW72.23.16 Transformer - Installation
NW72.27.01 Unit Protection 11kV - Maintenance Tests
NW72.23.13 Zone Sub - Inspection
NW72.23.07 Zone Sub - Maintenance
Miscellaneous
NW72.20.06 Fuse Application on the Network The technical specifications set out the
procedures for the maintenance and replacement
for our network assets. This includes the
procedures to be followed when testing and
working on the assets.
CPP30 – CPP43 Replacement
CPP100 – CPP120 Emergency maintenance,
scheduled maintenance and non scheduled
maintenance
NW72.20.07 Grounds Maintenance CPP168 General management, administration and
overheads

The rationale is to ensure the equipment on our
network is operated:
safely to ensure our health and safety
standards are met
prudently to ensure our network performance
and consumer performance standards and
targets are met
CPP109 Scheduled maintenance
CPP116 Non-scheduled maintenance
CPP119 Emergency maintenance
NW72.25.07 Metering Installations intended for Energy
Trading & compliance with EMCO
CPP40 Replacement
CPP110 Scheduled maintenance
CPP114 Non-scheduled maintenance
CPP119 Emergency maintenance
NW72.25.03 Orion Check Metering with Transpower at POS CPP40 Replacement
CPP110 Scheduled maintenance
CPP114 Non-scheduled maintenance
CPP119 Emergency maintenance
NW70.26.01 Ripple Control System - Technical Details CPP35 Replacement
CPP114 Non-scheduled maintenance
CPP119 Emergency maintenance NW72.26.02 Ripple Equipment Maintenance
NW72.26.04 Scada Master Maintenance CPP34 and CPP43 Replacement
CPP106 and CPP123 Scheduled maintenance
CPP114 Non-scheduled maintenance
CPP119 Emergency maintenance NW72.26.05 Scada RTU Maintenance
NW72.25.04 Tariff Meter Individual Testing CPP40 Replacement
CPP110 Scheduled maintenance
CPP114 Non-scheduled maintenance
CPP119 Emergency maintenance
9.3.1 Network operation plans
Reference Title Description/Rationale Relevance to capex/opex projects and programmes
NW20.40.10 Contingency Plan - AMI Stadium These set out our plans to mitigate the effects of
outages or other events for particular items which
have been identified as having a high risk to the
public, our staff, our network or our reputation.
CPP167 Network management and operations
NW20.40.09 Contingency Plan - Security of Supply,
Participant Outage Plan
NW20.40.02 Contingency Plan - Emergency Generators
NW20.40.04 Contingency Plan - Energy Shortage
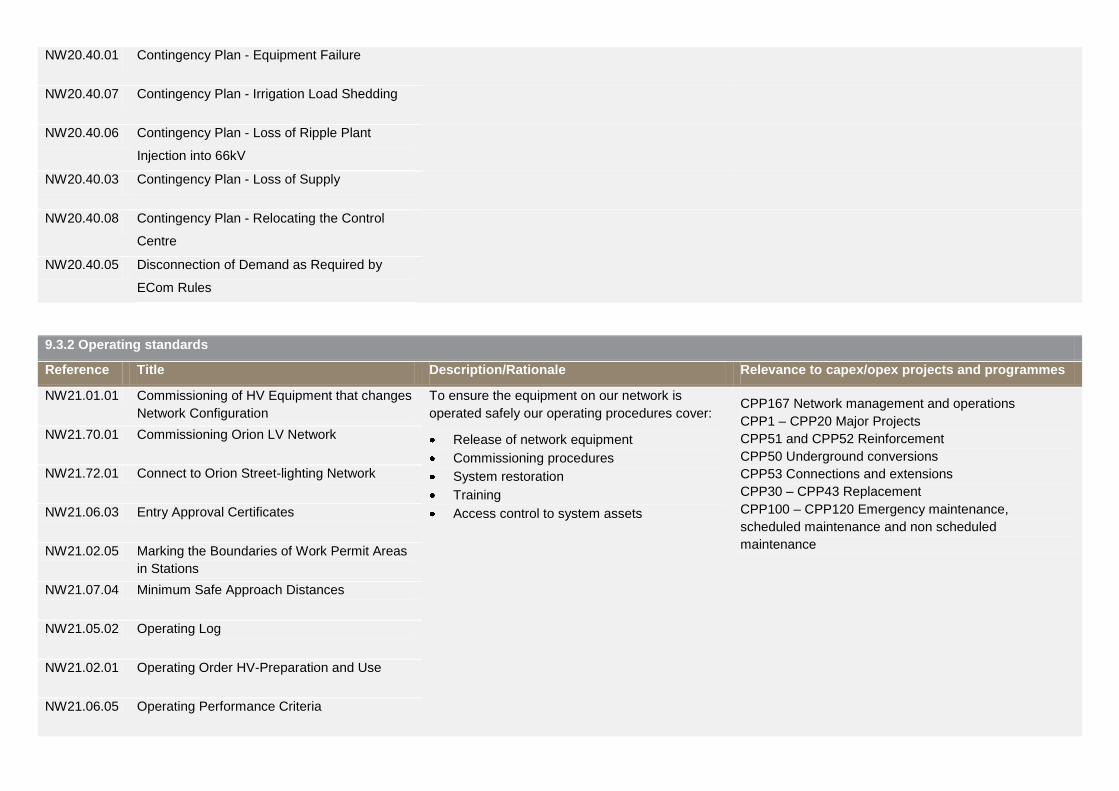
NW20.40.01 Contingency Plan - Equipment Failure
NW20.40.07 Contingency Plan - Irrigation Load Shedding
NW20.40.06 Contingency Plan - Loss of Ripple Plant
Injection into 66kV
NW20.40.03 Contingency Plan - Loss of Supply
NW20.40.08 Contingency Plan - Relocating the Control
Centre
NW20.40.05 Disconnection of Demand as Required by
ECom Rules
9.3.2 Operating standards
Reference Title Description/Rationale Relevance to capex/opex projects and programmes
NW21.01.01 Commissioning of HV Equipment that changes
Network Configuration
To ensure the equipment on our network is
operated safely our operating procedures cover:
Release of network equipment
Commissioning procedures
System restoration
Training
Access control to system assets
CPP167 Network management and operations
CPP1 – CPP20 Major Projects
CPP51 and CPP52 Reinforcement
CPP50 Underground conversions
CPP53 Connections and extensions
CPP30 – CPP43 Replacement
CPP100 – CPP120 Emergency maintenance,
scheduled maintenance and non scheduled
maintenance
NW21.70.01 Commissioning Orion LV Network
NW21.72.01 Connect to Orion Street-lighting Network
NW21.06.03 Entry Approval Certificates
NW21.02.05 Marking the Boundaries of Work Permit Areas
in Stations
NW21.07.04 Minimum Safe Approach Distances
NW21.05.02 Operating Log
NW21.02.01 Operating Order HV-Preparation and Use
NW21.06.05 Operating Performance Criteria

NW21.05.03 Operating Terms Dictionary
NW21.03.04 Orion's Mobile Generators
NW21.06.06 Permission to Work
NW21.02.08 Permit for HV Live Line Work
NW21.02.07 Permit for Work on Network Equipment
NW21.06.02 Permit Holder Certificates
NW21.07.03 Personal Protective Equipment
NW21.01.02 Release of Network Equipment
NW21.70.02 Request to Work or Operate LV Network
NW21.03.02 Restoration Following HV Network Fault
NW21.07.02 Station Security
NW21.03.03 Testing Installation Mains
NW21.02.09 Work Authorities
NW21.06.04 Work Authority Competency
9.3.3 Operating procedures
Reference Title Description/Rationale Relevance to capex/opex projects and programmes
NW22.30.04 Authorising Work Between the Consumer NCP
and POE
To ensure the equipment on our network is CPP167 Network management and operations
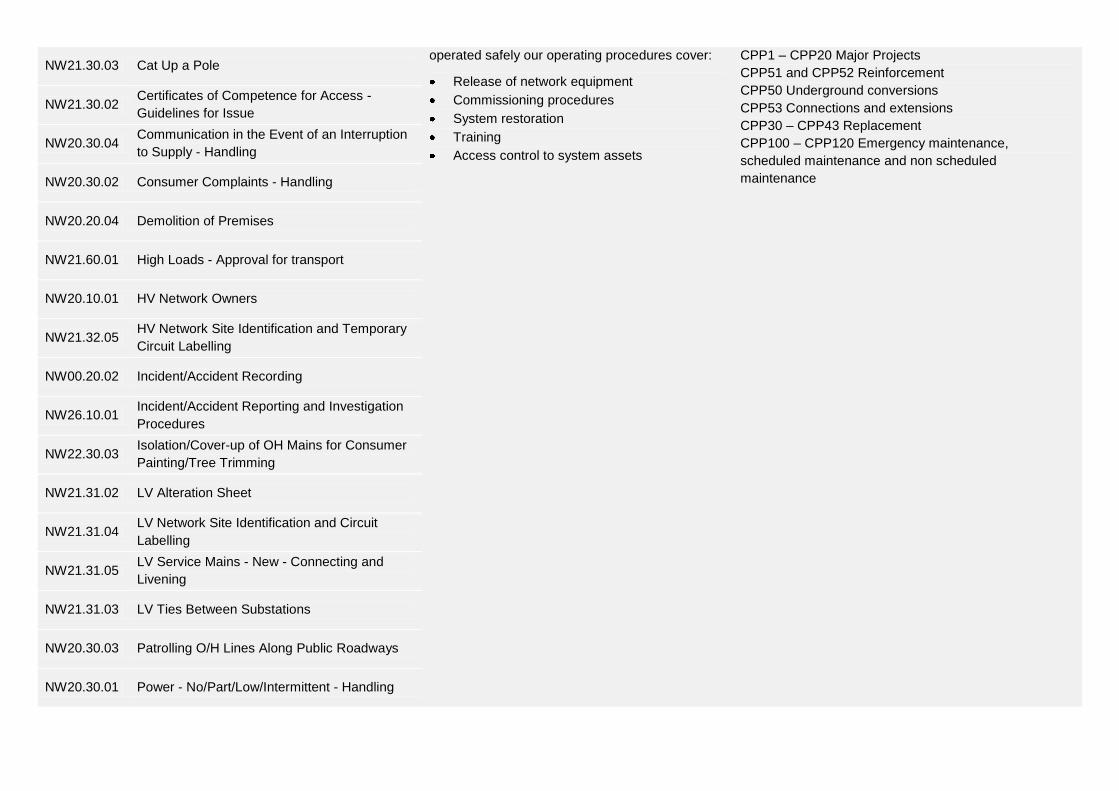
NW21.30.03 Cat Up a Pole operated safely our operating procedures cover:
Release of network equipment
Commissioning procedures
System restoration
Training
Access control to system assets
CPP1 – CPP20 Major Projects
CPP51 and CPP52 Reinforcement
CPP50 Underground conversions
CPP53 Connections and extensions
CPP30 – CPP43 Replacement
CPP100 – CPP120 Emergency maintenance,
scheduled maintenance and non scheduled
maintenance
NW21.30.02 Certificates of Competence for Access -
Guidelines for Issue
NW20.30.04 Communication in the Event of an Interruption
to Supply - Handling
NW20.30.02 Consumer Complaints - Handling
NW20.20.04 Demolition of Premises
NW21.60.01 High Loads - Approval for transport
NW20.10.01 HV Network Owners
NW21.32.05 HV Network Site Identification and Temporary
Circuit Labelling
NW00.20.02 Incident/Accident Recording
NW26.10.01 Incident/Accident Reporting and Investigation
Procedures
NW22.30.03 Isolation/Cover-up of OH Mains for Consumer
Painting/Tree Trimming
NW21.31.02 LV Alteration Sheet
NW21.31.04 LV Network Site Identification and Circuit
Labelling
NW21.31.05 LV Service Mains - New - Connecting and
Livening
NW21.31.03 LV Ties Between Substations
NW20.30.03 Patrolling O/H Lines Along Public Roadways
NW20.30.01 Power - No/Part/Low/Intermittent - Handling
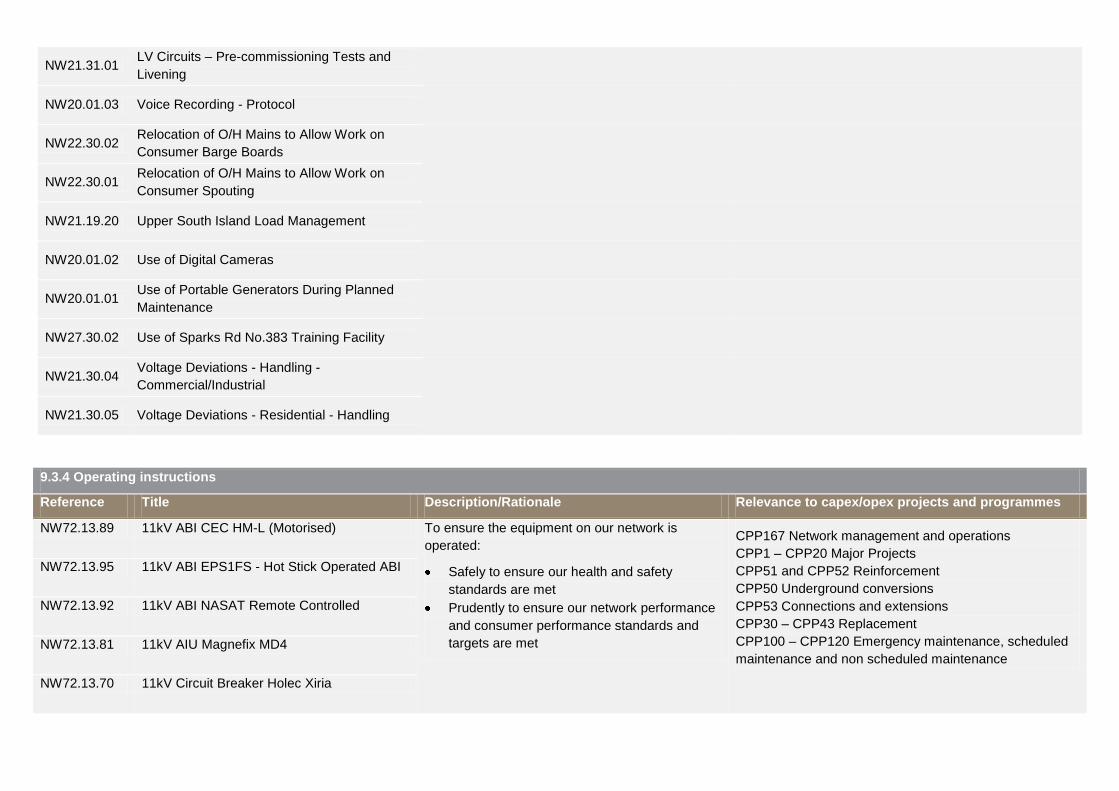
NW21.31.01 LV Circuits – Pre-commissioning Tests and
Livening
NW20.01.03 Voice Recording - Protocol
NW22.30.02 Relocation of O/H Mains to Allow Work on
Consumer Barge Boards
NW22.30.01 Relocation of O/H Mains to Allow Work on
Consumer Spouting
NW21.19.20 Upper South Island Load Management
NW20.01.02 Use of Digital Cameras
NW20.01.01 Use of Portable Generators During Planned
Maintenance
NW27.30.02 Use of Sparks Rd No.383 Training Facility
NW21.30.04 Voltage Deviations - Handling -
Commercial/Industrial
NW21.30.05 Voltage Deviations - Residential - Handling
9.3.4 Operating instructions
Reference Title Description/Rationale Relevance to capex/opex projects and programmes
NW72.13.89 11kV ABI CEC HM-L (Motorised) To ensure the equipment on our network is
operated:
Safely to ensure our health and safety
standards are met
Prudently to ensure our network performance
and consumer performance standards and
targets are met
CPP167 Network management and operations
CPP1 – CPP20 Major Projects
CPP51 and CPP52 Reinforcement
CPP50 Underground conversions
CPP53 Connections and extensions
CPP30 – CPP43 Replacement
CPP100 – CPP120 Emergency maintenance, scheduled
maintenance and non scheduled maintenance
NW72.13.95 11kV ABI EPS1FS - Hot Stick Operated ABI
NW72.13.92 11kV ABI NASAT Remote Controlled
NW72.13.81 11kV AIU Magnefix MD4
NW72.13.70 11kV Circuit Breaker Holec Xiria

NW72.13.211 11kV Enermet Ripple Plant
NW72.13.72 11kV Fuse switch Brush HFU
NW72.13.74 11kV Fuse switch F&P IB
NW72.13.79 11kV Fuse switch L&C GF3
NW72.13.86 11kV Fuse switch Statter VAA
NW72.13.87 11kV Fuse switch Statter VL
NW72.13.88 11kV Fuse switch Statter VL/2-OD
NW72.13.56 11kV GCB South Wales HK12SF6
NW72.13.96 11kV Line Fault Indicator LINETROLL 3500
NW72.13.91 11kV Line logger
NW72.13.90 11kV Neutral Earthing Resistor CCEPB
NW72.13.28 11kV OCB Brush VBAD
NW72.13.30 11kV OCB Brush VSI
NW72.13.32 11kV OCB C&F ULB1
NW72.13.33 11kV OCB C-P ALA3
NW72.13.34 11kV OCB F&P BVP3,4 & BVU3,4
NW72.13.23 11kV OCB GEC-AEI BVP17 & BTVP17

NW72.13.51 11kV OCB Reyrolle LA23T
NW72.13.57 11kV OCB South Wales C4X,D4,D4X
NW72.13.62 11kV OCB South Wales D4X,D6X
NW72.13.54 11kV OCB Statter AC01
NW72.13.55 11kV OCB Statter AC2
NW72.13.52 11kV OCB/VCB Reyrolle LMT & LMVP
NW72.13.78 11kV Oil switch L&C J4
NW72.13.83 11kV Oil switch Reyrolle IA23
NW72.13.49 11kV Pole VCB Control Relay Microtrip 2
NW72.13.45 11kV Pole VCB Cooper V4H 1ph
NW72.13.46 11kV Pole VCB McGraw Edison KF
NW72.13.47 11kV Pole VCB McGraw Edison KFE
NW72.13.48 11kV Pole VCB McGraw Edison KFME
NW72.13.41 11kV Pole VCB Nu-Lec Type N12
NW72.13.42 11kV Pole VCB Nu-Lec Type U12
NW72.13.80 11kV Sectionaliser McGraw Edison GN3E
NW72.13.84 11kV Sectionaliser Reyrolle OYS

NW72.13.63 11kV VCB Holec SVS
NW72.13.64 11kV VCB Toshiba VK10J25
NW72.13.66 11kV VCB/SF6 S&C Vista
NW72.13.203 11kV Voltage Regulator ASEA
NW72.13.202 11kV Voltage Regulator EEC
NW72.13.201 11kV Voltage Regulator Ferranti
NW72.13.204 11kV Voltage Regulator Siemens
NW72.13.19 33kV Fuse S&C SMD-20
NW72.13.20 33kV GCB Merlin Gerin (Transpower owned)
NW72.13.12 33kV OCB ASEA HLC & HKCYB
NW72.13.14 33kV OCB GEC OIKW3
NW72.13.16 33kV OCB McGraw Edison RVE
NW72.13.17 33kV OCB Sace RGE36
NW72.13.18 33kV OCB Sprecher
NW72.13.94 33kV VCB Tamco - VH3/VH3D
NW72.13.215 66/11kV Transformer - Pauwels Type ORF
40/140
NW72.13.11 66kV ABI SDCEM SR16200

NW72.13.10 66kV GCB Alstom DT1-72.5 (SF6)
NW72.13.07 66kV OCB ASEA HLC
NW72.13.08 66kV OCB Reyrolle 660SM120
NW72.13.09 66kV OCB Sprecher HGF309
NW72.13.99 Ground Fault Neutraliser
NW72.13.111 Hotstick Line Sniffer
NW72.13.120 Meter - Power Quality GE Multilin
NW72.13.03 OCB - AEI BVP17 Maintenance
NW72.13.02 OCB - South Wales 11kV CX, DX
Maintenance
NW72.13.110 Parabolic Pinpointer
NW72.13.112 Phasing Set - Fameca 4000
NW72.13.101 Relay - Feeder Management GE Multilin
SR760
NW72.13.102 Relay - Feeder Management SEL 587
NW72.13.103 Relay - Feeder Protection MiCOM
P120,122,123
NW72.13.105 Relay - Line Differential GE Multilin L90
NW72.13.106 Relay - Transformer Differential GE Multilin
T60
NW72.13.100 Relay - Transformer Management GE Type
SR745

NW72.13.107 Relay - Voltage Regulating a-eberle REG-D
NW72.13.210 Standby Generator - Simeon
NW72.13.97 Standby Generator Truck 350kVA
NW72.13.109 Standby Generator Truck 400kVA
NW72.13.98 Standby Generator Truck 440kVA
NW72.13.113 Static Generator Set 2500kVA
NW72.13.01 Transformer (Major) - Vacuum Filling
9.7.1 Risk Management
Reference Title Description/Rationale Relevance to capex/opex projects and programmes
NW70.60.02 Asset Risk Management Plan - Electricity Identifies significant risks to the Orion network
and provides a summary of contingencies to
eliminate, prevent or minimise the impact of those
risks.
This core plan and the associated documents support
our entire business operation, and thus are relevant to
all projects and programmes.
NW70.00.17 CDEM Act Summary Documents which support our asset risk
management plan
NW70.00.18 CDEMS Manual
NW70.00.19 Risk Management Summary
NW70.00.14 Disaster Resilience Summary Provides the Canterbury Civil Defence
Emergency Group with a high-level overview of
Orion’s services and operations to assist them
and our stakeholders with their roles in the event
of a civil emergency.
NW70.10.02 Environmental - Management Procedure - Oil
and Fuel
Contains the requirement for managing the
environmental risk mitigation standards and
procedures associated with oil/fuel contained
CPP1 – CPP20 Major Projects
CPP51 and CPP52 Reinforcement
CPP50 Underground conversions

within, used for the operation of, or work on our
electricity network assets.
CPP53 Connections and extensions
CPP30 – CPP43 Replacement
CPP100 – CPP120 Emergency maintenance,
scheduled maintenance and non scheduled
maintenance
NW70.10.01 Environmental - Management Procedure - SF6
Gas
Contains the requirement for managing the
environmental risk mitigation standards and
procedures associated with SF6 used for the
operation of and work on our electricity network
assets.
CPP1 – CPP20 Major Projects
CPP51 and CPP52 Reinforcement
CPP50 Underground conversions
CPP53 Connections and extensions
CPP30 – CPP43 Replacement
CPP100 – CPP120 Emergency maintenance,
scheduled maintenance and non scheduled
maintenance
NW70.60.03 Physical Security Plan This security plan details Orion’s security policies,
principles and procedures relating to the
restriction of physical access to our electrical
assets and associated infrastructure.
CPP1 – CPP20 Major Projects
CPP51 and CPP52 Reinforcement
CPP50 Underground conversions
CPP53 Connections and extensions
CPP30 – CPP43 Replacement
CPP100 – CPP120 Emergency maintenance,
scheduled maintenance and non scheduled
maintenance
CPP168 General management, administration and
overheads
NW70.10.06 Environmental - Risk Register (Parts A & B) The aim of this Environmental Risk Register is to
provide a summary of all the environmental risks,
related to our business and operations. This
includes estimates of the likelihood of their
occurrence, consequences and ways of mitigating
the risk.
This register supports our entire business operation,
and thus is relevant to all projects and programmes.
9.4.2 Hazard Identification
Reference Title Description/Rationale Relevance to capex/opex projects and programmes
OR00.10.02 Hazard Group - Armed Robbery These documents set out any identified hazards
and methods of controlling them. The rationale for
these is to ensure the safety of our employees,
contractors and the general public on our sites
These policies support our entire business operation,
and thus are relevant to all projects and programmes.
They ensure we operate safely for our staff, consumers,
contractors and other stakeholders. However the OR00.10.03 Hazard Group - Contractors

OR00.10.04 Hazard Group - Electricity and around our assets. responsibility for delivering them lies predominantly
within our corporate and infrastructure teams. Their
activities are included in the following CPP projects:
CPP160, CPP161, CPP165, CPP166 and CPP171
General management, administration and
overheads
CPP167 Network management and operations
OR00.10.05 Hazard Group - Extreme Temperatures
OR00.10.06 Hazard Group - Forklifts
OR00.10.07 Hazard Group - Manual Handling
OR00.10.08 Hazard Group - Office Environments
OR00.10.09 Hazard Group - Plant and Equipment
OR00.10.10 Hazard Group - Slips, Trips and Falls
OR00.10.11 Hazard Group - Stress and Fatigue
OR00.10.12 Hazard Group - Trenches and Open
Excavations
OR00.10.13 Hazard Group - Underground Services
OR00.10.14 Hazard Group - Vehicles
OR00.10.15 Hazard Group - Visitors and Others
OR00.10.16 Hazard Group - Working on the Road
9.5.1 Contract Management
Reference Title Description/Rationale Relevance to capex/opex projects and programmes
NW73.10.11 Construction Audit Process These set out the minimum requirements for most
contracts entered into by Orion. They are
intended to ensure:
All network projects and programmes:
CPP1 – CPP20 Major Projects
CPP51 and CPP52 Reinforcement
CPP50 Underground conversions
NW73.10.07 Contract - Administration

NW73.10.13 Contract - Evaluation of Tenders We always contract suppliers who are
capable of achieving the intended goal
All aspects of the contract are met
The contract covers all areas required
We receive the best possible price for the
contracted service
CPP53 Connections and extensions
CPP30 – CPP43 Replacement
CPP100 – CPP120 Emergency maintenance,
scheduled maintenance and non scheduled
maintenance
Also relevant to CPP167 Network management and
operations which is responsible for contract
management and performance
NW72.20.10 Contract - Hazard Management
NW73.00.03 Contract - Management
NW72.20.05 Contract - Performance Monitoring
NW73.10.16 Contract - Post Contract Evaluation
NW73.00.01 Contract - Standard Document
NW73.00.02 Contract - Standard Procedure
NW73.10.09 Contract - Tender Procedures
NW73.10.14 Contract - Works - Externally Driven
NW73.10.08 Contract - Works - Internally Driven
NW73.10.15 Contractors - Authorised and Approved List
NW72.11.03 Event Reporting
NW70.00.20 Geomedia WebMap Contractor Website - TUA
NW72.00.01 Health and Safety Checklist
NW73.10.10 Pricing Request
NW72.11.02 Working near the Orion network - Competency
NW72.20.03 Works - Emergency

NW73.10.18 Works - Environmental Audit
NW72.20.04 Works - General Requirements
NW73.10.17 Works - Management - Audit Procedure
9.6.1 Connections and Embedded Generation
Reference Title Description/Rationale Relevance to capex/opex projects and programmes
NW72.15.02 Connection and Livening Guide for Low
Voltage Electricity Installations
These outline the technical requirements relating
to extensions and connections to Orion’s
electricity network.
CPP53 Connections and extensions
NW70.10.03 Connection to the Network
NW72.15.05 Distributed Generation - Guide to Connection
NW70.10.09 Distributed Generation - Information Pack
NW70.10.04 Embedded Generation - Requirements
NW72.15.03 Guide to Permanent Disconnection of
Premises
NW72.15.04 Guide to Temporary Connections
NW72.15.01 Installation and Service Guide for Electricity
Connections and Metering
NW70.00.15 Network Code
NW70.00.45 Network Connections and Extension Policy

9.7.1 Procurement and Stock Management
Reference Title Description/Rationale Relevance to capex/opex projects and
programmes
NW72.20.08 Network Storage and Supply Services Stock and spares management policies ensure
equipment is available to facilitate efficient
emergency response and maintenance
programmes. Our stock management policies
seek to ensure that sufficient (but not excess)
stock for core items is held
Facilitates emergency maintenance
programmes (CPP117 – CPP119) and
scheduled and non-scheduled maintenance
programmes (CPP100- CPP116 and
CPP121)
NW72.20.09 Spares - Storage & Maintenance Management
Using WASP
NW72.20.11 Orion Stock Management
NW72.23.12 Spares - Long Term
9.7.2 Equipment Specifications
Reference Title Description/Rationale Relevance to capex/opex projects and programmes
NW74.23.04 Cable - Distribution - 11kV Equipment specifications set out the standard
requirements for core equipment used on our
network. These include accepted performance
criteria for each item of equipment. The rationale
for our equipment specifications includes:
Standardisation which enhances
efficiency of network construction and
maintenance activities by ensuring only
standard equipment is installed and
hence maintained
Enables many contractors to work on our
network with clear instructions regarding
the equipment to be used
Ensures our safety, performance and
environmental standards are met
CPP51 Reinforcement
CPP32 Replacement
CPP50 Underground conversions
CPP53 Connections and extensions
CPP118 Emergency maintenance
CPP104 Scheduled maintenance
CPP115 Non scheduled maintenance
NW74.23.11 Cable - Distribution - 400V
NW74.23.14 Cable - Subtransmission - 33kV CPP1 – CPP6 Urban Major Projects
CPP41 Replacement
CPP118 Emergency maintenance
CPP103 Scheduled maintenance
CPP115 Non scheduled maintenance
NW74.23.32 Cable - Subtransmission - 66kV - (Bromley to
Dallington/Rawhiti)
NW74.23.29 Cable - Subtransmission - 66kV - (McFaddens
to Dallington)
NW74.23.27 Cable - Subtransmission - 66kV - (Middleton)
NW74.23.31 Cable - Subtransmission - 66kV - 1600mm2Cu
XLPE
NW74.23.30 Cable - Subtransmission - 66kV - 300mm2Cu
XLPE

NW74.23.19 Cross Arms - Wooden CPP7, CPP8, CPP17, CPP18 Rural Major Projects
CPP52 Reinforcement
CPP30 and CPP31 Replacement
CPP53 Connections and Extensions
CPP117 Emergency maintenance
CPP100 and CPP101 scheduled maintenance
CPP113 Non scheduled maintenance
NW74.23.10 Insulator - HV Overhead Lines
NW74.23.17 Overhead Conductors
NW74.23.08 Pole – Hardwood
NW74.23.06 Pole – Softwood
NW74.23.09 Ripple Control System CPP33 and CPP35 Replacement
CPP119 Emergency maintenance
CPP107 and CPP121 Scheduled maintenance
CPP114 Non scheduled maintenance NW74.23.21 Communication System
NW74.23.13 Circuit Breaker - 11kV indoor CPP1 - CPP6 Urban Major Projects
CPP7 – CPP20 Rural Major Projects
CPP51 and CPP52 Reinforcement
CPP36 Replacement
CPP53 Connections and extensions
CPP119 Emergency maintenance
CPP112 Scheduled maintenance
CPP114 Non scheduled maintenance
NW74.23.28 Circuit Breaker - 33kV indoor
NW74.23.25 Circuit Breaker - 66kV
NW74.23.20 Earthing Equipment - Approved and
Application
NW74.23.15 Regulator - 11kV
NW74.23.12 Surge Arrestor - 66kV
NW74.23.23 Switchgear - 400V - Approved and Application
NW74.23.26 Current Transformer - 66kV CPP1 - CPP6 Urban Major Projects
CPP7 – CPP20 Rural Major Projects
CPP51 and CPP52 Reinforcement
CPP37 Replacement
CPP53 Connections and extensions
CPP119 Emergency maintenance
NW74.23.18 Current Transformer - 66kV - Outdoor
NW74.23.05 Transformer - Ground Mounted Distribution -
200 to 1000kVA

NW74.23.22 Transformer - Primary - 33/11kV 2.5MVA CPP108 Scheduled maintenance
CPP114 Non scheduled maintenance
NW74.23.16 Transformer - Primary - 66/11kV 11.5/23MVA
NW74.23.24 Transformer - Primary - 66/11kV 40MVA
NW74.23.07 Transformer - Primary - 66/11kV 7.5/10MVA
NW74.23.01 Kiosk Shell - Full CPP51 and CPP52 Reinforcement
CPP39 Replacement
CPP53 Connections and extensions
CPP119 Emergency maintenance
CPP109 Scheduled maintenance
CPP116 Non scheduled maintenance
NW74.23.02 Kiosk Shell - Half
NW74.23.03 Kiosk Shell - Quarter
9.7.3 Other network policies
Reference Title Description/Rationale Relevance to capex/opex projects and programmes
NW70.60.12 Long Term Load Forecasting Methodology for
Subtransmission and Zone Substations
Sets out the method and inputs used by Orion
when we determine our expected load growth.
CPP1 – CPP20 Major Projects
CPP51 and CPP52 Reinforcement
NW70.60.13 Project Budget Forecasting Process Describes how the project budget is established. CPP1 – CPP20 Major Projects
CPP51 and CPP52 Reinforcement
CPP50 Underground conversions
CPP53 Connections and extensions
NW70.60.14 Project Prioritisation and Deliverability Process Describes the primary factors used to prioritise
projects. Also details the steps we have taken to
ensure all projects are deliverable.
CPP1 – CPP20 Major Projects
CPP51 and CPP52 Reinforcement
CPP50 Underground conversions
CPP53 Connections and extensions
CPP30 – CPP43 Replacement
CPP100 – CPP120 Emergency maintenance,
scheduled maintenance and non scheduled
maintenance
NW70.60.15 Asset Management Lifecycle Budget
Forecasting Process
Describes the process used to forecast
maintenance expenditure and replacement
expenditure required as part of Orion’s lifecycle
management process.
CPP30 – CPP43 Replacement
CPP100 – CPP120 Emergency maintenance,
scheduled maintenance and non scheduled
maintenance

Network Architecture Review –
Subtransmission
Examines the subtransmission topologies as part
of an overall review of network design principles.
CPP1 – CPP20 Major Projects
CPP51 and CPP52 Reinforcement
NW70.60.06 Network Architecture Review – 11kV Examines the 11kV configuration as part of an
overall review of network design principles.
CPP1 – CPP20 Major Projects
CPP51 and CPP52 Reinforcement
NW70.60.10 Demand Side Management Review – Stage 1 Summarises the problems or opportunities where
demand side management may be able to
provide a cost effective solution.
CPP1 – CPP20 Major Projects
CPP51 and CPP52 Reinforcement
NW70.60.11 Demand Side Management Review – Stage 2 Determines the likelihood of demand side
management making a difference, identifies the
most likely initiatives and conducts an initial cost-
benefit analysis on each of these.
CPP1 – CPP20 Major Projects
CPP51 and CPP52 Reinforcement

Appendix 22 Consultants’ reports

Consultants’ reports
IM D3(1)(a) and (b) and (2)
Consultants’ reports relied on in CPP proposal
CPP proposal reference
Consultant Report Date Commissioned for CPP proposal
Relevance to CPP Proposal
Appendix 1 PwC Addressing catastrophic events under price –quality regulation
Dec 2012 Yes Independent review of our price path proposal with specific attention to our proposed ex-post recovery of the impact of the catastrophic earthquake events on our business, through prices
Appendix 2 NERA Review of PwC report on addressing catastrophic events under price –quality regulation
Feb 2013 Yes Independent review of PwC’s report
Appendix 3 LineTech Independent Engineer’s Report – Quality Standard Variation
Dec 2012 Yes Review of our proposed quality standard variation in accordance with CPP IM 5.4.5(c)
Appendix 11 Marsh Orion’s Network Catastrophe Insurance, Material Damage Insurance, Business Interruption Insurance, An Expert Report For Orion And The Commerce Commission
Oct 2012 Yes Independent review of the insurance practices of owners of electricity transmission and distribution assets including Orion
Appendix 14 SKM Independent Engineer’s Report on the Asset Adjustment Process of Orion NZ Ltd
Oct 2012 Yes (as part of s53ZD Notices)
Independent review of our proposed adjustments to the Initial RAB in accordance with EDB IMs 2.2.1
Appendix 16 LineTech Independent Engineer’s Report on non standard asset lives for ‘peak load and mobile generation’, and ‘power factor correction’ assets
Dec 2012 Yes Independent review of asset lives for which no standard life is prescribed
Appendix 32 Rider Levett Bucknall
Quantity Surveyor Report Oct 2012 Yes Estimates of annual increases in construction costs for the Canterbury region over the CPP regulatory period
Appendix 33 Davis Langdon
Quantity Surveyor Report Oct 2012 Yes Estimates of annual increases in construction costs for the Canterbury region over the CPP regulatory period
Appendix 34 Ian Harrison
Quantity Surveyor Report Nov 2012 Yes Estimates of annual increases in construction costs for the Canterbury region over the CPP regulatory period

Kestral Group
Resilience Lessons: Orion’s 2010 and 2011 Earthquake Experience
September 2011
No Independent review of Orion’s earthquake preparedness and response
EA Technology Limited
Orion Networks AMMAT Review 2012 23 October 2012
No Independent review of Orion’s asset management processes using the Commission’s Information Disclosure AMMAT framework
EA Technology Limited
Application of CBRM with Orion New Zealand
Marsh 2012
No Report summarising the models developed for and the application of CBRM to Orion’s key asset groups undertaken by EA Technology
SKM/PwC Report to the Electricity Networks Association - ODV Handbook
9 August 2010
No Presents industry wide construction costs for common electricity distribution assets, used as benchmarks against our own data prepared for the same purpose
MWH Environmental Performance Assessment
Prepared for Orion New Zealand Ltd
April 2009 No Assessed our environmental performance with particular focus on the impact of investment decisions on the environment. This report summarises and reassesses original assessments undertaken in 2007

Appendix 23 References to AMP

AMP references
IM D3(3)
2012 AMP information included in CPP proposal in response to Schedule D and subpart 4, section 8 of Part 5 of the CPP IMs
CPP proposal reference Description 2012 AMP reference
Section 2.2.5 Description of organisation structure 2.4 Management responsibilities
Section 6.2.7 System security planning criteria, which are relevant to network performance (as addressed in section 6) and network planning (as addressed in section 9)
5.3.1 Security standard
Section 9.4.1 Our asset management plan
Provides an overview of the 2012 and 2013 AMPs
2.1 Purpose of our AMP
Section 9.4.1 Relationship between our AMP and our mission, corporate plans and objectives
Explains the interrelationships between the AMP and Orion’s strategic plans and objectives
2.2 Business plans and goals
Section 9.4.3 Asset management process
Sets out the core steps of our asset management planning process
2.6 Asset management process
Section 9.5 Asset management drivers
Describes the core drivers for our asset management plans
2.5 Asset management drivers and 2.6.4 Introduction of new equipment types
Section 9.5.4 Information and systems
Describes the key asset information and systems relevant to our asset management planning
2.7 Systems and information
Section 9.6.1 – 9.6.10 Service categories, measures and targets
Defines service measures and targets (note this CPP Proposal includes targets which supersede those set out in the 2012 AMP, and which will be reflected in our 2013 AMP)
3.1 Introduction to service levels, 3.3 Service level measures and 3.4 Service level targets
Section 9.6.11 Determining service targets
Describes how service measures and targets have been derived in the past through consultation with consumers and other stakeholders
3.2 Consumer consultation
Section 9.6.12 Performance against service targets
Shows how we have performed against our service level targets for the current period
8 Evaluation of performance (data extracted from our 2008 – 2012 AMPs). Note we did not publish a 2011 AMP due to the need to focus our resources on the earthquake response
Section 9.7.2 Description of our distribution area
Describes the largest connections to our network
4.1.4 Large consumers,
Section 9.7.3 Network configuration
Describes the configuration of our network including a description of the points of supply, subtransmission system and zone substations
4.1 Network overview and 4.2 Network justification
5.2 Network architecture
Section 9.7.4 Distribution substations
Describes our distribution substation arrangements
4.4 Substations
Section 9.7.5 Low voltage network
Describes our LV network arrangements 4.8 Overhead lines – 400V and 4.12 Underground cables – 400V

Section 9.7.6 Secondary systems
Describes our communications, load management systems, DMS, metering and generation assets and systems
4.18 Generators, 4.20 Communications, 4.21 Load management systems, 4.22 Distribution management systems, 4.23 Metering
Section 9.8.1 Forecasting demand
Describes our approach to demand forecasting
5.1 Introduction to network development
Section 9.8 2 Key demand forecasting assumptions
Sets out the key assumptions relevant to demand forecasting
5.1 Introduction to network development, 5.4 Energy, demand and growth
Section 9.8.3 Method and assumptions for determining GXP and zone substation forecasts
Describes our load forecasting methodology and linkages to local TLA plans
5.4.2 Methodology for determining GXP and zone substation load forecasts
Section 9.8.4 Observed and extrapolated growth
Presents our load forecasts for the CPP regulatory period, and beyond to the end of the ten year AMP planning period
5.4.1 Observed and extrapolated growth
Section 9.8.5 GXP and zone substation load forecasts
Presents our load forecasts across our network. Note the CPP Proposal forecasts have been updated since the 2012 AMP was published. Our 2013 AMP forecasts will be consistent with these.
5.4.3 Transpower GXP load forecasts and 5.4.4 Orion urban zone substation load forecasts and 5.4.5 Orion rural zone substation load forecasts
Section 9.9.1 Introduction to Risk Management
Describes risk management responsibilities and processes
6.1 Introduction to Risk Management
Section 9.9.2 Risk management policies and plans
Describes our key risk management policies and plans
6.1.4 Risk management plans
Section 9.9.3 Risk assessments and mitigation measures
Describes our assessments of our key risks and mitigation measures we have adopted for business risks
6.2 Governance and operational business risks, 6.3 Safety, 6.4 Environmental management
Section 9.9.4 Risk assessments – network performance
Describes our assessments of our key risks we have adopted for network performance
6.5 Network risk analysis, 6.6 Interdependence, 6.7 Natural Disaster, 6.8 Asset failure
Section 9.9.5 Mitigation measures – network performance
Describes the mitigation measures we have adopted for network performance
6.9 Mitigation measures
Section 9.11.3 Project and programme deliverability
Explains our philosophy for project delivery 9.3.4 Project prioritisation
Section 9.13.6 Planning standards and key assumptions
Outlines the key standards and assumptions relevant to network planning
5.3 Planning criteria
Section 9.13.7 Network gap analysis
Assesses the degree to which we meet our security of supply standards
5.5 Network gap analysis
Section 9.13.10 Non-network solutions
Describes the extent to which we have considered non-network solutions in addressing network constraints
5.3.5 Non-network solutions
Asset Management Reports Describes each asset category, asset quantities, condition and life cycle asset management plans
4.5 – 4.24 Asset sections

Appendix 24 Asset Management Policy

Asset Management Policy
NW70.00.46

Table of Contents
1 Introduction ...............................................................................................................4
2 Network summary .....................................................................................................4
3 Aims and Objectives .................................................................................................6
4 Asset Management Benefits ....................................................................................7
5 Drivers .......................................................................................................................8
5.1 Investment principle.......................................................................................................... 8
5.2 Business drivers ............................................................................................................... 9
6 Service Levels ......................................................................................................... 11
7 Relevant Policies and Planning Standards ........................................................... 11
7.1 Statutory Compliance ..................................................................................................... 11
7.2 Asset lifecycle management ........................................................................................... 11
7.3 Asset management reports ............................................................................................ 12
7.4 Design standards............................................................................................................ 12
7.5 Technical specifications ................................................................................................. 13
7.6 Equipment specification ................................................................................................. 14
7.7 Operating standards ....................................................................................................... 15
7.8 Network code .................................................................................................................. 17
7.9 Consultants and contractors ........................................................................................... 17
7.10 Document control process .............................................................................................. 18
8 Asset Management Approach ................................................................................ 18
8.1 Asset management process ........................................................................................... 18
8.2 Planning priorities ........................................................................................................... 19
8.3 Asset management planning .......................................................................................... 20
8.3.1 Maintenance plan ...............................................................................................................20
8.3.2 Replacement plan ..............................................................................................................20
8.3.3 Creation/acquisition plan ....................................................................................................20
8.3.4 Disposal plan .....................................................................................................................20
8.4 Introduction of new equipment types.............................................................................. 20
8.5 Network development ..................................................................................................... 20
9 Asset Maintenance Practices ................................................................................. 21
9.1 Maintenance Practices ................................................................................................... 21
9.2 Time Based Maintenance ............................................................................................... 21
9.3 Condition Based Maintenance ....................................................................................... 22
9.3.1 CBRM ................................................................................................................................22
9.3.2 Asset management ............................................................................................................22
9.3.3 Risk management ..............................................................................................................23
9.3.4 CBRM methodology ...........................................................................................................23

Orion NZ Ltd – Asset Management Policy 3
3
9.4 Reliability Based Maintenance ....................................................................................... 24
9.5 Corrective Maintenance ................................................................................................. 25
10 Asset management structure ................................................................................. 25
11 Asset data ................................................................................................................ 25
12 Asset risk management plan .................................................................................. 26
12.1 Risk management tools .................................................................................................. 26
12.2 Safety risk management ................................................................................................. 27

Orion NZ Ltd – Asset Management Policy 4
4
1 Introduction
Orion owns the electricity distribution network servicing the Christchurch and central
Canterbury region. The major earthquake activity experienced in Christchurch and
surrounding areas since 2010 has resulted in considerable damage to Orion‘s network
and reduced electricity demand due to disruption to the economic activity in the region.
It has also caused significant damage to homes, particularly in the eastern suburbs of
Christchurch.
The damage to the network has compromised its performance, resulting in more network
outages than experienced before the earthquakes.
Over the years we have managed our business efficiently and prudently. We have
insured our assets where it is economically viable to do so and we have invested to
enhance the resilience and diversity of the network. Orion believes that the relative lack
of earthquake-related damage to our key substations, and our effective responses to the
earthquakes, have confirmed our asset management practices and meant that
earthquake related costs and losses to Orion and our consumers have been minimised.
In addition, the earthquake effects are ongoing. Even though major emergency repairs
are finished, there is still work ahead to build strength back into the electricity network.
Continuity of electricity supply is absolutely vital to the future of the city. The most
important contribution Orion can make to boosting both business and community
confidence in Christchurch is to keep the power on where it is needed, quickly respond if
supply is disrupted, and promptly provide accurate information during major power cuts.
2 Network summary
Orion‘s electricity distribution network is located in central Canterbury between the
Waimakariri and Rakaia rivers, and from the Canterbury coast to Arthur's Pass. Our
network covers 8,000 square kilometres of diverse geography, including Christchurch
city, Banks Peninsula, farming communities and high country.
The following map illustrates Orion‘s supply area.

Orion NZ Ltd – Asset Management Policy 5
5
Orion‘s network is fundamental to Canterbury‘s social and economic wellbeing. We
transport electricity from 15 Transpower grid exit points (GXPs) to more than 190,000
homes and businesses. With the exception of a few major customers, we charge
electricity retailers for this delivery service and retailers, in turn, charge homes and
businesses. Retailers also charge consumers for the cost of generating electricity plus
their retail charge.
The vast majority of our customers – over 85% – are residential households. The rest
are commercial or industrial premises. Business customers use around 60% of the
electricity delivered via our network, while residential customers account for the other
40%. To reach all of our customers, we manage a sophisticated network of electrical
assets, load control equipment and multiple computer systems.
Our network is both rural and urban, with consumer densities ranging from an average of
five connections per kilometre of line (excluding street-lighting circuit) in rural areas to an
average of 26 per kilometre in urban areas. Approximately 90% of our consumers are
located in the urban area of Christchurch with the remaining 10% in the rural area. We
have some 320 major business consumers with loads between 0.3 MW and 5MW.

Orion NZ Ltd – Asset Management Policy 6
6
Network Summary At 31 March 2012
Number of customer connections 190,682
Network maximum demand (MW) 633
Electricity delivered (GWh) 3,070
District/zone substations 52
Distribution/network substations 10,673
Kilometres of 66kV line and cable 200
Kilometres of 33kV line and cable 336
Kilometres of 11kV line and cable 5,657
Further information about Orion can be found on our website http://www.oriongroup.co.nz
3 Aims and Objectives
We aim to be New Zealand's leading utility network company. To achieve this, we focus
on managing our assets prudently to provide a reliable and high quality service into the
future. We use innovative asset management practices to ensure electricity is delivered
efficiently to consumers over the long term. Our objective is to optimise the lifecycle
costs for each network asset group (including creation, operation, maintenance, renewal
and disposal) to meet agreed service levels and future demand. We undertake
responsible stewardship of our network assets on behalf of our shareholders, retailers,
government agencies, contractors, electricity end users, financial institutions and the
general public.
Our goal is to provide and operate Orion‘s electricity network while meeting agreed
levels of service, quality, safety and profitability.

Orion NZ Ltd – Asset Management Policy 7
7
4 Asset Management Benefits
Adopting good asset management practices provides benefits for Orion and consumers
across the following dimensions:
Reduced risk – asset management will lead to greater knowledge of assets,
failure mechanisms and network risks, which allows for better development of
mitigation strategies to reduce the impact when the risks occur.
Increased operational cost efficiency through reduced maintenance expenditure
as unplanned and emergency events reduce in frequency and severity, and as
scheduled maintenance can be planned of ensure appropriate resources, parts,
optimised labour costs, etc,
Increased capital efficiency through optimisation of maintenance and
replacement expenditure to achieve lower asset lifecycle costs.
Stronger capability for service delivery through improved reliability of the network
assets and reduced unplanned interruptions.
Asset
Management
Practices
Policy and
Strategy
Management
Review
Checking
and
Corrective
Action
Implementation
and Operation
Asset
Management
Information Risk
Assessment and
Planning

Orion NZ Ltd – Asset Management Policy 8
8
Improved safety through setting prescribing procedures that ensure all
maintenance of assets is carried out in the safest manner possible.
5 Drivers
5.1 Investment principle
When we extend, replace, maintain and operate our network we consider the balance
between cost and the quality of supply provided. The optimum point of investment in the
network is achieved when the value of further expenditure would have exceeded the
value of benefits to our consumers. This concept is illustrated in the following diagram.
Put simply, we seek to find the right balance between cost and the quality of our
electricity delivery service. We seek to achieve this optimal point by economic analysis
when we develop asset management plans for our assets, this includes considering a
range of alternatives (e.g. maintenance versus renewal versus non-network solutions) to
arrive at the minimum total cost to consumers and Orion.
To achieve optimal outcomes, we also commit significant resources to participate
actively in the consultation phase of national rules and regulations. It is important that
rules and regulations that affect our industry are well-informed, principled and practical.
This includes balancing the benefits of greater service levels for consumers with the
increase in costs required to achieve those service levels.
The speed at which new asset and systems technologies become available has
increased in the last decade. We welcome these new initiatives and are committed to
keeping up-to-date with technological advancements.
In line with our ‗optimal point‘ approach above, we introduce new technology only when it
results in an economic balance of cost and network performance. We then modify our
standards and specifications to include the initiative.
More detail on technology initiatives is discussed in context within our AMP, for example:
Ground Fault Neutraliser (GFN) technology at rural zone substations
Modern communications technologies
Partial discharge testing and corona imaging technologies

Orion NZ Ltd – Asset Management Policy 9
9
5.2 Business drivers
Our top priority is the efficient and effective management of our electricity network. We
aim to provide consumers with a high level of service, a reliable and secure supply and
competitive prices. We also aim to provide our shareholders with an attractive risk
adjusted return on their investment.
The main business drivers which define the need, priority and scope for improved asset
management practices within Orion are summarised below:
Safety
We are committed to meeting our safety obligations. We will:
adopt appropriate safety standards for the creation of new assets
specify works to maintain assets in a safe condition
operate and work safely with documented procedures
develop appropriate risk management practices.
Like all companies, we are subject to the general provisions of the Health and Safety in
Employment Act 1992, which has far-reaching impacts. Other specific safety
requirements are found in the Electricity Act, the Electricity Regulations and the Building
Act.
Customer service
Consumers require electricity to be delivered safely, reliably, efficiently and
economically. We use asset management techniques to satisfy these requirements and
we seek to:
identify and satisfy consumer requirements
improve understanding of service level options, measures and associated costs.
Environmental responsibility
We are committed to being environmentally responsible. Legislation such as the
Resource Management Act 1991 and our own environmental sustainability policy govern
our activities.
Our major identified responsibilities are:
a duty to avoid discharge of any contaminants into the environment
a duty to avoid unreasonable noise
a duty to avoid, remedy or mitigate any adverse effect on the environment.
We also aim to minimise our environmental impact by incorporating the cost of carbon
into our network purchasing decisions. Approximately 77% of our carbon footprint is due
to electrical losses in our network. We have now included specific carbon costs to the
cost of electrical losses into our investment process.
Underground conversion projects are an asset enhancement driven partly by our
concern for the visual environment.

Orion NZ Ltd – Asset Management Policy 10
10
Economic efficiency
We aim to ensure that the financial returns on our network investment are appropriate.
Our asset management practices support economic efficiency as they:
provide a basis to monitor asset performance and utilisation
enable asset managers to plan and prioritise maintenance, renewal and growth
expenditure
quantify risk, and minimise high impact failures
extend the life of assets and optimise the trade-off between maintenance and
replacement
tender all work to competent contractors and thus ensure the best price for
specific works
conduct an economic cost benefit analysis on all major projects
optimise distribution network losses and network utilisation (load factor).
Legislation
Our aim is to achieve material compliance with all relevant legislation, regulations and
codes of practice that relate to how we manage our electricity distribution network,
including:
Electricity Act
Local Government Act
Electricity Reform Act
Building Act
Electricity Regulations
Health and Safety in Employment Act
Electricity (Hazards from Trees) Regulations
Health and Safety in Employment Regulations
Electricity Information Disclosure Requirements
Public Bodies Contract Act
NZ Electrical Codes of Practice
Public Works Act
Civil Defence Emergency Management Act
Electricity Amendment Act
Resource Management Act.
Material compliance is achieved using our risk based approach to ensuring compliance.
This ensures that we focus on the significant issues.
A list of our obligations is set out in the Statutory Compliance Manual.

Orion NZ Ltd – Asset Management Policy 11
11
6 Service Levels
The key to the successful management of Orion‘s assets is meeting the expectations of
our stakeholders. This is consistent with our ‗mission‘ and statement of intent (SOI). Our
SOI contains specific service level targets for reliability (SAIDI, SAIFI) and other aspects
of our business, some of which are outside the scope of the Asset Management Policy.
They encompass consumer-related service requirements and other requirements
relating to our asset management drivers as defined in the section above.
Our service level targets are based on a balance of:
• the results of consumer and stakeholder consultation
• safety considerations
• regulatory requirements
• international best practice
• past practice.
We have a range of service targets under each of the following service classes:
Network reliability
Network restoration
Network capacity
Power quality
Safety
Customer service
Environment
Economic efficiency
See the Asset Management Plan (AMP) for specific current and future year service
targets.
7 Relevant Policies and Planning Standards
7.1 Statutory Compliance
Asset management is to be carried out in accordance with Orion‘s Statutory Compliance
manual. Priorities are set using our risk based approach.
7.2 Asset lifecycle management
The relevant asset lifecycle policies and other management documents are set out
below:
Annual Work Plan NW70.01.17
Asset Management Plan NW70.60.01
Asset Performance Report NW71.01.02
Business Continuity Plan - Infrastructure Management NW70.60.04
Business Plan - Network NW70.20.00
Easements - Agreement to Grant NW70.00.13

Orion NZ Ltd – Asset Management Policy 12
12
Environmental - Management Manual NW70.00.08
Health and Safety - Management Manual NW70.00.16
Over-Boundary Maintenance Policy NW72.00.00
Overhead Line - Maintenance Costs NW72.01.01
Safety Management System Manual NW70.00.21
Underground Conversion NW70.00.10
7.3 Asset management reports
Each asset type has a report that provides a description and considers aspects of
performance, maintenance and/or renewal:
Circuit Breakers - HV NW70.00.33
Communication Systems NW70.00.34
Distribution Management Systems NW70.00.36
Generators NW70.00.39
Load Management Systems NW70.00.37
Metering NW70.00.38
Overhead Lines - 11kV NW70.00.27
Overhead Lines - LV NW70.00.25
Overhead Lines - Subtransmission NW70.00.26
Property - Corporate NW70.00.42
Property - Network NW70.00.43
Protection Systems NW70.00.22
Substations NW70.00.44
Switchgear - HV and LV NW70.00.24
Transformers - Distribution NW70.00.40
Transformers - Power NW70.00.23
Underground Cables - 11kV NW70.00.30
Underground Cables - 33kV NW70.00.31
Underground Cables - 66kV NW70.00.32
Underground Cables - Communication NW70.00.28
Underground Cables and Hardware - 400V NW70.00.29
Voltage Regulators NW70.00.41
7.4 Design standards
In order to manage the safety, cost, efficiency and quality aspects of our network we
seek to standardise network design and work practices. To achieve this we have design
standards and drawings that are available for use by approved designers/contractors.
Normally we only accept designs that conform to these standards. The relevant
standards that must be complied with for network design are set out below:
Cables - Underground Cable Design NW70.52.01
Earthing - Design NW70.59.01
Ground Fault Neutraliser - Design Application Guide NW70.57.06
Metering Design NW70.55.01
Network Asset Identification NW70.00.12
Network Design Overview NW70.50.05
Overhead Line - Design Manual NW70.51.02
Overhead Line - Design Standard NW70.51.01
Overhead Line - Technical Manual NW70.51.04
Overhead Line - Worked Examples NW70.51.03

Orion NZ Ltd – Asset Management Policy 13
13
Protection - Design NW70.57.01
Protection - Design - Application Guide Distribution Feeder and Transformer NW70.57.03
Protection - Design - Subtransmission NW70.57.02
Railway Crossing Application Form (KiwiRail) NW70.50.06
SCADA Functional Specification for Remote Sites NW70.56.01
Substation - Customer Premises NW70.53.02
Substation - Design NW70.53.01
7.5 Technical specifications
A comprehensive set of specifications and procedures (work instructions) for performing
different activities on our network has also been developed. These are intended for
authorised contractors who tender for any work on our network. The relevant
specifications that must be complied with for performing activities (e.g. maintenance,
renewals and network development projects) on our network are set out below:
Overhead Network
ABI maintenance NW72.21.04
Excavation Protocols - Near Electrical/Telecommunication Lines NW72.21.23
Overhead Line - Construction Checklist NW72.31.01
Overhead Line - Inspection & Assessment NW72.21.11
Overhead Line - Inspection Sheet NW72.31.02
Overhead Line - Retighten Components NW72.21.03
Overhead Line - Tower Painting NW72.21.05
Overhead Line - Visual Inspection of HV NW72.21.09
Overhead Line - Work NW72.21.01
Poles - Attachment Engineering Agreement - Between Orion & Telecom NW72.21.16
Poles - Ownership Agreement - Between Orion & Telecom NW72.21.22
Poles - Shared Use - Attachment Guideline NW72.21.17
Poles - Shared Use - Engineering Practice NW72.21.14
Poles - Shared Use - Engineering Practice - Telco Service Drops (Telstra) NW72.21.15
Standard Construction Drawing Set - Overhead NW72.21.18
Thermographic Survey of HV Network NW72.21.10
Tower Foundation Inspections NW72.21.19
Vegetation Cutting Notification NW72.14.01
Vegetation Work Adjacent to Overhead Lines NW72.24.01
Vibration Damper Installation NW72.21.13
Underground Network Cables - 66kV Civil Construction - McFaddens to Dallington NW72.22.04
Cables - 66kV Installation - McFaddens to Dallington NW72.22.05
Cables - Excavation & Backfilling NW72.22.02
Cables - Installation & Maintenance NW72.22.01
Cables - Recording Cables & Associated plant NW71.12.03
Cables - Testing NW72.23.24
Oil Filled Cable Contingency Plan NW72.12.02
Distribution Enclosure Installation NW72.22.03
Duct Installation For Future Use NW72.12.01
Low Voltage UG Network Inspection NW72.21.12
Standard Construction Drawing Set - Underground NW72.21.20
Substations Building Substation - Install Equipment NW72.23.18
Distribution Substation - Inspection NW72.23.03

Orion NZ Ltd – Asset Management Policy 14
14
Distribution Substation - Maintenance NW72.23.05
Distribution Transformer - Maintenance NW72.23.02
Earthing - Installation NW72.28.01
Earthing - Testing NW72.28.02
Kiosk Substation - Installation NW72.23.14
Mineral Insulating Oil - Maintenance NW72.23.01
Network Substation - Inspection NW72.23.04
Network Substation - Maintenance NW72.23.06
Network Substation - Seismic Strengthening NW72.23.19
OCB - Servicing After Fault Operation NW72.23.15
Partial Discharge Tests NW72.27.03
Pole Mounted Substation - Fuse Maintenance NW72.23.20
Power Transformer - Maintenance NW72.23.25
Protection NW72.27.02
Regulators - Install or Change on O/D Pad Mounted Sites NW72.23.22
Standard Construction Drawing Set - Substations NW72.21.21
Testing and Commissioning of Secondary Equipment NW72.27.04
Transformer - Installation NW72.23.16
Unit Protection 11kV - Maintenance Tests NW72.27.01
Zone Substation - Inspection NW72.23.13
Zone Substation - Maintenance NW72.23.07
Miscellaneous Fuse Application on the Network NW72.20.06
Grounds Maintenance NW72.20.07
Metering Installations intended for Energy Trading & compliance with EMCO NW72.25.07
Orion Check Metering with Transpower at POS NW72.25.03
Ripple Control System - Technical Details NW70.26.01
Ripple Equipment Maintenance NW72.26.02
SCADA Master Maintenance NW72.26.04
SCADA RTU Maintenance NW72.26.05
Tariff Meter Individual Testing NW72.25.04
7.6 Equipment specification
We seek to standardise the equipment used to construct components of our network. To
this end, a set of specifications detailing accepted performance criteria for significant
equipment has been developed. The relevant specifications that must be complied with
for supply of network components are set out below:
Cable - Distribution - 11kV NW74.23.04
Cable - Distribution - 400V NW74.23.11
Cable - Subtransmission - 33kV NW74.23.14
Cable - Subtransmission - 66kV - (Bromley to Dallington) NW74.23.32
Cable - Subtransmission - 66kV - (McFaddens to Dallington) NW74.23.29
Cable - Subtransmission - 66kV - (Middleton) NW74.23.27
Cable - Subtransmission - 66kV - 1600mm2 Cu XLPE NW74.23.31
Cable - Subtransmission - 66kV - 300mm2 Cu XLPE NW74.23.30
Circuit Breaker - 11kV indoor NW74.23.13
Circuit Breaker - 33kV indoor NW74.23.28
Circuit Breaker - 66kV NW74.23.25
Communication System NW74.23.21
Cross Arms - Wooden NW74.23.19

Orion NZ Ltd – Asset Management Policy 15
15
Current Transformer - 66kV NW74.23.26
Current Transformer - 66kV - Outdoor NW74.23.18
Earthing Equipment - Approved and Application NW74.23.20
Insulator - HV Overhead Lines NW74.23.10
Kiosk Shell - Full NW74.23.01
Kiosk Shell - Half NW74.23.02
Kiosk Shell - Quarter NW74.23.03
Overhead Conductors NW74.23.17
Pole - Hardwood NW74.23.08
Pole - Softwood NW74.23.06
Regulator - 11kV NW74.23.15
Ripple Control System NW74.23.09
Surge Arrestor - 66kV NW74.23.12
Switchgear - 400V - Approved and Application NW74.23.23
Transformer - Ground Mounted Distribution - 200 to 1000kVA NW74.23.05
Transformer - Primary - 33/11kV 2.5MVA NW74.23.22
Transformer - Primary - 66/11kV 11.5/23MVA NW74.23.16
Transformer - Primary - 66/11kV 40MVA NW74.23.24
Transformer - Primary - 66/11kV 7.5/10MVA NW74.23.07
7.7 Operating standards
To ensure the wide variety of equipment on our network is operated safely with minimum
impact on our consumers, we have developed an operating instruction for each different
type of equipment on our network. We add to these when any new equipment is
introduced (see AMP section 2.6.4 – process for the introduction of new equipment).
The relevant policies that must be complied with for operating equipment are set out
below:
11kV ABI CEC HM-L (Motorised) NW72.13.89
11kV ABI EPS1FS - Hot Stick Operated ABI NW72.13.95
11kV ABI NASAT Remote Controlled NW72.13.92
11kV AIU/MSU Magnefix MD4 NW72.13.81
11kV Circuit Breaker Holec Xiria NW72.13.70
11kV Enermet Ripple Plant NW72.13.211
11kV Fuse switch Brush HFU NW72.13.72
11kV Fuse switch F&P IB NW72.13.74
11kV Fuse switch L&C GF3 NW72.13.79
11kV Fuse switch Statter VAA NW72.13.86
11kV Fuse switch Statter VL NW72.13.87
11kV Fuse switch Statter VL/2-OD NW72.13.88
11kV GCB South Wales HK12SF6 NW72.13.56
11kV Line Fault Indicator LINETROLL 3500 NW72.13.96
11kV Line logger NW72.13.91
11kV Neutral Earthing Resistor NW72.13.90
11kV OCB Brush VBAD NW72.13.28
11kV OCB Brush VSI NW72.13.30
11kV OCB C&F ULB1 NW72.13.32
11kV OCB C-P ALA3 NW72.13.33
11kV OCB F&P BVP3,4 & BVU3,4 NW72.13.34
11kV OCB GEC-AEI BVP17 & BTVP17 NW72.13.23
11kV OCB Reyrolle LA23T NW72.13.51

Orion NZ Ltd – Asset Management Policy 16
16
11kV OCB South Wales C4X,D4,D4X NW72.13.57
11kV OCB South Wales D4X,D6X NW72.13.62
11kV OCB Statter AC01 NW72.13.54
11kV OCB Statter AC2 NW72.13.55
11kV OCB/VCB Reyrolle LMT & LMVP NW72.13.52
11kV Oil switch L&C J4 NW72.13.78
11kV Oil switch Reyrolle IA23 NW72.13.83
11kV Pole VCB Control Relay Microtrip 2 NW72.13.49
11kV Pole VCB Cooper V4H 1ph NW72.13.45
11kV Pole VCB McGraw Edison KF NW72.13.46
11kV Pole VCB McGraw Edison KFE NW72.13.47
11kV Pole VCB McGraw Edison KFME NW72.13.48
11kV Pole VCB Nu-Lec Type N12 NW72.13.41
11kV Pole VCB Nu-Lec Type U12 NW72.13.42
11kV Sectionaliser McGraw Edison GN3E NW72.13.80
11kV Sectionaliser Reyrolle OYS NW72.13.84
11kV VCB Holec SVS NW72.13.63
11kV VCB Toshiba VK10J25 NW72.13.64
11kV VCB/SF6 S&C Vista NW72.13.66
11kV Voltage Regulator ASEA NW72.13.203
11kV Voltage Regulator EEC NW72.13.202
11kV Voltage Regulator Ferranti NW72.13.201
11kV Voltage Regulator Siemens NW72.13.204
33kV Fuse S&C SMD-20 NW72.13.19
33kV GCB Merlin Gerin (Transpower owned) NW72.13.20
33kV OCB ASEA HLC & HKCYB NW72.13.12
33kV OCB GEC OIKW3 NW72.13.14
33kV OCB McGraw Edison RVE NW72.13.16
33kV OCB Sace RGE36 NW72.13.17
33kV OCB Sprecher NW72.13.18
33kV VCB Tamco - VH3/VH3D NW72.13.94
66/11kV Transformer - Pauwels Type ORF 40/140 NW72.13.215
66kV ABI SDCEM SR16200 NW72.13.11
66kV GCB Alstom DT1-72.5 (SF6) NW72.13.10
66kV OCB ASEA HLC NW72.13.07
66kV OCB Reyrolle 660SM120 NW72.13.08
66kV OCB Sprecher HGF309 NW72.13.09
Ground Fault Neutraliser NW72.13.99
Hotstick Line Sniffer NW72.13.111
Meter - Power Quality GE Multilin NW72.13.120
OCB - AEI BVP17 Maintenance NW72.13.03
OCB - South Wales 11kV CX, DX Maintenance NW72.13.02
Parabolic Pinpointer NW72.13.110
Phasing Set - Fameca 4000 NW72.13.112
Relay - Feeder Management GE Multilin SR760 NW72.13.101
Relay - Feeder Management SEL 587 NW72.13.102
Relay - Feeder Protection MiCOM P120,122,123 NW72.13.103
Relay - Line Differential GE Multilin L90 NW72.13.105
Relay - Transformer Differential GE Multilin T60 NW72.13.106
Relay - Transformer Management GE Type SR745 NW72.13.100
Relay - Voltage Regulating a-eberle REG-D NW72.13.107
Standby Generator - Simeon NW72.13.210

Orion NZ Ltd – Asset Management Policy 17
17
Standby Generator Truck 350kVA NW72.13.97
Standby Generator Truck 400kVA NW72.13.109
Standby Generator Truck 440kVA NW72.13.98
Static Generator Set 2500kVA NW72.13.113
Transformer (Major) - Vacuum Filling NW72.13.01
7.8 Network code
Our Network code is used to communicate with customers and contractors the general
requirements for connecting to our network.
7.9 Consultants and contractors
We maintain relationships with a number of consultants and contractors that work with
us to meet our asset management objectives. They do not have any management
responsibilities but operate on a fixed scope and/or period contract to meet the specific
needs of work/project requirements.
Works are identified through our capital works and maintenance programmes and
subsequently approved in an annual budget. Identified works are then designed and
completed using appropriate consultants and contractors.
All network maintenance and construction work (where possible and appropriate) is
competitively tendered to selected contractors. The contract works are processed and
managed by the Infrastructure management group.
The scope of out-sourced works to consultants and contractors can be outlined as:
Consultants
expert advice
detailed design.
Field services
emergency response services
spares and major plant services
some specialist asset inspections and non-invasive/non-destruction testing
maintenance of existing network infrastructure
installation and replacement of new or existing network infrastructure.
The relevant policies that must be complied with for working with consultants and
contractors are set out below:
Contract - Administration NW73.10.07
Contract - Construction Audit Process NW73.10.11
Contract - Evaluation of Tenders NW73.10.13
Contract - Hazard Management NW72.20.10
Contract - Management NW73.00.03
Contract - Performance Monitoring NW72.20.05
Contract - Post Contract Evaluation NW73.10.16
Contract - Standard Document NW73.00.01
Contract - Standard Procedure NW73.00.02

Orion NZ Ltd – Asset Management Policy 18
18
Contract - Tender Procedures NW73.10.09
Contract - Works - Externally Driven NW73.10.14
Contract - Works - Internally Driven NW73.10.08
Contractors - Authorised and Approved List NW73.10.15
Event Reporting NW72.11.03
Geomedia WebMap Contractor Website - TUA NW70.00.20
Health and Safety Checklist NW72.00.01
Pricing Request NW73.10.10
Working near the Orion network - Competency NW72.11.02
Works - Emergency NW72.20.03
Works - Environmental Audit NW73.10.18
Works - General Requirements NW72.20.04
Works - Management - Audit Procedure NW73.10.17
7.10 Document control process
Our Data Manager processes these ‗controlled documents‘ using our document control
process. Extensive use is made of an in-house process control application that
encompasses a restricted-access area on our website to make standard documents and
drawings accessible to approved contractors and designers.
We plan to introduce a document management system to help track and manage these
documents over the next few years.
The relevant policies to be complied with for document management are set out below:
Document Control NW70.50.03
Draughting and Records NW70.50.02
8 Asset Management Approach
8.1 Asset management process
We undertake lifecycle management and asset maintenance planning using whole of life
cost analysis, reliability centred maintenance (RCM), condition-based maintenance
(CBM) and risk management techniques. These techniques are used to improve our
performance so we can meet our network reliability targets. We have engaged EA
Technology Limited to develop Condition Based Risk Management (CBRM) models for
the majority of our network assets. These models use the results from our condition
monitoring programmes and will underpin the economic justification for our expenditure
forecasts. We are currently uploading our latest post-earthquake asset data into the
models. This project will provide valuable learning opportunities for our lifecycle
engineers as we develop CBRM expertise in-house.
Generally assets are not replaced on age alone, but are kept in service until their
continued maintenance is uneconomic or until they pose a safety, environmental or
reliability risk. Reliability performance is measured and used to identify areas where
further maintenance is needed to improve our delivery service or where maintenance
may be reduced without reducing service. We determine our maintenance priorities by
following the general principle that the assets supplying the greatest number of
consumers receive the highest priority.

Orion NZ Ltd – Asset Management Policy 19
19
Most other electricity distributors maintain electrical equipment only up to the boundary
of a property. We, however, commit to maintaining the lines, poles and all other electrical
equipment right up to the house or business building regardless of whether it is owned
by us. We apply this policy to provide our community with the best possible service.
This is of particular benefit to customers by reducing restoration times after a significant
weather event.
Our overall asset management process is as follows:
8.2 Planning priorities
Recent changes in regulations and industry codes of practice have highlighted the need
to mitigate safety risks for the public, employees and contractors. Therefore we continue
to:
• remove at-risk equipment
• increase security around substations and equipment
• tighten controls on equipment access.
In recent years we have focused on our ability to meet the growth needs of the
community while ensuring appropriate reliability and security. Network security is always
compromised during times when capital or maintenance works are carried out.
To mitigate risk associated with reduced security during these periods of change we:
• endeavour to plan work methods and contingencies to minimise any impact on
the network
• use programmes that allow for contingency events, such as ensuring 66kV oil
filled cable joint replacements are not compromised by other works

Orion NZ Ltd – Asset Management Policy 20
20
• programme works in a manner that provides consistent work for the skilled
resources available
• are proactive in the development and retention of skilled resources for the future
• schedule works at non-peak times of the day / year.
8.3 Asset management planning
Our asset management planning processes involves creation of:
8.3.1 Maintenance plan
The ongoing day to day work plans required to keep the asset serviceable and prevent
premature deterioration or failure. Three categories of maintenance are carried out:
• scheduled maintenance – work carried out to a predetermined schedule and
allocated budget
• unscheduled maintenance – work that must be performed outside the
predetermined schedule, but does not constitute an emergency
• emergency maintenance – work that must be done as a portion of the network
requires immediate repair.
8.3.2 Replacement plan
These are major work plans that do not increase the asset‘s design capacity but restore,
replace or renew an existing asset to its original capacity. Many assets are not
maintained and instead are replaced at the end of their economic life, while other assets
are assessed for the costs and benefits of maintenance versus replacement.
8.3.3 Creation/acquisition plan
This is capital work that creates a new asset or improves an existing asset beyond its
existing capacity.
8.3.4 Disposal plan
This is any of the activities associated with disposal of a decommissioned asset.
8.4 Introduction of new equipment types
New equipment is reviewed to carefully establish any benefits that it may provide and full
lifecycle costs. Introduction is planned to ensure that the equipment meets our technical
requirements and provides cost benefits. It must be able to be maintained and operated
to provide safe, cost effective utilisation to support our supply security requirements.
8.5 Network development
Maximum demand is the major driver of investment in our network. Developing our
network to meet future demand growth requires significant capital expenditure. When
scoping development projects we focus on energy and financial efficiency, consider new
non-network solutions to meet energy demand, and assess longer term investment risks.
Before spending capital on our network, we consider a number of options including those
available in demand side management and distributed generation.

Orion NZ Ltd – Asset Management Policy 21
21
The amount we spend on our network is influenced by existing and forecast consumer
demand for electricity and the number of new consumer connections to our network.
Other significant demands on capital include:
• meeting safety and environmental compliance requirements with existing ageing
equipment
• meeting and maintaining our security of supply standard
• meeting our reliability of supply targets.
The growth rate in overall maximum network system demand (measured in megawatts)
traditionally drives our capital investment. Maximum demand is strongly influenced in the
short term by climatic variations (specifically the severity of our winter conditions). In the
medium term our maximum system demand is influenced by growth factors such as
underlying population trends, growth in commercial/industrial output, and changes in
land use in the rural sector and in the Christchurch urban area as the city redevelops
post-earthquake.
9 Asset Maintenance Practices
We adopt whole lifecycle practices for our network assets and focus on optimising the
lifecycle costs for each asset group to meet agreed service levels & future demand.
Asset lifecycle management encompasses design, procurement, installation, operation,
maintenance, decommission and disposal.
Asset lifecycle management comprises two types of activities (and expenditure):
Maintenance (scheduled, non-scheduled and emergency) of assets throughout
an asset‘s economic life, and
Replacement of assets as the reach the end of their economic life.
Our asset lifecycle management approach focuses on maintaining assets so that they
are in appropriate condition and replacing assets in a timely manner. Running assets to
failure (electrically or mechanically) is not appropriate as the consequences of failure
poses a significant risk to people and property, and are very costly to rectify.
9.1 Maintenance Practices
We use a mixture of maintenance practices to service our equipment. No single method
provides the ultimate solution from an asset management perspective but by using a
combination of them we can tailor our maintenance schedule to best suit our
transformers.
9.2 Time Based Maintenance
Time based scheduled maintenance is usually carried out in line with asset
manufacturer‘s recommended maintenance cycles. These scheduled maintenance
programmes are documented in our Technical specifications.
Orion NZ Ltd – Asset Management Policy 22
22
9.3 Condition Based Maintenance
We are currently implementing a Condition Based Risk Management (CBRM) approach
for replacement/renewal of assets.
We use a condition based asset management assessment to help predict asset
replacement over time. We are currently transitioning from our existing in house
condition based asset management model to a more detailed condition based risk
management model developed by EA Technology Ltd (CBRM). For a period of time we
will operate both systems until we fully transition to CBRM. For example, we need to
ensure that the economic justification for money spent on asset replacement generated
from the new model is appropriate when compared to previous modelling and
approaches. Our present assumption is that we will maintain our current level of
maintenance expenditure which is based on our asset failure rates.
9.3.1 CBRM
CBRM is a structured process that combines asset information, engineering knowledge
and practical experience to define future condition, performance and risk for network
assets.
We have engaged EA Technologies Ltd to assist in developing CBRM models for the
majority of our network assets. These models use the results from our condition
monitoring programmes and will underpin the economic justification for our expenditure
forecasts when fully developed.
Generally assets are not replaced on age alone, but are kept in service until their
continued maintenance is uneconomic or until they pose a safety, environmental or
reliability risk.
Reliability performance is measured and used to identify areas where further
maintenance is needed to improve our delivery service or where maintenance may be
reduced without reducing service.
We determine our maintenance priorities by following the general principle that the
assets supplying the greatest number of consumers receive the highest priority, for
example where the consequences of failure are high (such as a subtransmission
transformer) the asset may be replaced when its condition is moderate, whereas if the
consequences of failure are very low, then it may only be replaced when it fails.
CBRM originated from two key drivers, which have increasingly become interlinked,
specifically asset management and risk management
9.3.2 Asset management
In order to manage the renewal of ageing networks cost effectively, it is vital to define
current asset condition and link this to current and future performance. This is achieved
through:
Effective, non-invasive condition assessment techniques
Improved information management

Orion NZ Ltd – Asset Management Policy 23
23
Systematic application of practical knowledge and experience of degradation,
failure, condition assessment, effects of environment, duty, maintenance history
etc.
With the introduction of modern electronic devices, the monitoring and control of
equipment has improved. Coupled with our inspection rounds, we are able to collect
good quality data on the reliability and condition of our assets. This information can then
be used to better determine / inform optimised maintenance schedules.
There are economic ramifications associated with this increase in testing and monitoring,
however this can be offset if less time based maintenance is undertaken. While we
develop the systems to enable effective condition monitoring we will continue to use a
scaled down version of the existing time based schedule.
9.3.3 Risk management
The facility to quantify and manage risk is increasingly recognised as a primary business
driver, both by electricity company managers and industry regulators. This requires
capturing the experience of asset performance, degradation and risk of failure.
9.3.4 CBRM methodology
CBRM combines these two areas into a sophisticated methodology for factoring the risks
and consequences of failure into condition-based asset management, making the new
CBRM solution an extremely powerful asset management system
An overview of the CBRM process is shown in Figure 1.
Figure 1 Overview of CBRM asset management process
The process can be summarised by a series of sequential steps as follows:
1. Define asset condition. 'Heath indices' for individual assets are derived and
built for different asset groups. Current health indices are measured on a scale of
0 to 10, where 0 indicates the best condition and 10 the worst.

Orion NZ Ltd – Asset Management Policy 24
24
2. Link current condition to performance. Health indices are calibrated against
relative probability of failure (PoF). The health index / PoF relationship for an
asset group is determined by matching the health index profile with the recent
failure rate.
3. Estimate future condition and performance. Knowledge of degradation
processes is used to 'age' health indices. The ageing rate for an individual asset
is dependent on its initial health index and operating conditions. Future failure
rates can then be calculated from aged health index profiles and the previously
defined health index / PoF relationship.
4. Evaluate potential interventions in terms of PoF and failure rates. The effect
of potential replacement, refurbishment or changes to maintenance regimes can
then be modelled and the future health index profiles and failure rates modified
accordingly.
5. Define and weight consequences of failure (CoF). A consistent framework is
defined and populated in order to evaluate consequences in significant
categories such as network performance, safety, financial, environmental, etc.
The consequence categories are weighted to relate them to a common monetary
($) unit.
6. Build risk model. For an individual asset, its probability and consequences of
failure are combined to quantify risk. The total risk associated with an asset
group is then obtained by summing the risk of the individual assets.
7. Evaluate potential interventions in terms of risk. The effect of potential
replacement, refurbishment or changes to maintenance regimes can then be
modelled to quantify the potential risk reduction associated with different
strategies.
8. Review and refine information and process. Building and managing a risk-
based process on the basis of asset specific information is not a one-off process.
The initial application will deliver results based on available information and,
crucially, identify opportunities for ongoing improvement that can be used to
progressively build an improved asset information framework.
We have applied the above steps to our network assets and asset models have been
constructed and will be maintained for a number of asset types. Over time additional
models will be developed.
9.4 Reliability Based Maintenance
This form of maintenance requires analysis of the failure modes of equipment. The
maintenance schedule is modified to mitigate any issues / factors before the equipment
fails. An example of this is the approach taken towards tap changers, in particular those
manufactured by Fuller. These units are known to be problematic and as a result have
been targeted for replacement with vacuum units which require less maintenance.
Again from a practical point of view this method of maintenance is one of the better types
employed. Its downside however is that it requires prior knowledge and / or a lot of
analysis of equipment failure modes.
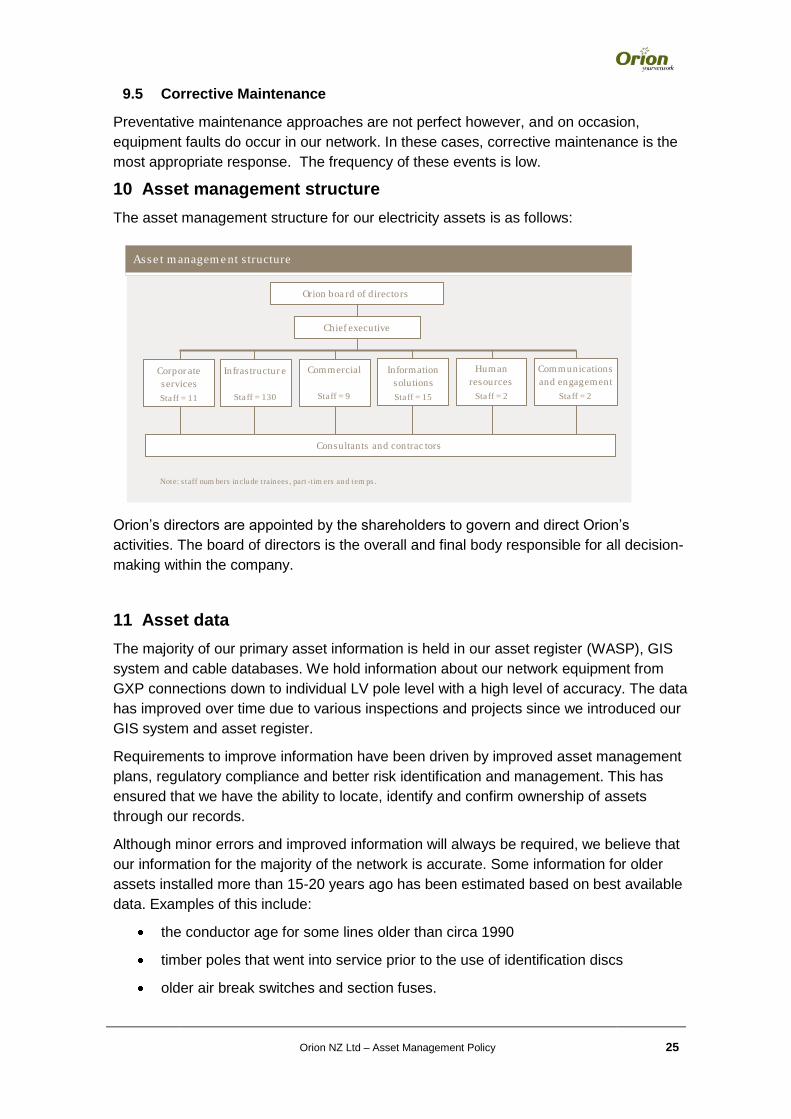
Orion NZ Ltd – Asset Management Policy 25
25
9.5 Corrective Maintenance
Preventative maintenance approaches are not perfect however, and on occasion,
equipment faults do occur in our network. In these cases, corrective maintenance is the
most appropriate response. The frequency of these events is low.
10 Asset management structure
The asset management structure for our electricity assets is as follows:
Orion‘s directors are appointed by the shareholders to govern and direct Orion‘s
activities. The board of directors is the overall and final body responsible for all decision-
making within the company.
11 Asset data
The majority of our primary asset information is held in our asset register (WASP), GIS
system and cable databases. We hold information about our network equipment from
GXP connections down to individual LV pole level with a high level of accuracy. The data
has improved over time due to various inspections and projects since we introduced our
GIS system and asset register.
Requirements to improve information have been driven by improved asset management
plans, regulatory compliance and better risk identification and management. This has
ensured that we have the ability to locate, identify and confirm ownership of assets
through our records.
Although minor errors and improved information will always be required, we believe that
our information for the majority of the network is accurate. Some information for older
assets installed more than 15-20 years ago has been estimated based on best available
data. Examples of this include:
the conductor age for some lines older than circa 1990
timber poles that went into service prior to the use of identification discs
older air break switches and section fuses.
Orion boa rd of directors
Chief executive
Asse t m anagem e nt s tructure
Note: s taff num bers include trainees , part -t im ers and tem ps.
Communications
and engagement
Staff = 2
Corpor ate
services
Staff = 11
Infras tructur e
Staff = 130
Commercial
Staff = 9
Information
solutions
Staff = 15
Human
resources
Staff = 2
Consultants and contrac tors

Orion NZ Ltd – Asset Management Policy 26
26
Refinement of data is an ongoing process. Compliance inspections and maintenance
regimes are the main source from which to confirm or update data. As we replace aging
assets with new assets over time all estimated data will be superseded.
Currently the only area identified where information needs to be improved is associated
with determining accurate connection assets of individual LV consumers. This
information is not easily accessible as it requires manual searches through archived
information. The requirement for this information is not deemed high priority and
information will be sourced associated with other inspection programmes over the next
five years.
Details of current data, compliance inspections and maintenance regimes for each asset
group are in the asset management report for the relevant asset.
12 Asset risk management plan
Our risk management process is based on the risk management standard
AS/NZS4360:2004. We have aligned to our Civil Defence responsibilities using the ‗four
R‘s‘ approach to resilience planning—reduction, readiness, response and recovery. We
have identified the responsibilities of key Orion staff which help to manage risk.
Our Asset Risk Management Plan (NW70.60.02) details exposure to and mitigation
measures for:
Natural disaster
Earthquake
Flooding
Slope hazard
Snow hazard
Wind hazard
Network asset failure
Contaminants entering the environment.
Also included is the approach to managing risk-based spares.
During the mid 1990s Orion took part in an ―engineering lifelines‖ study which examined
how natural disasters would affect Christchurch. That prompted us to spend $6 million
on seismic protection work and a further $35 million building resilience into our network.
12.1 Risk management tools
We have two risk assessment tools, both of which have been calibrated to present the
risk acceptability ranking in a similar manner:
Desktop—paper based work area assessment utilising a 5 x 5 risk acceptability
matrix.
Quantate—a dedicated risk management software application that allows us to
prioritise risk across our business with results presented on the bands of a risk
acceptability chart.

Orion NZ Ltd – Asset Management Policy 27
27
We have not yet implemented Quantate past the stage of entering some existing asset
risk assessments, and evaluating a small number of corporate risks, to provide a sample
database for evaluation and recommendation purposes.
Prior to the February 2011 earthquake we made an initial presentation of the Quantate
assessment of corporate risks to the Corporate Group in order to prepare for
implementation across the whole business, the project stopped at the time of the
February earthquake and has not yet been reactivated.
12.2 Safety risk management
While implementing our Safety Management System (SMS) for Public Safety we
identified a need for a more comprehensive process for documenting risk mitigation
actions. Quantate includes the functionality to provide this capability and additionally we
have prepared a draft retrospective table of the mitigation decisions taken with respect to
our Physical Security Plan.
In terms of security, the general principles are the prevention of unauthorised entry by
children and opportunist intruders without specialised tools, and to slow determined
intruders. This is achieved by having in place:
suitable warning to ensure knowledge of the hazard
reasonable measures to prevent access by members of the public
additional measures to deter detect and slow determined intruders at sites with a
higher risk.
In practice this is implemented as warning, barrier, warning, barrier, e.g.:
warning sign on locked external door, warning sign on shrouded equipment: or
warning sign on site perimeter fence, warning sign on internal switchyard fence.

Appendix 25 DSA (extract)

Extracts from Orion’s Delivery Services Agreement (DSA).
5 DELIVERY SERVICES
5.1 The Distributor shall, in accordance with this Agreement:
5.1.1 provide Delivery Services including the provision of the Associated Services and
such of the Discretionary Services as the Electricity Retailer may elect to acquire, to the
Electricity Retailer in accordance with Good Industry Practice, subject to clause 5.2; and
5.1.2 use its reasonable endeavours to meet the Performance Targets;
5.1.3 use its reasonable endeavours in its negotiations with Transpower to ensure that
transmission services are provided cost-effectively;
5.1.4 comply with MARIA, in so far as any obligations are placed on Distributors as
defined in MARIA, in the context of providing Delivery Services;
5.1.5 comply with its obligations as a member of the Electricity Complaints
Commissioner Scheme.
5.2 The Distributor shall use reasonable endeavours to provide continuous Delivery but does
not guarantee that the Distribution Network will provide Delivery which is free from defects or
interruptions. The Electricity Retailer shall ensure its contracts with Connected Customers
contain a similar provision, to the effect that the Distributor does not guarantee continuous
Delivery.
5.3 The Distributor shall accommodate the Electricity Retailer and all Other Electricity Retailers
equitably with regard to the Delivery Services. If the Distributor is Involved in electricity retailing
it shall at all times treat its electricity retailing activity in an economically equivalent manner to
the Electricity Retailer and Other Electricity Retailers.
5.4 If an Electricity Retailer requests the Distributor to upgrade its Delivery Service or extend its
Distribution Network, the Distributor may require the Electricity Retailer or the Connected
Customer to enter into a Connection Agreement to record the terms agreed between the
Distributor and the Electricity Retailer or Connected Customer in relation to the upgrade and/or
extension.
5.5 The Distributor will consult with the Electricity Retailer on any material changes to the Asset
Management Plan and consider any submissions made by the Electricity Retailer on the Asset
Management Plan in good faith. For the avoidance of doubt the Distributor’s obligation is to
consult only, and the determination of the Asset Management Plan is a matter for the
Distributor, at its discretion.
5.6 The Distributor may from time to time put in place a Non Performance Payment Schedule
pursuant to which, upon the happening of certain events, the Distributor will make a payment to
the Electricity Retailer in respect of the Connections affected by the event. A copy of the Non
Performance Payment Schedule to apply from the Commencement Date is set out in Schedule

F. Any variation to a Non Performance Payment Schedule will be introduced pursuant to clause
4.4 and may not be materially inferior to the Electricity Retailer than any existing Non
Performance Payment Schedule, without the consent in writing of the Electricity Retailer.
5.7 The Electricity Retailer acknowledges that there are existing arrangements and may be
written agreements applying to a particular Connection. The Electricity Retailer may request
from the Distributor details of any such arrangements or agreements applying to any particular
Connection. Such arrangements or agreements shall continue to apply unless the Distributor
agrees otherwise. Such arrangements or agreements may by way of example relate to matters
such as plant ratings, electrical protection settings, use of land and buildings, accommodation of
the Distributor’s Equipment or general physical layout of plant.
6 INTERRUPTION TO DELIVERY
The Distributor may interrupt or reduce Delivery at any time the Distributor considers it
appropriate to do so for planned or unplanned interruptions as follows:
6.1 Planned Interruptions
In situations where the Distributor determines the need for the interruption, in accordance with
Good Industry Practice, at least two hours in advance, including:
6.1.1 To enable the Distributor to inspect, effect alterations, maintenance, repairs or
additions to any part of the Distribution Network; or
6.1.2 To avoid the risk of danger to persons, damage to property or interference with the
regularity or efficiency of Delivery; or
6.1.3 To preserve and protect the proper working of the Distribution Network, and
meeting the Distributor’s obligations to Transpower or any other network owner through
which the Distributor directly or indirectly takes a supply of electricity; or
6.1.4 For the Distributor’s Load Management Service as specified in clause 7; or
6.1.5 If supply of electricity to a Network Supply Point is or will be reduced, impaired or
interrupted; or
6.1.6 In the event of an occurrence of Force Majeure; or
6.1.7 To accommodate the Electricity Retailer in the event of an envisaged shortage of
electricity; or
6.1.8 To allow the Electricity Retailer to inspect, effect alterations, maintain or repair any
fittings owned by the Electricity Retailer or Connected Customer.
6.2 Unplanned Interruptions
In situations where the Distributor does not know of the need for the interruption in advance,
such as:
6.2.1 Faults on the Distribution Network caused by equipment failure, accident, storm or
similar event; or

6.2.2 Overloading arising from a capacity shortage in the Distribution Network or
Transpower’s Grid; or
6.2.3 Emergencies; or
6.2.4 As a condition of the transmission service from Transpower, for the automatic low
frequency-initiated tripping of specified 11kV feeders in the event that the Transpower
Network integrity is endangered. (The Electricity Retailer and Other Electricity Retailers
are offered the opportunity to participate with the Distributor in the selection of the
specified feeders and/or Connected Customers).
6.3 Where the Distributor interrupts Delivery pursuant to clause 6.1, the Distributor shall liaise
with the Electricity Retailer to arrange for appropriate reasonable prior notice to be given to the
Electricity Retailers Connected Customers of its planned intention to interrupt the Delivery and
shall consult with the Electricity Retailer over the timing of the interruption to minimise
inconvenience to the Electricity Retailer’s Connected Customers. For routine planned
interruptions, appropriate prior notice shall be four days.
6.4 Where the Distributor interrupts Delivery pursuant to clause 6.1.8 the Electricity Retailer
shall be responsible for dealing with the Generators and Other Electricity Retailers and the
Distributor shall use its best endeavours to co-operate with the Electricity Retailer and all Other
Electricity Retailers who have electricity conveyed over the Network.
6.5 Where the Distributor interrupts Delivery pursuant to clause 6.2 and if at least all Connected
Customers supplied either from a distribution transformer in a built-up area or from a circuit
breaker in a non-built-up area are involved then as soon as is practicable, the Distributor shall
report to the Electricity Retailer the area affected by and reasons for the interruption and its
expected duration.
6.6 In all situations of interruptions, the Distributor shall use all reasonable endeavours to
minimise the period of interruption.
6.7 If there is a capacity shortage in the Distribution Network or Transpower’s Grid associated
with an interruption which creates a difficulty in Delivery and/or the transmission over the
Transpower Grid, the Distributor shall determine the priorities for maintaining and restoring
Delivery. The Distributor shall not make any determination under this clause for the purposes of
discriminating between the Electricity Retailer and other Electricity Retailers.
6.8 The Electricity Retailer shall forthwith advise the Distributor of any defect or interruption to
the electricity supply or other Distribution Network abnormality known to the Electricity Retailer,
as soon as practicable after receiving such knowledge. Where such advice was not initially in
writing, the Electricity Retailer will within 2 Business Days follow up the initial advice with written
advice to the Distributor.
7 LOAD MANAGEMENT SERVICES
7.1 The Charges as at the Date of Commencement are dependent on the Distributor s Load
Management Service, current at the Date of Commencement being maintained. The Distributor
shall continue to operate its current Load Management Service, until such time as a new basis

is agreed with the Electricity Retailer and Other ElectricityRetailers, including, without limitation,
for the following purposes:
7.1.1 To alleviate congestion on the Distribution Network and manage demand for
electricity at Network Supply Points;
7.1.2 To seek to minimise the transmission charges from Transpower;
7.1.3 To reduce the Distribution Network load in the event of emergencies occurring on
the Distribution Network or on Transpower’s Grid;
7.2 The Distributor may extend the use of its current Remote Signalling Service or provide other
Remote Signalling Services to the Electricity Retailer, at the Distributor’s discretion.
SCHEDULE B – Performance Targets
B1 Network Performance:
B1.1 The Distributor shall use reasonable endeavours to:
B1.1.1 Maintain the voltage at Connections to within the range specified in clause 53 of
the Electricity Regulations 1997. The Electricity Retailer acknowledges that maintenance
of voltage within the tolerance range may depend in part on the maintenance of the
power factor at Connected Customers Installations as set out in the Network Code.
B1.1.2 Ensure that the levels of harmonic voltages and currents passed into Connected
Customers Installations conform with the Limitation of Harmonic Levels Notice 1993,
Electrical Code of Practice 36, or any other notice in substitution thereof in so far as the
harmonic disturbance results from problems arising from a cause within the control of
the Distributor.
B1.1.3 Meet the reliability performance targets on a five yearly average basis as
published in its approved statement of corporate intent.
B1.1.4 Total number of proven customer voltage complaints per year where non
compliance with clause B1.1 is proven not to exceed 4 per 10,000 Connections.
B1.1.5 The Distributor shall on request provide the Electricity Retailer with reports on the
Distributor’s performance against the Distribution Network performance targets set out in
clauses B1.1.3 and B1.1.4 of this Schedule.
B2 Response to Enquiries:
B2.1 The Distributor shall use reasonable endeavours to respond to the Electricity Retailer’s
enquiries as follows:
B2.1.1 Provide acknowledgement to the Electricity Retailer of an enquiry or complaint
from the Electricity Retailer within 3 Business Days.
B2.1.2 Complete an investigation relating to such enquiry or complaint within 10
Business Days (where reasonably practicable to do so).

B2.1.3 Provide a report on the findings of an investigation within 5 Business Days of the
completion of the investigation, if requested.
B2.1.4 Respond promptly to all telephone calls or messages regarding situations of
emergencies such as broken wires, fire, vehicle accident or circumstances where life is
at risk. The Distributor shall dispatch services, as necessary. The costs of attendance
will be borne by the Distributor and such circumstances shall take priority over all other
undertakings with respect to continuity of Delivery.
B3 Reporting Unplanned Interruptions to Delivery:
B3.1 Pursuant to clause 6.5, the Distributor shall use reasonable endeavours to report such
interruptions to the Electricity Retailer to the following timetable. Such reporting shall be by a
process which is agreed between the parties:
B3.1.1 Within 15 minutes of the Distributor being advised of the occurrence of an
unplanned interruption, the Distributor shall advise the Electricity Retailer the time and
date of the event and the location and/or the connections affected.
B3.1.2 As soon as the Distributor has reliable information, the Distributor shall advise the
Electricity Retailer when restoration of Delivery is expected and the cause of the
unplanned interruption.
B3.1.3 Clauses B3.1.1 and B3.1.2 shall also apply with respect to the operation of the
Load Management Service.
B4 Fault Call Receipt and Field Service Dispatch
B4.1 In providing its Associated Service Fault Call Receipt and Field Service Dispatch, the
Distributor shall use reasonable endeavours to:
B4.1.1 Immediately advise the caller of any information known to the Distributor
regarding the event (Schedule C clause C1.2).
B4.1.2 Undertake an investigation and provide a report (if requested) pursuant to
Schedule C clause C1.7 and as detailed in Schedule B clauses B2.1.2 and B2.1.3.
B4.1.3 Have a fault person go to the vicinity of the fault within one hour (urban area) and
within two hours (rural area) where there is an unplanned interruption to Delivery to a
Major Customer Connection.
B4.1.4 Dispatch a standby generator with capacity of up to 300kVA to a Major Customer
Connection within 24 hours following an unplanned interruption to Delivery to the Major
Customer Connection except in circumstances of storms or Force Majeure.
SCHEDULE C – Associated Services
C1 Fault Call Receipt and Field Service Dispatch
The Distributor shall provide a service to receive fault calls from Connected Customers and the
Electricity Retailer and to dispatch operators, faults persons and repair crews, as appropriate.

Incoming information may be via telephone, facsimile, or other appropriate means. In providing
this service, the Distributor shall:
C1.1 Receive incoming calls.
C1.2 Advise the caller of any information known to the Distributor regarding the event, including
cause and expected duration.
C1.3 Advise the Electricity Retailer if at least all Connected Customers supplied either from a
distribution transformer in a built-up area or from a circuit breaker in a non built up area are
affected and provide information known to the Distributor regarding the event, including cause
and expected duration.
C1.4 Advise the news media if a significant number of customers are affected by the event.
C1.5 Liaise with Transpower, if Transpower’s plant is involved.
C1.6 Dispatch fault services, as required.
C1.7 Pursuant to clause 6.5, provide a written report to the Electricity Retailer after the event.
This report will detail the cause (if known), time of occurrence and duration of the event, the
number of Connected Customers affected and any measures taken to prevent recurrence. In
situations where a significant number of Connected Customers are affected, the Electricity
Retailer shall assist the Distributor by processing the calls from Connected Customers and
providing the Distributor with filtered information.
C2 New Connections
The Distributor shall undertake all negotiations with the owners of future Connected Customer’s
Installations or their agents with respect to the establishment of new Connections. This will
include settling a Connection Agreement with the party who is wanting to establish the new
Connection. An Electricity Retailer may be the agent for a developer or future Connected
Customer in negotiations with the Distributor. An Electricity Retailer shall become contractually
involved when a supply of energy is required.
C3 Modification of an Existing Connection
The Distributor shall undertake all negotiations with the Connected Customers or their agents
with respect to modifications to established Connections. This will include settling a Connection
Agreement with the Connected Customer. The Electricity Retailer may be the agent for the
Connected Customer. A modification could include, but is not limited to, an upgrading or
downgrading of the capacity or a conversion from an overhead to an underground Connection.
C4 Temporary Isolations
The Distributor shall arrange for the temporary isolation of a Connected Customer’s Installation
in response to a request from the Connected Customer or the Electricity Retailer provided that
where the request is from the Electricity Retailer, the Electricity Retailer shall indemnify the
Distributor from all losses or costs arising from the Distributor’s complying with the request,
provided the Distributor acts in accordance with Good Industry Practice. The Distributor shall

charge the party requesting the new service as detailed in its schedule of charges for
associated services.
C5 Provision of Ripple Signalling
Pursuant to clause 7, the Distributor shall provide ripple signals for its Load Management
Service, as part of the Delivery Service.
C6 Power Quality Complaints and Issues
The Distributor shall receive and act upon all enquiries or complaints from Connected
Customers or the Electricity Retailer regarding power quality. If investigations of any substance
are required, then the Distributor shall refer the matter to a contractor. The Distributor will cover
all expenses if the Distributor is at fault. Otherwise the enquiring party shall pay all expenses.
C7 Network Plant Removal or Re-siting
The Distributor shall deal with all enquiries from Connected Customers or the Electricity Retailer
regarding requests for Distribution Network equipment removal or re-siting. The Distributor shall
liaise with the enquiring party and negotiate the arrangements for the work to be executed. All
costs of plant removal or re-siting shall be borne by the enquiring party.
C8 Emergency Calls
The Distributor shall respond urgently to all telephone calls or messages regarding situations of
emergencies such as broken wires, fire, vehicle accident or circumstances where life is at risk.
The Distributor shall dispatch services, as necessary. The costs of attendance will be borne by
the Distributor and such circumstances shall take priority over all other undertakings with
respect to continuity of Delivery.
C9 Advance Notice of Planned Interruptions
Prior to implementing a planned interruption per clause 6.1, the Distributor shall use reasonable
endeavours to identify the Connections involved and despatch appropriate notices(s) as agreed
with the Electricity Retailer. Such notice can be sent either directly to the occupant at the
address of the connection or to the Electricity Retailer, as agreed.
C10 Use of Standby Generation for Load or Capacity Management
Where an interruption to Delivery is required or occurs which is initiated by the Distributor, the
Distributor may use its standby generator(s) to minimise the incidence and duration of
interruptions. This shall be solely at the Distributor’s discretion.
C11 Maintenance on Connected Customer’s side of Network Connection Point
The Distributor will, at its own cost, carry out repairs, maintenance and replacement of
equipment such as lines, cables and poles necessary for the supply of electricity between the
network connection point to the building entry point. This service covers fair wear and tear,
including damage caused by storms, but not damage caused by the Connected Customer or
any third party or the Connected Customer’s failure to comply with the Electricity Retailer’s
terms and conditions of supply.

C12 Complaints Handling Service
The Distributor will provide an in-house consumer complaints service for handling Lines
Complaints, as required in schedule D of the Electricity Complaints Commissioner Scheme. The
Distributor shall deal with all Lines Complaints except those relating to issues covered in
Schedule F of this Agreement where the Electricity Retailer and Distributor agree to the
Electricity Retailer handling these directly, within the limits given in Schedule F.
C13 Temporary Connections
The Distributor will provide an agency and subcontracting service with respect to temporary
connections that the Distributor provides, generally for building and construction sites. As an
agent, the Distributor will vet applications on behalf of the Electricity Retailer. As a
subcontractor, the Distributor will provide administration and information, process applications,
provide the temporary connection, and provide a boundary box (if required).
SCHEDULE D – Discretionary Services
D1 Provision of Additional Ripple Signals
The Distributor will negotiate with the Electricity Retailer to provide additional ripple signals over
and above those that are already established for the Load Management Service. The Distributor
shall use its best endeavours to provide these as required by the Electricity Retailer, subject to
the availability of time slots and the limitations of the Distributor’s ripple injection plants. Signals
required for the Load Management Service shall have priority and all additional signals provided
for the Electricity Retailer shall be chargeable.
D2 Use of Standby Generator for Energy Shortage
The Distributor may make its standby generator(s) available to the Electricity Retailer or
Connected Customers for use in situations of energy shortage, subject to the Distributor’s
requirements as set out in clause C10 taking priority. The Distributor shall charge the party
requiring this service.
D3 Temporary Connections
The Distributor may provide temporary boundary boxes to facilitate construction at temporary
connections.
SCHEDULE F -Non-Performance Payments Schedule (with reference to Clause 5.6)
F1 Restoration of Electricity Delivery
(a) In an urban area the desired target time to restore electricity delivery is within 1.5 hours.
Subject to clause F4 if the Distributor does not have electricity restored within three hours of
being notified of the fault the Distributor will pay $25.00 (GST inclusive) per Connection based
on verified claims received from Electricity Retailers.
(b) In a rural area the desired target time to restore electricity delivery is within three hours.
Subject to clause F4 if the Distributor does not have electricity restored within six hours of being

notified of the fault the Distributor will pay $25.00 (GST inclusive) per connection based on
verified claims received from Electricity Retailers.
(c) In the case of natural disaster (such as, but not limited to snow storms, high winds, lightning,
floods and earthquakes) the Distributor will use its best endeavours to restore electricity delivery
as soon as practicable. In these circumstances no non-performance payments will be made.
(d) Faults caused by a third party e.g. such as Transpower, contractor damage, vehicle or
machinery damage will not be subject to non-performance payments.
F2 Advance Notification of Planned Outage Affecting Delivery Service
(a) Where planned maintenance or network alterations (as per clause 6.1.1) need to be carried
out and the Delivery Service is to be interrupted the Electricity Retailer will be given a minimum
of four days notice of the Connections supplied by them affected by the outage or the
occupant(s) of the connection(s) affected will be directly notified as agreed with the Electricity
Retailer.
(b) If the Distributor fails to take these steps the non-performance payment for non-notification
shall be $15.00 (GST inclusive) per Connection based on each verified claim received from the
Electricity Retailer.
F3 New First Time Connections to the Network
(a) Where existing network reticulation is available in a street including existing boundary
connection boxes in underground areas, or road crossings, and existing poles in an overhead
low voltage reticulated area, then new residential property Connections will be made by the
Distributor within five Business Days of completion of all necessary Council, Telecom and other
approvals.
(b) In all other cases, new Connections which require additional capacity to be provided or
extensions to the network from the existing network, are subject to a design/build contract
generally between the agent of or owner of the premises to be connected and an authorised
contractor. The time taken for the connection will vary depending on size and location, and will
be subject to an agreed time frame as specified in the design/build contract.
When the new asset is completed and is ready for service the final Connection process will be
made by the Distributor within five Business Days, subject to receipt of all approvals and
notifications required to carry out enlivenment.
(c) Where the Distributor fails to meet the time frame in part F3(a), a payment of $25.00 (GST
inclusive) in respect of each Connection, for each verified claim received from the Electricity
Retailer, will be paid.
(d) Where the Distributor fails to meet the time frame in part F3(b), a payment of $100.00 (GST
inclusive) in respect of each Connection, for each verified claim by the Electricity Retailer, will
be paid.

F4 Limitations on Application of Guarantees
(a) No obligation to make any payment under the non-performance payment obligations in this
schedule shall arise where the failure to meet the standard was principally caused by an event
beyond the direct control of the Distributor, or principally caused by the actions of a third party or
the Electricity Retailer.
(b) The total liability of the Distributor under this non-performance payment schedule and all
other identical non-performance payment schedules with Other Electricity Retailers, shall be
included as part of the Distributor’s maximum total liability stated in clause 19.5. Payments shall
be apportioned by the Distributor acting reasonably.

Appendix 26 Detailed schedule of asset values

Closing RAB at FY12 by asset type
Subtransmission network ($ million)
Subtransmission
66 kV overhead lines (concrete pole) 0.3
66 kV overhead lines (wood pole) 5.9
66 kV overhead lines (steel tower and steel pole) 0.2
66 kV underground cables (PILC and Oil filled) 23.5
66 kV underground cables (XLPE) 9.8
33 kV overhead lines (concrete pole) 0.0
33 kV overhead lines (wood pole) 2.2
33 kV overhead lines (mixed construction) 7.4
33 kV underground cables (PILC) 1.1
33 kV underground cables (XLPE) 3.3
Pilot / communications circuits 4.1
Zone substations (excl. switchgear)
Zone substation land 8.9
Zone substation site development and buildings 25.4
Power transformers 26.5
Protection 15.4
Outdoor structure (concrete pole) 3.7
DC Supplies, batteries and inverters 0.1
Other items 0.9
Total 138.6
Distribution network ($ million)
Distribution lines and cables
11kV overhead lines (wood pole) 22.8
11kV overhead lines (mixed construction) 46.3
11kV underground cables (PILC) 90.0
11kV underground cables (XLPE) 63.0
Distribution substations
Distribution substation land 27.2
Distribution transformers (pole) 23.4
Distribution transformers (pad) 44.8
Distribution substations (pole) 2.6
Distribution substations (pad) 9.0
Distribution substations (building) 1.1
Switchgear cabinets 0.3
Total 330.5
Closing FY12 RAB values by asset type

Switchgear ($ million)
66/33kV air break isolators & surge diverters 2.8
66/33/11kV indoor circuit breakers 36.0
66/33/11kV outdoor circuit breakers and switchgear 0.6
11kV disconnectors & dropout fuses 23.8
11kV voltage regulators 1.5
11kV circuit breaker/recloser & sectionalisers 2.4
11kV MSU and oil switches 34.4
Total 101.5
Low voltage distribution network ($ million)
LV overhead lines (wood pole) 21.4
LV overhead lines (mixed construction) 26.9
LV underground cables (PILC) 4.6
LV underground cables (XLPE) 141.3
LV customer service connections and link pillars 34.9
Total 229.0
Supporting or secondary systems ($ million)
Ripple injection 5.6
SCADA and communications, UHF masters and repeaters 10.4
Peak load generators 0.6
Easements 0.4
Network spares 4.9
Finance leases 5.6
Capital contributions (10.3)
Total 17.1
Non system fixed assets ($ million)
Office Buildings 2.7
Information and Technology Systems 6.7
Office Furniture and Equipment 0.3
Tools, Plant and Machinery 1.8
Vehicles 2.1
Land 13.6
Total 27.4

Appendix 27 Construction cost benchmarks

Construction Cost Benchmarks
EDB Construction Cost Benchmarks
Asset Category Asset Description
2010 Orion
Costs
($000)
2010
Average
EDB Costs
($000)
Orion vs
Average
EDB Costs
(%)
SUBTRANS - LINES 33 kV Lines . Heavy (? 150 mm2 , ? 300 mm2 Al ) 73.3 76.8 -5%
SUBTRANS - LINES 33 kV Lines . DCct Heavy 108.5 137.4 -21%
SUBTRANS - CABLES 33 kV - Cables (? 240 mm2 Al) 137.1 360.8 -62%
SUBTRANS - CABLES 33 kV - Cables DCct (? 240 mm2 Al) 218.7 594.5 -63%
ZONE SUBS 33 kV Indoor Switchgear Cubicle 61.3 82.8 -26%
ZONE SUBS 22/11 kV Indoor Switchgear Cubicle 33.5 43.6 -23%
DIST LINES 11 kV O/H Medium (> 50 mm2 , < 150 mm2 Al ) 51.2 54.3 -6%
DIST LINES 11 kV O/H DCct Medium 86.3 80.6 7%
DIST LINES 11 kV O/H Underbuilt Medium 31.0 31.4 -1%
DIST CABLES 11 kV U/G Medium(> 50 mm2 , ? 240 mm2 Al ) 156.7 207.3 -24%
DIST CABLES 11 kV U/G DCct Medium 258.0 392.0 -34%
DIST SWGR 22/11 kV Disconnector 3 ph (Excl Pole) 8.2 8.1 1%
DIST SWGR 22/11 kV Load Break Switch (Excl Pole) 8.6 10.1 -15%
DIST SWGR 22/11 kV Dropout Fuse 3 Ph (Excl Pole) 1.5 1.8 -20%
DIST SWGR 22/11 kV Sectionaliser (Excl Pole) 20.6 18.2 13%
DIST SWGR 22/11 kV Recloser (Excl Pole) 20.5 35.3 -42%
DIST SWGR Ring Main Unit – 3 Way 26.9 30.6 -12%
DIST SWGR Extra Oil Switch 4.2 13.5 -69%
DIST SWGR Extra Fuse Switch 4.2 16.4 -74%
DIST TX - 1PH -11kV POLE Up to and including 15 kVA 2.6 2.7 -1%
DIST TX - 1PH -11kV POLE 30 kVA 3.1 3.5 -12%
DIST TX - 1PH -11kV POLE 75 kVA 7.2 7.1 1%
DIST TX - 3PH - 11kV POLE Up to and including 30 kVA 4.3 4.5 -4%
DIST TX - 3PH - 11kV POLE 50 kVA 4.9 5.7 -13%
DIST TX - 3PH - 11kV POLE 100 kVA 7.8 8.5 -8%
DIST TX - 3PH - 11kV POLE 200 kVA 11.6 12.4 -7%
DIST TX - 3PH - 11kV GRND 100 kVA 9.8 12.4 -21%
DIST TX - 3PH - 11kV GRND 200 kVA 13.2 15.7 -16%
DIST TX - 3PH - 11kV GRND 300 kVA 18.2 20.7 -12%
DIST TX - 3PH - 11kV GRND 500 kVA 22.2 26.9 -17%
DIST TX - 3PH - 11kV GRND 750 kVA 29.1 33.9 -14%
DIST TX - 3PH - 11kV GRND 1,000 kVA 34.9 39.4 -11%
DIST TX - 3PH - 11kV GRND 1,500 kVA 48.4 57.8 -16%
DIST SUB - POLE Pole Mounted (50 kVA or less) 2.3 4.9 -53%
DIST SUB - POLE Pole Mounted (100 kVA or more) 4.4 7.6 -42%
DIST SUB - GRND Ground Mounted (Covered) 29.5 17.7 67%
DIST SUB - GRND Kiosk (Masonry or block enclosure) 28.3 39.7 -29%

EDB Construction Cost Benchmarks
Asset Category Asset Description
2010 Orion
Costs
($000)
2010
Average
EDB Costs
($000)
Orion vs
Average
EDB Costs
(%)
LV LINES Overhead Medium 4 wire LV only (> 50 mm2, ? 150 mm2 Al) 137.1 112.7 22%
LV LINES Overhead Medium 2 wire LV only (> 50 mm2, ? 150 mm2 Al) 94.0 98.0 -4%
LV LINES Overhead Medium Underbuilt 2 wire (> 50 mm2, ? 150 mm2 Al) 45.4 45.3 0%
LV LINES Overhead Light Underbuilt 2 wire (? 50 mm2) Al 30.6 39.5 -23%
LV CABLES Underground Medium - LV Only (? 240 mm2) 155.0 148.0 5%
LV CABLES Underground Medium - with HV (? 240 mm2) 103.0 119.0 -13%
LV CABLES 2 way Link Pillar 3.5 3.5 0%
LV CABLES 4 way link pillar 4.9 7.0 -30%
CUST SERVICE CONN LV overhead - 1 ph 0.2 0.8 -70%
CUST SERVICE CONN LV overhead - 3 ph 0.4 1.1 -67%
CUST SERVICE CONN LV underground - 1 ph shared fuse pillar 1.3 1.7 -21%
CUST SERVICE CONN LV underground - 1 ph Own fuse pillar 1.3 1.7 -23%
CUST SERVICE CONN LV underground - 3 ph shared fuse pillar 1.7 2.0 -18%
CUST SERVICE CONN LV underground - 3 ph Own fuse pillar 1.6 1.9 -18%

Appendix 28 EDB opex benchmarks

Support opex benchmarks
Comparisons with like EDBs show that our support opex costs compare well. On a cost per ICP basis, general management, administration and overhead costs fall well below the peer group median in FY10 and FY11 and are considerably less than the industry average in both years. Our system management and operations costs fall within the third quartile of the peer group and are similar to the industry average in both years, as illustrated below.
There is some discrepancy in the allocations between these two support opex categories (which are prepared for ID purposes). Accordingly it is also appropriate to consider total support costs, which removes the influences of different approaches to allocating costs between the sub categories. When considering total corporate and network support costs, our costs on an ICP basis are less than the peer group median in FY10 and FY11 and considerably less than the industry average.
Rank FY10 Rank FY11
1 Unison Networks 147.2 1 Unison Networks 181.8
2 Wellington Electricity Lines 110.1 2 Wellington Electricity Lines 119.3
3 WEL Networks 108.9 3 Aurora Energy 113.6
4 Aurora Energy 103.3 4 WEL Networks 104.6
5 Orion New Zealand 102.4 5 Orion New Zealand 103.5
6 Powerco 100.8 6 Powerco 89.0
7 Vector 75.7 7 Vector 87.2
Industry Average 151.8 Industry Average 166.6
Industry Median 147.2 Industry Median 151.6
Peer Group First Quartile 101.6 Peer Group First Quartile 96.2
Peer Group Median 103.3 Peer Group Median 104.6
Peer Group Third Quartile 109.5 Peer Group Third Quartile 116.4
Rank FY10 Rank FY11
1 Unison Networks 114.7 1 Unison Networks 141.1
2 Powerco 81.7 2 Vector 79.8
3 Vector 71.7 3 Powerco 67.8
4 WEL Networks 71.4 4 WEL Networks 63.7
5 Orion New Zealand 51.6 5 Aurora Energy 54.1
6 Aurora Energy 44.0 6 Orion New Zealand 51.1
7 Wellington Electricity Lines 22.2 7 Wellington Electricity Lines 29.1
Industry Average 101.7 Industry Average 114.3
Industry Median 86.4 Industry Median 102.9
Peer Group First Quartile 47.8 Peer Group First Quartile 52.6
Peer Group Median 71.4 Peer Group Median 63.7
Peer Group Third Quartile 76.7 Peer Group Third Quartile 73.8
Rank FY10 Rank FY11
1 Wellington Electricity Lines 87.9 1 Wellington Electricity Lines 90.2
2 Aurora Energy 59.3 2 Aurora Energy 59.6
3 Orion New Zealand 50.8 3 Orion New Zealand 52.4
4 WEL Networks 37.5 4 WEL Networks 41.0
5 Unison Networks 32.4 5 Unison Networks 40.7
6 Powerco 19.1 6 Powerco 21.2
7 Vector 4.0 7 Vector 7.3
Industry Average 50.1 Industry Average 52.3
Industry Median 48.0 Industry Median 48.7
Peer Group First Quartile 25.8 Peer Group First Quartile 30.9
Peer Group Median 37.5 Peer Group Median 41.0
Peer Group Third Quartile 55.1 Peer Group Third Quartile 56.0
General Management, Administration and
Overheads plus System Management and
Operations ($/ICP)
General Management, Administration and
Overheads plus System Management and
Operations ($/ICP)
General Management, Administration and
Overheads ($/ICP)
System Management and Operations ($/ICP)
General Management, Administration and
Overheads ($/ICP)
System Management and Operations ($/ICP)

We note that we have excluded from this analysis, the $1.5m of extraordinary earthquake overhead costs incurred in FY11.
We also note that FY12 data was not available at the time this analysis was prepared (as FY12 ID disclosures were deferred until the end of calendar year 2012).
Peer Group Statistics
For the purpose of assessing relative performance, we have selected our peer group on the basis of the following indicators:
total size of the network (indicated by the total number of customer connections served) network density (indicated by the ratio of customer connections per circuit kilometre).
As there are significant scale differences in New Zealand, and as we fall towards the upper end of the scale spectrum, we have chosen to include total connections in our peer grouping approach. In our view this is reasonable because the smallest networks are considerably smaller than Orion and we would not expect similar scale influences for those networks.
In addition there is a considerable range of network densities (ICPs/km) across EDBs. As the underlying characteristics of predominantly urban networks differ to predominantly rural networks we have also used this criterion for our peer group selection.
As demonstrated above, Vector and Powerco are considerably larger than Orion, although they fall on either side on a connection density basis. The other networks included in the peer group are smaller (Wellington Electricity being the closest in size) and, with the exception of Wellington Electricity, have similar connection densities. The industry average for total connections (approximately 69,000) is considerably less than Orion. The industry average connection density (approximately 12 ICPs/km) is also considerably less than Orion.
ICPs
Rank FY10 Rank FY11
1 Vector 527,096 1 Vector 531,185
2 Powerco 317,489 2 Powerco 319,181
3 Orion New Zealand 192,179 3 Orion New Zealand 193,234
4 Wellington Electricity Lines 164,058 4 Wellington Electricity Lines 164,250
5 Unison Networks 108,212 5 Unison Networks 108,978
6 WEL Networks 84,276 6 WEL Networks 83,614
7 Aurora Energy 81,573 7 Aurora Energy 82,368
Industry Average 68,862 Industry Average 69,301
Industry Median 30,615 Industry Median 30,826
Peer Group First Quartile 96,244 Peer Group First Quartile 96,296
Peer Group Median 164,058 Peer Group Median 164,250
Peer Group Third Quartile 254,834 Peer Group Third Quartile 256,208
Rank FY10 Rank FY11
1 Wellington Electricity Lines 35.6 1 Wellington Electricity Lines 35.7
2 Vector 29.9 2 Vector 30.0
3 Orion New Zealand 17.9 3 Orion New Zealand 17.9
4 WEL Networks 16.7 4 WEL Networks 16.5
5 Aurora Energy 14.6 5 Aurora Energy 14.7
6 Unison Networks 11.3 6 Unison Networks 13.7
7 Powerco 10.6 7 Powerco 10.7
Industry Average 12.3 Industry Average 12.4
Industry Median 9.2 Industry Median 9.3
Peer Group First Quartile 12.9 Peer Group First Quartile 14.2
Peer Group Median 16.7 Peer Group Median 16.5
Peer Group Third Quartile 23.9 Peer Group Third Quartile 24.0
ICPs
ICPs/km ICPs/km

Appendix 29 Network security gaps

Network security gaps
The network gaps identified in the following tables arise because the cost of reinforcing
the network to the performance level identified in our security standard would be
economically prohibitive. That is, the cost to provide the security standard level of
performance would exceed what consumers are prepared to pay for it.
Transpower GXPs
The Electricity Participation Code includes a national transmission grid reliability
standard. This standard states that Transpower is required to maintain an N-1 level of
security for the core grid. The GXP gaps identified below are based on the application
of our security standard to the Transpower core-grid, spur or GXP assets. Proposed
projects for Transpower core grid assets will be subject to Commission approval.
The tables include current security standard gaps only. Additional projects listed in the
ten year AMP provide solutions for future forecast gaps that are not stated here.
Several projects address more than one security gap and are therefore quoted in more
than one location. Transpower meets the initial capital cost and then charges us an
annualised amount for the use of the additional assets. Transpower costs are
essentially passed through to us to be recovered from our consumers. Transpower
project costs are estimates only.
Transpower GXP security gaps
Network gap VOLL
per
event
$000
VOLL
p.a.
$000
Solution Cost
$000
(real
terms)
Cost
p.a.
$000
Benefit
cost
ratio
Proposed date
Addington
Single Addington
No.2 11kV GXP
busbar fault causing
complete loss of
supply to 23MW of
load.
Restoration
achievable in 2hrs.
534 8.0 Install bus zone
protection to
create two bus
zones as part of
the planned 11kV
switchgear
replacement.
Orion
27
2.9 2.8:1 2015 during
switchboard
replacement and
following Orion
purchase of the
assets
Bromley and Islington
Bromley 220/66kV
transformer failure
causing cascade trip
during high loads.
2,100 20 Upgrade Bromley
interconnectors.
TP
8,410
925 1:46 Contract signed
with Transpower to
complete work by
March 2013

Partial loss of
restoration for an
Islington 220/66kV
dual transformer
failure.
8,200 30 Upgrade Bromley
interconnectors.
TP
8,410
925 1:31 Contract signed
with Transpower to
complete work by
March 2013
Islington
Partial loss of
restoration for an
Islington 220/33kV
dual transformer
failure.
2,200 4 Templeton 66kV
substation. (1)
Orion
4,485
646 1:162 Influenced by load
growth at Wigram
and Templeton.
Hororata
Interruption to all
Hororata GXP load
for a 66kV bus fault
(restorable).
830 19 Install a 66kV bus
coupler
(75% of load will
remain on).
TP
500
55 1:2.9 Uneconomic. No
date proposed. The
planned 66kV links
from Highfield to
Greendale and
Darfield will
significantly reduce
the interrupted
load.
Partial loss of
restoration for a
Hororata 66/33kV
dual transformer
failure.
1,180 11 Convert Hororata
to 66kV. (1)
Orion
1,527
168 1:15.3 Hororata
conversion year
ending 31 March
2018.
Interruption to all
Hororata 33kV GXP
load for a 33kV bus
fault (restorable).
TBA TBA Install a 33kV bus
coupler
(will halve VOLL
values).
TP
250
28 TBA Uneconomic. No
date proposed. The
Hororata 33kV
switchboard is due
for replacement by
2020 and is
proposed to simply
33kV connections
and negate the
need for a 33kV
busbar.
Springston
Partial loss of
restoration for a
Springston 66kV
dual line or 66/33kV
TBA TBA Larcomb 66kV. TBA TBA TBA Year ending 31
March 2014.

transformer failure.
Interruption to all
Springston 33kV
GXP load for a 33kV
bus fault (restorable).
907 21 Install a 33kV bus
coupler
(will halve VOLL
values).
TP
250
28 1:1.3 It is envisaged that
the staged
conversion of the
substations on
Springston 33kV to
66kV will result in
an exit from all
33kV at Springston
by 2025, making
the proposed
solution
uneconomic.
Banks Peninsula
33kV sites will be
fed from 66kV to
33kV transformers
at Motukurara in
the future.

Orion security gaps
Substation Network gap Solution Cost
$000
Proposed
date
Dallington Single 66kV supply to Dallington
zone substation due to the
February 2011 earthquake.
Loss of 30MW of load for a
single 66kV line or transformer
failure. Restoration achievable
in 5min.
Complete a 66kV loop from
Rawhiti via proposed
Marshlands site by installing a
new cable from Marshlands to
McFaddens zone substation.
6,112 2020
Single Dallington 11kV busbar
fault causing complete loss of
supply to 33MW of load.
Restoration achievable in 2hrs.
Install bus zone protection to
create two bus zones as part
of the planned 11kV
switchgear replacement.
27.5 2019
Halswell Single Halswell 66kV busbar
fault causing complete loss of
supply to 42MW of load.
Installation of a bus coupler at
this stage is uneconomic. In
the longer term the Halswell
66kV bus arrangements will
need to change to a ring bus
to accommodate other
changes.
TBA TBA
Heathcote Single Heathcote 11kV busbar
fault causing complete loss of
supply to 21MW of load.
Restoration achievable in 2hrs.
Install bus zone protection to
create two bus zones as part
of the planned 11kV
switchgear replacement.
25 2019
Hoon Hay Single Hoon Hay 11kV busbar
fault causing complete loss of
supply to 28MW of load.
Restoration achievable in 2hrs.
Install bus zone protection to
create two bus zones as part
of the planned 11kV
switchgear replacement.
25 2026
Lancaster Loss of 18MW of load for a
single 66kV cable failure.
Restoration achievable in 5min.
Complete a 66kV loop from
Hoon Hay to Milton.
8,329 2025
Moffett Single Moffett St 11kV busbar
fault causing complete loss of
supply to 18MW of load.
Restoration achievable in 2hrs.
Install bus zone protection to
create two bus zones as part
of the planned 11kV
switchgear replacement.
50 2030
Papanui Interruption to all Papanui load
for a 66kV bus fault (restorable).
Our northern subtransmission
plan will provide an
opportunity to operate the
Papanui 66kV bus with a
permanent split.
NA 2020

Single busbar fault at Northcote
Rd No.123 network substation
on the Belfast 11kV ring causing
a cascading loss of supply to
24MW of load. Restoration
achievable in 2hrs.
Uneconomic to install an 11kV
bus coupler at Northcote Rd
No.123. The impact will be
reduced by the installation of
Marshland zone substation
(project 488) and then fully
solved by reconfiguring
Northcote Rd No.123.
NA NA
Rawhiti
Single 66kV supply to Rawhiti
zone substation due to the
February 2011 earthquake.
Install new cable from
Hawthornden zone substation
via proposed Waimakariri and
Marshlands sites (these
projects require a further
$12m which delivers shared
benefits for Rawhiti).
18,141 2016
Bishopdale Single Bishopdale 11kV busbar
fault causing cascading loss of
supply to 22MW of load.
Restoration achievable in 2hrs.
This security gap will be
resolved as part of scheduled
switchgear replacement at
Bishopdale.
25 2016

Appendix 30 Letter from CCC on undergrounding


Appendix 31Emergency maintenance contract terms (extract)
Emergency Maintenance Contract Terms (extract)
1. SCOPE OF WORKS
The contract shall serve as the governing document that will form the general terms and conditions for all Orion works ordered.
Works will include Emergency Work, Planned/Scheduled Work, Minor Works and third party/customer driven work associated with connecting to the Orion electricity distribution network.
The contractor is to provide for a full emergency works response within the High Country and Plains area and a partial (substation, communications, SCADA, ripple, HV cable first call and HV cable second call) emergency response service in the Banks Peninsula area.
Please note that the emergency response contractor for overhead reticulation and low voltage cable response in the Banks Peninsula area has a requirement to directly engage Connetics as Orion’s Nominated Subcontractor for the balance of the works that the contractor is not authorised by Orion to respond to.
The requirement for the Nominated Subcontractor status will be reviewed annually by Orion, work costs incurred under this requirement will be invoiced to Orion directly. Initial response and work completion requirements shall be met as if directed by Orion.
2. CONTRACT TERM
This is a three year contract and will terminate on the anniversary unless other agreements between the Principal and contractor have been secured.
A two year extension may be offered to roll over the contract term, however this will be dependent on the contractor’s overall performance of the contract and is subject to the agreed performance targets being met. It is also at the sole discretion of Orion.
3. PREPARATION
The tender submission shall provide relevant evidence and information to demonstrate that the contractor and subcontractors under their control have sufficient experience, skills and resources to fulfil the terms and conditions of the contract and are positioned to meet the specific contract objectives.
The provisions of all relevant statutes, regulations and bylaws of government, local and other public authorities must be complied with. If these are not contained in the contract documents, it is the contractor’s responsibility to check with the appropriate bodies to their requirements/standards.
The contractor must search out any records, locate and protect all utility services and landowner property that may be affected by the work being carried out.
4. GENERAL DESCRIPTION OF WORKS ORDERED
4.1 GENERAL Orion (the Principal) chooses a selective tender process to determine what contractor’s will be invited to undertake works ordered, there is no obligation on Orion to award any works to the contractor.
All works ordered under this contract are currently assessed as associated with the overhead reticulation, underground reticulation, substation assets, communication, SCADA and ripple assets within the Orion electricity distribution network area for the term of this contract.
Any work not associated with these particular assets is prohibited and not covered in this contract. The contractor will need to have in place a variation to this contract or other specific agreements with Orion in order for the work to be undertaken.
4.2 EMERGENCY WORKS
These are works of an urgent nature and repairs are to be undertaken immediately in conjunction with NW72.20.03.
The emergency works component of this contract requires that a live line response is available Monday to Friday 7.30am to 4.00pm only, outside these hours a live line response can be provided if practical.
4.3 PLANNED/SCHEDULED AND MINOR WORKS REQUESTED BY ORION
Work will be issued on a job by job basis as per the contractors quoted/tendered price or schedule of rates within the contract.
4.4 CUSTOMER DRIVEN WORK REQUESTED BY THIRD PARTY
This will be processed as outlined in NW70.10.03 and in conjunction with the connections and extensions policy. These works will be issued on a job by job basis as per the contractor’s quoted/tendered price or schedule of rates within the contract.
Any identified proposed work or design configurations that may impact adversely on the Orion network or third parties that are within the public domain will be reviewed by Orion. Orion has the sole discretion to take over the management of such work if required. This includes any quotations submitted for work requests, Orion will manage the selection of tenders with which the commercial/financial negotiations may be conducted and ensure that they are commercially advantageous. If this is the case and once agreed to by Orion, the contractor will be compensated for their justified associated costs.
4.5 COMPETITIVE PRICING
To achieve the best value for its contracted works Orion intends to procure competitive prices for goods and services associated with the overhead reticulation, underground reticulation, substation assets, communication, SCADA and ripple assets, having due regard to the long term network security and work quality.
All works ordered by Orion where they are liable for payment, with a value in excess of $5000 will be assessed by Orion, to ensure that the most cost effective options have been explored and that a competitive price process has been followed.
All work with a value in excess of $20,000 is to be performed as a separate tendered contract. The lowest overall price shall be the accepted/awarded price provided the

contractor conforms to the evaluation criteria. Otherwise the remaining assessed prices may be accepted, provided they conform to the evaluation criteria.
Generally the most cost effective options are expected to be explored and that a competitive price process has been followed before any Orion work orders or individual customer connection agreements are issued.
5. CONTRACTOR PERFORMANCE
5.1 GENERAL The contractor is responsible for providing the overall management, infrastructure, system support services and appropriate resources (competent persons, adequate materials and plant) required to undertake the services specified in this contract, meeting all standards and specifications referenced in but not limited to the information as included in the contract, including all physical aspects.
The contract requires the contractor to accept and manage all risks associated with the contract that indemnifies the Principal against any claim arising on account of but not limited to injury to persons or damage to property.
The contractor shall have in place or are already in a development stage of an integrated auditable Contract Management System that fundamentally meets the contracts Quality Assurance, Safety and Environmental requirements.
The contract requires the contractor to carry out internal audits on a regular basis, including a periodical formal audit of the contractor's Management System by an independent party. The results of such audits shall be made available to Orion on request.
5.2 PERFORMANCE REVIEW
Contractor performance will be monitored through the duration of the contract and will be formally reviewed 6 months prior to the three year contract completion date, the criteria may be re-established at the ongoing reviews as necessary.

1 6. CLAIMS AND PAYMENTS
6.1 GENERAL The contractor’s claims should be presented to Orion for assessment. These shall clearly identify the contract works that the claim relates to and if required shall be supported by an informative description that is sufficient to understand the work done and to justify the claims being made.
No payments will be made until satisfactory information has been received by Orion.
Any subcontractor invoices will be submitted to the head contractor for processing to the Principal/Orion.
Regarding emergency works response claims (refer NW72.20.03 section 3.10), these will be by way of a weekly invoice supported by the individual job information entered in the On-line Works Management Application.
6.2 CONTRACTOR ENGINEERING SUPPORT
Contractor engineering support is considered as additional resources needed where required to assist the contractor in performing their general duties under the contract, which may be due to unforeseen circumstances or unexpected escalations.
Where engineering support is claimed against the contract it must be justified and the contractor is to detail the types of tasks/services that are provided by their company with regards to the use of engineering support in their tender submission.
Engineering support claims should not be what would be expected as general administrational duties or support as per the fixed costs and management/supervision components within the contract.
6.3 CONTRACT SCHEDULES
The contractor is to prepare and submit all of the associated schedules of rates that will be used to manage the contractor’s claims and variations for the Orion works ordered under this contract.
The schedules shall typically include all day rates, fixed rates, generic tasks rates and be geographically aligned i.e. metropolitan or rural. Overall the schedules shall demonstrate and identify any risks and exposure to the contractor and Orion.
2 7. INITIATIVES
Continuous improvement of contractor performance is required to provide a means of measuring against particular legislative and/or Orion standards.
Customer service is about satisfied customers. To that end, customer interactions and service levels need to be maintained and improved where possible. Any records of private agreements shall be kept and if required will assist in minimizing disputes between the customer and contractor should they arise.
Where the contractor, is seeking approval to implement a new initiative, they must present this to the Engineers representative for consideration, including a brief report outlining benefits, risks and any mitigation if required.

3 8. STAFF DEVELOPMENT REQUIREMENTS
Staff should be trained in accordance with all industry and employer standards and also need to be exposed to emergency works and associated procedures and processes to become familiar with all facets of work to be undertaken. The overall objective is an outcome that the staff and trainees gain experience and understanding to assist in achieving the expected competencies in their particular discipline.
The overall outcome is to provide additional resource competent to carry out this contract. Any individual staff/trainee record shall be kept to show traceability.
4 9. SPECIALIST SERVICES
Orion will provide training for proprietary equipment and systems at cost. Contractors should identify their training needs to Orion by late November each year for inclusion in the following year’s budget.
It is expected that training requirements for specialist skills are clearly identified and a report submitted on a six monthly basis indicating completion of training.
The contractor shall maintain access to competent personnel, tools and equipment to fulfil fault response to the following specialist technical services:
1. 66kV and 33kV Cable Jointing – refer to 66kV and 33kV Cable Repair Contingency Plan NW72.12.02
2. Cable Fault Location
3. Fault Diagnostic Equipment for HV primary equipment (i.e. transformers, switchgear and associated protection)
4. SCADA, Electrical Network Communications and Ripple systems
Please detail within your tender submission your company’s process for maintaining competent staff to deliver this service and justify any fixed costs associated with the provision of this service.
5 10. MAJOR EMERGENCY RESPONSE
A major emergency is an event beyond the normal emergency; it could be described as a one in three year event that requires additional support systems and resource to restore supply.
In the event of a major emergency situation, to assist the contractor with transitioning from a ‘normal’ emergency works response to a major emergency response, Orion’s Network Asset Manager, Operations Manager, Engineer to the Contract or his Representative will direct this transition to the contractor, including any requirements or direction pertaining to the specific event.
When assisting in a major emergency response situation, the contractor is to use all existing systems and processes that would be used in ‘normal’ fault response work so that organizations are able to respond appropriately and reliably when faced with sudden and potentially catastrophic natural or technological emergencies.

Fundamental to this is the contractor’s own emergency preparedness plan and contingencies to protect any intellectual property, information and communication systems to maintain a coordinated response with all stakeholders during the event.
Our requirement is that a copy of the contractor’s emergency preparedness plan and the implementation process of the Emergency Response Management Information Systems (ERMIS) are available for assessment.
All schedules of vehicles, plant, equipment and human resources that would be available in a major emergency shall also be submitted.
Orion has in place an Electricity Supply Mutual Aid Agreement with various Network Operators which allows Orion to request further assistance under major emergency situations. This is a reciprocal arrangement and Orion may request you to assist other Network Operators under this agreement.
In the event of a perceived major emergency situation you should contact Orion prior to committing your resources to any other network operator.
Contractors would be expected to be available within 4 hours of a call and generally work would be expected to be performed during the hours of daylight.
Orion is to be notified of any changes to the list of available vehicles, plant, equipment and human resources in order to be current at all times.

Appendix 32Contract procedures and policies
1. NW73.00.01 Standard contract document 2. NW73.00.02 Standard contract procedures 3. NW73.00.03 Contract management policy 4. NW73.10.07 Contract administration 5. NW73.10.09 Contract tendering 6. NW73.10.13 Evaluation of tenders 7. NW73.10.15 Authorised contractors 8. NW73.10.16 Post contract evaluation 9. 0R00.00.19 Procurement policy
NETWORK ASSET MANAGEMENT
STANDARD CONTRACT DOCUMENT
NETWORK POLICY STANDARD
NW73.00.01

Orion NZ Ltd. Policy Standard Contract Document NW73.00.01
DISTRIBUTION REGISTER
COPY ISSUED TO
1. (Master) Asset Information Supervisor 2. Asset Manager 3. Contract & Information Manager 4. Contract Administrator 5. Engineering Manager Electricity
6. Engineering Manager Gas
7. Contractors 8. 9. 10.
Issue Date 08.03.99 Nw730001.doc Amendment No.1 Total Pages 4
2

Orion NZ Ltd. Policy Standard Contract Document NW73.00.01
AMENDMENT RECORD
Amendment No. Page Amended Amend Date Date Inserted Inserted by Approved by
1 4, Orion 08/03/99
The above table lists the amended pages in this standard, which have been distributed following the initial issue of this standard. Please insert the amended pages and discard the replaced pages. An update table is issued with each amendment. Check the new pages inserted against the table and fill out the “Date Inserted” and “Inserted By” spaces when inserting the amended pages. Amendments are marked with a vertical line against the left margin.
Issue Date 08.03.99 Nw730001.doc Amendment No.1 Total Pages 4
3

Orion NZ Ltd. Policy Standard Contract Document NW73.00.01
STANDARD CONTRACT DOCUMENT
Responsibility Notes Contract Administration
Standard Contract 3910 Specific to contract
Schedule to conditions of tendering Special Conditions Preliminary & General Standard Specification General
Specification Engineering Management
Scheduled Work NW 72 20 01
Non Scheduled Work NW 72 20 02 Standard Asset Specification Specification
Specific Engineering Management
Technical specifaction NW__ __ __ To Asset
or Technical Description Specific Technical Specifications Detail Specific to
Engineering Management
including Drawings, Major Materials Lists, Project to be
Schedule of work and Pricing schedules Performed
Issue Date 08.03.99 Nw730001.doc Amendment No.1 Total Pages 4
4

NETWORK ASSET MANAGEMENT
STANDARD CONTRACT PROCEDURE
NETWORK PROCEDURE STANDARD
NW73.00.02

Orion NZ Ltd. Policy Standard Contract Procedure NW73.00.02
DISTRIBUTION REGISTER
COPY ISSUED TO
1. (Master) Network Asset Information Supervisor 2. G.M Network Services 3. Network Asset Manager 4. Network Planning Manager 5. Network Operations Manager 6. Network Connections Manager 7. Contractors 8. 9. 10. 11. 12.
Issue Date 19.06.95 Nw730002.doc Amendment No.0 Total Pages 4
2

Orion NZ Ltd. Policy Standard Contract Procedure NW73.00.02
AMENDMENT RECORD
Amendment No. Page Amended Amend Date Date Inserted Inserted by Approved by
The above table lists the amended pages in this standard, which have been distributed following the initial issue of this standard. Please insert the amended pages and discard the replaced pages. An update table is issued with each amendment. Check the new pages inserted against the table and fill out the “Date Inserted” and “Inserted By” spaces when inserting the amended pages. Amendments are marked with a vertical line against the left margin.
Issue Date 19.06.95 Nw730002.doc Amendment No.0 Total Pages 4
3

Orion NZ Ltd. Policy Standard Contract Procedure NW73.00.02
STANDARD CONTRACT PROCEDURE
Standard Contract Standard Specification Scheduled Work NW 72 20 01 Non Scheduled Work NW 72 20 02 Technical Specification NW __ __ __ Or Technical Description Including Drawings Works Order Site Inspection Commissioning H V NW 21 01 01 L V NW 21 70 01
Issue Date 19.06.95 Nw730002.doc Amendment No.0 Total Pages 4
4

NETWORK ASSET MANAGEMENT
CONTRACT MANAGEMENT POLICY
NETWORK POLICY STANDARD
NW73.00.03

Orion NZ Ltd. Policy Contract Management NW73.00.03
Issue Date 08.03.99 Nw730003.doc Amendment No.3 Total Pages 4
2
DISTRIBUTION REGISTER
COPY ISSUED TO
1. (Master) Asset Information Supervisor 2. Asset Manager 3. Contract & Information Manager 4. Contractor Administrator 5. Engineering Manager Gas 6. Engineering Manager Electricity 7. Contractors 8. 9. 10. 11. 12.

Orion NZ Ltd. Policy Contract Management NW73.00.03
Issue Date 08.03.99 Nw730003.doc Amendment No.3 Total Pages 4
3
AMENDMENT RECORD
Amendment No. Page Amended Amend Date Date Inserted Inserted by Approved by
2 4 24.11.98 3 Orion 08.03.99
The above table lists the amended pages in this standard, which have been distributed following the initial issue of this standard. Please insert the amended pages and discard the replaced pages. An update table is issued with each amendment. Check the new pages inserted against the table and fill out the “Date Inserted” and “Inserted By” spaces when inserting the amended pages. Amendments are marked with a vertical line against the left margin.

Orion NZ Ltd. Policy Contract Management NW73.00.03
Issue Date 08.03.99 Nw730003.doc Amendment No.3 Total Pages 4
4
CONTRACT MANAGEMENT POLICY Orion wishes to develop, promote and retain a group of competent contractors. To achieve the best value for its contracted works Orion intends to get competitive prices for goods and services associated with work on the Network Asset, having due regard to the long term network security and work quality. All work initiated from the Asset Management division that Orion is liable to pay for, with a value in excess of $5,000, should only be performed after obtaining at least two prices. All work with a value in excess of $20,000 is to be performed as a separate tendered contract. The lowest overall price is to be the accepted price if the contractor conforms to the lowest price conforming criteria. Otherwise the remaining lowest price may be accepted provided it conforms to the lowest price conforming criteria. The exceptions to the above are as follows: • Emergency Works & Major Emergency Works which may be subject to a negotiated
arrangement between the parties including a fixed payment to secure adequate specialist resource.
• Emergency spares and stock storage
• SCADA and ripple works (a specialist service)
• Metering (a specialist service) Where there is only one supplier of goods and services a decision must be made on the basis of fair value for money. It will be necessary to make comparative judgements on fair value for money by comparing costs with the costs of similar goods and services. In some cases it may be necessary to include lifetime costs to justify a decision. Other situations may require a solution which may be the best overall technical solution that can be justified for reasons such as reliability or technical compatibility. It will be necessary for the person ordering the goods and services to state the reason for not accepting the lowest tendered price on document NW73.10.13 and attach this to the tender file. These exceptions will require authorisation by the Asset Manager.

NETWORK ASSET MANAGEMENT
CONTRACT ADMINISTRATION
NETWORK PROCEDURE STANDARD
NW73.10.07

Orion NZ Ltd. Procedure Contract Administration NW73.10.07
Issue Date 08.03.99 Nw731007.doc Amendment No.1 Total Pages 4
2
DISTRIBUTION REGISTER
COPY ISSUED TO
1. (Master) Asset Information Supervisor 2. Asset Manager 3. Contract & Information Manager 4. Contract Administrator 5. Engineering Manager Electricity 6. Engineering Manager Gas 7. Contractors 8. 9. 10. 11. 12.

Orion NZ Ltd. Procedure Contract Administration NW73.10.07
Issue Date 08.03.99 Nw731007.doc Amendment No.1 Total Pages 4
3
AMENDMENT RECORD
Amendment No. Page Amended Amend Date Date Inserted Inserted by Approved by
1 Orion 08.03.99
The above table lists the amended pages in this standard, which have been distributed following the initial issue of this standard. Please insert the amended pages and discard the replaced pages. An update table is issued with each amendment. Check the new pages inserted against the table and fill out the “Date Inserted” and “Inserted By” spaces when inserting the amended pages. Amendments are marked with a vertical line against the left margin.

Orion NZ Ltd. Procedure Contract Administration NW73.10.07
Issue Date 08.03.99 Nw731007.doc Amendment No.1 Total Pages 4
4
CONTRACT ADMINISTRATION Please allow, when planning for any jobs, the following contract administration times (minimum) after completion of all design documents. * Prepare tender 1 working day * Await tender prices 10 working days * Tender evaluate tender against schedule (Design) 3-5 working days * Tender response 7 working days * Possession of site 7 working days

NETWORK ASSET MANAGEMENT
CONTRACT TENDERING
ELECTRICITY NETWORK PROCEDURE
NW73.10.09

2

Orion NZ Ltd. Procedure Contract Tendering NW73.10.09
DISTRIBUTION REGISTER
COPY ISSUED TO
1. (Master) Network Information Supervisor
2. Network Asset Manager
3.
4.
5.
6.
7.
8.
9.
10.
© Copyright: Orion NZ Ltd. This Document is entitled to the full protection given by the Copyright Act 1994 to the holders of the copyright. Reproduction of any substantial passage from this document is a breach of the copyright. This copyright extends to all forms of photocopying and any storing of material in any kind of information retrieval system. All applications for reproduction in any form should be made to Orion NZ Ltd.
Issue Date 19.07.2004 Nw731009.doc Amendment No.4 3

Orion NZ Ltd. Procedure Contract Tendering NW73.10.09
AMENDMENT RECORD
Amendment No. Page Amended Amend Date Date Inserted Inserted by Approved by
2 6, Orion 08.03.99
3 4 09.05.00
4 9 19.07.04
The above table lists the amended pages in this standard, which have been distributed following the initial issue of this standard. Please insert the amended pages and discard the replaced pages.
An update table is issued with each amendment. Check the new pages inserted against the table and fill out the “Date Inserted” and “Inserted By” spaces when inserting the amended pages.
Amendments are marked with a vertical line against the left margin.
Issue Date 19.07.2004 Nw731009.doc Amendment No.4 4
NormanN
Amended Appendix A to reflect changes in contractors and company names.

Orion NZ Ltd. Procedure Contract Tendering NW73.10.09
TABLE OF CONTENTS
1. PREPARING DOCUMENTS .............................................................................................7
2. CALLING TENDERS.........................................................................................................7
3. CLOSING TENDERS ........................................................................................................7
4. TENDER EVALUATION....................................................................................................8
5. ACCEPTANCE OF TENDER ............................................................................................8
6. NOTIFICATION OF TENDER............................................................................................8
APPENDIX A..............................................................................................................................9
Issue Date 19.07.2004 Nw731009.doc Amendment No.4 5

Orion NZ Ltd. Procedure Contract Tendering NW73.10.09
Issue Date 19.07.2004 Nw731009.doc Amendment No.4 6

Orion NZ Ltd. Procedure Contract Tendering NW73.10.09
1. PREPARING DOCUMENTS Determine the type of work required:
♦ Design.
♦ Build.
♦ Design Build.
Determine whether a Design (Consultancy) type agreement, a Construction (NZS3910) or a Purchase (FIDIC) type agreement is required.
Prepare the Contract documents using the Contract Check List (NW 73.10.12) and confirming the following:
♦ Contract number.
♦ Contract title.
♦ Tender closing time, date and location.
♦ Required Design and Technical Specifications.
♦ Description of work.
♦ Start date.
♦ Duration or finish date.
♦ Any other Tender / Contract requirements.
2. CALLING TENDERS Determine in conjunction with the Originator/Contract Manager which Contractors to invite to tender.
Prepare invitation letters; bundle with documents and post to Contractors.
Prepare "Notices To Tenderers" to clarify the documents in response to tenderers requests as required. All invited tenderers must receive clarification notices.
3. CLOSING TENDERS Tenders closing in the Tender box are to be uplifted jointly by two officers using keys obtained from the Asset Management Office Administrator and the Ground Floor Receptionist.
Tenders shall be opened and the Tenderers names and offers recorded and signed by both officers. See Appendix A.
Issue Date 19.07.2004 Nw731009.doc Amendment No.4 7
Orion NZ Ltd. Procedure Contract Tendering NW73.10.09
4. TENDER EVALUATION Evaluate the tenders in conjunction with the originator of the work using the "Lowest Price Conforming Tender" method (NW73.10.13), consider any exceptions and deviations and obtain tender clarifications if required.
Notify both the successful and unsuccessful tenderers and advise the range of tendered prices.
5. ACCEPTANCE OF TENDER The successful tenderer shall be notified as stated in the Conditions of Tender.
6. NOTIFICATION OF TENDER The tenderers shall be notified as stated in the Conditions of Tender.
Issue Date 19.07.2004 Nw731009.doc Amendment No.4 8

Orion NZ Ltd. Procedure Contract Tendering NW73.10.09
APPENDIX A
TENDER RECEIPT FORM
CONTRACT ____/____ E (E=Electricity)
TENDERS CLOSED 1:00PM _____________________ 200__
TENDERER AMOUNT (EXCL GST)
Connetics
Areva T&D
Power Jointing
Independent Line Services
Line Maintenance Services
Electrix
Cherry Picker Specialists
Treescape
Southern Tree Maintenance
Richdale Builders
Kevin McGovern
Other
SIGNED: DATE:
SIGNED: DATE:
Issue Date 19.07.2004 Nw731009.doc Amendment No.4 9

NETWORK ASSET MANAGEMENT
EVALUATION OF TENDERS
NETWORK POLICY STANDARD
NW73.10.13

Orion NZ Ltd. Procedure Evaluation of Tenders NW73.10.13
Issue Date 27.03.03 Nw731013.doc Amendment No4
2
DISTRIBUTION REGISTER
COPY ISSUED TO
1. (Master) Asset Information Supervisor 2. Asset Manager 3. Contract & Information Manager 4. Contract Administrator 5. Engineering Manager Electricity 6. Strategic Planning Manager 7. 8. 9. 10. 11. 12.

Orion NZ Ltd. Procedure Evaluation of Tenders NW73.10.13
Issue Date 27.03.03 Nw731013.doc Amendment No4
3
AMENDMENT RECORD
Amendment No. Page Amended Amend Date Date Inserted Inserted by Approved by
2 Orion 08.03.99 3 8 16.08.00 4 6 27.03.03
The above table lists the amended pages in this standard, which have been distributed following the initial issue of this standard. Please insert the amended pages and discard the replaced pages. An update table is issued with each amendment. Check the new pages inserted against the table and fill out the “Date Inserted” and “Inserted By” spaces when inserting the amended pages. Amendments are marked with a vertical line against the left margin.

Orion NZ Ltd. Procedure Evaluation of Tenders NW73.10.13
Issue Date 27.03.03 Nw731013.doc Amendment No4
4
EVALUATION OF TENDERS
LOWEST PRICE CONFORMING TENDER METHOD
Further to Clause 107.1 of the Schedule to the Conditions of Tendering the tender evaluation process shall be conducted in two stages as follows: 1. The first stage shall consist of determination of tender acceptability when assessed against
each of seven non-price factors, and no others. Each factor shall be scored on a pass/fail basis. Any factor which scores a fail will exclude that tender from further consideration.
2. The second stage shall consist of the tendering authority determining which of the remaining conforming tenders has the lowest price.
Non-Price Factors The seven non-price factors are: Factor Definition 1. Relevant Experience The Tenderer's previous experience, particularly in technical
areas relevant to the Specification. 2. Track Record The Tenderer's record of completing projects to target,
performance levels, on schedule, within budget and safely. 3. Competency and Technical
Skills The ability that the Tenderer's proposed personnel have with
respect to the technical and legal requirement of the Specification. This includes appropriately trained, certificated and experienced persons for the class of work required to be done.
4. Adequacy of Safety
Management Plan The adequacy of the Tenderer's proposed Health and Safety
Management Plan to meet the requirements of the HASIE Act, Electricity Act and Electricity Regulations, Resource Management Act, and all other statutory requirements.
5. Quality Assurance The Tenderer must demonstrate developed procedures and
programmes which provide quality control of work processes. 6. Customer Service The tenderer must demonstrate a track record of commitment to
the delivery of the expected specified Customer Service standards.
7. Management Skills The ability within the Tenderer's organisation of people and
systems appropriate to the successful management of the project.

Orion NZ Ltd. Procedure Evaluation of Tenders NW73.10.13
Issue Date 27.03.03 Nw731013.doc Amendment No4
5
AAPPPPEENNDDIIXX AA:: TTeennddeerr AAsssseessssmmeenntt CChheecckk SShheeeett

Orion NZ Ltd. Procedure Evaluation of Tenders NW73.10.13
Issue Date 27.03.03 Nw731013.doc Amendment No4
6
TENDER ASSESSMENT
CONTRACT NUMBER : ____________________
(Completed with reference to Tender Assessment Procedure 25/3/94)
Contractor Name: 1 _________________ 2 _________________ 3 _________________ 4 ________________
1) Relevant Experience
2) Track Record
3) Competency & Technical Skills
4) Adequacy of Safety Management Plan
5) Quality Assurance
6) Customer Service
7) Management Skills
8) Price
The most suitable Contractor for the above contract is: _____________________________________________________
Their tendered price was $ ________________________
Signed: ____________________________________
Engineer to Contract
NOTES:

Orion NZ Ltd. Procedure Evaluation of Tenders NW73.10.13
Issue Date 27.03.03 Nw731013.doc Amendment No4
7
AAPPPPEENNDDIIXX BB:: CCoonnttrraacctt TTeennddeerr CChheecckk LLiisstt

Orion NZ Ltd. Procedure Evaluation of Tenders NW73.10.13
Issue Date 27.03.03 Nw731013.doc Amendment No4
8
CONTRACT TENDER CHECK LIST CONTRACT NUMBER: / E
(Year) /(Contract Number)(Asset) CONTRACTOR 1 _____________ 2 _____________ 3 ______________ 4 ______________ Quote or Schedule of Rates Competent Persons Health & Safety Subcontractors Insurance - Public Liability Insurance - Contract Works Bond Contractors Exceptions Programme of Works Comments:

AUTHORISED CONTRACTORS
INFRASTRUCTURE MANAGEMENT ELECTRICITY NETWORK PROCEDURE
NW73.10.15

Orion Procedure Authorised Contractors NW73.10.15
DETAILS OF DOCUMENT AMENDMENT No.5 Section
amended Description of amendment
Page 3 Contractor staff training.
© Copyright: Orion NZ Ltd.
This Document is entitled to the full protection given by the Copyright Act 1994
to the holders of the copyright. Reproduction of any substantial passage from this document
is a breach of the copyright. This copyright extends to all forms of photocopying and
any storing of material in any kind of information retrieval system. All applications for reproduction in any form should be made to Orion NZ Ltd.

Orion Procedure Authorised Contractors NW73.10.15
Issue Date 17.10.2005 Nw731015.doc Amendment No.5
3
DEFINITIONS
Orion New Zealand Ltd (“Orion”): Is a Network management company with its head office based in Christchurch New Zealand.
Authorised Contractor: Is a contractor who is allowed access to work on Orion’s network, such access may be limited as identified in Appendix B.
Invited Contractor: Is an Authorised Contractor who can be invited to carry out work for Orion. SCOPE
Orion reserves the right to tender work to contractors as it sees necessary to minimise risk to the Orion business. Not withstanding this Orion will limit contractors working on certain work to ensure a viable market for the remaining contractors. This should ensure contractors have sufficient income to allow them to invest in staff training, plant and equipment to ensure their future viability. Our expectation is that contractors would have at least 10% of their staff undertaking formal trade training at any one time. This will be assessed periodically from the supplied list of competent persons (refer Appendix A).
Orion’s policy for selecting contractors is to support regionally based contractors for mutual long term viability.
Contractors that are clearly standalone are considered in preference to contractors that have a direct power company association who will not be considered if their network is not open to direct competition.
Orion may consider an exception to provide specialist services not available from our exisiting contractors.
In order to maintain a viable emergency maintenance response contractor Orion currently have a sole source provision of emergency maintenance.
In order to retain sufficient resource in the event of a major emergency Orion have in place major emergency response contracts with identified Contractors.
Orion will enter into mutual aid agreements with contractors and power companies for assistance in the event of a major disaster.
The continued inclusion of Authorised and Invited Contractors is subject to ongoing review via Orion’s tender and contract management processes. Contractors may be added or removed at Orion’s discretion.
Being an Invited Contractor offers no guarantee of work, but provides the ability to tender for work contracted on a project by project basis.
The acceptance for Authorised Contractors to work on Orion’s network will be granted upon the contractor entering into a Work Specific, Minor Works or Building and Plant Maintenance Contract, as appropriate, with Orion.
The ability for contractors to undertake the type of work will be confirmed by gaining the appropriate Entry Approval Certificate (E.A.C) and/or Permit Holder Certificate (P.H.C) and the identification of the necessary skills on the list of compentent persons (Appendix A) supplied by the contractor.
The following customer driven work is considered contestable and as such can be carried out by all Authorised Contractors.
Subdivisions New Connections Minor Customer Initiated Work Street Light Installation
The following list identifies the type of work able to be undertaken by, and the invited status of, Authorised Contractors. Only those Invited Contractors identified on this list may be requested to carry out work for Orion.

Orion Procedure Authorised Contractors NW73.10.15
Issue Date 17.10.2005 Nw731015.doc Amendment No.5
4
While comprehensive, the included list is not definitive, notably where the work to be carried out is of a particularly large, occasional or specialised nature.
Contractors identified thus ** are signed up to the Minor Works or Building Services or other work specific 2 or 3 year term contracts.
Contractors identified thus * are signed up to individual works contracts only.

Orion Procedure Authorised Contractors NW73.10.15
Issue Date 17.10.2005 Nw731015.doc Amendment No.5
5
CURRENT TERM CONTRACT STATUS
CONTRACTOR CONTRACT DESCRIPTION EXPIRY DATE
Arbor-Tek Ltd 2006/008E Tree Cutting 31 March 2007
Cherry Picker Specialists Ltd 2006/009E Tree Cutting 31 March 2007
Connetics Ltd 2006/005E Minor Works 31 March 2008
C.T. & Associates Ltd 2006/001E Minor Customer 31 March 2006
Earl P Smith Ltd 2006/005E Minor Works 31 March 2008
Electro-Tech Services Ltd 2006/005E Minor Works 31 March 2008
FitzGerald Electrical Ltd 2006/005E Minor Works 31 March 2008
Green Acres Lawn Mowing 2006/023E Grounds Maint. 31 March 2008
HV Diagnostics Ltd 2006/010E Partial Discharge 31 March 2006
Independent Line Services Ltd 2006/005E Minor Works 31 March 2008
John McNeill Electrical Ltd 2006/001E Minor Customer 31 March 2006
L&S Painting Ltd 2006/005E Minor Works 31 March 2008
Line Maintenance Services (2004) Ltd 2006/005E Minor Works 31 March 2008
Power Jointing Ltd 2006/005E Minor Works 31 March 2008
Richdale Builders Ltd 2006/005E Minor Works 31 March 2008
Ritchie Family Trust 2006/019E Grounds Maint. 31 March 2008
Southern Tree Maintenance Ltd 2006/007E Tree Cutting 31 March 2007
Telpower (1998) Ltd 2006/001E Minor Customer 31 March 2006
TEMCO Ltd 2006/005E Minor Works 31 March 2008
Transfield E&T (New Zealand) Ltd 2006/005E Minor Works 31 March 2008
Trevor Saul 2006/005E Minor Works 31 March 2008

Orion Procedure Authorised Contractors NW73.10.15
Issue Date 17.10.2005 Nw731015.doc Amendment No.5
6
LIST OF AUTHORISED CONTRACTORS
Contractor Type of Work Status Connetics Ltd ** Substations Invited P O Box 2237 Cables Invited Christchurch Mail Centre Lines Invited CHRISTCHURCH 8015 Emergency Sole Source ATTENTION: BOB TAYLOR Customer Transfield E&T (New Zealand) Ltd ** Substations Invited P O Box 16219 Hornby CHRISTCHURCH 8030 ATTENTION: VINCE WILLIAMS Power Jointing Ltd ** Cables Invited P O Box 364 Customer Appendix B Kaiapoi CHRISTCHURCH 8252 ATTENTION: PAUL GOLDING Independent Line Services Ltd ** Lines Invited P O Box 24027 Customer Appendix B East Linwood Major Emergency Response Invited CHRISTCHURCH 8030 ATTENTION: GARY O’MALLEY Line Maintenance Services (2004) Ltd ** Lines Invited 3 Mapledale Pl Customer Appendix B Halswell Major Emergency Response Invited CHRISTCHURCH 8003 ATTENTION: PAUL VAN DER KLEY HV Diagnostics Ltd * Plant Testing/Monitoring Invited P O Box 33078 Barrington CHRISTCHURCH 8030 ATTENTION: GREG LINTON Arbor-Tek Ltd ** Trees Invited P O Box 37187 Halswell CHRISTCHURCH 8030 ATTENTION: BERNIE JORDAN

Orion Procedure Authorised Contractors NW73.10.15
Issue Date 17.10.2005 Nw731015.doc Amendment No.5
7
Contractor Type of Work Status Cherry Picker Specialists Ltd ** Trees Invited P O Box 18668 New Brighton CHRISTCHURCH 8030 ATTENTION: MARK GLASSEY Southern Tree Maintenance Ltd ** Trees Invited 34 Karanga Rd R D 2 LEESTON ATTENTION: GARETH DAVIES Richdale Builders Ltd ** Seismic Invited 12 Duncan St Sumner CHRISTCHURCH 8008 ATTENTION: EOIN RICHDALE C.T. & Associates Ltd ** Customer Appendix B P O Box 13256 Armagh CHRISTCHURCH 8031 ATTENTION: GEOFF CHAPMAN John McNeill Electrical Ltd ** Customer Appendix B P O Box 31154 Ilam CHRISTCHURCH 8030 ATTENTION: JOHN MCNEILL Telpower (1998) Ltd ** Customer Appendix B P O Box 9185 Addington CHRISTCHURCH 8030 ATTENTION: SHANE DONALDSON Electro-Tech Services Ltd ** Building Maint (Electrical) Invited P O Box 22676 High St CHRISTCHURCH 8032 ATTENTION: STEVE WALKER L&S Painting ** Building Maint (Painting) Invited 11 Porritt Pl Dallington CHRISTCHURCH 8006 ATTENTION: KEITH SPENCER

Orion Procedure Authorised Contractors NW73.10.15
Issue Date 17.10.2005 Nw731015.doc Amendment No.5
8
Contractor Type of Work Status Earl P Smith Ltd ** Building Maint (Carpentry) Invited 2/8 Pawaho Pl Heathcote Valley CHRISTCHURCH 8002 ATTENTION: EARL SMITH Trevor Saul ** Building Maint (Carpentry) Invited Lawcocks Rd Grounds Maintenance Invited R D 1 AMBERLEY ATTENTION: TREVOR SAUL Ritchie Family Trust ** Grounds Maintenance Invited 22 Croydon St Beckenham CHRISTCHURCH 8002 ATTENTION: ANTHONY RITCHIE Green Acres Lawn Mowing ** Grounds Maintenance Invited P O Box 7125 Sydenham CHRISTCHURCH 8035 ATTENTION: PAUL MACFARLANE FitzGerald Electrical Ltd ** Rural Operator Invited Okuti Vallery Rd R D LITTLE RIVER ATTENTION: MARK FITZGERALD Electrix Ltd Tower Painting Invited P O Box 1507 Waikato WAIKATO 2015 ATTENTION: TANGI GLASSIE TBS Farnsworth Ltd Tower Painting Invited P O Box 56416 Dominion Rd AUCKLAND 1030 ATTENTION: GRAHAM MATTHEWS TEMCO Ltd ** Tower Painting Invited P O Box 460 Network Surveys Invited Te Awamutu WAIKATO 2400 ATTENTION: CHRIS MUNN

Orion Procedure Authorised Contractors NW73.10.15
Issue Date 17.10.2005 Nw731015.doc Amendment No.5
9
Contractor Type of Work Status Tobins Ltd Tower Painting Invited P O Box 50267 Porirua WELLINGTON 6215 ATTENTION: MIKE TOBIN

Orion Procedure Authorised Contractors NW73.10.15
Issue Date 17.10.2005 Nw731015.doc Amendment No.5
APPENDIX A CONTRACT 200__/_____E
_________________________________________________________________________
LIST OF COMPETENT PERSONS
Competent Position Certification Previous Experience DATE OF LAST INSTRUCTION IN Persons No.
Safe Testing to Basic CPR Orion Working ensure First AHC
Practices safety Aid
Signature of Tenderer: ________________________________ Date: ____________________
THIS MUST BE PROVIDED WITH THE TENDER DOCUMENTS

Orion Procedure Authorised Contractors NW73.10.15
Issue Date 17.10.2005 Nw731015.doc Amendment No.5
APPENDIX B
NOTE: Contractors undertaking connections using live line techniques will be required to have procedures in place ensuring appropriate industry live work procedures are used. Independent Line Services Ltd Where Independent Line Services Ltd has built a low voltage underground cable extension for a customer, Orion will allow the following:
Connection to Orion’s existing LV overhead network by using live line techniques Connection to Orion’s existing LV cable network by using de-energised techniques The operation of any low voltage fuses associated with the new connection
Line Maintenance Services (2004) Ltd Where Line Maintenance Services Ltd has built a low voltage underground cable extension for a customer, Orion will allow the following:
Connection to Orion’s existing LV overhead network by using live line techniques Connection to Orion’s existing LV cable network by using de-energised techniques The operation of any low voltage fuses associated with the new connection
C.T. & Associates Ltd Where C.T. & Associates Ltd has built a low voltage underground cable extension for a customer, Orion will allow the following:
Connection to Orion’s existing LV overhead network by using live line techniques The operation of any low voltage fuses associated with the new connection
John McNeill Electrical Ltd Where John McNeill Electrical Ltd has built a low voltage underground cable extension for a customer, Orion will allow the following:
Connection to Orion’s existing LV overhead network by using live line techniques The operation of any low voltage fuses associated with the new connection
Power Jointing Ltd Where Power Jointing Ltd has built a low voltage overhead line extension for a customer, Orion will allow the following:
Connection to Orion’s existing LV overhead network by using live line techniques The operation of any low voltage fuses associated with the new connection
Telpower (1998) Ltd Where Telpower (1998) Ltd has built a low voltage underground cable extension for a customer, Orion will allow the following:
Connection to Orion’s existing LV overhead network by using live line techniques The operation of any low voltage fuses associated with the new connection

Orion Procedure Authorised Contractors NW73.10.15
Issue Date 17.10.2005 Nw731015.doc Amendment No.5
APPENDIX C
CONTRACTOR ACTIVITY MATRIX
TBA

NETWORK ASSET MANAGEMENT
POST CONTRACT EVALUATION
ELECTRICITY NETWORK PROCEDURE STANDARD
NW73.10.16

Orion NZ Ltd. Procedure Post Contract Evaluation
Issue Date 15.01.2004 Copyright Orion 27/07/2007 Amendment No.1
DDIISSTTRRIIBBUUTTIIOONN RREEGGIISSTTEERR
Copy Issued To
1 Network Information Supervisor 2 Network Asset Manager
AAMMEENNDDMMEENNTT RREECCOORRDD Amendment No. Page Amended Amend Date Date Inserted Inserted by Approved by
1 15.01.04
The above table lists the amended pages in this standard, which have been distributed following the initial issue of this standard. Please insert the amended pages and discard the replaced pages. An update table is issued with each amendment. Check the new pages inserted against the table and fill out the “Date Inserted” and “Inserted By” spaces when inserting the amended pages. Amendments are marked with a vertical line against the left margin.
© Copyright: Orion NZ Ltd. This Document is entitled to the full protection given by the Copyright Act 1994 to the holders of the copyright. Reproduction of any substantial passage from this document is a breach of the copyright. This copyright extends to all forms of photocopying and any storing of material in any kind of information retrieval system. All applications for reproduction in any form should be made to Orion NZ Ltd.

Orion NZ Ltd. Procedure Post Contract Evaluation
Issue Date 15.01.2004 Copyright Orion 27/07/2007 Amendment No.1
POST CONTRACT EVALUATION
Contract 200__/_____ E Factor Definition Assessment 1 2 3 4 5 1. Relevant Experience Demonstrated experience, particularly in
technical areas relevant to the Specification.
2. Track Record Completion of the project to target,
performance levels, on schedule, within budget and safely.
3. Competency and
Technical Competency of personnel with respect to the
technical and legal requirement of the Specification. Including appropriately trained, certificated and experienced persons for the class of work required to be done.
4. Adequacy of Safety Compliance of the Health and Safety
Management Plan in meeting the requirements of the HSE Act, Electricity Act and Electricity Regulations, Resource Management Act, and all other statutory requirements.
5. Quality Assurance Adequacy of procedures and programmes
providing quality control of work processes.
6. Customer Service Level of commitment to the delivery of the
specified Customer Service standards.
7. Management Skills Provision of people and systems appropriate
to the successful management of the project.
1. Excellent 2. Good 3. Adequate 4. Review Procedure 5. Review Contractor Status Comments: Signed: Date:

Procurement policy
Approved by the board 6 June 2012
OR00.00.19

Orion New Zealand Limited Procurement policy
Issue date 06.06.12 OR00.00.19 Amendment no 2 Page 2 of 7
Details of document amendment no. 2
Section amended
Description
No changes.
© Copyright: Orion New Zealand Limited This document is entitled to the full protection given by the Copyright Act 1994 to the holders of the copyright. Reproduction of any substantial passage from this document is a breach of the copyright. This copyright extends to all forms of photocopying and any storing of material in any kind of information retrieval system. All applications for reproduction in any form should be made to Orion New Zealand Limited.

Orion New Zealand Limited Procurement policy
Table of contents
1. Introduction ........................................................................................................................ 4
2. Risk based approach ......................................................................................................... 4
3. Strategic approach ............................................................................................................ 4
4. Framework for network procurement ................................................................................ 5
4.1 Ten year network asset management plan (AMP) ............................................. 5
4.2 Delegations of authority policy – OR00.00.11 .................................................... 6
4.3 Fraud and theft policy – OR00.00.08 .................................................................. 6
4.4 Contract management policy – NW73.00.03 ...................................................... 6
4.5 Authorised contractors procedure – NW73.10.15 ............................................... 6
4.6 Contract tendering procedure – NW73.10.09 ..................................................... 6
4.7 Contract administration procedure – NW73.10.07 .............................................. 6
4.8 Request for pricing procedure – NW73.10.10 .................................................... 6
4.9 Contract responsibilities procedure – NW73.10.08 ............................................ 6
4.10 Standard contract document policy – NW73.00.01 ............................................ 6
4.11 Standard contract procedure – NW73.00.02 ...................................................... 6
4.12 Evaluation of tenders policy – NW73.10.13 ........................................................ 7
5. Non-network procurement ................................................................................................. 7
6. Conclusion ......................................................................................................................... 7
Issue date 06.06.12 OR00.00.19 Amendment no 2 Page 3 of 7

Orion New Zealand Limited Procurement policy
1. Introduction
The objective of this policy is to ensure the following good practice principles are incorporated in all purchasing/procurement decisions made by Orion employees:
• to reflect the accountability of managers to the board, and of the board to shareholders
• to ensure best value for money
• to encourage and maintain effective and sustainable competitive markets among our suppliers
• to ensure lawfulness, fairness and integrity at all times
2. Risk based approach
We seek to prioritise control over purchasing decisions made by employees where higher financial values are involved and/or where outcomes are less certain.
We mitigate risk through our policies, procedures and practices which provide guidelines for employees around procurement and by developing long term contractual relationships with key suppliers.
3. Strategic approach
Our strategic approach to procurement is described as follows. We will seek:
• to procure only when it is in the best interests of Orion to do so
• to procure goods and services which are fit for purpose after taking into account whether Orion’s objectives can be better achieved in another manner, or deferred to a later time.
• best value for money over whole-of-life, including taking into account costs, benefits and risks of procurement as well as ongoing maintenance and other committed or potential costs to Orion which are a consequence of the procurement
• to effectively mitigate and/or manage potential liability and other risks created via procurement
• to manage our procurement with competent employees and expert advisors, and appropriate policies and procedures
• to encourage open, effective and sustainable competition between eligible suppliers
• to keep adequate records of our procurement, policies, procedures and decisions that facilitate audit and normal processes of accountability
• to comply with all applicable legal and contractual obligations
• to effectively manage all intellectual property rights and obligations created via procurement
• to effectively mitigate and/or manage any potential conflicts of interest in an open and acceptable manner
Issue date 06.06.12 OR00.00.19 Amendment no 2 Page 4 of 7

Orion New Zealand Limited Procurement policy
• to comply with any confidentiality obligations arising from the procurement process
• to have fair and transparent procurement processes that are free from fraud and impropriety
• to have procurement policies and processes that are sustainable from economic, social and environmental perspectives, as outlined in Orion’s environmental sustainability policy OR00.00.03
• to consistently innovate and improve on our procurement activities
As described in section 2 above and section 4 below:
• we adopt a risk based approach to our key procurement decisions
• our key procurement decisions largely relate to our management of our electricity distribution network, which accounts for over 80% of our cash expenditure (opex and capex).
Our key procurement document is therefore considered to be our ten year network asset management plan (AMP). Our AMP sets out our demand growth assumptions, our key network risks and our proposed spending priorities. Our spending in any year should be consistent with the current approved version of that plan. Exceptions to this plan occur, for example, when demand growth assumptions change, new information comes to light relating to key AMP assumptions or emergencies occur.
In all cases, we aim to invest in our network using a risk based approach (prioritised via a combination of likelihood and consequence) using good industry practice. The higher the overall risk, the greater the management focus.
Our AMP is a public document and we welcome comment from all of our stakeholders (including customers and suppliers) on any improvements that will enhance our AMP and procurement outcomes.
4. Framework for network procurement We use a number of key policies and procedures to provide guidelines to employees for
procurement.
With the exception of our Delegation of Authority policy, the other documents listed below are predominantly used in the Infrastructure group for network maintenance and development.
These documents control over 80% of cash expenditure per annum (excluding transmission charges and salaries/wages).
5. Ten year network asset management plan (AMP)
Our AMP outlines our forecasts for customer demand, our service standards, our key risks and our proposed procurement priorities for the next ten years. This plan is updated and is approved by the board before the start of each new financial year. Our AMP is published on our website and is open for public comment.
Issue date 06.06.12 OR00.00.19 Amendment no 2 Page 5 of 7

Orion New Zealand Limited Procurement policy
5.1 Delegations of authority policy – OR00.00.11
This policy outlines our general expenditure and approval rules for Orion.
5.2 Fraud and theft policy – OR00.00.08
This policy sets out our intention that all individuals associated with Orion will act with honesty, integrity and opposition to all forms of fraud and theft.
5.3 Contract management policy – NW73.00.03
This policy outlines our intentions to develop, promote and retain a group of competent contractors with due regard to long term network security and quality of the work performed.
5.4 Authorised contractors procedure – NW73.10.15
This procedure identifies the contractors which are approved to work on our network and outlines the method for selecting tenderers for procurement.
5.5 Contract tendering procedure – NW73.10.09
This procedure outlines our process for the basic preparation of the contract documents, the calling and closing of tenders and the evaluation of tenders through to accepting and notifying tenderers.
5.6 Contract administration procedure – NW73.10.07
This procedure outlines our minimum contract administration timeframes to allow for the processing of a contract through tendering to the possession of the work site by the successful contractor.
5.7 Request for pricing procedure – NW73.10.10
This procedure contains a form that employees who request works fill in and provide to the contract administration team to start preparation of the contract documents and the initiation of the tendering process.
5.8 Contract responsibilities procedure – NW73.10.08
This procedure identifies the relevant timeframes, functions and responsibilities of employees when requesting works to be priced and constructed.
5.9 Standard contract document policy – NW73.00.01
This policy details the responsibilities of employees around the preparation and creation of a standard contract based around NZS3910:2003. It also details the main technical specifications relevant for any contract.
5.10 Standard contract procedure – NW73.00.02
This procedure indicates a basic flow chart process around a standard contract.
Issue date 06.06.12 OR00.00.19 Amendment no 2 Page 6 of 7

Orion New Zealand Limited Procurement policy
Issue date 06.06.12 OR00.00.19 Amendment no 2 Page 7 of 7
5.11 Evaluation of tenders policy – NW73.10.13
This policy outlines the method used to assess/evaluate tenders and predominantly endorses the lowest conforming tender method.
6. Non-network procurement
Non-network procurement is wholly subject to our Delegations of Authority policy.
In particular, contracts for large value purchases are provided by the detailed schedule (Appendix 1 – specific spending authorities) within the policy.
Some items of significant expenditure are not subject to standard procurement policy rules - for example, rates and industry levies can be checked against the levy rate schedules and are not able to be negotiated.
Purchases for amounts in excess of $50,000 will be made on an official Orion purchase order.
Purchases for amounts between $20,000 and $50,000 are to be made in writing.
7. Conclusion
We have a range of policies and procedures to help achieve the best overall procurement outcomes for Orion. This policy will be reviewed annually and approved by the board.

Appendix 33 Rider Levett Bucknall estimates

DIRECTORS: MJ Timms. NR Robb. NJ O’Donnell. www.rlb.com
Rider Levett Bucknall Christchurch Ltd PO Box 461, Christchurch 8140 Unit 18a – Cavendish Business Park 150 Cavendish Road, Redwood Christchurch 8051, New Zealand
Tel: +64 3 3546873 Fax: +64 3 3546874 Email: [email protected]
29 October 2012 Orion New Zealand Ltd PO Box 13896 CHRISTCHURCH Attention: Mr David Freeman-Greene Dear Sir ESCALATION COSTS FOR CANTERBURY CONSTRUCTION WORKS Further to our recent discussion regarding likely escalation costs in Canterbury over the next 3-7 years. As discussed we do not get to see a lot of Civil projects but we can comment on what we are seeing in Commercial Construction and this may be reflected through the civils costs as no doubt resources will continue to be stretched in both sectors. At present commercial construction costs still remain fairly competitive especially at the main contractor level with many contractor’s still looking to secure work over the next 12 months. It doesn’t appear likely that any of the major anchor projects will really get underway until late 2013 at the earliest. However we have seen some movement in pricing amongst a few sub trades were work is available. Precast Concrete and Steelwork costs have increased over the past few months as demand increases. Labour costs have remained fairly static over the past 18 months and we wouldn’t expect them to increase over the next period and not come under pressure until the construction work really takes off. This is probably slightly different in the Civils area as this work is well underway in many areas. This being the case Im sure there will continue to be increases in the cost of labour for civils works. As no doubt you are aware the difficult thing is predicting what will happen when the workload increases and resources come under pressure. NZIER are forecasting Non Residential Building Cost increases (on a national average) of approx. 2013 (3.3%), 2014 (4.2%), 2015 (4.2%). We have been using at present in our estimates 5% per annum increase for each year moving forward up to 2017. We haven’t looked at anything beyond that date at present but would suggest that we would still be using the 5% figure until such time as we start to see things moving and get more accurate figures based on the actual movements in cost. In theory material costs shouldn’t increase outside of normal annual increases and it will be labour costs that are likely to drive the costs up as resources become harder to obtain. We are also likely to see main contractor costs increase as their direct management labour becomes more expensive to retain and they are likely to increase their margins as more work becomes available. Should you require any further information please contact us. Yours faithfully
Malcolm Timms Director Rider Levett Bucknall

Appendix 34 Davis Langdon estimates


Appendix 35 Ian Harrison and Associates estimates

IAN HARRISON and ASSOCIATES LTD CONSULTING QUANTITY SURVEYORS
100 Victoria Street, Christchurch 8144, P.O. Box 21-393, New Zealand Tel (03) 366-5881or (03) 366-7375, Fax (03) 379-6866
2010. Celebrating 40 years Quantity Surveying
Directors: Ian Harrison Life Member NZIQS, FNZIM, Reg. QS, Past President NZIQS Grant Moore ANZIQS, MNZIOB Stewart Harrison MNZIQS, Reg. QS
6th November 2012
David Freeman-Greene General Manager Commercial Orion Group
Orion Contracts Christchurch - 6 Year Forecast of Likely Cost Escalations
INTRODUCTION
Following the Earthquake Damage in Christchurch the various sectors in the
Construction Industry are faced with an increased workload in the widely publicised
Rebuild.
As Orion contracts would be affected by any abnormal cost escalations that result
from this, we have been requested to state an opinion on Labour Costs Escalations
to 2019, and in response we report on Construction Cost Escalations which are
primarily influenced by labour costs, and as manufactured materials also contain a
labour content we consider the Construction Cost Escalations are a reliable guide
for labour cost increases. The Rebuild workload of increased activity is directly
labour related.
THE CONSTRUCTION MARKET
This comprises a series of Market Sectors, some inter-related, but workloads can and
will vary between sectors. Having been involved with Orion on many Insurance
Claims for buildings and infrastructure, we envisage a large percentage of Orion’s
future workload being in the Civil Construction sector, and this has sub-sectors
related to various essential services involved.
Buildings for Orion would be in the Commercial Building sector, and most 11kV
substations are of restricted size and value, but district substations with 66kV inputs
are far more complex.
We do not envisage Orion having any direct involvement in the Residential Housing
market, other than supply of services via the Civil Construction sector.
THE CIVIL CONSTRUCTION SECTOR
There is no doubt activity in this sector is high and will increase due to damages to
essential services. SCIRT has been formed to organise and complete a wide range of
repairs and replacements to water supply, sewers and stormwater mains, and this is
presently only 12% complete and projected to continue to at least 2006, excluding
roading repairs.
Roading repairs are a very large activity, forecast to take 7 years to complete.

Page 2
IAN HARRISON and ASSOCIATES LTD
2010. Celebrating 40 years Quantity Surveying
The conclusion is this sector will have very high workloads for several years, and in
our opinion will draw on extra resources not currently available.
While presently Commercial Buildings are at a modest level we suspect some labour
resources from this have already transferred to the Civil sector for better pay rates
etc.
In summary this is the sector most under resourced, but is capable of increasing
outputs with external sourcing of machinery and operators – this is exactly what is
taking place. Costs increase as a direct result of excessive demand.
THE COMMERCIAL CONSTRUCTION SECTOR
Here we have a real challenge. Previous forecasts of increased activity have not
materialised – a quick tour of the CBD demonstrates demolition is still underway with
more to complete 2 years on. We understand there are delays in Insurance
settlements, and complexity in these, which has held back the expected rebuild.
Earlier forecasts did not appear to anticipate these factors. Our office has been
heavily involved in Insurance claims in this sector, and settlements are slow due to
oversees Re-insurers requiring details and costs, and Owners considering options
including cash out.
It is still not clear how commercial returns will be achieved as higher construction
costs suggest higher rentals, yet displacement of offices after Feb 2011 occurred
rapidly to suburban locations ( by necessity) – will this demand return or stay
suburban at lower construction costs and lower rentals ?
Activity forecast at $4B has to be viewed over a specific timeframe, and if say 10
years this would equate to $400M per year which is within present capacity. If the
timeframe shortens cost will then escalate further, this possibly lowering returns.
The outcome of this sector remains somewhat uncertain on timings, dependant on
activity levels which if these ramp up noticeably will place pressure on labour
resources.
THE RESIDENTIAL CONSTRUCTION SECTOR
This is clearly documented as being short of housing stock due to earthquake
damage – 7,860 houses are Red Zone, with considerably more with major damage.
In the last 2 years the CCC has issued $636M of earthquake related consents for
both residential and commercial properties. This acknowledges considerable non
consent repairs ( mainly residential) have also taken place. New houses total 616 in
the last 2 years to Sept 2012, this being well short of the number of condemned Red
Zone houses. Insurer IAG announced 5th Nov it would have 100 new homes
completed by Xmas and 500 total by June 2013, as well as 450 major repairs
completed. There were reservations expressed about these targets, but if achieved
they remain low percentages of the total demand.
This sector is under pricing pressures from high land and construction costs, and
compared to the foregone value of a depreciated Red Zone house, the difference
in cost is requiring Owners funds (cash or more likely mortgage). This may explain
slow rebuild figures – affordability.

Page 3
IAN HARRISON and ASSOCIATES LTD
2010. Celebrating 40 years Quantity Surveying
In summary new house construction is to increase and repairs are possibly 4 years
from completion – both these suggest increased activity spread over time.
FORECAST OF LIKELY COST ESCALATIONS – Labour and Materials to 2019
CIVIL SECTOR - clearly under the most pressure for resources – 20% to 25% inflation
over the next 2 years, then averaging 7% to 8% per annum ( double the normal rate)
COMMERCIAL CONSTRUCTION SECTOR - some movement due very soon – 15%
inflation over the next 2 years, then averaging 6% to 7% per annum.
RESIDENTIAL CONSTRUCTION SECTOR- a 10% increase has just occurred with
another rise likely to be 15% total over 2 years, then levelling out to 4% to 5% per
annum.
QUALIFICATIONS
The above is reliant on anticipated activity for the Earthquake Rebuild. The
timeframes for Civil are already established, whereas Commercial will be subject to
investment decisions, and Residential to affordability. Any overseas financial crises
affects our economy and inflation, as imported material content, and will alter our
forecasts.
While the initial request was for labour cost increases we believe the current general
sector costs escalations will focus on and represent higher demand for labour,
hence labour costs will rise as the most inflationary factor in construction costs. The
linkage between skills and productivity drives labour costs higher for contractors
requiring and competing for these attributes. Management costs also rise due to
shortages in professionals required, and contractors in some cases are arranging
worker accommodation (at a cost). These are ‘bundled’ into general construction
costs, labelled escalations but in this instance represent labour cost increases.
We offer the above Forecasts in good faith but with no guarantee as the variables
present can alter our present assumptions.
We trust this is of assistance to Orion NZ Ltd in assessment of labour cost increases.
Brian Le Fevre for Ian Harrison and Associates
Email [email protected]