Appendices - CAG
58
Appendices
-
Upload
khangminh22 -
Category
Documents
-
view
0 -
download
0
Transcript of Appendices - CAG
Appendices

115
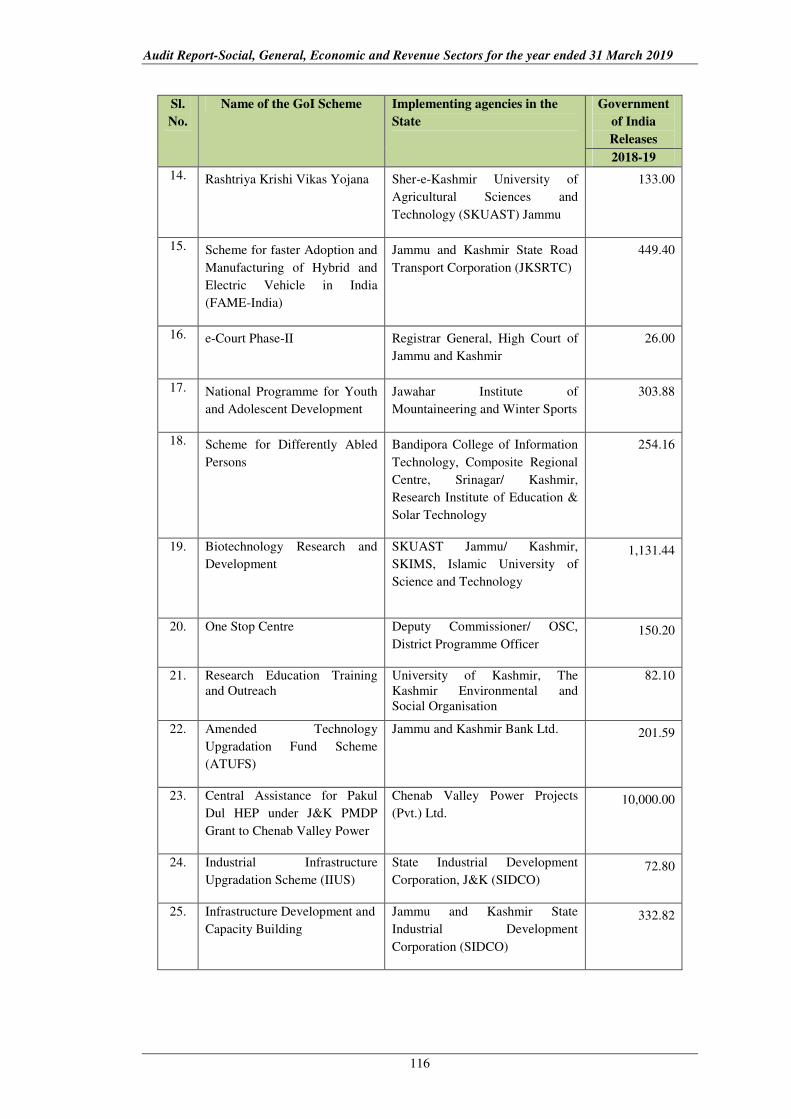
Appendix 1.1.1
(Refer Paragraph: 1.4; Page: 2)
Statement showing the funds transferred directly to the various State
Implementing Agencies under Programmes/ Schemes outside the State
budget during 2018-19
(`̀̀̀ in lakh)
Sl.
No.
Name of the GoI Scheme Implementing agencies in the
State
Government
of India
Releases
2018-19
1. Member of Parliament Local
Area Development Scheme
(MPLADS)
District Deputy Commissioners 4,000.00
2. Buddhist and Tibetian
Institutions and Memorials
Institute of Buddhist Studies 2,567.08
3. Assistance of IHMS/ FCIS/
IITTM/ NIWS, etc.
Institute and Hotel Management
and Catering Technology
659.05
4. Solar Power -Off grid Ladakh Renewable Energy
Development Agency
1,482.39
5. Scheme for Prevention of
Alcoholism and Substance
(Drugs) Abuse
Council for Rehabilitation of
Widows, Orphans, Handicapped
and Old Persons (Victims of
Militancy)
20.04
6. Assistance to Voluntary
Organisations for providing
Social Defence Services
Council for Rehabilitation of
Widows, Orphans, Handicapped
and Old Persons
300.00
7. Atal Innovation Mission (AIM)
including Self Employment and
Talent Utilization (SETU)
Various Higher Secondary
Schools
252.00
8. Electronic Governance Jammu and Kashmir
e-Governance (JKeGA)
379.00
9. Support to National Institute of
Technology (NIT)
National Institute of Technology,
Srinagar
19,159.00
10. National Mission on Teachers
and Training
Shri Mata Vaishno Devi
University (SMVDU) 269.00
11. National Programme for Diary
Development
J&K Milk Producers Co-operative
Limited
1,539.35
12. Pradhan Mantri Kisan Samman
Nidhi
Department of Agriculture
Production
9,147.70
13. Pradhan Mantri Sampada
Yojana
Khyber Agro Farms (P) Ltd. 150.07
Audit Report-Social, General, Economic and Revenue Sectors for the year ended 31 March 2019
116
Sl.
No.
Name of the GoI Scheme Implementing agencies in the
State
Government
of India
Releases
2018-19
14. Rashtriya Krishi Vikas Yojana Sher-e-Kashmir University of
Agricultural Sciences and
Technology (SKUAST) Jammu
133.00
15. Scheme for faster Adoption and
Manufacturing of Hybrid and
Electric Vehicle in India
(FAME-India)
Jammu and Kashmir State Road
Transport Corporation (JKSRTC)
449.40
16. e-Court Phase-II Registrar General, High Court of
Jammu and Kashmir
26.00
17. National Programme for Youth
and Adolescent Development
Jawahar Institute of
Mountaineering and Winter Sports
303.88
18. Scheme for Differently Abled
Persons
Bandipora College of Information
Technology, Composite Regional
Centre, Srinagar/ Kashmir,
Research Institute of Education &
Solar Technology
254.16
19. Biotechnology Research and
Development
SKUAST Jammu/ Kashmir,
SKIMS, Islamic University of
Science and Technology
1,131.44
20. One Stop Centre Deputy Commissioner/ OSC,
District Programme Officer 150.20
21. Research Education Training
and Outreach
University of Kashmir, The
Kashmir Environmental and
Social Organisation
82.10
22. Amended Technology
Upgradation Fund Scheme
(ATUFS)
Jammu and Kashmir Bank Ltd. 201.59
23. Central Assistance for Pakul
Dul HEP under J&K PMDP
Grant to Chenab Valley Power
Chenab Valley Power Projects
(Pvt.) Ltd. 10,000.00
24. Industrial Infrastructure
Upgradation Scheme (IIUS)
State Industrial Development
Corporation, J&K (SIDCO) 72.80
25. Infrastructure Development and
Capacity Building
Jammu and Kashmir State
Industrial Development
Corporation (SIDCO)
332.82
Appendices
117
Sl.
No.
Name of the GoI Scheme Implementing agencies in the
State
Government
of India
Releases
2018-19
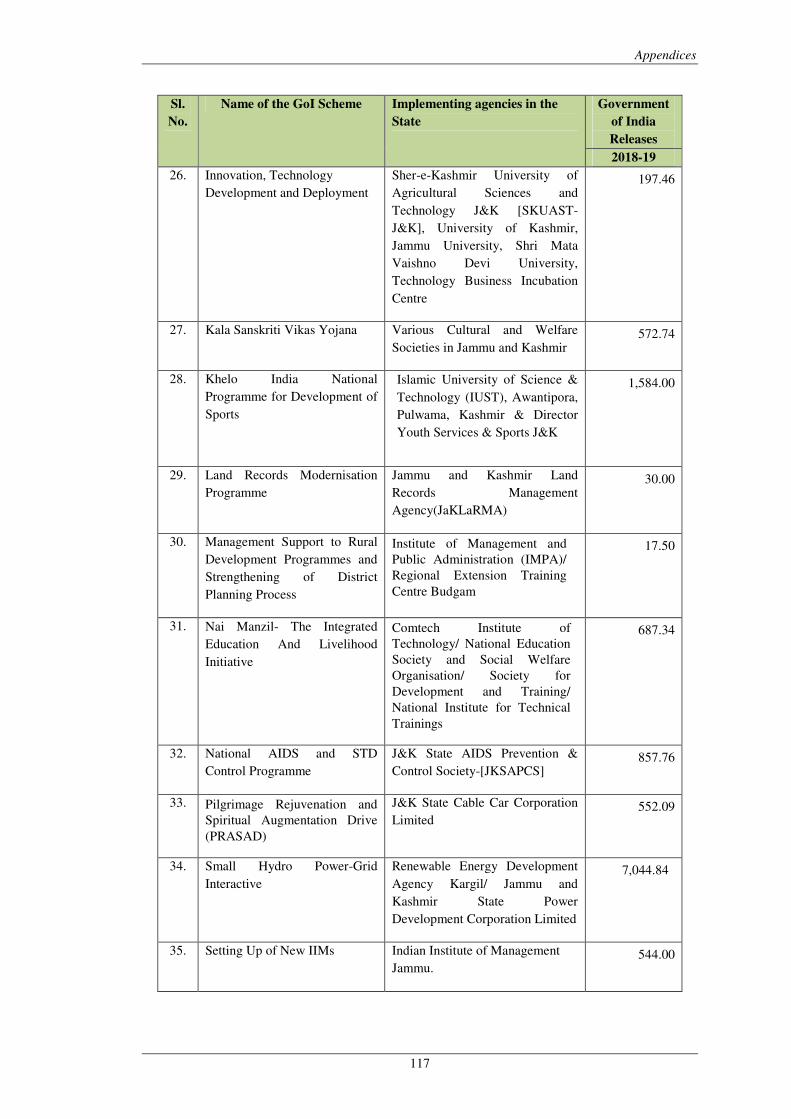
26. Innovation, Technology
Development and Deployment
Sher-e-Kashmir University of
Agricultural Sciences and
Technology J&K [SKUAST-
J&K], University of Kashmir,
Jammu University, Shri Mata
Vaishno Devi University,
Technology Business Incubation
Centre
197.46
27. Kala Sanskriti Vikas Yojana Various Cultural and Welfare
Societies in Jammu and Kashmir 572.74
28. Khelo India National
Programme for Development of
Sports
Islamic University of Science &
Technology (IUST), Awantipora,
Pulwama, Kashmir & Director
Youth Services & Sports J&K
1,584.00
29. Land Records Modernisation
Programme
Jammu and Kashmir Land
Records Management
Agency(JaKLaRMA)
30.00
30. Management Support to Rural
Development Programmes and
Strengthening of District
Planning Process
Institute of Management and
Public Administration (IMPA)/
Regional Extension Training
Centre Budgam
17.50
31. Nai Manzil- The Integrated
Education And Livelihood
Initiative
Comtech Institute of
Technology/ National Education
Society and Social Welfare
Organisation/ Society for
Development and Training/
National Institute for Technical
Trainings
687.34
32. National AIDS and STD
Control Programme
J&K State AIDS Prevention &
Control Society-[JKSAPCS] 857.76
33. Pilgrimage Rejuvenation and
Spiritual Augmentation Drive
(PRASAD)
J&K State Cable Car Corporation
Limited 552.09
34. Small Hydro Power-Grid
Interactive
Renewable Energy Development
Agency Kargil/ Jammu and
Kashmir State Power
Development Corporation Limited
7,044.84
35. Setting Up of New IIMs Indian Institute of Management
Jammu. 544.00
Audit Report-Social, General, Economic and Revenue Sectors for the year ended 31 March 2019
118
Sl.
No.
Name of the GoI Scheme Implementing agencies in the
State
Government
of India
Releases
2018-19
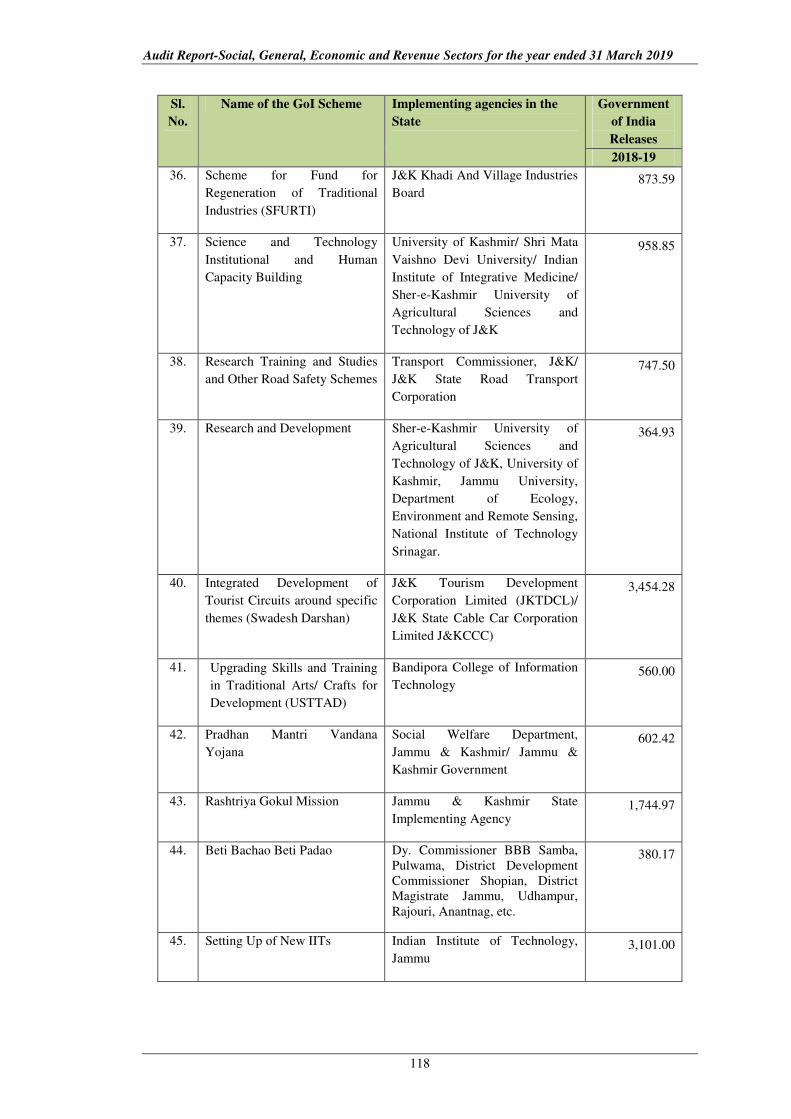
36. Scheme for Fund for
Regeneration of Traditional
Industries (SFURTI)
J&K Khadi And Village Industries
Board 873.59
37. Science and Technology
Institutional and Human
Capacity Building
University of Kashmir/ Shri Mata
Vaishno Devi University/ Indian
Institute of Integrative Medicine/
Sher-e-Kashmir University of
Agricultural Sciences and
Technology of J&K
958.85
38. Research Training and Studies
and Other Road Safety Schemes
Transport Commissioner, J&K/
J&K State Road Transport
Corporation
747.50
39. Research and Development Sher-e-Kashmir University of
Agricultural Sciences and
Technology of J&K, University of
Kashmir, Jammu University,
Department of Ecology,
Environment and Remote Sensing,
National Institute of Technology
Srinagar.
364.93
40. Integrated Development of
Tourist Circuits around specific
themes (Swadesh Darshan)
J&K Tourism Development
Corporation Limited (JKTDCL)/
J&K State Cable Car Corporation
Limited J&KCCC)
3,454.28
41. Upgrading Skills and Training
in Traditional Arts/ Crafts for
Development (USTTAD)
Bandipora College of Information
Technology 560.00
42. Pradhan Mantri Vandana
Yojana
Social Welfare Department,
Jammu & Kashmir/ Jammu &
Kashmir Government
602.42
43. Rashtriya Gokul Mission Jammu & Kashmir State
Implementing Agency 1,744.97
44. Beti Bachao Beti Padao Dy. Commissioner BBB Samba,
Pulwama, District Development
Commissioner Shopian, District
Magistrate Jammu, Udhampur,
Rajouri, Anantnag, etc.
380.17
45. Setting Up of New IITs Indian Institute of Technology,
Jammu 3,101.00
Appendices
119
Sl.
No.
Name of the GoI Scheme Implementing agencies in the
State
Government
of India
Releases
2018-19
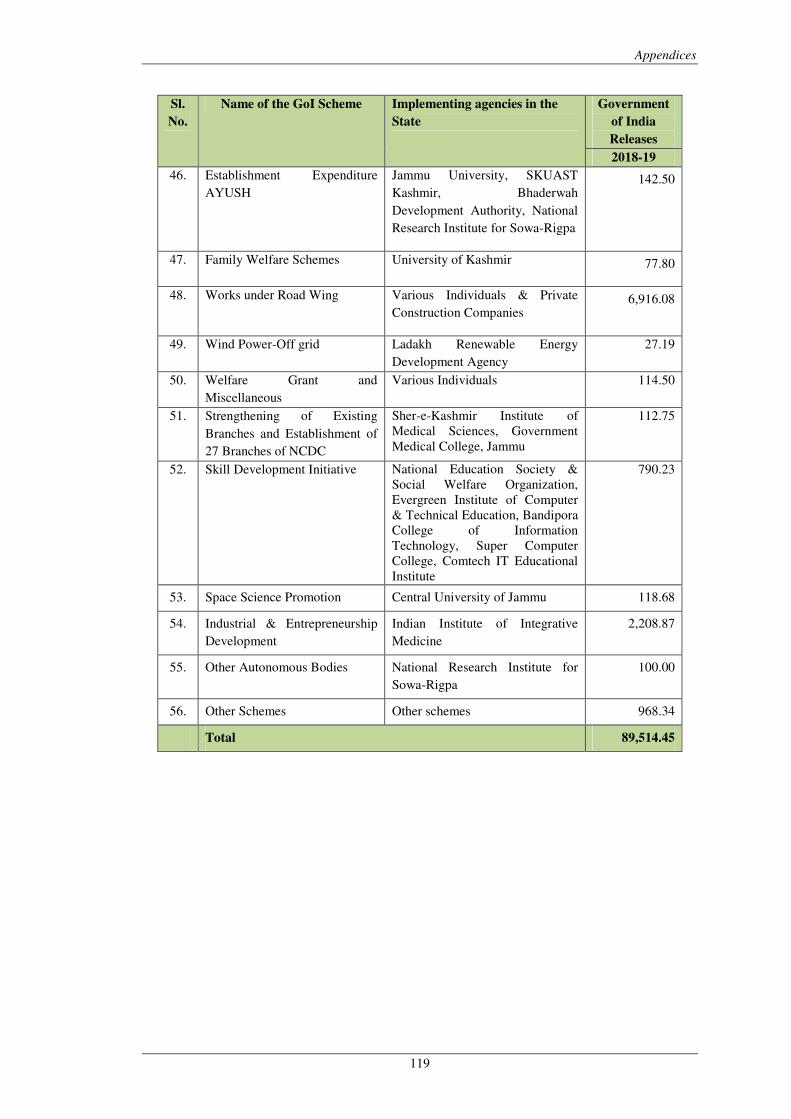
46. Establishment Expenditure
AYUSH
Jammu University, SKUAST
Kashmir, Bhaderwah
Development Authority, National
Research Institute for Sowa-Rigpa
142.50
47. Family Welfare Schemes University of Kashmir 77.80
48. Works under Road Wing Various Individuals & Private
Construction Companies 6,916.08
49. Wind Power-Off grid Ladakh Renewable Energy
Development Agency
27.19
50. Welfare Grant and
Miscellaneous
Various Individuals 114.50
51. Strengthening of Existing
Branches and Establishment of
27 Branches of NCDC
Sher-e-Kashmir Institute of
Medical Sciences, Government
Medical College, Jammu
112.75
52. Skill Development Initiative National Education Society &
Social Welfare Organization,
Evergreen Institute of Computer
& Technical Education, Bandipora
College of Information
Technology, Super Computer
College, Comtech IT Educational
Institute
790.23
53. Space Science Promotion Central University of Jammu 118.68
54. Industrial & Entrepreneurship
Development
Indian Institute of Integrative
Medicine
2,208.87
55. Other Autonomous Bodies National Research Institute for
Sowa-Rigpa
100.00
56. Other Schemes Other schemes 968.34
Total 89,514.45
Audit Report-Social, General, Economic and Revenue Sectors for the year ended 31 March 2019
120
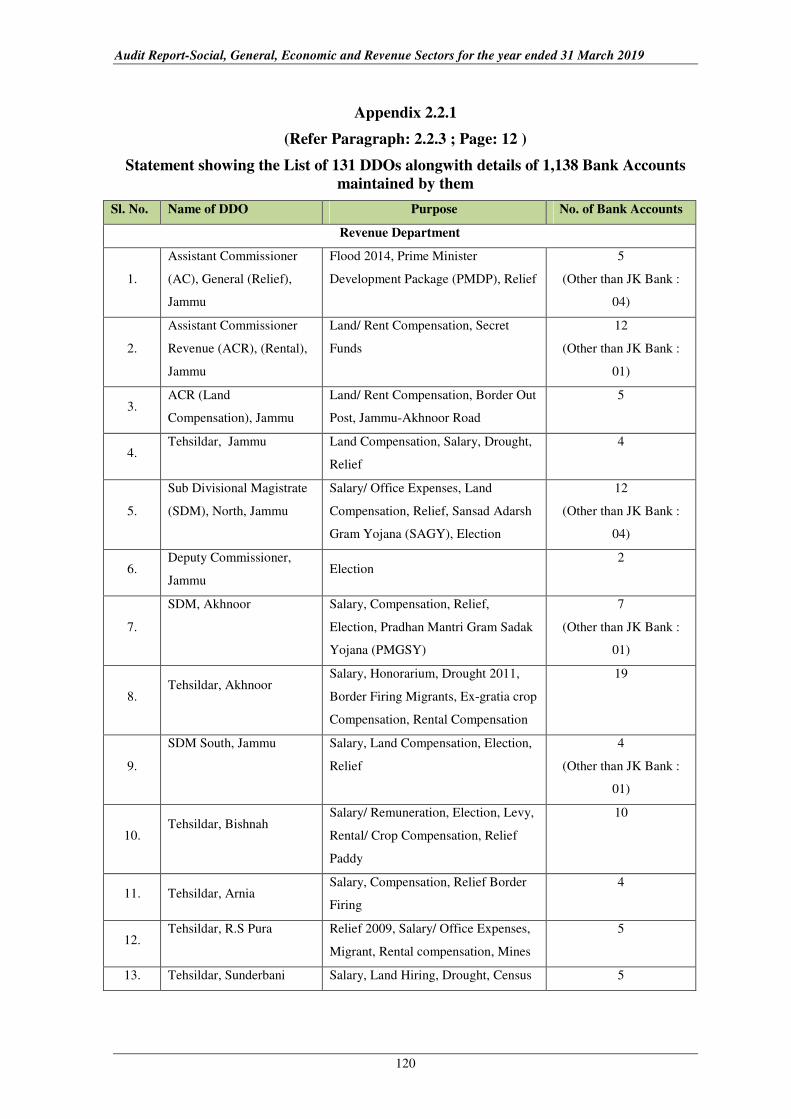
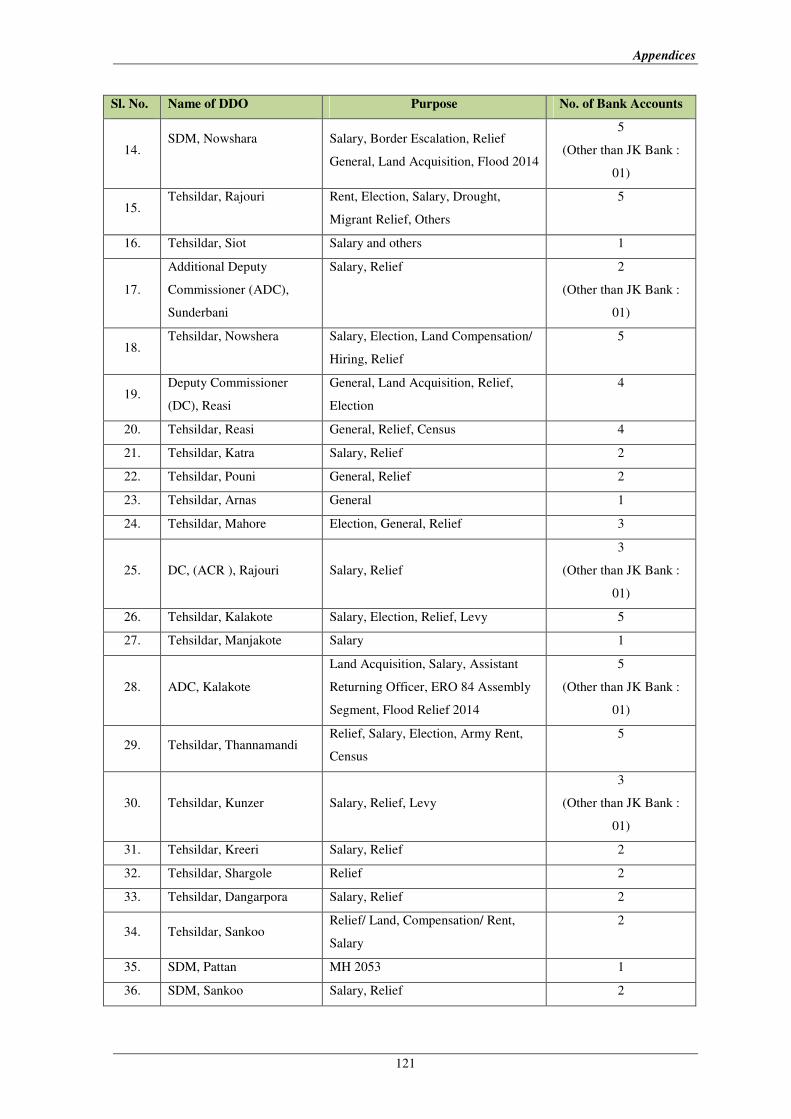
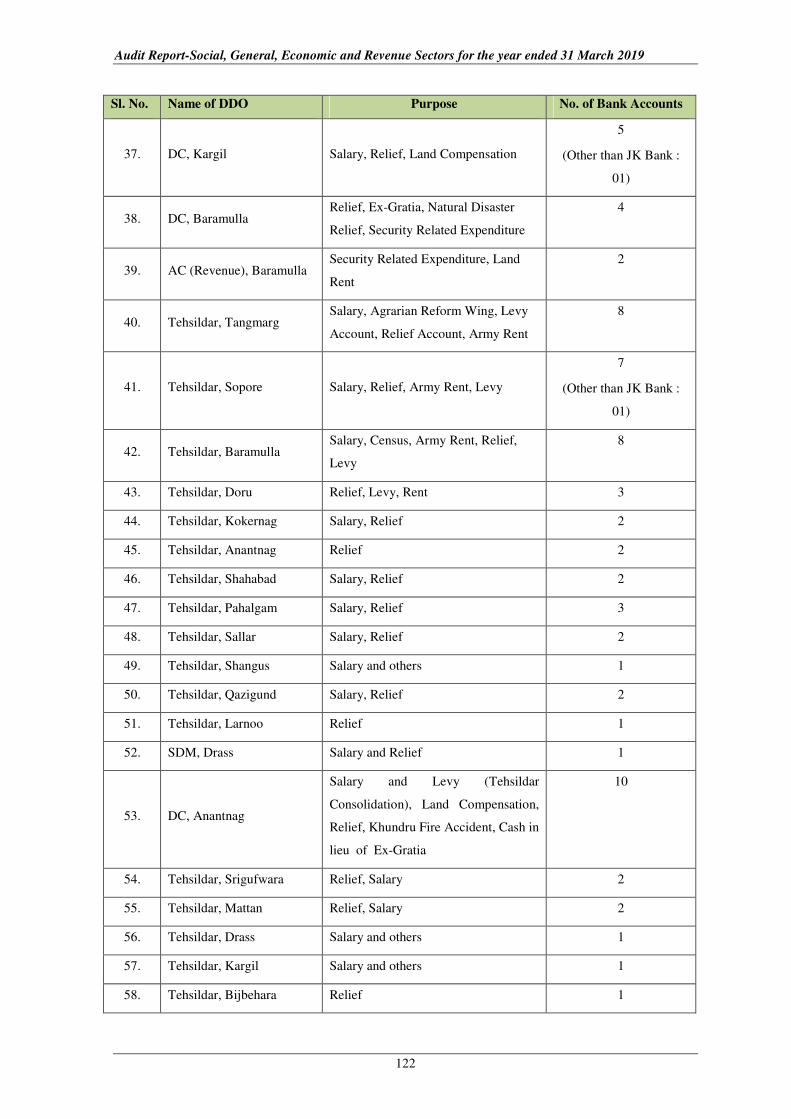
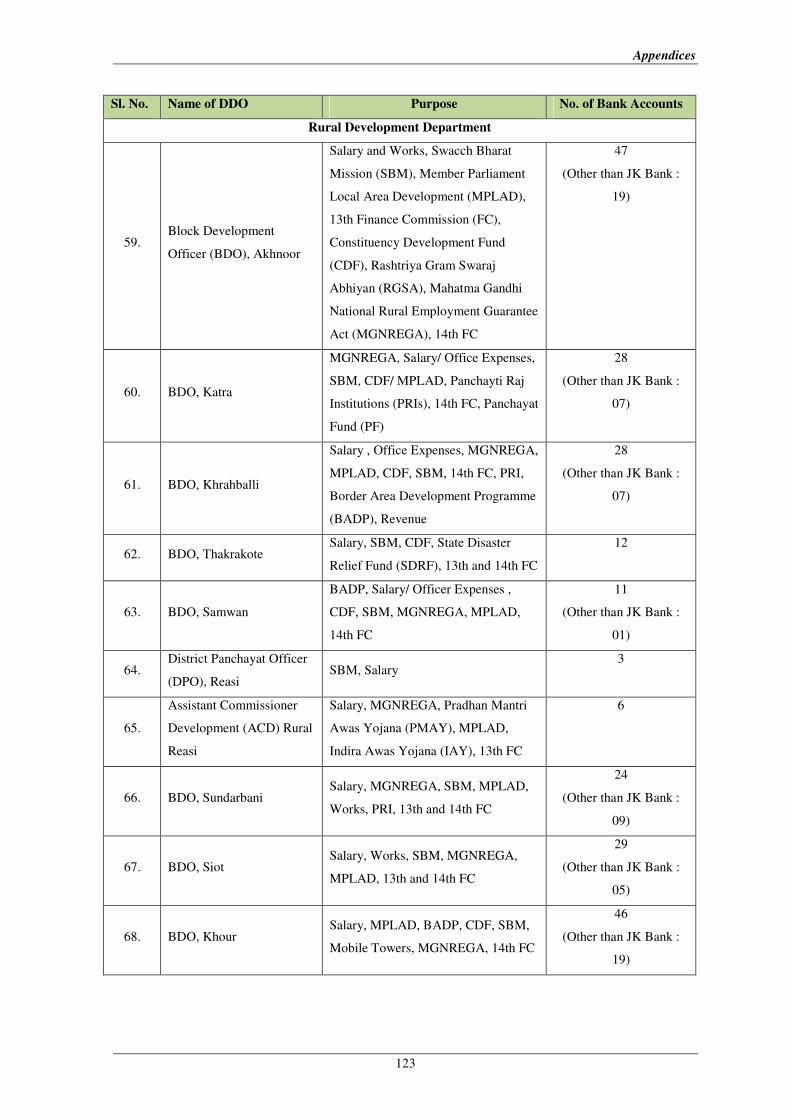
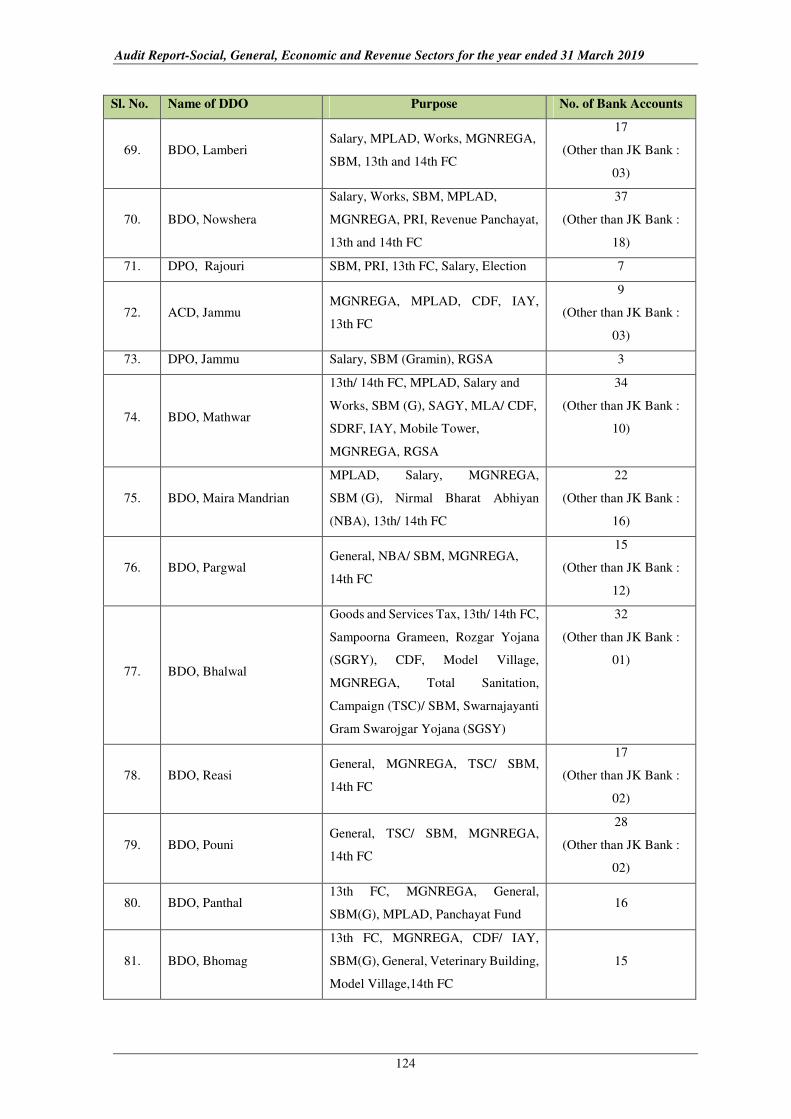
Appendix 2.2.1
(Refer Paragraph: 2.2.3 ; Page: 12 )
Statement showing the List of 131 DDOs alongwith details of 1,138 Bank Accounts
maintained by them
Sl. No. Name of DDO Purpose No. of Bank Accounts
Revenue Department
1.
Assistant Commissioner
(AC), General (Relief),
Jammu
Flood 2014, Prime Minister
Development Package (PMDP), Relief
5
(Other than JK Bank :
04)
2.
Assistant Commissioner
Revenue (ACR), (Rental),
Jammu
Land/ Rent Compensation, Secret
Funds
12
(Other than JK Bank :
01)
3. ACR (Land
Compensation), Jammu
Land/ Rent Compensation, Border Out
Post, Jammu-Akhnoor Road
5
4. Tehsildar, Jammu
Land Compensation, Salary, Drought,
Relief
4
5.
Sub Divisional Magistrate
(SDM), North, Jammu
Salary/ Office Expenses, Land
Compensation, Relief, Sansad Adarsh
Gram Yojana (SAGY), Election
12
(Other than JK Bank :
04)
6. Deputy Commissioner,
Jammu Election
2
7.
SDM, Akhnoor
Salary, Compensation, Relief,
Election, Pradhan Mantri Gram Sadak
Yojana (PMGSY)
7
(Other than JK Bank :
01)
8. Tehsildar, Akhnoor
Salary, Honorarium, Drought 2011,
Border Firing Migrants, Ex-gratia crop
Compensation, Rental Compensation
19
9.
SDM South, Jammu
Salary, Land Compensation, Election,
Relief
4
(Other than JK Bank :
01)
10. Tehsildar, Bishnah
Salary/ Remuneration, Election, Levy,
Rental/ Crop Compensation, Relief
Paddy
10
11. Tehsildar, Arnia Salary, Compensation, Relief Border
Firing
4
12. Tehsildar, R.S Pura
Relief 2009, Salary/ Office Expenses,
Migrant, Rental compensation, Mines
5
13. Tehsildar, Sunderbani Salary, Land Hiring, Drought, Census 5
Appendices
121
Sl. No. Name of DDO Purpose No. of Bank Accounts
14. SDM, Nowshara
Salary, Border Escalation, Relief
General, Land Acquisition, Flood 2014
5
(Other than JK Bank :
01)
15. Tehsildar, Rajouri
Rent, Election, Salary, Drought,
Migrant Relief, Others
5
16. Tehsildar, Siot Salary and others 1
17.
Additional Deputy
Commissioner (ADC),
Sunderbani
Salary, Relief
2
(Other than JK Bank :
01)
18. Tehsildar, Nowshera
Salary, Election, Land Compensation/
Hiring, Relief
5
19. Deputy Commissioner
(DC), Reasi
General, Land Acquisition, Relief,
Election
4
20. Tehsildar, Reasi General, Relief, Census 4
21. Tehsildar, Katra Salary, Relief 2
22. Tehsildar, Pouni General, Relief 2
23. Tehsildar, Arnas General 1
24. Tehsildar, Mahore Election, General, Relief 3
25. DC, (ACR ), Rajouri Salary, Relief
3
(Other than JK Bank :
01)
26. Tehsildar, Kalakote Salary, Election, Relief, Levy 5
27. Tehsildar, Manjakote Salary 1
28. ADC, Kalakote
Land Acquisition, Salary, Assistant
Returning Officer, ERO 84 Assembly
Segment, Flood Relief 2014
5
(Other than JK Bank :
01)
29. Tehsildar, Thannamandi Relief, Salary, Election, Army Rent,
Census
5
30. Tehsildar, Kunzer Salary, Relief, Levy
3
(Other than JK Bank :
01)
31. Tehsildar, Kreeri Salary, Relief 2
32. Tehsildar, Shargole Relief 2
33. Tehsildar, Dangarpora Salary, Relief 2
34. Tehsildar, Sankoo Relief/ Land, Compensation/ Rent,
Salary
2
35. SDM, Pattan MH 2053 1
36. SDM, Sankoo Salary, Relief 2
Audit Report-Social, General, Economic and Revenue Sectors for the year ended 31 March 2019
122
Sl. No. Name of DDO Purpose No. of Bank Accounts
37. DC, Kargil Salary, Relief, Land Compensation
5
(Other than JK Bank :
01)
38. DC, Baramulla Relief, Ex-Gratia, Natural Disaster
Relief, Security Related Expenditure
4
39. AC (Revenue), Baramulla Security Related Expenditure, Land
Rent
2
40. Tehsildar, Tangmarg Salary, Agrarian Reform Wing, Levy
Account, Relief Account, Army Rent
8
41. Tehsildar, Sopore Salary, Relief, Army Rent, Levy
7
(Other than JK Bank :
01)
42. Tehsildar, Baramulla Salary, Census, Army Rent, Relief,
Levy
8
43. Tehsildar, Doru Relief, Levy, Rent 3
44. Tehsildar, Kokernag Salary, Relief 2
45. Tehsildar, Anantnag Relief 2
46. Tehsildar, Shahabad Salary, Relief 2
47. Tehsildar, Pahalgam Salary, Relief 3
48. Tehsildar, Sallar Salary, Relief 2
49. Tehsildar, Shangus Salary and others 1
50. Tehsildar, Qazigund Salary, Relief 2
51. Tehsildar, Larnoo Relief 1
52. SDM, Drass Salary and Relief 1
53. DC, Anantnag
Salary and Levy (Tehsildar
Consolidation), Land Compensation,
Relief, Khundru Fire Accident, Cash in
lieu of Ex-Gratia
10
54. Tehsildar, Srigufwara Relief, Salary 2
55. Tehsildar, Mattan Relief, Salary 2
56. Tehsildar, Drass Salary and others 1
57. Tehsildar, Kargil Salary and others 1
58. Tehsildar, Bijbehara Relief 1
Appendices
123
Sl. No. Name of DDO Purpose No. of Bank Accounts
Rural Development Department
59. Block Development
Officer (BDO), Akhnoor
Salary and Works, Swacch Bharat
Mission (SBM), Member Parliament
Local Area Development (MPLAD),
13th Finance Commission (FC),
Constituency Development Fund
(CDF), Rashtriya Gram Swaraj
Abhiyan (RGSA), Mahatma Gandhi
National Rural Employment Guarantee
Act (MGNREGA), 14th FC
47
(Other than JK Bank :
19)
60. BDO, Katra
MGNREGA, Salary/ Office Expenses,
SBM, CDF/ MPLAD, Panchayti Raj
Institutions (PRIs), 14th FC, Panchayat
Fund (PF)
28
(Other than JK Bank :
07)
61. BDO, Khrahballi
Salary , Office Expenses, MGNREGA,
MPLAD, CDF, SBM, 14th FC, PRI,
Border Area Development Programme
(BADP), Revenue
28
(Other than JK Bank :
07)
62. BDO, Thakrakote Salary, SBM, CDF, State Disaster
Relief Fund (SDRF), 13th and 14th FC
12
63. BDO, Samwan
BADP, Salary/ Officer Expenses ,
CDF, SBM, MGNREGA, MPLAD,
14th FC
11
(Other than JK Bank :
01)
64. District Panchayat Officer
(DPO), Reasi SBM, Salary
3
65.
Assistant Commissioner
Development (ACD) Rural
Reasi
Salary, MGNREGA, Pradhan Mantri
Awas Yojana (PMAY), MPLAD,
Indira Awas Yojana (IAY), 13th FC
6
66. BDO, Sundarbani Salary, MGNREGA, SBM, MPLAD,
Works, PRI, 13th and 14th FC
24
(Other than JK Bank :
09)
67. BDO, Siot Salary, Works, SBM, MGNREGA,
MPLAD, 13th and 14th FC
29
(Other than JK Bank :
05)
68. BDO, Khour Salary, MPLAD, BADP, CDF, SBM,
Mobile Towers, MGNREGA, 14th FC
46
(Other than JK Bank :
19)
Audit Report-Social, General, Economic and Revenue Sectors for the year ended 31 March 2019
124
Sl. No. Name of DDO Purpose No. of Bank Accounts
69. BDO, Lamberi Salary, MPLAD, Works, MGNREGA,
SBM, 13th and 14th FC
17
(Other than JK Bank :
03)
70. BDO, Nowshera
Salary, Works, SBM, MPLAD,
MGNREGA, PRI, Revenue Panchayat,
13th and 14th FC
37
(Other than JK Bank :
18)
71. DPO, Rajouri SBM, PRI, 13th FC, Salary, Election 7
72. ACD, Jammu MGNREGA, MPLAD, CDF, IAY,
13th FC
9
(Other than JK Bank :
03)
73. DPO, Jammu Salary, SBM (Gramin), RGSA 3
74. BDO, Mathwar
13th/ 14th FC, MPLAD, Salary and
Works, SBM (G), SAGY, MLA/ CDF,
SDRF, IAY, Mobile Tower,
MGNREGA, RGSA
34
(Other than JK Bank :
10)
75. BDO, Maira Mandrian
MPLAD, Salary, MGNREGA,
SBM (G), Nirmal Bharat Abhiyan
(NBA), 13th/ 14th FC
22
(Other than JK Bank :
16)
76. BDO, Pargwal General, NBA/ SBM, MGNREGA,
14th FC
15
(Other than JK Bank :
12)
77. BDO, Bhalwal
Goods and Services Tax, 13th/ 14th FC,
Sampoorna Grameen, Rozgar Yojana
(SGRY), CDF, Model Village,
MGNREGA, Total Sanitation,
Campaign (TSC)/ SBM, Swarnajayanti
Gram Swarojgar Yojana (SGSY)
32
(Other than JK Bank :
01)
78. BDO, Reasi General, MGNREGA, TSC/ SBM,
14th FC
17
(Other than JK Bank :
02)
79. BDO, Pouni General, TSC/ SBM, MGNREGA,
14th FC
28
(Other than JK Bank :
02)
80. BDO, Panthal 13th FC, MGNREGA, General,
SBM(G), MPLAD, Panchayat Fund 16
81. BDO, Bhomag
13th FC, MGNREGA, CDF/ IAY,
SBM(G), General, Veterinary Building,
Model Village,14th FC
15
Appendices
125
Sl. No. Name of DDO Purpose No. of Bank Accounts
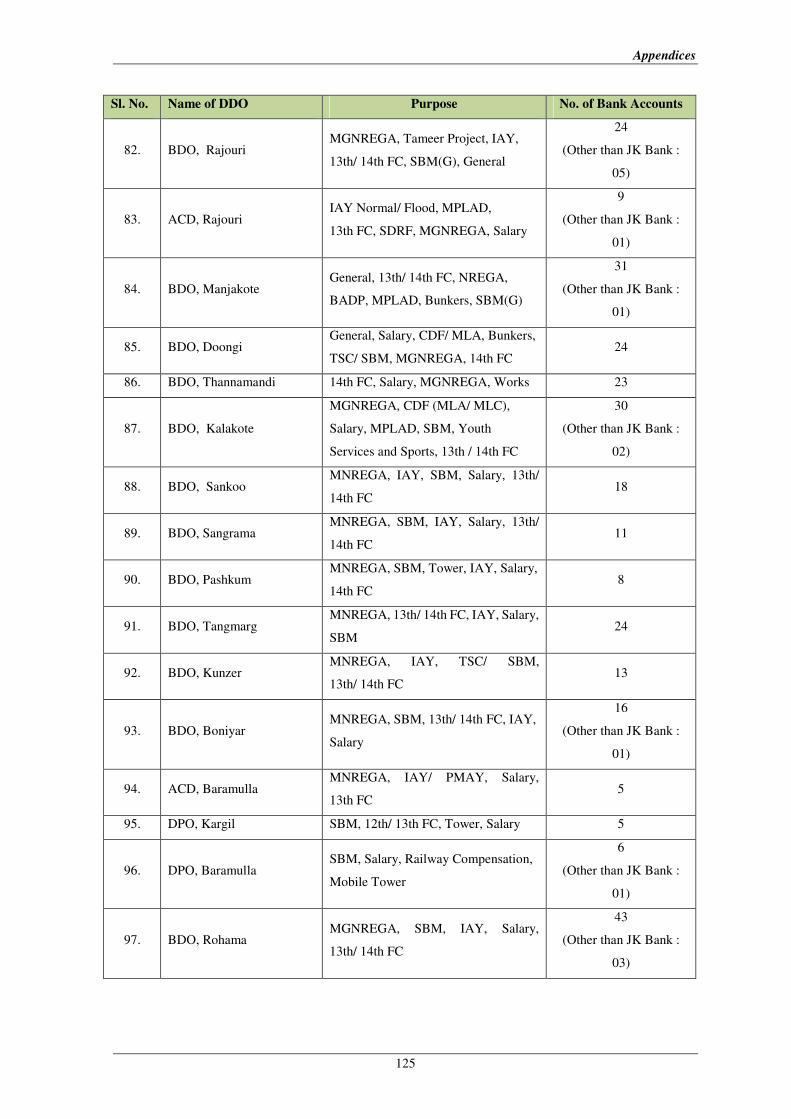
82. BDO, Rajouri MGNREGA, Tameer Project, IAY,
13th/ 14th FC, SBM(G), General
24
(Other than JK Bank :
05)
83. ACD, Rajouri IAY Normal/ Flood, MPLAD,
13th FC, SDRF, MGNREGA, Salary
9
(Other than JK Bank :
01)
84. BDO, Manjakote General, 13th/ 14th FC, NREGA,
BADP, MPLAD, Bunkers, SBM(G)
31
(Other than JK Bank :
01)
85. BDO, Doongi General, Salary, CDF/ MLA, Bunkers,
TSC/ SBM, MGNREGA, 14th FC 24
86. BDO, Thannamandi 14th FC, Salary, MGNREGA, Works 23
87. BDO, Kalakote
MGNREGA, CDF (MLA/ MLC),
Salary, MPLAD, SBM, Youth
Services and Sports, 13th / 14th FC
30
(Other than JK Bank :
02)
88. BDO, Sankoo MNREGA, IAY, SBM, Salary, 13th/
14th FC 18
89. BDO, Sangrama MNREGA, SBM, IAY, Salary, 13th/
14th FC 11
90. BDO, Pashkum MNREGA, SBM, Tower, IAY, Salary,
14th FC 8
91. BDO, Tangmarg MNREGA, 13th/ 14th FC, IAY, Salary,
SBM 24
92. BDO, Kunzer MNREGA, IAY, TSC/ SBM,
13th/ 14th FC 13
93. BDO, Boniyar MNREGA, SBM, 13th/ 14th FC, IAY,
Salary
16
(Other than JK Bank :
01)
94. ACD, Baramulla MNREGA, IAY/ PMAY, Salary,
13th FC 5
95. DPO, Kargil SBM, 12th/ 13th FC, Tower, Salary 5
96. DPO, Baramulla SBM, Salary, Railway Compensation,
Mobile Tower
6
(Other than JK Bank :
01)
97. BDO, Rohama MGNREGA, SBM, IAY, Salary,
13th/ 14th FC
43
(Other than JK Bank :
03)
Audit Report-Social, General, Economic and Revenue Sectors for the year ended 31 March 2019
126
Sl. No. Name of DDO Purpose No. of Bank Accounts
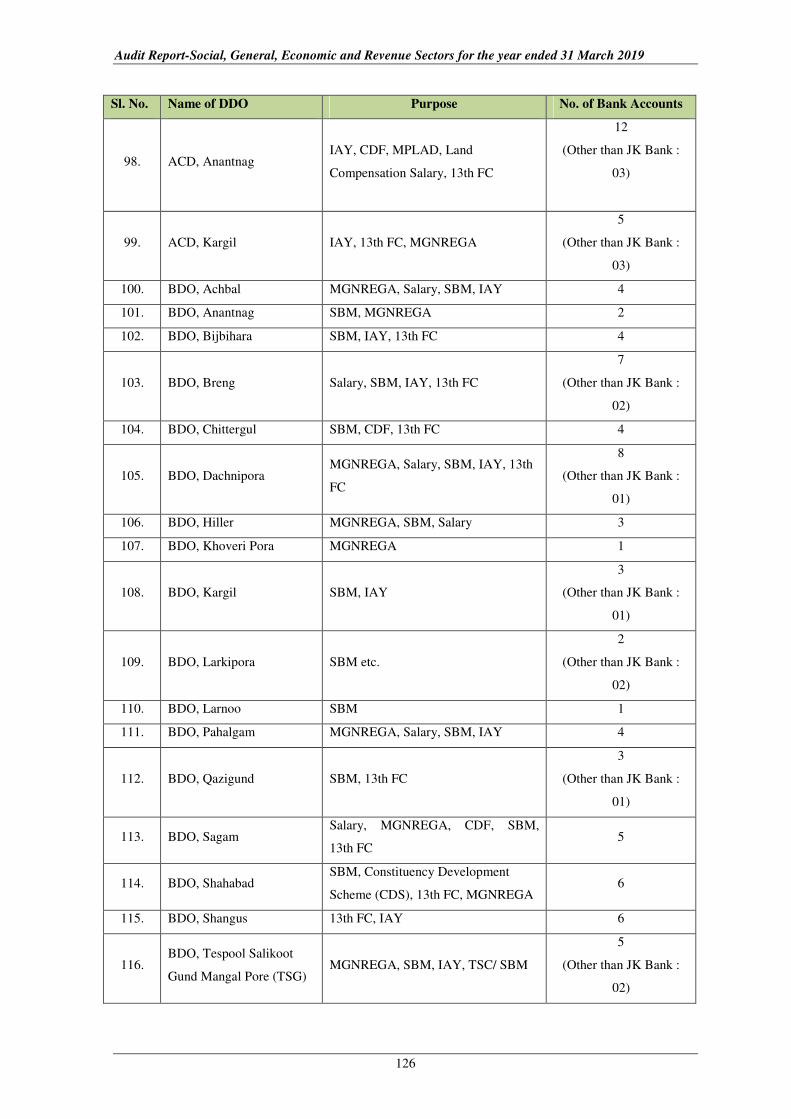
98. ACD, Anantnag IAY, CDF, MPLAD, Land
Compensation Salary, 13th FC
12
(Other than JK Bank :
03)
99. ACD, Kargil IAY, 13th FC, MGNREGA
5
(Other than JK Bank :
03)
100. BDO, Achbal MGNREGA, Salary, SBM, IAY 4
101. BDO, Anantnag SBM, MGNREGA 2
102. BDO, Bijbihara SBM, IAY, 13th FC 4
103. BDO, Breng Salary, SBM, IAY, 13th FC
7
(Other than JK Bank :
02)
104. BDO, Chittergul SBM, CDF, 13th FC 4
105. BDO, Dachnipora MGNREGA, Salary, SBM, IAY, 13th
FC
8
(Other than JK Bank :
01)
106. BDO, Hiller MGNREGA, SBM, Salary 3
107. BDO, Khoveri Pora MGNREGA 1
108. BDO, Kargil SBM, IAY
3
(Other than JK Bank :
01)
109. BDO, Larkipora SBM etc.
2
(Other than JK Bank :
02)
110. BDO, Larnoo SBM 1
111. BDO, Pahalgam MGNREGA, Salary, SBM, IAY 4
112. BDO, Qazigund SBM, 13th FC
3
(Other than JK Bank :
01)
113. BDO, Sagam Salary, MGNREGA, CDF, SBM,
13th FC 5
114. BDO, Shahabad SBM, Constituency Development
Scheme (CDS), 13th FC, MGNREGA 6
115. BDO, Shangus 13th FC, IAY 6
116. BDO, Tespool Salikoot
Gund Mangal Pore (TSG) MGNREGA, SBM, IAY, TSC/ SBM
5
(Other than JK Bank :
02)
Appendices
127
Sl. No. Name of DDO Purpose No. of Bank Accounts
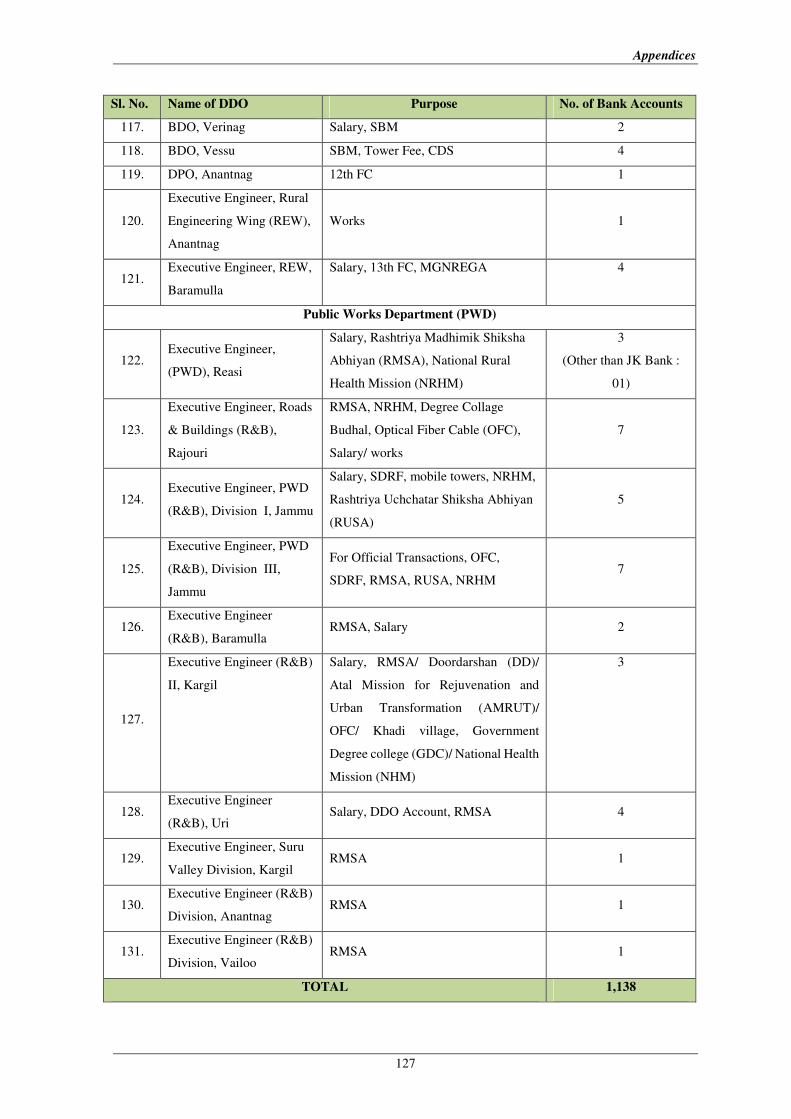
117. BDO, Verinag Salary, SBM 2
118. BDO, Vessu SBM, Tower Fee, CDS 4
119. DPO, Anantnag 12th FC 1
120.
Executive Engineer, Rural
Engineering Wing (REW),
Anantnag
Works 1
121. Executive Engineer, REW,
Baramulla
Salary, 13th FC, MGNREGA
4
Public Works Department (PWD)
122. Executive Engineer,
(PWD), Reasi
Salary, Rashtriya Madhimik Shiksha
Abhiyan (RMSA), National Rural
Health Mission (NRHM)
3
(Other than JK Bank :
01)
123.
Executive Engineer, Roads
& Buildings (R&B),
Rajouri
RMSA, NRHM, Degree Collage
Budhal, Optical Fiber Cable (OFC),
Salary/ works
7
124. Executive Engineer, PWD
(R&B), Division I, Jammu
Salary, SDRF, mobile towers, NRHM,
Rashtriya Uchchatar Shiksha Abhiyan
(RUSA)
5
125.
Executive Engineer, PWD
(R&B), Division III,
Jammu
For Official Transactions, OFC,
SDRF, RMSA, RUSA, NRHM 7
126. Executive Engineer
(R&B), Baramulla RMSA, Salary 2
127.
Executive Engineer (R&B)
II, Kargil
Salary, RMSA/ Doordarshan (DD)/
Atal Mission for Rejuvenation and
Urban Transformation (AMRUT)/
OFC/ Khadi village, Government
Degree college (GDC)/ National Health
Mission (NHM)
3
128. Executive Engineer
(R&B), Uri Salary, DDO Account, RMSA 4
129. Executive Engineer, Suru
Valley Division, Kargil RMSA 1
130. Executive Engineer (R&B)
Division, Anantnag RMSA 1
131. Executive Engineer (R&B)
Division, Vailoo RMSA 1
TOTAL 1,138
Audit Report-Social, General, Economic and Revenue Sectors for the year ended 31 March 2019
128
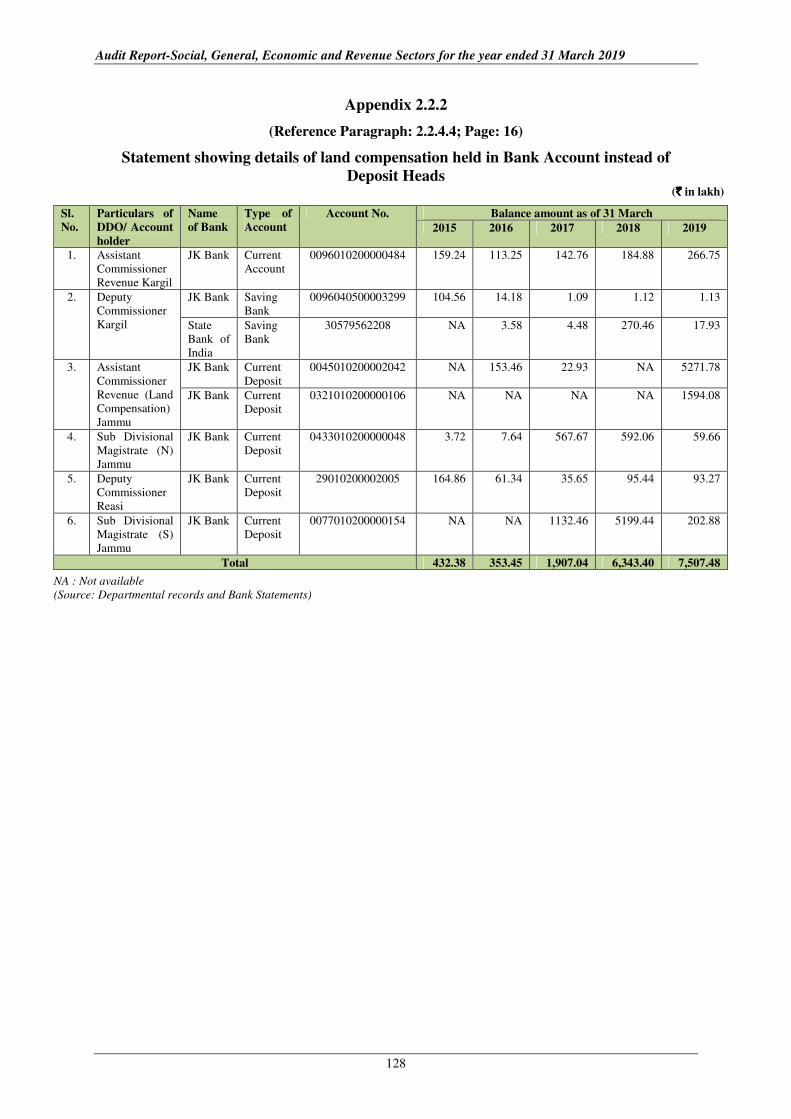
Appendix 2.2.2
(Reference Paragraph: 2.2.4.4; Page: 16)
Statement showing details of land compensation held in Bank Account instead of
Deposit Heads (`̀̀̀ in lakh)
Sl.
No.
Particulars of
DDO/ Account
holder
Name
of Bank
Type of
Account
Account No. Balance amount as of 31 March
2015 2016 2017 2018 2019
1. Assistant
Commissioner
Revenue Kargil
JK Bank Current
Account
0096010200000484 159.24 113.25 142.76 184.88 266.75
2. Deputy
Commissioner
Kargil
JK Bank Saving
Bank
0096040500003299 104.56 14.18 1.09 1.12 1.13
State
Bank of
India
Saving
Bank
30579562208 NA 3.58 4.48 270.46 17.93
3. Assistant
Commissioner
Revenue (Land
Compensation)
Jammu
JK Bank
Current
Deposit
0045010200002042 NA 153.46 22.93 NA 5271.78
JK Bank Current
Deposit
0321010200000106 NA NA NA NA 1594.08
4. Sub Divisional
Magistrate (N)
Jammu
JK Bank Current
Deposit
0433010200000048 3.72 7.64 567.67 592.06 59.66
5. Deputy
Commissioner
Reasi
JK Bank Current
Deposit
29010200002005 164.86 61.34 35.65 95.44 93.27
6. Sub Divisional
Magistrate (S)
Jammu
JK Bank Current
Deposit
0077010200000154 NA NA 1132.46 5199.44 202.88
Total 432.38 353.45 1,907.04 6,343.40 7,507.48
NA : Not available
(Source: Departmental records and Bank Statements)
Appendices
129
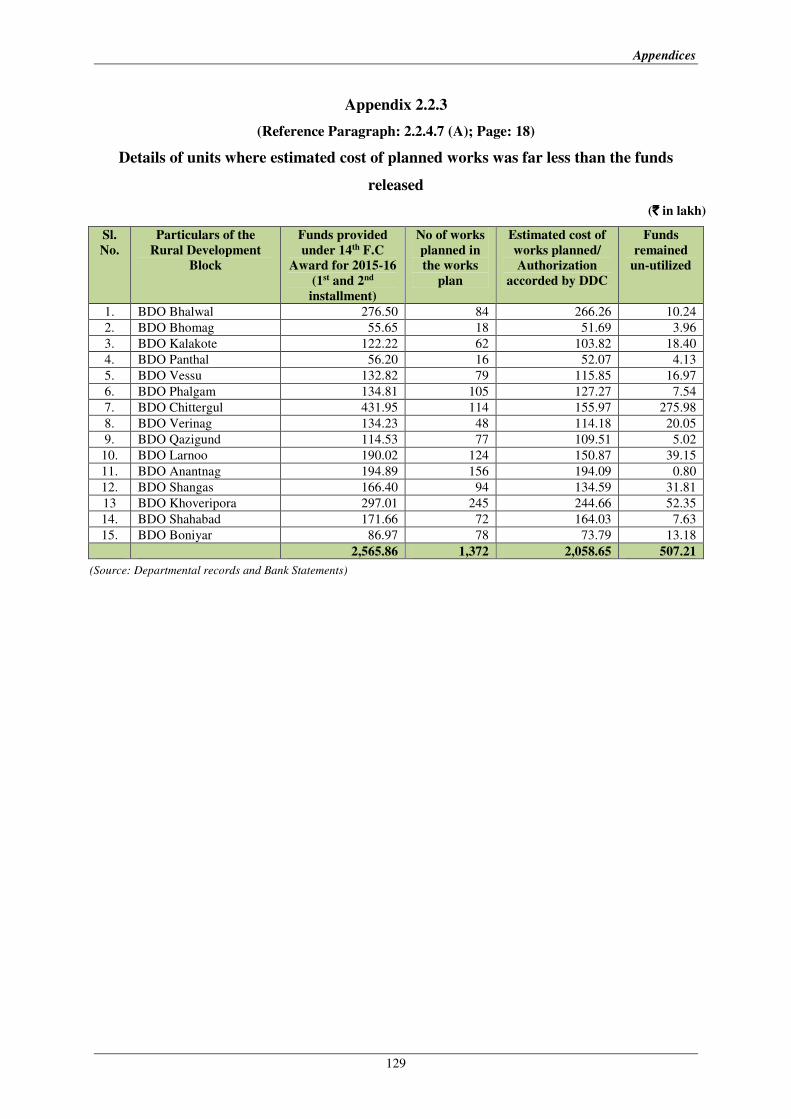
Appendix 2.2.3
(Reference Paragraph: 2.2.4.7 (A); Page: 18)
Details of units where estimated cost of planned works was far less than the funds
released
(`̀̀̀ in lakh)
Sl.
No.
Particulars of the
Rural Development
Block
Funds provided
under 14th F.C
Award for 2015-16
(1st and 2nd
installment)
No of works
planned in
the works
plan
Estimated cost of
works planned/
Authorization
accorded by DDC
Funds
remained
un-utilized
1. BDO Bhalwal 276.50 84 266.26 10.24
2. BDO Bhomag 55.65 18 51.69 3.96
3. BDO Kalakote 122.22 62 103.82 18.40
4. BDO Panthal 56.20 16 52.07 4.13
5. BDO Vessu 132.82 79 115.85 16.97
6. BDO Phalgam 134.81 105 127.27 7.54
7. BDO Chittergul 431.95 114 155.97 275.98
8. BDO Verinag 134.23 48 114.18 20.05
9. BDO Qazigund 114.53 77 109.51 5.02
10. BDO Larnoo 190.02 124 150.87 39.15
11. BDO Anantnag 194.89 156 194.09 0.80
12. BDO Shangas 166.40 94 134.59 31.81
13 BDO Khoveripora 297.01 245 244.66 52.35
14. BDO Shahabad 171.66 72 164.03 7.63
15. BDO Boniyar 86.97 78 73.79 13.18
2,565.86 1,372 2,058.65 507.21
(Source: Departmental records and Bank Statements)
Audit Report-Social, General, Economic and Revenue Sectors for the year ended 31 March 2019
130
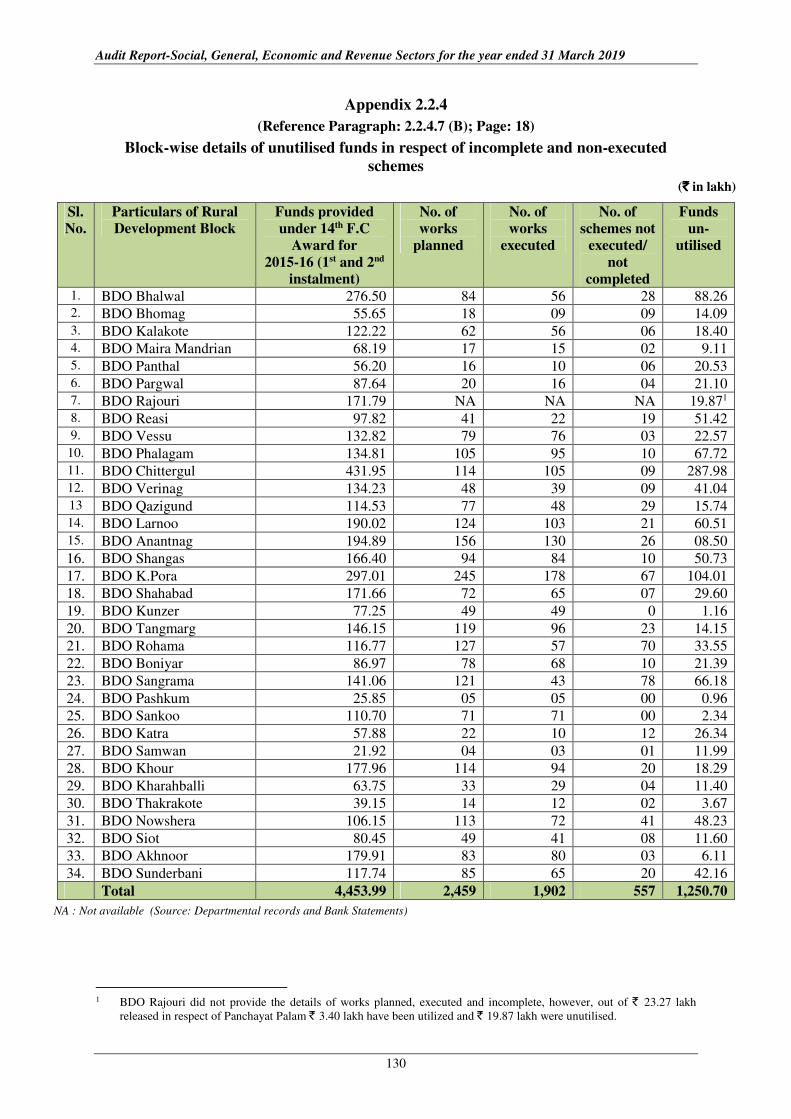
Appendix 2.2.4
(Reference Paragraph: 2.2.4.7 (B); Page: 18)
Block-wise details of unutilised funds in respect of incomplete and non-executed
schemes
(`̀̀̀ in lakh)
Sl.
No.
Particulars of Rural
Development Block
Funds provided
under 14th F.C
Award for
2015-16 (1st and 2nd
instalment)
No. of
works
planned
No. of
works
executed
No. of
schemes not
executed/
not
completed
Funds
un-
utilised
1. BDO Bhalwal 276.50 84 56 28 88.26 2. BDO Bhomag 55.65 18 09 09 14.09 3. BDO Kalakote 122.22 62 56 06 18.40 4. BDO Maira Mandrian 68.19 17 15 02 9.11 5. BDO Panthal 56.20 16 10 06 20.53 6. BDO Pargwal 87.64 20 16 04 21.10 7. BDO Rajouri 171.79 NA NA NA 19.871 8. BDO Reasi 97.82 41 22 19 51.42 9. BDO Vessu 132.82 79 76 03 22.57
10. BDO Phalagam 134.81 105 95 10 67.72 11. BDO Chittergul 431.95 114 105 09 287.98 12. BDO Verinag 134.23 48 39 09 41.04 13 BDO Qazigund 114.53 77 48 29 15.74 14. BDO Larnoo 190.02 124 103 21 60.51 15. BDO Anantnag 194.89 156 130 26 08.50
16. BDO Shangas 166.40 94 84 10 50.73
17. BDO K.Pora 297.01 245 178 67 104.01
18. BDO Shahabad 171.66 72 65 07 29.60
19. BDO Kunzer 77.25 49 49 0 1.16
20. BDO Tangmarg 146.15 119 96 23 14.15
21. BDO Rohama 116.77 127 57 70 33.55
22. BDO Boniyar 86.97 78 68 10 21.39
23. BDO Sangrama 141.06 121 43 78 66.18
24. BDO Pashkum 25.85 05 05 00 0.96
25. BDO Sankoo 110.70 71 71 00 2.34
26. BDO Katra 57.88 22 10 12 26.34
27. BDO Samwan 21.92 04 03 01 11.99
28. BDO Khour 177.96 114 94 20 18.29
29. BDO Kharahballi 63.75 33 29 04 11.40
30. BDO Thakrakote 39.15 14 12 02 3.67
31. BDO Nowshera 106.15 113 72 41 48.23
32. BDO Siot 80.45 49 41 08 11.60
33. BDO Akhnoor 179.91 83 80 03 6.11
34. BDO Sunderbani 117.74 85 65 20 42.16
Total 4,453.99 2,459 1,902 557 1,250.70
NA : Not available (Source: Departmental records and Bank Statements)
1 BDO Rajouri did not provide the details of works planned, executed and incomplete, however, out of ` 23.27 lakh
released in respect of Panchayat Palam ` 3.40 lakh have been utilized and ` 19.87 lakh were unutilised.
Appendices
131
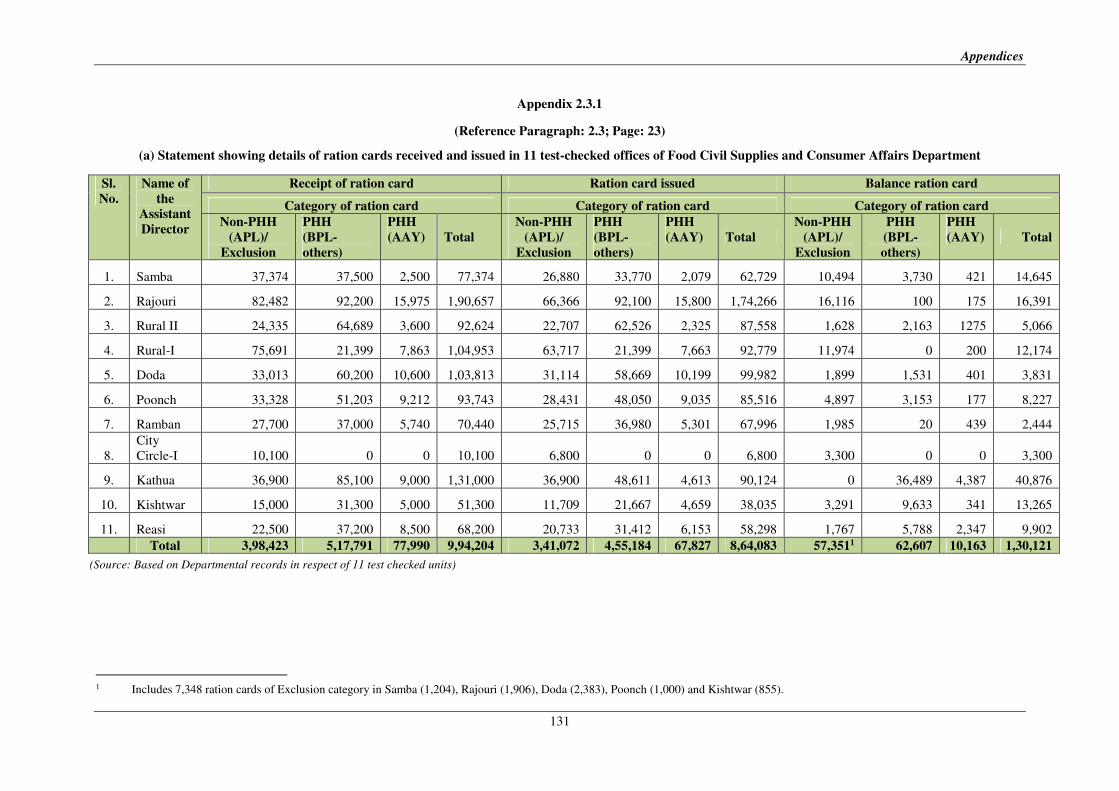
Appendix 2.3.1
(Reference Paragraph: 2.3; Page: 23)
(a) Statement showing details of ration cards received and issued in 11 test-checked offices of Food Civil Supplies and Consumer Affairs Department
Sl.
No.
Name of
the
Assistant
Director
Receipt of ration card Ration card issued Balance ration card
Category of ration card Category of ration card Category of ration card
Non-PHH
(APL)/
Exclusion
PHH
(BPL-
others)
PHH
(AAY) Total
Non-PHH
(APL)/
Exclusion
PHH
(BPL-
others)
PHH
(AAY) Total
Non-PHH
(APL)/
Exclusion
PHH
(BPL-
others)
PHH
(AAY) Total
1. Samba 37,374 37,500 2,500 77,374 26,880 33,770 2,079 62,729 10,494 3,730 421 14,645
2. Rajouri 82,482 92,200 15,975 1,90,657 66,366 92,100 15,800 1,74,266 16,116 100 175 16,391
3. Rural II 24,335 64,689 3,600 92,624 22,707 62,526 2,325 87,558 1,628 2,163 1275 5,066
4. Rural-I 75,691 21,399 7,863 1,04,953 63,717 21,399 7,663 92,779 11,974 0 200 12,174
5. Doda 33,013 60,200 10,600 1,03,813 31,114 58,669 10,199 99,982 1,899 1,531 401 3,831
6. Poonch 33,328 51,203 9,212 93,743 28,431 48,050 9,035 85,516 4,897 3,153 177 8,227
7. Ramban 27,700 37,000 5,740 70,440 25,715 36,980 5,301 67,996 1,985 20 439 2,444
8.
City
Circle-I 10,100 0 0 10,100 6,800 0 0 6,800 3,300 0 0 3,300
9. Kathua 36,900 85,100 9,000 1,31,000 36,900 48,611 4,613 90,124 0 36,489 4,387 40,876
10. Kishtwar 15,000 31,300 5,000 51,300 11,709 21,667 4,659 38,035 3,291 9,633 341 13,265
11. Reasi 22,500 37,200 8,500 68,200 20,733 31,412 6,153 58,298 1,767 5,788 2,347 9,902
Total 3,98,423 5,17,791 77,990 9,94,204 3,41,072 4,55,184 67,827 8,64,083 57,3511 62,607 10,163 1,30,121
(Source: Based on Departmental records in respect of 11 test checked units)
1 Includes 7,348 ration cards of Exclusion category in Samba (1,204), Rajouri (1,906), Doda (2,383), Poonch (1,000) and Kishtwar (855).
Audit Report-Social, General, Economic and Revenue Sectors for the year ended 31 March 2019
132
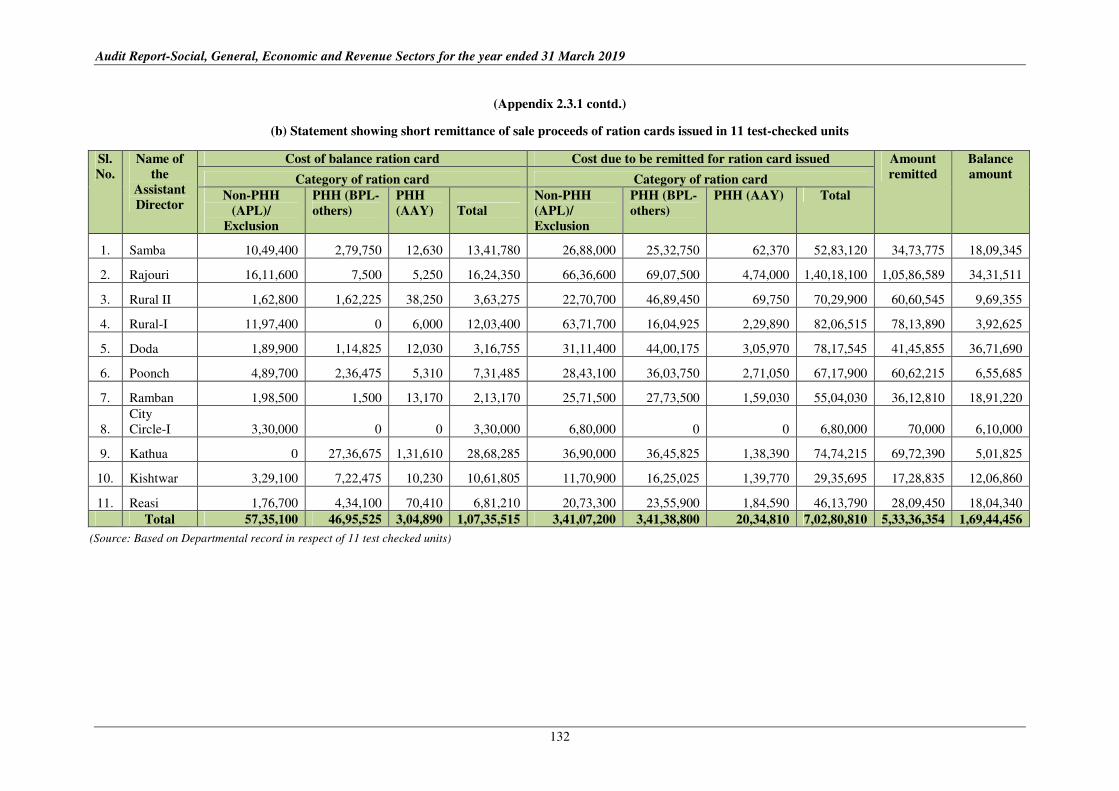
(Appendix 2.3.1 contd.)
(b) Statement showing short remittance of sale proceeds of ration cards issued in 11 test-checked units
Sl.
No.
Name of
the
Assistant
Director
Cost of balance ration card Cost due to be remitted for ration card issued Amount
remitted
Balance
amount Category of ration card Category of ration card
Non-PHH
(APL)/
Exclusion
PHH (BPL-
others)
PHH
(AAY) Total
Non-PHH
(APL)/
Exclusion
PHH (BPL-
others)
PHH (AAY) Total
1. Samba 10,49,400 2,79,750 12,630 13,41,780 26,88,000 25,32,750 62,370 52,83,120 34,73,775 18,09,345
2. Rajouri 16,11,600 7,500 5,250 16,24,350 66,36,600 69,07,500 4,74,000 1,40,18,100 1,05,86,589 34,31,511
3. Rural II 1,62,800 1,62,225 38,250 3,63,275 22,70,700 46,89,450 69,750 70,29,900 60,60,545 9,69,355
4. Rural-I 11,97,400 0 6,000 12,03,400 63,71,700 16,04,925 2,29,890 82,06,515 78,13,890 3,92,625
5. Doda 1,89,900 1,14,825 12,030 3,16,755 31,11,400 44,00,175 3,05,970 78,17,545 41,45,855 36,71,690
6. Poonch 4,89,700 2,36,475 5,310 7,31,485 28,43,100 36,03,750 2,71,050 67,17,900 60,62,215 6,55,685
7. Ramban 1,98,500 1,500 13,170 2,13,170 25,71,500 27,73,500 1,59,030 55,04,030 36,12,810 18,91,220
8.
City
Circle-I 3,30,000 0 0 3,30,000 6,80,000 0 0 6,80,000 70,000 6,10,000
9. Kathua 0 27,36,675 1,31,610 28,68,285 36,90,000 36,45,825 1,38,390 74,74,215 69,72,390 5,01,825
10. Kishtwar 3,29,100 7,22,475 10,230 10,61,805 11,70,900 16,25,025 1,39,770 29,35,695 17,28,835 12,06,860
11. Reasi 1,76,700 4,34,100 70,410 6,81,210 20,73,300 23,55,900 1,84,590 46,13,790 28,09,450 18,04,340
Total 57,35,100 46,95,525 3,04,890 1,07,35,515 3,41,07,200 3,41,38,800 20,34,810 7,02,80,810 5,33,36,354 1,69,44,456
(Source: Based on Departmental record in respect of 11 test checked units)
Appendices
133
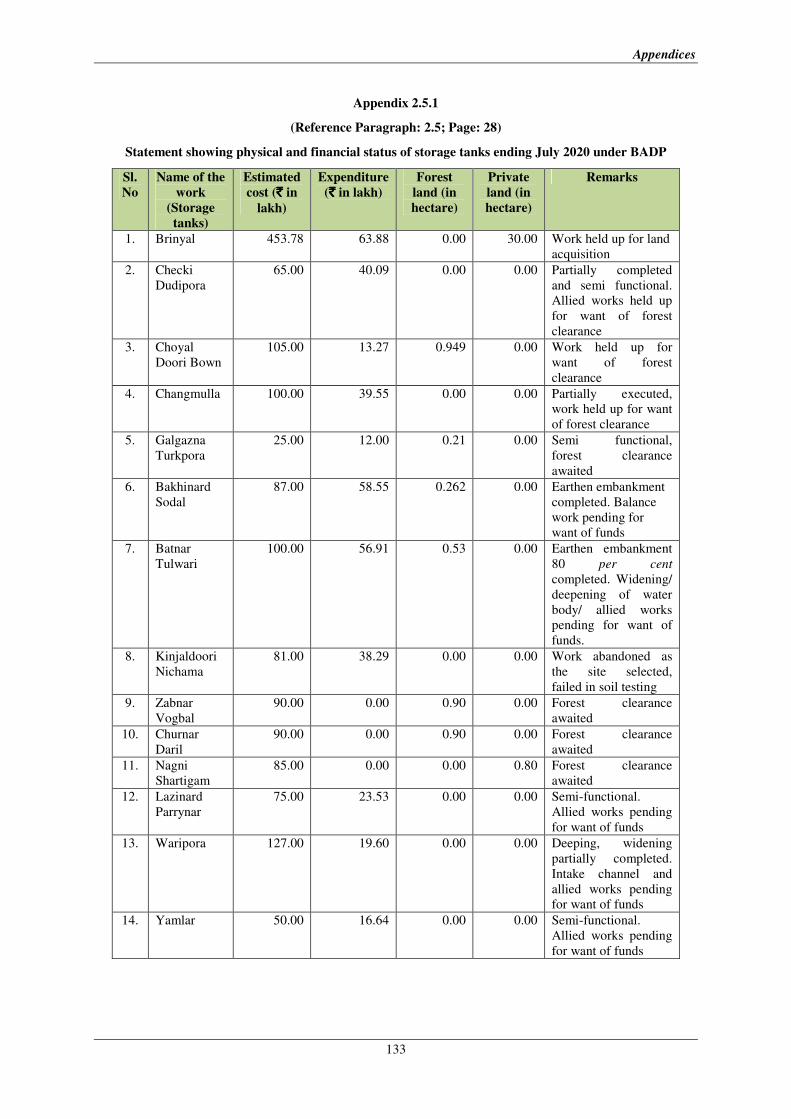
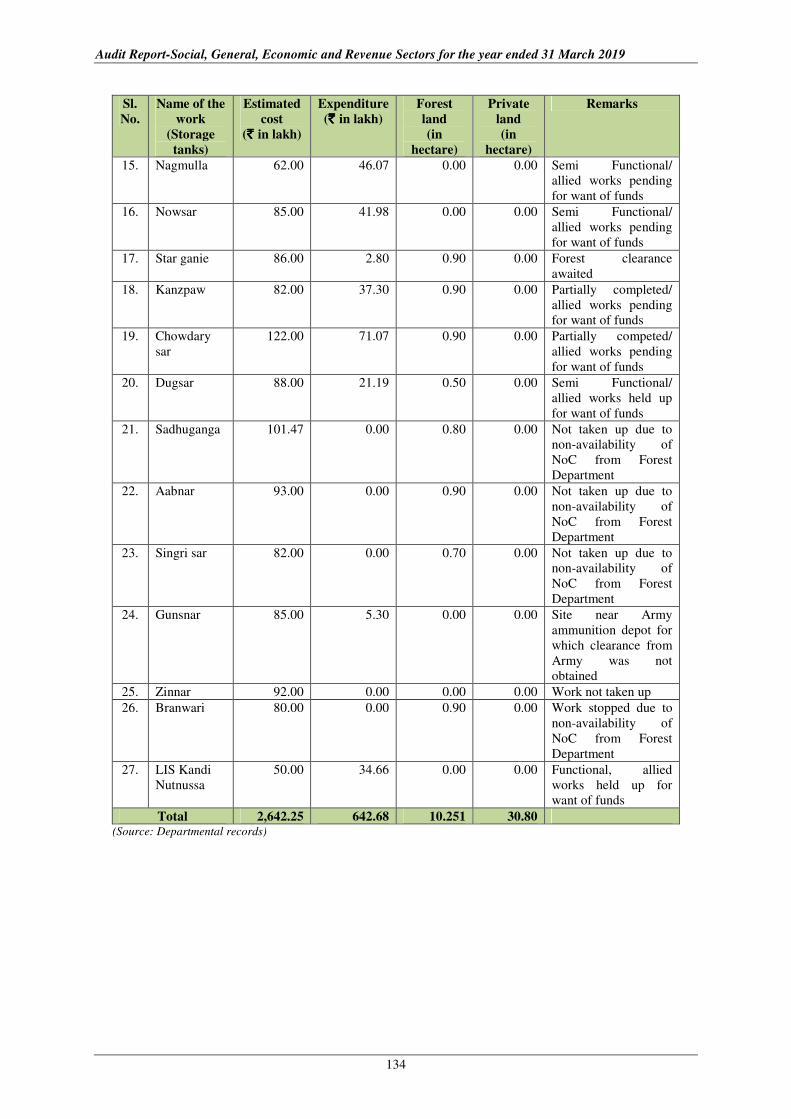
Appendix 2.5.1
(Reference Paragraph: 2.5; Page: 28)
Statement showing physical and financial status of storage tanks ending July 2020 under BADP
Sl.
No
Name of the
work
(Storage
tanks)
Estimated
cost (`̀̀̀ in
lakh)
Expenditure
(`̀̀̀ in lakh)
Forest
land (in
hectare)
Private
land (in
hectare)
Remarks
1. Brinyal 453.78 63.88 0.00 30.00 Work held up for land
acquisition
2. Checki
Dudipora
65.00 40.09 0.00 0.00 Partially completed
and semi functional.
Allied works held up
for want of forest
clearance
3. Choyal
Doori Bown
105.00 13.27 0.949 0.00 Work held up for
want of forest
clearance
4. Changmulla 100.00 39.55 0.00 0.00 Partially executed,
work held up for want
of forest clearance
5. Galgazna
Turkpora
25.00 12.00 0.21 0.00 Semi functional,
forest clearance
awaited
6. Bakhinard
Sodal
87.00 58.55 0.262 0.00 Earthen embankment
completed. Balance
work pending for
want of funds
7. Batnar
Tulwari
100.00 56.91 0.53 0.00 Earthen embankment
80 per cent
completed. Widening/
deepening of water
body/ allied works
pending for want of
funds.
8. Kinjaldoori
Nichama
81.00 38.29 0.00 0.00 Work abandoned as
the site selected,
failed in soil testing
9. Zabnar
Vogbal
90.00 0.00 0.90 0.00 Forest clearance
awaited
10. Churnar
Daril
90.00 0.00 0.90 0.00 Forest clearance
awaited
11. Nagni
Shartigam
85.00 0.00 0.00 0.80 Forest clearance
awaited
12. Lazinard
Parrynar
75.00 23.53 0.00 0.00 Semi-functional.
Allied works pending
for want of funds
13. Waripora 127.00 19.60 0.00 0.00 Deeping, widening
partially completed.
Intake channel and
allied works pending
for want of funds
14. Yamlar 50.00 16.64 0.00 0.00 Semi-functional.
Allied works pending
for want of funds
Audit Report-Social, General, Economic and Revenue Sectors for the year ended 31 March 2019
134
Sl.
No.
Name of the
work
(Storage
tanks)
Estimated
cost
(` ` ` ` in lakh)
Expenditure
(` ` ` ` in lakh)
Forest
land
(in
hectare)
Private
land
(in
hectare)
Remarks
15. Nagmulla 62.00 46.07 0.00 0.00 Semi Functional/
allied works pending
for want of funds
16. Nowsar 85.00 41.98 0.00 0.00 Semi Functional/
allied works pending
for want of funds
17. Star ganie 86.00 2.80 0.90 0.00 Forest clearance
awaited
18. Kanzpaw 82.00 37.30 0.90 0.00 Partially completed/
allied works pending
for want of funds
19. Chowdary
sar
122.00 71.07 0.90 0.00 Partially competed/
allied works pending
for want of funds
20. Dugsar 88.00 21.19 0.50 0.00 Semi Functional/
allied works held up
for want of funds
21. Sadhuganga 101.47 0.00 0.80 0.00 Not taken up due to
non-availability of
NoC from Forest
Department
22. Aabnar 93.00 0.00 0.90 0.00 Not taken up due to
non-availability of
NoC from Forest
Department
23. Singri sar 82.00 0.00 0.70 0.00 Not taken up due to
non-availability of
NoC from Forest
Department
24. Gunsnar 85.00 5.30 0.00 0.00 Site near Army
ammunition depot for
which clearance from
Army was not
obtained
25. Zinnar 92.00 0.00 0.00 0.00 Work not taken up
26. Branwari 80.00 0.00 0.90 0.00 Work stopped due to
non-availability of
NoC from Forest
Department
27. LIS Kandi
Nutnussa
50.00 34.66 0.00 0.00 Functional, allied
works held up for
want of funds
Total 2,642.25 642.68 10.251 30.80 (Source: Departmental records)

Appendices
135
Appendix 3.1.1
(Reference Paragraph: 3.10; Page: 43)
Unit-wise details of recovery accepted and recovery effected cases during 2018-19
(Amount `̀̀̀ in lakh)
Sl.
No.
Name of the unit Recovery accepted cases Recovery made
No. of
cases
Amount of
recovery
accepted
No. of cases Amount
recovered
1. Commercial Taxes Officer, Circle-
H, Jammu
6 39.20 8 41.58
2. Commercial Taxes Officer, Circle-
A, Jammu
2 0.54 2 0.54
3. Commercial Taxes Officer, Kargil 2 23.14 21 31.78
4. Chief Judicial Magistrate, Kargil 1 9.20 1 1.00
5. Deputy Commissioner Recovery,
Jammu
12 72.46 12 72.46
6. Commercial Taxes Officer, Circle-
I, Udhampur
23 82.74 2 5.73
7. Commercial Taxes Officer, Circle-
B, Jammu
4 16.41 - -
8. Commercial Taxes Officer, Circle-
J, Jammu
5 1.82 5 1.82
Total 55 245.51 51 154.91
(Source: Information compiled by the Office)
Audit Report-Social, General, Economic and Revenue Sectors for the year ended 31 March 2019
136
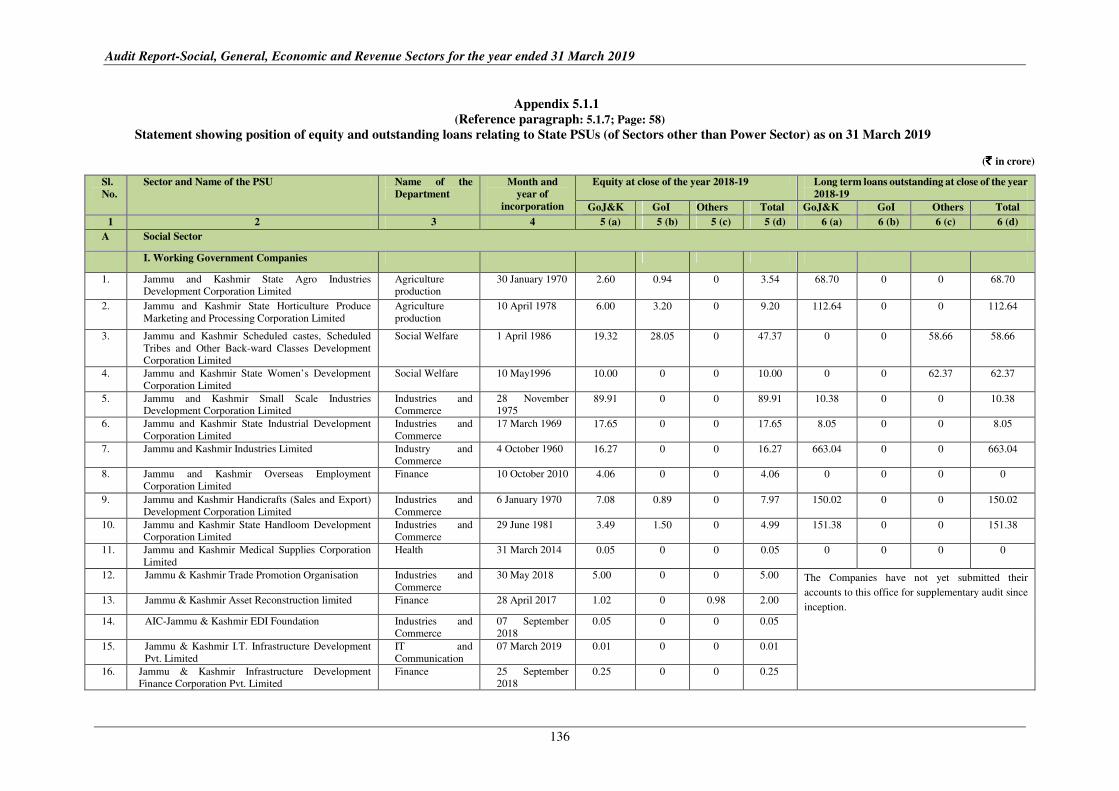
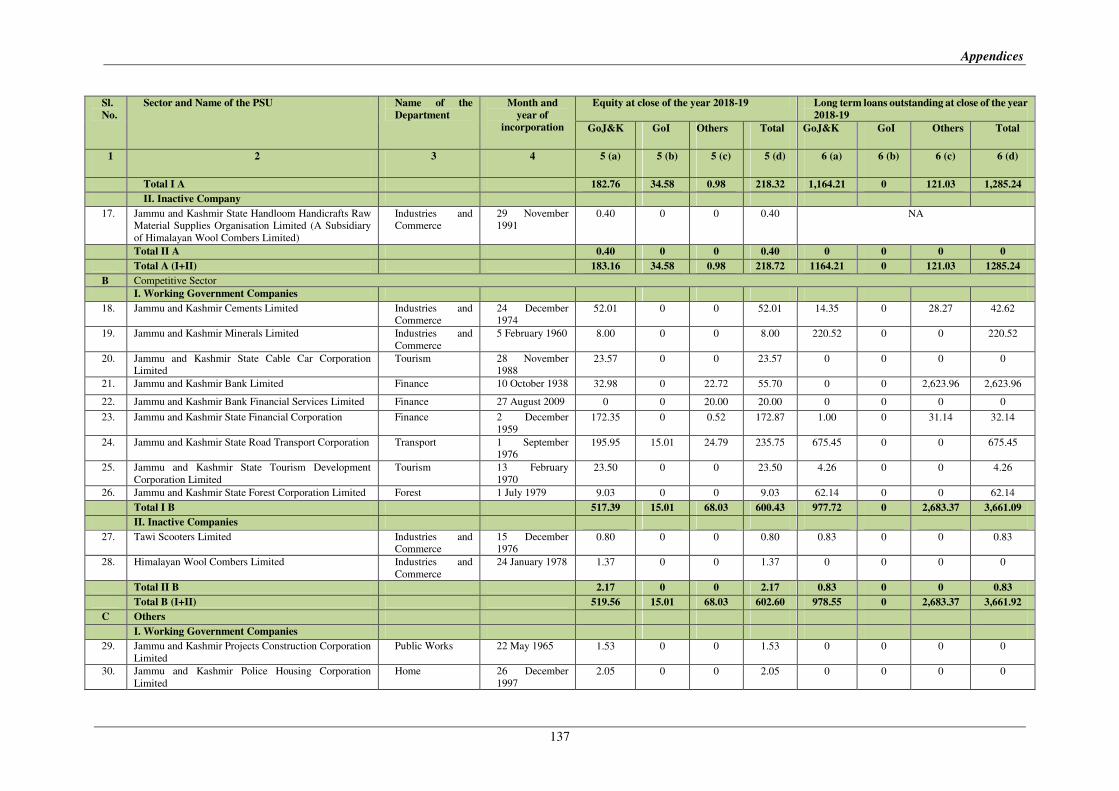
Appendix 5.1.1
(Reference paragraph: 5.1.7; Page: 58)
Statement showing position of equity and outstanding loans relating to State PSUs (of Sectors other than Power Sector) as on 31 March 2019
(`̀̀̀ in crore)
Sl.
No.
Sector and Name of the PSU Name of the
Department
Month and
year of
incorporation
Equity at close of the year 2018-19 Long term loans outstanding at close of the year
2018-19
GoJ&K GoI Others Total GoJ&K GoI Others Total
1 2 3 4 5 (a) 5 (b) 5 (c) 5 (d) 6 (a) 6 (b) 6 (c) 6 (d)
A Social Sector
I. Working Government Companies
1. Jammu and Kashmir State Agro Industries
Development Corporation Limited
Agriculture
production
30 January 1970 2.60 0.94 0 3.54 68.70 0 0 68.70
2. Jammu and Kashmir State Horticulture Produce
Marketing and Processing Corporation Limited
Agriculture
production
10 April 1978 6.00 3.20 0 9.20 112.64 0 0 112.64
3. Jammu and Kashmir Scheduled castes, Scheduled
Tribes and Other Back-ward Classes Development
Corporation Limited
Social Welfare 1 April 1986 19.32 28.05 0 47.37 0 0 58.66 58.66
4. Jammu and Kashmir State Women’s Development
Corporation Limited
Social Welfare 10 May1996 10.00 0 0 10.00 0 0 62.37 62.37
5. Jammu and Kashmir Small Scale Industries
Development Corporation Limited
Industries and
Commerce
28 November
1975 89.91 0 0 89.91 10.38 0 0 10.38
6. Jammu and Kashmir State Industrial Development
Corporation Limited
Industries and
Commerce
17 March 1969 17.65 0 0 17.65 8.05 0 0 8.05
7. Jammu and Kashmir Industries Limited Industry and
Commerce
4 October 1960 16.27 0 0 16.27 663.04 0 0 663.04
8. Jammu and Kashmir Overseas Employment
Corporation Limited
Finance 10 October 2010 4.06 0 0 4.06 0 0 0 0
9. Jammu and Kashmir Handicrafts (Sales and Export)
Development Corporation Limited
Industries and
Commerce
6 January 1970 7.08 0.89 0 7.97 150.02 0 0 150.02
10. Jammu and Kashmir State Handloom Development
Corporation Limited
Industries and
Commerce
29 June 1981 3.49 1.50 0 4.99 151.38 0 0 151.38
11. Jammu and Kashmir Medical Supplies Corporation
Limited
Health 31 March 2014 0.05 0 0 0.05 0 0 0 0
12. Jammu & Kashmir Trade Promotion Organisation Industries and
Commerce
30 May 2018 5.00 0 0 5.00 The Companies have not yet submitted their
accounts to this office for supplementary audit since
inception.
13. Jammu & Kashmir Asset Reconstruction limited Finance 28 April 2017 1.02 0 0.98 2.00
14. AIC-Jammu & Kashmir EDI Foundation Industries and
Commerce
07 September
2018
0.05 0 0 0.05
15. Jammu & Kashmir I.T. Infrastructure Development
Pvt. Limited
IT and
Communication
07 March 2019 0.01 0 0 0.01
16.
Jammu & Kashmir Infrastructure Development
Finance Corporation Pvt. Limited
Finance 25 September
2018
0.25 0 0 0.25
Appendices
137
Sl.
No.
Sector and Name of the PSU Name of the
Department
Month and
year of
incorporation
Equity at close of the year 2018-19 Long term loans outstanding at close of the year
2018-19
GoJ&K GoI Others Total GoJ&K GoI Others Total
1 2 3 4 5 (a) 5 (b) 5 (c) 5 (d) 6 (a) 6 (b) 6 (c) 6 (d)
Total I A 182.76 34.58 0.98 218.32 1,164.21 0 121.03 1,285.24
II. Inactive Company
17. Jammu and Kashmir State Handloom Handicrafts Raw
Material Supplies Organisation Limited (A Subsidiary
of Himalayan Wool Combers Limited)
Industries and
Commerce
29 November
1991 0.40 0 0 0.40 NA
Total II A 0.40 0 0 0.40 0 0 0 0
Total A (I+II) 183.16 34.58 0.98 218.72 1164.21 0 121.03 1285.24
B Competitive Sector
I. Working Government Companies
18. Jammu and Kashmir Cements Limited Industries and
Commerce
24 December
1974 52.01 0 0 52.01 14.35 0 28.27 42.62
19. Jammu and Kashmir Minerals Limited Industries and
Commerce
5 February 1960 8.00 0 0 8.00 220.52 0 0 220.52
20. Jammu and Kashmir State Cable Car Corporation
Limited
Tourism 28 November
1988 23.57 0 0 23.57 0 0 0 0
21. Jammu and Kashmir Bank Limited Finance 10 October 1938 32.98 0 22.72 55.70 0 0 2,623.96 2,623.96
22. Jammu and Kashmir Bank Financial Services Limited Finance 27 August 2009 0 0 20.00 20.00 0 0 0 0
23. Jammu and Kashmir State Financial Corporation Finance 2 December
1959
172.35 0 0.52 172.87 1.00 0 31.14 32.14
24. Jammu and Kashmir State Road Transport Corporation Transport 1 September
1976 195.95 15.01 24.79 235.75 675.45 0 0 675.45
25. Jammu and Kashmir State Tourism Development
Corporation Limited
Tourism 13 February
1970
23.50 0 0 23.50 4.26 0 0 4.26
26. Jammu and Kashmir State Forest Corporation Limited Forest 1 July 1979 9.03 0 0 9.03 62.14 0 0 62.14
Total I B 517.39 15.01 68.03 600.43 977.72 0 2,683.37 3,661.09
II. Inactive Companies
27. Tawi Scooters Limited Industries and
Commerce
15 December
1976 0.80 0 0 0.80 0.83 0 0 0.83
28. Himalayan Wool Combers Limited Industries and
Commerce
24 January 1978 1.37 0 0 1.37 0 0 0 0
Total II B 2.17 0 0 2.17 0.83 0 0 0.83
Total B (I+II) 519.56 15.01 68.03 602.60 978.55 0 2,683.37 3,661.92
C Others
I. Working Government Companies
29. Jammu and Kashmir Projects Construction Corporation
Limited
Public Works 22 May 1965 1.53 0 0 1.53 0 0 0 0
30. Jammu and Kashmir Police Housing Corporation
Limited
Home 26 December
1997
2.05 0 0 2.05 0 0 0 0
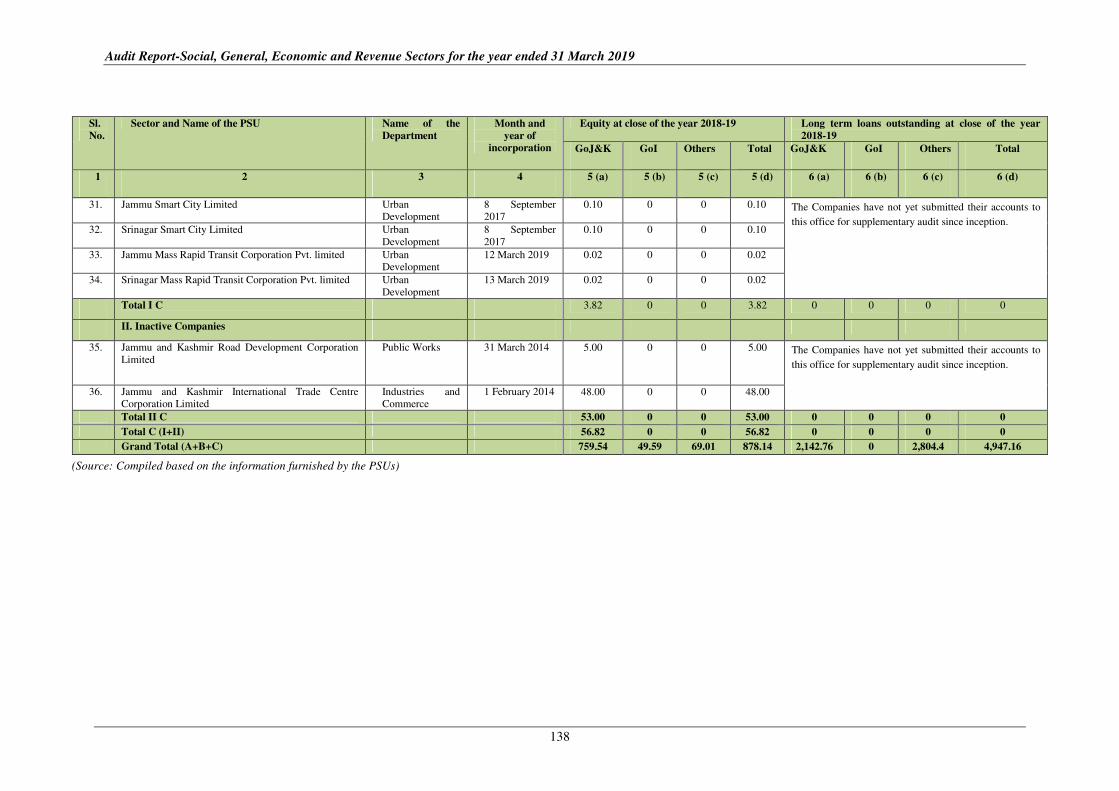
Audit Report-Social, General, Economic and Revenue Sectors for the year ended 31 March 2019
138
Sl.
No.
Sector and Name of the PSU Name of the
Department
Month and
year of
incorporation
Equity at close of the year 2018-19 Long term loans outstanding at close of the year
2018-19
GoJ&K GoI Others Total GoJ&K GoI Others Total
1 2 3 4 5 (a) 5 (b) 5 (c) 5 (d) 6 (a) 6 (b) 6 (c) 6 (d)
31. Jammu Smart City Limited Urban
Development
8 September
2017
0.10 0 0 0.10 The Companies have not yet submitted their accounts to
this office for supplementary audit since inception.
32. Srinagar Smart City Limited Urban
Development
8 September
2017
0.10 0 0 0.10
33. Jammu Mass Rapid Transit Corporation Pvt. limited Urban
Development
12 March 2019 0.02 0 0 0.02
34. Srinagar Mass Rapid Transit Corporation Pvt. limited Urban
Development
13 March 2019 0.02 0 0 0.02
Total I C 3.82 0 0 3.82 0 0 0 0
II. Inactive Companies
35. Jammu and Kashmir Road Development Corporation
Limited
Public Works 31 March 2014 5.00 0 0 5.00 The Companies have not yet submitted their accounts to
this office for supplementary audit since inception.
36. Jammu and Kashmir International Trade Centre
Corporation Limited
Industries and
Commerce
1 February 2014 48.00 0 0 48.00
Total II C 53.00 0 0 53.00 0 0 0 0
Total C (I+II) 56.82 0 0 56.82 0 0 0 0
Grand Total (A+B+C) 759.54 49.59 69.01 878.14 2,142.76 0 2,804.4 4,947.16
(Source: Compiled based on the information furnished by the PSUs)
Appendices
139
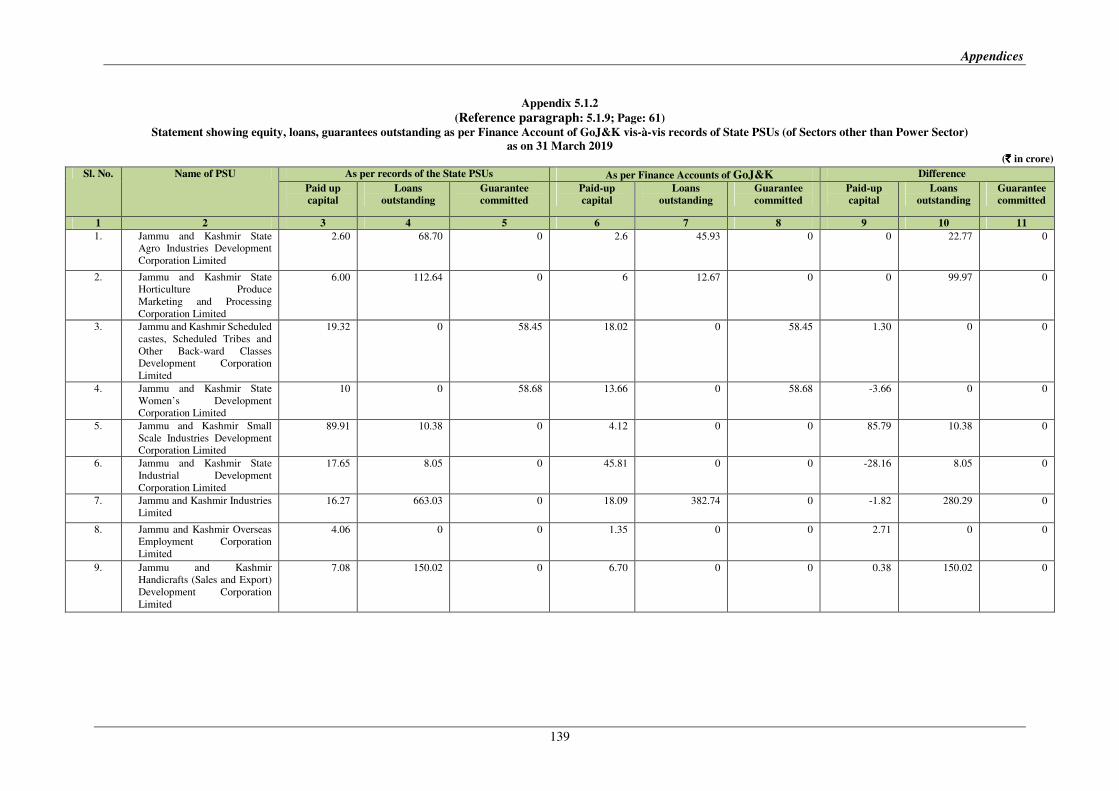
Appendix 5.1.2
(Reference paragraph: 5.1.9; Page: 61)
Statement showing equity, loans, guarantees outstanding as per Finance Account of GoJ&K vis-à-vis records of State PSUs (of Sectors other than Power Sector)
as on 31 March 2019 (`̀̀̀ in crore)
Sl. No. Name of PSU As per records of the State PSUs As per Finance Accounts of GoJ&K Difference
Paid up
capital
Loans
outstanding
Guarantee
committed
Paid-up
capital
Loans
outstanding
Guarantee
committed
Paid-up
capital
Loans
outstanding
Guarantee
committed
1 2 3 4 5 6 7 8 9 10 11
1. Jammu and Kashmir State
Agro Industries Development
Corporation Limited
2.60 68.70 0 2.6 45.93 0 0 22.77 0
2. Jammu and Kashmir State
Horticulture Produce
Marketing and Processing
Corporation Limited
6.00 112.64 0 6 12.67 0 0 99.97 0
3. Jammu and Kashmir Scheduled
castes, Scheduled Tribes and
Other Back-ward Classes
Development Corporation
Limited
19.32 0 58.45 18.02 0 58.45 1.30 0 0
4. Jammu and Kashmir State
Women’s Development
Corporation Limited
10 0 58.68 13.66 0 58.68 -3.66 0 0
5. Jammu and Kashmir Small
Scale Industries Development
Corporation Limited
89.91 10.38 0 4.12 0 0 85.79 10.38 0
6. Jammu and Kashmir State
Industrial Development
Corporation Limited
17.65 8.05 0 45.81 0 0 -28.16 8.05 0
7. Jammu and Kashmir Industries
Limited
16.27 663.03 0 18.09 382.74 0 -1.82 280.29 0
8. Jammu and Kashmir Overseas
Employment Corporation
Limited
4.06 0 0 1.35 0 0 2.71 0 0
9. Jammu and Kashmir
Handicrafts (Sales and Export)
Development Corporation
Limited
7.08 150.02 0 6.70 0 0 0.38 150.02 0
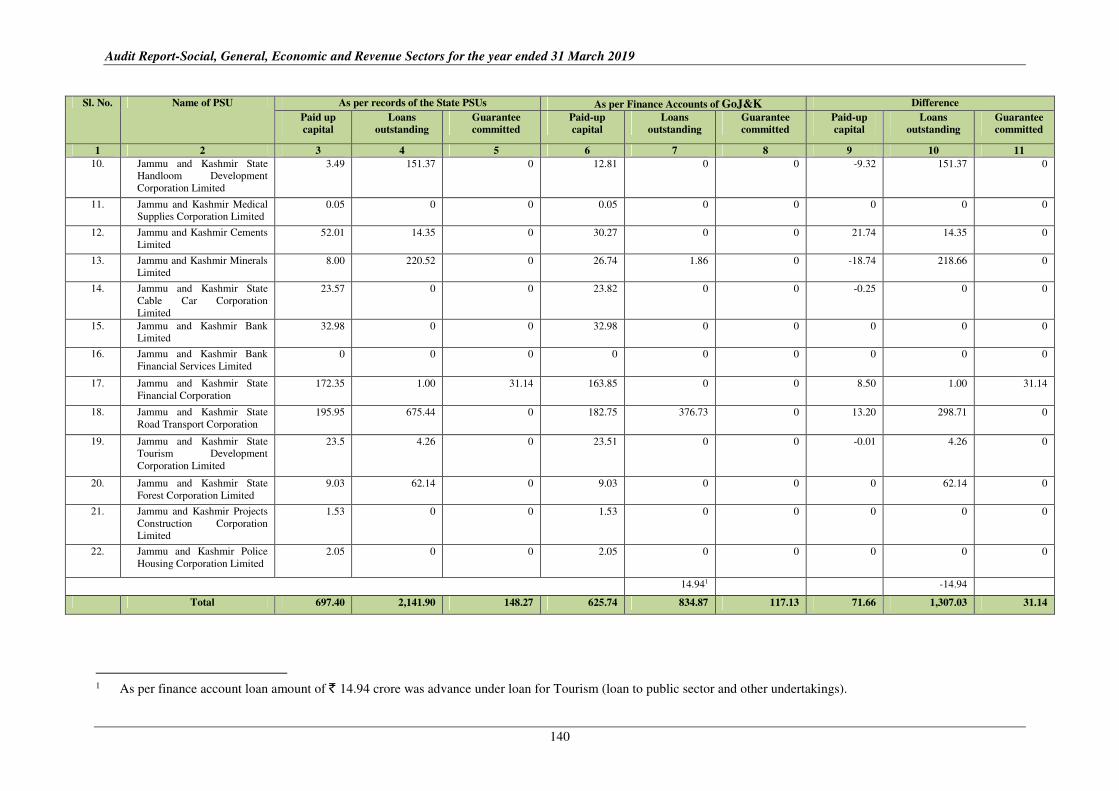
Audit Report-Social, General, Economic and Revenue Sectors for the year ended 31 March 2019
140
Sl. No. Name of PSU As per records of the State PSUs As per Finance Accounts of GoJ&K Difference
Paid up
capital
Loans
outstanding
Guarantee
committed
Paid-up
capital
Loans
outstanding
Guarantee
committed
Paid-up
capital
Loans
outstanding
Guarantee
committed
1 2 3 4 5 6 7 8 9 10 11
10. Jammu and Kashmir State
Handloom Development
Corporation Limited
3.49 151.37 0 12.81 0 0 -9.32 151.37 0
11. Jammu and Kashmir Medical
Supplies Corporation Limited 0.05 0 0 0.05 0 0 0 0 0
12. Jammu and Kashmir Cements
Limited
52.01 14.35 0 30.27 0 0 21.74 14.35 0
13. Jammu and Kashmir Minerals
Limited 8.00 220.52 0 26.74 1.86 0 -18.74 218.66 0
14. Jammu and Kashmir State
Cable Car Corporation
Limited
23.57 0 0 23.82 0 0 -0.25 0 0
15. Jammu and Kashmir Bank
Limited 32.98 0 0 32.98 0 0 0 0 0
16. Jammu and Kashmir Bank
Financial Services Limited
0 0 0 0 0 0 0 0 0
17. Jammu and Kashmir State
Financial Corporation
172.35 1.00 31.14 163.85 0 0 8.50 1.00 31.14
18. Jammu and Kashmir State
Road Transport Corporation
195.95 675.44 0 182.75 376.73 0 13.20 298.71 0
19. Jammu and Kashmir State
Tourism Development
Corporation Limited
23.5 4.26 0 23.51 0 0 -0.01 4.26 0
20. Jammu and Kashmir State
Forest Corporation Limited
9.03 62.14 0 9.03 0 0 0 62.14 0
21. Jammu and Kashmir Projects
Construction Corporation
Limited
1.53 0 0 1.53 0 0 0 0 0
22. Jammu and Kashmir Police
Housing Corporation Limited
2.05 0 0 2.05 0 0 0 0 0
14.941 -14.94
Total 697.40 2,141.90 148.27 625.74 834.87 117.13 71.66 1,307.03 31.14
1 As per finance account loan amount of ` 14.94 crore was advance under loan for Tourism (loan to public sector and other undertakings).
Appendices
141
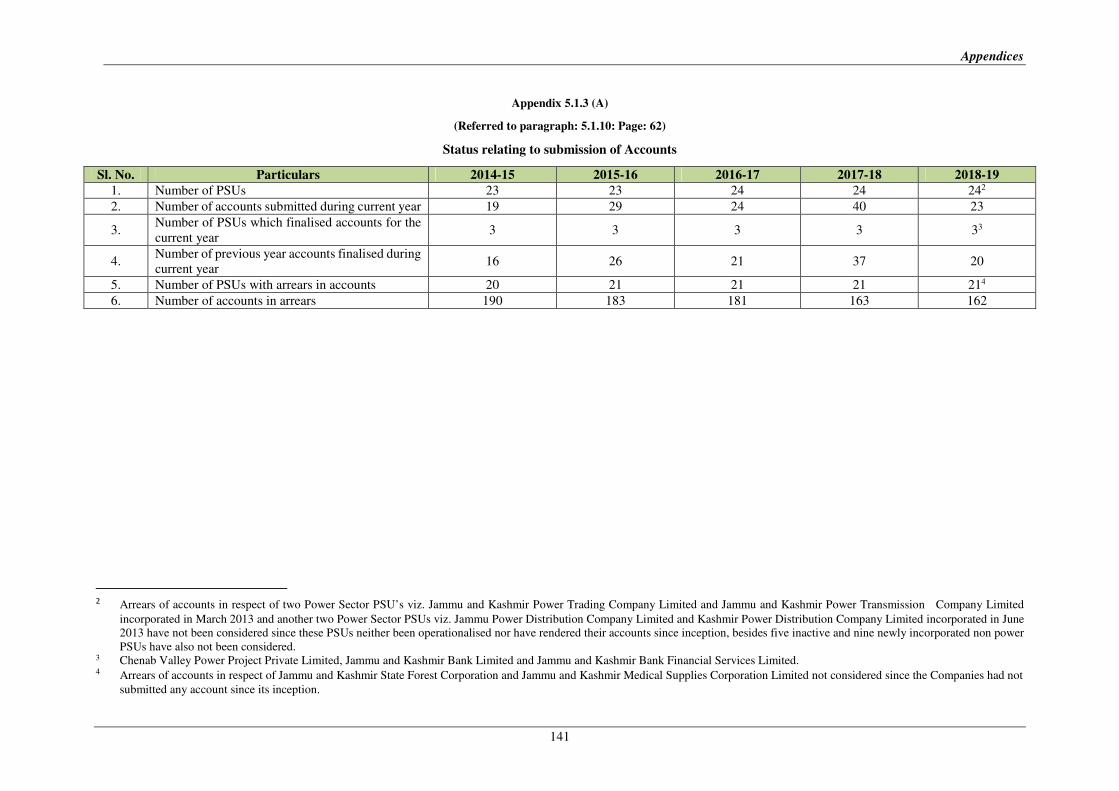
Appendix 5.1.3 (A)
(Referred to paragraph: 5.1.10: Page: 62)
Status relating to submission of Accounts
Sl. No. Particulars 2014-15 2015-16 2016-17 2017-18 2018-19
1. Number of PSUs 23 23 24 24 242 2. Number of accounts submitted during current year 19 29 24 40 23
3. Number of PSUs which finalised accounts for the
current year 3 3 3 3 33
4. Number of previous year accounts finalised during
current year 16 26 21 37 20
5. Number of PSUs with arrears in accounts 20 21 21 21 214
6. Number of accounts in arrears 190 183 181 163 162
2 Arrears of accounts in respect of two Power Sector PSU’s viz. Jammu and Kashmir Power Trading Company Limited and Jammu and Kashmir Power Transmission Company Limited
incorporated in March 2013 and another two Power Sector PSUs viz. Jammu Power Distribution Company Limited and Kashmir Power Distribution Company Limited incorporated in June
2013 have not been considered since these PSUs neither been operationalised nor have rendered their accounts since inception, besides five inactive and nine newly incorporated non power
PSUs have also not been considered. 3 Chenab Valley Power Project Private Limited, Jammu and Kashmir Bank Limited and Jammu and Kashmir Bank Financial Services Limited. 4 Arrears of accounts in respect of Jammu and Kashmir State Forest Corporation and Jammu and Kashmir Medical Supplies Corporation Limited not considered since the Companies had not
submitted any account since its inception.
Audit Report-Social, General, Economic and Revenue Sectors for the year ended 31 March 2019
142
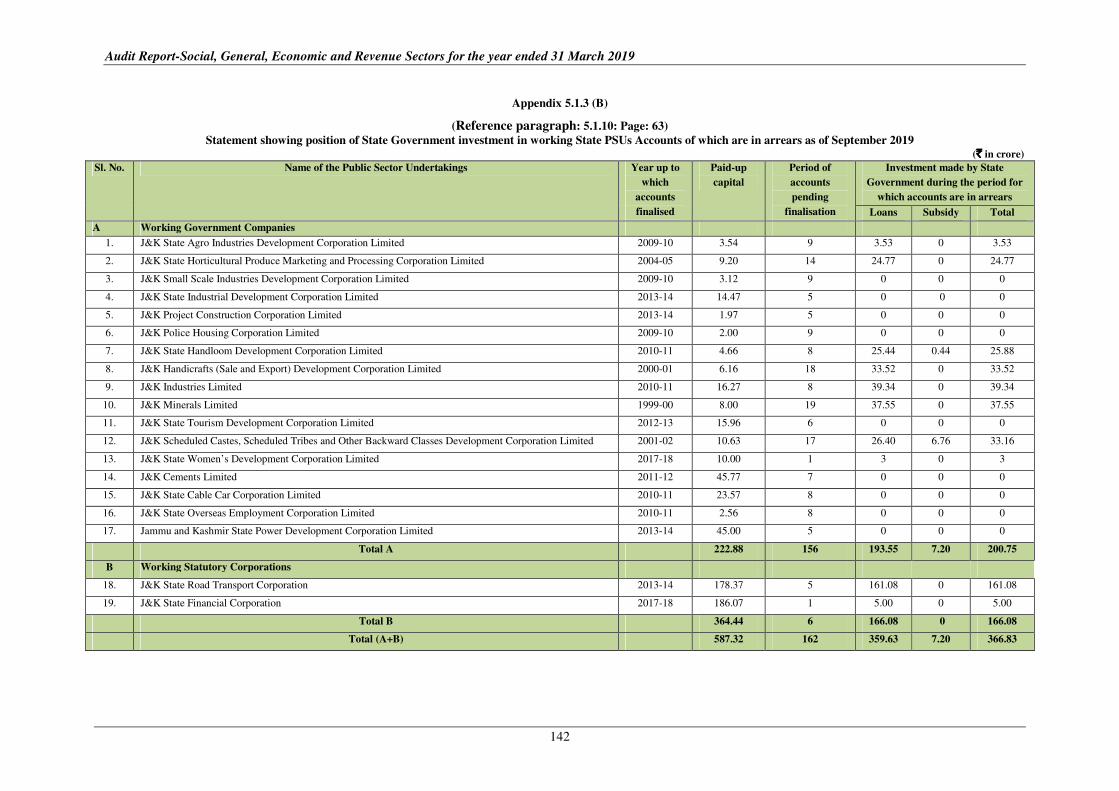
Appendix 5.1.3 (B)
(Reference paragraph: 5.1.10: Page: 63)
Statement showing position of State Government investment in working State PSUs Accounts of which are in arrears as of September 2019
(`̀̀̀ in crore)
Sl. No. Name of the Public Sector Undertakings Year up to
which
accounts
finalised
Paid-up
capital
Period of
accounts
pending
finalisation
Investment made by State
Government during the period for
which accounts are in arrears
Loans Subsidy Total
A Working Government Companies
1. J&K State Agro Industries Development Corporation Limited 2009-10 3.54 9 3.53 0 3.53
2. J&K State Horticultural Produce Marketing and Processing Corporation Limited 2004-05 9.20 14 24.77 0 24.77
3. J&K Small Scale Industries Development Corporation Limited 2009-10 3.12 9 0 0 0
4. J&K State Industrial Development Corporation Limited 2013-14 14.47 5 0 0 0
5. J&K Project Construction Corporation Limited 2013-14 1.97 5 0 0 0
6. J&K Police Housing Corporation Limited 2009-10 2.00 9 0 0 0
7. J&K State Handloom Development Corporation Limited 2010-11 4.66 8 25.44 0.44 25.88
8. J&K Handicrafts (Sale and Export) Development Corporation Limited 2000-01 6.16 18 33.52 0 33.52
9. J&K Industries Limited 2010-11 16.27 8 39.34 0 39.34
10. J&K Minerals Limited 1999-00 8.00 19 37.55 0 37.55
11. J&K State Tourism Development Corporation Limited 2012-13 15.96 6 0 0 0
12. J&K Scheduled Castes, Scheduled Tribes and Other Backward Classes Development Corporation Limited 2001-02 10.63 17 26.40 6.76 33.16
13. J&K State Women’s Development Corporation Limited 2017-18 10.00 1 3 0 3
14. J&K Cements Limited 2011-12 45.77 7 0 0 0
15. J&K State Cable Car Corporation Limited 2010-11 23.57 8 0 0 0
16. J&K State Overseas Employment Corporation Limited 2010-11 2.56 8 0 0 0
17. Jammu and Kashmir State Power Development Corporation Limited 2013-14 45.00 5 0 0 0
Total A 222.88 156 193.55 7.20 200.75
B Working Statutory Corporations
18. J&K State Road Transport Corporation 2013-14 178.37 5 161.08 0 161.08
19. J&K State Financial Corporation 2017-18 186.07 1 5.00 0 5.00
Total B 364.44 6 166.08 0 166.08
Total (A+B) 587.32 162 359.63 7.20 366.83
Appendices
143
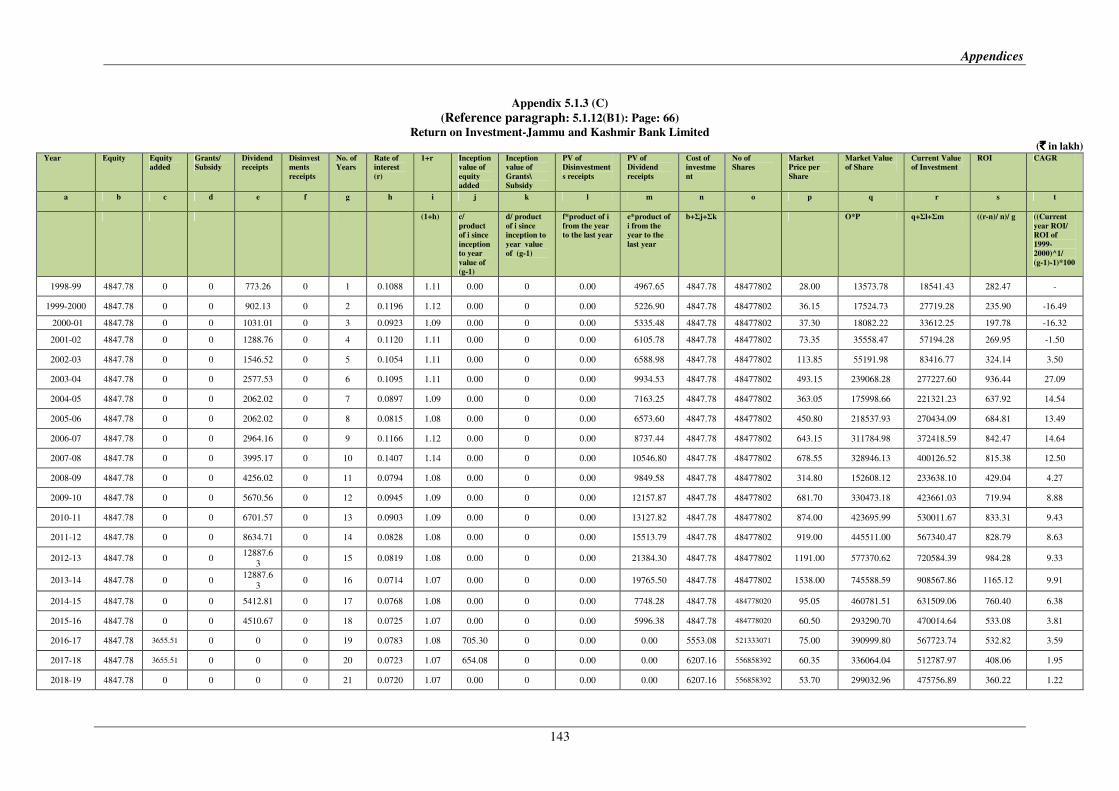
Appendix 5.1.3 (C)
(Reference paragraph: 5.1.12(B1): Page: 66)
Return on Investment-Jammu and Kashmir Bank Limited
(`̀̀̀ in lakh) Year Equity Equity
added
Grants/
Subsidy
Dividend
receipts
Disinvest
ments
receipts
No. of
Years
Rate of
interest
(r)
1+r Inception
value of
equity
added
Inception
value of
Grants\
Subsidy
PV of
Disinvestment
s receipts
PV of
Dividend
receipts
Cost of
investme
nt
No of
Shares
Market
Price per
Share
Market Value
of Share
Current Value
of Investment
ROI CAGR
a b c d e f g h i j k l m n o p q r s t
(1+h) c/
product
of i since
inception
to year
value of
(g-1)
d/ product
of i since
inception to
year value
of (g-1)
f*product of i
from the year
to the last year
e*product of
i from the
year to the
last year
b+Σj+Σk O*P q+Σl+Σm ((r-n)/ n)/ g ((Current
year ROI/
ROI of
1999-
2000)^1/
(g-1)-1)*100
1998-99 4847.78 0 0 773.26 0 1 0.1088 1.11 0.00 0 0.00 4967.65 4847.78 48477802 28.00 13573.78 18541.43 282.47 -
1999-2000 4847.78 0 0 902.13 0 2 0.1196 1.12 0.00 0 0.00 5226.90 4847.78 48477802 36.15 17524.73 27719.28 235.90 -16.49
2000-01 4847.78 0 0 1031.01 0 3 0.0923 1.09 0.00 0 0.00 5335.48 4847.78 48477802 37.30 18082.22 33612.25 197.78 -16.32
2001-02 4847.78 0 0 1288.76 0 4 0.1120 1.11 0.00 0 0.00 6105.78 4847.78 48477802 73.35 35558.47 57194.28 269.95 -1.50
2002-03 4847.78 0 0 1546.52 0 5 0.1054 1.11 0.00 0 0.00 6588.98 4847.78 48477802 113.85 55191.98 83416.77 324.14 3.50
2003-04 4847.78 0 0 2577.53 0 6 0.1095 1.11 0.00 0 0.00 9934.53 4847.78 48477802 493.15 239068.28 277227.60 936.44 27.09
2004-05 4847.78 0 0 2062.02 0 7 0.0897 1.09 0.00 0 0.00 7163.25 4847.78 48477802 363.05 175998.66 221321.23 637.92 14.54
2005-06 4847.78 0 0 2062.02 0 8 0.0815 1.08 0.00 0 0.00 6573.60 4847.78 48477802 450.80 218537.93 270434.09 684.81 13.49
2006-07 4847.78 0 0 2964.16 0 9 0.1166 1.12 0.00 0 0.00 8737.44 4847.78 48477802 643.15 311784.98 372418.59 842.47 14.64
2007-08 4847.78 0 0 3995.17 0 10 0.1407 1.14 0.00 0 0.00 10546.80 4847.78 48477802 678.55 328946.13 400126.52 815.38 12.50
2008-09 4847.78 0 0 4256.02 0 11 0.0794 1.08 0.00 0 0.00 9849.58 4847.78 48477802 314.80 152608.12 233638.10 429.04 4.27
2009-10 4847.78 0 0 5670.56 0 12 0.0945 1.09 0.00 0 0.00 12157.87 4847.78 48477802 681.70 330473.18 423661.03 719.94 8.88
2010-11 4847.78 0 0 6701.57 0 13 0.0903 1.09 0.00 0 0.00 13127.82 4847.78 48477802 874.00 423695.99 530011.67 833.31 9.43
2011-12 4847.78 0 0 8634.71 0 14 0.0828 1.08 0.00 0 0.00 15513.79 4847.78 48477802 919.00 445511.00 567340.47 828.79 8.63
2012-13 4847.78 0 0 12887.6
3 0 15 0.0819 1.08 0.00 0 0.00 21384.30 4847.78 48477802 1191.00 577370.62 720584.39 984.28 9.33
2013-14 4847.78 0 0 12887.6
3 0 16 0.0714 1.07 0.00 0 0.00 19765.50 4847.78 48477802 1538.00 745588.59 908567.86 1165.12 9.91
2014-15 4847.78 0 0 5412.81 0 17 0.0768 1.08 0.00 0 0.00 7748.28 4847.78 484778020 95.05 460781.51 631509.06 760.40 6.38
2015-16 4847.78 0 0 4510.67 0 18 0.0725 1.07 0.00 0 0.00 5996.38 4847.78 484778020 60.50 293290.70 470014.64 533.08 3.81
2016-17 4847.78 3655.51 0 0 0 19 0.0783 1.08 705.30 0 0.00 0.00 5553.08 521333071 75.00 390999.80 567723.74 532.82 3.59
2017-18 4847.78 3655.51 0 0 0 20 0.0723 1.07 654.08 0 0.00 0.00 6207.16 556858392 60.35 336064.04 512787.97 408.06 1.95
2018-19 4847.78 0 0 0 0 21 0.0720 1.07 0.00 0 0.00 0.00 6207.16 556858392 53.70 299032.96 475756.89 360.22 1.22
Audit Report-Social, General, Economic and Revenue Sectors for the year ended 31 March 2019
144
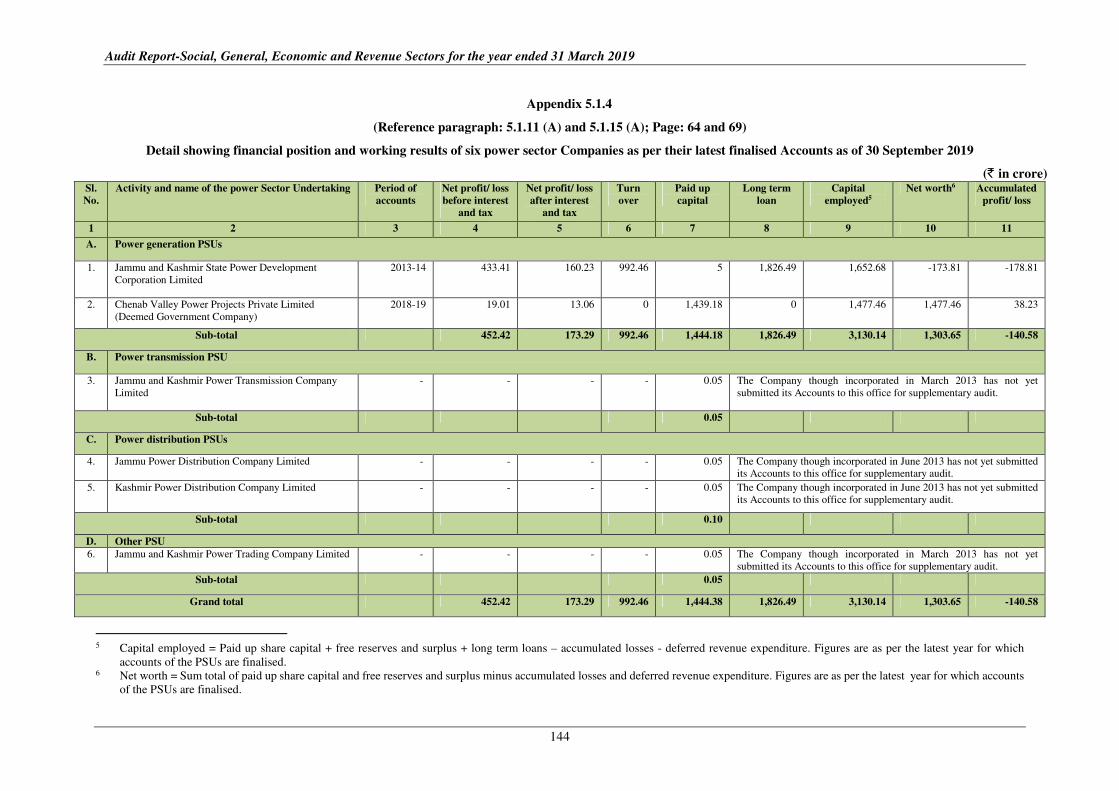
Appendix 5.1.4
(Reference paragraph: 5.1.11 (A) and 5.1.15 (A); Page: 64 and 69)
Detail showing financial position and working results of six power sector Companies as per their latest finalised Accounts as of 30 September 2019
(` in crore) Sl.
No.
Activity and name of the power Sector Undertaking Period of
accounts
Net profit/ loss
before interest
and tax
Net profit/ loss
after interest
and tax
Turn
over
Paid up
capital
Long term
loan
Capital
employed5
Net worth6 Accumulated
profit/ loss
1 2 3 4 5 6 7 8 9 10 11
A. Power generation PSUs
1. Jammu and Kashmir State Power Development
Corporation Limited
2013-14 433.41 160.23 992.46 5 1,826.49 1,652.68 -173.81 -178.81
2. Chenab Valley Power Projects Private Limited
(Deemed Government Company)
2018-19 19.01 13.06 0 1,439.18 0 1,477.46 1,477.46 38.23
Sub-total 452.42 173.29 992.46 1,444.18 1,826.49 3,130.14 1,303.65 -140.58
B. Power transmission PSU
3. Jammu and Kashmir Power Transmission Company
Limited
- - - - 0.05 The Company though incorporated in March 2013 has not yet
submitted its Accounts to this office for supplementary audit.
Sub-total 0.05
C. Power distribution PSUs
4. Jammu Power Distribution Company Limited - - - - 0.05 The Company though incorporated in June 2013 has not yet submitted
its Accounts to this office for supplementary audit.
5. Kashmir Power Distribution Company Limited - - - - 0.05 The Company though incorporated in June 2013 has not yet submitted
its Accounts to this office for supplementary audit.
Sub-total 0.10
D. Other PSU
6. Jammu and Kashmir Power Trading Company Limited - - - - 0.05 The Company though incorporated in March 2013 has not yet
submitted its Accounts to this office for supplementary audit.
Sub-total 0.05
Grand total 452.42 173.29 992.46 1,444.38 1,826.49 3,130.14 1,303.65 -140.58
5 Capital employed = Paid up share capital + free reserves and surplus + long term loans – accumulated losses - deferred revenue expenditure. Figures are as per the latest year for which
accounts of the PSUs are finalised. 6 Net worth = Sum total of paid up share capital and free reserves and surplus minus accumulated losses and deferred revenue expenditure. Figures are as per the latest year for which accounts
of the PSUs are finalised.
Appendices
145
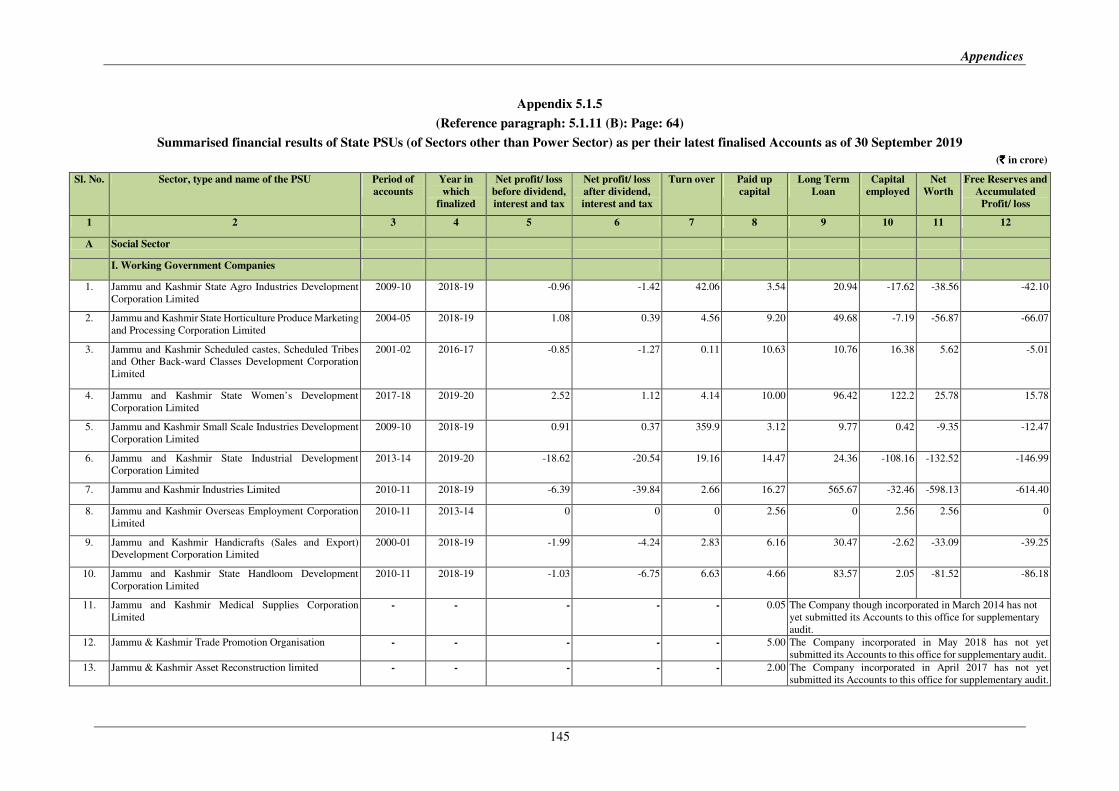
Appendix 5.1.5
(Reference paragraph: 5.1.11 (B): Page: 64)
Summarised financial results of State PSUs (of Sectors other than Power Sector) as per their latest finalised Accounts as of 30 September 2019
(`̀̀̀ in crore)
Sl. No. Sector, type and name of the PSU Period of
accounts
Year in
which
finalized
Net profit/ loss
before dividend,
interest and tax
Net profit/ loss
after dividend,
interest and tax
Turn over Paid up
capital
Long Term
Loan
Capital
employed
Net
Worth
Free Reserves and
Accumulated
Profit/ loss
1 2 3 4 5 6 7 8 9 10 11 12
A Social Sector
I. Working Government Companies
1. Jammu and Kashmir State Agro Industries Development
Corporation Limited
2009-10 2018-19 -0.96 -1.42 42.06 3.54 20.94 -17.62 -38.56 -42.10
2. Jammu and Kashmir State Horticulture Produce Marketing
and Processing Corporation Limited
2004-05 2018-19 1.08 0.39 4.56 9.20 49.68 -7.19 -56.87 -66.07
3. Jammu and Kashmir Scheduled castes, Scheduled Tribes
and Other Back-ward Classes Development Corporation
Limited
2001-02 2016-17 -0.85 -1.27 0.11 10.63 10.76 16.38 5.62 -5.01
4. Jammu and Kashmir State Women’s Development
Corporation Limited
2017-18 2019-20 2.52 1.12 4.14 10.00 96.42 122.2 25.78 15.78
5. Jammu and Kashmir Small Scale Industries Development
Corporation Limited
2009-10 2018-19 0.91 0.37 359.9 3.12 9.77 0.42 -9.35 -12.47
6. Jammu and Kashmir State Industrial Development
Corporation Limited
2013-14 2019-20 -18.62 -20.54 19.16 14.47 24.36 -108.16 -132.52 -146.99
7. Jammu and Kashmir Industries Limited 2010-11 2018-19 -6.39 -39.84 2.66 16.27 565.67 -32.46 -598.13 -614.40
8. Jammu and Kashmir Overseas Employment Corporation
Limited
2010-11 2013-14 0 0 0 2.56 0 2.56 2.56 0
9. Jammu and Kashmir Handicrafts (Sales and Export)
Development Corporation Limited
2000-01 2018-19 -1.99 -4.24 2.83 6.16 30.47 -2.62 -33.09 -39.25
10. Jammu and Kashmir State Handloom Development
Corporation Limited
2010-11 2018-19 -1.03 -6.75 6.63 4.66 83.57 2.05 -81.52 -86.18
11. Jammu and Kashmir Medical Supplies Corporation
Limited
- - - - - 0.05 The Company though incorporated in March 2014 has not
yet submitted its Accounts to this office for supplementary
audit.
12. Jammu & Kashmir Trade Promotion Organisation - - - - - 5.00 The Company incorporated in May 2018 has not yet
submitted its Accounts to this office for supplementary audit.
13. Jammu & Kashmir Asset Reconstruction limited - - - - - 2.00 The Company incorporated in April 2017 has not yet
submitted its Accounts to this office for supplementary audit.
Audit Report-Social, General, Economic and Revenue Sectors for the year ended 31 March 2019
146
Sl. No. Sector, type and name of the PSU Period of
accounts
Year in
which
finalized
Net profit/ loss
before dividend,
interest and tax
Net profit/ loss
after dividend,
interest and tax
Turn over Paid up
capital
Long Term
Loan
Capital
employed
Net
Worth
Free Reserves and
Accumulated
Profit/ loss
1 2 3 4 5 6 7 8 9 10 11 12
A Social Sector
I. Working Government Companies
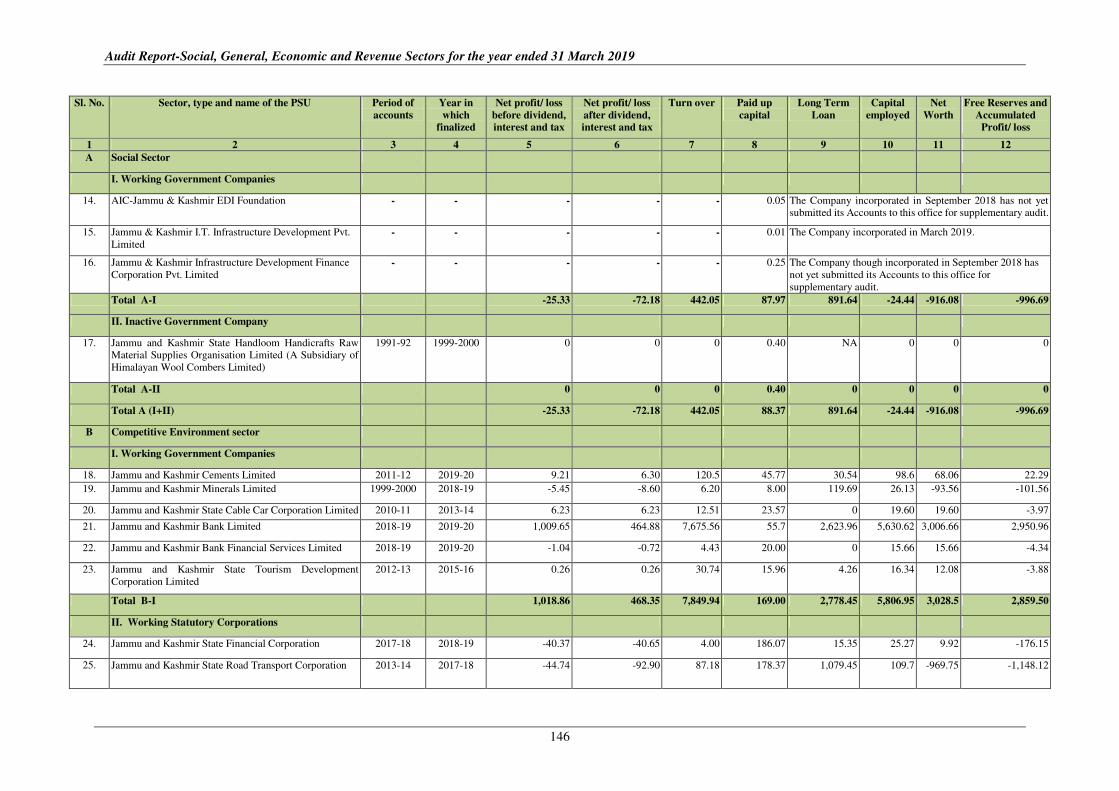
14. AIC-Jammu & Kashmir EDI Foundation - - - - - 0.05 The Company incorporated in September 2018 has not yet
submitted its Accounts to this office for supplementary audit.
15. Jammu & Kashmir I.T. Infrastructure Development Pvt.
Limited
- - - - - 0.01 The Company incorporated in March 2019.
16. Jammu & Kashmir Infrastructure Development Finance
Corporation Pvt. Limited
- - - - - 0.25 The Company though incorporated in September 2018 has
not yet submitted its Accounts to this office for
supplementary audit.
Total A-I -25.33 -72.18 442.05 87.97 891.64 -24.44 -916.08 -996.69
II. Inactive Government Company
17. Jammu and Kashmir State Handloom Handicrafts Raw
Material Supplies Organisation Limited (A Subsidiary of
Himalayan Wool Combers Limited)
1991-92 1999-2000 0 0 0 0.40 NA 0 0 0
Total A-II 0 0 0 0.40 0 0 0 0
Total A (I+II) -25.33 -72.18 442.05 88.37 891.64 -24.44 -916.08 -996.69
B Competitive Environment sector
I. Working Government Companies
18. Jammu and Kashmir Cements Limited 2011-12 2019-20 9.21 6.30 120.5 45.77 30.54 98.6 68.06 22.29
19. Jammu and Kashmir Minerals Limited 1999-2000 2018-19 -5.45 -8.60 6.20 8.00 119.69 26.13 -93.56 -101.56
20. Jammu and Kashmir State Cable Car Corporation Limited 2010-11 2013-14 6.23 6.23 12.51 23.57 0 19.60 19.60 -3.97
21. Jammu and Kashmir Bank Limited 2018-19 2019-20 1,009.65 464.88 7,675.56 55.7 2,623.96 5,630.62 3,006.66 2,950.96
22. Jammu and Kashmir Bank Financial Services Limited 2018-19 2019-20 -1.04 -0.72 4.43 20.00 0 15.66 15.66 -4.34
23. Jammu and Kashmir State Tourism Development
Corporation Limited
2012-13 2015-16 0.26 0.26 30.74 15.96 4.26 16.34 12.08 -3.88
Total B-I 1,018.86 468.35 7,849.94 169.00 2,778.45 5,806.95 3,028.5 2,859.50
II. Working Statutory Corporations
24. Jammu and Kashmir State Financial Corporation 2017-18 2018-19 -40.37 -40.65 4.00 186.07 15.35 25.27 9.92 -176.15
25. Jammu and Kashmir State Road Transport Corporation 2013-14 2017-18 -44.74 -92.90 87.18 178.37 1,079.45 109.7 -969.75 -1,148.12
Appendices
147
Sl. No. Sector, type and name of the PSU Period of
accounts
Year in
which
finalized
Net profit/ loss
before dividend,
interest and tax
Net profit/ loss
after dividend,
interest and tax
Turn over Paid up
capital
Long Term
Loan
Capital
employed
Net
Worth
Free Reserves and
Accumulated
Profit/ loss
1 2 3 4 5 6 7 8 9 10 11 12
B Competitive Environment sector
II. Working Statutory Corporations
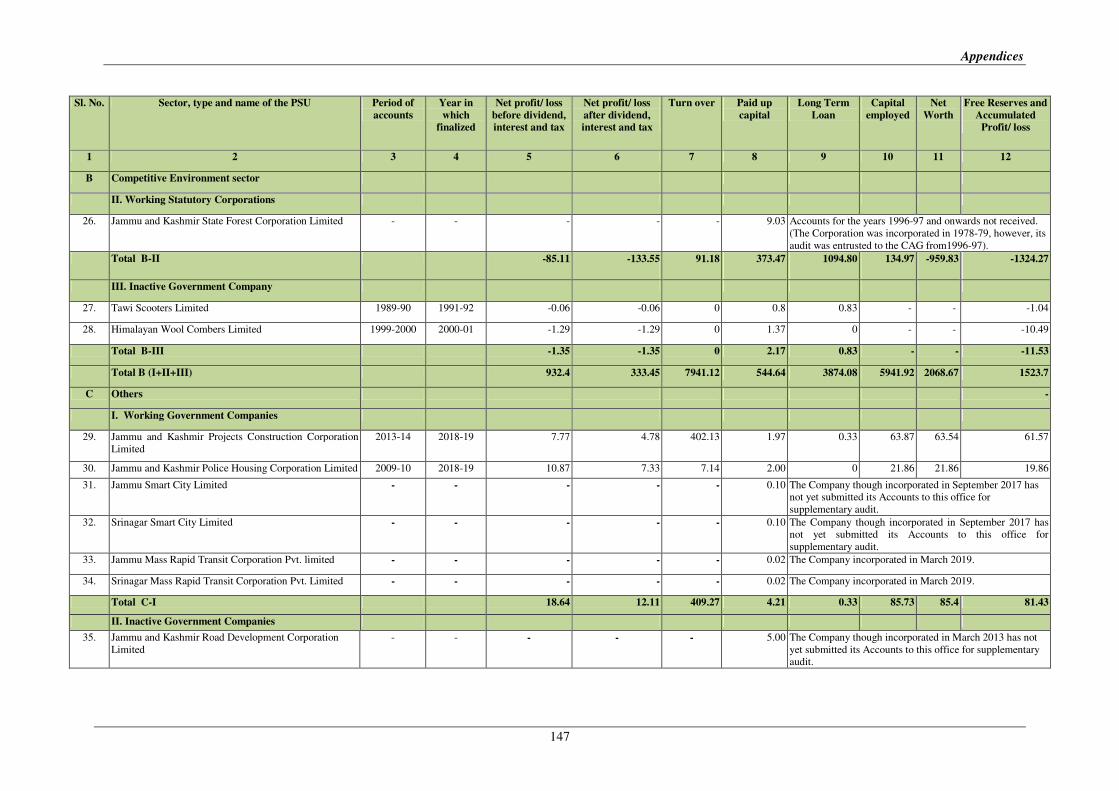
26. Jammu and Kashmir State Forest Corporation Limited - - - - - 9.03 Accounts for the years 1996-97 and onwards not received.
(The Corporation was incorporated in 1978-79, however, its
audit was entrusted to the CAG from1996-97).
Total B-II -85.11 -133.55 91.18 373.47 1094.80 134.97 -959.83 -1324.27
III. Inactive Government Company
27. Tawi Scooters Limited 1989-90 1991-92 -0.06 -0.06 0 0.8 0.83 - - -1.04
28. Himalayan Wool Combers Limited 1999-2000 2000-01 -1.29 -1.29 0 1.37 0 - - -10.49
Total B-III -1.35 -1.35 0 2.17 0.83 - - -11.53
Total B (I+II+III) 932.4 333.45 7941.12 544.64 3874.08 5941.92 2068.67 1523.7
C Others -
I. Working Government Companies
29. Jammu and Kashmir Projects Construction Corporation
Limited
2013-14 2018-19 7.77 4.78 402.13 1.97 0.33 63.87 63.54 61.57
30. Jammu and Kashmir Police Housing Corporation Limited 2009-10 2018-19 10.87 7.33 7.14 2.00 0 21.86 21.86 19.86
31. Jammu Smart City Limited - - - - - 0.10 The Company though incorporated in September 2017 has
not yet submitted its Accounts to this office for
supplementary audit.
32. Srinagar Smart City Limited - - - - - 0.10 The Company though incorporated in September 2017 has
not yet submitted its Accounts to this office for
supplementary audit.
33. Jammu Mass Rapid Transit Corporation Pvt. limited - - - - - 0.02 The Company incorporated in March 2019.
34. Srinagar Mass Rapid Transit Corporation Pvt. Limited - - - - - 0.02 The Company incorporated in March 2019.
Total C-I 18.64 12.11 409.27 4.21 0.33 85.73 85.4 81.43
II. Inactive Government Companies
35. Jammu and Kashmir Road Development Corporation
Limited
- - - - - 5.00 The Company though incorporated in March 2013 has not
yet submitted its Accounts to this office for supplementary
audit.
Audit Report-Social, General, Economic and Revenue Sectors for the year ended 31 March 2019
148
Sl. No. Sector, type and name of the PSU Period of
accounts
Year in which
finalized
Net profit/ loss
before
dividend,
interest and
tax
Net profit/ loss
after dividend,
interest and tax
Turn over Paid up
capital
Long Term
Loan
Capital
employed
Net Worth Free Reserves
and
Accumulated
Profit/ loss
1 2 3 4 5 6 7 8 9 10 11 12
C Others
II. Inactive Government Companies
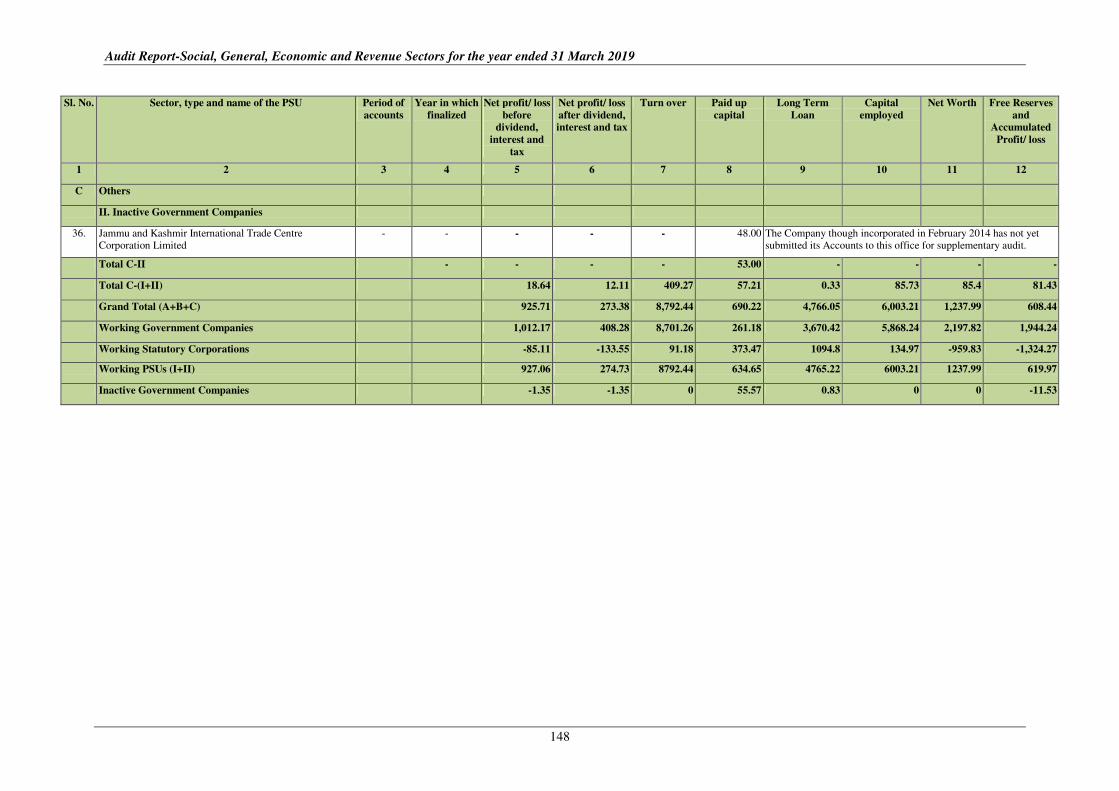
36. Jammu and Kashmir International Trade Centre
Corporation Limited
- - - - - 48.00 The Company though incorporated in February 2014 has not yet
submitted its Accounts to this office for supplementary audit.
Total C-II - - - - 53.00 - - - -
Total C-(I+II) 18.64 12.11 409.27 57.21 0.33 85.73 85.4 81.43
Grand Total (A+B+C) 925.71 273.38 8,792.44 690.22 4,766.05 6,003.21 1,237.99 608.44
Working Government Companies 1,012.17 408.28 8,701.26 261.18 3,670.42 5,868.24 2,197.82 1,944.24
Working Statutory Corporations -85.11 -133.55 91.18 373.47 1094.8 134.97 -959.83 -1,324.27
Working PSUs (I+II) 927.06 274.73 8792.44 634.65 4765.22 6003.21 1237.99 619.97
Inactive Government Companies -1.35 -1.35 0 55.57 0.83 0 0 -11.53
Appendices
149
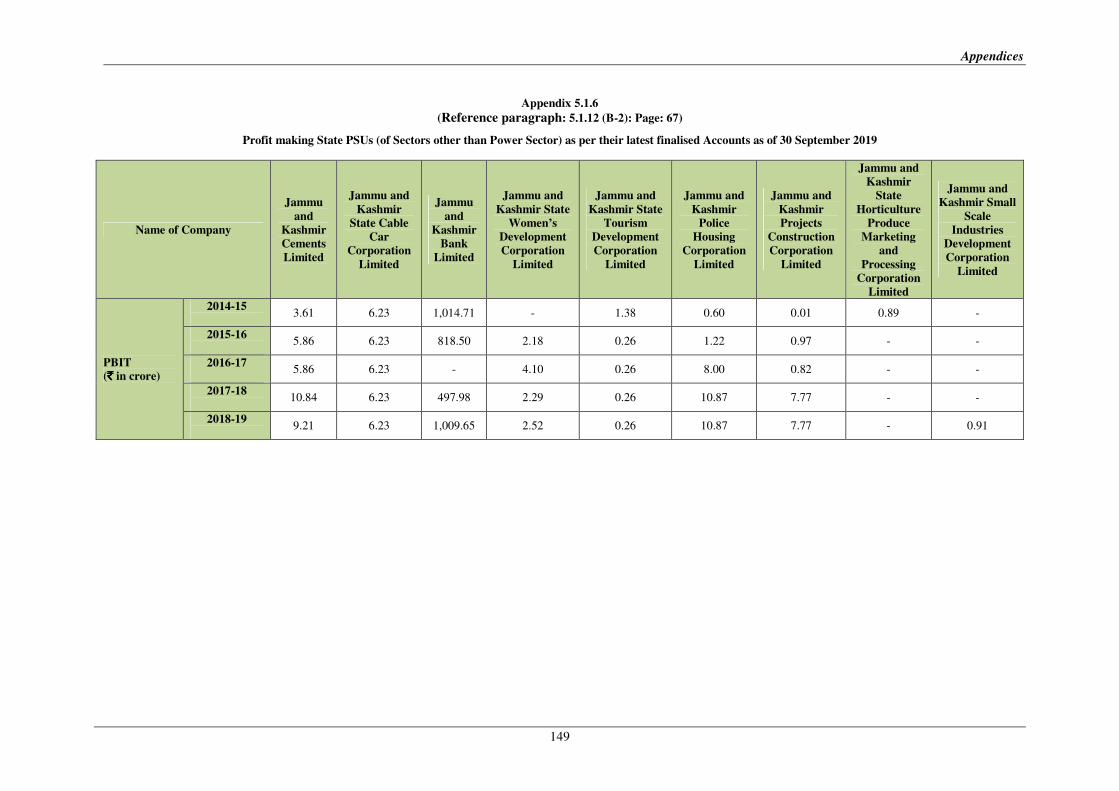
Appendix 5.1.6
(Reference paragraph: 5.1.12 (B-2): Page: 67)
Profit making State PSUs (of Sectors other than Power Sector) as per their latest finalised Accounts as of 30 September 2019
Name of Company
Jammu
and
Kashmir
Cements
Limited
Jammu and
Kashmir
State Cable
Car
Corporation
Limited
Jammu
and
Kashmir
Bank
Limited
Jammu and
Kashmir State
Women’s
Development
Corporation
Limited
Jammu and
Kashmir State
Tourism
Development
Corporation
Limited
Jammu and
Kashmir
Police
Housing
Corporation
Limited
Jammu and
Kashmir
Projects
Construction
Corporation
Limited
Jammu and
Kashmir
State
Horticulture
Produce
Marketing
and
Processing
Corporation
Limited
Jammu and
Kashmir Small
Scale
Industries
Development
Corporation
Limited
PBIT
(`̀̀̀ in crore)
2014-15
3.61 6.23 1,014.71 - 1.38 0.60 0.01 0.89 -
2015-16
5.86 6.23 818.50 2.18 0.26 1.22 0.97 - -
2016-17
5.86 6.23 - 4.10 0.26 8.00 0.82 - -
2017-18
10.84 6.23 497.98 2.29 0.26 10.87 7.77 - -
2018-19
9.21 6.23 1,009.65 2.52 0.26 10.87 7.77 - 0.91
Audit Report-Social, General, Economic and Revenue Sectors for the year ended 31 March 2019
150
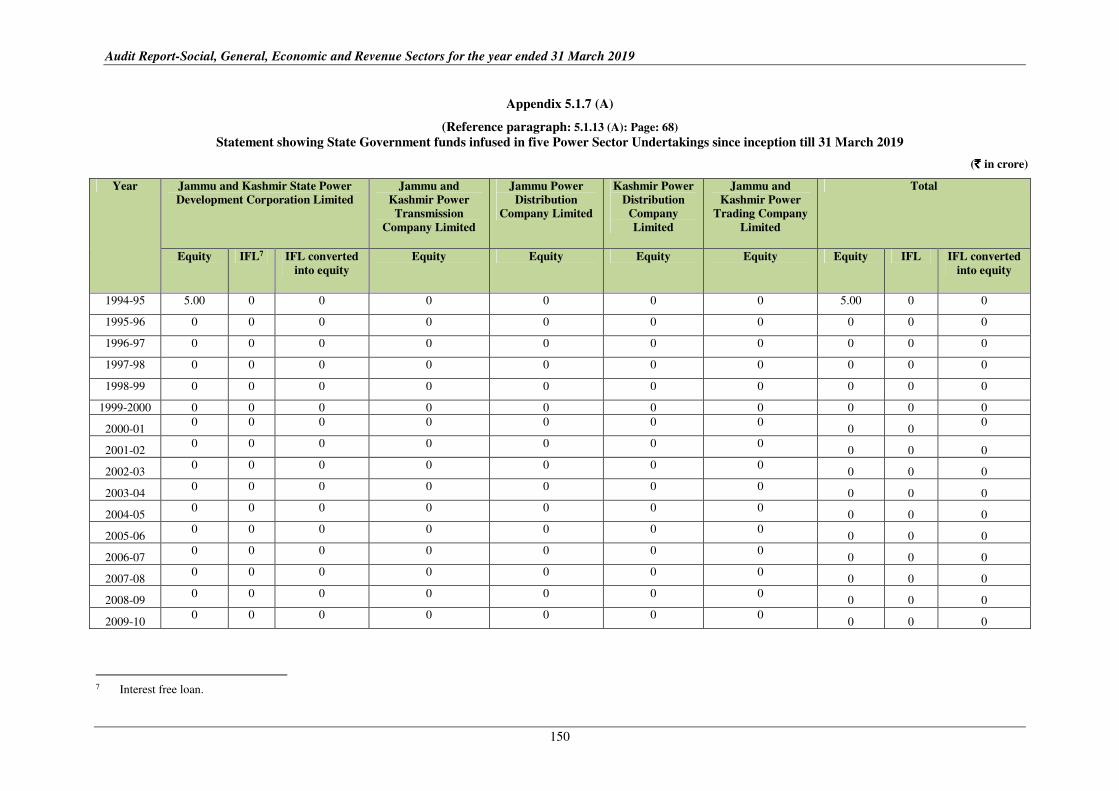
Appendix 5.1.7 (A)
(Reference paragraph: 5.1.13 (A): Page: 68)
Statement showing State Government funds infused in five Power Sector Undertakings since inception till 31 March 2019
(` ` ` ` in crore)
Year Jammu and Kashmir State Power
Development Corporation Limited
Jammu and
Kashmir Power
Transmission
Company Limited
Jammu Power
Distribution
Company Limited
Kashmir Power
Distribution
Company
Limited
Jammu and
Kashmir Power
Trading Company
Limited
Total
Equity IFL7 IFL converted
into equity
Equity Equity Equity Equity Equity IFL IFL converted
into equity
1994-95 5.00 0 0 0 0 0 0 5.00 0 0
1995-96 0 0 0 0 0 0 0 0 0 0
1996-97 0 0 0 0 0 0 0 0 0 0
1997-98 0 0 0 0 0 0 0 0 0 0
1998-99 0 0 0 0 0 0 0 0 0 0
1999-2000 0 0 0 0 0 0 0 0 0 0
2000-01 0 0 0 0 0 0 0
0 0 0
2001-02 0 0 0 0 0 0 0
0 0 0
2002-03 0 0 0 0 0 0 0
0 0 0
2003-04 0 0 0 0 0 0 0
0 0 0
2004-05 0 0 0 0 0 0 0
0 0 0
2005-06 0 0 0 0 0 0 0
0 0 0
2006-07 0 0 0 0 0 0 0
0 0 0
2007-08 0 0 0 0 0 0 0
0 0 0
2008-09 0 0 0 0 0 0 0
0 0 0
2009-10 0 0 0 0 0 0 0
0 0 0
7 Interest free loan.

Appendices
151
Year Jammu and Kashmir State Power
Development Corporation
Limited
Jammu and
Kashmir Power
Transmission
Company
Limited
Jammu Power
Distribution
Company
Limited
Kashmir
Power
Distribution
Company
Limited
Jammu and
Kashmir Power
Trading
Company
Limited
Total
Equity IFL8 IFL
converted
into equity
Equity Equity Equity Equity Equity IFL IFL
converted
into equity
2010-11 0 0 0 0 0 0 0 0 0 0
2011-12 0 0 0 0 0 0 0 0 0 0
2012-13 0 0 0 0.05 0 0 0.05 0.10 0 0
2013-14 0 0 0 0 0.05 0.05 0 0.10 0 0
2014-15 0 0 0 0 0 0 0 0 0 0
2015-16 0 0 0 0 0 0 0 0 0 0
2016-17 0 0 0 0 0 0 0 0 0 0
2017-18 0 0 0 0 0 0 0 0 0 0
2018-19 0 0 0 0 0 0 0 0 0 0
Total 5.00 0 0 0.05 0.05 0.05 0.05 5.20 0 0
8 Interest free loan.
Audit Report-Social, General, Economic and Revenue Sectors for the year ended 31 March 2019
152
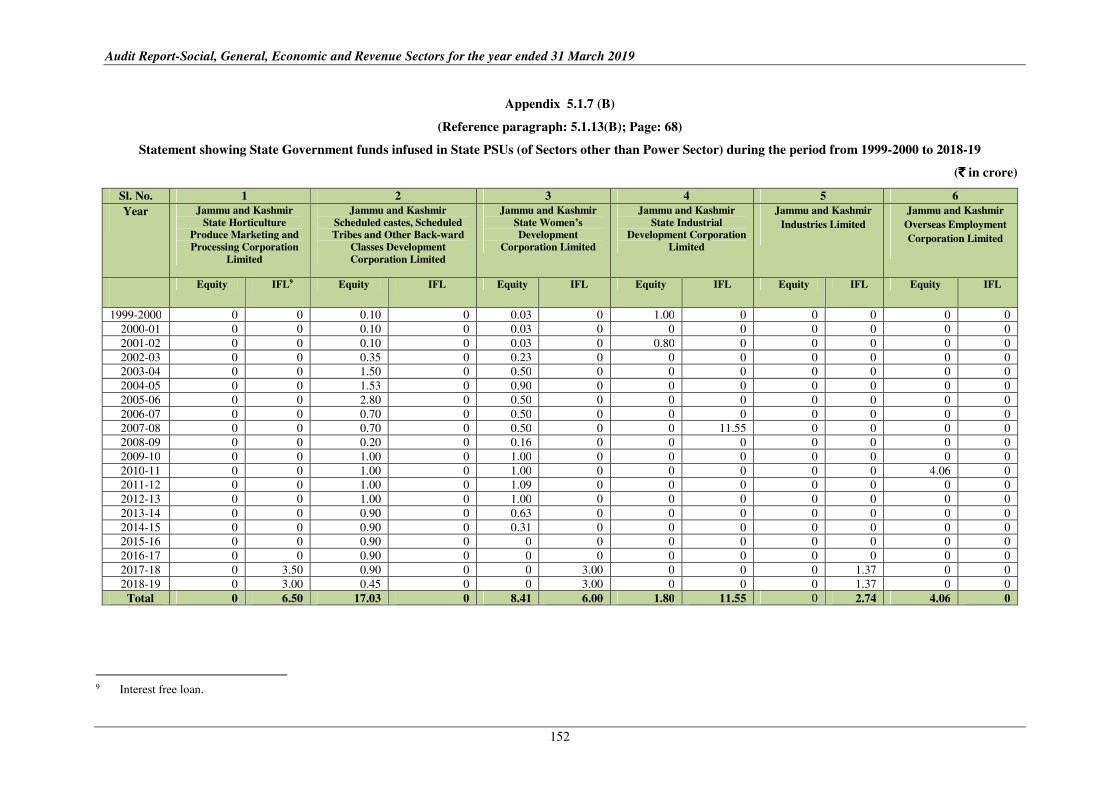
Appendix 5.1.7 (B)
(Reference paragraph: 5.1.13(B); Page: 68)
Statement showing State Government funds infused in State PSUs (of Sectors other than Power Sector) during the period from 1999-2000 to 2018-19
(`̀̀̀ in crore)
Sl. No. 1 2 3 4 5 6
Year Jammu and Kashmir
State Horticulture
Produce Marketing and
Processing Corporation
Limited
Jammu and Kashmir
Scheduled castes, Scheduled
Tribes and Other Back-ward
Classes Development
Corporation Limited
Jammu and Kashmir
State Women’s
Development
Corporation Limited
Jammu and Kashmir
State Industrial
Development Corporation
Limited
Jammu and Kashmir
Industries Limited
Jammu and Kashmir
Overseas Employment
Corporation Limited
Equity IFL9 Equity IFL Equity IFL Equity IFL Equity IFL Equity IFL
1999-2000 0 0 0.10 0 0.03 0 1.00 0 0 0 0 0
2000-01 0 0 0.10 0 0.03 0 0 0 0 0 0 0
2001-02 0 0 0.10 0 0.03 0 0.80 0 0 0 0 0
2002-03 0 0 0.35 0 0.23 0 0 0 0 0 0 0
2003-04 0 0 1.50 0 0.50 0 0 0 0 0 0 0
2004-05 0 0 1.53 0 0.90 0 0 0 0 0 0 0
2005-06 0 0 2.80 0 0.50 0 0 0 0 0 0 0
2006-07 0 0 0.70 0 0.50 0 0 0 0 0 0 0
2007-08 0 0 0.70 0 0.50 0 0 11.55 0 0 0 0
2008-09 0 0 0.20 0 0.16 0 0 0 0 0 0 0
2009-10 0 0 1.00 0 1.00 0 0 0 0 0 0 0
2010-11 0 0 1.00 0 1.00 0 0 0 0 0 4.06 0
2011-12 0 0 1.00 0 1.09 0 0 0 0 0 0 0
2012-13 0 0 1.00 0 1.00 0 0 0 0 0 0 0
2013-14 0 0 0.90 0 0.63 0 0 0 0 0 0 0
2014-15 0 0 0.90 0 0.31 0 0 0 0 0 0 0
2015-16 0 0 0.90 0 0 0 0 0 0 0 0 0
2016-17 0 0 0.90 0 0 0 0 0 0 0 0 0
2017-18 0 3.50 0.90 0 0 3.00 0 0 0 1.37 0 0
2018-19 0 3.00 0.45 0 0 3.00 0 0 0 1.37 0 0
Total 0 6.50 17.03 0 8.41 6.00 1.80 11.55 0 2.74 4.06 0
9 Interest free loan.
Appendices
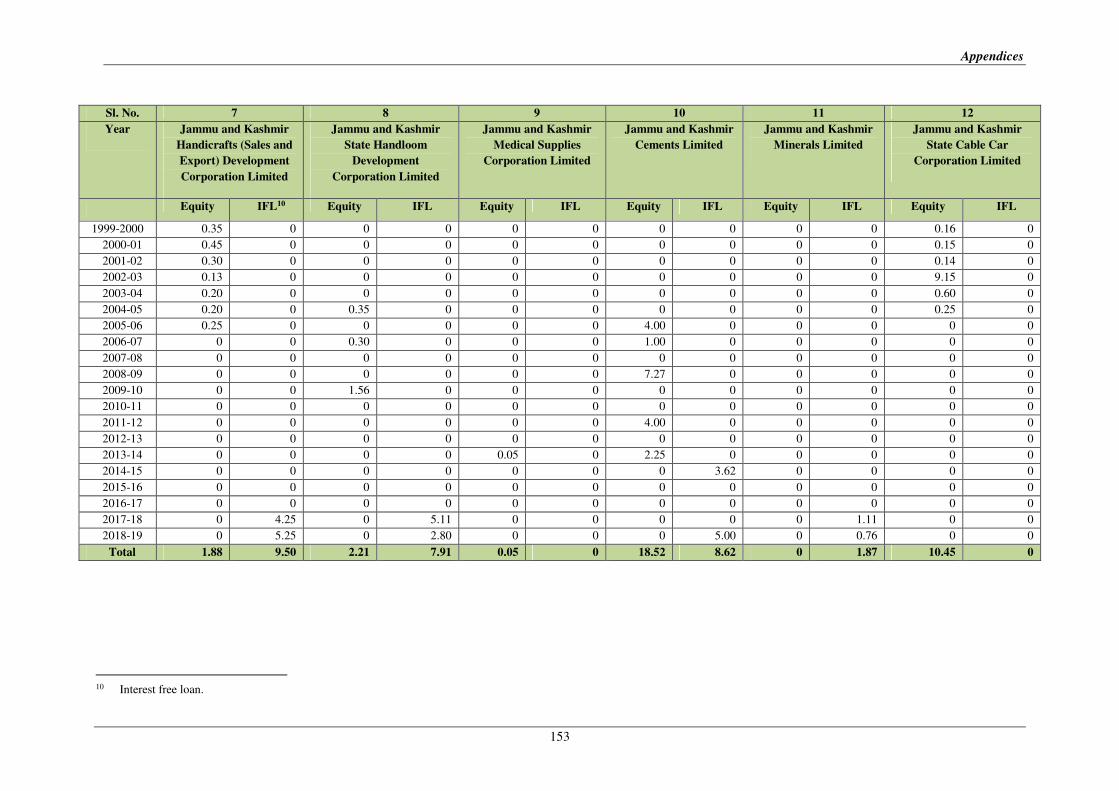
153
10 Interest free loan.
Sl. No. 7 8 9 10 11 12
Year Jammu and Kashmir
Handicrafts (Sales and
Export) Development
Corporation Limited
Jammu and Kashmir
State Handloom
Development
Corporation Limited
Jammu and Kashmir
Medical Supplies
Corporation Limited
Jammu and Kashmir
Cements Limited
Jammu and Kashmir
Minerals Limited
Jammu and Kashmir
State Cable Car
Corporation Limited
Equity IFL10 Equity IFL Equity IFL Equity IFL Equity IFL Equity IFL
1999-2000 0.35 0 0 0 0 0 0 0 0 0 0.16 0
2000-01 0.45 0 0 0 0 0 0 0 0 0 0.15 0
2001-02 0.30 0 0 0 0 0 0 0 0 0 0.14 0
2002-03 0.13 0 0 0 0 0 0 0 0 0 9.15 0
2003-04 0.20 0 0 0 0 0 0 0 0 0 0.60 0
2004-05 0.20 0 0.35 0 0 0 0 0 0 0 0.25 0
2005-06 0.25 0 0 0 0 0 4.00 0 0 0 0 0
2006-07 0 0 0.30 0 0 0 1.00 0 0 0 0 0
2007-08 0 0 0 0 0 0 0 0 0 0 0 0
2008-09 0 0 0 0 0 0 7.27 0 0 0 0 0
2009-10 0 0 1.56 0 0 0 0 0 0 0 0 0
2010-11 0 0 0 0 0 0 0 0 0 0 0 0
2011-12 0 0 0 0 0 0 4.00 0 0 0 0 0
2012-13 0 0 0 0 0 0 0 0 0 0 0 0
2013-14 0 0 0 0 0.05 0 2.25 0 0 0 0 0
2014-15 0 0 0 0 0 0 0 3.62 0 0 0 0
2015-16 0 0 0 0 0 0 0 0 0 0 0 0
2016-17 0 0 0 0 0 0 0 0 0 0 0 0
2017-18 0 4.25 0 5.11 0 0 0 0 0 1.11 0 0
2018-19 0 5.25 0 2.80 0 0 0 5.00 0 0.76 0 0
Total 1.88 9.50 2.21 7.91 0.05 0 18.52 8.62 0 1.87 10.45 0
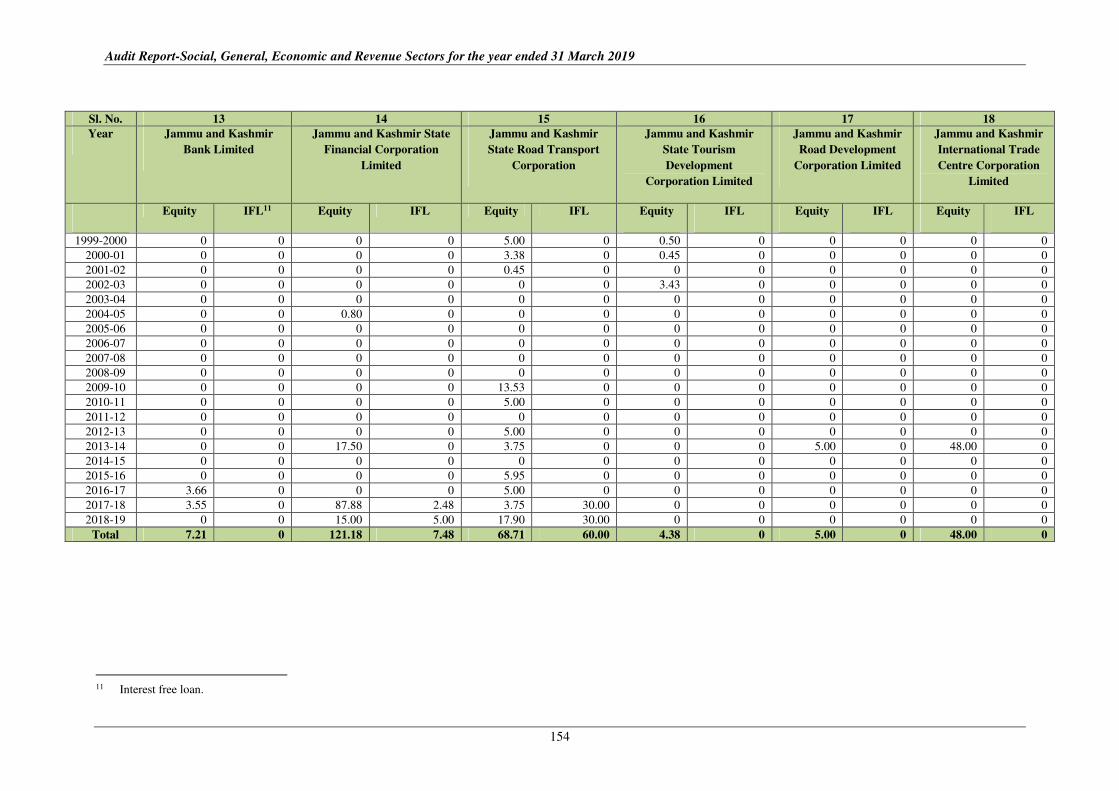
Audit Report-Social, General, Economic and Revenue Sectors for the year ended 31 March 2019
154
11 Interest free loan.
Sl. No. 13 14 15 16 17 18
Year Jammu and Kashmir
Bank Limited
Jammu and Kashmir State
Financial Corporation
Limited
Jammu and Kashmir
State Road Transport
Corporation
Jammu and Kashmir
State Tourism
Development
Corporation Limited
Jammu and Kashmir
Road Development
Corporation Limited
Jammu and Kashmir
International Trade
Centre Corporation
Limited
Equity IFL11 Equity IFL Equity IFL Equity IFL Equity IFL Equity IFL
1999-2000 0 0 0 0 5.00 0 0.50 0 0 0 0 0
2000-01 0 0 0 0 3.38 0 0.45 0 0 0 0 0
2001-02 0 0 0 0 0.45 0 0 0 0 0 0 0
2002-03 0 0 0 0 0 0 3.43 0 0 0 0 0
2003-04 0 0 0 0 0 0 0 0 0 0 0 0
2004-05 0 0 0.80 0 0 0 0 0 0 0 0 0
2005-06 0 0 0 0 0 0 0 0 0 0 0 0
2006-07 0 0 0 0 0 0 0 0 0 0 0 0
2007-08 0 0 0 0 0 0 0 0 0 0 0 0
2008-09 0 0 0 0 0 0 0 0 0 0 0 0
2009-10 0 0 0 0 13.53 0 0 0 0 0 0 0
2010-11 0 0 0 0 5.00 0 0 0 0 0 0 0
2011-12 0 0 0 0 0 0 0 0 0 0 0 0
2012-13 0 0 0 0 5.00 0 0 0 0 0 0 0
2013-14 0 0 17.50 0 3.75 0 0 0 5.00 0 48.00 0
2014-15 0 0 0 0 0 0 0 0 0 0 0 0
2015-16 0 0 0 0 5.95 0 0 0 0 0 0 0
2016-17 3.66 0 0 0 5.00 0 0 0 0 0 0 0
2017-18 3.55 0 87.88 2.48 3.75 30.00 0 0 0 0 0 0
2018-19 0 0 15.00 5.00 17.90 30.00 0 0 0 0 0 0
Total 7.21 0 121.18 7.48 68.71 60.00 4.38 0 5.00 0 48.00 0
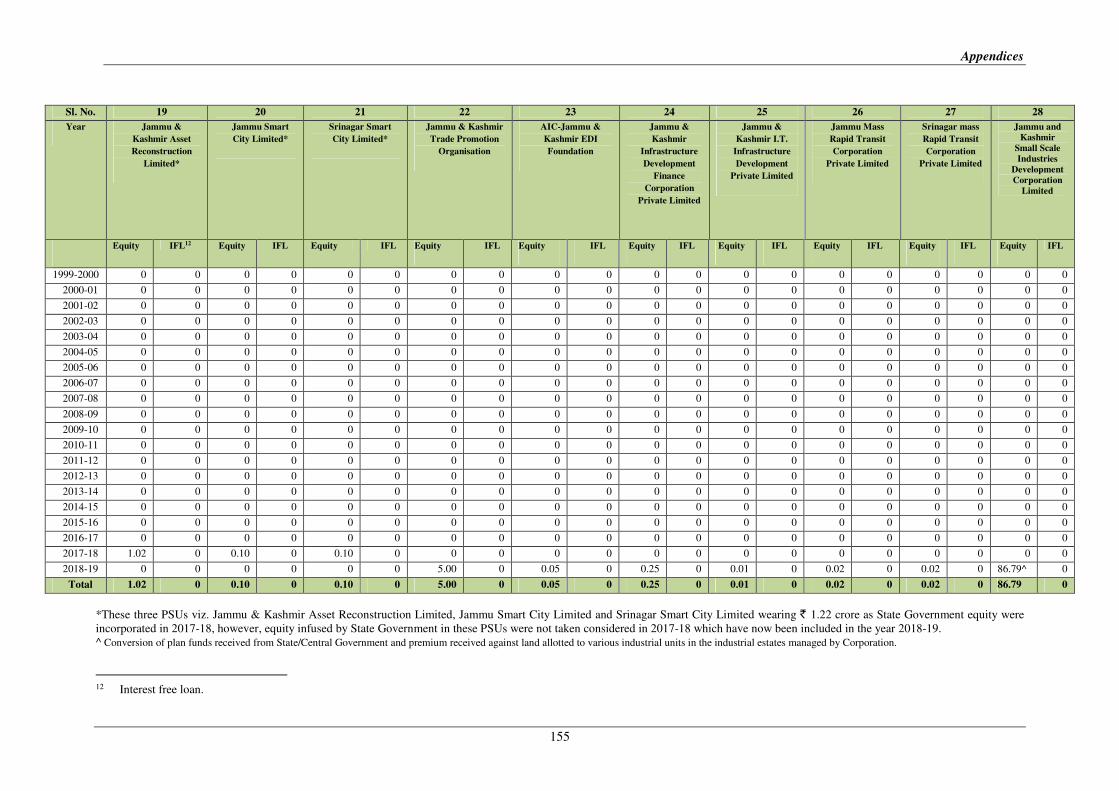
Appendices
155
*These three PSUs viz. Jammu & Kashmir Asset Reconstruction Limited, Jammu Smart City Limited and Srinagar Smart City Limited wearing ` 1.22 crore as State Government equity were
incorporated in 2017-18, however, equity infused by State Government in these PSUs were not taken considered in 2017-18 which have now been included in the year 2018-19.
^ Conversion of plan funds received from State/Central Government and premium received against land allotted to various industrial units in the industrial estates managed by Corporation.
12 Interest free loan.
Sl. No. 19 20 21 22 23 24 25 26 27 28
Year Jammu &
Kashmir Asset
Reconstruction
Limited*
Jammu Smart
City Limited*
Srinagar Smart
City Limited*
Jammu & Kashmir
Trade Promotion
Organisation
AIC-Jammu &
Kashmir EDI
Foundation
Jammu &
Kashmir
Infrastructure
Development
Finance
Corporation
Private Limited
Jammu &
Kashmir I.T.
Infrastructure
Development
Private Limited
Jammu Mass
Rapid Transit
Corporation
Private Limited
Srinagar mass
Rapid Transit
Corporation
Private Limited
Jammu and
Kashmir
Small Scale
Industries
Development
Corporation
Limited
Equity IFL12 Equity IFL Equity IFL Equity IFL Equity IFL Equity IFL Equity IFL Equity IFL Equity IFL Equity IFL
1999-2000 0 0 0 0 0 0 0 0 0 0 0 0 0 0 0 0 0 0 0 0
2000-01 0 0 0 0 0 0 0 0 0 0 0 0 0 0 0 0 0 0 0 0
2001-02 0 0 0 0 0 0 0 0 0 0 0 0 0 0 0 0 0 0 0 0
2002-03 0 0 0 0 0 0 0 0 0 0 0 0 0 0 0 0 0 0 0 0
2003-04 0 0 0 0 0 0 0 0 0 0 0 0 0 0 0 0 0 0 0 0
2004-05 0 0 0 0 0 0 0 0 0 0 0 0 0 0 0 0 0 0 0 0
2005-06 0 0 0 0 0 0 0 0 0 0 0 0 0 0 0 0 0 0 0 0
2006-07 0 0 0 0 0 0 0 0 0 0 0 0 0 0 0 0 0 0 0 0
2007-08 0 0 0 0 0 0 0 0 0 0 0 0 0 0 0 0 0 0 0 0
2008-09 0 0 0 0 0 0 0 0 0 0 0 0 0 0 0 0 0 0 0 0
2009-10 0 0 0 0 0 0 0 0 0 0 0 0 0 0 0 0 0 0 0 0
2010-11 0 0 0 0 0 0 0 0 0 0 0 0 0 0 0 0 0 0 0 0
2011-12 0 0 0 0 0 0 0 0 0 0 0 0 0 0 0 0 0 0 0 0
2012-13 0 0 0 0 0 0 0 0 0 0 0 0 0 0 0 0 0 0 0 0
2013-14 0 0 0 0 0 0 0 0 0 0 0 0 0 0 0 0 0 0 0 0
2014-15 0 0 0 0 0 0 0 0 0 0 0 0 0 0 0 0 0 0 0 0
2015-16 0 0 0 0 0 0 0 0 0 0 0 0 0 0 0 0 0 0 0 0
2016-17 0 0 0 0 0 0 0 0 0 0 0 0 0 0 0 0 0 0 0 0
2017-18 1.02 0 0.10 0 0.10 0 0 0 0 0 0 0 0 0 0 0 0 0 0 0
2018-19 0 0 0 0 0 0 5.00 0 0.05 0 0.25 0 0.01 0 0.02 0 0.02 0 86.79^ 0
Total 1.02 0 0.10 0 0.10 0 5.00 0 0.05 0 0.25 0 0.01 0 0.02 0 0.02 0 86.79 0
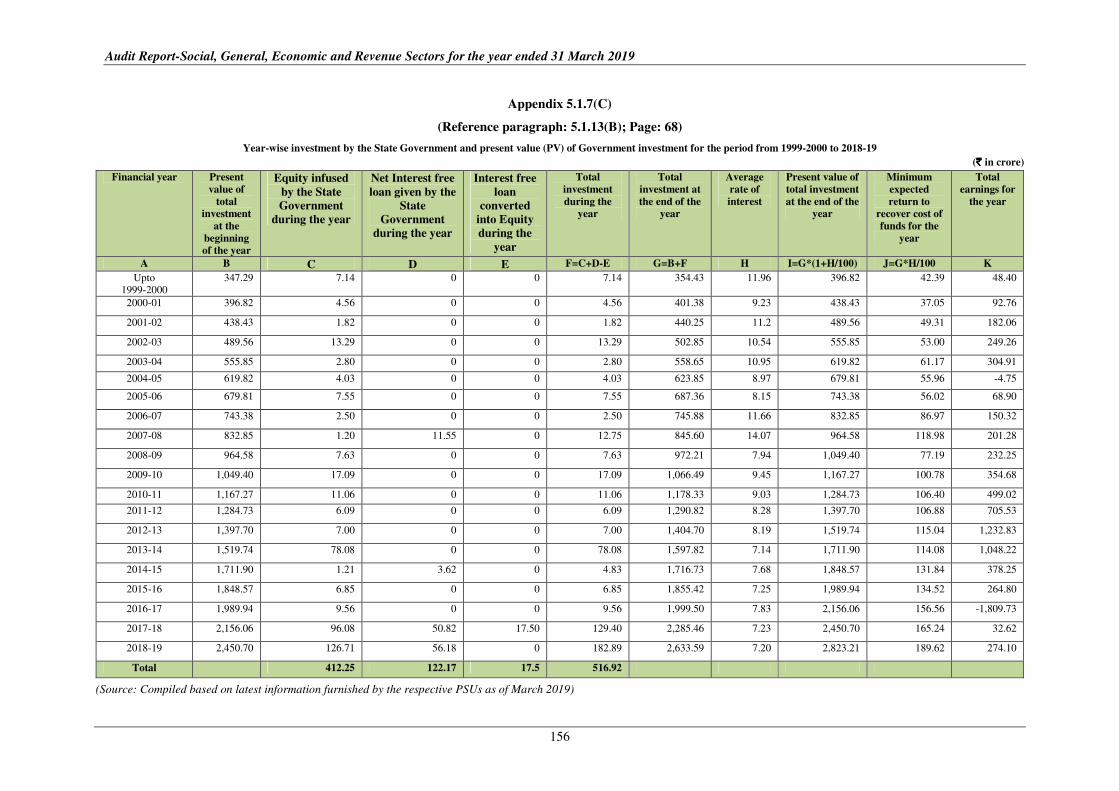
Audit Report-Social, General, Economic and Revenue Sectors for the year ended 31 March 2019
156
Appendix 5.1.7(C)
(Reference paragraph: 5.1.13(B); Page: 68)
Year-wise investment by the State Government and present value (PV) of Government investment for the period from 1999-2000 to 2018-19
(`̀̀̀ in crore)
Financial year Present
value of
total
investment
at the
beginning
of the year
Equity infused
by the State
Government
during the year
Net Interest free
loan given by the
State
Government
during the year
Interest free
loan
converted
into Equity
during the
year
Total
investment
during the
year
Total
investment at
the end of the
year
Average
rate of
interest
Present value of
total investment
at the end of the
year
Minimum
expected
return to
recover cost of
funds for the
year
Total
earnings for
the year
A B C D E F=C+D-E G=B+F H I=G*(1+H/100) J=G*H/100 K
Upto
1999-2000
347.29 7.14 0 0 7.14 354.43 11.96 396.82 42.39 48.40
2000-01 396.82 4.56 0 0 4.56 401.38 9.23 438.43 37.05 92.76
2001-02 438.43 1.82 0 0 1.82 440.25 11.2 489.56 49.31 182.06
2002-03 489.56 13.29 0 0 13.29 502.85 10.54 555.85 53.00 249.26
2003-04 555.85 2.80 0 0 2.80 558.65 10.95 619.82 61.17 304.91
2004-05 619.82 4.03 0 0 4.03 623.85 8.97 679.81 55.96 -4.75
2005-06 679.81 7.55 0 0 7.55 687.36 8.15 743.38 56.02 68.90
2006-07 743.38 2.50 0 0 2.50 745.88 11.66 832.85 86.97 150.32
2007-08 832.85 1.20 11.55 0 12.75 845.60 14.07 964.58 118.98 201.28
2008-09 964.58 7.63 0 0 7.63 972.21 7.94 1,049.40 77.19 232.25
2009-10 1,049.40 17.09 0 0 17.09 1,066.49 9.45 1,167.27 100.78 354.68
2010-11 1,167.27 11.06 0 0 11.06 1,178.33 9.03 1,284.73 106.40 499.02
2011-12 1,284.73 6.09 0 0 6.09 1,290.82 8.28 1,397.70 106.88 705.53
2012-13 1,397.70 7.00 0 0 7.00 1,404.70 8.19 1,519.74 115.04 1,232.83
2013-14 1,519.74 78.08 0 0 78.08 1,597.82 7.14 1,711.90 114.08 1,048.22
2014-15 1,711.90 1.21 3.62 0 4.83 1,716.73 7.68 1,848.57 131.84 378.25
2015-16 1,848.57 6.85 0 0 6.85 1,855.42 7.25 1,989.94 134.52 264.80
2016-17 1,989.94 9.56 0 0 9.56 1,999.50 7.83 2,156.06 156.56 -1,809.73
2017-18 2,156.06 96.08 50.82 17.50 129.40 2,285.46 7.23 2,450.70 165.24 32.62
2018-19 2,450.70 126.71 56.18 0 182.89 2,633.59 7.20 2,823.21 189.62 274.10
Total 412.25 122.17 17.5 516.92
(Source: Compiled based on latest information furnished by the respective PSUs as of March 2019)
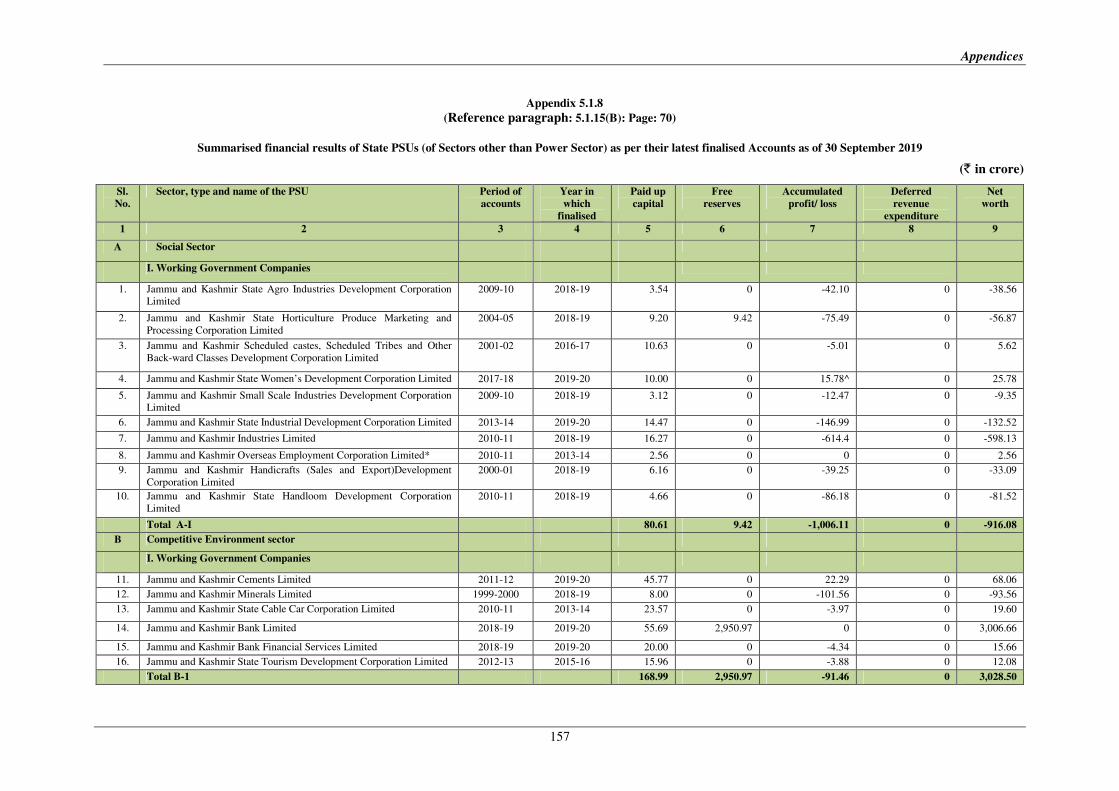
Appendices
157
Appendix 5.1.8
(Reference paragraph: 5.1.15(B): Page: 70)
Summarised financial results of State PSUs (of Sectors other than Power Sector) as per their latest finalised Accounts as of 30 September 2019
(` in crore)
Sl.
No.
Sector, type and name of the PSU Period of
accounts
Year in
which
finalised
Paid up
capital
Free
reserves
Accumulated
profit/ loss
Deferred
revenue
expenditure
Net
worth
1 2 3 4 5 6 7 8 9
A Social Sector
I. Working Government Companies
1. Jammu and Kashmir State Agro Industries Development Corporation
Limited 2009-10 2018-19 3.54 0 -42.10 0 -38.56
2. Jammu and Kashmir State Horticulture Produce Marketing and
Processing Corporation Limited
2004-05 2018-19 9.20 9.42 -75.49 0 -56.87
3. Jammu and Kashmir Scheduled castes, Scheduled Tribes and Other
Back-ward Classes Development Corporation Limited
2001-02 2016-17 10.63 0 -5.01 0 5.62
4. Jammu and Kashmir State Women’s Development Corporation Limited 2017-18 2019-20 10.00 0 15.78^ 0 25.78
5. Jammu and Kashmir Small Scale Industries Development Corporation
Limited 2009-10 2018-19 3.12 0 -12.47 0 -9.35
6. Jammu and Kashmir State Industrial Development Corporation Limited 2013-14 2019-20 14.47 0 -146.99 0 -132.52
7. Jammu and Kashmir Industries Limited 2010-11 2018-19 16.27 0 -614.4 0 -598.13
8. Jammu and Kashmir Overseas Employment Corporation Limited* 2010-11 2013-14 2.56 0 0 0 2.56
9. Jammu and Kashmir Handicrafts (Sales and Export)Development
Corporation Limited
2000-01 2018-19 6.16 0 -39.25 0 -33.09
10. Jammu and Kashmir State Handloom Development Corporation
Limited
2010-11 2018-19 4.66 0 -86.18 0 -81.52
Total A-I 80.61 9.42 -1,006.11 0 -916.08
B Competitive Environment sector
I. Working Government Companies
11. Jammu and Kashmir Cements Limited 2011-12 2019-20 45.77 0 22.29 0 68.06
12. Jammu and Kashmir Minerals Limited 1999-2000 2018-19 8.00 0 -101.56 0 -93.56
13. Jammu and Kashmir State Cable Car Corporation Limited 2010-11 2013-14 23.57 0 -3.97 0 19.60
14. Jammu and Kashmir Bank Limited 2018-19 2019-20 55.69 2,950.97 0 0 3,006.66
15. Jammu and Kashmir Bank Financial Services Limited 2018-19 2019-20 20.00 0 -4.34 0 15.66
16. Jammu and Kashmir State Tourism Development Corporation Limited 2012-13 2015-16 15.96 0 -3.88 0 12.08
Total B-1 168.99 2,950.97 -91.46 0 3,028.50
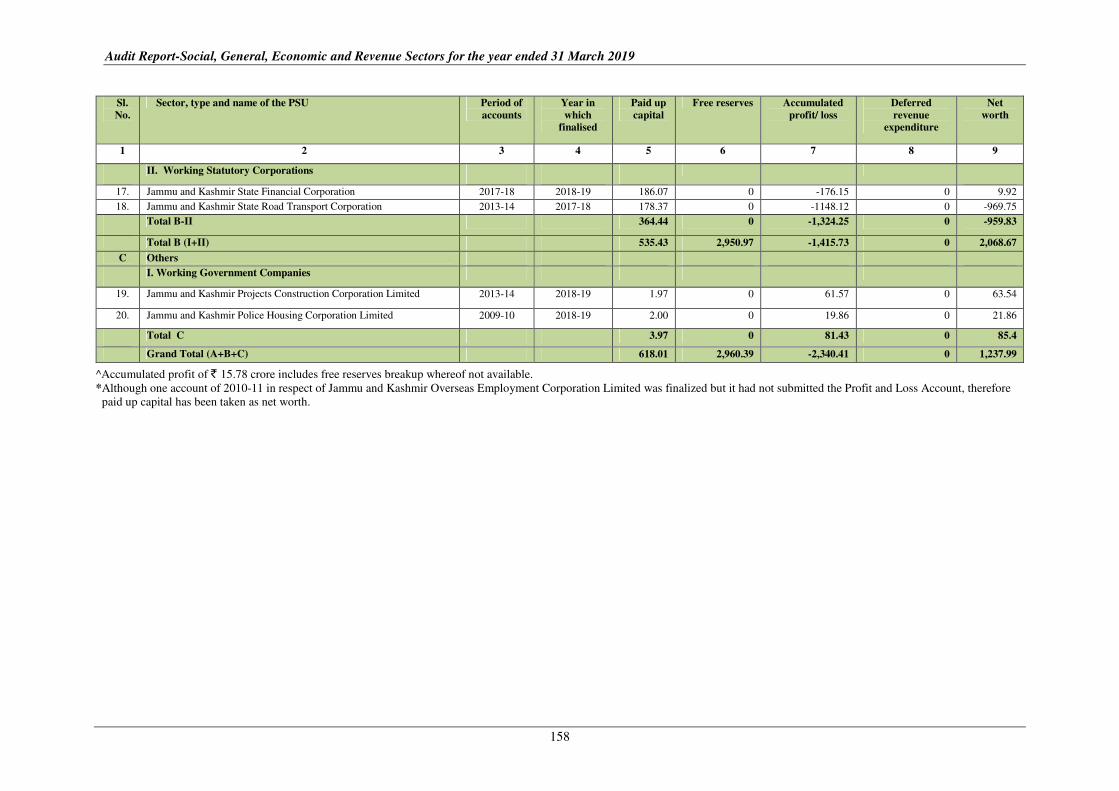
Audit Report-Social, General, Economic and Revenue Sectors for the year ended 31 March 2019
158
Sl.
No.
Sector, type and name of the PSU Period of
accounts
Year in
which
finalised
Paid up
capital
Free reserves Accumulated
profit/ loss
Deferred
revenue
expenditure
Net
worth
1 2 3 4 5 6 7 8 9
II. Working Statutory Corporations
17. Jammu and Kashmir State Financial Corporation 2017-18 2018-19 186.07 0 -176.15 0 9.92
18. Jammu and Kashmir State Road Transport Corporation 2013-14 2017-18 178.37 0 -1148.12 0 -969.75
Total B-II 364.44 0 -1,324.25 0 -959.83
Total B (I+II) 535.43 2,950.97 -1,415.73 0 2,068.67
C Others
I. Working Government Companies
19. Jammu and Kashmir Projects Construction Corporation Limited 2013-14 2018-19 1.97 0 61.57 0 63.54
20. Jammu and Kashmir Police Housing Corporation Limited 2009-10 2018-19 2.00 0 19.86 0 21.86
Total C 3.97 0 81.43 0 85.4
Grand Total (A+B+C) 618.01 2,960.39 -2,340.41 0 1,237.99
^Accumulated profit of ` 15.78 crore includes free reserves breakup whereof not available.
*Although one account of 2010-11 in respect of Jammu and Kashmir Overseas Employment Corporation Limited was finalized but it had not submitted the Profit and Loss Account, therefore
paid up capital has been taken as net worth.
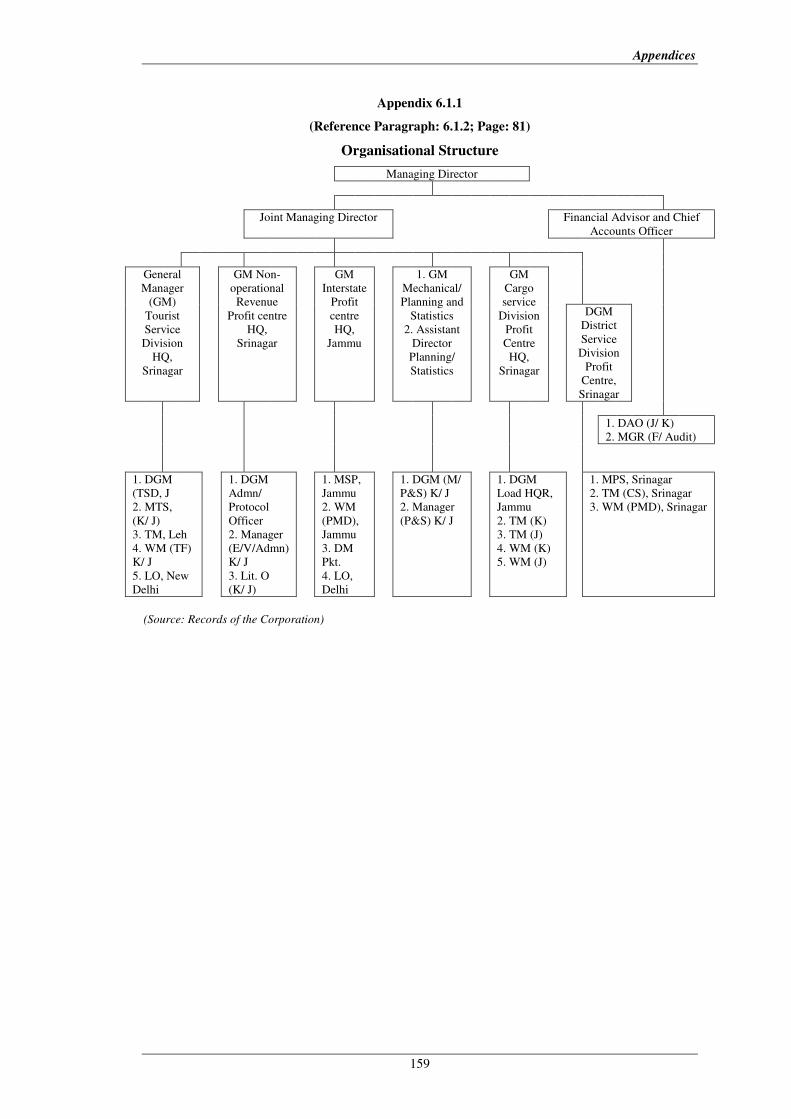
Appendices
159
Appendix 6.1.1
(Reference Paragraph: 6.1.2; Page: 81)
Organisational Structure
Managing Director
Joint Managing Director Financial Advisor and Chief
Accounts Officer
General
Manager
(GM)
Tourist
Service
Division
HQ,
Srinagar
GM Non-
operational
Revenue
Profit centre
HQ,
Srinagar
GM
Interstate
Profit
centre
HQ,
Jammu
1. GM
Mechanical/
Planning and
Statistics
2. Assistant
Director
Planning/
Statistics
GM
Cargo
service
Division
Profit
Centre
HQ,
Srinagar
DGM
District
Service
Division
Profit
Centre,
Srinagar
1. DAO (J/ K)
2. MGR (F/ Audit)
1. DGM
(TSD, J
2. MTS,
(K/ J)
3. TM, Leh
4. WM (TF)
K/ J
5. LO, New
Delhi
1. DGM
Admn/
Protocol
Officer
2. Manager
(E/V/Admn)
K/ J
3. Lit. O
(K/ J)
1. MSP,
Jammu
2. WM
(PMD),
Jammu
3. DM
Pkt.
4. LO,
Delhi
1. DGM (M/
P&S) K/ J
2. Manager
(P&S) K/ J
1. DGM
Load HQR,
Jammu
2. TM (K)
3. TM (J)
4. WM (K)
5. WM (J)
1. MPS, Srinagar
2. TM (CS), Srinagar
3. WM (PMD), Srinagar
(Source: Records of the Corporation)
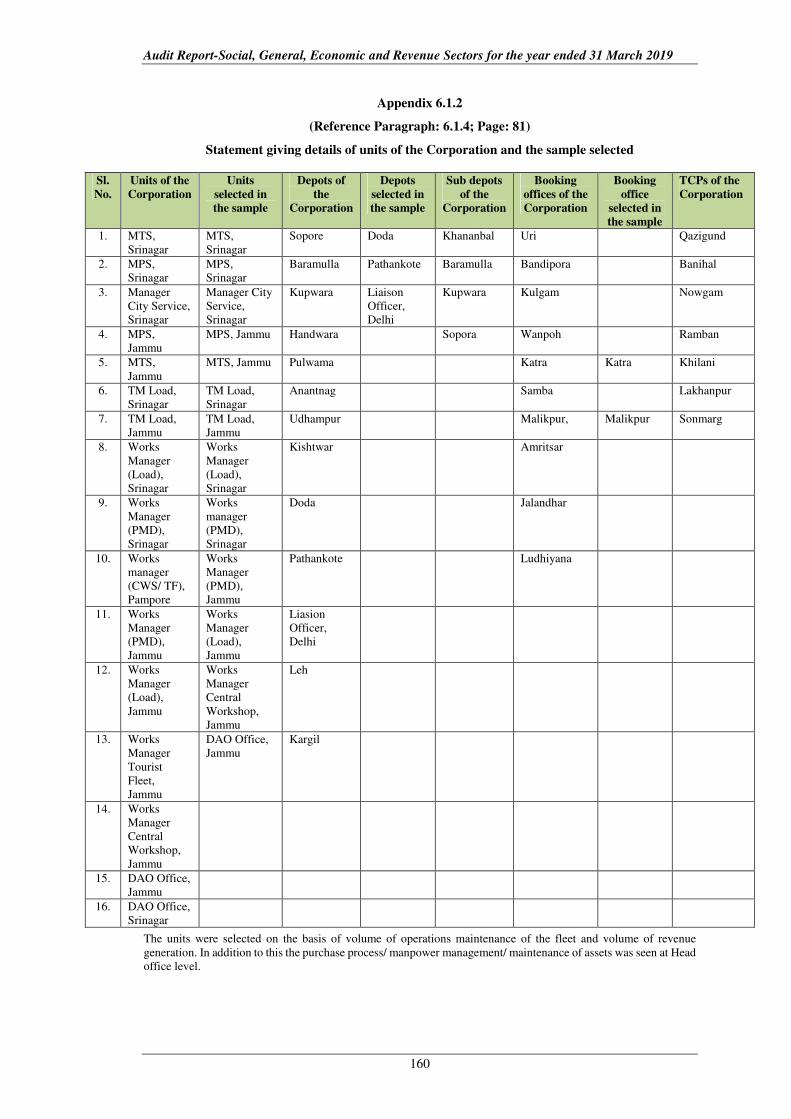
Audit Report-Social, General, Economic and Revenue Sectors for the year ended 31 March 2019
160
Appendix 6.1.2
(Reference Paragraph: 6.1.4; Page: 81)
Statement giving details of units of the Corporation and the sample selected
Sl.
No.
Units of the
Corporation
Units
selected in
the sample
Depots of
the
Corporation
Depots
selected in
the sample
Sub depots
of the
Corporation
Booking
offices of the
Corporation
Booking
office
selected in
the sample
TCPs of the
Corporation
1. MTS,
Srinagar
MTS,
Srinagar
Sopore Doda Khananbal Uri Qazigund
2. MPS,
Srinagar
MPS,
Srinagar
Baramulla Pathankote Baramulla Bandipora Banihal
3. Manager
City Service,
Srinagar
Manager City
Service,
Srinagar
Kupwara Liaison
Officer,
Delhi
Kupwara Kulgam Nowgam
4. MPS,
Jammu
MPS, Jammu Handwara Sopora Wanpoh Ramban
5. MTS,
Jammu
MTS, Jammu Pulwama Katra Katra Khilani
6. TM Load,
Srinagar
TM Load,
Srinagar
Anantnag Samba Lakhanpur
7. TM Load,
Jammu
TM Load,
Jammu
Udhampur Malikpur, Malikpur Sonmarg
8. Works
Manager
(Load),
Srinagar
Works
Manager
(Load),
Srinagar
Kishtwar Amritsar
9. Works
Manager
(PMD),
Srinagar
Works
manager
(PMD),
Srinagar
Doda Jalandhar
10. Works
manager
(CWS/ TF),
Pampore
Works
Manager
(PMD),
Jammu
Pathankote Ludhiyana
11. Works
Manager
(PMD),
Jammu
Works
Manager
(Load),
Jammu
Liasion
Officer,
Delhi
12. Works
Manager
(Load),
Jammu
Works
Manager
Central
Workshop,
Jammu
Leh
13. Works
Manager
Tourist
Fleet,
Jammu
DAO Office,
Jammu
Kargil
14. Works
Manager
Central
Workshop,
Jammu
15. DAO Office,
Jammu
16. DAO Office,
Srinagar
The units were selected on the basis of volume of operations maintenance of the fleet and volume of revenue
generation. In addition to this the purchase process/ manpower management/ maintenance of assets was seen at Head
office level.
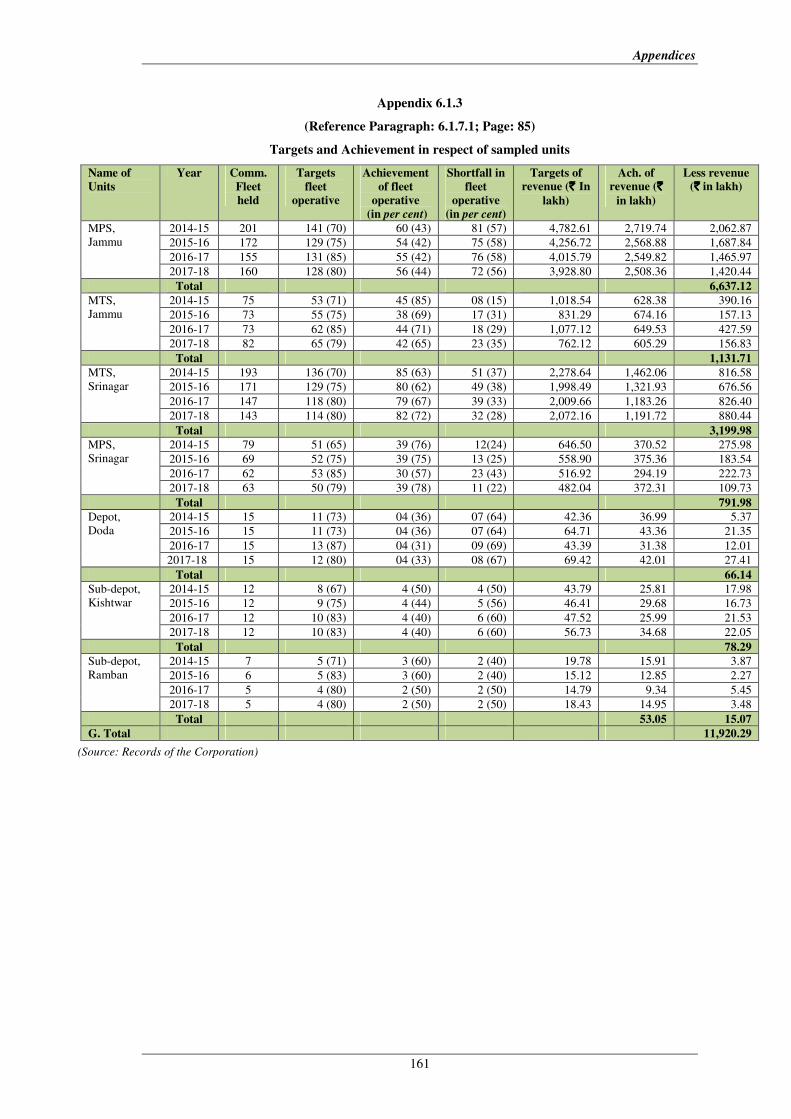
Appendices
161
Appendix 6.1.3
(Reference Paragraph: 6.1.7.1; Page: 85)
Targets and Achievement in respect of sampled units
Name of
Units
Year Comm.
Fleet
held
Targets
fleet
operative
Achievement
of fleet
operative
(in per cent)
Shortfall in
fleet
operative
(in per cent)
Targets of
revenue (` ` ` ` In
lakh)
Ach. of
revenue (` ` ` `
in lakh)
Less revenue
(`̀̀̀ in lakh)
MPS,
Jammu
2014-15 201 141 (70) 60 (43) 81 (57) 4,782.61 2,719.74 2,062.87
2015-16 172 129 (75) 54 (42) 75 (58) 4,256.72 2,568.88 1,687.84
2016-17 155 131 (85) 55 (42) 76 (58) 4,015.79 2,549.82 1,465.97
2017-18 160 128 (80) 56 (44) 72 (56) 3,928.80 2,508.36 1,420.44
Total 6,637.12
MTS,
Jammu
2014-15 75 53 (71) 45 (85) 08 (15) 1,018.54 628.38 390.16
2015-16 73 55 (75) 38 (69) 17 (31) 831.29 674.16 157.13
2016-17 73 62 (85) 44 (71) 18 (29) 1,077.12 649.53 427.59
2017-18 82 65 (79) 42 (65) 23 (35) 762.12 605.29 156.83
Total 1,131.71
MTS,
Srinagar
2014-15 193 136 (70) 85 (63) 51 (37) 2,278.64 1,462.06 816.58
2015-16 171 129 (75) 80 (62) 49 (38) 1,998.49 1,321.93 676.56
2016-17 147 118 (80) 79 (67) 39 (33) 2,009.66 1,183.26 826.40
2017-18 143 114 (80) 82 (72) 32 (28) 2,072.16 1,191.72 880.44
Total 3,199.98
MPS,
Srinagar
2014-15 79 51 (65) 39 (76) 12(24) 646.50 370.52 275.98
2015-16 69 52 (75) 39 (75) 13 (25) 558.90 375.36 183.54
2016-17 62 53 (85) 30 (57) 23 (43) 516.92 294.19 222.73
2017-18 63 50 (79) 39 (78) 11 (22) 482.04 372.31 109.73
Total 791.98
Depot,
Doda
2014-15 15 11 (73) 04 (36) 07 (64) 42.36 36.99 5.37
2015-16 15 11 (73) 04 (36) 07 (64) 64.71 43.36 21.35
2016-17 15 13 (87) 04 (31) 09 (69) 43.39 31.38 12.01
2017-18 15 12 (80) 04 (33) 08 (67) 69.42 42.01 27.41
Total 66.14
Sub-depot,
Kishtwar
2014-15 12 8 (67) 4 (50) 4 (50) 43.79 25.81 17.98
2015-16 12 9 (75) 4 (44) 5 (56) 46.41 29.68 16.73
2016-17 12 10 (83) 4 (40) 6 (60) 47.52 25.99 21.53
2017-18 12 10 (83) 4 (40) 6 (60) 56.73 34.68 22.05
Total 78.29
Sub-depot,
Ramban
2014-15 7 5 (71) 3 (60) 2 (40) 19.78 15.91 3.87
2015-16 6 5 (83) 3 (60) 2 (40) 15.12 12.85 2.27
2016-17 5 4 (80) 2 (50) 2 (50) 14.79 9.34 5.45
2017-18 5 4 (80) 2 (50) 2 (50) 18.43 14.95 3.48
Total 53.05 15.07
G. Total 11,920.29
(Source: Records of the Corporation)
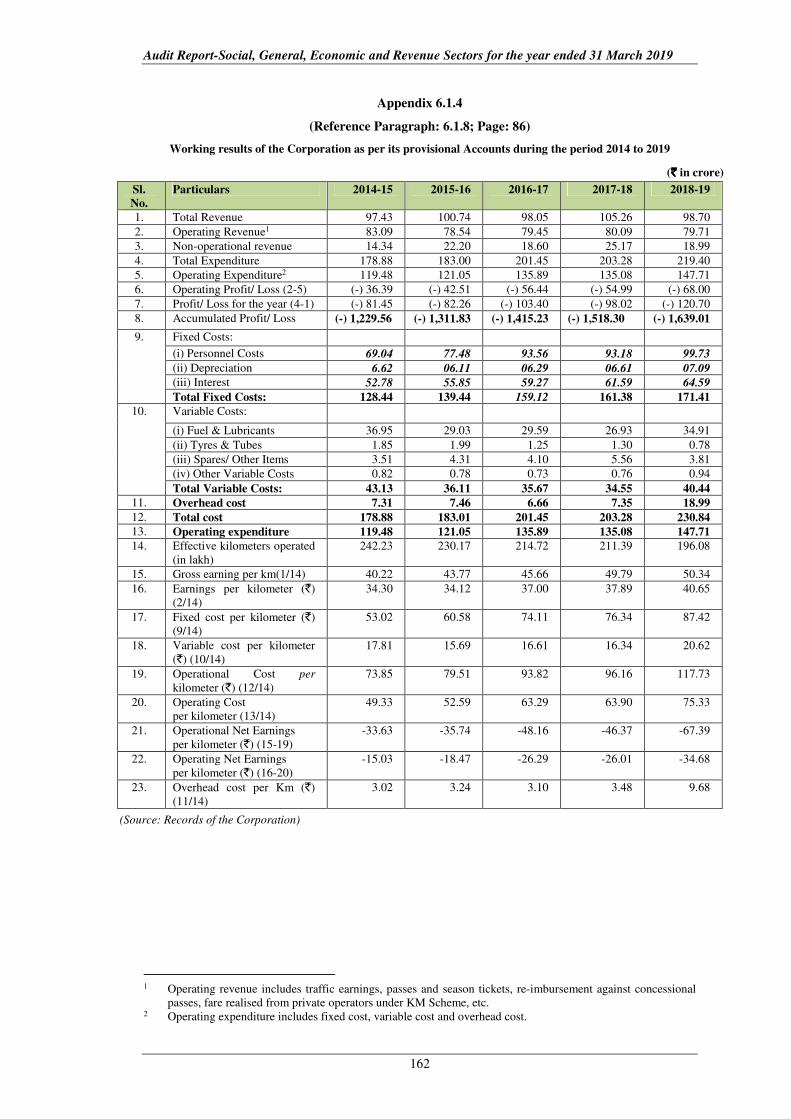
Audit Report-Social, General, Economic and Revenue Sectors for the year ended 31 March 2019
162
Appendix 6.1.4
(Reference Paragraph: 6.1.8; Page: 86)
Working results of the Corporation as per its provisional Accounts during the period 2014 to 2019
(`̀̀̀ in crore)
Sl.
No.
Particulars 2014-15 2015-16 2016-17 2017-18 2018-19
1. Total Revenue 97.43 100.74 98.05 105.26 98.70
2. Operating Revenue1 83.09 78.54 79.45 80.09 79.71
3. Non-operational revenue 14.34 22.20 18.60 25.17 18.99
4. Total Expenditure 178.88 183.00 201.45 203.28 219.40
5. Operating Expenditure2 119.48 121.05 135.89 135.08 147.71
6. Operating Profit/ Loss (2-5) (-) 36.39 (-) 42.51 (-) 56.44 (-) 54.99 (-) 68.00
7. Profit/ Loss for the year (4-1) (-) 81.45 (-) 82.26 (-) 103.40 (-) 98.02 (-) 120.70
8. Accumulated Profit/ Loss (-) 1,229.56 (-) 1,311.83 (-) 1,415.23 (-) 1,518.30 (-) 1,639.01
9. Fixed Costs:
(i) Personnel Costs 69.04 77.48 93.56 93.18 99.73
(ii) Depreciation 6.62 06.11 06.29 06.61 07.09
(iii) Interest 52.78 55.85 59.27 61.59 64.59
Total Fixed Costs: 128.44 139.44 159.12 161.38 171.41
10. Variable Costs:
(i) Fuel & Lubricants 36.95 29.03 29.59 26.93 34.91
(ii) Tyres & Tubes 1.85 1.99 1.25 1.30 0.78
(iii) Spares/ Other Items 3.51 4.31 4.10 5.56 3.81
(iv) Other Variable Costs 0.82 0.78 0.73 0.76 0.94
Total Variable Costs: 43.13 36.11 35.67 34.55 40.44
11. Overhead cost 7.31 7.46 6.66 7.35 18.99
12. Total cost 178.88 183.01 201.45 203.28 230.84
13. Operating expenditure 119.48 121.05 135.89 135.08 147.71
14. Effective kilometers operated
(in lakh)
242.23 230.17 214.72 211.39 196.08
15. Gross earning per km(1/14) 40.22 43.77 45.66 49.79 50.34
16. Earnings per kilometer (`)
(2/14)
34.30 34.12 37.00 37.89 40.65
17. Fixed cost per kilometer (`)
(9/14)
53.02 60.58 74.11 76.34 87.42
18. Variable cost per kilometer
(`) (10/14)
17.81 15.69 16.61 16.34 20.62
19. Operational Cost per
kilometer (`) (12/14)
73.85 79.51 93.82 96.16 117.73
20. Operating Cost
per kilometer (13/14)
49.33 52.59 63.29 63.90 75.33
21. Operational Net Earnings
per kilometer (`) (15-19)
-33.63 -35.74 -48.16 -46.37 -67.39
22. Operating Net Earnings
per kilometer (`) (16-20)
-15.03 -18.47 -26.29 -26.01 -34.68
23. Overhead cost per Km (`)
(11/14)
3.02 3.24 3.10 3.48 9.68
(Source: Records of the Corporation)
1 Operating revenue includes traffic earnings, passes and season tickets, re-imbursement against concessional
passes, fare realised from private operators under KM Scheme, etc. 2 Operating expenditure includes fixed cost, variable cost and overhead cost.
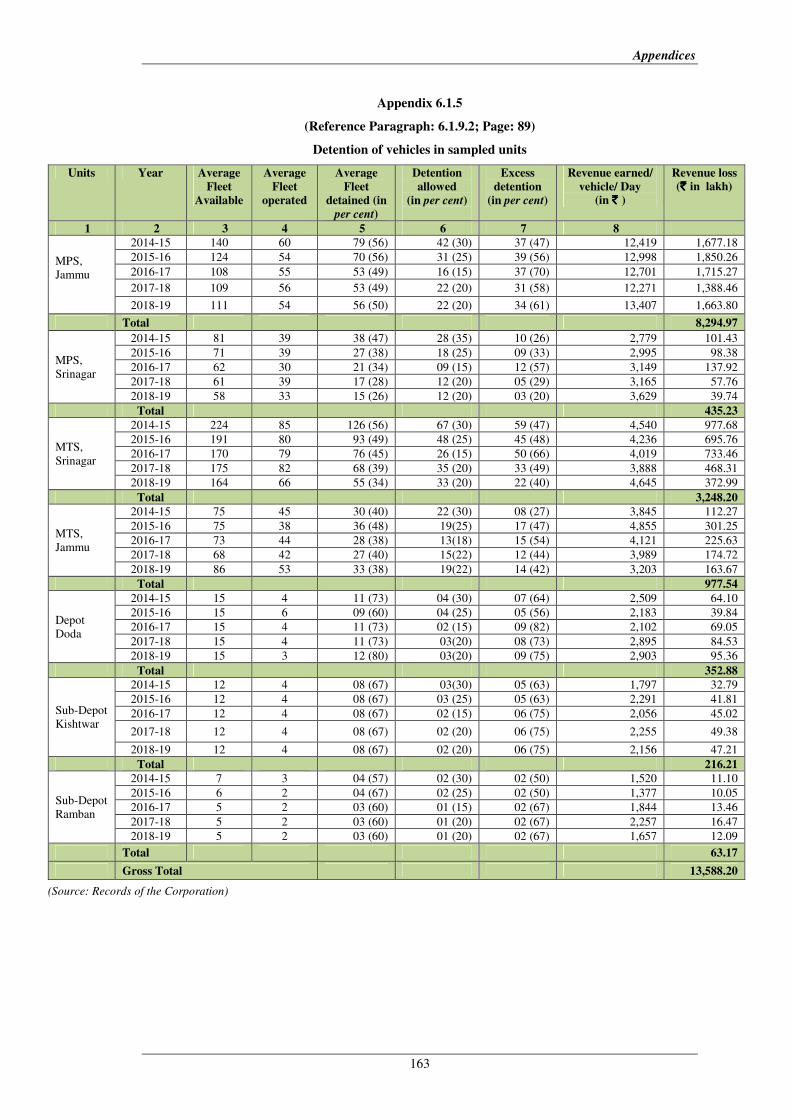
Appendices
163
Appendix 6.1.5
(Reference Paragraph: 6.1.9.2; Page: 89)
Detention of vehicles in sampled units
Units Year Average
Fleet
Available
Average
Fleet
operated
Average
Fleet
detained (in
per cent)
Detention
allowed
(in per cent)
Excess
detention
(in per cent)
Revenue earned/
vehicle/ Day
(in ` ` ` ` )
Revenue loss
(` ` ` ` in lakh)
1 2 3 4 5 6 7 8
MPS,
Jammu
2014-15 140 60 79 (56) 42 (30) 37 (47) 12,419 1,677.18
2015-16 124 54 70 (56) 31 (25) 39 (56) 12,998 1,850.26
2016-17 108 55 53 (49) 16 (15) 37 (70) 12,701 1,715.27
2017-18 109 56 53 (49) 22 (20) 31 (58) 12,271 1,388.46
2018-19 111 54 56 (50) 22 (20) 34 (61) 13,407 1,663.80
Total 8,294.97
MPS,
Srinagar
2014-15 81 39 38 (47) 28 (35) 10 (26) 2,779 101.43
2015-16 71 39 27 (38) 18 (25) 09 (33) 2,995 98.38
2016-17 62 30 21 (34) 09 (15) 12 (57) 3,149 137.92
2017-18 61 39 17 (28) 12 (20) 05 (29) 3,165 57.76
2018-19 58 33 15 (26) 12 (20) 03 (20) 3,629 39.74
Total 435.23
MTS,
Srinagar
2014-15 224 85 126 (56) 67 (30) 59 (47) 4,540 977.68
2015-16 191 80 93 (49) 48 (25) 45 (48) 4,236 695.76
2016-17 170 79 76 (45) 26 (15) 50 (66) 4,019 733.46
2017-18 175 82 68 (39) 35 (20) 33 (49) 3,888 468.31
2018-19 164 66 55 (34) 33 (20) 22 (40) 4,645 372.99
Total 3,248.20
MTS,
Jammu
2014-15 75 45 30 (40) 22 (30) 08 (27) 3,845 112.27
2015-16 75 38 36 (48) 19(25) 17 (47) 4,855 301.25
2016-17 73 44 28 (38) 13(18) 15 (54) 4,121 225.63
2017-18 68 42 27 (40) 15(22) 12 (44) 3,989 174.72
2018-19 86 53 33 (38) 19(22) 14 (42) 3,203 163.67
Total 977.54
Depot
Doda
2014-15 15 4 11 (73) 04 (30) 07 (64) 2,509 64.10
2015-16 15 6 09 (60) 04 (25) 05 (56) 2,183 39.84
2016-17 15 4 11 (73) 02 (15) 09 (82) 2,102 69.05
2017-18 15 4 11 (73) 03(20) 08 (73) 2,895 84.53
2018-19 15 3 12 (80) 03(20) 09 (75) 2,903 95.36
Total 352.88
Sub-Depot
Kishtwar
2014-15 12 4 08 (67) 03(30) 05 (63) 1,797 32.79
2015-16 12 4 08 (67) 03 (25) 05 (63) 2,291 41.81
2016-17 12 4 08 (67) 02 (15) 06 (75) 2,056 45.02
2017-18 12 4 08 (67) 02 (20) 06 (75) 2,255 49.38
2018-19 12 4 08 (67) 02 (20) 06 (75) 2,156 47.21
Total 216.21
Sub-Depot
Ramban
2014-15 7 3 04 (57) 02 (30) 02 (50) 1,520 11.10
2015-16 6 2 04 (67) 02 (25) 02 (50) 1,377 10.05
2016-17 5 2 03 (60) 01 (15) 02 (67) 1,844 13.46
2017-18 5 2 03 (60) 01 (20) 02 (67) 2,257 16.47
2018-19 5 2 03 (60) 01 (20) 02 (67) 1,657 12.09
Total 63.17
Gross Total 13,588.20
(Source: Records of the Corporation)
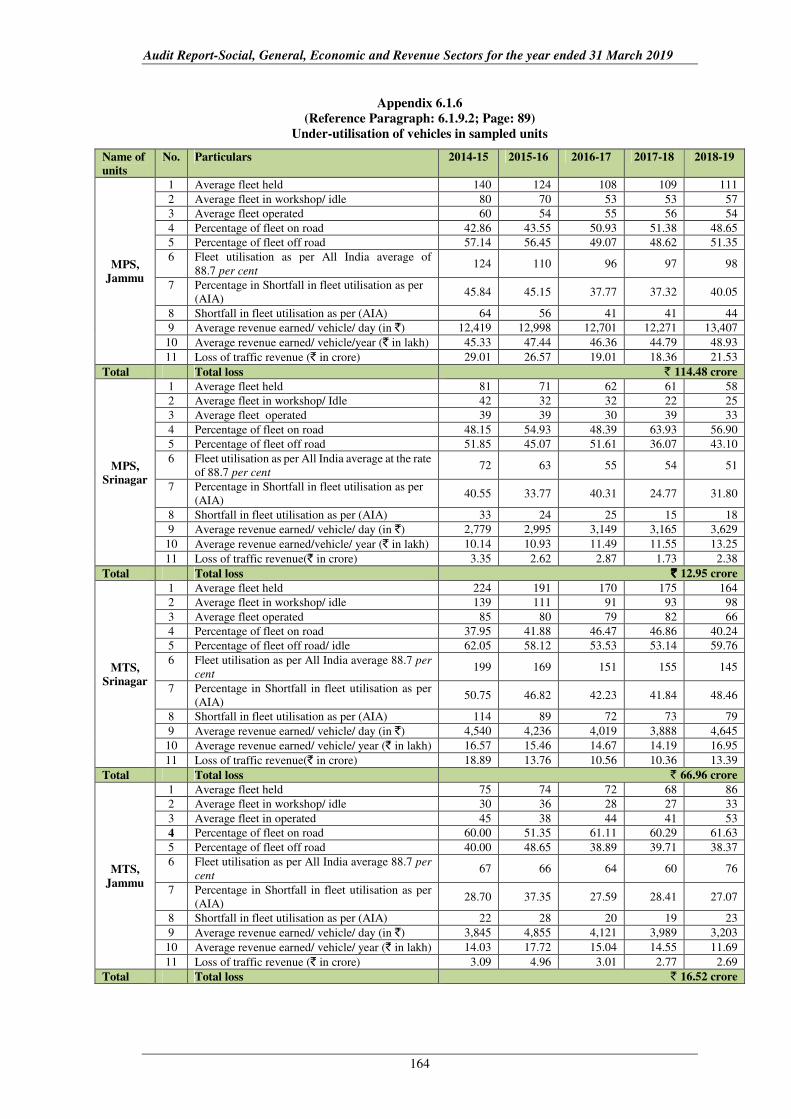
Audit Report-Social, General, Economic and Revenue Sectors for the year ended 31 March 2019
164
Appendix 6.1.6
(Reference Paragraph: 6.1.9.2; Page: 89)
Under-utilisation of vehicles in sampled units
Name of
units
No. Particulars 2014-15 2015-16 2016-17 2017-18 2018-19
MPS,
Jammu
1 Average fleet held 140 124 108 109 111
2 Average fleet in workshop/ idle 80 70 53 53 57
3 Average fleet operated 60 54 55 56 54
4 Percentage of fleet on road 42.86 43.55 50.93 51.38 48.65
5 Percentage of fleet off road 57.14 56.45 49.07 48.62 51.35
6 Fleet utilisation as per All India average of
88.7 per cent 124 110 96 97 98
7 Percentage in Shortfall in fleet utilisation as per
(AIA) 45.84 45.15 37.77 37.32 40.05
8 Shortfall in fleet utilisation as per (AIA) 64 56 41 41 44
9 Average revenue earned/ vehicle/ day (in `) 12,419 12,998 12,701 12,271 13,407
10 Average revenue earned/ vehicle/year (` in lakh) 45.33 47.44 46.36 44.79 48.93
11 Loss of traffic revenue (` in crore) 29.01 26.57 19.01 18.36 21.53
Total Total loss ` 114.48 crore
MPS,
Srinagar
1 Average fleet held 81 71 62 61 58
2 Average fleet in workshop/ Idle 42 32 32 22 25
3 Average fleet operated 39 39 30 39 33
4 Percentage of fleet on road 48.15 54.93 48.39 63.93 56.90
5 Percentage of fleet off road 51.85 45.07 51.61 36.07 43.10
6 Fleet utilisation as per All India average at the rate
of 88.7 per cent 72 63 55 54 51
7 Percentage in Shortfall in fleet utilisation as per
(AIA) 40.55 33.77 40.31 24.77 31.80
8 Shortfall in fleet utilisation as per (AIA) 33 24 25 15 18
9 Average revenue earned/ vehicle/ day (in `) 2,779 2,995 3,149 3,165 3,629
10 Average revenue earned/vehicle/ year (` in lakh) 10.14 10.93 11.49 11.55 13.25
11 Loss of traffic revenue(` in crore) 3.35 2.62 2.87 1.73 2.38
Total Total loss ` ` ` ` 12.95 crore
MTS,
Srinagar
1 Average fleet held 224 191 170 175 164
2 Average fleet in workshop/ idle 139 111 91 93 98
3 Average fleet operated 85 80 79 82 66
4 Percentage of fleet on road 37.95 41.88 46.47 46.86 40.24
5 Percentage of fleet off road/ idle 62.05 58.12 53.53 53.14 59.76
6 Fleet utilisation as per All India average 88.7 per
cent 199 169 151 155 145
7 Percentage in Shortfall in fleet utilisation as per
(AIA) 50.75 46.82 42.23 41.84 48.46
8 Shortfall in fleet utilisation as per (AIA) 114 89 72 73 79
9 Average revenue earned/ vehicle/ day (in `) 4,540 4,236 4,019 3,888 4,645
10 Average revenue earned/ vehicle/ year (` in lakh) 16.57 15.46 14.67 14.19 16.95
11 Loss of traffic revenue(` in crore) 18.89 13.76 10.56 10.36 13.39
Total Total loss ` 66.96 crore
MTS,
Jammu
1 Average fleet held 75 74 72 68 86
2 Average fleet in workshop/ idle 30 36 28 27 33
3 Average fleet in operated 45 38 44 41 53
4 Percentage of fleet on road 60.00 51.35 61.11 60.29 61.63
5 Percentage of fleet off road 40.00 48.65 38.89 39.71 38.37
6 Fleet utilisation as per All India average 88.7 per
cent 67 66 64 60 76
7 Percentage in Shortfall in fleet utilisation as per
(AIA) 28.70 37.35 27.59 28.41 27.07
8 Shortfall in fleet utilisation as per (AIA) 22 28 20 19 23
9 Average revenue earned/ vehicle/ day (in `) 3,845 4,855 4,121 3,989 3,203
10 Average revenue earned/ vehicle/ year (` in lakh) 14.03 17.72 15.04 14.55 11.69
11 Loss of traffic revenue (` in crore) 3.09 4.96 3.01 2.77 2.69
Total Total loss ` 16.52 crore
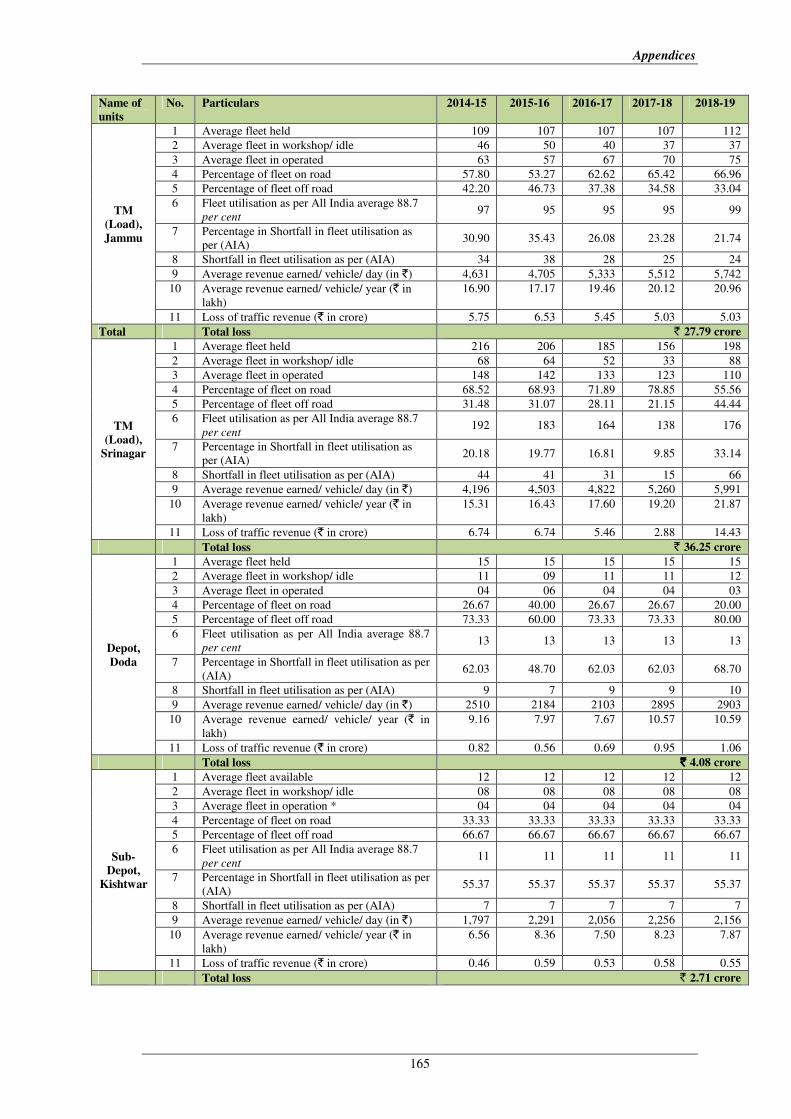
Appendices
165
Name of
units
No. Particulars 2014-15 2015-16 2016-17 2017-18 2018-19
TM
(Load),
Jammu
1 Average fleet held 109 107 107 107 112
2 Average fleet in workshop/ idle 46 50 40 37 37
3 Average fleet in operated 63 57 67 70 75
4 Percentage of fleet on road 57.80 53.27 62.62 65.42 66.96
5 Percentage of fleet off road 42.20 46.73 37.38 34.58 33.04
6 Fleet utilisation as per All India average 88.7
per cent 97 95 95 95 99
7 Percentage in Shortfall in fleet utilisation as
per (AIA) 30.90 35.43 26.08 23.28 21.74
8 Shortfall in fleet utilisation as per (AIA) 34 38 28 25 24
9 Average revenue earned/ vehicle/ day (in `) 4,631 4,705 5,333 5,512 5,742
10 Average revenue earned/ vehicle/ year (` in
lakh)
16.90 17.17 19.46 20.12 20.96
11 Loss of traffic revenue (` in crore) 5.75 6.53 5.45 5.03 5.03
Total Total loss ` 27.79 crore
TM
(Load),
Srinagar
1 Average fleet held 216 206 185 156 198
2 Average fleet in workshop/ idle 68 64 52 33 88
3 Average fleet in operated 148 142 133 123 110
4 Percentage of fleet on road 68.52 68.93 71.89 78.85 55.56
5 Percentage of fleet off road 31.48 31.07 28.11 21.15 44.44
6 Fleet utilisation as per All India average 88.7
per cent 192 183 164 138 176
7 Percentage in Shortfall in fleet utilisation as
per (AIA) 20.18 19.77 16.81 9.85 33.14
8 Shortfall in fleet utilisation as per (AIA) 44 41 31 15 66
9 Average revenue earned/ vehicle/ day (in `) 4,196 4,503 4,822 5,260 5,991
10 Average revenue earned/ vehicle/ year (` in
lakh)
15.31 16.43 17.60 19.20 21.87
11 Loss of traffic revenue (` in crore) 6.74 6.74 5.46 2.88 14.43
Total loss ` 36.25 crore
Depot,
Doda
1 Average fleet held 15 15 15 15 15
2 Average fleet in workshop/ idle 11 09 11 11 12
3 Average fleet in operated 04 06 04 04 03
4 Percentage of fleet on road 26.67 40.00 26.67 26.67 20.00
5 Percentage of fleet off road 73.33 60.00 73.33 73.33 80.00
6 Fleet utilisation as per All India average 88.7
per cent 13 13 13 13 13
7 Percentage in Shortfall in fleet utilisation as per
(AIA) 62.03 48.70 62.03 62.03 68.70
8 Shortfall in fleet utilisation as per (AIA) 9 7 9 9 10
9 Average revenue earned/ vehicle/ day (in `) 2510 2184 2103 2895 2903
10 Average revenue earned/ vehicle/ year (` in
lakh)
9.16 7.97 7.67 10.57 10.59
11 Loss of traffic revenue (` in crore) 0.82 0.56 0.69 0.95 1.06
Total loss ` ` ` ` 4.08 crore
Sub-
Depot,
Kishtwar
1 Average fleet available 12 12 12 12 12
2 Average fleet in workshop/ idle 08 08 08 08 08
3 Average fleet in operation * 04 04 04 04 04
4 Percentage of fleet on road 33.33 33.33 33.33 33.33 33.33
5 Percentage of fleet off road 66.67 66.67 66.67 66.67 66.67
6 Fleet utilisation as per All India average 88.7
per cent 11 11 11 11 11
7 Percentage in Shortfall in fleet utilisation as per
(AIA) 55.37 55.37 55.37 55.37 55.37
8 Shortfall in fleet utilisation as per (AIA) 7 7 7 7 7
9 Average revenue earned/ vehicle/ day (in `) 1,797 2,291 2,056 2,256 2,156
10 Average revenue earned/ vehicle/ year (` in
lakh)
6.56 8.36 7.50 8.23 7.87
11 Loss of traffic revenue (` in crore) 0.46 0.59 0.53 0.58 0.55
Total loss ` 2.71 crore
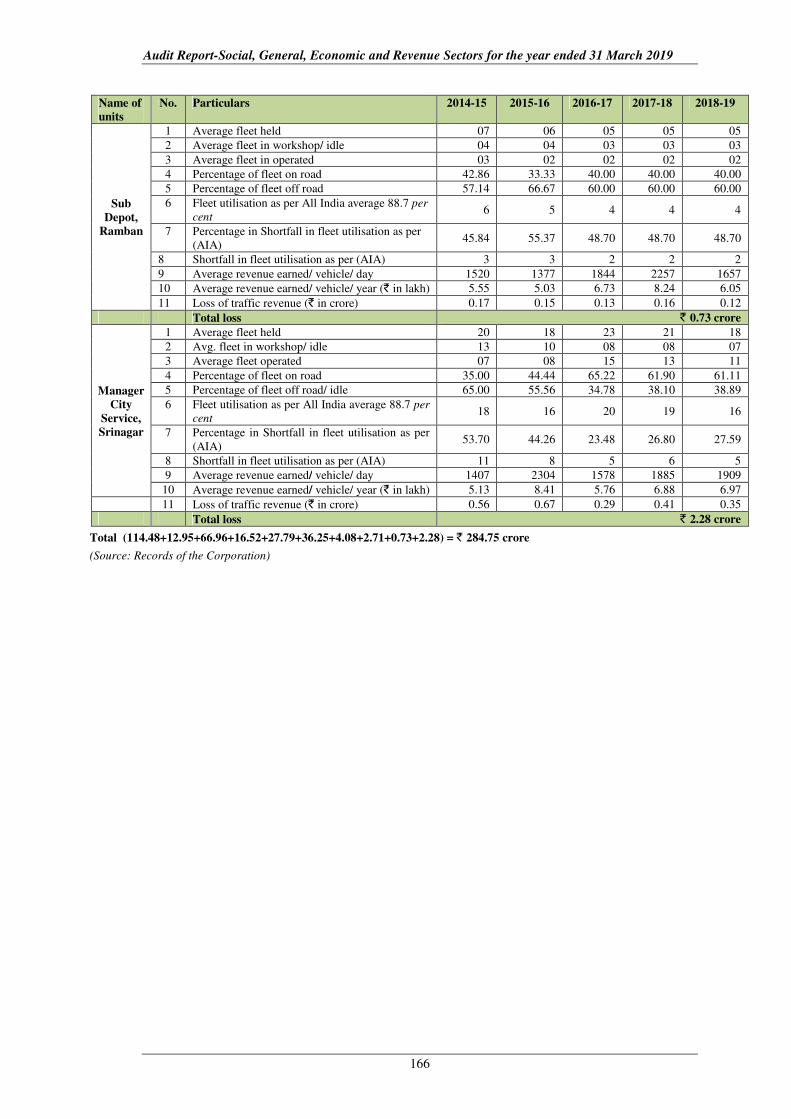
Audit Report-Social, General, Economic and Revenue Sectors for the year ended 31 March 2019
166
Name of
units
No. Particulars 2014-15 2015-16 2016-17 2017-18 2018-19
Sub
Depot,
Ramban
1 Average fleet held 07 06 05 05 05
2 Average fleet in workshop/ idle 04 04 03 03 03
3 Average fleet in operated 03 02 02 02 02
4 Percentage of fleet on road 42.86 33.33 40.00 40.00 40.00
5 Percentage of fleet off road 57.14 66.67 60.00 60.00 60.00
6 Fleet utilisation as per All India average 88.7 per
cent 6 5 4 4 4
7 Percentage in Shortfall in fleet utilisation as per
(AIA) 45.84 55.37 48.70 48.70 48.70
8 Shortfall in fleet utilisation as per (AIA) 3 3 2 2 2
9 Average revenue earned/ vehicle/ day 1520 1377 1844 2257 1657
10 Average revenue earned/ vehicle/ year (` in lakh) 5.55 5.03 6.73 8.24 6.05
11 Loss of traffic revenue (` in crore) 0.17 0.15 0.13 0.16 0.12
Total loss ` 0.73 crore
Manager
City
Service,
Srinagar
1 Average fleet held 20 18 23 21 18
2 Avg. fleet in workshop/ idle 13 10 08 08 07
3 Average fleet operated 07 08 15 13 11
4 Percentage of fleet on road 35.00 44.44 65.22 61.90 61.11
5 Percentage of fleet off road/ idle 65.00 55.56 34.78 38.10 38.89
6 Fleet utilisation as per All India average 88.7 per
cent 18 16 20 19 16
7 Percentage in Shortfall in fleet utilisation as per
(AIA) 53.70 44.26 23.48 26.80 27.59
8 Shortfall in fleet utilisation as per (AIA) 11 8 5 6 5
9 Average revenue earned/ vehicle/ day 1407 2304 1578 1885 1909
10 Average revenue earned/ vehicle/ year (` in lakh) 5.13 8.41 5.76 6.88 6.97
11 Loss of traffic revenue (` in crore) 0.56 0.67 0.29 0.41 0.35
Total loss ` 2.28 crore
Total (114.48+12.95+66.96+16.52+27.79+36.25+4.08+2.71+0.73+2.28) = ` 284.75 crore
(Source: Records of the Corporation)
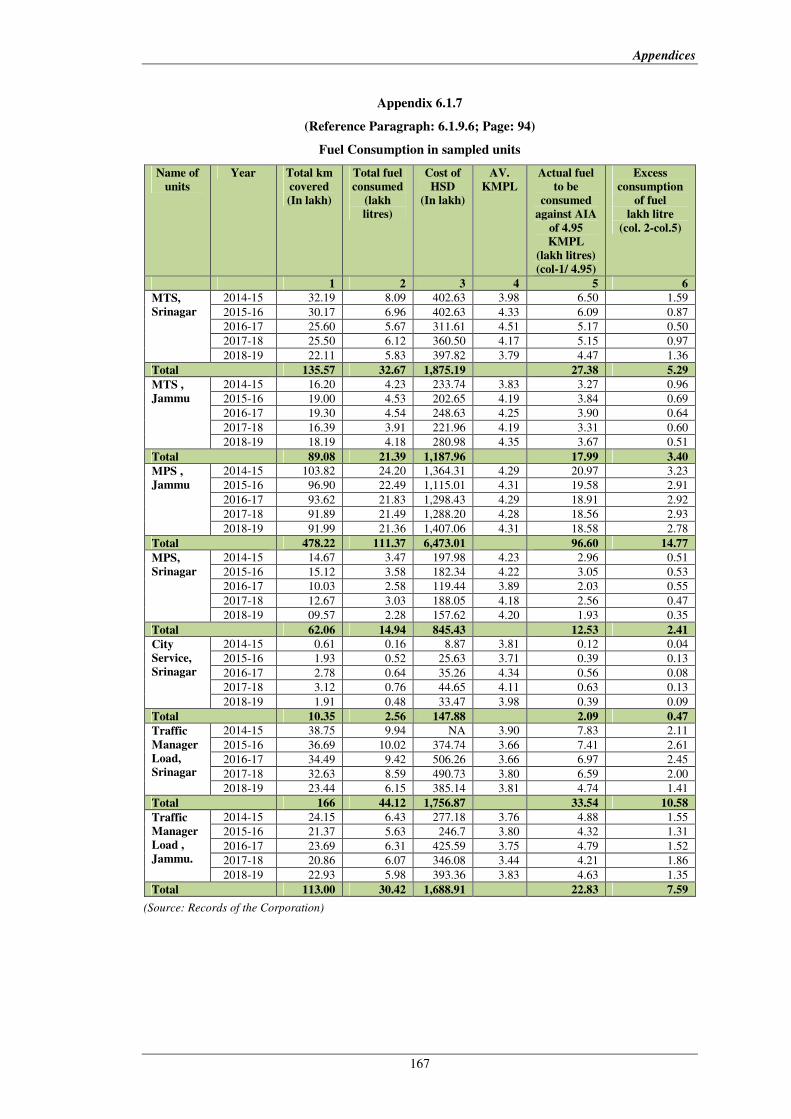
Appendices
167
Appendix 6.1.7
(Reference Paragraph: 6.1.9.6; Page: 94)
Fuel Consumption in sampled units
Name of
units
Year Total km
covered
(In lakh)
Total fuel
consumed
(lakh
litres)
Cost of
HSD
(In lakh)
AV.
KMPL
Actual fuel
to be
consumed
against AIA
of 4.95
KMPL
(lakh litres)
(col-1/ 4.95)
Excess
consumption
of fuel
lakh litre
(col. 2-col.5)
1 2 3 4 5 6
MTS,
Srinagar
2014-15 32.19 8.09 402.63 3.98 6.50 1.59
2015-16 30.17 6.96 402.63 4.33 6.09 0.87
2016-17 25.60 5.67 311.61 4.51 5.17 0.50
2017-18 25.50 6.12 360.50 4.17 5.15 0.97
2018-19 22.11 5.83 397.82 3.79 4.47 1.36
Total 135.57 32.67 1,875.19 27.38 5.29
MTS ,
Jammu
2014-15 16.20 4.23 233.74 3.83 3.27 0.96
2015-16 19.00 4.53 202.65 4.19 3.84 0.69
2016-17 19.30 4.54 248.63 4.25 3.90 0.64
2017-18 16.39 3.91 221.96 4.19 3.31 0.60
2018-19 18.19 4.18 280.98 4.35 3.67 0.51
Total 89.08 21.39 1,187.96 17.99 3.40
MPS ,
Jammu
2014-15 103.82 24.20 1,364.31 4.29 20.97 3.23
2015-16 96.90 22.49 1,115.01 4.31 19.58 2.91
2016-17 93.62 21.83 1,298.43 4.29 18.91 2.92
2017-18 91.89 21.49 1,288.20 4.28 18.56 2.93
2018-19 91.99 21.36 1,407.06 4.31 18.58 2.78
Total 478.22 111.37 6,473.01 96.60 14.77
MPS,
Srinagar
2014-15 14.67 3.47 197.98 4.23 2.96 0.51
2015-16 15.12 3.58 182.34 4.22 3.05 0.53
2016-17 10.03 2.58 119.44 3.89 2.03 0.55
2017-18 12.67 3.03 188.05 4.18 2.56 0.47
2018-19 09.57 2.28 157.62 4.20 1.93 0.35
Total 62.06 14.94 845.43 12.53 2.41
City
Service,
Srinagar
2014-15 0.61 0.16 8.87 3.81 0.12 0.04
2015-16 1.93 0.52 25.63 3.71 0.39 0.13
2016-17 2.78 0.64 35.26 4.34 0.56 0.08
2017-18 3.12 0.76 44.65 4.11 0.63 0.13
2018-19 1.91 0.48 33.47 3.98 0.39 0.09
Total 10.35 2.56 147.88 2.09 0.47
Traffic
Manager
Load,
Srinagar
2014-15 38.75 9.94 NA 3.90 7.83 2.11
2015-16 36.69 10.02 374.74 3.66 7.41 2.61
2016-17 34.49 9.42 506.26 3.66 6.97 2.45
2017-18 32.63 8.59 490.73 3.80 6.59 2.00
2018-19 23.44 6.15 385.14 3.81 4.74 1.41
Total 166 44.12 1,756.87 33.54 10.58
Traffic
Manager
Load ,
Jammu.
2014-15 24.15 6.43 277.18 3.76 4.88 1.55
2015-16 21.37 5.63 246.7 3.80 4.32 1.31
2016-17 23.69 6.31 425.59 3.75 4.79 1.52
2017-18 20.86 6.07 346.08 3.44 4.21 1.86
2018-19 22.93 5.98 393.36 3.83 4.63 1.35
Total 113.00 30.42 1,688.91 22.83 7.59
(Source: Records of the Corporation)
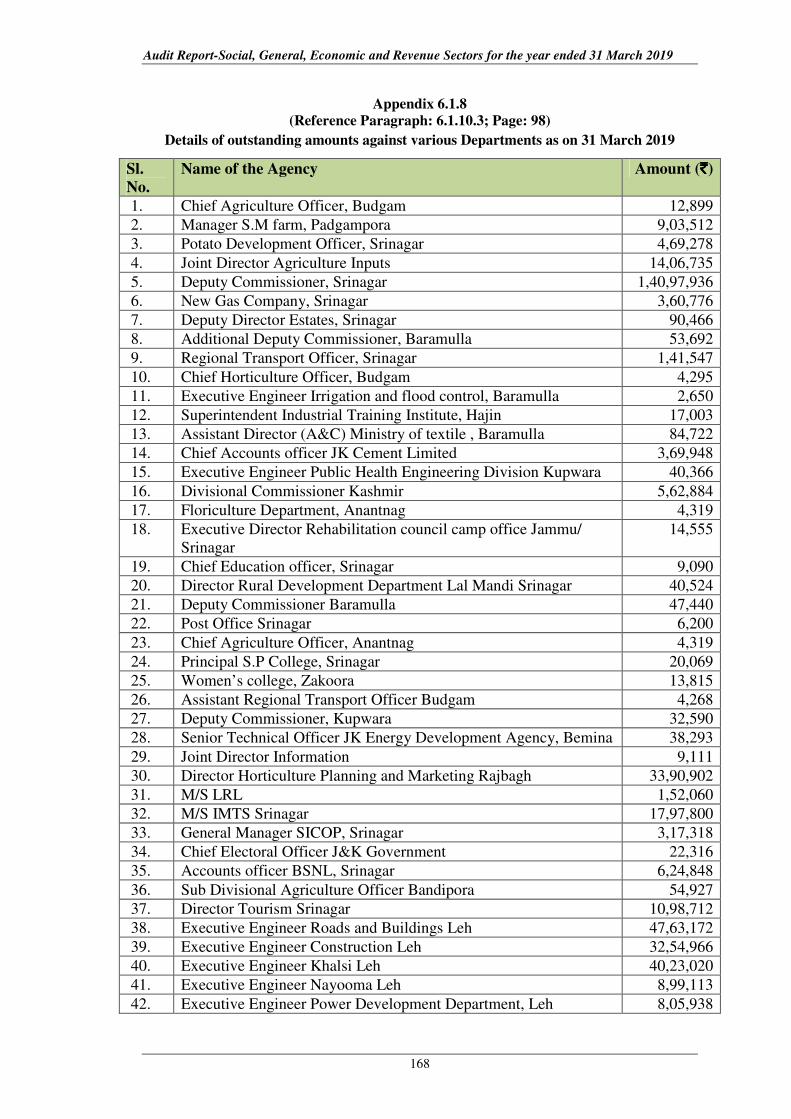
Audit Report-Social, General, Economic and Revenue Sectors for the year ended 31 March 2019
168
Appendix 6.1.8
(Reference Paragraph: 6.1.10.3; Page: 98)
Details of outstanding amounts against various Departments as on 31 March 2019
Sl.
No.
Name of the Agency Amount (`̀̀̀)
1. Chief Agriculture Officer, Budgam 12,899
2. Manager S.M farm, Padgampora 9,03,512
3. Potato Development Officer, Srinagar 4,69,278
4. Joint Director Agriculture Inputs 14,06,735
5. Deputy Commissioner, Srinagar 1,40,97,936
6. New Gas Company, Srinagar 3,60,776
7. Deputy Director Estates, Srinagar 90,466
8. Additional Deputy Commissioner, Baramulla 53,692
9. Regional Transport Officer, Srinagar 1,41,547
10. Chief Horticulture Officer, Budgam 4,295
11. Executive Engineer Irrigation and flood control, Baramulla 2,650
12. Superintendent Industrial Training Institute, Hajin 17,003
13. Assistant Director (A&C) Ministry of textile , Baramulla 84,722
14. Chief Accounts officer JK Cement Limited 3,69,948
15. Executive Engineer Public Health Engineering Division Kupwara 40,366
16. Divisional Commissioner Kashmir 5,62,884
17. Floriculture Department, Anantnag 4,319
18. Executive Director Rehabilitation council camp office Jammu/
Srinagar
14,555
19. Chief Education officer, Srinagar 9,090
20. Director Rural Development Department Lal Mandi Srinagar 40,524
21. Deputy Commissioner Baramulla 47,440
22. Post Office Srinagar 6,200
23. Chief Agriculture Officer, Anantnag 4,319
24. Principal S.P College, Srinagar 20,069
25. Women’s college, Zakoora 13,815
26. Assistant Regional Transport Officer Budgam 4,268
27. Deputy Commissioner, Kupwara 32,590
28. Senior Technical Officer JK Energy Development Agency, Bemina 38,293
29. Joint Director Information 9,111
30. Director Horticulture Planning and Marketing Rajbagh 33,90,902
31. M/S LRL 1,52,060
32. M/S IMTS Srinagar 17,97,800
33. General Manager SICOP, Srinagar 3,17,318
34. Chief Electoral Officer J&K Government 22,316
35. Accounts officer BSNL, Srinagar 6,24,848
36. Sub Divisional Agriculture Officer Bandipora 54,927
37. Director Tourism Srinagar 10,98,712
38. Executive Engineer Roads and Buildings Leh 47,63,172
39. Executive Engineer Construction Leh 32,54,966
40. Executive Engineer Khalsi Leh 40,23,020
41. Executive Engineer Nayooma Leh 8,99,113
42. Executive Engineer Power Development Department, Leh 8,05,938
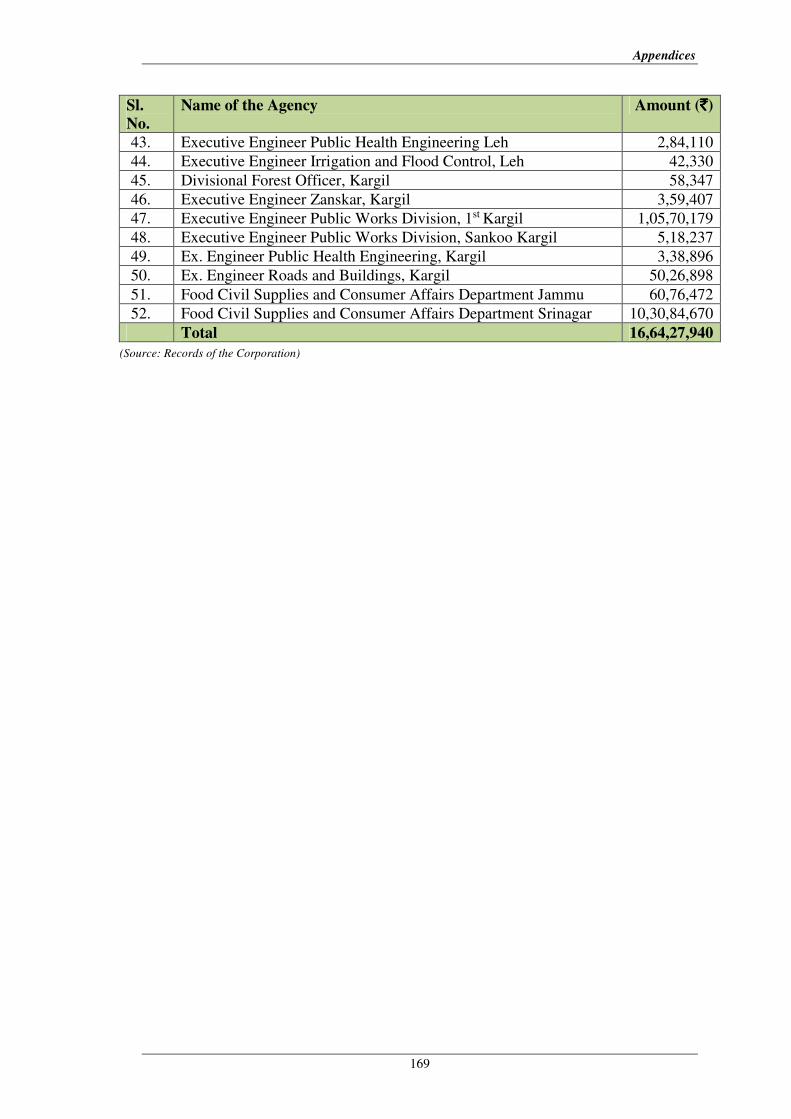
Appendices
169
Sl.
No.
Name of the Agency Amount (`̀̀̀)
43. Executive Engineer Public Health Engineering Leh 2,84,110
44. Executive Engineer Irrigation and Flood Control, Leh 42,330
45. Divisional Forest Officer, Kargil 58,347
46. Executive Engineer Zanskar, Kargil 3,59,407
47. Executive Engineer Public Works Division, 1st Kargil 1,05,70,179
48. Executive Engineer Public Works Division, Sankoo Kargil 5,18,237
49. Ex. Engineer Public Health Engineering, Kargil 3,38,896
50. Ex. Engineer Roads and Buildings, Kargil 50,26,898
51. Food Civil Supplies and Consumer Affairs Department Jammu 60,76,472
52. Food Civil Supplies and Consumer Affairs Department Srinagar 10,30,84,670
Total 16,64,27,940
(Source: Records of the Corporation)
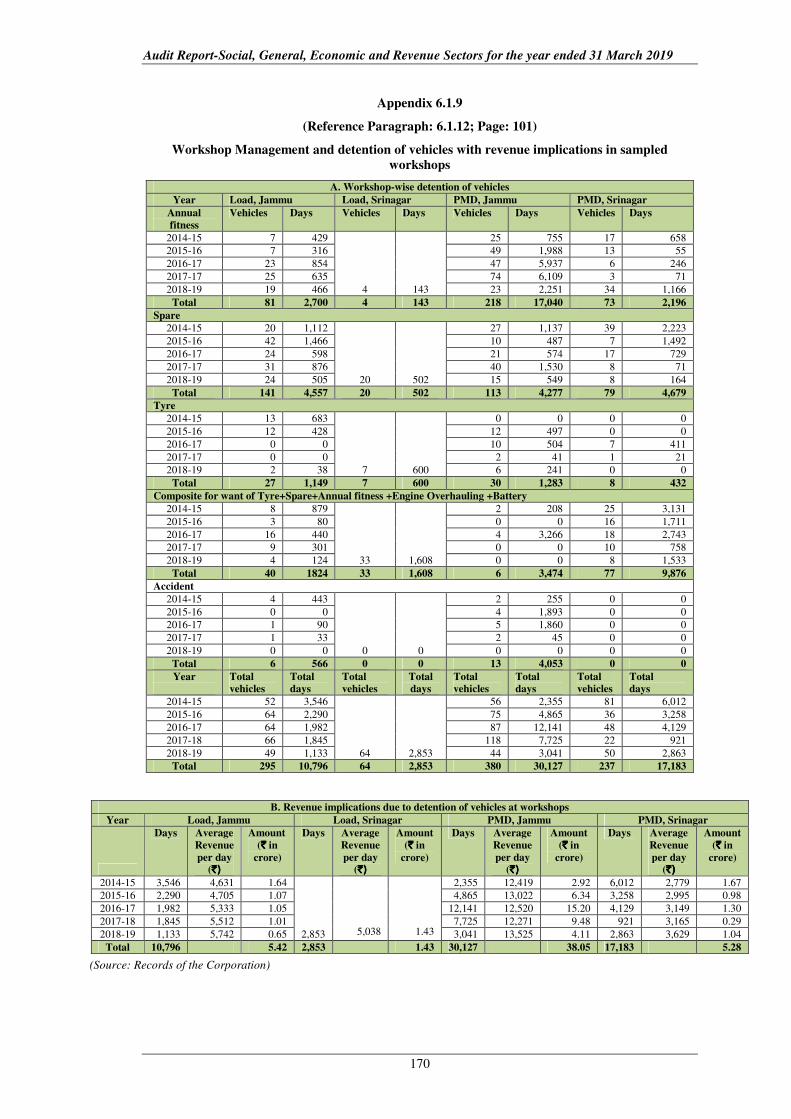
Audit Report-Social, General, Economic and Revenue Sectors for the year ended 31 March 2019
170
Appendix 6.1.9
(Reference Paragraph: 6.1.12; Page: 101)
Workshop Management and detention of vehicles with revenue implications in sampled
workshops
A. Workshop-wise detention of vehicles
Year Load, Jammu Load, Srinagar PMD, Jammu PMD, Srinagar
Annual
fitness
Vehicles Days Vehicles Days Vehicles Days Vehicles Days
2014-15 7 429
4 143
25 755 17 658
2015-16 7 316 49 1,988 13 55
2016-17 23 854 47 5,937 6 246
2017-17 25 635 74 6,109 3 71
2018-19 19 466 23 2,251 34 1,166
Total 81 2,700 4 143 218 17,040 73 2,196
Spare
2014-15 20 1,112
20 502
27 1,137 39 2,223
2015-16 42 1,466 10 487 7 1,492
2016-17 24 598 21 574 17 729
2017-17 31 876 40 1,530 8 71
2018-19 24 505 15 549 8 164
Total 141 4,557 20 502 113 4,277 79 4,679
Tyre
2014-15 13 683
7 600
0 0 0 0
2015-16 12 428 12 497 0 0
2016-17 0 0 10 504 7 411
2017-17 0 0 2 41 1 21
2018-19 2 38 6 241 0 0
Total 27 1,149 7 600 30 1,283 8 432
Composite for want of Tyre+Spare+Annual fitness +Engine Overhauling +Battery
2014-15 8 879
33 1,608
2 208 25 3,131
2015-16 3 80 0 0 16 1,711
2016-17 16 440 4 3,266 18 2,743
2017-17 9 301 0 0 10 758
2018-19 4 124 0 0 8 1,533
Total 40 1824 33 1,608 6 3,474 77 9,876
Accident
2014-15 4 443
0 0
2 255 0 0
2015-16 0 0 4 1,893 0 0
2016-17 1 90 5 1,860 0 0
2017-17 1 33 2 45 0 0
2018-19 0 0 0 0 0 0
Total 6 566 0 0 13 4,053 0 0
Year
Total
vehicles
Total
days
Total
vehicles
Total
days
Total
vehicles
Total
days
Total
vehicles
Total
days
2014-15 52 3,546
64 2,853
56 2,355 81 6,012
2015-16 64 2,290 75 4,865 36 3,258
2016-17 64 1,982 87 12,141 48 4,129
2017-18 66 1,845 118 7,725 22 921
2018-19 49 1,133 44 3,041 50 2,863
Total 295 10,796 64 2,853 380 30,127 237 17,183
B. Revenue implications due to detention of vehicles at workshops
Year Load, Jammu Load, Srinagar PMD, Jammu PMD, Srinagar
Days Average
Revenue
per day
(`)`)`)`)
Amount
(`̀̀̀ in
crore)
Days Average
Revenue
per day
(`)`)`)`)
Amount
(`̀̀̀ in
crore)
Days Average
Revenue
per day
(`)`)`)`)
Amount
(`̀̀̀ in
crore)
Days Average
Revenue
per day
(`)`)`)`)
Amount
(`̀̀̀ in
crore)
2014-15 3,546 4,631 1.64
2,853
5,038
1.43
2,355 12,419 2.92 6,012 2,779 1.67
2015-16 2,290 4,705 1.07 4,865 13,022 6.34 3,258 2,995 0.98
2016-17 1,982 5,333 1.05 12,141 12,520 15.20 4,129 3,149 1.30
2017-18 1,845 5,512 1.01 7,725 12,271 9.48 921 3,165 0.29
2018-19 1,133 5,742 0.65 3,041 13,525 4.11 2,863 3,629 1.04
Total 10,796 5.42 2,853 1.43 30,127 38.05 17,183 5.28
(Source: Records of the Corporation)