Buildings and Facilities Asset Management Plan
32
Buildings and Facilities Asset Management Plan APRIL 2022
-
Upload
khangminh22 -
Category
Documents
-
view
3 -
download
0
Transcript of Buildings and Facilities Asset Management Plan

Buildings and Facilities Asset Management
Plan
APRIL 2022
2
Document Control Version Date Revision Details Author Reviewed
1.0 Nov 2013 Initial plan completion WE
1.1 Jul 2014 Review and Updated WE
1.2 Oct 2015 Review and Updated WE
1.3 May 2016 Review and Updated WE
1.4 Sep 2017 Review and Updated WE
2.0 Jun 2018 Format review, update of modelling, clarification of service levels, plan improvements.
MB/RZ PA
3.0 Apr 2022 Updated to suit outsourced FM service, new condition and component data, and new modelling.
MB DH/ND
Asset Management Plan Alignment This document has been prepared in accordance with:
- Local Government Act Victoria (2020) - Local Government Asset Management Better Practice Guide (2015)
Local Government Victoria, - Asset Management Accountability Framework (2016)
Victoria State Government – Treasury and Finance, - ISO 55000 Series – Asset Management (2014)
International Standards, - International Infrastructure Management Manual (2020)
Institute of Public Works Engineering Australasia. - Local Government Act (2020).

3
Table of Contents Executive Summary .......................................................................................... 6
Introduction ..................................................................................................... 8
Strategic Objectives ........................................................................................ 10
Asset Overview ............................................................................................... 12
4.1. Service Category .......................................................................................................... 14
4.2. Major Service Facility Responsibility ............................................................................ 14
Levels of Service and Performance Indicators ................................................ 15
Asset Condition and Degradation ................................................................... 17
Operations ...................................................................................................... 20
Maintenance .................................................................................................. 21
Capital Renewal / Refurbishment ................................................................... 22
New Assets and Capital Upgrades .................................................................. 23
10.1. Overview .................................................................................................................. 23
10.2. Private Developments .............................................................................................. 23
10.3. Infrastructure Contributions Projects ...................................................................... 24
10.4. Councils 4-15 Year New Works Program ................................................................. 25
Transfers and Disposal Plan ............................................................................ 26
Lifecycle Costs - Annualised ............................................................................ 27
Financial Indicators ......................................................................................... 28
Risk Management ........................................................................................... 29
Improvement Plan .......................................................................................... 30
Appendix A: Building Assets 15 Year Financial Plan ($,000) ................................... 31

4
List of Tables Table 1.1 – Building Asset Portfolio Overview ($,000) ............................................. 6
Table 3.1 – Building Asset Related Documents and Systems ................................. 11
Table 4.1 – Building Asset Portfolio Overview ($M) .............................................. 12
Table 4.2 – Componentisation and Data Confidence ............................................ 13
Table 5.1 – Level of Service ................................................................................... 16
Table 6.1 – Condition Descriptors ......................................................................... 17
Table 6.2 – Asset Lives and Intervention Levels .................................................... 17
Table 7.1 – Operational Activities and Expenditure (2021, $,000) ......................... 20
Table 8.1 – Maintenance Expenditure (2021, $,000) ............................................. 21
Table 9.1 – Renewal Expenditure, Requirements and Backlog ($,000) .................. 22
Table 12.1 – Indicative Lifecycle Costings ($) ........................................................ 27
Table 12.1 – Critical Strategic Risks ....................................................................... 29
Table 15.1 – Buildings Asset Management Improvement Plan ............................. 30

5
List of Figures Figure 1.1 –Building Asset Condition Distribution ................................................... 7
Figure 1.2 – 15 Year Rolling Backlog Forecast ($, millions) ...................................... 7
Figure 1.3 – Building Financial Indicators for 2021/22 Financial Year ...................... 7
Figure 2.1 – Asset Management Framework ........................................................... 9
Figure 6.1 – Current Condition by Component for Administration, Community, Family, and Heritage Service Categories. .............................................................. 18
Figure 6.2 – Current Condition by Component for Investment, Library, Public Toilet and Recreation Service Categories. ....................................................................... 19
Figure 10.1 – Anticipated Additional Buildings Constructed from ICPs/DCPs ........ 24
Figure 10.2 - Capital Expenditure .......................................................................... 25

6
Executive Summary The City of Whittlesea manages its building portfolio to facilitate the delivery of services in a way that meets the community’s expectations in a safe, effective, and cost-efficient manner. This portfolio had a replacement cost of $473.4 Million as of 30 June 2021.
Melbourne is one of the fastest growing cities in Australia and, according to the Federal Government’s 2021 Population Statement, is predicted to be the most populated city in Australia by 2030. The City of Whittlesea is a growth area council that will contribute to providing the communities this population growth will require. This creates a unique management challenge; to protect the long-term sustainability and service provision of our asset base, we must ensure that existing assets continue to be proactively maintained as new assets are handed over to Council.
This plan provides a strategic overview of the services that the City of Whittlesea provides through the management of building assets, the associated costs, and the risks and mitigation measures in providing those services. This plan outlines Council’s adopted approach and its implications. Several scenarios were modelled in developing this plan and are available as an interactive digital dashboard here: City of Whittlesea Digital Asset Dashboard.
Table 1.1 shows the annual average operational, maintenance, renewal and upgrade/new construction expenditure on assets and the anticipated funding gap over the next 15 years.
Table 1.1 – Building Asset Portfolio Overview ($,000)
Service Category
Annualised Operations & Maintenance1
Annualised Renewal Budget1
New Assets &
Upgrades1
Backlog2 2022/23
Backlog2 2036/37
Administration 1,548
3,186 20,829
27 3,889
Community 2,704 22 4,655
Family 2,229 2 4,269
Heritage 63 - 37
Investment 281 11 1,228
Library 365 - 1,434
Public Toilet 412 2 166
Recreation 4,271 20 9,767
Other 25 - 3,625
Total 11,899 3,186 20,829 84 29,070
Note: 1. Budget figures are a 15-year average. Refer Appendix A for details. 2. ‘Backlog’ refers to works that are beyond the desired intervention level, but funding is not available to undertake those works.

7
Figure 1.1 –Building Asset Condition Distribution
Figure 1.2 – 15 Year Rolling Backlog Forecast ($, millions)
The existing backlog is addressed within the first year of this plan, and future backlog does not start to arise until 2030/31. Council is aware of this future requirement, will monitor the performance of the building assets, and will review funding availability in the later years.
Asset Sustainability Ratio
22%
𝑅𝑒𝑛𝑒𝑤𝑎𝑙 𝐸𝑥𝑝𝑒𝑛𝑑𝑖𝑡𝑢𝑟𝑒
𝐴𝑛𝑛𝑢𝑎𝑙 𝐷𝑒𝑝𝑟𝑒𝑐𝑖𝑎𝑡𝑖𝑜𝑛
A measure of the sustainability of current asset renewal practice.
Asset Renewal Funding
95%
𝐹𝑢𝑛𝑑𝑒𝑑 𝑅𝑒𝑛𝑒𝑤𝑎𝑙𝑠
𝐷𝑒𝑠𝑖𝑟𝑒𝑑 𝑅𝑒𝑛𝑒𝑤𝑎𝑙𝑠
A measure of how much of the required renewal
funding is available.
Remaining Service Potential
60%
𝐹𝑎𝑖𝑟 𝑉𝑎𝑙𝑢𝑒
𝐶𝑢𝑟𝑟𝑒𝑛𝑡 𝑅𝑒𝑝𝑙𝑎𝑐𝑒𝑚𝑒𝑛𝑡 𝐶𝑜𝑠𝑡
A measure of the remaining service life of
assets.
Average Annual Asset Consumption
1.38%
𝐴𝑛𝑛𝑢𝑎𝑙 𝐷𝑒𝑝𝑟𝑒𝑐𝑖𝑎𝑡𝑖𝑜𝑛
𝑅𝑒𝑝𝑙𝑎𝑐𝑒𝑚𝑒𝑛𝑡 𝐶𝑜𝑠𝑡
A measure of the rate of Building asset
consumption.
Figure 1.3 – Building Financial Indicators for 2021/22 Financial Year
Whilst the asset sustainability ratio is relatively low, it needs to be considered in the context of backlog, the asset renewal funding ratio, and annual depreciation relative to the timing of renewal requirements. Depreciation is calculated as an annualised rate from replacement value, rather than renewal works, and does not follow the same year-on-year profile as required renewal expenditure. It is expected that the year-on-year depreciation-based sustainability ratio will fluctuate. The renewal funding ratio shows Council’s current funding is meeting current annual renewal requirements.
$-
$5
$10
$15
$20
$25
$30
$35
Mill
ion
s

8
Introduction The City of Whittlesea is committed to providing effective and efficient services to the community. Council is proactively managing its asset portfolios to ensure the level of service provided meets the community’s expectations in the most cost-effective manner and has invested in systems, processes, and personnel to achieve this. This plan gives an overview of current practices and their long-term implications on service delivery to inform decision making and resource prioritisation.
This plan is broken into four sections addressing key long term sustainability questions:
Why does Council have building assets and what do we have? Section 3 – Strategic Objectives Section 0 – Asset Overview Section 5 – Levels of Service and Performance Indicators Section 6 – Asset Condition and Degradation
How do we manage our assets throughout their lifecycle and what does it cost? Section 7 – Operations Section 8 – Maintenance Section 9 – Capital Renewal Section 10 – New Assets and Capital Upgrades Section 11 – Transfers and Disposal Plan Section 12 – Lifecycle Costs - Annualised Section 13 – Financial Indicators
What are the risks in delivering the desired services and how do we mitigate them? Section 14 – Risk Management
How will we continue to get better at managing our building assets? Section 15 – Improvement Plan
This building and facilities asset management plan is part of Council’s overall Asset Management Framework. This framework defines the overall context for the management of community assets and ensures that the asset lifecycle activities link back to the community’s desired level of service as per the Whittlesea 2040 Community Strategic Plan. The framework is depicted in Figure 2.1.

9
Figure 2.1 – Asset Management Framework
Asset Management
Strategy
Whittlesea 2040
(10+ year focus)
Community Plan
(4 year focus)
Operational Plan
(1 year focus)
Informs
Informs
Asset Management
System/Database Asset
Inspections
Annual Report
Planning Reports
Asset Revaluation
Resourcing Strategy
Strategic
Plans/
Documents
Asset Management
Plans Asset Management
Plans Asset Management
Plans
All Plans
Drives

10
Strategic Objectives The City of Whittlesea’s Shaping Our Future Whittlesea 2040 Community Strategic Plan outlines the community’s vision for living and working in the City of Whittlesea. The Council have developed the Community Plan 2021-2025 which outlines how they plan to achieve that vision during their term.
The City of Whittlesea is responsible for both urban and rural areas and therefore is considered an interface Council. The municipality will experience significant population growth over the next 20 years, increasing from approximately 242,000 to 382,900 residents and thus is also considered a growth Council. This creates unique challenges in providing the required services for both established and rapidly developing areas to address today’s needs with consideration of our community’s ultimate demographic profile.
The City of Whittlesea has a comprehensive community consultation process for the development and update of the Community Strategic Plan and Community Plan that is validated with ongoing community surveys. This Buildings and Facilities Asset Management Plan utilises the outcome of those consultation processes and has been placed on public display to ensure this plan aligns with the vision of the community. Future iterations of this plan will use deliberative engagement practices to bring the community into its further development and update.
The strategic objectives Council achieves through the operation, maintenance, renewal, and upgrade of building assets align with Whittlesea 2040 as follows:
2. Liveable Neighbourhoods: 2.2 Well-designed neighbourhoods and vibrant town centres.
4. Sustainable Environment: 4.3 Leaders in clean, sustainable living.
Council has developed policies, strategies and plans to assist with facilitating, providing, and advocating for these objectives. It has also adopted systems to manage the quantum of data. A summary of these documents and systems is shown in Table 3.1.
In early 2021, Council adopted an Integrated Planning Framework to consolidate and align work across Council. The framework aims to deliver Council’s overarching community plan (Whittlesea 2040 – A Place for All), through eight major strategies. One of these strategies is the Long-Term Community Infrastructure Strategy (LTCIS). Once developed, the LTCIS will be a roadmap for Council’s infrastructure (community facility) investment across all community service areas, including early years, arts and culture, sport, recreation and leisure libraries, youth, ageing well, community development etc. Service areas will undertake planning including the development of service infrastructure profiles to identify infrastructure needs, service levels, timing, locational issues and collaboration approaches (such as shared use opportunities).
11
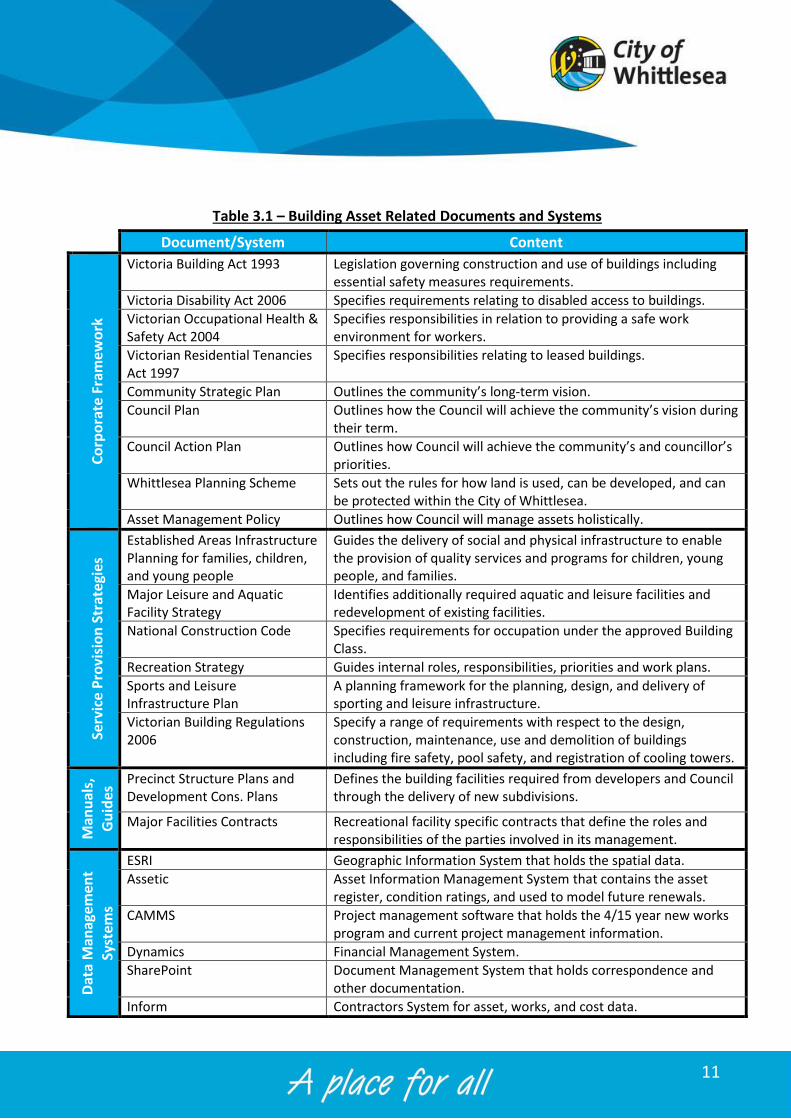
Table 3.1 – Building Asset Related Documents and Systems
Document/System Content
Co
rpo
rate
Fra
mew
ork
Victoria Building Act 1993 Legislation governing construction and use of buildings including essential safety measures requirements.
Victoria Disability Act 2006 Specifies requirements relating to disabled access to buildings.
Victorian Occupational Health & Safety Act 2004
Specifies responsibilities in relation to providing a safe work environment for workers.
Victorian Residential Tenancies Act 1997
Specifies responsibilities relating to leased buildings.
Community Strategic Plan Outlines the community’s long-term vision.
Council Plan Outlines how the Council will achieve the community’s vision during their term.
Council Action Plan Outlines how Council will achieve the community’s and councillor’s priorities.
Whittlesea Planning Scheme Sets out the rules for how land is used, can be developed, and can be protected within the City of Whittlesea.
Asset Management Policy Outlines how Council will manage assets holistically.
Serv
ice
Pro
visi
on
Str
ate
gies
Established Areas Infrastructure Planning for families, children, and young people
Guides the delivery of social and physical infrastructure to enable the provision of quality services and programs for children, young people, and families.
Major Leisure and Aquatic Facility Strategy
Identifies additionally required aquatic and leisure facilities and redevelopment of existing facilities.
National Construction Code Specifies requirements for occupation under the approved Building Class.
Recreation Strategy Guides internal roles, responsibilities, priorities and work plans.
Sports and Leisure Infrastructure Plan
A planning framework for the planning, design, and delivery of sporting and leisure infrastructure.
Victorian Building Regulations 2006
Specify a range of requirements with respect to the design, construction, maintenance, use and demolition of buildings including fire safety, pool safety, and registration of cooling towers.
Man
ual
s,
Gu
ides
Precinct Structure Plans and Development Cons. Plans
Defines the building facilities required from developers and Council through the delivery of new subdivisions.
Major Facilities Contracts Recreational facility specific contracts that define the roles and responsibilities of the parties involved in its management.
Dat
a M
anag
emen
t
Syst
ems
ESRI Geographic Information System that holds the spatial data.
Assetic Asset Information Management System that contains the asset register, condition ratings, and used to model future renewals.
CAMMS Project management software that holds the 4/15 year new works program and current project management information.
Dynamics Financial Management System.
SharePoint Document Management System that holds correspondence and other documentation.
Inform Contractors System for asset, works, and cost data.

12
Asset Overview Council owns and manages its building portfolio for a variety of reasons such as to directly provide services to the community, to facilitate service delivery by providing facilities that can be operated by other specialists to provide services, or to provide facilities to support Council staff, plant, equipment, and materials in delivering services.
There are currently 112 precincts with a total of 197 service categories within the portfolio. Some buildings within a precinct provide more than one service, such as a Community Activity Centre which can be comprised of community, family, and public toilets facilities. Table 4.1 shows the number of service categories provided with their associated value as of 30 June 2021.
Table 4.1 – Building Asset Portfolio Overview ($M)
Service Category Number Footprint
(sq.m)
Current Replacement
Cost ($)
Fair Value ($)
Annual Dep. ($)
Administration 15 16,380 61.8 36.2 0.9
Community 31 17,685 89.9 62.6 1.2
Family 60 19,784 91.6 60.1 1.4
Heritage 2 595 8.7 1.9 0.05
Investment 10 5,806 15.1 8.8 0.2
Library 4 5,113 28.7 17.2 0.4
Public Toilet 21 398 4.4 1.9 0.06
Recreation 54 47,514 173.2 91.4 2.4
Total 197 113,275 473.4 280.1 6.61
Council also has a service category of ‘Other’ that is used for maintenance and renewal activities on components that are common to multiple service categories. A HVAC system, solar panels, or rainwater tanks are examples of components common to multiple services within a building and are included in this category. It is noted that Council’s valuation methodology does not use this category and assigns these components to the primary service category of a building.
Council’s current degree of building componentisation and data confidence is outlined in Table 4.2. Council’s Facilities Management Service, including much of the operational and maintenance activities, was contracted out during the 2020/21 Financial Year. This contract also included a complete stocktake and condition audit of the existing asset register to ensure it was complete and accurate which has given Council a high level of confidence in the dataset.

13
Table 4.2 – Componentisation and Data Confidence
Asset Group Data Confidence
Levels1 Scope
Building High Floors, internal and external walls, doors, windows, ceilings, roof.
Electrical High Power distribution, solar panels, lighting, emergency exit signage.
Fire High Fire alarm system, fire suppression systems, smoke exhaust
system, portable fire equipment.
Furniture / Fixtures and Equipment
High Internal fit out and fixtures such as kitchens, bathrooms, telecommunication equipment, and general office furniture.
Hydraulics High Water supply, hot water systems, gas supply, and rainwater
treatment.
Mechanical High Heating and cooling systems, ventilation.
Recreational High Aquatics, gym, or internal sports equipment.
Security High CCTV, building access systems, alarms.
Note: 1. Data confidence colour-coding: Green = desired level, Orange = improvement desired, Red = improvement required.
Council has a proactive inspection and auditing process to ensure the buildings are managed effectively and efficiently. This includes complete condition audits and component stocktake undertaken every 2 years that verifies the register is complete and accurate and general inspections every 6 months to identify maintenance requirements and prioritise minor capital works.

14
4.1. Service Category The service category has been established to facilitate the effective management, prioritisation, resource allocation, and response times suitable to the usage of each category. The descriptors of the service categories are outlined in Table 4.1.
Table 4.3 – Service Category
Service Category Description
Administration An asset that supports the operation of Council, such as the Civic Centre or Epping Depot.
Community An asset that provides services and facilities for the general community to use, such as community centres or community halls.
Family An asset that provides services to families such as preschools, kindergartens, and maternal and child health.
Heritage Buildings with historical and cultural value that are being preserved for our history and an insight into the lifestyle of earlier generations.
Investment A building that has been purchased with the intention of leasing or future sale at a profit to fund capital works or service delivery.
Library A building leased to library service providers for the community to access a variety of media.
Public Toilet A toilet block that is intended for use by the public, generally located in recreational reserves, parks, or shopping precincts.
Recreation A facility designed to facilitate passive or active recreation such as aquatic centres or sport pavilions.
Other
Used for maintenance and renewal, this category is for components of buildings that support multiple service categories. Examples are a HVAC system or solar panels on the roof on a community activity centre.
4.2. Major Service Facility Responsibility Council provides a diverse range of services to our community. Some of these services require specialised skills whereby Council engages suitable specialists to manage the provision of those services. Major Facilities such as the Growling Frog Golf Course or Recreation and Aquatic Centres are some examples of such facilities managed by suitable specialists.
It is noted that while these Major Facilities have contracts in place specifying the terms and conditions of their management, ultimate funding of lifecycle costs (operational, maintenance, renewal, upgrade/new, and disposal) resides with Council. Throughout this plan these facilities have been included as per all Council building portfolio assets.

15
Levels of Service and Performance Indicators A key objective of asset management planning is to match the levels of service (LoS) the organisation delivers with the level of service expectations of customers1. Council therefore looks at level of service through the following perspectives:
1. Community Level of Service: Relates to the service or experience expected by the community utilising the asset. This covers attributes such as quality, reliability, responsiveness, sustainability, timeliness, accessibility, and cost effectiveness; and
2. Technical Level of Service: Relates to how the Council delivers the community level of service and the specific technical indicators that measure whether the minimum requirements have been met.
Council recognises that the ongoing development of the municipality requires not just the provision, but also the advocacy for and facilitation of building assets to deliver these services. This includes, but is not limited to, upgrade of the existing facilities and the provision of new building and community services. The Victorian State Government specifies that2 “A better service, not a better asset, is a key indication of successful asset management”, thus Council’s levels of service consider service delivery through advocacy and facilitation, in conjunction with asset performance.
The levels of service align with the organisation’s Strategic Objectives in Section 3, specifically the Whittlesea 2040 goals as follows:
3. Liveable Neighbourhoods: 2.2 Well-designed neighbourhoods and vibrant town centres.
5. Sustainable Environment: 4.3 Leaders in clean, sustainable living.
The number references for these goals have been cited in Table 5.1 to ensure the measured levels of service relate to the Community’s 2040 vision.
1 International Infrastructure Management Manual, IPWEA, 2020. 2 Guidelines for Developing an Asset Management Policy, Strategy and Plan, Department for Victorian Communities, 2004.

16
Table 5.1 – Level of Service
W2040 Goal
Community Level of Service Technical LoS Score
Co
nd
itio
n
2.2 Assets are in a condition to effectively support services that are delivered at the premises.
Assets are maintained at condition 3 (average) or better.
97%
Cap
abili
ty 2.2
Aquatic Facilities are appropriate and desirable for community use.
Number of visits to aquatic facilities per head of municipal population
0.77
Buildings and Facilities are appropriate to meet our community’s needs.
Buildings are accessible for all members of the community and are DDA compliant.
Under Assessment
Buildings support gender equity best practice and inclusive measures.
Buildings have spaces that are supportive of the diverse cultural and religious needs of our community.
4.3 Buildings are efficient to operate and minimise their impact on the environment.
Buildings that have solar panels installed.
32.5%
Buildings that have rainwater tanks installed.
34.5%

17
Asset Condition and Degradation Council collects asset specific condition and degradation indicators to assess asset and component performance throughout their lifecycle. For valuation, reporting, and overall network monitoring these indicators are aggregated into a standard condition rating as shown in Table 6.1.
Table 6.1 – Condition Descriptors
Assetic Condition Index
Condition Descriptor
0 New or as new asset.
1 Excellent - minimal maintenance may be required.
2 Good - minor maintenance work may be required.
3 Average - standard maintenance work required.
4 Poor - renewal required. Asset provides poor level of service.
5 Very Poor - urgent renewal required. Asset is unsafe or unusable.
6 Failed – asset has reached end of life and cannot be used.
The intent of Council is to undertake renewal works on an asset at the most cost-effective point in the asset lifecycle to deliver the community’s desired level of service. The intervention level of service (LoS) as per Table 6.1 and their associated lives are shown in Table 6.2.
Table 6.2 – Asset Lives and Intervention Levels
Asset Group Intervention Level (LoS)
Service lives (yrs)1
Useful Lives (yrs)
Building 4 7-60 10-90
Electrical 4 7-50 10-75
Fire 4 7-40 10-60
Furniture/Fixtures and Equipment 4 7-50 10-75
Hydraulics 4 7-50 10-75
Mechanical 4 7-25 10-38
Recreational 4 7-30 10-45
Security 4 7-25 10-38
Note: 1. Service life is the length of time an asset meets the desired level of service and determines the life to renewal. Useful Life is the anticipated time the component is available for use, regardless of condition.
2. Refer to table 4.2 for componentisation of Asset Group i.e. Asset Group, Building is scoped with Floors, internal and external walls, doors, windows, ceilings, roof.
Component condition data was collected in 2020/21 and shows that, overall, Council’s buildings are in a reasonably good condition. Figure 6.1 and Figure 6.2 show the current condition distribution per component by Building Service Category.

18
Figure 6.1 – Current Condition by Component for Administration, Community, Family, and
Heritage Service Categories.

19
Figure 6.2 – Current Condition by Component for Investment, Library, Public Toilet and
Recreation Service Categories.

20
Operations Operational activities are the ongoing, day to day actions and overheads required for the asset to operate effectively and safely in delivering the desired level of service. This includes utilities, condition inspections, and cleaning. The overview of current operational activities across all facilities and their associated costs are shown in Table 7.1.
Table 7.1 – Operational Activities and Expenditure (2021, $,000)
Activity Type Cost Contract Cleaning 1,802
Utilities - Electricity 1,020
Utilities - Water 320
Utilities - Gas 405
Insurance 524
Security Systems 149
Total 4,220
Part of the operational requirements of managing buildings is undertaking inspections and audits. This is to ensure that the desired level of service is being met and to ensure compliance with legislative requirements designed to ensure user safety. The frequencies of inspections are shown in Table 7.2 below.
Table 7.2 – Building Inspection Type and Frequency
Inspection type Description Frequency
Essential Services Audits
Audit of essential services such as Emergency lighting, Fire panels, Fire extinguishers, Paths of travel, and Hydrostatic hydrant tests.
Quarterly
Routine Inspections
Check for any maintenance issues that have arisen since the last inspection. Undertake legislated or critical inspections such as HVAC or Mechanical services audits.
6 Monthly
Condition Inspections Assess condition, assess for impairment, and inform renewal projections.
2 Yearly
Asbestos Audits Inspection and monitoring of asbestos within buildings to ensure that it is stable and health risks are minimised.
5 Yearly

21
Maintenance Maintenance activities refer to the ongoing, day to day actions that are necessary to ensure the assets provide the level of service desired and reach their anticipated useful life. As assets degrade, maintenance activities and their associated costs increase. This is as poorer condition assets require additional intervention to maintain the desired level of service. Maintenance activities are demarcated into two categories for budgeting purposes:
1. Planned/Routine Maintenance: Planned maintenance works are any necessary periodic works carried out to ensure the reliability or to sustain the design life of an asset. Typical planned maintenance activities include servicing of HVAC systems and servicing of lifts.
2. Reactive Maintenance: Reactive maintenance works are undertaken in response to inspections, assessments, or customer requests where an asset is identified as non-functional or damaged. Typical reactive maintenance activities for buildings include clearing a blocked sump, repairing a flickering light, patching a hole in a wall, or replacing minor fixed plant and equipment after a breakdown.
Where possible, Council intends to manage assets in such a way that maximises planned maintenance and minimises reactive maintenance. This provides the best service for the community with the fewest disruptions, reduces the asset lifecycle cost and mitigates risk.
Current maintenance costs by service category are shown in Table 8.1.
Table 8.1 – Maintenance Expenditure (2021, $,000)
Service Category Annual Cost Administration 667
Community 1,086
Family 1,009
Heritage 35
Investment 213
Library 159
Public Toilet 190
Recreation 1,950
Other 19
Total 5,328

22
Capital Renewal / Refurbishment Capital renewal and refurbishment primarily refers to any works required to replace or restore an existing asset to a new or as new condition. Common examples include painting internal walls, replacing the HVAC system, or the refurbishing of fit out and finishes without expanding the services provided. Council undertakes renewals to meet the desired levels of service defined in Table 5.1 by undertaking works at the end of service life as per Table 6.2.
The service lives defined are the averaged life for an asset component, thus each individual asset may have some variance from that averaged life. Renewal programs are reviewed, and specific components are physically inspected during the 6-montly inspection cycles, so work prioritisation can be adjusted for any environmental impacts that extend or reduce service life.
An analysis has been undertaken to assess assets that will degrade to their intervention level and are unable to be funded in the year their renewal is modelled to be required. This is defined as backlog and is shown in Table 9.1. The available funding is not all explicitly designated by the service categories, so where possible it has been allocated to the planned category, otherwise funding priorities are determined by the best return on investment. Factors such as community need, external funding opportunities, or environmental factors may change the allocation of funding in future years to best deliver the level of service the community requires, and this is reviewed through the works planning process. Further detail is provided in Appendix A.
Table 9.1 – Renewal Expenditure, Requirements and Backlog ($,000)
Service Category Annualised
Renewal Budget1
Annualised Required Works1
Annualised Average
Gap1
Current Backlog
15 Year Backlog
Administration
3,186
603 257 27 3,889
Community 768 309 22 4,655
Family 941 284 2 4,269
Heritage 20 2 - 37
Investment 178 81 11 1,228
Library 164 96 - 1,434
Public Toilet 30 11 2 166
Recreation 1,813 650 20 9,767
Other 601 242 - 3,625
Total 3,186 5,118 1,932 84 29,070
Note: 1. Budget figures are a 15-year average. Refer Appendix A for details.
The existing backlog is addressed within the first year of this plan, and future backlog does not start to arise until 2030/31. Council is aware of this future requirement, will monitor the performance of the building assets, and will review funding availability in these later years.
23
New Assets and Capital Upgrades
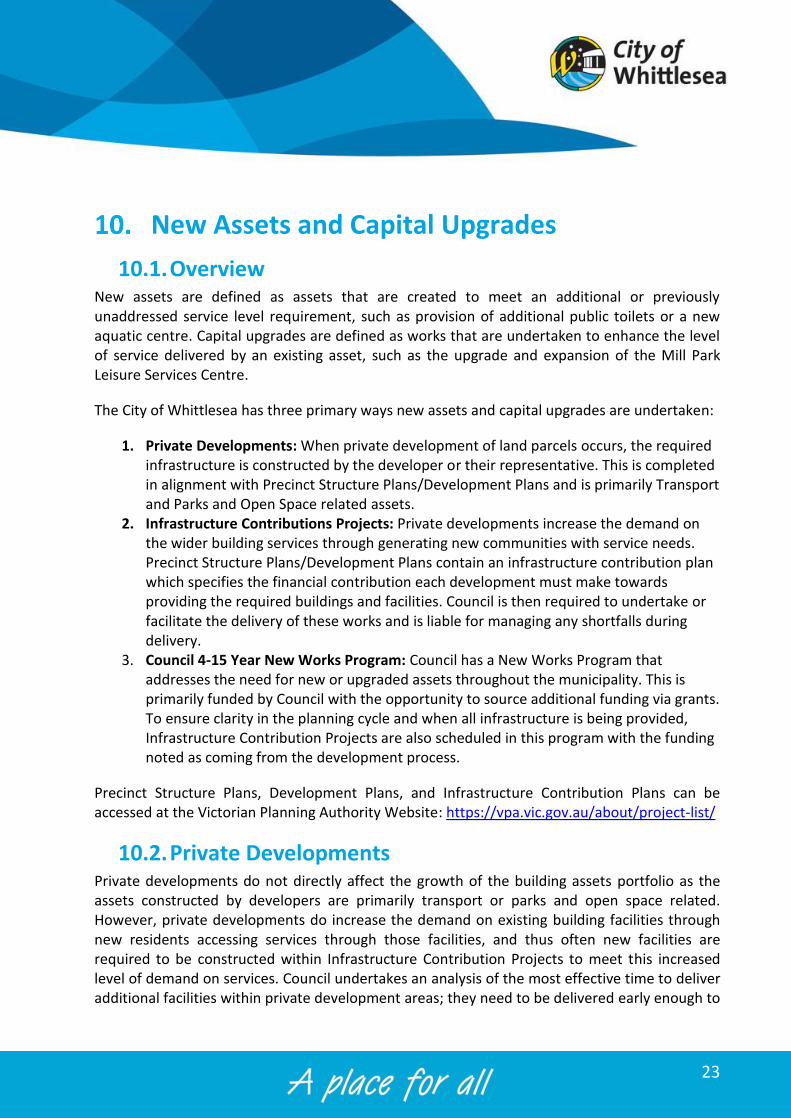
10.1. Overview New assets are defined as assets that are created to meet an additional or previously unaddressed service level requirement, such as provision of additional public toilets or a new aquatic centre. Capital upgrades are defined as works that are undertaken to enhance the level of service delivered by an existing asset, such as the upgrade and expansion of the Mill Park Leisure Services Centre.
The City of Whittlesea has three primary ways new assets and capital upgrades are undertaken:
1. Private Developments: When private development of land parcels occurs, the required infrastructure is constructed by the developer or their representative. This is completed in alignment with Precinct Structure Plans/Development Plans and is primarily Transport and Parks and Open Space related assets.
2. Infrastructure Contributions Projects: Private developments increase the demand on the wider building services through generating new communities with service needs. Precinct Structure Plans/Development Plans contain an infrastructure contribution plan which specifies the financial contribution each development must make towards providing the required buildings and facilities. Council is then required to undertake or facilitate the delivery of these works and is liable for managing any shortfalls during delivery.
3. Council 4-15 Year New Works Program: Council has a New Works Program that addresses the need for new or upgraded assets throughout the municipality. This is primarily funded by Council with the opportunity to source additional funding via grants. To ensure clarity in the planning cycle and when all infrastructure is being provided, Infrastructure Contribution Projects are also scheduled in this program with the funding noted as coming from the development process.
Precinct Structure Plans, Development Plans, and Infrastructure Contribution Plans can be accessed at the Victorian Planning Authority Website: https://vpa.vic.gov.au/about/project-list/
10.2. Private Developments Private developments do not directly affect the growth of the building assets portfolio as the assets constructed by developers are primarily transport or parks and open space related. However, private developments do increase the demand on existing building facilities through new residents accessing services through those facilities, and thus often new facilities are required to be constructed within Infrastructure Contribution Projects to meet this increased level of demand on services. Council undertakes an analysis of the most effective time to deliver additional facilities within private development areas; they need to be delivered early enough to

24
ensure that residents moving into new subdivisions have access to services, but not so early that the facilities are underutilised, or the facility is overservicing the community.
The rate of private developments and associated population growth is anticipated to continue through to at least 2040 when the anticipated population of approximately 382,900 is realised, and the rate of acquisition of new buildings and facilities is anticipated to continue through this period.
10.3. Infrastructure Contributions Projects Infrastructure Contributions Projects (ICPs) are identified in Precinct Structure Plans (PSP) with a defined scope of works. These projects include a cost estimate determined by the Victorian Planning Agency (VPA) as at the time the PSP is adopted, and Council collects this from the developments as part of their development process.
Council plans for ICPs in the New Works Program alongside prioritised capital works on an as needs basis or, if deemed beneficial to the community, will negotiate the delivery of this infrastructure by developers whilst they are on site constructing their own works. There are currently 40 new building projects identified within the New Works Program that are ICP related and are anticipated to be delivered within the next 15 years, as per Figure 10.1.
Figure 10.1 – Anticipated Additional Buildings Constructed from ICPs/DCPs
It is noted that there is a significant liability to Council that has been identified within the ICPs. This is caused by the contribution amounts being determined when the PSPs were adopted and changing design standards and construction costs increase the current day cost of the required works. The extent of this and the risk posed to Council is under review.
0
1
2
3
4
5
6
7
8
9
Projected New ICP/DCP Buildings

25
10.4. Councils 4-15 Year New Works Program Council plans the construction of building capital works, as determined from changing desired levels of service for a growing municipality, through the 4-15 Year New Works Program. This program covers the next 15 years of capital works and is assessed and reviewed in conjunction with the annual budget review process. Available funding is balanced between all asset classes on an as needs basis per year.
The major projects that Council is currently undertaking are listed on Council’s website available at Major Council projects - Whittlesea Council.
The distribution of this funding for Building assets between Expansion, Renewal, Upgrade, and New throughout the first 10 years of the program is as per Figure 10.2. Whilst the program covers 15 years, this funding breakdown is currently only available for the first 10 years.
Figure 10.2 - Capital Expenditure
Whilst the new works program lists the anticipated new, expansion, and upgrade of existing buildings and the associated costs, there is currently limited details on the specifics of each facility’s design within the program. This makes projecting the operating and maintenance costs for the buildings challenging. A typical building footprint has been used per facility type for strategic planning purposes. Future iterations of this plan will identify proposed building footprints for more accurate budget projection purposes.
$-
$10
$20
$30
$40
$50
$60
$70
$80
22/23 23/24 24/25 25/26 26/27 27/28 28/29 29/30 30/31 31/32
Mill
ion
s
Expansion New Renewal Upgrade

26
Transfers and Disposal Plan Council’s building portfolio has a range of building categories that all serve a different role in the delivery of services by Council to the community. This includes facilities Council directly operates, facilities managed by other organisations to deliver services on behalf of Council and buildings held for future potential financial gain.
The role the building fulfils for Council’s service delivery defines the method of disposal. For example, buildings that Council uses regularly to deliver services will require replacement or relocation to ensure the continuation of those services, while buildings held for future economic benefit will be sold on the market at a period where the best return will be realised or when funding is required to address specific community needs.
At this stage, there are no buildings or facilities identified for disposal.

27
Lifecycle Costs - Annualised To ensure effective planning of future capital works and that the additional operational and capital costs generated from vested assets is understood and accounted for, Council undertakes an assessment of the annual cost of managing the current asset portfolio. Operational and Maintenance expenditure is reviewed against the current portfolio to determine a unit rate per square meter of floor space. Council’s buildings are in a variety of conditions, from near-new to approaching need for refurbishment, so the existing costs give an indicative estimate of the future costs a new building will impose on Council throughout its lifecycle.
Depreciation is used as a proxy assessment for capital renewal requirements. With service lives ranging between 7-60 years, and useful lives being up to 90 years, the assessment period for future renewals can have a significant impact on the lifecycle renewal requirements. Depreciation is applied consistently throughout the life of the asset and gives Council the capacity to calculate future financial ratios for different long term financial plan and capital delivery scenarios.
Table 12.1 shows the current assessment of the building asset lifecycle costing.
Table 12.1 – Indicative Lifecycle Costings ($)
Annual Costs ($)
Service Category Unit Ops and Mtnce
Depreciation Cost
Total Cost
Administration Per sqm 75.9 55.2 131.1
Community Per sqm 122.3 67.6 189.9
Family Per sqm 90.7 71.6 162.3
Heritage Per sqm 86.7 89.3 176.0
Investment Per sqm 36.7 32.8 69.4
Library Per sqm 57.3 73.8 131.2
Public Toilet Per sqm 835.1 150.9 986.0
Recreation Per sqm 72.4 49.5 121.9
The ‘Other’ Service Category, as used for building components common to multiple services, does not have a footprint and thus a unit rate cannot be calculated. The cost associated has been distributed across the other service categories to account for this.

28
Financial Indicators Council uses financial indicators to reflect on the past year’s performance of its current asset management practices. This assists with identifying if there are specific areas that need attention or if the current practice is appropriate for the organisation and community.
Asset Sustainability for 2021/22: $1.45𝑀
$6.55𝑀 = 22%
The Asset Sustainability ratio is a financial estimate of whether assets are being replaced at the same rate that they are deteriorating. It is calculated by dividing the annual renewal expenditure by annual depreciation and is generally targeted at around 100%.
Whilst the result of 22% is significantly below the target, this ratio should be considered alongside the asset renewal funding ratio and rolling backlog. The low ratio here is due to the long life of infrastructure assets meaning that a low volume of work is required now, but there will be a high volume required in the future as can be seen from the projected backlog.
Asset Renewal Funding for 2021/22: $1.45𝑀
$1.54𝑀 = 95%
The Asset Renewal Funding ratio is a measure of how effectively Council is currently funding renewals by comparing the available renewal funding against the currently identified deliverable bank of works within the Asset Management Plan. It is calculated by dividing the Net Present Value of the funded renewal works by the Net Present Value of the desired capital renewal works.
Remaining Service Potential for 2021/22: $285𝑀
$473𝑀 = 60%
The Remaining Service Potential is a financial estimate of the overall aged condition of a local government’s assets. It gives an approximate percentage remaining life of the network and is calculated by dividing the Fair Value by the Current Replacement Cost.
Average Annual Asset Consumption for 2021/22: $6.55𝑀
$473.38𝑀 = 1.38%
The Average Annual Asset Consumption assesses the rate at which assets are being consumed and are losing their service potential. It is calculated by dividing the annual depreciation by the depreciable replacement cost.

29
Risk Management Council is committed to providing and maintaining a healthy and safe environment for the internal and external community. Council has determined a Hazard Identification, Risk Assessment and Control (HIRAC) procedure to outline how to assess and mitigate risks. In this plan’s context, the risks relate to business planning, management, service delivery and physical asset failure; that is, the risks in the building assets achieving the desired strategic objectives discussed in Section 3 and levels of service discussed in Table 5.1. The key strategic risks are outlined in Table 12.1.
Table 12.1 – Critical Strategic Risks
Risk Consequence Severity Control Measures Residual Severity
Failure to meet Levels of Service.
Resident unrest and frustration, reputational damage, economic loss within municipality, health and safety risk.
High Ongoing monitoring of delivery of service levels and community expectation, prioritisation of actions to meet levels of service.
Low
Insufficient funding allocated to asset renewals.
Service levels decline, unprotected assets degrade faster than anticipated, user safety declines, resident unrest.
High Prioritise renewal of ‘protective’ assets, review conditions and funding annually, monitor network performance.
Low
Vested asset quality doesn’t meet standards.
Increased cost liability, user safety declines, reputational damage.
High Clearly define design and performance standards for new assets, suitably resource vested asset supervision and defect assessment processes.
Low
Construction costs of Infrastructure Contributions Projects exceed collected funds.
Construction of development required buildings at Council’s cost, limited ability to fund other required works.
High Identify projects, update project costs, manage development construction stage timings, monitor estimated costs of delivering works against available funding.
Medium
Insufficient public gathering spaces for community.
Lack of community meeting spaces, inability for community to come together, resident unrest.
High Ongoing monitoring of buildings and facilities utilisation, proactively providing service solutions (advocacy, public-private partnership, new assets).
Low
Technological advancements.
Extensive building network unsuited to task, inability to quickly adjust to changes in user behaviour.
Unknown Monitor technological advancements, actively utilise Internet of Things opportunities, work with industry leaders in technological development.
Unknown

30
Improvement Plan The City of Whittlesea recognises that there is opportunity to improve asset management processes to ensure that the services provided by Council match the services desired by the community in the most effective means. Council has adopted an iterative, continual improvement approach to its asset management processes to achieve this.
General improvement actions have been outlined in the Asset Management Strategy. Further to these, buildings asset specific improvement actions are listed in Table 1515.1.
Table 15.1 – Buildings Asset Management Improvement Plan
Opportunity/Action Responsibility Timeframe Progress
(%) Monitor building component deterioration through inspection and condition audit processes and ensure that modelling and funding projections reflect the performance of the components.
Assets Team Service Providers
Ongoing Ongoing
Review of the anticipated delivery timeframes and details of buildings from developments and Council’s Capital Works Program and update future modelling to suit. For new, upgrade and expansion projects this review to be integrated with the development of the Long-Term Community Infrastructure Strategy (LTCIS).
Assets Team Service Providers Strategic Projects
Ongoing Ongoing
Monitor and update building service criteria and level of service metrics to ensure they accurately reflect the community requirements through the development of Service Infrastructure Profiles. This work will also align with the Long-Term Community Infrastructure Strategy for new, upgrade and expansion projects.
Assets Team Service Providers
Ongoing Ongoing
Expand levels of service to have a specific metric for the performance of each of the Service Categories.
Assets Team Service Providers
Jun 2023 0%
Identify and record the critical buildings for Council service delivery within the Asset Management System.
Assets Team Service Providers
Jun 2023 0%
Ensure that emergency response facilities are identified and prioritised in available funding modelling.
Assets Team Service Providers
Jun 2023 0%
Improve the integration between Council’s Asset Information Management System (Assetic) and the contractors for timely update of asset condition data and works orders.
Assets Team Jun 2023 0%
Undertake an assessment of projects in the New Works Program for years 11-15 for renewal/upgrade/expansion/new to refine the projections for those years.
Project Management
Office Jun 2023 0%

Appendix A: Building Assets 15 Year Financial Plan ($,000) Year 2022/23 2023/24 2024/25 2025/26 2026/27 2027/28 2028/29 2029/30 2030/31 2031/32 2032/33 2033/34 2034/35 2035/36 2036/37 Average
Operations Budget1
Cleaning 1,802 1,850 1,976 2,053 2,229 2,264 2,332 2,579 2,721 2,739 2,739 2,739 2,739 2,739 2,739 2,416
Security 149 152 160 165 178 182 187 204 213 215 215 215 215 215 215 192
Utilities - Electricity 1,020 1,038 1,095 1,129 1,220 1,244 1,279 1,394 1,458 1,471 1,471 1,471 1,471 1,471 1,471 1,314
Utilities - Water 320 326 343 354 383 390 401 437 458 462 462 462 462 462 462 412
Utilities - Gas 405 412 435 448 485 494 508 553 579 584 584 584 584 584 584 522
Insurance 524 533 562 580 627 639 657 716 749 756 756 756 756 756 756 675
Total 4,220 4,311 4,571 4,729 5,122 5,213 5,364 5,883 6,178 6,227 6,227 6,227 6,227 6,227 6,227 5,530
Maintenance Budget1
Administration 667 672 679 670 688 686 696 680 689 708 710 716 722 736 751 698
Community 1,086 1,186 1,394 1,508 1,720 1,716 1,802 2,104 2,334 2,364 2,368 2,378 2,388 2,409 2,435 1,946
Family 1,009 1,017 1,027 1,014 1,165 1,238 1,253 1,290 1,305 1,333 1,336 1,345 1,355 1,375 1,398 1,231
Heritage 35 35 36 35 36 36 37 36 36 37 37 38 38 39 39 37
Investment 213 215 217 214 220 219 222 217 220 226 227 229 231 235 240 223
Library 159 160 162 160 164 164 166 239 241 246 246 248 249 252 256 208
Public Toilet 190 191 193 191 196 195 198 194 196 202 202 204 206 210 214 199
Recreation 1,950 1,965 2,069 2,085 2,290 2,324 2,461 2,520 2,655 2,774 2,780 2,798 2,816 2,855 2,900 2,483
Other 19 19 19 19 20 20 20 19 20 20 20 20 21 21 21 20
Total 5,328 5,461 5,796 5,896 6,499 6,597 6,854 7,299 7,696 7,909 7,926 7,975 8,024 8,131 8,255 7,043
Renewal and Upgrade Budget2
New Works Program – Renewal 1,454 5,335 6,344 6,369 2,800 3,130 1,300 2,100 1,680 1,900 3,241 3,420 3,228 2,917 2,572 3,186
Total 1,454 5,335 6,344 6,369 2,800 3,130 1,300 2,100 1,680 1,900 3,241 3,420 3,228 2,917 2,572 3,186
New Assets and Upgrade Budget2
New Works Program – Expansion 0 500 1,500 0 0 0 250 2,750 0 0 625 703 729 632 632 555
New Works Program – New 2,010 3,601 21,074 62,370 12,980 1,200 16,695 28,000 12,474 15,477 17,588 19,146 20,700 20,663 16,492 18,031
New Works Program – Upgrade 1,787 1,167 3,995 2,055 3,575 2,345 1,325 3,275 2,295 475 2,229 2,274 2,384 2,223 2,240 2,243
Total 3,797 5,268 26,569 64,425 16,555 3,545 18,270 34,025 14,769 15,952 20,442 22,123 23,813 23,518 19,364 20,829
Grand Total Expenditure 14,798 20,374 43,279 81,419 30,976 18,484 31,789 49,307 30,323 31,988 37,837 39,745 41,293 40,793 36,418 36,588
Rolling Backlog 84 0 0 0 0 0 0 0 1,707 5,936 10,212 12,360 12,611 20,560 29,070
Note: 1. Operations and Maintenance budgets include the anticipated additional costs for the new building assets in Section 10 as per the lifecycle costs in Section 12. 2. Categorisation of works in the New Works Program between Renewal, Upgrade, Expansion, and New is not currently available for 32/33 to 36/37. These years use an average of the preceding 10-year period to ensure that renewal and backlog projections are visible outside of the 10-year Long Term Financial Planning Period.