Seeing further: extending visualization as a basis for usable security
Upload
khangminh22Category
view
0download
0
This technical paper is not an official IEA-ECB&CS Annex 35 publication. The views andjudgements expressed are those of the authors and do not necessarily reflect those of Annex 35or IEA-ECB&CS.
INTERNATIONAL ENERGY AGENCY
ENERGY CONSERVATION IN BUILDINGS AND COMMUNITY SYSTEMS
Pilot study report:
WIlkinson BuildingThe University of Sydney, Sydney, Australia
David Rowe. E-mail: [email protected]
I EA
View of Wilkinson Building from thesouth. The study area is in this wing.Level 2 is at the bottom of the picture andlevel 5 is at the top. The 600 mm widehorizontal overhangs can be seen abovehinged hopper type windows.
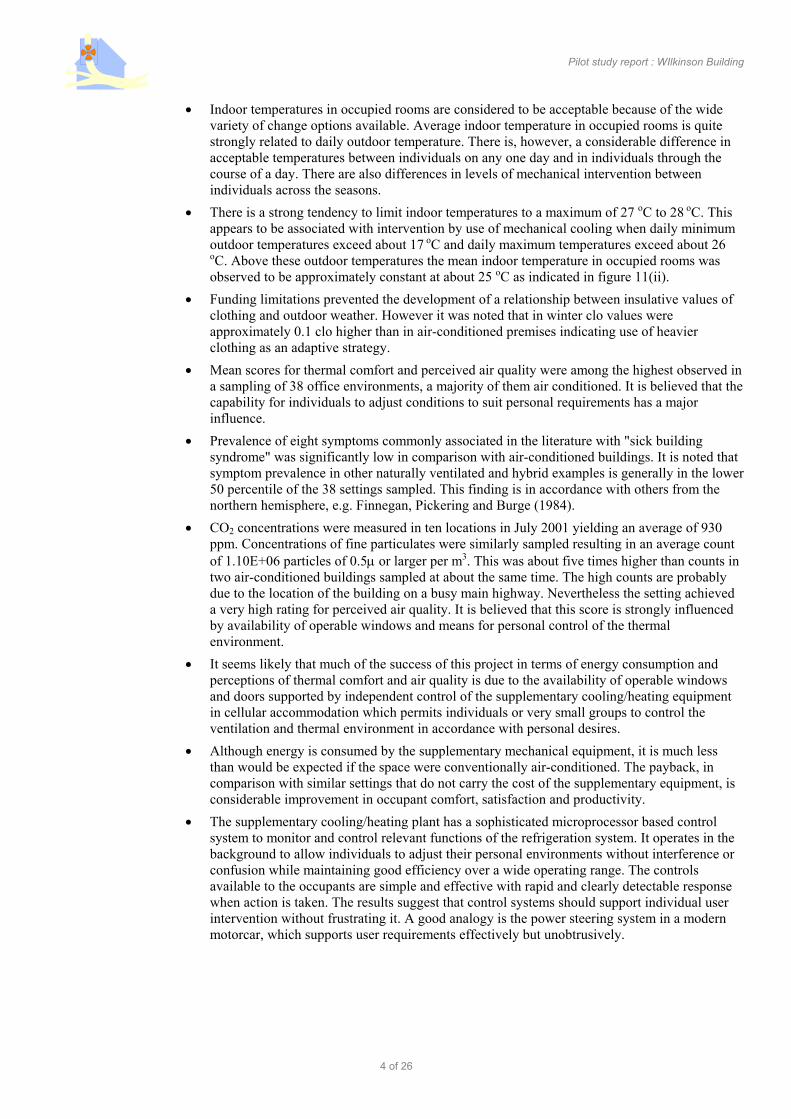
View from southeast of the central accesscore and atrium which provide some stackeffect for ventilation. The study area is inthe wing at the right of the picture.
Photo David Rowe
Photo John Fraser-Mifsud
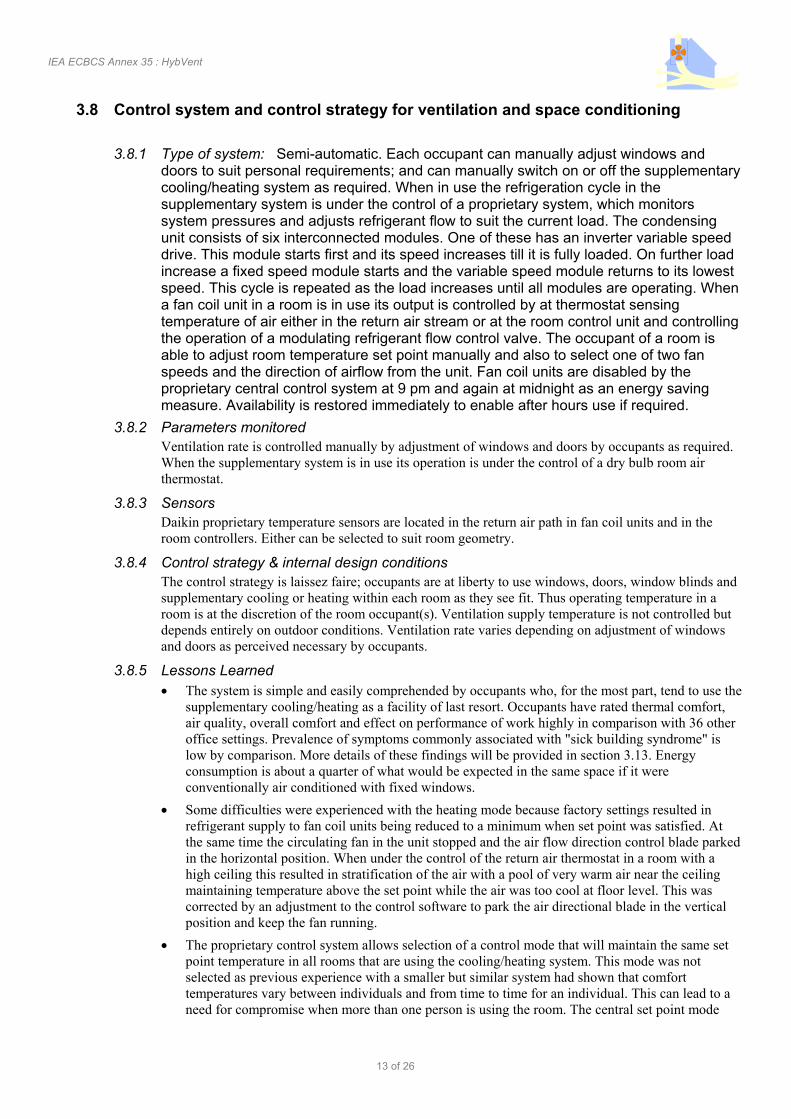
View to east showing study areas onlevels 4 and 5 and supplementaryreverse cycle refrigeration equipmenton the roof over level 3.
Photo David Rowe

Pilot study report : WIlkinson Building
2 of 26
1 GENERAL INFORMATION1.1.1 Report date January 2002
1.1.2 Principal researchers David Rowe, Honorary Senior Lecturer, Architectural andEnvironmental Science Group, Faculty of Architecture, the University of Sydney.
1.1.3 Other participants None.
1.1.4 Project title Hybrid Ventilation and Indoor Climate Control in Staff Offices in the WilkinsonBuilding.
1.1.5 Principal objectives• Definition of relationship between energy consumed by the on-demand, occupant controlled
climate control system and outdoor weather in a suite of naturally ventilated cellular officesprovided with supplementary refrigerated cooling/heating equipment in a moderate climate.
• Definition of relationship between occupant controlled indoor temperatures and outdoortemperature.
• Definition of relationship between mean clothing insulation values and outdoor weather.
• Comparison of occupant subjective perceptions of thermal comfort and air quality with thoseof occupants of other buildings.
• Comparison of prevalence of symptoms of "sick building syndrome" with those of occupantsof other buildings.
• Periodic sampling of CO2, particulates, VOCs and microbiological contaminants of indoor air.
1.1.6 Start date / End date 1 August 2000 to 31 December 2001
1.1.7 Number of man-hours Very approximately 800.
1.1.8 Project approach This is a retrofit project. The Wilkinson Building houses the Faculty ofArchitecture at the University of Sydney. The building was constructed in stagesbeginning in 1960. The final stage was completed in 1978. The whole building is anexample of hybrid ventilation. It accommodates teaching studios, tutorial rooms, lecturetheatres, a library, various laboratories including several computer laboratories,workshops and cellular offices for staff and graduate students. Lecture theatres, libraryand computer laboratories are air-conditioned. Teaching studios, workshops and cellularoffices are naturally ventilated through operable windows and doors. The ventilation ofdeep teaching spaces is supplemented by a centralised mechanical ventilation systemwith hot water coils for winter warming. A central gas fired boiler plant provides hot water,which is circulated to the heating coils in air conditioning and mechanical ventilationsystems and wall mounted panel radiators in offices. This project focuses on a particularstudy area comprising a suite of 25 naturally ventilated cellular offices for staff which wereprovided with an occupant controlled supplementary Variable Refrigerant Flow (VRF)cooling/heating system that was put into service in November 1997. The extent of thestudy was curtailed by the level of funding available. However the following activities havetaken place:-• Energy consumption of the supplementary cooling/heating equipment in the study area has been
monitored continuously and recorded at half hourly intervals since the beginning of December1997.
• Indoor temperature and occupancy status of each room in the study area has been monitored andrecorded since 1 October 2000. Some monitoring equipment problems have resulted in incompleterecords. Nevertheless sufficient are available to provide a representative sampling through a fullrange of outdoor climatic conditions for Sydney.
• Occupants' subjective perceptions of thermal comfort and air quality were sampled in August 1997(before installation of the supplementary equipment), in September 1998 and again in July 2001when sampling was also carried out in a group of similar rooms in the building that do not have the

IEA ECBCS Annex 35 : HybVent
3 of 26
supplementary cooling/heating equipment. Responses are compared with those from 34 otherAustralian office settings.
• During an investigation in September 2001 concentrations of CO2 and fine particulates weremeasured, and insulative value of occupants' clothing and their metabolic rates were estimated.Similar measurements were made at approximately the same time in two air-conditioned buildings.
1.1.9 Building selection The availability of the supplementary cooling/heating equipmentdonated by Daikin Australia Pty. Ltd. for experimental purposes and convenience oflocation were the catalysts for the project selection. Earlier sampling of occupantperceptions of thermal comfort and air quality in other buildings had suggested thatsatisfaction levels were likely to be high and energy consumption low in comparison withconventionally air-conditioned premises.
1.1.10 References• Finnegan, M. J., Pickering, C. A. C. and Burge P. S. (1984): “Building related illness” in
Clinical Allergy 16; pp 389 - 405.
• Vischer, J. (1987): User Manual: Tenant Questionnaire Survey. Public Works, CanadaArchitectural and Engineering Services, Ottawa.
• Vischer, J. (1989): "Environmental Quality in Offices". Van Nostrand, New York.
• Bordass, W. K., K. Bromley and A. J. Leaman (1994): User and occupant controls in officebuildings in Sterling, E., Bevia, C. and Collett, C., Eds,, Proc International Conference onBuilding Design, Technology and Occupant Well-being in Temperate Climates. The AmericanSociety of Heating, Refrigeration and Air Conditioning Engineers Inc. Atlanta.
• Rowe, D. M. and S. E. Wilke (1995): Thermal comfort and air quality in eight office buildings:an interim report in AIRAH. J. 49.7 pp 28 - 38.
• Leaman, A. and Bordass, W. (1997): "Strategies for Better Occupant Satisfaction" in Proc. 5thIndoor Air Quality Conference, 10 July 1997, London.
• de Dear, R. J., Brgaer, G. S. and Cooper, D. (1997). Developing an Adaptive Model ofThermal Comfort and Preferences. Sydney. Macquarie Research Ltd.
• Bauman, F. S., Carter, T. G., Baughman, A. V. and Arens, E. A. (1998). “Field Study of theImpact of a Desktop Task/Ambient Conditioning System in Office Buildings in Brager, G. S.,ed., ASHRAE Technical Data Bulletin Vol. 14, No. 1: Field Studies of Thermal Comfort andAdaptation. Atlanta. ASHRAE Inc.
• Rowe, D. M., Dinh, C. T. and Julian, W. G. (1999). “Mixed Mode Thermal Control: HighScore for Comfort, Low Energy Consumption” in Leonardi, E. ed., AIRAH.J 53.1. Sydney.Yaffa Publications.
• Rowe, D. M. and Dinh, C. T. (1999): Experience with occupant control of supplementarycooling in a naturally ventilated environment: some preliminary results from work in progress.In First International One Day Forum on Hybrid and Natural Ventilation. University ofSydney, September 1999.
• Rowe, D. M., Dinh, C. T. and Julian, W. G. (1999). “The Indoor Thermal Climate: aLongitudinal Study of Acceptability, Preference, Neutrality and Adaptation in a CommercialOffice Building” presented at the International Conference on Biometeorology and UrbanClimatology, 8 - 12 November 1999. Sydney.
1.1.11 Comments • Energy consumption of the supplementary cooling/heating equipment in the study area is less
than a quarter of the estimated amount that would be used by a well designed conventional airconditioning system with mechanical ventilation, cooling and heating for the same spaces,year on year.
• Average monthly energy consumption has a strong binomial relationship with monthly meanoutdoor temperature.
Pilot study report : WIlkinson Building
4 of 26
• Indoor temperatures in occupied rooms are considered to be acceptable because of the widevariety of change options available. Average indoor temperature in occupied rooms is quitestrongly related to daily outdoor temperature. There is, however, a considerable difference inacceptable temperatures between individuals on any one day and in individuals through thecourse of a day. There are also differences in levels of mechanical intervention betweenindividuals across the seasons.
• There is a strong tendency to limit indoor temperatures to a maximum of 27 oC to 28 oC. Thisappears to be associated with intervention by use of mechanical cooling when daily minimumoutdoor temperatures exceed about 17 oC and daily maximum temperatures exceed about 26oC. Above these outdoor temperatures the mean indoor temperature in occupied rooms wasobserved to be approximately constant at about 25 oC as indicated in figure 11(ii).
• Funding limitations prevented the development of a relationship between insulative values ofclothing and outdoor weather. However it was noted that in winter clo values wereapproximately 0.1 clo higher than in air-conditioned premises indicating use of heavierclothing as an adaptive strategy.
• Mean scores for thermal comfort and perceived air quality were among the highest observed ina sampling of 38 office environments, a majority of them air conditioned. It is believed that thecapability for individuals to adjust conditions to suit personal requirements has a majorinfluence.
• Prevalence of eight symptoms commonly associated in the literature with "sick buildingsyndrome" was significantly low in comparison with air-conditioned buildings. It is noted thatsymptom prevalence in other naturally ventilated and hybrid examples is generally in the lower50 percentile of the 38 settings sampled. This finding is in accordance with others from thenorthern hemisphere, e.g. Finnegan, Pickering and Burge (1984).
• CO2 concentrations were measured in ten locations in July 2001 yielding an average of 930ppm. Concentrations of fine particulates were similarly sampled resulting in an average countof 1.10E+06 particles of 0.5µ or larger per m3. This was about five times higher than counts intwo air-conditioned buildings sampled at about the same time. The high counts are probablydue to the location of the building on a busy main highway. Nevertheless the setting achieveda very high rating for perceived air quality. It is believed that this score is strongly influencedby availability of operable windows and means for personal control of the thermalenvironment.
• It seems likely that much of the success of this project in terms of energy consumption andperceptions of thermal comfort and air quality is due to the availability of operable windowsand doors supported by independent control of the supplementary cooling/heating equipmentin cellular accommodation which permits individuals or very small groups to control theventilation and thermal environment in accordance with personal desires.
• Although energy is consumed by the supplementary mechanical equipment, it is much lessthan would be expected if the space were conventionally air-conditioned. The payback, incomparison with similar settings that do not carry the cost of the supplementary equipment, isconsiderable improvement in occupant comfort, satisfaction and productivity.
• The supplementary cooling/heating plant has a sophisticated microprocessor based controlsystem to monitor and control relevant functions of the refrigeration system. It operates in thebackground to allow individuals to adjust their personal environments without interference orconfusion while maintaining good efficiency over a wide operating range. The controlsavailable to the occupants are simple and effective with rapid and clearly detectable responsewhen action is taken. The results suggest that control systems should support individual userintervention without frustrating it. A good analogy is the power steering system in a modernmotorcar, which supports user requirements effectively but unobtrusively.

IEA ECBCS Annex 35 : HybVent
5 of 26
2 TEST SITE DESCRIPTION
2.1 Geographic information
2.1.1 Location Sydney, Australia. Longitude 151 deg. E; latitude 33 deg. S.
2.1.2 Elevation (height above sea level) 90 metres.
2.1.3 Terrain Suburban, low-rise buildings and parkland, fronting a major highway.
2.1.4 Orientation South, southeast and northwest.
2.1.5 Comments Cooling and heating loads are perimeter dominated in all spaces.
2.2 Climate information (Summary)A Typical Reference Year real hour by hour climate data file for Sydney 1981 is available and was used for thereference energy simulation. A file of main climate data as recorded by the Australian Bureau of Meteorologyhas been maintained by the author since the beginning of year 2000.
2.2.1 Location of meteorological station Australian Bureau of Meteorology SydneyObservatory less than 5 km from the site. Latitude, longitude and elevation same as site.
2.2.2 % Frequency wind speed versus wind direction Wind speed mean for year 11.6 km/hr.Mean for January 12.3 km/hr. For June 11.6 km/hr. Winds are mainly from the north toeast in summer and from south to west in winter.
2.2.3 Air temperatures January mean maximum 25.7 oC, mean minimum 18.8 oC. June meanmaximum 18.8, mean minimum 9.6 oC. Mean temperature for year 18 oC.Design summer condition 31.5 oC dry bulb, 23 oC wet bulb. Winter 7 oC dry bulb, 80% RH.Figure 1 below shows monthly mean temperatures for the years 2000 and 2001. Innerbars represent one standard deviation and outer bars represent two standard deviations.
Figure 1. Monthly mean temperatures for years 2000 and 2001 shown by centres of bars. Inner barsrepresent one standard deviation, outer bars two standard deviations.
2.2.4 Degree day information Heating degree days, 18 oC base: 642
Cooling degree days, 26 oC base: 3 Solar excess degree hours: 8,677
Cooling degree-days as quoted do not reflect the requirement for latent cooling insummer. Most designers would use a lower base temperature if data were available.
2.2.5 Daylight / insolation Mean insolation January 6,539 Wh/m2; June 2,456 Wh/m2.Mean hours sunshine per day: January 7.2, June 5.2.
05
10152025303540
Jan-
00
Mar
-00
May
-00
Jul-0
0
Sep-
00
Nov
-00
Jan-
01
Mar
-01
May
-01
Jul-0
1
Sep-
01
Nov
-01
Jan-
02
Deg
rees
Cel
sius

Pilot study report : WIlkinson Building
6 of 26
2.2.6 Cloud factor Mean daily hours cloud cover: January 5.9; June 5.0.
2.2.7 Relative humidity & precipitation Design RH during summer 47% (31.5 oC dry bulb, 23oC wet bulb). Mean annual rainfall 1,216 mm. Mean annual rain days 139.
2.2.8 Barometric pressure Range 1005 to 1017 Hpascals at sea level.
2.2.9 Soil temperature No data.
2.2.10 Other meteorological parameters Prevailing humid NE to SE winds in summer(December, January, February) and early autumn. Cold, dry westerly winds in winter withwesterly airflow continuing but warming in spring.
2.2.11 Comments Warm humid weather in summer is a difficult adaptive challenge in an officeenvironment where dress codes may limit ability to reduce clothing insulation.
3 BUILDING DESCRIPTION
3.1 General description
3.1.1 Building name Wilkinson Building
3.1.2 Building type Tertiary education (Faculty of Architecture)
3.1.3 History
The building was constructed in stages from 1960 to 1978. The section in which the study area islocated was the last completed. The 25 offices on which the study is focused are naturally ventilatedthrough operable windows and doors. They were fitted out with supplementary cooling and reversecycle heating equipment at the end of 1997. The offices are also centrally heated with manuallycontrolled wall panel radiators provided as part of the original design.
3.1.4 Design philosophy for IAQ and thermal comfort, energy efficiency and other issues ofconcernThe design philosophy was based on the laissez faire principle that room occupants are the best sensorsof thermal comfort and air quality. The Sydney climate is such that for much of the year people canachieve indoor comfort by passive means by way of adaptive behaviours such as adjustment ofwindows, garment change or change of position. This can however be difficult in the warm to hotsummer months of December, January and February. In fact several staff members in rooms withoutmechanical cooling will admit to adjourning to work in the air conditioned library on hot afternoons; astriking example of behavioural adaptation. The intention behind the design was therefore to allowindividuals as much freedom as possible to make decisions and take control action to alter anunsatisfactory condition if required. It was believed that the selected supplementary cooling/heatingsystem would provide an additional degree of freedom but would use less energy than a conventionalair conditioning system with centrally controlled temperature operating in an environment of sealedwindows because it would be called into use only when considered necessary. A primary requirementof the refrigeration plant was that it has a sophisticated output control system that would actunobtrusively in the background to produce high efficiency across a wide range of loads.
The natural ventilation system in the study area is mainly wind driven through top hinged hopper orawning type windows and internal doors to corridors. Size of windows is based on the rule of thumbprinciple in the Building Code of Australia that area of operable openings in a room should have a totalarea equal to 5 percent of the floor area of the room served. Limited stack effect is available by way ofnarrow high-level windows in some of the rooms. Additional stack driven ventilation is available tooffices on levels 2 and 4 through corridors to a small atrium and open stairway extending from groundlevel to level 5 in the central access core. Night cooling is not available. The system works well at mosttimes of the year without mechanical intervention. Room occupants can operate windows and doorsand, when they consider it necessary, can switch on or off the refrigerated reverse cycle fan coil unit(s)and adjust temperature set point, fan speed and direction of air flow in their personal space.
A previous small pilot study had indicated that the system would tend to default to “off”; i.e. ifconditions in a room are acceptable then the system is not turned on. It had also shown that energy

IEA ECBCS Annex 35 : HybVent
7 of 26
consumption was likely to be much less than for a conventional mechanical cooling, heating andventilating system. Ventilation can be said to be “demand controlled” inasmuch as occupants’ open orclose windows as they see fit to maintain necessary ventilation. In practice, many of them prefer toopen windows and doors in pleasant weather but close them when hot dry or warm humid winds occurin summer or on the colder days in winter.
The supplementary cooling/heating system was designed to handle cooling and heating loads withindoor temperatures held at 24 oC (summer) and 20 oC (winter) under Sydney outdoor designconditions of 31.5 oC dry bulb, 23 oC wet bulb in summer and 7 oC dry bulb, 80 percent RH in winter.Cooling loads were estimated using CAMEL (Carrier Air-conditioning Method of Estimating Loads)1
cooling and heating load estimation software. Hour by hour energy simulation was performed usingBeaver/ESP2 software to estimate energy consumption that would be expected if the spaces weremechanically heated, cooled and ventilated. Results of this simulation are compared with actual monthby month energy consumption as indicated in figure 4.
3.1.5 CommentsResults to date indicate that occupants perceive thermal comfort and air quality better than reported bypeople in 36 other (mainly air conditioned) settings. Energy consumption over four years has averagedabout a quarter of what would be expected if the spaces were conventionally air conditioned withmechanical heating, cooling and ventilation.
3.2 Building geometry & materials
3.2.1 Plan
Figure 2. Block plan showing relationship of study area to the
whole building and the central access stair and atrium.
Not to scale.
1 Sourced from ACADS/BSG Ltd. High Street, Glen Iris, Victoria.2 Ibid.
N
Study area in thiswing. See figure 3.
Main open accessstair and atrium,level 1 to level 5.

Pilot study report : WIlkinson Building
8 of 26
Figure 3. Plan of study areas on levels 2, 4 and 5.
Not to scale.
3.2.2 Elevation Not available but please see photographs for typical details.
3.2.3 Building form Total building height 20 metres with five levels. The retrofit study areas areon levels 2, 4 and 5 as indicated in figures 2 and 3. The building has flat roofs ofreinforced concrete with three wings radiating from a central service and access corecontaining the main stairwell, single lift and a small atrium extending from level 1 to level5 as shown in figure 2
3.2.4 Volume The volume of the whole building is approximately 12,000 m3. Effective volumeof the retrofit area is 1,290 m3. The air-cooled condensing unit for the supplementary VRFcooling/heating system is mounted on the roof over level 4 of the northeast-southwestwing and occupies no internal space. Refrigerant and condensate piping runs are surfacemounted above head height in corridors and rooms. Droppers between floors areenclosed in existing service ducts. Fan coil evaporators are wall mounted in the rooms.Condensate is drained to existing drains or onto roofs. A small switchboard is located inan existing electrical cupboard on level 4 and a central indicator and control panel is wallmounted in a level 4 corridors. Internal volume occupied by the installation is negligible.
3.2.5 Floor area & materialsGross floor area of the pilot project is 430 m2. This does not include access corridors or passages.
Net useable floor area (NFA) is the same as the gross floor area.
Floors are of 150 mm thick reinforced concrete with underfelt and carpet. U-value 1.08 W/m2K.
3.2.6 Ceiling height: Varies from 2,700 to 3,500 mm.Roof over level 4 is of 150 mm reinforced concrete with waterproof membrane, 50 mm expandedpolystyrene insulation and 50 mm coarse gravel with ceiling of timber boarding below a 100 mm. airspace. U-value is 0.322 W/m2K. Area is 75 m2.
The roof over level 5 is of 150 mm unlined reinforced concrete with waterproof membrane. U-value is1.094 W/m2K. Area is 108 m2.
LEVEL 5 LEVEL 4 LEVEL 2
N 2 2 1 1
1
1
1
1
2
3
1
1
1 1
1
3
1
1
1
1 1 1
1
32
X Indicates number of occupants in room.
Central access corewith open stair here
Central access corewith open stair here
Central access corewith open stair here
Enclosed fire stair

IEA ECBCS Annex 35 : HybVent
9 of 26
3.2.7 Facades (external walls)Level 5
• Southeast: total area 48 m2. Spandrel of double brick with area 10.8 m2, U-value 2.02 W/m2K.Glazed area above spandrel including operable windows with total glass area 37.2 m2, U-value 5.9W/m2K.
• Southwest: total area 36 m2. Spandrel of double brick with area 8.1 m2, U-value 2.02 W/m2K.Glazed area above spandrel including operable windows with total glass area 27.9 m2, U-value 5.9W/m2K.
• Northwest: total area 48 m2. Spandrel of double brick with area 6.3 m2, U-value 2.02 W/m2K.Glazed area including operable windows with total glass area 41.7 m2, U-value 5.9 W/m2K.
Level 4
• Southwest: total area 48 m2. Spandrel of double brick with area 8.1 m2, U-value 2.02 W/m2K.Glazed area above spandrel including operable windows with total glass area 39.9 m2, U-value 5.9W/m2K.
• South: total area 48 m2. Spandrel of double brick with area 8.7 m2, U-value 2.02 W/m2K. Glazedarea above spandrel including operable windows and doors to courtyard on roof over level 3 withtotal glass area 39.3 m2, U-value 5.9 W/m2K.
Level 2
• Southeast: total area 48 m2. Spandrel of double brick with area 6.3 m2, U-value 2.02 W/m2K.Glazed area including operable windows with total glass area 41.7 m2, U-value 5.9 W/m2K.
• Southwest: total area 44 m2. Spandrel of double brick with area 9.9 m2, U-value 2.02 W/m2K.Glazed area above spandrel including operable windows with total glass area 34.1 m2, U-value 5.9W/m2K.
• South: total area 88 m2. Spandrel of double brick with area 19.8 m2, U-value 2.02 W/m2K. Glazedarea above spandrel including operable windows with total glass area 68.2 m2, U-value 5.9W/m2K.
3.2.8 WindowsLevel 5
• Southeast: total area 5.4 m2 (included in glass wall described above). Six operable hopper orawning type windows of 1,000 by 600 mm set in metal frames above spandrel with six smallerhopper windows above a metal head rail. Operable windows have flexible seal around edges fortight closure. U-value 5.9 W/m2K. External shading from roof overhang 600 mm wide.
• Southwest: total area 3.6 m2 (included in glass wall described above). Four operable hopper orawning type windows of 1,000 by 600 mm set in metal frames above spandrel with four smallerhopper windows above a metal head rail. Operable windows have flexible seal around edges fortight closure. U-value 5.9 W/m2K. External shading from roof overhang 600 mm wide.
• Northwest: total area 3.6 m2 (included in glass wall described above). Four operable hopper orawning type windows of 1,000 by 600 mm set in metal frames above spandrel with four smallerhopper windows above a metal head rail. Operable windows have flexible seal around edges fortight closure. U-value 5.9 W/m2K. External shading from roof overhang 600 mm wide.
Level 4
• Southwest: total area 4.8 m2 (included in glass wall described above). Eight operable hopper orawning type windows of 1,000 by 600 mm set in metal frames above spandrel. Operable windowshave flexible seal around edges for tight closure. U-value 5.9 W/m2K. Horizontal external shadingby concrete overhang 600 mm wide.
• South: total area 3.6 m2 (included in glass wall described above, plus with an external door to eachof the four rooms, leading to a courtyard, described in item 3.2.9 below). Four operable hopper orawning type windows of 1,000 by 600 mm set in metal frames above spandrel with four smallerhopper windows above a metal head rail. Operable windows have flexible seal around edges fortight closure. U-value 5.9 W/m2K. Horizontal external shading by concrete overhang 600 mmwide.

Pilot study report : WIlkinson Building
10 of 26
Level 2
• Southeast: total area 4.8 m2. (included in glass wall described above). Eight operable hopper orawning type windows of 1,000 by 600 mm set in metal frames above spandrel. Operable windowshave flexible seal around edges for tight closure. U-value 5.9 W/m2K. No external shading.
• Southwest: total area 3.6 m2. (included in glass wall described above). Six operable hopper orawning type windows of 1,000 by 600 mm set in metal frames above spandrel. Operable windowshave flexible seal around edges for tight closure. U-value 5.9 W/m2K. Some external shading fromadjacent trees.
• South: total area 5.4 m2 (included in glass wall described above). Six operable hopper or awningtype windows of 1,000 by 600 mm set in metal frames above spandrel with four smaller hopperwindows above a metal head rail. Operable windows have flexible seal around edges for tightclosure. U-value 5.9 W/m2K. Some external shading from adjacent trees.
3.2.9 External doors or hatchesLevel 4
• South: total area 7.0 m2 (one door to each of four rooms included in glass wall described above,leading to a courtyard on roof over level 3). The doors are metal framed and fully glazed. Theyhave weather strips and flexible seals around edges for tight closure. U-value 5.9 W/m2K.Horizontal external shading by concrete overhang 600 mm wide.
3.2.10 Number, volume and layout of rooms25 rooms used as offices for academic and administrative staff. Total volume 1,290 cubic metres.Layout as shown in figure 3.
3.2.11 Attic, basement, crawlspaceNone.
3.2.12 Interior walls, including moveable partitionsAll internal partitions are of unrendered single brick 110 mm thick. U-value 3.06.
3.2.13 Interior doors and devicesEach room has an interior door leading to an access corridor.
3.2.14 StairwellsThe study area is served by an open stairway in the central core area and an enclosed fire safe stair atthe east wing of the building as indicated on plan, figures 2 and 3.
3.2.15 Service risersOne elevator shaft in central access core with ventilation opening in roof of motor room. Several risersare grouped in the central core for electrical mains, fire and hydraulic service pipes and ducts formechanical ventilation to tutorial studios. They are blocked at each floor with concrete slabs.
3.2.16 CommentsThe building is of heavyweight construction with double brick or precast concrete panel outer walls,single brick interior partitions and reinforced concrete floors and ceilings. The roof over level 4 officesis insulated with 50 mm polystyrene with coarse gravel overlay. The concrete roof slab over level 5offices is uninsulated. This produces a significant radiant heat load, which is uncomfortable in summerbut welcome in winter. Ceilings on levels 2 and 4 are lined with timber boarding with natural finish.Building materials are mostly natural timber, brick and concrete with wool carpet on floors. Mostindoor brickwork is not painted. Furnishing materials are mostly manmade of with desks of particleboard and chairs upholstered with plastic materials. Most shelving is fabricated from steel. Ceilingheights vary from 2700 mm to 3500 mm. The fan coil units provide air movement with very low noiselevels. The building is located on a busy highway but the rooms in the study area are oriented awayfrom the road. Security risk due to the ventilation system is low as most windows are well aboveground level and are usually closed at night for protection from rain.

IEA ECBCS Annex 35 : HybVent
11 of 26
3.3 Air leakage data (type, location and crack length for each component)
3.3.1 Doors No data but external doors are metal framed and fitted with flexible seals andweatherstrips.
3.3.2 Windows No data. Metal framed and fitted with flexible seals.
3.3.3 Ventilation openings & stacks No data
3.3.4 Chimneys & flues No data
3.3.5 Communicating walls, such as cavity walls No data but fairly high leakage would beexpected through walls, which are not rendered internally or externally.
3.3.6 Structural joints: sole-plate, ceilings, corners, skirting boards, vapour and air barriertreatments No data
3.3.7 Service routes: plumbing outlets, drains, electrical outlets, etc. No data
3.3.8 Other air leakage zones such as stairwells & service risers No data
3.3.9 Background leakage No data
3.3.10 Neutral pressure level Not known
3.3.11 CommentsNo data available but it would seem that leakage is quite high because the average concentration of CO2
measured in July 2001 was 930 ppm although windows were not open in any of the rooms sampled.
3.4 Wind pressure coefficients Not known.
3.5 Space heatingBackground heating is available in the study area by way of manually controlled wall panel radiators servedfrom a natural gas fired central hot water heating system. Supplementary heating for offices in the study area isavailable from the reverse cycle refrigerated supplementary cooling/heating system. When a detailed thermalcomfort survey was conducted in July 2001 (mid winter) none of the rooms sampled was using either thebackground or supplementary systems.
Capacity of the supplementary refrigeration system for the rooms in the study area is 87 kW cooling. Thecondensing set is air-cooled. The system was installed in November 1997 and circulates refrigerant R22 to therooms on the system. The equipment is now available with zero ozone depletion refrigerants but these were notavailable when the equipment was manufactured.
A natural gas fired central heating boiler supplies hot water to panel radiators in most of the cellular offices inthe building and to heating coils in the mechanical ventilation systems in the tutorial studios. Three lecturetheatres, several computer laboratories and the library are air-conditioned
3.6 Ventilation
3.6.1 Ventilation principleVentilation of rooms in the study area is mainly wind driven cross flow from windows through doors tocorridors. Stack effect is also available for the rooms on levels 2 and 4 via internal doors, corridors andthe open stairway and atrium from level 1 to level 5. Doors on level 5 leading to the roof are kept openon fine days providing a clear path to outdoors. Windows are the main source of ventilation throughoutthe year.
3.6.2 ComponentsOn levels 2 and 4 airflow is through windows, across rooms to corridors and along corridors to centralstair and atrium and through an external door leading to the roof over level 4. On level 5 flow isthrough windows and internal doors to corridor and through an external door to the roof over level 4.

Pilot study report : WIlkinson Building
12 of 26
3.6.2.1 Fresh air inletsHinged awning or hopper type windows operated by room occupants to provide ventilation asdescribed in 3.6.1.
3.6.2.2 FansNo fan assistance provided for ventilation in study area offices. Cooling system performance couldpossibly be improved by installing small thermostatically controlled propeller fans in windows tooperate for nighttime cooling of the structure.
3.6.2.3 Heat recovery No heat recovery equipment.
3.6.2.4 Filtration No filtration of outdoor air. Fan coil units have coarse washable panel filters operating onrecirculated room air.
3.6.2.5 DuctsNo ducts.
3.6.2.6 Room supply & extract devicesWindows and doors as described in 3.6.1.
3.6.2.7 Air exhaust outletsDoors on levels 4 and 5.
3.6.3 Frequency of operation, duration of operating cycle: Fan coil units in rooms are operatedas required by occupants. The supplementary cooling/heating system is disabled at 9 pmand midnight each day to save operation after rooms are vacated. The system is howeverimmediately available for re-start if required in any room.
3.6.4 Balancing reportNo balancing required.
3.6.5 Ventilation rate (outdoor airflow supplied by system): Variable depending of adjustmentof windows but average CO2 concentration of 930 ppm measured in winter when mostwindows were closed suggests a rate of more than 7.5 l/s. per person.
3.6.6 Any recirculation between rooms due to HVAC system: No.
3.6.7 Space coolingSpace cooling is available on demand from the supplementary system as described herein. Night "free"cooling is not available but could be provided quite easily by installing a window mounted,thermostatically controlled propeller fan in each room to circulate cool air at night.
3.6.8 Comments: Surveys of occupants have shown that they are well satisfied with airquality, please see figure 6 (ii). It seems likely that their perception of it is influenced bytheir ability to adjust windows and limit temperature rise in rooms as desired.
3.7 Internal loads
3.7.1 Pattern of occupancyThe building is open from 8 am to 9 pm during autumn and spring semesters of 16 weeks each andfrom 8 am to 6 pm at other times. Staff have key card access to the building at all times Rooms can beunoccupied for lengthy periods when members of staff are absent on recreation or study leave. Averageoccupancy is estimated at 70 percent. Numbers of occupants in rooms are indicated in figure 3.Average space per person is 14 m2.
3.7.2 LightingLighting gain approximately 20 watts/ m2; Electric lights are controlled manually by switches in eachroom. Because each room has large windows it is not unusual to find electric lights off with occupantsrelying on daylight during daytime.
3.7.3 Other internal gainsEach room has at least one computer with estimated heat output of 200 watts.
IEA ECBCS Annex 35 : HybVent
13 of 26
3.8 Control system and control strategy for ventilation and space conditioning
3.8.1 Type of system: Semi-automatic. Each occupant can manually adjust windows anddoors to suit personal requirements; and can manually switch on or off the supplementarycooling/heating system as required. When in use the refrigeration cycle in thesupplementary system is under the control of a proprietary system, which monitorssystem pressures and adjusts refrigerant flow to suit the current load. The condensingunit consists of six interconnected modules. One of these has an inverter variable speeddrive. This module starts first and its speed increases till it is fully loaded. On further loadincrease a fixed speed module starts and the variable speed module returns to its lowestspeed. This cycle is repeated as the load increases until all modules are operating. Whena fan coil unit in a room is in use its output is controlled by at thermostat sensingtemperature of air either in the return air stream or at the room control unit and controllingthe operation of a modulating refrigerant flow control valve. The occupant of a room isable to adjust room temperature set point manually and also to select one of two fanspeeds and the direction of airflow from the unit. Fan coil units are disabled by theproprietary central control system at 9 pm and again at midnight as an energy savingmeasure. Availability is restored immediately to enable after hours use if required.
3.8.2 Parameters monitoredVentilation rate is controlled manually by adjustment of windows and doors by occupants as required.When the supplementary system is in use its operation is under the control of a dry bulb room airthermostat.
3.8.3 SensorsDaikin proprietary temperature sensors are located in the return air path in fan coil units and in theroom controllers. Either can be selected to suit room geometry.
3.8.4 Control strategy & internal design conditionsThe control strategy is laissez faire; occupants are at liberty to use windows, doors, window blinds andsupplementary cooling or heating within each room as they see fit. Thus operating temperature in aroom is at the discretion of the room occupant(s). Ventilation supply temperature is not controlled butdepends entirely on outdoor conditions. Ventilation rate varies depending on adjustment of windowsand doors as perceived necessary by occupants.
3.8.5 Lessons Learned• The system is simple and easily comprehended by occupants who, for the most part, tend to use the
supplementary cooling/heating as a facility of last resort. Occupants have rated thermal comfort,air quality, overall comfort and effect on performance of work highly in comparison with 36 otheroffice settings. Prevalence of symptoms commonly associated with "sick building syndrome" islow by comparison. More details of these findings will be provided in section 3.13. Energyconsumption is about a quarter of what would be expected in the same space if it wereconventionally air conditioned with fixed windows.
• Some difficulties were experienced with the heating mode because factory settings resulted inrefrigerant supply to fan coil units being reduced to a minimum when set point was satisfied. Atthe same time the circulating fan in the unit stopped and the air flow direction control blade parkedin the horizontal position. When under the control of the return air thermostat in a room with ahigh ceiling this resulted in stratification of the air with a pool of very warm air near the ceilingmaintaining temperature above the set point while the air was too cool at floor level. This wascorrected by an adjustment to the control software to park the air directional blade in the verticalposition and keep the fan running.
• The proprietary control system allows selection of a control mode that will maintain the same setpoint temperature in all rooms that are using the cooling/heating system. This mode was notselected as previous experience with a smaller but similar system had shown that comforttemperatures vary between individuals and from time to time for an individual. This can lead to aneed for compromise when more than one person is using the room. The central set point mode

Pilot study report : WIlkinson Building
14 of 26
was chosen in a similar installation in another institution and occupant rating for thermal comfortin it was significantly lower than in this project although the rating for air quality was similar.
• It is firmly believed that the high ratings for comfort and air quality achieved in this setting dependon the simplicity of the control system and level of personal control available to occupants. This inturn depends on single occupancy of most of the rooms. Achievement of such results would bemore difficult in open planned space typical of much modern office accommodation.
• The tuning period was negligible. Ten minutes explanation was sufficient to enable the people touse the system effectively and efficiently. The system tends to default to "off" because when oneenters a room and finds conditions acceptable one does not then go to a switch to modify them.And when a change is desired the first resort for most people is to adjust a window.
3.9 Pollutant sources
3.9.1 Interior sources Particle board in desks; manmade upholstery materials for chairs.
3.9.2 Exterior sources: The building stands on City Road, the a six lane road which is one ofthe main routes from the city and northern suburbs to southern suburbs and the southcoast, carrying heavy traffic throughout the day and evening. It is therefore exposed toconsiderable volumes of motor vehicle exhaust gases and ultrafine particulates.
3.10 Furniture, interior fittings: Rooms are furnished with desks, chairs and sometimesoccasional tables typical of modern commercial furniture i.e. constructed of manmadematerials such as particle board and upholstery materials. Bookshelves are usually of unitarysteel construction.
3.11 Costs
3.11.1 Building: Actual costs are not available for this existing building. The estimated currentcost for a building of this type would be in the order of E750 per m2.
3.11.2 Plant: Value of plant including cost of installation when built in 1997 was approximatelyE68,000. A dedicated electricity submain was installed from the main switchboard onlevel 1 to a system distribution board on level 4, which provides supply to the condensingunit and to fan coil units in all rooms on all floors at an additional cost of E8, 550. Thiswas necessary to capture all the energy used by the cooling/heating system. A further E2,000 was expended on a recording meter to measure all electrical energy consumed by it.
3.11.3 Control system: Cost of the proprietary control system is not know as a separate item butis included in Plant Cost at item 3.11.2. Cost of supply and installation of motion detectorsfor monitoring room temperatures and occupancy status in each room in the study wasE2, 280. This included cost of installation of a temperature sensor in each room andconnection to the monitoring system but did not include cost of the sensors digital andanalogue data gathering boards or microprocessors required to connect the system to anexisting computer which were donated by Honeywell Ltd. Cost of these items isestimated at E3, 800.
3.12 Monitoring programme• Energy consumed by the cooling/heating system has been monitored continuously and recorded at
half-hourly intervals by a digital recording instrument since the system commenced operation at thebeginning of December 1997.
• Occupant perceptions of comfort and satisfaction were sampled in August 1997 before thesupplementary system was commissioned and again in September 1998 after some 10 months of use.They were again sampled in July 2001, after nearly three years of use. It might be argued that theresults of the September 1998 sampling reflected the "Hawthorne" effect. However the July 2001results are very similar to the set taken nearly three years previously giving confidence that theimprovement is genuine.

IEA ECBCS Annex 35 : HybVent
15 of 26
These surveys were part of a larger work where subjective responses of occupants of 38 office settingswere measured. The surveys were based heavily on a methodology described by Vischer (1989)3. Thesurvey protocol is attached in appendix A.
• Health effects. Concurrently with the surveys of comfort and satisfaction participants were asked toindicate frequency of experience of eight symptoms of malaise or minor ill health. The symptoms listedwere sore eyes, headache, runny nose, dry throat, dry skin, lethargy, dizziness and nausea which arecommonly associated in the literature with "sick building syndrome".
• Outdoor weather conditions used are as recorded by the Australian Weather Bureau at the SydneyObservatory in the Sydney CBD. The observatory is about 5 km from the study site and themicroclimates at both places are very similar.
• Indoor space temperatures in all rooms in the study area are monitored continuously by a HoneywellExcel 500 building monitoring system and have been recorded on disc since 1 October 2000.Thermocouples in plastic housings are located under desktops to shield them from drafts and directsolar gains and to ensure that the temperatures are measured close to the bodies of seated occupants.This report is based on temperatures in rooms at 3 pm to provide a close approximation of steady stateconditions. It is believed that temperatures in occupied rooms must be regarded as acceptable to theoccupant(s), given the wide range of adaptive mechanisms available including mechanical intervention.Unfortunately due to a remnant Y2k problem with the recording system some records were lost butrecording was recommenced from 31 August 2001 and complete records are available from that date.Sufficient records are available to provide a representative sample covering a full range of temperaturesexperienced in the moderate Sydney climate throughout the year.
• Occupancy status Motion detectors are placed in all rooms in the study area and continuous recordshave been kept since October 2000. The records are incomplete for the same reason that some indoortemperature records are missing but the remainder match the indoor temperature records referred toabove. Where no motion was recorded between 9 am and 3 pm on any day, the room is treated asunoccupied.
• Use of supplementary cooling/heating system Room units in use are indicated on the central controlpanel on level 4. Manual records of status were noted intermittently in sufficient number to enable arelationship with outdoor temperature to be detected.
• Carbon dioxide concentrations were measured in ten rooms in the study area in July 2001.Measurement was carried out with a Drager air pump and detector tubes. Funding constraintsprevented more frequent sampling.
• Particulate concentrations in the size range >0.3µ were measured in ten rooms in the study area inJuly 2001. The instrument used was a MetOne laser particle counter. Funding constraints preventedmore frequent sampling.
• Volatile organic compounds and microbiological organisms could not be sampled as intended dueto funding constraints.
3.13 Results from monitoring programme• Energy consumption per annum for the supplementary cooling/heating system has varied between
21,131 and 22,550 kWh per annum during each of the four years of operation. This is compared withan estimated consumption of 97,017 kWh for a conventional air conditioning system for the samespace. The estimate was computed by dynamic simulation using hour-by-hour real weather file forTRY Sydney 1981. Occupancy of the study area is estimated to be 70 percent and this was applied tothe simulation as an occupancy diversity factor. Month by month consumption is illustrated in figure 4below. A serious effort was made to ensure that the estimate is conservative. The computational modelwas designed to provide a variable air volume air distribution system with outdoor air economy cyclesto apply full outdoor air when outdoor dry bulb temperature falls below 21oC. Dead band control ofindoor temperatures is applied to limit availability of cooling to occasions when indoor temperaturesare above 24 oC and to limit heating availability to occasions when indoor temperatures are below 20
3 Vischer, J. (1989): “Environmental Quality in Offices”. Van Nostrand, New York.

Pilot study report : WIlkinson Building
16 of 26
oC. The model also provides for conditioned air to be supplied from three separate air handling unitsfor north east, north west and south/south west zones. Despite these precautions it cannot beguaranteed that the simulation is an accurate representation of reality. However it is clear thatconsiderable savings have been achieved in comparison with performance of conventional airconditioning plant in conjunction with mechanical ventilation and fixed windows. Monthly energyconsumption and cost for the typical year 2001 are shown in table 1 below.
Table 1. Month by month energy consumption of the supplementary cooling/heating system for year2001
Jan Feb Mar Apr May Jun Jul Aug Sep Oct Nov Dec
Energy/mth kWh 2715 2901 2468 1440 1058 1509 1941 1628 839 1049 1252 1799
Cost/mth Euro 143 160 129 84 86 103 113 99 62 58 74 92
Figure 4. Month by month energy consumption of the supplementary cooling/heating system fromDecember 1997 to November 2001 compared with estimated consumption for a conventional air
conditioning system for the same spaces with fixed windows.
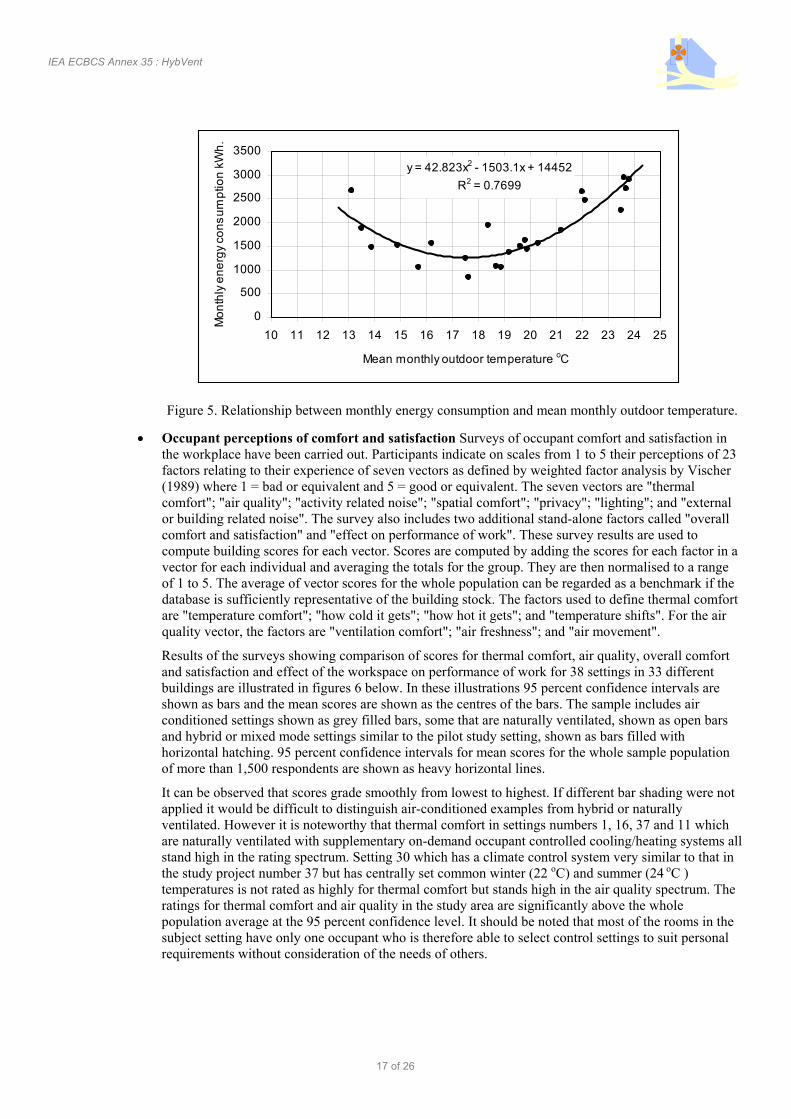
A strong binomial relationship is detectable between monthly energy consumption for thesupplementary cooling/heating system and outdoor mean monthly temperature. This relationship isillustrated in figure 5 below.
0
1000
2000
3000
4000
5000
6000
7000
8000
9000
10000
Dec
Mar
Jun
Sep
Dec
Mar
Jun
Sep
Dec
-00
Mar
Jun
Sep
Dec
Mar
Jun
Sep
kWh
per m
onth
Measured kWh Simulated kWh
IEA ECBCS Annex 35 : HybVent
17 of 26
Figure 5. Relationship between monthly energy consumption and mean monthly outdoor temperature.
• Occupant perceptions of comfort and satisfaction Surveys of occupant comfort and satisfaction inthe workplace have been carried out. Participants indicate on scales from 1 to 5 their perceptions of 23factors relating to their experience of seven vectors as defined by weighted factor analysis by Vischer(1989) where 1 = bad or equivalent and 5 = good or equivalent. The seven vectors are "thermalcomfort"; "air quality"; "activity related noise"; "spatial comfort"; "privacy"; "lighting"; and "externalor building related noise". The survey also includes two additional stand-alone factors called "overallcomfort and satisfaction" and "effect on performance of work". These survey results are used tocompute building scores for each vector. Scores are computed by adding the scores for each factor in avector for each individual and averaging the totals for the group. They are then normalised to a rangeof 1 to 5. The average of vector scores for the whole population can be regarded as a benchmark if thedatabase is sufficiently representative of the building stock. The factors used to define thermal comfortare "temperature comfort"; "how cold it gets"; "how hot it gets"; and "temperature shifts". For the airquality vector, the factors are "ventilation comfort"; "air freshness"; and "air movement".
Results of the surveys showing comparison of scores for thermal comfort, air quality, overall comfortand satisfaction and effect of the workspace on performance of work for 38 settings in 33 differentbuildings are illustrated in figures 6 below. In these illustrations 95 percent confidence intervals areshown as bars and the mean scores are shown as the centres of the bars. The sample includes airconditioned settings shown as grey filled bars, some that are naturally ventilated, shown as open barsand hybrid or mixed mode settings similar to the pilot study setting, shown as bars filled withhorizontal hatching. 95 percent confidence intervals for mean scores for the whole sample populationof more than 1,500 respondents are shown as heavy horizontal lines.
It can be observed that scores grade smoothly from lowest to highest. If different bar shading were notapplied it would be difficult to distinguish air-conditioned examples from hybrid or naturallyventilated. However it is noteworthy that thermal comfort in settings numbers 1, 16, 37 and 11 whichare naturally ventilated with supplementary on-demand occupant controlled cooling/heating systems allstand high in the rating spectrum. Setting 30 which has a climate control system very similar to that inthe study project number 37 but has centrally set common winter (22 oC) and summer (24 oC )temperatures is not rated as highly for thermal comfort but stands high in the air quality spectrum. Theratings for thermal comfort and air quality in the study area are significantly above the wholepopulation average at the 95 percent confidence level. It should be noted that most of the rooms in thesubject setting have only one occupant who is therefore able to select control settings to suit personalrequirements without consideration of the needs of others.
y = 42.823x2 - 1503.1x + 14452
R2 = 0.7699
0
500
1000
1500
2000
2500
3000
3500
10 11 12 13 14 15 16 17 18 19 20 21 22 23 24 25
Mean monthly outdoor temperature oC
Mo
nth
ly e
ne
rgy
con
su
mp
tion
kW
h.

Pilot study report : WIlkinson Building
18 of 26
Figure 6. Comparison of ratings for some comfort vectors between the study setting and those from arepresentative sample of Australian buildings.
Please note the differences between scores for settings 16 (September 1998) and 37 (July 2001) whichare from the study area and 13 (August 1997) and 36 (July 2001), which are from similar areas in theWilkinson building but lack supplementary cooling/heating.
1
2
3
4
5
26 28 8 15 12 19 31 5 33 13 36 7 25 22 17 6 9 20 24 A 30 32 10 23 21 27 14 3 29 2 34 4 35 1 18 38 16 37 11
Setting number
Th
erm
al c
omfo
rt
37
1630
3613
0
1
2
3
4
5
8 31 26 9 15 36 33 2 5 22 12 17 20 A 10 25 24 21 6 4 28 7 19 13 27 14 23 1 29 34 3 32 38 18 30 35 37 11 16
Setting number
Air
qu
alit
y in
dex 36
1316
3730
1
2
3
4
5
2 15 8 26 12 28 5 6 29 31 17 9 A 13 22 19 32 7 10 34 36 4 20 23 24 33 30 25 14 18 38 27 21 3 16 11 37 35 1
Setting number
Ove
rall
satis
fact
ion
13 36 30 16 37
1
2
3
4
5
2 15 8 28 32 26 12 5 6 29 13 17 19 A 9 31 24 27 10 34 22 20 7 18 33 38 4 21 36 16 3 23 11 14 25 1 30 37 35
Setting number
Eff
ect
on
per
form
ance
of
wo
rk
37
301613 36
(i) Thermal comfort
(ii) Air quality
(iii) Overall comfort
(iv) Effect on performance of work

IEA ECBCS Annex 35 : HybVent
19 of 26
Regression analysis was performed to investigate relationships between some of the comfort and healthvectors comfort and the relationships are illustrated in figure 7 below.
Figure 7. Relationships of varying strength are detectable between thermal comfort, air quality, overallcomfort and effect on performance of work.
Figure 7 indicates a strong relationship between perceptions of overall comfort and satisfaction andself-reported effect of the space on performance of work as would be expected. Influence ofperceptions of the correlated thermal comfort and air quality on overall comfort and performance ofwork are weaker and are diluted by other vectors such as spatial comfort, privacy and activity relatednoise. Nevertheless it would seem that perceptions of thermal comfort and air quality have a realinfluence and attention to them could be expected to produce worthwhile improvement in productivity.
• Health effects Combined rating for prevalence of eight symptoms of malaise or minor ill health oftenassociated in the literature with "sick building syndrome" as self-reported by occupants of 38 officesettings are shown in figure 8 below. Prevalence is reported on a scale from 1 to 5 where 1 = neverexperienced; 2 = rarely; 3 = once per week; 4 = twice per week; and 5 = daily. Scores for each person
R2 = 0.5522
1
2
3
4
5
1 2 3 4 5
Thermal comfort
Air
qual
ityR2 = 0.4664
1
2
3
4
5
1 2 3 4 5
Thermal comfort
Ove
rall
com
fort
R2 = 0.4713
1
2
3
4
5
1 2 3 4 5
Air quality
Ove
rall
com
fort
R2 = 0.2746
1
2
3
4
5
1 2 3 4 5
Thermal comfort
Effe
ct o
n pe
rfor
man
ce o
f w
ork
R2 = 0.3097
1
2
3
4
5
1 2 3 4 5
Air quality
Effe
ct o
n pe
rfor
man
ce o
f w
ork
R2 = 0.8517
1
2
3
4
5
1 2 3 4 5
Overall comfort
Effe
ct o
n pe
rfor
man
ce o
f w
ork
(iii)
(ii)(i)
(iv)
(v) (vi)

Pilot study report : WIlkinson Building
20 of 26
are totalled and the total for the setting is averaged and normalised to a range of 1 to 5 as for thecomfort scores. Results are illustrated in figure 8 below. As in figure 6 mean scores are at centres ofbars with ends of bars indicating upper and lower 95 percent confidence limits. Heavy horizontal linesrepresent the 95 percent confidence limits for the whole population mean. Inspection shows thatsettings 16 and 37 are among the lowest. It is noteworthy that mean prevalence scores for hybrid andnaturally ventilated settings are all below the whole population average. Scores for many of the airconditioned examples are at the higher end of the spectrum although if the definition of SBS is taken toinclude excessive symptom prevalence in relation to the whole population only settings 8 and 26 wouldwarrant further investigation with ratings significantly higher than the population average at the 95percent confidence level.
Figure 8. Comparison of ratings for prevalence of SBS symptoms between the study setting and thosefrom a representative sample of Australian buildings.
Regression analysis has been applied to examine the relationship, if any, between symptom prevalenceand perceptions of air quality and thermal comfort. Results are shown in figure 9 below. Associationsare detectable but are weak, particularly in the case of thermal comfort.
Figure 9. Relationships between SBS symptom prevalence and perceived air quality and thermalcomfort.
• Indoor space temperatures are strongly related to outdoor temperatures as illustrated in figure 10below.
R2 = 0.1871
1
2
3
4
5
1 2 3 4 5
Thermal comfort
SB
S p
reva
lenc
e
R2 = 0.2887
1
2
3
4
5
1 2 3 4 5
Air quality
SB
S p
reva
lenc
e
(i) SBS/air quality (ii) SBS/thermal comfort
1
2
3
4
5
13 16 11 35 1 27 37 12 28 31 7 21 30 36 33 3 29 32 18 2 10 25 6 A 17 20 34 14 23 24 4 38 19 9 22 5 15 26 8
Setting number
Sym
ptom
pre
vale
nce
1316 37
30
36

IEA ECBCS Annex 35 : HybVent
21 of 26
Figure 10. Associations between indoor and outdoor temperatures in occupied and unoccupied rooms.
As would be expected, warmer outdoor conditions are accompanied by increase in indoor temperatures.The plot for unoccupied rooms in figure 10 (ii) above shows a continuous approximately linear
(iii) Mean indoor temperatures in occupied rooms at 3 pm.
(iv) Mean indoor temperatures in unoccupied rooms at 3 pm.
(v) Mean indoor temperatures in occupied rooms at 3 pm.
(vi) Mean indoor temperatures in unoccupied rooms at 3 pm.
y = -0.0219x2 + 1.4323x + 1.9615R 2 = 0.5669
1012141618202224
26283032343638
10 12 14 16 18 20 22 24 26 28 30 32 34 36 38 40
Daily outdoor m axim um tem perature oC
y = 0.4169x + 14.367R 2 = 0.3365
10121416
18202224262830
32343638
10 12 14 16 18 20 22 24 26 28 30 32 34 36 38 40Daily outdoor m axim um tem perature oC
b
(i) Indoor temperatures in occupied rooms at 3 pm. (ii) Indoor temperatures in unoccupied rooms at 3 pm.
101214161820222426283032343638
5 7 9 11 13 15 17 19 21 23 25
Daily outdoor m inim um tem perature oC
101214161820222426283032343638
5 7 9 11 13 15 17 19 21 23 25Daily outdoor m inim um tem perature oC
y = 0.6694x + 13.706R 2 = 0.5448
101214161820222426283032343638
5 7 9 11 13 15 17 19 21 23 25
Daily outdoor m im im um tem perature oC
y = -0.0369x2 + 1.5342x + 8.9459R 2 = 0.6941
101214161820222426283032343638
5 7 9 11 13 15 17 19 21 23 25Daily outdoor m inim um tem perature oC
b

Pilot study report : WIlkinson Building
22 of 26
relationship. However the curvature in the pattern of points for occupied rooms in figure 10 (i) suggeststhat occupants accept the increase to a point when they intervene to limit indoor temperature rise. Italso indicates the range of temperatures that are accepted in the various rooms varies across a dailyrange of as much as 8 oC.
Figures 10 (iii) and 10 (iv) show the scatter of indoor daily mean temperatures in occupied andunoccupied rooms respectively plotted with daily minimum outdoor temperature as the independentvariable. Regression analysis shows a strong binomial relationship with temperatures in occupiedrooms (R2 = 0.69). The relationship with temperatures in unoccupied rooms is linear and somewhatweaker (R2 = 0.54). Weaker relationships with daily maximum temperatures are shown in figures 10(v) and (vi), possibly because daily minimum temperatures in Sydney are less variable than maximaand the effect of variations in maxima is dampened by the thermal inertia of the building. This isconvenient because the day minimum occurs before the daytime occupancy begins. The relationshipmight therefore be useful as a control algorithm. But it has limitations. If extrapolated below theobserved range it is likely to indicate temperatures that will be unacceptably low. And if extendedabove the range it will suggest unnecessarily lower acceptable indoor conditions as outdoorstemperatures continue to raise.
The indoor minima were therefore divided into two ranges of indoor temperatures in occupied rooms,up to 17 oC and upward from 17 oC. Linear regression was applied separately to each as indicated infigure 11 and it will be observed that the relationship is as strong for the lower range as it was underbinomial regression whilst there is no significant relationship for the upper range. Also the slope of theregression line for the lower range is very similar to that for the unoccupied rooms. This suggests thatmechanical intervention is not applied until necessary to limit indoor temperatures to a range between22 oC and 28 oC. It also suggests that a control strategy that does not allow mechanical cooling untilday minimum temperature reaches 16 oC to 17 oC might be acceptable to a majority of occupants.Although not defined in this work, it seems likely that a similar lower limit would be found to apply tooutdoor and indoor temperatures below the range encountered in this study.
Figure 11. Comparison of binomial and linear relationships between indoor and outdoor temperatures.
10
12
14
16
18
20
22
24
26
28
30
32
34
36
38
5 7 9 11 13 15 17 19 21 23 25D aily outdoor m inim um tem perature oC
y = 0.0451x + 23.825R 2 = 0.0044
y = 0.6136x + 14.405R 2 = 0.6861
y = -0.0369x2 + 1.5342x + 8.9459R 2 = 0.6941
10
12
14
16
18
20
22
24
26
28
30
32
34
36
38
5 7 9 11 13 15 17 19 21 23 25D aily outdoor m inim um tem perature oC
b
(i) Mean indoor temperature at 3 pm. Binomialregression with daily outdoor minimum temperature as independent variable.
(ii) Mean indoor temperature at 3 pm. Linearregressions with daily outdoor minimum
temperature as independent variable.

IEA ECBCS Annex 35 : HybVent
23 of 26
Considerable day to day variation in temperatures recorded in individual rooms is illustrated in recordsfrom five typical rooms as illustrated in figure 12 below. The reason(s) for these variations are notclear. They may be accounted for by passive adaptive actions by the room occupant or may be a resultof higher tolerance of variation in the knowledge that action to change the temperature can be taken atany time.
Figure 12. Day by day temperature variations in five typical rooms when occupied.
R 2 = 0.5133
15
20
25
30
5 10 15 20 25
R 2 = 0.3062
15
20
25
30
5 10 15 20 25
R 2 = 0.3415
15
20
25
30
5 10 15 20 25
R 2 = 0.338
15
20
25
30
5 10 15 20 25
R 2 = 0.5616
15
20
25
30
5 10 15 20 25
Day m inim um outdoor deg. C

Pilot study report : WIlkinson Building
24 of 26
Use of fancoil units. As explained above intermittent records have been kept of numbers of fan coilunits in use at 3 pm during the study period. Results of second order polynomial regression analysis ofthese data, illustrated in figure 13 below, show a strong relationship with outdoor day minimumtemperatures (i). Again the relationship with outdoor day maximum temperature (ii) is weaker,suggesting that the less variable daily minimum is a more reliable independent variable. The strength ofthe relationship in this case would be affected by diversity of room occupancy from day to day. A morecomplete set of data would be required before confident predications could be based on this analysis.However it seems that a small proportion of users feel the need to operate the mechanical equipment tomaintain acceptable indoor temperatures, even in the mildest weather, when outdoor minimum daytemperatures are in the range from about 7 oC to 13 oC. It is also possible that more units would be usedearly in the morning in this mild weather but, unfortunately, no details of such use are available.
Figure 13. Number of fan coil units in use at 3 pm with outdoor temperature as independent variable.
Carbon dioxide and particulate concentrations as the averages of concentrations measured in tenrooms in the study area (setting 37) in July 2001 are reported in table 2. Because it was winter thewindows in the study area were shut. The mean carbon dioxide concentration indicates a satisfactoryaverage rate of ventilation by outdoor air of about 8 litres per second per person. This suggests thatleakage infiltration is quite high. The high count of fine particulates is probably due to location of thebuilding beside a busy highway.
These concentrations in the study setting 37 are considerably higher than those observed in the sameyear and season in two air-conditioned office settings, numbers 26 and 34. However ratings foroccupant perceptions of thermal comfort, air quality, overall comfort and effect on performance ofwork in it are all higher and SBS symptom prevalence is lower as shown in figure 8. This suggests thatthe combination of operable windows and personal control of the thermal environment have abeneficial effect on occupant sensations of well-being.
Table 2. Concentrations of carbon dioxide and fine particles in three buildings.
Setting 26 Setting 34 Setting 37
Carbon dioxide ppm 660 770 930
Particle >0.3µ count/m3 2.49E+05 2.62E+05 1.10E+06
R 2 = 0.5185
0
3
6
9
12
15
18
21
24
27
12 14 16 18 20 22 24 26 28 30 32 34 36
Outdoor day m axim um tem perature o C
y = 0.0502x2 - 0.9619x + 7.6365R 2 = 0.6226
0
3
6
9
12
15
18
21
24
27
5 7 9 11 13 15 17 19 21 23 25
Outdoor day m inim um tem perature oC
(i) (ii)

IEA ECBCS Annex 35 : HybVent
25 of 26
3.14 Lessons Learned
Conclusions
• Well designed naturally ventilated buildings with ventilation through occupant controlled windows anddoors can provide thermal comfort and air quality as perceived by the occupants comparable with airconditioned premises in the moderate climate of Sydney and, by extrapolation, in similar climates inother parts of Australia and the world.
• Provision of supplementary on-demand mechanical cooling/heating equipment in the pilot study and inother buildings has raised occupant perceptions of comfort and well being significantly. In the light ofself-reported high rating for effect of the space on performance of work, it could be expected thatproductivity would be above average.
• Prevalence of eight symptoms of minor ill-health similar to those commonly associated in the literaturewith “sick building syndrome” is lower in naturally ventilated and mixed mode settings than in manyair conditioned premises.
• Hybrid systems, and indeed any ventilation systems, will be more acceptable to occupants if the controlsystems permit intervention by individuals to establish conditions that match their currently perceivedrequirements. These can frequently vary between individuals and can vary throughout the day for anyparticular person. Personal control may be more readily achieved in a setting such as the pilot studywhere accommodation is in the form of cellular offices, mostly with only one occupant.
• Occupants have demonstrated a tendency to use supplementary mechanical cooling/heating equipmentsparingly in the pilot study. They appear to have a preference for use of windows and other adaptivebehaviours to modify conditions in mild mid-season weather. Most do, however, appear to have anupper “tolerance” limit when active intervention will be applied if the opportunity is available. Asimilar lower tolerance limit will probably be found in colder climates. For many of those in this studyan acceptable range of indoor temperatures across the seasons would seem to lie between 18 oC and 27oC.
• It has been observed that the mechanical equipment provided in this pilot study tends to “default tooff”. If one enters ones room and finds conditions satisfactory, one does nothing. If not, adjustment ofwindows or doors is frequently the first choice. The result of this behaviour is evident in the lowenergy consumption of the cooling/heating system.
• Mean indoor temperatures in occupied rooms display a strong adaptive relationship to daily outdoorminimum temperatures until the latter reach about 17 oC. At this point the mean indoor temperaturetakes a constant value of about 25 oC as indicated in figure 11 (i). The number of fan coil units in usealso has a strong binomial relationship with day minimum outdoor temperature as shown in figure 12(i).
• Monthly energy consumption is strongly related to mean monthly outdoor temperature as shown infigure 5.
What did work?
• Simplicity and transparency of the interface between users and the cooling/heating system. Very littleinstruction was needed and people understand the system and use it intelligently to achieve theirobjectives.
• The modular variable flow refrigeration system has a sophisticated proprietary control system, whichenables it to operate with high part load efficiency over a wide range of loads. This system operates inthe background to support the manual control actions of occupants of individual rooms. A goodanalogy is with the power steering system on a motor vehicle, which assists the driver withoutinterfering with his/her intentions.
• The system has proven trouble free over four years of operation. Until recently the only maintenancecarried out has been occasional washing of the panel filters in the fan coil units. A breakdown of therefrigeration plant in March 2002 was due to water penetrating the casing of an external isolatingswitch of third party manufacture. This was quickly rectified and the system continues in use.
Pilot study report : WIlkinson Building
26 of 26
• In this project the real (and best) sensors of temperature and air quality are the occupants who are ableto implement decisions with rapid feedback to inform them of the effect.
• There can be little doubt that the high rating for air quality in this and similar situations is due to thecombination of operable windows and occupant controlled cooling/heating equipment. The influenceof thermal comfort on perceptions of air quality is illustrated in figure 7(i) above.
What did not work?
• Nothing really. However the supplementary system is charged with refrigerant 22 which will soon bephased out in Australia. When it was installed it was not available for use with completely non-ozonedepleting refrigerants. Current versions have now been modified to suit these. At installation the pipingsystem was carefully pressure tested with nitrogen gas and has given no sign of leaking in the fouryears of use to date.
• The already low energy consumption of the system could be further reduced by introduction ofnighttime cooling with outdoor air. This could be accomplished easily by installing small windowmounted fans in windows in the rooms and blowing cool air through them at night.
Initial and running costs
Initial cost of the supplementary system is no different from the cost of a conventional air conditioningsystem because it has to be sized for peak cooling and heating loads. Savings should be achievable inassociated building works because there is no need for concealment space for ductwork. Running costs areobviously higher than for a ”free running” naturally ventilated building without the supplementarycooling/heating system but the penalty is reduced occupant satisfaction. Energy cost, year on year, is abouta quarter of the cost that would be expected for a conventional air conditioning system for the same space.Maintenance costs are negligible.
Acknowledgments
The author and his colleagues in the Faculty of Architecture are grateful to Daikin Australia Pty. Ltd. forthe donation of the VRV equipment for experimental purposes without which this study would not havebeen possible; and to the University of Sydney for providing funding for its installation. Honeywell Ltdkindly donated the monitoring software and most of the hardware used to monitor occupancy status androom temperatures. Phil Granger and Ken Stewart of the Faculty Technical Services Branch wereunstinting with their assistance in servicing the monitoring equipment.
Copyright © 2022 FDOKUMEN