COLLEGE CAMPUS BUILDINGS UW-MADISON ...
103
UNIVERSIDAD PONTIFICIA DE COMILLAS ESCUELA TÉCNICA SUPERIOR DE INGENIERÍA INGENIERÍA INDUSTRIAL PROYECTO FIN DE MÁSTER COLLEGE CAMPUS BUILDINGS UW-MADISON. SUSTAINABILITY PERSPECTIVE COORDINADO POR UNIVERSITY OF WISCONSIN-MADISON Autor: Teresa Freire Barceló Director: Andrea Hicks Madrid, junio 2017
-
Upload
khangminh22 -
Category
Documents
-
view
0 -
download
0
Transcript of COLLEGE CAMPUS BUILDINGS UW-MADISON ...

UNIVERSIDAD PONTIFICIA DE COMILLAS
ESCUELA TÉCNICA SUPERIOR DE INGENIERÍA
INGENIERÍA INDUSTRIAL
PROYECTO FIN DE MÁSTER
COLLEGE CAMPUS BUILDINGS
UW-MADISON.
SUSTAINABILITY PERSPECTIVE
COORDINADO POR UNIVERSITY OF WISCONSIN-MADISON
Autor: Teresa Freire Barceló Director: Andrea Hicks
Madrid, junio 2017

Universidad Pontificia de Comillas Escuela superior de Ingeniería
2 College campus buildings UW-Madison. Sustainability perspective.
Teresa Freire Barceló

Universidad Pontificia de Comillas Escuela superior de Ingeniería
3 College campus buildings UW-Madison. Sustainability perspective.
Teresa Freire Barceló

Universidad Pontificia de Comillas Escuela superior de Ingeniería
4 College campus buildings UW-Madison. Sustainability perspective.
Teresa Freire Barceló

Universidad Pontificia de Comillas Escuela superior de Ingeniería
5 College campus buildings UW-Madison. Sustainability perspective.
Teresa Freire Barceló
Declaro, bajo mi responsabilidad, que el Proyecto presentado con el título College
Campus Buildings UW-Madison
Sustainability perspective
en la ETS de Ingeniería - ICAI de la Universidad Pontificia Comillas en el
curso académico 2016/2017 es de mi autoría, original e inédito y
no ha sido presentado con anterioridad a otros efectos. El Proyecto no es plagio de
otro, ni total ni parcialmente y la información que ha sido tomada
de otros documentos está debidamente referenciada.
Fdo.: Teresa Freire Barceló Fecha: 25/4/2017
Autorizada la entrega del proyecto
EL DIRECTOR DEL PROYECTO
Fdo.: Andrea Hicks Fecha: 27/4/2017

Universidad Pontificia de Comillas Escuela superior de Ingeniería
6 College campus buildings UW-Madison. Sustainability perspective.
Teresa Freire Barceló


Universidad Pontificia de Comillas Escuela superior de Ingeniería
9 College campus buildings UW-Madison. Sustainability perspective.
Teresa Freire Barceló
ABSTRACT
The project will assess all UW-Madison on-campus buildings GHG emissions, and focus
on the 3 main gases that have the higher impact, 𝐶𝑂2, 𝐶𝐻4and 𝑁2𝑂. Moreover, this project will
provide recommendations and ideas on how to reduce its GHG emissions in order to reach a
better Leadership in Energy and Environmental Design (LEED) certification in the future
constructed buildings.
LEED is an internationally recognized green building certification system created by
the U.S. Green Building Council. (Sustainability at American Colleges and Universities, n.d.)
The first prominent “sustainability” programs at colleges and universities focused on recycling of
wastes such as paper, glass, and plastics. Recently attention to sustainability started
encompassing the overall and perhaps greater impact that higher education plays in preparing
future generations to address the impacts of human life on the planet. Therefore, some
universities have already taken steps forward sustainability to achieve a better LEED
certification.
At the beginning of the project, previous research about other concerned universities with
the sustainable issue have been done. In addition, it has been payed more attention to the ones
that have counted its GHG emissions somehow. With this information, the scope of the project
it’s been defined and the attention has focused on the universities which have similar dimensions
to UW-Madison to find some relevant data. The results of this research is summarized in the
following table:
Table 1: Summary from the universities students CO2 emissions.
University Emissions per student (t CO2e/Student)
ANU (Phelps, 2009) 110,450 t CO2e. /21,113Students= 5.23
UIC (Cynthia Klein-Banai&Thomas L.
Theis, 2010) 275,000 t CO2e. /29,048Students= 9.47
California State Polytechnic University
(Paul Wingco, 2013)
29,516 t CO2e. /20,944Students= 1.41

Universidad Pontificia de Comillas Escuela superior de Ingeniería
10 College campus buildings UW-Madison. Sustainability perspective.
Teresa Freire Barceló
College of Charleston (P. Brian Fisher
Ph.D., Spring 2012) 67,812 t CO2e./11,619Students= 5.84
Drexel University (Ms Barbara A.W.
Clarke, 2009) 41,369 t CO2e./12,529Students= 3.30
Penn State University (Pennsylvania
State University, n.d.) 499,740 t CO2e./99,133Students= 5.04
University of Maryland (David Tilley,
2007) 352,000 t CO2e./38,140Students= 9.23
Secondly, since it is not easy to find relevant data to perform the GHG inventory,
different methods that could be applied were analyzed in case of sufficient data provided for any
of them. Eventually, the recruited data was enough to conduct a GHG emissions inventory of the
UW-Madison campus applying one of the studied methods. EPA standards method is applied to
analyze the 𝐶𝑂2, 𝐶𝐻4and 𝑁2𝑂 releases by the on campus buildings. These releases are mainly,
due to HVAC and electricity requirements. It has been chosen this method due to its simple
amount of data required, that matches with the available data. On the other hand, water, food,
transportation around the campus and hazardous waste won't be considered as there is not
available such detailed information.
The buildings operate in different manners depending on their use. Therefore, each
building is going to be classified within a category. The different categories considered are:
Dwelling buildings, Offices, School buildings (which are compound of labs, classrooms and
offices), Schools without a lab, Laboratories, Retail, Restaurant, Sport building, Service(Garage,
Police Station…), Historic, Leisure, Library, Greenhouse, Power plant and Hospital.
For each building category, it is going to be assumed a different energy consumption
based on real data in KWh/SF.
Table 2 Categories and subcategories weighed with their corresponding energy ratio in KWh/SF
Category Subcategory KWh/SF
per year
School 29%Office 50%Classroom 20%lab 1%Cafeteria 25.68

Universidad Pontificia de Comillas Escuela superior de Ingeniería
11 College campus buildings UW-Madison. Sustainability perspective.
Teresa Freire Barceló
*School(without
Lab) 29%Offices 70%Classroom 1%Cafeteria 7.57
Offices 100%Offices 18.72
Offices&Lab 50% each 56.16
Dweling 85%Rooms 15%Kitchens 21.66
Restaurant 20%Kitchen 80%Living room 65.59
Lab 100% lab 93.6
Hospital Surgery rooms/Patient Rooms/Offices 57.36
Hospital&Lab 80%Hospital 20% Lab 64.6
Leisure 75%Living rooms for events 10%Cafe
15%Offices 13.27
Sport Can be dry, Combined(with pool), ice rink for
Hokey. 41.62
Library 60%living rooms 40%Computer labs 26.84
Greenhouse 100% Plantation 67.2
Service Police/Boat/Garage 25.88
Power Plant 100% Machinery and Labs
Retail Store 100% 13.8
Historic 100%Space 13.27
With the EPA standards and taking into account the categories which data is specifically
obtained from California, which are: schools without a lab, Schools, hospitals and offices that
need to include the conversion factor from California to Madison. It is applied the following:
𝑆𝐹𝐵𝑢𝑖𝑙𝑑𝑖𝑛𝑔 ∗𝑀𝑊ℎ𝐶𝑎𝑙𝑖𝑓𝑜𝑟𝑛𝑖𝑎
𝑆𝐹∗ (
𝑙𝑏𝐶𝑂2
𝑀𝑊ℎ)𝐶𝑎𝑙𝑖𝑓𝑜𝑟𝑛𝑖𝑎 ∗
𝑙𝑏𝐶𝑂2𝑀𝑎𝑑𝑖𝑠𝑜𝑛
𝑙𝑏𝐶𝑂2𝐶𝑎𝑙𝑖𝑓𝑜𝑟𝑛𝑖𝑎
= 𝑙𝑏𝐶𝑂2𝑀𝑎𝑑𝑖𝑠𝑜𝑛
The other categories don´t require conversion factor so the equation is simplified as follows:
𝑆𝐹𝐵𝑢𝑖𝑙𝑑𝑖𝑛𝑔 ∗𝑀𝑊ℎ𝑀𝑎𝑑𝑖𝑠𝑜𝑛
𝑆𝐹∗ (
𝑙𝑏𝐶𝑂2
𝑀𝑊ℎ)𝑀𝑎𝑑𝑖𝑠𝑜𝑛 = 𝑙𝑏𝐶𝑂2𝑀𝑎𝑑𝑖𝑠𝑜𝑛
The results obtained are shown in the table below:
Table 3 Total GHG emissions for each type of building.
Categories Kg of CO2 Kg of CH4 Kg of N2O Kg of CO2e
Dwelling 16,917,540 2,012,753 296,307 17,051,011
Greenhouse 1,747,236 207,876 30,602 1,761,021
Historic 334,163 39,757 5,853 336,799

Universidad Pontificia de Comillas Escuela superior de Ingeniería
12 College campus buildings UW-Madison. Sustainability perspective.
Teresa Freire Barceló
Hospital 959,396 116,754 17,024 975,860
Hospital/Lab 37,890,426 4,507,989 663,643 38,189,364
Hospital/School 3,188,808 379,386 55,851 3,213,966
Lab 55,990,532 6,661,438 980,663 56,432,272
Leisure 5,509,875 655,534 96,504 5,553,346
Library 7,770,004 924,431 136,090 7,831,305
Office&Classrooms 60,895 7,245 1,067 61,375
Offices 794,404 96,675 14,097 808,036
Offices&Lab 29,544,216 3,515,004 517,461 29,777,306
Restaurant 3,522,559 419,094 61,697 3,550,351
Retail 70,081 8,338 1,227 70,634
School 13,404,523 1,631,267 237,861 13,634,545
School&SportsDry 130,626 15,541 2,288 131,657
School(Without
Lab)
365,665 44,500 6,489 371,940
Service 688,011 81,856 12,050 693,439
Service & Leisure 100,677 11,978 1,763 101,471
Service & Offices 976,772 116,211 17,108 984,479
Sport Combined 5,026,530 598,028 88,039 5,066,187
Sport Dry 11,849,368 1,409,771 207,539 11,942,854
Sport Ice rink 6,926,029 824,020 121,308 6,980,672
Grand Total 203,768,337 24,285,446 3,572,531 205,519,891
In the end, some proposals are made to decrease the on-campus GHG emissions
regarding each particular type of buildings. Consequently, LEED certification would take part at
the end of the project as a target for the new constructed buildings or the renovating of the
already existing ones to take these proposals into account to reach LEED certification standards.
Some conclusions have been drawn from above review:
■ The quantities are not that consistent nor the way to reach the most dangerous gas for the
atmosphere.
■ Lab buildings category use more energy consuming equipment. For instance, fume hoods
are necessary to clean the air in this areas and this equipment requires a high amount of
energy.
■ To control emissions there is a need of increasing awareness amongst stakeholder to
adopt such methods, which aren’t technologically better but environmentally safe.

Universidad Pontificia de Comillas Escuela superior de Ingeniería
13 College campus buildings UW-Madison. Sustainability perspective.
Teresa Freire Barceló
■ Shifting power generation technology from conventional sources to cogeneration or
hybrid technology results into substantial reduction in carbon emission.
■ Improvement in thermal performance of building envelope leads to reduction in carbon
emission.
■ Construction process should be made more environmental friendly.
■ The materials used in the buildings and the processes used should be identified and
assessed. This will help in improve energy efficiency (Ralegaonkar, 2011)
■ Simulation methods should be used at design stage to improve energy efficiency of
building system (Such as the proper shading device) which directly will result in
reduction in carbon emissions. Simulation method proves to be best for predicting
heating and cooling load (Ralegaonkar, 2011).
■ Each university is different, many facts should be considered (size, location, type of
college...) to make consistent comparisons.
■ GHG emissions inventory gives more detailed information than carbon footprint as it
keeps separated each gas releases. Nevertheless, carbon footprint results are easier to
interpret as it only uses 𝑪𝑶𝟐𝒆.
■ Investing in greener HVAC equipment can save a lot of money, as in the average US
buildings accounts for the 48% of the emissions.
■ A proposal that can help to reduce easily GHG emissions is requiring all residential
buildings to report their electricity and heating energy use.
Over 25 percent of Madison’s yearly energy costs ($3.6 out of nearly $14 million dollars)
are spent on buildings and facilities energy (Eric Anderson, 2012). The average American
household spends over $2000 per year on energy bills, the majority of which goes to heating and
cooling (EPA, Green building, 2016). Reducing building energy consumption can therefore
reduce energy use and greenhouse gas emissions, while helping Madison habitants save money.
(Eric Anderson, 2012)
In 1990 UW-Madison buildings used 995,299 therms of natural gas and 15,986,473 kWh
of electricity for a total cost of approximately $1.3 million. Some upgrades have been applied to
the UW buildings adding insulation systems, such as re-roofing, upgrading doors, replacing

Universidad Pontificia de Comillas Escuela superior de Ingeniería
14 College campus buildings UW-Madison. Sustainability perspective.
Teresa Freire Barceló
windows, etc. The energy savings from these measures has not been documented yet. The
expenditures in measures to improve energy efficiency it’s been between $300,000 to $500,000,
and annual savings from these measures are estimated to be $40,000/year. (Somers, 2002)
None of the policy options considered in this report will, on their own, result in GHG
emissions reductions on a scale large enough to achieve the Madison city's stated goal of an 80
percent reduction in GHG emissions by the year 2050. (Lydersen, 2016). However, if gradually
we contribute to implement measures to improve the situation, the outcomes will be considerably
appreciated. Furthermore, big amount of money will likely be necessary to achieve these goals.
Therefore, in addition to considering the efficacy of a few of the many GHG reduction
alternatives available, the economic impact should be considered.
RESUMEN
Este proyecto evaluará las emisiones de los gases efecto invernadero de todos los
edificios del campus de la Universidad de Wisconsin-Madison. Se centrará en los 3 gases que
producen el mayor impacto, 𝐶𝑂2, 𝐶𝐻4 y 𝑁2𝑂 . Además, el proyecto dará recomendaciones e
ideas de cómo reducir las emisiones de los gases para conseguir una certificación LEED
(Leadership in Energy and Environmental Design) mejor en los edificios que se construyan en un
futuro.
LEED es una certificación reconocida internacionalmente creada por U.S. Green
Building Council. (Sustainability at American Colleges and Universities, n.d.). Los primeros
programas llevados a cabo en favor de la sostenibilidad en las universidades americanas se
enfocaron en el reciclado de papel, vidrio y envases. Recientemente, se ha prestado atención a la
importancia de la educación en el tema de la sostenibilidad. Las futuras generaciones deben estar
preparadas para combatir el problema y reducir el impacto de la contaminación en el planeta.
Al comenzar el proyecto se ha realizado un estudio de las universidades que se han
preocupado anteriormente por el tema de la sostenibilidad. En particular, se ha prestado más
atención a las universidades que de alguna manera han cuantificado las emisiones de gases de
efecto invernadero. Con esta información se ha definido el alcance del proyecto y se han
evaluado en mayor detalle las universidades que en tamaño se parecen más a UW-Madison. A

Universidad Pontificia de Comillas Escuela superior de Ingeniería
15 College campus buildings UW-Madison. Sustainability perspective.
Teresa Freire Barceló
continuación, se muestra la tabla con las distintas universidades investigadas y una aproximación
de sus emisiones de CO2 por estudiante.
Tabla 4: Resumen de las emisiones de CO2 por estudiante.
Universidad Emisiones por estudiante
(t CO2e/Estudiante)
ANU (Phelps, 2009) 110,450 t CO2e. /21,113Estudiantes= 5.23
UIC (Cynthia Klein-Banai&Thomas L.
Theis, 2010) 275,000 t CO2e. /29,048Estudiantes= 9.47
California State Polytechnic University
(Paul Wingco, 2013)
29,516 t CO2e. /20,944 Estudiantes= 1.41
College of Charleston (P. Brian Fisher
Ph.D., Spring 2012) 67,812 t CO2e./11,619 Estudiantes= 5.84
Drexel University (Ms Barbara A.W.
Clarke, 2009) 41,369 t CO2e./12,529Estudiantes = 3.30
Penn State University (Pennsylvania
State University, n.d.) 499,740 t CO2e./99,133Estudiantes= 5.04
University of Maryland (David Tilley,
2007) 352,000 t CO2e./38,140 Estudiantes= 9.23
Por otro lado, ya que no es fácil recopilar la información necesaria para realizar un
inventario de los Gases de efecto invernadero (GEI), se van a analizar diferentes métodos para,
en función de la información recopilada, aplicar el más apropiado. Al final, la información
disponible era suficiente para aplicar uno de los métodos relacionado con los estándares de la
EPA (Environmental Protection Agency). Aplicando estos estándares obtenemos las emisiones
de 𝐶𝑂2, 𝐶𝐻4y 𝑁2𝑂 por los edificios del campus. Estas emisiones se deben principalmente a los
sistemas de HVAC y la cantidad de electricidad requerida. Se ha elegido este método por la
simplicidad de los datos necesarios para su aplicación, sin embargo, el consumo de agua, comida,
el transporte alrededor del campus y los residuos peligrosos no serán considerados ya que no hay
información tan detallada disponible.

Universidad Pontificia de Comillas Escuela superior de Ingeniería
16 College campus buildings UW-Madison. Sustainability perspective.
Teresa Freire Barceló
Los edificios operan de diferentes maneras en función de su aplicación. Por lo tanto, se
van a considerar distintas categorías de edificios y se van a clasificar cada uno en la que mejor
define su función. Las categorías son:
Viviendas, Oficinas, Universidad, Universidad sin laboratorio, Laboratorios, Comercio,
Restaurante, Edificio de deporte, Servicios varios (Garaje, policía,…), Edificio histórico, Ocio,
Biblioteca, Invernadero, Central eléctrica y Hospital.
Para cada categoría de edificio se va a asumir un consumo diferente de energía basado en
datos reales y expresado en KWh/SF.
Tabla 5 Categorias y subcategories de edificios y su correspondiente ratio de energía en KWh/SF
Categoria Subcategoría KWh/SF
al año
Universidad 29%Office 50%Classroom 20%lab 1%Cafeteria 25.68
*Universidad sin
lab 29%Offices 70%Classroom 1%Cafeteria 7.57
Oficinas 100%Offices 18.72
Oficinas y Lab 50% each 56.16
Vivienda 85%Rooms 15%Kitchens 21.66
Restaurante 20%Kitchen 80%Living room 65.59
Laboratorio 100% lab 93.6
Hospital Surgery rooms/Patient Rooms/Offices 57.36
Hospital&Lab 80%Hospital 20% Lab 64.6
Ocio 75%Living rooms for events 10%Cafe
15%Offices 13.27
Deporte Can be dry, Combined(with pool), ice rink for
Hokey. 41.62
Biblioteca 60%living rooms 40%Computer labs 26.84
Invernadero 100% Plantation 67.2
Servicio Police/Boat/Garage 25.88
Central eléctrica 100% Machinery and Labs
Comercio Store 100% 13.8
Historico 100%Space 13.27

Universidad Pontificia de Comillas Escuela superior de Ingeniería
17 College campus buildings UW-Madison. Sustainability perspective.
Teresa Freire Barceló
Con los estándares de la EPA y teniendo en cuenta las categorías en las que el dato de
KWh/SF ha sido obtenido de California, se aplica el factor de conversión de California a
Madison para dichas categorías con la siguiente fórmula:
𝑆𝐹𝐵𝑢𝑖𝑙𝑑𝑖𝑛𝑔 ∗𝑀𝑊ℎ𝐶𝑎𝑙𝑖𝑓𝑜𝑟𝑛𝑖𝑎
𝑆𝐹∗ (
𝑙𝑏𝐶𝑂2
𝑀𝑊ℎ)𝐶𝑎𝑙𝑖𝑓𝑜𝑟𝑛𝑖𝑎 ∗
𝑙𝑏𝐶𝑂2𝑀𝑎𝑑𝑖𝑠𝑜𝑛
𝑙𝑏𝐶𝑂2𝐶𝑎𝑙𝑖𝑓𝑜𝑟𝑛𝑖𝑎
= 𝑙𝑏𝐶𝑂2𝑀𝑎𝑑𝑖𝑠𝑜𝑛
El resto de categorías en las que la información se ha obtenido directamente del estado de
Wisconsin no necesitan facto de conversión. Luego la ecuación queda simplificada:
𝑆𝐹𝐵𝑢𝑖𝑙𝑑𝑖𝑛𝑔 ∗𝑀𝑊ℎ𝑀𝑎𝑑𝑖𝑠𝑜𝑛
𝑆𝐹∗ (
𝑙𝑏𝐶𝑂2
𝑀𝑊ℎ)𝑀𝑎𝑑𝑖𝑠𝑜𝑛 = 𝑙𝑏𝐶𝑂2𝑀𝑎𝑑𝑖𝑠𝑜𝑛
Los resultados obtenidos se muestran a continuación:
Tabla 6 Emisiones de GEI totales por tipo de edificio.
Categorias Kg de CO2 Kg de CH4 Kg de N2O Kg de CO2e
Viviendas 16,917,540 2,012,753 296,307 17,051,011
Invernadero 1,747,236 207,876 30,602 1,761,021
Edificio Historico 334,163 39,757 5,853 336,799
Hospital 959,396 116,754 17,024 975,860
Hospital/Lab 37,890,426 4,507,989 663,643 38,189,364
Hospital/Universidad 3,188,808 379,386 55,851 3,213,966
Lab 55,990,532 6,661,438 980,663 56,432,272
Ocio 5,509,875 655,534 96,504 5,553,346
Biblioteca 7,770,004 924,431 136,090 7,831,305
Oficinas y clases 60,895 7,245 1,067 61,375
Oficinas 794,404 96,675 14,097 808,036
Oficinas & Lab 29,544,216 3,515,004 517,461 29,777,306
Restaurante 3,522,559 419,094 61,697 3,550,351
Comercio 70,081 8,338 1,227 70,634
Universidad 13,404,523 1,631,267 237,861 13,634,545
Universidad &
deportes (seco)
130,626 15,541 2,288 131,657
Universidad sin Lab 365,665 44,500 6,489 371,940
Servicio 688,011 81,856 12,050 693,439
Servicio & Ocio 100,677 11,978 1,763 101,471
Servicio & Oficinas 976,772 116,211 17,108 984,479
Deportes
combinados
5,026,530 598,028 88,039 5,066,187
Deportes seco 11,849,368 1,409,771 207,539 11,942,854

Universidad Pontificia de Comillas Escuela superior de Ingeniería
18 College campus buildings UW-Madison. Sustainability perspective.
Teresa Freire Barceló
Deportes Patinaje
sobre hielo
6,926,029 824,020 121,308 6,980,672
Total 203,768,337 24,285,446 3,572,531 205,519,891
Al final, se harán algunas propuestas para reducir las emisiones de GEI del campus para
cada tipo de edificio en particular. Como consecuencia, la certificación LEED tendrá lugar al
final del proyecto como objetivo a conseguir por los edificios de nueva construcción o las
renovaciones de los edificios ya construidos.
Algunas conclusiones extraídas de la investigación anterior son:
■ La cantidad de gas liberado no es un dato consistente para asegurar cuál de los gases es la
mayor amenaza para la atmósfera puesto que cada uno afecta de una forma diferente.
■ Los edificios empleados exclusivamente para laboratorios, son los que mayor energía
consumen. Esto es debido a los equipos que utilizan y a la necesidad por ejemplo de
chimeneas para limpiar el aire del ambiente que consumen mucha energía.
■ Para disminuir las emisiones es necesario aumentar la concienciación de los accionistas
de las partes interesadas para que utilicen métodos, aunque no sean mejores
tecnológicamente, sean cuidadosos con el medio ambiente.
■ Cambio del uso de fuentes convencionales de energía a sistemas de cogeneración o de
tecnología híbrida disminuiría considerablemente las emisiones de carbono.
■ La mejora del rendimiento térmico del aislamiento del edificio conduce a la reducción de
emisiones de carbono.
■ El proceso de construcción debe ser más respetuoso con el medio ambiente.
■ Los materiales y los procesos utilizados en los edificios deben ser identificados y
evaluados, ayudando de esta manera a mejorar la eficiencia energética (Ralegaonkar,
2011)
■ Los métodos de simulación deben ser utilizados en la fase de diseño para mejorar la
eficiencia energética del sistema de construcción dando lugar a la reducción de las
emisiones de carbono. El método de simulación es el mejor para predecir la carga de
calefacción y refrigeración (Ralegaonkar, 2011).
■ Cada universidad es diferente, hay muchos factores que deben ser considerados (tamaño,
ubicación, tipo de universidad) para hacer comparaciones consistentes.

Universidad Pontificia de Comillas Escuela superior de Ingeniería
19 College campus buildings UW-Madison. Sustainability perspective.
Teresa Freire Barceló
■ El inventario de emisiones de GEI proporciona información más detallada que la huella
de carbono, ya que mantiene separadas la liberación de cada gas. Sin embargo, los
resultados de huella de carbono son más fáciles de interpretar, ya que sólo utiliza 𝐶𝑂2𝑒.
■ Invertir en equipos más ecológicos de HVAC puede ahorrar mucho dinero, ya que en los
edificios de Estados Unidos de media representa el 48% de las emisiones.
■ Una propuesta que puede ayudar a reducir fácilmente las emisiones de GEI es obligando
a que todos los edificios residenciales recopilen la información sobre su consumo de
energía eléctrica y de calefacción.
Más del 25 por ciento de los costos anuales de energía de Madison (3,6$ Millones sobre
casi 14$ millones de dólares) se gastan en edificios e instalaciones de energía (Eric Anderson,
2012). Un hogar estadounidense promedio gasta más de 2000$ al año en facturas de energía, de
donde la mayor parte corresponde al gasto destinado a calefacción y refrigeración (EPA, Green
building, 2016). La reducción del consumo de energía en los edificios favorecería al medio
ambiente reduciendo las emisiones de GEI, ayudando a su vez a la población de Madison a
ahorrar dinero. (Eric Anderson, 2012)
En 1990 los edificios de UW-Madison utilizaron 995,299 termas (1 EEUU therm= 29
kWh) de gas natural y 15,986,473 kWh de electricidad por un coste total de aproximadamente
1,3$ millones. Se han aplicado algunas mejoras a los edificios del campus de UW-Madison
mejorando los sistemas de aislamiento, como volver a techar, modernizando las puertas,
reemplazando ventanas, etc. El ahorro de energía una vez aplicadas estas medidas aun no ha sido
documentado. Los gastos, sin embargo, se sabe que han estado entre 300.000$ a 500.000$, y los
ahorros anuales de estas medidas se estiman en 40.000$ / año. (Somers, 2002)
Ninguna de las políticas consideradas en este informe resultará, por sí sola, en
reducciones de emisiones de GEI en una escala lo suficientemente grande como para alcanzar el
objetivo propuesto para Madison de reducir en un 80% las emisiones de GEI para el año 2050.
(Lydersen, 2016) . Sin embargo, si gradualmente contribuimos a implementar medidas para
mejorar la situación, los resultados serán apreciados considerablemente. Grandes cantidades de
dinero hace falta invertir para lograr estos objetivos. Por lo tanto, además de considerar la
eficacia de algunas de las alternativas de reducción de GEI disponibles, se debe considerar el
impacto económico.

Universidad Pontificia de Comillas Escuela superior de Ingeniería
20 College campus buildings UW-Madison. Sustainability perspective.
Teresa Freire Barceló

Universidad Pontificia de Comillas Escuela superior de Ingeniería
21 College campus buildings UW-Madison. Sustainability perspective.
Teresa Freire Barceló
Author: Teresa Freire Barceló
Supervisor: Andrea Hicks
Madrid, June 2017
COLLEGE CAMPUS
BUILDINGS UW-MADISON
SUSTAINABILITY PERSPECTIVE

Universidad Pontificia de Comillas Escuela superior de Ingeniería
22 College campus buildings UW-Madison. Sustainability perspective.
Teresa Freire Barceló

Universidad Pontificia de Comillas Escuela superior de Ingeniería
23 College campus buildings UW-Madison. Sustainability perspective.
Teresa Freire Barceló
Table of Contents
Introduction ...........................................................................................................25
Global overview .................................................................................................25
Background on different university campus ......................................................26
LEED Certification ............................................................................................40
UW-Madison concern ........................................................................................44
Objective ............................................................................................................46
Methods .................................................................................................................49
Greenhouse Gas (GHG) Emissions Inventory: 3 Scope system .......................49
Campus carbon footprint (CFP) ........................................................................52
EPA GHG Standards .........................................................................................54
Results ...................................................................................................................57
Conclusions ...........................................................................................................67
Recommendations .................................................................................................73
Data contacts .........................................................................................................81
Bibliography ..........................................................................................................83

Universidad Pontificia de Comillas Escuela superior de Ingeniería
24 College campus buildings UW-Madison. Sustainability perspective.
Teresa Freire Barceló

Universidad Pontificia de Comillas Escuela superior de Ingeniería
25 College campus buildings UW-Madison. Sustainability perspective.
Teresa Freire Barceló
Introduction
Global overview
Since 1880 until 2015 the average temperatures in USA have follow a steady uptick
significant and is expected to continue if action is not taken to greatly reduce greenhouse gas
emissions (Hasen, 2006).
The World Meteorological Organization’s (WMO) is working on this issue by reporting
annually in the ‘Greenhouse Gas Bulletin’ the atmospheric concentrations of greenhouse gases.
Emissions represent what goes into the atmosphere. Concentrations represent what remains in
the atmosphere after the complex system of interactions between the atmosphere, biosphere,
cryosphere and the oceans. About a quarter of the total emissions are taken up by the oceans and
another quarter by the biosphere, reducing the amount of CO2 in the atmosphere.
Thus, due to Greenhouse Gas (GHG) emissions there is a change in the energy present in
the atmosphere called, Radiative Forcing (RF). The three major greenhouse gases that take part
in the radiative forcing changes are, 𝐶𝑂2, 𝐶𝐻4 𝑎𝑛𝑑 𝑁2𝑂 and their presence have tend to increase
during the past 31 years. According to the Greenhouse Gas Bulletin in 2015 (World
Meteorological Organization, 2016), Carbon dioxide (𝐶𝑂2) accounted for about 65% of
radiative forcing by long-lived GHG. Methane (𝐶𝐻4 ) contributes to about 17% of radiative
forcing. Nitrous oxide ( 𝑁2𝑂 ) accounts for about 6% of radiative forcing by long-lived
greenhouse gases. Lastly, the other long-lived GHG such as Ozone-depleting
chlorofluorocarbons (CFCs), together with minor halogenated gases, contribute about 12% to
radiative forcing by long-lived greenhouse gases. (Theis&Cynthia Klein-Banai and Thomas L.,
2011)
Buildings in the United States comprise the 40% of energy consumption and likewise
carbon emissions. This means that some measures related with buildings should be considered.
As a considerable amount of square feet in USA is referred to college, this is going to be the
main concern of the project. The U.S. Environmental Protection Agency reported that: The
Energy Department estimates that colleges and universities spend around $6 billion annually on

Universidad Pontificia de Comillas Escuela superior de Ingeniería
26 College campus buildings UW-Madison. Sustainability perspective.
Teresa Freire Barceló
energy. For the Madison area, colleges and universities represent a big range of building types
including office, classroom, residential, laboratory, health care, and leisure or sporting buildings.
Background on different university campus
1- Campus Ecological Footprint Analysis (EFA) to Campus Carbon Footprint (CCF)
Since the 1960s, people on college and university campuses have made great strides
toward making their campuses “greener” places. (Venetoulis, 2001) Consequently, in some
campus areas more trees have been planted, a higher percentage of waste is being recycled or
composted, energy is being conserved, there has been a decline in the use of some toxic products,
and other applications are still being developed. For instance, the University of Redlands,
California USA (Venetoulis, 2001) and Southeastern Louisiana University (Caprice Lee, 2017)
have as a goal to reduce the negative impact their campuses have on the environment and
working towards to reduce their dependence of the grid using renewable technologies.
An ecological footprint is the area of productive land and water required for a given
population to maintain their consumption and absorb the ensuing waste over the course of one
year at prevailing levels of technology. This definition was given by the University of Redlands,
California. (Venetoulis, 2001). Another way to explain it would be that the EFA is a metric that
measures how much nature we have and how much nature we use. Deepening, it measures the
ecological assets that a given population requires to produce the natural resources it consumes
and to absorb its waste, especially carbon emissions (Network, 2017).
The Environmental Studies Department of Redlands University worked out on a project
using the uncompleted worksheet seen in Appendix A. The ecological footprint analysis starts
with the observation that within a given period of time all consumption of energy and materials,
and all discharge of wastes, require a finite amount of land and water area for resource
production and waste absorption. Building upon previous studies, Wackernagel led a team in
1997 and again in 1999, of researchers that estimated the amount of ecologically productive land
available and consumed in 52 countries and “the rest of the world”. This approach (Venetoulis,
2001) held that consumption of ecologically productive land across most countries is above
renewable rates and globally there is “consumption gap”, which means that what it’s been

Universidad Pontificia de Comillas Escuela superior de Ingeniería
27 College campus buildings UW-Madison. Sustainability perspective.
Teresa Freire Barceló
consumed is more than what the renewable services can provide over the course of a year
(indefinitely).
After conducting a EFA for Vancouver (Canada), another EFA for 29 of the largest cities
of the Baltic region of Europe, also for the five-county Los Angeles metropolitan area and for
southern California, Venetoulis, it’s been revealed that the stock of nature's capital is being used
up to fill the “consumption gap”. If this persists long time, the consequences would involve a
decrease in the population carrying capacity. Improvements in technology should be studied
because there is high probability that they could rectify this situation. (Venetoulis, 2001)
The University of Redlands has used a different method to pursue the campus ecological
footprint analysis. This method takes into account, the ecological impacts associated with water
(hydroprint), solid waste (wasteprint), energy (energyprint), and transportation (transportprint).
It should be noticed that the method considers the biggest ecological impacts, including
hydroprint, wasteprint, energyprint, and transportprint. However, they are not explained in detail
and do not provide a comprehensive estimate for all the potentially relevant as they are
simplified to make it easier for data collection. Although the point remains, the findings
presented in this paper only reflect part of the University's total ecological impact. As it can be
expected, even this partial ecological footprint has important sustainability implications and
encourage us to apply new methods to improve the current situation.
Once understood the EFA concept, it should be taken a step forward and explain the
campus carbon footprint concept which is widely used. The CCF refers to the land area required
to assimilate the entire CO2 produced by the mankind during its lifetime. The way of calculating
it, requires almost the same data depending on the accuracy of the calculation. The results are
also area units (square feet). An advantage of using CCF above EFA is that CO2 emission are a
more representative and easier to interpret units than waste quantities. CCF is a quantitative
expression of GHG emissions from an activity and can help in emission management and
evaluation of mitigation measures. The following table present the total equivalent CO2
emissions (which accounts also for other GHG gasses besides CO2) of some universities around
the world:
Universidad Pontificia de Comillas Escuela superior de Ingeniería
28 College campus buildings UW-Madison. Sustainability perspective.
Teresa Freire Barceló
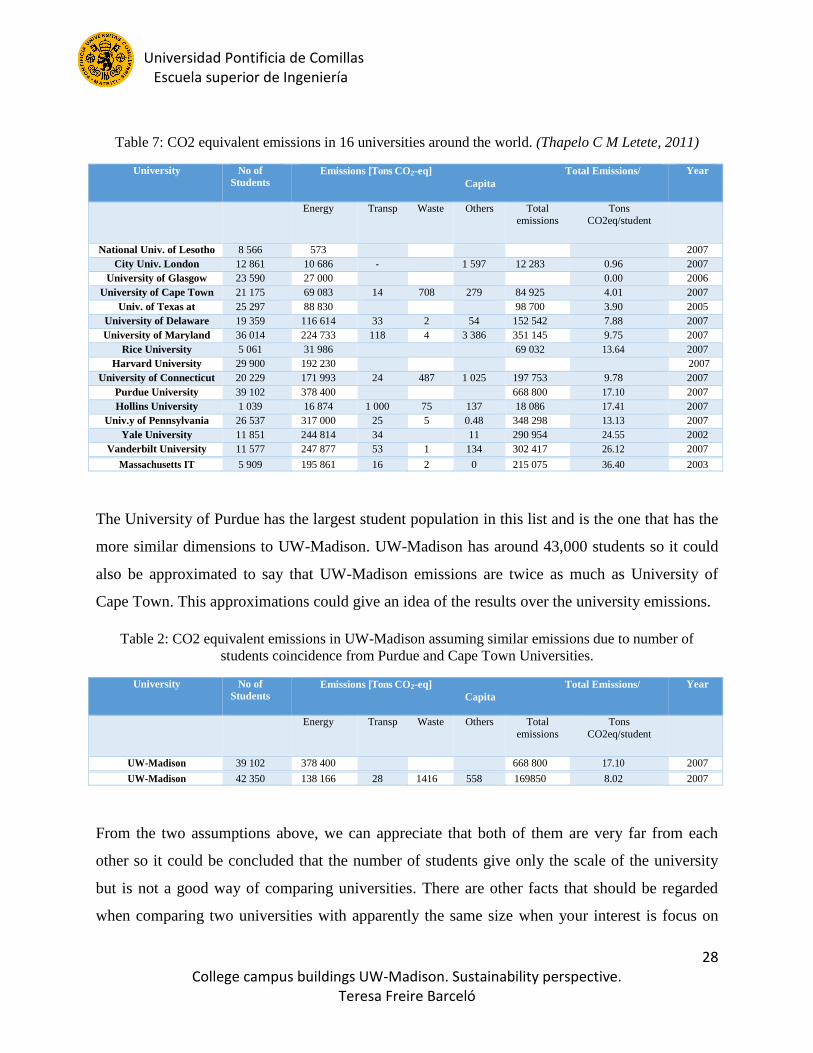
Table 7: CO2 equivalent emissions in 16 universities around the world. (Thapelo C M Letete, 2011)
University No of
Students Emissions [Tons CO2-eq] Total Emissions/
Capita Year
Energy Transp Waste Others Total emissions
Tons CO2eq/student
National Univ. of Lesotho 8 566 573 2007
City Univ. London 12 861 10 686 - 1 597 12 283 0.96 2007
University of Glasgow 23 590 27 000 0.00 2006
University of Cape Town 21 175 69 083 14 855
708 279 84 925 4.01 2007
Univ. of Texas at
Arlington
25 297 88 830 98 700 3.90 2005
University of Delaware 19 359 116 614 33 336
2 538
54 152 542 7.88 2007
University of Maryland 36 014 224 733 118 466
4 560
3 386 351 145 9.75 2007
Rice University 5 061 31 986 69 032 13.64 2007
Harvard University 29 900 192 230 2007
University of Connecticut 20 229 171 993 24 248
487 1 025 197 753 9.78 2007
Purdue University 39 102 378 400 668 800 17.10 2007
Hollins University 1 039 16 874 1 000 75 137 18 086 17.41 2007
Univ.y of Pennsylvania 26 537 317 000 25 548
5 750
0.48 348 298 13.13 2007
Yale University 11 851 244 814 34 904
11 236
290 954 24.55 2002
Vanderbilt University 11 577 247 877 53 308
1 098
134 302 417 26.12 2007
Massachusetts IT 5 909 195 861 16 407
2 807
0 215 075 36.40 2003
The University of Purdue has the largest student population in this list and is the one that has the
more similar dimensions to UW-Madison. UW-Madison has around 43,000 students so it could
also be approximated to say that UW-Madison emissions are twice as much as University of
Cape Town. This approximations could give an idea of the results over the university emissions.
Table 2: CO2 equivalent emissions in UW-Madison assuming similar emissions due to number of
students coincidence from Purdue and Cape Town Universities.
University No of
Students Emissions [Tons CO2-eq] Total Emissions/
Capita Year
Energy Transp Waste Others Total
emissions
Tons
CO2eq/student
UW-Madison 39 102 378 400 668 800 17.10 2007
UW-Madison 42 350 138 166 28 1416 558 169850 8.02 2007
From the two assumptions above, we can appreciate that both of them are very far from each
other so it could be concluded that the number of students give only the scale of the university
but is not a good way of comparing universities. There are other facts that should be regarded
when comparing two universities with apparently the same size when your interest is focus on

Universidad Pontificia de Comillas Escuela superior de Ingeniería
29 College campus buildings UW-Madison. Sustainability perspective.
Teresa Freire Barceló
the emissions. For instance, if the courses that the particular university offers require labs or not
as if not the university is less environmentally intensive. Moreover, if the university offers many
online courses or not. Besides, the quality of the university and the modernity of it, which would
include more technology devices, installed therefore more emissions.
2- Previous studies
i. Australian National University (ANU)
The Australian National University (ANU) affirms that education for sustainable
development (ESD) should pursue an integrative approach in modelling sustainability in the core
functions and systems of the university. Some universities are beginning to attempt to model
what a sustainable system might look like. (Dyball, 2009) As institutions, which prepare future
leaders, it is imperative that they demonstrate environmentally responsible action. A number of
higher education institutions have taken steps to integrate sustainability into the university
community by signing the Talloires Declaration, which is a 10-point action plan for
incorporating sustainability into the institution. A whole-of-university approach addresses the
Talloires commitments to sustainability by explicitly linking research, educational and
operational activities. (Dyball, 2009) It can be assumed that a university operates with the
complexity of a mini-city, and all its interdependent parts must be considered if it is to develop in
a sustainable manner. This approach seeks to break down currently existing barriers between
functional units of the institution. For example, the university structure may not allow for
research-led teaching or an education linked to campus operations. Campus operations and
facilities management are generally viewed as an independent part of the university and as
having little relevance to curriculum or research. A whole-of-university approach, however,
recognizes that all functions of the institution can benefit from sharing knowledge and that each
influences the student learning experience.
ANUgreen is the Sustainability Office of the Facilities and Services Division of the
university. (Dyball, 2009) This office demonstrates that campus operations and management can
play a vital role in increasing students’ awareness and understanding of sustainability. The ANU
is building a whole-systems educational program that links the principles of sustainability being
taught in the classroom with the principles of sustainability being implemented on the campus. A

Universidad Pontificia de Comillas Escuela superior de Ingeniería
30 College campus buildings UW-Madison. Sustainability perspective.
Teresa Freire Barceló
good example of linking curriculum, research and operations at the ANU involves the
university’s 12-month trial of an in-vessel organic waste composting unit. Operationally, this
trial seeks to divert from landfill 90 per cent of the organic waste on campus, including food
waste from residence halls and campus cafes. On the curriculum front, students are analyzing the
emissions offset by diverting this waste stream from landfill. In research, both students and
academics are looking at the microbial communities in the compost to enhance understanding of
the composting process and to improve the process itself. The convergence of education,
research and operations in this trial shows an important link between the everyday practice of
food consumption and actions that both the individual and the institution can take to achieve
positive outcomes. Given the complex nature of sustainability issues, it is imperative that
institutions of higher education pursue an integrative approach in modelling sustainability in
their core functions and systems. A whole-of-university approach to sustainability ensures that
core functions such as management and operations, which have traditionally been viewed as
providing only logistical support to the academic mission of the institution, become an
intentional part of the curriculum. (Dyball, 2009)
ii. Delft University of Technology (TU Delft), Netherlands.
The Delft University of technology divide the Campus management in four different
perspectives. This division could help other universities such as UW-Madison to arrange their
management to leave space for the environmental concern. The four perspectives are:
The Strategic side use is related to competitive advantage of the management team.
The financial statement is directly related to the profitability of the campus management.
The physical area involves the sustainable development, which is our main concern.
The functional part is the result of the campus management team productivity when
dealing with operations.

Universidad Pontificia de Comillas Escuela superior de Ingeniería
31 College campus buildings UW-Madison. Sustainability perspective.
Teresa Freire Barceló
Figure 1: The 4 perspectives of campus management. (Heijer, 2012)
iii. The University of Illinois in Chicago UIC
The University of Illinois in Chicago (UIC) prepared a GHG inventory for fiscal years 2004–
2008. UIC conducted a survey to obtain data regarding the commuting habits of its faculty, staff,
and students. In the year 2008, UIC’s carbon footprint was 275,000 metric tons of CO2
equivalent which is not significantly higher than the 2004 emissions that were 273,000 metric
tons of carbon dioxide equivalents. The percentage of the three main sources of emissions were
buildings, commuting and waste as shown in the figure:
Campus management
STRATEGIC: Goals to support, quality
ambitious.
FINANCIAL: Costs,
Benefits, Value
PHYSICAL: m2, condition,
location, quality.
FUNCTIONEEL: users satisfaction, mix of functions/
spaces
83%
16%1%
EMISSIONS UIC
buildings commuting waste
Figure 2 GHG Emissions 2008 data. (Cynthia
Klein-Banai&Thomas L. Theis, 2010)
Universidad Pontificia de Comillas Escuela superior de Ingeniería
32 College campus buildings UW-Madison. Sustainability perspective.
Teresa Freire Barceló
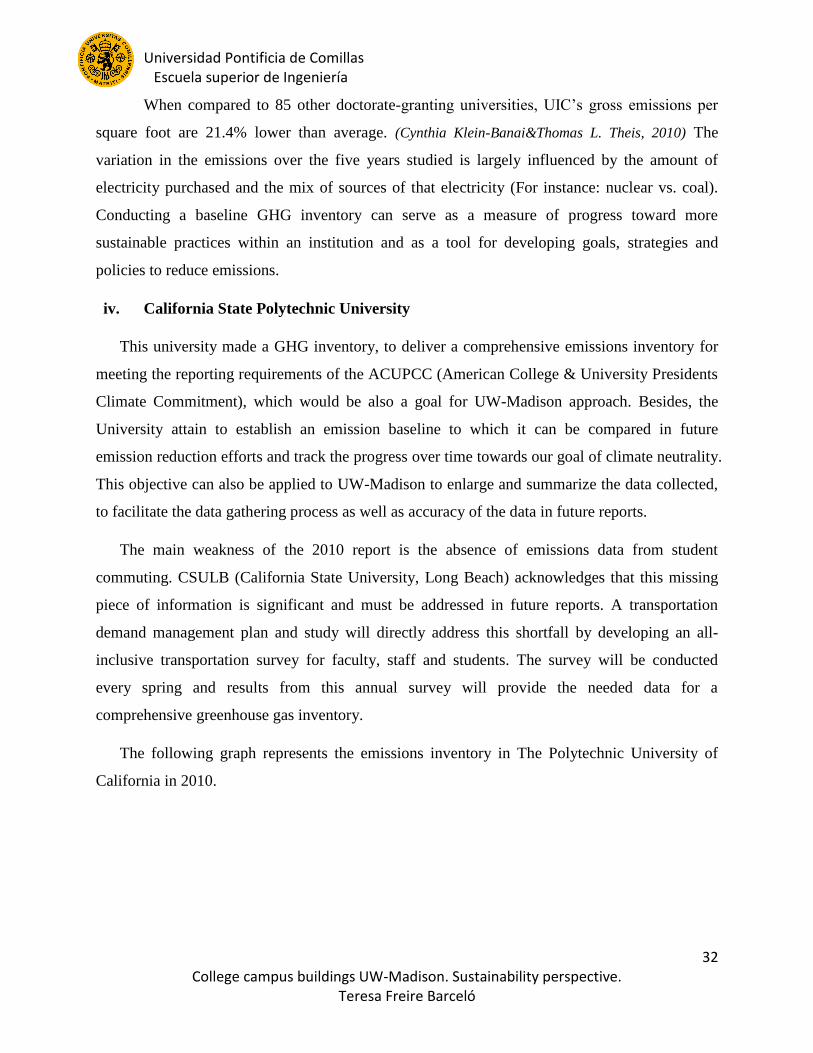
When compared to 85 other doctorate-granting universities, UIC’s gross emissions per
square foot are 21.4% lower than average. (Cynthia Klein-Banai&Thomas L. Theis, 2010) The
variation in the emissions over the five years studied is largely influenced by the amount of
electricity purchased and the mix of sources of that electricity (For instance: nuclear vs. coal).
Conducting a baseline GHG inventory can serve as a measure of progress toward more
sustainable practices within an institution and as a tool for developing goals, strategies and
policies to reduce emissions.
iv. California State Polytechnic University
This university made a GHG inventory, to deliver a comprehensive emissions inventory for
meeting the reporting requirements of the ACUPCC (American College & University Presidents
Climate Commitment), which would be also a goal for UW-Madison approach. Besides, the
University attain to establish an emission baseline to which it can be compared in future
emission reduction efforts and track the progress over time towards our goal of climate neutrality.
This objective can also be applied to UW-Madison to enlarge and summarize the data collected,
to facilitate the data gathering process as well as accuracy of the data in future reports.
The main weakness of the 2010 report is the absence of emissions data from student
commuting. CSULB (California State University, Long Beach) acknowledges that this missing
piece of information is significant and must be addressed in future reports. A transportation
demand management plan and study will directly address this shortfall by developing an all-
inclusive transportation survey for faculty, staff and students. The survey will be conducted
every spring and results from this annual survey will provide the needed data for a
comprehensive greenhouse gas inventory.
The following graph represents the emissions inventory in The Polytechnic University of
California in 2010.

Universidad Pontificia de Comillas Escuela superior de Ingeniería
33 College campus buildings UW-Madison. Sustainability perspective.
Teresa Freire Barceló
Figure 3 GHG Emissions in 2010 in CSULB (Paul Wingco, 2013)
Total 2010 GHG Emissions 29516 (In Metric Tons of equivalent CO2).
(Paul Wingco, 2013)
v. College of Charleston
The College of Charleston emitted a combined total of 67,812 Metric tons CO2e (carbon
dioxide equivalent) in 2011. This represents a footprint in the higher range for similarly sized
liberal arts & sciences institutions. (P. Brian Fisher Ph.D., Spring 2012). Relative to other
schools of higher education, the College has emissions directly owned by the College comprise
9.7% of our footprint, while emissions indirectly controlled by the College such as energy
production, comprise 52.2%, finally emissions affiliated with the College’s operations such as
travel and commuting, represent 38.1% of the footprint.
Energy represents the largest component of the College’s footprint, comprising 61% of total
emissions. Transportation comprises 28% of total emissions, with almost 17% of total emissions
from commuting and 11.5% from College-supported air travel. The remaining 3.6% consists of
various wastes generated by the College.
20,5%
1,3%
4,6%
45,2%
19,1%
4,3%5,0%
GHG emissions percentages
Stationary Combustion Fleet Fuels
Fugitive Emissions Purchased Electricity
Faculty/Staff Commuting Air Travel
Solid Waste

Universidad Pontificia de Comillas Escuela superior de Ingeniería
34 College campus buildings UW-Madison. Sustainability perspective.
Teresa Freire Barceló
The current footprint suggests focus on energy and transportation, but future projections of
CofC’s (College of Charleston) footprint suggest that total emissions will more than double by
the year 2050 with the majority of those emissions coming from energy usage. This suggests that
reducing our footprint should focus on building efficiency, energy infrastructure and use, and
finding ways to create more cost effectiveness for our energy trajectory. Therefore, measures
should be taken also in UW-Madison to prevent 2050 forecasts. Hence, some energy efficiency
recommendations will be made at the end of the report.
(P. Brian Fisher Ph.D., Spring 2012)
vi. Drexel University
Drexel University, as many others, in 2009 elected to perform a Greenhouse Gas Inventory.
The purpose of this Inventory was to benchmark the University’s greenhouse gas emissions and
to provide a consistent methodology for inventorying its emissions on an annual basis, from then
on. A Greenhouse Gas Inventory is necessary to set the most appropriate and efficient steps to
reduce the institution’s carbon footprint and potentially achieve carbon neutrality, so in this
matter it is going to be performed for UW-Madison.
The total greenhouse gas emissions for Drexel University for fiscal year 2008 are 41,369
Metric tons eCO2 for the University City Main Campus. This equates to:
Either, 3.30 Metric tons of eCO2 per full time equivalent student primarily
enrolled at the University City Main Campus (12,529 students).
Or, 12.5 Metric tons of eCO2 per 1,000 square feet.
Drexel’s greenhouse gas emissions are due to:
• 739 Metric tons of eCO2 from 23,671 gallons of gasoline and 30,129 gallons of diesel
fuel of University Fleet usage
• 33,068 Metric tons of eCO2 from 57,352 MWh of Electricity purchased.
• 5,792 Metric tons of eCO2 from 81,037 thousand pounds of Steam purchased.
• 1,770 Metric tons of eCO2 from 318,998 hundred cubic feet of Natural Gas and Oil
used onsite. (Ms Barbara A.W. Clarke, 2009)

Universidad Pontificia de Comillas Escuela superior de Ingeniería
35 College campus buildings UW-Madison. Sustainability perspective.
Teresa Freire Barceló
The relation (percentage) between the different main components that contribute to the
greenhouse gases releases is very similar for all the university campus inventories, so it can be a
benchmark to assess the overall amount of emissions considered in this project, as it is only
going to consider the UW-Madison Campus buildings neglecting the transport emissions for
instance.
vii. Pennsylvania State University
Pennsylvania State University is a public institution that was founded in 1855. It has a total
undergraduate enrollment of 40,742, its setting is city, similar to UW-Madison conditions with
the fact that UW has 43,192 students. Penn campus size is 8,556 acres 9 times bigger than UW
Campus. (Pennsylvania State University, n.d.)
Penn State as UW-Madison, is working on different measures to reduce its greenhouse gas
emissions by 35% (from its 2005 peak) by 2020. It has an even more ambitious target of an 85%
reduction by 2050. UW has a similar target of reducing its carbon emissions by 80 percent by
2050.
The majority of Penn State’s emissions come from energy production and consumption.
Through 2020, emissions will come from the production of purchased electricity and from the
operation of the steam plants. Another large contributor to emissions would be commuter traffic.
Most of the University’s reductions have come from some strategies, with 56% coming
through its Energy Program. The University has already dropped its energy usage, despite the
fact that during that same time the University added more than 1 million square feet of building
space.
An investment of almost $75M over a 10 year period in energy conservation initiatives
ranging from tuning up existing buildings to optimize their performance, installing HVAC
upgrades, updating temperature controls, retrofitting lighting fixtures, installing occupancy
sensors, and improving building envelopes. These investments in energy efficiency will continue
over the next three decades, as will the deployment of a targeted renewable energy sources.

Universidad Pontificia de Comillas Escuela superior de Ingeniería
36 College campus buildings UW-Madison. Sustainability perspective.
Teresa Freire Barceló
Aerospace technology it’s been adapted as a way of creating steam and generating electricity,
helping in this way to reduce energy consumption. A Combustion Turbine and Heat Recovery
Steam Generator was installed in the East Campus Steam Plant improving the efficiency of the
steam system, and reducing our emissions drastically.
Conversion from coal to natural gas has increased the reduction of the energy required. Three
coal-fired boilers have been replaced by two, new, high-capacity, gas-fired boilers. The switch
from coal to natural gas and upgrades to both East and West Campus Steam Plants will improve
on Penn State’s already highly efficient District Energy System. In 2011 PSU’s system operated
at 72%. At the time the project will be completed, the system will operate at 80%.
In addition to providing sustainable energy, the partnership offers exciting educational
opportunities for students. Interns from engineering and environmental science are involved in
areas such as design, management practices, power generation, economics, and environmental
impact. The project currently supports five interns each year.
In order to influence behavior, the University adopted an Energy Conservation Policy
designed to lower energy consumption through employee and student action. This policy
establishes guidelines and practices for lighting use, interior space temperature setpoints,
computer power management, and the use of office equipment, appliances, and fume hoods. (The
Pennsylvania State University, 2015). This policy would be recommendable for UW to apply it
as well. (AASHE, n.d.)
viii. University of Maryland
University of Maryland President Mote signed the American College and University
Presidents Climate Commitment in 2007, which is a pledge to reduce campus GHG emissions
and achieve carbon neutrality. Neutrality is defined as the process of reducing and offsetting
carbon producing operations that makes the campus net carbon emissions equal to zero.
The University’s GHG emissions ranged from a high of 376,670 metric tons of CO2e in
2003 to a low of just under 352,000 metric tones of CO2e in 2007. The latter amount is

Universidad Pontificia de Comillas Escuela superior de Ingeniería
37 College campus buildings UW-Madison. Sustainability perspective.
Teresa Freire Barceló
equivalent to the GHGs emitted by 60,000 cars or sequestered by 105,000 acres of Maryland
forest in a year. (David Tilley, 2007)
Figure 4 Total University greenhouse gas emissions (FY 2002-2007) associated with energy use,
agriculture, solid waste and refrigerant releases. (David Tilley, 2007)
The inventory demonstrated that the major sources of GHG emissions were from the
electricity (40%) and steam produced by the campus co-generation plant (23%), purchased
electricity and transportation including daily commuting of the campus community, air travel
and the University fleet (34%). In 2007, these sources accounted for 97% of the campus GHG
emissions. Other emissions from small stationary sources, solid waste, refrigerant releases and
agricultural operations together account for only 3% of total GHG emissions in 2007. (David
Tilley, 2007)
3- Solutions to Implement due to background researches.
As not for-profit institutions, higher education has not been driven by the same lean
operating principles as business and industry. Lean management is an approach to running an
organization that supports the concept of continuous improvement, a long-term approach to work
that systematically seeks to achieve small, incremental changes in processes in order to improve
efficiency and quality. (Rouse, n.d.) Four things that have been applied in some higher education
335000
340000
345000
350000
355000
360000
365000
370000
375000
380000
2002 2003 2004 2005 2006 2007
eCO
2 (
Met
ric
To
nes
)
Year
UM Carbon Footprint

Universidad Pontificia de Comillas Escuela superior de Ingeniería
38 College campus buildings UW-Madison. Sustainability perspective.
Teresa Freire Barceló
institutions due to Lean Management are: 1) led efforts to reduce confusion and rework by
simplifying the school’s programs and requirements; 2) conducted seminars for faculty on Lean
management and important tools such as root cause analysis; 3) applied Lean principles and
practices to the particular courses taught; and 4) gained the participation of faculty, staff, alumni,
and senior managers to improve a graduate M.S. in management degree program using kaizen (a
Japanese business philosophy of continuous improvement of working practices, personal
efficiency, etc.) . (Bob Emilani, 2005) Yet, higher education typically owns, operate and
maintain their facilities for decades, if not centuries. Academic institutions have recognized that
they are well prepared to take on a leadership role in fighting climate change due to their role in
educating future generations of leaders. (Georges Dyer and Jennifer Andrews, 2014) This
responsibility extends to the institution’s own greenhouse gas emission reductions, energy and
water conservation, and other sustainability initiative. It’s considered a sustainable university a
higher educational institution, that addresses, involves and promotes, the decrease of negative
environmental, economic, societal, and health impacts produced while using the necessary
resources in order to fulfill the teaching, research, outreach and partnership functions, besides
stewardship in ways to help society to change their habits to more sustainable lifestyles. Using a
whole systems approach to the greening of the campus bridges academic content, administrative
policies, and facilities management practices and enables campus wide opportunities for
education for sustainability. Further, we can learn from what other universities are doing around
the world to solve these global issues. Reducing greenhouse gas emissions to combat climate
change is one way to minimize environmental impact. To begin with, the average consumption
per student should decrease. The following table shows the CO2 emissions per student in the
seven universities reviewed in the previous section.
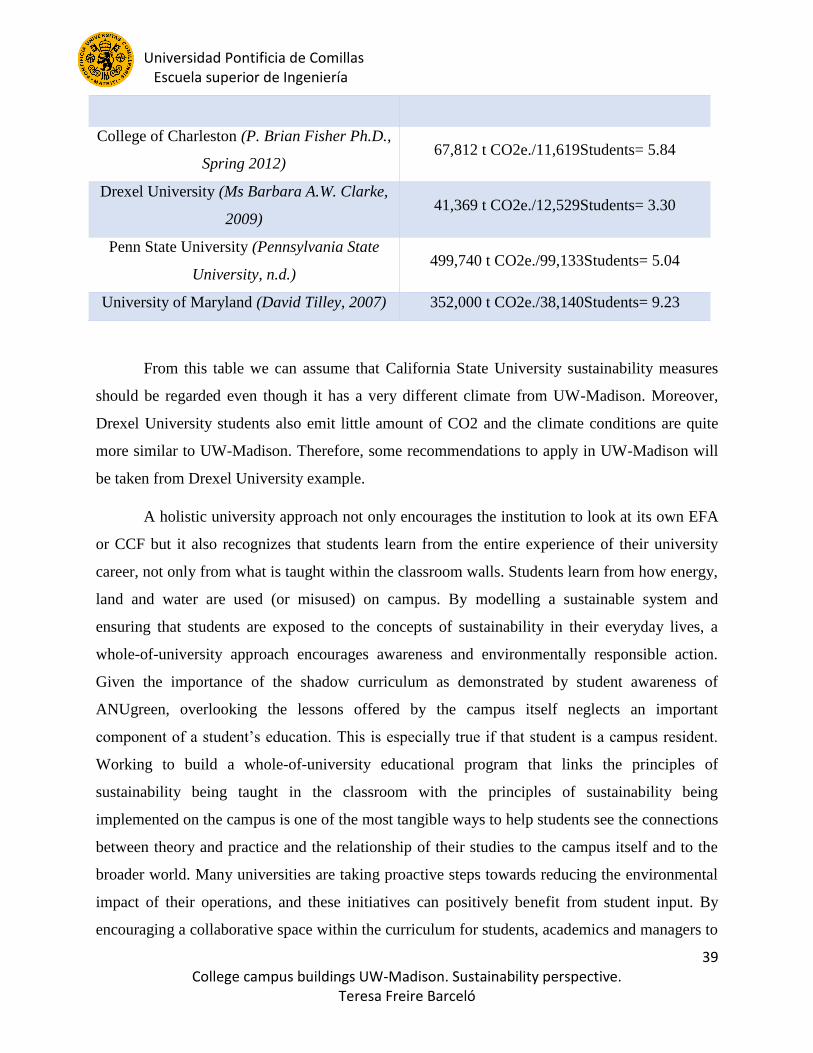
Table 3. Summary from the universities students CO2 emissions.
University Emissions per student (t CO2e/Student)
ANU (Phelps, 2009) 110,450 t CO2e. /21,113Students= 5.23
UIC (Cynthia Klein-Banai&Thomas L. Theis,
2010) 275,000 t CO2e. /29,048Students= 9.47
California State Polytechnic University (Paul
Wingco, 2013) 29,516 t CO2e. /20,944Students= 1.41
Universidad Pontificia de Comillas Escuela superior de Ingeniería
39 College campus buildings UW-Madison. Sustainability perspective.
Teresa Freire Barceló
College of Charleston (P. Brian Fisher Ph.D.,
Spring 2012) 67,812 t CO2e./11,619Students= 5.84
Drexel University (Ms Barbara A.W. Clarke,
2009) 41,369 t CO2e./12,529Students= 3.30
Penn State University (Pennsylvania State
University, n.d.) 499,740 t CO2e./99,133Students= 5.04
University of Maryland (David Tilley, 2007) 352,000 t CO2e./38,140Students= 9.23
From this table we can assume that California State University sustainability measures
should be regarded even though it has a very different climate from UW-Madison. Moreover,
Drexel University students also emit little amount of CO2 and the climate conditions are quite
more similar to UW-Madison. Therefore, some recommendations to apply in UW-Madison will
be taken from Drexel University example.
A holistic university approach not only encourages the institution to look at its own EFA
or CCF but it also recognizes that students learn from the entire experience of their university
career, not only from what is taught within the classroom walls. Students learn from how energy,
land and water are used (or misused) on campus. By modelling a sustainable system and
ensuring that students are exposed to the concepts of sustainability in their everyday lives, a
whole-of-university approach encourages awareness and environmentally responsible action.
Given the importance of the shadow curriculum as demonstrated by student awareness of
ANUgreen, overlooking the lessons offered by the campus itself neglects an important
component of a student’s education. This is especially true if that student is a campus resident.
Working to build a whole-of-university educational program that links the principles of
sustainability being taught in the classroom with the principles of sustainability being
implemented on the campus is one of the most tangible ways to help students see the connections
between theory and practice and the relationship of their studies to the campus itself and to the
broader world. Many universities are taking proactive steps towards reducing the environmental
impact of their operations, and these initiatives can positively benefit from student input. By
encouraging a collaborative space within the curriculum for students, academics and managers to

Universidad Pontificia de Comillas Escuela superior de Ingeniería
40 College campus buildings UW-Madison. Sustainability perspective.
Teresa Freire Barceló
critically reflect on university performance with regard to sustainability, many positive benefits
can ensue including improvement in campus environmental performance and building the
capacity of students to become agents of change.
Ultimately, it should be taken into consideration what a previous research on higher
education found out. The study proved that distance learning High Education (HE) courses
involve 87% less energy and 85% lower CO2 emissions than the full-time campus-based courses.
Part-time campus HE courses reduce energy and CO2 emissions by 65% and 61% respectively
compared to full-time campus courses. The research confirmed that the lower impacts of part-
time and distance compared to full-time campus courses is mainly due to a reduction in student
travel and elimination of much energy consumption of students’ housing, plus economies in
campus site utilization. On the other side, E-learning according to the research seems to offer
only relatively small energy and emissions reductions (20% and 12% respectively) compared to
mainly print-based distance learning courses, the reason is because online learning requires more
energy for computing and paper for printing (Roy & Potter, 2008). This approach could open the
door to new GHG emissions reduction methods rarely regarded.
LEED Certification
Leadership in Energy and Environmental Design (LEED) is an internationally
recognized green building certification system created by the U.S. Green Building Council.
(Sustainability at American Colleges and Universities, n.d.) The first prominent “sustainability”
programs at colleges and universities focused on recycling of wastes such as paper, glass, and
plastics. Recently attention to sustainability started encompassing the overall and perhaps greater
impact that higher education plays in preparing future generations to address the impacts of
human life on the planet.
Colleges and university new facilities are constructed to meet green building standards,
and the administrators are developing green purchasing policies. Programs that promote public
transit, carpooling, and bicycling are found on many campuses (Cynthia Klein-Banai&Thomas L.
Theis, 2010). UW-Madison is committed to renovating and constructing buildings that aid in the
success of its students and staff, and are sustainable for the years to come. In order to benchmark
these practices, campus is pursuing a minimum of LEED Silver certification on most of its new

Universidad Pontificia de Comillas Escuela superior de Ingeniería
41 College campus buildings UW-Madison. Sustainability perspective.
Teresa Freire Barceló
Figure 5 LEED Certified Projects (University of Wisconsin-Madison, 2017)
and renovated facilities. In LEED certification, an effort is made to pursue points which have a
strong return on investment (University of Wisconsin-Madison, 2017). This initiative along with
others, will gradually transform UW-Madison's campus to meet the needs of development today,
without compromising the needs of future generations.
LEED Certified Projects
Table 4 LEED Certified Projects (University of Wisconsin-Madison, 2017)
Building LEED Certification Type
UW Medical Foundation
Centennial Building Gold School
Education Building Platinum School
Wisconsin Institutes for
Discovery Gold Lab
Union South Gold Leisure
Nancy Nicholas Hall Gold School
Student Athlete Performance
Center - McClain Center Silver Sport
LaBahn Arena Silver Sport
Wisconsin Energy Institute Gold School
Lakeshore Residence Hall
Phase II Gold Dwelling
Signe Skott Cooper Hall Silver School
Student Athlete Performance
Center - Camp Randall North
Addition
Silver Sport
Platinum
Gold
Silver

Universidad Pontificia de Comillas Escuela superior de Ingeniería
42 College campus buildings UW-Madison. Sustainability perspective.
Teresa Freire Barceló
It is remarkable the platinum project, which renovated nearly 71,000 GSF in the existing
Education building including a 37,000 GSF replacement and a four story addition. This project
also included the reconstruction of the rear north facade.
In June of 2011, The Education Building received LEED Platinum Certification and
became an Energy Star rated building. This was the second building on the UW-Madison
campus to achieve LEED Certification. LEED New Construction (version 2.2) was the
rating system pursued for this renovation and addition and earned a total of 52 points.
77% of the core and shell of the previous Education Building were reused in the
construction of the new building.
The grand staircase and casework, including 40 doors from the original structure,
were refurbished and restored for the new Education Building.
The Education Building has a green roof which helps reduce the quantity and rate of
storm water runoff.
The Education Building is the first State-owned Energy Star-rated building in Wisconsin.
Approximately 85% of the new wood content is Forest Stewardship Council (FSC)
certified wood – which means the wood comes from a forest being managed in an
environmentally responsible manner.
During demolition and construction approximately 75% of non-hazardous materials were
recycled and salvaged.
Occupant controls for lighting and thermal comfort are located throughout the building so
that occupants can control the settings for personal comfort while remaining as energy
efficient as possible.
Potable water consumption was reduced by 99.5% compared to a baseline building
through the use of native plants, green roofs & harvesting rain water.
Having green & reflective roofs along with underground parking helps reduce heat island
effect by creating surfaces that do not readily absorb heat

Universidad Pontificia de Comillas Escuela superior de Ingeniería
43 College campus buildings UW-Madison. Sustainability perspective.
Teresa Freire Barceló
Compared to a baseline building, the Education Building uses 40% less water through
many water-reduction strategies and conservation fixtures.
Over 1500 buses stop each week day withing a quarter mile of the building and 318
bicycle stalls are located within 200 yards of the building providing easy commuter
access.
Currently Tracking LEED Certification
Table 5 Currently Tracking LEED Certification (University of Wisconsin-Madison, 2017)
Building LEED Certification Type
Charter Street Heating Plant
Upgrades Gold Power plant
Memorial Union
Reinvestment Phases I Silver Offices
School of Music Silver School
Wisconsin Institutes for
Medical Research Phase II Silver Lab
Figure 6 Currently Tracking LEED Certification (University of Wisconsin-Madison, 2017)
To explain the way these buildings work to implant measures to be more environmentally
friendly it will be given the details of the gold tracking project. The campus Charter Street
Heating Plant delivers heating and cooling to the campus. The project to track the gold
certification includes providing a new water treatment system and mechanical, electrical and
control system replacement and the following upgrades:
There are four bus stops within a quarter mile of the building for public transportation.

Universidad Pontificia de Comillas Escuela superior de Ingeniería
44 College campus buildings UW-Madison. Sustainability perspective.
Teresa Freire Barceló
All plants and grass surrounding this site require no irrigation.
Currently 80% of the construction waste has been diverted from the landfill.
70% of wood products are derived from sustainable forestry practices as certified by the
Forest Stewardship Council (FSC).
Low-emitting paints, sealants, adhesives, carpets and furnishings were used throughout
this building to protect indoor air quality.
No smoking is allowed around the building which also protects the indoor air quality.
UW-Madison concern
The University of Wisconsin–Madison is a public research university in Madison,
Wisconsin, United States. It was first created when Wisconsin achieved statehood in 1848, UW–
Madison is the official state university of Wisconsin, and the flagship campus of the University
of Wisconsin System. It was the first public university established in Wisconsin and remains the
oldest and largest public university in the state. It became a land-grant institution in 1866. The
933-acre main campus includes four National Historic Landmarks including The Wisconsin
State Capitol. (Academic Planning and Institutional, 2015)
UW–Madison is organized into 20 schools and colleges, which enrolled 29,302
undergraduates, 9,445 graduate, and 2,459 professional students and granted 6,659 bachelors’,
3,493 graduate and professional degrees in 2013–2014. The University employs over 21,796
faculty and staff. Its comprehensive academic program offers 136 undergraduate majors, along
with 148 master's degree programs and 120 doctoral programs. (Academic Planning and
Institutional, 2015)
The UW is one of America's Public Ivy universities, which refers to top public
universities in the United States capable of providing a collegiate experience comparable with
the Ivy League. UW–Madison has also a very high research activity in the Carnegie
Classification of Institutions of Higher Education. In 2012, it had research expenditures of more
than $1.1 billion, the third highest among universities in the country. Wisconsin is a founding
member of the Association of American Universities. (Britt, 2013)
Universidad Pontificia de Comillas Escuela superior de Ingeniería
45 College campus buildings UW-Madison. Sustainability perspective.
Teresa Freire Barceló
UW-Madison campus consists of approximately 250 different buildings. (Somers, 2002)
For this project 219 have been found, however power plants are not going to be considered as
buildings for our concern and neither two buildings which are considered as part of the
university but they are not on the campus area. Hence, in the end 215 buildings are going to be
studied. (University of Wisconsin-Madison, n.d.). The buildings operate in different manners
depending on their use. Therefore, each building is going to be classified within a category. The
different categories are:
Dwelling buildings, Offices, School buildings (which are compound of labs, classrooms and
offices), Schools without a lab, Laboratories, Retail, Restaurant, Sport building, Service(Garage,
Police Station…), Historic, Leisure, Library, Greenhouse, Power plant and Hospital.
This classification is based on a particular criteria that differentiates enough all the
different buildings that integrate the UW-Madison Campus according to the energy consumption
of each of it. The procedure on the selection of the most appropriate category for each building is
looking what kind of building it is and what are its uses. Then a decision will be made over its
category.
Each category require a different amount of energy per square foot as the utilities that the
building require and the usage that will be given to them are very different from one to the other
(e.g. The sports building over a Lab). This amount of energy per sq. ft. will be calculated with
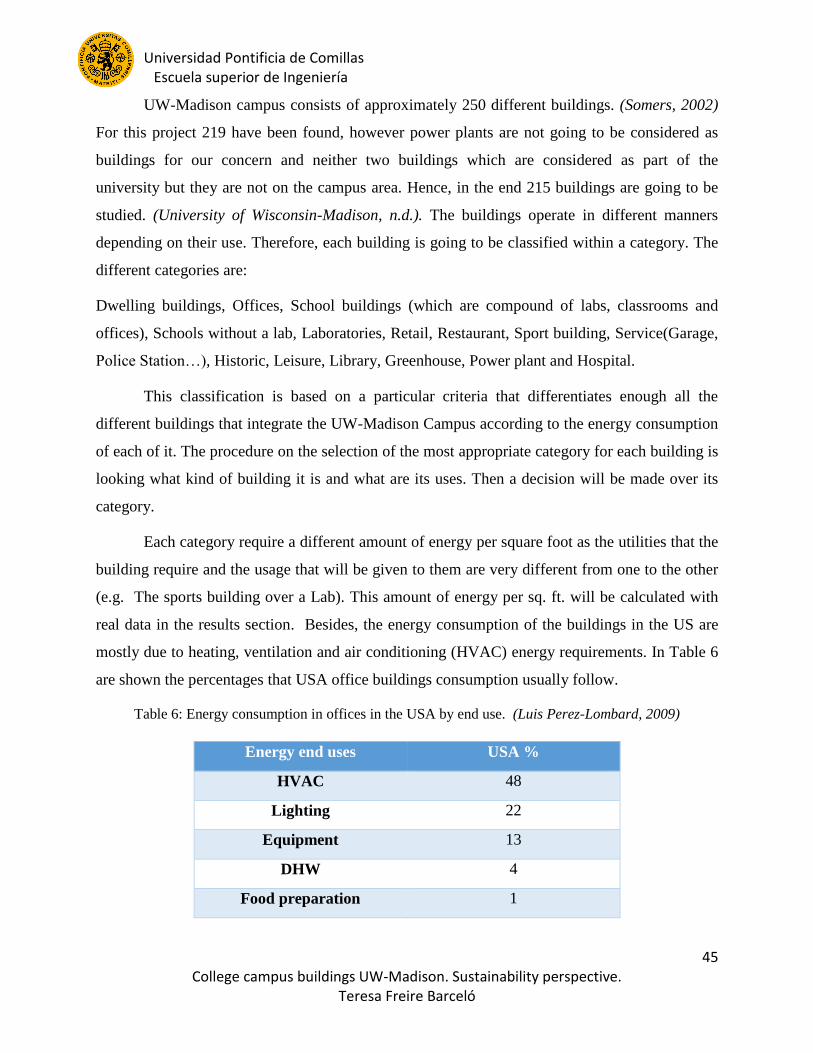
real data in the results section. Besides, the energy consumption of the buildings in the US are
mostly due to heating, ventilation and air conditioning (HVAC) energy requirements. In Table 6
are shown the percentages that USA office buildings consumption usually follow.
Table 6: Energy consumption in offices in the USA by end use. (Luis Perez-Lombard, 2009)
Energy end uses USA %
HVAC 48
Lighting 22
Equipment 13
DHW 4
Food preparation 1

Universidad Pontificia de Comillas Escuela superior de Ingeniería
46 College campus buildings UW-Madison. Sustainability perspective.
Teresa Freire Barceló
Refrigeration 3
Others 10
These data could help to make a decision over future considerations of investing in better
equipment for the different building energy uses. It can be concluded from table 4 that investing
in a more environmentally friendly HVAC equipment would considerably reduce the energy
consumption thus reducing CO2 emissions. On the other side, investing in a better cooking
system wouldn’t have a significant impact on the energy consumed.
Objective
The project will assess all UW-Madison on-campus buildings GHG emissions, and focus
on the 3 main gases that have the higher impact, 𝐶𝑂2, 𝐶𝐻4and 𝑁2𝑂. Moreover, this project will
provide recommendations and ideas on how to reduce its GHG emissions in order to reach a
better LEED certification in the future constructed buildings.
First, previous research about other concerned universities with the sustainable issue have
been done. In addition, it has been payed more attention to the ones that have counted its GHG
emissions somehow. With this information, the scope of the project it’s been defined and the
attention has focused on the universities which have similar dimensions to UW-Madison to find
some relevant data.
Secondly, the recruited data has been used to conduct a GHG emissions inventory of the
UW-Madison campus. Since, it is not easy to find these data, different methods that could be
applied are defined in case of sufficient data provided. EPA standards method will be applied to
analyze the 𝐶𝑂2, 𝐶𝐻4and 𝑁2𝑂 releases by the campus buildings. These releases are mainly, due
to HVAC and electricity requirements. It has been chosen this method thankful to the available
data. On the other hand, water, food, transportation around the campus and hazardous waste
won't be considered as there is not available such detailed information.
Thirdly, some proposals are made to decrease the on-campus GHG emissions regarding
each particular type of buildings. Consequently, LEED certification would take part at the end of

Universidad Pontificia de Comillas Escuela superior de Ingeniería
47 College campus buildings UW-Madison. Sustainability perspective.
Teresa Freire Barceló
the project as a target for the new constructed buildings or the renovating of the already existing
ones to take these proposals into account to reach LEED certification standards.
Consequently, this report aims to encourage the students and policymakers of UW-
Madison make better informed decisions regarding energy use and policy. This would come up
with a mitigation of the effects of climate change. None of the policy options considered in this
report will, on their own, result in GHG emissions reductions on a scale large enough to achieve
the Madison city's stated goal of an 80 percent reduction in GHG emissions by the year 2050.
(Lydersen, 2016). However, if gradually we contribute to implement measures to improve the
situation, the outcomes will be considerably appreciated. Furthermore, big amount of money
will likely be necessary to achieve these goals. Therefore, in addition to considering the efficacy
of a few of the many GHG reduction alternatives available, the economic impact should be taken
into account in future studies.

Universidad Pontificia de Comillas Escuela superior de Ingeniería
48 College campus buildings UW-Madison. Sustainability perspective.
Teresa Freire Barceló

Universidad Pontificia de Comillas Escuela superior de Ingeniería
49 College campus buildings UW-Madison. Sustainability perspective.
Teresa Freire Barceló
Methods
Greenhouse Gas (GHG) Emissions Inventory: 3 Scope system
First of all, to understand what a GHG emissions inventory is, the life cycle assessment
(LCA) concept should be explained. LCA is a technique to assess environmental impacts
associated with all the stages of a product's life from cradle to grave (i.e., from raw material
extraction through materials processing, manufacture, distribution, use, repair and maintenance,
and disposal or recycling) (ISO 14040, 2006). A GHG emissions inventory is a type of LCA that
represents the environmental impact of several types of activities that are typically seen as targets
for sustainability initiatives. In particular, this time the assessed product is going to be the
campus buildings. It is going to be taken into account the energy used for heating, cooling and
electricity. GHG inventories have some limitations as they do not account for hazardous waste
disposal, air pollutants, water usage, or wastewater and storm water generation. A GHG
emissions inventory allows to examine differences between energy sources, but major limitations
of the approach are that other types of emissions, embodied energy, and material wastes
associated with electricity generation are not. Although they do not account for all environmental
impacts, they use a relatively simple, standardized methodology that is becoming a common
measure of environmental impact and sustainability used by hundreds of universities across
North America such as, California State Polytechnic University, Pomona, College of Charleston,
University of New Hampshire and Washington University in St. Louis. (Campus Ghg
Inventories, n.d.)
The basis for a climate action plan is a GHG inventory. The generally accepted
methodology for conducting an inventory is based on the Greenhouse Gas Protocol developed by
World Business Council for Sustainable Development and the World Resource Institute
(WBCSD/WRI, 2001). Conducting a baseline GHG inventory can serve as a measure of progress
toward more sustainable practices within an institution and as a tool for developing goals,
strategies and policies to reduce emissions. Like many local governments around the country, the
City of Madison is trying to reduce its emissions of heat-trapping greenhouse gases (GHG) such
as carbon dioxide. (Lydersen, 2016) The university tries to accomplish the plan of reducing its

Universidad Pontificia de Comillas Escuela superior de Ingeniería
50 College campus buildings UW-Madison. Sustainability perspective.
Teresa Freire Barceló
carbon emissions by 80 percent by 2050, by reducing overall energy consumption by half by
2030, and get a quarter of its electricity, heating and transportation energy from clean sources by
2025.
These small-scale efforts can combine to have profound impacts. Through proactive
measures around land use patterns, transportation demand management, energy efficiency, green
building, waste diversion and more, local governments can lead the way to emissions reductions
throughout the United States. To achieve that goal, the city of Madison partnered with the
University of Wisconsin–Madison in 2010 to produce its first-ever emissions inventory. At the
beginning of the process of inventorying emissions increased the city’s efforts toward reducing
GHG emissions. The city cataloged all energy use and resultant GHG emissions attributable to
government operations.
A few years later when it was time to update that inventory with 2014 data, the UW–
Madison graduate students team from the Nelson Institute for Environmental Studies, were
pursuing an Energy Analysis and Policy (EAP) certificate in the spring of 2015. The outcomes
verify that buildings are a major cause of GHG emissions as shown in figure 6 (Carl
Christiansen, 2015).
Figure 7. 2014 City of Madison greenhouse gas emissions by government activity sector in tons of carbon
dioxide equivalents (1,000 tons of carbon dioxide equivalent) (Carl Christiansen, 2015).
26
15
15
13
11
5
5
0,49,6
Buildings and facilities
Water delivery facilities
Transit fleet
solid waste facilities
Vehicle fleet
Streetlights and traffic signals
Employee commute
Employee waste
Others

Universidad Pontificia de Comillas Escuela superior de Ingeniería
51 College campus buildings UW-Madison. Sustainability perspective.
Teresa Freire Barceló
On the other hand, when conducting an inventory, it is necessary to determine which
sources the GHG emissions are attributed to as a way to prevent counting emissions twice. It will
be explained a way of conducting a GHG inventory based on a set of accounting standards that
classify the scope of the emissions based on the source. The classification also intends to help
organizations categorize GHG into those that they control (e.g. Scope 1) versus those that they
can influence (e.g. Scope 3). These standards provide concepts and systems that guarantee
transparency, accuracy, and standardization for carbon management. These protocols are used by
the majority of reporting institutions worldwide. (Steve Boles, 2016) The three scopes are
defined as follows:
• Scope 1 includes GHG emissions from direct sources owned or controlled by the
institution—production of electricity, heat or steam, transportation or materials, products, waste,
and fugitive emissions. (Steve Boles, 2016)
i. Stationary Combustion: from the combustion of fossil fuels (e.g. natural gas, fuel oil,
propane, etc.) for comfort heating or other industrial applications
ii. Mobile Combustion: from the combustion of fossil fuels (e.g. gasoline, diesel) used in the
operation of vehicles or other forms of mobile transportation
iii. Process Emissions: emissions released during the manufacturing process in specific
industry sectors (e.g. cement, iron and steel, ammonia)
iv. Fugitive Emissions: unintentional release of GHG from sources including refrigerant
systems and natural gas distribution
For the majority of organizations, the stationary and mobile combustion sources of Scope 1 GHG
will be the most relevant. (Steve Boles, 2016)
• Scope 2: are also referred to as Energy Indirect GHG. This scope includes GHG
emissions from purchases of electricity, heat, or steam. (Importations)
• Scope 3 includes other indirect sources of GHG emissions that may result from the
activities of the institution but occur from sources owned or controlled by another entity, such as:
business travel, outsourced activities and contracts, emissions from waste generated by the
institution when the GHG emissions occur at a facility controlled by another company (e.g.,

Universidad Pontificia de Comillas Escuela superior de Ingeniería
52 College campus buildings UW-Madison. Sustainability perspective.
Teresa Freire Barceló
methane emissions from landfill waste), and the commuting habits of community members.
Based on data from many companies that have conducted comprehensive assessments of their
Scope 3 emissions, it is evident that Scope 3 GHG are by far the largest component of most
organizations’ carbon footprint.
The goal of using this method is to calculate emissions from all three scopes. Even
though it is a very complete method that encompass energy emissions in detail from the all three
scopes, to perform it in a good manner also requires a lot of detailed information which it hasn’t
been possible to achieve. Hence, this method is not going to be applied to UW-Madison. On the
other hand, two more methods are going to be explained and only the EPA eGRID table method
would be applied in this project.
Campus carbon footprint (CFP)
The main difference between carbon footprint and GHG inventory is that CFP is the
total set of greenhouse gas emissions caused by an individual, event, organization or product
expressed as CO2e. While the GHG inventory
reflects all the different gases separately.
(Carbon trust, n.d.). The UW-Madison students
analyzed emission trends for specific energy
sectors. Afterwards, they proposed policy tools
for reducing Madison’s carbon emissions. They
identified transportation as a problem sector
that accounts for 41% of CO2e. emissions. This
carbon footprint can be reduced by increasing
the use of public transportation to commute to
work. The traffic congestion during daily rush
hours causes significant emission spikes, and as
transportation is considered beyond the scope
of the project, we will focus on the second and
third main factors: commercial stores on campus 30% (retail buildings) and residential buildings
on campus (dwelling type) which account for 17% of the total GHG emissions. (Schmidt, 2015)
30%
17%
10%
41%
1%1%
CO2e. emissions trends
Commercial
Residential
Industrial
Transportation
Waste
Water &wastewater
Figure 8, 2014 Madison’s percentage of GHG
consumption sectors . (Schmidt, 2015)

Universidad Pontificia de Comillas Escuela superior de Ingeniería
53 College campus buildings UW-Madison. Sustainability perspective.
Teresa Freire Barceló
The aim of this project is UW-Madison emissions, therefore it should be regarded a very
useful tool founded called: Campus Carbon Calculator . (Campus Carbon Calculator, n.d.) It’s
interesting because the name of the tool is exactly what we are looking for in this project. To
operate the tool, the following major emissions sources data should be included: on-campus
energy production; purchased electricity; natural gas service to buildings for laboratories and
cooking; transportation (including air travel and commuting); waste; paper; agriculture; and
refrigerants. Campus Carbon Calculator also includes the six GHGs defined by the Kyoto
Protocol (carbon dioxide, methane, nitrous oxide, sulfur hexafluoride, hydrofluorocarbons, and
perfluorocarbons). Each gas, based on its atmospheric chemistry, captures different amounts of
reflected heat, thus contributing differently to the greenhouse effect, which is known as its global
warming potential (GWP).Thus collaborating with different rates into the Carbon Footprint.
(Cynthia Klein-Banai&Thomas L. Theis, 2010)
The Campus Carbon Calculator calculates emissions using this formula:
A x Fg = Eg
Where A is the quantification of an activity in units that can be combined with emission
factor of GHG g (Fg) to obtain the resulting emissions for that gas (Eg).
Total GHG emissions can be expressed as the sum of the emissions for each gas
multiplied by its GWP. GHG emissions are reported here in metric tons of carbon dioxide
equivalents (metric tons CO2e).
GHG =∑g Eg x GWPg
The 2012 carbon inventory provides estimations of the GHG mitigate impact of a few
policy alternatives which only two of them are from this research concern. The increase in
electricity production from solar panels and the electricity use reduction through building
efficiency benchmarking. Over the solutions proposed, these alternatives were chosen based on
the availability of evidence regarding their potential impact, the scale of that potential impact,
and the political feasibility of their implementation in the Madison context. The analysis made
used a new software capable of forecasting GHG emissions under various scenarios, therefore
this it’s been considered as a potential tool for the project performance. However, the quantity

Universidad Pontificia de Comillas Escuela superior de Ingeniería
54 College campus buildings UW-Madison. Sustainability perspective.
Teresa Freire Barceló
and variety of multiple scenarios and different possible actions are beyond the boundaries of this
project. (Adam Anderson, 2014)
EPA GHG Standards
The last method that it’s going to be considered in this project is calculating the GHG
UW-Madison emissions using the Environmental Policy Agency (EPA) standards. (US
Environmental Protection Agency, 2012). With the little amount of data collected it would be the
most appropriate approach to develop the total GHG emissions. It would be taken
into account only CO2, CH4and N2O of the UW-Madison campus for this project.
First of all, some assumptions should be made in order to be able to use the EPA
eGRID2012 standards provided. (US Environmental Protection Agency, 2012). These standards
provide with the 3 mentioned above gases releases (in lb.) over the power consumed (MWh or
GWh) depending on the USA area. MROE is the area that corresponds with Madison. Each type
of building would be considered to have a different power consumption as depending on the kind
of building and the usage that is given to them. The power required to operate would be different
(e.g. Laboratories are going to consume much more than classrooms). These assumptions would
be made according to reliable data.

Universidad Pontificia de Comillas Escuela superior de Ingeniería
55 College campus buildings UW-Madison. Sustainability perspective.
Teresa Freire Barceló
Table 7 EPA data for GHG emissions over the different USA subregions. (EPA government, n.d.)
The founded data is from California State therefore CAMX is also highlighted as it corresponds
with California data and will be used for future calculations.

Universidad Pontificia de Comillas Escuela superior de Ingeniería
56 College campus buildings UW-Madison. Sustainability perspective.
Teresa Freire Barceló
Figure 9: Map of eGRID Subregions (EPA government, n.d.)
Since is a very simplified approach to the GHG Madison campus releases, thus the
method does not take into account: the campus fleet energy use, the commuting habits,
refrigerant use, air travel, and waste disposal. For this reason, it will be easier to get results using
this method.

Universidad Pontificia de Comillas Escuela superior de Ingeniería
57 College campus buildings UW-Madison. Sustainability perspective.
Teresa Freire Barceló
Results
For each building category, it is going to be assumed a different energy consumption. The
main aim is to calculate the KWh/SF for each category. The categories are compound of
subcategories that altogether weighed depending on the percentage of the building considered of
this subcategory it can be obtained the category power consumption per square foot. These
percentages have been based on self-criteria after deepen in the buildings usage. The categories
and subcategories are related as follows:
School: 29%Office, 40%Classroom 30%Lab, 1%Cafeteria.
*School(without Lab): 39%Offices, 60%Classroom, 1%Cafeteria.
Offices: 100%Offices.
Offices&Lab: 50% Offices, 50% Lab.
Dweling: 85%Rooms, 15%Kitchens.
Restaurant: 20%Kitchen, 80%Living room.
Lab: 100% Lab.
Hospital: Surgery rooms/Patient Rooms/Offices.
Hospital/Lab: 80%Hospital, 20% Lab.
Leisure: 75%Living rooms for events, 10%Cafe, 15%Offices.
Sport: Can be dry, Combined (with pool), Ice rink for hokey.
Library: 60%Living rooms 40%Computer labs.
Greenhouse: 100% Plantation.
Service: Police/Boat/Garage
Power Plant: 100% Machinery and Labs.
Retail: 100%Store.
Historic: 100%Space.
Thus the subcategories are:
Office, Classroom, Lab/Computer Lab, Cafe/Kitchen, Living Room/Room/Patient room/Sports
room/Space, Surgery room, Sport Dry, Sport Combination, Sport ice rink, Plantation, Store.
First, it has been found data from The University of California-Irvine for the Hospital, Office
building and College energy ratios. These three categories are three of the main categories and
hence, they are going to be explained in detail.

Universidad Pontificia de Comillas Escuela superior de Ingeniería
58 College campus buildings UW-Madison. Sustainability perspective.
Teresa Freire Barceló
HOSPITAL
In the US, there are about 22,000 in-patient health care buildings, and around 16,400 outpatient
buildings. The average hospital size is about 74,600 square feet and all in-patient health care
buildings account for 1.6 billion square feet, which is about 3% of all commercial floor space in
the U.S.
Health care buildings account for 11 percent of all commercial energy consumption, using a total
of 561 trillion Btu of combined site electricity 38%, natural gas 46%, fuel oil 21%, and district
steam or hot water 13%. They are the fourth highest consumer of total energy of all the building
types. Using the above data it is going to be calculated the energy ratio for hospital buildings
category:
561 𝑡𝑟𝑖𝑙𝑙𝑖𝑜𝑛𝐵𝑡𝑢
(22000 + 16400)𝑏𝑢𝑖𝑙𝑑𝑖𝑛𝑔𝑠= 1.46 ∗ 1010𝐵𝑡𝑢/𝑏𝑢𝑖𝑙𝑑𝑖𝑛𝑔
1.46 ∗1010𝐵𝑡𝑢
𝑏𝑢𝑖𝑙𝑑𝑖𝑛𝑔∗
1𝐾𝑊ℎ
3412.14𝐵𝑡𝑢∗
1𝑏𝑢𝑖𝑙𝑑𝑖𝑛𝑔
74600𝑆𝐹= 57.357
𝐾𝑊ℎ
𝑆𝐹 𝑝𝑒𝑟 𝑦𝑒𝑎𝑟
The average end use of these energy sources in U.S. hospitals it is shown in the figure below:
Figure 10: Health care buildings percentage of energy end use. (University of California, 2007)
12%
33%
18%
10%
27%
HEALTH CARE BUILDINGS ENERGY USE
Other Lighting Office Equipment Water Heating Space Heating

Universidad Pontificia de Comillas Escuela superior de Ingeniería
59 College campus buildings UW-Madison. Sustainability perspective.
Teresa Freire Barceló
The cost intensity for typical hospitals in California is more than twice as high as that for office
buildings. Typical average electricity demands for hospitals are in the range 100 kW-5 MW.
OFFICE BUILDINGS
Although office buildings represent the second largest amount of buildings and floor space, they
account for 19% of all commercial energy consumption due to the big amount of buildings of
this type.
They use a total of 1.0 quadrillion Btu of combined site electricity 66%, natural gas 23%, fuel oil
3%, and district steam or hot water 7%.
The average office building is 14,900 square feet and office buildings represent 18 percent of the
total commercial floor space in the US. Which is 87 billion SF (CBECS, 2015)
87𝑏𝑖𝑙𝑙𝑖𝑜𝑛 𝑆𝐹 ∗ 18%
14900= 1051007 𝑏𝑢𝑖𝑙𝑑𝑖𝑛𝑔𝑠
1015𝐵𝑡𝑢
1051007 𝑏𝑢𝑖𝑙𝑑𝑖𝑛𝑔𝑠∗
0.000293071𝐾𝑊ℎ
1𝐵𝑡𝑢
1𝑏𝑢𝑖𝑙𝑑𝑖𝑛𝑔
14900𝑆𝐹= 18.72
𝐾𝑊ℎ
𝑆𝐹 𝑝𝑒𝑟 𝑦𝑒𝑎𝑟
Figure 11: Office buildings percentage of energy end use. (University of California, 2007)
11%
30%
16%
9%
25%
9%
OFFICE BUILDINGS ENERGY USE
Other Lighting Office Equipment
Water Heating Space Heating Space cooling

Universidad Pontificia de Comillas Escuela superior de Ingeniería
60 College campus buildings UW-Madison. Sustainability perspective.
Teresa Freire Barceló
SCHOOL WITHOUT A LAB
Education buildings are the fifth most prevalent commercial building type in the U.S., with
approximately 309,000 buildings. This category is considered as school without a lab. They are,
on average, the largest commercial buildings, with 25,100 square feet per building, and they
account for 13% of all commercial floor space.
Each building consume a total of 0.19 Gigawatt hours of energy per year. The distribution of
energy sources accounts for 36% of electricity, 40% of Natural Gas, 15% of district Heat and 9%
for Fuel oil. From the data above it is obtained the KWh/SF per year of this category of buildings.
0.19𝐺𝑊ℎ
25100𝑆𝐹= 7.57
𝐾𝑊ℎ
𝑆𝐹𝑝𝑒𝑟 𝑦𝑒𝑎𝑟
Education buildings are on average less energy intensive than office buildings.
The average end use of these energy sources in U.S. education buildings can be classified as
follows:
Figure 12: College buildings percentage of energy end use. (University of California, 2007)
Before converting these numbers into 𝐶𝑂2, 𝐶𝐻4 𝑜𝑟 𝑁2𝑂emissions, the origin of these data should
be regarded. As the data from the building categories above is from California State, it is
necessary to add a conversion factor that would improve the quality of our results converting the
17%
45%
24%
14%
UNIVERSITY BUILDING ENERGY USE
Other Lighting Office Equipment Water Heating

Universidad Pontificia de Comillas Escuela superior de Ingeniería
61 College campus buildings UW-Madison. Sustainability perspective.
Teresa Freire Barceló
values obtained from California to Wisconsin State. The argument that is going to be use is the
following:
𝑆𝐹𝐵𝑢𝑖𝑙𝑑𝑖𝑛𝑔 ∗𝑀𝑊ℎ𝐶𝑎𝑙𝑖𝑓𝑜𝑟𝑛𝑖𝑎
𝑆𝐹∗ (
𝑙𝑏𝐶𝑂2
𝑀𝑊ℎ)𝐶𝑎𝑙𝑖𝑓𝑜𝑟𝑛𝑖𝑎 ∗
𝑙𝑏𝐶𝑂2𝑀𝑎𝑑𝑖𝑠𝑜𝑛
𝑙𝑏𝐶𝑂2𝐶𝑎𝑙𝑖𝑓𝑜𝑟𝑛𝑖𝑎
= 𝑙𝑏𝐶𝑂2𝑀𝑎𝑑𝑖𝑠𝑜𝑛
California stands for the CAMX EPA egrid region.
The conversion factor will be calculated for each gas as follows:
𝑙𝑏𝐶𝑂2𝑀𝑎𝑑𝑖𝑠𝑜𝑛
𝑙𝑏𝐶𝑂2𝐶𝑎𝑙𝑖𝑓𝑜𝑟𝑛𝑖𝑎
Table 8 Conversion factor required for Hospital, School (without a lab) and offices data. (EPA
government, n.d.)
Gas Conversion factor from California data
to Wisconsin
𝑪𝑶𝟐 0.36
𝑪𝑯𝟒 0.74
𝑵𝟐𝑶 0.88
𝑪𝑶𝟐𝒆 0.365
SPORT BUILDINGS
Sport buildings Energy Consumption converted into KWh/SF:
Table 9 Energy ratio for sport building types (Best Practice Programme, n.d.)
Description kWh/m^2 per year kWh/SF per year
Local dry sports center 448 41.62
Combined center 750 69.68
Ice rink
472 (Remarkable
+electricity than Heating
Fuel then + expensive)
43.85

Universidad Pontificia de Comillas Escuela superior de Ingeniería
62 College campus buildings UW-Madison. Sustainability perspective.
Teresa Freire Barceló
LABORATORIES
Laboratories in the U.S. are energy-intensive facilities that use anywhere from 30 to 100
kilowatt-hours (kWh) of electricity and 75,000 to 800,000 Btu of natural gas per square foot
annually. Actual use varies with such factors as the age of the facility, the type of research done
there, and the climate zone in which the lab is located. In a typical laboratory, lighting and space
heating account for approximately 74 percent of total energy use, making these systems the best
targets for energy savings. (Business Energy Advisor, Managing energy costs in Laboratories,
2016)
Laboratories typically consume 5 to 10 times more energy per square foot than the office
buildings do. For the regular college labs it is going to be assumed an approximation of 5 times
what the office buildings consume. (EPA, Laboratories for the 21st Century: An Introduction to
Low-Energy Design , 2008)
18.72𝐾𝑊ℎ
𝑆𝐹 𝑝𝑒𝑟 𝑦𝑒𝑎𝑟 ∗ 5 = 93.6
𝐾𝑊ℎ
𝑆𝐹
LIBRARY, RETAIL, HISTORIC, SERVICE (Such as Police station, Garage…),
RESTAURANT
Conversion from the founded data for these categories from KBTU/SF into KWh/SF:
Table 10: Collected data for some building categories and its energy ratio converted into KWh/SF. (US
Enegy use intensity by energy type, n.d.)
Category KBTU/SF KWh/SF
Dwelling 73.9 21.66
Restaurant 223.8 65.59
Hospital 196.9 57.36
Library 91.6 26.84
Service 88.3 25.88
Retail 47.1 13.8
Historic 45.3 13.27
Leisure 45.3 13.27
Once we have obtained most of the categories ratio, we proceed to calculate the rest with the
total percentage of each of them:

Universidad Pontificia de Comillas Escuela superior de Ingeniería
63 College campus buildings UW-Madison. Sustainability perspective.
Teresa Freire Barceló
SCHOOL:
From School without a lab it’s been obtained that classrooms and cafeterias consume a total of 3
KWh/SF then:
𝑆ℎ𝑜𝑜𝑙 = 0.29 ∗ 18.72 + 0.51 ∗ 3 + 0.2 ∗ 93.6 = 25.68 𝐾𝑊ℎ/𝑆𝐹
HOSPITAL/LAB
From both results, by applying the percentage of each of the two categories it is obtained the
following ratio:
𝐻𝑜𝑠𝑝𝑖𝑡𝑎𝑙&𝐿𝑎𝑏 = 0.8 ∗ 57.36 + 0.2 ∗ 131 = 72𝐾𝑊ℎ/𝑆𝐹
GREENHOUSE
For 10000SF greenhouse, it consumes 56000KWh per month, that means:
56000
10000∗ 12𝑚𝑜𝑛𝑡ℎ𝑠 = 67.2
𝐾𝑊ℎ
𝑆𝐹 𝑝𝑒𝑟 𝑦𝑒𝑎𝑟
(Michael Bomford, 2010)
The following table collects all the data calculated above:
Table 11. Categories and subcategories weighed with their corresponding energy ratio in KWh/SF
Category Subcategory KWh/SF
per year
School 29%Office 50%Classroom 20%lab
1%Cafeteria
25.68
*School(without
Lab)
29%Offices 70%Classroom 1%Cafeteria 7.57 California
Offices 100%Offices 18.72 California
Offices&Lab 50% each 56.16
Dweling 85%Rooms 15%Kitchens 21.66
Restaurant 20%Kitchen 80%Living room 65.59
Lab 100% lab 93.6
Hospital Surgery rooms/Patient Rooms/Offices 57.36 California
Hospital&Lab 80%Hospital 20% Lab 64.6

Universidad Pontificia de Comillas Escuela superior de Ingeniería
64 College campus buildings UW-Madison. Sustainability perspective.
Teresa Freire Barceló
Leisure 75%Living rooms for events 10%Cafe
15%Offices
13.27
Sport Can be dry, Combined(with pool), ice rink for
Hokey.
41.62 69.68 43.85
Library 60%living rooms 40%Computer labs 26.84
Greenhouse 100% Plantation 67.2
Service Police/Boat/Garage 25.88
Power Plant 100% Machinery and Labs
Retail Store 100% 13.8
Historic 100%Space 13.27
It is going to be applied a different equation for the categories which data is specifically obtained
from California, which are: schools without a lab, Schools, hospitals and offices including the
conversion factor from California to Madison:
𝑆𝐹𝐵𝑢𝑖𝑙𝑑𝑖𝑛𝑔 ∗𝑀𝑊ℎ𝐶𝑎𝑙𝑖𝑓𝑜𝑟𝑛𝑖𝑎
𝑆𝐹∗ (
𝑙𝑏𝐶𝑂2
𝑀𝑊ℎ)𝐶𝑎𝑙𝑖𝑓𝑜𝑟𝑛𝑖𝑎 ∗
𝑙𝑏𝐶𝑂2𝑀𝑎𝑑𝑖𝑠𝑜𝑛
𝑙𝑏𝐶𝑂2𝐶𝑎𝑙𝑖𝑓𝑜𝑟𝑛𝑖𝑎
= 𝑙𝑏𝐶𝑂2𝑀𝑎𝑑𝑖𝑠𝑜𝑛
For the other categories it will be applied the following equation:
𝑆𝐹𝐵𝑢𝑖𝑙𝑑𝑖𝑛𝑔 ∗𝑀𝑊ℎ𝑀𝑎𝑑𝑖𝑠𝑜𝑛
𝑆𝐹∗ (
𝑙𝑏𝐶𝑂2
𝑀𝑊ℎ)𝑀𝑎𝑑𝑖𝑠𝑜𝑛 = 𝑙𝑏𝐶𝑂2𝑀𝑎𝑑𝑖𝑠𝑜𝑛
In Appendix C it can be seen the results particularized for each building. The total amount of
gases in Kg of each gas per type of building in UW-Madison is shown in the following table:
Table 12 Total GHG emissions for each type of building.
Categories Kg of CO2 Kg of CH4 Kg of N2O Kg of CO2e
Dwelling 16,917,540 2,012,753 296,307 17,051,011
Greenhouse 1,747,236 207,876 30,602 1,761,021
Historic 334,163 39,757 5,853 336,799
Hospital 959,396 116,754 17,024 975,860
Hospital/Lab 37,890,426 4,507,989 663,643 38,189,364
Hospital/School 3,188,808 379,386 55,851 3,213,966
Lab 55,990,532 6,661,438 980,663 56,432,272
Leisure 5,509,875 655,534 96,504 5,553,346
Library 7,770,004 924,431 136,090 7,831,305
Office&Classrooms 60,895 7,245 1,067 61,375

Universidad Pontificia de Comillas Escuela superior de Ingeniería
65 College campus buildings UW-Madison. Sustainability perspective.
Teresa Freire Barceló
Offices 794,404 96,675 14,097 808,036
Offices&Lab 29,544,216 3,515,004 517,461 29,777,306
Restaurant 3,522,559 419,094 61,697 3,550,351
Retail 70,081 8,338 1,227 70,634
School 13,404,523 1,631,267 237,861 13,634,545
School&SportsDry 130,626 15,541 2,288 131,657
School(Without Lab) 365,665 44,500 6,489 371,940
Service 688,011 81,856 12,050 693,439
Service & Leisure 100,677 11,978 1,763 101,471
Service & Offices 976,772 116,211 17,108 984,479
Sport Combined 5,026,530 598,028 88,039 5,066,187
Sport Dry 11,849,368 1,409,771 207,539 11,942,854
Sport Ice rink 6,926,029 824,020 121,308 6,980,672
Grand Total 203,768,337 24,285,446 3,572,531 205,519,891
This table represents the total GHG emissions of UW-Madison due to buildings consumption.

Universidad Pontificia de Comillas Escuela superior de Ingeniería
66 College campus buildings UW-Madison. Sustainability perspective.
Teresa Freire Barceló

Universidad Pontificia de Comillas Escuela superior de Ingeniería
67 College campus buildings UW-Madison. Sustainability perspective.
Teresa Freire Barceló
Conclusions
The following conclusions have been drawn from above review:
As the results show, the highest gas release is of CO2, contributing to global warming.
Thus, there is a great need on developing measures to decrease CO2 emissions. Besides,
Methane(CH4) contribute 8 times more than Nitrous oxide(N2O) in terms of quantity.
However, the global warming potential is different for these three gases. According to
EPA standards, methane is about 25 times more potent than CO2, and N2O is about 298
times more potent than CO2 (Emission Factors for Greenhouse GasInventories, 2014).
Thus the quantities are not that consistent nor the way to reach the most dangerous gas
for the atmosphere.
The category that release the biggest amount of GHG are the Lab buildings, where there
are 22 buildings of this category. Thus, Hospital/Lab also has a considerable effect even
though there are only 2 buildings of this type. This is due to the size of one of the two
Hospital/Lab buildings considered which is 946,519 SF. The main reason is because lab
buildings category use more energy consuming equipment. For instance, fume hoods are
necessary to clean the air in this areas and this equipment requires a high amount of
energy.
The next one in the list would be the office&lab buildings which there are only 8
buildings but it can be concluded that considerably Laboratory spaces are the ones that
emit the higher amount of gases.
Advance Technology (Such as, automatic doors) implemented in the buildings and
improved lifestyle (e.g. Everyone has his own computer) is responsible for increasing
carbon emissions (Due to the increase in the electricity used per person). To control
emissions there is a need of increasing awareness amongst stakeholder to adopt such
methods, which are technologically better but environmentally safe.
Shifting power generation technology from conventional sources to cogeneration or
hybrid technology results in to substantial reduction in carbon emission.

Universidad Pontificia de Comillas Escuela superior de Ingeniería
68 College campus buildings UW-Madison. Sustainability perspective.
Teresa Freire Barceló
Improvement in thermal performance of building envelope leads to reduction in carbon
emission. From research literature it’s been found that retrofitting, reconstruction and
selection of appropriate U-factors for building materials lead to a saving of carbon
emission up to 31–36%. Furthermore, reuse, recycling and regeneration energy through
combustion together can save up to 10% of total energy and subsequently
emission.(Ralegaonkar, 2011)
Construction process should be made more environmental friendly by replacing part of
energy intensive building material by waste or recycled material. Use of prefabricated
building elements, replacing energy intensive clinker in Portland cements (Fly ash,
furnace slag), minimizing production energy in cement (dry process of clinker formation),
minimizing production energy in masonry blocks (CMU, CSRE wall), using timber-
based material and recycled steel can achieve substantial reduction in energy and
emission. Sixty-five to 95% clinker to cement ratio results in around 32% reduction in
CO2 emission. Use of recycled steel saves about 80% of energy in production process.
(Ralegaonkar, 2011)
The materials used in the buildings and the processes that are contributing to GHG
emissions should be identified and assessed. This will help in improving energy
efficiency and environmental performance of building at the same time. (Ralegaonkar,
2011)
Simulation methods should be used at design stage to improve energy efficiency of
building system (Such as the proper shading device) which directly will result in
reduction in carbon emissions. Simulation method proves to be best for predicting
heating and cooling load (Ralegaonkar, 2011).
Background work has been made in the Sustainable concern in University Campuses.
The conclusion is that each university is a world, after making comparisons between the
other universities GHG emissions and UW campus emissions, it can be assure that many
facts should be considered (size, location, type of college...) to make a consistent
comparison.
GHG emissions inventory gives more detailed information than carbon footprint as it
keeps separated each gas releases. Nevertheless, carbon footprint results are easier to

Universidad Pontificia de Comillas Escuela superior de Ingeniería
69 College campus buildings UW-Madison. Sustainability perspective.
Teresa Freire Barceló
interpret and to compare between different campuses emissions as it only uses one
common unit which is 𝐶𝑂2𝑒.
Investing in greener HVAC equipment can save a lot of money throughout the building
lifetime, as in the average US buildings accounts for the 48% of the emissions.
A proposal that can help to reduce easily GHG emissions is requiring all residential
buildings to report their electricity and heating energy use. While nobody would be fined
for consuming too much energy, research studies have demonstrated the effectiveness of
this peer pressure system for reducing GHG emissions. (Schmidt, 2015)
Once applied the EPA standards method the results over the UW campus emissions have
brought us some conclusions on the three sustainability aspects:
I. The impact of the GHG emissions on society
Overall, energy conservation interventions have shown confusing results arisen from
the fact that approximately 80% of Americans regularly express strong environmental
concern, however barely 20% of Americans actually translate this concern into concrete
actions in their everyday practices. On the other hand, insights into potential pathways to
avoid the “value-action gap” are emerging in the social sciences. Sustainability and
environmental planning initiatives tend toward greater degrees of success as long as
social capital and information networks are strong and well interconnected. By engaging
individuals and groups in energy efficiency interventions via non-coerced commitment
and the clear visualization of new social norms and peer performance can help people to
view themselves as concerned about mitigating climate change and increase the speed of
changing society behavior into a more active attitude. (Hal S. Knowles)
II. The impact of the GHG emissions on the environment
Zero net energy (ZNE) is a building with zero net energy consumption, meaning
the total amount of energy used by the building on an annual basis is roughly equal to the
amount of renewable energy created on the site. Thus, retrofitting or building a city
facility that meets ZNE standards would cut municipal energy costs and carbon emissions
from energy. (P. Torcellini, 2006)

Universidad Pontificia de Comillas Escuela superior de Ingeniería
70 College campus buildings UW-Madison. Sustainability perspective.
Teresa Freire Barceló
The following bullet points are a summary of Madison’s strongest environmental
programs. Madison can build on these strengths to achieve its greenhouse gas reduction
goals and continue with the intention of reaching ZNE standards in new building
construction. (Somers, 2002)
o First curbside recycling program in the nation (began collecting newspapers in 1968).
Madison currently recycles 50% of its waste.
o Extensive bicycle program with bike racks, lockers, and over 100 miles of bikeways.
o Extensive Metro Transit bus system with 164 buses daily.
o Methane gas utilization at sewerage plant and two largest landfills for electricity and
steam generation.
o Streetlight conversion from mercury vapor and incandescent bulbs to high-pressure
sodium (11,000 fixtures).
o Conversion of 200 red traffic signals to light-emitting diode (LED) fixtures.
o School District, City, and County participation in the EPA Energy Star Buildings
Partnership.
o Full member in the ICLEI Cities for Climate Protection Campaign.
o Largest wind power project (11 MW) in the eastern United States. Implemented by the
local utility, MG&E(Madison Gas & Electric) , production from the 17 wind turbines
began in June 1999. The wind program sold out faster than any other green power
program in the U.S.
o Rideshare Etc. program operates 67 vanpools with 900 riders.
o No pesticide or fertilizer use on green spaces or parks.
o 2500 trees planted per year.
o Sustainable Lifestyle Campaign started 40 neighborhood ecoteams.
III. The cost of the GHG emissions
Over 25 percent of Madison’s yearly energy costs ($3.6 out of nearly $14 million
dollars) are spent on buildings and facilities energy (Eric Anderson, 2012). The average
American household spends over $2000 per year on energy bills, the majority of which

Universidad Pontificia de Comillas Escuela superior de Ingeniería
71 College campus buildings UW-Madison. Sustainability perspective.
Teresa Freire Barceló
goes to heating and cooling (EPA, Green building, 2016). Reducing building energy
consumption can therefore reduce energy use and greenhouse gas emissions, while
helping Madison habitants save money. (Eric Anderson, 2012)
The top energy-using buildings in Madison city have been tracked since 1988 using a
software program called Fast Accounting System for Energy Reporting (FASER).
(Somers, 2002). In 1990 UW-Madison buildings used 995,299 therms of natural gas and
15,986,473 kWh of electricity for a total cost of approximately $1.3 million. Some
upgrades have been applied to the UW buildings adding insulation systems, such as re-
roofing, upgrading doors, replacing windows, etc. when remodeling, the equipment
efficiency improves as soon as replacements are done. The energy savings from these
measures has not been documented yet. The expenditures in measures to improve energy
efficiency it’s been between $300,000 to $500,000, with payback periods between 6
months to 20 years. The outcomes are expected to be worth it in terms of profitability
besides the decrease on environmental impact. Thus, annual savings from these measures
are estimated to be $40,000/year. (Somers, 2002)

Universidad Pontificia de Comillas Escuela superior de Ingeniería
72 College campus buildings UW-Madison. Sustainability perspective.
Teresa Freire Barceló

Universidad Pontificia de Comillas Escuela superior de Ingeniería
73 College campus buildings UW-Madison. Sustainability perspective.
Teresa Freire Barceló
Recommendations
Some highlighting recommendations to apply in the UW-Madison campus buildings are
going to be explained and classified their application to the different building categories.
Furthermore, for all kind of buildings would be recommendable to use the SPS 363 Energy
conservation code in Wisconsin, which is a chapter that provides flexibility to permit the use of
innovative approaches and techniques to achieve the effective use of energy. (Legislative
Reference Bureau, 2011)
For Schools, Offices and Dwelling buildings
From Pennsylvania State it can be taken some ideas on actions that can be taken to conserve
energy in buildings. (The Pennsylvania State University, 2015). Some of them that have already
been applied in Pennsylvania, would work as well for UW-Madison. These are the following
measures:
Installing room occupancy sensors which can automatically turn lights on when
someone enters a room and off when someone leaves, are a smart and easy way to
save energy in commercial applications. Sensors help meet the mandatory
requirements set for building construction and renovation, as well as contribute to
obtaining points in several LEED credit categories (Lutron Electronics Co., n.d.)
Installing heat recovery equipment. This measure is particularly effective in
northern climates (Irving, n.d.)
Replacing inefficient lighting with higher efficiency fluorescent and LED
technologies.
Programming thermostats to a reasonable temperature including breaks shutdown
systems. This means that during extended break periods like the winter holiday or
spring break, the buildings conserve energy by reducing the temperature inside
them to 55 degrees Fahrenheit and turning lights and computers off. Thus, the few
people left in the city should dress with warmer clothes than usual to be
comfortable inside.
Upgrading/reprogramming control systems.

Universidad Pontificia de Comillas Escuela superior de Ingeniería
74 College campus buildings UW-Madison. Sustainability perspective.
Teresa Freire Barceló
Steam system enhancements and improving steam traps. It is remarkable that more
than 45% of all the fuel burned by U.S. manufacturers is consumed to raise steam.
Steam is used to heat raw materials and treat semi-finished products. It is also a
power source for equipment, as well as for building heat and electricity generation.
But steam is not free. It costs approximately $18 billion annually to feed the boilers
generating steam. Many manufacturing facilities can recapture energy through the
installation of more efficient steam equipment and processes. A typical industrial
facility can realize steam savings of 20 percent by improving their steam system. If
steam system improvement were adopted industry-wide, the benefits would be $4
billion in fuel cost reduction and 32 million metric tons of emission reductions.
(Alan Bandes & Bruce Gorelick, n.d.)
Installing low-flow water fixtures: switching to water-efficient appliances and
fixtures will also save money on energy costs, as you end up using significantly
less hot water. You also extend the life of your water heater. (Handyman Matters,
2017)
Lab ventilation improvements.
Updating and replacing heating systems
Motor replacement
Variable frequency drives will allow you to match the speed of the motor-driven
equipment to the process requirement resulting in energy savings. (Hartman, 2014)
Cleaning, flushing and passivating HVAC piping: to remove debris such as slit,
sand, scale, iron oxide deposits, weld slug and other contaminants that are present
in a pipework system (Webmaster, 2015) and passivating also inhibits the system
from corrosion.
For Sport buildings
The following actions require little or no capital investment and will considerably decrease the
GHG emissions of a Sport facility either is combined, with ice-rink or only dry sports building.
(ENERGY CONSUMPTION GUIDE, 2001)

Universidad Pontificia de Comillas Escuela superior de Ingeniería
75 College campus buildings UW-Madison. Sustainability perspective.
Teresa Freire Barceló
Review the standards of lighting, heating, ventilation and other energy-intensive
functions required in each area, and how long these services are to be provided.
For timed equipment, such as external lighting and most central ventilation plant, the
automatic time settings should be at the minimum reasonable.
Ensure that all plant is operated and maintained to work effectively.
Make sure that small or local requirements, such as cleaning or ventilation, do not cause
the rest of a large system to be brought into operation or cause inefficient use of central
plant.
Make sure that room air temperatures, and water temperatures in swimming pools, are set
appropriately and checked regularly.
If ventilation plant has high/low or variable settings, check that the plant normally runs at
a low setting, and is only turned up when the facility is heavily occupied. Overnight,
ventilation plant should normally be off, except for swimming pool ventilation systems,
which may need to run at a reduced speed.
Ensure that energy-saving equipment or features are used as intended. Any automatic
lighting or plant controls should be fully understood and properly commissioned and set
up.
Water costs can be comparable to energy costs. Hence, constant effort and monitoring is
required to control consumption and reduce water waste.
Appropriate and effective maintenance is essential, including checking and re-calibrating
controls.
Measures requiring significant expenditure should be reviewed from time to time and
implemented if suitably cost-effective. Eligible technologies currently include: (ENERGY
CONSUMPTION GUIDE, 2001)
combined heat and power
lighting systems
boiler systems
pipework insulation
refrigeration
high-efficiency motors

Universidad Pontificia de Comillas Escuela superior de Ingeniería
76 College campus buildings UW-Madison. Sustainability perspective.
Teresa Freire Barceló
variable speed drives.
Lighting: old lighting systems in sports areas, pools or general areas can be inefficient. Thus,
replacement with efficient systems can sometimes be worth it. Most lighting should be high-
frequency fluorescent tube or compact fluorescent fittings.
Heating systems: for central systems, high-efficiency (preferably condensing) boilers will
provide substantial savings. Sometimes localized and locally controlled heating can use less
energy, particularly where only occasional heat is required.
Heat recovery: Recovering heat from swimming pool exhaust air is generally cost-effective if
appropriately designed.
Combined heat and power (CHP): is generally cost-effective in larger swimming pools, which
have a suitable year-round heat load for pool heating. Assessing the costs and benefits of CHP in
an accurately manner is important to be aware on the project inversion.
Building fabrication: improving insulation to current sport building, is cost-effective. Even new
sports buildings are often far from airtight, so checking and sealing can often be justified,
particularly where complaints of draughts have resulted in increasing the heat settings and hours
of operation.
Ventilation fans: more efficient fans that can take advantage of low speed operation for most of
the time can save well over 50% of the ventilation energy. (ENERGY CONSUMPTION GUIDE,
2001)
Pool covers: reduce heat losses from pool water, and avoid the need for ventilation at night. This
further reduces heating and electrical costs in a well-designed, controlled and managed system.
For Laboratory buildings
As laboratories consume so much energy, the potential for energy and economic savings
through energy efficiency improvements and energy conservation is very high, some studies
estimate that implementing some measures can result in 50% savings for laboratories and clean-
room facilities. (Business Energy Advisor, Managing energy costs in Laboratories, 2016)

Universidad Pontificia de Comillas Escuela superior de Ingeniería
77 College campus buildings UW-Madison. Sustainability perspective.
Teresa Freire Barceló
The National Renewable Energy Laboratory’s (NREL’s) Science & Technology Facility
(S&TF) is a 71,300-square-foot building with laboratories, office space, and common areas, in
Golden, Colorado. The S&TF was designed to assist renewable-energy research and speed up the
time to market for these technologies. Staying true to NREL’s mission, the S&TF was also
designed to use much less energy than a standard laboratory facility in fact, it uses 41% less
energy by cost when compared to traditional labs. The S&TF accomplishes these savings by the
following measures that are also recommended to be applied in UW Lab buildings: (Colorado
Laboratory Uses 41 Percent Less Energy than Traditional Labs, n.d.)
Using an efficient condensing boiler for space heating.
Using a variable-speed chiller and both direct and indirect evaporative cooling system for
space cooling.
Using fan-coil units to provide heating and cooling directly to laboratories, reducing the
need for inefficient reheat systems.
Using an air-distribution system under the floor provides fan-energy savings and allows
the economizer and evaporative cooling system to operate longer by increasing the
supply-air temperature. The system uses variable-air-volume boxes under the floor as
well, allowing offices individual temperature control and reducing overhead ductwork.
The S&TF also uses daylighting in all occupied areas and takes advantage of exterior
shading.
Incorporating an automatic lighting control system to curb lighting waste.
Using demand-controlled ventilation to eliminate unnecessary ventilation to unoccupied
or lightly occupied spaces.
Other recommendations would be: (Energy, 2015)
HVAC make up the majority of the building’s energy demand. Hence, depending on
how sophisticated the HVAC control is, and the occupant work schedule of the
lab, the facility managers can program the building’s HVAC system to operate at the
minimum rate when the building is unoccupied, and raise it to the needed ventilation
rate when the building is in use.

Universidad Pontificia de Comillas Escuela superior de Ingeniería
78 College campus buildings UW-Madison. Sustainability perspective.
Teresa Freire Barceló
Turning off the lights at the end of the day, utilizing task lighting, unplugging lab
equipment and using appliance timers would reduce the operational costs of the lab.
Switching an Ultra-Low Temperature Freezer used to store samples from -80 degrees
Celsius to -70 degrees Celsius can potentially reduce the freezer’s energy
consumption by 30%. This can save the lab a substantial amount of money and can be
done without the risk of damaging most samples.
A fume hood is a ventilation device installed in lab spaces, that protects workers from
breathing in volatile chemicals by drawing in air from the lab space and pushing the
air outside the building. The number of fume hoods in a lab is critical for the utility
costs. With fairly simple behavioral changes, like using a sash (a moveable shield at
the opening of the fume hood) when the fume hood is not in use. Also keeping fume
hoods free of obstacles (wires, computers, etc.) that will prevent you from lowering
the sash, especially when not in use. (researchers, n.d.)
For Greenhouse buildings
The principles of the developing field of building science applied to greenhouse designs include
measures that are recommended to use in UW-Madison Greenhouse buildings: (Larry Kinney
and John Hutson, 2012)
Keep the time constant of the building long through insulation and thermal mass.
Control the flow of solar flux, both light and heat.
Control the temperature and flow of air.
Integrate the systems of the greenhouse to optimize plant growth.
Future designs should allow more sunlight, mostly diffuse, into the greenhouse during
warm months.
The next generation of shutters should employ fiberglass frames and better means to
actuate them.

Universidad Pontificia de Comillas Escuela superior de Ingeniería
79 College campus buildings UW-Madison. Sustainability perspective.
Teresa Freire Barceló
Personal recommended behaviors
If the UW-Madison concerned population follow these common tips, the campus carbon
footprint would be considerably reduced: (Reduce Your Carbon Emissions, n.d.)
Turn off your lights whenever leaving a room, even if it is for a short period of time.
Unplug electronics when not in use.
Set the thermostat two degrees cooler in the winter and two degrees warmer in the summer.
Clean or replace air filters on the air conditioner at least once a month.
Replace any incandescent light bulbs with Compact Fluorescent Light Bulbs (CFL) or Light-
Emitting Diodes (LED).
Turn off the faucet while brushing your teeth.
Use dishwashers instead of washing the dishes by hand. Dishwashers use less hot water than
washing by hand.
Use low-flow showerheads in your showers and faucet aerators in your sinks to conserve
water.
Start a compost pile for grass clippings, leaves, vegetable peelings, fruit rinds, and barnyard
animal manure.
Recycling allows some materials to be reused and prevents other hazardous materials from
contaminating our soil.
Use recycled paper and recycle printer cartridges. Only print when necessary and print on
both sides of the paper.
Trying to use carpool to work and for personal trips would reduce the CO2 emissions due to
transportation. Consider walking, biking, or using public transportation as an alternative.
Try driving during non-peak hours.
Consider purchasing a hybrid or more efficient car if need one.
Buying local products when possible to reduce the number of products that are transported
long distances.

Universidad Pontificia de Comillas Escuela superior de Ingeniería
80 College campus buildings UW-Madison. Sustainability perspective.
Teresa Freire Barceló

Universidad Pontificia de Comillas Escuela superior de Ingeniería
81 College campus buildings UW-Madison. Sustainability perspective.
Teresa Freire Barceló
Data contacts
Andrea Hicks, Civil and Environmental Engineering professor: [email protected]
Jill Sakai, direction of communication efforts for the Office of Sustainability: [email protected]
Robert Lamppa, director of the UW Physical Plant : [email protected]
Dan Okoli: [email protected]

Universidad Pontificia de Comillas Escuela superior de Ingeniería
82 College campus buildings UW-Madison. Sustainability perspective.
Teresa Freire Barceló

Universidad Pontificia de Comillas Escuela superior de Ingeniería
83 College campus buildings UW-Madison. Sustainability perspective.
Teresa Freire Barceló
Bibliography
(n.d.).
AASHE. (n.d.). Association for the Advancement of Sustainability in Higher Education. Retrieved from
http://www.aashe.org/resources/campus-greenhouse-gas-emissions-inventories
Academic Planning and Institutional, R. (2015, November). UW facts and figures. Retrieved from
http://www.wisc.edu/about/facts/
Adam Anderson, T. B.-F. (2014, Spring). Madison Community Operations Carbon Inventory 2012 .
Retrieved from https://www.lafollette.wisc.edu/images/publications/workshops/2014-
carbon.pdf
Alan Bandes & Bruce Gorelick. (n.d.). Why do steam traps fail? What can you do about it? Retrieved
from Reliable Plant: http://www.reliableplant.com/Read/20504/why-do-steam-traps-fail-what-
can-you-do-about-it
Best Practice Programme, E. E. (n.d.). Energy use in sports and recreation buildings. Retrieved from
http://www.cibse.org/getmedia/34def23a-c65b-405e-9dff-ce181c0b1e0d/ECG78-Energy-Use-
in-Sports-and-Recreation-Buildings.pdf.aspx
Bob Emilani. (2005, February). Lean in Higher Education. Retrieved from
https://www.abdn.ac.uk/staffnet/documents/0502-emiliani-lean-higher-education_(2).pdf
Britt, R. (2013, November). Higher Education R&D Expenditures Remain Flat in FY 2012. Retrieved from
https://www.nsf.gov/statistics/infbrief/nsf14303/
Business Energy Advisor. (2016, September 19). Managing energy costs in Laboratories. Retrieved from
https://bizenergyadvisor.com/laboratories
Business Energy Advisor. (n.d.). Colorado Laboratory Uses 41 Percent Less Energy than Traditional Labs.
Retrieved from https://bizenergyadvisor.com/BEA1/BEA-CS-9/Case-Study/NREL
Campus Carbon Calculator, U. (n.d.). University of New Hampshire. Retrieved from
http://campuscarbon.com/Calculator.aspx
Campus Ghg Inventories. (n.d.). Retrieved from The association for the advancement of sustainability in
Higher education: http://www.aashe.org/resources/campus-greenhouse-gas-emissions-
inventories
Caprice Lee. (2017, Feb). Southeastern Louisiana University. Retrieved from
http://www.southeastern.edu/admin/phys_plant/green/
Carbon trust. (n.d.). Retrieved from What is a carbon footprint?:
https://web.archive.org/web/20090511102744/http://www.carbontrust.co.uk/solutions/Carbo
nFootprinting/what_is_a_carbon_footprint.htm

Universidad Pontificia de Comillas Escuela superior de Ingeniería
84 College campus buildings UW-Madison. Sustainability perspective.
Teresa Freire Barceló
Carl Christiansen, A. L. (2015, Spring). Madison City Operations Tracking Framework: A Roadmap to
Sustainability . Retrieved from
https://www.lafollette.wisc.edu/images/publications/workshops/2015-city-sustainability.pdf
CBECS, C. B. (2015, March 4). U.S. Energy Information dministration. Retrieved from
https://www.eia.gov/consumption/commercial/reports/2012/buildstock/
Cynthia Klein-Banai&Thomas L. Theis. (2010). A Greenhouse Gas Inventory as a Measure of
Sustainability for an Urban Public Research University.
David Tilley, R. S. (2007). CARBON FOOTPRINT OF THE UNIVERSITY OF MARYLAND. Retrieved from
http://www.aashe.org/documents/resources/UMD_GHG_FullRpt_FY02-07.pdf
Dyball, J. M. (2009). Developing a Whole-of-University Approach to Educating for Sustainability. Journal
of Education for Sustainable Development .
Emission Factors for Greenhouse GasInventories. (2014, April). GWP. Retrieved from
https://www.epa.gov/sites/production/files/2015-07/documents/emission-factors_2014.pdf
ENERGY CONSUMPTION GUIDE. (2001, Sept). Energy use in sports and recreation buildings. Retrieved
from http://www.cibse.org/getmedia/34def23a-c65b-405e-9dff-ce181c0b1e0d/ECG78-Energy-
Use-in-Sports-and-Recreation-Buildings.pdf.aspx
Energy Penn State. (n.d.). Penn State Physical Plant. Retrieved from
http://opp.psu.edu/sustainability/energy
Energy, A. t. (2015, 5 28). Improving Energy Efficiency In The Lab. Retrieved from
https://www.ase.org/blog/improving-energy-efficiency-lab
EPA. (2008, August). Laboratories for the 21st Century: An Introduction to Low-Energy Design . Retrieved
from http://www.i2sl.org/documents/toolkit/lowenergy_508.pdf
EPA. (2016, 2 20). Green building. Retrieved from https://archive.epa.gov/greenbuilding/web/html/
EPA government. (n.d.). Retrieved from https://www.epa.gov/energy/egrid-2014-summary-tables
Eric Anderson, S. B. (2012). City of Madison Sustainability Plan. Madison:
http://www.cityofmadison.com/sustainability/documents/SustainPlanSupportingDocFinal.pdf.
Georges Dyer and Jennifer Andrews. (2014). Presidents’Climate Commitment. Retrieved from Higher
Education’s Role in Adapting to a Changing Climate: http://secondnature.org/wp-
content/uploads/Higher_Education_Role_Adapting_Changing_Climate.pdf
Hal S. Knowles, I. (n.d.). Realizing residential building greenhouse gas emissions reductions: The case for
a Web-based geospatial building performance and social marketing tool . Retrieved from
https://www3.epa.gov/ttnchie1/conference/ei17/session5/knowles.pdf
Handyman Matters. (2017, Jan 4). 4 Benefits To Installing Low-Flow Appliances In Your Home. Retrieved
from http://www.handymanmatters.com/blog/4-benefits-to-installing-low-flow-appliances-in-
your-home/

Universidad Pontificia de Comillas Escuela superior de Ingeniería
85 College campus buildings UW-Madison. Sustainability perspective.
Teresa Freire Barceló
Hartman, C. (2014, 3 30). Benefits of VFDS, Inverters & drives. Retrieved from
http://www.vfds.com/blog/benefits-of-vfds-inverters-drives
Hasen, e. a. (2006). Retrieved from
https://en.wikipedia.org/wiki/Instrumental_temperature_record#cite_note-1
Heijer, A. d. (2012, March 8). Managing the university campus information to support real estate
decisions. Retrieved from http://www.his-
he.de/ab32/NL_HS_Bau/05_AK_NuB_1_2012_den_Heijer.pdf
Irving, B. (n.d.). This Old House TV. Retrieved from https://www.thisoldhouse.com/ideas/case-installing-
heat-recovery-ventilator
ISO 14040. (2006). Defining Life cycle Assessment. Retrieved from http://www.gdrc.org/uem/lca/lca-
define.html
Larry Kinney and John Hutson. (2012). Energy-Efficient Greenhouse Breakthrough. Retrieved from
http://aceee.org/files/proceedings/2012/data/papers/0193-000414.pdf
Legislative Reference Bureau. (2011, Dec). Chapter SPS 363 ENERGY CONSERVATION. Retrieved from
http://docs.legis.wisconsin.gov/code/admin_code/sps/safety_and_buildings_and_environment
/361_366/363.pdf
Luis Perez-Lombard, J. O. (2009). A review on buildings energy consumption information . Elsevier.
Lutron Electronics Co. (n.d.). Save energy with Lutron. Retrieved from
https://www.lutron.com/TechnicalDocumentLibrary/3683197.pdf
Lydersen, K. (2016, June 8). Madison adopts plan to cut carbon emissions 80 percent by 2050. Retrieved
from http://midwestenergynews.com/2016/06/08/madison-adopts-plan-to-cut-carbon-
emissions-80-percent-by-2050/
Michael Bomford. (2010). Energy farms. Retrieved from
https://energyfarms.wordpress.com/2010/12/02/energy-and-vertical-farms/
Ms Barbara A.W. Clarke. (2009, April 30). Drexel University, greenhause gas inventory. Retrieved from
http://www.aashe.org/files/DRXL%20GHG%20Report.pdf
Network, G. F. (2017). Ecological Footprint. Retrieved from http://www.footprintnetwork.org/our-
work/ecological-footprint/
P. Brian Fisher Ph.D., J. J. (Spring 2012). College of Charleston Campus emissions report. Charleston:
http://sustainability.cofc.edu/documents/FY2012%20Greenhouse%20Gas%20Report.
P. Torcellini, S. P. (2006). Zero Energy Buildings: A Critical Look at the Definition . National Renewable
Energy Laboratory .
Paul Wingco. (2013). Greenhouse Gas Inventory Summary Report. California:
https://www.csulb.edu/sites/default/files/csulb_2010_ghg_inventory_report.pdf.

Universidad Pontificia de Comillas Escuela superior de Ingeniería
86 College campus buildings UW-Madison. Sustainability perspective.
Teresa Freire Barceló
Pennsylvania State University, U. P. (n.d.). Retrieved from
http://colleges.usnews.rankingsandreviews.com/best-colleges/penn-state-6965
Phelps, L. (2009, Dec). ANU CARBON EMISSIONS INVENTORY. Retrieved from
http://sustainability.anu.edu.au/__documents/green-projects/carbonemissionsphelps.pdf
Ralegaonkar, V. A. (2011). Review of carbon emission through buildings: threats, causes and solution.
International Journal of Low-Carbon Tech, 143-148.
Reduce Your Carbon Emissions. (n.d.). Retrieved from
http://www.madisonal.gov/index.aspx?NID=656&PREVIEW=YES
researchers, F. a. (n.d.). PennState Sustainability in our Laboratories. Retrieved from
http://sustainability.psu.edu/sustainable-labs
Rouse, M. (n.d.). Tech Target. Retrieved from http://searchcio.techtarget.com/definition/lean-
management
Roy, R., & Potter, S. a. (2008). Designing low carbon higher education systems: Environmental impacts of
campus and distance learning systems. International Journal of Sustainability in Higher
Education, 116-130.
Schmidt, S. (2015, July 2). UW-Madison. Retrieved from
https://energy.wisc.edu/news/uw%E2%80%93madison-students-help-city-cut-carbon-emissions
Somers, J. (2002, Jan). CLIMATE PROTECTION PLAN . Retrieved from
https://www.cityofmadison.com/sustainability/City/documents/ccp_2002.pdf
Steve Boles. (n.d.). Sustainability from BPA worldwide. Retrieved from WHAT ARE THE DIFFERENCES
BETWEEN SCOPE 1, 2 AND 3 GREENHOUSE GAS EMISSIONS?:
http://www.icomplisustainability.com/index.php/ask-the-expert/ghg-management/item/63-
what-are-the-differences-between-scope-1-2-and-3-greenhouse-gas-emissions/63-what-are-
the-differences-between-scope-1-2-and-3-greenhouse-gas-emissions
Sustainability at American Colleges and Universities. (n.d.). Retrieved from
https://en.wikipedia.org/wiki/Sustainability_at_American_Colleges_and_Universities
Thapelo C M Letete, N. W. (2011). Carbon footprint of the University of Cape Town. Journal of Energy in
Southern Africa .
The Pennsylvania State University. (2015). PennState Physical Plant. Retrieved from
http://opp.psu.edu/sustainability/energy
The University of Illinois at Chicago. (n.d.). Retrieved from http://www.uic.edu/
Theis&Cynthia Klein-Banai and Thomas L. (2011). Quantitative analysis of factors affecting greenhouse
gas emissions at institutions of higher education (UIC). Elsevier.
University of California, I. (2007, April 16). Advanced Power&Energy program. Retrieved from
http://www.apep.uci.edu/der/buildingintegration/2/BuildingTemplates/Office.aspx

Universidad Pontificia de Comillas Escuela superior de Ingeniería
87 College campus buildings UW-Madison. Sustainability perspective.
Teresa Freire Barceló
University of Wisconsin-Madison. (2017, Jan). Retrieved from
http://www.cpd.fpm.wisc.edu/Sustainability.htm
University of Wisconsin-Madison. (n.d.). Campus Buildings. Retrieved from
http://www.map.wisc.edu/buildings/
US Enegy use intensity by energy type. (n.d.). Portfolio Manager, Energy Star. Retrieved from
https://portfoliomanager.energystar.gov/pdf/reference/US%20National%20Median%20Table.p
df
US Environmental Protection Agency. (2012). Retrieved from https://www.epa.gov/energy/egrid
UW Steam ChW and KWh Sales - FY16 UW Campus FY06-FY16 CO2e. (2016, 11 21). Retrieved from UW-
Madison CO2e lb GSF exclude CSC-AFCH.PDF
Venetoulis, J. (2001). Assessing the ecological impact of a university. Retrieved from
https://personalwebs.coloradocollege.edu/~hdrossman/EV120/efcampus.pdf
Webmaster. (2015, August 13). Safe work-Method of statement-. Retrieved from
http://safeworkmethodofstatement.com/method-of-statement-for-cleaning-flushing-and-
passivation-of-chilled-water-piping/
World Meteorological Organization. (2016, October 24). Retrieved from
http://public.wmo.int/en/media/press-release/globally-averaged-co2-levels-reach-400-parts-
million-2015

Universidad Pontificia de Comillas Escuela superior de Ingeniería
88 College campus buildings UW-Madison. Sustainability perspective.
Teresa Freire Barceló

Universidad Pontificia de Comillas Escuela superior de Ingeniería
89 College campus buildings UW-Madison. Sustainability perspective.
Teresa Freire Barceló
Appendix A. Footprint worksheet (Venetoulis, 2001)

Universidad Pontificia de Comillas Escuela superior de Ingeniería
90 College campus buildings UW-Madison. Sustainability perspective.
Teresa Freire Barceló

Universidad Pontificia de Comillas Escuela superior de Ingeniería
91 College campus buildings UW-Madison. Sustainability perspective.
Teresa Freire Barceló

Universidad Pontificia de Comillas Escuela superior de Ingeniería
92 College campus buildings UW-Madison. Sustainability perspective.
Teresa Freire Barceló
Appendix B (University of Wisconsin-Madison, n.d.)
UW-Madison buildings size and category.
Building Size [SF] Type
Capitol Ct 1220 49,666 Offices&Lab
Engineering Dr 1410 34,336 School
Monroe St 1433 7,814 School
University Ave 1610 17,975 School
Linden Dr 1645 2,441 Dwelling
University Ave 1800 3,170 Dwelling
Linden Dr 1910 6,752 School&SportsDry
Bernard Ct 206 2,414 Dwelling
Brooks St N 209 3,403 Dwelling
Brooks St N 215-217 2,436 Dwelling
Park St N 21 223,748 Offices
Mills St N 30 43,916 School
432 East Campus Mall 19,041 School(Without
Lab)
Henry Mall 445 36,358 School
Charter St N 45 15,193 School
Herrick Dr 502 6,838 School
State St 711 8,833 Retail
University Bay Dr 901 1,587 Dwelling
Adams Residence Hall
6,932 Dwelling
6,765 Dwelling
5,932 Dwelling
361 Offices
6,183 Dwelling
5,417 Dwelling
7,339 Dwelling
6,818 Dwelling
6,860 Dwelling
Agricultural Bulletin Building 2,776 Offices
Agricultural Dean's Residence 5,134 Dwelling
Agricultural Engineering Building 14,325 School
Agricultural Engineering Laboratory 25,065 Lab
Agricultural Hall 51,406 School
American Family Children's Hospital 165,234 Hospital
Animal Science Building 75,441 School

Universidad Pontificia de Comillas Escuela superior de Ingeniería
93 College campus buildings UW-Madison. Sustainability perspective.
Teresa Freire Barceló
Armory & Gymnasium 39,600 Leisure
Art Lofts 48,057 School
Athletic Operations Building 9,962 Offices
Atmospheric Oceanic & Space Sciences Bldg 79,598 School
Babcock Hall 80,314 School
Bardeen Medical Laboratories 42,038 Lab
Service Memorial Institute 71,177 Offices&Lab
Medical Sciences 39,803 School
Barnard Residence Hall 30,509 Dwelling
Bascom Hall 87,100 School
Below Alumni Center 14,768 School(Without
Lab)
Biotron Laboratory 37,988 Lab
Birge Hall 97,080 School
Bock Laboratories, Robert M 40,907 Lab
Bradley Memorial Building 9,753 Office&Classrooms
Bradley Residence Hall, Harold C 36,558 Dwelling
Psychology Building, W J Brogden 64,281 School
Camp Randall Sports Center 97,722 Sport Dry
Camp Randall Stadium 172,066 Sport Dry
Carillon Tower 188 Historic
Schuman Shelter, Carl 807 Offices
Carson Gulley Center 21,047 Restaurant
Chadbourne Residence Hall 82,494 Dwelling
Chamberlin Hall, Thomas C 177,815 School
Chamberlin House 10,879 School
Heating and Cooling Plant-Charter St 4,967 Power plant
Chazen Building 43,612 Historic
Chemistry Bldg, F Daniels & J H Mathews 225,120 Offices&Lab
Cole Residence Hall 32,151 Dwelling
Computer Sciences 133,570 School
Kronshage Residence Hall
10,930 Dwelling
10,917 Dwelling
12,930 Dwelling
8,586 Dwelling
Elvehjem Building, Conrad A 61,803 Leisure
Dairy Barn 35,344 Leisure
Dairy Cattle Center 27,218 School
Davis Residence Hall, Susan B 7,993 Dwelling

Universidad Pontificia de Comillas Escuela superior de Ingeniería
94 College campus buildings UW-Madison. Sustainability perspective.
Teresa Freire Barceló
Smith Greenhouse, D C 8,088 Greenhouse
Dejope Residence Hall 129,159 Dwelling
Biochemical Sciences, DeLuca, Hector F 106,486 School
Biochemistry Building, DeLuca, Hector F 36,129 School
Biochemistry Laboratories, DeLuca, Hector F 113,206 Lab
Wisconsin Institute for Discovery 49,065 School
University Apartments Community Center 20,695 Dwelling
Educational Sciences 104,014 School
Education Building 74,084 School
Engineering Centers Building 113,519 School
Engineering Hall 271,602 School
Engineering Research Building 84,996 Lab
Environment Health and Safety 54,530 School
Enzyme Institute 40,123 Lab
Extension Building 43,505 School
Field House 79,352 Leisure
Fleet & Service Garage 14,196 Service & Offices
Fluno Center for Executive Education
School
Forest Products Laboratory
Lab
Genetics-Biotechnology Center Building 116,600 Lab
Gilman House 10,353 Dwelling
Goodman Softball Main Building 2,876 Leisure
Goodnight Hall, Scott H 33,200 School
Gordon Dining & Event Center 72,366 Restaurant
Grainger Hall 375,725 School
Gymnasium-Natatorium 150,587 Leisure
Biomedical Sciences Laboratories, Hanson, Robert P 27,654 Lab
Harlow Center 22,941 Lab
Hasler Laboratory of Limnology, Arthur D 11,084 Lab
Health Sciences Learning Center 236,371 School
White Hall, Helen C 253,308 School
Smith Annex, Hiram 7,722 School
Smith Hall, Hiram 11,716 School
Horse Barn 13,802 Leisure
Moore Hall-Agronomy 20,419 School
Horticulture 17,196 Lab
Plant Sciences 36,458 School
Humphrey Hall 10,092 School
Ingraham Hall, Mark H 55,479 School

Universidad Pontificia de Comillas Escuela superior de Ingeniería
95 College campus buildings UW-Madison. Sustainability perspective.
Teresa Freire Barceló
Jones House 10,976 Offices
Jorns Hall 10,118 School
Kellner Hall 26,621 Leisure
King Hall 11,133 School
Soils 17,748 School
LaBahn Arena 21,831 Sport Ice rink
Lathrop Hall 51,236 School
Law Building 114,614 School
Leopold Residence Hall, Aldo 35,681 Dwelling
Livestock Laboratory 18,221 Lab
Lowell Center 80,397 School
Mack House 11,249 Dwelling
Materials Science and Engineering Bldg 27,652 School
McArdle Building 54,373 Lab
McClain Athletic Facility 130,009 Dry Sport
Meat Science and Muscle Biology Lab 16,528 Lab
Mechanical Engineering Building 154,365 School
Bardeen Medical Laboratories 42,038 Lab
Service Memorial Institute 71,177 School
Medical Sciences 39,803 School
Medical Sciences Center 237,271 School
Meiklejohn House 3,691 Dwelling
Memorial Library 362,719 Library
Memorial Union 128,800 Leisure
Merit Residence Hall 12,216 Dwelling
Microbial Sciences Building 248,728 School
Middleton Building, William S 28,601 School
Humanities Building, Mosse, George L 165,726 School(Without
lab)
Music Hall 16,063 School(Without
lab)
Nicholas Hall, Nancy 113,289 School
Nicholas-Johnson Pavilion and Plaza 22,309 Sport Ice rink
Nielsen Tennis Stadium 95,402 Sport Dry
Noland Zoology Building, Lowell E 56,574 School
North Hall 12,219 Dwelling
Nutritional Sciences 30,600 School
Observatory Hill Office Building 3,848 Office&Lab
Ogg Residence Hall, Frederic A 120,483 Dwelling

Universidad Pontificia de Comillas Escuela superior de Ingeniería
96 College campus buildings UW-Madison. Sustainability perspective.
Teresa Freire Barceló
Phillips Residence Hall, Vel 33,686 Dwelling
Police and Security Facility 8,739 Service
Porter Boathouse 37,501 Service
Poultry Research Laboratory 18,129 Lab
Pyle Center 79,624 Offices
Radio Hall 8,500 School
Rennebohm Hall 120,714 School
Russell Laboratories 93,167 Lab
Rust, Henry & Schreiner, David Hall 12,345
School of Social Work Building 21,083 School(Without
lab)
Science Hall 58,054 School
Seed Building 16,340 School
Sellery Residence Hall 151,928 Dwelling
Service Building 37,191 Service & Offices
Service Building Annex 24,799 Service & Offices
Social Science Bldg, Sewell, William 120,387 School
Cooper Hall, Signe Skott 87,931 School
Slichter Residence Hall 39,448 Dwelling
Smith Residence Hall, Newell J 97,135 Dwelling
Southeast Recreational Facility (SERF) 125,472 Sport Combined
Southeast Residence Halls
Dwelling
South Hall 13,513 Dwelling
Historical Society, State
Historic
Steenbock Memorial Library 88,037 Library
Sterling Hall 90,480 School(Without
lab)
Stock Pavilion 33,668 School
Stovall Building, William D-Hygiene Lab 47,377 Lab
Sullivan Residence Hall 33,541 Dwelling
Swenson House 10,419 Dwelling
Taylor Hall, Henry 18,756 School
Teacher Education 63,111 School
Kohl Center, The 230,587 Sport Ice rink
Tripp Residence Hall-Botkin House 7,511 Dwelling
Tripp Residence Hall-High House 5,321 Dwelling
Tripp Residence Hall-Fallows House 5,951 Dwelling
Tripp Residence Hall-Frankenburger House 7,029 Dwelling
Tripp Residence Hall-Mail Room & Main Desk 711 Dwelling

Universidad Pontificia de Comillas Escuela superior de Ingeniería
97 College campus buildings UW-Madison. Sustainability perspective.
Teresa Freire Barceló
Tripp Residence Hall-Bashford House 7,184 Dwelling
Tripp Residence Hall-Vilas House 6,816 Dwelling
Tripp Residence Hall-Gregory House 5,906 Dwelling
Tripp Residence Hall-Spooner House 6,385 Dwelling
Turner House 10,588 Dwelling
Union South 183,415 Leisure
Apartment Facilities Office 2,733 Offices
University Club 8,948 Service & Leisure
University Houses 1 3,744 Dwelling
Dairy Forage Research Center-US
University Ave 1848
Offices
Clinical Science Center 946,519 Hospital/Lab
UW Medical Foundation Centennial 73,677 Hospital/Lab
Van Hise Hall 133,467 School
Van Vleck Hall, E B 56,478 School
Veterans Administration Hospital
Hospital
Veterinary Medicine Building 144,270 Lab
Vilas Communication Hall 150,036 School(Without
lab)
Waisman Center 133,585 Hospital/School
Greenhouse-Walnut St 37,136 Greenhouse
WARF Office Building 88,237 Offices
Observatory, Washburn 3,100 School
Water Science and Engineering Laboratory 26,559 Lab
Waters Residence Hall, Elizabeth 93,135 Dwelling
Weeks Hall for Geological Sci, Lewis G 82,652 School
Wendt Commons, Kurt F 52,774 Library
West Campus Cogeneration Facility Gross:
94,200
Wisconsin Energy Institute 53,305 Offices&Lab
Wisconsin Institutes for Medical Research 438,539 Offices&Lab
Primate Center, Wisconsin 17,435 School
Veterinary Diagnostic Lab-WI 47,374 Offices&Lab
Witte Residence Hall 149,522 Dwelling
Bayliss Co-Op, Zoe 7,400 Dwelling
Zoology Research Building 25,994 Offices&Lab

Universidad Pontificia de Comillas Escuela superior de Ingeniería
98 College campus buildings UW-Madison. Sustainability perspective.
Teresa Freire Barceló
Appendix C
GHG released by each UW-Madison building.
Building CO2 CH4 N2O CO2e
Capitol Ct 1220 1603613.3 190789 28087 1616265.04
Engineering Dr 1410 89255.347 10862 1583.82 90786.9711
Monroe St 1433 20312.246 2471.9 360.437 20660.8048
University Ave 1610 46725.445 5686.26 829.134 47527.2544
Linden Dr 1645 30397.62 3616.54 532.408 30637.4437
University Ave 1800 39475.812 4696.61 691.411 39787.258
Linden Dr 1910 130626.37 15541.2 2287.89 131656.952
Bernard Ct 206 30061.391 3576.53 526.519 30298.5617
Brooks St N 209 42377.346 5041.82 742.23 42711.6842
Brooks St N 215-217 30335.356 3609.13 531.317 30574.6878
Park St N 21 423988.94 51597.4 7523.6 431264.603
Mills St N 30 114158.25 13892.5 2025.72 116117.213
432 East Campus Mall 14590.667 1775.61 258.908 14841.0436
Henry Mall 445 94511.472 11501.6 1677.09 96133.2915
Charter St N 45 39493.723 4806.2 700.808 40171.4368
Herrick Dr 502 17775.165 2163.15 315.417 18080.1872
State St 711 70081.061 8337.85 1227.46 70633.9692
University Bay Dr 901 19762.812 2351.27 346.142 19918.7313
Adams Residence Hall
86323.762 10270.3 1511.94 87004.8177
84244.122 10022.9 1475.52 84908.7697
73870.825 8788.73 1293.83 74453.6322
684.07319 83.2485 12.1387 695.811903
76996.512 9160.61 1348.58 77603.9798
67457.562 8025.72 1181.51 67989.7717
91392.108 10873.3 1600.71 92113.1502
84904.128 10101.4 1487.08 85573.9826
85427.151 10163.6 1496.24 86101.1324
Agricultural Bulletin Building 5260.3523 640.16 93.3439 5350.62006
Agricultural Dean's Residence 63933.381 7606.43 1119.78 64437.7862
Agricultural Engineering Building 37237.385 4531.61 660.77 37876.3794
Agricultural Engineering Laboratory 1348829.1 160476 23624.5 1359470.7
Agricultural Hall 133628.27 16261.9 2371.21 135921.337
American Family Children's Hospital 959396.4 116754 17024.3 975859.663
Animal Science Building 196106.5 23865.2 3479.87 199471.688

Universidad Pontificia de Comillas Escuela superior de Ingeniería
99 College campus buildings UW-Madison. Sustainability perspective.
Teresa Freire Barceló
Armory & Gymnasium 302119.99 35944.5 5291.57 304503.581
Art Lofts 124922.65 15202.5 2216.73 127066.329
Athletic Operations Building 18877.388 2297.29 334.975 19201.3246
Atmospheric Oceanic & Space Sciences Bldg 206912.49 25180.3 3671.62 210463.11
Babcock Hall 208773.71 25406.8 3704.65 212356.267
Bardeen Medical Laboratories 2262201.3 269144 39622 2280049.05
Service Memorial Institute 2298159.3 273422 40251.8 2316290.75
Medical Sciences 103466.64 12591.4 1835.99 105242.131
Barnard Residence Hall 379926.67 45201.5 6654.34 382924.118
Bascom Hall 226413.7 27553.5 4017.67 230298.963
Below Alumni Center 11316.369 1377.15 200.807 11510.5578
Biotron Laboratory 2044257.7 243214 35804.7 2060385.92
Birge Hall 252356.39 30710.6 4478.01 256686.835
Bock Laboratories, Robert M 2201338.5 261903 38556 2218706.09
Bradley Memorial Building 60894.968 7244.94 1066.56 61375.4013
Bradley Residence Hall, Harold C 455254.49 54163.6 7973.69 458846.239
Psychology Building, W J Brogden 167096.43 20334.8 2965.09 169963.807
Camp Randall Sports Center 2338340.6 278203 40955.6 2356789.08
Camp Randall Stadium 4117280.9 489851 72113.3 4149764.33
Carillon Tower 1434.307 170.646 25.1216 1445.62306
Schuman Shelter, Carl 1529.2162 186.098 27.1356 1555.45763
Carson Gulley Center 793672.23 94426.6 13901 799933.946
Chadbourne Residence Hall 1027292.6 122221 17992.8 1035397.49
Chamberlin Hall, Thomas C 462224.47 56250.5 8202.08 470156.258
Chamberlin House 28279.617 3441.5 501.816 28764.8957
Chazen Building 332728.71 39586.2 5827.67 335353.792
Chemistry Bldg, F Daniels & J H Mathews 7268663 864785 127309 7326009.45
Cole Residence Hall 400374.39 47634.3 7012.47 403533.164
Computer Sciences 347210.99 42253.9 6161.19 353169.144
Kronshage Residence Hall
136110.61 16193.7 2383.95 137184.457
135948.72 16174.4 2381.11 137021.292
161016.48 19156.8 2820.17 162286.828
106920.92 12720.8 1872.7 107764.478
Elvehjem Building, Conrad A 471513.18 56098 8258.46 475233.202
Dairy Barn 269649.72 32081.4 4722.86 271777.135
Dairy Cattle Center 70752.331 8610.22 1255.49 71966.4428
Davis Residence Hall, Susan B 99536.329 11842.3 1743.36 100321.626
Smith Greenhouse, D C 312481.11 37177.2 5473.04 314946.445
Dejope Residence Hall 1608408.9 191359 28170.9 1621098.56

Universidad Pontificia de Comillas Escuela superior de Ingeniería
100 College campus buildings UW-Madison. Sustainability perspective.
Teresa Freire Barceló
Biochemical Sciences, DeLuca, Hector F 276806.99 33686.1 4911.88 281557.007
Biochemistry Building, DeLuca, Hector F 93916.194 11429.2 1666.52 95527.7982
Biochemistry Laboratories, DeLuca, Hector F 6091982.5 724790 106700 6140045.5
Wisconsin Institute for Discovery 127542.92 15521.4 2263.22 129731.557
University Apartments Community Center 257713.54 30661.3 4513.8 259746.783
Educational Sciences 270381.11 32904.1 4797.86 275020.853
Education Building 192579.02 23436 3417.28 195883.678
Engineering Centers Building 295089.05 35910.9 5236.3 300152.789
Engineering Hall 706020.82 85919.4 12528.2 718136.153
Engineering Research Building 4573910.8 544178 80111.1 4609996.88
Environment Health and Safety 141749.01 17250.2 2515.31 144181.429
Enzyme Institute 2159148.9 256883 37817 2176183.64
Extension Building 113089.87 13762.5 2006.76 115030.498
Field House 605399.63 72027 10603.4 610175.963
Fleet & Service Garage 182005.37 21654 3187.79 183441.312
Genetics-Biotechnology Center Building 6274624.7 746519 109899 6324128.62
Gilman House 128925.26 15338.8 2258.1 129942.423
Goodman Softball Main Building 21941.846 2610.52 384.307 22114.957
Goodnight Hall, Scott H 86302.351 10502.6 1531.42 87783.3015
Gordon Dining & Event Center 2728887 324668 47795.9 2750416.68
Grainger Hall 976685.27 118858 17331.1 993445.21
Gymnasium-Natatorium 1148872.3 136686 20122.3 1157936.38
Biomedical Sciences Laboratories, Hanson, Robert P 1488151.6 177052 26064.7 1499892.39
Harlow Center 1234529.7 146877 21622.5 1244269.59
Hasler Laboratory of Limnology, Arthur D 596466.04 70964.2 10447 601171.884
Health Sciences Learning Center 614438.95 74774.3 10903.1 624982.734
White Hall, Helen C 658466.14 80132.2 11684.3 669765.438
Smith Annex, Hiram 20073.095 2442.8 356.193 20417.5498
Smith Hall, Hiram 30455.372 3706.27 540.424 30977.9868
Horse Barn 105299.5 12527.9 1844.3 106130.263
Moore Hall-Agronomy 53078.545 6459.41 941.868 53989.3745
Horticulture 925372.61 110096 16207.7 932673.377
Plant Sciences 94771.419 11533.2 1681.7 96397.699
Humphrey Hall 26233.835 3192.53 465.514 26684.0084
Ingraham Hall, Mark H 144215.91 17550.4 2559.08 146690.656
Jones House 20798.857 2531.12 369.072 21155.7658
Jorns Hall 26301.421 3200.76 466.713 26752.7544
Kellner Hall 203099.4 24163.6 3557.24 204701.763
King Hall 28939.882 3521.85 513.532 29436.4908
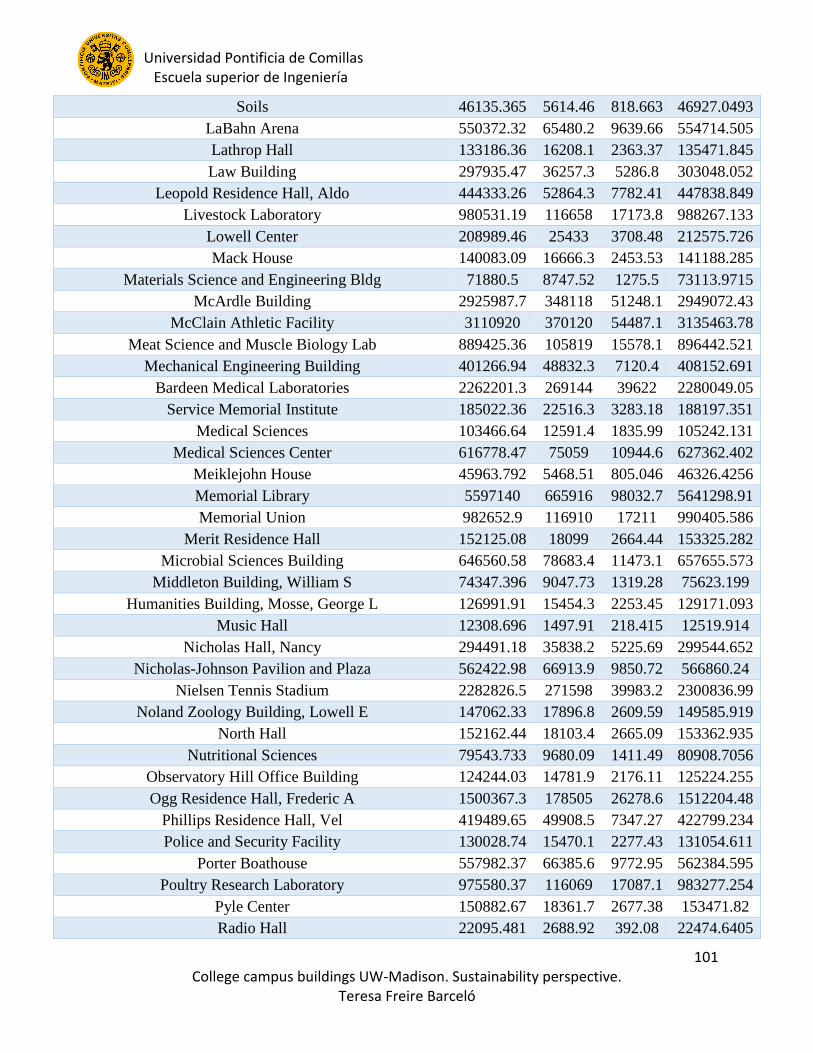
Universidad Pontificia de Comillas Escuela superior de Ingeniería
101 College campus buildings UW-Madison. Sustainability perspective.
Teresa Freire Barceló
Soils 46135.365 5614.46 818.663 46927.0493
LaBahn Arena 550372.32 65480.2 9639.66 554714.505
Lathrop Hall 133186.36 16208.1 2363.37 135471.845
Law Building 297935.47 36257.3 5286.8 303048.052
Leopold Residence Hall, Aldo 444333.26 52864.3 7782.41 447838.849
Livestock Laboratory 980531.19 116658 17173.8 988267.133
Lowell Center 208989.46 25433 3708.48 212575.726
Mack House 140083.09 16666.3 2453.53 141188.285
Materials Science and Engineering Bldg 71880.5 8747.52 1275.5 73113.9715
McArdle Building 2925987.7 348118 51248.1 2949072.43
McClain Athletic Facility 3110920 370120 54487.1 3135463.78
Meat Science and Muscle Biology Lab 889425.36 105819 15578.1 896442.521
Mechanical Engineering Building 401266.94 48832.3 7120.4 408152.691
Bardeen Medical Laboratories 2262201.3 269144 39622 2280049.05
Service Memorial Institute 185022.36 22516.3 3283.18 188197.351
Medical Sciences 103466.64 12591.4 1835.99 105242.131
Medical Sciences Center 616778.47 75059 10944.6 627362.402
Meiklejohn House 45963.792 5468.51 805.046 46326.4256
Memorial Library 5597140 665916 98032.7 5641298.91
Memorial Union 982652.9 116910 17211 990405.586
Merit Residence Hall 152125.08 18099 2664.44 153325.282
Microbial Sciences Building 646560.58 78683.4 11473.1 657655.573
Middleton Building, William S 74347.396 9047.73 1319.28 75623.199
Humanities Building, Mosse, George L 126991.91 15454.3 2253.45 129171.093
Music Hall 12308.696 1497.91 218.415 12519.914
Nicholas Hall, Nancy 294491.18 35838.2 5225.69 299544.652
Nicholas-Johnson Pavilion and Plaza 562422.98 66913.9 9850.72 566860.24
Nielsen Tennis Stadium 2282826.5 271598 39983.2 2300836.99
Noland Zoology Building, Lowell E 147062.33 17896.8 2609.59 149585.919
North Hall 152162.44 18103.4 2665.09 153362.935
Nutritional Sciences 79543.733 9680.09 1411.49 80908.7056
Observatory Hill Office Building 124244.03 14781.9 2176.11 125224.255
Ogg Residence Hall, Frederic A 1500367.3 178505 26278.6 1512204.48
Phillips Residence Hall, Vel 419489.65 49908.5 7347.27 422799.234
Police and Security Facility 130028.74 15470.1 2277.43 131054.611
Porter Boathouse 557982.37 66385.6 9772.95 562384.595
Poultry Research Laboratory 975580.37 116069 17087.1 983277.254
Pyle Center 150882.67 18361.7 2677.38 153471.82
Radio Hall 22095.481 2688.92 392.08 22474.6405

Universidad Pontificia de Comillas Escuela superior de Ingeniería
102 College campus buildings UW-Madison. Sustainability perspective.
Teresa Freire Barceló
Rennebohm Hall 313792.23 38187 5568.18 319176.912
Russell Laboratories 5013618.8 596492 87812.5 5053174.03
School of Social Work Building 16155.404 1966.04 286.674 16432.6307
Science Hall 150909.54 18365 2677.86 153499.15
Seed Building 42475.314 5169.04 753.716 43204.1912
Sellery Residence Hall 1891949.9 225094 33137.1 1906876.51
Service Building 476821.77 56729.6 8351.43 480583.675
Service Building Annex 317945.28 37827.3 5568.75 320453.727
Social Science Bldg, Sewell, William 312942.2 38083.6 5553.1 318312.299
Cooper Hall, Signe Skott 228573.86 27816.4 4056 232496.189
Slichter Residence Hall 491243.48 58445.4 8604.03 495119.165
Smith Residence Hall, Newell J 1209616.1 143913 21186.2 1219159.4
Southeast Recreational Facility (SERF) 5026530.4 598028 88038.6 5066187.48
South Hall 168276.54 20020.6 2947.33 169604.169
Steenbock Memorial Library 1358504.6 161627 23793.9 1369222.55
Sterling Hall 69332.681 8437.46 1230.29 70522.4317
Stock Pavilion 87518.902 10650.6 1553.01 89020.7288
Stovall Building, William D-Hygiene Lab 2549510.2 303326 44654.1 2569624.72
Sullivan Residence Hall 417683.97 49693.7 7315.65 420979.312
Swenson House 129747.16 15436.6 2272.49 130770.801
Taylor Hall, Henry 48755.629 5933.33 865.159 49592.2772
Teacher Education 164055.05 19964.7 2911.12 166870.239
Kohl Center, The 5813233.5 691626 101818 5859097.32
Tripp Residence Hall-Botkin House 93534.013 11128.1 1638.23 94271.9541
Tripp Residence Hall-High House 66262.08 7883.49 1160.57 66784.8579
Tripp Residence Hall-Fallows House 74107.431 8816.88 1297.98 74692.1048
Tripp Residence Hall-Frankenburger House 87531.697 10414 1533.1 88222.2827
Tripp Residence Hall-Mail Room & Main Desk 8854.0385 1053.4 155.077 8923.89287
Tripp Residence Hall-Bashford House 89461.903 10643.7 1566.91 90167.7165
Tripp Residence Hall-Vilas House 84879.222 10098.5 1486.64 85548.8802
Tripp Residence Hall-Gregory House 73547.049 8750.21 1288.16 74127.3014
Tripp Residence Hall-Spooner House 79512.006 9459.89 1392.64 80139.3193
Turner House 131851.7 15687 2309.36 132891.952
Union South 1399326.7 166484 24508.9 1410366.77
Apartment Facilities Office 5178.8699 630.244 91.898 5267.73942
University Club 100676.97 11978 1763.34 101471.27
University Houses 1 46623.798 5547.04 816.606 46991.6384
Clinical Science Center 35154037 4182429 615716 35431386.7
UW Medical Foundation Centennial 2736388.8 325560 47927.3 2757977.68

Universidad Pontificia de Comillas Escuela superior de Ingeniería
103 College campus buildings UW-Madison. Sustainability perspective.
Teresa Freire Barceló
Van Hise Hall 346943.25 42221.3 6156.44 352896.804
Van Vleck Hall, E B 146812.78 17866.4 2605.16 149332.087
Veterinary Medicine Building 7763637.2 923674 135978 7824888.82
Vilas Communication Hall 114969.03 13991.2 2040.1 116941.905
Waisman Center 3188808.2 379386 55851.3 3213966.42
Greenhouse-Walnut St 1434755 170699 25129.4 1446074.58
WARF Office Building 167203.78 20347.9 2967 170073.005
Observatory, Washburn 8058.352 980.663 142.994 8196.63358
Water Science and Engineering Laboratory 1429226 170041 25032.6 1440501.99
Waters Residence Hall, Elizabeth 1159804.3 137987 20313.7 1168954.66
Weeks Hall for Geological Sci, Lewis G 214851.26 26146.4 3812.49 218538.116
Wendt Commons, Kurt F 814358.96 96887.8 14263.3 820783.882
Wisconsin Energy Institute 1721109.1 204768 30144.9 1734687.87
Wisconsin Institutes for Medical Research 14159525 1684620 248001 14271236.9
Primate Center, Wisconsin 45321.732 5515.44 804.225 46099.4537
Veterinary Diagnostic Lab-WI 1529609.3 181984 26790.8 1541677.2
Witte Residence Hall 1861988.1 221529 32612.3 1876678.35
Bayliss Co-Op, Zoe 92151.737 10963.7 1614.02 92878.7725
Zoology Research Building 839292.94 99854.3 14700 845914.577