Asset Management Plan - Electra
180
Doc # 62900 (1) Asset Management Plan 1 April 2016 – 31 March 2026 General Manager – Network Electra Limited PO Box 244 LEVIN 5540 www.electra.co.nz
-
Upload
khangminh22 -
Category
Documents
-
view
3 -
download
0
Transcript of Asset Management Plan - Electra

Doc # 62900 (1)
Asset Management Plan 1 April 2016 – 31 March 2026
General Manager – Network
Electra Limited
PO Box 244
LEVIN 5540
www.electra.co.nz

(2)
(3)
Contents
1 Introduction ....................................................................................................... 6
2 Summary of the Plan ........................................................................................ 7
2.1 Introduction ............................................................................................. 7
2.2 Purpose of the plan ................................................................................. 7
2.3 Our network ............................................................................................. 8
2.4 Asset Management Plan Overview ........................................................ 9
2.5 Asset management processes ............................................................... 9
2.6 Levels of service ................................................................................... 11
2.7 Life cycle asset management ............................................................... 13
2.8 Maintaining assets through the life cycle ........................................... 14
2.9 Meeting demand .................................................................................... 14
2.10 Summary of forecast expenditure .................................................... 16
2.11 Risk management .............................................................................. 20
2.12 Performance evaluation .................................................................... 20
3 Background and Objectives ............................................................................ 22
3.1 Purpose of the Plan ............................................................................... 22
3.2 Interaction with other goals, processes and plan .............................. 22
3.3 Planning period ..................................................................................... 24
3.4 Stakeholder interests ............................................................................ 25
3.5 Asset management accountabilities ................................................... 28
3.6 Asset management systems and processes ...................................... 31
3.6.1 Managing routine asset inspections and network maintenance 34
3.6.2 Planning and implementing network development processes... 34
3.6.3 Measuring network performance (SAIDI etc) ............................... 35
4 Assets Covered .............................................................................................. 36
4.1 High-level description of the distribution network ............................. 36
4.1.1 Distribution area ............................................................................. 36
4.1.2 Significant large consumers .......................................................... 37
4.1.3 Description of the load characteristics for different parts of the
network .......................................................................................................... 37
4.1.4 Peak demand and total electricity delivered ................................ 38
4.2 Network configuration .......................................................................... 39
4.2.1 GXP and 33kV embedded generation ........................................... 39
4.2.2 Description of the sub-transmission system ............................... 40
4.2.3 11kV Distribution network.............................................................. 42
4.2.4 Distribution transformers .............................................................. 43
4.2.5 400V network................................................................................... 43
4.2.6 Consumer connections .................................................................. 44
4.2.7 Load control .................................................................................... 45
4.2.8 Protection and control ................................................................... 45
4.2.9 SCADA and communications ........................................................ 46
4.2.10 Other assets .................................................................................... 46
(4)
4.3 Network assets ...................................................................................... 47
4.3.1 Assets owned at bulk supply points ............................................. 48
4.3.2 Sub-transmission network ............................................................. 48
4.3.3 Zone substations ............................................................................ 50
4.3.4 Distribution network ....................................................................... 55
4.3.5 Distribution transformers .............................................................. 57
4.3.6 Distribution switchgear .................................................................. 58
4.3.7 400V network................................................................................... 59
4.3.8 Consumer connections .................................................................. 61
4.3.9 Protection and control ................................................................... 61
4.3.10 Load control and communications ............................................... 63
4.3.11 Office Buildings Depots and Workshops ..................................... 64
4.3.12 Office Furniture and Equipment .................................................... 64
4.3.13 Motor Vehicles ................................................................................ 64
4.3.14 Tools, Plant and Other Machinery ................................................. 65
4.4 Justification for the assets ................................................................... 66
5 Service Levels ................................................................................................ 67
5.1 Consumer performance targets ........................................................... 67
5.1.1 Primary service levels .................................................................... 68
5.1.2 Secondary service levels ............................................................... 70
5.2 Other performance targets ................................................................... 71
5.3 Justification for service level targets .................................................. 72
6 Lifecycle Asset Management Plan ................................................................. 74
6.1 Summary of the management of the asset lifecycle .......................... 74
6.1.1 Asset operations criteria and assumptions ................................. 75
6.1.2 Asset maintenance planning criteria and assumptions .............. 76
6.1.3 Asset renewal and refurbishment criteria and assumptions ...... 78
6.1.4 Reliability, Safety and Environment criteria and assumptions... 80
6.1.5 System growth criteria and assumptions ..................................... 80
6.1.6 Consumer connection criteria and assumptions ......................... 81
6.1.7 Retiring assets criteria and assumptions ..................................... 81
6.2 Asset Inspections and maintenance policies and programmes ....... 82
6.2.1 Grid Exit Point (GXP) assets .......................................................... 84
6.2.2 Sub-transmission assets ............................................................... 84
6.2.3 Zone substations ............................................................................ 86
6.2.4 Distribution Assets ......................................................................... 89
6.2.5 Other Network Assets (Ripple Injection and SCADA) ................. 95
6.2.6 Non-Network Assets ....................................................................... 96
6.2.7 Tree trimming and management ................................................... 97
6.2.8 Summary of maintenance expenditure ....................................... 100
7 Network Development Plan .......................................................................... 101
7.1 Development planning criteria and assumptions............................. 101
7.1.1 Planning approaches and criteria ............................................... 101
7.1.2 Meeting demand ........................................................................... 104
7.1.3 Meeting security requirements .................................................... 106

(5)
7.2 Prioritising development projects ..................................................... 108
7.3 Demand forecasts ............................................................................... 109
7.3.1 Issues arising from demand projections .................................... 112
7.4 Network constraints ............................................................................ 113
7.5 Distributed generation ........................................................................ 115
7.6 Non-asset solutions ............................................................................ 116
7.7 Network Development Plan including project descriptions ............ 117
7.7.1 GXP and transmission development .......................................... 118
7.7.2 Sub-transmission development .................................................. 118
7.7.3 Zone substation development ..................................................... 120
7.7.4 Distribution network ..................................................................... 122
7.7.5 Other Network Assets .................................................................. 126
7.7.6 Non Network Assets ..................................................................... 127
7.7.7 Summary of expenditure by cost category ................................ 128
7.7.8 Summary of development costs for all asset categories .......... 131
8 Risk Management ........................................................................................ 132
8.1 Risk analysis ....................................................................................... 132
8.1.1 Electra Group’s Policy – Risk Management ............................... 132
8.1.2 Insurance ....................................................................................... 132
8.1.3 Risk management reviews ........................................................... 133
8.1.4 Identifying risks ............................................................................ 134
8.1.5 Risk and project prioritisation ..................................................... 136
8.2 Management of risk ............................................................................. 138
8.3 Emergency response and contingency plans .................................. 141
8.3.1 Continuity of key business processes ....................................... 141
8.3.2 Reinstating the network after a disaster ..................................... 142
8.3.3 Restoration of key component failures ...................................... 142
9 Performance Evaluation ............................................................................... 143
9.1 Review of progress against plan ....................................................... 143
9.1.1 Maintenance Plan ......................................................................... 143
9.1.2 Development Plan ......................................................................... 144
9.1.3 Actual performance against target performance ....................... 144
9.2 Improvement initiatives ...................................................................... 145
10 Expenditure reconciliation and forecasts .................................................. 148
Appendix A – Electricity Distribution (Information Disclosure) Requirements 2009 –
Requirement 7(2) ............................................................................................... 167
Appendix B – Summary of Compliance with Disclosure Requirements .............. 171
4.3.9 & 4.3.10 ............................................................................................... 173
Appendix C – Glossary of Terms ........................................................................ 178
Appendix D – Amendments to the plan for this version ...................................... 180

Doc # 62900 (6)
1 Introduction
This Asset Management Plan (“AMP”) applies to the electricity distribution network owned by
Electra Limited and covers the period 1 April 2016 – 31 March 2026. It documents the network
assets and describes plans for maintaining the existing assets and the investment in new assets for
this period. Electra is committed to achieving service standards which meet our consumer’s
requirements. This AMP details the steps taken by Electra to meet these service levels.
We welcome comments on the AMP from interested parties and where appropriate these will be
taken into consideration for future plans. Comments should be directed to:
General Manager – Network
Electra Limited
PO Box 244
LEVIN 5540
Disclaimer
The information and statements made in this Asset Management Plan are prepared in good faith,
are based on assumptions and forecasts made by Electra Limited and represent Electra Limited’s
intentions and opinions at the date of issue. Circumstances will change, assumptions and
forecasts may prove to be inaccurate, events may occur that were not predicted, and Electra
Limited may, at a later date, decide to take different actions to those that it currently intends to take.
Electra Limited does not give any assurance, explicitly or implicitly, about the accuracy of the
information or whether Electra Limited will actually implement the plan or undertake any or all work
mentioned in the document. Except for any statutory liability which cannot be excluded, Electra
Limited, its Directors, office holders, shareholders and representatives will not accept any liability
whatsoever by reason of, or in connection with, any information in this document or any actual or
purported reliance on it by any person. Electra Limited may at any time change any information in
this document. When considering any content of this Asset Management Plan, persons should
take appropriate expert advice in relation to their own circumstances and must rely solely on their
own judgment and expert advice obtained. All monetary values in this document are in constant
price 2016 NZ dollars (ie no provision for inflation) unless stated otherwise.

Doc # 62900 (7)
2 Summary of the Plan
2.1 Introduction
This Asset Management Plan (“AMP”) relates to the electricity distribution services supplied via the
electricity distribution network owned by Electra Limited (“Electra”) and covers the period 1 April
2016 – 31 March 2026. It documents the network assets and describes our plans for maintaining
the existing assets and investing in new assets for this period. Electra is committed to achieving
service standards which meet our consumers’ requirements. This AMP details the steps taken by
Electra to meet these service levels. It is reviewed on an annual basis.
2.2 Purpose of the plan
The purpose of this AMP is to provide a governance and management framework that ensures that
Electra meets the requirements of its Asset Management Policy statements below
a. Electra will maintain and manage its network assets at defined levels to enable the safe, efficient and effective delivery of electricity to its consumers.
b. Electra will monitor standards and service levels to ensure that they meet/support consumer and Board goals and objectives.
c. Electra will develop and maintain asset inventories of its entire infrastructure.
d. Electra will establish infrastructure replacement strategies through the use of full life cycle costing principles.
e. Electra will plan financially for the appropriate level of maintenance and replacement of assets to deliver service levels and extend the useful life, of assets.
f. Electra will plan for and provide stable long term pricing/funding to replace and/or renew and/or decommission infrastructure assets.
g. Where appropriate, Electra will consider and incorporate asset management in its other corporate plans.
This purpose is consistent with Electra’s overall business mission and goals. Electra’s mission, as
stated in our Statement of Corporate Intent (“SCI”) is “to enhance the region’s development
through the provision of 21st
century infrastructure” in the form of a safe, efficient and effective
electricity delivery system.
This is reflected at the operational level by the network team with its own specific mission “to
maximise value for consumers and owners through competitive prices, quality services with
safe and efficient operations.” This plan is about ensuring delivery of service targets on an
ongoing basis – that is in the short term and over the next 10+ years.
Most importantly this AMP, along with Electra’s other plans, demonstrates that Electra is
responsibly managing its electricity network assets to best-practice levels. The AMP is set in
context by asset condition, risk analysis, company policies and load projections. It provides a focus
for continuous improvement in the management of the electricity assets and demonstrates
responsible ownership of Electra's electricity distribution network on behalf of consumers,
(8)
shareholders, retailers, government agencies, contractors, staff, financial institutions and the
general public. The AMP is also a technical document which is used regularly by staff to manage
Electra’s assets. This year’s AMP looks ahead for 10 years from 1 April 2016, with the main focus
on the first five years – for this period specific projects have been identified and discussed. Beyond
this period, analysis is more indicative.
Disclosure of this AMP in this format meets the provisions of clause 2.6 and Attachment A of the
Electricity Distribution Information Disclosure Determination 2013. A summary of the links between
this AMP and the Disclosure Requirements is included in Appendix B.
2.3 Our network
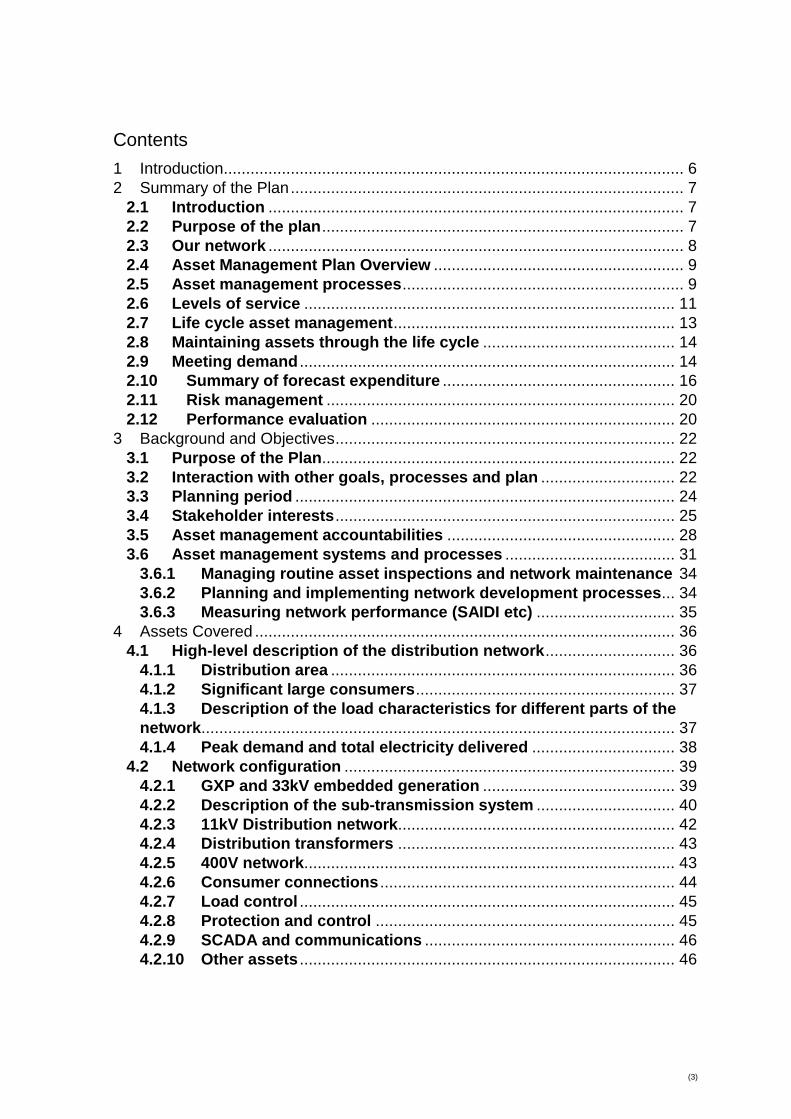
Electra’s assets are spread over the Horowhenua and Kapiti districts on the narrow strip of land
located between the Tasman Sea and the Tararua Ranges, reaching from Foxton and Tokomaru in
the north to Paekakariki in the south, as illustrated below. The network covers approximately 1,628
km2.
Figure 2.1: Network coverage area
(9)
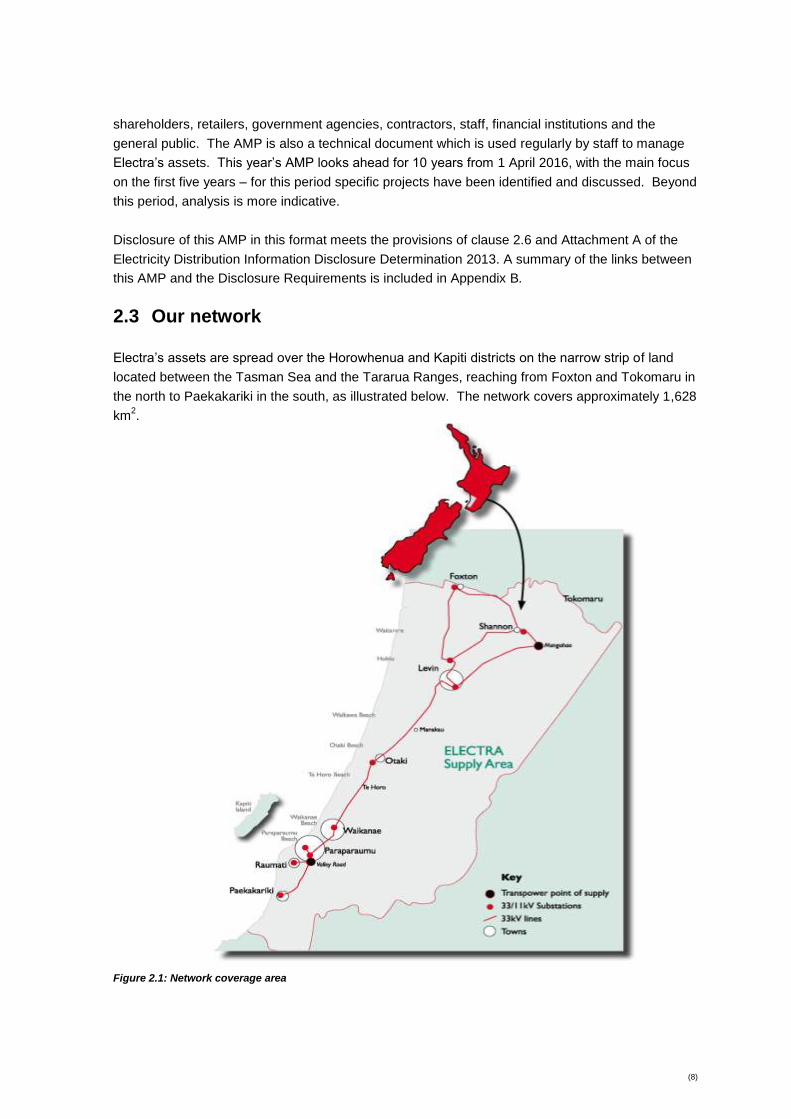
The table below summarises the key statistics of Electra’s network at 1 April 2015:
Description Quantity
Number of Consumer Connections 43690
Network Maximum Demand (MW) 89MW
Electricity Delivered Annually 402GWh
Total kilometres of Lines and Cables 2256km
Number of Zone Substations 10
Number of Distribution Substations 2509
Value of Network Assets1 $143m
Table 2.1: Key statistics of Electra’s network
2.4 Asset Management Plan Overview
To meet the objectives set by the Asset Management Policy, Electra’s strategy is to maintain the existing capability of the network by providing measured and sustainable asset maintenance and renewal programmes. These programmes are based on known asset lifecycles specific to the local environment and monitored through regular inspection and systematic assessment.
This 2016 Asset Management Plan (AMP) continues to emphasise a sustained asset replacement programme in the medium to long term. This is consistent with the path of our previous plan. There continues to be less accent on growth, partly because we have little indication of any turn around in this area, but also simply because there are increasing numbers of ageing assets that need replacing in a timely fashion to prevent the network from aging further overall and to maintain system reliability.
While the focus is on renewal and replacement, we also expect the programme to result in a concurrent improvement in underlying reliability for our customers by installing devices that can provide and act on the increasing amount of data that is currently available. The increased availability and application of data and technology will also enhance our ability to respond to changing customer expectations.
Some projects such as the additional feeders at Waikanae and Otaki, while still included in the 10 year plan, have been deferred until later in the planning period as the trigger points for action will occur later than previously forecast. Some renewal and replacement work has been brought forward to create a consistent work flow and resource allocation.
Projected capital expenditure over the next 10 years is expected to be 6% for growth, 11% for reliability and 83% for renewal and replacement work.
Capital costs are expected to average $9.14m per year over the next 10 years while operational costs are expected to average $4.45m per year over the same period. Electra has the flexibility to modify this approach if growth accelerates beyond our expectations. This will require additional capital expenditure at the rate of approximately $1.1 million per percentage point of additional growth.
2.5 Asset management processes
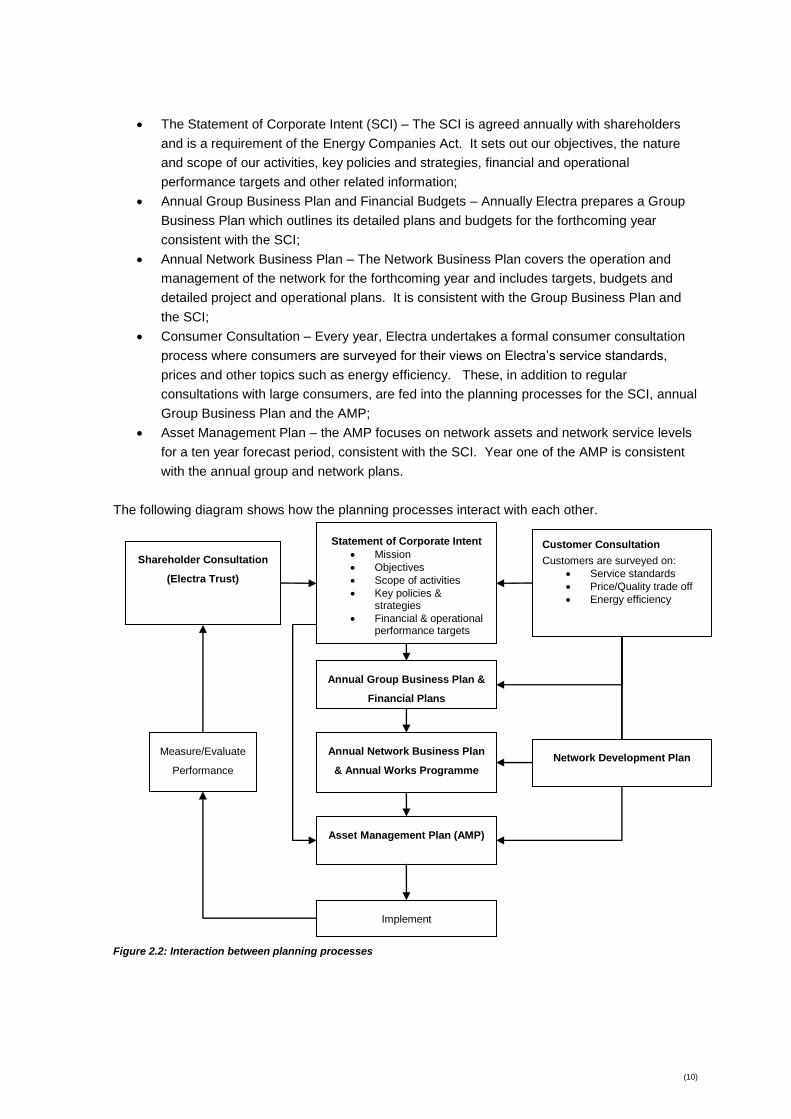
The AMP is a key component of Electra’s overall planning process which comprises:
1 Regulatory Asset Base as at 31 March 2015
(10)
The Statement of Corporate Intent (SCI) – The SCI is agreed annually with shareholders
and is a requirement of the Energy Companies Act. It sets out our objectives, the nature
and scope of our activities, key policies and strategies, financial and operational
performance targets and other related information;
Annual Group Business Plan and Financial Budgets – Annually Electra prepares a Group
Business Plan which outlines its detailed plans and budgets for the forthcoming year
consistent with the SCI;
Annual Network Business Plan – The Network Business Plan covers the operation and
management of the network for the forthcoming year and includes targets, budgets and
detailed project and operational plans. It is consistent with the Group Business Plan and
the SCI;
Consumer Consultation – Every year, Electra undertakes a formal consumer consultation
process where consumers are surveyed for their views on Electra’s service standards,
prices and other topics such as energy efficiency. These, in addition to regular
consultations with large consumers, are fed into the planning processes for the SCI, annual
Group Business Plan and the AMP;
Asset Management Plan – the AMP focuses on network assets and network service levels
for a ten year forecast period, consistent with the SCI. Year one of the AMP is consistent
with the annual group and network plans.
The following diagram shows how the planning processes interact with each other.
Figure 2.2: Interaction between planning processes
Statement of Corporate Intent
Mission
Objectives
Scope of activities
Key policies & strategies
Financial & operational performance targets
Customer Consultation
Customers are surveyed on:
Service standards
Price/Quality trade off
Energy efficiency
Shareholder Consultation
(Electra Trust)
Annual Group Business Plan &
Financial Plans
Annual Network Business Plan
& Annual Works Programme
Asset Management Plan (AMP)
Implement
Measure/Evaluate
Performance
Network Development Plan

(11)
2.6 Levels of service
Electra’s primary service levels are supply continuity and restoration. This is based on Electra’s
original five year average set by the Commerce Commission along with ongoing feedback provided
from consumer surveys. These targets can be challenging to continually meet as reliability naturally
decays when growth occurs as there are more components to fail and more customers affected
when they do. To measure performance in this area the following three internationally accepted
indices have been adopted:
SAIDI – system average interruption duration index. This is a measure of how many
system minutes of supply are interrupted per year;
SAIFI – system average interruption frequency index. This is a measure of how many
system interruptions occur per year;
CAIDI – consumer average interruption duration index. This is a measure of how long the
“average” consumer is without supply each year.
The target service levels illustrated overleaf reflect targets derived following Electra’s planning and
consultation processes, noted above. The forecast service performance levels are dependent on
achieving the network maintenance and development plans outlined in Sections 6 and 7 of this
AMP.
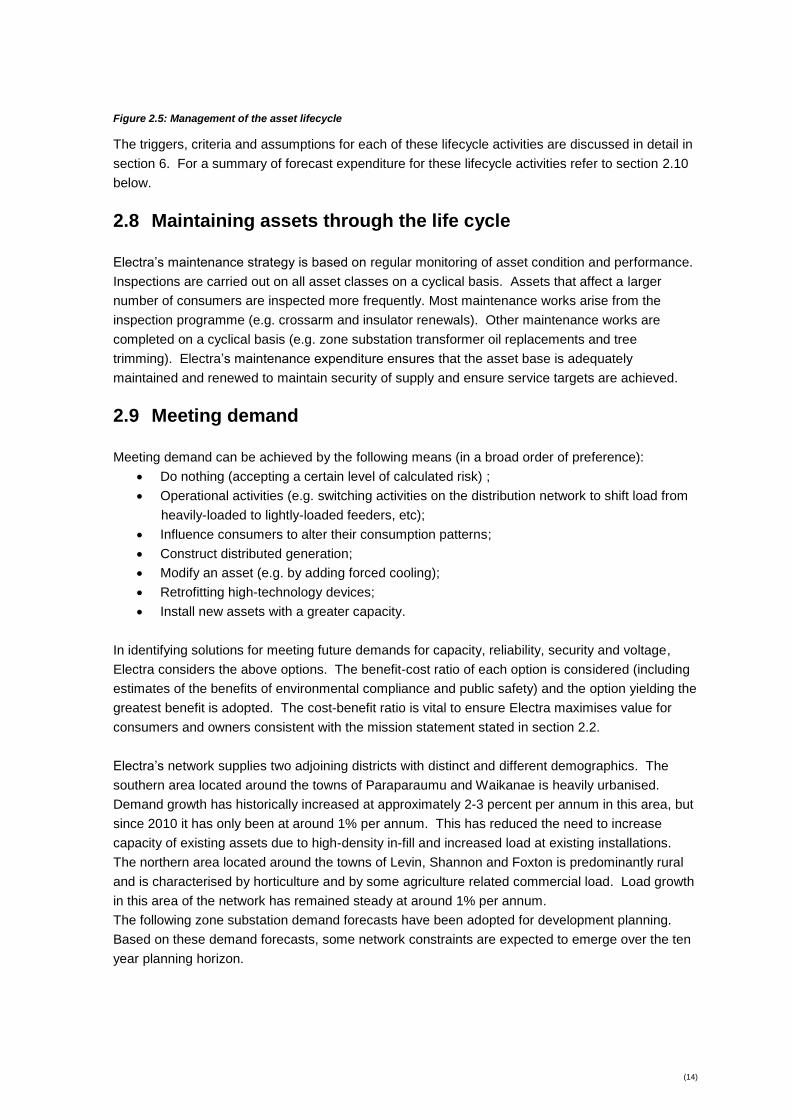
The following figure displays Electra’s SAIFI for last 15 years, plus the targets until 2027:
0
0.5
1
1.5
2
2.5
3
3.5
4
1999
2000
2001
2002
2003
2004
2005
2006
2007
2008
2009
2010
2011
2012
2013
2014
2015
2016
2017
2018
2019
2020
2021
2022
2023
2024
2025
2026
2027
SAIFI
Electra
Industry
Average
Actual Target
Figure 2.3: Electra’s actual verses target SAIFI
(12)
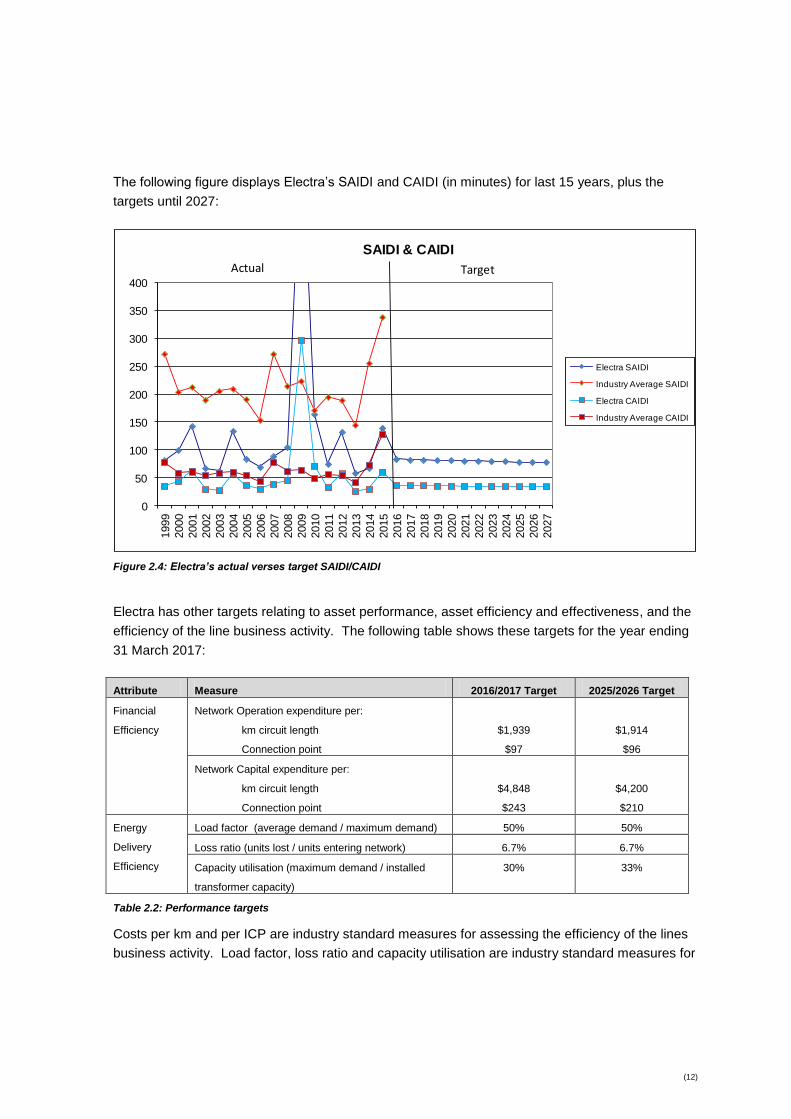
The following figure displays Electra’s SAIDI and CAIDI (in minutes) for last 15 years, plus the
targets until 2027:
0
50
100
150
200
250
300
350
400
1999
2000
2001
2002
2003
2004
2005
2006
2007
2008
2009
2010
2011
2012
2013
2014
2015
2016
2017
2018
2019
2020
2021
2022
2023
2024
2025
2026
2027
SAIDI & CAIDI
Electra SAIDI
Industry Average SAIDI
Electra CAIDI
Industry Average CAIDI
Actual Target
Figure 2.4: Electra’s actual verses target SAIDI/CAIDI
Electra has other targets relating to asset performance, asset efficiency and effectiveness, and the
efficiency of the line business activity. The following table shows these targets for the year ending
31 March 2017:
Attribute Measure 2016/2017 Target 2025/2026 Target
Financial
Efficiency
Network Operation expenditure per:
km circuit length
Connection point
$1,939
$97
$1,914
$96
Network Capital expenditure per:
km circuit length
Connection point
$4,848
$243
$4,200
$210
Energy
Delivery
Efficiency
Load factor (average demand / maximum demand) 50% 50%
Loss ratio (units lost / units entering network) 6.7% 6.7%
Capacity utilisation (maximum demand / installed
transformer capacity)
30% 33%
Table 2.2: Performance targets
Costs per km and per ICP are industry standard measures for assessing the efficiency of the lines
business activity. Load factor, loss ratio and capacity utilisation are industry standard measures for
(13)
assessing asset performance and efficiency. Using industry standard measures allows for easier
benchmarking with other lines businesses.
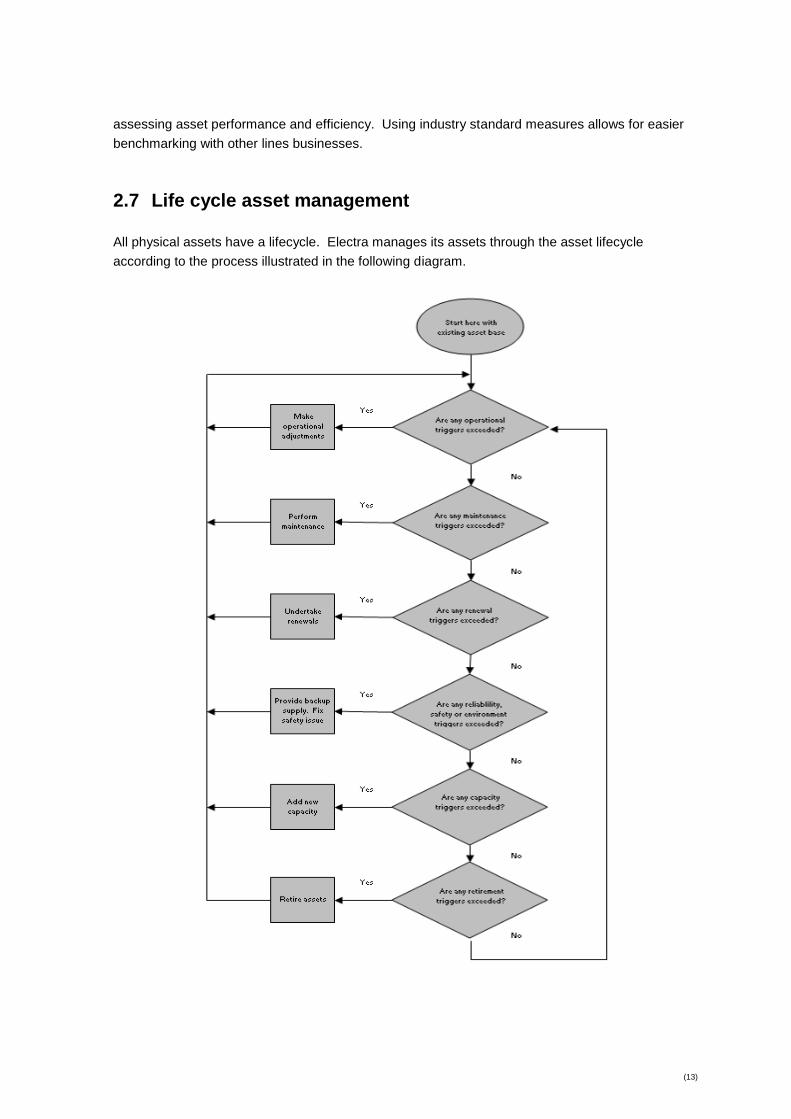
2.7 Life cycle asset management
All physical assets have a lifecycle. Electra manages its assets through the asset lifecycle
according to the process illustrated in the following diagram.
(14)
Figure 2.5: Management of the asset lifecycle
The triggers, criteria and assumptions for each of these lifecycle activities are discussed in detail in
section 6. For a summary of forecast expenditure for these lifecycle activities refer to section 2.10
below.
2.8 Maintaining assets through the life cycle
Electra’s maintenance strategy is based on regular monitoring of asset condition and performance.
Inspections are carried out on all asset classes on a cyclical basis. Assets that affect a larger
number of consumers are inspected more frequently. Most maintenance works arise from the
inspection programme (e.g. crossarm and insulator renewals). Other maintenance works are
completed on a cyclical basis (e.g. zone substation transformer oil replacements and tree
trimming). Electra’s maintenance expenditure ensures that the asset base is adequately
maintained and renewed to maintain security of supply and ensure service targets are achieved.
2.9 Meeting demand
Meeting demand can be achieved by the following means (in a broad order of preference):
Do nothing (accepting a certain level of calculated risk) ;
Operational activities (e.g. switching activities on the distribution network to shift load from
heavily-loaded to lightly-loaded feeders, etc);
Influence consumers to alter their consumption patterns;
Construct distributed generation;
Modify an asset (e.g. by adding forced cooling);
Retrofitting high-technology devices;
Install new assets with a greater capacity.
In identifying solutions for meeting future demands for capacity, reliability, security and voltage,
Electra considers the above options. The benefit-cost ratio of each option is considered (including
estimates of the benefits of environmental compliance and public safety) and the option yielding the
greatest benefit is adopted. The cost-benefit ratio is vital to ensure Electra maximises value for
consumers and owners consistent with the mission statement stated in section 2.2.
Electra’s network supplies two adjoining districts with distinct and different demographics. The
southern area located around the towns of Paraparaumu and Waikanae is heavily urbanised.
Demand growth has historically increased at approximately 2-3 percent per annum in this area, but
since 2010 it has only been at around 1% per annum. This has reduced the need to increase
capacity of existing assets due to high-density in-fill and increased load at existing installations.
The northern area located around the towns of Levin, Shannon and Foxton is predominantly rural
and is characterised by horticulture and by some agriculture related commercial load. Load growth
in this area of the network has remained steady at around 1% per annum.
The following zone substation demand forecasts have been adopted for development planning.
Based on these demand forecasts, some network constraints are expected to emerge over the ten
year planning horizon.

(15)
1999 2000 2001 2002 2003 2004 2005 2006 2007 2008 2009 2010 2011 2012 2013 2014 2015 2016 2017 2018 2019 2020 2021 2022 2023 2024 2025
Actuals Forecast
Shannon 3.9 3.9 4.1 4.3 4.1 4.2 4.1 4.3 4.8 4.8 5.9 3.6 5.0 5.3 4.7 4.03 4.2 4.2 4.2 4.3 4.3 4.3 4.3 4.3 4.4 4.4 4.4
Foxton 6.8 7.3 7.6 7.9 8.2 8.4 8.6 9.2 9.6 9.6 7.1 7.0 7.1 7.4 6.8 6.41 6.83 6.9 7.0 7.0 7.1 7.2 7.3 7.3 7.4 7.5 7.5
Levin West 9.0 8.9 8.9 9.1 9.2 8.9 9.0 9.5 9.8 9.8 11.5 10.0 11.4 11.7 11.5 12.29 13.46 13.7 13.9 14.2 14.4 14.6 14.9 15.1 15.4 15.7 15.9
Levin East 14.6 14.9 15.8 14.7 15.0 15.6 16.6 17.8 15.8 16.1 18.5 17.3 16.0 16.9 15.7 13.3 13.72 13.9 14.1 14.2 14.4 14.6 14.7 14.9 15.1 15.3 15.5
Otaki 10.5 10.5 10.8 11.1 11.4 11.5 11.2 12.0 12.9 13.9 12.5 12.3 11.7 12.0 12.2 10.17 10.6 10.8 11.0 11.2 11.4 11.6 11.8 12.0 12.2 12.4 12.7
Waikanae 12.4 12.4 12.4 12.8 12.1 12.4 13.2 14.1 14.8 15.2 15.1 16.0 15.9 16.3 15.7 13.43 14.36 14.6 14.9 15.2 15.5 15.9 16.2 16.5 16.8 17.2 17.5
Paraparaumu 26.1 27.6 27.2 25.8 17.8 14.2 13.8 14.8 15.9 16.2 14.1 16.2 13.7 14.3 13.3 12.85 12.53 12.8 13.0 13.3 13.6 13.8 14.1 14.4 14.7 15.0 15.3
Paraparaumu West 0.0 0.0 0.0 0.0 7.2 10.0 10.4 11.1 11.4 11.7 13.4 10.5 12.3 14.7 13.4 11.89 13.44 13.8 14.3 14.7 15.1 15.6 16.0 16.5 17.0 17.5 18.1
Raumati 11.0 11.3 11.4 10.9 10.5 10.8 10.4 11.0 11.2 11.3 12.7 12.6 12.2 12.4 11 10.41 10.15 10.3 10.4 10.5 10.6 10.7 10.8 10.9 11.0 11.1 11.2
Paekakariki 2.5 2.6 2.3 2.7 2.8 2.9 2.8 3.0 3.9 3.9 4.6 2.8 4.3 4.3 4.2 3.31 2.46 2.5 2.5 2.5 2.5 2.5 2.5 2.5 2.5 2.5 2.5
0.0
5.0
10.0
15.0
20.0
25.0
30.0
De
man
d (
MW
)
Zone Substations
Figure 2.6: Maximum demand by zone substation (financial year)
The following table shows the main sub transmission circuits that are expected to become
constrained within the planning horizon. It also contains a description of the constraint coupled
with the intended action to remedy it. These projects constitute a significant portion of the
extension and upsizing components of the development plan.
The constraints noted below while included in this developmental plan, may be affected by the
outcomes of discussions with Transpower regarding development of the GXP’s supplying the
Electra network. This is discussed in more detail in section 7.4, Network Constraints.
Constraint Description Intended Remedy
Shannon & Mangahao –
Levin East 600A circuits
Once the load at Mangahao GXP reaches
35MVA, there is the potential for
overloading these circuits in an (n-1)
outage.
Complete the separation of the
Mangahao-Levin East 33kV line
by installing a cable from
Arapaepae Road to Levin East.
(currently under construction)
Table 2.3: Network constraints on the sub-transmission network
There are no known load or voltage constraints on the 11kV network over the forecast period.
However, there are a number of developing beach settlements that are on single 11kV spur lines
that over the planning period will require duplication due to the number of consumers that will be
affected by any interruption and the consequential impact on system performance, SAIDI and
SAIFI in particular.

(16)
2.10 Summary of forecast expenditure
We changed the criteria for budgeting in 2013/14 so that rather than differentiating by the
financially based operational and capital expenditure we use asset based lifecycle and
development expenditure. The primary difference in the two methods is that capital expenditure for
replacement and renewal purpose is added to maintenance expenditure and becomes lifecycle
expenditure. Development expenditure is effectively capital expenditure excluding replacement and
renewal. Both systems have been included in this summary but only the lifecycle/development
expenditure is shown in the body of the Asset Management Plan.
A summary of Electra’s forecast maintenance expenditure in constant price NZ dollars is shown in
the figure below.
2017 2018 2019 2020 2021 2022 2023 2024 2025 2026
Refurbishment & Renewal Maintenance 457 458 436 458 458 458 458 436 458 458
Fault & Emergency Maintenance 2226 2305 2305 2305 2305 2105 2105 2105 2105 2012
Routine & Preventative Maintenance 897 1043 1043 1043 1043 1043 1043 1043 1043 1043
Vegetation 1591 1591 1591 1591 1591 1591 1591 1591 1591 1591
0
1000
2000
3000
4000
5000
6000
$000s
Figure 2.7: Summary of Electra’s forecast operating and maintenance expenditure
A summary of Electra’s forecast capital expenditure over the next ten years is shown in the figure
overleaf. These figures are in constant price NZ dollars (ie no provision for inflation). The majority
of planned capital expenditure is aimed to maintain serviceability of the network and reduce the risk
of declining network reliability using the average age as a proxy measurement. Other projects
such as the installation of RMUs for network sectionalisation offset the natural degradation in
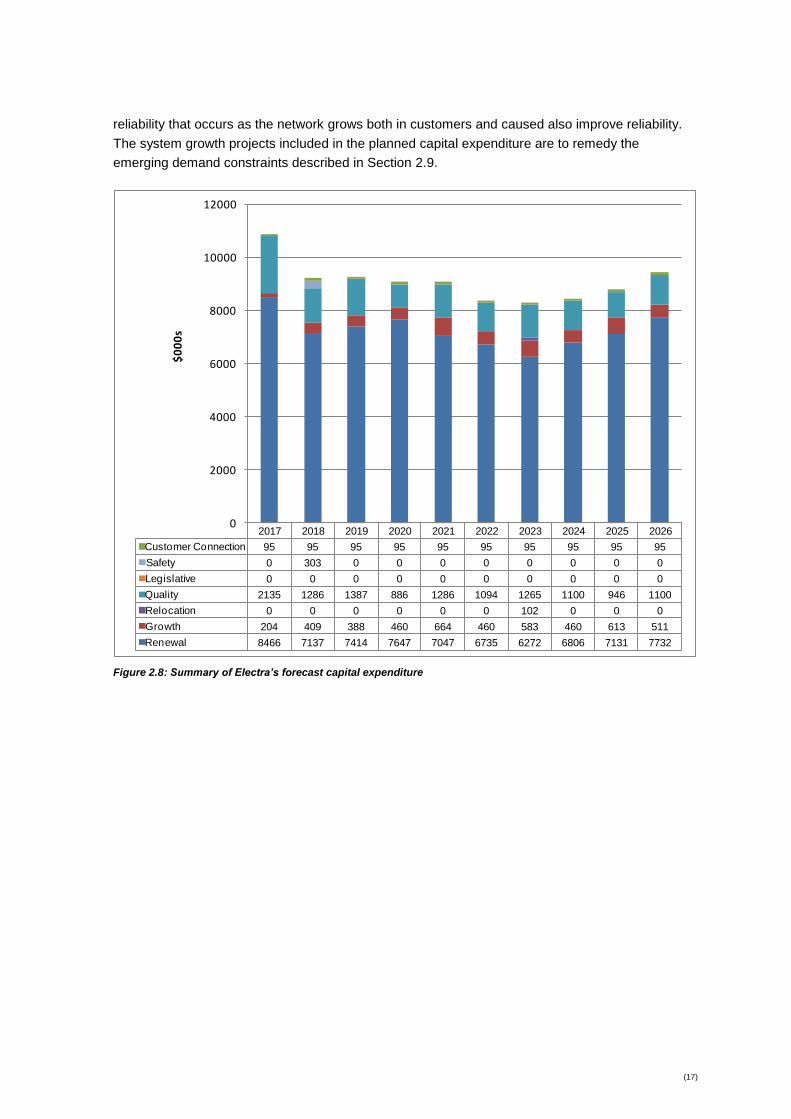
(17)
reliability that occurs as the network grows both in customers and caused also improve reliability.
The system growth projects included in the planned capital expenditure are to remedy the
emerging demand constraints described in Section 2.9.
2017 2018 2019 2020 2021 2022 2023 2024 2025 2026
Customer Connection 95 95 95 95 95 95 95 95 95 95
Safety 0 303 0 0 0 0 0 0 0 0
Legislative 0 0 0 0 0 0 0 0 0 0
Quality 2135 1286 1387 886 1286 1094 1265 1100 946 1100
Relocation 0 0 0 0 0 0 102 0 0 0
Growth 204 409 388 460 664 460 583 460 613 511
Renewal 8466 7137 7414 7647 7047 6735 6272 6806 7131 7732
0
2000
4000
6000
8000
10000
12000
$0
00
s
Figure 2.8: Summary of Electra’s forecast capital expenditure

(18)
A summary of Electra’s forecast lifecycle expenditure in constant price NZ dollars is shown in the
figure below.
2017 2018 2019 2020 2021 2022 2023 2024 2025 2026
Renewal 8466 7137 7414 7647 7047 6735 6272 6806 7131 7732
Refurbishment & Renewal Maintenance 457 458 436 458 458 458 458 436 458 458
Fault & Emergency Maintenance 2226 2305 2305 2305 2305 2105 2105 2105 2105 2012
Routine & Preventative Maintenance 897 1043 1043 1043 1043 1043 1043 1043 1043 1043
Vegetation 1591 1591 1591 1591 1591 1591 1591 1591 1591 1591
0
2000
4000
6000
8000
10000
12000
14000
16000
$000s
Figure 2.9: Summary of Electra’s forecast lifecycle expenditure
(19)
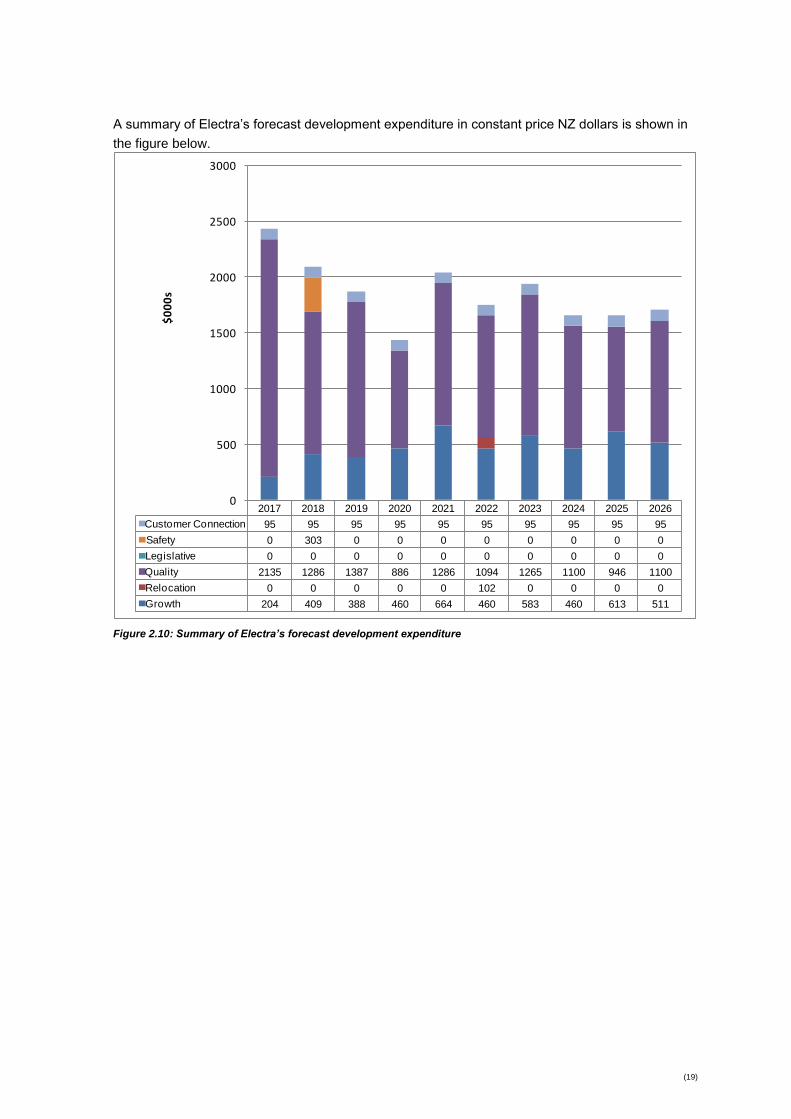
A summary of Electra’s forecast development expenditure in constant price NZ dollars is shown in
the figure below.
2017 2018 2019 2020 2021 2022 2023 2024 2025 2026
Customer Connection 95 95 95 95 95 95 95 95 95 95
Safety 0 303 0 0 0 0 0 0 0 0
Legislative 0 0 0 0 0 0 0 0 0 0
Quality 2135 1286 1387 886 1286 1094 1265 1100 946 1100
Relocation 0 0 0 0 0 102 0 0 0 0
Growth 204 409 388 460 664 460 583 460 613 511
0
500
1000
1500
2000
2500
3000$
00
0s
Figure 2.10: Summary of Electra’s forecast development expenditure
(20)
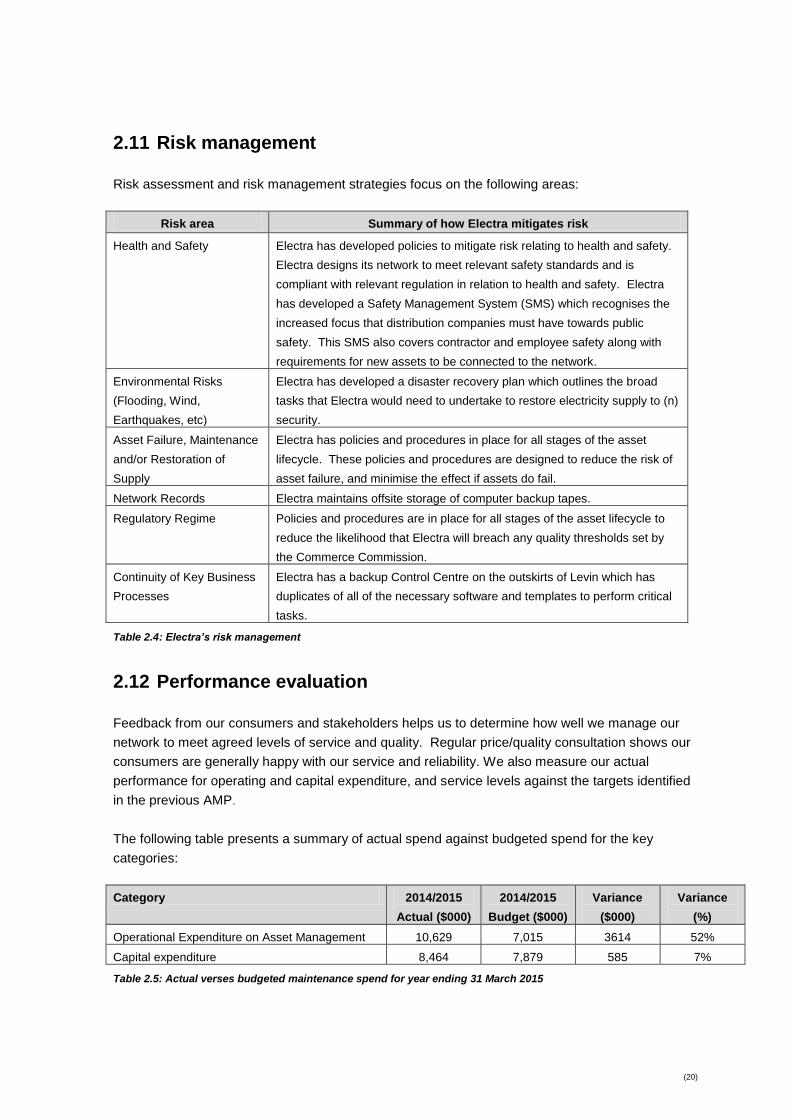
2.11 Risk management
Risk assessment and risk management strategies focus on the following areas:
Risk area Summary of how Electra mitigates risk
Health and Safety Electra has developed policies to mitigate risk relating to health and safety.
Electra designs its network to meet relevant safety standards and is
compliant with relevant regulation in relation to health and safety. Electra
has developed a Safety Management System (SMS) which recognises the
increased focus that distribution companies must have towards public
safety. This SMS also covers contractor and employee safety along with
requirements for new assets to be connected to the network.
Environmental Risks
(Flooding, Wind,
Earthquakes, etc)
Electra has developed a disaster recovery plan which outlines the broad
tasks that Electra would need to undertake to restore electricity supply to (n)
security.
Asset Failure, Maintenance
and/or Restoration of
Supply
Electra has policies and procedures in place for all stages of the asset
lifecycle. These policies and procedures are designed to reduce the risk of
asset failure, and minimise the effect if assets do fail.
Network Records Electra maintains offsite storage of computer backup tapes.
Regulatory Regime Policies and procedures are in place for all stages of the asset lifecycle to
reduce the likelihood that Electra will breach any quality thresholds set by
the Commerce Commission.
Continuity of Key Business
Processes
Electra has a backup Control Centre on the outskirts of Levin which has
duplicates of all of the necessary software and templates to perform critical
tasks.
Table 2.4: Electra’s risk management
2.12 Performance evaluation
Feedback from our consumers and stakeholders helps us to determine how well we manage our
network to meet agreed levels of service and quality. Regular price/quality consultation shows our
consumers are generally happy with our service and reliability. We also measure our actual
performance for operating and capital expenditure, and service levels against the targets identified
in the previous AMP.
The following table presents a summary of actual spend against budgeted spend for the key
categories:
Category 2014/2015
Actual ($000)
2014/2015
Budget ($000)
Variance
($000)
Variance
(%)
Operational Expenditure on Asset Management 10,629 7,015 3614 52%
Capital expenditure 8,464 7,879 585 7%
Table 2.5: Actual verses budgeted maintenance spend for year ending 31 March 2015
(21)
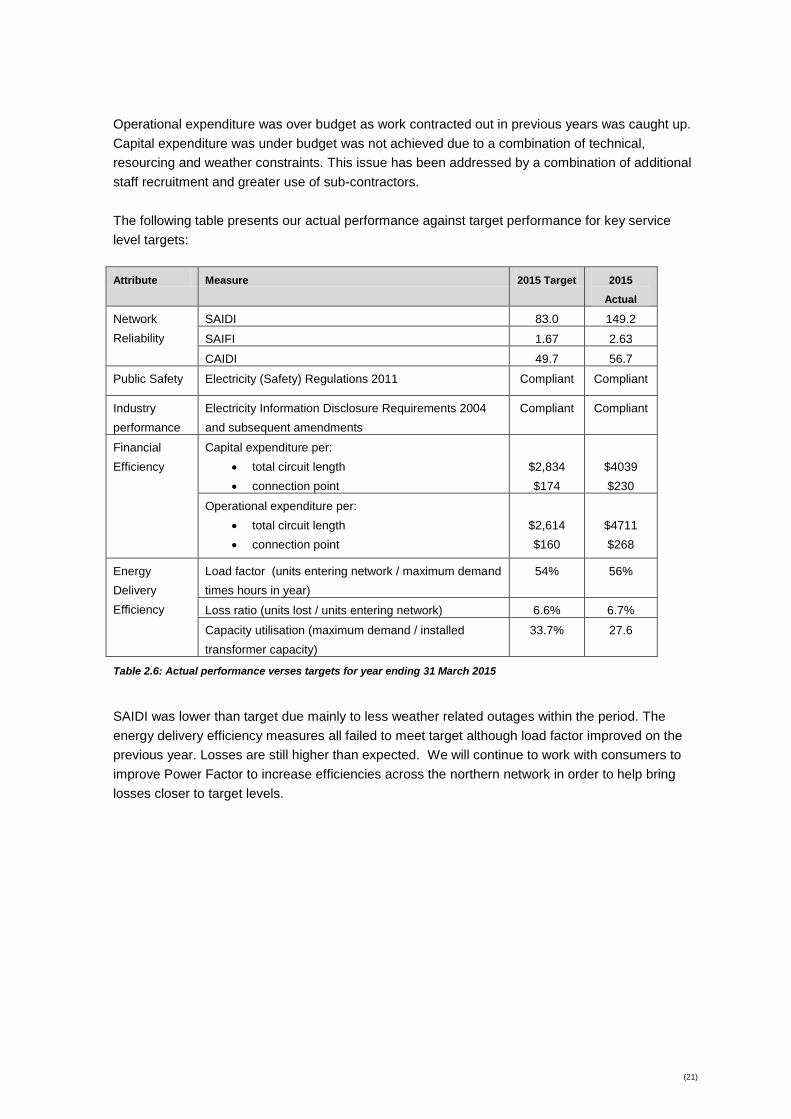
Operational expenditure was over budget as work contracted out in previous years was caught up.
Capital expenditure was under budget was not achieved due to a combination of technical,
resourcing and weather constraints. This issue has been addressed by a combination of additional
staff recruitment and greater use of sub-contractors.
The following table presents our actual performance against target performance for key service
level targets:
Attribute Measure 2015 Target 2015
Actual
Network
Reliability
SAIDI 83.0 149.2
SAIFI 1.67 2.63
CAIDI 49.7 56.7
Public Safety Electricity (Safety) Regulations 2011 Compliant Compliant
Industry
performance
Electricity Information Disclosure Requirements 2004
and subsequent amendments
Compliant Compliant
Financial
Efficiency
Capital expenditure per:
total circuit length
connection point
$2,834
$174
$4039
$230
Operational expenditure per:
total circuit length
connection point
$2,614
$160
$4711
$268
Energy
Delivery
Efficiency
Load factor (units entering network / maximum demand
times hours in year)
54% 56%
Loss ratio (units lost / units entering network) 6.6% 6.7%
Capacity utilisation (maximum demand / installed
transformer capacity)
33.7% 27.6
Table 2.6: Actual performance verses targets for year ending 31 March 2015
SAIDI was lower than target due mainly to less weather related outages within the period. The
energy delivery efficiency measures all failed to meet target although load factor improved on the
previous year. Losses are still higher than expected. We will continue to work with consumers to
improve Power Factor to increase efficiencies across the northern network in order to help bring
losses closer to target levels.

(22)
3 Background and Objectives
3.1 Purpose of the Plan
This AMP has been prepared by Electra to provide a governance and management framework that
ensures that Electra:
Sets service levels for its electricity network that will meet consumer, community and
regulatory requirements;
Understands the current and future network capacity, reliability and security of supply
requirements, and the issues that drive these requirements;
Has robust and transparent processes in place for managing all phases of the network life
cycle, from conception to disposal;
Considers the classes of risk its network business faces and has systematic processes in
place to mitigate identified risks;
Makes adequate provision for funding all phases of the network lifecycle;
Makes decisions within systematic and structured frameworks across the business; and
Builds knowledge of its asset’s location, age and condition and the network’s likely future
behaviour and performance.
This purpose is consistent with Electra’s overall business mission and strategic objectives, as
demonstrated in section 3.2 below. Most importantly this AMP, along with Electra’s other plans,
demonstrates that Electra is responsibly managing its electricity network assets to best-practice
levels. The AMP is set in context by risk analysis, company policies and load projections. It
provides a focus for continuous improvement in the management of the electricity assets and
demonstrates responsible ownership of Electra's electricity distribution network on behalf of
consumers, shareholders, retailers, government agencies, contractors, staff, financial institutions
and the general public. The AMP is also a technical document which is used regularly by our staff
to manage our assets.
Disclosure of this AMP in this format meets the provisions of the Electricity Distribution Information
Disclosure Determination 2013. A summary of the links between this AMP and the Disclosure
Requirements is included in Appendix B.
3.2 Interaction with other goals, processes and plan
Electra is 100% owned by the Electra Trust whose beneficiaries are Electra’s consumers.
Electra’s mission, as stated in our Statement of Corporate Intent (“SCI”) is “to enhance the
region’s development through the provision of 21st
century infrastructure, Electra will
endeavour to maximise value for consumers and owners through competitive prices, quality
services with safe and efficient operations.”
(23)
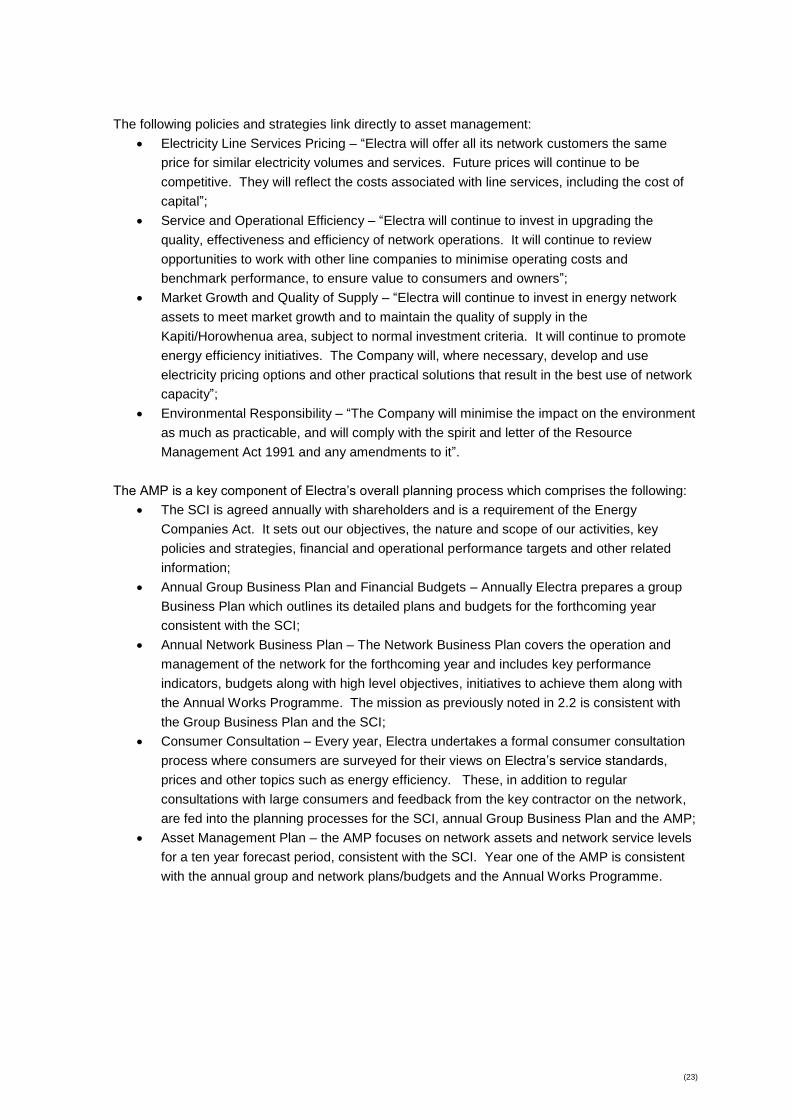
The following policies and strategies link directly to asset management:
Electricity Line Services Pricing – “Electra will offer all its network customers the same
price for similar electricity volumes and services. Future prices will continue to be
competitive. They will reflect the costs associated with line services, including the cost of
capital”;
Service and Operational Efficiency – “Electra will continue to invest in upgrading the
quality, effectiveness and efficiency of network operations. It will continue to review
opportunities to work with other line companies to minimise operating costs and
benchmark performance, to ensure value to consumers and owners”;
Market Growth and Quality of Supply – “Electra will continue to invest in energy network
assets to meet market growth and to maintain the quality of supply in the
Kapiti/Horowhenua area, subject to normal investment criteria. It will continue to promote
energy efficiency initiatives. The Company will, where necessary, develop and use
electricity pricing options and other practical solutions that result in the best use of network
capacity”;
Environmental Responsibility – “The Company will minimise the impact on the environment
as much as practicable, and will comply with the spirit and letter of the Resource
Management Act 1991 and any amendments to it”.
The AMP is a key component of Electra’s overall planning process which comprises the following:
The SCI is agreed annually with shareholders and is a requirement of the Energy
Companies Act. It sets out our objectives, the nature and scope of our activities, key
policies and strategies, financial and operational performance targets and other related
information;
Annual Group Business Plan and Financial Budgets – Annually Electra prepares a group
Business Plan which outlines its detailed plans and budgets for the forthcoming year
consistent with the SCI;
Annual Network Business Plan – The Network Business Plan covers the operation and
management of the network for the forthcoming year and includes key performance
indicators, budgets along with high level objectives, initiatives to achieve them along with
the Annual Works Programme. The mission as previously noted in 2.2 is consistent with
the Group Business Plan and the SCI;
Consumer Consultation – Every year, Electra undertakes a formal consumer consultation
process where consumers are surveyed for their views on Electra’s service standards,
prices and other topics such as energy efficiency. These, in addition to regular
consultations with large consumers and feedback from the key contractor on the network,
are fed into the planning processes for the SCI, annual Group Business Plan and the AMP;
Asset Management Plan – the AMP focuses on network assets and network service levels
for a ten year forecast period, consistent with the SCI. Year one of the AMP is consistent
with the annual group and network plans/budgets and the Annual Works Programme.

(24)
The following diagram shows how the planning processes interact with each other.
Figure 3.1: Interaction between planning processes
Thus, strategic policy flows directly into asset management, which is captured in the AMP for long
term asset management. Each year Electra consolidates the first year of the AMP and any recent
commercial, asset or operational issues into the annual business plan. An important component of
the Annual Network Business Plan is the Annual Works Programme which scopes and costs each
individual activity or project that is expected to be undertaken in the year ahead. A critical activity
for Electra is to firstly ensure that this Annual Works Programme accurately reflects the projects
scheduled for the current year in the AMP and secondly ensure that each project is implemented
according to the scope prescribed in the works programme. All the planning documents above are
approved at the Board level prior to implementation.
3.3 Planning period
This AMP covers the period 1 April 2016 – 31 March 2026. Maintenance and development plans
are most specific for the initial five year period to 31 March 2021. Similar plans through to 31
March 2026 are more indicative and are provided for strategic direction. Proposed activities
towards the end of this planning horizon are based on current views, trends and assumptions and
may change as more accurate information emerges over time.
The AMP was approved by Electra’s Board during the Board meeting held 31 March 2016.
Statement of Corporate Intent
Mission
Objectives
Scope of activities
Key policies & strategies
Financial & operational performance targets
Customer Consultation
Customers are surveyed on:
Service standards
Price/Quality trade off
Energy efficiency
Etc
Shareholder Consultation
(Electra Trust)
Annual Group Business Plan &
Financial Plans
Annual Network Business Plan
& Annual Works Programme
Asset Management Plan (AMP)
Implement
Measure/Evaluate
Performance
Network Development Plan
(25)
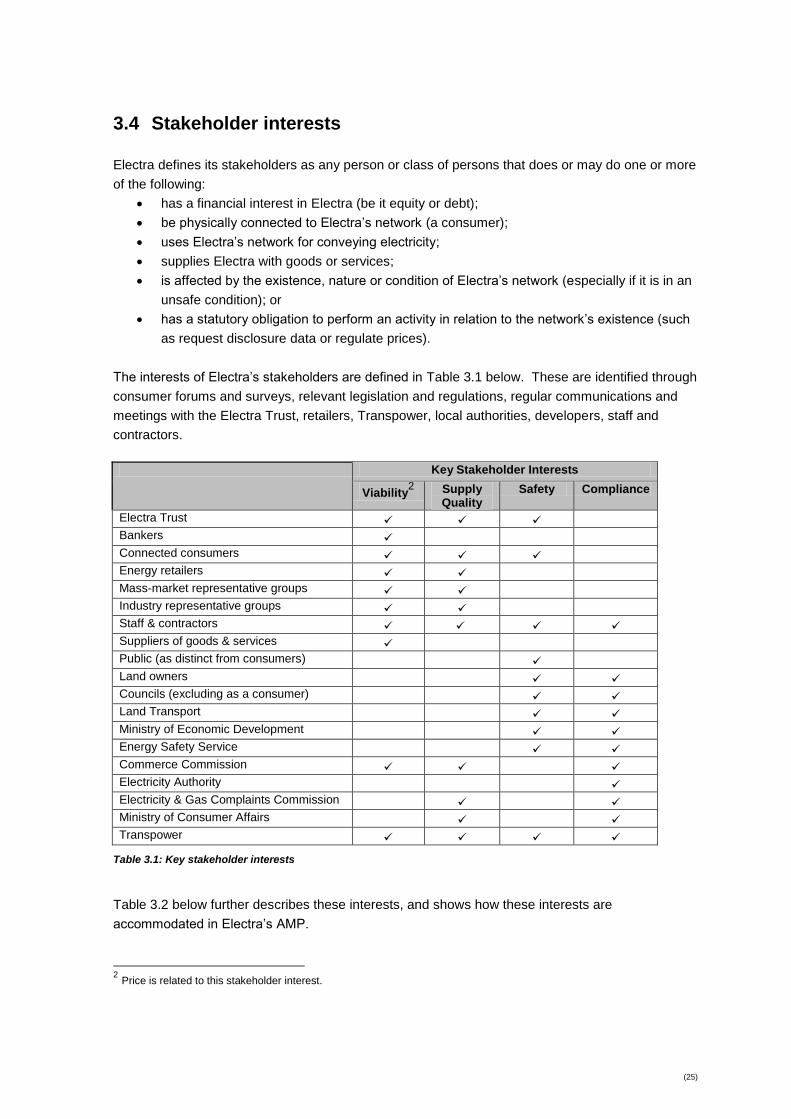
3.4 Stakeholder interests
Electra defines its stakeholders as any person or class of persons that does or may do one or more
of the following:
has a financial interest in Electra (be it equity or debt);
be physically connected to Electra’s network (a consumer);
uses Electra’s network for conveying electricity;
supplies Electra with goods or services;
is affected by the existence, nature or condition of Electra’s network (especially if it is in an
unsafe condition); or
has a statutory obligation to perform an activity in relation to the network’s existence (such
as request disclosure data or regulate prices).
The interests of Electra’s stakeholders are defined in Table 3.1 below. These are identified through
consumer forums and surveys, relevant legislation and regulations, regular communications and
meetings with the Electra Trust, retailers, Transpower, local authorities, developers, staff and
contractors.
Key Stakeholder Interests
Viability2 Supply
Quality Safety Compliance
Electra Trust
Bankers
Connected consumers
Energy retailers
Mass-market representative groups
Industry representative groups
Staff & contractors
Suppliers of goods & services
Public (as distinct from consumers)
Land owners
Councils (excluding as a consumer)
Land Transport
Ministry of Economic Development
Energy Safety Service
Commerce Commission
Electricity Authority
Electricity & Gas Complaints Commission
Ministry of Consumer Affairs
Transpower
Table 3.1: Key stakeholder interests
Table 3.2 below further describes these interests, and shows how these interests are
accommodated in Electra’s AMP.
2 Price is related to this stakeholder interest.

(26)
Interest Description How Electra accommodate interests
Viability Viability is necessary to
ensure that the Trust and
other providers of finance
such as bankers have
sufficient reason to keep
investing in Electra.
Electra will accommodate its stakeholders’ needs for long-term
viability by delivering earnings that are sustainable and reflect
an appropriate risk-adjusted return on capital employed. In
general terms this will need to be at least as good as Electra’s
owners could obtain from a term deposit at the bank plus a
margin to reflect the risks to capital in an increasingly
regulated lines sector.
Price is the key to viability, but must be managed to be in line
with similar network companies and to provide a satisfactory
discount to Electra’s consumer/owners.
Supply Quality Emphasis on supply
continuity, restoration and
reducing flicker is essential
to minimising interruptions to
consumers businesses.
Electra will accommodate its stakeholders’ needs for supply
quality by focussing resources on continuity and restoration.
Many of the renewal jobs discussed in this AMP are aimed at
maintaining Electra’s security of supply. Electra’s most recent
mass-market survey (December 2015) indicated a general
satisfaction with the present supply quality.
Safety Staff, contractors and the
public at large must be able
to move around and work on
Electra’s network safely.
Electra will ensure that the public at large are kept safe by
ensuring that all above-ground assets are structurally sound,
live conductors are well out of reach, all enclosures are kept
locked, and all exposed metal is earthed.
Electra will also ensure that the public are kept safe via its
Safety Management System (SMS).
Electra will ensure the safety of its staff and contractors by
providing all necessary equipment, improving safe work
practices, and ensuring that workers are stood down in unsafe
conditions.
Motorists will be kept safe by ensuring that above-ground
structures are kept as far as possible from the carriage way
within the constraints Electra faces in regard to private land
and road reserve.
Compliance Electra needs to comply with
many statutory requirements
ranging from safety to
information disclosure.
Electra will ensure that all safety issues are adequately
documented and available for inspection by authorised
agencies as well as for learning by its own staff and
contractors.
Electra will disclose performance information in a timely and
compliant fashion.
Table 3.2: Accommodating stakeholders interests
Table 3.2 below further describes the communication processes used between Electra and the
various stakeholders identified above.

(27)
Stakeholder Communication Plan
Electra Trust Quarterly briefings
Bankers Quarterly meetings
Connected consumers As required via 0800 phone number and website enquiry
section, Annual Review mail out, Annual General
Meeting, annual customer survey.
Energy retailers As required, at least annually
Mass-market representative groups Annual General Meeting
Industry representative groups Annually via meetings and conferences
Staff & contractors Weekly Staff meeting, Monthly Contractor meeting, as
required for specific projects
Suppliers of goods & services As required
Public (as distinct from consumers) As required via 0800 phone number and website enquiry
section
Land owners As required for specific projects
Councils (excluding as a consumer) Monthly Emergency Management meeting, annual
planning disclosure, as required for specific projects.
Land Transport As required
Ministry of Economic Development As required
Energy Safety Service As required
Commerce Commission Annually via Disclosures
Electricity Authority As required
Electricity & Gas Complaints Commission As required
Ministry of Consumer Affairs As required
Transpower Quarterly updates, annual planning meeting
Table 3.3: Stakeholder communications
Electra manages possible conflicting stakeholder interests by:
Considering the needs of all stakeholders during planning;
Undertaking cost/benefit analysis;
Balancing security needs against the cost of non supply; and
Considering our legislative requirements – including the requirement to operate as a
successful business under the Energy Companies Act 1992.
Wherever possible, Electra will endeavour to resolve conflicts of interest in a responsible manner,
and will follow due process in order to discharge its responsibilities in respect of its obligations for
electricity supply. Our priorities for managing conflicting interests are:
Safety - Electra will give top priority to safety. Even if it has to exceed budget or risk non-
compliance, Electra will not compromise the safety of its staff, contractors or the public;
Viability - Electra will give second priority to viability because without it Electra will cease to
exist which makes supply quality and compliance irrelevant;
Supply quality – Electra will give third priority to security of supply. Security of supply is
important to consumers connected to Electra’s Network;
Compliance - Electra will give lower priority to compliance that is not safety related. Most
aspects of compliance attempt to defend consumer interests in the face of supposed

(28)
monopoly power, however Electra reasons that if all stakeholders except the regulator are
happy then the regulator is not reflecting stakeholder wishes.
These conflicting interests are taken into account in the prioritisation of jobs (if applicable). Section
7.2 provides more information about prioritisation of jobs.
3.5 Asset management accountabilities
All shares in Electra Limited are owned by the Electra Trust. Between the Trust and the Electra
CEO sits a Board of Directors. The following diagram shows the organisational structure of the
Electra Network. This is followed by a discussion of the roles and responsibilities held by each
group.
Trust
Board
CEO
GM Network
Network Operations Manager
Control Centre Operator/Network
Technician
Network Technician/Control Centre Operator X
2
After Hours Control Room Operator
Network Planning & Development
Manager
Network Analyst Network EngineerNetwork Systems
Engineer P/TData Entry
Operator P/T
Figure 3.2: Organisational chart
The Electra Trust is elected by the consumers connected to the Electra network. They represent
the interests of Electra’s consumers and appoint the members of the Electra Board.
The Electra Board is responsible for the direction and control of the Company, including business
plans and the AMP. Asset management performance (including capital and maintenance works
completed, and progress against budget) and quality statistics are reported to the Board monthly.
(29)
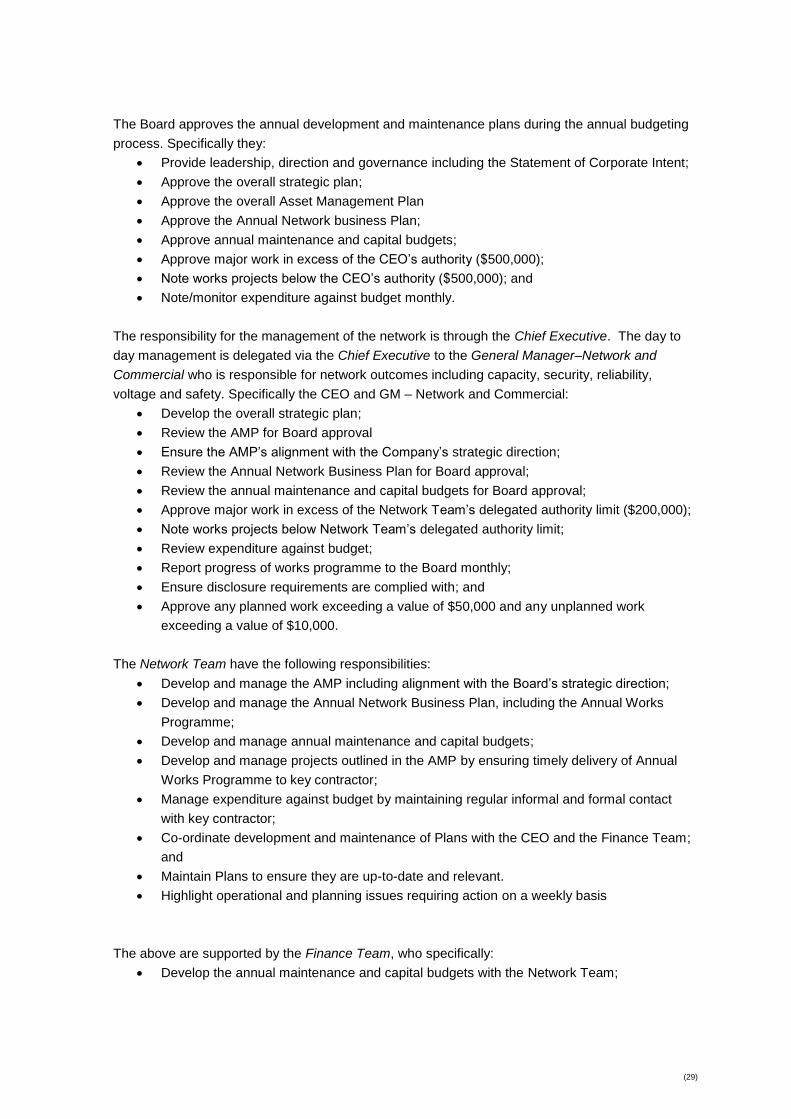
The Board approves the annual development and maintenance plans during the annual budgeting
process. Specifically they:
Provide leadership, direction and governance including the Statement of Corporate Intent;
Approve the overall strategic plan;
Approve the overall Asset Management Plan
Approve the Annual Network business Plan;
Approve annual maintenance and capital budgets;
Approve major work in excess of the CEO’s authority ($500,000);
Note works projects below the CEO’s authority ($500,000); and
Note/monitor expenditure against budget monthly.
The responsibility for the management of the network is through the Chief Executive. The day to
day management is delegated via the Chief Executive to the General Manager–Network and
Commercial who is responsible for network outcomes including capacity, security, reliability,
voltage and safety. Specifically the CEO and GM – Network and Commercial:
Develop the overall strategic plan;
Review the AMP for Board approval
Ensure the AMP’s alignment with the Company’s strategic direction;
Review the Annual Network Business Plan for Board approval;
Review the annual maintenance and capital budgets for Board approval;
Approve major work in excess of the Network Team’s delegated authority limit ($200,000);
Note works projects below Network Team’s delegated authority limit;
Review expenditure against budget;
Report progress of works programme to the Board monthly;
Ensure disclosure requirements are complied with; and
Approve any planned work exceeding a value of $50,000 and any unplanned work
exceeding a value of $10,000.
The Network Team have the following responsibilities:
Develop and manage the AMP including alignment with the Board’s strategic direction;
Develop and manage the Annual Network Business Plan, including the Annual Works
Programme;
Develop and manage annual maintenance and capital budgets;
Develop and manage projects outlined in the AMP by ensuring timely delivery of Annual
Works Programme to key contractor;
Manage expenditure against budget by maintaining regular informal and formal contact
with key contractor;
Co-ordinate development and maintenance of Plans with the CEO and the Finance Team;
and
Maintain Plans to ensure they are up-to-date and relevant.
Highlight operational and planning issues requiring action on a weekly basis
The above are supported by the Finance Team, who specifically:
Develop the annual maintenance and capital budgets with the Network Team;

(30)
Review expenditure against budget; and
Maintain the financial models to ensure financial information is up-to-date for decision-
making.
Electra has recently brought its former contracting subsidiary back in-house to enable a stronger
focus on Electra work. Electra Distribution Operations is Electra’s key contractor and the majority of
works under this plan will be completed by Electra’s Distribution Operations staff under
performance based agreements.
Subcontractors are also engaged drawing from existing contractors already approved to carry out
work on the network for third parties or from specialists approved on a contract by contract basis.
Other parties contracted for work directly by Electra are
ICONA Ltd of Ashhurst who manage and maintain SCADA and Control Centre radio
communications. ICONA provide similar specialised support for a number of other EDB’s
Callcare of Blenheim who provide Call Centre and minor fault management services to
Electra and a number of other EDB’s, effectively pooling the resources enabling greater
flexibility and capacity to handle events.
Eagle Technology of Wellington for GIS support for the ESRI system used by a number of
other EDB’s and Local Authorities.

(31)
3.6 Asset management systems and processes
Electra uses a number of asset management systems to facilitate best practice asset management.
Table 3.3 below summarises Electra’s asset information systems:
System Data Held What data is used for
NIMS (GIS) Contains geospatial information for all
assets including asset description,
location, age, electrical attributes,
condition and associated easements
Used by field, real-time operators, planning and
project management staff within the Network
team to obtain information on asset location,
attributes and connectivity
iPad GPS co-ordinates for all scheduled
maintenance assets. This information
includes, but is not limited to asset ID,
date of inspection and condition of
asset
Used to determine the maintenance work for
the following year
SCADA Asset operational information
including loadings, voltages,
temperatures and switch positions
Measuring load on various parts of the network.
This is used for assessing security, load
forecasts and feeder configurations
NIMS (incident
tracking)
System outages, location, duration,
cause, number of consumers affected
Used to identify assets that are causing
outages and to report on SAIFI/SAIDI and
CAIDI
Valuation
Spreadsheets
Asset types, quantities, ages,
expected total lives, remaining lives
and values
Used for system fixed asset valuations
Paper &
Electronic
Documents
Miscellaneous records, design and
operational files
Used to support GIS (NIMs) data
Table 3.3: Electra’s asset information systems
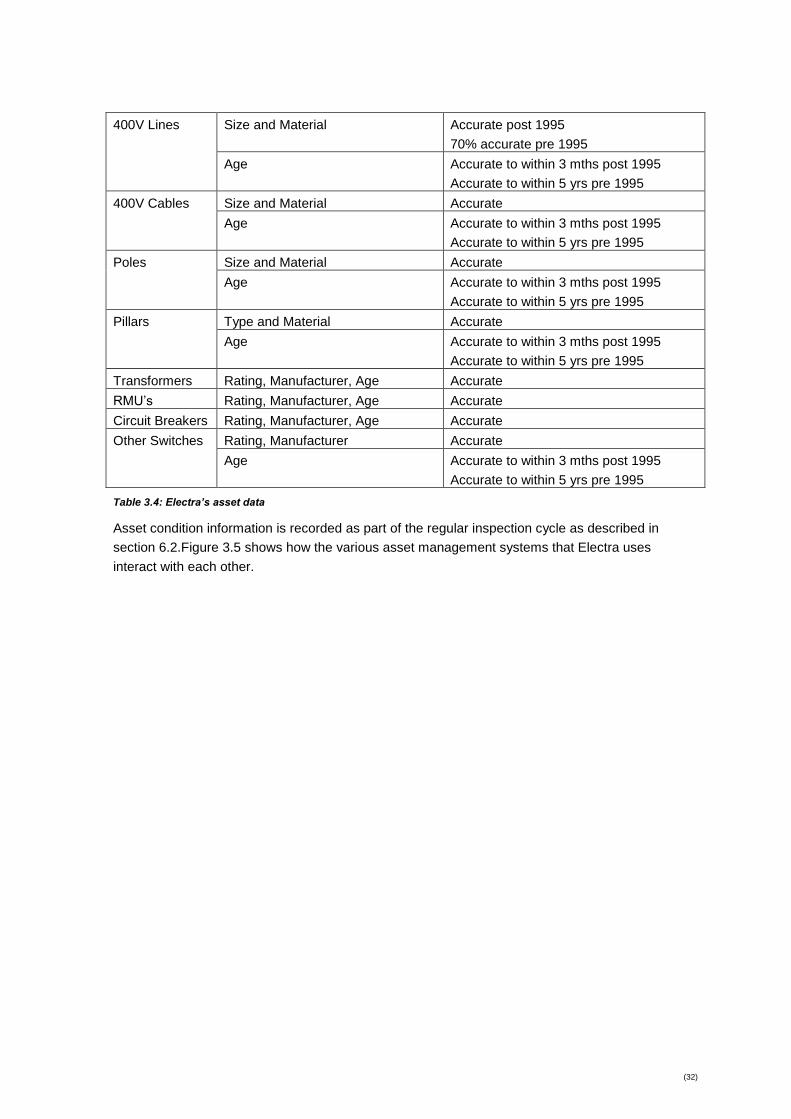
Reconciliation between the various data sets means that Electra now has improved data quality
levels for its assets. These are summarised in the table below.
Asset Type Asset Information Held Information Quality
33kV Lines Size and Material Accurate
Age Accurate to within 6 mths
33kV Cables Size and Material Accurate
Age Accurate to within 3 mths
11kV Lines Size and Material Accurate
Age Accurate to within 6 mths post 1995
Accurate to within 5 yrs pre 1995
11kV Cables Size and Material Accurate
Age Accurate to within 3 mths post 1995
Accurate to within 5 yrs pre 1995
(32)
400V Lines Size and Material Accurate post 1995
70% accurate pre 1995
Age Accurate to within 3 mths post 1995
Accurate to within 5 yrs pre 1995
400V Cables Size and Material Accurate
Age Accurate to within 3 mths post 1995
Accurate to within 5 yrs pre 1995
Poles Size and Material Accurate
Age Accurate to within 3 mths post 1995
Accurate to within 5 yrs pre 1995
Pillars Type and Material Accurate
Age Accurate to within 3 mths post 1995
Accurate to within 5 yrs pre 1995
Transformers Rating, Manufacturer, Age Accurate
RMU’s Rating, Manufacturer, Age Accurate
Circuit Breakers Rating, Manufacturer, Age Accurate
Other Switches Rating, Manufacturer Accurate
Age Accurate to within 3 mths post 1995
Accurate to within 5 yrs pre 1995
Table 3.4: Electra’s asset data
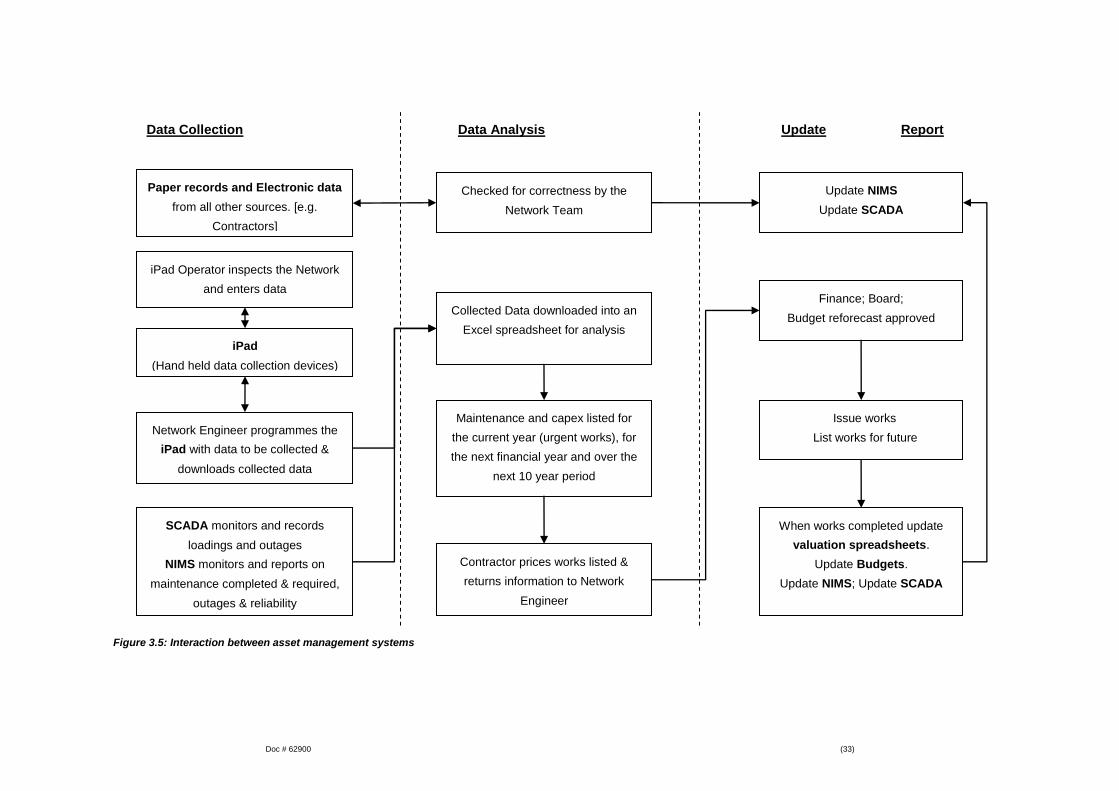
Asset condition information is recorded as part of the regular inspection cycle as described in
section 6.2.Figure 3.5 shows how the various asset management systems that Electra uses
interact with each other.
Doc # 62900 (33)
Figure 3.5: Interaction between asset management systems
iPad
(Hand held data collection devices)
Network Engineer programmes the
iPad with data to be collected &
downloads collected data
SCADA monitors and records
loadings and outages
NIMS monitors and reports on
maintenance completed & required,
outages & reliability
Paper records and Electronic data
from all other sources. [e.g.
Contractors]
Checked for correctness by the
Network Team
Update NIMS
Update SCADA
Finance; Board;
Budget reforecast approved
Issue works
List works for future
When works completed update
valuation spreadsheets.
Update Budgets.
Update NIMS; Update SCADA
Collected Data downloaded into an
Excel spreadsheet for analysis
Maintenance and capex listed for
the current year (urgent works), for
the next financial year and over the
next 10 year period
Contractor prices works listed &
returns information to Network
Engineer
Data Collection Data Analysis Update Report
iPad Operator inspects the Network
and enters data

Doc # 62900
(34)
Electra has identified that its asset age information for 11kV and 400V circuits is incomplete for
assets that were installed prior to 1 April 1995. To overcome this, an average weighted age was
applied to each asset based on the associated transformers. This is not ideal, as transformers and
circuits are installed and replaced independently of each other. During 2010 Electra undertook re-
estimating the age of each asset based on the type of line or cable in use and believes this has
resulted in a more accurate age profile for circuits installed prior to 1 April 1995. All circuits
installed or replaced since then have had installation dates recorded against each asset in NIMS.
Over time this information will become accurate as old assets are replaced with new assets.
No other gaps in information have been identified. Any assets that do not match that recorded in
Electra’s systems will be identified (and records updated) as part of the inspection programme.
The processes for key network information tasks are described below:
3.6.1 Managing routine asset inspections and network maintenance
Annual asset information is stored electronically within the network management group. All
individual equipment classes are contained within their own folders within the year of inspection.
Inspections since 2005 have been captured electronically and stored for use with the GIS software.
Previous inspection data is stored in spreadsheets. More specific detail about asset inspections
and network maintenance policies and programmes are provided in section 6.2.
3.6.2 Planning and implementing network development processes
Development of the 11kV and 400V distribution network is usually driven by private development
needs. These may in turn point to an area of the existing network which needs to be developed,
strengthened or have additional 11kV feeders constructed from a zone substation to supply the
expected forward demand.
System load analysis is undertaken to ensure that the expected forward load may be able to be
supplied from the existing network after a simple reconfiguration (and for how long). If the analysis
identifies that the system cannot meet the forward load, then Electra investigates whether the lines
and/or cables need to be up-sized to cope with the additional load, or whether an additional 11kV
supply is required from the nearest zone substation. At the same time, security of supply to the
added area is explored. This applies to areas of the network including zone substations and the
33kV sub-transmission network.
All the possible and reasonable solutions are explored before a decision is made as to the final
working solution. On large jobs such as zone substation rebuilds, external consultants are used to
explore the various options. Projects are approved by staff with the appropriate delegated authority
limit (refer to section 3.5 regarding accountabilities). Post job reviews are completed to ensure
compliance with job specifications.

(35)
3.6.3 Measuring network performance (SAIDI etc)
All 33kV and 11kV outage information is entered in NIMS into the Incident Tracking programme.
NIMS is able to produce reports on these incidents; one group of which are associated with SAIDI,
SAIFI and CAIDI.
Data relating to the asset replacement is entered directly into the NIMS GIS data set. Reports are
then able to be created showing progress against plan. This data is cross-checked against the
accounting system asset register to provide quality assurance.
(36)
4 Assets Covered
4.1 High-level description of the distribution network
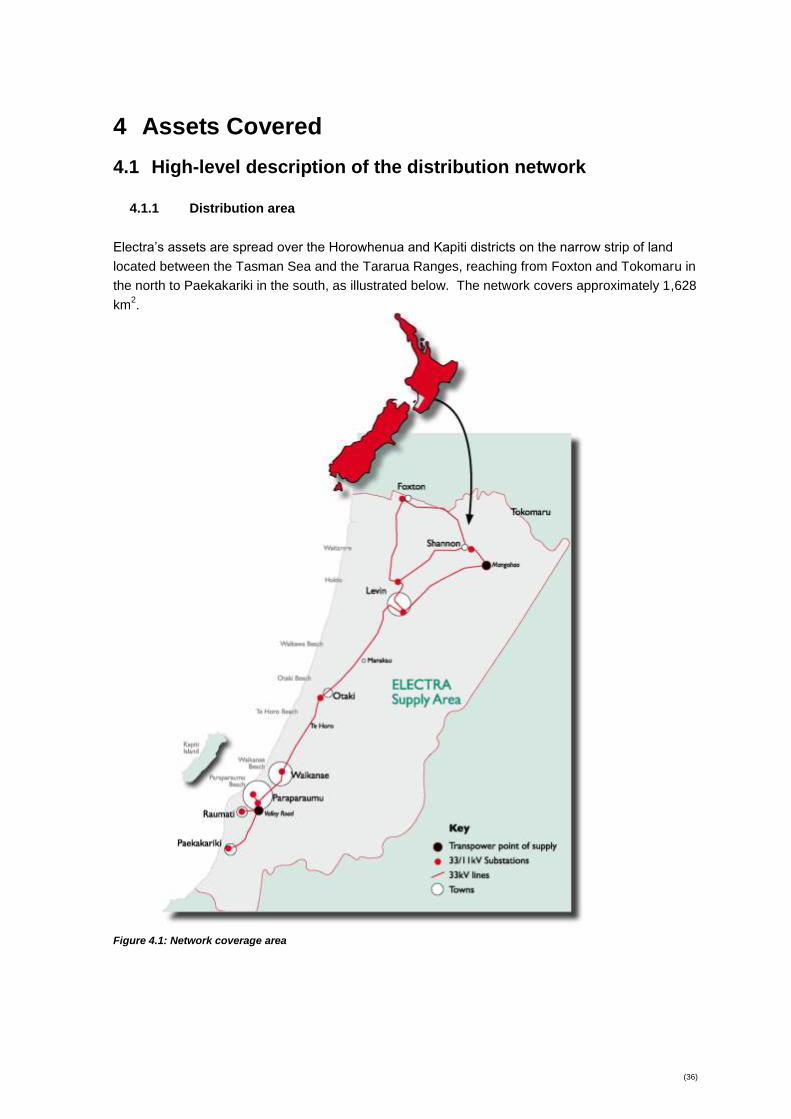
4.1.1 Distribution area
Electra’s assets are spread over the Horowhenua and Kapiti districts on the narrow strip of land
located between the Tasman Sea and the Tararua Ranges, reaching from Foxton and Tokomaru in
the north to Paekakariki in the south, as illustrated below. The network covers approximately 1,628
km2.
Figure 4.1: Network coverage area

(37)
The population of Electra’s network area is about 79,500 up from 76,000 in 2007. The Horowhenua
District has grown by 0.8% in the last 7 years while the Kapiti District has grown by 6.3% during the
same period albeit at a slower rate over the past 3 years. This has been largely due to the impacts
of slower economic growth.
Key energy and demand figures for the year ending 31 March 2015 are as follows:
Parameter Value for Year Ending 31/3/15 Long-term trend
Energy conveyed 402 GWh Decreasing
Coincident maximum
demand
89.0 MW Decrease over last year,
overall trend is static but is
dependent on temperature
Load factor 55.5% Increased compared with prior
years. Largely dependent on
maximum demand
Distribution Transformer
Capacity utilisation
27.0% Lower than previous year -
Largely dependent on
maximum demand
ICPs 44,511 Increasing by 200-300 per
annum
Table 4.1: Energy & demand statistics
4.1.2 Significant large consumers
Electra does not have large industrial consumers of the size typically found on many other
networks. Electra’s largest consumers in no particular order are:
Alliance Group Limited, Levin (meat processors);
Carter Holt Harvey, Levin (packaging manufacturer);
Kapiti Coast District Council (sewage and water treatment);
Pak’n’Save, Paraparaumu (supermarket);
Unisys NZ, Paraparaumu (data processing).
Kiwirail, Kapiti Coast (suburban transportation)
Together they represent less than 5% of the total usage on Electra’s network. This presents a risk
profile that is significantly less than the national average of 20% for the 5 largest connections for
EDB’s. Individually they do not significant impact on network operations or development. Each
consumer’s future demands and security needs are periodically discussed during Electra’s normal
consultative processes and where appropriate, specific needs are factored into the AMP.
4.1.3 Description of the load characteristics for different parts of the network
Electra’s supply area, while contiguous, comprises of two distinct and different demographic and
economic profiles along geographical lines as follows:

(38)
The southern area located around the towns of Paraparaumu and Waikanae is heavily
urbanised and relatively affluent, being the popular northern suburbs of Wellington that are
within easy commuting distance of the capital. The southern area is essentially a dense
suburban area that includes some light industry, an increasing number of big-box retailers,
professional services and extensive growth of residential housing. This is evidenced by the
lowest overall kWh consumption per consumer of all New Zealand networks. The key
electrical characteristic of this area has formerly been the need for up-sizing existing
assets due to high-density in-fill. This has now changed with reduced growth.
The northern area located around the towns of Levin, Shannon and Foxton is
predominantly rural and is characterised by horticulture and by some agriculture related
commercial load. The urban areas have a strong rural services base. Some resurgence
of niche services such as tourism and antiques is emerging in the smaller towns such as
Shannon and Foxton. The northern area’s economy remains closely tied to vegetable and
dairy prices.
4.1.4 Peak demand and total electricity delivered
Non coincident peak loads for the year ended 31 December 2015 for each GXP are shown by the
following table:
GXP Summer (Peak MW)
October - March
Winter (Peak MW)
April - September
Mangahao 31.164 32.538
Paraparaumu 44.986 61,092
Table 4.2: Peak demands by GXP
The electricity delivered for the year ending 31 March 2015 for Mangahao GXP was 175.5 GWh,
and for Paraparaumu GXP was 266.9 GWh. The peak demand by zone substation for the year
ended 31 December 2015 was:
Zone Substation Peak MW
Shannon 4.2
Foxton 6.8
Levin East 13.7
Levin West 13.5
Otaki 10.6
Waikanae 14.4
Paraparaumu 12.5
Paraparaumu West 13.4
Raumati 10.2
Paekakariki 2.5
Table 4.3: Zone substation peak demands

(39)
4.2 Network configuration
4.2.1 GXP and 33kV embedded generation
The Electra network is supplied from two Transpower GXPs. Electra’s northern network takes
33kV supply via four circuits at Mangahao GXP which is adjacent to the Mangahao hydro power
station in the foothills of the Tararua Ranges, approximately 5km east of Shannon. Electra has
concerns in the short to medium term about capacity, security, reliability and voltage when it is
required to supply the Otaki zone substation from Mangahao. These will be addressed when the
existing switchyard is rebuilt (expected 2020)
The Mangahao Power Station is the subject of a Generation Connection Agreement between
Electra and the Joint Venture Partners Todd Energy and King Country Energy with the purpose of
sharing transmission benefits resulting from the demand reduction at the Grid Exit Point.
Operational control of the station has not changed except that generation is focused where
possible around regional co-incident peaks.
Electra’s southern area takes 33kV supply via five circuits from Paraparaumu GXP which is
situated on the hillside above Paraparaumu. Due to the relatively high growth in this area of
Electra’s network, prudent and timely up-sizing of the GXP assets to maintain capacity, security,
reliability and voltage has been seen as an on-going challenge for Electra and Transpower. The
creation of a new highway access to Wellington has enabled the upgrading of this site to almost
double the original capacity with direct connection to the 220kV transmission lines running between
Manawatu and Wellington. This project was completed in the 2014/2015 financial year.
GXP Winter Firm Capacity (MVA) Current peak Load (MW - 2015)
Mangahao 30.00 32.54
Paraparaumu 120.00 61.09
Table 4.4: Firm capacity of GXP’s
Electra’s southern network load is predominantly domestic and shows a marked variation between
summer and winter. Many Kapiti Coast residents commute to Wellington which adds to the evening
peak as there is little commercial load during the day. This would result in the lowest load factor in
New Zealand if the southern area were a standalone network.
In the northern area of the network there is a much more typical load pattern due to a higher
portion of commercial load and domestic consumers living and working in the same geographical
location. The variation between summer and winter loads is also less marked due to increased
irrigation offsetting heating loads.
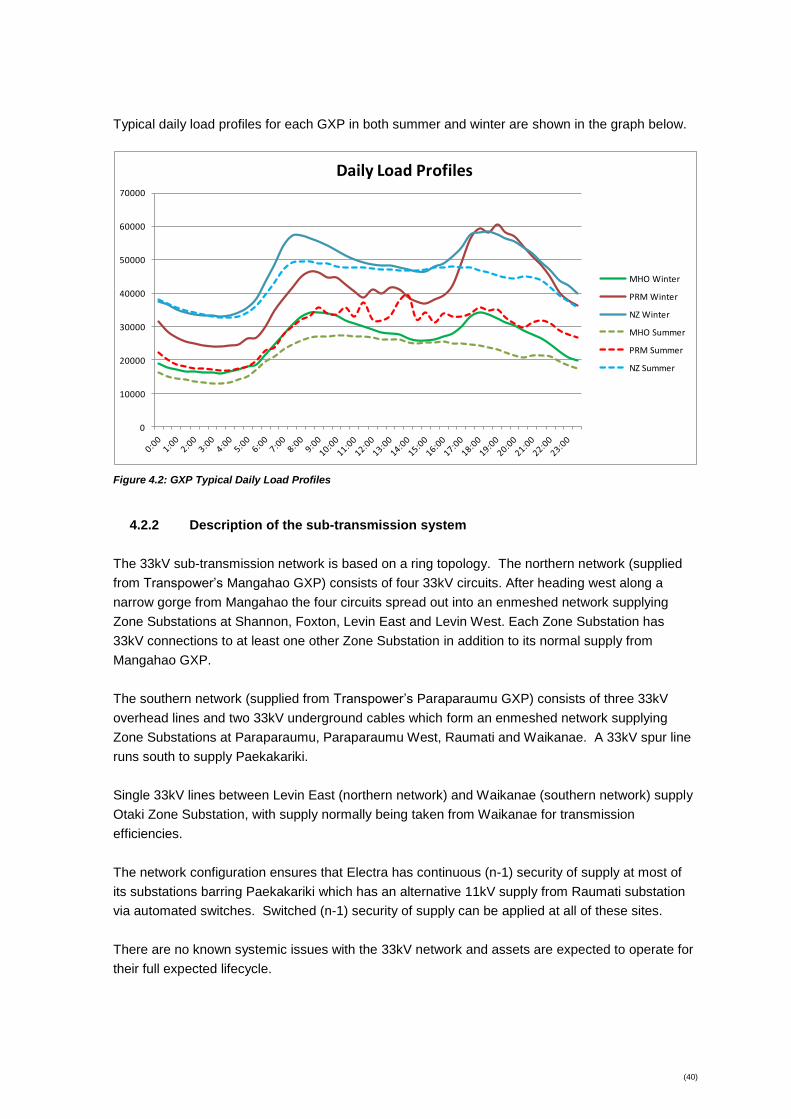
(40)
Typical daily load profiles for each GXP in both summer and winter are shown in the graph below.
0
10000
20000
30000
40000
50000
60000
70000
Daily Load Profiles
MHO Winter
PRM Winter
NZ Winter
MHO Summer
PRM Summer
NZ Summer
Figure 4.2: GXP Typical Daily Load Profiles
4.2.2 Description of the sub-transmission system
The 33kV sub-transmission network is based on a ring topology. The northern network (supplied
from Transpower’s Mangahao GXP) consists of four 33kV circuits. After heading west along a
narrow gorge from Mangahao the four circuits spread out into an enmeshed network supplying
Zone Substations at Shannon, Foxton, Levin East and Levin West. Each Zone Substation has
33kV connections to at least one other Zone Substation in addition to its normal supply from
Mangahao GXP.
The southern network (supplied from Transpower’s Paraparaumu GXP) consists of three 33kV
overhead lines and two 33kV underground cables which form an enmeshed network supplying
Zone Substations at Paraparaumu, Paraparaumu West, Raumati and Waikanae. A 33kV spur line
runs south to supply Paekakariki.
Single 33kV lines between Levin East (northern network) and Waikanae (southern network) supply
Otaki Zone Substation, with supply normally being taken from Waikanae for transmission
efficiencies.
The network configuration ensures that Electra has continuous (n-1) security of supply at most of
its substations barring Paekakariki which has an alternative 11kV supply from Raumati substation
via automated switches. Switched (n-1) security of supply can be applied at all of these sites.
There are no known systemic issues with the 33kV network and assets are expected to operate for
their full expected lifecycle.
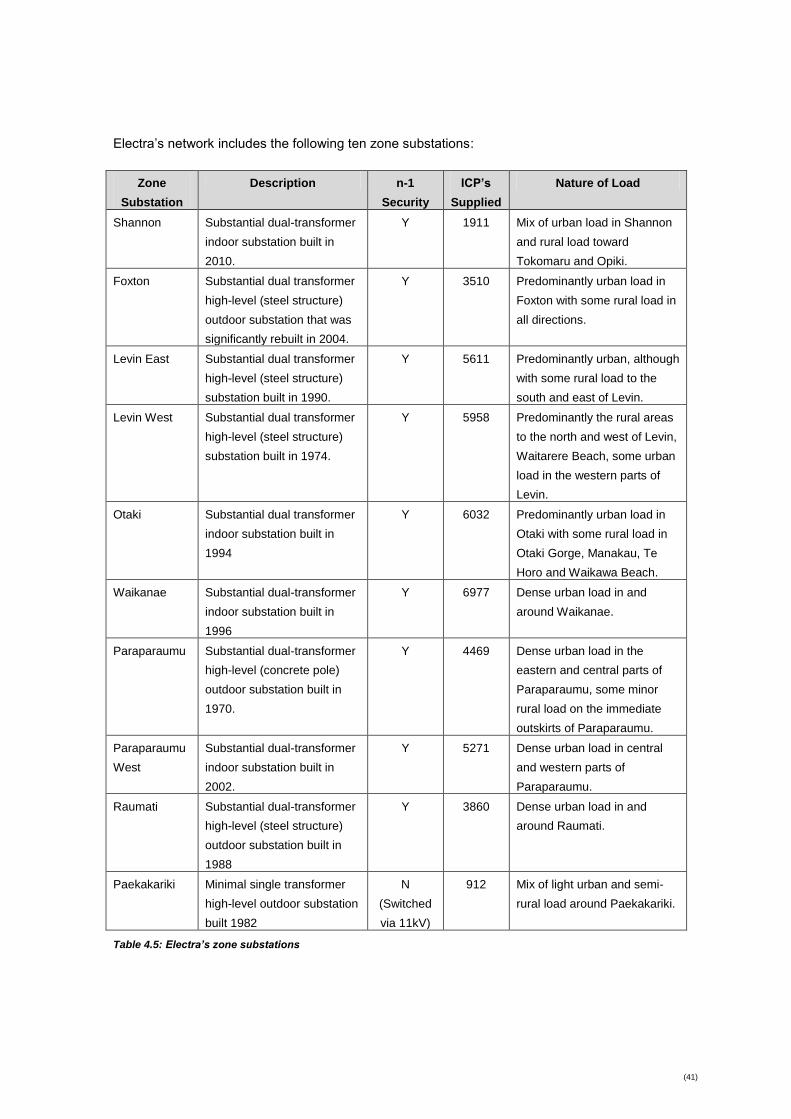
(41)
Electra’s network includes the following ten zone substations:
Zone
Substation
Description n-1
Security
ICP’s
Supplied
Nature of Load
Shannon Substantial dual-transformer
indoor substation built in
2010.
Y 1911 Mix of urban load in Shannon
and rural load toward
Tokomaru and Opiki.
Foxton Substantial dual transformer
high-level (steel structure)
outdoor substation that was
significantly rebuilt in 2004.
Y 3510 Predominantly urban load in
Foxton with some rural load in
all directions.
Levin East Substantial dual transformer
high-level (steel structure)
substation built in 1990.
Y 5611 Predominantly urban, although
with some rural load to the
south and east of Levin.
Levin West Substantial dual transformer
high-level (steel structure)
substation built in 1974.
Y
5958 Predominantly the rural areas
to the north and west of Levin,
Waitarere Beach, some urban
load in the western parts of
Levin.
Otaki Substantial dual transformer
indoor substation built in
1994
Y 6032 Predominantly urban load in
Otaki with some rural load in
Otaki Gorge, Manakau, Te
Horo and Waikawa Beach.
Waikanae Substantial dual-transformer
indoor substation built in
1996
Y 6977 Dense urban load in and
around Waikanae.
Paraparaumu Substantial dual-transformer
high-level (concrete pole)
outdoor substation built in
1970.
Y 4469 Dense urban load in the
eastern and central parts of
Paraparaumu, some minor
rural load on the immediate
outskirts of Paraparaumu.
Paraparaumu
West
Substantial dual-transformer
indoor substation built in
2002.
Y 5271 Dense urban load in central
and western parts of
Paraparaumu.
Raumati Substantial dual-transformer
high-level (steel structure)
outdoor substation built in
1988
Y
3860 Dense urban load in and
around Raumati.
Paekakariki Minimal single transformer
high-level outdoor substation
built 1982
N
(Switched
via 11kV)
912 Mix of light urban and semi-
rural load around Paekakariki.
Table 4.5: Electra’s zone substations
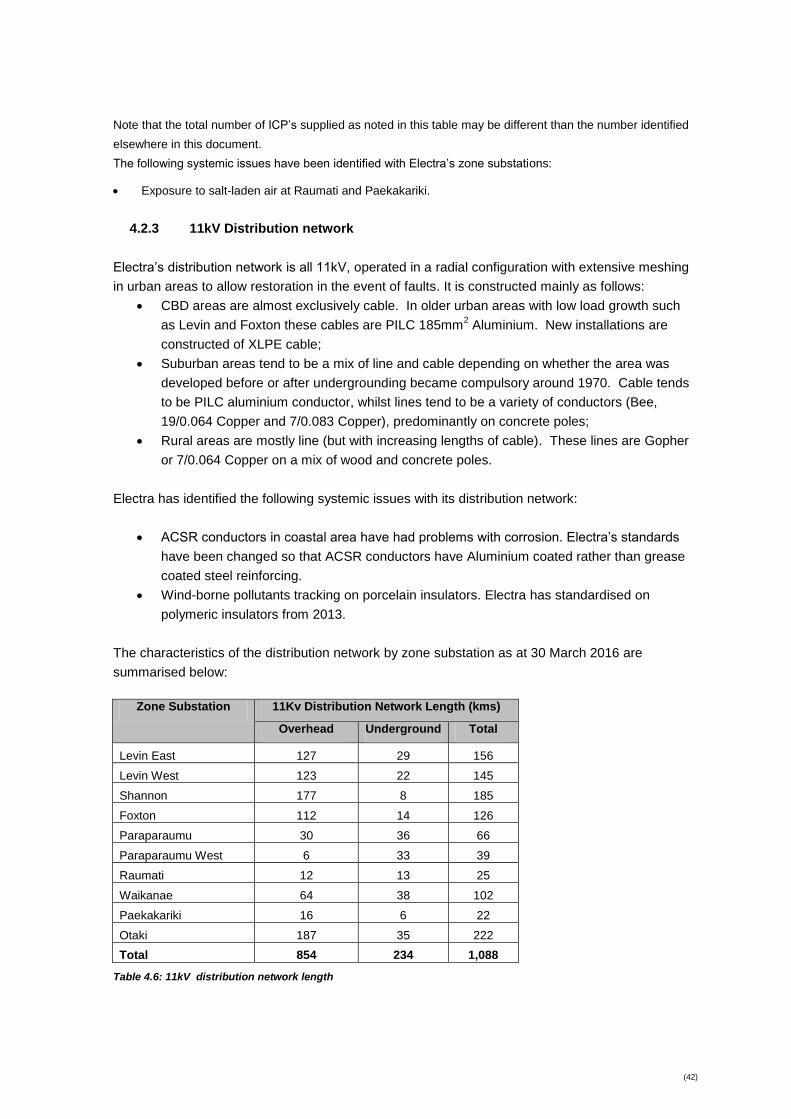
(42)
Note that the total number of ICP’s supplied as noted in this table may be different than the number identified
elsewhere in this document.
The following systemic issues have been identified with Electra’s zone substations:
Exposure to salt-laden air at Raumati and Paekakariki.
4.2.3 11kV Distribution network
Electra’s distribution network is all 11kV, operated in a radial configuration with extensive meshing
in urban areas to allow restoration in the event of faults. It is constructed mainly as follows:
CBD areas are almost exclusively cable. In older urban areas with low load growth such
as Levin and Foxton these cables are PILC 185mm2 Aluminium. New installations are
constructed of XLPE cable;
Suburban areas tend to be a mix of line and cable depending on whether the area was
developed before or after undergrounding became compulsory around 1970. Cable tends
to be PILC aluminium conductor, whilst lines tend to be a variety of conductors (Bee,
19/0.064 Copper and 7/0.083 Copper), predominantly on concrete poles;
Rural areas are mostly line (but with increasing lengths of cable). These lines are Gopher
or 7/0.064 Copper on a mix of wood and concrete poles.
Electra has identified the following systemic issues with its distribution network:
ACSR conductors in coastal area have had problems with corrosion. Electra’s standards
have been changed so that ACSR conductors have Aluminium coated rather than grease
coated steel reinforcing.
Wind-borne pollutants tracking on porcelain insulators. Electra has standardised on
polymeric insulators from 2013.
The characteristics of the distribution network by zone substation as at 30 March 2016 are
summarised below:
Zone Substation 11Kv Distribution Network Length (kms)
Overhead Underground Total
Levin East 127 29 156
Levin West 123 22 145
Shannon 177 8 185
Foxton 112 14 126
Paraparaumu 30 36 66
Paraparaumu West 6 33 39
Raumati 12 13 25
Waikanae 64 38 102
Paekakariki 16 6 22
Otaki 187 35 222
Total 854 234 1,088
Table 4.6: 11kV distribution network length
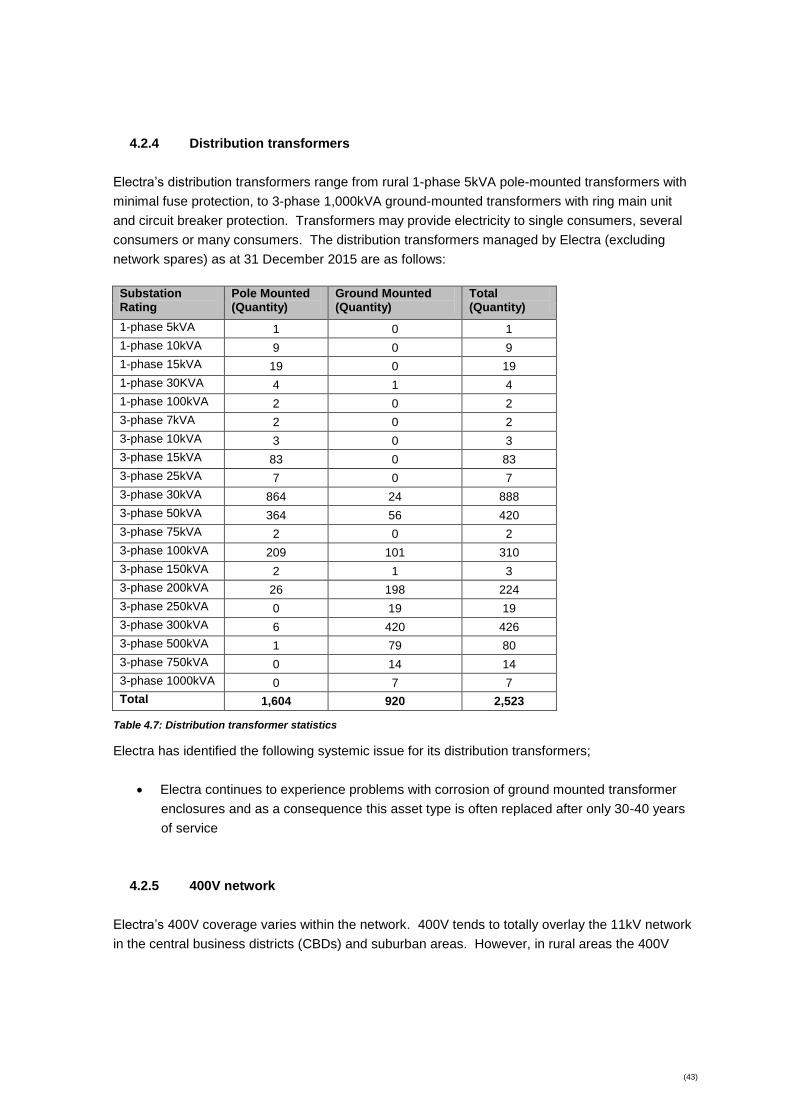
(43)
4.2.4 Distribution transformers
Electra’s distribution transformers range from rural 1-phase 5kVA pole-mounted transformers with
minimal fuse protection, to 3-phase 1,000kVA ground-mounted transformers with ring main unit
and circuit breaker protection. Transformers may provide electricity to single consumers, several
consumers or many consumers. The distribution transformers managed by Electra (excluding
network spares) as at 31 December 2015 are as follows:
Substation Rating
Pole Mounted (Quantity)
Ground Mounted (Quantity)
Total (Quantity)
1-phase 5kVA 1 0 1
1-phase 10kVA 9 0 9
1-phase 15kVA 19 0 19
1-phase 30KVA 4 1 4
1-phase 100kVA 2 0 2
3-phase 7kVA 2 0 2
3-phase 10kVA 3 0 3
3-phase 15kVA 83 0 83
3-phase 25kVA 7 0 7
3-phase 30kVA 864 24 888
3-phase 50kVA 364 56 420
3-phase 75kVA 2 0 2
3-phase 100kVA 209 101 310
3-phase 150kVA 2 1 3
3-phase 200kVA 26 198 224
3-phase 250kVA 0 19 19
3-phase 300kVA 6 420 426
3-phase 500kVA 1 79 80
3-phase 750kVA 0 14 14
3-phase 1000kVA 0 7 7
Total 1,604 920 2,523
Table 4.7: Distribution transformer statistics
Electra has identified the following systemic issue for its distribution transformers;
Electra continues to experience problems with corrosion of ground mounted transformer
enclosures and as a consequence this asset type is often replaced after only 30-40 years
of service
4.2.5 400V network
Electra’s 400V coverage varies within the network. 400V tends to totally overlay the 11kV network
in the central business districts (CBDs) and suburban areas. However, in rural areas the 400V
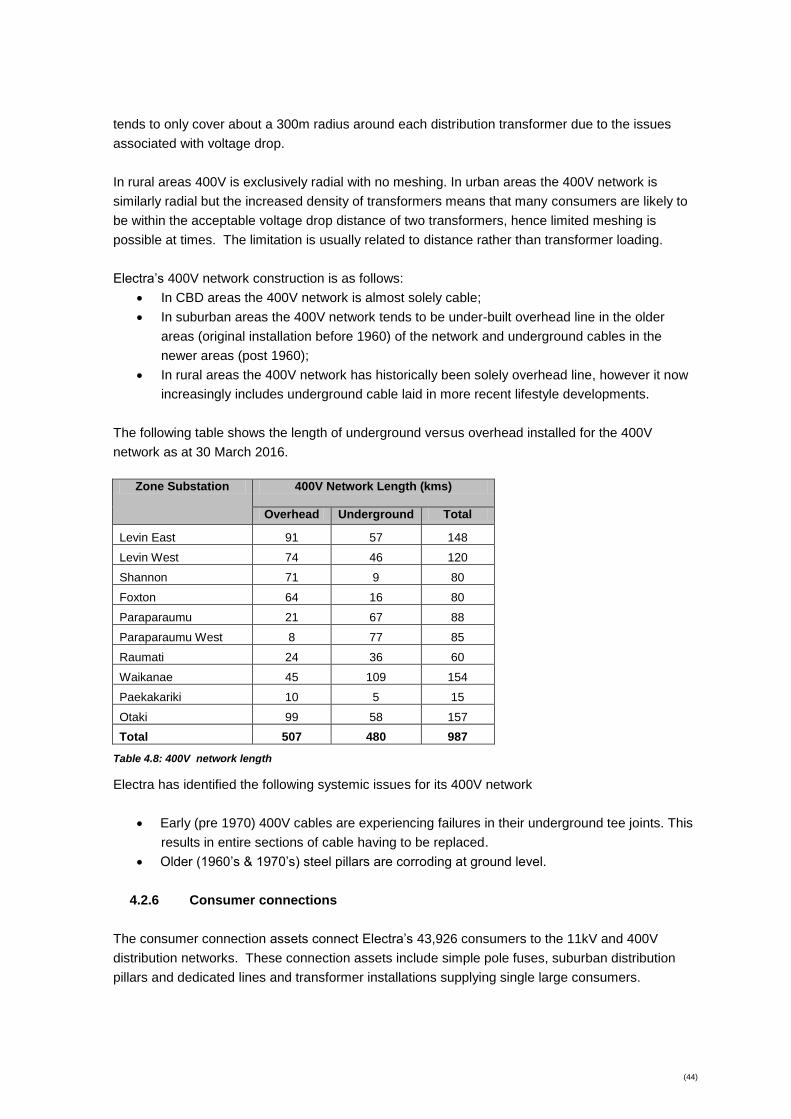
(44)
tends to only cover about a 300m radius around each distribution transformer due to the issues
associated with voltage drop.
In rural areas 400V is exclusively radial with no meshing. In urban areas the 400V network is
similarly radial but the increased density of transformers means that many consumers are likely to
be within the acceptable voltage drop distance of two transformers, hence limited meshing is
possible at times. The limitation is usually related to distance rather than transformer loading.
Electra’s 400V network construction is as follows:
In CBD areas the 400V network is almost solely cable;
In suburban areas the 400V network tends to be under-built overhead line in the older
areas (original installation before 1960) of the network and underground cables in the
newer areas (post 1960);
In rural areas the 400V network has historically been solely overhead line, however it now
increasingly includes underground cable laid in more recent lifestyle developments.
The following table shows the length of underground versus overhead installed for the 400V
network as at 30 March 2016.
Zone Substation 400V Network Length (kms)
Overhead Underground Total
Levin East 91 57 148
Levin West 74 46 120
Shannon 71 9 80
Foxton 64 16 80
Paraparaumu 21 67 88
Paraparaumu West 8 77 85
Raumati 24 36 60
Waikanae 45 109 154
Paekakariki 10 5 15
Otaki 99 58 157
Total 507 480 987
Table 4.8: 400V network length
Electra has identified the following systemic issues for its 400V network
Early (pre 1970) 400V cables are experiencing failures in their underground tee joints. This
results in entire sections of cable having to be replaced.
Older (1960’s & 1970’s) steel pillars are corroding at ground level.
4.2.6 Consumer connections
The consumer connection assets connect Electra’s 43,926 consumers to the 11kV and 400V
distribution networks. These connection assets include simple pole fuses, suburban distribution
pillars and dedicated lines and transformer installations supplying single large consumers.
(45)
In most cases the fuse holder forms the demarcation point between Electra’s network and the
consumers’ assets (the “service main”). This is usually located at or near the physical boundary of
the consumers’ property. These assets form the point of delivery for Electra’s distribution services.
The following systemic issue with consumer connections has been identified:
Electra has had to replace some earlier generation pillars formed from thin grade steel and
non UV stabilised polymers due to corrosion and material deterioration effects. The bulk of
this work has been completed and normal lifecycle durations are expected from now on.
4.2.7 Load control
Electra currently owns and operates the following load control transmitter facilities for the control of
ripple relays:
1 Zellweger SFU-K/203 80 KVA ripple injection plant located in the Shannon Zone
Substation to cover the northern area. This plant was installed in 2011 as part of the
substation rebuild.
1 Zellweger SFU-G/60 60 KVA ripple injection plant located in an Electra building on-site at
the Transpower Paraparaumu GXP This plant was installed in 1994.
1 Zellweger SFU-K/203 80 KVA ripple injection plant in storage at Paraparaumu West
Substation. This acts as a backup for the both plants
These plants are similar and based on the Zellweger MLC Local Controller and the SFU- static
frequency converter. Low voltage supply to each plant is from the local 415 V AC station supply
transformer. Injection from each plant is into the Electra 33 kV sub-transmission system at 283Hz.
The majority of the individual ripple control receivers are owned by energy retailers with the
exception of approximately 2,500 mounted in distribution transformers and on poles to control the
streetlights, under veranda lighting and controlled load pilot systems. These are owned by Electra.
4.2.8 Protection and control
Electra’s network protection includes the following broad classifications of assets:
CB protection relays including over-current, earth-fault, sensitive earth-fault and auto-
reclose functions as well as more recent equipment which include voltage, frequency,
directional, and distance, bus zone and CB fail functionality;
Transformer and tap changer temperature sensors including surge arrestors, explosion
vents and oil level sensors.
Batteries, battery chargers and battery monitors provide the DC supply systems for circuit breaker
control, protection and SCADA functionality.
Electra has standardised on the Eberle range of tap change controllers. These allow software
updating of settings and they provide all of the analogue and digital information required on site
and by SCADA.

(46)
4.2.9 SCADA and communications
Electra uses an iSCADA system for control and monitoring of zone substations and remote
switching devices and for activating load control plant. This system was installed during the year
ended 31 March 2010. The SCADA master station is located in the Levin West zone substation.
SCADA information is then broadcast to the main Electra office in which the main Network
Operating Control Centre is located. At the Levin West zone substation an Emergency Control
Centre which is identical in systems exists as a backup to the main one.
SCADA control and monitoring information is communicated via radio and micro-wave links. The
following sites are located and interlinked so as to provide a “fail safe” information data path.
These sites also provide voice repeater links.
Forest Heights at Waikanae;
Mataihuka south of Paraparaumu;
Moutere Hill west of Levin; and
Levin West zone substation Control Centre.
Tunapo at Paekakariki
4.2.10 Other assets
Since 2008 Electra has owned a 500 kVA 3 phase mobile diesel generator set. This is primarily
used to provide electricity within the Electra network during planned and unplanned outages.
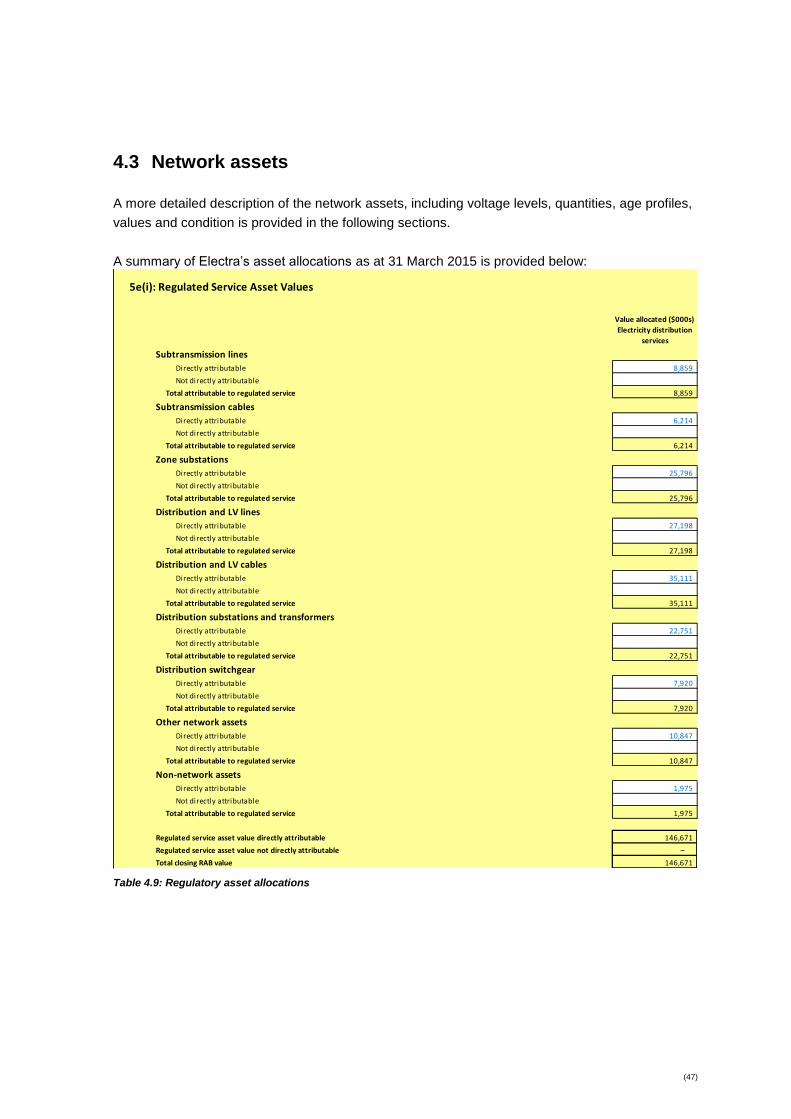
(47)
4.3 Network assets
A more detailed description of the network assets, including voltage levels, quantities, age profiles,
values and condition is provided in the following sections.
A summary of Electra’s asset allocations as at 31 March 2015 is provided below:
5e(i): Regulated Service Asset Values
Value allocated ($000s)
Electricity distribution
services
Subtransmission lines
Directly attributable 8,859
Not directly attributable
Total attributable to regulated service 8,859
Subtransmission cables
Directly attributable 6,214
Not directly attributable
Total attributable to regulated service 6,214
Zone substations
Directly attributable 25,796
Not directly attributable
Total attributable to regulated service 25,796
Distribution and LV lines
Directly attributable 27,198
Not directly attributable
Total attributable to regulated service 27,198
Distribution and LV cables
Directly attributable 35,111
Not directly attributable
Total attributable to regulated service 35,111
Distribution substations and transformers
Directly attributable 22,751
Not directly attributable
Total attributable to regulated service 22,751
Distribution switchgear
Directly attributable 7,920
Not directly attributable
Total attributable to regulated service 7,920
Other network assets
Directly attributable 10,847
Not directly attributable
Total attributable to regulated service 10,847
Non-network assets
Directly attributable 1,975
Not directly attributable
Total attributable to regulated service 1,975
Regulated service asset value directly attributable 146,671
Regulated service asset value not directly attributable –
Total closing RAB value 146,671
Table 4.9: Regulatory asset allocations
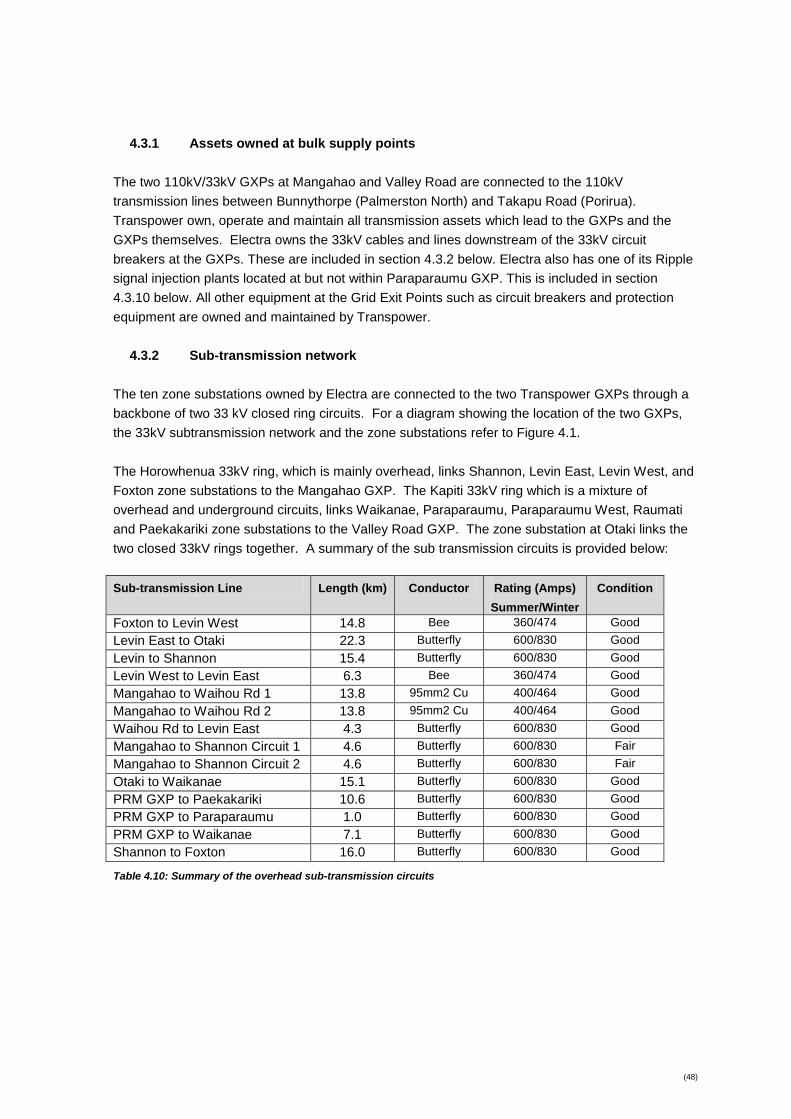
(48)
4.3.1 Assets owned at bulk supply points
The two 110kV/33kV GXPs at Mangahao and Valley Road are connected to the 110kV
transmission lines between Bunnythorpe (Palmerston North) and Takapu Road (Porirua).
Transpower own, operate and maintain all transmission assets which lead to the GXPs and the
GXPs themselves. Electra owns the 33kV cables and lines downstream of the 33kV circuit
breakers at the GXPs. These are included in section 4.3.2 below. Electra also has one of its Ripple
signal injection plants located at but not within Paraparaumu GXP. This is included in section
4.3.10 below. All other equipment at the Grid Exit Points such as circuit breakers and protection
equipment are owned and maintained by Transpower.
4.3.2 Sub-transmission network
The ten zone substations owned by Electra are connected to the two Transpower GXPs through a
backbone of two 33 kV closed ring circuits. For a diagram showing the location of the two GXPs,
the 33kV subtransmission network and the zone substations refer to Figure 4.1.
The Horowhenua 33kV ring, which is mainly overhead, links Shannon, Levin East, Levin West, and
Foxton zone substations to the Mangahao GXP. The Kapiti 33kV ring which is a mixture of
overhead and underground circuits, links Waikanae, Paraparaumu, Paraparaumu West, Raumati
and Paekakariki zone substations to the Valley Road GXP. The zone substation at Otaki links the
two closed 33kV rings together. A summary of the sub transmission circuits is provided below:
Sub-transmission Line Length (km) Conductor Rating (Amps)
Summer/Winter
Condition
Foxton to Levin West 14.8 Bee 360/474 Good
Levin East to Otaki 22.3 Butterfly 600/830 Good
Levin to Shannon 15.4 Butterfly 600/830 Good
Levin West to Levin East 6.3 Bee 360/474 Good
Mangahao to Waihou Rd 1 13.8 95mm2 Cu 400/464 Good
Mangahao to Waihou Rd 2 13.8 95mm2 Cu 400/464 Good
Waihou Rd to Levin East 4.3 Butterfly 600/830 Good
Mangahao to Shannon Circuit 1 4.6 Butterfly 600/830 Fair
Mangahao to Shannon Circuit 2 4.6 Butterfly 600/830 Fair
Otaki to Waikanae 15.1 Butterfly 600/830 Good
PRM GXP to Paekakariki 10.6 Butterfly 600/830 Good
PRM GXP to Paraparaumu 1.0 Butterfly 600/830 Good
PRM GXP to Waikanae 7.1 Butterfly 600/830 Good
Shannon to Foxton 16.0 Butterfly 600/830 Good
Table 4.10: Summary of the overhead sub-transmission circuits
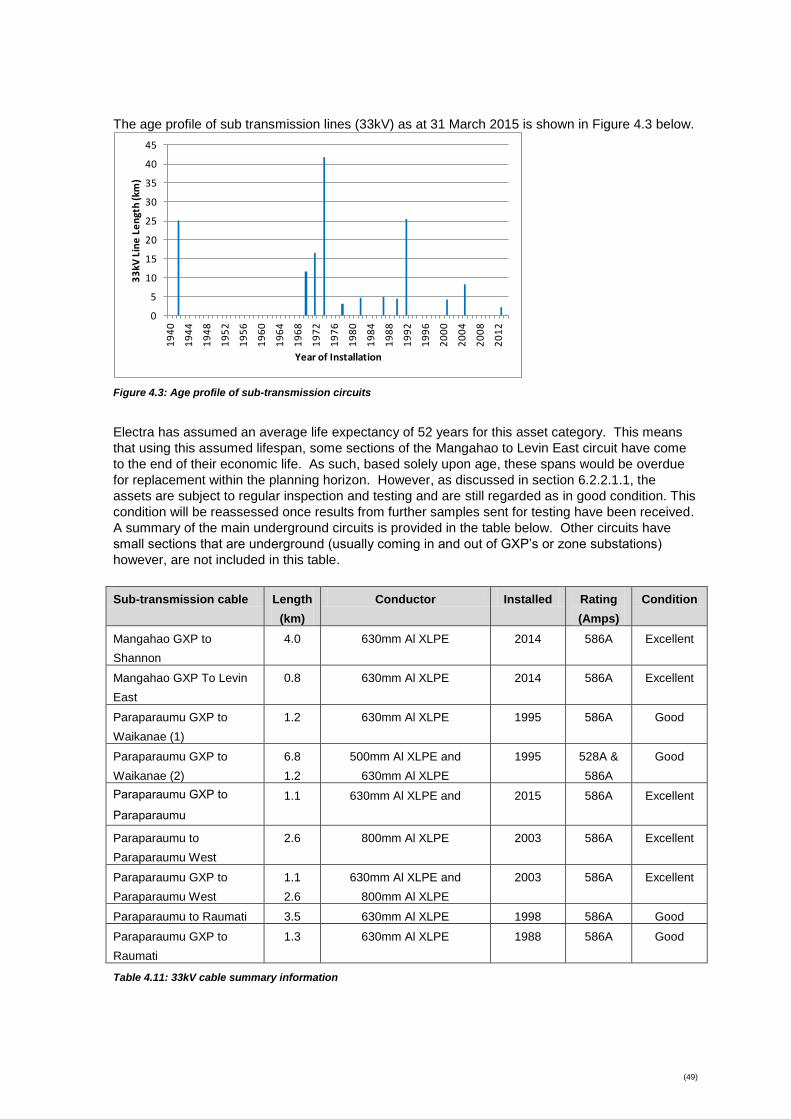
(49)
The age profile of sub transmission lines (33kV) as at 31 March 2015 is shown in Figure 4.3 below.
0
5
10
15
20
25
30
35
40
45
19
40
19
44
19
48
19
52
19
56
19
60
19
64
19
68
19
72
19
76
19
80
19
84
19
88
19
92
19
96
20
00
20
04
20
08
20
12
33
kV L
ine
Le
ngt
h (k
m)
Year of Installation
Figure 4.3: Age profile of sub-transmission circuits
Electra has assumed an average life expectancy of 52 years for this asset category. This means
that using this assumed lifespan, some sections of the Mangahao to Levin East circuit have come
to the end of their economic life. As such, based solely upon age, these spans would be overdue
for replacement within the planning horizon. However, as discussed in section 6.2.2.1.1, the
assets are subject to regular inspection and testing and are still regarded as in good condition. This
condition will be reassessed once results from further samples sent for testing have been received.
A summary of the main underground circuits is provided in the table below. Other circuits have
small sections that are underground (usually coming in and out of GXP’s or zone substations)
however, are not included in this table.
Sub-transmission cable Length
(km)
Conductor Installed Rating
(Amps)
Condition
Mangahao GXP to
Shannon
4.0 630mm Al XLPE 2014 586A Excellent
Mangahao GXP To Levin
East
0.8 630mm Al XLPE 2014 586A Excellent
Paraparaumu GXP to
Waikanae (1)
1.2 630mm Al XLPE 1995 586A Good
Paraparaumu GXP to
Waikanae (2)
6.8
1.2
500mm Al XLPE and
630mm Al XLPE
1995 528A &
586A
Good
Paraparaumu GXP to
Paraparaumu
1.1 630mm Al XLPE and
2015 586A Excellent
Paraparaumu to
Paraparaumu West
2.6 800mm Al XLPE 2003 586A Excellent
Paraparaumu GXP to
Paraparaumu West
1.1
2.6
630mm Al XLPE and
800mm Al XLPE
2003 586A Excellent
Paraparaumu to Raumati 3.5 630mm Al XLPE 1998 586A Good
Paraparaumu GXP to
Raumati
1.3 630mm Al XLPE 1988 586A Good
Table 4.11: 33kV cable summary information
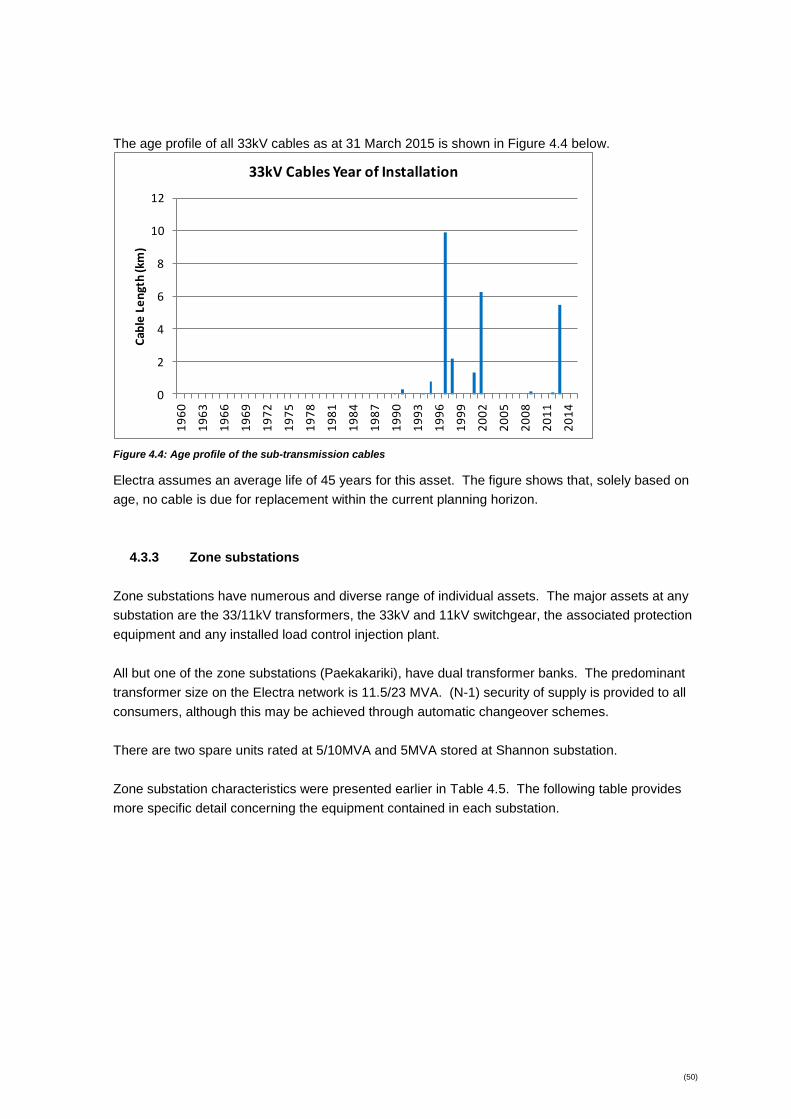
(50)
The age profile of all 33kV cables as at 31 March 2015 is shown in Figure 4.4 below.
0
2
4
6
8
10
12
19
60
19
63
19
66
19
69
19
72
19
75
19
78
19
81
19
84
19
87
19
90
19
93
19
96
19
99
20
02
20
05
20
08
20
11
20
14
Cab
le L
en
gth
(km
)
33kV Cables Year of Installation
Figure 4.4: Age profile of the sub-transmission cables
Electra assumes an average life of 45 years for this asset. The figure shows that, solely based on
age, no cable is due for replacement within the current planning horizon.
4.3.3 Zone substations
Zone substations have numerous and diverse range of individual assets. The major assets at any
substation are the 33/11kV transformers, the 33kV and 11kV switchgear, the associated protection
equipment and any installed load control injection plant.
All but one of the zone substations (Paekakariki), have dual transformer banks. The predominant
transformer size on the Electra network is 11.5/23 MVA. (N-1) security of supply is provided to all
consumers, although this may be achieved through automatic changeover schemes.
There are two spare units rated at 5/10MVA and 5MVA stored at Shannon substation.
Zone substation characteristics were presented earlier in Table 4.5. The following table provides
more specific detail concerning the equipment contained in each substation.
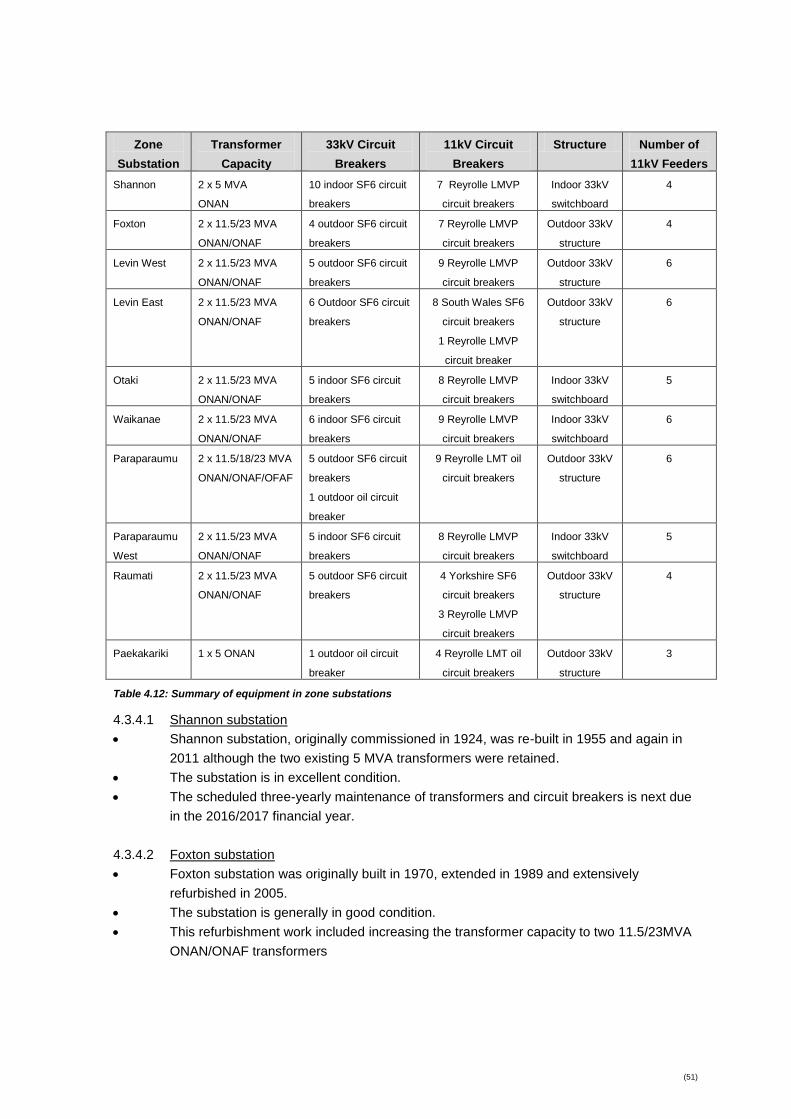
(51)
Zone
Substation
Transformer
Capacity
33kV Circuit
Breakers
11kV Circuit
Breakers
Structure Number of
11kV Feeders
Shannon 2 x 5 MVA
ONAN
10 indoor SF6 circuit
breakers
7 Reyrolle LMVP
circuit breakers
Indoor 33kV
switchboard
4
Foxton 2 x 11.5/23 MVA
ONAN/ONAF
4 outdoor SF6 circuit
breakers
7 Reyrolle LMVP
circuit breakers
Outdoor 33kV
structure
4
Levin West 2 x 11.5/23 MVA
ONAN/ONAF
5 outdoor SF6 circuit
breakers
9 Reyrolle LMVP
circuit breakers
Outdoor 33kV
structure
6
Levin East 2 x 11.5/23 MVA
ONAN/ONAF
6 Outdoor SF6 circuit
breakers
8 South Wales SF6
circuit breakers
1 Reyrolle LMVP
circuit breaker
Outdoor 33kV
structure
6
Otaki 2 x 11.5/23 MVA
ONAN/ONAF
5 indoor SF6 circuit
breakers
8 Reyrolle LMVP
circuit breakers
Indoor 33kV
switchboard
5
Waikanae 2 x 11.5/23 MVA
ONAN/ONAF
6 indoor SF6 circuit
breakers
9 Reyrolle LMVP
circuit breakers
Indoor 33kV
switchboard
6
Paraparaumu 2 x 11.5/18/23 MVA
ONAN/ONAF/OFAF
5 outdoor SF6 circuit
breakers
1 outdoor oil circuit
breaker
9 Reyrolle LMT oil
circuit breakers
Outdoor 33kV
structure
6
Paraparaumu
West
2 x 11.5/23 MVA
ONAN/ONAF
5 indoor SF6 circuit
breakers
8 Reyrolle LMVP
circuit breakers
Indoor 33kV
switchboard
5
Raumati 2 x 11.5/23 MVA
ONAN/ONAF
5 outdoor SF6 circuit
breakers
4 Yorkshire SF6
circuit breakers
3 Reyrolle LMVP
circuit breakers
Outdoor 33kV
structure
4
Paekakariki 1 x 5 ONAN 1 outdoor oil circuit
breaker
4 Reyrolle LMT oil
circuit breakers
Outdoor 33kV
structure
3
Table 4.12: Summary of equipment in zone substations
4.3.4.1 Shannon substation
Shannon substation, originally commissioned in 1924, was re-built in 1955 and again in
2011 although the two existing 5 MVA transformers were retained.
The substation is in excellent condition.
The scheduled three-yearly maintenance of transformers and circuit breakers is next due
in the 2016/2017 financial year.
4.3.4.2 Foxton substation
Foxton substation was originally built in 1970, extended in 1989 and extensively
refurbished in 2005.
The substation is generally in good condition.
This refurbishment work included increasing the transformer capacity to two 11.5/23MVA
ONAN/ONAF transformers
(52)
The scheduled five-yearly maintenance of transformers, circuit breakers and structure is
next due in the 2020/2021 financial year.
4.3.4.3 Levin West substation
Levin West substation was built in 1976.
The substation is generally in good condition.
The 11kV feeder circuit breakers were frequently operated and these were retrofitted in
1998 with vacuum units to minimize maintenance costs and increase safety at the site.
One 11.5/23MVA transformer was installed in 2000 and another 11.5/23MVA transformer
was installed in 2011 to replace the second (5MVA) transformer.
Routine five-yearly maintenance is next due in the 2017/2018 financial year.
4.3.4.4 Levin East substation
Levin East substation was built in 1990.
The substation is generally in good condition.
In 2005, both 33kV/11kV transformers had a major tap changer overhaul and oil
refurbishment on site.
The scheduled five-yearly maintenance of transformers, circuit breakers and structure is
next due in the 2019/2020 financial year.
4.3.4.5 Otaki substation
Otaki substation was built in 1994.
The substation is in good condition.
Routine five-yearly maintenance of transformers and circuit breakers is next due in the
2018/2019 financial year
4.3.4.6 Waikanae substation
Waikanae substation was built in 1996.
The substation is in good condition.
Routine five-yearly maintenance of transformers and circuit breakers is next due in the
2020/2021 financial year.
4.3.4.7 Paraparaumu substation
Paraparaumu substation was originally built in 1970.
The substation is generally in average condition.
Routine maintenance of transformers, circuit breakers and the structure was last
completed in the 2012/13 financial year.
The two transformer OLTCs underwent a major overhaul in 2005 as a result of moisture
and arcing compounds found during DGA analysis.
A significant rebuilding of the substation is underway with expected commissioning in
2016. This includes removal of the old overhead structure and replacement of the outdoor
33kV SF6 circuit breakers and existing indoor 11kV oil circuit breakers with indoor
vacuum types.
4.3.4.8 Paraparaumu West substation
(53)
Paraparaumu West substation was built in 2003.
The substation is in good condition.
The substation is predominantly indoors barring the two transformers which are installed
outside.
Routine five-yearly maintenance of transformers and circuit breakers is next due in the
2017/2018 financial year.
4.3.4.9 Raumati substation
Raumati substation was built in 1988.
The substation is generally in good condition.
Initially one 11.5/23MVA transformer was installed. A second 11.5/23MVA unit in 2012.
A 33 kV bus protection scheme was installed during 2009/2010 to lessen the outage
impact of any fault on the 33 kV outdoor busbar.
The three yearly routine maintenance of the transformers, circuit breakers and structure is
next due in the 2016/2017 financial year.
Allowance has been made for the partial replacement (1/2 the 11kV switchboard and
outdoor structure) of the substation toward the end of the planning period. The actual
timetable will be determined by asset condition and ongoing maintenance costs.
4.3.4.10 Paekakariki substation
Paekakariki substation was built in 1982.
The substation is generally in good condition.
Routine three yearly maintenance of transformers, circuit breakers and the structure is
next due in the 2018/2019 financial year.
4.3.4.11 Zone substations in general
Zone capacity had previously been identified as nearing/exceeding present capabilities late in this
decade. This coupled with the capacity restraints at the Transpower GXP’S led to Electra
reviewing alternative transmission solutions to meet future growth needs. The works associated
with the Transmission Gully highway upgrade have removed those constraints giving more
certainty to Electra’s future transmission and sub transmission arrangements. This will result in any
growth being met by increased zone transformer capacity in the first instance, with increased sub
transmission capacity attained in conjunction with the lifecycle replacement programme.
The following figure shows the age profile of the zone substation transformers.
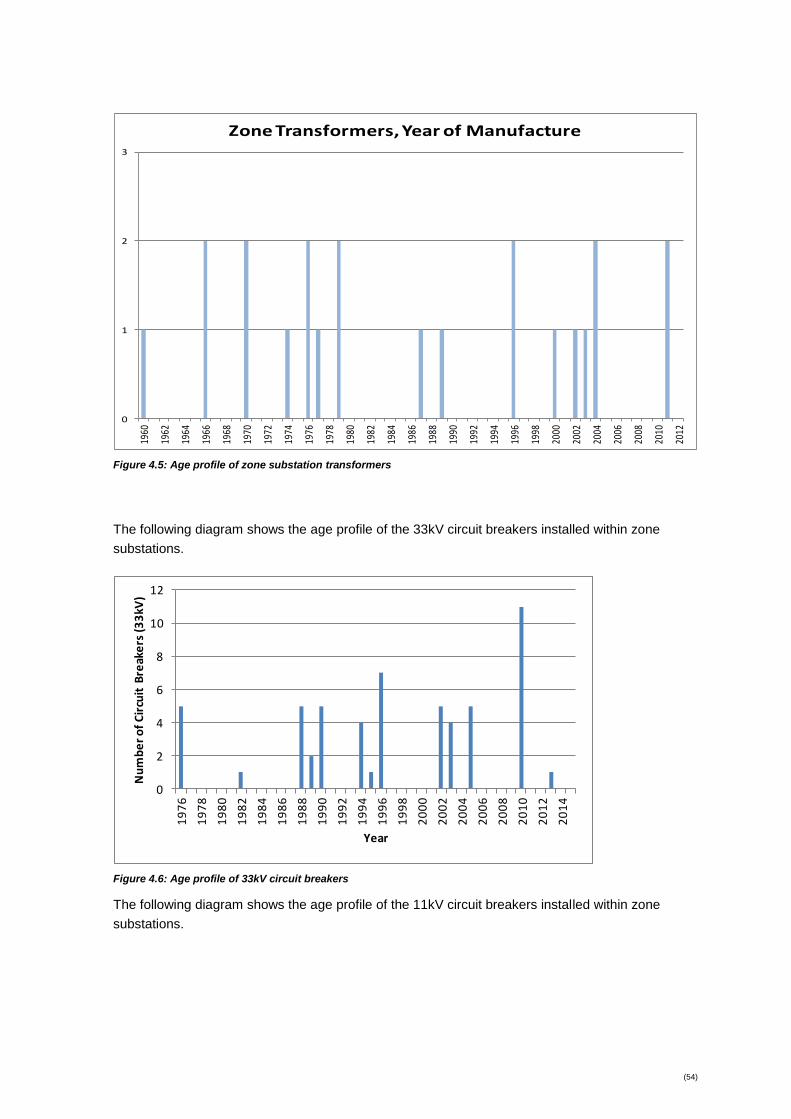
(54)
0
1
2
319
60
1962
1964
1966
1968
1970
1972
1974
1976
1978
1980
1982
1984
1986
1988
1990
1992
1994
1996
1998
2000
2002
2004
2006
2008
2010
2012
Zone Transformers, Year of Manufacture
Figure 4.5: Age profile of zone substation transformers
The following diagram shows the age profile of the 33kV circuit breakers installed within zone
substations.
0
2
4
6
8
10
12
19
76
19
78
19
80
19
82
19
84
19
86
19
88
19
90
19
92
19
94
19
96
19
98
20
00
20
02
20
04
20
06
20
08
20
10
20
12
20
14
Nu
mb
er
of
Cir
cuit
Bre
ake
rs (
33
kV)
Year
Figure 4.6: Age profile of 33kV circuit breakers
The following diagram shows the age profile of the 11kV circuit breakers installed within zone
substations.
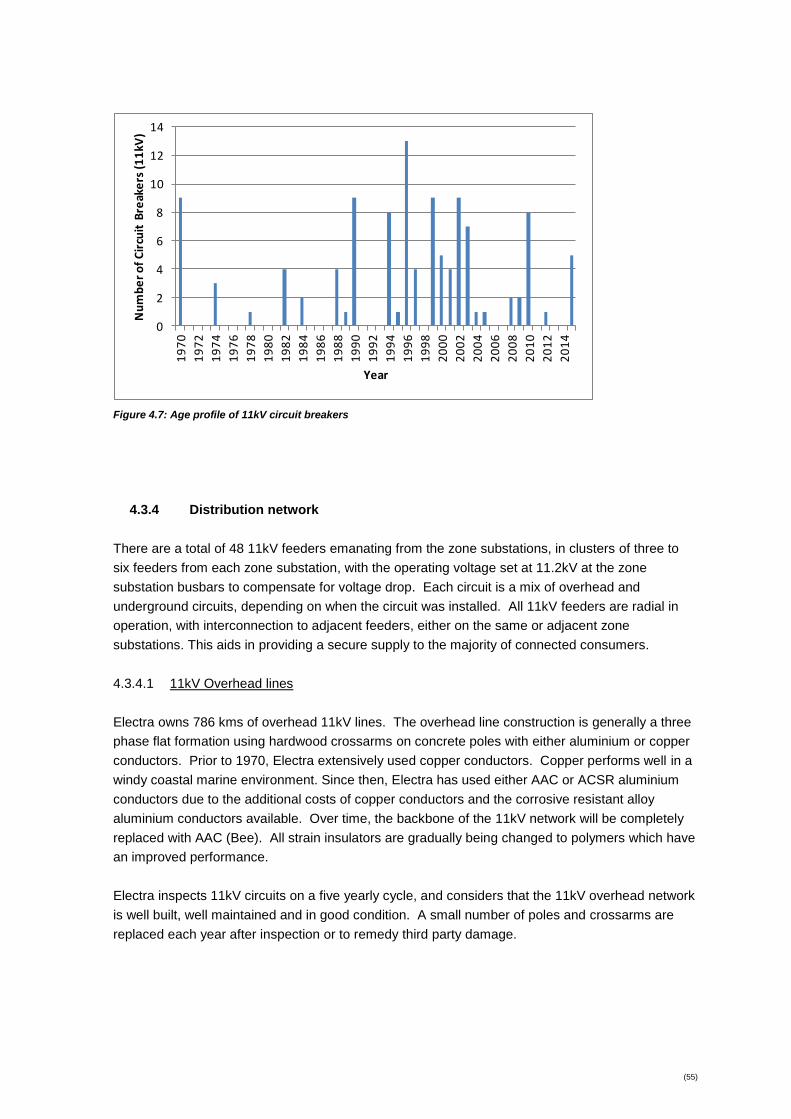
(55)
0
2
4
6
8
10
12
14
19
70
19
72
19
74
19
76
19
78
19
80
19
82
19
84
19
86
19
88
19
90
19
92
19
94
19
96
19
98
20
00
20
02
20
04
20
06
20
08
20
10
20
12
20
14
Nu
mb
er
of
Cir
cuit
Bre
ake
rs (
11
kV)
Year
Figure 4.7: Age profile of 11kV circuit breakers
4.3.4 Distribution network
There are a total of 48 11kV feeders emanating from the zone substations, in clusters of three to
six feeders from each zone substation, with the operating voltage set at 11.2kV at the zone
substation busbars to compensate for voltage drop. Each circuit is a mix of overhead and
underground circuits, depending on when the circuit was installed. All 11kV feeders are radial in
operation, with interconnection to adjacent feeders, either on the same or adjacent zone
substations. This aids in providing a secure supply to the majority of connected consumers.
4.3.4.1 11kV Overhead lines
Electra owns 786 kms of overhead 11kV lines. The overhead line construction is generally a three
phase flat formation using hardwood crossarms on concrete poles with either aluminium or copper
conductors. Prior to 1970, Electra extensively used copper conductors. Copper performs well in a
windy coastal marine environment. Since then, Electra has used either AAC or ACSR aluminium
conductors due to the additional costs of copper conductors and the corrosive resistant alloy
aluminium conductors available. Over time, the backbone of the 11kV network will be completely
replaced with AAC (Bee). All strain insulators are gradually being changed to polymers which have
an improved performance.
Electra inspects 11kV circuits on a five yearly cycle, and considers that the 11kV overhead network
is well built, well maintained and in good condition. A small number of poles and crossarms are
replaced each year after inspection or to remedy third party damage.
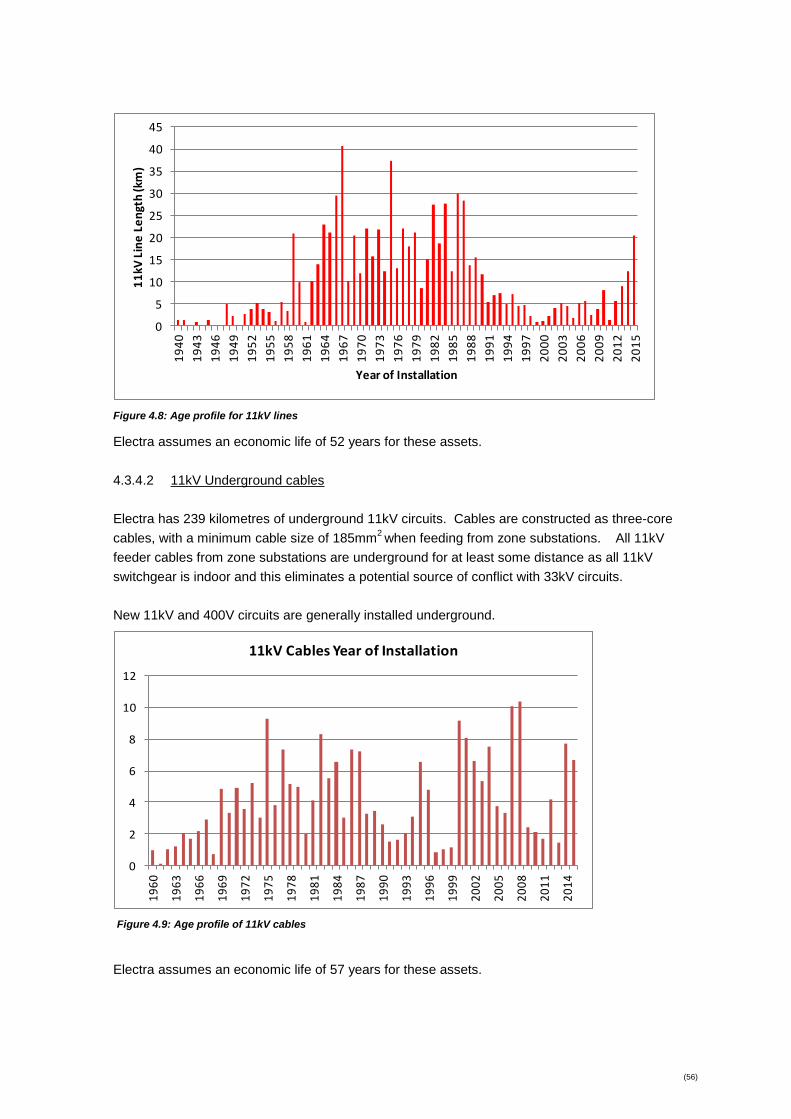
(56)
0
5
10
15
20
25
30
35
40
45
19
40
19
43
19
46
19
49
19
52
19
55
19
58
19
61
19
64
19
67
19
70
19
73
19
76
19
79
19
82
19
85
19
88
19
91
19
94
19
97
20
00
20
03
20
06
20
09
20
12
20
15
11
kV L
ine
Le
ngt
h (k
m)
Year of Installation
Figure 4.8: Age profile for 11kV lines
Electra assumes an economic life of 52 years for these assets.
4.3.4.2 11kV Underground cables
Electra has 239 kilometres of underground 11kV circuits. Cables are constructed as three-core
cables, with a minimum cable size of 185mm2 when feeding from zone substations. All 11kV
feeder cables from zone substations are underground for at least some distance as all 11kV
switchgear is indoor and this eliminates a potential source of conflict with 33kV circuits.
New 11kV and 400V circuits are generally installed underground.
0
2
4
6
8
10
12
19
60
19
63
19
66
19
69
19
72
19
75
19
78
19
81
19
84
19
87
19
90
19
93
19
96
19
99
20
02
20
05
20
08
20
11
20
14
11kV Cables Year of Installation
Figure 4.9: Age profile of 11kV cables
Electra assumes an economic life of 57 years for these assets.

(57)
4.3.5 Distribution transformers
These transformers are used to supply groups of up to 130 end use customers from the 11kV
network. Details of transformer sizes and ratings were summarised earlier in Table 4.7.
All pole mounted transformers have a set of associated drop out fuses. Where these pole
transformers are at the end of long spur lines, Electra installs a set of drop out fuses at the
connection to the main 11kV line to improve fault location and isolation. Electra also aims to install
a separate drop out fuse where access to the 11kV route is difficult.
Likewise, all ground transformers have either an associated drop out fuse or have local fuses
installed in the 11kV cubicle.
Electra inspects all ground mounted transformers biannually. Pole mounted transformers are
inspected as part of the 11kV network five yearly inspection cycle. The assets requiring
replacement are identified from these inspections.
Electra generally does not undertake a structured refurbishment programme on distribution
transformers which are less than 100kVA as this is not an economic option for these lower rated
transformers.
The age profile of the distribution transformers by year of manufacture is shown below.
0
20
40
60
80
100
120
140
160
19
27
19
40
19
48
19
53
19
56
19
59
19
62
19
65
19
68
19
71
19
74
19
77
19
80
19
83
19
86
19
89
19
92
19
95
19
98
20
01
20
04
20
07
20
10
20
13
Nu
mb
er
of
Un
its
Year of Manufacture
Figure 4.10: Age profile of 11kV/400V distribution transformers
Electra assumes an economic life of 45 years for transformers.
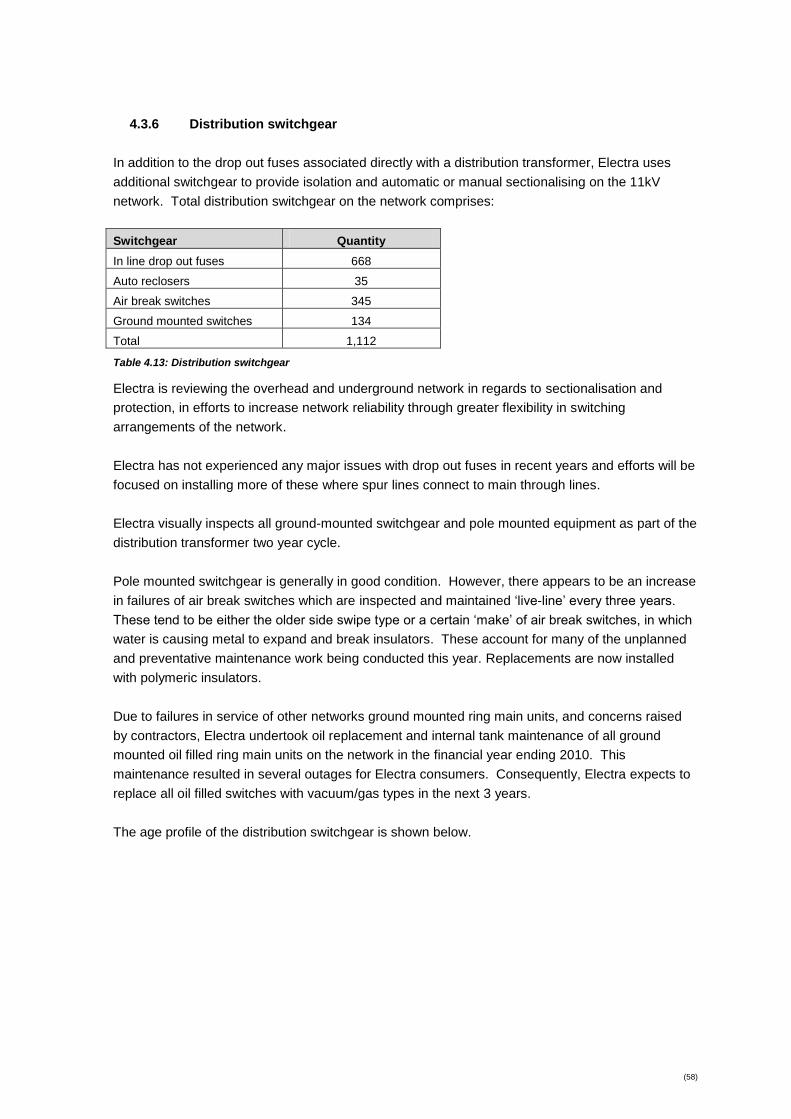
(58)
4.3.6 Distribution switchgear
In addition to the drop out fuses associated directly with a distribution transformer, Electra uses
additional switchgear to provide isolation and automatic or manual sectionalising on the 11kV
network. Total distribution switchgear on the network comprises:
Switchgear Quantity
In line drop out fuses 668
Auto reclosers 35
Air break switches 345
Ground mounted switches 134
Total 1,112
Table 4.13: Distribution switchgear
Electra is reviewing the overhead and underground network in regards to sectionalisation and
protection, in efforts to increase network reliability through greater flexibility in switching
arrangements of the network.
Electra has not experienced any major issues with drop out fuses in recent years and efforts will be
focused on installing more of these where spur lines connect to main through lines.
Electra visually inspects all ground-mounted switchgear and pole mounted equipment as part of the
distribution transformer two year cycle.
Pole mounted switchgear is generally in good condition. However, there appears to be an increase
in failures of air break switches which are inspected and maintained ‘live-line’ every three years.
These tend to be either the older side swipe type or a certain ‘make’ of air break switches, in which
water is causing metal to expand and break insulators. These account for many of the unplanned
and preventative maintenance work being conducted this year. Replacements are now installed
with polymeric insulators.
Due to failures in service of other networks ground mounted ring main units, and concerns raised
by contractors, Electra undertook oil replacement and internal tank maintenance of all ground
mounted oil filled ring main units on the network in the financial year ending 2010. This
maintenance resulted in several outages for Electra consumers. Consequently, Electra expects to
replace all oil filled switches with vacuum/gas types in the next 3 years.
The age profile of the distribution switchgear is shown below.
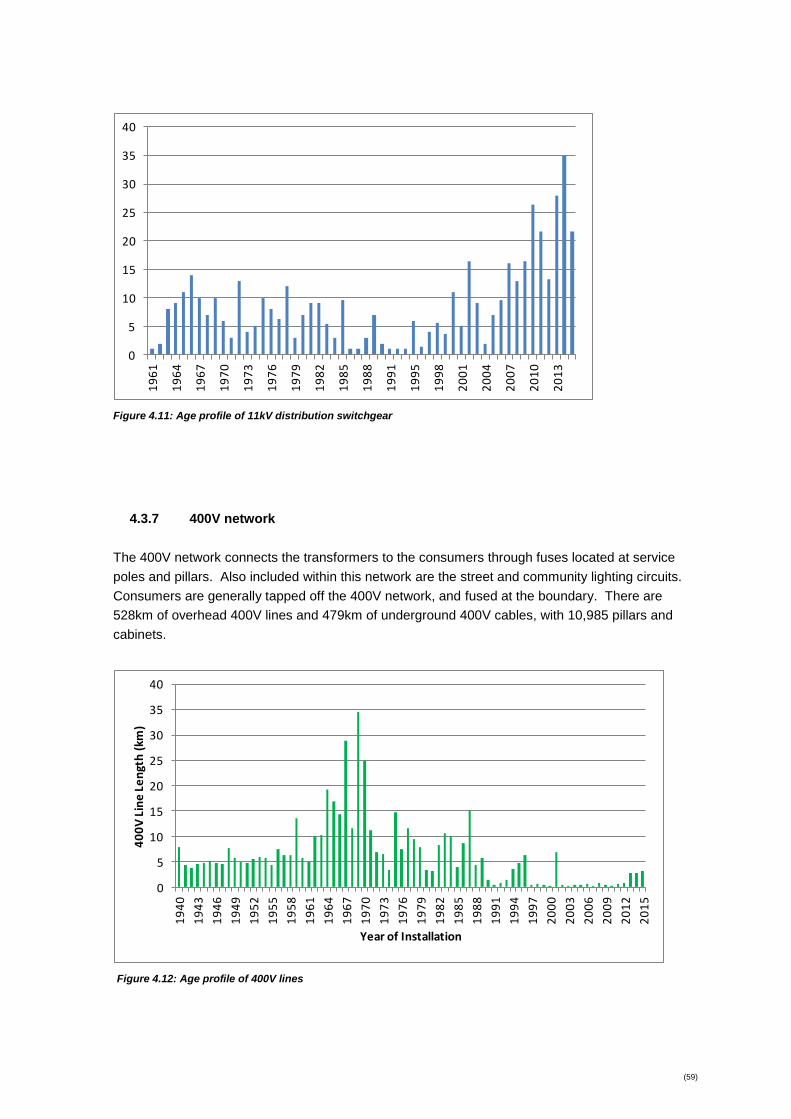
(59)
0
5
10
15
20
25
30
35
40
19
61
19
64
19
67
19
70
19
73
19
76
19
79
19
82
19
85
19
88
19
91
19
95
19
98
20
01
20
04
20
07
20
10
20
13
Figure 4.11: Age profile of 11kV distribution switchgear
4.3.7 400V network
The 400V network connects the transformers to the consumers through fuses located at service
poles and pillars. Also included within this network are the street and community lighting circuits.
Consumers are generally tapped off the 400V network, and fused at the boundary. There are
528km of overhead 400V lines and 479km of underground 400V cables, with 10,985 pillars and
cabinets.
0
5
10
15
20
25
30
35
40
19
40
19
43
19
46
19
49
19
52
19
55
19
58
19
61
19
64
19
67
19
70
19
73
19
76
19
79
19
82
19
85
19
88
19
91
19
94
19
97
20
00
20
03
20
06
20
09
20
12
20
15
40
0V
Lin
e L
en
gth
(km
)
Year of Installation
Figure 4.12: Age profile of 400V lines
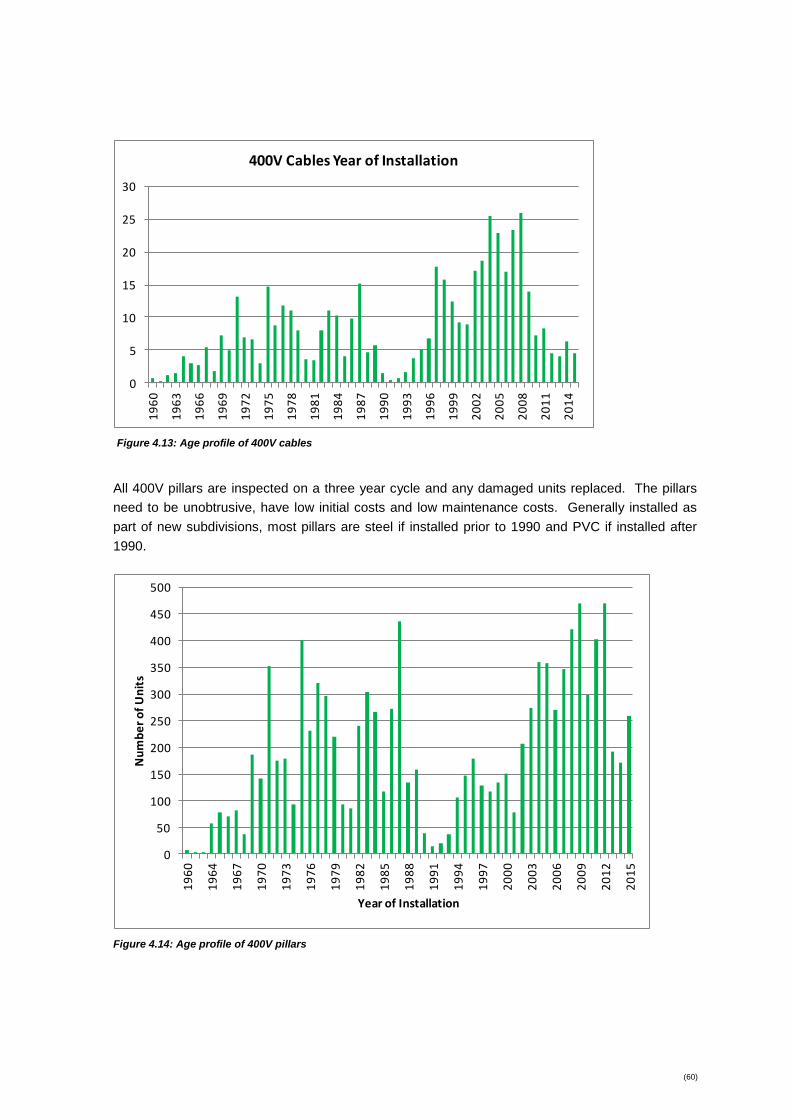
(60)
0
5
10
15
20
25
30
19
60
19
63
19
66
19
69
19
72
19
75
19
78
19
81
19
84
19
87
19
90
19
93
19
96
19
99
20
02
20
05
20
08
20
11
20
14
400V Cables Year of Installation
Figure 4.13: Age profile of 400V cables
All 400V pillars are inspected on a three year cycle and any damaged units replaced. The pillars
need to be unobtrusive, have low initial costs and low maintenance costs. Generally installed as
part of new subdivisions, most pillars are steel if installed prior to 1990 and PVC if installed after
1990.
0
50
100
150
200
250
300
350
400
450
500
19
60
19
64
19
67
19
70
19
73
19
76
19
79
19
82
19
85
19
88
19
91
19
94
19
97
20
00
20
03
20
06
20
09
20
12
20
15
Nu
mb
er
of
Un
its
Year of Installation
Figure 4.14: Age profile of 400V pillars
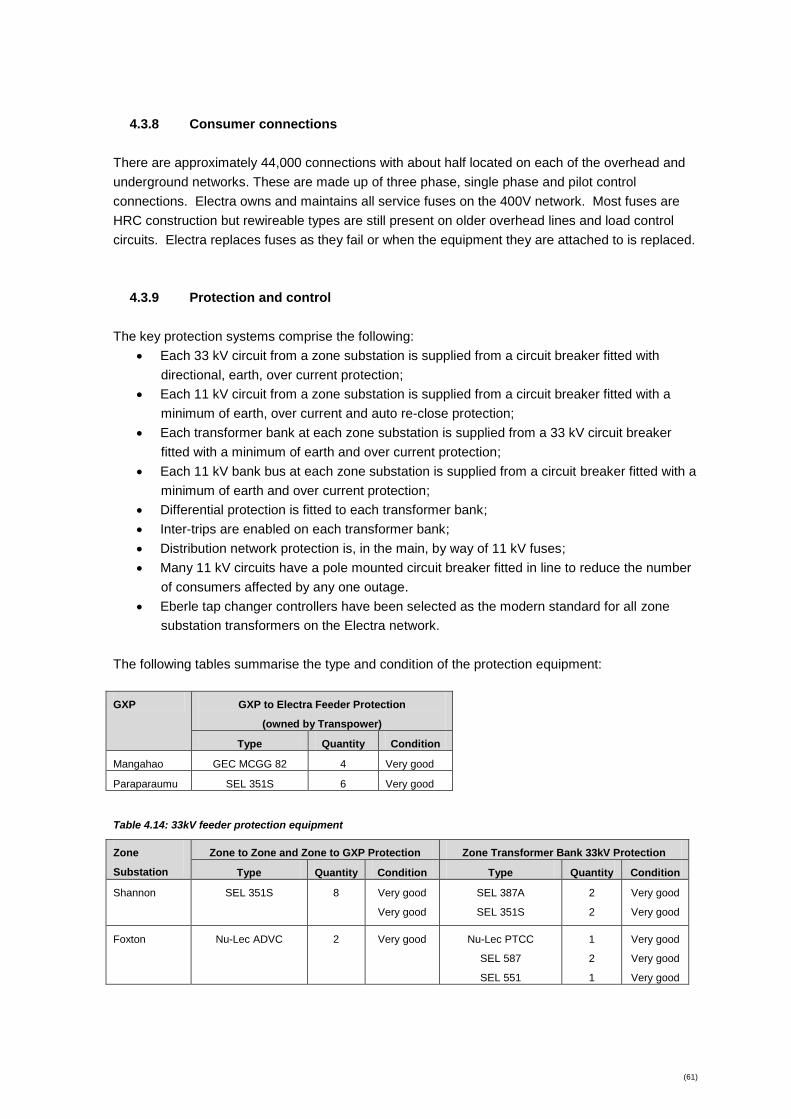
(61)
4.3.8 Consumer connections
There are approximately 44,000 connections with about half located on each of the overhead and
underground networks. These are made up of three phase, single phase and pilot control
connections. Electra owns and maintains all service fuses on the 400V network. Most fuses are
HRC construction but rewireable types are still present on older overhead lines and load control
circuits. Electra replaces fuses as they fail or when the equipment they are attached to is replaced.
4.3.9 Protection and control
The key protection systems comprise the following:
Each 33 kV circuit from a zone substation is supplied from a circuit breaker fitted with
directional, earth, over current protection;
Each 11 kV circuit from a zone substation is supplied from a circuit breaker fitted with a
minimum of earth, over current and auto re-close protection;
Each transformer bank at each zone substation is supplied from a 33 kV circuit breaker
fitted with a minimum of earth and over current protection;
Each 11 kV bank bus at each zone substation is supplied from a circuit breaker fitted with a
minimum of earth and over current protection;
Differential protection is fitted to each transformer bank;
Inter-trips are enabled on each transformer bank;
Distribution network protection is, in the main, by way of 11 kV fuses;
Many 11 kV circuits have a pole mounted circuit breaker fitted in line to reduce the number
of consumers affected by any one outage.
Eberle tap changer controllers have been selected as the modern standard for all zone
substation transformers on the Electra network.
The following tables summarise the type and condition of the protection equipment:
GXP GXP to Electra Feeder Protection
(owned by Transpower)
Type Quantity Condition
Mangahao GEC MCGG 82 4 Very good
Paraparaumu SEL 351S 6 Very good
Table 4.14: 33kV feeder protection equipment
Zone
Substation
Zone to Zone and Zone to GXP Protection Zone Transformer Bank 33kV Protection
Type Quantity Condition Type Quantity Condition
Shannon SEL 351S 8 Very good
Very good
SEL 387A
SEL 351S
2
2
Very good
Very good
Foxton Nu-Lec ADVC 2 Very good Nu-Lec PTCC
SEL 587
SEL 551
1
2
1
Very good
Very good
Very good

(62)
Levin East GEC KCEG 140
Nulec PTCC
1
2
Very good
Very good
Nulec PTCC
GEC MBCH12
2
2
Very good
Very good
Levin West Nulec ADVC 3 Very good SEL 387A
SEL 351S
2
1
Very good
Very good
Otaki GEC KCCG 140 2 Very good GEC KCCG 140
REY Duobias-M
2
2
Very good
Good
Waikanae SEL 267-4
SEL 251
2
1
Good
Good
SEL 587 2 Very good
Paraparaumu REY 4C21/2B3
SEL387A
1
1
Good
Very good
Paraparaumu
West
SEL 351S 2 Very good SEL 587 2 Very good
Raumati SEL 351S
SEL 311L
SEL487B
1
1
1
Very good
Very good
Very good
SEL387A
SEL351S
2
2
Very good
Very good
Paekakariki Nulec ADVC 1 Very good REY TJM 11 1 Good
Table 4.15: Sub-transmission protection
Zone
Substation
Zone Transformer Bank 11kV Protection 11kV Feeder Protection
Type Quantity Condition Type Quantity Condition
Shannon SEL 387A 2 Very good SEL 351S 4 Very good
Foxton SEL 551 2 Good SEL 351S 4 Very good
Levin East GEC MCGG 82 2 Average GEC MCGG 82
SEL 351S
4
1
Average
Very good
Levin West SEL 387A
GE SR760
1
1
Good
Poor
SEL 751A
SEL 351S
3
3
Very good
Very good
Waikanae SEL 251C 2 Good SEL 251
SEL 751A
5
1
Good
Very good
Otaki GEC KCCG 140 2 Good GEC KCGG 140 5 Good
Paraparaumu REY TJM 10
2
Good REY TJM 10
REY TJV
SEL 751A
3
2
1
Good
Good
Very good
Paraparaumu
West
SEL 351S 2 Very good SEL 351S 5 Very good
Raumati SEL 387A 2 Very good SEL 351S 4 Very good
Paekakariki REY TJM 11 1 Good SEL 351S 3 Very good
Table 4.16: Zone substation protection equipment
Electra has a number of battery chargers and power supplies from a number of manufacturers.
Although some are over fifteen years old, they are still in good serviceable condition because they
have not been over-loaded or run at full load for any length of time. All batteries and UPSs are
rated to give a minimum of six hours continuous standby load.

(63)
4.3.10 Load control and communications
Electra has several secondary networks that work in conjunction with the electricity network
including two ripple injection plants, one central SCADA system (and Control Centre), one NIMS
and the two radio (UHF and VHF) voice and data networks.
The ripple injection plants are used to control water-heating load, other storage heating loads, and
street-lighting. These plants are virtually maintenance free and upgrades are generally limited to
auxiliary equipment such as PLCs.
The SCADA master station and displays were replaced in 2009 with an iSCADA system supplied
by Catapault Software. This has made SCADA accurate and easy to use and maintain (given it is
New Zealand based support). Additionally, during 2011 iSCADA was made available on various
desktops with the Electra office.
Due to the amount of high speed data required to ensure that SCADA and load management are
working at maximum speed with the least amount of errors, the communication links were
upgraded in 2005/06. Communication between substations in the Paraparaumu/Raumati area is
via fibre optic cable with backup via radio links. The remainder of the network communicates by a
combination of pure radio path data and microwave links. The system is rated “fail safe” in that if
one of the repeater data paths fail these links will look for alternative paths to ensure the data gets
through. The system is in good condition and well maintained in order to ensure radio spectrum
compliance.
Electra is presently implementing an IP Network using DNP3 protocol as the communication
method. This will continue to increase the reliability of the communications system. The following
diagram shows the communication network associated with SCADA:

(64)
Figure 4.15: SCADA communications network
4.3.11 Office Buildings Depots and Workshops
Electra’s main office building is located in Levin and was constructed in 2006. Electra has depots in
Levin and Paraparaumu. The Levin depot has a small workshop for fitting out transformers and
light engineering. Most engineering and structural work is contracted out to specialised businesses.
4.3.12 Office Furniture and Equipment
Electra’s offices and depots have furniture to enable office and administrative functions to be
carried out. In Electra’s main office there are workstations for 19 staff and furnishings for two
meeting rooms. In the Levin depot there are workstations for 4 staff and in Paraparaumu Depot
there are workstations for 12 staff and two meeting rooms.
4.3.13 Motor Vehicles
Electra’s vehicle fleet consists of the following:
Nine heavy line construction trucks
Five Elevated Platform Vehicles
Four technician vans
Twenty five light utility vehicles
Thirteen cars

(65)
4.3.14 Tools, Plant and Other Machinery
Field staff are provided with tools to carry out the work necessary to provide Electra’s distribution
services. These tools vary from hand tools to test and monitoring equipment to prove the safety of
Electra’s assets.

(66)
4.4 Justification for the assets
All assets are justified by present or anticipated requirements to meet existing network standards
and service levels. An engineering review undertaken of the network during the 2004 ODV
valuation optimised out just $112,000 of assets or 0.06% of the value of the network. A review was
undertaken of the network assets to ascertain their “Fair Value” in 2015 which will be used to
highlight any additional optimisation requirements.
Electra designs and builds its network to meet the requirements of stakeholders. Stakeholders
were discussed in section 3.4. Some assets need to deliver greater service levels than others (for
example the Paraparaumu West zone substation supplying the rapidly growing beach area has a
higher capacity and security level than the Paekakariki zone substation which supplies the small
residential area located in southern Kapiti). Matching the level of investment in assets to the
expected service levels requires consideration of the following issues:
An intimate understanding of how asset ratings and configurations impact on service levels
such as capacity, security, reliability and voltage stability;
An understanding of the asymmetric nature of under-investment and over-investment i.e.
over-investing creates service levels before they are needed, but under-investing can lead
to service interruptions and in some cases catastrophic failure;
Recognition of the discrete sizes of many classes of components (for example a 220kVA
load will require a 300kVA transformer that is only 73% loaded). In some cases capacity
can be staged through use of modular components;
Recognition that Electra’s existing network has been built up over 80 years by a series of
incremental investment decisions that may have been optimal at the time but when taken
in aggregate at the present moment may well be sub-optimal; and
The need to accommodate future demand growth.
In theory an asset would be justified if the service level it creates is equal to the service level
required. In practice asymmetric risks, discrete component ratings, the non-linear behavior of
materials and uncertain future growth rates combine to justify an asset if its service level is not
significantly greater than that required, after allowing for demand growth and discrete component
ratings. More information about service levels targets is provided in section 5. Further discussion
of demand growth is provided in section 7.3.
At this time, Electra is not aware of any assets which are at risk of stranding. Electra consults with
consumers (as shown in Figure 3.5) to find out future load requirements of consumers. Electra is
not aware of any large load that may reduce or disconnect from the network which would leave
assets stranded.
Doc # 62900
(67)
5 Service Levels
5.1 Consumer performance targets
The purpose of this section is to meet the AMP objective of setting service levels for its electricity
network that will meet consumer, community and regulatory requirements as discussed in section
3.1. It also ties in with the following key policies and strategies of the SCI as noted in section 3.2:
Service and Operational Efficiency - Electra will continue to invest in upgrading the quality,
effectiveness and efficiency of network operations. It will continue to review opportunities
to work with other line companies to minimise operating costs and benchmark
performance, to ensure value to consumers and owners;
Market Growth and Quality of Supply - Electra will continue to invest in energy network
assets to meet customer led growth and to improve the quality of supply in the
Kapiti/Horowhenua area, subject to normal investment criteria. It will continue to promote
energy efficiency initiatives. Electra will, where necessary, develop and use electricity
pricing options and other practical solutions that result in the best use of network capacity.
Consultation with consumers consistent with the process shown in Figure 3.1 is a vital ingredient to
setting these service level targets.
This section firstly describes the service levels Electra expects to create for its consumers (which is
what they pay for) and secondly the service levels Electra expects to create for other key
stakeholder groups (which consumers are expected to subsidise).
Electra’s annual research shows that both residential and commercial consumers value continuity
of supply and prompt restoration of supply more highly than other attributes such as answering the
phone quickly, quick processing of new connection applications etc. There is also an increasing
value which consumers place on the absence of flicker, sags, surges and brown-outs. However,
other research that Electra is aware of indicates that flicker is probably noticed more often than it is
a problem. In addition there is only a tiny proportion of consumers who say they would be willing to
pay in addition to what they are paying now in order to get a more reliable supply. Consistent with
other sectors consumers are ever more likely to want greater reliability/quality for the same or a
lesser price.
The challenge with these results is that the service levels valued by consumers depend in most
situations on fixed asset solutions. Getting the power back on quickly at the 11kV and 33kV level
through automated switching as opposed to an individual property which might rely more on the
timing and skills of an individual person, fall into this category. Hence the tendency to require
capital expenditure solutions (as opposed to training or process solutions) to address this. This
raises the following issues:
Limited substitutability between service levels i.e. prompt phone response will not
compensate for frequent loss of power, but consumers do require and appreciate up to
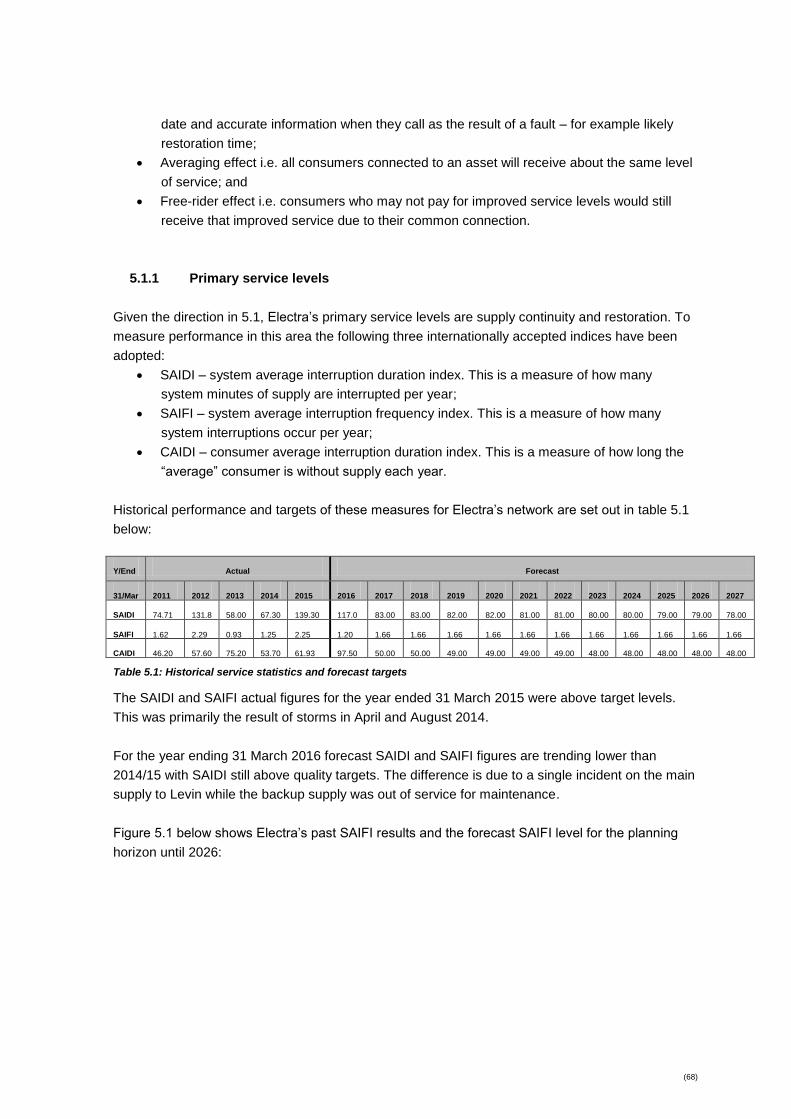
(68)
date and accurate information when they call as the result of a fault – for example likely
restoration time;
Averaging effect i.e. all consumers connected to an asset will receive about the same level
of service; and
Free-rider effect i.e. consumers who may not pay for improved service levels would still
receive that improved service due to their common connection.
5.1.1 Primary service levels
Given the direction in 5.1, Electra’s primary service levels are supply continuity and restoration. To
measure performance in this area the following three internationally accepted indices have been
adopted:
SAIDI – system average interruption duration index. This is a measure of how many
system minutes of supply are interrupted per year;
SAIFI – system average interruption frequency index. This is a measure of how many
system interruptions occur per year;
CAIDI – consumer average interruption duration index. This is a measure of how long the
“average” consumer is without supply each year.
Historical performance and targets of these measures for Electra’s network are set out in table 5.1
below:
Y/End Actual Forecast
31/Mar 2011 2012 2013 2014 2015 2016 2017
2018 2019 2020 2021 2022 2023 2024 2025
2026
2027
SAIDI 74.71 131.8
009
58.00 67.30 139.30 117.0
0
83.00 83.00 82.00 82.00 81.00 81.00 80.00 80.00 79.00 79.00 78.00
SAIFI 1.62 2.29 0.93 1.25 2.25 1.20 1.66 1.66 1.66 1.66 1.66 1.66 1.66 1.66 1.66 1.66 1.66
CAIDI 46.20 57.60 75.20
.60
53.70 61.93 97.50 50.00 50.00 49.00 49.00 49.00 49.00 48.00 48.00 48.00 48.00 48.00
Table 5.1: Historical service statistics and forecast targets
The SAIDI and SAIFI actual figures for the year ended 31 March 2015 were above target levels.
This was primarily the result of storms in April and August 2014.
For the year ending 31 March 2016 forecast SAIDI and SAIFI figures are trending lower than
2014/15 with SAIDI still above quality targets. The difference is due to a single incident on the main
supply to Levin while the backup supply was out of service for maintenance.
Figure 5.1 below shows Electra’s past SAIFI results and the forecast SAIFI level for the planning
horizon until 2026:

(69)
0
0.5
1
1.5
2
2.5
3
3.5
41999
2000
2001
2002
2003
2004
2005
2006
2007
2008
2009
2010
2011
2012
2013
2014
2015
2016
2017
2018
2019
2020
2021
2022
2023
2024
2025
2026
2027
SAIFI
Electra
Industry
Average
Actual Target
Figure 5.1: Electra’s actual and target SAIFI
0
50
100
150
200
250
300
350
400
1999
2000
2001
2002
2003
2004
2005
2006
2007
2008
2009
2010
2011
2012
2013
2014
2015
2016
2017
2018
2019
2020
2021
2022
2023
2024
2025
2026
2027
SAIDI & CAIDI
Electra SAIDI
Industry Average SAIDI
Electra CAIDI
Industry Average CAIDI
Actual Target
Figure 5.2: Electra’s actual and target SAIDI/CAIDI
In practical terms this means Electra’s consumers can broadly expect network reliability to remain
reasonably constant. As noted in Table 3.2, Electra’s most recent mass-market survey (carried out
in December 2015) still indicates a general satisfaction with the present supply quality. Some
variations to the network reliability may be caused by the following issues:

(70)
The dead-line line maintenance that will need to be completed over the next ten year
period (which is unable to be completed using live line techniques);
The impact of extreme weather.
Dead-line works will be required where the distribution network is either under-hung or has other
higher voltages located above the work sites. Every endeavour will continue to be made to reduce
and minimise the impact of outages by the use of alternative routes or portable generators where it
is practical to do so.
Generally, Electra does not differentiate service quality across different consumers although there
are natural variations due to geographical location and network topology (eg customers located
further away from main supply points are more likely to experience variations in service quality).
Electra’s philosophy is to keep things as uncomplicated as possible and this is reflected in there
being no price differentiations within consumer groupings (i.e. any differentiation between urban
and rural consumers would be arbitrary as the existence of lifestyle properties located on urban
fringes removes any clear distinction between these property types.). All pricing is designed where
possible to optimise asset utilisation on the network, no matter who the consumer is. Electra has a
variety of pricing options based on how much and when electricity is being consumed. Consumers
are able to choose the option that best suits them (dependant on how retailers repackage Electra’s
network prices).
Electra’s consumer base is overwhelmingly residential and thus network capacity must meet the
demands of high short-term morning and evening peaks, without the benefits of balancing daytime
commercial and industrial load. Similarly, as any consumer is able to utilise a particular network
tariff option Electra does not explicitly differentiate the level of service provided. This is reinforced
by our relatively dense network (20% above the national average). In practice there are areas
around the CBD’s in Levin and Paraparaumu where there are concentrations of commercial
consumers for whom we are able to keep service levels higher than average due to the proximity of
alternative supply paths, but generally our restoration time in the event of a power outage is similar
all consumers.
The network development plan (explained in detail in section 7) includes a number of renewal
projects that aim to reduce the risk of equipment failure that would have an impact on SAIFI and
SAIDI. There are some projects, such as the installation of RMUs for network sectionalisation
which have the effect of improved reliability and reduced outage times. These projects are factored
into the target service levels identified in section 5.1.1.
5.1.2 Secondary service levels
Secondary service levels are the attributes of service that consumers have ranked below supply
continuity and restoration. Some of these service levels are process driven which implies:
They tend to be cheaper than fixed asset solutions, for example: working overtime to
process new connection application back logs, diverting over-loaded phones or improving
the shut-down notification process; and
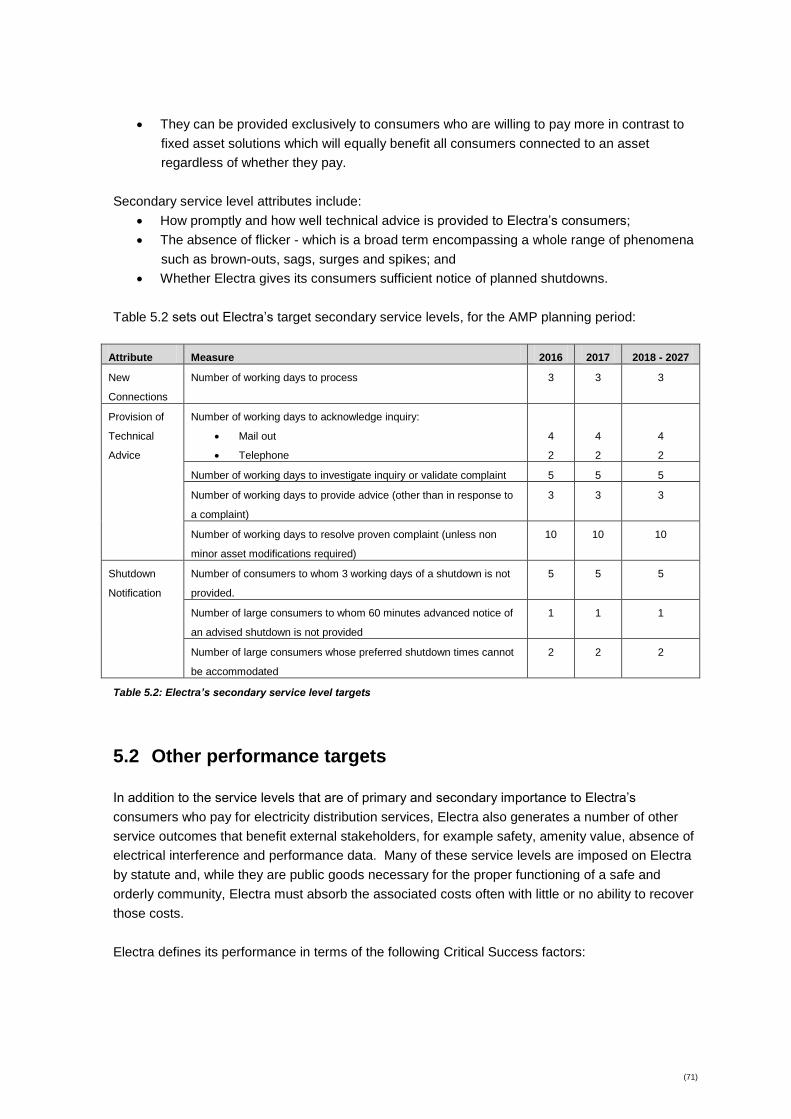
(71)
They can be provided exclusively to consumers who are willing to pay more in contrast to
fixed asset solutions which will equally benefit all consumers connected to an asset
regardless of whether they pay.
Secondary service level attributes include:
How promptly and how well technical advice is provided to Electra’s consumers;
The absence of flicker - which is a broad term encompassing a whole range of phenomena
such as brown-outs, sags, surges and spikes; and
Whether Electra gives its consumers sufficient notice of planned shutdowns.
Table 5.2 sets out Electra’s target secondary service levels, for the AMP planning period:
Attribute Measure 2016 2017 2018 - 2027
New
Connections
Number of working days to process 3 3 3
Provision of
Technical
Advice
Number of working days to acknowledge inquiry:
Mail out
Telephone
4
2
4
2
4
2
Number of working days to investigate inquiry or validate complaint 5 5 5
Number of working days to provide advice (other than in response to
a complaint)
3 3 3
Number of working days to resolve proven complaint (unless non
minor asset modifications required)
10 10 10
Shutdown
Notification
Number of consumers to whom 3 working days of a shutdown is not
provided.
5 5 5
Number of large consumers to whom 60 minutes advanced notice of
an advised shutdown is not provided
1 1 1
Number of large consumers whose preferred shutdown times cannot
be accommodated
2 2 2
Table 5.2: Electra’s secondary service level targets
5.2 Other performance targets
In addition to the service levels that are of primary and secondary importance to Electra’s
consumers who pay for electricity distribution services, Electra also generates a number of other
service outcomes that benefit external stakeholders, for example safety, amenity value, absence of
electrical interference and performance data. Many of these service levels are imposed on Electra
by statute and, while they are public goods necessary for the proper functioning of a safe and
orderly community, Electra must absorb the associated costs often with little or no ability to recover
those costs.
Electra defines its performance in terms of the following Critical Success factors:

(72)
Maintaining and growing a reputation for Integrity, Quality and Excellence within the
electricity industry and in the Kapiti/Horowhenua area and in all other areas where we
operate;
Exceeding Service Expectations for our consumers (consistent with Electra’s mission
statement to provide ‘quality services and efficient operations’);
Facilitating growing Awareness and Pride by consumers in their locally owned Electra
Group of companies that return benefits to them by way of discounts;
Asset efficiency/Energy delivery efficiency; and
Financial efficiency of the lines business.
In this respect, a number of performance targets have been set for measuring Electra’s success, as
illustrated below:
Attribute Measure 2016 2017 2018 -
2027
Marketing Fault resolution service ratings (out of 5) Resolution Timeliness
4.6 4.6
Public Safety Electricity (Safety) Regulations 2011 Compliant
Electricity (Hazards from Trees) Regulations 2004 Compliant
Industry performance Electricity Information Disclosure Requirements 2005 and subsequent amendments
Compliant
Financial Efficiency Capital expenditure per km $3,031 $3,031 Annual planning
adjustment
Operational expenditure per km $3,587 $3,587 Annual CPI
adjustment
Capital expenditure per connection point $182 $182 Annual planning
adjustment
Operational expenditure per connection point $216 $216 Annual CPI
adjustment
Energy Delivery Efficiency
Load factor (units entering network / maximum demand multiplied by hours in year)
55% 50% 50%
Loss ratio (units lost / units entering network) 6.6% 7.0% 6.7%
Capacity utilisation (maximum demand / installed transformer capacity)
35.5% 30.0% 33.0%
Table 5.3: Performance targets
Electra’s financial efficiency targets are set with an objective to maintain direct costs about the
same as network companies with similar disclosed characteristics: Aurora Energy, Counties Power,
Unison, Waipa Networks and WEL Networks.
5.3 Justification for service level targets
Electra primarily justifies its service levels in the following ways:
On the basis that the majority of consumers have expressed a preference for similar levels
of supply continuity and restoration in return for paying about the same line charges;

(73)
By the physical characteristics and configuration of the network which embody an implicit
level of reliability which is expensive to significantly alter (but which can be altered if a
consumer or group of consumers agrees to pay for the alteration);
Due to the diminishing returns of each dollar spent on reliability improvements;
Through any consumers’ specific request (and agreement to pay for) a particular service
level;
When an external agency imposes a service level or in some cases an unrelated condition
or restriction that manifests as a service level such as a requirement to place all new lines
underground or a requirement to maintain clearances.
Many of these justifications relate to the consumer consultation with consumers and stakeholders
that Electra undertakes on a regular basis as identified in section 3.2. The results of the last survey
(carried out in December 2015) are summarised below.
94% of residential and 88% of commercial customers agree that “Electra provides a
reliable supply of electricity”.
0% of residential and 2% of commercial customers would like Electra to provide a more
reliable/better quality power supply.
Consequently Electra does not intend to substantially alter overall service levels for the duration of
the planning period.
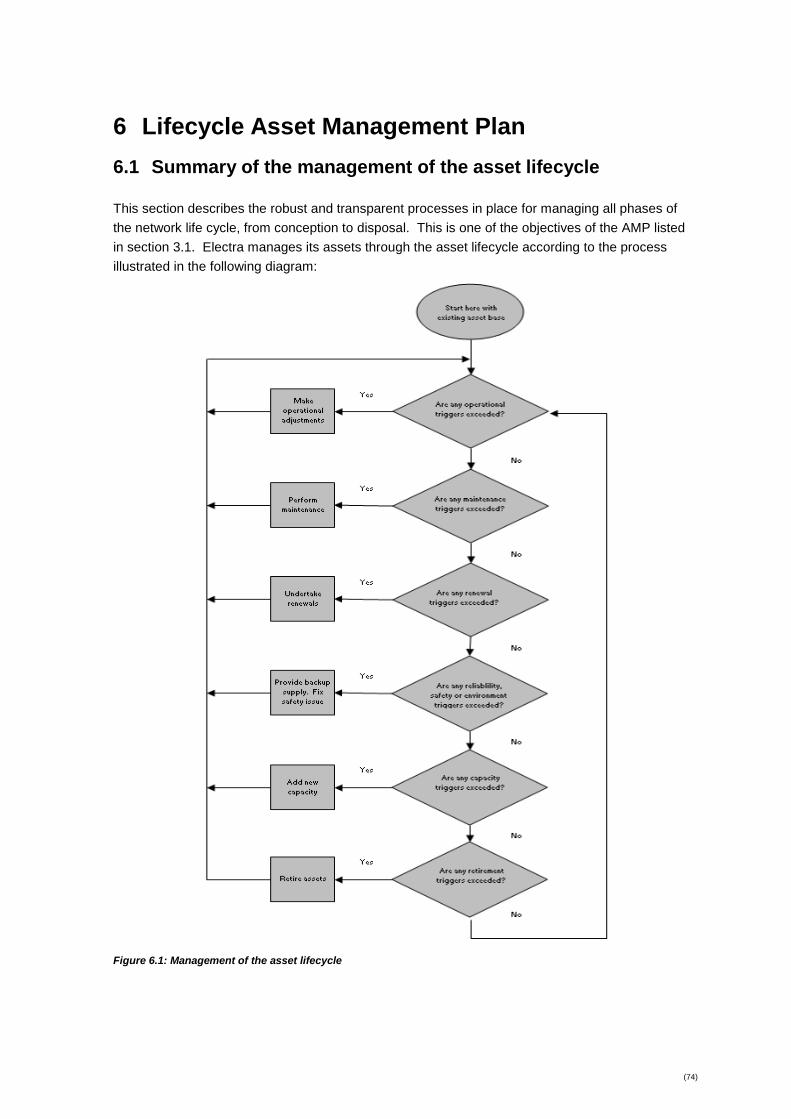
(74)
6 Lifecycle Asset Management Plan
6.1 Summary of the management of the asset lifecycle
This section describes the robust and transparent processes in place for managing all phases of
the network life cycle, from conception to disposal. This is one of the objectives of the AMP listed
in section 3.1. Electra manages its assets through the asset lifecycle according to the process
illustrated in the following diagram:
Figure 6.1: Management of the asset lifecycle

(75)
The key steps in the asset lifecycle are:
Operations – altering the operating parameters of the asset, i.e. its configuration;
Inspection & Maintenance – predominately associated with routine inspection, testing,
vegetation management, and replacing or renewing items that are component parts of as
asset (including both pre-planned and fault/emergency maintenance);
Renewal – replacing non-consumable components with an identical item with similar
functionality which may significantly extend the asset’s life;
Reliability, Safety and Environment – associated with maintaining or improving the safety
of the network for consumers, employees and the public, or with the improvement of
reliability or service standards, or with meeting new or enhanced environmental
requirements;
System Growth (add new capacity) – replacing non-consumable components with a similar
item with greater capacity;
Retirement – removing an asset from service and disposing of it.
The following sections primarily discuss the first two key steps of the asset life cycle (Operations;
and Inspection & Maintenance) in detail including policies, programmes and actions. However for
completeness it also provides a summary of the renewal, reliability, system growth and retirement
criteria. Section 7 contains Electra’s detailed plans for these steps in the context of the Network
Development Plan.
6.1.1 Asset operations criteria and assumptions
Actively operating electricity distribution assets predominantly involves doing nothing and simply
letting the electricity flow from the GXPs to consumers’ premises. However occasional intervention
is required when a trigger point is exceeded.
Table 6.1 outlines the key operational triggers adopted by Electra for each class of assets. Note
that whilst temperature triggers will usually follow demand triggers, this may not always be the
case, for example an overhead conductor joint might get hot because it is loose or corroded rather
than overloaded.
Asset
Category
Voltage Trigger Demand Trigger Temperature Trigger
400V lines
and cables
Voltage routinely drops too low
to maintain at least 94% of
nominal voltage at the point of
supply.
Voltage routinely rises too high
to maintain no more than 106%
of nominal voltage at the point
of supply.
Consumers’ pole or pillar fuse
blows repeatedly.
Transformer fuses blow
repeatedly
Signs of overheating on fittings
Infra-red survey reveals hot
joint.
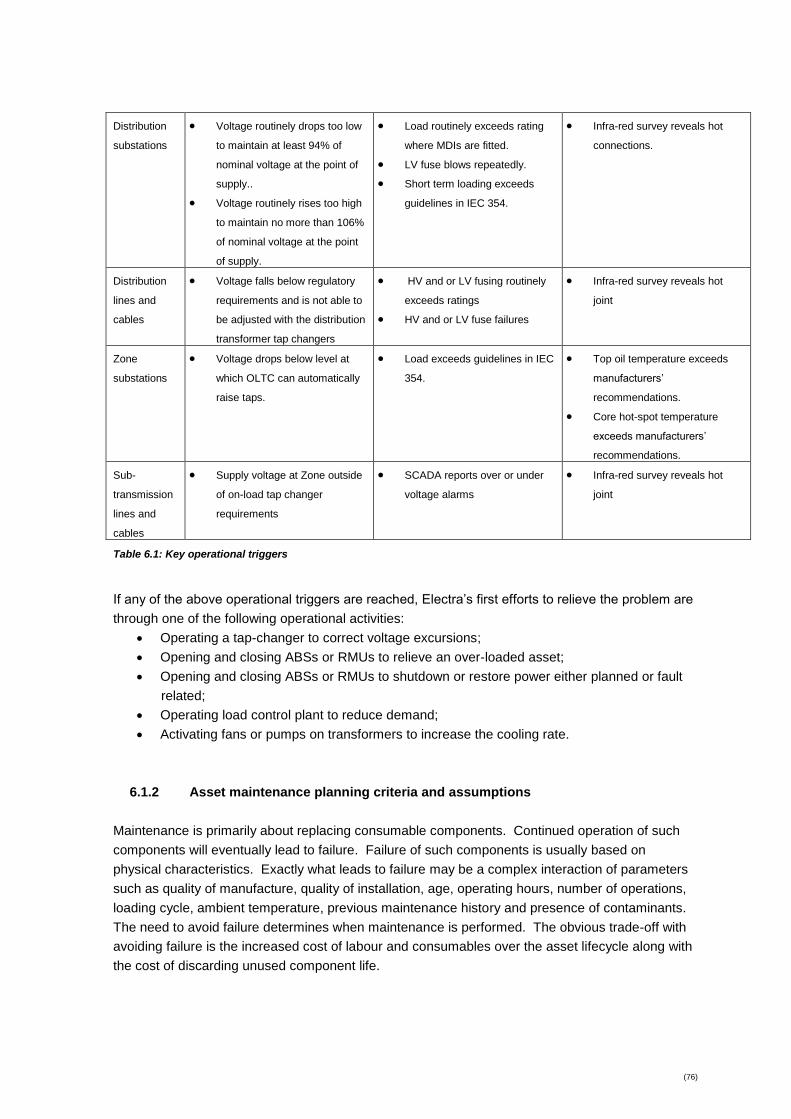
(76)
Distribution
substations
Voltage routinely drops too low
to maintain at least 94% of
nominal voltage at the point of
supply..
Voltage routinely rises too high
to maintain no more than 106%
of nominal voltage at the point
of supply.
Load routinely exceeds rating
where MDIs are fitted.
LV fuse blows repeatedly.
Short term loading exceeds
guidelines in IEC 354.
Infra-red survey reveals hot
connections.
Distribution
lines and
cables
Voltage falls below regulatory
requirements and is not able to
be adjusted with the distribution
transformer tap changers
HV and or LV fusing routinely
exceeds ratings
HV and or LV fuse failures
Infra-red survey reveals hot
joint
Zone
substations
Voltage drops below level at
which OLTC can automatically
raise taps.
Load exceeds guidelines in IEC
354.
Top oil temperature exceeds
manufacturers’
recommendations.
Core hot-spot temperature
exceeds manufacturers’
recommendations.
Sub-
transmission
lines and
cables
Supply voltage at Zone outside
of on-load tap changer
requirements
SCADA reports over or under
voltage alarms
Infra-red survey reveals hot
joint
Table 6.1: Key operational triggers
If any of the above operational triggers are reached, Electra’s first efforts to relieve the problem are
through one of the following operational activities:
Operating a tap-changer to correct voltage excursions;
Opening and closing ABSs or RMUs to relieve an over-loaded asset;
Opening and closing ABSs or RMUs to shutdown or restore power either planned or fault
related;
Operating load control plant to reduce demand;
Activating fans or pumps on transformers to increase the cooling rate.
6.1.2 Asset maintenance planning criteria and assumptions
Maintenance is primarily about replacing consumable components. Continued operation of such
components will eventually lead to failure. Failure of such components is usually based on
physical characteristics. Exactly what leads to failure may be a complex interaction of parameters
such as quality of manufacture, quality of installation, age, operating hours, number of operations,
loading cycle, ambient temperature, previous maintenance history and presence of contaminants.
The need to avoid failure determines when maintenance is performed. The obvious trade-off with
avoiding failure is the increased cost of labour and consumables over the asset lifecycle along with
the cost of discarding unused component life.
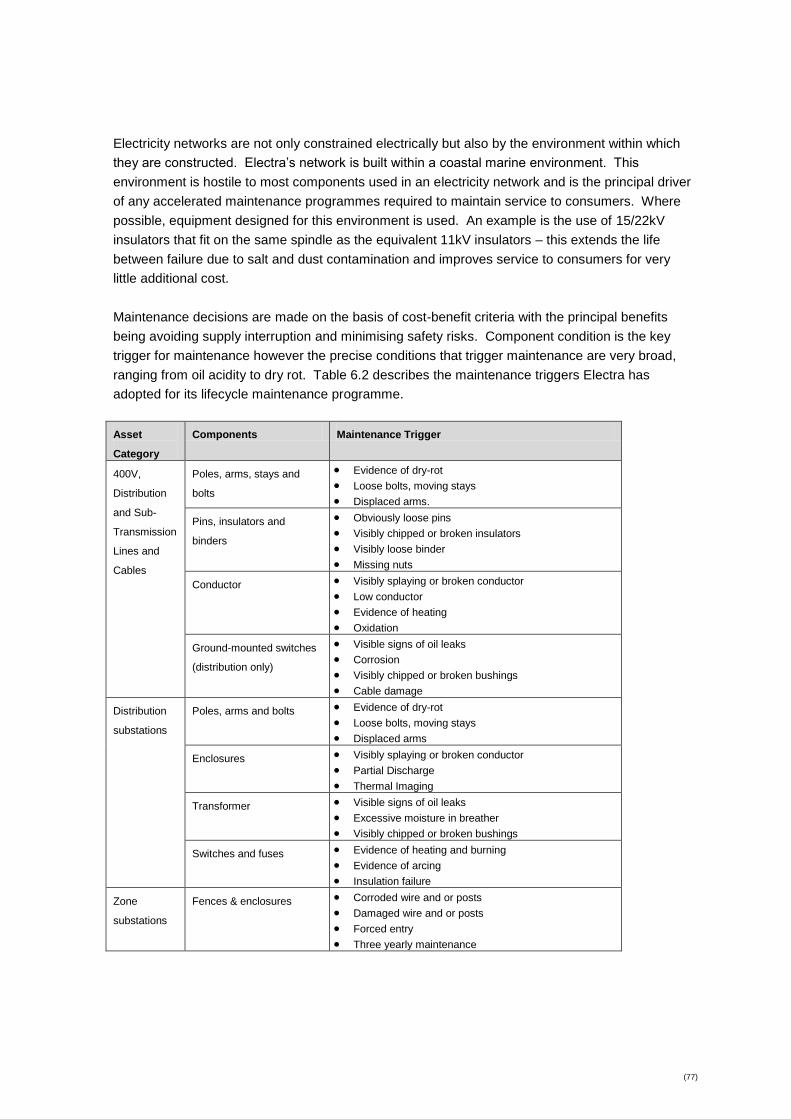
(77)
Electricity networks are not only constrained electrically but also by the environment within which
they are constructed. Electra’s network is built within a coastal marine environment. This
environment is hostile to most components used in an electricity network and is the principal driver
of any accelerated maintenance programmes required to maintain service to consumers. Where
possible, equipment designed for this environment is used. An example is the use of 15/22kV
insulators that fit on the same spindle as the equivalent 11kV insulators – this extends the life
between failure due to salt and dust contamination and improves service to consumers for very
little additional cost.
Maintenance decisions are made on the basis of cost-benefit criteria with the principal benefits
being avoiding supply interruption and minimising safety risks. Component condition is the key
trigger for maintenance however the precise conditions that trigger maintenance are very broad,
ranging from oil acidity to dry rot. Table 6.2 describes the maintenance triggers Electra has
adopted for its lifecycle maintenance programme.
Asset
Category
Components Maintenance Trigger
400V,
Distribution
and Sub-
Transmission
Lines and
Cables
Poles, arms, stays and
bolts
Evidence of dry-rot
Loose bolts, moving stays
Displaced arms.
Pins, insulators and
binders
Obviously loose pins
Visibly chipped or broken insulators
Visibly loose binder
Missing nuts
Conductor Visibly splaying or broken conductor
Low conductor
Evidence of heating
Oxidation
Ground-mounted switches
(distribution only)
Visible signs of oil leaks
Corrosion
Visibly chipped or broken bushings
Cable damage
Distribution
substations
Poles, arms and bolts Evidence of dry-rot
Loose bolts, moving stays
Displaced arms
Enclosures Visibly splaying or broken conductor
Partial Discharge
Thermal Imaging
Transformer Visible signs of oil leaks
Excessive moisture in breather
Visibly chipped or broken bushings
Switches and fuses Evidence of heating and burning
Evidence of arcing
Insulation failure
Zone
substations
Fences & enclosures Corroded wire and or posts
Damaged wire and or posts
Forced entry
Three yearly maintenance

(78)
Buildings Build up of dirt / grime
Flaking paint
Damaged and or rotting boards
Leaks
Three yearly maintenance
Bus work & conductors Damaged insulators
Evidence of heating
Splaying conductors
Oxidation
Three yearly maintenance
33kV switchgear From oil and gas analysis results
Number of operations due to fault tripping or switching
Visible signs of oil leaks
Corrosion
Evidence of heating
Visibly chipped or broken bushings
Cable damage
Three yearly maintenance
Transformer From oil and gas analysis results
Corrosion
Evidence of heating
Visibly chipped or broken bushings
Cable damage
Tap Changer number of operations
Three yearly maintenance
11kV switchgear
From oil and gas analysis results
Number of operations due to fault tripping or switching
Visible signs of oil leaks
Corrosion
Evidence of heating
Visibly chipped or broken bushings
Cable damage
Three yearly maintenance
Bus work & conductors Evidence of heating
Splaying conductors
Oxidation
Three yearly maintenance
Instrumentation Requirement of regulation
Failure to operate correctly
Three yearly maintenance
Table 6.2: Key maintenance triggers
6.1.3 Asset renewal and refurbishment criteria and assumptions
Electra classifies work as renewal if there is no change (usually an increase) in functionality i.e. the
output of any asset does not change. A key criterion for renewing an asset is when the capitalised
operating and maintenance costs exceed the renewal cost, and this can occur in a number of ways
as follows:
Operating costs become excessive for example: increasing level of inputs into a SCADA
system requires an increasing level of manning;
Maintenance costs begin to accelerate for example: a transformer needs more frequent oil
changes as the seals and gaskets perish;
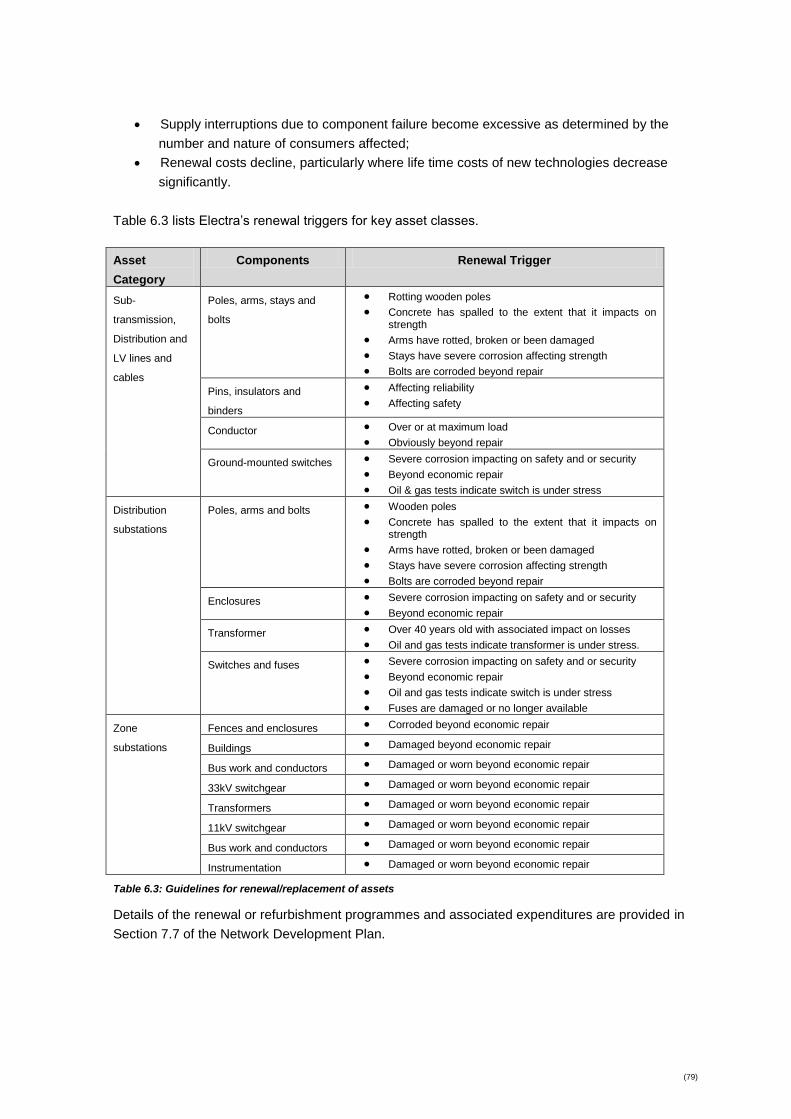
(79)
Supply interruptions due to component failure become excessive as determined by the
number and nature of consumers affected;
Renewal costs decline, particularly where life time costs of new technologies decrease
significantly.
Table 6.3 lists Electra’s renewal triggers for key asset classes.
Asset
Category
Components Renewal Trigger
Sub-
transmission,
Distribution and
LV lines and
cables
Poles, arms, stays and
bolts
Rotting wooden poles
Concrete has spalled to the extent that it impacts on strength
Arms have rotted, broken or been damaged
Stays have severe corrosion affecting strength
Bolts are corroded beyond repair
Pins, insulators and
binders
Affecting reliability
Affecting safety
Conductor Over or at maximum load
Obviously beyond repair
Ground-mounted switches Severe corrosion impacting on safety and or security
Beyond economic repair
Oil & gas tests indicate switch is under stress
Distribution
substations
Poles, arms and bolts Wooden poles
Concrete has spalled to the extent that it impacts on strength
Arms have rotted, broken or been damaged
Stays have severe corrosion affecting strength
Bolts are corroded beyond repair
Enclosures Severe corrosion impacting on safety and or security
Beyond economic repair
Transformer Over 40 years old with associated impact on losses
Oil and gas tests indicate transformer is under stress.
Switches and fuses Severe corrosion impacting on safety and or security
Beyond economic repair
Oil and gas tests indicate switch is under stress
Fuses are damaged or no longer available
Zone
substations
Fences and enclosures Corroded beyond economic repair
Buildings Damaged beyond economic repair
Bus work and conductors Damaged or worn beyond economic repair
33kV switchgear Damaged or worn beyond economic repair
Transformers Damaged or worn beyond economic repair
11kV switchgear Damaged or worn beyond economic repair
Bus work and conductors Damaged or worn beyond economic repair
Instrumentation Damaged or worn beyond economic repair
Table 6.3: Guidelines for renewal/replacement of assets
Details of the renewal or refurbishment programmes and associated expenditures are provided in
Section 7.7 of the Network Development Plan.
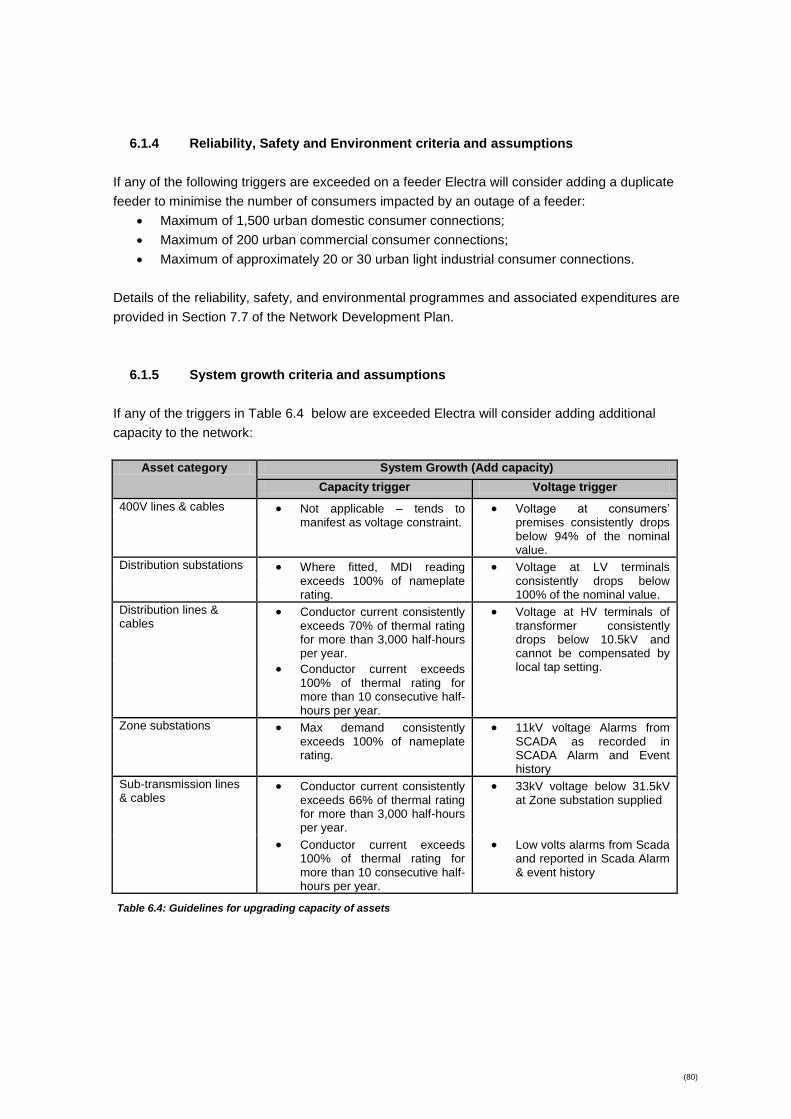
(80)
6.1.4 Reliability, Safety and Environment criteria and assumptions
If any of the following triggers are exceeded on a feeder Electra will consider adding a duplicate
feeder to minimise the number of consumers impacted by an outage of a feeder:
Maximum of 1,500 urban domestic consumer connections;
Maximum of 200 urban commercial consumer connections;
Maximum of approximately 20 or 30 urban light industrial consumer connections.
Details of the reliability, safety, and environmental programmes and associated expenditures are
provided in Section 7.7 of the Network Development Plan.
6.1.5 System growth criteria and assumptions
If any of the triggers in Table 6.4 below are exceeded Electra will consider adding additional
capacity to the network:
Asset category System Growth (Add capacity)
Capacity trigger Voltage trigger
400V lines & cables Not applicable – tends to manifest as voltage constraint.
Voltage at consumers’ premises consistently drops below 94% of the nominal value.
Distribution substations Where fitted, MDI reading exceeds 100% of nameplate rating.
Voltage at LV terminals consistently drops below 100% of the nominal value.
Distribution lines & cables
Conductor current consistently exceeds 70% of thermal rating for more than 3,000 half-hours per year.
Voltage at HV terminals of transformer consistently drops below 10.5kV and cannot be compensated by local tap setting. Conductor current exceeds
100% of thermal rating for more than 10 consecutive half-hours per year.
Zone substations Max demand consistently exceeds 100% of nameplate rating.
11kV voltage Alarms from SCADA as recorded in SCADA Alarm and Event history
Sub-transmission lines & cables
Conductor current consistently exceeds 66% of thermal rating for more than 3,000 half-hours per year.
33kV voltage below 31.5kV at Zone substation supplied
Conductor current exceeds 100% of thermal rating for more than 10 consecutive half-hours per year.
Low volts alarms from Scada and reported in Scada Alarm & event history
Table 6.4: Guidelines for upgrading capacity of assets

(81)
Electra uses a range of technical and engineering standards to achieve an optimal mix of the
following outcomes:
Comply with sensible environmental and public safety requirements.
Meet likely demand growth for a reasonable time horizon including consideration of
modularity and scalability;
Minimise over-investment;
Minimise the risk of long-term stranding;
Minimise corporate risk exposure commensurate with other goals;
Maximise operational flexibility;
Maximise the fit with software capabilities such as engineering and operational expertise
and vendor support;
Given the fairly simple nature of Electra’s network, standard designs are generally adopted for all
asset classes with minor site-specific alterations. These designs embody the wisdom and
experience of current standards, industry guidelines and manufacturers recommendations. Work
identified by Electra as needing to be done is almost solely carried out by Electra’s Distribution
Operations staff.
As part of the building and commissioning process Electra’s information records are recorded
through the “as-built” process and all testing of new assets is documented.
Details of the system growth programmes and associated expenditures are provided in Section 7.7
of the Network Development Plan.
6.1.6 Consumer connection criteria and assumptions
These projects are driven by consumers. Typically these projects include assets to connect a
consumer to the existing network. This category includes upstream assets that are changed to
meet the load of a new consumer (or existing consumer requesting a larger capacity) which causes
unacceptable peaks on existing upstream assets. Given the nature of this work, consumers are
able to approach up to three contractors authorised to work on Electra’s network (Electra
Distribution Operations, Scanpower and Connetics) to obtain quotes.
6.1.7 Retiring assets criteria and assumptions
Key criteria for retiring an asset include:
Its physical presence is no longer required (usually because a consumer has reduced or
ceased demand);
It creates unacceptable risk exposure, either because its inherent risks have increased
over time or because safe exposure levels have reduced. Assets retired for safety reasons
are not re-deployed or sold for re-use;
(82)
Where better options exist to deliver similar outcomes and there are no suitable
opportunities for re-deployment, for example replacing lubricated bearings with high-impact
nylon bushes;
Where an asset has been up-sized and no suitable opportunities exist for re-deployment.
6.2 Asset Inspections and maintenance policies and programmes
The following sections describe the approach adopted by Electra to inspecting and maintaining for
all asset categories. This includes a description of the inspections, tests, condition monitoring
carried out, the intervals at which this is done, and the actions taken to address any systemic
problems by asset category.
The following table summarises the planned inspection programme for the planning period to 2025:
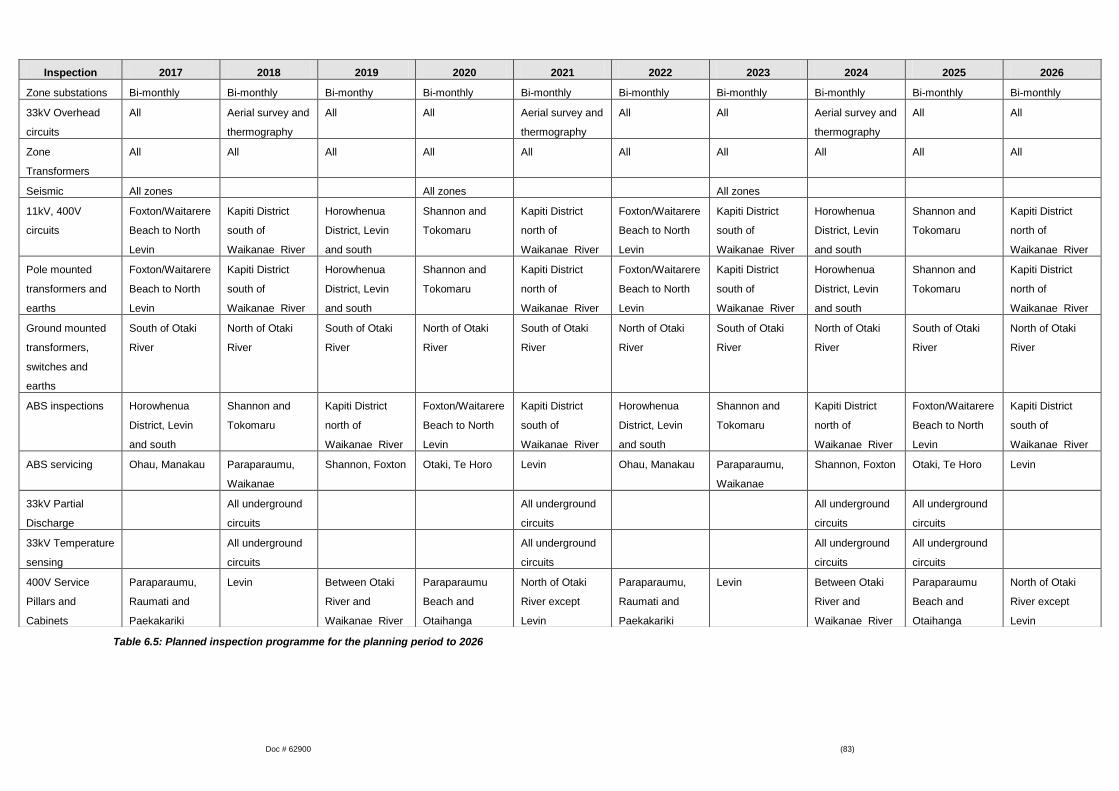
Doc # 62900 (83)
Table 6.5: Planned inspection programme for the planning period to 2026
Inspection 2017 2018 2019 2020 2021 2022 2023 2024 2025 2026
Zone substations Bi-monthly Bi-monthly Bi-monthy Bi-monthly Bi-monthly Bi-monthly Bi-monthly Bi-monthly Bi-monthly Bi-monthly
33kV Overhead
circuits
All Aerial survey and
thermography
All All Aerial survey and
thermography
All All Aerial survey and
thermography
All All
Zone
Transformers
All All All All All All All All All All
Seismic All zones All zones All zones
11kV, 400V
circuits
Foxton/Waitarere
Beach to North
Levin
Kapiti District
south of
Waikanae River
Horowhenua
District, Levin
and south
Shannon and
Tokomaru
Kapiti District
north of
Waikanae River
Foxton/Waitarere
Beach to North
Levin
Kapiti District
south of
Waikanae River
Horowhenua
District, Levin
and south
Shannon and
Tokomaru
Kapiti District
north of
Waikanae River
Pole mounted
transformers and
earths
Foxton/Waitarere
Beach to North
Levin
Kapiti District
south of
Waikanae River
Horowhenua
District, Levin
and south
Shannon and
Tokomaru
Kapiti District
north of
Waikanae River
Foxton/Waitarere
Beach to North
Levin
Kapiti District
south of
Waikanae River
Horowhenua
District, Levin
and south
Shannon and
Tokomaru
Kapiti District
north of
Waikanae River
Ground mounted
transformers,
switches and
earths
South of Otaki
River
North of Otaki
River
South of Otaki
River
North of Otaki
River
South of Otaki
River
North of Otaki
River
South of Otaki
River
North of Otaki
River
South of Otaki
River
North of Otaki
River
ABS inspections Horowhenua
District, Levin
and south
Shannon and
Tokomaru
Kapiti District
north of
Waikanae River
Foxton/Waitarere
Beach to North
Levin
Kapiti District
south of
Waikanae River
Horowhenua
District, Levin
and south
Shannon and
Tokomaru
Kapiti District
north of
Waikanae River
Foxton/Waitarere
Beach to North
Levin
Kapiti District
south of
Waikanae River
ABS servicing Ohau, Manakau Paraparaumu,
Waikanae
Shannon, Foxton Otaki, Te Horo Levin Ohau, Manakau Paraparaumu,
Waikanae
Shannon, Foxton Otaki, Te Horo Levin
33kV Partial
Discharge
All underground
circuits
All underground
circuits
All underground
circuits
All underground
circuits
33kV Temperature
sensing
All underground
circuits
All underground
circuits
All underground
circuits
All underground
circuits
400V Service
Pillars and
Cabinets
Paraparaumu,
Raumati and
Paekakariki
Levin Between Otaki
River and
Waikanae River
Paraparaumu
Beach and
Otaihanga
North of Otaki
River except
Levin
Paraparaumu,
Raumati and
Paekakariki
Levin Between Otaki
River and
Waikanae River
Paraparaumu
Beach and
Otaihanga
North of Otaki
River except
Levin

Doc # 62900
(84)
6.2.1 Grid Exit Point (GXP) assets
These assets are owned, inspected and maintained by Transpower.
6.2.2 Sub-transmission assets
6.2.2.1 Overhead sub-transmission assets
6.2.2.1.1 Inspection policies and programmes on overhead sub-transmission assets
Electra inspects the 33kV overhead circuits annually as one part of its life-cycle asset management
process. Special inspections, including the use of thermal imaging every five years, are also used
to enhance the maintenance planning process.
All line surveys are carried out by experienced Electra Distribution Operations employees who walk
the line route and note any visual defects. Under certain conditions, these inspections may be
undertaken using live line techniques. This is usually when a close-in inspection is required such
as the three yearly ABS inspections. All overhead circuits are visually inspected as follows:
Asset Inspection Guidelines
Poles Type, leaning, spalling of concrete/or rot
Cross arms and insulators Type, rot, lean, brackets, contamination
Conductor Incorrect sag, damaged conductor
Trees Growth around overhead lines, new planting, or potential fire sources
Slips etc Slips or other ground disturbances threatening poles, structures or underground cables
Buildings Construction under/near lines or over cables
Vodafone lines clearance from ground and Electra’s circuits
Thermography Five yearly – 33kV only
Table 6.6: Inspection guidelines for overhead lines
Electra's contractors record this information electronically and the information is stored in Electra's
NIMS system. In some instances, paper recorded inspections means are also used. All inspection
results are filtered by condition and purchase orders are raised for remedial or replacement works
in the next financial year, urgent work is completed immediately. Electra’s contractors are relied
upon to provide accurate and quantified condition assessments.
Electra has used Industrial Research Limited (IRL) to complete physical strength and remaining life
tests on 33kV conductors removed from service. These test results are a critical part of condition
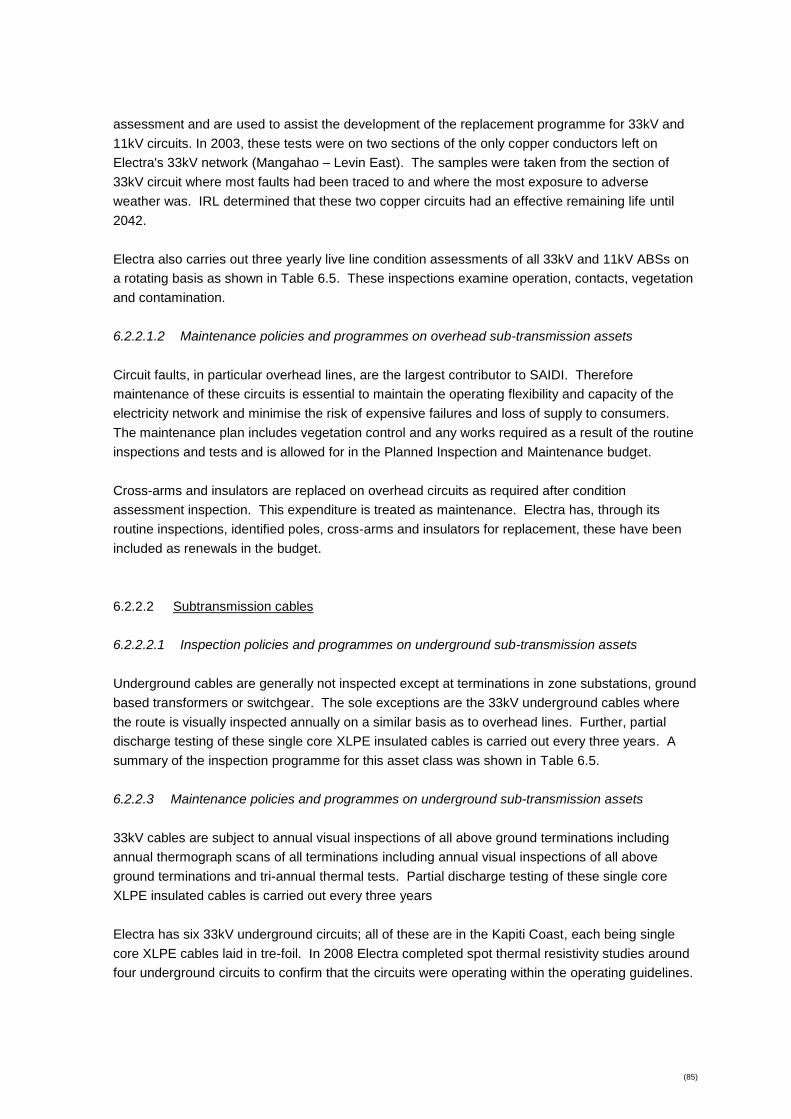
(85)
assessment and are used to assist the development of the replacement programme for 33kV and
11kV circuits. In 2003, these tests were on two sections of the only copper conductors left on
Electra's 33kV network (Mangahao – Levin East). The samples were taken from the section of
33kV circuit where most faults had been traced to and where the most exposure to adverse
weather was. IRL determined that these two copper circuits had an effective remaining life until
2042.
Electra also carries out three yearly live line condition assessments of all 33kV and 11kV ABSs on
a rotating basis as shown in Table 6.5. These inspections examine operation, contacts, vegetation
and contamination.
6.2.2.1.2 Maintenance policies and programmes on overhead sub-transmission assets
Circuit faults, in particular overhead lines, are the largest contributor to SAIDI. Therefore
maintenance of these circuits is essential to maintain the operating flexibility and capacity of the
electricity network and minimise the risk of expensive failures and loss of supply to consumers.
The maintenance plan includes vegetation control and any works required as a result of the routine
inspections and tests and is allowed for in the Planned Inspection and Maintenance budget.
Cross-arms and insulators are replaced on overhead circuits as required after condition
assessment inspection. This expenditure is treated as maintenance. Electra has, through its
routine inspections, identified poles, cross-arms and insulators for replacement, these have been
included as renewals in the budget.
6.2.2.2 Subtransmission cables
6.2.2.2.1 Inspection policies and programmes on underground sub-transmission assets
Underground cables are generally not inspected except at terminations in zone substations, ground
based transformers or switchgear. The sole exceptions are the 33kV underground cables where
the route is visually inspected annually on a similar basis as to overhead lines. Further, partial
discharge testing of these single core XLPE insulated cables is carried out every three years. A
summary of the inspection programme for this asset class was shown in Table 6.5.
6.2.2.3 Maintenance policies and programmes on underground sub-transmission assets
33kV cables are subject to annual visual inspections of all above ground terminations including
annual thermograph scans of all terminations including annual visual inspections of all above
ground terminations and tri-annual thermal tests. Partial discharge testing of these single core
XLPE insulated cables is carried out every three years
Electra has six 33kV underground circuits; all of these are in the Kapiti Coast, each being single
core XLPE cables laid in tre-foil. In 2008 Electra completed spot thermal resistivity studies around
four underground circuits to confirm that the circuits were operating within the operating guidelines.
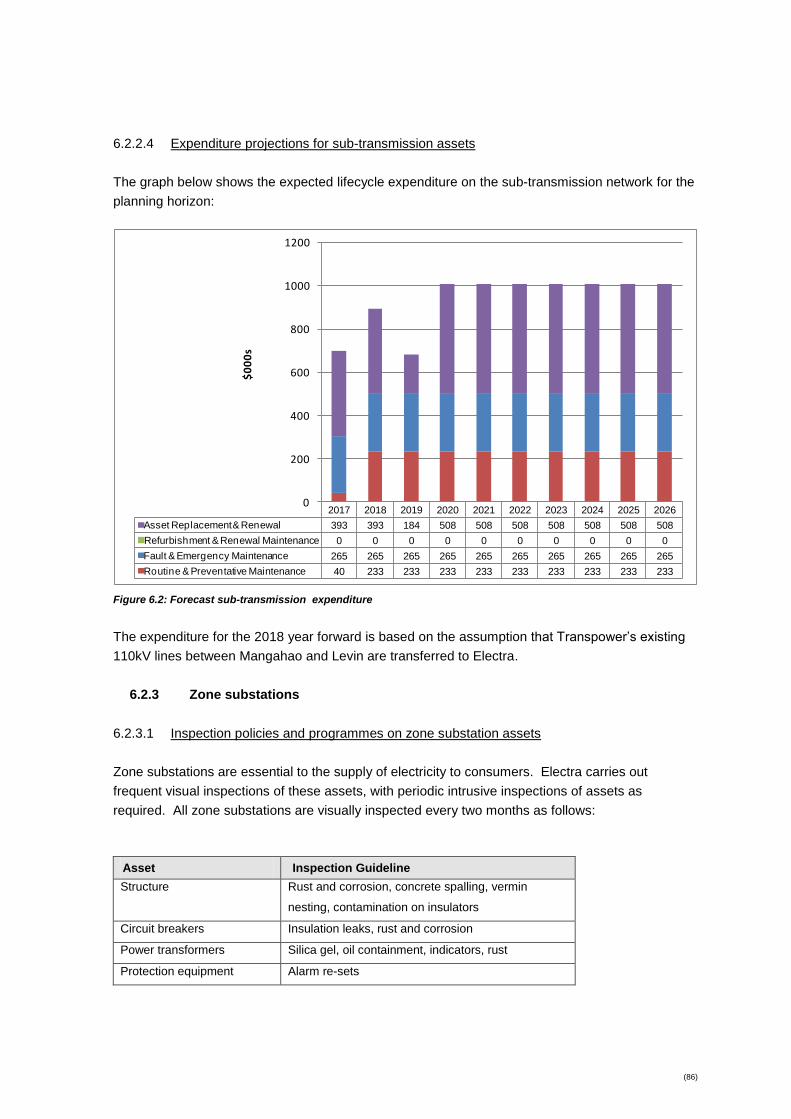
(86)
6.2.2.4 Expenditure projections for sub-transmission assets
The graph below shows the expected lifecycle expenditure on the sub-transmission network for the
planning horizon:
2017 2018 2019 2020 2021 2022 2023 2024 2025 2026
Asset Replacement & Renewal 393 393 184 508 508 508 508 508 508 508
Refurbishment & Renewal Maintenance 0 0 0 0 0 0 0 0 0 0
Fault & Emergency Maintenance 265 265 265 265 265 265 265 265 265 265
Routine & Preventative Maintenance 40 233 233 233 233 233 233 233 233 233
0
200
400
600
800
1000
1200$
00
0s
Figure 6.2: Forecast sub-transmission expenditure
The expenditure for the 2018 year forward is based on the assumption that Transpower’s existing
110kV lines between Mangahao and Levin are transferred to Electra.
6.2.3 Zone substations
6.2.3.1 Inspection policies and programmes on zone substation assets
Zone substations are essential to the supply of electricity to consumers. Electra carries out
frequent visual inspections of these assets, with periodic intrusive inspections of assets as
required. All zone substations are visually inspected every two months as follows:
Asset Inspection Guideline
Structure Rust and corrosion, concrete spalling, vermin
nesting, contamination on insulators
Circuit breakers Insulation leaks, rust and corrosion
Power transformers Silica gel, oil containment, indicators, rust
Protection equipment Alarm re-sets

(87)
Batteries Voltages, condition
Perimeter fence and building
security
Condition, holes, electric fences
Remote control Confirm status and remote checks
Site security Locks, debris in structures
Minor repairs Blown light bulbs
Grounds Vegetation, debris
Post earthquake As required
Table 6.7: Visual inspection guidelines for zone substations
During the bi-monthly inspections, grounds maintenance is undertaken at each zone substation
which includes mowing lawns, pruning trees, weed control, cleaning drains and gutters, washing
walls and windows and other housekeeping tasks.
The inspection programme has several circuit breakers that will require maintenance and/or
replacement within the time period of this plan. The work for this is shown as a renewal in the
network development plan (refer Table 7.12).
Additional equipment tests are also undertaken, typically as follows:
Asset Test
33kV/11kV transformer Annual vibration analysis, DGA, particle and Furans Analysis – main tank, tap
changer
Earths Annual earth tests including step and touch potentials
33kV oil filled VTs Annual DGA, particle and Furans Analysis
Oil filled circuit breakers Annual DGA, particle and Furans Analysis
SF6 filled circuit breakers Annual particle and Furans Analysis
Indoor switchgear Biennial partial discharge and thermography (Years 2017, 2019, 2021)
Oil Containment Five yearly checks on integrity of oil containment
Table 6.8: Equipment test guidelines for zone substations
Electra also has an independent seismic inspection of all zone substations completed periodically.
This inspection reviews the structure integrity of the buildings, switchgear, equipment racks,
structures and transformer seismic tie-downs. The last inspection was completed in 2015 and did
not indicate any significant issues with non-compliance with the relevant standard.
6.2.3.2 Maintenance policies and programmes on zone substation assets
Maintenance of zone substations is essential to maintain the operating capability of the electricity
network and to minimise the risk of expensive failures. However, Electra does not undertake
maintenance for the sake of maintaining equipment. All maintenance is based on either condition

(88)
assessment arising from the inspection programme (for example overhaul of power transformers)
or on manufacturer’s recommendations.
Although development projects will influence the maintenance of individual zone substations
(particularly those where replacement or refurbishment are imminent), no significant change to
maintenance practices is anticipated at this stage.
As a minimum, Electra maintains zone substations, other than after faults, on a five yearly cycle.
This five yearly routine maintenance includes:
transformers and tap changers;
minor repair work;
maintaining oil within acceptable industry standards;
correcting oil leaks;
maintenance as recommended by the various manufacturers (IOMS manuals);
painting (outdoor only);
lubrication of moving parts;
inspection, cleaning and replacements of insulators;
corrosion control, cleaning off rust and other residues and replacing protective coatings;
removal of debris;
confirm operation of all switches;
recalibration and confirmation of protection operation;
test all lightning arrestors associated with the transformers and bus structures;
test earth connections for physical deterioration on all above ground equipment;
earth tests on the earth grid;
water blasting of concrete;
repairs to buildings and fences as required;
landscaping as required.
A condition assessment of each zone substation is forwarded to Electra for review and inclusion
within maintenance and development plans.
The zone substation five yearly maintenance cycle is illustrated below and the work is generally
carried out over the summer months:
Year Zone
2016/17 Raumati & Shannon
2017/18 Levin West & Paraparaumu West
2018/19 Otaki & Paekakariki
2019/20 Levin East & Paraparaumu
2020/21 Foxton & Waikanae
Table 6.9: Zone substation maintenance schedule
All maintenance and refurbishments are included in the maintenance budget. Replacements or
upgrades are included in the capital budget.
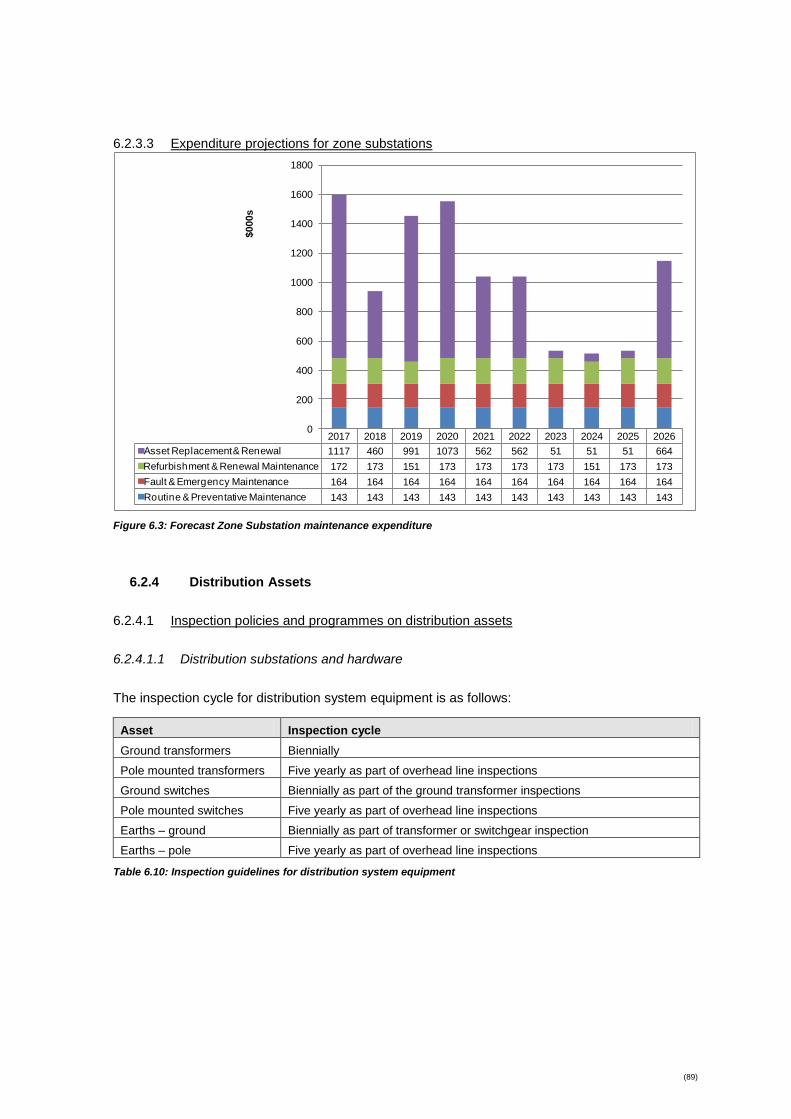
(89)
6.2.3.3 Expenditure projections for zone substations
2017 2018 2019 2020 2021 2022 2023 2024 2025 2026
Asset Replacement & Renewal 1117 460 991 1073 562 562 51 51 51 664
Refurbishment & Renewal Maintenance 172 173 151 173 173 173 173 151 173 173
Fault & Emergency Maintenance 164 164 164 164 164 164 164 164 164 164
Routine & Preventative Maintenance 143 143 143 143 143 143 143 143 143 143
0
200
400
600
800
1000
1200
1400
1600
1800
$000s
Figure 6.3: Forecast Zone Substation maintenance expenditure
6.2.4 Distribution Assets
6.2.4.1 Inspection policies and programmes on distribution assets
6.2.4.1.1 Distribution substations and hardware
The inspection cycle for distribution system equipment is as follows:
Asset Inspection cycle
Ground transformers Biennially
Pole mounted transformers Five yearly as part of overhead line inspections
Ground switches Biennially as part of the ground transformer inspections
Pole mounted switches Five yearly as part of overhead line inspections
Earths – ground Biennially as part of transformer or switchgear inspection
Earths – pole Five yearly as part of overhead line inspections
Table 6.10: Inspection guidelines for distribution system equipment
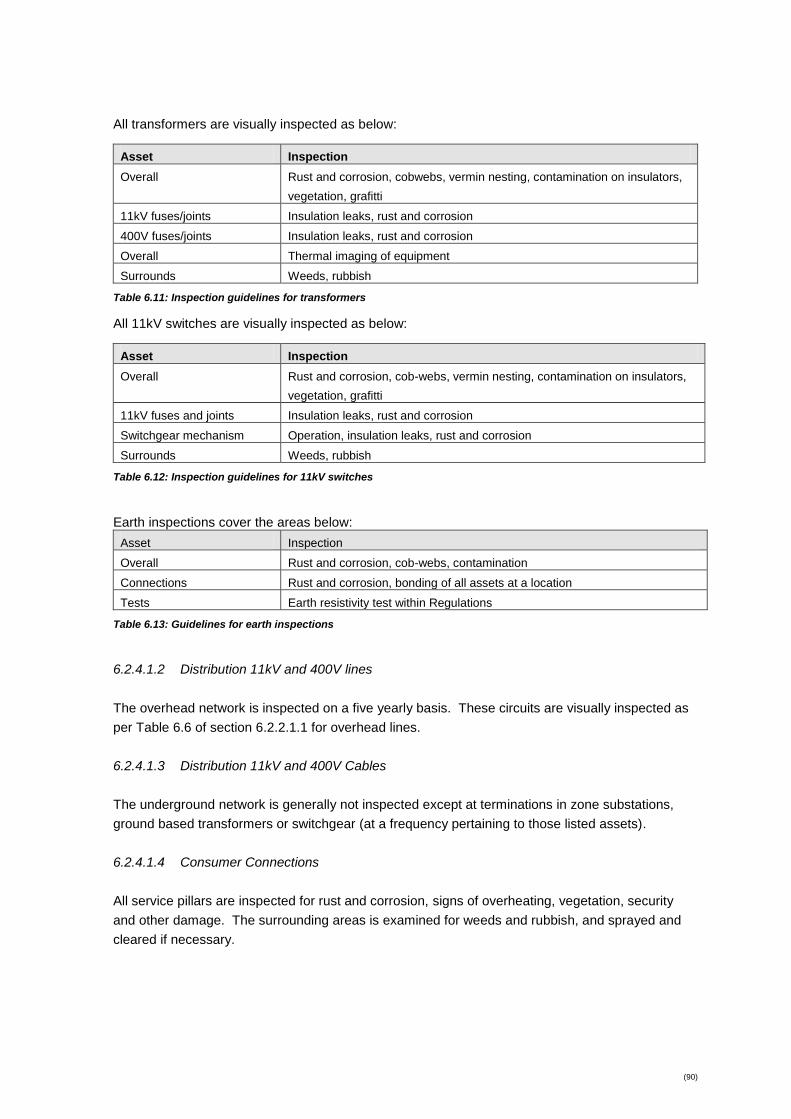
(90)
All transformers are visually inspected as below:
Asset Inspection
Overall Rust and corrosion, cobwebs, vermin nesting, contamination on insulators,
vegetation, grafitti
11kV fuses/joints Insulation leaks, rust and corrosion
400V fuses/joints Insulation leaks, rust and corrosion
Overall Thermal imaging of equipment
Surrounds Weeds, rubbish
Table 6.11: Inspection guidelines for transformers
All 11kV switches are visually inspected as below:
Asset Inspection
Overall Rust and corrosion, cob-webs, vermin nesting, contamination on insulators,
vegetation, grafitti
11kV fuses and joints Insulation leaks, rust and corrosion
Switchgear mechanism Operation, insulation leaks, rust and corrosion
Surrounds Weeds, rubbish
Table 6.12: Inspection guidelines for 11kV switches
Earth inspections cover the areas below:
Asset Inspection
Overall Rust and corrosion, cob-webs, contamination
Connections Rust and corrosion, bonding of all assets at a location
Tests Earth resistivity test within Regulations
Table 6.13: Guidelines for earth inspections
6.2.4.1.2 Distribution 11kV and 400V lines
The overhead network is inspected on a five yearly basis. These circuits are visually inspected as
per Table 6.6 of section 6.2.2.1.1 for overhead lines.
6.2.4.1.3 Distribution 11kV and 400V Cables
The underground network is generally not inspected except at terminations in zone substations,
ground based transformers or switchgear (at a frequency pertaining to those listed assets).
6.2.4.1.4 Consumer Connections
All service pillars are inspected for rust and corrosion, signs of overheating, vegetation, security
and other damage. The surrounding areas is examined for weeds and rubbish, and sprayed and
cleared if necessary.

(91)
6.2.4.2 Maintenance policies and programmes on distribution network assets
6.2.4.2.1 Distribution transformers and hardware
Electra maintains transformers, other than after faults, based on the condition inspections, as
outlined above and annual MDI readings (where fitted) and analysis and annual thermograph scan
of all terminations. In addition routine preventative maintenance includes:
minor repair work on transformer, structures or associated 11kV or 400V fuses;
maintaining oil within acceptable industry standards;
correcting corrosion and oil leaks;
inspections and repairs to tap changers;
replacement of transformers, structures or associated 11kV or 400V fuses as required; and
cleaning of site.
Buffalo grass is very prevalent in the Kapiti Coast and the transformers are regularly sprayed for
weeds. Regular inspections and treatments are done to minimise the incidence of faults due to
these. Cobwebs can also cause flashovers in 11kV and 400V transformer bays. Regular
inspections and treatments are done to minimise the incidence of faults due to these.
Graffiti does not impact in the operation of the electricity network; however, it does have a social
and environmental impact. Regular inspections and treatments are undertaken to remove it from
ground mounted assets.
Equipment failures can occur randomly, without warning, and range from a simple drop out fuse
operating or a simple mechanism fault on an ABS to a transformer or auto-recloser failing in
service.
Electra maintains switchgear, other than after faults, based on the condition inspections outlined
above and annual thermograph scans of all terminations. Routine maintenance includes:
minor repair work on switchgear and structures;
maintaining oil within acceptable industry standards;
correcting corrosion and oil leaks;
inspections and repairs to operating mechanisms;
replacement of switchgear, structures or associated 11kV or 400V fuses;
painting; and
cleaning of site.
Replacements are completed as renewal capital projects, and are included in the development
plans outlined in Section 7.7.
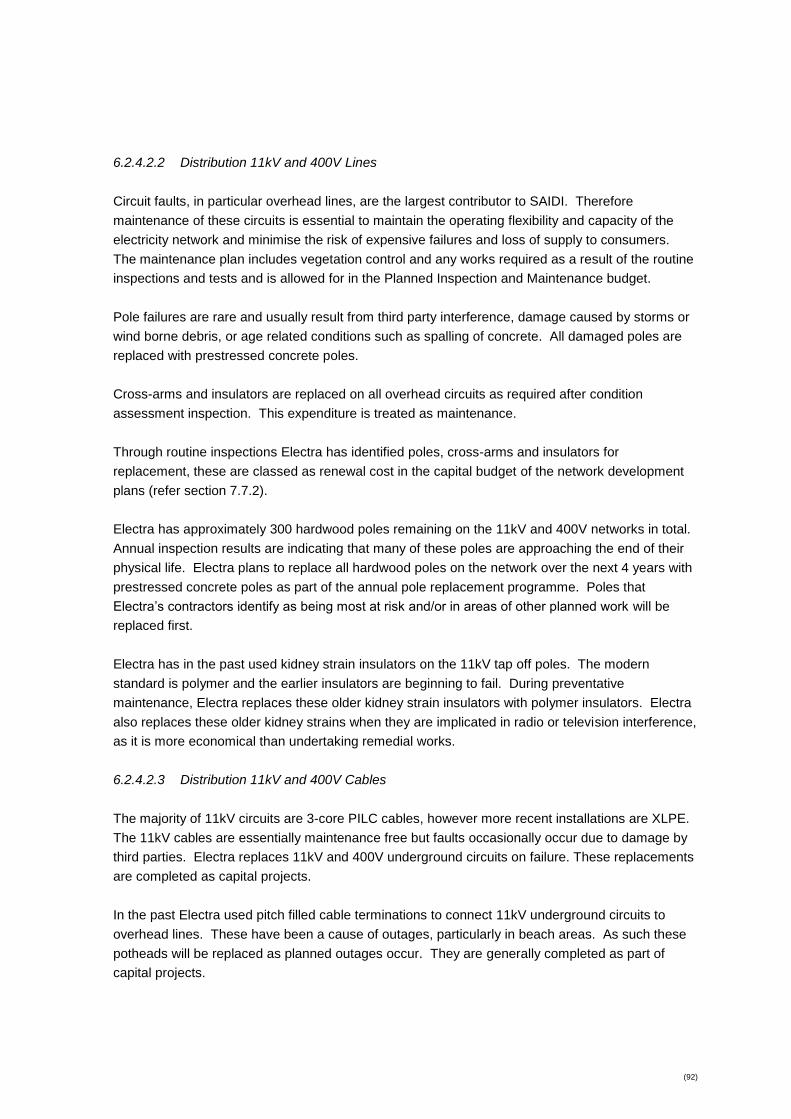
(92)
6.2.4.2.2 Distribution 11kV and 400V Lines
Circuit faults, in particular overhead lines, are the largest contributor to SAIDI. Therefore
maintenance of these circuits is essential to maintain the operating flexibility and capacity of the
electricity network and minimise the risk of expensive failures and loss of supply to consumers.
The maintenance plan includes vegetation control and any works required as a result of the routine
inspections and tests and is allowed for in the Planned Inspection and Maintenance budget.
Pole failures are rare and usually result from third party interference, damage caused by storms or
wind borne debris, or age related conditions such as spalling of concrete. All damaged poles are
replaced with prestressed concrete poles.
Cross-arms and insulators are replaced on all overhead circuits as required after condition
assessment inspection. This expenditure is treated as maintenance.
Through routine inspections Electra has identified poles, cross-arms and insulators for
replacement, these are classed as renewal cost in the capital budget of the network development
plans (refer section 7.7.2).
Electra has approximately 300 hardwood poles remaining on the 11kV and 400V networks in total.
Annual inspection results are indicating that many of these poles are approaching the end of their
physical life. Electra plans to replace all hardwood poles on the network over the next 4 years with
prestressed concrete poles as part of the annual pole replacement programme. Poles that
Electra’s contractors identify as being most at risk and/or in areas of other planned work will be
replaced first.
Electra has in the past used kidney strain insulators on the 11kV tap off poles. The modern
standard is polymer and the earlier insulators are beginning to fail. During preventative
maintenance, Electra replaces these older kidney strain insulators with polymer insulators. Electra
also replaces these older kidney strains when they are implicated in radio or television interference,
as it is more economical than undertaking remedial works.
6.2.4.2.3 Distribution 11kV and 400V Cables
The majority of 11kV circuits are 3-core PILC cables, however more recent installations are XLPE.
The 11kV cables are essentially maintenance free but faults occasionally occur due to damage by
third parties. Electra replaces 11kV and 400V underground circuits on failure. These replacements
are completed as capital projects.
In the past Electra used pitch filled cable terminations to connect 11kV underground circuits to
overhead lines. These have been a cause of outages, particularly in beach areas. As such these
potheads will be replaced as planned outages occur. They are generally completed as part of
capital projects.
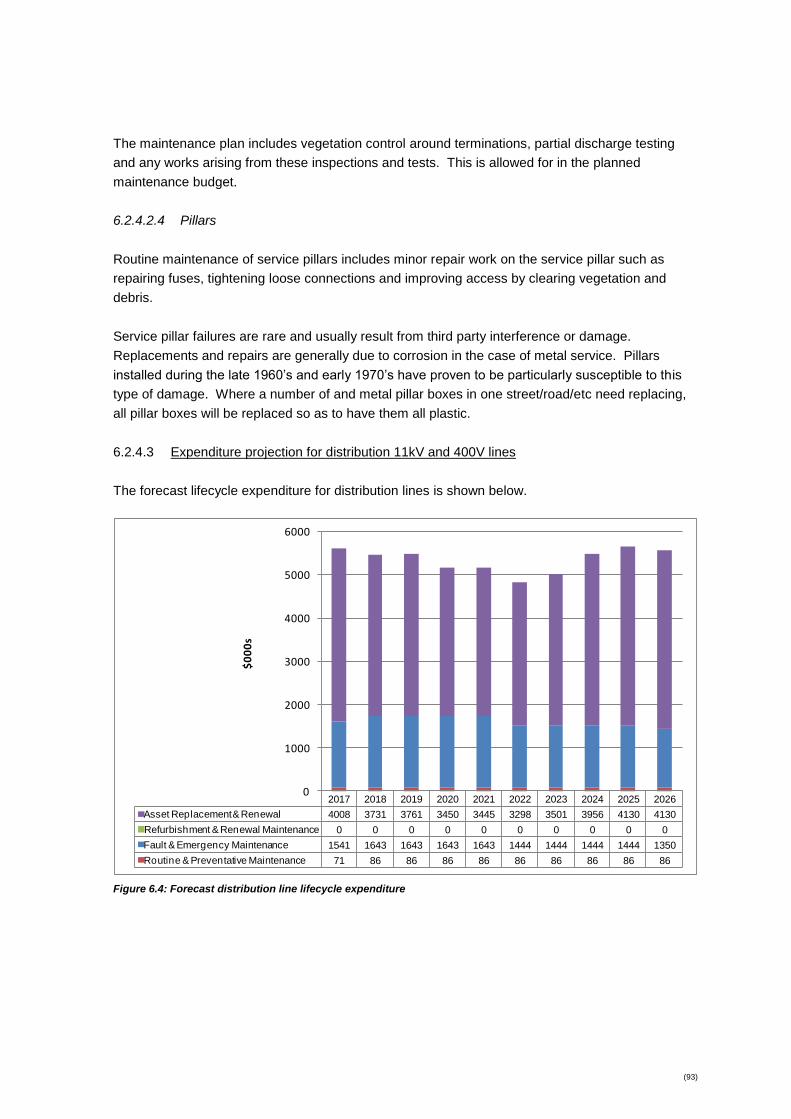
(93)
The maintenance plan includes vegetation control around terminations, partial discharge testing
and any works arising from these inspections and tests. This is allowed for in the planned
maintenance budget.
6.2.4.2.4 Pillars
Routine maintenance of service pillars includes minor repair work on the service pillar such as
repairing fuses, tightening loose connections and improving access by clearing vegetation and
debris.
Service pillar failures are rare and usually result from third party interference or damage.
Replacements and repairs are generally due to corrosion in the case of metal service. Pillars
installed during the late 1960’s and early 1970’s have proven to be particularly susceptible to this
type of damage. Where a number of and metal pillar boxes in one street/road/etc need replacing,
all pillar boxes will be replaced so as to have them all plastic.
6.2.4.3 Expenditure projection for distribution 11kV and 400V lines
The forecast lifecycle expenditure for distribution lines is shown below.
2017 2018 2019 2020 2021 2022 2023 2024 2025 2026
Asset Replacement & Renewal 4008 3731 3761 3450 3445 3298 3501 3956 4130 4130
Refurbishment & Renewal Maintenance 0 0 0 0 0 0 0 0 0 0
Fault & Emergency Maintenance 1541 1643 1643 1643 1643 1444 1444 1444 1444 1350
Routine & Preventative Maintenance 71 86 86 86 86 86 86 86 86 86
0
1000
2000
3000
4000
5000
6000
$0
00
s
Figure 6.4: Forecast distribution line lifecycle expenditure

(94)
6.2.4.4 Expenditure projection for distribution 11kV and 400V cables
The expenditure forecast includes lifecycle expenses for distribution cables is shown below.
2017 2018 2019 2020 2021 2022 2023 2024 2025 2026
Asset Replacement & Renewal 218 218 218 382 218 218 218 218 300 300
Refurbishment & Renewal Maintenance 0 0 0 0 0 0 0 0 0 0
Fault & Emergency Maintenance 36 36 36 36 36 36 36 36 36 36
Routine & Preventative Maintenance 53 53 53 53 53 53 53 53 53 53
0
50
100
150
200
250
300
350
400
450
500
$0
00
s
Figure 6.5: Forecast distribution cable lifecycle expenditure
6.2.4.5 Expenditure projection for distribution substations and transformers
The forecast lifecycle expenditure for distribution substations and transformers is shown below.
2017 2018 2019 2020 2021 2022 2023 2024 2025 2026
Asset Replacement & Renewal 2090 1729 1734 1721 1727 1636 1468 1559 1555 1555
Refurbishment & Renewal Maintenance 285 285 285 285 285 285 285 285 285 285
Fault & Emergency Maintenance 40 40 40 40 40 40 40 40 40 40
Routine & Preventative Maintenance 40 40 40 40 40 40 40 40 40 40
0
500
1000
1500
2000
2500
3000
$0
00
s
Figure 6.6: Forecast distribution substation and transformer lifecycle expenditure
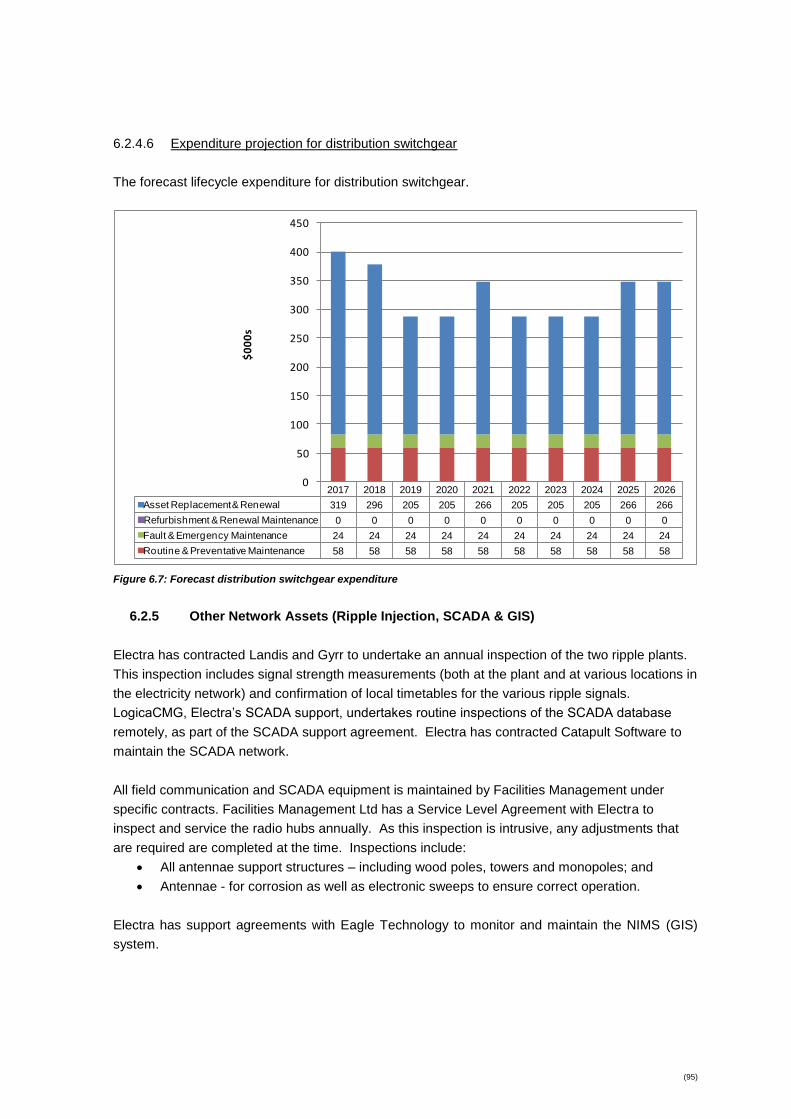
(95)
6.2.4.6 Expenditure projection for distribution switchgear
The forecast lifecycle expenditure for distribution switchgear.
2017 2018 2019 2020 2021 2022 2023 2024 2025 2026
Asset Replacement & Renewal 319 296 205 205 266 205 205 205 266 266
Refurbishment & Renewal Maintenance 0 0 0 0 0 0 0 0 0 0
Fault & Emergency Maintenance 24 24 24 24 24 24 24 24 24 24
Routine & Preventative Maintenance 58 58 58 58 58 58 58 58 58 58
0
50
100
150
200
250
300
350
400
450
$0
00
s
Figure 6.7: Forecast distribution switchgear expenditure
6.2.5 Other Network Assets (Ripple Injection, SCADA & GIS)
Electra has contracted Landis and Gyrr to undertake an annual inspection of the two ripple plants.
This inspection includes signal strength measurements (both at the plant and at various locations in
the electricity network) and confirmation of local timetables for the various ripple signals.
LogicaCMG, Electra’s SCADA support, undertakes routine inspections of the SCADA database
remotely, as part of the SCADA support agreement. Electra has contracted Catapult Software to
maintain the SCADA network.
All field communication and SCADA equipment is maintained by Facilities Management under
specific contracts. Facilities Management Ltd has a Service Level Agreement with Electra to
inspect and service the radio hubs annually. As this inspection is intrusive, any adjustments that
are required are completed at the time. Inspections include:
All antennae support structures – including wood poles, towers and monopoles; and
Antennae - for corrosion as well as electronic sweeps to ensure correct operation.
Electra has support agreements with Eagle Technology to monitor and maintain the NIMS (GIS)
system.

(96)
6.2.5.1 Expenditure projection for other network assets
The forecast lifecycle expenditure for other network assets.
2017 2018 2019 2020 2021 2022 2023 2024 2025 2026
Asset Replacement & Renewal 320 308 320 308 320 308 320 308 320 308
Refurbishment & Renewal Maintenance 0 0 0 0 0 0 0 0 0 0
Fault & Emergency Maintenance 156 133 133 133 133 133 133 133 133 133
Routine & Preventative Maintenance 423 376 376 376 376 376 376 376 376 376
0
100
200
300
400
500
600
700
800
900
1000
$0
00
s
Axis Title
Figure 6.8: Forecast Other Network Asset lifecycle expenditure
6.2.6 Non-Network Assets
Electra policy regarding non network assets to allow for lifecycle replacement matching the rate of
depreciation.
Electra’s vehicle replacement policy is outlined below.
Cars - Petrol – 4 years or 130,000kms
Cars - Diesel – 4 years or 160,000kms
Utes and Vans – 6 years or 160,000kms
Trucks to be determined by the General Manager but average to be 10 years
Electra’s Generator is serviced after every 250 hours of running time. This service includes
replacement of filters, lubricants and coolants. The electrical connections including cables are
tested annually. A Certificate of Fitness is obtained for the trailer at 6 monthly intervals.
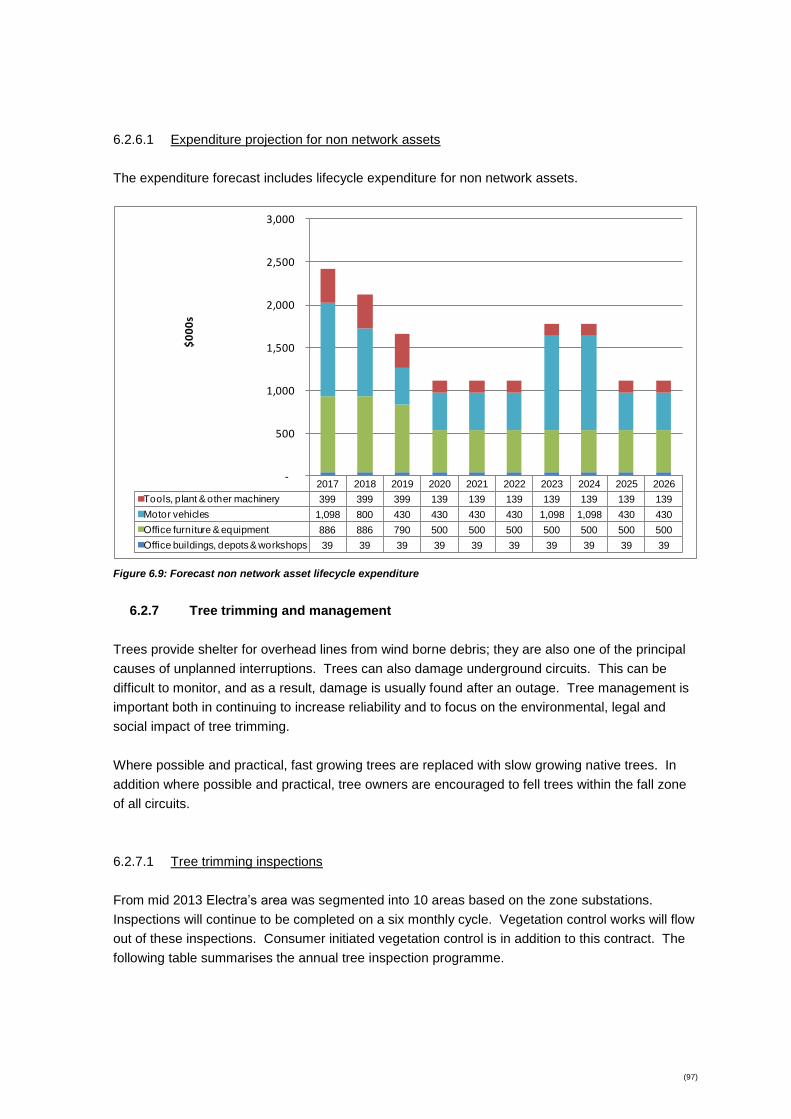
(97)
6.2.6.1 Expenditure projection for non network assets
The expenditure forecast includes lifecycle expenditure for non network assets.
2017 2018 2019 2020 2021 2022 2023 2024 2025 2026
Tools, plant & other machinery 399 399 399 139 139 139 139 139 139 139
Motor vehicles 1,098 800 430 430 430 430 1,098 1,098 430 430
Office furniture & equipment 886 886 790 500 500 500 500 500 500 500
Office buildings, depots & workshops 39 39 39 39 39 39 39 39 39 39
-
500
1,000
1,500
2,000
2,500
3,000
$0
00
s
Figure 6.9: Forecast non network asset lifecycle expenditure
6.2.7 Tree trimming and management
Trees provide shelter for overhead lines from wind borne debris; they are also one of the principal
causes of unplanned interruptions. Trees can also damage underground circuits. This can be
difficult to monitor, and as a result, damage is usually found after an outage. Tree management is
important both in continuing to increase reliability and to focus on the environmental, legal and
social impact of tree trimming.
Where possible and practical, fast growing trees are replaced with slow growing native trees. In
addition where possible and practical, tree owners are encouraged to fell trees within the fall zone
of all circuits.
6.2.7.1 Tree trimming inspections
From mid 2013 Electra’s area was segmented into 10 areas based on the zone substations.
Inspections will continue to be completed on a six monthly cycle. Vegetation control works will flow
out of these inspections. Consumer initiated vegetation control is in addition to this contract. The
following table summarises the annual tree inspection programme.

(98)
Area (Zone Substation) Month to inspect and maintain
Shannon April & October
Foxton & Levin East & Levin West May & November
Otaki June & December
Waikanae July & January
Paraparaumu & Paraparaumu West August & February
Raumati &Paekakariki September & March
Table 6.14: Vegetation plan
The Electricity (Hazards from Trees) Regulations 2004 were issued in late December 2004. These
regulations essentially outline the separation between trees and lines – both for existing
installations/trees and for the planting of new trees near existing electricity circuits. The
Regulations include the following separations between existing trees and overhead lines. These
are not always sufficient to minimise or eliminate hazards between trees and electricity circuits.
Voltage Minimum Separation
230V/400V 0.5 metres
11kV 1.6 metres
33kV 2.5 metres
Table 6.15: Minimum separation between trees and electricity circuits for spans 150 metres and less
Electra's contractor is compiling a database on trees near overhead lines allowing a planned
approach to tree maintenance for future years.
Tree trimming maintenance
Electra’s tree management plan is as follows:
Electricity (Hazards from Trees) Regulations 2004 notifications will be complied with;
All trees that have "no interest" will be reviewed balancing the aesthetic value of the tree to
the local environment against the impact on consumers of probable faults being caused by
that tree. Electra's default position is that the tree is removed. Electra may, at its own
discretion, replace the tree with a slow growing native;
All trees that have a declared "interest" will be recorded for future reference and application
of the Electricity (Hazards from Trees) Regulations 2004. These regulations require the
person declaring the "interest" to also take responsibility for the on-going costs associated
with maintaining the tree;
Other vegetation, such as toi toi and flaxes have been planted around ground mounted
transformers by local residents. This can cause several problems including flashover faults
due to vegetation growing inside the transformer. Any vegetation planted either within the
transformer easement area (if on private property), or within one metre if the transformer is
installed on a legal road, will be removed.

(99)
Electra will continue to:
Remove vegetation within the minimum separation distances on the 33kV and backbone
11kV feeders;
Re-inspect the 33kV networks, and concentrate on 20 areas of concern along with
completing any minor trims as required
Continually updating the database.
Monitor tree-sourced interruptions closely to ensure that the budget is sufficient for long-
term sustainability and that improvements in reliability are sustained;
Ensure that tree owners, or others with declared interests in trees, maintain their trees
clear of Electra's power lines.
Expenditure relating to tree trimming is included in the expenditure forecasts for distribution lines
(refer Figure 6.5: Forecast distribution cable lifecycle expenditure
6.2.4.5 Expenditure projection for distribution substations and transformers
The forecast lifecycle expenditure for distribution substations and transformers is shown below.
2017 2018 2019 2020 2021 2022 2023 2024 2025 2026
Asset Replacement & Renewal 2090 1729 1734 1721 1727 1636 1468 1559 1555 1555
Refurbishment & Renewal Maintenance 285 285 285 285 285 285 285 285 285 285
Fault & Emergency Maintenance 40 40 40 40 40 40 40 40 40 40
Routine & Preventative Maintenance 40 40 40 40 40 40 40 40 40 40
0
500
1000
1500
2000
2500
3000
$0
00
s
Figure 6.6: Forecast distribution substation and transformer lifecycle expenditure
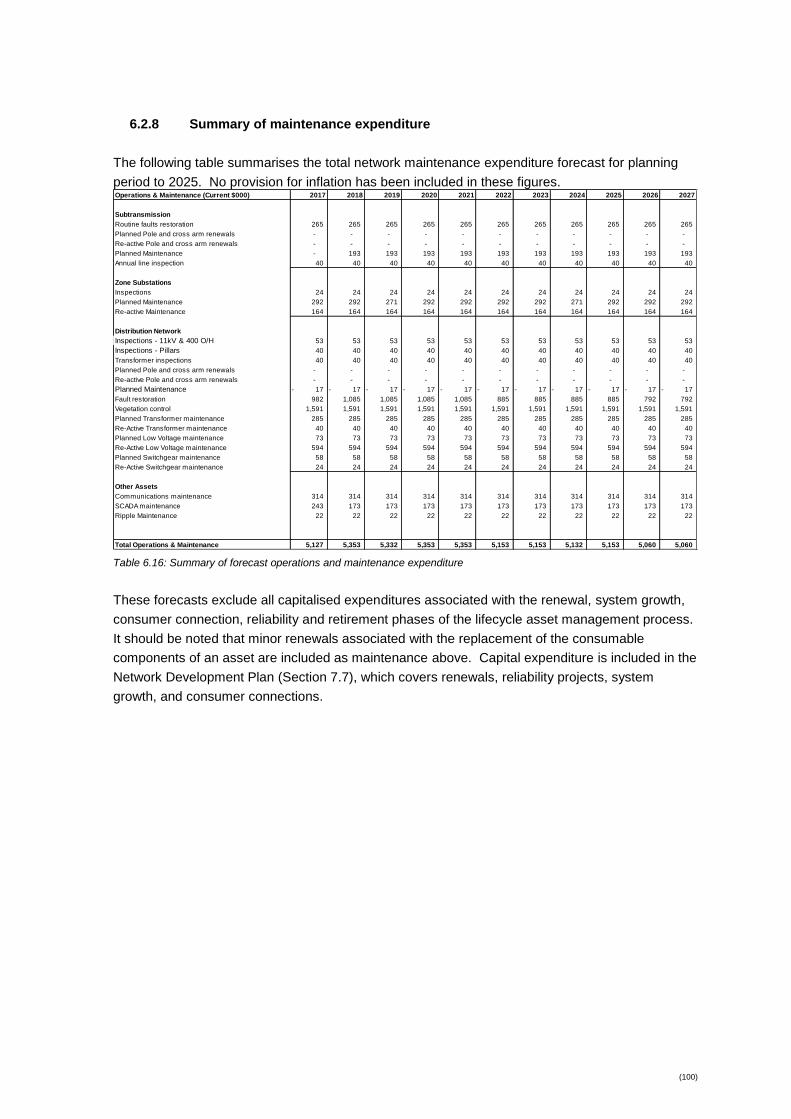
(100)
6.2.8 Summary of maintenance expenditure
The following table summarises the total network maintenance expenditure forecast for planning
period to 2025. No provision for inflation has been included in these figures. Operations & Maintenance (Current $000) 2017 2018 2019 2020 2021 2022 2023 2024 2025 2026 2027
Subtransmission
Routine faults restoration 265 265 265 265 265 265 265 265 265 265 265
Planned Pole and cross arm renewals - - - - - - - - - - -
Re-active Pole and cross arm renewals - - - - - - - - - - -
Planned Maintenance - 193 193 193 193 193 193 193 193 193 193
Annual line inspection 40 40 40 40 40 40 40 40 40 40 40
Zone Substations
Inspections 24 24 24 24 24 24 24 24 24 24 24
Planned Maintenance 292 292 271 292 292 292 292 271 292 292 292
Re-active Maintenance 164 164 164 164 164 164 164 164 164 164 164
Distribution Network
Inspections - 11kV & 400 O/H 53 53 53 53 53 53 53 53 53 53 53
Inspections - Pillars 40 40 40 40 40 40 40 40 40 40 40
Transformer inspections 40 40 40 40 40 40 40 40 40 40 40
Planned Pole and cross arm renewals - - - - - - - - - - -
Re-active Pole and cross arm renewals - - - - - - - - - - -
Planned Maintenance 17- 17- 17- 17- 17- 17- 17- 17- 17- 17- 17-
Fault restoration 982 1,085 1,085 1,085 1,085 885 885 885 885 792 792
Vegetation control 1,591 1,591 1,591 1,591 1,591 1,591 1,591 1,591 1,591 1,591 1,591
Planned Transformer maintenance 285 285 285 285 285 285 285 285 285 285 285
Re-Active Transformer maintenance 40 40 40 40 40 40 40 40 40 40 40
Planned Low Voltage maintenance 73 73 73 73 73 73 73 73 73 73 73
Re-Active Low Voltage maintenance 594 594 594 594 594 594 594 594 594 594 594
Planned Switchgear maintenance 58 58 58 58 58 58 58 58 58 58 58
Re-Active Switchgear maintenance 24 24 24 24 24 24 24 24 24 24 24
Other Assets
Communications maintenance 314 314 314 314 314 314 314 314 314 314 314
SCADA maintenance 243 173 173 173 173 173 173 173 173 173 173
Ripple Maintenance 22 22 22 22 22 22 22 22 22 22 22
Total Operations & Maintenance 5,127 5,353 5,332 5,353 5,353 5,153 5,153 5,132 5,153 5,060 5,060
Table 6.16: Summary of forecast operations and maintenance expenditure
These forecasts exclude all capitalised expenditures associated with the renewal, system growth,
consumer connection, reliability and retirement phases of the lifecycle asset management process.
It should be noted that minor renewals associated with the replacement of the consumable
components of an asset are included as maintenance above. Capital expenditure is included in the
Network Development Plan (Section 7.7), which covers renewals, reliability projects, system
growth, and consumer connections.
Doc # 62900
(101)
7 Network Development Plan
This section covers the following lifecycle activities shown in Figure 6.1:
Asset replacement and renewal;
Reliability, Safety and Environment projects;
System growth.
In addition to the above lifecycle activities, the network development plan includes projects relating
to asset relocations and forecast expenditure associated with new consumer connections.
7.1 Development planning criteria and assumptions
7.1.1 Planning approaches and criteria
Electra’s development plans are driven primarily by demand (consumer led growth) or performance
and service standards and targets. At its most fundamental level, demand is created by
consumers drawing energy across their individual connections. The demand at each connection
aggregates up the network to the distribution transformer, then to the distribution network, the zone
substation, the sub-transmission network back to the GXP and ultimately through the grid to a
power station.
Electra has adopted the 11kV feeder as its fundamental planning unit which typically represents
one or more of the following combinations of consumer connection.
An aggregation of up to 1500 urban domestic consumer connections;
An aggregation of up to 200 urban commercial consumer connections;
An aggregation of up to 20 or 30 urban light industrial consumer connections;
A single large industrial consumer especially if that consumer is likely to create a lot of
harmonics or flicker.
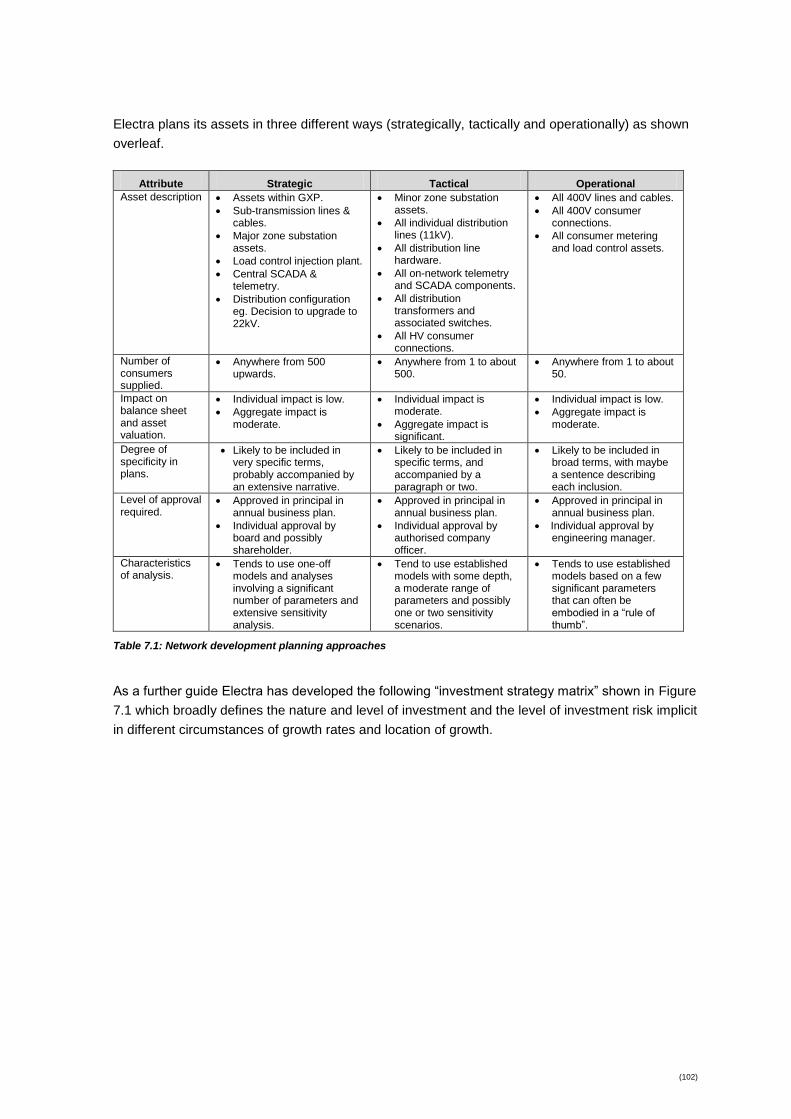
(102)
Electra plans its assets in three different ways (strategically, tactically and operationally) as shown
overleaf.
Attribute Strategic Tactical Operational
Asset description Assets within GXP.
Sub-transmission lines & cables.
Major zone substation assets.
Load control injection plant.
Central SCADA & telemetry.
Distribution configuration eg. Decision to upgrade to 22kV.
Minor zone substation assets.
All individual distribution lines (11kV).
All distribution line hardware.
All on-network telemetry and SCADA components.
All distribution transformers and associated switches.
All HV consumer connections.
All 400V lines and cables.
All 400V consumer connections.
All consumer metering and load control assets.
Number of consumers supplied.
Anywhere from 500 upwards.
Anywhere from 1 to about 500.
Anywhere from 1 to about 50.
Impact on balance sheet and asset valuation.
Individual impact is low.
Aggregate impact is moderate.
Individual impact is moderate.
Aggregate impact is significant.
Individual impact is low.
Aggregate impact is moderate.
Degree of specificity in plans.
Likely to be included in very specific terms, probably accompanied by an extensive narrative.
Likely to be included in specific terms, and accompanied by a paragraph or two.
Likely to be included in broad terms, with maybe a sentence describing each inclusion.
Level of approval required.
Approved in principal in annual business plan.
Individual approval by board and possibly shareholder.
Approved in principal in annual business plan.
Individual approval by authorised company officer.
Approved in principal in annual business plan.
Individual approval by engineering manager.
Characteristics of analysis.
Tends to use one-off models and analyses involving a significant number of parameters and extensive sensitivity analysis.
Tend to use established models with some depth, a moderate range of parameters and possibly one or two sensitivity scenarios.
Tends to use established models based on a few significant parameters that can often be embodied in a “rule of thumb”.
Table 7.1: Network development planning approaches
As a further guide Electra has developed the following “investment strategy matrix” shown in Figure
7.1 which broadly defines the nature and level of investment and the level of investment risk implicit
in different circumstances of growth rates and location of growth.

(103)
Prevailing load
growth
Location of
demand growth
Lo Hi
Within
existing network
footprint
Outside of
existing network
footprint
Figure 4.1.2(b) – Investment strategy matrix
Quadrant 4
� CapEx will be dominated by new
assets that require both extension
and possibly up-sizing.
� Likely to absorb lots of cash – may
need capital funding.
� Easily diverts attention away from
legacy assets.
� Need to confirm regulatory
treatment of growth.
� May have a high commercial risk
profile if a single customer is
involved.
Quadrant 3
� CapEx will be dominated by new
assets that require both extension
and possibly up-sizing.
� Likely to absorb lots of cash – may
need capital funding.
� Easily diverts attention away from
legacy assets.
� Likely to result in low capacity
utilisation unless modular
construction can be adopted.
� May have high stranding risk.
Quadrant 1
� CapEx will be dominated by
renewals (driven by condition).
� Easy to manage by advancing or
deferring straightforward CapEx
projects.
� Possibility of stranding if demand
contracts.
Quadrant 2
� CapEx will be dominated by up-
sizing rather than renewal (assets
become too small rather than worn
out).
� Regulatory treatment of additional
revenue arising from volume thru’
put as well as additional
connections may be difficult.
� Likely to involve tactical upgrades
of many assets
Figure 7.1: Investment strategy mix
Electra’s predominant development modes are:
Normally Quadrant 2 in the southern area because of the high density in-fill development
that requires extensive up-sizing of existing assets but little in the way of extending the
assets beyond the existing network footprint because of the Kapiti Coast District Council’s
preference for high-density infill rather than sprawl. This has moved to Quadrant 1 in recent
years due to underlying economic conditions but is expected to return to Quadrant 2 later
in the planning period;
Quadrant 1 in most parts of the northern area because of the low level of load growth, and
because what little growth there is generally occurs within or very close to the existing
footprint. Apart from isolated occasions Electra does not expect the Development Plan
mode in the northern area to migrate into other quadrants;
Quadrant 4 in beach front settlements located in both the southern and northern areas.
7.1.1.1 Trigger points and criteria for planning new capacity.
The first step in meeting future demand is to determine if the projected demand will result in any
triggers in relation to capacity, reliability, security or voltage. These points were outlined for each
asset class in section 6.1.4 and in Table 6.4.
Low High
(104)
Zone power transformers are upsized to a twin bank of similar size transformers when the load
reaches the normal 11 kV load rating of 11.5MVA (Electra’s “standard” zone power transformers
are 11.5/23.0 MVA).
Circuit breakers, all voltages, are either upsized or additional circuit breakers and circuits installed
when normal load reaches 80 percent of the circuit breaker rating. This ensures that any fault
currents do not cause “nuisance” trippings.
33 kV and 11 kV feeders are re-enforced when the normal load rating reaches 70 percent of the
cable/line rating and . This ensures that any fault currents do not cause “nuisance” trippings and
that plant arrives prior to any “over-load” occurring.
Because new capacity has valuation, depreciation, return and pricing implications, Electra will
always try to meet demand by other, less investment-intensive means. If a trigger point is
breached, Electra will then move to identify a range of options to bring the assets’ operating
parameters back to within the acceptable range of trigger points. These options are described in
section 7.1.2.
7.1.2 Meeting demand
Table 6.4 defines the trigger points at which the capacity of each class of asset needs to be
increased. Exactly what is done to increase the capacity of individual assets within these classes
can take the following forms (in a broad order of preference):
Do nothing - accept that one or more parameters have exceeded a trigger point. In reality,
do nothing options would only be adopted if the benefit-cost ratio of all other reasonable
options were unacceptably low and if assurance was provided to the Chief Executive and
Board that the do nothing option did not represent an unacceptable increase in risk to
Electra. An example of where a do nothing option might be adopted is where the voltage
at the far end of an 11kV overhead line falls below the threshold for a few days per year –
the benefits of correcting such a constraint may be too low;
Operational activities - in particular switching activities on the distribution network to shift
load from heavily-loaded to lightly-loaded feeders or winding up a tap changer to mitigate a
voltage problem can avoid new investment. The downside to this approach is that it may
increase line losses, reduce security of supply, or compromise protection settings;
Influence consumers to alter their consumption patterns - this allows assets to perform at
levels below the trigger points. Examples include shifting demand to different time zones,
negotiating interruptible tariffs with certain consumers so that overloaded assets can be
relieved, or assisting a consumer to adopt a substitute energy source to avoid new
capacity;
Construct distributed generation – This allows adjacent assets to perform at levels below
the trigger point. Distributed generation would be particularly useful where additional
capacity could eventually be stranded or where primary energy is going to waste, e.g.
waste steam from a process;
Modify an asset - allowing the trigger point to move to a level that is not exceeded, e.g. by
adding forced cooling. This is essentially a subset of the above approach, but generally
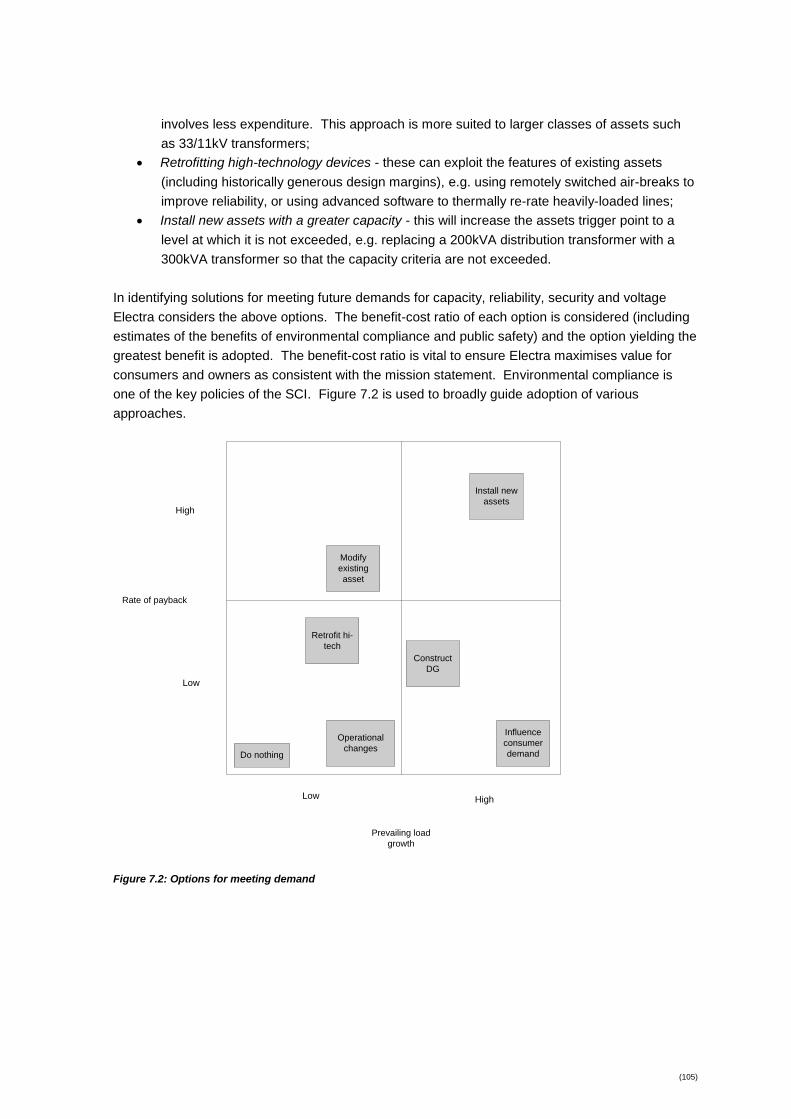
(105)
involves less expenditure. This approach is more suited to larger classes of assets such
as 33/11kV transformers;
Retrofitting high-technology devices - these can exploit the features of existing assets
(including historically generous design margins), e.g. using remotely switched air-breaks to
improve reliability, or using advanced software to thermally re-rate heavily-loaded lines;
Install new assets with a greater capacity - this will increase the assets trigger point to a
level at which it is not exceeded, e.g. replacing a 200kVA distribution transformer with a
300kVA transformer so that the capacity criteria are not exceeded.
In identifying solutions for meeting future demands for capacity, reliability, security and voltage
Electra considers the above options. The benefit-cost ratio of each option is considered (including
estimates of the benefits of environmental compliance and public safety) and the option yielding the
greatest benefit is adopted. The benefit-cost ratio is vital to ensure Electra maximises value for
consumers and owners as consistent with the mission statement. Environmental compliance is
one of the key policies of the SCI. Figure 7.2 is used to broadly guide adoption of various
approaches.
Prevailing load
growth
Rate of payback
Lo Hi
Lo
Hi
Do nothing
Install new
assets
Influence
consumer
demand
Construct
DG
Modify
existing
asset
Retrofit hi-
tech
Operational
changes
Figure 4.2.1(a) – Options for meeting demand
Figure 7.2: Options for meeting demand
Low
Low
High
High
(106)
7.1.3 Meeting security requirements
A key component of security is the level of redundancy that enables supply to be restored
independently of repairing or replacing a faulty component. Typical approaches to providing
security to a zone substation include:
Provision of an alternative sub-transmission circuit into the substation, preferably
separated from the principal supply by a 33kV bus-tie;
Provision to back-feed on the 11kV network from adjacent substations where sufficient
11kV capacity and interconnection exists. This firstly requires those adjacent substations
to be restricted to less than nominal rating and secondly requires a prevailing topography
that enables interconnection;
Use of local embedded generation.
The most difficult issue with security is that it involves a level of investment beyond what is required
to meet demand, and over time demand growth can erode the security headroom.
The Electra sub-transmission is configured as a ring so that any one fault on any one line or cable
does not cause a loss of supply to a zone substation and ensures that lines and cables left in
service are able to handle the added loads. Any one sub-transmission line or cable under normal
system configuration may only be carrying 150 Amps but under a fault condition this load may
double or triple.
7.1.3.1 Prevailing security standards
The commonly adopted security standard in New Zealand is the EEA Guideline which reflects the
UK standard P2/5 that was developed by the Chief Engineer’s Council in the late 1970’s. P2/5 is a
strictly deterministic standard, that is, it prescribes a level of security for specific amounts and
nature of load with no consideration of individual circumstances.
Deterministic standards are now beginning to give way to probabilistic standards in which the value
of lost load and the failure rate of supply components is estimated to determine an upper limit of
investment required to avoid interruption.
A key characteristic of deterministic standards such as P2/5 and the EEA Guidelines is that rigid
adherence generally results in at least some degree of over investment. Accordingly the EEA
Guidelines recommend that individual circumstances be considered.
From a security perspective, local generation would need to have 100% availability to contribute to
permanent security. This is unlikely from a reliability perspective and even less likely from a
primary energy perspective such as run-of-the-river hydro, wind or solar. For this reason the
emerging UK standard P2/6 provides for minimal contribution of such generation to security.

(107)
7.1.3.2 Electra’s security standards
Table 7.2 below describes the security standards Electra aims to achieve. In setting target security
levels Electra’s preferred means of providing security to urban zone substations will be by
secondary sub-transmission assets with any available back-feeding on the 11kV providing a third
tier of security.
Description Load type First fault Second fault
GXP Greater than 12MW or 6,000 consumers.
No loss of supply.
50% of load restored in 15 minutes, 100% of load restored in 2 hours
Zone substation Between 4 and 12MW or 2,000 to 6,000 consumers.
No loss of supply
All load restored within 60 minutes.
Zone Substation Between 0.5 and 4 MW
Loss of supply 100 % load restored within 30 minutes from adjacent substations.
Fault repair time
11kV Feeder Between 2.0 and 4.0 MW
Loss of supply Supply restored within 30 minutes from adjacent feeders.
Loss of supply Supply restored within 240 minutes from adjacent feeders.
11kV Feeder Between 0.5 and 2.0 MW
Loss of supply Supply restored within 30 minutes from adjacent feeders.
Fault repair time
11kV Feeder Between 0 and 0.5 MW
Fault repair time Fault repair time
400V Feeder Between 0 and 0.5 MW
Fault repair time Fault repair time
Table 7.2: Target security levels
These standards will help Electra to meet many of its service targets described in Section 5.
7.1.4 Standardisation practices
Electra standardises a range of practices, asset configurations and materials across its asset
lifecycle as follows...
Lifecycle
component
Standardisation Benefits of standardisation
Detail design Standard design criteria eg. all
poles will have a 2x factor of
safety, voltage limits within the LV
network.
Standard detail designs. It should
be noted that the number of
separate components involved
results in several hundred
component, however most
assemblies fall within a few
standardised designs.
Longevity of design principles.
Minimises risk of unsafe or
non-compliant assets (an ex-
ante control mechanism).
Minimises risk of non-
compliance with regulatory
standards such as volt-drop,
strength, clearances etc.
(108)
Construction Construction standards specify
methods of installation and precise
order of assembly.
Minimum competency
requirements for installers.
Minimise the risk of poor
workmanship.
Minimise the breadth of
competencies required.
Creates accountability of
installers.
Establishes criteria for post-
completion auditing of works.
Materials & supply A small number of alternative
materials eg. transformers, cable
fittings etc are approved.
Multiple suppliers are used to
ensure market prices are obtained.
New components will not be
adopted unless more than 1
supplier can be identified.
Minimse stock holdings.
Minimise breadth of asset
specific skills required.
Minimises risk of non-
compliance, especially safety.
Assists emergency sourcing of
components.
7.2 Prioritising development projects
Section 3.4 outlines Electra’s approach to managing possible conflicting stakeholder interests.
This is applied when prioritising development projects.
Prioritisation is strongly linked to risk management (which is discussed further in section 8).
Projects that reduce risks with high likelihood and high consequence are prioritised over projects
with low likelihood and low consequence.
Prioritisation is also required where funds are constrained. Electra has a gearing of 21 percent,
and therefore it has significant security to cover future funding needs. The Statement of Corporate
Intent which is approved annually by the Trustees (Shareholders) includes a funding constraint.
This ultimately limits the value of projects that can be funded in any one period. Currently the
Capital Ratio Target is to “maintain shareholders funds at not less than 40% of total assets”.
Each of the possible approaches to meeting demand that are outlined in Section 7.1.2 provide
potential solutions that are considered. Electra’s policies for the development aspects of the asset
lifecycle management (renewal, reliability, upgrading and retirement) are outlined in Sections 6.1.3
and 6.1.7.
Provided that an operational activity such as switching the network to shift load did not increase the
likelihood of loss of security of supply then this option is taken first. This option, in most cases,
improves capacity utilisation at minimal cost. The longer term mitigation to meet future demand is
logged as “future date” development projects in the capital expenditure budget. In addition,
summer and winter load in the network area in question are also monitored to provide the
information necessary to make informed decisions about future options and the timing for future
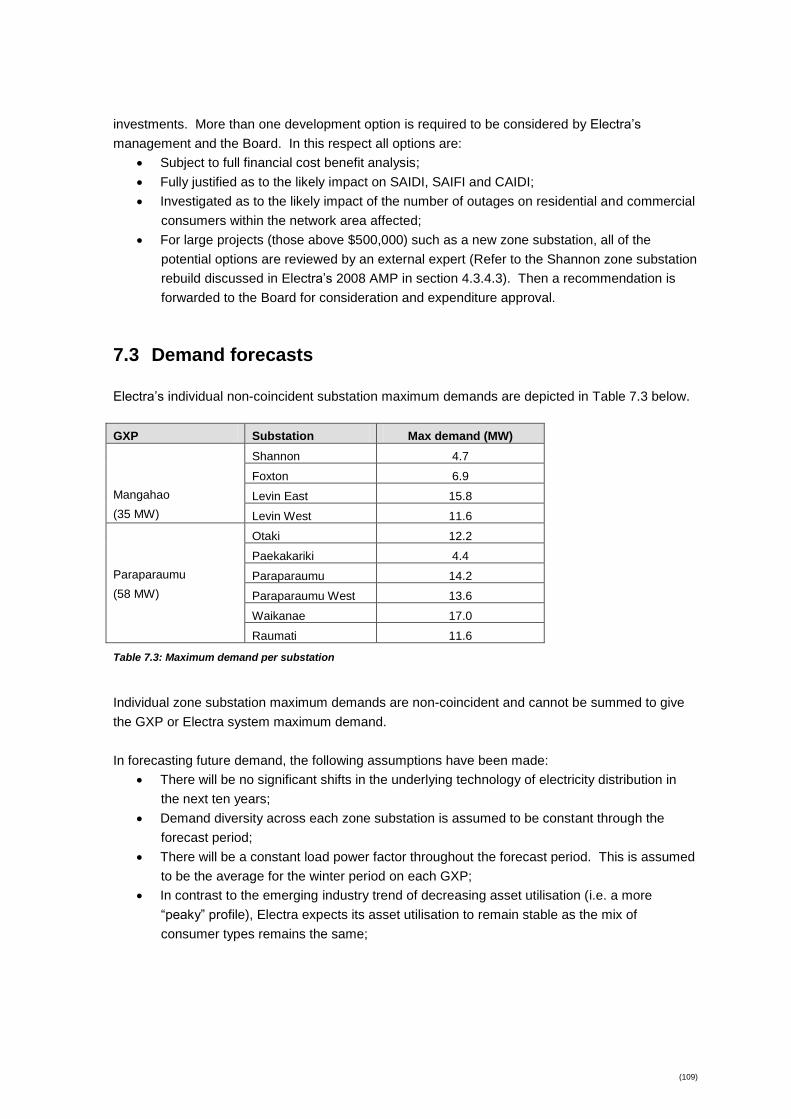
(109)
investments. More than one development option is required to be considered by Electra’s
management and the Board. In this respect all options are:
Subject to full financial cost benefit analysis;
Fully justified as to the likely impact on SAIDI, SAIFI and CAIDI;
Investigated as to the likely impact of the number of outages on residential and commercial
consumers within the network area affected;
For large projects (those above $500,000) such as a new zone substation, all of the
potential options are reviewed by an external expert (Refer to the Shannon zone substation
rebuild discussed in Electra’s 2008 AMP in section 4.3.4.3). Then a recommendation is
forwarded to the Board for consideration and expenditure approval.
7.3 Demand forecasts
Electra’s individual non-coincident substation maximum demands are depicted in Table 7.3 below.
GXP Substation Max demand (MW)
Mangahao
(35 MW)
Shannon 4.7
Foxton 6.9
Levin East 15.8
Levin West 11.6
Paraparaumu
(58 MW)
Otaki 12.2
Paekakariki 4.4
Paraparaumu 14.2
Paraparaumu West 13.6
Waikanae 17.0
Raumati 11.6
Table 7.3: Maximum demand per substation
Individual zone substation maximum demands are non-coincident and cannot be summed to give
the GXP or Electra system maximum demand.
In forecasting future demand, the following assumptions have been made:
There will be no significant shifts in the underlying technology of electricity distribution in
the next ten years;
Demand diversity across each zone substation is assumed to be constant through the
forecast period;
There will be a constant load power factor throughout the forecast period. This is assumed
to be the average for the winter period on each GXP;
In contrast to the emerging industry trend of decreasing asset utilisation (i.e. a more
“peaky” profile), Electra expects its asset utilisation to remain stable as the mix of
consumer types remains the same;
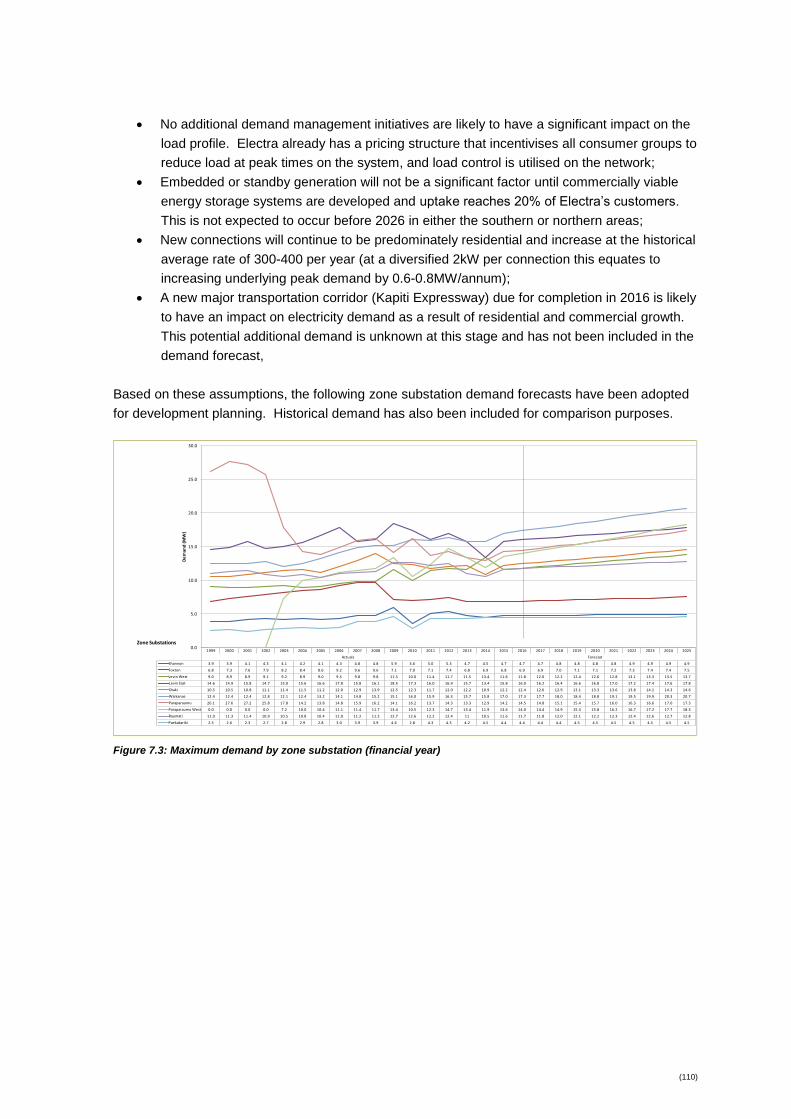
(110)
No additional demand management initiatives are likely to have a significant impact on the
load profile. Electra already has a pricing structure that incentivises all consumer groups to
reduce load at peak times on the system, and load control is utilised on the network;
Embedded or standby generation will not be a significant factor until commercially viable
energy storage systems are developed and uptake reaches 20% of Electra’s customers.
This is not expected to occur before 2026 in either the southern or northern areas;
New connections will continue to be predominately residential and increase at the historical
average rate of 300-400 per year (at a diversified 2kW per connection this equates to
increasing underlying peak demand by 0.6-0.8MW/annum);
A new major transportation corridor (Kapiti Expressway) due for completion in 2016 is likely
to have an impact on electricity demand as a result of residential and commercial growth.
This potential additional demand is unknown at this stage and has not been included in the
demand forecast,
Based on these assumptions, the following zone substation demand forecasts have been adopted
for development planning. Historical demand has also been included for comparison purposes.
1999 2000 2001 2002 2003 2004 2005 2006 2007 2008 2009 2010 2011 2012 2013 2014 2015 2016 2017 2018 2019 2020 2021 2022 2023 2024 2025
Actuals Forecast
Shannon 3.9 3.9 4.1 4.3 4.1 4.2 4.1 4.3 4.8 4.8 5.9 3.6 5.0 5.3 4.7 4.5 4.7 4.7 4.7 4.8 4.8 4.8 4.8 4.9 4.9 4.9 4.9
Foxton 6.8 7.3 7.6 7.9 8.2 8.4 8.6 9.2 9.6 9.6 7.1 7.0 7.1 7.4 6.8 6.9 6.8 6.9 6.9 7.0 7.1 7.1 7.2 7.3 7.4 7.4 7.5
Levin West 9.0 8.9 8.9 9.1 9.2 8.9 9.0 9.5 9.8 9.8 11.5 10.0 11.4 11.7 11.5 13.4 11.6 11.8 12.0 12.2 12.4 12.6 12.8 13.1 13.3 13.5 13.7
Levin East 14.6 14.9 15.8 14.7 15.0 15.6 16.6 17.8 15.8 16.1 18.5 17.3 16.0 16.9 15.7 13.4 15.8 16.0 16.2 16.4 16.6 16.8 17.0 17.2 17.4 17.6 17.8
Otaki 10.5 10.5 10.8 11.1 11.4 11.5 11.2 12.0 12.9 13.9 12.5 12.3 11.7 12.0 12.2 10.9 12.2 12.4 12.6 12.9 13.1 13.3 13.6 13.8 14.1 14.3 14.6
Waikanae 12.4 12.4 12.4 12.8 12.1 12.4 13.2 14.1 14.8 15.2 15.1 16.0 15.9 16.3 15.7 15.8 17.0 17.3 17.7 18.0 18.4 18.8 19.1 19.5 19.9 20.3 20.7
Paraparaumu 26.1 27.6 27.2 25.8 17.8 14.2 13.8 14.8 15.9 16.2 14.1 16.2 13.7 14.3 13.3 12.9 14.2 14.5 14.8 15.1 15.4 15.7 16.0 16.3 16.6 17.0 17.3
Paraparaumu West 0.0 0.0 0.0 0.0 7.2 10.0 10.4 11.1 11.4 11.7 13.4 10.5 12.3 14.7 13.4 11.9 13.6 14.0 14.4 14.9 15.3 15.8 16.2 16.7 17.2 17.7 18.3
Raumati 11.0 11.3 11.4 10.9 10.5 10.8 10.4 11.0 11.2 11.3 12.7 12.6 12.2 12.4 11 10.5 11.6 11.7 11.8 12.0 12.1 12.2 12.3 12.4 12.6 12.7 12.8
Paekakariki 2.5 2.6 2.3 2.7 2.8 2.9 2.8 3.0 3.9 3.9 4.6 2.8 4.3 4.3 4.2 4.5 4.4 4.4 4.4 4.4 4.5 4.5 4.5 4.5 4.5 4.5 4.5
0.0
5.0
10.0
15.0
20.0
25.0
30.0
De
man
d (
MW
)
Zone Substations
Figure 7.3: Maximum demand by zone substation (financial year)

Doc # 62900
(111)
The following assumptions have been applied in deriving the zone substation demand forecasts:
Zone
Substation
Rate and Nature of Growth Provision for Growth
Shannon About 0.5% per year, mainly lifestyle
blocks around Tokomaru.
End of life replacement of existing lines with greater
capacity conductors is expected to cope with any
growth for the remainder of the planning period
Foxton About 1.0% per year, mainly
residential development at Foxton
Beach.
End of life replacement of existing lines with greater
capacity conductors will satisfy growth demand off this
zone substation for the planning period.
Levin East About 1.7% per year, mainly
commercial and lifestyle blocks to the
south and east of Levin.
An additional feeder was constructed in 2015/15. This,
combined with replacement of existing lines with
greater capacity conductors, is expected to cope with
any growth for the remainder of the planning period
Levin West About 1.3% per year, mainly
residential properties at Waitarere
Beach and lifestyle properties to the
north and west of Levin.
The additional feeder at Levin East will allow growth to
be managed by load transfer to Levin East.
Otaki About 1.8% per year, mainly lifestyle
blocks in Manakau and Te Horo.
Load is being managed by redistribution amongst
existing feeders. An additional feeder is proposed
within the planning period.
Waikanae About 2.6% per year, mainly
residential.
Capacity on existing feeders continues to be increased
end of life replacement. An additional feeder allowing
full duplication if the main supply to Waikanae Beach is
proposed within the planning period.
Paraparaumu About 2.0% per year, mainly
commercial and residential infill.
Increased utilisation of existing capacity. The
construction of Paraparaumu West has allowed much
of the former load to be transferred.
Paraparaumu
West
About 3.0% per year, mainly
commercial and residential infill.
An additional feeder will ultimately be needed with the
ongoing development of Paraparaumu Airport. This
will be factored into the development plan once a better
understanding of development timing is known.
Raumati About 1.0% per year, mainly
residential infill.
An additional feeder could be required if there is land
spare from the Kapiti Expressway development. This
has not yet been factored into the development plan.
Paekakariki About 0.3% per year, mainly
residential infill.
No loading parameters are expected to be exceeded
during the planning period, therefore no growth related
projects are proposed either.
Table 7.4: Zone substation growth forecast and planned actions
Many of the provisions for growth are aimed at maintaining reliability, security of supply from
breakages and support from alternative zone substations. These are consistent with Electra’s
service level targets outlined in Section 5.1.1.
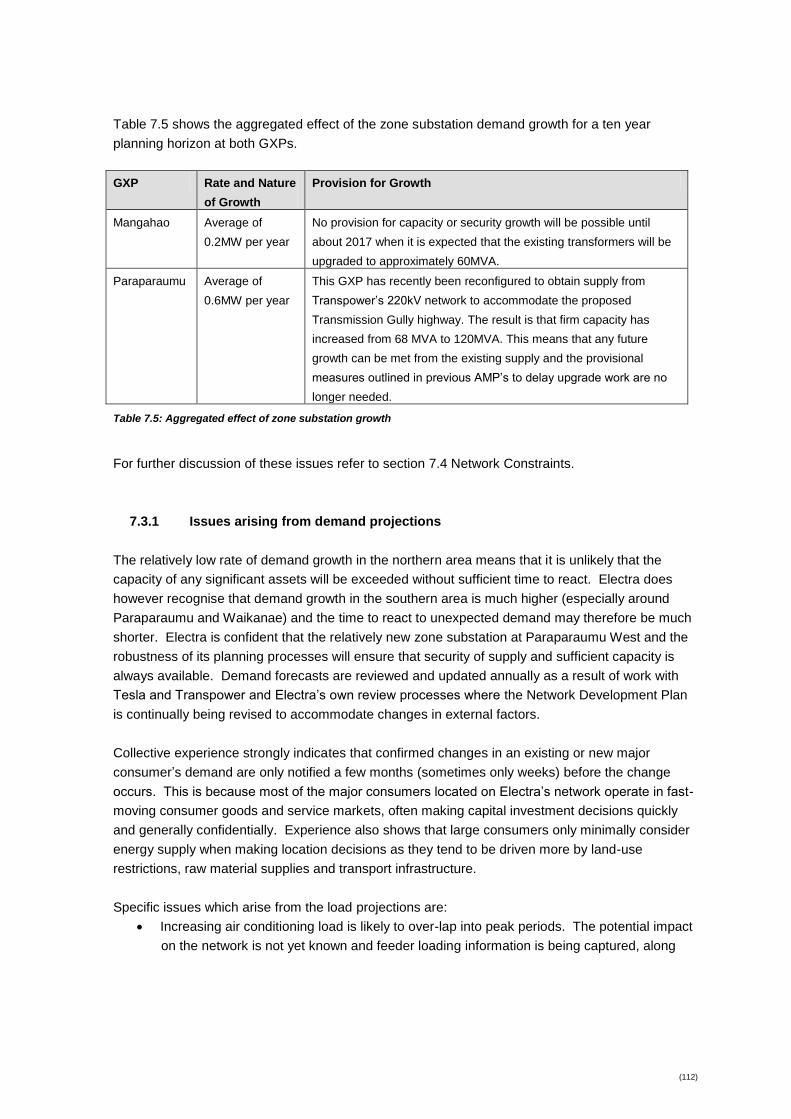
(112)
Table 7.5 shows the aggregated effect of the zone substation demand growth for a ten year
planning horizon at both GXPs.
GXP Rate and Nature
of Growth
Provision for Growth
Mangahao Average of
0.2MW per year
No provision for capacity or security growth will be possible until
about 2017 when it is expected that the existing transformers will be
upgraded to approximately 60MVA.
Paraparaumu Average of
0.6MW per year
This GXP has recently been reconfigured to obtain supply from
Transpower’s 220kV network to accommodate the proposed
Transmission Gully highway. The result is that firm capacity has
increased from 68 MVA to 120MVA. This means that any future
growth can be met from the existing supply and the provisional
measures outlined in previous AMP’s to delay upgrade work are no
longer needed.
Table 7.5: Aggregated effect of zone substation growth
For further discussion of these issues refer to section 7.4 Network Constraints.
7.3.1 Issues arising from demand projections
The relatively low rate of demand growth in the northern area means that it is unlikely that the
capacity of any significant assets will be exceeded without sufficient time to react. Electra does
however recognise that demand growth in the southern area is much higher (especially around
Paraparaumu and Waikanae) and the time to react to unexpected demand may therefore be much
shorter. Electra is confident that the relatively new zone substation at Paraparaumu West and the
robustness of its planning processes will ensure that security of supply and sufficient capacity is
always available. Demand forecasts are reviewed and updated annually as a result of work with
Tesla and Transpower and Electra’s own review processes where the Network Development Plan
is continually being revised to accommodate changes in external factors.
Collective experience strongly indicates that confirmed changes in an existing or new major
consumer’s demand are only notified a few months (sometimes only weeks) before the change
occurs. This is because most of the major consumers located on Electra’s network operate in fast-
moving consumer goods and service markets, often making capital investment decisions quickly
and generally confidentially. Experience also shows that large consumers only minimally consider
energy supply when making location decisions as they tend to be driven more by land-use
restrictions, raw material supplies and transport infrastructure.
Specific issues which arise from the load projections are:
Increasing air conditioning load is likely to over-lap into peak periods. The potential impact
on the network is not yet known and feeder loading information is being captured, along
(113)
with temperature and rainfall to identify any relevant trends. This issue has not been
factored into the load forecast;
The increasing popularity of beach-front settlements will require up-sizing or duplication of
existing 11kV lines. This is required to minimise the effects of outages which have an
impact on the security levels described in Section 5;
Consumer expectations for increased reliability are likely to emerge in seaside locations as
these settlements become permanent residences; The effects of electrification and double
tracking of the main trunk rail from Paraparaumu to Waikanae has not been specifically
factored into the demand forecasts as it has only recently been completed. Over time the
demand effects will be fully assessed. It is not believed that the immediate effect is
significant.
7.4 Network constraints
Major network constraints that Electra may face in the future occur at the two grid exit point
connections (GXPs) on the network. For many years it has been suggested that a new GXP is
required for this network. However, load has not grown at the rate predicted. With the increased
number of actual and proposed transportation projects, it is possible that load growth within the
area may increase more rapidly in the future. But this also must be seen in the context of continued
patchy overall economic growth both nationally and internationally.
Mangahao GXP exceeded the transformers n-1 winter capacity by approximately 2.5MW in 2015.
This is expected to increase to approximately 8MW by 2027. The supply transformer overload is
managed operationally as Mangahao generation is contracted to be and is usually available at peak
load periods. If Mangahao continues to generate at 13MW or more, this issue could be delayed
beyond the forecast period. The expected end of life rebuilding of Mangahao’s switchyard provide a
convenient opportunity to increase capacity.
The recent upgrading of Paraparaumu GXP (as a result of the Transmission Gully highway project)
has increased its capacity and removed any transmission constraints in the Kapiti area.
Based on several small reports that were conducted in previous years, it was initially decided that
an additional zone substation would be built at Manakau to ease the load at the Paraparaumu GXP.
This zone substation would get supply via the existing 33kV from the Mangahao GXP. This
however would continue to reduce the ability to transfer load during emergency conditions as well
as increasing the load requirements at Mangahao GXP and has been deferred in preference to
11kV capacity upgrades for the time being.
The following table shows the main 33 kV circuits that are expected to become constrained, a
description of the constraint, and the intended action to remedy the constraint. Note that the
intended remedies are dependent upon the GXP (or alternative) solution that is developed and
intended remedies will be finalized once this is known. These remedies are still the most likely
scenario based on information to hand as at date of this document.
(114)
Network constraints within the Electra system have been identified as shown in table 2.3 and
represented here for ease of reading. While these projects are included within the AMP budget, it
is possible that as a result of the work being conducted by Transpower and Tesla, the constraints
may change as a result of a proposed GXP or alternative transmission solution. When this is
known more fully, these network constraints will be reassessed to establish if they remain valid.
Constraint Description Intended Remedy
Shannon & Mangahao –
Levin East circuits
Once the load at Mangahao GXP
reaches 35MVA, there is the
potential for overloading these
circuits in an (n-1) outage.
Complete the separation of the
Mangahao-Levin East 33kV line
by installing a cable from
Arapaepae Road to Levin East.
Levin West – Levin East
circuit
This forms part of the ring system
from Mangahao, consequently
constraints will manifest themselves
in the Shannon & Mangahao to
Levin East circuits.
Short term - Introducing
Summer/Winter ratings
Long term - Splitting the
Mangahao – Levin East 33kV
line at Arapaepae Rd.
Table 7.6: Network constraints on the sub-transmission network
There are a number of developing beach settlements (eg Waikawa Beach, Hokio Beach, Waitarere
Beach) that are on single 11kV spur lines that may, over the planning period, require duplication
due to the number of consumers that will be affected by any interruption. Duplication as opposed to
up-sizing gives the added advantage of improved security and improved reliability, which means
the impact of an outage has less impact on security targets discussed in Section 5.

(115)
7.5 Distributed generation
Electra recognises the potential value of distributed generation in the following ways:
Reduction of peak demand at Transpower GXPs;
Reducing the impact of existing network constraints;
Avoiding investment in additional network capacity;
Making a very minor contribution to supply security where consumers are prepared to
accept that local generation is not as secure as network investment;
Making better use of local primary energy resources thereby avoiding line losses;
Avoiding the environmental impact associated with large scale power generation.
Electra also recognises that distributed generation can have the following less desirable effects:
Increased fault levels, requiring protection and switchgear upgrades;
Increased line losses if surplus energy is exported through a network constraint;
Potential stranding of assets, or at least of part of an assets capacity.
Electra takes an active interest in the development of larger scale distributed generation that
potentially benefits both the generator and Electra. A major benefit of this type of distributed
generation is in reducing transmission charges.
This has been the case at Mangahao GXP where the existing hydro-electric power station is now
treated as embedded for transmission purposes. Cooperative used of the generation has reduced
our transmission charges significantly (approximately 40%) because these charges are based on
the average of the 100 highest regional peaks. However this has only resulted in a reduction of the
system peak load of 6% as the generation was not available at all times.
It should also be noted that photovoltaics (PV) without storage will contribute little or nothing to
reducing peak demand on Electra’s network, particularly during the peak winter period.
Apart from Mangahao, which is notionally embedded at the grid exit point there are 263 distributed
generation sites on the Electra network with a combined capacity of 680kW. This had been growing
at a rate of 200% per annum (admittedly off a low base), but since feed in prices offered by
retailers were reduced in 2014, new connections have been steady at approximately 100 per
annum for the last two years. While we initially expected that it would not be until there several
hundred distributed generation sites that a material impact may occur and warrant further attention
in the Asset Management Plan, modelling has now shown that given the size and nature of most
installations, 5000 sites (greater than 10% of connections) would be needed to materially impact
the current operational assumptions of the business. Furthermore, it is expected that the limited
availability of installers combined with market saturation will allow sufficient time to adjust our
planning assumptions. Electra therefore, does not take into account the effect of distributed
generation in its Asset Management Planning process at this stage.
The key requirements for those wishing to connect distributed generation to the network are
contained in Electra’s Distributed Generation Policies:

(116)
Network Requirement Policy or Condition
Connection Terms and
Conditions
An annual administration fee may be payable by the connecting party to
Electra.
Installation of suitable metering (refer to technical standards below)
shall be at the expense of the distributed generator and its associated
energy retailer.
Electra is happy to recognise and share the benefits of distributed
generation that arise from reducing costs (such as transmission costs,
or deferred investment in the network) provided the distributed
generation is of sufficient size to provide real benefits.
Those wishing to connect distributed generation must satisfy Electra
that a contractual arrangement with a suitable party is in place
Safety Standards A party connecting distributed generation must comply with any and all
safety requirements promulgated by Electra.
Electra reserves the right to physically disconnect any distributed
generation that does not comply with such requirements.
Technical Standards Metering capable of recording both imported and exported energy must
be installed. If the owner of the distributed generation wishes to share
in any benefits accruing to Electra, such metering may need to be half-
hourly.
Electra may require a distributed generator of greater than 10kW to
demonstrate that operation of the distributed generation will not interfere
with operational aspects of the network, particularly such aspects as
protection and control.
All connection assets must be designed and constructed to technical
standards not dissimilar to Electra’s own prevailing standards.
Electra reserves the right to decline connection applications to a feeder
that already has sufficient connected generation to destabilise
operations.
Table 7.7: Key requirements for connecting distributed generation
Electra is not aware of any other firm distributed generation projects that are likely to emerge within
the planning horizon. However, a number of projects have been discussed with various parties
including opportunities for peak generation in Electra’s southern area. This is at the early
discussion phase and will be included in future planning if it looks like becoming a reality that will
impact the network.
7.6 Non-asset solutions
As discussed in section 7.1.2 Electra routinely considers a range of non-asset solutions, and has a
preference for solutions that avoid or defer new investment.

(117)
Electra’s pricing structure has signals for all consumer groups to reduce load during peak periods.
For example peak pricing is 42% higher than average pricing while off peak pricing is only 17% of
average pricing. Approximately 60% of Electra customers have their peak loads managed using
load control equipment already in use on the network. At this stage no other demand management
initiatives are foreseen in the planning horizon, but any new initiative likely to have a significant
impact would be considered. A pricing review was completed in 2012 to ensure that pricing signals
are having the impact expected. One new pricing option was introduced in 2013 as a result.
Electra has a Generation Connection Agreement for Mangahao Power Station. This agreement
has the purpose of sharing transmission benefits resulting from the demand reduction at the Grid
Exit Point by generation being focused where possible around regional co-incident peaks.
Over recent years Electra has encouraged and subsidised the installation of a range of energy
efficiency products including hot water cylinder wraps and thermostats, home insulation and energy
efficient lighting within the Electra area. Research shows that in 2012 78% of consumer
households had energy efficient lights in some or all of their fittings. That figure was 54% for
commercial consumers. Electra continues to discuss other energy efficiency measures with end
users including active engagement with larger consumers to improve load factor.
7.7 Network Development Plan including project descriptions
The network development plan has been disaggregated by the following asset groups:
GXP and transmission development;
Sub-transmission development;
Zone Substation development;
Distribution feeders (which includes all 11kV & 400V circuits and distribution switchgear);
Other assets.
Each of these sections is further disaggregated to the following categories:
Projects currently underway or planned to start in the next twelve months – for these
projects a detailed description is provided, and the reasons for choosing the selected
option is stated;
Projects planned for the next four years – for these a summary description of the project is
provided;
Projects being considered for the remainder of the AMP period – these are discussed at
high level, and it should be noted that this group of projects and associated costs are more
speculative.
Each section includes separate identification of expenditure on all the main types of development
projects as follows:
Reliability, Safety and Environment;
Asset Replacement and Renewal;
System Growth (Up-sizing);
Consumer Connection;
Asset Relocations;
(118)
Overhead to Underground (OHUG) conversion.
7.7.1 GXP and transmission development
GXP and transmission assets are owned by Transpower. The Mangahao GXP has two 30MVA
110/33kV transformers installed. The firm capacity of this GXP is 30MVA (summer/winter). The
load is slowly increasing on this GXP, the transformers are predicted to reach 8MW overload by
2027. They are scheduled for end of life replacement in 2023 but may be replaced earlier in
conjunction with other work at the Transpower site. At that point the opportunity will be taken to
increase the capacity at the site to 60MVA enable Otaki to be supplied from Mangahao at any time
if required..
The Paraparaumu GXP has recently been upgraded from two 60MVA 110/33kV transformers
upgraded to two 120MVA 220/33kV transformers
On completion of the above projects no further development work is envisioned for the duration of
the planning period.
7.7.1.1 Expenditure projections
Works associated with the Grid exit points is included in Transpower’s Asset Management Plan. As
there are no further development plans projected Electra has not set aside a budget for research
associated with the GXP’s or transmission system.
7.7.2 Sub-transmission development
Load growth will be catered for by upgrading capacity of existing circuits and zone substations
and/or constructing new zone substations and 33kV circuits. Such projects are complementary to
each other and to life-cycle maintenance plans.
The overall condition of the 33 kV sub-transmission overhead network is good. The IRL report on
the two aged copper circuits between Mangahao and Levin East concluded that these circuits are
generally in good condition and should, statistically, last until 2042. There is no proposal to renew
any conductors within the ten year forecast period. The samples were removed from the area most
prone to high winds and other sources of mechanical stress. Electra has, therefore, delayed the
renewal of these circuits and routine annual inspections and maintenance will continue on them.
The double circuit line from Mangahao to Levin is currently operated as a single circuit as it is
joined together approximately 5km north of Levin at Waihou Rd. Once capacity at Mangahao GXP
is increased this will enable Otaki to transfer permanently from Paraparaumu. With Otaki
connected via Levin it is considered prudent to duplicate the last 5km of line into Levin East
substation. This will have the dual benefit of increasing capacity and reliability. In the long term full

(119)
separation of the lines is planned when the line is scheduled for rebuilding (20 plus) years from
now.
Electra’s Foxton-Shannon 33kV circuit is built along the Foxton-Shannon Highway which crosses
the flood plains of the Manawatu River. This can lessen the stability of the 33kV poles along this
route, but there is no concern with the overall condition of the overhead line. Any poles that have
increased their lean will continue to be re-guyed, a culvert installed behind them and, where
necessary, re-blocked with gravel.
The over-all condition of the 33 kV sub-transmission underground cables is good and there is no
proposal to renew the major cables within the ten year forecast period. The application of
summer/winter ratings to defer replacement will mean that some of the short sections of cable
connecting the substations with the overhead subtransmission system will need to be increased in
capacity. This will be carried out on a case by case basis as individual load thresholds are reached.
7.7.2.1 Detailed description of projects currently underway or planned to start in the twelve
months ending 31 March 2017
Table 7.8 below summarises the network development projects and projected costs for the year
ending 31 March 2017:
Circuit Expected Cost
(2016 $000’s)
Primary Purpose
Tararua Rd – Arapaepae Rdi) 615 Reliability
Table 7.8: Sub-transmission Network Development Budget Year Ending 2017
(i) Tararua Rd - Arapaepae Rd - Duplicate line with an underground cable. At described in
7.7.2 above the dual circuit from Mangahao to Levin combined into one line at Waihou
Rd. This project involves installing cable in conjunction with the additional 11kV feeder
described below along part of that route. This project will ensure an increased capacity
n-1 system into this substation and the wider urban area. Costs were to be split over
the 2014/15 and 2015/16 financial years but the impending availability of the existing
Transpower 110kV lines means that any further expenditure will be deferred until final
ownership is determined.
7.7.2.2 Projects planned for years ending 2018-2022
Table 7.9 below summarises the sub transmission network development projects and projected
costs for the period 2018-2022:
Circuit Timing Expected Cost
(2016 $000’s)
Primary Purpose
Table 7.9: Sub-transmission Network Development Budget 2018-2022
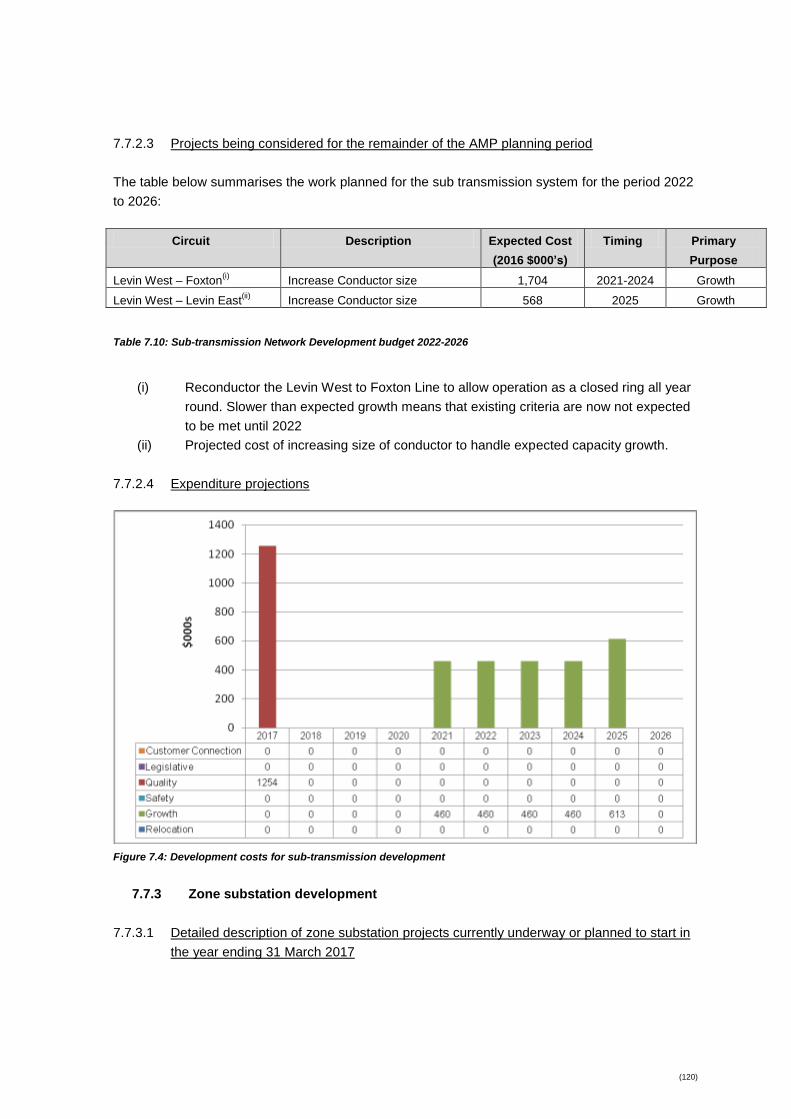
(120)
7.7.2.3 Projects being considered for the remainder of the AMP planning period
The table below summarises the work planned for the sub transmission system for the period 2022
to 2026:
Circuit Description Expected Cost
(2016 $000’s)
Timing Primary
Purpose
Levin West – Foxton(i)
Increase Conductor size 1,704 2021-2024 Growth
Levin West – Levin East(ii)
Increase Conductor size 568 2025 Growth
Table 7.10: Sub-transmission Network Development budget 2022-2026
(i) Reconductor the Levin West to Foxton Line to allow operation as a closed ring all year
round. Slower than expected growth means that existing criteria are now not expected
to be met until 2022
(ii) Projected cost of increasing size of conductor to handle expected capacity growth.
7.7.2.4 Expenditure projections
Figure 7.4: Development costs for sub-transmission development
7.7.3 Zone substation development
7.7.3.1 Detailed description of zone substation projects currently underway or planned to start in
the year ending 31 March 2017

(121)
Zone Substation Description Expected Cost
(2016 $000’s)
Primary
Purpose
All Protection (i)
199 Reliability
Table 7.11: Development projects for zone substations 2017
(i) Replacement and reprogramming of protection systems for both distance and bus
zone protection schemes.
7.7.3.2 Projects planned for years ending 2018-2022
Zone
Substation
Description Expected Cost
(2015 $000’s)
Timing Primary
Purpose
All (i)
Protection upgrades 539 2018 Reliability
All(ii)
Arc Flash Protection 303 2018 Safety
Paekakariki (ii)
2nd Transformer 95 2018 Reliability
Table 7.12: Development projects for zone substations 2018 – 2021
(i) All - Protection upgrades. This will be needed as the system loads increase and
protection grading between feeders and zones becomes a problem with the existing
relays. The work involves installing bus zone circuit breakers and associated
modifications to the existing substation structures. Only those sites of concern will be
completed at this time and will be based on feeder loads.
(ii) Installation of arc flash protection in substations to prevent injury to personnel in the
event of a fault during operation. It is expected that this will become an industry
standard practice by 2019.
(iii) Relocation of a spare zone transformer from Shannon to Paekakariki as a non-
commissioned spare for future installation. Price is for transportation installation
including oil retention system.
7.7.3.3 Projects being considered for the remainder of the AMP planning period
Zone Substation Description Expected Cost
(2016 $000)
Timing Primary Purpose
Manakau (ii)
Substation 946 2026-2027 Growth
Table 7.13: Development projects for zone substations 2022 - 2026
(i) Manakau - To meet additional demand for lifestyle blocks around Manakau and Te
Horo, which are placing stress on the Otaki zone substation. At this stage installing a
small rural substation north of Otaki still appears to be the most suitable option to meet
the requirements for load centre, proximity to sub-transmission lines and distribution
feeder route diversity. If the rate of growth in the area slows then it will become more
economic the install extra capacity as part of the lifecycle replacement program of
existing equipment rather than with additional specific assets.

(122)
7.7.3.4 Expenditure projections
2017 2018 2019 2020 2021 2022 2023 2024 2025 2026
Customer Connection 0 0 0 0 0 0 0 0 0 0
Legislative 0 0 0 0 0 0 0 0 0 0
Quality 225 583 102 0 0 0 0 0 0 0
Safety 0 303 0 0 0 0 0 0 0 0
Growth 0 0 0 0 0 0 0 0 0 511
Relocation 0 0 0 0 0 0 0 0 0 0
0
100
200
300
400
500
600
700
800
900
1000
$000s
Figure 7.5: Development costs for zone substations
7.7.4 Distribution network
7.7.4.1 Distribution transformers
There are no specific development plans for individual distribution transformers and substations.
Funds have been allocated for the installation of monitoring equipment to gather data for a “smart
grid” trial and relocation of indoor sites when they are scheduled for renewal.
Equipment Description Expected Cost
(2015 $000’s)
Timing Primary
Purpose
Transformers Smart Grids 75 2019 Quality
Transformers Smart Grids 94 2024 Quality
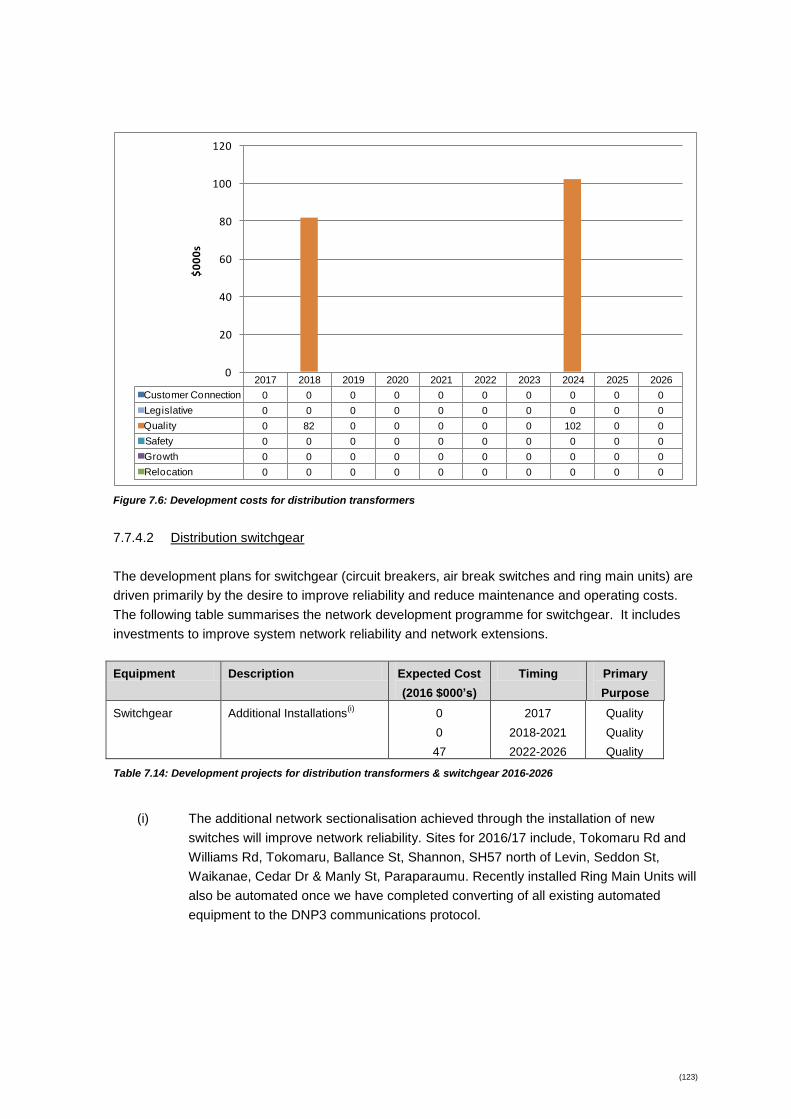
(123)
2017 2018 2019 2020 2021 2022 2023 2024 2025 2026
Customer Connection 0 0 0 0 0 0 0 0 0 0
Legislative 0 0 0 0 0 0 0 0 0 0
Quality 0 82 0 0 0 0 0 102 0 0
Safety 0 0 0 0 0 0 0 0 0 0
Growth 0 0 0 0 0 0 0 0 0 0
Relocation 0 0 0 0 0 0 0 0 0 0
0
20
40
60
80
100
120
$0
00
s
Figure 7.6: Development costs for distribution transformers
7.7.4.2 Distribution switchgear
The development plans for switchgear (circuit breakers, air break switches and ring main units) are
driven primarily by the desire to improve reliability and reduce maintenance and operating costs.
The following table summarises the network development programme for switchgear. It includes
investments to improve system network reliability and network extensions.
Equipment Description Expected Cost
(2016 $000’s)
Timing Primary
Purpose
Switchgear Additional Installations(i)
0
0
47
2017
2018-2021
2022-2026
Quality
Quality
Quality
Table 7.14: Development projects for distribution transformers & switchgear 2016-2026
(i) The additional network sectionalisation achieved through the installation of new
switches will improve network reliability. Sites for 2016/17 include, Tokomaru Rd and
Williams Rd, Tokomaru, Ballance St, Shannon, SH57 north of Levin, Seddon St,
Waikanae, Cedar Dr & Manly St, Paraparaumu. Recently installed Ring Main Units will
also be automated once we have completed converting of all existing automated
equipment to the DNP3 communications protocol.
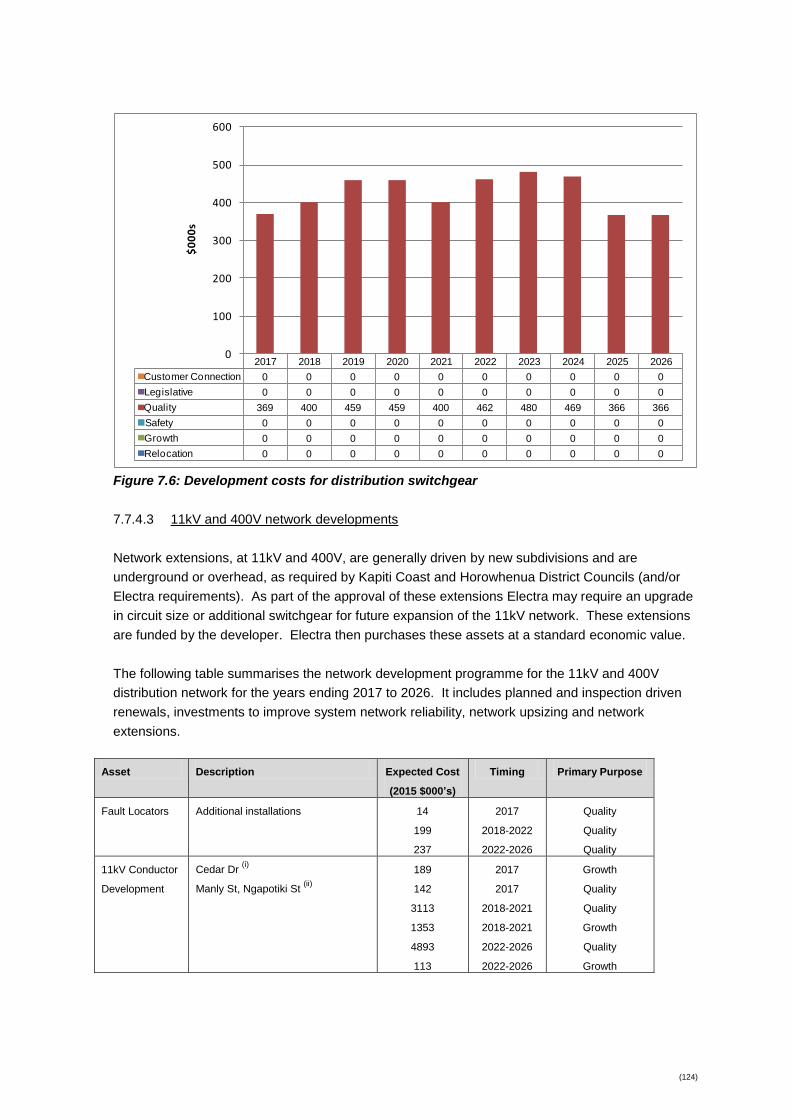
(124)
2017 2018 2019 2020 2021 2022 2023 2024 2025 2026
Customer Connection 0 0 0 0 0 0 0 0 0 0
Legislative 0 0 0 0 0 0 0 0 0 0
Quality 369 400 459 459 400 462 480 469 366 366
Safety 0 0 0 0 0 0 0 0 0 0
Growth 0 0 0 0 0 0 0 0 0 0
Relocation 0 0 0 0 0 0 0 0 0 0
0
100
200
300
400
500
600
$0
00
s
Figure 7.6: Development costs for distribution switchgear
7.7.4.3 11kV and 400V network developments
Network extensions, at 11kV and 400V, are generally driven by new subdivisions and are
underground or overhead, as required by Kapiti Coast and Horowhenua District Councils (and/or
Electra requirements). As part of the approval of these extensions Electra may require an upgrade
in circuit size or additional switchgear for future expansion of the 11kV network. These extensions
are funded by the developer. Electra then purchases these assets at a standard economic value.
The following table summarises the network development programme for the 11kV and 400V
distribution network for the years ending 2017 to 2026. It includes planned and inspection driven
renewals, investments to improve system network reliability, network upsizing and network
extensions.
Asset Description Expected Cost
(2015 $000’s)
Timing Primary Purpose
Fault Locators Additional installations 14
199
237
2017
2018-2022
2022-2026
Quality
Quality
Quality
11kV Conductor
Development
Cedar Dr (i)
Manly St, Ngapotiki St (ii)
189
142
3113
1353
4893
113
2017
2017
2018-2021
2018-2021
2022-2026
2022-2026
Growth
Quality
Quality
Growth
Quality
Growth

(125)
400V Conductor
Development
400V Upgrades(iii)
38
151
189
2017
2018-2021
2022-2026
Quality
Quality
Quality
Network
Extensions
Subdivision extensions (iv)
95
379
473
2017
2018-2021
2022-2026
Connection
Connection
Connection
Total 11,757
Table 7.15: Capital projects for 11kV/400V Network
(i) Cedar Dr, Paraparaumu. Replacement of a 30 year old cable installed at the early
stages of a subdivision that is no longer able to cope with expected demand.
(ii) Manly St, Ngapotiki St. Installation of a cable linking two parts of Paraparaumu Beach
increasing network resilience and increase load transfer capacity in the area
(iii) Installation of short paralleling sections of cable to minimize outages for planned work
such as transformer replacements.
(iv) Purchase of customer led network extensions. The majority of cost is paid for by the
developer and a notional payment is made to transfer the newly created asset to
Electra for future operation and maintenance.
The following figure summarises the projected capital costs for both 11kV and 400V lines and
cables over the planning period.
2017 2018 2019 2020 2021 2022 2023 2024 2025 2026
Customer Connection 95 95 95 95 95 95 95 95 95 95
Legislative 0 0 0 0 0 0 0 0 0 0
Quality 194 41 245 41 501 552 705 450 501 654
Safety 0 0 0 0 0 0 0 0 0 0
Growth 204 409 388 460 204 0 123 0 0 0
Relocation 0 0 0 0 0 0 0 0 0 0
0
100
200
300
400
500
600
700
800
900
1000
$0
00
s
Figure 7.7: Development costs for 11kV and 400V distribution lines and cables
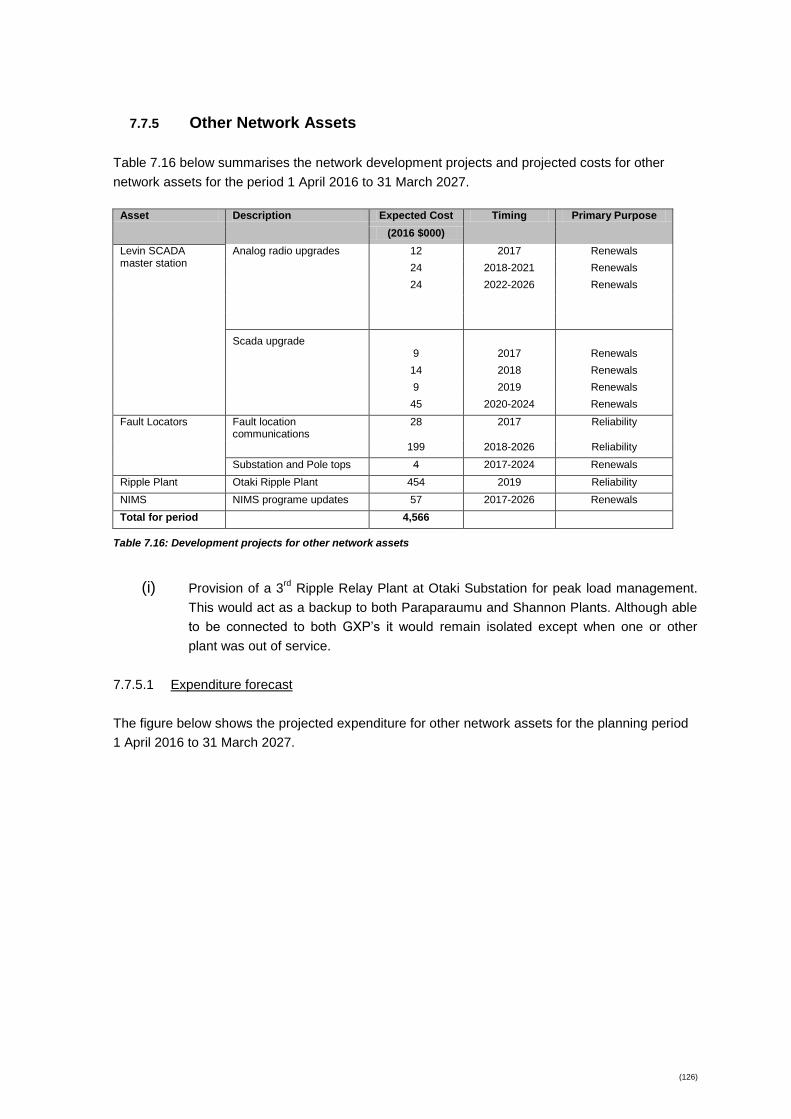
(126)
7.7.5 Other Network Assets
Table 7.16 below summarises the network development projects and projected costs for other
network assets for the period 1 April 2016 to 31 March 2027.
Asset Description Expected Cost Timing Primary Purpose
(2016 $000)
Levin SCADA master station
Analog radio upgrades 12 2017 Renewals
24 2018-2021 Renewals
24 2022-2026 Renewals
Scada upgrade
9 2017 Renewals
14 2018 Renewals
9 2019 Renewals
45 2020-2024 Renewals
Fault Locators Fault location communications
28 2017 Reliability
199 2018-2026 Reliability
Substation and Pole tops 4 2017-2024 Renewals
Ripple Plant Otaki Ripple Plant 454 2019 Reliability
NIMS NIMS programe updates 57 2017-2026 Renewals
Total for period 4,566
Table 7.16: Development projects for other network assets
(i) Provision of a 3rd
Ripple Relay Plant at Otaki Substation for peak load management.
This would act as a backup to both Paraparaumu and Shannon Plants. Although able
to be connected to both GXP’s it would remain isolated except when one or other
plant was out of service.
7.7.5.1 Expenditure forecast
The figure below shows the projected expenditure for other network assets for the planning period
1 April 2016 to 31 March 2027.
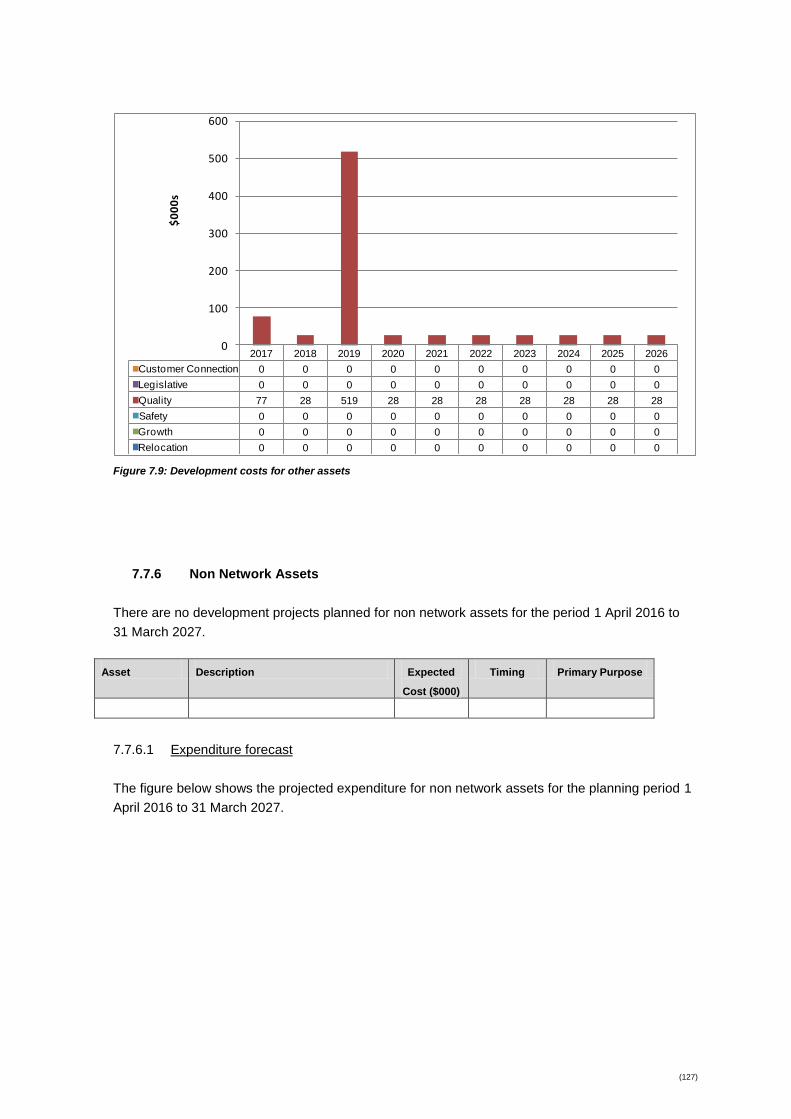
(127)
2017 2018 2019 2020 2021 2022 2023 2024 2025 2026
Customer Connection 0 0 0 0 0 0 0 0 0 0
Legislative 0 0 0 0 0 0 0 0 0 0
Quality 77 28 519 28 28 28 28 28 28 28
Safety 0 0 0 0 0 0 0 0 0 0
Growth 0 0 0 0 0 0 0 0 0 0
Relocation 0 0 0 0 0 0 0 0 0 0
0
100
200
300
400
500
600
$0
00
s
Figure 7.9: Development costs for other assets
7.7.6 Non Network Assets
There are no development projects planned for non network assets for the period 1 April 2016 to
31 March 2027.
Asset Description Expected
Cost ($000)
Timing Primary Purpose
7.7.6.1 Expenditure forecast
The figure below shows the projected expenditure for non network assets for the planning period 1
April 2016 to 31 March 2027.
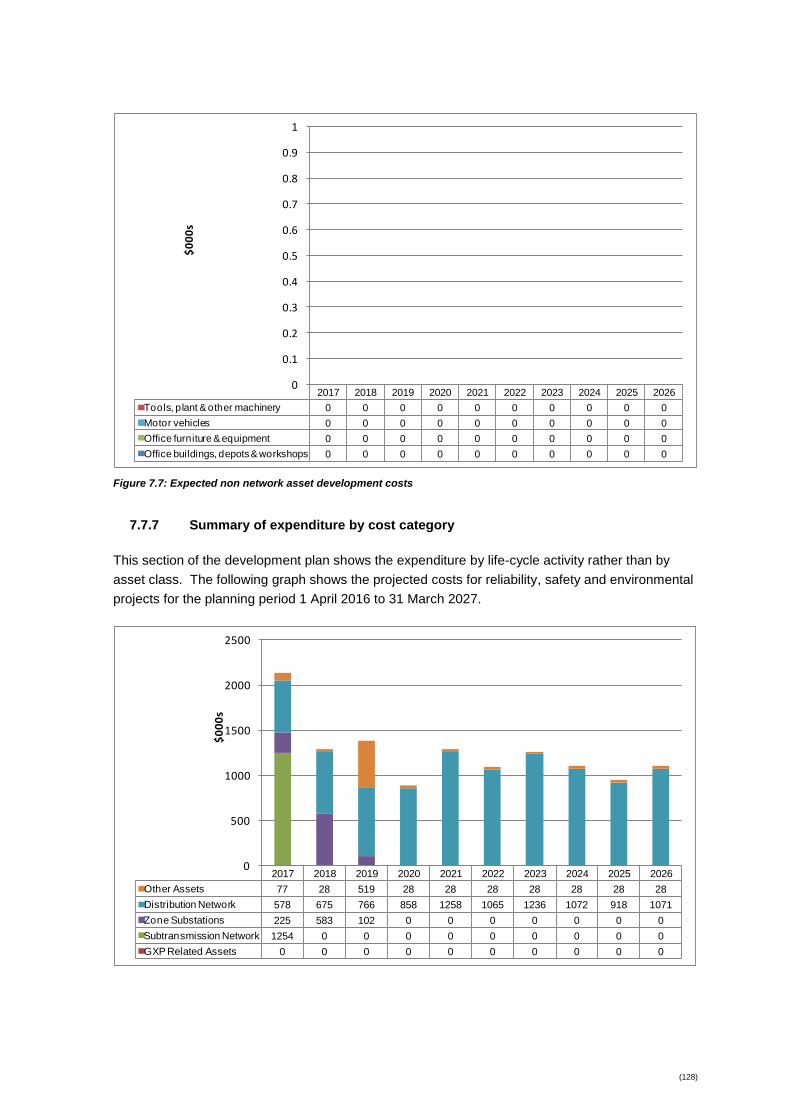
(128)
2017 2018 2019 2020 2021 2022 2023 2024 2025 2026
Tools, plant & other machinery 0 0 0 0 0 0 0 0 0 0
Motor vehicles 0 0 0 0 0 0 0 0 0 0
Office furniture & equipment 0 0 0 0 0 0 0 0 0 0
Office buildings, depots & workshops 0 0 0 0 0 0 0 0 0 0
0
0.1
0.2
0.3
0.4
0.5
0.6
0.7
0.8
0.9
1
$0
00
s
Figure 7.7: Expected non network asset development costs
7.7.7 Summary of expenditure by cost category
This section of the development plan shows the expenditure by life-cycle activity rather than by
asset class. The following graph shows the projected costs for reliability, safety and environmental
projects for the planning period 1 April 2016 to 31 March 2027.
2017 2018 2019 2020 2021 2022 2023 2024 2025 2026
Other Assets 77 28 519 28 28 28 28 28 28 28
Distribution Network 578 675 766 858 1258 1065 1236 1072 918 1071
Zone Substations 225 583 102 0 0 0 0 0 0 0
Subtransmission Network 1254 0 0 0 0 0 0 0 0 0
GXP Related Assets 0 0 0 0 0 0 0 0 0 0
0
500
1000
1500
2000
2500
$0
00
s
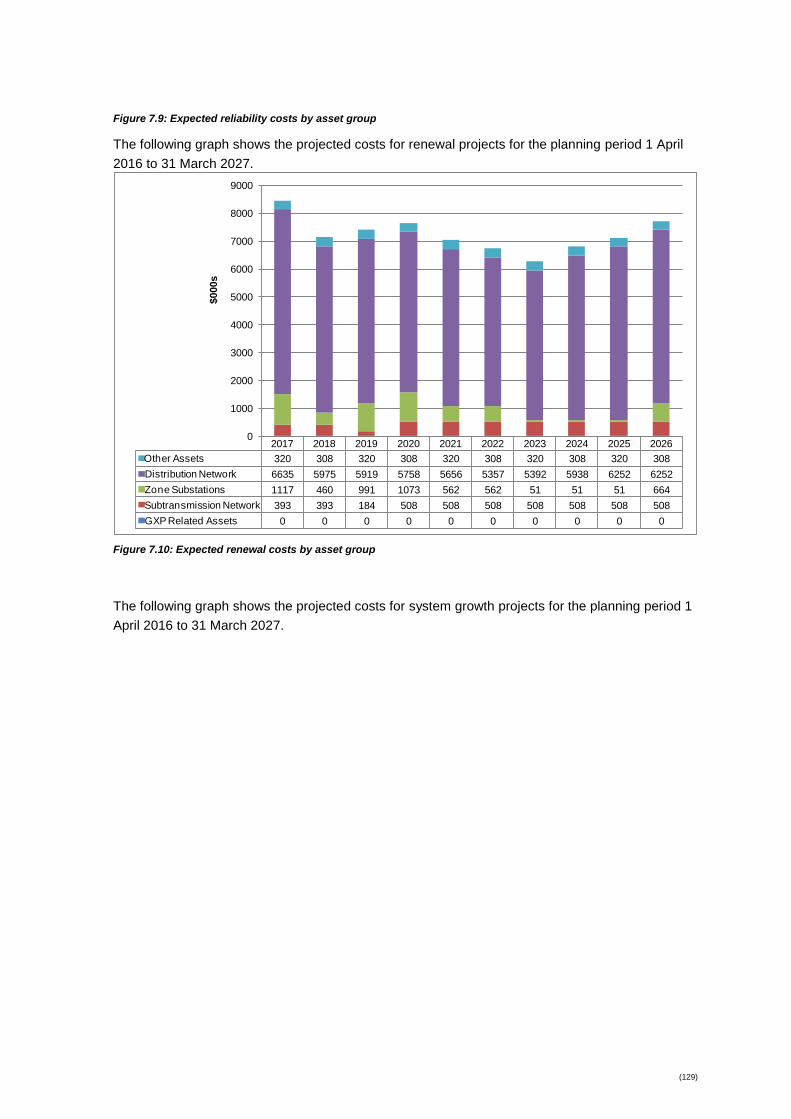
(129)
Figure 7.9: Expected reliability costs by asset group
The following graph shows the projected costs for renewal projects for the planning period 1 April
2016 to 31 March 2027.
2017 2018 2019 2020 2021 2022 2023 2024 2025 2026
Other Assets 320 308 320 308 320 308 320 308 320 308
Distribution Network 6635 5975 5919 5758 5656 5357 5392 5938 6252 6252
Zone Substations 1117 460 991 1073 562 562 51 51 51 664
Subtransmission Network 393 393 184 508 508 508 508 508 508 508
GXP Related Assets 0 0 0 0 0 0 0 0 0 0
0
1000
2000
3000
4000
5000
6000
7000
8000
9000
$000s
Figure 7.10: Expected renewal costs by asset group
The following graph shows the projected costs for system growth projects for the planning period 1
April 2016 to 31 March 2027.

(130)
2017 2018 2019 2020 2021 2022 2023 2024 2025 2026
Other Assets 0 0 0 0 0 0 0 0 0 0
Distribution Network 204 409 388 460 204 0 123 0 0 0
Zone Substations 0 0 0 0 0 0 0 0 0 511
Subtransmission Network 0 0 0 0 460 460 460 460 613 0
GXP Related Assets 0 0 0 0 0 0 0 0 0 0
0
100
200
300
400
500
600
700
$0
00
s
Figure 7.11: Expected system growth costs by asset group
The following graph shows the projected costs for customer connection projects for the planning
period 1 April 2016 to 31 March 2027
2017 2018 2019 2020 2021 2022 2023 2024 2025 2026
Other Assets 0 0 0 0 0 0 0 0 0 0
Distribution Network 95 95 95 95 95 95 95 95 95 95
Zone Substations 0 0 0 0 0 0 0 0 0 0
Subtransmission Network 0 0 0 0 0 0 0 0 0 0
GXP Related Assets 0 0 0 0 0 0 0 0 0 0
0
10
20
30
40
50
60
70
80
90
100
$000s
Figure 7.12: Expected consumer connection costs by asset group

(131)
7.7.8 Summary of development costs for all asset categories
The following graph shows the projected development expenditure for all network asset categories
for the planning period 1 April 2016 to 31 March 2027 by activity.
2017 2018 2019 2020 2021 2022 2023 2024 2025 2026
Customer Connection 95 95 95 95 95 95 95 95 95 95
Legislative 0 0 0 0 0 0 0 0 0 0
Quality 578 675 766 858 1258 1065 1236 1072 918 1071
Safety 0 0 0 0 0 0 0 0 0 0
Growth 204 409 388 460 204 0 123 0 0 0
Relocation 0 0 0 0 0 102 0 0 0 0
0
200
400
600
800
1000
1200
1400
1600
1800$
00
0s
Figure 7.8: Summary of development costs by activity
(132)
8 Risk Management
8.1 Risk analysis
Electra’s network business is exposed to a wide range of risks. Aside from the obvious physical
risks such as cars hitting poles, vandalism, public safety and storm damage, the network business
is exposed to ever increasing regulatory risk that imposes new costs and distortions whilst
restricting revenue. This section examines Electra’s physical risk exposures, describes what it has
done and will do about these exposures, and what it will do when disaster inevitably strikes.
8.1.1 Electra Group’s Policy – Risk Management
8.1.1.1 What is Risk Management?
There is risk involved in any business venture. The key to a successful business operation is
assessing and managing those risks to ensure business continuity and success. Risk
Management is not simply a compliance issue, but rather a way of viewing a company’s operation
for areas that could have a significant impact on long term viability. Risk can present either a
hazard or an opportunity in terms of the company’s objectives, therefore risk management activities
should be closely monitored. The ultimate responsibility for risk management lies with the
company’s Board of Directors.
8.1.1.2 The policy
The Electra Limited Board of Directors has tasked management to monitor and manage risks to the
company and formally report results to the Board in March each year. Risks to the Electra Group
are to be managed in two distinct ways as follows:
Insurance cover; and
Risk management reviews.
8.1.2 Insurance
The company’s insurances are reviewed for insurance required, adequacy of cover and marketed
and renewed on an annual basis. The successful company is provided with an annual declaration
which includes factors which may impact on the company’s risk exposure. Risk exposure will be
insured against wherever practicable. A risk committee comprising selected Board members, the
Chief Executive and the Chief Finance Officer will assess annual proposals and present
recommendations to the Electra Limited Board for approval.
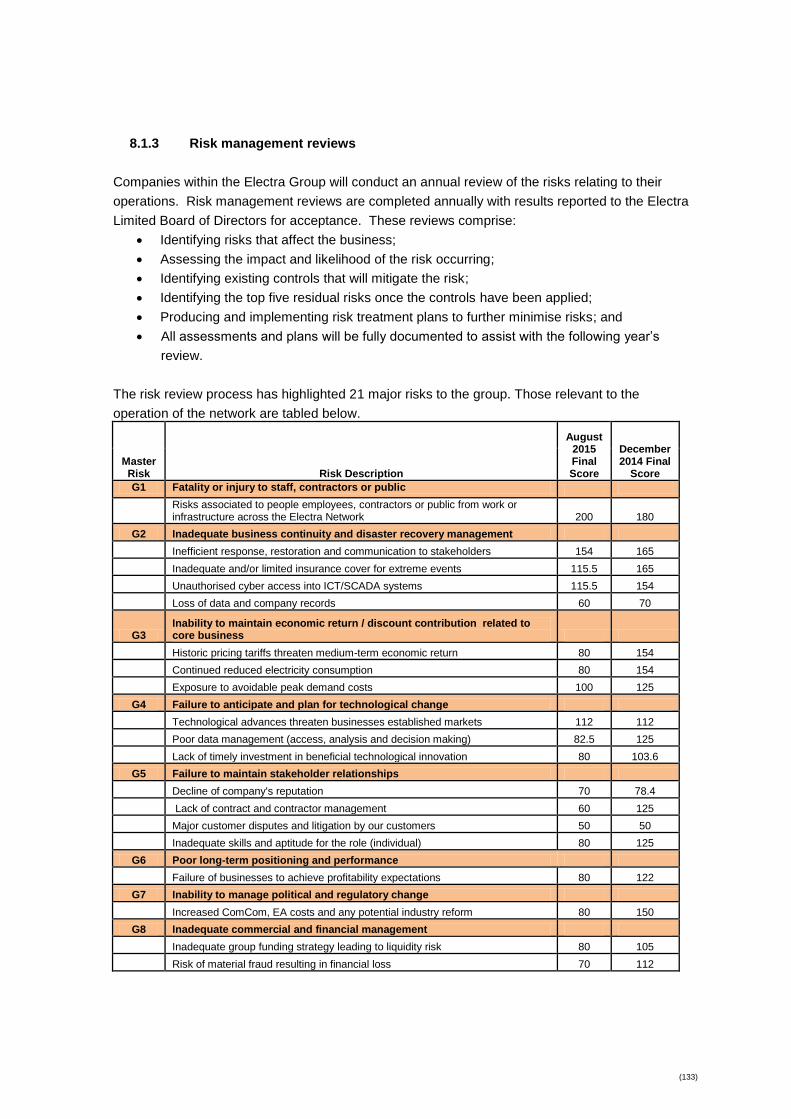
(133)
8.1.3 Risk management reviews
Companies within the Electra Group will conduct an annual review of the risks relating to their
operations. Risk management reviews are completed annually with results reported to the Electra
Limited Board of Directors for acceptance. These reviews comprise:
Identifying risks that affect the business;
Assessing the impact and likelihood of the risk occurring;
Identifying existing controls that will mitigate the risk;
Identifying the top five residual risks once the controls have been applied;
Producing and implementing risk treatment plans to further minimise risks; and
All assessments and plans will be fully documented to assist with the following year’s
review.
The risk review process has highlighted 21 major risks to the group. Those relevant to the
operation of the network are tabled below.
Master Risk Risk Description
August 2015 Final Score
December 2014 Final
Score
G1 Fatality or injury to staff, contractors or public
Risks associated to people employees, contractors or public from work or infrastructure across the Electra Network 200 180
G2 Inadequate business continuity and disaster recovery management
Inefficient response, restoration and communication to stakeholders 154 165
Inadequate and/or limited insurance cover for extreme events 115.5 165
Unauthorised cyber access into ICT/SCADA systems 115.5 154
Loss of data and company records 60 70
G3 Inability to maintain economic return / discount contribution related to core business
Historic pricing tariffs threaten medium-term economic return 80 154
Continued reduced electricity consumption 80 154
Exposure to avoidable peak demand costs 100 125
G4 Failure to anticipate and plan for technological change
Technological advances threaten businesses established markets 112 112
Poor data management (access, analysis and decision making) 82.5 125
Lack of timely investment in beneficial technological innovation 80 103.6
G5 Failure to maintain stakeholder relationships
Decline of company's reputation 70 78.4
Lack of contract and contractor management 60 125
Major customer disputes and litigation by our customers 50 50
Inadequate skills and aptitude for the role (individual) 80 125
G6 Poor long-term positioning and performance
Failure of businesses to achieve profitability expectations 80 122
G7 Inability to manage political and regulatory change
Increased ComCom, EA costs and any potential industry reform 80 150
G8 Inadequate commercial and financial management
Inadequate group funding strategy leading to liquidity risk 80 105
Risk of material fraud resulting in financial loss 70 112

(134)
(i) This risk has been mitigated somewhat by Electra’s recent withdrawal from non-core
business contracting to focus on the Electra network.
(ii) This risk has been reduced due to the lack of uptake for these technologies.
(iii) Upgraded as a result of the Canterbury earthquakes, this risk has now been mitigated
by extended insurance cover.
.
8.1.4 Identifying risks
Electra staff and management regularly complete a comprehensive risk analysis on the network
and the supporting management structures. These risk analyses are reviewed by and agreed by
the Directors. From this analysis, Electra identified the critical elements and plans that were
required to manage these risks. Key risks are listed below.
8.1.4.1 Safety risks
To operate and maintain an electrical network involves hazardous situations that cannot entirely be
eliminated. Electra is committed to provide a safe reliable network that does not place our staff,
community or environment at risk.
This has been underpinned with the implementation of the Safety Management System (SMS) that
has recently been incorporated into the business. The SMS system is independently audited by
Telarc and as a result a certificate verifying compliance with the standard has been issued.
Electra’s strategies to mitigate risks relating to personal safety are:
Development and maintenance of safety policies and manuals;
Safety related network improvements have the highest priority (as discussed in section
3.4);
Design, operate and develop a network in compliance with regulations and accepted
industry practice.
Operation of a Safety Management System (SMS). This is a regulatory requirement that
focuses on public safety and was certified to NZS7901 in 2012 and renewed in 2015.
Some of the key aspects of the health and safety policy are to:
Identify and control hazards by eliminating, isolating or minimising them;
Work with team members in actively identifying, reporting and dealing with any potential
hazard to himself or herself or any other person while at work;
Provide and maintain training and information to enable team members to fulfil their own
and the Company’s personal obligations for health and safety;
Any accident, health and safety incident, near miss or significant safety issue must be
reported to the Company using the procedure explained in our health and safety manual;
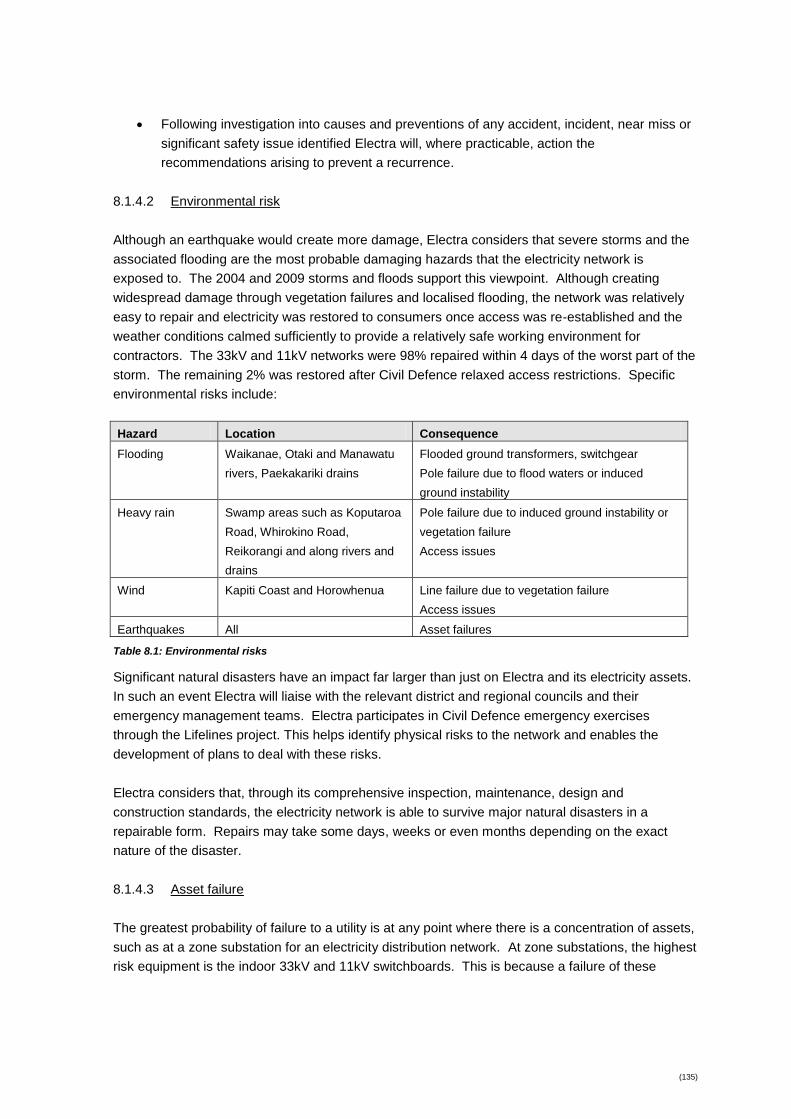
(135)
Following investigation into causes and preventions of any accident, incident, near miss or
significant safety issue identified Electra will, where practicable, action the
recommendations arising to prevent a recurrence.
8.1.4.2 Environmental risk
Although an earthquake would create more damage, Electra considers that severe storms and the
associated flooding are the most probable damaging hazards that the electricity network is
exposed to. The 2004 and 2009 storms and floods support this viewpoint. Although creating
widespread damage through vegetation failures and localised flooding, the network was relatively
easy to repair and electricity was restored to consumers once access was re-established and the
weather conditions calmed sufficiently to provide a relatively safe working environment for
contractors. The 33kV and 11kV networks were 98% repaired within 4 days of the worst part of the
storm. The remaining 2% was restored after Civil Defence relaxed access restrictions. Specific
environmental risks include:
Hazard Location Consequence
Flooding Waikanae, Otaki and Manawatu
rivers, Paekakariki drains
Flooded ground transformers, switchgear
Pole failure due to flood waters or induced
ground instability
Heavy rain Swamp areas such as Koputaroa
Road, Whirokino Road,
Reikorangi and along rivers and
drains
Pole failure due to induced ground instability or
vegetation failure
Access issues
Wind Kapiti Coast and Horowhenua Line failure due to vegetation failure
Access issues
Earthquakes All Asset failures
Table 8.1: Environmental risks
Significant natural disasters have an impact far larger than just on Electra and its electricity assets.
In such an event Electra will liaise with the relevant district and regional councils and their
emergency management teams. Electra participates in Civil Defence emergency exercises
through the Lifelines project. This helps identify physical risks to the network and enables the
development of plans to deal with these risks.
Electra considers that, through its comprehensive inspection, maintenance, design and
construction standards, the electricity network is able to survive major natural disasters in a
repairable form. Repairs may take some days, weeks or even months depending on the exact
nature of the disaster.
8.1.4.3 Asset failure
The greatest probability of failure to a utility is at any point where there is a concentration of assets,
such as at a zone substation for an electricity distribution network. At zone substations, the highest
risk equipment is the indoor 33kV and 11kV switchboards. This is because a failure of these

(136)
assets will cause subsequent damage to adjacent assets. This will increase the extent of any
outage and the restoration time.
Assets are more likely to fail towards the end of their useful life. As discussed in section 6.2,
Electra inspects all its assets on a cyclical basis. Any assets that are of poor condition and are
assessed to have a high likelihood of failure either have maintenance tasks performed on the asset
to extend its asset life, or are replaced with a new asset. These replacements are shown as
‘renewals’ in the network development plan discussed in section 7.7.
8.1.4.4 Network records
Electra records asset information electronically. The principal servers are located within Electra’s
head office. The inherent risk with this is reduced by offsite storage of computer backup tapes,
including SCADA, and contracts with suppliers to provide temporary support if required.
8.1.4.5 Regulatory regime
As a Trust owned Electricity Distribution Business, Electra is no longer subject to the Commerce
Commission’s targeted control regime – where network prices and quality standards are monitored
at specified levels. This is the most significant risk to a lines company and in particular investment
within that network. While not subject to having prices regulated by the Commerce Commission,
Electra is confident about being able to invest at a sensible level that allows delivery of an effective
and efficient electricity supply to consumers and is still subject to the information disclosure regime.
Further, Electra will also be closely observed by its consumers/owners in terms of both price and
other key performance factors. Consumers are represented by the Electra Trust and as noted the
company undertakes annual surveys around service levels and other attributes.
8.1.5 Risk and project prioritisation
As discussed in section 7.2, projects that reduce risks with high likelihood and high consequence
are prioritised over projects with low likelihood and low consequence. The consequence criteria
are shown in the table below. delete
Economic Safety
Social and Environmental
Operational
Measure $ Value Degree of Harm Level of Interest SAIDI
0.1 Minor <$100k Minor incident, no medical attention
required Minimal interest
Less than 0.1 minute
5 Moderate $100k to
$500k First Aid treatment on
site Local media
coverage 0.1 to 1 minute

(137)
20 Serious $500k to $2m Incident requiring medical attention
Regional coverage.
1 to 5 minutes
40 Major $2m to $7m Hospitalisation. National coverage
5 to 10 minutes
100 Catastrophic >$7m Fatality. International
coverage 10 or more
minutes
Table 8.2: Consequence criteria
The following table discloses the frequency criteria:
Frequency Criteria
1 Rarely
10 Yearly/Seldom
12 Monthly/Occasional
15 Weekly/Frequent
20 Daily/Continuous
Table 8.3: Likelihood criteria
The following table discloses the probability criteria:
Probability Criteria
0.04 Improbable
0.2 Remote
0.4 Occasional
0.8 Likely
1.0 Certain
Table 8.4: Probability criteria

(138)
The combination of the consequence and frequency and probability criteria produces a risk rating.
Projects are then ranked in priority based on this risk rating. The expected time to complete any
project is then factored into scheduling work for the Asset Management Plan.
8.2 Management of risk
Electra manages risk through a combination of measures. These can include both physical and
operational measures and will be focused on management and minimization of them.
Specific plans include both physical and operational mitigation measures ranging from replacing
assets to insurance and access to financial reserves.
Physical risk management is part of Electra’s overall legislative compliance programme. Electra,
using the relevant electricity industry and building seismic codes, has a robust network.
Aspect of work How risks are managed
Data integrity As-built plans are required for all new extensions.
Asset data is required for all new extensions and all replacement or
maintenance programmes.
Easements All new assets on private property are suitably protected by
registered easements.
Control of work All work on the electricity assets – regardless of voltage – must be
co-ordinated through the Control Centre.
Work must comply, as a minimum, with the Electricity Industry Safety
Rules.
Strength of works As a minimum, all new extensions and all replacement or
maintenance work must comply with relevant Electrical Codes of
Practice and Electra’s Network Construction standards.
Table 8.5: How risks are managed
The following table summarises asset specific risk mitigation and management features of the
network assets.
Network
Component
How risks are managed

(139)
Transformers
and
Switchgear
Use of insulating oil
Oil containment where located outside
All zone transformers have individual oil containment with oil spill kits located at each
zone substation in case of other spills
Where a distribution transformer or switchgear has leaked, all affected ground is
removed and suitably disposed of in accordance with local by-laws.
VESDA sniffer systems for fire containment are installed at each zone substation’s
switchgear building
All zone transformers and switchboards have annual diagnostic testing to locate
potential faults before they occur.
Buildings
and Zone
Substations
All major projects, such as a new zone substation, are specifically designed for their
location – electrically and structurally.
All buildings are built to the relevant building code.
Electra has seismically engineered bracing on all power transformers at zone
substations, with seismic bracing for switchgear and other components as required.
Electra has replaced all zone substation access locks with a tiered key system in
2002, distribution transformers completed in 2003 and all other 11kV equipment in
2004. Access keys are only provided to employees and contractors on a “need to
have” basis – the need determined by Electra and not the contractor.
Electra completed security fences at the remaining zone substations in 2004.
Electra undertakes bi-monthly visual inspections of all zone substations. Any
necessary repairs are scheduled immediately.
Network
Design
As a minimum, Electra uses the Electricity Act and associated Regulations as the
basis for construction and maintenance of the network.
Electra, through the design process, ensures that, as the network develops, further
interconnection is provided at 11kV.
Reticulation Electra requires pole strength calculations for all new pole transformers and
overhead extensions
Underground cables are specified to withstand through short-circuit faults along with
capacity requirements.
The annual network inspections identify any deterioration affecting physical strength,
and safety clearances to ensure public safety.
Network
Operation
Electra generally operates the 33kV network in two meshed networks to provide a
high level of support for the zone substations. Foxton, Otaki and Paekakariki are not
on the closed 33kV rings; these substations are backed up by the 33kV and 11kV
network through automatic changeover schemes.
Although the 11kV network is operated in a radial manner, all backbone feeders are
interconnected with other feeders from the same zone substation and adjacent zone
substations.
Spares Electra holds modern equivalent spares for all electrical assets on the network at a
contractor’s depot in Paraparaumu and Levin
Individual zone substations have site-specific spares stored at each site as
appropriate.
Table 8.6: How risks are managed for different network components

(140)
Electra also uses insurance as the basis for financial risk management, covering professional and
director’s indemnity, public liability, buildings and plant, loss of profit and vehicles. Except for zone
substations, it is not possible for Electra to insure the electricity network for catastrophic damage.
Electra requires insurance of its contractors to cover contract works, all project assets, public
liability and liquidated damages.
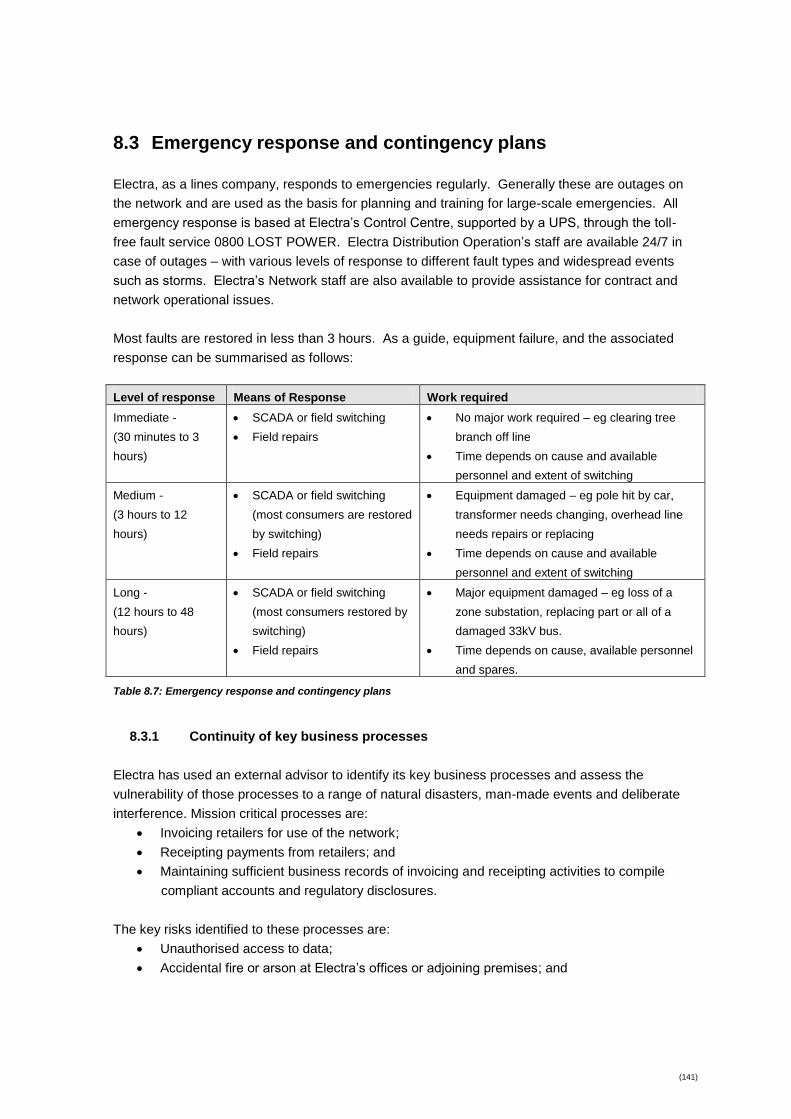
(141)
8.3 Emergency response and contingency plans
Electra, as a lines company, responds to emergencies regularly. Generally these are outages on
the network and are used as the basis for planning and training for large-scale emergencies. All
emergency response is based at Electra’s Control Centre, supported by a UPS, through the toll-
free fault service 0800 LOST POWER. Electra Distribution Operation’s staff are available 24/7 in
case of outages – with various levels of response to different fault types and widespread events
such as storms. Electra’s Network staff are also available to provide assistance for contract and
network operational issues.
Most faults are restored in less than 3 hours. As a guide, equipment failure, and the associated
response can be summarised as follows:
Level of response Means of Response Work required
Immediate -
(30 minutes to 3
hours)
SCADA or field switching
Field repairs
No major work required – eg clearing tree
branch off line
Time depends on cause and available
personnel and extent of switching
Medium -
(3 hours to 12
hours)
SCADA or field switching
(most consumers are restored
by switching)
Field repairs
Equipment damaged – eg pole hit by car,
transformer needs changing, overhead line
needs repairs or replacing
Time depends on cause and available
personnel and extent of switching
Long -
(12 hours to 48
hours)
SCADA or field switching
(most consumers restored by
switching)
Field repairs
Major equipment damaged – eg loss of a
zone substation, replacing part or all of a
damaged 33kV bus.
Time depends on cause, available personnel
and spares.
Table 8.7: Emergency response and contingency plans
8.3.1 Continuity of key business processes
Electra has used an external advisor to identify its key business processes and assess the
vulnerability of those processes to a range of natural disasters, man-made events and deliberate
interference. Mission critical processes are:
Invoicing retailers for use of the network;
Receipting payments from retailers; and
Maintaining sufficient business records of invoicing and receipting activities to compile
compliant accounts and regulatory disclosures.
The key risks identified to these processes are:
Unauthorised access to data;
Accidental fire or arson at Electra’s offices or adjoining premises; and

(142)
An earthquake of Richter magnitude 7.5.
Mitigating actions taken include:
Maintaining a backup Control Centre off-site from the head office that contains all the
necessary software and templates to perform critical tasks discussed above;
Review of the physical security of the principal server in regard to unauthorised physical
interference, fire damage or earthquake damage; and
A review of Electra’s vulnerability to being “hacked” over the web.
8.3.2 Reinstating the network after a disaster
Electra has developed a disaster recovery plan which outlines the broad tasks that Electra would
need to undertake to restore electricity supply to (n) security under the following publicly credible
disaster scenarios:
An earthquake of Richter magnitude 7.5 or greater on a major Wellington fault;
Volcanic activity at Ruapehu resulting in ash coverage of about 10mm throughout the
Northern part of Electra’s area;
A 1 in 100 year flood of the Otaki, Waikanae or Manawatu Rivers; or
A tsunami impacting on the West Coast that could inundate up to 2km inland.
Preparation of this plan has revealed that Electra has already put many recovery initiatives in place
and has coordinated its likely responses with other agencies in both the Kapiti and Horowhenua
districts.
Key recommendations of the plan are as follows:
That the levels of spares outlined in Appendix 3 of the disaster recovery plan be regularly
reviewed for on-going suitability and for correct storage;
That the food stock outlined in Appendix 4 of the disaster recovery plan be regularly
maintained and rotated.
8.3.3 Restoration of key component failures
Electra has considered the following network failure scenarios in order to assess its ability to
promptly restore (n) security of supply:
Busbar faults at each zone substation
Loss of each subtransmission circuit
Loss of each zone substation transformer
Loss of each communication hub
Inability to access the Electra Head Office and associated systems.
The likely outcomes of each scenario have been considered, along with the tasks required to
restore (n) security of supply and the resources required for each task.
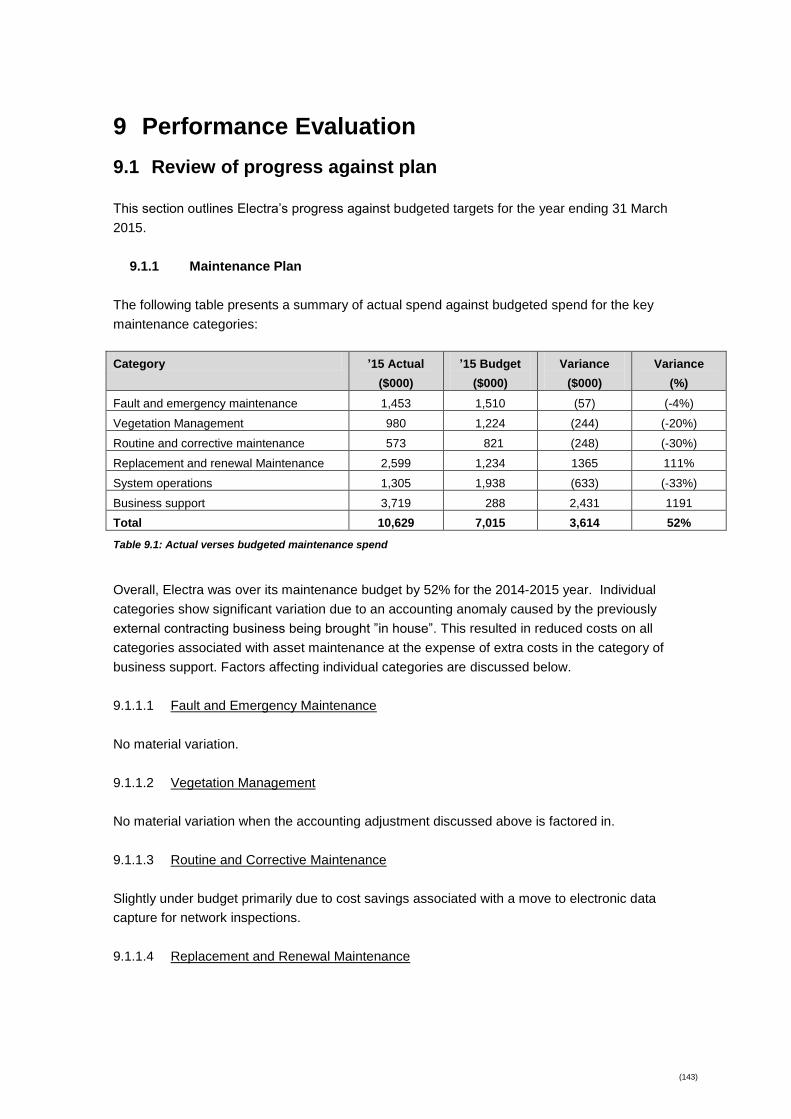
(143)
9 Performance Evaluation
9.1 Review of progress against plan
This section outlines Electra’s progress against budgeted targets for the year ending 31 March
2015.
9.1.1 Maintenance Plan
The following table presents a summary of actual spend against budgeted spend for the key
maintenance categories:
Category ’15 Actual
($000)
’15 Budget
($000)
Variance
($000)
Variance
(%)
Fault and emergency maintenance 1,453 1,510 (57) (-4%)
Vegetation Management 980 1,224 (244) (-20%)
Routine and corrective maintenance 573 821 (248) (-30%)
Replacement and renewal Maintenance 2,599 1,234 1365 111%
System operations 1,305 1,938 (633) (-33%)
Business support 3,719 288 2,431 1191
Total 10,629 7,015 3,614 52%
Table 9.1: Actual verses budgeted maintenance spend
Overall, Electra was over its maintenance budget by 52% for the 2014-2015 year. Individual
categories show significant variation due to an accounting anomaly caused by the previously
external contracting business being brought ”in house”. This resulted in reduced costs on all
categories associated with asset maintenance at the expense of extra costs in the category of
business support. Factors affecting individual categories are discussed below.
9.1.1.1 Fault and Emergency Maintenance
No material variation.
9.1.1.2 Vegetation Management
No material variation when the accounting adjustment discussed above is factored in.
9.1.1.3 Routine and Corrective Maintenance
Slightly under budget primarily due to cost savings associated with a move to electronic data
capture for network inspections.
9.1.1.4 Replacement and Renewal Maintenance

(144)
Significantly overr budget as a result of catch up work from previous years using external
contractors.
9.1.1.5 System Operations
No material variation when the accounting adjustment discussed above is factored in.
9.1.1.6 Business Support
No material variation when the accounting adjustment discussed above is factored in.
9.1.2 Development Plan
The following table presents a summary of actual spend against budgeted spend for the key
development categories:
Category '15 Actual
($000)
'15 Budget
($000)
Variance
($000)
Variance
(%)
Consumer Connection(i)
- 94 (94) (-100.0%)
System Growth(ii)
1 778 (777) (-100.0%)
Reliability, Safety & Environment(iii)
2,305 1,639 666 41%
Asset Replacement/Renewal(iv)
5,954 5,180 774 15%
Asset Relocation(iii)
203 188 15 8%
Total(ii)
8,464 7,879 585 7%
Table 9.2: Actual verses budgeted spend
(i) Customer Connections are budgeted on a net basis for vested assets. Electra spent $0 on
vested assets.
(ii) System Growth was under spent due to the late completion of a project in Paraparaumu
Beach. This work has now been completed. Also some of the work completed on Shannon
substation was classified as System Growth but had been budgeted under Reliability,
Safety & Environment.
(iii) The late completion of the Paraparaumu GXP to Paraparaumu Zone Substation cables
means these assets will now be commissioned in the 2015/16 year.
(iv) On budget.
(v) On budget.
(vi) Overall, Electra over spent its development budget by 7% for the 2014/15 year. This was a
result of delays to two significant projects in Paraparaumu and Shannon from the 2013/14
year which was under spent by 23%, both of which are now complete.
9.1.3 Actual performance against target performance
The following table presents our actual performance against target performance for our key service
level targets.
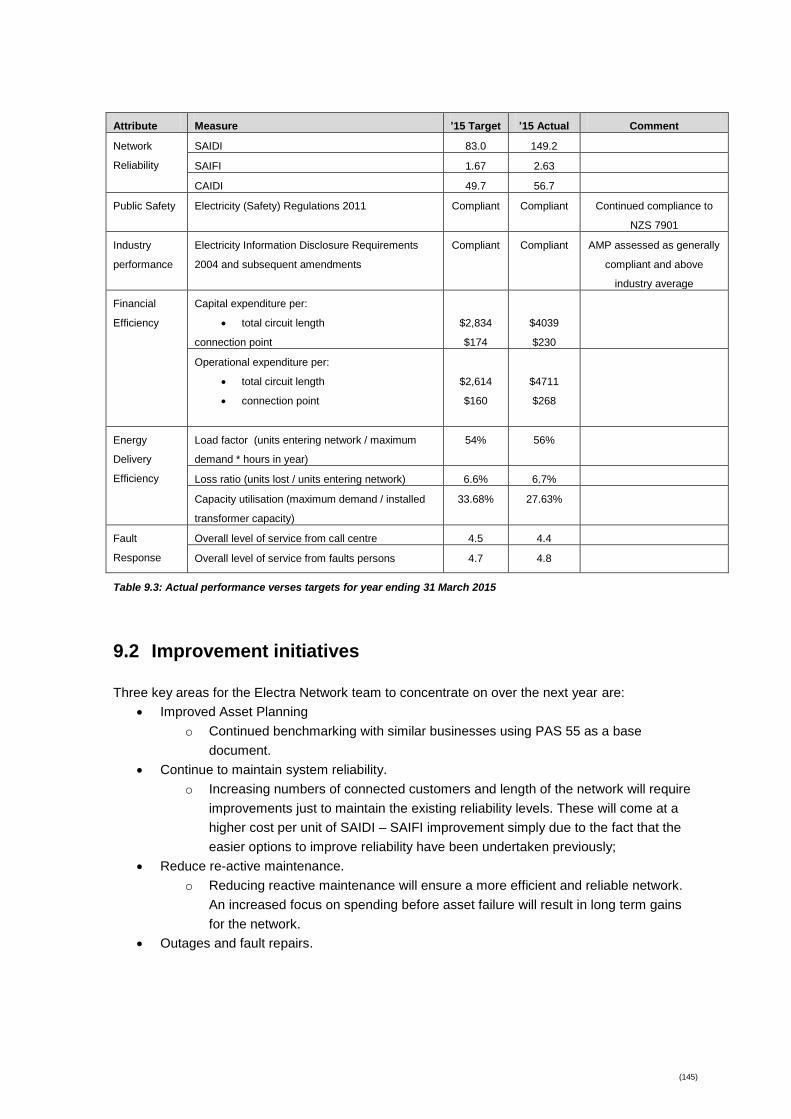
(145)
Attribute Measure ’15 Target ’15 Actual Comment
Network
Reliability
SAIDI 83.0 149.2
SAIFI 1.67 2.63
CAIDI 49.7 56.7
Public Safety Electricity (Safety) Regulations 2011 Compliant Compliant Continued compliance to
NZS 7901
Industry
performance
Electricity Information Disclosure Requirements
2004 and subsequent amendments
Compliant Compliant AMP assessed as generally
compliant and above
industry average
Financial
Efficiency
Capital expenditure per:
total circuit length
connection point
$2,834
$174
$4039
$230
Operational expenditure per:
total circuit length
connection point
$2,614
$160
$4711
$268
Energy
Delivery
Efficiency
Load factor (units entering network / maximum
demand * hours in year)
54% 56%
Loss ratio (units lost / units entering network) 6.6% 6.7%
Capacity utilisation (maximum demand / installed
transformer capacity)
33.68% 27.63%
Fault
Response
Overall level of service from call centre 4.5 4.4
Overall level of service from faults persons 4.7 4.8
Table 9.3: Actual performance verses targets for year ending 31 March 2015
9.2 Improvement initiatives
Three key areas for the Electra Network team to concentrate on over the next year are:
Improved Asset Planning
o Continued benchmarking with similar businesses using PAS 55 as a base
document.
Continue to maintain system reliability.
o Increasing numbers of connected customers and length of the network will require
improvements just to maintain the existing reliability levels. These will come at a
higher cost per unit of SAIDI – SAIFI improvement simply due to the fact that the
easier options to improve reliability have been undertaken previously;
Reduce re-active maintenance.
o Reducing reactive maintenance will ensure a more efficient and reliable network.
An increased focus on spending before asset failure will result in long term gains
for the network.
Outages and fault repairs.
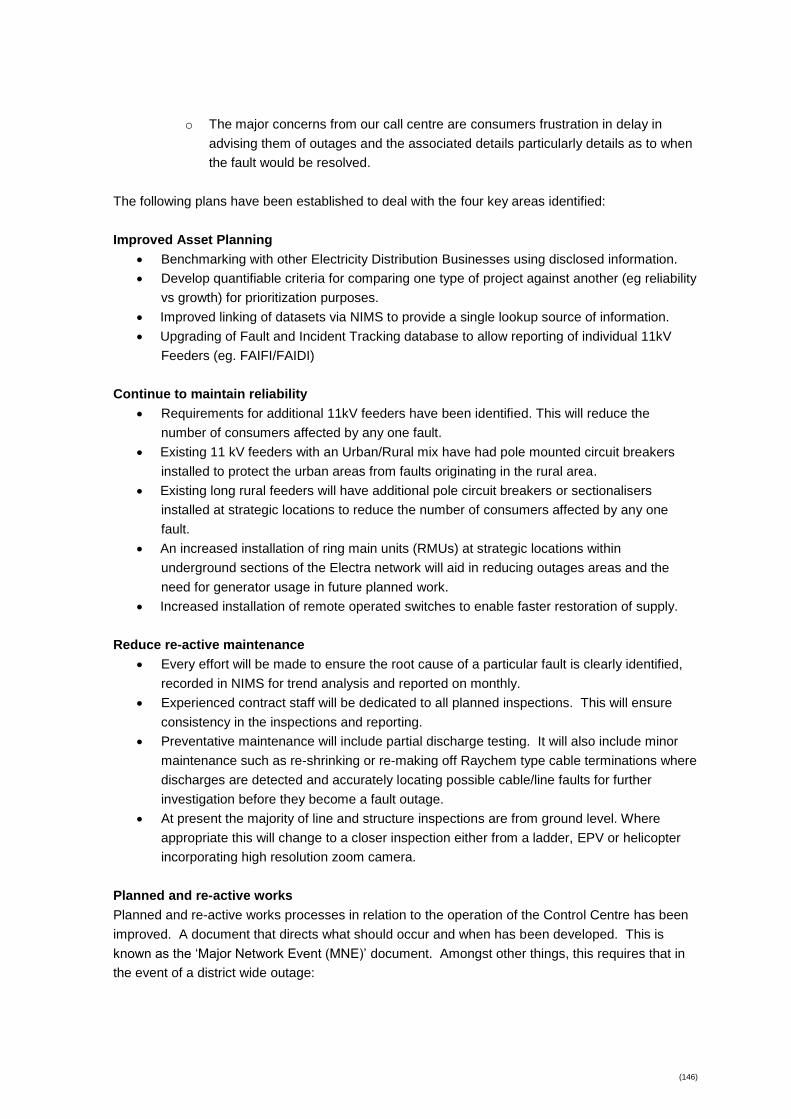
(146)
o The major concerns from our call centre are consumers frustration in delay in
advising them of outages and the associated details particularly details as to when
the fault would be resolved.
The following plans have been established to deal with the four key areas identified:
Improved Asset Planning
Benchmarking with other Electricity Distribution Businesses using disclosed information.
Develop quantifiable criteria for comparing one type of project against another (eg reliability
vs growth) for prioritization purposes.
Improved linking of datasets via NIMS to provide a single lookup source of information.
Upgrading of Fault and Incident Tracking database to allow reporting of individual 11kV
Feeders (eg. FAIFI/FAIDI)
Continue to maintain reliability
Requirements for additional 11kV feeders have been identified. This will reduce the
number of consumers affected by any one fault.
Existing 11 kV feeders with an Urban/Rural mix have had pole mounted circuit breakers
installed to protect the urban areas from faults originating in the rural area.
Existing long rural feeders will have additional pole circuit breakers or sectionalisers
installed at strategic locations to reduce the number of consumers affected by any one
fault.
An increased installation of ring main units (RMUs) at strategic locations within
underground sections of the Electra network will aid in reducing outages areas and the
need for generator usage in future planned work.
Increased installation of remote operated switches to enable faster restoration of supply.
Reduce re-active maintenance
Every effort will be made to ensure the root cause of a particular fault is clearly identified,
recorded in NIMS for trend analysis and reported on monthly.
Experienced contract staff will be dedicated to all planned inspections. This will ensure
consistency in the inspections and reporting.
Preventative maintenance will include partial discharge testing. It will also include minor
maintenance such as re-shrinking or re-making off Raychem type cable terminations where
discharges are detected and accurately locating possible cable/line faults for further
investigation before they become a fault outage.
At present the majority of line and structure inspections are from ground level. Where
appropriate this will change to a closer inspection either from a ladder, EPV or helicopter
incorporating high resolution zoom camera.
Planned and re-active works
Planned and re-active works processes in relation to the operation of the Control Centre has been
improved. A document that directs what should occur and when has been developed. This is
known as the ‘Major Network Event (MNE)’ document. Amongst other things, this requires that in
the event of a district wide outage:

(147)
Two control operators are present in the Control Centre with one operator dedicated to
completing any network switching required.
One operator will regularly update all records and call centre on the areas affected and
progress to time. This operator will also update retailers, radio stations and emergency
services on outage restoration progress.
The Managers are present in the Control Centre area to ensure restoration is completed
systematically and that records are being updated.
The Operations Manager is present and co-ordinates works required with the contractors
involved.

(148)
10 Expenditure reconciliation and forecasts
The following tables summarise the forecast of capital and operating expenditure for the year asset
management planning period and shows a reconciliation of actual expenditure against forecast for
the year ending 31 March 2015, which is the most recent financial year for which data is available.
This disclosure is made consistent with Requirement 7(1) of the Electricity Distribution (Information
Disclosure) Determination 2012.
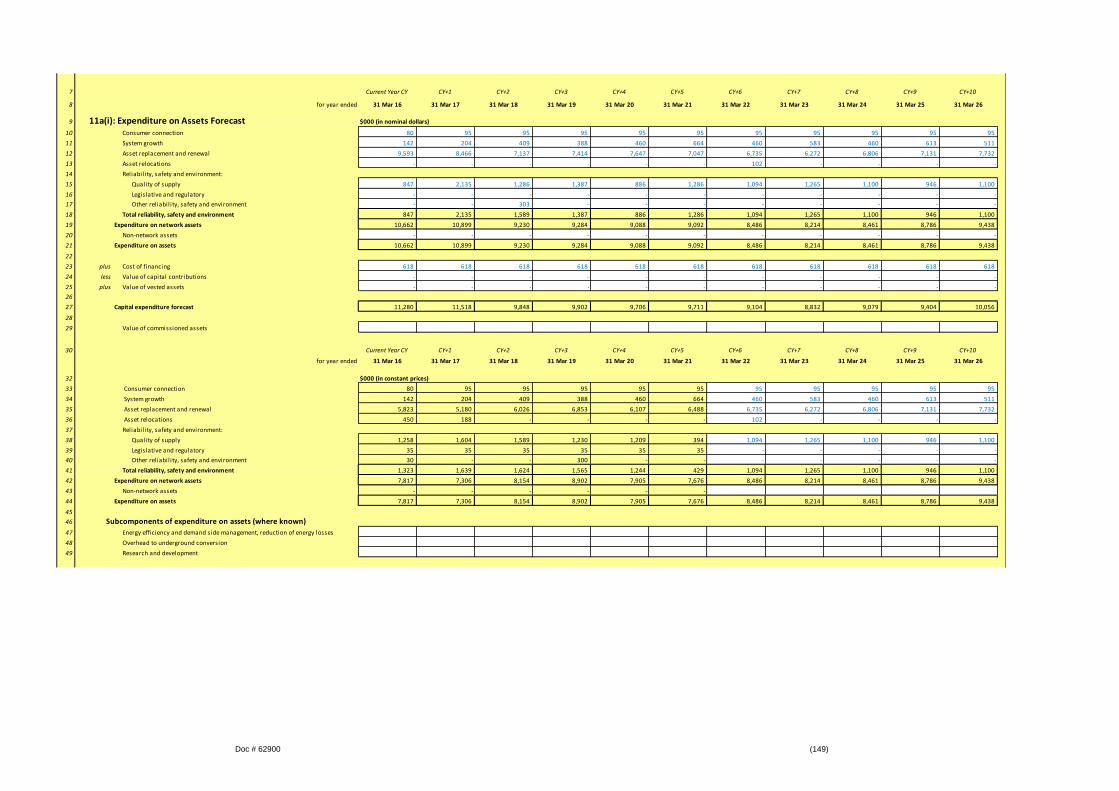
Doc # 62900 (149)
7 Current Year CY CY+1 CY+2 CY+3 CY+4 CY+5 CY+6 CY+7 CY+8 CY+9 CY+10
8 for year ended 31 Mar 16 31 Mar 17 31 Mar 18 31 Mar 19 31 Mar 20 31 Mar 21 31 Mar 22 31 Mar 23 31 Mar 24 31 Mar 25 31 Mar 26
9 11a(i): Expenditure on Assets Forecast $000 (in nominal dollars)
10 Consumer connection 80 95 95 95 95 95 95 95 95 95 95
11 System growth 142 204 409 388 460 664 460 583 460 613 511
12 Asset replacement and renewal 9,593 8,466 7,137 7,414 7,647 7,047 6,735 6,272 6,806 7,131 7,732
13 Asset relocations - - - - - - 102 - - - -
14 Reliability, safety and environment:
15 Quality of supply 847 2,135 1,286 1,387 886 1,286 1,094 1,265 1,100 946 1,100
16 Legislative and regulatory - - - - - - - - - - -
17 Other reliability, safety and environment - - 303 - - - - - - - -
18 Total reliability, safety and environment 847 2,135 1,589 1,387 886 1,286 1,094 1,265 1,100 946 1,100
19 Expenditure on network assets 10,662 10,899 9,230 9,284 9,088 9,092 8,486 8,214 8,461 8,786 9,438
20 Non-network assets - - - - - - - - - - -
21 Expenditure on assets 10,662 10,899 9,230 9,284 9,088 9,092 8,486 8,214 8,461 8,786 9,438
22
23 plus Cost of financing 618 618 618 618 618 618 618 618 618 618 618
24 less Value of capital contributions - - - - - - - - - - -
25 plus Value of vested assets - - - - - - - - - - -
26
27 Capital expenditure forecast 11,280 11,518 9,848 9,902 9,706 9,711 9,104 8,832 9,079 9,404 10,056
28
29 Value of commissioned assets
30 Current Year CY CY+1 CY+2 CY+3 CY+4 CY+5 CY+6 CY+7 CY+8 CY+9 CY+10
for year ended 31 Mar 16 31 Mar 17 31 Mar 18 31 Mar 19 31 Mar 20 31 Mar 21 31 Mar 22 31 Mar 23 31 Mar 24 31 Mar 25 31 Mar 26
32 $000 (in constant prices)
33 Consumer connection 80 95 95 95 95 95 95 95 95 95 95
34 System growth 142 204 409 388 460 664 460 583 460 613 511
35 Asset replacement and renewal 5,823 5,180 6,026 6,853 6,107 6,488 6,735 6,272 6,806 7,131 7,732
36 Asset relocations 450 188 - - - - 102 - - - -
37 Reliability, safety and environment:
38 Quality of supply 1,258 1,604 1,589 1,230 1,209 394 1,094 1,265 1,100 946 1,100
39 Legislative and regulatory 35 35 35 35 35 35 - - - - -
40 Other reliability, safety and environment 30 - - 300 - - - - - - -
41 Total reliability, safety and environment 1,323 1,639 1,624 1,565 1,244 429 1,094 1,265 1,100 946 1,100
42 Expenditure on network assets 7,817 7,306 8,154 8,902 7,905 7,676 8,486 8,214 8,461 8,786 9,438
43 Non-network assets - - - - - -
44 Expenditure on assets 7,817 7,306 8,154 8,902 7,905 7,676 8,486 8,214 8,461 8,786 9,438
45
46 Subcomponents of expenditure on assets (where known)
47 Energy efficiency and demand side management, reduction of energy losses
48 Overhead to underground conversion
49 Research and development
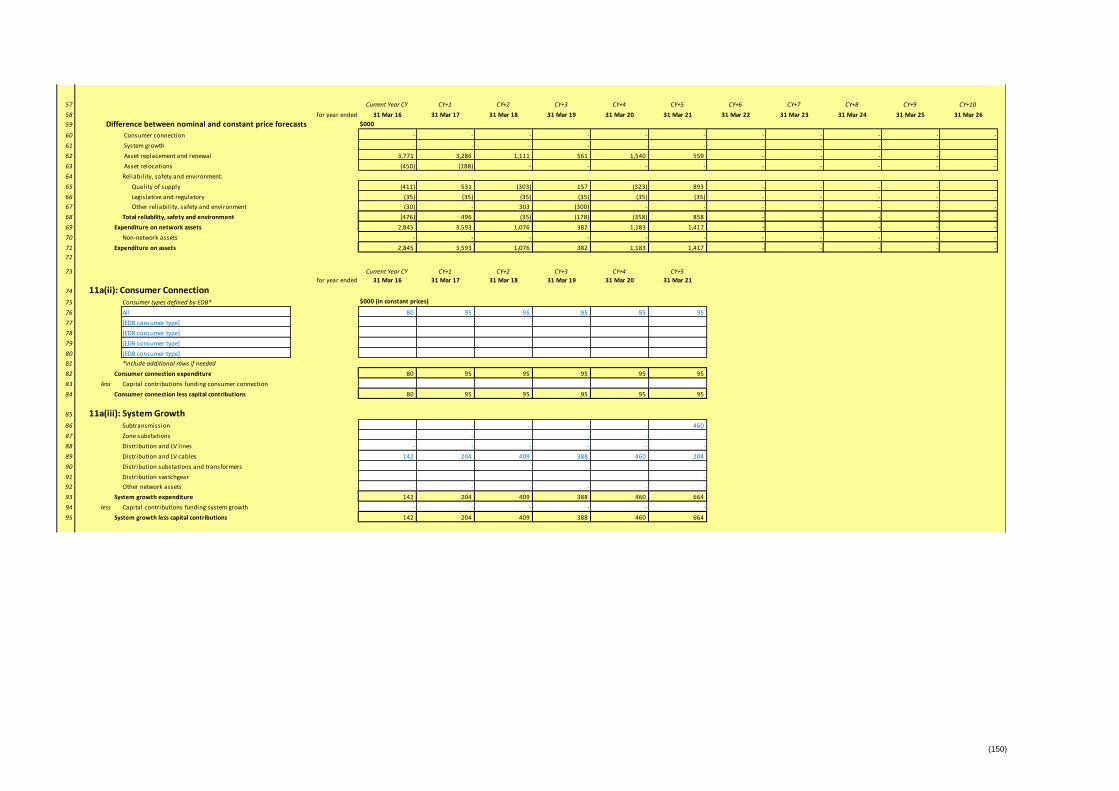
(150)
57 Current Year CY CY+1 CY+2 CY+3 CY+4 CY+5 CY+6 CY+7 CY+8 CY+9 CY+10
58 for year ended 31 Mar 16 31 Mar 17 31 Mar 18 31 Mar 19 31 Mar 20 31 Mar 21 31 Mar 22 31 Mar 23 31 Mar 24 31 Mar 25 31 Mar 26
59 Difference between nominal and constant price forecasts $000
60 Consumer connection - - - - - - - - - - -
61 System growth - - - - - - - - - - -
62 Asset replacement and renewal 3,771 3,286 1,111 561 1,540 559 - - - - -
63 Asset relocations (450) (188) - - - - - - - - -
64 Reliability, safety and environment:
65 Quality of supply (411) 531 (303) 157 (323) 893 - - - - -
66 Legislative and regulatory (35) (35) (35) (35) (35) (35) - - - - -
67 Other reliability, safety and environment (30) - 303 (300) - - - - - - -
68 Total reliability, safety and environment (476) 496 (35) (178) (358) 858 - - - - -
69 Expenditure on network assets 2,845 3,593 1,076 382 1,183 1,417 - - - - -
70 Non-network assets - - - - - - - - - - -
71 Expenditure on assets 2,845 3,593 1,076 382 1,183 1,417 - - - - -
72
73 CY+1 CY+2 CY+3 CY+4 CY+5
74 11a(ii): Consumer Connectionfor year ended 31 Mar 16 31 Mar 17 31 Mar 18 31 Mar 19 31 Mar 20 31 Mar 21
75 Consumer types defined by EDB* $000 (in constant prices)
76 All 80 95 95 95 95 95
77 [EDB consumer type]
78 [EDB consumer type]
79 [EDB consumer type]
80 [EDB consumer type]
81 *include additional rows if needed
82 Consumer connection expenditure 80 95 95 95 95 95
83 less Capital contributions funding consumer connection
84 Consumer connection less capital contributions 80 95 95 95 95 95
85 11a(iii): System Growth86 Subtransmission - - - - - 460
87 Zone substations - - - - - -
88 Distribution and LV lines - - - - - -
89 Distribution and LV cables 142 204 409 388 460 204
90 Distribution substations and transformers -
91 Distribution switchgear -
92 Other network assets - - - - - -
93 System growth expenditure 142 204 409 388 460 664
94 less Capital contributions funding system growth - - - - - -
95 System growth less capital contributions 142 204 409 388 460 664
Current Year CY
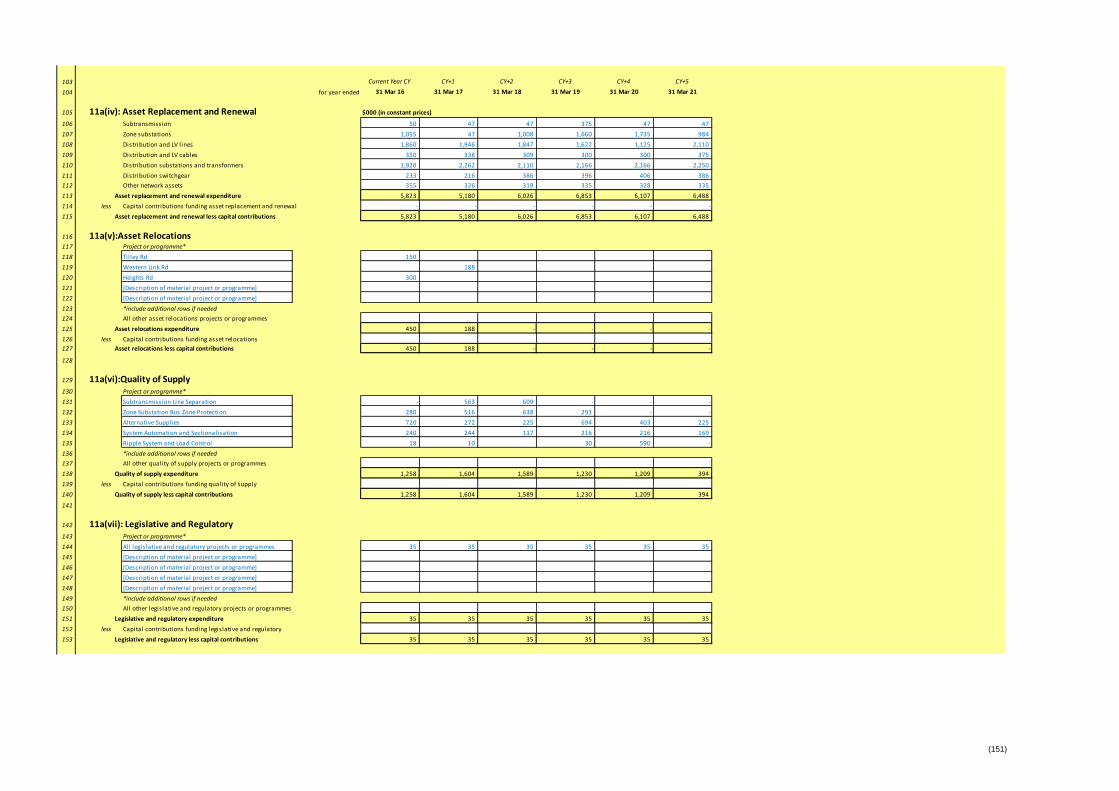
(151)
103 Current Year CY CY+1 CY+2 CY+3 CY+4 CY+5
104 for year ended 31 Mar 16 31 Mar 17 31 Mar 18 31 Mar 19 31 Mar 20 31 Mar 21
105 11a(iv): Asset Replacement and Renewal $000 (in constant prices)
106 Subtransmission 50 47 47 375 47 47
107 Zone substations 1,055 47 1,008 1,660 1,735 984
108 Distribution and LV lines 1,860 1,946 1,847 1,622 1,125 2,110
109 Distribution and LV cables 350 338 309 300 300 375
110 Distribution substations and transformers 1,920 2,262 2,110 2,166 2,166 2,250
111 Distribution switchgear 233 216 386 396 406 386
112 Other network assets 355 326 319 335 328 335
113 Asset replacement and renewal expenditure 5,823 5,180 6,026 6,853 6,107 6,488
114 less Capital contributions funding asset replacement and renewal - - - - - -
115 Asset replacement and renewal less capital contributions 5,823 5,180 6,026 6,853 6,107 6,488
116 11a(v):Asset Relocations117 Project or programme*
118 Tilley Rd 150
119 Western Link Rd 188
120 Heights Rd 300
121 [Description of material project or programme]
122 [Description of material project or programme]
123 *include additional rows if needed
124 All other asset relocations projects or programmes
125 Asset relocations expenditure 450 188 - - - -
126 less Capital contributions funding asset relocations
127 Asset relocations less capital contributions 450 188 - - - -
128
129 11a(vi):Quality of Supply130 Project or programme*
131 Subtransmission Line Separation - 563 609 - - -
132 Zone Substation Bus Zone Protection 280 516 638 291 - -
133 Alternative Supplies 720 272 225 694 403 225
134 System Automation and Sectionalisation 240 244 117 216 216 169
135 Ripple System and Load Control 18 10 - 30 590 -
136 *include additional rows if needed
137 All other quality of supply projects or programmes
138 Quality of supply expenditure 1,258 1,604 1,589 1,230 1,209 394
139 less Capital contributions funding quality of supply
140 Quality of supply less capital contributions 1,258 1,604 1,589 1,230 1,209 394
141
142 11a(vii): Legislative and Regulatory143 Project or programme*
144 All legislative and regulatory projects or programmes 35 35 35 35 35 35
145 [Description of material project or programme]
146 [Description of material project or programme]
147 [Description of material project or programme]
148 [Description of material project or programme]
149 *include additional rows if needed
150 All other legislative and regulatory projects or programmes
151 Legislative and regulatory expenditure 35 35 35 35 35 35
152 less Capital contributions funding legislative and regulatory
153 Legislative and regulatory less capital contributions 35 35 35 35 35 35
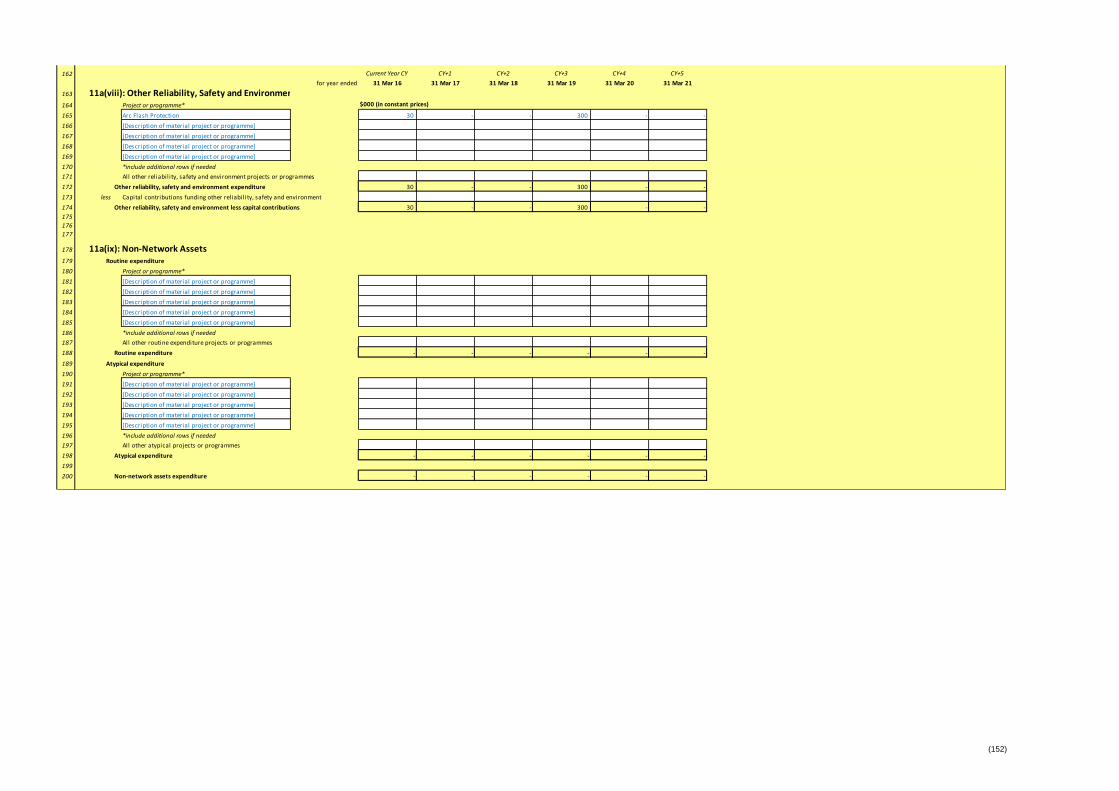
(152)
162 Current Year CY CY+1 CY+2 CY+3 CY+4 CY+5
163 11a(viii): Other Reliability, Safety and Environmentfor year ended 31 Mar 16 31 Mar 17 31 Mar 18 31 Mar 19 31 Mar 20 31 Mar 21
164 Project or programme* $000 (in constant prices)
165 Arc Flash Protection 30 - - 300 - -
166 [Description of material project or programme]
167 [Description of material project or programme]
168 [Description of material project or programme]
169 [Description of material project or programme]
170 *include additional rows if needed
171 All other reliability, safety and environment projects or programmes
172 Other reliability, safety and environment expenditure 30 - - 300 - -
173 less Capital contributions funding other reliability, safety and environment
174 Other reliability, safety and environment less capital contributions 30 - - 300 - -
175
176
177
178 11a(ix): Non-Network Assets179 Routine expenditure
180 Project or programme*
181 [Description of material project or programme]
182 [Description of material project or programme]
183 [Description of material project or programme]
184 [Description of material project or programme]
185 [Description of material project or programme]
186 *include additional rows if needed
187 All other routine expenditure projects or programmes
188 Routine expenditure - - - - - -
189 Atypical expenditure
190 Project or programme*
191 [Description of material project or programme]
192 [Description of material project or programme]
193 [Description of material project or programme]
194 [Description of material project or programme]
195 [Description of material project or programme]
196 *include additional rows if needed
197 All other atypical projects or programmes
198 Atypical expenditure - - - - - -
199
200 Non-network assets expenditure - - - - - -

(153)
7 Current Year CY CY+1 CY+2 CY+3 CY+4 CY+5 CY+6 CY+7 CY+8 CY+9 CY+10
8 for year ended 31 Mar 16 31 Mar 17 31 Mar 18 31 Mar 19 31 Mar 20 31 Mar 21 31 Mar 22 31 Mar 23 31 Mar 24 31 Mar 25 31 Mar 26
9 Operational Expenditure Forecast $000 (in nominal dollars)
10 Service interruptions and emergencies 1,480 1,510 1,547 1,584 1,628 1,672 1,724 1,776 1,835 1,894 1,954
11 Vegetation management 1,200 1,224 1,254 1,284 1,320 1,356 1,398 1,440 1,488 1,536 1,585
12 Routine and corrective maintenance and inspection 805 821 841 861 886 910 938 966 998 1,030 1,062
13 Asset replacement and renewal 1,210 1,234 1,291 1,295 1,331 1,396 1,410 1,452 1,531 1,549 1,591
14 Network Opex 4,695 4,789 4,932 5,024 5,165 5,334 5,470 5,634 5,853 6,010 6,192
15 System operations and network support 1,874 1,938 2,023 2,088 2,160 2,226 2,294 2,363 2,438 2,511 2,575
16 Business support 283 288 294 300 308 316 325 334 344 355 365
17 Non-network opex 2,157 2,226 2,317 2,388 2,468 2,542 2,619 2,697 2,782 2,866 2,940
18 Operational expenditure 6,852 7,015 7,249 7,412 7,633 7,876 8,089 8,331 8,635 8,876 9,132
19 Current Year CY CY+1 CY+2 CY+3 CY+4 CY+5 CY+6 CY+7 CY+8 CY+9 CY+10
20 for year ended 31 Mar 16 31 Mar 17 31 Mar 18 31 Mar 19 31 Mar 20 31 Mar 21 31 Mar 22 31 Mar 23 31 Mar 24 31 Mar 25 31 Mar 26
21 $000 (in constant prices)
22 Service interruptions and emergencies 1,480 1,439 1,439 1,439 1,439 1,439 1,439 1,439 1,439 1,439 1,439
23 Vegetation management 1,200 1,125 1,125 1,125 1,125 1,125 1,125 1,125 1,125 1,125 1,125
24 Routine and corrective maintenance and inspection 795 764 764 764 764 764 764 764 764 764 764
25 Asset replacement and renewal 1,205 1,134 1,158 1,134 1,134 1,158 1,134 1,134 1,158 1,134 1,134
26 Network Opex 4,680 4,463 4,486 4,463 4,463 4,486 4,463 4,463 4,486 4,463 4,463
27 System operations and network support 1,767 1,820 1,830 1,845 1,860 1,875 1,890 1,905 1,920 1,940 1,960
28 Business support 277 277 277 277 277 277 277 277 277 277 277
29 Non-network opex 2,044 2,097 2,107 2,122 2,137 2,152 2,167 2,182 2,197 2,217 2,237
30 Operational expenditure 6,724 6,560 6,593 6,585 6,600 6,638 6,630 6,645 6,683 6,680 6,700
31 Subcomponents of operational expenditure (where known)
32
33 20 20 20 20 20 20 20 20 20 20 20
34 Direct bil l ing* N/A N/A N/A N/A N/A N/A N/A N/A N/A N/A N/A
35 Research and Development 20 20 20 20 20 20 20 20 20 20 20
Insurance 250 260 275 290 305 320 335 350 370 390 410
37 * Direct billing expenditure by suppliers that direct bill the majority of their consumers
38
39 Current Year CY CY+1 CY+2 CY+3 CY+4 CY+5 CY+6 CY+7 CY+8 CY+9 CY+10
40 for year ended 31 Mar 16 31 Mar 17 31 Mar 18 31 Mar 19 31 Mar 20 31 Mar 21 31 Mar 22 31 Mar 23 31 Mar 24 31 Mar 25 31 Mar 26
41 Difference between nominal and real forecasts $000
42 Service interruptions and emergencies - 70 107 144 189 233 285 337 396 455 515
43 Vegetation management - 99 129 159 195 231 273 315 363 411 460
44 Routine and corrective maintenance and inspection 10 57 77 97 121 146 174 202 234 266 298
45 Asset replacement and renewal 5 100 133 160 197 238 275 318 373 414 457
46 Network Opex 15 326 446 561 702 847 1,007 1,171 1,366 1,547 1,729
47 System operations and network support 107 118 193 243 300 351 404 458 518 571 615
48 Business support 6 11 17 23 31 39 48 57 67 78 88
49 Non-network opex 113 129 210 266 331 390 452 515 585 649 703
50 Operational expenditure 128 455 656 827 1,033 1,237 1,459 1,686 1,951 2,196 2,432
Energy efficiency and demand side management, reduction of
energy losses

(154)
7
8
9
Voltage Asset category Asset class Units Grade 1 Grade 2 Grade 3 Grade 4 Grade unknownData accuracy
(1–4)
10 All Overhead Line Concrete poles / steel structure No. - 95.25% 4.75% 3 5.00%
11 All Overhead Line Wood poles No. - 37.78% 62.22% - 3 44.00%
12 All Overhead Line Other pole types No. N/A
13 HV Subtransmission Line Subtransmission OH up to 66kV conductor km 16.43% 82.22% 1.35% 4 2.00%
14 HV Subtransmission Line Subtransmission OH 110kV+ conductor km N/A
15 HV Subtransmission Cable Subtransmission UG up to 66kV (XLPE) km 79.70% 20.30% 4 -
16 HV Subtransmission Cable Subtransmission UG up to 66kV (Oil pressurised) km N/A
17 HV Subtransmission Cable Subtransmission UG up to 66kV (Gas pressurised) km N/A
18 HV Subtransmission Cable Subtransmission UG up to 66kV (PILC) km N/A
19 HV Subtransmission Cable Subtransmission UG 110kV+ (XLPE) km N/A
20 HV Subtransmission Cable Subtransmission UG 110kV+ (Oil pressurised) km N/A
21 HV Subtransmission Cable Subtransmission UG 110kV+ (Gas Pressurised) km N/A
22 HV Subtransmission Cable Subtransmission UG 110kV+ (PILC) km N/A
23 HV Subtransmission Cable Subtransmission submarine cable km N/A
24 HV Zone substation Buildings Zone substations up to 66kV No. 10.00% 50.00% 40.00% 4 10.00%
25 HV Zone substation Buildings Zone substations 110kV+ No. N/A
26 HV Zone substation switchgear 22/33kV CB (Indoor) No. 61.54% 38.46% 4
27 HV Zone substation switchgear 22/33kV CB (Outdoor) No. 7.69% 92.31% 4 19.23%
28 HV Zone substation switchgear 33kV Switch (Ground Mounted) No. N/A
29 HV Zone substation switchgear 33kV Switch (Pole Mounted) No. 100.00% 3 13.64%
30 HV Zone substation switchgear 33kV RMU No. N/A
31 HV Zone substation switchgear 50/66/110kV CB (Indoor) No. N/A
32 HV Zone substation switchgear 50/66/110kV CB (Outdoor) No. N/A
33 HV Zone substation switchgear 3.3/6.6/11/22kV CB (ground mounted) No. 10.34% 81.60% 8.06% 3 10.34%
34 HV Zone substation switchgear 3.3/6.6/11/22kV CB (pole mounted) No. N/A
% of asset forecast
to be replaced in
next 5 years
Asset condition at start of planning period (percentage of units by grade)

(155)
43
44
Voltage Asset category Asset class Units Grade 1 Grade 2 Grade 3 Grade 4 Grade unknownData accuracy
(1–4)
45 HV Zone Substation Transformer Zone Substation Transformers No. 90.00% 10.00% 4 -
46 HV Distribution Line Distribution OH Open Wire Conductor km 11.20% 83.30% 5.50% 3 7.00%
47 HV Distribution Line Distribution OH Aerial Cable Conductor km N/A
48 HV Distribution Line SWER conductor km N/A
49 HV Distribution Cable Distribution UG XLPE or PVC km 61.30% 38.70% 3 -
50 HV Distribution Cable Distribution UG PILC km 100.00% - 3 2.50%
51 HV Distribution Cable Distribution Submarine Cable km N/A
52 HV Distribution switchgear 3.3/6.6/11/22kV CB (pole mounted) - reclosers and sectionalisers No. 3.00% 85.00% 12.00% 4 6.00%
53 HV Distribution switchgear 3.3/6.6/11/22kV CB (Indoor) No. 12.00% 78.00% 10.00% 4 12.00%
54 HV Distribution switchgear 3.3/6.6/11/22kV Switches and fuses (pole mounted) No. 2.00% 67.00% 31.00% 3 10.00%
55 HV Distribution switchgear 3.3/6.6/11/22kV Switch (ground mounted) - except RMU No. N/A
56 HV Distribution switchgear 3.3/6.6/11/22kV RMU No. 2.00% 59.00% 39.00% 3 10.00%
57 HV Distribution Transformer Pole Mounted Transformer No. 2.50% 65.20% 32.30% 4 10.00%
58 HV Distribution Transformer Ground Mounted Transformer No. 10.90% 48.40% 40.70% 4 15.00%
59 HV Distribution Transformer Voltage regulators No. N/A
60 HV Distribution Substations Ground Mounted Substation Housing No. N/A
61 LV LV Line LV OH Conductor km 2.60% 1.20% 96.20% 3 4.00%
62 LV LV Cable LV UG Cable km - 44.00% 56.00% 3 2.00%
63 LV LV Streetlighting LV OH/UG Streetlight circuit km 100.00% 3 2.00%
64 LV Connections OH/UG consumer service connections No. 10.80% 42.20% 15.00% 32.00% 2 12.00%
65 All Protection Protection relays (electromechanical, solid state and numeric) No. 15.00% 55.00% 30.00% 4 20.00%
66 All SCADA and communications SCADA and communications equipment operating as a single system Lot 80.00% 20.00% 3 20.00%
67 All Capacitor Banks Capacitors including controls No. N/A
68 All Load Control Centralised plant Lot 100.00% 4 -
69 All Load Control Relays No. 100.00% 3 10.00%
70 All Civils Cable Tunnels km N/A
% of asset forecast
to be replaced in
next 5 years
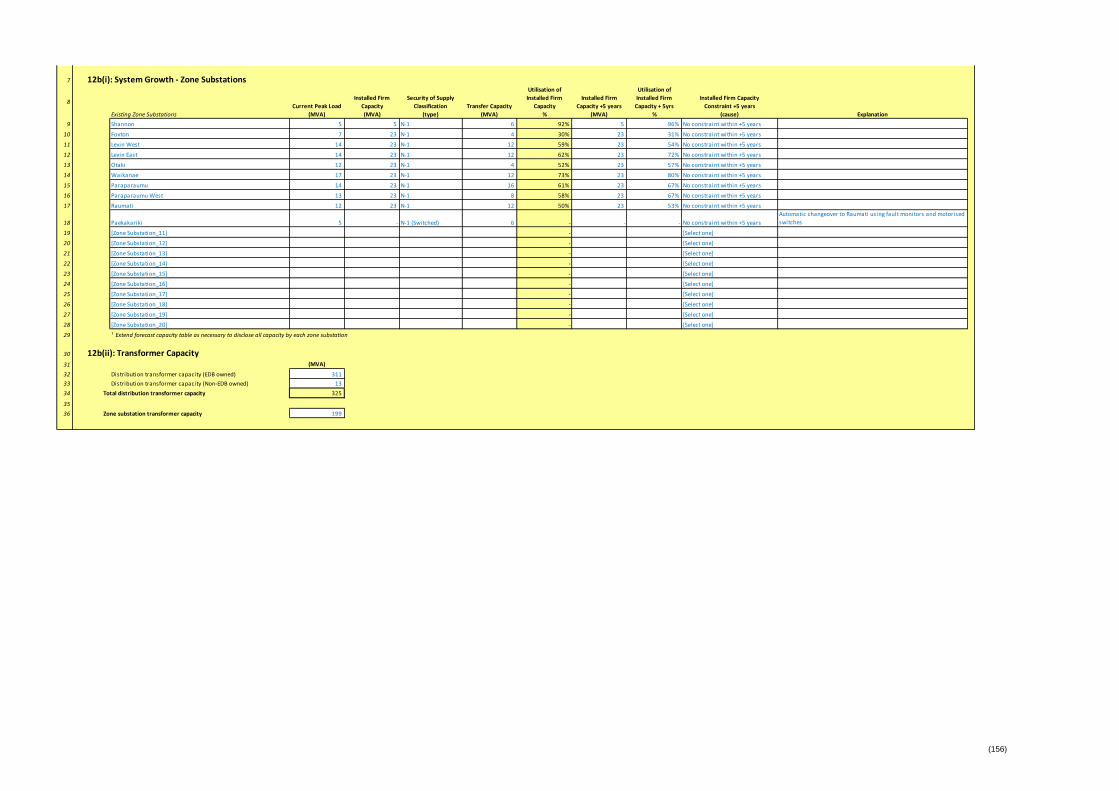
(156)
7 12b(i): System Growth - Zone Substations
8
Existing Zone Substations
Current Peak Load
(MVA)
Installed Firm
Capacity
(MVA)
Security of Supply
Classification
(type)
Transfer Capacity
(MVA)
Utilisation of
Installed Firm
Capacity
%
Installed Firm
Capacity +5 years
(MVA)
Utilisation of
Installed Firm
Capacity + 5yrs
%
Installed Firm Capacity
Constraint +5 years
(cause) Explanation
9 Shannon 5 5 N-1 6 92% 5 96% No constraint within +5 years
10 Foxton 7 23 N-1 4 30% 23 31% No constraint within +5 years
11 Levin West 14 23 N-1 12 59% 23 54% No constraint within +5 years
12 Levin East 14 23 N-1 12 62% 23 72% No constraint within +5 years
13 Otaki 12 23 N-1 4 52% 23 57% No constraint within +5 years
14 Waikanae 17 23 N-1 12 73% 23 80% No constraint within +5 years
15 Paraparaumu 14 23 N-1 16 61% 23 67% No constraint within +5 years
16 Paraparaumu West 13 23 N-1 8 58% 23 67% No constraint within +5 years
17 Raumati 12 23 N-1 12 50% 23 53% No constraint within +5 years
18 Paekakariki 5 - N-1 (Switched) 6 - - - No constraint within +5 years
Automatic changeover to Raumati using fault monitors and motorised
switches
19 [Zone Substation_11] - [Select one]
20 [Zone Substation_12] - [Select one]
21 [Zone Substation_13] - [Select one]
22 [Zone Substation_14] - [Select one]
23 [Zone Substation_15] - [Select one]
24 [Zone Substation_16] - [Select one]
25 [Zone Substation_17] - [Select one]
26 [Zone Substation_18] - [Select one]
27 [Zone Substation_19] - [Select one]
28 [Zone Substation_20] - [Select one]
29 ¹ Extend forecast capacity table as necessary to disclose all capacity by each zone substation
30 12b(ii): Transformer Capacity31 (MVA)
32 Distribution transformer capacity (EDB owned) 311
33 Distribution transformer capacity (Non-EDB owned) 13
34 Total distribution transformer capacity 325
35
36 Zone substation transformer capacity 199
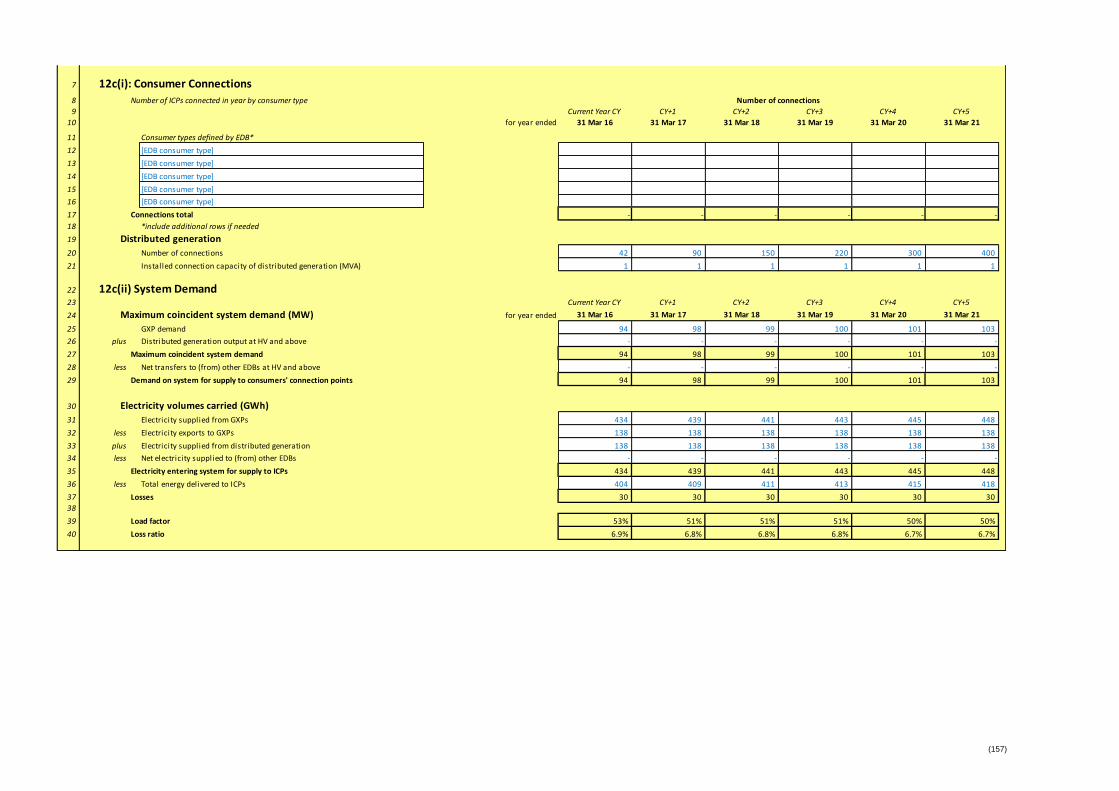
(157)
7 12c(i): Consumer Connections
8 Number of ICPs connected in year by consumer type
9 Current Year CY CY+1 CY+2 CY+3 CY+4 CY+5
10 for year ended 31 Mar 16 31 Mar 17 31 Mar 18 31 Mar 19 31 Mar 20 31 Mar 21
11 Consumer types defined by EDB*
12 [EDB consumer type]
13 [EDB consumer type]
14 [EDB consumer type]
15 [EDB consumer type]
16 [EDB consumer type]
17 Connections total - - - - - -
18 *include additional rows if needed
19 Distributed generation
20 Number of connections 42 90 150 220 300 400
21 Installed connection capacity of distributed generation (MVA) 1 1 1 1 1 1
22 12c(ii) System Demand23 Current Year CY CY+1 CY+2 CY+3 CY+4 CY+5
24 Maximum coincident system demand (MW) for year ended 31 Mar 16 31 Mar 17 31 Mar 18 31 Mar 19 31 Mar 20 31 Mar 21
25 GXP demand 94 98 99 100 101 103
26 plus Distributed generation output at HV and above - - - - - -
27 Maximum coincident system demand 94 98 99 100 101 103
28 less Net transfers to (from) other EDBs at HV and above - - - - - -
29 Demand on system for supply to consumers' connection points 94 98 99 100 101 103
30 Electricity volumes carried (GWh)
31 Electricity supplied from GXPs 434 439 441 443 445 448
32 less Electricity exports to GXPs 138 138 138 138 138 138
33 plus Electricity supplied from distributed generation 138 138 138 138 138 138
34 less Net electricity supplied to (from) other EDBs - - - - - -
35 Electricity entering system for supply to ICPs 434 439 441 443 445 448
36 less Total energy delivered to ICPs 404 409 411 413 415 418
37 Losses 30 30 30 30 30 30
38
39 Load factor 53% 51% 51% 51% 50% 50%
40 Loss ratio 6.9% 6.8% 6.8% 6.8% 6.7% 6.7%
Number of connections
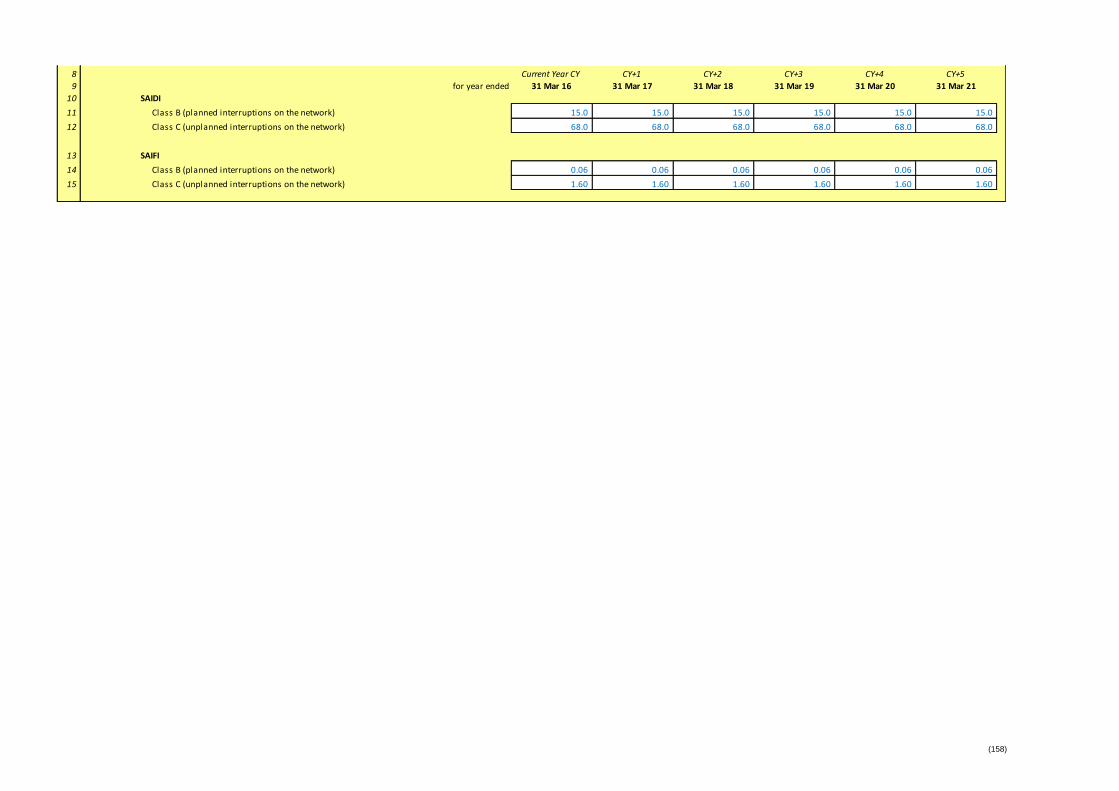
(158)
8 Current Year CY CY+1 CY+2 CY+3 CY+4 CY+5
9 for year ended 31 Mar 16 31 Mar 17 31 Mar 18 31 Mar 19 31 Mar 20 31 Mar 21
10 SAIDI
11 Class B (planned interruptions on the network) 15.0 15.0 15.0 15.0 15.0 15.0
12 Class C (unplanned interruptions on the network) 68.0 68.0 68.0 68.0 68.0 68.0
13 SAIFI
14 Class B (planned interruptions on the network) 0.06 0.06 0.06 0.06 0.06 0.06
15 Class C (unplanned interruptions on the network) 1.60 1.60 1.60 1.60 1.60 1.60
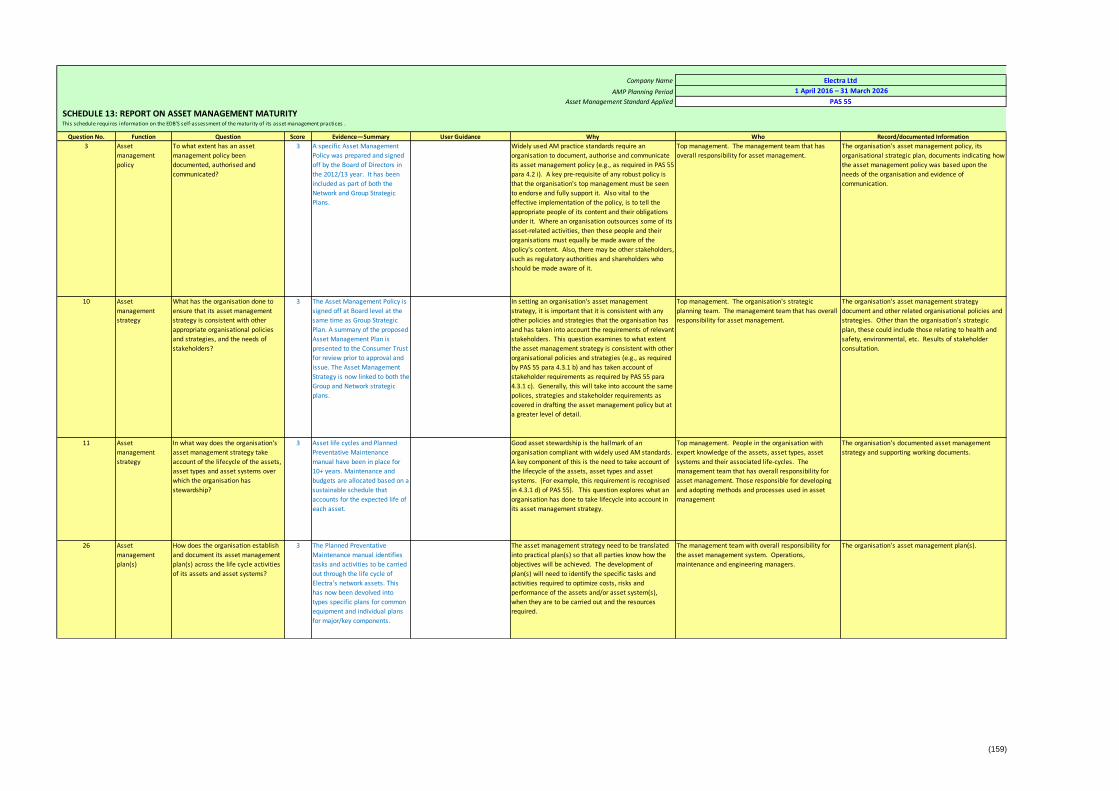
(159)
Company Name
AMP Planning Period
Asset Management Standard Applied
SCHEDULE 13: REPORT ON ASSET MANAGEMENT MATURITY
Question No. Function Score Evidence—Summary User Guidance Why Who Record/documented Information
3 Asset
management
policy
3 A specific Asset Management
Policy was prepared and signed
off by the Board of Directors in
the 2012/13 year. It has been
included as part of both the
Network and Group Strategic
Plans.
Widely used AM practice standards require an
organisation to document, authorise and communicate
its asset management policy (e.g., as required in PAS 55
para 4.2 i). A key pre-requisite of any robust policy is
that the organisation's top management must be seen
to endorse and fully support it. Also vital to the
effective implementation of the policy, is to tell the
appropriate people of its content and their obligations
under it. Where an organisation outsources some of its
asset-related activities, then these people and their
organisations must equally be made aware of the
policy's content. Also, there may be other stakeholders,
such as regulatory authorities and shareholders who
should be made aware of it.
Top management. The management team that has
overall responsibility for asset management.
The organisation's asset management policy, its
organisational strategic plan, documents indicating how
the asset management policy was based upon the
needs of the organisation and evidence of
communication.
10 Asset
management
strategy
3 The Asset Management Policy is
signed off at Board level at the
same time as Group Strategic
Plan. A summary of the proposed
Asset Management Plan is
presented to the Consumer Trust
for review prior to approval and
issue. The Asset Management
Strategy is now linked to both the
Group and Network strategic
plans.
In setting an organisation's asset management
strategy, it is important that it is consistent with any
other policies and strategies that the organisation has
and has taken into account the requirements of relevant
stakeholders. This question examines to what extent
the asset management strategy is consistent with other
organisational policies and strategies (e.g., as required
by PAS 55 para 4.3.1 b) and has taken account of
stakeholder requirements as required by PAS 55 para
4.3.1 c). Generally, this will take into account the same
polices, strategies and stakeholder requirements as
covered in drafting the asset management policy but at
a greater level of detail.
Top management. The organisation's strategic
planning team. The management team that has overall
responsibility for asset management.
The organisation's asset management strategy
document and other related organisational policies and
strategies. Other than the organisation's strategic
plan, these could include those relating to health and
safety, environmental, etc. Results of stakeholder
consultation.
11 Asset
management
strategy
3 Asset life cycles and Planned
Preventative Maintenance
manual have been in place for
10+ years. Maintenance and
budgets are allocated based on a
sustainable schedule that
accounts for the expected life of
each asset.
Good asset stewardship is the hallmark of an
organisation compliant with widely used AM standards.
A key component of this is the need to take account of
the lifecycle of the assets, asset types and asset
systems. (For example, this requirement is recognised
in 4.3.1 d) of PAS 55). This question explores what an
organisation has done to take lifecycle into account in
its asset management strategy.
Top management. People in the organisation with
expert knowledge of the assets, asset types, asset
systems and their associated life-cycles. The
management team that has overall responsibility for
asset management. Those responsible for developing
and adopting methods and processes used in asset
management
The organisation's documented asset management
strategy and supporting working documents.
26 Asset
management
plan(s)
3 The Planned Preventative
Maintenance manual identifies
tasks and activities to be carried
out through the life cycle of
Electra's network assets. This
has now been devolved into
types specific plans for common
equipment and individual plans
for major/key components.
The asset management strategy need to be translated
into practical plan(s) so that all parties know how the
objectives will be achieved. The development of
plan(s) will need to identify the specific tasks and
activities required to optimize costs, risks and
performance of the assets and/or asset system(s),
when they are to be carried out and the resources
required.
The management team with overall responsibility for
the asset management system. Operations,
maintenance and engineering managers.
The organisation's asset management plan(s).
Electra Ltd
1 April 2016 – 31 March 2026
PAS 55
This schedule requires information on the EDB’S self-assessment of the maturity of its asset management practices .
To what extent has an asset
management policy been
documented, authorised and
communicated?
Question
In what way does the organisation's
asset management strategy take
account of the lifecycle of the assets,
asset types and asset systems over
which the organisation has
stewardship?
How does the organisation establish
and document its asset management
plan(s) across the life cycle activities
of its assets and asset systems?
What has the organisation done to
ensure that its asset management
strategy is consistent with other
appropriate organisational policies
and strategies, and the needs of
stakeholders?
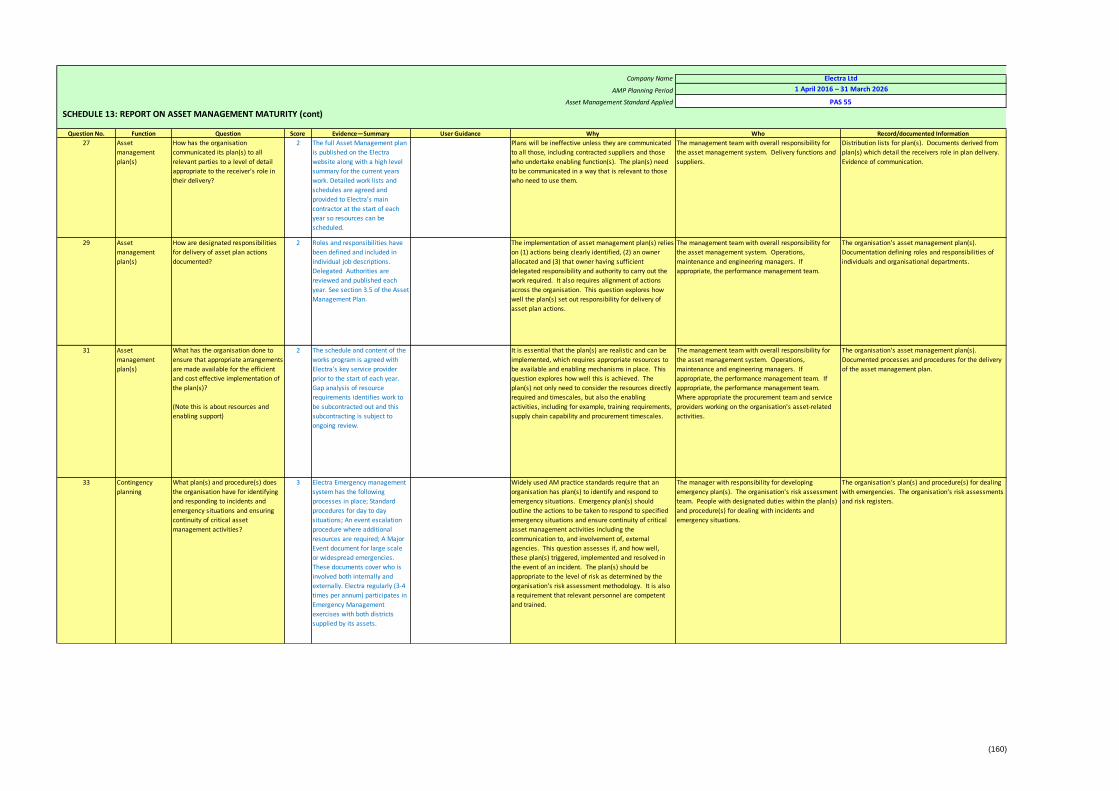
(160)
Company Name
AMP Planning Period
Asset Management Standard Applied
SCHEDULE 13: REPORT ON ASSET MANAGEMENT MATURITY (cont)
Question No. Function Score Evidence—Summary User Guidance Why Who Record/documented Information
27 Asset
management
plan(s)
2 The full Asset Management plan
is published on the Electra
website along with a high level
summary for the current years
work. Detailed work lists and
schedules are agreed and
provided to Electra's main
contractor at the start of each
year so resources can be
scheduled.
Plans will be ineffective unless they are communicated
to all those, including contracted suppliers and those
who undertake enabling function(s). The plan(s) need
to be communicated in a way that is relevant to those
who need to use them.
The management team with overall responsibility for
the asset management system. Delivery functions and
suppliers.
Distribution lists for plan(s). Documents derived from
plan(s) which detail the receivers role in plan delivery.
Evidence of communication.
29 Asset
management
plan(s)
2 Roles and responsibilities have
been defined and included in
individual job descriptions.
Delegated Authorities are
reviewed and published each
year. See section 3.5 of the Asset
Management Plan.
The implementation of asset management plan(s) relies
on (1) actions being clearly identified, (2) an owner
allocated and (3) that owner having sufficient
delegated responsibility and authority to carry out the
work required. It also requires alignment of actions
across the organisation. This question explores how
well the plan(s) set out responsibility for delivery of
asset plan actions.
The management team with overall responsibility for
the asset management system. Operations,
maintenance and engineering managers. If
appropriate, the performance management team.
The organisation's asset management plan(s).
Documentation defining roles and responsibilities of
individuals and organisational departments.
31 Asset
management
plan(s)
2 The schedule and content of the
works program is agreed with
Electra's key service provider
prior to the start of each year.
Gap analysis of resource
requirements identifies work to
be subcontracted out and this
subcontracting is subject to
ongoing review.
It is essential that the plan(s) are realistic and can be
implemented, which requires appropriate resources to
be available and enabling mechanisms in place. This
question explores how well this is achieved. The
plan(s) not only need to consider the resources directly
required and timescales, but also the enabling
activities, including for example, training requirements,
supply chain capability and procurement timescales.
The management team with overall responsibility for
the asset management system. Operations,
maintenance and engineering managers. If
appropriate, the performance management team. If
appropriate, the performance management team.
Where appropriate the procurement team and service
providers working on the organisation's asset-related
activities.
The organisation's asset management plan(s).
Documented processes and procedures for the delivery
of the asset management plan.
33 Contingency
planning
3 Electra Emergency management
system has the following
processes in place; Standard
procedures for day to day
situations; An event escalation
procedure where additional
resources are required; A Major
Event document for large scale
or widespread emergencies.
These documents cover who is
involved both internally and
externally. Electra regularly (3-4
times per annum) participates in
Emergency Management
exercises with both districts
supplied by its assets.
Widely used AM practice standards require that an
organisation has plan(s) to identify and respond to
emergency situations. Emergency plan(s) should
outline the actions to be taken to respond to specified
emergency situations and ensure continuity of critical
asset management activities including the
communication to, and involvement of, external
agencies. This question assesses if, and how well,
these plan(s) triggered, implemented and resolved in
the event of an incident. The plan(s) should be
appropriate to the level of risk as determined by the
organisation's risk assessment methodology. It is also
a requirement that relevant personnel are competent
and trained.
The manager with responsibility for developing
emergency plan(s). The organisation's risk assessment
team. People with designated duties within the plan(s)
and procedure(s) for dealing with incidents and
emergency situations.
The organisation's plan(s) and procedure(s) for dealing
with emergencies. The organisation's risk assessments
and risk registers.
Electra Ltd
1 April 2016 – 31 March 2026
PAS 55
What plan(s) and procedure(s) does
the organisation have for identifying
and responding to incidents and
emergency situations and ensuring
continuity of critical asset
management activities?
How has the organisation
communicated its plan(s) to all
relevant parties to a level of detail
appropriate to the receiver's role in
their delivery?
How are designated responsibilities
for delivery of asset plan actions
documented?
Question
What has the organisation done to
ensure that appropriate arrangements
are made available for the efficient
and cost effective implementation of
the plan(s)?
(Note this is about resources and
enabling support)
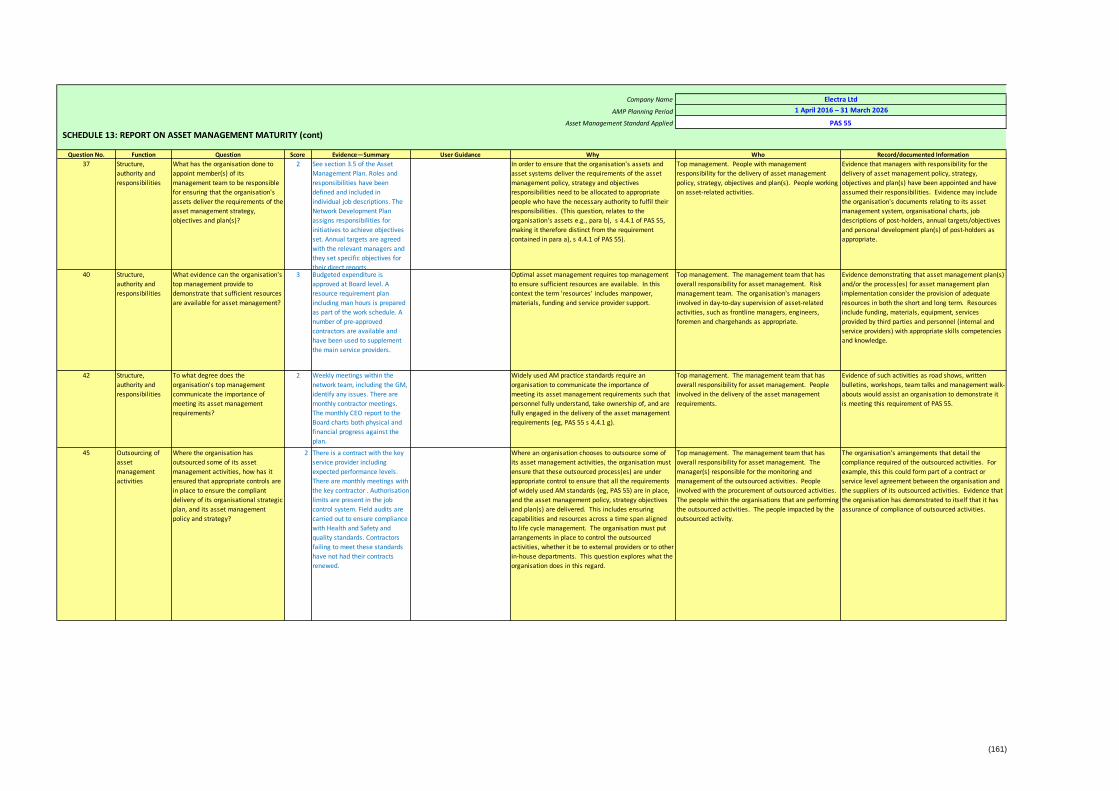
(161)
Company Name
AMP Planning Period
Asset Management Standard Applied
SCHEDULE 13: REPORT ON ASSET MANAGEMENT MATURITY (cont)
Question No. Function Score Evidence—Summary User Guidance Why Who Record/documented Information
37 Structure,
authority and
responsibilities
2 See section 3.5 of the Asset
Management Plan. Roles and
responsibilities have been
defined and included in
individual job descriptions. The
Network Development Plan
assigns responsibilities for
initiatives to achieve objectives
set. Annual targets are agreed
with the relevant managers and
they set specific objectives for
their direct reports.
In order to ensure that the organisation's assets and
asset systems deliver the requirements of the asset
management policy, strategy and objectives
responsibilities need to be allocated to appropriate
people who have the necessary authority to fulfil their
responsibilities. (This question, relates to the
organisation's assets e.g., para b), s 4.4.1 of PAS 55,
making it therefore distinct from the requirement
contained in para a), s 4.4.1 of PAS 55).
Top management. People with management
responsibility for the delivery of asset management
policy, strategy, objectives and plan(s). People working
on asset-related activities.
Evidence that managers with responsibility for the
delivery of asset management policy, strategy,
objectives and plan(s) have been appointed and have
assumed their responsibilities. Evidence may include
the organisation's documents relating to its asset
management system, organisational charts, job
descriptions of post-holders, annual targets/objectives
and personal development plan(s) of post-holders as
appropriate.
40 Structure,
authority and
responsibilities
3 Budgeted expenditure is
approved at Board level. A
resource requirement plan
including man hours is prepared
as part of the work schedule. A
number of pre-approved
contractors are available and
have been used to supplement
the main service providers.
Optimal asset management requires top management
to ensure sufficient resources are available. In this
context the term 'resources' includes manpower,
materials, funding and service provider support.
Top management. The management team that has
overall responsibility for asset management. Risk
management team. The organisation's managers
involved in day-to-day supervision of asset-related
activities, such as frontline managers, engineers,
foremen and chargehands as appropriate.
Evidence demonstrating that asset management plan(s)
and/or the process(es) for asset management plan
implementation consider the provision of adequate
resources in both the short and long term. Resources
include funding, materials, equipment, services
provided by third parties and personnel (internal and
service providers) with appropriate skills competencies
and knowledge.
42 Structure,
authority and
responsibilities
2 Weekly meetings within the
network team, including the GM,
identify any issues. There are
monthly contractor meetings.
The monthly CEO report to the
Board charts both physical and
financial progress against the
plan.
Widely used AM practice standards require an
organisation to communicate the importance of
meeting its asset management requirements such that
personnel fully understand, take ownership of, and are
fully engaged in the delivery of the asset management
requirements (eg, PAS 55 s 4.4.1 g).
Top management. The management team that has
overall responsibility for asset management. People
involved in the delivery of the asset management
requirements.
Evidence of such activities as road shows, written
bulletins, workshops, team talks and management walk-
abouts would assist an organisation to demonstrate it
is meeting this requirement of PAS 55.
45 Outsourcing of
asset
management
activities
2 There is a contract with the key
service provider including
expected performance levels.
There are monthly meetings with
the key contractor . Authorisation
limits are present in the job
control system. Field audits are
carried out to ensure compliance
with Health and Safety and
quality standards. Contractors
failing to meet these standards
have not had their contracts
renewed.
Where an organisation chooses to outsource some of
its asset management activities, the organisation must
ensure that these outsourced process(es) are under
appropriate control to ensure that all the requirements
of widely used AM standards (eg, PAS 55) are in place,
and the asset management policy, strategy objectives
and plan(s) are delivered. This includes ensuring
capabilities and resources across a time span aligned
to life cycle management. The organisation must put
arrangements in place to control the outsourced
activities, whether it be to external providers or to other
in-house departments. This question explores what the
organisation does in this regard.
Top management. The management team that has
overall responsibility for asset management. The
manager(s) responsible for the monitoring and
management of the outsourced activities. People
involved with the procurement of outsourced activities.
The people within the organisations that are performing
the outsourced activities. The people impacted by the
outsourced activity.
The organisation's arrangements that detail the
compliance required of the outsourced activities. For
example, this this could form part of a contract or
service level agreement between the organisation and
the suppliers of its outsourced activities. Evidence that
the organisation has demonstrated to itself that it has
assurance of compliance of outsourced activities.
Electra Ltd
1 April 2016 – 31 March 2026
What evidence can the organisation's
top management provide to
demonstrate that sufficient resources
are available for asset management?
Where the organisation has
outsourced some of its asset
management activities, how has it
ensured that appropriate controls are
in place to ensure the compliant
delivery of its organisational strategic
plan, and its asset management
policy and strategy?
PAS 55
What has the organisation done to
appoint member(s) of its
management team to be responsible
for ensuring that the organisation's
assets deliver the requirements of the
asset management strategy,
objectives and plan(s)?
To what degree does the
organisation's top management
communicate the importance of
meeting its asset management
requirements?
Question

(162)
Company Name
AMP Planning Period
Asset Management Standard Applied
SCHEDULE 13: REPORT ON ASSET MANAGEMENT MATURITY (cont)
Question No. Function Score Evidence—Summary User Guidance Why Who Record/documented Information
48 Training,
awareness and
competence
3 The resource chart for each
year's plan identifies overall
numbers and skill sets required
for the current work schedule.
The monthly meeting with the
main service provider also
discusses skills training and
sucession planning. Resource
shortages are highlighted to
guide the use of subcontractors
in the short term and
independent consultants
employed to verify identified
long term requirements.
There is a need for an organisation to demonstrate that
it has considered what resources are required to
develop and implement its asset management system.
There is also a need for the organisation to
demonstrate that it has assessed what development
plan(s) are required to provide its human resources with
the skills and competencies to develop and implement
its asset management systems. The timescales over
which the plan(s) are relevant should be commensurate
with the planning horizons within the asset
management strategy considers e.g. if the asset
management strategy considers 5, 10 and 15 year time
scales then the human resources development plan(s)
should align with these. Resources include both 'in
house' and external resources who undertake asset
management activities.
Senior management responsible for agreement of
plan(s). Managers responsible for developing asset
management strategy and plan(s). Managers with
responsibility for development and recruitment of staff
(including HR functions). Staff responsible for training.
Procurement officers. Contracted service providers.
Evidence of analysis of future work load plan(s) in
terms of human resources. Document(s) containing
analysis of the organisation's own direct resources and
contractors resource capability over suitable
timescales. Evidence, such as minutes of meetings,
that suitable management forums are monitoring
human resource development plan(s). Training plan(s),
personal development plan(s), contract and service
level agreements.
49 Training,
awareness and
competence
2 The contractor authorisation
process identifies competencies
for the various tasks to be
carried out on the network. This
forms part of the Safety
Management System. Training
records are kept for operators
and field staff.
Widely used AM standards require that organisations to
undertake a systematic identification of the asset
management awareness and competencies required at
each level and function within the organisation. Once
identified the training required to provide the necessary
competencies should be planned for delivery in a timely
and systematic way. Any training provided must be
recorded and maintained in a suitable format. Where
an organisation has contracted service providers in
place then it should have a means to demonstrate that
this requirement is being met for their employees. (eg,
PAS 55 refers to frameworks suitable for identifying
competency requirements).
Senior management responsible for agreement of
plan(s). Managers responsible for developing asset
management strategy and plan(s). Managers with
responsibility for development and recruitment of staff
(including HR functions). Staff responsible for training.
Procurement officers. Contracted service providers.
Evidence of an established and applied competency
requirements assessment process and plan(s) in place
to deliver the required training. Evidence that the
training programme is part of a wider, co-ordinated
asset management activities training and competency
programme. Evidence that training activities are
recorded and that records are readily available (for both
direct and contracted service provider staff) e.g. via
organisation wide information system or local records
database.
50 Training,
awareness and
competence
2 Our contractor authorisation
process identifies competencies
for the various tasks to be
carried out on the network. This
forms part of the Safety
Management System. System
audits ensure these records are
kept up to date and field audits
confirm that the appropriate staff
carry out the tasks. The main
contractor has an internal
position of trainer/auditor which
also carries out auditing of
safety and compliance to
required skill levels. In addition a
skill matrix is in development
that identifies the skills required
for each role against network
requirements and will be
assessed against skills annually.
A critical success factor for the effective development
and implementation of an asset management system is
the competence of persons undertaking these activities.
organisations should have effective means in place for
ensuring the competence of employees to carry out
their designated asset management function(s). Where
an organisation has contracted service providers
undertaking elements of its asset management system
then the organisation shall assure itself that the
outsourced service provider also has suitable
arrangements in place to manage the competencies of
its employees. The organisation should ensure that the
individual and corporate competencies it requires are in
place and actively monitor, develop and maintain an
appropriate balance of these competencies.
Managers, supervisors, persons responsible for
developing training programmes. Staff responsible for
procurement and service agreements. HR staff and
those responsible for recruitment.
Evidence of a competency assessment framework that
aligns with established frameworks such as the asset
management Competencies Requirements Framework
(Version 2.0); National Occupational Standards for
Management and Leadership; UK Standard for
Professional Engineering Competence, Engineering
Council, 2005.
Electra Ltd
1 April 2016 – 31 March 2026
PAS 55
How does the organisation develop
plan(s) for the human resources
required to undertake asset
management activities - including the
development and delivery of asset
management strategy, process(es),
objectives and plan(s)?
How does the organisation identify
competency requirements and then
plan, provide and record the training
necessary to achieve the
competencies?
How does the organization ensure
that persons under its direct control
undertaking asset management
related activities have an appropriate
level of competence in terms of
education, training or experience?
Question
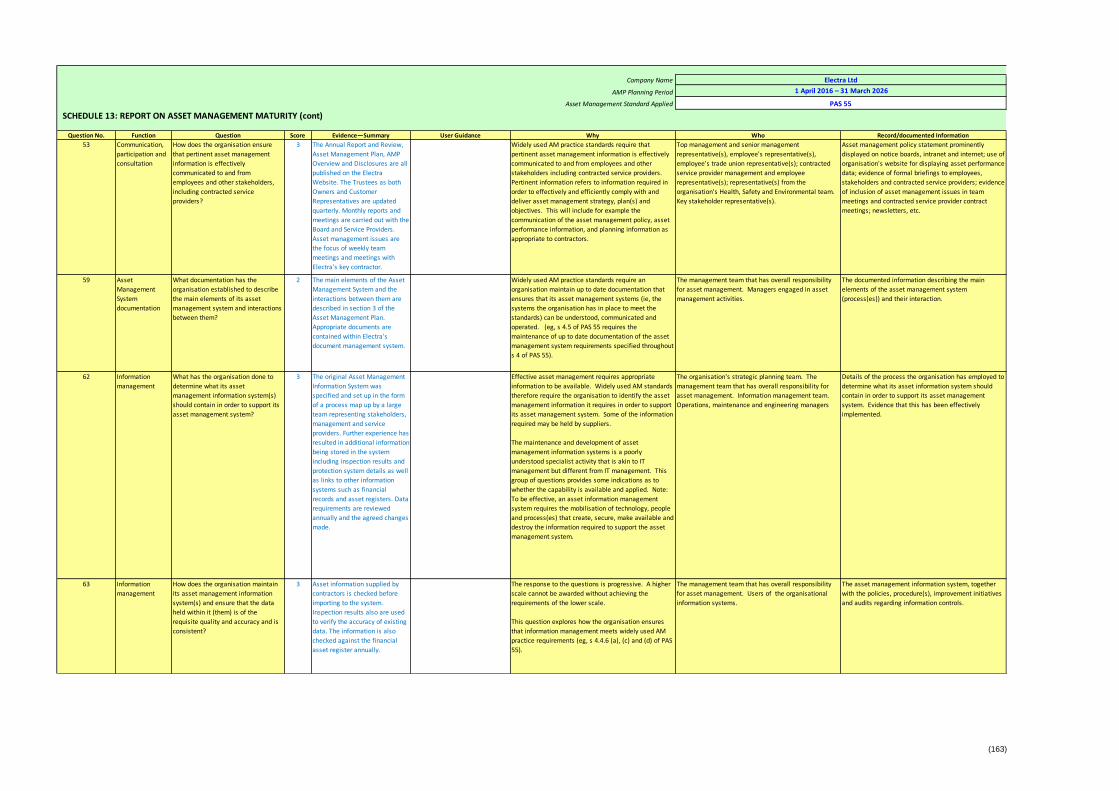
(163)
Company Name
AMP Planning Period
Asset Management Standard Applied
SCHEDULE 13: REPORT ON ASSET MANAGEMENT MATURITY (cont)
Question No. Function Score Evidence—Summary User Guidance Why Who Record/documented Information
53 Communication,
participation and
consultation
3 The Annual Report and Review,
Asset Management Plan, AMP
Overview and Disclosures are all
published on the Electra
Website. The Trustees as both
Owners and Customer
Representatives are updated
quarterly. Monthly reports and
meetings are carried out with the
Board and Service Providers.
Asset management issues are
the focus of weekly team
meetings and meetings with
Electra's key contractor.
Widely used AM practice standards require that
pertinent asset management information is effectively
communicated to and from employees and other
stakeholders including contracted service providers.
Pertinent information refers to information required in
order to effectively and efficiently comply with and
deliver asset management strategy, plan(s) and
objectives. This will include for example the
communication of the asset management policy, asset
performance information, and planning information as
appropriate to contractors.
Top management and senior management
representative(s), employee's representative(s),
employee's trade union representative(s); contracted
service provider management and employee
representative(s); representative(s) from the
organisation's Health, Safety and Environmental team.
Key stakeholder representative(s).
Asset management policy statement prominently
displayed on notice boards, intranet and internet; use of
organisation's website for displaying asset performance
data; evidence of formal briefings to employees,
stakeholders and contracted service providers; evidence
of inclusion of asset management issues in team
meetings and contracted service provider contract
meetings; newsletters, etc.
59 Asset
Management
System
documentation
2 The main elements of the Asset
Management System and the
interactions between them are
described in section 3 of the
Asset Management Plan.
Appropriate documents are
contained within Electra's
document management system.
Widely used AM practice standards require an
organisation maintain up to date documentation that
ensures that its asset management systems (ie, the
systems the organisation has in place to meet the
standards) can be understood, communicated and
operated. (eg, s 4.5 of PAS 55 requires the
maintenance of up to date documentation of the asset
management system requirements specified throughout
s 4 of PAS 55).
The management team that has overall responsibility
for asset management. Managers engaged in asset
management activities.
The documented information describing the main
elements of the asset management system
(process(es)) and their interaction.
62 Information
management
3 The original Asset Management
Information System was
specified and set up in the form
of a process map up by a large
team representing stakeholders,
management and service
providers. Further experience has
resulted in additional information
being stored in the system
including inspection results and
protection system details as well
as links to other information
systems such as financial
records and asset registers. Data
requirements are reviewed
annually and the agreed changes
made.
Effective asset management requires appropriate
information to be available. Widely used AM standards
therefore require the organisation to identify the asset
management information it requires in order to support
its asset management system. Some of the information
required may be held by suppliers.
The maintenance and development of asset
management information systems is a poorly
understood specialist activity that is akin to IT
management but different from IT management. This
group of questions provides some indications as to
whether the capability is available and applied. Note:
To be effective, an asset information management
system requires the mobilisation of technology, people
and process(es) that create, secure, make available and
destroy the information required to support the asset
management system.
The organisation's strategic planning team. The
management team that has overall responsibility for
asset management. Information management team.
Operations, maintenance and engineering managers
Details of the process the organisation has employed to
determine what its asset information system should
contain in order to support its asset management
system. Evidence that this has been effectively
implemented.
63 Information
management
3 Asset information supplied by
contractors is checked before
importing to the system.
Inspection results also are used
to verify the accuracy of existing
data. The information is also
checked against the financial
asset register annually.
The response to the questions is progressive. A higher
scale cannot be awarded without achieving the
requirements of the lower scale.
This question explores how the organisation ensures
that information management meets widely used AM
practice requirements (eg, s 4.4.6 (a), (c) and (d) of PAS
55).
The management team that has overall responsibility
for asset management. Users of the organisational
information systems.
The asset management information system, together
with the policies, procedure(s), improvement initiatives
and audits regarding information controls.
Electra Ltd
1 April 2016 – 31 March 2026
PAS 55
Question
What has the organisation done to
determine what its asset
management information system(s)
should contain in order to support its
asset management system?
How does the organisation maintain
its asset management information
system(s) and ensure that the data
held within it (them) is of the
requisite quality and accuracy and is
consistent?
What documentation has the
organisation established to describe
the main elements of its asset
management system and interactions
between them?
How does the organisation ensure
that pertinent asset management
information is effectively
communicated to and from
employees and other stakeholders,
including contracted service
providers?

(164)
Company Name
AMP Planning Period
Asset Management Standard Applied
SCHEDULE 13: REPORT ON ASSET MANAGEMENT MATURITY (cont)
Question No. Function Score Evidence—Summary User Guidance Why Who Record/documented Information
64 Information
management
2 Continual feedback is supplied
by users of the asset
information. Obsolete data is
removed to streamline usage.
Asset information is now
available to field staff using
mobile devices including the
ability to annotate and send in
changes identified on site.
Widely used AM standards need not be prescriptive
about the form of the asset management information
system, but simply require that the asset management
information system is appropriate to the organisations
needs, can be effectively used and can supply
information which is consistent and of the requisite
quality and accuracy.
The organisation's strategic planning team. The
management team that has overall responsibility for
asset management. Information management team.
Users of the organisational information systems.
The documented process the organisation employs to
ensure its asset management information system aligns
with its asset management requirements. Minutes of
information systems review meetings involving users.
69 Risk management
process(es)
2 Electra has Risk Committes at
both management and Board
level. They carry out an annual
review and reassessment of all
company risks. The Electra Safety
Management System also has
procedures for identifying
physical risks on the network.
Incident investigations are
logged, including actions to be
taken. These are followed up in
the regular meetings.
Risk management is an important foundation for
proactive asset management. Its overall purpose is to
understand the cause, effect and likelihood of adverse
events occurring, to optimally manage such risks to an
acceptable level, and to provide an audit trail for the
management of risks. Widely used standards require
the organisation to have process(es) and/or
procedure(s) in place that set out how the organisation
identifies and assesses asset and asset management
related risks. The risks have to be considered across
the four phases of the asset lifecycle (eg, para 4.3.3 of
PAS 55).
The top management team in conjunction with the
organisation's senior risk management representatives.
There may also be input from the organisation's Safety,
Health and Environment team. Staff who carry out risk
identification and assessment.
The organisation's risk management framework and/or
evidence of specific process(es) and/ or procedure(s)
that deal with risk control mechanisms. Evidence that
the process(es) and/or procedure(s) are implemented
across the business and maintained. Evidence of
agendas and minutes from risk management meetings.
Evidence of feedback in to process(es) and/or
procedure(s) as a result of incident investigation(s).
Risk registers and assessments.
79 Use and
maintenance of
asset risk
information
2 The results of the risk
assessments feed into objectives
for Electra's strategic plan. This
can include risks associated with
resourcing and training
particularly around specialist or
key personnel. This has already
resulted in safety being elevated
to Electra's number one risk.
Widely used AM standards require that the output from
risk assessments are considered and that adequate
resource (including staff) and training is identified to
match the requirements. It is a further requirement that
the effects of the control measures are considered, as
there may be implications in resources and training
required to achieve other objectives.
Staff responsible for risk assessment and those
responsible for developing and approving resource and
training plan(s). There may also be input from the
organisation's Safety, Health and Environment team.
The organisations risk management framework. The
organisation's resourcing plan(s) and training and
competency plan(s). The organisation should be able to
demonstrate appropriate linkages between the content
of resource plan(s) and training and competency plan(s)
to the risk assessments and risk control measures that
have been developed.
82 Legal and other
requirements
2 Electra subscribes to Brooker's
for legal updates and is party to
a number of industry groups such
as ENA. Electra, along with a
number of similar organisations,
engages PWC to assess any
legislative requirements or
changes. Telarc carries out
annual audits of Electra's Safety
Management System. As an
Electricity Distrubutor Electra is
also subject to a number of
compliance audits.
In order for an organisation to comply with its legal,
regulatory, statutory and other asset management
requirements, the organisation first needs to ensure
that it knows what they are (eg, PAS 55 specifies this in
s 4.4.8). It is necessary to have systematic and
auditable mechanisms in place to identify new and
changing requirements. Widely used AM standards
also require that requirements are incorporated into the
asset management system (e.g. procedure(s) and
process(es))
Top management. The organisations regulatory team.
The organisation's legal team or advisors. The
management team with overall responsibility for the
asset management system. The organisation's health
and safety team or advisors. The organisation's policy
making team.
The organisational processes and procedures for
ensuring information of this type is identified, made
accessible to those requiring the information and is
incorporated into asset management strategy and
objectives
1 April 2016 – 31 March 2026
PAS 55
How has the organisation's ensured
its asset management information
system is relevant to its needs?
Question
Electra Ltd
How has the organisation
documented process(es) and/or
procedure(s) for the identification and
assessment of asset and asset
management related risks throughout
the asset life cycle?
How does the organisation ensure
that the results of risk assessments
provide input into the identification of
adequate resources and training and
competency needs?
What procedure does the
organisation have to identify and
provide access to its legal, regulatory,
statutory and other asset
management requirements, and how
is requirements incorporated into the
asset management system?
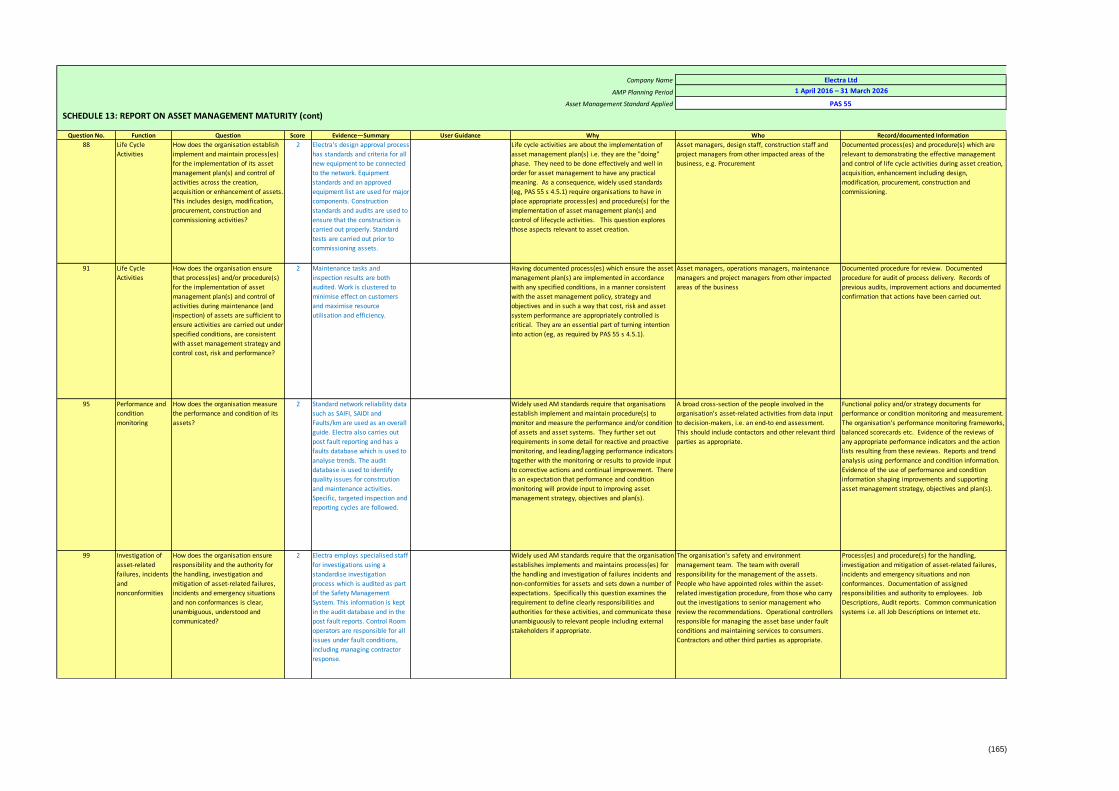
(165)
Company Name
AMP Planning Period
Asset Management Standard Applied
SCHEDULE 13: REPORT ON ASSET MANAGEMENT MATURITY (cont)
Question No. Function Score Evidence—Summary User Guidance Why Who Record/documented Information
88 Life Cycle
Activities
2 Electra's design approval process
has standards and criteria for all
new equipment to be connected
to the network. Equipment
standards and an approved
equipment list are used for major
components. Construction
standards and audits are used to
ensure that the construction is
carried out properly. Standard
tests are carried out prior to
commissioning assets.
Life cycle activities are about the implementation of
asset management plan(s) i.e. they are the "doing"
phase. They need to be done effectively and well in
order for asset management to have any practical
meaning. As a consequence, widely used standards
(eg, PAS 55 s 4.5.1) require organisations to have in
place appropriate process(es) and procedure(s) for the
implementation of asset management plan(s) and
control of lifecycle activities. This question explores
those aspects relevant to asset creation.
Asset managers, design staff, construction staff and
project managers from other impacted areas of the
business, e.g. Procurement
Documented process(es) and procedure(s) which are
relevant to demonstrating the effective management
and control of life cycle activities during asset creation,
acquisition, enhancement including design,
modification, procurement, construction and
commissioning.
91 Life Cycle
Activities
2 Maintenance tasks and
inspection results are both
audited. Work is clustered to
minimise effect on customers
and maximise resource
utilisation and efficiency.
Having documented process(es) which ensure the asset
management plan(s) are implemented in accordance
with any specified conditions, in a manner consistent
with the asset management policy, strategy and
objectives and in such a way that cost, risk and asset
system performance are appropriately controlled is
critical. They are an essential part of turning intention
into action (eg, as required by PAS 55 s 4.5.1).
Asset managers, operations managers, maintenance
managers and project managers from other impacted
areas of the business
Documented procedure for review. Documented
procedure for audit of process delivery. Records of
previous audits, improvement actions and documented
confirmation that actions have been carried out.
95 Performance and
condition
monitoring
2 Standard network reliability data
such as SAIFI, SAIDI and
Faults/km are used as an overall
guide. Electra also carries out
post fault reporting and has a
faults database which is used to
analyse trends. The audit
database is used to identify
quality issues for constrcution
and maintenance activities.
Specific, targeted inspection and
reporting cycles are followed.
Widely used AM standards require that organisations
establish implement and maintain procedure(s) to
monitor and measure the performance and/or condition
of assets and asset systems. They further set out
requirements in some detail for reactive and proactive
monitoring, and leading/lagging performance indicators
together with the monitoring or results to provide input
to corrective actions and continual improvement. There
is an expectation that performance and condition
monitoring will provide input to improving asset
management strategy, objectives and plan(s).
A broad cross-section of the people involved in the
organisation's asset-related activities from data input
to decision-makers, i.e. an end-to end assessment.
This should include contactors and other relevant third
parties as appropriate.
Functional policy and/or strategy documents for
performance or condition monitoring and measurement.
The organisation's performance monitoring frameworks,
balanced scorecards etc. Evidence of the reviews of
any appropriate performance indicators and the action
lists resulting from these reviews. Reports and trend
analysis using performance and condition information.
Evidence of the use of performance and condition
information shaping improvements and supporting
asset management strategy, objectives and plan(s).
99 Investigation of
asset-related
failures, incidents
and
nonconformities
2 Electra employs specialised staff
for investigations using a
standardise investigation
process which is audited as part
of the Safety Management
System. This information is kept
in the audit database and in the
post fault reports. Control Room
operators are responsible for all
issues under fault conditions,
including managing contractor
response.
Widely used AM standards require that the organisation
establishes implements and maintains process(es) for
the handling and investigation of failures incidents and
non-conformities for assets and sets down a number of
expectations. Specifically this question examines the
requirement to define clearly responsibilities and
authorities for these activities, and communicate these
unambiguously to relevant people including external
stakeholders if appropriate.
The organisation's safety and environment
management team. The team with overall
responsibility for the management of the assets.
People who have appointed roles within the asset-
related investigation procedure, from those who carry
out the investigations to senior management who
review the recommendations. Operational controllers
responsible for managing the asset base under fault
conditions and maintaining services to consumers.
Contractors and other third parties as appropriate.
Process(es) and procedure(s) for the handling,
investigation and mitigation of asset-related failures,
incidents and emergency situations and non
conformances. Documentation of assigned
responsibilities and authority to employees. Job
Descriptions, Audit reports. Common communication
systems i.e. all Job Descriptions on Internet etc.
1 April 2016 – 31 March 2026
PAS 55
Electra Ltd
How does the organisation ensure
that process(es) and/or procedure(s)
for the implementation of asset
management plan(s) and control of
activities during maintenance (and
inspection) of assets are sufficient to
ensure activities are carried out under
specified conditions, are consistent
with asset management strategy and
control cost, risk and performance?
How does the organisation measure
the performance and condition of its
assets?
Question
How does the organisation ensure
responsibility and the authority for
the handling, investigation and
mitigation of asset-related failures,
incidents and emergency situations
and non conformances is clear,
unambiguous, understood and
communicated?
How does the organisation establish
implement and maintain process(es)
for the implementation of its asset
management plan(s) and control of
activities across the creation,
acquisition or enhancement of assets.
This includes design, modification,
procurement, construction and
commissioning activities?
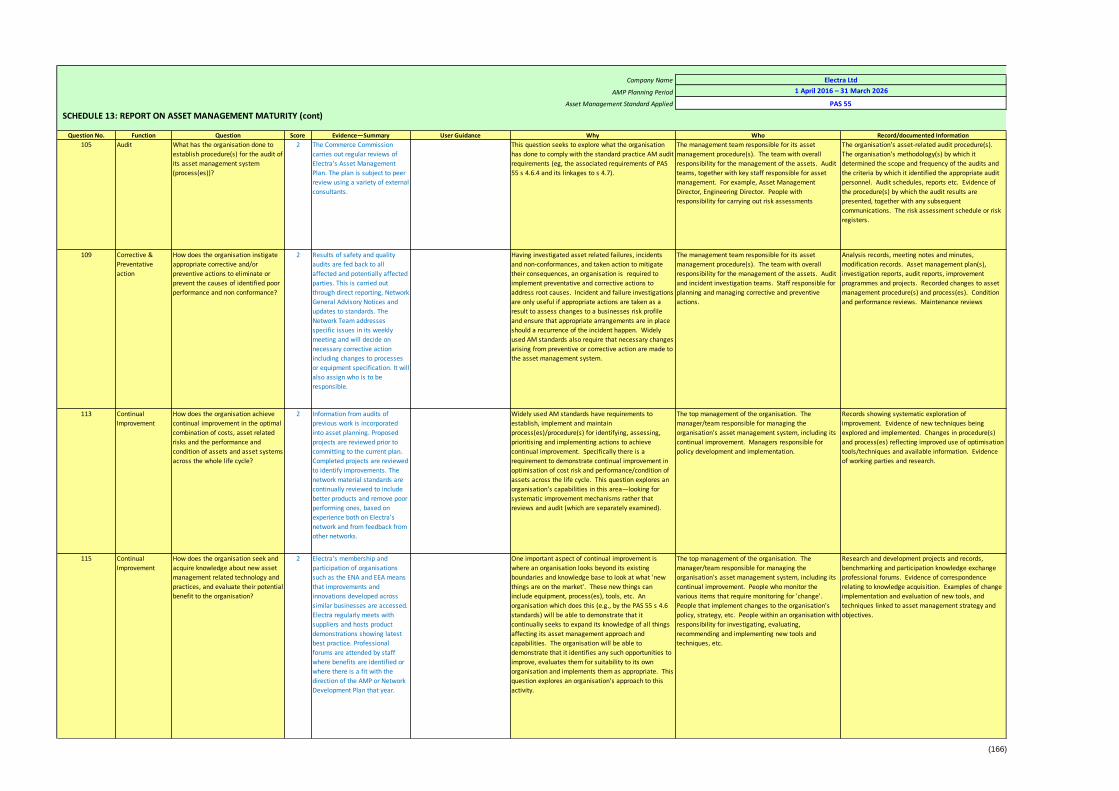
(166)
Company Name
AMP Planning Period
Asset Management Standard Applied
SCHEDULE 13: REPORT ON ASSET MANAGEMENT MATURITY (cont)
Question No. Function Score Evidence—Summary User Guidance Why Who Record/documented Information
105 Audit 2 The Commerce Commission
carries out regular reviews of
Electra's Asset Management
Plan. The plan is subject to peer
review using a variety of external
consultants.
This question seeks to explore what the organisation
has done to comply with the standard practice AM audit
requirements (eg, the associated requirements of PAS
55 s 4.6.4 and its linkages to s 4.7).
The management team responsible for its asset
management procedure(s). The team with overall
responsibility for the management of the assets. Audit
teams, together with key staff responsible for asset
management. For example, Asset Management
Director, Engineering Director. People with
responsibility for carrying out risk assessments
The organisation's asset-related audit procedure(s).
The organisation's methodology(s) by which it
determined the scope and frequency of the audits and
the criteria by which it identified the appropriate audit
personnel. Audit schedules, reports etc. Evidence of
the procedure(s) by which the audit results are
presented, together with any subsequent
communications. The risk assessment schedule or risk
registers.
109 Corrective &
Preventative
action
2 Results of safety and quality
audits are fed back to all
affected and potentially affected
parties. This is carried out
through direct reporting, Network
General Advisory Notices and
updates to standards. The
Network Team addresses
specific issues in its weekly
meeting and will decide on
necessary corrective action
including changes to processes
or equipment specification. It will
also assign who is to be
responsible.
Having investigated asset related failures, incidents
and non-conformances, and taken action to mitigate
their consequences, an organisation is required to
implement preventative and corrective actions to
address root causes. Incident and failure investigations
are only useful if appropriate actions are taken as a
result to assess changes to a businesses risk profile
and ensure that appropriate arrangements are in place
should a recurrence of the incident happen. Widely
used AM standards also require that necessary changes
arising from preventive or corrective action are made to
the asset management system.
The management team responsible for its asset
management procedure(s). The team with overall
responsibility for the management of the assets. Audit
and incident investigation teams. Staff responsible for
planning and managing corrective and preventive
actions.
Analysis records, meeting notes and minutes,
modification records. Asset management plan(s),
investigation reports, audit reports, improvement
programmes and projects. Recorded changes to asset
management procedure(s) and process(es). Condition
and performance reviews. Maintenance reviews
113 Continual
Improvement
2 Information from audits of
previous work is incorporated
into asset planning. Proposed
projects are reviewed prior to
committing to the current plan.
Completed projects are reviewed
to identify improvements. The
network material standards are
continually reviewed to include
better products and remove poor
performing ones, based on
experience both on Electra's
network and from feedback from
other networks.
Widely used AM standards have requirements to
establish, implement and maintain
process(es)/procedure(s) for identifying, assessing,
prioritising and implementing actions to achieve
continual improvement. Specifically there is a
requirement to demonstrate continual improvement in
optimisation of cost risk and performance/condition of
assets across the life cycle. This question explores an
organisation's capabilities in this area—looking for
systematic improvement mechanisms rather that
reviews and audit (which are separately examined).
The top management of the organisation. The
manager/team responsible for managing the
organisation's asset management system, including its
continual improvement. Managers responsible for
policy development and implementation.
Records showing systematic exploration of
improvement. Evidence of new techniques being
explored and implemented. Changes in procedure(s)
and process(es) reflecting improved use of optimisation
tools/techniques and available information. Evidence
of working parties and research.
115 Continual
Improvement
2 Electra's membership and
participation of organisations
such as the ENA and EEA means
that improvements and
innovations developed across
similar businesses are accessed.
Electra regularly meets with
suppliers and hosts product
demonstrations showing latest
best practice. Professional
forums are attended by staff
where benefits are identified or
where there is a fit with the
direction of the AMP or Network
Development Plan that year.
One important aspect of continual improvement is
where an organisation looks beyond its existing
boundaries and knowledge base to look at what 'new
things are on the market'. These new things can
include equipment, process(es), tools, etc. An
organisation which does this (e.g., by the PAS 55 s 4.6
standards) will be able to demonstrate that it
continually seeks to expand its knowledge of all things
affecting its asset management approach and
capabilities. The organisation will be able to
demonstrate that it identifies any such opportunities to
improve, evaluates them for suitability to its own
organisation and implements them as appropriate. This
question explores an organisation's approach to this
activity.
The top management of the organisation. The
manager/team responsible for managing the
organisation's asset management system, including its
continual improvement. People who monitor the
various items that require monitoring for 'change'.
People that implement changes to the organisation's
policy, strategy, etc. People within an organisation with
responsibility for investigating, evaluating,
recommending and implementing new tools and
techniques, etc.
Research and development projects and records,
benchmarking and participation knowledge exchange
professional forums. Evidence of correspondence
relating to knowledge acquisition. Examples of change
implementation and evaluation of new tools, and
techniques linked to asset management strategy and
objectives.
Question
Electra Ltd
1 April 2016 – 31 March 2026
PAS 55
How does the organisation seek and
acquire knowledge about new asset
management related technology and
practices, and evaluate their potential
benefit to the organisation?
What has the organisation done to
establish procedure(s) for the audit of
its asset management system
(process(es))?
How does the organisation instigate
appropriate corrective and/or
preventive actions to eliminate or
prevent the causes of identified poor
performance and non conformance?
How does the organisation achieve
continual improvement in the optimal
combination of costs, asset related
risks and the performance and
condition of assets and asset systems
across the whole life cycle?
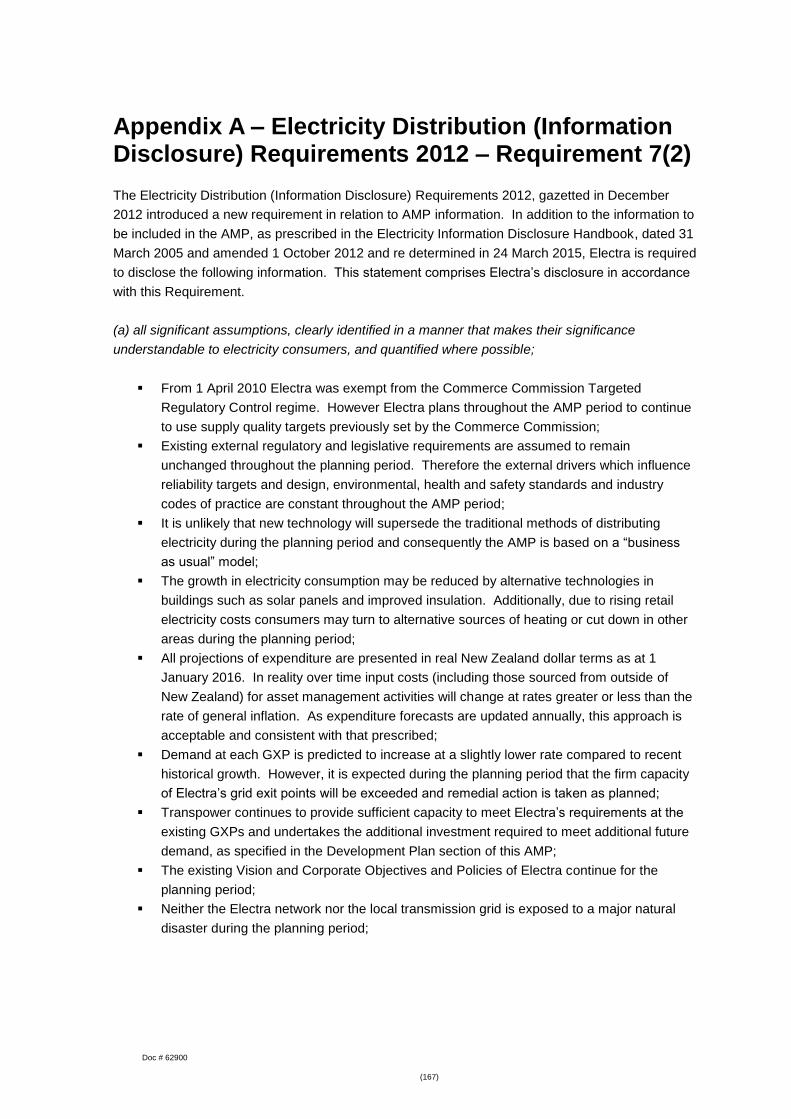
Doc # 62900
(167)
Appendix A – Electricity Distribution (Information Disclosure) Requirements 2012 – Requirement 7(2)
The Electricity Distribution (Information Disclosure) Requirements 2012, gazetted in December
2012 introduced a new requirement in relation to AMP information. In addition to the information to
be included in the AMP, as prescribed in the Electricity Information Disclosure Handbook, dated 31
March 2005 and amended 1 October 2012 and re determined in 24 March 2015, Electra is required
to disclose the following information. This statement comprises Electra’s disclosure in accordance
with this Requirement.
(a) all significant assumptions, clearly identified in a manner that makes their significance
understandable to electricity consumers, and quantified where possible;
From 1 April 2010 Electra was exempt from the Commerce Commission Targeted
Regulatory Control regime. However Electra plans throughout the AMP period to continue
to use supply quality targets previously set by the Commerce Commission;
Existing external regulatory and legislative requirements are assumed to remain
unchanged throughout the planning period. Therefore the external drivers which influence
reliability targets and design, environmental, health and safety standards and industry
codes of practice are constant throughout the AMP period;
It is unlikely that new technology will supersede the traditional methods of distributing
electricity during the planning period and consequently the AMP is based on a “business
as usual” model;
The growth in electricity consumption may be reduced by alternative technologies in
buildings such as solar panels and improved insulation. Additionally, due to rising retail
electricity costs consumers may turn to alternative sources of heating or cut down in other
areas during the planning period;
All projections of expenditure are presented in real New Zealand dollar terms as at 1
January 2016. In reality over time input costs (including those sourced from outside of
New Zealand) for asset management activities will change at rates greater or less than the
rate of general inflation. As expenditure forecasts are updated annually, this approach is
acceptable and consistent with that prescribed;
Demand at each GXP is predicted to increase at a slightly lower rate compared to recent
historical growth. However, it is expected during the planning period that the firm capacity
of Electra’s grid exit points will be exceeded and remedial action is taken as planned;
Transpower continues to provide sufficient capacity to meet Electra’s requirements at the
existing GXPs and undertakes the additional investment required to meet additional future
demand, as specified in the Development Plan section of this AMP;
The existing Vision and Corporate Objectives and Policies of Electra continue for the
planning period;
Neither the Electra network nor the local transmission grid is exposed to a major natural
disaster during the planning period;
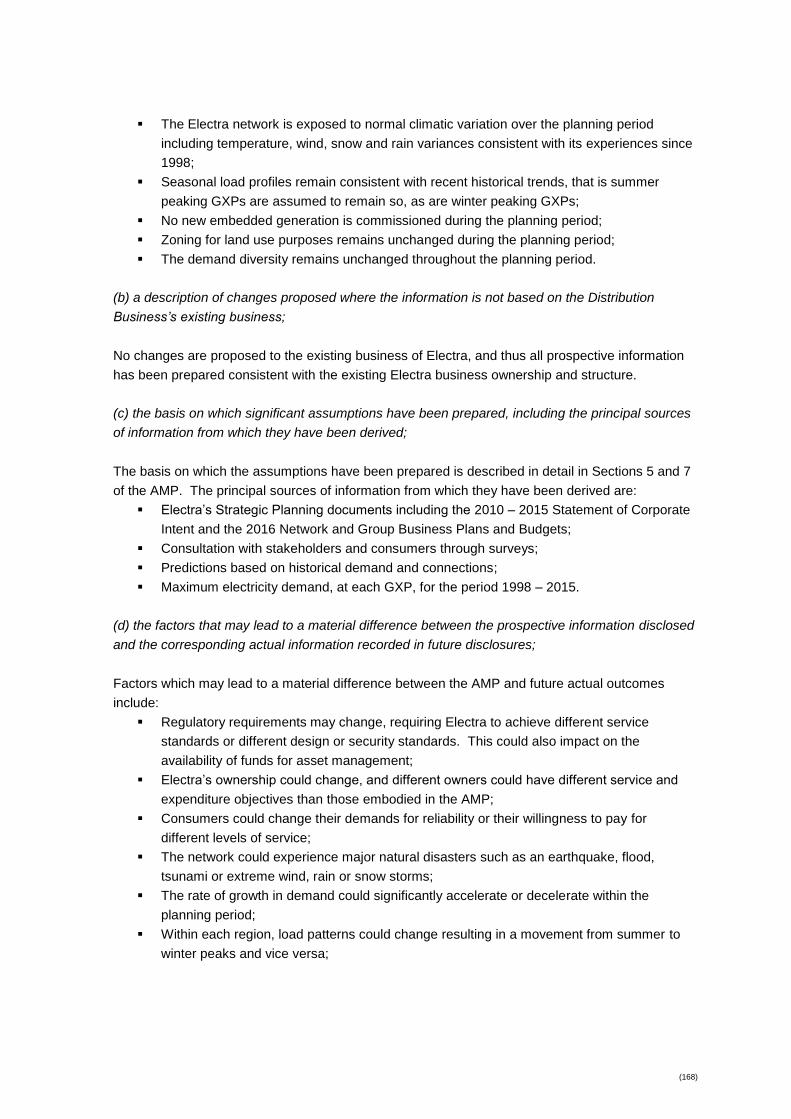
(168)
The Electra network is exposed to normal climatic variation over the planning period
including temperature, wind, snow and rain variances consistent with its experiences since
1998;
Seasonal load profiles remain consistent with recent historical trends, that is summer
peaking GXPs are assumed to remain so, as are winter peaking GXPs;
No new embedded generation is commissioned during the planning period;
Zoning for land use purposes remains unchanged during the planning period;
The demand diversity remains unchanged throughout the planning period.
(b) a description of changes proposed where the information is not based on the Distribution
Business’s existing business;
No changes are proposed to the existing business of Electra, and thus all prospective information
has been prepared consistent with the existing Electra business ownership and structure.
(c) the basis on which significant assumptions have been prepared, including the principal sources
of information from which they have been derived;
The basis on which the assumptions have been prepared is described in detail in Sections 5 and 7
of the AMP. The principal sources of information from which they have been derived are:
Electra’s Strategic Planning documents including the 2010 – 2015 Statement of Corporate
Intent and the 2016 Network and Group Business Plans and Budgets;
Consultation with stakeholders and consumers through surveys;
Predictions based on historical demand and connections;
Maximum electricity demand, at each GXP, for the period 1998 – 2015.
(d) the factors that may lead to a material difference between the prospective information disclosed
and the corresponding actual information recorded in future disclosures;
Factors which may lead to a material difference between the AMP and future actual outcomes
include:
Regulatory requirements may change, requiring Electra to achieve different service
standards or different design or security standards. This could also impact on the
availability of funds for asset management;
Electra’s ownership could change, and different owners could have different service and
expenditure objectives than those embodied in the AMP;
Consumers could change their demands for reliability or their willingness to pay for
different levels of service;
The network could experience major natural disasters such as an earthquake, flood,
tsunami or extreme wind, rain or snow storms;
The rate of growth in demand could significantly accelerate or decelerate within the
planning period;
Within each region, load patterns could change resulting in a movement from summer to
winter peaks and vice versa;
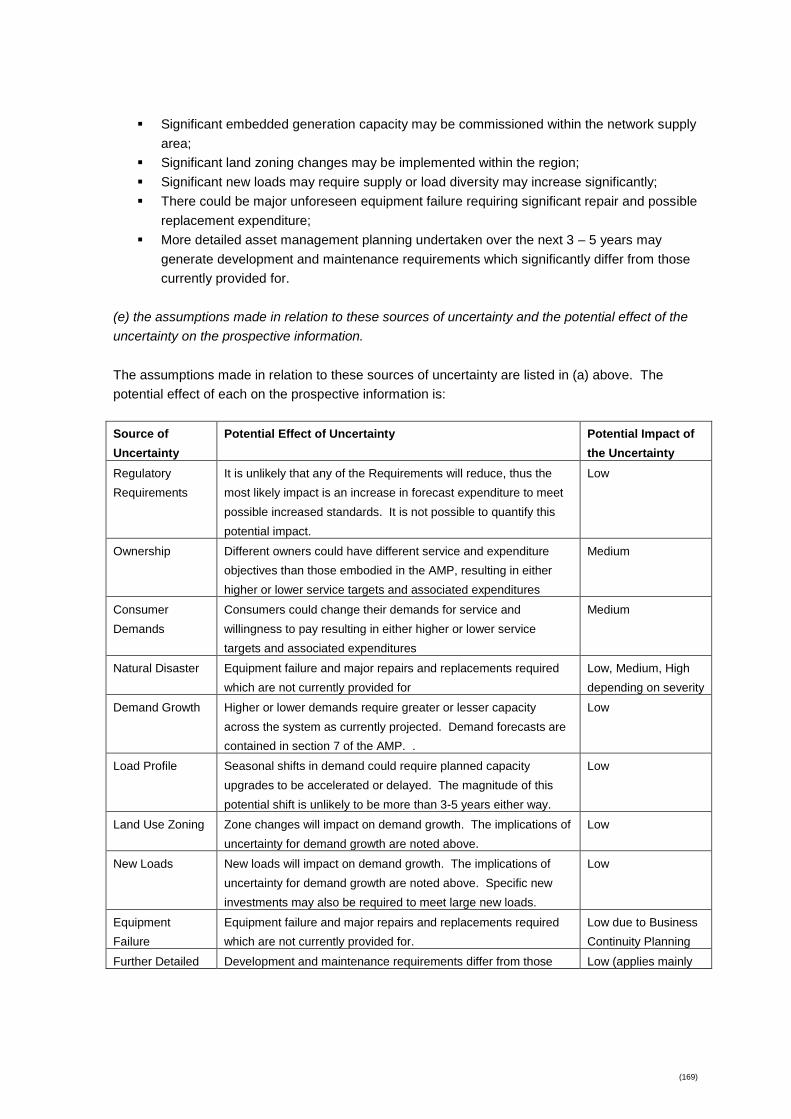
(169)
Significant embedded generation capacity may be commissioned within the network supply
area;
Significant land zoning changes may be implemented within the region;
Significant new loads may require supply or load diversity may increase significantly;
There could be major unforeseen equipment failure requiring significant repair and possible
replacement expenditure;
More detailed asset management planning undertaken over the next 3 – 5 years may
generate development and maintenance requirements which significantly differ from those
currently provided for.
(e) the assumptions made in relation to these sources of uncertainty and the potential effect of the
uncertainty on the prospective information.
The assumptions made in relation to these sources of uncertainty are listed in (a) above. The
potential effect of each on the prospective information is:
Source of
Uncertainty
Potential Effect of Uncertainty Potential Impact of
the Uncertainty
Regulatory
Requirements
It is unlikely that any of the Requirements will reduce, thus the
most likely impact is an increase in forecast expenditure to meet
possible increased standards. It is not possible to quantify this
potential impact.
Low
Ownership Different owners could have different service and expenditure
objectives than those embodied in the AMP, resulting in either
higher or lower service targets and associated expenditures
Medium
Consumer
Demands
Consumers could change their demands for service and
willingness to pay resulting in either higher or lower service
targets and associated expenditures
Medium
Natural Disaster Equipment failure and major repairs and replacements required
which are not currently provided for
Low, Medium, High
depending on severity
Demand Growth Higher or lower demands require greater or lesser capacity
across the system as currently projected. Demand forecasts are
contained in section 7 of the AMP. .
Low
Load Profile Seasonal shifts in demand could require planned capacity
upgrades to be accelerated or delayed. The magnitude of this
potential shift is unlikely to be more than 3-5 years either way.
Low
Land Use Zoning Zone changes will impact on demand growth. The implications of
uncertainty for demand growth are noted above.
Low
New Loads New loads will impact on demand growth. The implications of
uncertainty for demand growth are noted above. Specific new
investments may also be required to meet large new loads.
Low
Equipment
Failure
Equipment failure and major repairs and replacements required
which are not currently provided for.
Low due to Business
Continuity Planning
Further Detailed Development and maintenance requirements differ from those Low (applies mainly

(170)
Planning currently predicted for the later five years of the planning period,
particularly for the 33kV, 11kV and 400V networks.
to years 6 – 10 of the
AMP)
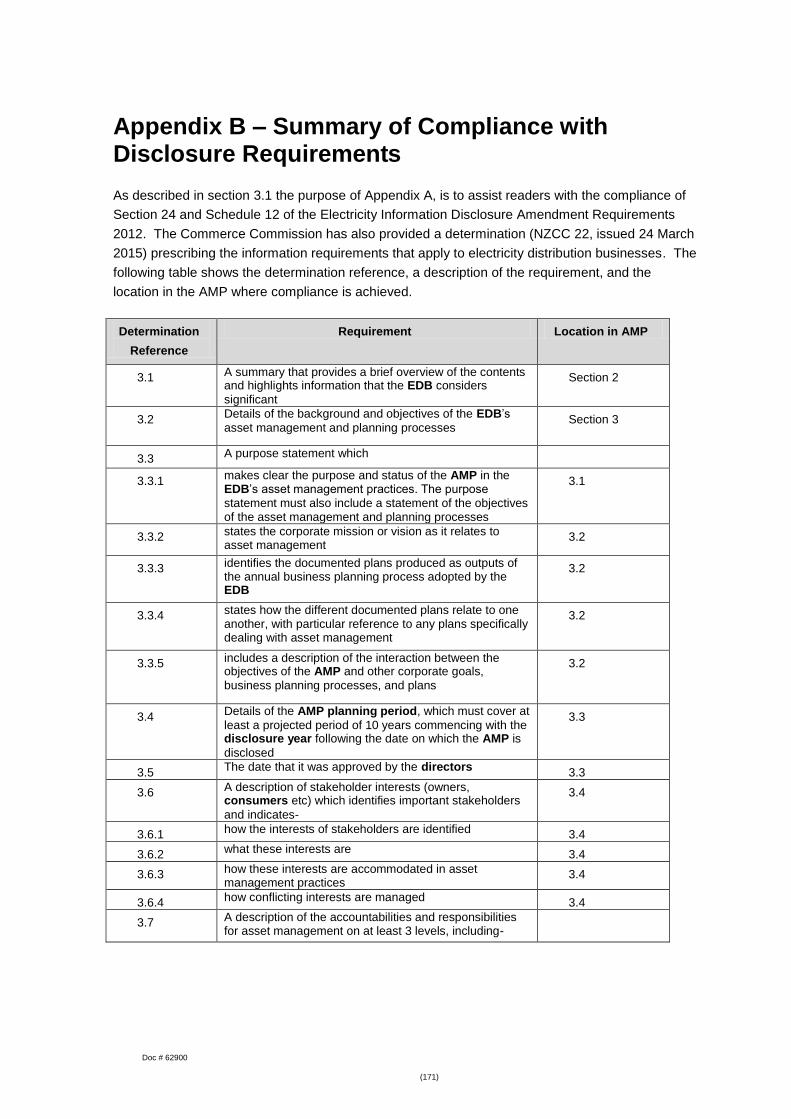
Doc # 62900
(171)
Appendix B – Summary of Compliance with Disclosure Requirements
As described in section 3.1 the purpose of Appendix A, is to assist readers with the compliance of
Section 24 and Schedule 12 of the Electricity Information Disclosure Amendment Requirements
2012. The Commerce Commission has also provided a determination (NZCC 22, issued 24 March
2015) prescribing the information requirements that apply to electricity distribution businesses. The
following table shows the determination reference, a description of the requirement, and the
location in the AMP where compliance is achieved.
Determination
Reference
Requirement Location in AMP
3.1 A summary that provides a brief overview of the contents and highlights information that the EDB considers
significant
Section 2
3.2
Details of the background and objectives of the EDB’s
asset management and planning processes Section 3
3.3 A purpose statement which
3.3.1 makes clear the purpose and status of the AMP in the EDB’s asset management practices. The purpose
statement must also include a statement of the objectives of the asset management and planning processes
3.1
3.3.2 states the corporate mission or vision as it relates to asset management
3.2
3.3.3 identifies the documented plans produced as outputs of the annual business planning process adopted by the EDB
3.2
3.3.4 states how the different documented plans relate to one another, with particular reference to any plans specifically dealing with asset management
3.2
3.3.5 includes a description of the interaction between the objectives of the AMP and other corporate goals,
business planning processes, and plans
3.2
3.4 Details of the AMP planning period, which must cover at
least a projected period of 10 years commencing with the disclosure year following the date on which the AMP is
disclosed
3.3
3.5 The date that it was approved by the directors
3.3
3.6 A description of stakeholder interests (owners, consumers etc) which identifies important stakeholders
and indicates-
3.4
3.6.1 how the interests of stakeholders are identified 3.4
3.6.2 what these interests are 3.4
3.6.3 how these interests are accommodated in asset management practices
3.4
3.6.4 how conflicting interests are managed 3.4
3.7 A description of the accountabilities and responsibilities for asset management on at least 3 levels, including-

(172)
3.7.1 governance—a description of the extent of director
approval required for key asset management decisions and the extent to which asset management outcomes are regularly reported to directors
3.5
3.7.2
executive—an indication of how the in-house asset management and planning organisation is structured
3.5
3.7.3 field operations—an overview of how field operations are managed, including a description of the extent to which field work is undertaken in-house and the areas where outsourced contractors are used
3.5
3.8 All significant assumptions must be-
3.8.1 quantified where possible Appendix A
3.8.2 clearly identified in a manner that makes their significance understandable to interested persons, including
Appendix A
3.8.3 a description of changes proposed where the information is not based on the EDB’s existing business
N/A
3.8.4 the sources of uncertainty and the potential effect of the uncertainty on the prospective information
Appendix A
3.8.5 the price inflator assumptions used to prepare the financial information disclosed in nominal New Zealand dollars in the Report on Forecast Capital Expenditure set
out in Schedule 11a and the Report on Forecast Operational Expenditure set out in Schedule 11b.
Appendix A
3.9 A description of the factors that may lead to a material difference between the prospective information disclosed and the corresponding actual information recorded in future disclosures
Appendix A
3.10 An overview of asset management strategy and delivery 2.4
3.11 An overview of systems and information management data
3.6
3.12 A statement covering any limitations in the availability or completeness of asset management data and disclose any initiatives intended to improve the quality of this data
3.6
3.13 A description of the processes used within the EDB for-
3.13.1
managing routine asset inspections and network
maintenance 3.6.1
3.13.2 planning and implementing network development
projects 3.6.2
3.13.3 measuring network performance.
3.6.3
3.14 An overview of asset management documentation, controls and review processes
Section 10
3.15 An overview of communication and participation processes
3.5
3.16 The AMP must present all financial values in constant price New Zealand dollars except where specified
otherwise
Section 10
3.17 The AMP must be structured and presented in a way that the EDB considers will support the purposes of AMP
disclosure set out in clause 2.6.2 of the determination.
4 The AMP must provide details of the assets covered,
including-
4.1 a high-level description of the service areas covered by the EDB and the degree to which these are interlinked,
including-
4.1
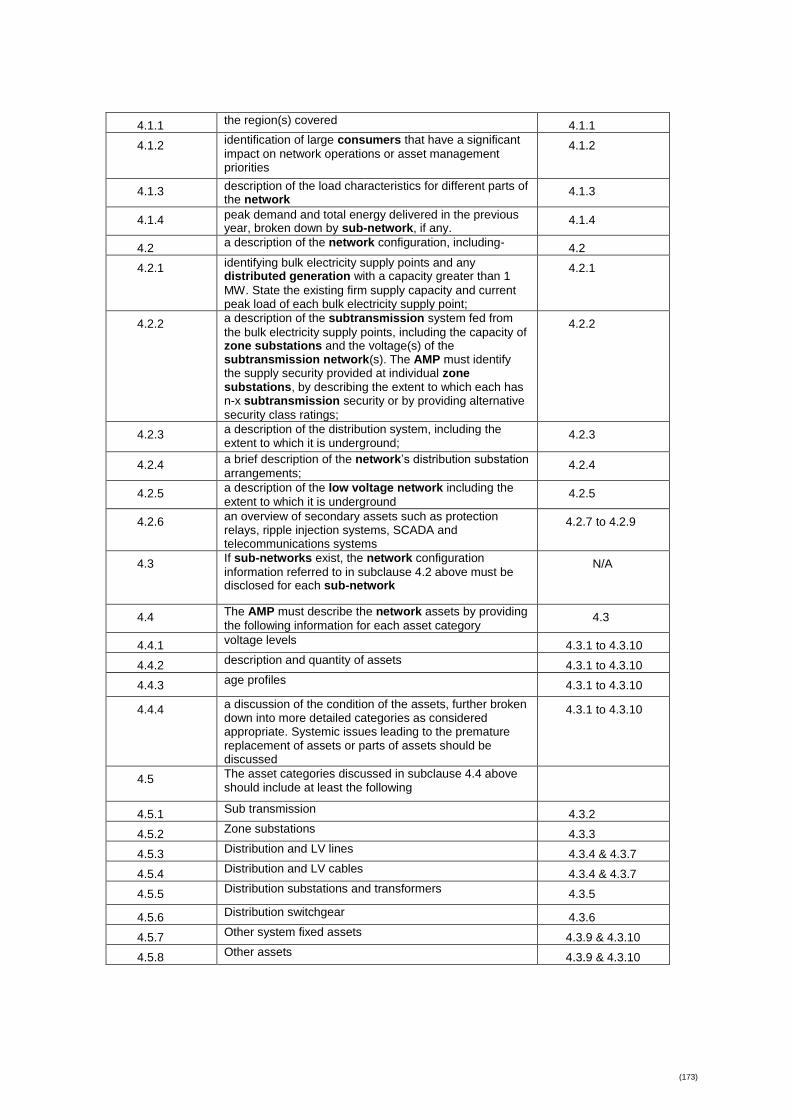
(173)
4.1.1 the region(s) covered 4.1.1
4.1.2 identification of large consumers that have a significant
impact on network operations or asset management priorities
4.1.2
4.1.3 description of the load characteristics for different parts of the network
4.1.3
4.1.4 peak demand and total energy delivered in the previous year, broken down by sub-network, if any.
4.1.4
4.2 a description of the network configuration, including-
4.2
4.2.1 identifying bulk electricity supply points and any distributed generation with a capacity greater than 1
MW. State the existing firm supply capacity and current peak load of each bulk electricity supply point;
4.2.1
4.2.2 a description of the subtransmission system fed from
the bulk electricity supply points, including the capacity of zone substations and the voltage(s) of the subtransmission network(s). The AMP must identify the supply security provided at individual zone substations, by describing the extent to which each has n-x subtransmission security or by providing alternative
security class ratings;
4.2.2
4.2.3 a description of the distribution system, including the extent to which it is underground;
4.2.3
4.2.4 a brief description of the network’s distribution substation
arrangements; 4.2.4
4.2.5 a description of the low voltage network including the
extent to which it is underground 4.2.5
4.2.6 an overview of secondary assets such as protection relays, ripple injection systems, SCADA and telecommunications systems
4.2.7 to 4.2.9
4.3 If sub-networks exist, the network configuration
information referred to in subclause 4.2 above must be disclosed for each sub-network
N/A
4.4 The AMP must describe the network assets by providing
the following information for each asset category 4.3
4.4.1 voltage levels 4.3.1 to 4.3.10
4.4.2 description and quantity of assets 4.3.1 to 4.3.10
4.4.3 age profiles 4.3.1 to 4.3.10
4.4.4 a discussion of the condition of the assets, further broken down into more detailed categories as considered appropriate. Systemic issues leading to the premature replacement of assets or parts of assets should be discussed
4.3.1 to 4.3.10
4.5 The asset categories discussed in subclause 4.4 above should include at least the following
4.5.1 Sub transmission 4.3.2
4.5.2 Zone substations 4.3.3
4.5.3 Distribution and LV lines 4.3.4 & 4.3.7
4.5.4 Distribution and LV cables 4.3.4 & 4.3.7
4.5.5 Distribution substations and transformers 4.3.5
4.5.6 Distribution switchgear 4.3.6
4.5.7 Other system fixed assets 4.3.9 & 4.3.10
4.5.8 Other assets 4.3.9 & 4.3.10
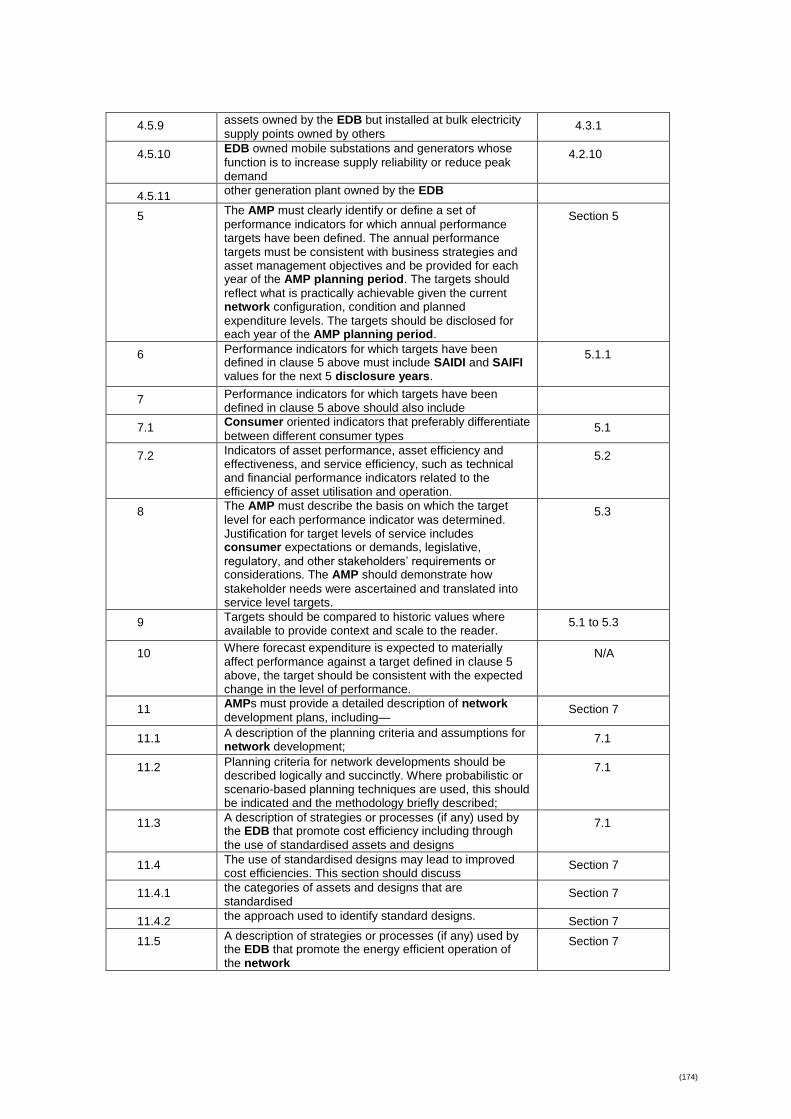
(174)
4.5.9 assets owned by the EDB but installed at bulk electricity
supply points owned by others 4.3.1
4.5.10 EDB owned mobile substations and generators whose
function is to increase supply reliability or reduce peak demand
4.2.10
4.5.11 other generation plant owned by the EDB
5 The AMP must clearly identify or define a set of
performance indicators for which annual performance targets have been defined. The annual performance targets must be consistent with business strategies and asset management objectives and be provided for each year of the AMP planning period. The targets should
reflect what is practically achievable given the current network configuration, condition and planned
expenditure levels. The targets should be disclosed for each year of the AMP planning period.
Section 5
6 Performance indicators for which targets have been defined in clause 5 above must include SAIDI and SAIFI values for the next 5 disclosure years.
5.1.1
7 Performance indicators for which targets have been defined in clause 5 above should also include
7.1 Consumer oriented indicators that preferably differentiate
between different consumer types 5.1
7.2 Indicators of asset performance, asset efficiency and effectiveness, and service efficiency, such as technical and financial performance indicators related to the efficiency of asset utilisation and operation.
5.2
8 The AMP must describe the basis on which the target
level for each performance indicator was determined. Justification for target levels of service includes consumer expectations or demands, legislative,
regulatory, and other stakeholders’ requirements or considerations. The AMP should demonstrate how
stakeholder needs were ascertained and translated into service level targets.
5.3
9 Targets should be compared to historic values where available to provide context and scale to the reader.
5.1 to 5.3
10 Where forecast expenditure is expected to materially affect performance against a target defined in clause 5 above, the target should be consistent with the expected change in the level of performance.
N/A
11 AMPs must provide a detailed description of network
development plans, including— Section 7
11.1 A description of the planning criteria and assumptions for network development;
7.1
11.2 Planning criteria for network developments should be described logically and succinctly. Where probabilistic or scenario-based planning techniques are used, this should be indicated and the methodology briefly described;
7.1
11.3 A description of strategies or processes (if any) used by the EDB that promote cost efficiency including through
the use of standardised assets and designs
7.1
11.4 The use of standardised designs may lead to improved cost efficiencies. This section should discuss
Section 7
11.4.1 the categories of assets and designs that are standardised
Section 7
11.4.2 the approach used to identify standard designs. Section 7
11.5 A description of strategies or processes (if any) used by the EDB that promote the energy efficient operation of the network
Section 7

(175)
11.6 A description of the criteria used to determine the capacity of equipment for different types of assets or different parts of the network
Section 7
11.7 A description of the process and criteria used to prioritise network development projects and how these processes
and criteria align with the overall corporate goals and vision.
Section 7
11.8 Details of demand forecasts, the basis on which they are derived, and the specific network locations where
constraints are expected due to forecast increases in demand
7.3
11.8.1 explain the load forecasting methodology and indicate all the factors used in preparing the load estimates
7.3
11.8.2 provide separate forecasts to at least the zone substation level covering at least a minimum five year
forecast period. Discuss how uncertain but substantial individual projects/developments that affect load are taken into account in the forecasts, making clear the extent to which these uncertain increases in demand are reflected in the forecasts
7.3
11.8.3 identify any network or equipment constraints that may
arise due to the anticipated growth in demand during the AMP planning period
7.4
11.8.4 discuss the impact on the load forecasts of any anticipated levels of distributed generation in a network, and the projected impact of any demand
management initiatives
7.5
11.9 Analysis of the significant network level development
options identified and details of the decisions made to satisfy and meet target levels of service, including-
7.7
11.9.1 the reasons for choosing a selected option for projects where decisions have been made
7.7
11.9.2 the alternative options considered for projects that are planned to start in the next five years and the potential for non-network solutions described
Section 7
11.9.3 consideration of planned innovations that improve efficiencies within the network, such as improved
utilisation, extended asset lives, and deferred investment
Section 7
11.10 A description and identification of the network development programme including distributed generation and non-network solutions and actions to be
taken, including associated expenditure projections. The network development plan must include-
Section 7
11.10.1 a detailed description of the material projects and a summary description of the non-material projects currently underway or planned to start within the next 12 months
7.7
11.10.2 a summary description of the programmes and projects planned for the following four years (where known)
7.7
11.10.3 an overview of the material projects being considered for the remainder of the AMP planning period
7.7
11.11 A description of the EDB’s policies on distributed generation, including the policies for connecting distributed generation. The impact of such generation
on network development plans must also be stated.
7.5
11.12 description of the EDB’s policies on non-network
solutions, including- 7.6
11.12.1 economically feasible and practical alternatives to conventional network augmentation. These are typically approaches that would reduce network demand and/or
improve asset utilisation; and
7.6
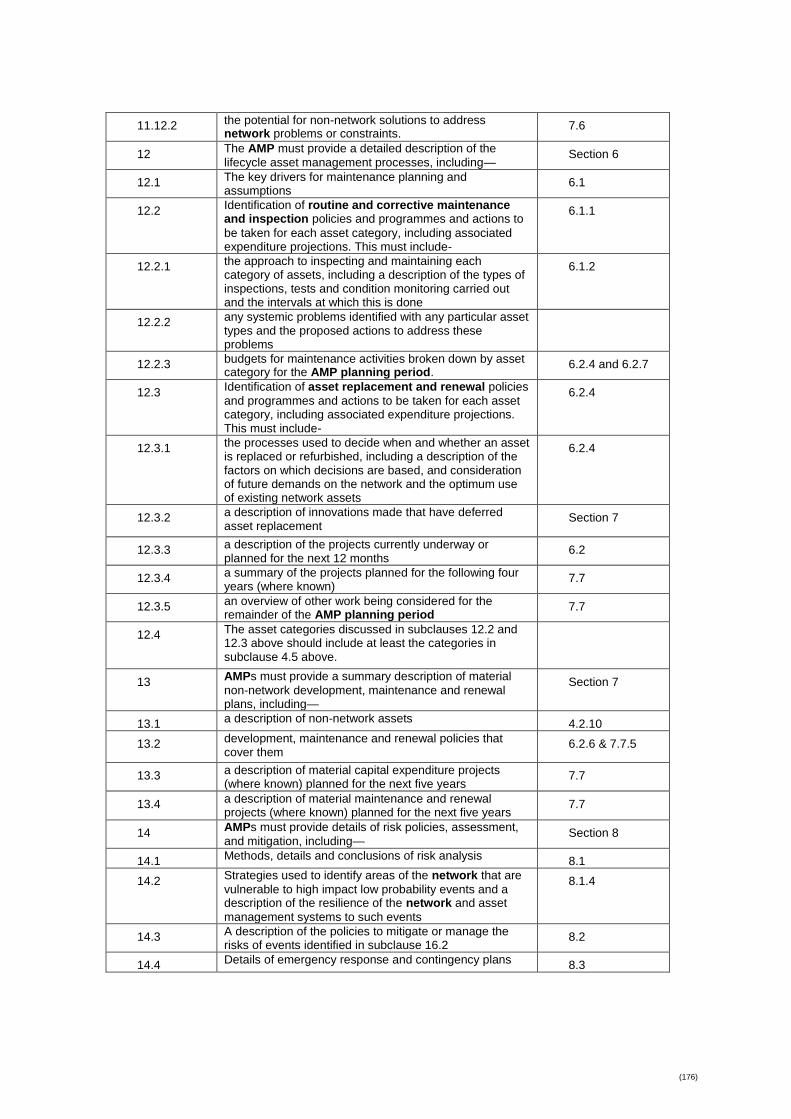
(176)
11.12.2 the potential for non-network solutions to address network problems or constraints.
7.6
12 The AMP must provide a detailed description of the
lifecycle asset management processes, including— Section 6
12.1 The key drivers for maintenance planning and assumptions
6.1
12.2 Identification of routine and corrective maintenance and inspection policies and programmes and actions to
be taken for each asset category, including associated expenditure projections. This must include-
6.1.1
12.2.1 the approach to inspecting and maintaining each category of assets, including a description of the types of inspections, tests and condition monitoring carried out and the intervals at which this is done
6.1.2
12.2.2 any systemic problems identified with any particular asset types and the proposed actions to address these problems
12.2.3 budgets for maintenance activities broken down by asset category for the AMP planning period.
6.2.4 and 6.2.7
12.3 Identification of asset replacement and renewal policies
and programmes and actions to be taken for each asset category, including associated expenditure projections. This must include-
6.2.4
12.3.1 the processes used to decide when and whether an asset is replaced or refurbished, including a description of the factors on which decisions are based, and consideration of future demands on the network and the optimum use of existing network assets
6.2.4
12.3.2 a description of innovations made that have deferred asset replacement
Section 7
12.3.3 a description of the projects currently underway or planned for the next 12 months
6.2
12.3.4 a summary of the projects planned for the following four years (where known)
7.7
12.3.5 an overview of other work being considered for the remainder of the AMP planning period
7.7
12.4 The asset categories discussed in subclauses 12.2 and 12.3 above should include at least the categories in subclause 4.5 above.
13 AMPs must provide a summary description of material
non-network development, maintenance and renewal plans, including—
Section 7
13.1 a description of non-network assets 4.2.10
13.2 development, maintenance and renewal policies that cover them
6.2.6 & 7.7.5
13.3 a description of material capital expenditure projects (where known) planned for the next five years
7.7
13.4 a description of material maintenance and renewal projects (where known) planned for the next five years
7.7
14 AMPs must provide details of risk policies, assessment,
and mitigation, including— Section 8
14.1 Methods, details and conclusions of risk analysis 8.1
14.2 Strategies used to identify areas of the network that are
vulnerable to high impact low probability events and a description of the resilience of the network and asset
management systems to such events
8.1.4
14.3 A description of the policies to mitigate or manage the risks of events identified in subclause 16.2
8.2
14.4 Details of emergency response and contingency plans 8.3
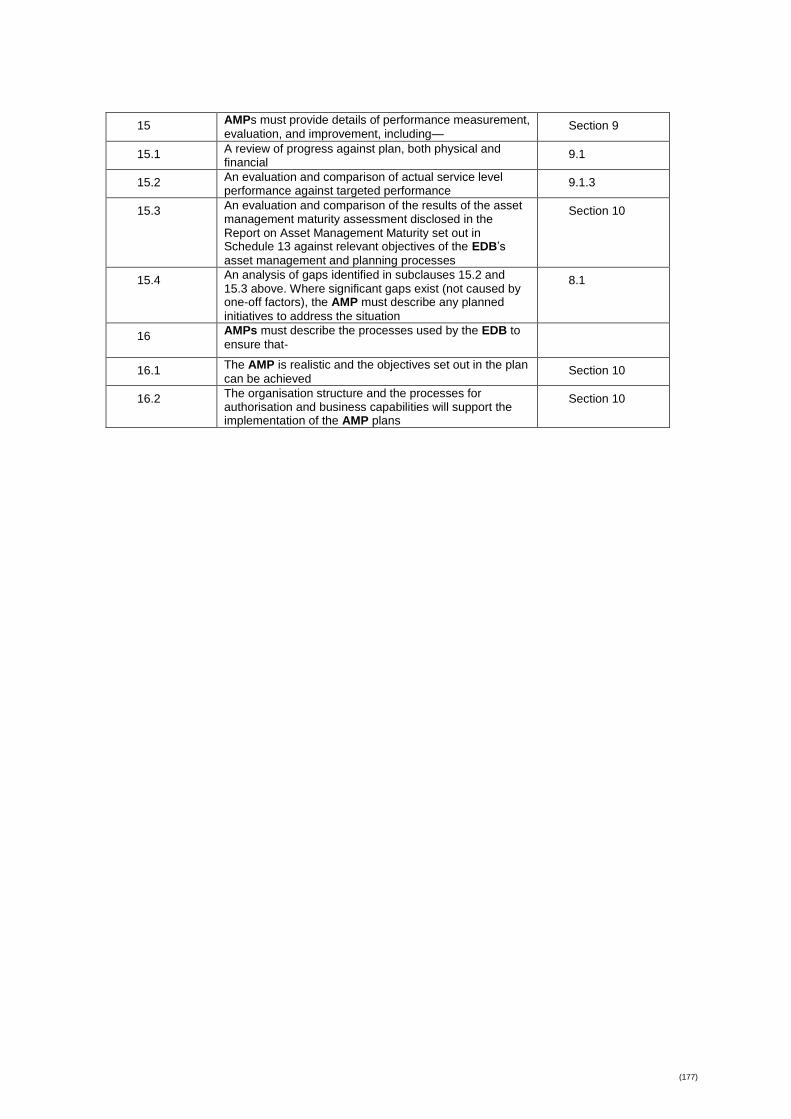
(177)
15 AMPs must provide details of performance measurement,
evaluation, and improvement, including— Section 9
15.1 A review of progress against plan, both physical and financial
9.1
15.2 An evaluation and comparison of actual service level performance against targeted performance
9.1.3
15.3 An evaluation and comparison of the results of the asset management maturity assessment disclosed in the Report on Asset Management Maturity set out in Schedule 13 against relevant objectives of the EDB’s
asset management and planning processes
Section 10
15.4 An analysis of gaps identified in subclauses 15.2 and 15.3 above. Where significant gaps exist (not caused by one-off factors), the AMP must describe any planned
initiatives to address the situation
8.1
16 AMPs must describe the processes used by the EDB to
ensure that-
16.1 The AMP is realistic and the objectives set out in the plan
can be achieved Section 10
16.2 The organisation structure and the processes for authorisation and business capabilities will support the implementation of the AMP plans
Section 10
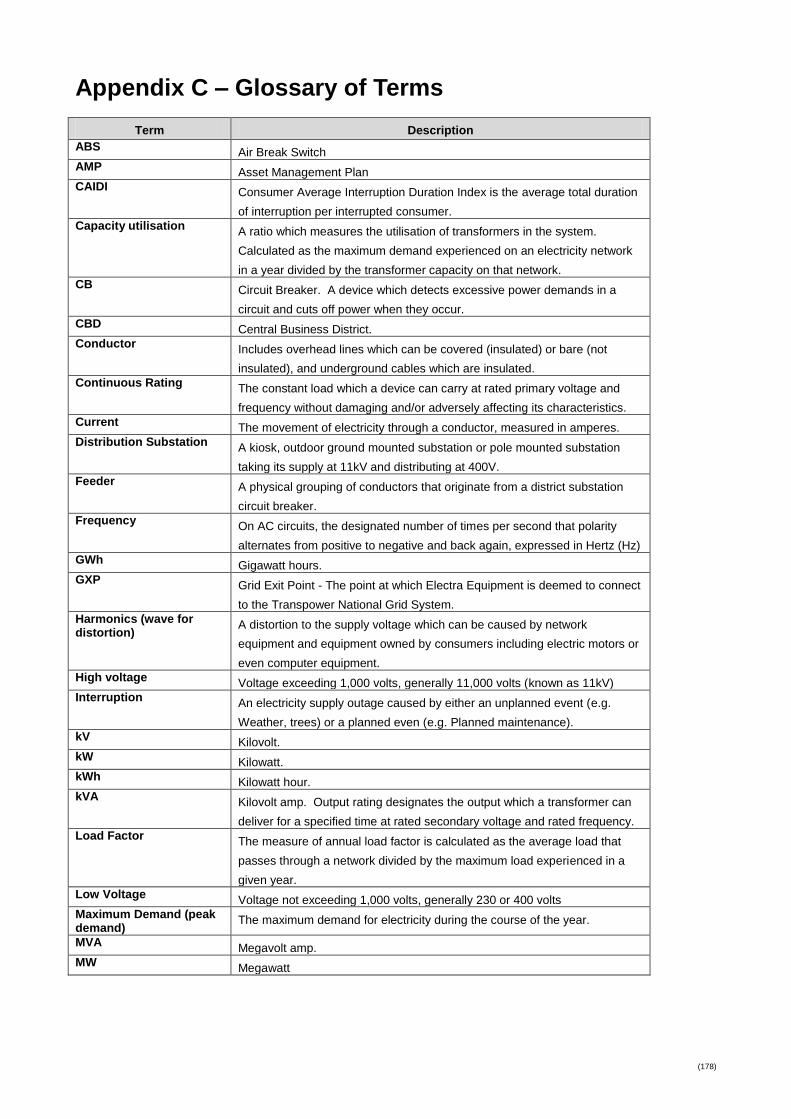
(178)
Appendix C – Glossary of Terms
Term Description
ABS Air Break Switch
AMP Asset Management Plan
CAIDI Consumer Average Interruption Duration Index is the average total duration
of interruption per interrupted consumer.
Capacity utilisation A ratio which measures the utilisation of transformers in the system.
Calculated as the maximum demand experienced on an electricity network
in a year divided by the transformer capacity on that network.
CB Circuit Breaker. A device which detects excessive power demands in a
circuit and cuts off power when they occur.
CBD Central Business District.
Conductor Includes overhead lines which can be covered (insulated) or bare (not
insulated), and underground cables which are insulated.
Continuous Rating The constant load which a device can carry at rated primary voltage and
frequency without damaging and/or adversely affecting its characteristics.
Current The movement of electricity through a conductor, measured in amperes.
Distribution Substation A kiosk, outdoor ground mounted substation or pole mounted substation
taking its supply at 11kV and distributing at 400V.
Feeder A physical grouping of conductors that originate from a district substation
circuit breaker.
Frequency On AC circuits, the designated number of times per second that polarity
alternates from positive to negative and back again, expressed in Hertz (Hz)
GWh Gigawatt hours.
GXP Grid Exit Point - The point at which Electra Equipment is deemed to connect
to the Transpower National Grid System.
Harmonics (wave for distortion)
A distortion to the supply voltage which can be caused by network
equipment and equipment owned by consumers including electric motors or
even computer equipment.
High voltage Voltage exceeding 1,000 volts, generally 11,000 volts (known as 11kV)
Interruption An electricity supply outage caused by either an unplanned event (e.g.
Weather, trees) or a planned even (e.g. Planned maintenance).
kV Kilovolt.
kW Kilowatt.
kWh Kilowatt hour.
kVA Kilovolt amp. Output rating designates the output which a transformer can
deliver for a specified time at rated secondary voltage and rated frequency.
Load Factor The measure of annual load factor is calculated as the average load that
passes through a network divided by the maximum load experienced in a
given year.
Low Voltage Voltage not exceeding 1,000 volts, generally 230 or 400 volts
Maximum Demand (peak demand)
The maximum demand for electricity during the course of the year.
MVA Megavolt amp.
MW Megawatt
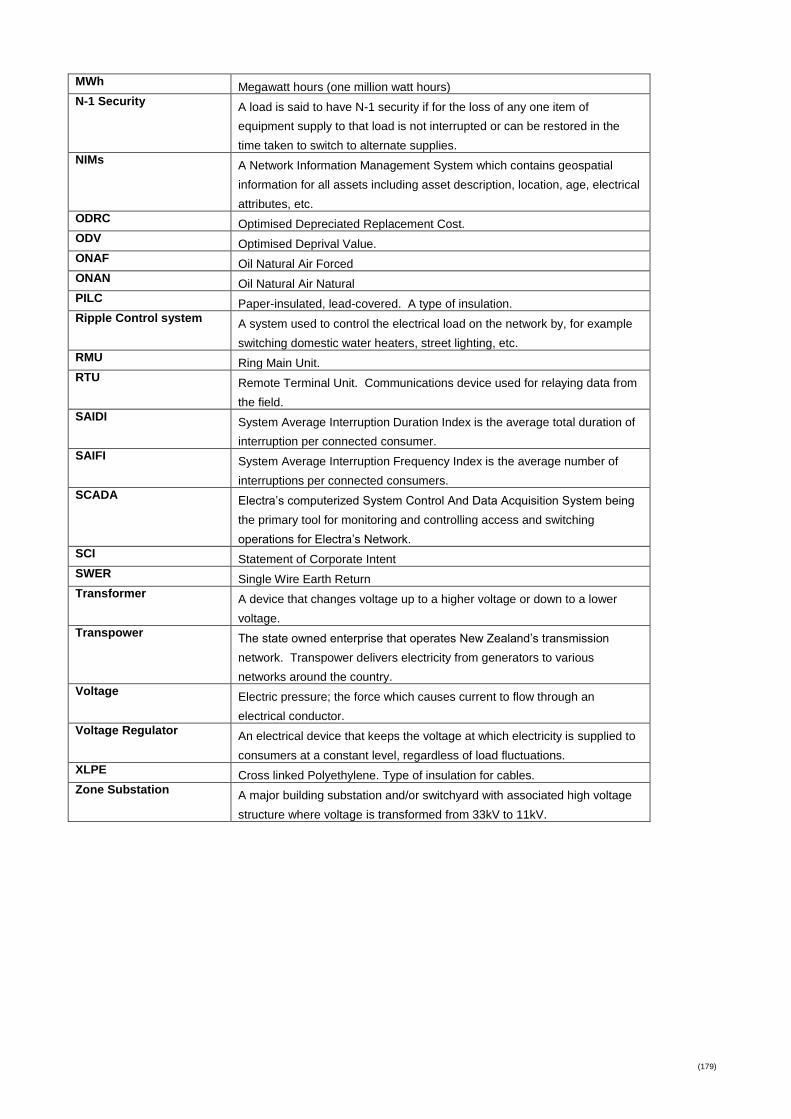
(179)
MWh Megawatt hours (one million watt hours)
N-1 Security A load is said to have N-1 security if for the loss of any one item of
equipment supply to that load is not interrupted or can be restored in the
time taken to switch to alternate supplies.
NIMs A Network Information Management System which contains geospatial
information for all assets including asset description, location, age, electrical
attributes, etc.
ODRC Optimised Depreciated Replacement Cost.
ODV Optimised Deprival Value.
ONAF Oil Natural Air Forced
ONAN Oil Natural Air Natural
PILC Paper-insulated, lead-covered. A type of insulation.
Ripple Control system A system used to control the electrical load on the network by, for example
switching domestic water heaters, street lighting, etc.
RMU Ring Main Unit.
RTU Remote Terminal Unit. Communications device used for relaying data from
the field.
SAIDI System Average Interruption Duration Index is the average total duration of
interruption per connected consumer.
SAIFI System Average Interruption Frequency Index is the average number of
interruptions per connected consumers.
SCADA Electra’s computerized System Control And Data Acquisition System being
the primary tool for monitoring and controlling access and switching
operations for Electra’s Network.
SCI Statement of Corporate Intent
SWER Single Wire Earth Return
Transformer A device that changes voltage up to a higher voltage or down to a lower
voltage.
Transpower The state owned enterprise that operates New Zealand’s transmission
network. Transpower delivers electricity from generators to various
networks around the country.
Voltage Electric pressure; the force which causes current to flow through an
electrical conductor.
Voltage Regulator An electrical device that keeps the voltage at which electricity is supplied to
consumers at a constant level, regardless of load fluctuations.
XLPE Cross linked Polyethylene. Type of insulation for cables.
Zone Substation A major building substation and/or switchyard with associated high voltage
structure where voltage is transformed from 33kV to 11kV.

(180)
Appendix D – Amendments to the plan for this version
Section Amendment
4.3 Major maintenance cycle for zone substations extended to 5 yearly and
sequence modified
All Construction Business overhead costs allocated to the relevant
Maintenance Category
All Revised Capitalisation Policy results in crossarm renewals and
replacements being re-categorised from Operational to Capital expenditure
6.2.2 Maintenance cost projections modified to allow for potential purchase and
operation of Transpower 110kV lines between Mangahao & Levin