ASSET MANAGEMENT PLAN - South Burnett Regional Council
116
PO Box 336 Kingaroy Qld 4610 Phone 07 4189 9100 Facsimile 07 4162 4806 Email: [email protected] www.southburnett.qld.gov.au ASSET MANAGEMENT PLAN Wastewater 27 May 2020
-
Upload
khangminh22 -
Category
Documents
-
view
1 -
download
0
Transcript of ASSET MANAGEMENT PLAN - South Burnett Regional Council

PO Box 336 Kingaroy Qld 4610 Phone 07 4189 9100 Facsimile 07 4162 4806
Email: [email protected] www.southburnett.qld.gov.au
ASSET MANAGEMENT PLAN
Wastewater 27 May 2020
Wastewater Asset Management Plan v0.03 2
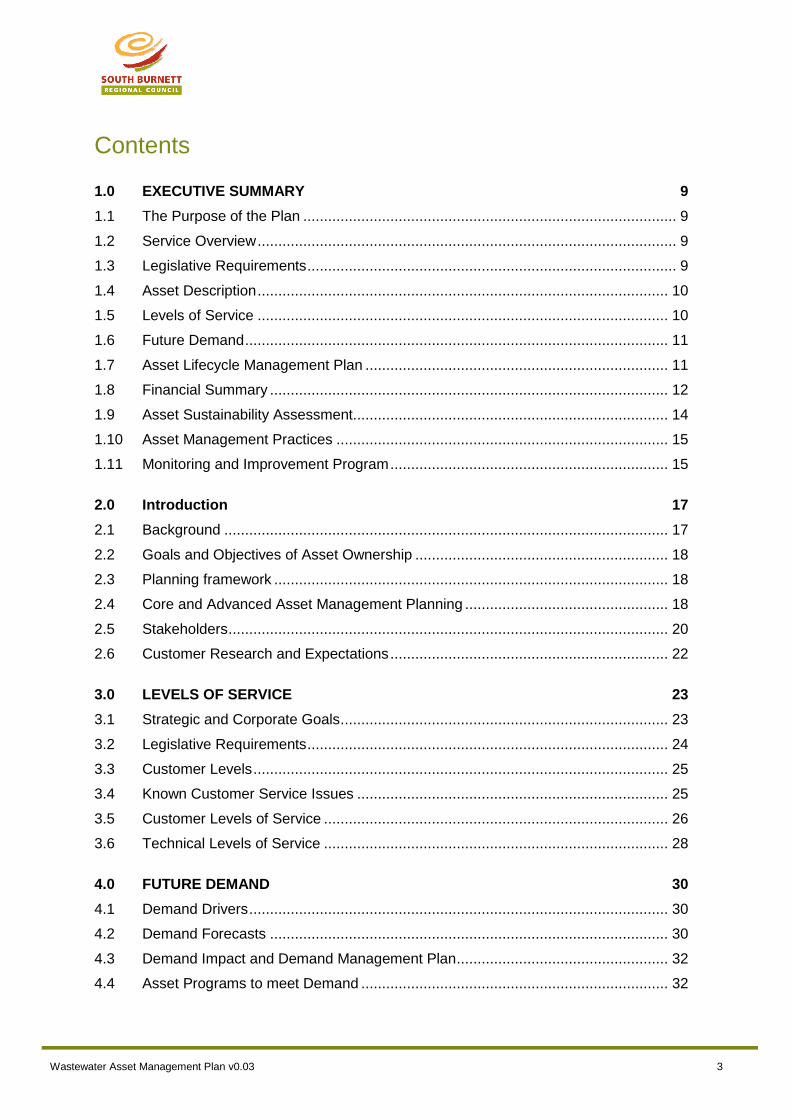
Document Control
Wastewater Asset Management Plan
Ver. Date Revision Details Author Reviewer Approver
0.01 11/05/2020 First draft Chris Egbars
(Shepherd Services)
0.02 22/05/2020 Second draft Chris Egbars Tim Low
0.03 27/05/2020 Revisions for May 2020 AMP review
John Gorman
(Door 3 Consulting)
Tim Low Aaron Meehan
0.04 17/06/2020 Adopted at Ordinary General Meeting of Council
John Gorman Aaron Meehan Council
Notes
1. Primary number changes to Versions (e.g. V1.00 to V2.00) will be made when the document undergoes its regular review and when significant changes are made to standards and guidelines for inspections, intervention levels or works.
2. Secondary number changes (V1.00 to V1.01) will apply to minor amendments that do not materially impact the documents and are intended only to clarify or update issues.
3. This template is based on the 2019 NAMSPLUS template purchased from the Institute of Public Works Engineering Australasia.
Wastewater Asset Management Plan v0.03 3
Contents
1.0 EXECUTIVE SUMMARY 9
1.1 The Purpose of the Plan .......................................................................................... 9
1.2 Service Overview ..................................................................................................... 9
1.3 Legislative Requirements ......................................................................................... 9
1.4 Asset Description ................................................................................................... 10
1.5 Levels of Service ................................................................................................... 10
1.6 Future Demand ...................................................................................................... 11
1.7 Asset Lifecycle Management Plan ......................................................................... 11
1.8 Financial Summary ................................................................................................ 12
1.9 Asset Sustainability Assessment............................................................................ 14
1.10 Asset Management Practices ................................................................................ 15
1.11 Monitoring and Improvement Program ................................................................... 15
2.0 Introduction 17
2.1 Background ........................................................................................................... 17
2.2 Goals and Objectives of Asset Ownership ............................................................. 18
2.3 Planning framework ............................................................................................... 18
2.4 Core and Advanced Asset Management Planning ................................................. 18
2.5 Stakeholders .......................................................................................................... 20
2.6 Customer Research and Expectations ................................................................... 22
3.0 LEVELS OF SERVICE 23
3.1 Strategic and Corporate Goals ............................................................................... 23
3.2 Legislative Requirements ....................................................................................... 24
3.3 Customer Levels .................................................................................................... 25
3.4 Known Customer Service Issues ........................................................................... 25
3.5 Customer Levels of Service ................................................................................... 26
3.6 Technical Levels of Service ................................................................................... 28
4.0 FUTURE DEMAND 30
4.1 Demand Drivers ..................................................................................................... 30
4.2 Demand Forecasts ................................................................................................ 30
4.3 Demand Impact and Demand Management Plan ................................................... 32
4.4 Asset Programs to meet Demand .......................................................................... 32
Wastewater Asset Management Plan v0.03 4
4.5 Climate Change and Adaption ............................................................................... 33
4.6 Technological Change ........................................................................................... 34
5.0 ASSET PROFILE 35
5.1 Asset Hierarchy ..................................................................................................... 35
5.2 Asset Quantities and Costs .................................................................................... 35
5.3 Asset Useful Lives ................................................................................................. 36
5.4 Asset Age Profile ................................................................................................... 37
5.5 Pipework Length, Material and Size Profile ............................................................ 38
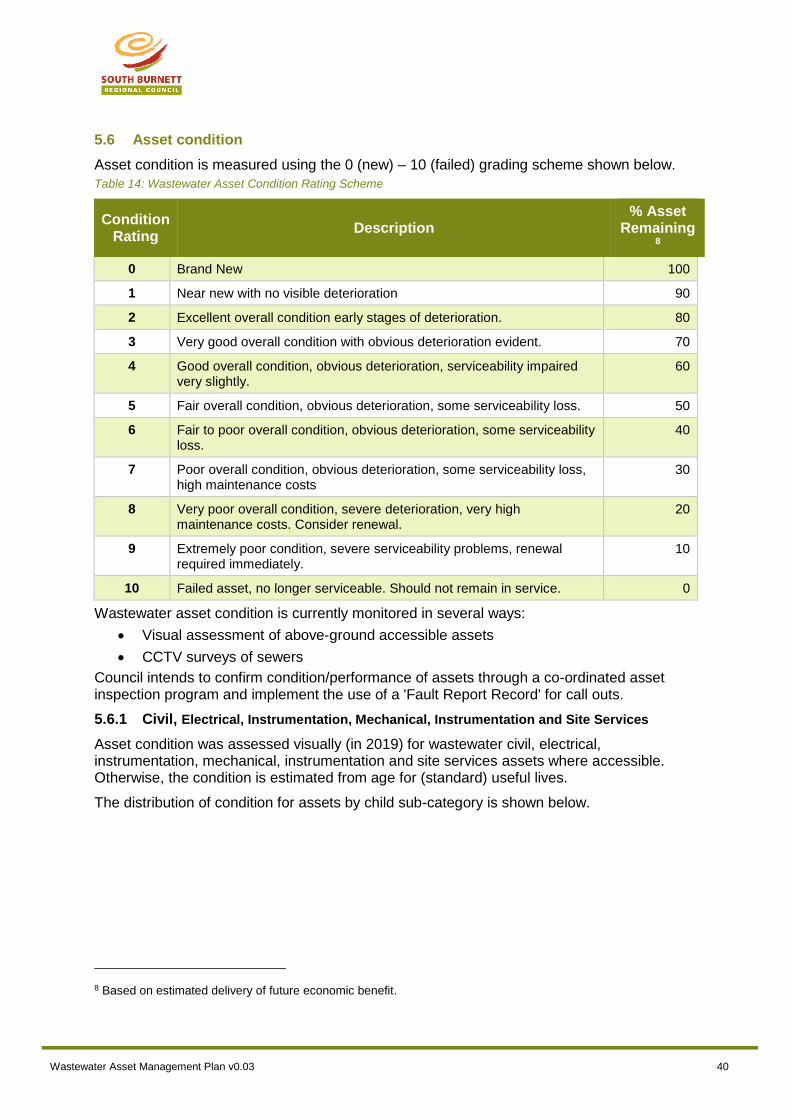
5.6 Asset condition ...................................................................................................... 40
5.7 Asset Utilisation ..................................................................................................... 45
5.8 Asset Capacity and Performance ........................................................................... 45
6.0 LIFECYCLE MANAGEMENT PLAN 47
6.1 Operations and Maintenance Plan ......................................................................... 47
6.2 Renewal Plan ........................................................................................................ 49
6.3 Summary of historical renewal costs ...................................................................... 51
6.4 Summary of future renewal costs ........................................................................... 51
6.5 Acquisition Plan ..................................................................................................... 53
6.6 Disposal Plan ......................................................................................................... 56
7.0 RISK MANAGEMENT PLANNING 57
7.1 Critical Assets ........................................................................................................ 57
7.2 Infrastructure Resilience Approach ........................................................................ 58
7.3 Risk Assessment ................................................................................................... 58
8.0 FINANCIAL SUMMARY 59
8.1 Long-Term Financial Forecast ............................................................................... 59
8.2 Forecast costs for long term financial plan ............................................................. 59
8.3 Sustainability of service delivery ............................................................................ 60
8.4 Funding Strategy ................................................................................................... 62
8.5 Valuation Forecasts ............................................................................................... 62
8.6 Key Assumptions Made in Financial Forecasts ...................................................... 63
8.7 Forecast Reliability and Confidence ....................................................................... 64
9.0 INFORMATION MANAGEMENT 66
9.1 Asset Information Management Systems ............................................................... 66
Wastewater Asset Management Plan v0.03 5
9.2 Asset Data Management ....................................................................................... 67
10.0 PLAN IMPROVEMENT AND MONITORING 70
10.1 Status of Asset Management Practices.................................................................. 70
10.2 Improvement Priorities ........................................................................................... 70
10.3 Key Performance Indicators (Improvement) ........................................................... 70
10.4 Improvement Plan .................................................................................................. 71
10.5 Monitoring and Review Procedures ....................................................................... 76
11.0 REFERENCES 78
Appendix A: Glossary 79
Appendix B: Wastewater Asset Hierarchy 82
Appendix C: Acquisition Forecast 83
Appendix D: Operation Forecast 84
Appendix E: Maintenance Forecast 85
Appendix F: Renewal Forecast Summary 86
Appendix G: Budget Summary by Lifecycle Activity 87
Appendix H: Budgeted Forward Works Program Projects 88
Appendix I: 20 Years Forecast Renewals 91
Appendix J: Schematics 109
List of Figures Figure 1: 20 Years Lifecycle Summary .................................................................................13
Figure 2: Asset Renewal Investment Planned Against Target ..............................................15
Figure 3: South Burnett Region ............................................................................................17
Figure 4: Wastewater Related Functions ..............................................................................22
Figure 5: Wastewater Asset Distribution by Type at May 2020 .............................................28
Figure 6: Regional Growth Projections (2016 - 2041): QGSO and LGIP (ABS) ....................31
Figure 7: Age Condition vs Cost Profile – ‘Child’ Above Ground Asset .................................37
Wastewater Asset Management Plan v0.03 6
Figure 8: Age Profile – Below Ground Assets .......................................................................37
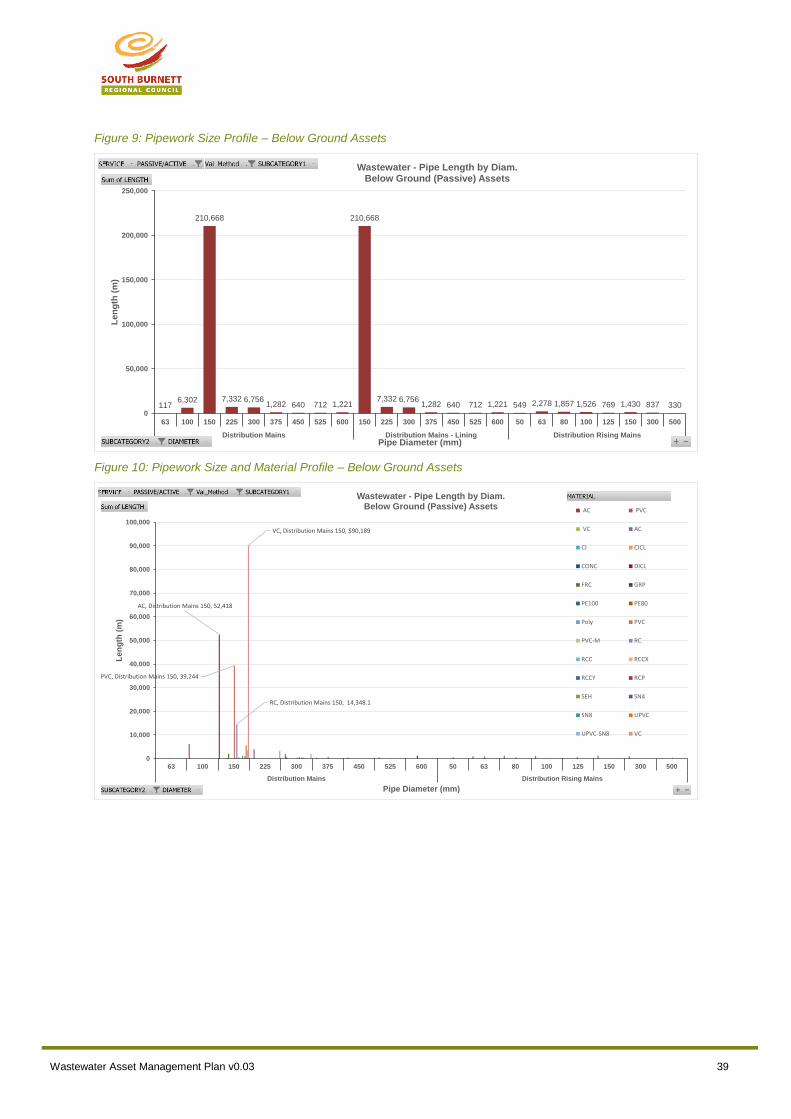
Figure 9: Pipework Size Profile – Below Ground Assets .......................................................39
Figure 10: Pipework Size and Material Profile – Below Ground Assets ................................39
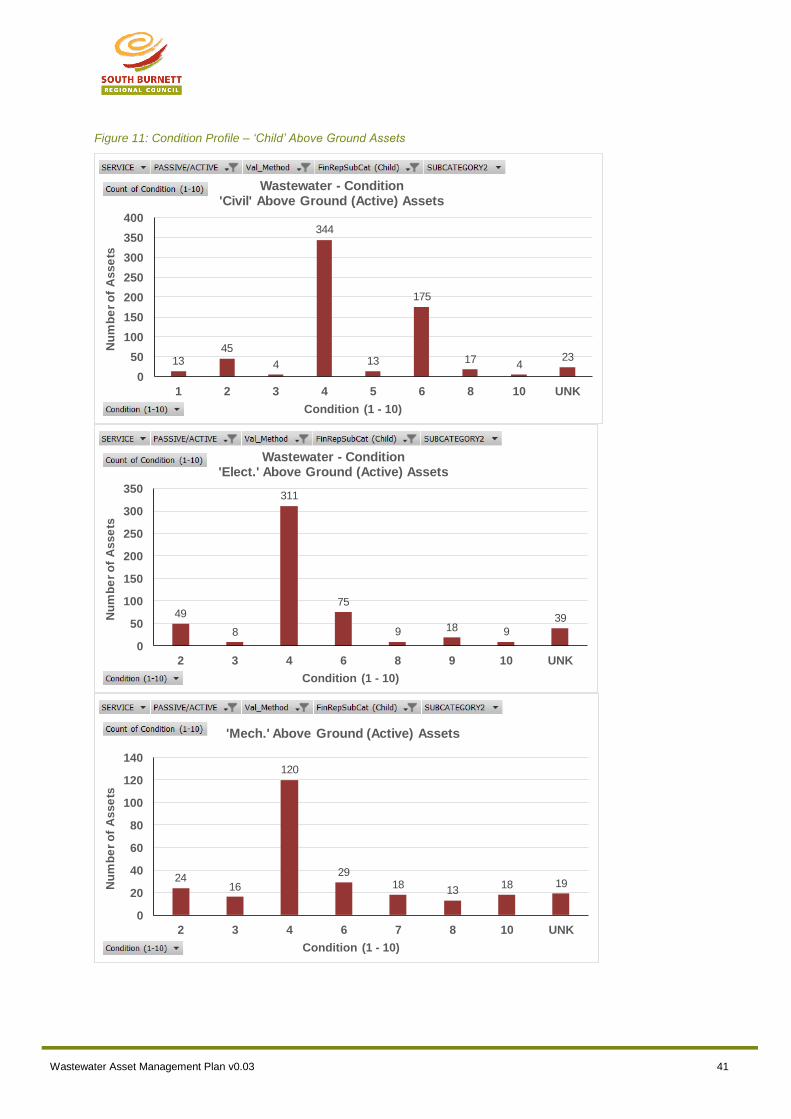
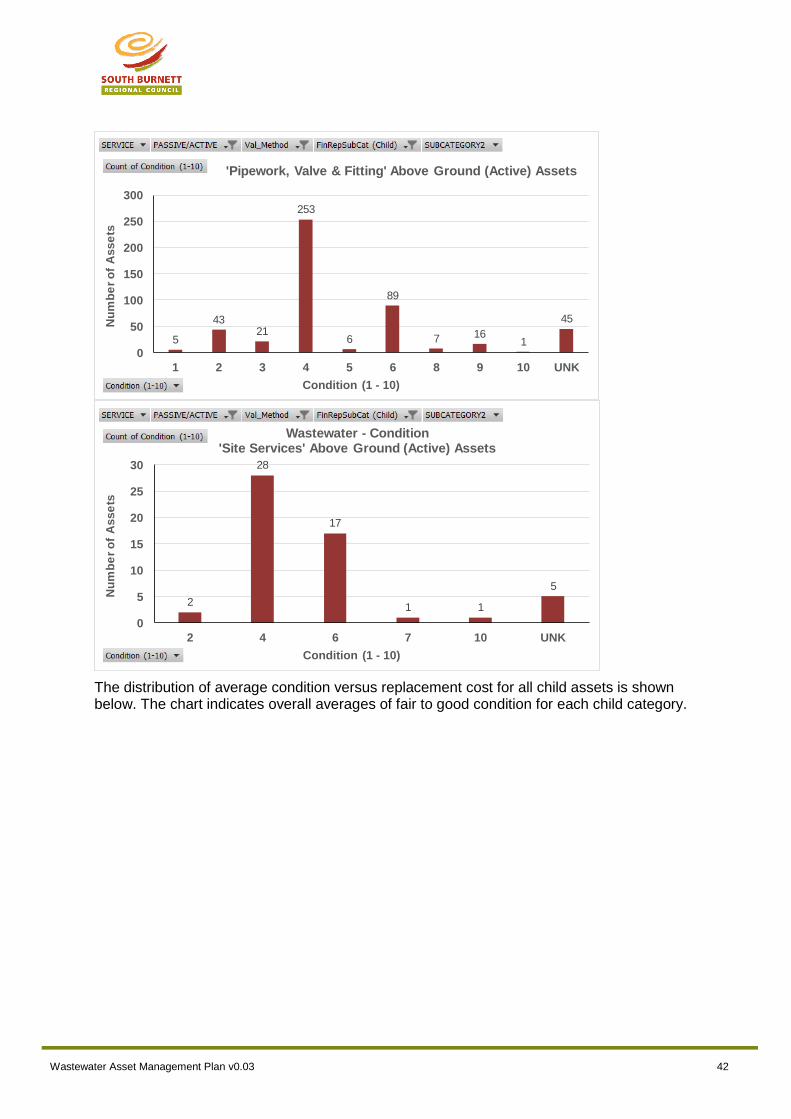
Figure 11: Condition Profile – ‘Child’ Above Ground Assets .................................................41
Figure 12: Average Condition vs Cost Profile – ‘Child’ Above Ground Assets ......................43
Figure 13: Condition Profile – Distribution Trunk Mains, Rising Mains and Manholes Below Ground Assets .....................................................................................................................43
Figure 14: Average Condition vs Cost Profile – Below Ground Pipework Assets ..................45
Figure 15: Projected and Planned OPEX .............................................................................49
Figure 16: Planned Renewals – Below Ground (passive) and Above Ground (active) ..........51
Figure 17: Projected and Planned Renewals ........................................................................52
Figure 18: Planned Renewals, Depreciation and Sustainability Index ...................................53
Figure 19: Acquisition Summary ...........................................................................................55
Figure 20: 20 Years Lifecycle Summary ...............................................................................56
Figure 21: Risk Management Process (Abridged) ................................................................58
Figure 22: Planned CAPEX and OPEX ................................................................................60
Figure 23: Asset Sustainability Targets and Planned Renewals ...........................................61
Figure 24: Asset Sustainability Ratios for Planned and Projected Renewals ........................62
Figure 25: Asset Costs from Planned CAPEX (20 Years) .....................................................63
Figure 26: Asset Forecast Renewals ....................................................................................91
List of Tables Table 1: Wastewater Asset Summary as at 30 June 2020] ...................................................10
Table 2: Key Stakeholders in the Asset Management Plan ..................................................20
Table 3: Wastewater Service Goals......................................................................................23
Table 4: Legislative Requirements .......................................................................................24
Table 5: Customer Level of Service Measures .....................................................................26
Table 6: SBRC Wastewater Asset Distribution as at May 2020 ............................................27
Table 7: Technical Levels of Service: Pipework, Valves & Fittings (Below Ground) ..............28
Table 8: South Burnett Population Growth Estimates 2016-41 (QGSO) ...............................30
Table 9: 2019 connections and projected demand (LGIP) ....................................................31
Table 10: Demand Management Plan ..................................................................................32
Table 11: Managing the Impact of Climate Change on Assets ..............................................33
Table 12: Wastewater Asset Valuation Summary as at 30 June 2020 ..................................35
Table 13: Typical Useful Lives for Wastewater Assets..........................................................36
Wastewater Asset Management Plan v0.03 7
Table 14: Wastewater Asset Condition Rating Scheme ........................................................40
Table 15: Asset Category Average Condition as at 2020 ......................................................45
Table 16: WWTP Design Capacity versus EP ......................................................................46
Table 17: Known Service Performance Deficiencies ............................................................46
Table 18: Average Historical OPEX by Subcategory ............................................................48
Table 19: Forecast 2019/20 OPEX by Business Unit ............................................................48
Table 20: Maintenance Budget Trends .................................................................................48
Table 21: Renewal Priority Ranking Criteria .........................................................................51
Table 22: Acquired Assets Priority Ranking Criteria .............................................................54
Table 23: Failure modes and Impacts for Asset Categories ..................................................57
Table 24: Forecast Costs for Long Term Financial Plan .......................................................59
Table 25: Data Confidence Grading System .........................................................................64
Table 26: Data Confidence Assessment for Data used in Asset Management Plan .............64
Table 27: Work Category Definition ......................................................................................66
Table 28: Wastewater Asset Management Improvement Plan ..............................................71
Table 29: Glossary ...............................................................................................................79
Table 30: SBRC Approved Wastewater Hierarchy ................................................................82
Table 31: Acquisition Forecast Summary .............................................................................83
Table 32: Operation Forecast Summary ...............................................................................84
Table 33: Maintenance Forecast Summary ..........................................................................85
Table 34: Renewal Forecast Summary .................................................................................86
Table 35: Budget Summary by Lifecycle Activity ..................................................................87
Table 36: Budgeted Forward Works Program Projects .........................................................88

Wastewater Asset Management Plan v0.03 8
Abbreviations The following abbreviations are used in this document:
AC Asbestos Cement
AMP Asset Management Plan
ABS Australian Bureau of Statistics
CAPEX Capital Expenditure
CSS Customer Service Standards
FWP Forward Works Plan
km Kilometre
LCC Life Cycle Cost
LCE Life Cycle Expenditure
LoS Levels of Service
OPEX Operations and Maintenance Expenditure
MIPP Maturing the Infrastructure Pipeline Program
ML Megalitre
SBRC South Burnett Regional Council
QAO Queensland Audit Office
PI Performance Indicator
RUL Remaining Useful Life
SL Service Level
SWIM Statewide Water Information Management
VC Vitreous Clay
WWAMMP Wastewater Asset Maintenance Management Plan
WWTP Wastewater Treatment Plant

Wastewater Asset Management Plan v0.03 9
1.0 EXECUTIVE SUMMARY
1.1 The Purpose of the Plan
This plan covers the assets that provide wastewater treatment and reuse services.
The purpose of this plan is to document current and required actions to sustainably provide Council-approved levels of service in the most cost-effective manner while appropriately managing the associated risks.
The plan sets out:
What services Council provides, to whom and to what level.
The whole-of-life costs of the assets used to deliver these services.
The constraints, risks, challenges, opportunities and options associated with delivery of these services.
The level of funding required to sustainably deliver current levels of service for the foreseeable future.
1.2 Service Overview
Services included in this AMP are:
Construction and maintenance services for:
Treatment plants
Effluent re-use assets
Pump stations
Sewer mains
Rising mains
Manholes
Wastewater services excluded from this AMP are:
Construction and maintenance services related to:
Irrigation of recycled water at golf courses, e.g. Murgon, sporting precinct at Kingaroy and Wondai sports complex
1.3 Legislative Requirements
The pieces of legislation that inform and control how we deliver this service are shown in section 3.2 here.

Wastewater Asset Management Plan v0.03 10
1.4 Asset Description
Council’s Wastewater is comprised of the following assets:
Table 1: Wastewater Asset Summary as at 30 June 2020]
Asset Category Number
of Facilities
Current Replacement
Cost
Accum. Depreciation
Written Down Cost
Wastewater Transfer
Sewage Pump Stations 25 $7,265,299. $4,652,752 $4,652,7512
Wastewater Transfer
Effluent Re-use Pump Stations 2 $668,039 $335,819
$335,819
Wastewater Treatment and Processing
Treatment Plants 9 $42,991,379 $28,650,350 $28,650,350
Wastewater Distribution
Effluent Re-use 1 $364,787 $249,843 $249,843
Wastewater Distribution
Distribution Mains and Lining approx. 235 km
$42,938,602 $22,955,347 $19,983,256
Distribution Rising Mains approx. 9.6
km (23) $1,296,986 $468,289 $468,289
Manholes 4,107 $14,759,559 $4,166,213 $4,166,213
Total $110,284,651 $22,955,347 $58,506,522
This asset class makes up 9.3% of the Council’s total infrastructure asset stock (end June 2019 total replacement cost).
The past peaks of asset investment, e.g. 3 years ago approximately $25 million of above-ground assets and $26.6 million of below ground of assets 50 to 62 years ago, may require peaks in renewals in the future.
1.5 Levels of Service
The objective of wastewater service provision is to provide:
Safe, reliable, and affordable wastewater services to our communities as required under the Water Supply (Safety and Reliability) Act 2008, Local Government Act 2009 S97(2)(e)
Wastewater services and treatment processes meeting the requirement of our approval under the Environmental Protection Act 1994.
The levels of service and standards are:
Connected assessments can be assured of a continuous service
Less than 15 breaks/blockages per 100 km per year
Wastewater Asset Management Plan v0.03 11
100% of breaks and blockages responded to within 60 mins
Potential environmental impacts will be identified and properly managed by Council in providing and managing the service
Meeting license limits for WWTP effluent and reuse
Council will provide a wastewater service sufficient to meet current and planned demand.
Percent of properties meeting sewer design flow design criteria.
The main service consequences of the Planned Budget are:
Ensuring a sufficient, safe, and reliable wastewater service while managing environmental impacts.
1.6 Future Demand
Future population growth is predicted to be 20.4% for the next 20 years. It is estimated the (medium) projected population will reach approximately 41,254 persons by the year 2036. As a result, demand is viewed as influencing this class of assets over the next 20 years.
Council is currently developing a regional economic development strategy and strategic regional Wastewater plan with Wide Bay Burnett Regional Organisation of Councils. This AMP will be reviewed following the completion of these documents.
The primary drivers of demand for this service are:
Population change
Industrial demand
Customer preferences and expectations
Health and environmental regulations
Technological changes
These will be managed through a combination of managing existing assets, upgrading of existing assets and providing new assets to meet demand and demand management. Demand management practices include non-asset solutions, insuring against risks and managing failures.
Water Restrictions Policy
Water-saving initiatives and devices focused on in-home efficiency
1.7 Asset Lifecycle Management Plan
1.7.1 What does it cost to provide the current level of service?
The forecast lifecycle costs necessary to provide the services covered by this Asset Management Plan includes operation, maintenance, renewal, acquisition, and disposal of assets over the 20-year planning period is approximately $103.3 million ($5,164,763 on average per year. In comparison, Council’s planned expenditure is a sufficient $108.5 million ($5,426,940 on average per year).
1.7.1.1 Operations and Maintenance (OPEX)
Operations
The forecast 20-year average annual maintenance cost for water assets is approximately $2 million per annum, and this is 1.7% of the average current replacement cost of these assets.
Maintenance
Wastewater Asset Management Plan v0.03 12
The forecast 20-year average annual maintenance cost for water assets is approximately $1.1 million per annum, and this is 1% of the average current replacement cost of these assets.
The SWIM reported OPEX for 2018/2019 equates to approximately $500 per connection.
As a benchmark, the SWIM reported median OPEX of other Queensland Councils was $389 per connection.
Council’s higher than median annual OPEX is attributable to:
Numerous towns and facilities to manage including 9 treatment plants
Diverse network assets
Relatively old network assets – average age 42 years and remaining life 25 years
Large service areas with proportionally low connections per kilometre of main.
1.7.1.2 Capital (CAPEX)
At present, there are few projects in the forward works program beyond year 10 due to a lack of information for decision making. This will change when Council includes recommendations from MIPP on new and upgrade projects and renewals from this AMP.
Renewals
Council’s 20-year planned asset renewal forecast (forward works program) for Wastewater assets is approximately $31.5 million over the next 20 years, which is 29% of the current replacement cost. This compares to $30 million of forecast renewals resulting from recent condition assessment and remaining life estimations for 2020 water valuations.
The breakup of Council’s planned 20-year Wastewater asset renewals is as follows:
Approximately $25.8 million for distribution (sewer) mains
Approximately $0.03 million for sewer rising mains
Approximately $5.7 for treatment plants
New and Upgrade Capital Works
Planned new and upgrade Waterworks (forward works program) over the next 20 years totals approximately $10.4 million. This amounts to a 9% increase on current replacement cost.
1.8 Financial Summary
1.8.1 What we will do
Estimated available funding (excluding depreciation) for the 20-year period is approximately $108.6 million or approximately $5.4 million on average per year over 20 years as per the long-term financial plan or budget forecast. This is 5% more than the of the cost (approximately $103.3 million) to sustain the current level of service at the lowest lifecycle cost while effectively managing risk.
The reality is that only what is funded in the long-term financial plan can be provided. The emphasis of the Asset Management Plan is to communicate the consequences that this will have on the service provided and risks, so that decision making is informed.
The anticipated, planned budget leaves a surplus of approximately $0.3 million on average per year of the forecast lifecycle costs required to provide services in the Asset Management Plan compared with planned budget currently included in the Long-Term Financial Plan. This is shown in the figure below.
Wastewater Asset Management Plan v0.03 13
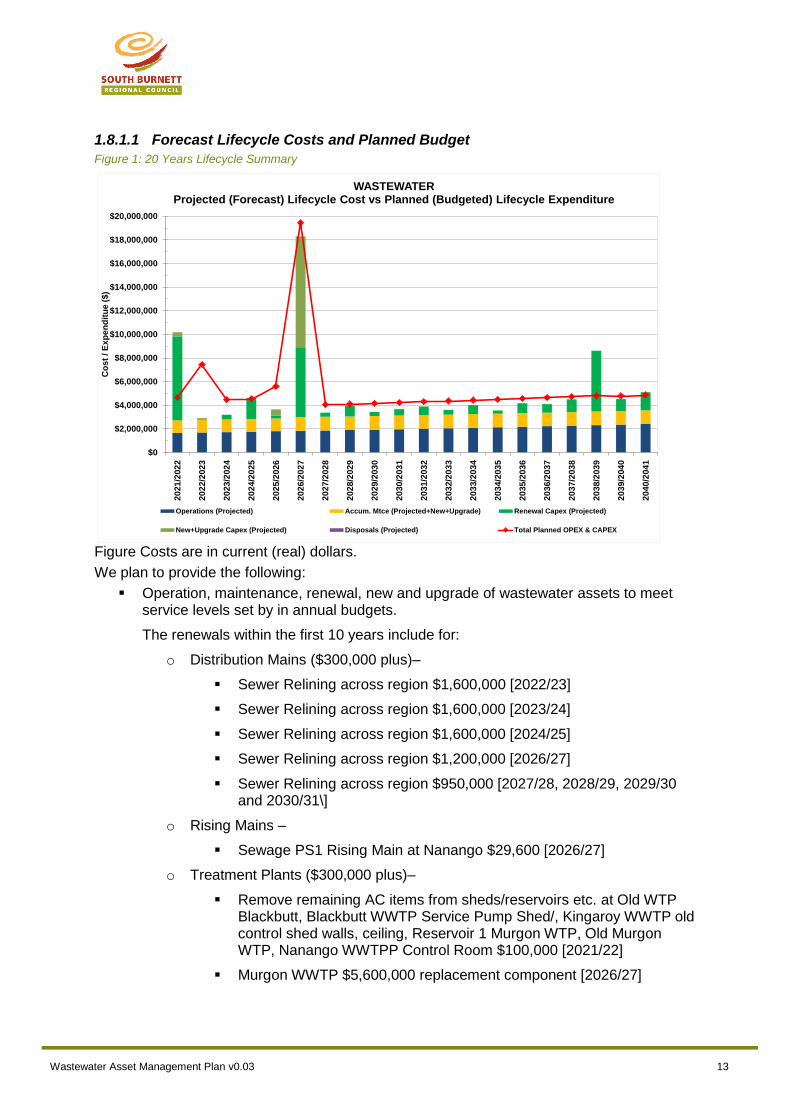
1.8.1.1 Forecast Lifecycle Costs and Planned Budget
Figure 1: 20 Years Lifecycle Summary
Figure Costs are in current (real) dollars.
We plan to provide the following:
Operation, maintenance, renewal, new and upgrade of wastewater assets to meet service levels set by in annual budgets.
The renewals within the first 10 years include for:
o Distribution Mains ($300,000 plus)–
Sewer Relining across region $1,600,000 [2022/23]
Sewer Relining across region $1,600,000 [2023/24]
Sewer Relining across region $1,600,000 [2024/25]
Sewer Relining across region $1,200,000 [2026/27]
Sewer Relining across region $950,000 [2027/28, 2028/29, 2029/30 and 2030/31\]
o Rising Mains –
Sewage PS1 Rising Main at Nanango $29,600 [2026/27]
o Treatment Plants ($300,000 plus)–
Remove remaining AC items from sheds/reservoirs etc. at Old WTP Blackbutt, Blackbutt WWTP Service Pump Shed/, Kingaroy WWTP old control shed walls, ceiling, Reservoir 1 Murgon WTP, Old Murgon WTP, Nanango WWTPP Control Room $100,000 [2021/22]
Murgon WWTP $5,600,000 replacement component [2026/27]
$0
$2,000,000
$4,000,000
$6,000,000
$8,000,000
$10,000,000
$12,000,000
$14,000,000
$16,000,000
$18,000,000
$20,000,000
20
21/2
02
2
20
22/2
02
3
20
23/2
02
4
20
24/2
02
5
20
25/2
02
6
20
26/2
02
7
20
27/2
02
8
20
28/2
02
9
20
29/2
03
0
20
30/2
03
1
20
31/2
03
2
20
32/2
03
3
20
33/2
03
4
20
34/2
03
5
20
35/2
03
6
20
36/2
03
7
20
37/2
03
8
20
38/2
03
9
20
39/2
04
0
20
40/2
04
1
Co
st
/ E
xp
en
dit
ue
($
)
WASTEWATERProjected (Forecast) Lifecycle Cost vs Planned (Budgeted) Lifecycle Expenditure
Operations (Projected) Accum. Mtce (Projected+New+Upgrade) Renewal Capex (Projected)
New+Upgrade Capex (Projected) Disposals (Projected) Total Planned OPEX & CAPEX
Wastewater Asset Management Plan v0.03 14
The new and upgrade works over the 20 years include for:
o Distribution (sewer) Mains
River Road Trunk Replace and Upgrade, (2000/10-STP), Kingaroy $102,000 [2021/2022]
Haly Street Sewer Replace and Upgrade, (2156/25-2115/20), Kingaroy $189,000 [2021/2022]
Ivory St SPS Replace and Upgrade, Kingaroy $30,000 [2021/2022]
Replace and Upgrade Douglas St Sewer PS, Kingaroy $26,000 [2021/2022
Chataway St Sewer Replace and Upgrade (101/37-101/22), Murgon $61,400 [2022/2023]
CED Pump Station Replace and Upgrade, Proston $30,000 [2022/2023]
Northern Trunk Sewer Upgrade (2327/6 - 2000/28), Kingaroy $460,000 [2025/2026]
Fisher St Sewer Upgrade (2000/91-2000/87), Kingaroy $14,640 [2025/2026]
First Ave Sewer Upgrade (2008/6-2008/2), Kingaroy $19,000 [2025/2026]
Cornish St Sewer Upgrade Kingaroy (2053/14-2053/80), Kingaroy $27,000 [2025/2026]
Douglas St Sewer Upgrade (102/7-101/1), Murgon $32,000 [2026/2027]
Sewer PS1 Rising Main Upgrade, Nanango $7,400 [2026/2027]
o Treatment Plants –
Murgon WWTP $9,400,000 upgrade component [2026/27]
1.8.2 What we cannot do
We currently allocate enough budget to sustain these services at the specified standard or to provide all new services being sought.
1.8.3 Managing the Risks
Our present budget levels are sufficient to continue to manage risks in the medium term.
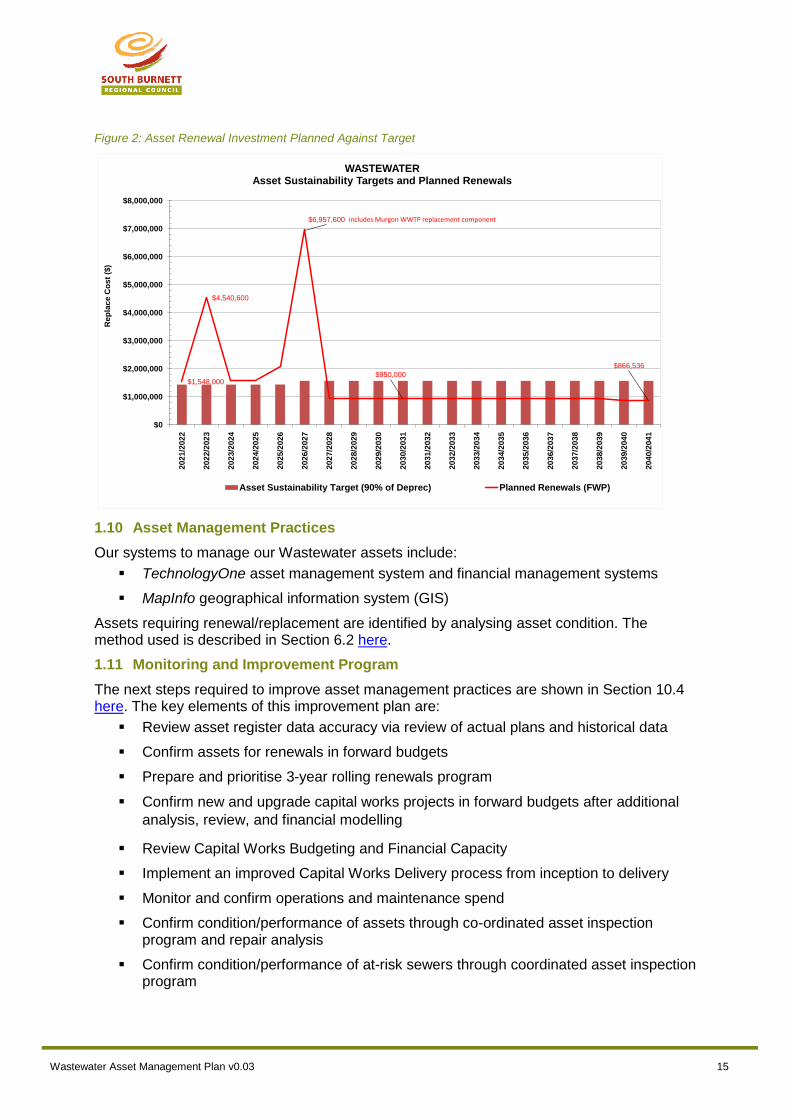
1.9 Asset Sustainability Assessment
Based on current levels of service and funding, this service is financially sustainable over the medium term (i.e., next 10 years) and long term.
Over 20 years, the sustainability target is an average annual $1.54 million compared to planned renewals expenditure of approximately $1.6 million per year.
The diagram below shows that planned asset renewal expenditure is expected to be below the target of 90% of depreciation from 2027/2028 onwards. Increased renewals expenditure will likely be required to avoid a decline in service levels.
Wastewater Asset Management Plan v0.03 15
Figure 2: Asset Renewal Investment Planned Against Target
1.10 Asset Management Practices
Our systems to manage our Wastewater assets include:
TechnologyOne asset management system and financial management systems
MapInfo geographical information system (GIS)
Assets requiring renewal/replacement are identified by analysing asset condition. The method used is described in Section 6.2 here.
1.11 Monitoring and Improvement Program
The next steps required to improve asset management practices are shown in Section 10.4 here. The key elements of this improvement plan are:
Review asset register data accuracy via review of actual plans and historical data
Confirm assets for renewals in forward budgets
Prepare and prioritise 3-year rolling renewals program
Confirm new and upgrade capital works projects in forward budgets after additional
analysis, review, and financial modelling
Review Capital Works Budgeting and Financial Capacity
Implement an improved Capital Works Delivery process from inception to delivery
Monitor and confirm operations and maintenance spend
Confirm condition/performance of assets through co-ordinated asset inspection program and repair analysis
Confirm condition/performance of at-risk sewers through coordinated asset inspection program
$1,548,000
$4,540,600
$6,957,600
$950,000
$866,536
$0
$1,000,000
$2,000,000
$3,000,000
$4,000,000
$5,000,000
$6,000,000
$7,000,000
$8,000,000
20
21/2
02
2
20
22/2
02
3
20
23/2
02
4
20
24/2
02
5
20
25/2
02
6
20
26/2
02
7
20
27/2
02
8
20
28/2
02
9
20
29/2
03
0
20
30/2
03
1
20
31/2
03
2
20
32/2
03
3
20
33/2
03
4
20
34/2
03
5
20
35/2
03
6
20
36/2
03
7
20
37/2
03
8
20
38/2
03
9
20
39/2
04
0
20
40/2
04
1
Re
pla
ce
Co
st
($)
WASTEWATERAsset Sustainability Targets and Planned Renewals
Asset Sustainability Target (90% of Deprec) Planned Renewals (FWP)
includes Murgon WWTP replacement component

Wastewater Asset Management Plan v0.03 16
Identify critical assets and asset risk profile
Document Maintenance Management Strategy and Schedule
o Document maintenance management activities
Develop Critical Spares Inventory Management System
Asset register/GIS updates and improvements Process
Improve ‘As constructed’ data capture procedure
Define staff roles and responsibilities
Wastewater Asset Management Plan v0.03 17
2.0 Introduction
2.1 Background
This Asset Management Plan communicates:
the requirements for the sustainable delivery of Wastewater services through management of assets, risk and compliance with regulatory requirements; and
the required funding to provide the specified levels of service over the long-term planning period.
The Asset Management Plan should be read in conjunction with other Council planning documents, namely:
Asset Management Policy (2019)
Asset Management Strategy (2018)
Asset Management Governance Framework (2019)
Operational Budget – Wastewater (2020)
Wastewater 10-year Capital Works
Long Term Financial Plan.
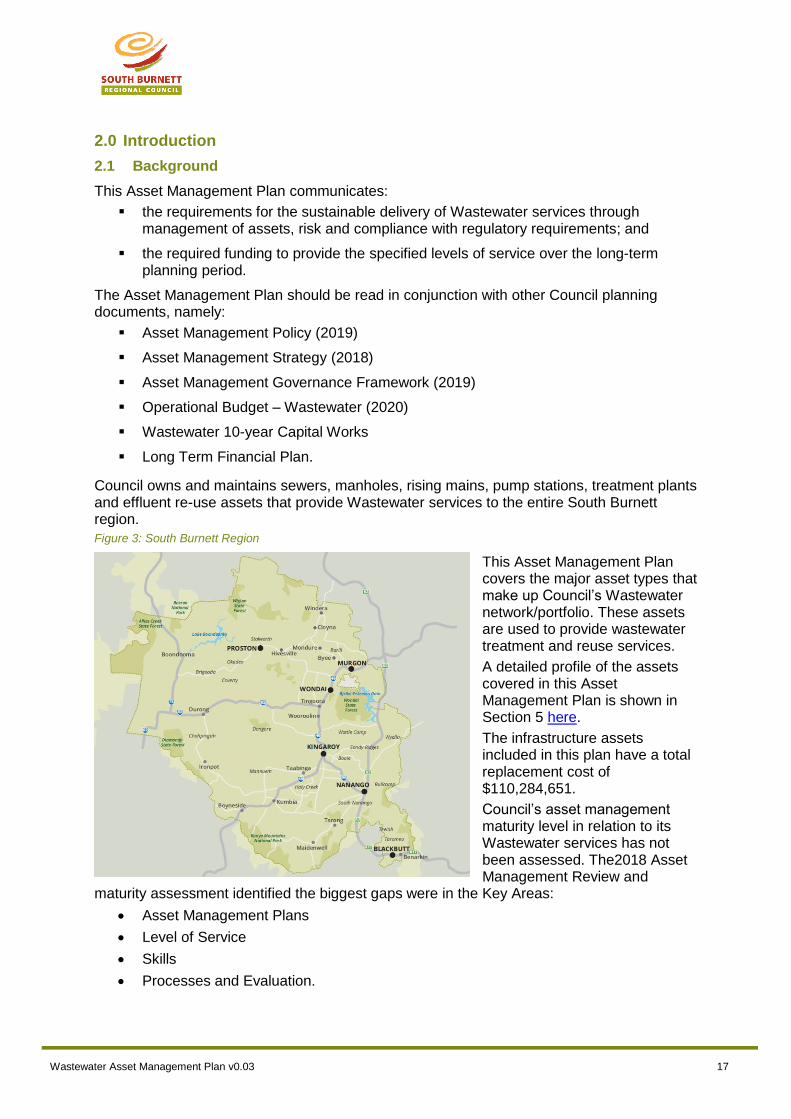
Council owns and maintains sewers, manholes, rising mains, pump stations, treatment plants and effluent re-use assets that provide Wastewater services to the entire South Burnett region.
Figure 3: South Burnett Region
This Asset Management Plan covers the major asset types that make up Council’s Wastewater network/portfolio. These assets are used to provide wastewater treatment and reuse services.
A detailed profile of the assets covered in this Asset Management Plan is shown in Section 5 here.
The infrastructure assets included in this plan have a total replacement cost of $110,284,651.
Council’s asset management maturity level in relation to its Wastewater services has not been assessed. The2018 Asset Management Review and
maturity assessment identified the biggest gaps were in the Key Areas:
Asset Management Plans
Level of Service
Skills
Processes and Evaluation.

Wastewater Asset Management Plan v0.03 18
On-going investment and support are required to improve our asset lifecycle and information management practices for Wastewater services. This investment will improve the quality of future iterations of this plan.
2.2 Goals and Objectives of Asset Ownership
Our goal in managing assets is to sustainably meet the defined level of service (as amended from time to time) in the most cost-effective manner while adequately controlling the risks associated with delivering those services.
The key elements of infrastructure asset management are:
Providing a defined level of service and monitoring performance;
Managing the impact of growth through demand management and infrastructure investment;
Taking a lifecycle approach to developing cost-effective management strategies for the long-term that meet the defined level of service;
Identifying, assessing and appropriately controlling risks, and
Linking to a long-term financial plan which identifies required, affordable forecast costs and how it will be allocated.
2.3 Planning framework
Key elements of the Asset Management Planning framework required to deliver on these goals are:
Levels of service – specifies the services and levels of service to be provided,
Future demand – how this will impact on future service delivery and how this is to be met,
Lifecycle management – how to manage its existing and future assets to provide defined levels of service,
Financial summary – what funds are required to provide the defined services,
Asset management practices – how we manage provision of the services,
Monitoring – how the plan will be monitored to ensure objectives are met,
Asset management improvement plan – how we increase asset management maturity.
Other references to the benefits, fundamentals principles and objectives of asset management are:
International Infrastructure Management Manual 20151
ISO 550002
2.4 Core and Advanced Asset Management Planning
The concepts of ‘core’ and ‘advanced asset management are discussed in Section 4.2.1 of the International Infrastructure Management Manual 2015.
As a ‘core’ Asset Management Plan, this document includes:
1 Based on IPWEA 2015 IIMM, Sec 2.1.3, p 2| 13
2 ISO 55000 Overview, principles and terminology
Wastewater Asset Management Plan v0.03 19
a review of strategic trends facing the Council and potential impacts on the asset stock, asset condition and performance against key indicators;
long term financial forecasts for the 20-years from 2021/22 to 2040/41;
an assessment of the financial sustainability of the assets included in this plan; and
an improvement plan for managing the assets.
The financial implications of providing the specified levels of service into the future are also provided in a separate spreadsheet model that accompanies this Asset Management Plan.
However, the following caveats should be noted about the quality of information contained in this initial plan:
Council’s Planned (i.e. Budgeted) CAPEX is derived from the current (April 2020) FWP.
Council’s Planned (i.e. Budgeted) Opex is based on wastewater operational budget as at April 2020.
Forecast renewals are derived from valuations as at 30 June 2020 based on Asset register as at April 2020].
Notwithstanding these caveats, the benefits of this plan are:
It will assist Council to make informed decisions about its Wastewater assets;
It documents Council’s current methodology for managing the Wastewater assets across the asset lifecycle;
It identifies opportunities for improvement in the way council operates and manages its Wastewater;
It documents Council’s plan for improving its management practices of Wastewater assets;
It provides an initial assessment of the financial sustainability of the current Wastewater levels of service.
Future versions of the plan will contain refined asset lifecycle cost forecasts based on improved asset data.

Wastewater Asset Management Plan v0.03 20
2.5 Stakeholders
Key stakeholders in this Asset Management Plan are shown below:
Table 2: Key Stakeholders in the Asset Management Plan
Key Stakeholder Role in Asset Management Plan
Councillors Stewards of the community’s resources and assets.
Represent the needs of community and service level expectations.
Endorse asset management policy and plans.
Ensure the organisation is financially sustainable.
Chief Executive Officer (CEO)
Overall responsibility for developing an asset management policy, plans and procedures and reporting on the status and effectiveness of asset management within Council.
Allocate resources to meet the organisation’s objectives in providing approved levels of service while managing risks;
Ensuring the organisation is financially sustainable.
Asset Management Group Custodian of the corporate asset register for Wastewater assets and ensuring the asset valuations are accurate;
Preparation of asset sustainability and financial reports incorporating asset depreciation in compliance with current Australian accounting standards;
Asset Management System and Geographic Information System development and administration;
Develop 10 Year Capital Works Plans and budgeting;
Ensure approved funds are applied appropriately to ensure best value for money is delivered to the community;
Develop the maintenance standards required, so Council meets the specified technical and community levels of service.
Staff Verify the size, location, condition and performance of assets.
Provide local knowledge/history about Wastewater assets.
Perform Capital Works, Operation and Maintenance activities as directed to meet agreed levels of service;
Liaison internally with the Senior Management Team around asset activity prioritisation and planning.
The community (residents, businesses, property owners), Developers, Consultants/Contractors)
Be informed of service levels, risks and associated costs.
Participate in consultation processes.
Provide feedback on the quality and value for money of Council’s services.
State and Federal Government
Provide Leadership in promoting Best Practice Asset Management.
Recognising the importance of local government assets to the community.
Wastewater Asset Management Plan v0.03 21
Key Stakeholder Role in Asset Management Plan
Contribute funding to support the provision, maintenance and renewal of community assets.

Wastewater Asset Management Plan v0.03 22
Our organisational structure for service delivery for Wastewater assets is detailed below.
Figure 4: Wastewater Related Functions
2.6 Customer Research and Expectations
Council currently gauges customer satisfaction and expectations around Wastewater levels of service through:
Analysis of customer service requests.
Gathering stakeholder feedback during community Listening Tours.
Future revisions of the Asset Management Plan will incorporate customer consultation mechanisms around service levels and costs of providing the service. This will assist the Council in matching the service types, levels, risks and consequences with the community’s ability and willingness to pay for these services.
Wastewater Asset Management Plan v0.03 23
3.0 LEVELS OF SERVICE
3.1 Strategic and Corporate Goals
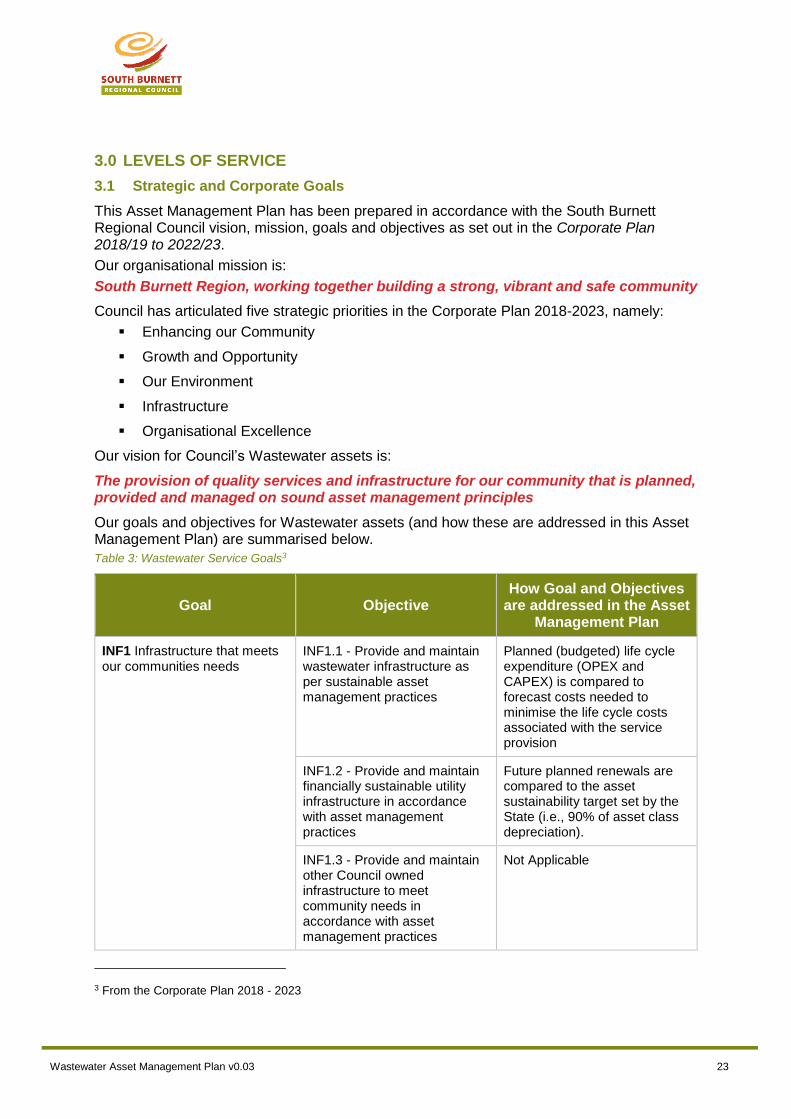
This Asset Management Plan has been prepared in accordance with the South Burnett Regional Council vision, mission, goals and objectives as set out in the Corporate Plan 2018/19 to 2022/23.
Our organisational mission is:
South Burnett Region, working together building a strong, vibrant and safe community
Council has articulated five strategic priorities in the Corporate Plan 2018-2023, namely:
Enhancing our Community
Growth and Opportunity
Our Environment
Infrastructure
Organisational Excellence
Our vision for Council’s Wastewater assets is:
The provision of quality services and infrastructure for our community that is planned, provided and managed on sound asset management principles
Our goals and objectives for Wastewater assets (and how these are addressed in this Asset Management Plan) are summarised below.
Table 3: Wastewater Service Goals3
Goal Objective How Goal and Objectives
are addressed in the Asset Management Plan
INF1 Infrastructure that meets our communities needs
INF1.1 - Provide and maintain wastewater infrastructure as per sustainable asset management practices
Planned (budgeted) life cycle expenditure (OPEX and CAPEX) is compared to forecast costs needed to minimise the life cycle costs associated with the service provision
INF1.2 - Provide and maintain financially sustainable utility infrastructure in accordance with asset management practices
Future planned renewals are compared to the asset sustainability target set by the State (i.e., 90% of asset class depreciation).
INF1.3 - Provide and maintain other Council owned infrastructure to meet community needs in accordance with asset management practices
Not Applicable
3 From the Corporate Plan 2018 - 2023
Wastewater Asset Management Plan v0.03 24
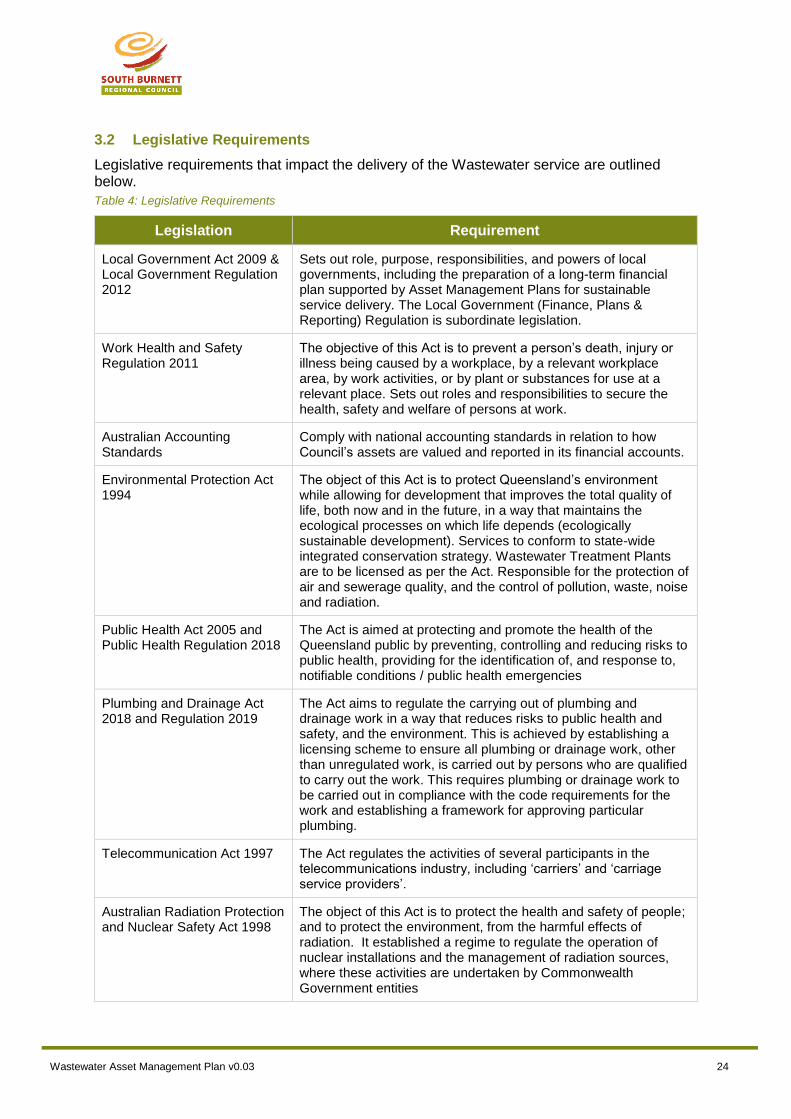
3.2 Legislative Requirements
Legislative requirements that impact the delivery of the Wastewater service are outlined below.
Table 4: Legislative Requirements
Legislation Requirement
Local Government Act 2009 & Local Government Regulation 2012
Sets out role, purpose, responsibilities, and powers of local governments, including the preparation of a long-term financial plan supported by Asset Management Plans for sustainable service delivery. The Local Government (Finance, Plans & Reporting) Regulation is subordinate legislation.
Work Health and Safety Regulation 2011
The objective of this Act is to prevent a person’s death, injury or illness being caused by a workplace, by a relevant workplace area, by work activities, or by plant or substances for use at a relevant place. Sets out roles and responsibilities to secure the health, safety and welfare of persons at work.
Australian Accounting Standards
Comply with national accounting standards in relation to how Council’s assets are valued and reported in its financial accounts.
Environmental Protection Act 1994
The object of this Act is to protect Queensland’s environment while allowing for development that improves the total quality of life, both now and in the future, in a way that maintains the ecological processes on which life depends (ecologically sustainable development). Services to conform to state-wide integrated conservation strategy. Wastewater Treatment Plants are to be licensed as per the Act. Responsible for the protection of air and sewerage quality, and the control of pollution, waste, noise and radiation.
Public Health Act 2005 and Public Health Regulation 2018
The Act is aimed at protecting and promote the health of the Queensland public by preventing, controlling and reducing risks to public health, providing for the identification of, and response to, notifiable conditions / public health emergencies
Plumbing and Drainage Act 2018 and Regulation 2019
The Act aims to regulate the carrying out of plumbing and drainage work in a way that reduces risks to public health and safety, and the environment. This is achieved by establishing a licensing scheme to ensure all plumbing or drainage work, other than unregulated work, is carried out by persons who are qualified to carry out the work. This requires plumbing or drainage work to be carried out in compliance with the code requirements for the work and establishing a framework for approving particular plumbing.
Telecommunication Act 1997 The Act regulates the activities of several participants in the telecommunications industry, including ‘carriers’ and ‘carriage service providers’.
Australian Radiation Protection and Nuclear Safety Act 1998
The object of this Act is to protect the health and safety of people; and to protect the environment, from the harmful effects of radiation. It established a regime to regulate the operation of nuclear installations and the management of radiation sources, where these activities are undertaken by Commonwealth Government entities
Wastewater Asset Management Plan v0.03 25
Legislation Requirement
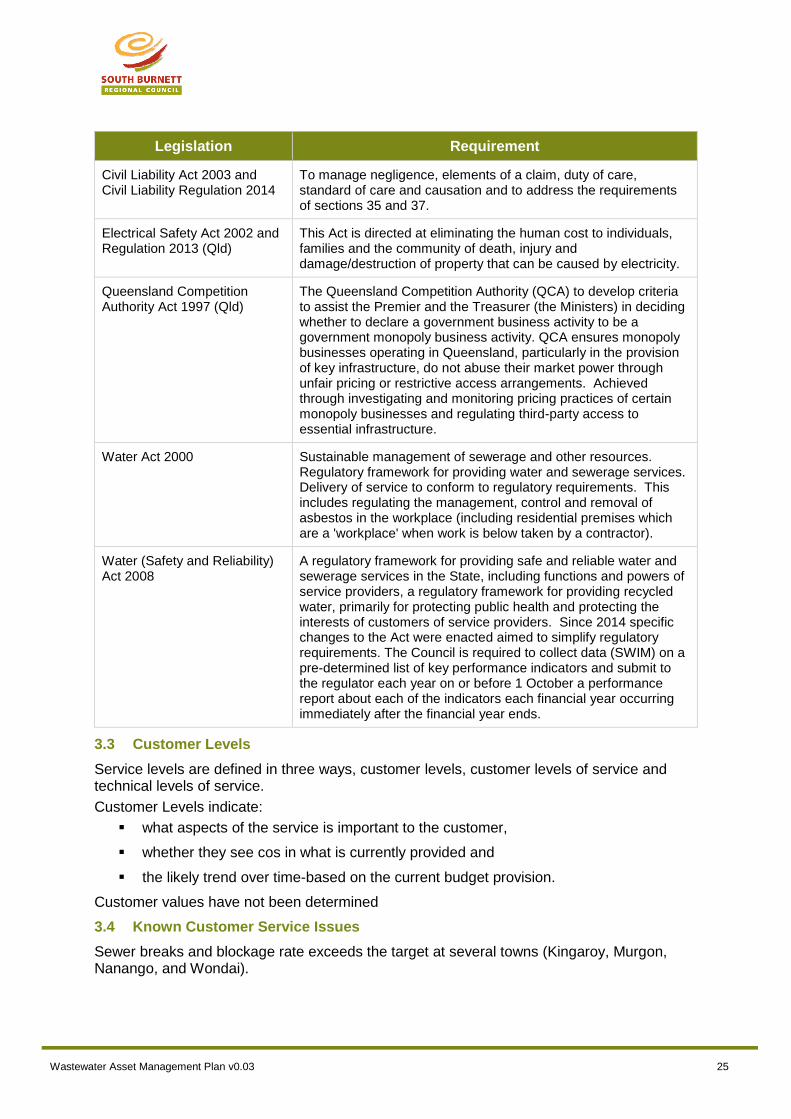
Civil Liability Act 2003 and Civil Liability Regulation 2014
To manage negligence, elements of a claim, duty of care, standard of care and causation and to address the requirements of sections 35 and 37.
Electrical Safety Act 2002 and Regulation 2013 (Qld)
This Act is directed at eliminating the human cost to individuals, families and the community of death, injury and damage/destruction of property that can be caused by electricity.
Queensland Competition Authority Act 1997 (Qld)
The Queensland Competition Authority (QCA) to develop criteria to assist the Premier and the Treasurer (the Ministers) in deciding whether to declare a government business activity to be a government monopoly business activity. QCA ensures monopoly businesses operating in Queensland, particularly in the provision of key infrastructure, do not abuse their market power through unfair pricing or restrictive access arrangements. Achieved through investigating and monitoring pricing practices of certain monopoly businesses and regulating third-party access to essential infrastructure.
Water Act 2000 Sustainable management of sewerage and other resources. Regulatory framework for providing water and sewerage services. Delivery of service to conform to regulatory requirements. This includes regulating the management, control and removal of asbestos in the workplace (including residential premises which are a 'workplace' when work is below taken by a contractor).
Water (Safety and Reliability) Act 2008
A regulatory framework for providing safe and reliable water and sewerage services in the State, including functions and powers of service providers, a regulatory framework for providing recycled water, primarily for protecting public health and protecting the interests of customers of service providers. Since 2014 specific changes to the Act were enacted aimed to simplify regulatory requirements. The Council is required to collect data (SWIM) on a pre-determined list of key performance indicators and submit to the regulator each year on or before 1 October a performance report about each of the indicators each financial year occurring immediately after the financial year ends.
3.3 Customer Levels
Service levels are defined in three ways, customer levels, customer levels of service and technical levels of service.
Customer Levels indicate:
what aspects of the service is important to the customer,
whether they see cos in what is currently provided and
the likely trend over time-based on the current budget provision.
Customer values have not been determined
3.4 Known Customer Service Issues
Sewer breaks and blockage rate exceeds the target at several towns (Kingaroy, Murgon, Nanango, and Wondai).
Wastewater Asset Management Plan v0.03 26
3.4.1 CAPEX Strategy
Capital works are generally undertaken by Council staff other than sewer relining
Capital works are undertaken by Council construction crews, e.g. gravity sewer. Tenders are let for contractors to undertake and project manage large/complex works, e.eg trunk sewers, treatment plants. Projects funded under Works for Queensland (W4Q) program generally preclude use of Council staff.
3.4.2 OPEX Strategy
The operations and maintenance strategy entails having critical spares and general operation, inspection and maintenance activities works being carried out by Council staff. Electrical repairs (other than components easy to replace) and other specialised repairs/servicing are undertaken by external providers.
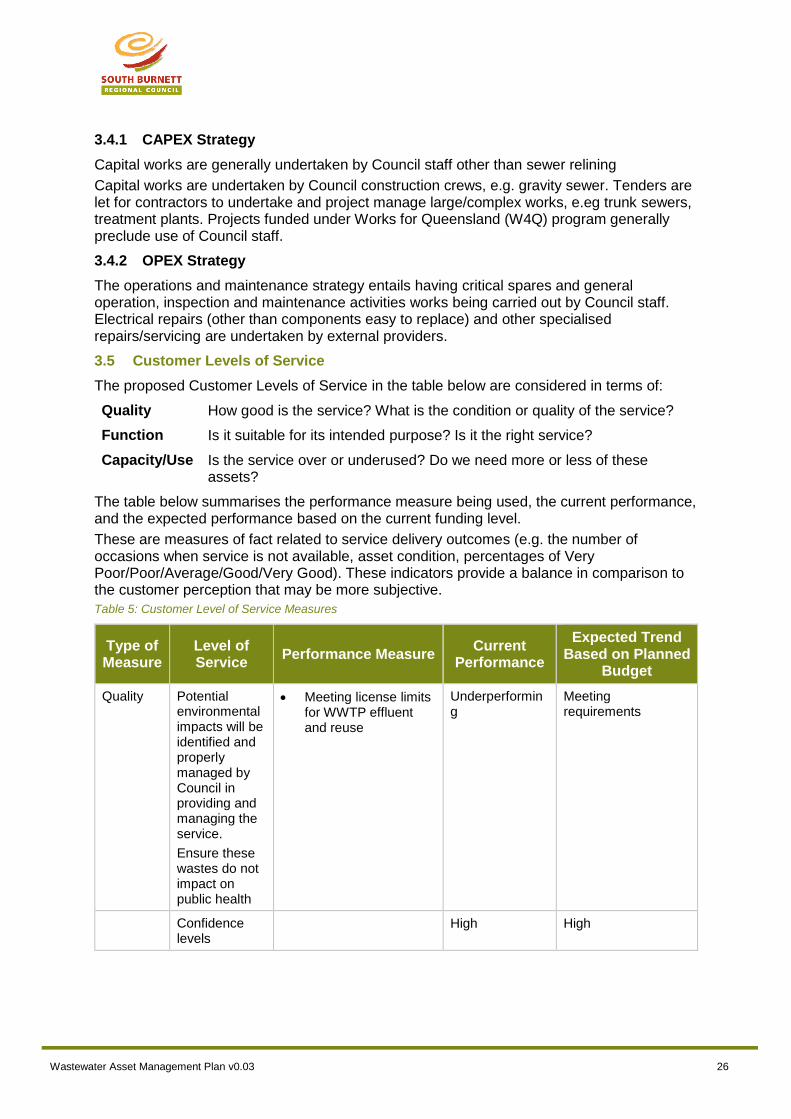
3.5 Customer Levels of Service
The proposed Customer Levels of Service in the table below are considered in terms of:
Quality How good is the service? What is the condition or quality of the service?
Function Is it suitable for its intended purpose? Is it the right service?
Capacity/Use Is the service over or underused? Do we need more or less of these assets?
The table below summarises the performance measure being used, the current performance, and the expected performance based on the current funding level.
These are measures of fact related to service delivery outcomes (e.g. the number of occasions when service is not available, asset condition, percentages of Very Poor/Poor/Average/Good/Very Good). These indicators provide a balance in comparison to the customer perception that may be more subjective.
Table 5: Customer Level of Service Measures
Type of Measure
Level of Service
Performance Measure Current
Performance
Expected Trend Based on Planned
Budget
Quality Potential environmental impacts will be identified and properly managed by Council in providing and managing the service.
Ensure these wastes do not impact on public health
Meeting license limits for WWTP effluent and reuse
Underperforming
Meeting requirements
Confidence levels
High High
Wastewater Asset Management Plan v0.03 27
Type of Measure
Level of Service
Performance Measure Current
Performance
Expected Trend Based on Planned
Budget
Function Connected assessments can be assured of continuous service.
100% of breaks and blockages responded to within 60 mins
Number of breaks and blockages (less than 15 per 100 km per year)
86% (2018/19)
23.5 (2018/19)
Improving
Improving
Confidence levels
High Medium
Capacity Council will provide a wastewater service sufficient to meet current and planned demand.
Percent of properties meeting design flow as determined from the current land use zoning density and design criteria
Not determined Likely inadequate – revised increased budget when modelling results available
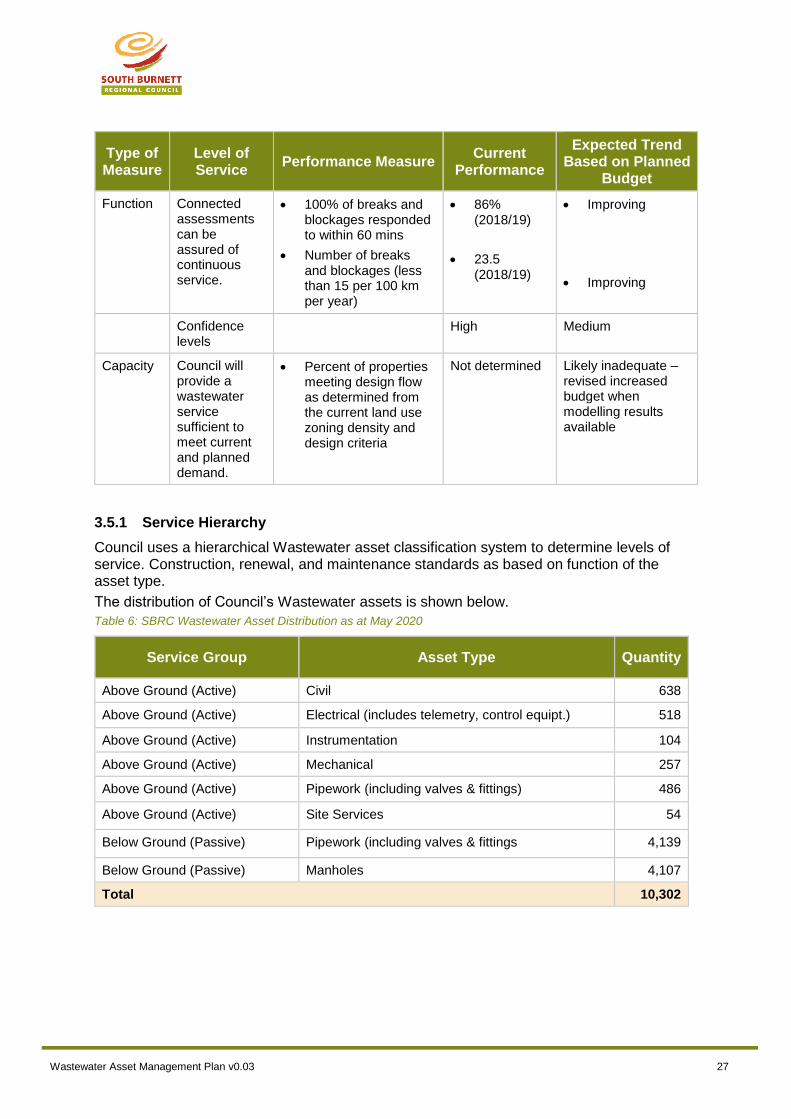
3.5.1 Service Hierarchy
Council uses a hierarchical Wastewater asset classification system to determine levels of service. Construction, renewal, and maintenance standards as based on function of the asset type.
The distribution of Council’s Wastewater assets is shown below.
Table 6: SBRC Wastewater Asset Distribution as at May 2020
Service Group Asset Type Quantity
Above Ground (Active) Civil 638
Above Ground (Active) Electrical (includes telemetry, control equipt.) 518
Above Ground (Active) Instrumentation 104
Above Ground (Active) Mechanical 257
Above Ground (Active) Pipework (including valves & fittings) 486
Above Ground (Active) Site Services 54
Below Ground (Passive) Pipework (including valves & fittings 4,139
Below Ground (Passive) Manholes 4,107
Total 10,302
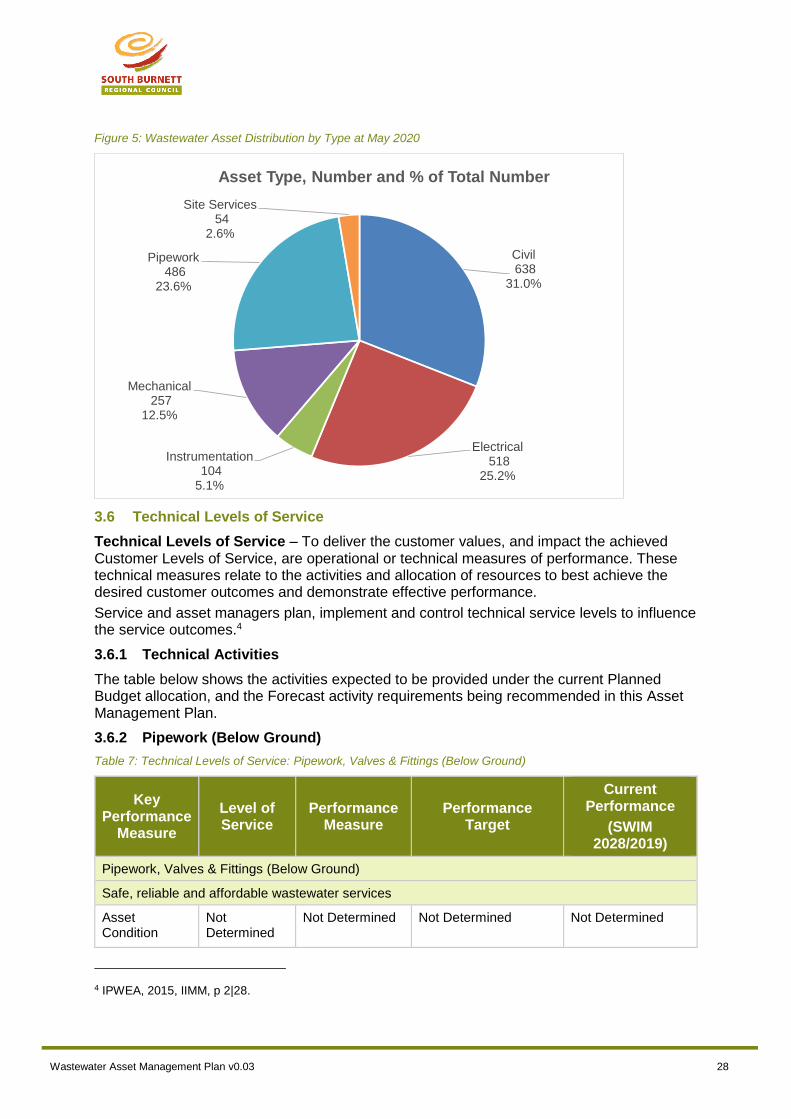
Wastewater Asset Management Plan v0.03 28
Figure 5: Wastewater Asset Distribution by Type at May 2020
3.6 Technical Levels of Service
Technical Levels of Service – To deliver the customer values, and impact the achieved Customer Levels of Service, are operational or technical measures of performance. These technical measures relate to the activities and allocation of resources to best achieve the desired customer outcomes and demonstrate effective performance.
Service and asset managers plan, implement and control technical service levels to influence the service outcomes.4
3.6.1 Technical Activities
The table below shows the activities expected to be provided under the current Planned Budget allocation, and the Forecast activity requirements being recommended in this Asset Management Plan.
3.6.2 Pipework (Below Ground)
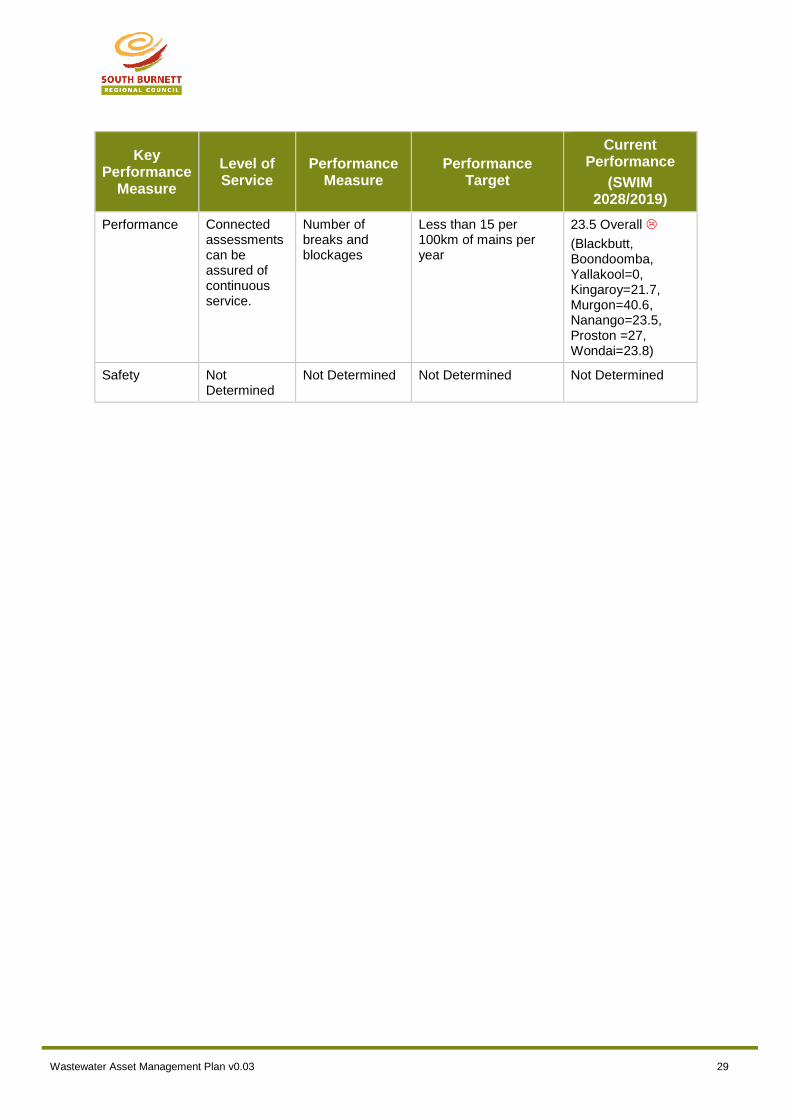
Table 7: Technical Levels of Service: Pipework, Valves & Fittings (Below Ground)
Key Performance
Measure
Level of Service
Performance Measure
Performance Target
Current Performance
(SWIM 2028/2019)
Pipework, Valves & Fittings (Below Ground)
Safe, reliable and affordable wastewater services
Asset Condition
Not Determined
Not Determined Not Determined Not Determined
4 IPWEA, 2015, IIMM, p 2|28.
Civil638
31.0%
Electrical518
25.2%
Instrumentation104
5.1%
Mechanical257
12.5%
Pipework486
23.6%
Site Services54
2.6%
Asset Type, Number and % of Total Number
Wastewater Asset Management Plan v0.03 29
Key Performance
Measure
Level of Service
Performance Measure
Performance Target
Current Performance
(SWIM 2028/2019)
Performance Connected assessments can be assured of continuous service.
Number of breaks and blockages
Less than 15 per 100km of mains per year
23.5 Overall
(Blackbutt, Boondoomba, Yallakool=0, Kingaroy=21.7, Murgon=40.6, Nanango=23.5, Proston =27, Wondai=23.8)
Safety Not Determined
Not Determined Not Determined Not Determined
Wastewater Asset Management Plan v0.03 30
4.0 FUTURE DEMAND
4.1 Demand Drivers
Drivers affecting demand include things such as population change, industrial and commercial demand, regulations, changes in demographics, seasonal factors, consumer preferences and expectations, technological changes, economic factors, agricultural practices (e.g. Proston rural scheme), environmental awareness, etc.
4.2 Demand Forecasts
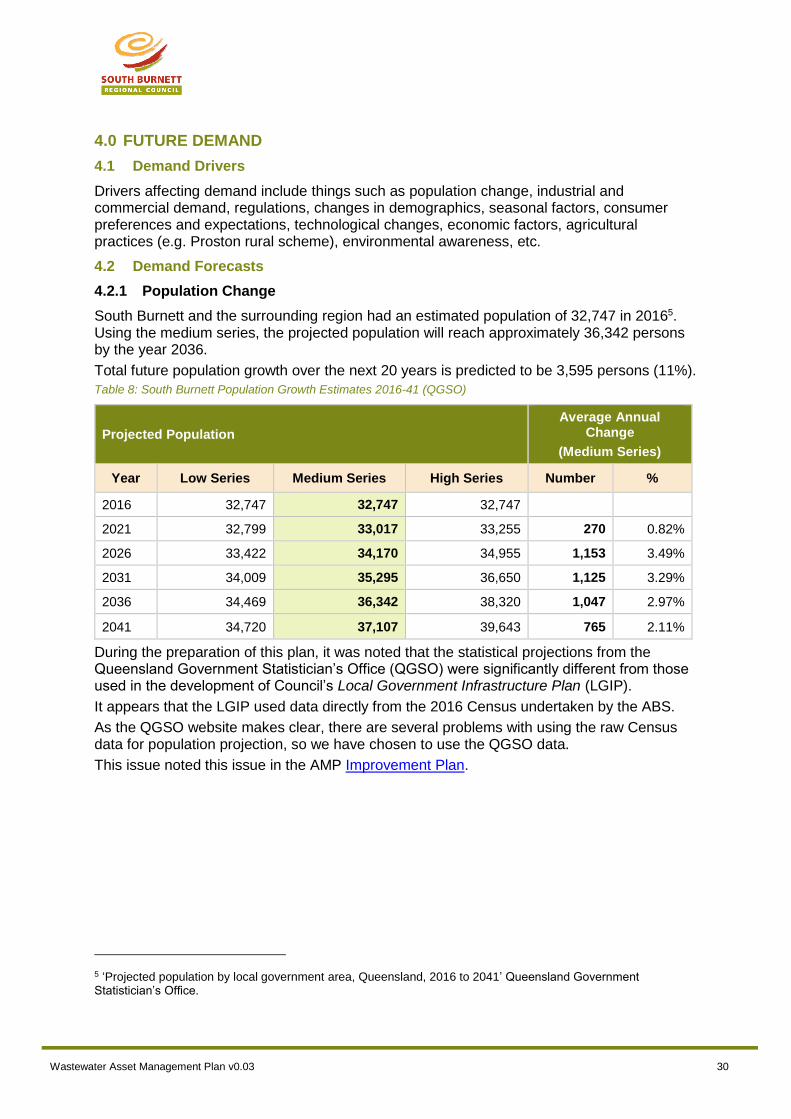
4.2.1 Population Change
South Burnett and the surrounding region had an estimated population of 32,747 in 20165. Using the medium series, the projected population will reach approximately 36,342 persons by the year 2036.
Total future population growth over the next 20 years is predicted to be 3,595 persons (11%).
Table 8: South Burnett Population Growth Estimates 2016-41 (QGSO)
Projected Population
Average Annual Change
(Medium Series)
Year Low Series Medium Series High Series Number %
2016 32,747 32,747 32,747
2021 32,799 33,017 33,255 270 0.82%
2026 33,422 34,170 34,955 1,153 3.49%
2031 34,009 35,295 36,650 1,125 3.29%
2036 34,469 36,342 38,320 1,047 2.97%
2041 34,720 37,107 39,643 765 2.11%
During the preparation of this plan, it was noted that the statistical projections from the Queensland Government Statistician’s Office (QGSO) were significantly different from those used in the development of Council’s Local Government Infrastructure Plan (LGIP).
It appears that the LGIP used data directly from the 2016 Census undertaken by the ABS.
As the QGSO website makes clear, there are several problems with using the raw Census data for population projection, so we have chosen to use the QGSO data.
This issue noted this issue in the AMP Improvement Plan.
5 ‘Projected population by local government area, Queensland, 2016 to 2041’ Queensland Government Statistician’s Office.

Wastewater Asset Management Plan v0.03 31
Figure 6: Regional Growth Projections (2016 - 2041): QGSO and LGIP (ABS)
4.2.2 Equivalent Population Change
The data Council has about the number of connected properties in 2019 and projected future demand for service catchments comes from Council’s Local Government Infrastructure Plan (LGIP). The issues with LGIP population projections are explained above.
It is also noted more accurate data is required for the number of connections at locations.
Table 9: 2019 connections and projected demand (LGIP)
Service Catchment
Connected Properties
Existing and Projected Demand (EP)
(Source: LGIP)
2019 2016 2021 2026 2031 2036 Ultimate
Blackbutt 352 1,112 1,195 1,290 1,389 1,484 2,215
Boondooma 14 ND ND ND ND ND ND
Kingaroy 3,861 12,212 13,015 14,012 15,140 16,050 28,844
Murgon 1,014 3,369 3,563 3,803 4,058 4,300 6,512
Nanango 1,122 4,076 4,197 4,423 4,688 4,882 8,731
Proston 1616 407 422 443 452 465 557
Wondai 765 3,652 3,834 4,058 4,298 4,567 7,420
Yallakool 1 ND ND ND ND ND ND
ND – Not Determined
6 Connected properties for Proston unreliable
Wastewater Asset Management Plan v0.03 32
The LGIP projections do not match more reliable QGSO medium series projections, and thus it recommended the LGIP projections be updated in the future.
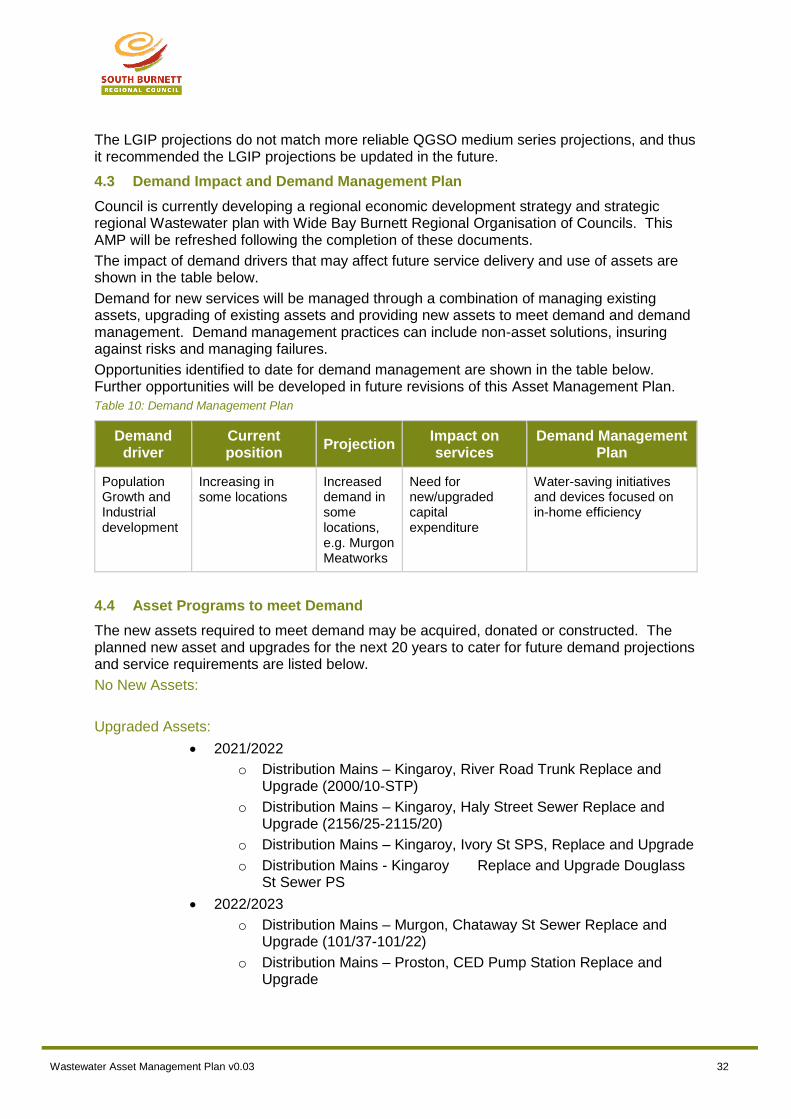
4.3 Demand Impact and Demand Management Plan
Council is currently developing a regional economic development strategy and strategic regional Wastewater plan with Wide Bay Burnett Regional Organisation of Councils. This AMP will be refreshed following the completion of these documents.
The impact of demand drivers that may affect future service delivery and use of assets are shown in the table below.
Demand for new services will be managed through a combination of managing existing assets, upgrading of existing assets and providing new assets to meet demand and demand management. Demand management practices can include non-asset solutions, insuring against risks and managing failures.
Opportunities identified to date for demand management are shown in the table below. Further opportunities will be developed in future revisions of this Asset Management Plan.
Table 10: Demand Management Plan
Demand driver
Current position
Projection Impact on services
Demand Management Plan
Population Growth and Industrial development
Increasing in some locations
Increased demand in some locations, e.g. Murgon Meatworks
Need for new/upgraded capital expenditure
Water-saving initiatives and devices focused on in-home efficiency
4.4 Asset Programs to meet Demand
The new assets required to meet demand may be acquired, donated or constructed. The planned new asset and upgrades for the next 20 years to cater for future demand projections and service requirements are listed below.
No New Assets:
Upgraded Assets:
2021/2022
o Distribution Mains – Kingaroy, River Road Trunk Replace and Upgrade (2000/10-STP)
o Distribution Mains – Kingaroy, Haly Street Sewer Replace and Upgrade (2156/25-2115/20)
o Distribution Mains – Kingaroy, Ivory St SPS, Replace and Upgrade
o Distribution Mains - Kingaroy Replace and Upgrade Douglass St Sewer PS
2022/2023
o Distribution Mains – Murgon, Chataway St Sewer Replace and Upgrade (101/37-101/22)
o Distribution Mains – Proston, CED Pump Station Replace and Upgrade
Wastewater Asset Management Plan v0.03 33
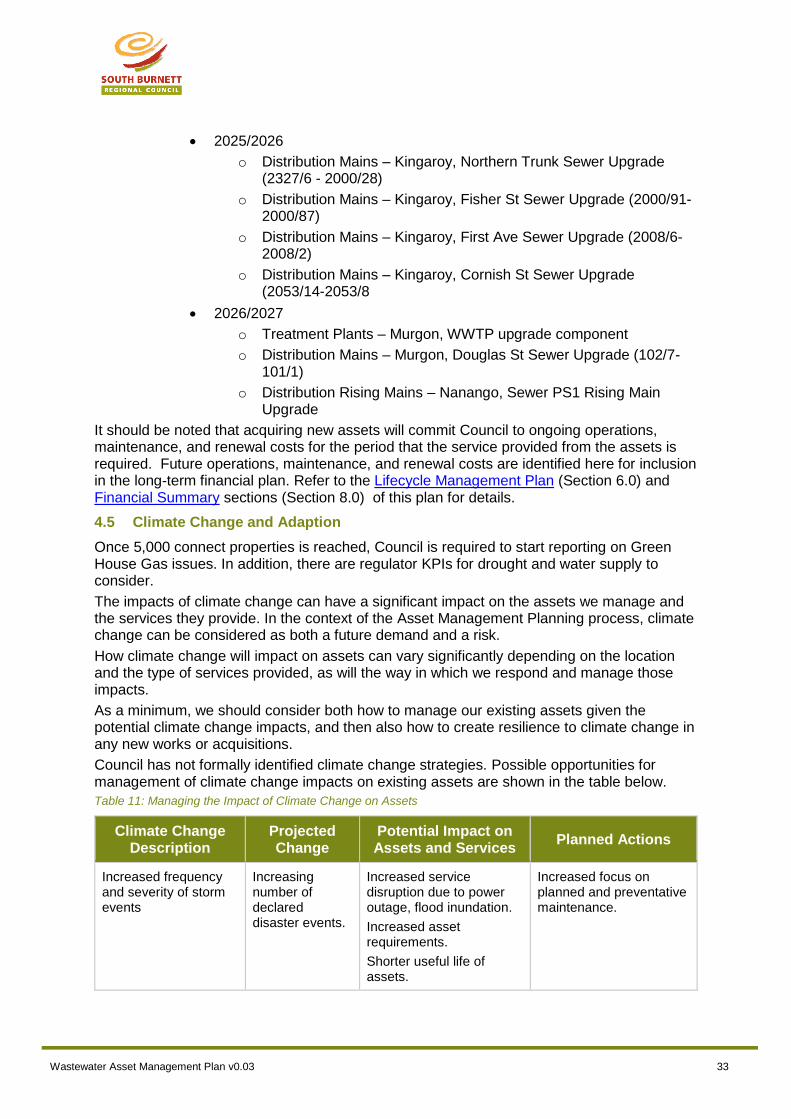
2025/2026
o Distribution Mains – Kingaroy, Northern Trunk Sewer Upgrade (2327/6 - 2000/28)
o Distribution Mains – Kingaroy, Fisher St Sewer Upgrade (2000/91-2000/87)
o Distribution Mains – Kingaroy, First Ave Sewer Upgrade (2008/6-2008/2)
o Distribution Mains – Kingaroy, Cornish St Sewer Upgrade (2053/14-2053/8
2026/2027
o Treatment Plants – Murgon, WWTP upgrade component
o Distribution Mains – Murgon, Douglas St Sewer Upgrade (102/7-101/1)
o Distribution Rising Mains – Nanango, Sewer PS1 Rising Main Upgrade
It should be noted that acquiring new assets will commit Council to ongoing operations, maintenance, and renewal costs for the period that the service provided from the assets is required. Future operations, maintenance, and renewal costs are identified here for inclusion in the long-term financial plan. Refer to the Lifecycle Management Plan (Section 6.0) and Financial Summary sections (Section 8.0) of this plan for details.
4.5 Climate Change and Adaption
Once 5,000 connect properties is reached, Council is required to start reporting on Green House Gas issues. In addition, there are regulator KPIs for drought and water supply to consider.
The impacts of climate change can have a significant impact on the assets we manage and the services they provide. In the context of the Asset Management Planning process, climate change can be considered as both a future demand and a risk.
How climate change will impact on assets can vary significantly depending on the location and the type of services provided, as will the way in which we respond and manage those impacts.
As a minimum, we should consider both how to manage our existing assets given the potential climate change impacts, and then also how to create resilience to climate change in any new works or acquisitions.
Council has not formally identified climate change strategies. Possible opportunities for management of climate change impacts on existing assets are shown in the table below.
Table 11: Managing the Impact of Climate Change on Assets
Climate Change Description
Projected Change
Potential Impact on Assets and Services
Planned Actions
Increased frequency and severity of storm events
Increasing number of declared disaster events.
Increased service disruption due to power outage, flood inundation.
Increased asset requirements.
Shorter useful life of assets.
Increased focus on planned and preventative maintenance.
Wastewater Asset Management Plan v0.03 34
Climate Change Description
Projected Change
Potential Impact on Assets and Services
Planned Actions
Increased asset impairment expense.
Additionally, the way in which we construct new assets should recognise that there is opportunity to build in resilience to climate change impacts. Building resilience will have several benefits, including:
Assets will withstand the impacts of climate change
Services can be sustained
Assets that can endure may potentially lower the lifecycle cost and reduce their carbon footprint
The impact of climate change on assets is a new and complex discussion, and resilience opportunities will be developed in future revisions of this Asset Management Plan.
4.6 Technological Change
The impacts of climate change can have a significant impact on the assets we manage and the services they provide. In the context of the Asset Management Planning process, climate change can be considered as both a future demand and a risk.

Wastewater Asset Management Plan v0.03 35
5.0 ASSET PROFILE
5.1 Asset Hierarchy
An asset hierarchy provides a framework for structuring data in an information system to assist in collection of data, reporting information and making decisions. The hierarchy shown in Appendix B includes the asset class and component used for asset planning and financial reporting and service level hierarchy used for service planning and delivery.
5.2 Asset Quantities and Costs
Council’s Wastewater assets are costed at fair value (cost to replace service capacity) and depreciated using the straight-line method over their useful lives.
The best available estimate of the cost of the Wastewater assets are shown below.
Current Replacement Cost $ 110,284,651
Depreciated Replacement Cost7 $ 58,506,522
Annual Depreciation $ 1,589,093
These costs are comprised of the following components:
Table 12: Wastewater Asset Valuation Summary as at 30 June 2020
Asset Category/ Sub-category
Number of Facilities
Current Replacement
Cost ($)
Written Down Value ($)
Annual Depreciation
($)
Wastewater Transfer
Sewage Pump Stations
25 $7,265,299. $4,652,7512 $139,098.
Wastewater Transfer
Effluent Re-use Pump Stations
2 $668,039 $335,819 $20,271
Wastewater Treatment and Processing
Treatment Plants 9 $42,991,379 $28,650,350 $604,726
Wastewater Distribution
Effluent Re-use 1 $364,787 $249,843 $6,149
Wastewater Distribution
Distribution Mains and Lining approx. 235 km $42,938,602 $19,983,256 $567,468
Distribution Rising Mains
approx. 9.6 km (23) $1,296,986 $468,289 $21,391
Manholes 4,107 $14,759,559 $4,166,213 $229,988
Total $110,284,651 $58,506,522 $1,589,093
This asset class was valued in April 2020 and the following changes were noted in the Valuer’s report:
7 Also reported as Written Down Cost, Carrying or Net Book Cost.
Wastewater Asset Management Plan v0.03 36
1. Moderate to significant modification to construction rates (refer valuation report)
based on a modern equivalent replacement cost or based on actual dimensions and
construction rates by first principles.
2. Includes significant costs for assets previously not valued and new assets.
5.3 Asset Useful Lives
5.3.1 Typical Asset Useful Lives
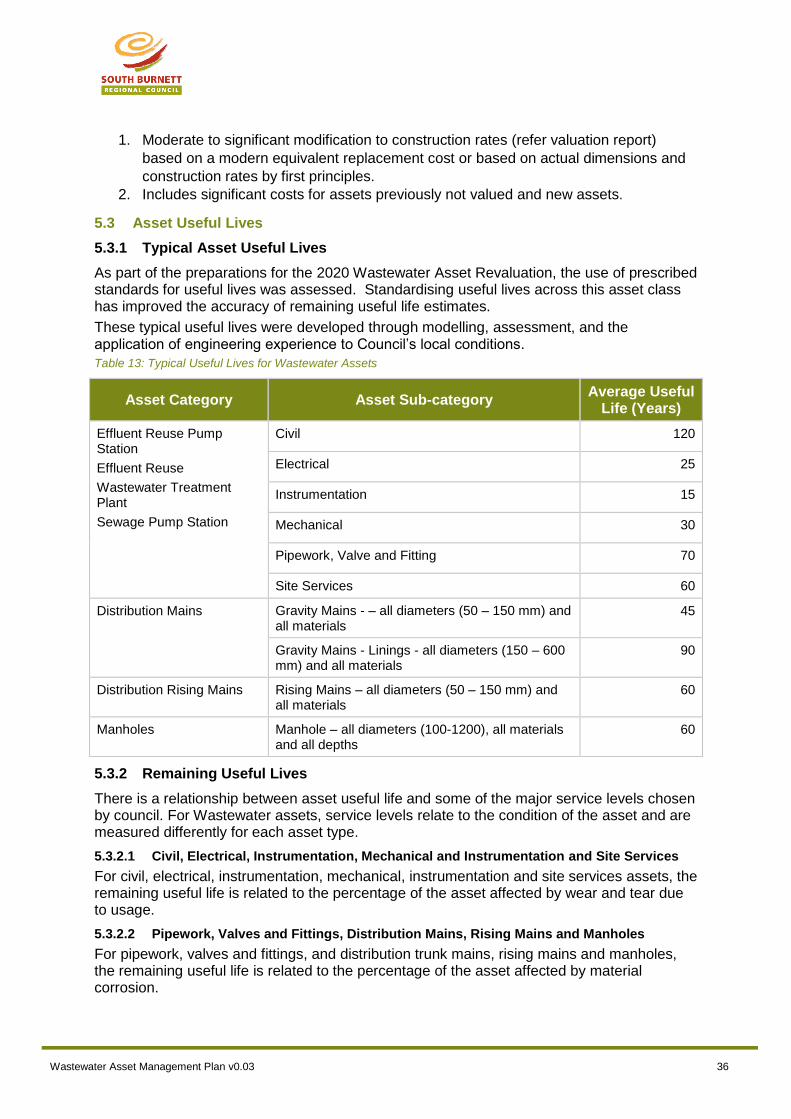
As part of the preparations for the 2020 Wastewater Asset Revaluation, the use of prescribed standards for useful lives was assessed. Standardising useful lives across this asset class has improved the accuracy of remaining useful life estimates.
These typical useful lives were developed through modelling, assessment, and the application of engineering experience to Council’s local conditions.
Table 13: Typical Useful Lives for Wastewater Assets
Asset Category Asset Sub-category Average Useful
Life (Years)
Effluent Reuse Pump Station
Effluent Reuse
Wastewater Treatment Plant
Sewage Pump Station
Civil 120
Electrical 25
Instrumentation 15
Mechanical 30
Pipework, Valve and Fitting 70
Site Services 60
Distribution Mains Gravity Mains - – all diameters (50 – 150 mm) and all materials
45
Gravity Mains - Linings - all diameters (150 – 600 mm) and all materials
90
Distribution Rising Mains Rising Mains – all diameters (50 – 150 mm) and all materials
60
Manholes Manhole – all diameters (100-1200), all materials and all depths
60
5.3.2 Remaining Useful Lives
There is a relationship between asset useful life and some of the major service levels chosen by council. For Wastewater assets, service levels relate to the condition of the asset and are measured differently for each asset type.
5.3.2.1 Civil, Electrical, Instrumentation, Mechanical and Instrumentation and Site Services
For civil, electrical, instrumentation, mechanical, instrumentation and site services assets, the remaining useful life is related to the percentage of the asset affected by wear and tear due to usage.
5.3.2.2 Pipework, Valves and Fittings, Distribution Mains, Rising Mains and Manholes
For pipework, valves and fittings, and distribution trunk mains, rising mains and manholes, the remaining useful life is related to the percentage of the asset affected by material corrosion.
Wastewater Asset Management Plan v0.03 37
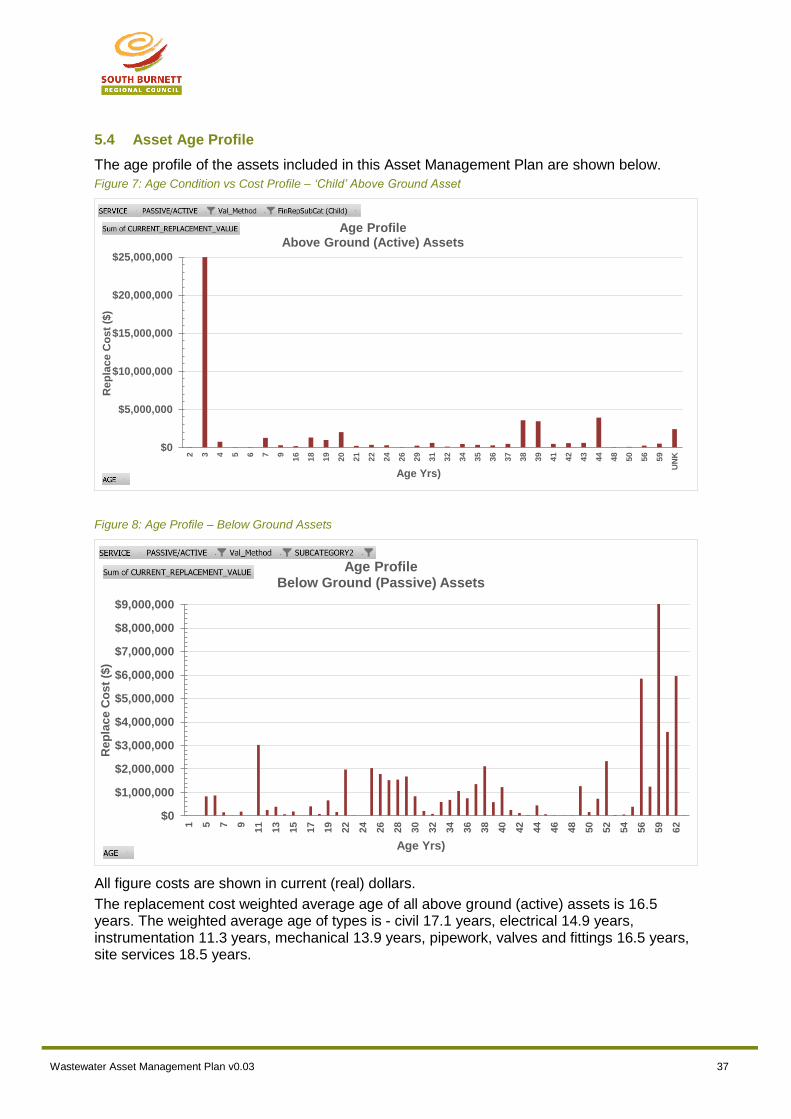
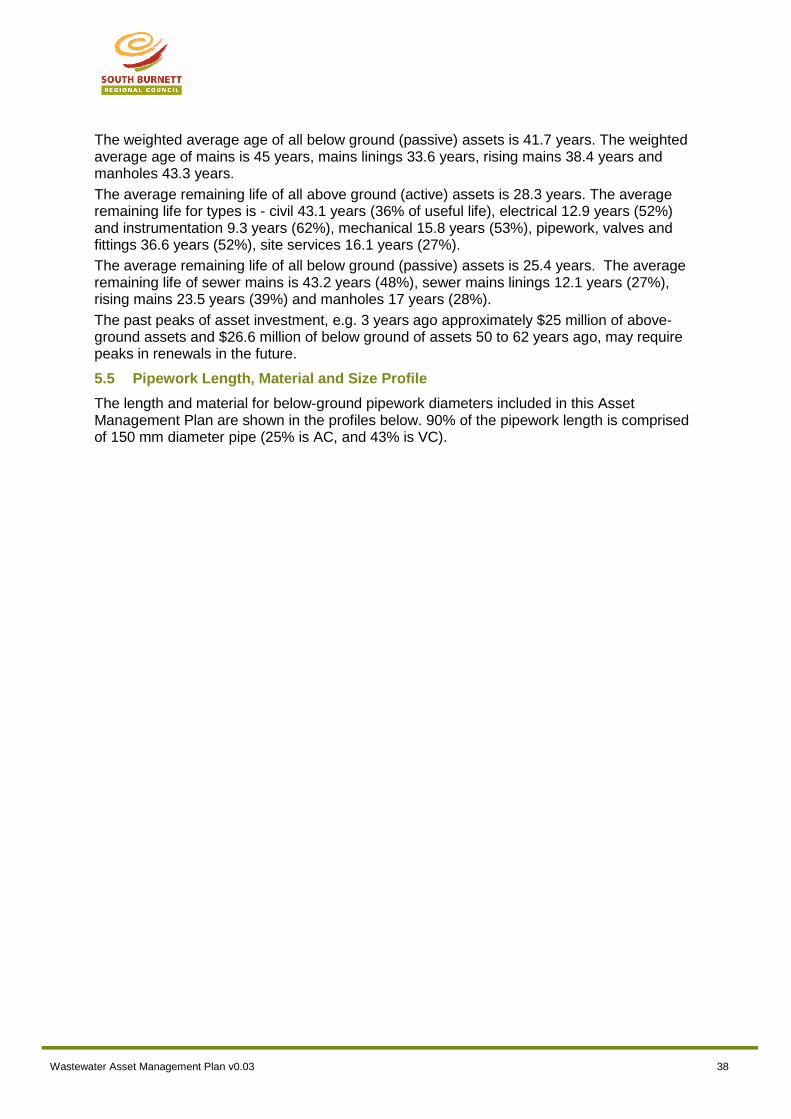
5.4 Asset Age Profile
The age profile of the assets included in this Asset Management Plan are shown below.
Figure 7: Age Condition vs Cost Profile – ‘Child’ Above Ground Asset
Figure 8: Age Profile – Below Ground Assets
All figure costs are shown in current (real) dollars.
The replacement cost weighted average age of all above ground (active) assets is 16.5 years. The weighted average age of types is - civil 17.1 years, electrical 14.9 years, instrumentation 11.3 years, mechanical 13.9 years, pipework, valves and fittings 16.5 years, site services 18.5 years.
$0
$5,000,000
$10,000,000
$15,000,000
$20,000,000
$25,000,000
2 3 4 5 6 7 9
16
18
19
20
21
22
24
26
29
31
32
34
35
36
37
38
39
41
42
43
44
48
50
56
59
UN
K
Re
pla
ce
Co
st
($)
Age Yrs)
Age ProfileAbove Ground (Active) Assets
$0
$1,000,000
$2,000,000
$3,000,000
$4,000,000
$5,000,000
$6,000,000
$7,000,000
$8,000,000
$9,000,000
1 5 7 9
11
13
15
17
19
22
24
26
28
30
32
34
36
38
40
42
44
46
48
50
52
54
56
59
62
Re
pla
ce
Co
st
($)
Age Yrs)
Age ProfileBelow Ground (Passive) Assets
Wastewater Asset Management Plan v0.03 38
The weighted average age of all below ground (passive) assets is 41.7 years. The weighted average age of mains is 45 years, mains linings 33.6 years, rising mains 38.4 years and manholes 43.3 years.
The average remaining life of all above ground (active) assets is 28.3 years. The average remaining life for types is - civil 43.1 years (36% of useful life), electrical 12.9 years (52%) and instrumentation 9.3 years (62%), mechanical 15.8 years (53%), pipework, valves and fittings 36.6 years (52%), site services 16.1 years (27%).
The average remaining life of all below ground (passive) assets is 25.4 years. The average remaining life of sewer mains is 43.2 years (48%), sewer mains linings 12.1 years (27%), rising mains 23.5 years (39%) and manholes 17 years (28%).
The past peaks of asset investment, e.g. 3 years ago approximately $25 million of above-ground assets and $26.6 million of below ground of assets 50 to 62 years ago, may require peaks in renewals in the future.
5.5 Pipework Length, Material and Size Profile
The length and material for below-ground pipework diameters included in this Asset Management Plan are shown in the profiles below. 90% of the pipework length is comprised of 150 mm diameter pipe (25% is AC, and 43% is VC).
Wastewater Asset Management Plan v0.03 39
Figure 9: Pipework Size Profile – Below Ground Assets
Figure 10: Pipework Size and Material Profile – Below Ground Assets
1176,302
210,668
7,332 6,7561,282 640 712 1,221
210,668
7,332 6,7561,282 640 712 1,221 549 2,278 1,857 1,526 769 1,430 837 330
0
50,000
100,000
150,000
200,000
250,000
63 100 150 225 300 375 450 525 600 150 225 300 375 450 525 600 50 63 80 100 125 150 300 500
Distribution Mains Distribution Mains - Lining Distribution Rising Mains
Len
gth
(m
)
Pipe Diameter (mm)
Wastewater - Pipe Length by Diam.Below Ground (Passive) Assets
AC, Distribution Mains 150, 52,418
PVC, Distribution Mains 150, 39,244
RC, Distribution Mains 150, 14,348.1
VC, Distribution Mains 150, $90,189
0
10,000
20,000
30,000
40,000
50,000
60,000
70,000
80,000
90,000
100,000
63 100 150 225 300 375 450 525 600 50 63 80 100 125 150 300 500
Distribution Mains Distribution Rising Mains
Len
gth
(m
)
Pipe Diameter (mm)
Wastewater - Pipe Length by Diam.Below Ground (Passive) Assets AC PVC
VC AC
CI CICL
CONC DICL
FRC GRP
PE100 PE80
Poly PVC
PVC-M RC
RCC RCCX
RCCY RCP
SEH SN4
SN8 UPVC
UPVC-SN8 VC
Wastewater Asset Management Plan v0.03 40
5.6 Asset condition
Asset condition is measured using the 0 (new) – 10 (failed) grading scheme shown below.
Table 14: Wastewater Asset Condition Rating Scheme
Condition Rating
Description % Asset
Remaining8
0 Brand New 100
1 Near new with no visible deterioration 90
2 Excellent overall condition early stages of deterioration. 80
3 Very good overall condition with obvious deterioration evident. 70
4 Good overall condition, obvious deterioration, serviceability impaired very slightly.
60
5 Fair overall condition, obvious deterioration, some serviceability loss. 50
6 Fair to poor overall condition, obvious deterioration, some serviceability loss.
40
7 Poor overall condition, obvious deterioration, some serviceability loss, high maintenance costs
30
8 Very poor overall condition, severe deterioration, very high maintenance costs. Consider renewal.
20
9 Extremely poor condition, severe serviceability problems, renewal required immediately.
10
10 Failed asset, no longer serviceable. Should not remain in service. 0
Wastewater asset condition is currently monitored in several ways:
Visual assessment of above-ground accessible assets
CCTV surveys of sewers
Council intends to confirm condition/performance of assets through a co-ordinated asset inspection program and implement the use of a 'Fault Report Record' for call outs.
5.6.1 Civil, Electrical, Instrumentation, Mechanical, Instrumentation and Site Services
Asset condition was assessed visually (in 2019) for wastewater civil, electrical, instrumentation, mechanical, instrumentation and site services assets where accessible. Otherwise, the condition is estimated from age for (standard) useful lives.
The distribution of condition for assets by child sub-category is shown below.
8 Based on estimated delivery of future economic benefit.
Wastewater Asset Management Plan v0.03 41
Figure 11: Condition Profile – ‘Child’ Above Ground Assets
1345
4
344
13
175
17 423
0
50
100
150
200
250
300
350
400
1 2 3 4 5 6 8 10 UNK
Nu
mb
er
of
As
se
ts
Condition (1 - 10)
Wastewater - Condition'Civil' Above Ground (Active) Assets
49
8
311
75
9 18 9
39
0
50
100
150
200
250
300
350
2 3 4 6 8 9 10 UNK
Nu
mb
er
of
Asse
ts
Condition (1 - 10)
Wastewater - Condition'Elect.' Above Ground (Active) Assets
2416
120
2918
1318 19
0
20
40
60
80
100
120
140
2 3 4 6 7 8 10 UNK
Nu
mb
er
of
As
se
ts
Condition (1 - 10)
'Mech.' Above Ground (Active) Assets
Wastewater Asset Management Plan v0.03 42
The distribution of average condition versus replacement cost for all child assets is shown below. The chart indicates overall averages of fair to good condition for each child category.
5
4321
253
6
89
7 161
45
0
50
100
150
200
250
300
1 2 3 4 5 6 8 9 10 UNK
Nu
mb
er
of
Ass
ets
Condition (1 - 10)
'Pipework, Valve & Fitting' Above Ground (Active) Assets
2
28
17
1 1
5
0
5
10
15
20
25
30
2 4 6 7 10 UNK
Nu
mb
er
of
As
se
ts
Condition (1 - 10)
Wastewater - Condition'Site Services' Above Ground (Active) Assets

Wastewater Asset Management Plan v0.03 43
Figure 12: Average Condition vs Cost Profile – ‘Child’ Above Ground Assets
5.6.2 Distribution Mains, Rising Mains and Manholes
Asset condition is estimated from age for (standard) useful lives.
The distribution of condition for wastewater distribution mains, rising mains and manholes is shown below.
Figure 13: Condition Profile – Distribution Trunk Mains, Rising Mains and Manholes Below Ground Assets
$34,263,652
$4,045,625
$647,454
$5,568,333 $5,259,094
$1,505,347
4.54.5
4.94.9
4.4
4.8
4.10
4.20
4.30
4.40
4.50
4.60
4.70
4.80
4.90
5.00
$0
$5,000,000
$10,000,000
$15,000,000
$20,000,000
$25,000,000
$30,000,000
$35,000,000
$40,000,000
Civil Electrical Instrumentation Mechanical Pipework, Valveand Fitting
Site Services
Co
nd
itio
n (
1-1
0)
Re
pla
ce
Valu
e
($)
Wastewater - Average Condition'Child' Above Ground (Active) Assets
393
1573
2150
0
500
1000
1500
2000
2500
2 4 6
Nu
mb
er
of
Assets
Condition (1 - 10)
Wastewater - ConditionDistribution Mains Below Ground (Passive) Assets
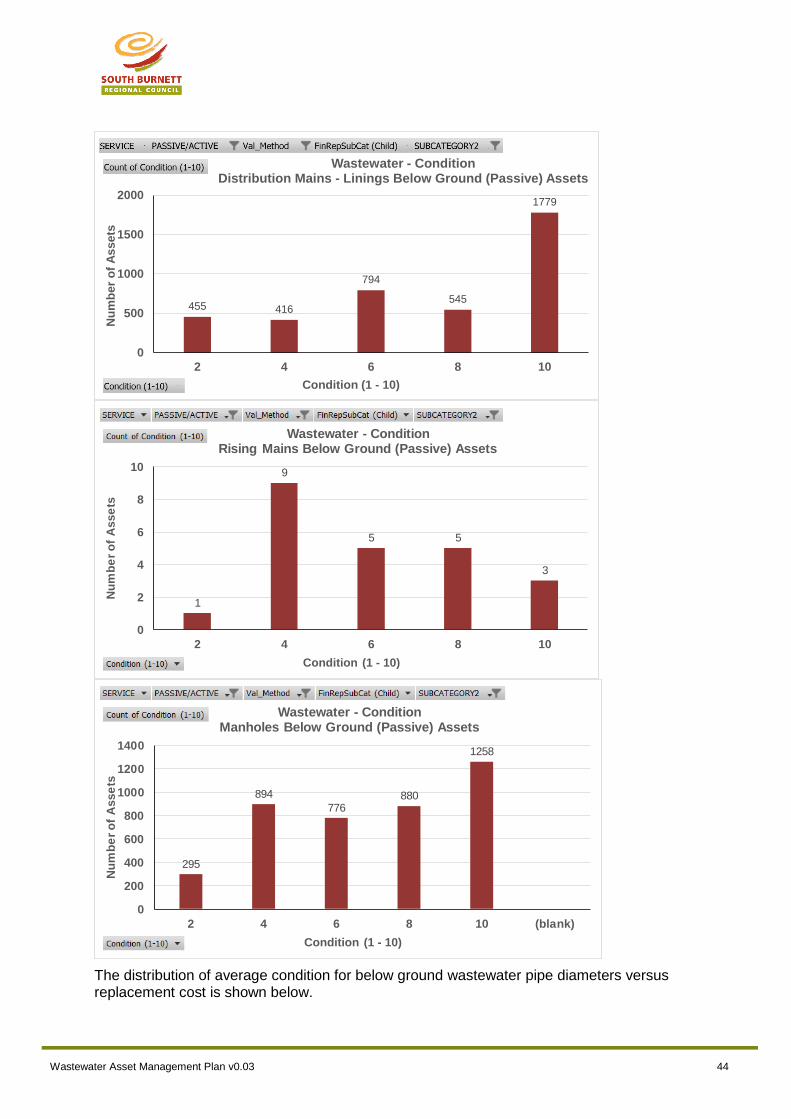
Wastewater Asset Management Plan v0.03 44
The distribution of average condition for below ground wastewater pipe diameters versus replacement cost is shown below.
455 416
794
545
1779
0
500
1000
1500
2000
2 4 6 8 10
Nu
mb
er
of
Assets
Condition (1 - 10)
Wastewater - ConditionDistribution Mains - Linings Below Ground (Passive) Assets
1
9
5 5
3
0
2
4
6
8
10
2 4 6 8 10
Nu
mb
er
of
As
se
ts
Condition (1 - 10)
Wastewater - ConditionRising Mains Below Ground (Passive) Assets
295
894
776880
1258
0
200
400
600
800
1000
1200
1400
2 4 6 8 10 (blank)
Nu
mb
er
of
As
se
ts
Condition (1 - 10)
Wastewater - ConditionManholes Below Ground (Passive) Assets
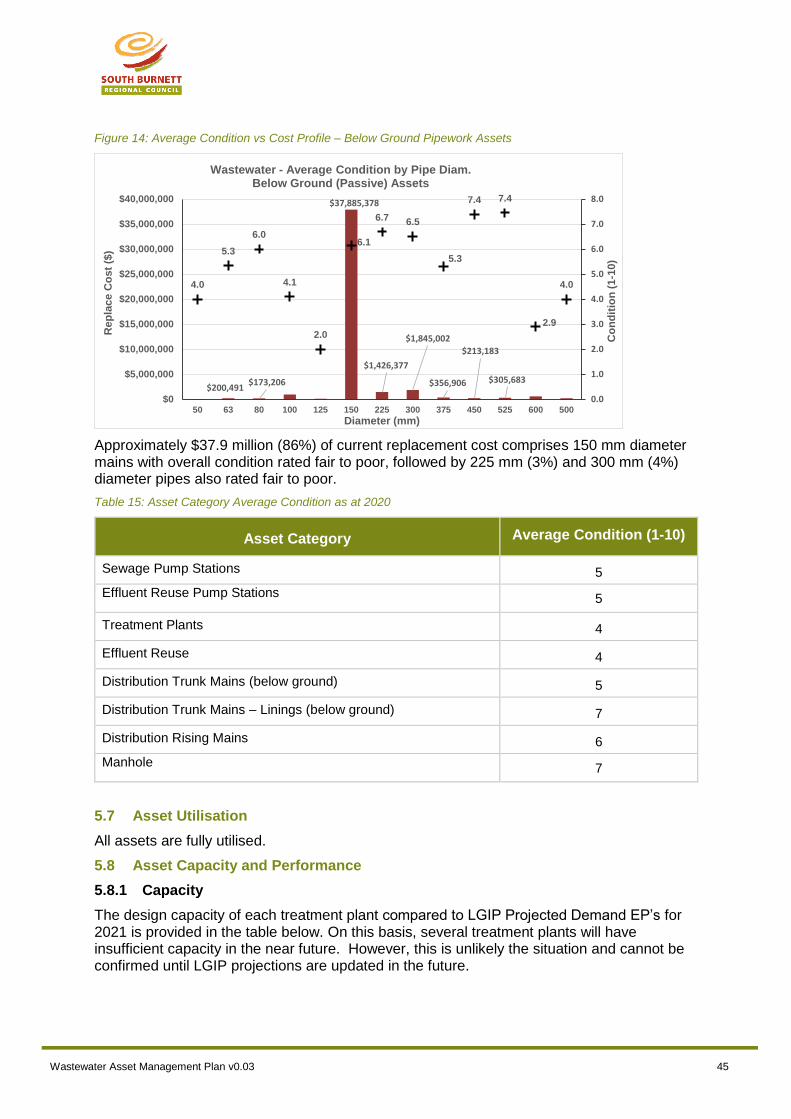
Wastewater Asset Management Plan v0.03 45
Figure 14: Average Condition vs Cost Profile – Below Ground Pipework Assets
Approximately $37.9 million (86%) of current replacement cost comprises 150 mm diameter mains with overall condition rated fair to poor, followed by 225 mm (3%) and 300 mm (4%) diameter pipes also rated fair to poor.
Table 15: Asset Category Average Condition as at 2020
Asset Category Average Condition (1-10)
Sewage Pump Stations 5
Effluent Reuse Pump Stations 5
Treatment Plants 4
Effluent Reuse 4
Distribution Trunk Mains (below ground) 5
Distribution Trunk Mains – Linings (below ground) 7
Distribution Rising Mains 6
Manhole 7
5.7 Asset Utilisation
All assets are fully utilised.
5.8 Asset Capacity and Performance
5.8.1 Capacity
The design capacity of each treatment plant compared to LGIP Projected Demand EP’s for 2021 is provided in the table below. On this basis, several treatment plants will have insufficient capacity in the near future. However, this is unlikely the situation and cannot be confirmed until LGIP projections are updated in the future.
$200,491$173,206
$37,885,378
$1,426,377
$1,845,002
$356,906
$213,183
$305,683
4.0
5.3
6.0
4.1
2.0
6.1
6.7 6.5
5.3
7.4 7.4
2.9
4.0
0.0
1.0
2.0
3.0
4.0
5.0
6.0
7.0
8.0
$0
$5,000,000
$10,000,000
$15,000,000
$20,000,000
$25,000,000
$30,000,000
$35,000,000
$40,000,000
50 63 80 100 125 150 225 300 375 450 525 600 500
Co
nd
itio
n (
1-1
0)
Rep
lace C
ost
($)
Diameter (mm)
Wastewater - Average Condition by Pipe Diam.Below Ground (Passive) Assets
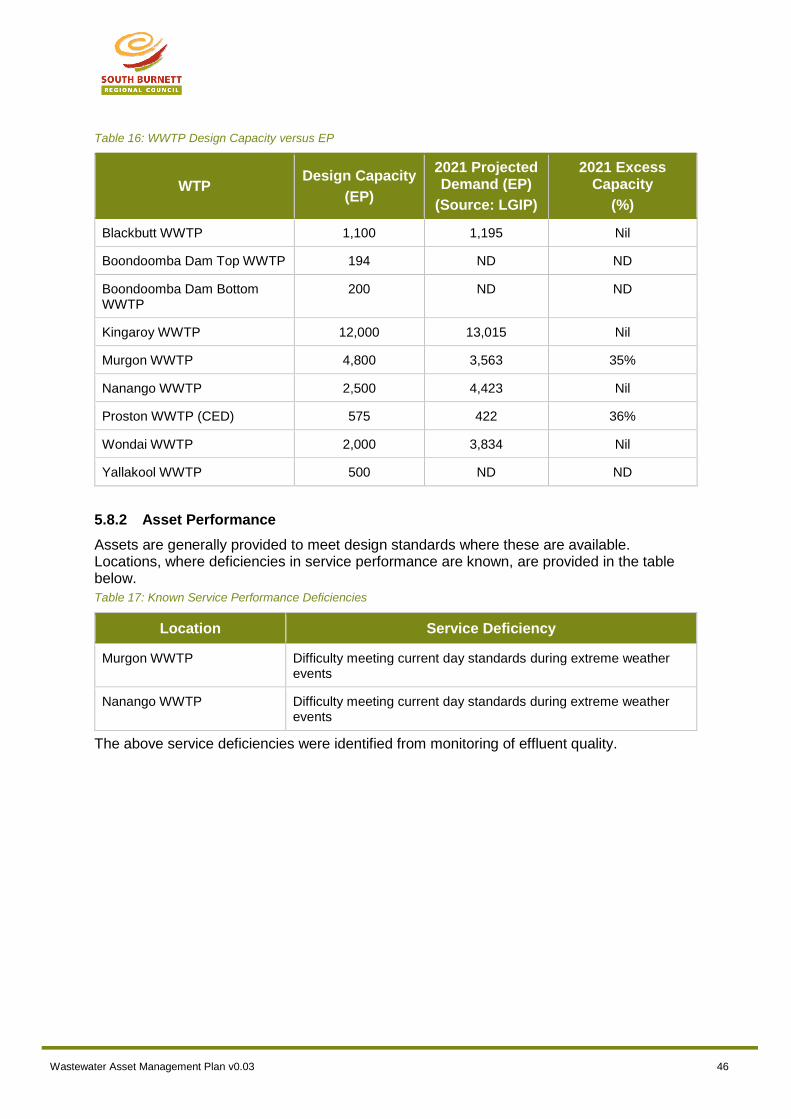
Wastewater Asset Management Plan v0.03 46
Table 16: WWTP Design Capacity versus EP
WTP Design Capacity
(EP)
2021 Projected Demand (EP)
(Source: LGIP)
2021 Excess Capacity
(%)
Blackbutt WWTP 1,100 1,195 Nil
Boondoomba Dam Top WWTP 194 ND ND
Boondoomba Dam Bottom WWTP
200 ND ND
Kingaroy WWTP 12,000 13,015 Nil
Murgon WWTP 4,800 3,563 35%
Nanango WWTP 2,500 4,423 Nil
Proston WWTP (CED) 575 422 36%
Wondai WWTP 2,000 3,834 Nil
Yallakool WWTP 500 ND ND
5.8.2 Asset Performance
Assets are generally provided to meet design standards where these are available. Locations, where deficiencies in service performance are known, are provided in the table below.
Table 17: Known Service Performance Deficiencies
Location Service Deficiency
Murgon WWTP Difficulty meeting current day standards during extreme weather events
Nanango WWTP Difficulty meeting current day standards during extreme weather events
The above service deficiencies were identified from monitoring of effluent quality.
Wastewater Asset Management Plan v0.03 47
6.0 LIFECYCLE MANAGEMENT PLAN
The lifecycle management plan details how South Burnett Regional Council plans to manage and operate its assets at the approved levels of service (Refer to Section 3) while managing life cycle costs. At present, there are few projects in the forward works program beyond year 10 due to a lack of information for decision making. This will change when Council includes recommendations from the MIPP.
6.1 Operations and Maintenance Plan
Operations include regular activities to provide services. Examples of typical operational activities include pumping and treatment of wastewater.
Maintenance includes all actions necessary for retaining an asset as near as practicable to an appropriate service condition including regular ongoing day-to-day work necessary to keep assets operating. Examples of typical maintenance activities include:
Treatment plants - Six monthly full safety audit inspection, Detailed schedules in manuals for large mechanical items. Reactive removal of lagoon sludge build-up.
Telemetry – annual testing of radio, battery
Switchboards – reactive maintenance
Instruments (analysers and laboratory) – annual serving contracts for inspections
Magnetic Flowmeters - Bi-annual calibration
Pump Stations - submersible pump sets typically run to fail. Regular weekly inspections (pump hrs run, amp meters to check pumps not overloaded, clean probes/rags) except daily high-risk Perkins St at Murgon. These are mainly low cost, low risk (duplicate) pump sets, easily replaced or spares available. All stations have an annual full safety audit inspection.
Reticulation pipework – work is largely reactive and is unplanned. Sewer main blockages and breaks are attended to as soon as possible to restore service to customers within the maximum time frame targets specified in the Customer Service Levels. The work is generally identified via customer complaints that are communicated to Council’s operational staff. Also, Council carries out adhoc cockroach spraying. CCTV inspections are carried out regularly for at-risk sewers, e.g. monthly for Kingaroy sewers with trade waste. A program of cleaning and/or regular CCTV surveys is undertaken to inputs to confirm condition (thus remaining life) and pick up impending performance issues. Survey information provides more accurate information for renewal planning - relining a sewer prior to failing costs substantially less than replacement of the sewer, particularly the deeper sewers
Other than for treatment plants, maintenance is reactive. Operation and maintenance activities for treatment plants are undertaken as per plant operation and maintenance manuals.
The historical operations and maintenance expenditure for the last three years (2016/17 to 2018/19) taken from SWIM reported data are summarised below. Average annual OPEX is approximately $5.1 million.

Wastewater Asset Management Plan v0.03 48
Table 18: Average Historical OPEX by Subcategory
Asset Type 3 Years Avg.
Annual OPEX ($) % of Total
OPEX
% of Replacement
Costs
Below ground (passive) assets $1,012,135 20% 1.7%
Above ground (active) assets $4,048,539 80% 7.9%
Total $5,060,674 4.6%
Average annual OPEX is approximately $5.1 million.
Future annual OPEX is based on the current Forward Works Planning program amounts ($2,684,991 in 2021/22, $2,743,713 in 2021/22, $2,803,404 in 2022/23 etc.).The breakdown of budgeted expenditure into operations and maintenance is derived from the forecast expenditure for 2019/20, based on 41 weeks of actuals by account description. It is summarised by Business Unit below:
Table 19: Forecast 2019/20 OPEX by Business Unit
Business Unit Operations ($) Maintenance ($)
Business Unit: 1127 - Waste Water General Operations
$406,988 $227,891
Business Unit: 1128 - Blackbutt Wastewater $51,023 $31,186
Business Unit: 1129 - Boondooma Wastewater $13,406 $20,452
Business Unit: 1130 - Kingaroy Wastewater $543,622 $408,701
Business Unit: 1131 - Murgon Wastewater $170,731 $135,999
Business Unit: 1132 - Nanango Wastewater $199,771 $101,868
Business Unit: 1133 - Proston CED Services $27,347 $19,871
Business Unit: 1134 - Wondai Wastewater $195,555 $120,146
Total $1,608,443 $1,066,115
The trend in maintenance budgets is shown in the table below.
Table 20: Maintenance Budget Trends
Year Maintenance Budget ($)
2018/19 $2,080,211
2019/20 (forecast) $1,066,115
2020/21(FWP portion)
2020/21 (Forecast based on 2019/20 actuals)
$1,357,420
$1,066,115
Maintenance budget levels are adequate to meet projected service levels, which may be less than or equal to current service levels. Where maintenance budget allocations are such that they will result in a lesser level of service, the service consequences and service risks have
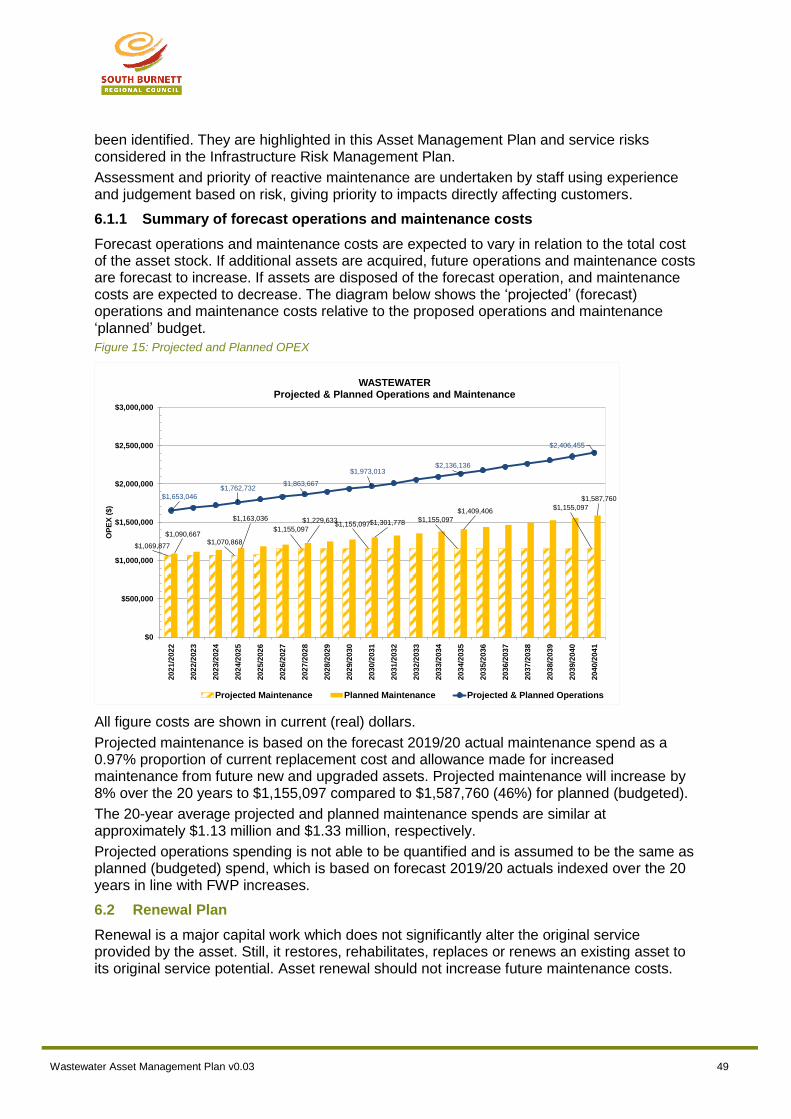
Wastewater Asset Management Plan v0.03 49
been identified. They are highlighted in this Asset Management Plan and service risks considered in the Infrastructure Risk Management Plan.
Assessment and priority of reactive maintenance are undertaken by staff using experience and judgement based on risk, giving priority to impacts directly affecting customers.
6.1.1 Summary of forecast operations and maintenance costs
Forecast operations and maintenance costs are expected to vary in relation to the total cost of the asset stock. If additional assets are acquired, future operations and maintenance costs are forecast to increase. If assets are disposed of the forecast operation, and maintenance costs are expected to decrease. The diagram below shows the ‘projected’ (forecast) operations and maintenance costs relative to the proposed operations and maintenance ‘planned’ budget.
Figure 15: Projected and Planned OPEX
All figure costs are shown in current (real) dollars.
Projected maintenance is based on the forecast 2019/20 actual maintenance spend as a 0.97% proportion of current replacement cost and allowance made for increased maintenance from future new and upgraded assets. Projected maintenance will increase by 8% over the 20 years to $1,155,097 compared to $1,587,760 (46%) for planned (budgeted).
The 20-year average projected and planned maintenance spends are similar at approximately $1.13 million and $1.33 million, respectively.
Projected operations spending is not able to be quantified and is assumed to be the same as planned (budgeted) spend, which is based on forecast 2019/20 actuals indexed over the 20 years in line with FWP increases.
6.2 Renewal Plan
Renewal is a major capital work which does not significantly alter the original service provided by the asset. Still, it restores, rehabilitates, replaces or renews an existing asset to its original service potential. Asset renewal should not increase future maintenance costs.
$1,069,877$1,070,868
$1,155,097$1,155,097
$1,155,097
$1,155,097
$1,090,667
$1,163,036 $1,229,633 $1,301,778
$1,409,406
$1,587,760$1,653,046
$1,762,732$1,863,667
$1,973,013$2,136,136
$2,406,455
$0
$500,000
$1,000,000
$1,500,000
$2,000,000
$2,500,000
$3,000,000
20
21/2
02
2
20
22/2
02
3
20
23/2
02
4
20
24/2
02
5
20
25/2
02
6
20
26/2
02
7
20
27/2
02
8
20
28/2
02
9
20
29/2
03
0
20
30/2
03
1
20
31/2
03
2
20
32/2
03
3
20
33/2
03
4
20
34/2
03
5
20
35/2
03
6
20
36/2
03
7
20
37/2
03
8
20
38/2
03
9
20
39/2
04
0
20
40/2
04
1
OP
EX
($)
WASTEWATERProjected & Planned Operations and Maintenance
Projected Maintenance Planned Maintenance Projected & Planned Operations
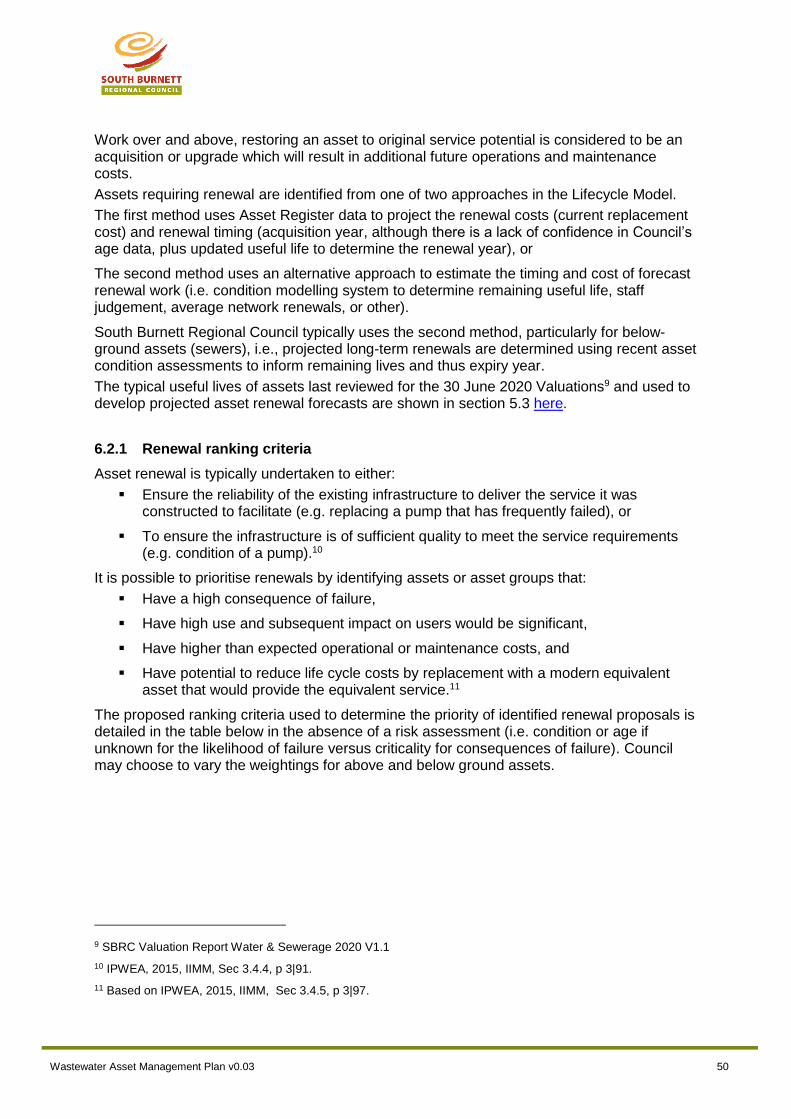
Wastewater Asset Management Plan v0.03 50
Work over and above, restoring an asset to original service potential is considered to be an acquisition or upgrade which will result in additional future operations and maintenance costs.
Assets requiring renewal are identified from one of two approaches in the Lifecycle Model.
The first method uses Asset Register data to project the renewal costs (current replacement cost) and renewal timing (acquisition year, although there is a lack of confidence in Council’s age data, plus updated useful life to determine the renewal year), or
The second method uses an alternative approach to estimate the timing and cost of forecast renewal work (i.e. condition modelling system to determine remaining useful life, staff judgement, average network renewals, or other).
South Burnett Regional Council typically uses the second method, particularly for below-ground assets (sewers), i.e., projected long-term renewals are determined using recent asset condition assessments to inform remaining lives and thus expiry year.
The typical useful lives of assets last reviewed for the 30 June 2020 Valuations9 and used to develop projected asset renewal forecasts are shown in section 5.3 here.
6.2.1 Renewal ranking criteria
Asset renewal is typically undertaken to either:
Ensure the reliability of the existing infrastructure to deliver the service it was constructed to facilitate (e.g. replacing a pump that has frequently failed), or
To ensure the infrastructure is of sufficient quality to meet the service requirements (e.g. condition of a pump).10
It is possible to prioritise renewals by identifying assets or asset groups that:
Have a high consequence of failure,
Have high use and subsequent impact on users would be significant,
Have higher than expected operational or maintenance costs, and
Have potential to reduce life cycle costs by replacement with a modern equivalent asset that would provide the equivalent service.11
The proposed ranking criteria used to determine the priority of identified renewal proposals is detailed in the table below in the absence of a risk assessment (i.e. condition or age if unknown for the likelihood of failure versus criticality for consequences of failure). Council may choose to vary the weightings for above and below ground assets.
9 SBRC Valuation Report Water & Sewerage 2020 V1.1
10 IPWEA, 2015, IIMM, Sec 3.4.4, p 3|91.
11 Based on IPWEA, 2015, IIMM, Sec 3.4.5, p 3|97.

Wastewater Asset Management Plan v0.03 51
Table 21: Renewal Priority Ranking Criteria
Criteria Weighting
Condition (or age if unknown) 25%
Economics (LCC – cost and difficulty of repairs vs replacement) 10%
Technical Obsolescence 15%
Reliability (outage/failure frequency, effect on system or customers)
20%
Workplace Health and Safety Risk (risk of illness/injury) 30%
Total 100%
6.3 Summary of historical renewal costs
The annual amount of approximately $174,000 was spent on Wastewater asset renewals for the last five years to 2018/19 as reported by Council in the SWIM data.
6.4 Summary of future renewal costs
The amount budgeted for Wastewater asset renewals is $855,000 for 2019/20 and $600,000 for 2020/21. Future planned renewals for below ground(passive) and above ground (active) assets including $5.6 million Murgon WWTP replacement portion (total cost $15 million 2026/2027) are shown in the chart below. All figure costs are shown in current (real) dollars.
It is acknowledged many below ground assets to go in are also planned as upgrades, not just renewals. That is, increases in pipe diameter, which was based on the 2016 model MIPP will change.
Figure 16: Planned Renewals – Below Ground (passive) and Above Ground (active)
$600,000
$1,448,000
$4,540,600
$1,600,000
$1,600,000
$2,082,560$1,357,600
$950,000$950,000
$950,000$950,000
$950,000$950,000
$950,000
$950,000
$950,000
$950,000
$950,000
$950,000
$866,536
$866,536
$100,000
$5,600,000
$0
$1,000,000
$2,000,000
$3,000,000
$4,000,000
$5,000,000
$6,000,000
$7,000,000
$8,000,000
20
20/2
02
1
20
21/2
02
2
20
22/2
02
3
20
23/2
02
4
20
24/2
02
5
20
25/2
02
6
20
26/2
02
7
20
27/2
02
8
20
28/2
02
9
20
29/2
03
0
20
30/2
03
1
20
31/2
03
2
20
32/2
03
3
20
33/2
03
4
20
34/2
03
5
20
35/2
03
6
20
36/2
03
7
20
37/2
03
8
20
38/2
03
9
20
39/2
04
0
20
40/2
04
1
Ren
ew
als
Co
st
($)
WASTEWATERPlanned (FWP) Renewals
Passive Renewals (FWP) Active Renewals (FWP)
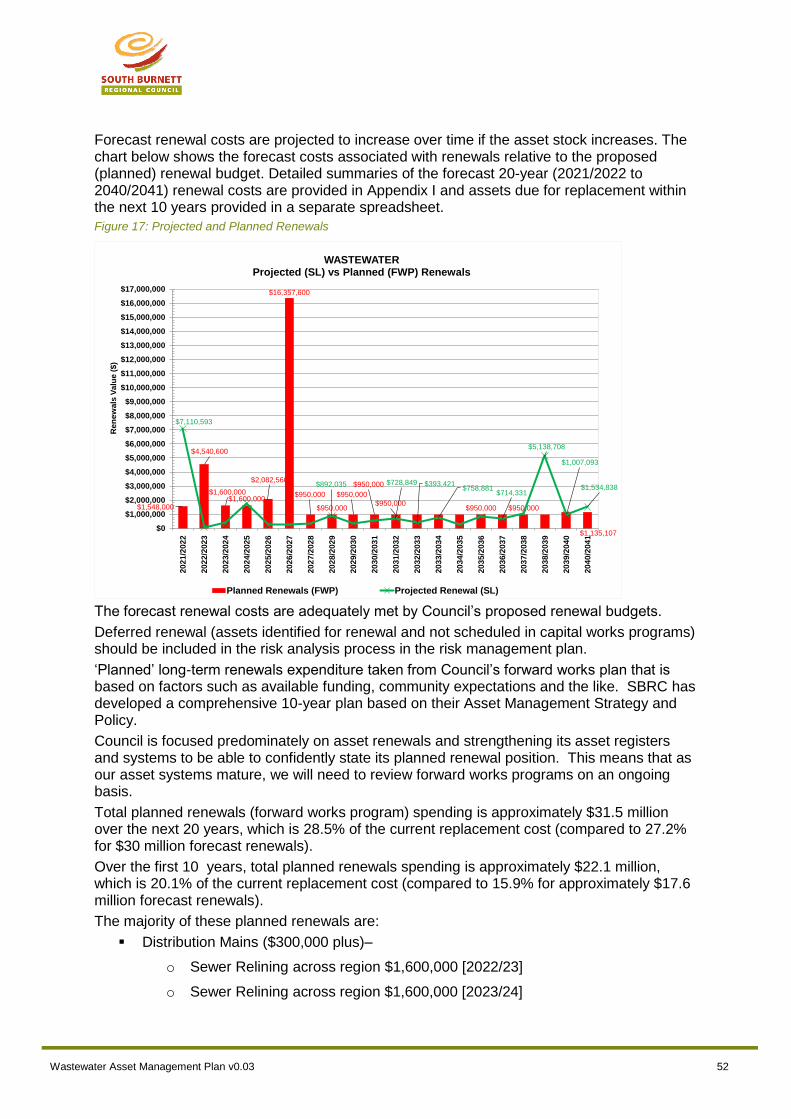
Wastewater Asset Management Plan v0.03 52
Forecast renewal costs are projected to increase over time if the asset stock increases. The chart below shows the forecast costs associated with renewals relative to the proposed (planned) renewal budget. Detailed summaries of the forecast 20-year (2021/2022 to 2040/2041) renewal costs are provided in Appendix I and assets due for replacement within the next 10 years provided in a separate spreadsheet.
Figure 17: Projected and Planned Renewals
The forecast renewal costs are adequately met by Council’s proposed renewal budgets.
Deferred renewal (assets identified for renewal and not scheduled in capital works programs) should be included in the risk analysis process in the risk management plan.
‘Planned’ long-term renewals expenditure taken from Council’s forward works plan that is based on factors such as available funding, community expectations and the like. SBRC has developed a comprehensive 10-year plan based on their Asset Management Strategy and Policy.
Council is focused predominately on asset renewals and strengthening its asset registers and systems to be able to confidently state its planned renewal position. This means that as our asset systems mature, we will need to review forward works programs on an ongoing basis.
Total planned renewals (forward works program) spending is approximately $31.5 million over the next 20 years, which is 28.5% of the current replacement cost (compared to 27.2% for $30 million forecast renewals).
Over the first 10 years, total planned renewals spending is approximately $22.1 million, which is 20.1% of the current replacement cost (compared to 15.9% for approximately $17.6 million forecast renewals).
The majority of these planned renewals are:
Distribution Mains ($300,000 plus)–
o Sewer Relining across region $1,600,000 [2022/23]
o Sewer Relining across region $1,600,000 [2023/24]
$1,548,000
$4,540,600
$1,600,000$1,600,000
$2,082,560
$16,357,600
$950,000
$950,000
$950,000
$950,000
$950,000$950,000 $950,000
$1,135,107
$7,110,593
$892,035 $728,849 $393,421$758,881
$714,331
$5,138,708
$1,007,093
$1,534,838
$0
$1,000,000
$2,000,000
$3,000,000
$4,000,000
$5,000,000
$6,000,000
$7,000,000
$8,000,000
$9,000,000
$10,000,000
$11,000,000
$12,000,000
$13,000,000
$14,000,000
$15,000,000
$16,000,000
$17,000,000
20
21/2
02
2
20
22/2
02
3
20
23/2
02
4
20
24/2
02
5
20
25/2
02
6
20
26/2
02
7
20
27/2
02
8
20
28/2
02
9
20
29/2
03
0
20
30/2
03
1
20
31/2
03
2
20
32/2
03
3
20
33/2
03
4
20
34/2
03
5
20
35/2
03
6
20
36/2
03
7
20
37/2
03
8
20
38/2
03
9
20
39/2
04
0
20
40/2
04
1
Re
ne
wa
ls V
alu
e (
$)
WASTEWATERProjected (SL) vs Planned (FWP) Renewals
Planned Renewals (FWP) Projected Renewal (SL)

Wastewater Asset Management Plan v0.03 53
o Sewer Relining across region $1,600,000 [2024/25]
o Sewer Relining across region $1,200,000 [2026/27]
o Sewer Relining across region $950,000 [2027/28, 2028/29, 2029/30 and 2030/31\]
Rising Mains –
o Sewage PS1 Rising Main at Nanango $29,600 [2026/27]
Treatment Plants ($300,000 plus)–
o Remove remaining AC items from sheds/reservoirs etc. at Old WTP Blackbutt, Blackbutt WWTP Service Pump Shed/, Kingaroy WWTP old control shed walls, ceiling, Reservoir 1 Murgon WTP, Old Murgon WTP, Nanango WWTPP Control Room $100,000 [2021/22]
o Murgon WWTP $5,6000,000 replacement component of total $15,000,000 for new plant [2026/27]
A comparison over the first 10 years of planned renewals expenditure versus forecast depreciation and the ratio of renewals to depreciation (sustainability ratio) is shown below.
The chart shows the State’s sustainability target of 90% of depreciation.
Figure 18: Planned Renewals, Depreciation and Sustainability Index
6.5 Acquisition Plan
Acquisition reflects are new assets that did not previously exist or works which will upgrade or improve an existing asset beyond its existing service capacity. Acquisitions may be the result of growth, demand, social or environmental needs. Assets may also be donated to Council be developers or other levels of government.
0.4
1.0
2.8
1.0 1.0
1.3
4.0
0.5 0.5 0.5
0.0
0.9
1.8
2.7
3.6
4.5
$0
$1,000,000
$2,000,000
$3,000,000
$4,000,000
$5,000,000
$6,000,000
$7,000,000
$8,000,000
$9,000,000
$10,000,000
$11,000,000
$12,000,000
$13,000,000
$14,000,000
$15,000,000
$16,000,000
$17,000,000
20
21/2
02
2
20
22/2
02
3
20
23/2
02
4
20
24/2
02
5
20
25/2
02
6
20
26/2
02
7
20
27/2
02
8
20
28/2
02
9
20
29/2
03
0
20
30/2
03
1
Su
sta
ina
bilit
y R
ati
o
Ren
ew
al C
os
t / A
nn
ual
Dep
rec
iati
on
($)
WASTEWATERPlanned (FWP) Renewals vs Sustainability Ratio and Depreciation
Planned Renewals (FWP) Depreciation SR (Renewal (FWP)/Depreciation) Target Ratio=0.9

Wastewater Asset Management Plan v0.03 54
6.5.1 Selection criteria
Proposed upgrade of existing assets, and new assets, are identified from various sources such as community requests, proposals identified by strategic plans or partnerships with others. Potential upgrade and new works should be reviewed to verify that they are essential to the Entities needs. Proposed upgrade and new work analysis should also include the development of a preliminary renewal estimate to ensure that the services are sustainable over the longer term. Verified proposals can then be ranked by priority and available funds and scheduled in future works programmes. The priority ranking criteria is detailed in the table below.
Table 22: Acquired Assets Priority Ranking Criteria
Criteria Weighting
System performance improvement 35%
Reliability of treatment improvement 35%
Maintenance minimisation 10%
Links to Community Plan and Corporate Plan 5%
Links to works programs and strategies 5%
Community Request 10%
Total 100%
6.5.2 Summary of future asset acquisition costs
When an Entity commits to new or upgraded assets, they must be prepared to fund future operations, maintenance, and renewal costs. They must also account for future depreciation when reviewing long term sustainability.
When reviewing the long-term impacts of asset acquisition, it is useful to consider the cumulative cost of the acquired assets being taken on by the Entity. The cumulative cost of all acquisition work, including assets that are constructed and contributed shown in the chart below. The Planned (Budgeted) Forward Works Program Projects are listed in Appendix H. This will change when Council includes in the FWP recommendations from the MIPP. The current 10 years FWP is conservative until the results of this study are obtained.
Wastewater Asset Management Plan v0.03 55
Figure 19: Acquisition Summary
All figure costs are shown in current (real) dollars.
Expenditure on new assets and services in the capital works program will be accommodated in the long-term financial plan, but only to the extent that there is available funding. The above chart shows the impact of new and upgraded assets that will require a commitment to the funding of ongoing operations, increased depreciation, maintenance, and renewal costs for the period that the service provided from the assets is required.
6.5.3 Summary of asset forecast costs
The financial projections from this asset plan are shown in the diagram below. These projections include forecast costs for asset acquisition, operation, maintenance, renewal, and disposal, shown relative to the proposed budget. Depreciation is excluded
The bars in the graphs represent the forecast costs needed to minimise the life cycle costs associated with the service provision. The proposed budget line indicates the estimate of available funding. The gap between the forecast work and the proposed budget is the basis of the discussion on achieving balance between costs, levels of service and risk to achieve the best value outcome.
The planned (budgeted) expenditure meets the forecast cost for the majority of years. The average annual planned and forecast expenditures are approximately $5.4 million and $5.2 million, respectively.
$347,000$520,640
$9,439,400
$4,816$6,085
$155,024
$155,024 $155,024
$3,762
$88,982
$88,982 $88,982
$0
$20,000
$40,000
$60,000
$80,000
$100,000
$120,000
$140,000
$160,000
$180,000
$0
$1,000,000
$2,000,000
$3,000,000
$4,000,000
$5,000,000
$6,000,000
$7,000,000
$8,000,000
$9,000,000
$10,000,000
20
21/2
02
2
20
22/2
02
3
20
23/2
02
4
20
24/2
02
5
20
25/2
02
6
20
26/2
02
7
20
27/2
02
8
20
28/2
02
9
20
29/2
03
0
20
30/2
03
1
20
31/2
03
2
203
2/2
033
20
33/2
03
4
20
34/2
03
5
20
36/2
03
7
20
37/2
03
8
203
8/2
039
20
39/2
04
0
20
40/2
04
1
De
pre
c. /
Mai
nte
nan
ce V
alu
e
New
Wo
rks
Val
ue
WASTEWATERPlanned New & Upgrade Works Effect on Depreciation and Maintenance
Combined New (FWP) + Upgrade (FWP) Depreciation Added Increased Mtce Added
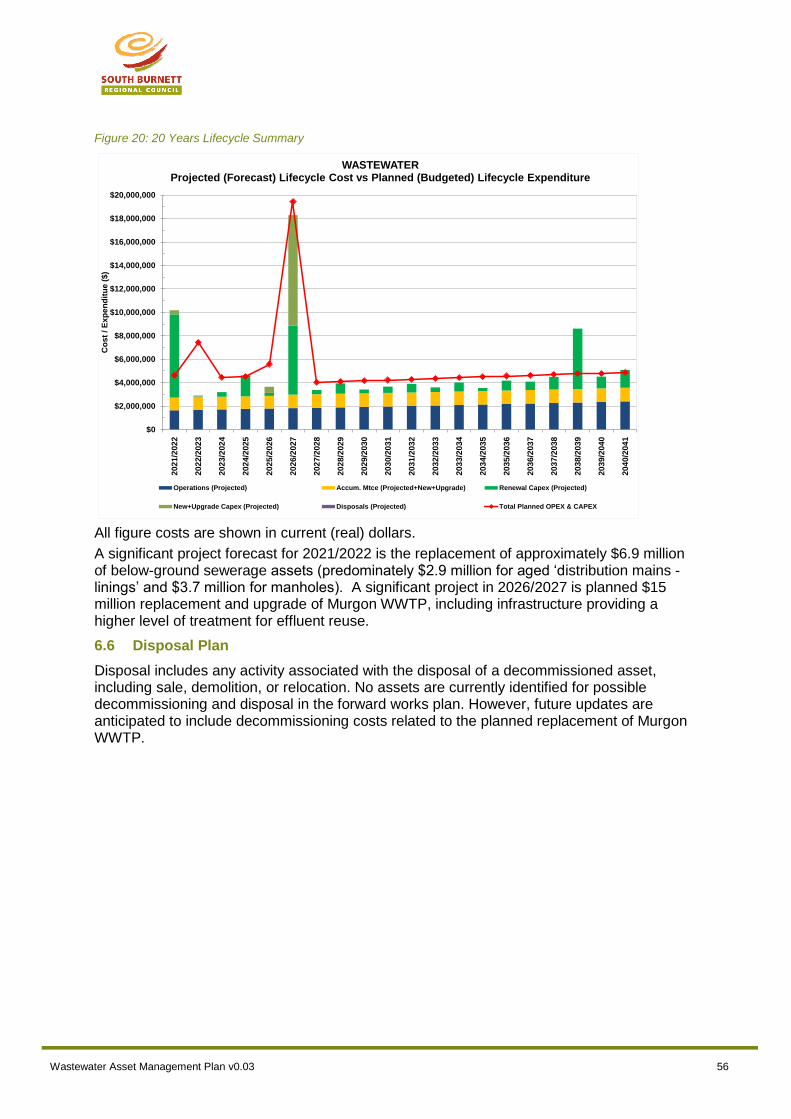
Wastewater Asset Management Plan v0.03 56
Figure 20: 20 Years Lifecycle Summary
All figure costs are shown in current (real) dollars.
A significant project forecast for 2021/2022 is the replacement of approximately $6.9 million of below-ground sewerage assets (predominately $2.9 million for aged ‘distribution mains - linings’ and $3.7 million for manholes). A significant project in 2026/2027 is planned $15 million replacement and upgrade of Murgon WWTP, including infrastructure providing a higher level of treatment for effluent reuse.
6.6 Disposal Plan
Disposal includes any activity associated with the disposal of a decommissioned asset, including sale, demolition, or relocation. No assets are currently identified for possible decommissioning and disposal in the forward works plan. However, future updates are anticipated to include decommissioning costs related to the planned replacement of Murgon WWTP.
$0
$2,000,000
$4,000,000
$6,000,000
$8,000,000
$10,000,000
$12,000,000
$14,000,000
$16,000,000
$18,000,000
$20,000,000
20
21/2
02
2
20
22/2
02
3
20
23/2
02
4
20
24/2
02
5
20
25/2
02
6
20
26/2
02
7
20
27/2
02
8
20
28/2
02
9
20
29/2
03
0
20
30/2
03
1
20
31/2
03
2
20
32/2
03
3
203
3/2
034
20
34/2
03
5
20
35/2
03
6
20
36/2
03
7
20
37/2
03
8
20
38/2
03
9
20
39/2
04
0
20
40/2
04
1
Co
st
/ E
xp
en
dit
ue
($)
WASTEWATERProjected (Forecast) Lifecycle Cost vs Planned (Budgeted) Lifecycle Expenditure
Operations (Projected) Accum. Mtce (Projected+New+Upgrade) Renewal Capex (Projected)
New+Upgrade Capex (Projected) Disposals (Projected) Total Planned OPEX & CAPEX
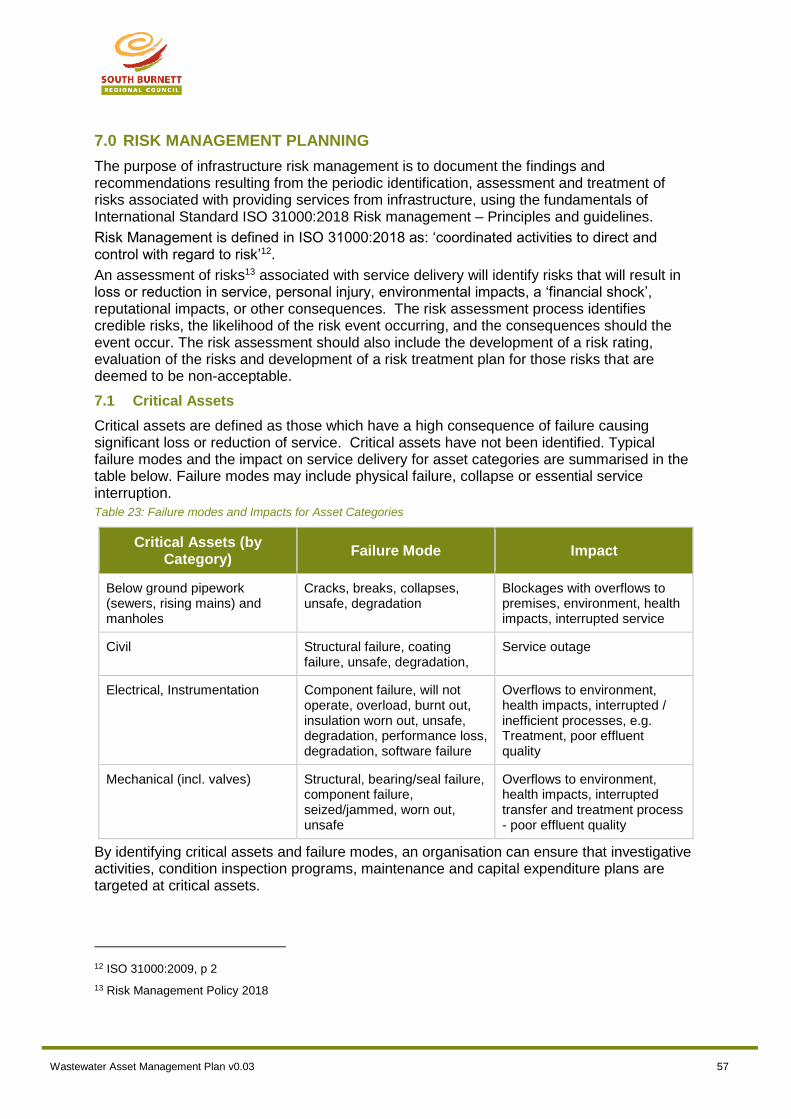
Wastewater Asset Management Plan v0.03 57
7.0 RISK MANAGEMENT PLANNING
The purpose of infrastructure risk management is to document the findings and recommendations resulting from the periodic identification, assessment and treatment of risks associated with providing services from infrastructure, using the fundamentals of International Standard ISO 31000:2018 Risk management – Principles and guidelines.
Risk Management is defined in ISO 31000:2018 as: ‘coordinated activities to direct and control with regard to risk’12.
An assessment of risks13 associated with service delivery will identify risks that will result in loss or reduction in service, personal injury, environmental impacts, a ‘financial shock’, reputational impacts, or other consequences. The risk assessment process identifies credible risks, the likelihood of the risk event occurring, and the consequences should the event occur. The risk assessment should also include the development of a risk rating, evaluation of the risks and development of a risk treatment plan for those risks that are deemed to be non-acceptable.
7.1 Critical Assets
Critical assets are defined as those which have a high consequence of failure causing significant loss or reduction of service. Critical assets have not been identified. Typical failure modes and the impact on service delivery for asset categories are summarised in the table below. Failure modes may include physical failure, collapse or essential service interruption.
Table 23: Failure modes and Impacts for Asset Categories
Critical Assets (by Category)
Failure Mode Impact
Below ground pipework (sewers, rising mains) and manholes
Cracks, breaks, collapses, unsafe, degradation
Blockages with overflows to premises, environment, health impacts, interrupted service
Civil Structural failure, coating failure, unsafe, degradation,
Service outage
Electrical, Instrumentation Component failure, will not operate, overload, burnt out, insulation worn out, unsafe, degradation, performance loss, degradation, software failure
Overflows to environment, health impacts, interrupted / inefficient processes, e.g. Treatment, poor effluent quality
Mechanical (incl. valves) Structural, bearing/seal failure, component failure, seized/jammed, worn out, unsafe
Overflows to environment, health impacts, interrupted transfer and treatment process - poor effluent quality
By identifying critical assets and failure modes, an organisation can ensure that investigative activities, condition inspection programs, maintenance and capital expenditure plans are targeted at critical assets.
12 ISO 31000:2009, p 2
13 Risk Management Policy 2018

Wastewater Asset Management Plan v0.03 58
In order to risk, Council has service agreements in place and standardised equipment, e.g. dosing pumps), parts/components in stores or easily available (a stocktake of minimum parts required is done every 2 weeks) and critical spares at treatment plants.
7.2 Infrastructure Resilience Approach
The resilience of our critical infrastructure is vital to the ongoing provision of services to customers. To adapt to changing conditions, we need to understand our capacity to ‘withstand a given level of stress or demand’, 1 and to respond to possible disruptions to ensure continuity of service.
Resilience is built on aspects such as response and recovery planning, financial capacity, climate change and crisis leadership.
We do not currently measure our resilience in service delivery. This will be included in future iterations of the Asset Management Plan.
7.3 Risk Assessment
The risk management process used is shown in the figure below. It is an analysis and problem-solving technique designed to provide a logical process for the selection of treatment plans and management actions to protect the community against unacceptable risks. This process is based on the fundamentals of International Standard ISO 31000:2018. Council’s current Risk Management Policy (due for review last December 2019) including the process for identifying and managing risks is based on AS/NZS ISO 31000:200914.
The risk assessment process identifies credible risks, the likelihood of the risk event occurring, the consequences should the event occur, development of a risk rating, evaluation of the risk and development of a risk treatment plan for non-acceptable risks.
An assessment of risks15 associated with service delivery will identify risks that will result in loss or reduction in service, personal injury, environmental impacts, a ‘financial shock’, reputational impacts, or other consequences.
Future updates of this AMP will include assessment and management of risks.
14 Source: ISO 31000:2018, Figure 1, p9
15 Risk Management Policy 2018
Figure 21: Risk Management Process (Abridged)
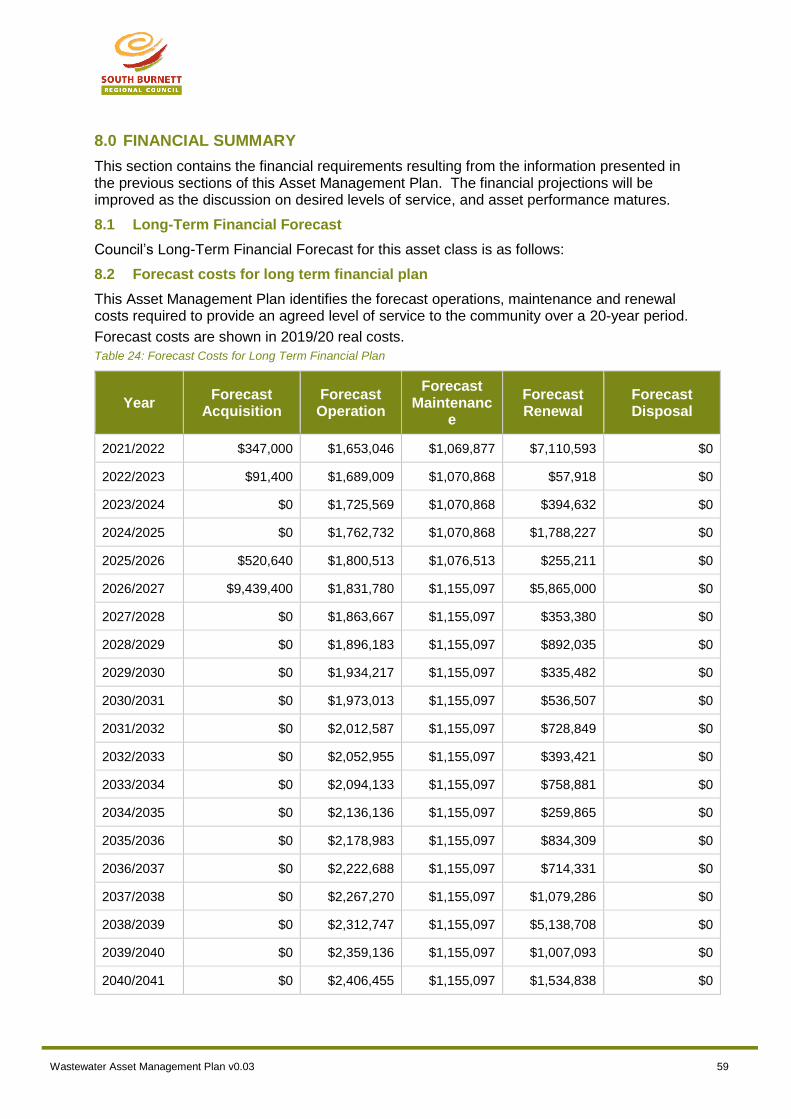
Wastewater Asset Management Plan v0.03 59
8.0 FINANCIAL SUMMARY
This section contains the financial requirements resulting from the information presented in the previous sections of this Asset Management Plan. The financial projections will be improved as the discussion on desired levels of service, and asset performance matures.
8.1 Long-Term Financial Forecast
Council’s Long-Term Financial Forecast for this asset class is as follows:
8.2 Forecast costs for long term financial plan
This Asset Management Plan identifies the forecast operations, maintenance and renewal costs required to provide an agreed level of service to the community over a 20-year period.
Forecast costs are shown in 2019/20 real costs.
Table 24: Forecast Costs for Long Term Financial Plan
Year Forecast
Acquisition Forecast Operation
Forecast Maintenanc
e
Forecast Renewal
Forecast Disposal
2021/2022 $347,000 $1,653,046 $1,069,877 $7,110,593 $0
2022/2023 $91,400 $1,689,009 $1,070,868 $57,918 $0
2023/2024 $0 $1,725,569 $1,070,868 $394,632 $0
2024/2025 $0 $1,762,732 $1,070,868 $1,788,227 $0
2025/2026 $520,640 $1,800,513 $1,076,513 $255,211 $0
2026/2027 $9,439,400 $1,831,780 $1,155,097 $5,865,000 $0
2027/2028 $0 $1,863,667 $1,155,097 $353,380 $0
2028/2029 $0 $1,896,183 $1,155,097 $892,035 $0
2029/2030 $0 $1,934,217 $1,155,097 $335,482 $0
2030/2031 $0 $1,973,013 $1,155,097 $536,507 $0
2031/2032 $0 $2,012,587 $1,155,097 $728,849 $0
2032/2033 $0 $2,052,955 $1,155,097 $393,421 $0
2033/2034 $0 $2,094,133 $1,155,097 $758,881 $0
2034/2035 $0 $2,136,136 $1,155,097 $259,865 $0
2035/2036 $0 $2,178,983 $1,155,097 $834,309 $0
2036/2037 $0 $2,222,688 $1,155,097 $714,331 $0
2037/2038 $0 $2,267,270 $1,155,097 $1,079,286 $0
2038/2039 $0 $2,312,747 $1,155,097 $5,138,708 $0
2039/2040 $0 $2,359,136 $1,155,097 $1,007,093 $0
2040/2041 $0 $2,406,455 $1,155,097 $1,534,838 $0
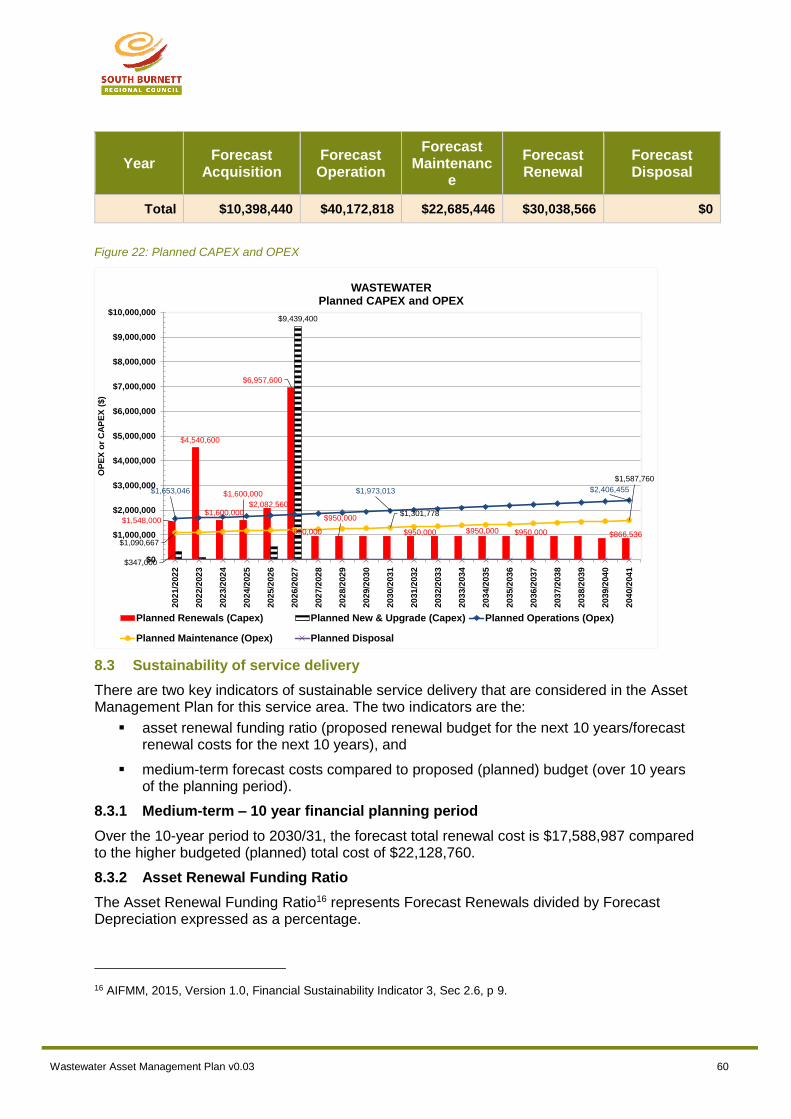
Wastewater Asset Management Plan v0.03 60
Year Forecast
Acquisition Forecast Operation
Forecast Maintenanc
e
Forecast Renewal
Forecast Disposal
Total $10,398,440 $40,172,818 $22,685,446 $30,038,566 $0
Figure 22: Planned CAPEX and OPEX
8.3 Sustainability of service delivery
There are two key indicators of sustainable service delivery that are considered in the Asset Management Plan for this service area. The two indicators are the:
asset renewal funding ratio (proposed renewal budget for the next 10 years/forecast renewal costs for the next 10 years), and
medium-term forecast costs compared to proposed (planned) budget (over 10 years of the planning period).
8.3.1 Medium-term – 10 year financial planning period
Over the 10-year period to 2030/31, the forecast total renewal cost is $17,588,987 compared to the higher budgeted (planned) total cost of $22,128,760.
8.3.2 Asset Renewal Funding Ratio
The Asset Renewal Funding Ratio16 represents Forecast Renewals divided by Forecast Depreciation expressed as a percentage.
16 AIFMM, 2015, Version 1.0, Financial Sustainability Indicator 3, Sec 2.6, p 9.
$1,548,000
$4,540,600
$1,600,000
$1,600,000
$2,082,560
$6,957,600
$950,000
$950,000
$950,000 $950,000 $950,000 $866,536
$347,000
$9,439,400
$1,653,046 $1,973,013 $2,406,455
$1,090,667
$1,301,778
$1,587,760
$0
$1,000,000
$2,000,000
$3,000,000
$4,000,000
$5,000,000
$6,000,000
$7,000,000
$8,000,000
$9,000,000
$10,000,000
20
21/2
02
2
20
22/2
02
3
20
23/2
02
4
20
24/2
02
5
20
25/2
02
6
20
26/2
02
7
20
27/2
02
8
20
28/2
02
9
20
29/2
03
0
20
30/2
03
1
20
31/2
03
2
20
32/2
03
3
20
33/2
03
4
20
34/2
03
5
20
35/2
03
6
20
36/2
03
7
20
37/2
03
8
20
38/2
03
9
20
39/2
04
0
20
40/2
04
1
OP
EX
or
CA
PE
X (
$)
WASTEWATERPlanned CAPEX and OPEX
Planned Renewals (Capex) Planned New & Upgrade (Capex) Planned Operations (Opex)
Planned Maintenance (Opex) Planned Disposal

Wastewater Asset Management Plan v0.03 61
The Asset Renewal Funding (Asset Sustainability) Ratio is an important indicator that illustrates that over the next 10 years we expect to have an average 133% of the funds required for the optimal renewal of assets (93% over the next 20 years).
Annual predictions for planned renewals for the next 10 years are illustrated in the chart below. These are shown against the asset sustainability target set by the State (i.e., 90% of asset class depreciation). The 10 years annual average sustainability target is $1,503,219 compared to the planned renewals average annual $2,212,876indicating asset sustainability over this period if current service levels are maintained.
Figure 23: Asset Sustainability Targets and Planned Renewals
The chart below shows ratios for projected (forecast) and planned renewals against the target for 20 years.
$1,548,000
$4,540,600
$6,957,600
$950,000
$0
$1,000,000
$2,000,000
$3,000,000
$4,000,000
$5,000,000
$6,000,000
$7,000,000
$8,000,000
20
22/2
02
3
20
23/2
02
4
20
24/2
02
5
20
25/2
02
6
20
26/2
02
7
20
27/2
02
8
20
28/2
02
9
20
29/2
03
0
20
30/2
03
1
20
31/2
03
2
Rep
lac
e C
os
t ($
)
WASTEWATERAsset Sustainability Targets and Planned Renewals
Asset Sustainability Target (90% of Deprec) Planned Renewals (FWP)
includes Murgon WWTP replacement component
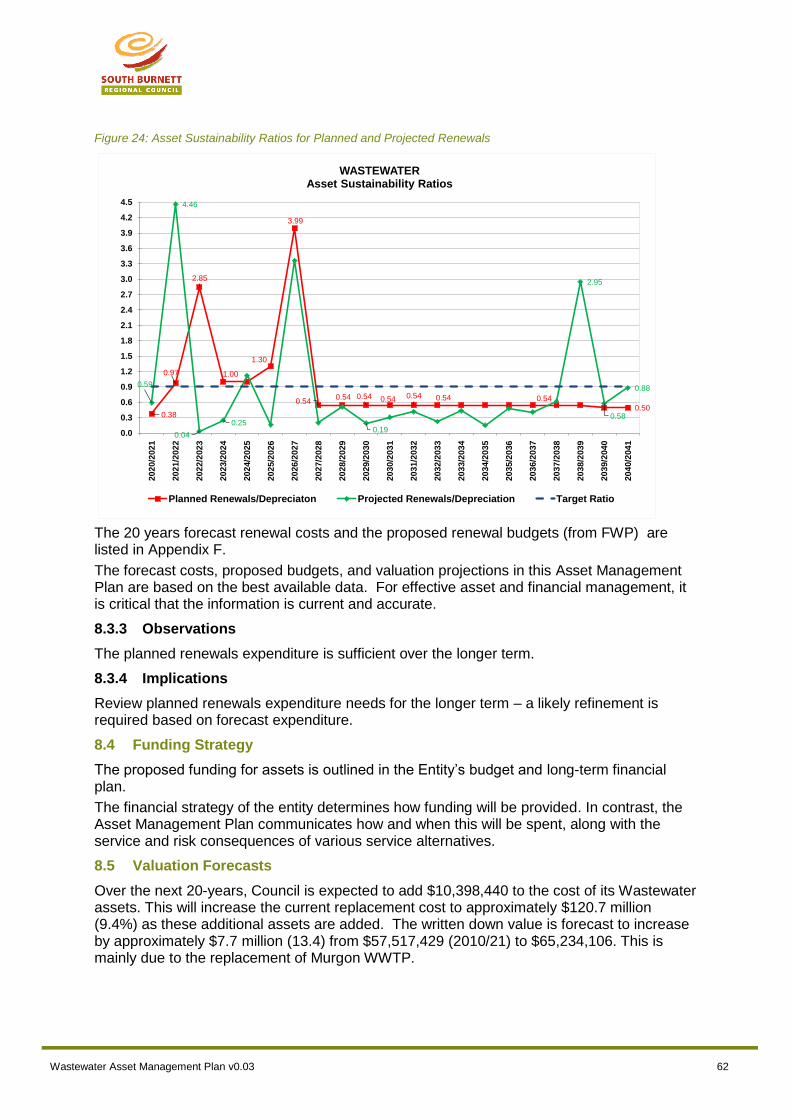
Wastewater Asset Management Plan v0.03 62
Figure 24: Asset Sustainability Ratios for Planned and Projected Renewals
The 20 years forecast renewal costs and the proposed renewal budgets (from FWP) are listed in Appendix F.
The forecast costs, proposed budgets, and valuation projections in this Asset Management Plan are based on the best available data. For effective asset and financial management, it is critical that the information is current and accurate.
8.3.3 Observations
The planned renewals expenditure is sufficient over the longer term.
8.3.4 Implications
Review planned renewals expenditure needs for the longer term – a likely refinement is required based on forecast expenditure.
8.4 Funding Strategy
The proposed funding for assets is outlined in the Entity’s budget and long-term financial plan.
The financial strategy of the entity determines how funding will be provided. In contrast, the Asset Management Plan communicates how and when this will be spent, along with the service and risk consequences of various service alternatives.
8.5 Valuation Forecasts
Over the next 20-years, Council is expected to add $10,398,440 to the cost of its Wastewater assets. This will increase the current replacement cost to approximately $120.7 million (9.4%) as these additional assets are added. The written down value is forecast to increase by approximately $7.7 million (13.4) from $57,517,429 (2010/21) to $65,234,106. This is mainly due to the replacement of Murgon WWTP.
0.38
0.97
2.85
1.00
1.30
3.99
0.540.54 0.54 0.54 0.54 0.54 0.54
0.50
0.59
4.46
0.04
0.250.19
2.95
0.58
0.88
0.0
0.3
0.6
0.9
1.2
1.5
1.8
2.1
2.4
2.7
3.0
3.3
3.6
3.9
4.2
4.5
20
20/2
02
1
20
21/2
02
2
20
22/2
02
3
20
23/2
02
4
20
24/2
02
5
20
25/2
02
6
20
26/2
02
7
20
27/2
02
8
20
28/2
02
9
20
29/2
03
0
20
30/2
03
1
20
31/2
03
2
20
32/2
03
3
20
33/2
03
4
20
34/2
03
5
20
35/2
03
6
20
36/2
03
7
20
37/2
03
8
20
38/2
03
9
20
39/2
04
0
20
40/2
04
1
WASTEWATERAsset Sustainability Ratios
Planned Renewals/Depreciaton Projected Renewals/Depreciation Target Ratio
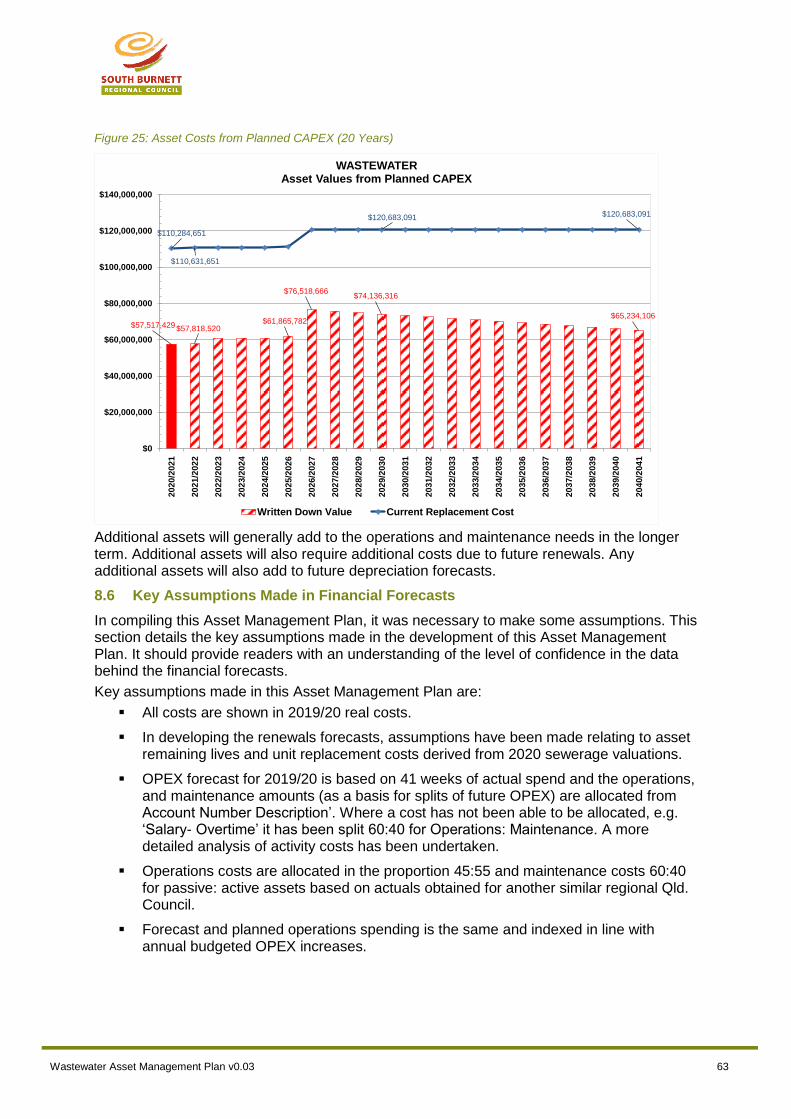
Wastewater Asset Management Plan v0.03 63
Figure 25: Asset Costs from Planned CAPEX (20 Years)
Additional assets will generally add to the operations and maintenance needs in the longer term. Additional assets will also require additional costs due to future renewals. Any additional assets will also add to future depreciation forecasts.
8.6 Key Assumptions Made in Financial Forecasts
In compiling this Asset Management Plan, it was necessary to make some assumptions. This section details the key assumptions made in the development of this Asset Management Plan. It should provide readers with an understanding of the level of confidence in the data behind the financial forecasts.
Key assumptions made in this Asset Management Plan are:
All costs are shown in 2019/20 real costs.
In developing the renewals forecasts, assumptions have been made relating to asset remaining lives and unit replacement costs derived from 2020 sewerage valuations.
OPEX forecast for 2019/20 is based on 41 weeks of actual spend and the operations, and maintenance amounts (as a basis for splits of future OPEX) are allocated from Account Number Description’. Where a cost has not been able to be allocated, e.g. ‘Salary- Overtime’ it has been split 60:40 for Operations: Maintenance. A more detailed analysis of activity costs has been undertaken.
Operations costs are allocated in the proportion 45:55 and maintenance costs 60:40 for passive: active assets based on actuals obtained for another similar regional Qld. Council.
Forecast and planned operations spending is the same and indexed in line with annual budgeted OPEX increases.
$57,517,429 $57,818,520$61,865,782
$76,518,666$74,136,316
$65,234,106
$110,284,651
$110,631,651
$120,683,091 $120,683,091
$0
$20,000,000
$40,000,000
$60,000,000
$80,000,000
$100,000,000
$120,000,000
$140,000,000
20
20/2
02
1
20
21/2
02
2
20
22/2
02
3
20
23/2
02
4
20
24/2
02
5
20
25/2
02
6
20
26/2
02
7
20
27/2
02
8
20
28/2
02
9
20
29/2
03
0
20
30/2
03
1
20
31/2
03
2
20
32/2
03
3
20
33/2
03
4
20
34/2
03
5
20
35/2
03
6
20
36/2
03
7
20
37/2
03
8
20
38/2
03
9
20
39/2
04
0
20
40/2
04
1
WASTEWATERAsset Values from Planned CAPEX
Written Down Value Current Replacement Cost

Wastewater Asset Management Plan v0.03 64
Forecast maintenance costs for current asset stock is based on (forecast) actuals for 2019/20 plus increased maintenance due to new and upgraded assets as a % of the cost. The % is 2019/20 maintenance as a proportion of the 2020 replacement cost.
The budgeted and forecast costs for new, upgrade and renewals project over the 20-year period are based on Council provided data for the first 18 years and the historical average annual cost adopted for the remaining 2 years.
The list of new and upgrade CAPEX projects is incomplete. Council is awaiting outcomes in coming months of consultant ‘Morris Water’ modelling, e.g. pipeline upgrade costs, which will inform updates of the FWP and the next version of Water AMP.
8.7 Forecast Reliability and Confidence
The forecast costs, proposed budgets, and valuation projections in this Asset Management Plan are based on the best available data. For effective asset and financial management, it is critical that the information is current and accurate. Data confidence is classified on an A - E level scale17 in accordance with the table below.
Table 25: Data Confidence Grading System
Confidence Grade
Description
A. Highly reliable Data based on sound records, procedures, investigations and analysis, documented properly and agreed as the best method of assessment. Dataset is complete and estimated to be accurate ± 2%
B. Reliable Data based on sound records, procedures, investigations and analysis, documented properly but has minor shortcomings, for example, some of the data is old, some documentation is missing and/or reliance is placed on unconfirmed reports or some extrapolation. Dataset is complete and estimated to be accurate ± 10%
C. Uncertain Data based on sound records, procedures, investigations, and analysis which is incomplete or unsupported, or extrapolated from a limited sample for which grade A or B data are available. Dataset is substantially complete, but up to 50% is extrapolated data and accuracy estimated ± 25%
D. Very Uncertain
Data is based on unconfirmed verbal reports and/or cursory inspections and analysis. Dataset may not be fully complete, and most data is estimated or extrapolated. Accuracy ± 40%
E. Unknown None or very little data held.
The estimated confidence level for and reliability of data used in this Asset Management Plan is shown in the table below.
Table 26: Data Confidence Assessment for Data used in Asset Management Plan
Data Confidence Assessment
Comment
Demand drivers C If population growth or industrial development forecasts prove to be incorrect, there may be over or under investment in new assets.
17 IPWEA, 2015, IIMM, Table 2.4.6, p 2|71.
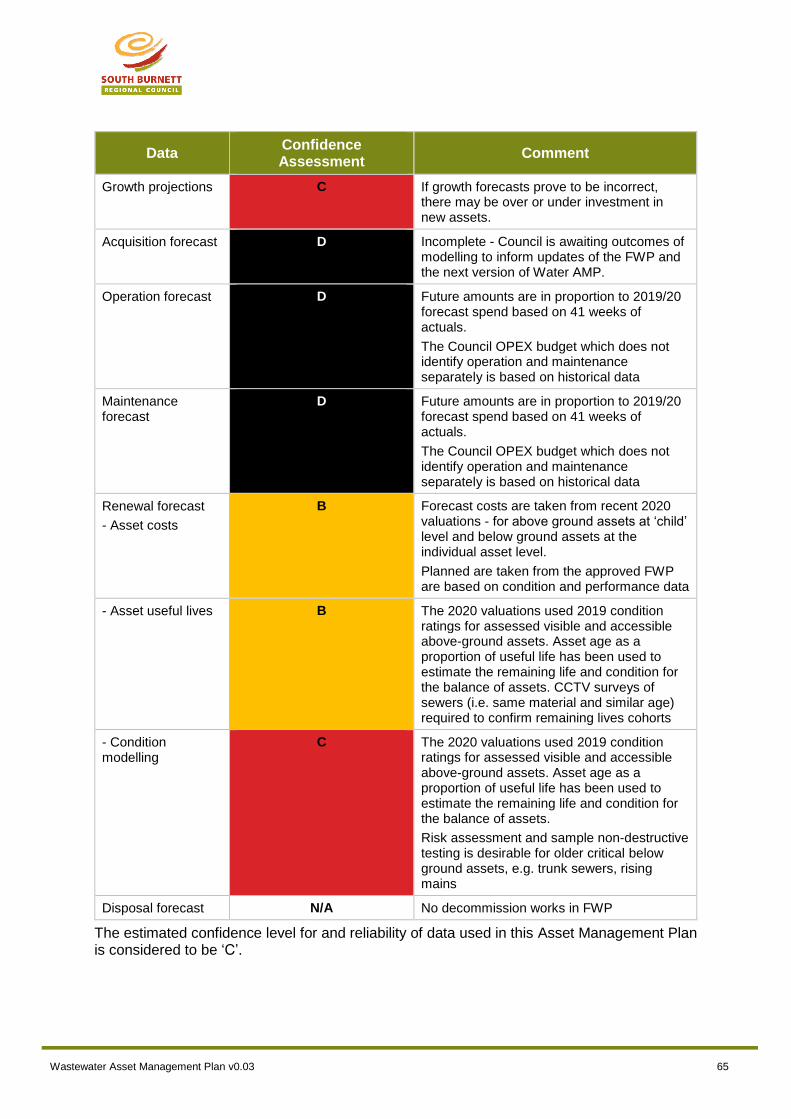
Wastewater Asset Management Plan v0.03 65
Data Confidence Assessment
Comment
Growth projections C If growth forecasts prove to be incorrect, there may be over or under investment in new assets.
Acquisition forecast D Incomplete - Council is awaiting outcomes of modelling to inform updates of the FWP and the next version of Water AMP.
Operation forecast D Future amounts are in proportion to 2019/20 forecast spend based on 41 weeks of actuals.
The Council OPEX budget which does not identify operation and maintenance separately is based on historical data
Maintenance forecast
D Future amounts are in proportion to 2019/20 forecast spend based on 41 weeks of actuals.
The Council OPEX budget which does not identify operation and maintenance separately is based on historical data
Renewal forecast
- Asset costs
B Forecast costs are taken from recent 2020 valuations - for above ground assets at ‘child’ level and below ground assets at the individual asset level.
Planned are taken from the approved FWP are based on condition and performance data
- Asset useful lives B The 2020 valuations used 2019 condition ratings for assessed visible and accessible above-ground assets. Asset age as a proportion of useful life has been used to estimate the remaining life and condition for the balance of assets. CCTV surveys of sewers (i.e. same material and similar age) required to confirm remaining lives cohorts
- Condition modelling
C The 2020 valuations used 2019 condition ratings for assessed visible and accessible above-ground assets. Asset age as a proportion of useful life has been used to estimate the remaining life and condition for the balance of assets.
Risk assessment and sample non-destructive testing is desirable for older critical below ground assets, e.g. trunk sewers, rising mains
Disposal forecast N/A No decommission works in FWP
The estimated confidence level for and reliability of data used in this Asset Management Plan is considered to be ‘C’.
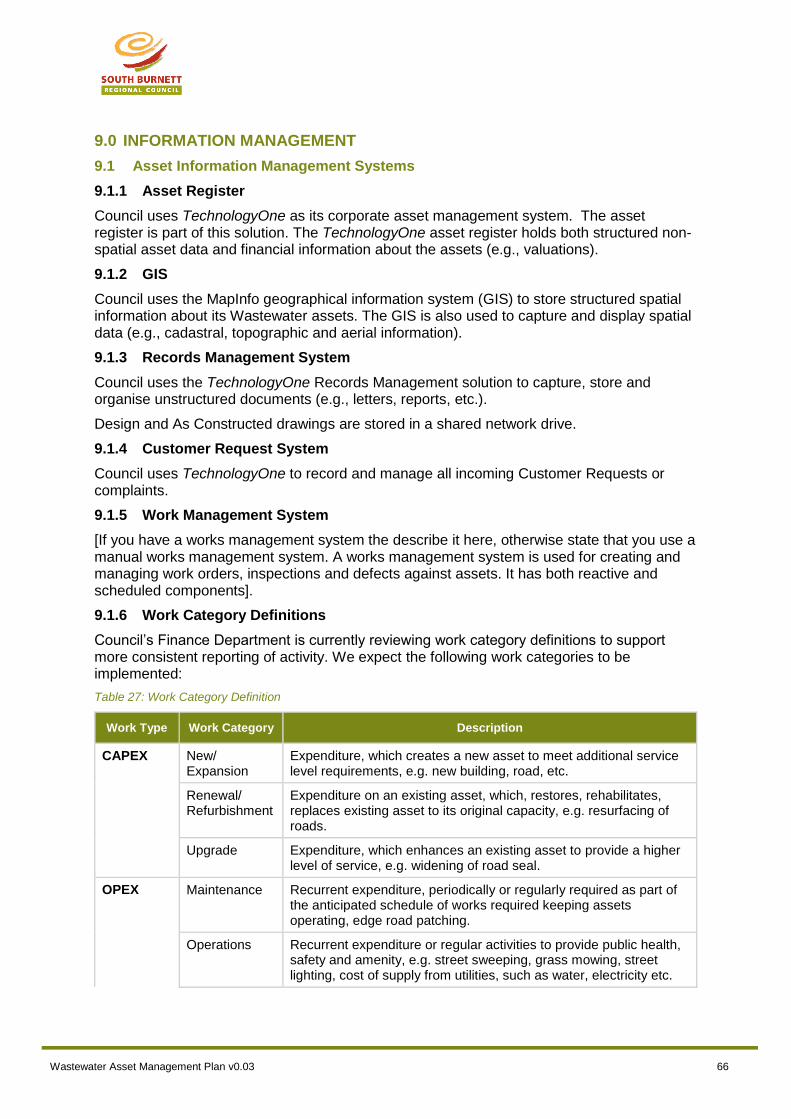
Wastewater Asset Management Plan v0.03 66
9.0 INFORMATION MANAGEMENT
9.1 Asset Information Management Systems
9.1.1 Asset Register
Council uses TechnologyOne as its corporate asset management system. The asset register is part of this solution. The TechnologyOne asset register holds both structured non-spatial asset data and financial information about the assets (e.g., valuations).
9.1.2 GIS
Council uses the MapInfo geographical information system (GIS) to store structured spatial information about its Wastewater assets. The GIS is also used to capture and display spatial data (e.g., cadastral, topographic and aerial information).
9.1.3 Records Management System
Council uses the TechnologyOne Records Management solution to capture, store and organise unstructured documents (e.g., letters, reports, etc.).
Design and As Constructed drawings are stored in a shared network drive.
9.1.4 Customer Request System
Council uses TechnologyOne to record and manage all incoming Customer Requests or complaints.
9.1.5 Work Management System
[If you have a works management system the describe it here, otherwise state that you use a manual works management system. A works management system is used for creating and managing work orders, inspections and defects against assets. It has both reactive and scheduled components].
9.1.6 Work Category Definitions
Council’s Finance Department is currently reviewing work category definitions to support more consistent reporting of activity. We expect the following work categories to be implemented:
Table 27: Work Category Definition
Work Type Work Category Description
CAPEX New/ Expansion
Expenditure, which creates a new asset to meet additional service level requirements, e.g. new building, road, etc.
Renewal/ Refurbishment
Expenditure on an existing asset, which, restores, rehabilitates, replaces existing asset to its original capacity, e.g. resurfacing of roads.
Upgrade Expenditure, which enhances an existing asset to provide a higher level of service, e.g. widening of road seal.
OPEX Maintenance Recurrent expenditure, periodically or regularly required as part of the anticipated schedule of works required keeping assets operating, edge road patching.
Operations Recurrent expenditure or regular activities to provide public health, safety and amenity, e.g. street sweeping, grass mowing, street lighting, cost of supply from utilities, such as water, electricity etc.
Wastewater Asset Management Plan v0.03 67
Work Type Work Category Description
Disposal Expenditure related to the disposal of an asset.
The development of a standardised method for allocating asset-related costs has been identified in the AMP Improvement Plan (Section 10.4).
9.1.7 Financial Management System
Council uses TechnologyOne as its corporate financial management system. It records and stores and reports on all financial and business operations. TechnologyOne is used for the entire spectrum of financial activity, including:
General Ledger
Job costing
Procurement
Inventory
HR and payroll
Data is entered into (or generated within) the system from source documentation (e.g., staff timesheets for payroll transactions or purchase orders for goods and services).
Technology One also generates all statutory and financial management reports that are available to all levels of staff and elected representatives.
9.1.8 ICT Infrastructure Platform
Council’s ICT platform (i.e., network, servers, and computing devices) meet Wastewater Services’ requirements.
There are some connectivity issues at remote sites, but these relate more to the telecommunication providers’ networks than Council’s ICT infrastructure.
9.1.9 Systems Fitness-for-Purpose Assessment
The information systems used to manage Wastewater assets are fit-for-purpose because:
Waste services operations are supported by our own software (i-Weigh).
This software isn’t integrated with Council’s TechnologyOne platform. However, for what Waste Services pay in yearly subscription fees compared to an alternative integrated solution, any manual input is presently cost-effective.
TechnologyOne is labour intensive to set up and maintain. However, this is the corporate solution and, therefore, it is unlikely that Waste Services will change.
9.2 Asset Data Management
9.2.1 Accounting and financial data sources
This Asset Management Plan utilises accounting and financial data. The source of this data is the TechnologyOne enterprise application suite.
9.2.2 Financial Management Data Requirements
9.2.2.1 Asset Valuation
In accordance with Accounting Standard AASB1041, Council is required to account for all its assets, including the cost of current and non-current assets in financial reports thereby

Wastewater Asset Management Plan v0.03 68
identifying to the community the level of investment in assets. These assets are then depreciated on an annual basis to reflect the community usage of its infrastructure assets.
Council splits its Assets into classes for valuation purposes. Council asset classes are:
Land
Buildings
Plant & Equipment
Roads, Drainage & Bridges
Water
Sewerage
Other Infrastructure
Each class is valued in its entirety to reflect its fair cost. Council uses independent external valuers to undertake the valuation process. Verification of the completeness of Council’s Asset Register will be undertaken as part of the development of the Individual Asset Plans.
9.2.2.2 Asset Depreciation
Council’s infrastructure assets are non-current assets, and their depreciation is treated as follows:
Buildings, plant and equipment, infrastructure, and other assets which have limited useful lives are systematically depreciated over their useful lives to the Council in a manner which reflects consumption of the service potential embodied in those assets. Estimates of remaining useful lives and residual costs are made on a regular basis. Depreciation rates and methods are reviewed annually.
Where infrastructure assets have separate identifiable components that are subject to regular replacement, these components are assigned distinct useful lives and residual costs, and a separate depreciation rate is determined for each component.
9.2.2.3 Capitalisation of Assets
Each class of assets have been recognised in accordance with Council’s Asset Management Policy. The asset recognition thresholds detailed in the policy have applied when recognising Wastewater assets unless otherwise stated here.
9.2.2.4 Asset management data sources
This Asset Management Plan also utilises asset management data. The primary source of this data is the TechnologyOne enterprise application suite.
TechnologyOne data is augmented with other asset-related data stored in:
MapInfo (GIS)
Shared network drives (Drawings)
Spreadsheets (asset modelling data)
9.2.3 Asset Management Data Requirements
Electronically stored data is vital to sound management of assets. It is used for several purposes and for development of rolling works programs based on priority of needs. These programs are then used for strategic financial modelling for the organisation.
Wastewater Asset Management Plan v0.03 69
9.2.4 Data Management Roles and Responsibilities
9.2.4.1 Asset Data Manager
The manager of the asset will determine the extent of additional information required in order to manage, maintain and report on infrastructure assets to ensure optimal asset function and asset lifecycle as well as management.
9.2.4.2 Asset Section
Asset Section staff are responsible for ensuring the updating and maintaining of the asset data to meet the organisational operational and financial requirements in delivering efficient and effective asset management.
This means ensuring that inspection data and information from Works Orders, is entered into the system when appropriate. Assistance may well be required for undertaking data installation into the system. However, the Asset Officers are responsible for ensuring its integrity.
It should be noted that procedures for Works Orders are still in development, and there is no formal system currently in place. However, it is an aim to have a functioning Works Order system to support sound asset management.
9.2.5 Data Quality Assessment
A key issue with collecting and storing this information is the recognition that it must be kept up-to-date. Obsolete data can produce meaningless information when efforts are made to use it for works programming and financial modelling.
As there may be a prohibitive cost to data collection, it is essential that consideration be given to collecting and storing only that data which will be useful to management needs.

Wastewater Asset Management Plan v0.03 70
10.0 PLAN IMPROVEMENT AND MONITORING
10.1 Status of Asset Management Practices18
The current level of asset management maturity has not been formally determined. It is likely to be at a minimum (basic) to core level.
10.2 Improvement Priorities
Review asset register data accuracy via review of actual plans and historical data
Confirm assets for renewals in forward budgets
Prepare and prioritise 3-year rolling renewals program
Confirm new and upgrade capital works projects in forward budgets after additional
analysis, review, and financial modelling
Review Capital Works Budgeting and Financial Capacity
Implement an improved Capital Works Delivery process from inception to delivery
Monitor and confirm operations and maintenance spend
Confirm condition/performance of assets through co-ordinated asset inspection program and repair analysis
Confirm condition/performance of at-risk sewers through coordinated asset inspection program
Identify critical assets and asset risk profile
Document Maintenance Management Strategy and Schedule
o Document maintenance management activities
Develop Critical Spares Inventory Management System
Asset register/GIS updates and improvements Process
Improve ‘As constructed’ data capture procedure
Define staff roles and responsibilities.
10.3 Key Performance Indicators (Improvement)
The effectiveness of this Asset Management Plan can be measured in the following ways:
The degree to which the required forecast costs identified in this Asset Management Plan are incorporated into the long-term financial plan.
The degree to which the detailed multi-year works programs, budgets, business plans and corporate structures take into account the ‘global’ works program trends provided by the Asset Management Plan.
The degree to which the existing and projected service levels and service consequences, risks and residual risks are incorporated into the Strategic Plan and associated plans.
Progress towards the achievement of Council’s Asset Renewal Funding Ratio target (this target is currently 0.9).
18 ISO 55000 Refers to this the Asset Management System

Wastewater Asset Management Plan v0.03 71
10.4 Improvement Plan
It is important that an entity recognise areas of their Asset Management Plan and planning process that require future improvements to ensure effective asset management and informed decision making. The improvement plan generated from this Asset Management Plan is shown below.
Table 28: Wastewater Asset Management Improvement Plan
Item Improvement Task Description Priority
(H/M/L)
Internal $ External $
Responsible Person
Completion Date
LEVELS OF SERVICE
1 Confirm LOS Confirm proposed LOS and include in CSS High To Be determined
To Be determined
Manager WWW June 2020
2 Confirm Customer Service Standard
Finalise draft 2019 Customer Service Standard including review of targets in line with outcomes of this AMP.
High To Be determined
To Be determined
Manager WWW June 2020
3 Formally gauge customer satisfaction and expectations
Incorporate customer consultation mechanisms around on service levels and costs of providing the service (Include in improvement strategy)
Medium To Be determined
To Be determined
Manager WWW June 2021
CAPEX
4 Confirm Assets for Renewals in Forward Budgets
Adopt the asset renewal profiles to meet service levels in the AMP as the basis for future renewals budgeting and revising the forward works plan
High To Be determined
To Be determined
Manager WWW June 2021.
5 Prepare 3-year rolling renewals program
For assets identified in the 5-year renewal profiles monitor their condition/performance and confirm assets for short term (3 years) rolling renewals program.
High To Be determined
To Be determined
Manager WWW June 2021.
6 Prioritise 3 years renewals program
Prioritise 3 years renewals program using criteria in this AMP with high priority renewals for next years detailed in works program and budget.
High To Be determined
To Be determined
Manager WWW June 2021.
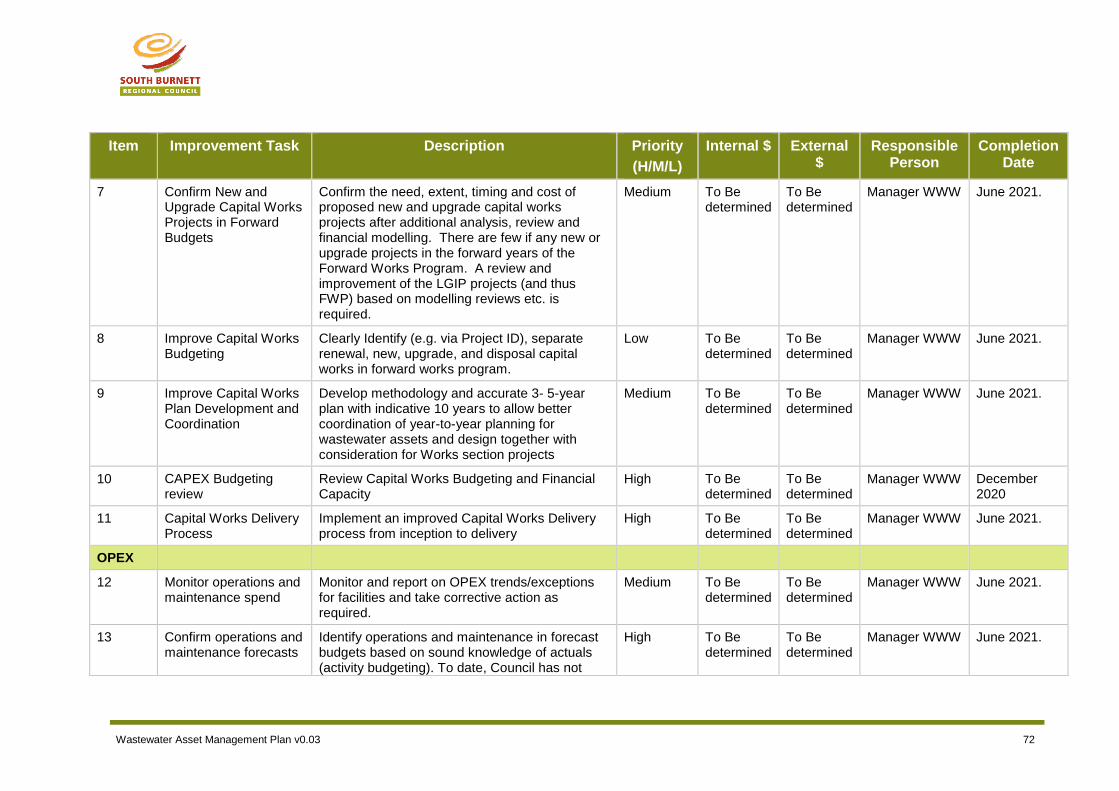
Wastewater Asset Management Plan v0.03 72
Item Improvement Task Description Priority
(H/M/L)
Internal $ External $
Responsible Person
Completion Date
7 Confirm New and Upgrade Capital Works Projects in Forward Budgets
Confirm the need, extent, timing and cost of proposed new and upgrade capital works projects after additional analysis, review and financial modelling. There are few if any new or upgrade projects in the forward years of the Forward Works Program. A review and improvement of the LGIP projects (and thus FWP) based on modelling reviews etc. is required.
Medium To Be determined
To Be determined
Manager WWW June 2021.
8 Improve Capital Works Budgeting
Clearly Identify (e.g. via Project ID), separate renewal, new, upgrade, and disposal capital works in forward works program.
Low To Be determined
To Be determined
Manager WWW June 2021.
9 Improve Capital Works Plan Development and Coordination
Develop methodology and accurate 3- 5-year plan with indicative 10 years to allow better coordination of year-to-year planning for wastewater assets and design together with consideration for Works section projects
Medium To Be determined
To Be determined
Manager WWW June 2021.
10 CAPEX Budgeting review
Review Capital Works Budgeting and Financial Capacity
High To Be determined
To Be determined
Manager WWW December 2020
11 Capital Works Delivery Process
Implement an improved Capital Works Delivery process from inception to delivery
High To Be determined
To Be determined
Manager WWW June 2021.
OPEX
12 Monitor operations and maintenance spend
Monitor and report on OPEX trends/exceptions for facilities and take corrective action as required.
Medium To Be determined
To Be determined
Manager WWW June 2021.
13 Confirm operations and maintenance forecasts
Identify operations and maintenance in forecast budgets based on sound knowledge of actuals (activity budgeting). To date, Council has not
High To Be determined
To Be determined
Manager WWW June 2021.

Wastewater Asset Management Plan v0.03 73
Item Improvement Task Description Priority
(H/M/L)
Internal $ External $
Responsible Person
Completion Date
been able to separate operations cost from maintenance.
ASSETS
14 Confirm condition/performance of assets
Confirm condition/performance of assets through coordinated asset inspection program and repair analysis
Consider implementing the use of 'Fault Report Record' for call outs - repairs, inspections to record condition/performance of assets, e.g. main breaks, sewer connection blockages.
Medium To Be determined
To Be determined
Water & Wastewater Engineer
June 2021.
15 Confirm condition / performance of at-risk (critical) sewers
Condition assess critical below ground sewers through coordinated asset inspection program, e.g. sample CCTV surveys of aged sewers and samples of cohorts (i.e. same material and similar age) to confirm condition and remaining lives of cohorts
Medium To Be determined
To Be determined
Water & Wastewater Engineer
June 2021.
RISK
16 Determine asset risk profile
Assign risk rating to all assets Medium To Be determined
$15,000 Water & Wastewater Engineer
December 2020
17 Identify critical assets Identifying critical assets and failure modes to enable targeted investigative activities, condition inspection programs, maintenance and capital expenditure plans for critical assets
Medium To Be determined
To Be determined
Water & Wastewater Engineer
June 2021.
OPERATIONS AND MAINTENANCE

Wastewater Asset Management Plan v0.03 74
Item Improvement Task Description Priority
(H/M/L)
Internal $ External $
Responsible Person
Completion Date
18 Maintenance Management Strategy and Schedule
Document Council’s Maintenance Management Strategy for asset types including refine/develop, document in summary form a ‘Maintenance Schedule’ (e.g. a calendar year program of activities with frequency and responsibility).
Medium To Be determined
To Be determined
Project Coordinator Water & Wastewater
June 2021
19 Document Maintenance Management Activities
Document the required minimum routine inspection and maintenance management activities and prepare basic inspection/ checklists that align with technical service measures, particularly for critical assets, e.g. pump station, reservoir inspections (external/internal)
Medium To Be determined
To Be determined
Project Coordinator Water & Wastewater
June 2021
20 Develop Critical Spares Inventory Management System
Continue to identify, list and procure if necessary, spares for critical assets and components including contact details documented for suppliers/repairers, e.g. pumps.
Medium To Be determined
To Be determined
Project Coordinator Water & Wastewater
June 2021
DATA MANAGEMENT
21 Asset Register/GIS Updates and Improvements Process
Complete update of GIS mapping as required Medium To Be determined
To Be determined
Water & Wastewater Engineer
June 2021
22 Asset Register/GIS Updates and Improvements Process
Review asset register data accuracy via review of actual plans and historical data
High To Be determined
To Be determined
Water & Wastewater Engineer
June 2021
23 Asset Register/GIS Updates and Improvements Process
Identify/confirm critical valves and ensure separated in the register (could be included in Pipework, Valves & Fittings)
Medium To Be determined
To Be determined
Water & Wastewater Engineer
June 2021
24 Asset Register/GIS Updates and Improvements
Decide on the process to correct asset attribute data inconstancies. Address missing and incorrect attribute data (main sizes, materials and install dates/age, or a mixture of all)
Medium To Be determined
To Be determined
Water & Wastewater Engineer
June 2021

Wastewater Asset Management Plan v0.03 75
Item Improvement Task Description Priority
(H/M/L)
Internal $ External $
Responsible Person
Completion Date
25 Asset Register/GIS Updates and Improvements Process
Update registers with condition data for sewers from CCTV surveys and condition reports.
Medium To Be determined
To Be determined
Water & Wastewater Engineer
June 2021
26 Asset Register/GIS Updates and Improvements Process
Develop a process for field capture (e.g. staff measure onsite as part of routine operations) and GIS/register system updating of missing asset attribute data (e.g. sewer manhole depths)
Medium To Be determined
To Be determined
Water & Wastewater Engineer
June 2021
27 Improve ‘As Constructed’ Data Capture procedure
Develop and implement ‘as constructed’ work procedure and Process to handover Donated Assets (e.g. in Asset Accounting Manual)
Medium To Be determined
To Be determined
Water & Wastewater Engineer
June 2021
STAFF MANAGEMENT
28 Define Roles and Responsibilities
Ensure roles and responsibilities are clearly defined and communicated for positions relating to water asset management.
Medium To Be determined
To Be determined
Manager WWW June 2021
Wastewater Asset Management Plan v0.03 76
10.5 Monitoring and Review Procedures
This asset management plan will be reviewed bi-annually. This review shall include, but not be limited to:
Condition and performance of assets:
Changes in overall condition;
Levels of service achieved;
Financial forecasts;
Validation of estimated costs for asset works.
Progress on Capital Works Development Program;
Recommendations for amendments;
The performance and appropriateness of asset documents, including:
Asset Management Policy;
Asset Management Strategy;
Individual Asset Management Plans;
Individual Asset Class Specifications.
10.5.1 Audit Review Process
Council will implement an audit process to ensure:
Assets are recorded accurately within Council’s asset management system;
Condition assessments and maintenance inspections are conducted in accordance with Council’s Individual Asset Class Specifications frequency, methodology and criteria;
Works programs are developed according to relevant criteria;
Works are completed as per Council’s Individual Asset Specifications;
Completed works are recorded in the asset management system; and
Expenditure is correctly allocated between capital and maintenance in accordance with Council’s guidelines.
10.5.2 Reviewing Maintenance Management Performance
SBRC has developed a Wastewater Asset Maintenance Management Plan that defines the maintenance service and standard levels for Wastewater assets.
Part of the annual budget process is to review asset performance following delivery of the maintenance program. Actual expenditures are compared to those budgeted, and any significant variances are analysed with any necessary remedial action accounted for in the new budget.
Effectiveness of the various maintenance activities is reviewed to ensure that they are delivering what is required to keep the asset performing at the required level of service.
Part of this process is to determine whether it is effective to continue funding maintenance or in fact that the particular asset or asset component requires rehabilitation, renewal or upgrading or even being downgraded.
Wastewater Asset Management Plan v0.03 77
10.5.3 Reporting Asset Achievements
Council’s Annual Report is the vehicle that is used by Council to report asset management achievements of maintenance and refurbishment and renewal strategies against planned targets and programs to the community.
Wastewater Asset Management Plan v0.03 78
11.0 REFERENCES
Institute of Public Works Engineering Australasia. (2008). NAMS.PLUS Asset Management.
Institute of Public Works Engineering Australasia. (2012). LTFP Practice Note 6 PN Long Term Financial Plan.
Institute of Public Works Engineering Australasia. (2015). Australian Infrastructure Financial Management Manual (2nd ed.).
Institute of Public Works Engineering Australasia. (2015). International Infrastructure Management Manual (3rd ed.).
International Standards Organisation. (2014). ISO 55000:2014 Asset management – Overview, principles and terminology.
International Standards Organisation. (2014). ISO 55001:2014 Asset management – Management Systems – Requirements.
International Standards Organisation. (2018). ISO 31000:2018, Risk management – Guidelines.
International Standards Organisation. (2018). ISO 55002:2018 Guidelines for the application of ISO 55001.

Wastewater Asset Management Plan v0.03 79
Appendix A: Glossary
The following terms defined/ described to clarify concepts referred to in this document.
Table 29: Glossary
Term Description
Asset Condition Assessment The process of continuous or periodic inspection, assessment, measurement, and interpretation of the resultant data to indicate the condition of a specific asset to determine the need for some preventative or remedial action.
Asset Management
The combination of management, financial, economic, engineering and other practices applied to physical assets to provide the required level of service in the most cost-effective manner.
Asset Management Plan
A plan developed for the management of one or more infrastructure assets that combines multi-disciplinary management techniques (including technical and financial) over the lifecycle of the asset in the most cost-effective manner to provide specified level of service. A significant component of the plan is a long-term cash flow projection for the activities.
Asset Renewal Replacement or rehabilitation to original size and capacity of a road or drainage asset or the component of the asset. Renewals are “capitalised” so that the cost can be depreciated over the future life of the asset.
Core Asset Management Asset management which relies primarily on the use of an asset register, maintenance management systems, job/resource management, condition assessment and defined levels of service, in order to establish alternate treatment options and long-term cash flow predictions. Priorities are usually established on the basis of financial return gained by carrying out the work (rather than risk analysis and optimised renewal decision making).
Infrastructure Assets Physical assets of the entity or of another entity that contribute to meeting the public's need for access to major economic and social facilities and services, e.g. roads, drainage, footpaths and cycleways. These are typically large, interconnected networks or portfolios of composite assets. The components of these assets may be separately maintained, renewed or replaced individually so that the required level and standard of service from the network of assets is continuously sustained. Generally, the components and hence the assets have long lives. They are fixed in place and are often have no market value.
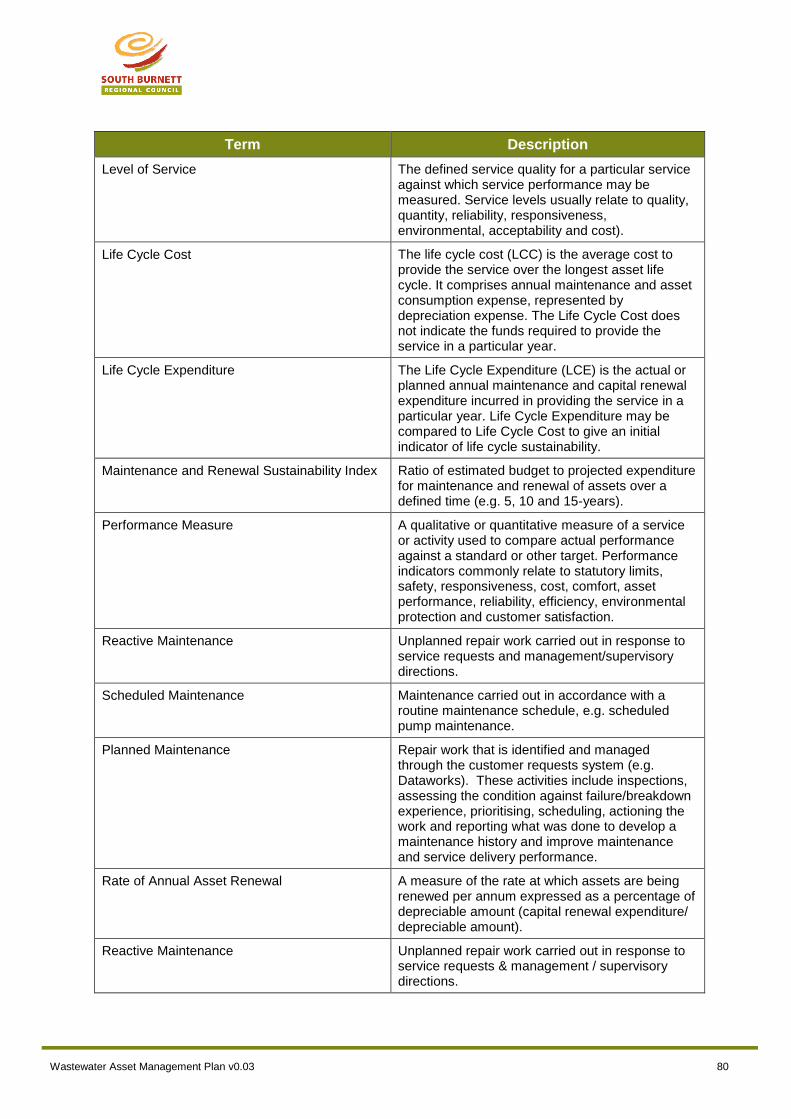
Wastewater Asset Management Plan v0.03 80
Term Description
Level of Service The defined service quality for a particular service against which service performance may be measured. Service levels usually relate to quality, quantity, reliability, responsiveness, environmental, acceptability and cost).
Life Cycle Cost The life cycle cost (LCC) is the average cost to provide the service over the longest asset life cycle. It comprises annual maintenance and asset consumption expense, represented by depreciation expense. The Life Cycle Cost does not indicate the funds required to provide the service in a particular year.
Life Cycle Expenditure
The Life Cycle Expenditure (LCE) is the actual or planned annual maintenance and capital renewal expenditure incurred in providing the service in a particular year. Life Cycle Expenditure may be compared to Life Cycle Cost to give an initial indicator of life cycle sustainability.
Maintenance and Renewal Sustainability Index Ratio of estimated budget to projected expenditure for maintenance and renewal of assets over a defined time (e.g. 5, 10 and 15-years).
Performance Measure A qualitative or quantitative measure of a service or activity used to compare actual performance against a standard or other target. Performance indicators commonly relate to statutory limits, safety, responsiveness, cost, comfort, asset performance, reliability, efficiency, environmental protection and customer satisfaction.
Reactive Maintenance Unplanned repair work carried out in response to service requests and management/supervisory directions.
Scheduled Maintenance Maintenance carried out in accordance with a routine maintenance schedule, e.g. scheduled pump maintenance.
Planned Maintenance Repair work that is identified and managed through the customer requests system (e.g. Dataworks). These activities include inspections, assessing the condition against failure/breakdown experience, prioritising, scheduling, actioning the work and reporting what was done to develop a maintenance history and improve maintenance and service delivery performance.
Rate of Annual Asset Renewal A measure of the rate at which assets are being renewed per annum expressed as a percentage of depreciable amount (capital renewal expenditure/ depreciable amount).
Reactive Maintenance Unplanned repair work carried out in response to service requests & management / supervisory directions.

Wastewater Asset Management Plan v0.03 81
Term Description
Recurrent Expenditure Relatively small (immaterial) expenditure or that which has benefits expected to last less than 12 months. Recurrent expenditure includes operating and maintenance expenditure.
Remaining Life The time remaining until an asset ceases to provide the required service level or economic usefulness. Age plus remaining life is economic life (also useful life).
Renewal Expenditure Major works which do not increase the asset’s design capacity but restores, rehabilitates, replaces, or renews an existing asset to its original service potential.
Upgrade/Expansion Expenditure Work over and above, restoring an asset to original service potential.
Useful Life (also economic life) Either:(a) the period over which an asset is expected to be available for use by an entity, or (b) the number of production or similar units expected to be obtained from the asset by the entity.
It is estimated or expected time between placing the asset into service and removing it from service, or the estimated period of time over which the future economic benefits embodied in a depreciable asset, are expected to be consumed by the Council.
New Assets Activities that create a wastewater asset that did not exist previously or extend an asset beyond its original size or capacity. New assets are also “capitalised”, but they increase the asset base rather than restore its capacity to perform.

Wastewater Asset Management Plan v0.03 82
Appendix B: Wastewater Asset Hierarchy
Council’s Wastewater asset hierarchy is shown below.
Table 30: SBRC Approved Wastewater Hierarchy
Functional Use (L1) Functional Use (L2)
Waste Water Distribution Reticulation sewers
Waste Water Distribution Reticulation Services Connections & IOS
Waste Water Distribution Distribution Rising Mains
Waste Water Distribution Effluent Reuse
Waste Water Transfer Sewage Pump Stations
Waste Water Transfer Effluent Pump Stations
Waste Water Transfer Facilities & Site Infrastructure
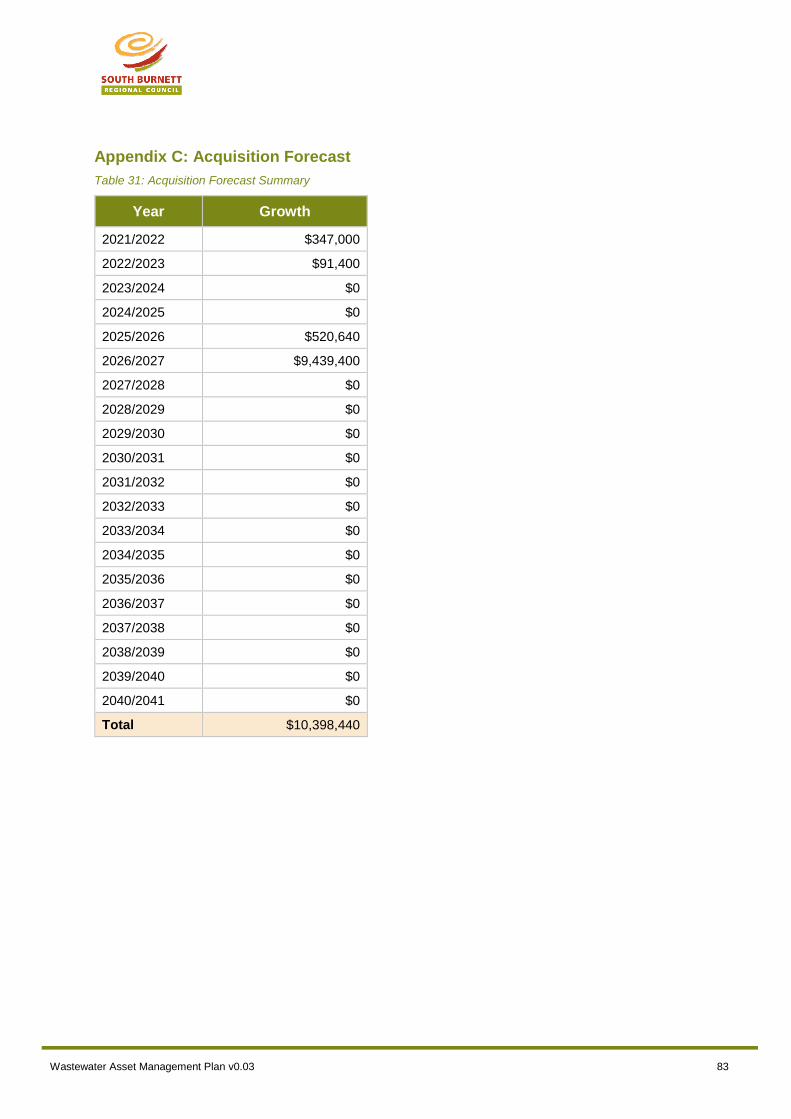
Wastewater Asset Management Plan v0.03 83
Appendix C: Acquisition Forecast
Table 31: Acquisition Forecast Summary
Year Growth
2021/2022 $347,000
2022/2023 $91,400
2023/2024 $0
2024/2025 $0
2025/2026 $520,640
2026/2027 $9,439,400
2027/2028 $0
2028/2029 $0
2029/2030 $0
2030/2031 $0
2031/2032 $0
2032/2033 $0
2033/2034 $0
2034/2035 $0
2035/2036 $0
2036/2037 $0
2037/2038 $0
2038/2039 $0
2039/2040 $0
2040/2041 $0
Total $10,398,440

Wastewater Asset Management Plan v0.03 84
Appendix D: Operation Forecast
‘Additional Operation Forecast ‘is the increase from the previous year (i.e. current year minus previous year).
Table 32: Operation Forecast Summary
Year Additional Operation
Forecast Total Operation
Forecast
2021/2022 -$394,888 $1,653,046
2022/2023 $35,963 $1,689,009
2023/2024 $36,560 $1,725,569
2024/2025 $37,163 $1,762,732
2025/2026 $37,781 $1,800,513
2026/2027 $31,267 $1,831,780
2027/2028 $31,887 $1,863,667
2028/2029 $32,516 $1,896,183
2029/2030 $38,034 $1,934,217
2030/2031 $38,796 $1,973,013
2031/2032 $39,574 $2,012,587
2032/2033 $40,368 $2,052,955
2033/2034 $41,178 $2,094,133
2034/2035 $42,003 $2,136,136
2035/2036 $42,847 $2,178,983
2036/2037 $43,705 $2,222,688
2037/2038 $44,582 $2,267,270
2038/2039 $45,477 $2,312,747
2039/2040 $46,389 $2,359,136
2040/2041 $47,319 $2,406,455
Total $358,521 $40,172,819

Wastewater Asset Management Plan v0.03 85
Appendix E: Maintenance Forecast
Table 33: Maintenance Forecast Summary
Year Additional
Maintenance Forecast
Total Maintenance Forecast
2021/2022 $3762 $1,069,877
2022/2023 $ $1,070,868
2023/2024 $0 $1,070,868
2024/2025 $0 $1,070,868
2025/2026 $5645 $1,076,513
2026/2027 $78583 $1,155,097
2027/2028 $0 $1,155,097
2028/2029 $0 $1,155,097
2029/2030 $0 $1,155,097
2030/2031 $0 $1,155,097
2031/2032 $0 $1,155,097
2032/2033 $0 $1,155,097
2033/2034 $0 $1,155,097
2034/2035 $0 $1,155,097
2035/2036 $0 $1,155,097
2036/2037 $0 $1,155,097
2037/2038 $0 $1,155,097
2038/2039 $0 $1,155,097
2039/2040 $0 $1,155,097
2040/2041 $0 $1,155,097
Total $87,990 $22,685,449
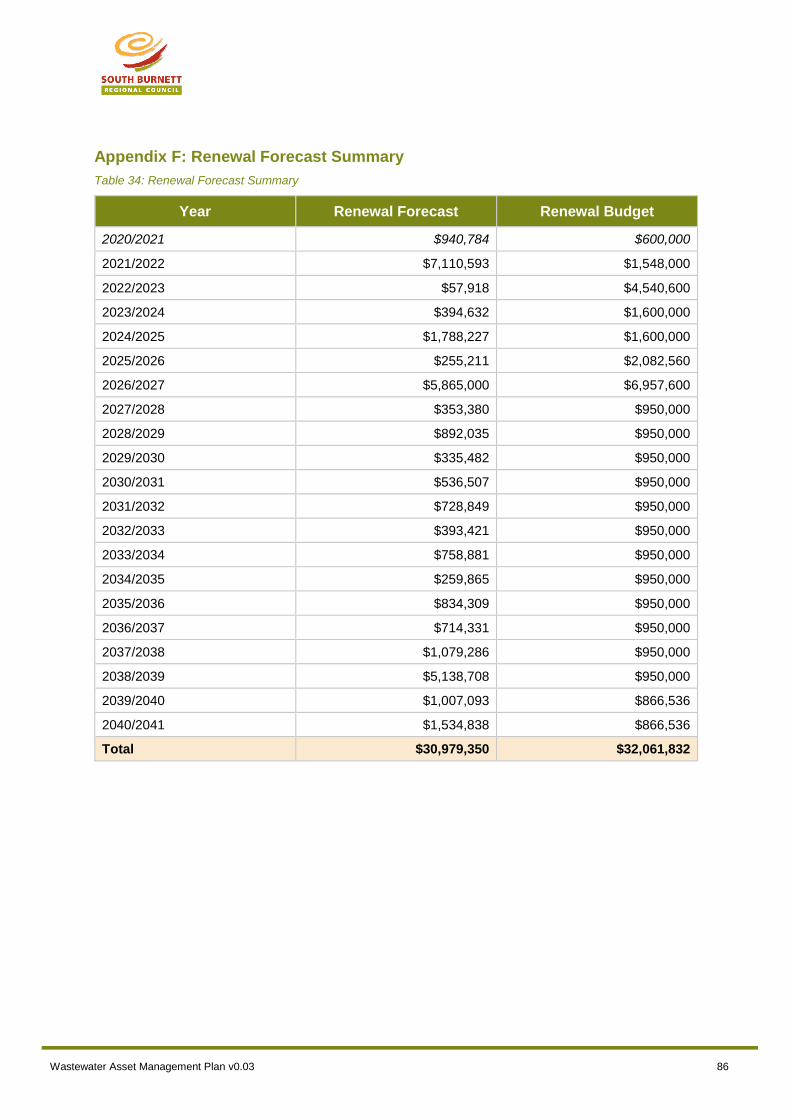
Wastewater Asset Management Plan v0.03 86
Appendix F: Renewal Forecast Summary
Table 34: Renewal Forecast Summary
Year Renewal Forecast Renewal Budget
2020/2021 $940,784 $600,000
2021/2022 $7,110,593 $1,548,000
2022/2023 $57,918 $4,540,600
2023/2024 $394,632 $1,600,000
2024/2025 $1,788,227 $1,600,000
2025/2026 $255,211 $2,082,560
2026/2027 $5,865,000 $6,957,600
2027/2028 $353,380 $950,000
2028/2029 $892,035 $950,000
2029/2030 $335,482 $950,000
2030/2031 $536,507 $950,000
2031/2032 $728,849 $950,000
2032/2033 $393,421 $950,000
2033/2034 $758,881 $950,000
2034/2035 $259,865 $950,000
2035/2036 $834,309 $950,000
2036/2037 $714,331 $950,000
2037/2038 $1,079,286 $950,000
2038/2039 $5,138,708 $950,000
2039/2040 $1,007,093 $866,536
2040/2041 $1,534,838 $866,536
Total $30,979,350 $32,061,832

Wastewater Asset Management Plan v0.03 87
Appendix G: Budget Summary by Lifecycle Activity
Table 35: Budget Summary by Lifecycle Activity
Year Acquisition Operation Maintenanc
e Renewal Disposal Total
2021/2022 $347,000 $1,653,046 $1,090,667 $1,548,000 $0 $4,638,713
2022/2023 $91,400 $1,689,009 $1,114,395 $4,540,600 $0 $7,435,404
2023/2024 $0 $1,725,569 $1,138,516 $1,600,000 $0 $4,464,085
2024/2025 $0 $1,762,732 $1,163,036 $1,600,000 $0 $4,525,768
2025/2026 $520,640 $1,800,513 $1,187,964 $2,082,560 $0 $5,591,677
2026/2027 $9,439,400 $1,831,780 $1,208,594 $6,957,600 $0 $19,437,374
2027/2028 $0 $1,863,667 $1,229,633 $950,000 $0 $4,043,300
2028/2029 $0 $1,896,183 $1,251,087 $950,000 $0 $4,097,270
2029/2030 $0 $1,934,217 $1,276,181 $950,000 $0 $4,160,397
2030/2031 $0 $1,973,013 $1,301,778 $950,000 $0 $4,224,791
2031/2032 $0 $2,012,587 $1,327,889 $950,000 $0 $4,290,476
2032/2033 $0 $2,052,955 $1,354,523 $950,000 $0 $4,357,478
2033/2034 $0 $2,094,133 $1,381,692 $950,000 $0 $4,425,825
2034/2035 $0 $2,136,136 $1,409,406 $950,000 $0 $4,495,542
2035/2036 $0 $2,178,983 $1,437,676 $950,000 $0 $4,566,658
2036/2037 $0 $2,222,688 $1,466,512 $950,000 $0 $4,639,200
2037/2038 $0 $2,267,270 $1,495,927 $950,000 $0 $4,713,198
2038/2039 $0 $2,312,747 $1,525,932 $950,000 $0 $4,788,679
2039/2040 $0 $2,359,136 $1,556,539 $866,536 $0 $4,782,210
2040/2041 $0 $2,406,455 $1,587,760 $866,536 $0 $4,860,750
Total $10,398,440 $40,172,818 $26,505,707 $31,461,832 $0 $108,538,797
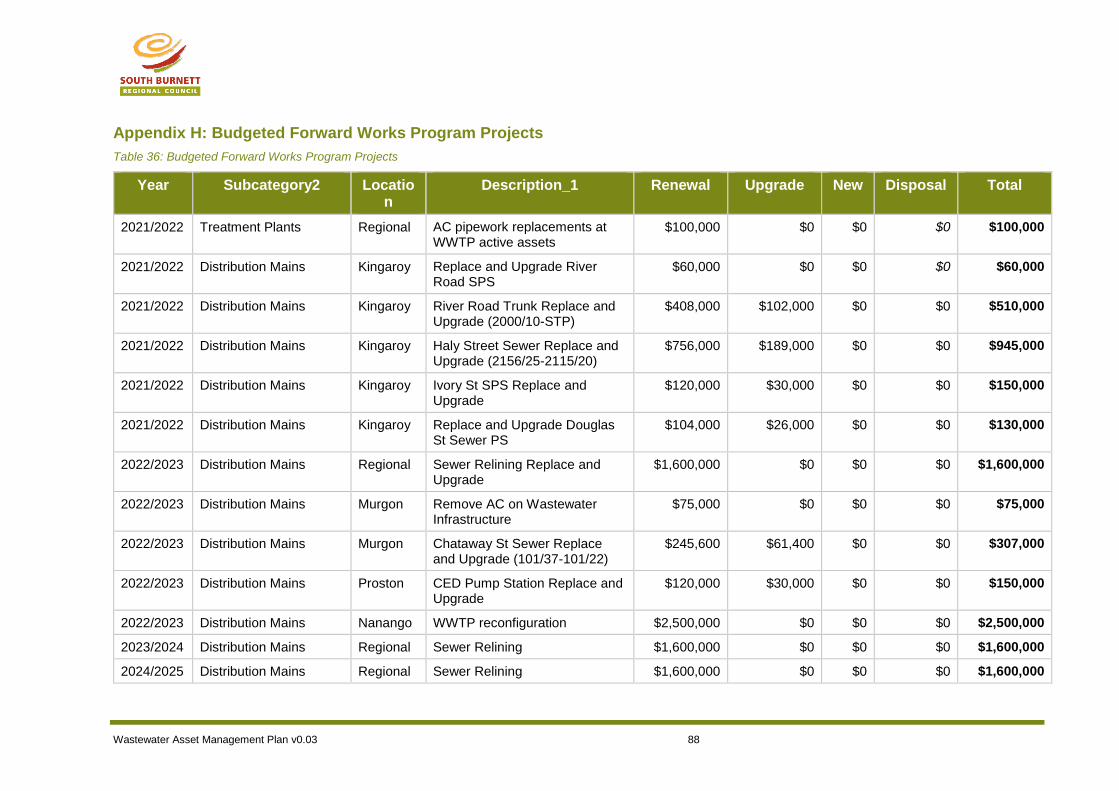
Wastewater Asset Management Plan v0.03 88
Appendix H: Budgeted Forward Works Program Projects
Table 36: Budgeted Forward Works Program Projects
Year Subcategory2 Location
Description_1 Renewal Upgrade New Disposal Total
2021/2022 Treatment Plants Regional AC pipework replacements at WWTP active assets
$100,000 $0 $0 $0 $100,000
2021/2022 Distribution Mains Kingaroy Replace and Upgrade River Road SPS
$60,000 $0 $0 $0 $60,000
2021/2022 Distribution Mains Kingaroy River Road Trunk Replace and Upgrade (2000/10-STP)
$408,000 $102,000 $0 $0 $510,000
2021/2022 Distribution Mains Kingaroy Haly Street Sewer Replace and Upgrade (2156/25-2115/20)
$756,000 $189,000 $0 $0 $945,000
2021/2022 Distribution Mains Kingaroy Ivory St SPS Replace and Upgrade
$120,000 $30,000 $0 $0 $150,000
2021/2022 Distribution Mains Kingaroy Replace and Upgrade Douglas St Sewer PS
$104,000 $26,000 $0 $0 $130,000
2022/2023 Distribution Mains Regional Sewer Relining Replace and Upgrade
$1,600,000 $0 $0 $0 $1,600,000
2022/2023 Distribution Mains Murgon Remove AC on Wastewater Infrastructure
$75,000 $0 $0 $0 $75,000
2022/2023 Distribution Mains Murgon Chataway St Sewer Replace and Upgrade (101/37-101/22)
$245,600 $61,400 $0 $0 $307,000
2022/2023 Distribution Mains Proston CED Pump Station Replace and Upgrade
$120,000 $30,000 $0 $0 $150,000
2022/2023 Distribution Mains Nanango WWTP reconfiguration $2,500,000 $0 $0 $0 $2,500,000
2023/2024 Distribution Mains Regional Sewer Relining $1,600,000 $0 $0 $0 $1,600,000
2024/2025 Distribution Mains Regional Sewer Relining $1,600,000 $0 $0 $0 $1,600,000
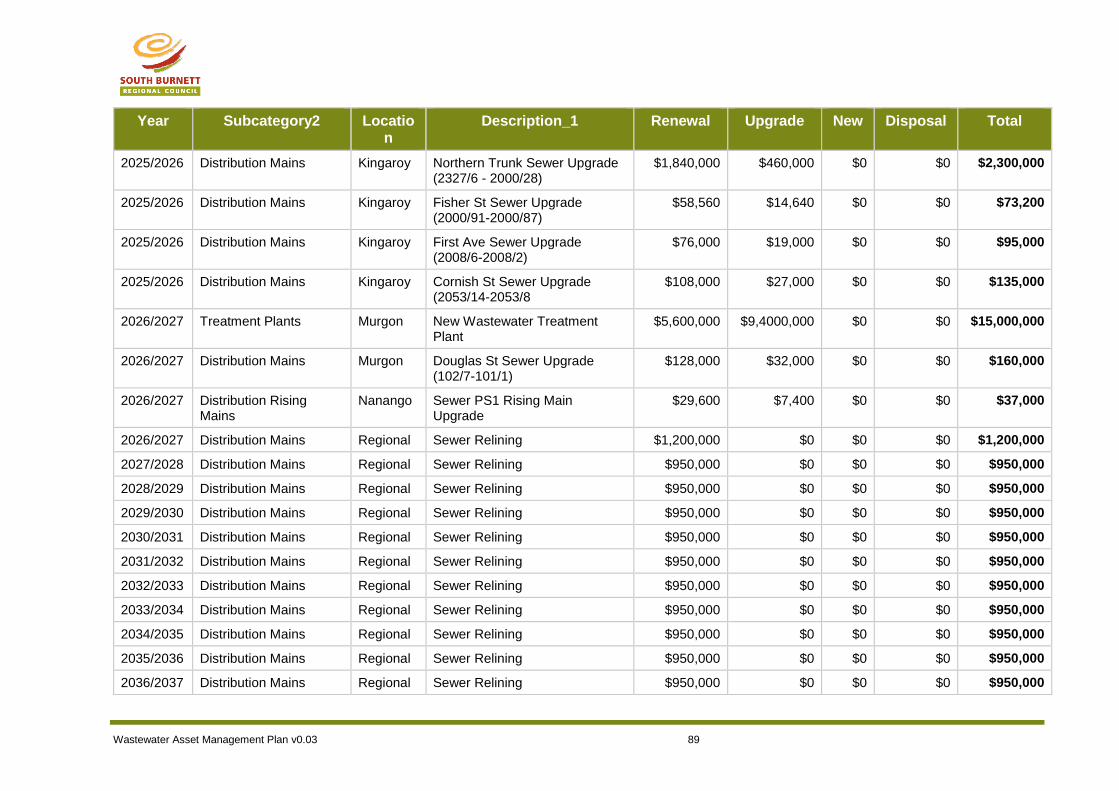
Wastewater Asset Management Plan v0.03 89
Year Subcategory2 Location
Description_1 Renewal Upgrade New Disposal Total
2025/2026 Distribution Mains Kingaroy Northern Trunk Sewer Upgrade (2327/6 - 2000/28)
$1,840,000 $460,000 $0 $0 $2,300,000
2025/2026 Distribution Mains Kingaroy Fisher St Sewer Upgrade (2000/91-2000/87)
$58,560 $14,640 $0 $0 $73,200
2025/2026 Distribution Mains Kingaroy First Ave Sewer Upgrade (2008/6-2008/2)
$76,000 $19,000 $0 $0 $95,000
2025/2026 Distribution Mains Kingaroy Cornish St Sewer Upgrade (2053/14-2053/8
$108,000 $27,000 $0 $0 $135,000
2026/2027 Treatment Plants Murgon New Wastewater Treatment Plant
$5,600,000 $9,4000,000 $0 $0 $15,000,000
2026/2027 Distribution Mains Murgon Douglas St Sewer Upgrade (102/7-101/1)
$128,000 $32,000 $0 $0 $160,000
2026/2027 Distribution Rising Mains
Nanango Sewer PS1 Rising Main Upgrade
$29,600 $7,400 $0 $0 $37,000
2026/2027 Distribution Mains Regional Sewer Relining $1,200,000 $0 $0 $0 $1,200,000
2027/2028 Distribution Mains Regional Sewer Relining $950,000 $0 $0 $0 $950,000
2028/2029 Distribution Mains Regional Sewer Relining $950,000 $0 $0 $0 $950,000
2029/2030 Distribution Mains Regional Sewer Relining $950,000 $0 $0 $0 $950,000
2030/2031 Distribution Mains Regional Sewer Relining $950,000 $0 $0 $0 $950,000
2031/2032 Distribution Mains Regional Sewer Relining $950,000 $0 $0 $0 $950,000
2032/2033 Distribution Mains Regional Sewer Relining $950,000 $0 $0 $0 $950,000
2033/2034 Distribution Mains Regional Sewer Relining $950,000 $0 $0 $0 $950,000
2034/2035 Distribution Mains Regional Sewer Relining $950,000 $0 $0 $0 $950,000
2035/2036 Distribution Mains Regional Sewer Relining $950,000 $0 $0 $0 $950,000
2036/2037 Distribution Mains Regional Sewer Relining $950,000 $0 $0 $0 $950,000

Wastewater Asset Management Plan v0.03 90
Year Subcategory2 Location
Description_1 Renewal Upgrade New Disposal Total
2037/2038 Distribution Mains Regional Sewer Relining $950,000 $0 $0 $0 $950,000
2038/2039 Distribution Mains Regional Sewer Relining $950,000 $0 $0 $0 $950,000
2039/2040 Distribution Mains Regional 2021/22 - 2038/39 Average Spend
$866,536 $0 $0 $0 $866,536
2040/2041 Distribution Mains Regional 2021/22 - 2038/39 Average Spend
$866,536 $0 $0 $0 $866,536
Total $31,461,832 $10,398,440 $0 $0 $41,860,272
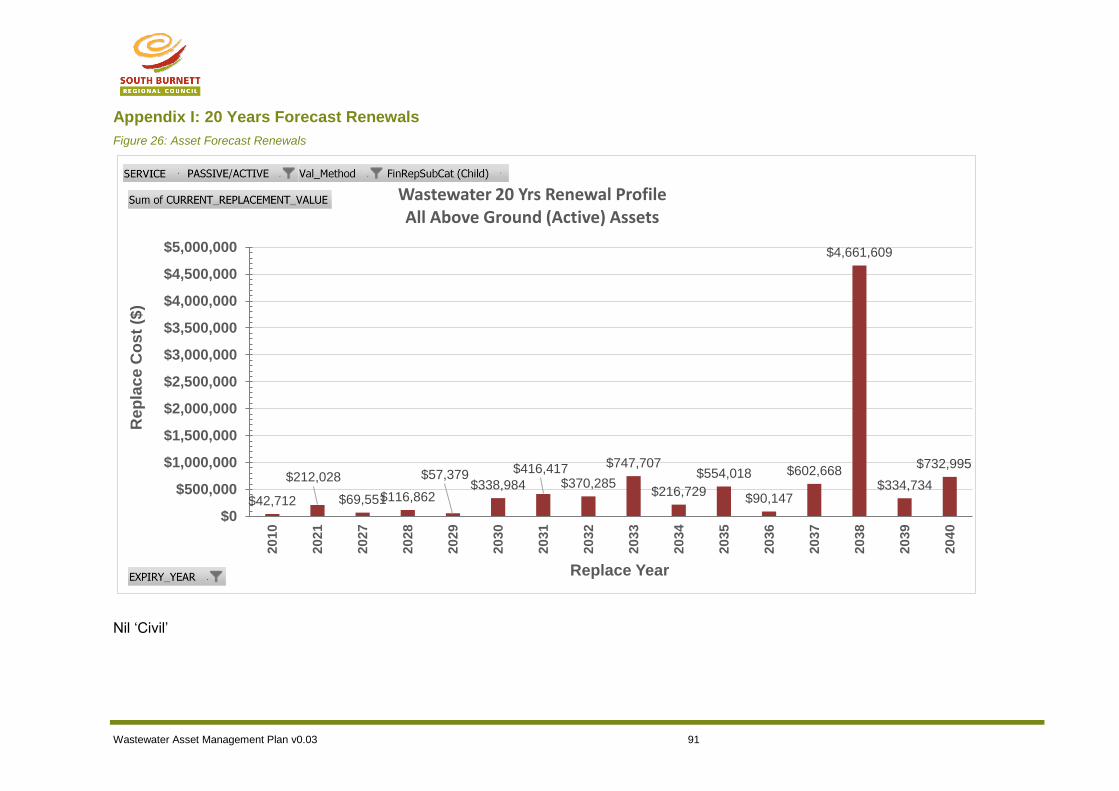
Wastewater Asset Management Plan v0.03 91
Appendix I: 20 Years Forecast Renewals
Figure 26: Asset Forecast Renewals
Nil ‘Civil’
$42,712
$212,028
$69,551$116,862
$57,379$338,984
$416,417$370,285
$747,707
$216,729
$554,018
$90,147
$602,668
$4,661,609
$334,734
$732,995
$0
$500,000
$1,000,000
$1,500,000
$2,000,000
$2,500,000
$3,000,000
$3,500,000
$4,000,000
$4,500,000
$5,000,000
20
10
20
21
20
27
20
28
20
29
20
30
20
31
20
32
20
33
20
34
20
35
20
36
20
37
20
38
20
39
20
40
Rep
lac
e C
os
t ($
)
Replace Year
Wastewater 20 Yrs Renewal ProfileAll Above Ground (Active) Assets
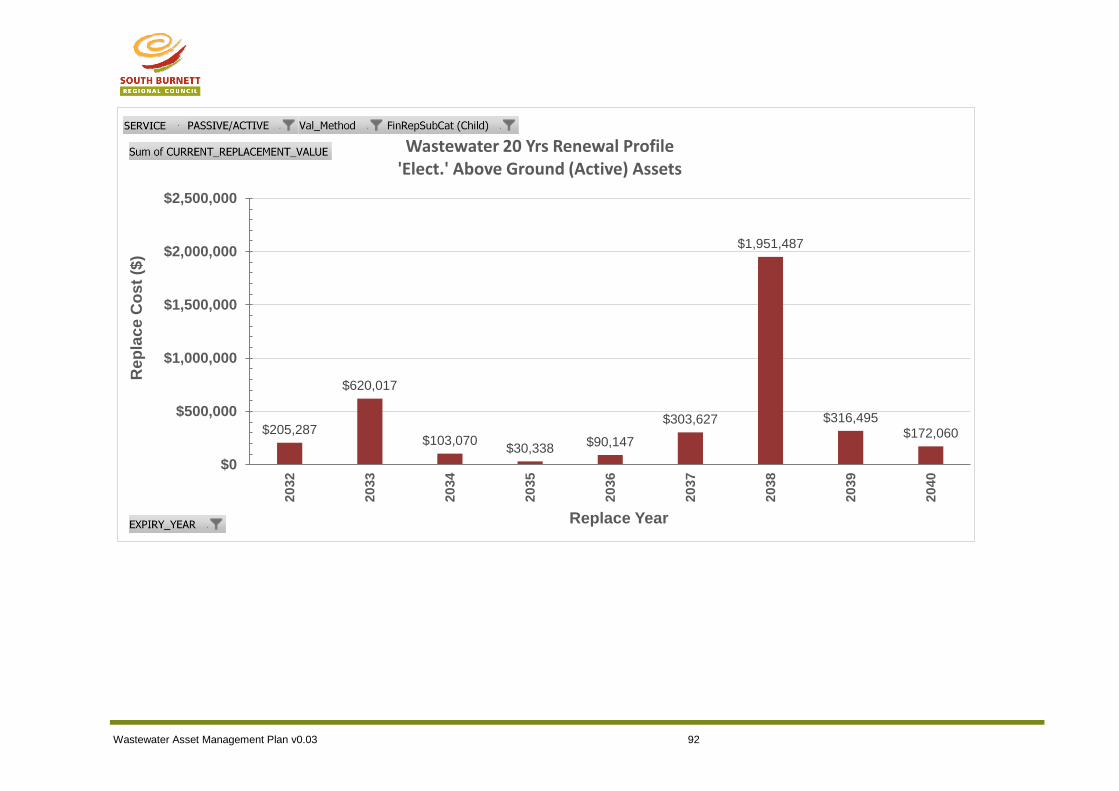
Wastewater Asset Management Plan v0.03 92
$205,287
$620,017
$103,070$30,338
$90,147
$303,627
$1,951,487
$316,495$172,060
$0
$500,000
$1,000,000
$1,500,000
$2,000,000
$2,500,000
20
32
20
33
20
34
20
35
20
36
20
37
20
38
20
39
20
40
Rep
lac
e C
os
t ($
)
Replace Year
Wastewater 20 Yrs Renewal Profile'Elect.' Above Ground (Active) Assets
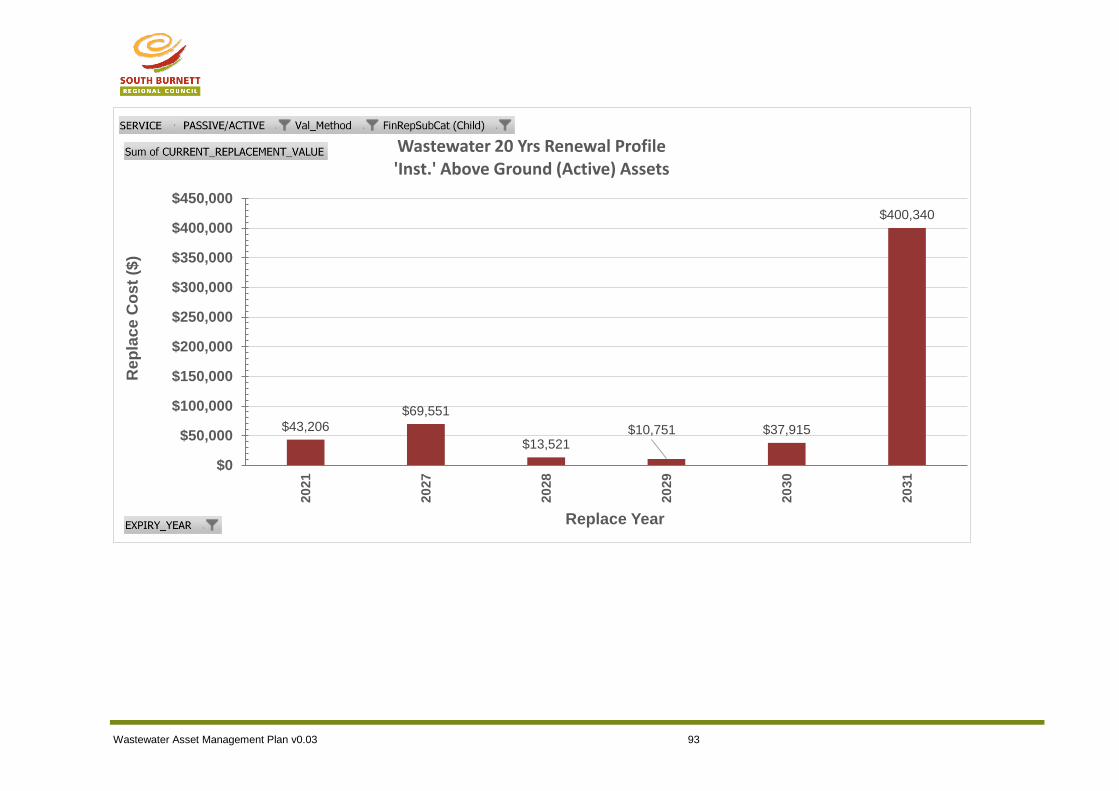
Wastewater Asset Management Plan v0.03 93
$43,206
$69,551
$13,521$10,751 $37,915
$400,340
$0
$50,000
$100,000
$150,000
$200,000
$250,000
$300,000
$350,000
$400,000
$450,000
20
21
20
27
20
28
20
29
20
30
20
31
Rep
lac
e C
os
t ($
)
Replace Year
Wastewater 20 Yrs Renewal Profile'Inst.' Above Ground (Active) Assets
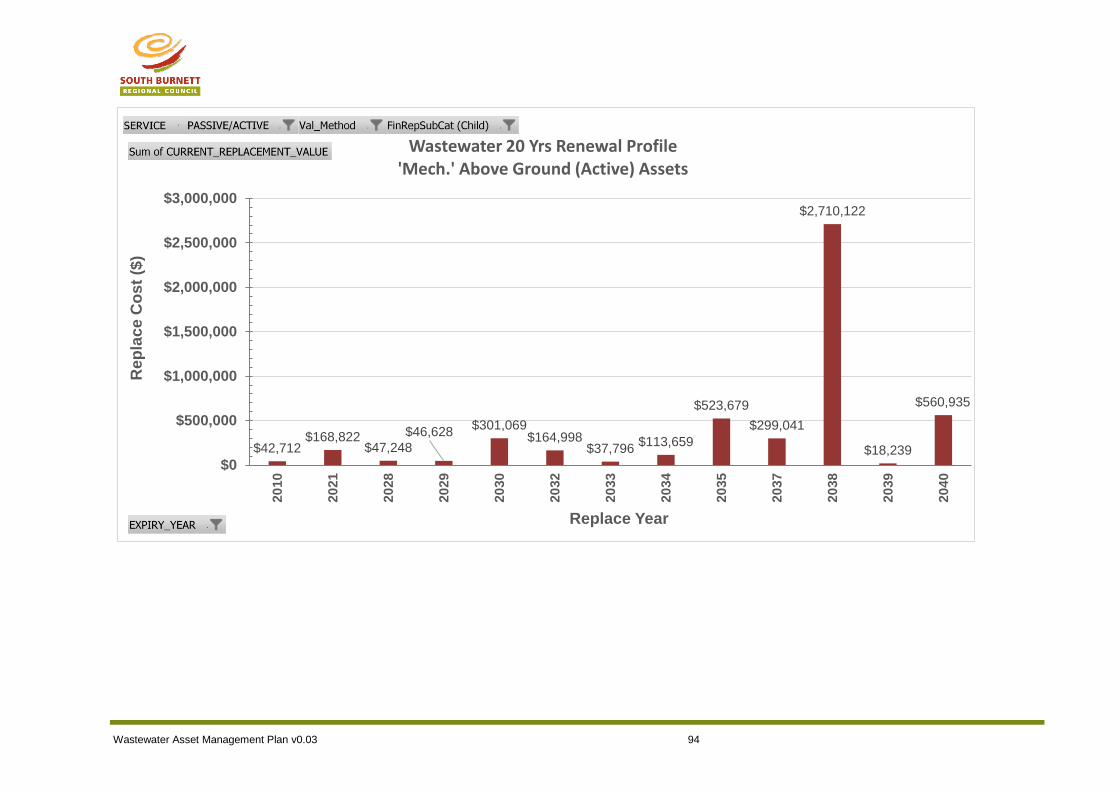
Wastewater Asset Management Plan v0.03 94
$42,712$168,822
$47,248
$46,628$301,069
$164,998$37,796
$113,659
$523,679
$299,041
$2,710,122
$18,239
$560,935
$0
$500,000
$1,000,000
$1,500,000
$2,000,000
$2,500,000
$3,000,000
20
10
20
21
20
28
20
29
20
30
20
32
20
33
20
34
20
35
20
37
20
38
20
39
20
40
Rep
lac
e C
os
t ($
)
Replace Year
Wastewater 20 Yrs Renewal Profile'Mech.' Above Ground (Active) Assets
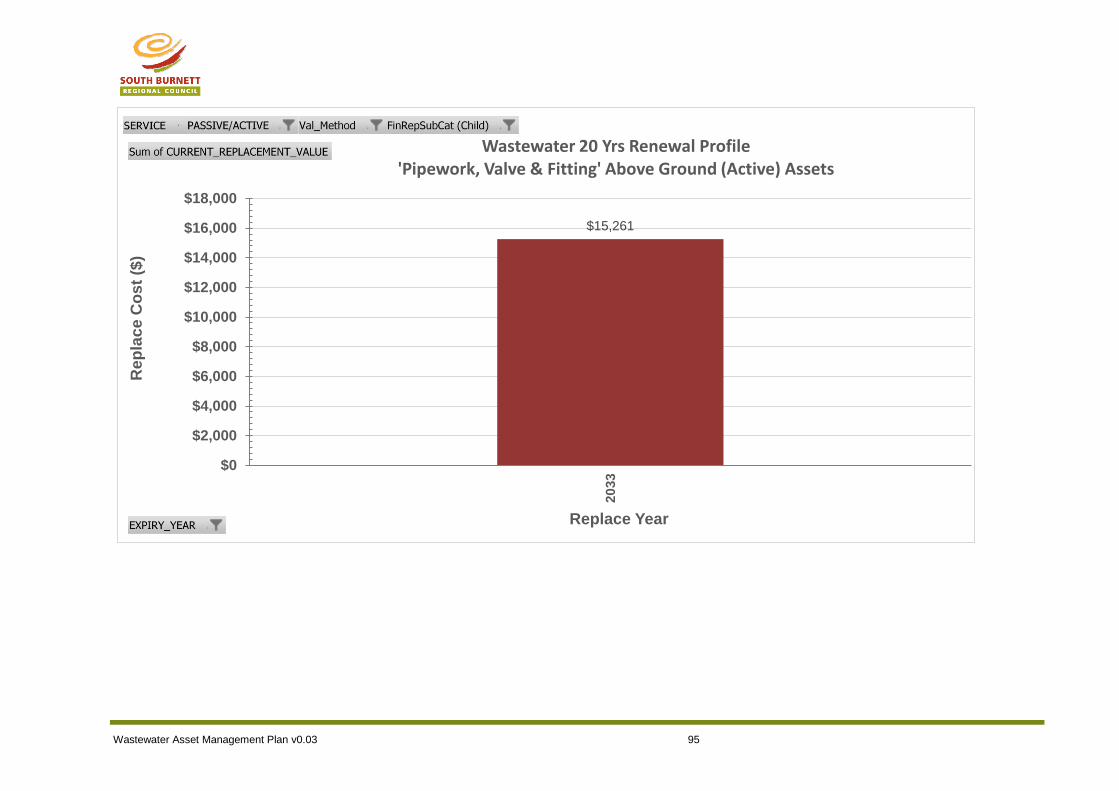
Wastewater Asset Management Plan v0.03 95
$15,261
$0
$2,000
$4,000
$6,000
$8,000
$10,000
$12,000
$14,000
$16,000
$18,000
20
33
Rep
lac
e C
os
t ($
)
Replace Year
Wastewater 20 Yrs Renewal Profile'Pipework, Valve & Fitting' Above Ground (Active) Assets

Wastewater Asset Management Plan v0.03 96
$56,094
$16,077
$74,633
$0
$10,000
$20,000
$30,000
$40,000
$50,000
$60,000
$70,000
$80,000
20
28
20
31
20
33
Rep
lac
e C
os
t ($
)
Replace Year
Wastewater 20 Yrs Renewal Profile'Site Services' Above Ground (Active) Assets
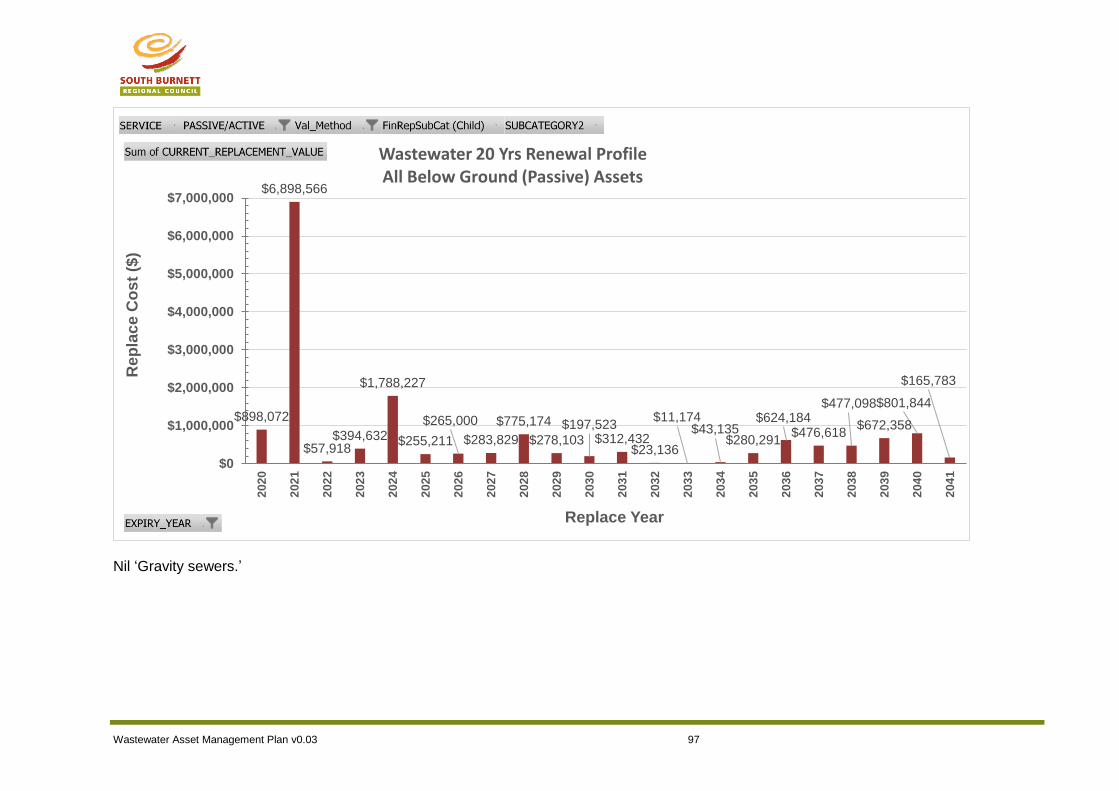
Wastewater Asset Management Plan v0.03 97
Nil ‘Gravity sewers.’
$898,072
$6,898,566
$57,918$394,632
$1,788,227
$255,211
$265,000
$283,829
$775,174
$278,103
$197,523$312,432
$23,136
$11,174$43,135
$280,291
$624,184$476,618
$477,098
$672,358
$801,844
$165,783
$0
$1,000,000
$2,000,000
$3,000,000
$4,000,000
$5,000,000
$6,000,000
$7,000,000
202
0
202
1
202
2
202
3
202
4
202
5
202
6
202
7
202
8
202
9
203
0
203
1
203
2
203
3
203
4
203
5
203
6
203
7
203
8
203
9
204
0
204
1
Re
pla
ce
Co
st
($)
Replace Year
Wastewater 20 Yrs Renewal ProfileAll Below Ground (Passive) Assets
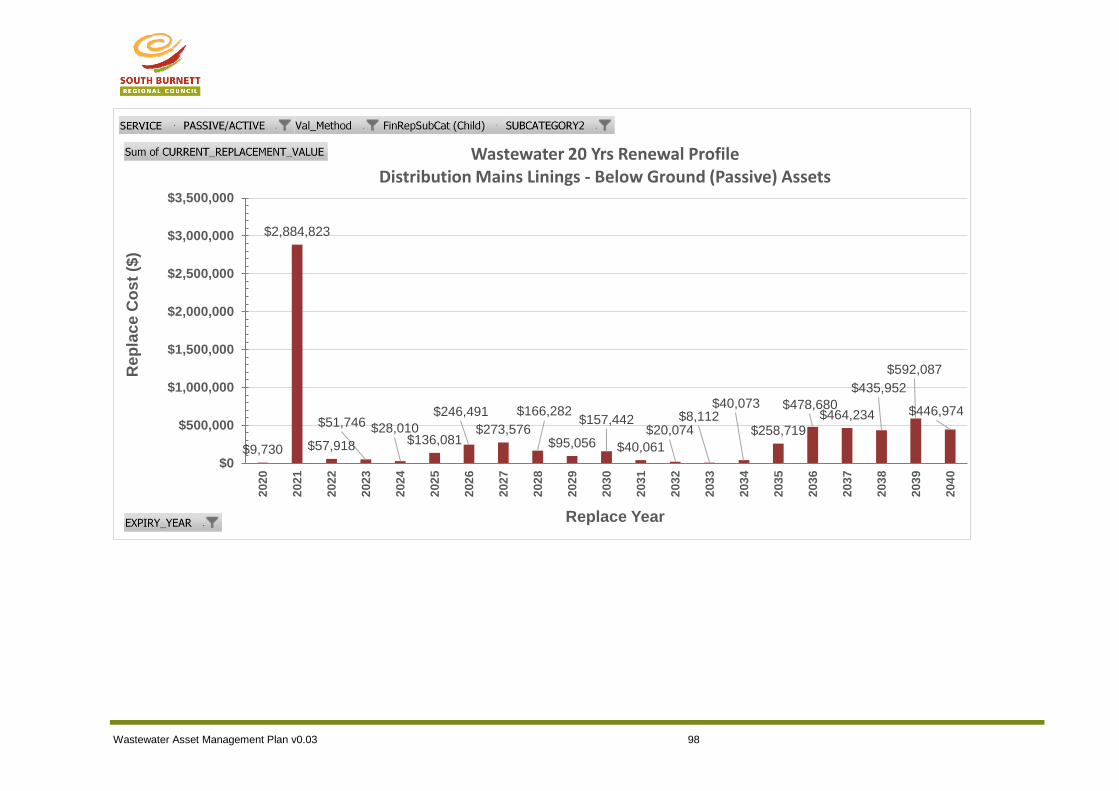
Wastewater Asset Management Plan v0.03 98
$9,730
$2,884,823
$57,918
$51,746 $28,010$136,081
$246,491
$273,576
$166,282
$95,056
$157,442
$40,061
$20,074$8,112
$40,073
$258,719
$478,680$464,234
$435,952
$592,087
$446,974
$0
$500,000
$1,000,000
$1,500,000
$2,000,000
$2,500,000
$3,000,000
$3,500,000
202
0
202
1
202
2
202
3
202
4
202
5
202
6
202
7
202
8
202
9
203
0
203
1
203
2
203
3
203
4
203
5
203
6
203
7
203
8
203
9
204
0
Rep
lac
e C
os
t ($
)
Replace Year
Wastewater 20 Yrs Renewal ProfileDistribution Mains Linings - Below Ground (Passive) Assets
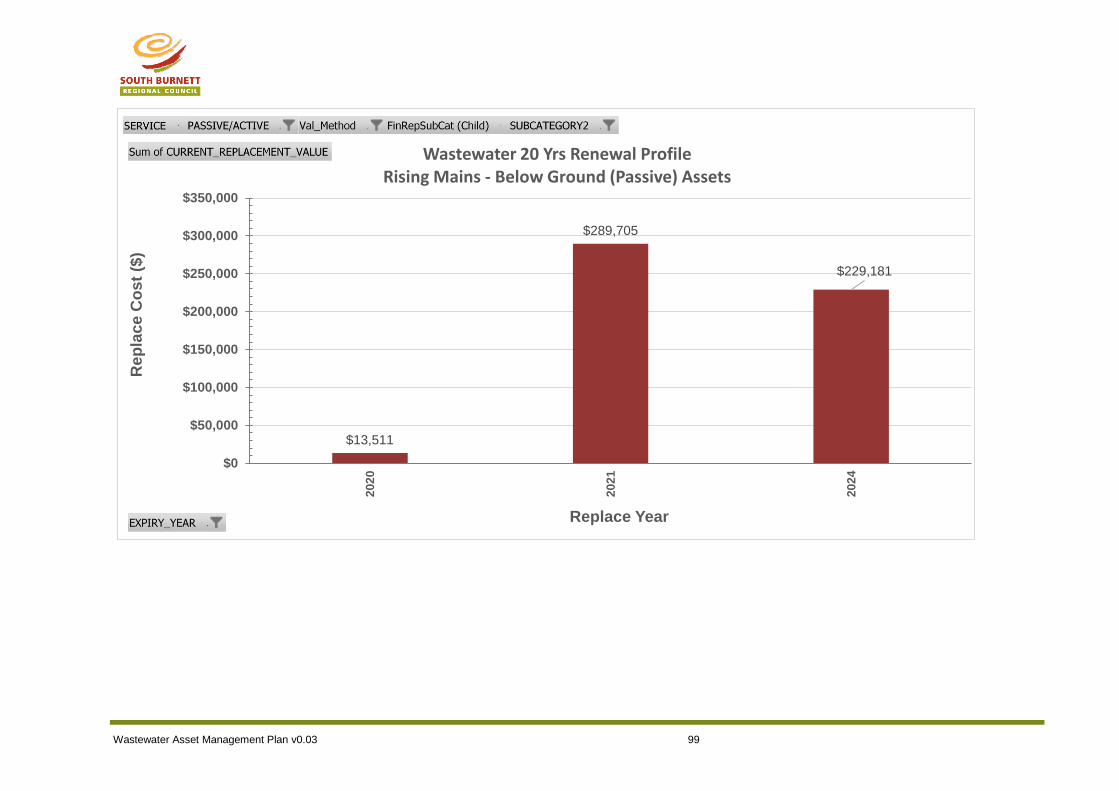
Wastewater Asset Management Plan v0.03 99
$13,511
$289,705
$229,181
$0
$50,000
$100,000
$150,000
$200,000
$250,000
$300,000
$350,000
202
0
202
1
202
4
Rep
lac
e C
os
t ($
)
Replace Year
Wastewater 20 Yrs Renewal ProfileRising Mains - Below Ground (Passive) Assets
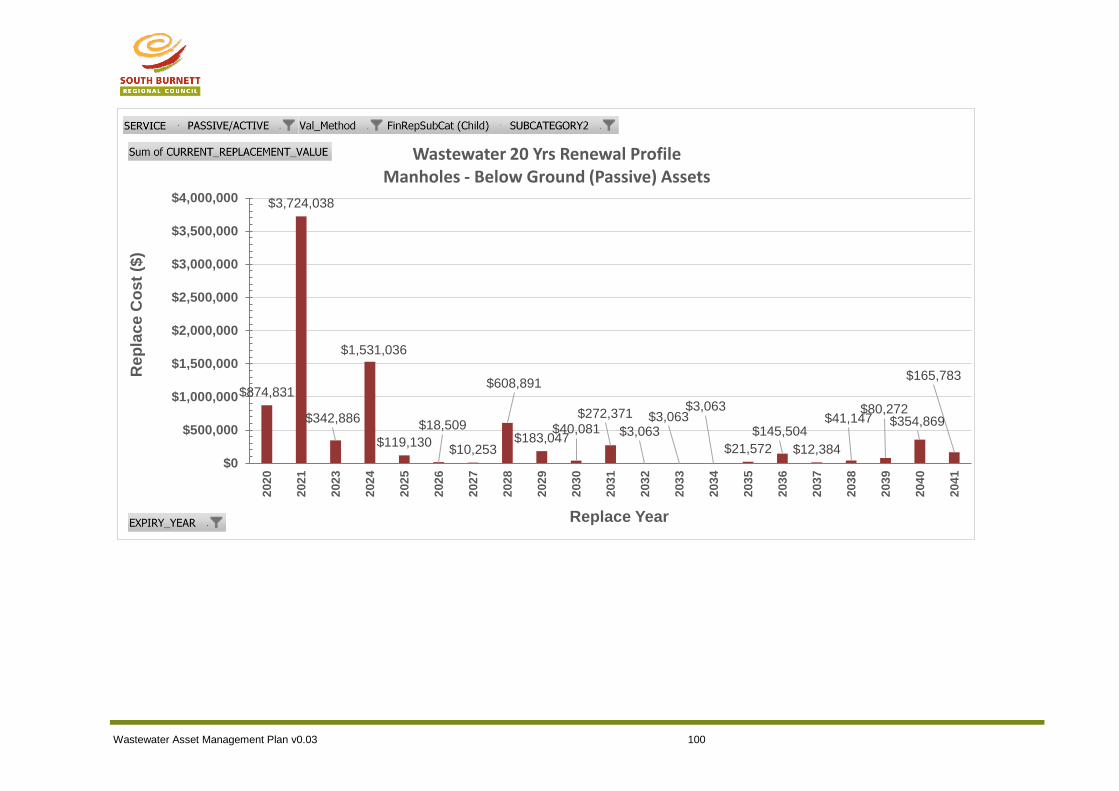
Wastewater Asset Management Plan v0.03 100
$874,831
$3,724,038
$342,886
$1,531,036
$119,130
$18,509
$10,253
$608,891
$183,047$40,081
$272,371
$3,063$3,063
$3,063
$21,572
$145,504
$12,384
$41,147$80,272
$354,869
$165,783
$0
$500,000
$1,000,000
$1,500,000
$2,000,000
$2,500,000
$3,000,000
$3,500,000
$4,000,000
202
0
202
1
202
3
202
4
202
5
202
6
202
7
202
8
202
9
203
0
203
1
203
2
203
3
203
4
203
5
203
6
203
7
203
8
203
9
204
0
204
1
Rep
lac
e C
os
t ($
)
Replace Year
Wastewater 20 Yrs Renewal ProfileManholes - Below Ground (Passive) Assets
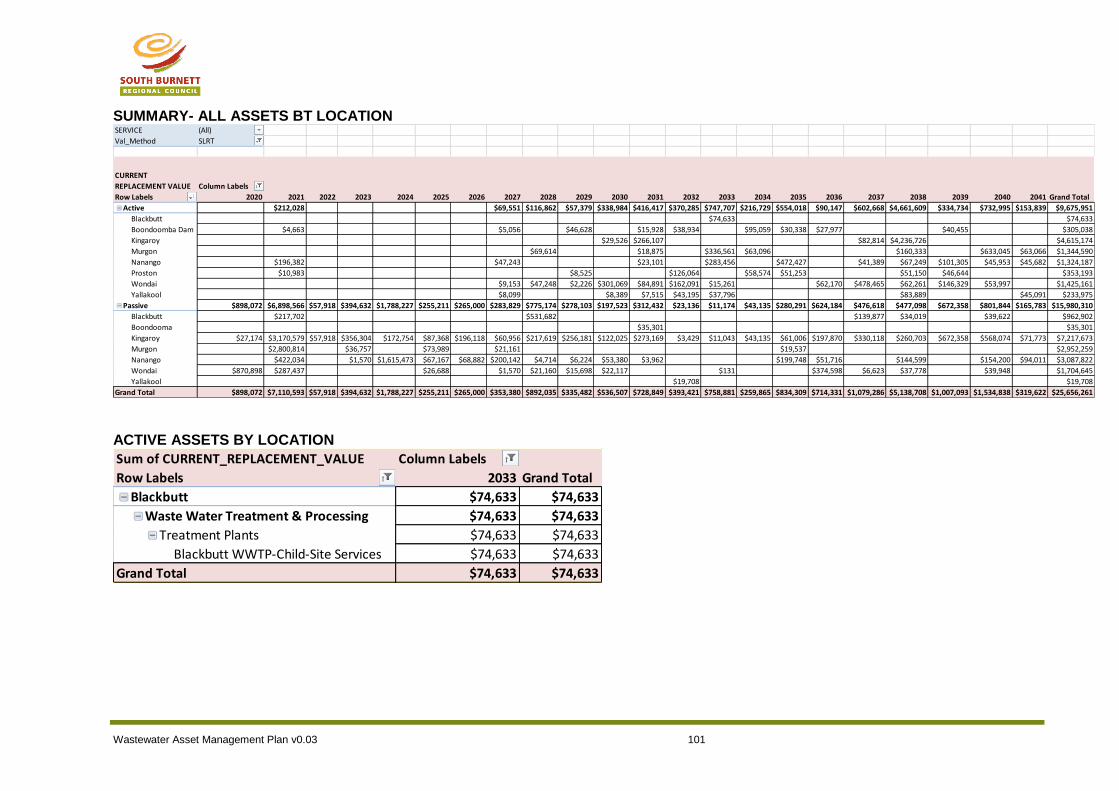
Wastewater Asset Management Plan v0.03 101
SUMMARY- ALL ASSETS BT LOCATION
ACTIVE ASSETS BY LOCATION
SERVICE (All)
Val_Method SLRT
CURRENT
REPLACEMENT VALUE Column Labels
Row Labels 2020 2021 2022 2023 2024 2025 2026 2027 2028 2029 2030 2031 2032 2033 2034 2035 2036 2037 2038 2039 2040 2041 Grand Total
Active $212,028 $69,551 $116,862 $57,379 $338,984 $416,417 $370,285 $747,707 $216,729 $554,018 $90,147 $602,668 $4,661,609 $334,734 $732,995 $153,839 $9,675,951
Blackbutt $74,633 $74,633
Boondoomba Dam $4,663 $5,056 $46,628 $15,928 $38,934 $95,059 $30,338 $27,977 $40,455 $305,038
Kingaroy $29,526 $266,107 $82,814 $4,236,726 $4,615,174
Murgon $69,614 $18,875 $336,561 $63,096 $160,333 $633,045 $63,066 $1,344,590
Nanango $196,382 $47,243 $23,101 $283,456 $472,427 $41,389 $67,249 $101,305 $45,953 $45,682 $1,324,187
Proston $10,983 $8,525 $126,064 $58,574 $51,253 $51,150 $46,644 $353,193
Wondai $9,153 $47,248 $2,226 $301,069 $84,891 $162,091 $15,261 $62,170 $478,465 $62,261 $146,329 $53,997 $1,425,161
Yallakool $8,099 $8,389 $7,515 $43,195 $37,796 $83,889 $45,091 $233,975
Passive $898,072 $6,898,566 $57,918 $394,632 $1,788,227 $255,211 $265,000 $283,829 $775,174 $278,103 $197,523 $312,432 $23,136 $11,174 $43,135 $280,291 $624,184 $476,618 $477,098 $672,358 $801,844 $165,783 $15,980,310
Blackbutt $217,702 $531,682 $139,877 $34,019 $39,622 $962,902
Boondooma $35,301 $35,301
Kingaroy $27,174 $3,170,579 $57,918 $356,304 $172,754 $87,368 $196,118 $60,956 $217,619 $256,181 $122,025 $273,169 $3,429 $11,043 $43,135 $61,006 $197,870 $330,118 $260,703 $672,358 $568,074 $71,773 $7,217,673
Murgon $2,800,814 $36,757 $73,989 $21,161 $19,537 $2,952,259
Nanango $422,034 $1,570 $1,615,473 $67,167 $68,882 $200,142 $4,714 $6,224 $53,380 $3,962 $199,748 $51,716 $144,599 $154,200 $94,011 $3,087,822
Wondai $870,898 $287,437 $26,688 $1,570 $21,160 $15,698 $22,117 $131 $374,598 $6,623 $37,778 $39,948 $1,704,645
Yallakool $19,708 $19,708
Grand Total $898,072 $7,110,593 $57,918 $394,632 $1,788,227 $255,211 $265,000 $353,380 $892,035 $335,482 $536,507 $728,849 $393,421 $758,881 $259,865 $834,309 $714,331 $1,079,286 $5,138,708 $1,007,093 $1,534,838 $319,622 $25,656,261
Sum of CURRENT_REPLACEMENT_VALUE Column Labels
Row Labels 2033 Grand Total
Blackbutt $74,633 $74,633
Waste Water Treatment & Processing $74,633 $74,633
Treatment Plants $74,633 $74,633
Blackbutt WWTP-Child-Site Services $74,633 $74,633
Grand Total $74,633 $74,633

Wastewater Asset Management Plan v0.03 102
Sum of CURRENT_REPLACEMENT_VALUE Column Labels
Row Labels 2021 2027 2029 2031 2032 2034 2035 2036 2039 Grand Total
Boondooma Dam $4,663 $5,056 $46,628 $15,928 $38,934 $95,059 $30,338 $27,977 $40,455 $305,038
Waste Water Transfer $15,928 $38,934 $44,496 $40,455 $139,812
Sewage Pump Stations $15,928 $38,934 $44,496 $40,455 $139,812
Boondooma Dam Sewage Pump Station 1 (SPS 1)-Child-Electrical $44,496 $44,496
Boondooma Dam Sewage Pump Station 1 (SPS 1)-Child-Instrumentation $8,343 $8,343
Boondooma Dam Sewage Pump Station 1 (SPS 1)-Child-Mechanical $38,934 $38,934
Boondooma Dam Sewage Pump Station 2 (SPS 2)-Child-Electrical $40,455 $40,455
Boondooma Dam Sewage Pump Station 2 (SPS 2)-Child-Instrumentation $7,585 $7,585
Waste Water Treatment & Processing $4,663 $5,056 $46,628 $50,563 $30,338 $27,977 $165,225
Treatment Plants $4,663 $5,056 $46,628 $50,563 $30,338 $27,977 $165,225
Boondooma Dam Bottom WWTP-Child-Electrical $27,977 $27,977
Boondooma Dam Bottom WWTP-Child-Instrumentation $4,663 $4,663
Boondooma Dam Bottom WWTP-Child-Mechanical $46,628 $46,628
Boondooma Dam Top WWTP-Child-Electrical $30,338 $30,338
Boondooma Dam Top WWTP-Child-Instrumentation $5,056 $5,056
Boondooma Dam Top WWTP-Child-Mechanical $50,563 $50,563
Grand Total $4,663 $5,056 $46,628 $15,928 $38,934 $95,059 $30,338 $27,977 $40,455 $305,038
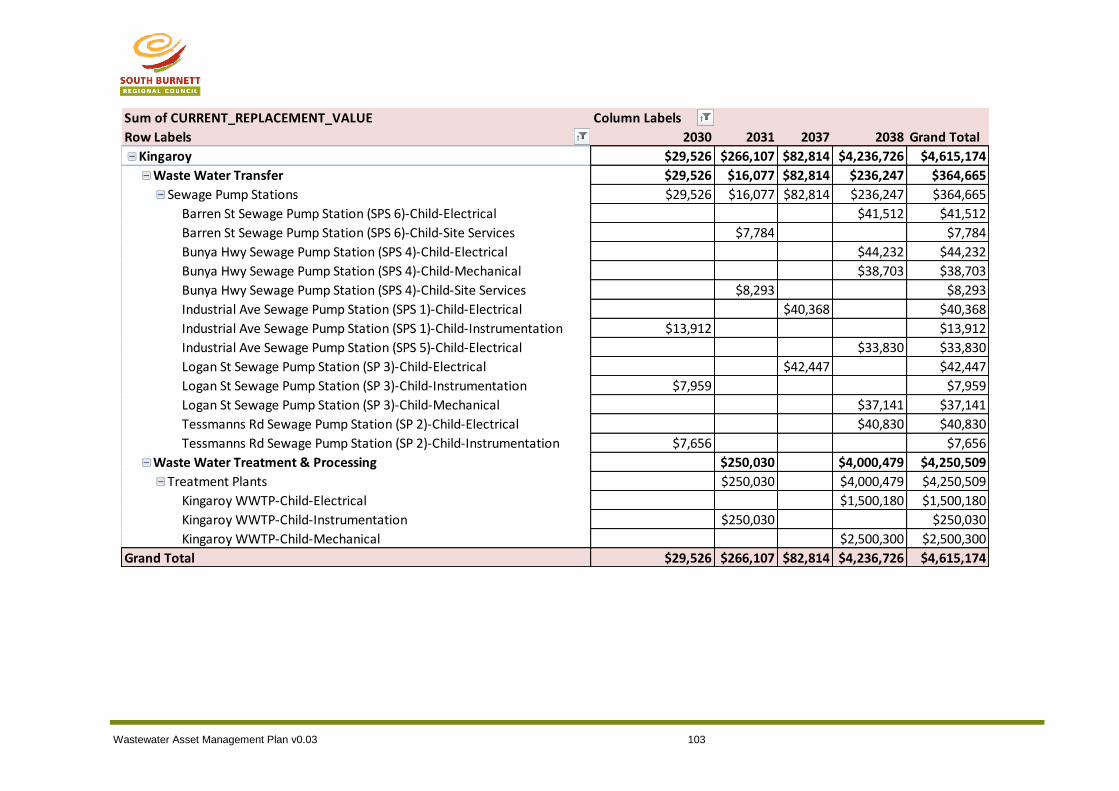
Wastewater Asset Management Plan v0.03 103
Sum of CURRENT_REPLACEMENT_VALUE Column Labels
Row Labels 2030 2031 2037 2038 Grand Total
Kingaroy $29,526 $266,107 $82,814 $4,236,726 $4,615,174
Waste Water Transfer $29,526 $16,077 $82,814 $236,247 $364,665
Sewage Pump Stations $29,526 $16,077 $82,814 $236,247 $364,665
Barren St Sewage Pump Station (SPS 6)-Child-Electrical $41,512 $41,512
Barren St Sewage Pump Station (SPS 6)-Child-Site Services $7,784 $7,784
Bunya Hwy Sewage Pump Station (SPS 4)-Child-Electrical $44,232 $44,232
Bunya Hwy Sewage Pump Station (SPS 4)-Child-Mechanical $38,703 $38,703
Bunya Hwy Sewage Pump Station (SPS 4)-Child-Site Services $8,293 $8,293
Industrial Ave Sewage Pump Station (SPS 1)-Child-Electrical $40,368 $40,368
Industrial Ave Sewage Pump Station (SPS 1)-Child-Instrumentation $13,912 $13,912
Industrial Ave Sewage Pump Station (SPS 5)-Child-Electrical $33,830 $33,830
Logan St Sewage Pump Station (SP 3)-Child-Electrical $42,447 $42,447
Logan St Sewage Pump Station (SP 3)-Child-Instrumentation $7,959 $7,959
Logan St Sewage Pump Station (SP 3)-Child-Mechanical $37,141 $37,141
Tessmanns Rd Sewage Pump Station (SP 2)-Child-Electrical $40,830 $40,830
Tessmanns Rd Sewage Pump Station (SP 2)-Child-Instrumentation $7,656 $7,656
Waste Water Treatment & Processing $250,030 $4,000,479 $4,250,509
Treatment Plants $250,030 $4,000,479 $4,250,509
Kingaroy WWTP-Child-Electrical $1,500,180 $1,500,180
Kingaroy WWTP-Child-Instrumentation $250,030 $250,030
Kingaroy WWTP-Child-Mechanical $2,500,300 $2,500,300
Grand Total $29,526 $266,107 $82,814 $4,236,726 $4,615,174
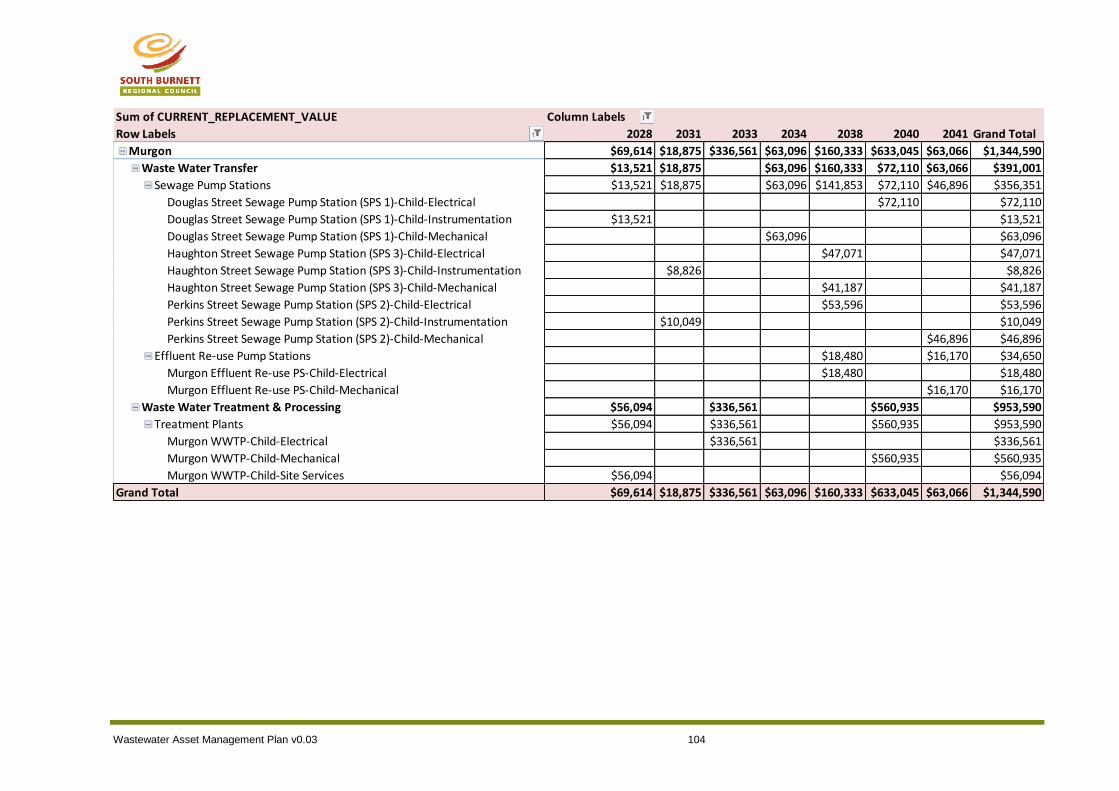
Wastewater Asset Management Plan v0.03 104
Sum of CURRENT_REPLACEMENT_VALUE Column Labels
Row Labels 2028 2031 2033 2034 2038 2040 2041 Grand Total
Murgon $69,614 $18,875 $336,561 $63,096 $160,333 $633,045 $63,066 $1,344,590
Waste Water Transfer $13,521 $18,875 $63,096 $160,333 $72,110 $63,066 $391,001
Sewage Pump Stations $13,521 $18,875 $63,096 $141,853 $72,110 $46,896 $356,351
Douglas Street Sewage Pump Station (SPS 1)-Child-Electrical $72,110 $72,110
Douglas Street Sewage Pump Station (SPS 1)-Child-Instrumentation $13,521 $13,521
Douglas Street Sewage Pump Station (SPS 1)-Child-Mechanical $63,096 $63,096
Haughton Street Sewage Pump Station (SPS 3)-Child-Electrical $47,071 $47,071
Haughton Street Sewage Pump Station (SPS 3)-Child-Instrumentation $8,826 $8,826
Haughton Street Sewage Pump Station (SPS 3)-Child-Mechanical $41,187 $41,187
Perkins Street Sewage Pump Station (SPS 2)-Child-Electrical $53,596 $53,596
Perkins Street Sewage Pump Station (SPS 2)-Child-Instrumentation $10,049 $10,049
Perkins Street Sewage Pump Station (SPS 2)-Child-Mechanical $46,896 $46,896
Effluent Re-use Pump Stations $18,480 $16,170 $34,650
Murgon Effluent Re-use PS-Child-Electrical $18,480 $18,480
Murgon Effluent Re-use PS-Child-Mechanical $16,170 $16,170
Waste Water Treatment & Processing $56,094 $336,561 $560,935 $953,590
Treatment Plants $56,094 $336,561 $560,935 $953,590
Murgon WWTP-Child-Electrical $336,561 $336,561
Murgon WWTP-Child-Mechanical $560,935 $560,935
Murgon WWTP-Child-Site Services $56,094 $56,094
Grand Total $69,614 $18,875 $336,561 $63,096 $160,333 $633,045 $63,066 $1,344,590
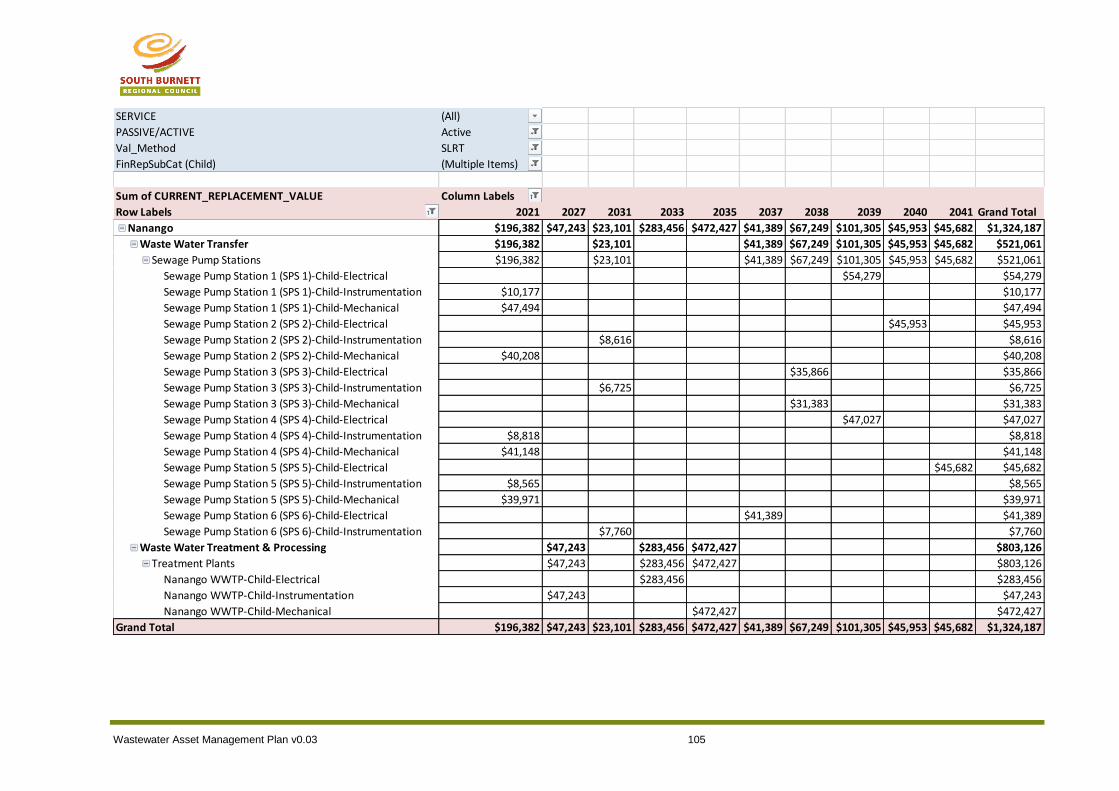
Wastewater Asset Management Plan v0.03 105
SERVICE (All)
PASSIVE/ACTIVE Active
Val_Method SLRT
FinRepSubCat (Child) (Multiple Items)
Sum of CURRENT_REPLACEMENT_VALUE Column Labels
Row Labels 2021 2027 2031 2033 2035 2037 2038 2039 2040 2041 Grand Total
Nanango $196,382 $47,243 $23,101 $283,456 $472,427 $41,389 $67,249 $101,305 $45,953 $45,682 $1,324,187
Waste Water Transfer $196,382 $23,101 $41,389 $67,249 $101,305 $45,953 $45,682 $521,061
Sewage Pump Stations $196,382 $23,101 $41,389 $67,249 $101,305 $45,953 $45,682 $521,061
Sewage Pump Station 1 (SPS 1)-Child-Electrical $54,279 $54,279
Sewage Pump Station 1 (SPS 1)-Child-Instrumentation $10,177 $10,177
Sewage Pump Station 1 (SPS 1)-Child-Mechanical $47,494 $47,494
Sewage Pump Station 2 (SPS 2)-Child-Electrical $45,953 $45,953
Sewage Pump Station 2 (SPS 2)-Child-Instrumentation $8,616 $8,616
Sewage Pump Station 2 (SPS 2)-Child-Mechanical $40,208 $40,208
Sewage Pump Station 3 (SPS 3)-Child-Electrical $35,866 $35,866
Sewage Pump Station 3 (SPS 3)-Child-Instrumentation $6,725 $6,725
Sewage Pump Station 3 (SPS 3)-Child-Mechanical $31,383 $31,383
Sewage Pump Station 4 (SPS 4)-Child-Electrical $47,027 $47,027
Sewage Pump Station 4 (SPS 4)-Child-Instrumentation $8,818 $8,818
Sewage Pump Station 4 (SPS 4)-Child-Mechanical $41,148 $41,148
Sewage Pump Station 5 (SPS 5)-Child-Electrical $45,682 $45,682
Sewage Pump Station 5 (SPS 5)-Child-Instrumentation $8,565 $8,565
Sewage Pump Station 5 (SPS 5)-Child-Mechanical $39,971 $39,971
Sewage Pump Station 6 (SPS 6)-Child-Electrical $41,389 $41,389
Sewage Pump Station 6 (SPS 6)-Child-Instrumentation $7,760 $7,760
Waste Water Treatment & Processing $47,243 $283,456 $472,427 $803,126
Treatment Plants $47,243 $283,456 $472,427 $803,126
Nanango WWTP-Child-Electrical $283,456 $283,456
Nanango WWTP-Child-Instrumentation $47,243 $47,243
Nanango WWTP-Child-Mechanical $472,427 $472,427
Grand Total $196,382 $47,243 $23,101 $283,456 $472,427 $41,389 $67,249 $101,305 $45,953 $45,682 $1,324,187

Wastewater Asset Management Plan v0.03 106
Sum of CURRENT_REPLACEMENT_VALUE Column Labels
Row Labels 2021 2029 2032 2034 2035 2038 2039 Grand Total
Proston $10,983 $8,525 $126,064 $58,574 $51,253 $51,150 $46,644 $353,193
Waste Water Transfer $10,983 $0 $40,814 $58,574 $51,253 $0 $46,644 $208,268
Sewage Pump Stations $10,983 $58,574 $51,253 $120,810
Proston SPS-Child-Electrical $58,574 $58,574
Proston SPS-Child-Instrumentation $10,983 $10,983
Proston SPS-Child-Mechanical $51,253 $51,253
Effluent Re-use Pump Stations $0 $40,814 $0 $46,644 $87,458
Proston Effluent PS-Child-Electrical $46,644 $46,644
Proston Effluent PS-Child-Mechanical $40,814 $40,814
Proston WWTP-Child-Electrical $0 $0
Proston WWTP-Child-Instrumentation $0 $0
Proston WWTP-Child-Mechanical $0 $0
Waste Water Treatment & Processing $8,525 $85,250 $51,150 $144,926
Treatment Plants $8,525 $85,250 $51,150 $144,926
Proston WWTP-Child-Electrical $51,150 $51,150
Proston WWTP-Child-Instrumentation $8,525 $8,525
Proston WWTP-Child-Mechanical $85,250 $85,250
Grand Total $10,983 $8,525 $126,064 $58,574 $51,253 $51,150 $46,644 $353,193

Wastewater Asset Management Plan v0.03 107
Sum of CURRENT_REPLACEMENT_VALUE Column Labels
Row Labels 2010 2027 2028 2029 2030 2031 2032 2033 2036 2037 2038 2039 2040 Grand Total
Wondai $42,712 $9,153 $47,248 $2,226 $301,069 $84,891 $162,091 $15,261 $62,170 $478,465 $62,261 $146,329 $53,997 $1,467,873
Waste Water Transfer $42,712 $9,153 $47,248 $301,069 $36,747 $162,091 $15,261 $48,814 $40,000 $91,611 $53,997 $848,703
Sewage Pump Stations $42,712 $9,153 $47,248 $124,239 $36,747 $48,814 $91,611 $53,997 $454,521
Golf Course Sewage Pump Station (SPS 2)-Child-Instrumentation $9,445 $9,445
Golf Course Sewage Pump Station (SPS 2)-Child-Mechanical $44,079 $44,079
Hodge St Sewage Pump Station (SPS 5)-Child-Electrical $45,125 $45,125
Hodge St Sewage Pump Station (SPS 5)-Child-Instrumentation $8,461 $8,461
Hodge St Sewage Pump Station (SPS 5)-Child-Mechanical $39,484 $39,484
Ivory St Sewage Pump Station (SPS 1)-Child-Electrical $53,997 $53,997
Ivory St Sewage Pump Station (SPS 1)-Child-Instrumentation $10,125 $10,125
Ivory St Sewage Pump Station (SPS 1)-Child-Mechanical $47,248 $47,248
North Burrows St Sewage Pump Station (SPS 4)-Child-Electrical $48,814 $48,814
North Burrows St Sewage Pump Station (SPS 4)-Child-Instrumentation $9,153 $9,153
North Burrows St Sewage Pump Station (SPS 4)-Child-Mechanical $42,712 $42,712
South Burrows St Sewage Pump Station (SPS 3)-Child-Electrical $46,486 $46,486
South Burrows St Sewage Pump Station (SPS 3)-Child-Instrumentation $8,716 $8,716
South Burrows St Sewage Pump Station (SPS 3)-Child-Mechanical $40,676 $40,676
Effluent Re-use Pump Stations $176,830 $0 $162,091 $15,261 $40,000 $394,183
Wondai Effluent Reuse - Transfer PS-Child-Electrical $122,091 $122,091
Wondai Effluent Reuse - Transfer PS-Child-Mechanical $106,830 $106,830
Wondai Effluent Reuse - Transfer PS-Child-Pipework, Valve and Fitt $15,261 $15,261
Wondai Effluent Reuse -Irrigation PS-Child-Electrical $40,000 $40,000
Wondai Effluent Reuse -Irrigation PS-Child-Mechanical $35,000 $35,000
Wondai Effluent Reuse -Relift PS-Child-Electrical $40,000 $40,000
Wondai Effluent Reuse -Relift PS-Child-Mechanical $35,000 $35,000
Wondai WWTP-Effluent PS-Child-Electrical $0 $0
Wondai WWTP-Effluent PS-Child-Instrumentation $0 $0
Wondai WWTP-Effluent PS-Child-Mechanical $0 $0
Wondai WWTP-Effluent PS-Child-Pipework, Valve and Fitting $0 $0
Waste Water Treatment & Processing $2,226 $29,904 $13,356 $478,465 $22,261 $546,212
Treatment Plants $2,226 $29,904 $13,356 $478,465 $22,261 $546,212
Wondai Effluent Reuse-Treatment-Child-Electrical $13,356 $13,356
Wondai Effluent Reuse-Treatment-Child-Instrumentation $2,226 $2,226
Wondai Effluent Reuse-Treatment-Child-Mechanical $22,261 $22,261
Wondai WWTP-Child-Electrical $179,424 $179,424
Wondai WWTP-Child-Instrumentation $29,904 $29,904
Wondai WWTP-Child-Mechanical $299,041 $299,041
Waste Water Distribution $18,239 $54,718 $72,957
Effluent Re-use $18,239 $54,718 $72,957
Wondai Effluent Reuse - Lagoons-Child-Electrical $36,479 $36,479
Wondai Effluent Reuse - Lagoons-Child-Instrumentation $18,239 $18,239
Wondai Effluent Reuse - Lagoons-Child-Mechanical $18,239 $18,239
Grand Total $42,712 $9,153 $47,248 $2,226 $301,069 $84,891 $162,091 $15,261 $62,170 $478,465 $62,261 $146,329 $53,997 $1,467,873

Wastewater Asset Management Plan v0.03 108
Sum of CURRENT_REPLACEMENT_VALUE Column Labels
Row Labels 2027 2030 2031 2032 2033 2038 2041 Grand Total
Yallakool $8,099 $8,389 $7,515 $43,195 $37,796 $83,889 $45,091 $233,975
Waste Water Transfer $8,099 $8,389 $43,195 $37,796 $83,889 $181,369
Sewage Pump Stations $8,099 $8,389 $43,195 $37,796 $83,889 $181,369
Yallakool Sewage Pump Station 1 (SPS 1)-Child-Electrical $43,195 $43,195
Yallakool Sewage Pump Station 1 (SPS 1)-Child-Instrumentation $8,099 $8,099
Yallakool Sewage Pump Station 1 (SPS 1)-Child-Mechanical $37,796 $37,796
Yallakool Sewage Pump Station 2 (SPS 2)-Child-Electrical $44,741 $44,741
Yallakool Sewage Pump Station 2 (SPS 2)-Child-Instrumentation $8,389 $8,389
Yallakool Sewage Pump Station 2 (SPS 2)-Child-Mechanical $39,148 $39,148
Waste Water Treatment & Processing $7,515 $45,091 $52,606
Treatment Plants $7,515 $45,091 $52,606
Yallakool WWTP-Child-Electrical $45,091 $45,091
Yallakool WWTP-Child-Instrumentation $7,515 $7,515
Grand Total $8,099 $8,389 $7,515 $43,195 $37,796 $83,889 $45,091 $233,975
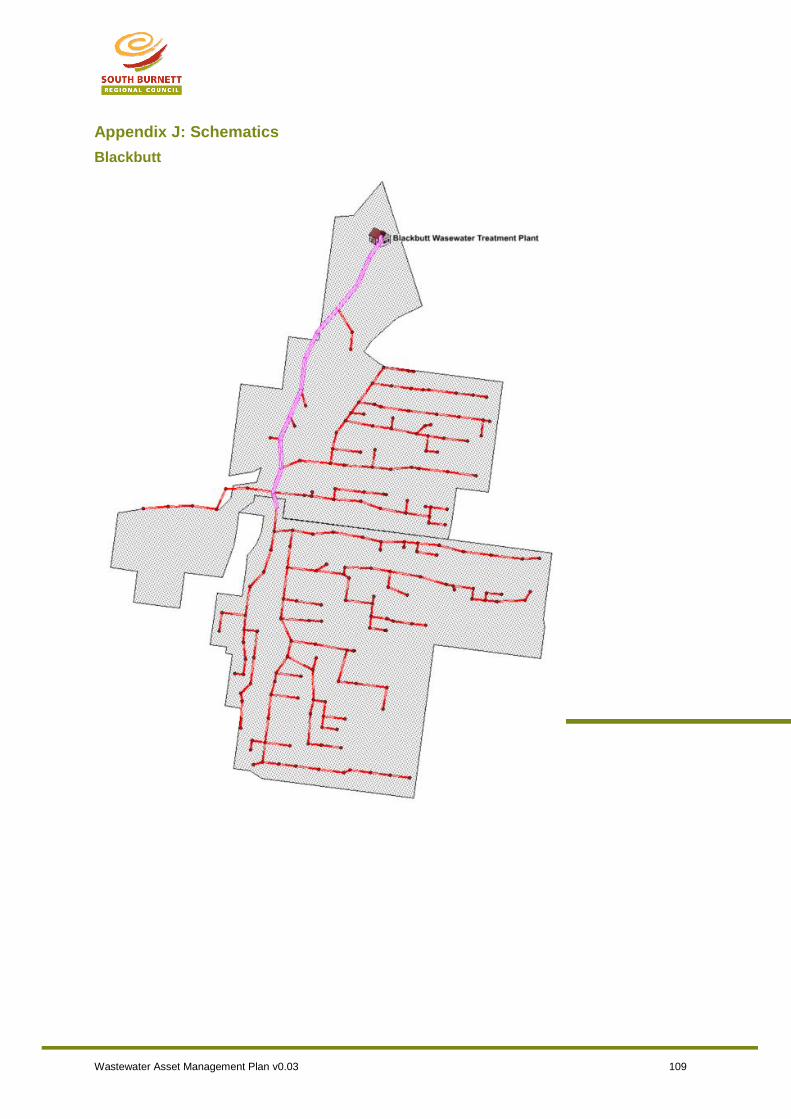
Wastewater Asset Management Plan v0.03 109
Appendix J: Schematics
Blackbutt
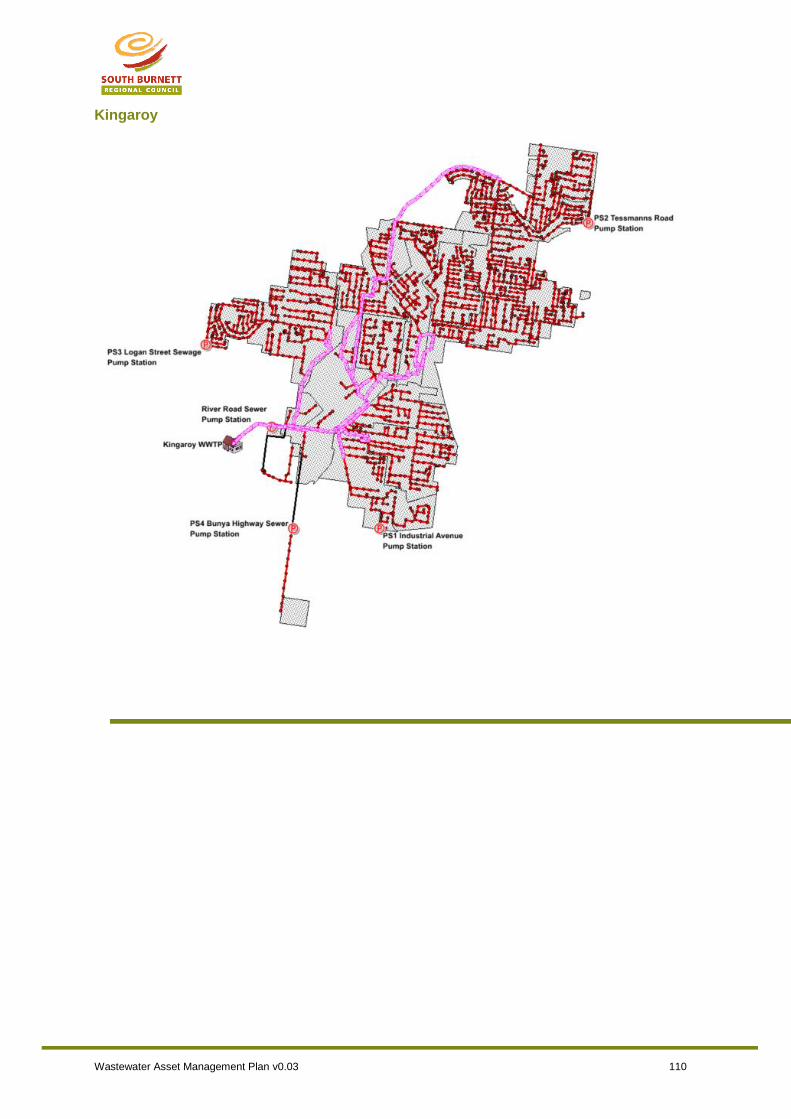
Wastewater Asset Management Plan v0.03 110
Kingaroy
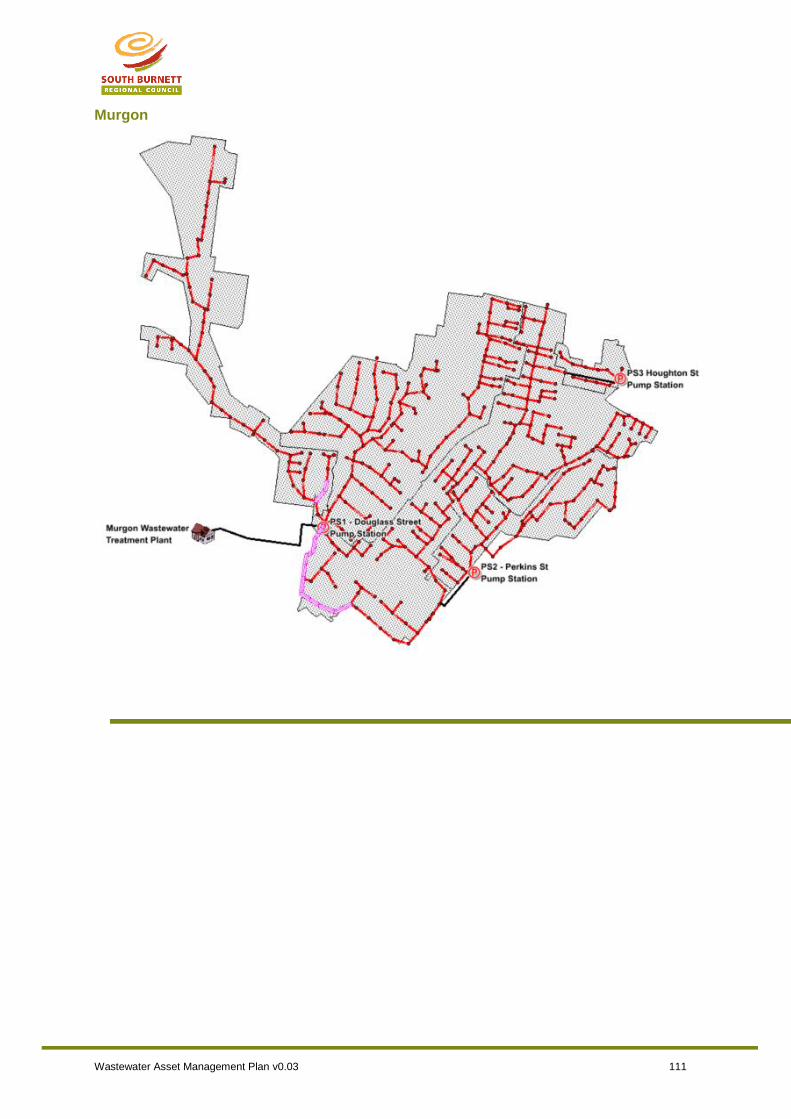
Wastewater Asset Management Plan v0.03 111
Murgon
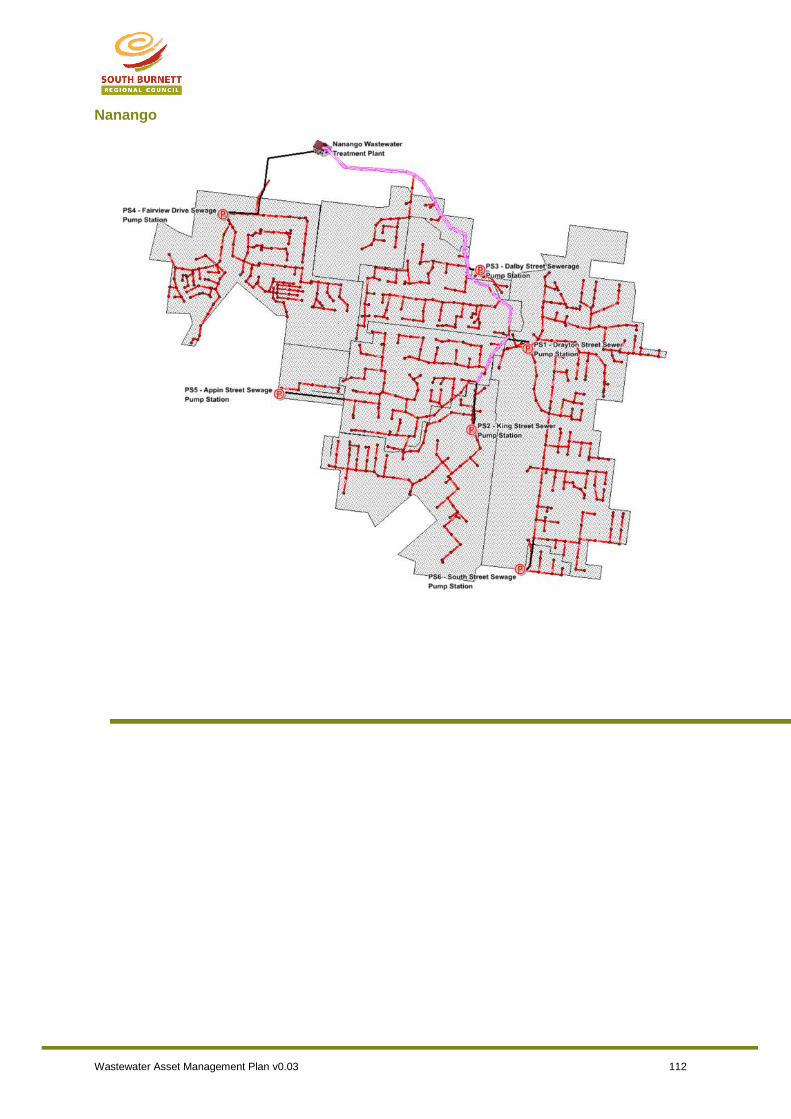
Wastewater Asset Management Plan v0.03 112
Nanango
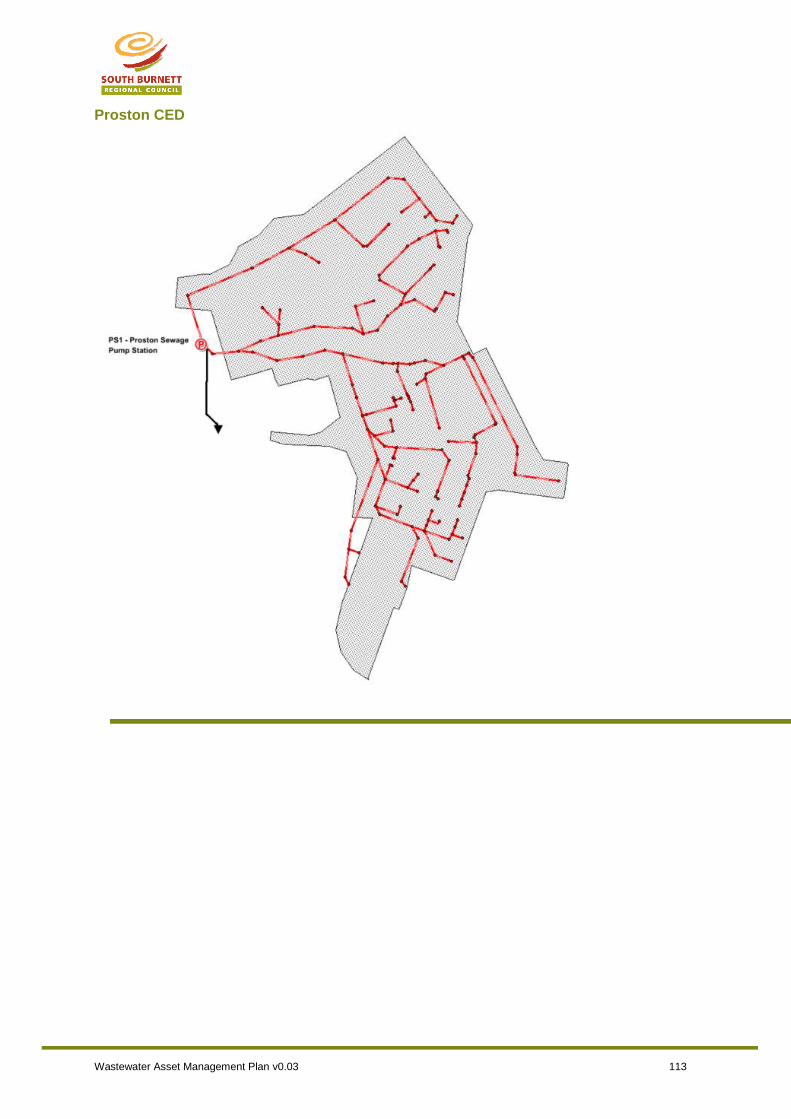
Wastewater Asset Management Plan v0.03 113
Proston CED

Wastewater Asset Management Plan v0.03 114
Wondai

Wastewater Asset Management Plan v0.03 115
Boondooma Dam

Wastewater Asset Management Plan v0.03 116
Yallakool