VietnAM - Stockbiz
85
Q3 2011 www.businessmonitor.com FOOD & DRINK REPORT ISSN 1749-3072 Published by Business Monitor International Ltd. VIETNAM INCLUDES BMI'S FORECASTS
-
Upload
khangminh22 -
Category
Documents
-
view
5 -
download
0
Transcript of VietnAM - Stockbiz
Q3 2011www.businessmonitor.com
food & drink report
iSSn 1749-3072published by Business Monitor international Ltd.
VietnAMINCLUDES BMI'S FORECASTS

Vietnam Food & Drink Q3 2011INCLUDES BMI'S 5-YEAR FORECASTS
Part of BMI's Industry Report & Forecasts Series
Published by: Business Monitor International
Copy deadline: April 2011
Business Monitor InternationalMermaid House,2 Puddle Dock,London, EC4V 3DS,UKTel: +44 (0) 20 7248 0468Fax: +44 (0) 20 7248 0467Email: [email protected]: http://www.businessmonitor.com
© 2011 Business Monitor InternationalAll rights reserved.
All information contained in this publication iscopyrighted in the name of Business MonitorInternational, and as such no part of thispublication may be reproduced, repackaged,redistributed, resold in whole or in any part, or usedin any form or by any means graphic, electronic ormechanical, including photocopying, recording,taping, or by information storage or retrieval, or byany other means, without the express written consentof the publisher.
DISCLAIMERAll information contained in this publication has been researched and compiled from sources believed to be accurate and reliable at the time ofpublishing. However, in view of the natural scope for human and/or mechanical error, either at source or during production, Business MonitorInternational accepts no liability whatsoever for any loss or damage resulting from errors, inaccuracies or omissions affecting any part of thepublication. All information is provided without warranty, and Business Monitor International makes no representation of warranty of any kind asto the accuracy or completeness of any information hereto contained.

CONTENTS
BMI Industry View .................................................................................................................................. 7
SWOT ..................................................................................................................................................... 9
Drink Industry SWOT . . . . . . . . . . . . . . . . . . . . . . . . . . . . . . . . . . . . . . . . . . . . . . . . . . . . . . . . . . . . . . . . . . . . . . . . . . . . . . . . . . . . . . . . . . . . . . . . . . . . . . . . . . . . . . . . . . . . . . . . . . . . . . . . . . . . . . 9
Food Industry SWOT . . . . . . . . . . . . . . . . . . . . . . . . . . . . . . . . . . . . . . . . . . . . . . . . . . . . . . . . . . . . . . . . . . . . . . . . . . . . . . . . . . . . . . . . . . . . . . . . . . . . . . . . . . . . . . . . . . . . . . . . . . . . . . . . . . . . . . 10
Grocery Retail Industry SWOT . . . . . . . . . . . . . . . . . . . . . . . . . . . . . . . . . . . . . . . . . . . . . . . . . . . . . . . . . . . . . . . . . . . . . . . . . . . . . . . . . . . . . . . . . . . . . . . . . . . . . . . . . . . . . . . . . . . . . . . . . . . . 11
Industry Business Environment Overview ............................................................................................ 12
Global Food & Drink View . . . . . . . . . . . . . . . . . . . . . . . . . . . . . . . . . . . . . . . . . . . . . . . . . . . . . . . . . . . . . . . . . . . . . . . . . . . . . . . . . . . . . . . . . . . . . . . . . . . . . . . . . . . . . . . . . . . . . . . . . . . . . . . . 12
Commodity Prices Pressuring Margins . . . . . . . . . . . . . . . . . . . . . . . . . . . . . . . . . . . . . . . . . . . . . . . . . . . . . . . . . . . . . . . . . . . . . . . . . . . . . . . . . . . . . . . . . . . . . . . . . . . . . . . . . . . . . . . . . . 12
Signs Of A Consumer Recovery In Developed Markets . . . . . . . . . . . . . . . . . . . . . . . . . . . . . . . . . . . . . . . . . . . . . . . . . . . . . . . . . . . . . . . . . . . . . . . . . . . . . . . . . . . . . . . . . . . . . . . . . 13
Emerging Markets Look Ever More Attractive . . . . . . . . . . . . . . . . . . . . . . . . . . . . . . . . . . . . . . . . . . . . . . . . . . . . . . . . . . . . . . . . . . . . . . . . . . . . . . . . . . . . . . . . . . . . . . . . . . . . . . . . . . 14
Big Deals Could Be Back On The Agend . . . . . . . . . . . . . . . . . . . . . . . . . . . . . . . . . . . . . . . . . . . . . . . . . . . . . . . . . . . . . . . . . . . . . . . . . . . . . . . . . . . . . . . . . . . . . . . . . . . . . . . . . . . . . . . . 16
Table: BMI FOOD & DRINK CORE VIEWS . . . . . . . . . . . . . . . . . . . . . . . . . . . . . . . . . . . . . . . . . . . . . . . . . . . . . . . . . . . . . . . . . . . . . . . . . . . . . . . . . . . . . . . . . . . . . . . . . . . . . . . . . 17
Asia Pacific Risk/Reward Ratings . . . . . . . . . . . . . . . . . . . . . . . . . . . . . . . . . . . . . . . . . . . . . . . . . . . . . . . . . . . . . . . . . . . . . . . . . . . . . . . . . . . . . . . . . . . . . . . . . . . . . . . . . . . . . . . . . . . . . . . . . 18
Table: ASIA PACIFIC FOOD & DRINK RISK/REWARD RATINGS -Q3 2011 . . . . . . . . . . . . . . . . . . . . . . . . . . . . . . . . . . . . . . . . . . . . . . . . . . . . . . . . . . . . . . . . . . . . 23
Vietnam Food & Drink Business Environment Rating .......................................................................... 25
Consumer Outlook ................................................................................................................................ 27
Industry Forecast Scenario ................................................................................................................... 31
Food . . . . . . . . . . . . . . . . . . . . . . . . . . . . . . . . . . . . . . . . . . . . . . . . . . . . . . . . . . . . . . . . . . . . . . . . . . . . . . . . . . . . . . . . . . . . . . . . . . . . . . . . . . . . . . . . . . . . . . . . . . . . . . . . . . . . . . . . . . . . . . . . . . . . . . . . 31
Table: Table: Vietnam Food Consumption Indicators . . . . . . . . . . . . . . . . . . . . . . . . . . . . . . . . . . . . . . . . . . . . . . . . . . . . . . . . . . . . . . . . . . . . . . . . . . . . . . . . . . . . . . . . . . . . . . . . . . 32
Table: Table: Vietnam Canned Food Sales . . . . . . . . . . . . . . . . . . . . . . . . . . . . . . . . . . . . . . . . . . . . . . . . . . . . . . . . . . . . . . . . . . . . . . . . . . . . . . . . . . . . . . . . . . . . . . . . . . . . . . . . . . . . . 33
Table: Table: Vietnam Confectionery Sales . . . . . . . . . . . . . . . . . . . . . . . . . . . . . . . . . . . . . . . . . . . . . . . . . . . . . . . . . . . . . . . . . . . . . . . . . . . . . . . . . . . . . . . . . . . . . . . . . . . . . . . . . . . . 33
Table: Table: Vietnam Food & Drink Trade Indicators . . . . . . . . . . . . . . . . . . . . . . . . . . . . . . . . . . . . . . . . . . . . . . . . . . . . . . . . . . . . . . . . . . . . . . . . . . . . . . . . . . . . . . . . . . . . . . . . 35
Drink . . . . . . . . . . . . . . . . . . . . . . . . . . . . . . . . . . . . . . . . . . . . . . . . . . . . . . . . . . . . . . . . . . . . . . . . . . . . . . . . . . . . . . . . . . . . . . . . . . . . . . . . . . . . . . . . . . . . . . . . . . . . . . . . . . . . . . . . . . . . . . . . . . . . . . . 35
Table: Table: Vietnam Alcoholic Drink Sales and Sales Growth . . . . . . . . . . . . . . . . . . . . . . . . . . . . . . . . . . . . . . . . . . . . . . . . . . . . . . . . . . . . . . . . . . . . . . . . . . . . . . . . . . . . . . 36
Table: Table: Vietnam Hot Drink Sales . . . . . . . . . . . . . . . . . . . . . . . . . . . . . . . . . . . . . . . . . . . . . . . . . . . . . . . . . . . . . . . . . . . . . . . . . . . . . . . . . . . . . . . . . . . . . . . . . . . . . . . . . . . . . . . . 37
Table: Table: Vietnam Soft Drink Sales and Sales Growth . . . . . . . . . . . . . . . . . . . . . . . . . . . . . . . . . . . . . . . . . . . . . . . . . . . . . . . . . . . . . . . . . . . . . . . . . . . . . . . . . . . . . . . . . . . . 39
Mass Grocery Retail . . . . . . . . . . . . . . . . . . . . . . . . . . . . . . . . . . . . . . . . . . . . . . . . . . . . . . . . . . . . . . . . . . . . . . . . . . . . . . . . . . . . . . . . . . . . . . . . . . . . . . . . . . . . . . . . . . . . . . . . . . . . . . . . . . . . . . . 39
Table: Table: Vietnam MGR Indicators - Value Sales by Format - Historical Data & Forecasts . . . . . . . . . . . . . . . . . . . . . . . . . . . . . . . . . . . . . . . . . . . . . . . . . . . . . . 41
Table: Grocery Retail Sales by Format - Historical Data & Forecasts (%) . . . . . . . . . . . . . . . . . . . . . . . . . . . . . . . . . . . . . . . . . . . . . . . . . . . . . . . . . . . . . . . . . . . . . . . . . . . . 42
Food ..................................................................................................................................................... 43
Industry Trends And Developments . . . . . . . . . . . . . . . . . . . . . . . . . . . . . . . . . . . . . . . . . . . . . . . . . . . . . . . . . . . . . . . . . . . . . . . . . . . . . . . . . . . . . . . . . . . . . . . . . . . . . . . . . . . . . . . . . . . . . . . 43
Market Overview . . . . . . . . . . . . . . . . . . . . . . . . . . . . . . . . . . . . . . . . . . . . . . . . . . . . . . . . . . . . . . . . . . . . . . . . . . . . . . . . . . . . . . . . . . . . . . . . . . . . . . . . . . . . . . . . . . . . . . . . . . . . . . . . . . . . . . . . . . 45
Drink ..................................................................................................................................................... 47
Industry Trends And Developments . . . . . . . . . . . . . . . . . . . . . . . . . . . . . . . . . . . . . . . . . . . . . . . . . . . . . . . . . . . . . . . . . . . . . . . . . . . . . . . . . . . . . . . . . . . . . . . . . . . . . . . . . . . . . . . . . . . . . . . 47
Market Overview . . . . . . . . . . . . . . . . . . . . . . . . . . . . . . . . . . . . . . . . . . . . . . . . . . . . . . . . . . . . . . . . . . . . . . . . . . . . . . . . . . . . . . . . . . . . . . . . . . . . . . . . . . . . . . . . . . . . . . . . . . . . . . . . . . . . . . . . . . 49
Mass Grocery Retail .............................................................................................................................. 51
Industry Trends And Developments . . . . . . . . . . . . . . . . . . . . . . . . . . . . . . . . . . . . . . . . . . . . . . . . . . . . . . . . . . . . . . . . . . . . . . . . . . . . . . . . . . . . . . . . . . . . . . . . . . . . . . . . . . . . . . . . . . . . . . . 51
Market Overview . . . . . . . . . . . . . . . . . . . . . . . . . . . . . . . . . . . . . . . . . . . . . . . . . . . . . . . . . . . . . . . . . . . . . . . . . . . . . . . . . . . . . . . . . . . . . . . . . . . . . . . . . . . . . . . . . . . . . . . . . . . . . . . . . . . . . . . . . . 52
Table: Structure Of Vietnam's Mass Grocery Retail Market By Estimated Number Of Outlets . . . . . . . . . . . . . . . . . . . . . . . . . . . . . . . . . . . . . . . . . . . . . . . . . . . . . . 54
Table: Structure Of Vietnam's Mass Grocery Retail Market - Sales Value By Format (US$mn) . . . . . . . . . . . . . . . . . . . . . . . . . . . . . . . . . . . . . . . . . . . . . . . . . . . . . 54
Vietnam Food & Drink Q3 2011
© Business Monitor International Page 5
Table: Structure Of Vietnam's Mass Grocery Retail Market - Sales Value By Format (VNDbn) . . . . . . . . . . . . . . . . . . . . . . . . . . . . . . . . . . . . . . . . . . . . . . . . . . . . . 55
Table: Average Sales Per Outlet By Format - 2010 . . . . . . . . . . . . . . . . . . . . . . . . . . . . . . . . . . . . . . . . . . . . . . . . . . . . . . . . . . . . . . . . . . . . . . . . . . . . . . . . . . . . . . . . . . . . . . . . . . . . 55
Competitive Landscape ........................................................................................................................ 56
Food . . . . . . . . . . . . . . . . . . . . . . . . . . . . . . . . . . . . . . . . . . . . . . . . . . . . . . . . . . . . . . . . . . . . . . . . . . . . . . . . . . . . . . . . . . . . . . . . . . . . . . . . . . . . . . . . . . . . . . . . . . . . . . . . . . . . . . . . . . . . . . . . . . . . . . . . 56
Table: Key Players in Vietnam's Food Sector - 2011 . . . . . . . . . . . . . . . . . . . . . . . . . . . . . . . . . . . . . . . . . . . . . . . . . . . . . . . . . . . . . . . . . . . . . . . . . . . . . . . . . . . . . . . . . . . . . . . . . . . 56
Drink . . . . . . . . . . . . . . . . . . . . . . . . . . . . . . . . . . . . . . . . . . . . . . . . . . . . . . . . . . . . . . . . . . . . . . . . . . . . . . . . . . . . . . . . . . . . . . . . . . . . . . . . . . . . . . . . . . . . . . . . . . . . . . . . . . . . . . . . . . . . . . . . . . . . . . . 56
Table: Key Players in Vietnam's Drink Sector - 2011 . . . . . . . . . . . . . . . . . . . . . . . . . . . . . . . . . . . . . . . . . . . . . . . . . . . . . . . . . . . . . . . . . . . . . . . . . . . . . . . . . . . . . . . . . . . . . . . . . . 56
Mass Grocery Retail . . . . . . . . . . . . . . . . . . . . . . . . . . . . . . . . . . . . . . . . . . . . . . . . . . . . . . . . . . . . . . . . . . . . . . . . . . . . . . . . . . . . . . . . . . . . . . . . . . . . . . . . . . . . . . . . . . . . . . . . . . . . . . . . . . . . . . . 57
Table: Key Players in Vietnam's Mass Grocery Retail Sector - 2011 . . . . . . . . . . . . . . . . . . . . . . . . . . . . . . . . . . . . . . . . . . . . . . . . . . . . . . . . . . . . . . . . . . . . . . . . . . . . . . . . . . 57
Company Analysis ................................................................................................................................ 59
Unilever Vietnam . . . . . . . . . . . . . . . . . . . . . . . . . . . . . . . . . . . . . . . . . . . . . . . . . . . . . . . . . . . . . . . . . . . . . . . . . . . . . . . . . . . . . . . . . . . . . . . . . . . . . . . . . . . . . . . . . . . . . . . . . . . . . . . . . . . . . . . . . . 59
Nestlé Vietnam . . . . . . . . . . . . . . . . . . . . . . . . . . . . . . . . . . . . . . . . . . . . . . . . . . . . . . . . . . . . . . . . . . . . . . . . . . . . . . . . . . . . . . . . . . . . . . . . . . . . . . . . . . . . . . . . . . . . . . . . . . . . . . . . . . . . . . . . . . . . . 61
Masan Consumer . . . . . . . . . . . . . . . . . . . . . . . . . . . . . . . . . . . . . . . . . . . . . . . . . . . . . . . . . . . . . . . . . . . . . . . . . . . . . . . . . . . . . . . . . . . . . . . . . . . . . . . . . . . . . . . . . . . . . . . . . . . . . . . . . . . . . . . . . . . 63
Vietnam Dairy Products Joint Stock Company (Vinamilk) . . . . . . . . . . . . . . . . . . . . . . . . . . . . . . . . . . . . . . . . . . . . . . . . . . . . . . . . . . . . . . . . . . . . . . . . . . . . . . . . . . . . . . . . . . . . . . . 65
San Miguel Pure Foods (VN) Co Ltd . . . . . . . . . . . . . . . . . . . . . . . . . . . . . . . . . . . . . . . . . . . . . . . . . . . . . . . . . . . . . . . . . . . . . . . . . . . . . . . . . . . . . . . . . . . . . . . . . . . . . . . . . . . . . . . . . . . . . . 67
Hanoi Beer Alcohol Beverage Corp (Habeco) . . . . . . . . . . . . . . . . . . . . . . . . . . . . . . . . . . . . . . . . . . . . . . . . . . . . . . . . . . . . . . . . . . . . . . . . . . . . . . . . . . . . . . . . . . . . . . . . . . . . . . . . . . . . . 69
Saigon Beer Alcohol and Beverage Corporation (Sabeco) . . . . . . . . . . . . . . . . . . . . . . . . . . . . . . . . . . . . . . . . . . . . . . . . . . . . . . . . . . . . . . . . . . . . . . . . . . . . . . . . . . . . . . . . . . . . . . . . 71
Carlsberg . . . . . . . . . . . . . . . . . . . . . . . . . . . . . . . . . . . . . . . . . . . . . . . . . . . . . . . . . . . . . . . . . . . . . . . . . . . . . . . . . . . . . . . . . . . . . . . . . . . . . . . . . . . . . . . . . . . . . . . . . . . . . . . . . . . . . . . . . . . . . . . . . . . 73
Metro Cash & Carry . . . . . . . . . . . . . . . . . . . . . . . . . . . . . . . . . . . . . . . . . . . . . . . . . . . . . . . . . . . . . . . . . . . . . . . . . . . . . . . . . . . . . . . . . . . . . . . . . . . . . . . . . . . . . . . . . . . . . . . . . . . . . . . . . . . . . . . 75
Saigon Co-op . . . . . . . . . . . . . . . . . . . . . . . . . . . . . . . . . . . . . . . . . . . . . . . . . . . . . . . . . . . . . . . . . . . . . . . . . . . . . . . . . . . . . . . . . . . . . . . . . . . . . . . . . . . . . . . . . . . . . . . . . . . . . . . . . . . . . . . . . . . . . . . 77
Methodology ......................................................................................................................................... 79
Risk/Reward Ratings Methodology . . . . . . . . . . . . . . . . . . . . . . . . . . . . . . . . . . . . . . . . . . . . . . . . . . . . . . . . . . . . . . . . . . . . . . . . . . . . . . . . . . . . . . . . . . . . . . . . . . . . . . . . . . . . . . . . . . . . . . . . 79
Ratings System . . . . . . . . . . . . . . . . . . . . . . . . . . . . . . . . . . . . . . . . . . . . . . . . . . . . . . . . . . . . . . . . . . . . . . . . . . . . . . . . . . . . . . . . . . . . . . . . . . . . . . . . . . . . . . . . . . . . . . . . . . . . . . . . . . . . . . . . . . . . . 79
Indicators . . . . . . . . . . . . . . . . . . . . . . . . . . . . . . . . . . . . . . . . . . . . . . . . . . . . . . . . . . . . . . . . . . . . . . . . . . . . . . . . . . . . . . . . . . . . . . . . . . . . . . . . . . . . . . . . . . . . . . . . . . . . . . . . . . . . . . . . . . . . . . . . . . . 79
Table: Returns . . . . . . . . . . . . . . . . . . . . . . . . . . . . . . . . . . . . . . . . . . . . . . . . . . . . . . . . . . . . . . . . . . . . . . . . . . . . . . . . . . . . . . . . . . . . . . . . . . . . . . . . . . . . . . . . . . . . . . . . . . . . . . . . . . . . . . . . . . . . 79
Glossary ............................................................................................................................................... 81
Food & Drink . . . . . . . . . . . . . . . . . . . . . . . . . . . . . . . . . . . . . . . . . . . . . . . . . . . . . . . . . . . . . . . . . . . . . . . . . . . . . . . . . . . . . . . . . . . . . . . . . . . . . . . . . . . . . . . . . . . . . . . . . . . . . . . . . . . . . . . . . . . . . . 81
Mass Grocery Retail . . . . . . . . . . . . . . . . . . . . . . . . . . . . . . . . . . . . . . . . . . . . . . . . . . . . . . . . . . . . . . . . . . . . . . . . . . . . . . . . . . . . . . . . . . . . . . . . . . . . . . . . . . . . . . . . . . . . . . . . . . . . . . . . . . . . . . . 81
BMI Food & Drink Forecasting and Sources ......................................................................................... 83
How We Generate Our Industry Forecasts . . . . . . . . . . . . . . . . . . . . . . . . . . . . . . . . . . . . . . . . . . . . . . . . . . . . . . . . . . . . . . . . . . . . . . . . . . . . . . . . . . . . . . . . . . . . . . . . . . . . . . . . . . . . . . . . 83
Sourcing . . . . . . . . . . . . . . . . . . . . . . . . . . . . . . . . . . . . . . . . . . . . . . . . . . . . . . . . . . . . . . . . . . . . . . . . . . . . . . . . . . . . . . . . . . . . . . . . . . . . . . . . . . . . . . . . . . . . . . . . . . . . . . . . . . . . . . . . . . . . . . . . . . . . 84
Vietnam Food & Drink Q3 2011
© Business Monitor International Page 6
BMI Industry View
A large, youthful population and a rapid influx of foreign direct investment as firms seek to take advantage
of this favourable demographic picture underline the enormous potential of Vietnam's food, drink and mass
grocery retail markets, as evidenced by our latest industry forecasts. Investment will continue to flow into
the industry, helping to drive double-digit annual sales growth across many market sub-sectors, especially
given the level of maturity being reached within sectors of the industry in other South East Asian markets.
That said, we note that an inflationary environment and government measures to stem inflation and put
economic growth on a more sustainable footing could serve to undermine demand in the short term.
Headline Industry Data
• Food Consumption will grow by 72.3% to 2015, albeit from a very low base thanks to rising consumeraffluence and the ongoing spread of mass grocery retail
• We have revised up our 2011 Vietnam beer consumption forecast from high single digits to 17.7% on theback of sustained industry investment and the strong performance of leading industry players
• To 2015 we expect mass grocery retail sales to increase by 54.1% (2011 growth is forecast at 15.9%),with hypermarkets set to be the outperformers in growth terms
Key Industry Trends
Weaker Retail Sales Data - Vietnamese retail sales of goods and services rose by 22.6% year-on-year in
Q111 to reach VND451.8trn. Adjusted for inflation, which remains elevated, sales increased by 8.7%. The
inflation-adjusted increase is far lower than the growth rate experienced for the same period of 2010 and
2009 (24.1% and 14.4% respectively). Weaker growth has been attributed to the severity of inflationary
pressures and the impact this has had on consumer spending power. A number of retailers have already
unveiled measures that attempt to address this problem by launching significant promotional campaigns,
offering discounts across a range of daily essential items (among them are Big C and Lotte Mart) in an
attempt to show that they are sharing the burden of elevated costs with consumers and thus retaining
consumer loyalty.
Inflation Remains A Concern - The inflationary burden on the Vietnamese consumer is getting heavier.
With Brent crude prices reaching highs not seen since mid-2008, Vietnamese manufacturers and suppliers
have increased their sale prices, as they contend with soaring electricity and fuel prices. In response to the
respective 20% and 15% increases in petrol and electricity prices announced by the government, the
majority of Vietnamese manufacturers and suppliers raised their sale prices from March 1 2011. Faced with
Vietnam Food & Drink Q3 2011
© Business Monitor International Page 7
the threat of surging transportation costs and sale prices from manufacturers, Vietnamese retailers have
hiked prices of perishable products, which are directly exposed to petrol and electricity price increases, by
10-18%. On the other hand, prices of non-perishable goods, which bear indirect influences from inflationary
trends in fuel and electricity, have been increased by 5%.
Key Company Trends
Largest Ever PE Deal - Global private equity (PE) firm Kohlberg Kravis Roberts & Co (KKR) has agreed
to acquire a 10% stake in Vietnamese consumer goods producer Masan Consumer. Vietnam is emerging
on the radars of PE investors looking to entrench themselves in the favourable consumer plays of emerging
markets (EMs). KKR has agreed to acquire the stake in Masan Consumer, the largest producer of
condiments like fish, soy and chilli sauce and the second biggest producer of instant noodles in Vietnam, for
US$159mn, marking the largest PE investment in the country. Masan Consumer is a subsidiary of Masan
Group, one of the largest private sector conglomerates in Vietnam. Upon completion of the acquisition,
Masan Group's equity stake in Masan Consumer will decrease from 86.6% to 78%.
Key Risks to Outlook
We remain concerned that excessive monetary tightening in an attempt to battle rising inflationary pressures
could result in a hard landing for the Vietnamese economy. Nonetheless, inflation remains a problem that
must be tackled. Manufacturers have already had to implement a number of price hikes and while larger
retailers have tried to counter the impact of these via loyalty problems, they will not be able to profitably
sustain these indefinitely, meaning higher costs will have to be passed on to consumers.
Vietnam Food & Drink Q3 2011
© Business Monitor International Page 8
SWOT
Drink Industry SWOT
Vietnam Drink Industry SWOT
Strengths • Vietnamese consumers, particularly the young and affluent, are interested in brands, and,accordingly, renowned Western products backed by investment in marketing and promotionstend to have highly successful launches.
• The wealthy urban centres of Hanoi and Ho Chi Minh City now provide highly receptiveconsumer audiences.
• Alcoholic drinks are widely consumed and have gained popularity in recent years.
• Vietnam has been one of the fastest-growing economies in Asia in recent years, with GDPgrowth averaging 7.6% annually between 2000 and 2009
Weaknesses • There are wide income disparities between urban and rural areas, and local consumptionpatterns vary significantly according to income.
• The drinks industry remains largely fragmented except for a few key sectors, such as alcoholicand soft drinks.
• Vietnam's infrastructure is still weak. Roads, railways and ports are inadequate to cope with thecountry's economic growth and links with the outside world.
Opportunities • Accession to the WTO, in January 2007, will continue to benefit Vietnamese exporters, with thegradual removal of market barriers and trade restrictions set to increase competition.
• Vietnam's large domestic market, growing export opportunities and low labour costs, as well asthe prospect of acquiring newly privatised drink companies, offer further investmentopportunities.
• A growing tourism sector is fuelling interest in convenience categories, in addition to sub-sectorssuch as soft and alcoholic drinks.
• In line with consumers' rising disposable incomes, there are opportunities for premium-brandedproducts in the soft and alcoholic drinks sub-sectors.
• The global trend towards health-consciousness provides an opportunity for drinks manufacturersto diversify into perceived healthier options.
Threats • Vietnam's WTO membership may result in smaller companies unable to cope with the increasedcompetition being forced out of business.
• Rising raw-material costs threaten profitability in this competitive market in which higher pricescannot easily be passed on to consumers.
�
Vietnam Food & Drink Q3 2011
© Business Monitor International Page 9
Food Industry SWOT
Vietnam Food Industry SWOT
Strengths • The food-processing sector accounts for a sizeable proportion of industrial output and GDP, withthe sector attracting significant foreign investment in recent years from the likes of Unilever,Nestlé and San Miguel.
• Vietnamese consumers, particularly the young and affluent, are interested in brands and,accordingly, renowned Western products backed by investment in marketing and promotionstend to have highly successful launches.
• The wealthy urban centres of Hanoi and Ho Chi Minh City now provide highly receptiveconsumer audiences.
• Large and diverse domestic agricultural output aids the stability of ingredient supplies and pricesfor local producers -- a vital strength during this period of global volatility.
Weaknesses • There are wide income disparities between urban and rural areas, and local consumptionpatterns vary significantly according to income.
• The food-processing industry remains largely fragmented except for a few key sectors, such asdairy and confectionery.
• The country's agricultural sector has been criticised for being too slow to adapt to newtechnologies to be globally competitive in the long term, although the government is workinghard to address this.
• Vietnam's infrastructure is still weak. Roads, railways and ports are inadequate to cope with thecountry's economic growth and links with the outside world.
• The lack of white goods among large sections of the consumer base slows down thedevelopment of the high-potential dairy sector
Opportunities • Accession to the WTO continues to benefit Vietnamese exporters, with the gradual removal ofmarket barriers and trade restrictions set to increase competition.
• Rising income levels and changing lifestyles, particularly in urban areas, are increasingconsumer demand for snacks, convenience and luxury food items.
• Vietnam's large domestic market, growing export opportunities and low labour costs, as well asthe prospect of acquiring newly privatised food companies, offer further investment opportunities.
• The country's agricultural sector is in need of significant investment and willing investors canexpect assisted entry.
• A growing tourism sector fuels interest in convenience categories
Threats • Vietnam's WTO membership may result in smaller companies unable to cope with the increasedcompetition being forced out of business.
• Rising commodity costs will remain a risk for the profitability of processed-food manufacturers;farmers themselves also claim this as a threat, with the primary level reportedly seeing little inthe way of these higher prices.
�
Vietnam Food & Drink Q3 2011
© Business Monitor International Page 10
Grocery Retail Industry SWOT
Vietnam Mass Grocery Retail Industry SWOT
Strengths • The potential size of the MGR market makes it an attractive target for foreign retailers onceimproved market terms are granted. Further growth is expected, especially in the supermarketformat.
• Hypermarkets, supermarkets and convenience stores have all proved popular in Vietnam,catering to different types of consumers and different shopping occasions.
• A growing multinational presence in the retail sector has aided the acceptance of modern retailbest-practices in Vietnam, particularly things like added-value in-store services.
• The formation of buying groups has proved an effective means of facilitating quicker expansionamong smaller industry players.
Weaknesses • Vietnam's retail distribution networks remain underdeveloped and expansion-oriented firms mustinvest in infrastructural development as well as new store openings.
• Regulations governing international participation in modern retail in Vietnam have resulted inslow rates of expansion, and aspects of government policy continue to make life challenging forforeign firms in spite of WTO accession.
• Poverty levels among the country's vast rural population hugely inhibit the potential audiencesize for modern retail in Vietnam.
■ .
Opportunities • The hypermarket concept is still in its infancy and, as familiarity with modern retailing grows, thisformat will represent an immense growth opportunity.
• Modern retail is currently focused on the major urban centres of the north and south, which stillboast space for new entrants, and central Vietnam and the provinces provide furtheropportunities still.
• Modern retail concepts, such as discounting and private labelling, should prove popular withprice-conscious Vietnamese consumers as familiarity with modern retailing builds.
• Rapid urbanisation and the development of new housing complexes provide ideal locations forthe rolling out of modern retail outlets with a large and receptive audience.
Threats • Were industry majors Tesco, Carrefour and Wal-Mart all to enter Vietnam, the window ofopportunity for other entrants would rapidly close.
• Rising operating costs will threaten retailer profit margins; with it difficult to pass price increaseson to consumers in such a price sensitive environment.
�
Vietnam Food & Drink Q3 2011
© Business Monitor International Page 11
Industry Business Environment Overview
Global Food & Drink View
Developments within the global food and drink industry in the past three months have continued to reflect
and support BMI's core industry views. Of particular importance in the last quarter has been the impact of
rising commodity prices - a factor that BMI was particularly quick to recognise was likely to impact
margins and also the valuation of food and drink firms. Rising global prices are also becoming an
increasingly important factor in emerging markets, where surging inflation threatens to undermine
confidence and put downwards pressure on growth in spending power.
Over the quarter we have seen encouraging signs of a consumer recovery in several important developed
markets, including the US, Germany and France. However, we expect high unemployment, fiscal austerity
measures and looming rate hikes to put pressure on growth rates over the longer term. Growth in emerging
markets has continued to impress and for many firms has acted to offset the lacklustre rates of growth in
developed markets.
Commodity Prices Pressuring Margins
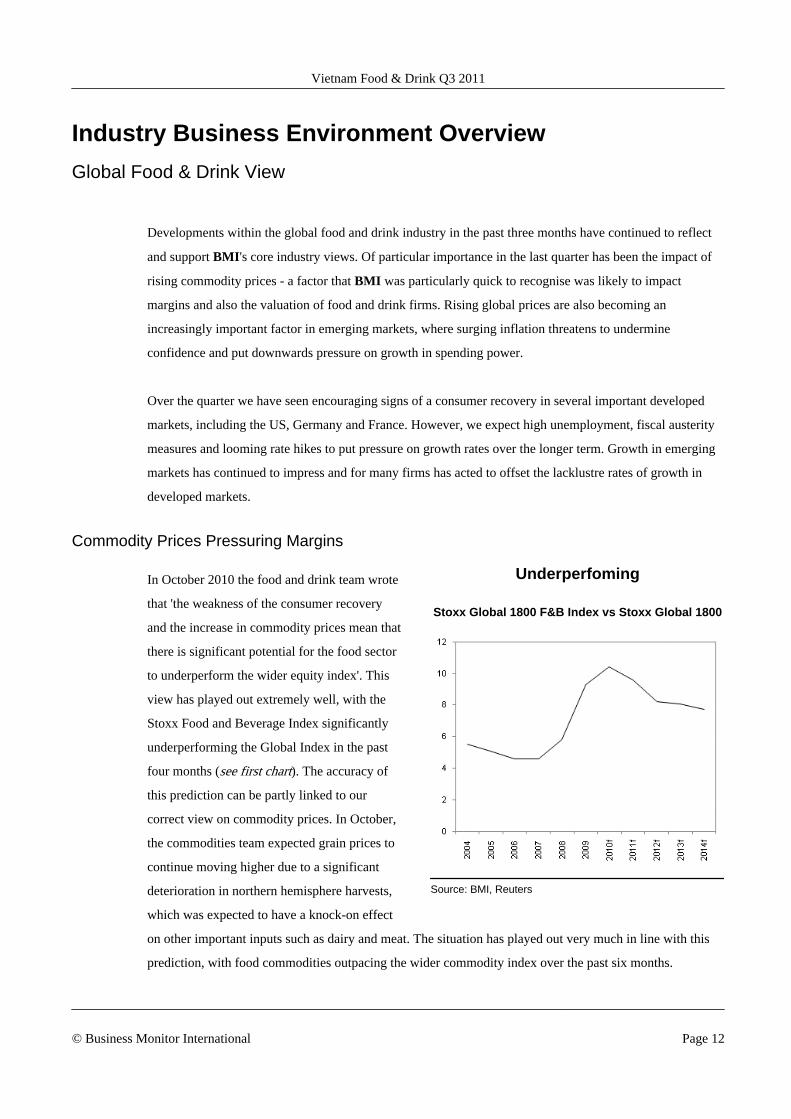
In October 2010 the food and drink team wrote
that 'the weakness of the consumer recovery
and the increase in commodity prices mean that
there is significant potential for the food sector
to underperform the wider equity index'. This
view has played out extremely well, with the
Stoxx Food and Beverage Index significantly
underperforming the Global Index in the past
four months (see first chart). The accuracy of
this prediction can be partly linked to our
correct view on commodity prices. In October,
the commodities team expected grain prices to
continue moving higher due to a significant
deterioration in northern hemisphere harvests,
which was expected to have a knock-on effect
on other important inputs such as dairy and meat. The situation has played out very much in line with this
prediction, with food commodities outpacing the wider commodity index over the past six months.
Underperfoming
Stoxx Global 1800 F&B Index vs Stoxx Global 1800
Source: BMI, Reuters
Vietnam Food & Drink Q3 2011
© Business Monitor International Page 12
Most major food groups have now reported their results for the fourth quarter of 2010 and they tell a clear
story, with margins falling due to rising costs. In response food groups have announced that they will begin
to raise prices more aggressively in 2011 and firms such as Unilever have suggested that they have learnt
from the experience of 2008, when they priced up and down effectively. However, BMI is concerned that
the consumer environment could make price increases harder to implement than in the past, with the slow
pace of economic recovery continuing to weigh on consumer confidence and with retailers very reluctant to
accept price increases. In addition, since 2008 consumer savviness has increased in many important markets
- for example private labels and discount stores have made huge strides in the US and parts of Europe where
they had previously had little presence, such as in Spain and Italy, meaning that any attempt to pass on price
increases could simply strengthen the trend towards lower priced products and retail formats.
A general ramp up in commodity prices, including in a sharp increase in the price of energy, has acted to
drive up inflation in both developed and emerging markets. This has led to a general move towards
hawkishness among central banks. In emerging markets, food inflation has been particularly rampant, with
double-digit levels of growth seen in many parts of the market. Given the disproportionate impact of rising
prices on poorer sections of societies in countries such as China and Brazil, such governments are under
pressure to cool down their economies and they have already begun raising interest rates. We are pencilling
in further rate hikes in these and several other important emerging markets including India and Indonesia
over the coming year, which will put downwards pressure on growth momentum.
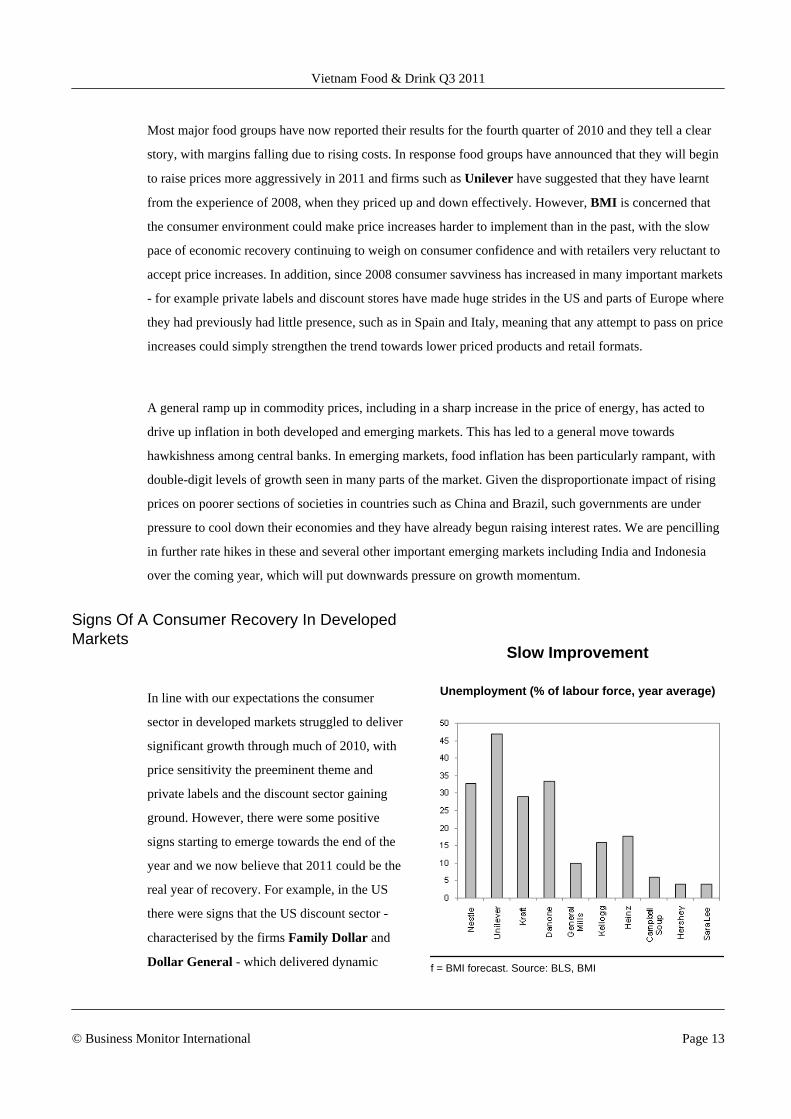
Signs Of A Consumer Recovery In DevelopedMarkets
In line with our expectations the consumer
sector in developed markets struggled to deliver
significant growth through much of 2010, with
price sensitivity the preeminent theme and
private labels and the discount sector gaining
ground. However, there were some positive
signs starting to emerge towards the end of the
year and we now believe that 2011 could be the
real year of recovery. For example, in the US
there were signs that the US discount sector -
characterised by the firms Family Dollar and
Dollar General - which delivered dynamic
Slow Improvement
Unemployment (% of labour force, year average)
f = BMI forecast. Source: BLS, BMI
Vietnam Food & Drink Q3 2011
© Business Monitor International Page 13
growth during the downturn, started to slow
towards the end of 2010.
BMI believes this lower rate of growth (combined with improving results at mainstream retailers) can be
attributed to an upturn in consumer confidence in the second half of 2010, combined with an improved
outlook for GDP growth in 2011. The big downside risks for the US economy in 2011 - that taxes rise and
unemployment benefits are not extended - actually turned into a major upside surprise in December 2010,
after Congress not only approved an extension of the income tax regime and unemployment benefits, but
also cut payroll taxes by two percentage points. This improvement in the consumer outlook will be greeted
warmly by most retailers, but for discount operators, which have thrived thanks to the weak economic
environment, a stronger retail sector could actually have a detrimental impact on results. This is borne out
by Family Dollar's sales growth slowing as 2010 progressed, with comparable sales in December climbing
by just 4%.
A similar story was seen in Europe, where the movement towards discount stores seems to have peaked in
many important markets, including Germany, the UK and France. Germany proved to be one of the
country's best positioned to bounce back from the economic downturn and this has been reflected in the
relative growth of the retail sector. For example, German retailer Rewe registered growth of 4% in its
German sales during the year. This growth was driven by the company's supermarket outlets, with growth
up by 6.4%, but was weighed down by the underperformance of the company's Penny discount stores,
which registered a 1.2% contraction in revenues. The outperformance of the supermarket sector is in line
with a strengthening of the domestic consumer market and is reminiscent of the two years leading up to the
economic crisis, when questions were asked about the long-term prospects for the discount sector in the
German market.
Emerging Markets Look Ever More Attractive
Despite these signs of recovery in developed markets, we continue to believe that the pace of growth in the
consumer sector over the next five years is unlikely to match the boom levels seen in the years leading up to
the financial crisis. Fiscal austerity measures are only now starting to be felt by the average consumer, while
rising inflation means that consumers may also soon have to contend with rising interest rates and mortgage
repayments. Unemployment across the US and eurozone is also remaining stubbornly high and looks
unlikely to fall significantly until we are some way into the economic recovery. BMI has a relatively
pessimistic outlook for employment in the US, believing that the credit boom actually masked massive
structural problems in the US economy, for which there is no quick fix. Because of this, we are forecasting
that unemployment will not go back to its pre-crisis lows over the next ten years (see second chart).
Vietnam Food & Drink Q3 2011
© Business Monitor International Page 14
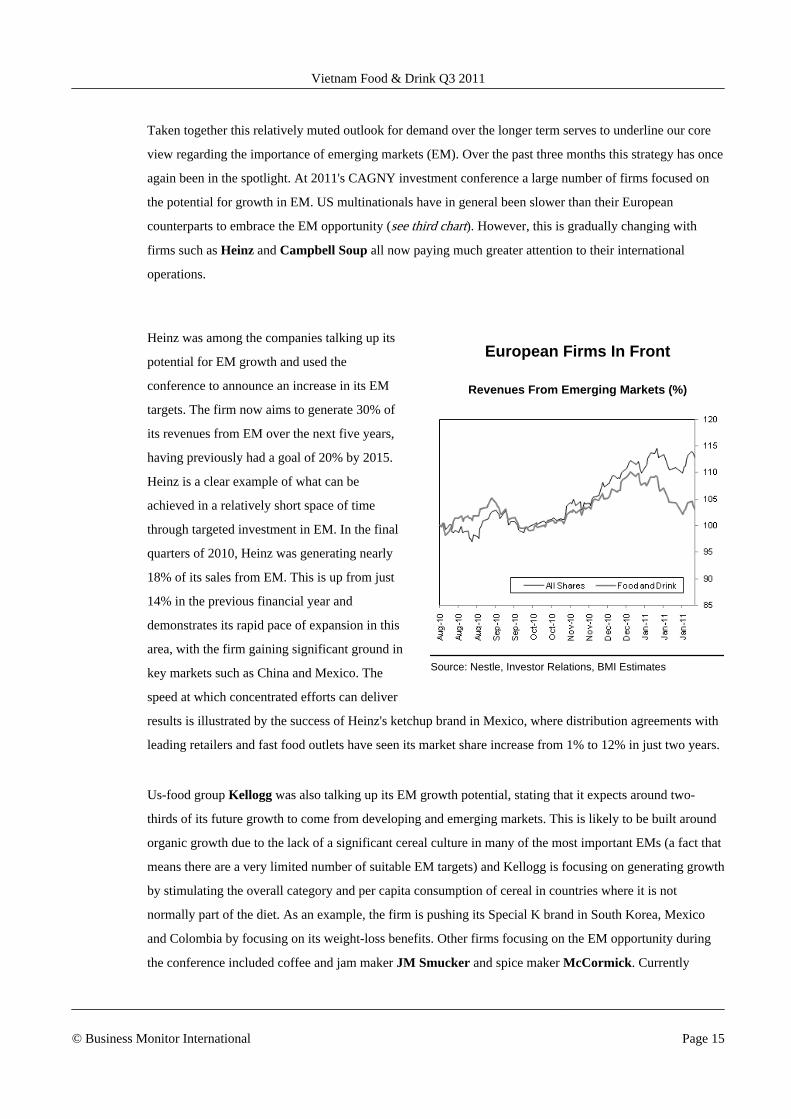
Taken together this relatively muted outlook for demand over the longer term serves to underline our core
view regarding the importance of emerging markets (EM). Over the past three months this strategy has once
again been in the spotlight. At 2011's CAGNY investment conference a large number of firms focused on
the potential for growth in EM. US multinationals have in general been slower than their European
counterparts to embrace the EM opportunity (see third chart). However, this is gradually changing with
firms such as Heinz and Campbell Soup all now paying much greater attention to their international
operations.
Heinz was among the companies talking up its
potential for EM growth and used the
conference to announce an increase in its EM
targets. The firm now aims to generate 30% of
its revenues from EM over the next five years,
having previously had a goal of 20% by 2015.
Heinz is a clear example of what can be
achieved in a relatively short space of time
through targeted investment in EM. In the final
quarters of 2010, Heinz was generating nearly
18% of its sales from EM. This is up from just
14% in the previous financial year and
demonstrates its rapid pace of expansion in this
area, with the firm gaining significant ground in
key markets such as China and Mexico. The
speed at which concentrated efforts can deliver
results is illustrated by the success of Heinz's ketchup brand in Mexico, where distribution agreements with
leading retailers and fast food outlets have seen its market share increase from 1% to 12% in just two years.
Us-food group Kellogg was also talking up its EM growth potential, stating that it expects around two-
thirds of its future growth to come from developing and emerging markets. This is likely to be built around
organic growth due to the lack of a significant cereal culture in many of the most important EMs (a fact that
means there are a very limited number of suitable EM targets) and Kellogg is focusing on generating growth
by stimulating the overall category and per capita consumption of cereal in countries where it is not
normally part of the diet. As an example, the firm is pushing its Special K brand in South Korea, Mexico
and Colombia by focusing on its weight-loss benefits. Other firms focusing on the EM opportunity during
the conference included coffee and jam maker JM Smucker and spice maker McCormick. Currently
European Firms In Front
Revenues From Emerging Markets (%)
Source: Nestle, Investor Relations, BMI Estimates
Vietnam Food & Drink Q3 2011
© Business Monitor International Page 15
Smucker generates nearly all of its revenues in North America, but used the conference to reveal it was
exploring plans to enter the attractive Chinese market. The firm revealed it was exploring a number of
avenues for market entry, including an acquisition of or partnership with a local firm. With a debt-to-
EBITDA ratio of only 0.89, Smucker looks well positioned to make acquisitions and it has previously
demonstrated an appetite for large-scale transformational takeovers.
Meanwhile, McCormick announced a target of generating 12% of its revenues from EM by 2015, which
compares to 9% at present. The firm highlighted the tremendous opportunity in India, where consumers
traditionally buy spices in bulk, but where middle-class consumers are increasingly 'seeking the higher
quality and convenience of branded products'. With even medium-sized producers now seeking out
acquisitions in EM, the battle to acquire attractive assets can only intensify, with a positive result for EM
valuations. While acquisitions can be a straightforward way to gain EM exposure, particularly for firms that
have little or none, the success of Heinz has also demonstrated the enormous amount that can be done by
simply investing in distribution and marketing, with many developed market firms already in possession of
brands and products that have enormous potential for growth in EM countries.
Big Deals Could Be Back On The Agend
Strong growth in EMs combined with a return to growth in developed markets means that many firms look
to be feeling more confident about their long-term prospects and we believe that this could spur a significant
ramp up in M&A activity in 2011. During much of 2010 there was a general attitude of caution, with firms
waiting to see which way the global economy was moving before committing to any big deals. In Q111 we
saw the first tentative steps in this direction, with PepsiCo purchasing a 66% stake in Russia's Wimm-Bill-
Dann for US$3.8bn, General Mills looking set to buy a 50% stake in Yoplait for EUR800mn and Diageo
agreeing to acquire Turkey's Mey Icki for US$2.1bn.
All of the major deals concluded by consumer groups in Q111 were bolt-on acquisitions and we are yet to
see a return to the more transformative deals seen in the years leading up to the financial crisis, such as
InBev's acquisition of Anheuser-Busch or Pernod Ricard's purchase of Absolut Maker Vin & Spirit.
However, with economies of scale such an important force in the food and drink sector, these kinds of deals
are sure to eventually re-emerge and we think that they could once again be on the cards in 2011. Firms that
we think are in a strong financial position to fund major acquisitions during 2011 include Diageo, Nestlé
and SABMiller, with acquisitions seen as a viable way to prop up relatively lacklustre sales growth in
developed markets.
One of our long-term core views is that multinationals with balanced developed and EM portfolios are best
positioned for growth. For EM-based firms this means that we see acquisitions in developed markets are a
Vietnam Food & Drink Q3 2011
© Business Monitor International Page 16
priority as they look to develop better rounded companies with less volatile earnings. This trend has been
evident over the last six months with Colombia's largest food company Grupo Nacional de Chocolates
announcing it is to purchase US cookie producer Fehr Foods for US$84mn, while Chilean wine producer
Concha y Toro is to buy California-based Fetzer Vineyards from US drinks firm Brown Forman. This
follows on from Mexican bakery firm Grupo Bimbo announcing in November it is to acquire Sara Lee's
North American bakery business for US$925mn and is a trend that we expect to gather pace as major firms
in the EMs of Asia and Latin America start to look to develop businesses that can truly compete on a global
scale.
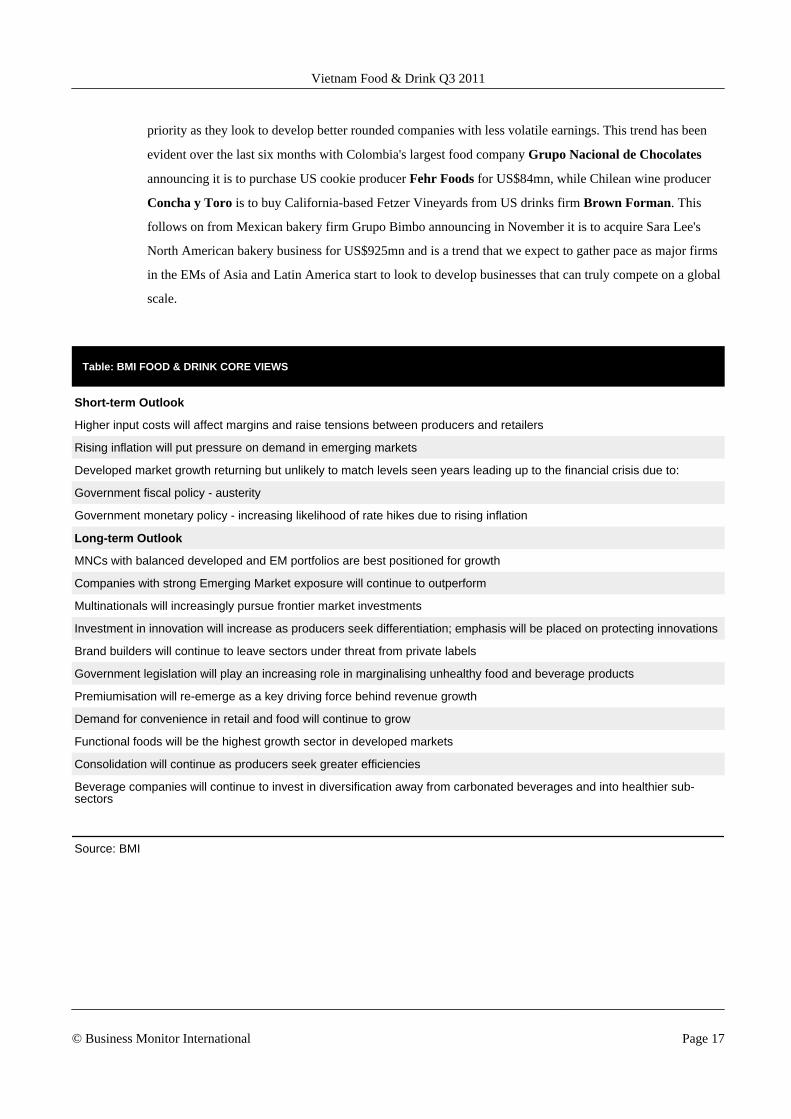
Table: BMI FOOD & DRINK CORE VIEWS
Short-term Outlook
Higher input costs will affect margins and raise tensions between producers and retailers
Rising inflation will put pressure on demand in emerging markets
Developed market growth returning but unlikely to match levels seen years leading up to the financial crisis due to:
Government fiscal policy - austerity
Government monetary policy - increasing likelihood of rate hikes due to rising inflation
Long-term Outlook
MNCs with balanced developed and EM portfolios are best positioned for growth
Companies with strong Emerging Market exposure will continue to outperform
Multinationals will increasingly pursue frontier market investments
Investment in innovation will increase as producers seek differentiation; emphasis will be placed on protecting innovations
Brand builders will continue to leave sectors under threat from private labels
Government legislation will play an increasing role in marginalising unhealthy food and beverage products
Premiumisation will re-emerge as a key driving force behind revenue growth
Demand for convenience in retail and food will continue to grow
Functional foods will be the highest growth sector in developed markets
Consolidation will continue as producers seek greater efficiencies
Beverage companies will continue to invest in diversification away from carbonated beverages and into healthier sub-sectors
Source: BMI
Vietnam Food & Drink Q3 2011
© Business Monitor International Page 17
Asia Pacific Risk/Reward Ratings
The 9.0 magnitude earthquake and tsunami that struck Japan on March 11 2011 has inevitably placed a
damper on the country's investment appeal. Although Japan was top in our Q211 Asia Pacific food and
drink (F&D) risk/reward ratings, thanks to an enviable balance of a low-risk operating environment and
high consuming levels, the recent spate of natural catastrophes in Japan saw the country slip to the second
position this quarter. Indeed, the extensive damages caused to Japan's transport infrastructure and tough
domestic picture are likely to keep potential investors at bay in the near term, thus dimming the
attractiveness of Japan.
Meanwhile, high-growth economies such as China, India and Indonesia continue to feature strongly in our
risk/reward ratings, underlining the massive abundance of opportunities in Asian Pacific emerging markets
(EMs). More noteworthy of mention is, however, the upward shifts in rankings for India and Indonesia. We
have repeatedly stressed that the developed economies of the Asia Pacific region will gradually lose their
investment appeal over the coming decades as opportunities for long-term growth dwindle, and our updated
risk/reward ratings for this quarter bear out this view.
Quake Deals Japan A Blow, China Now Tops
The recent dynamics in Japan has tipped the country off its top spot in our Q311 Asia Pacific F&D risk/
reward ratings. Japan's risk/reward rating score has declined from 63.7 in the last quarter to 61.8 presently,
implying a shaky operating environment for consumer goods investors.
Vietnam Food & Drink Q3 2011
© Business Monitor International Page 18
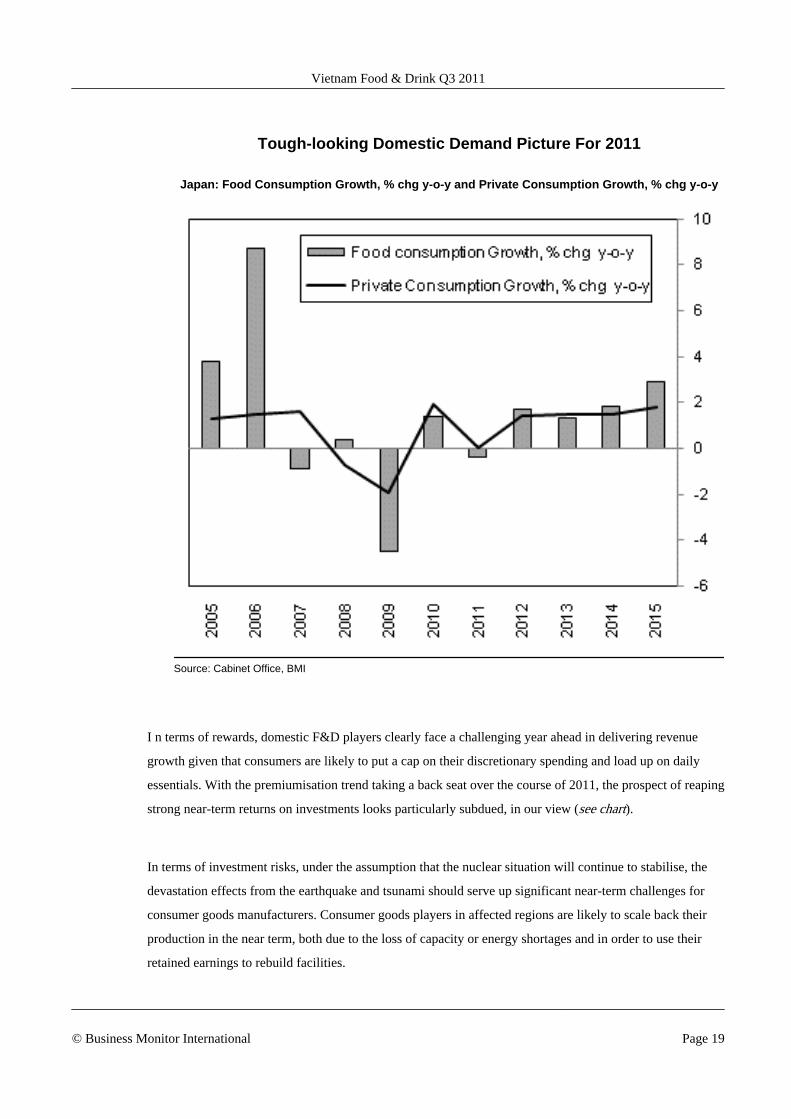
Tough-looking Domestic Demand Picture For 2011
Japan: Food Consumption Growth, % chg y-o-y and Private Consumption Growth, % chg y-o-y
Source: Cabinet Office, BMI
I n terms of rewards, domestic F&D players clearly face a challenging year ahead in delivering revenue
growth given that consumers are likely to put a cap on their discretionary spending and load up on daily
essentials. With the premiumisation trend taking a back seat over the course of 2011, the prospect of reaping
strong near-term returns on investments looks particularly subdued, in our view (see chart).
In terms of investment risks, under the assumption that the nuclear situation will continue to stabilise, the
devastation effects from the earthquake and tsunami should serve up significant near-term challenges for
consumer goods manufacturers. Consumer goods players in affected regions are likely to scale back their
production in the near term, both due to the loss of capacity or energy shortages and in order to use their
retained earnings to rebuild facilities.
Vietnam Food & Drink Q3 2011
© Business Monitor International Page 19
While the near-term dynamics bode poorly for Japan, investors are also likely to lose interest in the country
over the longer horizon due to its limited prospects for growth and high level of market maturity. Yes,
Japan's high F&D consumption levels, well-developed labour force and low levels of bureaucracy will
remain strong attractions for investors but realistically the market is mature and clearly would not be the
best place to search for solid long-term revenue growth.
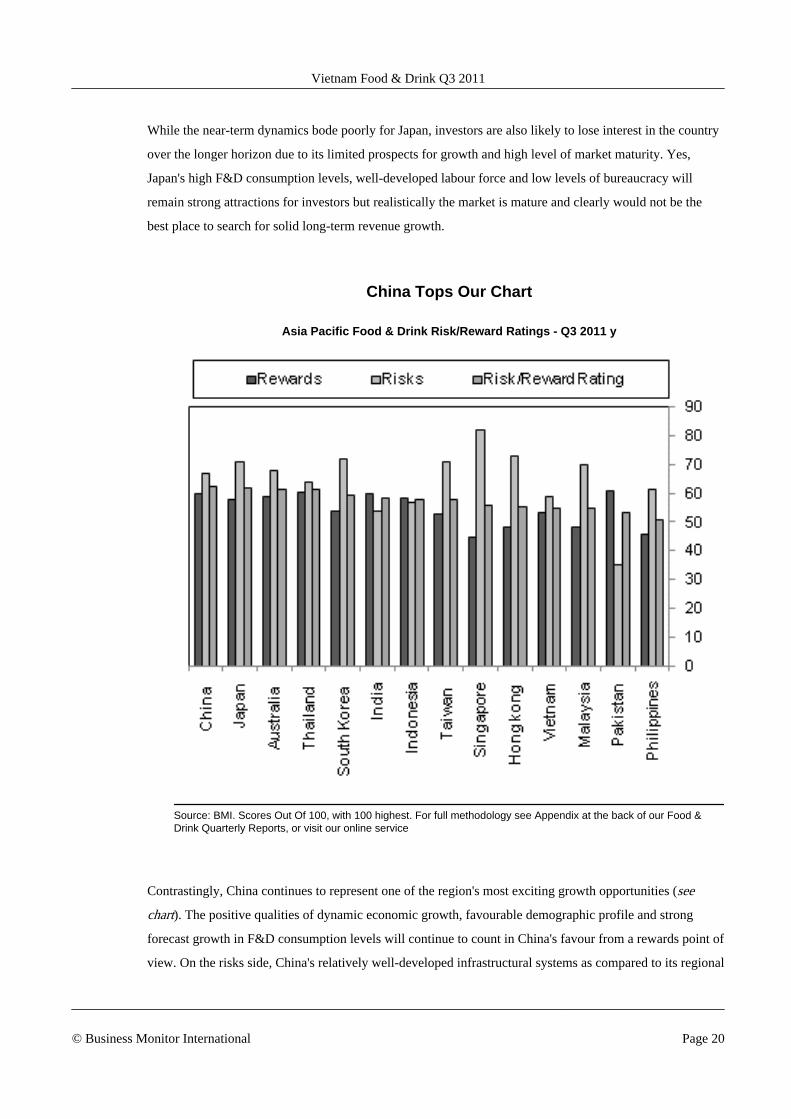
China Tops Our Chart
Asia Pacific Food & Drink Risk/Reward Ratings - Q3 2011 y
Source: BMI. Scores Out Of 100, with 100 highest. For full methodology see Appendix at the back of our Food &Drink Quarterly Reports, or visit our online service
Contrastingly, China continues to represent one of the region's most exciting growth opportunities (see
chart). The positive qualities of dynamic economic growth, favourable demographic profile and strong
forecast growth in F&D consumption levels will continue to count in China's favour from a rewards point of
view. On the risks side, China's relatively well-developed infrastructural systems as compared to its regional
Vietnam Food & Drink Q3 2011
© Business Monitor International Page 20
developing market peers and sturdy near-term economic fundamentals further accentuates the country's
reputation as an enticing foreign direct investment (FDI) destination. This healthy balance of risk to reward
ensures that China remains one of the largest recipients of foreign investment and also explains its top
position in our rankings.
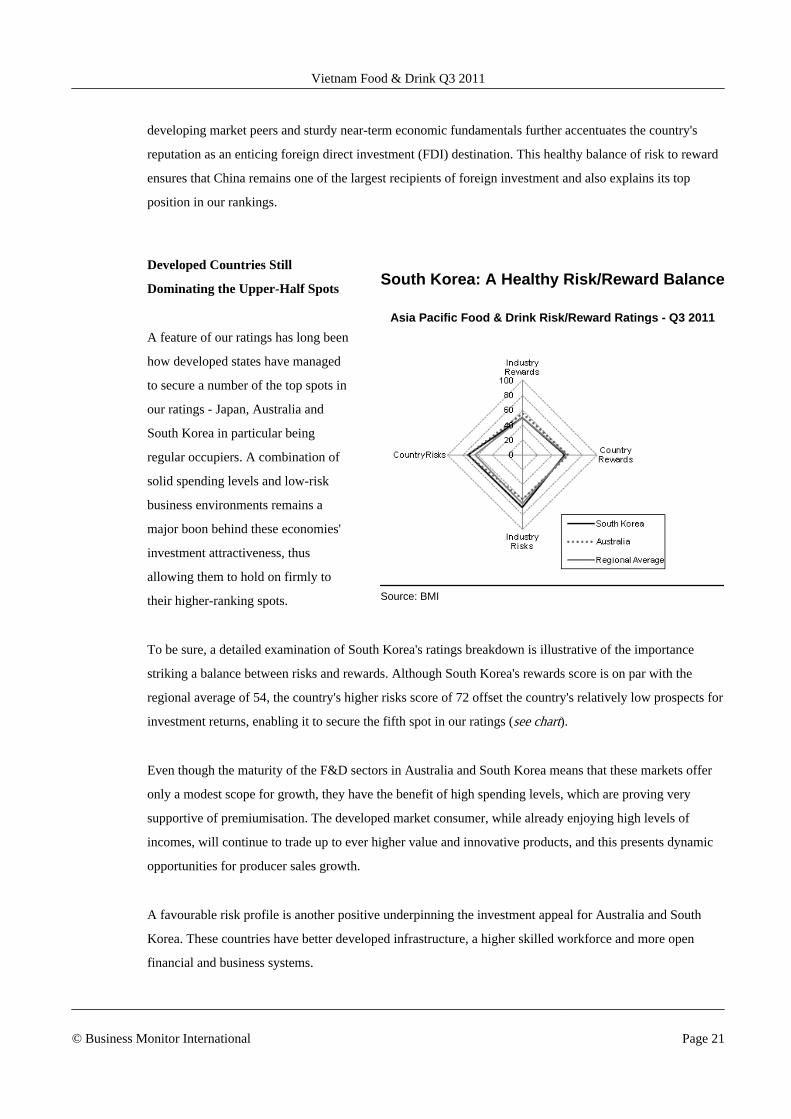
Developed Countries Still
Dominating the Upper-Half Spots
A feature of our ratings has long been
how developed states have managed
to secure a number of the top spots in
our ratings - Japan, Australia and
South Korea in particular being
regular occupiers. A combination of
solid spending levels and low-risk
business environments remains a
major boon behind these economies'
investment attractiveness, thus
allowing them to hold on firmly to
their higher-ranking spots.
To be sure, a detailed examination of South Korea's ratings breakdown is illustrative of the importance
striking a balance between risks and rewards. Although South Korea's rewards score is on par with the
regional average of 54, the country's higher risks score of 72 offset the country's relatively low prospects for
investment returns, enabling it to secure the fifth spot in our ratings (see chart).
Even though the maturity of the F&D sectors in Australia and South Korea means that these markets offer
only a modest scope for growth, they have the benefit of high spending levels, which are proving very
supportive of premiumisation. The developed market consumer, while already enjoying high levels of
incomes, will continue to trade up to ever higher value and innovative products, and this presents dynamic
opportunities for producer sales growth.
A favourable risk profile is another positive underpinning the investment appeal for Australia and South
Korea. These countries have better developed infrastructure, a higher skilled workforce and more open
financial and business systems.
South Korea: A Healthy Risk/Reward Balance
Asia Pacific Food & Drink Risk/Reward Ratings - Q3 2011
Source: BMI
Vietnam Food & Drink Q3 2011
© Business Monitor International Page 21
Fast-Growing EMs Closing The Gap
While the likes of Australia, Japan and South Korea are likely to stay put in their top-ranking positions in
the near-to-medium term, we acknowledge that the Asian Pacific EMs are quickly catching up with their
developed market counterparts.
We like the long-term promise of domestic-demand oriented countries such as India, Indonesia and
Vietnam, which backed by massive consumer bases, provides dynamic long-term growth potential for
consumer-facing players. Although the negative attributes of weak distribution and labour infrastructure,
perceived excessive bureaucracy and corruption will remain key stumbling blocks to attracting foreign
investment in these EMs, which explains their weak risks scores, these markets will continue to climb up
our ratings ladder and potentially take over the leading positions from developed markets over the long
horizon.
Specifically, India and Indonesia have overtaken Taiwan and moved up the rankings by one spot to the sixth
and seventh position respectively in this quarter, underlining the countries' increasingly attractive
investment appeal. At the bottom half of our risk/reward table, Vietnam and Malaysia are also closing the
gap with their developed market peers.
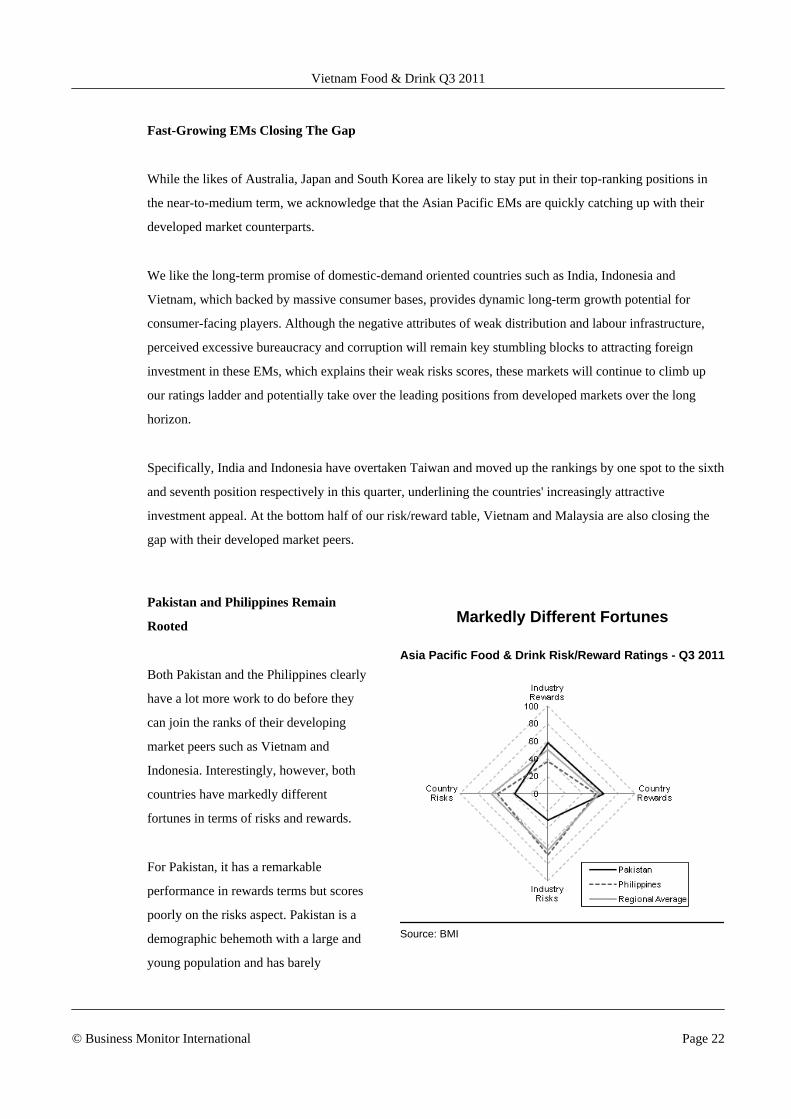
Pakistan and Philippines Remain
Rooted
Both Pakistan and the Philippines clearly
have a lot more work to do before they
can join the ranks of their developing
market peers such as Vietnam and
Indonesia. Interestingly, however, both
countries have markedly different
fortunes in terms of risks and rewards.
For Pakistan, it has a remarkable
performance in rewards terms but scores
poorly on the risks aspect. Pakistan is a
demographic behemoth with a large and
young population and has barely
Markedly Different Fortunes
Asia Pacific Food & Drink Risk/Reward Ratings - Q3 2011
Source: BMI
Vietnam Food & Drink Q3 2011
© Business Monitor International Page 22
scratched the surface of its potential on the consumer side, with incomes generally still very low. However,
Pakistan remains beset by challenges such as a destabilising insurgency, poor infrastructure and a chronic
lack of electricity generation capacity, which drags down its overall ratings score.
The situation in the Philippines is just the opposite of Pakistan (see chart). The Philippines scores high on
the risks aspect on the back of a favourable regulatory environment and reasonably-strong near-term
economic fundamentals, but has yet been able to secure higher-ranking spots due to its low F&D
consumption levels and food consumption growth.
Looking Ahead
China's ascent is unsurprising given the country's domestic demand credentials and we would expect it to
retain this leading position over the coming decade. While we do not expect our developed states such as
Australia and South Korea to fall away too quickly, further upwards movements by EMs such as India,
Indonesia and Vietnam are likely over the coming years, in line with greater industry investment and
improvements in domestic best practice, and in turn allowing them to close the gap with our developed
markets. Pakistan's size and the fact that on a per capita GDP basis disposable incomes remain low, which
translates into massive room for growth in F&D consumption levels, suggest that it has the potential to
climb up our ratings table, but this remains a distant possibility given its structural shortcomings.
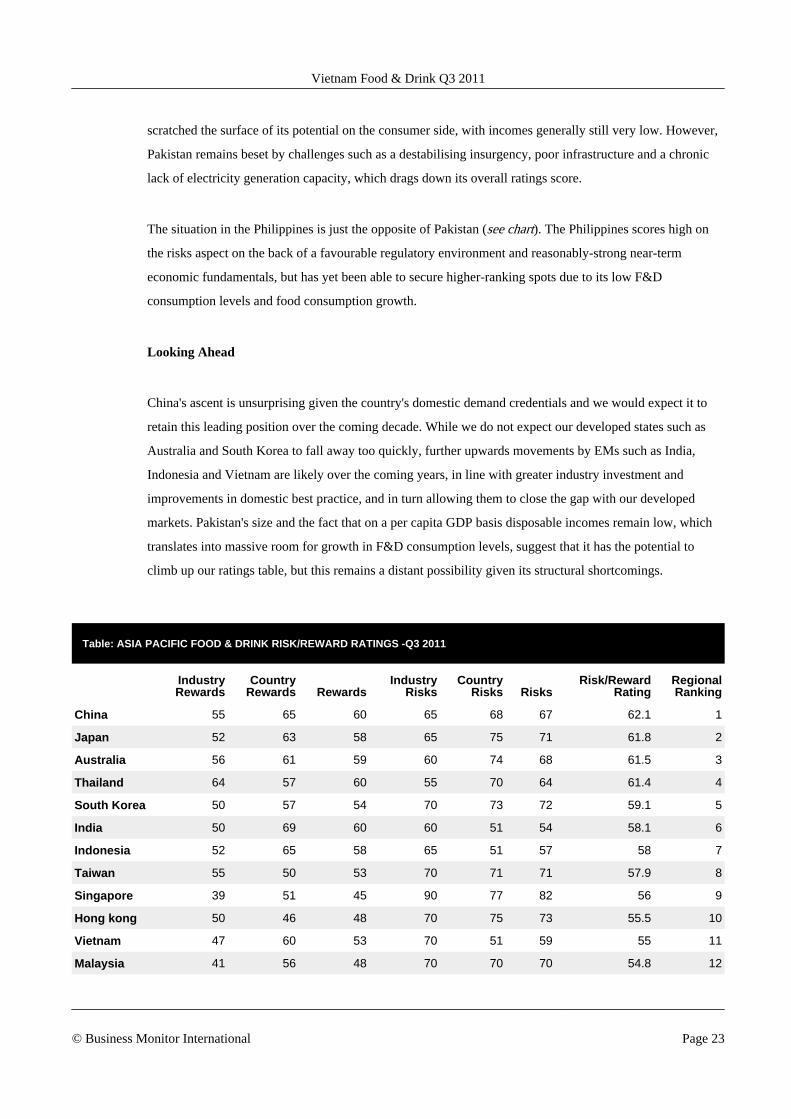
Table: ASIA PACIFIC FOOD & DRINK RISK/REWARD RATINGS -Q3 2011
IndustryRewards
CountryRewards Rewards
IndustryRisks
CountryRisks Risks
Risk/RewardRating
RegionalRanking
China 55 65 60 65 68 67 62.1 1
Japan 52 63 58 65 75 71 61.8 2
Australia 56 61 59 60 74 68 61.5 3
Thailand 64 57 60 55 70 64 61.4 4
South Korea 50 57 54 70 73 72 59.1 5
India 50 69 60 60 51 54 58.1 6
Indonesia 52 65 58 65 51 57 58 7
Taiwan 55 50 53 70 71 71 57.9 8
Singapore 39 51 45 90 77 82 56 9
Hong kong 50 46 48 70 75 73 55.5 10
Vietnam 47 60 53 70 51 59 55 11
Malaysia 41 56 48 70 70 70 54.8 12
Vietnam Food & Drink Q3 2011
© Business Monitor International Page 23
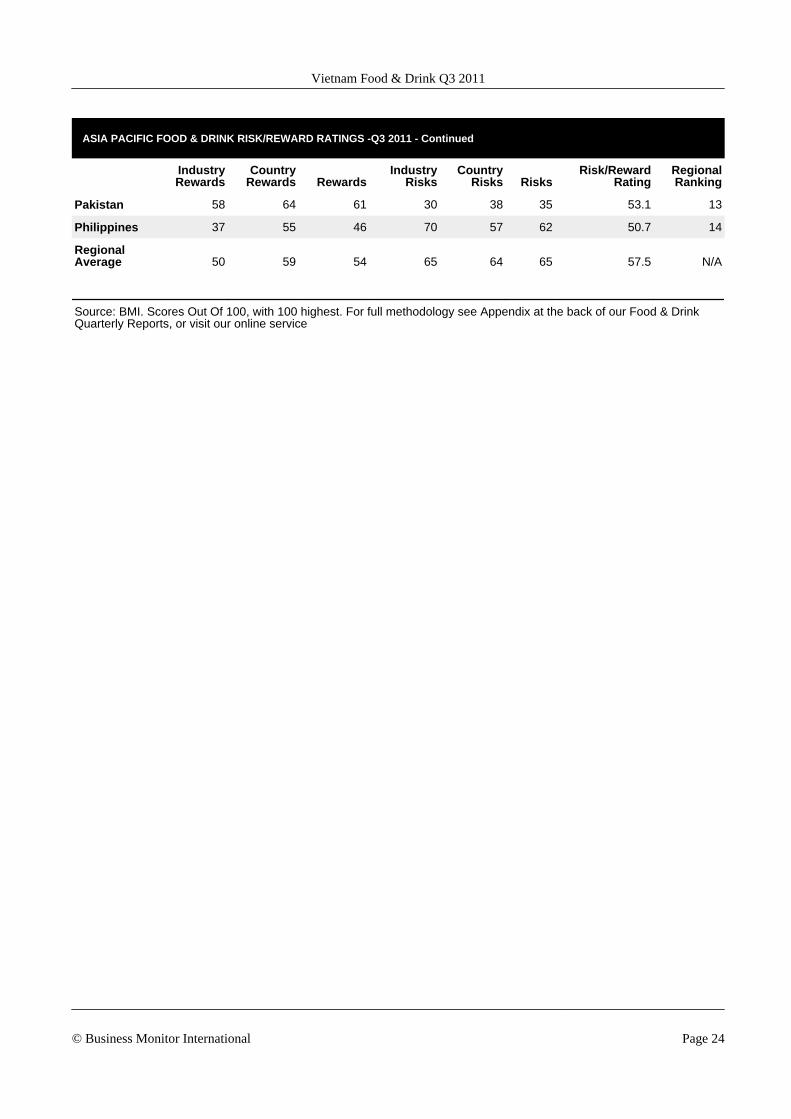
ASIA PACIFIC FOOD & DRINK RISK/REWARD RATINGS -Q3 2011 - Continued
IndustryRewards
CountryRewards Rewards
IndustryRisks
CountryRisks Risks
Risk/RewardRating
RegionalRanking
Pakistan 58 64 61 30 38 35 53.1 13
Philippines 37 55 46 70 57 62 50.7 14
RegionalAverage 50 59 54 65 64 65 57.5 N/A
Source: BMI. Scores Out Of 100, with 100 highest. For full methodology see Appendix at the back of our Food & DrinkQuarterly Reports, or visit our online service
Vietnam Food & Drink Q3 2011
© Business Monitor International Page 24
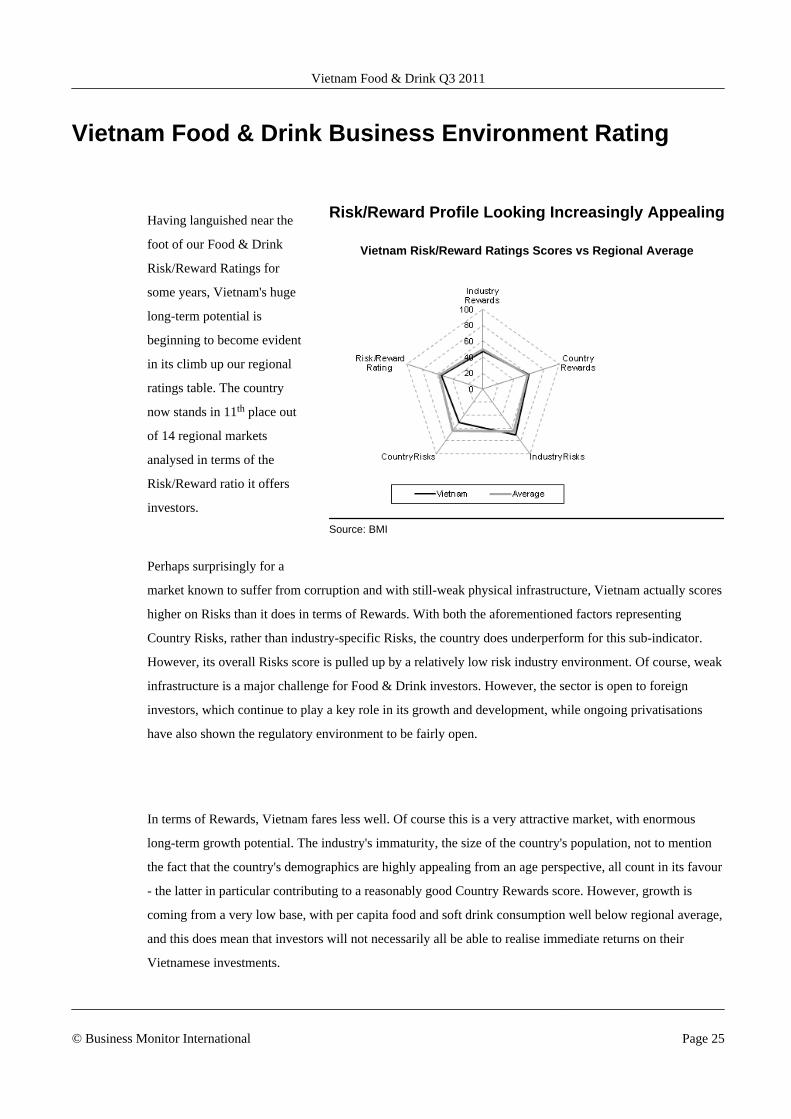
Vietnam Food & Drink Business Environment Rating
Having languished near the
foot of our Food & Drink
Risk/Reward Ratings for
some years, Vietnam's huge
long-term potential is
beginning to become evident
in its climb up our regional
ratings table. The country
now stands in 11th place out
of 14 regional markets
analysed in terms of the
Risk/Reward ratio it offers
investors.
Perhaps surprisingly for a
market known to suffer from corruption and with still-weak physical infrastructure, Vietnam actually scores
higher on Risks than it does in terms of Rewards. With both the aforementioned factors representing
Country Risks, rather than industry-specific Risks, the country does underperform for this sub-indicator.
However, its overall Risks score is pulled up by a relatively low risk industry environment. Of course, weak
infrastructure is a major challenge for Food & Drink investors. However, the sector is open to foreign
investors, which continue to play a key role in its growth and development, while ongoing privatisations
have also shown the regulatory environment to be fairly open.
In terms of Rewards, Vietnam fares less well. Of course this is a very attractive market, with enormous
long-term growth potential. The industry's immaturity, the size of the country's population, not to mention
the fact that the country's demographics are highly appealing from an age perspective, all count in its favour
- the latter in particular contributing to a reasonably good Country Rewards score. However, growth is
coming from a very low base, with per capita food and soft drink consumption well below regional average,
and this does mean that investors will not necessarily all be able to realise immediate returns on their
Vietnamese investments.
Risk/Reward Profile Looking Increasingly Appealing
Vietnam Risk/Reward Ratings Scores vs Regional Average
Source: BMI
Vietnam Food & Drink Q3 2011
© Business Monitor International Page 25
That said, notwithstanding the low base from which growth is coming, we would expect Vietnam to
continue its climb up the Ratings over the medium-term, as spending picks up and growth remains at hugely
attractive levels.
Vietnam Food & Drink Q3 2011
© Business Monitor International Page 26
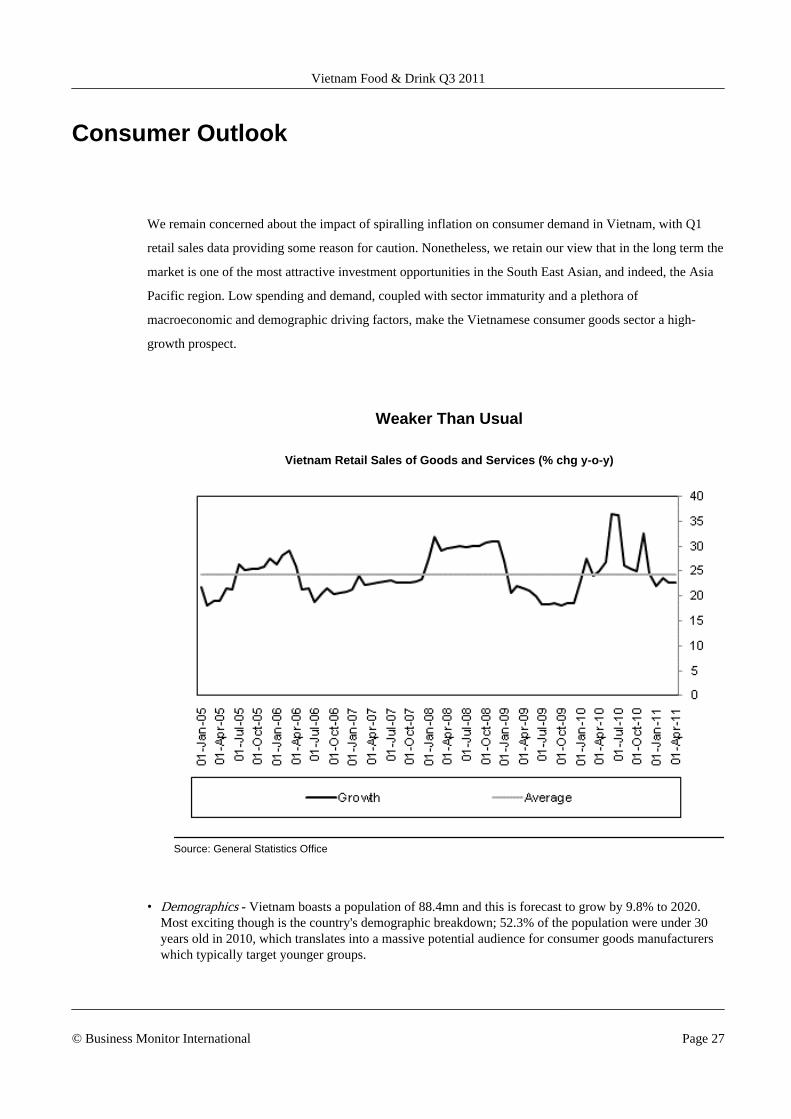
Consumer Outlook
We remain concerned about the impact of spiralling inflation on consumer demand in Vietnam, with Q1
retail sales data providing some reason for caution. Nonetheless, we retain our view that in the long term the
market is one of the most attractive investment opportunities in the South East Asian, and indeed, the Asia
Pacific region. Low spending and demand, coupled with sector immaturity and a plethora of
macroeconomic and demographic driving factors, make the Vietnamese consumer goods sector a high-
growth prospect.
Weaker Than Usual
Vietnam Retail Sales of Goods and Services (% chg y-o-y)
Source: General Statistics Office
• Demographics - Vietnam boasts a population of 88.4mn and this is forecast to grow by 9.8% to 2020.Most exciting though is the country's demographic breakdown; 52.3% of the population were under 30years old in 2010, which translates into a massive potential audience for consumer goods manufacturerswhich typically target younger groups.
Vietnam Food & Drink Q3 2011
© Business Monitor International Page 27
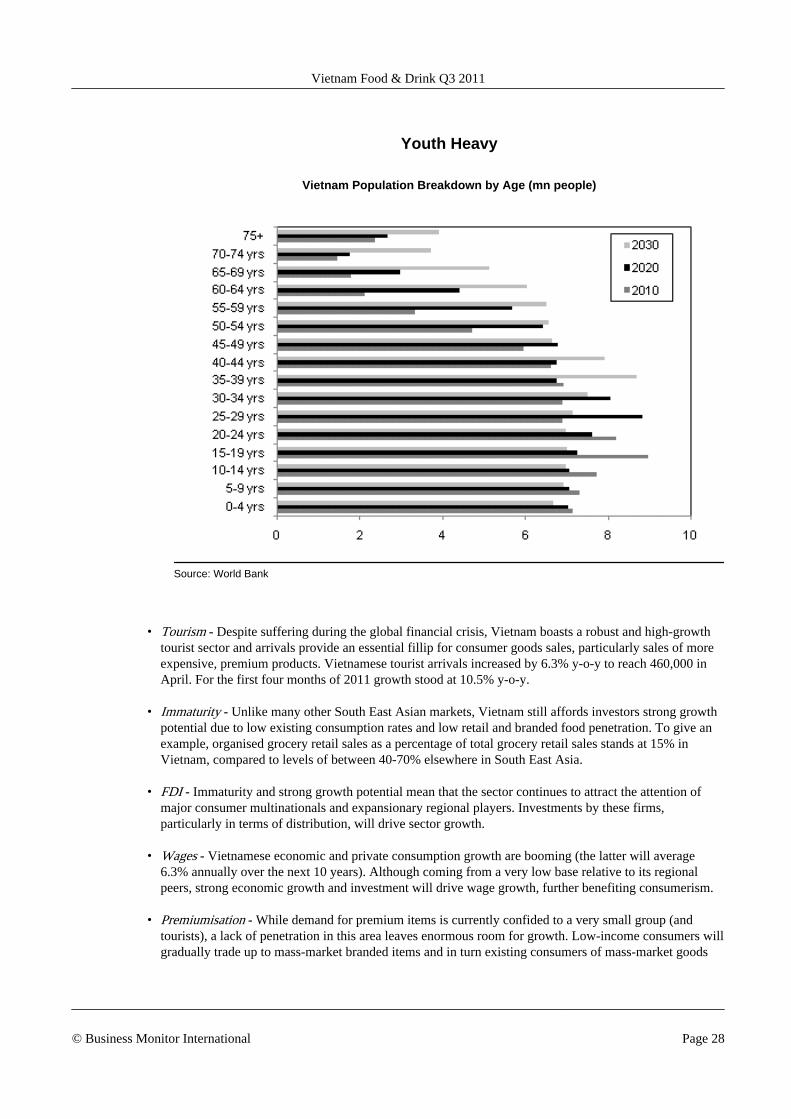
Youth Heavy
Vietnam Population Breakdown by Age (mn people)
Source: World Bank
• Tourism - Despite suffering during the global financial crisis, Vietnam boasts a robust and high-growthtourist sector and arrivals provide an essential fillip for consumer goods sales, particularly sales of moreexpensive, premium products. Vietnamese tourist arrivals increased by 6.3% y-o-y to reach 460,000 inApril. For the first four months of 2011 growth stood at 10.5% y-o-y.
• Immaturity - Unlike many other South East Asian markets, Vietnam still affords investors strong growthpotential due to low existing consumption rates and low retail and branded food penetration. To give anexample, organised grocery retail sales as a percentage of total grocery retail sales stands at 15% inVietnam, compared to levels of between 40-70% elsewhere in South East Asia.
• FDI - Immaturity and strong growth potential mean that the sector continues to attract the attention ofmajor consumer multinationals and expansionary regional players. Investments by these firms,particularly in terms of distribution, will drive sector growth.
• Wages - Vietnamese economic and private consumption growth are booming (the latter will average6.3% annually over the next 10 years). Although coming from a very low base relative to its regionalpeers, strong economic growth and investment will drive wage growth, further benefiting consumerism.
• Premiumisation - While demand for premium items is currently confided to a very small group (andtourists), a lack of penetration in this area leaves enormous room for growth. Low-income consumers willgradually trade up to mass-market branded items and in turn existing consumers of mass-market goods
Vietnam Food & Drink Q3 2011
© Business Monitor International Page 28
will gradually increase their discretionary spending on these products, creating opportunities for premiumproduct sales.
The aforementioned factors and a relatively relaxed regulatory environment will stand Vietnam in good
stead to attract investments from the world's major F&D players, which could further stimulate consumer
interest in modern retailing methods and higher-value F&D products.
Singapore MGR operator NTUC Fairprice is the latest company to jump aboard the inbound investment
bandwagon in Vietnam, joining the likes of South Korean retailer Lotte, Japan's FamilyMart and German
retailer Metro as it looks to capitalise on the country's emerging market potential. While UK retailer Tesco
has stayed silent on speculation that it is weighing up an entry into the Vietnamese market, we would not be
surprised if Vietnam were to pop up on the retailer's long-term radar, given the country's high-growth retail
prospects. Clearly, investments in the retail sector will only intensify and consumption habits should move
up several notches over the coming years, as the variety of consumer products and demand increase.
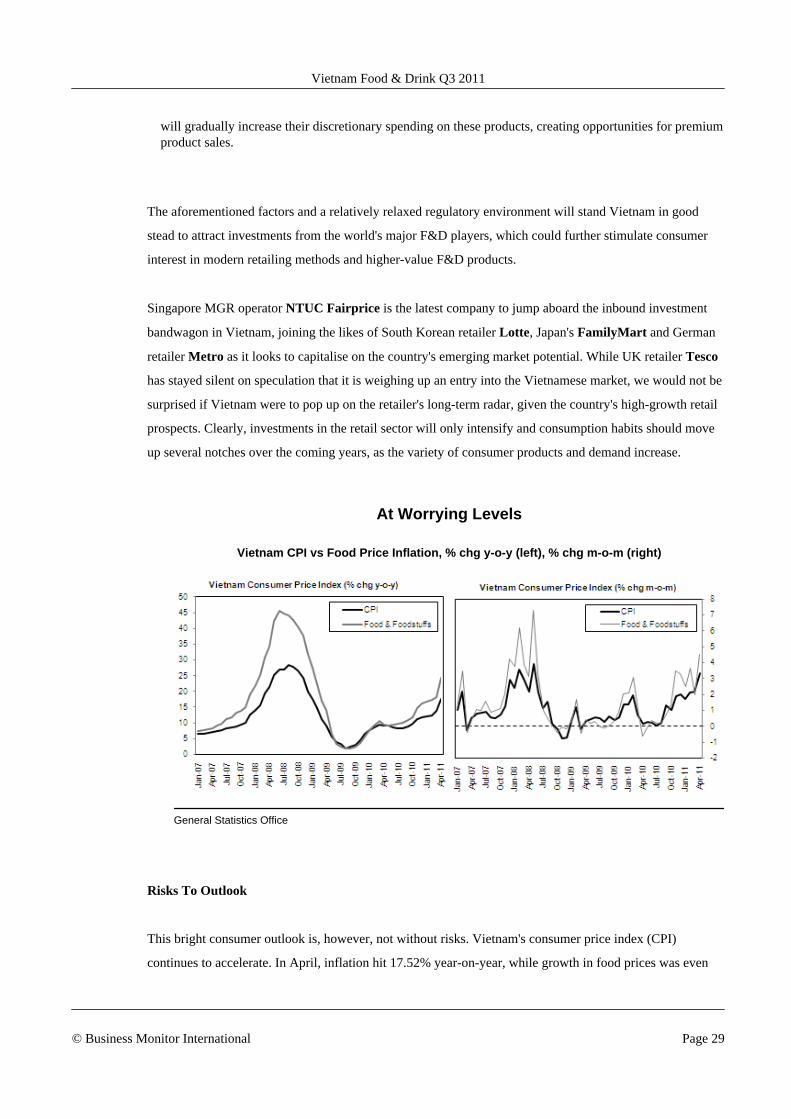
At Worrying Levels
Vietnam CPI vs Food Price Inflation, % chg y-o-y (left), % chg m-o-m (right)
General Statistics Office
Risks To Outlook
This bright consumer outlook is, however, not without risks. Vietnam's consumer price index (CPI)
continues to accelerate. In April, inflation hit 17.52% year-on-year, while growth in food prices was even
Vietnam Food & Drink Q3 2011
© Business Monitor International Page 29
more dramatic at 24.43%. Monthly growth figures underline the severity of this trend. Month-on-month GPI
growth in April stood at 3.32%, a third consecutive monthly gain.
The need to get inflation under control raises the risk of further rate hikes in 2011 (following a 100 basis
point hike in April). Of course the downward pressure that inflation places on demand makes inflation the
greater risk and yet aggressive tightening does increase the risk of a hard landing for the Vietnamese
economy and this would of course also pose a threat to consumer goods players even if it could ultimately
translate into greater long-term economic stability.
Vietnam Food & Drink Q3 2011
© Business Monitor International Page 30
Industry Forecast Scenario
Food
Food Consumption
• To 2015, food consumption in Vietnam is forecast to experience strong growth of 72.3%, at which pointconsumption is expected to reach VND496.7trn.
• Per capita food consumption is forecast to grow by 64.0% over the same time period, reaching a fairlymodest VND5.4mn by 2015, reflecting the low starting base.
This impressive level of growth in food consumption could be attributed to two key factors: the rising
affluence among Vietnamese consumers and an ongoing expansion of the country's mass grocery retail
(MGR) industry.
At present, income levels in Vietnam are a long way behind developed economies and consumer purchases
remain largely centred on food staples and daily necessities. However, as incomes start to accelerate off a
low base on the back of sturdy economic growth, consumer tastes and preferences are expected to calibrate
towards the higher-value food and beverage segments, which should guarantee a receptive and growing
audience for branded food and beverage products in the medium term.
The ongoing expansion of the MGR industry will also drive up per capita food consumption levels,
provided goods sold through such outlets remain competitively priced. Ultimately, food consumption
growth will be driven by the government's ability to harness rural spending power and by modern retailers'
ability to find a model that stirs consumer interest, without forgetting that price will remain the major
purchasing determinant.
Vietnam Food & Drink Q3 2011
© Business Monitor International Page 31
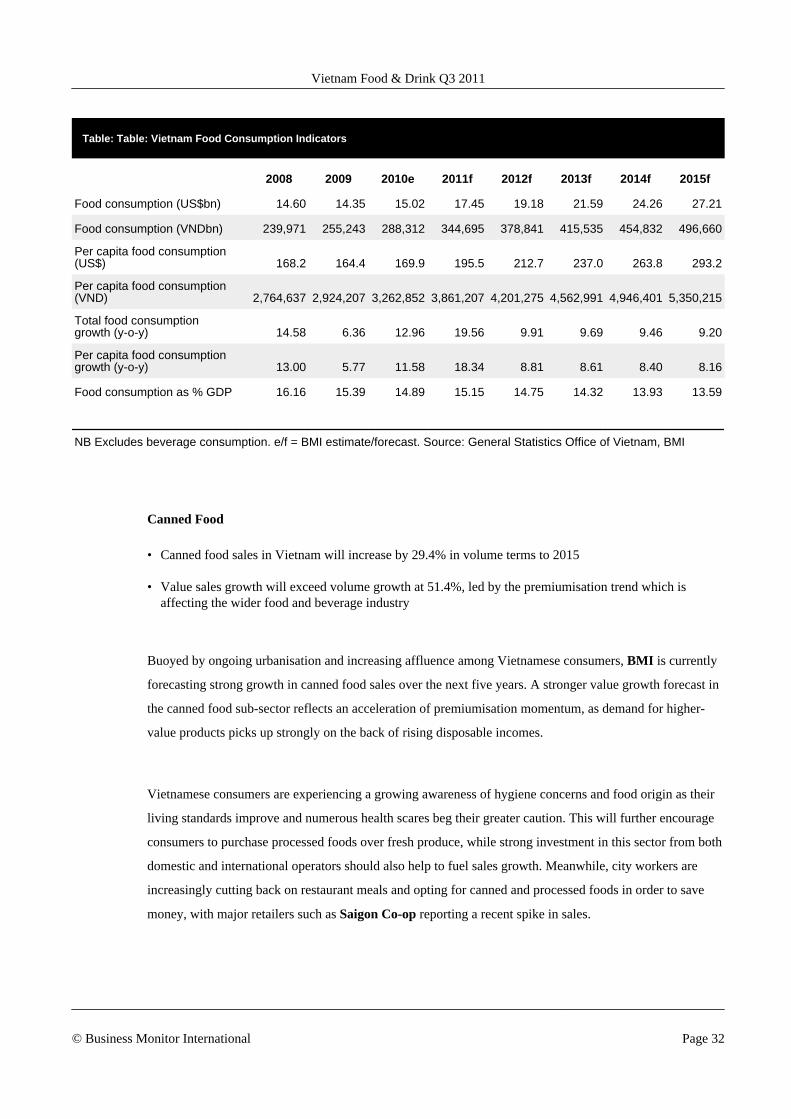
Table: Table: Vietnam Food Consumption Indicators
2008 2009 2010e 2011f 2012f 2013f 2014f 2015f
Food consumption (US$bn) 14.60 14.35 15.02 17.45 19.18 21.59 24.26 27.21
Food consumption (VNDbn) 239,971 255,243 288,312 344,695 378,841 415,535 454,832 496,660
Per capita food consumption(US$) 168.2 164.4 169.9 195.5 212.7 237.0 263.8 293.2
Per capita food consumption(VND) 2,764,637 2,924,207 3,262,852 3,861,207 4,201,275 4,562,991 4,946,401 5,350,215
Total food consumptiongrowth (y-o-y) 14.58 6.36 12.96 19.56 9.91 9.69 9.46 9.20
Per capita food consumptiongrowth (y-o-y) 13.00 5.77 11.58 18.34 8.81 8.61 8.40 8.16
Food consumption as % GDP 16.16 15.39 14.89 15.15 14.75 14.32 13.93 13.59
NB Excludes beverage consumption. e/f = BMI estimate/forecast. Source: General Statistics Office of Vietnam, BMI
Canned Food
• Canned food sales in Vietnam will increase by 29.4% in volume terms to 2015
• Value sales growth will exceed volume growth at 51.4%, led by the premiumisation trend which isaffecting the wider food and beverage industry
Buoyed by ongoing urbanisation and increasing affluence among Vietnamese consumers, BMI is currently
forecasting strong growth in canned food sales over the next five years. A stronger value growth forecast in
the canned food sub-sector reflects an acceleration of premiumisation momentum, as demand for higher-
value products picks up strongly on the back of rising disposable incomes.
Vietnamese consumers are experiencing a growing awareness of hygiene concerns and food origin as their
living standards improve and numerous health scares beg their greater caution. This will further encourage
consumers to purchase processed foods over fresh produce, while strong investment in this sector from both
domestic and international operators should also help to fuel sales growth. Meanwhile, city workers are
increasingly cutting back on restaurant meals and opting for canned and processed foods in order to save
money, with major retailers such as Saigon Co-op reporting a recent spike in sales.
Vietnam Food & Drink Q3 2011
© Business Monitor International Page 32
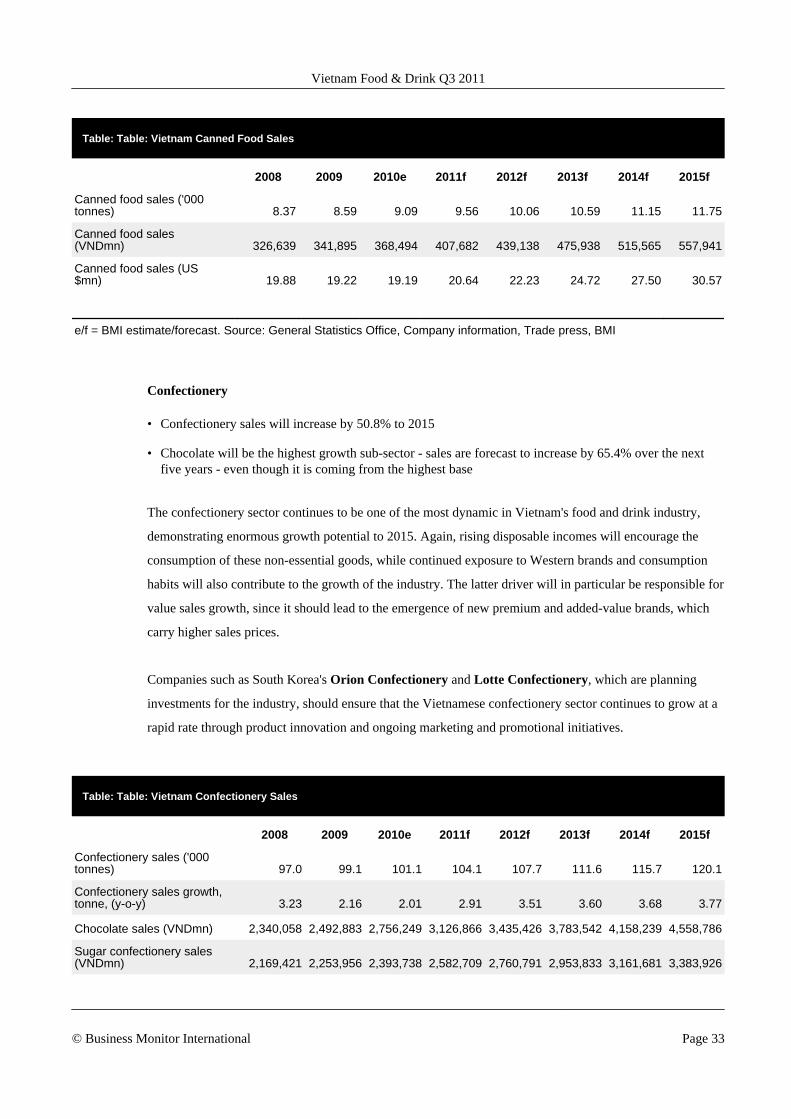
Table: Table: Vietnam Canned Food Sales
2008 2009 2010e 2011f 2012f 2013f 2014f 2015f
Canned food sales ('000tonnes) 8.37 8.59 9.09 9.56 10.06 10.59 11.15 11.75
Canned food sales(VNDmn) 326,639 341,895 368,494 407,682 439,138 475,938 515,565 557,941
Canned food sales (US$mn) 19.88 19.22 19.19 20.64 22.23 24.72 27.50 30.57
e/f = BMI estimate/forecast. Source: General Statistics Office, Company information, Trade press, BMI
Confectionery
• Confectionery sales will increase by 50.8% to 2015
• Chocolate will be the highest growth sub-sector - sales are forecast to increase by 65.4% over the nextfive years - even though it is coming from the highest base
The confectionery sector continues to be one of the most dynamic in Vietnam's food and drink industry,
demonstrating enormous growth potential to 2015. Again, rising disposable incomes will encourage the
consumption of these non-essential goods, while continued exposure to Western brands and consumption
habits will also contribute to the growth of the industry. The latter driver will in particular be responsible for
value sales growth, since it should lead to the emergence of new premium and added-value brands, which
carry higher sales prices.
Companies such as South Korea's Orion Confectionery and Lotte Confectionery, which are planning
investments for the industry, should ensure that the Vietnamese confectionery sector continues to grow at a
rapid rate through product innovation and ongoing marketing and promotional initiatives.
Table: Table: Vietnam Confectionery Sales
2008 2009 2010e 2011f 2012f 2013f 2014f 2015f
Confectionery sales ('000tonnes) 97.0 99.1 101.1 104.1 107.7 111.6 115.7 120.1
Confectionery sales growth,tonne, (y-o-y) 3.23 2.16 2.01 2.91 3.51 3.60 3.68 3.77
Chocolate sales (VNDmn) 2,340,058 2,492,883 2,756,249 3,126,866 3,435,426 3,783,542 4,158,239 4,558,786
Sugar confectionery sales(VNDmn) 2,169,421 2,253,956 2,393,738 2,582,709 2,760,791 2,953,833 3,161,681 3,383,926
Vietnam Food & Drink Q3 2011
© Business Monitor International Page 33
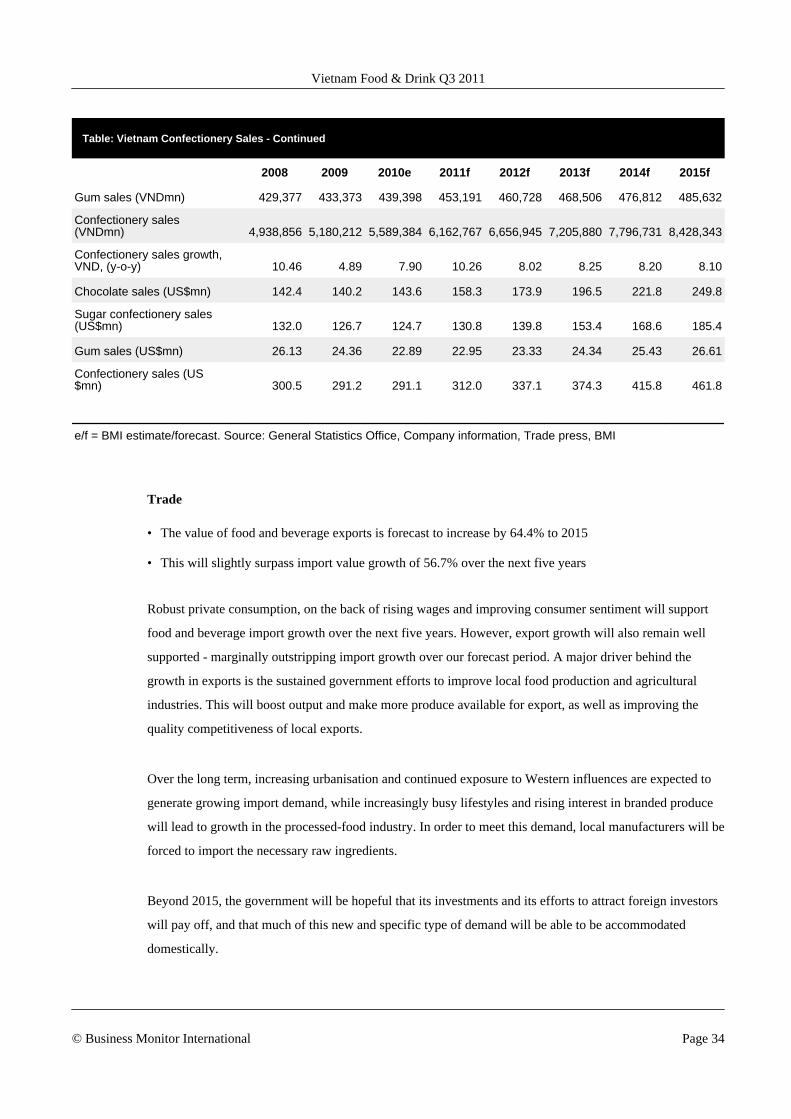
Table: Vietnam Confectionery Sales - Continued
2008 2009 2010e 2011f 2012f 2013f 2014f 2015f
Gum sales (VNDmn) 429,377 433,373 439,398 453,191 460,728 468,506 476,812 485,632
Confectionery sales(VNDmn) 4,938,856 5,180,212 5,589,384 6,162,767 6,656,945 7,205,880 7,796,731 8,428,343
Confectionery sales growth,VND, (y-o-y) 10.46 4.89 7.90 10.26 8.02 8.25 8.20 8.10
Chocolate sales (US$mn) 142.4 140.2 143.6 158.3 173.9 196.5 221.8 249.8
Sugar confectionery sales(US$mn) 132.0 126.7 124.7 130.8 139.8 153.4 168.6 185.4
Gum sales (US$mn) 26.13 24.36 22.89 22.95 23.33 24.34 25.43 26.61
Confectionery sales (US$mn) 300.5 291.2 291.1 312.0 337.1 374.3 415.8 461.8
e/f = BMI estimate/forecast. Source: General Statistics Office, Company information, Trade press, BMI
Trade
• The value of food and beverage exports is forecast to increase by 64.4% to 2015
• This will slightly surpass import value growth of 56.7% over the next five years
Robust private consumption, on the back of rising wages and improving consumer sentiment will support
food and beverage import growth over the next five years. However, export growth will also remain well
supported - marginally outstripping import growth over our forecast period. A major driver behind the
growth in exports is the sustained government efforts to improve local food production and agricultural
industries. This will boost output and make more produce available for export, as well as improving the
quality competitiveness of local exports.
Over the long term, increasing urbanisation and continued exposure to Western influences are expected to
generate growing import demand, while increasingly busy lifestyles and rising interest in branded produce
will lead to growth in the processed-food industry. In order to meet this demand, local manufacturers will be
forced to import the necessary raw ingredients.
Beyond 2015, the government will be hopeful that its investments and its efforts to attract foreign investors
will pay off, and that much of this new and specific type of demand will be able to be accommodated
domestically.
Vietnam Food & Drink Q3 2011
© Business Monitor International Page 34
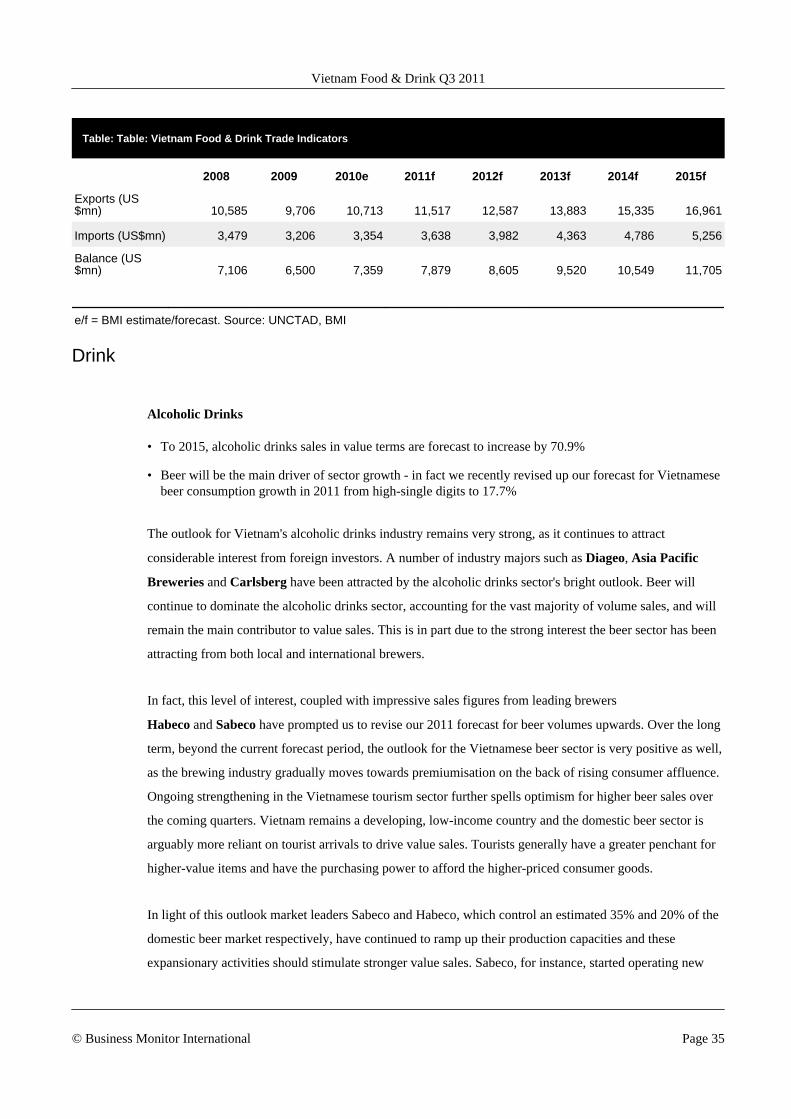
Table: Table: Vietnam Food & Drink Trade Indicators
2008 2009 2010e 2011f 2012f 2013f 2014f 2015f
Exports (US$mn) 10,585 9,706 10,713 11,517 12,587 13,883 15,335 16,961
Imports (US$mn) 3,479 3,206 3,354 3,638 3,982 4,363 4,786 5,256
Balance (US$mn) 7,106 6,500 7,359 7,879 8,605 9,520 10,549 11,705
e/f = BMI estimate/forecast. Source: UNCTAD, BMI
Drink
Alcoholic Drinks
• To 2015, alcoholic drinks sales in value terms are forecast to increase by 70.9%
• Beer will be the main driver of sector growth - in fact we recently revised up our forecast for Vietnamesebeer consumption growth in 2011 from high-single digits to 17.7%
The outlook for Vietnam's alcoholic drinks industry remains very strong, as it continues to attract
considerable interest from foreign investors. A number of industry majors such as Diageo, Asia Pacific
Breweries and Carlsberg have been attracted by the alcoholic drinks sector's bright outlook. Beer will
continue to dominate the alcoholic drinks sector, accounting for the vast majority of volume sales, and will
remain the main contributor to value sales. This is in part due to the strong interest the beer sector has been
attracting from both local and international brewers.
In fact, this level of interest, coupled with impressive sales figures from leading brewers
Habeco and Sabeco have prompted us to revise our 2011 forecast for beer volumes upwards. Over the long
term, beyond the current forecast period, the outlook for the Vietnamese beer sector is very positive as well,
as the brewing industry gradually moves towards premiumisation on the back of rising consumer affluence.
Ongoing strengthening in the Vietnamese tourism sector further spells optimism for higher beer sales over
the coming quarters. Vietnam remains a developing, low-income country and the domestic beer sector is
arguably more reliant on tourist arrivals to drive value sales. Tourists generally have a greater penchant for
higher-value items and have the purchasing power to afford the higher-priced consumer goods.
In light of this outlook market leaders Sabeco and Habeco, which control an estimated 35% and 20% of the
domestic beer market respectively, have continued to ramp up their production capacities and these
expansionary activities should stimulate stronger value sales. Sabeco, for instance, started operating new
Vietnam Food & Drink Q3 2011
© Business Monitor International Page 35
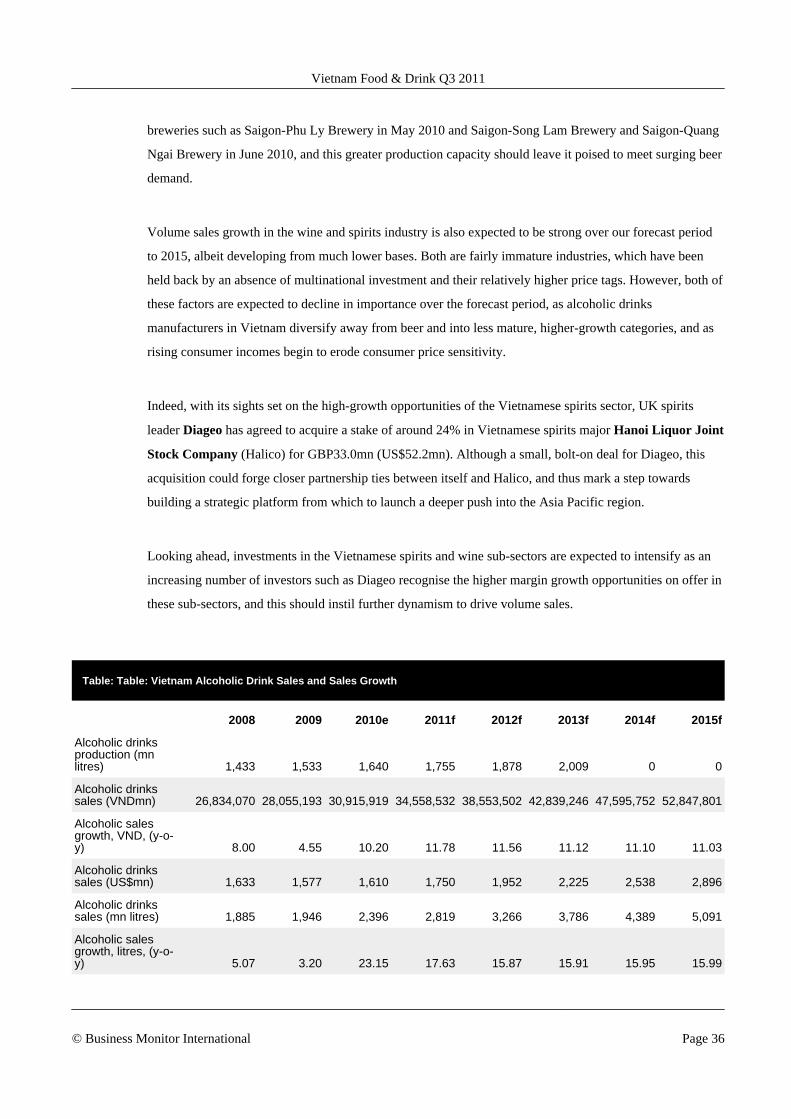
breweries such as Saigon-Phu Ly Brewery in May 2010 and Saigon-Song Lam Brewery and Saigon-Quang
Ngai Brewery in June 2010, and this greater production capacity should leave it poised to meet surging beer
demand.
Volume sales growth in the wine and spirits industry is also expected to be strong over our forecast period
to 2015, albeit developing from much lower bases. Both are fairly immature industries, which have been
held back by an absence of multinational investment and their relatively higher price tags. However, both of
these factors are expected to decline in importance over the forecast period, as alcoholic drinks
manufacturers in Vietnam diversify away from beer and into less mature, higher-growth categories, and as
rising consumer incomes begin to erode consumer price sensitivity.
Indeed, with its sights set on the high-growth opportunities of the Vietnamese spirits sector, UK spirits
leader Diageo has agreed to acquire a stake of around 24% in Vietnamese spirits major Hanoi Liquor Joint
Stock Company (Halico) for GBP33.0mn (US$52.2mn). Although a small, bolt-on deal for Diageo, this
acquisition could forge closer partnership ties between itself and Halico, and thus mark a step towards
building a strategic platform from which to launch a deeper push into the Asia Pacific region.
Looking ahead, investments in the Vietnamese spirits and wine sub-sectors are expected to intensify as an
increasing number of investors such as Diageo recognise the higher margin growth opportunities on offer in
these sub-sectors, and this should instil further dynamism to drive volume sales.
Table: Table: Vietnam Alcoholic Drink Sales and Sales Growth
2008 2009 2010e 2011f 2012f 2013f 2014f 2015f
Alcoholic drinksproduction (mnlitres) 1,433 1,533 1,640 1,755 1,878 2,009 0 0
Alcoholic drinkssales (VNDmn) 26,834,070 28,055,193 30,915,919 34,558,532 38,553,502 42,839,246 47,595,752 52,847,801
Alcoholic salesgrowth, VND, (y-o-y) 8.00 4.55 10.20 11.78 11.56 11.12 11.10 11.03
Alcoholic drinkssales (US$mn) 1,633 1,577 1,610 1,750 1,952 2,225 2,538 2,896
Alcoholic drinkssales (mn litres) 1,885 1,946 2,396 2,819 3,266 3,786 4,389 5,091
Alcoholic salesgrowth, litres, (y-o-y) 5.07 3.20 23.15 17.63 15.87 15.91 15.95 15.99
Vietnam Food & Drink Q3 2011
© Business Monitor International Page 36
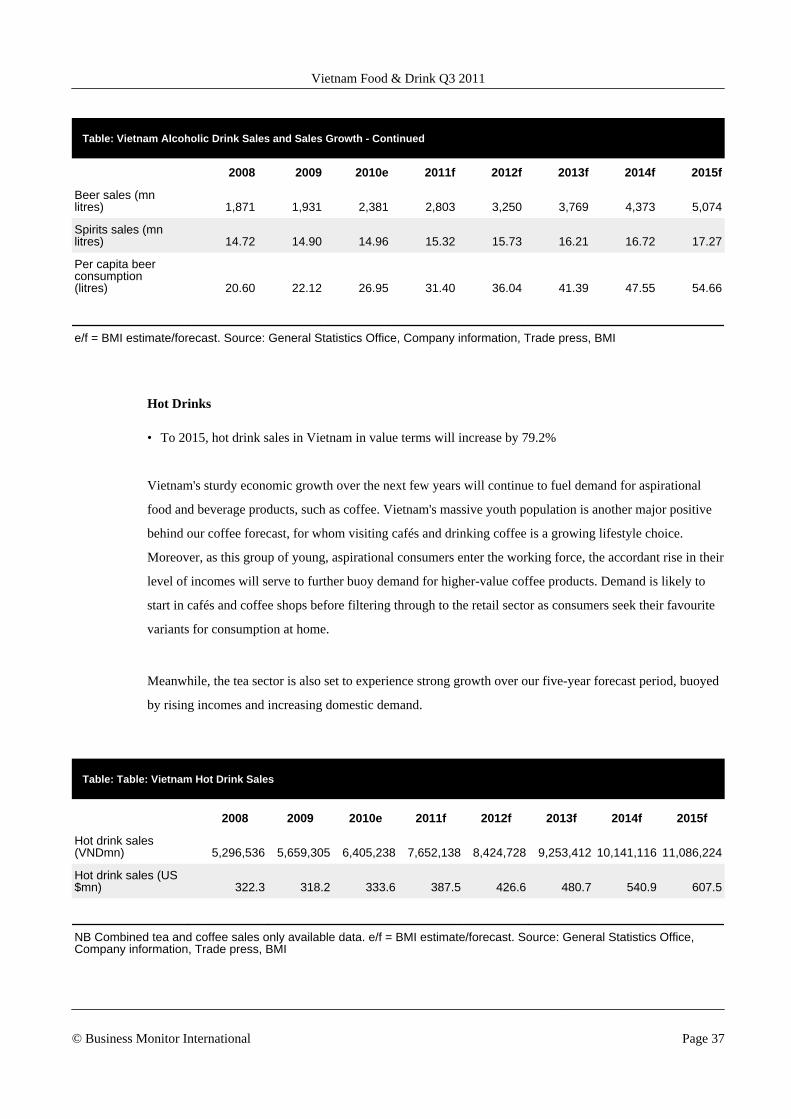
Table: Vietnam Alcoholic Drink Sales and Sales Growth - Continued
2008 2009 2010e 2011f 2012f 2013f 2014f 2015f
Beer sales (mnlitres) 1,871 1,931 2,381 2,803 3,250 3,769 4,373 5,074
Spirits sales (mnlitres) 14.72 14.90 14.96 15.32 15.73 16.21 16.72 17.27
Per capita beerconsumption(litres) 20.60 22.12 26.95 31.40 36.04 41.39 47.55 54.66
e/f = BMI estimate/forecast. Source: General Statistics Office, Company information, Trade press, BMI
Hot Drinks
• To 2015, hot drink sales in Vietnam in value terms will increase by 79.2%
Vietnam's sturdy economic growth over the next few years will continue to fuel demand for aspirational
food and beverage products, such as coffee. Vietnam's massive youth population is another major positive
behind our coffee forecast, for whom visiting cafés and drinking coffee is a growing lifestyle choice.
Moreover, as this group of young, aspirational consumers enter the working force, the accordant rise in their
level of incomes will serve to further buoy demand for higher-value coffee products. Demand is likely to
start in cafés and coffee shops before filtering through to the retail sector as consumers seek their favourite
variants for consumption at home.
Meanwhile, the tea sector is also set to experience strong growth over our five-year forecast period, buoyed
by rising incomes and increasing domestic demand.
Table: Table: Vietnam Hot Drink Sales
2008 2009 2010e 2011f 2012f 2013f 2014f 2015f
Hot drink sales(VNDmn) 5,296,536 5,659,305 6,405,238 7,652,138 8,424,728 9,253,412 10,141,116 11,086,224
Hot drink sales (US$mn) 322.3 318.2 333.6 387.5 426.6 480.7 540.9 607.5
NB Combined tea and coffee sales only available data. e/f = BMI estimate/forecast. Source: General Statistics Office,Company information, Trade press, BMI
Vietnam Food & Drink Q3 2011
© Business Monitor International Page 37
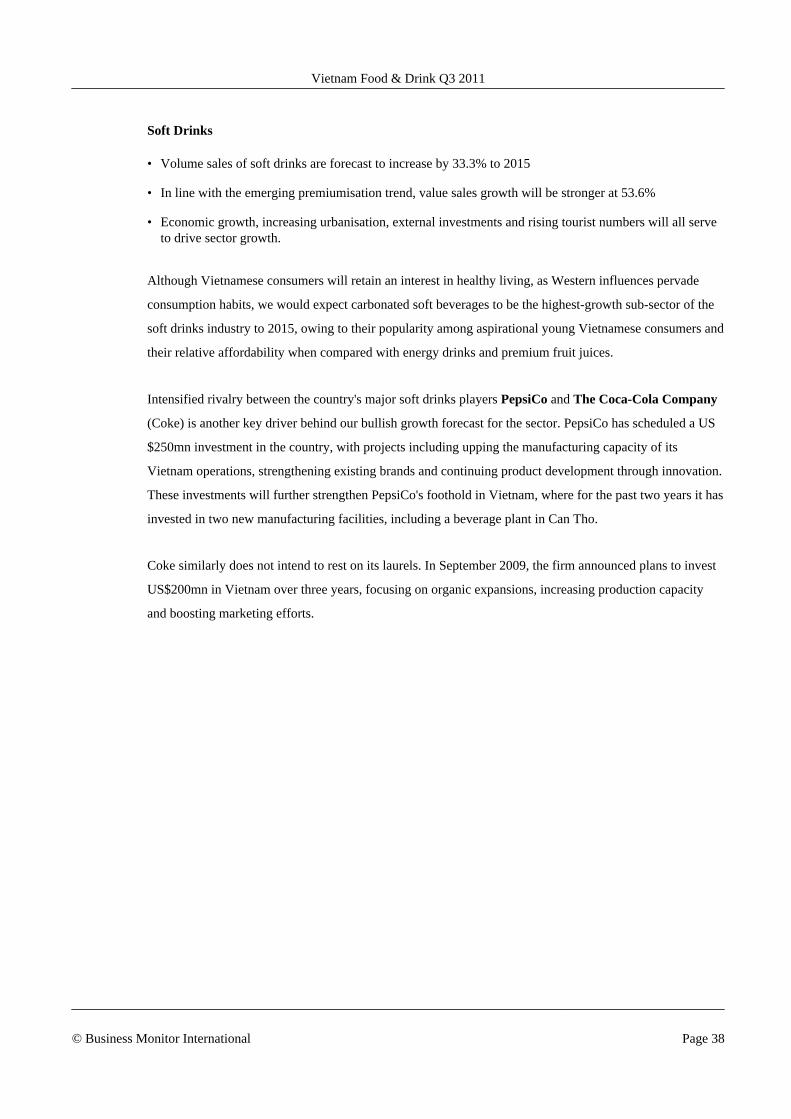
Soft Drinks
• Volume sales of soft drinks are forecast to increase by 33.3% to 2015
• In line with the emerging premiumisation trend, value sales growth will be stronger at 53.6%
• Economic growth, increasing urbanisation, external investments and rising tourist numbers will all serveto drive sector growth.
Although Vietnamese consumers will retain an interest in healthy living, as Western influences pervade
consumption habits, we would expect carbonated soft beverages to be the highest-growth sub-sector of the
soft drinks industry to 2015, owing to their popularity among aspirational young Vietnamese consumers and
their relative affordability when compared with energy drinks and premium fruit juices.
Intensified rivalry between the country's major soft drinks players PepsiCo and The Coca-Cola Company
(Coke) is another key driver behind our bullish growth forecast for the sector. PepsiCo has scheduled a US
$250mn investment in the country, with projects including upping the manufacturing capacity of its
Vietnam operations, strengthening existing brands and continuing product development through innovation.
These investments will further strengthen PepsiCo's foothold in Vietnam, where for the past two years it has
invested in two new manufacturing facilities, including a beverage plant in Can Tho.
Coke similarly does not intend to rest on its laurels. In September 2009, the firm announced plans to invest
US$200mn in Vietnam over three years, focusing on organic expansions, increasing production capacity
and boosting marketing efforts.
Vietnam Food & Drink Q3 2011
© Business Monitor International Page 38
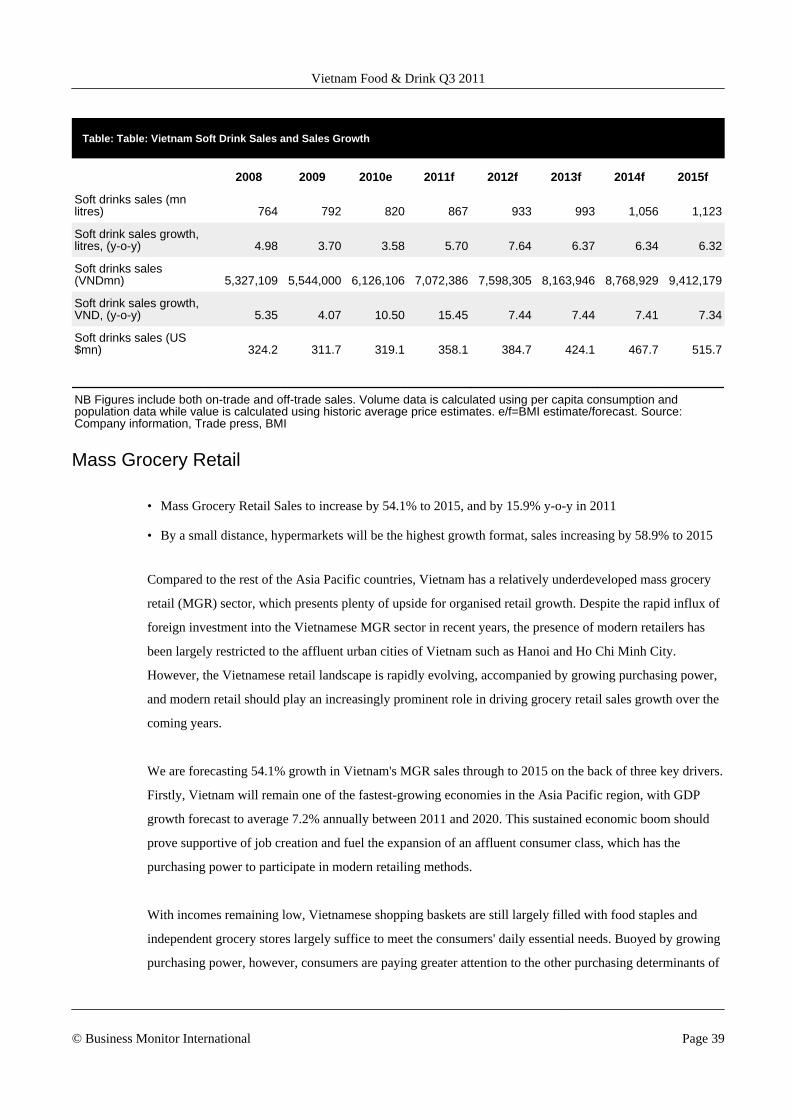
Table: Table: Vietnam Soft Drink Sales and Sales Growth
2008 2009 2010e 2011f 2012f 2013f 2014f 2015f
Soft drinks sales (mnlitres) 764 792 820 867 933 993 1,056 1,123
Soft drink sales growth,litres, (y-o-y) 4.98 3.70 3.58 5.70 7.64 6.37 6.34 6.32
Soft drinks sales(VNDmn) 5,327,109 5,544,000 6,126,106 7,072,386 7,598,305 8,163,946 8,768,929 9,412,179
Soft drink sales growth,VND, (y-o-y) 5.35 4.07 10.50 15.45 7.44 7.44 7.41 7.34
Soft drinks sales (US$mn) 324.2 311.7 319.1 358.1 384.7 424.1 467.7 515.7
NB Figures include both on-trade and off-trade sales. Volume data is calculated using per capita consumption andpopulation data while value is calculated using historic average price estimates. e/f=BMI estimate/forecast. Source:Company information, Trade press, BMI
Mass Grocery Retail
• Mass Grocery Retail Sales to increase by 54.1% to 2015, and by 15.9% y-o-y in 2011
• By a small distance, hypermarkets will be the highest growth format, sales increasing by 58.9% to 2015
Compared to the rest of the Asia Pacific countries, Vietnam has a relatively underdeveloped mass grocery
retail (MGR) sector, which presents plenty of upside for organised retail growth. Despite the rapid influx of
foreign investment into the Vietnamese MGR sector in recent years, the presence of modern retailers has
been largely restricted to the affluent urban cities of Vietnam such as Hanoi and Ho Chi Minh City.
However, the Vietnamese retail landscape is rapidly evolving, accompanied by growing purchasing power,
and modern retail should play an increasingly prominent role in driving grocery retail sales growth over the
coming years.
We are forecasting 54.1% growth in Vietnam's MGR sales through to 2015 on the back of three key drivers.
Firstly, Vietnam will remain one of the fastest-growing economies in the Asia Pacific region, with GDP
growth forecast to average 7.2% annually between 2011 and 2020. This sustained economic boom should
prove supportive of job creation and fuel the expansion of an affluent consumer class, which has the
purchasing power to participate in modern retailing methods.
With incomes remaining low, Vietnamese shopping baskets are still largely filled with food staples and
independent grocery stores largely suffice to meet the consumers' daily essential needs. Buoyed by growing
purchasing power, however, consumers are paying greater attention to the other purchasing determinants of
Vietnam Food & Drink Q3 2011
© Business Monitor International Page 39
product quality, hygiene and service. Modern retail outlets such as hypermarkets, supermarkets, discount
and convenience stores provide more compelling alternatives to traditional retail stores in these aspects, and
the opening of these modern retail stores should accelerate as a growing number of consumers yearn for a
more conducive shopping experience.
Secondly, tourism should also support stronger traffic performance across modern retail stores. Vietnam is
increasingly becoming one of South East Asia's top attractions and higher tourism levels should translate
into stronger demand for higher-value food and beverage products, such as convenient and packaged food
and alcoholic beverages, which can easily be found on the shelves of modern retail stores.
Lastly, we foresee greater multinational involvement, particularly in the less-urbanised areas, to assist the
emergence of modern retail. For now, traditional retail stores will continue to dominate Vietnam's retail
landscape. However, retailers could find it increasingly difficult to expand their networks in big cities,
which are witnessing rapid crowding. Such a scenario would, in turn, prompt retailers to turn to under-
retailed areas in search of future growth, encouraging the spread of modern retail across the country.
Of course, the major risk for retailers looking to expand in the less-urbanised areas of Vietnam is that few
communities exist that can support modern retail development at present. Even the low prices offered by
discounters would be unlikely to attract buyers in rural communities, for whom self-sufficiency and wet
markets remain the sole methods of consumption. Another challenge retailers could face in expanding their
rural presence is the country's poor infrastructure, which complicates supply chain management.
Nonetheless, modern retailers are likely to gradually turn their heads towards rural areas, as they look to
entrench themselves early in the country's favourable retail play.
Stretching its retailing footprint beyond the big cities, where it is already enjoying rapid growth, French
retailer Groupe Casino opened its 14th Vietnamese outlet in the city of Nam Dinh and hopes to replicate its
urban success in the smaller provinces and cities. German retail operator Metro Cash & Carry is also
looking further afield for longer-term growth opportunities by opening distribution centres in the provinces
of Binh Dinh, An Giang and Binh Duong, as well as in the southern city of Vung Tau.
Over our five-year forecast period, we expect the outperformance of the supermarket and hypermarket sub-
sectors as they are set to receive the most attention from new retail investors, owing to their greater per-
store profitability levels. Singaporean MGR operator NTUC Fairprice and Vietnamese retailer Saigon
Union of Trading Co-operatives are two recent examples of companies looking to exploit the high per-
store profitability levels in the hypermarket sector. NTUC Fairprice and Saigon Union of Trading Co-
Vietnam Food & Drink Q3 2011
© Business Monitor International Page 40
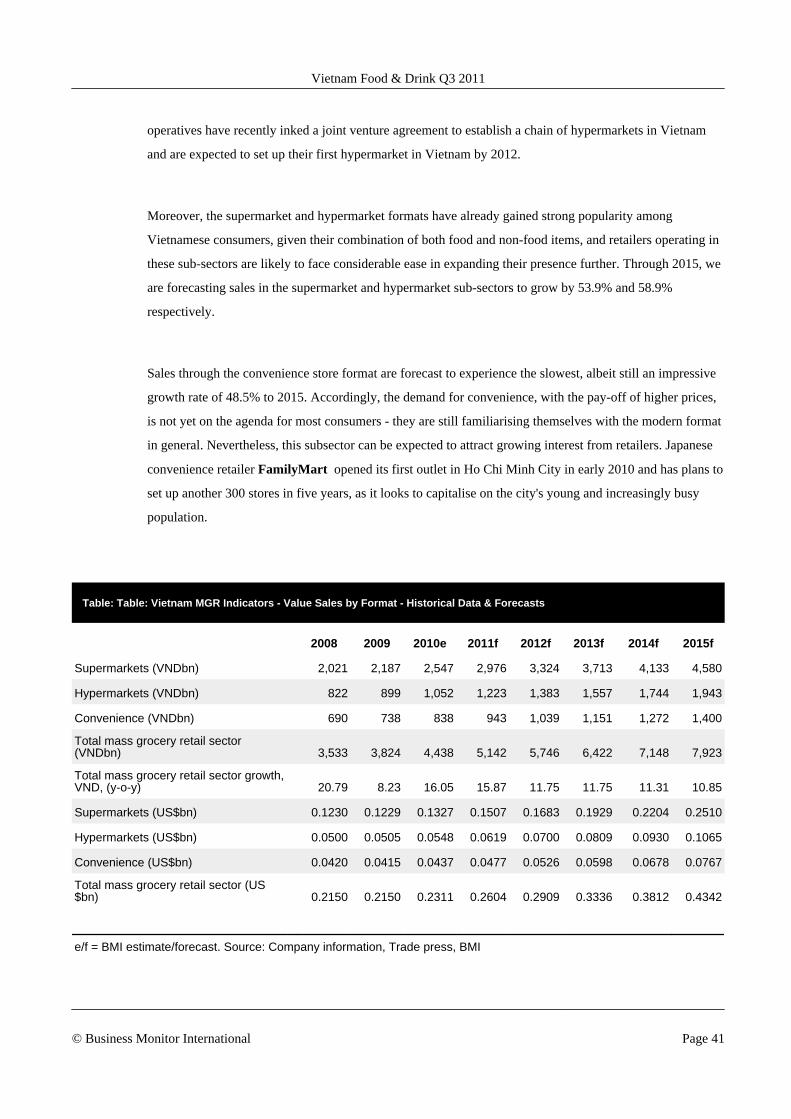
operatives have recently inked a joint venture agreement to establish a chain of hypermarkets in Vietnam
and are expected to set up their first hypermarket in Vietnam by 2012.
Moreover, the supermarket and hypermarket formats have already gained strong popularity among
Vietnamese consumers, given their combination of both food and non-food items, and retailers operating in
these sub-sectors are likely to face considerable ease in expanding their presence further. Through 2015, we
are forecasting sales in the supermarket and hypermarket sub-sectors to grow by 53.9% and 58.9%
respectively.
Sales through the convenience store format are forecast to experience the slowest, albeit still an impressive
growth rate of 48.5% to 2015. Accordingly, the demand for convenience, with the pay-off of higher prices,
is not yet on the agenda for most consumers - they are still familiarising themselves with the modern format
in general. Nevertheless, this subsector can be expected to attract growing interest from retailers. Japanese
convenience retailer FamilyMart opened its first outlet in Ho Chi Minh City in early 2010 and has plans to
set up another 300 stores in five years, as it looks to capitalise on the city's young and increasingly busy
population.
Table: Table: Vietnam MGR Indicators - Value Sales by Format - Historical Data & Forecasts
2008 2009 2010e 2011f 2012f 2013f 2014f 2015f
Supermarkets (VNDbn) 2,021 2,187 2,547 2,976 3,324 3,713 4,133 4,580
Hypermarkets (VNDbn) 822 899 1,052 1,223 1,383 1,557 1,744 1,943
Convenience (VNDbn) 690 738 838 943 1,039 1,151 1,272 1,400
Total mass grocery retail sector(VNDbn) 3,533 3,824 4,438 5,142 5,746 6,422 7,148 7,923
Total mass grocery retail sector growth,VND, (y-o-y) 20.79 8.23 16.05 15.87 11.75 11.75 11.31 10.85
Supermarkets (US$bn) 0.1230 0.1229 0.1327 0.1507 0.1683 0.1929 0.2204 0.2510
Hypermarkets (US$bn) 0.0500 0.0505 0.0548 0.0619 0.0700 0.0809 0.0930 0.1065
Convenience (US$bn) 0.0420 0.0415 0.0437 0.0477 0.0526 0.0598 0.0678 0.0767
Total mass grocery retail sector (US$bn) 0.2150 0.2150 0.2311 0.2604 0.2909 0.3336 0.3812 0.4342
e/f = BMI estimate/forecast. Source: Company information, Trade press, BMI
Vietnam Food & Drink Q3 2011
© Business Monitor International Page 41
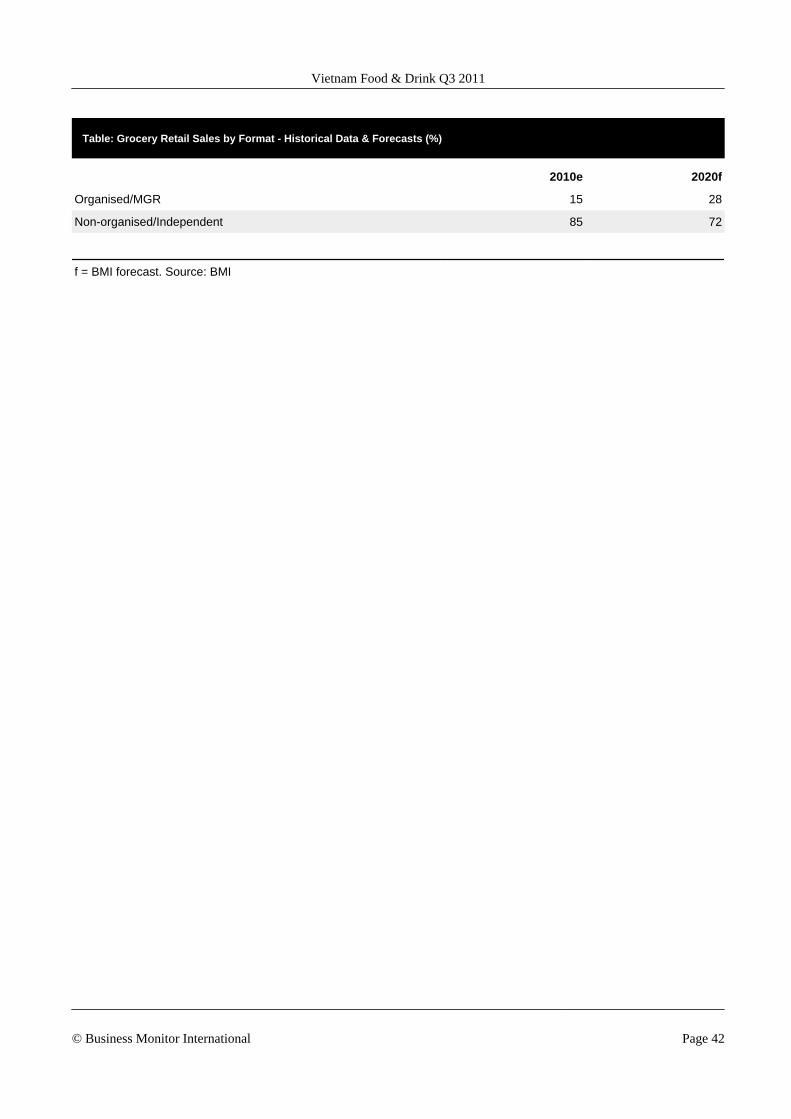
Table: Grocery Retail Sales by Format - Historical Data & Forecasts (%)
2010e 2020f
Organised/MGR 15 28
Non-organised/Independent 85 72
f = BMI forecast. Source: BMI
Vietnam Food & Drink Q3 2011
© Business Monitor International Page 42
Food
Industry Trends And Developments
Massive Potential Evident As Masan Secures Largest Ever Private Equity Investment In Vietnam
Masan Consumer Corp (formerly Masan Food before broadening its business to include telecoms and
resources interests) is to sell a 10% stake in its business to private equity firm Kohlberg Kravis Roberts
(KKR) for US$159mn. The deal values Masan Consumer at US$1.6bn and represents the largest ever
private equity investment in Vietnam.
A market leader in soya, fish products, chilli sauce and a major player in instant noodles, Masan is a high
growth business benefiting from Vietnam's burgeoning consumer story. Already present in high-growth
consumer categories and keen to diversify further, Masan's appeal to KKR is unsurprising. Supported by
KKR, Masan is expected to intensify its expansion efforts, most likely with a focus on mergers and
acquisitions having previously relied more on organic expansion.
Food Price Inflation An Ongoing Concern
The inflationary burden on the Vietnamese consumer is getting heavier. With Brent crude prices reaching
highs not seen since mid-2008, Vietnamese manufacturers and suppliers have increased their sale prices, as
they contend with soaring electricity and fuel prices. In response to the respective 20% and 15% increases
in petrol and electricity prices announced by the government, the majority of Vietnamese manufacturers and
suppliers raised their sale prices from March 1 2011. Faced with the threat of surging transportation costs
and sale prices from manufacturers, Vietnamese retailers have hiked prices of perishable products, which
are directly exposed to petrol and electricity price increases, by 10-18%. On the other hand, prices of non-
perishable goods, which bear indirect influences to inflationary trends in fuel and electricity, have been
increased by 5%.
This inflationary environment should place a particularly tight squeeze on the Vietnamese consumer. Travel
expenses and utilities bills have pushed higher in recent weeks, putting greater stress on consumer
purchasing power. Given that Vietnamese consumers spend a significant proportion of their household
budgets on food, higher food prices are likely to trigger reduced spending on non-essential food and
beverage products (such as seafood) this year. Vietnamese retailers are likely to feel the squeeze from both
ends. On the one hand, operational fees of retailers have been rising due to higher utilities costs, thus
Vietnam Food & Drink Q3 2011
© Business Monitor International Page 43
placing a greater burden on retailers' margins. On the other hand, retailers could find it challenging to
register strong revenue growth in 2011 as consumers lessen their purchases.
Outlook For Rice Sector Remains Positive
We maintain our expectations for Vietnam rice output to grow by 1.2% to reach 25.3mn tonnes in 2010/11
on the back of a slight improvement in yields. This dynamic reinforces our projection for rice prices to
remain subdued. While Vietnamese rice exports for 2011 are officially forecast slightly lower than 2010, we
believe they are in a long-term uptrend. We expect Vietnam to maintain its position as second largest price
exporter in 2010/11.
We expect rice production in Vietnam to grow modestly by 1.2% to 25.3mn tonnes in 2010/11 on the back
of higher yields. According to the US Department of Agriculture, rice yields in Vietnam are projected to
increase year-on-year to 5.41 tonnes/hectare, up from 5.39 tonnes/hectare. This increase in production
should boost regional rice supplies and reinforce our outlook for rice prices to remain subdued over the
medium term.
Although exports for 2011 are officially forecast by the Vietnam Food Association (VFA) to come in
between 5.5-6.1mn tonnes, slightly lower than 2010's record of 6.8mn tonnes, we note that this level is still
considerably higher than the 2007-2010 average of 5.3mn tonnes. Moreover, it is not unusual for officials to
understate rice export figures at the start of the year to ensure domestic food security, and we do not rule out
upward revisions to export targets as 2011 unfolds.
Recent reports of diesel shortages could pose some downside risks to our supply view. According to the
local distributor of the Vietnam Fuel Corporation in the Mekong Delta region where rice is predominantly
grown, the shortage of diesel is a result of lower sales commission from selling the fuel. This has resulted in
increased smuggling across the border into Cambodia where diesel can be sold at a higher price. Farmers in
the Delta typically power pumps using the cheap fuel and the current diesel scarcity could possibly delay
harvesting of the Winter/Spring crop. That said, we believe that this is a minor downside risk as farmers
have already harvested more than 60% of the crop in the Delta region as of March 30 according to the VFA.
Vietnam Food & Drink Q3 2011
© Business Monitor International Page 44
Market Overview
Agriculture
Owing to the country's vast population, food security - or the state's desire to be free from reliance on food
imports - has always been something of an issue in Vietnam. As a result, Vietnam's agricultural sector has
become one of its most important industries and serving as a major employment provider, particularly in
rural areas.
Thanks to significant government investment in the sector, agriculture in Vietnam has developed
enormously in recent years, and output is now achieving annual growth to the point where the country can
now meet domestic demand in most areas. In fact, some agricultural subsectors have developed to such an
extent that surplus produce is becoming available for the export market. This has predominantly occurred in
the fields of livestock and fisheries, which are also, owing to their potential profitability, the areas that have
attracted most private investment in recent years.
However, despite improvements over the review period, Vietnam's agricultural industry still has some way
to go if it is to become globally competitive and prove a real stimulant to the country's economy.
Considerable investment in new processing facilities that meet international standards will be needed, while
production capacity will also need to be increased to meet the longer-term storage needs of processed foods.
Agricultural losses also remain a problem and a review of harvesting techniques will also be needed if the
industry is to fulfil its vast potential.
Food Processing
Vietnam's food-processing industry comprises around 260 seafood-processing plants (the country is a major
exporter), 24 slaughter houses and meat-processing plants, 160 beverage plants, 65 fruit- and vegetable-
processing plants, 27 plants manufacturing instant noodles and 23 confectionery manufacturers. Despite a
significant proportion of processed food being imported, consumption of imported produce remains fairly
low in the country - although it has increased in the main population centres of Ho Chi Minh City and
Hanoi.
Overall, the Vietnamese food-processing industry remains largely fragmented, and is dominated by
relatively small domestic operators. International firms, including companies such as Procter & Gamble
and The Coca-Cola Company, have had to enter into joint ventures with domestic operators in order to be
Vietnam Food & Drink Q3 2011
© Business Monitor International Page 45
allowed to operate in the country. This has been enough of a deterrent to prevent significant foreign
investment in the country's agribusiness and food-processing industries, and this lack of investment has
contributed to the underdevelopment of these industries and their failure to fulfil their full potential.
Food Consumption
In terms of consumption trends, the expansion of modern lifestyles and the rise in disposable incomes -
which have accompanied Vietnam's economic growth, particularly in major urban centres - have increased
consumer demand for snacks, convenience foods and premium and luxury food items. Domestic food
manufacturers are beginning to respond to this trend, albeit slowly, and increase the range of ready-to-eat
and semi-prepared foods on offer. In addition, domestic food producers are having to confront the penchant
for Western consumption habits and brands that is common in Vietnam, particularly among younger and
more affluent consumers. The dairy sector in particular has experienced very strong growth in recent years,
along with increasing urbanisation and rising incomes. Huge multinational companies have managed to
sway consumer preferences, owing to their considerable advertising and promotional power, and domestic
firms have to work hard to secure brand loyalty.
Vietnam Food & Drink Q3 2011
© Business Monitor International Page 46
Drink
Industry Trends And Developments
Positive Results At Brewers Underline Industry Potential
Sabeco reported a 21% increase in its total production output (a good proxy for domestic demand) for 2010
and is forecasting a 20% growth in its total production output for 2011. Habeco's results also point to strong
demand in the beer market, with production output reaching 600mn litres of beer in 2010, which exceeded
its forecast of 588mn litres. These positive results have contributed to an increase in our beer market growth
forecast (see Industry Forecast Scenario - Drink), while over the longer-term horizon, the premiumisation
trend is expected to influence both growth and the make-up of the leading brewers' product portfolios.
Strong growth potential has already attracted significant investments from major brewers, such as Asia
Pacific Breweries and Carlsberg, and more multinational brewers are likely to jump into the fray over the
coming years and further stimulate dynamism to buoy beer sales.
Diageo Reaffirms Vietnam Commitment With Halico Buy
With its sights set on the immense growth opportunities in the Asia Pacific region, UK spirits
giant Diageo has agreed to acquire a stake of around 24% in Vietnamese spirits major Hanoi Liquor Joint
Stock Company (Halico) for GBP33.0mn (US$52.2mn). Although a small, bolt-on deal for Diageo, this
acquisition could forge closer partnership ties between itself and Halico, and thus mark a step towards
building a strategic platform from which to launch a deeper push into the Asian Pacific region. The stake
purchase is expected to be completed by June 2011. Besides benefiting from the Vietnamese growth story,
Diageo's acquisition is likely to be a prelude to further partnerships in the Asia Pacific region. In February
2008, Diageo entered into a joint venture with Halico to bump up its presence in the Vietnamese spirits
market, and its acquisition of a 24% stake in Halico demonstrates a desire to further strengthen and leverage
on the existing distribution and marketing relations with the firm.
Supply Chain Investment Further Underlines Positive Outlook
US packaging manufacturer Ball is building a new US$45mn drinks can factory in Vietnam, according to
Beverage Daily. The firm claims that the move is to capitalise on growing demand, not just in Vietnam but
throughout South East Asia. Ball forecasts that the drinks can market in the region will grow by 15%
Vietnam Food & Drink Q3 2011
© Business Monitor International Page 47
annually over the coming years. The plant is expected to become operational in early 2012, producing
850mn cans annually. The project will be a 50:50 joint venture with Thai Beverage Can Ltd Production.
The two firms are already joint venture partners in Thailand.
Coffee Still Buoyant But Exports Weaker
We recently bumped up our production estimates for the 2010/11 coffee harvest in Vietnam to 18.4mn 60kg
bags in accordance with recently released government estimates. However, this improved production should
not significantly weigh on prices given currently low global coffee stocks. Indeed, we believe that coffee
prices should continue to remain elevated in the short term. Strong Vietnamese output of robusta coffee will
likely sustain the bean's underperformance versus LIFFE robusta coffee.
BMI has raised its forecast for Vietnam's 2010/11 coffee crop in line with official expectations. Indeed
reports from Dak Lak, the largest coffee-producing region in Vietnam, indicate that 2010/11 coffee
production increased 6% year-on-year to 400,000 tonnes (6.7mn bags). The 2010/11 Vietnamese coffee
market year runs from October 2010 to September 2010/11, and harvesting takes place between November
2010 and February 2011.
Despite an anticipated crop improvement in 2010/11, exports are expected to be weaker this year compared
to a year ago. According to anecdotal reports, Vietnamese exports of coffee could fall 1.8% in 2010/11,
likely due to the government stockpiling scheme to store 500,000 tonnes of coffee beans from December to
May. Although the scheme is meant to help smooth out price fluctuations, we do think the scheme has been
successful up to now. Indeed, local prices having risen almost 6% year-to-date, and February export loading
is also expected to have fallen more than 40% month-on-month from 140,000 tonnes in January, due to
delays as exporters could not buy coffee locally as a result of higher domestic prices. These dynamics
should ensure that coffee prices remain elevated in the near term. According to the price ratio chart between
Vietnam coffee prices and LIFFE robusta coffee, the strong trend of the former outperforming the latter
should continue to hold in the foreseeable future
Vietnam Food & Drink Q3 2011
© Business Monitor International Page 48

Market Overview
Soft Drinks
Per capita consumption of soft drinks in
Vietnam is low, but it is growing. The soft
drinks sector is dominated by
multinationals The Coca-Cola Company
and PepsiCo, which jointly command an
estimated 88% share of the market. The
major focus of the multinationals is on
carbonated soft beverages, with small local
drinks firms producing other types of
drinks and fighting it out for the remaining
market share. The largest of the other
players is Saigon Beverages Joint Stock
Company (Tribeco), with an approximate
6% market share.
Smaller drinks companies have had a chance in recent years to win some market share back from the major
multinationals owing to the rising interest in healthy drinks, such as teas and juices, in which these local
firms specialise. In fact, the competition that these high-growth categories have stimulated has seen
investment interest in the soft drinks sector increase in recent months. Most recently, Japanese major Kirin
Beverage announced plans for a Vietnamese soft drinks joint venture (JV) with local noodle producer
Acecook.
The country's largest and second largest coffee manufacturers - respectively Vinacafe Bienhoa Joint Stock
Company and Thai Hoa Coffee Corporation - are leading the investment activity in the coffee sector at
present. Thai Hoa Coffee will invest US$34mn in a processing plant with the capacity to produce 65,000
tonnes of fresh coffee, 100,000 tonnes of dry coffee and 2,000 tonnes of soluble coffee annually.
Meanwhile, Vinacafe Bienhoa has constructed a plant capable of supplying 3,200 tonnes of exportable
instant coffee. Singapore's Jayangti Pte has also joined the investment activity in the coffee sector, investing
US$16.5mn in a factory with the capacity to produce 6,000 tonnes of instant coffee by mid-2011. Coffee
giant Trung Nguyen Corporation is starting work on a US$40mn instant coffee plant, which is expected to
have an annual capacity of 60,000 tonnes. Most recently Outspan Vietnam Coffee Company under
Sabeco Dominates
Vietnam Beer Industry Market Share; 2010 BMI estimate
Source: Trade press, Company reports
Vietnam Food & Drink Q3 2011
© Business Monitor International Page 49
Singapore's Olam Group invested US$50mn opening a coffee plant with an initial annual capacity of 4,000
tonnes before rising to 7,000 tonnes after two years.
Alcoholic Drinks
In the brewery sector, several multinational operators have established JVs to avoid being subject to the
high import duties on beer. Domestically produced international brands include Heineken, Fosters, Tiger,
Carlsberg and San Miguel, with the first three all produced by Heineken and Fraser & Neave's Asian
JV APB. The government levies substantial duties on all imported alcoholic beverages and there are also
consumption taxes. There is a substantial black market for smuggled products, with the government
estimating that a third of spirit sales come from smuggled goods. High taxes have created this smuggling
problem, which the government now must work hard to address. Owing to the inherent price sensitivity of
Vietnamese consumers, the majority of alcoholic drink products in the country fall at the economy end of
the market. However, this is changing gradually - particularly within wealthy urban centres - with the
brewing industry a major driver of this slow move towards premiumisation.
A number of foreign players have invested in the Vietnamese market, including the Danish major Carlsberg
(operating both alone and via a stake in Habeco), UK spirits leader Diageo (operating both alone and
through a partnership with Halico), the Philippines' San Miguel Corporation, which recently announced
plans to boost beer production in Vietnam to 1mn hectolitres, Anglo-South African brewing leader
SABMiller (which recently bought out local partner Vinamilk), UK-based Scottish & Newcastle (S&N),
with its partner Vinataba (S&N's Vietnamese operations fell into the hands of Carlsberg after the Danish
firm's takeover of the UK brewery and asset split in partnership with Heineken and Carlsberg has
subsequently decided to withdraw from its JV with Vinataba), and most recently Japan's Sapporo through
its acquisition of a 65% stake in Kronenbourg Vietnam, the Carlsberg and Vinataba 50:50 JV. Heineken's
Vietnamese operation is controlled through Vietnam Brewery, which is majority-owned by the Dutch
brewing major and its regional affiliate APB. The group's Vietnamese partner is Saigon Trading
Corporation (Satra). Government privatisations of state-owned brewing companies have given foreign
players a chance to increase their market share in Vietnam and this process is likely to be ongoing in the
coming years.
However, despite the growing presence of multinationals in the market, local firms continue to dominate
and state-backed brewers Sabeco and Habeco control an impressive 35% and 20% of the local beer market
respectively.
Vietnam Food & Drink Q3 2011
© Business Monitor International Page 50
Mass Grocery RetailIndustry Trends And Developments
First Quarter Retail Data Weaker Than In Recent History
Vietnamese retail sales of goods and services rose by 22.6% year-on-year in Q111 to reach VND451.8trn.
Adjusted for inflation, which remains elevated due to high fuel, packaging and food prices, sales increased
by 8.7%. The inflation-adjusted increase is far lower than the growth rate experienced in Q110 and Q109
(24.1% and 14.4% respectively). Weaker growth has been attributed to the severity of inflationary pressures
and the impact this has had on consumer spending power.
A number of retailers have already unveiled measures that attempt to address this problem. BMI retains its
core view that we will see a moderation of global food price inflation in the second half of 2011.
Nonetheless, retailers have launched significant promotional campaigns, offering discounts across a range
of daily essential items (among them are Big C and Lotte Mart) in an attempt to show that they are sharing
the burden of elevated costs with consumers, and thus retain consumer loyalty.
Starting To Consider New Retail Locations
Pockets of wealth in less-urbanised areas are beginning to attract the attention of foreign retailers.
Stretching its retailing footprint beyond the big cities, where it is already enjoying rapid growth, French
retailer Groupe Casino has opened its 14th Vietnamese outlet in the city of Nam Dinh and hopes to
replicate its urban success in the smaller provinces and cities. German mass grocery retailer (MGR) Metro
Cash & Carry is also looking further afield for strong growth opportunities by opening distribution centres
in the provinces of Binh Dinh, An Giang and Binh Duong, as well as in the southern city of Vung Tau.
Yet domestic retailers do not intend to let these massive growth opportunities slip through their fingers.
Interestingly, domestic retailers have sought partnerships with foreign retailers in expanding their retail
reach rather than going it alone. A recent example would be Trung Nguyen Group's partnership with
Japanese retailer AEON 's convenience subsidiary Ministop to develop a convenience store chain in
Vietnam.
This strategy can be linked to the capital springboard and expertise provided by foreign retailers. By linking
up with a financially powerful, expansion-oriented foreign retailer, domestic retailers should find
themselves in a stronger position to contend with growing competition from big multinational retailers.
Vietnam Food & Drink Q3 2011
© Business Monitor International Page 51
For now, traditional retail stores will continue to dominate Vietnam's retail landscape. Eventually, however,
retailers could find it increasingly difficult to expand their networks in big cities, which are witnessing rapid
crowding. Such a scenario would, in turn, prompt retailers to turn to under-retailed areas in search of future
growth, encouraging the spread of modern retail across the country
Immense Retail Growth Sparks Expansion And Speculation
UK retail leader Tesco has stayed silent on speculation that it is considering a foray into the Vietnamese
retail market. Growing organically in Asia remains a keystone in Tesco's wider emerging market (EM)
strategy and we would not be surprised if Vietnam were to emerge on the retailer's long-term radar. Tesco's
rumoured entry is not the only piece of speculation to arise from the market's undoubted potential. South
Korean retailer Lotte has denied news published by the JoongAng Ilbo newspaper regarding its plans to
acquire Vietnam-based retailer Maximark. According to the newspaper, the company was in talks to
acquire the local supermarket chain, to which Lotte replied that the firm does not have any plans to purchase
the retailer because the owner does not have any intentions of divesting its Vietnamese operations.
Nonetheless, Lotte did recently announce that it is planning to accelerate its expansion in China to reduce its
reliance on South Korea's increasingly mature domestic market, while Vietnam and India are also on Lotte's
long-term expansion radar.
With more concrete plans to expand are Singapore MGR operator NTUC Fairprice, which has inked a
joint venture agreement with Vietnam's Saigon Union of Trading Co-operatives to establish a chain of
hypermarkets in Vietnam. Given Saigon's local expertise and NTUC's experience in operating hypermarket
stores, this is clearly a formidable-looking partnership, and their expansionary activities are likely to place
considerable upward pressure on our hypermarket growth forecast for Vietnam. This follows Japanese
convenience retailer FamilyMart announcing plans to focus on its Asian operations outside of Japan, with
a focus on Vietnam and China, in order to reduce its reliance on its stagnant domestic market. The
company, which operates one outlet in Vietnam, is aiming to launch five more stores in Ho Chi Minh City
in the near term, and expand its Vietnamese network by opening a total of 300 outlets in five years.
Market Overview
Over the past five years, an increasing presence of supermarkets and shopping centres has been gradually
eroding the traditionally dominant position of open-air markets in urban areas. Modern MGR outlets are
now concentrated around Vietnam's major urban centres. The vast majority of these outlets are to be found
in and around the main urban centres of Hanoi and Ho Chi Minh City, although modern retail outlets are
increasingly appearing in smaller central towns and cities.
Vietnam Food & Drink Q3 2011
© Business Monitor International Page 52
Convenience stores in Vietnam are generally larger than those in Western Europe or the US and stock a
wider range of goods, in order to fully cater for areas that do not have the scale to warrant a large
supermarket outlet. In rural areas of the country, open-air markets continue to dominate, although this can
be expected to change, as modern retail formats become more commonplace and this acceptance spreads to
the provinces.
Unlike many markets in the region, the Vietnamese authorities initially encouraged the entry of modern
retailers, rather than viewing them as a threat to traditional operators. In Hanoi, city authorities have
actively encouraged supermarket expansion as a means of modernising lifestyles and progressing towards a
fully functioning market economy. However, as cities have started to get more crowded, with the market
share of traditional retailers suffering accordingly, there have been signs that the government is
backtracking on this open policy slightly. In line with the country's WTO accession, the Vietnamese
government now looks set to have to walk the fine line between allowing foreign investment in order to
stimulate modernisation and job creation, while at the same time employing restrictions to protect its
traditional retail sector.
Owing to the growing demands of customers in Vietnam, supermarkets are increasingly providing a wider
variety of products. Demand for a wide range of produce and a certain standard of product has risen in line
with disposable incomes, which have in turn increased in line with improvements in the economy. Food
products such as fresh meat and vegetables, ready-to-cook meals and snack foods are sold alongside non-
food product lines, including toys, gifts and electrical appliances in supermarkets and hypermarkets. In fact,
MGR outlets in Vietnam currently focus more on non-food items than similar stores in the Western world.
Daily food items are still, for the most part, purchased from markets. Accordingly, for the time being, stores
are better off giving more floor space to profitable non-food items. If they are to effectively erode the
market share of traditional retail, however, this focus will have to change and they will need to compete
directly in terms of stocking the sorts of foods available in markets - namely fresh food produce - at low
prices.
In addition to open-air markets and modern MGR outlets, there are also a large number of small,
independently operated grocery store chains. The most significant of these operators include Western
Canned Food, Kim Thanh, Food Stuff Shop and Hanoi Star. International operators within the sector
include Germany's Metro, France's Vindémia (now wholly owned by Casino), Japan's Seiyu and, most
recently, Hong Kong's Dairy Farm. In addition to the above, speculation continues to grow concerning the
possible entry of some of the world's leading multinational retailers. The UK's Tesco, France's Carrefour
and US-based Wal-Mart have all been linked with a possible market entry and, in preparation for this,
Vietnam Food & Drink Q3 2011
© Business Monitor International Page 53
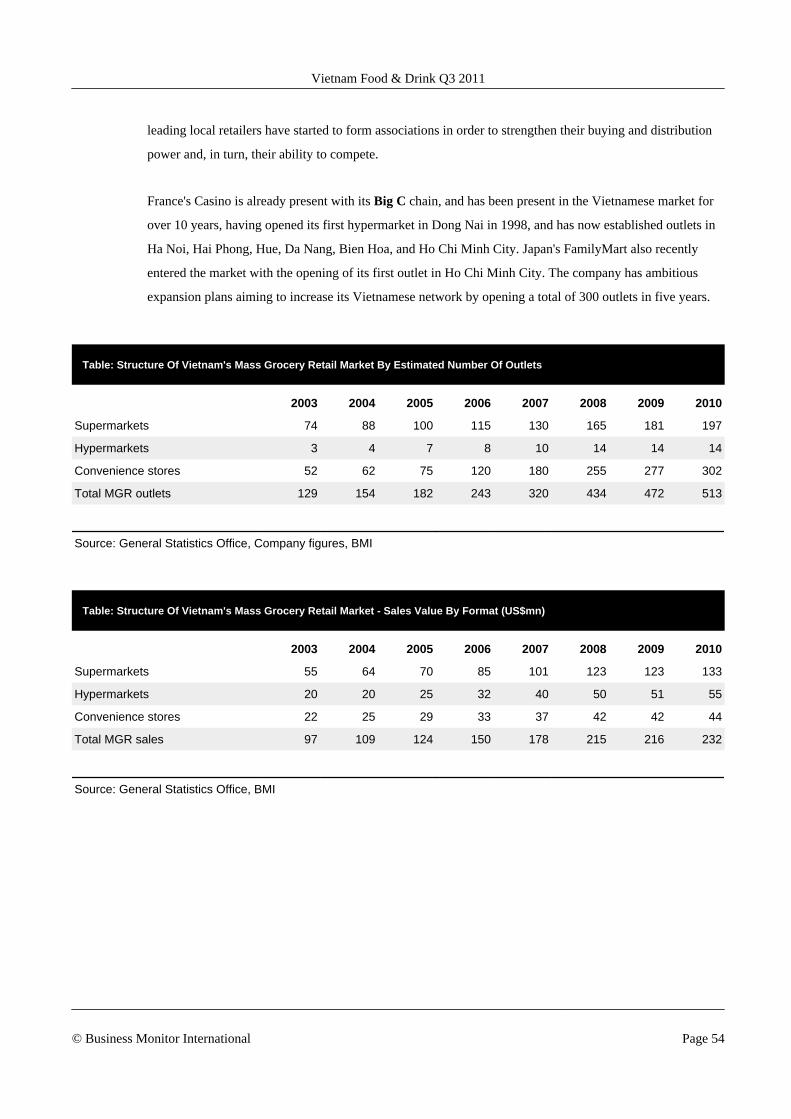
leading local retailers have started to form associations in order to strengthen their buying and distribution
power and, in turn, their ability to compete.
France's Casino is already present with its Big C chain, and has been present in the Vietnamese market for
over 10 years, having opened its first hypermarket in Dong Nai in 1998, and has now established outlets in
Ha Noi, Hai Phong, Hue, Da Nang, Bien Hoa, and Ho Chi Minh City. Japan's FamilyMart also recently
entered the market with the opening of its first outlet in Ho Chi Minh City. The company has ambitious
expansion plans aiming to increase its Vietnamese network by opening a total of 300 outlets in five years.
Table: Structure Of Vietnam's Mass Grocery Retail Market By Estimated Number Of Outlets
2003 2004 2005 2006 2007 2008 2009 2010
Supermarkets 74 88 100 115 130 165 181 197
Hypermarkets 3 4 7 8 10 14 14 14
Convenience stores 52 62 75 120 180 255 277 302
Total MGR outlets 129 154 182 243 320 434 472 513
Source: General Statistics Office, Company figures, BMI
Table: Structure Of Vietnam's Mass Grocery Retail Market - Sales Value By Format (US$mn)
2003 2004 2005 2006 2007 2008 2009 2010
Supermarkets 55 64 70 85 101 123 123 133
Hypermarkets 20 20 25 32 40 50 51 55
Convenience stores 22 25 29 33 37 42 42 44
Total MGR sales 97 109 124 150 178 215 216 232
Source: General Statistics Office, BMI
Vietnam Food & Drink Q3 2011
© Business Monitor International Page 54
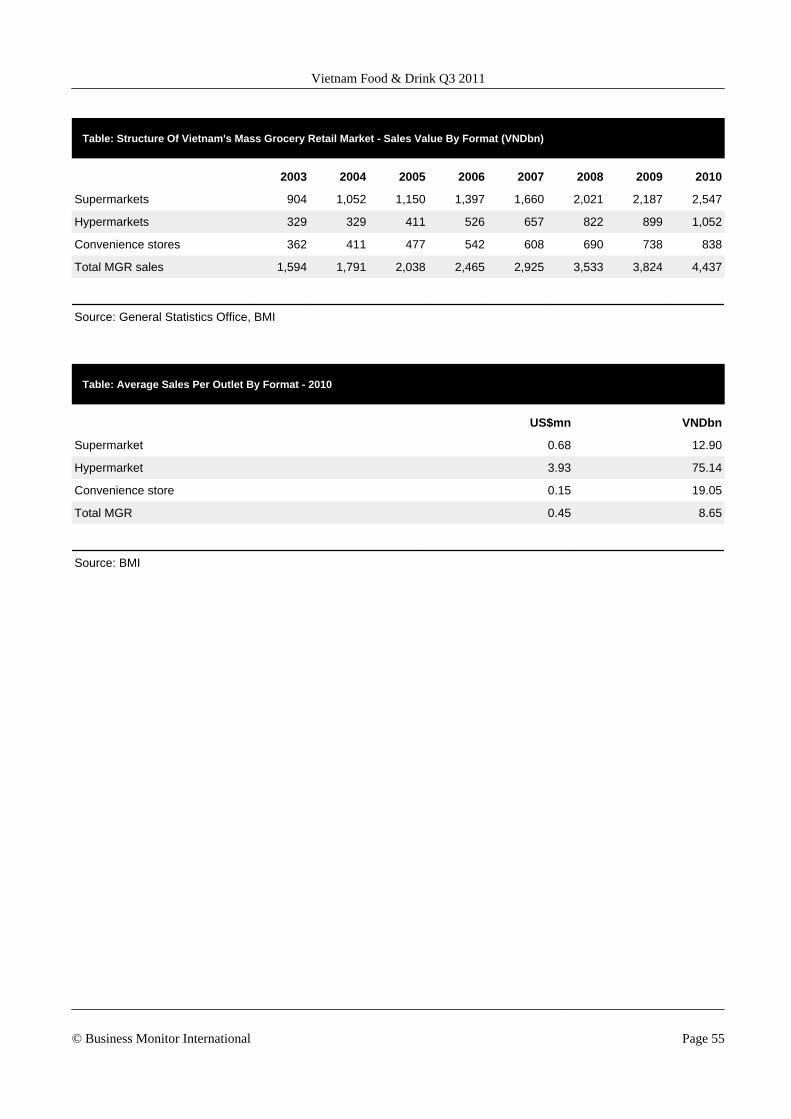
Table: Structure Of Vietnam's Mass Grocery Retail Market - Sales Value By Format (VNDbn)
2003 2004 2005 2006 2007 2008 2009 2010
Supermarkets 904 1,052 1,150 1,397 1,660 2,021 2,187 2,547
Hypermarkets 329 329 411 526 657 822 899 1,052
Convenience stores 362 411 477 542 608 690 738 838
Total MGR sales 1,594 1,791 2,038 2,465 2,925 3,533 3,824 4,437
Source: General Statistics Office, BMI
Table: Average Sales Per Outlet By Format - 2010
US$mn VNDbn
Supermarket 0.68 12.90
Hypermarket 3.93 75.14
Convenience store 0.15 19.05
Total MGR 0.45 8.65
Source: BMI
Vietnam Food & Drink Q3 2011
© Business Monitor International Page 55
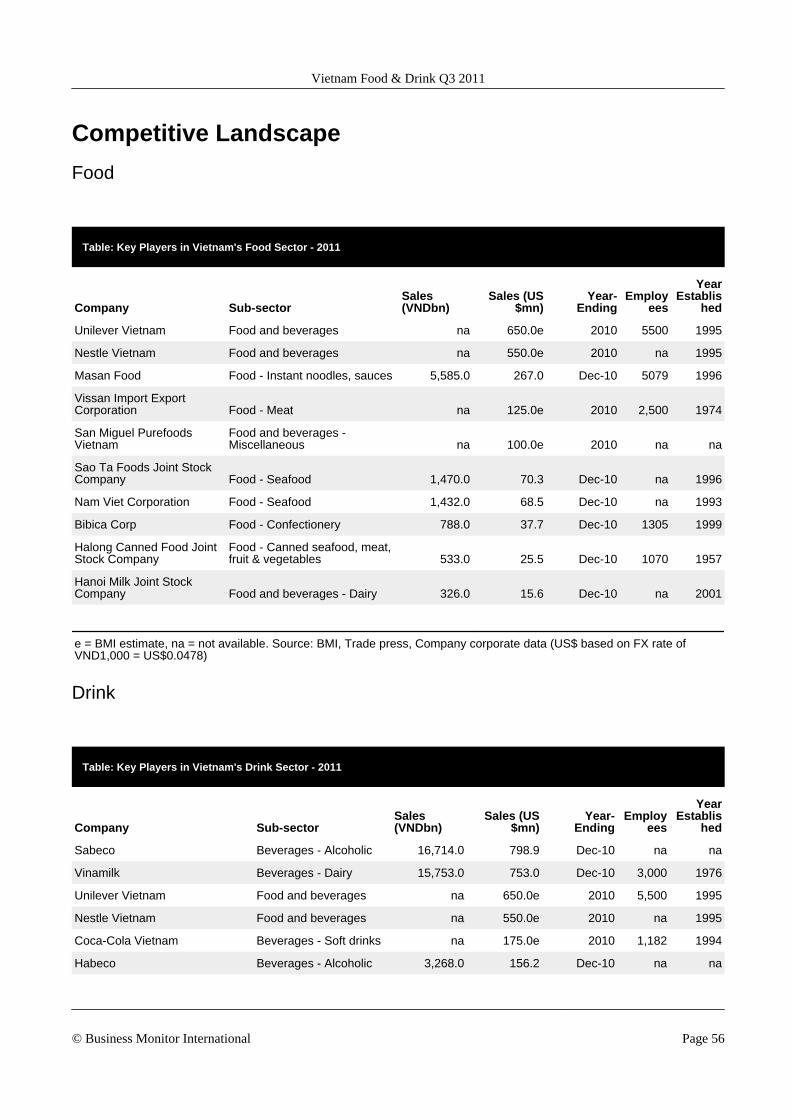
Competitive Landscape
Food
Table: Key Players in Vietnam's Food Sector - 2011
Company Sub-sectorSales(VNDbn)
Sales (US$mn)
Year-Ending
Employees
YearEstablis
hed
Unilever Vietnam Food and beverages na 650.0e 2010 5500 1995
Nestle Vietnam Food and beverages na 550.0e 2010 na 1995
Masan Food Food - Instant noodles, sauces 5,585.0 267.0 Dec-10 5079 1996
Vissan Import ExportCorporation Food - Meat na 125.0e 2010 2,500 1974
San Miguel PurefoodsVietnam
Food and beverages -Miscellaneous na 100.0e 2010 na na
Sao Ta Foods Joint StockCompany Food - Seafood 1,470.0 70.3 Dec-10 na 1996
Nam Viet Corporation Food - Seafood 1,432.0 68.5 Dec-10 na 1993
Bibica Corp Food - Confectionery 788.0 37.7 Dec-10 1305 1999
Halong Canned Food JointStock Company
Food - Canned seafood, meat,fruit & vegetables 533.0 25.5 Dec-10 1070 1957
Hanoi Milk Joint StockCompany Food and beverages - Dairy 326.0 15.6 Dec-10 na 2001
e = BMI estimate, na = not available. Source: BMI, Trade press, Company corporate data (US$ based on FX rate ofVND1,000 = US$0.0478)
Drink
Table: Key Players in Vietnam's Drink Sector - 2011
Company Sub-sectorSales(VNDbn)
Sales (US$mn)
Year-Ending
Employees
YearEstablis
hed
Sabeco Beverages - Alcoholic 16,714.0 798.9 Dec-10 na na
Vinamilk Beverages - Dairy 15,753.0 753.0 Dec-10 3,000 1976
Unilever Vietnam Food and beverages na 650.0e 2010 5,500 1995
Nestle Vietnam Food and beverages na 550.0e 2010 na 1995
Coca-Cola Vietnam Beverages - Soft drinks na 175.0e 2010 1,182 1994
Habeco Beverages - Alcoholic 3,268.0 156.2 Dec-10 na na
Vietnam Food & Drink Q3 2011
© Business Monitor International Page 56
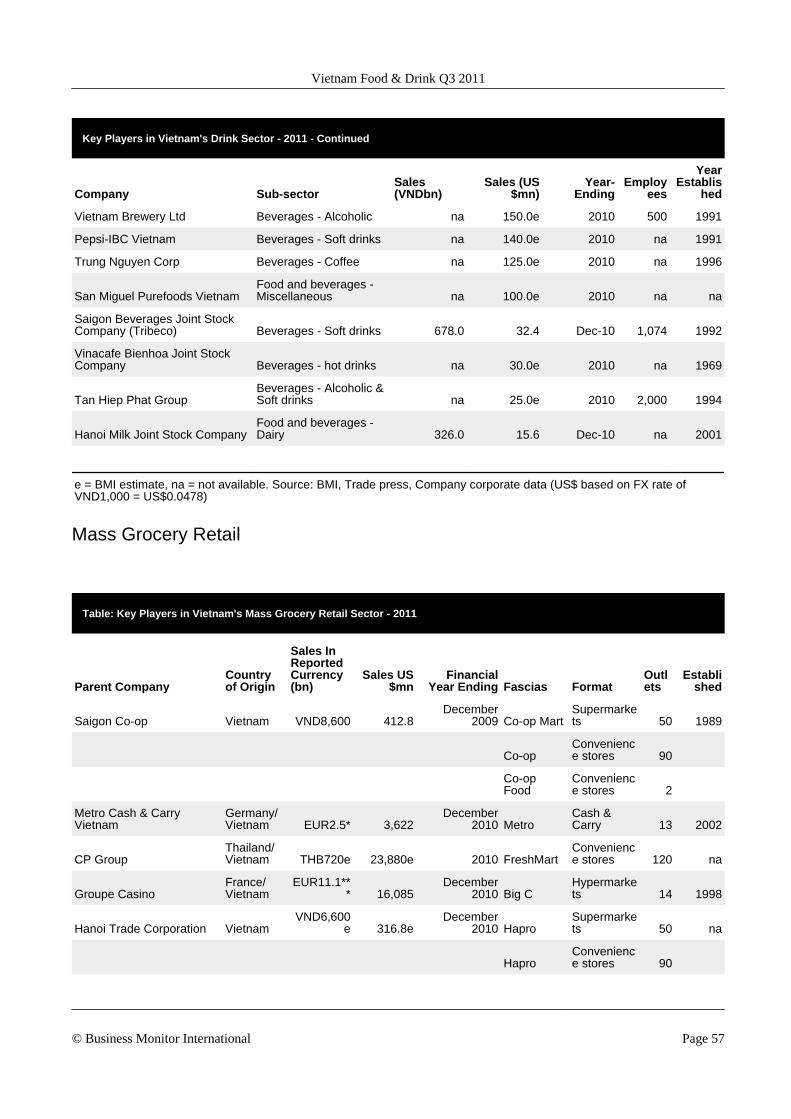
Key Players in Vietnam's Drink Sector - 2011 - Continued
Company Sub-sectorSales(VNDbn)
Sales (US$mn)
Year-Ending
Employees
YearEstablis
hed
Vietnam Brewery Ltd Beverages - Alcoholic na 150.0e 2010 500 1991
Pepsi-IBC Vietnam Beverages - Soft drinks na 140.0e 2010 na 1991
Trung Nguyen Corp Beverages - Coffee na 125.0e 2010 na 1996
San Miguel Purefoods VietnamFood and beverages -Miscellaneous na 100.0e 2010 na na
Saigon Beverages Joint StockCompany (Tribeco) Beverages - Soft drinks 678.0 32.4 Dec-10 1,074 1992
Vinacafe Bienhoa Joint StockCompany Beverages - hot drinks na 30.0e 2010 na 1969
Tan Hiep Phat GroupBeverages - Alcoholic &Soft drinks na 25.0e 2010 2,000 1994
Hanoi Milk Joint Stock CompanyFood and beverages -Dairy 326.0 15.6 Dec-10 na 2001
e = BMI estimate, na = not available. Source: BMI, Trade press, Company corporate data (US$ based on FX rate ofVND1,000 = US$0.0478)
Mass Grocery Retail
Table: Key Players in Vietnam's Mass Grocery Retail Sector - 2011
Parent CompanyCountryof Origin
Sales InReportedCurrency(bn)
Sales US$mn
FinancialYear Ending Fascias Format
Outlets
Established
Saigon Co-op Vietnam VND8,600 412.8December
2009 Co-op MartSupermarkets 50 1989
Co-opConvenience stores 90
Co-opFood
Convenience stores 2
Metro Cash & CarryVietnam
Germany/Vietnam EUR2.5* 3,622
December2010 Metro
Cash &Carry 13 2002
CP GroupThailand/Vietnam THB720e 23,880e 2010 FreshMart
Convenience stores 120 na
Groupe CasinoFrance/Vietnam
EUR11.1*** 16,085
December2010 Big C
Hypermarkets 14 1998
Hanoi Trade Corporation VietnamVND6,600
e 316.8eDecember
2010 HaproSupermarkets 50 na
HaproConvenience stores 90
Vietnam Food & Drink Q3 2011
© Business Monitor International Page 57

Key Players in Vietnam's Mass Grocery Retail Sector - 2011 - Continued
Parent CompanyCountryof Origin
Sales InReportedCurrency(bn)
Sales US$mn
FinancialYear Ending Fascias Format
Outlets
Established
Vietnam National TextileAnd Garment Group Vietnam na 20e na
Vinatexmart
Supermarkets 56 na
Saigon TradingCorporation Vietnam na 13e na Saigon
Supermarkets 12 1995
Dairy Farm InternationalHoldings Vietnam na 2,395.8**
December2010
Wellcome/Citimart
Supermarkets 3 na
Intimex Hanoi Vietnam na 9e 2010 IntimexSupermarkets 14 1979
An Phong Company Vietnam na 3e 2010 MaximarkSupermarkets 11 na
SeiyuJapan/Vietnam na 2e 2010 Seiyu
Supermarkets 1 na
na = not available, e = estimate, *Asia/Africa sales ** East Asia regional sales, ***International Sales, Source: CompanyFinancials, Trade press, BMI
Vietnam Food & Drink Q3 2011
© Business Monitor International Page 58
Company AnalysisUnilever Vietnam
Strengths • Strong brand appeal facilitates reach to Vietnamese consumers.
• Diverse product portfolio with multiple price entry points allows Unilever Vietnam to capitalise onvarying demand from the different income groups.
• Complete ownership of its local subsidiary means full operational control.
• Focus on affordability ensures access to a wide lower income consumer base.
Weaknesses • Limited food product offerings as compared to the other F&D multinationals limit further salesopportunities.
• The absence of a local partner could impact its ability to respond to changing local tastepreferences.
Opportunities • Urbanisation and middle-class growth could dramatically increase Unilever Vietnam's existingconsumer base.
• Rising incomes could increase demand for non-essential consumer items.
• Relative sector immaturity provides massive long-term growth opportunities for UnileverVietnam.
• Vietnam's favourable demographic profile is well-suited to Unilever's FMCG portfolio.
Threats • Not a problem for non-perishable personal care items, food expansion may necessitate furthersupply chain investment due to underdeveloped infrastructure.
• Input cost volatility cannot easily be passed on in such a price-sensitive environment.
• Increased competition from rival multinationals and expansionary local and regional playerscould undermine the company's strong market share position.
�
Overview Unilever Vietnam is a wholly owned subsidiary of Anglo-Dutch fast-moving consumer
goods leader Unilever. The parent took full control of the subsidiary in mid-2009, buying
the 33.3% stake it did not already own from its local partner. By far the largest section of
Unilever's portfolio in Vietnam is accounted for by personal care products, while the
company also has a large number of homecare brands. Its presence in the food sector is
relatively smaller than that of its other consumer products but it does have some notable
brands in Knorr, Lipton and Wall's.
Strategy Given Vietnam's still-vast income inequalities, Unilever has wisely made product
affordability its strategic focus. The majority of its products are at the economy or mass-
market end of the market. Notably, the company has recently decided to invest in
Vietnam Food & Drink Q3 2011
© Business Monitor International Page 59
promoting its Wall's ice cream brand in the country -- targeting both out-of-house and
take-home shoppers. As a luxury item, this move could suggest that Unilever is now
increasingly looking at premiumisation opportunities in line with Vietnam's rising
disposable incomes. The fact that substantial brand-building and distribution investments
are being made (i.e. branded freezers) lends further weight to the idea that a growing
audience for these sorts of products exists. However, the company is continuing to
import ice cream from its Thai subsidiary, rather than prioritising local capacity increases,
which tells much about the scale of the opportunity on offer in Vietnam's ice cream
market at present.
Nonetheless, if premiumisation remains a relatively minor opportunity, certainly relative
to some regional markets, Vietnam has been an outperformer for Unilever. While the
company does not provide a country-specific performance breakdown it has announced
that the market provided double-digit volume sales growth in 2010.
Financial Data Unilever does not publish country-specific performance data. Vietnam is included within
the Asia, Africa and Central & Eastern Europe operating region.
• Estimated local sales: US$650mn
Asia, Africa and Central & Eastern Europe Revenue
• 2010: EUR17.69bn• 2009: EUR14.90bn• 2008: EUR14.47bn• 2007: EUR13.42bn
Asia, Africa and Central & Eastern Europe Operating Income
• 2010: EUR2.25bn• 2009: EUR1.93bn• 2008: EUR1.70bn• 2007: EUR1.71bn
Vietnam Food & Drink Q3 2011
© Business Monitor International Page 60
Nestlé Vietnam
Strengths • Strong brand appeal facilitates reach to young, aspirational Vietnamese consumers.
• Strong price proposition will appeal to emerging consumers.
• Health and wellness commitment should appeal to an increasingly affluent middle class.
Weaknesses • Despite a growing commitment to South East Asia, Vietnam has received relatively lessinvestment from the parent company than other neighbouring economies.
• Domestic and multinational competition is high, even in this fragmented market place, andNestlé Vietnam will have to continue pouring in capital investments to secure its market share.
Opportunities • High birth rates create strong sales opportunities for Nestlé's infant nutrition products.
• Urbanisation and middle class growth could dramatically increase Nestlé Vietnam's existingconsumer base.
• Rising incomes could increase demand for non-essential consumer items.
• Relative sector immaturity provides massive long-term growth opportunities for Nestlé Vietnam.
Threats • Further expansion in Nestlé's core dairy sector will necessitate significant supply chaininvestments to improve distribution infrastructure.
• Input cost volatility cannot easily be passed on in such a price-sensitive environment.
�
Overview Nestlé Vietnam is a wholly owned subsidiary of Swiss food and beverage major Nestlé.
The subsidiary domestically manufacturers beverages, dairy products and prepared
meals and cooking ingredients out of three Vietnamese production plants. The company
also distributes pharmaceuticals in Vietnam, although it imports rather than domestically
manufactures these goods. In terms of food and beverage brands, the company markets
Nescafé, La Vie, Gau, Milo, Nestea and Maggi in Vietnam.
Strategy Given Nestlé's enormous global product portfolio, its Vietnamese product offerings are
actually fairly limited. Interestingly, the company appears to have a dual-pronged growth
strategy, aspects of which might appear incompatible but which have propelled it to one
of the country's leading consumer goods players. It emphasises product value. That is
not to say that it is only focused on economy products; however, it does engage in price
promotions in an effort to build customer loyalty among Vietnamese consumers.
Avoiding economy positioning, Nestlé Vietnam is also pushing the health and wellness
credentials that the company promotes globally. With discretionary spending still limited
among much of Vietnamese society, necessity remains a far more important purchasing
determinant than health. However, by combining its health push with its value
positioning, Nestlé is developing a long-term strategy that should appeal to both
Vietnam Food & Drink Q3 2011
© Business Monitor International Page 61
Vietnam's increasingly affluent middle classes (via the health push) and its emerging
consumer base (via the value push).
While this reflects the company's mid-term Vietnamese strategy, Nestlé has given an
indication that it may review its product portfolio in a number of emerging markets where
rising commodity costs are threatening margins and where a price-sensitive environment
makes these costs harder to pass on to consumers. With a lack of higher-margin
premium products in Vietnam, the market could be the subject of a review although
whether this means a reduction in portfolio size or not is as yet unclear.
Financial Data Nestlé does not post country-specific performance data for Vietnam. Vietnam resides
within its Zone Asia, Oceania and Africa operating region, under the Other Asian Markets
division.
• Estimated local sales: US$550mn
Other Asian Markets Revenue
2010: CHF7.80bn
2009: CHF6.89bn
2008: CHF6.64bn
Vietnam Food & Drink Q3 2011
© Business Monitor International Page 62
Masan Consumer
Strengths • A nationwide distribution network gives Masan rare access to both of the country's high-spending urban centres and the rural, low-spending population.
• Established strong brands are a significant advantage in the current regional environment offood hygiene and safety scares.
• An increasingly diversified product portfolio which caters specifically to local tastes.
• Investment from a leading private equity fund should provide capital for expansion.
Weaknesses • Local consumers generally do not exhibit strong brand loyalty or a preference for Vietnameseproducts.
• Domestic and multinational competition is high, even in this fragmented marketplace, and MasanFood will have to continue pouring in capital investments to secure its market share.
Opportunities • A young and fast-growing population represents a receptive audience for branded foods.
• Further product development in perceived healthy, and innovative product channels is a long-term opportunity, even if the audience for such goods is currently small.
• Masan has received investments from a number of multinationals, providing funds for futureexpansions, product launches and marketing campaigns. The latest PE investment is justanother example of this.
• The company has confirmed that it may consider mergers and acquisitions as a means ofaccelerating growth.
Threats • Despite having an established nationwide distribution network, the movement of goods remainsa problem given the country's underdeveloped infrastructure.
• The arrival of multinationals, with an emphasis on branded food sales, will jeopardise Masan'smarket share.
• The return of higher input costs could threaten margins, with these difficult to pass on toconsumers in what remains a price sensitive environment.
• The return of inflationary pressures could reduce discretionary spending, with branded food andbeverages to suffer.
�
Overview Masan Consumer, formerly Masan Food (a name change which reflects its desire to
diversify into a wider range of consumer products) is part of conglomerate Masan Group,
a company that is also engaged in financial services via its Techcombank arm. The
company is a leading producer of instant noodles and sauces, including soy sauce, fish
sauce and chilli sauce. A branded food specialist, its key brand names include Nam Ngu,
Chin-Su, Tam Thai Tu and Omachi. The company controls 74% of the domestic fish
sauce market, 80% of the Vietnamese soy sauce market and 40% of the local premium
instant noodles market.
Vietnam Food & Drink Q3 2011
© Business Monitor International Page 63
Strategy Having attracted investments from both international and domestic private equity firms,
Masan will look to continue to exploit the rising demand for branded food and beverage
products via investment in marketing and brand-building initiatives and the ongoing
expansion of its existing nationwide distribution network. The latest PE investment, the
largest ever PE investment in Vietnam, underlines the firm's appeal - investors see the
company as a great way of benefiting from Vietnam's great consumer growth story; this
is a local firm, with strong brands, a balanced portfolio and an impressive distribution
network.
Masan has been a key local player in terms of Vietnam's transition from non-branded to
branded foodstuffs. If it is to maintain healthy growth rates in the long term it may also
have to look to further portfolio diversification. Increased investment from international
food and drink companies, with powerhouse brands and immense marketing resources,
will create additional competitive pressure for Masan and yet the company does have the
advantage of an existing distribution reach and an established domestic name.
However, Masan will not sit on its position and its latest capital investment will help
facilitate its move into non-food consumer products, including beverages, home and
personal care. To aid its transition to a more diversified company, Masan will seek to
establish umbrella brands, thus leveraging of off its existing strong brand name. This is
an advisable strategy if under pressure from Western powerhouse brands. The company
is also likely to pursue increased manufacturing efficiency, a priority that must be
balanced against expansionary investments during such a period of volatile input costs.
Financial Data • 2010 Revenue: VND5,586bn• 2009 Revenue: VND3,958bn• 2010 EBITDA: VND1,425bn• 2009 EBITDA: VND715bn• 2010 Net Income: VND1,253bn• 2009 Net Income: VND669bn
Vietnam Food & Drink Q3 2011
© Business Monitor International Page 64
Vietnam Dairy Products Joint Stock Company (Vinamilk)
Strengths • A market-leading dairy brand name, which dominates sales in this high-growth channel.
• A diverse product range and a large export division allow Vinamilk to offset downturns in onecategory with an improved performance elsewhere.
• Benefiting from soaring demand for both primary and processed dairy products in the fast-growing local economy.
Weaknesses • Competition from international investors is intense and Vinamilk will have to keep up itsexpansionary activities in order to secure its market share.
• Reliance on Vietnam, which is characterised by a vast low-income rural population, means thatVinamilk faces a limited audience size for fresh dairy.
• Vinamilk still faces raw material shortages, importing over 70% of its raw material from abroad,and this places it highly exposed to commodity price volatility.
Opportunities • In urban centres, processed dairy products represent a high-value, high-margin channel.
• Dairy consumption at the mass-market level is experiencing high single-digit growth annually.
• Experience in the emerging Vietnamese market should increase Vinamilk's chances of successwhen exporting to other emerging South East Asian markets.
• Increasing product diversification, such as with instant coffee, will allow the company to benefitfrom strong forecast growth in the other food and drink subsectors.
• Vinamilk's recent investments in domestic capacity expansions and in New Zealand's Miraka willallow it to ease current supply shortages.
Threats • Vietnam's weak distribution infrastructure reduces sales opportunities for perishable, high-valuedairy products.
• Vinamilk considers itself disadvantaged by the strength of international brand names and theirprevalence will only increase going forward.
• Rising commodity costs threaten profitability, particularly with regard to mass-market primaryproducts.
�
Overview Vinamilk is the market leader in Vietnam's dairy industry. It produces over 200 dairy
products for both domestic sale and for export. The company recently released more of
its state-owned equity in order to reduce the state's share to 50% and qualify for stock-
market listing. Vinamilk controls an estimated 75% of the high-growth Vietnamese dairy
market.
Strategy To exploit the rewards on offer in the Vietnamese dairy sector, Vietnam's largest dairy
producer, Vinamilk, has reportedly started construction on a US$120mn milk factory in
the southern Binh Duong province. We are maintaining our upbeat assessment of the
Vietnam Food & Drink Q3 2011
© Business Monitor International Page 65
growth prospects of Vietnam's dairy sector on the back of the country's strong economic
rebound and favourable demographics. The country's economic recovery has lifted many
Vietnamese out of poverty and we believe consumer spending will continue to hold up
very strongly over the coming years. Moreover, Vietnam's massive and relatively young
population will continue to bolster demand for dairy products.
The new factory will have a capacity of 400mn litres of milk per year when it becomes
operational in 2012, and is expected to double its capacity by 2017. The company is also
planning to increase its stock of milk cows to 80,000, which will allow it to boost its milk
supply by 1.3mn litres a day.
While we are largely positive on the outlook for Vietnam's dairy sector, we do see certain
risks limiting the scope for long-term growth in the dairy industry. In the wake of the
melamine contamination scandal in China, Vietnam's lack of a national quality-control
body for dairy products continues to weigh on consumer confidence and domestic
demand for dairy products, and the poor quality of the country's dairy products (the
majority of domestically produced dairy products have lower-than-advertised protein
levels) deters consumers from drinking locally produced fluid milk. In view of this, we
expect Vinamilk to continue ramping up investments in marketing and branding initiatives
to improve consumer confidence in its dairy brands.
Financial Data Q1 2011 Revenue: VND4,630bn (+40% y-o-y)
Q1 2011 Net Profit: VND1,000bn (+22% y-o-y)
Revenue
• 2010: VND16,081bn• 2009: VND10,820bn• 2008: VND8,381bn• 2007: VND6,675bn• 2006: VND6,289bn
Net Profit
• 2010: VND3,616bn• 2009: VND2,376bn• 2008: VND1,249bn• 2007: VND963bn• 2006: VND660bn
Vietnam Food & Drink Q3 2011
© Business Monitor International Page 66
San Miguel Pure Foods (VN) Co Ltd
Strengths • San Miguel is a hugely important regional food company and thus a highly influential parentcompany.
• The company has a strong tradition in health food production, which stands it in good stead asthe global health trend catches up with emerging Asia.
Weaknesses • Questions have been raised about Pure Foods' ability to balance meat farming, feeds andbranded food operations, with product focus tending to be the industry buzzword during thisperiod of high operating costs.
• The company has faced significant negative publicity in recent years, with accusations that itsplant has caused serious environmental and health concerns.
Opportunities • High feed prices should help to supplement Pure Foods' profits for as long as grain demand fromthe alternative energy sector remains strong.
• Branded consumer food products represent an important long-term growth channel for thecompany.
• Processed meat products, which meet the emerging demand for convenience, should prove thenext logical step for Pure Foods.
Threats • Regional food hygiene scares have served to undermine consumer confidence in local meatproducers.
• Growing competition from international food manufacturers could undermine any competitiveadvantage Pure Foods possesses from being a regional player.
• Just as higher animal feed costs will benefit Pure Foods in its feed division, they could make lifemore challenging in the company's meat-farming sector.
�
Overview Pure Foods is a leading Vietnamese food and beverage company and is part of the
Philippines-based San Miguel Corporation, which owns 97% of the company. In 2003,
Pure Foods acquired a pig-farming and feeding-mill facility from Taiwan Tea Corporation.
It was the food division's first acquisition and feeds now contribute around 15% to group
revenue. In Vietnam, 80% of the unit's output is utilised directly by the business, while
the remainder is sold to customers within Vietnam. As well as feed, the unit produces
and distributes Le Gourmet processed meat products.
Strategy Pure Foods is focused on increasing revenues and improving profit margins by boosting
operating efficiencies across all divisions. Accordingly, it embraces and attempts to use
the most up-to-date technologies in its business activities. In terms of specific strategies,
the company intends to increase the size of its hog farm by 19%, after the division
contributed particularly significantly to profits. The company has recently opened five
Vietnam Food & Drink Q3 2011
© Business Monitor International Page 67

Monterey Meatshops in southern Vietnam. Three are in major supermarkets in Ho Chi
Minh City, with the remaining two in Binh Duong.
Pure Foods Filipino parent company San Miguel is now looking to sell up to 49% of Pure
Foods in order to finance its diversification into other sectors. Such a capital injection
could benefit the Vietnamese subsidiary. The parent's diversification strategy has meant
that Pure Foods has not received significant expansionary investments in recent years
and a renewed focus, triggered by a new partner, could accelerate revenue growth for
the Vietnamese unit.
Financial Data San Miguel Corporation does not publish financial data at a country-level
• 2010 Vietnam Revenue Estimate: US$100mn
Vietnam Food & Drink Q3 2011
© Business Monitor International Page 68
Hanoi Beer Alcohol Beverage Corp (Habeco)
Strengths • Vietnam's beer market has grown at a rapid pace, supported by economic growth, rising tourismand favourable age demographics.
• The company is already looking to regional expansion, profitable partnerships and premiumbrands.
• Dominant position in the North of country.
• Several major brands in the key economy sector.
Weaknesses • In 2008, Habeco postponed its scheduled IPO due to challenging trading conditions in the localmarket. Global uncertainty continues to restrict access to new capital from this source.
• Relatively weaker dominance in the more affluent southern part of Vietnam limits the potential forstronger revenue growth.
• Focus on economy segment could eventually prove an impediment to growth as incomesincrease.
Opportunities • Vietnam's proximity to the dynamic frontier beer markets of Laos, Cambodia and Myanmar offerup huge opportunities for regional expansion.
• Increasingly close relationship with Carlsberg should facilitate wider distribution and synergies.
• We recently revised up our beer consumption growth forecast for 2011, highlighting the extent ofthe short-term opportunity on offer.
Threats • Competition in the sector continues to intensify as multinationals seek out the few truly explosivegrowth opportunities that remain in the regional beer market.
• The expansion pace of the market leaders has raised concerns that the beer industry is nowoversupplied, particularly when one considers that much of the country still lives in poverty.
• Sabeco has reportedly attracted the attention of US giant Anheuser-Busch InBev. A takeoverwould likely lead to an increase in investment and hence competition.
�
Overview Habeco is a major Vietnamese brewer and dominates sales in the north of the country,
particularly in the increasingly affluent city of Hanoi. In early 2007, Carlsberg acquired a
10% stake in the company and in September 2009 increased its holding to 30%, making
it Habeco's largest single strategic investor. The firm has a focus on economy brands,
which has helped it ward off international competition and deliver sustained growth. The
firm is also positioning itself for growth in the spirits markets. In 2008, through its
subsidiary Hanoi Liquor Joint Stock Company (Halico), the company entered into a JV
with UK-based spirits leader Diageo, the world's largest spirits company. The two
companies have joined forces to expand within what remains a fledgling branded spirits
industry and to exploit the strong growth potential that exists in the market.
Vietnam Food & Drink Q3 2011
© Business Monitor International Page 69
Strategy The benefits of Carlsberg's acquisition have been substantial for Habeco. The local firm
now has access to a number of popular Western beer brands and while these are for
now beyond the financial reach of the average Vietnamese consumer, this is slowly
changing in line with the country's sustained and impressive GDP growth. As well as the
share sale, the two companies are now expected to co-operate in other key business
areas, perhaps marketing and distribution, to effectively combine their respective
expertise.
Faced with multinational competition in recent years, Habeco has focused closely on its
competitive strengths. The company has continued to pursue growth in the Bia Hoi
segment, this low margin but high volume, keg-only product now accounting for 40% of
its total sales. The unique distribution challenges of Bia Hoi - it is sold in the Hanoi area's
plethora of street cafés, typically to lower income consumers - has kept international
players out of this segment and given local players some breathing space. In extending
its relationship with Carlsberg, Habeco is expressing an interest in widening its own
product portfolio and looking for ways to improve margins.
Carlsberg and Habeco together control around 33% of Vietnam's beer market, putting
them on level pegging with Sabeco which dominates in the higher-spending south.
Together, the two partners will be optimistic about achieving market leadership, after
which wider regional growth is likely to become a priority, with the attractive frontier
markets of Laos, Cambodia and Myanmar on the doorstep. Habeco will be looking to
leverage the expertise of new shareholder Carlsberg, to increase distribution beyond its
northern stronghold and to add new brands to its portfolio to support the popular Hanoi
Beer and Halida brands.
Habeco's strategy of playing to its strengths while leveraging off of an international
partner to increase distribution and boost its premium profile served it well in 2010.
Producing 600mn litres of beer (using production as a good proxy for consumption), the
company exceeded its production growth target of 588mn litres for the year.
Financial Data • 2010 Revenue: VND3,268bn (US$156.2mn)
Vietnam Food & Drink Q3 2011
© Business Monitor International Page 70
Saigon Beer Alcohol and Beverage Corporation (Sabeco)
Strengths • Dominance in what is perceived as one of the world's highest-potential beer markets providesstrong growth potential.
• Strong economy beer brands Saigon Beer and Beer 333 are very popular in the south.
• Its economy-heavy portfolio means that Sabeco brands tend to perform well even during periodsof low consumer confidence.
Weaknesses • A disappointing IPO, although not attributable to the perceived attractiveness of Sabeco itself, isreflective of tough market conditions.
• A predominantly economy portfolio reduces Sabeco's competitiveness in wealthy urban centresand its ability to exploit the tourist dollar.
Opportunities • A potential MNC partnership would improve brand portfolio and boost the availability of capital,with behemoths SABMiller, Anheuser-Busch InBev, Asahi Breweries and Heineken all thought tobe interested.
• Tourism represents an excellent opportunity for Sabeco to enter the premium branded segment.
• Regional diversity allows for easy expansion in what remains an immature market despiteinvestment levels.
• We recently revised up our beer consumption growth forecast for 2011, highlighting the extent ofthe short-term opportunity on offer.
Threats • Rising raw material costs threaten profitability in this competitive market in which higher pricescannot easily be passed on to consumers.
• Significant expansion plans from Carlsberg, APB and Habeco could threaten Sabeco's marketshare.
�
Overview Sabeco is Vietnam's leading brewer, controlling around 33% of total beer sales and a far
larger proportion of sales in southern Vietnam. The state-backed brewer has recently
commenced initial privatisation and had planned to offload around 20% of its shares in
order to raise US$560mn. Tough market conditions meant than only 61% of this target
was reached, although this was not seen as a poor reflection on Sabeco, whose flagship
Saigon Beer and Beer 333 continue to enjoy strong success. The state currently holds
an 89.5% stake in Sabeco.
Strategy Sabeco's IPO was meant to raise funds to support continued expansion; a vital
requirement if it is to continue to dominate amid intense local and international
competition. Although short of initial targets, IPO funds are likely to drive further
expansion, with regional diversity thought to be a particular priority.
Vietnam Food & Drink Q3 2011
© Business Monitor International Page 71
Sabeco increased production by 21% in 2010 thanks in part to the construction of a
50mn-litres-per-annum factory in the south central province of Ninh Thuan; this followed
on the back of the establishment of the 200mn-litres-per-annum Cu Chi brewery in
March 2008.
As well as expansion, brand diversification remains a key element of the company's
strategy as it looks to complement its popular local economy brands with some premium,
potentially international, products. Finding a multinational partner could contribute
enormously towards this and should not be a difficult objective for such an attractive firm.
Financial Data • 2010 Revenue: VND16,714bn• 2009 Revenue: VND15,400bn
Vietnam Food & Drink Q3 2011
© Business Monitor International Page 72
Carlsberg
Strengths • Carlsberg's strong financial capacity enables it to pour in significant capital investments withoutthe need for immediate returns.
• Famous Carlsberg brand should prove popular with young, brand-oriented consumers.
• Early pursuit of a diverse regional presence has given Carlsberg a head-start.
• Carlsberg acquired Scottish & Newcastle's Vietnamese business. S&N had itself beenexpansionary in Vietnam thus significantly lifting Carlsberg's output.
Weaknesses • Distribution infrastructure remains problematic, with separate brewing facilities in separateregions the best way to overcome this, despite the obvious expense.
• Carlsberg lacks a presence in the economy end of the market, and in such a price-sensitivemarket, these brands remain the most popular.
• Carlsberg will have to invest heavily in acquisitions and expansions if it is to achieve its goal ofestablishing a strong presence across the country.
Opportunities • Economic growth should lift sales of Carlsberg's premium, international brands.
• Small-scale brewers, struggling with increased competition, could represent handy market sharebuilding acquisition targets.
• We recently revised up our beer consumption growth forecast for 2011, highlighting the extent ofthe short-term opportunity on offer.
Threats • In line with market liberalisation, the beer market will receive a flood of investment in the comingyears dramatically ramping up competition levels.
• Rising commodity costs threaten brewers in a market where higher costs cannot be passed onto consumers.
�
Overview Carlsberg entered Vietnam in 1993 via the acquisition of a 60% stake in South East Asia
Brewery in northern Vietnam. It has since expanded, acquiring 30% of Halong Brewery
in the north east of the country in early 2007 and 50% of Central Vietnam's Hue Brewery
in 1994, followed by an announcement in late 2009 that it would acquire the remaining
50%. Also in early 2007, Carlsberg acquired a 10% stake in state-owned Habeco,
followed by a 16% stake in April 2008, then in September 2009 it further upped its stake
to 30%, making it Habeco's largest single strategic investor. The Danish company now
has a market share of around 10% in Vietnam, which will increase following the
completion of the Hue Brewery acquisition, and is the country's second largest
international player behind Heineken-backed Asia Pacific Breweries. Carlsberg
estimates that together it and Habeco control 33% of Vietnam's beer market, putting
them on level pegging with market leader Sabeco.
Vietnam Food & Drink Q3 2011
© Business Monitor International Page 73
Strategy One of Carlsberg's key objectives in Vietnam is to improve its regional presence. To this
end, it has formed a joint venture - Hanoi Vung Tau Joint Stock Company - with Habeco
for a brewery construction in southern Vietnam, thus complementing its northern, north-
eastern and central facilities. Carlsberg's focus remains on economy local brands, such
as Hue. However, it is increasingly targeting tourists and wealthy urban residents with its
premium, eponymous Carlsberg brand. The Vietnamese beer market continues to attract
major investment and Carlsberg will want to ensure that its early entry sees it retains a
favourable position. Inorganic growth will be integral to this, and Carlsberg is expected to
play an active role in the future auction of small-scale brewers. With its increased stake
in Habeco, the company is optimistic about achieving market leadership, after which
regional growth is likely to become a priority. The company has also been investing
heavily in marketing and brand building, and is now the sponsor of the Carlsberg Gulf
Classic in the region.
Financial Data For the Asia Region
• Q310 Revenue (end September 2010): DKK1.5bn (US$273.3mn), decline of 1.9%• 2009 Revenue: DKK4.2bn (US$765.3mn), growth of 18.9%
Operational Data • 2009 market share (including Habeco): 33%
Vietnam Food & Drink Q3 2011
© Business Monitor International Page 74
Metro Cash & Carry
Strengths • The financial backing of parent company Metro enables it to pour in significant capitalinvestments without the need for immediate returns.
• By remaining in the wholesale sector, Metro is able to exploit the needs of the country's still-strong independent retail sector.
• As one of few international brands in the market, Metro has proved popular among consumers.
• Metro's strategy for growth is very compatible with Vietnam's current economy, as this remainsan inherently price-sensitive market, with premium brands appealing to very few
Weaknesses • Distribution remains a problem for Metro, particularly with regard to the sale of perishables, asVietnam's infrastructure is still weak with roads, railways and ports that are inadequate to copewith the country's growth
• Metro will have to continue to invest heavily in expansions and distribution networks, with littleshort-term returns.
Opportunities • In the long term, Metro could consider unveiling one of its popular European consumer retailbrands on to the Vietnamese market.
• By working with local suppliers, Metro is ensuring that its economic contribution extends beyondretail, putting it in a favourable negotiating position with government.
• Expansion into increasingly wealthy central cities is an important growth channel for Metro.
Threats • The arrival of fellow multinationals, in line with sector liberalisation, will erode an element ofMetro's competitive differentiation.
• Rising operating costs threaten profit margins with these hard to pass on to buyers on such aprice-sensitive independent sector.
�
Overview Germany's Metro Group has been the pioneer of the cash-and-carry format in Vietnam
having entered the market in 2002. It operates 13 outlets and is Vietnam's leading
multinational retailer. As is the case across its entire Asian store network, Metro is
present only in the wholesale format in Vietnam and has not to date hinted at amending
this strategy to incorporate consumer grocery retailing.
Strategy Metro plans to pursue a reasonably moderate expansion strategy in Vietnam, investing
US$120mn in opening five more stores - subject to the receipt of further licences for new
store openings - with Hanoi, Ho Chi Minh City, Nha Trang and Dong Nai representing
potential targets. Metro is also intent on building its relationship with suppliers, with a
view to ultimately adding Vietnamese produce to its global network. To date, this has
focused on non-food items, although growing demand for Vietnamese seafood, fruit and
vegetables has prompted Metro to establish another sourcing office in the country. A
Vietnam Food & Drink Q3 2011
© Business Monitor International Page 75

recent loan from the European Investment Bank will assist Metro both in financing store
openings and in enabling Metro to invest in supplier training. The fact that Metro is
present only in the wholesale sector necessitates a relatively modest approach to
growth, although the company will be wary of the effect of greater competition following
sector liberalisation.
Financial Data Metro Group does not publish country-specific financial data
• 2010 Asia/Africa Revenue: EUR2.50bn (US$3.62bn)• 2009 Vietnam Revenue Estimate: US$150mn
Operational Data • Estimated number of employees: 3,000• Average registered customers per Vietnamese store: 90,000
Vietnam Food & Drink Q3 2011
© Business Monitor International Page 76
Saigon Co-op
Strengths • Saigon Co-op has a very strong brand in the southern part of the country, where its name issynonymous with low prices.
• Operating in both the supermarket and convenience sectors diversifies Saigon Co-op's potentialaudience size.
• With a focus on low-cost and increasingly, private label goods, the company is well positionedfor strong performance during periods of low consumer confidence.
Weaknesses • Scale-building investments of the type needed if Saigon Co-op is to remain competitive will beenormously costly.
• Unlike its potential rivals, Saigon Co-op cannot make high-risk investments, needing immediatereturns in order to remain afloat.
• Unlike in many other markets in the region, being a domestic operator does not give Saigon Co-op a major advantage against its foreign counterparts.
Opportunities • Saigon Co-op's low profit mark-up will give it a strong edge over its multinational rivals shouldthey enter Vietnam.
• Price-cutting promotions are an excellent means of generating customer loyalty, although theyare becoming increasingly hard to offer.
• Seeking partnerships is a wise means of building scale in a low-risk manner.
• Planned fresh food and convenience offerings are strong long-term growth prospects.
• The retailer has announced plans to launch an outlet in neighbouring Cambodia, which has a farless developed MGR sector, giving it a first mover advantage.
Threats • The imminent arrival of international retailers poses a real threat to Saigon Co-op's marketleadership, as it is far less experienced than the newcomers.
• Focus on Vietnamese brands could backfire as exposure to Western brands increases.
• Price hikes - a result of volatile food prices - could threaten customer loyalty.
�
Overview Saigon Co-op is Vietnam's leading retailer. The firm has 70 convenience stores and 43
supermarkets, the majority of which are located in Ho Chi Minh City, where Co-op
controls 50% of the city's supermarket sector. It has also recently launched a new chain
of convenience stores called Co-op Food. Its network is oriented towards low-income
consumers, although it increasingly resembles that of the modern retail concept
proliferating in the country.
Strategy Saigon targets Vietnam's low-income population - providing choice at affordable prices.
Its strategy involves maintenance of this image and, having been forced to raise prices in
Vietnam Food & Drink Q3 2011
© Business Monitor International Page 77
2008 due to high wholesale costs, it has since been promoting a five-pronged approach
to keeping prices low. This involves requesting suppliers to justify price increases;
building stockpiles of basic items; improving distribution to ensure supply and reduce
panic buying; accepting lower profit margins; and looking for further cost cuts through
efficiency. As well as targeting 100 supermarkets by 2015, it is also targeting logistical
improvements and, potentially, further joint ventures and partnerships to help meet its
store-opening aims, particularly in those cities in which it lacks expertise or infrastructure.
Saigon Co-op's slim margin mark-up should help it in the face of multinational
competition. The firm has joined the trend towards private-label goods, recently
developing its Co-op Mart brand for frozen and dried goods and its SGC brand for
clothing. It has also recently launched a chain of small-scale convenience stores, Co-op
Food and has ambitions of expanding this to 120 outlets by 2012. Bringing convenience
to residential areas of Ho Chi Minh City, along with further supermarket openings, is part
of the company's strategy for preparing for the arrival of multinational competition. The
retailer recently announced plans to build its first ever overseas supermarket in
Cambodia.
Financial Data Company Data • 2009 Revenue: VND8.6trn (US$438.6mn), growth of 35%• 2008 Revenue: VND6.4trn (US$326.4mn); growth of 48.9%
Vietnam Food & Drink Q3 2011
© Business Monitor International Page 78
Methodology
Risk/Reward Ratings Methodology
BMI's approach in assessing the risk/reward balance for food and drink industry investors globally
is fourfold. First, we identify factors, in terms of current industry/country trends and forecast industry/
country growth, which represent opportunities to would-be investors. Second, we identify country and
industry-specific traits that pose or could pose operational risks to would-be investors. Third, where
possible we attempt to identify objective indicators that may serve as proxies for issues/trends to avoid
subjectivity. Finally, we use BMI's proprietary Country Risk Ratings (CRR) in a nuanced manner to ensure
that only the aspects most relevant to the food and drink industry are incorporated. Overall, the system
offers an industry-leading, comparative insight into the opportunities/risks for companies across the globe.
Ratings System
Conceptually, the ratings system divides into two distinct areas:
Rewards: evaluation of sector's size and growth potential in each country, and also broader industry/
state characteristics that may inhibit its development.
Risks: evaluation of industry-specific dangers and those emanating from the country's political/
economic profile that call into question the likelihood of anticipated returns being realised over the assessed
time
period.
Indicators
The following indicators have been used. Overall, the ratings use three subjectively measured
indicators, and 41separate indicators/datasets.
Table: Returns
Industry Rewards
Food and drink consumptionper capita, US$
Indicator denotes overall breadth of market. Large markets score higher than smaller ones.
Soft drink consumption percapita, US$
Indicator denotes overall breadth of market. Large markets score higher than smaller ones.
Vietnam Food & Drink Q3 2011
© Business Monitor International Page 79
Returns - Continued
Industry Rewards
Alcoholic drink consumptionper capita, litres
Indicator denotes overall breadth of market. Large markets score higher than smaller ones.
Per-capita food consumptiongrowth, five-year % growth
Indicator denotes sector dynamism. Scores based on total growth over our five-yearforecast period.
Food and drink trade balanceIndicator denotes market's natural resources and dependency on imports for food and rawingredient supply.
Country Rewards
Economic structure Ratingfrom BMI's CRR.
Evaluates structural balance of economy; evaluating issues such as over-reliance onsingle sectors/markets as well as past economic volatility.
Population size Proxy forpotential market size.
Large countries considered more attractive.
GDP per capita, US$ Proxyfor wealth.
Size of population is important, but needs to be considered in relation to spending power.High income states receive better scores than low income states.
Market entry potential/maturity
Subjective rating based on level of industry development and level and strength of industrycompetition in a market. Mature and/or competitive markets get low scores.
NB See Business Environment section for regional and country-specific ratings explanations. Source: BMI
Vietnam Food & Drink Q3 2011
© Business Monitor International Page 80
Glossary
Food & Drink
Food Consumption: All four food consumption indicators (food consumption in local currency,
food consumption in US dollar terms, per-capita food consumption and food consumption as a % of
GDP) relate to off-trade food and non-alcoholic drinks consumption, unless stated in the relevant table/
section.
Off-trade: Relates to an item consumed away from the premises on which it was purchased. For example, a
bottle of water bought in a supermarket would count as off-trade, while a bottle of water purchased as part
of a meal in a restaurant would count as on-trade.
Canned Food: Relates to the sale of food products preserved by canning; inclusive of canned meat and fish,
canned ready meals, canned desserts and canned fruits and vegetables. Volume sales are measured
in thousand tonnes as opposed to on a unit basis to allow for cross-market comparisons.
Confectionery: Refers to retail sales of chocolate, sugar confectionery and gum products. Chocolate
sales include chocolate bars and boxed chocolates; gum sales incorporate both bubble gum and chewing
gum; and sugar confectionery sales include hard boiled sweets, mints, jellies and medicated sweets.
Trade: In the majority of BMI's Food & Drink reports, we use the United Nations Standard
International Trade Classification, using categories Food and Live Animals, Beverages and Tobacco,
Animal and Vegetable Oils, Fats and Waxes and Oil-seeds and Oleaginous Fruits. Where an alternative
classification is used owing to data availability, this is clearly stated in the relevant report.
Drinks Sales: Soft drink sales (including carbonates, fruit juices, energy drinks, bottled water,
functional beverages and ready-to-drink tea and coffee), alcoholic drink sales (including beer, wine and
spirits) and tea and coffee sales (excluding ready-to-drink tea and coffee products, which are incorporated
under BMI's soft drinks banner) are all off-trade only, unless stated in the relevant table/section.
Mass Grocery Retail
Mass Grocery Retail: BMI classifies mass grocery retail (MGR) as organised retail, performed
by companies with a network of modern grocery retail stores and modern distribution networks. MGR
differs from independent or traditional retail, which relates to informal, independent-owned grocery stores
or traditional market retailing. MGR incorporates hypermarket, supermarket, convenience and
Vietnam Food & Drink Q3 2011
© Business Monitor International Page 81
discount retailing, and in unique cases co-operative retailing. Where supermarkets are independently owned
and not classified as MGR, BMI will state so clearly within the relevant report.
Hypermarket: BMI classifies hypermarkets as retail outlets selling both groceries and a large range
of general merchandise goods (non-food items) and typically over 2,500m² in size. Traditionally only
found on the outskirts of town centres, hypermarkets are increasingly appearing in urban locations.
Supermarket: Supermarkets are the original and still most globally prevalent form of self-service grocery
retail outlet. BMI classifies supermarkets as over 300m², up to the size of a hypermarket. The typical
supermarket carries both fresh and processed food items and will stock a range of non-food items, most
commonly household and beauty goods. In addition, the average supermarket will increasingly
offer customers some added-value services, such as dry cleaning or in-store ATMs etc.
Discount stores: Although most commonly between 500m² and 1,500m² in size, and thus of the
same classification as supermarkets, discount stores will typically have a smaller floor-space than
their supermarket counterparts. Other distinguishing features include the prevalence of low-priced and
privatelabel goods, an absence of added-value services - often called a no-frills environment - and a
high product turnover rate.
Convenience stores: BMI's classification of convenience stores includes small outlets typically
below 300m² in size, with long opening hours and located in high footfall areas. These stores mainly sell
fastmoving food and drink products (such as confectionery, beverages and snack foods) and non-food
items, typically stocking only two or three brand choices per item and often carrying higher prices than
other forms of grocery store.
Co-operatives: BMI classifies co-operatives as retail stores that are independently owned but which
club together to form buying groups, under a co-operative arrangement, trading under the same
banner, although each is privately owned. The arrangement is similar to a franchise system, although all
profits are returned to members. The term is becoming more archaic with fewer co-operatives remaining
that conform to this model. Most co-operative groups now have a more centralised management structure
and operate more like normal supermarkets, and are thus classified as such within BMI's reports
Vietnam Food & Drink Q3 2011
© Business Monitor International Page 82
BMI Food & Drink Forecasting and Sources
How We Generate Our Industry Forecasts
BMI's industry forecasts are generated using the best-practice techniques of time-series modelling and
causal/econometric modelling. The precise form of model we use varies from industry to industry, in each
case being determined, as per standard practice, by the prevailing features of the industry data being
examined. BMI mainly uses OLS estimators and, in order to avoid relying on subjective views and
encourage the use of objective views, BMI uses a 'general-to-specific' method. BMI mainly uses a linear
model, but simple non-linear models, such as the log-linear model, are used when necessary. During periods
of 'industry shock', for example a deep industry recession, dummy variables are used to determine the level
of impact.
Effective forecasting depends on appropriately selected regression models. BMI selects the best model
according to various different criteria and tests, including, but not exclusive to:
• R2 tests explanatory power; adjusted R2 takes degree of freedom into account
• Testing the directional movement and magnitude of coefficients
• Hypothesis testing to ensure coefficients are significant (normally t-test and/or P-value)
• All results are assessed to alleviate issues related to auto-correlation and multi-collinearity
BMI uses the selected best model to perform forecasting.
It must be remembered that human intervention plays a necessary and desirable role in all of BMI's industry
forecasting. Experience, expertise and knowledge of industry data and trends ensures that analysts spot
structural breaks, anomalous data, turning points and seasonal features where a purely mechanical
forecasting process would not.
Within the Food & Drink industry, this intervention might include, but is not exclusive to: significant
company expansion plans; new product development that might influence pricing levels; dramatic changes
in local production levels; product taxation; the regulatory environment and specific areas of legislation;
changes in lifestyles and general societal trends; the formation of bilateral and multilateral trading
agreements and negotiations; political factors influencing trade; and the development of the industry in
neighbouring markets that are potential competitors for foreign direct investment.
Example of Food Consumption Model:
Vietnam Food & Drink Q3 2011
© Business Monitor International Page 83
(Food Consumption)t = β0 + β1*(GDP)t + β2*(Inflation)t + β3*(Lending Rate)t + β4* (Foreign Exchange
Rate)t + β5*(Government Expenditure)t + β6*(Food Consumption)t-1 + εt
Sourcing
BMI's industry forecasts are generated using the best-practice techniques of time-series modelling and
causal/econometric modelling. The precise form of model we use varies from industry to industry, in each
case being determined, as per standard practice, by the prevailing features of the industry data being
examined. BMI mainly uses OLS estimators and, in order to avoid relying on subjective views and
encourage the use of objective views, BMI uses a 'general-to-specific' method. BMI mainly uses a linear
model, but simple non-linear models, such as the log-linear model, are used when necessary. During periods
of 'industry shock', for example a deep industry recession, dummy variables are used to determine the level
of impact.
Vietnam Food & Drink Q3 2011
© Business Monitor International Page 84

Reproduced with permission of the copyright owner. Further reproduction prohibited without permission.