Multi-Product Firms and Product Quality
38
NBER WORKING PAPER SERIES MULTI-PRODUCT FIRMS AND PRODUCT QUALITY Kalina Manova Zhiwei Zhang Working Paper 18637 http://www.nber.org/papers/w18637 NATIONAL BUREAU OF ECONOMIC RESEARCH 1050 Massachusetts Avenue Cambridge, MA 02138 December 2012 We thank Andrew Bernard, Meredith Crowley, Jonathan Eaton, Carsten Eckel, Doireann Fitzgerald, Penny Goldberg, Elhanan Helpman, Beata Javorcik, Robert Johnson, Marc Melitz, Peter Neary, Stephen Redding, Robert Staiger, Jim Tybout, and Eric Verhoogen for insightful conversations, and conference participants at the 2012 AEA Annual Meeting, 2012 NBER ITI Spring Meeting, 2012 EIIT Conference, and 2011 IGC Trade Programme Meeting for their comments. Kalina Manova acknowledges support from the International Growth Centre (LSE), the Freeman Spogli Institute (Stanford), and the Institute for Research in the Social Sciences (Stanford). The views expressed herein are those of the authors and do not necessarily reflect the views of the National Bureau of Economic Research. NBER working papers are circulated for discussion and comment purposes. They have not been peer- reviewed or been subject to the review by the NBER Board of Directors that accompanies official NBER publications. © 2012 by Kalina Manova and Zhiwei Zhang. All rights reserved. Short sections of text, not to exceed two paragraphs, may be quoted without explicit permission provided that full credit, including © notice, is given to the source.
-
Upload
independent -
Category
Documents
-
view
7 -
download
0
Transcript of Multi-Product Firms and Product Quality

NBER WORKING PAPER SERIES
MULTI-PRODUCT FIRMS AND PRODUCT QUALITY
Kalina ManovaZhiwei Zhang
Working Paper 18637http://www.nber.org/papers/w18637
NATIONAL BUREAU OF ECONOMIC RESEARCH1050 Massachusetts Avenue
Cambridge, MA 02138December 2012
We thank Andrew Bernard, Meredith Crowley, Jonathan Eaton, Carsten Eckel, Doireann Fitzgerald,Penny Goldberg, Elhanan Helpman, Beata Javorcik, Robert Johnson, Marc Melitz, Peter Neary, StephenRedding, Robert Staiger, Jim Tybout, and Eric Verhoogen for insightful conversations, and conferenceparticipants at the 2012 AEA Annual Meeting, 2012 NBER ITI Spring Meeting, 2012 EIIT Conference,and 2011 IGC Trade Programme Meeting for their comments. Kalina Manova acknowledges supportfrom the International Growth Centre (LSE), the Freeman Spogli Institute (Stanford), and the Institutefor Research in the Social Sciences (Stanford). The views expressed herein are those of the authorsand do not necessarily reflect the views of the National Bureau of Economic Research.
NBER working papers are circulated for discussion and comment purposes. They have not been peer-reviewed or been subject to the review by the NBER Board of Directors that accompanies officialNBER publications.
© 2012 by Kalina Manova and Zhiwei Zhang. All rights reserved. Short sections of text, not to exceedtwo paragraphs, may be quoted without explicit permission provided that full credit, including © notice,is given to the source.

Multi-Product Firms and Product QualityKalina Manova and Zhiwei ZhangNBER Working Paper No. 18637December 2012JEL No. D22,F10,F12,F14,L10,L11,L15
ABSTRACT
This paper proposes that quality differentiation is an important feature of the operations of multi-productfirms. We develop a model in which manufacturers vary product quality across their product rangeby using inputs of different quality levels. Firms’ core competency is in varieties of superior qualitythat bring higher sales despite being more expensive. Using detailed customs data for China, we establishfour new stylized facts consistent with this model. First, firms earn more bilateral and global revenuesfrom their more expensive products. Second, exporters focus on their top expensive goods, drop cheaperarticles and earn lower revenues in markets where they sell fewer varieties. Third, companies' salesare more skewed towards their core expensive goods in destinations where they offer less items. Finally,export prices are positively correlated with input prices across products within a firm. Our results haveimportant implications for the aggregate and distributional effects of trade reforms and exchange ratemovements.
Kalina ManovaDepartment of EconomicsStanford University579 Serra MallStanford, CA 94305and [email protected]
Zhiwei ZhangNomura SecuritiesHong [email protected]


# Obs Average St Dev Min 5th Percentile
95th Percentile Max
Variation across firms within products
1. firm-product prices (product FE) 898,247 0.00 1.33 -12.03 -2.02 2.18 13.61
2. firm-product-destination prices (product FE) 2,179,923 0.00 1.24 -12.12 -1.93 2.02 13.65
3. st dev of prices across firms within dest-product pairs (dest-product FE)
159,778 0.90 0.74 0.00 0.08 2.30 8.36
Variation across products within firms
4. st dev of prices across products within firms (firm FE, product FE)
74,034 0.85 0.63 0.00 0.13 2.05 8.21
5. st dev of prices across products within firm-dest pairs (firm-dest FE, product FE)
330,805 0.74 0.63 0.00 0.07 1.94 9.07
Product Rank by Sales 1 2 3 4 5 >5 Total
Product Rank by Price
1 4.39% 1.91% 1.09% 0.69% 0.50% 2.16% 10.75%
2 2.02% 2.03% 1.05% 0.66% 0.46% 2.02% 8.24%
3 1.13% 1.14% 1.16% 0.68% 0.45% 1.93% 6.50%
4 0.73% 0.71% 0.72% 0.77% 0.46% 1.91% 5.30%
5 0.50% 0.49% 0.50% 0.50% 0.53% 1.89% 4.40%
>5 1.98% 1.96% 1.98% 1.99% 2.00% 54.90% 64.82%
Total 10.75% 8.25% 6.50% 5.30% 4.40% 64.81% 100.00%
Table 1. The Variation in Export Prices across Firms, Products and Destinations
This table summarizes the variation in f.o.b. export prices across firms, products, and destinations in 2005. Line 1 (Line 2): summarystatistics for firm-product (firm-product-destination) log prices, after taking out product fixed effects. Line 3: for each destination-productmarket with multiple Chinese exporters, we record the standard deviation of log prices across firms. Line 3 shows how this standarddeviation varies across destination-product pairs. Line 4 (Line 5): for each multi-product firm, we record the standard deviation of logprices across products (by destination). Line 4 (Line 5) shows how this standard deviation varies across firms (firm-destination pairs).
Table 2. Ranking Firms' Products by Export Prices and RevenuesThis table ranks products within multi-product firms based on either worldwide export revenues (columns) or export price (rows). Thetop selling or most expensive product within each firm is ranked first, the second most receives rank 2, etc. For each firm-product pair,we construct the export price as the ratio of worldwide export revenues and quantities, demeaned by its product-specific averageacross firms. Each cell in the table shows what percent of all firm-product pairs receive a certain rank by price and revenue.

Dependent variable: (log) export price by firm and product
Market Rauch R&D Adv. + R&D ProductPower Dummy Intensity Intensity Rank
(1) (2) (3) (4) (5) (6)
(log) Revenue 0.039 0.040 0.028 0.034 0.036 0.076(68.94)*** (70.37)*** (17.21)*** (47.48)*** (37.83)*** (17.50)***
Market Share -0.361(-12.12)***
(log) Revenue x 0.017 0.298 0.144Quality Differentiation (9.49)*** (9.66)*** (4.33)***
Quality Differentiation -0.170 -4.776 -0.011(-9.53)*** (-15.54)*** (-0.04)
Firm FE Y Y Y Y Y Y
R-squared 0.41 0.41 0.44 0.42 0.42 0.69# observations 898,247 898,247 619,357 871,596 875,097 898,247# firms 96,522 96,522 84,464 93,514 94,005 96,522
Dependent variable: (log) export price by firm, product and destination
Market Rauch R&D Adv. + R&D ProductPower Dummy Intensity Intensity Rank
(1) (2) (3) (4) (5) (6)
(log) Revenue 0.040 0.042 0.033 0.032 0.035 0.101(84.92)*** (87.33)*** (21.87)*** (52.65)*** (43.35)*** (16.85)***
Market Share -0.077(-18.34)***
(log) Revenue x 0.012 0.413 0.216Quality Differentiation (7.37)*** (17.94)*** (7.99)***
Quality Differentiation -0.170 -6.416 -1.512(-10.94)*** (-29.22)*** (-6.34)***
Firm-Destination FE Y Y Y Y Y Y
R-squared 0.53 0.53 0.57 0.53 0.53 0.73# observations 2,179,923 2,179,923 1,494,839 2,130,413 2,139,735 2,179,923# dest-firm pairs 724,622 724,622 564,012 706,738 711,036 724,622
This table examines the relationship between bilateral export prices and revenues across products within firm-destination pairs. Foreach firm, product and destination, we demean the (log) price by the product-destination specific average across firms. Market poweris proxied by the firm's share of total Chinese exports by product-destination. Products' scope for quality differentiation is measuredas in Table 3. Column 6 uses products' rank by price and revenue across products within each firm-destination pair instead of (log)price and revenue. All regressions include a constant term and firm-destination pair fixed effects. Robust T-statistics in parentheses.***, **, and * indicate significance at the1%, 5%, and 10% level.
Baseline
Table 3. Worldwide Export Prices and Revenues across Products within a Firm
This table examines the relationship between worldwide export prices and revenues across products within firms. For each firm-product pair, we construct the (log) export price as the ratio of worldwide export revenues and quantities, demeaned by its product-specific average across firms. Market power is proxied by the firm's share of total Chinese exports by product. Products' scope forquality differentiation is proxied by the Rauch dummy for differentiated goods (Column 3), sectors' R&D intensity (Column 4), orsectors' combined advertising and R&D intensity (Column 5). Column 6 uses products' rank by price and revenue across productswithin each firm instead of (log) price and revenue. All regressions include a constant term and firm fixed effects. Robust T-statisticsin parentheses. ***, **, and * indicate significance at the1%, 5%, and 10% level.
Baseline
Table 4. Bilateral Export Prices and Revenues across Products within a Firm-Destination

Baseline Market Power Hom Goods Diff Goods Proc Imports HS-3 Product
(1) (2) (3) (4) (5) (6)
(log) Input Price 0.14 0.14 0.08 0.13 0.17 0.20(37.83)*** (37.82)*** (2.92)*** (26.85)*** (27.52)*** (31.36)***
Input Market Share 0.13(1.49)
Output Market Share -0.06(-1.16)
Firm FE Y Y Y Y Y Y
R-squared 0.42 0.42 0.65 0.47 0.44 0.56# observations 232,966 232,966 13,334 140,197 118,381 87,760# firms 37,102 37,102 5,936 27,797 22,583 37,102# product categories 6,120 6,120 1,025 2,732 5,153 171
Baseline Market Power Hom Goods Diff Goods Proc Imports IO Sector
(1) (2) (3) (4) (5) (6)
(log) Input Price 0.11 0.11 -0.02 0.10 0.13 0.17(24.12)*** (24.13)*** (-0.72) (16.87)*** (15.92)*** (20.02)***
Input Market Share -0.46(-1.50)
Output Market Share 1.00(1.95)*
Firm FE Y Y Y Y Y Y
R-squared 0.39 0.39 0.58 0.43 0.37 0.48# observations 553,070 553,070 34,548 348,593 330,604 183,336# firms 55,733 55,733 12,888 45,708 36,042 55,733# product categories 5,985 5,985 1,150 2,619 5,578 92
Panel B. Input price based on all imports and IO tables
Table 5. Export Prices and Imported-Input Prices
This table examines the relationship between firms' export prices and imported input prices. The outcome variable is firms' (log)export price by HS-8 digit product, except in Column 6 where it is the weighted average (log) export price by HS-3 digit product orIO sector using export revenues as weights. The input price is the weighted average of (log) import prices for inputs matched tothe output product, using import values as weights. It is based on imports in the same HS-3 digit product category (Panel A) or onall inputs using input-output tables (Panel B). All prices have been demeaned by their product-specific average across firmsbefore any further manipulation. In Column 5 only processing imports enter the calculation. Market power in output markets isproxied by the firm's share of total Chinese exports by product category. Market power in input markets is proxied by the firm'saverage share of total Chinese imports across all inputs matched to the output product. Column 3 (4) restricts the sample tohomogeneous (differentiated) export products only. All regressions include a constant term and firm fixed effects. Robust T-statistics in parentheses. ***, **, and * indicate significance at the1%, 5%, and 10% level.
Dependent variable: (log) export price by firm and product categoryPanel A. Input price based on imports in same HS-3 product
All All Hom Goods Diff Goods
(1) (2) (3) (4) (5) (6)
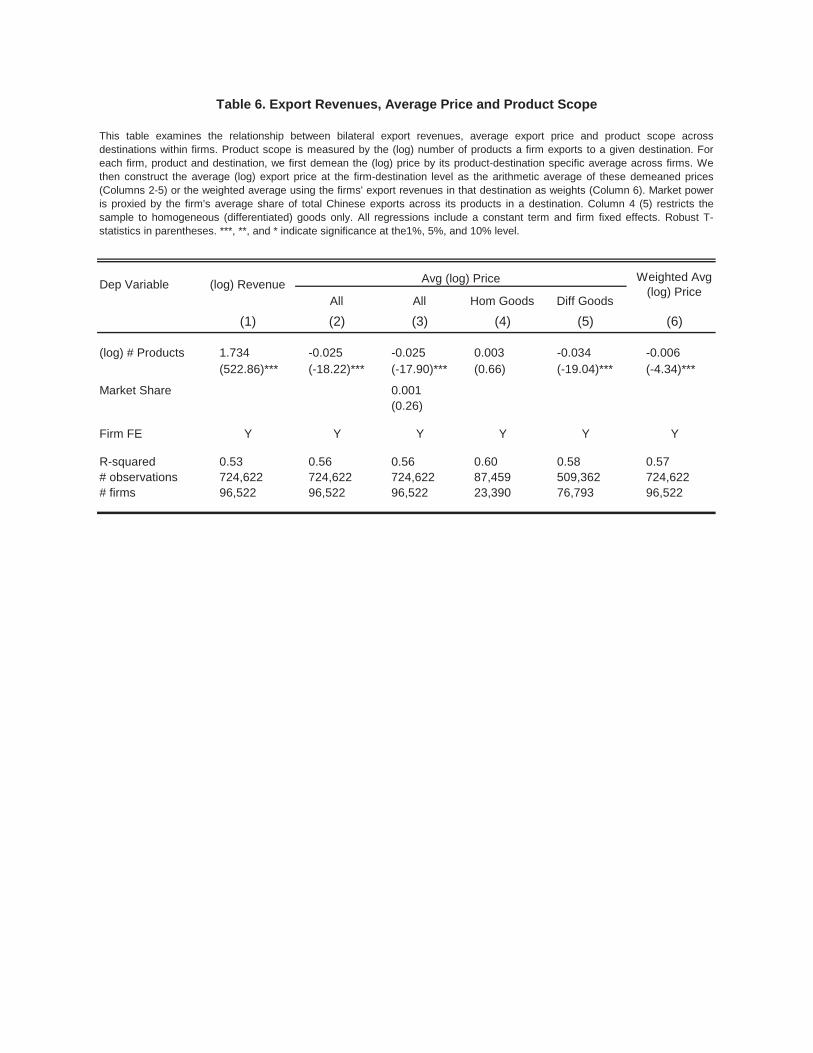
(log) # Products 1.734 -0.025 -0.025 0.003 -0.034 -0.006(522.86)*** (-18.22)*** (-17.90)*** (0.66) (-19.04)*** (-4.34)***
Market Share 0.001(0.26)
Firm FE Y Y Y Y Y Y
R-squared 0.53 0.56 0.56 0.60 0.58 0.57# observations 724,622 724,622 724,622 87,459 509,362 724,622# firms 96,522 96,522 96,522 23,390 76,793 96,522
Dep Variable (log) Revenue Avg (log) Price Weighted Avg (log) Price
Table 6. Export Revenues, Average Price and Product Scope
This table examines the relationship between bilateral export revenues, average export price and product scope acrossdestinations within firms. Product scope is measured by the (log) number of products a firm exports to a given destination. Foreach firm, product and destination, we first demean the (log) price by its product-destination specific average across firms. Wethen construct the average (log) export price at the firm-destination level as the arithmetic average of these demeaned prices(Columns 2-5) or the weighted average using the firms' export revenues in that destination as weights (Column 6). Market poweris proxied by the firm's average share of total Chinese exports across its products in a destination. Column 4 (5) restricts thesample to homogeneous (differentiated) goods only. All regressions include a constant term and firm fixed effects. Robust T-statistics in parentheses. ***, **, and * indicate significance at the1%, 5%, and 10% level.

Dep Variable 10th Perc 90th Perc
All Hom Goods Diff Goods # Goods 2 # Goods 2
(1) (2) (3) (4) (5)
# Products 0.433 0.364 0.422 -0.017 0.822(46.13)*** (13.56)*** (47.34)*** (-2.63)*** (36.13)***
Firm FE Y Y Y Y Y
R-squared 0.72 0.66 0.70 0.29 0.83# observations 724,622 87,459 509,362 330,805 330,805# firms 96,522 23,390 76,793 70,672 70,672
Dep Variable 10th Perc 90th Perc
All Hom Goods Diff Goods # Goods 2 # Goods 2
(1) (2) (3) (4) (5)
# Products 0.046 -0.014 0.056 -0.291 0.366(5.47)*** (-0.54) (6.82)*** (-19.75)*** (27.98)***
Firm FE Y Y Y Y Y
R-squared 0.91 0.86 0.90 0.67 0.96# observations 724,622 87,459 509,362 330,805 330,805# firms 96,522 23,390 76,793 70,672 70,672
Table 7. Product Scope and Product Rank
This table illustrates that firms focus on their core expensive products in markets where they export fewer goods. Foreach firm, we rank products globally based on worldwide export revenues (Panel A) or based on worldwide exportprices (worldwide export revenues divided by worldwide export quantities), demeaned by their product-specificaverage across firms (Panel B). The top product receives rank 1 and the bottom product - a rank equal to the numberof products the firm exports. We use this global ranking of products to measure the average, 10th percentile and 90th
percentile rank observed across the products sold by a firm in a given destination. Product scope is measured byfirms' number of bilaterally exported products. Column 2 (3) restricts the sample to homogeneous (differentiated)goods only. Columns 4 and 5 restrict the sample to firm-destination pairs with 2 or more products. All regressionsinclude a constant term and firm fixed effects. Robust T-statistics in parentheses. ***, **, and * indicate significance atthe1%, 5%, and 10% level.
Panel B. Products ranked by global price
Average Rank
Panel A. Products ranked by global sales
Average Rank

Products Ranked by
All Hom Goods Diff Goods All Hom Goods Diff Goods
(1) (2) (3) (4) (5) (6)
(log) # Products -0.42 -0.65 -0.42 -0.18 -0.34 -0.21(-100.24)*** (-17.69)*** (-79.50)*** (-19.21)*** (-4.53)*** (-17.22)***
Firm FE Y Y Y Y Y Y
R-squared 0.49 0.58 0.52 0.28 0.48 0.32# observations 330,805 21,793 218,413 330,805 21,793 218,413# firms 70,672 9,600 52,237 70,672 9,600 52,237
Bilateral Sales Bilateral Price
Dependent variable: (log) ratio of export revenues of top to second-ranked product, by firm and destination
Table 8. Product Scope and the Concentration of Sales in Core Products
This table shows that firms concentrate sales in their core expensive products in markets where they export fewer goods. Theoutcome variable is the (log) ratio of the sales of a firm's top product to the sales of its second-ranked product, by destination.For each firm-destination, we rank products based on the firm's bilateral export sales or bilateral export prices (demeaned bytheir product-destination specific averages across firms). Columns 2 and 5 (3 and 6) restrict the sample to homogeneous(differentiated) goods only. All regressions include a constant term and firm fixed effects. Robust T-statistics in parentheses. ***,**, and * indicate significance at the1%, 5%, and 10% level.

Dependent variable: (log) export price by firm, product and destination
Rauch R&D Adv. + R&DDummy Intensity Intensity
(1) (2) (3) (4)
(log) Revenue 0.081 0.036 0.077 0.065(70.07)*** (9.36)*** (54.61)*** (35.32)***
(log) Revenue x 0.054 0.200 0.616Quality Differentiation (12.97)*** (3.17)*** (10.63)***
Destination-Product FE Y Y Y Y
R-squared 0.744 0.729 0.741 0.741# observations 2,179,923 1,494,839 2,130,413 2,139,735# dest-product pairs 258,056 163,873 247,867 249,874
Appendix Table 1. Export Prices and Revenues
This table reproduces results from Manova and Zhang (2012). It examines the relationship betweenexport prices and revenues across firms within a destination-product market. Products' scope forquality differentiation is measured as in Table 3. All regressions include a constant term anddestination-product pair fixed effects, and cluster errors by destination-product. T-statistics inparenthesis. ***, **, and * indicate significance at the1%, 5%, and 10% level.
Baseline
across Firms within a Destination-Product

No
Yes
Figure 1. Comparing Prices across Products

Avg
Firm 1
Firm 2
Figure 2. Comparing Prices across Products within Firms