China's Exporters and Importers: Firms, Products, and Trade Partners

MULTI-PRODUCT EXPORTERS: PRODUCT CHURNING,UNCERTAINTY AND EXPORT DISCOVERIES*
Leonardo Iacovone and Beata S. Javorcik
Recent research on international trade focuses on firm-product-level heterogeneity and the role ofuncertainty in shaping international trade. This article contributes to the literature by examiningproduct-level dynamics within firms in the context of Mexican trade integration under NAFTA. The datashow intense product churning within firms and confirm the existence of within-firm product het-erogeneity. The data indicate that new exporters enter foreign markets with a small number ofvarieties, most of which were previously sold at home, and with a small export small volume. The dataalso suggest that export discoveries are relatively rare and are imitated within a short period of time.
To deepen the understanding of the complex interactions between globalisation andeconomic development, trade economists have recently increased their interest in tworelated areas: the link between micro-heterogeneity and aggregate export response,and the role of uncertainty in international trade. It has been recognised that progressin both areas can contribute to devising more effective policies for promoting growth(Hausmann and Rodrik, 2003; Bartelsman and Doms, 2000; Tybout, 2000).
Developments in the first area encompass groundbreaking contributions thatallowed for the incorporation of firm-level heterogeneity into trade models (Melitz,2003; Yeaple, 2005; Bernard et al., 2007a,b), innovative empirical studies evaluatingfirm-level responses to trade reforms (Pavcnik, 2002; Trefler, 2004; Schor, 2004;Fernandes, 2007; Harrison, 2007) and pioneering work explaining the determinants ofgeographical expansion of exporters (Eaton et al., 2004a,b; Eaton et al., 2008).
More recently, the theoretical literature has moved even further by unwrapping firmsand incorporating another layer of heterogeneity, namely heterogeneity at the productlevel, and relating it to international trade (Arkolakis and Muendler, 2009; Baldwin andGu, 2009; Bernard et al., 2006; Eckel and Neary, 2010; Feenstra and Ma, 2008; Nockeand Yeaple, 2006; Mayer et al., 2009). These models capture endogenous dynamicsacross firms (e.g. exporting activities undertaken by some firms versus the exclusivefocus on the domestic market by others) as well as within firms (e.g. some productsbeing exported but not others). The aggregate responses to policy changes emerge as acombination of these multiple dynamics.
* The authors are grateful to Gerardo Leyva and Abigail Duran for granting us access to INEGI data at theoffices of INEGI in Aguascalientes subject to complying with the confidentiality requirements set by theMexican Law. Special thanks go to all INEGI employees who provided assistance and answered our questions,in particular to Gabriel Romero, Alejandro Cano, Araceli Martinez, Armando Arellanes, Ramon Sanchez,Otoniel Soto, Candido Aguilar, Adriana Ramirez. The authors also thank Roberto Alvarez, Bernard Hoek-man, Wolfgang Keller, Christopher Kurz, Emanuel Ornelas, Steve Redding, Petia Topalova, Alan Winters,Adrian Wood, the participants of the World Bank Trade Seminar, the 2008 Empirical Investigations inInternational Trade Conference, the 2008 Midwest International Economics Conference, the 2008 LACEARegional Integration Network Conference, the 2008 Royal Economic Society Conference, the 2008 NortheastUniversities Development Consortium Conference and four anonymous referees for their useful comments.The findings, interpretations and conclusions expressed in this article are entirely those of the authors. Theydo not necessarily represent the view of the World Bank, its Executive Directors or the countries theyrepresent.
The Economic Journal, 120 (May), 481–499. doi: 10.1111/j.1468-0297.2010.02356.x. � The Author(s). Journal compilation � Royal Economic
Society 2010. Published by Blackwell Publishing, 9600 Garsington Road, Oxford OX4 2DQ, UK and 350 Main Street, Malden, MA 02148, USA.
[ 481 ]

Progress in the literature focusing on the role of uncertainty in international tradehas been stimulated by the need to explain the patterns recently documented usingtrade statistics the predominance of smaller flows after establishing new trade rela-tionships, a large number of short-lived trade relationships and a limited number ofnew trade relationships that manage to survive and grow. The literature in this area,which originated with the contribution by Rauch and Watson (2003), emphasises therole of information asymmetries and uncertainty in shaping the decisions of exportersand determining patterns of trade (Araujo and Ornelas, 2007; Albornoz et al., 2008).
Yet due to data constraints, there is limited evidence that can corroborate orcontradict the predictions emerging from the above mentioned theories. Do firmsfrequently adjust the number of products exported or produced? Do they do so inresponse to changes in trade policy? Do exporters entering export markets for the firsttime start with a small number of products and low export volumes? What types ofproducts do new exporters tend to sell abroad?
In this article, we rely on a unique dataset at the firm-product level to examinefirm and product-level dynamics in the aftermath of a profound liberalisation. Ourdataset is unique in that it includes information on both exports and domestic salesand covers multiple years.1 Our focus is on the Mexican economy after theimplementation of the North American Free Trade Agreement (NAFTA). The aimof our study is to shed light on how well the predictions of the theoretical literaturematch the patterns observed in Mexico. As many of the models produce predictionsrelated to bilateral trade liberalisation, Mexico is a very suitable setting for such ananalysis. Focusing on the period after NAFTA reforms gives us a unique window, amagnifying lens, to study how multi-product firms respond to suddenly findingthemselves in a more open and globalised setting. These irreversible trade reformstogether with a dramatic exogenous shock, a sharp devaluation of the peso, expandedthe access of Mexican firms to the US market and stimulated large responses at the firmand product-level. In fact, the threefold increase in Mexican exports between 1993 and2002 and growing export diversification in the post-NAFTA period have already beendocumented by studies relying on aggregated trade statistics (Romalis, 2007; Feenstraand Kee, 2007).
Several interesting findings, that broadly match the theoretical predictions of modelsof multi-product firms, emerge from our analysis. We document intense productchurning at the firm level and show that it is systematically related to trade liberalisa-tion. This supports the conclusions of the recent theoretical models suggesting thatproduct churning within the firm is another margin of adjustment taking place inresponse to globalisation (Bernard et al., 2006; Eckel and Neary, 2010; Nocke andYeaple, 2006). As predicted by the theory, we also show that firms are more likely todiscontinue domestic sales of their fringe varieties than of their core ones.
Further, we document patterns consistent with the predictions of theoreticalmodels where uncertainty and information asymmetries shape international trade flows
1 Although several studies documenting patterns at the establishment-product level have emerged in thepast couple of years, they tend to focus either on total production or solely on exports. Moreover, unlike ourstudy, they rely mostly on cross-sectional information (Alvarez et al., 2007; Arkolakis and Muendler, 2009;Bernard et al., 2006, forthcoming; Eaton et al., 2008; Goldberg et al., 2008; Manova and Zhang, 2009; Mayeret al., 2009).
482 [ M A YT H E E C O N O M I C J O U R N A L
� The Author(s). Journal compilation � Royal Economic Society 2010

(Rauch and Watson, 2003). We show that new exporters break into export markets with asingle variety and a very small volume (relative to their total sales of the variety). Accordingto Rauch and Watson (2003), starting small allows importers to test the credibility oftheir foreign partners or the suitability of their products in the export market. We alsodocument that conditional on survival, the volume of exports grows over time.
The presence of uncertainty facing future exporters manifests itself in several ways.First, new exporters overwhelmingly enter a foreign market with a variety already sold athome. Second, we observe that export discoveries, i.e., products not previouslyexported from Mexico, constitute a relatively low share of new export varieties added byexporters. However, the footsteps of a producer introducing an export discovery arefollowed by other exporters within a short period of time. Finally, we show that a vastpercentage of export varieties do not survive for more than a year in the foreignmarket, though the survival rate increases with the variety�s tenure in the exportmarket.
Our study is related to the small but fast growing literature that documentspatterns observed at the firm-product level. It includes the pioneering work byBernard et al. (2006, forthcoming). The former study examines production patternsin general. The latter study is primarily a theoretical contribution but includes someempirical results on the link between the intensive and the extensive margins ofexports. Both studies are based on the US data. Our study is also related to recentstudies analysing dynamics of multi-product firms from developing countries, whichfocus on somewhat different issues (Goldberg et al., forthcoming; Arkolakis andMuendler, 2009).
We believe that our findings can be informative to policy makers and researchersinterested in the link between the structure of a country�s exports and growth; see anemerging literature started by Hausmann et al. (2007). Understanding the dynamics ofintroducing new export varieties at the firm level constitutes the first step in under-standing how a country can upgrade its export structure and what policies, if any, canstimulate this process.
This article is structured as follows. The next Section describes the data. Section 2documents variety churning within a firm and links it to changes in trade policies.Section 3 focuses on uncertainty, information asymmetries and search costs, whileSection 4 discusses export discoveries. The last Section presents the conclusions.
1. Data
Our analysis is based on data from the Monthly Industrial Survey (Encuesta IndustrialMensual (EIM)) administered by the Instituto Nacional de Estadıstica Geografıa eInformatica (INEGI) in Mexico in order to monitor short-term trends. The survey isrun in parallel with the Annual Industrial Survey (Encuesta Industrial Anual (EIA)) onthe same sample of establishments.
The unit of observation is described as �the manufacturing establishment where theproduction takes place�. Each establishment is classified in its respective class of activity(clase) based on the basis of its principal product. The clase or class of activity isequivalent to the 6-digit level Mexican System of Classification of Productive Activities
2010] 483M U L T I - P R O D U C T E X P O R T E R S I N M E X I C O
� The Author(s). Journal compilation � Royal Economic Society 2010

(CMAP). Thanks to a one-time effort to identify multi-plant firms, we are able toidentify establishments that belonged to the same firm in 2003.2
The EIM sample includes 6,291 establishments belonging to 5,493 firms operatingin 205 clases of activity. The sampling framework is based on the 1993 industrialcensus. In each of the selected 205 clases, the survey samples the largest firms untilthe coverage reaches 85% of the sectoral output. In sectors with fewer than 20plants, all entities are surveyed. Moreover, all establishments with more than 100employees are automatically included in the sample. Maquiladoras are not surveyedby either EIM or EIA. The surveys cover about 85% of Mexican industrial outputproduced by non-maquiladora establishments. The size of the sample decreases overtime due to some establishments exiting the market. No systematic effort is made toreplace exiting producers. This means that we observe exit but no entry in our data.The sample covers on average over 50% of total Mexican exports with thepercentage covered increasing in the later years.
We use the EIM panel covering the period 1994–2003 which contains informationon the value of total production, net sales and export sales. Particularly valuable forour purpose is the fact that the EIM collects information at the establishment-product level. Each clase contains a list of possible products, which was developed in1993 and remained unchanged during the entire period under observation. The listincludes 4,085 products of which 3,183 are actually produced during the periodunder study. For instance, the clase Uniforms (identified by the CMAP code 322006)lists 18 products: sports uniforms, school uniforms, military uniforms, uniforms fordoctors and nurses, uniforms for members of other organisations, generic uniformsfor workers, safety uniforms for workers, other uniforms, laboratory coats, camisolesand shirts, headgear, uniforms for chefs, aprons, jackets, other work clothing, othersports clothing, other products not elsewhere classified and other subproducts notelsewhere classified. The clase of small electrical appliances (CMAP code 383304)contains 29 products, including vacuum cleaners, coffee makers, toasters, toasterovens, 110 volt heaters and 220 volt heaters (within each group of heaters theclassification distinguishes between heaters of different sizes: less than 25 litres,25–60 litres, 60–120 litres, more than 60 litres). These examples illustrate thenarrowness of product definitions and the richness of micro-level informationavailable in our dataset.
As we are not interested in short-run trends, we aggregate monthly EIM data intoannual observations. We also aggregate establishment-product-level data into firm-product-level information. In the case of multi-establishment firms with differentestablishment producing the same product, the figures are aggregated into one firm-product observation per year.3
We supplement the EIM data with the information on the establishment�s ageavailable from the EIA and with information on Mexican tariffs imposed on importsfrom NAFTA countries (obtained from Secretarıa de Economıa) and US MFN (Most
2 This means that we are assuming that ownership structure observed in 2003 was prevailing during thewhole period covered by our sample.
3 As most Mexican firms have only a single establishment, conducting our analysis at the establishment-level would lead to very similar results. There are only 473 multi-establishment firms in our data, owning onaverage three establishments each.
484 [ M A YT H E E C O N O M I C J O U R N A L
� The Author(s). Journal compilation � Royal Economic Society 2010

Favoured Nation) and NAFTA tariffs.4 Tariff data, available originally at the 8-digitHarmonised System (HS) classification, are matched with the Mexican product-levelclassification.5
The number of firms in the sample varies between 5,493 in 1994 and 3,871 in 2003(see Table 1). Between 1,402 and 1,889 firms are engaged in exporting. As indicatedin Table 1, the number of varieties produced (hereafter, we will refer to each firm-product combination as a product variety) ranges from 18,079 in 1994 to 12,495 in2003, while the number of exported varieties expands from 2,730 in 1994 to 3,160 in2003, reaching the peak of 4,025 in 1998.
2. Is There Evidence of Variety Churning Being Another Margin ofAdjustment?
Recent models of multi-product firms predict that product churning within the firm isanother margin of adjustment taking place in response to globalisation. In the modelproposed by Bernard et al. (2006), product churning is due to firm-level productivityinteracting with firm-product-specific competencies. A symmetric reduction in coun-tries� fixed or variable trade costs will cause all firms to drop their lowest-competencyvarieties due to the general equilibrium influence of growing export opportunities onlabour markets. At the same time, declining trade costs will result in an increase in boththe proportion of varieties exporters sell abroad as well as their level of exports of eachvariety.
In Eckel and Neary (2010), multi-product firms are characterised by core compe-tence in the production of a particular variety and are less efficient in the production ofvarieties outside their core competence. Firms internalise demand linkages between
4 The latter set of figures was kindly provided to us by John Romalis.5 Note that the US tariff data include information on both ad valorem and specific tariffs. Specific tariffs
were converted into ad valorem equivalents by John Romalis and were added to the ad valorem rates. In somecases, this adjustment produced a figure suggesting that combined tariffs were increasing (rather thandecreasing) under NAFTA. We dropped these figures (pertaining to about 1% of the sample) from theanalysis.
Table 1
Number of Firms and Varieties
Year
No. of firms No. of varieties
All Exporting All Exported
1994 5,493 1,402 18,079 2,7301995 5,238 1,631 17,576 3,2691996 4,965 1,795 16,581 3,7281997 4,752 1,889 15,804 3,9341998 4,579 1,849 15,295 4,0251999 4,420 1,708 14,808 3,7532000 4,292 1,660 14,181 3,5932001 4,138 1,541 13,619 3,3862002 3,987 1,469 13,150 3,2092003 3,871 1,457 12,495 3,160
Total 49,451 17,792 163,470 37,778
2010] 485M U L T I - P R O D U C T E X P O R T E R S I N M E X I C O
� The Author(s). Journal compilation � Royal Economic Society 2010
varieties they produce. The presence of the cannibalisation effect and core compe-tencies leads to an adjustment in the range of varieties produced (firm scope).Opening a country to international trade, which increases both the market size and thelevel of competition, will lead to a reduction in firm scope as firms drop their fringevarieties.
In the model of Nocke and Yeaple (2006), where firms differ in terms of productivitybut all varieties produced within a firm are symmetric, multilateral trade liberalisationwill result in large firms decreasing their scope and small firms doing the opposite.
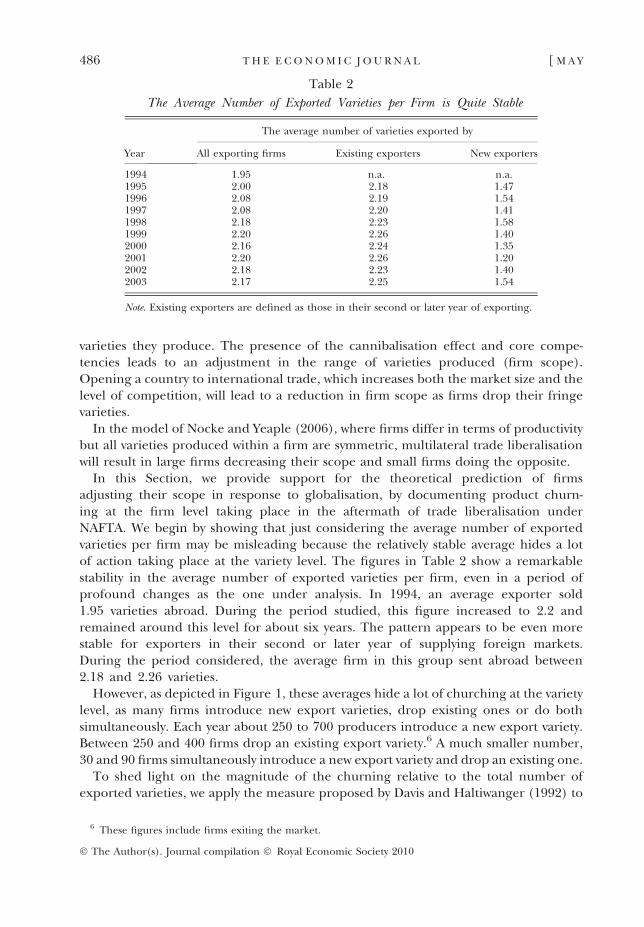
In this Section, we provide support for the theoretical prediction of firmsadjusting their scope in response to globalisation, by documenting product churn-ing at the firm level taking place in the aftermath of trade liberalisation underNAFTA. We begin by showing that just considering the average number of exportedvarieties per firm may be misleading because the relatively stable average hides a lotof action taking place at the variety level. The figures in Table 2 show a remarkablestability in the average number of exported varieties per firm, even in a period ofprofound changes as the one under analysis. In 1994, an average exporter sold1.95 varieties abroad. During the period studied, this figure increased to 2.2 andremained around this level for about six years. The pattern appears to be even morestable for exporters in their second or later year of supplying foreign markets.During the period considered, the average firm in this group sent abroad between2.18 and 2.26 varieties.
However, as depicted in Figure 1, these averages hide a lot of churching at the varietylevel, as many firms introduce new export varieties, drop existing ones or do bothsimultaneously. Each year about 250 to 700 producers introduce a new export variety.Between 250 and 400 firms drop an existing export variety.6 A much smaller number,30 and 90 firms simultaneously introduce a new export variety and drop an existing one.
To shed light on the magnitude of the churning relative to the total number ofexported varieties, we apply the measure proposed by Davis and Haltiwanger (1992) to
Table 2
The Average Number of Exported Varieties per Firm is Quite Stable
Year
The average number of varieties exported by
All exporting firms Existing exporters New exporters
1994 1.95 n.a. n.a.1995 2.00 2.18 1.471996 2.08 2.19 1.541997 2.08 2.20 1.411998 2.18 2.23 1.581999 2.20 2.26 1.402000 2.16 2.24 1.352001 2.20 2.26 1.202002 2.18 2.23 1.402003 2.17 2.25 1.54
Note. Existing exporters are defined as those in their second or later year of exporting.
6 These figures include firms exiting the market.
486 [ M A YT H E E C O N O M I C J O U R N A L
� The Author(s). Journal compilation � Royal Economic Society 2010

our context. More specifically, we define export variety creation as the number of newexport varieties introduced at time t divided by the total number of varieties exportedat t. Similarly, we define export variety destruction as the number of varieties ceasing to beexported at time t divided by the total number of exported varieties at t. We refer to thesum of the two as gross churning and to the difference as net churning.
As illustrated at the bottom of Table 3, net churning of 7.4% observed in the wholeeconomy (this is the average over all years) is much lower that the 30% figure found forgross churning, the 19% figure for export variety creation and 11% for export varietydestruction. High gross churning rates are observed in all 2-digit sectors ranging fromthe low of 20% in mineral based industries to 38% in textiles, garments and leather and43% in wood products. Export variety creation ranges from about 13% in mineral-basedindustries to 28% in wood products. Export variety destruction (which accounts for exiting
0
100
200
300
400
500
600
700
800
1995 1996 1997 1998 1999 2000 2001 2002 2003
Firms introducing new export varietiesFirms dropping export varietiesFirms doing both
Fig. 1. Variety Churning at the Firm LevelNote. Exiting firms are included among those dropping export products.
Table 3
Export Variety Churning by Sector
Export varietycreation (1)
Export varietydestruction (2)
Gross churning(1) + (2)
Net churning(1)�(2)
Food, beverages and tobacco 0.203 0.113 0.316 0.090Textiles, garments, leather 0.219 0.161 0.380 0.057Wood products 0.277 0.151 0.428 0.126Pulp and paper 0.169 0.104 0.273 0.065Chemical products 0.167 0.109 0.276 0.058Mineral based industries 0.132 0.066 0.198 0.066Basic metals 0.152 0.094 0.246 0.058Machinery and transport equipment 0.185 0.097 0.282 0.088Other industries 0.160 0.076 0.236 0.084
All sectors 0.188 0.114 0.302 0.074
2010] 487M U L T I - P R O D U C T E X P O R T E R S I N M E X I C O
� The Author(s). Journal compilation � Royal Economic Society 2010

plants) varies between a low of 8% in other industries to a high of 16% in textiles,garments and leather.7
To check to what extent variety churning is related to trade reforms, in Figure 2 weplot the change in the number of exported varieties against the change in the 6-digitindustry-level tariff imposed by the US on imports from Mexico. We find that industriesexperiencing a larger tariff decline saw a larger increase in the number of exportedvarieties, which is consistent with the theoretical prediction that a lower cost of sendinggoods abroad will encourage firms to export more varieties.8
Churning is not limited to just exported varieties. According to the theory, a lowercost of importing goods from abroad will lead to a decline in firm scope as firms droptheir marginal varieties sold on the domestic market. However, this prediction is notcorroborated by the industry-level data, as Figure 3 depicts a positive relationshipbetween the decline in Mexican tariffs and the change in the number of varieties solddomestically. The observed pattern may be due to the fact that sector-specific tariffsalso include tariffs on inputs.9 Thus the Figure captures two opposing effects: increased
80
60
40
20
0
–20
–0.2 –0.15 –0.1 –0.05 0
Cha
nge
in th
e nu
mbe
r of
exp
orte
d pr
oduc
ts
Change in US Tariffs under NAFTA
Fig. 2. Variety Churning and Tariff Changes under NAFTA: Exported Varieties and US Tariffs
7 If exiting firms were excluded from the calculation of export variety destruction, the measure would rangefrom 6% in mineral-based industries to 16% in textile, leather and garments industry with the economy widemeasure reaching 11.5%.
8 Though, it is important to note that the theoretical prediction is at the firm level, while the figurespresented are at the industry level. In a related study, Iacovone and Javorcik (2008), we show that theanticipated decline in US tariffs has led to higher investment outlays among Mexican producers, especially insectors with high advertisement intensity, and that investment was a key determinants of introduction of newvarieties on export markets.
9 And access to more intermediate input varieties will have a positive effect on firm scope; see Goldberget al. (2008).
488 [ M A YT H E E C O N O M I C J O U R N A L
� The Author(s). Journal compilation � Royal Economic Society 2010

competition facing domestically-produced varieties and access to a higher number ofintermediate input varieties.
The theoretical prediction that in the aftermath of trade liberalisation firms will droptheir lowest-competency varieties pertains to firm behaviour (Bernard et al., 2006; Eckeland Neary, 2010), so next we turn to the firm-variety-level data. And indeed the pre-diction finds empirical support at the micro level. In Table 4, we regress an indicatorvariable equal to one if firm f �s will discontinue its sales of variety i at time t + 1, andzero otherwise, on the importance of the variety to the firm at time t. The importance ismeasured by the share of the variety i in the firm�s total sales at time t (variety rele-vance), the value of the firm sales of the variety at t (variety sales volume) and the firm�sshare in the national sales of the product p to which variety i belongs (variety marketshare).10 We also control for the firm�s age (in the case of multi-establishment firms weuse the age of the oldest establishment), the Mexican NAFTA tariff and the US NAFTAtariff specific to the product p at time t. The regression is estimated as a linear prob-ability model and includes year and 6-digit industry fixed effects.11
The data indicate that fringe varieties are more likely to be discontinued than corevarieties. The results are statistically significant at the 1% level for all three measures ofvariety importance. The data also suggest that older producers are less likely todiscontinue production of a variety.12 Further, we find a positive relationship between
300
200
100
0
–100
–0.25 –0.2 –0.15 –0.1 –0.05 0Change in Maxican Tariffs under NAFTA
Cha
nge
in n
umbe
r of
dom
estic
pro
duct
s
Fig. 3. Variety Churning and Tariff Changes under NAFTA: Domestic Varieties and Mexican Tariffs
10 Recall that within the product category of widgets, varieties will be defined as widgets produced bydifferent firms.
11 Using a probit specification, not reported to save space, leads to the same conclusions.12 Ideally, we would like to use the variety age rather than firm age, but unfortunately this information is
not available. The theoretical model of Bernard et al. forthcoming, predicts a negative relationship betweenthe probability of a variety being dropped and the variety�s tenure.
2010] 489M U L T I - P R O D U C T E X P O R T E R S I N M E X I C O
� The Author(s). Journal compilation � Royal Economic Society 2010

Tab
le4
Dro
ppin
gD
omes
tic
Var
ieti
es
(1)
(2)
(3)
(4)
(5)
(6)
(7)
(8)
Var
iety
rele
van
ce�
0.10
6***
�0.
102*
**(0
.003
)(0
.004
)V
arie
tysa
les
volu
me
(lo
g)�
0.04
9***
�0.
047*
**(0
.000
)(0
.001
)V
arie
tym
arke
tsh
are
�0.
081*
**�
0.08
5***
(0.0
03)
(0.0
04)
Fir
mag
e(l
og)
�0.
010*
**�
0.00
9***
(0.0
02)
(0.0
02)
Mex
ican
tari
ff�
0.13
3**
�0.
009
�0.
085*
0.01
8(0
.044
)(0
.096
)(0
.045
)(0
.094
)M
exic
anta
riff�
Var
iety
rele
van
ce0.
048
(0.0
47)
Mex
ican
tari
ff�
Var
iety
sale
s�
0.01
7*(0
.009
)M
exic
anta
riff�
Var
iety
mar
ket
shar
e�
0.16
5**
(0.0
64)
Mex
ican
tari
ff�
Pla
nt
age
�0.
040
(0.0
26)
US
tari
ff�
0.07
5**
�0.
016
�0.
112*
**�
0.08
8**
(0.0
33)
(0.0
35)
(0.0
33)
(0.0
30)
R2
0.04
40.
146
0.03
60.
026
0.04
30.
143
0.03
80.
027
N13
9,33
413
3,43
513
7,83
311
0,58
912
0,16
611
5,93
811
9,04
395
,634
Not
e.T
he
ou
tco
me
vari
able
iseq
ual
to1
ifva
riet
yi
sold
do
mes
tica
lly
atti
me
tw
ill
be
dis
con
tin
ued
int
+1,
and
zero
oth
erw
ise.
All
spec
ifica
tio
ns
incl
ud
e6-
dig
itin
du
stry
fixe
def
fect
san
dye
arfi
xed
effe
cts.
Ro
bu
stst
and
ard
erro
rsar
ere
po
rted
inco
lum
ns
(1)
to(4
).In
colu
mn
s(5
)to
(8)
stan
dar
der
rors
are
clu
ster
edat
the
pro
du
ct-y
ear
leve
l.
490 [ M A YT H E E C O N O M I C J O U R N A L
� The Author(s). Journal compilation � Royal Economic Society 2010

tariff protection (Mexican NAFTA tariff) and the probability of the variety�s survival. Theestimates on the interaction terms suggest that the effect of protection is stronger for corevarieties. The last two findings are statistically significant in two of four specifications.13
Although the international trade literature has examined the patterns of introduc-tion and discontinuation of export products and contrasted changes in the number ofproducts exported with the changes in the volume of exports at the product level usingnational trade statistics (Hummels and Klenow, 2005; Besedes and Prusa, 2006, 2007;Evenett and Venables, 2002), churning of export products at the firm level has notbeen extensively documented before.14 As we have shown in this Section, relying onfirm-product-level data uncovers a lot of variation and patterns that are missed whenmore aggregated information is used.
3. Importance of Uncertainty, Information Asymmetries and Search Costs
Recent theoretical (Rauch and Watson, 2003) and empirical contributions (Besedesand Prusa, 2006) point towards the importance of information asymmetries, trust andsearch costs as crucial determinants of trade patterns. The existence of these factors isplausible explanation for why new entrants into export markets may make a relativelysmall contribution to their country�s overall export growth.
In Rauch and Watson�s (2003) model, search costs and information asymmetries leadimporters from developed countries to start with small orders to test the credibility ofan exporter located in a developing country. In an environment where potentialtrading partners are heterogeneous and there is incomplete information about theirreliability, the buyer will need to gain confidence in the seller before awarding a largeorder. For this reason, in a newly established trading relationship the buyer may startwith some trial orders in order to assess the reliability and quality of a new tradingpartner.15
These theoretical predictions find support in the Mexican data. We find that firmsentering foreign markets for the first time start small in terms of the number ofexported varieties and the export volume. This is illustrated in Figure 4 which relatesthe average number of export varieties to the firm�s experience in export markets. Theyear when a firm begins to export is identified as zero on the horizontal axis. Asillustrated in the Figure, new exporters begin their sales in foreign markets with one ortwo export varieties (1.5 varieties on average). Two years later the average number ofexported varieties increases to almost 2. The total number of varieties sold by the firmincreases slightly in the year the firm enters foreign markets and remains stableafterwards. New exporters also start small in terms of the export volume.16 Figure 5
13 Our findings are in contrast with those of Goldberg et al. (2009) who do not observe a link betweenvariety dropping and tariff declines in India.
14 Notable exceptions include work of Baldwin and Gu (2004, 2009) and Baldwin et al. (2005) who examinethe relationship between firm diversification and trade liberalisation using Canadian data and work ofBernard et al. (2006) who document a similar pattern for products produced and sold (in general) in the US.These authors conclude that product switching is frequent, widespread and influential in determining both firmand aggregate outcomes.
15 A similar mechanism is also proposed by Araujo and Ornelas (2007).16 New exporters are defined as firms which export at time t but were not exporting at t � 1. We do not
impose a condition that the firm continues exporting in all years depicted in the Figure.
2010] 491M U L T I - P R O D U C T E X P O R T E R S I N M E X I C O
� The Author(s). Journal compilation � Royal Economic Society 2010

indicates that first-year exports account for only a small fraction of a firm�s total sales(about 12%). The volume of exports increases in subsequent years, getting close to20% in the fifth year of exporting.
Rauch and Watson�s (2003) model does not predict that all new trading relationshipswill start small but rather it postulates that there will be a whole distribution of startingvolumes. A large extent of uncertainty will be associated with a distribution of startingvolumes skewed to the left (i.e., more small orders). This appears to be the case inMexico, as illustrated in Figure 6, which depicts the distribution of the export values ofvarieties in their first year of being exported, normalised by the total sales of the varietyby a given firm. The distribution is skewed to the left indicating that most tradingrelationships start with small volumes.
A further piece of evidence supporting the importance of uncertainty comes fromthe observation that new exporters not only start small but also start by exportingvarieties they have previously been selling on the domestic market. As evident fromTable 5, in 79% of cases, firms enter foreign markets with a variety they sold domes-tically in at least one of the previous three years. In 75% of cases the variety was solddomestically within the past two years. Over two-thirds of firm sold the newly exportedvariety at home in the year before.
Starting with the variety already sold in the domestic market limits the risk faced byfirms entering foreign markets for the first time. Should the export operation becomeunsuccessful they can divert the unsold goods to the Mexican market. While futureexporters may need to upgrade the quality of their future export products (for
3.0
2.5
2.0
1.5
1.0
0.5
0
–4 –2 0 2 4 6Period Around Switching
Sold (Domestically and Exported) Exported
Ave
rage
num
ber
of p
rodu
cts
Fig. 4. New Exporters Start Small: Number of Exported VarietiesNote. Period 0 corresponds to the year of entry into export markets.
492 [ M A YT H E E C O N O M I C J O U R N A L
� The Author(s). Journal compilation � Royal Economic Society 2010

evidence see Iacovone and Javorcik (2008)), the cost of doing so is probably lower thanthe cost of starting production of a new product from scratch.
The risks faced by existing exporters are likely to be lower. They are familiar with theexport markets and thus better positioned to predict how well a new variety will sellthere. Moreover, thanks to their long-standing relationships with foreign buyers theymay be able to obtain much more information on the sales prospects of a new variety.Past interactions with the foreign buyer may make it easier to assess how much theirjudgment may be trusted. It is also plausible that foreign customers request theirMexican partners to widen the assortment of exported goods or that active exportersintroduce new export items in response to new business opportunities they havespotted while being active in foreign markets.
Thus it is not surprising that new exporters are more likely than establishedexporters to enter foreign markets with varieties previously sold at home. While onaverage 85% of new export varieties sold abroad by firms entering export markets forthe first time were previously sold at home, the corresponding figure for establishedexporters is only 69% (see Table 6).17
The uncertainty about opportunities in export markets is also reflected in the factthat foreign sales of many varieties are discontinued quite quickly. This is illustrated in
20
15
10
5
0
–4 –2 0 2 4 6Period Around Switching
Rat
io o
f E
xpor
ts to
Tot
al S
ales
Fig. 5. New Exporters Start Small: Export Revenue Relative to Total Sales of the VarietyNote. The graph depicts the value of exports of a variety newly introduced in export marketsrelative to the firm’s total sales of the variety (expressed in %). Period 0 corresponds to theyear when the variety is first introduced into export markets.
17 We define experienced exporters as those firms that are in their second or later year of exportingactivity.
2010] 493M U L T I - P R O D U C T E X P O R T E R S I N M E X I C O
� The Author(s). Journal compilation � Royal Economic Society 2010

Table 7, which follows Brooks (2006) and presents export market survival rates ofvarieties introduced in a given year. Only about two-thirds of new export varieties areexported for more than one year. Between 46% and 60% of varieties (depending onthe cohort) survive for at least three years in foreign markets. Only 37% of exportvarieties introduced into foreign markets in 1995 are still exported in 2003. Interest-ingly, as illustrated in Table 8, which presents annual survival rates, the survival rates
4
3
2
Den
sity
1
0
0 0.2 0.4 0.6 0.8 1Export Revenue/Total Sales
Fig. 6. New Exporters Start Small: Distribution of Export Revenue Relative to Total Sales of theVariety in the First Year of Being Exported
Note. The Figure depicts the export value of a variety in its first year of being exported normalisedby the total sales of the variety by a given firm.
Table 5
Firms Tend to Enter Export Markets with Varieties Previously Sold at Home
Year
% Share of new export varieties sold in Mexico
at t �1 at t �1 or t�2 at t �1 or t �2 or t �3
1995 82 n.a. n.a.1996 69 77 n.a.1997 69 76 801998 65 73 761999 63 71 742000 70 78 812001 67 75 792002 72 81 852003 73 77 79
Average 1997–2003 68 75 79
494 [ M A YT H E E C O N O M I C J O U R N A L
� The Author(s). Journal compilation � Royal Economic Society 2010

Table 6
New Exporters are More Likely Than Existing Exporters to Enter Foreign Markets withVarieties Previously Sold at Home
YearNo. of newexporters
Percentage ofnew exporters
starting to export witha product previously
sold domestically
No. of existing exportersintroducing a new
export variety
Percentage of existingexporters introducing a
new export variety that waspreviously sold domestically
1995 602 90 470 751996 460 87 539 651997 358 87 470 671998 225 80 474 661999 166 68 315 692000 163 89 263 722001 124 86 243 692002 120 83 189 782003 219 78 207 75
Total 2,437 85 3,170 69
Note. Varieties previously sold at home are defined as those sold on the domestic market at t�1.
Table 7
Export Variety Survival Rates by Cohort (relative to the year of introduction) (%)
Year 1995 1996 1997 1998 1999 2000 2001 2002 2003
1995 1001996 68 1001997 60 67 1001998 57 59 66 1001999 51 51 50 59 1002000 46 48 45 51 55 1002001 42 42 41 47 48 55 1002002 38 39 40 40 40 46 60 1002003 37 38 36 36 36 38 50 53 100
Notes. Each cell presents the percentage of varieties within a cohort that continue to be exported in year t.
Table 8
Export Variety Survival Rates by Cohort (relative to the previous period) (%)
Year 1995 1996 1997 1998 1999 2000 2001 2002 2003
1995 1001996 68 1001997 88 67 1001998 94 88 66 1001999 89 87 76 59 1002000 92 93 90 86 55 1002001 90 89 91 92 87 55 1002002 90 93 97 86 85 83 60 1002003 98 96 92 90 90 82 84 53 100
Notes. Each cell presents the percentage of varieties that were exported at t � 1 and continue to be exportedat t.
2010] 495M U L T I - P R O D U C T E X P O R T E R S I N M E X I C O
� The Author(s). Journal compilation � Royal Economic Society 2010

are the lowest in the initial period. While only between half and two-third of varietiessurvive between the entry year and the subsequent period, between 76% and 88%survive between the second and third year after entry. Broadly speaking, the probabilityof continued presence in export markets, conditional on being exported at time t � 1,increases with the time elapsed from the year of entry. These findings are consistentwith the model of Araujo and Ornelas (2007) and the recent results based on product-level trade statistics or transaction-level data (Besedes and Prusa, 2006, 2007; Eatonet al., 2008; and others).
4. Discovery
A theoretical model incorporating uncertainty and opportunities for imitation(Hausmann and Rodrik, 2003) predicts that we should witness a limited amount ofexport discovery, i.e., introducing into export markets a product that has not beenexported from Mexico before. The theory predicts that firms potentially capable ofproducing a certain good will hold off until someone else introduces the product firstand, having witnessed their success, they will imitate quickly.
Consistent with these predictions, we show in Table 9 that export discovery is arelatively rare phenomenon. We find that most firms introduce in export markets aproduct that others have already been exporting. Furthermore, we find that once a firmhas introduced an export product previously not exported by any other firm, otherfirms follow quickly (though, admittedly, we do not have a benchmark to which we cancompare the speed of imitation). On average, a discovery is simultaneously introducedby more then one firm (that is, between one and two firms introduce a variety that is anexport discovery). For approximately half of the new discoveries, an additional firmstarts exporting the same product in the following year. The same happens one yearlater. However, three years after the discovery takes place the rate of diffusion slowsdown but continues until at least the eighth year which is the longest time period oursample allows us to consider (see Table 10).
Table 9
New Export Products and Export Discoveries
Year New export varieties Export discoveriesDiscoveries as a % of
all new export varieties
1995 1,072 352 331996 999 319 321997 828 253 311998 699 172 251999 481 97 202000 426 100 232001 367 101 282002 309 80 262003 426 113 27
Total 5,607 1,587 28
496 [ M A YT H E E C O N O M I C J O U R N A L
� The Author(s). Journal compilation � Royal Economic Society 2010

5. Conclusions
In the past few years, the international trade literature has made a lot of progress inunderstanding the link between micro-heterogeneity and aggregate export response aswell as in modelling the role uncertainty in international trade. In this article, wecontribute to the literature by examining within-firm product-level dynamics in theaftermath of a profound liberalisation. Our objective is to shed light on how well thepredictions of the theoretical literature match the patterns observed in Mexico after itjoined NAFTA.
Our results are consistent with the theoretical predictions emerging from the recentmodels of multi-product firms. We uncover the existence of intense variety churning atthe firm level and show that it is systematically related to exogenous trade reforms. Thissupports the predictions of the recent theoretical models emphasising that changes infirm product scope are another margin of adjustment taking place in response tochanges in trade costs.
We also document micro-level patterns consistent with the predictions of models thatemphasise the role of uncertainty and information asymmetries in shaping trade pat-terns. We show that new exporters break into export markets with between one and twovarieties and a small volume. We document a large dispersion in the distribution ofvariety-level export volumes normalised by variety-level total sales. As expected, we findthat the distribution is skewed to the left, which is suggestive of the presence ofuncertainty in new trade relationships. We also find that new exporters usually enterforeign markets with a product already sold at home. These findings are consistent witha model in which starting small allows producers to test the credibility of the foreignpartner or the suitability of their products abroad. Finally, we show that many newlyintroduced export products do not survive for more than a year.
The interplay between uncertainty and possibility of imitation, as found in the modelof self-discovery of Hausmann and Rodrik (2003), suggests that new export discoverieswill be undersupplied. Our results indeed show that export discoveries constitute alimited share of new export varieties and that the footsteps of a producers introducingan export discovery are quickly followed by other exporters.
Table 10
Diffusion of Export Discoveries
YearAverage no of firms
exporting a discoveryAverage value of
exports (by product) US$% increase in the export
volume of a new discovery
1 1.4 3,8352 1.5 6,241 1633 1.7 7,831 1204 1.7 8,263 1065 1.6 6,993 856 1.5 6,420 927 1.3 6,315 988 1.3 7,657 121
Notes. The Table includes only export discoveries introduced in 1995 and 1996. Only caseswith more than 20 active firms are taken into account.
2010] 497M U L T I - P R O D U C T E X P O R T E R S I N M E X I C O
� The Author(s). Journal compilation � Royal Economic Society 2010

It is important to stress that by emphasising the role of uncertainty in shapingpatterns of trade and exports dynamics we do not intend to conclude that this is theonly factor preventing diversification in developing countries. In fact, we think that theexistence of substantial fixed costs and the need for quality upgrading prior to sup-plying export markets are certainly equally, if not more, important factors, as showed byvarious studies (Roberts and Tybout, 1997; Das et al., 2007; Iacovone and Javorcik,2008).
We believe our findings are informative for both policy makers and researchersconcerned with the structure and determinants of a country�s exports patterns.Understanding the dynamics of introducing new export varieties at the firm levelconstitutes the first step in understanding how a country can upgrade its exportstructure and what policies, if any, can stimulate this process.
World BankUniversity of Oxford and CEPR
ReferencesAlbornoz, F., Calvo Pardo, H., Corcos, G. and Ornelas, E. (2008). �Sequential exporting�, mimeo, London
School of Economics.Alvarez, R., Faruq, H. and Lopez, R. (2007). �New products in export markets: learning form experience and
learning from others�, mimeo, Indiana University, Bloomington.Araujo, L. and Ornelas, E. (2007). �Trust-based trade�, CEP Discussion Paper No. 820, LSE.Arkolakis, C. and Muendler, M.-A. (2009). �The extensive margin of exporting goods: a firm-level analysis�,
mimeo, University of California, San Diego.Baldwin, J. and Gu, W. (2004). �Trade liberalization and export-market participation, productivity growth, and
innovation�, Oxford Review of Economic Policy, vol. 20(3), pp. 372–92.Baldwin, J. and Gu, W. (2009). �The impact of trade on plant scale, production-run length and diversification�,
in (T. Dunne, B. Jensen and M. Roberts, eds), Producer Dynamics: New Evidence from Micro Data, vol. 68 ofStudies in Income and Wealth, pp. 557–92, Chicago: University of Chicago Press.
Baldwin, J., Caves, R. and Gu, W. (2005). �Responses to trade liberalization: changes in product diversificationin foreign- and domestic-controlled plants�, in (L. Eden and W. Dobson, eds), Governance, Multinationalsand Growth: New Horizons in International Business, pp. 209–46, Cheltenham and Northampton, MA: Elgar.
Bartelsman, E.J. and Doms, M. (2000). �Understanding productivity: lessons from longitudinal microdata�,Journal of Economic Literature, vol. 38(3), pp. 569–94.
Bernard, A.B., Redding, S.J. and Schott, P.K. (2006). �Multi-product firms and trade liberalization�, CEPDiscussion Papers No. 769, LSE.
Bernard, A.B., Redding, S.J. and Schott, P.K. (2007a). �Comparative advantage and heterogeneous firms�,Review of Economic Studies, vol. 74(1), pp. 31–66.
Bernard, A.B., Redding, S.J. and Schott, P.K. (forthcoming). �Multi-product firms and product switching�,American Economic Review.
Bernard, A.B., Jensen, J.B., Redding, S. and Schott, P. (2007b). �Firms in international trade�, Journal ofEconomic Perspectives, vol. 21(3), pp. 105–30.
Besedes, T. and Prusa, T.J. (2006). �Product differentiation and duration of us import trade�, Journal ofInternational Economics, vol. 70(2), pp. 339–58.
Besedes, T. and Prusa, T.J. (2007). �The role of extensive and intensive margins and export growth�, NBERWorking Paper No. 13628.
Brooks, E. (2006). �Why don�t firms export more? Product quality and Colombian plants�, Journal of Develop-ment Economics, vol. 80(1), pp. 160–78.
Das, S., Roberts, M. and Tybout, J. (2007). �Market entry costs, producer heterogeneity and export dynamics�,Econometrica, vol. 75(3), pp. 837–73.
Davis, S. and Haltiwanger, J. (1992). �Gross job creation, gross job destruction, and employment reallocation�,Quarterly Journal of Economics, vol. 107(3), pp. 819–63.
Eaton, J., Eslava, M., Kugler, M. and Tybout, J. (2008). �Export dynamics in Colombia: transaction-levelevidence�, in (E. Helpman, D. Marin and T. Verdier, eds), The Organization of Firms in a Global Economy,pp. 231–72, Cambridge, MA: Harvard University Press.
498 [ M A YT H E E C O N O M I C J O U R N A L
� The Author(s). Journal compilation � Royal Economic Society 2010

Eaton, J., Kortum, S. and Kramarz, F. (2004a). �An anatomy of international trade: evidence from Frenchfirms�, mimeo, New York University.
Eaton, J., Kortum, S. and Kramarz, F. (2004b). �Dissecting trade: firms, industries, and export destinations�,American Economic Review: Papers and Proceedings, vol. 94(2), pp. 150–4.
Eckel, C. and Neary, J.P. (2010). �Multi-product firms and flexible manufacturing in the global economy�,Review of Economic Studies, vol. 77(1), pp. 188–217.
Evenett, S.J. and Venables, A. (2002). �Export growth by developing economies: market entry and bilateraltrade�, mimeo, London School of Economics.
Feenstra, R. and Kee, H.L. (2007). �Trade liberalization and export variety: a comparison of Mexico andChina�, World Economy, vol. 30(1), pp. 5–21.
Feenstra, R. and Ma, H. (2008). �Optimal choice of product scope for multiproduct firms under monopolisticcompetition�, in (E. Helpman, D. Marin and T. Verdier, eds), The Organization of Firms in the GlobalEconomy, pp. 173–99, Cambridge, MA: Harvard University Press.
Fernandes, A.M. (2007). �Trade policy, trade volumes and plant–level productivity in Colombian manufac-turing industries�, Journal of International Economics, vol. 71(1), pp. 52–71.
Goldberg, P.K., Khandelwal, A., Pavcnik, N. and Topalova, P. (2008). �Imported intermediate inputs anddomestic product growth: evidence from India�, mimeo, Princeton University.
Goldberg, P.K., Khandelwal, A., Pavcnik, N. and Topalova, P. (forthcoming). �Multi-product firms andproduct turnover in the developing world: evidence from India�, Review of Economics and Statistics.
Harrison, A. (ed.) (2007). Globalization and Poverty, Chicago: University of Chicago Press.Hausmann, R. and Rodrik, D. (2003). �Economic development as self-discovery�, Journal of Development
Economics, vol. 72(2), pp. 603–33.Hausmann, R., Hwang, J. and Rodrik, D. (2007). �What you export matters�, Journal of Economic Growth,
vol. 12(1), pp. 1–25.Hummels, D. and Klenow, P.J. (2005). �The variety and quality of a nation�s exports�, American Economic Review,
vol. 95(3), pp. 704–23.Iacovone, L. and Javorcik, B.S. (2008). �Shipping the good tequila out: investment, domestic unit values and
entry of multi-product plants into export markets�, mimeo, University of Oxford.Manova, K. and Zhang, Z. (2009). �Export prices and heterogeneous firm models�, mimeo, Stanford
University.Mayer, T., Melitz, M. and Ottaviano, G. (2009). �Market size, competition and the product mix of exporters�,
mimeo, Princeton University.Melitz, M.J. (2003). �The impact of trade on intra–industry reallocations and aggregate industry productivity�,
Econometrica, vol. 71(6), pp. 1695–725.Nocke, V. and Yeaple, S. (2006). �Globalization and endogenous firm scope�, PIER Working Paper Archive
No. 06–015, Penn Institute for Economic Research, Department of Economics, University of Pennsyl-vania.
Pavcnik, N. (2002). �Trade liberalization, exit, and productivity improvement: evidence from Chilean plants�,Review of Economic Studies, vol. 69(1), pp. 245–76.
Rauch, J. and Watson, J. (2003). �Starting small in an unfamiliar environment�, International Journal of IndustrialOrganization, vol. 21(September), pp. 1021–42.
Roberts, M.J. and Tybout, J.R. (1997). �The decision to export in Colombia: an empirical model of entry withsunk costs�, American Economic Review, vol. 87(4), pp. 545–64.
Romalis, J. (2007). �NAFTA�s and CUSFTA�s impact on international trade�, Review of Economics and Statistics,vol. 89(3), pp. 416–35.
Schor, A. (2004). �Heterogeneous productivity response to tariff reduction, evidence from Brazilian manu-facturing firms�, Journal of Development Economics, vol. 75(2), pp. 373–96.
Trefler, D. (2004). �The long and short of the Canada-US. Free Trade Agreement�, American Economic Review,vol. 94(4), pp. 870–95.
Tybout, J. (2000). �Manufacturing firms in developing countries: how well do they do, and why?�, Journal ofEconomic Literature, vol. 38(1), pp. 11–44.
Yeaple, S.R. (2005). �A simple model of firm heterogeneity, international trade, and wages�, Journal ofInternational Economics, vol. 65(1), pp. 1–20.
2010] 499M U L T I - P R O D U C T E X P O R T E R S I N M E X I C O
� The Author(s). Journal compilation � Royal Economic Society 2010
Copyright © 2022 FDOKUMEN