Success and failure of African exporters
39
ISSN 2042-2695 CEP Discussion Paper No 1054 June 2011 Success and Failure of African Exporters Olivier Cadot, Leonardo Iacovone, Denisse Pierola and Ferdinand Rauch
Transcript of Success and failure of African exporters

ISSN 2042-2695
CEP Discussion Paper No 1054
June 2011
Success and Failure of African Exporters
Olivier Cadot, Leonardo Iacovone, Denisse Pierola and Ferdinand Rauch

Abstract Using a novel dataset with transactions level exports data from four African countries (Malawi, Mali, Senegal and Tanzania), this paper uncovers evidence of a high degree of experimentation at the extensive margin associated with low survival rates, consistent with high and middle income country evidence. Consequently, the authors focus on the questions of what determines success and survival beyond the first year and find that survival probability rises with the number of firms exporting the same product to the same destination from the same country, pointing towards the existence of cross-firm synergies. Accordingly the evidence is consistent with the hypothesis that those synergies may be driven by information spillovers. More intuitively and consistently with multi-product firms models, the analysis also finds that firms more diversified in terms of products, but even more in terms of markets, are more likely to be successful and survive beyond the first year. Keywords: Africa, export survival JEL Classifications: F10, F14, O55 This paper was produced as part of the Centre’s Globalisation Programme. The Centre for Economic Performance is financed by the Economic and Social Research Council. Acknowledgements This paper is part of a World Bank research project initiated by Paul Brenton and Denisse Pierola. Financial support from the BNPP Trust Fund on Improving the Survival of African Exports and from the World Bank Research Support Budget is gratefully acknowledged. We are also grateful to the Malawi Revenue Authority, the Direction Générale des Douanes du Mali, the Direction Générale des Douanes du Sénégal, and the Tanzania Revenue Authority for their cooperation and willingness to share data. We thank Frances Aidoo, William Baah-Boateng, Sidiki Guindo, Anthony Mveyange and Nelson Nsiku for their assistance in the collection of the customs data used in this paper. Olivier Cadot is Professor of Economics at the University of Lausanne and Director of the Institut d'Economie Appliquee (Crea). Leonardo Iacovone is an Economist with the Development Research Group, World Bank. Denisse Pierola is an Economist in the Trade and International Integration Team, Development Research Group, World Bank. Ferdinand Rauch is a Research Officer with the Globalisation Programme, Centre for Economic Performance, London School of Economics. Published by Centre for Economic Performance London School of Economics and Political Science Houghton Street London WC2A 2AE All rights reserved. No part of this publication may be reproduced, stored in a retrieval system or transmitted in any form or by any means without the prior permission in writing of the publisher nor be issued to the public or circulated in any form other than that in which it is published. Requests for permission to reproduce any article or part of the Working Paper should be sent to the editor at the above address. © O. Cadot, L. Iacovone, D. Pierola and F. Rauch, submitted 2011

1 Introduction
In spite of great strides since the late 1990s, low-income country exports arestill marginal in world trade and suffer from various vulnerabilities, rangingfrom low unit values to volatility, concentration and low survival (see forexample Fugazza and Molina 2009). Low survival is not necessarily a signof welfare loss if it reflects strong experimentation at the extensive margin,but it can be inefficient if sunk costs of entry and exit are substantial, assuggested by the work of Das, Robert and Tybout (2007). In particular, theweak contribution of the extensive margin to overall export growth (Besedesand Prusa 2007) may be explained by high failure rates, the flip side of lowsurvival. Thus, identifying drivers of the ‘sustainability margin’ of exportsis important for our understanding of the constraints to low-income countryexport growth. This is what the present paper sets up to do, using a newtransaction-level export dataset obtained from Customs authorities in fourAfrican countries.
The key contributions of this paper are twofold. First, we document, for asample of four low income African countries, a set of stylized facts on exportsurvival that is broadly consistent with the emerging firm-level literature, sofar confined to OECD or middle-income countries. Second, we provide novelevidence on a key outcome of interest, namely survival beyond the first yearafter entry into export markets. In particular, we identify a cross-firm “syn-ergy effect” suggestive of external economies in export survival, a potentialdriver of sustainability that has been hitherto overlooked in the literature.Increasing the number of exporters of similar products to the same destina-tion exerts a positive externality on new entrants. That is, the more similarthey are, the higher the survival probability of new entrants. When evaluat-ing the mechanisms behind these results we find evidence consistent with theexistence of information spillovers driving them. For a Senegalese exporter,for instance, the probability of surviving past the first year (22% in 2001)would rise to 26% if the number of national competitors selling the sameproduct (product identified at HS 6 digits) on the same destination marketwere to double from the baseline 22 to 44.
Our results may help explain a finding highlighted in Easterly, Resheffand Schwenkenberg (2009), namely, that national export success often takesthe form of ‘big hits’, with one narrow export item suddenly growing rapidly.
2

If a sufficient number of exporters target one market simultaneously, ourresults imply that their chances of surviving increase, possibly triggering avirtuous cycle of entry, survival and growth.
Like Eaton et al. (2008), we also find that export spells that survive tendto grow. For instance, in Senegal, products that entered a market in 2001and survived till 2008 had reached, by then, four times their entry volume.
Lastly, export scale and scope at the firm level, by which we mean respec-tively destinations per product and products per destination, both evaluatedat the time the firm launches a new product-destination combination, matterfor its survival.
From a policy perspective, our findings could be construed as contribut-ing to a possible rationale for using public funds to promote national exportsabroad. The synergy we identify is akin to external economies, as the pres-ence of competitors from the same countries exporting the same product tothe same destination provides potential new entrants with information onthe profitability of these exports ventures, help identifying potential buyersas well as provide information about the consumers’ preferences and there-fore increases their likelihood of surviving. Similarly, this information be-comes available to financial institutions and ease financial constraints of newexporters as shown by the fact that these ‘synergy effects’ are especiallyimportant for firms in sectors that are more dependent from the financialsector. However, these external economies may not be fully internalized byexporters as incumbents have not sufficient incentives to explicitly assist newentrants, leading to a market failure. Public intervention, in the form of ex-port promotion, through market-product specific information and “matchingwith buyers” services, could possibly help overcome these market failures, al-though the record of publicly-financed export promotion is patchy, especiallyin developing countries (see Lederman, Olarreaga and Payton 2010), and theeffects we identify even if statistically robust are quantitatively small.
The paper is organized as follows. Section 2 discusses the recent liter-ature related to this paper. Section 3 presents qualitative evidence basedon a recent survey of African exporters conducted by the World Bank thatmotivates the consequent analysis and presents a brief description of thedata. Section 4 discusses the estimation strategy and the result, Section 5
3

concludes.
2 Export survival: What do we know?
At the product level, the determinants of export survival have been ex-plored by a small but growing literature. Besedes and Prusa (2006) used twopanels of U.S. imports, one spanning 1972-88 with tariff-schedule data, theother spanning the 1989-2001 period with 10-digit data (the Feenstra-NBERdataset). In both cases, they found that half of all trade relationships lastedonly one year and three quarters lasted three years or less. Once censoringwas taken into account, median duration was two years. Most strikingly, thispattern of short duration was robust to aggregation at HS6, even though onewould expect interruptions to be smoothed out by aggregation. They alsofound negative duration dependence, meaning that the hazard rate fell asexport spells grew older. This finding, however, has been recently contestedby Brenton, Saborowsky and von Uexhull (2010).1 In terms of survival de-terminants, Besedes and Prusa (2006) found that industrial-country exportslasted longer, and so did exports of machinery, a finding confirmed by theanalysis of Asian trade flows by Obashi (2010).
Besedes and Prusa (2006) explored the determinants of export survivalfurther by testing the implications of a search model proposed by Rauch andWatson (2003) in which importers search for low-cost suppliers and exportersinvest optimally in production capacity in the face of moral hazard (risk ofnon-payment). Such model implies that, in general, smaller initial trans-actions have a lower life expectancy; however, differentiated goods, wheremoral hazard is highest, involve both smaller initial transactions and longerlife expectancy. The model’s predictions are upheld by Cox regressions onU.S. import data using Rauch’s (1999) index of product differentiation as aregressor. That is, the hazard rate is 23% higher for homogenous productsthan for differentiated ones, although initial transactions are 40% to 350%larger. In related work, Besedes (2008) also finds supports for the Rauch-
1Brenton et al. argue that the assumption of proportional hazards, which is needed forCox regressions to be valid, typically does not hold in export-duration samples (this can beverified using a Schonfeld test). Using the alternative Prentice-Gloeckler (1978) estimator,they find no duration dependence. Brenton et al.’s critique applies to the quasi-entiretyof the export-survival literature.
4

Watson hypotheses on a restricted sample of Rauch-differentiated productswhere he proxies search costs by the number of potential suppliers and reli-ability by income levels.
Evidence on trade flows from other countries largely confirmed these earlyfindings. The determinants of export duration were explored by Nitsch (2009)using Cox regressions on a ten-year panel of German imports at the HS8 level.He found that gravity variables (distance, exporter GDP, common language,common border, etc.) influenced the duration of trade flows pretty muchthe same way they influenced trade volumes. Interestingly, he found thatthe short duration of trade flows held even when flows below 10’000 euroswere excluded. Fugazza and Molina (2009) extended the exploration to anine-year panel of HS6 bilateral trade flows between 96 countries using, asregressors, gravity variables and time required for export procedures (basedon the World Bank’s Doing Business surveys) as proxies for fixed costs. Be-sides usual findings on the effect of gravity variables and income levels, theyalso found that fixed costs reduced survival.2 A similar exercise was carriedout on Asian trade flows by Obashi (2010) with largely convergent results. Inparticular, the 2-to-3 year median survival seems to hold across all samplesstudied. Obashi also found that vertical trade relationships (involving thesale of semi-finished product) have hazard rates one-third lower than thoseinvolving the sale of final goods, and that they are less sensitive to tradecosts (e.g. distance or exchange-rate fluctuations).
A smaller number of recent papers have made use of the growing avail-ability of firm-level datasets to shed new light on the determinants of exportsurvival. For instance, Gorg et al. (2008) tested the implications of theheterogeneous-firm model of Bernard et al. (2006) on a rich panel of 2,043Hungarian firms spanning the transition from centrally-planned to marketeconomy (1992-2003). Their data contained firm characteristics and exportsat the firm-HS6 level. They found large product turnover during the period asfirms constantly rearranged their product portfolios. They also found longersurvival for products located close to the firm’s core competencies and to thecountry’s comparative advantage. These results are consistent with those
2This is unintuitive: in microeconomics, the shut-down point depends on average vari-able costs, not on fixed costs. However the fixed export costs they consider are incurredfor each transaction, although they do not depend on transaction size. They are thereforenot really fixed when looking at flows aggregated to the annual level.
5

of Iacovone and Javorcik (2010) who showed the importance of churning atthe firm level in response to exogenous opportunities provided by increasedglobalization. Alvarez and Lopez (2008) used Tobit regressions to study thedeterminants of industry-level rates of entry and exit into exporting usinga 10-year panel of 5’000 Chilean plants. They found that within-industryheterogeneity, measured (inter alia) by the dispersion of firm-level produc-tivity levels, played an important role in explaining firm turnover in andout of exporting. By contrast, trade costs, factor intensities, and exchange-rate fluctuations were found to have only marginal impacts. Carballo andVolpe (2008) used a 6-year panel of firm-level Peruvian exports at the HS10level to explore how diversification strategies (in terms of products and mar-kets) affected the survival of firm-level exporting activity. They found thatboth geographical and product-wise diversification raised survival, but geo-graphical diversification more so—presumably because it proxies for productquality.
3 Data
3.1 Qualitative evidence from a World Bank survey
Preliminary indications on how African exporters venture and survive (ornot) on foreign markets can be gleaned from a 2009 survey focusing on ex-port survival conducted by the World Bank in four African countries.3 Thesurvey, which had three sections (basic information on the firm, constraintson survival, and opportunities and plans for future expansion), asked ex-porters specific questions on their initial entry into and survival on exportmarkets. On the basis of the information provided, respondents were clas-sified into three categories: (i) current exporters, (ii) past exporters (whofailed), and (iii) intermittent exporters.
As shown by Table 7 in the appendix, roughly two thirds of the respon-dents (a bit more among regular exporters) identified their first client throughrelatives, friends, intermediaries and suppliers. More formal or technology-related channels (e.g. trade fairs or online research) came only second, and
3The countries are Malawi, Mali, Senegal and Tanzania. See Appendix 1 for morebackground information on the survey.
6

only a tenth of the initial contacts were made through export promotionagencies or exporters’ associations. This highlights the importance of infor-mal networks and suggest that the “thickness” of a certain network wherethere are many firms exporting similar countries to similar destination mayhelp to expand the chance of identifying appropriate buyers among throughcontacts with relatives, friends, intermediaries and suppliers.4
Product experience, whether through domestic or foreign sales, appearsas a strong driver of geographical export expansion. A majority of respon-dents reported that their initial export product was one they were alreadyselling domestically, as opposed to starting a new line taylored to the for-eign customer’s needs. This suggests that experience matters and indirectly,it also could imply a natural 3-step expansion strategy: first the domesticmarket, then regional markets with similar preferences (so domestically soldproducts can be tried there), finally more differentiated markets. This is con-sistent with results in Cadot, Carrere and Strauss-Kahn (2009) who showedthat the survival of LDC exports was higher when export to OECD marketswas preceded by a small number of years of exports to regional markets.Moreover, when asked whether their most recent export product in a givendestination was a new one or one that had previously been exported else-where, respondents overwhelmingly indicated the latter.
When asked how the opportunity to export a new product came aboutin the first place, the majority of regular exporters answered that they wereapproached by an existing buyer asking for a new product, suggesting thatexport experience matters beyond domestic experience in terms of establish-ing a “network” of buyers to identify market opportunities.
Finally, in an open question about constraints on export (or export expan-sion in the case of the current exporters), a large proportion of respondents(31%) identified access to finance as the main factor limiting their operations.Moreover, the percentage was higher (42%) among past (failed) exporters,suggesting that credit constraints are not just a perception, but a realityeffectively hurting the survival of exports.
4The role of networks for trade is a theme largely developed in the writings of Rauch(1999)
7

3.2 Customs data
Our export dataset is generated from raw data files collected by customsauthorities containing export flows at the transaction level. The files wereprovided by the customs authorities of Malawi, Mali, Senegal and Tanza-nia. Each of them contains information on products exported at the highestlevel of disaggregation of the HS code used by these administrations: 10-digitfor Mali and Senegal and 8-digit for Malawi and Tanzania. In addition toproduct information, each file contains information on destination market,FOB shipment value, net weight, port used and date of transaction. Originalnames and tax IDs identifying the individual firm were replaced by ‘dummy’digital IDs so as to preserve confidentiality. We aggregated transactions upto annual totals at the 6-digit level, the standard level used in cross-countrycomparisons. Finally, for consistency, we filtered out years with different portcoverage. For instance, for Malawi we have information from 2004 onward;however, as fewer ports were covered in 2004 than in other years, we ex-cluded 2004 from our sample for that country. Sample periods are 2005-2008for Malawi and Mali, 2000-2008 for Senegal, and 2003-2008 for Tanzania.
Table 1 presents some basic descriptive statistics. Tanzania has thelargest number of exporters (1,359), followed by Malawi (856), Senegal (715),and Mali (280); however, they are less diversified than those of other coun-tries in our sample in terms of markets. Mali’s exporters are, on average, themost diversified in terms of products.
Our variables of interests are indexed as follows. Let f be a firm, d adestination, p a product (at HS6), t the starting year of an export spell, andvcfpdt the dollar value of exports of product p to destination d in calendar yeart by firm f from country c. Because there are no multi-country firms in oursample, indexing observations by firm eliminates the need to index them byorigin country. We aggregate transactions to annual (f, p, d, t) quartets, ourprimary sample unit.
8

Table 1: Descriptive statistics
Nr firms Nr prod. Nr dest. Nr prod/firm Nr dest/firm Nr firms/prod Nr firms/dest Init. value (USD)Mean Median Mean Median Mean Median Mean Median Mean Median
Mali 280 575 99 2.54 2 3.89 2 1.89 1 7.18 2 219,694 5,373Malawi 856 932 102 1.57 1 4.10 2 3.76 1 13.19 3 106,475 571Senegal 715 1,653 100 3.10 1 6.76 2 2.92 2 22.17 5 47,111 3,446Tanzania 1,359 1,689 137 2.49 1 3.62 1 2.91 1 24.69 7 83,078 2,858
This table shows, for each source country: The number of firms, products, destinations, the number of products per firm,
number of destination per firm, number of firms per product, number of firms per destination and the value of those firms
that entered the export market. All values are computed for the year 2006.
9

Before turning to survival analysis (next section), a few observations areimportant. Following the literature on the intensive and extensive margins(e.g. Evenett and Venables 2003 or Brenton and Newfarmer 2007), we groupour primary sample units into new firms, new products (for existing firms),new destinations (for existing firm-products), and continuing firm-product-destinations. Items labeled ‘new’ refer to units that are present in the dataat time t but not at time t − 1.5 These groupings create four mutually ex-clusive categories. The ‘new-firm’ category includes all product-destinationcombinations served at time t by an exporter appearing in the data in thatyear (except the first year). The ‘new-product’ category includes all product-destination combinations served at time t by an existing exporter —one thatalready exported at t − 1— who did not export that product anywhere att − 1. The ‘new-destination’ category includes all product-destination com-binations served at time t by an existing exporter who did not serve thatdestination with any product at t − 1. The ‘existing product-destination’category includes all product-destination combinations served at time t byan exporter who was also serving that product-destination at t − 1. Moreformally, let vf,t−1 stand for f ’s exports of any product to any destinationat t− 1, vfp,t−1 for its exports of product p to any destination, vfd,t−1 for itsexports of any product to destination d, vfpd,t−1 for its exports of product pto destination d. Our four categories are
NF = {(f, p, d, t)s.t.vfpdt > 0 and vf,t−1 = 0},NP = {(f, p, d, t)s.t.vfpdt > 0, vf,t−1 > 0 and vfp,t−1 = 0},ND = {(f, p, d, t)s.t.vfpdt > 0, vf,t−1 > 0 and vfd,t−1 = 0},
EPD = {(f, p, d, t)s.t.vfpdt > 0 and vfpd,t−1 > 0}.
The dollar value of export sales in the first three categories can only go fromzero at t − 1 to some positive value at t; these variations add up to the ex-tensive margin. Changes in the dollar value of exports in the last categoryform the intensive margin.
Figure 1 decomposes the exports flows into these four categories both interms of their number, i.e. count of trade flows, and value.
5Observations in the sample period’s initial year are considered left-censored and notused.
10

Figure 1: Decomposition of exports flows
Note: This graph classifies each of the origin-firm-product-destination observations into one of four mutually exclusive groups: New Destinationincludes units of existing firms which export an existing product to a new destination; New Products includes existing firms that add a productto their portfolio, New Firms includes all units from firms that did not export before, while Continued includes all other units. The first setof graphs displays the share of observations, and the second set the share of total values of each category.
11

Analyzing the export values, existing products sold in existing destina-tions (i.e. observations for which firm, destination and HS6 at time t are allthe same as they were at time t-1) dominate in dollar value, although notalways in the count of observations. For example, in Tanzania, continuedfirm-product-destinations accounted for 90 percent of export value in 2006but only for 25% of the observation count. This suggests that our coun-tries experiment substantially. This fact is consistent with the findings ofCadot, Carriere and Strauss-Kahn (2010) for low-income countries, Freundand Pierola (2010) for Peru and Iacovone and Javorcik (2010) for Mexico.Continuing firm product destinations make up a relatively small number ofexport transactions, but a large share of export values. This confirms thefindings of Besedes and Prusa (2007) and Brenton and Newfarmer (2007),who also show the importance of the intensive margin in explaining exportgrowth in developing countries (see also Evenett and Venables 2002).
Another interesting stylized fact, consistent with existing firm-level lit-erature modeling exporters dynamics (Rauch and Watson 2003), confirmsthat when a firm’s product manages to survive in a given destination marketbeyond its first year, it will grow significantly over time. Conditional on sur-vival, Senegalese firm-product-destinations that appeared in 2001 (we don’tknow the initial year of those appearing in 2000, the sample’s initial year,because they are censored) grew by a factor of over four between 2001 and2008. Similarly, Tanzanian firm-product-destinations that appeared in 2005grew by a factor of over three by 2008.
Following Brooks (2006), Table 2 shows the number of firms, firm-products,and firm-product-destinations by a given year of entry and tracks the sur-vival of this cohort over time for each origin country. Naturally, the numbersdecrease because of the exit. What is remarkable, however, is how large theattrition is in the first year and how quickly it slows down over time. Forinstance, in Senegal, of the 206 firms that started exporting in 2001, only84 made it to 2002 (a death rate of 59%); however, of the 24 still around in2007, only 3 had failed by 2008 (a death rate of “just” 12%). To make thispoint more clear, the third column of Table 2, calculated from the secondone, shows the survival rate with respect to the previous year (i.e. one minusthe annual death rate). Survival rates increase over time. For instance, 59percent of firms that entered in 2001 dropped out by 2002, while 13 percentof firms that survived until 2007 survive also until 2008. This casual obser-
12

Table 2: Survival cohorts
Senegal Tanzania Mali MalawiEntry:2001 Entry:2004 Entry:2005 Entry:2005
Nr Y-Exit Exit Nr Y-Exit Exit Nr Y-Exit Exit Nr Y-Exit ExitFirm2001 2062002 84 0.59 0.592003 57 0.32 0.722004 40 0.30 0.81 4202005 35 0.13 0.83 194 0.54 0.54 273 6702006 29 0.17 0.86 118 0.39 0.72 159 0.42 0.42 217 0.68 0.682007 24 0.17 0.88 85 0.28 0.80 123 0.23 0.55 154 0.29 0.772008 21 0.13 0.90 75 0.12 0.82 103 0.16 0.62 126 0.18 0.81Product2001 20552002 449 0.78 0.782003 192 0.57 0.912004 117 0.39 0.94 26562005 94 0.20 0.95 497 0.81 0.81 1047 33222006 78 0.17 0.96 200 0.60 0.92 305 0.71 0.71 325 0.90 0.902007 61 0.22 0.97 106 0.47 0.96 166 0.46 0.84 174 0.46 0.952008 54 0.11 0.97 71 0.33 0.97 123 0.26 0.88 127 0.27 0.96Product destinations2001 33262002 718 0.78 0.782003 356 0.50 0.892004 245 0.31 0.93 49082005 167 0.32 0.95 837 0.83 0.83 1391 38282006 129 0.23 0.96 295 0.65 0.94 286 0.79 0.79 509 0.87 0.872007 101 0.22 0.97 167 0.43 0.97 122 0.57 0.91 316 0.38 0.922008 84 0.17 0.97 113 0.32 0.98 82 0.33 0.94 224 0.29 0.94
Note: In the columns labelled Nr we document for each origin country the number of firmsproducts and destinations in the first available year, and follow this cohort of units overtime. Column Y-Exit shows the exit rate (ie. the share of units that left) with respect tothe previous year, and column Exit the exit rate with respect to the entry year.
13

vation is consistent with Besedes and Prusa’s decreasing-hazard rate finding(annual death rates are discrete-time approximations to instantaneous hazardrates) although, as noted, this finding must be taken cautiously. Comparingthe upper panel (firms) with middle and lower ones (products and product-destinations respectively), there is less stability at more disaggregate levels.
Additionally, the fourth column shows cumulative death rates relative tothe first year. In all cases these rates are high, and above 80% in 2008 inmost cases (with the only exception of Mali at the firm level). In all fourcountries, the very high death rates after the first year suggest that a binarycoding of survival based on second-year outcomes is a good summary mea-sure of survival.
Overall, the results presented in Figure 1 and Table 2 suggest that thereis substantial churning in export products and destinations within firms; inother words, firms continuously experiment with products and destinations.Thus, Hausman and Rodrik’s ‘self-discovery’ process (Hausman and Rodrik2003) seems to hold not only at the national level, but also—quite naturally—at the firm level. This pattern is also consistent with the notion that firmsface uncertainty about export costs or demand parameters, a notion that iscentral to the heterogeneous-firms literature.
In sum, the preliminary evidence presented above confirms existing find-ings about export growth and survival: a) the intensive margin representsthe largest share of export growth in terms of values, however these valuesare concentrated over a small number of transactions and firms; b) there issubstantial experimentation in the exporting activity in the form of entry bynew firms or the introduction of new products or destinations each year; c)one-year survival rates are low; past the first year, death rates significantlyslow down and transaction volumes grow.
4 Estimation strategy and results
4.1 Estimation strategy
After aggregating the transactions to cumulated annual totals, the primarysample remains a panel, as each firm-product-destination (f, p, d) triplet is
14

observed repeatedly over several years. However, as we are interested in thesurvival past the first year, the data needs to undertake a second transfor-mation. We define a new (f, p, d, t) quartet as one that appears for the firsttime in the database, and say that this quartet ‘survives’ if it lasts more thanone year. The quartet is then associated to a survival dummy (our depen-dent variable) equal to one. If it lasts only one year, the survival dummy isset equal to zero for that quartet. If it has already appeared in the sampleor if it is left-censored (i.e. already active the first year of the sample), wedrop it. Multiple spells account for only a very small number of observations,since our sample periods are only a few years except for Senegal. Thus, wereduce our panel to a quasi-cross-section, even though each observation hasan initial-year tag allowing us to control for calendar time. Doing so allowsus to bypass the issue of how long a spell break should be to be considereda ‘death’, an issue that has been discussed at length in the survival liter-ature and that has no clear-cut answer. Two additional reasons make thisbinary definition of survival attractive. First, our panels are too short tocarry out a full-fledged survival analysis. Second, as the descriptive analysisabove showed, once a firm has survived the first year, its survival probabil-ity dramatically increases; so understanding survival beyond the first year isespecially important.6
As already noted, firm and country indices are redundant, so we useeither a country superscript c or a firm subscript f , but not both, and runour regressions on a pooled cross-country sample.7 Our dependent variableis
sfpdt =
{1 ifvfpdt > 0, vfpd,t−` = 0 ∀ ` > 0, andvfpd,t+1 > 00 ifvfpdt > 0, vfpd,t−` = 0 ∀ ` > 0, andvfpd,t+1 = 0.
(1)
In 1, the expression “∀ ` > 0” means “over the sample period” as a singlespell over the sample period could be a multiple one over an (unobserved)longer sample. The estimating equation is
6This choice comes with both a cost and a benefit. On one hand, we lose information,as a two-year spell is treated as equivalent to a 3- or 4-year one; on the other hand, we gainrobustness, as the probability of wrongly treating a two-or-more year spell as a one-yearone is fairly low.
7We also ran, for robustness, separate regressions by origin country. The results ofthese regressions are available upon request. They are qualitatively similar to those ofcross-country (pooled) regressions reported here.
15

Pr(sfpdt = 1) = φ (xfpdtβ + δi + δcd + δt + ufpdt) (2)
where φ is the probit function and ufpdt is an error term. Our specification in-cludes industry fixed effects at HS2 (δi), origin-destination fixed effects (δcd),and spell-start year fixed effects (δt). The vector of regressors xfpdt includesmeasures of the firm’s scale and scope as well as proxies for agglomerationand market attractiveness. These proxies are counts of (i) nc
pdt, the numberof firms from origin country c exporting product p to destination d; (ii) nfpt,the number of destinations to which firm f exports product p; (iii) nfdt, thenumber of products that firm f exports to destination d; (iv) nc
dt, the num-ber of (product × firm) combinations active in the bilateral trade betweenorigin c and destination d; they also include (v) vfpdt, the initial value offirm f ’s export spell (product p to destination d); and (vi) zfp, the share ofproduct p in firm f ’s overall export sales. That is, the notation conventionis to omit the index of the dimension over which the count is summed. Allcounts are put in logs, and we use robust standard errors clustered at theproduct-destination level throughout.
In customs data, E.U. countries are entered as separate destinationsrather than as a whole. We have kept this convention, so a destinationshould be taken, as far as the E.U. is concerned, as a member state. Thiscreates an asymmetry in the treatment of destinations between the U.S.,which is taken as a whole, and the E.U., which is broken down. However,as African exports tend to be heavily concentrated on E.U. markets, the al-ternative assumption (bundling all E.U. destinations together) would havedrastically reduced the number of destinations and potentially obfuscatedsome geographical diversification issues, as marketing channels are, in spiteof the Single Market, still somewhat separate across E.U. member states.
We estimate equation 2 by probit, reporting marginal effects. Typically,marginal effects of a probit estimation can be interpreted like the coefficientin a linear probability model, and also in the present case a robustness checkreveals that quantitatively the difference between the results from a linearprobability model and the probit’s marginal effects at the mean are verysmall.8
8Results of a comparison of the linear probability model and Probit estimates areavailable upon request.
16

4.2 Baseline results
Baseline regression results are shown in Table 3. Before turning to theirdetailed interpretation, it is important to stress that the effects to be dis-cussed are simultaneously present in each regression and so are conditionalon each other. Also, it is important to note that these must be interpretedas conditional on starting to export. The probability of survival beyond thefirst year t can be estimated only for those trade flows that started at t− 1,so we exclude left-censored spells (those already active at the start of thesample) and multiple ones.9 The first column presents the baseline results.The second differs from the first in that all right-hand side (RHS) variablesare lagged by one year. The third and the fourth include one additionalcontrol each, the share of product p in firm f ’s export portfolio in the thirdand origin country c’s revealed comparative advantage (RCA) in product pin the fourth. The fifth runs a counterfactual experiment which is discussedbelow.
Consider first the results in Column (1). The first regressor of interest islnnc
pdt, the log of the number of firms selling the same product (p) in the samedestination (d). That is, if spell (f, p, d, t) is mens’ t-shirts sold in Franceby a Senegalese firm in 2006, lnnc
pdt is the log of the number of Senegalesefirms exporting mens’ t-shirts in France in 2006. The effect is positive andsignificant at the 1% level in all specifications. That is, more companies fromthe same country selling the same product in the same destination togetherraise each other’s survival probability. This is a striking network effect, towhich we will come back at some length later on. How large is the effect?Let us write the probability of survival as πfpdt = Pr(sfpdt = 1). Recallingthat the coefficients reported in Table 3 are marginal effects, using the pointestimate of of 0.0566 in the first cell of Column (1), and the average numberof Senegalese firms selling to each destination (nSEN
pdt = 22) we can write
9The number of multiple spells is very limited and their inclusion does not influenceour results.
17

Table 3: Determinants of survival past the first year
Regressors (log) (1) (2) (3) (4) (5)
ncpdt Firm count 0.0566*** 0.0431*** 0.0544*** 0.0563***
(0.00283) (0.00306) (0.00282) (0.00285)n−cpdt Firm count 0.00449
(0.00727)nfpt Dest. count 0.125*** 0.0820*** 0.125*** 0.125*** 0.116***
(0.00270) (0.00296) (0.00269) (0.0027) (0.00397)nfdt Prod. count 0.0375*** 0.0224*** 0.0478*** 0.0375*** 0.0301***
(0.00163) (0.00152) (0.00184) (0.00163) (0.00218)vfpdt Init. value 0.0304*** 0.0332*** 0.0277*** 0.0304*** 0.0335***
(0.000898) (0.000889) (0.000921) (0.000898) (0.00125)ncdt Prod. × firm -0.00477 -0.0213*** -0.00723 -0.00472 -0.00131
(0.00594) (0.00397) (0.00595) (0.00594) (0.0084)zfp Prod. share 0.0771***
(0.00640)RCAcp <0.0001 <0.0001
(<0.0001) (<0.0001)
RHS vars lagged No Yes No No NoHS2 FE Yes Yes Yes Yes YesOrigin-dest. FE Yes Yes Yes Yes YesTime effects Yes Yes Yes Yes YesObs. 57,063 57,063 57,063 57,063 11,185
Note: Probit estimations, marginal effects reported. Origin-destination, hs2 and year fixedeffects. Robust standard errors clustered by origin-destination-product.
18

∆πfpdt = 0.0566 [ln(ncpdt + 1)− ln(nc
pdt)]
= 0.0566 [ln(23)− ln(22)] (3)
= 0.0025.
Using the illustrative attrition rates in Table 2, a Senegalese firm entering in2001 has a first-year attrition rate of 0.78 (78%) at the product-destinationspell level, implying a survival probability of 0.22. We take this number asour baseline probability of survival, πfpdt. Raising it by 0.0025 means a neg-ligible increase of 0.2 percentage points. Doubling the number of nationalcompetitors on a given product-destination niche, from the baseline of 22 to44, would raise the first-year survival probability by 3.9 percentage points,from 0.22 to 0.26 (a proportional increase of 18%).
Skipping the second regressor which is a placebo used in Column (5) anddiscussed later on, the second regressor in Column (1) is lnnfpt, the countof destinations to which product p is exported by firm f , a proxy for thescale at which the firm exports, and thus probably produces, product p.Scale significantly raises the probability of survival in all regressions. Thismay reflect either more robust production lines (say, a larger number ofmachines, meaning that failure of one of them is more easily made up byothers), better information about the cross-country drivers of a product’sdemand, or, alternatively, higher product quality. How large is the effect?Using a calculation similar to that in (3), an additional destination10 raisesthe probability of survival by
∆πfpdt = 0.125 [ln(2.55)− ln(1.55)] = 0.062.
That is, the baseline first-year probability of survival of a spell goes up by6.2 percentage points, from 0.22 to 0.28, when the mean Senegalese exporteradds one destination to his portfolio at the product level. If she was to doublethe number of his destinations for that product, the first-year survival prob-ability would rise by 8.7 percentage points, from 0.22 to 0.31 (a proportionalrise of 39%).
10The average number of destinations per product, for a Senegalese firm, is 1.55. Thisis lower than the number appearing in Table 1 which is the total number of destinationsper firm, not per firm-product.
19

The next regressor, lnnfdt, is the log of the number of products firm fexports to destination d, a proxy for its ‘scope’ in that destination. The ef-fect is, again, positive and significant. As for its magnitude, if our Senegalesefirm adds one product to its average destination d, from a baseline of 3.48products,11 the usual calculation gives a rise of just 1 percentage point in thesurvival probability. With a doubling of the number of products, the survivalprobability rises by 2.5 percentage points, from 0.22 to 0.245, a proportionalrise of 11%.
Thus, adding one product to a given destination has a smaller effect onspell survival (1 percentage point) than adding an additional destinationfor that product (1.7 percentage point). This is somewhat natural, as ouranalysis is at a disaggregated level in terms of products (5,000 products atHS6), so the additional product sold on destination d can be very close tothe original; by contrast, destination countries are much fewer, so addingone more shipping destination for product p is a substantial move (althoughit may involve adding one E.U. member state which would mean expandingwithin the Single Market space). An alternative explanation goes as follows.Increasing either scope or size raises the firm’s visibility and therefore hasa positive demand effect. However, there may be supply effects running atcross-purposes. When a firm adds one export destination to a given lineof products, it expands production, potentially making the value chain morerobust to accidental fluctuations. By contrast, when it adds one product to adestination, the firm diversifies production and therefore spreads managerialattention and risk management over a wider range of activities, potentiallyresulting in more accidents. In that case, the supply effect runs against thedemand effect, resulting in a lower net change in spell survival.
The next regressor is a control for the export spell’s initial value, vfpdt,which has been shown to correlate with spell survival at the product (multi-firm) level. This is confirmed at the firm level, although the effect is, again,small. Using the coefficient in Table 3 (0.0304), a doubling of the initial valueof the Senegalese firm’s average export spell ($47’111 from Table 1) wouldraise the probability of spell survival by 0.021, or 2 percentage points, from0.22 to 0.241.
11Again, this number differs from the one appearing in Table 1, which is the total numberof products per firm, not per firm-destination.
20

The last regressor, lnncdt, is a count of the firm-product pairs from coun-
try c active on destination d. If c is Senegal and one Senegalese firm sellstwo HS6 products in the E.U. and another one sells three, nc
dt = 5 for allfive observations with c = Senegal and d = E.U. in year t. It is a proxy forthe size of the bilateral trade relationship.This variable is never significantexcept in Column (2).
Column (2) of table 3 is very similar to Column (1) except that all theexplanatory variables are lagged by one period. Results are essentially un-changed, except for nc
dt whose coefficient becomes negative and significant.What that means is that more firm-product combinations from a given originto a given destination are associated with a lower probability of survival pastthe first year. Without making too much of this result, one can interpret itas follows. Given that we include origin-destination fixed effects, nc
dt picksup only the time-variant component of bilateral shocks, like booms in thedestination market. The negative coefficient suggests that a growth expan-sion (a boom) in t− 1 triggers crowding in followed by retrenchment.12
Column (3) introduces an additional regressor. The literature on multi-product firms suggests that firms have core and marginal products, and thatthey have a stronger competitive advantage in the former (see for instanceEckel and Neary 2010 for a theoretical model and Iacovone, Rauch and Win-ters 2010 for an empirical test of this hypothesis). For each multiproductfirm f and product p, we proxy how close is that product from the firm’s‘core’ by ln zfp, the log of its share in the total firm’s export sales. Resultssuggest that it correlates positively with first-year survival probability evenafter controling for dollar initial value; that is, the probability of survival for‘core’ products is substantially higher than for others. For instance, a prod-uct representing 80% of the firm’s export sales (all destinations together)would have a first-year survival probability on a given destination higher by
12Confirming this interpretation, when we exclude the destination fixed effects, thecoefficient on this variable becomes positive, suggesting that permanently more attractivemarkets are associated with longer survival, which is consistent with our interpretation.This “crowding-in” result is also consistent with a finding by Bussolo, Iacovone, and Molina(2010) who found, using firm-level data from the Dominican Republic, that the reduction oftariffs following the signature of CAFTA led to some over-crowding of Dominican exports,followed by retrenchment.
21
10 percentage points than a product representing 20% of the firm’s exportsales.
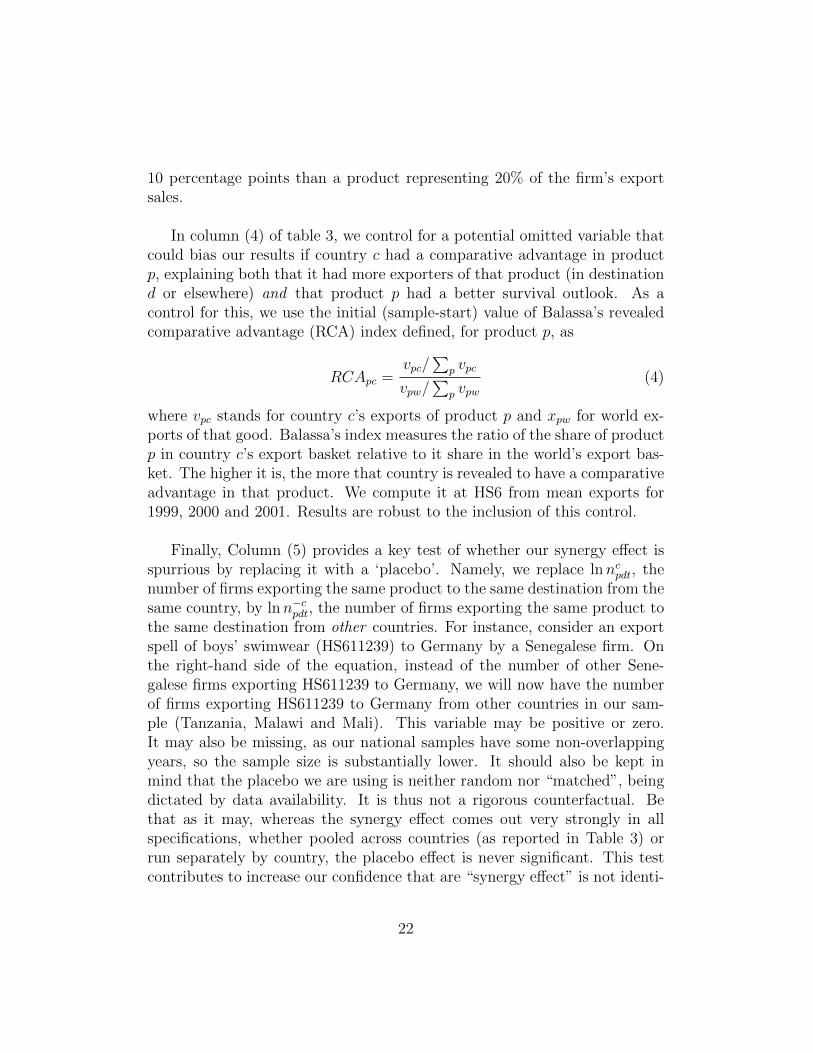
In column (4) of table 3, we control for a potential omitted variable thatcould bias our results if country c had a comparative advantage in productp, explaining both that it had more exporters of that product (in destinationd or elsewhere) and that product p had a better survival outlook. As acontrol for this, we use the initial (sample-start) value of Balassa’s revealedcomparative advantage (RCA) index defined, for product p, as
RCApc =vpc/
∑p vpc
vpw/∑
p vpw(4)
where vpc stands for country c’s exports of product p and xpw for world ex-ports of that good. Balassa’s index measures the ratio of the share of productp in country c’s export basket relative to it share in the world’s export bas-ket. The higher it is, the more that country is revealed to have a comparativeadvantage in that product. We compute it at HS6 from mean exports for1999, 2000 and 2001. Results are robust to the inclusion of this control.
Finally, Column (5) provides a key test of whether our synergy effect isspurrious by replacing it with a ‘placebo’. Namely, we replace lnnc
pdt, thenumber of firms exporting the same product to the same destination from thesame country, by lnn−c
pdt, the number of firms exporting the same product tothe same destination from other countries. For instance, consider an exportspell of boys’ swimwear (HS611239) to Germany by a Senegalese firm. Onthe right-hand side of the equation, instead of the number of other Sene-galese firms exporting HS611239 to Germany, we will now have the numberof firms exporting HS611239 to Germany from other countries in our sam-ple (Tanzania, Malawi and Mali). This variable may be positive or zero.It may also be missing, as our national samples have some non-overlappingyears, so the sample size is substantially lower. It should also be kept inmind that the placebo we are using is neither random nor “matched”, beingdictated by data availability. It is thus not a rigorous counterfactual. Bethat as it may, whereas the synergy effect comes out very strongly in allspecifications, whether pooled across countries (as reported in Table 3) orrun separately by country, the placebo effect is never significant. This testcontributes to increase our confidence that are “synergy effect” is not identi-
22
fying some spurious correlation; it also suggests that there is some nationalelement in the synergy we identify (recall that regressions include bilateralorigin-destination fixed effects).
4.3 Interpreting the synergy effect
4.3.1 Extended networks and “institutional production capabili-ties”
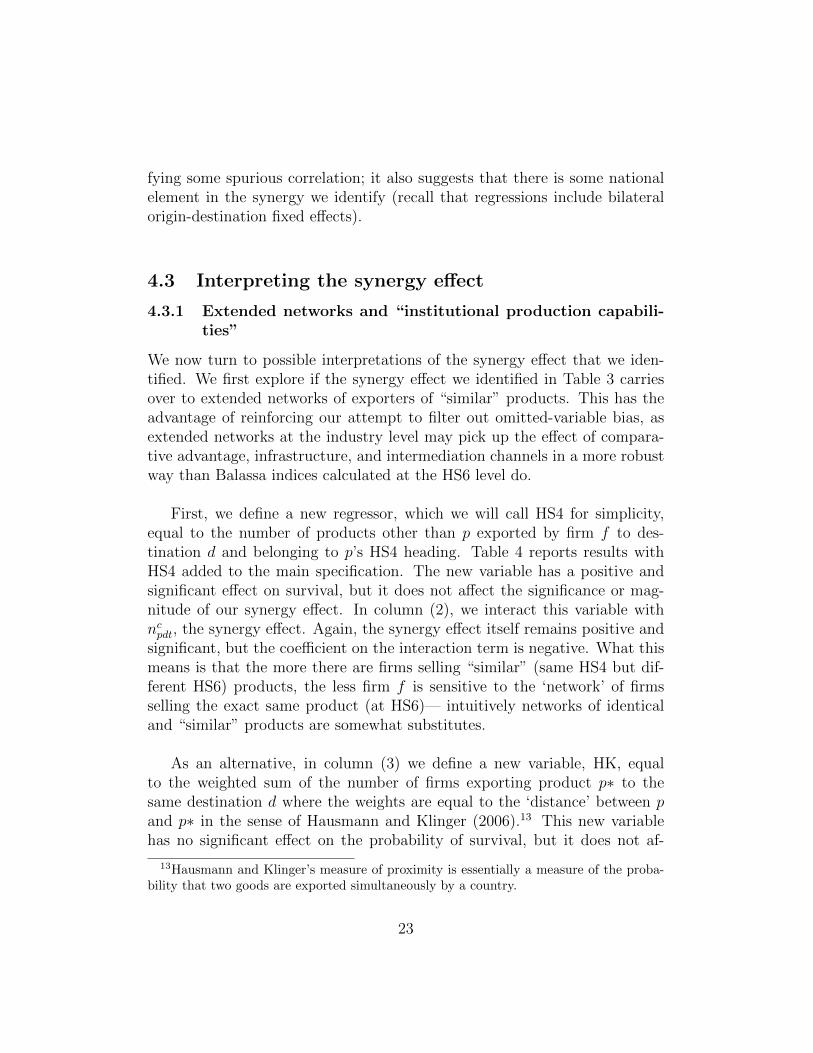
We now turn to possible interpretations of the synergy effect that we iden-tified. We first explore if the synergy effect we identified in Table 3 carriesover to extended networks of exporters of “similar” products. This has theadvantage of reinforcing our attempt to filter out omitted-variable bias, asextended networks at the industry level may pick up the effect of compara-tive advantage, infrastructure, and intermediation channels in a more robustway than Balassa indices calculated at the HS6 level do.
First, we define a new regressor, which we will call HS4 for simplicity,equal to the number of products other than p exported by firm f to des-tination d and belonging to p’s HS4 heading. Table 4 reports results withHS4 added to the main specification. The new variable has a positive andsignificant effect on survival, but it does not affect the significance or mag-nitude of our synergy effect. In column (2), we interact this variable withncpdt, the synergy effect. Again, the synergy effect itself remains positive and
significant, but the coefficient on the interaction term is negative. What thismeans is that the more there are firms selling “similar” (same HS4 but dif-ferent HS6) products, the less firm f is sensitive to the ‘network’ of firmsselling the exact same product (at HS6)— intuitively networks of identicaland “similar” products are somewhat substitutes.
As an alternative, in column (3) we define a new variable, HK, equalto the weighted sum of the number of firms exporting product p∗ to thesame destination d where the weights are equal to the ‘distance’ between pand p∗ in the sense of Hausmann and Klinger (2006).13 This new variablehas no significant effect on the probability of survival, but it does not af-
13Hausmann and Klinger’s measure of proximity is essentially a measure of the proba-bility that two goods are exported simultaneously by a country.
23

Table 4: Extended networks(1) (2) (3) (4)
ncpdt 0.0551*** 0.0699*** 0.0607*** 0.0709***
(0.00364) (0.00624) (0.00300) (0.00362)nfpt 0.151*** 0.151*** 0.132*** 0.132***
(0.00374) (0.00374) (0.00289) (0.00289)nfdt 0.0322*** 0.0321*** 0.0305*** 0.0304***
(0.00112) (0.00112) (0.000916) (0.000915)vfpdt 0.0414*** 0.0413*** 0.0375*** 0.0376***
(0.00199) (0.00198) (0.00166) (0.00165)ncdt -0.0170** -0.0178** 0.00101 0.00175
(0.00860) (0.00858) (0.00585) (0.00585)HS4 0.0113*** 0.0170***
(0.00285) (0.00330)HS4 ×npdt -0.00805***
(0.00284)HK 0.00466 0.0179***
(0.00419) (0.00483)HK ×npdt -0.0241***
(0.00553)Observations 38451 38451 52212 52212
Note: Probit estimations, marginal effects reported. Origin-destination, HS2and year fixed effects. Robust standard errors clustered by origin-destination-product.
fect it; interacted, in Column (4), the effect is, again, negative, suggestingsome substitutability between the networks of identical and “close” products.
In conclusion, in this subsection we evaluated the possibility that ourresults could be driven not by the “synergy” effects due to the presence ofcompanies exporting same HS6 products to same destination but rather bysome “broader” extended networks. In the light of recent work of Hidalgo etal (2007) we could be concerned that a key omitted variable driving our re-sults is indeed the existence of some broader “institutional capabilities”. Forthis reason, we added to our baseline specifications two new variable captur-ing these potential “institutional capabilities” and found that, while indeed
24

these are important and there seems to be some substitutability betweenthese and the “synergy effect”, nevertheless the inclusion of these variablesdoes not alter our previous results.
4.3.2 Information and access to finance
We now turn to an exploration of the mechanisms that could explain our re-sults, primarily focusing on the hypothesis that the “synergy effect” is drivenby the existence of some “information spillovers”.
First, this synnergy effect could indicate the presence of information ex-ternalities. For instance, when technical regulations or buyer policies changein the destination market, exporters may share information about upcomingchanges, improving their ability to anticipate and adapt to these changes.Alternatively, buyers may take suppliers from a given country more seriously(and therefore share more information with them or show more flexibility inthe face of glitches) when there is a critical mass of them and improve theirreliability. If this conjecture is correct, we should expect a stronger synergyeffect for products characterized by higher quality heterogeneity for whichinformation asymmetries between buyers and producers are potentially moreimportant. We proxy product p’s quality heterogeneity by ρp, the coefficientof variation of its FOB unit value across exporters in 2000 (the initial valuein our sample) using COMTRADE data, with a higher ρp meaning moreheterogeneous quality.14 The results are presented in column (1) of Table 5.The coefficient on the interaction term ρp × lnnpdt is positive, although sig-nificant only at the 10% level, suggesting that the synnergy effect is strongerfor products with a high unit-value dispersion, where information is moreimportant.
Given the importance of finance, as shown by the survey discussed in Sec-tion 3, an alternative hypothesis could be that while information is still a keydeterminant of the synergy effect the mechanism behind it could be insteaddifferent. Consider the following scenario. A Senegalese firm is approachedby a US buyer to provide a small trial order of t-shirts. Upon successfuldelivery and sale, the buyer is happy and contacts again the Senegalese firmfor a larger order. Now the Senegalese firm has to ramp up capacity and,
14We explored results on sub-samples split by Rauch’s categories in a table that isavailable upon request.
25

Table 5: Mechanisms behind the synergy effect(1) (2) (3) (4) (5)
ncpdt 0.0552*** 0.0512*** 0.0932*** 0.0455*** 0.0816***
(0.00437) (0.00496) (0.0112) (0.00577) (0.0121)nfpt 0.132*** 0.132*** 0.138*** 0.132*** 0.137***
(0.00290) (0.00289) (0.00343) (0.00289) (0.00343)nfdt 0.0375*** 0.0377*** 0.0369*** 0.0378*** 0.0370***
(0.00166) (0.00165) (0.00183) (0.00165) (0.00183)vfpdt 0.0305*** 0.0307*** 0.0290*** 0.0307*** 0.0291***
(0.000916) (0.000918) (0.00104) (0.000918) (0.00104)ncdt 0.00110 0.00131 -0.00275 0.00142 -0.00234
(0.00585) (0.00585) (0.00635) (0.00585) (0.00635)ρ -0.00610 -0.00641 -0.0194***
(0.00500) (0.00499) (0.00565)ρp × nc
pdt 0.00954* 0.00971* 0.0139**(0.00561) (0.00553) (0.00653)
rp 0.0114* 0.0115*(0.00640) (0.00640)
rp × ncpdt 0.0140** 0.0141**
(0.00586) (0.00584)κ 0.168*** 0.174***
(0.0451) (0.0451)κp × nc
pdt -0.115*** -0.107***(0.0346) (0.0347)
Obs. 52212 52212 37838 52212 37838Note: Probit estimations, marginal effects reported. Origin-destination, HS2 and yearfixed effects. Robust standard errors clustered by origin-destination-product.
26
for that, it needs support from financial institutions. But the financial insti-tutions may not take letters of credit from the buyer at face value, becauseare aware of all sorts of glitches – quality or other – that may emerge downthe line. Anecdotal experience suggests that, in Sub-Saharan Africa, thebanks’ response will typically be ‘no’ irrespective of the “proofs of profitabil-ity” that the exporter shows, and the trade relationship with the US buyerwill end before it had a chance to bear fruit. However, if several Senegalesefirms already sell t-shirts on the US market, the same financial institutionsmay be more easily convinced about the chances of success of this ventureand better evaluate the potential risks involved in this transaction. If thisscenario is representative, the synergy effect should be stronger for productsthat are especially dependent on external finance than for others as initialfinancial constraints would be more binding in these sectors. In order totest this conjecture we interact our variable identifying the synergy effectwith the measure of dependence from external finance proposed by Rajanand Zingales (1998).15 We construct our rp variable at the product level byusing concordance tables between ISIC3 and HS6 classification, and assign-ing to each HS product the Rajan-Zingales index of the ISIC code to whichthat product belong. Column (2) of Table 5 shows that the interaction termrp × lnnpdt is positive and significant.
As an alternative way of getting a handle on the degree of dependencefrom finance, we use a proxy for ‘asset tangibility’ proposed by Braun (2003).16
The idea that firms with more tangible assets presents lower risks as theseprovides real guarantees for bank loans, and information asymmetries (ad-verse selection or moral hazard) are less important with good collateral, sosynnergy effects should play a lesser role. In accordance with this conjecture,in column (3) of Table 5 we show that the interaction of asset tangibility (rp)
15Rajan and Zingales’ measure of financial dependence is an industry-level variablecalculated for 27 3-digits ISIC industries and nine 4-digits ones using compustat data forthe US. Let k be capital expenditure and x operational cash flow at the firm level. Rajanand Zingales’ index for industry j, rj , is the median value of (k−x)/k across all compustatfirms in industry j. Index values, given in Table 1 of Rajan-Zingales (1998), range from-0.45 for tobacco (ISIC 314) to 1.49 for drugs (ISIC 3522).
16Braun proxies asset tangibility by the ratio of net property, plant and equipment tomarket value at the firm level, using US compustat data. The industry-level variable isconstructed, like in Rajan-Zingales, by taking the industry median at the ISIC 3-digitlevel. Index values, given in Table 1 of Braun (2003), range from 0.09 (leather products)to 0.67 (petroleum refineries).
27

and the synergy effect has a negative and significant coefficient, implying thatfirms belonging to industries with high asset tangibility (essentially capital-intensive industries) are less sensitive to the synergy effect.17
Given that these interactions have significant explanatory power, we com-bine them to address a potential omitted variable bias, and to compare therecoefficients in a joint multivariate regression. In columns (4) and (5) wecombine one regressors capturing each of the three hypothesis that these in-teractions try to capture: information, financial constraints or capabilities.We find that typically the same signs, magnitudes and statistical significancelevels persist as the ones just discussed, and the interpretations from aboveare valid when we control for all these effects simultaneously.
5 Concluding remarks
In spite of their growing interest for the profession, firm-level datasets arestill rare for low-income countries, and virtually inexistent for African coun-tries. Our exploration of African customs data on firm-level exports revealeda set of stylized facts that are consistent with evidence from previous studiesanalyzing rich or middle-income countries. We showed that exporters in ourset of African countries experiment a lot on export markets, at a low scaleand with low survival rates, particularly in the first year. That is, they op-erate in a difficult environment characterized by very high “infant-mortalityrates”. Therefore we investigate more in detail what determines if they sur-vive beyond their first year.
The most striking finding coming out of our analysis —and which couldnot be observed on the product-level data used by previous studies of exportsurvival—is that exporters of similar goods to the same destination exert apositive externality on new entrants. That is, the more they are, the higherthe survival probability of new entrants—although the effect is relativelysmall. This finding is at first sight surprising, as one might expect that ex-porters of a given product to the same destination may crowd out each other,either through price competition or simply by offering more choice to buy-
17Similarly as done for the proxy of external dependence borrowed from Rajan andZingales, we construct the asset-tangibility variable at the product level, κp, by assigningto that product the corresponding ISIC3 value of Braun’s index.
28

ers who could them ‘hop’ from one to the other, reducing survival rates atthe individual level. Strikingly, the synergy effect disappears if we measurethe network as the number of firms exporting the same product from otherorigin countries from our dataset. That is, the synergy effect is truly national.
Various conjectures could explain our result. First, it could be drivenby omitted-variable bias (e.g. supportive infrastructure at the national levelor comparative advantage). We control for this by including the country’srevealed-comparative advantage index as a regressor, without altering theresults. Relatedly, we follow the idea developed in various papers by Haus-mann and Klinger (2006) that product-specific capabilities explain successin export markets and investigate if our synergy effect disappears when con-trolling for some proxies of these “production capabilities”, which would bemore likely to be driven by omitted variables. Again, our results are robust,although we also find that synergy effects and production capabilities appearto be substitutes for each other.
Finally, we explore various conjectures drawing on information asymme-tries and access to finance. For instance, access to credit may be easier whenmany exporters of the same product from the same origin simultaneously op-erate in the same destination, as larger numbers may provide signals aboutprofitability to both new entrants as well as financing institutions. First, ourhypothesis is that an exporter may obtain precious information through thenetwork of competitors, potential buyers, relatives or friends involved in thesame manufacturing activity and exporting to the same market. Second, ourhypothesis is that an isolated exporter might have more difficulties convinc-ing the financial institutions that the risks she faces are manageable giventhe uncertain environment of export relations. If other firms are success-fully in operation, by contrast, the financial institution can use the successof others as a predictor of its client’s potential. We verify these conjecturesin different ways. First, we interact the synergy effect with quality hetero-geneity (proxied by the cross-country dispersion in unit values at the productlevel). Second, we interact it with indicators of dependence on bank financeand asset structure (as a measure of the scope for moral hazard). In bothcases, interaction terms are positive and strongly significant, suggesting thatsynergy effects are stronger in sectors where informational asymmetries arehigher, and dependence on external finance is more intense.
29

Our results are suggestive of a potential market failure if exporters fail tointernalize the positive externality that they exert on new entrants. This maybe taken as an argument in support of government-sponsored export promo-tion. However, policy implications should be interpreted very cautiously,as the record of export promotion in developing countries is highly uneven.In addition it may well be that exporters could internalize the externalitythrough mutual-support professional organizations.
30

References
[1] Alvarez, Roberto, and Ricardo Lopez, 2008, ‘Entry and Exit in Interna-tional Markets: Evidence from Chilean Data’, Review of InternationalEconomics 16, 692-708.
[2] Albornoz, Facundo, Hector Pardo, Gegory Corcos and Emanuel Ornelas,2010, ‘Sequential Exporting’; CEPR discussion paper 8103.
[3] Bernard, Andrew, Bradford Jensen and Peter Schott, 2006, ‘TradeCosts, Firms and Productivity’, Journal of Monetary Economics 53,917-937.
[4] Besedes, Tibor, 2008, ‘A Search Cost Perspective on Formation andDuration of Trade’, Review of International Economics 16, 853-849.
[5] Besedes, Tibor, and Thomas Prusa, 2006, ‘Ins, Outs and the Durationof Trade,” Canadian Journal of Economics 104,
[6] Besedes, Tibor, and Thomas Prusa, 2006, ‘A Search Cost Perspective onFormation and Ducation of Trade’, Journal of International Economics70, 339-358.
[7] Besedes, Tibor, and Thomas Prusa, 2007, ‘The Role of Extensive andIntensive Margins and Export Growth,’, NBER Working Paper 13628.
[8] Braun, Mathias (2003), ‘Financial Contractibility and Asset Hardness’;unpublished dissertation, Harvard University.
[9] Brenton, Paul, Christian Saborowski, and Erik von Uexkull, 2009, ‘Whatdetermines the low survival rate of developing country exportflows?’,World Bank Policy Research Working Paper WPS 4951.
[10] Brenton, Paul, and Richard Newfarmer, 2007, ‘Watching More Than theDiscovery Channel: Export Cycles and Diversification in Development’,World Bank Policy Research Working Paper.
[11] Brenton, Paul, Denisse Pierola and Erik von Uexkull, 2009, ‘TheLife and Death of Trade Flows: Understanding the Survival Rates ofDeveloping-Country Exporters’, Breaking Into New Markets: Emerg-ing Lessons for Export Diversification, Shaw , Newfarmer, Walkenhorst(Edts.), The World Bank.
31

[12] Brooks, E., 2006, ‘Why don’t Firms Export More? Product Quality andColombian plants’, Journal of Development Economics 80, 160-178.
[13] Carballo, Jeronimo, and Christian Volpe Martincus, 2008, ‘Is exportpromotion effective in developing countries? Firm-level evidence on theintensive and the extensive margins of exports’, Journal of InternationalEconomics 76, 89-106.
[14] Cadot, Olivier, Celine Carrere and Vanessa Strauss-Kahn, 2007, ‘TradeDiversification, Income, and Growth: What Do We Know?’, mimeo,ILO.
[15] —, — and —, 2011, ‘Export Diversification: What’s behind the Hump?’,forthcoming, The Review of Economics and Statistics.
[16] Das, Sanghamitra, Mark J. Roberts and James R. Tybout, 2007, ‘Mar-ket Entry Costs, Producer Heterogeneity and Export Dynamics’, Econo-metrica 75, 837-873.
[17] Easterly, William, Ariel Reshef and Julia Schwenkenberg, 2009, ‘ThePower of Exports’, World Bank Policy Research Working Paper 5081.
[18] Eaton, Jonathan, Marcela Eslava, Maurice Kugler and James Tybout,2008, ‘Export Growth in Colombia: Firm-Level Evidence’, The Orga-nization of Firms in a Global Economy, edited by Elhanan Helpman,Dalia Marin, and Thierry Verdier, Harvard University Press.
[19] Eckel, Carsten, and Peter Neary, 2010, ‘Multi-Product Firms and Flexi-ble Manufacturing in the Global Economy’, Review of Economic Studies77, 188-217.
[20] Evenett, Simon J., and Anthony Venables, 2002, ‘Export Growth by De-veloping Economies: Market Entry and Bilateral Trade’ mimeo, LondonSchool of Economics.
[21] Feenstra, R.C., 1996, ‘US imports, 1972-1994: Data and Concordances’,NBER Working Paper 5515.
[22] Frankel, Jeffrey A., and David Romer, 1999, ‘Does Trade CauseGrowth?’, The American Economic Review 89, 379-399.
32

[23] Freund, Caroline, and Denisse Pierola, 2010, ‘Export entrepreneurs: ev-idence from Peru’, World Bank Policy Research Working Paper Series5407.
[24] Gorg, Holger, Aoife Hanley and Eric Strobl, 2008, ‘Productivity effectsof international outsourcing: Evidence from plant level data’, CanadianJournal of Economics 41, 670-688.
[25] Hausmann, Ricardo, 2008, ‘The Other Hand: High Bandwidth Devel-opment Policy’, Harvard University, John F. Kennedy School of Gov-ernment Working Paper rwp08-060.
[26] Hausmann, Ricardo, and Bailey Klinger, 2006, ‘Structural Transforma-tion and Patterns of Comparative Advantage in the Product Space’,Harvard University, John F. Kennedy School of Government WorkingPaper rwp06-041.
[27] Hausmann, Ricardo, Jason Hwang and Dani Rodrik, 2007, ‘What youexport matters’, Journal of Economic Growth 12, 1-25.
[28] Hausmann, Ricardo, and Dani Rodrik, 2003, ‘Economic Developmentas Self-Discovery’, Journal of Development Economics 72, 603-633.
[29] Hidalgo, Cesar, Bailey Klinger, A.L. Barabasi and Ricardo Hausmann,2007, ‘The Product Space Conditions the Development of Nations’, Sci-ence, 317(5837): 482-487.
[30] Iacovone, Leonardo and Beata Javorcik, 2010, ‘Multi-Product Ex-porters: Product Churning, Uncertainty and Export Discoveries’, forth-coming, Economic Journal.
[31] Lederman, Daniel, Marcelo Olarreaga and Lucie Payton (2010), ‘Ex-port Promotion Agencies: Do They Work?’; Journal of DevelopmentEconomics 91, 257-265.
[32] Molina, Ana Cristina, and Marco Fugazza, 2009, ‘The determinants oftrade survival’, HEI Working Paper 5.
[33] —, Maurizio Bussolo and Leonardo Iacovone, 2010, ‘The DR-CAFTAand the extensive margin : a firm-level analysis,’ World Bank PolicyResearch Working Paper Series 5340.
33

[34] Nitsch, Volker, 2009, ‘Die Another Day: Duration in German ImportTrade’, CESifo Working Paper Series 2085.
[35] Obashi, Ayako, 2010, ‘Stability of Production Networks in East Asia:Duration and Survival of Trade’, Japan and the World Economy 22,21-30.
[36] Rajan, Raghuram, and Luigi Zingales (1998), ‘Financial Dependenceand Growth’; American Economic Review 88, 559-586.
[37] Rauch, James E., 1999, ‘Networks Versus Markets in InternationalTrade’, Journal of International Economics 48, 7-35.
[38] — and Joel Watson, 2003, ‘Starting small in an Unfamiliar Environ-ment’, International Journal of Industrial Organization 21, 1021-1042.
[39] World Bank (2009), ‘World Bank Indicators Database’.
34

6 Appendix 1
This survey was conducted over a sample of exporters randomly drawn fromthe customs data in each country, after applying some pre-established guide-lines that took into account the following criteria:
• exporting status of the firm,
• its size,
• its location
• the economic sector (at the 2-digit level of the HS Code)
In particular, all the exporters in each country were classified in fourgroups according to the evolution of their exporting status: a) regular ex-porters are those exporters with consecutive exports until 2008 (last yearcovered by the customs data in all four countries), b) past exporters are theexporters who were exporting consecutively for at least two years and thenexited the market before 2008, c) intermittent exporters are those who ex-ported erratically during the period included in the sample and finally, d)new exporters are those exporters who appear for the first time in the samplein 2008.
Over 200 firms were contacted in each country; however, due to low coop-eration and identification problems with some of the firms, the final sampleby country and exporting group is as follows:
Country Intermit New Reg Past Total
Mwi 9 9 59 14 91Mli 10 18 48 22 98Sen 15 25 43 39 122Tza 15 7 48 14 84
Total 49 59 198 89 395
35

Table 6: Survey Responses on Importance of Networks (in %)Question 1: First time exporters: How was the contact with the first client made?
MLI MWI SEN TZA AllResearch online 14 11 24 35 21Third party contact 73 68 77 51 67Competitors’ network 8 12 24 11 14Trade Fair 20 12 19 34 21Export Promotion Agency 12 11 5 13 10Exporters’ Association 9 7 8 8 8Another channel 16 24 5 11 14
Question 2: If the company looked for its buyers, how did it approach them?Research online 26 31 29 41 32Third party contact 74 72 76 57 70Competitors’ network 19 18 23 21 20Trade Fair 40 35 28 52 39Export Promotion Agency 18 19 11 21 17Exporters’ Association 14 5 6 17 11Another channel 10 20 15 6 13
Question 3: If the buyers approached the company, how did they approach it?Company’s website 22 30 29 53 33Old clients of the company 25 28 33 32 30Third-party contacts 62 75 75 66 69Competitors’ network 14 28 21 26 22Trade Fair 34 33 20 55 35Export Promotion Agency 18 21 7 25 18Another channel 9 22 15 8 13
Question 4: How did the opportunity to export a new product come about?An existing buyer approached the company 54 46 50 68 54The company saw saw demand in a buyers’ market 33 46 50 56 46The company saw successful competitors 17 27 13 32 22Success with selling the product domestically 38 42 44 68 48Through a third party 46 23 25 35 32Any other type of opportunity? 17 19 13 6 14
36

CENTRE FOR ECONOMIC PERFORMANCE Recent Discussion Papers
1053 Björn Eriksson Tobias Karlsson Tim Leunig Maria Stanfors
Gender, Productivity and the Nature of Work and Pay: Evidence from the Late Nineteenth-Century Tobacco Industry
1052 Hartmut Lehmann Jonathan Wadsworth
The Impact of Chernobyl on Health and Labour Market Performance
1051 Jörn-Steffen Pischke Money and Happiness: Evidence from the Industry Wage Structure
1050 Tim Leunig Joachim Voth
Spinning Welfare: the Gains from Process Innovation in Cotton and Car Production
1049 Francesca Cornaglia Andrew Leigh
Crime and Mental Wellbeing
1048 Gianluca Benigno Hande Küçük-Tuger
Portfolio Allocation and International Risk Sharing
1047 Guy Mayraz Priors and Desires: A Model of Payoff-Dependent Beliefs
1046 Petri Böckerman Alex Bryson Pekka Ilmakunnas
Does High Involement Management Lead to Higher Pay?
1045 Christos Genakos Tommaso Valletti
Seesaw in the Air: Interconnection Regulation and the Structure of Mobile Tariffs
1044 Giordano Mion Luca David Opromolla
Managers’ Mobility, Trade Status and Wages
1043 Javier Ortega Gregory Verdugo
Immigration and the Occupational Choice of Natives: A Factor Proportions Approach
1042 Nicholas Bloom Benn Eifert Aprajit Mahajan David McKenzie John Roberts
Does Management Matter? Evidence from India
1041 Joshua D. Angrist Stacey H. Chen Brigham R. Frandsen
Did Vietnam Veterans Get Sicker in the 1990s? The Complicated Effects of Military Service on Self-Reported Health
1040 Tanvi Desai Felix Ritchie
Effective Researcher Management

1039 Ralf Martin Mirabelle Muûls Laure B. de Preux Ulrich J. Wagner
Anatomy of a Paradox: Management Practices, Organisational Structure and Energy Efficiency
1038 Giordano Mion Linke Zhu
Import Competition from and Outsourcing to China: A Curse or Blessing for Firms?
1037 William Brown David Marsden
Individualisation and Growing Diversity of Employment Relationships
1036 John Van Reenen Does Competition Raise Productivity through Improving Management Quality?
1035 Florence Kondylis Marco Manacorda
School Proximity and Child Labor Evidence from Rural Tanzania
1034 Lars Boerner Albrecht Ritschl
Communal Responsibility and the Coexistence of Money and Credit under Anonymous Matching
1033 Gianluca Benigno Pierpaolo Benigno Salvatore Nisticó
Second-Order Approximation of Dynamic Models with Time-Varying Risk
1032 Gianluca Benigno Chuigang Chen Christopher Otrok Alessandro Rebucci Eric R. Young
Financial Crises and Macro-Prudential Policies
1031 Dennis Novy International Trade without CES: Estimating Translog Gravity
1030 Alex Bryson John Forth
The Evolution of the Modern Worker: Attitudes to Work
1029 Fabrice Defever The Spatial Organization of Multinational Firms
1028 Elhanan Helpman Oleg Itskhoki Stephen Redding
Trade and Labor Market Outcomes
1027 Nicholas Oulton Long Term Implications of the ICT Revolution: Applying the Lessons of Growth Theory and Growth Accounting
1026 Maarten Goos Alan Manning Anna Salomons
Explaining Job Polarization in Europe: the Roles of Technology, Globalization and Institutions
The Centre for Economic Performance Publications Unit Tel 020 7955 7284 Fax 020 7955 7595
Email [email protected] Web site http://cep.lse.ac.uk