Thuwathu/Bujimulla Indigenous Protected Area - Carpentaria ...
Upload
khangminh22Category
view
2download
0
ICES SCIENTIFIC REPORTS RAPPORTS SCIENTIFIQUES DU CIEM
ICES INTERNATIONAL COUNCIL FOR THE EXPLORATION OF THE SEA
CIEM COUNSEIL INTERNATIONAL POUR L’EXPLORATION DE LA MER
WORKING GROUP ON BYCATCH OF PROTECTED SPECIES (WGBYC)
VOLUME 1 | ISSUE 51

International Council for the Exploration of the Sea Conseil International pour l’Exploration de la Mer
H.C. Andersens Boulevard 44-46
DK-1553 Copenhagen V
Denmark
Telephone (+45) 33 38 67 00
Telefax (+45) 33 93 42 15
www.ices.dk
The material in this report may be reused for non-commercial purposes using the recommended cita-
tion. ICES may only grant usage rights of information, data, images, graphs, etc. of which it has owner-
ship. For other third-party material cited in this report, you must contact the original copyright holder
for permission. For citation of datasets or use of data to be included in other databases, please refer to
the latest ICES data policy on ICES website. All extracts must be acknowledged. For other reproduction
requests please contact the General Secretary.
This document is the product of an expert group under the auspices of the International Council for the
Exploration of the Sea and does not necessarily represent the view of the Council.
ISSN number: 2618-1371 I © 2019 International Council for the Exploration of the Sea

ICES Scientific Reports
Volume 1 | Issue 51
WORKING GROUP ON BYCATCH OF PROTECTED SPECIES (WGBYC)
Recommended format for purpose of citation:
ICES. 2019. Working Group on Bycatch of Protected Species (WGBYC).
ICES Scientific Reports. 1:51. 163 pp. http://doi.org/10.17895/ices.pub.5563
Editors
Sara Königson • Kelly Macleod
Authors
Sara Bonanomi • Maurice Clarke • Bram Couperus • Christian von Dorrien • Peter Evans • Ruth Fernan-
dez • Nicole Hielscher • Katarzyna Kamińska • Allen Kingston • Sven Koschinski • Finn Larsen • Ana
Marçalo • Hélène Peltier • Carlos Pinto • Maris Plikshs • Gudjon Sigurðsson • Adam Wozniczka

ICES | WGBYC 2019 | I
Contents
i Executive summary .......................................................................................................................iii ii Expert group information .............................................................................................................. v 1 Review and summarize annual national reports submitted to the European Commission
under Regulation 812/2004 and other published documents and collated bycatch rates
and estimates in EU waters (ToR A) .............................................................................................. 1 1.1 EU legislation concerning the bycatch of protected, endangered and threatened
species (PETS) .................................................................................................................. 1 1.2 Monitoring under (EC) Regulation 812/2004-Overview .................................................. 3 1.3 Monitoring under (EC) Regulation 812/2004 by Member States (including non-
cetacean bycatch events when provided) ....................................................................... 3 1.4 Observed PETS specimens, bycatch rates and mortality estimates, total and
observed effort obtained from the ICES WGBYC Data call (includes non-
cetacean species) ............................................................................................................. 8 1.5 Other monitoring programmes and associated bycatch estimates ............................... 10 1.5.1 EU Member States ......................................................................................................... 10 1.5.2 Non-EU Member States ................................................................................................. 11 1.6 Auxiliary data (strandings, entanglement and interviews) indicative of the
impact of bycatch........................................................................................................... 12 1.7 Conclusions .................................................................................................................... 13
2 Collate and review information from National Regulation 812/2004 reports and
elsewhere relating to the implementation of bycatch mitigation measures and ongoing
bycatch mitigation trials, compile recent results and coordinate further work on
protected species bycatch mitigation (ToR B) ............................................................................. 49 2.1 Mitigation compliance carried out under (EC) Reg. 812/2004 -Mandatory and
voluntary mitigation measures ...................................................................................... 49 2.1.1 Member states ............................................................................................................... 49 2.1.2 Mitigation trials outside the EU ..................................................................................... 54 2.1.3 Protected species bycatch mitigation studies from recent literature (2018–19) .......... 55 2.2 Conclusions .................................................................................................................... 57
3 Evaluate the range of (minimum/maximum) impacts of bycatch on protected species
populations where possible, furthering the bycatch risk approach to assess likely
conservation level threats and prioritize areas where additional monitoring is needed
(ToR C) ......................................................................................................................................... 58 3.1 Evaluating the impacts of bycatch on protected species populations using
WGBYC at-sea monitoring data ..................................................................................... 58 3.1.1 Marine Mammals: Bycatch Risk Assessment ................................................................. 58 3.1.2 Marine Mammals: Summary and comparison of minimum and maximum
bycatch rates 2005-2017 ............................................................................................... 61 3.1.3 Seabirds: Summary of minimum and maximum bycatch rates for 2017 ....................... 64 3.1.4 Elasmobranchs: summary of minimum and maximum bycatch rates for 2017 ............ 66 3.2 Evaluating the impacts of bycatch using strandings data: harbour porpoise and
common dolphins .......................................................................................................... 69 3.3 Prioritising areas where additional monitoring is needed: Regional Coordination
Group request for input to risk assessment of North Atlantic Fishing Grounds. ........... 70 3.3.1 Review of taxonomic grouping in the risk assessment and the assignment to risk
categories ....................................................................................................................... 72 3.3.2 Review the presence/absence of taxonomic groups by area ........................................ 72 3.3.3 Comparison observer effort distribution in DCF- and dedicated surveys ...................... 73 3.4 Other approaches to risk assessment: Mapping bycatch risk in relation to
seabird & cetacean distributions in NW European Seas ................................................ 73

ii | ICES SCIENTIFIC REPORTS 1: 51 | ICES
3.5 Conclusions .................................................................................................................... 74 4 Continue to develop, improve and coordinate with other ICES WGs on methods for
bycatch monitoring, research and assessment within the context of European legislation
(e.g. MSFD) and regional conventions (e.g. OSPAR) (TOR D) .................................................... 108 4.1 Coordination with WGCATCH ...................................................................................... 108 4.2 WGBYC coordination with Expert Groups/Workshops working on
elasmobranchs ............................................................................................................. 109 4.2.1 Working Group on Elasmobranch Fishes (WGEF) ........................................................ 109 4.2.2 WKSHARK5 ................................................................................................................... 110 4.3 ICES Working Group on Marine Mammal Ecology (WGMME) .................................... 110
5 Continue to develop collaborative research proposals among WGBYC members to
pursue research projects and funding opportunities in support of researching protected
and target species behaviour in relation to fishing gear (ToR E) ............................................... 114 6 Continue, in cooperation with the ICES Data Centre, to develop, improve, populate
through formal Data Call, and maintain the database on bycatch monitoring and
relevant fishing effort in European waters. (Intersessional (ToR F) ......................................... 116 6.1 Needs of WGBYC for the new RDBES ........................................................................... 116 6.2 ICES WGBYC Data call .................................................................................................. 116 6.3 Fish species of interest to WGBYC ............................................................................... 117 6.4 Comparison of effort from different sources (RDB & WGBYC) .................................... 118 6.5 Collating data from 2005 until 2017 into a single table ............................................... 122
7 References ................................................................................................................................. 125 Annex 1: List of participants........................................................................................................ 128 Annex 2: Resolutions .................................................................................................................. 130 Annex 3: Recommendations 2019 .............................................................................................. 136 Annex 4: ICES WGBYC Data Call for ICES advisory work of the Working Group on Bycatch
of Protected Species (WGBYC) ..................................................................................... 137 Annex 5: Tables, Figures, Acronyms ........................................................................................... 155 Annex 6: Reviewers Reports ....................................................................................................... 159

ICES | WGBYC 2019 | III
i Executive summary
Six Terms of Reference (ToRs; Annex 2) were addressed during the meeting through plenary and
subgroups. The 2019 report is structured in the same order as the ToRs. Contributions to ToRs
were requested in advance of the meeting and all data submissions were requested via a formal
WGBYC/ICES data call (Annex 7). The data call requested data on fishing effort, monitoring ef-
fort and protected species (marine mammals, seabirds, reptiles and fish) bycatch incidents in
2017. Of the 24 countries contacted, 20 responded to the data call. Many countries continue to
submit data late (one-third) and the quality of the data submissions is variable. The data call
referred to bycatch of fish, as per the list provided in Table 1D of the Commission Implementing
Decision (EU) 2016/1251 adopting a Multiannual Union Programme (EU-MAP); however,
WGBYC this year reviewed this list to create a priority fish bycatch list since many of the species
on D1 are commercially caught and other scientific bodies, e.g. ICES expert groups, carry out
assessments for these.
Member States (MS) reports on the implementation of Regulation 812/2004 during 2017 were
reviewed. Most MS continue to monitor protected species bycatch using fisheries observers con-
ducting sampling under the Data Collection Framework (DCF); only a few countries have a ded-
icated bycatch observer programme. With the upcoming repeal of Regulation 812/2004 in 2019,
WGBYC will in future receive its data from monitoring under EU-MAP. Monitoring of smaller
vessels (<15m) in the European fleet has to date generally been poor, and sampling designs under
EU-MAP need to ensure representative coverage of relevant metiers for protected species by-
catch. In 2017, bycatch records from the datacall included 148 cetaceans (5 species); 63 seals ( 4
species), 528 birds (22 species); 97,816 elasmobranchs (49 species) and 15 turtles (2 species) ..
Equivalent data from non-EU countries was also received from the USA and Iceland.
MS’s compliance with the pinger requirements of Regulation 812/2004 is difficult to gauge from
the submitted reports, as there are reporting inconsistencies and in-complete information. Only
the UK appears to comply fully and reported that all relevant vessels are equipped with “DDD”
pingers used under a derogation and there is active enforcement in place. But in general, there
has been little progress in the mitigation of cetacean bycatch and the effectiveness of pingers
appears to vary between with fishing metiers and geographical areas.
WGBYC completed Bycatch Risk Assessments (BRA) for harbour porpoise and grey seals in the
Celtic Seas (CS) and Greater North Sea (NS) ecoregions. Data were pooled from 2015-2017 and
minimum and maximum bycatch rates extrapolated using 2017 fishing effort data for nets, bot-
tom trawls and pelagic trawls. Bycatch rates of both species were highest in nets in both ecore-
gions; however, French data also included a high number of seal bycatch incidents in bottom
trawls, but these records could not be verified during the meeting. The percentage mortality of
the grey seal population in the CS and NS ecoregions due to bycatch was estimated at 1.5 - 2.8%.
For harbour porpoise, in the NS between 0.33 - 0.59% in nets, and in the CS between 0.29 - 0.8%
in nets and bottom trawls combined; both of these estimates are below the ASCOBANS 1.7%
threshold defining unacceptable levels of interaction and below the 1% precautionary environ-
mental limit. However, ICES ecoregions are arbitrary and are unlikely to reflect true population
structure of harbour porpoise; the working group therefore conducted a further BRA using the
latest definition of a Celtic Sea subpopulation and this suggested that levels of mortality in 2017
due to bycatch may be between 2.12 - 5.57% of that subpopulation. This demonstrates the im-
portance of assessing population level impacts at appropriate spatial scales. It also worth noting
that most of the observation data comes from DCF monitoring which likely biases bycatch rates
downward. Additional estimates of harbour porpoise and common dolphin bycatch mortality
IV | ICES SCIENTIFIC REPORTS 1:51 | ICES
based on stranding data were also presented for the North Sea and Bay of Biscay/English Chan-
nel as WGBYC continue to assess the performance of those methods for estimating by-catch lev-
els.
For the first time, WGBYC prepared comprehensive summaries of elasmobranch and seabird
data from 2017, and calculated lower and upper confidence intervals around the bycatch rates
using the available monitoring data. For both taxa, the main focus was placed on species of
higher perceived conservation concern. Access to monthly fishing effort data was considered an
important prerequisite for usefully extrapolating seabird bycatch data because of the seasonality
in bycatch rates (driven by seasonality in seabird distribution and behaviours). Calculated con-
fidence intervals around seabird bycatch rates were wide; though precision levels could be im-
proved upon in future by generating multi-annual bycatch rates in or-der to utilise more data.
Elasmobranch bycatch was very common in all ecoregions. The range of bycatch rates presented
highlight those species, gears and areas where bycatch may be a particular concern; the data also
contribute usefully to a more general scientific understanding of the distribution and abundance
of some elasmobranch species.
WGBYC has made considerable progress forming relationships with other ICES expert groups;
the relationship established with WGEF should help facilitate the work of both groups going
forward. WGBYC also undertook a review of the risk assessment being used by the Regional
Coordination Groups to develop regional sampling plans under EU-MAP. An exercise compar-
ing levels of dedicated bycatch monitoring versus DCF monitoring effort in North Atlantic fish-
ing grounds, high-lighted the trivial amount of dedicated PS monitoring days undertaken in
2017. In the North Sea for example, there were just 22 days of dedicated bycatch monitoring
compared to 1829 days monitoring under the DCF.
WGBYC conducted a comparative analysis of the 2017 effort data contained within the WGBYC
database with equivalent data from the ICES Regional Database. Significant differences were
highlighted between the datasets from individual countries, gear and vessel size categories. Nei-
ther database was consistently better than the other, however, reliance solely on the RBD as the
source of fishing effort data in future would require that all countries submit data to it in a usable
format for WGBYC bycatch assessments (e.g. the UK’s submission to the RBD could not be used
in the comparative analysis because the UK did not provide effort to the RDB as “days at sea”
which is not currently a mandatory field. Historically “days at sea” has been the common metric
provided through Regulation 812/2004 reports and thus enables pooling of national datasets to
estimate overall bycatch rates.
WGBYC has collated bycatch monitoring and fishing effort data since 2005. To date, the requests
for these data and the required reporting format have gradually evolved. This presents chal-
lenges to using the entire dataset as data from the early years are not fully compatible with more
recent years. WGBYC began the process of making the entire dataset usable this year but this
requires further work. However, this is an invaluable exercise that will maximise the value of
the dataset by providing a significant time series of data which will enable the group to look at
inter-annual trends in bycatch rates by metier and area. This ongoing process will also identify
core fields and data needs that will be required in future data calls and from the RDB, to ensure
ongoing compatibility. It is of paramount importance to the work of WGBYC that the transition
from using data from Regulation 812/2004 data collection and data storage structures can be ac-
commodated in the RDB (and upcoming RDBES) so that the full time series is maintained and
available for analysis.
ICES | WGBYC 2019 | V
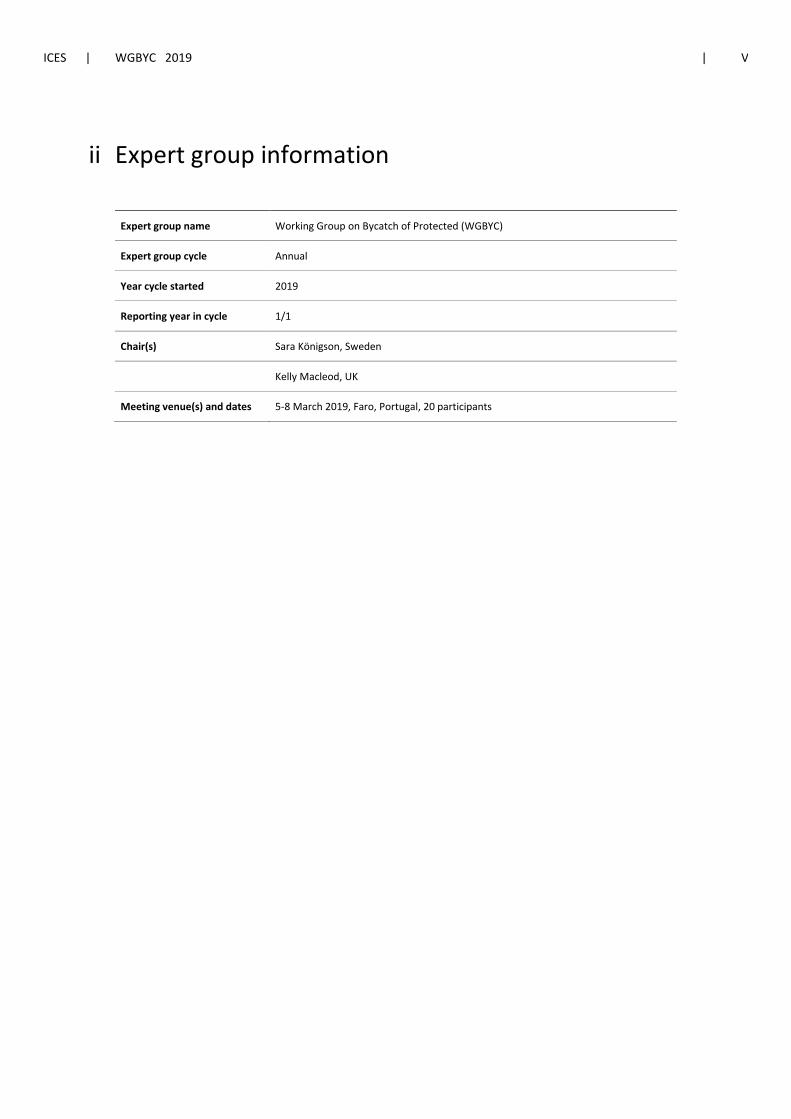
ii Expert group information
Expert group name Working Group on Bycatch of Protected (WGBYC)
Expert group cycle Annual
Year cycle started 2019
Reporting year in cycle 1/1
Chair(s) Sara Königson, Sweden
Kelly Macleod, UK
Meeting venue(s) and dates 5-8 March 2019, Faro, Portugal, 20 participants

ICES | WGBYC 2019 | 1
1 Review and summarize annual national reports sub-mitted to the European Commission under Regula-tion 812/2004 and other published documents and collated bycatch rates and estimates in EU waters (ToR A)
1.1 EU legislation concerning the bycatch of protected, endangered and threatened species (PETS)
The work of WGBYC is primarily driven by the requirements of Council Regulation (EC) No.
812/2004 of 26 April 2004 laying down measures concerning incidental catches of cetaceans in
fisheries (hereafter referred to as Reg.812/2004). The Regulation has two components: Articles 1–
3 concerning the use of Acoustic Deterrent Devices (ADDs or ‘pingers’) on vessels of 12 m or
over in métiers identified in Annex I, and; Articles 4 and 5 concerning monitoring of ‘incidental
catches of cetaceans using observers on board the vessels flying their flag and with an overall
length of 15 m or over, for the fisheries and under the conditions defined in Annex III’. Member
States (MS) are obliged to establish Pilot or Scientific Studies on smaller vessels operating in the
same broad metiers. MS are also required to report annually on their monitoring effort, fishing
effort, number of incidental catches of cetaceans and the use of pingers to the EC. The annual
review of these reports are central to the work of WGBYC. WGBYC have repeatedly highlighted
the shortcomings of this Regulation (primarily it does not necessarily target all métiers with the
highest bycatch rates) and also the lack of compliance from MS with regards to pinger imple-
mentation and reporting.
Other appropriate data on cetacean bycatch may also be submitted through Reg.812/2004 re-
ports. These data are most commonly linked to at-sea observations carried out for the purposes
of fisheries monitoring in accordance with the EU Data Collection Framework Regulation
2017/1004 (DCF)1. The aims of the DCF are to “establish rules on the collection, management and use
of biological, environmental, technical and socio-economic data concerning the fisheries sector” and con-
tribute “towards reaching the objectives of the common fisheries policy, which include the protection of
the marine environment, the sustainable management of all commercially exploited species, and in partic-
ular the achievement of good environmental status in the marine environment” under the Marine Strat-
egy Framework Directive (MSFD). In Article 4, it states that it “shall establish a multiannual Union
programme for the collection and management of data”. Article 4 is realised through Implementing
Decisions (e.g. (EU) 2016/1251 of 12 July 2016). The implementing decision states that data col-
lected should include ‘incidental bycatch of all birds, mammals and reptiles and fish protected under
Union legislation and international agreements, including the species listed in Table 1D, and if the species
is absent in the catch during scientific observer trips on fishing vessels or by the fishers themselves through
logbooks’. Table 1D lists ‘Species to be monitored under protection programmes in the Union or under
international obligations’. While the collection of protected species bycatch data through the DCF
as part of the Multiannual Plan (DC-/EU-MAP) may facilitate targeted sampling of métiers of
concern, the use of non-dedicated protected species bycatch observers may lead to downward
bias in the number of recorded events (see ICES 2015).
1 https://datacollection.jrc.ec.europa.eu/legislation/current/obligations

2 | ICES SCIENTIFIC REPORTS 1:51 | ICES
The state of play of the revision of the EU Technical Measures Regulation was presented and
discussed. Following an agreement in substance between the European Parliament and the Eu-
ropean Council, a final legal text is being prepared though it is not yet published. The main ele-
ments of the agreement are :
1. The existing Regulation 812/2004 is repealed. Corresponding and replacement provisions
will be included in the new Technical Measures Regulation.
2. Measures to monitor, manage and mitigate bycatches of sensitive species (including but
not limited to cetaceans, birds and turtles) will be subject to regionalised management
where Member States should prepare Joint Recommendations to the European Commis-
sion who will, subject to scientific and technical validation, propose the measures for
adoption into EU law. Member States will be required to take the necessary steps to
collect data on the relevant species.
3. The objectives of the new Regulation will be to ensure that incidental catches of sensitive
marine species are minimised and where possible eliminated such that they do not rep-
resent a threat to the conservation status of these species; to minimise negative environ-
mental impacts of fishing on marine habitats and to put in place management measures
for the purposes of complying with the Habitats, Birds, Water Framework and Marine
Strategy Framework Directives. The new technical measures should ensure that by-
catches of marine mammals, marine reptiles, seabirds and other non-commercially ex-
ploited species do not exceed levels in Union legislation and international agreements.
4. Provisions existing in Regulation 812/2004 concerning vessel sizes, areas and fishing
gears where pingers are required or where monitoring of bycatches is mandatory have
been retained.
5. Detailed technical descriptions of pingers will not be carried over from Regulation
812/2004. The Commission may request technical advice in order to develop a new de-
scription to be adopted as an Implementing Regulation.
6. Submission of annual reports on bycatches by Member States will cease to be a legal
requirement. However, data collection should be incorporated in data exchange and stor-
age systems accessible to scientific instances. The European Commission is to prepare
triennial reports (the first of which is due in 2020) for presentation to Parliament and
Council.
In discussion, it was brought forward that the existing minimum vessel LOAs where use of ping-
ers is obligatory (12m) and where monitoring of bycatches is required (15m) are inappropriate
as many bycatches are made from smaller vessels. It was also questioned how any failure by
Member States to meet their responsibilities under the new Regulation would be followed up.
There are many obligations to monitor and introduce measures to reduce protected species by-
catch out with those within legislation specific to fisheries and the Common Fisheries Policy. As
examples, MS have obligations under Council Directive 92/43/EEC2 of 21 May 1992 on the con-
servation of natural habitats and of wild fauna and flora (the ‘Habitats Directive’). Article 12
states ‘Member States shall establish a system to monitor the incidental capture and killing of the animal
species listed in Annex IV (a). In the light of the information gathered, Member States shall take further
research or conservation measures as required to ensure that incidental capture and killing does not have
a significant negative impact on the species concerned.’ The revised Commission Decision 2017/8483
relating to the implementation of the MSFD specifies a primary criterion for the assessment of
Good Environmental Status (GES) linked to the assessment of bycatch; Primary criterion: D1C1
—The mortality rate per species from incidental bycatch is below levels which threaten the species, such
2 https://eur-lex.europa.eu/legal-content/EN/TXT/?uri=celex%3A31992L0043
3 https://eur-lex.europa.eu/legal-content/EN/TXT/?uri=CELEX%3A32017D0848

ICES | WGBYC 2019 | 3
that its long- term viability is ensured. Specific to seabirds, is the European Commission’s ‘Action
Plan for reducing incidental catches of seabirds in fishing gears’ (EU-POA) which was published
in 2012. It seeks to provide a management framework to minimise seabird bycatch to as low
levels as are practically possible. Robust data pertaining to fishing effort and bycatch monitoring
data are required by MS to assess the impact of bycatch and work towards meeting the various
legislative requirements and commitments.
1.2 Monitoring under (EC) Regulation 812/2004-Overview
The WG was provided with MS annual reports to the European Commission on at-sea observa-
tions carried out under Reg. 812/2004 in 2017. Six of the relevant4 23 EU MS were not affected by
any part of Reg. 812/2004 (hereafter in this section termed “the Regulation”) in 2017 (Bulgaria,
Croatia, Cyprus, Greece, Malta, Romania) because their vessels do not fish in areas covered by
the Regulation (Table 1). Two MS that are affected by the Regulation, but which did not submit
reports to the EC were Lithuania and Spain (Table 1). Reports were received from the remaining
15 of the 17 MS affected by Articles 4–5 of the Regulation. The reports from Belgium, Denmark,
Estonia, France, Finland, Italy, Germany, Ireland, Latvia, Netherlands, Poland, Portugal, Slove-
nia and the UK were obtained via the EC. The report from Sweden was submitted directly to
WGBYC. Section 1.3 below summarizes text extracted directly from individual MS reports.
The quality and scope of the information provided in the annual reports continues to be variable,
with some MS simply repeating the information provided in previous years. Consistent with the
annual content of WGBYC reports from previous years the Regulation reports have been re-
viewed for:
1. Implementation of mandatory monitoring of cetacean bycatch, and information on vol-
untary mitigation and observation schemes (see 2 for mitigation);
2. Information on cetacean bycatch (including records of individual bycatch events and by-
catch estimates, and magnitude of observer coverage provided by MS);
3. Information on bycatch of non-cetacean taxa;
4. Other relevant issues emanating from the annual reports.
1.3 Monitoring under (EC) Regulation 812/2004 by Member States (including non-cetacean bycatch events when provided)5
In Belgium, no specific observer scheme was in place in 2017 to monitor bycatch of marine mam-
mals. Fishing trips were only observed on board vessels with towed gear for the purposes of
stock surveys and to fulfil other monitoring requirements. No bycatch of marine mammals was
observed during fishing operations. Due to the small number of vessels affected, Belgium states
that commercial fishing practices in the country have a limited impact on the marine mammal
populations.
Denmark reported no specific monitoring programs for incidental bycatch of marine mammals
during 2017 in the Danish pelagic trawl fishery. The reason for not continuing the monitoring
programs carried out from 2006–2008 was that the observer schemes, with a coverage up to 7%,
had no records of incidental bycatch of marine mammal species in this fishery. Neither was any
specific monitoring according to the Regulation carried out in the Danish gillnet fishery. Instead,
observer data on incidental catches of marine mammals from gillnets was collected under the
Data Collection Regulation scheme (DCR). Monitoring was carried out on vessels <15 m in area
4 The word “relavant” was inserted for clarification based on the reviewers’ comments.
5 Heading updated based on reviewers comments.

4 | ICES SCIENTIFIC REPORTS 1:51 | ICES
27.3.a (15 days at sea; 0.8% coverage; one bycaught harbour porpoise), vessels <15 m in area 27.4
(4 days at sea; 0.8% coverage; zero porpoise bycatch), and vessels >15 m in area 27.4 (15 days at
sea; 0.5% coverage; zero porpoise bycatch). In addition, video monitoring continued in 2017 on
board 9 different vessels fishing in areas 27.SD22-23 and 27.3a. The data have not yet been
analyzed.
The Estonian national monitoring program of incidental catches of cetaceans in 2017 covered
observations of 53 trips in pelagic trawl fisheries in area 3.d (SD 28, 29 and 32). The observations
were carried out on 12 different vessels and 61 hauls. No incidental bycatch of cetaceans was
observed in 2017. The observer coverage was 3.9%.
According to Estonian data, the incidental catches of cetaceans in areas where Estonian fishing
effort is mainly situated (SD 32, 29, 28, 27) is zero. The reason is likely due to the very low density
of cetaceans in these areas. According to the SAMBAH project (SAMBAH 2016) the probability
of detection of harbour porpoise in Estonian EEZ is around 0% in both winter and summer. Es-
tonia reported that there is no fishing effort using static gear with vessels larger than 15 m be-
cause static gears are used in fisheries by boats up to 10 m. However, no monitoring has been
conducted to assess the incidental catches of cetaceans for boats up to 10 m, but according to
interviews with fishermen there have been no cetacean catches.
Finland reported that in accordance with Article 6 of the Regulation, an observer program ran
during years 2006 and 2007 and no harbour porpoises or other cetaceans were observed by au-
thorities as bycatch or otherwise during this two-year period. As a result, no observer program
has been in place since. Furthermore, it is stated that the Finnish National Fisheries Act obliges
all vessels, regardless of size, to report in their logbooks harbour porpoise or cetaceans caught as
bycatch. Authorities have not received any reports of bycaught harbour porpoises or cetaceans.
In France, the program Obsmer manages all the observations at sea required by various fishery
regulations. During 2017, 701 trips and 855 fishing days were monitored by observers. A total of
208 trips representing 314 days at sea were monitored for towed gears in ICES areas 7 (including
7k), 8 and in the Mediterranean sea. A total of 296 trips and 383 days at sea were monitored for
static gears in ICES area 8. In addition, 197 trips and 158 days at sea were dedicated to set nets
in areas requiring pingers under the Regulation (Subareas 4 and 7). Five species of cetaceans,
representing 80 individuals, were observed bycaught during the year 2017. Specifically, in mid-
water pair trawlers (PTM), 49 common dolphins were bycaught in division 27.8 a; 8 common
dolphins and one harbour porpoise in 27.8 b and 5 pilot whales were bycaught in 27.8 c. In otter
twin trawls (OTT), a harbour porpoise bycatch was observed in Division 27.7 g. In otter bottom
trawls (OTB), one common dolphin (27.7 h) and one harbour porpoise (27.8 a) were recorded. In
gillnets (GNS), a common dolphin was bycaught in 27.8 b. In trammel nets (GTR) 4 common
dolphins and 4 harbour porpoises were bycaught in 27.8 b, and one in 27.8 a. In the Mediterra-
nean Sea (GSA 07), a bottlenose dolphin and an unidentified dolphin were bycaught in otter
bottom trawls (OTB). Additionally 2 striped dolphins were by caught in midwater otter trawls
(OTM). The low coverage of metiers (1.5% for towed gears and <1% for static gears) by at sea
observers did not allow production of estimates of total cetacean bycatch.
Germany monitored under the DCF observer programme, trying to follow the requirements of
Reg. 812/2004 as much as possible. It was not always possible to achieve the sampling intensity
required under the Regulation in some fleet segments for technical reasons and in other cases
owing to a lack of capacity in the sampling programme, which is adapted to the requirements of
the EU fisheries data collection programme (DCF). Sampling effort for fleet segments >= 15 m
(pelagic trawls, Subareas 6, 7, 8) was 17.8 % and met the requirements of the Regulation (An-
nex III, point 3) while that for the sectors of pelagic trawls, in 3 a, b, c, d, 4 and 9 (Annex III,
row E) as well as stationary gill nets and entangling nets, 6 a, 7 a, b, 8 a, b, c and 9 a (Annex III,

ICES | WGBYC 2019 | 5
row C) and those in 3 b, c, d (Annex III, row G) did not. In fleet segment A (pelagic trawls,
Subareas 6, 7, 8), a bycatch of one grey seal (Halichoerus grypus) was noted.
Ireland reported a total of 33 trips comprising 106 days at sea and 98 hauls were observed in
pelagic trawl fisheries in 2017. All of this work was carried out as part of Data Collection Frame-
work (DCF) monitoring and surveys. Following a period of intensive monitoring of set net fish-
eries from 2011 to 2013 no further regular monitoring of set net fisheries occurred until 2017
when one under 15m vessel was observed for two days. No cetacean bycatch was observed in
pelagic fisheries in 2017. However 3 dolphins (one of which was released alive) were reported
as caught in three separate events by demersal otter trawls during this time period.
A total of 7 common dolphins have been observed from a total of 1635 days at sea observed in
pelagic trawls since monitoring under EC 812/2004 commenced in 2005. Of these, a total of 219
days were carried out as part of dedicated independent observer programmes from 2010 to 2012
in a range of pelagic trawl fisheries with no cetacean bycatch observed. Results to date suggest
that the risk of bycatch of cetaceans and other protected species in Irish pelagic trawl fisheries is
low.
In Italy, the observer program conducted under Regulation (EC) no. 812/2004 is an ad- hoc mon-
itoring program in which observers are trained to collect not only data on cetacean bycatch, but
also additional data on bycatch of other protected species under the Habitats Directive. A total
of 196 days were monitored on board 15 pelagic pair trawlers between GSA 16 (3 vessels) and
GSA 17 (12 vessels) in 2017, which represent 14.7% coverage of the national midwater trawl fleet.
3 bottlenose dolphins (Tursiops truncatus) were accidentally caught in GSA 17 (Chioggia, north-
ern Adriatic Sea). Observers from the monitoring programme were also trained to collect bycatch
data of other PETS under HD (i.e. loggerhead turtles) and species of conservation concern (e.g.
sharks, pelagic rays and skates). 3 loggerhead turtles (Caretta caretta) and a large number of
sharks and rays were taken as bycatch in GSA 17. However, the report records only 3 starry rays
(Raja asterias) and 2 common eagle rays (Myliobatis aquila) were unintentionally caught in GSA
16.
The Latvian national monitoring program of incidental catches of cetaceans in 2017 covered ob-
servations of 513 trips in pelagic trawl fisheries. The observations were carried out by 5 observers
on 13 different vessels. No incidental bycatch of cetaceans was observed in 2017; this is similar
to previous reports from 2006–2016. Reported observer coverage was 10.3% of the pelagic trawl
fishery with vessels 12–18 m in area 27.3.d (SD28.1- Gulf of Riga), and 9.7% with vessels 24–40
m in area 27.3.d (SD 25,26 and 28.2). Coverage was estimated using days at sea. The lack of
observed bycatch over the full decadal time period indicates that cetacean monitoring under the
Regulation has no practical significance in Latvian fisheries. Traditionally Latvian pelagic trawls
fishery are targeting sprat and 90-93% of effort is allocated to SD28.2.and 28.1. Therefore, Latvia
reiterated that continuation of its cetacean bycatch monitoring program is an unnecessary ex-
penditure of financial and human resources. Latvia proposed to stop future observations for its
fleet segments.
In the Netherlands, the monitoring of all protected species bycatch is implemented in the new
Data Collection Framework (DCF) since January 2017. During 10 fishing trips, 71 days and 210
hauls were observed in fleet segment NLD003, and 78 days and 192 hauls were observed in fleet
segment NLD004. With a total number of fleet days of 388 in fleet segment NLD003 and 776 in
fleet segment NLD004, the coverage was 18.3% and 10.1% respectively. Thus, the target of the
Pilot Monitoring Scheme (PMS) of 10% for NLD003 and 5% for NLD004 has been fulfilled. In
addition to these trips, two more observer trips were carried out on board foreign flagged trawl-
ers which makes the total number of monitored trips by the Netherlands at twelve. The observer
effort on board foreign trawlers consisted of 27 days (62 hauls), covering approximately 13.4%
of the total Dutch monitoring effort. The data collected during the trips on foreign flagged vessels

6 | ICES SCIENTIFIC REPORTS 1:51 | ICES
will be made available to the ICES database on incidental bycatch. The observed bycatch rate of
zero dolphins per day in the pelagic fishery in 2017 is in line with the findings in 2006 - 2016
when the observed bycatch rate was 0.00-0.01 dolphins per day.
In addition to cetaceans, the report includes information on incidental bycatches of megafauna
species listed in Table ID of EU Decision 2016/2051. Seven bluefin tuna (Thunnus thynnus) were
caught in five incidents by the NLD003 fleet segment in 2017; one grey seal (Halichoerus grypus)
was caught in one incident; four porbeagles (Lamna nasus) were caught during four incidents in
both fleet segments; one thresher shark (Alopias sp.) was caught in one incident. This report also
presents the results of three monitoring day trips in set gill nets fishery and two day trips in
trammel net fishery. In one of the gill net trips, two common guillemots (Uria aalge) and four red
throated divers (Gavia stellata) were caught.
In Poland, the Cetacean Bycatch Monitoring Programme, which has been a part of the National
Fishery Data Collection Programme since 2015, continued in 2017. Observers aim to monitor
commercial catch and bycatch of cetaceans or other marine mammals, as well as seabirds and
protected fish species, such as twaite shad (Alosa fallax) or Atlantic sturgeon (Acipenser oxyrhyn-
chus). In summary, observation has been conducted on 8 vessels over 15 m operating from 4
ports, one vessel under 15 m (Kołobrzeg) and 4 fishing boats operating within the Gulf of
Gdańsk. The observers spent 50 days at sea, including 24 days on vessels operating pelagic trawls
(OTM), 8 days on trips where fishing has been carried out using bottom-set gillnets (GNS), 12
days on one bottom otter trawl (OTB) and 6 days on a vessel using drifting longlines (LLD). No
cases of bycatch of any marine mammal or seabird was observed nor bycatch of other protected
fish species.
In Portugal, monitoring of bycatch of cetaceans and other protected species on the mainland
were provided by IPMA at-sea observations carried out under the National Biological Sampling
Program (PNAB/EU-DCF). As in previous years, following the requirements of Reg.812/2004,
Portugal is required to monitor fleet segments >= 15m for GNS and GTR only in Subarea 9a. The
monitoring programme was maintained with its common limitations as sampling intensity re-
quired by the Regulation is frequently not achieved for practical and logistical reasons. A total
of 14 trips and 46 hauls were observed in set nets (GNS and GTR) included in the polyva-
lent/multi gear fishery (vessels ≥15 m) operating in the Portuguese waters of ICES Division 9.a.
This observation effort translated into coverage of 0.11% of the fishing effort of boats operating
off mainland Portuguese ports. The efforts on other métiers such as demersal trawls (OTB) and
purse seine (PS) for Division 9.a were also presented. In 2017, onboard observers (DCF) recorded
bycatch of 3 common dolphins (Delphinus delphis) in the purse seine fishery (PS) only, but one
animal was released alive. During the same period, mortality of 2 Larus michahellis and 1 Morus
bassanus were recorded in GNS and GTR.
In Slovenia, vessels fishing under Reg. 812/2004 were monitored by the Fisheries Research Insti-
tute of Slovenia during the course of its regular monitoring activities (monitoring of catches and
discards) under the DCF. In addition, the Slovenian non-governmental organisation Morigenos
has an independent long-term monitoring and conservation programme of observing bottlenose
dolphins (Tursiops truncatus). No deaths of cetaceans due to fishing were reported in 2017.
In Spain, there is no dedicated observer programme for protected species bycatch. Monitoring
is carried out under the DCF observer programme, and protected species are routinely recorded
by the IEO and AZTI. Spain did not submit the Reg. 812/2004 annual report to the EC this year.
Data on total effort, monitoring effort and bycatch events for the Spanish fishing fleets operating
in ICES major fishing area 27 (Subarea 7 and Divisions 6b, 9a, 14b, 2a and 2b) in 2017 (collected
under the DCF observer programme) were provided through the WGBYC data call (Annex 7).
The data include one cetacean bycatch event of a single common dolphin (Delphinus delphis) by
a bottom trawler in Subarea 7. Bycatch events of 10 fish species, including 9 elasmobranchs, have

ICES | WGBYC 2019 | 7
been reported for 2017. Spain has not officially reported any data from the Spanish fishing fleet
operating in Subareas 1, 8 and 12 or from the fleet operating in the Mediterranean Sea and the
NAFO Regulatory area (major fishing area 21).
Sweden reported monitoring effort included in the 812/2004 report for data collected within the
EU Data Collection Framework, where on-board observation was carried out in trawl fisheries
but also pot fisheries for crayfish. In the bottom trawl fisheries (OTB) 54 days at sea (DaS) were
observed out of a total effort of 8687 DaS including all areas around Sweden. In the pelagic trawl
(OTT) métier 74 DaS were observed of a total of 7661 DaS. In the pot and trap (FPO) fisheries, 11
trips were observed of a total of 16038 DaS. In longline fisheries (LLS) 4 DaS were observed out
of a total of 459 DaS. No bycatch of cetaceans was observed in these fisheries. Catch of other
protected species were not included in the report. Also, there has been a pilot project with on-
board observers dedicated to observing bycatch of marine mammals in gillnet fisheries in the
south of the country. All together there was 36 observed DaS and two harbour porpoises were
caught in Area 23 in large meshed gillnets. One tufted duck, one common eider, one great cor-
morant, three razorbills and three common guillemot were caught in Area 23 in cod gill nets or
gill nets with large meshes. Due to the low monitored effort, no total bycatch numbers can be
estimated. Total effort of gillnet fisheries were 19471 DaS.
For the United Kingdom, in 2017, 217 dedicated protected species bycatch monitoring days were
conducted during 157 trips on board static net vessels and 114 dedicated bycatch monitoring
days during 41 trips on pelagic trawlers. Cetacean bycatch was observed in static net gears (large
mesh tangle and trammel nets and gillnets) in Subarea 7: 5 harbour porpoises (Phocoena phocoena)
and 3 common dolphins (Delphinus delphis). The UK’s dedicated bycatch monitoring program
records all protected species bycatch and further documented 3 grey seals (Halichoerus grypus)
and 17 seabirds (15 common guillemots [Uria aalge] and 2 cormorants [Phalacrocorax carbo]).
Rarer and/or protected fish species recorded included 20 small-eyed ray (Raja microocellata), 2
marbled electric ray (Torpedo marmorata), 1361 common skate (Dipturus batis), 216 blue shark (Pri-
onace glauca), 69 undulate ray (Raja undulata), 32 tope (Galeorhinus galeus), 44 porbeagle shark
(Lamna nasus) and 4 shads (Alosa spp). One sunfish (Mola mola) was also recorded.
Under other English, Welsh and Northern Irish fishery monitoring programmes 72 and 466 days
of non-dedicated sampling in static net (including drift net) and demersal trawl fisheries, respec-
tively, was conducted. 14 days monitoring were also achieved in midwater trawl and line fish-
eries. All of these monitoring days (n=552) were conducted under the national discard sampling
programmes to meet requirements of the Data Collection Framework. There were no records of
marine mammal bycatch recorded during this monitoring effort.
To estimate total bycatch in the UK static net fleet, key assumptions were made in the treatment
of the underlying fishing effort and observed monitoring data. Therefore, bycatch estimates are
likely biased, and will likely underestimate bycatch for larger offshore vessels and overestimate
for smaller inshore vessels. However, with this caveat in mind, the “best” estimate of harbour
porpoise bycatch for 2017 in all UK net fisheries in the absence of pingers is 1,282 animals
(range:718 - 2402; CV=0.08), and if all over 12 m boats used pingers in relevant areas the estimate
is 1,098 animals (range: 587-2615; CV=0.10). Bycatch estimates for common dolphins and seals
in 2017 are 258 (range 140-737) and 572 (range 429-1077) respectively.

8 | ICES SCIENTIFIC REPORTS 1:51 | ICES
1.4 Observed PETS specimens, bycatch rates and mortality esti-mates, total and observed effort obtained from the ICES WGBYC Data call (includes non-cetacean species)
Prior to the WGBYC 2019 meeting, a WGBYC/ICES data call (Annex 7) requesting 2017 bycatch
data from dedicated (i.e. Reg. 812/2004) and non-dedicated (i.e. DCF) monitoring programmes
was issued. The data call is issued to EU Member States and ICES Member countries with coastal
areas in the European Atlantic (e.g. Iceland). This section summarises bycatch data obtained
through the data call and extracted from the WGBYC database (section 6) for 2017.
The total number of specimens or number of incidents of marine mammal, seabird and elasmo-
branch bycatch, total fishing effort and observed effort aggregated by gear type (métier level 3),
ecoregion (Figure 1) and ICES Division extracted from the WGBYC database for 2017 are sum-
marised in Table 2. A total of 63 seals (four species; 4 animals unidentified to species) and 148
cetaceans (from five species: 75 common dolphins; 59 harbour porpoises 6 long-finned pilot
whales, 3 striped dolphin and 4 bottlenose dolphins and an unidentified delphinid) were ob-
served bycaught in 20176. Bycatch rates were calculated by dividing the total number of observed
bycaught specimens for a given species by the total number of observed days in each fishery
stratum (Table 2). This method was also used to summarise seabird and elasmobranch bycatches
given the increased reporting frequency for those taxa in 2017. A total of 528*** seabird specimens
and 14 associated bycatch rates are reported for at least 20 bird species. A total of 97,8167 elas-
mobranch specimens and 10 associated bycatch rates are reported for 49*** elasmobranch species
(Table 2).
Bycatch estimates were provided by certain countries for some seabird, elasmobranch, marine
mammal and turtle species in some parts of Icelandic and Mediterranean waters for 2017. For
other areas, a notable bycatch rate for non-marine mammal species consisted primarily of a range
of elasmobranch species taken mostly in pelagic trawl fisheries in the Greater North Sea (Spiny
dogfish Squalus acanthias, in Division 27.4.a) and in bottom-trawl and net fisheries in the Greater
North Sea and Celtic Seas (Table 2).
6 Numbers of bycaught marine mammals have been updated after the Advice Drafting Group (ADGBYC)
7 Numbers of bycaught birds and elasmobranch species have been updated after the Advice Drafting Group (ADGBYC)

ICES | WGBYC 2019 | 9
Figure 1. Map of ICES Ecoregions including ICES Statistical Areas, ices.dk. February 2017.
There are insufficient data to provide cetacean bycatch rates according to pinger functionality
and/or presence/absence. As a result, all observed bycaught specimens were combined to pro-
vide uncorrected (i.e. functioning or presence/absence of pingers) by-catch rates for each stratum.
A compilation of all 2017 monitored strata with and without bycatch estimates re-ported through
the WGBYC data call are summarized in Table 2. Data were aggregated by ecoregion and ICES
Division for consistency across taxa and improve the accessibility or transferability of these data
to other ICES Working Groups (WGs). No extrapolated bycatch estimates were provided. In this
section, WGBYC has not computed total bycatch estimates due to uncertainty associated with
incomplete spatial/temporal dedicated monitoring coverage and completeness of total fishing
effort data as reported to WGBYC (ICES 2014). However, bycatch risk assessments based on ob-
served specimens, observed days monitored and fishing effort are carried out by WGBYC where
more data are available for certain species and metiers (see ToR C).
Table 3 provides a compilation of bycatch of marine mammals for the EU MS only, using data
from both the WGBYC data call and Reg. 812/2004 reports. A mismatch was found between by-
catch numbers provided in the Reg 812/2004 reports and the data provided through the datacall.
The data call resulted in higher numbers in some regions for observation days at sea, number of
incidents and number of specimens. One MS submitted more detailed information with regards
to bycatch of cetaceans through the Reg. 812/2004 report than was submitted through the data
call, reporting 1 bottlenose dolphin and 2 striped dolphin bycatch in the Mediterranean in bot-
tom and pelagic trawls respectively.

10 | ICES SCIENTIFIC REPORTS 1:51 | ICES
1.5 Other monitoring programmes and associated bycatch esti-mates
1.5.1 EU Member States
Although not in the Portuguese Reg. 812/2004 report, for the Azores region (ICES area 10), a
study was conducted in the pole and line fishery which targets tuna (Cruz et al. 2018). Based on
data collected by observers on ∼50% of vessels operating from 1998 to 2012, the influence of
various environmental and fisheries-related factors in common dolphin bycatch was investi-
gated and fleet-wide estimates of total bycatch using design-based and model-based methods
calculated. Total bycatch calculated from the traditional stratified ratio estimation approach was
196 (95% CI: 186–205), while the negative binomial GAM estimated 262 (95% CI: 249–274) dol-
phins. This work concludes that rates of common dolphin bycatch in the pole-and-line tuna fish-
ery in the Azores are low, despite considerable variations between years
Denmark runs a large video monitoring project on Danish gill net vessels which ran between
Spring 2016-2018. This video monitoring was used to increase the monitoring coverage of gill
netters and develop new monitoring methods for future monitoring programs. Results from this
monitoring project, which included 15 vessels, should provide a more reliable basis for estimat-
ing bycatch of marine mammals and seabirds in those fisheries. In 2017, video monitoring was
carried out on board 9 different vessels fishing in areas 27.SD22-23 and 27.3a. The results are
currently being processed.
Greece does not submit a Reg. 812/2004 annual report to the EC, due to no fishing activity of
Greek vessels under the condition defined in the Annexes of the Regulation. However, since
2017, Greece has been collecting data on the effects of fisheries on the Incidental Bycatch of Pro-
tected, Endangered and Threatened species under the premises of the Commission Implement-
ing Decision (EU) 2016/1251 within the Data Collection Framework. In 2017, Greece conducted
a pilot study on incidental bycatch in Greek fisheries. This pilot study covered the main métiers
of the Greek fleet (GTR, GNS, OTB, PS, FPO and LLS related métiers); however, due to adminis-
trative difficulties the pilot was limited only to the north part of the GSA 22 area (Aegean Sea).
A total of 822 days at sea were monitored. The observed coverage of the total fishing effort for
2017 was 0.073%.8 No cetacean or birds bycatch incidents were recorded. One turtle (Caretta
caretta) bycatch was recorded in gill nets. Several sharks and rays were caught: 93 Spiny Dog-
fishes (Squalus acanthias) in 5 incidents and in three different métiers, 9 Common Smoothhounds
(Mustelus mustelus) in 6 incidents and in three different métiers, 13 Gulper sharks (Centrophorus
granulosus) in one incident in trammel nets, 2 Blue skates (Dipturus batis) in one incident in a
bottom otter trawl, one Angular roughshark (Oxynotus centrina) in a bottom trawl and one spiny
butterfly ray (Gymnura altavela) in a trammel net. Finally, two PET Osteichthyes were recorded:
Twaite shad (Alosa fallax), 49 individuals in 12 incidents from three métiers, and short-snouted
seahorse (Hippocampus hippocampus), 4 specimens in 3 incidents from 2 métiers. Purse seines were
also monitored but bycatch of PETS was not recorded.
In the Netherlands, bycatch of harbour porpoises in the Dutch fishery has been under investiga-
tion through REM (Remote Electronic Monitoring) in which 10 vessels participated. In one ob-
servation day in 2017, 4 red throated divers and 2 common guillemots were reported as bycatch
in a gill net fishery targeting bass from the beach, in very shallow water. This type of fishery is
very different from the overall effort recorded in the Dutch set gill net fishery, which generally
targets sole in the North Sea.
8 Sentence added based on the reviewers’ comments.

ICES | WGBYC 2019 | 11
A recently published work for the northwest Spanish sub-region (Saavedra et al. 2018) shows
analysis of a 10-year time-series of data collected from multidisciplinary research surveys to es-
timate common dolphin (Delphinus delphis) abundance and trends in continental shelf waters.
Data obtained from dedicated dual-platform surveys were used to correct the detection bias in
the data collected using single-platforms (attraction toward the observation platform and ani-
mals missed on the track-line), to obtain absolute abundance estimates for calculating bycatch
limits. The estimated safe bycatch limit for this area calculated from these abundance values were
218 [153, 310], 81 [56, 115] and 383 [268, 546] per year, respectively.
1.5.2 Non-EU Member States
WGBYC is working towards incorporating monitoring effort, fishing effort and bycatch data
from non-EU states/countries that have fishing fleets in the North Atlantic. Iceland joined
WGBYC in 2017 and has provided a summary of its PETS monitoring and bycatch below. An
overview of marine mammal, seabird and turtle bycatch estimates and coverage rates from the
US Northwest Atlantic are also included below.
Monitoring in Icelandic waters during 2017 included 71 trips/days on lumpsucker gillnet ves-
sels, 60 trips/days on cod gillnet vessels, 72 trips/377 days on demersal trawl vessels, 143 trips/192
days on long line vessels fishing within the Icelandic EEZ. This monitoring effort amounted to
0.5-2% coverage of the relevant fleets†††.
Observed marine mammal bycatch in the lumpsucker fishery was 16 harbour porpoises, 34 har-
bour seals, 4 grey seals, 3 harp seals, and 1 ringed seal. Observed seabird bycatch in the lump-
sucker fishery was 62 common eider, 20 black guillemots, 47 common guillemots, 1 Brünnich’s
guillemot, 10 cormorant/shags, 2 long tailed duck, 1 common loon, 1 razorbill and 1 northern
gannet. Observed marine mammal bycatch in the cod fishery was 28 harbour porpoises and 1
ringed seal. Observed seabird bycatch in the cod fishery was 3 northern fulmars, 2 gannets, and
8 common guillemots. Observed marine mammal bycatch in the demersal trawl fishery was 1
harp seal while no seabirds were observed in that fishery. Observed seabird bycatch in the long-
line fishery was 69 northern fulmars, 24 northern gannets, 5 lesser black-backed gulls, and 35
herring gulls.
Raised estimates are available for the lumpsucker fishery based on observations from 2014–2018.
These estimates are per year and are stratified by management area. Estimated raised marine
mammal bycatch in the lumpsucker fishery was 3223 (1225–5221) animals, thereof 1389 (903–
1875) harbour seals, 989 (405–1573) grey seals, 528 (296–760) harbour porpoises, 240 (82–398)
harp seals, 49 (1–98) ringed seals and 28 (10–46) bearded seals. Estimated raised seabird bycatch
in the lumpsucker fishery was 8339 (4837–11841) birds, thereof 3508 (2140–4876) common eiders,
1653 (926–2546) black guillemots, 2001 (680–3322) common guillemots, 929 (316–1542) cormo-
rants/shags, 63 (11–115) long tailed ducks, 50 Atlantic puffins (11–90), and less than 50 razorbills,
black-legged kittiwakes, gannets and common loons.
US Northwest Atlantic 2017 bycatch estimates (mortality and serious injuries for small cetaceans
and pinnipeds) (Table 4) have not yet undergone review by the US Atlantic Scientific Review
Group and subsequent public comment period. As a result, small cetacean and pinniped bycatch
estimates reported for 2017 should be treated as preliminary. Final 2017 estimates are expected
to be published in the 2019 US Atlantic and Gulf Of Mexico Marine Mammal Stock Assessment
Report during 2020. Earlier US Marine Mammal Stock Assessment Reports can also be found
online https://www.fisheries.noaa.gov/national/marine-mammal-protection/marine-mammal-
stock-assessment-reports-region. Reported sea turtle bycatch estimates from gillnet fisheries
were extracted from the referenced literature.

12 | ICES SCIENTIFIC REPORTS 1:51 | ICES
In summary, during 2017 fisheries observers monitored gillnet and bottom-trawl fisheries in
both the New England and mid-Atlantic regions of the US Northwest Atlantic. Observer cover-
age in gillnet fisheries was 12% and 9%, respectively for each area. Harbour porpoise, common
dolphin, grey seal, harbour seal, harp seal, and offshore bottlenose dolphin were observed as
bycatch in New England gillnet fisheries. Harbour porpoise, common dolphin and harbour seal
were observed as bycatch in mid-Atlantic gillnet fisheries. Total 2017 bycatch estimates and rel-
ative standard error (CV) attributed to gillnet fisheries for these species ranged from three
(CV=0.62) harbour seals to 930 (CV=0.16) grey seals (Table 4) (Orphanides in review).
Sea turtle bycatch reported for the US Northwest Atlantic remains unchanged from what was
reported in WGBYC in 2018 (ICES 2018a). For convenience, the information is repeated in this
report. Murray (2018) reported average sea turtle bycatch in gillnet fisheries, 2012–2016, for the
Georges Bank to mid-Atlantic where overall coverage was 10%. During this period the total es-
timated bycatch and relative standard error (CV) for loggerhead sea turtles was 705 (CV=0.29),
followed by kemp’s ridley (Lepidochelys kempii) 145 (CV=0.43) and leatherback (Dermochelys cori-
acea) sea turtles 27 (CV=0.71) (Table 4).
Observer coverage in 2017 New England and mid-Atlantic bottom-trawl fisheries targeting fish
species only was 12% and 14%, respectively. Only white-sided (Lagenorhynchus acutus) dolphin
and grey seal were observed as bycatch in New England bottom-trawl fisheries. In the mid-At-
lantic region, common dolphin, Risso’s dolphin, offshore bottlenose dolphin, and grey seal were
observed as bycatch in bottom-trawl fisheries. Total 2017 bycatch estimates and relative standard
error (CV) attributed to bottom-trawl fisheries for these species ranged from 15 (CV=0.64) white-
sided dolphins to 380 (CV=0.23) common dolphins (Lyssikatos et al. in prep) (Table 4).
1.6 Auxiliary data (strandings, entanglement and interviews) indic-ative of the impact of bycatch
In the absence of at-sea observer monitoring programmes or when monitoring effort is low, data
from other sources such as cetacean strandings can be assessed to highlight the occurrence of
bycatch. Belgium, Denmark, Franceand Portugal have reported on assessments of auxiliary data
in their Reg. 812/2004 reports or directly to WGBYC.
In 2017 the Royal Belgian Institute of Natural Sciences (RBINS)/Operational Directorate for the
Natural Environment (OD Nature) in Belgium provided data of marine mammals strandings
along the Belgian coast in 2017: 93 stranded harbour porpoises (Phocoena phocoena) were recorded
- a much lower number than in 2016, but close to the 10-year average. The cause of death of the
stranded animals was systematically established where possible. Of the 34 animals examined, 9
were found to have been caught incidentally in fishing operations (26.5 %), although it is not
possible to be sure in what type of fishing gear. It is, however, known that the recreational use
of tangle nets at sea or on shore was not the cause, as the legal ban on those fishing methods is
enforced.
Concerning strandings in Denmark, the Danish report states that the number of stranded har-
bour porpoises decreased since 2008, from 224 to 74 with an annual average of 135 individuals
with some animals believed to have been bycaught. It further explains that there is no organized
network of volunteers in Denmark who systematically search for stranded marine mammals,
therefore there are some uncertainties in the numbers.
France reports that between the 1st of February 2017 and the 31st of March, 793 cetaceans were
found stranded along the French Atlantic coasts. 84% of them were common dolphins, and most
of them presented evidence of death in fishing gears. An approach was tested that could help to
identify the fisheries potentially involved in any given stranding event. To do this it was exam-
ined how the likely distributions of mortality of bycaught dolphins inferred from carcass drift

ICES | WGBYC 2019 | 13
modelling coincide with fishing effort statistics in the same area at the same dates for different
fleets, generated from the Vessel Monitoring System (VMS). Using reverse drift modelling, two
main mortality areas were identify during these events (one coastal and one along the continental
slope of the bay of Biscay), and 3,690 common dolphins (95% CI = 2,230-6,900]) were estimated
to have died in fishing gears of the Bay of Biscay during February and March 2017. The relation-
ship between origin of stranded bycaught dolphins and fishing effort distribution during the
different stranding events was strongly positive for French midwater pair trawlers, Spanish otter
bottom trawlers and French Danish seiners. Co-occurrence highlights a risk but does not prove
an interaction of fishing effort with common dolphins nor its intensity. Beyond this diversity of
gears, two characteristics appeared to be shared: targeting predatory fishes (sea bass and hake)
in winter and using high vertical opening gears.
Portugal runs local strandings networks around the country coordinated by the Portuguese
Wildlife Society and the Institute for Nature Conservation and Forests (ICNF). In 2017, stranding
results were presented for the southern Portuguese coast only (Algarve), where 47 cetaceans
were recovered stranded, 23,4% of which evidences of death in fishing gears. Species concerned
mostly common dolphins (n=18 ind., bycatch for 38.9%), minke whales (n=6 ind., bycatch for
16.7%) and bottlenose dolphins (n=5 ind., bycatch for 20%). Particularly for these species, most
evidence relied on interaction with fixed net fisheries (either gill/trammel nets or illegal coastal
driftnets).
1.7 Conclusions
The quality and scope of the information provided by the reports for 2017 continues to
be variable, with some MS simply repeating the information provided in previous years.
Most countries rely on the DCF sampling programme to monitor marine mammal and
other protected species bycatch, only a few countries have a dedicated onboard observer
protected species bycatch monitoring programme for the purposes of meeting the re-
quirements of Reg. 812/2004.
Relying only on observations carried out under the DCF may lead to underestimation of
bycatch events as some bycatches may be missed by the observers who focus mostly on
other tasks (e.g. fish sampling). This is a concern to WGBYC in existing data but particu-
larly moving forward to data collection driven by the EU-MAP. WGBYC continues to
have insufficient data to provide bycatch rates according to pinger functionality and/or
presence/absence in relevant métiers.
Only UK, Iceland and Italy reported extrapolated bycatch estimates for some species of
cetaceans, birds, marine turtles and seals.
The records of bycaught specimens and monitored days within the data obtained
through the data call were higher than those reported in the Regulation 812/2004 reports.
Monitoring coverage per métier and vessel size was highly variable within each ecore-
gion and ICES Division, with some countries relying on monitoring vessel sizes and gear
types only mandatory in the Reg. 812/2004 (>15 m for set-nets and pelagic trawls). In-
creased sampling is required on smaller vessels, which make up the majority of the Eu-
ropean fleet and would likely account for a significant proportion of bycatch.
Nonetheless, the data available provide an indication of bycatch rates for various taxa by
gear and ecoregion. Bycatch of marine mammals was observed in all ecoregions in nets,
purse seines, rod-and pole and trawl gears (pelagic and bottom trawl). The Mediterra-
nean is the only EU region from which bycatch of marine turtles has been recorded based
on the data submitted to the WGBYC database. Seabirds are also bycaught in most ecore-
gions, and –depending on species specific feeding behaviour- are mainly taken in nets
and longlines.

14 | ICES SCIENTIFIC REPORTS 1:51 | ICES
High bycatch rates were observed for some elasmobranch species which are of conser-
vation concern, particularly in trawl gears in the Celtic Sea, the Greater North Sea and
nets in the Celtic Sea. A notably high bycatch rate for some vulnerable species on the
IUCN red list of threatened species was observed in the Greater North Sea ecoregion for
trawl gears.
WGBYC is working toward incorporating monitoring effort, fishing effort and bycatch
data from non-EU countries that have fishing fleets operating in the North Atlantic and
adjoining seas. In 2017, bycatch monitoring data were available for Iceland and USA:
from the USA, bycatch estimates were provided for several marine mammal and marine
turtle species; from Iceland, bycatches were reported for seabirds, seals and cetaceans. In
both countries, the gear of most concern is set nets and also longlines for birds in Iceland.
Information from cetacean strandings schemes, was presented by a few countries
(France, Denmark, Netherlands, Portugal, and Belgium). France had very large numbers
of stranded cetaceans in the Bay of Biscay in 2017 (n = 793), 84 % of which were common
dolphins, most showing evidence of having been bycaught. The numbers of stranded
bycaught animals recorded on the shores of the Bay of Biscay demonstrates that a dedi-
cated bycatch observer/Remote Electronic Monitoring programme is required for rele-
vant fisheries in this area.
Information provided through the Member States’ Reg. 812/2004 reports and other addi-
tional and relevant sources of information is limited. For many areas and métiers, there
is insufficient monitored effort to enable any assessment of the over-all impact of fisher-
ies on cetaceans or other protected species.
WGBYC hopes that the consistency of bycatch data at a regional scale will be improved
through EU-MAP and thereby ICES WGBYC will be able to give better advice on the
impact of fisheries on protected and potentially vulnerable species. However, this will
only be achieved if Member States sampling takes full-account of the necessary sampling
protocols for PETS and carry out bycatch monitoring in the relevant métiers with suffi-
cient observer coverage

ICES | WGBYC 2019 | 15
Table 1 Summary table of coastal EU Member States (MS) regarding the status of Reg. 812/2004 report submissions to the European Commission (Green = Yes for report with data on observer effort (either days at sea or other measurement, e.g. effort per haul or set); Pale grey = Yes for report with no data on observer effort (either days at sea or other measurement); Darker grey = As for pale grey but report only received in 2019; Orange = no report submitted; *** No Reg.812/2004 report but reports on cetacean bycatch observations made under DCF sent to the Commission. Some of this information was made available at the meeting; **** Data made available at the meeting.
Coastal Member State
of the EU
Monitor-ing (Art. 4-5) Report Reg 812/2004 & effort data provided
Fishing in areas affected
2006 2007 2008 2009 2010 2011 2012 2013 2014 2015 2016 2017
Estonia EE Yes
Finland FI Yes
Latvia LV Yes
Lithuania LT Yes
Poland PL Yes
Italy IT Yes
Slovenia SI Yes
Portugal PT Yes ****
Spain ES Yes **** ****
Germany DE Yes ***
France FR Yes ****
Ireland IE Yes
Netherlands NL Yes ****
United Kingdom UK Yes
Belgium BE Yes
Denmark DK Yes
Sweden SE Yes **** **** **** ****
Bulgaria BG (MS since 2007) No
Croatia HR (MS since 2013) No
Cyprus CY No
Greece GR No
Malta MT No
Romania RO (Ms since 2007) No

16 | ICES SCIENTIFIC REPORTS 1:51 | ICES

ICES | WGBYC 2019 | 17
Table 29 Total number of bycatch specimens or *number of incidents reported and bycatch rates derived from the ICES WGBYC data call for 2017 data. In most Member States, data submitted to ICES WGBYC data call reflect the same data as in the Reg. 812/2004 report. However, Germany, France, Denmark and Spain had additional information not included in this table. Bycatch numbers and rates are grouped by ecoregion, taxa, métier and species.
Ecoregion Area Code Metier3 Taxa Species Total Ob-served Effort (Days at sea)
Fishing Effort (Days at sea)
Inci-dents
Total No. Speci-mens
Bycatch Rate
(Speci-men/DaS)
Azores 27.10.a.2 Longlines Elasmobranch Deania calcea 1,226 10,392 4 58 0.047
Azores 27.10.a.2 Longlines Elasmobranch Isurus oxyrinchus 1,226 10,392 19 31 0.025
Azores 27.10.a.2 Longlines Elasmobranch Alopias superciliosus 1,226 10,392 2 2 0.002
Azores 27.10.a.2 Longlines Elasmobranch Dipturus batis 1,226 10,392 45 113 0.092
Azores 27.10.a.2 Longlines Elasmobranch Alopias vulpinus 1,226 10,392 2 2 0.002
Azores 27.10.a.2 Longlines Elasmobranch Dalatias licha 1,226 10,392 52 178 0.145
Azores 27.10.a.2 Longlines Elasmobranch Centrophorus granulosus 1,226 10,392 16 70 0.057
Azores 27.10.a.2 Longlines Elasmobranch Centrophorus squamosus 1,226 10,392 1 1 0.001
Azores 27.10.a.2 Longlines Elasmobranch Isurus paucus 1,226 10,392 4 4 0.003
Azores 27.10.a.2 Longlines Elasmobranch Pteroplatytrygon violacea 1,226 10,392 2 2 0.002
Azores 27.10.a.2 Longlines Elasmobranch Raja clavata 1,226 10,392 82 1293 1.055
9 New data were included for western Mediterranean after the Advice Drafting Group (ADG) 2019 when a new extraction from the databse was carried out. The naming of the Mediterranean
areas “Ionian Sea and Central Mediterranen sea, Adriatic Sea, Aegean-Levantine Sea” was corrected.

18 | ICES SCIENTIFIC REPORTS 1:51 | ICES
Ecoregion Area Code Metier3 Taxa Species Total Ob-served Effort (Days at sea)
Fishing Effort (Days at sea)
Inci-dents
Total No. Speci-mens
Bycatch Rate
(Speci-men/DaS)
Azores 27.10.a.2 Longlines Elasmobranch Etmopterus pusillus 1,226 10,392 47 353 0.288
Azores 27.10.a.2 Longlines Elasmobranch Etmopterus spinax 1,226 10,392 56 2413 1.968
Azores 27.10.a.2 Hooks and lines Elasmobranch Deania calcea 1,576 26,457 2 87 0.055
Azores 27.10.a.2 Hooks and lines Elasmobranch Dipturus batis 1,576 26,457 1 4 0.003
Azores 27.10.a.2 Hooks and lines Elasmobranch Dalatias licha 1,576 26,457 2 2 0.001
Azores 27.10.a.2 Hooks and lines Elasmobranch Raja clavata 1,576 26,457 48 268 0.170
Azores 27.10.a.2 Hooks and lines Elasmobranch Etmopterus pusillus 1,576 26,457 3 17 0.011
Azores 27.10.a.2 Hooks and lines Elasmobranch Etmopterus spinax 1,576 26,457 3 18 0.011
Azores 27.10.a.2 Longlines Marine Mammal Globicephala melas 1,226 10,392 1 1 0.001
Azores 27.10.a.2 Hooks and lines Marine Mammal Delphinus delphis 1,576 26,457 1 1 0.001
Baltic Sea 27.3.b.23 Nets Marine Bird Uria aalge 17 2,446 2 3 0.176
Baltic Sea 27.3.b.23 Nets Marine Bird Phalacrocorax carbo 17 2,446 1 1 0.059
Baltic Sea 27.3.b.23 Nets Marine Bird Somateria mollissima 17 2,446 1 1 0.059
Baltic Sea 27.3.b.23 Nets Marine Bird Alca torda 17 2,446 1 3 0.176
Baltic Sea 27.3.b.23 Nets Marine Bird Aythya fuligula 17 2,446 1 1 0.059
Baltic Sea 27.3.c.22 Nets Marine Bird Aythya marila 15 52,419 1 8 0.523

ICES | WGBYC 2019 | 19
Ecoregion Area Code Metier3 Taxa Species Total Ob-served Effort (Days at sea)
Fishing Effort (Days at sea)
Inci-dents
Total No. Speci-mens
Bycatch Rate
(Speci-men/DaS)
Baltic Sea 27.3.d.29 Nets Marine Bird Phalacrocorax carbo 23 13,302 4 8 0.348
Baltic Sea 27.3.d.29 Nets Marine Bird Somateria mollissima 23 13,302 4 13 0.565
Baltic Sea 27.3.d.30 Nets Marine Bird Mergus 25 26,017 2 13 0.520
Baltic Sea 27.3.d.30 Nets Marine Bird Marine Bird 25 26,017 1 1 0.040
Baltic Sea 27.3.d.30 Nets Marine Bird Phalacrocorax carbo 25 26,017 13 29 1.160
Baltic Sea 27.3.d.30 Nets Marine Bird Somateria mollissima 25 26,017 2 7 0.280
Baltic Sea 27.3.d.30 Nets Marine Bird Mergus merganser 25 26,017 5 8 0.320
Baltic Sea 27.3.d.30 Nets Marine Bird Clangula hyemalis 25 26,017 1 2 0.080
Baltic Sea 27.3.d.30 Nets Marine Bird Aythya fuligula 25 26,017 1 1 0.040
Baltic Sea 27.3.d.30 Traps Marine Bird Somateria mollissima 14 11,437 1 1 0.071
Baltic Sea 27.3.d.32 Nets Marine Bird Mergus 8 8,861 2 8 1.000
Baltic Sea 27.3.d.32 Nets Marine Bird Phalacrocorax carbo 8 8,861 9 29 3.625
Baltic Sea 27.3.d.32 Nets Marine Bird Somateria mollissima 8 8,861 3 3 0.375
Baltic Sea 27.3.d.32 Nets Marine Bird Mergus merganser 8 8,861 3 9 1.125
Baltic Sea 27.3.d.32 Nets Marine Bird Podiceps cristatus 8 8,861 2 3 0.375
Baltic Sea 27.3.d.32 Nets Marine Bird Aythya marila 8 8,861 1 1 0.125

20 | ICES SCIENTIFIC REPORTS 1:51 | ICES
Ecoregion Area Code Metier3 Taxa Species Total Ob-served Effort (Days at sea)
Fishing Effort (Days at sea)
Inci-dents
Total No. Speci-mens
Bycatch Rate
(Speci-men/DaS)
Baltic Sea 27.3.d.32 Nets Marine Bird Clangula hyemalis 8 8,861 1 2 0.250
Baltic Sea 27.3.d.32 Nets Marine Bird Anas platyrhynchos 8 8,861 2 2 0.250
Baltic Sea 27.3.d.32 Traps Marine Bird Phalacrocorax carbo 12 6,920 5 5 0.417
Baltic Sea 27.3.d.32 Traps Marine Bird Mergus merganser 12 6,920 1 1 0.083
Baltic Sea 27.3.b.23 Nets Marine Mammal Phocoena phocoena 17 2,446 1 2 0.118
Baltic Sea 27.3.d.28.1 Traps Marine Mammal Halichoerus grypus 13 2,615 1 1 0.077
Baltic Sea 27.3.d.29 Pelagic trawls Marine Mammal Halichoerus grypus 13 1,569 1 1 0.077
Baltic Sea 27.3.d.32 Nets Marine Mammal Halichoerus grypus 8 8,861 1 2 0.250
Baltic Sea 27.3.d.32 Traps Marine Mammal Halichoerus grypus 12 6,920 2 3 0.250
Barents Sea 27.1.b Bottom trawls Elasmobranch Amblyraja radiata 2 59 1 38 19.00
Bay of Biscay and the Iberian Coast 27.8.a Bottom trawls Elasmobranch Hexanchus griseus 123 46,469 1 1 0.008
Bay of Biscay and the Iberian Coast 27.8.a Bottom trawls Elasmobranch Dipturus batis 123 46,469 3 3 0.024
Bay of Biscay and the Iberian Coast 27.8.a Bottom trawls Elasmobranch Dipturus oxyrinchus 123 46,469 1 1 0.008
Bay of Biscay and the Iberian Coast 27.8.a Bottom trawls Elasmobranch Squalus acanthias 123 46,469 4 16 0.130
Bay of Biscay and the Iberian Coast 27.8.a Bottom trawls Elasmobranch Raja undulata 123 46,469 12 44 0.358
Bay of Biscay and the Iberian Coast 27.8.a Nets Elasmobranch Dalatias licha 169 30,069 1 1 0.006

ICES | WGBYC 2019 | 21
Ecoregion Area Code Metier3 Taxa Species Total Ob-served Effort (Days at sea)
Fishing Effort (Days at sea)
Inci-dents
Total No. Speci-mens
Bycatch Rate
(Speci-men/DaS)
Bay of Biscay and the Iberian Coast 27.8.a Nets Elasmobranch Leucoraja circularis 169 30,069 3 60 0.354
Bay of Biscay and the Iberian Coast 27.8.a Nets Elasmobranch Raja undulata 169 30,069 20 37 0.218
Bay of Biscay and the Iberian Coast 27.8.a Pelagic trawls Elasmobranch Cetorhinus maximus 45 5,534 1 1 0.022
Bay of Biscay and the Iberian Coast 27.8.a Pelagic trawls Elasmobranch Squalus acanthias 45 5,534 1 1 0.022
Bay of Biscay and the Iberian Coast 27.8.b Bottom trawls Elasmobranch Raja undulata 25 10,938 6 41 1.658
Bay of Biscay and the Iberian Coast 27.8.b Longlines Elasmobranch Hexanchus griseus 18 6,790 1 1 0.057
Bay of Biscay and the Iberian Coast 27.8.b Longlines Elasmobranch Raja undulata 18 6,790 3 3 0.170
Bay of Biscay and the Iberian Coast 27.8.b Nets Elasmobranch Hexanchus griseus 221 20,688 3 3 0.014
Bay of Biscay and the Iberian Coast 27.8.b Nets Elasmobranch Raja microocellata 221 20,688 9 43 0.194
Bay of Biscay and the Iberian Coast 27.8.b Nets Elasmobranch Raja undulata 221 20,688 63 204 0.922
Bay of Biscay and the Iberian Coast 27.8.c Pelagic trawls Elasmobranch Gymnura altavela 86 2,770 1 1 0.012
Bay of Biscay and the Iberian Coast 27.9.a Bottom trawls Elasmobranch Galeus melastomus 63 33,555 7 105 1.667
Bay of Biscay and the Iberian Coast 27.9.a Bottom trawls Elasmobranch Raja montagui 63 33,555 9 33 0.524
Bay of Biscay and the Iberian Coast 27.9.a Bottom trawls Elasmobranch Squalus acanthias 63 33,555 1 3 0.048
Bay of Biscay and the Iberian Coast 27.9.a Bottom trawls Elasmobranch Raja clavata 63 33,555 14 61 0.968
Bay of Biscay and the Iberian Coast 27.9.a Bottom trawls Elasmobranch Galeorhinus galeus 63 33,555 2 10 0.159

22 | ICES SCIENTIFIC REPORTS 1:51 | ICES
Ecoregion Area Code Metier3 Taxa Species Total Ob-served Effort (Days at sea)
Fishing Effort (Days at sea)
Inci-dents
Total No. Speci-mens
Bycatch Rate
(Speci-men/DaS)
Bay of Biscay and the Iberian Coast 27.9.a Bottom trawls Elasmobranch Raja undulata 63 33,555 19 58 0.921
Bay of Biscay and the Iberian Coast 27.9.a Bottom trawls Elasmobranch Etmopterus spinax 63 33,555 1 16 0.254
Bay of Biscay and the Iberian Coast 27.9.a Nets Elasmobranch Rostroraja alba 21 118,720 2 12 0.571
Bay of Biscay and the Iberian Coast 27.8.a Nets Marine Bird Uria aalge 169 30,069 2 4 0.024
Bay of Biscay and the Iberian Coast 27.8.a Nets Marine Bird Phalacrocorax carbo 169 30,069 1 2 0.012
Bay of Biscay and the Iberian Coast 27.8.b Nets Marine Bird Uria aalge 221 20,688 3 3 0.014
Bay of Biscay and the Iberian Coast 27.8.b Nets Marine Bird Puffinus mauretanicus 221 20,688 2 4 0.018
Bay of Biscay and the Iberian Coast 27.9.a Nets Marine Bird Morus bassanus 21 118,720 1 1 0.048
Bay of Biscay and the Iberian Coast 27.9.a Nets Marine Bird Larus michahellis 21 118,720 1 2 0.095
Bay of Biscay and the Iberian Coast 27.8.a Bottom trawls Marine Mammal Phocoena phocoena 123 46,469 1 1 0.008
Bay of Biscay and the Iberian Coast 27.8.a Nets Marine Mammal Delphinus delphis 169 30,069 1 1 0.006
Bay of Biscay and the Iberian Coast 27.8.a Pelagic trawls Marine Mammal Delphinus delphis 45 5,534 6 49 1.101
Bay of Biscay and the Iberian Coast 27.8.b Nets Marine Mammal Phocoena phocoena 221 20,688 4 4 0.018
Bay of Biscay and the Iberian Coast 27.8.b Nets Marine Mammal Delphinus delphis 221 20,688 5 5 0.023
Bay of Biscay and the Iberian Coast 27.8.b Pelagic trawls Marine Mammal Phocoena phocoena 9 1,709 1 1 0.118
Bay of Biscay and the Iberian Coast 27.8.b Pelagic trawls Marine Mammal Delphinus delphis 9 1,709 6 8 0.941

ICES | WGBYC 2019 | 23
Ecoregion Area Code Metier3 Taxa Species Total Ob-served Effort (Days at sea)
Fishing Effort (Days at sea)
Inci-dents
Total No. Speci-mens
Bycatch Rate
(Speci-men/DaS)
Bay of Biscay and the Iberian Coast 27.8.c Pelagic trawls Marine Mammal Globicephala melas 86 2,770 1 5 0.058
Bay of Biscay and the Iberian Coast 27.9.a Seines Marine Mammal Delphinus delphis 40 14,269 1 2 0.050
Celtic Seas 27.7 Bottom trawls Elasmobranch Galeus melastomus 117 NULL 30 210 1.795
Celtic Seas 27.7 Bottom trawls Elasmobranch Dipturus batis 117 NULL 94 1064 9.094
Celtic Seas 27.7 Bottom trawls Elasmobranch Squalus acanthias 117 NULL 1 1 0.009
Celtic Seas 27.7 Bottom trawls Elasmobranch Raja clavata 117 NULL 33 113 0.966
Celtic Seas 27.7 Bottom trawls Elasmobranch Leucoraja circularis 117 NULL 2 4 0.034
Celtic Seas 27.7 Bottom trawls Elasmobranch Galeorhinus galeus 117 NULL 1 4 0.034
Celtic Seas 27.7 Bottom trawls Elasmobranch Raja undulata 117 NULL 4 18 0.154
Celtic Seas 27.7 Bottom trawls Elasmobranch Etmopterus spinax 117 NULL 5 29 0.248
Celtic Seas 27.6.a Bottom trawls Elasmobranch Dipturus intermedius 173 1,574 12 19 0.110
Celtic Seas 27.6.a Bottom trawls Elasmobranch Dipturus nidarosiensis 271 1,574 1 7 0.026
Celtic Seas 27.6.a Bottom trawls Elasmobranch Hexanchus griseus 173 1,574 5 11 0.064
Celtic Seas 27.6.a Bottom trawls Elasmobranch Dipturus batis 173 1,574 2 2 0.012
Celtic Seas 27.6.a Bottom trawls Elasmobranch Dipturus batis 271 1,574 5 33 0.122
Celtic Seas 27.6.a Bottom trawls Elasmobranch Dipturus batis 96 1,133 57 181 1.885

24 | ICES SCIENTIFIC REPORTS 1:51 | ICES
Ecoregion Area Code Metier3 Taxa Species Total Ob-served Effort (Days at sea)
Fishing Effort (Days at sea)
Inci-dents
Total No. Speci-mens
Bycatch Rate
(Speci-men/DaS)
Celtic Seas 27.6.a Bottom trawls Elasmobranch Dalatias licha 173 1,574 2 10 0.058
Celtic Seas 27.6.a Bottom trawls Elasmobranch Chlamydoselachus anguineus 173 1,574 1 1 0.006
Celtic Seas 27.6.a Bottom trawls Elasmobranch Somniosus microcephalus 173 1,574 2 2 0.012
Celtic Seas 27.6.a Bottom trawls Elasmobranch Dipturus oxyrinchus 173 1,574 29 186 1.076
Celtic Seas 27.6.a Bottom trawls Elasmobranch Squalus acanthias 173 1,574 10 208 1.204
Celtic Seas 27.6.a Bottom trawls Elasmobranch Centroscymnus coelolepis 271 1,574 1 1 0.004
Celtic Seas 27.6.a Bottom trawls Elasmobranch Raja clavata 271 1,574 26 149 0.550
Celtic Seas 27.6.a Bottom trawls Elasmobranch Amblyraja radiata 271 1,574 2 3 0.011
Celtic Seas 27.6.a Longlines Elasmobranch Squalus acanthias 51 779 1 1 0.020
Celtic Seas 27.6.a Pelagic trawls Elasmobranch Lamna nasus 27 315 2 2 0.074
Celtic Seas 27.6.a Pelagic trawls Elasmobranch Squalus acanthias 27 315 2 4 0.148
Celtic Seas 27.6.b Bottom trawls Elasmobranch Prionace glauca 12 1,533 1 1 0.083
Celtic Seas 27.6.b Bottom trawls Elasmobranch Dipturus batis 36 1,533 5 9 0.250
Celtic Seas 27.6.b Bottom trawls Elasmobranch Raja clavata 12 1,533 1 2 0.167
Celtic Seas 27.7.a Bottom trawls Elasmobranch Dipturus batis 72 2,935 4 10 0.139
Celtic Seas 27.7.b Bottom trawls Elasmobranch Dipturus batis 51 2,397 11 27 0.529

ICES | WGBYC 2019 | 25
Ecoregion Area Code Metier3 Taxa Species Total Ob-served Effort (Days at sea)
Fishing Effort (Days at sea)
Inci-dents
Total No. Speci-mens
Bycatch Rate
(Speci-men/DaS)
Celtic Seas 27.7.f Bottom trawls Elasmobranch Dipturus batis 7 940 2 25 3.685
Celtic Seas 27.7.f Bottom trawls Elasmobranch Dipturus batis 29 940 2 5 0.172
Celtic Seas 27.7.f Bottom trawls Elasmobranch Raja microocellata 7 940 1 90 13.266
Celtic Seas 27.7.f Bottom trawls Elasmobranch Squalus acanthias 7 940 1 20 2.948
Celtic Seas 27.7.f Bottom trawls Elasmobranch Squalus acanthias 29 940 2 4 0.138
Celtic Seas 27.7.f Nets Elasmobranch Lamna nasus 62 - 4 4 0.064
Celtic Seas 27.7.f Nets Elasmobranch Squatina squatina 62 - 1 1 0.016
Celtic Seas 27.7.f Nets Elasmobranch Prionace glauca 62 - 1 2 0.032
Celtic Seas 27.7.f Nets Elasmobranch Hexanchus griseus 62 - 1 1 0.016
Celtic Seas 27.7.f Nets Elasmobranch Dipturus batis 62 - 1 1 0.016
Celtic Seas 27.7.f Nets Elasmobranch Raja microocellata 62 - 4 6 0.096
Celtic Seas 27.7.f Nets Elasmobranch Squalus acanthias 62 - 23 89 1.425
Celtic Seas 27.7.f Nets Elasmobranch Galeorhinus galeus 62 - 11 16 0.256
Celtic Seas 27.7.g Bottom trawls Elasmobranch Dipturus intermedius 97 4,425 2 3 0.031
Celtic Seas 27.7.g Bottom trawls Elasmobranch Tetronarce nobiliana 36 4,425 4 4 0.111
Celtic Seas 27.7.g Bottom trawls Elasmobranch Hexanchus griseus 97 4,425 1 1 0.010

26 | ICES SCIENTIFIC REPORTS 1:51 | ICES
Ecoregion Area Code Metier3 Taxa Species Total Ob-served Effort (Days at sea)
Fishing Effort (Days at sea)
Inci-dents
Total No. Speci-mens
Bycatch Rate
(Speci-men/DaS)
Celtic Seas 27.7.g Bottom trawls Elasmobranch Dipturus batis 35 10,185 16 46 1.331
Celtic Seas 27.7.g Bottom trawls Elasmobranch Dipturus batis 97 4,425 48 1058 10.858
Celtic Seas 27.7.g Bottom trawls Elasmobranch Dipturus batis 36 4,425 18 100 2.778
Celtic Seas 27.7.g Bottom trawls Elasmobranch Dipturus batis 216 13,626 163 517 2.394
Celtic Seas 27.7.g Bottom trawls Elasmobranch Squalus acanthias 35 10,185 2 16 0.463
Celtic Seas 27.7.g Bottom trawls Elasmobranch Squalus acanthias 97 4,425 16 598 6.137
Celtic Seas 27.7.g Bottom trawls Elasmobranch Squalus acanthias 36 4,425 4 6 0.167
Celtic Seas 27.7.g Bottom trawls Elasmobranch Raja undulata 216 13,626 7 16 0.074
Celtic Seas 27.7.g Nets Elasmobranch Dipturus batis 26 - 1 1 0.038
Celtic Seas 27.7.g Nets Elasmobranch Lamna nasus 26 - 17 32 1.215
Celtic Seas 27.7.g Nets Elasmobranch Prionace glauca 26 - 20 218 8.278
Celtic Seas 27.7.g Nets Elasmobranch Dipturus batis 26 - 2 2 0.076
Celtic Seas 27.7.g Nets Elasmobranch Squalus acanthias 26 - 33 272 10.329
Celtic Seas 27.7.g Nets Elasmobranch Galeorhinus galeus 26 - 1 2 0.076
Celtic Seas 27.7.g Seines Elasmobranch Dipturus intermedius 12 92 1 2 0.163
Celtic Seas 27.7.g Seines Elasmobranch Dipturus batis 12 92 4 12 0.981

ICES | WGBYC 2019 | 27
Ecoregion Area Code Metier3 Taxa Species Total Ob-served Effort (Days at sea)
Fishing Effort (Days at sea)
Inci-dents
Total No. Speci-mens
Bycatch Rate
(Speci-men/DaS)
Celtic Seas 27.7.g Seines Elasmobranch Dipturus batis 5 1,033 1 1 0.200
Celtic Seas 27.7.g Seines Elasmobranch Squalus acanthias 12 92 3 17 1.389
Celtic Seas 27.7.h Bottom trawls Elasmobranch Tetronarce nobiliana 43 10,296 5 5 0.116
Celtic Seas 27.7.h Bottom trawls Elasmobranch Prionace glauca 43 10,296 1 2 0.047
Celtic Seas 27.7.h Bottom trawls Elasmobranch Dipturus batis 200 10,296 69 461 2.304
Celtic Seas 27.7.h Bottom trawls Elasmobranch Dipturus batis 43 10,296 81 430 10.000
Celtic Seas 27.7.h Bottom trawls Elasmobranch Dipturus batis 9 1,043 2 4 0.444
Celtic Seas 27.7.h Bottom trawls Elasmobranch Torpedo marmorata 43 10,296 2 2 0.047
Celtic Seas 27.7.h Bottom trawls Elasmobranch Squalus acanthias 200 10,296 18 210 1.050
Celtic Seas 27.7.h Bottom trawls Elasmobranch Squalus acanthias 43 10,296 12 28 0.651
Celtic Seas 27.7.h Bottom trawls Elasmobranch Galeorhinus galeus 43 10,296 1 1 0.023
Celtic Seas 27.7.h Nets Elasmobranch Dipturus batis 28 2,078 3 551 19.930
Celtic Seas 27.7.h Nets Elasmobranch Lamna nasus 28 2,078 9 18 0.651
Celtic Seas 27.7.h Nets Elasmobranch Tetronarce nobiliana 28 2,078 1 1 0.036
Celtic Seas 27.7.h Nets Elasmobranch Prionace glauca 28 2,078 1 1 0.036
Celtic Seas 27.7.h Nets Elasmobranch Torpedo marmorata 28 2,078 1 1 0.036

28 | ICES SCIENTIFIC REPORTS 1:51 | ICES
Ecoregion Area Code Metier3 Taxa Species Total Ob-served Effort (Days at sea)
Fishing Effort (Days at sea)
Inci-dents
Total No. Speci-mens
Bycatch Rate
(Speci-men/DaS)
Celtic Seas 27.7.h Nets Elasmobranch Squalus acanthias 14 2,078 3 4 0.279
Celtic Seas 27.7.h Nets Elasmobranch Squalus acanthias 28 2,078 9 243 8.789
Celtic Seas 27.7.h Nets Elasmobranch Galeorhinus galeus 28 2,078 7 9 0.326
Celtic Seas 27.7.h Nets Elasmobranch Raja undulata 28 2,078 4 5 0.181
Celtic Seas 27.7.j Bottom trawls Elasmobranch Dipturus nidarosiensis 66 4,636 1 1 0.015
Celtic Seas 27.7.j Bottom trawls Elasmobranch Hexanchus griseus 66 4,636 6 17 0.257
Celtic Seas 27.7.j Bottom trawls Elasmobranch Dipturus batis 66 4,636 7 87 1.316
Celtic Seas 27.7.j Bottom trawls Elasmobranch Dipturus batis 25 4,636 5 22 0.880
Celtic Seas 27.7.j Bottom trawls Elasmobranch Dalatias licha 66 1,375 1 13 0.197
Celtic Seas 27.7.j Nets Elasmobranch Dipturus batis 12 1,375 5 806 68.914
Celtic Seas 27.7.j Nets Elasmobranch Lamna nasus 12 1,375 2 2 0.171
Celtic Seas 27.7.j Nets Elasmobranch Squatina squatina 179 1,375 2 3 0.017
Celtic Seas 27.7.j Nets Elasmobranch Dipturus batis 179 1,375 39 95 0.531
Celtic Seas 27.7.j Nets Elasmobranch Squalus acanthias 12 1,375 5 10 0.855
Celtic Seas 27.7.j Nets Elasmobranch Galeorhinus galeus 12 1,375 3 5 0.428
Celtic Seas 27.7.j Pelagic trawls Elasmobranch Lamna nasus 1 30 1 1 1.000
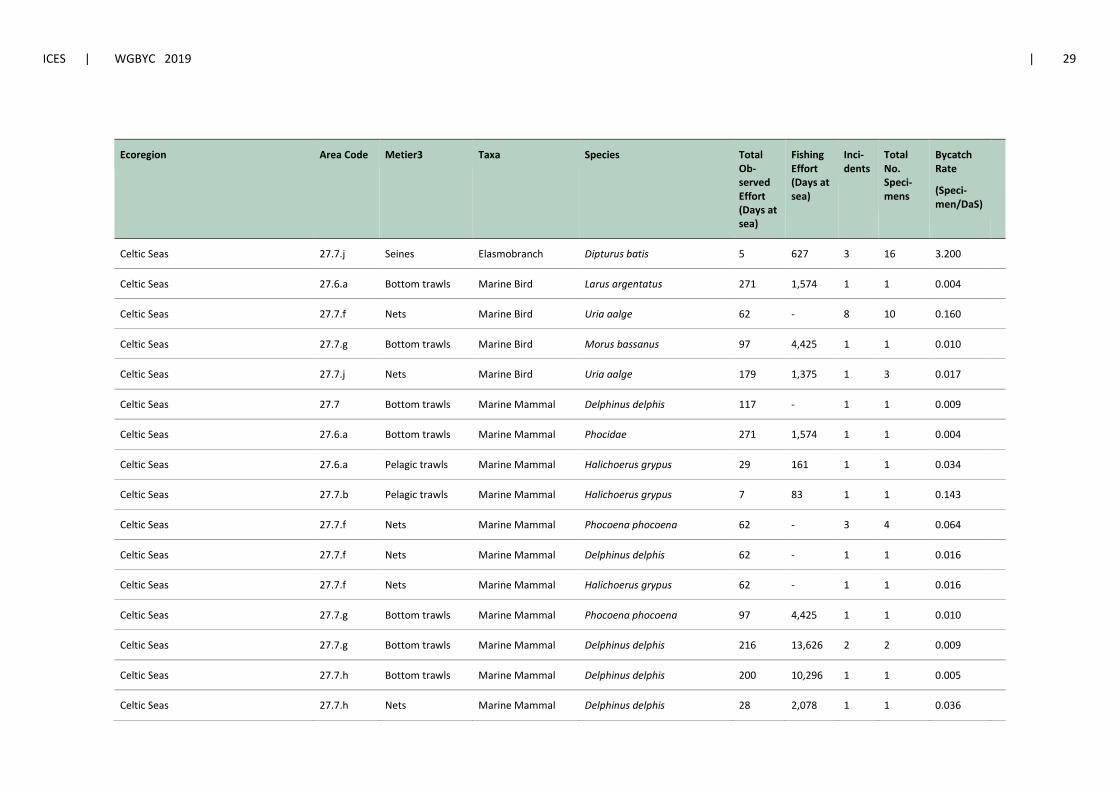
ICES | WGBYC 2019 | 29
Ecoregion Area Code Metier3 Taxa Species Total Ob-served Effort (Days at sea)
Fishing Effort (Days at sea)
Inci-dents
Total No. Speci-mens
Bycatch Rate
(Speci-men/DaS)
Celtic Seas 27.7.j Seines Elasmobranch Dipturus batis 5 627 3 16 3.200
Celtic Seas 27.6.a Bottom trawls Marine Bird Larus argentatus 271 1,574 1 1 0.004
Celtic Seas 27.7.f Nets Marine Bird Uria aalge 62 - 8 10 0.160
Celtic Seas 27.7.g Bottom trawls Marine Bird Morus bassanus 97 4,425 1 1 0.010
Celtic Seas 27.7.j Nets Marine Bird Uria aalge 179 1,375 1 3 0.017
Celtic Seas 27.7 Bottom trawls Marine Mammal Delphinus delphis 117 - 1 1 0.009
Celtic Seas 27.6.a Bottom trawls Marine Mammal Phocidae 271 1,574 1 1 0.004
Celtic Seas 27.6.a Pelagic trawls Marine Mammal Halichoerus grypus 29 161 1 1 0.034
Celtic Seas 27.7.b Pelagic trawls Marine Mammal Halichoerus grypus 7 83 1 1 0.143
Celtic Seas 27.7.f Nets Marine Mammal Phocoena phocoena 62 - 3 4 0.064
Celtic Seas 27.7.f Nets Marine Mammal Delphinus delphis 62 - 1 1 0.016
Celtic Seas 27.7.f Nets Marine Mammal Halichoerus grypus 62 - 1 1 0.016
Celtic Seas 27.7.g Bottom trawls Marine Mammal Phocoena phocoena 97 4,425 1 1 0.010
Celtic Seas 27.7.g Bottom trawls Marine Mammal Delphinus delphis 216 13,626 2 2 0.009
Celtic Seas 27.7.h Bottom trawls Marine Mammal Delphinus delphis 200 10,296 1 1 0.005
Celtic Seas 27.7.h Nets Marine Mammal Delphinus delphis 28 2,078 1 1 0.036

30 | ICES SCIENTIFIC REPORTS 1:51 | ICES
Ecoregion Area Code Metier3 Taxa Species Total Ob-served Effort (Days at sea)
Fishing Effort (Days at sea)
Inci-dents
Total No. Speci-mens
Bycatch Rate
(Speci-men/DaS)
Celtic Seas 27.7.j Nets Marine Mammal Delphinus delphis 179 1,375 1 1 0.006
Celtic Seas 27.7.j Nets Marine Mammal Halichoerus grypus 179 1,375 2 2 0.011
Celtic Seas 27.7.j Nets Marine Mammal Phocidae 179 1,375 2 2 0.011
Faroes 27.5.b Bottom trawls Elasmobranch Dalatias licha 10 - 3 4 0.391
Greater North Sea 27.3.a.20 Bottom trawls Elasmobranch Scyliorhinus canicula 61 10,032 4 10 0.164
Greater North Sea 27.3.a.20 Bottom trawls Elasmobranch Dipturus linteus 61 10,032 7 29 0.475
Greater North Sea 27.3.a.20 Bottom trawls Elasmobranch Squalus acanthias 61 10,032 14 476 7.803
Greater North Sea 27.3.a.20 Bottom trawls Elasmobranch Raja clavata 61 10,032 5 10 0.164
Greater North Sea 27.3.a.20 Bottom trawls Elasmobranch Amblyraja radiata 61 10,032 37 871 14.279
Greater North Sea 27.3.a.20 Bottom trawls Elasmobranch Mustelus asterias 61 10,032 1 1 0.016
Greater North Sea 27.3.a.20 Bottom trawls Elasmobranch Etmopterus spinax 61 10,032 16 159 2.607
Greater North Sea 27.3.a.21 Bottom trawls Elasmobranch Scyliorhinus canicula 28 2,902 1 5 0.179
Greater North Sea 27.3.a.21 Bottom trawls Elasmobranch Squalus acanthias 28 2,902 3 14 0.500
Greater North Sea 27.3.a.21 Bottom trawls Elasmobranch Raja clavata 28 2,902 1 3 0.107
Greater North Sea 27.3.a.21 Bottom trawls Elasmobranch Amblyraja radiata 28 2,902 2 3 0.107
Greater North Sea 27.4.a Bottom trawls Elasmobranch Dipturus intermedius 149 1,405 2 5 0.034
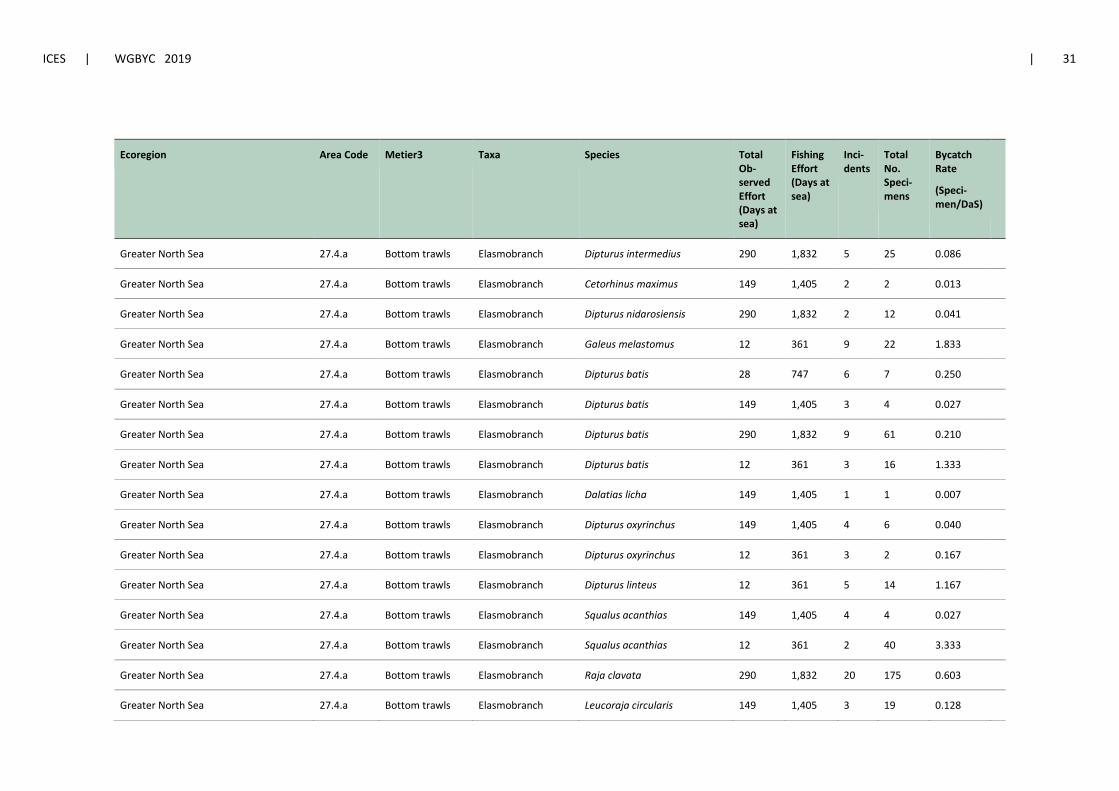
ICES | WGBYC 2019 | 31
Ecoregion Area Code Metier3 Taxa Species Total Ob-served Effort (Days at sea)
Fishing Effort (Days at sea)
Inci-dents
Total No. Speci-mens
Bycatch Rate
(Speci-men/DaS)
Greater North Sea 27.4.a Bottom trawls Elasmobranch Dipturus intermedius 290 1,832 5 25 0.086
Greater North Sea 27.4.a Bottom trawls Elasmobranch Cetorhinus maximus 149 1,405 2 2 0.013
Greater North Sea 27.4.a Bottom trawls Elasmobranch Dipturus nidarosiensis 290 1,832 2 12 0.041
Greater North Sea 27.4.a Bottom trawls Elasmobranch Galeus melastomus 12 361 9 22 1.833
Greater North Sea 27.4.a Bottom trawls Elasmobranch Dipturus batis 28 747 6 7 0.250
Greater North Sea 27.4.a Bottom trawls Elasmobranch Dipturus batis 149 1,405 3 4 0.027
Greater North Sea 27.4.a Bottom trawls Elasmobranch Dipturus batis 290 1,832 9 61 0.210
Greater North Sea 27.4.a Bottom trawls Elasmobranch Dipturus batis 12 361 3 16 1.333
Greater North Sea 27.4.a Bottom trawls Elasmobranch Dalatias licha 149 1,405 1 1 0.007
Greater North Sea 27.4.a Bottom trawls Elasmobranch Dipturus oxyrinchus 149 1,405 4 6 0.040
Greater North Sea 27.4.a Bottom trawls Elasmobranch Dipturus oxyrinchus 12 361 3 2 0.167
Greater North Sea 27.4.a Bottom trawls Elasmobranch Dipturus linteus 12 361 5 14 1.167
Greater North Sea 27.4.a Bottom trawls Elasmobranch Squalus acanthias 149 1,405 4 4 0.027
Greater North Sea 27.4.a Bottom trawls Elasmobranch Squalus acanthias 12 361 2 40 3.333
Greater North Sea 27.4.a Bottom trawls Elasmobranch Raja clavata 290 1,832 20 175 0.603
Greater North Sea 27.4.a Bottom trawls Elasmobranch Leucoraja circularis 149 1,405 3 19 0.128
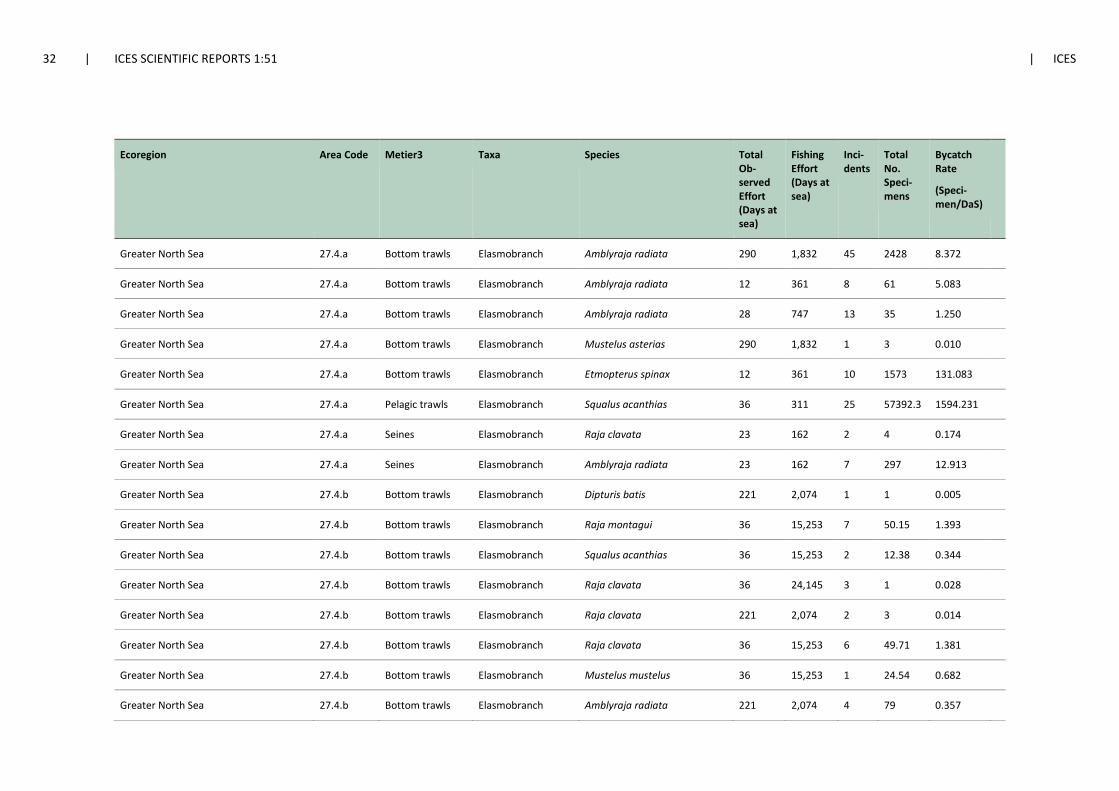
32 | ICES SCIENTIFIC REPORTS 1:51 | ICES
Ecoregion Area Code Metier3 Taxa Species Total Ob-served Effort (Days at sea)
Fishing Effort (Days at sea)
Inci-dents
Total No. Speci-mens
Bycatch Rate
(Speci-men/DaS)
Greater North Sea 27.4.a Bottom trawls Elasmobranch Amblyraja radiata 290 1,832 45 2428 8.372
Greater North Sea 27.4.a Bottom trawls Elasmobranch Amblyraja radiata 12 361 8 61 5.083
Greater North Sea 27.4.a Bottom trawls Elasmobranch Amblyraja radiata 28 747 13 35 1.250
Greater North Sea 27.4.a Bottom trawls Elasmobranch Mustelus asterias 290 1,832 1 3 0.010
Greater North Sea 27.4.a Bottom trawls Elasmobranch Etmopterus spinax 12 361 10 1573 131.083
Greater North Sea 27.4.a Pelagic trawls Elasmobranch Squalus acanthias 36 311 25 57392.3 1594.231
Greater North Sea 27.4.a Seines Elasmobranch Raja clavata 23 162 2 4 0.174
Greater North Sea 27.4.a Seines Elasmobranch Amblyraja radiata 23 162 7 297 12.913
Greater North Sea 27.4.b Bottom trawls Elasmobranch Dipturis batis 221 2,074 1 1 0.005
Greater North Sea 27.4.b Bottom trawls Elasmobranch Raja montagui 36 15,253 7 50.15 1.393
Greater North Sea 27.4.b Bottom trawls Elasmobranch Squalus acanthias 36 15,253 2 12.38 0.344
Greater North Sea 27.4.b Bottom trawls Elasmobranch Raja clavata 36 24,145 3 1 0.028
Greater North Sea 27.4.b Bottom trawls Elasmobranch Raja clavata 221 2,074 2 3 0.014
Greater North Sea 27.4.b Bottom trawls Elasmobranch Raja clavata 36 15,253 6 49.71 1.381
Greater North Sea 27.4.b Bottom trawls Elasmobranch Mustelus mustelus 36 15,253 1 24.54 0.682
Greater North Sea 27.4.b Bottom trawls Elasmobranch Amblyraja radiata 221 2,074 4 79 0.357

ICES | WGBYC 2019 | 33
Ecoregion Area Code Metier3 Taxa Species Total Ob-served Effort (Days at sea)
Fishing Effort (Days at sea)
Inci-dents
Total No. Speci-mens
Bycatch Rate
(Speci-men/DaS)
Greater North Sea 27.4.b Bottom trawls Elasmobranch Amblyraja radiata 36 15,253 155 597.85 16.607
Greater North Sea 27.4.b Bottom trawls Elasmobranch Amblyraja radiata 36 24,145 14 78 2.167
Greater North Sea 27.4.c Bottom trawls Elasmobranch Raja montagui 21 30,036 6 254.96 12.141
Greater North Sea 27.4.c Bottom trawls Elasmobranch Raja clavata 21 30,036 27 556.67 26.508
Greater North Sea 27.4.c Nets Elasmobranch Galeorhinus galeus 3 115 4 4 1.333
Greater North Sea 27.7.d Bottom trawls Elasmobranch Raja microocellata 179 20,164 4 43 0.240
Greater North Sea 27.7.d Bottom trawls Elasmobranch Squalus acanthias 96 18,811 1 1 0.010
Greater North Sea 27.7.d Bottom trawls Elasmobranch Raja undulata 96 18,811 15 37 0.386
Greater North Sea 27.7.d Bottom trawls Elasmobranch Raja undulata 179 20,164 91 1827 10.211
Greater North Sea 27.7.d Bottom trawls Elasmobranch Raja undulata 5 10,624 8 50 10.000
Greater North Sea 27.7.d Nets Elasmobranch Dipturus batis 28 10,624 4 4 0.143
Greater North Sea 27.7.d Nets Elasmobranch Dasyatis pastinaca 28 10,624 1 1 0.036
Greater North Sea 27.7.d Nets Elasmobranch Raja microocellata 94 10,624 1 1 0.011
Greater North Sea 27.7.d Nets Elasmobranch Raja microocellata 28 10,624 4 4 0.143
Greater North Sea 27.7.d Nets Elasmobranch Galeorhinus galeus 28 10,624 4 4 0.143
Greater North Sea 27.7.d Nets Elasmobranch Raja undulata 94 10,624 33 85 0.906

34 | ICES SCIENTIFIC REPORTS 1:51 | ICES
Ecoregion Area Code Metier3 Taxa Species Total Ob-served Effort (Days at sea)
Fishing Effort (Days at sea)
Inci-dents
Total No. Speci-mens
Bycatch Rate
(Speci-men/DaS)
Greater North Sea 27.7.d Nets Elasmobranch Raja undulata 28 10,624 31 86 3.071
Greater North Sea 27.7.d Pelagic trawls Elasmobranch Lamna nasus 39 138 2 2 0.051
Greater North Sea 27.7.d Pelagic trawls Elasmobranch Raja clavata 15 52 1 1 0.067
Greater North Sea 27.7.d Pelagic trawls Elasmobranch Mustelus asterias 39 138 34 202.17 5.184
Greater North Sea 27.7.d Pelagic trawls Elasmobranch Raja undulata 21 3,152 4 72 3.509
Greater North Sea 27.7.d Seines Elasmobranch Raja undulata 21 913 5 16 0.762
Greater North Sea 27.7.e Bottom trawls Elasmobranch Lamna nasus 167 15,655 1 1 0.006
Greater North Sea 27.7.e Bottom trawls Elasmobranch Tetronarce nobiliana 167 15,655 5 6 0.036
Greater North Sea 27.7.e Bottom trawls Elasmobranch Cetorhinus maximus 102 15,655 2 2 0.020
Greater North Sea 27.7.e Bottom trawls Elasmobranch Prionace glauca 167 15,655 2 2 0.012
Greater North Sea 27.7.e Bottom trawls Elasmobranch Dipturus batis 102 15,655 10 206 2.025
Greater North Sea 27.7.e Bottom trawls Elasmobranch Dipturus batis 167 15,655 35 150 0.898
Greater North Sea 27.7.e Bottom trawls Elasmobranch Torpedo marmorata 167 15,655 9 12 0.072
Greater North Sea 27.7.e Bottom trawls Elasmobranch Squalus acanthias 102 15,655 10 372 3.656
Greater North Sea 27.7.e Bottom trawls Elasmobranch Squalus acanthias 167 15,655 4 6 0.036
Greater North Sea 27.7.e Bottom trawls Elasmobranch Galeorhinus galeus 167 15,655 4 6 0.036

ICES | WGBYC 2019 | 35
Ecoregion Area Code Metier3 Taxa Species Total Ob-served Effort (Days at sea)
Fishing Effort (Days at sea)
Inci-dents
Total No. Speci-mens
Bycatch Rate
(Speci-men/DaS)
Greater North Sea 27.7.e Bottom trawls Elasmobranch Raja undulata 102 15,655 60 1407 13.829
Greater North Sea 27.7.e Bottom trawls Elasmobranch Raja undulata 167 15,655 129 287 1.719
Greater North Sea 27.7.e Dredges Elasmobranch Raja undulata 18 12,563 1 1 0.056
Greater North Sea 27.7.e Nets Elasmobranch Dipturus batis 131 12,563 2 2 0.015
Greater North Sea 27.7.e Nets Elasmobranch Prionace glauca 131 12,563 3 4 0.031
Greater North Sea 27.7.e Nets Elasmobranch Dasyatis pastinaca 131 12,563 2 2 0.015
Greater North Sea 27.7.e Nets Elasmobranch Raja microocellata 68 12,563 1 1 0.015
Greater North Sea 27.7.e Nets Elasmobranch Raja microocellata 131 12,563 5 10 0.076
Greater North Sea 27.7.e Nets Elasmobranch Squalus acanthias 131 12,563 3 19 0.145
Greater North Sea 27.7.e Nets Elasmobranch Galeorhinus galeus 131 12,563 9 9 0.069
Greater North Sea 27.7.e Nets Elasmobranch Raja undulata 68 12,563 32 143 2.114
Greater North Sea 27.7.e Nets Elasmobranch Raja undulata 131 12,563 4 145 1.108
Greater North Sea 27.7.e Pelagic trawls Elasmobranch Lamna nasus 10 41 1 2 0.200
Greater North Sea 27.7.e Pelagic trawls Elasmobranch Alopias vulpinus 10 41 1 3 0.300
Greater North Sea 27.7.e Pelagic trawls Elasmobranch Alopias vulpinus 3 41 1 1 0.333
Greater North Sea 27.7.e Seines Elasmobranch Dipturus batis 2 51 2 9 5.964
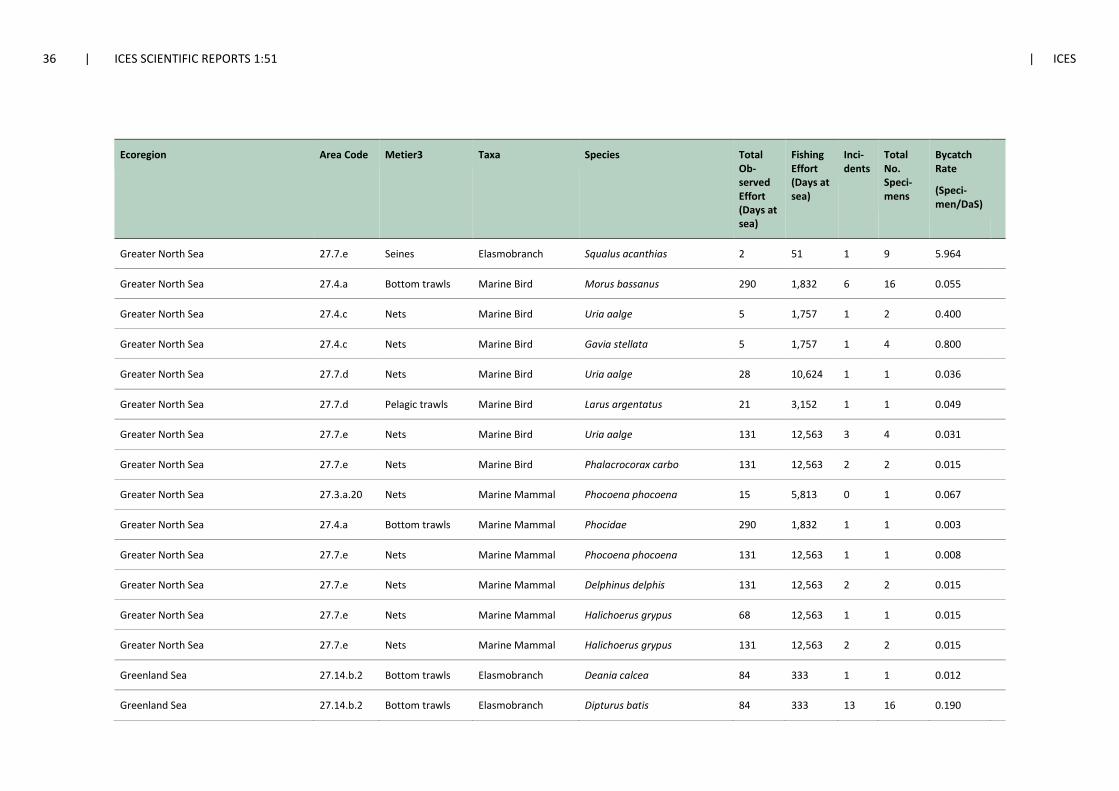
36 | ICES SCIENTIFIC REPORTS 1:51 | ICES
Ecoregion Area Code Metier3 Taxa Species Total Ob-served Effort (Days at sea)
Fishing Effort (Days at sea)
Inci-dents
Total No. Speci-mens
Bycatch Rate
(Speci-men/DaS)
Greater North Sea 27.7.e Seines Elasmobranch Squalus acanthias 2 51 1 9 5.964
Greater North Sea 27.4.a Bottom trawls Marine Bird Morus bassanus 290 1,832 6 16 0.055
Greater North Sea 27.4.c Nets Marine Bird Uria aalge 5 1,757 1 2 0.400
Greater North Sea 27.4.c Nets Marine Bird Gavia stellata 5 1,757 1 4 0.800
Greater North Sea 27.7.d Nets Marine Bird Uria aalge 28 10,624 1 1 0.036
Greater North Sea 27.7.d Pelagic trawls Marine Bird Larus argentatus 21 3,152 1 1 0.049
Greater North Sea 27.7.e Nets Marine Bird Uria aalge 131 12,563 3 4 0.031
Greater North Sea 27.7.e Nets Marine Bird Phalacrocorax carbo 131 12,563 2 2 0.015
Greater North Sea 27.3.a.20 Nets Marine Mammal Phocoena phocoena 15 5,813 0 1 0.067
Greater North Sea 27.4.a Bottom trawls Marine Mammal Phocidae 290 1,832 1 1 0.003
Greater North Sea 27.7.e Nets Marine Mammal Phocoena phocoena 131 12,563 1 1 0.008
Greater North Sea 27.7.e Nets Marine Mammal Delphinus delphis 131 12,563 2 2 0.015
Greater North Sea 27.7.e Nets Marine Mammal Halichoerus grypus 68 12,563 1 1 0.015
Greater North Sea 27.7.e Nets Marine Mammal Halichoerus grypus 131 12,563 2 2 0.015
Greenland Sea 27.14.b.2 Bottom trawls Elasmobranch Deania calcea 84 333 1 1 0.012
Greenland Sea 27.14.b.2 Bottom trawls Elasmobranch Dipturus batis 84 333 13 16 0.190

ICES | WGBYC 2019 | 37
Ecoregion Area Code Metier3 Taxa Species Total Ob-served Effort (Days at sea)
Fishing Effort (Days at sea)
Inci-dents
Total No. Speci-mens
Bycatch Rate
(Speci-men/DaS)
Greenland Sea 27.14.b.2 Bottom trawls Elasmobranch Centroscymnus coelolepis 84 333 6 6 0.071
Greenland Sea 27.14.b.2 Bottom trawls Elasmobranch Amblyraja radiata 84 333 16 29 0.345
Iceland Sea 27.5.a.2 Longlines Marine Bird Larus argentatus 132 13,372 1 35 0.265
Iceland Sea 27.5.a.2 Longlines Marine Bird Fulmarus glacialis 132 13,372 9 69 0.523
Iceland Sea 27.5.a.2 Longlines Marine Bird Morus bassanus 132 13,372 3 24 0.182
Iceland Sea 27.5.a.2 Longlines Marine Bird Larus fuscus 132 13,372 1 5 0.038
Iceland Sea 27.5.a.2 Nets Marine Bird Uria aalge 131 12,813 13 55 0.420
Iceland Sea 27.5.a.2 Nets Marine Bird Cepphus grylle 131 12,813 6 20 0.153
Iceland Sea 27.5.a.2 Nets Marine Bird Uria lomvia 131 12,813 1 1 0.008
Iceland Sea 27.5.a.2 Nets Marine Bird Somateria mollissima 131 12,813 13 62 0.473
Iceland Sea 27.5.a.2 Nets Marine Bird Gavia immer 131 12,813 1 1 0.008
Iceland Sea 27.5.a.2 Nets Marine Bird Phalacrocoracidae 131 12,813 6 10 0.076
Iceland Sea 27.5.a.2 Nets Marine Bird Fulmarus glacialis 131 12,813 2 3 0.023
Iceland Sea 27.5.a.2 Nets Marine Bird Morus bassanus 131 12,813 3 3 0.023
Iceland Sea 27.5.a.2 Nets Marine Bird Clangula hyemalis 131 12,813 2 2 0.015
Iceland Sea 27.5.a.2 Nets Marine Bird Alca torda 131 12,813 1 1 0.008

38 | ICES SCIENTIFIC REPORTS 1:51 | ICES
Ecoregion Area Code Metier3 Taxa Species Total Ob-served Effort (Days at sea)
Fishing Effort (Days at sea)
Inci-dents
Total No. Speci-mens
Bycatch Rate
(Speci-men/DaS)
Iceland Sea 27.5.a.2 Bottom trawls Marine Mammal Pagophilus groenlandicus 377 9,382 1 1 0.003
Iceland Sea 27.5.a.2 Nets Marine Mammal Phocoena phocoena 131 12,813 37 44 0.336
Iceland Sea 27.5.a.2 Nets Marine Mammal Phoca vitulina 131 12,813 19 34 0.260
Iceland Sea 27.5.a.2 Nets Marine Mammal Halichoerus grypus 131 12,813 4 4 0.031
Iceland Sea 27.5.a.2 Nets Marine Mammal Pagophilus groenlandicus 131 12,813 2 3 0.023
Iceland Sea 27.5.a.2 Nets Marine Mammal Phoca hispida 131 12,813 2 2 0.015
Norwegian Sea 27.2.a Bottom trawls Elasmobranch Dipturus nidarosiensis 2 14 1 29 14.500
Norwegian Sea 27.2.a.2 Bottom trawls Elasmobranch Raja oxyrinchus 87 140 3 3 0.034
Norwegian Sea 27.2.a.2 Bottom trawls Elasmobranch Dipturus batis 87 140 20 50 0.575
Norwegian Sea 27.2.a.2 Bottom trawls Elasmobranch Raja clavata 87 140 2 3 0.034
Norwegian Sea 27.2.a.2 Bottom trawls Elasmobranch Amblyraja radiata 87 140 42 128 1.471
Ionian Sea and Central Mediterranen sea 16 Pelagic trawls Elasmobranch Myliobatis aquila 23 2,620 4 11 0.478
Ionian Sea and Central Mediterranen sea 16 Pelagic trawls Elasmobranch Raja asterias 23 2,620 3 4 0.174
Adriatic Sea 17 Bottom trawls Elasmobranch Dipturus oxyrinchus 30 35,727 1 1 0.033
Adriatic Sea 17 Pelagic trawls Elasmobranch Aetomylaeus bovinus 173 12,556 1 1 0.006
Adriatic Sea 17 Pelagic trawls Elasmobranch Mustelus punctulatus 173 12,556 20 35 0.202
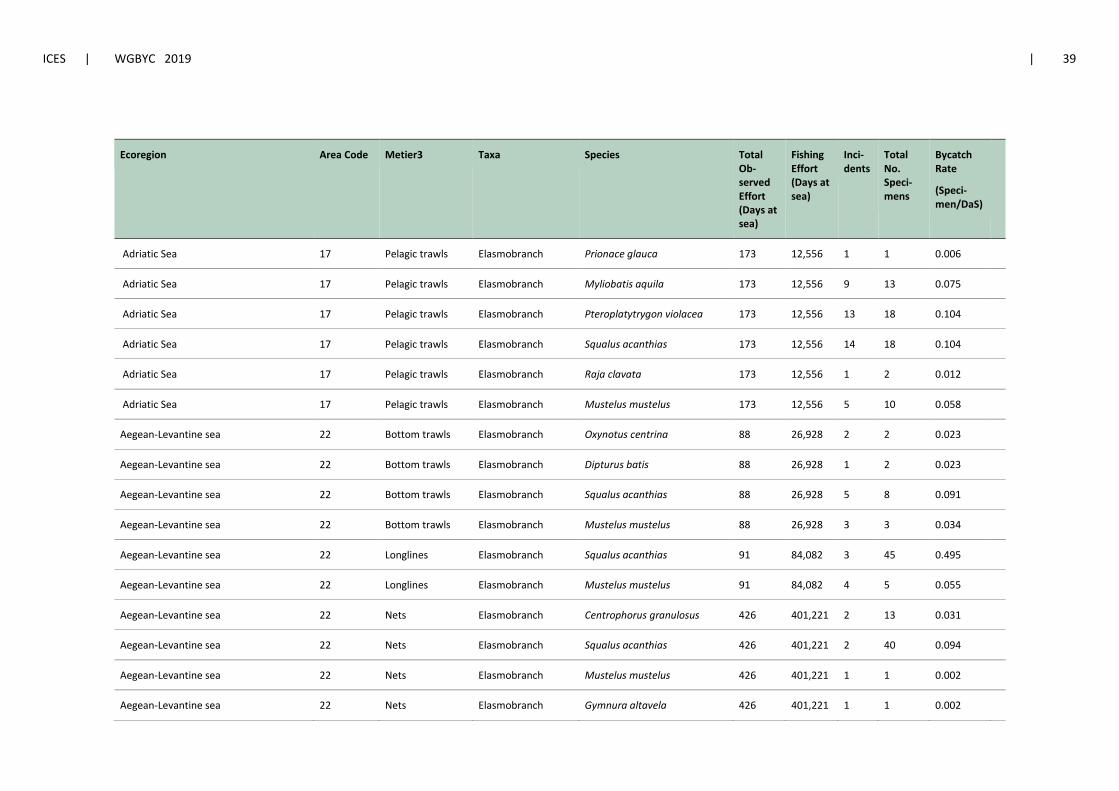
ICES | WGBYC 2019 | 39
Ecoregion Area Code Metier3 Taxa Species Total Ob-served Effort (Days at sea)
Fishing Effort (Days at sea)
Inci-dents
Total No. Speci-mens
Bycatch Rate
(Speci-men/DaS)
Adriatic Sea 17 Pelagic trawls Elasmobranch Prionace glauca 173 12,556 1 1 0.006
Adriatic Sea 17 Pelagic trawls Elasmobranch Myliobatis aquila 173 12,556 9 13 0.075
Adriatic Sea 17 Pelagic trawls Elasmobranch Pteroplatytrygon violacea 173 12,556 13 18 0.104
Adriatic Sea 17 Pelagic trawls Elasmobranch Squalus acanthias 173 12,556 14 18 0.104
Adriatic Sea 17 Pelagic trawls Elasmobranch Raja clavata 173 12,556 1 2 0.012
Adriatic Sea 17 Pelagic trawls Elasmobranch Mustelus mustelus 173 12,556 5 10 0.058
Aegean-Levantine sea 22 Bottom trawls Elasmobranch Oxynotus centrina 88 26,928 2 2 0.023
Aegean-Levantine sea 22 Bottom trawls Elasmobranch Dipturus batis 88 26,928 1 2 0.023
Aegean-Levantine sea 22 Bottom trawls Elasmobranch Squalus acanthias 88 26,928 5 8 0.091
Aegean-Levantine sea 22 Bottom trawls Elasmobranch Mustelus mustelus 88 26,928 3 3 0.034
Aegean-Levantine sea 22 Longlines Elasmobranch Squalus acanthias 91 84,082 3 45 0.495
Aegean-Levantine sea 22 Longlines Elasmobranch Mustelus mustelus 91 84,082 4 5 0.055
Aegean-Levantine sea 22 Nets Elasmobranch Centrophorus granulosus 426 401,221 2 13 0.031
Aegean-Levantine sea 22 Nets Elasmobranch Squalus acanthias 426 401,221 2 40 0.094
Aegean-Levantine sea 22 Nets Elasmobranch Mustelus mustelus 426 401,221 1 1 0.002
Aegean-Levantine sea 22 Nets Elasmobranch Gymnura altavela 426 401,221 1 1 0.002

40 | ICES SCIENTIFIC REPORTS 1:51 | ICES
Ecoregion Area Code Metier3 Taxa Species Total Ob-served Effort (Days at sea)
Fishing Effort (Days at sea)
Inci-dents
Total No. Speci-mens
Bycatch Rate
(Speci-men/DaS)
Adriatic Sea 17 Pelagic trawls Marine Mammal Tursiops truncatus 173 12,556 1 3 0.017
Adriatic Sea 17 Pelagic trawls Marine Turtle Caretta caretta 173 12,556 3 3 0.017
Adriatic Sea 22 Nets Marine Turtle Caretta caretta 426 401,221 1 1 0.002
Western Mediterranean 1 Bottom trawls Elasmobranch Centrophorus granulosus 118 22,537 4 5 0.042
Western Mediterranean 1 Bottom trawls Elasmobranch Dalatias licha 118 22,537 1 9 0.076
Western Mediterranean 1 Bottom trawls Elasmobranch Etmopterus spinax 118 22,537 57 2945 24.958
Western Mediterranean 1 Bottom trawls Elasmobranch Heptranchias perlo 118 22,537 8 13 0.110
Western Mediterranean 1 Bottom trawls Elasmobranch Leucoraja circularis 118 22,537 4 4 0.034
Western Mediterranean 1 Bottom trawls Elasmobranch Raja clavata 118 22,537 17 46 0.3898
Western Mediterranean 2 Bottom trawls Elasmobranch Centrophorus granulosus 50 952 1 5 0.1
Western Mediterranean 2 Bottom trawls Elasmobranch Dalatias licha 50 952 25 48 0.96
Western Mediterranean 2 Bottom trawls Elasmobranch Etmopterus spinax 50 952 176 4945 98.9
Western Mediterranean 2 Bottom trawls Elasmobranch Hexanchus griseus 50 952 2 2 0.04
Western Mediterranean 2 Bottom trawls Elasmobranch Rostroraja alba 50 952 3 3 0.06
Western Mediterranean 5 Bottom trawls Elasmobranch Etmopterus spinax 98 9,165 24 1954 19.939
Western Mediterranean 5 Bottom trawls Elasmobranch Heptranchias perlo 98 9,165 5 5 0.051

ICES | WGBYC 2019 | 41
Ecoregion Area Code Metier3 Taxa Species Total Ob-served Effort (Days at sea)
Fishing Effort (Days at sea)
Inci-dents
Total No. Speci-mens
Bycatch Rate
(Speci-men/DaS)
Western Mediterranean 5 Bottom trawls Elasmobranch Hexanchus griseus 98 9,165 2 2 0.020
Western Mediterranean 5 Bottom trawls Elasmobranch Leucoraja circularis 98 9,165 1 1 0.010
Western Mediterranean 5 Bottom trawls Elasmobranch Mustelus mustelus 98 9,165 8 18 0.184
Western Mediterranean 5 Bottom trawls Elasmobranch Raja clavata 98 9,165 54 671 6.847
Western Mediterranean 6 Bottom trawls Elasmobranch Dalatias licha 253 78,733 1 1 0.004
Western Mediterranean 6 Bottom trawls Elasmobranch Etmopterus spinax 253 78,733 60 1123 4.439
Western Mediterranean 6 Bottom trawls Elasmobranch Leucoraja circularis 253 78,733 1 2 0.008
Western Mediterranean 6 Bottom trawls Elasmobranch Mustelus mustelus 253 78,733 4 11 0.0435
Western Mediterranean 6 Bottom trawls Elasmobranch Raja clavata 253 78,733 31 100 0.395
Western Mediterranean 6 Bottom trawls Elasmobranch Squalus acanthias 253 78,733 1 1 0.004
Western Mediterranean 7 Bottom trawls Elasmobranch Dalatias licha 180,75 11,661 2 60 0.332
Western Mediterranean 7 Bottom trawls Elasmobranch Etmopterus spinax 180,75 11,661 12 217 1.200
Western Mediterranean 7 Bottom trawls Elasmobranch Raja clavata 180,75 11,661 18 47 0.260
Western Mediterranean 7 Bottom trawls Elasmobranch Squalus acanthias 96,25 3,486 4 42 0.436
Western Mediterranean 1~5~6 Longlines Elasmobranch Alopias vulpinus 570 7,789 3 3 0.005
Western Mediterranean 1~5~6 Longlines Elasmobranch Isurus oxyrinchus 570 7,789 2 2 0.003

42 | ICES SCIENTIFIC REPORTS 1:51 | ICES
Ecoregion Area Code Metier3 Taxa Species Total Ob-served Effort (Days at sea)
Fishing Effort (Days at sea)
Inci-dents
Total No. Speci-mens
Bycatch Rate
(Speci-men/DaS)
Western Mediterranean 1~5~6 Longlines Elasmobranch Mobula mobular 570 7,789 6 7 0.012
Western Mediterranean 7 Longlines Marine Bird Puffinus mauretanicus 8 3,115 1 1 0.125
Western Mediterranean 1~5~6 Longlines Marine Bird Larus audouinii 570 7,789 3 5 0.009
Western Mediterranean 1~5~6 Longlines Marine Bird Larus michahellis 570 7,789 2 2 0.003
Western Mediterranean 1~5~6 Longlines Marine Bird Puffinus mauretanicus 570 7,789 3 3 0.005
Western Mediterranean 1~5~6 Longlines Marine Bird Puffinus yelkouan 570 7,789 1 2 0.003
Western Mediterranean 6 Bottom trawls Marine mammal Stenella coeruleoalba 253 78,733 1 1 0.004
Western Mediterranean 7 Bottom trawls Marine mammal Delphinidae 180,75 11,660 1 1 0.005
Western Mediterranean 7 Longlines Marine mammal Tursiops truncatus 20 7,301 1 1 0.05
Western Mediterranean 7 Pelagic trawls Marine mammal Stenella coeruleoalba 6 370 1 2 0.333
Western Mediterranean 1~5~6 Longlines Marine Turtle Caretta caretta 570 7,789 8 10 0.017
Western Mediterranean 1~5~6 Longlines Marine Turtle Dermochelys coriacea 570 7,789 1 1 0.001

ICES | WGBYC 2019 | 43
Table 310. Marine mammal bycatch reported in the Regulation 812/2004 reports compared with data submitted to the database for data collection during 2017.
Reported Database
Species ICES Subarea Level 3 Metier Observed days at sea
Total num-ber incidents
Total number specimens
Observed days at sea
Total number of incidents
Total number of specimens
Bycatch rate (Number of specimens/days at sea ob-
served 11
Phocoena pho-coena
27.3.b.23 Nets 36 1 2 17 1 2 0.12
27.8.a Bottom trawls 123 1 1 123 1 1 0.01
27.8.b Nets 221 4 4 221 4 4 0.02
27.8.b Pelagic trawls 9 1 1 9 1 1 0.12
27.7.g Bottom trawls 97 1 1 97 1 1 0.01
27.7.f Nets 62 3 4 62 3 4 0.06
27.3.a.20 Nets 15 1 0 15 1 1 0.07
27.7.e Nets 131 1 1 131 1 1 0.01
27.5.a.2*** Nets 131 37 44 0.34
Subtotal 694 13 15 806 50 59
Delphinus delphis 27.10.a.2^ Rods and lines 1576 1 1 0.0006
27.8.a Nets 169 1 1 169 1 1 0.01
10 Data for FAO area 37, GSA 06 and GSA 07 have been added after the Advice Drafting Group (ADGBYC) 2019 when a new extraction of the database was carried out.
11 Some numbers that had been rounded to zero corrected based on the reviewers’ report.

44 | ICES SCIENTIFIC REPORTS 1:51 | ICES
Reported Database
Species ICES Subarea Level 3 Metier Observed days at sea
Total num-ber incidents
Total number specimens
Observed days at sea
Total number of incidents
Total number of specimens
Bycatch rate (Number of specimens/days at sea ob-
served 11
27.8.b Nets 221 5 5 221 5 5 0.02
27.8.a Pelagic trawls 45 6 49 45 6 49 1.10
27.8.b Pelagic trawls 9 6 8 9 6 8 0.94
27.9.a* Seines 40 1 3 40 1 2 0.05
27.7 Bottom trawls 117 1 1 0.01
27.7.g Bottom trawls 216 2 3 216 2 2 0.01
27.7.h Bottom trawls 200 1 1 200 1 1 0.005
27.7.f Nets 62 1 1 62 1 1 0.02
27.7.h Nets 28 1 1 28 1 1 0.04
27.7.j Nets 179 1 1 0.01
27.7.e Nets 131 2 2 131 2 2 0.02
Subtotal 1121 26 74 2993 29 75
Globicephala me-las
27.10.a.2^ Longlines 1226 1 1 0.0008
27.8.c Pelagic trawls 86 1 5 86 1 5 0.058
Subtotal 86 1 5 1312 2 6
Tursiops truncatus GSA07** Bottom trawls 1 1

ICES | WGBYC 2019 | 45
Reported Database
Species ICES Subarea Level 3 Metier Observed days at sea
Total num-ber incidents
Total number specimens
Observed days at sea
Total number of incidents
Total number of specimens
Bycatch rate (Number of specimens/days at sea ob-
served 11
GSA07 Longlines 20 1 1 0.05
GSA17 Pelagic trawls 173 1 3 173 2 4 0.02
Subtotal 173 2 4 193 1 3
Stenellla coerorule-oalba
GSA06 Bottom trawls 253 1 1 0.004
GSA07 Pelagic trawls 1 2 6 1 2 0.33
Subtotal 1 2 259 2 3
Delphinidae GSA07 Bottom trawls 181 1 1 0.005
Subtotal 181 1 1 0.005
Halichoerus grypus 27.3.d.32 Nets 8 1 2 0.25
27.3.d.29 Pelagic trawls 13 1 1 0.08
27.3.d.28.1 Traps 13 1 1 0.08
27.3.d.32 Traps 12 2 3 0.25
27.7.f Nets 62 1 1 62 1 1 0.02
27.7.j Nets 179 2 2 0.01
27.6.a Pelagic trawls 29 1 1 29 1 1 0.03

46 | ICES SCIENTIFIC REPORTS 1:51 | ICES
Reported Database
Species ICES Subarea Level 3 Metier Observed days at sea
Total num-ber incidents
Total number specimens
Observed days at sea
Total number of incidents
Total number of specimens
Bycatch rate (Number of specimens/days at sea ob-
served 11
27.7.b Pelagic trawls 7 1 1 7 1 1 0.14
27.7.e Nets 68 1 1 0.01
27.7.e Nets 131 2 2 131 2 2 0.02
27.5.a.2*** Nets 131 4 4 0.03
Subtotal 229 5 5 653 17 19
Phoca vitulina 27.5.a.2*** Nets 131 19 34 0.26
Subtotal 131 19 34
Pusa hispida 27.5.a.2*** Nets 131 2 2 0.02
Subtotal 131 2 2
Pagophilus groen-landicus
27.5.a.2*** Bottom trawls 377 1 1 0.003
27.5.a.2*** Nets 131 2 3 0.02
Subtotal 508 3 4
TOTAL 2303 48 105 7161 127 207
* animals released alive were not included in the database, but mentioned in the report
** mentioned in the report but data not entered in the database
*** not an EU Member State, no 812/2004 report submited but data added to the database
^incidents from the Azores (Division 10.a) not included in the 812/2004 report from Portugal.

ICES | WGBYC 2019 | 47
Table 4. Summary of fished and observed effort in the US Northwest Atlantic Ecoregion, and observed number of PET specimens bycaught. Bycatch estimates for the metier (Level 3) and their source are also given.
Area Gear Type (Metier level 3)
Species Total Ob-server Effort (metric tons)
Total Fish-ing Effort (metric tons)
Total No. Specimens
Bycatch Rates S(pecimens/DaS)
Bycatch Esti-mate (CV)
Source
New England Sink Gillnets Phocoena phocoena 1635 13624 19 - 136 (CV=0.28) Orphanides (in review)
New England Sink Gillnets Delphinus delphis 1635 13624 20 - 133 (CV=0.28) Orphanides (in review)
New England Sink Gillnets Halichoerus grypus 1635 13624 158 - 930 (CV=0.16) Orphanides (in review)
New England Sink Gillnets Phoca vitulina 1635 13624 63 - 298 (CV=0.18) Orphanides (in review)
New England Sink Gillnets Pagophilus groenlandicus 1635 13624 6 - 44 (CV=0.37) Orphanides (in review)
New England Sink Gillnets Tursiops truncatus 1635 13624 1 - 8 (CV=0.92) Orphanides (in review)
Mid-Atlantic Sink Gillnets Phocoena phocoena 718 7979 1 - 9 (CV=.95) Orphanides (in review)
Mid-Atlantic Sink Gillnets Delphinus delphis 718 7979 2 - 22 (CV=0.71) Orphanides (in review)
Mid-Atlantic Sink Gillnets Phoca vitulina 718 7979 1 - 3 (CV=0.62) Orphanides (in review)
New England Bottom Trawls Lagenorhynchus acutus 635 5201 2 - 15 (CV=0.64) Lyssikatos et al. (in prep)
New England Bottom Trawls Halichoerus grypus 635 5201 2 - 16 (CV=0.66) Lyssikatos et al. (in prep)
Mid-Atlantic Bottom Trawls Delphinus delphis 1197 8592 66 - 380 (CV=0.23) Lyssikatos et al. (in prep)
Mid-Atlantic Bottom Trawls Grampus griseus 1197 8592 7 - 43 (CV=0.51) Lyssikatos et al. (in prep)
Mid-Atlantic Bottom Trawls Halichoerus grypus 1197 8592 5 - 26 (CV=0.40) Lyssikatos et al. (in prep)
Mid-Atlantic Bottom Trawls Tursiops truncatus 1197 8592 3 - 22 (CV=0.66) Lyssikatos et al. (in prep)
Georges Bank to Mid-Atlantic Sink Gillnets Caretta caretta 4902 51533 27 - 705 (CV=0.29) Murray 2018

48 | ICES SCIENTIFIC REPORTS 1:51 | ICES
Area Gear Type (Metier level 3)
Species Total Ob-server Effort (metric tons)
Total Fish-ing Effort (metric tons)
Total No. Specimens
Bycatch Rates S(pecimens/DaS)
Bycatch Esti-mate (CV)
Source
Georges Bank to Mid-Atlantic Sink Gillnets Lepidochelys kempii 4902 51533 7 - 145 (CV=0.43) Murray 2018
Georges Bank to Mid-Atlantic Sink Gillnets Dermochelys coriacea 4902 51533 2 - 27 (CV=0.71) Murray 2018

ICES | WGBYC 2019 | 49
2 Collate and review information from National Regu-lation 812/2004 reports and elsewhere relating to the implementation of bycatch mitigation measures and ongoing bycatch mitigation trials, compile re-cent results and coordinate further work on pro-tected species bycatch mitigation (ToR B)
2.1 Mitigation compliance carried out under (EC) Reg. 812/2004 -Mandatory and voluntary mitigation measures
Relevant text extracted from Member States (EC) Reg. 812/2004 reports pertaining to mitigation
compliance is summarized below by MS. Article 2 of Reg. 812/2004 requires certain métiers (iden-
tified in Annex I) to use pingers to mitigate against cetacean bycatch. However, other mitigation
methods such as alternative fishing gear or modified gear can also be reported by MS. Also in-
cluded are results from presentations provided to WGBYC from Iceland and Portugal that de-
scribed ongoing bycatch mitigation research trials and summaries from relevant literature.
2.1.1 Member states
Belgium reports that the use of acoustic deterrent devices, or ‘pingers’, has not yet become stand-
ard practice in Belgian tangle net fishing. Furthermore, it should be noted that the number of
national fleet vessels using this fishing method is limited (at present only two vessels) and do
not meet the basic conditions, i.e. length of fleet, to be subject to this requirement. As in other
recent years, there was no scientific monitoring of the use of pingers on vessels in 2017.
In Denmark, a total of 22 Danish vessels were obliged to use pingers in 2017. In 3.d.24/3.c.22 only
a few vessels are required to use pingers (2%), compared to 63% of the vessels operating in 3.a &
4. The pinger type “AQUAmark100” has generally been used in the Danish gill net fisheries,
where the use of pingers is mandatory. However, this pinger model is no longer available in
Denmark, so other types are now being used. The Danish Fishermen Association has informed,
that a 10 kHz pinger is the most widely used pinger in Danish fisheries due to the option of
changing the batteries. The 10 kHz pinger, however, does not have the same effect as the Aqua-
Mark 100, so the distance between these is mandatory and has to be 100 m. The latest derogation
was issued in relation to AquaMark 100, however, other devices with the same specifications can
also be used with increased spacing. More studies on new devices are planned in collaboration
with DTU Aqua and the fisheries organisations.
Monitoring of pingers is a mandatory part of the general inspection of gill net vessels in Den-
mark. When a gear is checked during a fishery inspection operation, the fisheries inspector reg-
isters if there is a requirement to use pingers in the particular area. If there is a requirement, it is
checked whether the pingers are active and deployed with the correct spacing. In 2017, the Dan-
ish fisheries inspection did not conduct any inspections. This is primarily due to a large organi-
zational change and transfer of responsibility to another ministry (formerly the Ministry of Food,

50 | ICES SCIENTIFIC REPORTS 1:51 | ICES
Agriculture and Fisheries, now the Ministry of Foreign Affairs). For the same reasons, no inspec-
tions were carried out on foreign vessels in 2017. It is expected, that the Danish Fisheries Inspec-
tion Agency will conduct inspections again in 2019 at the same level as previous years.
The Danish fisheries authorities has in previous annual reports mentioned the inspection of man-
datory pingers on net gears used by vessels from other Member States, in cases where infringe-
ments have been noted. Denmark has no knowledge of whether the Commission has followed
up upon these infringements with the respective Member States. The Danish Fisheries authori-
ties note that there is a need for trilateral communication with the Member States in question, a
task the Commission should be lead on, also so that any infringements will be prosecuted.
Denmark has conducted two mitigation trials since May 2018. One tested whether pingers could
reduce the depredation by cormorants on fish caught in pound nets. The trial was conducted as
a controlled sequential experiment, using 3 kHz pingers manufactured by Future Oceans. Pre-
liminary results shows that the mean dive time of cormorants inside the pound net was signifi-
cantly shorter (79 s vs. 114 s) when pingers were deployed than in the control period. Further
analyses are needed to determine if the shorter dive time results in reduced depredation.
The second trial was a continuation of a controlled experiment conducted in early 2018, which
tested if light (Fishtek NetLight prototype) or pingers (Future Oceans, 3 kHz) could reduce the
amount of seabird bycatch in the cod gillnet fishery. The lights were deployed with 20 m spacing
on both the lead and bottom line, however in a zigzag setup creating lights every 10 m. Pingers
were deployed with a spacing of 20 m. A total of 165 strings of nets were fished, of which 82
were control strings, 42 were strings with lights and 41 were pinger strings. Altogether 52 sea-
birds were caught, of which 30 were common eiders and 10 were common guillemots. The pre-
liminary analyses showed no significant effects of lights or pingers on bycatch of seabirds.
Denmark is also continuing the development and testing of fishing gear as alternatives to gill
nets for catching cod. This includes both small-scale Danish seines, baited pots and Pontoon
traps.
In Estonia, there was no static gear fishery in ICES Division 24 where pinger use is obligatory
for boats >12 m under Reg. 812/2004. Therefore, no pingers were used by the Estonian fleet. No
other pinger use was implemented.
In France, 77 vessels operating in Subarea 7 in 2017 were obliged to use pingers under Reg.
812/2004, but only 9 vessels operating with static gears (GNS-GTR) deployed pingers (STM
DDD03L) in Subarea 7. No studies were carried out in 2017 to evaluate the effect of pingers on
cetacean bycatch.
In 2017, Germany had fisheries operating in some areas listed in Annex I to Reg. 812/2004 where
the use of pingers is mandatory. Fishing vessels use analogue and digital pingers that are com-
mercially available. In order to carry out compliance monitoring, the personnel of the competent
federal and state authorities were equipped with Pinger Detector Amplifiers (Etec model
PD1102) and trained accordingly. The detectors determine whether a pinger in the water actually
emits its ultrasonic signals. However, pinger signals are masked by the inspection vessel noise
when pingers are checked when nets are already in place. The relevant provision (Article 2(2) of
Reg. 812/2004) merely requires pingers to be operational when setting the gear. Thus, no penal-
ties could be imposed for any infringements found using the current procedure. In 2017, federal
fishing protection vessels inspected a total of five fishing vessels obliged to use pingers. No vio-
lations were found. In the state of Mecklenburg-Vorpommern (Baltic Sea), no inspections of
acoustic deterrent devices were carried out in 2017. The eight gillnetters ≥12 m registered in
Mecklenburg-Vorpommern with a licence allowing the use of static nets were not encountered
in ICES Division 3.24 during the setting of gillnets in the course of sea inspections. The fishing
gear listed in Annex I to Reg. 812/2004 was not used in the territories of the Länder of Lower

ICES | WGBYC 2019 | 51
Saxony and Bremen (North Sea) during the periods described in the Regulation and therefore no
controls were carried out. Coastal waters of Schleswig-Holstein in the Baltic Sea do not fall within
the scope of Annex I of Reg. 812/2004. During 2016, no activities of vessels requiring deterrent
devices were seen in the coastal waters of Schleswig-Holstein in the North Sea.
In 2017, the Thünen Institute successfully completed a BMEL-funded innovation project
launched in August 2012. Under this project, a new type of warning device (‘Porpoise Alert’,
PAL) was developed and its effectiveness in commercial fishing with static nets was tested. The
PAL has led to a statistically significant reduction in the bycatch of porpoises of around 70 % in
the western Baltic Sea (Dorrien and Chladek, 2018). Since the spring of 2017, the Baltic Sea Infor-
mation Centre in Eckernförde has provided 1,680 PAL devices to fishermen in Schleswig-Hol-
stein. The Ministry of Energy, Agriculture, the Environment, Nature and Digitalization of Schles-
wig-Holstein aims at having a validation and testing study conducted.
Currently, the project STELLA at the Thünen-Institute for Baltic Sea Fisheries funded by the Fed-
eral Agency for Nature Conservation (BfN) is developing a holistic approach to minimize conflict
between gillnet fisheries and nature conservation goals. Within this project, modified gillnets
reducing bycatch of harbour porpoises (and birds) are being developed. To this end, a simulation
study determining the "ideal" object to enhance the acoustic reflectivity of gillnets was carried
out. So far, small acrylic glass spheres have been identified to create an echo as strong as a table
tennis ball - thus an object 5 times their size. This is due to resonance effects at 130kHz. This has
been confirmed in an experiment in a large acoustic tank. Additionally, a prototype gillnet was
equipped with the spheres (distance between spheres = 30cm) and echogram images were taken
at 38 kHz and 120kHz of both the modified and a standard net. In the 120 kHz echogram the
rows of spheres are clearly visible, while the standard netting is not visible at all. Floatline and
leadline are visible for both nets. The next steps include a behavioural study of porpoises around
the modified nets as well as a commercial trial of the modified gillnets.
In Ireland, the number of vessels currently using pingers is unknown. Extensive research on the
practicalities and spacing of gillnet pingers has previously been carried out by BIM in Ireland
and has been reported in previous reports under Reg. 812/2004 and at WGBYC. BIM have also
been heavily involved in the development and testing of pelagic trawl pingers as also reported
previously. Based on pinger spacing research carried out by Ireland and Denmark, a temporary
derogation under Article 3(2) of Reg. 812/2004 allowed for an increase in maximum spacing be-
tween pingers to 500m for digital devices from 13 June 2007 for a period of two years. This der-
ogation has not yet been renewed.
ADDs can reduce harbour porpoise bycatch in set net fisheries. Numerous trials have shown that
pingers of several types can reduce porpoise bycatch by around 90%. ADDs are, however, ex-
pensive where many are required (e.g. for set net fisheries), require periodic maintenance to
check and replace batteries and can interfere with net setting and hauling. There is still ambiva-
lence towards ADDs from NGOs due to perceived habitat exclusion and environmental noise
effects. The seriousness of these effects is unproven. Habituation has also been cited as a reason
that ADDs don’t work although again there is no evidence that this is an issue. DDD devices
have potential to work in pelagic trawl fisheries where incidental bycatch of common dolphins
may occur.
In Italy, interactive pingers (DiD 01) were voluntarily used by a few midwater pair trawlers in
GSA 17 (northern Adriatic subarea). Between March and June 2017, 51 fishing operations (25
with pingers and 26 without) were monitored to evaluate the interaction between bottlenose
dolphin (Tursiops truncatus) and midwater pair trawlers and to assess the effectiveness of pingers
by using passive acoustic method and photo-identification techniques. A significantly high num-
ber of clicks was detected in nets without pingers. With pingers, no clicks were recorded during
hauling, 1,570 click during trawling and 745 during steaming; on the other hand, without pinger,

52 | ICES SCIENTIFIC REPORTS 1:51 | ICES
366 signals were recorded during hauling, 23,583 during trawling and 4,291 during steaming.
These preliminary results confirm that the use of the interactive pinger can influence the pres-
ence of dolphins during fishing operations. Excluder devices have been previously tested (e.g.
FLEXGRID, SUPERSHOOTER) but proved unsuitable for reducing bycatch in midwater trawls.
New mitigation measures should be developed and trials are needed to monitor protected spe-
cies and species of conservation concern.
According to the report from Latvia, no vessels were fishing with static gear covered by Reg.
812/2004 in 2017. Thus, pingers were not deployed and no scientific studies and pilot projects
aimed at monitoring and assessing the effects of pinger use were conducted.
In the Netherlands, the use of pingers is obligatory in ICES Subarea 4 for vessels larger than 12m
in the period 1 August until 31 October, using nets that do not exceed 400m in length (the regu-
lation intends to cover set net fishery at wrecks, where relatively short net lengths are being
used). The vast majority of the Dutch set gillnet fleet fishes in this period for sole with much
longer nets. If some vessels are required to use pingers, this is not registered or known by gov-
ernment authorities, nor are the fishermen aware that they should use pingers. Most likely, no
acoustic deterrents are in use by Dutch gill net fishers. However, the number of vessels larger
that 12m fishing on wrecks (that is with nets that do not exceed 400m) is most likely very low, if
not zero.
In Poland, the Ministry of Agriculture and Rural Development in 2008 purchased 500
AQUATEC AQUAmark pingers and handed them on to the owners of fishing vessels. In 2015 a
detailed test of the functioning of the pingers was conducted using a pinger tester (253 pingers
had to be replaced). Since the end of 2015, the Ministry of Maritime Economy and Inland Navi-
gation has not controlled the inventory of pingers on fishing vessels nor monitored the exchange
of pingers between vessels. Vessel owners have been informed that they, not the administrative
bodies, were responsible for the equipment of their ships with pingers, where it was required.
At the same time, they have been made aware that they were obliged to replace malfunctioning
devices with functioning ones. Group purchase of new pingers is planned after the entry into
force of the Regulation on Technical Measures in this fishery, based on the resources of the Eu-
ropean Maritime and Fisheries Fund for the period 2014-2020. In 2017, during controls of fishing
vessels conducted by Sea Fishery Inspectors from District Sea Fishery Inspectorate in Szczecin -
in charge of supervision over commercial fishery in the Polish part of ICES Division 24, no case
of absence of pingers was recorded. In 2017, the Polish sea fishery administration also did not
receive any information from abroad on violation of Reg. 812/2004 by fishing vessels flagged in
Poland.
In Portugal, according to Articles 2 and 3 of the Reg. 812/2004 the use of acoustic deterrent de-
vices are not mandatory for the ICES Division 9a. However, some information is gathered based
on voluntary opportunistic deployments since 2011-2012. Field tests performed up to 2015 were
conducted within the scope of the projects SafeSea EEAGrants (2008-2010) and Life+ MarPro
(2011-2017). These past trials were conducted with FUMUNDA 10 kHz and 70 kHz pingers. For
the northwestern coast, during 2011-2012, field assays were performed in 7 boats using trammel
nets. In these trials, the cetacean species interacting the most (96.7 %) was the common dolphin.
11 common dolphins were bycaught in control nets and 2 common dolphins in nets using ping-
ers. For the Southern Portuguese coast, during 2014-2015, field assays were performed in 1 fish-
ing boat using gillnets. The bottlenose dolphin was the only species observed to interact with
gillnets with levels of fish and gear damage. These trials indicated that the use of this type of
pingers was not an effective tool to reduce interactions and bycatch of bottlenose dolphins in set
nets. In fact, throughout the 2-year study there was the bycatch of 2 bottlenose dolphins that
occurred in pingered nets only.

ICES | WGBYC 2019 | 53
A presentation to WGBYC from Paulo Vasconcelos described the preliminary results of a pilot
study performed by the IPMA - Olhão to test the effect of pingers in reducing the interactions
between dolphins and gillnets operated by the small-scale fishing boats based in the fishing har-
bour of Quarteira (Algarve coast - southern Portugal). The experiments were performed within
the framework of a partnership established between the IPMA - Olhão and the Quarteira’s fish-
ery association (QUARPESCA - Associação dos Armadores Pescadores de Quarteira) and were
carried out onboard the small-scale fishing vessel “Zé Rita” (Q-1169-L: 7.12 m length overall; 72
hp) with a crew composed by the skipper and one fisherman. The fishing operations were per-
formed with gillnets (50 m panel length; # 60 mm mesh size) equipped with pingers (FISHTEK
Marine®: Dolphin Anti-Depredation Pinger - Model BP40): ≈ 50 net panels with pingers vs. ≈ 50
nets panels without pingers (experimental control). All experiments were followed by one fish-
ery observer onboard and the sampling of the catches was performed by 3-4 fishery biologists at
the wholesale market immediately upon the boat arrival at the fishing harbour. The fishery ob-
server onboard registered diverse information in fishing logbooks (e.g. date, location, fishing
bank, number of net panels with and without pingers, time and coordinates at setting and haul-
ing the nets, fishing depth, dolphins sightings, interactions, damages and/or predation) and
monitored the entire fishing surveys using a GPS tracking device (vessel position, vessel speed,
distance covered). The fishery biologists separated the catches obtained with and without ping-
ers, subdivided the species (target, commercial, bycatch and discard species), photographed the
specimens for subsequent measurement of individual length and recorded the total weight of
the catches. Overall, the pilot study comprised 31 fishing surveys performed during approxi-
mately six months (May - October 2018), covering a considerable fishing area (≈ 96 nmi2) and
depth range (6 - 49 m) depending on the main target species. These fishing surveys targeted
mainly two highly priced fish species (striped red mullet - Mullus surmuletus and European hake
- Merluccius merluccius), although accompanied by several other commercially valuable fish spe-
cies due to the multispecific character of this small-scale fishery. The fishing experiments in-
volved a total of 3014 net panels (≈ 150.7 km), including 1493 net panels with pingers (≈ 74.7 km)
and 1521 net panels without pingers (≈ 76.0 km). The overall catches included 55 species (com-
mercial and bycatch species), comprising 23,348 individuals with a total weight of 3,137.6 kg,
mostly of commercially valuable species (2,887.5 kg). The current raw data (unstandardised
catches) displays slightly balanced catches between nets equipped with pingers (1,686.5 kg) and
nets without pingers (1,451.1 kg). Further developments of this study in terms of data treatment
and statistical analyses will imply the standardisation of the catches (number and weight) of the
commercial, bycatch and discard species (e.g. 50 panels, 1000 m net, 3 h soaking time), followed
by the comparison of diverse descriptor parameters of the catches (e.g. catch per unit effort -
CPUE, bycatch per unit effort - BCPUE, gross profit per unit effort - PPUE, bycatch rate - BR,
discard rate - DR) obtained from gillnets with and without pingers.
Moreover, a new project conducted by CCMAR-University of Algarve which started at the end
of 2017 (Mar2020-iNOVPESCA), will approach mitigation strategies regarding reducing interac-
tions of cetaceans and Algarve coastal fisheries, especially purse seining (PS) and set nets
(GNS+GTR). Pinger type to be used will be DDD and DiD (STM Products, Verona, Italy) with
models adapted to set nets and purse seining. Trials were commenced in the Spring of 2018.
Sweden reported that the implementation of pingers as required under Reg. 812/2004, most
likely are not being implemented in regulated fisheries in Sweden. However, in 2015 a project
started with the purpose of implementing pingers on a voluntary basis. After discussions with
fishermen, Banana pingers were chosen for the project. The fishermen regard the Banana pinger
to be practical to use and that the bycatch of harbour porpoises has decreased. The voluntarily
pinger use has continued in 2017 and during that year 9 fishermen used pingers voluntarily.
Seven fishermen are using pingers in the lumpsucker gillnet fishery and three fishermen are

54 | ICES SCIENTIFIC REPORTS 1:51 | ICES
using pingers in the cod gillnet fishery. Fishermen are reporting their fishing effort and use of
pingers to the Swedish University of Agriculture Science.
In the Swedish small-scale coastal fisheries, alternative fishing gear is still being developed. Ex-
amples of alternative gears under development are cod pots, fyke nets for cod, seine nets for
flatfish, vendace and cod and trap-nets for cod. In 2017 to 2018 there has been an implementation
project with the purpose of fulfilling the use of cod pots in the South Baltic Sea. Two fishermen
are now fishing commercially with cod pots as an alternative to gillnets.
In 2017, 24 UK registered vessels of ≥12m fished with gear types (bottom set-nets and entangling
nets) and in areas specified as requiring acoustic deterrent devices under Reg. 812/2004. All rel-
evant skippers are aware of the requirements of the Regulation. The 22 inspections carried out
at sea by UK authorities in 2017, found a high level of compliance and only one warning was
issued. These vessels represent just 2% of the UK’s static net fleet in terms of vessel numbers, but
were responsible for 13% of the total days at sea and 45% of landings by weight by the netting
sector.
These vessels mainly use the DDD-03L acoustic deterrent device, authorized for use by the UK
Government under derogation. Guidance for the correct deployment and use of these devices is
provided by the UK’s Marine Management Organisation. These pingers continue to be effective
at reducing harbour porpoise bycatch; since 2008, observed bycatch rates in pingered nets are
83% lower than in unpingered nets. Their effectiveness for other cetacean species, such as com-
mon dolphin, is currently unknown due to low sample sizes precluding a statistically robust
comparison.
2.1.2 Mitigation trials outside the EU
In Iceland, porpoise alerting devices (PALs) were tested in April 2018 in the cod gillnet fishery.
Two commercial vessels were used for the experiment, one in Hunafloi in northern Iceland, and
one on the southeast coast, known hot spots for cetacean bycatch. In each area, three paired sets
of 12 nets were set, where half of the sets were set with PALs according to the manufacturer’s
description (four PALs per set). One nautical mile was between the paired sets to avoid interac-
tion from the devices on the control sets. A total of 98 sets were hauled over a week. A total of 23
porpoises were caught in the trial. Twelve of those animals were caught in the sets with PALs,
and eleven in the control sets. No significant difference was therefore observed between the PAL
and control sets. Interestingly, almost all the bycaught porpoises in the PAL sets (eleven out of
twelve) were large adult males, while the gender ratio was six males and five females in the
control sets. Interestingly, eight of the twelve porpoises caught in the PAL sets were found right
by the PAL device, suggesting possible attraction of adult males towards the PAL devices.
In USA 2018, the NOAA Fisheries Northeast Fisheries Science Center in Woods Hole Massachu-
setts had no new gear-related projects investigating methods to reduce bycatch of marine mam-
mals or sea turtles beyond what was reported last year in ICES (2019) annual report - Sec. 4.1.2.
Final contract reports describing research results can be found here:
https://www.nefsc.noaa.gov/read/protspp/PR_gear_research/

ICES | WGBYC 2019 | 55
2.1.3 Protected species bycatch mitigation studies from recent liter-ature (2018–19)
The articles highlighted below were selected based on knowledge of peer-reviewed papers pub-
lished over the last year. This was supplemented by Google Scholar and Web of Science searches
using a filter for publication years (2018 and 2019), and the keywords “bycatch”, “mitigation”
and “reduction”. If the papers in question reviewed or tested factors affecting bycatch, bycatch
mitigation devices or alternative fishing gears aimed to reduce the bycatch of marine mammals,
seabirds, reptiles and other PET species, they were included in this review.
2.1.3.1 Fishing gear optimization and alternative gears
2.1.3.1.1 Marine mammals
No new mitigation studies for marine mammals were found in the literature.
2.1.3.1.2 Seabirds
Field et al. (2019) reports on work conducted in the coastal fisheries of the Baltic Sea; a collabo-
rative project between the Lithuanian Ornithological Society, the Polish National Marine Fisher-
ies Research Institute, the Royal Society for the Protection of Birds and BirdLife International
conducted with Lithuanian and Polish inshore fishers to test potential solutions to seabird by-
catch. Three different net modifications were trailed: small black and white striped panels; green
LED lights, and; flashing white LED lights. None of these three modifications resulted in reduced
seabird bycatch which is contrary to evidence from a similar trial in Peru where green lights on
the top of nets reduced the numbers of Guanay cormorants caught. In the Lithuanian/Polish
fisheries, the main species being bycaught are ducks. More worryingly, using white flashing
lights or black and white panels increased the numbers of Long-tailed ducks being accidentally
caught. We think this attraction response may be something to do with the importance of black
and white contrast to this species which has striking black and white plumage. The problem,
therefore remains an intractable one. Various other approaches could be tried, including pre-
venting the conflict between fishers and birds in either time or space by closing areas to fishing
at certain times. However, this seems unlikely to be acceptable to fishers or the economies they
support. Other options, such as preventing seabirds diving in the vicinity of nets using deter-
rents, or using different types of lights, net materials, or even acoustic methods could be tried,
but until we know more of the effects of these on the fish catch, or the birds’ behaviours, trials
will have to continue. This study also highlights the need to be able to publish negative results
(not always an easy task) to enable rapid refocussing of effort and resources away from unfruitful
avenues of research.
Cortés and González-Solís (2018) investigated four mitigation measures in the artisanal demersal
longline fishery for European hake in the Western Mediterranean. The measures tested were
night setting, tori lines, weighted hooks and artificial bait. Night setting reduced bycatch risk
without affecting the target and non-commercial fish catches, while the other methods did not
reduce the bycatch risk and/or had a negative effect on catch/fishing operation. The authors con-
clude that night setting stands out as the best mitigation measure for reducing the bycatch levels
without compromising target catches.
In another study on longline fisheries, Jiménez et al. (2018) looked at the effect of branch line
weighting on bycatch rates of seabirds in Uruguay. The author found that using a 65 g weight
on 1 m leader lines reduced the number of bird attacks on the lines, in addition to lower the

56 | ICES SCIENTIFIC REPORTS 1:51 | ICES
seabird bycatch rate by 42.5%. The authors conclude that this measure would work best in com-
bination with other bycatch mitigation measures, such as night setting, and doing so could result
in zero seabird bycatch in that South American pelagic fishery.
The effectiveness of the “hookpod”, a mitigation device for pelagic longline fisheries, was tested
in a study by Sullivan et al. (2018). The hookpod is a plastic capsule that covers the point and
barb of longline hooks while setting the gear, and that way preventing bird bycatch. Using this
gear resulted in a bycatch rate of 0.04 birds/1000 hooks, compared to a rate of 0.8 birds/1000
hooks in the control. No significant difference in catch of target species was detected, although
the catch was highly variable between trips.
In a study using penguins in captivity, Hanamseth et al. (2018) looked at the effect of gillnet
filament colour (green, orange, clear) on collision rates of the penguins. Orange coloured mono-
filament lines resulted in lower collision rates (5.5%) while clear and green lines resulted in
higher rates of collision (31-36%) suggesting that orange nets might be more visible to diving
birds. In another study on gillnets, Mangel et al. (2018) investigated using LED lights to illumi-
nate gillnets to reduce seabird bycatch. Illuminating the nets resulted in 85% reduction of guanay
cormorant bycatch, as 39 birds were caught in control nets, while 6 were caught in the illumi-
nated nets.
In a study on seabird mitigation measures in the Australian trawl fishery, Koopman et al. (2018)
tested the effectiveness of two industry designed mitigation devices, a baffler and a water
sprayer. Both the experimental devices showed 84% and 59% reduction in interaction rate (bird
interactions per shot) compared to the control. The author conclude that the new mitigation de-
vices can greatly contribute to the reduction of incidental fishing mortality in this Australian
trawl fishery, and potentially in other trawl fisheries.
2.1.3.1.3 4.1.3.1.3 Elasmobranchs
In an effort to reduce rates of bycatch of sharks and rays in the Australian trap fishery for red
snapper, traps with permanent magnets added to the traps were tested against a control with no
magnets (Richards et al. 2018). The addition of the magnets reduced incidences of elasmobranch
bycatch (mainly Brachelurus waddi) by over a third, while increasing the catch of the target spe-
cies. The authors conclude that magnets can be used as a bycatch reduction device in that fishery,
without harming the profitability of the fishery.

ICES | WGBYC 2019 | 57
2.2 Conclusions
As in earlier years, Member States’ reports on Reg. 812/2004 are inconsistent and do not
always follow the agreed format for reporting, making it difficult to get an overview of
how many vessels in each MS are required to use pingers, of the level of compliance and
of the level of enforcement. Of all the submitted Reg. 812/2004 reports, it appears that
only in the UK pinger use is fully implemented and there is active enforcement.
With respect to bycatch mitigation, development of effective mitigation measures are in
general hampered by a lack of understanding of the aetiology of bycatch, and more re-
search is needed on this to guide the development.
For marine mammals, little progress in mitigating bycatch has happened and results
have been inconsistent and ambiguous. Effectiveness of pingers to reduce bycatch of
small cetaceans varies with species, area and fishing métier with no apparent reasons to
why this is; results from experiments testing the PAL, as an example, highlight this
point.12
For seabirds, research has suggested a number of bycatch mitigation techniques that
could be used to reduce bycatch of some species in particular fisheries, but more research
is needed on the general applicability of these techniques.
Further development of mitigation measures as well as trials to test their effectiveness
are needed to reduce the bycatch of protected species in many fisheries. In particular,
research is needed on identification of bycatch hot-spots, on why pingers are effective in
some fisheries and not in others and on the possible effects of habituation and habitat
exclusion in relation to pinger deployment.
12 Sentence “results from experiments testing the PAL, as an example, highlight this point” added based on reviewers’
comments.

58 | ICES SCIENTIFIC REPORTS 1:51 | ICES
3 Evaluate the range of (minimum/maximum) im-pacts of bycatch on protected species populations where possible, furthering the bycatch risk ap-proach to assess likely conservation level threats and prioritize areas where additional monitoring is needed (ToR C)
Bycatch Risk Assessments (BRA), as described in WKREV812 (ICES, 2011) were undertaken by
a subgroup using data held in the WGBYC database. The subgroup focused during the 2019
meeting on an assessment for grey seals (Halichoerus grypus) and harbour porpoise (Phocoena
phocoena). Bycatch of harbour porpoise has recently been the focus of a joint workshop organised
by the North Atlantic Marine Mammal Commission and the Norwegian Institute for Marine Re-
search (NAMMCO_NIMR 2019) to assess the status of this species in the North Atlantic. How-
ever, WGBYC uses the most recent data available (2017). WGBYC has been using the BRA ap-
proach since 2012, but its application to understand population impacts can be challenging given
that monitoring effort is patchy and many metiers have not been sampled. Few countries have
undertaken dedicated monitoring programmes or pilot projects to assess bycatch rates, and con-
sequently, there has been some attention to developing alternative approaches to derive mortal-
ity estimates of cetaceans due to bycatch. France has led in this area of work (Peltier et al. 2012,
2014, 2016) using strandings and drift models to quantify the amount and sources of bycatch. We
provide an update on the most recent work undertaken in this regard.
3.1 Evaluating the impacts of bycatch on protected species populations using WGBYC at-sea monitoring data
3.1.1 Marine Mammals: Bycatch Risk Assessment
The BRA approach relies on the use of the ICES WGBYC database, which holds data submitted
by MS that are subject to Reg. 812/2004 (Table 1). MS data are submitted to the WGBYC database
in an aggregated form. Data are aggregated by MS, year, métier and ICES Division (see ICES,
2019). Bycatch event level data (i.e. haul or tow level data) are not available. Days at sea (DaS) is
the only aggregated unit of effort that is consistently reported among MS. Consequently, moni-
tored and total fishing effort, and estimated bycatch rates are reported in units associated with
DaS.
Total bycatch Ŷ of species (i) by region (r) was estimated as the product of the ratio of the sum of
observed specimens (yi) to observed DaS (x), times total fishing DaS (X) summed over ICES areas
(a) of interest:
�̂�𝑖𝑟 = ∑ 𝑦𝑖𝑎𝑟
∑ 𝑥𝑎𝑟
∙ ∑ 𝑋𝑎𝑟
Due to the aggregated nature of data submissions to the WGBYC database, more traditional ap-
proaches to estimating uncertainty around a point estimate (e.g. bootstrapping) could not be
applied. Alternatively, a binomial or Poisson probability density function (Source excel code:

ICES | WGBYC 2019 | 59
John Pezzullo–Kissimmee Florida USA, suggested reference: CJ Clopper and ES Pearson, 1934)
was used to calculate the range (lower and upper) of bycatch estimates from an expected 95%
confidence interval (CI). Bycatch events of harbour porpoise and grey seals were both treated as
binomial for the purposes of calculating 95% confidence intervals around a bycatch rate. Ob-
served DaS are either porpoise/seal positive or porpoise negative with a maximum of one animal
observed in any one day (it is unusual to observe more than one animal bycaught in a single
day). The estimate of the 95% confidence intervals around harbour porpoise and grey seal by-
catch rates were then used to generate maximum and minimum bycatch totals based on the fish-
ing effort data. The results were set in the context of regional abundance estimates of the pro-
tected species of interest .
Estimates are derived for two ecoregions; the Celtic Sea (Divisions 6a, 6.b.2, 7.c.2, f, g , h, 7.j.2,
7.j.1 and 7.k.2.) and Greater North Sea (Divisions 4 a b, c, 7d 7e and 3a20 and 21). It was not
possible to derive bycatch rate estimates throughout the whole of the Celtic Sea Ecoregion for
several reasons: for example in Division 2.a. a large part of the area is covering parts of the Nor-
wegian Sea and areas north of the Faroes where WGBYC do not hold information on bycatch
rates or fishing effort. Bycatch mortality was also assessed in the east Biscay shelf (Divisions 8a
and b). This is an area where there are many bycatch records for the species of interest; this area
has also recently been redefined as a “Celtic Sea” assessment unit for harbour porpoise (NAM-
MCO_NIMR 2019) and the implications of this were considered.
The gear types assessed in the BRA were netting (GNS, GTR, GND), bottom trawling (OTB, OTT,
PTB) and pelagic trawling (OTM, PTM). The data on bycatch used in the BRA spanned 2015-
2017. The decision to use these data rather than earlier data the WGBYC hold (from 2005) was
based on an assessment of the compatibility of the different annual datasets (see ToR C, section
5.1.2). Submission of data to WGBYC prior to that collected in 2015, was less controlled than it
has been in recent years through formal data calls and the use of a data template with mandatory
fields and fixed vocabularies (see ToR F, section 6.5).
Pooling data from 2015 until 2017 gives a reasonable high observer coverage in certain areas and
métiers (Table 5.). The maximum observer coverage is in the Celtic Sea in midwater trawls (14.1
%). It is also the area with the highest coverage in set net fisheries (6.9 %). When data from 2015
and 2017 were pooled, the highest bycatch rate for harbour porpoise was observed in set gillnets
in the Celtic and North Sea. Pooling data over years and Divisions, the harbour porpoise bycatch
rate ranged from 0.0002–0.0492 porpoise per DaS (95% CI) depending on area and métier. Using
the reported fishing effort, the total bycatch in nets in 2017 for the Celtic Sea Ecoregion ranged
from 230–471 harbour porpoises. No porpoises were observed bycaught in midwater trawls and
a maximum of 182 porpoises were caught in bottom trawls in the Celtic Sea Ecoregion. In the
Greater North Sea (which also includes 3a), the estimated bycatch could range from 1,175 – 2,126
harbour porpoises per annum in nets. With regards to grey seals, the highest bycatch rate was
observed in bottom trawls in the Celtic Sea. These reported incidents were mainly reported by
France and were reported as incidents and not the number of individuals. Therefore, we have
assumed that one incident equals one individual grey seal. With the exception of these reports
bycatch of grey seals were highest in set nets. Pooling data over years and Divisions, the grey
seal bycatch rate ranged from 0.0003 to 0.0381 (95% CI) depending on area and metier with the
highest bycatch rate in bottom trawls in the Celtic Sea. Using the reported fishing effort, extrap-
olating the total bycatch in nets in 2017 for the Celtic Sea Ecoregion ranged from 101-282 grey
seals. The maximum of 2,149 grey seals were found in bottom trawls in the Celtic Sea. This high
number of bycatch derives from a single country reporting high bycatches of seals during 2016
and 2017. These singular events, when scaled across the fleet, likely cause an upward bias. The
confidence intervals around the bycatch rate are very wide (figure 2) and the numbers presented
are most likely not representative. No bycatch of grey seals were observed in bottom or midwa-
ter trawls in the North Sea.
60 | ICES SCIENTIFIC REPORTS 1:51 | ICES
In 2016, the SCANS-III project (Hammond et al., 2017) surveyed the north western European
shelf and offshore waters to generate precise abundance estimates for the more common cetacean
species. Unlike previous SCANS surveys, Irish waters were not surveyed as part of this project
but through an independent programme ObSERVE (Rogan et al., 2018). The abundance estimates
from these two projects were used to generate abundance estimates for harbour porpoise Celtic
Sea Ecoregion and SCANS-III used for the Greater North Sea, so that bycatch estimates could be
put into context of “population” sizes.
ASCOBANS defines a total anthropogenic removal above 1.7% of the best available estimate of
abundance to be considered unacceptable in the case of the harbour porpoise. It further proposes
an intermediate precautionary aim to reduce bycatch to less than 1% of the best available popu-
lation estimate (“a precautionary environmental limit”) (ASCOBANS 2016). Table 7 shows that
bycatch of harbour porpoise in the Celtic Sea Ecoregion as we have defined it is likely below the
1% precautionary environmental limit (95% CI 0.29-0.80%). The greatest proportion of mortality
is due to nets. It should be noted that there is considerable netting and documented bycatch in
7e, some of which is within the Celtic Sea Ecoregion but has not been included here because there
is no way to apportion fishing or monitoring effort within the subarea to this ecoregion. This will
give rise to an underestimate of bycatch in the ecoregion. This result contrasts with the findings
from last year’s BRA (ICES 2018a) which suggested that bycatch in part of the Celtic Seas Ecore-
gion (Subarea 7) was potentially exceeding the 1% environmental limit (1.08-2.42%) for the cor-
responding portion of harbour porpoise population. This probably reflects the fact that bycatch
of harbour porpoise in the Celtic Seas Ecoregion is focused in the southern part (predominantly
Subarea 7 where much of the netting effort is). The discrepancy in the results highlights the issues
surrounding assessing bycatch within “artificially” defined ecoregions that have no real bearing
on biological populations; so population impacts are not truly reflected.
A NAMMCO_NIMR (2019) workshop reviewed the stock structure of harbour porpoise in the
Northeast Atlantic. The assessment unit (AU) they defined as “Celtic Seas” based on a range of
evidence to support stock structure for this species, is approximated by ICES Divisions 7 f, g, h,
e and 8 a and b. The WGBYC data show that much of the observed bycatch of harbour porpoise
in Subarea 7 occurs in these Divisions and also the eastern Biscay Shelf. For this reason, the range
of mortality in the eastern Biscay Shelf was also assessed and in nets amounted to 205- 740 ani-
mals per annum. This estimate when considered together with the relevant Divisions within
Subarea 7 (as per Celtic Seas AU), could amount to a range of bycatch in the AU of 536-1409
harbour porpoise per year (Table 8). The abundance of harbour porpoise in this AU is approxi-
mately 25,28113 and the bycatch range represents 2.12-5.57 % of the best available abundance
estimate (from Hammond et al. 2017) for this area.
In the Greater North Sea Ecoregion, the BRA suggests that bycatch mortality of harbour porpoise
is below the 1% threshold (95% CI 0.33-0.59) (Table 7).
The abundance of grey seals in the Greater North Sea and Celtic Seas was assessed for the OSPAR
Intermediate Assessment (OSPAR_IA 2017) and the combined areas approximate those of the
relevant ICES ecoregions when combined. Abundance of grey seals in this area was estimated to
be 111,504 animals. WGBYC estimates of potential low and high (95% CI) bycatch estimates for
the Celtic Seas and Greater North Sea Ecoregions combined were 1.689-3.173 animals which rep-
resents 1.51-2.85% of the best available abundance estimate for this region (Table 7). A further
207- 918 grey seals are estimated to be taken in the eastern Biscay Shelf, primarily in nets (Table
7). There are no “environmental limits”, such as ASCOBANS definition of total anthropogenic
removal, for seals; however, under the Marine Strategy Framework Directive, indicators for seals
13 Approximated as SCANS-III blocks B and D (Hammond et al 2017) and ObSERVE strata 4 and 8 (Rogan et al. 2018)

ICES | WGBYC 2019 | 61
look at trends in population abundance. The population of grey seals in these areas is steadily
increasing (OSPAR_IA 2017).
WGBYC again caveats the results of the BRA given that the bycatch estimates are subject to un-
quantifiable biases. In particular, the fishing effort used to scale-up bycatch rates is likely to be
underestimated as effort from smaller vessels is not fully represented. In this respect, the bycatch
range may be underestimated. Bycatch monitoring is also largely carried out through DCF fish-
eries observers; only a few countries have dedicated at-sea observers in a protected species by-
catch monitoring programme. WGBYC have reported previously on the downward bias in by-
catch rates from data collected in non-dedicated vs. dedicated observer schemes. Depending on
the observer protocol and procedures, bycaught animals falling out of the net during hauling
(e.g. Kindt-Larsen et al., 2012) may be overlooked which might also produce additional down-
ward bias. Conversely, monitoring has focused on larger vessels, which are assumed to have
higher bycatch due to larger numbers of nets set and this would cause a positive bias in the
assessments. The magnitude of potential bias in fishing effort and bycatch numbers is unknown.
3.1.2 Marine Mammals: Summary and comparison of minimum and maximum bycatch rates 2005-2017
Bycatch events for marine mammals are relatively rare and a summary of the data in the WGBYC
database for 2005–2017 was compiled (Table 9). The marine mammals that were included in the
summary were: Common dolphin (Delphinus delphis), grey seal, harbor porpoise, white beaked
dolphin (Lagenorhynchus albirostris), Atlantic white-sided dolphin (Lagenorhynchus acutus),
striped dolphin (Stenella coeruleoalba), “seals” (Phocidae), harbor seal (Phoca vitulina), bottlenose
dolphin (Tursiops truncatus) and Long-finned pilot whale (Globicephala melas). BRAs can only be
carried out for those species that are better represented in the dataset. However, metier specific
minimum and maximum bycatch rates of the other species can be estimated in the same way as
described in 5.1.1. These rates have not been scaled up (even though in some cases the sample
size is fairly large) due to the fact that the numbers bycaught differ significantly over the years
in certain areas and/or metiers. This can be due to the fact that fishing effort and methods might
have changed over time along with species distribution and abundance. However, they can be
used to show relative levels of risk across metiers and ecoregions. When calculating 95% confi-
dence intervals all species except for common dolphins have been treated as binomial events.
Bycatch rates for common dolphins were estimated using a poisson distribution.
The highest bycatch rate was found in midwater trawls for common dolphins in the eastern Bis-
cay shelf (8a and 8b), where the rate ranged from 0.285 to 0.372 dolphins per DaS (95% CI). These
high bycatch rates are most likely highly influenced by the fact that only a certain métier with
known high bycatch rates has been observed and in this analysis we have pooled several métiers.
However, for all other species and in all areas the highest bycatch rates are found in set net fish-
eries. For harbour porpoise the highest bycatch rates were in set net fisheries in the Celtic and
North Sea (0.0594 to 0.0801 and 0.0297 to 0.040, 95% CI). Grey seals have the highest bycatch rates
in set nets in the Celtic Sea (0.0411 to 0.0589, 95% CI).
Extrapolations of high and low numbers of bycaught porpoises and grey seals, in different
metiers and areas, using pooled data from 2005 until 2017 were compared to extrapolation of
high and low numbers of bycaught porpoises and grey seals based on data from the same area
and metier but pooled only from 2015 to 2017 (grey seals, Figure 2 and harbour porpoise, Figure
3. Marine mammal data are summarised for 2015-2017 period is in Table 6) . The comparison
showed large differences in the number of bycaught individuals in some areas and metiers de-
pending on the time period of the dataset used. For example, there is a large difference in grey
seal bycatch in the Celtic Sea depending on which data are pooled. There are higher bycatch

62 | ICES SCIENTIFIC REPORTS 1:51 | ICES
numbers in set net fisheries if data from the early period (2005-2017) are pooled than the later
period (2015-2017). In the eastern Biscay shelf and the Greater North Sea in set net fisheries, the
high and low bycatch estimates are greater and have larger uncertainty when data are pooled
during the more recent period (2015-2017) compared to those based on the earlier data. This is
most likely due to limited sample size of the shorter recent time period. Another explanation can
be that there are different bycatch rates depending on metiers. Pooling metiers in level 4 might
give biases both with regards to bycatch rates as well as when these are extrapolated to total
bycatch estimates.

ICES | WGBYC 2019 | 63
Figure 2. Estimation of high and low bycatch extimates for grey seals using two periods of data. Period 1 uses data pooled over the years 2005 until 2017. Period two uses data pooled over 2015 to 2017. Fishing effort used to extrapolate the numbers is from 2017.
Figure 3. Estimation of high and low bycatch extimates for harbour porpoise using two periods of data. Period 1 uses data pooled over the years 2005 until 2017. Period two uses data pooled over 2015 to 2017. Fishing effort used to extrapolate the numbers is from 2017.
0
500
1000
1500
2000
2500
1 2 1 2 1 2 1 2 1 2 1 2
GNS,GTR,GND
GNS,GTR,GND
OTB,OTT
OTB,OTT
PTM,OTM
PTM,OTM
GNS,GTR,GND
GNS,GTR,GND
OTB,OTT,PTB
OTB,OTT,PBT
GNS,GTR,GND
GNS,GTR,GND
CelticSea
CelticSea
CelticSea
CelticSea
CelticSea
CelticSea
Biscayeast-shelf
Biscayeast-shelf
Biscayeast-shelf
Biscayeast-shelf
NorthSea
NorthSea
Nu
mb
er o
f in
div
idu
als
Halichoerus grypus
0
500
1000
1500
2000
2500
1 2 2 1 1 2 2 1 1 2 1 2 1
GNS,GTR,GND
GNS,GTR,GND
OTB,OTT
OTB,OTT,
GNS,GTR,GND
GNS,GTR,GND
OTB,OTT,PBT
OTB,OTT,PTB
PTM,OTM
PTM,OTM
GNS,GTR,GND
GNS,GTR,GND
PTM,OTM
CelticSea
CelticSea
CelticSea
CelticSea
Biscayeast-shelf
Biscayeast-shelf
Biscayeast-shelf
Biscayeast-shelf
Biscayeast-shelf
Biscayeast-shelf
NorthSea
NorthSea
NorthSea
Nu
mb
er o
f in
div
idu
als
Phocoena phocoena

64 | ICES SCIENTIFIC REPORTS 1:51 | ICES
Estimates of high and low harbour porpoise bycatch estimates were also compared (Figure 3).
With regards to harbour porpoise, there is a difference in bycatch estimates in set net fisheries in
the Celtic sea; higher bycatch estimates when data from the earlier period is pooled. We also see
higher estimates in the eastern Biscay shelf set net fisheries pooling data from the later period
compared to the earlier period. The range between high and low estimates is also largely indic-
ative of the smaller sample size in shorter time periods.
The results from the comparison analysis, as well as the summary of bycatch rates do indicate
that there is a need to analyse data using a higher metier level as well as taking into regards
changes in fisheries and abundance of the concerned species over the time period.
3.1.3 Seabirds: Summary of minimum and maximum bycatch rates for 2017
A number of bird species groups are known to be susceptible to bycatch in various types of
fishing gear. Among these are: ducks, grebes, phalaropes, skuas, auks, gulls, terns, divers, storm-
petrels, petrels/fulmar, shearwaters, sulids and cormorants. Fishing gears known to catch birds
are static and drift nets, hooks and lines/longlines, seines/surrounding nets, midwater and de-
mersal trawls, traps and dredges, based on information collated by JWGBIRD (ICES 2018). Table
10 lists those species susceptible to bycatch within OSPAR, HELCOM and GFCM areas. Moreo-
ver, Redlist status (OSPAR, HELCOM, BirdLife and IUCN) is given and whether the species is
listed in Annex I of the Birds Directive or as a migratory species. A similar table was provided
by Volker Dierschke, Chair of JWGBIRD, and discussed in the WGBYC subgroup. It can be seen
that many of those species are classed as endangered either regionally or globally. Bycatch risk
is generally considered to be closely linked to species specific foraging behaviour. For example,
surface-feeding seabirds are more inclined to suffer bycatch during line setting operations in
longline fisheries when they are attracted by baited hooks or when gear is being deployed or
hauled in other gear types; while diving species are generally more at risk of bycatch in bottom-
set gears such as static nets and traps when the gear is properly fishing.
The EU Plan of Action on Seabirds addresses the possible impacts of bycatch on protected species
populations. Systematic collection and reporting of data on seabird bycatch is essential to tack-
ling seabird bycatch (EU Commission 2012). WGBYC issued a data call in late 2018 requesting
fishing effort, monitoring effort and bycatch records from MS national databases for 2017. For
many species the data indicate that often more than one individual is bycaught in those hauls
when bycatch occurs, making statistical analysis less straightforward due to the clumped distri-
bution of the data. Severe bycatch events, where multiple birds are caught in the same fishing
trip, are even more challenging when overall data quantities are relatively low and the full dis-
tribution is not well understood.
Table 11 provides bycatch rates for selected species, areas and gears. The records presented in
this table were chosen based upon two basic criteria: 1) Is the species generally considered to be
of high conservation concern, in which case we included that species to at least highlight the
occurrence of bycatch or 2) if the species was not considered to be of high conservation concern,
was there a reasonable level of monitoring data in the WGBYC database on which to base the
calculation of a bycatch rate? The term “reasonable” in this context was not fully defined by
subgroup members but could be formalised in future, potentially based on some metric relating
to monitored effort vs fishing effort. The resulting selection included 367 bycaught individuals .
In the data call, bycatch numbers and incidences were reported on a monthly basis but these
were subsequently pooled by species within areas due to low monitored effort in individual
months. Reporting of monthly fishing effort in the WGBYC data call is not a mandatory field (it
is for monitored effort) because it was considered that this level of resolution is not available

ICES | WGBYC 2019 | 65
from all national fisheries databases. Consequently, monthly (or pooled) bycatch rates were not
extrapolated to the total effort to produce bycatch estimates. Given the strong seasonal influence
on behaviour of seabirds, the ability to generate stratified total bycatch estimates at finer tem-
poral resolutions is more meaningful than what would be possible to achieve with WGBYC ex-
isting data.
We present monthly (or pooled) bycatch rates with 95% confidence intervals (calculated by boot-
strapping) to provide a measure of the uncertainty around the estimated rate (Table 11). In cases
where the monitored fishing effort is low and the bycatch data are widely dispersed, the confi-
dence intervals are wide and thus are not particularly useful for extrapolating using total fishing
effort. It was discussed by the subgroup that a possible approach to address this situation might
be to generate multi-annual bycatch rates (which should have tighter confidence intervals due
to increased monitoring levels and improved insight into the statistical distribution of the data)
as more data are obtained. As bycatch rates gradually become more robust the subgroup may be
in a position to begin applying rates to total fishing effort, as is done for marine mammals, to
produce bycatch estimates for particular species and metiers.
For Icelandic waters (27.5.a.2) (Table 11), bycatch rates were calculated for black and common
guillemot, long tailed duck, northern fulmar, gannet and common eider in gillnets and given as
95% confidence intervals. Cormorant and shag cannot always be well distinguished and thus a
bycatch rate for the family Phalacrocoracidae is given. Further, bycatch rates of northern fulmars
and gannets in longlines were calculated.
In the Western Mediterranean (GFCM areas 1, 5 and 6) (Table 11), Audouin’s gull bycatch rates
were calculated. Although based on a low monitored fishing effort, bycatch of Balearic shearwa-
ters in gillnets and longlines is given due to the high conservation value of this species. Also
some bycatch of this species has been observed in longlines in Celtic/Irish Sea (27.7) but only
with a low observed effort which did not allow for calculating rates.
Bycatch rates are also given for gannets in otter and pair trawls in the southern North Sea
(27.4.a), cormorants in gillnets in the Baltic Sea (27.3.d.29-30 and 32) and common guillemots in
gillnets in the Bay of Biscay (27.8.a-b) and the Celtic/Irish Sea (27.7.e-f-j) (Table 10).

66 | ICES SCIENTIFIC REPORTS 1:51 | ICES
3.1.4 Elasmobranchs: summary of minimum and maximum bycatch rates for 2017
Elasmobranchs are not protected under the Habitats Directive, but species listed by the OSPAR
List of Threatened and/or Declining Species and Habitats are factually protected according to the
OSPAR Biological Diversity and Ecosystems Strategy and also the Marine Strategy Framework
Directive (MSFD). A number of species are protected according to the Convention on Migratory
Species (CMS). Some countries around Europe have national protection for some elasmobranchs,
e.g. basking shark in UK, Norway, Iceland etc. The main international protection they have is
under the EU’s Common Fisheries Policy (CFP) prohibited species list and the deep water elas-
mobranch Total Allowable Catch (TAC) list. The deep water species are also protected by North-
East Atlantic Fisheries Commission (NEAFC). These prohibitions in EU and NEAFC essentially
allow discarding of dead or alive bycatch.
The EU’s MSFD requires that for commercial elasmobranch species the level of fishing mortality
is quantified against the fishing mortality (F) consistent with maximum sustainable yield, and
stock size is above a level termed MSY B trigger. For non-commercial elasmobranchs, MSFD
requires that fishing mortality due to bycatch is below levels that affect the long term sustaina-
bility of the species. Essentially this is similar to the F criterion for the commercial species.
There is no single definition of what constitutes endangered or threatened status of elasmo-
branchs in Europe. However, the EU red list (Nieto et al. 2015) is widely used. There are also
global and regional red lists published by the International Union for the Conservation of Nature
(IUCN).
This is the second time that elasmobranch data have been accessed formally by WGBYC. Due
largely to the quantity of elasmobranch bycatch data received for 2017 (as obtained through the
WGBYC 2019 data call) we consider this more recent years data to be more representative of
potentially available data residing in national databases, than data obtained for 2016 through the
previous data call. WGBYC has collated all bycatch data for protected elasmobranchs from 2017
to provide an over-view of the degree of bycatch by gear and geographic region for various spe-
cies, from records for the countries which submitted data. These are provided in section 3, Table
2.
The data have been screened to some extent, mainly correcting species names ac-cording to the
World Register of Marine Species (WoRMS). Thus data submitted as Dipturus flossada were re-
assigned as Dipturus batis. Some errors relating to spatial areas were corrected, based on the
known or expected species composition in these areas. For instance, data submitted simply as
areas 1, 2, 5, 6 and 7 were re-assigned from ICES Subareas to the Mediterranean GFCM Subareas
1, 2, 5, 6 and 7.
For more specific presentational purposes, WGBYC has focussed on species of high and medium
conservation concern, using the EU red list of fishes (Nieto et al. 2015) as the basis for classifica-
tion. Species classified as “endangered” or “critically endangered” were considered to be of high
conservation concern. Those classified as “vulnerable” are classified as of medium concern; those
classified as “near threatened”, or “data deficient” were considered for now to be of low conser-
vation concern; whilst those classified as “least concern” are considered to be of no conservation
concern. The least concern species are often characterised by large numbers of observations (e.g.
Etmopterus spinax) reflecting the relatively high abundance of those species in some areas. Fur-
ther work on producing raised or extrapolated discard estimates for these species could be a
useful exercise to help assess total mortality but this is beyond the scope of WGBYC at this time.

ICES | WGBYC 2019 | 67
Bycatch rates, in terms of numbers of specimens per observed day at sea in a particular metier
were calculated for all species of high and medium conservation concern and presented in Table
12. These estimates include confidence intervals, calculated using poisson distributions.
In the North and Celtic Seas, the most frequently observed species was Dipturus batis the blue
skate, followed by Squalus acanthias, the spiny dogfish (North and Celtic Seas). In Biscay/Iberia,
Leucoraja circularis, the sandy ray was more frequent than D. batis or S. acanthias. Bottom trawls
accounted for most of the observations in all regions. Dipturus batis and Squalus acanthias by-
catches were most frequently observed in ICES Divisions 4a (Northern North Sea), 6a (West of
Scotland) and 7e, f, g, j (Western Channel and Celtic Sea). For the more severely depleted species
in the ICES area, Squatina squatina, the angel shark, and Rostroraja alba, the white skate, low num-
bers of observed bycatches were recorded in gill nets in ICES Divisions 7f (Bristol Channel), 7j
(SW Ireland) and 9a (Portugal).
Dalatias licha, the kitefin shark and Centrophorus granulosus, the gulper shark, were the most fre-
quently observed deepwater species, with most records of both species from Portuguese
(Azorean) waters. Lamna nasus, the porbeagle dominated observed pelagic bycatches, mostly
from gill nets in 7g (Celtic Sea).
In the Mediterranean the dominant species in observations were Dalatias licha and Squalus acan-
thias, mainly caught by bottom trawls. The main areas for these species were GFCM areas 7 and
22 (Western Mediterranean) respectively.
For species of medium conservation concern, in the Atlantic, tope shark, Galeorhinus galeus is the
most observed, in both trawls and gillnets. In the Mediterranean Mustelus sharks were the most
observed, mostly in trawls.
Abundant aggregating species such as S. acanthias, were recorded in large numbers in some by-
catch events. On the other hand, the low frequency of species such as S. squatina illustrates their
extremely low abundance, depleted state and restricted spatial distribution. Some of the large
bodied skates were recorded in large numbers in the Atlantic, though less so in the Mediterra-
nean. Noteworthy is the paucity of observations of some formerly abundant species such as Cen-
troscymnus coelolepis, the Portuguese dogfish, and Centrophorus squamosus, the leafscale gulper
shark. Further work is required to understand the underlying issues with these data.
This analysis can be used to plan further research into bycatch, especially of the rarer species.
More work may be required to raise to population scale estimates. It should be noted that in
some cases the presented number of observations has already been raised from a sample of the
total catch at haul level. This is standard procedure in catch sampling for abundant species
and/or large hauls. Where a haul consists of a large catch of a particular species, it is impossible
to sample the entire haul. So a sample is taken, consisting of a known proportion of the total
catch. This sample is fully evaluated for number of specimens per species. The number of speci-
mens per species is then “raised” to the total catch by multiplying it by a “raising factor” which
is the ratio of the total catch to the sampled catch. This procedure may be repeated in several
hierarchical steps, such that there may be sub-samples of the sampled catch , if this is required
to handle very large catches.
Bycatch rates are illustrated in Figure 9, for two example species taken in bottom trawls. One
species, Dipturus batis species complex, is of high conservation concern (Critically Endangered
in the Redlist). The other, Dipturus oxyrinchus, is a data poor species ranked as “Near Threatened”
in the Redlist. Figure 4 implies that the latter species is less abundant than the Critically Endan-
gered D. batis, and hence it may warrant further attention by ICES WGEF, and in the Fish Bio-
diversity assessment context. However it should be noted that although this species is data poor
it is endemic to European waters, and hence warrants further attention.

68 | ICES SCIENTIFIC REPORTS 1:51 | ICES
Figure 4. Illustration of bycatch rates (individuals per observed day at sea) for two species, Dipturus batis from trawl, a species of high conservation concern (left); and Dipturus oxyrinchus from trawls, a species of low conservation concern, but for which data are largely lacking in ICES to conduct any assessment (right). White to dark blue represents lowest to highest bycatch rates. The values of the bycatch rates are shown on the maps.14
14 Last sentence of the Figure caption added base don reviewers’ comments.

ICES | WGBYC 2019 | 69
Overall, the 2019 data call has been a success, and the inclusion of elasmobranchs in the WGBYC
data call is considered to have increased scientific understanding of the extent of bycatch of these
species across metiers and areas. This represents a considerable development in scientific
knowledge. The analyses presented by the working group are preliminary in nature, and serve
as a scoping exercise, to allow for more detailed investigation and refined analyses in future
years.
3.2 Evaluating the impacts of bycatch using strandings data: harbour porpoise and common dolphins
In previous years, WGBYC has reported on the development of modelling methods to quantify
bycatch using data from strandings (Peltier et al. 2012; 2014, 2016). This year, Peltier presented
new analyses to the group on bycatch of harbor porpoise in the North Sea and harbor porpoise
and common dolphin in the Channel and Bay of Biscay.
Harbour porpoise stranding time series were gathered from North Sea coastlines of Denmark,
Germany, the Netherlands, Belgium, the United Kingdom and France from 1990 to 2014. A total
of 16,517 stranded harbour porpoises were reported from 1990-2014 across the study area. Ad-
ditionally, a total of 895 animals showing evidence of being bycaught were recovered from 1990-
2015 along the coasts of the English Channel (n=533) and the Bay of Biscay (n=362). This approach
is geographically explicit and is based on drift back-calculations (thereafter named ‘reverse drift
modelling’) in order to reconstruct the trajectory of every stranded harbour porpoise from its
stranding location to its likely area of death at sea (Peltier et al., 2016). Since 1990, the highest
density of dead harbour porpoises at sea were predicted in the North Sea. Their distribution was
widely extended in the eastern part of the North Sea, whereas mortality areas of porpoises along
the western North Sea coasts remained very coastal. Over the years, predicted densities of by-
caught harbour porpoise increased, and slowly moved down to the southeast North Sea.
Mortality areas were identified in the English Channel since the late 90’s and in the Bay of Biscay
from the early 2000’s onwards. In the Bay of Biscay, the distribution of dead porpoises was lo-
cated almost entirely on the continental shelf. From 1997 to 2004, the distribution of bycaught
harbour porpoises inferred from strandings was mostly located in the western Channel and the
Celtic Sea. Then, since 2009 the eastern Channel became an area of high densities of bycaught
harbour porpoises, and later the south of the Bay of Biscay close to the Spanish border. In the
whole area (Bay of Biscay, English Channel and Celtic Sea) the average annual number of by-
caught porpoises was estimated at 530 [330 – 1,030] individuals from the available data for 1990
to 2015. From 2012 – 2015 an increase was observed15: the yearly average estimate reached 1,300
[810-2,520] bycaught porpoises, that could exceed the commonly used threshold of 1.7% of the
best population estimations (provided by SCANS-III survey and French dedicated aerial surveys
in summer 2011 in the same area), as sustainable anthropogenic removal. A slight decrease in
the estimated number of bycaught porpoises occurred in 201516.
In the Bay of Biscay, harbour porpoise and common dolphin strandings revealed different by-
catch processes. The phenomenon seems chronic, as stranded harbour porpoises with evidence
of having been bycaught are collected all year round. Maxima are reached in winter. Common
dolphin strandings suggested a trophic interaction with sea bass and hake fisheries (midwater
15 Based on reviewers comments it has been clarified in the text that the selected time period was motivated by data
availability; 1990 – 2015 & 2012
16 Last sentence eof the paragraph added after the reviewers’ report was received.

70 | ICES SCIENTIFIC REPORTS 1:51 | ICES
trawlers and gill nets): common dolphins and predator fishes concentrate on feeding areas tar-
geting small pelagic fish. The bycatch process appears to be localized rather than widely dis-
persed, and therefore easy to miss by on-board observers.
The last available extrapolation of harbour porpoise bycatch by the French dedicated observer
program in 2009 (n=300) is consistent with the estimate inferred from strandings (200 to 620 ind.)
in sub area 27.8. Estimates provided for common dolphins are diverging following both moni-
toring tools (in 2009: 1,000 ind. following national report vs 2010 to 6,210 ind. inferred from
strandings). But estimates from standings are very close to those provided by WGBYC BRA
based on 2016 data (BRA : 1,607 to 4,355 ind. vs 1,400 to 4,800 ind. inferred from strandings in
2016) (ICES, 2018a).
3.3 Prioritising areas where additional monitoring is needed: Regional Coordination Group request for input to risk assessment of North Atlantic Fishing Grounds.
The group was asked by the RCG to review part of the WKBYC/FishPi “risk assessment” (ICES,
2013). WKBYC developed a methodology to estimate the bycatch risk of different groups of spe-
cies, based on the métier, fishing effort and abundance in each different fishing region. The group
combined this risk with the DCF sampling effort, to provide an index of which areas and fishing
gears are most in need of sampling (ICES 2013). The FishPi project used this method and applied
to the North Atlantic and North Sea. WGBYC applied the method to the Baltic Sea at last year’s
meeting (ICES 2018). A review of the method and updating of results (using most recent effort
data) is a task to be addressed in the current coordinated fishPi 2 project but most Member States
in this project are also represented in WGBYC. The RCG require the outputs to inform the design
of sampling under the EU-MAP, and therefore, RCG asked WGBYC to assist with this task. The
assessment method is summarised in Figure 5.

ICES | WGBYC 2019 | 71
Figure 5. WKBYC/FishPi Risk Assessment methodology.
The specific tasks for a subgroup established in WGBYC were:
To review the taxonomic grouping used in the WKBYK/FishPi method (Table 1, Figure
5)
To review the assignment of risk categories in the table that indicates susceptibility of
different taxa to bycatch by metier (Table 1 in Figure 5 above);
To review presence/absence in the abundance table (Table 2 in Figure 5 above); and
Compare and comment on the at-sea observer effort carried out under the DCF versus
observer effort in observer programs that target (groups of) protected species.
Table 1 Table 2
Risk of species group vs metier Abundance of species in fishing grounds
(expert opinion) (expert opinion)
code 1: low risk code 1: present
2: some risk 0: absent
3: high risk
Table 3.1 - 3.13
Potential risk by species and metiers,
in each fishing ground
table 4 table 5
Effort by metier and fishing ground Effort by metier vs fishing ground
(days at sea) standarization (standarized) multiplication
(2011 DCF National Programs Report) code: 0 0
1 1-100
2 101-1,000
3 1,001-10,000
4 10,001-100,000
5 100,001-1000,000
Table 6.1-6.13
Risk index for each species and metier, in each fishing ground
Table 7 Table 8
Risk index for each metier and fishing ground sum sum Risk index for each species and fishing ground
(summed across all species) (summed across all metiers)
multiplication
72 | ICES SCIENTIFIC REPORTS 1:51 | ICES
3.3.1 Review of taxonomic grouping in the risk assessment and the assignment to risk categories
A subgroup was established to review how the range of taxa susceptible to bycatch had been
classified for the purposes of the risk assessment (Table 1, Figure 5). The subgroup observed that
the divisions into “taxonomic groups” was not consistent, as a group may contain only one spe-
cies (“harbour porpoise”, “lamprey”) or may cover several classes (“round fish”). In addition,
the groups do not differentiate small fish from megafauna and pelagics from demersal organisms
even though the risk of bycatch to different gears likely varies. The group discussed these incon-
sistencies and considered the current grouping arbitrary; they questioned whether it was fit-for-
purpose. The different groups originate from the WKBYK (ICES, 2013) for the purposes of as-
sessing the distribution of at-sea observer effort under the (pre 2017) DCF. Sampling under the
DCF, is targeted mainly to fisheries where most commercial species are caught. From a PETS
sampling point of view the observer effort should be targeted to fisheries with a high bycatch of
protected species of different groups. The method should be able to determine to what extent the
at sea-observer programs do cover these fisheries. The results of the assessment WKBYC and
FishPi very clearly show the discrepancies between the distribution of the observer effort and
the high risk metiers in the different Fishing Grounds. The subgroup therefore concluded that
the taxonomic grouping fits it original purpose. However, the group noticed the use of the name
“risk assessment” (in WKBYC) may create false expectation about the way these tables can be
interpreted.
There were also discussions on the definitions of each of the groups; so what are the differences
between “dolphins” and “large whales”; between “surface feeding” birds and “diving birds” but
it was concluded that this is not directly relevant for the assessment of observer effort distribu-
tion.
As the categorization of risk (to being bycaught) is on a scale of 1-3 (lowest-highest risk) and is
based on expert opinion, the risk-assignment by metier for each taxonomic group can lead to
large discussions. In general, the group agreed on assignment of the risk categories but in some
cases another code has been suggested (Table 13). The upgrading from 1 to 2 for several metiers
under “Round Fish” is based on the consideration that the number of species in this group is
large and diverse, making it likely that at least some species are susceptible to being bycaught.
Risk categories were also upgraded for some metiers for harbour porpoise and “large whales”.
Beach seines are one of the gears to which harbour porpoises are more vulnerable (Read, 2015;
Sequeira et al, 1996; Vingada et al, 2011) and risk assignment was consequently upgraded.
The risk category for large whales in “Pots and Traps” was been upgraded from 1 to 2 based on
recent publications on entanglements of minke whales (Balaenoptera acutorostrata) and humpback
whales (Megaptera novaeangliae) in pots and traps (Northridge et al, 2010; Ryan et al, 2016).
3.3.2 Review the presence/absence of taxonomic groups by area
Given the coarse approach for the purpose of the assessment (as described above) differences in
the calculated risk index by species-group, metier and area should be limited. The subgroup
agreed completely with the assignment of presence/absence (1 or 0) as previously assigned by
WKBYK and FishPi.

ICES | WGBYC 2019 | 73
3.3.3 Comparison observer effort distribution in DCF- and dedicated surveys
The request from the RCG was to also give an indication of the amount of observer effort in
dedicated PETS survey compared to the distribution of DCF observer effort. The observer effort
was extracted from the WGBYC database as observer days at sea. For each North Atlantic Fishing
Ground the number of DCF observer days (“DCF SAMP DAYS”) and the number of dedicated
observer days (“DED SAMP DAYS”) were extracted by metier and made available on the Share-
Point for RCG intersessional work. An example for the North Sea is given in Table 14; there were
just 22 days of dedicated PETS monitoring compared to 1829 days under the DCF over all
metiers.
3.4 Other approaches to risk assessment: Mapping by-catch risk in relation to seabird & cetacean distribu-tions in NW European Seas
Peter Evans gave a short presentation on the risk assessments undertaken as part of a five-year
UK research initiative called the Marine Ecosystem Research Programme funded by the Natural
Environment Research Council and Department of the Environment, Food and Rural Affairs.
The project looked at the overlap in space and time between fishing effort using different gear
types and the density distributions of different cetacean and seabird species. For fishing effort,
the aim was to draw upon both AIS and VMS data to map fishing effort, using the EU vessel
register for further information on vessel length, country of origin, gear types carried, and
catches. Using algorithms developed largely by Global Fishing Watch, to attempt to better dis-
criminate periods when vessels are actively fishing, maps are produced for each of the years
2012-17 split by country, by gear type, by month and by year. These are then compared with
monthly maps of modelled predicted densities and abundance for the twelve most common ce-
tacean and twelve seabird species, and areas of overlap identified. Examples of areas of greatest
overlap for high risk fisheries and species are presented for common guillemot and harbour por-
poise for static gillnets, and common dolphin from pelagic trawls. The main areas of overlap in
common guillemot with static gillnets were northern North Sea, West Norway, Skagerrak and
English Channel. For harbour porpoise and static gillnets, it was west of Norway and Denmark,
the eastern English Channel, Celtic Sea and South-west Approaches to the English Channel (the
Baltic Sea was included in the analysis). For common dolphin and pelagic trawls, it was the west-
ern English Channel, northern Bay of Biscay, and north-west Spain. Assessments of risk will be
developed taking into account observed relative bycatch rates, species vulnerabilities according
to population status and life history features, and other information such as overlap between
dietary preferences and target fish catches. These can then be used to inform when and where to
focus monitoring and mitigation actions.

74 | ICES SCIENTIFIC REPORTS 1:51 | ICES
3.5 Conclusions
Bycatch Risk Assessments (BRA) were conducted for grey seal (Halichoerus grypus) and
harbour porpoise (Phocoena phocoena) in the Celtic Seas and Greater North Sea ecoregions.
In 2017, bycatch rates of harbour porpoise were highest in nets (GNS, GTR, GND) in both
ecoregions; in the Celtic Seas, harbour porpoise total bycatch in nets was estimated to be
230-471; in the Greater North Sea the estimated bycatch in nets ranged from 1,175 – 2,126
porpoise per annum.
These harbour porpoise bycatch estimates were below the ASCOBANS 1.7% threshold
of unacceptable interaction. They are also below the 1% precautionary environmental
limit defined by ASCOBANS for bycatch.
However, the harbour porpoise BRA was also carried out for a biologically defined Celtic
Seas Assessment Unit for this species; total bycatch in nets in 2017 was estimated to be
536-1,409 animals (>2% of the population abundance) which exceeds both ASCOBANS
thresholds.
Grey seal bycatch was purportedly highest in bottom trawls in the Celtic Sea ecoregion;
however, this was driven by an entry in French data of an incident with multiple indi-
viduals which could not be verified. This aside, bycatch rates were highest in nets (GNS,
GTR, GND) in the Celtic Seas ecoregion.
In 2017, the percentage mortality of grey seals due to bycatch in the Celtic and Greater
North Sea ecoregions combined was estimated to be 1.5 - 2.8% of the best estimate of
abundance.
High and low bycatch rates were also estimated for all marine mammals in the entire
WGBYC database (2005-2017) for the Greater North Sea and Celtic Seas Ecoregions and
the eastern Bay of Biscay shelf (8a & b); the bycaught species recorded over this period
are Common dolphin (Delphinus delphis), grey seal, harbour porpoise, white beaked dol-
phin (Lagenorhynchus albirostris), Atlantic white-sided dolphin (Lagenorhynchus acutus),
striped dolphin (Stenella coeruleoalba),harbour seal (Phoca vitulina), bottlenose dolphin
(Tursiops truncatus) and long-finned pilot whale (Globicephala melas)
The highest bycatch rates when WGBYC database (2005-2017) was analysed were re-
ported for common dolphin from observations of mid-water trawls in the eastern Bay of
Biscay. Observed bycatch rates were 0.285 – 0.372 dolphins per day at sea observed.
These rates were lower than those using just recent data 2015-2017 of 0.424-0.676 dol-
phins per day at sea observed.
Results were presented from modelling time-series data from stranded harbour porpoise
that had been identified as being bycaught along the coasts of the North Sea, English
Channel and Bay of Biscay. Between 1990-2014, in the North Sea, predicted densities of
harbour porpoise bycatch mortality increased and distribution of mortality areas moved
to the south eastern North Sea. In the Bay of Biscay (1990-2015), predicted harbour por-
poise bycatch was almost entirely restricted to the continental shelf. Predicted bycatch
density increased in the western Channel and Celtic Sea between 1997-2004. In the Bay
of Biscay, English Channel and Celtic Sea the average annual number of bycaught por-
poises was estimated at 530 (330 – 1,030).
Confidence intervals around bycatch rates for seabirds were generally wide due to lim-
ited monitoring effort in particular metiers; seasonal or monthly bycatch estimates are
preferable for seabirds given the patterns of distribution/abundance with time of year. In
2017, highest bycatch rates were calculated for gannet (Morus bassanus) in set longlines,

ICES | WGBYC 2019 | 75
the great cormorant (Phalacrocorax carbo) in set gillnets, common eider (Somateria mollis-
sima) in set gillnets and Balearic sharewater (Puffinus mauretanicus) in set gillnets and
trammelnets.17
Elasmobranch bycatch was very common in all ecoregions. Notably high bycatch rates
were recorded in the Azores in hooks and lines of Deania calcea; in the Bay of Biscay/Ibe-
riain nets of Leucoraja circularis; in Celtic Seas in nets of Dipturus flossada; in the Greater
North Sea in pelagic trawls of Squalas acanthias; and in the Mediterranean in bottom
trawls of Dalatias licha.
All of the bycatch estimates from WGBYC are biased by the distribution and “quality”
of monitoring effort and need to be interpreted with caution. Sampling is not representa-
tive, and bias is introduced from various sources. For example, monitoring of larger ves-
sels and data collection using fisheries observers (i.e. as part of the DCF) dominate the
dataset. An exercise comparing dedicated versus DCF monitoring effort in North Atlan-
tic fishing grounds, highlighted the trivial number of dedicated PETS monitoring days
in 2017. In the North Sea, there were just 22 days of dedicated monitoring compared to
1829 under the DCF.
However, the BRAs and summary bycatch rates do serve to flag metiers and areas where
further monitoring may be justified; where mitigation should be considered; and high-
lights those species that may be at risk.
17 Paragraph updated after the Advice Drafting Group (ADGBYC) 2019 when a new extraction from the data base was
carried out.
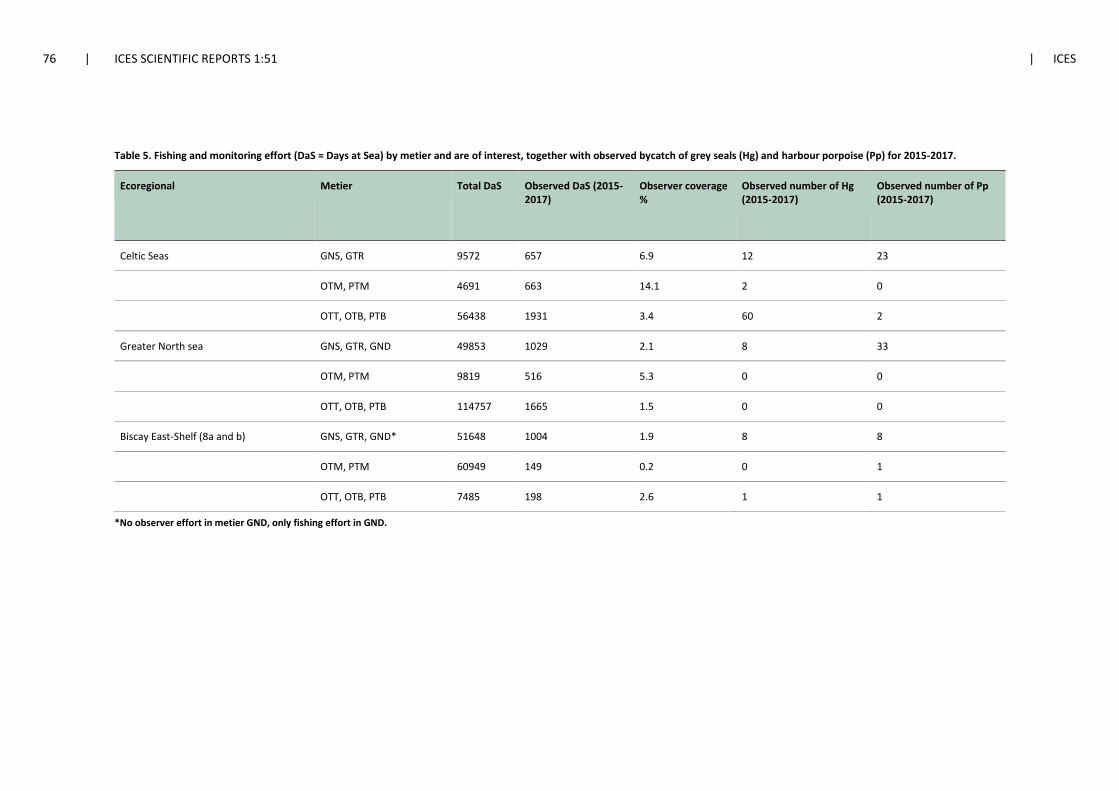
76 | ICES SCIENTIFIC REPORTS 1:51 | ICES
Table 5. Fishing and monitoring effort (DaS = Days at Sea) by metier and are of interest, together with observed bycatch of grey seals (Hg) and harbour porpoise (Pp) for 2015-2017.
Ecoregional Metier Total DaS Observed DaS (2015-2017)
Observer coverage %
Observed number of Hg (2015-2017)
Observed number of Pp (2015-2017)
Celtic Seas GNS, GTR 9572 657 6.9 12 23
OTM, PTM 4691 663 14.1 2 0
OTT, OTB, PTB 56438 1931 3.4 60 2
Greater North sea GNS, GTR, GND 49853 1029 2.1 8 33
OTM, PTM 9819 516 5.3 0 0
OTT, OTB, PTB 114757 1665 1.5 0 0
Biscay East-Shelf (8a and b) GNS, GTR, GND* 51648 1004 1.9 8 8
OTM, PTM 60949 149 0.2 0 1
OTT, OTB, PTB 7485 198 2.6 1 1
*No observer effort in metier GND, only fishing effort in GND.

ICES | WGBYC 2019 | 77
Table 6. Total and observed effort in days at sea (DaS) and number of observed number of specimen pooled per métiers described in column Metier L4, area and during the years 2015 to 2017. The marine mammals included in the table are: Delphinus delphis, Halichoerus grypus, Phocoena phocoena , Lagenorhynchus albirostris, Lagenorhynchus acutus, Stenella coeruleoalba, Phoci-dae, Phoca vitulina, Tursiops truncatus and Globicephala melas. If the species is not seen in the table it means there are no bycatch incidents of that species. Total DaS from WGBYC database for 2017. Bycatch rate = Specimens/DaS observed
Ecoregion Metier L4 Years pooled
Total fishing effort 2017
DaysAtSea Observed
Observer coverage %
Species Specimens Low by-catch
rate (95% CI)
High by-catch
rate (95% CI)
North Sea GNS. GTR 2015-2017 49853 1029 2.1 Delphinus delphis 5 0.0016 0.0113
Halichoerus grypus 8 0.0039 0.0140
Phocoena phocoena 33 0.0236 0.0426
PTM, OTM 2015-2017 9819 516 5.3 Phoca vitulina 3 0.0016 0.0150
OTT, OTB, PBT 2015-2017 114757 1665 1.5 Phocidae 1 0.0000 0.0028
Celtic Sea GNS, GTR, GND 2015-2017 9572 657 6.9 Delphinus delphis 9 0.0063 0.0260
Halichoerus grypus 12 0.0106 0.0294
Phocoena phocoena 23 0.0240 0.0492
Globicephala melas 2 0.0005 0.0096
phocidae 2 0.0005 0.0096
PTM, OTM 2015-2017 4691 663 14.1 Delphinus delphis 20 0.0184 0.0466
Halichoerus grypus 2 0.0005 0.0095
Lagenorhynchus albirostris 1 0.0001 0.0071
OTB, OTT 2015-2017 56438 1931 3.4 Delphinus delphis 5 0.0008 0.0060

78 | ICES SCIENTIFIC REPORTS 1:51 | ICES
Ecoregion Metier L4 Years pooled
Total fishing effort 2017
DaysAtSea Observed
Observer coverage %
Species Specimens Low by-catch
rate (95% CI)
High by-catch
rate (95% CI)
Halichoerus grypus 60 0.0249 0.0384
Phocoena phocoena 2 0.0002 0.0033
Stenella coeruleoalba 1 0.0000 0.0025
Phocidae 1 0.0000 0.0025
Biscay East-Shelf (8a and b) GNS, GTR, GND* 2015-2017 51648 1004 1.9 Delphinus delphis 22 0.0137 0.0332
Halichoerus grypus 8 0.0040 0.0143
Phoca vitulina 1 0.0001 0.0047
Phocoena phocoena 8 0.0040 0.0143
PTM/OTM 2015-2017 60949 149 0.2 Delphinus delphis 80 0.4246 0.6664
Phocoena phocoena 1 0.0002 0.0373
OTB, OTT, PBT 2017 7485 198 2.6 Halichoerus grypus 1 0.0003 0.0237
Phocoena phocoena 1 0.0003 0.0237
*No observer effort in metier GND, only fishing effort in GND.
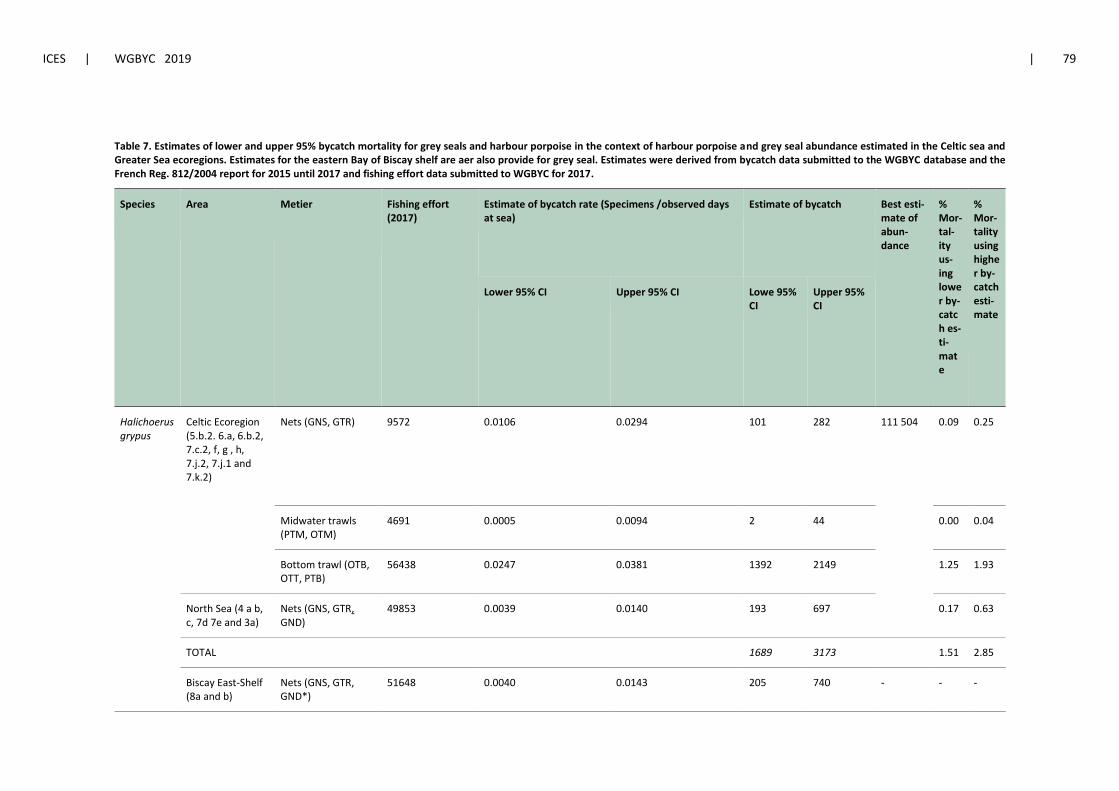
ICES | WGBYC 2019 | 79
Table 7. Estimates of lower and upper 95% bycatch mortality for grey seals and harbour porpoise in the context of harbour porpoise and grey seal abundance estimated in the Celtic sea and Greater Sea ecoregions. Estimates for the eastern Bay of Biscay shelf are aer also provide for grey seal. Estimates were derived from bycatch data submitted to the WGBYC database and the French Reg. 812/2004 report for 2015 until 2017 and fishing effort data submitted to WGBYC for 2017.
Species
Area
Metier
Fishing effort (2017)
Estimate of bycatch rate (Specimens /observed days at sea)
Estimate of bycatch Best esti-mate of abun-dance
% Mor-tal-ity us-ing lower by-catch es-ti-mate
% Mor-tality using higher by-catch esti-mate
Lower 95% CI Upper 95% CI Lowe 95% CI
Upper 95% CI
Halichoerus grypus
Celtic Ecoregion (5.b.2. 6.a, 6.b.2, 7.c.2, f, g , h, 7.j.2, 7.j.1 and 7.k.2)
Nets (GNS, GTR) 9572 0.0106 0.0294 101 282 111 504
0.09 0.25
Midwater trawls (PTM, OTM)
4691 0.0005 0.0094 2 44 0.00 0.04
Bottom trawl (OTB, OTT, PTB)
56438 0.0247 0.0381 1392 2149 1.25 1.93
North Sea (4 a b, c, 7d 7e and 3a)
Nets (GNS, GTR, GND)
49853 0.0039 0.0140 193 697 0.17 0.63
TOTAL
1689 3173 1.51 2.85
Biscay East-Shelf (8a and b)
Nets (GNS, GTR, GND*)
51648 0.0040 0.0143 205 740 - - -

80 | ICES SCIENTIFIC REPORTS 1:51 | ICES
Species
Area
Metier
Fishing effort (2017)
Estimate of bycatch rate (Specimens /observed days at sea)
Estimate of bycatch Best esti-mate of abun-dance
% Mor-tal-ity us-ing lower by-catch es-ti-mate
% Mor-tality using higher by-catch esti-mate
Lower 95% CI Upper 95% CI Lowe 95% CI
Upper 95% CI
Bottom trawl (OTB, OTT, PTB)
7485 0.0003 0.0237 2 178 - -
TOTAL 207 918
Phocoena phocoena
Celtic Ecoregion (6.a, 6.b.2, 7.c.2, f, g , h, 7.j.2, 7.j.1 and 7.k.2)
Nets (GNS, GTR) 9572 0.0240 0.0492 230 471 81860 0.28 0.58
Bottom trawl (OTB, OTT, PTB)
56438 0.0002 0.0032 10 182 0.01 0.22
TOTAL 0.29 0.80
North Sea (4 a b, c, 7d 7e and 3a)
Nets (GNS, GTR, GND*)
49853 0.0236 0.0426 1175 2126 359428 0.33 0.59
TOTAL 0.33 0.59
*No observer effort in metier GND, only fishing effort in GND.

ICES | WGBYC 2019 | 81
Table 8. Estimates of lower and upper 95% bycatch mortality for harbour porpoise in the context of harbour porpoise abundance estimates in the Celtic Sea Assessment Unit (NAMMCO_NIMR 2019). Estimates were derived from bycatch data submitted to the WGBYC database and the French Reg. 812/2004 report for 2015 until 2017 and fishing effort data submitted to WGBYC for 2017.
Species Area Metier Fishing effort (2017)
Estimate of by-catch rate (Speci-mens/observed days at sea)
Estimate of by-catch
Best estimate of abundance (SCANS-III)
% Mortality using lower bycatch es-timate
% Mortality using higher bycatch es-timate
Lower 95% CI Upper 95% CI Lower 95% CI Upper 95% CI
Phocoena phocoena
Celtic Ecore-gion (7e, f, g, h))
Nets (GNS, GTR, GND*)
16216 0.0204 0.0413 331 669 25,281 1.31 2.65
Biscay East-Shelf (8a and b)
51648 0.0040 0.0143 205 740 0.81 2.93
Total
536 1409 2.12 5.57

82 | ICES SCIENTIFIC REPORTS 1:51 | ICES
Table 9. Observed DaS, number of individuals and bycatch rates (individuals per day at sea) for marine mammal species, pooled by metier described and by area using data pooled over different time periods between 2005 until 2017 and held within the WGBYC database. Bycatch rate = specimens/DaS observed
Ecoregion Metier L4 Years pooled DaysAtSea Ob-served
Marine mammal Species Specimens Low bycatch rate (95% CI)
High by-catch rate (95% CI)
North Sea
GNS, GTR, GND 2008-2017 3402.15 Delphinus delphis 14 0.0022 0.0069
Halichoerus grypus 8 0.0012 0.0042
Phoca vitulina 2 0.0001 0.0018
Phocoena phocoena 118 0.0297 0.0403
Stenella coeruleoalba 2 0.0001 0.0018
Tursiops truncatos 2 0.0001 0.0018
Lagenorhynchus acutus 1 1.5077E-05 0.0014
Lagenorhynchus albirostris 1 1.5077E-05 0.0014
PTM. OTM 2008-2017 1783.77 Delphinus delphis 59 0.0252 0.0427
Phoca vitulina 5 0.0011 0.0059
Phocoena phocoena 1 2.8751E-05 0.0027
Tursiops truncatos 5 0.0011 0.0059
OTB. OTT. PBT 2010-2017 2883 Delphinus delphis 3 0.0002 0.0030
Phocidae 1 1.7791E-05 0.0016
Celtic Sea
GNS. GTR 2005-2017 1720.37 Delphinus delphis 27 0.0103 0.0228
Halichoerus grypus 85 0.0411 0.0589

ICES | WGBYC 2019 | 83
Ecoregion Metier L4 Years pooled DaysAtSea Ob-served
Marine mammal Species Specimens Low bycatch rate (95% CI)
High by-catch rate (95% CI)
Phoca vitulina 12 0.0040 0.0113
Phocoena phocoena 119 0.0594 0.0801
Globicephala melas 2 0.0002 0.0036
Phocidae 2 0.0002 0.0036
PTM. OTM 2007-2017 1449 Delphinus delphis 41 0.0203 0.0384
Halichoerus grypus 13 0.0053 0.0142
Globicephala melas 6 0.0018 0.0082
Lagenorhynchus albirostris 1 0.00003 0.0033
OTB. OTT. 2016-2017 1945.58 Delphinus delphis 5 0.0008 0.006
Halichoerus grypus 60 0.0247 0.0381
Phocoena phocoena 2 0.0002 0.0032
Stenella coeruleoalba 1 2.6358E-05 0.0024
Phocidae 1 2.6358E-05 0.0024
Eastern Biscay Shelf (8a and b)
GNS. GTR. GND* 2008-2017 2558.82 Delphinus delphis 48 0.0138 0.0249
Halichoerus grypus 8 0.0015 0.0056
Phoca vitulina 1 2.0044E-05 0.0018
Phocoena phocoena 26 0.0071 0.0141

84 | ICES SCIENTIFIC REPORTS 1:51 | ICES
Ecoregion Metier L4 Years pooled DaysAtSea Ob-served
Marine mammal Species Specimens Low bycatch rate (95% CI)
High by-catch rate (95% CI)
Stenella coeruleoalba 4 0.0005 0.0036
PTM. OTM 2008-2017 686.42 Delphinus delphis 224 0.285 0.372
Phocoena phocoena 2 0.0005 0.0094
OTB. OTT. PTB 2017 198.18 Halichoerus grypus 1 0.0003 0.0237
Phocoena phocoena 1 0.0003 0.0237
*No observer effort in metier GND, only fishing effort in GND.

ICES | WGBYC 2019 | 85
Table 10. List of seabird species of the NE Atlantic, the Mediterranean Sea and the Baltic Sea with relevant fishing métiers concerning bycatch, regions of sea with occurrence and status of various Red Lists IUCN criteria given below; note that UK and Ireland use a slightly different system). For sources, see marked (*) references
species
Pu
rse
se
ine
(P
S)
Pe
lagi
c tr
awls
OTM
, PTM
)
Bo
tto
m t
raw
ls (
TBB
, OTB
, OTT
, PTB
)
Ne
ts (
GN
S, G
TR, G
ND
)
Ho
oks
an
d lo
ngl
ine
s (L
LS, L
LD)
Po
ts a
nd
tra
ps
(FP
O)
NE
Atl
.: A
rcti
c W
ate
rs (
OSP
AR
I)
NE
Atl
.: G
reat
er
No
rth
Se
s (O
SPA
R II
)
NE
Atl
.: C
elt
ic S
eas
(O
SPA
R II
I)
NE-
Atl
.: B
ay o
f B
isca
y, Ib
eri
an C
oat
s (O
SPA
R IV
)
NE
Atl
.: W
ide
r A
tlan
tic
(OSP
AR
V)
Me
dit
err
ane
an S
ea
Bal
tic
Sea
Re
d L
ist
Wo
rld
(IU
CN
20
18
)
Re
d L
ist
Euro
pe
(B
ird
Life
Inte
rnat
ion
al 2
01
5)
Re
d L
ist
EU2
7 (
Bir
dLi
fe In
tern
atio
nal
20
15
)
Re
d L
ist
Bal
tic
Sea
(HEL
CO
M 2
01
3)
OSP
AR
Lis
t o
f Th
reat
en
ed
an
d/o
r D
ecl
inin
g Sp
eci
es
and
Hab
i-
tats
(O
SPA
R 2
00
8)
Bir
d D
ire
ctiv
e A
nn
ex I
Bir
d D
ire
ctiv
e m
igra
tory
sp
eci
es
scientific name
wit
hb
enth
ic f
eed
ing
du
cks
Common Pochard x x x x x x VU VU VU x Aythya ferina
Tufted Duck x x x x x x x NT x Aythya fuligula
Greater Scaup x x x x x x x VU VU VU x Aythya marila
Steller's Eider x x x VU EN EN x x x Polysticta stelleri
King Eider x x x x Somateria spectabilis
Common Eider x x x x x x x NT VU EN EN x Somateria mollissima
Velvet Scoter x x x x x x x VU VU VU EN x Melanitta fusca
Common Scoter x x x x x x x EN x Melanitta nigra
Long-tailed Duck x x x x x x VU VU VU EN x Clangula hyemalis

86 | ICES SCIENTIFIC REPORTS 1:51 | ICES
Common Goldeneye x x x x x x x x Bucephala clangula
mer
gan
-ser
s
Smew x x x x x x x Mergellus albellus
Goosander x x x x x x x Mergus merganser
Red-breasted Mergan-
ser x x x x x x x x NT VU VU x Mergus serrator
div
ers
Red-throated Diver x x x x x x x x CR x x Gavia stellata
Black-throated Diver x x x x x x x x CR x x Gavia arctica
Great Northern Diver x x x x x x VU VU x x Gavia immer
White-billed Diver x x x x x NT VU x Gavia adamsii
pet
rels
an
d s
torm
pet
rels
European Storm Petrel x x x x x x x x x x x Hydrobates pelagicus
Band-rumped Storm
Petrel x x x x x x Hydrobates castro
Monteiro's Storm Pet-
rel x x x x VU VU VU x Hydrobates monteiroi
Leach's Storm Petrel x x x x x x x x VU VU x x Hydrobates leucorhoa
White-faced Storm
Petrel x x x x EN EN x x Pelagodroma marina
Desertas Petrel x x x x VU VU VU x x Pterodroma deserta
Zino's Petrel x x x x EN EN EN x x Pterodroma madeira
Bulwer's Petrel x x x x x x Bulweria bulwerii
Fulm
ar
and
shea
rwat
ers
Northern Fulmar x x x x x x EN VU x Fulmarus glacialis
Scopoli's Shearwater x x x x x x x x x Calonectris diomedea
Cory's Shearwater x x x x x x x x x Calonectris borealis

ICES | WGBYC 2019 | 87
Sooty Shearwater x x x x x x x x x NT x Ardenna grisea
Great Shearwater x x x x x x x x x x Ardenna gravis
Manx Shearwater x x x x x x x x x x x Puffinus puffinus
Balearic Shearwater x x x x x x x x CR CR CR x x Puffinus mauretanicus
Yelkouan Shearwater x x x x VU x x Puffinus yelkouan
Barolo Shearwater x x x x x NT NT x x x Puffinus baroli
greb
es
Red-necked Grebe x x x x x x EN x Podiceps grisegena
Great Crested Grebe x x x x x x x x Podiceps cristatus
Horned Grebe x x x x x x x x VU NT VU VU x x Podiceps auritus
gan-
nets Northern Gannet x x x x x x x x x x x x x Morus bassanus
cormo
-rants European Shag* x x x x x x x x x x NT x x
Phalacrocorax aristo-
telis
Great Cormorant x x x x x x x x x x x x Phalacrocorax carbo
rails Eurasian Coot x x x x x x x NT x Fulica atra
gulls
Black-legged Kittiwake x x x x x x x x x x VU VU EN EN x x Rissa tridactyla
Sabine's Gull x x x x x x x x x x Xema sabini
Slender-billed Gull x x x x x x x Chroicocephalus genei
Black-headed Gull x x x x x x x x x x x x
Chroicocephalus ridi-
bundus
Little Gull x x x x x x NT NT x x Hydrocoloeus minutus
Audouin's Gull x x x x x x x x Ichthyaetus audouinii

88 | ICES SCIENTIFIC REPORTS 1:51 | ICES
Mediterranean Gull x x x x x x x x x EN x x
Ichthyaetus melano-
cephalus
Common Gull x x x x x x x x x x x Larus canus
Great Black-backed
Gull x x x x x x x x x x Larus marinus
Glaucous Gull x x x x x x x x x x Larus hyperboreus
Iceland Gull x x x x x x x x Larus glaucoides
Herring Gull x x x x x x x x x NT VU x Larus argentatus
Yellow-legged Gull x x x x x x x x x Larus michahellis
Lesser Black-backed
Gull* x x x x x x x x x x VU x x Larus fuscus
tern
s
Caspian Tern x x x NT VU x x Hydroprogne caspia
Sandwich Tern x x x x x x x x Thalasseus sandvicensis
Little Tern x x x x x x x x Sternula albifrons
Roseate Tern x x x x x x x x Sterna dougallii
Common Tern x x x x x x x x x x Sterna hirundo
Arctic Tern x x x x x x x x x Sterna paradisaea
Black Tern x x x x x x Chlidonias niger
sku
as
Great Skua x x x x x x x Stercorarius skua
Pomarine Skua x x x x x x x x Stercorarius pomarinus
Arctic Skua x x x x x x x x EN x Stercorarius parasiticus
Long-tailed Skua x x x x x x x
Stercorarius longicau-
dus
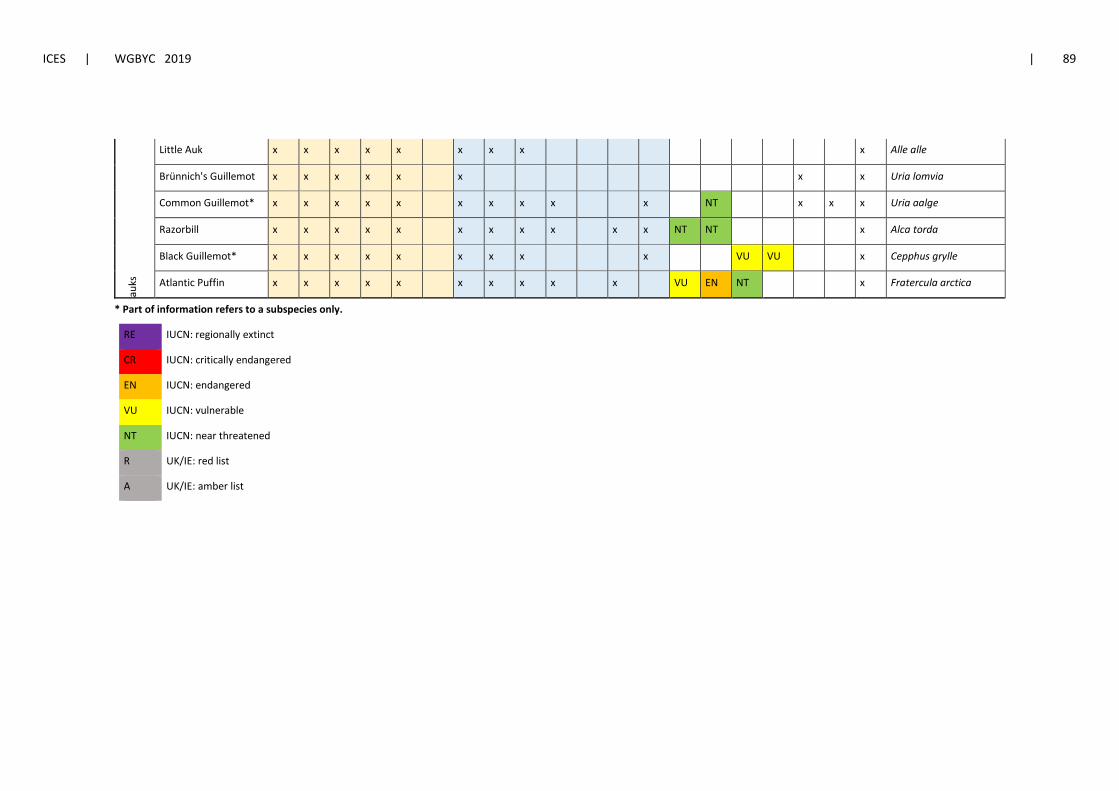
ICES | WGBYC 2019 | 89
auks
Little Auk x x x x x x x x x Alle alle
Brünnich's Guillemot x x x x x x x x Uria lomvia
Common Guillemot* x x x x x x x x x x NT x x x Uria aalge
Razorbill x x x x x x x x x x x NT NT x Alca torda
Black Guillemot* x x x x x x x x x VU VU x Cepphus grylle
Atlantic Puffin x x x x x x x x x x VU EN NT x Fratercula arctica
* Part of information refers to a subspecies only.
RE IUCN: regionally extinct
CR IUCN: critically endangered
EN IUCN: endangered
VU IUCN: vulnerable
NT IUCN: near threatened
R UK/IE: red list
A UK/IE: amber list

90 | ICES SCIENTIFIC REPORTS 1:51 | ICES
Table 11. Bycatch rates (individuals per day at sea) for selected seabird species, areas and gears. In order to obtain reasonable observed effort, a number of months or areas were combined. One country uploaded decimals for observed days at sea.
Month AreaCode MetierL4 DaysAtSea Observed Species Specimens Incidents Low bycatch rate (95% CI)
High bycatch rate (95% CI)
3,4,6,7 27.5.a.2 GNS 126 Cepphus grylle 20 6 0.10 0.25
3 27.5.a.2 GNS 43 Clangula hyemalis 2 2 0.01 0.17
4 27.5.a.2 GNS 74 Fulmarus glacialis 3 2 0.01 0.12
1,2,3,5,7,10 27.5.a.2 LLS 89 Fulmarus glacialis 69 9 0.60 0.98
4,5,6 GFCM 1~5~6 LLD 39 Larus audouinii 5 3 0.04 0.30
4 27.5.a.2 GNS 74 Morus bassanus 3 3 0.01 0.12
5 27.5.a.2 LLS 23 Morus bassanus 24 3 0.67 1.55
6 27.4.a OTB,PTB 151 Morus bassanus 16 6 0.06 0.17
3,6,7 27.5.a.2 GNS 52 Phalacrocoracidae 10 6 0.09 0.35
4 to 11 27.3.d.29,30,32 GNS 36 Phalacrocorax carbo 49 21 1.01 1.80
7,8 27.8.b GNS,GTR 8 Puffinus mauretanicus 4 2 0.14 1.27
5,8 GFCM 1~5~6 LLD 107 Puffinus mauretanicus 3 3 0.01 0.08
4,5,10 27.3.d.29,30 GNS 14 Somateria mollissima 19 5 0.82 2.12
3 to 7 27.5.a.2 GNS 131 Somateria mollissima 62 13 0.36 0.61
1,2,3,5,10,11,12 27.7e,f,j GNS 57 Uria aalge 14 11 0.14 0.42
11 27.8a,b GNS 14 Uria aalge 6 4 0.15 0.90
3 to 5 27.5.a.2 GNS 122 Uria aalge 55 13 0.34 0.59

ICES | WGBYC 2019 | 91
Table 12: Bycatch of protected elasmobranchs of high and medium conservation concern expressed in numbers and rate (no. specimens) presented by Ecoregion, and ICES/GFCM area
Ecoregion Area Gear Species Observed Effort (Days at sea)
Fishing Effort (Days at sea)
Total Ob-served
Total no. Speci-mens
Low CI High CI By-catch rate (mean event rate)
Low rate (speci-mens/DaS
)
High rate (speci
mens/ DaS)
Red List Cri-te-rion
Type
Azores 27.10.a.2 Longlines Alopias supercilio-sus
1226 10392 2 2.0 0.24 7.22 1 0.1 3.6 EN Pelagic
Azores 27.10.a.2 Longlines Alopias vulpinus 1226 10392 2 2.0 0.24 7.22 1 0.1 3.6 EN Pelagic
Azores 27.10.a.2 Longlines Centrophorus granulosus
1226 10392 16 70.0 54.57 88.44 4 3.4 5.5 CR Deep-water
Azores 27.10.a.2 Longlines Centrophorus squamosus
1226 10392 1 1.0 0.03 5.57 1 0.0 5.6 EN Deep-water
Azores 27.10.a.2 Longlines Dalatias licha 1226 10392 52 178.0 152.81 206.16 3 2.9 4.0 EN Deep-water
Azores 27.10.a.2 Rods and lines
Dalatias licha 1576 26457 2 2.0 0.24 7.22 1 0.1 3.6 EN Deep-water
Azores 27.10.a.2 Longlines Deania calcea 1226 10392 4 58.0 44.04 74.98 15 11.0 18.7 EN Deep-water
Azores 27.10.a.2 Rods and lines
Deania calcea 1576 26457 2 87.0 69.68 107.31 44 34.8 53.7 EN Deep-water
Azores 27.10.a.2 Longlines Raja batis 1226 10392 45 113.0 93.13 135.86 3 2.1 3.0 CR Demersal
Azores 27.10.a.2 Rods and lines
Raja batis 1576 26457 1 4.0 1.09 10.24 4 1.1 10.2 CR Demersal
Biscay/Iberia 27.9.a~27.8.c
Bottom trawls
Centrophorus squamosus
126 NULL 2 9.0 4.12 17.08 5 2.1 8.5 EN Deep-water

92 | ICES SCIENTIFIC REPORTS 1:51 | ICES
Ecoregion Area Gear Species Observed Effort (Days at sea)
Fishing Effort (Days at sea)
Total Ob-served
Total no. Speci-mens
Low CI High CI By-catch rate (mean event rate)
Low rate
(speci-mens/DaS)
High
rate (specimens/
DaS)
Red List Cri-te-rion
Type
Biscay/Iberia 27.9.a~27.8.c
Nets Centrophorus squamosus
30 NULL 1 1.0 0.03 5.57 1 0.0 5.6 EN Deep-water
Biscay/Iberia 27.8.a Pelagic trawls Cetorhinus maxi-mus
45 5737 1 1.0 0.03 5.57 1 0.0 5.6 EN Pelagic
Biscay/Iberia 27.8.a Nets Dalatias licha 169 30750 1 1.0 0.03 5.57 1 0.0 5.6 EN Deep-water
Biscay/Iberia 27.9.a~27.8.c
Bottom trawls
Deania calcea 126 NULL 6 21.0 13.00 32.10 4 2.2 5.4 EN Deep-water
Biscay/Iberia 27.9.a~27.8.c
Nets Deania calcea 30 NULL 3 5.0 1.62 11.67 2 0.5 3.9 EN Deep-water
Biscay/Iberia 27.8.a Bottom trawls
Dipturus batis 123 48000 3 3.0 0.62 8.77 1 0.2 2.9 CR Demersal
Biscay/Iberia 27.9.a Bottom trawls
Galeorhinus galeus
126 54797 2 10.0 4.80 18.39 5 2.4 9.2 VU Demersal
Biscay/Iberia 27.9.a~27.8.c
Bottom trawls
Galeorhinus galeus
126 NULL 3 16.0 9.15 25.98 5 3.0 8.7 VU Demersal
Biscay/Iberia 27.8.c Pelagic trawls Gymnura altavela 86 3400 1 1.0 0.03 5.57 1 0.0 5.6 CR Demersal
Biscay/Iberia 27.8.a Nets Leucoraja circu-laris
169 30750 3 60.0 45.79 77.23 20 15.3 25.7 EN Demersal
Biscay/Iberia 27.9.a~27.8.c
Nets Mustelus mus-telus
30 NULL 3 3.0 0.62 8.77 1 0.2 2.9 VU Demersal

ICES | WGBYC 2019 | 93
Ecoregion Area Gear Species Observed Effort (Days at sea)
Fishing Effort (Days at sea)
Total Ob-served
Total no. Speci-mens
Low CI High CI By-catch rate (mean event rate)
Low rate
(speci-mens/DaS)
High
rate (specimens/
DaS)
Red List Cri-te-rion
Type
Biscay/Iberia 27.9.a Nets Rostroraja alba 21 165095
2 12.0 6.20 20.96 6 3.1 10.5 CR Demersal
Biscay/Iberia 27.8.a Bottom trawls
Squalus acanthias 123 48000 4 16.0 9.15 25.98 4 2.3 6.5 EN Demersal
Biscay/Iberia 27.8.a Pelagic trawls Squalus acanthias 45 5737 1 1.0 0.03 5.57 1 0.0 5.6 EN Demersal
Biscay/Iberia 27.9.a Bottom trawls
Squalus acanthias 126 54797 1 3.0 0.62 8.77 3 0.6 8.8 EN Demersal
Celtic Seas 27.6.a Bottom trawls
Centroscymnus coelolepis
540 2914 1 1.0 0.03 5.57 1 0.0 5.6 EN Deep-water
Celtic Seas 27.6.a Bottom trawls
Dalatias licha 540 2914 2 10.0 4.80 18.39 5 2.4 9.2 EN Deep-water
Celtic Seas 27.7.j Bottom trawls
Dalatias licha 91 7299 1 13.0 6.92 22.23 13 6.9 22.2 EN Deep-water
Celtic Seas 27.7 Bottom trawls
Dipturus batis 117 NULL 94 1064.0 1001.02 1129.90 11 10.6 12.0 CR Demersal
Celtic Seas 27.6.a Bottom trawls
Dipturus batis 540 2914 64 216.0 188.15 246.81 3 2.9 3.9 CR Demersal
Celtic Seas 27.6.b Bottom trawls
Dipturus batis 48 1577 5 9.0 4.12 17.08 2 0.8 3.4 CR Demersal
Celtic Seas 27.7.a Bottom trawls
Dipturus batis 306 4567 4 10.0 4.80 18.39 3 1.2 4.6 CR Demersal

94 | ICES SCIENTIFIC REPORTS 1:51 | ICES
Ecoregion Area Gear Species Observed Effort (Days at sea)
Fishing Effort (Days at sea)
Total Ob-served
Total no. Speci-mens
Low CI High CI By-catch rate (mean event rate)
Low rate
(speci-mens/DaS)
High
rate (specimens/
DaS)
Red List Cri-te-rion
Type
Celtic Seas 27.7.b Bottom trawls
Dipturus batis 51 3501 11 27.0 17.79 39.28 2 1.6 3.6 CR Demersal
Celtic Seas 27.7.f Nets Dipturus batis 62 NULL 1 1.0 0.03 5.57 1 0.0 5.6 CR Demersal
Celtic Seas 27.7.f Bottom trawls
Dipturus batis 69 7458 4 30.0 20.24 42.83 8 5.1 10.7 CR Demersal
Celtic Seas 27.7.g Nets Dipturus batis 32 1535 2 2.0 0.24 7.22 1 0.1 3.6 CR Demersal
Celtic Seas 27.7.g Seines Dipturus batis 17 1125 5 13.0 6.92 22.23 3 1.4 4.4 CR Demersal
Celtic Seas 27.7.g Bottom trawls
Dipturus batis 384 28236 245 1721.0 1640.64 1804.28 7 6.7 7.4 CR Demersal
Celtic Seas 27.7.h Bottom trawls
Dipturus batis 252 12857 152 895.0 837.32 955.61 6 5.5 6.3 CR Demersal
Celtic Seas 27.7.j Seines Dipturus batis 5 627 3 16.0 9.15 25.98 5 3.0 8.7 CR Demersal
Celtic Seas 27.7.j Nets Dipturus batis 191 1606 39 95.0 76.86 116.13 2 2.0 3.0 CR Demersal
Celtic Seas 27.7.j Bottom trawls
Dipturus batis 91 7299 12 109.0 89.50 131.49 9 7.5 11.0 CR Demersal
Celtic Seas 27.7.g Nets Dipturus flossada 32 1535 1 1.0 0.03 5.57 1 0.0 5.6 CR Demersal
Celtic Seas 27.7.h Nets Dipturus flossada 42 2118 3 551.0 505.95 598.99 184 168.6 199.7 CR Demersal
Celtic Seas 27.7.j Nets Dipturus flossada 191 1606 5 806.0 751.31 863.62 161 150.3 172.7 CR Demersal

ICES | WGBYC 2019 | 95
Ecoregion Area Gear Species Observed Effort (Days at sea)
Fishing Effort (Days at sea)
Total Ob-served
Total no. Speci-mens
Low CI High CI By-catch rate (mean event rate)
Low rate
(speci-mens/DaS)
High
rate (specimens/
DaS)
Red List Cri-te-rion
Type
Celtic Seas 27.6.a Bottom trawls
Dipturus interme-dius
540 2914 12 19.0 11.44 29.67 2 1.0 2.5 CR Demersal
Celtic Seas 27.7.g Seines Dipturus interme-dius
17 1125 1 2.0 0.24 7.22 2 0.2 7.2 CR Demersal
Celtic Seas 27.7.g Bottom trawls
Dipturus interme-dius
384 28236 2 3.0 0.62 8.77 2 0.3 4.4 CR Demersal
Celtic Seas 27.7 Bottom trawls
Galeorhinus galeus
117 NULL 1 4.0 1.09 10.24 4 1.1 10.2 VU Demersal
Celtic Seas 27.7.f Nets Galeorhinus galeus
62 NULL 11 16.0 9.15 25.98 1 0.8 2.4 VU Demersal
Celtic Seas 27.7.g Nets Galeorhinus galeus
32 1535 1 2.0 0.24 7.22 2 0.2 7.2 VU Demersal
Celtic Seas 27.7.h Bottom trawls
Galeorhinus galeus
252 12857 1 1.0 0.03 5.57 1 0.0 5.6 VU Demersal
Celtic Seas 27.7.h Nets Galeorhinus galeus
42 2118 7 9.0 4.12 17.08 1 0.6 2.4 VU Demersal
Celtic Seas 27.7.j Nets Galeorhinus galeus
191 1606 3 5.0 1.62 11.67 2 0.5 3.9 VU Demersal
Celtic Seas 27.6.a Pelagic trawls Lamna nasus 97 2139 2 2.0 0.24 7.22 1 0.1 3.6 CR Pelagic
Celtic Seas 27.7.f Nets Lamna nasus 62 NULL 4 4.0 1.09 10.24 1 0.3 2.6 CR Pelagic
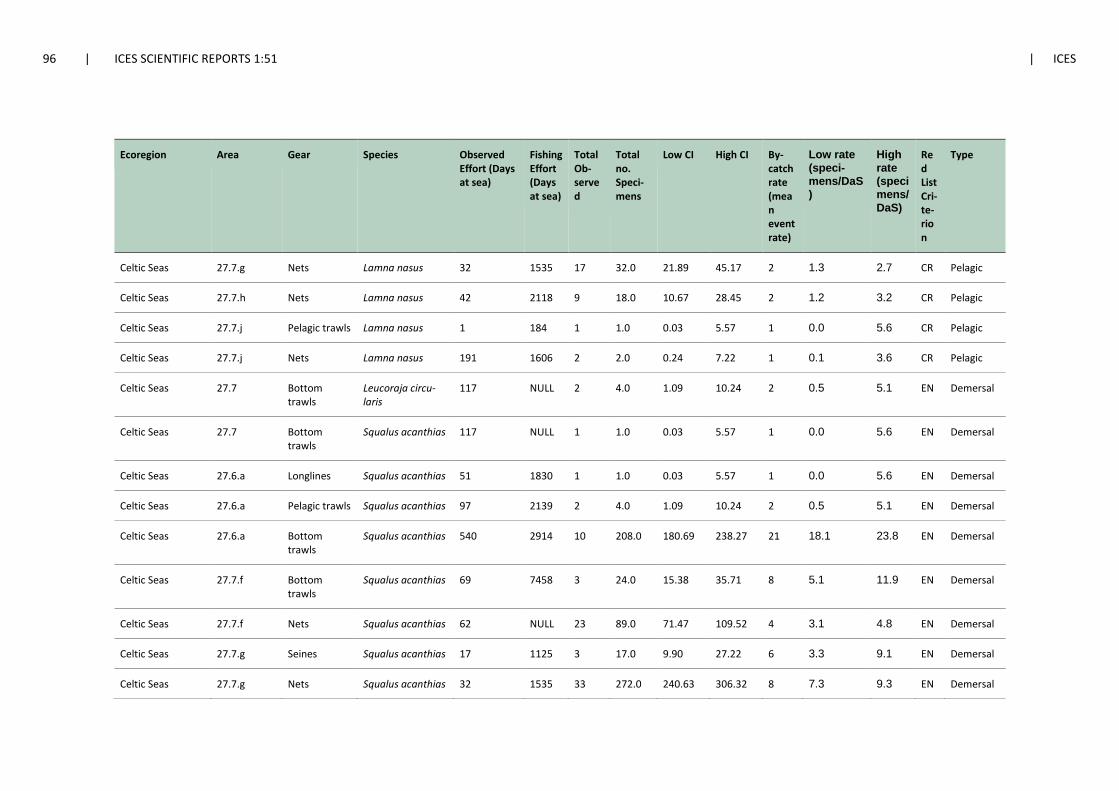
96 | ICES SCIENTIFIC REPORTS 1:51 | ICES
Ecoregion Area Gear Species Observed Effort (Days at sea)
Fishing Effort (Days at sea)
Total Ob-served
Total no. Speci-mens
Low CI High CI By-catch rate (mean event rate)
Low rate
(speci-mens/DaS)
High
rate (specimens/
DaS)
Red List Cri-te-rion
Type
Celtic Seas 27.7.g Nets Lamna nasus 32 1535 17 32.0 21.89 45.17 2 1.3 2.7 CR Pelagic
Celtic Seas 27.7.h Nets Lamna nasus 42 2118 9 18.0 10.67 28.45 2 1.2 3.2 CR Pelagic
Celtic Seas 27.7.j Pelagic trawls Lamna nasus 1 184 1 1.0 0.03 5.57 1 0.0 5.6 CR Pelagic
Celtic Seas 27.7.j Nets Lamna nasus 191 1606 2 2.0 0.24 7.22 1 0.1 3.6 CR Pelagic
Celtic Seas 27.7 Bottom trawls
Leucoraja circu-laris
117 NULL 2 4.0 1.09 10.24 2 0.5 5.1 EN Demersal
Celtic Seas 27.7 Bottom trawls
Squalus acanthias 117 NULL 1 1.0 0.03 5.57 1 0.0 5.6 EN Demersal
Celtic Seas 27.6.a Longlines Squalus acanthias 51 1830 1 1.0 0.03 5.57 1 0.0 5.6 EN Demersal
Celtic Seas 27.6.a Pelagic trawls Squalus acanthias 97 2139 2 4.0 1.09 10.24 2 0.5 5.1 EN Demersal
Celtic Seas 27.6.a Bottom trawls
Squalus acanthias 540 2914 10 208.0 180.69 238.27 21 18.1 23.8 EN Demersal
Celtic Seas 27.7.f Bottom trawls
Squalus acanthias 69 7458 3 24.0 15.38 35.71 8 5.1 11.9 EN Demersal
Celtic Seas 27.7.f Nets Squalus acanthias 62 NULL 23 89.0 71.47 109.52 4 3.1 4.8 EN Demersal
Celtic Seas 27.7.g Seines Squalus acanthias 17 1125 3 17.0 9.90 27.22 6 3.3 9.1 EN Demersal
Celtic Seas 27.7.g Nets Squalus acanthias 32 1535 33 272.0 240.63 306.32 8 7.3 9.3 EN Demersal
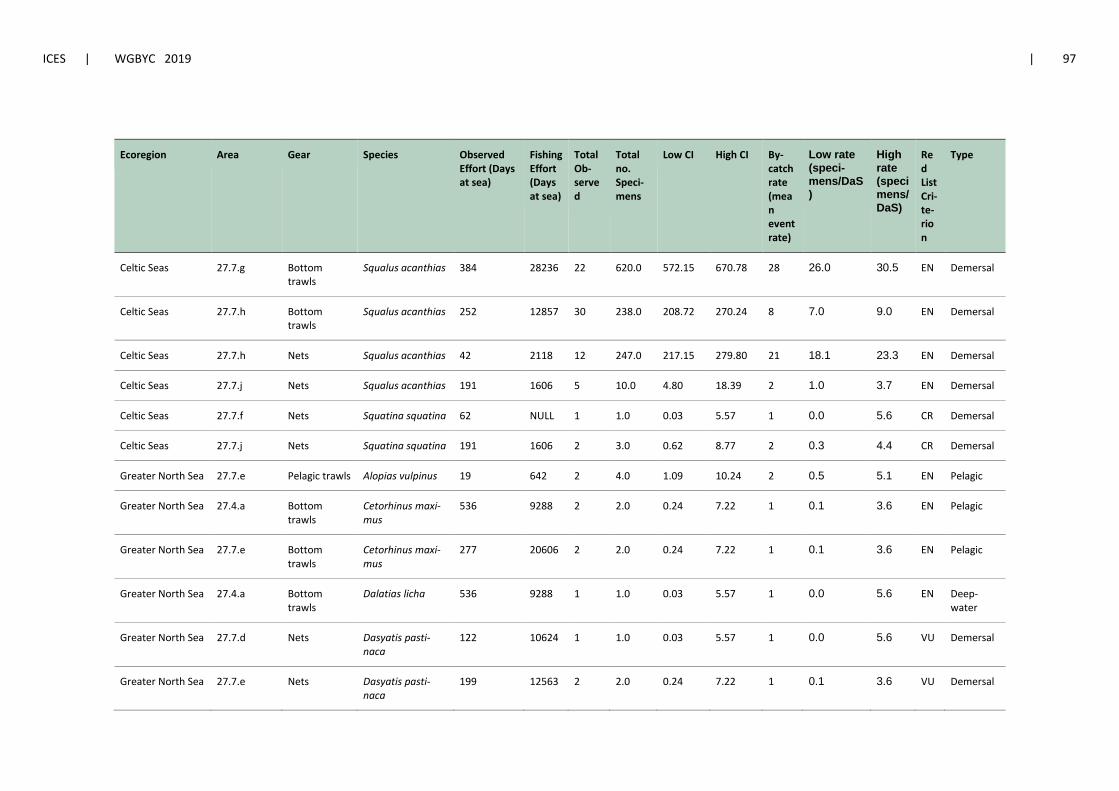
ICES | WGBYC 2019 | 97
Ecoregion Area Gear Species Observed Effort (Days at sea)
Fishing Effort (Days at sea)
Total Ob-served
Total no. Speci-mens
Low CI High CI By-catch rate (mean event rate)
Low rate
(speci-mens/DaS)
High
rate (specimens/
DaS)
Red List Cri-te-rion
Type
Celtic Seas 27.7.g Bottom trawls
Squalus acanthias 384 28236 22 620.0 572.15 670.78 28 26.0 30.5 EN Demersal
Celtic Seas 27.7.h Bottom trawls
Squalus acanthias 252 12857 30 238.0 208.72 270.24 8 7.0 9.0 EN Demersal
Celtic Seas 27.7.h Nets Squalus acanthias 42 2118 12 247.0 217.15 279.80 21 18.1 23.3 EN Demersal
Celtic Seas 27.7.j Nets Squalus acanthias 191 1606 5 10.0 4.80 18.39 2 1.0 3.7 EN Demersal
Celtic Seas 27.7.f Nets Squatina squatina 62 NULL 1 1.0 0.03 5.57 1 0.0 5.6 CR Demersal
Celtic Seas 27.7.j Nets Squatina squatina 191 1606 2 3.0 0.62 8.77 2 0.3 4.4 CR Demersal
Greater North Sea 27.7.e Pelagic trawls Alopias vulpinus 19 642 2 4.0 1.09 10.24 2 0.5 5.1 EN Pelagic
Greater North Sea 27.4.a Bottom trawls
Cetorhinus maxi-mus
536 9288 2 2.0 0.24 7.22 1 0.1 3.6 EN Pelagic
Greater North Sea 27.7.e Bottom trawls
Cetorhinus maxi-mus
277 20606 2 2.0 0.24 7.22 1 0.1 3.6 EN Pelagic
Greater North Sea 27.4.a Bottom trawls
Dalatias licha 536 9288 1 1.0 0.03 5.57 1 0.0 5.6 EN Deep-water
Greater North Sea 27.7.d Nets Dasyatis pasti-naca
122 10624 1 1.0 0.03 5.57 1 0.0 5.6 VU Demersal
Greater North Sea 27.7.e Nets Dasyatis pasti-naca
199 12563 2 2.0 0.24 7.22 1 0.1 3.6 VU Demersal

98 | ICES SCIENTIFIC REPORTS 1:51 | ICES
Ecoregion Area Gear Species Observed Effort (Days at sea)
Fishing Effort (Days at sea)
Total Ob-served
Total no. Speci-mens
Low CI High CI By-catch rate (mean event rate)
Low rate
(speci-mens/DaS)
High
rate (specimens/
DaS)
Red List Cri-te-rion
Type
Greater North Sea 27.4.a Bottom trawls
Dipturus batis 536 9288 15 81.0 64.33 100.68 5 4.3 6.7 CR Demersal
Greater North Sea 27.4.b Bottom trawls
Dipturus batis 393 77471 1 1.0 0.03 5.57 1 0.0 5.6 CR Demersal
Greater North Sea 27.7.d Nets Dipturus batis 122 10624 4 4.0 1.09 10.24 1 0.3 2.6 CR Demersal
Greater North Sea 27.7.e Bottom trawls
Dipturus batis 277 20606 45 356.0 319.98 394.97 8 7.1 8.8 CR Demersal
Greater North Sea 27.7.e Seines Dipturus batis 2 95 2 9.0 4.12 17.08 5 2.1 8.5 CR Demersal
Greater North Sea 27.7.e Nets Dipturus flossada 199 12563 2 2.0 0.24 7.22 1 0.1 3.6 CR Demersal
Greater North Sea 27.4.a Bottom trawls
Dipturus interme-dius
536 9288 7 30.0 20.24 42.83 4 2.9 6.1 CR Demersal
Greater North Sea 27.3.a.20 Bottom trawls
Dipturus linteus 149 29095 7 29.0 19.42 41.65 4 2.8 5.9 CR Demersal
Greater North Sea 27.4.a Bottom trawls
Dipturus linteus 536 9288 5 14.0 7.65 23.49 3 1.5 4.7 CR Demersal
Greater North Sea 27.4.c Nets Galeorhinus galeus
23 5457 4 4.0 1.09 10.24 1 0.3 2.6 VU Demersal
Greater North Sea 27.7.d Nets Galeorhinus galeus
122 10624 4 4.0 1.09 10.24 1 0.3 2.6 VU Demersal

ICES | WGBYC 2019 | 99
Ecoregion Area Gear Species Observed Effort (Days at sea)
Fishing Effort (Days at sea)
Total Ob-served
Total no. Speci-mens
Low CI High CI By-catch rate (mean event rate)
Low rate
(speci-mens/DaS)
High
rate (specimens/
DaS)
Red List Cri-te-rion
Type
Greater North Sea 27.7.e Bottom trawls
Galeorhinus galeus
277 20606 4 6.0 2.20 13.06 2 0.6 3.3 VU Demersal
Greater North Sea 27.7.e Nets Galeorhinus galeus
199 12563 9 9.0 4.12 17.08 1 0.5 1.9 VU Demersal
Greater North Sea 27.7.d Pelagic trawls Lamna nasus 75 3384 2 2.0 0.24 7.22 1 0.1 3.6 CR Pelagic
Greater North Sea 27.7.e Bottom trawls
Lamna nasus 277 20606 1 1.0 0.03 5.57 1 0.0 5.6 CR Pelagic
Greater North Sea 27.7.e Pelagic trawls Lamna nasus 19 642 1 2.0 0.24 7.22 2 0.2 7.2 CR Pelagic
Greater North Sea 27.4.a Bottom trawls
Leucoraja circu-laris
536 9288 3 19.0 11.44 29.67 6 3.8 9.9 EN Demersal
Greater North Sea 27.4.b Bottom trawls
Mustelus mus-telus
393 77471 1 24.5 15.38 35.71 25 15.4 35.7 VU Demersal
Greater North Sea 27.4.a Bottom trawls
Raja batis 536 9288 6 7.0 2.81 14.42 1 0.5 2.4 CR Demersal
Greater North Sea 27.3.a.20 Bottom trawls
Squalus acanthias 149 29095 14 476.0 434.19 520.75 34 31.0 37.2 EN Demersal
Greater North Sea 27.3.a.21 Bottom trawls
Squalus acanthias 88 13096 3 14.0 7.65 23.49 5 2.6 7.8 EN Demersal
Greater North Sea 27.4.a Bottom trawls
Squalus acanthias 536 9288 6 44.0 31.97 59.07 7 5.3 9.8 EN Demersal

100 | ICES SCIENTIFIC REPORTS 1:51 | ICES
Ecoregion Area Gear Species Observed Effort (Days at sea)
Fishing Effort (Days at sea)
Total Ob-served
Total no. Speci-mens
Low CI High CI By-catch rate (mean event rate)
Low rate
(speci-mens/DaS)
High
rate (specimens/
DaS)
Red List Cri-te-rion
Type
Greater North Sea 27.4.a Pelagic trawls Squalus acanthias 77 1933 25 57392.3
56923.41
57863.49
2296 2276.9 2314.5
EN Demersal
Greater North Sea 27.4.b Bottom trawls
Squalus acanthias 393 77471 2 12.4 6.20 20.96 6 3.1 10.5 EN Demersal
Greater North Sea 27.7.d Bottom trawls
Squalus acanthias 280 39012 1 1.0 0.03 5.57 1 0.0 5.6 EN Demersal
Greater North Sea 27.7.e Bottom trawls
Squalus acanthias 277 20606 14 378.0 340.85 418.09 27 24.3 29.9 EN Demersal
Greater North Sea 27.7.e Nets Squalus acanthias 199 12563 3 19.0 11.44 29.67 6 3.8 9.9 EN Demersal
Greater North Sea 27.7.e Seines Squalus acanthias 2 95 1 9.0 4.12 17.08 9 4.1 17.1 EN Demersal
Mediterranean Sea
1~5~6 Longlines Alopias vulpinus 570 7789 3 3.0 0.62 8.77 1 0.2 2.9 EN Pelagic
Mediterranean Sea
1 Bottom trawls
Centrophorus granulosus
118 22537 4 5.0 1.62 11.67 1 0.4 2.9 CR Deep-water
Mediterranean Sea
2 Bottom trawls
Centrophorus granulosus
50 952 1 5.0 1.62 11.67 5 1.6 11.7 CR Deep-water
Mediterranean Sea
22 Nets Centrophorus granulosus
426 401221
2 13.0 6.92 22.23 7 3.5 11.1 CR Deep-water
Mediterranean Sea
1 Bottom trawls
Dalatias licha 118 22537 1 9.0 4.12 17.08 9 4.1 17.1 EN Deep-water

ICES | WGBYC 2019 | 101
Ecoregion Area Gear Species Observed Effort (Days at sea)
Fishing Effort (Days at sea)
Total Ob-served
Total no. Speci-mens
Low CI High CI By-catch rate (mean event rate)
Low rate
(speci-mens/DaS)
High
rate (specimens/
DaS)
Red List Cri-te-rion
Type
Mediterranean Sea
2 Bottom trawls
Dalatias licha 50 952 25 48.0 35.39 63.64 2 1.4 2.5 EN Deep-water
Mediterranean Sea
6 Bottom trawls
Dalatias licha 253 78740 1 1.0 0.03 5.57 1 0.0 5.6 EN Deep-water
Mediterranean Sea
7 Bottom trawls
Dalatias licha 277 15178 2 60.0 45.79 77.23 30 22.9 38.6 EN Deep-water
Mediterranean Sea
22 Bottom trawls
Dipturus batis 88 26928 1 2.0 0.24 7.22 2 0.2 7.2 CR Demersal
Mediterranean Sea
22 Nets Gymnura altavela 426 401221
1 1.0 0.03 5.57 1 0.0 5.6 CR Demersal
Mediterranean Sea
1 Bottom trawls
Leucoraja circu-laris
118 22537 4 4.0 1.09 10.24 1 0.3 2.6 EN Demersal
Mediterranean Sea
5 Bottom trawls
Leucoraja circu-laris
98 9177 1 1.0 0.03 5.57 1 0.0 5.6 EN Demersal
Mediterranean Sea
6 Bottom trawls
Leucoraja circu-laris
253 78740 1 2.0 0.24 7.22 2 0.2 7.2 EN Demersal
Mediterranean Sea
1~5~6 Longlines Mobula mobular 570 7789 6 7.0 2.81 14.42 1 0.5 2.4 EN Pelagic
Mediterranean Sea
5 Bottom trawls
Mustelus mus-telus
98 9177 8 18.0 10.67 28.45 2 1.3 3.6 VU Demersal
Mediterranean Sea
6 Bottom trawls
Mustelus mus-telus
253 78740 4 11.0 5.49 19.68 3 1.4 4.9 VU Demersal

102 | ICES SCIENTIFIC REPORTS 1:51 | ICES
Ecoregion Area Gear Species Observed Effort (Days at sea)
Fishing Effort (Days at sea)
Total Ob-served
Total no. Speci-mens
Low CI High CI By-catch rate (mean event rate)
Low rate
(speci-mens/DaS)
High
rate (specimens/
DaS)
Red List Cri-te-rion
Type
Mediterranean Sea
17 Pelagic trawls Mustelus mus-telus
173 12556 5 10.0 4.80 18.39 2 1.0 3.7 VU Demersal
Mediterranean Sea
22 Bottom trawls
Mustelus mus-telus
88 26928 3 3.0 0.62 8.77 1 0.2 2.9 VU Demersal
Mediterranean Sea
22 Longlines Mustelus mus-telus
91 84082 4 5.0 1.62 11.67 1 0.4 2.9 VU Demersal
Mediterranean Sea
22 Nets Mustelus mus-telus
426 401221
1 1.0 0.03 5.57 1 0.0 5.6 VU Demersal
Mediterranean Sea
17 Pelagic trawls Mustelus punctu-latus
173 12556 20 35.0 24.38 48.68 2 1.2 2.4 VU Demersal
Mediterranean Sea
16 Pelagic trawls Myliobatis aquila 23 2620 4 11.0 5.49 19.68 3 1.4 4.9 VU Demersal
Mediterranean Sea
17 Pelagic trawls Myliobatis aquila 173 12556 9 13.0 6.92 22.23 1 0.8 2.5 VU Demersal
Mediterranean Sea
22 Bottom trawls
Oxynotus centrina 88 26928 2 2.0 0.24 7.22 1 0.1 3.6 VU Demersal
Mediterranean Sea
2 Bottom trawls
Rostroraja alba 50 952 3 3.0 0.62 8.77 1 0.2 2.9 CR Demersal
Mediterranean Sea
6 Bottom trawls
Squalus acanthias 253 78740 1 1.0 0.03 5.57 1 0.0 5.6 EN Demersal
Mediterranean Sea
7 Bottom trawls
Squalus acanthias 277 15178 4 42.0 30.27 56.77 11 7.6 14.2 EN Demersal

ICES | WGBYC 2019 | 103
Ecoregion Area Gear Species Observed Effort (Days at sea)
Fishing Effort (Days at sea)
Total Ob-served
Total no. Speci-mens
Low CI High CI By-catch rate (mean event rate)
Low rate
(speci-mens/DaS)
High
rate (specimens/
DaS)
Red List Cri-te-rion
Type
Mediterranean Sea
17 Pelagic trawls Squalus acanthias 173 12556 14 18.0 10.67 28.45 1 0.8 2.0 EN Demersal
Mediterranean Sea
22 Bottom trawls
Squalus acanthias 88 26928 5 8.0 3.45 15.76 2 0.7 3.2 EN Demersal
Mediterranean Sea
22 Longlines Squalus acanthias 91 84082 3 45.0 32.82 60.21 15 10.9 20.1 EN Demersal
Mediterranean Sea
22 Nets Squalus acanthias 426 401221
2 40.0 28.58 54.47 20 14.3 27.2 EN Demersal

104 | ICES SCIENTIFIC REPORTS 1:51 | ICES
Table 13. Classification of bycatch risk for different taxanomic groupings and gear based on expert opinion of WGBYC participants18: 1 = low risk; 2= medium risk; 3 = high risk. WGBYC revied the entries and upgraded some risk scores, shown in brackets.
Gear Lampreys Roundfish Turtles Diving birds Surface birds Seals Dolphins Harbour porpoise Large Whales
Boat dredge [DRB] 1 1 1 1 1 1 1 1 1
Bottom otter trawl [OTB] 2 2 3 1 2 2(1) 1 1 1
Multi-rig otter trawl [OTT] 2 2 3 1 1 1 1 1 1
Bottom pair trawl [PTB] 2 2 3 1 1 1 1 1 1
Beam trawl [TBB] 2 1 3 1 1 1 1 1 1
Midwater otter trawl [OTM] 1 3 2 2 2 2 2 1 2(1)
Pelagic pair trawl [PTM] 1 3 2 2 2 2 2 1 2(1)
Hand and Pole lines [LHP] [LHM] 1 1(2) 1 1 1 1 1 1 1
Trolling lines [LTL] 1 1(2) 1 2 3 1 1 1 1
Drifting longlines [LLD] 1 1(2) 3 2 3 1 1 1 2
Set longlines [LLS] 1 1(2) 3 2 3 1 1 1 2
Pots and Traps [FPO] 2 1 1 1 1 1 1 1 2(3)
Fykenets [FYK] 3 2 1 2 1 3 1 1 1
Stationary uncovered poundnets [FPN] 1 1 1 1 1 2 1 1 1
Trammelnet [GTR] 1 3 3 3 1 3 2 3 2
Set gillnet [GNS] 1 3 3 3 1 3 2 3 2
18 Based on reviewers’ comments it was specified that this classification was based on expert opinion of WGBYC participants

ICES | WGBYC 2019 | 105
Gear Lampreys Roundfish Turtles Diving birds Surface birds Seals Dolphins Harbour porpoise Large Whales
Driftnet [GND] 1 3 3 3 3 3 3 3 3
Purse-seine [PS] 1 1(2) 1 1 1 1 2 1 1
Lampara nets [LA] 1 1(2) 1 1 1 1 1 1 1
Fly shooting seine [SSC] 2 2 1 1 1 1 1 1 1
Anchored seine [SDN] 2 2 1 1 1 1 1 1 1
Pair seine [SPR] 2 2 1 1 1 1 1 1 1
Beach and boat seine [SB] [SV] 2 2 1 1 1 1 1(2) 1(2) 1
Glass eel fishing 2 1 1 1 1 1 1 1 1

106 | ICES SCIENTIFIC REPORTS 1:51 | ICES
Table 14. Example (North Sea) of the output created for the request of the RCG to compare observer effort distribution in DCF- and dedicated surveys. The table also summarise the risk categories from the FishPi appraoch* The information on these columns has not been updated by WGBYC 2019. Extracted from the FishPi report WP3 (FishPi project, MARE/2014/19, “Strength-ening regional cooperation in the area of fisheries data collection in the north sea and eastern arctic”, table 12).
Summed Risk* Risk Category* DCF Monitoring
(Days at Sea)
Dedicated Monitoring
(Days at Sea)
Boat dredge [DRB] 32 2
Bottom otter trawl [OTB] 60 3 588
Multi-rig otter trawl [OTT] 40 2 347
Bottom pair trawl [PTB] 30 2 181
Beam trawl [TBB] 36 2 280
Midwater otter trawl [OTM] 45 2 154
Pelagic pair trawl [PTM] 45 2 17
Hand and Pole lines [LHP] [LHM] 24 1 5
Trolling lines [LTL] 0 0
Drifting longlines [LLD] 0 0
Set longlines [LLS] 36 2 11
Pots and Traps [FPO] 50 2 2
Fykenets [FYK] 14 1 1
Stationary uncovered poundnets [FPN] 0 0
Trammelnet [GTR] 72 3 108 13
Set gillnet [GNS] 72 3 60 8

ICES | WGBYC 2019 | 107
Summed Risk* Risk Category* DCF Monitoring
(Days at Sea)
Dedicated Monitoring
(Days at Sea)
Driftnet [GND] 66 3 5 1
Purse-seine [PS] 18 1
Lampara nets [LA] 0 0
Fly shooting seine [SSC] 30 2 49
Anchored seine [SDN] 30 2 21
Pair seine [SPR] NA NA
Beach and boat seine [SB] [SV] 0 0
Glass eel fishing NA NA

108 | ICES SCIENTIFIC REPORTS 1:51 | ICES
4 Continue to develop, improve and coordinate with other ICES WGs on methods for bycatch monitor-ing, research and assessment within the context of European legislation (e.g. MSFD) and regional con-ventions (e.g. OSPAR) (TOR D)
4.1 Coordination with WGCATCH
ICES WGCATCH met 5-9th November 2018. WGCATCH considers the design of sampling of
commercial catches and given that PETS data will be collected through DC-MAP, then coopera-
tion with this expert group is of importance to WGBYC. This cooperation was initiated in 2018,
when the joint workshop WKPETSAMP was organised with a view to focus on data collection
protocols and survey design. However, two tasks have not been fully addressed through PET-
SAMP, and WGCATCH have asked WGBYC to assist them with. These are:
1. Prepare definitions of fields in the RDBES relevant to the at-sea sampling of PETS. Ex-
plore the necessity for additional fields from other sampling schemes and define any
proposed fields.
2. Prepare guidelines for at-sea sampling programs, listing best practices and relevant pa-
rameters for PETS sampling for specific fisheries (this was formerly a WKPETSAMP ToR)
The request was received by WGBYC Chairs just a couple of days in advance of the meeting and
therefore the group agreed that we would continue to work intersessionally with WGCATCH,
through a meeting in the first instance. With regards (1), WGBYC (2018) reviewed proposed
fields relevant to PETS sampling for the RDBES, but WGCATCH consider that these and addi-
tional fields need to be more clearly defined as their meanings may be different depending on
the fishery being sampled. For example, we want observers to make a visual sample of the activ-
ity (rather than recording the sample as weight, as is done for fish), but the length of time this
should be for needs to be determined. Also, use of terms means different things depending on
the gear; “slipping” in purse seines has different meaning to slipping in a gillnet. Currently the
RDB is not designed to store PETS sampling data but the RDBES needs to be; alignment of na-
tional databases to RDBES PETS fields would greatly facilitate data storage and submission to
ICES.
WGBYC considered that (2) would be best tackled through a workshop. Existing best practice
PETS sampling procedures would need to be collated (e.g. from the US) and relevant experts
would need to attend. The workshop should take into account work already progressed through
the FishPi project. The proposal for a workshop will be discussed with WGCATCH and if
deemed necessary, Terms of Reference drafted intersessionally.

ICES | WGBYC 2019 | 109
4.2 WGBYC coordination with Expert Groups/Workshops working on elasmobranchs
4.2.1 Working Group on Elasmobranch Fishes (WGEF)
In 2019, WGBYC further built on the relationship established with the WGEF in 2018. WGBYC
are mainly concerned with avoiding duplication of tasks between the groups but also better un-
derstanding the data collated by WGEF and its use, with a view to complimenting where appro-
priate. WGBYC is responsible for bycatch data pertaining to PET species i.e. Protected, Endan-
gered and Threatened. All of the elasmobranch species requested identified through the WGBYC
data call qualify as protected, either under the CFP prohibition list, or the deep-sea fisheries reg-
ulation. However, not all species on the list are endangered or threatened (Nieto et al. 2015). If
we take the critically endangered “CE”, endangered “EN” and vulnerable “VU” species as qual-
ifying as endangered and threatened, then WGBYC’s responsibility is solely for these species
(Table 15). Those classified as near threatened “NT” or least concern “LC” in the red list are not
the responsibility of WGBYC. Data deficient “DD” species that are listed as protected, and some
others which are not, should be included in the data call to improve the information available.
WGEF’s main responsibility is to assess and draft advice for commercial elasmobranchs. How-
ever some of these also partly or wholly qualify as PET species, e.g. Squalus acanthias, the spiny
dogfish. For commercial species, the main responsibility is with WGEF, across all categories of
assessments. For Category 1 and 2 (full assessments giving F and stock size estimates), bycatch
estimation is not an issue, provided that dead discards are included in the assessment. Of course
a species may cease to be PET, either locally or globally, if ICES advice suggests this is appropri-
ate, e.g. Raja undulata the undulate ray.
There is overlap between WGEF and WGBYC for especially category 3 and 4 (trends only) as-
sessments (Table 16). These assessments usually give a stock trend but not a fishing mortality
trend. Thus, WGBYC could have a role in estimating bycatch trends. Category 5/6 (bycatch spe-
cies with no information on trends) are usually stocks which WGEF cannot provide more infor-
mation on. WGBYC can have a role here, as is the case for Category 3 and 4 stocks.
The D1 (non-commercial fish, MSFD descriptor 1) group, which has yet to be formally estab-
lished, will concern itself only with non-commercial species, whether they are PET or not. ICCAT
has responsibility for commercial pelagic sharks, and for pelagic sharks as bycatch in tuna and
bill fish fisheries. The D1 group would draw upon assessments from WGEF, ICCAT or WGBYC,
rather than reinventing the wheel. However, there may be instances where this group is best
placed to produce estimates of bycatch mortality.
The 2019 data call shows that there are considerable data on discarded bycatch e.g. for Squalus
acanthias. These data could be accessed by WGEF to improve the assessment of the stock, by
including discard mortality. This would remove the need for WGBYC to consider bycatch of that
species, because the advised catch (if any) would include bycatch and discards.
It will be important to establish synergies between the groups, to avoid duplication, to assist one
another and in preparing data calls. Table 3 shows some obvious synergies. WGEF, ICCAT-
sharks and WGBYC have much commonality. If discards are included in the assessments and
advice for category 1 and 2 PET stocks, then WGBYC need not have a role (bycatch F already
estimated). However this would require new data calls and more work for WGEF/ICCAT.
WGBYC’s responsibility is PET species for which estimates of bycatch are not forthcoming al-
ready. This means that it is mostly concerned with Categories 3-6 assessments. For category 3
and 4, WGBYC could assist with estimation of bycatch levels. For categories 5 and 6, WGBYC

110 | ICES SCIENTIFIC REPORTS 1:51 | ICES
could take the lead because WGEF probably cannot make any progress with existing data. WGEF
would benefit from raised bycatch data provided by WGBYC.
ICCAT’s remit is pelagic sharks and sharks by-caught in tuna or billfish fisheries. For such spe-
cies straddling the ICES area there needs to be some discussion on how to collaborate. This also
relates to non-elasmobranch fish by-caught in these fisheries e.g. Mola mola, the ocean sunfish.
The D1 group would only work on species that have not been handled by the ICES or ICCAT
groups already. This would mainly confine the D1 group’s activities to non-commercial, non-
PET species Category 3-6 stocks. D1 assessments should draw on work already done by ICES or
ICCAT e.g. for Squalus acanthias, Isurus oxyrinchus etc.
Table 17 summarises the potential synergies between the groups.
4.2.2 WKSHARK5
The Workshop on incorporating discards into the assessments and advice of elasmobranch
stocks (WKSHARK5) met in Leeuwarden, Netherlands from 25 February – 1 March 2019 to:
a) Investigate and propose a raising method for elasmobranch fishes when a species is
mostly discarded, as standard raising procedures are not applicable;
b) Evaluate and define the data quality and onboard coverage; discard retention patterns
between fleets and countries; discard survival, as well as the definition of acceptable
types/sources of data required for advice;
c) propose how to include discard information into the advisory process for elasmobranch
fishes;
d) Propose a method to provide fishing opportunities that ensure that exploitation is sus-
tainable when a species has been under moratorium, as is the case with the undulate ray
A presentation on the work of WGBYC was given during WKSHARK5. The workshop is an ini-
tiative of WGEF and is mostly attended by the members of this group. The goal of the presenta-
tion was to present the work of WGBYC and discuss possible overlap and areas for coordination
with regards to elasmobranch assessments. WGEF carries out analyses on the basis of survey
data Bycatch information may be a useful addition to the work of this group as they do not
collate information from the wider commercial fisheries sampling. It was agreed that the Chairs
keep in contact intersessionally (if needed) to inform each other of relevant developments within
the group.
Of current interest is an upcoming data call to address questions from NEAFC/OSPAR to ICES.
The purpose is to collate scientific knowledge on a list of deep sea elasmobranchs to be used by
both organisations when respectively considering possible future measures and to ensure
healthy populations of deep-sea elasmobranchs. WGBYC has provided bycatch numbers of these
species on the list by metier and ecoregion (table 12.
4.3 ICES Working Group on Marine Mammal Ecology (WGMME)
WGMME has a ToR C to: ‘Review additional aspects of marine mammal fishery interactions not
covered by WGBYC. Details of this ToR to be agreed with WGBYC.‘ Ahead of the 2018 meeting,
WGBYC suggested that topics not directly related to bycatch, such as depredation on catches or
competition with fisheries, could fall within the WGMME remit. In 2019, WGBYC also proposed
that it would be valuable for WGMME to critically evaluate methods for assessing thresholds
and/or update thresholds for cetacean bycatch; WGBYC utilises established thresholds against
which to compare its estimates of bycatch mortality to understand population level impacts.

ICES | WGBYC 2019 | 111
However, in 2019, WGMME undertook the following assessments as part of its TOR C:
i. Seal interactions with fisheries (e.g. in which fisheries and by whom is it reported; how
many seals are bycaught in fisheries);
ii. Other sources of cetacean bycatch data, i.e. those not being used in current bycatch as-
sessments: the nature and utility of information available on cetacean bycatch, by
area/country, gear, species).
iii. Identify potential risk areas (i.e. species-area-fishery combinations associated with a high
risk of negative impacts on marine mammal populations due to fishery bycatch mortal-
ity).
iv. Revise existing thresholds for bycatch: WGMME reviewed this topic in 2013 and 2014,
describing various approaches used to set safe limits for bycatch mortality in marine
mammal populations.
WGBYC note that there is considerable overlap between the EGs with regards to the aims i-iii)
identified by WGMME. With regards to i) seal bycatch/interaction has been addressed previ-
ously by WGBYC, specifically in 2011 and the group has, since 2012, collated information on the
bycatch of species “other than cetaceans” (see ToRs and data calls). However, WGMME collated
information (strandings, at-sea monitoring projects, interviews) to document seal bycatch at their
meeting to fill their perception of a “gap” in the bycatch work undertaken by WGBYC. To com-
plement the information that WGMME has pulled together, WGBYC agreed at its meeting to
evaluate the seal data within its WGBYC database through the use of the BRA framework (see
3.1.1). WGBYC holds data from dedicated and non-dedicated monitoring programmes since
2005 and have been used in this report to look at the risk posed to grey seals by metier and
ecoregion.
Under ii), WGMME (2019) reports that “WGBYC compiles data from National Reports from the
MS related to EC Regulation 812/2014 and that in the last two years ICES has issued data calls
for information on fishing effort, monitoring/sampling effort and bycatch numbers obtained
from other monitoring programs, including the fisheries data collection framework (DCF, now
EU-MAP). However, at present, WGBYC does not routinely make use of information from
strandings, voluntary recording schemes, interview surveys etc.” WGBYC has, in fact, issued
datacalls annually since its inception, although they have been formalised the last two years
through the ICES formal process; this greatly improved the response. WGBYC has also collated
data from sources other than Reg812/DCF monitoring, including pilot projects and those using
Remote Electronic Monitoring into its database. Additionally, WGBYC has, since 2012, reported
on bycatch from other sources of information, including strandings (e.g. USA, Portugal and
France) and interviews. WGBYC concluded that the work on strandings estimating bycatch
numbers was important and should stay within WGBYC. At this year’s meeting, the French del-
egate proposed to undertake a more complete summary of bycatch information from all north-
east Atlantic strandings networks where possible for future WGBYC reports. WGBYC already
provides some summaries where the information has been included in Reg812/2004 reports and
given that these data are now being more widely used in WGBYC analyses to assess total mor-
tality, the group agreed to the suggestion. This will provide a better understanding of the da-
tasets that underpin these analyses and WGBYC agreed that it is important to compare the by-
catch estimates derived from strandings to estimates based on on-board observer/electronic data.
In relation to WGMME ToR C (iii), WGBYC has been conducting risk assessments since 2012.
WGBYC, however, has focussed on using the data collected from at-sea monitoring rather than
other sources for this purpose.
Ongoing discussions with WGMME are clearly needed to avoid ongoing duplication and clarify
next years’ work.

112 | ICES SCIENTIFIC REPORTS 1:51 | ICES
Table 15. Roles and responsibilities between WGEF, WGBYC and fish biodiversity group (MSFD “D1” Descriptor) for elasmobranchs by quality of the assessment possible. Note the fish biodi-versity group has yet to be established, and may be under OSPAR.
Red list CE EN VU NT LC DD
ICES Cat 1/2 EF EF EF EF EF n.a.
ICES Cat 3/4 EF/BYC/D1 EF/BYC/D1 EF/BYC/D1 EF/D1 EF/D1 n.a.
ICES Cat 5/6 BYC/D1 BYC/D1 BYC/D1 D1 D1 BYC, D1, EF
Table 16. Roles and responsibilities of groups working on elasmobranchs.
Red list CE EN VU NT LC DD
WGEF Yes if assessment (incl. discards) possible Yes if commercial
WGBYC Yes if bycatch is an issue No Yes
ICCAT-Sharks Yes if commercial + pelagic Yes if commercial + pelagic
ICCAT-Ecosystem Yes if pelagic + bycatch is an issue Yes if pelagic + bycatch is an issue
D1 (non-commercial) Yes, but only for species not dealt with above Yes

ICES | WGBYC 2019 | 113
Table 17. Potential synergies between the groups.
WGEF WGBYC ICCAT-Sharks ICCAT-Ecosystem D1
WGEF Discards needed
WGBYC Cat 3/4: bycatch F estimation
Cat 5/6 BYC lead
-
ICCAT-Sharks For discussion between ICES and ICCAT For discussion on stocks straddling ICES area
-
ICCAT-Ecosystem - For discussion on stocks straddling ICES area
Yes -
D1 Collaboration on discards (cat 3-6) Cat 3-6 PET species Non-commercial pelagic species - -

114 | ICES SCIENTIFIC REPORTS 1:51 | ICES
5 Continue to develop collaborative research pro-posals among WGBYC members to pursue research projects and funding opportunities in support of re-searching protected and target species behaviour in relation to fishing gear (ToR E)
The annual WGBYC meeting continues to be an important opportunity for participants to dis-
cuss and consider existing collaborative research and potential future work. At this year’s meet-
ing, WGBYC considered future potential collaboration projects, key research areas and
knowledge gaps. There was insufficient time to develop proposals but participants were tasked
to continue discussions intersessionally, especially if funding opportunities arise19.
The group discussed the potential need to explore Electronic Monitoring (EM) as a tool for mon-
itoring bycatch of protected species within EU-MAP monitoring. The Regulation 812/2004 will
be repealed and monitoring bycatch of protected species will be included in the monitoring
within EU-MAP. WGBYC has highlighted the issues around use of non-dedicated PETS observ-
ers to collect bycatch data; essentially, bycatch rates tend to be biased low when PETS bycatch
data are recorded through fisheries observers rather than dedicated PETS observers. The use of
EM could be an effective means of collecting reliable data under the new sampling requirements
of the EU-MAP. Sample design including how to monitor, what métiers to monitor and to a
certain extent how much to monitor has been evaluated in WGBYC reports (2018, and current)
as well as in the FishPi report (fishPi 2019). In the fishPi report several EM proposals to be used
within EU-MAP monitoring are listed and together with basic cost analysis for the different EM
proposals.
The technique is readily available and can be cheap and there are many manufacturers all over
the world providing solutions for monitoring both large and small scale fisheries. EM monitoring
is in use in some fisheries today and there are approximately a thousand EM monitoring systems
installed on fishing vessels all over the world (Michelin et al., 2019). An overview of the current
state of EM use, the benefits of the technology, and the main barriers to broader adoption is
described in Michelin et al., (2019). However, EM monitoring is not adopted in EU fisheries and
to enhance implementation a collaborative project between Member States could be initiated try-
ing out and evaluating different EM monitoring methods in a future EU-MAP. A project pro-
posal would not only include one type of monitoring for example using only Remote Electronic
Monitoring (REM) which has been tried out already by many Member States including Sweden,
Denmark and the Netherlands, but also looking at combining many monitoring approaches such
as onboard observers, REM, portable cameras and monitoring landings.
With regard to finding effective mitigation methods for reducing the bycatch of harbour por-
poises, one question that remains unanswered is why harbour porpoise are actually bycaught?
How they might detect a net and if possible avoid it. By using several underwater sound record-
ers (soundtraps), harbour porpoises movement can be followed within a distance of 200 meters.
The SMRU, UK are studying the movement of harbour porpoises in the vicinity of a gillnet
equipped with pingers to track harbour porpoise deterrent behaviour. Using sound traps (e.g.
Macaulay et al. 2017) to study harbour porpoise behaviour near different types of gillnets will
19 The last sentence of the paragraph was added based on reviewers’ comments.

ICES | WGBYC 2019 | 115
provide valuable insights into the behaviour of porpoises around the nets and could provide
insights to novel mitigation.
Another area of great concern regarding carrying out reliable bycatch risk assessments is getting
accurate data on fishing effort. WGBYCs´ analysis of data submitted through the ICES WGBYC
datacall as well to ICES RBD show inconclusive reporting on fishing effort for many fisheries
(small-scale for example) and by many Member States. Projects have been carried out trying to
estimate relative fishing effort in different areas by using AIS data (see 3.4). This is a step forward,
however there are disadvantages in using AIS data in that not all fishing vessels are currently
required to use AIS and AIS does not show the type of gear in the water. However, a comparative
analysis of the outcome of estimated fishing effort from AIS compared to actual fishing effort in
an area would be a valuable exercise to inform on the use of AIS data to estimate fishing effort.
Data on fishing effort could also be collected by Member States by expanding reporting for small
scale fisheries to the EU logbook or getting this information by other means such as mobile phone
apps. Another method of collecting data on fishing effort could be by using remote satellite anal-
ysis, but this approach has the same disadvantages as AIS with not knowing which gears are
actually set in the water.
A new program funded by measure 39 of the EMFF will start in 2019 for three years in France,
conducted by the French Institute for marine research and exploitation (Institut Français de Re-
cherche et d’Exploitation de la Mer - IFREMER,), representatives of the industry from the Commit-
tee for marine fisheries and fish farming (Comité National des Pêches Maritimes et des Elevages Ma-
rins - CNPMEM,), regional grouping of professional fishermen (Pêcheurs de Bretagne), Aglia and
Observatoire Pélagis (University of La Rochelle and CNRS).
The aim of this project is to develop or adapt mitigation strategies for common dolphin bycatch
in the Bay of Biscay. One of the listed actions is the development of a new interactive and unidi-
rectional pinger adapted for midwater pair trawlers. Different net adaptations will be tested for
gillnets, including the development and test of acoustic reflectors. Analyses on by catch circum-
stances and fishermen interviews will generate reflections around best practices and bycatch
avoidance strategies.

116 | ICES SCIENTIFIC REPORTS 1:51 | ICES
6 Continue, in cooperation with the ICES Data Centre, to develop, improve, populate through formal Data Call, and maintain the database on bycatch moni-toring and relevant fishing effort in European wa-ters. (Intersessional (ToR F)
6.1 Needs of WGBYC for the new RDBES
As Regulation 812/2004 will be repealed, monitored data on bycatch of PETS in commercial fish-
eries will be included in ICES RDBES (ICES Regional database and estimation system). To be
able to submit data on PETS into the RDBES, the database needs to be modified. The recording
of bycatch handling by fishers can be diverse depending on, for example, the fisheries monitored;
it can take place in different parts of the vessel or during different stages of the fishing operation.
Studies have shown that depending on whether the observer is a dedicated marine mammal
observer compared to a discard observer you get higher bycatch rates using the former, suggest-
ing that discard observation might be incomplete when monitoring PETS. For the calculation of
catches and bycatch, WGBYC and other ICES EGs need the RDBES to provide a “picture” of the
fishing operation associated to each data record that has been effectively screened and the species
likely to have been detected at each stage. On the 18th of October 2018, Bram Couperus (Co-chair
WKPETSAMP, member WGBYC), Sara Königson (Co-chair WGBYC) and Nuno Prista (Core-
Group of RDBES) had an intersessional meeting to review the version of the current datamodel
v.1.15. The fishing process was characterized by three separate defined processes:
1. Slipping- In fishing operations such as purse-seiners, the net may be opened and part of
the catch released without ever coming onboard. In those cases, marine mammals but
also some fish species (e.g., sardines) are released and these are frequently quantified in
number or weight. In gillnet fisheries slipping is characterized by species falling out from
the net while on the outside of the boat.
2. Hauling- This is when the nets are taken onboard and for example the cod-end of the
trawl is opened and catch is emptied or when the gillnet comes into the vessel.
3. Sorting- This is when observers generally take a sample of a from the large catch and
screen. This can in some fisheries be carried out below deck. These observation can be
representative for most fish and crustaceans however not for rare protective species or
mega-fauna.
One of the main requirements from WGBYC for the new RDBES is that it will be possible to
distinguish between non-observation (missing values) and observation (true 0s, positive values).
Until now in the WGBYC database and in RDBES it is not possible to distinguish the situations
above which makes a difference for bycatch monitoring of for example large mammals.
6.2 ICES WGBYC Data call
On 14th December 2018, WGBYC issued an official data call for the second time (Annex 7 to the
report to include data call). The call aims to collect data describing total fishing effort, monitor-
ing/sampling effort and protected species bycatch incidents from 2017. The data supports ICES
annual advice on the impact of bycatch on small cetaceans and other marine animals to answer

ICES | WGBYC 2019 | 117
a standing request from the European Commission for advice on the impacts of fisheries on the
marine environment.
Data were requested through the data call to 18 out of the 20 ICES countries (all ICES countries
except USA and Canada). In addition, six Mediterranean non-ICES countries were included in
the call (i.e. Croatia, Cyprus, Greece, Italy, Malta and Slovenia).
The majority of the contacted countries submitted data through the call (20 out of 24 countries;
Cyprus, Malta, Russia and Norway did not submit) but the quality and quantity of the data pro-
vided varied widely among nations. Further, about a third of the countries submitted data after
the deadline outlined in the data call.
WGBYC reiterates that to facilitate data submission and processing it is recommended that each
nation nominates a single organization to coordinate and provide bycatch data in future ICES
data calls.
In the latest data call, WGBYC referred to Table D1 in the EU-MAP for a list of bony fish to be
reported. However, following requests from some countries as to regards which species the
group are interested in, the group reviewed the Table to develop a WGBYC priority species list
(see section 6.3 below).
The database template includes fixed/mandatory vocabularies for several data fields, which fa-
cilitates data collation across countries but can give rise to submission challenges, particularly
for nations that submit data for the first time and for which tailored vocabularies may be needed.
During 2018, updates were made to the data submission format and several fields have been
changed from “optional” to “mandatory” in the latest database template. For example “observer
days at sea”, “number of incidents (with and without pingers)” and “number of specimens (with
and without pingers)” are now mandatory. Importantly, it is also now mandatory that any by-
catch record should be linked to a bycatch monitored effort record. This year, however, the fact
that “days at sea” is not the mandatory metric for fishing effort presented problems and the
group will make it so in next year’s data call. WGBYC would also recommend that “days at sea”
is a mandatory field for the RDB(ES) to ensure continuity of WGBYCs time series of bycatch data
and assessments. Developments of the database template are ongoing and will, in particular, be
mindful of data collection under the EU-MAP and the fact that 2018 data (to be assessed at
WGBYC 2020) will be the last time data collected under Reg812/2004 will be submitted.
Over the course of the WGBYC meeting, it also became apparent that the spatial scale at which
fisheries data were to be submitted is not fixed within the template; consequently some data
were received at ICES subareas (preferred), others by division and yet others aggregated over
multiple divisions. For example, the allowed entries could be “1~5~6” or “27.2.b.2” where the
former is not useable for generating metier specific bycatch rates and consequently cannot be
used in the bycatch risk assessments carried out by the group. This causes problems for assess-
ments of bycatch rates.
6.3 Fish species of interest to WGBYC
In Table 1D 'Species to be monitored under protection programmes in the Union or under inter-
national obligations' of the Commission Implementing Decision (EU) 2016/1251 adopting a mul-
tiannual Union programme (EU-MAP) for the collection, management and use of data in the
fisheries and aquaculture sectors for the period 2017-2019, those species are listed which are to
be recorded by the member states as part of the data collection programme. The list contains 121
entries of bony fish, 7 of which are multiple entries and 63 entries for the area of the Baltic Sea
alone. The list was critically reviewed during this year's meeting to determine which of these

118 | ICES SCIENTIFIC REPORTS 1:51 | ICES
bony fish species are relevant for the work of WGBYC and should therefore be queried in the
annual Data Calls.
An initial decision was taken by the group to remove commercial species for which other scien-
tific entities, e.g. ICES expert groups, carry out assessments. Additionally, it was noted that many
bony fish species are listed for the Baltic Sea area, based on HELCOM. Our review shows that
this is likely due to the EU Table 1D list being based on a list from HELCOM that listed almost
all species occurring in the Baltic Sea as a preparatory stage for the classification of species on
the current HELCOM Red List. The group reviewed the remainder of species, taking into account
their conservation status; as a consequence, some were classified as 'not applicable' (NA) or 'least
concern' (LC), so they were not included on the WGBYC Species List. Species, listed in the EU
Habitats Directive were included in the WGBYC species list. The final list is given in Table 18.
6.4 Comparison of effort from different sources (RDB & WGBYC)
WGBYC has historically used fishing effort data for static nets and midwater trawls obtained
through MS annual Reg. 812 reports for contextualising reported bycatch rates and to form the
basis of bycatch risk assessments for those gear types. WGBYC was informed in 2017 that Reg.
812 was in the process of being repealed, so when that process is complete annual reports will
no longer be submitted to the EC meaning this source of fishing effort data will not be available
to the working group. To identify possible alternative sources of fishing effort data a comparison
of four different effort datasets (WGBYC data call, RDB, VMS, Logbooks) was conducted during
the 2018 WGBYC meeting, the results of which are described in the working group report from
that year (ICES 2018a). Based on this comparison the WGBYC data call and RDB datasets were
considered to be the most complete of the four but some broad discrepancies between them were
evident but there was insufficient time at the meeting to investigate this more fully. Conse-
quently it was agreed that at the 2019 WGBYC meeting a more thorough comparison of these
two datasets should be conducted to understand any possible biases in reported effort levels if
WGBYC transitioned to using the RDB as the primary source of fishing effort data.
In late 2018 WGBYC issued a formal data call to MS requesting fishing effort, monitoring effort
and bycatch data for 2017 from national databases. A request was also sent to the ICES secretariat
in early 2019 to request fishing effort data from 2017 from the RDB. This section describes the
results and conclusions from this comparative analysis of the effort data available in each dataset.
Effort data from some countries (e.g. UK, Portugal) are not included because comparable effort
metrics were not submitted to both databases.
Two broad gear types, static nets and midwater trawls were separated into under 10m and over
10m fleets by MS, as this was the only size category consistent between the two datasets. There
was almost no midwater trawl effort in either dataset for under 10m vessels so we have not
presented those data here. Figures 6 - 8 show the differences in recorded effort (days at Sea) by
MS between the two datasets for each gear type / vessels size category.

ICES | WGBYC 2019 | 119
Figure 6. Differences between RDB and WGBYC datasets for under 10m netters.

120 | ICES SCIENTIFIC REPORTS 1:51 | ICES
Figure 7 Differences between RDB and WGBYC datasets for over 10m netters.
Figure 8 Differences between RDB and WGBYC datasets for over 10m midwater trawls.

ICES | WGBYC 2019 | 121
Significant country specific differences were found between the two datasets in each gear / vessel
size combination. In the under 10m gill netting datasets (Figure 6) Germany and France had
much higher reported effort in the WGBYC database compared to the RDB. According to the
German WGBYC members present at the meeting this discrepancy was due to significant over-
estimation of effort for small German vessels due to a peculiar artefact of the effort recording
system in place which means that if a small boat registers even a single day at sea in a particular
calendar month, that boat is registered as fishing for the entire month (i.e. circa 30 days). The
difference in the French effort data in this category could not be determined at the meeting and
so needs further investigation. The lower reported effort for Poland in the WGBYC database is
thought to be because monitored effort rather than total effort for 2017 was submitted in error to
the WGBYC database.
For over 10m gill netting vessels (Figure 7) Germany, France and Poland show much the same
general pattern as the under 10m gill netting category with Germany and France reporting
higher effort to the WGBYC database and Poland higher to the RDB.
The discrepancies between the two datasets are smaller for midwater trawls (Figure 8) with Fin-
land, Poland, Estonia and the Netherlands showing the greatest differences. Further investiga-
tion is needed to determine the reasons for this. The reporting of midwater trawl effort by most
other MS appears to be relatively consistent.
The scale of some of the identified differences between these datasets raises important questions
about the suitability of any single existing fishing effort dataset for use in assessments of pro-
tected species bycatch that utilize effort data in calculations of total mortality or risk. Addition-
ally the fact that days at sea is not mandatory in the current RDB also means that the utility of
that particular effort data source is further reduced as significant gaps may arise from MS simply
not reporting data in that format. For now the judgement of the members of WGBYC that worked
on this effort data comparison is that the group should continue requesting data from MS
through an annual formal ICES/WGBYC data call in the standard format, but also obtain equiv-
alent data for the same years from the RDB. This will allow a synthesis of both datasets to be
undertaken prior to the WGYC meeting each year. With sufficient scrutiny and understanding
of the issues contained within each dataset it should be possible to produce a single “most com-
plete” dataset utilising the most accurate data originating from either the ICES/WGBYC data call
or via the RDB.
A new version of the RDB, the RDBES, is currently in development and WGBYC recommend
that days at sea is incorporated as a mandatory field for future data submissions to that database
so that all countries submit equivalent and comparable formats to both databases.

122 | ICES SCIENTIFIC REPORTS 1:51 | ICES
6.5 Collating data from 2005 until 2017 into a single table
WGBYC has, since 2005, collected data on bycatch in fisheries along with fishing effort according
to Regulation 812/2004. WGBYC has a database for this data however data has been summarized
and submitted differently by member states over the years from 2005-2017. To carry out trend
analysis on bycatch rates over time, areas and in different métiers , it would be helpful to have
all the observed effort and bycatch data collated and submitted into a single table to facilitate
assessment of bycatch rates over time or development of a temporal mean which can be applied
to recent fishing effort data. This structure has arisen as a result of the evolution of the way in
which WGBYC requests and stores the bycatch data. It has also been driven by policy drivers,
particularly Reg. 812/2004 to date, but going forward EU-MAP data collection will be the prior-
ity.
Member states received a WGBYC data template on which to base data submissions to the group;
however, the early template allowed flexibility in how the data were entered. For example, by-
catch estimates could have been pooled over multiple divisions where a member state had con-
ducted monitoring which makes it impossible to drill down to métier-specific bycatch rates/esti-
mates. Some member states only submit the number of bycatch incidents and not the number of
individuals bycaught. To alleviate these issues, the template has become more structured over-
time and fixed vocabularies have been introduced. Data submission guidance has developed and
more formal data calls (WGBYC 2016) and ICES\WGBYC (2017 and 2018) are now used to im-
prove the standard of data submissions.
The entire dataset is not suitable for analysis of all taxa. The data submitted was initially required
only by Reg. 812/2004 and therefore only data held by WGBYC on cetacean bycatch can be used
from 2005 until 2014 this is because bycatch on other bycaught PETS was not asked for even
though some member states did report such bycatch. It is for this reason that the summary table
of bycatch records for the period 2005-2017 presented in ToR C was only applicable to marine
mammals (see 0).
Data submitted for 2015-2017 is relatively compatible due to the structured datacall. However,
during WGBYC 2019 efforts were made to pool data from 2005 until 2014 submitted to the
WGBYC database for further analysis. However, with regards to different member states sub-
mitting data differently, many assumptions had to be made while pooling data.
In order to pool the data, a common metric of fishing and monitored effort is needed. WGBYC
has always worked with, and now requests, both effort types in Days at Sea (DaS) and observed
days at sea (obDaS). However fishing effort can be reported both in DaS and trips. Therefore,
when only trips have been reported in certain métiers we have converted the number of observed
trips into Observed DaS. WGBYC used the information provided by WGCATCH (2019) for this
conversion which concluded that for set gillnets for small boats, one trip equals one DaS. In other
métiers, such as OTM or OTT, the mean number of DaS per trip has been calculated for the métier
of concern. Thereafter, the mean DaS has been included when only trips were reported.
Over the time period, cases of duplicated data submissions were identified. Only the latest sub-
mitted data has been retained.
If only the number of incidents was reported and not the number of individuals, Member States’
Reg. 812/2004 report was referred to try and fill information gaps. However this was only pos-
sible to do for cetaceans, in the case of grey seals, for example, we have assumed that one incident
equals one caught individual. This information has then been added to the summarized data.
The outputs from this collation exercise is a summarized data table for the entire period 2005-
2017 which is held within the WGBYC database.

ICES | WGBYC 2019 | 123
Despite the efforts to create the summarized table, WGBYC decided that only the more recent
data 2015-2017 would be used in the BRAs. Earlier data were only used to summarise bycatch
rates of marine mammals and not scaled up using fishing effort data. There are a number of
reasons for this relating to the pre-2015 data which:
were not collected through formal datacall
were not standardized sufficiently, resulting in assumptions being made on how to use
available data
assumptions around fishing effort and monitored effort in particular, could give rise to
large bias in bycatch estimates
WGBYC have considered these issues and the value of the collated data. The group considers
that the best way to resolve this issue and ensure there is a consistent time-series of data, is to
request resubmission of all data using the new data template. However, the effort involved for
countries may be prohibitive.

124 | ICES SCIENTIFIC REPORTS 1:51 | ICES
Table 18. WGBYC proposed priority bony fish list.
Scientific name Common name
Acipenser spp. Sturgeon sp.
Alosa alosa Allis shad
Alosa fallax Twait shad
Coregonus lavaretus (previously Coregonus balticus) (migratory) European white-fish
Coregonus lavaretus (previously Coregonus maraena) (stationary) European white-fish
Hippocampus guttulatus (previously Hippocampus ramulosus) Long-snouted seahorse
Hippocampus hippocampus Short-snouted seahorse
Hippoglossus hippoglossus Atlantic halibut
Lampetra fluviatilis European River lamprey
Petromyzon marinus Sea lamprey

ICES | WGBYC 2019 | 125
7 References
ASCOBANS 2016. Resolution No.5: Monitoring and Mitigation of Small Cetacean By-
catch.https://www.ascobans.org/sites/default/files/document/MOP8_2016-5_Bycatch.pdf
*BirdLife International 2015. European Red List of Birds. Luxembourg. [Red List Europe and EU27]
Corte´s V, Gonza´lez-Sol´ıs J 2018. Seabird bycatch mitigation trials in artisanal demersal longliners of the
Western Mediterranean. PLoS ONE 13(5): e0196731. https://doi.org/10.1371/ journal.pone.0196731
Cruz, M.J., Machete, M., Menezes, G., Rogan, E., Silva, M.A., 2018. Estimating common dolphin bycatch in
the pole-and-line tuna fishery in the Azores. PeerJ 6, e4285. https://doi.org/10.7717/peerj.4285
*del Hoyo J & Collar NJ 2014. HBW and BirdLife International Illustrated Checklist of the Birds of the
World. Vol. 1 Non-passerines. Barcelona. [seabird distribution]
Dorrien C von, Chladek J-C (2018) Sicherung der Wettbewerbsfähigkeit der deutschen Fischerei durch
Entwicklung innovativer, praxistauglicher PAL-Warngeräte zur Minimierung von Schweinswal-
Beifängen - Schlussbericht des Teilprojektes 1. Rostock: Thünen-Institut für Ostseefischerei, 17pp.
https://literatur.thuenen.de/digbib_extern/dn060166.pdf
European Commission (2012): Action Plan for reducing incidental catches of seabirds in fishing gear. COM
(2012) 665 final. 16 pp.
Field, R., Crawford, R., Enever, R., Linkowski, T., Martin, G., Morkūnas, J., Morkūnė, R., Rouxel, Y., Oppel,
S., High contrast panels and lights do not reduce bird bycatch in Baltic Sea gillnet fisheries, Global
Ecology and Conservation (2019), doi: https://doi.org/10.1016/j.gecco.2019.e00602
fishPi, 2019. Deliverable 3.1 - A regional sampling plan for data collection of PETS (Protected, Endangered,
and Threatened Species). fishPi project (MARE/2014/19): Strengthening regional cooperation in the
area of fisheries data collection in the North Sea and Eastern Arctic.
Hammond, P. S., Lacey, C., Gilles, A. , Viquerat, S., Börjesson, P., Herr, H., Macleod, K., Ridoux, V., Santos,
M.B., Scheidat, M., Teilmann, J., Vingada, J. and Øien, N. 10 2017. Estimates of cetacean abundance in
European Atlantic waters in summer 2016 from the SCANS-III aerial and shipboard surveys. Final
Project Report. 40pp. https://synergy.st-andrews.ac.uk/scans3/files/2017/05/SCANS-III-design-based-
estimates-2017-05-12-final-revised.pdf
Hanamseth, R, Barry Baker, G, Sherwen, S, Hindell, M, Lea, M-A. 2018. Assessing the importance of net
colour as a seabird bycatch mitigation measure in gillnet fishing. Aquatic Conserv: Mar Freshw Eco-
syst. 28: 175- 181. https://doi.org/10.1002/aqc.2805
*HELCOM 2013. HELCOM Red List of Baltic Sea species in danger of becoming extinct. Baltic Sea Environ-
ment Proceedings No. 140. [Red List Baltic Sea]
ICES. 2013. Report of the Workshop on Bycatch of Cetaceans and other Protected Species (WKBYC), 20–22
March 2013, Copenhagen, Denmark. ICES CM 2013/ACOM:36. 55 pp.
ICES. 2019. Report of the Working Group on Bycatch of Protected Species (WGBYC), 4–7 February 2014,
Copenhagen, Denmark. ICES CM 2014/ACOM:28. 30 pp.
ICES. 2015. Report of the Working Group on Bycatch of Protected Species (WGBYC), 2-6 February 2015,
ICES Headquarters, Copenhagen, Denmark. ICES CM 2015\ACOM:26. 82 pp.
*ICES 2018. Report of the Joint OSPAR/HELCOM/ICES Working Group on Marine Birds (JWGBIRD), 1-5
October 2018 Oostende, Belgium. In prep. [gear types relevant for bycatch per species group]
ICES. 2018a. Report from the Working Group on Bycatch of Protected Species (WGBYC), 1–4 May 2018,
Reykjavik, Iceland. ICES CM 2018/ACOM:25. 128 pp
*IUCN 2018. The IUCN Red List of Threatened Species. Version 2018-2. <www.iucnredlist.org>. Down-
loaded on 21 February 2019. [Red List world]

126 | ICES SCIENTIFIC REPORTS 1:51 | ICES
Jimenez, S., Domingo, A., Forselledo, R., Sullivan, B. J. & Yates, O. 2018. Mitigating bycatch of threatened
seabirds: the effectiveness of branch line weighting in pelagic longline fisheries. Animal Conservation.
https://doi.org/10.1111/acv.12472
Koopman M, Boag S, Tuck GN, Hudson R, Knuckey I, Alderman R (2018) Industry-based development of
effective new seabird mitigation devices in the southern Australian trawl fisheries. Endang Species Res
36:197-211. https://doi.org/10.3354/esr00896
Lyssikatos MC, Chavez-Rosales S, Hatch J. In prep. Estimates of cetacean and pinniped bycatch in Northeast
and Mid-Atlantic bottom trawl fisheries, 2013-2017. Woods Hole, MA (US)
Macaulay, Jamie & Gordon, Jonathan & Gillespie, Douglas & Malinka, Chloe & Northridge, Simon. (2017).
Passive acoustic methods for fine-scale tracking of harbour porpoises in tidal rapids. The Journal of the
Acoustical Society of America. 141. 1120-1132. 10.1121/1.4976077.
Mangel JC, Wang J, AlfaroShigueto J, Pingo S, Jimenez A, Carvalho F, Swimmer Y, Godley BJ. 2018 Illumi-
nating gillnets to save seabirds and the potential for multi-taxa bycatch mitigation.R. Soc. open sci. 5:
180254. http://dx.doi.org/10.1098/rsos.180254
Michelin, M., Elliott, M., Bucher, M., Zimring, M. and Sweeney, M. (2018). Catalyzing the Growth of Elec-
tronic Monitoring in Fisheries. The Nature Conservancy and California Environmental Associates. 64
pp.
Murray KT. 2018. Estimated bycatch of sea turtles in sink gillnet gear. NOAA Technical Memorandum
NMFS-NE-242. Electronic access at: http://www.nefsc.noaa.gov /publications/.
NAMMCO_NIMR 2019. North Atlantic Marine Mammal Commission and the Norwegian Institute for Ma-
rine Research: Report of the Status of Harbour Porpoise in the North Atlantic Workshop. Tromsø, Nor-
way. December 2018. 187 pp.
Nieto, A., Ralph, G.M., Comeros-Raynal, M.T., Kemp, J., García Criado, M., Allen, D.J., Dulvy, N.K., Walls,
R.H.L., Russell, B., Pollard, D., García, S., Craig, M., Collette, B.B., Pollom, R., Biscoito, M., Labbish
Chao, N., Abella, A., Afonso, P., Álvarez, H., Carpenter, K.E., Clò, S., Cook, R., Costa, M.J., Delgado, J.,
Dureuil, M., Ellis, J.R., Farrell, E.D., Fernandes, P., Florin, A-B., Fordham, S., Fowler, S., Gil de Sola, L.,
Gil Herrera, J., Goodpaster, A., Harvey, M., Heessen, H., Herler, J., Jung, A., Karmovskaya, E., Keskin,
C., Knudsen, S.W., Kobyliansky, S., Kovačić, M., Lawson, J.M., Lorance, P., McCully Phillips, S., Mun-
roe, T., Nedreaas, K., Nielsen, J., Papaconstantinou, C., Polidoro, B., Pollock, C.M., Rijnsdorp, A.D.,
Sayer, C., Scott, J., Serena, F., Smith-Vaniz, W.F., Soldo, A., Stump, E. and Williams, J.T. 2015. European
Red List of marine fishes. Luxembourg: Publications Office of the European Union
Northridge, S., Cargill, A., Coran, A., Mandleberg, L., Calderan, S., and Reid, R.J. 2010. Entanglement of
minke whales in Scottish waters: an investigation into occurrence, causes and mitigation. Sea Mammal
Research Unit, Final Report to Scottish Government CR/2007/49. 57pp
Orphanides CD. In review. Estimates of cetacean and pinniped bycatch in the 2017 New England sink and
mid-Atlantic gillnet fisheries. Woods Hole, MA (US)
*OSPAR 2008. https://www.ospar.org/work-areas/bdc/species-habitats/list-of-threatened-declining-spe-
cies-habitats [OSPAR List of Threatened and/or Declining Species and Habitats]
OSPAR_IA, 2017. Seal Abundance and Distribution. https://oap.ospar.org/en/ospar-assessments/interme-
diate-assessment-2017/biodiversity-status/marine-mammals/seal-abundance-and-distribution/
Peltier, H., Dabin, W., Daniel, P., Van Canneyt, O., Dorémus, G., Huon, M. and Ridoux, V. 2012. The signif-
icance of stranding data as indicators of cetacean populations at sea: modelling the drift of cetacean
carcasses. Ecological Indicators, 18, pp.278-290.
Peltier, H., Jepson, P.D., Dabin, W., Deaville, R., Daniel, P., Van Canneyt, O. and Ridoux, V. 2014. The con-
tribution of stranding data to monitoring and conservation strategies for cetaceans: Developing spa-
tially explicit mortality indicators for common dolphins (Delphinus delphis) in the eastern North-At-
lantic. Ecological Indicators, 39, pp.203-214.

ICES | WGBYC 2019 | 127
Peltier, H., Authier, M., Deaville, R., Dabin, W., Jepson, P.D., Van Canneyt, O., Daniel, P. and Ridoux, V.
2016. Small cetacean bycatch as estimated from stranding schemes: the common dolphin case in the
northeast Atlantic. Environmental Science & Policy, 63, pp.7-18.
Read, F.L., 2015. Understanding Cetacean and Fisheries Interactions in the North-West Iberian Peninsula.
PhD Thesis, Universidad de Vigo, 327 pp.
Rogan, E., Breen, P., Mackey, M., Cañadas, A., Scheidat, M., Geelhoed, S. & Jessopp, M. (2018). Aerial sur-
veys of cetaceans and seabirds in Irish waters: Occurrence, distribution and abundance in 2015-2017.
Department of Communications, Climate Action & Environment and National Parks and Wildlife Ser-
vice (NPWS), Department of Culture, Heritage and the Gaeltacht, Dublin, Ireland. 297pp.
Ryan, C., Leaper, R., Evans, P.G.H., Robinson, K.P., Haskins, G.N., Calderan, S., Harries, O., Froud, K.,
Brownlow, A., and Jack, A. (2016) Entanglement: an emerging threat to humpback whales in Scottish
waters. Presented to the Scientific Committee Meeting of the International Whaling Commission, 2016,
SC/66b/HIM/01
Richards, R. J., Raoult, V., Powter, D. M., Gaston, T. F. 2018. Permanent magnets reduce bycatch of benthic
sharks in an ocean trap fishery. Fisheries Research. 208 :16-21.
Saavedra, C., Gerrodette, T., Louzao, M., Valeiras, J., García, S., Cerviño, S., Pierce, G.J., Santos, M.B., 2018.
Assessing the environmental status of the short-beaked common dolphin (Delphinus delphis) in
North-western Spanish waters using abundance trends and safe removal limits. Prog. Oceanogr., Mul-
tidisciplinary integrated surveys 166, 66–75. https://doi.org/10.1016/j.pocean.2017.08.006
SAMBAH, 2016. Final Report of the SAMBAH project. LIFE Project Number LIFE08 NAT/S/000261. 77pp.
http://www.sambah.org/SAMBAH-Final-Report-FINAL-for-website-April-2017.pdf
Sequeira, M., Inácio, A., Silva, M.A., and Reiner, F. 1996. Arrojamentos de mamíferos marinhos na Costa
Continental Portuguesa entre 1989 e 1994. Estudos de Biología e Conservação da Natureza 19. Instituto
de Conservação da Natureza. Lisboa. 52 pp. In Portuguese.
Sullivan, B. J., Kibel, B. , Kibel, P. , Yates, O. , Potts, J. M., Ingham, B. , Domingo, A. , Gianuca, D. , Jiménez,
S. , Lebepe, B. , Maree, B. A., Neves, T. , Peppes, F. , Rasehlomi, T. , Silva-Costa, A. and Wanless, R. M.
(2018), At-sea trialling of the Hookpod: a ‘one-stop’ mitigation solution for seabird bycatch in pelagic
longline fisheries. Anim Conserv, 21: 159-167. doi:10.1111/acv.12388
*Svensson L, Mullarney K & Zetterström D 2015. Der Kosmos Vogelführer. 2nd edition. Stuttgart. [seabird
distribution]
Vingada, J., Ferreira, M., Marçalo, A., Santos, J. Araújo, H., Oliveira, I., Monteiro, S., Nicolau, L., Gomes, P.,
Tavares, C. and Eira, C., 2011. SAFESEA- Manual de apoio para a promoção de uma pesca mais sus-
tentável e de um mar seguro para cetáceos. Programa EEA Grants- EEA Financial mechanism 2004-
2009 (projecto 0039), Braga. 114 pp. In Portuguese

128 | ICES SCIENTIFIC REPORTS 1:51 | ICES
Annex 1: List of participants
Name Institute Country of Institute E-mail
Adam Woźniczka National Marine Fisheries Research Institute
Poland [email protected]
Allen Kingston University of St Andrews
Sea Mammal Research Unit
Gatty Marine Laboratory
Ana Marçalo Centre of Marine Sciences-CCMAR
University of the Algarve
Portugal [email protected]
Bram Couperus Wageningen University & Research Netherlands [email protected]
Carlos Pinto International Council for the Explo-ration of the Sea
Data Centre
Denmark [email protected]
Christian von Dorrien Baltic Sea Fisheries Germany [email protected]
Finn Larsen DTU-Aqua Denmark [email protected]
Gudjon Sigurdsson Marine Research Institute Iceland [email protected]
Hélène Peltier University of La Rochelle France [email protected]
Katarzyna Kaminska Dept of Fisheries
Ministry of Agriculture and Rural Development
Poland [email protected]
Kelly Macleod
Chair
Joint Nature Conservation Commit-tee
Kenneth Patterson
Observer
European Commission Directorate for Maritime Affairs and Fisheries-DGMare
European Commis-sion
Maris Plikshs Institute of Food Safety Animal Health and Environment (BIOR)
Latvia [email protected]
Maurice Clarke Marine Institute Ireland [email protected]
Nicole Hielscher Institute of Sea Fisheries
Thünen Institute
Germany [email protected]
Peter Evans
Chair-invited
School of Ocean Sciences
Bangor University
ASCOBANS/ ACCO-BAMS
Ruth Fernandez ICES Denmark [email protected]

ICES | WGBYC 2019 | 129
Name Institute Country of Institute E-mail
Sara Bonanomi
Chair-invited
talian National Research Council (CNR)
Institute of Marine Biological Re-sources and Biotechnologies (IRBIM)
Italy [email protected]
Sara Königson
Chair
Swedish University of Agricultural Sciences
Sweden [email protected]
Sven Koschinski Consultant Meereszoologie Germany [email protected]

130 | ICES SCIENTIFIC REPORTS 1:51 | ICES
Annex 2: Resolutions
Terms of Reference for 2019 meeting
The Working Group on Bycatch of Protected Species, chaired by Kelly Macleod, UK and Sara
Königson, Sweden, will meet in Faro, Portugal 5–8th March 2019. The Terms of Reference pro-
posed:
a) Review and summarize annual national reports submitted to the European Commission
under Regulation 812/2004 and other published documents to collate bycatch rates and
estimates in EU waters and wider North Atlantic;
b) Collate and review information from national Regulation 812/2004 reports and elsewhere
in the North Atlantic relating to the implementation of bycatch mitigation measures and
ongoing bycatch mitigation trials and compile recent results on protected species bycatch
mitigation;
c) Evaluate the range of (minimum/maximum) impacts of bycatch on protected species
populations where possible, furthering the bycatch risk approach to assess likely conser-
vation level threats and prioritize areas where additional monitoring is needed;
d) Continue to develop, improve and coordinate with other ICES WGs on methods for by-
catch monitoring, research and assessment within the context of European legislation
(e.g. MSFD) and regional conventions (e.g. OSPAR) (intersessional);
e) Continue to coordinate and support among WGBYC members research proposals/pro-
jects and funding opportunities in support of researching protected species bycatch mit-
igation;
f) Continue, in cooperation with the ICES Data Centre, to develop, improve, populate
through formal Data Call, and maintain the database on bycatch monitoring and relevant
fishing effort in European waters. (Intersessional).
WGBYC will report by 8th April 2019 to the attention of the Advisory Committee.

ICES | WGBYC 2019 | 131
Agenda
Tuesday 5st March
Time Type Item
08:30 Plenary Laptop/network setup
08:45
Welcome & Introductions
House keeping
Ways of working
09:00 Plenary – de-ciding tasks
TOR A) Summary of reports (bycatch estimates): status review
- 812 report summaries by MS
- summaries from ancillary data (e.g. strandings)
- summaries bycatch rates from literature/metadatabase in N Atlantic (spreadsheet)
- outputs: tables (previous + advice)
TOR B) Summary of reports (mitigation): status review
- 812 report summaries by MS
- summaries from new literature in N Atlantic: mitigation trials & compile results
09:45 Presentations TOR C) Evaluation of population level impacts
Methods of calculating and modelling seabird by-catch based on effort data and on-boat observations
Evaluation of harbour porpoise bycatch using European strandings data
10:30 Plenary TOR C) Evaluation of population level impacts :
Seabirds: WGBYC data; JWGBIRD; EU PoA
Elasmobranchs: WGBYC data; WGEF
Marine mammals
11:30 Plenary TOR C) prioritise areas for more monitoring
How do we provide clarity on metiers to sample? RCG_NA_PETS subgroup work: North At-lantic risk assessment update (FishPi method)
Update monitoring metadatabase
13:30 Presenta-tion/plenary
TOR F) Report from the database subgroup
Data call
Response
Agree additional Tasks

132 | ICES SCIENTIFIC REPORTS 1:51 | ICES
Repeat effort comparison: unpick the problems and bias. How can it be improved? Other sources effort? Review WGCATCH approach for SSF
MERP approach –present to the subgroup
Combining older and new WGBYC data
14:30 Plenary ToR D) Continue to develop, improve and coordinate with other ICES WGs on methods for bycatch monitoring, research and assessment within the context of European legislation (e.g. MSFD) and regional conventions (e.g. OSPAR)
WGCATCH ;JWGBIRD ;WGEF ; WKSHARKS; WGMME
15:00 Plenary TOR E) Continue to coordinate and support among WGBYC members research pro-posals/projects and funding opportunities in support of researching protected species by-catch mitigation
Identify key research questions/priorities
Can we work up to a collaborative research proposal? UK soundtrap work - opportunities for collaborating? ( present to subgroup)
16:00
Sub-group work – organising group & planning for day 2. Start tasks as time allows
18:00 Close
Wednesday
08:30 Presentation Welcome from CCMAR represented by Jorge Gonçalves with a brief presentation on the work of the Coastal Fisheries and Research Group
8:45 Work session All ToRs
11:30 Presentations Tor B) Bycatch mitigation
PAL trials in the Icelandic cod gillnet fishery – preliminary results
Testing pingers to reduce interactions between dolphins and trammel nets: preliminary results of a pilot study off the Algarve coast (southern Portugal)
12:45 lunch
13:30
13:30-15:30
Work session All ToRs
Elasmo subgroup: Remote join to WGEF Chairs
17:15 Plenary Review of progress
18:00 Close
Thursday
08:30 Plenary Tasks
Work session All TORs

ICES | WGBYC 2019 | 133
12:30 Lunch
13:30 Plenary ToRs: Status review – Subgroup lead to update, present key results and draft conclusions, 2 slides for review by group
15:30 Close : Excursion & social
Friday
08:30 Work session Finishing up – all TORs
11:00 Plenary Reviewing ToR conclusions
Draft recommendations
12:30 Lunch
13:30 Plenary Writing and reviewing texts
Finalise Recommendations
15:45 2020 ToRs
16:15 Wrap up
Next meeting – timing; venues
16:30 CLOSE

134 | ICES SCIENTIFIC REPORTS 1:51 | ICES
WGBYC terms of reference for the 2020 meeting
The Working Group on Bycatch of Protected Species, chaired by Kelly Macleod, UK and Sara
Königson, Sweden, will meet in [near Amsterdam] on XXXX 2020. The Terms of Reference pro-
posed:
a) Review and summarise annual national reports (Reg812/2004) or data submitted through
the annual data call and other published documents to collate bycatch rates and estimates
in EU waters and wider North Atlantic;
b) Collate and review information from national (Regulation 812/2004) reports and else-
where in the North Atlantic relating to the implementation of bycatch mitigation
measures and ongoing bycatch mitigation trials and compile recent results on protected
species bycatch mitigation;
c) Evaluate the range of (minimum/maximum) impacts of bycatch on protected species
populations where possible to assess likely conservation level threats and prioritize areas
where additional monitoring/mitigation is needed;
d) Continue to develop, improve and coordinate with other ICES WGs on methods for by-
catch monitoring, research and assessment.
e) Identify potential research projects and funding opportunities to further understand
PETS bycatch and its mitigation
f) Continue, in cooperation with the ICES Data Centre, to develop, improve, populate
through formal Data Call, and maintain the database on bycatch monitoring and relevant
fishing effort in ICES and Mediterranean waters (Intersessional).
Supporting Information
Priority The current activities of this Group will lead ICES into issues related to the ecosystem affects of fisheries, especially with regard to the application of the Precautionary Approach. Consequently, these activities are considered to have a very high priority.
Scientific justification
a–b) This is essential to use in answering part of the European Commission MoU request to “provide any new information regarding the impact of fisher-ies on marine mammals, seabirds...”;
c) ICES Member Countries are required to reduce levels of bycatch under several pieces of legislation; the response to this ToR will help meet that aim;
d) Bycatch monitoring and assessment is fundamental to the work of the group; in light of significant changes in legislation that will impact monitoring programs for PETS any improvements in coordination and methods will help the group and other workers in this field;
e) Improving scientific understanding how target and non-target catches interact with commercial fishing gear is fundamental to developing effective mitigation measures to reduce bycatch on vulnerable species;
f) An operating database allows for more efficient response to future advice requests and an audit trail for information used in the Group’s reports; remaining intersessional ToR’s all aim to increase effeciency of WGBYC’s tasks in providing advice to various groups;
g) The European Commission has decided not to amend Res. 812/2004 and to integrate monitoring of protected and endangered species into the new DCF (DC-MAP). It is essential to cooperate with the scientists who design observer schemes and protocols for the monitoring of catch and discards;
Resource requirements
None beyond usual Secretariat facilities
Participants 15–25
Secretariat facilities
Secretariat support with meeting organization and final editing of report
Financial No financial implications.

ICES | WGBYC 2019 | 135
Linkages to advisory committees
ACOM
Linkages to other committees or groups
JWGBIRD, WGFTFB, WGMME, WGSE, WGEF, WGCATCH, WGMIXFISH, WGSFD, WGNSSK, SCICOM
Linkages to other organizations
NAMMCO, ASCOBANS, ACCOBAMS, GFCM, EC, IWC

136 | ICES SCIENTIFIC REPORTS 1:51 | ICES
Annex 3: Recommendations 2019
Recommendation Addressed to
Best practice sampling procedures for PETS need to be further developed and pre-sented to the RCGs and/or national contacts leading sampling programmes under the EU-MAP. This would include further definition of sampling fields as asked for by WGCATCH. WGBYC consider this would be best achieved through a workshop.
WGCATCH/WKPETSAMP
WGBYC recommends that WGCATCH work with us to deliver estimates of fishing effort for the small-scale netting fisheries for 2018 prior to WGBYC 2020 meeting.
WGCATCH
WGBYC concluded that the 2017 fishing effort data from the RDB could not be used for their PETS bycatch estimates WGBYC recommends that RDB discusses with the data needs of WGBYC to fulfil its advisory role to the European Commission.
SCRDB(ES)
WGBYC recommend that WGMME could request WGBYC to estimate/assess bycatch of specific species of their interest to reduce duplication between groups and enhance outputs of both.
WGMME
In 2018, WGBYC recommended the RDB Steering Group include additional fields to ac-commodate the new format of protected species data collection. New data fields were recommended by PETSAMP and reviewed by WGBYC. In 2019, WGBYC recommend that the RDB continue to work with WGBYC to ensure RDB(ES) can store PETS data from 2020.
RDB(ES)

ICES | WGBYC 2019 | 137
Annex 4: ICES WGBYC Data Call for ICES advisory work of the Working Group on Bycatch of Protected Species (WGBYC)
Data call: Data submission for ICES advisory work of the Working Group on Bycatch of Pro-
tected Species (WGBYC)
1. Scope of the Data Call
This data call aims to collate data describing fishing effort, monitoring effort, and bycatch event
records of protected species from 2017. These data will support the provision of ICES manage-
ment advice on the wider effects of fishing activity, and for the activities of other relevant ICES
Working Groups.
2. Rationale
ICES has a standing request from the European Commission to advise and inform on the impact
of fisheries on the ecosystem and to give warnings of any serious threats from fishing activities
alone or in conjunction with any other relevant activity to local ecosystems or species as soon as
ICES is aware of such threats. ICES currently provides advice on the effect of fishing on small
cetaceans and other marine animals and the requested data will be used by the ICES advisory
groups involved in the provision of such advice.
Currently, ICES summarizes information about the bycatch of marine mammals and other pro-
tected species as reported by EU Member States (MS) under Council Regulation (EC) No.
812/2004 (Reg 812/2004) and other mechanisms. Thus far, the available data have been insuffi-
cient to allow robust assessments of the overall effect of EU fisheries on a variety of protected
species (ICES 201820). Reg 812/2004 is due to be repealed, and consequently ICES is now prepar-
ing for the transition away from using MS Reg 812/2004 reports as the primary source of data on
the bycatch of cetaceans (as well as other protected and endangered species). In future, data pro-
vision will be through the ICES regional database (RDB) because of Commission Implementing
Decision (EU) 2016/125121 (EU MAP). This data call aims to improve consistency and complete-
ness in the reporting of bycatch data at a regional scale. ICES acquisition of fisheries sampling
and protected species bycatch data will aid the transition from Reg 812/2004 to EU MAP, and
improve the ability of ICES to advise on the effect of fisheries on protected species.
The data will be used to provide summaries of bycatch rates by species / gear type and area, and
will inform the development of risk assessments. These will be designed to provide insights into
the potential effects of fisheries on protected and endangered species.
20 ICES 2018. Bycatch of small cetaceans and other marine animals – review of national reports under
Council Regulation (EC) No. 812/2004 and other information. In Report of the ICES Advisory Committee,
2018. ICES Advice 2018, 8 pp.
http://www.ices.dk/sites/pub/Publication%20Reports/Advice/2018/2018/byc.eu.pdf
21 EU, 2016. Commission Implementing Decision (EU) 2016/1251 of 12 July 2016 adopting a multiannual
Union programme for the collection, management and use of data in the fisheries and aquaculture sectors
for the period 2017-2019 (notified under document C(2016) 4329).

138 | ICES SCIENTIFIC REPORTS 1:51 | ICES
The data will also be used to undertake a comparative assessment of fishing effort data acquired
from different sources. Any inconsistencies will, therefore, be understood as WGBYC transition-
ing from Reg 812/2004 reports to the RDB as their main source of effort data that underpins ad-
vice.
3. Legal framework
All governments or intergovernmental commissions that request and receive advice from ICES,
and all contracting parties to OSPAR and HELCOM, have signed international agreements un-
der UNCLOS 1995 Fish Stocks agreement articles 5 and 6, as well as WSSD 2002 article 30. By
signing, they agree to incorporate the effect of fisheries on other components of marine ecosys-
tems, and to implement an ecosystem approach to oceans policy that includes fisheries. These
agreements also include an obligation to support assessments of the effects of fisheries on pro-
tected and endangered species, and on the environment (UNCLOS FSA art 6).
For EU Member States this data call is under Council Regulation 812/2004, the DCF regulation
((EC) No 2017/1004 and Commission Decision 2016/1251/EU), and in particular Article 17(3) of
regulation (EC) No 2017/1004 which states that regarding “...requests made by end-users of scientific
data in order to serve as a basis for advice to fisheries management, Member States shall ensure that rele-
vant detailed and aggregated data are updated and made available to the relevant end-users of scientific
data within the deadlines set in the request,...”
For non-EU states with fisheries operating in the North Atlantic, there is a requirement to make
fisheries data available to support fisheries management under OSPAR, HELCOM, and UN-
CLOS.
These data are made available to facilitate the scientific basis for advice in support of marine
policies. ICES also has a policy on data use, which governs decisions on who is given access and
what they can do with the data; see http://ices.dk/marine-data/Documents/Data_Pol-
icy_RDB.pdf.
This data call follows the principles of personal data protection as referred to in paragraph (9) of
the preamble in Regulation (EU) 2017/1004, and repealing Council Regulation (EC) No 199/2008.
4. Deadlines
ICES request that the data be delivered by the 15th of February 2019, to provide enough time for
additional quality assurance and data handling procedures before the upcoming WGBYC meet-
ing in March 2019. Data submitted after this date cannot be processed and will not be taken
into account at the WGBYC 2019 meeting.
5. Data to report
5.1 Geographic and temporal scope
The geographical scope of this data call includes all areas covered by the monitoring and miti-
gation requirements of Reg 812/2004, and other North Atlantic (and adjacent) areas including:
Northwest Atlantic Fisheries Organisation (NAFO) Fishing Areas http://www.fao.org/fish-
ery/area/Area21/en
ICES Fishing Areas (http://www.fao.org/fishery/area/Area27/en) on as detailed a level as possi-
ble (including the adjustments to the North East Atlantic Fisheries Commission (NEAFC) Regu-
latory Areas https://www.neafc.org/managing_fisheries/measures/ra_map)
Geographical subareas (GSA) of the General Fisheries Commission for the Mediterranean
(GFCM) http://www.fao.org/gfcm/data/maps/gsas

ICES | WGBYC 2019 | 139
The temporal scope is for data collected specifically from 2017. However, historical data (i.e.
2009-2016) that have not been submitted previously to ICES (by EU and non-EU countries)
should also be submitted in the same format. Please refer to Section 6 – Annex 1 and 2 for specific
guidance on the data submission process, format, data fields, and definitions.
5.2 Data types
Data covered by this data call include:
For EU countries:
1. Data describing fishing effort, monitoring/sampling effort and incidental bycatch of cetaceans
in pelagic trawl, high opening trawl, bottom set net, and drift net fisheries in accordance with
the reporting requirements of EC Council Regulation 812/2004; and
2. Data describing monitoring/sampling effort and incidental bycatch of any non-cetacean pro-
tected species (i.e. species officially protected under national or international legislation), to in-
clude all other marine mammals (phocids etc.), all seabird species, all sea turtle species, and any
protected, prohibited (see pages 26 and 27 of the WGEF 2018 report for a list of EU-prohibited
elasmobranchs) or zero TAC elasmobranchs and protected fish species, from the same gear types
as listed in point 1.
3. Data describing monitoring effort and incidental bycatch of all protected species (as defined
in points 1 and 2 above) recorded from any other monitored gear types (demersal trawls, lines
etc.) under national data collection programmes (e.g. DCF etc.) or other monitoring pro-
grammes.
For non-EU countries:
1. Data from any non-EU countries describing fishing effort, monitoring/sampling effort and in-
cidental bycatch of any protected species (as defined in points 1&2 above) by gear type and area.
6. Data submission
Data submissions must conform to the present structure of the WGBYC format definition
(http://datsu.ices.dk/web/selRep.aspx?Dataset=128). To facilitate the submission of the data ICES
has developed an Excel template. The template can be found here: http://bycatch.ices.dk/up-
load/bycatchReporting_template.zip
Once the Excel data submission template is completed (see Annex 1), go to the “Export_data”
sheet and press the “Export data to XML” button to create a data file in XML format, then save
it onto your computer or network. Note: please do not use the Excel automatic XML conversion
function, as it will not produce the correct file.
Go to the bycatch portal http://bycatch.ices.dk
Press the ‘Submit data’ link and log in with your ICES sharepoint user credentials. If you do not
have access to ICES sharepoint, please contact [email protected] for assistance.
Full step-by-step instructions on how to submit data using the WGBYC data template is pro-
vided in Annex 1. The data format and look-up vocabularies are described in detail in Annex 2.
7. Contact information
For support concerning any issues about the data call please contact the ICES Secretariat ad-
[email protected] or the WG chairs Sara Königson ([email protected]) and Kelly Macleod
8. Electronic outputs

140 | ICES SCIENTIFIC REPORTS 1:51 | ICES
Data on fishing effort, monitored effort, and bycatch of protected species will be aggregated by
ICES Areas and ecoregion, as well as by GSA area in the Mediterranean. This data will be shown
in maps and tables within ICES Bycatch reports and in ICES Advice22. Aggregated data will also
be visible and accessible on the ICES Publications Library.
22 ICES 2018. Bycatch of small cetaceans and other marine animals – review of national reports under Coun-
cil Regulation (EC) No. 812/2004 and other information. In Report of the ICES Advisory Committee, 2018.
ICES Advice 2018, 8 pp. http://www.ices.dk/sites/pub/Publication%20Reports/Ad-
vice/2018/2018/byc.eu.pdf

ICES | WGBYC 2019 | 141
Annex 1. Data submission procedure
In the data submission template available from the ICES bycatch web-page, there are four work-
sheet tabs (Annex 2: Table 1 - File Information, Table 2 - Fishing Effort, Table 3 - Bycatch Moni-
toring Effort, and Table 4 - Bycatch Events) that contain mandatory data elements (red columns).
These require completion in order for data to be uploaded properly. Reporting of the non-man-
datory data elements (green columns) is encouraged when available. The worksheets and their
respective data entry fields are described in more detail in Annex 2 below. ICES Data Centre has
broadened the list of vocabularies to support data entry into several fields. Below are the brief
step-by-step instructions for entering and uploading data.
The first step is to click on the link provided here: http://bycatch.ices.dk/login.aspx to access the
data entry and upload template from the data submission site. ICES sharepoint login credentials
are required to login and can be requested at [email protected].

142 | ICES SCIENTIFIC REPORTS 1:51 | ICES
After entering your username and password, the second step is to download the template (see
below).
Step 3 is to review the ‘README’ tab in the template.
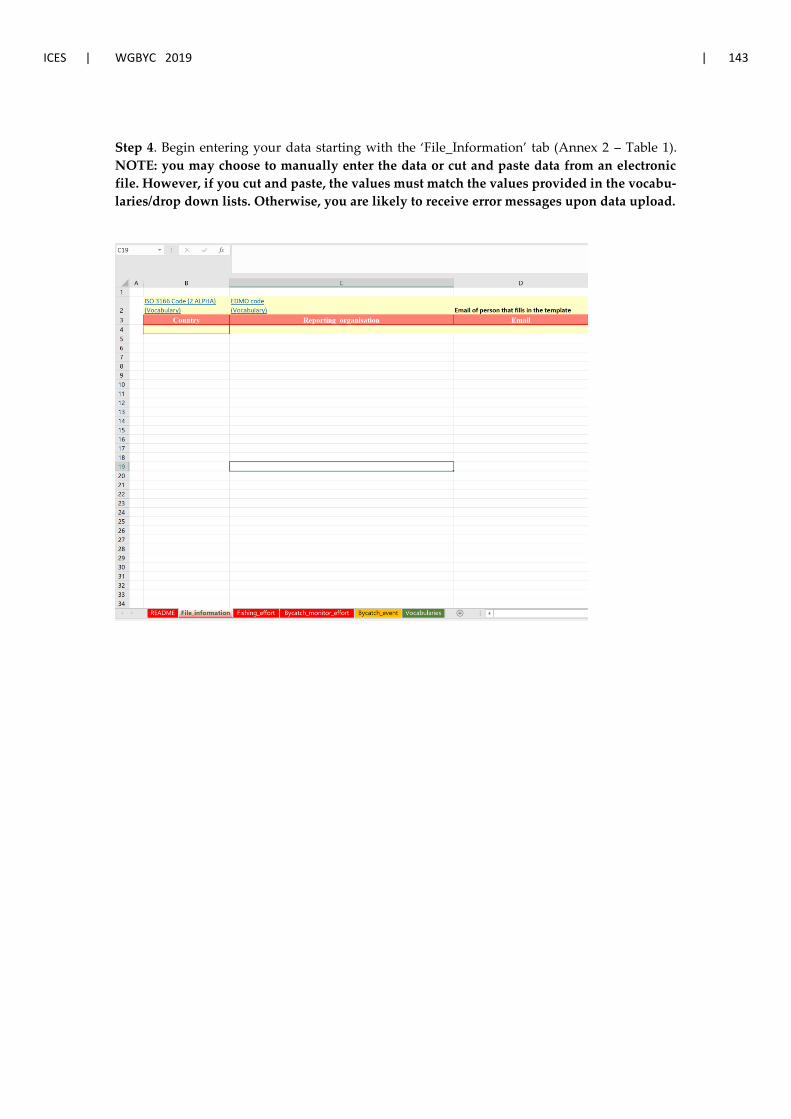
ICES | WGBYC 2019 | 143
Step 4. Begin entering your data starting with the ‘File_Information’ tab (Annex 2 – Table 1).
NOTE: you may choose to manually enter the data or cut and paste data from an electronic
file. However, if you cut and paste, the values must match the values provided in the vocabu-
laries/drop down lists. Otherwise, you are likely to receive error messages upon data upload.

144 | ICES SCIENTIFIC REPORTS 1:51 | ICES
Step 5. Move on to the ‘Fishing Effort’ table. Then begin to populate the remaining columns and
rows given the data.
Note: The fields in red are mandatory and the ones in green are optional.
Step 6. After completing the Fishing effort table, move on to the next tab ‘Bycatch_monitor_ef-
fort’ (Annex 2 – Table 3).

ICES | WGBYC 2019 | 145
Step 7. After completing the Monitoring Fishing effort table, move on to the next tab ‘By-
catch_event’ (Annex 2 – Table 3). This tab is where observed bycatch events, bycatch rates, and
estimates for different species are entered and linked with the Bycatch monitored effort and the
Fishing effort. Any bycatch record of year, month, gear, area, vessel size, monitor program type,
and monitoring protocol should correspond to a record within the Bycatch monitored effort ta-
ble.
Step 8. Go back to the readme tab, export your data to XML file, and save the file locally in your
computer.

146 | ICES SCIENTIFIC REPORTS 1:51 | ICES
Step 9. Go back to the http://bycatch.ices.dk/submitData.aspx link, and browse to your directory
where you saved your XML file and then click ‘Upload your File’ to upload your data to the
database.
Step 10. After data upload is initiated a message will appear, with the summary of your data,
and any possible error messages. If the file has no errors, then you should see (below) the “Import
the data to the database” button.
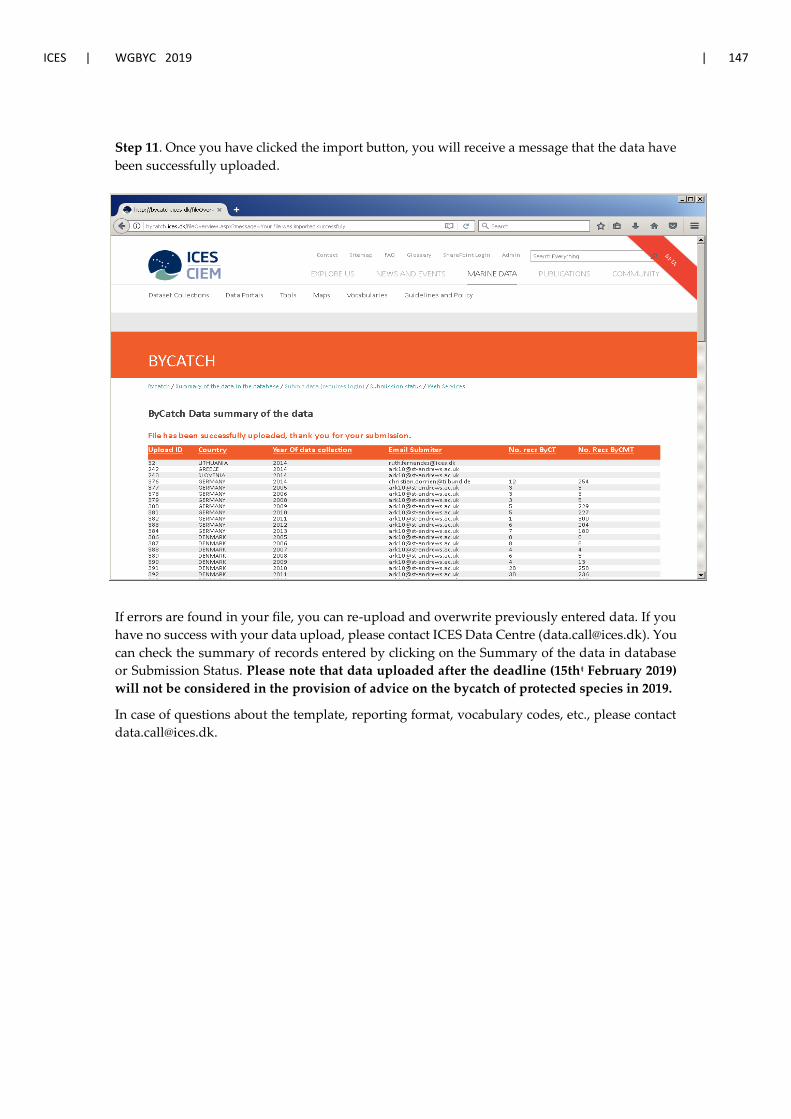
ICES | WGBYC 2019 | 147
Step 11. Once you have clicked the import button, you will receive a message that the data have
been successfully uploaded.
If errors are found in your file, you can re-upload and overwrite previously entered data. If you
have no success with your data upload, please contact ICES Data Centre ([email protected]). You
can check the summary of records entered by clicking on the Summary of the data in database
or Submission Status. Please note that data uploaded after the deadline (15tht February 2019)
will not be considered in the provision of advice on the bycatch of protected species in 2019.
In case of questions about the template, reporting format, vocabulary codes, etc., please contact

148 | ICES SCIENTIFIC REPORTS 1:51 | ICES
Annex 2. Data submission format in detail
There are four tables (worksheets) in the Excel file for submission, in addition to a RE-
ADME. This Annex explains the type (character [char], numeric, or text) and meaning of
each field, and whether the field is mandatory (M) or optional (O). Mandatory fie ld head-
ers are coloured red in the tables and must be completed; optional field headers are green.
Table 19. File Information Table
FIELD NAME FIELD
TYPE
OBLIGA-
TION
DESCRIPTION GUIDANCE
Country Char M ISO 2-alpha country
code
Use vocabulary link in tem-
plate Reporting_
organisa-
tion
Char M EDMO code of the organi-
zation responsible for the
data.
Use vocabulary link in tem-
plate
E-mail Char M E-mail address for the
point of contact about the
data.
Valid e-mail address
Table 20. Fishing_effort Table (for fishing effort)
FIELD
NAME
FIELD
TYPE
OBLIGA-
TION
DESCRIPTION GUIDANCE
Year Numeric M Four-digit year (e.g.
2015)
Enter the year when the data were
collected.
Month Numeric O One or two-digit month
(e.g 1 for January)
Enter the month when the data
were collected.
Area type Char M Area reference type Specify which area reference
codes you are using: ICES areas,
GFSM GSAs, NAFO areas
Area code Char M Area code, where the
majority of trips were
observed
Use code options from the look-
up lists for each area type; multi-
ple areas must be separated by ‘~’
Metier Level
3
Char M Generic gear group Use vocabulary options provided
in the template drop down list; if
‘other’ is selected, please provide
explanation in the comment field.
Metier Level
4
Char M Gear type Use vocabulary options provided
in the template drop down list
Metier Level
5
Char M Target species group Use vocabulary options provided
in the template drop down list
Metier Level
6
Char O Mesh size and other se-
lective devices
If applicable, briefly provide the
mesh size ranges and other selec-
tive devices applicable for the mé-
tier, according to Appendix IV of
the Commission Decision
2008/949/E
Vessel size
range [m]
Char M The size range of vessel
that was observed in
metres
Use vocabulary options provided
in the template drop down list.
Days at sea F Numeric M Total number of days at
sea corresponding to
fishing time (e.g. 60)
Indicate total days at sea operating at
Métier Level V according to Appen-
dix IV of the Commission Decision
2008/949/E

ICES | WGBYC 2019 | 149
FIELD
NAME
FIELD
TYPE
OBLIGA-
TION
DESCRIPTION GUIDANCE
Vessels F Numeric O The total number of ves-
sels
Indicate total number of vessels oper-
ating at Métier Level 5 according to
Appendix IV of the Commission De-
cision 2008/949/E
Trips F Numeric O The Total number of
trips
Indicate total number trips operating
at Métier Level 5 according to Ap-
pendix IV of the Commission Deci-
sion 2008/949/E
Total length
of nets F
[km]
Numeric O Total length of nets in
kilometres (km)
Indicate total length of nets (km) de-
ployed at Métier level 5 according to
Appendix IV of the Commission De-
cision 2008/949/E
Total km
hours F
Numeric O Total soak time of nets
in kilometre hours
(kmh) (this information
is intended for fixed
gears).
Indicate total soak time (kmh) fished
at Métier level 5 according to Appen-
dix IV of the Commission Decision
2008/949/E
No. of hauls
F
Numeric O Total number of hauls
fished
Total number of hauls (aka tows or
sets) fished at Métier level 5
Total towing
time F
Numeric O Total time tow deployed
for fishing in hours (h)
(this information is in-
tended for mobile gears)
Total tow time fished (h) at the Mé-
tier level reported.
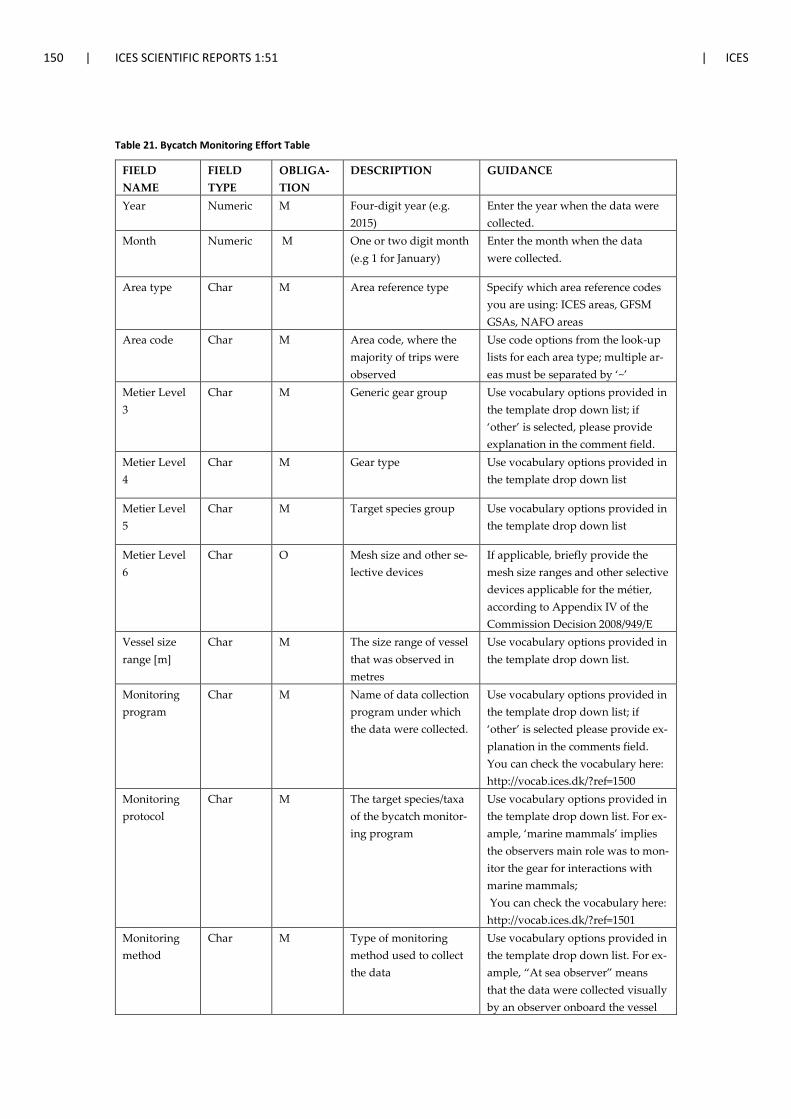
150 | ICES SCIENTIFIC REPORTS 1:51 | ICES
Table 21. Bycatch Monitoring Effort Table
FIELD
NAME
FIELD
TYPE
OBLIGA-
TION
DESCRIPTION GUIDANCE
Year Numeric M Four-digit year (e.g.
2015)
Enter the year when the data were
collected.
Month Numeric M One or two digit month
(e.g 1 for January)
Enter the month when the data
were collected.
Area type Char M Area reference type Specify which area reference codes
you are using: ICES areas, GFSM
GSAs, NAFO areas
Area code Char M Area code, where the
majority of trips were
observed
Use code options from the look-up
lists for each area type; multiple ar-
eas must be separated by ‘~’
Metier Level
3
Char M Generic gear group Use vocabulary options provided in
the template drop down list; if
‘other’ is selected, please provide
explanation in the comment field.
Metier Level
4
Char M Gear type Use vocabulary options provided in
the template drop down list
Metier Level
5
Char M Target species group Use vocabulary options provided in
the template drop down list
Metier Level
6
Char O Mesh size and other se-
lective devices
If applicable, briefly provide the
mesh size ranges and other selective
devices applicable for the métier,
according to Appendix IV of the
Commission Decision 2008/949/E
Vessel size
range [m]
Char M The size range of vessel
that was observed in
metres
Use vocabulary options provided in
the template drop down list.
Monitoring
program
Char M Name of data collection
program under which
the data were collected.
Use vocabulary options provided in
the template drop down list; if
‘other’ is selected please provide ex-
planation in the comments field.
You can check the vocabulary here:
http://vocab.ices.dk/?ref=1500
Monitoring
protocol
Char M The target species/taxa
of the bycatch monitor-
ing program
Use vocabulary options provided in
the template drop down list. For ex-
ample, ‘marine mammals’ implies
the observers main role was to mon-
itor the gear for interactions with
marine mammals;
You can check the vocabulary here:
http://vocab.ices.dk/?ref=1501
Monitoring
method
Char M Type of monitoring
method used to collect
the data
Use vocabulary options provided in
the template drop down list. For ex-
ample, “At sea observer” means
that the data were collected visually
by an observer onboard the vessel

ICES | WGBYC 2019 | 151
FIELD
NAME
FIELD
TYPE
OBLIGA-
TION
DESCRIPTION GUIDANCE
Fishery target
species
Char O Name of the main target
species. Minimum spec-
ification – taxonomic
group or common
name; Maximum speci-
fication – scientific
name of the species.
If more than one species, separate
scientific names by ‘~’
e.g. Sprattus sprattus~Clupea ha-
rengus
Pinger char-
acteristics
Char O Pinger (i.e. acoustic de-
terrent devices) specifi-
cations according to An-
nex II or Article 3.2 in
Council Regulation (EC)
812/2004.
Indicate type of device being used.
Use vocabulary options provided in
the template drop down list; Type 1
or Type 2 (http://eur-lex.eu-
ropa.eu/legal-con-
tent/EN/TXT/?uri=celex:32004R0812,
DDD=Dolphin Dissuasive Device;
MIX = a mixture of acoustic deter-
rents used; other=devices other than
Type 1, Type 2, DDD, or a mixture
of these 3 types)
If other pinger is used, please spec-
ify in the comments field.
You can check the vocabulary here:
http://vocab.ices.dk/?ref=1504
Other mitiga-
tion measures
Char O Other observed active
or passive mitigation
techniques used on the
gear.
Other observed mitigation tech-
niques could include escape panels
and reflective gear.
Vessels Ob-
served
Numeric O Total observed number
of vessels
Indicate the total number of vessels
that were monitored at the Métier
level reported.
Trips Ob-
served
Numeric O Total observed number
of trips
Indicate the total number of trips
that were monitored at the Métier
level reported.
Days at sea
Observed
Numeric M Total observed number
of days at sea (e.g. 60)
Indicate total days at sea observed
at the Métier level reported.
Hauls with
pingers Ob-
served [%]
Numeric O The percentage of hauls
observed with pingers
Indicate the % of observed hauls
that were equipped with pingers
(acoustic deterrent devices)
Total length
of nets Ob-
served [km]
Numeric O Total observed length of
nets in kilometres (km)
Indicated the total length of nets ob-
served (km) at the Métier level re-
ported.
Total km
hours Ob-
served
Numeric O Total observed soak
time of nets in kilometre
hours (kmh) (this infor-
mation is intended for
fixed gears).
Indicate total observed soak time
(kmh) at the Métier level reported.
No. of hauls
Observed
Numeric O Total observed number
of hauls
Total number of hauls (e.g. tows or
sets) at the Métier level reported.

152 | ICES SCIENTIFIC REPORTS 1:51 | ICES
FIELD
NAME
FIELD
TYPE
OBLIGA-
TION
DESCRIPTION GUIDANCE
Total towing
time Ob-
served
Numeric O Total observed towing
time in hours (h) (this
information is intended
for mobile gears)
Total tow time observed (h) at the
Métier level reported.
Type of 812
monitoring
Text O Type of monitoring pro-
gram under Reg. 812
Indicate type of monitoring pro-
gram conducted in
agreement with Article 4 and Annex
III of Council Regulation (EC)
Monitoring scheme, Pilot monitor-
ing schemes or Scientific studies.
You can check the vocabulary here:
http://vocab.ices.dk/?ref=1505
Comments Char O Provide additional in-
formation as appropri-
ate.
Follow guidance for mandatory
fields; comments for optional fields
are encouraged but not required.

ICES | WGBYC 2019 | 153
Table 22. Bycatch Event Table
FIELD
NAME
FIELD
TYPE
OBLI-
GA-
TION
DESCRIPTION GUIDANCE
Year Nu-
meric
M Four-digit year (e.g. 2015) Enter the year when the data were
collected.
Month Nu-
meric
M One or two-digit month (e.g 1
for January)
Enter the month when the data
were collected.
Area type Char M Area reference type Specify which area reference codes
you are using: ICES areas, GFSM
GSAs, NAFO areas
Area code Char M Area code, where the majority
of trips were observed
Use code options from the look-up
lists for each area type; multiple ar-
eas must be separated by ‘~’
Metier Level
3
Char M Generic gear group Use vocabulary options provided in
the template drop down list; if
‘other’ is selected, please provide
explanation in the comment field.
Metier Level
4
Char M Gear type Use vocabulary options provided in
the template drop down list
Metier Level
5
Char M Target species group Use vocabulary options provided in
the template drop down list
Metier Level
6
Char O Mesh size and other selective
devices
If applicable, briefly provide the
mesh size ranges and other selective
devices applicable for the métier,
according to Appendix 4 of the
Commission Decision 2008/949/E
Vessel size
range [m]
Char M The size range of vessel that
was observed in metres
Use vocabulary options provided in
the template drop down list.
Monitoring
program
type
Char M Name of data collection pro-
gram under which the data
were collected.
Use vocabulary options provided in
the template drop down list; if
‘other’ is selected please provide ex-
planation in the comments field.
You can check the vocabulary here:
http://vocab.ices.dk/?ref=1500
Monitoring
protocol
Char M The target species/taxa by the
human observer/monitoring
program. See guidance if elec-
tronic monitoring was used.
Use vocabulary options provided in
the template drop down list. For ex-
ample, ‘marine mammals’ implies
the observer’s main role was to
monitor the gear for interactions
with marine mammals.
You can check the vocabulary here:
http://vocab.ices.dk/?ref=1501
Monitoring
method
Char M Type of monitoring method
done to collect data
Use vocabulary options provided in
the template drop down list. For ex-
ample, “At sea observer” means

154 | ICES SCIENTIFIC REPORTS 1:51 | ICES
that the data were collected visually
by an observer onboard the vessel
Bycatch spe-
cies
Char M Name of species caught inci-
dentally. Minimum specifica-
tion – taxonomic group or
common name; Maximum
specification – scientific name
of the species.
Use WoRMS to verify the valid spe-
cies name
http://www.marinespecies.org/
Is cetacean Char O Yes; No Indicate if the animal is a cetacean.
No. of speci-
mens with
pingers
Nu-
meric
M Total number of observed
specimens incidentally caught
in gear equipped with pingers.
Number of live and dead specimens
caught in gear equipped with ping-
ers.
No. of speci-
mens with-
out pingers
Nu-
meric
M Total number of observed
specimens incidentally caught
in gear NOT equipped with
pingers.
Number of live and dead specimens
caught in gear NOT equipped with
pingers.
No. of inci-
dents with
pingers
Nu-
meric
M Number of fishing operations
equipped with pingers that
caught animals (dead and live
animals)
For example, this would be the total
number of fishing operations [e.g.
haul] observed that were equipped
with pingers and had incidental by-
catch of that species.
No. of inci-
dents with-
out pingers
Nu-
meric
M Number of fishing operations
that caught animals (dead and
live
animals)
For example, this would be the total
number of fishing operations [e.g.
haul] observed that were NOT
equipped with pingers and had in-
cidental bycatch of that species
Bycatch rate
with pingers
Nu-
meric
O The ratio of observed speci-
mens incidentally taken as by-
catch per unit of observed fish-
ing effort from gear equipped
with pingers.
Indicate per unit of observed fish-
ing effort, the bycatch rate (i.e total
number of specimens per days at
sea observed),
for a given species from gear that
was equipped with pingers.
Bycatch rate
without
pingers
Nu-
meric
O The ratio of specimens inci-
dentally taken as bycatch per
unit of observed fishing effort
from gear NOT equipped with
pingers.
Indicate per unit of observed fish-
ing effort, the bycatch rate (i.e total
number of specimens per days at
sea observed),) for a given species
from gear that was NOT equipped
with pingers.
Total By-
catch Esti-
mate
Nu-
meric
O Estimated total number of ani-
mals taken as bycatch derived
from observed incidental by-
catch.
Provide the total bycatch estimate
for each of the different species re-
ported.
Coefficient
of Variation
[%]
Nu-
meric
O Coefficient of Variation (%) Provide the estimated CV (standard
deviation/bycatch estimate x 100)
associated with the total bycatch es-
timate for each species.

ICES | WGBYC 2019 | 155
Annex 5: Tables, Figures, Acronyms
Tables
Table 1 Summary table of coastal EU Member States (MS) regarding the status of Reg. 812/2004
report submissions to the European Commission (Green = Yes for report with data on observer
effort (either days at sea or other measurement, e.g. effort per haul or set); Pale grey = Yes for
report with no data on observer effort (either days at sea or other measurement); Darker grey =
As for pale grey but report only received in 2019; Orange = no report submitted; *** No
Reg.812/2004 report but reports on cetacean bycatch observations made under DCF sent to the
Commission. Some of this information was made available at the meeting; **** Data made avail-
able at the meeting. 30
Table 2 Total number of bycatch specimens or *number of incidents reported and bycatch rates
derived from the ICES WGBYC data call for 2017 data. In most Member States, data submitted
to ICES WGBYC data call reflect the same data as in the Reg. 812/2004 report. However, Ger-
many, France, Denmark and Spain had additional information not included in this table. Bycatch
numbers and rates are grouped by ecoregion, taxa, métier and species. 31
Table 3. Marine mammal bycatch reported in the Regulation 812/2004 reports compared with
data submitted to the database for data collection during 2017. 49
Table 4. Summary of fished and observed effort in the US Northwest Atlantic Ecoregion, and
observed number of PET specimens bycaught. Bycatch estimates for the metier (Level 3) and
their source are also given. 52
Table 5. Fishing and monitoring effort (DaS = Days at Sea) by metier and are of interest, together
with observed bycatch of grey seals (Hg) and harbour porpoise (Pp) for 2015-2017. 79
Table 6. Total and observed effort in days at sea (DaS) and number of observed number of spec-
imen pooled per métiers described in column Metier L4, area and during the years 2015 to 2017.
The marine mammals included in the table are: Delphinus delphis, Halichoerus grypus, Phocoena
phocoena , Lagenorhynchus albirostris, Lagenorhynchus acutus, Stenella coeruleoalba, Phocidae, Phoca
vitulina, Tursiops truncates and Globicephala melas. If the species is not seen in the table it means
there are no bycatch incidents of that species. Total DaS from WGBYC database for 2017.
80
Table 7. Estimates of lower and upper 95% bycatch mortality for grey seals and harbour porpoise
in the context of harbour porpoise and grey seal abundance estimated in the Celtic sea and
Greater Sea ecoregions. Estimates for the eastern Bay of Biscay shelf are also provide for grey
seal. Estimates were derived from bycatch data submitted to the WGBYC database and the
French Reg. 812/2004 report for 2015 until 2017 and fishing effort data submitted to WGBYC for
2017. 82
Table 8. Estimates of lower and upper 95% bycatch mortality for harbour porpoise in the context
of harbour porpoise abundance estimates in the Celtic Sea Assessment Unit (NAMMCO_NIMR
2019). Estimates were derived from bycatch data submitted to the WGBYC database and the
French Reg. 812/2004 report for 2015 until 2017 and fishing effort data submitted to WGBYC for
2017. 84
Table 9. Observed DaS, number of individuals and bycatch rates (individuals per day at sea) for
marine mammal species, pooled by metier described and by area using data pooled over differ-
ent time periods between 2005 until 2017 and held within the WGBYC database. 84

156 | ICES SCIENTIFIC REPORTS 1:51 | ICES
Table 10. List of seabird species of the NE Atlantic, the Mediterranean Sea and the Baltic Sea with
relevant fishing métiers concerning bycatch, regions of sea with occurrence and status of various
Red Lists IUCN criteria given below; note that UK and Ireland use a slightly different system).
For sources, see marked (*) references 88
Table 11. Bycatch rates (individuals per day at sea) for selected seabird species, areas and gears.
In order to obtain reasonable observed effort, a number of months or areas were combined. One
country uploaded decimals for observed days at sea. 95
Table 12: Bycatch of protected elasmobranchs of high and medium conservation concern ex-
pressed in numbers and rate (no. specimens) presented by Ecoregion, and ICES/GFCM area
97
Table 13. Classification of bycatch risk for different taxonomic groupings and gear 1 = low risk;
2= medium risk; 3 = high risk. WGBYC revised the entries and upgraded some risk scores, shown
in brackets. 103
Table 14. Example (North Sea) of the output created for the request of the RCG to compare ob-
server effort distribution in DCF- and dedicated surveys. The table also summarise the risk cat-
egories from the FishPi approach* The information on these columns has not been updated by
WGBYC 2019. Extracted from the FishPi report WP3 (FishPi project, MARE/2014/19, “Strength-
ening regional cooperation in the area of fisheries data collection in the north sea and eastern
arctic”, table 12). 105
Table 15. Roles and responsibilities between WGEF, WGBYC and fish biodiversity group (MSFD
“D1” Descriptor) for elasmobranchs by quality of the assessment possible. Note the fish biodi-
versity group has yet to be established, and may be under OSPAR. 112
Table 16. Roles and responsibilities of groups working on elasmobranchs. 112
Table 17. Potential synergies between the groups. 113
Table 18. WGBYC proposed priority bony fish list. 123
Table 19. File Information Table 149
Table 20. Fishing effort Table (for fishing effort) 149
Table 21. Bycatch Monitoring Effort Table 150
Table 22. Bycatch Event Table 152
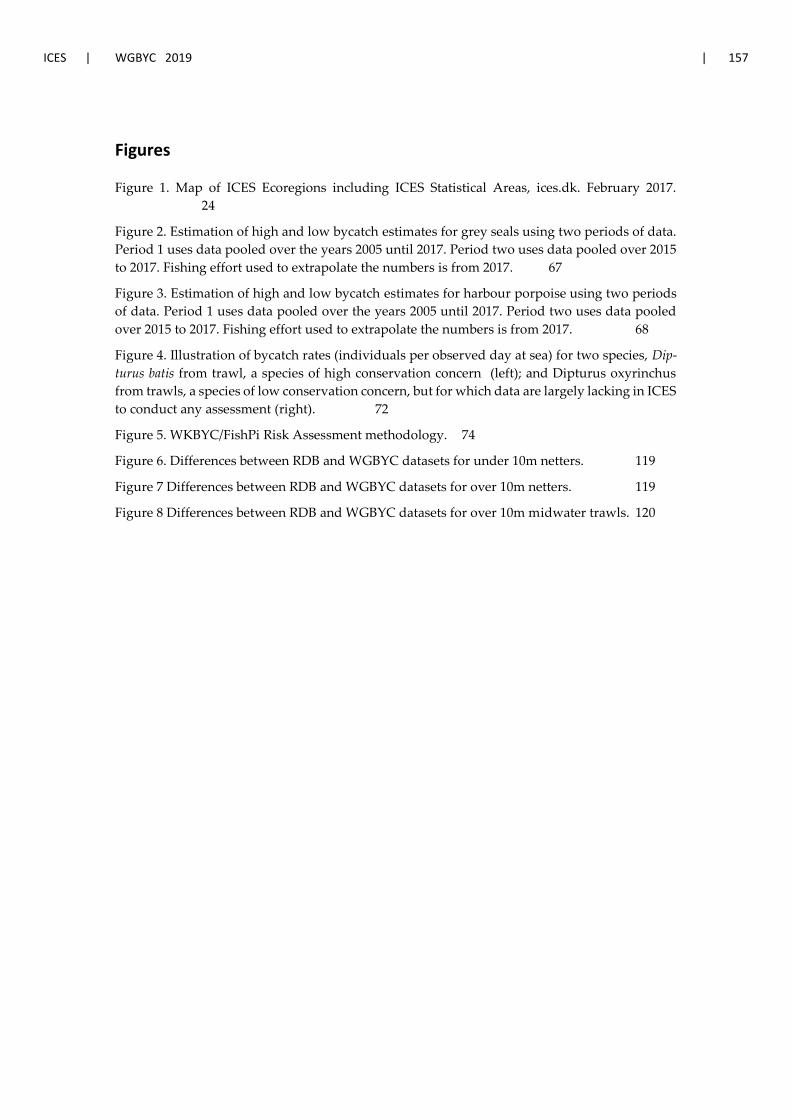
ICES | WGBYC 2019 | 157
Figures
Figure 1. Map of ICES Ecoregions including ICES Statistical Areas, ices.dk. February 2017.
24
Figure 2. Estimation of high and low bycatch estimates for grey seals using two periods of data.
Period 1 uses data pooled over the years 2005 until 2017. Period two uses data pooled over 2015
to 2017. Fishing effort used to extrapolate the numbers is from 2017. 67
Figure 3. Estimation of high and low bycatch estimates for harbour porpoise using two periods
of data. Period 1 uses data pooled over the years 2005 until 2017. Period two uses data pooled
over 2015 to 2017. Fishing effort used to extrapolate the numbers is from 2017. 68
Figure 4. Illustration of bycatch rates (individuals per observed day at sea) for two species, Dip-
turus batis from trawl, a species of high conservation concern (left); and Dipturus oxyrinchus
from trawls, a species of low conservation concern, but for which data are largely lacking in ICES
to conduct any assessment (right). 72
Figure 5. WKBYC/FishPi Risk Assessment methodology. 74
Figure 6. Differences between RDB and WGBYC datasets for under 10m netters. 119
Figure 7 Differences between RDB and WGBYC datasets for over 10m netters. 119
Figure 8 Differences between RDB and WGBYC datasets for over 10m midwater trawls. 120
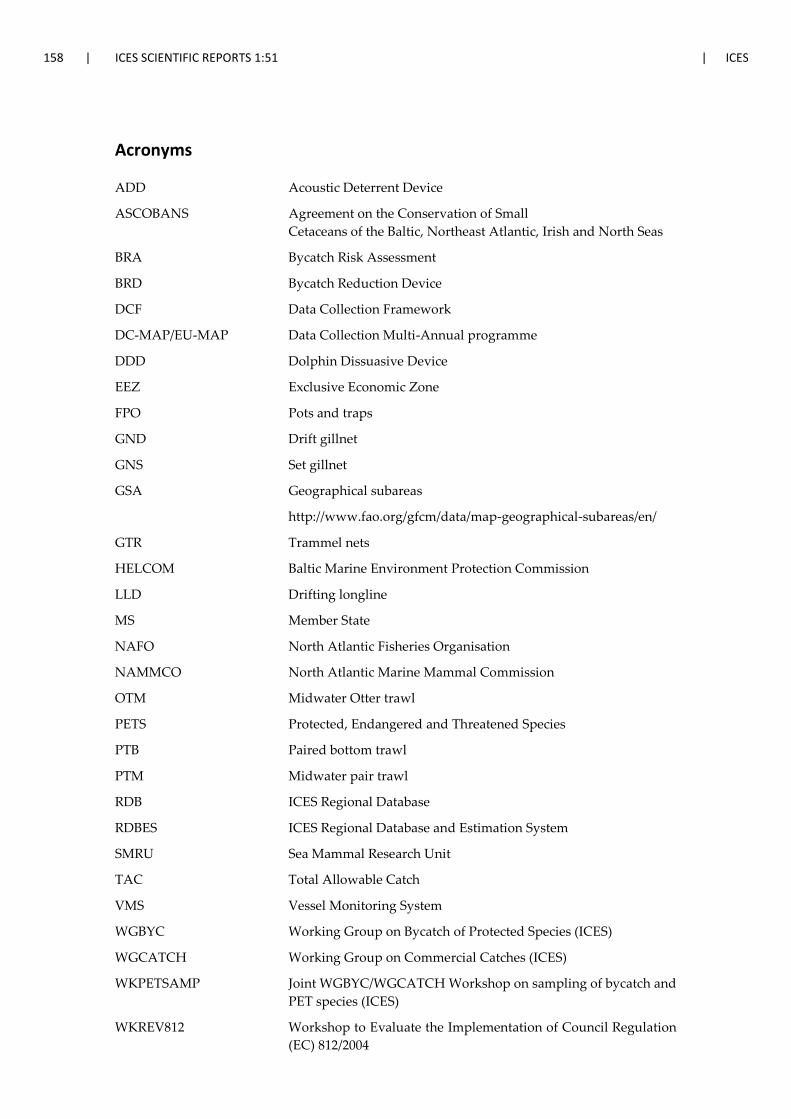
158 | ICES SCIENTIFIC REPORTS 1:51 | ICES
Acronyms
ADD Acoustic Deterrent Device
ASCOBANS Agreement on the Conservation of Small
Cetaceans of the Baltic, Northeast Atlantic, Irish and North Seas
BRA Bycatch Risk Assessment
BRD Bycatch Reduction Device
DCF Data Collection Framework
DC-MAP/EU-MAP Data Collection Multi-Annual programme
DDD Dolphin Dissuasive Device
EEZ Exclusive Economic Zone
FPO Pots and traps
GND Drift gillnet
GNS Set gillnet
GSA Geographical subareas
http://www.fao.org/gfcm/data/map-geographical-subareas/en/
GTR Trammel nets
HELCOM Baltic Marine Environment Protection Commission
LLD Drifting longline
MS Member State
NAFO North Atlantic Fisheries Organisation
NAMMCO North Atlantic Marine Mammal Commission
OTM Midwater Otter trawl
PETS Protected, Endangered and Threatened Species
PTB Paired bottom trawl
PTM Midwater pair trawl
RDB ICES Regional Database
RDBES ICES Regional Database and Estimation System
SMRU Sea Mammal Research Unit
TAC Total Allowable Catch
VMS Vessel Monitoring System
WGBYC Working Group on Bycatch of Protected Species (ICES)
WGCATCH Working Group on Commercial Catches (ICES)
WKPETSAMP Joint WGBYC/WGCATCH Workshop on sampling of bycatch and
PET species (ICES)
WKREV812 Workshop to Evaluate the Implementation of Council Regulation
(EC) 812/2004

ICES | WGBYC 2019 | 159
Annex 6: Reviewers Reports
Title: Review of ICES Working Group on Bycatch of Protected Species (WGBYC) Meeting Report
Reviewer: Chris Orphanides, NOAA
Date: June 2019
Summary: Overall I thought that the working group did a very good job assembling the report
it reflects well on all the work and analysis they have done. So, I have relatively few comments.
As someone not terribly familiar with the European bycatch setting, I appreciated the overview
sections describing the regulations, upcoming changes, and the definitions of acronyms in the
beginning of the report. In general, it seemed that there was a lot of care was taken to get the
details of the document right. It made things much more clear than when I reviewed last year’s
document. The group appears to have nicely fulfilled most of the terms of reference. However,
for ToR E, it wasn’t clear whether proposals came out of the fruitful discussions that were had
on potential research. But, all in all, it is a very solid document.
Review and summarize annual national reports submitted to the European Commission
under Regulation 812/2004 and other published documents and collated bycatch rates and
estimates in EU waters (Tor A)
The report does a good job reviewing and summarizing national reports and other data
summarizing available protected species interactions. The summaries are hampered somewhat
by inconsistent reporting on the part of the member states, but that is out of the hands of the
authors of this WGBYC report.
Collate and review information from National Regulation 812/2004 reports and elsewhere
relating to the implementation of bycatch mitigation measures and ongoing bycatch
mitigation trials, compile recent results and coordinate further work on protected species
bycatch mitigation (ToR B)
This section provides a good and intereseting summary of bycatch mitigation efforts underway
or completed in the EU, plus a helpful summary of recent bycatch mitigation efforts elsewhere.
It is unclear whether the WGBYC has met the portion of the ToR that deals with coordinating
future work on protected species bycatch. The report summarizes work that has been done, but
does not discuss its role coordinating future work.
In the third bullet of the conclusions, I think the conclusion is a bit broad. I would suggest adding
that pinger effectiveness varies by species in addition to area and fishing métier. My understand-
ing is that they are fairly effective with harbour porpoise, but less so with other species. The
report mentions the effectiveness of the banana pinger in Sweden, and ADDs in Ireland and
England. The PAL had mixed results, but that is experimental still at this point and takes a dif-
ferent approach than most pingers.
Evaluate the range of (minimum/maximum) impacts of bycatch on protected species
populations where possible, furthering the bycatch risk approach to assess likely
conservation level threats and prioritize areas where additional monitoring is needed (ToR C)
This section did a very good job assessming the potential bycatch ranges of numerous species
and more detailed analysis on harbor porpoise and gray seals, which is appropriate. Below are
a handful of small comments about the text

160 | ICES SCIENTIFIC REPORTS 1:51 | ICES
Is there some text or a figure missing on page 64 (section 5.1)? Maybe that is just a
formatting issue. The same things occurs several times in that chapter
There is a typo in Table 8 “Lowe”.
In Figure 4, it is hard to see some of those numbers on the map.
In the third paragraph of section 5.2, are the numbers in the brackets confidence
intervals “1,300 [810;2520]”? Would a dash between them be better?
In the second to last paragraph in section 5.2, I don’t understand why the process being
“localized” would result in it being easy to miss by observers.
Continue to develop, improve and coordinate with other ICES WGs on methods for bycatch
monitoring, research and assessment within the context of European legislation (e.g. MSFD)
and regional conventions (e.g. OSPAR) (TOR D)
This section was well organized and clear and it appears well worth the effort given all the
overlap between different groups.
Continue to develop collaborative research proposals among WGBYC members to pursue
research projects and funding opportunities in support of researching protected and target
species behaviour in relation to fishing gear (ToR E)
This section discusses a number of useful ideas for research projects, however it is unclear if any
of them became actual research proposals. Some EM proposals may have come out of these
discussions, though it is unclear if those came about before the time period discussed in this
report. This is the one area where it seems that the WGBYC may not met the terms of reference.
It may be that these discussions did, or will shortly, result in proposals, but that is not clear from
the text.
Continue, in cooperation with the ICES Data Centre, to develop, improve, populate through
formal Data Call, and maintain the database on bycatch monitoring and relevant fishing effort
in European waters. (Intersessional (ToR F)
The working group appears to have met this term of refernce with all their work on the bycatch
and fishing effort databases.
The reviewer concludes that the work is at a sufficient scientific standard for ICES to base its
advice on bycatch of protected species.

ICES | WGBYC 2019 | 161
Reviewer: Daniel Oesterwind, Thunen Institute
Date: June 2019
Note: The comments had been inserted by the reviewer in the draft report text and were later collated by
the ICES Secretariat
Detailed comments
Section 3.2. Monitoring under (EC) Regulation 812/2004-Overview
The text says “Six of the 23 EU MS were not affected by any part of Reg. 812/2004 (hereafter in this
section termed “the Regulation”)”. However, this are only the relevant MS, otherwise there are 28
EU-MS
Section 3.3. Monitoring reported under (EC) Regulation 812/2004 by Member States (includ-
ing non-cetacean bycatch events when provided)
The following and the next section is a bit confusing. E.g. for Spain, no report was provided and
the mentioned data are based of the data call, which will be dealt with in the next section.
Section 3.5. Other monitoring programmes and associated bycatch estimates
Greece:
The text says “… A total of 822 days at sea were monitored. No cetacean or birds bycatch incidents were
recorded…”. Any Idea about the observed coverage of the total fishing effort?
Section 3.5.2. Non-EU Member States
The text says “Monitoring in Icelandic waters during 2017 included 71 trips/days on lumpsucker gill-
net vessels, 60 trips/days on cod gillnet vessels, 72 trips/377 days on demersal trawl vessels, 143 trips/192
days on long line vessels fishing within the Icelandic EEZ. “ Any idea about the coverage of the total
fishing effort?
Section 3.6. Auxiliary data (strandings, entanglement and interviews) indicative of the impact
of bycatch
The text says “In the absence of at-sea observer monitoring programmes or when monitoring effort is low,
data from other sources such as cetacean strandings or video monitoring can be assessed to highlight the
occurrence of bycatch. Belgium, Denmark, France, Netherlands and Portugal have reported on assess-
ments of auxiliary data in their Reg. 812/2004 reports or directly to WGBYC. “ This is already men-
tioned for Denmark in the section before.
Section 3.7. Conclusions
The text says “High bycatch rates were observed for some elasmobranch species which are of
conservation concern, particularly in trawl gears in the Celtic Sea, the Greater North Sea and nets
in the Celtic Sea. A notably high bycatch rate for some vulnerable species on the IUCN red list of threat-
ened species was observed in the Greater North Sea ecoregion for trawl gears. “ Is the IUCN status listed
in he Table?
The text says “In conclusion, information provided through the Member States’ Reg. 812/2004 reports
and other additional and relevant sources of information is limited. For many areas and métiers, there is
insufficient monitored effort to enable any assessment of the over-all impact of fisheries on cetaceans or
other protected species. “ This is already the conclusion section
Table 2.
The IUCN status of the different species within the region would be very interesting

162 | ICES SCIENTIFIC REPORTS 1:51 | ICES
I would suggest to round the effort to full days and use a comma as thousands separator
Bycatch rates: I guess three decimal places would be enough
Table 3.
Column: Bycatch rate (Number of specimens/day at sea observed: zero values might be confus-
ing if bycatch is listed
Section 4.2. Conclusions
The text says “In conclusion, further development of mitigation measures as well as trials to test their
effectiveness are needed to reduce the bycatch of protected species in many fisheries. In particular, research
is needed on identification of bycatch hot-spots, on why pingers are effective in some fisheries and not in
others and on the possible effects of habituation and habitat exclusion in relation to pinger deployment.”
This is already the conclusion section
Section 5.1. Evaluating the impacts of bycatch on protected species populations using WGBYC
at-sea monitoring data
The text says “… The results were set in the context of regional abundance estimates of the protected
species of interest .”. How were those estimates performed?
The text says “The discrepancy in the results highlights the issues surrounding assessing bycatch
within “artificially” defined ecoregions that have no real bearing on biological populations; so
population impacts are not truly reflected. ” In future, the group should try to estimate the rates
and BRA on population level instead on the basis of ecoregions.
Section 5.1.2. Marine Mammals: Summary and comparison of minimum and maximum by-
catch rates 2005–2017
The text says “The results from the comparison analysis, as well as the summary of bycatch rates
do indicate that there is a need to analyse data using a higher metier level as well as taking into
regards changes in fisheries and abundance of the concerned species over the time period. “ Are
there any statistically significant differences?
Section 5.1.4. Elasmobranchs: summary of minimum and maximum bycatch rates for 2017
Typo:
Figure 9. The explanation of the colour code and numbers in the field are missing
Section 5.2. Evaluating the impacts of bycatch using strandings data: harbour porpoise and
common dolphins
The text says “In the whole area (Bay of Biscay, English Channel and Celtic Sea) the average annual
number of bycaught porpoises was estimated at 530 [330 – 1,030] individuals from 1990 to 2015. A de-
crease was highlighted in 2015. Since 2012 the yearly average estimate reached 1,300 [810; 2,520] by-
caught porpoises, …” Is there any explanation? What is the reason for the selected time period
(1990–2015 & 2012–)?
Section 5.5. Conclusions
The text says “High and low bycatch rates were also estimated for all marine mammals in the
entire WGBYC database (2005-2017) for the Greater North Sea and Celtic Seas Ecoregions and
the eastern Bay of Biscay shelf (8a & b);…” Change “high and low” to “minimum and maxi-
mum”?
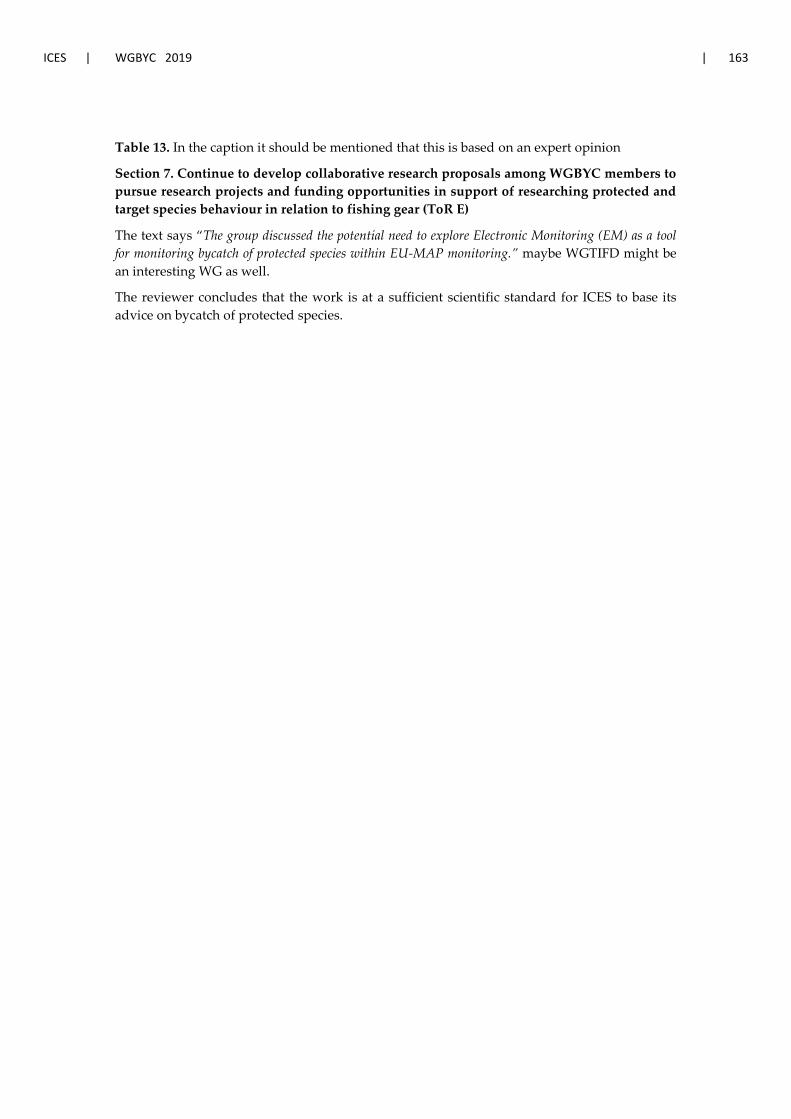
ICES | WGBYC 2019 | 163
Table 13. In the caption it should be mentioned that this is based on an expert opinion
Section 7. Continue to develop collaborative research proposals among WGBYC members to
pursue research projects and funding opportunities in support of researching protected and
target species behaviour in relation to fishing gear (ToR E)
The text says “The group discussed the potential need to explore Electronic Monitoring (EM) as a tool
for monitoring bycatch of protected species within EU-MAP monitoring.” maybe WGTIFD might be
an interesting WG as well.
The reviewer concludes that the work is at a sufficient scientific standard for ICES to base its
advice on bycatch of protected species.
Copyright © 2022 FDOKUMEN