ICES WGSPEC REPORT 2012 SCICOM STEERING GROUP ON ECOSYSTEM FUNCTIONS
Upload
khangminh22Category
view
3download
0
HAL Id: hal-00768794https://hal.archives-ouvertes.fr/hal-00768794
Submitted on 24 Dec 2012
HAL is a multi-disciplinary open accessarchive for the deposit and dissemination of sci-entific research documents, whether they are pub-lished or not. The documents may come fromteaching and research institutions in France orabroad, or from public or private research centers.
L’archive ouverte pluridisciplinaire HAL, estdestinée au dépôt et à la diffusion de documentsscientifiques de niveau recherche, publiés ou non,émanant des établissements d’enseignement et derecherche français ou étrangers, des laboratoirespublics ou privés.
New Insights on Ices in Centaur and TransneptunianPopulations
M.A. Barucci, A. Alvarez-Candal, F. Merlin, I.N. Belskaya, C. de Bergh, D.Perna, F. Demeo, S. Fornasier
To cite this version:M.A. Barucci, A. Alvarez-Candal, F. Merlin, I.N. Belskaya, C. de Bergh, et al.. New Insights on Icesin Centaur and Transneptunian Populations. Icarus, Elsevier, 2011, 10.1016/j.icarus.2011.04.019.hal-00768794

Accepted Manuscript
New Insights on Ices in Centaur and Transneptunian Populations
M.A. Barucci, A. Alvarez-Candal, F. Merlin, I.N. Belskaya, C. de Bergh, D.
Perna, F. DeMeo, S. Fornasier
PII: S0019-1035(11)00154-0
DOI: 10.1016/j.icarus.2011.04.019
Reference: YICAR 9796
To appear in: Icarus
Received Date: 12 January 2011
Revised Date: 21 April 2011
Accepted Date: 21 April 2011
Please cite this article as: Barucci, M.A., Alvarez-Candal, A., Merlin, F., Belskaya, I.N., de Bergh, C., Perna, D.,
DeMeo, F., Fornasier, S., New Insights on Ices in Centaur and Transneptunian Populations, Icarus (2011), doi:
10.1016/j.icarus.2011.04.019
This is a PDF file of an unedited manuscript that has been accepted for publication. As a service to our customers
we are providing this early version of the manuscript. The manuscript will undergo copyediting, typesetting, and
review of the resulting proof before it is published in its final form. Please note that during the production process
errors may be discovered which could affect the content, and all legal disclaimers that apply to the journal pertain.
NEW INSIGHTS ON ICES IN CENTAUR AND TRANSNEPTUNIAN POPULATIONS*
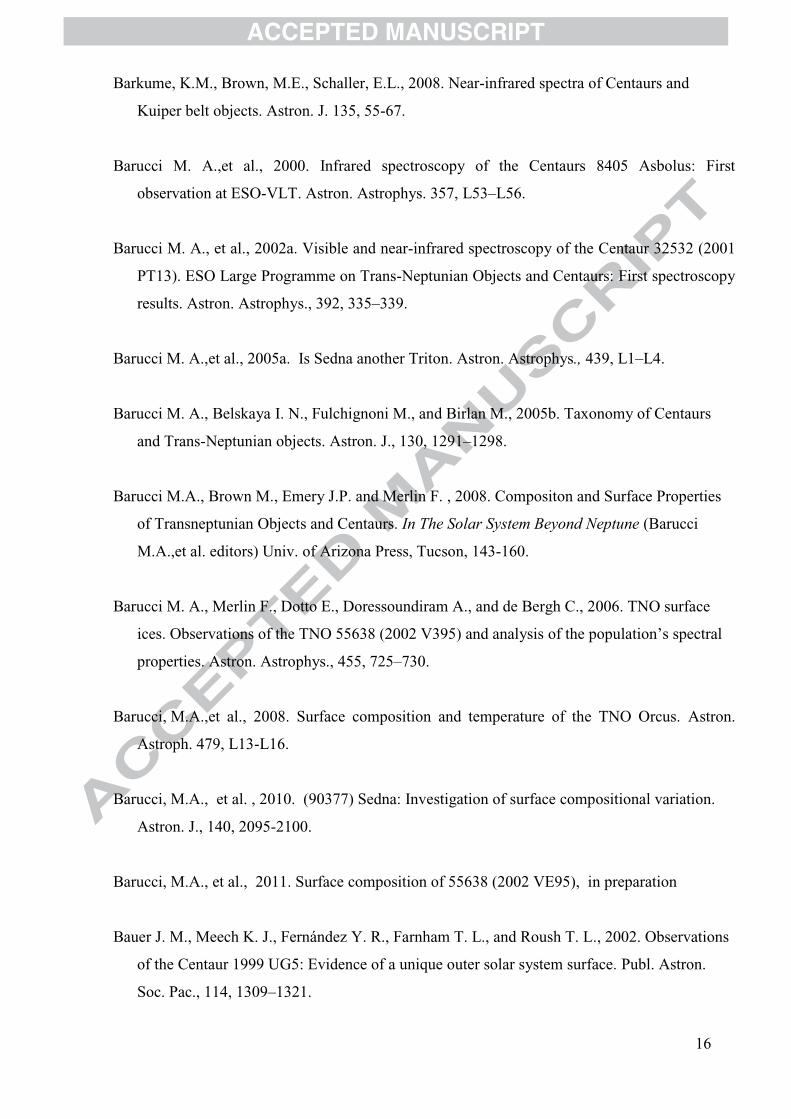
M.A. Barucci1, A. Alvarez-Candal2 , F. Merlin1, 3, I. N. Belskaya1, 4 , C. de Bergh1, D. Perna5, F.
DeMeo6, and S. Fornasier1,3
1LESIA, Observatoire de Paris, 5, place .Jules Janssen, 92195 Meudon Principal Cedex, France
2ESO, Alonso de Córdova 3107, Vitacura Casilla 19001, Santiago 19, Chile 3Université de Paris Diderot-Paris VII, Paris 4Instituite of Astronomy, Kharkiv National University, 35 Sumska str., 61022 Kharkiv, Ukraine 5INAF-Osservatorio Astronomico Capodimonte, Salita Moiariello 16, 80131 Napoli, Italy 6MIT, 77 Massachusetts Avenue 54-416, Cambridge, MA 02139, USA
*Based on observations made with ESO-VLT, under Large Program ID 178.C-0036 (PI: M. A.
Barucci)
Pages: 36
Tables: 4
Figures: 8

Proposed Running Head: Ices on Centaurs and TNOs
Editorial correspondence to:
Dr. M.A. Barucci
Observatoire de Paris
F-92195 Meudon Cedex
Phone: +33 14 507 77 75
Fax: +33 14 507 71 44
E-mail: [email protected]

3
Abstract
A Large Program (LP) has been carried out at ESO-VLT using almost simultaneously the
UT1, UT2 and UT4 telescopes (Cerro Paranal, Chile). The aim of this Large Program was to
obtain simultaneous visible and near-IR spectroscopic measurements (using FORS, ISAAC and
SINFONI instruments) with a S/N ratio as high as possible for almost all objects among different
dynamical groups observable within the VLT capability.
In this paper we present results on the second half of the Large Program which includes
new near-infrared spectroscopy data of 20 objects. For 12 of them for which we had obtained the
complete spectral range (V+J+H+K bands), we apply a radiative transfer model to the entire
spectral range to constrain their surface composition.
We also present an analysis of all near-IR spectral data available on TNOs and Centaurs
from both the complete LP and the literature. An overview for a total sample of 75 objects is thus
carried out analyzing the ice content with respect to the physical and dynamical characteristics.
The major new results are: i) all objects classified as BB class seem to have icy surfaces; ii) the
possible presence of CH3OH has primarily been detected on very red surfaces (RR class objects)
and iii) the majority of Centaurs observed multiple times have an heterogeneous composition.
Key Words: Transneptunian objects, Centaurs, spectroscopy.

4
1. Introduction
The study of the small bodies that orbit the Sun beyond Neptune, the Transneptunian
Objects (TNOs), has completely changed our view of the formation and evolution of the Solar
System. It has shown that this region of the Solar System, although very far from the Sun, has
been heavily perturbed, as indicated by the presence of bodies with highly inclined and/or very
eccentric orbits and the existence of widely different dynamical classes. It has also shown that,
although these objects reside in more or less the same region of the Solar System, they can have
very different surface characteristics, with few apparent links between their orbital and surface
properties (Doressoundiram et al., 2008).
Given the faintness of TNOs, spectroscopic observations of these objects can only be
carried out at a limited number of places around the world, since they require large telescopes
and well-adapted instruments. Furthermore, they are very time demanding. This is why the
number of objects for which high quality spectroscopy was possible, and particularly in the near-
infrared range which is essential for surface composition studies, concerned only a small fraction
of the objects discovered thus far (about 40 objects out of more than 1200).
The near-infrared spectroscopic observations have been obtained essentially with the ESO-
VLT in Chile, the Keck, Gemini and Subaru telescopes in Hawaii and the TNG telescope in the
Canary Islands. A few other telescopes have been used to get visible spectra, and some very
limited observations have been made in the far-IR with the Spitzer (see Barucci et al., 2008) and
Herschel (Mueller et al. 2010) Space telescopes. Various surface compounds have been detected,
including ices of water, methane, nitrogen, carbon monoxide, methanol, ethane and ammonia.
Some silicates are also present, as well as complex refractory carbonaceous compounds. The
largest objects, such as Pluto, Eris, Haumea and Makemake have unique surface properties (see
review by Brown 2008) as they have retained the most volatile species. Surfaces of smaller
objects are less well known but the existing observations raise many questions. It is very difficult
at this point to make the link between their current surface characteristics and all possible
processes that could have modified them: different regions of formation for the objects,
differences in orbital evolution, solar and cosmic ray irradiation, destructive and non-destructive
collisions, etc. In particular, the very red colors of some of them, the existence or absence of
water ice signatures in their spectra, the two classes of Centaurs (which are escapees from the
Transneptunian region), are some of the main puzzles that remain to be solved. For that, it is
essential to increase the sample of objects for which high quality data are available in each of the
currently defined dynamical classes (dynamically hot and dynamically cold classical objects,
resonant objects, scattered disk objects, detached objects, Centaurs).

5
The ESO-Very Large Telescope in Chile has played an important role in the spectroscopy
of TNOs over the past years. A Large Program (LP) has been carried out at ESO-VLT mainly
during 2007-2008 using almost simultaneously the UT1, UT2 and UT4 telescopes (Cerro
Paranal, Chile). The aim of this large program was to obtain simultaneous visible and near-IR
spectroscopy (using FORS, ISAAC and SINFONI instruments) with as high S/N ratio as
possible for almost all objects observable within the VLT capability. The program focused on
high quality spectroscopy for objects selected among different dynamical groups.
Results of visible spectral measurements for 43 TNOs and Centaurs obtained in the
framework of this Large Program were presented and discussed in Alvarez-Candal et al. (2008)
and Fornasier et al. (2009). The near-infrared observations in the range of 1.49-2.4 microns of 21
objects were presented in Guilbert et al. (2009a). Data on a few more objects were published by
Protopapa et al. (2009), Alvarez-Candal et al. (2010), DeMeo et al. (2010), Merlin et al. (2009
and 2010a,b), Guilbert et al. (2009b) and Barucci et al. (2008 and 2010). Here we present results
on the second half of the LP which includes new data on near-infrared spectroscopy of 20
objects. We also present an analysis of all spectral data available both from the complete LP and
the literature, covering the near-infrared spectral range. An overview for a total sample of 75
objects is thus carried out.
2. Observation and Data Reduction
The near-infrared spectroscopy has been performed in the J band with ISAAC and in H+K
with SINFONI. In this paper, we present the J spectra for four objects and H+K spectra for 20
objects observed in the framework of the Large Program.
Observational conditions of objects spectroscopically investigated during the second part
of the LP are reported in Table 1. For each object we report the observational date and universal
time (UT of the beginning of the exposure), the median seeing during the observation, the visible
magnitude, the total exposure time in seconds, the airmass value at the beginning and at the end
of observation, the observed solar analog stars with their airmass used to remove the solar and
telluric contributions, and the instrument used. The V magnitudes are given as measured by
Perna et al. (2010) which were generally obtained simultaneously with the SINFONI
observations. In a few cases when the object’s magnitude was not measured by Perna et al.
(2010) we give a catalogue value of the V magnitude, as reported in the ephemerides. Below we
briefly describe the specifics of observations and data reduction for each instrument.
2.1 SINFONI observations

6
SINFONI is an integral field unit spectrograph on Unit 4 (Yepun) of the VLT. It has been
used to observe the H and K bands simultaneously with the same grism and a spectral resolution
of 1500. The spatial resolution was 0.25 arcsec/spaxels, with corresponding FoVs of 8.0 arcsec.
The instrument was used in the no-AO mode, except during the nights of 2007 December,
for which a Laser Guide Star (LGS) was used.
All data were reduced using the SINFONI pipeline versions 1.9.4 and 2.0.0, released by
ESO. The reduction followed that described in Guilbert et al. (2009a) until the buildup of the
science cubes, but without proceeding with the sky-subtraction. This last step was performed
using a more thorough procedure (Davies, 2007) to improve the sky-subtraction and to obtain
higher quality data.
Once the cubes are sky-subtracted they are combined to obtain the final science cube. The
spectra are then extracted using a cylindrical aperture of 5 spaxels (see below) with QFitsView,
developed by the Max Plank Institute (Garching bei München). The spectra of the science
objects were then divided by that of a solar analogue star observed the same night, with the same
setup and an airmass matching as close as possible that of the science object. The spectra of the
analogue star were extracted using the same aperture as the science object to minimize possible
systematic geometric effects. The related observational circumstances are reported in Table 1.
One crucial part of the extraction of the reduced spectra was to decide the optimal aperture
size to be used. The spectra obtained with SINFONI are not perfectly aligned with the z-axis
(wavelength axis), therefore using too small of an aperture could cause an off-center extraction
of the spectra at some wavelengths, depending on where we center the cylinder for the
extraction. Using an aperture too large to gather all the flux will include places with negative
flux (results of the sky subtraction) and will decrease the S/N ratio due to the inclusion of large
residuals from the background.
To choose the “optimal” aperture we extracted the spectra of an object using different
aperture sizes (from 1 to 14 spaxels, corresponding to 0.25 up to 3.5 arcsec on the sky), and
performed two tests. First, we studied the change of the S/N ratio (measured at 1.6 and 2.2 µm)
against the aperture size. Second, we computed the slope introduced in the spectra while varying
the aperture size. For this test we used an aperture size of 5 spaxels as a reference which our
previous experience, based on a trial-and-error approach, indicated as a good first guess. We
found that aperture sizes between 5 and 7 spaxels provide a good balance between S/N and
spurious spectral slope in the extracted spectra. So we decided to stick to our choice of 5 spaxels
to extract the spectra.

7
The spectra obtained with SINFONI are shown in Fig. 1. All spectra are normalized to 1.55
microns and are shifted vertically by a constant for clarity.
2.2. ISAAC observations
Near-infrared spectroscopy in the J band (1.1–1.4 µm) has been obtained using the SW
mode of the ISAAC instrument (equipped with a Rockwell Hawaii 1024 × 1024 pixel Hg:Cd:Te
array), mounted at the VLT–UT1 (Antu). The spectral resolution is about 500 with a 1'' slit. The
observations were executed by nodding the object along the slit by 10'' between two positions A
and B. First steps of the reduction procedure were performed using the ESO ISAAC pipeline
(which runs through EsoRex, the ''ESO Recipe Execution Tool''): flat-fielding, wavelength
calibration (through atmospheric OH lines or Xe-Ar lamp lines), A-B (or B-A) subtraction for
each pair of frames, correction for spatial and spectral axis distortion, and shifting and adding of
the frames. The resulting combined spectrum of the object was then extracted using ESO-
MIDAS.
The TNOs reflectivities were obtained by dividing the spectra by that of the solar analog
star closest in time and airmass, as reported in Table 1. The spectra were finally smoothed with a
median filter technique (e.g., Barucci et al. 2000), with a box of 10 Å in the spectral direction
and a threshold around 10-25%. Due to the time constraints and priority given to the photometry
in this wavelength range we obtained J spectra for only four objects. The obtained spectra are
reported in Fig. 3 and 4.
3. Results
In what follows we combine the spectroscopic and photometric data that were obtained
from nearly simultaneous visible and near-infrared observations carried out at UT1, UT2 and
UT4 VLT–ESO telescopes (Cerro Paranal, Chile) in the framework of the LP. For the H and K
bands, we analyzed the spectral behavior measuring the depth of the possible water ice band
absorption (at 2.0 µm), and the slope in the K band as described below. Finally for the objects for
which we obtained higher quality spectra and a complete range of observations, a surface model
has been investigated.
3.1 SINFONI spectral analysis

8
In order to obtain some quantitative information from the spectra, we computed a set of values to
help us characterize a priori the spectra. The parameters we used are the depth D, calculated as
the fractional difference in flux at 2.0 µm with respect to that at 1.75 µm, and the slope of the K
part of the spectra (Sk), computed between 2.05 and 2.3 microns. The first parameter, defined as
D (%) = (1 – flux2.0μm/flux1.75μm ) × 100 (1)
gives us an idea of the possible amount of water ice present on the objects’ surfaces. It was
computed as the median value of the flux between 1.71-1.79 µm and 2.0-2.1 µm. The error
assigned to each value of flux was the standard deviation in each interval. The error in D was
obtained by error propagation.
The second parameter Sk was computed by a linear fit in the range of 2.05-2.3 µm. It
could point to the presence of methanol-like compounds that might affect the slope of the spectra
at these large wavelengths.
The results are reported in Table 2. The analysis of these 2 parameters demonstrates the
level of diversity in the measured spectra. Given the way the K slope has been defined, it is
positive only for objects for which the spectral behavior is red, or for those with a significant
H2O ice content.
3.2 Spectral combination
To interpret the surface composition and apply the best fit model we used the visible
spectroscopic data obtained almost simultaneously using FORS2 and presented in Fornasier et al.
(2009). We also used the V, J, H and K photometry to calibrate and align the different
spectroscopic ranges, as reported and discussed in Perna et al. (2010). The already published V
spectra, together with the new J and H + K spectra, calibrated with the simultaneous photometry,
are reported in Fig. 2-4.
3.3 Model fits
In order to investigate the surface properties of these objects, we use the spectral model
developed by Hapke (1981, 1993). The composition and physical parameters are obtained
following the work described in Merlin et al. (2010a). In that work, neglecting the interferences
and simplifying the computation at zero phase angle, the geometric albedo is defined as:

9
Alb = r0(0.5 + r0/6) + (w/8) ((1+ B0) P(0)-1)
where w is the single-scattering albedo and r0 is the bihemispherical reflectance. The w
parameter depends on the optical constants of the material and is described in Hapke (1981). B0
is the ratio of the near-surface contribution to the total particle scattering at zero phase and P(0)
is the phase function, approximated by a single Henyey-Greenstein function. See Merlin et al.
(2010a) for a complete explanation.
To investigate the surface composition, we used a set of identified or possible compounds
for which optical constants are available. The general approach is to use the chemical
compounds that can account for the present signatures, or plausible compounds for these distant
objects that can reproduce the general spectral behavior. The code allows iterating with varying
albedo, components, quantities and grain sizes with a minimization of the chi square between the
model and the observed data. For each object we ran models considering amorphous and
crystalline water ice, olivine, Triton, Titan and ice tholins, kerogen, pyroxene, methanol,
methane, amorphous carbon and kaolinite.
Results of the best fit models for 12 objects are reported in Table 3 which contains the
percentage of the different components and particle size in microns. The results were obtained
with albedos in the V band given in Table 3 for which the model gives the best χ2. Lykawka and
Mukai (2005) found a correlation between the albedo and the object size when H<5.5,
suggesting that objects with brighter absolute magnitude should have higher albedo and this is in
agreement with our results. For the resonant object 2003 AZ84 the albedo has been derived from
Spitzer observations by Stansberry et al. (2008).
The best model fits are reported in Fig. 2-3-4. For two of them (2004 UX10 and 2008
SJ236) we present two models as we do not find a single best fit for the entire spectral range. For
10 of the analyzed objects, we needed H2O (in crystalline or amorphous or both states) to model
their surface composition while for four of them (2004 TY364, 2004 UX10, 2008 FC76, and 2008
SJ236) CH3OH is necessary to fit the general spectral behaviors. For two objects, we use a blue
component like kaolinite, using the method described by Merlin et al. (2010b) to extract optical
constants.
3.4 Overview of the spectral behavior
We obtained near-infrared spectra for 12 TNOs and 8 Centaurs, including 11 objects (2003
CO1, 2004 UX10, 2005 RM43, 2003 MW12, 2007 UK126, 2002 KY14, 2003 UZ413, 2007 UM126,

10
2007 VH305, 2008 FC76, and 2008 SJ236) which had not previously been observed in the near-
infrared range. Several objects have spectra showing the 2 and 1.5/1.65 µm bands associated to
water ices (amorphous/crystalline state) and a few of them also show features at around 2.27 µm
due probably to methanol. The deepest spectral band at 2 µm and the largest slope were
measured for (145453) 2005 RR43. This object belongs to the Haumea family which is known to
have a water ice rich surface (e.g. Barkume et al. 2008). Our spectrum shows the presence of
crystalline water ice because of a strong absorption feature at 1.65 µm (see Fig. 4), as reported
by previous authors (Pinilla-Alonso et al. 2007, Barkume et al. 2008). The depth of this band
seems slightly different between the three different spectra even if the signal to noise ratio is
more limited for the data of Barkume et al. (2008) and Pinilla-Alonso et al. (2007). The slope in
the near infrared is similar in the three cases as well as the slope observed in the visible spectra.
The rotational period (P=5.08±0.04 h) determined by Perna et al. (2009), in the framework of
this LP, is not precise enough to confirm or not the homogeneity of the surface.
Four objects, (145451) 2005 RM43, (15874) 1996 TL66, (208996) 2003 AZ84, and 2003
UZ413, also show rather deep water ice bands. All these objects have a neutral color in the visible
and belong to the BB taxonomic group (Barucci et al. 2005b). The near infrared spectra of the
detached object (145451) 2005 RM43 and the 3:2 resonant object 2003 UZ413 (Fig.4) were
measured for the first time. The modelling of these spectra implies the presence of crystalline
water ice (see Table 3). The spectra of another 3:2 resonant object, (208996) 2003 AZ84, were
previously reported by Guilbert et al. (2009) within the first part of the LP and Barkume et al.
(2008). The observations performed by Barkume et al. (2008) are not compatible with the
presence of crystalline water ice, contrary to the spectrum obtained in this paper (see Fig. 4),
where the absorption feature reported at 1.65 µm is compatible with the signature of crystalline
water ice. Merlin et al. (2010a) gave more details on modelling and suggested a heterogeneous
surface composition of this object. The infrared spectrum of SDO (15874) 1996 TL66 was first
presented by Luu and Jewitt (1998). They did not find evidence for absorption features. This
object was observed twice within the LP in 2007 (Guilbert et al. 2009) and 2008 (this work).
Although the spectra are rather noisy (Fig. 1), the presence of water ice is suggested with around
20% deep absorption band present at 2 µm.
The largest negative slope in the range 2.05-2.3 microns was measured for the classical
object (144897) 2004 UX10 in December 2007, however, the spectrum was noisy. Better quality
observations in November 2008 showed a smaller but still negative spectral slope. Three more
objects, classical (55637) 2002 UX25, and Centaurs 2007 VH305 and 2008 SJ236, also revealed
noticeable negative spectral slopes in the 2.05-2.3 µm range. These objects can be considered as

11
possible candidates to have methanol-like compounds in their surfaces. New observations are
needed for confirmation.
The spectra of the 3:2 resonant object 2003 UZ413 (Fig.4), Centaur 2007 UM126 (Fig.2), and
the classical object (174567) 2003 MW12 show the largest positive slope in the range 2.05-2.3
microns. The best model fitting the spectra of two of them was obtained assuming the presence
of ice tholin on their surfaces (see Table 3).
Other measured objects show less pronounced spectral features. For some of them a 2 µm
band has been marginally detected while for others, the estimated band depth at 2 µm is within
the uncertainties of measurements (see Table 2).
Comparing the new data with previously published data we found two objects with a
possible heterogeneous surface composition. These objects are the 3:2 resonant object (208996)
2003 AZ84 (see discussion above), and the classical object (120348) 2004 TY364. Barkume et al.
(2008) obtained a spectrum of 2004 TY364 from 1.4 to 2.4 µm. Their spectrum is mainly flat in
this wavelength range and the depth of the absorption band at 2.0 µm is near 4%, which is very
close to that measured on our spectrum. However, there is significant variation around 2.25 µm,
with a deep absorption band present on our spectrum (see Fig. 2), that we interpret as the
presence of CH3OH, not reported on the previous spectrum. This suggests a heterogeneous
surface that should be confirmed in the near infrared and also verified from the visible range.
Looking at the spectral K region for the other objects, some signatures (with different shape
and centers) also seem to be present for 2005 RR43 at 2.23 µm and for 2007 VH305 at 2.24 µm.
For the first object, the only component able to create a feature at 2.23 µm is NH3 in its pure
state but a large band at 2.0 µm is needed. A band at 2.0 µm is indeed visible in the spectrum,
but it is already well reproduced by water ice in the models. For 2007 VH305, the only possible
compound to interpret the absorption band centred at 2.24 microns, could be diluted ammonia in
water ice but there is no clear evidence of water ice on its spectrum. Except for these objects for
which absorption bands are questionable, we do not report any other absorption features for other
objects. For 2003AZ84 and 2005RM43, there is a small feature close to 2.29 microns possibly due
to noise. No components available in our data base are able to fit a feature located at this
wavelength.
4. Discussion on global analysis
We have analyzed all the available data from both the LP and the literature which covered
the near-infrared spectral range to detect possible relationships between spectral characteristics
and other properties. Table 4 presents objects for which near-infrared data are available. It

12
contains the dynamical type of the object, as defined by Gladman et al. (2008), its taxonomic
class according to Barucci et al. (2005b), the absolute magnitude H, information on the ice
detection, an estimation of the depth of the water ice band at 2.0 µm D, its uncertainty σD, as
published in the related papers, and their references. In the last column the ice detection criteria
have been also added: Y for “sure detection”, T for “tentative detection” and N for “no
detection”. The data for 75 objects were collected, including 2 satellites (Charon and Hi’iaka),
among which 33 objects were observed during several observing runs.
To investigate the presence of ice on surfaces of TNOs and Centaurs we have divided the
objects from Table 4 into three groups (Y, T, and N). The first group (labeled Y) represents
objects for which ice spectral features has D>3% and are statistically significant (>3σD). This
group also includes 5 objects (2060 Chiron, 10199 Chariklo, 31824 Elatus, 54598 Bienor and
90377 Sedna) for which water ice has been clearly previously detected (see Table 4 for
references). This sample contains 30 objects for which the presence of ices in the topmost
surface layer is confirmed by detection of absorption bands and classified as “sure”. 14 of these
objects have abundant ice content (D>20%). This group also includes the three objects (Pluto,
Eris and Makemake) rich in methane ice (see Table 4). For 18 objects the water ice band at 2.0
µm was not detected within the accuracy of observations (i.e. 3σD), and are labeled T. This
second group includes objects with clear evidence of the 2.0 µm band, but have been classified
as “tentative” as they do not follow the strictly defined statistical criteria, even if the H2O band
can be clearly visible on the spectra. The third group (labeled N) consists of objects for which
the measured band depth is small (D≤3%) or the band was not found within the accuracy of
observations (error larger than the band depth D). We define this group as no ice (present on the
surface), but higher quality data would be required to be sure that no ice is present.
The distribution of ice has been analyzed as a function of their absolute magnitude (Fig.5),
taxonomy (Fig. 6) and as a function of their dynamical classes (Fig. 7).
In Fig. 5 all analyzed objects for which D is available have been plotted versus absolute
magnitude H. If several measurements of the same object are available, we use the largest value
of the measured depth D for further analysis. The most abundant ice content corresponds to the
brightest objects (smaller absolute magnitude H), which correspond in general to objects with
larger diameter.
The ratio of icy bodies (sure, tentative and no ice) to all considered objects as a function of
their taxonomy is shown in Fig.6. The BB class, which contains objects with neutral visible
spectra, is mainly dominated by bodies with “sure” and abundant water ice content (see Table 4).
The IR class does not contain any object with sure water ice. Centaurs are mainly distributed in
the BR and RR classes, with similar H2O ice content distribution.

13
In the complete sample of 75 objects, the CH3OH ice seems mainly present on RR class
objects (very red surfaces). This detection could indicate a chemically primitive nature for these
objects.
Figure 7 illustrates a distribution of the depth of the 2 micron band as a function of the
orbital type. The depths of the water ice band are typically distributed in the same way,
excluding the satellite Charon and the objects from the Haumea family for which the depth at 2
µm is greater. There is no Centaurs found with an abundant surface ice content (D>20%). In our
sample we have only three objects belonging to the cold classical population and all of them
have no ice detection on their surface.
The behavior of the presence of ice content and dynamical parameters (semimajor axis,
inclination and eccentricity) is shown in Fig.8. The distribution of ice content is almost random
and slightly different from that presented by Brown et at. (2007). All classes are distributed
randomly, except in the Centaur population, for which no high ice content on the surface is
present.
5. Conclusions
In this paper we report the new near-IR observations obtained during the second period of
the Large Program performed at VLT-ESO, Chile. New spectra have been obtained in the H+K
band with SINFONI for twenty objects and also in the J band with ISAAC for four of them. For
12 of these objects with higher quality data and with complete spectra available from the visible
to near-infrared, and the photometric data to properly adjust the different bands, a radiative
transfer model has been used to interpret the observed spectra and investigate the surface
composition. As described by Barucci et al. (2008) much of the information obtained from
spectral modeling is nonunique, especially if the albedo is not available, the S/N is not very high
and/or there are no specific features of particular components. Nevertheless, this is the best way
we have to investigate the surface compositions of TNOs. For all the objects observed during the
LP, the presence of ices has been quantified with the measurements of the D and Sk parameters.
All the H & K band spectra of TNOs available in the literature have been collected and analyzed
to find correlations with ice abundance, dynamical classes and taxonomical classes.
On the analysis of 75 objects, the major results are :

14
1) all objects classified as BB class objects seem to have icy surfaces. The objects of the IR
class, present only among classical and resonant populations, do not contain any body
with “sure” water ice determination;
2) the possible presence of CH3OH have been mainly detected on very red surfaces (objects
following the RR class);
3) the majority of Centaurs observed multiple times have an heterogeneous composition.
This seems to indicate a major characteristics of the Centaur population for which the
variation affecting the surface could be due not only to the presence of some “fresh”
areas resurfaced by impacts, but also to a temporal/sporadic activity. No Centaur is found
with an abundant surface ice content;
4) objects with abundant water ice content (D>20%) tend to have a smaller absolute
magnitude which corresponds in general to a larger size;
5) The classical objects are abundant both among icy bodies and bodies with no ice content.
All dynamically cold objects of the classical population in our sample (3 bodies) have no
ice.
The surface properties of Centaurs and TNOs are in general different due essentially to their
different dynamical evolution. It is important to underline that Centaurs are small but still visible
because they are not too far. The surface of these objects should be compared with those of
TNOs in the same diameter range. In this last case, we are limited to the brighter ones implying
a bias due to the fact that icy objects are usually brighter and easier to be observed.
All the objects classified in the group “no detectable ice” could contain small amounts of ice
that can be detected in the future when the quality of the spectra is improved by using larger
telescopes.
Other ices could exist (DeMeo et al., 2010), but their signatures are hidden inside the S/N
ratio of our data and their amount could be up to a few %. The expected presence of more
volatile ices (CH4, N2, CO and CO2) has been well described (e.g. Levi and Podolak, 2009) for
TNOs and depends on their density, radius, and surface temperature.
It is difficult to draw a compositional formation and evolution scenario for the TNO
population because we are still far from having a sufficient knowledge of their surface
properties. The limits of the available ground-based telescopes does not currently permit us to
improve the observational knowledge of these objects. Moreover, few theoretical models or
laboratory simulations (formation processes models, internal evolution models, space weathering
effects, etc.) are available.
This population contains objects which are all supposed (on the basis of the available
estimation of their densities) to be formed of ices (mainly H2O) and rock in the interior with

15
different surface compositions and properties connected with their evolution history. Irradiation
is an important process that can alter the TNO surfaces (Hudson et al. 2008), but ice grains could
also already be irradiated before they accreted into planetesimals.
It is clear that the color of TNOs and Centaurs depends on many parameters, as for example
the amount of ice present on their surface and their heliocentric distance. The facts that i)
CH3OH ice seems to be mainly present on very red surface objects, and ii) all neutral surface
objects have H2O ice (at high content) on their surface, provide important constraints to the
global scenario. The presence of CH3OH ice on the reddest objects is in favor of the hypothesis
that those surfaces are more primordial. New and well determined albedos, thanks to the
Herschel mission (Müller et al. 2010), will allow us to better characterize the surface properties
of these populations.
Our present knowledge of these objects will improve in a substantial way when new
technologies and new sky surveys become available and space missions, like New Horizons,
provide more precise data.
Acknowledgements
We thank C. Dumas for his help in carrying out this LP and R. Davies for supporting the analysis
of SINFONI spectra. We are also particularly grateful to H. Bohnhardt and an anonymous
referee which comments improved the paper.
References
Alvarez-Candal, A., Barucci, M.A., Merlin, F., Guilbert, A., and de Bergh, C., 2007. A search
for rotational variations on trans-Neptunian objects. Astron. Astrophys. 475, 369-374.
Alvarez-Candal, A., Fornasier, S., Barucci, M.A., de Bergh, C., Merlin, F., 2008. Visible
spectroscopy of the new ESO large program on trans-Neptunian objects and Centaurs. Part 1.
Astron. Astroph. 487, 741-748.
Alvarez-Candal, A.,et al., 2010. The trans-Neptunian object (42355) Typhon: composition and
dynamical evolution. Astron. Astroph. 511, 35-40.
Barkume K. M., Brown M. E., and Shaller E. L., 2006. Water ice on the satellite of Kuiper belt
object 2003 EL61. Astrophys. J. Lett., 640, L87–L89.
16
Barkume, K.M., Brown, M.E., Schaller, E.L., 2008. Near-infrared spectra of Centaurs and
Kuiper belt objects. Astron. J. 135, 55-67.
Barucci M. A.,et al., 2000. Infrared spectroscopy of the Centaurs 8405 Asbolus: First
observation at ESO-VLT. Astron. Astrophys. 357, L53–L56.
Barucci M. A., et al., 2002a. Visible and near-infrared spectroscopy of the Centaur 32532 (2001
PT13). ESO Large Programme on Trans-Neptunian Objects and Centaurs: First spectroscopy
results. Astron. Astrophys., 392, 335–339.
Barucci M. A.,et al., 2005a. Is Sedna another Triton. Astron. Astrophys., 439, L1–L4.
Barucci M. A., Belskaya I. N., Fulchignoni M., and Birlan M., 2005b. Taxonomy of Centaurs
and Trans-Neptunian objects. Astron. J., 130, 1291–1298.
Barucci M.A., Brown M., Emery J.P. and Merlin F. , 2008. Compositon and Surface Properties
of Transneptunian Objects and Centaurs. In The Solar System Beyond Neptune (Barucci
M.A.,et al. editors) Univ. of Arizona Press, Tucson, 143-160.
Barucci M. A., Merlin F., Dotto E., Doressoundiram A., and de Bergh C., 2006. TNO surface
ices. Observations of the TNO 55638 (2002 V395) and analysis of the population’s spectral
properties. Astron. Astrophys., 455, 725–730.
Barucci, M.A.,et al., 2008. Surface composition and temperature of the TNO Orcus. Astron.
Astroph. 479, L13-L16.
Barucci, M.A., et al. , 2010. (90377) Sedna: Investigation of surface compositional variation.
Astron. J., 140, 2095-2100.
Barucci, M.A., et al., 2011. Surface composition of 55638 (2002 VE95), in preparation
Bauer J. M., Meech K. J., Fernández Y. R., Farnham T. L., and Roush T. L., 2002. Observations
of the Centaur 1999 UG5: Evidence of a unique outer solar system surface. Publ. Astron.
Soc. Pac., 114, 1309–1321.
17
Brown M. E., 2000a. Near-Infrared spectroscopy of Centaurs and irregular satellites. Astron. J.,
119, 977–983.
Brown M.E., 2008. The Largest kuiper belt Objects. In: Barucci, M.A., Boehnhardt, H.
Cruikshank, D., Morbidelli A. (Eds.). The Solar System Beyond Neptune. Univ. of Arizona
Press, Tucson, pp. 335-344.
Brown M. E. and Koresko C. C., 1998. Detection of water ice on the Centaur 1997 CU26.
Astrophys. J. Lett., 505, L65–L67.
Brown M. E., Blake G. A., and Kessler J. E., 2000b. Near-infrared spectroscopy of the bright
Kuiper belt object 2000 EB173. Astrophys. J. Lett., 543, L163–L165.
Brown M. E., Trujillo C., and Rabinowitz D. L. ,2005. Discovery of a planetary-sized object in
the scattered Kuiper belt. Astrophys. J. Lett., 635, L97–L100.
Brown, M.E.,et al.., 2007. Methane and ethane on the bright Kuiper Belt object 2005 FY9.
Astron. J. 133, 284-289.
Brown M. E., Barkume K. M., Ragozzine D., and Schaller E. L., 2007. A collisional family of
icy objects in the Kuiper belt. Nature, 446, 294–296.
Brown R. H., Cruikshank D. P., and Pendleton Y., 1999. Water ice on Kuiper belt object 1996
TO66. Astron. J. Lett., 519, L101–L104.
Cruikshank D. P.,et al., 1998. The composition of Centaur 5145 Pholus. Icarus, 135, 389–407.
Dalle Ore, C.M., et al., 2009. Composition of KBO (50000) Quaoar. Astron. Astrophys., 501,
349–357.
Davies, R.I., 2007. A method to remove residual OH emission from near-infrared spectra. Mon.
Not. R. Astron. Soc. 375, 1099–1105.
de Bergh C.,et al., 2004. Aqueous altered silicates in the surface of two Plutinos? Astron.
Astrophys., 416, 791–798.

18
de Bergh C.,et al., 2005. The surface of the trans-Neptunian object 90482 Orcus. Astron.
Astrophys., 437, 1115–1120.
DeMeo, F.,et al. ,2010a. A spectroscopic analysis of Jupiter-coupled object (52872) Okyrhoe,
and TNOs (90482) Orcus and (73480) 2002 PN34. Astron. Astrophys., 521, 35-43.
DeMeo, F.E.,et al., 2010b. A search for ethane on Pluto and Triton. Icarus 208, 412-424.
Delsanti, A.,et al., 2010. Methane, ammonia, and their irradiation products at the surface of an
intermediate-size KBO?. A portrait of Plutino (90482) Orcus. Astron. Astroph. 520, 40-54.
Doressoundiram A.,et al., 2003. ESO Large Programme on Trans-Neptunian Objects and
Centaurs: Spectroscopic investigation of Centaur 2001 BL41 and TNOs (26181) 1996 GQ21
and 26375 1999 DE9. Astron. J., 125, 2721–2727.
Doressoundiram A.,et al., 2005. Spectral characteristics and modelling of the trans-Neptunian
object (55565) 2002 AW197 and the Centaurs (55576) 2002 GB10 and (83982) 2002 GO9.
Planet. Space Sci., 53, 1501–1509.
Doressoundiram A., Boehnhardt H., Tegler S.C., and Trujillo C., 2008. Color properties and
Trends of the Transneptunian Objects. In: Barucci, M.A., Boehnhardt, H. Cruikshank, D.,
Morbidelli A. (Eds.). The Solar System Beyond Neptune. Univ. of Arizona Press, Tucson,
91-104.
Dotto E.,et al., 2003a. ESO Large Programme on Trans-Neptunian Objects and Centaurs:
Searching for water ice on 47171 1999 TC36, 1998 SG35, and 2000 QC243. Icarus, 162,
408–414.
Dotto E., et al. , 2003b. Unveiling the nature of 10199 Chariklo: Near-infrared observations and
modelling. Icarus, 164, 122–126.
Fornasier S., Dotto E., Barucci M. A., and Barbieri C. , 2004. Water ice on the surface of the
large TNO 2004 DW. Astron. Astrophys., 422, L43–L46.

19
Fornasier, S.,et al., 2009. Visible spectroscopy of the new ESO large programme on trans-
Neptunian objects and Centaurs: final results. Astron. Astroph. 508, 457-465.
Foster M. J., Green S. F., McBride N., and Davies J. K., 1999. Detection of water ice on 2060
Chiron. Icarus, 141, 408–410.
Gladman, B., Marsden, B.G., Vanlaerhoven, C., 2008. Nomenclature in the Outer Solar System.
In: Barucci, M.A., Boehnhardt, H. Cruikshank, D., Morbidelli A. (Eds.). The Solar System
beyond Neptune. University of Arizona Press, Tucson. pp. 43–57.
Grundy W. M., 2009. Is the missing ultra-red material colorless ice? Icarus 199, 560-563;
Grundy W. M., Buie M. W., and Spencer J. R. , 2005. Near-infrared spectrum of low-inclination
classical Kuiper belt object (79360) 1997 CS29. Astron. J., 130, 1299–1301.
Guilbert, A.,et al., 2009a. ESO-Large Program on TNOs: Near-infrared spectroscopy with
SINFONI, Icarus, 201, 272-283.
Guilbert, A.,et al., 2009b. A portrait of Centaur 10199 Chariklo. Astron. Astroph. 501, 777-784.
Hapke, B., 1981. Bidirectional reflectance spectroscopy. 1. Theory. J. Geophys. Res. 86, 4571–
4586.
Hapke, B., 1993. Theory of Reflectance and Emittance Spectroscopy. Topics in Remote Sensing.
Cambridge University Press, c1993, Cambridge, UK.
Hudson, R.L.,et al., 2008. Laboratory Studies of the Chemistry of Transneptunian Object Surface
Materials. In: Barucci, M.A., Boehnhardt, H. Cruikshank, D., Morbidelli A. (Eds.). The Solar
System beyond Neptune. University of Arizona Press, Tucson. pp. 507-524.
Jewitt D. and Luu J., 2001. Colors and spectra of Kuiper belt objects. Astron. J., 122, 2099–
2114.
Jewitt D. and Luu J., 2004. Crystalline water ice on the Kuiper belt object (50000) Quaoar.
Nature, 432, 731–733.
20
Levi A., and Podolak, M., 2009. Corona-like atmospheric escape from KBOs. II. The behavior
of aerosols. Icarus, 202, 681-693.
Licandro J. and Pinilla-Alonso N. , 2005. The inhomogeneous surface of Centaur 32522 Thereus
(2001 PT13). Astrophys. J., 630, L93–L96.
Licandro J., Oliva E., and Di Martino M., 2001. NICS-TNG infrared spectroscopy of trans-
neptunian 2000 EB173 and 2000 WR106. Astron. Astrophys., 373, L29–L32.
Licandro J., et al., 2006. Methane ice rich surface of large TNO 2005 FY9. Astron. Astrophys.,
445, L35–L38.
Licandro J., di Fabrizio L., Pinilla-Alonso N., de Leon J., and Oliva E., 2006b. Trans-Neptunian
object (55636) 2002 TX300, a fresh icy surface in the outer solar system. Astron. Astrophys.,
457, 329–333.
Luu J., and Jewitt D. ,1998. Optical and Infrared Reflectance Spectrum of Kuiper Belt Object
1996 TL 66. Astrophys. J. Lett., 494, L117–L120.
Luu J., Jewitt D., and Trujillo C., 2000. Water ice in 2060 Chiron and its implications for
Centaurs and Kuiper belt objects. Astrophys. J. Lett., 531, L151–L154.
Lykawka, P.S., Mukai, T., 2005. Higher albedos and size distribution of large transneptunian
objects. Planet. Space Sci. 53, 1319–1330.
Merlin F., Barucci M. A., Dotto E., de Bergh C., and Lo Curto G., 2005. Search for surface
variations on TNO 47171 and Centaur 32532. Astron. Astrophys., 444, 977–982.
Merlin, F.,et al., 2007. Properties of the icy surface of the TNO 136108 (2003 EL61). Astron.
Astroph. 466, p.1185-1188.
Merlin, F., et al., 2009. Stratification of methane ice on Eris' surface. Astron. J., 137, 315-328.

21
Merlin, F., et al., 2010a. Surface composition and physical properties of several trans-neptunian
objects from the Hapke scattering theory and Shkuratov model. Icarus, 208, 945-954.
Merlin, F.,et al., 2010b. Chemical and physical properties of the variegated Pluto and Charon
surfaces. Icarus, 210, 930-943.
Müller, T.G., et al.``TNOs are Cool'': A survey of the trans-Neptunian region. I. Results from
the Herschel science demonstration phase (SDP)2010. Astron. Astroph. 518, L146-L150.
Owen T. C., et al., 1993. Surface ices and the atmospheric composition of Pluto. Science, 261,
745–748.
Perna, D., et al., 2009. Rotations and densities of trans-Neptunian objects. Astron. Astrophys.,
508,451-455.
Perna, D., et al., 2010. Colors and taxonomy of Centaurs and trans-Neptunian objects. Astron.
Astrophys., 510, 53-60.
Pinilla-Alonso, N.; Licandro, J.; Gil-Hutton, R.; Brunetto, R., 2007. The water ice rich surface of
(145453) 2005 RR43: a case for a carbon-depleted population of TNOs? Astron. Astroph.
468, L25-L28
Protopapa, S., et al., 2009. ESO large program about transneptunian objects: surface variations
on (47171) 1999 TC36. Astron. Astroph. 501, 375-380
Romon-Martin J., Barucci M. A., de Bergh C., Doressoundiram A., Peixinho N., and Poulet F.,
2002. Observations of Centaur 8405 Asbolus: Searching for water ice. Icarus, 160, 59–65.
Romon-Martin J., Delahodde C., Barucci M. A., de Bergh C., and Peixinho N., 2003.
Photometric and spectroscopic observations of (2060) Chiron at the ESO Very Large
Telescope. Astron. Astrophys., 400, 369–373.
Schaller, E. L., & Brown, M. E., 2007. Detection of Methane on Kuiper Belt Object (50000)
Quaoar. Astrophys. J., 670, L49-L51

22
Stansberry, J., et al., 2008. Physical Properties of Kuiper Belt and Centaur Objects: Constraints
from the Spitzer Space Telescope. In: Barucci, M.A., Boehnhardt, H. Cruikshank, D.,
Morbidelli A. (Eds.). The Solar System beyond Neptune. University of Arizona Press,
Tucson. pp. 161–179.
Trujillo C. A., Brown M. E., Rabinowitz D. L., and Geballe T. R., 2005. Near infrared surface
properties of the two intrinsically brightest minor planets: (90377) Sedna and (90482) Orcus.
Astrophys. J., 627, 1057–1065.
Trujillo C. A., Brown M. E., Barkume K. M., Schaller E. L., and Rabinowitz D. L., 2007. The
surface of 2003 EL61 in the near infared. Astrophys. J., 655, 1172–1178.

23
Table 1. Observational circumstances of the new observed objects
Object Date Seeingb Vc UT start
Texp
Air-mass Analog (airmass) Instrument
5145 Pholus 12 Apr 2008 0.40 21.3 7:55 5400 1.140-1.170
SA110-361s (1.102) SINFONI
15874 1996 TL66 23 Nov 2008 1.20 20.9* 3:59 9000 1.232-1.549
Hyades 142 (1.425) SINFONI
44594 1999 OX3 22 Sep 2008 0.85 21.3 1:21 9600 1.128-1.034
SA115 271 (1.107) SINFONI
55576 Amycus 12 Apr 2008 0.95 20.4 3:09 7800 1.350-1.020
SA102 1081 (1.120) SINFONI
55637 2002 UX25 04 Dec 2007a 1.05 19.9* 0:45 4200 1.206-1.249
LD 93 101 (1.219) SINFONI
05 Dec 2007a 1.10 --- 0:51 1800 1.206-1.235
HD 1368 (1.241) SINFONI
95626 2002 GZ32 13 Apr 2008 0.63 19.7* 5:16 3600 1.140-1.180
HD147935 (1.160) SINFONI
120061 2003 CO1 12 Apr 2008 0.50 19.6 5:32 7800 1.110-1.240
SA102 1081 (1.120) SINFONI
120348 2004 TY364
21 Nov 2008 0.85 20.6 1:34 7800 1.025-1.076
SA98 978 (1.134) SINFONI
144897 2004 UX10 06 Dec 2007a 1.05 20.6 0:31 5400 1.121-1.175
HD 1368 (1.104) SINFONI
22 Nov 2008 0.90 --- 2:25 8400 1.126-1.391
SA93 101 (1.335) SINFONI
145451 2005 RM43 05 Dec 2007a 1.10 20.1 2:17 5400 1.124-1.198
LD 93 101 (1.190) SINFONI
07 Dec 2007a 0.80 20.1 3:54 2160 1.141- 1.194
HD2966 (1.174) ISAAC
145453 2005 RR43 07 Dec 2007a 1.45 20.1 3:21 6600 1.115-1.301
Hyades 143 (1.385) SINFONI
174567 2003 MW12
13 Apr 2008 0.70 20.6 6:24 6600 1.180-1.090
HD147935 (1.160) SINFONI
208996 2003 AZ84 22 Nov 2008 0.90 20.5 7:20 5400 1.249-1.287
SA115 271 (1.109) SINFONI
229762 2007 UK126
21 Sep 2008 1.05 20.4 7:24 8400 1.139-1.078
SA93 101 (1.115) SINFONI
22 Sep 2008 1.49 20.4 8:37 2520 1.078- 1.099
Hip018768 (1.054) ISAAC
2002 KY14 21 Sep 2008 0.85 19.9 23:30 5400 1.660-1.272
SA112 1333 (1.275) SINFONI
22 Sep 2008 1.42 19.9 3:00 2880 1.224- 1.319
Hip092515 (1.261) ISAAC

24
Object Date Seeingb Vc UT start
Texp
Air-mass Analog (airmass) Instrument
2003 UZ413 21 Nov 2008 1.25 20.6 4:16 7200 1.157-1.555
SA93 101 (1.183) SINFONI
2007 UM126 21 Sep 2008 1.05 20.9 3:25 3000 1.216-1.092
SA115 271 (1.175) SINFONI
22 Sep 2008 0.85 20.9 4:27 4200 1.144-1.087
SA93 101 (1.122) SINFONI
2007 VH305 23 Nov 2008 1.20 21.4 0:36 4200 1.140-1.263
SA93 101 (1.167) SINFONI
2008 FC76 20 Sep 2008 1.05 20.4 23:40 7200 1.440-1.248
SA112 1333 (1.201) SINFONI
22 Sep 2008 1.14 20.4 0:37 3240 1.285- 1.249
Hip092515 (1.261) ISAAC
2008 SJ236 22 Nov 2008 0.90 20.8 0:30 5400 1.257-1.398
SA93 101 (1.335) SINFONI
aObservations performed in AO mode with LGS bSeeing = the median seeing during the observation cVisible magnitude from Perna et al. 2010 (except * = reported from the ephemeris).
Table 2. Spectral parameters on observed objects
Number Name Date D (%) σD (%) Sk
σSk Class
5145 Pholus 13 Apr 2008 13.2 11.8 -0.3 0.3 Cen 15874 1996 TL66 23 Nov 2008 19.5 18.6 -0.6 0.5 SDO 44594 1999 OX3 22 Sep 2008 6 5.4 0 0.2 SDO 55576 Amycus 13 Apr 2008 7.4 5.3 -0.4 0.2 Cen 55637 2002 UX25 04 Dec 2007 11.9 14.3 -1.1 0.2 Cl 55637 2002 UX25 05 Dec 2007 - - - - Cl 95626 2002 GZ32 14 Apr 2008 9.6 5.7 0.1 0.2 Cen
120061 2003 CO1 13 Apr 2008 4.6 3.5 0.4 0.1 Cen 120348 2004 TY364 21 Nov 2008 5.8 5.4 -0.6 0.1 Cl 144897 2004 UX10 06 Dec 2007 20.1 15.5 -1.8 0.3 Cl 144897 2004 UX10 22 Nov 2008 5.6 9.7 -0.7 0.2 Cl 145451 2005 RM43 05 Dec 2007 25.5 16.9 0.1 0.4 Det 145453 2005 RR43 07 Dec 2007 74.5 13.1 7.1 0.7 Cl 174567 2003 MW12 14 Apr 2008 -4.5 5.3 0.7 0.1 Cl 208996 2003 AZ84 22 Nov 2008 16.5 12.8 -0.4 0.5 3:2 229762 2007 UK126 21 Sep 2008 11 7.2 -0.5 0.2 Det
250112 2002 KY14 22 Sep 2008 8.8 8.0 -0.2 0.1 Cen 2003 UZ413 21 Nov 2008 17.7 10.7 0.8 0.3 3:2 2007 UM126 21 Sep 2008 -5.1 9.5 1.2 0.3 Cen 2007 UM126 22 Sep 2008 - - - - Cen 2007 VH305 23 Nov 2008 7.5 13.6 -1.0 0.4 Cen 2008 FC76 21 Sep 2008 4.1 8.0 -0.2 0.2 Cen 2008 SJ236 22 Nov 2008 6.9 13 -1.5 0.4 Cen

25
Table 3. Results on the surface composition with the different components (in %) and particle size (in microns). The particles sizes are given in parentheses. H2Ocr is for H2O ice in cristalline state, while H2Oam is for amorphous state.
Object Alb H2Ocr H20am CH3OH Olivine Ice T. Titan T. Triton T.
Kero-gen
Carbon
44594 1999 OX3 0.05 - 5(30) - 34(45) - 24(2) 20(3) 17(30) - 120348 2004 TY364 0.10 - 14(5) 37(20) - - 8(1) 28(3) - 13(10) 144897 2004 UX10
144897 2004 UX10 0.10 0.10
- -
- -
- 59(50)
54(12) -
- -
15(1) 10(1)
18(1) 13(3)
13(70) 18(5)
- -
145451 2005 RM43 0.20 28(20) 14(200) - 4(5) - 2(1) 6(1) - 46(10) 145453 2005 RR43 0.30 66(20) 21(200) - 7(75) - - 2(1) - 4(10) 208996 2003 AZ84 0.12* 13(20) 31(30) - - - - 10(1) - 46(10)
229762 2007 UK1261 0.20 - 12(50) - - - 17(1) 32(1) 4(20) 15(10)
2002 KY14 0.06 - 9(45) - - - 30(1) 33(2) 28(20) 10(10) 2003 UZ413 0.10 17(20) - - - 38(15) 19(60) 3(200) - 23(10) 2007 UM126 0.14 - 30(10) - - 10(5) - 40(20) - 20(10) 2008 FC76 0.05 - - 26(20) 5(200) - 16(2) 24(1) - 29(10) 2008 SJ236
2
2008 SJ236 0.07 0.07
- -
- 3(200)
26(200)
25(33) 7(1)
- -
2(5) 7(80)
23(6) 43(2)
12(20) 14(20)
- -
1&2The models also include 20 and 38%, respectively, of a component with a general spectral behavior close to the kaolinite in the near infrared (see text) and with a particle size of 15 µm. Synthetic models of 144897 2004 UX10 and 2008 SJ236 including methanol are also presented to have a better fit on the K region and are reported in dashed lines on Figure 2. * For 2003 AZ84, the used albedo has been derived by Stansberry et al. 2008. Table 4. List of the objects for which near-infrared spectral observations are available. In the last column the ice detection is reported (Y for “sure detection”, T for “tentative detection” and N for “no detection”)
N Object Type Class H Ices D
(%) σD Reference Ice
detection 1 2060 Chiron Cen BB 6.5 H2Ovar ~5
10 + 0
Fos99 Lu00 Br00a Ro03
Y
2 5145 Pholus Cen RR 7.1 H2O, CH3OH
12 13 13
3 12
Cr98 Br00a LP-this paper
Y
3 8405 Asbolus Cen BR 9.0 None 0 0 <0
1
Ba00 Br00a, Ro02 Bark08
N
4 10199 Chariklo Cen BR 6.4 H2Ovar ~10 + 7-14 <0
BrK98 Br00a Dot03b LP-Gu09b
Y
5 15789 1993 SC 3:2 RR 7.0 None? 0 10 Je01 N 6 15874 1996 TL66 SDO BB 5.4 H2O
<20 24 20
11 19
Lu98 LP-Gu09a LP-this paper
T
7 15875 1996 TP66 3:2 RR 6.9 None <0 4 Bark08 N 8 19308 1996 TO66* Cl BB 4.5 H2O 65 5 Br99 Y 9 19521 Chaos Cl IR 4.8 None <0 4 Bark08 N 10 20000 Varuna Cl
IR 3.6 None? +
<0 2
Li01 Bark08
N
11 24835 1995 SM55* Cl BB 4.8 H2O 56 6 Bark08 Y

26
12 26181 1996 GQ21 11:2 RR 5.2 H2O, CH3OH?
9 2 Bark08
Y
13 26375 1999 DE9 5:2 IR 4.7 H2Ovar? ~10 15 <0 <0 +
8 2
Je01 Alv07 Bark08 LP-Gu09a LP-Me10a
T
14 28978 Ixion 3:2 IR 3.2 H2O 6 7
4 4
Bark08 LP-Gu09a
T
15 29981 1999 TD10 SDO BR 8.8 None <0 0 Bark08 N 16 31824 Elatus Cen RR 10.
1 H2Ovar + Bau02 Y
17 32532 Thereus Cen BR 9.0 H2Ovar + + 10
3
Ba02, Me05 Li05 LP-Gu09a
Y
18 33340 1998 VG44 3:2 IR 6.5 None? <0 10 Bark08 N 19 38628 Huya
(2000 EB173) 3:2 IR 4.7 H2Ovar +
<7 + 15 <0
7 2
Li01 Br00c dB04 Alv07 Bark08
T
20 42301 2001 UR163 9:4 RR 4.2 None? 0 10 Bark08 N 21 42355 Typhon SDO BR 7.2 H2O 14
11 7 3
Alv10 LP-Gu09a
Y
22 44594 1999 OX3 SDO RR 7.4 H2O? 6 5 LP-this paper T 23 47171 1999 TC36 3:2 RR 4.9 H2Ovar +
8 4
2 3
Dot03a, Me05 Bark08 LP-Gu09a, LP-Pr09
Y
24 47932 2000 GN171 3:2 IR 6.0 None? <0 <0 4
16 6
dB04, Alv07 Bark08 LP-Gu09a
N
25 50000 Quaoar Cl RR 2.5 H2O, CH4, NH3, C2H6?
22 25
1 2
Je04 LP-Gu09a Sch07, Da09
Y
26 52872 Okyrhoe (1998 SG35)
JC BR 11.0
None? + 4 2
2 2
Dot03a Bark08 LP-DM10a
T
27 54598 Bienor (2000 QC243)
Cen BR 7.6 H2O + 4 16
2 6
Dot03a Bark08 LP-Gu09a
Y
28 55565 2002 AW197 Cl IR 3.4 None? + 3 3
2 7
Dor05 Bark08 LP-Gu09a
N
29 55576 Amycus (2002 GB10)
Cen RR 7.8 H2O + 7
5
Dor05 LP-this paper
T
30 55636 2002 TX300* Cl BB 3.3 H2O 67 64
10 1
Li06b Bark08
Y
31 55637 2002 UX25 Cl IR 3.6 None? 2 12
2 14
Bark08 LP-this paper
N
32 55638 2002 VE95 3:2 RR 5.3 H2O CH3OH?
5 9 11
4 2 6
Ba06 Bark08 LP-Ba11
Y
33 60558 Echeclus JC BR 9.0 None <0 LP-Gu09a N 34 63252 2001 BL41 Cen BR 11.
7 None? - Dor03 N
35 65489 Ceto (2003 FX128)
SDO -- 6.3 H2O 14 4 Bark08 Y
36 66652 1999 RZ253 Cl RR 5.9 None? <0 14 Bark08 N 37 73480 2002 PN34 SDO BR 8.2 H2O 13 11 LP-DM10a T 38 79360 1997 CS29 Cl RR 5.2 None? 0 10 Gr05 N

27
39 83982 Crantor Cen RR 9.1 H2O 13 14 11 6
4 1 4
Dor05 Alv07 Bark08 LP-Gu09a
Y
40 84522 2002 TC302 5:2 -- 3.8 H2O 9 4 Bark08 T 41 84922 2003 VS2 3:2 -- 4.2 H2O 7 2 Bark08 Y 42 90377 Sedna Det RR 1.6 H2O
CH4, N2
+ 27
13
Ba05a, Tr05 LP-Ba10
Y
43 90482 Orcus (2004 DW)
3:2 BB 2.3 H2O, NH3? 30 + 30 25 35
3 5 4
Fo04 Tr05, dB05 LP-Gu09a, LP-Ba08 Del10 LP-DM10a
Y
44 90568 2004 GV9 Cl BR 4.0 None 0 3 LP-Gu09a N 45 95626 2002 GZ32 Cen BR 6.8 H2Ovar? <0
10 2 6
Bark08 LP-this paper
T
46 119951 2002 KX14 Cl RR-IR+
4.4 None <0 3
12 4
Bark08 LP-Gu09a
N
47 120061 2003 CO1 Cen BR+ 8.9 None? 5 4 LP-this paper T 48 120132 2003 FY128 Det BR 5.0 None?
7 <0
16
Bark08 LP-Gu09a
N
49 120178 2003 OP32* Cl BB+ 4.1 H2O 74 0 Bark08 Y 50 120348 2004 TY364 Cl -- 4.5 H2O 4
6 2 5
Bark08 LP-this paper
T
51 127546 2002 XU93 SDO 8.0 None? 3 8 Bark08 N 52 134340 Pluto 3:2 BR -
0.7 CH4,CO, N2, C2H6?
Ow93, DM10b, Me10b
Y
53 136108 Haumea* Cl BB 0.2 H2O + 48
0
Tr07, Me07 Bark08
Y
54 136199 Eris Det BB -1.2
CH4, N2 Br05, Me09 Y
55 136472 Makemake Cl BR+ -0.3
CH4 Li06a, Br07,Bark08
Y
56 144897 2004 UX10 Cl BR 4.5 H2O? 6 20
10 16
LP-this paper T
57 145451 2005 RM43 Det BB 4.4 H2O 26 17 LP-this paper T 58 145452 2005 RN43 Cl RR-
IR+ 3.9 None? 3
1 2 3
Bark08 LP-Gu09a
N
59 145453 2005 RR43* Cl BB 4.0 H2O 83 65 74
5 2 13
PA07 Bark08 LP-this paper
Y
60 174567 2003 MW12 Cl -- 3.6 None? <0 5 LP-this paper N 61 202421 2005 UQ513 -- 3.4 H2O 6 1 Bark08 Y 62 208996 2003 AZ84 3:2 BB 3.6 H2O 18
17 17
4 6 13
Bark08 LP-Gu09a LP-this paper
Y
63 229762 2007 UK126 Det -- 3.4 H2O 11 7 LP-this paper T 64 250112 2002 KY14 Cen RR 9.5 H2O 9 8 LP-this paper T 65 2003 QW90 Cl RR+ 5.3 H2O 21 11 LP-Gu09a T 66 2003 UZ413 3:2 BB 4.3 H2O 18 11 LP-this paper T 67 2004 NT33 Cl -- 4.4 None? 3 1 Bark08 N 68 2004 PG115 SDO -- 5.0 H2O 10 2 Bark08 Y 69 2005 QU182 SDO -- 3.4 None <0 2 Bark08 N 70 2007 UM126 Cen BR 10.
1 None? <0 10 LP-this paper N
71 2007 VH305 Cen BR 11.5
None? 8 14 LP-this paper N
72 2008 FC76 Cen RR 9.1 None? 4 8 LP-this paper N 73 2008 SJ236 Cen RR 12.
2 None? 7 13 LP-this paper N

28
74 Charon 3:2 0.9 H2O, NH3 58 3 Br00b
Me10a Y
75 Hi’iaka* Cl H2O 87 11 Bark06 Y
*Haumea’s family, **new determination of taxonomy class, + the presence of the band was reported in the corresponding paper but its depth was not calculated References: Alv07 = Alvarez-Candal et al. (2007); Alv10 = Alvarez-Candal et al. (2010); Ba00 = Barucci et al. (2000); Ba02 = Barucci et al. (2002a); Ba05a = Barucci et al. (2005a); Ba06 = Barucci et al. (2006); Ba10= Barucci et al. (2010) ;Ba11= Barucci et al (2011) ; Bark06 = Barkume et al. (2006); Bark08 = Barkume et al. (2008); Bau02 = Bauer et al. (2002); Br99 = Brown et al. (1999); Br00a = Brown (2000); Br00b = Brown and Calvin (2000); Br00c = Brown et al (2000); Br05 = Brown et al. (2005); Br07 = Brown et al. (2007); BrK98 = Brown and Koresko (1998); Cr98 = Cruikshank et al. (1998); Da09 = Dalle Ore et al. (2009) ; dB04 = de Bergh et al. (2004); dB05 = de Bergh et al. (2005); DM10a = DeMeo et al. (2010a); DM10b = DeMeo et al. (2010b); Del10 = Delsanti et al. (2010); Dor03 = Doressoundiram et al. (2003); Dor05 = Doressoundiram et al. (2005); Dot03a = Dotto et al. (2003a); Dot03b = Dotto et al. (2003b); Fo04a = Fornasier et al. (2004a); Fos99 = Foster et al. (1999); Gr05 = Grundy et al. (2005); Gu09a = Guilbert et al. (2009a); Gu09b = Guilbert et al. (2009b); Je01 = Jewitt and Luu (2001); Je04 = Jewitt and Luu (2004); Li01 = Licandro et al. (2001); Li05 = Licandro and Pinilla-Alonso (2005); Li06a = Licandro et al. (2006a); Li06b = Licandro et al. (2006b); Lu00 = Luu et al. (2000); Lu98 = Luu and Jewitt (1998); Me05 = Merlin et al. (2005); Me07 = Merlin et al. (2007); Me09 = Merlin et al. (2009); Me10a = Merlin et al. (2010a); Me10b = Merlin et al. (2010b); Ow93 = Owen et al. (1993); PA07 = Pinilla-Alonso et al. (2007); Pr09 = Protopapa et al. (2009); Ro02 = Romon-Martin et al. (2002); Ro03 = Romon et al. (2003); Sch07=Schaller and Brown (2007) ; Tr05 = Trujillo et al. (2005); Tr07 = Trujillo et al. (2007).
Figure captions
Figure 1ab. Spectra of Centaurs (a) and TNOs (b) obtained with SINFONI and smoothed at a
resolution of 250. They are normalized to 1.55 microns and shifted by 1 unit for clarity except
2005 RR43 shifted by 1.5. For 2004 UX10 spectra correspond to Dec 2007 (1) and Nov 2008 (2).
Figure 2. Spectrum of 2008SJ236, 2004UX10, 2004 TY364 and 2007 UM126. Continuous, dashed
and doted black lines represent the synthetic spectrum obtained with Hapke model. The
continuous or dashed lines of the model represent the ranges where the model has been
computed. Visible and near-infrared photometry data have been converted in reflectance (circles
with errors) and used to connect the different part of the spectra. For the objects 2004 UX10 and
2008 SJ236, two models have been presented. Reflectance spectra of the last three objects have
been shifted by +1.5, +2.5, and +3.5 units for clarity.
Figure 3. Spectrum of 2007 UK126, 1999OX3, 2002KY14 and 2008 FC76. Reflectance spectra of
the three last objects have been shifted by +1, +2.5, and +3.5 units for clarity. See caption of
Fig.2 for details.

29
Figure 4. Spectrum of 2005 RR43, 2005 RM43, 2003 AZ84 and 2003 UZ413. Reflectance spectra of
the three last objects have been shifted by +1, +2, and +3 units for clarity. See caption of Fig.2
for details.
Figure 5. Depth of the 2 µm water band D versus the absolute magnitude H for objects of
different dynamical classes. Haumea’s family is not included in the graph.
Figure 6. Number of icy (white) and non-icy (black) bodies as a function of their taxonomical
class. Objects for which ice determination is considered as tentative, are shown by hatched areas.
Figure 7. The depth of the 2 micron band as a function of dynamical classes. The members of
Haumea’s family are shown as open circles. The three cold classical objects of our sample did
not show the 2 µm water ice band in their spectra.
Figures 8ab. Eccentricity and inclination of transneptunian objects vs. semimajor axis for icy
(open circles) and non-icy (black circles) bodies. Objects for which ice determination is
considered as tentative are shown by grey circles. The three objects with methane ice are
included. Haumea’s family members are shown by crossed circles. Sedna has been excluded as
its semimajor axis is out of the plot.

31
1.6 1.8 2.0 2.20
1
2
3
4
5
6
7
8
9
10
2007 VH305
2008 FC76
2008 SJ236
2002 KY14
2007 UM126
2003 CO1
No
rma
lize
d F
lux
Wavelength (m)
Pholus
Amycus
2002 GZ32

32
1.6 1.8 2.0 2.20
1
2
3
4
5
6
7
8
9
10
11
12
13
14
2005 RM43
(2)
(1)2004 UX10
2004 TY364
2002 UX25
1999 OX3
1996 TL66
2003 UZ413
2003 MW12
2003 AZ84
No
rma
lize
d F
lux
Wavelength (m)
2005 RR43
2007 UK126
Figures 1a, 1b.

33
Figure 2.
Figure 3.

34
Figure 4.
Figure 5.

35
0
2
4
6
8
10
12
14
Cent
Cent
TNOs
TNOs
TNOs
RRIRBR
N
BB
TNOs
Cent
Figure 6.
0
10
20
30
40
50
60
70
80
90
Classical
(cold)
De
pth
of 2
m
ba
nd
(%
)
(hot)Res SDO Det Cen
Figure 7.

36
10 20 30 40 50 60 70 80 90 100 110 120
0.0
0.1
0.2
0.3
0.4
0.5
0.6
0.7
0.8
0.9
Eris
Makemake
Pluto
Semimajor axis, AU
Ecce
ntr
icity
10 20 30 40 50 60 70 80 90 100 110 120
0
5
10
15
20
25
30
35
40
45 Eris
Makemake
Inclin
atio
n, d
eg
Semimajor axis, AU
Pluto
Figures 8a, 8b.

We present an analysis of all near-IR spectral data available on TNOs and Centaurs both
from new data from an ESO-Large Program and the literature.
On the analysis of 75 objects, the major results are :
1) all objects classified as BB class objects have icy surfaces. The objects of the IR class,
present only among classical and resonant populations, do not contain any body with
“sure” water ice determination;
2) the possible presence of CH3OH have been mainly detected on very red surfaces
(objects following the RR class);
3) the majority of Centaurs observed multiple times have an heterogeneous composition.
This seems to indicate a major characteristics of the Centaur population for which the
variation affecting the surface could be due not only to the presence of some “fresh”
areas resurfaced by impacts, but also to a temporal/sporadic activity. No Centaur is
found with an abundant surface ice content;
4) objects with abundant water ice content tend to have a smaller absolute magnitude
which corresponds in general to a larger size;
5) the classical objects are abundant both among icy bodies and bodies with no ice
content. All dynamically cold objects of the classical population in our sample (3
bodies) have no ice.
The new results provide important constraints to the global formation and evolution
scenario for the TNO population.
Copyright © 2022 FDOKUMEN