WABER 2010 - CentAUR
993
Proceedings of the West Africa Built Environment Research (WABER) Conference 2011 (19-21 July 2011, Accra, Ghana) Book Published Version Laryea, S., Leiringer, R. and Hughes, W., eds. (2011) Proceedings of the West Africa Built Environment Research (WABER) Conference 2011 (19-21 July 2011, Accra, Ghana). WABER, Reading, UK, pp991. ISBN 9780956606013 Available at http://centaur.reading.ac.uk/20829/ It is advisable to refer to the publisher’s version if you intend to cite from the work. See Guidance on citing . Publisher: WABER Publisher statement: Published by West Africa Built Environment Research (WABER) Conference C/o Dr Samuel Laryea School of Construction Management and Engineering University of Reading PO Box 219, Reading, UK RG6 6AW Email: [email protected] © The copyright for papers in this publication belongs to the authors of the papers. Correspondence All correspondence
-
Upload
khangminh22 -
Category
Documents
-
view
1 -
download
0
Transcript of WABER 2010 - CentAUR

Proceedings of the West Africa Built Environment Research (WABER) Conference 2011 (19-21 July 2011, Accra, Ghana)
Book
Published Version
Laryea, S., Leiringer, R. and Hughes, W., eds. (2011) Proceedings of the West Africa Built Environment Research (WABER) Conference 2011 (19-21 July 2011, Accra, Ghana). WABER, Reading, UK, pp991. ISBN 9780956606013 Available at http://centaur.reading.ac.uk/20829/
It is advisable to refer to the publisher’s version if you intend to cite from the work. See Guidance on citing .
Publisher: WABER
Publisher statement: Published by West Africa Built Environment Research (WABER) Conference C/o Dr Samuel Laryea School of Construction Management and Engineering University of Reading PO Box 219, Reading, UK RG6 6AW Email: [email protected] © The copyright for papers in this publication belongs to the authors of the papers. Correspondence All correspondence
relating to the WABER Conference should be addressed to: Dr Sena Agyepong Central University Accra, Ghana Email: [email protected] Please visit www.waberconference.com for more information Declaration All papers in this publication have been through a review process involving initial screening of abstracts, review by at least two referees, reporting of comments to authors, modifications of papers by authors and re-evaluation of re-submitted papers to ensure quality of content.
All outputs in CentAUR are protected by Intellectual Property Rights law, including copyright law. Copyright and IPR is retained by the creators or other copyright holders. Terms and conditions for use of this material are defined in the End User Agreement .
www.reading.ac.uk/centaur
CentAUR
Central Archive at the University of Reading
Reading’s research outputs online

WEST AFRICA BUILT
ENVIRONMENT RESEARCH
(WABER) CONFERENCE
19-21 July 2011
Accra, Ghana
Proceedings of the WABER 2011
conference
Editors
Dr Samuel Laryea
Dr Roine Leiringer
Professor Will Hughes
CONSTRUCTIONAL ENGINEERS
AND CONTRACTORS
K + H LIMITED

Proceedings of the West Africa Built Environment Research (WABER) Conference 2011
Accra, Ghana, 19-21 July 2011
Editors
Dr Samuel Laryea, University of Reading, UK
Dr Roine Leiringer, Chalmers University of Technology, Sweden
Professor Will Hughes, University of Reading, UK
First published 2011
ISBN 978-0-9566060-1-3
Published by
West Africa Built Environment Research (WABER) Conference
C/o Dr Samuel Laryea
School of Construction Management and Engineering
University of Reading
PO Box 219, Reading, UK
RG6 6AW
Email: [email protected]
© The copyright for papers in this publication belongs to the authors of the papers.
Correspondence
All correspondence relating to the WABER Conference should be addressed to:
Dr Sena Agyepong
Central University
Accra, Ghana
Email: [email protected]
Please visit www.waberconference.com for more information
Declaration
All papers in this publication have been through a review process involving initial screening
of abstracts, review by at least two referees, reporting of comments to authors, modifications
of papers by authors and re-evaluation of re-submitted papers to ensure quality of content.

i
FOREWORD
Welcome to this year‘s WABER conference in Accra, Ghana. Thank you for coming and we hope you
enjoy the conference. The WABER conference has developed rapidly in the past three years, but our
aims remain the same. We strive to: help young built environment researchers in West Africa (WA) to
develop their research work and skills through constructive face-to-face interaction with their peers
and experienced international academics; supply a platform for interaction among more senior
academics and an outlet for disseminating their research work; and to serve as a vehicle for developing
the built environment field in Africa.
Three conferences have so far been organized, 2009-2011, bringing together nearly three hundred
academics, researchers and practitioners from 50+ different institutions in WA. Through WABER,
many young researchers have been helped to develop their research work and skills through
constructive face-to-face interaction with experienced academics. We find this encouraging and we
will continue to work together with colleagues in WA to develop initiatives that provide young
researchers in WA with opportunities to develop their research potential and aspirations.
This year‘s conference proceedings consist of 95 papers. This represents around 50 percent of
abstracts and full papers that were initially submitted. We congratulate the authors of papers that
made it into the proceedings for a job well done. The published papers cover a wide array of topics
including: Building services, Construction design and technology, Construction economics and
finance, Construction education, Construction materials and production, Contracts, Cost and financial
management, Energy generation and consumption, Engineering sciences, Facilities management,
Health and safety, Housing, Human resources and skills, Information technology, Materials science,
Procurement, Project administration and management, Quantity surveying, Real estate and planning,
Risk management, Supply chain management, Sustainable technologies, Urban planning and
development, Waste management. As such they reflect various areas of socio-economic development
aspirations of countries in West Africa. One thing that is strikingly clear is that the construction sector
has an important part to play in helping to realize these aspirations.
We hope that the publication and discussion of these papers at this conference will contribute towards
the development of knowledge and technologies for development in West Africa and beyond. Given
that the delegates at this year‘s conference come from 10 different countries and 45 different academic
institutions, there is plenty of scope for cross boundary interaction and learning. The conference also
provides for a rich intellectual, international and multicultural blend and platform for networking and
developing new knowledge, connections and longer-term collaborations. We hope that the delegates
make good use of this opportunity.
We wish to express strong appreciation to two companies in Ghana who have supported us financially.
The first is A-Kon Consults Limited who are Chartered Quantity Surveyors with head office based in
Accra. The second is K+H Limited who are Constructional Engineers and Contractors with head
office based in Takoradi. We are grateful for your support and input and we look forward to a
mutually beneficial long-term relationship.
We are blessed to have four distinguished Keynote Speakers: Professor George Ofori (National
University of Singapore); Dr Roine Leiringer (Chalmers University, Sweden); Dr Chris Harty
(University of Reading, UK); and Professor Will Hughes (University of Reading, UK). Thank you
very much for coming. As always, many thanks are due to Dr Sena Agyepong for her excellent and
capable management of our local organizing arrangements. Above all, thank you to all of you for
coming to this conference. Our conference next year (2012) will take place in Nigeria and we look
forward to seeing all of you again. Enjoy Accra and have a safe journey back home.
Dr Samuel Laryea
School of Construction Management and Engineering
University of Reading, July 2011


iii
SCIENTIFIC COMMITTEE
Professor Will Hughes, University of Reading, UK
Professor George Ofori, National University of Singapore, Singapore
Dr Chris Harty, University of Reading, UK
Dr Sena Agyepong, Central University, Ghana
Dr Scott Fernie, Heriot-Watt University, UK
Professor George W.K. Intsiful, KNUST, Kumasi, Ghana
Dr Martin M. Tuuli, Loughborough University, UK
Professor Denis F. Cioffi, George Washington University, USA
Professor Anny Nathaniel Aniekwu, University of Benin, Nigeria
Dr Mrs Bola Babalola, Obafemi Awolowo University, Nigeria
Professor Kabir Bala, Ahmadu Bello University, Nigeria
Cathy Hughes, University of Reading, UK
Professor Raymond Nkado, University of the Witwatersrand, South Africa
Dr Felix Hammond, University of Wolverhampton, UK
Professor K.T. Odusami, University of Lagos, Nigeria
Dr Aaron Anvuur, University College London, UK
Dr Emmanuel Adinyira, KNUST, Kumasi, Ghana
Professor Stella Zubairu, Federal University of Technology, Minna, Nigeria
Dr Kemi Adeyeye, University of Brighton, UK
Dr Paul Alagidede, University of Stirling, Scotland
Rev. Dr. Frank Fugar, KNUST, Kumasi, Ghana
Dr Nongiba A. Kheni, Tamale Polytechnic, Ghana
Dr Nii Ankrah, University of Wolverhampton, UK
Dr Tyler Frazier, Technische Universität Berlin, Germany
Dr Wisdom Kwawu, University of Reading, UK
Dr Franklin Obeng-Odoom, University of Sydney, Australia
Mrs. Paula Cardellino, Universidad ORT Uruguay, Montevideo, Uruguay
Dr Ajibade Ayodeji Aibinu, University of Melbourne, Australia
Dr Wellington Didibhuku Thwala, University of Johannesburg, South Africa
Dr Ola Uduku, Edinburgh College of Art, Scotland
Professor Jianguo Chen, Tongji University, China
Dr Emmanuel Adu Essah, University of Reading, UK
Dr Roine Leiringer, Chalmers University of Technology, Sweden
Dr Samuel Laryea, University of Reading, UK


v
REVIEW PANEL
In addition to the members of our scientific committee, the following people have helped
to review abstracts and papers for the conference and we would like to acknowledge their
contribution and thank them.
Dr. Moshood O. Fadeyi, British University in Dubai, UAE Dr Shu-Ling Lu, University of Reading, UK
Josip Sertic, University of Zagreb, Croatia Dr Carmel M. Lindkvist, University of Reading, UK
Yingbin Feng, University of Western Sydney, Australia Dr Victor Chen, University of Melbourne, Australia
Dr Li Shan, Department of Building, National University of
Singapore, Singapore
Dr Stefan Christoffer Gottlieb, Danish Building Research
Institute, Aalborg University
Dr Hasan Haroglu, University of Reading, UK Dr Gabriel Nani, KNUST, Kumasi, Ghana
Dr Richard Nyuur, University of Swansea, Wales Amna Shibeika, University of Reading, UK
Mr. Igor Martek, University of Melbourne, Australia Dr Kumi Tashiro, The University of Hong Kong
Dauda Dan-Asabe, University of Reading, UK Kulomri Adogbo, Ahmadu Bello University, Nigeria
Patrick Manu, University of Wolverhampton, UK Sohrab Donyavi, University of Reading, UK
Damilola Ekundayo, Northumbria University, UK Afolabi A. Dania, University of Reading, UK
Ms Ma Shichao, The University of Hong Kong Ms Shen Yu Zhong, The University of Hong Kong
Tangi Rebekka Amakali, University of Reading, UK Peter Gangas Chindo, Ahmadu Bello University, Nigeria
Dr Bekithemba Mpofu, College of Estate Management, UK Dr T.K Chan, University of Melbourne, Australia
Sarfo Mensah, Kumasi Polytechnic, Ghana Prof Christine Räisänen, Chalmers University, Sweden
Funlola Famuyiwa, University of Lagos, Nigeria Alan Zhai, Loughborough University
Dr De-Graft Owusu-Manu, KNUST, Kumasi, Ghana John Shen Yuzhong, University of Hong Kong
Dr Stephen Kong, Civil Engineering and Development
Department, Hong Kong
Ms Betty Chiu, The University of Hong Kong
Dr Michael Boansi, KNUST, Kumasi, Ghana Dr Mark Adom Asamoah, KNUST, Kumasi, Ghana
Ms Chuanjing Ju Carrie, The University of Hong Kong Ms Rita Zhang, Peilhua, The University of Hong Kong
Dr Rita Li, Hong Kong Shue Yan University Dr. Zhikun Ding, The University of Hong Kong
Dr. Alan Zhai, China Harbour Engineering Company Ltd Mr Tony Wei Lu, The University of Hong Kong
Dr. Jacky, The University of Hong Kong Mr Enoch Sackey, Loughborough University, UK
Mr Zhang Yu, The University of Hong Kong Dr. Yunyan Jia, The University of Hong Kong
Mr. John Kissi, Mouchel Ltd, UK Mr John Shen Yuzhong, The University of Hong Kong
Ms Dan Zhang, The University of Hong Kong Dr Hao Wu, University of Melbourne, Australia
Dr James Rotimi, University of Auckland, New Zealand Dr. Raglan Lam, Raglan Ltd, Hong Kong


vii
THEME LEADERS
We are grateful to the following academics for leading the refereeing process for papers relating
to the research areas designated against their name(s):
Dr Franklin Obeng-Odoom, University of Sydney, Australia
Housing, land use and urban economic development, urbanisation
Dr Aaron Anvuur, University College of London, UK
Organisation strategy and supply chain management
Dr Martin Tuuli, Loughborough University, UK
Quantity surveying, cost and financial management
Dr Sena Agyepong, Central Univeristy, Ghana
Human resources and skills
Dr Kemi Adeyeye, University of Brighton, UK
Construction design and technology
Dr Tyler Frazier, Technische Universität Berlin, Germany
Urban infrastructure planning, land development regulations, real estate price modeling
Dr Wisdom Kwawu, University of Reading, UK
Facilities management
Dr Roine Leiringer, Chalmers University, Sweden
Dr Samuel Laryea, University of Reading, UK
Procurement, contracting and risk management
Dr Ajibade Ayodeji Aibinu, University of Melbourne, Australia
Contract administration
Dr Emmanuel Adu Essah, University of Reading, UK
Solar energy systems, sustainable technologies, building services

PROGRAMME
TUESDAY 19 JULY 2011 - 08:00-17:30
08:00-09:00 REGISTRATION
OPENING SESSION
09:00-09:10 Welcome address by Mr. Moses Anibaba (Director of British Council in Ghana): Role of the British Council in Africa
09:10-09:15 Opening remarks by Professor Will Hughes (Editor-in-chief of Construction Management and Economics; and Professor of Construction Management and Economics,
University of Reading, UK)
09:15-09:25 Guest of Honour address by Hon. Samia Nkrumah (MP, Parliament of Ghana)
Title of address: ―Role of the built environment community in the development of societies in Africa‖
09:25-09:35 Chairman‘s remarks by Mr. Nat Amarteifio (Architect and Former Mayor of Accra)
09:35:09:45 Official WABER 2011 Group Photograph
KEYNOTE ADDRESS
10:00-10:05 Introduction of keynote address/speaker by Mr Samuel Asare-Konadu, MD of A-Kon Consults Ltd
10:05-10:30 A-Kon Consults Keynote address by Professor Will Hughes (Professor of Construction Management and Economics, University of Reading, UK; Editor-in-chief of
Construction Management and Economics journal)
Title: Academic profile and conflicting agendas: individuals, departments, universities, journals, industry
10:30-10:40 Q&A
10:40-11:00 Refreshments and networking break
WORKSHOP SESSION (11:00-13:00)
Chairperson Dr Ola Uduku (Edinburgh College of Art School of Architecture, Scotland)
11:00-11:10 Managing the adverse health and safety influence of subcontracting – Patrick Manu, Nii Ankrah, David Proverbs, Subashini Suresh and Emmanuel Adukpo
11:10-11:20 A review of the current health and safety legislation in Botswana relative to construction industry stakeholders – Erastus Mwanaumo and Wellington Thwala
11:20-11:40 Discussion
11:40-11:50 Identification of health and safety performance improvement measuring indicators – Justus Agumba, Wellington Thwala and Theo Haupt
11:50-12:00 Investigating the perceptions of architects in the Ghanaian building industry with regard to photovoltaic energy technology – Naa Adjeley Ashiboe-Mensah, Fred
Akuffo and Frank Fugar
12:00-12:20 Discussion
12:20-12:30 Exploring waste minimization measures in the Ghanaian construction industry – J Ayarkwa, K Agyekum and E Adinyira
12:30-12:40 Designing out waste on mass housing construction sites in Minna, Niger state – Oluwatoyin Ayodeji Olaniyan
12:40-13:00 Discussion

13:00-14:00 Lunch and networking break
KEYNOTE ADDRESS
14:00-14:30 Keynote address by Professor George Ofori (National University of Singapore, Singapore)
Title: A review of construction industry development programmes
14:30-14:40 Q&A
14:40-15:00 Networking break
WORKSHOP SESSION (15:00-17:30)
Chairperson Dr Esi Ansah (Ashesi University, Ghana)
15:00-15:10 Urbanisation and the marketplace in West African countries – Enitan Oloto and Kayode Adebayo
15:10-15:20 Reinventing prototype buildings: The significance of prefabrication in mass housing construction – Lateef Lawal
15:20-15:40 Discussion
15:40-15:50 Gender issues in land: Implications for housing development in Nigeria – Ajayi Adebola
15:50-16:00 Urban land use planning in Ghana - Kwasi Awuah, Felix Hammond, Colin Booth and Jessica Lamond
16:00-16:20 Discussion
16:20-16:30 Hydrological performance of rainwater harvesting system in the residential sector – Omolara Lade, David Oloke, Collin Booth, Michael Fullen and David Proverbs
16:30-16:40 The likely effect of sustainable landscape on the quality of life through tourism – Dorcas Ayeni, O.J. Ebohon and A.H. Taki
16:40-17:00 Discussion
17:00-17:10 Innovative approaches to sustainable built environments in Nigeria – Chinwe Sam-Amobi
17:10-17:20 Framework analysis of technology and design of sustainable affordable housing in Nigeria - Olatunji Olagunju, David Oloke, Felix Hammond and Pat Costello
17:20-17:30 Discussion
17:30 Close
SOCIALISING
19:30 Socialising at the new Movenpick Ambassador Hotel in Accra City Centre
http://www.moevenpick-hotels.com/en/pub/your_hotels/worldmap/accra/overview.cfm

WEDNESDAY 20 JULY 2011 - 09:00-17:30
RESEARCH SKILLS WORKSHOP (MAIN AUDITORIUM)
09:00-10:30 Data collection and analysis: what is data, how do you collect it, and how do you analyse it? – Dr Chris Harty (School of Construction Management and Engineering,
University of Reading, UK)
10:30-11:00 Refreshments and networking break
PARALLEL SESSIONS (11:00-13:10)
STREAM 1 (MAIN AUDITORIUM)
Chairperson Dr Martin M. Tuuli (Loughborough University, UK)
11:00-11:10 Energy generation and consumption in Ghana – Emmanuel Essah
11:10-11:20 Industrial training in Ghana: perceptions of the undergraduate construction student – J. Ayarkwa, E. Adinyira and K. Agyekum
11:20-11:30 Discussion
11:30-11:40 Factors affecting women enrolment in construction education in Nigeria – Joshua Dada
11:40-11:50 Built environment education and research in West Africa – Samuel Laryea
11:50-12:00 Discussion
Chairperson Professor Joshua Ayarkwa (KNUST, Kumasi, Ghana)
12:10-12:20 Causes of variations on building projects in Nigeria – J.A. Babalola and A.F. Idehen
12:20-12:30 On the accuracy of cost estimates – Haruna Musa, Yahaya Ibrahim and Ahmed Ibrahim
12:30-12:40 Discussion
12:40-12:50 A comparative analysis of clients‘ and consultants‘ perspective of construction project performance – William Gyadu-Asiedu
12:50-13:00 Performance of building projects funded by public organizations – Sarfo Mensah, Ayirebi Dansoh and Peter Amoah
13:00-13:10 Discussion
13:10-14:30 Lunch and networking break
STREAM 2 (SEMINAR ROOM)
Chairperson Dr Noah Karley (Heriot Watt University, Scotland)
11:00-11:10 A comparative study of housing transformation processes in three government estates in South Western, Nigeria – Victor Adegbehingbe
11:10-11:20 An overview of human settlement in Nigeria: A ray of hope for the slum dwellers? – Clinton Aigbavboa and Wellington Thwala
11:20-11:30 Discussion
11:30-11:40 Affordability assessment of the housing units built from federal mortgage bank‘s loans in Nigeria – Musa Nuhu Madawaki

11:40-11:50 Public-private participation in housing in Nigeria and the case for community participation – Abraham Taiwo and Olumuyiwa Adegun
11:50-12:00 Discussion
Chairperson Professor Kabir Bala (Ahmadu Bello University, Nigeria)
12:10-12:20 Historical overview of housing provision in pre and post independence Ghana – T. Kwofie, E. Adinyira and E. Botchway
12:20-12:30 House owners‘ participation in mass housing provision in Niger State Nigeria – Adedayo Folaranmi
12:30-12:40 Discussion
12:40-12:50 Framework for performance-based post-occupancy evaluation of educational institution buildings in Nigeria – Aliyu Shika and Abubakar Dardau
12:50-13:00 Post occupancy evaluation of public office buildings in Minna urban – Ayoola Babatunde, Ayo Adeniran and Kemiki Olurotimi
13:00-13:10 Discussion
13:10-14:30 Lunch and networking break
KEYNOTE ADDRESS (MAIN AUDITORIUM)
14:30-14:55 K+H Ltd Keynote address by Dr Roine Leiringer (Chalmers University, Sweden)
Title: Built environment research in West Africa: current trends and future directions
14:55-15:05 Q&A
PARALLEL SESSIONS (15:10-17:30)
STREAM 1 (MAIN AUDITORIUM)
Chairperson Dr Emmanuel Olufemi Omisore (Obafemi Awolowo University, Nigeria)
15:10-15:20 Jos plateau volcanic deposits as sustainable cementitious materials for partial replacement of Portland cement in concrete mixtures
15:20-15:30 Effect of replacement of sand with granite fines on the compressive and tensile strengths of palm kernel shell concrete – John Babafemi and Babatunde Olawuyi
15:30-15:40 Discussion
15:40-15:50 Effects of Nigerian rice husk ash produced using a charcoal fired incinerator on properties of cement mortar and concrete – A.E. Abalaka, O.G. Okoli, M.M. Garba and
I.K. Zubairu
15:50-16:00 Establishing the compressive strength of sandcrete blocks produced in the Central Region, Ghana – Emmanuel Bamfo-Agyei
16:00-16:10 Discussion
16:10-16:30 Networking break
Chairperson Dr Victor Adegbehingbe (Federal University of Technology, Akure, Nigeria)
16:30-16:40 Factors influencing the extensive use of glass on facades of office buildings in Accra, – Adwoa Difie Ampadu-Asiamah and Emmanuel Akoi-Gyebi Adjei
16:40-16:50 Cost implications of biodegradation of Khaya grandifoliola (dry land mahogany) by aspergillus spp in residential buildings – I.H. Mshelgaru and A.D. Abdulazeez
17:00-17:10 Discussion
17:00-17:10 Establishing a maintenance cost profile of residential buildings – D. O. Mac-Barango and I. I. Kakulu
17:10-17:20 Drivers for estimating construction costs of institutional building projects in Nigeria – Baba Waziri and Kabir Bala

17:20-17:30 Discussion
17:30 Close
STREAM 2 (SEMINAR ROOM)
Chairperson Mrs Mae-ling Lokko / Joe Osae-Addo (Constructs LLC, Ghana)
15:10-15:20 Merging architectural and sculptural forms in the building industry - Victor Kweku Bondzie Micah and Owusu-Ansah Ankra
15:20-15:30 Client-architect behaviours towards cost advice in Nigeria – Baba Adama Kolo, Badiru Yunusa and Anita Dzikwi
15:30-15:40 Discussion
15:40-15:50 Designs and construction of buildings in Ghana: The disability factor – Kwaku Owusu and Nana Buabeng Owusu-Ansah
15:50-16:00 Bioclimatic and design strategies analysis towards the improvement of comfort in semi-detached houses in Ghana - David Nyame-Tawiah, Christian Koranteng and
Adeline Mawupemor Woyome
16:00-16:10 Discussion
16:10-16:30 Networking break
Chairperson Dr Sena Agyepong (Ashesi University, Ghana)
16:30-16:40 An evaluation of the trend of budgetary allocations for infrastructural development in Osun state, south-western, Nigeria – Opawole Akintayo, Jagboro Onajite and
Babatunde Olusola
16:40-16:50 Constraints in real estate development finance in Ghana – Nkyi Benjamin Appiagyei and Ayirebi Dansoh
17:00-17:10 Discussion
17:00-17:10 Remittances to Ghana: Benefits to the housing sector and impact of financial crisis – Noah Kofi Karley
17:10-17:20 Spatial scales and measurement of housing values in Nigeria – Ola Aluko
17:20-17:30 Discussion
17:30 Close
SOCIALISING
19:30 Socialising at Alisa Hotel in North Ridge Accra
http://www.alisahotels.com/

THURSDAY 21 JULY 2011 - 09:00-17:30
WORKSHOP SESSION
Chairperson Professor G.W.K. Intsiful (KNUST, Kumasi, Ghana)
09:00-09:10 Sources of deficient information regime in urban real estate markets in Sub-Saharan African countries – Stanislaus Adiaba, Felix Hammond, David Proverbs, Jessica
Lamond and Colin Booth
09:10-09:20 Public private partnership (PPP) in housing delivery in Niger State – Suleiman Bolaji
09:20-09:30 An integrated relationship and supply chain management framework for improving engineering and design service delivery to building contractors in Ghana – Nanyi
Orgen, Divine Ahadzie, Joshua Ayarkwa, Edward Badu
09:30-09:50 Discussion
PARALLEL SESSIONS (10:00-13:10)
STREAM 1 (MAIN AUDITORIUM)
Chairperson Dr Wellington Didibhuku Thwala (University of Johannesburg, South Africa)
10:00-10:10 Casual workers preference of occupational health and safety items on building construction sites in Ghana – Frederick Owusu Danso, Edward Badu and Divine Ahadzie
10:10-10:20 Influence of construction site OHS facilities on OHS performance in Nigeria – Godwin Idoro
10:20-10:30 Discussion
10:30-10:40 Health and safety in Ghanaian construction industry – A. Nimo Boakye, B.B. Akomah and David Coles
10:40-10:50 How should health and safety be measured as a tender evaluation criterion in the Ghanaian construction industry? – Wise Akortsu
10:50-11:00 Discussion
11:00-11-30 Refreshments and networking break
Chairperson Dr Emmanuel Essah (University of Reading, UK)
11:30-11:40 Sustainable construction in Nigeria – James Jatau and Anthony Westcott
11:40-11:50 ―Sustainable‖ or ―green‖ construction in Lagos, Nigeria – Immaculata Nwokoro and Henry Onukwube
11:50-12:00 Discussion
12:10-12:20 Sustainable tourism architecture – Stephen Oluigbo
12:20-12:30 Malaika Children‘s Village, Mkuranga, Tanzania: A case study of sustainable construction in Africa - Ifeyinwa Dimoriaku and Rita Obiozo
12:30-12:40 Discussion
12:40-12:50 The thermal performance of an educational office building in Ghana - Jimmy Nkrumah, Christian Koranteng and Kojo Safo-Kantanka
12:50-13:00 A study of the sources of noise pollution and their impacts on the built environment – S.A. Ganiyu and Y.M.D. Adedeji
13:00-13:10 Discussion
13:10-14:30 Lunch and networking break

STREAM 2 (SEMINAR ROOM)
Chairperson Dr Nii Ankrah (University of Wolverhampton, UK)
10:00-10:10 Dynamics of empowerment in projects – Enoch Sackey, Martin Tuuli and Andy Dainty
10:10-10:20 Influence of channels of recruitment on performance of construction workers in Nigeria – Godwin Idoro and Ebenezer Bamidele
10:20-10:30 Discussion
10:30-10:40 Capacity-building in contract administration: key to effective utilization of District Assembly Common Fund – M Boadu, J Eshun and E Opoku-Ware
10:40-10:50 Leader influences on training effectiveness of construction professionals - Henry Onukwube
10:50-11:00 Discussion
11:00-11-30 Refreshments and networking break
Chairperson Dr Gabriel Nani (KNUST, Kumasi, Ghana)
11:30-11:40 Geosophic perspective in Yoruba urbanism – Olaniyi Okedele and Tunji Adejumo
11:40-11:50 Factors influencing land accessibility for housing development in Abuja, Nigeria – Andrew Stanley and O. Orobowale
11:50-12:00 Discussion
12:10-12:20 Assessment of patronage of Natural History Museum, Obafemi Awolowo University, Ile-Ife, Nigeria - Emmanuel Olufemi Omisore
12:20-12:30 Revitalization of Nigerian urban centres through effective use of open public spaces: a case study of Onitsha metropolis – N Okolo, C Okpala, K Ezeji and A Okolie
12:30-12:40 Discussion
12:40-12:50 Mining activities in Nigeria urban environment: Impetus for community development or environmental deterioration? – Samson Adeyinka, Albert Abegunde, Nathaniel
Adeoye, S. Adeyemi
12:50-13:00 An investigation into the Environmental Protection Agency in the Ghanaian construction industry – E. Opintan-Baah, P.P. Yalley, P. Kwaw and G. Osei-Poku
13:00-13:10 Discussion
13:10-14:30 Lunch and networking break
PARALLEL SESSIONS (14:30-16:40)
STREAM 1 (MAIN AUDITORIUM)
Chairperson Professor Will Hughes (University of Reading, UK)
14:30-14:40 An investigation on why adjudication is not a popular dispute resolution method in the Ghanaian construction industry – Eric Baffour-Awuah, Charles Vroom and Peter
Otchere
14:40-14:50 Management of building construction disputes in Nigeria – Henry Onukwube
14:50-15:00 Discussion
15:00-15:10 Challenges facing the smooth implementation of Ghana‘s Public Procurement Law, 2003, Act 663 – Collins Ameyaw, Sarfo Mensah and Ernest Osei-Tutu
15:10-15:20 Assessing the impact of the National Building Regulation, 1996, L.I.1630 in Ghana – John Dadzie and David Coles
15:20-15:30 Discussion

Chairperson Professor Okedele Olaniyi (University of Lagos, Nigeria)
15:40-15:50 An investigative study of the impact of distance and demographic variables on the price of cement – D.O. Mac-Barango
15:50-16:00 Diesel (Ago) pump price increase and the prices of selected building materials in Nigeria (1990–2009) – John Idiake
16:00-16:10 Discussion
16:10-16:20 Partnering: an alternative contractual arrangement for construction project delivery in Ghana – Samuel Ansah
16:20-16:30 Evaluating the benefits of BOT infrastructure projects in Nigeria – Alhassan Dahiru and S. Bustani
16:30-16:40 Discussion
STREAM 2 (SEMINAR ROOM)
Chairperson Dr Chris Harty (University of Reading, UK)
14:30-14:40 Critical success factors for the implementation of Total Quality Management (TQM) in real estate development in Ghana – Kobina Imbeah and Ayirebi Dansoh
14:40-14:50 Investigation into the use of Total Quality Management in Nigerian construction industry – Peter Gangas Chindo and Kulomri Adogbo
14:50-15:00 Discussion
15:00-15:10 Construction participants‘ perspective on multi-criteria selection practice in Lagos State, Nigeria – Folasade Alabi
15:10-15:20 Influence of IT use at pre-contract stage of construction projects in Akwa Ibom State Nigeria – Jimmy Wilson and Godwin Idoro
15:20-15:30 Discussion
Chairperson Rev. Dr Frank Fugar (KNUST, Kumasi, Ghana)
15:40-15:50 Security measures adopted by estate surveyors shopping malls in Kaduna, Nigeria - David Ayock Ishaya and Daniel Dabo
15:50-16:00 Enhancing the image of transport terminals in Ghana – Peter Yalley, Gloria Osei Poku and Harold Adjarko
16:00-16:10 Discussion
16:10-16:20 Clay exploration, aesthetics and environmental sustainability: a case study of Akure and Ado-Ekiti, Nigeria – Ganiyu Sulayman Olubunmi and Ganiyu Sikiru Abiodun
16:20-16:30 Impact of improper solid waste disposal on urban housing in Akure, Nigeria – Alexander Fakere and Olaniyi Aluko
16:30-16:40 Discussion
CLOSING SESSION
16:45-17:00 Conference summary – Dr Roine Leiringer
17:00-17:30 Presentation of certificates and prizes – Professor Will Hughes
17:30 Close and refreshments
SOCIALISING
19:30 Socialising at Novotel Hotel in Accra City Centre
http://www.novotel.com/gb/hotel-1021-novotel-accra-city-centre/index.shtml


xvii
CONTENTS
SECTION 1: KEYNOTES
Academic profile and conflicting agendas: individuals, departments, universities, journals, industry -
Will Hughes 1
Developing the Construction Industry: A decade of change in four countries - George Ofori, Evelyn
Teo Ai Lin and Imelda Krisiani Tjandra 3
Built environment research in West Africa: current trends and future directions - Roine Leiringer 17
Data collection and analysis: what is data, how do you collect it, and how do you analyse it? - Chris
Harty 19
SECTION 2: CONFERENCE PAPERS
A comparative analysis of clients‘ and consultants‘ perspective of construction project performance -
William Gyadu-Asiedu 23
A comparative study of housing transformation processes in three government estates in South
Western, Nigeria - Victor Adegbehingbe 37
A comparison of selected national acoustics building codes - Sikiru Ganiyu and Olu Ogunsote 45
A review of the current health and safety legislation in Botswana relative to construction industry
stakeholders - Erastus Mwanaumo and Wellington Thwala 47
A study of the sources of noise pollution and their impacts on the built environment - S.A. Ganiyu and
Y.M.D. Adedeji 59
Affordability assessment of the housing units built from federal mortgage bank‘s loans in Nigeria -
Musa Nuhu Madawaki 69
Affordable housing initiative in Nigeria: use of composite panels - Y.M.D Adedeji, C. Arum and B.
Ajayi 79
Analysis of the socio-economic characteristics and housing condition in the core neighbourhood of
Akure, Nigeria - Bamidele M. Ogunleye 91
An appraisal of housing conditions in residential core area of Akure city in South Western Nigeria -
Victor Adegbehingbe 93
An evaluation of the trend of budgetary allocations for infrastructural development in Osun state,
south-western, Nigeria - Opawole Akintayo, Jagboro Onajite and Babatunde Olusola 105
An integrated relationship and supply chain management framework for improving engineering and
design service delivery to building contractors in Ghana - Nenyi Orgen, Divine Ahadzie,
Joshua Ayarkwa, Edward Badu 119
An investigation into the activities of the Environmental Protection Agency (EPA) in the Ghanaian
construction industry: A case study of Sekondi-Takoradi Metropolis – E. Opintan-Baah, P.P.
Yalley, P. Kwaw and G. Osei-Poku 131
An investigation on why adjudication is not a popular dispute resolution method in the Ghanaian
construction industry - Eric Baffour-Awuah , Charles Vroom and Peter Otchere 143
An investigative study of the impact of distance and demographic variables on the price of cement -
D.O. Mac-Barango 153
An overview of human settlement in Nigeria: A ray of hope for the slum dwellers? - Clinton
Aigbavboa and Wellington Thwala 167
Assessing the impact of the National Building Regulation, 1996, L.I.1630 in Ghana - John Dadzie and
David Coles 181
Assessment of patronage of Natural History Museum, Obafemi Awolowo University, Ile-Ife, Nigeria -
Emmanuel Olufemi Omisore 183

xviii
Bioclimatic and design strategies analysis towards the improvement of comfort in semi-detached
houses in Ghana - David Nyame-Tawiah, Christian Koranteng and Adeline Mawupemor
Woyome 193
Built environment education and research in West Africa - Samuel Laryea 203
Capacity-building in contract administration: key to effective utilization of District Assembly
Common Fund of infrastructural development - Michael Boadu, Joseph Eshun and Emmanuel
Opoku-Ware 215
Casual workers preference of occupational health and safety items on building construction sites in
Ghana - Frederick Owusu Danso, Edward Badu and Divine Ahadzie 217
Causes of variations on building projects in Nigeria - J.A. Babalola and A.F. Idehen 229
Challenges facing the smooth implementation of Ghana‘s Public Procurement Law, 2003, Act 663 -
Collins Ameyaw , Sarfo Mensah and Ernest Osei-Tutu 237
Clay exploration, aesthetics and environmental sustainability: a case study of Akure and Ado-Ekiti,
Nigeria - Ganiyu Sulayman Olubunmi and Ganiyu Sikiru Abiodun 249
Client-architect behaviours towards cost advice in Nigeria - Baba Adama Kolo, Badiru Yunusa and
Anita Dzikwi 251
Constraints in real estate development finance in Ghana - Nkyi Benjamin Appiagyei and Ayirebi
Dansoh 261
Construction participants‘ perspective on multi-criteria selection practice in Lagos State, Nigeria -
Folasade Alabi 273
Cost implications of biodegradation of Khaya grandifoliola (dry land mahogany) by aspergillus spp in
residential buildings - I.H. Mshelgaru and A.D. Abdulazeez 281
Critical success factors for the implementation of Total Quality Management (TQM) in real estate
development in Ghana - Kobina Imbeah and Ayirebi Dansoh 291
Designs and construction of buildings in Ghana: The disability factor - Kwaku Owusu and Nana
Buabeng Owusu-Ansah 305
Designing out waste on mass housing construction sites in Minna, Niger state - Oluwatoyin
Olaniyan 315
Diesel (Ago) pump price increase and the prices of selected building materials in Nigeria (1990–2009)
- John Idiake 325
Drivers for estimating construction costs of institutional building projects in Nigeria - Baba Waziri and
Kabir Bala 335
Dynamics of empowerment in projects - Enoch Sackey, Martin Tuuli and Andy Dainty 347
Effect of oil coating on steel bar on the strength of reinforced concrete - Emmanuel Adukpo, Samuel
Oteng-Seifah and Patrick Manu 361
Effect of replacement of sand with granite fines on the compressive and tensile strengths of palm kernel
shell concrete - John Babafemi and Babatunde Olawuyi 371
Effects of Nigerian rice husk ash produced using a charcoal fired incinerator on properties of cement
mortar and concrete - A.E. Abalaka, O.G. Okoli, M.M. Garba and I.K. Zubairu 379
Energy generation and consumption in Ghana - Emmanuel A. Essah 391
Enhancing the image of transport terminals in Ghana - Peter Yalley, Gloria Osei Poku and Harold
Adjarko 403
Establishing a maintenance cost profile of residential buildings – D O Mac-Barango and I I Kakulu 413
Establishing the compressive strength of sandcrete blocks produced in the Central Region, Ghana -
Emmanuel Bamfo-Agyei 427
Evaluating the benefits of BOT infrastructure projects in Nigeria - Alhassan Dahiru and S. Bustani 435
Exploring waste minimization measures in the Ghanaian construction industry – J Ayarkwa, K
Agyekum and E Adinyira 443
Factors affecting women enrolment in construction education in Nigeria - Joshua Dada 453
Factors influencing land accessibility for housing development in Abuja, Nigeria - Andrew Stanley and
O. Orobowale 465
Factors influencing the extensive use of glass on facades of office buildings in Accra, Ghana - Adwoa
Difie Ampadu-Asiamah and Emmanuel Akoi-Gyebi Adjei 473

xix
Framework analysis of technology and design of sustainable affordable housing in Nigeria - Olatunji
Olagunju, David Oloke, Felix Hammond and Pat Costello 487
Framework for performance-based post-occupancy evaluation of educational institution buildings in
Nigeria - Aliyu Shika and Abubakar Dardau 501
Gender issues in land: Implications for housing development in Nigeria - Ajayi Adebola 509
Geosophic perspective in Yoruba urbanism - Olaniyi Okedele and Tunji Adejumo 517
Health and safety in Ghanaian construction industry - A. Nimo Boakye, B.B. Akomah and David Coles
- 529
Historical overview of housing provision in pre and post independence Ghana - T. Kwofie, E. Adinyira
and E. Botchway 541
House owners‘ participation in mass housing provision in Niger State Nigeria - Adedayo Folaranmi 559
How should health and safety be measured as a tender evaluation criterion in the Ghanaian construction
industry? - Wise Akortsu 571
Hydrological performance of rainwater harvesting system in the residential sector - Omolara Lade,
David Oloke, Collin Booth, Michael Fullen and David Proverbs 585
Identification of health and safety performance improvement measuring indicators - Justus Agumba,
Wellington Thwala and Theo Haupt 593
Impact of improper solid waste disposal on urban housing in Akure, Nigeria - Alexander Fakere and
Olaniyi Aluko 607
Industrial training in Ghana: perceptions of the undergraduate construction student - J. Ayarkwa, E.
Adinyira and K. Agyekum 617
Influence of channels of recruitment on performance of construction workers in Nigeria - Godwin
Idoro and Ebenezer Bamidele 629
Influence of construction site OHS facilities on OHS performance in Nigeria - Godwin Idoro 641
Influence of IT use at pre-contract stage of construction projects in Akwa Ibom State Nigeria - Jimmy
Wilson and Godwin Idoro 651
Innovative approaches to sustainable built environments in Nigeria - Chinwe Sam-Amobi 663
Investigating the perceptions of architects in the Ghanaian building industry with regard to photovoltaic
energy technology - Naa Adjeley Ashiboe-Mensah, Fred Akuffo and Frank Fugar 675
Investigation into the use of total quality management in Nigerian construction industry - Peter Gangas
Chindo and Kulomri Adogbo 683
Jos plateau volcanic deposits as sustainable cementitious materials for partial replacement of Portland
cement in concrete mixtures - Danjuma Dadu 691
Leader influences on training effectiveness of construction professionals - Henry Onukwube 703
Malaika Children‘s Village, Mkuranga, Tanzania: A case study of sustainable construction in Africa -
Ifeyinwa Dimoriaku and Rita Obiozo 715
Management of building construction disputes in Nigeria - Henry Onukwube 725
Managing the adverse health and safety influence of subcontracting - Patrick Manu, Nii Ankrah, David
Proverbs, Subashini Suresh and Emmanuel Adukpo 735
Merging architectural and sculptural forms in the building industry - Victor Kweku Bondzie Micah and
Owusu-Ansah Ankra 745
Mining activities in Nigeria urban environment: Impetus for community development or environmental
deterioration? - Samson Adeyinka, Albert Abegunde, Nathaniel Adeoye, S. Adeyemi 747
On the accuracy of cost estimates - Haruna Musa, Yahaya Ibrahim and Ahmed Ibrahim 761
Partnering: an alternative contractual arrangement for construction project delivery in Ghana - Samuel
Ansah 771
Performance of building projects funded by public organizations - Sarfo Mensah, Ayirebi Dansoh and
Peter Amoah 783
Post occupancy evaluation of public office buildings in Minna urban - Ayoola Babatunde, Ayo
Adeniran and Kemiki Olurotimi 795
Public private partnership (PPP) in housing delivery in Niger State - Suleiman Bolaji 805

xx
Public-private participation in housing in Nigeria and the case for community participation - Abraham
Taiwo and Olumuyiwa Adegun 807
Regeneration of biophilic architectural concepts and psychosocial values in building design - Rita
Obiozo 817
Reinventing prototype buildings - Lateef Lawal 819
Remittances to Ghana: Benefits to the housing sector and impact of financial crisis - Noah Kofi
Karley 827
Revitalization of Nigerian urban centres through effective use of open public spaces: a case study of
Onitsha metropolis - Ndidi Okolo, Chukwura Okpala, Kelechi Ezeji and Anthony Okolie 841
Security measures adopted by estate surveyors shopping malls in Kaduna, Nigeria - David Ayock
Ishaya and Daniel Dabo 843
Sources of deficient information regime in urban real estate markets in Sub-Saharan African countries
- Stanislaus Adiaba, Felix Hammond, David Proverbs, Jessica Lamond and Colin Booth 845
Spatial scales and measurement of housing values in Nigeria - Ola Aluko 861
Sustainable construction in Nigeria - James Jatau and Anthony Westcott 871
―Sustainable‖ or ―green‖ construction in Lagos, Nigeria - Immaculata Nwokoro and Henry
Onukwube 883
Sustainable tourism architecture - Stephen Oluigbo 897
The context of human resource in the Ghanaian public sector - Michael Boadu and Emmanuel Opoku-
Ware 905
The likely effect of sustainable landscape on the quality of life through tourism - Dorcas Ayeni, O.J.
Ebohon and A.H. Taki 907
The problem of non-completion of infrastructure projects in Ghana - Andrew Oppong-Danquah, Noel
Painting, Kemi Adeyeye and Kassim Gidado 919
The thermal performance of an educational office building in Ghana - Jimmy Nkrumah, Christian
Koranteng and Kojo Safo-Kantanka 929
Urban land use planning in Ghana - Kwasi Awuah, Felix Hammond, Colin Booth and Jessica
Lamond 939
Urbanisation and the marketplace in West African countries - Enitan Oloto and Kayode Adebayo 953
INDEX OF AUTHORS 963
INDEX OF KEYWORDS 965

SECTION 1: KEYNOTES


Hughes, W.P. (2011) Academic profile and conflicting agendas: individuals, departments, universities,
journals, industry In: Laryea, S., Leiringer, R. and Hughes, W. (Eds) Procs West Africa Built
Environment Research (WABER) Conference, 27-28 July 2010, Accra, Ghana, 1-2.
1
ACADEMIC PROFILE AND CONFLICTING AGENDAS:
INDIVIDUALS, DEPARTMENTS, UNIVERSITIES,
JOURNALS, INDUSTRY
Professor Will Hughes1
Editor-in-Chief, Construction Management and Economics, School of Construction Management and
Engineering, University of Reading, PO Box 219, Reading, RG6 6AW, UK
This presentation covers the conflicting agendas and pressures that beset the
academic. We are all members of diverse constituencies, as individuals, members of
departments and faculties, members of a university, authors and referees in journals
and, to varying degrees, contributors to industry. Universities have a distinctive task.
As Edward Shils has said, ―it is the methodical discovery and teaching of truths about
serious and important things‖.
A ―scientific‖ truth is not the same as a religious truth. One is relative, the other
absolute. Science is no more than a provisional consensus. It involves the
observation of certain specific phenomena within a theoretical framework in order to
develop better explanations that improve our collective understanding. It is not the
mere reporting of phenomena - i.e. science is not journalism. The focus on academic
outputs relates to an intensifying search for recognition in the wider disciplinary
community, as well as to competition for promotion. The conflicting agendas require
academics to produce ―multi-purpose papers‖ which fulfil several functions: they
record scientific progress in the field, they create the sense of a ―bundle of
knowledge‖ or community of specialist scholars, they develop wider recognition in
the academic community, they provide evidence for promotion cases. But academic
outputs are not journalism and not dissemination, therefore not necessarily directly
useful for industry.
To ensure that academic outputs are robust, they are peer evaluated. This involves
questioning whether a paper makes a satisfactory contribution. Editors seek to
encourage the exercise of judgement in their referees but referees do not decide the
fate of the paper, editors do. Institutional pressures mean that a rational response is
needed to the combined impact of increasing costs and decreasing income. This
means an ever sharper dependence on league tables, rankings and evaluations of
―impact‖. There is a universal problem of measurement, which as that you tend to
only get what you measure. Any individual academic has to decide where to publish.
It is necessary to develop a publication strategy that is most likely to measure up in
terms of impact factors, league tables but this tends to transform the motivation to
publish from reporting the results of research to demonstrating research-active status.
But for an individual, the important thing is placing papers with peers.
In the area of built environment research, there are some important and difficult
questions: Are practitioners and academics too close or too distant? What is the
business case for funding research? Indeed, what is the business case for funding
journals? There is a tendency for these pressures to re-write the academic agenda.
Therefore, how should we respond? There is a choice between institutional and
ethical responses. Is the agenda career-building or institution-building? There are

Hughes
2
clearly consequences that depend on the mode of measurement. And there are
common misconceptions of relationship between quality and quantity. For example,
is there a choice between developing new insights and making money?
In conclusion, what helps us to progress in our careers is peer recognition. What
makes us useful to departments and universities is recognition and impact. What
makes a scientific paper useful is conformance with the customs and practice of the
particular academic field. What makes academics useful to industry is being able to
provide practical and positive advice. There are many conflicting agendas, in
response to which the successful academic has to develop diverse tactics.

Ofori, G., Ai Lin, E.T. and Tjandra, I.K. (2011) Developing the Construction Industry: A decade of
change in four countries In: Laryea, S., Leiringer, R. and Hughes, W. (Eds) Procs West Africa Built
Environment Research (WABER) Conference, 19-21 July 2011, Accra, Ghana, 3-16.
3
DEVELOPING THE CONSTRUCTION INDUSTRY: A
DECADE OF CHANGE IN FOUR COUNTRIES
George Ofori1, Evelyn Teo Ai Lin
2, Imelda Krisiani Tjandra
3
Department of Building, National University of Singapore, Singapore
The report on the UK construction industry entitled Rethinking Construction which
was written by a task force led by Sir John Egan (1998) inspired the construction
industries in many parts of the world to carry out comprehensive reviews of the
industries. Although there are similarities in the programmes of the countries, they
were shaped by different institutional contexts, and their implementation faced
different problems and challenges. Despite the extensive literature on change
initiatives in each of the countries, there is hardly any international comparison of the
programmes. The background to, and implementation of, the construction industry
reform studies in the UK, Singapore, Hong Kong, and Malaysia are presented. The
achievements realised, and challenges faced, in each country are discussed. The
potential contribution which researchers can make and the merits of international
research collaboration are highlighted.
Keywords: change, construction industry development, contextual constraints,
international research collaboration.
INTRODUCTION
In the past decade, a number of studies have focused on reviewing the construction
processes, practices, and performances in their countries. The studies have focused on
how to re-engineer, reinvent, revalue, and rethink construction to improve its
performance. The Egan Report (1998) inspired the initiation of construction industry
reviews in several other countries. These include the Construction 21 (C21) study in
Singapore (Construction 21 Steering Committee, 1999) and the Construct for
Excellence report in Hong Kong (CIRC, 2001). Subsequently, in Malaysia, the
Construction Industry Development Board (CIDB) and the Building Industry
Presidents Council (BIPC) proposed recommendations and action plans to overcome
the challenges faced by the construction industry, in the form of the Construction
Industry Master Plan (CIMP) (CIDB, 2007). The reports produced from the studies
have become blueprints on which programmes for the development of the respective
construction industries have been based.
A joint research project is currently being undertaken on the change programmes for
the construction industries in the UK, Singapore, and Hong Kong, to compare the
objectives of the construction industry change programmes, and the outcomes from,
their implementation. and the institutional characteristics of the construction industries
in the three jurisdictions are also being studied. There were key similarities and
differences among the three programmes. All three studies were intended to attain a

Ofori, Ai Lin and Tjandra
4
radical transformation of construction industry performance through a planned series
of change initiatives. Performance targets relating to each of the recommendations
were also set. However, the three reports were shaped by very different sets of local
concerns. They also advocated different institutional arrangements for implementing
the desired changes. Hence, it is possible to draw lessons from the three
implementation programmes for future construction industry improvements in each
jurisdiction and in other countries as well.
The background of construction industry improvement programmes in the UK,
Singapore, Hong Kong and Malaysia is presented. Overviews of the progress which
has been attained under the respective programmes in each country are then provided.
The similarities and differences of the development among the four countries are
discussed. The perceived future of the construction industry in Singapore is presented
as a case study.
Objectives of paper
A joint study is being undertaken on construction industry development by teams from
the University of Hong Kong, University of Reading and National University of
Singapore. The collaboration involves the utilisation of a jointly developed research
method. Box One shows the aim and objectives of the joint research.
Box One Collaborative research on industry development initiatives: Research aims and objectives
Research aims and objectives
The aim of the collaborative research is to study the implementation of the respective construction industry
improvement programmes in Hong Kong, Singapore and the UK. The objectives are:
To compare the institutional characteristics of the construction industries in Hong Kong, Singapore and the UK.
In light of the above, to ascertain and evaluate the extent to which the respective implementation programmes have
achieved the objectives set.
To evaluate the respective roles of government and private sector agencies in the implementation of the advocated
reforms.
To draw lessons from the three implementation programmes for future industry improvements in each context.
To develop a research agenda for contributing to the effort to realise improvements in the construction industries of
the three locations in addition to other national/regional contexts.
To present specific, tailored recommendations for the use of performance targets, with particular emphasis on
appropriateness and monitoring.
Box Two presents the agreed research method which was adopted by the partners. In
Singapore, the study involved the following stages: (a) interviews of prominent
practitioners and administrators who were involved in the C21 process; (b) an
extensive industry-wide questionnaire survey of developers, consultants (architects,
engineers and quantity surveyors), contractors, subcontractors; (c) joint research
workshop and conference (in Singapore) on the future of construction in Singapore;
and (d) forum of construction industry leaders. The forum replaced the case studies
whih had been part of the original programme, after it became apparent that such case
studies were unlikely to yield the desired results in the particular context of the
construction industry in Singapore.
CONSTRUCTION INDUSTRY IMPROVEMENT PROGRAMMES
IN FOUR COUNTRIES
This section provides an overview of the background of construction industry
improvement programmes in each of the four countries, in chronological order of the
year of publication.

Construction industry reform
5
IMPROVEMENT PROGRAMME IN THE UNITED KINGDOM
In the UK, the construction industry has been perceived as under-achieving, in terms
of meeting its own needs and those of its clients. Hence, a Construction Task Force
was set up to advise the Deputy Prime Minister (from the clients‘ perspective) on the
opportunities to improve the efficiency and quality of delivery of UK construction, to
reinforce the impetus for change, and to make the industry more responsive to
customer needs.
Box Two Collaborative research on industry development initiatives: Research method
The research adopts a multi-method of ‗contextualist research‘ which emphasises the importance of locating
present behaviour in the context of its historical antecedents (Pettigrew, 2003). Of particular importance is to focus
on the dynamics of change in the three jurisdictions under consideration. Few current researchers within the
context of construction management give significant attention to time, with the result that much of their work is an
‗exercise in comparative statics‘. In contrast, the research approach would recommend that researchers follow the
approach of historians to ‗reconstruct past contexts, processes, and decisions‘ in order to discover patterns, find
underlying mechanisms and triggers, and combine inductive search with deductive reason (Orton, 1997). An
important underlying principle is that the context within which change is instigated must be conceptualised as an
active part of analysis (Fernie et al., 2007). But context is not only shaping, it is also shaped by action (Pettigrew,
1997). The advocated research approach will unpack how the three contexts have been shaped over time and the
influence that this has had on the implementation of the respective change agendas. The research differs that it
adopts a ‗becoming ontology‘ rather than a ‗being ontology‘ (Chia, 1995). As such it focuses on continuous
processes of flux and transformation, rather than static characteristics that can be possessed and measured.
The research involves the following stages:
Comparative analysis of pre-existing dynamics of sectoral change in the three locations. This will involve an
historical analysis of available statistics and published sources.
Archival studies and review of literature on performance-improvement initiatives in each location to provide the
basis for the formulation of the questionnaire
Empirical studies in the three locations, comprising.
Workshops with prominent practitioners and policy makers (i) to verify the outputs from stages (1) and (2) and to
identify emergent issues.
A questionnaire survey using a common set of questionnaire, adapted in each case to suit the local context
A series of semi-structured interviews with prominent practitioners and policy makers in each location.
Five detailed case studies of indicative firms in each location, with particular emphasis on the interaction between
the firms‘ adopted strategies and the broader dynamics of change.
Workshops (3 no.) among the research teams and other invited international academics.
Publication of a joint report on the research project.
The Egan Report (1998) identified the problems that needed to be tackled, including
the need to modernise, to address the dissatisfaction of private_ and public-sector
clients due to under-achievement, as well as fragmentation of the industry.
Learning from the experience of the manufacturing and service industries, the Egan
Report (1998) identified five key drivers of change: (i) committed leadership; (ii) a
focus on the customer; (iii) integrated processes and teams; (iv) a quality driven
agenda; and (v) commitment to people. To drive dramatic performance improvement,
the report proposed that the construction industry should set clear measurable
objectives, and then adopt quantified targets, milestones and performance indicators.
Pointing out that there are significant inefficiencies in the construction process, the
report aimed for a much more systematised and integrated project process to reduce
waste and improve both quality and efficiency. The report noted that substantial
changes in the culture and structure of the construction industry were required to
enable improvements in the project processes. These include changes in working
conditions, skills and training, approaches to design, use of technology, and
relationships between companies.

Ofori, Ai Lin and Tjandra
6
The Task Force called for commitment from major clients, the construction industry,
and the government to improve the efficiency and quality of construction. It
encouraged the public sector, as the largest client group, to play a leading role in the
development of a more sophisticated and demanding customer base for construction.
IMPROVEMENT PROGRAMME IN SINGAPORE
The Construction 21 Committee Manpower was established in May 1998 by the
Ministry of Manpower (MOM) to address the manpower problems in the construction
industry in Singapore. It was subsequently merged with the Committee on Practices in
the Construction Industry set up by the Ministry of National Development (MND) to
form the Construction 21 Steering Committee.
The Construction 21 Committee and its four working groups comprised more than 80
people from the private, public, and people sectors. They represented the professional
bodies, trade associations, regulatory bodies, public agencies, unions, tertiary
institutions, and the public, represented by Members of Parliament.
The committee undertook study missions to Hong Kong, Japan, UK and US to learn
the best practices in the industry. It also sought the views of Sir John Egan and
Professor Daniel Jones, who were involved in the development of Egan Report
(1998).
It was initially intended that the committee would investigate issues related to labour
supply and productivity in the industry, but it conducted a thorough investigation and
cover many aspects of the industry, from Processes (practices, techniques, and
integrated approach to construction), and Players (professionalism and skills) to
Products (exporting construction expertise). It developed a vision for the Singapore
construction industry: ―To be a World Class Builder in the Knowledge Age‖, with the
change in the public‘s perception of the construction industry from a Dirty,
Demanding, and Dangerous (3D) industry to a Professional, Productive, and
Progressive (3P) industry. The committee made 39 recommendations under 6 strategic
thrusts, which were: (i) enhancing the professionalism of the industry; (ii) raising the
skills level; (iii) improving industry practices and techniques; (iv) an integrated
approach to construction; (v) developing an external wing; and (vi) a collective
championing effort for the construction industry.
IMPROVEMENT PROGRAMME IN HONG KONG
The Construction Industry Review Committee (CIRC), with membership widely
drawn from the construction and property sectors, trades unions, universities, clients,
and government, was set up in April 2000 to investigate issues in the construction
industry in Hong Kong and to make recommendations for improvement. The report of
the CIRC, entitled ―Construct for Excellence‖ (CIRC, 2001) grouped the issues under
three headings: performance, process, and business. The vision for the construction
industry was: ―an integrated construction industry that is capable of continuous
improvement towards excellence in a market-driven environment‖.
The report made 109 recommendations, which were grouped under seven key aims:
(i) fostering a quality culture; (ii) achieving value in construction procurement; (iii)
nurturing a professional workforce; (iv) developing an efficient, innovative, and
productive industry; (v) improving safety and environmental performance; (vi)
devising a new institutional framework to drive the industry; and (vii) implementation
of a change programme for industry.

Construction industry reform
7
One of the recommendations was to set up an ―industry co-ordinating body‖ to lead a
change programme. The Provisional Construction Industry Co-ordination Board
(PCICB) was established in September 2001 with membership drawn in part from the
members of the Review Committee.
IMPROVEMENT PROGRAMME IN MALAYSIA
In Malaysia, following a decline in the performance of the construction industry, it
was realised that there was an urgent need for the foundations of the industry to be
strengthened to prepare it to face its future challenges. In 2003, the Construction
Industry Development Board (CIDB) and the Building Industry Presidents Council
(BIPC) identified the need to propose recommendations and action plans to attain this
aim. The Construction Industry Master Plan (CIMP) was developed by the CIDB in
collaboration with the BIPC and various organisations representing the industry.
The master plan, which covers the period of 2006-2015, outlined a strategic roadmap
to develop the construction industry into a world-class, innovative, and knowledgeable
global solution provider.
In order to achieve the vision, seven strategic thrusts were identified, and these formed
the basis of the main recommendations. The thrusts were (i) integrate the construction
industry value chain to enhance productivity and efficiency; (ii) strengthen the image
of the construction industry; (iii) strive for the highest standard of quality,
occupational safety and health, and environmental practices; (iv) develop human
resource capabilities and capacities in the construction industry; (v) innovate through
research and development (R&D) and adopt new construction methods; (vi) leverage
on information and communication technology in the construction industry; and (vii)
benefit from globalisation including the export of construction products and services.
A smaller committee comprising representatives of the Ministry of Works, Ministry
of Entrepreneur and Cooperative Development, and Ministry of Finance would handle
the implementation of the seven thrusts.
CHANGES IN THE FOUR COUNTRIES
This section presents the changes that have been happening in the four countries ever
since the publications of the improvement programmes in the respective countries.
CHANGE IN THE UNITED KINGDOM
In the UK, the Strategic Forum was formed in 2001 to oversee the industry reform
movement. It had revised the set of targets to be achieved by the end of 2007
(Strategic Forum for Construction, 2002). Recently, the time frame has been extended
to 2012, relating to the construction works for the 2012 Olympic Games.
After the publication of the Egan Report, at least eleven more reports have been
published. The reports were target-driven, focusing on performance measurement for
efficiency. The latest report, Never Waste a Good Crisis, published in October 2009,
reviewed the progress which had been made since the publication of the Egan Report.
The report (Constructing Excellence, 2009) portrayed a dim situation. It noted that
whereaqs there had been some progress, this was nowhere near enough to what had
been expected. It also observed that the commitment to the principles in the Egan
Report was only skin-deep. Few of the targets set in the Egan Report had been met in
full, whereas most of them had fallen considerably short.

Ofori, Ai Lin and Tjandra
8
The Egan Report (1998) had set seven targets for 10 to 20% year-on-year
improvement in capital cost, construction time, predictability, defects, accidents,
productivity, turnover and profits. Constructing Excellence (2009) reported that, in
general, the Egan targets had not been met in the industry. Improvement in
profitability was largely due to favourable economic conditions in the last decade.
While there were significant improvements in safety and productivity prforshowed
reasonable progress, there was still a need for major improvement in the area of
predictability. A programme of demonstration projects had been successful; more than
500 projects worth £14 billion had contributed to the industry‘s knowledge base of
innovation and best practice (Constructing Excellence, 2009).
The report (Constructing Excellence, 2009) identified four key blockers to progress.
Firstly, the growing economy in the years following the publication of the
recommendations provided no impetus for a radical transformation of the construction
industry. Secondly, there was a lack of capable people within the industry, particularly
at the senior management level with the leadership skills required to bring about a
radical cultural change. Thirdly, a lack of integration in the delivery process impeded
continuous improvement. Fourthly, the diverse and fragmented structure of the
industry made it difficult to serve the interests of the industry as a whole.
Furthermore, Green et al. (2008) argue that industry improvement reviews tend to
insist that firms should adopt ‗best practice‘ recipes such as lean thinking, partnering,
and integrated teams. While the reports following the Egan Report (1998) focus on
integration, the challenge is that the industry is heavily fragmented. There is hardly
any effort to think of how to adapt the organisational routines to changing
circumstances.
CHANGE IN SINGAPORE
The BCA closely co-ordinated and monitored the following-up of the
recommendations. Even the recommendations that had not been approved (i.e. export
promotion and research) were followed up. As one interviewee noted, “The report
card on C21 would be a decent one because everything that can be done has been
done. In many cases, they went beyond what was proposed.”
In terms of the transformation from a 3D to a 3P industry, the interviewees agreed that
the industry has progressed, but the degree of progression was not as much as it
should have been. On strategic thrust 1, the Construction Real Estate Network
(CORENET) project, a major IT initiative to provide an integrated infrastructure for
the construction industry stakeholders to communicate with each other and exchange
information, was as the most significant achievement of C21. The professionalism of
the industry has been improved, but there is still room for improvement. New awards
have been created, incorporating key points from previous ones. Many new degree
programmes have been started to meet the needs of the industry, but a number of the
interviewees expressed their concerns about the quality of the curriculum and
graduates. There has been improvement in the implementation of the Continuing
Professional Development (CPD) programme; it has now become mandatory for some
professions, notably, architecture and engineering. A common code of conduct for the
construction industry, which was one of the C21 recommendations, was drafted but it
has not been implemented because, according to one interviewee, it was considered to
be so general that it was not necessary. In the C21 report, the multi-layered
subcontracting system was mentioned as one of the causes of poor productivity in the
industry. Many of the small firms are poorly managed, lack the incentive and ability to

Construction industry reform
9
invest in training and in new technology, and are unable to reap economies of scale in
their operations, resulting in much wastage (Construction 21 Steering Committee,
1999). One of the recommendations in C21 was to license all contractors including
sub-contractors in order to enhance their standards and professionalism. As the
licensing was only implemented in December 2008, the impact has yet to be realised.
On strategic thrust 2, the issue of foreign workers was the main concern for many
interviewees. They highlighted the cultural differences, transient nature of the
workers, the hidden costs, low level of skills, impact on safety performance, and the
support provided by the government to the workers. The Man-Year Entitlements
(MYE), which determines the number of foreign workers which a company can
employ for each project as determined by the cost and duration of the works, had been
tightened and then the cuts had been somewhat restored in response to feedback from
the industry. Unexpected practices have developed, which gave an impression that the
MYE was still at a comfortable level for the contractors and hence, ineffective. There
has been improvement on the construction workers‘ skills, with the introduction by
the BCA of the Skill Evaluation Certificate (SEC) and Skill Evaluation Certificate
(Knowledge) – SEC (K).
On strategic thrust 3, the interviewees noted that, owing to the legislation on
buildability, productivity has improved, but there was still room for improvement.
BCA‘s policy on productivity performance has progressed from considering
buildability as the main determinant towards constructability. The Construction
Quality Assessment Scheme (CONQUAS) (an objective method for assessing the
quality of a construction project which was introduced in 1989) has improved quality
to a certain degree, and it has been extended to the Quality Mark for residential
buildings which seeks to give owners and end purchasers of units an indication of the
quality. The National Productivity and Quality Specifications (NPQS) has been
launched, but it has not been pervasively used in the industry. The NPQS is currently
being revamped in an exercise involving a number of professional institutions.
C21 also targeted improvement in construction safety. The Joint MND-MOM Review
Committee (JRC) on Construction Safety was convened after two serious accidents in
2004, in order to review the regulatory framework and ancillary systems to raise
safety standards in the construction industry (JRC, 2005). The committee identified
gaps in the regulatory framework and ancillary systems. It has made recommendations
to help strengthen the legislative provisions pertaining to temporary structures, raise
professionalism and competency of professionals, contractors, and supervisors, and
make transparent the public sector procurement system to take safety into account.
The Construction (Design and Management) or CDM Regulations will require
designers to work closely with contractors in thinking through safety management for
the entire life-cycle of a project (Gan, 2008). ―Implementing WSH2015 for
Construction Industry‖ was launched in 2007 to guide the efforts of the construction
sector. Since then, considerable improvements have been made, including the
development of the Construction Safety Audit Scoring System (ConSASS), the review
and enhancement of the Construction Safety Orientation Course (CSOC), the
publication of the construction accident case study booklet, the release on Guidelines
on Design for Safety (DFS) in Buildings and Structures as well as the inaugural
Construction Chief Executive Officer (CEO) Summit, where CEOs from top
construction companies signed to pledge management commitment for zero injuries.
The guide has since been updated to include areas for enhancement and new areas of
work to achieve sectoral targets by 2018. ‖Implementing WSH 2018 for Construction

Ofori, Ai Lin and Tjandra
10
Sector in Singapore‖ (WSH Council, 2010) was published in April 2010. It sets the
targeted outcomes, key strategies and initiatives to further enhance WSH standards in
the construction sector and aims to guide all stakeholders to create a safer and
healthier construction sector with a progressive and pervasive WSH culture.
Research remains limited and segregated within the construction industry in
Singapore. However, research within the industry has been encouraged by the recent
MND Research Fund for the Built Environment, which is administered by the BCA.
In terms of safety, there has been much progress in the regulations and in the systems
introduced by companies. However, these have not had the desired appreciable impact
on performance. A web-based application for the Construction Management System
was completed in 2004, but it did not take off in the industry. Finally, on the
initiatives under thrust 3, the advice that modifications to the standard contracts for the
private sector should be minimised has not been realised. On the contrary, indeed,
many of the professional institutions have introduced additional new standard contract
forms.
On strategic thrust 4, Design and Build (D&B) was one of the procurement methods
encouraged by C21 owing to its perceived potential to foster integration in the
construction process. However, some of the the interviewees emphasized that, as a
procurement method, D&B may not be appropriate for certain projects. D&B is now
mainly used in civil engineering projects. For building projects, it is more of Design,
Development and Build. The formation of multi-disciplinary firms, as encouraged by
C21, did not take off in the industry.
On strategic thrust 5, BCA has launched a number of programmes to promote exports
of construction services, such as the Export Digest, Export Link Services, workshops,
seminars, mission trips, and executive programmes. Singapore-based architects have
done quite well abroad. Contractors have been aware of the need to go overseas,
especially when there are fewer jobs in Singapore. A number of consortia have been
set up to pursue projects overseas, and they have won and undertaken some works.
In terms of strategic thrust 6 on a collective championing effort, BCA actively
monitored and followed up on the list of C21 recommendations. CIJC was formed in
2000 to formalise the co-operation among the key organizations in the construction
industry embracing clients, various design professionals, and contractors. It comprises
the Presidents of nine professional institutions and trade associations in Singapore‘s
construction industry. Within CIJC, each institution was assigned relevant C21
initiatives to monitor progress in their implementation. BCA held quarterly meetings
with CIJC to track the progress of implementation; in addition, there were many ad
hoc meetings. Feedback sessions with the industry were also conducted. However, as
found in the interviews, it is widely realised that the main limitation of CIJC is that
there is no real leadership; the presidency rotates every year among the member
organisations.
In summary, the adoption of a range of progressive practices in Singapore has been
encouraged by C21. CORENET has been most successful. CONQUAS, buildability,
and CPD programmes have also been promoted by C21. However, there were some
recommendations that have not been implemented, such as codes of conduct and
Construction (Design and Management) Regulations, which are working in progress.
Some of the C21 initiatives and programmes have not succeeded. These include the
intention to reduce the number of foreign workers in the industry, specifically the
MYE scheme, maintainability study, NPQS, Construction Management System,
standardization of contracts, and formation of multi-disciplinary firms.

Construction industry reform
11
The construction industry in Singapore continues to face new challenges. Among
others, companies have to deal with rising costs of land and construction materials,
and shortage of construction workers and rising wages. Owing to nthe impact of the
major initiatives such as awards for performance, buildability, and CONQUAS, point-
scoring system has become the main focus above all. After a decade of
implementation of improvement initiatives, some underlying issues remain. Some
characteristics of the industry, such as low productivity, labour intensity of work, and
low-technology construction methods, remain. While commending the government for
its efforts in regulating the construction market and industry, there is a sense among
the industry stakeholders interviewed that there might be too many regulations.
Hence, it is important to strike a balance, as too many regulations may dampen
creativity. Given the limited supply of Singaporean construction workers, foreign
workers are in Singapore to stay. Hence, the issue of foreign construction workers will
have to be continually addressed. Finally, there is a need to strengthen the role of
professional institutions and trade associations, tertiary educational institutions, and
the CIJC.
CHANGE IN HONG KONG
Prior to the formation of the statutory co-ordinating body as recommended by CIRC
(CIRC, 2001), the implementation of the CIRC recommendations was undertaken by
an interim body, the PCICB. The process of implementing the recommendations had
been held up by the unexpected delays in the formulation and promulgation of the
legislation. The bill to set up the Construction Industry Council (CIC) was introduced
in the Legislative Council only in 2004, while the tasks of implementation were
handed over to the CIC only in 2007.
Interim reports (PCICB, 2005; ETWB, 2007) have reviewed the progress made in the
implementation of the CIRC initiatives. The general perception was that there had
been good progress in the implementation programmes. Nevertheless, Kumaraswamy
et al. (2010) noted that there were areas for improvement, as found out from
interviews with industry stakeholders.
Although the setting up of CIC is in the right direction towards the establishment of an
institutional framework as envisaged by ―Construct for Excellence‖ (CIRC, 2001),
many believed that CIC lacks regulatory power, hence the progress in formulating and
disseminating industry development initiatives was slow (Kumaraswamy et al., 2010).
Safety levels in construction, especially on public-sector projects, have been
significantly improved. Quality levels have also been improved mainly due to the
introduction of registration schemes for workers and subcontractors. Alternative
procurement methods such as D&B and target cost contracts have not been as widely
used as envisaged in the CIRC recommendations. There had been improvements in
the development of an environmentally responsible industry, especially with the
formation of the Hong Kong Green Building Council. In terms of nurturing a
professional workforce, the regeneration of the workforce was identified as the key
problem, as the image of the industry had made it difficult to attract new people to
join the industry (Kumaraswamy et al., 2010).
In summary, although the overall progress in the implementation of the CIRC
recommendations in Hing Kong is satisfactory, there is room for improvement in
certain areas such as improving the image of the industry, attracting new entrants to
join the workforce, as well as implementing programmes in the private sector.

Ofori, Ai Lin and Tjandra
12
CHANGE IN MALAYSIA
In Malaysia, despite the decline in the volume of construction projects due to the
recent global financial crisis, the construction industry remains strong and important
to the national economy. However, growing dependence on foreign workers create a
number of social issues such as proper treatment, discrimination, and violation.
In the future, the focus will be on the implementation of IT, green initiatives, and
prefabrication. The government will continue to provide leadership in the
implementation of the CIMP recommendations. It will also have to provide incentives
and implement stimulus packages. The Green Building Index was launched in 2009 to
assess environmental impacts of buildings and create guidelines for new building
construction. The Industrialised Building System (IBS) programme will continue to be
streamlined to promote prefabrication, improve productivity, and reduce the reliance
on foreign workers.
As it is now five years since the CIMP was launched, a comprehensive review of the
impact and effectiveness of the implementation of the initiatives under the master plan
should be conducted.
SIMILARITIES AND DIFFERENCES AMONG THE FOUR
COUNTRIES
Similarities and differences in the construction industry development programmes in
the four countries studied can be drawn. The institutional contexts within which the
reforms occurred were distinctive in each country. However, in all four countries,
there were specific targets to achieve within a certain period based on specific
recommendations. There was a radical tone of performance improvement in all four
reports.
There are similarities in the original strategic thrusts of the four countries, as shown in
Table 1. All countries studied highlighted improvements in quality and the issue of
integration. While the Egan Report is more general, on this point, the last three reports
(Singapore, Hong Kong, and Malaysia) are very specific and very similar in terms of
structure, strategic thrusts, and recommendations, and implementation plans.
Environmental performance, which was included in ―Construct for Excellence‖ of
Hong Kong and the CIMP of Malaysia, was not considered in the Egan Report of the
UK and C21 of Singapore. However, the UK and Singapore have since focused on the
issues. In the UK, Environmental Performance Indicators (EPIs) were launched in
2001 and sustainability has since been singled out as one of the key improvement
areas (Strategic Forum, 2002, 2008). In Singapore, improving the environmental
performance of the construction industry has been a major focus of the BCA over the
past few years. The environmental development programme includes: making
certification to environmental management system a requirement for medium-sized to
large construction and consultancy firms; formulating benchmarks for assessing the
environmental performance of both new and existing buildings, and infrastructure
items (the Green Mark Scheme was launched in 2005); and providing funds to support
R&D on the subject. The BCA has formulated two master plans for environmental
performance, and the Singapore Green Building Council was set up in 2009. The
regulations require buildings to meet a minimum Green Mark score before being
granted building plan approval. The green building initiatives have been quite
successful; they have been strongly supported in the industry, by clients, practitioners
and users.

Construction industry reform
13
In all four countries, it was realised that many problems were deeply rooted in the
construction industry; hence there was a need for a radical transformation that
required a strong commitment from all stakeholders of the industry. The poor image
of the industry was one of the concerns; it was considered to be making it difficult to
attract new entrants to join the industry. This issue is particularly pressing in
Singapore and Hong Kong which have relatively small population sizes. Other issues
include low productivity, labour intensity of the work processes, as well as the
diverse and fragmented structure of the industry. An ―industry co-ordinating body‖
was proposed to lead the change programme in each country. In the UK and Hong
Kong, the co-ordinating bodies were formed specifically for the reform programme.
Over the years, during the implementation of the change programmes, it was apparent
that the major institutions involved in it should be strengthened. In Singapore, many
of the initiatives have been implemented with the support of legislation. While this has
been effective, and many of the interviewees commended the government for its
efforts, there was a feeling that the industry was over regulated. On the other hand, in
Hong Kong, it is felt that the CIC lacks regulatory powers.
INFORMATION TECHNOLOGY
In the future, Building Information Model (BIM) will be used as a platform to
facilitate the integration of knowledge in design and construction, and handing over to
facilities management. BCA, together with the Industry Foundation Classes (IFC)
Implementers Work Group (IIWG) of International Alliance for Interoperability (IAI),
have been promoting the use of BIM.
As BCA is promoting green buildings, BIM facilitates the design of such buildings.
For instance, designers are able to perform energy data analysis and to determine how
―green‖ their virtual building models are. From there, they can explore ways to
improve the building‘s energy consumption. BIM can also simulate the amount of
daylight during different times of the day, month and year. This allows architects,
engineers and builders to experiment with different sun-shading features that can be
integrated into a building‘s design.
To encourage the adoption of this technology, BCA introduced a pilot project for the
electronic submission of building plans. More than 10 architecture sites were involved
in this pilot, and their live projects were submitted to various regulatory agencies,
including BCA. The feedback from both the industry and various agencies was
positive. With the success of the pilot project, the various agencies are now ready to
receive and process architectural submissions created using BIM from the industry
starting January 2010 (BCA, 2009).
CONCLUDING REMARKS
The four countries reviewed
In all the four countries reviewed, there is a general agreement that the involvement of
the various stakeholders of the construction industries is of paramount importance in
order to make reform happen. The general view is that progress has been made, but
much more remains to be done; the degree of progression has not been as much as had
been expected. Some of the underlying issues remain.
One decade after the publication of the reports, there were some questions among
respondents in the study on whether the programmes are still relevant to answer
today‘s challenges. However, construction industries of the four countries reviewed
have been keeping in touch with ongoing developments; for example, in Singapore,

Ofori, Ai Lin and Tjandra
14
there has been a focus on through continuous improvement in IT applications, and in
the area of sustainability which was neither mentioned nor envisaged in the C21
report.
The results obtained from the study so far also show that it is important to better
understand the different institutional contexts shaping the changes in the construction
industry in each country. At the same time, lessons learned from other countries will
be useful for formulating strategies and recommendations for actions in other nations,
so long as the specific initiatives are shaped with due recognition of the local
contextual dynamics.
Table 1 Visions and strategic thrusts for the construction industries in the UK, Singapore, Hong Kong, and Malaysia (in
chronological order)
United Kingdom
Egan Report (1998) Singapore
Construction 21 (1999) Hong Kong
(Construct for Excellence
(2001)
Malaysia
Construction Industry
Master Plan Malaysia
2006-2015 (2007)
VISION:
―A modern construction
industry (the need for a
new way of working, such
as lean production,
standardisation,
partnering).‖
VISION:
―To be a world class
builder in the knowledge
age.‖
VISION:
―An integrated construction
industry that is capable of
continuous improvement
towards excellence in a
market-driven
environment.‖
VISION:
―A world-class, innovative,
and knowledgeable global
solution provider.‖
KEY DRIVERS OF
CHANGE:
STRATEGIC THRUSTS: STRATEGIC THRUSTS: STRATEGIC THRUSTS:
Committed leadership.
A focus on the customer.
A commitment to people.
Enhancing professionalism
of industry.
Raising the skills level.
Nurturing professional
workforce.
Develop human resource
capabilities and capacities
in the construction
industry.
Strengthen the construction
industry image.
Leverage on information
and communication
technology in the
construction industry.
A quality driven agenda. Improving industry
practices and techniques.
Fostering a quality culture.
Improving safety and
environmental
performance.
Strive for the highest
standard of quality,
occupational safety and
health and environmental
practices.
Integrated processes and
teams.
Adopting an integrated
approach to construction.
Achieving value in
construction procurement.
Integrate the construction
industry value chain to
enhance productivity and
efficiency.
Developing an efficient,
innovative, productive
industry.
Innovate through research
and development and adopt
new construction methods.
Developing an external
wing.
Benefit from globalisation
including the export of
construction products and
services.
Collective championing
effort for construction
industry.
Devising a new
institutional framework to
drive the industry.
Implementation of a change
programme for industry.

Construction industry reform
15
Other construction industry development programmes
Construction industry development programmes are being implemented in countries at
all levels of development. These include the Netherlands, Sweden and the United
States, as well as South Africa and Rwanda. Much has been achieved in most cases,
but more remains to be done. The study discussed in this paper underscores the
importance of country specificity. It shows that understanding of the economic, social
and administrative context is key to progress in these efforts. Thus, care should be
taken in seeking to replicate what has worked in one country in one‘s own nation.
Another issue is the need for appropriate institutional frameworks, and for the
involvement of all key stakeholders in the programme formulation and
implementation efforts. Finally, whereas this is beyond the scope of this study, there is
potential benefit in requinal inter-national collaboration in tackling common issues.
International collaboration
The study also shows that researchers, both as individual and groups have much to
contribute in the effort to formulate effective construction industry development
programmes. For example, such research can explore the likely institutional and
contextual constraints and problems, and propose possible solutions. Thus, researchers
constitute an important resource, especially in the developing countries. There is even
greater value in international collaboration on industry development. WABER
provides an excellent forum to facilitate the identification of research subjects of
common interest, the formulation of common research frameworks and methods, and
in the comparison of findings and potentially useful programmes.
ACKNOWLEDGEMENTS
The authors gratefully acknowledge the funding received from the National University
of Singapore Research Fund. We are also grateful to our research partners in Hong
Kong and the UK, in particular, the Principal Investigators, Professor Stuart Green
and Professor Mohan Kumaraswamy respectively.
REFERENCES
Building and Construction Authority (2009). Media Release: Educating Singaporeans to be
savvy in green buildings. BCA; Singapore.
Constructing Excellence (2009) Never Waste a Good Crisis. London.
Construction 21 Steering Committee (1999) Reinventing Construction. Ministry of Manpower
and Ministry of National Development; Singapore.
Construction Industry Development Board (2007) Construction Industry Master Plan
Malaysia 2006-2015. CIDB; Malaysia.
Construction Industry Review Committee (2001) Construct for Excellence. HKSAR
Government; Hong Kong.
Egan, J. (1998) Rethinking Construction. DETR; London.
Environment Transport & Works Bureau (2007) Overall review of implementation of
construction industry review committee recommendations. [internet] Hong Kong:
ETWB. Retrieved from http://www.legco.gov.hk/yr06-
07/english/panels/plw/papers/plw0724cb1-2148-2-e.pdf [Accessed 13 September
2010].
Green, S. D., Larsen, G. D. and Kao, C. C. (2008) ―Competitive strategy revisited: contested
concepts and dynamic capabilities‖ Construction Management and Economics, Vol.
26, No 1, pp.63-78. doi: 10.1080/01446190701656174

Ofori, Ai Lin and Tjandra
16
Gan, K. Y. (2008) Speech by Mr Gan Kim Yong, Acting Minister for Manpower at
the WSH Council 2008 Construction CEO Summit, 18 November. [internet]
Singapore: MOM. Retrieved from
http://www.mom.gov.sg/publish/momportal/en/press_room/mom_speeches/
2008/speech_by_mr_gan_kim.print.html?Status=1 [Accessed 28 July 2009].
Joint MND-MOM Review Committee (2005) Report of the Joint MND-MOM Review
Committee on Construction Safety. [internet] Singapore: MOM. Retrieved
from
http://www.mom.gov.sg/publish/etc/medialib/mom_library/corporate/files.Par.
53281.File.dat/MNDMOM_Constr_Safety_Report16Mayfinal1.pdf [Accessed
28 July 2009].
Kumaraswamy, M., Ofori, G., Mahesh, G., Teo, E., Tjandra, I., and Wong, K. (2010)
Construction Industry Improvement Initiatives: Are We Really Translating Rhetoric
into Reality? In R. Rameezdeen, S. Senaratne and Y.G. Sandanayake (Eds.),
Proceedings of International Research Conference on Sustainability in Built
Environment, Colombo, Sri Lanka, 18 & 19 June, ISBN: 978-955-9027-33-1 (pp.116-
125). BEMRU, University of Moratuwa; Colombo.
Ministry of Trade and Industry (2010) 2010 GDP Growth Forecast Maintained at 13.0 to 15.0
Per Cent. [internet] Singapore: MTI (Published 2010) Retrieved from
http://app.mti.gov.sg/data/ article/22542/doc/ESS_2Q10__PressRelease.pdf.
[Accessed 16 September 2010].
Provisional Construction Industry Coordination Board (2005) Progress report on
implementation of recommendations of the construction industry review committee.
[internet] Hong Kong: CIC (Published 2005) Retrieved from http://pcicb-
archive.hkcic.org/eng/progress/download/p-PCICB-142.e.pdft. [Accessed 13
September 2010].
Strategic Forum for Construction (2002) Accelerating Change. Rethinking Construction;
London.
Strategic Forum for Construction (2008) Construction Commitments. Rethinking
Construction; London.
Workplace Safety and Health Council (2010) Implementing WSH 2018 for Construction
Sector in Singapore: Towards a Progressive and Pervasive Safety and Health Culture.
WSH Council; Singapore.

Leiringer, R. (2011) Built environment research in West Africa: current trends and future directions In:
Laryea, S., Leiringer, R. and Hughes, W. (Eds) Procs West Africa Built Environment Research
(WABER) Conference, 19-21 July 2011, Accra, Ghana, 17-18.
17
BUILT ENVIRONMENT RESEARCH IN WEST AFRICA:
CURRENT TRENDS AND FUTURE DIRECTIONS
Dr Roine Leiringer1
Dept. of Civil and Environmental Engineering, Chalmers University of Technology, Gothenburg, SE-
41296 Sweden
The countries in West Africa (WA) are pushing for socio-economic development. It is
evident that the construction sector has an important part to play in helping to realise
this goal. It is equally evident that this necessitates an increased emphasis on research
in the built environment in order to develop the necessary capacity, capabilities,
knowledge and technologies for the sector. Such research work is not trivial and is
liable to be highly context driven. It is therefore of interest to look into what kind of
problems WA researchers are working on and the means and methods that they draw
upon. Or put slightly differently, does the research that is undertaken match the socio-
economic aspirations of countries in the region and is it aligned with international
research endeavours and our current common knowledge? It is also of interest to look
at how the research is carried out. Are the research methods used appropriate and
adequate for the research problem at hand?
The West Africa Built Environment Research (WABER) conference was initiated in
2008. The objective is to provide a vehicle for the development of built environment
research in WA through giving young researchers and early-career scholars an outlet
for their research work; and to supply a platform for networking and collaboration
among more senior academics. Two conferences have so far been organised, in 2009
and 2010, bringing together 180 academics, researchers and practitioners from the
WA region. These delegates represent more than 30 universities/polytechnics, as well
as a multitude of other research institutions.
This presentation draws on content analysis of the papers in the proceedings of these
two conferences: 2008 (25) and 2009 (55), as well as those published in this current
2011 conference. These 170+ research papers provide a window into current research
priorities and trends and, thus, offer an opportunity to understand the kinds of research
work undertaken by built environment researchers in West Africa. They also provide
an opportunity to further look into the how research is commonly undertaken.
Several conclusions are drawn from this content analysis exercise, including: 1) the
two most common problem areas are ‗Physical infrastructure and environment‘ and
‗Economics and construction industry development‘. More than half of the published
papers deal with issues within these two domains. 2) In more than 2/3s of the papers
the problem formulation is given at a national level. Very few papers take a local,
regional or international perspective. 3) There is a stark overrepresentation of survey
studies relying on questionnaires for data collection. There are four times as many
papers using surveys as there are of any other research method. 4) In a significant
number of cases the chosen research method is not suitable for the problem under
investigation.

Leiringer
18
The findings lay bare some of the many challenges that are faced by academics in
WA. It is clear that WA research by necessity is extremely problem driven. An
apparent downside of the heavy focus on current practice is that the research in many
cases takes the form of consultancy work. As such, the outputs are at times both valid
and important however the impact is local and predominantly short term. There is,
therefore, a need to look into how research problems can be formulated and
appropriate research methods be used, so that knowledge can be created and
distributed, thus providing a foundation for a more long term impact. The presentation
ends with a couple of suggestions for alternative directions for future research and
development work.

Harty, C. (2011) Data collection and analysis: what is data, how do you collect it, and how do you
analyse it? In: Laryea, S., Leiringer, R. and Hughes, W. (Eds) Procs West Africa Built Environment
Research (WABER) Conference, 27-28 July 2010, Accra, Ghana, 19.
19
DATA COLLECTION AND ANALYSIS: WHAT IS DATA,
HOW DO YOU COLLECT IT, AND HOW DO YOU
ANALYSE IT?
Dr Chris Harty1
School of Construction Management and Engineering, University of Reading, UK
Good data collection and analysis form the keystones of good research, whether for a
PhD or 10 year research project! This practical session will begin with a brief
overview of approaches to data collection and analysis, with an emphasis on practical
issues of data collection strategies, access and ethics, managing data sets and
producing analyses which are consistent with the methodologies and theoretical
frameworks employed.
The main part of the session will be a Q&A, where we will look at participants
particular issues around data collection and analysis strategies and processes. What
sort of data should we collect for a particular research problem or focus? How do we
go about negotiating access or managing ethical and IP issues? How might we
structure data sets or how should we represent data within thesis or papers? Any issues
you might have be encountering as you do your research, please bring them along!


SECTION 2: CONFERENCE PAPERS


Gyadu-Asiedu, W. (2011) A comparative analysis of clients‘ and consultants‘ perspective of
construction project performance In: Laryea, S., Leiringer, R. and Hughes, W. (Eds) Procs West Africa
Built Environment Research (WABER) Conference, 19-21 July 2011, Accra, Ghana, 23-36.
23
A COMPARATIVE ANALYSIS OF CLIENTS’ AND
CONSULTANTS’ PERSPECTIVE OF CONSTRUCTION
PROJECT PERFORMANCE
William Gyadu-Asiedu1
Sunyani Polytechnic, P.O.Box 206, Sunyani, BA Region, Ghana
The true state of construction projects at any stage in its life cycle has often been a
source of disagreement between clients and their consultants leading to several
disputes. This is due to the fact that consultants have always defined the performance
of a project using their own perspective models which do not always meet clients‘
expectations. In recent times, construction project clients have become more involved
in their projects, ensuring best practice and even, sustainability. Clients, thus, have
their own perspective of project performance which needs to be considered in any
assessment model in order to meet their satisfaction. Using interviews and multiple
surveys, the study identified the key measures that defined the project performance in
the perspectives of clients and consultants in Ghana. These were found to be
fundamentally different, both in content and in focus. It then combined the two
perspectives into a ―shared perspective‖ and tested it on the individual stakeholders.
The research also showed that given the same criteria, clients and consultants placed
relatively similar emphasis on the same criterion; predicting a common direction with
marginal dissimilarity. This pointed to the conclusion that the real differences that
exist between clients and consultants is basically due to the different perspectives
used by the two stakeholders in assessing project performance. Hence the study
recommends that for effective assessment of construction project, a framework of the
―shared perspective‖ representing both perspectives should be used.
Key words: client, consultant, Ghana, performance.
INTRODUCTION
Undesirable project performance results have been noted as a major hindrance to the
development and growth of construction industries of several countries. Identified in
various forms as low productivity, delays, cost overrun, poor quality and so on, poor
project performance has been noted as the bane of construction industries of several
countries, particularly, developing countries (Mutijwaa and Rwelamila, 2007; Le-Hoai
et al., 2008). These have put an unimaginable stress on project execution relationships
resulting in suspicion, mistrust, accusations and counter accusations between the key
partners on a project in an industry that is supposed to thrive on healthy relationships.
Another dimension to the disagreement bothers not only on the poor levels of project
execution but also on the reportage of the true state of projects to clients and in a way
that will properly inform them. This lack of accurate and timely information from
consultants to sponsors of projects has given room for disagreements between the two,
and, sometimes, causing the latter to lose confidence in the former (Gyadu-Asiedu,
2009, pp.). These define the conflicts that usually exist between clients and

Gyadu-Asiedu
24
consultants. The research, thus, focused on identifying what represents clients‘ views
on a project performance and how they wish it to be assessed. These results are then
compared with those of the consultants to determine the gap that influences the
disputes and disagreements between the two stakeholders. Subsequently, this is
expected to inform the design of a tool for performance measurement and
management to ensure that projects achieve the purpose for which they are being
implemented.
CLIENTS’ PERSPECTIVE, NOT MERELY SATISFACTION
A major problem in project assessment is that most of the performance measurement
models discussed in literature relating to clients or customers refer only to client
satisfaction, customer satisfaction or end-user satisfaction (Freeman & Beale, 1992;
Lim and Mohammed, 1999; Atkinson, 1999; Sadeh et al., 2000; Chan and Cahan,
2004; Patankul and Milosevic, 2009). Some of these measures include: cost, time,
quality, client‟s (or customer‟s) satisfaction, contribution to business, financial and
commercial success, environmental Impact, benefits to defence and national
infrastructure, project execution efficiency, benefit to end user, technical innovation,
future perspective, personal growth, etc. Such measures render clients‘ role in the
project execution rather passive. This state of affairs does not move in tandem with
recent developments in construction where the client is seen as initiator of
improvement, innovation and sustainable construction.
For example, the relative important role played by clients in the implementation
process of projects has been well acknowledged (Bennet et al., 1988; Latham, 1994;
Yisa et al., 1996). The performance of the project throughout the phases is, to a large
extent, a function of the client‘s disposition towards it. This is because the client may
in the course of the project (a) ensure consistent funding (a) delay funding (c) divert
funding or (d) stop funding altogether, causing delay or abandonment of the project.
In other cases, the client could have inconsistent and erratic wishes, authorizing
variations here and there throughout the project‘s life to the great frustration of
consultants, the project manager and the contractor. The appointment of a consultant
and, subsequently, a contractor is thus by no means a foregone conclusion.
With regard to the improvements required in the industry, Latham (1994 p4)
emphasised the need of the government as a client to ―deliberately set out to use their
spending power…… to assist the productivity and competitiveness of the industry, in
addition to obtaining value for money generally in the long term‖. In addition, he
proposes that a government department ―should take the lead to ensure best practice
and drive for improvements are implemented throughout the public sector...‖, and
also, that leading clients ―have a substantial role to play in setting demanding
standards and insisting upon improvements‖. ― Ultimately‖, he continued, ―they have
the most to gain from ensuring the implementation of best practice‖. Yisa et al. (1996)
note that public clients are gaining more autonomy in project execution and are
placing emphasis on speed, value-based services and cost-time-quality performance
for a particular project. This implies that clients are also concerned about development
satisfaction, not completion or use satisfaction alone. This indicates that their
involvement in the building process is increasing.
If such roles are attributable to the modern client, it calls for a project assessment
criteria that goes beyond a mere client satisfaction as is being considered –it requires
the assessment of a whole perspective of the client of project performance as
represented by a number of criteria and indicators. In other words, client satisfaction,

Project performance
25
if it will have to be considered, should be a declaration by clients after they have
considered the achievements of all the criteria and indicators that represent their
perspective of project performance at the appropriate stage of the project; not by
practitioners or consultants.
Another reason for having a special focus on clients in assessing project performance
has to do with the different types of clients existing in the construction industry. For
example, Melville and Gordon, (1983 pp 8-16) identified six kinds of clients. These
are: (i) the individual client (ii) the committee client: For example, sports clubs,
tenants associations, charitable or religious organisations; (iii) the company client:
the Lay and the Informed or Expert; (iv) the local authority client, acting for and on
behalf of the government; (v) the central government: Most of the capital investments
in a developing country are undertaken by the central government (Ofori, 1999
&2001); and (vi) nationalised institutions of the government. In another research,
Mbachu (2003) categorises clients into two broad bases. One is based on
―characteristics of the client system‖: nature of organisational entity, source of project
finance, construction industry experience, level of knowledge of the construction
industry, frequency of project development, complexity of client organisation, type of
business activities, purpose group of buildings mostly procured and procurement
interests. He grouped these into three distinct classification based on the nature of
clients: public, individual (Private), and corporation clients. The second one is ―needs-
based categorisation of clients‖: similarity of overall needs preferences and
development needs preferences. Mbachu (2003) notes two categorisation of clients‘
needs: non-observable (latent) and observable (stated and non-stated but expected)
needs (Mbachu, 2003 pp 38-40). From the foregoing, the modern client in the
construction industry could be identified according to which of the parameters is
applicable to them. This goes to prove that all clients are not to be treated the same
way regarding what gives them satisfaction: a client is not just a client. Figure 1
provides a proposed synthesised model by which clients in the industry could be
identified according to their needs and characteristics. By this model it is also possible
to appreciate that the type of client could be categorised differently based on the
present needs and characteristics. The obvious differences that distinguish one from
the other inevitably will lead to each of them having a peculiar way of looking at
project performance, have different expectations, and hence a different perspective.
Identifying this perspectives and meeting the specific expectations is what can account
for their true satisfaction. The foregoing illustrates that the assessment of clients‘
satisfaction as a criterion is simply inadequate in reflecting their true needs,
expectation and functionality. Supporting this view, Ryd (2004) pointed out that a
―good understanding of the ‗client‘s situation‘‖ –―which demands effective means of
working within the construction and management processes‖ –is the ―basis for being
able to satisfy the needs of the client‖. Hence Hill et al. (2007) propose the creation of
a ―shared mind‖ or ―shared vision‖. Applying this concept will create a single model
in which both the perspectives of the now ―active-client‖ and the consultants will be
represented to ensure a better assessment of the performance of the project to facilitate
comprehensive project management and real client satisfaction.

Gyadu-Asiedu
26
Fig. 1 A Model for Identification of clients according to Needs and
Characteristics (Based on Melville and Gordon, 1983; Mbachu, 2003)
METHOD
The study used three-staged sequential mixed methods to develop criteria of project
performance which represent the perspective of stakeholders (clients and consultants)
of project performance.
Clients‟ Research
Clients‘ research began with an interview of eight major Government clients –the
main focus of the study –in order to obtain key themes and subsequently, statement
that indicated what constitute their expectations from their consultants as well as their
projects. Key themes identified in the interview were used as basis to design the pilot
survey. The pilot survey followed the framework of Mbachu‘s (2003) questionnaires
in which four types of clients were targeted (Government client, Investors, Real Estate
Developers and Owner Occupiers). The main purse of this survey was to determine
the extent to which private clients (Owner Occupiers, Investors and Real Estate
Developers on one hand) and Public Clients on the other hand agreed on the measures
(key indicators and sub-indicators).This was followed by the first main survey which
analysis resulted in identifying measures of assessment. These were qualitatively
filtered and clustered (Gyadu-Asiedu, 2009) to arrive at measures and sub-measures
that were used in the final surveys. The second and final main survey focused only on
government clients and was meant to establish a relationship between (1) the
dimensions and their indicators and (2) the indicators and their sub-indicators in a way
that would be usable in assessment. The various measures within a relationship were
weighted to show their level of influence among the set.
Sampling for clients‟ research
Client Type
Stated Need
Characteristic
s
Latent Need
Nature of org. entity
Source of finance
Complexity of org.
Experience in const.
Type of bus. activity
Purpose of group bidgs.
Level of knowledge in const.
Frequency of proj. dev.
Procurement
interest

Project performance
27
Purposive deliberate sampling was used to select 8 interviewees from 4 central
government agencies (ministries): 2 Metropolitan assemblies; 1 district assembly and
one department for the interview. In the first survey, 5 central government agencies
(Ministries) were sampled out of 10, 70 assemblies were sampled out 138; 5
Nationalised institutions out of 10, 11 company clients were selected out 52 financial
institution who are also construction clients; 20 out of 61 registered Real Estate
developers and 15 private individual clients with additional 5 owner occupiers. A total
sample size of 131 + 10% = 144 was selected.
In the final survey, only the government agencies were selected for the survey: 70 + 5
+ 5 = 80. In addition, consultants participated in clients‘ survey. Based on resource
constraints, and because more than 80% of the practising professionals are based in
the capital (Accra) and to a smaller extent, the next biggest city (Kumasi), the survey
population for the research was mainly restricted to these cities with additions from
three other capital towns (Takoradi, Cape Coast, Koforidua and Sunyani), that is, six
out of the 10 regions.
Practitioners Research
In the case of consultants or practitioners research, three consecutive surveys were
undertaken to identify, filter and cluster the main measures and sub-measures that
could be used to assess project performance. In the first survey, performance measures
as obtained from literature formed the basis of the questionnaires. The purpose was to
find out from consultant the relevance of the measures in Ghana. Respondents were
also asked, in the process, to provide other measures which they knew were relevant
in Ghana but were not captured in literature. Together these formed the basis of the
second survey which was meant to confirm the identified measures in the first survey.
After the second survey, an experts‘ workshop was organised to discuss and validate
the identified measures. For the purposes of the workshop, one qualified as an ‗expert‘
when one was a professional structural engineer, quantity surveyor, project manager
or architect, which meant that they belong to the respective recognised institutions in
Ghana and have been in good standing for not less than three years at the time of the
workshop. The results from the workshop were filtered and clustered into measurable
items. For both clients and practitioners penultimate surveys, filtering and clustering
of measured were assessed against the following range of qualities (DTRL (2001, p.
29): redundancy (necessary and important ones), operationality (clearly defined
enough for assessment), size, and mutual independence of preference –It is required in
multi-criteria analysis (MCA) that criteria and what they measure must be
independent of each other. This condition must be met if the sum of weighted
averages is to be used to combine preference scores across criteria. It means that
whenever two criteria are closely related that they are not preference independent of
each other, they should be combined into a single criterion, which captures the
common dimension of their value. The same is true of the indicators.
The final survey for the practitioners was done to establish an equation relating the
sub-measures to their specific main measures just like that of clients.
For purposes of comparison between the perspectives of the two stakeholders which is
the essence of this research, the criteria that defines clients needs/motivation was
merged with the criteria defining project performance in practitioners‘ perspective to
form a ―shared perspective‖ and the two stakeholders were asked to rate them
according to their level of influence. The results of the analysis threw more light on

Gyadu-Asiedu
28
the issue of disagreements between the two stakeholders and whether or not these
disagreements are warranted.
Sampling for practitioners‟ research
Table 1 show the approaches used in the entire data collection. Tables 2 and 3 show
the details of clients‘ and practitioners‘ research and data collection methods .
Table 1 Approaches used in the data collection
Table 2 Client‘s Research Methods and data collections
A total population of the focused groups was obtained from the professional bodies.
224 firms were isolated from 2036 registered professionals (as at 1996) comprising
223 Quantity Surveyors (45 firms), 254 Architects (130 firms), and 1829 Engineers
(31 firms). From the list of engineers only the structural engineers were considered
and 31 firms were identified. Because two state firms have branches in all the 10
regions, the total number of firms was increased to 244 out of which 157 were
randomly sampled for all the research. In the second survey, 145 were reached with
the questionnaire. For the practitioners‘ workshop, purposive deliberate sampling was
used to select 40 experts. respectively.
Key: QUAN = Quantitative; qual = Qualitative; Capitalisation shows the predominant
approach in the mix.
Project performance
29
FINDINGS
Table 3 Practitioners‘ Research Methods and data collections
Clients‟ Perspective
Two main dimensions were identified as representing clients‘ interest, satisfaction
criteria and hence their perspective of project performance:
(1) Needs/Motivation (N/M) and (ii) Expectations from service providers (ESP). These
are each defined by criteria and indicators which may vary from client to client and
over time. We conclude that it is simply inappropriate and a gross underestimation to
refer to any one indicator among the rest as ―clients‘ satisfaction‖ as has often been
the case in literature. Clients have ―perspectives‖ of projects, which must be identified
and satisfied by their employees. This will be the true measure of clients‘ satisfaction.
Practically, this could be used when assessing construction project performance in the
Ghanaian construction industry. Focusing on the government clients, N/M is defined
by contribution to good governance (CGG), contribution to national infrastructure
(CNI) and addressing future infrastructural needs (AFIN). Without prejudice to other
possibilities, this research limited the service providers to Project
Managers/Consultant (PM/C), Architects (ARCH), Quantity Surveyors (QS),
Consulting Engineers (CE) and Contractors (Con). Others may be roped in while
existing ones may be removed according to the demands of the project. Together with
their needs/motivation of undertaking project, clients‘ expectations from these service
providers must also be fully met for them to be satisfied. The equations below show
the relationship between dimensions and criteria describing clients‘ perspective.
Because the weightings of each set of sub-measures that define the main measure add
up to 100%, the analysis of the survey results established the following relationship
between them. In addition, clients‘ position, based on interview, was that they expect
100% performance from every service provider hence equal weighting is given them,
distributed according to their number (equation 2).

Gyadu-Asiedu
30
N/M = 32.1CGG1 + 37.9CNI + 30AFIN………………………………….1
ESP = 2.0 ARCH +2.0 QS +2.0 SE + 2.0PM/C + 2.0 Con.........................2
These are represented in the Figures 2 and 3 below.
Practitioners‟ Perspective
Analysed results from the practitioners‘ responses represent the weightings for each of
the measures and sub-measures. Together they represent the models of practitioners‘
perspective of project performance. Equation 3 describes practitioners‘ perspective
model.
PP = 26.2C + 18.5T + 20.1Q + 14.9MEE + 10.2EI + 9.8SI ….............................3
32.1
37.9
30
0
10
20
30
40
Good Governance
Contribution to NationaI
Infrastructure
Addressing Future
Infrastructural Needs
20
20
2020
20
05
101520
Expectns. from Quantity Surveyors
Expectns. from Architects
Expectns. from Project
Managers/Consu…
Expectations. From Consulting
Engineers
Expectns. from Contractors
Fig. 2 Clients’ Model of their Needs/Motivation Criteria.
Fig. 3 Clients‘ Model of the five criteria that represent their expectations from service
providers. [NB: Equal weightings for all show that clients expect nothing less than 100%
from each service provider].

Project performance
31
This describes the relationships between Project Performance (PP) and the criteria by
which they could be assessed. The relationship shows that in assessing project
performance (PP) in the perspective of practitioners, cost ( C ) must be given the
highest priority with 26.2%, followed by quality (Q): 20.1%, then time (T): 18.5%,
management and execution efficiency (MEE): 14.9%, environment impact (EI): 10.2%
and social impact (SI): 9.8%. This relationship provides information as to which
criterion is playing what role at any level of project performance at any stage of the
assessment. Each of the six criteria is also measurable by their respective indicators as
shown in equations 3.1 to 3.6
C = 12.8 ESC +20.3MC + 9LC + 10.5IC + 22.2FC + 25.2TCO ….......................................3.1
T = 20.6TVC+ 30.1TP + 13.9IT + 35.4TW………………………………...........................3.2
Q = 15.2R+ 21.5MTR + 17.5STR + 28.2E/AR + 17.7V........................................................3.3
MEE = 16.2DMP + 15.6CR + 21.4EPT + 19.2SCON + 14IAW + 13.7SM..........................3.4
EI= 27.6IE + 21.1NEE + 19.9NRI + 31.3DC.........................................................................3.5
SI = 33.5NPA+ 35.4NSCA + 30.8TRA..................................................................................3.6
Where,
i. Cost (C) has the following indicators: [environmental and social cost (ESC),
managerial cost (MC), legal cost (LC), incidental cost (IC), fluctuation cost FC) and
total cost overrun (TCO)]
ii. Time (T) has following indicators :[ time of variation and certification (TVC), time
of payment of certified works (TP), incidental time (IT), time of completion of major
works (TW)]
iii. Quality (Q) has the following indicators: [reworks (number /extent) (R), material
tests records (MTR), service test records (STR), Engineer‟s/Architect‟s
approval/disapproval (E/AR), variation (number/extent) (V)]
iv. Management and Execution Efficiency : (MEE) has the following indicators
[decision making process (DMP), communication and reports (CR), efficiency of
project team (EPT), supervision of contractor (SCON), inspection and approval of
works (IAW), site meeting regularity (SM)]
v. Environmental Impact (EI) has the following : [investments on environmental
issues (IE), number of employees with environmental tasks (NEE), number of reported
incidents (NEE), degree of compliance (DE)] and
vi. Social Impact (SI) has the following indicators : [number of populations affected
(NPA), number and types of community and institutional structures affected (NSCA),
type of community/social resources affected (TRA)]
Equation (3) is depicted in the Polygon below (Figure 4).

Gyadu-Asiedu
32
The Shared Perspective
The last part of the analysis yielded the results of the shared perspective (i.e. a
combination of the two perspectives): (1) clients‘ model on the shared perspective (2)
practitioners model on the shared perspective, and (3) the combined model (clients‘
and practitioners‘) of the shared perspective as shown in equations 4, 5 and 6; and
Figures 5, 6 and 7. Figure 8 depicts the superimposition of the two polygons
representing the individual models on the shared perspective for further highlights on
the comparison.
i. Clients‘ Model of the Shared Perspective
PP = 17.6Cost + 11.4T + 18.3Q + 7.6EI + 10.3SI + 11.7MEE + 11.6 ESP + 11.5N/M.......4
ii. Practitioners‘ Model of the Shared Perspective
PP = 18.1Cost + 14.3T + 16.4Q + 8.4EI + 8.5SI + 11.4MEE + 9.6 ESP + 12.9N/M..........5
iii. Combined Model of the Shared Perspective
PP = 17.9C + 13.2T + 17.2Q + 8.1EI + 9.2SI + 11.5MEE + 10.4ESP + 12.4N/M….........6
The corresponding ―polygons‖ are shown below:
26.2
18.5
20.114.9
10.2
9.80
10
20
30Cost
Time
Quality
Management Execution …
Environmental Impact
Social Impact
17.6
11.4
18.3
7.6
10.311.7
11.6
11.5
0
5
10
15
20Cost
Time
Quality
Environmental Impact
Social Impact
Management Execution …
Expectns. From Service …
Need/Motivation
Fig. 4 A Model of Practitioners‘ Perspective.
Fig. 5 A Model of the eight combined criteria in Clients‘ Separate view.

Project performance
33
18.114.3
16.48.4
8.511.4
9.6
12.9
05
101520
Cost
Time
Quality
Environmental …
Social Impact
Management …
Expectns. From …
Need/Motivation
17.9213.18
17.158.08
9.1911.53
10.41
12.39
05
101520
Cost
Time
Quality
Environmental …
Social Impact
Management …
Expectns. From …
Need/Motivation
17.6
11.418.3
7.6
10.311.7
11.6
11.5
18.1
14.3
16.4
8.48.511.4
9.6
12.9
0
5
10
15
20Cost
Time
Quality
Environmental Impact
Social Impact
Management Execution Efficiency
Expectns. From Service Providers
Need/Motivation
Fig. 6 A Model of the eight combined criteria in Practitioners‘ Separate View
Fig. 7 A Model of the ‗Shared Perspective‘ of construction project performance.
Fig.8 Comparison of Clients‘ and Practitioners‘ ratings of the eight main criteria
[NB: Dark-continuous colour line represents practitioners‘ rating; Light-broken colour line
represents client‘s rating.]

Gyadu-Asiedu
34
DISCUSSIONS: HIGHLIGHTING THE “PERFORMANCE
POLYGONS” The analyses of the two surveys have resulted in the perspectives in which
practitioners on one hand, and clients on the other, wish to assess the performance of
construction projects in Ghana. They believe that in assessing project performance
with the identified criteria and indicators, they attach different import to each of them
according to the demands of the project, the expectations of the clients and other
contingency factors. This is the essence of attaching weightings to these measures.
The weightings attached represent the averages of what importance the stakeholders
attach to each criterion based on their experiences. The findings have shown that
project performance (and particularly in construction) should be assessed with multi-
criteria and multi-indicators with varying weightings to reflect the project‘s needs.
Consequently, this research agrees with Atkinson (1999) that the assessment of a
construction project performance should be considered in excess of the iron triangle of
cost, time and quality. Working within the contingency theory as applied to the
project situation, this research also notes that in the special case of construction
projects the term ‗multidimensional‘ as used to describe ‗multi-criteria‘ is not limited
to the ‗numbers‘ of the ―measures‖ used. Its meaning should extend to cover the
number of changes these set of criteria and indicators can undergo due to the
peculiarity of the needs of the project. In other words, the set of multi-measures used
to assess construction project performance have the degree of freedom to undergo a
number of changes contingent on the project‘s needs including, but not limited to:
i. Changes in weightings attached to the criteria and indicators according to their
relative importance in the present project;
ii. Changes in the number of criteria and indicators that are necessary to define a
criterion, in other words, a change in an aspect of the definition of a criterion (by
extension or reduction in the sub-measures);
iii. Changes across the project life cycle.
Therefore, this research likens the multidimensional, multi-criteria nature of these
assessment measures to “an irregular polygon with „kn‟ degrees of freedom” where in
this model, the degrees of freedom is determined by managerial decisions and include
the freedom of the model to be ―adapted‖ and ―adopted‖ to any project situation
(position); the freedom for the weightings to change to reflect the particular project
situation, and the various phases across the project life cycle (rotational orientation);
the freedom to increase or decrease the number of the indicators depending on the
project circumstances, number and weights of parameters and needs (overall-size);
and the possible resultant forms the assessment will take based on the various
adaptations (shape)[ NB: words in italics describe the degrees of freedom for a typical
irregular polygon]. The model, thus, agrees with the contingency theory which is
summarised as ―one size does not fit all (Shenhar et al., 1997)‖. The research, thus,
posits that models for assessing construction project performance should be
contingency-based. Again, like all polygons, each corner can have several angles –
each criterion can have several indicators.
CONCLUSION
Finally, a cursory observation of the shapes of figures 5, 6, 7 and 8 show that the
differences in perspectives between clients and practitioners regarding the combined

Project performance
35
criteria (the eight) has to do only with the extent or emphasis and not the focus or
direction, generally. The similarities between the shapes and the directions suggests,
loosely though, that the disputes that usually exist between clients and practitioners
regarding the status of a project may be an exaggeration of the reality based on mere
perception and the use of limited measures. Bissah et al. (2003) gave five
reasons/sources of conflict in project environment: project goals not well defined,
administrative procedures, schedules, communication problems and resource
allocation. Each of these creates a conflict situation as a result of undefined
expectations and inadequate information on procedure or the lack of it. It shows that it
is possible to minimise this suspicion and the resulting disagreements or disputes if
things are clarified between and among key stakeholders of a project, and expressed in
a ‗shared perspective‘. One of the means of eliminating this is by using a front-ended
project management approach in which ―expectations will be agreed as expectation,
criteria will be agreed as criteria, and weightings to be agreed as weightings‖ from the
outset and throughout the project. Not meeting these fundamental requirements and
the absence of adequate updates based on issues agreed on will always generate
―perceptions‖ based on suspicions in the minds of one stakeholder against the other
where there is, in most cases, only a slight difference between the reality and what is
supposed to be made clear.
Subsequently, these criteria are expected to be used into an assessment model which
would measure the extent to which the project is succeeding or failing to achieve its
set objectives based on the agreed criteria and indicators throughout the project life
cycle –performance. This would include the determination of known factors that affect
the smooth execution of the project in the forms of relationship issues, supervision by
consultants, attitude of clients towards the project, those relating to the project, the
external environment etc. Thus, the determination of the criteria and their indicators
will be a necessary precursor for effective project performance measurement and
management for desired results.
REFERENCES
Atkinson, R. (1999), ―Project Management: Cost, Time and Quality, Two Best Guesses and A
Phenomenon: It‘s Time to Accept Other Success Criteria‖, International Journal of
Project Management, 17 (6)337-42
Bennett, J., Flanagan, R., Lansley, P., Gray, C. and Atkin, B. (1988), ―Building Britain 2001‖,
Centre for Strategic Studies in Construction‖. University of Reading, Reading.
Bissah, A.K.F., Wu, X., Zhang, T (2003), ―Managing and Resolving Conflict in Project
Environment‖, Conference proceedings, Second International Construction in the 21st
Century (CITC-II), ―Sustainability and Innovation in Management & Technology.
DTLR, (2001), Multi Criteria Analysis: A Manual. Department of Transport, Local Government
and the Regions, London.
Freeman, M and Beale, P. (1992), ―Measuring Project Success‖, Project Management Journal 23
(1), 8-17.
Gyadu-Asiedu, W (2009), Assessment of Construction Project Performance: Modeling Clients
and Practitioners‘ Perspective. A Published PhD Dissertation by the Technology
University of Eindhoven, Faculty of Architecture, Planning and Building.
Hill, K., Slivon, C. and Draper, J (2007), ―Another Approach to Transforming Project Delivery:
Creating a Shared Mind‖, Proceedings IGLC, Michigan, USA, pp 417-422
Latham, M. (1994), Constructing the team, Joint Review of Procurement and Contractual
Arrangement in the United Kingdom. Design, Drawing and Print Services.
Le-Hoai, L, Lee,Y.D., Lee, J.Y. (2008), ―Delay and Cost Overruns in Vietnam Large
Construction Projects: A Comparison with other selected Countries‖, KSCE Journal of
Civil Engineering, 12(6):367-377

Gyadu-Asiedu
36
Lim, K.C., Mohammed, A.Z., (1999). ―Criteria of Project Success: An Exploration Re-
Examination‖. International journal of project management, Vol. 17 No.4, pp.243-8, as
quoted in Chan, A.P.C and Chan, A.P.L., (2004). ―Key Performance Indicators for
Measuring Construction Success‖. Benchmarking: An International Journal Vol.11 No.
2, 2004 Pp. 2003-221.
Latham, M. (1994), Constructing the team, Joint Review of Procurement and Contractual
Arrangement in the United Kingdom. Design, Drawing and Print Services.
Melvile, I.A., and Gordon, I.A., (1983), Professional Practice for Building Works, the Estate
Gazzette Limited.
Mutijwaa, P., and Rwelamila, D (2007), ―Project Management Competence in Public Sector
Infrastructure Organisation‖, Construction Management and Economics, Vol. 25, pp55-
66
Ofori, G. (1999), ―Satisfying the customer by changing production patterns to realise sustainable
construction. Proceedings‖, Joint Triennial Symposium of CIB Commissions W65 and
55, Cape Town, 5-10 September, Vol. 1, pp. 41-56.
Ofori, G. (2001), ―Indicators for Measuring Construction Industry Development in Developing
Countries‖, Building Research & Information, Vol. 29, No. 1, pp 40-50
Ryd, N. (2004), ―Facilitating Construction Briefing –from the Client‘s Perspective‖, Nordic
Journal of Surveying and Real Estate Research, Vol.1, pp. 86-101.
Shenhar, A.J., Levy, O., Dvir, D. (1997), ―Mapping the dimensions of project Success‖, Project
Management Journal 8 (2) 5-13.
Yisa, S.B., Ndekugri, I and Brian, A. (1996), ―A Review of Changes in the UK Construction
Industry. Their Implication for the Marketing of Construction Services‖. European
Journal of Marketing. 30 (30) 47-64. MCB University Press.
Adegbehingbe, V.O. (2011) A comparative study of housing transformation processes in three
government estates in South Western, Nigeria In: Laryea, S., Leiringer, R. and Hughes, W. (Eds)
Procs West Africa Built Environment Research (WABER) Conference, 19-21 July 2011, Accra, Ghana,
37-44.
37
A COMPARATIVE STUDY OF HOUSING
TRANSFORMATION PROCESSES IN THREE
GOVERNMENT ESTATES IN SOUTH WESTERN,
NIGERIA
Victor Olufemi Adegbehingbe1
Department of Architecture, Federal University of Technology, Akure, Nigeria
This Comparative study on Housing transformation examines the transformation
processes in three government estates. It seeks to highlight the differences in the
processes. The study investigates the oldest estates in three out of six states that made
up of South-Western, Nigeria as case study. Data for the study were collected through
observation, interview schedules and structured questionnaires administered on 474
transformers. Variables investigated include: Cost, Duration and Mode of
transformation; Reaction to transformation activities in the neighbourhood; Effect on
Environment and mode of construction . Results from the survey were analysed using
descriptive statistics in form of frequency tables, percentages and charts, chi-square
test and correlation analysis. Findings indicated that people embarked on Housing
transformation to provide those infrastructures that were not provided by
Government. The studies identify delay of approval of plan and lack of cash flow as
problems encountered in the transformation process. The need to provide transformers
with credit facilities, accommodate extension as phase construction, seek proper
approval for proposals are some of the recommendations emphasized in the study.
Keywords: government estate, housing transformation, income level, infrastructure,
Nigeria, phase construction.
INTRODUCTION
The deficit in housing in Nigeria has driven many inhabitants in the few states that
provided formal housing estates to carryout physical transformation of their dwellings.
According to Makachia(2005), physical housing transformation are understood as
modifications, firstly, of the existing design product by the expansion of plinth area,
addition of spaces laterally and vertically, or by adding spatial units like rooms,
alcoves, corridors, etc. Secondly, Makachia(2005) viewed physical housing
transformation as quantitatively re-organising the disposition of the provided spaces
through relocating, resizing of opening spaces and/or the exterior environment.
Physical transformations presume that the architect made no provision for the
phenomenon at conception and design stage. As a result of unguided physical
transformations, estates designed for residence assume different and multi-use
buildings, incorporating cottage production and light industry, petty trade as well as
social functions like recreation, bars and nursery schools. (Tipple 2000).

Adegbehingbe
38
In Lagos, Ibadan and Akure and typical of other urban settlement in Nigeria and the
third world, physical housing transformation have resulted in not only estates with un-
envisaged aesthetics, but crowding and congestion (Adegbehingbe and
Fadamiro,2007) . Emerging also are building units devoid of any desired comfort and
privacy, reduced interior lighting, ventilation and other physical environmental
degradation are observed by the researcher (.Adegbehingbe, Fadamiro and Ogunsote
2010.). This paper highlights the differences in housing transformation processes in
the three Government estates, and recommends the need to provide transformers with
credit facilities, accommodate extension as phase construction, and seek proper
approval for proposals.
PROBLEM STATEMENT
Nigerian government at various levels could not meet the housing need of the people
(Nigeria housing policy 2004). Even the few ones provided could not meet the
expectation of the occupants (Tipple 2004). Some facilities needed where not
provided and some not needed were provided (FGN 2001,Olotuah,2006). This has
made the residential estates to be haphazardly developed to the detriment of the users
(Agbola 1998). This brought about unplanned environment, which made the
residential estates physically and functionally not alien with the existing physical
regulations. Furthermore, most of the physical transformation activities taking place
on the residential estates were not officially approve by planning authorities. Thus,
leading to continuous destruction of unauthorized extensions by appropriate planning
authorities. Lots of money earlier used in carrying out these physical transformation
were lost (Nwuzi 1995). Many of the transformed buildings were converted to various
usages, such as hotel accommodation and guest houses, thereby attracting social and
security problems to the studied estates. Makachia (2005) asserted in a study that the
environment generated are often wanting in emerging space and land use conflicts.
HYPOTHESIS
Within the context of this study, the null form of hypothesis was used. The null
hypothesis of the study are:
H1: The duration of the physical transformation has no significant relationship with
the cost of transformation in the study area.
H2: The mode of construction used while transforming buildings has no significant
effect on the environment.
H3: Mode of transformation has no significant relationship with the reactions to
physical transformation activities in the neighbourhood.
RESEARCH DESIGN
The study was carried out in the three oldest estates in three states out of the six states
that made up of south-western Nigeria. The three states and housing estates are:-
Ijapo Estates Akure, Ondo State, Old Bodija Estates in Ibadan, Oyo state and Ikeja
GRA, in Lagos, Lagos state, using close ended questionnaire. The survey sought to
identify factors responsible for physical transformation activities that were carried out
by occupants of the study estates. This was supported by preliminary site observation,
and informal discussions with occupants of the residential buildings.
In the research, a total number of 474 questionnaires were retrieved and analysed in
the study area. Among the variables examined are:-

Government estates
39
Cost of transformation
- Duration of transformation
- Reaction to physical transformation activities in the neighbourhood.
- Effect of physical transformation on the environment
- Mode of transformation
- Mode of constructions
The population of this study was the household heads that transformed their buildings
in the three study estates in Akure, Ibadan and Lagos.
Table 1 shows the percentage of distribution of questionnaires in the study areas.
S/NO Housing Estate Town/State No of Respondent Retrieved
and Analysed
1 Ikeja Housing Estate Ikeja, Lagos State 133
2 Old Bodija Housing Estate Ibadan, Oyo State 201
3. Ijapo Housing Estate Akure, Ondo State 140
Total 474
Source: Adegbehingbe, 2009
RESULTS AND DISCUSSION OF FINDINGS
The analyses in Tables 2-7 deals with the comparative analysis of transformed
buildings in the selected estates of Old Bodija, Ikeja and Ijapo Housing Estate. These
involved the comparison of the following variables, among others: spaces / Bedrooms
added after moving in, cost and duration of transformation, reaction and effect of
transformation activities, Area gained through transformation, home based enterprises
and other uses after transformation; mode of transformation, External and Internal
area affected by transformation, problem before and during transformation, reason
affecting transformation factor responsible for transformation and mode of
construction of transformation. Out of these only six variables are discuss below .The
descriptive statistics are presented in Tables 2- 7.
Cost of Transformation
Respondents of each study estate were asked how much is the cost (in Naira) of each
transformation carried out by them. The costs were compared among the three study
estates. In Old Bodija and Ijapo Estates, the cost were mostly less than 250,000 Naira
while in Ikeja, the cost are between 501,000-750,000 Naira. However a reasonable
number spent above 1million naira in all the study estates.
Table 2 : Cost of Transformation
S/N Cost of transformation in Naira (CT
Transformation)
Ikeja Old Bodija Ijapo
Freq % Freq % Freq %
1. Less than 250,000 14 10.5 108 53.7 54 38.60
2. 251,000-500,000 24 18.0 29 14.4 23 16.4
3. 501,000-750,000 44 33.1 19 9.5 15 10.70
4. 751,000-1,000,000 12 9.0 6 3.0 11 7.9
5. Above One Million 39 29.30 39 19.4 37 26.4
Total 133 100 201 100 140 100
Source: Adegbehingbe, 2009

Adegbehingbe
40
This is due to the type of mode of transformation that are common in each study estate
.The study shows that the most common type of mode in both Old Bodija(53.7%) and
Ijapo (38.60%) is Renovation and Repainting and mostly costs less than 250,000
Naira. It was observed that a reasonable number of buildings in all the three study
estates were demolished and rebuilt, each costing above 1million Naira each ( Ikeja
29.30% ,Old Bodija 19.4% and Ijapo 26.4%). The study shows that most of
respondents in Ikeja carry out rehabilitation of buildings costing between 501,000-
750,000 naira (33.1%).
Duration of Transformation
How long it takes to carry out transformation (Duration) was investigated among
respondents in each study estate. The comparison shows that in all the three estates:
Ijapo 82.9%, Ikeja 86.5%, Old Bodija 60.2% of transformation takes less than 1 year
and between 1 and 2 years. However, in old Bodija 19.4% of the transformation
carried out takes above 5 years.
Table 3: Duration of Transformation.
S/N Duration of Transformation (Du-
transform)
Ikeja Old Bodija Ijapo
Freq % Freq % Freq %
1. Less than 1year 71 53.4 34 16.9 74 52.9
2. 1 – 2yrs 44 33.1 87 43.3 42 30.0
3. 2 – 3yrs 12 9.0 22 10.9 15 10.7
4. 3 – 4yrs 4 3.0 10 5.0 2 1.4
5. 4 – 5yrs 1 0.8 9 4.5 3 2.1
6 Above 5yrs 1 0.8 39 19.4 4 2.9
Total 133 100 201 100 140 100
Source: Adegbehingbe, 2009
This finding supports why there was no abandoned transformed buildings and the fact
that before a transformer starts embarking on any transformation, a substantial amount
of money to be spent are accessible to him or her.
Reaction to Physical Transformation activities in the Neighbourhood
The researcher observed that a lot of transformation activities took place or are taken
place during the survey, the respondents were asked their reactions to all these
activities taken place in their neigbourhood and the response were compared with each
other. Table 4: Reaction to Physical Transformation, Activities in the Neighbourhood
(Re - Transformation)
S/N Reaction to transformation
activities (RE-Transform)
Ikeja Old Bodija Ijapo
Freq % Freq % Freq %
1. Indifferent 43 32.3 100 49.8 46 32.9
2. Worrisome 25 18.8 2 1.0 10 7.1
3. Providing Infrastructure 62 47.746.6 88 43.8 84 60.0
4. Others 3 2.3 11 5.5 --- ---
Total 133 100 201 100 140 100
Source: Adegbehingbe, 2009
Majority of respondents in all the estate agreed that the physical transformation
activities were providing infrastructure facilities which government can‘t provide. Old
Bodija 43.8%, Ikeja 46.6%, Ijapo 84%, while a lot of respondent were indifferent to
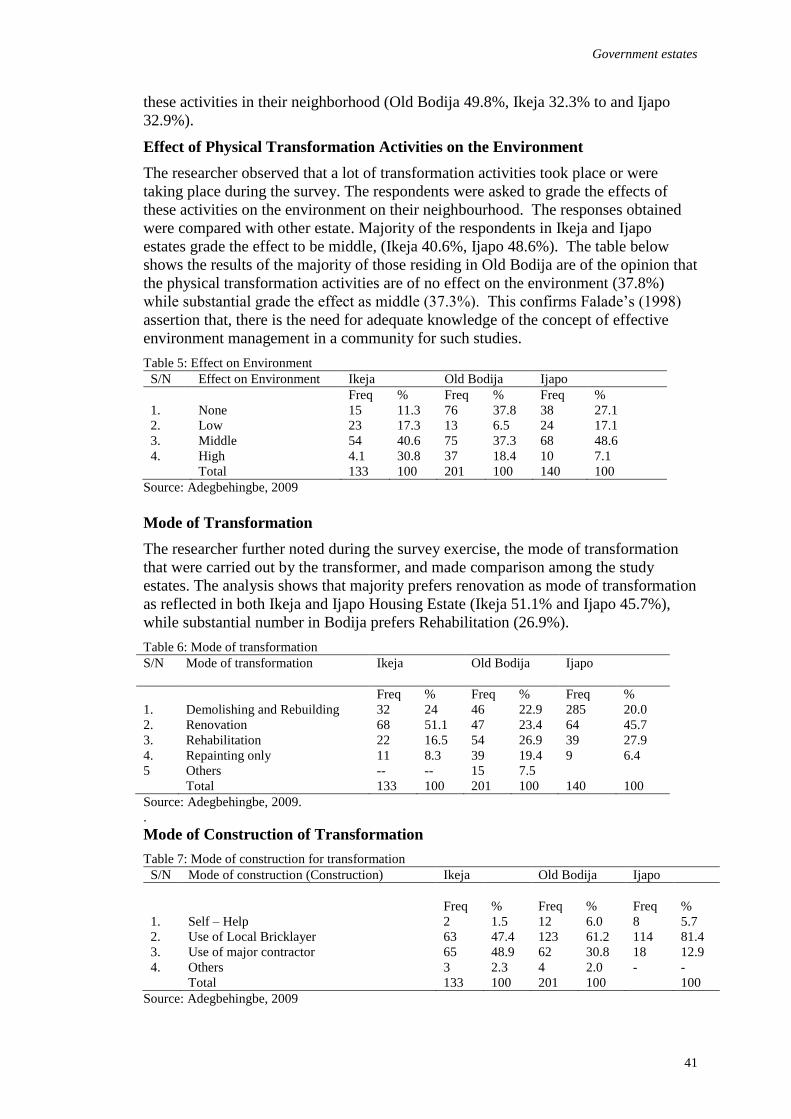
Government estates
41
these activities in their neighborhood (Old Bodija 49.8%, Ikeja 32.3% to and Ijapo
32.9%).
Effect of Physical Transformation Activities on the Environment
The researcher observed that a lot of transformation activities took place or were
taking place during the survey. The respondents were asked to grade the effects of
these activities on the environment on their neighbourhood. The responses obtained
were compared with other estate. Majority of the respondents in Ikeja and Ijapo
estates grade the effect to be middle, (Ikeja 40.6%, Ijapo 48.6%). The table below
shows the results of the majority of those residing in Old Bodija are of the opinion that
the physical transformation activities are of no effect on the environment (37.8%)
while substantial grade the effect as middle (37.3%). This confirms Falade‘s (1998)
assertion that, there is the need for adequate knowledge of the concept of effective
environment management in a community for such studies.
Table 5: Effect on Environment
S/N Effect on Environment Ikeja Old Bodija Ijapo
Freq % Freq % Freq %
1. None 15 11.3 76 37.8 38 27.1
2. Low 23 17.3 13 6.5 24 17.1
3. Middle 54 40.6 75 37.3 68 48.6
4. High 4.1 30.8 37 18.4 10 7.1
Total 133 100 201 100 140 100
Source: Adegbehingbe, 2009
Mode of Transformation
The researcher further noted during the survey exercise, the mode of transformation
that were carried out by the transformer, and made comparison among the study
estates. The analysis shows that majority prefers renovation as mode of transformation
as reflected in both Ikeja and Ijapo Housing Estate (Ikeja 51.1% and Ijapo 45.7%),
while substantial number in Bodija prefers Rehabilitation (26.9%).
Table 6: Mode of transformation
S/N Mode of transformation
Ikeja Old Bodija Ijapo
Freq % Freq % Freq %
1. Demolishing and Rebuilding 32 24 46 22.9 285 20.0
2. Renovation 68 51.1 47 23.4 64 45.7
3. Rehabilitation 22 16.5 54 26.9 39 27.9
4. Repainting only 11 8.3 39 19.4 9 6.4
5 Others -- -- 15 7.5
Total 133 100 201 100 140 100
Source: Adegbehingbe, 2009.
.
Mode of Construction of Transformation
Table 7: Mode of construction for transformation
S/N Mode of construction (Construction) Ikeja Old Bodija Ijapo
Freq
%
Freq
%
Freq
%
1. Self – Help 2 1.5 12 6.0 8 5.7
2. Use of Local Bricklayer 63 47.4 123 61.2 114 81.4
3. Use of major contractor 65 48.9 62 30.8 18 12.9
4. Others 3 2.3 4 2.0 - -
Total 133 100 201 100 100
Source: Adegbehingbe, 2009

Adegbehingbe
42
During the survey exercise, the researcher asked from respondents, what mode of
construction were used while transforming their buildings. The table below indicates
that respondents in all the estates made use of local bricklayers, Ikeja (47.4%), old
Bodija (61.2%) and Ijapo (81.4%). It is of note that a large percentage of respondents
at Ikeja (48.0%) and old Bodija (30.8%) made use of major contractor.
SUMMARY OF FINDINGS
The study reveals that majority of cost of transformation were either less than N250,
000 or above One Million Naira (Nigerian Currency), and majority of transformation
took less than one year to complete. Majority of respondents in the study estates
agreed that physical transformation activities were providing infrastructures which
government could not provide. Old Bodija recorded 43.8%, Ikeja 46.6% and Ijapo
60%. While a lot of respondents were indifference to these activities in their
neighbourhoods, Old Bodija recorded (49.0%), Ijapo (32.3%) and Ijapo (32.9%)
respectively.
Majority of residents in Old Bodija were of the opinion that the physical
transformation activities were of no effect on the environment with 37.8% rated the
effect to be middle. The majority of respondents in Ikeja and Ijapo estates graded the
effect to be middle. This confirm Falade‘s (1988) assertion that there is the need for
adequate knowledge of the concept of effective environmental management in a
community for such study. The study shows that major prefer mode in both Ikeja and
Ijapo Housing Estate is Renovation (Ikeja 51.1%) and Ijapo (45.7%). While prefer
mode at old Bodija is Rehabilitation (26.9%). Substantial mode in Bodija is
Demolition and Rebuilding (22.9%) and Renovation (23.4%). When asked what mode
of construction was used while transforming their buildings. Ikeja GRA relied on
Professional builders (63%) while majority of transformers in Ijapo housing estate
made use of local bricklayers (81.4%).
In Ijapo housing estate, out of the surveyed 249 buildings, 140 were transformed, while
109 were not transformed.43 buildings are semi-detached, while 66 were of duplex
buildings. In many transformation that took place, few external areas were affected. A
typical example is the one being used as an office building, where the building was
almost in original condition except some changes in external finishing. Another
typical example was the one constructed as a corridor access to a duplex building.
Many of these buildings were transformed from their original design form, by
demolishing original building on the plot and replacing them with another one. Not
only main buildings were being transformed, wall fencing was also included. While
many required the roof line to be raised.
In old bodija housing estate, out of the surveyed 323 dwellings, 201 were transformed,
while 122 were not transformed( still in original design form). Out of these 122 not
transformed, 32 number are storey buildings, 15 number are two bedrooms bungalow
and 75 number are of semi-detached bungalows. In many of the transformation that
took place at the old bodija estate, only internal areas were affected, the external areas
were observed to be almost in original conditions. An ongoing transformation at the
time of survey is the one in which a balcony was transformed to accommodate
additional toilet facilities in a storey building. Many of these buildings were
transformed from their original design form by demolishing original building on the
plot and replaced with another one which are still under construction at the time of
Government estates
43
survey. Available open spaces between two dwellings were transformed to a
restaurant. In many transformation only front view were affected.
In Ikeja GRA, there are a total of 714 plots dominated by residential use. Whereas, the
estate was purely residential environment before independence, the non-provision for
other uses made this estate inadequate. Consequently, the land use study as at the time
of survey, show that this estate is made up of residential, commercial, public,
recreational and service industry.
There were two types of buildings initially constructed on the estate ( bungalow and
storey building). As at the time of survey, fifty-four number of the bungalow type, and
one hundred and twenty six type of the storey building are still in original design
form(Not-transformed). Out of these, one hundred and twenty nine(129) dwellings
were sampled (30-bungalow and 99 storey building). At the time of survey, noticeable
numbers of dwellings in original design stages are being demolished and replaced
with a massive construction of twenty units of 3 bedroom bungalow, still under
construction at the time of survey. This is a case of gentrification.( Fagbohun,2003).
In many occasion, only the front view was affected, while many extensions required
the roof line to be raised. In Ikeja GRA, out of the 133 transformed building
surveyed,8.3% were repainted, 16.5% were rehabilitated, 51.1% were renovated,
while 24% of the transformed building were originally demolished and rebuilt with
additional rooms and etc.
CONCLUSIONS
It is clear that the three null hypothesis examined in this study show significant
relationship between the two variables in each case of the hypothesis, thus confirming
the validity of the research findings. Occupants of residential buildings transformed
their buildings due to inadequacy noted in the design of the original building on the
study areas. Due to non-approval of application for transformation on time,
transformers usually embarked on unguided transformation. This will be reduced, if
approval can be communicated within a practicable time limit thus avoiding undue
transformation.
RECOMMENDATIONS
In view of the above findings, the study therefore recommends the following:
In the short term, there is an urgent need to increase the number of staff of the
planning approval authority in the housing corporation responsible for the
management of the study estates, especially those in the contravention section. They
should make sure that no modification or alterations are made in a building until these
had been approved by the appropriate authority.
There is an obvious need to educate the occupants of the study estates on the negative
influence of indiscriminate building transformation on the residential environment.
When approval for transformations is considered, it is recommended that necessary
accounts of the effects of the proposed development on the household should be
considered. It is recommended that economic and environmental implications should
be considered along with planning and structural considerations.
Government should ensure that adequate net working of basic infrastructure such as
drainage, water, electricity, etc are provided before an area is approved for
development.

Adegbehingbe
44
REFERENCES
Adegbehingbe, V.O and Fadamiro, J.A.( 2007).Sustainability of built environment in Nigeria:
Self-help transformation of Public housing option. A Conference Proceedings of
International conference in Built Environment in the 21st Century (ICiBE 2007) Kuala
Lumpur, Malaysia,13-15June.
Adegbehingbe,V.O. Fadamiro J.A.& Ogunsote O.O.(2010) .Reducing the need for Housing
transformation in South- Western, Nigeria by Addressing the Causative Agent.
Proceedings of the 1st International Conference, School of Environmental
Technology, The Federal Universty of Technology, Akure, Nigeria, 25-27 October.
Agbola,S.B (1998). The Housing of Nigerians. A Review of Policy Development and
implementation in the Housing Sector. Research Report, No 14. Development Centre,
Ibadan, Nigeria, 79-86.
Fagbohun P.O.(2003).Housing and Livability in Nigeria Cities: A study into Housing
situation in Oshodi, Lagos. A paper presented at a National Workshop on Private
sector Driven Housing delivery 30th-31
st July, Lagos, Nigeria.
Falade J.B (1998). Public Acquisition of land for land scraping and open space management.
Journal of Nigeria Institute of Town Planners (XI) 1-13.
Federal Republic of Nigeria (2001). (Presidential Committee Report on Urban Developing
and Housing).
Federal Government of Nigeria FGN(2004). National Housing Policy for Nigeria, Federal
Ministry of Works and Housing,Abuja.
Makachia P.A.(2005).Influence of house form on dweller-initiated transformation in urban
housing. IAHS World congress on housing.33rd
,Pretoria,South Africa
Mai M.M. (2006) Transformation of Vernacular Housing Pattern, in peni-urban Abuja,
Nigeria. Unpublished PhD Thesis, university Teknologi, Malaysia.
National Population Commission (1996) Census final results.
Nwuzi, I.A. (1995). Change of use and structural alterations in the Residential Areas of Port
Harcourt. A case study of Diobu. An unpublished master thesis. The center for urban
regional planning, faculty of social scerce, university of Ibadan.
Olotuah,A.O.(2000). Evaluation of sub-urban Housing Conditions in Akure, Nigeria. Africa
Journal of Development studies 2(192)165.
Tipple A.G. (2000): Extending Themselves user initiated Transformation of Government built
housing in developing countries. Liverpool University Press, Liverpool, 20-48.
Tipple, A.G. (2004): The place of Homebased Enterprises in the informal sector: Evidence
from Cochabamba and Pretoria, urban studies, 42(4) 61-68.

Ganiyu, S.A. and Ogunsote, O.O. (2011) A comparison of selected national acoustics building codes:
case study of Cathedral Road, Akure In: Laryea, S., Leiringer, R. and Hughes, W. (Eds) Procs West
Africa Built Environment Research (WABER) Conference, 19-21 July 2011, Accra, Ghana, 45-45.
45
A COMPARISON OF SELECTED NATIONAL
ACOUSTICS BUILDING CODES: CASE STUDY OF
CATHEDRAL ROAD, AKURE
Sikiru Abiodun Ganiyu1 and Olu Ola Ogunsote
2
1Department of Architecture, Federal University of Technology, Akure, Nigeria
2Department of Architecture, Faculty of Environmental Sciences, University of Jos, Jos, Nigeria
There are three problems that this present generation has to cater for: Poverty,
Population and Pollution. Industrialisation and urbanisation has taken the problems of
noise pollution to an unprecedented catastrophic level both in the developed and the
developing nations of the modern world. While the advance countries have taken
some legislative measures in form of Acoustics Building Codes to control the
problem of noise and its attendant effects, the developing nations like Nigeria may not
have faired well in this regards. This paper, therefore, is an attempt to compare the
building codes in some selected countries of the world with emphasis on the acoustics
regulations of the building codes. The countries whose Acoustic Building Codes are
to be examined include: England (United Kingdom), United State of America, New
Zealand, Australia and Nigeria. The Acoustic Building Codes of these nations will be
compared with that of Nigeria in terms of regulatory provisions. A practical case
study of Cathedral – Ondo road, Akure will be made to evaluate the level of
compliance with the provisions of the National Building Code, if any.
Keywords: acoustics, building code, noise, pollution, urbanisation.


Mwanaumo, E. and Thwala. W.D. (2011) A review of the current health and safety legislation in
Botswana relative to construction industry stakeholders In: Laryea, S., Leiringer, R. and Hughes, W.
(Eds) Procs West Africa Built Environment Research (WABER) Conference, 19-21 July 2011, Accra,
Ghana, 47-57.
47
A REVIEW OF THE CURRENT HEALTH AND SAFETY
LEGISLATION IN BOTSWANA RELATIVE TO
CONSTRUCTION INDUSTRY STAKEHOLDERS
Erastus Mwanaumo1
and Wellington Didibhuku Thwala2
1Building Sciences Department, Tshwane University of Technology, Pretoria, South Africa
2Department of Construction Management and Quantity Surveying, University of Johannesburg,
Johannesburg, South Africa
Most of the health and safety (H&S) regulations and legislation commonly found in
Southern African developing countries are based on legislation enacted in the
industrialized countries in the late 19th
and early 20th
centuries. This is evident in
many factories acts promulgated for developing nations dating back to colonial times
or soon after independence was granted. Botswana, formerly a British Protectorate,
has two H&S legal frameworks meant for construction industry, viz. the Botswana
Factories Act and the Workman‘s Compensation Act. In 1972 Lord Robens, the
Chairman of a Royal Safety Commission Report, recommended self-regulation as this
would engender continuous improvement and improve standards in legislation within
a goal-setting legal framework supported by codes of practice and / or performance
standards. These standards could be revised more easily than primary legislation
which may require difficult enactment passage in parliament. This has not happened
in the case of the Botswana Factories Act. International scholars affirm that the
presence of legislation addressing H&S indicates a level of commitment and provides
the framework within which H&S can occur. Many scholars agree that construction
industry is unique and requires specific tailor made H&S laws and regulations as a
starting point of preventive measures. The purpose of this paper is to review existing
legislation to highlight the extent of coverage and relevance to the construction
industry in Botswana. The review established that the current factories act is still
largely meant to cover the industrial / manufacturing industries. It further established
that there is no statutory obligation clearly stipulated to deal with H&S at the
conceptual stage of any construction project within the construction industry. This
suggests that there is urgent need for the state to arrange a forum with the construction
industry practitioners to formulate regulations that will be specific and current for the
construction industry.
Keywords: Botswana Factories Act, Health and safety, Workmen‘s Compensation
Act.
INTRODUCTION
Most of the health and safety (H&S) regulations and legislation commonly found in
Southern African developing countries are based on the legislation used in the
industrialized countries in the late 19th
and early 20th
centuries. In particular, the
Factories Act is the specific H&S legislation used by the developing countries that
were colonized by Great Britain (Rantanen, 1992). This is evident in many Factories

Mwanaumo and Thwala
48
Acts for the developing nations dating back to colonial times or soon after
independence was granted. The purpose of the legislation at the time was generally to
provide protection to workers in industrial enterprises when governments were
striving to promote industrialization and was based on relevant enactments in force in
the colonizing State.
Since independence, Botswana, formerly a British Protectorate essentially has two
kinds of H&S legal frameworks for the construction industry, viz. the Factories Act
and the Workmen‘s Compensation Act. Both of these acts emanate from the old
British legislation that covers largely industrial/manufacturing industries. The
Botswana Factories Act is similar to the ‗Robens style‘ of legislation derived from the
UK and is a penal code (but not a criminal code) (Dingsdag, Sheahan & Biggs, 2006).
It differs from the ‗Robens style‘ in that it is not dependent on self-regulation by
individual industry or factory. However, the Robens legislation, first introduced in the
UK in 1974, was intended to engender continuous improvement and to improve
standards in legislation within a goal-setting legal framework supported by codes of
practice and / or performance standards which could be revised more easily than
primary legislation which may require difficult enactment passage in parliament
(Dingsdag et al., 2006). However, this has not happened in the case of the Factories
Act, probably due to the inability of the Act to address all pertinent issues dealing with
H&S, especially in the construction industry.
Developed nations have over the years identified that the level of H&S risks involved
in the construction industry determine the degree of detail, time and effort required to
comply with the legal duties. International scholars affirm that the presence of
legislation addressing H&S indicates a level of commitment and provides the
framework within which H&S can occur (Halpin and Woodhead, 1998). They further
add that for the legal framework to be effective, it should specify all H&S activities
including provision of regular briefings to increase the H&S awareness of personnel at
all levels.
According to Ahasan (2001), the work practices of local workers in many developing
African nations are difficult to understand in the context of the proper way of doing
things. What leads to good performance varies from a flexible attitude towards H&S
to unwillingness to learn or to apply national laws related to H&S. Lubega,
Kiggundu, and Tindiwensi, (2000) further conducted research in five districts of
Uganda. The group recommended ways for minimising and / or avoiding re-
occurrence of accidents which included a review of the existing H&S regulations,
enforcement, sensitisation and training.
The aim of this paper is to report on the review of the Botswana Factories Act 1973
(no.31 of 1973) of the Republic of Botswana and to highlight the extent of coverage
and relevance of the Act to the construction industry, particularly with respect to the
roles of construction project stakeholders in H&S interventions.
REVIEW OF LITERATURE
Over the years, progressive research contends that the concept of designing for H&S
at the conceptual stage of each project is a viable H&S intervention in the construction
industry (Gambatese, 2003). In 1985, the International Labor Organisation (ILO,
1985) acknowledged that designers should be involved when considering construction
H&S. The European Foundation for the Improvement of Living and Working
Conditions (1991) deduced that 60% of the accidents it surveyed could have been

Health and safety
49
eliminated, reduced or avoided had more thought been given during the design stage.
Further research conducted in Europe by Mackenzie, Gibbs and Bouchlaghem (1999)
affirms the other researchers‘ findings that accidents happen due to shortcomings in
design.
In the United States of America (USA), research conducted by Hecker, Gibbons and
Barsotti (2001) established that antecedents in design, planning, scheduling and
material specifications likely contributed to ergonomic risks of workers during the
construction process. The ideal situation, therefore, is for construction H&S to be
considered right at the conceptual stage of each project (Szymberski, 1997).
These findings agree that besides workers on site, project stakeholders such as
architects, engineers, the client, and the inspectors are contibutors to the causes of
incidents and accidents experienced on site. Why then is H&S not considered at the
conceptual stage of each construction project in Botswana?
The Botswana construction industry still follows the traditional method of procuring
projects. This method entails the involvement of designers and the client during the
pre-contract stage when the project conceptualisation and feasibility study take place.
After the initial stages have been concluded, the main contractor, domestic and
specialised subcontractors are then procured for post-contract activities and join the
earlier stakeholders in the execution of the project. Clearly then, at the conceptual
stage, only the designers and the client (the financier of the project) are involved.
THE ROLE OF LEGISLATION IN A MULTI-STAKEHOLDER
INTERVENTION
European legislation
Legislation plays an important role in any state. It is important to government in many
ways: it is used diversely to implement policies, provide a framework for decision-
making, regulate activity in the private sector, and prohibit conduct. To be effective,
responsibilities of the industry and individuals would therefore have to be clearly
stipulated in the legislation.
Construction industry practitioners are aware of the industry hazards and the related
preventive measures. Since the EU recognized that construction was a highly
hazardous industry, in 1992 it published a special Directive (EU Directive No.
92/57/EC of June 1992) that transformed the view of H&S in construction. This
Directive is now known worldwide as the Construction Sites Directive (CSD) (Alves
Dias, 2009). Since then, the construction industry has changed in all countries of the
EU, and H&S in construction is now a matter of concern that most construction
stakeholders are conscious of.
Since its publication, each EU country has brought the provisions of the CSD into
national law. Some countries have made this Directive work by creating the
mechanisms and means for effective implementation while others have made a
―simple‖ transposition with few adaptations to their own situation, thereby sometimes
creating confusion for those who must implement it or check its application every day.
Other countries still have changed, or are changing, their first transposition, clarifying
it and/or adding detail. In spite of the common base introduced by the CSD, the fact is
that each country in the EU has its own approach (Alves Dias, 2009).
The CSD introduced a new approach to the improvement of OSH in construction. It
highlighted the importance of prevention measures (managerial and material) to

Mwanaumo and Thwala
50
reduce work-related accidents and diseases in construction. It took the provisions of
ILO Convention No.167 on ―Safety and Health in Construction‖ (1988) into account
and included specific roles and responsibilities concerning H&S, including the client
and designer. The concept of H&S coordination for the design phase and for the
construction phase was also introduced. This resulted in two new stakeholders in the
construction process (the H&S coordinators for the design phase and for the
construction phase) as well as the introduction of three new documents concerning
hazard prevention (the prior notice, the safety and health plan, and the safety and
health file) (Alves Dias, 2009).
United States of America legislation
In the United States, the Occupational Safety and Health Administration (OSHA) Act
1970 is responsible for enforcing labour regulations and delegating enforcement
powers to 21 states, Puerto Rico, and the Virgin Islands (CPWR, 2002, 1). As part of
its enforcement strategy, OSHA employs inspectors to conduct site visits and check
whether construction sites are complying with H&S regulations.
OSHA also addresses the relationship between design and construction H&S in a
number of ways (Cavanaugh, 2004). The standards are often a combination of
performance-orientated and design-specific provisions.
Consequently the American Society of Civil Engineers‘ (ASCE) policy statement
recognises that the engineers have responsibility for considering safety and
constructability in the designs and specifications as well as that all stakeholders in
construction must collaborate to ensure that H&S regulations and standards are
complied with in construction (ASCE 2001).
Cavanaugh (2004), asserts that OSHA‘s policy on holding engineering firms
responsible for incidents and accidents on site was affirmed by a federal court appeals
case (Reich vs. SGH, 1993) where engineering firm - SGH - was charged by OSHA
for two serious violations:
1. Inadequate formwork to support the intended load; and
2. Failure to have formwork drawings available on site.
The review commission concluded that the design firm (SGH) did not exercise the
substantial supervision required during the construction. This case resulted in
designers, engineering firms, being held responsible for general supervision of
construction works and that they have a contractual right to control H&S.
The success of this case lies in the court‘s recognition that designers have an
important role to play throughout the construction project processes – and that
includes H&S consideration at the conceptual stage of each project.
Australian regulations and legislation
Australia has many organisations or agencies that deal with H&S construction
regulations and legislation. Recommendation 19 of the Cole Inquiry encouraged the
Commonwealth to refer to the National Occupational Health and Safety Commission
(NOHSC), a body established as an overseeing agency to coordinate state, territory
and federal programs in an attempt to work towards the prevention of occupational
injuries and deaths (NOHSC, 2005).
The National Occupational Health and Safety Strategy 2002-2012 is a document that
outlined five specific goals that would help reduce the overall number of injuries and

Health and safety
51
deaths by reducing hazards and engaging managers and workers to consider and
incorporate H&S, encourage proactive hazard reduction, and integrate the design
phase into other areas (NOHSC, 2005).
In 2005, NOHSC released an outline of National Standards for Construction Work in
order to prescribe preventive action to avert occupational deaths, injuries and disease
(NOHSC, 2005). The document, among other issues, specifies the responsibilities of
different stakeholders, which are presented under the headings of ‗responsibilities of
clients‘ and ‗responsibilities of designers‘ (NOHSC, 2005). In a general sense, the
document is a successful guide to prescriptive stakeholder responsibilities.
STATUS QUO OF H&S AND LEGISLATION IN BOTSWANA
The current scenario in Botswana regarding the H&S legislative framework is that
Botswana only has the out dated Factories Act and Workmen‘s Compensation Act
system in dealing with H&S issues and is finding it difficult to move to the new H&S
Act system. The country still does not have the H&S national policy although it has
been in draft form for over five years now.
Botswana further faces the problem of the administrative framework. The H&S issues
are divided among three individual government ministries:
1. Ministry of Health under the department of Occupational Health Unit which deals
mostly with health;
2. Ministry of Labour and Home Affairs under the Occupational Safety and Health
Department, which deals with factory workers‘ safety and also workmen‘s
compensation; and
3. Ministry of Minerals, Energy and Water Resource, which deals with the safety of
mining, explosives and quarrying activities.
All three Ministries are independent units with fixed administration structures, own
budgets, own goals and aims and yet all are supposed to be addressing one common
goal - the employee‘s H&S.
Botswana construction projects, as in many countries, are ephemeral in nature,
constantly changing in status, covering a huge range of construction processes of
varying complexity and scale. The work processes and people change almost daily on
sites. The industry is further highly fragmented, both in the workforce and
professional disciplines. The fragmentation is echoed through the considerable
number of representative bodies for clients, designers, contractors, suppliers and trade
unions. There is no one body that represents all the organisations involved in the
construction industry, and there are some groups who are not represented at all in the
bodies that do exist.
One of the disturbing facts about the construction industry in Botswana is that it is
undocumented. The industry has few information sources in the country, for example,
Central Statistics office (CSO) has some information on the number of construction
industry firms, and the employment in the sector.
The construction industry in Botswana further faces inadequate recording and
notification systems. As a result official data on the incidence of occupational
accidents and diseases on construction sites are imprecise and underestimated. For
instance, labour statistics from the Central Statistics Office (CSO) indicate that 17%
of the population, which equates to 285 382 people, were formally employed for the
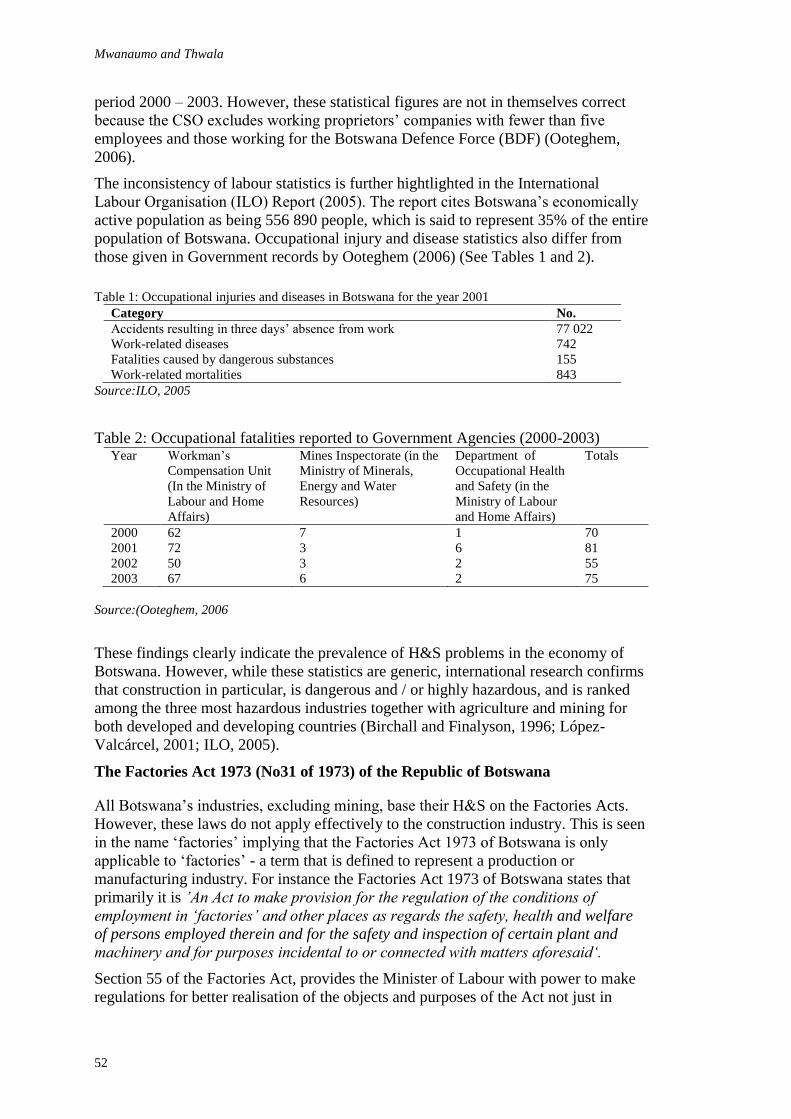
Mwanaumo and Thwala
52
period 2000 – 2003. However, these statistical figures are not in themselves correct
because the CSO excludes working proprietors‘ companies with fewer than five
employees and those working for the Botswana Defence Force (BDF) (Ooteghem,
2006).
The inconsistency of labour statistics is further hightlighted in the International
Labour Organisation (ILO) Report (2005). The report cites Botswana‘s economically
active population as being 556 890 people, which is said to represent 35% of the entire
population of Botswana. Occupational injury and disease statistics also differ from
those given in Government records by Ooteghem (2006) (See Tables 1 and 2).
Table 1: Occupational injuries and diseases in Botswana for the year 2001
Category No.
Accidents resulting in three days‘ absence from work 77 022
Work-related diseases 742
Fatalities caused by dangerous substances 155
Work-related mortalities 843
Source:ILO, 2005
Table 2: Occupational fatalities reported to Government Agencies (2000-2003) Year Workman‘s
Compensation Unit
(In the Ministry of
Labour and Home
Affairs)
Mines Inspectorate (in the
Ministry of Minerals,
Energy and Water
Resources)
Department of
Occupational Health
and Safety (in the
Ministry of Labour
and Home Affairs)
Totals
2000 62 7 1 70
2001 72 3 6 81
2002 50 3 2 55
2003 67 6 2 75
Source:(Ooteghem, 2006
These findings clearly indicate the prevalence of H&S problems in the economy of
Botswana. However, while these statistics are generic, international research confirms
that construction in particular, is dangerous and / or highly hazardous, and is ranked
among the three most hazardous industries together with agriculture and mining for
both developed and developing countries (Birchall and Finalyson, 1996; López-
Valcárcel, 2001; ILO, 2005).
The Factories Act 1973 (No31 of 1973) of the Republic of Botswana
All Botswana‘s industries, excluding mining, base their H&S on the Factories Acts.
However, these laws do not apply effectively to the construction industry. This is seen
in the name ‗factories‘ implying that the Factories Act 1973 of Botswana is only
applicable to ‗factories‘ - a term that is defined to represent a production or
manufacturing industry. For instance the Factories Act 1973 of Botswana states that
primarily it is ‟An Act to make provision for the regulation of the conditions of
employment in „factories‟ and other places as regards the safety, health and welfare
of persons employed therein and for the safety and inspection of certain plant and
machinery and for purposes incidental to or connected with matters aforesaid„.
Section 55 of the Factories Act, provides the Minister of Labour with power to make
regulations for better realisation of the objects and purposes of the Act not just in

Health and safety
53
factories but also ‗in other places‘, whilst Section 61 gives the Minister of Labour the
authority to extend any part of the Act to certain types of workplaces which form
these ‗other places‘. It is to be noted that the Minister‘s powers have been used to
extend the application of the Act to:
Building operations – that is the construction, structural alteration, repair or
maintenance of a building (including re-pointing, re-decoration and external
cleaning of the structure), the demolition of a building, and the preparation for,
and laying the foundation of, an intended building
Works of engineering construction – such as the construction of any railway line
or siding, and the construction, structural alteration or repair (including re-pointing
and re-painting) or the demolition of any tunnel, bridge, viaduct, waterworks,
reservoir, pipeline, aqueduct, sewer, sewage works, or gas holder, and such other
works as may be specified by the Minister
Although Section 61 of the Botswana Factories Act Number 31 of 1973 gives the
Minister of Labour the authority to extend any part of the Act to building operations
and works of engineering construction, the only aspects stated in the Act that are
related to construction are for site activities. There is no mention of designers, clients,
or any other construction industry pre-contract role players‘ responsibilities. From the
perspective of the Factories Act, the employer referred to represents the Contractor
who is the employer of labour on site as opposed to the client – the financier of the
construction project.
The evident from the Factories Act shows that responsibilities of designers, producers,
importers and suppliers included are those dealing with the processes in the factories.
These designers are not the designers of the construction projects that are involved in
the preconstruction stage of the construction project. Rather they are designers that
operate in the completed built-up structure designing the processes that would be
performed in that building. Clearly the H&S issues in the pre-contract stage of
construction projects are not covered by the section covering the designers mentioned
in the Act.
In essence, the existing Botswana Factories Act does not adequately address the
regulations and legislation required for improving H&S performance and compliance
in the construction industry. Further, the voluntary compliance which is reinforced by
a measure of positive behaviour and attitude is equally weak. The construction
workers seldom strike and are themselves less organized because of the temporary
nature of their work. This behaviour has contributed to the lack of urgency by the state
to review the Factories Act as there is no pressure from the industry participants and
practitioners.
Loewenson (1999) suggests that a move from an old to a new legal framework
depends to some extent on the complexity of their pre-existing laws. A more highly
developed set of regulations based on the existing legal framework could make it
difficult to move from the dated Factories Act system to the new H&S Act system.
The provision made in the Factories Act that its application may be extended to
include the construction industry is therefore futile and only shows that construction is
not a priority. The Act does not relate to specific activities in construction but
provides guidelines for the general factory environment.
Besides these inadequacies of the Factories Act relative to H&S during pre-contract
construction activities, the Act also has problems dealing with enforcement. Musonda

Mwanaumo and Thwala
54
(2005) established an overwhelming complaint about the inadequacy of inspection
services, when 80% of the respondents said that the Inspector of Factories had never
visited their construction sites.
CONCLUSION
The purpose of the paper was to discuss the Factories Act of 1973 of Botswana to
highlight the relevance of it to the modern H&S construction norms and practices. The
literature review revealed that developed nations‘ construction H&S is driven by
legislation and regulations. It also established that countries such as the United States
of America, Australia and the European states – particularly the UK – have recognised
the need to include roles and responsibilities of construction industry stakeholders into
their legislation and regulations. This enables the industry practitioners to consider
H&S at the conceptual stage of each project.

Health and safety
55
Why is H&S not considered at the conceptual stage of each project in Botswana? The
analysis indicates that there is neither statutory obligation nor the desire on the part of
designers and the client to consider H&S during project conceptualisation. The
discussion further highlighted that perhaps the challenges faced by the construction
industry in prioritising H&S lies in the failure of the legislation to clearly stipulate the
practitioners‘ obligations.
RECOMMENDATIONS
It is the view of the authors that the relevant state authorities should arrange forums
with the construction industry stakeholders to draft new H&S construction regulations
for Botswana that will define the responsibilities and obligations of the stakeholders
and be industry specific.
The authors would like to recommend that all Governments that are still using the
outdated Factories Acts systems to enforce H&S regulations in construction projects
should appoint review committees that should seek to replace the existing Factories
Act system with a much more modern construction H&S legislative system.
REFERENCES
Ahasan, R. (2001) ―Legacy of Implementing Industrial Health and Safety in Developing
Countries‖. Journal of Physiological Anthropology, 20:6, pp311-319.

Mwanaumo and Thwala
56
Alves Dias, L. (2003) ―Inspecting Occupation Safety and Health in Construction Industry‖.
International Training Centre of the International Labour Organisation, 1st Edition,
Turin, Italy, pp 10-20.
Birchall, S.J. and Finlayson, H. (1996) ―The application of European derived safety
management regulations to the UK construction industry‖. In Dias, L.M.A. and
Coble, R.J. (eds.), Implementation of Safety and Health on Construction Sites,
Proceedings of the First International Conference of CIB Working Commission W99.
Lisbon, Portugal, 4-7 September, pp. 41-51.
Cavanaugh, D. (2004) ―The role of design in OSHA regulations‖. In Hecker, S., Gambatese,
J., Weinstein, M. (Eds.), Designing for Safety and Health in Construction:
Proceedings from a Research and Practice Symposium, September 15–16, Portland,
OR, USA, pp. 186–193.
Center to Protect Workers Rights (CPWR) (2002) OSHA's enforcement of construction safety
and health regulations. The Construction Chartbook, CPWR, USA:.
Dingsdag, D.P., Sheahan, V.L., and Biggs, H.C. (2006) ―Safety Culture in the Construction
Industry: Changing behaviour through enforcement and education?‖, In Proceedings
Clients Driving Innovation: Moving Ideas into Practice. The Second International
Conference of the CRC for Construction Innovation. Accessed from: https://
eprints.qut.edu.au/3802/1/3802.pdf, 17th September 2010.
European Foundation (1991) ―From Drawing Board to Building Site‖. European Foundation
for the Improvement of Living and Working Conditions. London, HMSO Books.
European Union Directive 92/57/EEC (1992) ―Implementation of minimum safety and health
requirements at temporary or mobile construction sites‖. JOCE Nr. L 245.
Gambatese, J. (2003) ―Investigation of the Viability of Designing for Safety‖. The Center to
Protect Workers Rights, USA.
Halpin, D.W., Woodhead, R.W. (1998) Construction Management, Wiley, New York, NY.
Health and Safety Executive (1997) Successful Health and Safety Management. HSE Books,
Sudbury.
Hecker, S., Gibbons, B., and Barsotti, A. (2001) ―Making ergonomic changes in construction:
worksite training and task interventions‖. In Alexander, D. and Rabourn, R. (eds.),
Applied Ergonomics, Taylor & Francis, London, pp. 162-189.
International Labour Organisation – ILO (1988) ―Convention 167 on Safety and Health in
Construction‖. Geneva, Switzerland.
International Labour Organization (ILO) (1985) Safety and Health in Building and Civil
Engineering Work, International Labor Office, Geneva, Switzerland.
International Labour Organization (ILO) Report (2005) ―World Day for Safety and Health at
Work 2005‖, A Background Paper, In Focus Programme on Safe Work International
Labour Office, Geneva.
Loewenson R. (1999) ―Occupational Health and Safety in Southern Africa: Trends and Policy
Issues‖. ILO/SAMAT Policy Paper No. 8. SRO-Harare, Zimbabwe: International
Labour Organization, pp 1-26.
López-Valcárcel, A. (2001) ―Occupational safety and health in the construction work‖. In
African Newsletter on Occupational H&S Construction and Mining, 11:1, pp 2-8

Health and safety
57
Lubega, H. A., Kiggundu, B. M. and Tindiwensi, D. (2000) ―An Investigation into the Causes
of Accidents in the Construction Industry in Uganda‖, 2nd International Conference
On Construction In Developing Countries: Challenges Facing The Construction
Industry In Developing Countries, 15-17 Nov 2002, Botswana, pp1-12[online]
Available http://buildnet.csir.co.za
Mackenzie, J., Gibbs, A.G.F., and Bouchlaghem, N.M. (1999) ―Communication of H&S in
the design phase‖. In Singh A, Hinze J.H and Coble R .J (eds.), Implementation of
Safety and Health on Construction Sites. Rotterdam: A.A. Balkema
Musonda, I. (2005) ―Health and safety (H&S) awareness and implementation in Botswana‘s
construction industry‖. Proceedings 4th Triennial International Conference,
Rethinking and Revitalizing Construction Safety, Health, Environment and Quality.
Port Elizabeth, South Africa, CIB 142, May 2005, pp 17-20.
National Occupational Health and Safety Commission (NOHSC) (2005) Occupational Health
and Safety. http://www.nohsc.gov.au/ (Accessed 16 October 2008).
Ooteghem, P.V. (2006) Work related injuries and illnesses in Botswana. International Journal
of Occupational and Environmental Health, 12:1 pp 42-51.
Paton, N. (2003) Measure of success. Occupational Health, 57:12, pp16-19.
Rantanen, J. (1992) ―Legislation as a tool in occupational health and safety‖. In African
Newsletter on Occupational Health and Safety, Helsinki, 2:3, pp 64-67.
Szymberski, R. 1997. Construction Project Safety Planning. TAPPI Journal, 80:11 pp 69-74.

Ganiyu, S.A. and Adedeji, Y.M.D. (2011) A study of the sources of noise pollution and their impacts
on the built environment: A case study of Oba-Ile Housing Estate, Akure, Nigeria In: Laryea, S.,
Leiringer, R. and Hughes, W. (Eds) Procs West Africa Built Environment Research (WABER)
Conference, 19-21 July 2011, Accra, Ghana, 59-67.
59
A STUDY OF THE SOURCES OF NOISE POLLUTION
AND THEIR IMPACTS ON THE BUILT
ENVIRONMENT: A CASE STUDY OF OBA-ILE
HOUSING ESTATE, AKURE, NIGERIA
S. A. Ganiyu1 and Y.M. D. Adedeji
2
Department of Architecture, Federal University of Technology, Akure, Nigeria
Among the problems associated with technological advancement made by man in
modern times which is not receiving enough attention from those responsible for the
planning and designing of the built environment is noise pollution. Noise, an
unwanted and irritating sound, is a form of environmental pollution and a source of
stress. Loud noise is harmful and impacts negatively on the quality of the built
environment. This paper, therefore, seeks to identify the major sources of noise and
its impact in the built environment of a typical housing estate in Akure, the capital of
Ondo State. The paper adopted a survey research method. It relied on the data
collected from a survey carried out on some of the buildings along the major streets in
Oba-Ile Housing Estate, Akure, Nigeria. It was observed that noises from vehicular
traffic, pedestrian traffic and religious buildings, as the major sources of external
noise, have very serious negative effects on the residents. Generating sets,
telephone/mobile phones, radio and television sets constitute the major sources of
internal noise with very serious negative effects on the residents of the study area. It
recommends good design and building orientation, adequate set back, reduction in the
opening sizes and reduction of noise from sources as some of the ways to minimise
the problems of noise pollution in built environment.
Keywords: environmental pollution, noise, Oba-Ile housing estate, Nigeria.
INTRODUCTION
Noise which is an unwanted sound that disrupts human activities has been a major
concern in many of the built environments. The focus of study is to identify the
sources of noise pollution in typical residential estate of the built environment in order
to proffer solution that will enhance the comfort of the residents. Relevant literatures
were reviewed with a view to define the problem, identify the sources of noise
pollution and the physiological and psychological effects of noise pollution on man.
The results of a structured questionnaire administered on 35 residents of Oba-Ile
Housing Estate, Akure are presented and discussed. Adequate set back, zoning,
regular supply of electricity and creation of public awareness and enlightenment on
the negative and damaging effects of noise are recommended as practical ways of
reducing the impact of noise on the residents of residential areas of the built
environment.

Ganiyu and Adedeji
60
LITERATURE REVIEW
Noise pollution is displeasing human, animal or machine-created sound that disrupts
the activity or balance of human or animal life (Wikipedia, 2010). Noise, according to
Ephraime (2002), can be defined as undesirable sound and erratic; intermittent or
statistically random oscillation. Ogunsote (1991) affirmed that it is an unwanted or
damaging sound which interferes with what people are trying to do, or that which has
an adverse effect on health and safety. Noise can also be understood as a complex
sound, a mixture of many different frequencies or notes not harmonically related.
Microsoft Encarta (2007) defines environmental noise pollution as the
exposure of people or animals to levels of sound that are annoying, stressful, or
damaging to the ears. It posited that loud and frightening sounds are part of nature;
only in recent centuries has much of the world become urban, industrial, and
chronically noisy. Noise can be transferred either through the air (known as air-borne
sound/noise) or through solid structures/materials (structure-borne sound/noise or
impact noise).
SOURCES OF NOISE POLLUTION IN THE BUILT
ENVIRONNENT
To be able to effectively deal with the problem of noise, there is a need to first identify
the sources of noise. According to Ogunsote (1991), the major sources of noise can be
broadly divided into two: external and internal sources. However, Gregory (1998)
identified three categories of source of noise to include:
Sources associated with activities and office equipment;
Sources associated with operation of building services; and
Sources of environmental sound from outside the building.
The first two categories of Gregory‘s classification can be referred to as internal
sources while the third category tallies with the external sources of Ogunsote‘s
classification (Ganiyu and Ogunsote, 2010).
EXTERNAL SOURCES OF NOISE
These constitute the major sources of environmental noise. They are noises that may
be difficult to control from the source. They include, but are not limited to the
following: noise from traffic and automobiles; noise from industries like quarries and
mining industries; noise from pedestrians; noise from religious institutions like
churches and mosques; noise from advertising agents and hawkers; noise from rallies
like political campaigns, and so on (Ganiyu and Ogunsote, 2010).
INTERNAL SOURCES OF NOISE
These are noises associated with human activities within the building, operation of
building services and office equipment. These may include door slam, footfall
(especially in multi-storey buildings), conversation, radio and television sets, fans and
air-conditioners, home appliances and motorised appliances such as power generating
sets (Ogunsote, 2010).
These sources of noise can all be sources of vibration that may interfere with
occupants of built environment‘s activities and comfort. While some of these are
tolerable and desirable, Ephraime (2002) posited that quite a number of them are
undesirable, cause discomfort and may be harmful and hazardous. Table 1 shows
relative noise levels and their subjective impressions.

Noise pollution
61
Table 1: Relative Noise Levels and Subjective Impressions.
Noise Source Distance from
Noise Source (feet)
A-Weighted Sound
Level in Decibels
Noise
Environment
Subjective
Impression
Civil Defence Siren 100 130
Jet Takeoff 200 120 Pain Threshold
110 Rock Music
Concert
Pile Driver 100 100 Very Loud
Helicopter 1000 90 Printing Press
Plant Loud
Freight Cars 50 80
Vacuum Cleaner 10 70 Garbage Disposal Moderately Loud
60 Data Processing
Centre
Light Traffic 100 50 Department Store
Large Transformer 200 40 Business Office Quiet
30 Quiet Bedroom
Soft Whisper 5 20 Recording Studio
10 Hearing
Threshold
Source: Ganiyu and Ogunsote (2010)
IMPACT OF NOISE
The effect of noise on any human being may be psychological or physiological
(Ogunsote, 2010, Adedeji and Folorunsho, 2010). This may range from annoyance to
permanent and immediate loss of hearing. Psychological effects of noise may include
annoyance, stress, weakness in children, mental fatigue, tension, loss of privacy and
so on. The physiological effects include sleeplessness, a paling in the skin, hearing
damages that range from temporary threshold shift through permanent threshold shift
to deafness. Medical experts, according to Ephraime (2002), believe that noise
pollution in cities poses greatest threat to unborn babies and children. Excessive noise
exposure can cause both anatomical abnormalities and more subtle deviations in
human and metabolic functions. Loud noise is believed to cause dilated pupils,
constricts blood vessels, create cardiac and intestinal ailment. Noise interferes with
speech, sleep leisure and learning.
Ephraime (2002) asserted that incessant and loud noise is hazardous to the built
environment – both life and property. The negative impact of noise on the built
environment increases with the noise level and depend on the distance from the source
of the noise. The impact also varies with the time of the day as noise level tolerable in
the day time may cause significant discomfort at night. The degree of the negative
impact may also vary with location since urban dwellers are generally more tolerant of
noise than rural dwellers (Ogunsote, 2010). Sudden and very intense noise level will
cause more damage than monotonous noise. It should be note, however, that the
degree of disturbance and impact caused by noise depends on individuals.
According to Wikipedia(2010) noise can cause hearing impairment, hypertension,
ischemic heart disease, annoyance, premature ejaculation, bowel movements, sleep
disturbance, death and decreased sexual performance. Changes in the immune system
and birth defects have also been attributed to noise exposure. Noise exposure has also
been known to induce tinnitus, hypertension, vasoconstriction and other
cardiovascular impacts. Beyond these effects, elevated noise levels can create stress,
increase workplace accident rates, and stimulate aggression and other anti-social
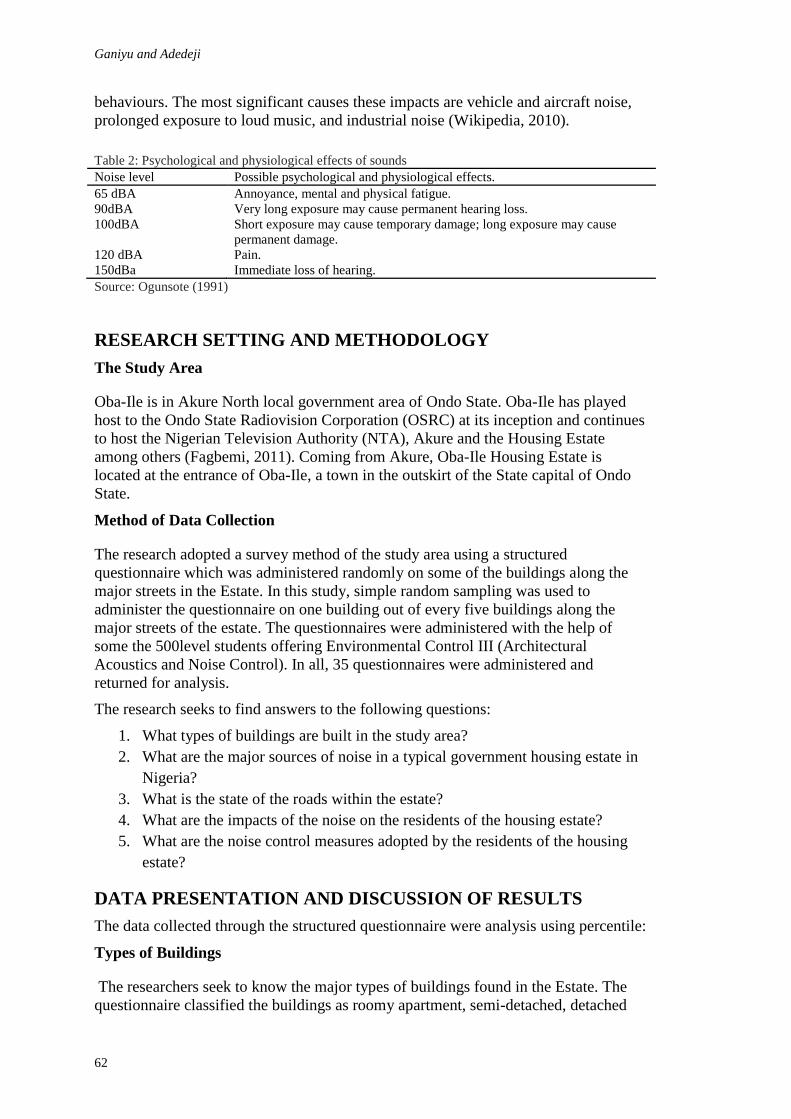
Ganiyu and Adedeji
62
behaviours. The most significant causes these impacts are vehicle and aircraft noise,
prolonged exposure to loud music, and industrial noise (Wikipedia, 2010).
Table 2: Psychological and physiological effects of sounds
Noise level Possible psychological and physiological effects.
65 dBA Annoyance, mental and physical fatigue.
90dBA Very long exposure may cause permanent hearing loss.
100dBA
Short exposure may cause temporary damage; long exposure may cause
permanent damage.
120 dBA Pain.
150dBa Immediate loss of hearing.
Source: Ogunsote (1991)
RESEARCH SETTING AND METHODOLOGY
The Study Area
Oba-Ile is in Akure North local government area of Ondo State. Oba-Ile has played
host to the Ondo State Radiovision Corporation (OSRC) at its inception and continues
to host the Nigerian Television Authority (NTA), Akure and the Housing Estate
among others (Fagbemi, 2011). Coming from Akure, Oba-Ile Housing Estate is
located at the entrance of Oba-Ile, a town in the outskirt of the State capital of Ondo
State.
Method of Data Collection
The research adopted a survey method of the study area using a structured
questionnaire which was administered randomly on some of the buildings along the
major streets in the Estate. In this study, simple random sampling was used to
administer the questionnaire on one building out of every five buildings along the
major streets of the estate. The questionnaires were administered with the help of
some the 500level students offering Environmental Control III (Architectural
Acoustics and Noise Control). In all, 35 questionnaires were administered and
returned for analysis.
The research seeks to find answers to the following questions:
1. What types of buildings are built in the study area?
2. What are the major sources of noise in a typical government housing estate in
Nigeria?
3. What is the state of the roads within the estate?
4. What are the impacts of the noise on the residents of the housing estate?
5. What are the noise control measures adopted by the residents of the housing
estate?
DATA PRESENTATION AND DISCUSSION OF RESULTS
The data collected through the structured questionnaire were analysis using percentile:
Types of Buildings
The researchers seek to know the major types of buildings found in the Estate. The
questionnaire classified the buildings as roomy apartment, semi-detached, detached

Noise pollution
63
and multi-storey buildings. The research revealed that there are three (3) distinct types
of building in the estate. Table 3 shows that the number of semi-detached buildings is
fifteen (15) representing 42.8%, while those of detached buildings is thirteen (13)
representing 37.2% and seven (7) duplexes representing 20% . Because majority of
the buildings are semi-detached, the ease with which noise from one dwelling unit
interferes with the comfort and privacy of the other family is greatly increased. The
impacts of both air-borne and structure-borne noises are very significant in semi-
detached buildings than detached buildings.
Table 3: Types of Building
Types of Building Number of building Percentage (%)
Face-face (Roomy Apartment) 0 0
Semi-detached 15 42.8
Detached bungalow 13 37.2
Duplex 7 20
Multi-storey 0 0
Total 35 100
Source: Researchers‘ field survey (2011)
Types and Sources of Noise
Two types of sources of noise were identified: i. the external sources of noise and, ii.
the internal sources of noise. Respondents identified vehicular traffic, generating sets
and pedestrian traffic as the major sources of external noise while grinding machine,
electronic appliances, mobile phones and washing machines were identified as the
major sources of internal noise. This observation is in line with the submission of
Ogunsote (2010). Besides, Plate 1 show a gridding machine situated at the entrance of
a residential building which is major source of noise. Since there are no shopping
malls within the estate, residents take the advantage to put all sorts of business
ventures in front of their houses regardless of the noise implication. Epileptic power
supply has become a permanent decimal in the residential areas which has forced
everybody to find alternative to NEPA. Household generators (I-pass-my-neighbour),
a common feature in the residential estate, do not only generate noise pollution but
capable of air and water pollution. Proliferation of mobile phones coupled with lack of
phone ethics, especially at night (extra-cool) is one of the major source of noise
pollution that can cause stress, sleeplessness and reduce productivity.
Plate 1: Grinding machine: a source of noise in the study area
Source: Researchers‘ field survey (2011).
State of the Roads

Ganiyu and Adedeji
64
All the roads in the Estate are either graded or tarred (see Plate 2). As a result of the
states of roads, cars often move at very high speed thereby generating noise in the
neighbourhood. Respondents agreed that there is a relationship between the state of
the road and the level of noise been generated within the estate. There are no
sufficient buffer zones to minimize the impacts of the vehicular and pedestrian traffic
noise in some of the buildings in the study area as demonstrated in Plate 2.
Commercial busses which are also allowed to ply within the estate can worsen the
vehicular traffic within the estate coupled with their habitual but irritating and noisy
horns meant to attract passengers.
Plate 2: A building bounded by a tarred and graded roads with inadequate setbacks Source:
Researchers‘ field survey (2011).
Assessment of the Noise Impact
Of all the sources of external noise examined, respondents submitted that generating
set, vehicular traffic; pedestrian traffic and religious buildings were found to have
significant impact on the people of the study area (see Table 4). Generating sets of
various sizes and ages are often put on at night when residents are supposed to be
resting and/or sleeping. The noise emanating from these generators can cause to a lot
of negative psychological and physical impacts on the residents. Such psychological
impacts can include annoyance, stress and mental fatigue. Sleeplessness, temporary
hearing damage, physical fatigues are some of the physical impacts that can arise from
regular exposure to such noise. These findings corroborate the observation of
Ephraime (2002) that persistent noise is injurious to the built environment. There is
neither railway nor factory within the estate that can pose any serious noise threat to
the residents. The location of the airport is very far from the estate; hence the impact
of the noise is very minimal.
Table 4: Impacts of External Noise on the Study Area
Source of External
Noise
Very Significant
Impact
Significant
Impact
Average
Impact
Mild
Impact
No Impact
Vehicular traffic 31 4 0 0 0
Pedestrian traffic. 1 6 13 8 7
Train 0 0 0 0 35
Aircraft 0 0 0 10 25
Churches 0 6 13 5 11
Mosques 0 0 7 6 22
Advertising agents 0 0 0 7 28
Factory/Industry 0 0 0 0 35
Generating Set. 24 6 5 0 0
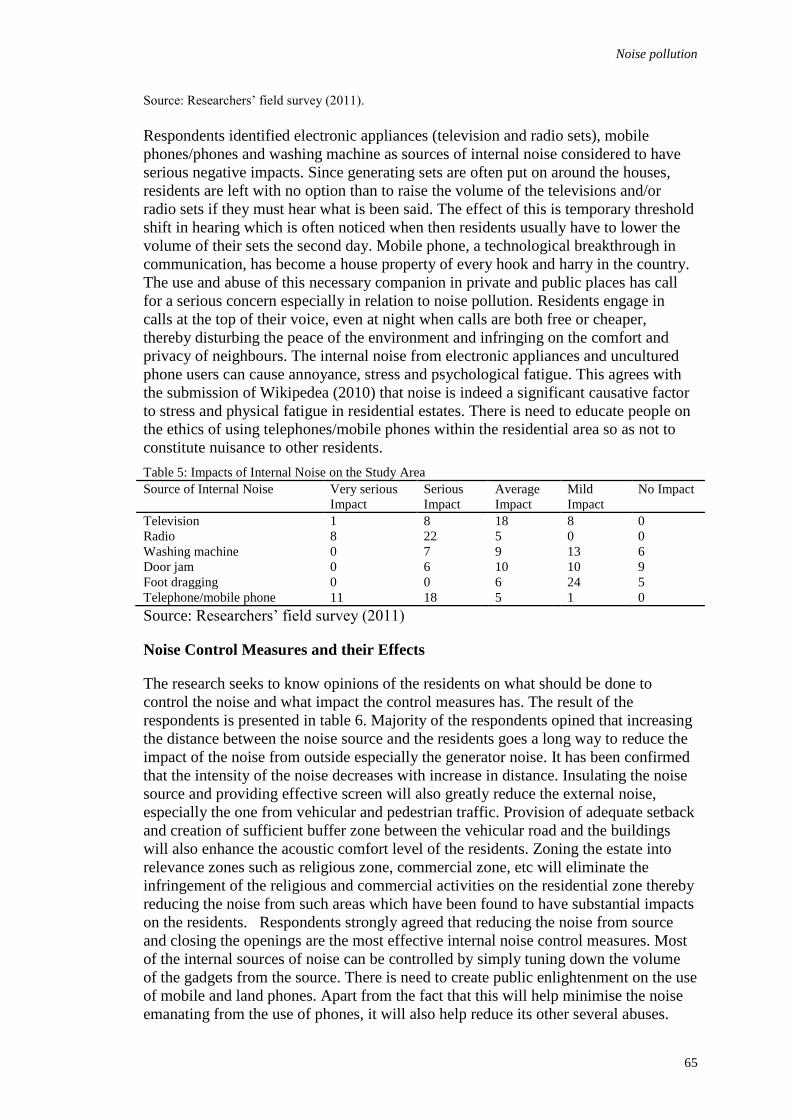
Noise pollution
65
Source: Researchers‘ field survey (2011).
Respondents identified electronic appliances (television and radio sets), mobile
phones/phones and washing machine as sources of internal noise considered to have
serious negative impacts. Since generating sets are often put on around the houses,
residents are left with no option than to raise the volume of the televisions and/or
radio sets if they must hear what is been said. The effect of this is temporary threshold
shift in hearing which is often noticed when then residents usually have to lower the
volume of their sets the second day. Mobile phone, a technological breakthrough in
communication, has become a house property of every hook and harry in the country.
The use and abuse of this necessary companion in private and public places has call
for a serious concern especially in relation to noise pollution. Residents engage in
calls at the top of their voice, even at night when calls are both free or cheaper,
thereby disturbing the peace of the environment and infringing on the comfort and
privacy of neighbours. The internal noise from electronic appliances and uncultured
phone users can cause annoyance, stress and psychological fatigue. This agrees with
the submission of Wikipedea (2010) that noise is indeed a significant causative factor
to stress and physical fatigue in residential estates. There is need to educate people on
the ethics of using telephones/mobile phones within the residential area so as not to
constitute nuisance to other residents.
Table 5: Impacts of Internal Noise on the Study Area
Source of Internal Noise Very serious
Impact
Serious
Impact
Average
Impact
Mild
Impact
No Impact
Television 1 8 18 8 0
Radio 8 22 5 0 0
Washing machine 0 7 9 13 6
Door jam 0 6 10 10 9
Foot dragging 0 0 6 24 5
Telephone/mobile phone 11 18 5 1 0
Source: Researchers‘ field survey (2011)
Noise Control Measures and their Effects
The research seeks to know opinions of the residents on what should be done to
control the noise and what impact the control measures has. The result of the
respondents is presented in table 6. Majority of the respondents opined that increasing
the distance between the noise source and the residents goes a long way to reduce the
impact of the noise from outside especially the generator noise. It has been confirmed
that the intensity of the noise decreases with increase in distance. Insulating the noise
source and providing effective screen will also greatly reduce the external noise,
especially the one from vehicular and pedestrian traffic. Provision of adequate setback
and creation of sufficient buffer zone between the vehicular road and the buildings
will also enhance the acoustic comfort level of the residents. Zoning the estate into
relevance zones such as religious zone, commercial zone, etc will eliminate the
infringement of the religious and commercial activities on the residential zone thereby
reducing the noise from such areas which have been found to have substantial impacts
on the residents. Respondents strongly agreed that reducing the noise from source
and closing the openings are the most effective internal noise control measures. Most
of the internal sources of noise can be controlled by simply tuning down the volume
of the gadgets from the source. There is need to create public enlightenment on the use
of mobile and land phones. Apart from the fact that this will help minimise the noise
emanating from the use of phones, it will also help reduce its other several abuses.

Ganiyu and Adedeji
66
Table 6: Noise Control Measures in the Study Area
Item Strongly Agree
(4)
Agree
(3)
Disagree
(2)
Strongly
Disagree (1)
Close the windows and doors 5 22 8 0
Reduce the noise at source 23 8 4 0
Move away from the source 0 10 9 16
Indifference to the noise 0 0 22 13
Adequate setback/buffer zone 25 8 2 35
Public awareness/ Enlightenment 18 10 7 0
Zoning within the estate 28 7 0 35
Relocate from the area 0 11 22 2
Source: Researchers‘ field survey (2011)
RECOMMENDATIONS AND CONCLUSION
Recommendations
Based on the above findings, the following recommendations are proposed:
1. Buildings should be sited with adequate setback from the road to minimize the
effects of the vehicular and pedestrian traffic noise. Where possible, buffer
zones made of fence, trees, hedges and/or shrubs should be provided to reduce
the impact of the noise on residents.
2. Shopping malls and/or corner shops should be provided for residential housing
estates to discourage the location of grinding machines within the residential
area of the estate.
3. Government should ensure regular supply and distribution of electricity to all
residential areas, especially at night to discourage the use of generating sets
which has become a necessity in every household in Nigeria. The use of
generating sets in the residential estates poses a serious health hazard to
residents as it does not only serve as noise pollution but also air poisoning.
4. Zoning the religious area away from the residential area will go a long way to
reduce noise generated from religious buildings especially at night when
residents are expected to take rest after a busy working day. Government
should enact laws that will prohibit the use of public address system by
religious buildings at night. Government should also constitute special squad
for enforcement of the law.
5. There is need to create public awareness to educate the masses on the ethics of
using phones and electronic appliances which may induce general negative
physiological and psychological impacts on the built environment.
CONCLUSIONS
The aim of this research was to study the major sources of noise pollution in typical
government housing estate in Akure, Nigeria and assess the level of its impacts on the
residents with a view to proffer ways at minimising the damaging effects of the noise
pollution. The findings of the study are applicable to government owned housing
estates in the south-western part of Nigeria. The fact that sources of noise pollution in
our built environment is growing wider by the day and their impacts taking toll on the
lives of residents of built environment can no longer be disputed. For effective control
of these impacts, this paper confirmed vehicular traffic, generating sets, religious
buildings and pedestrian traffic as the major sources of negative generators of external

Noise pollution
67
noise pollution and electronic appliances, mobile phones and washing machine as the
main sources of noise pollution from within the building in a typical housing estate in
Akure, Nigeria. The study identified vehicular traffic, generating sets, mobile phones
and household equipment/appliances as source with serious impact on the residents of
the housing estate. The paper finally recommend adequate setbacks, buffer zones,
shopping malls/corner shops, constant electricity supply, zoning and law enactment
and enforcement as necessary measures towards controlling the negative impact of
noise pollution in residential estates.
ACKNOWLEDGEMENT
The authors acknowledge the efforts of some of the 500level students of the
Department of Architecture, Federal University of Technology, Akure during field
studies and in the collection and analysis of data.
REFERENCES
Ephraime, E. E. (2002) The Decaying City: The Prevailing Instruments of Decay
Governments Inaction and Public Attitudinal Posturing. In: The Decaying City:
Architect's Dilemma and Responsibilities. Edited by Arc. Faworaja et al. pp. 16 -24.
Fagbemi S. (2011). The Untold Story of An Ancient Yoruba Town, Oba-Ile (Part 4 of 4)
(http://focusnigeria.com/oloba-oba-ile.htm)
Ganiyu, S. A. and Ogunsote, O. O. (2010) A Study of the Sources and Control of
Environmental Noise Pollution on a Typical Street in Akure, Nigeria. A paper
presented in an International Conterence organised by School of Environmental
Technology, Federal University of Technology, Akure.
Gregory, C. T. (1998) ―Building Noise Control Applications‖ in Architectural Acoustics.
Edited by William J. C. and Joseph A. W. pp. 100 -150.
Adedeji, Y. M. D. and Folorunso C. O. (2010) Pollution Management in Housing
Environment and health of Urban Dwellers. A paper presented in an International
Conterence organised by School of Environmental Technology, Federal University of
Technology, Akure.
Ogunsote, O. O. (2010) Environmental Control – Acoustics and Noise Control. Unpublished
Lecture Notes, Department of Architecture, Federal University of Technology, Akure.
(Also available on http://sdngnet.com/Files/Lectures/FUTA-ARC-507/)
Wikipedia (2010) Health Effects from Noise.
(http://en.wikipedia.org/wiki/health_effects_from_noise#cite_note-
RosenHall1990-1).


Madawaki, M.N. (2011) Affordability assessment of the housing units built from federal mortgage
bank‘s loans in Nigeria In: Laryea, S., Leiringer, R. and Hughes, W. (Eds) Procs West Africa Built
Environment Research (WABER) Conference, 19-21 July 2011, Accra, Ghana, 69-78.
69
AFFORDABILITY ASSESSMENT OF THE HOUSING
UNITS BUILT FROM FEDERAL MORTGAGE BANK’S
LOANS IN NIGERIA
Musa Nuhu Madawaki1
Department of Building, Ahmadu Bello University, Zaria, Kaduna state, Nigeria
Low affordability has been a central concern in Nigeria‘s housing problem. This is
traceable to either insufficient income, excessive cost of Housing, or both. Affordable
housing units are ones built within financial abilities of buyers or whose rent or
mortgage does not exceed 30 % of gross annual household income (Andrew in Musa-
Haddery 2011). Currently, majority of Nigerians cannot afford to own houses even
after solutions were attempted by the Federal Mortgage Bank of Nigeria (FMBN)
through the grant of loans to developers to construct various classes of housing units
and another set of loans through Primary Mortgage Institutions (PMIs) to individuals
that contributed to Nigeria‘s National Housing Fund to buy the housing units
produced. The only hypothesis of the study assumed no significant relationship
between gross average annual incomes of the low, middle, and high income groups in
Nigeria and the costs at which the various classes of housing units were sold. Data
was collected via questionnaires administered on FMBN and mortgagors through
stratified purposive sampling. Analyses were by ratio tests and Spearman‘s ranked
correlation. Findings revealed acceptance of null hypothesis for relationship between
the gross annual income of the lowest paid income group and the costs at which low
income housing units were sold. The null hypothesis was rejected each for
relationship between the gross average annual incomes of the middle and high income
groups and the costs at which the respective incomes housing units were sold. The
patronage of local improved materials and improved naira value were advocated.
Keywords: affordability, gross annual income, mortgage loan, naira value.
INTRODUCTION
In most countries of West Africa, the ownership of affordable good quality Housing
has being a problem justifying serious public and private sectors intervention (Yao
2007; Karley 2008; Atagher 2008; Cudjoe 2010). For instance, in Nigeria since
independence, affordable Housing has been the major policy concern of relevant
Housing and Mortgage Institutions (Sanusi 2003; Ahmed 2008; Okereke 2010).
However, critics are of the view that despite this policy efforts, only the needs of the
middle and high-income classes are met (Ayorinde and Morenikeji 1994; Okonkwo
2004; Sambo 2006; Bala 2007a; 2007b). The current research effort aims to provide
additional proof that indeed, all the Housing and Mortgage strategies put in place by
the FMBN since 1992 have not yielded significant results in the enablement stride
with respect to households earning below US $1.50 a day in Nigeria.
Previous research works indicate poor coordination between intent and action by the
Nigeria‘s Housing / Mortgage Planners and players (Ayorinde and Morenikeji 1994;

Housing
70
Wahab 1995; Mosaku 1997; Olotuah 2000; Anthonio 2001; Groves 2004; Gomez
2006; Ojo 2009; Okereke 2010). And, failure to produce and distribute low-priced
materials and components to people in need as reasons for the poor results in the case
of affordable good quality housing for the low-income (Karley 2008; FRCN 2010).
STATEMENT OF THE RESEARCH PROBLEM
Insufficient income and excessive cost of housing are two problems militating against
affordable Housing in Nigerian. The country‘s low-income earners (persons whose
earnings are below US $1.50, or (N225.00k) per day) appear to be the worst hit. This
is because a sizeable portion of the low-income earners are not qualified to access
FMBN‘s loans on the grounds of earning below the Minimum National Wage of
N6,750.00k per month (or, N81,000.00k per annum). Even the few that qualify, find it
difficult to purchase FMBN‘s facilitated housing units from the Bank‘s loans alone
and not even when added to savings.
AIM OF THE STUDY
To evaluate the relationships between the gross annual incomes of low, middle, and
high-income mortgagors of the FMBN and the costs at which the Bank‘s facilitated
housings units were sold to qualified members of the three income groups during the
period between 2009 and 2010 in the various states of Nigeria.
JUSTIFICATION FOR THE STUDY
The house is one of three man‘s most basic needs that contributes to the health status
of its occupants and determines the economic growth of individuals and nations.
Currently, less than 25 % of the 150 million people in Nigeria own houses (Atagher
2008). The rest of the population leaves in rented quarters or make-shift residences
(NPC 2006). This certainly reflects the severity of Housing stress and inconveniences
arising from homelessness amongst Nigerians (Kaltho 2008). Indeed, in Nigeria the
low-income group constitute the majority (NPC Op. Cit.) and have the least access to
resources for good quality affordable Housing (Bala, 2007a; Adebowale 2007; Stock
2008; Ojo 2009). The consequences of these malfunctions show in haphazard physical
development, numerous un-authorized ditches excavated to obtain earth for
construction. Most of the ditches become breeding grounds for mosquitoes. And,
some of the ditches turn into dangerous ponds. Also, there is open air defecation with
consequences for public health in many Nigerian settlements (Sattaur 2004; Musa
2009). Hence, there is the need to resolve the crisis in its entirety.
LITERATURE REVIEW
Affordability is frequently mentioned in most discussions on Housing (Burnett 2006).
However, affordability has been viewed from many standpoints. One of the
standpoints expressed affordability as a relationship between the level of housing
expenditure and household income (Musa-Haddery 2011). This view incorporates
elements of Housing within acceptable standards without imposing unreasonable
burden on the household income. Andrew (2004) observed that affordability is
influenced by a range of factors including salary progression, fiscal and economic
policies, and financial market characteristics. And, that the concept affordability in
Housing changes over time, depending on such factors as: number of dependants, age,
job security, and changes in interest on loans and so on. However, Karley (2008) is of
the view that an affordable mortgage loans is dictated by three factors, namely: house
price, income and the amount loanable to the mortgagor. The view taken in this paper

Madawaki
71
concerns households' ability to 'reasonably' meet the consumer costs of Housing
suitable to their residential needs (Musa-Haddery Op. Cit.). Affordability as used in
this study, refers to the ability of the household to meet the monthly amortization or
rent payment that approximates to one third of the total household income
(Neuteboom 2004; Ural 2006; Karley 2008).
THEORETICAL FRAMEWORK
Philip (2001) observed that: “Affordability in Housing is income relative”. Also, Andrew
2004 argued ―affordable housing units as ones built within the financial abilities of
buyers or one whose rent or mortgage does not exceed 30 % of the gross annual
household income‖. This view incorporates the elements of Housing within acceptable
standards without imposing unfair burden on household income. As such, how
affordable were FMBN‘s facilitated housing units to people within low, middle, and
high-income groups that accessed the relevant housing units during the period
between 1992 and 2010 in 26 selected states of Nigeria?
RESEARCH METHOD AND DESIGN
This study is essentially comparative. Four sets of data were found and the
relationships between them analyzed for significance. The four sets of data are;
(i), the volumes of dual funding to low, middle, and high-incomes‘ Housing by the
FMBN through direct disbursements to the accounts of property developers and to
NHF-contributors through their PMIs during the period between 1992 and 2010 in 26
selected states of Nigeria.
(ii), the average costs of low, middle, and high-incomes housing unit in the various
states of Nigeria in each of the selected state during the period under review (1992 -
2010).
(iii), the gross average annual incomes of persons that accessed the loans in each
income group during the study period (1992 - 2010).
(iv), the character of relationships between the FMBN‘s averages pooled funding to
various incomes Housing and the respective gross annual income of persons that
accessed the loans in each income group
The FMBN‘s average pooled funding to each particular income‘s Housing in every
state was obtained by adding the loans disbursed to developers for each particular
class of income‘s housing units to the loans disbursed to individuals National Housing
Fund (NHF) contributors via their PMIs and dividing the sum by two.
DATA COLLECTION
The study relied on historical data sourced from developers, official records of the
National Headquarters, and State branch-offices of the Federal Mortgage Bank of
Nigeria (FMBN). Also, data was sourced from the National Salaries, Incomes and
Wages Commission of Nigeria.
METHOD OF DATA ANALYSIS
Hypothesis of the research work
HO1 --- There is no significant relationship between the gross annual income of
members of an income group in Nigeria and the cost at which the income‘s FMBN‘s

Housing
72
facilitated housing units was sold to members of the group during the period between
1992 and 2010.
Tools for Testing the Hypothesis
Ratio analysis and Spearman‘s ranked correlation were the tools used to test the
hypothesis.
Spearman‘s coefficient of ranked correlation is expressed as: (r) = 1 – (6 d2 / n
2
– n)
The coefficient of correlation r determines the strength of the link between paired sets
of ranked data. In this analysis, the ranks were assigned from the highest to smallest
values for each set of data. The SPSS 13 statistical package was used to carry out the
ranking and calculations.
The Decision Rule
(a.) For affordability, Unit cost of housing / gross household income 30% .When
ratio 30% => House is unaffordable (Andrew 2004, Ural 2006)
(b.) Spearman‘s coefficient of ranked correlation ranges between 1 r 1. A value
of r close to zero signifies a weak or no correlation (Spiegel and Stephens 2007).
Comments on the ratios of mortgagors‘ income to cost per each class of housing units

Madawaki
73
The ratio tests between gross average annual income, average pooled loan, and unit
costs of Houses revealed that the housing units sold to members of the middle and
high-income groups were affordable to the two income groups (R < 30 %). However,
the case was not same for the low-income group in all the states studied (R > 30 %).
A further analysis was carried out between gross average annual incomes of persons
that accessed FMBN‘s loans and the costs at which the various classes of housing
units were sold to the respective members of the low, middle, and high-income
groups. In later this part of the study, the tool for analysis is the Spearman‘s ranked
correlation.
But, r = 1 [6 D2 n(n
2 1)]
Applying the relevant values, we have: r = 1 [6 D2 (n
3 n)] = 1 [6 D
2 (26
3
26)]
= 1 – [6 1144.00 17550] = 1 – 0.598 = 0.402
The correlation coefficient r(low-income) is 0.40 which is positive and week. Therefore,
HO1 stands accepted.
That is; there is no significant relationship between the gross annual income of
members of an income group in Nigeria and the cost at which the income‘s FMBN‘s
facilitated housing units was sold to members of the group during the period between
1992 and 2010.
But , r = 1 [6 D2 n(n
2 1)]

Housing
74
Applying the relevant values, we have: r = 1 [6 D2 (n
3 n)] = 1 [6 D
2 (26
3
26)]
= 1 – [6 1312.50 17550] = 1 – 0.45 = 0.55
The correlation coefficient r(middle-income) is 0.60 which is positive and fair. Therefore,
HO1 stands rejected. This means acceptance of H1.
That is; there is significant relationship between the gross annual income of members
of an income group in Nigeria and the cost at which the income‘s FMBN‘s facilitated
housing units were sold to members of the group during the period between 1992 and
2010.
Table 03: Unit cost of middle-income house in the market to mortgagors‘ average annual income
But , r = 1 [6 D2 n(n
2 1)]
Applying the relevant values, we have: r = 1 [6 D2 (n
3 n)] = 1 [6 D
2 (26
3
26)]
= 1 – [6 1401.75 17550] = 1 – 0.48 = 0.52
The correlation coefficient r(high-income) is 0.50 which is positive and fair. Therefore,
HO1 stands rejected. This means acceptance of H1.
That is; there is significant relationship between the gross annual income of members
of an income group in Nigeria and the cost at which the income‘s FMBN‘s facilitated
housing units were sold to members of the group during the period between 1992 and
2010.
Table 04: Unit cost of high-income house in the market to mortgagors‘ average annual income
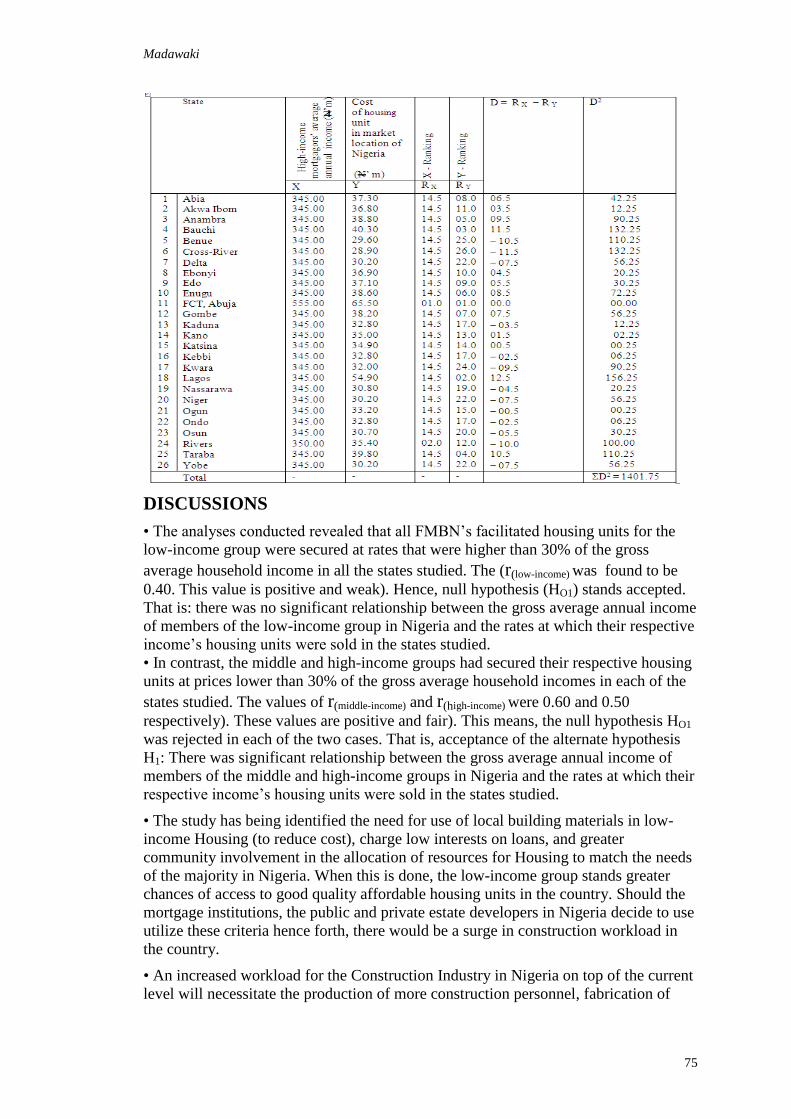
Madawaki
75
DISCUSSIONS
• The analyses conducted revealed that all FMBN‘s facilitated housing units for the
low-income group were secured at rates that were higher than 30% of the gross
average household income in all the states studied. The (r(low-income) was found to be
0.40. This value is positive and weak). Hence, null hypothesis (HO1) stands accepted.
That is: there was no significant relationship between the gross average annual income
of members of the low-income group in Nigeria and the rates at which their respective
income‘s housing units were sold in the states studied.
• In contrast, the middle and high-income groups had secured their respective housing
units at prices lower than 30% of the gross average household incomes in each of the
states studied. The values of r(middle-income) and r(high-income) were 0.60 and 0.50
respectively). These values are positive and fair). This means, the null hypothesis HO1
was rejected in each of the two cases. That is, acceptance of the alternate hypothesis
H1: There was significant relationship between the gross average annual income of
members of the middle and high-income groups in Nigeria and the rates at which their
respective income‘s housing units were sold in the states studied.
• The study has being identified the need for use of local building materials in low-
income Housing (to reduce cost), charge low interests on loans, and greater
community involvement in the allocation of resources for Housing to match the needs
of the majority in Nigeria. When this is done, the low-income group stands greater
chances of access to good quality affordable housing units in the country. Should the
mortgage institutions, the public and private estate developers in Nigeria decide to use
utilize these criteria hence forth, there would be a surge in construction workload in
the country.
• An increased workload for the Construction Industry in Nigeria on top of the current
level will necessitate the production of more construction personnel, fabrication of

Housing
76
building components, and where necessary, out-right importation of construction tools
and equipment.
• However, the industry remains unaware of what happened in the states whose data
on the finance disbursed to various incomes‘ Housing by the FMBN were not made
available and therefore, not analyzed. This would invariably affect the planning of
anticipated workload in those states.
CONCLUSION
Low-income earners in the 26 states studied had accessed FMBN‘s sponsored housing
units at prices greater than 30% of their gross annual incomes compared to the prices
at which accesses were made by the middle and high-income earners during the period
between 1992 and 2010. This result has exposed the inability of the Bank‘s current
plan to meet the housing needs of low-income earners in Nigeria. Also, this discovery
confirmed the ineffectiveness of the Housing Supply Channels patronized by the
FMBN through developers with the support of state governments in meeting the
housing needs of the low-income earners. The persistence of the malfunctions
confirmed indifference on the parts of the Federal and States‘ Housing Authorities, the
FMBN, and the Nigerian Building and Roads Research Institute (NIBRRI) as agents
charged with ensuring solution and hence, complacency on the part of state as arbiter
and thus, protection of class interest.
There is a strong need for systematic re-examine of the FMBN‘s current lending
policy with regard to methods for facilitating access to the resources for Housing –
particularly as it affects the low-income group in Nigeria. Doing this would stimulate
the country‘s economic growth, revolutionise the construction industry and ensure
sustained environmental quality and public health.
RECOMMENDATIONS
From the results of the study, the following recommendations are made;
Specific Recommendations:
(a.) In view of low affordability of FMBN‘s sponsored housing units to the low-
income earners in all the states studied, low interest mortgage and timely release of
the loans be considered for first time home buyers. This would encourage greater
access to good quality affordable Housing by number of low-income families in all
the states of Nigeria.
(b.) NBRRI and other improved local building materials such as stabilised earth,
reinforced plastics, bricks, and partially replaced cement etcetera should be patronized
to beat the current high cost of Housing in Nigeria.
(c.) NIBRRI should be given the task of monitoring and coordinating the research
works, as well as, the dispensing of the improved building materials/components.
General Recommendation:
(d.) Training programmes in Architecture, Housing, and Building Construction
should be reviewed to produce sufficient number of persons who are capable of
generating designs and the production of truly low-income housing units that are
appropriate to the low-income group in Nigeria.

Madawaki
77
REFERENCES
Adebowale, A. (Ed.)(2007). ―Nigeria in 10 Minutes – Save time searching for facts on
Nigeria‖.Nigeriaguide;
http:uK.oneworld.net/guide/Nigeria/development?gclid=CPuG1apm. Retrieved at
4.45 GMT. Tuesday, 16th October.
Ajanlekoko, A. S. (2001). ―Sustainable Housing Development in Nigeria – The Financial and
Infrastructural Implication‖. A paper delivered at an International Conference on
Spatial Information for Sustainable Development. Nairobi, Kenya. 2–5 October.
Akinwunmi, A. A. (2009). An Investigation into Factors Affecting Housing Finance Supply in
Emerging Economies: A Case Study of Nigeria. An unpublished Ph. D. (Banking and
Finance) dissertation submitted to The School of Postgraduate Studies, University of
Wolverhampton, Wolverhampton (United Kingdom).
Atagher, M. I. (2008). ―Effective Mortgage Financing for Nigerian Workers under the
National Housing Fund (NHF)‖. A paper presented by the Acting Managing Director/
CEO Federal Mortgage Bank of Nigeria (FBMN) in collaboration with the Nigeria
Labour Congress (NLC) on April 7th and 8th, at Zaranda Hotel Bauchi, Bauchi State,
Nigeria.
Andrew, I. (2004). Housing Affordability and Income Mobility for the Poor: a Review of
Trends and Strategies for Meeting America‘s Housing Needs (MAHN).
htt:p//www.nlitic.org/index.htm. Downloaded at about 1.15 p.m. GMT. Wednesday;
2nd June, 2004. Pp 1 – 12.
Bala, K. (2007a). ―An Analysis of the Loan Disbursements by Mortgage Institutions on
Housing Construction, Purchase, and Rehabilitation Works in Nigeria‖. The
Construction Focus. Journal of the Academy of Building Sciences (JABS), Ahmadu
Bello University, Zaria, Nigeria. Vol. 1 No. 1. Jan. Pp 64 -74.
Burnett, J. (2006) (5th Ed). A Social History of Housing 1815 – 1970. Methuen and Co Ltd,
London (UK). Pp 1 to 2.
Cudjoe, F. (2010). Ghana: How Affordable is the STX-Ghana Affordable Housing Project?
IMANI - The Foreign Policy Magazine of influential think tank in Africa. February.
F.M.B.N., (1998). ―Five years Report on the implementation of the National Housing Fund
[NHF] (1992 – 1997)‖. Housing Today – Journal of the Association of Housing
Corporation of Nigeria [AHCN]. Vol. 1; No 2. November/December. Pp 31 to 39.
--- (2008a). ―National Housing Fund issued N37bn in 16 years‖. The Daily Trust News
Paper. The Media Trust Nigeria Ltd, Abuja, Nigeria. Tuesday, 24th June. P 45.
Karley, n. K. (2008). ―Ghana residential property delivery constraints and affordability
analysis‖. The housing finance international publication. Sunday, June 1.
Kaltho, J. B. (2008). ―The Development Action Plan 2007 – 2011 as tool for building
harmonious cities in Niger State of Nigeria‖. Guest lecture on the occasion of the
Niger celebration of World Habitat Day held at the U. K. Bello Centre. Minna,
Nigeria. 8th October.
Musa, M. N. (2009). ―Towards Equity in Access to Mortgage for Housing in Nigeria‖. An
occasional paper. The Department of Building, Ahmadu Bello University, Zaria,
Nigeria. Nov.
Musa-Haddery (2011). An Affordability Value Approach to Housing Design for Federal
Civil Servants in Abuja. An unpublished Ph. D, (Const. Mgt.) dissertation submitted
to The School Postgraduate Studies, Ahmadu Bello University, Zaria (Nigeria).

Housing
78
Neuteboom, p. (2004). ―A comparative analysis of the net cost of a mortgage for homeowners
in Europe‖. Journal of Housing and the Built Environment. Volume 19, Number 2 /
June, 2004. The Springer, Netherlands. Pp 169-186. Retieved 15th August 2006 at
10.25 GMT.
NPC [Nigeria-National Population Commission] (2006). ―Population Data Sheet 1 of 2006
and Summary of Sensitive Tables Vol. 1. The National Secretariat of the National
Population and Housing Commission of Nigeria (NPHC), Abuja (Nigeria).
Ojo, A. O. (2009). The Role of Secondary Mortgage Facility in expanding the availability of
funds for Mortgage Finance in Nigeria. A Master of Science thesis submitted to the
Postgraduate School, KTH Architecture and the Built Environment University,
Stockholm (Sweden).
Okereke, O. (2010). ―Nigerian National Housing Scheme: Still in the Lurch‖. The Economy
Magazine on-line www.theeconomyng.com/new56.html. March. Retrieved:
December, 2010. At about 3.25 GMT.
Ope, K. M. (2005). Analysis of the Financial Allocation by State Governments to Housing
Construction in Nigeria. An unpublished M. Tech. (Const. Mgt.) thesis submitted to
the school of postgraduate studies, F.U.T. Minna, Nigeria.
Sattaur, O. (Ed.) (2004). Meeting Every One‘s Needs . The Nigeria-National Economic
Empowerment and Development Strategy (Needs). The National Planning
commission in conjunction with the Central Bank of Nigeria, Abuja (Nigeria) 3-31.
Spiegel, M. R. and Stephens, L. J. (2007) (4th Ed.). Schaum‘s Outline Theory and Problems
of Statistics. Tata McGraw-Hill Publishing Company. New Delhi (India). Pp 17 to
436.
Stock, R. C. (2008). ―Nigeria- in DVD‖. Microsoft Corporation, New York (USA).
Vance, I. (2008). ―Putting the ‗Housing‘ Back into Housing Finance for the poor: The Case of
Guatemala‖. The Global Urban Development Magazine. Vol 4. Issue 2.
Yao, R. (2007). ―A West African perspective of housing as a human right: The case of Côte
d‘Ivoire‖. Habitat for Humanity.

Adedeji, Y.M.D., Arum, C. and Ajayi, B. (2011) Affordable housing initiative in Nigeria: use of
composite panels In: Laryea, S., Leiringer, R. and Hughes, W. (Eds) Procs West Africa Built
Environment Research (WABER) Conference, 19-21 July 2011, Accra, Ghana, 79-89.
79
AFFORDABLE HOUSING INITIATIVE IN NIGERIA:
USE OF COMPOSITE PANELS
Yomi Michael Daisiowa Adedeji1, Chinwuba Arum
2 and Babatunde Ajayi
3
1Department of Architecture, Federal University of Technology, Akure, Nigeria
2Department of Civil Engineering, Federal University of Technology, Akure, Nigeria
3Department of Forestry and Wood Technology, Federal University of Technology, Akure, Nigeria
One main challenge facing housing in Nigeria is the rising cost of building
construction, which is a factor of the over reliance on the importation of building
materials. This study investigates the use of cement-fibres composite panels, a local
building material made of cement reinforced with coconut shaft, a by-product of
coconut palm, for cost-efficient and low-cost building panels. Data were collected
through experimental and survey methods. The empirical survey, conducted among
selected leading professionals in the building industry namely architects, engineers,
quantity surveyors and builders includes the use of questionnaire, interview methods
and observations. Besides, interview schedules administered to building professionals
were used to collect information on sampled projects that exhibited the use of the
material to elicit opinions on them. The water absorption, thickness, swelling and
linear expansion and aesthetical satisfaction of the material were tested. Results from
analysis of the field survey on eleven (11) buildings shows that cement-bonded
composite panels are comparatively cheaper, sound-proof, durable, lighter-weight and
environmentally friendly than the conventional sandcrete blocks and should be a
replacement to conventional masonry in housing delivery.
Keywords: affordable, building panels, composite, housing, Nigeria.
INTRODUCTION
This paper focuses on developing a framework for a cost-efficient building system for
low-income class in Nigeria through materials initiative. It investigates the application
of cement-fibres composite panels made of cement reinforced with coconut shaft, a
by-product of coconut palm for affordable building panels for housing delivery in
Nigeria.
Housing industry is one of the most important sectors of the Nigerian economy. As a
basic human need that comes after food and clothing (FGN, 2004), it is necessary for
human privacy, comfort and satisfaction (Fasakin, 2006). Housing is an essential
indicator of national, economic, historical, cultural and technological development of
any society and a ―social desideratum‖ with a universal appeal (Adedeji, 2007). As
reported by Arum (2010), according to the U. S. Green Building Council, in the
United States alone, buildings account for 72% of electricity consumption, 39% of
energy use, 38% of all carbon dioxide (CO2) emissions, 40% of raw materials use,

Affordable housing
80
30% of waste output (136 million tons annually), and 14% of potable water
consumption.
Despite the important role of housing and construction sectors to man‘s economy, the
sector is plagued with numerous problems ranging from high cost of building
materials; lack of access to land titles and slow implementation of vital policies;
reconciling citizens‘ affordability with agency profitability and rapid decline in
competent skilled workers in the housing industry among others (Fasakin and
Ogunsemi, 2003). It is however observed that the rising cost of building construction
in Nigeria can be attributed to some other factors, which include high transportation
cost, devaluation of national currency (Naira), uncontrollable prices of building
materials and particularly, the inability of production companies to meet high demand
for building materials and the over dependency on the importation of building
materials. Locally sourced building materials in Nigeria, which would have facilitated
sustainable development remain underdeveloped to a socially and economically
acceptable level owing to the underdeveloped state of the economy. Recently, in the
most developed countries, it has been verified that the traditional and conventional
technologies used for construction and maintenance of buildings are inefficient and
resource wasteful due to enormous amount of resources consumed. This situation
leads to an increasing demand for further development of their technologies (Ghosh,
2002). More rational constructive processes can be implemented with the introduction
of technologies that allow reduction of labour, materials, time and fund. Such
reduction becomes possible through the use of materials initiative. This paper seeks to
provide information for the provision of cost-effective housing for the teeming
population of Nigeria through the use of agro-allied composite materials applied in
dry masonry system. Thus, the adoption of this untapped indigenous materials,
elimination of bedding mortar and wastages associated with conventional masonry
work as canvassed in this research increases housing stock substantially, accelerates
construction, reduces labour and wastages thereby reducing cost.
INFLATION AND PRICES OF BUILDING MATERIALS
The decline of the economy started in the early 1980s when the spot price of a barrel
of crude oil fell from N 24.00 in 1980 to N 13.50 in 1986 (Giwa, 1992). Prior to this
decline, agriculture earned the largest foreign exchange up to 1973 when the Middle-
East war propelled crude oil into celebrity. However, in the early1980s a gradual
downward trend in the economy began. Oil revenue dropped from N 13.20 billion in
1980 to N 10.02 billion in 1981and N 8.5 billion in 1982. By 1987, the economy was
characterized by a high fiscal deficit of 23.93 percent and a low industrial capacity
utilization of less than 30 percent (Fasakin, 2006).
With the introduction of the Structural Adjustment Programme (SAP) in 1986 by the
Federal Government to arrest the continuous decline of the economy, every sector of
the nation was adversely affected. This resulted into a long and unending search for a
realistic exchange for the Naira, a search that resulted into unimaginable depreciation
of the currency from N0.60 in 1980 to N135.75 to a dollar in 2003. Inflation rate
soared and prices of building materials skyrocketed beyond the reach of many
Nigerians. Besides, the dearth of many infrastructure facilities in Nigeria such as
electricity (which is a failed project till date), inadequate water supply and poor road
networks attributed to unhealthy economic state in the country, thereby forcing many
manufacturing firms to fold up or relocate to neighbouring countries with better
manufacturing environment. Consequently, the price of cement for example, which

Adedeji, Arum and Ajayi
81
accounts for about 65 percent of material cost of construction continued to be on the
increase due to some economic factors (Fasakin & Ogunsemi, 2003). It is therefore
necessary to search for alternative materials initiative, sourced and renewable locally
in ameliorating housing problems.
Development of wood products and cement-bonded composite materials
In recent development, man has gradually improved the technologies adopted in wood
processing in order to achieve better products in terms of utilisation for constructional
works up till this age (Adedeji, 2010). The forest has always been man‘s resort for
major raw materials needed for constructional, recreational and technological designs
and fabrication. This is due to the uniqueness of the major product of the forest (that is
timber) in terms of its ability to naturally regenerate itself, its durability, its
workability and adaptability to different environmental conditions. This has eventually
resulted in increased demand for building materials and wood fibre products. Wood-
based products including cement-bonded particle boards, fibre boards and particle
boards have facilitated to a great extent, the utilization of logging and the processing
of wood wastes. The increasing rate of timber exploitation especially in developing
countries, and the huge wood waste generated call for erection and establishment of
quick-built, low-cost particle boards‘ production to serve as substitutes (Ajayi, 2002).
Cement-bonded particle board is more versatile than resin-bonded boards and suitable
for interior and exterior uses simply because of its resistant to freeze and thaw, fire,
water and rot. It does not contain hazardous volatiles, and the processed dust is non-
aggressive. It has a better dimensional stability, does not produce formal dehydes gas
and does not release poisons and toxic gases (Moslemi, 2008). Cement-bonded
products can be classified into cement-bonded boards, wood-wool excelsior boards
and gypsum- bonded boards. The excellent properties of cement-bonded made them
useful for ceiling, walling, roofing, flooring, claddings, partitioning and shuttering.
Uses of products depend on their reliability and resistance to fire, insect attack during
natural disasters such as earthquakes and tropical storms (Remirez-Coretti et al,
1998). Wood-cement products are highly resistant against fire, insect and fungi.
Table 1: Table of yearly Agricultural outputs (Coconut)
Year 1970 1971 1972 1973 1974 1975 1976 1977 1978 1979 1980 1981
Coconut 83.0 97.0 86.0 99.0 99.0 99.0 99.0 92.0 92.0 90.0 90.0 100.0
Year 1982 1983 1984 1985 1986 1987 1988 1989 1990 1991 1992 1993
Coconut 110.0 100.0 101.0 102.0 104.0 105.0 108.0 110.0 118.0 129.0 135.0 140.0
Year 1994 1995 1996 1997 1998 1999 2000 2001 2002 2003 2004
Coconut 145.0 149.0 151.0 154.0 167.0 175.0 181.0 183.0 187.0 201.1 216.0
Source: Central Bank of Nigeria Statistical Bulletin, 2004
Cement composites materials are increasingly gaining ground in the construction
industry day after day. In the North American markets, fibre cement composites have
gained an increasing foothold over the last twenty years. The penetration of these
materials into the housing and construction markets has been steady and the level of
acceptance of its application has substantially increased as against the use of wood
and other materials (Moslemi, 2008). The first mineral-bonded wood composite
panels utilised a magnetic binder and were developed in Austria in the early 1900s.
These products still exists today mainly for interior applications, and are currently
manufactured in Europe and the U.S. by Knauf Insulation and Tectum respectively
(Aro, 2008). Architects, builders and manufacturers are becoming more interested in

Affordable housing
82
developing products that meets structural requirements, has less of a weight penalty,
more elasticity and possessed the attributes of mineral-bonded wood composites.
Usually, cement- bonded wood are produced from strands, particles or fibres wood
mixed together with cement and manufactured into panels, bricks, tiles and other
products used in the construction industry. This high density product was developed in
the 1970s to replace asbestos-cement board for structural applications. The need to use
agricultural wastes for the cement-bonded particle board production has been
motivated by the availability of cement binder and increased awareness for conversion
of the country‘s wood waste for value added panel products. Moreover, it has the
tendency to bust the national economy and gives a sustained income over a long
period. This assertion can be supported by annual production growth in Table 1,
which increases from 83.0m tonnes in 1970 to 216.0m tonnes in 2004 (CBN 2004).
Common uses of this product in Europe are facades, electrically heated and raised
floors, permanent shuttering of concrete floors and walls and fire and moisture
resistant furniture.
Source: Adedeji and Ajayi, 2008.
The acceptability of these products stems from availability and widespread
distribution of raw materials locally. However, the scarcity of the economically wood
species, over exploitation of natural and plantation hardwood species, lack of effective
utilisation of wood resources due to huge wastes incurred in wood processing
industries and encroachment into free and reserved forests by unlicensed timber
exploiters call for concerted efforts from all stakeholders to find common solutions to
the rapid depletion of wood resources in Nigeria and world-wide (Ajayi, 2011).
MATERIALS AND METHODS
Coconut Husk Fibre (Cocos Nucifera)
Coconut husk fibre is the main material used for this study. Coconut is of two distinct
varieties which are: (i) the tall palm and (ii) the dwarf palm. Agricultural residues
have been indicated as possible raw materials for cement-bonded boards.

Adedeji, Arum and Ajayi
83
Sources of Raw Materials
An alternative source of raw material to indigenous and exotic hardwood species is
from the agricultural sector. The nature of residues used for board production has
effect on the final board, so the choice of residues to be used for cement-bonded
boards needs adequate consideration. However, the use of such raw materials for the
production of panel products suitable as alternative to sawn timber will increase the
industrial and economic base of the national development. The major materials are
inorganic binder, wood/agriculture wastes and the chemical reagent (Orisabinu, 2007).
Mixing Ratio
The cement mixing ratio gives an indication of the proportion of cement to wood per
weight of the board. It is the proportion by weight of cement to wood in a board
within a given density range. It is the cement binder that changes in board production.
The quality of the cement binder needed to produce board of considerable length
appeared to be associated with the density of the wood species used.
Methods
The study employed two (2) research activities: (1) the experimental design method
used for production of the cement-bonded boards and (2) the survey method used to
collect data on applications of Coconut Composite Panels (CCP) (used in housing
construction from different locations in Nigeria) and conventional sandcrete blocks
(used commonly in the building industry in Nigeria). The laboratory research work
was a collaborative work with the Department of Forestry and Wood Technology,
Federal University of Technology, Akure. For the survey method, data were collected
through case studies, observations and interview schedules administered to key
practising professionals in the building industry that are involved in the use of these
materials for building projects in the study area. Descriptive statistics analysis was
used to analyse data collected. Cement-bonded boards were produced from mixture of
coconut husk fibre and cement. The material was sun-dried for two weeks and later
transferred to the laboratory of Forestry Research Institute of Nigeria, Ibadan for
processing. The coconut husk fibre was pre-heated with hot water at a temperature of
800C for 1 h to remove the inhibitory water soluble chemicals present in the material
that are capable of poisoning the cement and thereby slow down the setting and curing
of the cement binder (Ajayi, 2008). After 1 h, the water was drained off and the
materials were dried to moisture content of approximately 12%. The raw materials
were then packed to the laboratory for the production of cement-bonded boards.
Experimental Procedures
The experimental design used in this research is 2 x 2 x 3 factorial experiment in
Completely Randomized Design (CRD), the combination that gives 12 treatments.
Raw materials include: coconut husk fibre, Portland cement, additives and water,
which was calculated based on this formula:
Wt = W (0.30-MC+0.60C). Where Wt= weight of water (g), W= wood drying weight
(g); MC= moisture content (%); C= cement weight (g)
The amount of materials required to produce a board of 600 x 600 x 12 mm were
calculated and measured out to the level of combination in the experiment as stated
below. The following production variables were used:

Affordable housing
84
1) Board density of 1000 kg/m3, 1100 kg/m
3, 1200 kg/m
3
2) Additive concentration (CaCl2): 1%, 2%
3) Mixing ratio of cement: coconut husk fibre (mass), 2.0:1, 2.5:1
Constant factors are:
4) Board thickness: 6 mm
5) Moisture content: approximately 12%
6) Board size: 600 mm x 600 mm x 12 mm
7) Pressing pressure: 1.23 N/mm2
Materials were poured inside a plastic bowl and mixed thoroughly until well-blended
lump-free mixture obtained. The quantity of additives required was dissolved in the
measured quantity of water and mixed together. The water containing chemical
additives, calcium chloride was then added and mixed with the material while the
mixture is hand-formed into wooden mould. Plastic moulds of varied sizes ( 600 x
600, 600 x 1200, 600 x 2100) mm were used to cast the furnish into uniform mat and
pre-pressed using plastic cauls plate. The steel plate was covered with polythene sheet
before board formation to prevent the sticking of the board onto the plates. After
board formation, the top plastic plates were removed; another polythene sheet was
placed on the mat before placing metal cauls plate. The mat was then moved to the
hydraulic press and pressed with the aid of hydraulic jack, under pressing pressure of
1.23 N/mm2 and left for 24 h. The pressed mat under compression was released, the
boards were removed from the cauls and wrapped with polythene sheet and kept in the
laboratory environment for 28 days to ensure further curing of the cement. Loss of
water from the boards was prevented through proper wrapping of the sheet.
Thereafter, the board were stacked for 21 days at a relative humidity of 65 ±2 % while
the edges of the boards were properly trimmed.
The water absorption, thickness, swelling and linear expansion were examined.
Specimens were cut into size of 152 mm x 152 mm according to the ASTMD1037,
(1978). The water absorption test samples were weighed first before soaking and the
initial weight recorded. The tested samples were then placed horizontally in a large
container of water at a temperature of 200C. These samples were soaked in water for
24 h; thereafter boards were weighed using weighing balance to determine water
absorption. Thickness and linear section were measured using Veneer Calliper to
assess thickness swelling and linear expansion.
Plate 1: Cement-bonded Composite Boards
Adedeji, Arum and Ajayi
85
Source: Adedeji and Ajayi, 2008
Components of CCP Initiative
The components of the CCP wall panel is made of lightweight sandwich panels,
consisting of 12mm thick layer of Expanded Polystyrene (EP) fixed to boards (600
x1200 to 1200 x 2400) mm ranges and 25mm thickness of composite panel shaft at
the centre, finished with two 6mm thick plasterboard at the interior. The panels were
factory-made. Installation was done with laminated steel profile. The floor, which
composed of cement, sand and kernel shaft of the ratio 1: 3: 6, this can either be
obtained from palm tree or any other plants that has similar property. The material
which is of tensile property is used to reinforce the cement which is brittle and only
good in compression.
RESULTS AND DISCUSSION
The cement-bonded boards of 12mm in thickness were produced from coconut husk
fibre / particles. The effect of cement / coconut husk fibre of 2:1 and 3:1, additive
concentration of 1%, 2% and 3% and the board density of 1000 kg/m and 1200 kg/m
on Water Absorption (WA), Thickness Swelling (TS), Linear Expansion (LE),
Modulus of Rupture (MOR) and Modulus of Elasticity were investigated. Boards
produced exhibited means values ranging from 33.81 to 47.28% for WA, 0.33 to
1.08% for TS, 0.14 to 0.38 for LE, 0.16 to 1.38 N/mm for MOR and 1.572 to 6436.52
N/mm for MOE.
The mean values for water absorption, thickness swelling and linear expansion ranged
between 14.8% and 19.72%, 0.12% and 0.86% and 0.20% and 0.99% respectively.
Cement to palm kernel fibre ratio, additive concentration and board density showed
the effect on the reaction of boards to water. It was observed that as the board density,
additive concentration and mixing ratio increased, water absorption, thickness
swelling and linear expansion decreased. This shows that board produced at the
highest levels of board density (1200 kg/m3), additive concentration (2%) and mixing
ratio of (2.5: 1) is most dimensionally stable board as the cement content in board is
higher. The high concentration of calcium chloride caused retardation of inhibitory
chemical substances and increased the exothermic reaction of cement binder to
produce highly stable boards. It further shows a lower spring back tendency when the
pressure was released from the press and after water immersion treatment. The high
compression ratio of board, the presence of less void spaces, better inter-fibre surface
contact area may be due to the reduction in water absorption, thickness swelling and
linear expansion values and board‘s spring back (Adedeji and Ajayi, 2008). The
highest values for water absorption, thickness swelling and linear expansion at mixing
ratio 2.0:1, additive concentration 1% and board density (1000 kg/m3) may be due to
the fact that additive concentration, board density and mixing ratio had strong
influence on the boards‘ physical properties.
The results shows that as the mixing ratio, additive concentration and board density
increases, the WA, TS, LE, of coconut husk fibre based cement / coconut husk fibre /
particles ratio (3:1), additive concentration (3%) and board density (1200 kg/m) were
strongest and most dimensionally stable than those produced at the other levels. Also,
the study shows that coconut husk fibre is suitable for manufacturing of board; it
further shows that cement-bonded particle boards could be produced from coconut
husk-fibre after hot water treatment, all the production variables have significant
effect on the properties investigated. The results supports an early research work

Affordable housing
86
carried out whereby wood waste is being used to produce floor and wall tiles using
cement as binding agent (Adedeji and Ajayi, 2008).
Modular Coordination and Construction
Modular coordination and mass production is an important feature of dry construction
system. This refers to simplifying the process of assembly through industrialisation,
modularisations, standardisation, and continuous flow processes. The reduction of
operations required for a production process means less chance of the occurrence of
errors, waste and rework. This follows the same logic that the fewer the number of
operations, the higher the quality of the product and a predictive timeline, resulting in
cost savings. This is the fundamental principal that ensures that is the most cost
effective affordable housing building construction technology and will continuously
improve by simply eliminating waste and rework.
Eleven housing projects were selected randomly from the data obtained through case
study and interviews of professionals involved in their construction. One of these
projects is the Students‘ hostel, Ambrose Ali University, Ekpoma where the CCP
material was extensively demonstrated. In the institution, design of these hostels was
of modular system while construction of the sub structure followed the same
procedure for wet masonry system up to Damp Proof Course (DPC) level. The over
site concrete floors were of the composition of cement, sand and palm kernel shells of
1:3: 5 ratio. CCP wall panels were used for the framed masonry walls (Figure 3). In
the case of the super structure, masonry work was carried out through assemblage of
pre-fabricated panels produced from the experiment described above. Speed of
construction was achieved since materials were produced industrially, modularly
coordinated on site and construction process was dry.
Estimates of masonry cost, productive hours and number of labour involved were
obtained on the size and rate paid for these operations and compared with other
similar housing projects constructed with conventional sandcrete blocks (Table 2).
Table 2: Selected Data from Executed Project Sites
Dry Masonry Wet Masonry
S/
N
Area
(m2)
Rate
(N)
Cost N
(in 1000)
Labour (No
per gang)
Pro. Hr.
m2/h
Cost N (in
1000)
Labour (No
per gang)
Pro. Hr.
m2/h
1 284 1650 184.7 6 6.40 411.8 28 1.40
2 242 1650 157.3 5 7.24 305.9 20 1.44
3 164 1800 106.6 3 4.71 237.8 12 1.71
4 220 1450 143.0 5 6.5 333.5 18 1.50
5 184 1650 119.6 4 6.14 266.8 16 1,47
6 335 1700 217.8 7 5,65 485.8 24 1.65
7 230 1750 149.5 5 4.78 333.5 16 1.78
8 372 1650 241.8 6 6.61 539.4 27 1.61
9 175 1750 113.8 3 5.52 253.8 14 1.52
10 320 1650 208.0 6 5.72 464.0 26 1.72
11 165 1550 107.3 3 5.42 239.3 12 1.42
Source: Researcher‟s field survey (2007) in collaboration with Department of Quantity Surveying,
Federal University of Technology, Akure
While the productive hours of dry masonry is higher, the cost and number of servers
involved in the masonry operations reduced significantly as compared with that of
conventional masonry. This further corroborates an observation made by Anand and
Ramamurthy (2003) on a study carried out on comparison of output from different

Adedeji, Arum and Ajayi
87
types of masonry works, where a crew of one person, achieved the productivity of 4.1
m/h with the use of hollow-interlocking blocks.
Furthermore, bill of quantities of a wing of the Students‘ hostel was prepared and
compared with another hostel of the same size in the institution but constructed with
conventional blocks. The summary of the bills is as presented in Table 3. The analysis
shows a significant difference in the cost of masonry work of interlocking block over
the conventional ones, which is the focus of this research. This difference could be
attributed to the exclusion of the indirect and non-contributory operations, which are
more pronounced in conventional masonry that are reduced to minimum or
completely eliminated in interlocking masonry, as they are unnecessary for its
construction. (Anand and Ramamurthy 2000) observed that solid-interlocking and
hollow-interlocking block systems were developed as part of the efforts towards
improving productivity of conventional and interlocking masonry. A similar study
carried out by Braganca, et al (2002) established similar results. The use of CCP
system is therefore cost-efficient, less labour dependent and faster than the
conventional as analysed in Table 3.
Table 3: Comparative summary between the bills of quantities of the project constructed with CCP
material and that constructed with the conventional materials for the same design
S/
No
Elements‘ Summary Conventional Recommended
Model
Difference % of
Difference
1 Substructure 635,650.00 635,650.00 - -
2 Concrete work 69,050.00 69,050.00 - -
3 Masonry work 398,750.00 177,375.00 221,375.00 125
4 Roofing 565,000.00 565,000.00 - -
5 Woodwork 287,243.00 237,777.00 49,466.00 21
6 Metalwork 141,700.00 141,700.00 -
7 Electrical and
Engineering Installations
205,000.00 205,000.00 - -
8 Plumbing and Engineering
Installations
469,570.00 469,570.00 - -
9 Glazing 65,760.00 65,760.00 -
10 Floor, Walls and Ceiling
Finishes
583,510.00 510,635.00 72,875.00 14
11 Painting and Decorations 217,875.00 139,500.00 78,375.00 56
12 Drainage / External works 250,000.00 250,000.00 - -
13 Contingencies 194,455.40 86,675.48 107,779.92
Total 4,083,563.40 3,553,694.48 529,868.92
Source: Researcher‟s data (2007)
CONCLUSION
The adoption of coconut composite panels for provision of cost-efficient housing
through dry masonry system as canvassed in this paper is a possibility in proffering
solutions to high cost of housing that has made this essential human need unaffordable
to many Nigerian. The study revealed that it is possible to produce cement-bonded
particle boards using palm coconut fibre with Portland cement binder after hot water
treatment. It showed that dimensional stability of cement were influenced by
cement/coconut fibre ratio, as board density and additive concentration increased the
water absorption (W.A.), thickness swelling (TS) and Linear Expansion (LE)
decreased. Also, boards produced at the highest levels cement-coconut fibre ratio of
2:5:1 additive concentration 2% and board density showed the highest resistance to
Affordable housing
88
water intake and lowest spring back. Dimensionally, stable boards can be produced
from coconut fibre with Portland cement after hot water treatment. The finding is
capable of stimulating improved standardised cement-bonded particles boards
production from coconut fibre for industrial and economic development. Boards
produced could be used as alternative to sandcrete blocks and sawn timber for
construction works and furniture.
REFERENCES
Adedeji, Y.M.D. Materials preference options for sustainable low-income housing in selected
cities in Nigeria. Ph.D Thesis, Department of Architecture, Federal University of
Technology, Akure, 2007.
Adedeji, Y.M.D. (2008). Interlocking masonry: a panacea for sustainable low-cost housing in
Nigeria. Pakistan Journal of Social Sciences, 5(8): 744-750.
Adedeji, Y.M.D. and Fasakin, J.O. (2008). Acceptability indices of interlocking masonry for
housing construction in Nigeria. Medwell Journals: Pakistan Journal of Social
Sciences 5 (7): 696-700
Adedeji, Y.M.D. and Ajayi, B. (2008). Cost-effective composite building panels for walls and
ceilings in Nigeria. Proceedings of IIBCC- 11th International Inorganic-Bonded
Composite Conference, Madrid, Spain, Nov 4th-7
th.
Adedeji, Y.M.D. (2010). Technology and standardised composite cement fibres for housing in
Nigeria. Journal of the Nigerian Institutes of Architects, 1: 19-24.
Ajayi, B. (2002). Preliminary investigation of cement-bonded particleboard from maize stalks
residues. The Nigerian Journal of Forestry 32 (1): 33-37.
Ajayi, B. (2008). Properties of cement-bonded particleboard produced from agricultural by-
products. Invited Paper by the Faculty of Forestry and Forestry Ecology, Centre for
Tropical and Subtropical Agriculture and Forestry, 9th June 2008. University of
Gottingen. Germany.
Ajayi, B. (2011). Durability characteristics of cement-bonded particle boards manufactured
from maize stalk residue. Journal of Forestry Research, 22 (1), 111-115.
Anand, K. B., &. Ramamurthy, K (2000). Development and performance evaluation of
interlocking block masonry. Journal of Architectural Engineering; 6(2), 45-51.
Anand, K. B., and Ramamurthy, K. (2003). Laboratory-based productivity study on
alternative masonry system. Journal of Construction Engineering and Management,
(6), 241.
Asiodu, I.P.C (2001). The place of housing in Nigerian economic and social development. The
Quantity Surveyor, 35, 2-7.
Aro, M. (2008). Wood strand cement board. Proceedings of IIBCC- 11th International
Inorganic-Bonded Composite Conference, Madrid, Spain, Nov 4th-7
th.
ASTM. (1978) ASTM D1037-78. Standard Methods of Evaluating the Properties of Wood-
base Fibre and Particle Panel Materials. American Society for Testing and Materials,
Philadelphia.
Braganca, L., Almeida, M., Mateus, R. and Mendonca, P. (2002). Comparison between
conventional and MBT constructive solutions from an economic and environmental
point of view. Case study. In O. Ural, V. Abrantes and A. Tadeu (Ed.), XXX World
Congress on Housing, University of Coimbra, Portugal.

Adedeji, Arum and Ajayi
89
Moslemi, A L (2008). Technology and market considerations for fibre cement composite.
Proceedings of IIBCC- 11th International Inorganic-Bonded Composite Conference,
Madrid, Spain, Nov 4th-7
th.
Fasakin, J. O. (2006). Asymmetry in philosophy and practice of physical planning in Nigeria.
43rd
series of Inaugural lecture, Federal University of Technology, Akure, 11th, April,
2006.
Fasakin, J.O. &.Ogunsemi, D. R. (2003). Modelling the selling prices of residential building
in Nigeria. Journal of Financial Management of Property and Construction, 8 (2),
111-114.
Federal Republic of Nigeria (2004). (National Housing Policy). Draft Jan, 104-106.
Gallo, H., Arini, R. and Brasil, L. (2002). The earth architecture as a possible sustainable
factor. In O. Ural, V. Abrantes and A. Tadeu (Ed.), XXX World Congress on Housing,
University of Coimbra, Portugal.
Ghosh, S. K. (2002). Low cost building materials. In O. Ural, V. Abrantes and A. Tadeu (Ed.),
XXX World Congress on Housing, University of Coimbra, Portugal.
Giwa, R.F. (1992). Thoughts on the Nigerian economy. Ibadan: Med net Ltd (Publications),
90-99.
Hydraform New information Package Accessed from www.hydraformnigeria.com on 15th
November, 2009.
Orisabinu, A.A. (2007). Dimensional Stability of cement bonded particle board produced
from palm tree. B. Tech Dissertation of Department of Forestry and Wood
Technology, The Federal University of Technology, Akure.
Ramirez-Coretti, G., Eckelman, C. A. and Wolfe, R. W. (1998). Inorganic bonded composite
wood panel systems for low-cost housing: A central American perspective. Forestry
Proc. J 48 (4): 62-68.
Wahab, K.A. (2006). Federal Government economic reforms, human development and due
process. A paper delivered at the first annual lecture of the School of Environmental
Technology, Federal University of Technology, Akure.


Ogunleye, B.M (2011) Analysis of the socio-economic characteristics and housing condition in the
core neighbourhood of Akure, Nigeria In: Laryea, S., Leiringer, R. and Hughes, W. (Eds) Procs West
Africa Built Environment Research (WABER) Conference, 19-21 July 2011, Accra, Ghana, 91-91.
91
ANALYSIS OF THE SOCIO-ECONOMIC
CHARACTERISTICS AND HOUSING CONDITION IN
THE CORE NEIGHBOURHOOD OF AKURE, NIGERIA
Bamidele M. Ogunleye1
Federal University of Technology, Akure, Ondo State, Nigeria
The paper highlighted survey on low – income settlements in the core area of Akure,
the capital of Ondo State, Nigeria and examined the socio – economic characteristics
of the respondent and the physical state of the building they occupy. It gathers field
data among residents of low income neighbourhoods of Akure using random
sampling technique. The data were analysed using simple frequency and percentage
distribution tables. The study revealed that most of the residents are engaged in the
informal sector of the economy (self employed), their income level is very low and
that household size is very high .The survey carried out on housing revealed that most
dwellings were constructed before 1960 and are of monolithic type. They are lacking
in essential infrastructures and a large number are unsatisfactory by modern
standards. Since the failure of slum clearance scheme suggest that wholesale
clearance of substandard housing area particularly those built up during the pre
colonial period are not practicable in Nigeria urban areas, and while we are aware of
the fact that findings of a study of this type may be more typical of the case than more
general to other cities, there is every reason to believe that the issues involved are
more national than local. The policy recommendations have therefore been geared to
reflect this observation.
Keywords: Akure, city, core neighbourhood, housing, urbanisation.

Adegbehingbe, V.O. (2011) An appraisal of housing conditions in residential core area of Akure city in
South Western Nigeria: a case study of Erekesan In: Laryea, S., Leiringer, R. and Hughes, W. (Eds)
Procs West Africa Built Environment Research (WABER) Conference, 19-21 July 2011, Accra, Ghana,
93-104.
93
AN APPRAISAL OF HOUSING CONDITIONS IN
RESIDENTIAL CORE AREA OF AKURE CITY IN
SOUTH WESTERN NIGERIA: A CASE STUDY OF
EREKESAN
Victor Olufemi Adegbehingbe1
Department of Architecture, Federal University of Technology, Akure, Nigeria
This paper appraises the condition of housing in residential core area of Akure city in
SouthWestern Nigeria taking Erekesan, which consists of Erekesan-Itanla, Eruoba,
Afunbiowo, Alakure, Alakure-Ijofi and Iworokosagba as case study. Assessing the
quality of existing housing stock, quality of the housing environment, and the
availability of the neighbourhood facilities were the major objectives. Data were
obtained through questionnaire, personal interview, physical observation of the
housing structures and were analysed with appropriate statistical tools. The study
reveals a homeownership rate of 40% with average occupancy ratio of 8 persons per
household. Only 35.38% of the housing units surveyed have functional wc, 41.31%
are with pit-latrine and 23.25% with no toilet facilities. 65.7% of the household
depends on well for their domestic water supply while as low as 8.3% use in house
taps. 42% of houses were constructed of compressed earth bricks, 23% used mud
bricks while 17.5% used cement block. 16.5% of these dwellings were in good
condition as against 83.5% with notable defects. About 22.5% households practice
planned maintenance but only 16.8% have maintenance budgets, hence most houses
do not show evidence of proper maintenance. Only 29.70% of the houses surveyed
have access to good urban infrastructures such as road network and drainage system.
The paper suggests massive construction of boreholes and pipe borne water,
improvement on waste management scheme, engagement of more environmental
inspectors, slum upgrading and improvement and direct government investments in
urban infrastructure.
Keywords: housing stock, housing quality, housing environment, urban infrastructure,
planned maintenance.
INTRODUCTION
Housing, literally is defined as Buildings or other shelters in which people live. A
place to live, a dwelling etc and to a nation, is a critical component in social and
economic fabric. Housing represents one of the most basic human needs. As a unit of
the environment, it has a profound influence on the health, efficiency, social
behaviour, satisfaction and general welfare of the community (Onibokun 1998). To
most groups housing means shelter but to others it means more as it serves as one of
the best indicators of a person‘s standard of living and his or her place in the society.
(Nubi, 2008). It is a priority for the attainment of living standard and it is important to
both rural and urban areas. These attribute make demand for housing to know no

Adegbehingbe
94
bound as population growth and urbanisation are increase very rapidly and the gap
between housing need and supply becomes widen. Despite the significance of
housing, adequate supply has remained a mirage to all carder of the society in Nigeria.
The situation is very particular to most developing countries where population grow at
exponential rate and rapid urbanisation becoming a norm, and discrepancy in housing
need and supply is high.
The proportion of the Nigerian population living in urban centres has increased
phenomenally over the years. While only 7% of Nigerians lived in urban centers in the
1930s, and 10% in 1950s, by 1970, 1980 and 1990, 20%, 27% and 35% lived in the
cities respectively (Okupe, 2002). Over 45% of Nigerians now live in urban centers of
varying sizes. The incidence of this population in urban centers has created severe
housing problems, resulting in overcrowding in adequate dwellings, and in a situation
in which 60% of Nigerians can be said to be ―houseless persons‖ (FGN, 2004).
The desire to live in a house depends on how conducive and attractive the housing
unit is. Conduciveness of a housing unit can be expressed by certain factors such as
circulation space within the unit, the availability and affordability of basic amenities
such as water, electricity, toilet facilities, occupancy ratio etc. attractiveness on the
other hand is a function of the neighbourhood facilities (accessibility, shopping
centers, schools, security, hospital etc) and quality of the environment (drainage
system, method of refuse collection and disposal, road network etc), personal taste,
social value and affordability.
Quality of housing and that of the environment have direct bearing on the lives of
people in that community because; environmental quality and quality of live are two
variables of the same equation. Quality living depends so much on the quality of the
environment one lives in. According to Ebong (1983), as reported in Dung-Gwon and
Ibrahim (2006), the quality of environment affects not only the well-being of a people,
but also their productivity, way of living as well as the ordinary decencies of their
lives.
Housing of a good quality in a good environment is prerequisite to quality living. That
is for people to have quality life, they need housing in the required quantity and
quality in an efficient environment free from disease, robbery, assault etc which
facilities their comfort and enjoyment (Fagbohun, 2003; Dung –Gwon and
Ibrahim,2006;Sanda and Jambol,2010). Therefore, for people to function as they
should, they need adequate housing in a conducive environment; functional housing
units in a planned environment accorded the basic necessities for livability (Sanda and
Jambol,2010). Assessing the conditions for housing in our cities therefore becomes a
necessity in order to determine their functions, conduciveness and livability.
The aim of this study is to appraise the condition of housing in residential core area of
Akure city, Ondo State, in South-Western, Nigeria taking Erekesan as a case study.
The objectives of the study include the assessment of the socio-economic
characteristics of the respondents with respect to their income and household size, the
conditions of the infrastructural facilities/amenities, the quality of the existing housing
stock in the study area and ascertain the availability and quality of urban infrastructure
within the neighbourhood(neighbourhood facilities). Erekesan, is one of the three
neighbourhoods that made up of the core area of Akure, the capital of Ondo
State,Nigeria. The other two are Idiagba-Ijemikin and Obanla. Most buildings in these
neighbourhoods are in very poor state, with only few of them in sound conditions.

Housing conditions
95
LITERATURE REVIEW
Housing Condition:
Housing condition refers to the state of the physical, environmental and the
satisfactory level of a particular housing unit measured against some variables of
livability at a particular time (Omole, 2001,SandaandJambol2010). These variables
include the status of the housing stock, housing facilities, occupancy rates, housing
environmental quality, neighbourhood facilities, materials used in construction, age of
the dwelling, variety and adequacy of facilities provided in the dwelling, level of
satisfaction with housing facilities and spatial location of residential housing
(Omole,2001,Sanda and Jambo2010). Others include the maintenance level, social
and economic wellbeing.
Housing condition therefore considers the totality of the environment rather than the
unit in isolation. In Nigeria and most part of the developing world, due to factors such
as insufficient funds, weak mortgage market, and poor delivery mechanisms, attention
is centred on raising the physical unit rather than the totality of the housing
environment. Developments are carried out without really paying attention to planning
details such as material and assembly technologies, development control and planning
regulations. The results are town with no space for infrastructural development such
as road network and drainage systems, Hence slums become common features at
fringes of virtually all Nigerian cities. Sheer neglect, poor maintenance, poor location
and inadequate facilities and services as this is compounded by unique characteristics
of houses found in Nigerian cities (Augustine, 2005;SandaandJambol,2010).
The condition of housing in Nigeria is so bad that Wahab et al (1990) as reported in
Omole (2005) stressed that, most houses (housing environment inclusive) in all the
states of the federation require either minor or major repairs. There is therefore the
need to embark on this study so as to proffer practical measures for better livability in
the study area.
PROBLEM STATEMENT
Buildings are poorly laid out with inadequate roads between them, inadequate
drainage and provision for refuse evacuation. There are high densities of buildings,
the crowding of large numbers of people into those buildings, lack of space for open
air living between houses, Substandard housing and acute sanitary problem (Olotuah,
2009).
Lack of functional in house facilities, and inadequate water supply. Few house hold
practice planned maintenance, hence there are evidence of poor maintenance. This
clearly shows evidence of poor housing condition in the study area.
In view of the fundamental role of housing in the overall well being and productivity
of man, this paper asserts the need to improve the housing condition of the core-area
of Akure city, so that residents, who are the least able to afford decent housing, will be
able to contribute meaningfully to the economics of Akure city in particular and the
National economy in general.
RESEARCH METHOD
The site of the study:
Research investigation took place in the core area of Akure- the administrative and
political capital of Ondo State of Nigeria. The city is located within Ondo State in the
South western part of Nigeria. It lies within latitude 7 15N and 7 28N north of the

Adegbehingbe
96
equator and longitudes 5 6N and 5 21‘E east of the Greenwich meridian. It is located
approximately 700kilometer south west of Abuja, the federal capital of Nigeria and
about350 kilometer to Lagos the former capital of Nigeria and it is located within the
tropical rain forest region of Nigeria where rainfall is high throughout the year. It
became the capital city of Ondo state and a local government headquarters in 1976.
The city‘s morphology has changed over time to assume its present status with its
attendant land use problems, as experienced in similar medium sized urban centres in
Nigeria . Akure has three kinds of residential settlement patterns: the core area, the
peripheral neighbourhood core and the suburbs (Olotuah, 2000,Akin and
Oyetunji,2010). The city has witnessed immense growth in size of built up areas,
number of immigrants, transportation and commercial activities and has attracted both
major investors and private developers into the town (Akin and Oyetunji,2010).. The
total area is approximately 41.2km2 and it lies on a relative plain of about 250m above
the sea level.
The population of the city grew from 38,852 (Thirty two thousand, eight hundred and
fifty two ) in 1952 to 71,106 (Seventy one thousand, one hundred and six) in 1963. Its
population was estimated to be 112,850 (one hundred and two thousand , eight
hundred and fifty (DHV, 1985); 144,544 (One hundred and forty four thousand, five
hundred and forty four ) in 1987, 148,880 (One hundred and forty eight thousand,
eight hundred and eighty) in 1988, 153,347 (One hundred and fifty three seven
thousand, three hundred and forty seven) in 1989 and 157,947 (One hundred and fifty
seven thousand, nine hundred and forty seven) in 1990 (Ondo State of Nigeria, 1990).
The 1991 national population census however, put the population of Akure at 239,124
(Two hundred and thirty nine thousand, one hundred and twenty four and its
estimated population in 1996 was 269,207 (Two hundred and sixty nine thousand, two
hundred and seven) NPC, 1996. Based on the last census conducted in 2006, the city‘s
population is 353,211 i.e three hundred and fifty three thousand, two hundred and
eleven (NPC, 2006).
Akure has three kinds of residential settlement patterns: the core area, the peripheral
neighbourhood core and the suburbs (Olotuah, 2000). The study investigated the core
area, which consists of the three neighbourhoods, namely Erekesan, Idiagba-Ijemikin
and Obanla. Out of the three, the study took place at Erekesan which consists of
Erekesan- Itanla, Eruoba and Afunbiowo, Alakure, Alakure -Ijofi and Iworokosagba,.
Research Database: The Primary data was collected by means of questionnaires
corroborated with personal interviews and physical observation of the housing
structures. Data measured on nominal scale were analysed using descriptive statistics
such as frequency distribution and percentages. Mean score were used to analyse data
measured on ordinal scale. The study area was divided into six strata, each unit of
Erekesan forms a stratum. Data for analyses was collected by the use of a set of
questionnaire administered on 600 residents of the core area community. A total of
600 questionnaires were distributed (100 to each sub-unit). 480, (80%) were retrieved
and analysed.
Sampling:
Pilot survey was conducted during which layout plan of the area was drawn, since the
researcher could not lay his hand on updated ones.The pilot survey was carried out in
the month of January, 2011.
In order to gather necessary data from the household of the core area, a pre-
determined number of 600 households was decided. The use of a particular
mathematical model to determine the sample size may result in a sample size that

Housing conditions
97
cannot be easily managed by the researcher. Going by the words of Fasakin (2000),
the above is rational and safer since the use of a straight jacket statistical formula to
obtain a sample size and proportion is fraught with dangers. Among other things
,samples obtained through such methods invariably fall short of the need for a
flexible relationship of sample sizes of particular aggregate
populations(Fasakin2000,Emamanuel,2010).
The primary research instrument used was research questionnaire, developed over a
month. The reason stated above influenced the decision to administer same number of
questionnaire (600) to the study area. The second phase was carried out in the month
of February and March, 2011. The number of houses on selected streets was initially
obtained in a pilot survey.
Data collection process:
Data collection process was handled by a team comprising the author as principal
researcher, a research assistant and twenty four field assistants who are either third or
fourth year student of School of Environment Studies (comprising of Architecture,
Urban studies, Quantity survey, Estate Management and Industrial Design) of Federal
University of Technology, Akure, Nigeria. The field assistants were picked on the
basis of their knowledge of the Core area being native of Akure town. While the
research assistant and six of the field assistants reside in the research area. They were
able to explain the purpose of the survey to the residence in their native language
(Akure dialet). Moreover, since some of the research assistants live in this community,
the respondents see them as one of them. This is responsible for having a very high
rate of response (80%). In addition, The survey was conducted on Fridays, Saturdays,
Sundays and Mondays in the months of February and March, 2011. Mondays was
included since some residents (mostly farmers) regard this day as a day of relaxation
after busy weekend.
Data Analysis:
Out of the 600 questionnaire used for this research, 480 were retrieved and analysed
.This represent 80%. The processing of the data analysis involved the use of statistical
soft wares named statistical package of social statistics (SPSS) version and Microsoft
Excel 2007.
The variables examined took into consideration the relevant data required for the
research.
The data were obtained from the household heads. The questionnaire contained 30
questions and four sections. The variables included in the questionnaires solicited
information on (a) Socio-economic characteristic (5 questions). (b) Building facilities
(10 questions). (c) Structural conditions (10 questions). (d) Physical infrastructures (5
questions).
The socio economic section contains questions on occupation, sex, marital status,
income, rent paid.
The building facilities section contain questions on Age of building, type of kitchen,
type of toilet, number of toilet, type of bathroom, source of water supply, how regular
is electricity supply, number of bedrooms.
The structural condition section contain question on: state of repair of building,
materials used for building walls, floors and roof and condition of wall.
The physical infrastructure section contain: Nature of road in the community, type
of communal infrastructure, accessibility to other part of the city and type of drainage
provided. Date obtained from field survey were analysed using Uni- variate

Adegbehingbe
98
Analysis. This involved in presentation of data obtained from the field tables to
describe the frequency of data obtained and pattern by observed attributes. Because of
space, only thirteen variables are presented in this paper. These are: income structure,
housing cost (rent paid), number of rooms occupied, condition of housing unit, source
of water supply, type of toilet facilities, solid waste disposal method, age of housing
unit, income spent on housing, materials used for construction, physical condition of
housing unit, type of maintenance in operation and condition of Neighbourhood
infrastructure.
RESEARCH FINDINGS AND DISCUSSION
Research findings:
Socio-economics characteristics of respondents and housing condition.
Income structure by respondents:
Table 1 depicts the pattern of income structure of the respondents as obtained from the
field investigation. Analysis of table 1 shows that a high proportion of the respondents
(75%) earn below N15,000 monthly. In other words, majority of respondents (75.6%)
can be classified as low-income earners, while about 20% can be classified as middle-
income earners. The remaining householders (6.4percentage f the sampled population)
are therefore under the high income group. This results shows that majority of
residents of the study area are:
Table 1: Income profile of households‘ heads
Monthly income in naira Response Percentage
Below 5,000 60 12.5
6,000 – 10,000 168 35
11,000 – 15,000 132 27.5
16,000 – 20,0000 36 07.5
21,0000 – 30,000 48 10.0
31,000 – 40,000 36 07.5
Total 480 100
Source: Field survey 2011
low and medium income earners. The implication is that they will not be able to pay
high rents on build their own housing and equally be able to meet other necessities of
life, when faced with problem of high rents. The few that are of high income earners
seems to be attached culturally to the area.
Housing Cost (Rent) paid by respondents: Table 2: monthly rents on housing units by householders
Monthly income (Naira) Frequency Percent
Below 500 95 19.7
501 – 1000 176 36.7
1001 – 2000 101 21.0
2001 – 5000 78 16.3
5001 – 10,000 27 5.6
Above 10,000 3 0.7
Total 480 100
Source : Field Survey, 2011.
The rent paid on housing unit occupied or equivalent if owner occupied is the cost of
housing in the study area. Table 2 shows the monthly rent paid by respondents on
housing units occupied by them. Analysis of the table shows that the highest number

Housing conditions
99
of respondents pays between N500 and N1,000 on housing,. This group accounted for
36.7 percent of the sampled population. Those that paid between N1,000 and N2,000
come next (21%). Others are those that pay below N500. (19.7%). N5,000 to N1,000
(5.6%). A very small proportion of the respondents (0.7%) pays above N10,000
monthly for their housing. Investigation shows that apart from paying for rents,
householders also pay other charges like electricity bills, water, sanitation, and refuse
disposal bills. All these add up (plus rents) to the total housing cost of householders.
Income spent on housing by respondents:
Table 3 shows the percentage of monthly income of respondent spent on rents. A
close observation of the table revealed that a significant proportion (43.62percent) of
the sampled respondent pay above 30 percent of their monthly income on rent.
However, this figure is less than that of Lagos where average monthly rents is about
60 percent of the national minimum wage as against 20 percent set by the United
Nations (FRG, 1977; Fawehinmi, 2000). 43 percent of the sampled respondents pay
less than the acceptable 30 percent of their monthly income on housing. This confirms
previous studies that the average monthly rent is about 60 percent of the national
minimum wage as against the 20 percent set by the United Nations (Adeagbo, 1997).
This is a serious problem considering the fact that about 70 percent of the urban low
income group live in rented rather than owner occupied houses (National Housing
Policy, 1991). The fact that about seven out of every ten urban low income earners
spend 60 percent of their monthly salary on rents means that the majority of Nigerians
are partly impoverished as a consequence of housing shortage.
Table 3: Percentage of income spent on housing
Monthly income (Naira) Frequency Percent
Below 20 89 18.58
20 – 30 120 25.04
30 – 60 177 36.98
60 – 90 85 17.67
Above 90 9 1.73
Total 480 100
Source: Field survey, 2011
Number of rooms occupied by respondents:
The numbers of rooms occupied was used to measure the size of housing unit
occupied by respondents in the study area. The result is as depicted in table 4.
Analysis of table 4 shows that majority of respondents (31percent) are occupying one
room apartment.
Table 4: number of rooms occupied by respondents.
No of Room Frequency Percentage
Tenement(compound type) 116 24.19
One Room 149 31.00
Two Rooms 120 24.91
Three Rooms 65 13.53
Four Rooms 25 5.19
Five Rooms 5 1.16
Total 480 100
Source: Field Survey, 2011.
Two rooms apartments follow this with 24.91% and 24.19% of respondents are of
tenement type. 13.53 percent of the respondents are occupying three rooms and 5.19%
are occupying four bedrooms. While householders occupying five room and above
recorded the least number of respondents (1.16percent). The implication of this result

Adegbehingbe
100
when compared with the findings of Aribigbola (2005) that majority of householders
prefer flat apartment and previous studies that revealed household size in Nigeria to be
six, then the current housing of people in the area is inadequate to meet their needs.
Condition of housing unit:
The overall physical soundness of the sampled dwelling was assessed. The assessment
ranges from buildings, which were considered to be physically sound and need no
repairs, through those that needed minor or major repairs to make them sound and to
those which were regarded poor/dilapidated. The last category was reserved for units
which were so defective that the cost of putting them back into service would be
greater than the cost of replacing such units altogether (Wahab et al. 1990). Table 5
shows that majority (60%) of building investigated are in poor/dilapidated physical
conditions. The fair buildings accounted for 34.2 percent while the good ones only
accounted for 5.8% of the sampled buildings.
Table 5: Building conditions:
Condition of Building Total Percentage
Good 28 5.8
Fair 164 34.2
Poor 288 60.0
Total 480 100.0
However, since the physical attributes of housing is just one of the variables or bundle
of services that made up housing, other parameters of housing condition such as water
supply availability and type of toilet facilities and refuse disposal system among
others were also examined.
Source of water supply:
Table 6 shows the major sources of water supply in the study area. Analysis of the
table show that majority of residents of the study area depend on wells for their water
supply. This constitutes 65.7 percent of all residents in all the houses. This is followed
by those categorised as others (19.5percent) which include springs, brooks, rain,
streams and in some cases public tap. Boreholes and pipe-borne water accounted for
6.0 and 8.3 percents of water supply respectively. The implication of this is that
majority of residents depends on water supply from unsafe sources thereby lowering
the quality of housing in the study area.
Table 6: source of water supply
Source of water supply No of Houses Percentage
Pipe borne water 40 8.3
Boreholes 29 6.0
Wells 315 65.7
None 2 0.4
Others 94 19.5
Total 480 100.0
Source: Field survey, 2011
Type of toilet facilities:
Table 7 shows that the highest percentage (41.31%) of buildings in Erekesan is
provided with pit latrine. This is closely followed by water closet (35.38 percent).
The table also shows that 23.25 percent of all buildings in Erekesan lack any form of
toilet facilities. The fact that 35.38 percent of buildings in the Erekesan and another

Housing conditions
101
23.25 percent of all buildings do not have any form of toilet facilities indicate that
majority of buildings in Erekesan is substandard and that many residents of
Erekesan will defecate any where and cause environment problems.
Table 7: Type of toilet facilities
Type of Toilet No of Houses Percentage
Water closet 170 35.38
Pit latrine 198 41.31
None 110 23.25
Others 2 0.07
Total 480 100.00
Source: Field survey 2011.
Solid waste disposal method: Another indicator of housing quality is refuse
collection and disposal system. On method of refuse collection and disposal in the
study area, the Waste management Authority is responsible for collection and disposal
of waste from 31.2 percent of all the building in the area (see table 8). 55.1 percent
and 11.8 percent of waste generated in the city are disposed off by dumping them on
dump site and by burning respectively. These methods are not only unhealthy but
destroy and pollute the environment.
Table 8: solid waste disposal method
Method of Disposal No of Houses Percentage
Waste Management Van/Point 149 31.2
Dump Site 264 55.1
Burning/Incineration 56 11.8
Others 11 1.8
Total 480 100.00
Source: Field survey 2011
QUALITY OF THE EXISTING HOUSING STOCK IN THE
STUDY AREA
Building, like human beings have life span which is a function of age, materials used ,
level of maintenance, usage etc. These factors were investigated into, so as to
determine the quality of the existing housing stock.
Table 9: Approximate Age of Housing Units
Age of Structures (Yrs) Response percentage
< 10 18 07.5
11 – 20 36 15.5
21 – 30 48 20.5
31 - 40 60 25.0
41 and above 78 35.0
Total 480 100.0
Source: Field survey, 2011
Table 9 present the approximate ages of the building surveyed. Out of 480 households
surveyed, 60% are aged between 31 years and above. This explains why most of them
are sub-standard, with no designs, and no plan approvals. These type of houses do not
give the occupants the desired aesthetics and comfort.

Adegbehingbe
102
Table 10 shows majority of the residential buildings( 65% ) are either constructed
with compressed earth bricks and mud bricks. Whereas the remaining buildings
(35%) are either of combination of cement and mud brick and cement blocks only.
Table 10: Materials used for construction of Housing Units in the study area:
Materials Response Percentage
Cement Blocks 84 17.5
Mud Bricks 112 23.0
Timber 00 00.0
Compressed Earth Bricks 200 42
Cement and Mud Bricks 84 17.5
Total 480 100.0
Source: Field Survey 2011
The buildings are showing signs of defects such as cracks in walls, leaking roofs,
dampness rising inside the rooms. These reflects the result of the survey on physical
Housing Condition in the study area are as presented in Table 11.
Table 11: Physical Condition of Housing Units in the Study Area
Building Elements Bad Fair Good
No % No % No %
Foundation 115 45.0 100 42.0 24 15.0
Wall-External 108 42.0 96 40.5 36 12.0
Internal 108 44.0 84 32.5 54 20.5
Floor 132 50.0 142 35.0 24 17.5
Roof 120 52.0 115 32.5 42 17.5
Total 46.6 36.9 16.5
Source: Field Survey, 2011
Table 12: Type of Maintenance in Operation
Type of Maintenance Response Percentage
Planned Maintenance 108 22.5
Corrective Maintenance 372 77.5
Total 480 100.0
Source: Field Survey, 2011
Table 13: Condition of Neighbourhood Infrastructure
Neighbourhood
Infrastructure
Bad Fair Good
No % No % No %
Drainage System 132 50.0 66 27.5 42 25.5
Road Network 126 45.5 78 32.5 36 35.0
Electricity Supply 120 48. 40 109 45.4 11 28.6
Total 47.96 22.34 29.70
Source: Field Survey, 2011
Only 16.5% of the households surveyed are in good condition 36.9% have one form of
notable defect or the other. While 46.6% are completely bad, yet they are occupied.
Table 12, presents the result of an investigation into the type of maintenance practised
in the study area and shows that only 22.5% households plan for maintaining their
houses due to lack of fund. As a result most houses show lack of proper maintenance
which affect the life span of the structures.

Housing conditions
103
AVAILABILITY AND QUALITY OF NEIGHBOURHOOD
INFRASTRUCTURE:
Urban housing infrastructure was surveyed to determine their conditions and the result
is shown on Table 13.The study area lacked functional and necessary urban
infrastructure such as drainage systems & Electricity supply as 47.96% houses do not
have access to these facilities. They are either not provided at all or the few available
ones are not functioning properly. Only 29.70% have access to functional urban
facilities,while access by 22.34% can be said to be fair. Houses were build without
paying attention to planning details such as set back. Hence most houses are
accessible through narrow foot paths, with no allowances for construction of drainage
channels. The few channels available have become refuse dumping pits. Hence refuse
dumps are common sights in Erekesan and the first rain of the year do wash these
waste into peoples‘ houses making them vulnerable to diseases such as typhoid fever,
cholera etc. Based on the assessment of the infrastructure, the study area can best be
qualified as a slum. However, through the ongoing State urban renewal program, the
quality of infrastructure are now improved when compared with some years ago,
especially the road network.
CONCLUSION AND RECOMMENDATIONS
Erekesan is a typical low income settlement marred with numerous housing problems.
These are social, environmental and economic in nature. These problems manifest in
shortages of accommodation unit, sub-standard building, overcrowding, inadequate
and non-functioning social amenities, unsatisfactory and unwholesome environmental
conditions and poor quality air circulation. Similarly, the environmental and economic
conditions of the study area exhibited the characteristics of slum neighbourhood
typical of fringe settlements in most Nigerian towns, characterized by unplanned
developments, uncoordinated system of development and long term neglect by the
government.
From these findings, the following measures are suggested as means of resolving the
deplorable housing conditions in the study area as well as others with similar
problems:
Urban development and restoration should be a major concern of governments in
order to reduce the environmental stress experienced in the study area. This is
achievable with major investments committed to urban infrastructure and services.
This however, requires the will of government without undue politicking.
The residents of the study area (Erekesan) which is part of the core area of Akure city
are culturally attached to the land, it is impracticable to embark on total clearance and
resettlement programme. Slum upgrading and improvement should therefore be aimed
at.
Adequate and quality drinking water should be provided through construction of
boreholes and pipe-borne water in order to eliminate water borne diseases.
Recently introduced waste management schemes should be improved upon, while
more environmental inspectors should be engaged.
Monthly environmental sanitations programme should be improved upon with
workable measures of enforcing it in order to keep the environment clean.

Adegbehingbe
104
Poor housing is in intricately linked with poverty and it is indeed informed by it, thus
government has a definite role to play in addressing the high unequal distribution of
wealth in the country. The poverty alleviation programmes of government should be
stepped up to reduce unemployment rate in the country.
This paper appraises the housing conditions in Erekesan, a part of the core area of
Akure city, the Ondo State Nigeria. It assess the quality of existing housing
environment and the availability of the neighbourhood facility. The study concludes
that the housing condition is very poor and proffers recommendations to improve
them.
REFERENCES
Aribigbola A (2005): study of Urban Housing choice in Akure, ondo State, Nigeria.
Unpublished Ph.D.Thesis, Department of urban and Required Planning, Obafemi
Awolowo University, Ile-ife
Augustine S.T. (2005). Housing condition in Kakuri District, Kaduna. Unpublished M.Sc
Thesis in the Department of Geographical and Planning, University of Jos.
DHV Consulting Engineers (1985). Report on Ondo State Urban Development Project.
Preparation Study final Report, Amersfourt.
Dung – Givon, J.Y Ibrahim, D.M. (2006) Urban Environment Quality Perception in Gombe
Town,
Nigeria. Nigeria journal of Environmental Sciences, Jos 10(1), 89-103
Fagbohun, P.O. (2003). Housing and livability in Nigeria cities: A study into Housing
situation in Oshodi, Lagos. A paper presented at a National Workshop on private
sector Driven Housing delivery, 30th – 31
st July, Lagos, Nigeria.
Fawehinmi, S.A. Government search for Affordable Rental Housing in Nigeria. The mis-step
& Rent controls Pp 40-45 in: Effective Housing in the 21st century Nigeria, o.B.
Akinbamijo, A.O. Fawehinmi, D.R. Ogunsemi and Olutuah, A (Eds). The
Environmental Forum Federal University of Technology, Akure.
Federal Government of Nigeria (2006). National Housing Policy.
Federal Government of Nigeria, FGN (2004). National Housing Policy for Nigeria, Federal
Ministry of Works and Housing, Abuja.
National Population commission (1996). Census ‘91 final results, Ondo state.
Okupe, L (2002): Private sector initiative in Housing Development in Nigeria. How feasible?
Housing today, vol 1, no 6 Pp 21-26.
Olotuah, A.O. (2000). Evaluation of suburban Housing conditions in Akure, Nigeria. Africa
Journal of Development studies, 2(192). 165.
Olotuah, A.O. S Ajenifujah A.O. (2009) Architectural Education and Housing Provision in
Nigeria‘ In CEBE Transactions. Online Journal of centre for Education in the Built
Environment, Cardiff University, UK, 6(1).
Ondo State Government (1990). Digest of Demographic statistics of Ondo State. Ministry of
Finance, Budget and Planning, Akure.

Akintayo, O., Onajite, J.G. and Olusola, B.S. (2011) An evaluation of the trend of budgetary allocations
for infrastructural development in Osun state, south-western, Nigeria In: Laryea, S., Leiringer, R. and
Hughes, W. (Eds) Procs West Africa Built Environment Research (WABER) Conference, 19-21 July
2011, Accra, Ghana, 105-117.
105
AN EVALUATION OF THE TREND OF BUDGETARY
ALLOCATIONS FOR INFRASTRUCTURAL
DEVELOPMENT IN OSUN STATE, SOUTH-WESTERN,
NIGERIA
Opawole Akintayo1, Jagboro Godwin Onajite and Babatunde Solomon Olusola
Department of Quantity Surveying, Obafemi Awolowo, University, Ile-Ife, Nigeria
Infrastructure development depends substantially on budgetary financing in Nigeria.
The budgetary allocations have, however, been criticized to be based on non-
procedural approach. While this has necessitated a scientific methodology, research
effort in this area is limited. The study assessed the trend of budget allocations for
infrastructure projects with the view to examining how the trends have impacted the
level of execution of public infrastructure projects. Data for the study were based on
archival data of budgetary allocations of five infrastructural projects from ten editions
of Osun State budget between1999–2008 and structured questionnaire directed to
construction professionals and financial administrators in the public service of the
State. These are architects, quantity surveyors, builders, town planners, estate
surveyors, engineers (civil, mechanical and electrical), accountants and economists.
The infrastructure projects are education, transportation, rural/urban electrification,
health, housing and water projects. Data analysis was done through, mean, percentage
and time series analysis. Trend functions obtained for each projects were modified by
coefficient generated by setting the implementation level of the projects at 100% to
generate appropriate models for budget allocation for the projects. These models
would serve as tool for predicting the budget allocation for infrastructure development
by policy makers in the state. Moreover, findings from the study indicated poor level
implementation of public financed infrastructure suggesting the budgeting
methodology and consistence level of the trend of budgetary allocations as significant
to implementation level of public financed infrastructure in Nigeria.
Key words: infrastructure, budgetary allocation, project execution.
INTRODUCTION
Infrastructure procurement is basically through three financing options. These are
public financing, private finance initiative (PFI), and public private partnership (PPP)
initiatives (Oyegoke, 2005; Ashwort and Hogg, 2007; and Tsema, 2008). However,
the level of private sector participation in infrastructure development is identified to
be significantly low in Nigeria with progressive participation only in education and
communication infrastructure (Ayodele, 2006; and Ilori, 2006). The Private-Public
Partnership (PPP), likewise, is only in the recent gaining popularity in Nigeria
(Tsema, 2008). Thus, the financing of infrastructure, like in most developing
countries, is traditionally public task through public budgetary allocation in Nigeria.
This situation makes public policy makers and the construction industry the major

Akintayo, Onajite and Olusola
106
actors in infrastructure development in Nigeria. However, Mogbo (2001) and Offoreh
(2006) see budgetary allocation procedure for infrastructure sector in Nigeria to be
based on non-procedural approach. This procedure has been criticised as the reason
for lack of connectivity between budget sizes and projects they are intended to
finance. In most cases, projects covered by a fiscal year budgetary allocation are not
completed or abandoned. This phenomenon though becoming worrisome, could be
traceable to deficiency in the previous trend of public budgetary allocations to cope
with the desirable level of infrastructure constructions. This has necessitated an
empirical evaluation of trend of budgetary allocation for infrastructure development in
Nigeria.
PREVIOUS WORK
Although literature abounds on the subject of infrastructural development in Nigeria,
limited studies have correlated budgetary financing to level of execution of
infrastructural projects (Mogbo (2001; Frank, 2003; Offoreh, 2006)
Oforeh (2006) studied the role of the Nigerian Institute of Quantity Surveyors as an
agent of economic development. The study identified poor level profile of
infrastructure projects implementation in Nigeria as resulting from low level input of
construction professionals in infrastructure policy formulation at the macro-economic
level. Studies by Mogbo (2001) and Frank (2003) identified infrastructure projects as
projects of high capital outlay. Furthermore, Frank (2003) identified the major causes
of poor performance of infrastructure in urban centers in Nigeria as factors relating to
high cost of infrastructure provision, failure of government to adopt liberalization
policies in dealing with urban infrastructure matters, and inadequate budgeting by the
public sector. On the other hand, Mogbo (2001) posits that the low level
implementation of infrastructure development in Nigeria could be correlated to level
of contribution of the construction professionals in the budgeting process.
Further studies on infrastructure development include Ogunsemi and Saka (2006) and
Olayiwola and Adeleye (2005). Ogunsemi and Saka (2006) article is restricted to the
New Partnership for Africa's Development (NEPAD) initiative and the challenge of
efficient cost management of infrastructure development in Nigeria. Olayiwola and
Adeleye (2005) studied the challenges and problems of rural infrastructure
development in Nigeria. The study only highlighted the concept of rural infrastructural
planning and examined the Nigerian rural infrastructural policies over the years 1960-
1990. The major problems and challenges posed by the various rural infrastructural
development identified include lack of spatial focus in rural development planning;
lack of perceptual focus in the development plans; restriction of means of rural
infrastructural provision to public funding; and lack of action and appropriate
institutional arrangements for the execution of rural infrastructural programmes.
METHOD
The study area is Osun state, in the South Western region of Nigeria. The choice of
Osun state was purposive as almost all infrastructure development in the state is
dependent on budgetary financing. A total of seventy-two (72) properly completed
questionnaire by 6 architects, 4 quantity surveyor, 6 town planner, 5 estate surveyors,
4 builders, 21 engineers (mechanical, civil, and electrical) and 26
economists/accountants representing a response rate of 70% of total 106
questionnaires administered were completed and returned for the analysis provided
quantitative data for the study. Archival data for the study were budgetary allocations

Budgetary allocation
107
from ten editions of the State budget for five types of infrastructural projects between
1999–2008. These are education, transportation, rural/urban electrification, health,
housing and water projects. The questionnaire was of two parts. The first part
identified the demographic features of the respondents; and the second part relates to
the scoring by the respondents of the implementation of the projects in the state on the
scale of 0-100% where 0 represents lowest ranking and 100 representing highest
ranking. Data analysis was done through mean, percentage and time series analysis.
The distribution of the respondents is shown in table 1. Trend function obtained for
each project was modified by coefficient generated by setting the execution level of
the project at 100% to generate appropriate model for budget allocations for the
projects.
DATA ANALYSIS
Table 1 shows the percentage representation of the respondents as 8.3% for architects,
8.3% for town planners, 5.6% for builders, 5.6% for quantity surveyors, 29.2% for
engineers, 6.9% for estate surveyors and 36.1% for economists/accountants. This
result expressed adequate opinion of the infrastructure stakeholders as both the
financial administrators and construction professional are adequately represented.
Table 1: Type of Respondents
Respondents Number
administered
Number collected Percentage (%)
Architects 8 6 8.3
Town Planners 7 6 8.3
Builders 8 4 5.6
Quantity Surveyors 4 4 5.6
Engineers 40 21 29.2
Estate Surveyors 7 5 6.9
Accountants/Economists 32 26 36.1
Total 106 72 100.0
Table 2 shows that 26.4% of the respondents are holders of Master of Science or
Masters of Technology; 44.5% are holders of Bachelor of Science or Bachelor of
Technology; 18.1% obtained Post Graduate Diploma (PGD); 9.7% holds Higher
National Diploma (HND); and 1.4% holds Doctor of Philosophy. The result shows
that all the respondents possess the minimum registration qualification of their various
professional bodies in Nigeria and are of adequate academic training to supply reliable
data for this study.
Table 2: Academic Qualification of the Respondents
Qualification Number of the Respondents Percentage (%)
Ph.D 1 1.4
M.Sc/M.Tech 19 26.4
B.Sc/B.Tech. 32 44.4
PGD (Post Graduate Diploma) 13 18.1
HND (Higher National Diploma) 7 9.7
Total 72 100
In table 3, the mean work experience is estimated at 14 years, which represents the
working experience of about 52% of the respondents. With this average working
experience, respondents are deemed experienced enough to supply reliable data for
this study.

Akintayo, Onajite and Olusola
108
Table 4 shows the professional qualification of the respondents. Sixty-seven (67)
respondents representing 93.1% of the total respondents are either associate or
corporate members of their various professional bodies. The result shows that the
respondents are either associate or corporate members of the various professional
bodies or posses some other professional qualification. This shows that the
respondents are in the position to supply reliable data for this research.
Table 3: Working Experience of Respondents
Years Midpoint ( X) Frequency (F) FX
0-5 2.5 7 17.5
5-10 7.5 10 75.0
1-15 13 4 52.0
16-20 18 13 234.0
20- 25 22.5 27 607.5
Above 26 26 11 286
Total 72 1272
Mean = 14
Table 4: Professional Qualification of the Respondents
Professionals Number Percentage (%)
Nigerian Institute of Architects (NIA) 4 5.6
Nigerian Institute of Town Planners (TPL) 5 6.9
Nigerian Institute of Building (NIOB) 4 5.6
Nigerian Institute of Quantity Surveyors (NIQS) 4 5.6
Nigerian Society of Engineers (NSE) 19 26.4
Nigerian Institute of Estate Valuers and Surveyors (NIEVS) 5 6.9
Institute of Chartered Accountant (ICAN)/Association of National
Accountants of Nigeria (ANAN)
25 34.7
Others 1 1.4
Non Professionally Qualified (NPQ) 5 6.9
Total 72 100
Table 5 shows the trend of budgetary allocations for infrastructural development
between the years 1999-2008 in Osun state. The mean budget allocation for
infrastructure is established as N10, 195.0m which represents 63.2% of the mean
capital budget and 47.1% of the mean total budget. The detail of the trend of budget
allocation is illustrated in figures 1-8. These results almost agree with the findings of
Oforeh (2006) and Ayodele (2008), who identified capital expenditure as staggering
between 65 – 70% in the annual budgets of the three tiers of government in Nigeria,
with allocation to infrastructure as often responsible for about 50% of the capital
expenditure.

Budgetary allocation
109
Table 6 shows the mean budget allocation expressed as percentage of capital budget and
total budget. The mean budget allocation expressed as percentage of capital budget for
education, rural/urban electrification, health, transportation, water, and housing were
established as 14.98%, 1.56%, 7.71%, 22.73%, 14.89%, and 1.43% respectively. On the
other hand, the mean budget allocations for education, rural/urban electrification, health,
transportation, water, and housing expressed as percentage of total budget allocation
were established as 6.60%, 0.69%, 3.39%, 3.39%, 10.67%, 7.60%, and 0.62% respectively.
Table 6: Budget Allocation as Percentage of Capital Budget and Total Budget
Year Total
Budget
Capital
Project
Budget
Allocation to
Infrastructure
Budget Allocation as
% of Capital Budget
(%)
Budget Allocation as
% of Total Budget
(%)
1999 4,790.00 1,530.00 850.40 55.58 17.75
2000 11,820.00 6,700.00 5,106.21 76.21 43.21
2001 20,480.00 12,040.00 8,100.75 67.22 39.57
2002 18,870.00 10,710.00 7,292.50 68.09 38.65
2003 14,530.00 4,830.00 2,976.57 61.69 20.48
2004 18,910.00 6,910.00 4,136.72 59.84 21.86
2005 25,220.00 11,630.00 7,085.00 61.00 28.09
2006 29,050.00 13,500.00 7,982.72 58.52 27.48
2007 34,770.00 17,790.00 11,491.68 64.51 33.05
2008 38,010.00 16,310.00 9,719.53 59.59 25.57
Mean 21,645.00
10,195.00
6474.21
63.23 29.57
Author‘s Calculation (2010) x = % of Capital Budget; y = % of Total Budget.
Figure 1: Trend of Budgetary Allocation for Infrastructural Projects in Osun State
The trend of budget allocations for infrastructure between the years 1999-2008 is as
shown in figure1. Going by the profile of the graph of allocation versus year, there
was an upward increase from N850.4m in 1999 up to N8,100.21m in 2001 and a
gradual declining pattern from N8,100.21m in 2001 to N2,976.57m in 2003. This
y = 754.3x +06R² = 0.505
0
2000
4000
6000
8000
10000
12000
14000
1998 2000 2002 2004 2006 2008 2010
Bu
dge
t A
lloca
tio
n
Year
Budget Allocation for Infrastructure in Osun State (1999 - 2008 Millions)

Akintayo, Onajite and Olusola
110
downward trend was, however, reversed in 2003 and steadily climbed to
N11,491.68m in 2008. The distortion of steady increase from 1999 to 2008 could be
attributed to the fluctuation of the revenue in the same period in Osun state as
exemplified by the decline of price of crude oil (Odularu, 2008). Another factor that
could be responsible for this volatility is the fact that the political situation was still
very much unstable transiting from military rule to civilian democracy. It would be
noted that the ‗due process‘ application to procurement of public was also heightened
in this period. While these could be considered significant factors, other factors
including better institutional framework, population growth and sustained
commitment of the state government to improve the state infrastructural base could
have been responsible for the upward trend. While the best fit line revealed an average
consistent trend defined by the value of R² (R² = 0.505), it should be noted, however,
that the value of R² (0.505) does not suggest or in any way indicate the adequacy of
allocations across the years. The graph presents a statistical trend relationship which is
defined by Y = 754.3x + 06, where x is the budget year and 06 the intercept on the Y
axis.
Table 7: Trend of Sectoral Budgetary Allocation for Infrastructural Projects (Millions)
Year Education Rural/Urban
Electrification
Transportation Water Health Housing
1999 204.90 30.00 405.00 120.00 56.50 34.00
2000 422.70 60.00 1,060.00 3,260 250.02 53.49
2001 436.00 40.00 3,500 3,600 443.50 81.25
2002 1,260 185.00 2,430 2,230 1,200 187.50
2003 966.68 41.80 609.00 525.20 743.89 90.00
2004 1,300 188.00 724.00 972.50 796.50 155.72
2005 1,310 57.00 3,930 675.00 1,040 73.00
2006 1,920 179.00 4,170 506.70 1,120 87.02
2007 5,080 370.00 3,960 634.08 1,120 327.60
2008 3,560 516.40 3,800 593.94 993.00 256.19
Mean 1646.03
166.72
2458.80
1311.74
756.34
134.58
Figure 2: Trend of Budgetary Allocation for Educational Infrastructural Projects
Thus keeping other macro-economic variables constant, the fit yield could be
extrapolated to make a projection of allocations for subsequent years, that is years
beyond 2008. The gradient of the straight line model produced would, however,
require further improvement to adjust for proportionality between the adequacy of the
budget allocation and the level of implementation of the projects.
-2000
0
2000
4000
6000
1998 2000 2002 2004 2006 2008 2010
Bu
dge
t A
lloca
tio
n
Year
Budget Allocation to Education Infrastructure in Osun State (1999-2008, Millions)

Budgetary allocation
111
The trend of budgetary allocation for educational infrastructural development
between1999-2008 is as shown in figure 2. There was a progressive increase from
N204.9m in 1999 to N1, 260m in 2002 and from N966.68m in 2003 to peak value of
N5,080m in 2006 which gradually declined to N3,560m in 2008. Distortions were
noted in 2003 and 2007. This could presumably be attributed to political factor as
dictated by change in government in these periods. On the overall, the trend graph
could be represented by best fit line with co-linearity coefficient of R2 = 0.707 which
indicate a consistent trend in the allocations and thus establish the increase in the
budget allocations over the ten (10) years as statistically significant. The linear trend
model produced is represented as Y= 428.4x – 85682.
Figure 3: Trend of budgetary allocation for transportation projects
Figure 3 shows the trend of budget allocations for road infrastructure between the
years 1999-2008. The allocation rose gradually from N405m in 1999 to N3,500m in
2001. This sharply declined to N609m in 2003. Slight increase occurred between 2003
and 2004. There was, however, a consistent increasing trend from N724.0m in 2004 to
N4,170.0m in 2006. This again assumed a gentle declined trend from N4,174.0m in
2006 to N3,800.0m in 2008. Distortions were noticed in 2001, 2003 and 2006. From
2003 to 2008, there was poor consistency in the trend as shown by the graph, though
there was significant increase from N724.0m in 2004 to N3,930.0m in 2005 (81.6%
increase). The graph on the overall could be represented by fit line with co-linearity
coefficient of R2 = 0.459 which indicate low consistency and poor statistical
significance among the budgetary allocations over the ten years. A more consistent
trend was obtained between 2005 and 2008. This produced an overall model of Y=
356.4x – 71175. The inconsistence in the pattern of budget allocations for this
category of infrastructure as defined by R2 = 0.459 suggests absence of macro-
economic framework to guide the budget allocations and poor commitment of
government to this category of infrastructure. The inconsistence in the budget
allocation also suggests projects-allocations imbalance which could have resulted in
budget strain during projects execution. Should this trend continue unabated, the state
may experience poor level execution of road projects and consequently high profile of
road infrastructure decay. This may pose poor rural-urban integration in the state and
thus impact negatively on the economic growth of the state. Improved model could,
however, be obtained by subjecting the model to further time series analysis, such as
stochastic regression.
y = 356.48x - 711759R² = 0.4591
0
1000
2000
3000
4000
5000
1998 2000 2002 2004 2006 2008 2010
Bu
dge
t A
lloca
tio
n
Year
Budget Allocation for Transortation Infrastructure in Osun State (1999-2008, Millions)

Akintayo, Onajite and Olusola
112
Figure 4: Trend of Budgetary Allocation for Rural/Urban Electrification Projects
Figure 5: Trend of Budgetary Allocation for Rural/Urban Electrification Projects
In figure 4, the trend of budget allocations for rural/urban electrification remained
poorly consistent until 2005. This is evident from the linearity coefficient of the fit
line (R2 = 0.620).
The pattern, however, assumed almost perfect consistence (R
2 = 1)
between 2005 to 2008 with the allocations improving from N57.0m to 516.4m, that is,
88.9%. While the model produced (Y = 42.45x – 84889), may seem less predictive for
the overall allocations, a better fit line was drawn across 2004-2008. This is shown in
figure 5. This produced a linear function Y = 156.9x – 31457 with improved
characteristics, that is, gradient (156.9), intercept (31457) and R² (0.993).
Figure 6: Trend of Budgetary Allocation for Water Infrastructure Projects
y = 42.453x - 84889R² = 0.6239
-200
0
200
400
600
1998 2000 2002 2004 2006 2008 2010
Bu
dge
t A
lloca
tio
n
Year
Budget Allocation for Rural/Urban Electrification in Osun State (1999-2008, Millions)
y = 156.92x - 314579R² = 0.9936
0200400600
2004 2005 2006 2007 2008 2009
Bu
dge
t A
lloca
tio
n
Year
Budget Allocation for Rural/Urban Electrification in Osun State (1999-2008, Millions)
y = -204.85x + 411728R² = 0.2463
0
2000
4000
1998 2000 2002 2004 2006 2008 2010
Bu
dge
t A
lloca
tio
n
Year
Budget Allocation for Water Infrastructure in Osun State (1999-2008, Millions)
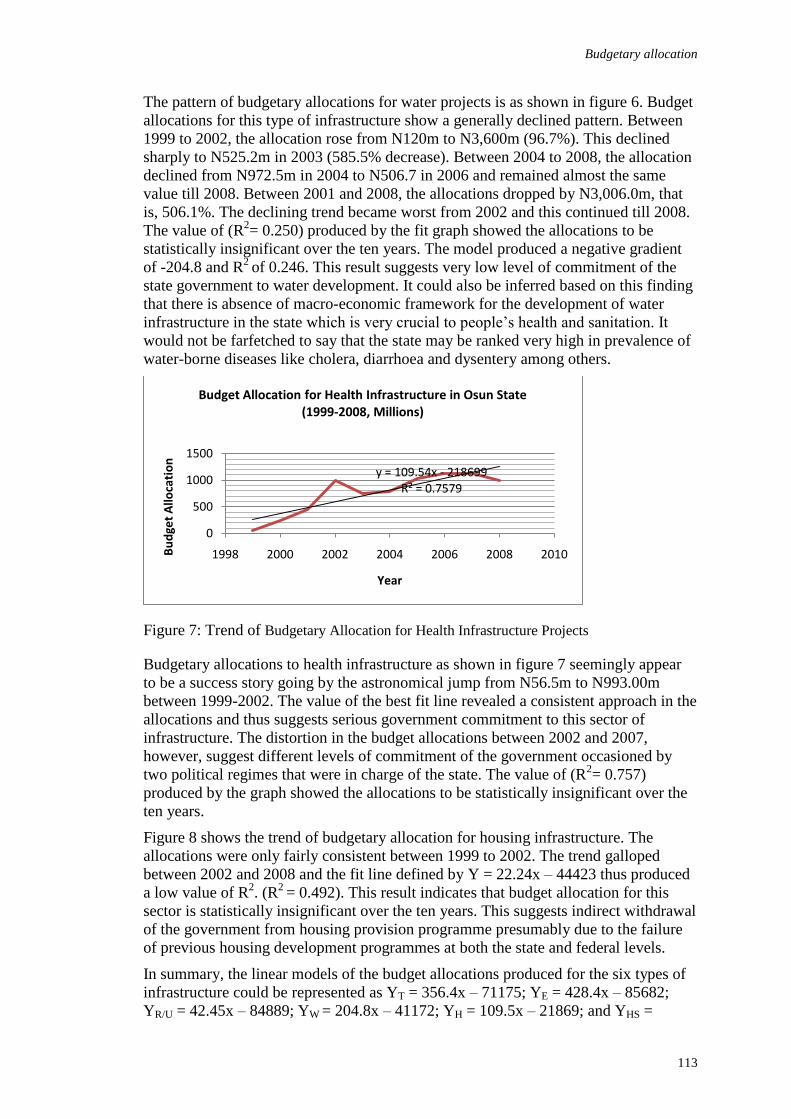
Budgetary allocation
113
The pattern of budgetary allocations for water projects is as shown in figure 6. Budget
allocations for this type of infrastructure show a generally declined pattern. Between
1999 to 2002, the allocation rose from N120m to N3,600m (96.7%). This declined
sharply to N525.2m in 2003 (585.5% decrease). Between 2004 to 2008, the allocation
declined from N972.5m in 2004 to N506.7 in 2006 and remained almost the same
value till 2008. Between 2001 and 2008, the allocations dropped by N3,006.0m, that
is, 506.1%. The declining trend became worst from 2002 and this continued till 2008.
The value of (R2= 0.250) produced by the fit graph showed the allocations to be
statistically insignificant over the ten years. The model produced a negative gradient
of -204.8 and R2
of 0.246. This result suggests very low level of commitment of the
state government to water development. It could also be inferred based on this finding
that there is absence of macro-economic framework for the development of water
infrastructure in the state which is very crucial to people‘s health and sanitation. It
would not be farfetched to say that the state may be ranked very high in prevalence of
water-borne diseases like cholera, diarrhoea and dysentery among others.
Figure 7: Trend of Budgetary Allocation for Health Infrastructure Projects
Budgetary allocations to health infrastructure as shown in figure 7 seemingly appear
to be a success story going by the astronomical jump from N56.5m to N993.00m
between 1999-2002. The value of the best fit line revealed a consistent approach in the
allocations and thus suggests serious government commitment to this sector of
infrastructure. The distortion in the budget allocations between 2002 and 2007,
however, suggest different levels of commitment of the government occasioned by
two political regimes that were in charge of the state. The value of (R2= 0.757)
produced by the graph showed the allocations to be statistically insignificant over the
ten years.
Figure 8 shows the trend of budgetary allocation for housing infrastructure. The
allocations were only fairly consistent between 1999 to 2002. The trend galloped
between 2002 and 2008 and the fit line defined by Y = 22.24x – 44423 thus produced
a low value of R2. (R
2 = 0.492). This result indicates that budget allocation for this
sector is statistically insignificant over the ten years. This suggests indirect withdrawal
of the government from housing provision programme presumably due to the failure
of previous housing development programmes at both the state and federal levels.
In summary, the linear models of the budget allocations produced for the six types of
infrastructure could be represented as YT = 356.4x – 71175; YE = 428.4x – 85682;
YR/U = 42.45x – 84889; YW = 204.8x – 41172; YH = 109.5x – 21869; and YHS =
y = 109.54x - 218699R² = 0.7579
0
500
1000
1500
1998 2000 2002 2004 2006 2008 2010Bu
dge
t A
lloca
tio
n
Year
Budget Allocation for Health Infrastructure in Osun State (1999-2008, Millions)

Akintayo, Onajite and Olusola
114
22.24x – 44423, for transportation, education, rural/urban electrification, water, health
and housing respectively, where x is the budget year. However, the model obtainable
in this type of analysis has been criticized by Jacque and Koopman (2007) to be less
predictive as it is based on fit lines only which may not adequately define the true
values of the x variable. The models would, however, provide a better predictor of
budget allocations rather than existing procedure which have been criticized to be
based on imaginary approach by Mogbo (2001) and rule of thumb by Bamberger
(2000).
Figure 8: Trend of Budgetary Allocation for Housing Infrastructure Projects
As earlier described in figure 1, these models could only provide tools for forecast on
the basis of trend of previous allocations, but may not guarantee the prediction of
values of budget allocations that ensures good projects implementation. A way of
improving the models, however, is to improve the gradient of fit line in each model.
This was achieved by improving the gradients of x variable in the models with the
information from the analysis of the implementation of the projects, that is, upward
shift of the linear model in each case to the right.
Table 8: Assessment of Level of Execution of Infrastructural Projects in Osun State Infrastructure Percentage Implementation (%)
0-10 11-
20
21-
30
31-
40
41-
50
51-60 61-
70
71-
80
81-90 91-
100
TWV Mean
Rural/Urban
Electrification
4 5 4 10 14 15 5 9 5 1 3554.00 49.36
Transportation 4 4 10 9 18 10 9 4 4 0 3264.00 45.33
Education 1 4 3 8 11 18 15 9 1 2 3865.50 53.69
Health 2 1 4 9 15 15 7 14 3 2 3925.00 54.51
Water 4 2 4 15 22 10 6 7 1 1 3344.00 46.44
Housing 9 10 12 5 18 10 3 4 1 0 2641.50 36.69
Table 8 shows the quantitative assessment of the level of implementation of budgetary
financed infrastructural projects on the scale of 0-100% where 0 represents lowest
ranking and 100 representing highest ranking. The table shows the highest mean
implementation of 54.51% which indicate average for health infrastructural projects.
This is followed by education infrastructure with mean percentage of 53.69%.
Housing infrastructure; transportation; rural/urban electrification; and water
infrastructure projects were rated as executed at 36.69%, 45.33%, 46.44% and 49.36%
y = 22.24x - 44423R² = 0.4924
0
100
200
300
400
1998 2000 2002 2004 2006 2008 2010
Bu
dge
t A
lloca
tio
n
Year
Budget Allocation for Housing Infrastructure in Osun State (1999-2008, Millions)

Budgetary allocation
115
respectively which are below average. These results indicate that if this trend of levels
of execution continues, the state would continue to witness decline trend of
infrastructure development, the adverse effect of which may include reduced quality
of education, poor health delivery and high risk of water related diseases among
others. This will significantly reduce the standard of living and the economic
development in the state.
Table 9: Relationship between Budgetary Allocations for Infrastructure Projects and Projects
Implementation
Variable Education Rural/Urban
Electrification
Transportation Water Health Housing
Mean Budget
Allocation (Millions)
(X)
1,646.03 166.72 2,458.80 1,311.74 756.34 134.58
Mean Implementation
(%) (Y)
53.69 49.36 45.33 46.44 54.51 36.69
Correlation Models YEI =
0.0031x+48.
58
YR/UI =
0.243x+8.89
YTI = 0.012x+15.12 YWI =
0.056x-
27.57
YHI = -
0.050x+92.76
YHSI =-
0.037+41.67
Correlation coefficient 0.0031 0.243 0.012 0.056 0.050 0.037
X100 =Estimated Value
of x for Y= 100%
16,587.10 374.94 7,073.33 2,272.68 3855.20 1576.49
Improved correlation
coefficient= X100/ X
10.08 2.25 2.88 1.73 5.10 11.71
Source: Author‘s Calculation (2010)
Table 9 shows the relationship between the budgetary allocations for infrastructural
projects and level of execution of the projects. The linear relationship between
budgetary allocation and percentage execution for each project were generated in each
case.
Estimated values of mean budget allocations (X100, in Millions) for Y= 100% were
calculated for each infrastructure projects and improved correlation coefficient (K =
X100/ X) were computed in each case. The values of K obtained are 10.08, 2.25, 2.88,
1.73, 5.10 and 11.71 for education, rural/urban electrification, transportation, water,
health and housing respectively.
The linear models obtained are YEI= 0.0031x+48.58; YR/UI = 0.243x+8.89; YTI =
0.012x+15.12; YHI = 0.056x-27.57; YWI = -0.050x+92.76; YHSI =-0.037+41.67 for
education, rural/urban electrification, transportation, water, health and housing
respectively.
Thus keeping all other factors influencing the level of implementation constant and
assuming a direct proportional relationship between mean budget allocation and level
of project execution, the linear models of budgetary allocations earlier established as
YT = 356.4x – 71175; YE = 428.4x – 85682; YR/U = 42.45x – 84889; YW = 204.8x –
41172; YH = 109.5x – 21869; and YHS = 22.24x – 44423, for transportation,
education, rural/urban electrification, water, health and housing respectively, in table
figures 1-6 were adjusted with corresponding value of K for each project. The models
thus become YTm = 1026.43x – 71175; YEm = 4318.27x – 85682; YR/Um = 95.51x –
84889; YWm = 354.30x – 41172; YHm = 558.45x – 21869; and YHSm = 260.43x –
44423, for transportation, education, rural/urban electrification, water, health and
housing respectively. The improved models imply an upward shift of the fit lines in
figures 1-8.

Akintayo, Onajite and Olusola
116
CONCLUSION
The study showed the mean budget allocation expressed as percentage of capital
budget for education, rural/urban electrification, health, transportation, water, and
housing as 14.98%, 1.56%, 7.71%%, 22.73%, 14.89%, and 1.43% respectively. On
the other hand, the mean budget allocations for education, rural/urban electrification,
health, transportation, water, and housing expressed as percentage of total budget
allocation were established as 6.60%, 0.69%, 3.39%, 3.39%, 10.67%, 7.60%, and
0.62% respectively. The patterns of the trend of the allocations over the ten years were
fairly statistically significant in allocations for education, rural/urban electrification
and health infrastructure and statistically insignificant for transportation, water and
housing infrastructure. These could presumably be attributed to factor including the
fluctuating revenue base of the state, poor commitment by the government to
infrastructural development, present political volatility, and absence of macro-
economic framework for infrastructural development in the state. The trend of the
budget allocations were defined by linear models as YT = 356.4x – 71175; YE =
428.4x – 85682; YR/U = 42.45x – 84889; YW = 204.8x – 41172; YH = 109.5x – 21869;
and YHS = 22.24x – 44423, for transportation, education, rural/urban electrification,
water, health and housing respectively, where x is the budget year.
The study established the mean level of implementation of health, education, housing
infrastructure, transportation, rural/urban electrification and water infrastructure
projects as 54.51%, 53.69%, 36.69%, 45.33%, 46.44% and 49.36% respectively.
Based on the relationship between the mean budgetary allocations and percentage
implementation of each project, the models were modified as YTm = 1026.43x –
71175; YEm = 4318.27x – 85682; YR/Um = 95.51x – 84889; YWm = 354.30x – 41172;
YHm = 558.45x – 21869; and YHSm = 260.43x – 44423, for transportation, education,
rural/urban electrification, water, health and housing respectively. These models
would serve as tool for predicting the budget allocation for infrastructure development
by policy makers in the state.
REFERENCES
Ashwort, A. and Hogg, K., (2007), Willis‘s Practice and Procedure for Quantity Surveyor.
Blackwell Publishing Ltd, Oxford, UK.
Bamberger, R.J. (2000), Infrastructure Support for Economic Development. In: Infrastructure
and Economic Development. Publication of National Transportation Library, U.S.A.
(MetroPlan 2000), 2-18.
Frank, I. (2003), The State of Urban Infrastructure in Nigeria. In: Urban Finance and
Infrastructure Development in Nigeria. First Edition. pp 35-48.
Ilori, M.O. (2006), The Role of the Government in the Development of Basic Infrastructure.
www.centbank.org/OUP/PRODUCTION Retrieve on 7th of June, 2008.Jacques,
J.F. and Koopman, S.J. (2007), Practical Econometrics: An Introduction to State
Space Time Series Analysis. Oxford University Press Inc. New York, 2-8.Mogbo,
T.C. (2001), the Construction Sector and the Economic Growth of Nigeria, 1981-
1995. Journal of the Nigerian Institute of Quantity Surveyors, Vol. 35, No.2, pp 8-13.
Odularu G.O. (2008), Crude Oil and the Nigerian Economic Performmamnce.
www.ogbus.ru/eng/authors/odularu/odularu_1.pdf . Retrieved on 15th of Feb.,
2009.

Budgetary allocation
117
Oforeh E. C., (2006), The Nigerian Institute of Quantity Surveyors as an Agent of Economic
Development. Paper Presented at 22nd
Biennial Conference and General meeting of
the Nigerian Institute of Quantity Surveyors, 22nd-25th Nov.,2006 at Channel View
Hotel/Conference Centre, Calabar, Cross River State, Nigeria.
Ogunsemi, D. R., and Saka, N (2006), The NEPAD Initiative and The Challenge of Efficient
Cost Management o f Infrastructure Development n Nigeria. Paper Presented at 22nd
Biennial Conference and General meeting of the Nigerian Institute of Quantity
Surveyors, 22nd-25th Nov.,2006 at Channel View Hotel/Conference Centre, Calabar,
Cross River State, Nigeria.
Olayiwola, L.M. and Adeleye, O.A. (2005), Rural Infrastructural Development in Nigeria:
Between 1960 and 1999-Problems and Challenges. Journal of Social Science 11 (2),
91-96 (2005).
Oyegoke, A.S. (2005), Infrastructure Project Finance and Execution Development Strategies.
Journal of The Nigerian Institute of Quantity Surveyors, Vol.52, No 3, Pp 11-19
Tsema, O.S.T. (2008), Public Private Partnership (PPP) Agreement and Negotiation Processes
Within the Context of Millennium Development Goals (MDG). Paper presented at the
23rd Biennial Conference of The Nigeria Institute of Quantity Surveyors, Hamdala
Hotel, Kaduna, Nigeria. 5th-8
th November, 2008.


Orgen et al. (2011) An integrated relationship and supply chain management framework for improving
engineering and design service delivery to building contractors in Ghana In: Laryea, S., Leiringer, R.
and Hughes, W. (Eds) Procs West Africa Built Environment Research (WABER) Conference, 19-21
July 2011, Accra, Ghana, 119-129.
119
AN INTEGRATED RELATIONSHIP AND SUPPLY
CHAIN MANAGEMENT FRAMEWORK FOR
IMPROVING ENGINEERING AND DESIGN SERVICE
DELIVERY TO BUILDING CONTRACTORS IN GHANA
Nenyi K. Orgen1, Divine K. Ahadzie
2, Joshua Ayarkwa
3, Edward Badu
4
1Department of Building technology, Kumasi Polytechnic, Box 854, Kumasi, Ghana
2 Centre for settlements studies, college of Architecture and planning, Kwame Nkrumah University of
Science and Technology, Kumasi, Ghana
3,4Department of Building Technology, Kwame Nkrumah University of Science and Technology,
Kumasi, Ghana
The culture of construction industry is well noted as being very competitive,
fragmented, having little cooperation and being full of mistrust. Besides, in the review
of relevant literature, the traditional supply chain relationships are criticized as
adversarial and thus lack effective communication. Many research interventions both
local - Ghanaian contract relationship development efforts such as public procurement
act, suggested mergers and foreign efforts like relationship management (RM) and
supply chain relationship (SCR) approaches are being increasingly developed. The
construction industry maturity level to cope with such interventions is identified to be
of four levels of relationships which can help the integrated relationship guidelines;
for the transformation of the existing non collaborative and adversarial situation and
for the improvement of EDSD work which seems to be worse in Ghana. The
justifications offered for the Ghanaian situation that seems to have worse of such
culture are inadequate, poorly articulated designs, delay in payment, strong adherence
to the traditional system of procurement, inconsistent, uncoordinated control of
projects, failure to capture clients requirements in tender document and lots of
variations in the construction phases. There is little of such integrated research
approach of exploring change of the culture and collaborative relationship levels
concepts together to transform the construction industry. This PhD research is to find
an integrated relationship management - supply chain relationship approach to
improve engineering and design service delivery (EDSD) to contractors in Ghana.
Management and supply chain relationships concepts for improvement concerning
how to achieve improved service delivery, the expected useful academic and
industrial outcomes are explored.
Key words: engineering/design service delivery, integrated approach, relationship
management, supply chain relationship.
INTRODUCTION
There is sufficient evidence in literature which indicates that the construction industry
has fragmented culture that accounts for its poor performance over the years (Latham,
3 ayarkwajosh@yahoo

Orgen, Ahadzie, Ayarkwa and Badu
120
1994; Egan, 1998; Bresnen and Marshall, 2002; Naoum, 2003; Baiden et al. 2006;
Bresnen, 2007; Pryke, 2009). Besides, the industry is recognized as full of mistrust,
more self-interested and competitive. Further, lack of effective communication has
resulted in adversarial relationship (Latham, 1994; Chan et al. 2004; Pryke, 2009).
The quest to transform the varying negative characteristics of the industry (Cheung
and Rowlinson, 2005) as in the developing countries like Ghana calls for proactive
integrated relationship improvement approach. The relationship management (RM)
and supply chain relationship (SCR) concepts which have engaged the attention of the
developed economies and have been successful for some time now are identified for
the improvement of engineering/design service delivery (EDSD) purpose. This paper
investigates to confirm through literature review the adversarial working relationship
situation that seems to exist amongst EDSD practitioners and between them and
constructors on the supply chain of information flow (SCIf). Also, it is to explore the
possibility of integrating RM & SCR concepts and models to improve traditional non
collaborative and adversarial relationship that seems to characterize the EDSD
activities. Further, to indentify the appropriate relationship attitudes and behaviours
which will improve inter-EDSD practitioners and inter-EDSD organisational
relationships for improvement and the continuous improvement of EDSD works. The
paper is structured as follows; first, a background to the proposed research is
presented. The definition of EDSD is provided to help clarify the content of the study.
The problem statement is then presented followed by a rigorous literature review of
the theoretical bases that would be considered. The next section describes how the
theoretical framework would be applied in Ghanaian context including what could be
the expected outcome. The paper concludes with a summary of issues discussed.
BACKGROUND AND CONTRIBUTION BY OTHER
RESEARCHERS
It is very clear in the literature that the non collaborative working and adversarial
relationship have existed in the construction industry for many years. The situation is
exacerbated by mistrust, inward looking attitude by similar organisations, lack of
commitment for the success of others and full pursuance of individual professional
agenda. These may account for the poor performance of the construction industry.
Realizing how bad the state of adversarial relationship is and the effect on the
performance of the industry, many researchers have made wonderful strives through
various interventions to break down the barriers and cycles of the harsh or adversarial
culture.
Many interventions including relationship management concepts development
(Chenng and Rowlinson, 2004; Smyth and Edkins, 2007) and the construction supply
chain management principles have engaged the attention of a number of researchers
(Yeo and Ning, 2002; Pryke, 2009; Meng, 2010). Also teams‘ integration or integrated
teams are similar efforts embarked upon to break down barriers to effective
collaborative working (Baiden et al. 2006; Smyth, and Fitch, 2009; Pryke, 2009).
Baiden et al. (2006) observed that none of the project teams as per the case study
projects covered by their research was completely fragmented. Pryke (2009)
compared the current state of the construction industry to Stevens‘s (1989) model of
transition of firms and concluded that the vast majority of the industry falls in the
baseline category; ie the traditional fragmented state. This is a manifestation that the
adversarial cultural relationship has not seen much change. Meng (2010) in his efforts
to deal with the adversarial relationships distinguished four clear levels of

Supply chain management
121
construction cultural relationships for assessment of relationship levels: traditional,
transitional, short-term and long-term.
Public Procurement Act (Act 663) was enacted in 2003 to reform contract works,
goods and consultancy services and to improve investor relationships in Ghana. It was
also to correct inefficiencies in the Public Procurement system. However, a probe into
the Act revealed that the Act cannot achieve effective culture change for value for
money due to disputes and wastes associated with the traditional procurement system
as stated by the Act 663. Aside that, there is persisting spectre adversarial contracting
relationships that have other serious implications including quality of construction
workforce (Anvuur, 2006). The argument was carried further that there was the need
to allow the adaptation of other procurement methods with guidelines if effective
value for money was to be realised (Anvuur, 2006). Similarly, it is on record that
contractors in Ghana face varying difficulties, which create harsh relationship that call
for arbitration and mediation and also get very late payment for work done without
interest (Laryea, 2010). As a way of improving relationship it was recommended that
there should be change through right strategic, proper development of professionalism
and seeking mergers with other firms with similar organizational values (Laryea,
2010).
From the discussion, non collaborative and adversarial relationship in construction
activities in Ghana seems to be persisting and real collaborative cultural change in the
industry is still not in sight. The various interventions given seem not to have
engendered the expected changes in the adversarial relationship for improvement of
EDSD to contractors. There are many questions unanswered that call for change of
‗mind set‘ in a developing country like Ghana, which wallows in a culture of
fragmentation and adversarial relationship. This situation is exacerbated by fiscal and
monetary constraints and corruption (Anvuur, 2006). It seems there is a lack of
relationship knowledge and no relationship learning taking place among the
individuals, groups/ organizations that can cause required change. Increased
knowledge implies not encountering the same problems over and over again and not
reinventing solutions to problems (Mensah, 2007). Learning process must be made to
include the practice of taking feed backs from executed projects. In support of this
practice, Loo [2003] stresses that taking feedbacks from projects and learning from
experiences improve performance of a project. There should be a culture change of the
adversarial relationship through a change of ‗mind set‘ towards collaborative and non
adversarial relationship to allow for an improved and continuous improvement of
EDSD to building contractors.
ENGINEERING/DESIGN SERVICE DELIVERY (EDSD)
In this study, EDSD covers the work of professionals (EDSD practitioners) trained in
project management, architecture, civil engineering, quantity surveying, geometrics
engineering, estate management and facility management who produce information
flow. It also includes the handling of the use of information flowing from initiation,
planning, executing, controlling to closing of a project. EDSD practitioners are
professionals who are either in-house or external consultants working for clients.
These are professionals who form part of clients‘ organization and need to develop the
appropriate culture (Cheung and Rowlinson, 2005); or, are agents of principals
(clients) who run agencies for EDSD work which are produced for selected
contractors. The EDSD practitioners provide the supply chain of information flow
Orgen, Ahadzie, Ayarkwa and Badu
122
(SCIf)which is different from other supply chains such as the flow of materials,
labour, plant and equipment including temporary work (Hatmoko and Scott, 2010).
This supply chain of information flow consists of documentations such as drawings,
specifications, contract conditions, explanations and clarifications which form the
basis of all activities in the project (Edum-Fotwe et al. 2001).The EDSD work of
providing SCIf is for decision-making, which affects planning, executing, controlling
and closing of projects. Thus it is obvious that EDSD practitioners are responsible for
all other conduct of sharing information between the supply chain members. This
information sharing among members is seen as key to effective supply chain
management of projects (Titus, 2005; Hatmoko and Scott, 2010) It is also worth
noting that delay in the information flow may slow down decision-making of all the
project teams, which is identified as the main cause of delay in projects delivery
(Chan and Kumaraswamy, 1997).
So, it is out of the EDSD work to contractors that almost all the construction SCIf
originates for construction project works. Therefore, the object of the on-going PhD
research paper is to carry out an in-depth study of how to use an integrated RM and
SCR approach to achieve non adversarial and collaborative relationships. This is in
order to improve the EDSD to contractors in Ghana, specifically. The dimensions for
the change of culture will be drawn from the strength of both RM and SCR concepts:
(a) to change behavioural relationship among the EDSD practitioners in organizing
and producing timely SCIf (b) to improve the relationship between practitioners and
contractors for continuous improvement of EDSD to contractors (suppliers).
THE PROBLEM STATEMENT AND JUSTIFICATION FOR THE
STUDY IN THE CONTEXT OF GHANA
An extensive literature review reveals strong indications that Ghanaian contractors
face a number of EDSD problems which end in harsh or adversarial relationship.
Anvuur (2006) and Laryea (2010) confirm the harsh conditions prevailing in the
construction industry in Ghana. This situation has been attributed to inadequate and
poorly articulated designs, delay in payment, the traditional system - ‗one way
procurement system‘, failure to capture clients requirements in tender document and
lot of variations in the construction phases (Anvuur, 2006; Laryea, 2010). Beside,
information flows which are inconsistent and lack coherence with law and best
practices result in non collaborative and adversarial relationship (see case no 8, PPA,
2009). In other developing countries the construction industry does not look different
from that of Ghana. Odusami et al. (2003) provided strong evidence that in the
Nigerian construction industry it is not uncommon to observe uncoordinated
information flows for EDSD activities and instructions. These come as a result of lack
of proper allocation and location of authority amongst the EDSD practitioners. Many
a time, one such problem which results in a non collaborative behavioural culture and
adversarial relationships in some developed economies like UK, is cost cutting of
tender figure or projects cost. This is done either through bullying or at best through
transaction –based relational contracting that soon limits continuous improvement
agenda (Skitmore and Smyth, 2007). This also seems to be happening in developing
countries like Ghana and Nigeria. Besides, contractors in Ghana face sceptics and
actions of unscrupulous clients and their agents (EDSD practitioners), which leads to
abandonment of partnering – collaborations (Alderman and Ivory 2007).
The problems are compounded as shown by a research carried out into causes of cost
overrun, which indicated that five out of eight problems indentified were design

Supply chain management
123
management related. The problems include non compliance of design with planning or
statutory requirement, incomplete design at the time of going to tender, lack of co-
ordination, ambiguity of risk allocation and inadequacy of management control
(Odusami et al, 2003). Who leads the project team or who leads the EDSD
practitioners‘ team is another major issue that could lead to a controversy, non co-
operation and adversarial relationship amongst the EDSD practitioners where actors
who are not project managers claim to be one. Uncoordinated and inconsistent
instructions from EDSD practitioners often lead to mistrust, lack of commitment, and
poor or no communication leading to frustration, difficulties and adversarial
relationship between them and contractors. The adversarial relationship occurs due to
wrong, abuse or acting contrary to the Law and authority in the construction industry
in Ghana (see no 7 PPA, 2009). These problems are all contentious issues that mostly
develop into harsh or conflicts situations that end in adversarial relationships between
mostly EDSD practitioners and building contractors in Ghana. It is on this basis that
the integrated RM and SCR concepts are being explored to determine whether their
integration can help change the non collaborative and adversarial culture to achieve
the required improvement in EDSD to building contractors in Ghana.
LITERATURE REVIEW THE SIGNIFICANCE OF
RELATIONSHIP MANAGEMENT IN THE
CONSTRUCTION SUPPLY CHAIN MANAGEMENT
The relationship management (RM) is a very broad
pragmatic concept which makes use of all
important possible
traditional and
non traditional
(innovative)
methods to change
individual and
organizational
attitudes,
behaviour,
systems and strategies towards achieving a non
adversarial relationship. But, the RM concept is not
without weaknesses and is based on
these that integration with the
construction supply chain
management (CSCM) becomes
very useful. The essence of
integrating RM with CSCM is to
enable the supply chain
relationships (SCR) engender
effective or strong performance by
introducing some available
developed models and concepts.
Supply chain relationships (SCR)
concepts are among the three
components of the supply chain
management (CSCM). The CSCM
is a management process and has
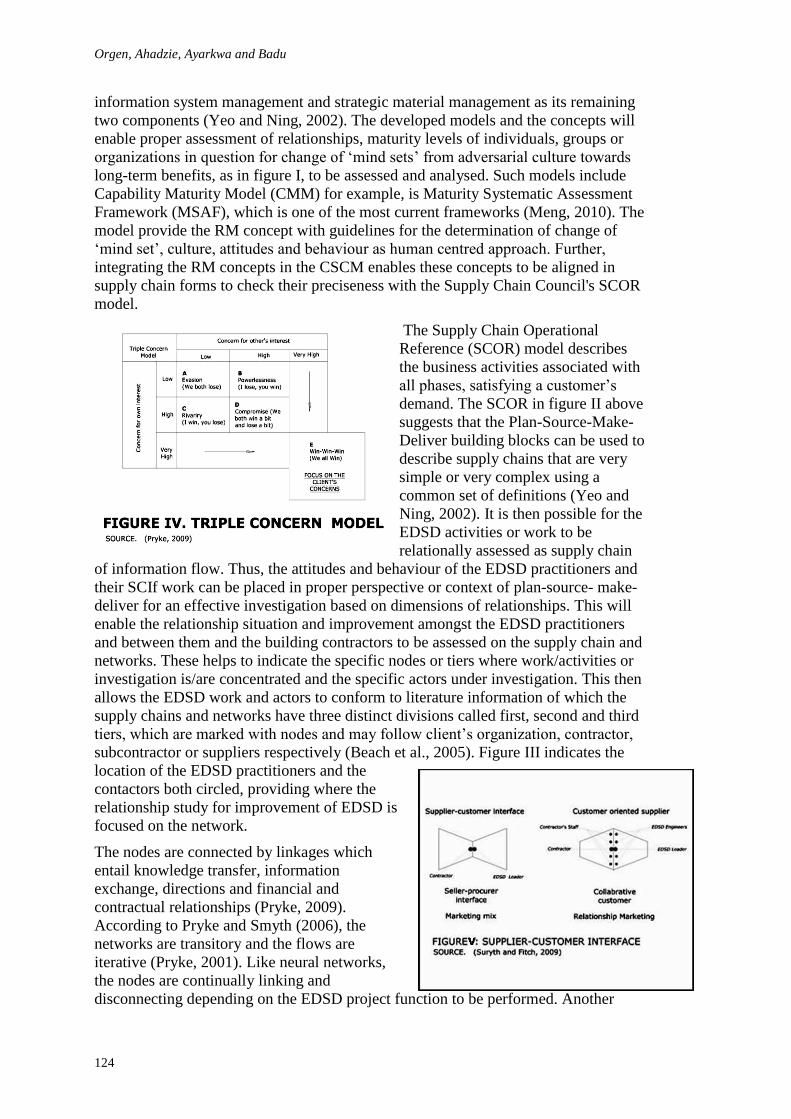
Orgen, Ahadzie, Ayarkwa and Badu
124
information system management and strategic material management as its remaining
two components (Yeo and Ning, 2002). The developed models and the concepts will
enable proper assessment of relationships, maturity levels of individuals, groups or
organizations in question for change of ‗mind sets‘ from adversarial culture towards
long-term benefits, as in figure I, to be assessed and analysed. Such models include
Capability Maturity Model (CMM) for example, is Maturity Systematic Assessment
Framework (MSAF), which is one of the most current frameworks (Meng, 2010). The
model provide the RM concept with guidelines for the determination of change of
‗mind set‘, culture, attitudes and behaviour as human centred approach. Further,
integrating the RM concepts in the CSCM enables these concepts to be aligned in
supply chain forms to check their preciseness with the Supply Chain Council's SCOR
model.
The Supply Chain Operational
Reference (SCOR) model describes
the business activities associated with
all phases, satisfying a customer‘s
demand. The SCOR in figure II above
suggests that the Plan-Source-Make-
Deliver building blocks can be used to
describe supply chains that are very
simple or very complex using a
common set of definitions (Yeo and
Ning, 2002). It is then possible for the
EDSD activities or work to be
relationally assessed as supply chain
of information flow. Thus, the attitudes and behaviour of the EDSD practitioners and
their SCIf work can be placed in proper perspective or context of plan-source- make-
deliver for an effective investigation based on dimensions of relationships. This will
enable the relationship situation and improvement amongst the EDSD practitioners
and between them and the building contractors to be assessed on the supply chain and
networks. These helps to indicate the specific nodes or tiers where work/activities or
investigation is/are concentrated and the specific actors under investigation. This then
allows the EDSD work and actors to conform to literature information of which the
supply chains and networks have three distinct divisions called first, second and third
tiers, which are marked with nodes and may follow client‘s organization, contractor,
subcontractor or suppliers respectively (Beach et al., 2005). Figure III indicates the
location of the EDSD practitioners and the
contactors both circled, providing where the
relationship study for improvement of EDSD is
focused on the network.
The nodes are connected by linkages which
entail knowledge transfer, information
exchange, directions and financial and
contractual relationships (Pryke, 2009).
According to Pryke and Smyth (2006), the
networks are transitory and the flows are
iterative (Pryke, 2001). Like neural networks,
the nodes are continually linking and
disconnecting depending on the EDSD project function to be performed. Another

Supply chain management
125
significance of integrating RM with CSCM is to have a model to regulate the generic
cultural concept of win-win-win (we all win) in project(s) procurement. This involves
developing cultural and collaborative changes in relationships that can be social
capital /investment for the parties involved to experience integrity and concern for
each other‘s interest, which will lead to both parties, in an exchange, gaining great
increase in performance. Win-win-win relationship and concern for all, which will be
realized among EDSD practitioners (client‘s organizational members) and between
them and building contractors can then be properly classified and measured as
traditional (adversarial), short–term or long-term in accordance with relationships
dimensions for improvement. These relationships articulated in many ways, have
become evident that trust, which is argued as a measure of relationship strength, a
critical success factor in partnering projects (Kadefors, 2004) and a good surrogate
measure for relationship strength, can no longer be excluded from any analysis of
relationships. (Smyth, and Edkins, 2007). Researchers such as Bennett and Jayes
(1995); Kadefors (2004); Cheung and Rowlinson (2004) have concentrated on diverse
aspects of trust and processes of trust development.
Rosseau et al (1998) defined Trust as a psychological state comprising the intention to
accept vulnerability based upon positive expectations of the intentions or behaviour of
another. Also, this is what Smyth, and Edkins (2007) had to say, in project context:
Trust is a disposition and attitude concerning the willingness to rely upon the actions
of or be vulnerable towards another party, under circumstances of contractual and
social obligations with the potential for collaboration. An extensive review of
literature revealed the following features of trust (Smyth, 2003) summary: i.
Characteristics of trust, ii. Components of trust, iii. Conditions of trust, iv. Levels of
trust, v. Operational basis for trust, vi. Evidence of trust, vii. Trust in the market,
(Baier, 1994; McKeeman, 2002). Other important factors for relationship strength are
confidence (Smyth, and Edkins, 2007) loyalty (Smyth and Fitch, 2009),
communication, commitment, alignment of objectives, and problem solving (Meng,
2010). These would be achieved in each project execution though the appropriate
integrated strengths of RM and SCR concepts including the most extensive and
comprehensive work of Gummesson (2001). Whose work knocked down the gauntlet
to challenge the marketing mix as given by Borden (1964), the so called 4Ps, product,
place, promotion and price (McCarthy, 1964) and its parameters. A substitution of a
minimum of thirty relationships (30Rs) subdivided into four groups were offered as: i.
Classic Market Relationships ii. Related supply chain management delivery channel
iii. Mega Relationships and iv. Nano Relationships (Smyth and Fitch, 2009). Finally,
by an effective use of a facilitator (Cheung and Rowlinson, 2005) working within a
human agency such as EDSD organization(s) a transformation of the adversarial
working culture is expected. The agency would as well help to achieve the right
relationships by asserting that expense should be made on critical events basically
known as the moments of truth, during EDSD interface activities, meetings of
personnel –suppliers - customers from the two parties as may occur as shown in figure
V. above, for such issues as claims and orders (Smyth and Fitch, 2009)
RELATIONSHIP MANAGEMENT (RM) IN THE CONTEXT OF
GHANA
Relationship Management derived its development from relationship marketing
(Gronroos, 2000; Gummesson, 2001; Ford et al. 2003; Smyth, 2008). This
management concept is a paradigm shift from adversarial behaviour towards more
collaborative practices which have their conceptual origins in relational contracting

Orgen, Ahadzie, Ayarkwa and Badu
126
(Smyth and Fitch, 2009). Thus, from the issues raised in the problem statement the
individuals, EDSD practitioners and the EDSD organizations in the construction
industry in Ghana need attitudinal or behavioural change. They have to develop a
culture that willingly accepts criticisms, objective confrontation for holistic change of
‗mind set‘ as in figure I towards a win-win collaborative relationship and not the
traditional win-lose or one off project culture (Cheung and Rowlinson, 2005). In the
developing countries, like Ghana, most often, project procurement is seen following
the traditional adversarial relationship trends with least resistance. This is due to the
difficulty for most humans to accept change voluntarily. In spite of the fact that some
old practices are barriers to the development of collaborative culture and non
adversarial relationship, the losing party or parties almost always block the change
towards the non adversarial of win-win relationship cultural change through change of
‗mind set‘ for long term benefits, which RM concept ensures (Cheung and Rowlinson,
2005).
In Ghana, the RM will help to introduce the behavourial aspects in addition to the
required systems and strategies for the particular project(s) under execution. The
essential project management structures, systems or strategies that will not be a barrier
to collaborative culture and non adversarial relationship in construction industry in
Ghana will be preserved. Thus, the RM adopts systems and strategies that are essential
for effective execution of project(s); paying uttermost attention to behaviourial and
attitudinal relationship that can lead to collaborative relationship by reduction or
elimination of discords, disputes conflicts and for improved performance. In this
sense, it is the project management behavioural and attitudinal practices that generate
non collaborative and adversarial relationship. This situation needs to change during
adversarial cultural transformation of the EDSD practitioners in the Ghanaian
construction industry. This adversarial cultural change through RM is aimed at
achieving win-win-win situation for all parties – that is Ghanaian construction actors
or players showing concern for others in the field which will generate valve for money
in project execution. The most common procurement system used in Ghana is the case
where design is separated from the construction -the traditional system. The industry
seems to prefer and accept this old system rather than any other procurement system
or innovative changes or reformation/ transformation. Yet it is the weaknesses of the
persisting adversarial contracting approach (Anvuur, 2006), full of non collaborative
and adversarial relationships that have consumed the good manners, joy and concern
for others in the EDSD to contractors. It is the loss of collaborative relationship
culture that RM seeks to address by the appropriate relationships from the thirty
relationship (30Rs) (Gummesson, 2001). That apart, the systems that evolved from the
relational contracting arises from the structure of the market. A positive atmosphere in
this context is resultant upon structure rather then agency and thus management has a
passive or reactive role (Smyth and Edkins, 2007). In this regard, partnering and
alliancing, for example, cannot be used for completely behavioural and attitudinal
change towards collaborative and non adversarial relationship culture in the
construction industry in Ghana. They are discords, disputes and conflicts prone to
some extent. The RM is a procurement approach which thrives by building a right
relationship and breaking down barriers by the right relationships development. RM is
viewed differently by different individuals and organizations but it can be applied to
any project delivery systems (PDS). The role of RM is not ―mates rates‖ approach;
―you are my mate you should give me the variation‖ is a misconception. Rather RM is
to proactively manage a project in order to maximize progress (and quality) while
minimising disputes among project team members (Cheung and Rowlinson, 2005).

Supply chain management
127
So the RM in Ghanaian construction industry will make it free from political,
economic, social, religious or ethnic ties or any other affiliation and rather strive
toward non aligned contracting of win-win-win and not win-lose (concern for others)
situation (Pryke, 2001). That is why in Ghana, the EDSD practitioners who are
knowledgeable and can accept confrontation with understanding, errors, omissions
from feedbacks and manage relationship changes through change of ‗mind set‘ better
for the improvement of EDSD, have become the target for investigation and adoption
in this research.
THE EXPECTED OUTCOME AND BENEFIT TO ACADEMIA
AND INDUSTRY
The integrated relationship and supply chain management framework studies will
provide information or data of the type of relationship and maturity level that exist
among highly educated professionals and between them and contractors in Ghana.
Integrated conceptual guidelines will be developed to improve collaborative culture
and relationship which will reduce or eliminate adversarial relationship, foster trust,
commitment, confidence, alignment of objectives and problem solving among EDSD
practitioners and between them and the contractors. In addition, the study will produce
an integrated framework that will offer open channel for regular free flow of EDSD
practitioners‘ peers‘ and contractors‘ feedbacks for improvement of EDSD to
contractors in Ghana. The marketing and negotiating skills will improve for repeat and
referral business. Such a situation will move the industry towards a win-win-win
situation instead of the existing win-lose situation. This situation will bring continuous
improvement, through learning and acquiring knowledge to show concern for others,
which yield long-term benefits in the construction and improvement in the EDSD to
Ghana contractors.
On the industrial front, the integrated relationship and supply chain management
framework will offer information that will help to improve collaborative culture and
relationship and maturity levels in order to achieve improvement in the EDSD to
contractors in Ghana. This will help to obtain proper estimates, contract conditions,
specifications from properly articulated drawings with all the essential detailing.
These will then be used to achieve realistic tender figures or projects cost that will not
call for cost cutting and reduce or eliminate resultant variations. Also, minimum
variations will help to produce projects on budgets and make savings. Further,
improvement in the EDSD will help project executors (contractors) to deliver projects
with less or no disputes. There will be high level performance through collective
problems solving which will help realize value for money for clients. The study, due
to expected collaborative and relationship changes emphasizes on trust, commitment,
confidence and alignment of objectives and collective solution to problems. These will
save time to help in the completion of project on schedule, achieve good quality and
of the right health and safety standards. The integrated relationship and CSCM
framework is expected to break down barriers of either political, economical, social,
religious or ethnic ties or affiliations in winning contracts. Contracts would then be
won on non-aligned basis only by proper relationships, business attitudes and
behaviourial standards.
Academically, the framework and other data acquired during the study can be used as
bases, guide or reference for further collaborative culture and relationship
management studies. Also the studies can be repeated or replicated between other tiers
and nodes on the construction supply chain and gather data for analysis to improve

Orgen, Ahadzie, Ayarkwa and Badu
128
collaborative culture and relationship management gradually through out the supply
chain network. The records of feedbacks from the contractors and the EDSD
practitioners and peers will be a useful guide for improving, strengthening and
underpinning professional requirements during teaching and learning. Further, the
study will create awareness among students and staff that professional competence
can be more beneficial to the individual or organization(s) when right relationship
behaviours and attitudes for repeat and referral business have been mastered/acquired.
Besides, it will free young academicians‘ and professionals‘ minds from thinking of
having ties or affiliation before getting a good building contracts after school.
CONCLUSION
In the literature, it was obvious that adversarial relationship and mistrust were rooted
in the construction industry for a very long time. The EDSD practitioners (as
intermediaries or agents of the clients) seem trusted and for that matter, their EDSD
activities seemed to have avoided investigation. There is little evidence in the
literature about investigation of their relationship with contractors. The investigation
showed that non collaborative and adversarial relationship existed amongst the EDSD
practitioners and between them and the contractors in Ghana. It is also evident that out
of the four relationship maturity levels identified as traditional adversarial, transitional
term, short term and long term relationships, a majority of the industry is still in the
baseline level of the traditional adversarial relationship situation. Besides, the
exploration revealed that behavioural attitudes such as showing concern for other
parties through trust, loyalty, confidence, problem solving, objectives alignment,
communication, openness for feedbacks are essential for managing the appropriate
thirty relationships (30Rs). This will result in constant flow of free feedbacks for
developing and improving of the EDSD to contractors. Further, it is obvious that
structures, strategies and systems of project management and other procurement
processes are still characterized by discords, disputes and conflicts. So, the integrated
intervention of RM and SCR has a dual focus on the one hand to achieve discords,
disputes and conflicts free relationship and on the other, to channel the constant free
flow of feedback to improve EDSD to contractors based on the relationship level
obtained.
REFERENCES
Anvuur,A. and Kumaraswamy, M. M. (2006)Taking Forward Public Procurement Reforms in
Ghana. CIB
W107 Construction in Developing Economies International Symposium, “Construction in
Developing Economies: New Issues and Challenges” January 18th – 20
th –Santiago
Chile.
Bresnen, M. (2007) Deconstructing partnering in project-based organization: Seven pillars,
seven Paradoxes and seven deadly sins. International Journal of Project
Management, 25, 365 – 374.
Bresnen, M. and Marshall, N. (2002) The Engineering or evolution of co-operation? A tale of
two Partnering projects. . International Journal of Project Management, 20, 497 –
505.
Baiden,B.K.,Price,A.D.F. and Dainty A.R.J. (2006) The extent of team integration within
construction projects. International Journal of Project Management, 24, 13-23. Chan,
D.W.M. and Kumaraswamy, M. M. (1997) A comparative study of cost overruns in
Hong Kong construction projects. International Journal of Project Management,
15(1) 55-63.

Supply chain management
129
Cheung, F.Y.K. and Rowlinson, S. (2005) Relational Contracting: The way forward or just a
brand name? research by Australian Cooperative Research Centre for Construction
Innovation.
Chenng, F.Y. K. and Rowlinson, S. (2004) A review of the concepts and Definitions of the
Various Forms of Relational Contracting. International Symposium of the CIB W92
on Procurement Systems ―Project Procurement for Infrastructure Construction ―7-10
January, 2004, Chennai, India.
Edum- Fotwe, F.T.,Thorpe, A. and McCaffer, R. ( 2001) Information procurement practices of
key actors in construction supply chains. European Journal of Purchasing and supply
management, 7, 1 55-64..
Gronroos, C. (2000) Service Management and Marketing, John Willy and Sons, London.
Gummesson, E. (2001) Total Relationship Marketing. Butterwort-Heinemann,
Oxford.
Hatmoko, J.U.D. and Scott, S. (2010) Simulating the impact of supply chain management
practice on the performance of medium-sized building projects. Construction
Management and Economics, January –March 2010, 28, 35-49.
Kadefors, A. (2004) Trust in project relationships – inside the black box. International Journal
of Project Management 22, 2004, 175-182.
Laryea, S. (2010) Challenges and opportunities facing contractors in Ghana. West Africa Built
Environment Research (WABER) Conference, 27-28 July 2010, Accra, Ghana, 215-
226.
Mensah, S. (2007) The Effect of Project Management Practices on Building Projects
Performance: The of three organisations. Master of Science thesis in construction
management submitted to Kwame Nkrumah University of Science and Technology,
Kumasi, Ghana.
Meng, X. (2010) Assessment framework for construction supply chain relationships:
Development and evaluation, Int.Journal of Project Management, 28, 695-707.
Odusami, K.T., Iyagba, R.R.O. and Omirin M. M. (2003) The relationship between project
leadership, team composition and construction project performance in Nigeria.
International Journal of Project Management, 21, 519-527.
PPA (2009) Public Procurement Authority‘s, Finding of case No. 8. Accra, Ghana,
ppaghana.org. PPA, (2009) Public Procurement Authority‘s, Finding of case No. 7.
Accra, Ghana, ppaghana.org.
Pryke. S. (2009) Construction Supply chain Management Concepts and Case Studies, Oxford
UK, Blackwell publishing Ltd.
Rosseau, D.M.,Sitkin. B., Burt, R.S., Camerer, C.( 1998) Not so different after all a cross-
discipline view of 22trust. Academy of Management Review 23(3); 393-404.
Smyth, E. (2008) The credibility gap in stakeholder management: ethics and evidence of
relationship management. Construction Management and Economics, April -June
2008, 26, 633-543.
Smyth, H. and Edkins, A. (2007) Relationship management in the management of PFI/PPP
projects in UK. International Journal of Project Management, 25, 2007, 232-240.
Smyth, H. and Fitch, T. (2009) Application of relationship marketing and management: a
large contractor case study. Construction Management and Economics, April –
June2009, 27, 399-410.
Yeo K. T. and Ning, J. H.(2002) Integrating supply chain and critical chain concepts in
engineer-procure-construct (EPC) projects. International Journal of Project
Management,20, 253-262.


Opintan-Baah, E., Yalley, P.P., Kwaw, P. and Osei-Poku, G. (2011) An investigation into the activities
of the Environmental Protection Agency (EPA) in the Ghanaian construction industry: A case study of
Sekondi-Takoradi Metropolis In: Laryea, S., Leiringer, R. and Hughes, W. (Eds) Procs West Africa
Built Environment Research (WABER) Conference, 19-21 July 2011, Accra, Ghana, 131-141.
131
AN INVESTIGATION INTO THE ACTIVITIES OF THE
ENVIRONMENTAL PROTECTION AGENCY (EPA) IN
THE GHANAIAN CONSTRUCTION INDUSTRY: A CASE
STUDY OF SEKONDI-TAKORADI METROPOLIS
Emmanuel Opintan-Baah1, P.P. Yalley
2, P. Kwaw
3 and G. Osei-Poku
4
1,4 Building Technology Department, School of Engineering, Takoradi Polytechnic, Takoradi
2,3 Civil Engineering Department, School of Engineering, Takoradi Polytechnic, Takoradi,
A study was conducted with the purpose of investigating into the activities of the
Environmental Protection Agency (EPA) in order to ascertain the extent of
enforcement of the Environmental Protection Agency Act in the Ghanaian
Construction Industry. A literature review focused on environmental management and
impact assessment, the Environmental Protection Agency Act and their relationship
with the construction industry. Closed-ended and open-ended questions were posed
and sent to purposive sampled construction industry stakeholders in the Sekondi-
Takoradi Metropolis. Also a structured interview was conducted for an official from
the Environmental Protection Agency in Sekondi-Takoradi. It emerged from the
studies that more than 50% of the stakeholders, most of who were in the building
sector, had never obtained an Environmental permit. Again it was noted that most of
the stakeholders in the construction industry were aware that obtaining an
Environmental permit was not a prerequisite for the execution of building projects. It
was concluded that it was a fact that a lot more had to be done by the EPA regarding
monitoring of construction activities and the enforcement of the Environmental
Protection Agency Act. The strict enforcement of the Environmental Protection
Agency Act, increase in publicity on Environmental Management, reduction in the
duration between applying for an environmental permit and receiving it and banning
the use of environmentally unfriendly materials were the recommendations made after
the research; as these would help improve environmental quality in the Ghanaian
Construction Industry.
Keywords: Environment, Environmental Protection Act, Environmental Protection
Agency, Ghana, Sekondi-Takoradi.
INTRODUCTION
Environmental Management involves the controlling of human interaction with the
environment with the aim of preserving and sustaining the environment. One of man‘s
major interactions with the environment is construction, which has never stopped
since creation. Construction‘s lifecycle begins when raw materials are extracted from
the earth, followed by manufacturing, transport and use, and ends with waste
management including recycling and final disposal.
1
4

Opintan-Baah, Yalley, Kwaw and Osei-Poku
132
The building and construction sector is a significant consumer of raw and natural
materials. It also produces wastes that contribute to the emission of greenhouse gases
which are potentially damaging to the natural environment. Construction and post-
construction activities generally consume 50% of global material resources and
specifically, 70% of global timber products. In addition, 45% of all energy generated
is used to heat, ventilate and light buildings and 40% of water is used for sanitation
and other uses in buildings. The current population increase of 73 million per year will
also place higher demands on the consumption of raw and natural materials (Wyk,
2009). This therefore calls for the need to study into the activities of The
Environmental Protection Agency so as to ascertain how the Environmental Protection
Agency Act is being enforced in the Ghanaian construction industry.
This study delves into Environmental Management in the Ghanaian construction
industry in order to ascertain compliance with any laid down environmental
management procedures in the planning and execution of building projects; and also
suggests ways of improving compliance of the Environmental Protection Agency Act
in Sekondi-Takoradi in the Ghanaian construction industry. This will be done through
the following objectives:
To appraise the Environmental Protection Agency Act of Ghana and its
enforcement with regard to the construction industry.
To find out if the stakeholders in the Ghanaian construction industry are aware
of environmental management procedures and are complying with the
Environmental Protection Agency Act, and
To suggest means of improving the enforcement of the Environmental
Protection Agency Act of Ghana in the construction industry by the
Environmental Protection Agency.
ENVIRONMENTAL MANAGEMENT
Occurrences in the world today suggest that environmental management involves
more than biophysical manipulation and control. It concerns the mutually beneficial
management of the humankind-nature interaction to ensure environmental and social
equality for future generations (Carley and Christie, 2000).
Construction is directly or indirectly involved in all aspects of mankind‘s existence on
this earth. No wonder the construction industry is seen to consume a great chunk of
the natural resources and to contribute greatly to the emission of global warming
gases. Apart from the statistics given in the introduction, Šelih and Vrtnik (2005) also
confirm that the major impact associated with construction activities stems from the
consumption of materials, many of which are nonrenewable.
Some major trends in the world today include population growth and land conversion
and degradation due to urbanization, industrialization, deforestation, desertification
and soil degradation, conversion of wet lands and valleys and many others (Carley and
Christie, 2000). A careful consideration of each of these trends revealed the
involvement of the construction industry in one way or another. For example the
growth in population would mean the need for more houses and other infrastructure to
be provided by the construction industry; urbanization and industrialization requires
construction; deforestation, desertification and soil degradation could be as a result of
extracting raw materials to be used in the construction industry etc.

Environmental protection
133
In the UK and other European countries all organisations are to comply with certain
standards and are closely monitored by many institutions and laws, some being
general and others being for specific activities and organisations. In Ghana apart from
the EPA it is usually only the local authorities that are involved in some way to ensure
compliance with environmental management in the construction industry. Since
construction is seen to cut across almost every activity on earth it becomes very
necessary for any organisation which is to monitor and enforce environmental
management to pay critical attention to all that goes on in the construction industry.
The onus therefore falls on the EPA of Ghana to structure its activities such that all
construction activities from the extraction of materials for manufacture to the actual
usage and after can be closely monitored to ensure effective environmental
management.
ENVIRONMENTAL MANAGEMENT LEGISLATION IN GHANA
There is the need to briefly review literature on environmental management in the
construction industry in Ghana and the Environmental Protection Agency Act in
Ghana. Ghana established the Environmental Protection Council (EPC), as a public
institution with oversight responsibility for the environment in 1974 through the
National Redemption Council Decree, (NRCD) number 239. However, NRCD 239
was porous in the opinion of the researchers in that, it made no reference to
environmental impact assessment. The closest that decree 239 came to this concept
was in Section 2, which among other things, required the Environmental Protection
Council to ensure the observance of proper safeguards in the planning and execution
of all development projects including those already in existence that are likely to
interfere with the quality of the environment.
In March 1989 a government directive was issued that required that, the EPC be
consulted on development proposals and that a ―certificate of clearance‖ be issued
indicating that adequate provisions had been made in the project proposals to contain
potential adverse environmental impacts.
By the 1990s, awareness on environmental issues had risen to such an extent that all
over the world governments of countries had to formulate policies and enact laws to
ensure environmental management in all activities. For most governments,
environmental management became an objective. Ghana therefore enacted the
Environmental Protection Agency Act which established the Environmental
Protection Agency (EPA) to enforce and monitor environmental management.
According to the institute of environmental management and assessment (IEMA), the
environmental regulation of businesses and other organisations is intended to protect
human health and the environment from harm within the context of sustainable
development
In 1994, Ghana enacted the Environmental Protection Agency Act, 1994 (Act 490)
(GEPAA 1994). This act created a body corporate called the Environmental Protection
Agency (EPA) to replace the EPC. This agency has been in existence and in charge of
environmental issues to date. Among its functions the EPA was mandated to ―ensure
compliance with any laid down environmental assessment procedures in the planning
and execution of development projects, including compliance in respect of existing
projects.‖
The vision of the lawmakers with respect to regulations was realized in the
Environmental Assessment Regulations, 1999 (L. I. 1652) which came into force on

Opintan-Baah, Yalley, Kwaw and Osei-Poku
134
the 24th
of June 1999. The L. I. 1652 deals with the various procedures to be
followed prior to the grant of a permit, procedures for filing complaints, offences and
penalties.
Act 490 together with L. I. 1652 establishes the Environmental Assessment Systems
in Ghana which briefly comprises Registration, Screening, Environmental Impact
Assessment and Environmental Management Planning.
Although, Act 490 and L. I. 1652 exist there are still a lot of environmentally
unfriendly activities going on in the construction industry in Ghana such as, wrongful
use of land (for example building in water ways); improper disposal of construction
and demolition waste; improper storage and use of chemicals; destroying of natural
flora and fauna and pollution and emissions, just to mention a few. What is happening
with these laws? This study aims to find out.
OVERVIEW OF THE ENVIRONMENTAL MANAGEMENT
SYSTEM IN THE CONSTRUCTION INDUSTRY IN GHANA
In practicing Environmental Management, Ghana has made Environmental
Assessment a requirement for specific Undertakings. The word ―undertaking‖ is
defined here as ―any enterprise, activity, scheme of development, construction,
project, structure, building, work, investment, plan, programme, any modifications,
extension, abandonment, demolition, rehabilitation or decommissioning of such
undertaking may have a significant impact in its implementation (GEACap 2001).
The undertakings required by law to conduct Environmental Assessment in Ghana fall
under the following sectors: Agriculture, Energy, Forestry and wildlife, General
construction and services, Health, Manufacturing industry, Mining, Tourism and
Transportation (GEPAA 1994).
Environmental Impact Assessment (EIA) takes care of the planning stage of an
undertaking, while an Environmental Management Plan (EMP) covers the
implementation or operational phase of the undertaking (GEACap2001). Any
undertaking approved for development by the EPA is required to submit an Annual
Environmental Report (AER), Environmental Management Plans (EMPs) and
Environmental Impact Statements. Also management of an undertaking is required to
conduct periodic, systematic and objective evaluation to assess the environmental
effectiveness of the operational and management systems of the undertaking. The
management of the undertaking may appoint an independent expert to conduct the
audit in order to be fully informed of the true status of the environmental management
programme in place.
However, the EPA is charged with the responsibility to conduct its own audit termed
―Compliance Audit‖, to verify and inform itself about the compliance status of an
undertaking (GEPAA, 1994). This in the opinion of the current researchers is
tantamount to conflict of interest.
Environmental Impact Assessment
This is section 12 of the Act 490 and it has two subsections. The first subsection states
that; ―the Agency may, by notice in writing, require a person responsible for an
undertaking which in the opinion of the Board has, or is likely to have, adverse effect
on the environment to submit within the period specified in the notice, an
Environmental Impact Assessment (EIA).

Environmental protection
135
The second subsection stresses that when the Agency issues such a notice (that
mentioned in the first subsection), it would have to inform any governmental body in
charge of the issuance of a permit, license, consent or an approval for the undertaking
affecting the environment (that the notice has been issued). This is done so that the
governmental body would not grant the permit, license, consent or approval until it is
informed in writing by the Agency that the notice it (the Agency) issued has been
complied with. If the above provisions are there why do we see siting of building
structures in wrong locations like water ways?
Besides the above provision there is also an Enforcement Notice where the EPA
considers that the activities of an undertaking pose a serious threat to the environment
or to public health has the to prevent or stop the activities. Such an enforcement notice
is required to specify; the offending activity, the steps required to be taken, the time
within which the steps shall be taken and the immediate cessation, where necessary, of
the offending activities. Here it is also made clear that anyone who acts contrary to an
enforcement notice, will have committed an offence and would be liable to a fine and
in default a term of imprisonment not exceeding one year or both the fine and the
imprisonment. This aspect of the Act is what this study will concentrate in its
investigation to ascertain the effectiveness of the Act 490.
RESEARCH METHODS
Combination of quantitative and qualitative research methodology was used in this
research. Data obtained for this research was limited to stakeholders in the
construction industry namely: Clients, Contractors, Engineers, Quantity Surveyors,
Architects, and Site Supervisors in the Sekondi-Takoradi Metropolis through
questionnaire survey. Structured interview was conducted for personnel from the
Environmental Protection Agency (EPA), the implementing agency of the
Environmental Protection Agency Act.
The sample for the questionnaire was selected by the Stratified Random Sampling
procedure; where the population was divided into clients, contractors, engineers, etc.
and from these groups, respondents were selected randomly. A sample size of thirty
was therefore selected for the administration of the questionnaire.
For the interviews the sample was selected by the purposive sampling method. This
was because officials of the EPA in the opinion of the researchers were the most
suitable source of information since they are the enforcers and monitors of
environmental management. Here, a sample size of two was selected.
Survey Questionnaire
To elicit credible information for analysis, a questionnaire was designed to be
answered by stakeholders of the Ghanaian construction industry. The questionnaire
consisted of four sections in the following order.
Section A: The background of the respondents, this section of the questionnaire was to
gain general information about the respondents
Section B: Assessment of the awareness of the respondents on environmental
management in the Ghanaian construction industry. Questions were to help the
researchers to determine the degree of awareness of respondents of environmental
management procedures in the Ghanaian construction industry.
Section C: The adequacy of environmental management in the Ghanaian construction
industry. Questions were structured to assess the knowledge of respondents on

Opintan-Baah, Yalley, Kwaw and Osei-Poku
136
environmental management in the Ghanaian construction industry and also to find out
if respondents were complying with the Environmental Protection Agency Act.
Section D: Suggestions of steps to be taken to improve environmental management in
the Ghanaian construction industry. The questions were framed to obtain information
on the opinion of the respondents on how to improve environmental management in
the Ghanaian construction industry. Using a Likert scale from ‗strongly agree‘ to
‗strongly disagree‘, respondents were given the options to suggest how to improve
environmental management in the construction industry in Ghana. Details of the
statements and their responses are tabulated in Table 4 of the next section.
Structured Interview
Structured interview questions were designed for the officials of the EPA to obtain
first-hand information from the professionals in charge of environmental management
in Ghana.
RESULTS AND DISCUSSION OF RESEARCH DATA
The results from the fieldwork (the questionnaires and the interview) are presented
and analysed in this section.
Analysis and discussion of Data obtained from the Questionnaire
In all, 30 questionnaires were distributed to potential respondents who are
stakeholders of the construction industry. Out if these, 20 were received representing
67%. The respondents were made up of the following: three clients, five Contractors,
three Engineers, three Quantity Surveyors, two Architects, and four Site Supervisors.
Section A of the questionnaire
This Section was mainly meant to categorise responses. Table 1 records the details of
the responses to Section A of the questionnaire. It could be seen from Table 1 that
some respondents had been involved in more than one of the project categories.
However, the larger proportion about 95% of the respondents had been involved in
building projects. It could be said that a very large proportion of the respondents
(95%) had been involved in building projects for the past five to fifteen years.
Table 1. Questions and Responses obtained in Section A of the questionnaire
Questions Purpose Number of respondents and their Reponses.
Which of the following
project categories have
you been involved in?
To help in classifying the
respondents.
Building
projects
Major Civil
Eng. Projects
Minor Civil
Eng. Projects
19 (95%) 2(10%) 8 (40%)
How long have you
been involved in the
construction industry?
This question will elicit
how long a person has
been working.
1-5yrs 6-15yrs <15
7 (35%)
10 (50%)
3 (15%) In which category does
your position in your
organization fall?
The objective of this
question is to find out
whether environmental
awareness exists at all
the levels indicated as
response options.
Top level Middle level Artisans
8 (40%) 12 (60%) 0

Environmental protection
137
On the position of respondents in their respective organizations, it came out that the
sample was made up of only Top and Middle level management, with the greatest
proportion (60%) being middle level management. Though the researchers wanted to
have a sample covering all three levels indicated in Table 1, there were some
difficulties in getting respondents who were artisans or site operatives. This level of
respondents was not ready to participate in the survey for various reasons.
Section B of the Questionnaire
From Table 2 a greater proportion of the respondents (55%) had never obtained an
Environmental Permit from the EPA. Relating this to the responses in Table 1 it could
be deduced that a greater number of stakeholders in the building industry, had never
obtained any environmental permit for projects executed for the past five to fifteen
years. Also, while only 10% of the respondents had dealt with the EPA in relation to
construction activities, there was a tie between those who had seldom dealt (45%)
with the EPA and those who had never dealt (45%) with the EPA. This does not augur
very well for effective environmental management in the Ghanaian construction
industry.
It was also revealed that the majority of the respondents (55%) were aware of the
procedure for obtaining an environmental permit for construction projects, but they
were also aware that it was not a requirement to obtain an environmental permit for
their activities.
Table 2. Questions to assess the Awareness of Environmental Management in the Ghanaian Construction
Industry
Question Purpose of the Question Answer options
Have you ever had to obtain an
environmental permit from the
Environmental Protection
Agency (EPA)?
A response to these questions will be
analysed against a response to
question three of section A to
evaluate the respondents‘ awareness
of environmental management.
Yes
9
(45%)
No
11
(55%)
How many times have you had
to deal with the EPA in relation
to construction activities?
Often
2
(10%)
Seldom
9
(45%)
Never
9
(45%)
Are you aware of the procedure
for obtaining an environmental
permit for a construction
project?
These two questions will be analysed
together to determine a respondent‘s
true awareness since the right answer
to question 4 is well known by the
researchers. Therefore the two
answers must correspond.
Yes
11
(55%)
No
9
(45%)
In Ghana, is it a requirement to
obtain an environmental permit
for all construction activities?
Yes
6
(30%)
No
13
(65%)
In summary, Section B was meant to evaluate the respondents‘ degree of awareness of
the environmental management requirements in the Ghanaian construction industry.
From the results it could be concluded that the respondents had some awareness of
environmental management. At least majority of the respondents knew the procedure
for obtaining an environmental permit but also knew it was not a requirement to get a
permit for all construction activities.
Section C of the Questionnaire
For an assessment system to be seen as adequate, the one being assessed should at
least be aware of the parameters used for the assessment, hence this section was
designed to find out the level of awareness of the parameters for Environmental
Assessment. It came out that only 15% of the respondents were fully aware of these

Opintan-Baah, Yalley, Kwaw and Osei-Poku
138
parameters, although the majority of the respondents, 60% had a fair idea of the
parameters for environmental assessments. This was deemed a positive sign in the
opinion of the researchers.
Table 3. Questions to assess the extent of awareness of Environmental Management Assessment parameters in the
Ghanaian Construction Industry
Question Purpose of the Question Options
To what extent are you aware of the
parameters on which construction
projects are assessed
environmentally?
This question tries to verify
knowledge of the assessment
procedure by the one being
assessed.
Fully
Aware
3
(15%)
Have a fair
idea
12
(60%)
Not aware
5
(25%)
How often do EPA officials visit
your site(s) to ensure compliance
with environmental management
procedures?
This question verifies the
frequency of visits by officials of
the EPA to construction sites.
Often
0
Seldom
10
(50%)
Never
10
(50%)
Do you see the environmental
assessment procedures in the
construction industry to be fair to all
parties?
This question is to test the fairness
of the environmental assessment
procedures to all parties involved
in construction.
Yes
12
(60%)
No
6
(30%)
How would you rate the duration
between putting in an application
for an environmental permit and
receiving it?
The responses to these two
questions would also aid the
researchers to judge the
perception of respondents in terms
of the adequacy of environmental
management in the construction
industry
Fast
2
(13.3%)
Slow
9
(60%)
Very slow
4
(26.7%)
How would you describe the EPA
during an environmental
assessment?
Co-
operative
4
(20%)
Not co-
operative
2
(10%)
Fair
14
(70%)
Another important characteristic of an adequate environmental management system is
frequent visitation of sites by the assessor to monitor and ensure compliance. The
researchers posed a question to find out whether EPA officials paid frequent visits to
construction sites. The responses indicated a tie between EPA officials paying visits
seldom and never. It would therefore not be wrong to say that the EPA had more to do
in relation to site visitation to monitor and to ensure compliance with environmental
issues. Even though, a greater proportion of the respondents (70%) said that the
Environmental Assessment by EPA was fair, about 60% of the respondents were of
the view that the process was slow.
Section D of the Questionnaire - Steps to be taken to Improve Environmental
Management in the Ghanaian Construction Industry
This section was to solicit the views of the respondents on possible steps to be taken to
improve environmental management in the Ghanaian construction industry. Nine steps
were suggested on a Likert scale of ‗strongly agree‘ to ‗strongly disagree‘. The
respondents were given the choice to express their degree of agreement or
disagreement on a particular statement.
A total of 20 respondents were asked to read each statement carefully and tick in the
spaces provided, the response that accurately represented their opinion. In all cases at
least 75% of the respondents agreed that publicity, amendments of the Act, and
building laws, good assessment methods, fast tracking of the permit processes,
tougher penalties for none compliance of the Act and banning the use of unfriendly
materials were some of the ways that could be used to improve environmental
management in the construction industry. It should be noted that, more than 12 of the
20 respondents laid emphasis on publicity of the activities of the EPA, reducing the

Environmental protection
139
duration of obtaining the environmental permit and banning of hazardous materials,
by strongly agreeing to statements in items 1, 5 and 9 (Table 4.)
Table 4 suggested statements on improving the environmental management in the construction industry
It
ems
Steps to be taken to improve environmental management
in the Ghanaian construction industry
RESPONSES
ST
RO
NG
LA
GR
EE
AG
RE
E
NE
UT
RA
L
DIS
AG
RE
E
ST
RO
NG
LY
DIS
AG
RE
E
1 Increase in publicity of environmental management 16 4 0 0 0
2 Revision or amendment of the EPA Act and the
environmental assessment regulations
4 11 2 2 0
3 Revision of Building Regulations 7 9 1 3 0
4 Developing specific assessment methods for the construction
industry
5 14 1 0 0
5 Reducing the duration between putting in an application for
an environmental permit and receiving it
13 5 2 0 0
6 Increasing or strengthening penalties for breaking
environmental laws
9 10 1 0 0
7 Making environmental management a contractual requirement
for contractors when tendering
7 10 0 3 0
8 Learning from other countries, like the UK, which are doing
better in environmental management
7 11 1 1 0
9 Banning the use of environmentally unfriendly materials 14 5 0 1 0
DATA OBTAINED FROM THE INTERVIEW
It was in the research programme to interview two officials from the EPA (one from
the field level and the Metropolitan Director of the Sekondi-Takoradi EPA).
Nonetheless, the researchers were able to interview only one person; the Senior
Programmes Officer. This was because the Metropolitan Director was very busy and
the fieldworkers (Inspectors) were out on assignments.
The first question posed was on how the EPA was faring with environmental
management in the Ghanaian construction industry. To this the EPA official answered
that they were doing quite well but as usual there was more room for improvement.
He went further to outline the environmental assessment procedure to the researchers.
He also stressed that the EPA would have to do more monitoring to ensure compliance
of the environmental laws, which was a confirmation of what the stakeholders of the
construction industry strongly agreed to (Table 4).
Asked whether the EPA‘s activities covered all sectors of the construction industry,
the official replied in the affirmative with an exception of residential buildings. The
researchers also wanted to know why environmental permits were not required for
residential buildings. The EPA official explained that they were not mandated by law
to issue permits for residential buildings, but the Town and Country Planning
Department together with the Environmental Health and Sanitation Department of the
District Assemblies were responsible of issuing of other permits for residential
purposes. The officer further explained that it was the duty of these departments to
ensure that, environmental management policies were adhered to before the permits
were issued.

Opintan-Baah, Yalley, Kwaw and Osei-Poku
140
The next question was on whether some changes or revisions to the EPA Act and L. I.
1652 would be helpful to achieve efficient environmental management in the
Ghanaian construction industry. To this the EPA official answered ‗yes‘. When asked
to recommend changes, he recommended that certain aspects of the Act and L. I. 1652
be revised for example introducing environmental assessment for residential buildings
in Ghana as is done in the UK and the EU countries.
Finally, the EPA official stated that previously they used to carry out a lot of publicity
but that had reduced in recent times. It is therefore necessary to increase publicity as
stated in the issues that arose from the questionnaire to stakeholders. On the whole the
interview was very enlightening and confirmed some of the issues that came out
during the administering of the questionnaire.
CONCLUSION AND RECOMMENDATIONS
A study was conducted on the activities of EPA in the construction industry in Ghana,
using Sekondi Takoradi Metropolis as a case study area. A combination of
quantitative and qualitative research methodology was used in this research. Data
obtained for this research was limited to stakeholders in the construction industry
namely: Contractors, Engineers, Quantity Surveyors, Architects, and Site
Supervisors in Sekondi-Takoradi Metropolis through questionnaire survey. Structured
interview was conducted for personnel‘s from Environmental Protection Agency
(EPA).
It emerged from the studies that more than 50% of the stakeholders, most of who were
in the building sector, had never obtained Environmental Permits. The study
concluded that lack of specific enforcement of the Environmental Protection Agency
Act in the building construction industry and the lack of frequent visits by the EPA to
building construction sites are major factors affecting effective environmental
management in the Ghanaian construction industry. Since the EPA is responsible for
every aspect of environmental management, this means a second look should be taken
at their activities.
It is therefore recommended that, EPA should increase publicity on environmental
issues and their various activities related to environmental management; embark on
regular visits to construction project sites and come out with environmental
management procedures specifically for the building construction industry in Ghana.
ACKNOWLEDGEMENTS
The Authors are very grateful to staff of the Environmental Protection Agency in
Sekondi-Takoradi for being very supportive and co-operative during the study.
REFERENCES
Environmental Protection Agency, Ghana (2001), Ghana Environmental Assessment Capacity
Development Programme (GEACap), Environmental Assessment Administration
Systems manual, unpublished
Llewellyn van Wyk, (2009) CSIR investigates use of natural fibre composites in construction
[http://www.scienceinafrica.co.za], 24th May 2009
The Parliament of Ghana (1994), The Environmental Protection Agency Act, 1994
(Act490), Ghana Publishing Company, 1994, Accra.
National Redemption Council Decree, (NRCD) number 239, Ghana Publishing Company,
1974, Accra.

Environmental protection
141
Environmental Assessment Regulations, 1999, Legislative Instrument 1652 (L. I. 1652),
Ghana Publishing Company, Accra.
Naoum S.G. (2007) Dissertation Research and Writing for Construction Students second
edition, Elesevier, Hungary
Carley, M and Christie, I (2000), Managing sustainable development second edition,
Earthscan Publications, UK
Šelih, J and Vrtnik, G (2005) Quality and environmental management systems in Slovenian
construction companies, Report No. PR36, Faculty of Civil and Geodetic
Engineering, Slovenian Construction Cluster of Slovenia, Ljubljana, Slovenia.
Hemming, C (2005) Effective compliance management, the environmentalist, issue number
33, Decenber 2005
IEMA, (2005) Managing compliance with environmental Law: a good practice guide
Practitioner, volume 6, December 2005.


Baffour-Awuah et al. (2011) An investigation on why adjudication is not a popular dispute resolution
method in the Ghanaian construction industry In: Laryea, S., Leiringer, R. and Hughes, W. (Eds) Procs
West Africa Built Environment Research (WABER) Conference, 19-21 July 2011, Accra, Ghana, 143-
151.
143
AN INVESTIGATION ON WHY ADJUDICATION IS NOT
A POPULAR DISPUTE RESOLUTION METHOD IN THE
GHANAIAN CONSTRUCTION INDUSTRY
Eric Baffour-Awuah1, Charles Bentum Vroom and Peter Kweku Otchere
School of Engineering, Takoradi Polytechnic, Ghana
Adjudication as a method of dispute resolution in the Ghanaian construction industry
is almost non-existent, mainly due to the fact that no legislative instrument has been
passed in relation to it [1]. The contrary can be said about arbitration, which attained
parliamentary ascent in 1961. Adjudication and arbitration as construction dispute
resolution methods were compared to ascertain why the latter is more popular once a
dispute arises during the execution of a construction contract, despite the fact that the
time frame for making an award on an arbitration case is almost unlimited[2], whilst a
case referred to adjudication (according to the UK technicalities) should last no more
than 28 days (or a maximum of 42 days if the adjudicator makes a request and both
parties agree)[3]. In all, 50 questionnaires were administered to construction experts
consisting of 30 contractors, 10 quantity surveyors and 10 architects. The survey
consisted of 15 statements that measured the parties‘ attitude and opinion in relation
to their perception of adjudication and arbitration as construction dispute resolution
tools in the Ghanaian construction industry, with the respondents indicating their level
of agreement of each statement on a 5 level scale. It was found from the survey
conducted, that adjudication is not as popular as arbitration because there is not
enough knowledge on it. Therefore a conscious effort must be made by all major
stakeholders affiliated with the Ghanaian construction industry to disseminate
information about adjudication to its members.
Key words: construction dispute, adjudication, construction contract, award.
INTRODUCTION
Most parties that are involved in the construction industry believe that conflicts are
bound to arise during the execution of the project. Many of these parties believe that
this is promoted by the standard forms of contracts used [4]. For all parties bound by
a construction contract though, the main objective is common – a structure. The
motivation for providing the structure mostly has to do with the profit each respective
party is due. The client and the contractor can make a profit in a diverse number of
ways. If a situation arises that compromises the profit any party is due, conflicts are
inevitable. The potential for claims and disputes is eminent and all parties must take
cognizance of this fact before any contractual relationships commence.
In Sindall versus Solland (2001), His Honour Judge Lloyd QC sheds light on what a
dispute is pertaining to the construction industry by asserting that [5],

Baffour-Awuah, Vroom and Otchere
144
“For there to be a dispute…it must be clear that a point has emerged from the process
of discussion or negotiation that has ended and that there is something which needs to
be decided.”
Another point to be taken is that before a case can be referred to arbitration or
adjudication, there must be dispute between the contracting parties. A mere claim is
insufficient grounds for a case to be referred to arbitration or adjudication. If for
example a contractor simply sends the client a letter complaining of monies owed for
alleged delays, the contractor cannot immediately conclude that a dispute has arisen
[6].
“It crystallizes into a dispute when I have had a reasonable opportunity to consider
the complaint, so I can “take a position”. If I tell you to go to hell, ignore you or
shilly-shally, the claim automatically metamorphoses into a dispute.”
Simply put, a dispute does not arise until it is affirmed that the claim made by the
referring party is not accepted by the responding party. There are various
circumstances that can mean that a claim has been dismissed or rejected by the
responding party, however Mr. Justice Jackson in the case Amec versus The Secretary
of State for Transport (2004) enumerates the following: [4] An express rejection;
Silence; Prevarication; Delay in response to the claim
ARBITRATION
Arbitration can be traced back to the Egyptian times and the Middle Ages. It was
incepted to resolve disputes that arose between parties and its prime objective was to
provide a speedy means of dispensing justice using a simple procedure, especially
since the courts were becoming more and more constrained by procedural formalities.
Infact, the first English statute on arbitration was in 1698 [7]. In a nutshell, arbitration
can be said to be a process whereby the parties to a dispute agree to have the dispute
settled amicably [8]. An independent third party has to settle the said dispute and the
decision he/she makes must be legally binding on the parties involved. The decision
to refer a dispute to arbitration can be entered into after the dispute has arisen or may
be written into the contract by way of a clause referring any future disputes that may
arise during the execution of the project to arbitration. The third party may also be
chosen by general consensus between the contracting parties or may be appointed by a
person (or a professional body) named in the contract.
Arbitration is mostly selected as a means of dispute resolution mainly due to the facts
that;
Arbitration is private – i.e. involves only the disputing parties and the arbitrator.
The arbitrator is familiar with the technicalities of the construction field.
Due to the familiarity of the arbitrator with the technicalities of the dispute, time
and money are saved (in relation to litigation).
Arbitration does away with the intrinsic long delays associated with the courts.
The decision of the arbitrator (the award) is final and binding on the disputing
parties.
As time went on though, the reputation of arbitration as a cheap and quick tool of
dispute resolution in the construction industry (especially in the UK) began to get
tarnished. Prior to 1998 though (in the UK), most standard forms of contracts (with
the exception of the New Engineering Contract (NEC) 2nd
Edition, Institute of
Chemical Engineers (IChemE) and the Institute of Civil Engineers (ICE) forms of
contract) ensured that all disputes were settled using arbitration [4]. In 2006 for

Dispute resolution
145
example, an arbitration case was reported to have lasted for nine years and cost an
average of £54,000; although this case was quite extreme, the report went on to say
that an average case last for 14 months [9]. Apart from the nine year case, the second
longest recorded case lasted for four years and four months [10]. According to
Leneham (2006)[10], arbitrations involving claims larger than £500,000 last for an
average of 27 months whilst those worth up to £50,000 last for up to 9.6 months.
Claims that ranged between £50,000 and £500,000 last for an average of 11.2 months.
These harrowing facts about arbitration in the UK were previously being experienced
in Australia. A report stated that [13];
“… arbitration has broken down as a cheap and efficient means of resolving
construction disputes…”
It must also be noted though, that the arbitrator is not a courtroom judge (who is
financed by the state), but an independent professional who is widely adept with not
only the arbitral process, but also in technical knowledge of the matters spelt out in the
dispute, thereby differentiating the arbitral method from the litigation process.
2.1 Arbitration versus Litigation
Litigation as a process however is slow mainly due to the fact that the procedures that
have to be followed are lengthy meaning that a considerably large amount of time
must elapse before a dispute reaches the court. A great advantage of litigation over
arbitration is that the services of the judge and the accommodation of the trial are
provided by the state. Over a period of time, litigation has attracted a lot of bad press.
Hibberd and Newman (1999) [4] make mention of the fact that a survey conducted of
top 400 companies in the UK by The Times Top 1000 to sample the opinions of
respondents pertaining to litigation exposed the fact that 70% of the respondents were
of the view that the whole process took too long whilst 40% thought the costs
associated with litigation were “far too high” [9]. Also, the former chairman of the
Construction Industry Council (CIC) in the UK was quoted saying, [10]
“You can‟t win if you go to court. The high legal costs are part of it. Litigation is
long and repetitive. The legal system is abysmal and inefficient.”
THE GHANAIAN CONSTRUCTION INDUSTRY AND
ARBITRATION
In Ghana, almost all developmental projects are funded by international bodies like
The World Bank, the International Monetary Fund (IMF), and the International
Development Agency [1]. As such, all Conditions of Contract are written in
accordance with these bodies‘ requirements.
Also, any differences in opinion that may ensure between parties are mostly settled
amicably and the project in hand can be completed on time. In some situations
though, these differences cannot be settled amicably and will result in either the
contractor claiming on the grounds of an extension of time, or the client/employer
claiming for liquidated damages. When a dispute erupts between the contracting
parties, the case must be settled using dispute resolution tools or the courts. Of these
forms of dispute resolution, arbitration is the most popular tool employed to settle
disputes. Most contracts are written to make provision for arbitration should a dispute
erupt, with other contracts being written in such a manner that disputes are avoided
altogether.

Baffour-Awuah, Vroom and Otchere
146
The construction industry is generally known as the world‘s most litigious industry
(Ghana Highway Authority, 2008) [1] and the ASCE Journal (2007) [12] states that in
the USA, nearly $5billion is used up on arbitration and litigation alone. The Ghana
Highway Authority (GHA) [1], 2008 states that, “…a dispute occurs when parties
actively disagree about or debate (over) a matter of opinion.” It furthermore goes on
to say that, “a contract dispute arises as a result of disagreement in opinion about a
term of contract, which interpretation places a burden, confers a right or obligation
on one party.”
The unending demand to deliver projects in less time, at lower costs, but at high
qualities and the infinite complexities, adversarial operating environments, the
contractor‘s request for compensation not anticipated in the terms of the original
contract and finally the client/employer‘s request for compensation for the
contractor‘s failure to meet contractual terms are also noted as secondary contributors
to disputes in the Ghanaian construction industry.
3.1 The Ghana Arbitration Act, 1961
The Ghana Arbitration Act, 1961 was published in schedule with the United Nations
Convention on the Recognition and Enforcement of Foreign Arbitral Awards adopted
at the Headquarters of the United Nations in New York on 10th
June, 1958. The Act is
the thirty-eighth Act of Parliament of the Republic of Ghana, and it attained
parliamentary assent on the 16th
day of March 1961 when it was enacted by the
President of Ghana and the National Assembly. Its prime objective is to “…regulate
the settlement of differences by arbitration and to provide for the enforcement of
awards.” (Ghana Arbitration Act, 1961).
The Act defines arbitration as “…the reference of a difference between two or more
parties to a person other than a court for determination after hearing the parties in a
judicial manner.” The Act states that before arbitration can be used as a method of
dispute resolution, an ‗arbitration agreement‘, which is a contract and in writing must
stipulate that any present or future differences that may come about (in the project),
must be referred to arbitration irrespective of the fact that an arbitrator is named in the
contract or not. Furthermore, the Act (1961), goes on to say that, “an arbitration
agreement may relate to any issue arising between the parties to it which is capable of
being the subject of a civil action but an arbitrator is not entitled to make an award in
the nature of a judgment in rem, that is, a decision affecting the status of a person or
thing or determining any interest in property except as between the parties
themselves”.
The final decision of an arbitrator (or umpire) appointed by, or by virtue of the
arbitration agreement, is also irreversible, and only the Court (i.e. the High Court) can
revoke a decision.
3.2 Time for making an award
“The time, if any, limited for making an award, whether under this Act or otherwise,
may be enlarged by order of the Court (the High Court) whether that time has expired
or not…an arbitrator or umpire may make an award at any time.” (Ghana
Arbitration Act, 1961). This means that there is no specified time frame laid down for
an arbitrator or umpire to make an award.
Adjudication

Dispute resolution
147
Adjudication as a method of dispute resolution in the construction industry was
introduced in the UK as a result of a recommendation by Sir Michael Latham in 1994.
Sir Latham, in his report, Constructing the Team HMSO, 1994, made the
recommendation that [15];
“Adjudication should be the normal method of dispute resolution for main contract
and sub-contractor disputes. Appeals to Arbitration or the Courts should be after
practical completion unless immediate or exceptional issues arise for the Courts; like
either party refusing to implement the award of the adjudication.”
With this recommendation, on May 1 1998, Part II of the Housing Grants,
Construction and Regeneration Act 1996 (specifically Section 108(1)) now means that
every party to a construction contract has a legal right to refer any dispute that arises
under the contract to adjudication under a procedure stipulated or in accordance to the
Act. Since then, disputes referred to adjudication include liquidated ascertained
damages, additional cost and loss, variations, extensions of time, measurement,
workmanship, contractual interpretation, negligence claims as well as the principal
issue of payment. Dancaster (2005) summarizes adjudication by asserting that [3];
“What is adjudication? It is a process whereby a dispute arising between the parties
to a contract is referred for the decision of a third party. That in itself does not sound
much different from the existing processes of arbitration and the courts. In actual
fact, in its basic concept it is not. Adjudication is all to do with the rights and
obligations of the parties. It must therefore be a Judicial process. The big difference
is in the time scales imposed on the adjudicator. He has to reach a decision within 28
days of the dispute being referred to him. There is therefore insufficient time for
detailed statements of case, discovery and all the other procedural matters beloved of
the legal and arbitral establishment.”
Once the dispute has been referred to the adjudicator, he/she has up to 28 days (the
adjudicator can request for another 14 days and this can be granted as long as both
disputing parties agree) to make an award. To commence an adjudication case, the
referring party has to serve a Notice of Adjudication which defines the nature of the
dispute to the adjudicator and the responding party. After the Notice is sent, the
responding party has seven (7) days to mount a defense after which, the hearing
commences. Louch (2000) comments that, “Adjudication, the low cost, fast-track
means of resolving disputes and getting cash flowing through the contractual
chain…is proving phenomenally popular.” [16]. These sentiments were evident in the
number of cases that were being referred to adjudication. Between 1998 and 2002, the
Royal Institute of Chartered Surveyors (RICS) recorded more than 1,050 cases [15],
whilst Richards (2005) also notes that between May 1998 and 2003, an estimated
2,500 cases were recorded [17].

Baffour-Awuah, Vroom and Otchere
148
Fig. 1 Trend of adjudication and litigation cases (1996-2003) in the UK construction
industry (Source: Fenwick Elliott , 2006)
David Blake, the founder of QS Blake Newport and a practicing member of the
company‘s specialist dispute resolution business unit was quoted saying [12];
“I don‟t think arbitration has recovered from the adjudication onslaught. Most
people are seeing the benefits of adjudication.”
Methodology
The information gathered from the literature review was used to design a
questionnaire containing 16 statements. The questionnaire attempts to determine the
attitudes of the respondents about the following in relation to construction disputes: 1)
knowledge on arbitration and adjudication; b) allocation of risk; c) disputes and
dispute resolution methods.
Table 1 Categorization of statements
Knowledge on arbitration and adjudication Statements 7,8,11,12,13
Allocation of risk Statements 4,5,6,14
Disputes and dispute resolution methods Statements 3,9,10,15
A final statement (statement 16) requires the respondents to put in statement from
their perception (if any) as to why adjudication is not popularly used as a dispute
resolution tool in the Ghanaian construction industry. The statements were devised to
measure the respondents‘ view by registering them on a 5-point scale ranging from
either ‗strongly agree‘ to ‗strongly disagree‘, ‗very broad‘ to ‗very narrow‘ or
‗always‘ to ‗never‘ pending on the question at hand.
Sampling method
The sampling technique used was the non probability sampling method i.e., purposive
sampling under which, the expert sampling was utilized. Expert sampling comprises of
the assembling of persons with acknowledged experience and expertise in a particular
area or field. This sampling method is useful in situations where a targeted sample should
be reached quickly and accurately as possible and the ‗experts‘ can provide the feedbacks
accurately and quickly. Thus architects, quantity surveyors and contractors became the
targeted group and for the sake of this research, the ‗experts‘ since disputes normally arise
due to either a design problem or pricing and are always between the contractor and the
client. These ‗experts‘ were selected from the cities of Kumasi, Accra and Takoradi
mainly because major construction activities were observed to be undertaken in these
metropolitan areas and they were chosen from private firms, Architects and Engineering
Services Limited (AESL), Department of Urban Roads, Department of Feeder Roads and
the Department of Works and Housing.
DISCUSSION OF RESULTS
The questionnaire designed was given to a total of 30 contractors, 10 architects and 10
quantity surveyors in the 3 metropolitan areas mentioned above, but only 18
contractors, 8 quantity surveyors and 9 architects responded. Each of the three
categories of the statements stated in the methodology was discussed.
The numbers in the boxes represent the total number of respondents for each
statement of the questionnaire.
Knowledge on arbitration and adjudication
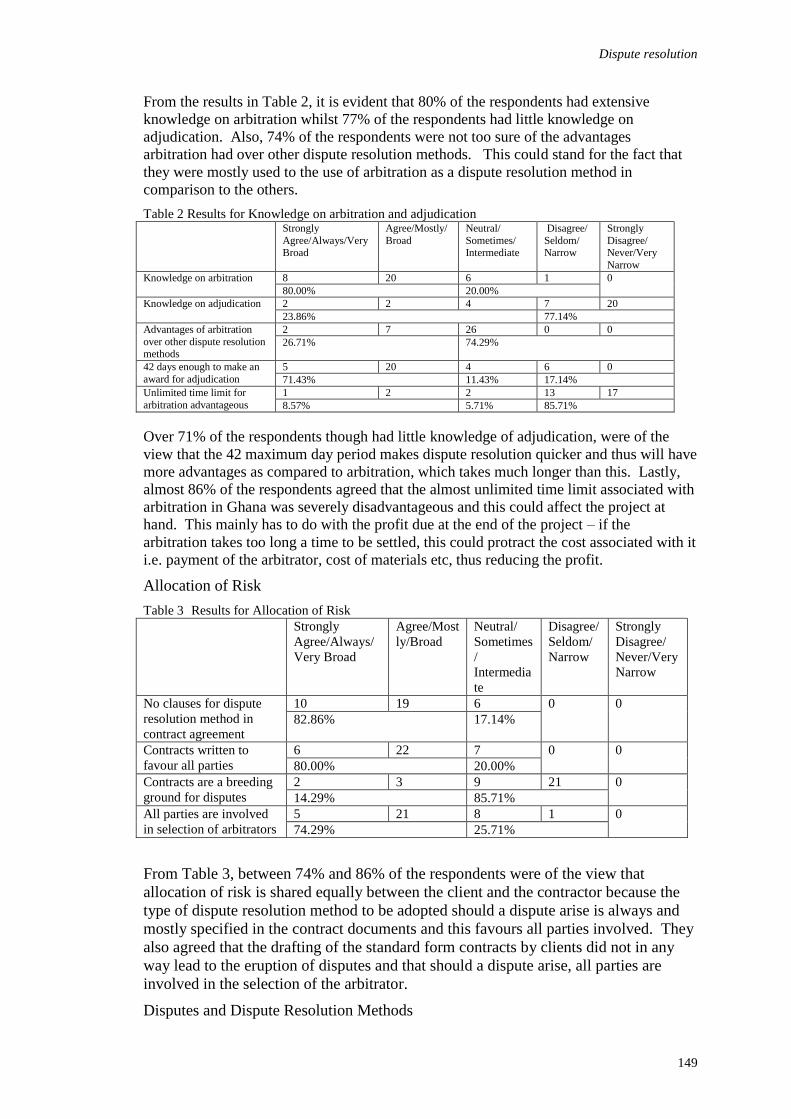
Dispute resolution
149
From the results in Table 2, it is evident that 80% of the respondents had extensive
knowledge on arbitration whilst 77% of the respondents had little knowledge on
adjudication. Also, 74% of the respondents were not too sure of the advantages
arbitration had over other dispute resolution methods. This could stand for the fact that
they were mostly used to the use of arbitration as a dispute resolution method in
comparison to the others.
Table 2 Results for Knowledge on arbitration and adjudication Strongly
Agree/Always/Very Broad
Agree/Mostly/
Broad
Neutral/
Sometimes/ Intermediate
Disagree/
Seldom/ Narrow
Strongly
Disagree/ Never/Very
Narrow
Knowledge on arbitration 8 20 6 1 0
80.00% 20.00%
Knowledge on adjudication 2 2 4 7 20
23.86% 77.14%
Advantages of arbitration
over other dispute resolution methods
2 7 26 0 0
26.71% 74.29%
42 days enough to make an
award for adjudication
5 20 4 6 0
71.43% 11.43% 17.14%
Unlimited time limit for
arbitration advantageous
1 2 2 13 17
8.57% 5.71% 85.71%
Over 71% of the respondents though had little knowledge of adjudication, were of the
view that the 42 maximum day period makes dispute resolution quicker and thus will have
more advantages as compared to arbitration, which takes much longer than this. Lastly,
almost 86% of the respondents agreed that the almost unlimited time limit associated with
arbitration in Ghana was severely disadvantageous and this could affect the project at
hand. This mainly has to do with the profit due at the end of the project – if the
arbitration takes too long a time to be settled, this could protract the cost associated with it
i.e. payment of the arbitrator, cost of materials etc, thus reducing the profit.
Allocation of Risk
Table 3 Results for Allocation of Risk
Strongly
Agree/Always/
Very Broad
Agree/Most
ly/Broad
Neutral/
Sometimes
/
Intermedia
te
Disagree/
Seldom/
Narrow
Strongly
Disagree/
Never/Very
Narrow
No clauses for dispute
resolution method in
contract agreement
10 19 6 0 0
82.86% 17.14%
Contracts written to
favour all parties
6 22 7 0 0
80.00% 20.00%
Contracts are a breeding
ground for disputes
2 3 9 21 0
14.29% 85.71%
All parties are involved
in selection of arbitrators
5 21 8 1 0
74.29% 25.71%
From Table 3, between 74% and 86% of the respondents were of the view that
allocation of risk is shared equally between the client and the contractor because the
type of dispute resolution method to be adopted should a dispute arise is always and
mostly specified in the contract documents and this favours all parties involved. They
also agreed that the drafting of the standard form contracts by clients did not in any
way lead to the eruption of disputes and that should a dispute arise, all parties are
involved in the selection of the arbitrator.
Disputes and Dispute Resolution Methods

Baffour-Awuah, Vroom and Otchere
150
From Table 4, even though the standard form contracts were not a breeding ground for
disputes, 80% of the respondents however were of the opinion that disputes are likely
to erupt during the execution of the project and that once the dispute has arisen, 89%
of the respondents agreed that arbitration is used the most. 74% of the respondents
were also of the view that because adjudication is not incorporated into standard form
contracts, it is hardly used as a dispute resolution tool. Lastly, majority of respondents
(83%) agreed that projects are not necessarily abandoned because disputes were not
settled amicably and that one way or the other, disputes are mostly settled.
Table 4 Results for Disputes and Dispute Resolution Methods
Strongly
Agree/Alway
s/Very Broad
Agree/Mostl
y/Broad
Neutral/
Sometimes/
Intermediate
Disagree/
Seldom/
Narrow
Strongly
Disagree/
Never/Very
Narrow
Disputes inevitable in
Ghanaian construction
industry
5 23 7 0 0
80.00% 20.00%
Arbitration mostly used
in Ghana
4 27 0 4 0
88.57% 11.43%
Adjudication mostly
used in Ghana
0 4 5 7 19
11.43% 14.29% 74.29%
Projects abandoned in
Ghana
0 6 29 0 0
17.16% 82.86%
The last statement of the questionnaire required each respondent to give their
perception as to why in their opinion, adjudication is not popular in Ghana. Out of the
18 contractors, 13 of them (representing 72%) believed that there is not enough
information or knowledge on adjudication. The remaining 5 contractors however,
were of the opinion that there is no legislative instrument on adjudication with one of
them stating that, ―Most of the judgment proceedings are not in line with the
constitution of…Ghana…so parties…feel reluctant to resort to adjudication…‖ 3
architects stated that adjudication takes a longer time and costs more because it has to
go through the courts (of course, this is false) and 4 architects were of the view that
there is little information on adjudication. It can be observed here that out of the 9
architects, 7 (representing 77.80%) believe that there is little information on
adjudication. Lastly, out of the 8 Quantity Surveyors, 3 were of the view that
adjudication involves the courts whilst 3 were of the view that there is very little
information with the remaining 2 being of the opinion that arbitration is good enough.
Here too 6 of them (representing 75%) were of the view that there is little information
on adjudication. In all, it is evident that 74% of the respondents stated (either directly
or indirectly), that they had little knowledge on adjudication.
CONCLUSION
It can be observed from Table 4 that disputes are inevitable in the Ghanaian
construction industry. Once a dispute arises during the execution of the project,
arbitration is mostly used to settle the dispute. Table 1 also sheds light on the fact that
the general knowledge on adjudication as a dispute resolution medium is minuscule.
The fact that personnel (experts) in the Ghanaian construction industry know so little
about adjudication as a quick and relatively cheap tool of dispute resolution is noticed
to be the reason why it is not being utilized. Arbitration attained parliamentary assent
in 1961 but there is no Act of Parliament on adjudication. Statement 16 of the

Dispute resolution
151
questionnaire (see Appendix I) required the respondents to give their perception as to
why adjudication is not popularly used in the Ghanaian construction industry and the
statement which kept on being reverberated by the respondents was that there was not
enough knowledge on the subject. The conclusion can therefore be drawn that the
reason why adjudication receives very little patronage is simply that those involved in
the construction industry in Ghana simply do not know anything about it.
RECOMMENDATION
Adjudication attained royal assent in 1998 in the UK and has since then been very
popular in resolving construction disputes. Lord Latham was commissioned by Her
Majesty the Queen to write a report and as part of his recommendation, adjudication
was incepted. It is recommended that all major stakeholders in Ghana who are
directly or indirectly involved in the construction industry make the effort to educate
all involved in the construction industry on adjudication. This might seem like a
daunting task since there even is no Act of Parliament on it but they say a journey of a
million miles, starts with one step.
REFERENCES
[1]Baffour-Awuah, E. (2009), An investigation to find out why adjudication is not a popular
method of dispute resolution in the Ghanaian construction industry, A dissertation
submitted to the HAN University of Applied Sciences in partial fulfillment of the
award of Master‘s in Construction Project Management.
[2]The Ghana Arbitration Act, 1961.
[3]Dancaster, C. (2003) ―Special Report: Dispute Resolution‖, Construction Manager. pp 19-
21
[4]Hibberd, P. and Newman, P. (1999), ADR and Adjudication in Construction Disputes,
Blackwell Science p1, pp16-18.
[5]Glover, J. (2005), ―What is a dispute?‖ Fenwick Elliot Review, p9.
[6]Bingham, T. (2001), ―Looking for trouble.‖ Building 23, p5.
[7]Rutherford, M. and Sims, J. (1997), Arbitration Act 1996: A Practical Guide, Sweet and
Maxwell, p3.
[8]Powell-Smith, V., Sims. J. and Dancaster, C. (1998), Construction Arbitrations (2nd
Edition), Blackwell Science, pp1 – 5.
[9]Survey by the law firm, Herbert Smith, The Times, January 1995.
[10]Building, 7 February 1992, p9.
[11]Coles, D.C.H. (2009), Course Reader on Construction Contract Claims, Extension of
Time and Construction Dispute Resolution Technique (Course Reader 5), HAN
University of Applied Science.
[12]Leneham, E. (2006), ―The Arbitration Files.‖, Feature, 3 February 2006, pp 14 – 15.
[13]National Building and Construction Council Joint Working Party (1989), ―Strategies for
the Reduction of Claims and Disputes in the Construction Industry‖ – a research
report (various authors). NBCC, Canberra.
[14]Murdoch, J. and Hughes, W. (2008), Construction Contracts –Law and Management (4th
Edition), Taylor-Francis, pp 375 -380.
[15] Coles, D.C.H. (2009), Lecture Notes on Dispute Resolution Methods, HAN University of
Applied Sciences.
[16]Louch, R. (2000), ―How to prepare a case for adjudication‖, ASI Journal, p 37
[17]Richards, D. (2005), ―Let‘s settle this‖, Construction Manager, p 18.


Mac-Barango, D.O. (2011) An investigative study of the impact of distance and demographic variables
on the price of cement In: Laryea, S., Leiringer, R. and Hughes, W. (Eds) Procs West Africa Built
Environment Research (WABER) Conference, 19-21 July 2011, Accra, Ghana, 153-166.
153
AN INVESTIGATIVE STUDY OF THE IMPACT OF
DISTANCE AND DEMOGRAPHIC VARIABLES ON THE
PRICE OF CEMENT
D. O. Mac-Barango1
Department of Quantity Surveying, Rivers State University of Science and Technology, Port –
Harcourt, Nigeria
Distance appears to be the major obstacle to overcome in most economic activities,
since spatial disparity occurs between the points of demand and supply. Cement a
core construction material has to be transported from points of manufacture to final
consumption locations. The impact of locational variations on total cost of
construction products, is a solemnly inputed factor at bidding and tendering stages,
tender figures are fixed with reference to administrative headquarters, even when the
projects are in other locations. The study investigates the impact of the following
variables on the price of cement: (i) The distance from administrative capital (Port
Harcourt) to other locations. (ii) Population (iii) Geographical size (iv) The
population density of these locations. The research methodology obtains data of
mean price values of cement, in locations outside the administrative quarters through
primary sources. Data for the variables of distance, population and geographical sizes
of locations are effected through secondary data source. The research employs the
statistical tool of regression, for the analysis of data. The research concludes that
variables, did not significantly impact on the prices of cement and that price
necessitated by spatial disparities of locations are explainable by other variables. It
recommends that cement availability should take into cognizance the volume of
construction and other economic activities.
Keywords: demographic variable, economic variable, price of cement, transportation.
INTRODUCTION
The retailers of cement deposit the material principally on depots and outlets situated
in the state capital, from where local consumers are supplied. The depots within the
state capital get their supply principally from Lagos Port, complimented by supplies
from Onne port in the case with direct imports from overseas. Some of the principal
manufacturing companies include Ibeto cement, the Eagle cement in Port Harcourt
environs, others include Ewekoro, Nkalagu, Elephant cement companies. Some of
these companies have shut down operations principally due to their over dependence
on imported material component for manufacture. The concept of distance from
Depot (within Port-Harcourt) to towns in the local government areas becomes an
issue, since there is spatial disparity. The research appraises the impact of spatial
disparity on the price of cement. This is with a view to developing models that
establish the relationships between the prices of cement and the variables of (i)
Distance (ii) Population (iii) Geographical size (iv) Population density. It therefore
seeks to serve as predictive models for determining the prices of cement and use such
Cement price
154
outcomes as tools for decision making during bidding, tendering and implementation
stages of future projects resultant of these factors. Some other economic and
environmental factors that influence the prices of cement (from the state capital to
locations outside it) would also be revealed.
BACKGROUND OF STUDY
Those charged with the responsibility for setting cost limits on public sector building,
most notably in the field of housing, have been able to apply effective regional
allowances and revise them on occasion to reflect changing regional conditions.
Regional allowances calculated for local authority housing in England and Wales have
shown that expensive areas produce tender levels in the order of 20% above the
lowest. Mainland Scotland excluding Orkney and Shetland and the Western isles
show a similar range, but whereas in England tenders for housing appear to be highest
in the major urban areas, in Scotland they are highest in parts which are remote from
the main areas of activity. In view of the obvious importance of local cost influence,
uncertainty and anxiety often surround the cost control of work in unfamiliar locations
especially if they are remote where there is experience of similar work. (Avery
1982a). Bello (1997), has asserted that the differences in costs of the construction
materials (cement, aggregate, tender and reinforcement) do not depend on transport in
Kaduna state. Transport cost of building materials is not consistent with the average
distance covered. Wemegah (1998), collaborates that distance from Lagos does not
significantly influence cement prices in Nigeria. This could be due to depot system
operated by cement-producing/importing companies. Cost due to distances are
figured into the price of cement on a uniform basis all over Nigeria. The study also
shows that there is no significant relationship between the cost of cement, from Minna
(a state capital) to selected local government areas of the state. There is however, a
departure from the outcome of Olatejus (2000), result which shows that there is
significant relationship between the prices of selected building materials and the
distance from Kaduna metropolis. He stated further that some extraneous variables
collectively account for a great percentage of the variation. The results of research
finding indicate that cement, timber, roofing sheet and granite had R-square values of
50.2%, 28.3%, 32.3% and 74.7% respectively. In conclusion therefore, the
relationship between the price of building materials (cement, timber, roofing sheet and
granite) and the distance were significant enough form to the basis for predicting the
prices of materials in Kaduna state. Mogbo (2002a), produces empirical evidence that
regional variations in the prices of imported building materials in Nigeria are not
influenced by the distances of retail depots from the major warehouses located in
Lagos or Onitsha which are the points of distribution to the retail outlets from they are
purchased and used for construction. The survey result generally indicates R2 value
below 50% for all material except nails. Importantly also, except for ceiling board,
reinforcement bars and nails, the results indicate that generally, the further the
distance were from Onitsha, the higher the prices. The generally weak correlation
suggests that the possible increases in prices were accounted for by other variables
except distance. He further posited that such factors may be principally due to the
forces of supply and demand, weight of the materials and packaging. He concludes
from the study that distance plays a minimal role in the variation of prices of building
materials. Other factors which influence the cost of building materials should be
explored so as to determine the role of each factor in the regional variations of prices
of building materials. Areas of high population densities may likely induce high
volumes of construction works necessitating high demands for building materials.

Mac-Barango
155
Mac-Barango (2006), also buttresses that the economic variables of supply and
demand factors, population; population density and the volume economic and
construction activities are potent factors that could necessitate locational differentials
in materials costs. Environmental influences are considered also paramount.
According to Mogbo (2002b), prototype projects (such as hospitals, dispensaries, post
offices, schools and colleges), have always been designed and tendered for by the
government at Federal, State and Local government levels. The government normally
awards such contracts to contractors of equal capacity. The problems had always been
how to mark-up prices to reflect regional variations. For example, during the
execution of the petroleum (special) Trust Fund‘s project between 1996 and 1999, the
Fund was confronted with such problems and it had to order the various project
consultants to establish necessary benchmarks for awarding contracts for projects
located in urban and rural areas as well as those sited in the riverine communities.
Kawu, (1994), has noted that the greatest problem of the construction industry in
Nigeria is finding a ready source of cost information that will cover convenient
geographical locations throughout the country. Lagos has remained the major
entrance port of all building materials and equipment. Recently, it has become
particularly difficult to establish, other sales depots else where other than Lagos which
would have made pricing exercise for estimators much easier.
JUSTIFICATION OF STUDY
It is hoped that more detailed understanding of locational differences in tender levels
will have practical applications. Detailed assessment of locational influence would
help to explain the underlying reasons for allowances calculated by governments or
others for defined types of building. Early cost forecasts, whether for broadly similar
work or work with distinctly different characteristics cold then be made with greater
confidence. It seems that there will always be a need for more information about the
influence of locality on individual elements and specific forms of construction for cost
planning. (Avery 1982b). Harris and Mc Caffer (1983), have opined that greater
attention to material control may pay important dividends in the form of increased
profit. There is a growing evidence that losses due to materials are often significantly
higher than those due to other causes. According to Adegboro (1992), construction
materials are expensive in Nigeria because, they are mostly imported as finished
goods and raw materials have to be imported for the materials manufactured in
Nigeria such as cement, steel, aluminum, etc. By the time they get to the market, the
consumer is probably paying six or seven times the cost at source. One of the primary
weaknesses of the construction industry is undoubtedly that of price communication.
Research into building price trends and building cost forecasting will go a long way in
standardizing cost projections. (Ajanlekoko, 1987). Dayyabu (1994), posits that,
cement is the most expensive material used in producing mortar for block work and
concrete for either plain or reinforce concrete. Despite the high cost of cement, it still
remains as one of the most commonly used and most important in the construction
industry, which itself is a very significant sector of any type of economy. He further
revealed that in frame structure the combined cost of block work and concrete work
consumed more than forty percent (40%) of the total cost of construction in four
bedroom flats. While in three bedroom bungalow, the combined cost consumed
between twenty five to thirty percent (25-30%). Yusuf (2004) has buttressed that
concrete constitutes a large percentage of components required for a building,
particularly high rise building. The cost of concrete is about 54% in relation to
openings (18%) finishing‘s (17%) wall (9%) and excavation (2%). Holmes (1995),

Cement price
156
has stated that cement is the most expensive ingredient in concrete and although
assumed to be the most reliable, since it is very carefully controlled during
manufacture, should be sampled and tested. Onukube (2000), has observed that the
physical resources on a given project can run from 40 to 60 percent of total installed
project cost. The overall philosophy for controlling the physical material budget is to
start with an estimate of the physical materials cost and convert it into budget that
becomes our baseline for buying them.
DISTANCE AND TRANSPORTATION
Distance, is the space between two points. Ullman (1957) posits that a spatial
disparity occurs between supply and demand points such spatial interactions are
influenced by distance. Distance thus is the main barrier to be overcome. Transport
cost, has to be incurred in moving person or commodity over distances. Robinson
(1975), submits that the most important consideration in transport are: the cost of
carriage, the speed of carriage and the quality of load factor. The use of route is
primarily determined by cost of carriage, which are attributed to four factors. The
distance over which goods have to be transported, the means of transport used for
carriage, the obstacles and handicaps of free movement and the nature of the goods
carried.
THE MEANS OF TRANSPORTATION
Ataev et-al (1980), asserted that transportation and handling operations account for
25-35% of the total construction and erection costs, whereas labour costs 40-50% of
the total necessary amount. Prefabricated structures are generally delivered from
construction industry plants without additional handing and erected directly from the
transport vehicles. At the same time, a large proportion of such loads as inert
materials, cement, alabaster, concrete, wood (timber), woodwork, small-piece wall
material and others are supplied from manufacturers and base depots with inevitable
additional handling. Transportation and handling costs may be lowered and
operations speeded up by a judiciary chosen combination of transportation and
handling machines when determining the most efficient kind of transport and
choosing transportation means, the transportability of loads should be taken into
account. In construction application, truck haulage has many advantages over rail
transport, such as relative simplicity and independence of operation and high gradient
capability and manoeurability. This explains why motor vehicles are the most
versatile transport means and one most employed in construction. Adeniyi (1987),
observed that in contemporary Nigeria the distribution of building materials and towns
within the country is mostly done with lorries and tippers. Avery (1982c), has posited
that remoteness is of course, an imprecise term and its effect on the cost of materials
needed for a project is by no means a constant. Apart from the fact that various
materials are likely to come from different places freight charges will be influenced by
volume or weight and size of order. Further costs are likely if materials are
dangerous, fragile or difficult to handle. Heavy materials with low initial cost such as
sand and gravel tend to be worst affected by distance and difficult transport
conditions. Martin (2000), has averted that consultants should access the effects of
locations of a project on pricing level.
THE INFLUENCE OF LOCATION ON PRICE
The cost of building affected is by its location, in addition to a whole range of design
factors and localized variables which include market factors such as demand and

Mac-Barango
157
supply of labour and materials, workload, taxation and grants and the physical
characteristics of the site-its size, accessibility and typography. While all these factors
are particular to a time and place, certain areas of the countries tend to have different
tender levels to others. It is stressed that even within countries or large conurbations,
there are considerable variations in tender levels and these may outweigt the effect of
general regional factors. (Seeley 1983). In a similar vein, Zubair (2005a), submits that
projects in the Niger Delta region are more difficult to execute because of the
peculiarities of the region. The weather could be considered to be harsh and the
terrain difficult thereby making logistics very difficult. In some cases, because of the
difficult access, labour force and materials are difficult to source locally. Even within
the Niger Delta region. There is the factor of upland and Riverline areas. The terrain
of the Riverine areas is generally very difficult, the mode of transportation is through
the rivers that criss-cross the delta and the weather very harsh. In some places
materials are not available locally necessitating its importation from the upland
through the rivers with the attendant risk of losing some through boat mishaps and
multiple handling. Hence materials are therefore transported solely by boat and towed
barges. This creates multiple handling of the materials with its attendant cost
implication. The waste factor crated thus is high.
Vandalism is not entirely confined to known locations but risks in some areas are
clearly higher than others. Protection against vandalism is more likely to be needed in
urban areas than remote country ones and costs can again be quantified. Security is an
increasingly important overhead cost in many urban areas but one which hardly ever
features in tenders for work away from the major conurbations. (Avery 1982D). The
storage of materials require proper planning in-order to provide adequate protection,
reduce waste and damage. Materials may even be stored in a raised platform.
Materials with high tendency to damage as a result of high humidity are planned for
short duration of storage at site. (Zubari 2005b).
DEMOGRAPHIC AND SOCIAL VARIABLES THAT INFLUENCE
PRICE
A planned socio-economic development decision of nation cannot be carried out
without the population factor being inclusive. The population density is also a
determinant factor in the allocation of road networks. The geographical areas (size) of
an area determines the total length of the road network to be allocated to the area.
(Hoyles 1988). Transportation provides the channel through which some interactions
take place along which information flows. The need for transportation is an integral
facet of everyday life. Its efficiency, contributes largely to the level of productivity,
economic growth and thus the standard of living (Bala 1976) and (Ratcliffe, 1981).
The growth and development of every society is dependent on the efficacy of its
available road networks. Without road transport, it would be apparent that there
would be a dislocation in its economic transactions (Nwoji, 1995). The contribution of
road transportation to the development of the country is decisive in the sense that
changes occur in the pattern of internal communication to meet the demands of an
independent self-sustaining economy (Udo, 1980) and (Kuhn 1995). The
development of a nation and transportation are closely tied especially when one
considers the crucial role of transportation in the socio-economic development of any
nation, a well planned, adequately maintained, efficiently managed and properly
operated transport system is a pre-requisite to the development in all sectors of
national economy. (Salter 1977), (Caparetis 1991) and (Kulin, 1995). Economic
growth will be enhanced by lower transport cost for the industry through reduced

Cement price
158
travel times, improved access to port and manufacturing facilities, and higher
productivity through increased and dimension units. The tourism industry is enhanced
by improved access and travel conditions through increased and dimension units. (Mc
Quillen 1996).
ECONOMIC VARIABLES AND THE PRICE OF CEMENT
Spatial disparity in material economics of cement, detects that the economic and
demographic variables of population, the size of the user location (its geographical
size and the market, the quantum of cement needed visa viz the volume of
construction activities in the user location and the manufacturing/sale points be given
due cognizance in the evaluation of decision matrices bordering on cement. These
variables propensity to influence the price mechanism of cement, within localities and
time frame depend on the prices of substitutes and compliments, the purchasing power
of buyers, the psychological tastes preferences, and the numbers of buyers within a
time period. This is influenced by the quantities sellers are willing to place out per
time period. (Sharp and Register 1988) and Shutt (1988a).
Supply is a measure of flow, of how much firms are willing to sell, and it measures as
so much per period of time. The collective behavior of all firms in a particular market
is determined by the price of the commodity, the goals of the firms, the state of
technology. Collolarity, the total quantity demanded in any market depends on the
price of the commodity being sold, on the prices of all other commodities, on the total
income of all the households buying in that market, on the distribution of that income
among the households and on tastes. (Lipsey 1983), (Powell 1989a) and (Begg et-al
1991).
Fundamental to monetarism is the belief that the levels of public spending must be
used as a policy instrument to achieve control over growth of the money supply.
Government uses its fiscal policy instruments for the overall management of the
economy in pursuit of whatever are its economic objectives. (Powell 1989b).
Government through its fiscal and monetary instruments attain certain economic
objectives. Monetarist policy, stimulates or retards the supply of money. Fiscal
policy is achieved through the instrument of taxation. (Shutt 1988b).
In periods of inflation, the general level of prices that is enough commodity, prices are
rising so that on the average, prices in general are rising. During inflation some
commodities may be falling in price and some may be rising, but the commodities in
price are dominant and they exert upward force on the general price level. (Sharp and
Register, 1988b).
According to Jagboro (1992) the normal economic concept of the law of demand and
supply applies to the building industry like any other industry. When materials are
available in large quantities price will tend to be lower than in case of scarcity. Other
factors that affect the prices are the capacity of the industry relative to the demand
currently being placed upon it and the ability of industry to forecast the level of
activity so as to budget for future requirement. Some imported materials like cement,
reinforcing bars and sanitary wares fluctuate as a result of the exchange and monetary
policies.
RESEARCH METHOD
This research examines the influence of distance on the price of cement, from Port
Harcourt to locations in other local governments areas. Data collected was also
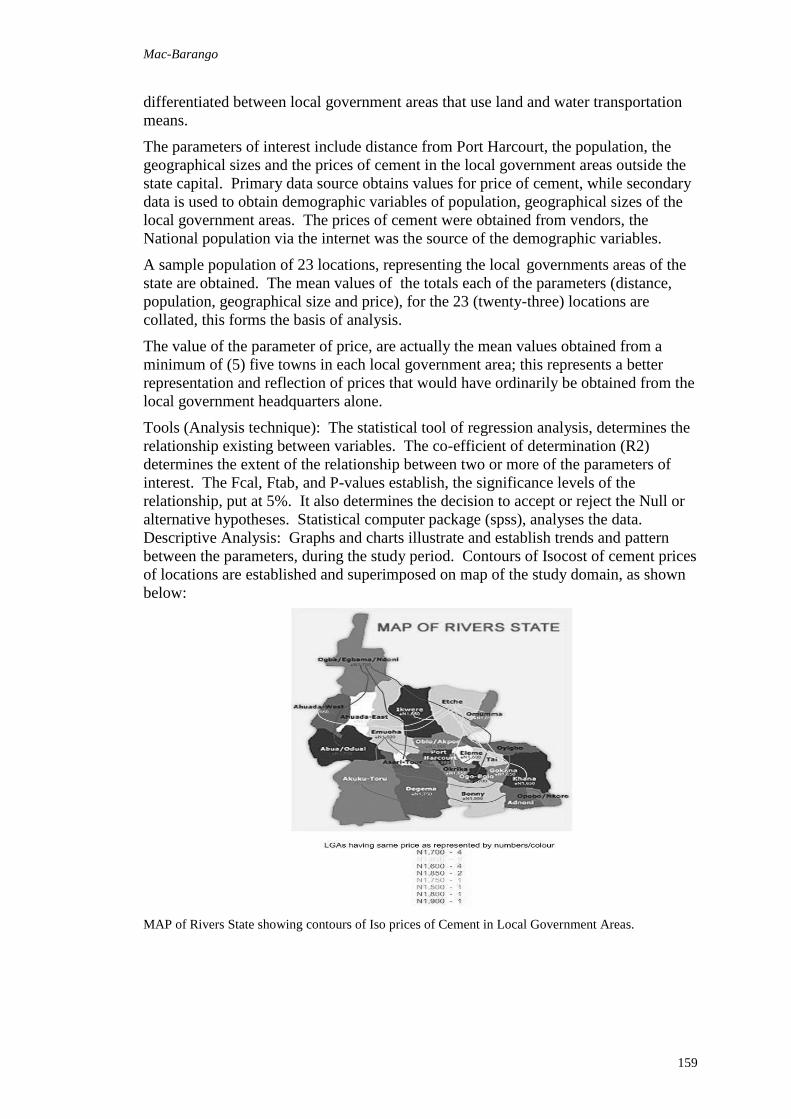
Mac-Barango
159
differentiated between local government areas that use land and water transportation
means.
The parameters of interest include distance from Port Harcourt, the population, the
geographical sizes and the prices of cement in the local government areas outside the
state capital. Primary data source obtains values for price of cement, while secondary
data is used to obtain demographic variables of population, geographical sizes of the
local government areas. The prices of cement were obtained from vendors, the
National population via the internet was the source of the demographic variables.
A sample population of 23 locations, representing the local governments areas of the
state are obtained. The mean values of the totals each of the parameters (distance,
population, geographical size and price), for the 23 (twenty-three) locations are
collated, this forms the basis of analysis.
The value of the parameter of price, are actually the mean values obtained from a
minimum of (5) five towns in each local government area; this represents a better
representation and reflection of prices that would have ordinarily be obtained from the
local government headquarters alone.
Tools (Analysis technique): The statistical tool of regression analysis, determines the
relationship existing between variables. The co-efficient of determination (R2)
determines the extent of the relationship between two or more of the parameters of
interest. The Fcal, Ftab, and P-values establish, the significance levels of the
relationship, put at 5%. It also determines the decision to accept or reject the Null or
alternative hypotheses. Statistical computer package (spss), analyses the data.
Descriptive Analysis: Graphs and charts illustrate and establish trends and pattern
between the parameters, during the study period. Contours of Isocost of cement prices
of locations are established and superimposed on map of the study domain, as shown
below:
MAP of Rivers State showing contours of Iso prices of Cement in Local Government Areas.

Cement price
160
PRESENTATION, ANALYSIS OF DATA AND DISCUSSION OF
RESULTS
The study, investigated the impact of distance and other demographic variables on the price of cement
in Rivers State, using inferential as well as descriptive statistics.
Table 3.10: Summary of Raw Data used for Analysis:
Location
(L.G.A.)
Distance from Port
Harcourt City (km)
to 22 L.G.A in R/S
Price of
Cement Per
Bag N
Populatio
n
Area
km2
Populatio
n Density
L.G.A.
Headquarte
r
Abua/Odual 104 1700 282,998 704 402 Abua
Ahoada East 77 1650 166,747 341 489 Ahoada
Ahoada West 98 1650 249,425 403 619 Akinima
Akuku Toru 49 1850 156,006 1,443 109 Abonnema
Asari Toru 37 1700 226,106 113 1,948 Buguma
Andoni 62 1800 211,009 233 906 Ngo
Bonny 41 1900 215,358 642 355 Bonny
Degema 45 1750 249,773 1,011 247 Degema
Eleme 26 1600 190,884 138 1,383 Eleme
Emuoha 30 1600 201,901 831 243 Emuoha
Etche 48 1650 249,454 805 310 Okehi
Gokana 45 1650 228,828 126 1,816 Kpor
Ikwerre 40 1650 189,726 655 290 Isiokpo
Khana 57 1650 294,217 560 525 Bori
Obio/Akpor 13 1600 464,789 260 1,788 Rumuodo
Ogba/Egbema/
Ndoni 112 1700 284,010 969 293 Omoku
Ogu/Bolo 39 1700 74,683 89 839 Ogu
Okrika 30 1650 222,026 222 1,000 Okrika
Omumma 33 1650 100,366 170 590 Eberi
Opobo/Nkoro 70 1850 151,511 130 1,165 Opobo
Town
Oyigbo 30 1600 122,687 248 595 Afam
Port Harcourt - 1500 541,115 109 4,964 Port
Harcourt
Tai 43 1650 117,797 159 741 Sakpenina
Source: Author Field Work (ii) National Population Commission

Mac-Barango
161
Descriptive Analysis of Data:
The descriptive charts show the pattern and trends between variables, and mean price
of cement and population for LGA(s) accessible by land. Port Harcourt, which has the
highest population is less than (550,000) recorded the least mean price. Akuku, with
the highest mean price of cement, has a population less than (160,000). Ogu/Bolo,
though with the population, has a mean price of N1,700.
The Chart, for mean price of cement and the geographical areas, indicate that Akuku
LGA with the highest mean price also has the largest area. Generally the mean prices
of cement do not show, a progressive increase according to the geographical areas of
the local government areas. Prices of cement, are not reflective of geographical seizes
of LGAs.Ogu/Bolo, though has the least geographical area (less than 160km2) records
mean price value of N1,700, which is at per with Asara, Abua/Odual having
geographical areas of (113)km2 and 704km
2 respectively.
DISCUSSION OF RESULTS
Research findings establish as follows
A weak positive relationship that indicates significance between the distance from
Port Harcourt (using land) and the mean price of cement. The model, is y = 1599.403
+ 1.113 (x), R2 value = 34.10%, Fcal (4.38), Ftab (9.302), P value = (0.007). The
statistics of the analysis between the parameters of the mean values of cement prices
Fig. 1: MEAN PRICE OF CEMENT AND POPULATION OF
AND LOCAL GOVERNMENT AREAS.
Fig. 2: MEAN PRICE OF CEMENT AND GEOGRAPHICAL AREAS OF LOCAL
GOVERNMENT AREAS.

Cement price
162
and distance show that both variables increase in same direction (a positive
relationship). The correlation between both variables is a weak one establishing an R2
of 34.10%. The outcome of the Fcal and P values led to the acceptance of the Null
hypothesis. There is no significant relationship between the variables of distance and
price of cement (for local government accessible on land).
There is a significant relationship (though) a weak positive one, between the
population of LGA(s) accessible through land and the mean price of cement. The
model, is of the form, y = 1701.730 + 0.000 (x), R2
value = 20.9%, Fcal (4.38), Ftab
(4.767), P value = (0.042). The statistics of the analysis between the parameters of
population of LGA(s) and the mean values of cement prices show that both variables
increase in the same direction (a positive relationship). The correlation, extent of
relationship is a weak one, with an R2 value of 20.9%. The outcome of the Fcal, Ftab
and P value statistics, led to the acceptance of the alternative hypothesis. There is a
significant relationship between the variables of population and price of cement (for
local government areas accessible on land).
There is no significant relationship, between the geographical (Area of LGA(s))
accessible through land and the mean price of cement. The model, is of the form, y =
1615.98 + 0.076 (x), R2 value = 30.4%, Fcal (4.38), Ftab (7.84), P value = (0.012).
The statistics of the analysis between the parameters of the mean values of cement
prices and geographical areas of LGA(s) show that both variables increase in the same
direction (a positive relationship). The degree of relationship is weak, establishing an
R2
value of 30.4%. The outcome of the Fcal, Ftab and P value statistics led to the
acceptance of the null hypothesis. There is no significant relationship between the
variables of geographical areas of LGA(s) and the mean values of cement prices (for
LGA(s) accessible through land).
There is no significant relationship between distance from Port Harcourt (using sea)
and the mean price of cement. The model, is of the form, y = 2070.613 – 6.616 (x), R2
value = 92.4%, Fcal (161.40), Ftab (12.08), P value = (0.178). The analysis between
the parameters of the mean values of cement prices and distance from Port Harcourt
(using sea) show that both variables increase in he opposite directions (a negative
relationship). The correlation between the variables is a strong one, establishing an R2
value of 92.4%. The outcome of the Fcal, Ftab and P value led to the acceptance of
the null hypothesis. There is no statistically significant relationship between the
variables of distance and price of cement (for LGA(s) accessible through sea).
There is no significant relationship between population of LGA(s) accessible (by sea)
and the mean price of cement. The model, is of the form, y = 1719.854 + 0.001 (x), R2
value = 17.0%, Fcal (161.40), Ftab (0.205), P value = (0.729). The analysis between
the parameters of population of LGA(s) accessible (by sea) and the mean values of
cement prices show that both variables increase in the same direction. The correlation
between both variables is a weak one, establishing an R2 value of 17.0%. the outcome
of the Fcal, Ftab and values led to the acceptance of null hypothesis. There is no
statistically significant relationship between the variables of population and the prices
of cement (for LGA(s) accessible (by sea).
There is no significant relationship between the geographical size (areas) of LGA
(using sea) and the mean price of cement. The model, is of the form, y = 1776.843 +
0.186 (x), R2 value = 88.2%, Fcal (161.40), Ftab (7.465), P value = (0.233). The
analysis between the parameters of the mean values of cement prices and the
geographical size (areas) of LGA(s) show that both variables increase in the same

Mac-Barango
163
direction (a positive relationship). The correlation between both variables is a strong
one, establishing R2 value of 88.2%. The outcome of the Fcal, Ftab and P value led to
the acceptance of the Null hypothesis. There is no statistically significant relationship
between the variables (cement and geographical areas) for LGA(s) accessible through
sea.
IMPLICATIONS OF RESULTS OUTCOME
The outcome of the analysis between distance from Port Harcourt to the local
government headquarters either accessible by land and sea, is indicative that the
impact of distance on price of cement is infinistimal. Variations in the price of cement
are explainable by other factors – the state of roads, ready availability and
transportation means used. (2) The outcome of the analysis between population
of LGA(s) and the mean price of cement, shows that though population as an
economic variable has a propensity to influence the price of cement, the matrices of
the population structure, disposal income of the target group, amidst the volume of
economic activities should not be isolated. (3) Outcome of analysis between
geographical (areas) of LGA(s) and the mean prices of cement shows that the
demographic variable of size cannot unilaterally influence price rather variables like
volume of economic activities, economic population and the state of terrain and
difficulties encountered within and between areas are potent sources.
CONCLUSION
Cement, is a predominant material used in concrete and construction works generally
in Nigeria. Variables of spatial disparity can influence the dynamics of its
transportation and distribution from location to location; peculiarities of regions
(topography, terrain, economic climatic and conditions) can influence its price within
localities. Research findings conclude as follows: (1) The price of cement is not
influenced by Distance from the state capital for both LGA(s) accessible by land or
sea. (2) the population of locations accessible by sea. (3) The geographical size
(areas) of LGA(s) accessible by land and sea. (4) The price is however influenced by
population of LGA(s) accessible land. The research findings therefore imply that
values of the Dependent (cement prices) cannot be adequately predicted from the
values of Independent variables of (Distance, Geographical size and Population) for
LGA(s) accessible by both land and sea. Population of LGA(s) accessible by land can
however attempt to predict the price of cement, though the strength of the outcome is
likely to be weak. Locations of Iso costs from cement price contour, show that those
LGA(s) headquarters are not equ-distance from Port Harcourt, yet they have same
price of cement.
The study recommends as follows:
Construction cost analyst – Quantity surveyors and other professionals in the built
environment as well as policy makers, during the pricing and synthesis of bills of
quantities for construction works procurement should discard the impct of the
variables of (i) distance (ii) population, geographical size (areas) for both LGA(s)
accessible both by land and sea. However some weighting could inputed for the
impact of population for LGA(s) accessible through land. They should give due
cognizance to the impact of terrain, typography, other environmental as well as
economic factors outside the tested variables (for instance the prevalent macro-
economic variables, the volume of construction activities). Weighted factors should
be inputed for their impact.

Cement price
164
Recommendation for further studies:
It recommends similar studies to investigate the impact of distance on some other
building materials and constituents of concrete (sand, chippings). (ii) Investigate the
impact of distance on price of cement from the local headquarters (as supply centres)
to other towns within the local government areas.
REFERENCES
Adegboro, T. A. (1992): Construction industry in Nigeria paper in ―The Nigerian Quantity
Surveyor Vol. 14 (April)‖ Journal of the Nigerian Institute of Quantity Surveyor‘
Lagos, Nigeria p(10).
Adeniyi, E. O. (1987): Transport planning and development in Nigeria. ―Construction in
Nigeria‖ journal of the Federation of building and civil Engineering Contractors in
Nigeria. Vol. 14. No. 3 pp(52)
Ajanlekoko, J. O. (1987): Controlling Cost in the Construction Industry: The text of an
article ―the Lagos Q. S. Digest‖. Journal of the Nigerian Institute of Quantity
Surveyors, Lagos State chapter. (p5)
Ataev, S. S. Zolotnitsky, N. D, Bondarik L. N., Gromov, L. N., Ovchinnikon, E. V. and
Tamkovich, A. T. (1980): Construction Technology‖ MIR publishers. Moscow
pp(29-30).
Avery, D. W (1982a): Problems of Locality in Construction Cost forecasting and control in
(Ed) P. S. Brandon: Building Cost Techniques: New Editions. E and F. N. Spon Ltd.
London, New York. Pp (159-160).
Avery, D. W (1982b): Problems of Locality in Construction Cost forecasting and control in
(Ed) P. S. Brandon: Building Cost Techniques: New Editions. E and F. N. Spon Ltd.
London, New York. Pp (160-161).
Avery, D. W (1982c): Problems of Locality in Construction Cost forecasting and control in
(Ed) P. S. Brandon: Building Cost Techniques: New Editions. E and F. N. Spon Ltd.
London, New York. Pp (163-164).
Bala, A (1976): Public Transportation in Kaduna state unpublished PhD Thesis. National
Institute of Transport Technology, Zaria.
Begg D, Fischer, S and Dornbusch, R (1991): ―Economics Third edition‖. McGraw-Hill
Book company London, New York pp (60-61).
Bello Sheriff (1997): Transport and cost of selected construction materials. (A case study of
Kaduna State). Unpublished Research dissertation. Department of Quantity
Surveying. Federal University of Technology, Minna (unpublished) pp55-56
Caparetis, T, Levy, H and Wolden, T (1991): Sub-Suharan Transport Program, Road
maintenance initiative, Building capacity for policy Reform Vol. 1. Report on the
policy seminars, EDI Seminar series Washington D. C. World Bank.
Dayyabu, A. U (1994): Review of Block work and Concrete Work in Nigerian Housing
Construction. Study of cost and construction. Unpublished Research project
dissertation. Department of Quantity Surveying. Federal University of Technology,
Minna, Nigeria. Pp(6 and 23).
Harris, F and Mc Caffer (1983): Modern Construction Management third edition. Black well
Scientific Publications. Oxford, London Edingburgh p(119)
Holmes, Roy (1995): ―Introduction to Civil Engineering Construction third edition‖ College
Estate Management, Reading. Pp(34-35).
Holyes, B (1988): Transport and Development in the Tropical Africa, John Murray publisher
Ltd, London. Pp(44-45)

Mac-Barango
165
Jagboro, G. O. (1992): The role of Professionals in the choice, and utilization of local building
materials. Paper in the ―Nigerian Quantity Surveyor‖ Vol. 14 Journal of the Nigeria
Institute of Quantity Surveyings, Lagos, Nigeria. P (23).
Kawu, A. M (1994): ―Construction cost price book‖ ―Newproquants Consult‖ Kano Nigeria
p(vi)
Kutin, T. E. (1995): Transport and Communication Systems Planning, Reconstruction and
Development in Nigeria. In (Ed): Ayida, A. A. and Onitan H. M. A. reconstruction
and Development Nigeria. Proceedings of a National Conference Ibadan. Niser and
Oxford Univeristy press. Pp(489-520).
Lipsey, R. G (1983): ―An Introduction to Positive Economy: Sixth edition‖ English Language
Book Society. London pp (81, 85-86)
Mac-Barango D. O. (2006): Locational Variations in the elemental cost of bungalows due to
climatic and environmental influences in Nigeria. Paper in ―The Quantity Surveyor‖.
Journal of the Nigerian Institute of Quantity Surveyor‖. Vol. 54 P(33).
Martin J. (2000): How to produce the best early cost advice to clients. ―Chartered Quantity
Surveyor‖ London 32-33
Mc Quillen (1996): Reforms of Road Sector Management and Financing, Federal Ministry of
Works and Housing Road Vision 2000: Workshop papers. P (3).
Mogbo (2002a): The effect of distance on the Regional Variations in the prices of imported
building materials in Nigeria: paper in ―The Quantity Surveyor‖ Journal of the
Nigerian Institute of Quantity, Surveyor, Lagos, Nigeria. Vol. 38 Pp(14 and 15)
Mogbo (2002b): The effect of distance on the Regional Variations in the prices of imported
building materials in Nigeria: paper in ―The Quantity Surveyor‖ Journal of the
Nigerian Institute of Quantity, Surveyor, Lagos, Nigeria. Vol. 38 Pp(14)
Nwoji, C. (1995): Deplorable state of Roads, Daily Champion Newspaper Friday September
22. P(9)
Olateju, S.O. (2000): The analysis of the effect of price of selected building materials in
Kaduna State. Unpublished Research dissertation. Department of Quantity
Surveying. FUT, Minna (unpublished). P(55)
Onukwube, H. N. (2000): Project Evaluation Techniques, the text of article in ―The Quantity
Surveyor‖. Journal of the Nigerian Institute of Quantity Surveyors. Jun/Sept. Vol. 32.
(page 24)
Powell, R (1989a) ―Economics for Professional and Business Studies‖ . Dp publications,
London. Pp (13-14).
Powell, R (1989b) ―Economics for Professional and Business Studies‖ . Dp publications,
London. Pp (288 and 290).
Ratcliffe, J. (1981): An Introduction to Town and Country Planning. London. Hutchinson &
Co. Publishers. Pp (63-69).
Salter, R. J (1977): Highway Traffic Analysis and Design. London Heinman Education
Books. P(128).
Seeley I. H. (1983): Building Economics third edition. Macmillan publishers Ltd. London &
Basingstoke. Pp(61 and 161.
Sharp, A. M and Register, C. A (1988a) ―Economics of Social issues. Eighth edition‖
Longman Group. England pp (29 and 30).
Sharp, A. M and Register, C. A (1988b) ―Economics of Social issues. Eighth edition‖
Longman Group. England p (334).
Shutt, R. C (1988a) ―Economics for the Construction Industry: second edition. Longman
Group. England pp (60 and 73).
Shutt, R. C (1988b) ―Economics for the Construction Industry: second edition. Longman
Group. England pp (191-197, 199).

Cement price
166
Udo, R. K. (1980): Geographical Region of Nigeria. Heinemann Education books. London.
P (95)
Uliman, E (1957): ―American commodity flow Seattle‖. University of Washington press.
Wheeler, J. O. and Muller, P. O. (1986). ―Economic Geography‖ second edition. Wiley
Publishers
Yusuf, S. M (2004): Cost Profile of Ground and First Floor of a Four Flat Two Bedroom
Residential (Concrete Work). Unpublished Research Dissertation. Department of
Quantity Surveying. Federal University of Technology, Minna, Nigeria. Pp(1 and
79).
Zubair, S. A (2005a) Factor influencing project cost in Niger Delta. Paper in the Niger Delta
Q. S. Port Harcourt. P(5 and 6).

Aigbavboa, C. and Thwala, W. (2011) An overview of human settlement in Nigeria: A ray of hope for
the slum dwellers? In: Laryea, S., Leiringer, R. and Hughes, W. (Eds) Procs West Africa Built
Environment Research (WABER) Conference, 19-21 July 2011, Accra, Ghana, 167-179.
167
AN OVERVIEW OF HUMAN SETTLEMENT IN
NIGERIA: A RAY OF HOPE FOR THE SLUM
DWELLERS?
Clinton Aigbavboa1 and Wellington Thwala
2
School of Civil Engineering and the Built Environment, University of Johannesburg, Doornfontein
Campus, Johannesburg, 2028, South Africa
Provision of affordable housing to its citizens has remained the principal focus of
every successive government in Nigeria. This is because of the pivotal role played by
housing in national development, advancement and growth on one hand and its being
a necessity in the life of the people, on the other. The Nigeria housing problem
basically relates to quantitative and qualitative inadequacies regardless of the various
government policies that have been formulated in the past towards overcoming the
huge shortage through several Housing Reform Programmes. Despite these past
efforts, adequate housing provision continues to be an illusion to ordinary Nigerian.
This paper reviews housing in Nigeria; the policies and agencies supporting housing
delivery in Nigeria, such as the Government, private sector and others. Slum
upgrading and other issues helping the delivery of affordable and adequate housing in
Nigeria is also discussed. Based on the above, the success achieved to date is
compared with the support received and the lessons learnt to date are also presented.
The paper is mainly a literature review/survey. Finally, the paper closes with some
recommendations for the future.
Keywords: housing, Government policy, Nigeria, slum, slum upgrading.
INTRODUCTION
Provision of affordable and adequate housing for its citizens has remained the
principal focus of every successive government in Nigeria. This is because of the vital
role played by housing in national development and growth on one hand and its being
a necessity in the life of the people, on the other. At a primary level Van Vliet (1998)
says that housing is shelter where people live and on the secondary level it is a critical
component in social and economic establishment. According to Novick (1990)
housing is the environment, which exerts the greatest and most immediate influence
on the lives of the people, their health, well-being and satisfaction towards life. Thus,
habitable and decent housing in a serene environment that would protect the populace
from unwanted diseases, injury and discomfort and guarantee safety remains the
concern of every individual, corporate bodies and the government in Nigeria (Jolaoso
et al., 2008).
Housing is recognized world-wide as one of the basic necessities of life and a pre-
requisite to the survival of man (Onibokun, 1983; United Nations, 1992; Salau, 1990).
It is a priority for the attainment of living standard and it is important to both rural and
urban areas. A house also affords the physical structure in which human, social, 1 [email protected]
Human settlement in Nigeria
168
economic, and cultural resources are realized, enriched, and integrated (Ademiluyi,
2010). Ademiluyi further informs that in the traditional African setting and in most
developing nations, housing is one of the greatly cherished material properties. This is
because of the other functions that a house performs in the traditional society which
includes the protection of family cohesion and values, taking care of the aged through
the extended family system, and the protection of the ancestral values, among others.
In developing nations, a home of one‘s own represents a precious refuge. Indeed, the
literature on housing in developing countries often show that housing ranks above
education and health services as a priority (Ferguson, 2001). Thus, households in
developing countries value homeownership more than households in advanced
industrialized countries. In fact, in most developing nations when a family does not
have a house they can call their own, that family is regarded as the poorest of the poor.
Thus, the importance of providing adequate housing (housing that meets the needs and
expectations of the people, ranging from the supplied quantity to the quality, thus
assuring the quality of life of the people) in any country cannot be over-emphasized,
much less a country like Nigeria with a GDP- per capita income of $2, 400.
However, acquiring access to a house and to the components that comprise housing
and housing policy—land and property rights, building materials, basic services,
regulations, subsidies, and credit—are extraordinarily difficult for most households in
developing countries (Angel, 2000). Housing has an intense effect on the health,
social behaviour, satisfaction and the quality of life of a community (Nubi, 2008).
According to the Human Rights Resources Centre (2008) housing is essential for
normal healthy living as it fulfils deep-seated psychological needs for privacy and
personal space; physical needs for security and protection from inclement weather and
social needs for basic gathering points where important relationships are forged and
nurtured. In many societies, a house also serves an important function as an economic
centre where essential commercial activities are performed.
Despite the fundamental role of housing in the life of every individual and the nation,
and in spite of the United Nations‘ recognition of the need to globally attain affordable
shelter for all, inclusive of the Millennium Development Goal (MDG) of meaningfully
making a significant impact in the lives of at least 100 million urban poor, the housing
crisis remains one of the problems and a grave and rising challenge facing both urban
and rural residents, particularly in the developing countries. According to the United
Nations World Population projections (2004) an estimated 68 – 80 million houses is
needed annually to house the annual increase in world population growth. Also, the
United Nations Population Fund (2003) informs that the world population passed 6.8
billion in 2009 and is expected to reach between 7.9 and 10.9 billion by 2050. Over
90% of the growth during the next two decades is forecasted to occur in the
developing countries. According to Mthembi-Mahanyele (2002), it is in the
developing nations of the world, that the fundamental challenge of housing provision
for the future lies. According to Ademiluyi (2010) the ―situation even becomes more
serious and worrisome when one realizes the fact that despite a number of political,
social, and religious initiatives taken in the past in some of these developing countries,
a large proportion of their population still lives in sub-standard and poor housing and
in deplorable and unsanitary residential environments‖. This is the situation of Nigeria
today, where housing provision by the government commenced before political
independence in 1960 and where, despite numerous government involvements and
huge investments in housing provision, the problem still remains impossible to solve
as many rural and urban populations in Nigeria do not have free access to safe and

Aigbavoa and Thwala
169
affordable housing. This, according to Onibokun (1990) is as a result of the
government not able to set up systems that enable the citizens to access housing
effectively, and even when they are set-up, the systems are hijacked by the political
parties to foster their mandate amongst the people and the rich and middle class not
needing them become beneficiaries while the poor is left with nothing.
Nigeria being the 8th largest nations in the world will not be spared from the
challenges ahead, as more and more Nigerians make towns and cities their homes,
which will result in a social, economic, environmental and political challenge for the
time to come. Without the proper formulation of policies and likewise their
implementation, housing will be a mirage to the ordinary citizens who cannot
independently access housing. It is against this backdrop that the paper attempts a
review of housing in Nigeria to date. The paper is structured into four parts. Following
this introduction, section two focuses on the policies and agencies supporting housing
delivering in Nigeria, section three will give a review on slum upgrading in Nigeria
and other issues relating to government programmes supporting slum upgrading and
how they are financed, which are generally the issues helping the delivery of
affordable housing from the prevailing slum condition in the cities of Nigeria. Based
on the above, the success achieved to date is compared with the support received and
the lessons learnt to date are also present. Finally, the paper closes with some
recommendations for the future.
POLICIES SUPPORTING HOUSING DELIVERING IN NIGERIA
The Federal Government of Nigeria adopted its first housing Policy in 1991, in
response to the Agenda 21 of Global Shelter Strategy, aimed at achieving sustainable
human settlement development. This was in response to the exploding population and
urban growth rate and also an acceptance, for the first time, that government alone
was incapable of addressing the alarming gap in the housing needs of all Nigerians.
The current housing policy is the main document supporting housing delivery in
Nigeria with reference to past policies. A review of past housing policies and
programmes of both the public sectors as contained in the National Housing Policy
(2006) reveals that effective implementation of housing policies and programmes are
yet to be made and that most of the policies and programmes do not satisfy the quest
of the average Nigerian.
The adopted 1991 policy was reviewed in 2004 with the ultimate goal to ensure that
all Nigerians own or have access to decent, safe and healthy housing accommodation
at affordable cost (National Housing Policy, 2006). The most significant differences
between the new policy and the previous ones is that housing is now seen in context of
the overall National Development in contrast to when housing was regard as a social
service and a natural fall-out of the national economic development. Secondly, the
policy has identified the fact that different people both within and between income
groups tend to have different demands for housing, moving away from the one-size-fit
all syndrome. This is evident from the ultimate goal of the Housing Policy which is,
―to ensure that all Nigerians own or have access to decent housing accommodation at
affordable cost‖. Thirdly, the current focus is on removing all barriers to the supply of
housing and to providing of incentives to all parties involved in the housing delivery
system.
The previous policies from the past until now has always been formulated with good
intentions, but the formulators of the policies do not spell out the direction, neither do
they take into consideration the amount of involvement required from the would-be

Human settlement in Nigeria
170
beneficiaries. A typical short coming of the previous ones usually has the slogan of
―housing for all Nigerians‖. This statement ordinarily assumed that all families in
Nigeria would be provided with adequate housing regardless of who needed one and
with no contribution or participation being expected from the beneficiaries
(Ajanlekoko, 2001). For instance, accessing land in most states for the execution of
the intended programmes are not readily available and most land accessed is too far
from existing infrastructures like roads, water and electricity.
In Nigeria, the major policy steps taken, so far, towards solving the housing crisis in
the country can be summarise below:
Policies to date Reason for policy formation
Formation of the Lagos Executive Development Board (LEDB) - 1928
The Board was authorized to carry out slum clearance, land reclamation, and the development of residential and industrial estates.
The setting up of Nigerian Building Society
(NBS) - 1956
Provision of housing loans to both civil servants and the Nigerian public.
Establishment of housing corporations – 1964 The regional housing corporations were mandated to develop estates and at the same time provide mortgage for the people to build houses and pay back
over many years.
Establishment of the Federal Housing Authority,
established under Decree No. 40 of 1973 and amended by CAP 136 LFN of 1990 – 1973
Its roles was to make proposals to the government for housing and ancillary
infrastructural services and implementing those approved by government.
The creation of the National Site and Services Scheme - 1986
Formed to provide land for government housing with essential infrastructural facilities for housing developments in well-planned
environments. Also, to provide well laid-out serviced plots in each of the 36
state capitals of the federation, including FCT Abuja.
The formation of the National Prototype Housing Program by the Federal Ministry of
Works and Housing
To complement the objectives of the National Site and Services Scheme. The project was embarked upon to demonstrate the feasibility of
constructing functional, effective, and affordable housing units through imaginative designs, judicious specification of materials, and efficient
management of construction.
The setting up of the State Housing Corporation To provide housing to the populace at affordable prices;
The creation of the Federal Mortgage Bank of
Nigeria - 1977
To finance housing loans to prospective housing developers at minimal
interest rates.
The setting up of the National Housing Program
(NHP) in 1991 and the National Housing Fund (NHF) scheme by Decree No 3 of 1992
To provide self-loans to potential housing developers and also monitor
developments in the housing sector.
The deconsolidation of the Federal Mortgage
Bank of Nigeria (FMBN) through the
establishment of the Federal Mortgage Finance Limited (FMFL)
To take over retail mortgage portfolios previously handled by the bank and
also to facilitate effective management of the National Housing Fund
(NHF) Scheme.
The setting up of a Housing Policy Council
(HPC)
To monitor development in the housing sector and also to set up the
machinery for the review of the 1978 Land Use Decree (LUD) in order to make more land available for large scale land developers.
The creation of the ministry of Housing and
Urban Development in June 2003
Charged with the responsibility of ensuring adequate and sustainable
housing delivery and maintenance of a conducive living environment that
meets the needs and aspirations of Nigerians.
The review of the mandate given to the Federal
Housing Authority to include provisions of the
National Social Housing as part of the strategy towards meeting the Millennium Development
Goal.
The authority also plans to facilitate the provision of two million housing
units before 2015, which is not a realistic goal with the way housing issues
are still be treated in the country.
Others are the formulation of the National Housing Policy (NHP) in 1984, the
establishment of the Infrastructural Development Fund (IDF) in 1985, and the Urban
Development Bank (UDB) in 1992 (Federal Republic of Nigeria, 1997).
In addition to the above, all the introduced National Development Plans (NDPs) from
1962-1985 and the National Rolling Plans (NRPs) from 1990 to date plainly recognize
the importance of providing affordable housing in the country as a tool for stimulating
the national economy (Ademiluyi, 2010; Gbolagade, 2005), but little has been done to
bring about an actualization of the policy intentions.

Aigbavoa and Thwala
171
There are several challenges facing the provision of housing in Nigeria, with
particular emphasis to the low-income group; unlike the case of South Africa where
government provide houses free of charge to the low-income group or disadvantage
poor, through the South Africa National Housing Subsidy schemes; to make a start
into economic independence and freedom. Shu‘aibu (2007) posits that the problems
associated with the attainment of affordable housing in Nigeria include compromises
during implementation, lack of political sensitivity, corruption, amongst others. Any
compromises made during implementation that sought to alter basic policy goals are
normally detrimental to the successful execution of any housing policy. Though policy
implementation is a tedious process that requires a great deal of analysis before
starting it, but the reality of basic housing can only be realised if there is proper
implementation of policies. Furthermore, lack of adequate data relating to the
magnitude of the problem, which is as a result of the absence of a national data bank
for housing; inconsistency in policies and programs, including regular changes of
policies with changes of government without proper assessment of the existing ones;
lack of efficient and sustainable credit delivery to the housing sector; incomes level of
those needing houses, this is relatively low in comparison with house market prices,
resulting in an affordability problem; high cost of building materials; the rapid annual
growth rate of the Nigerian population, which was estimated at 3.3% on the basis of
annual birth rate of 49.3 per 1,000. All these coupled with the rapid population
growth/urbanization a problem of an increasing poverty level among the citizenry,
which has risen from 65% in 1996 to about 70% in 2009, according to UNDP and
World Bank estimates confirming UN-habitat (2009) statement that 70% of the urban
dwellers in Nigeria live in slums; lack of effective coordination among Housing
Agencies. While all the three tiers of the government are involved in one way or the
other in housing matters, their activities are hardly coordinated.
SLUM IN NIGERIA
According to Kim (2008) slums, informal settlements, shantytowns, favela, ghettos:
are words which describe an urban typology that has become the focus of intense
interest for architects, urbanists, social-economists, and scholars such as Rem
Koolhaus, Robert Neuwirth, Jeffrey D. Sachs and Mike Davis to mention a few.
Despite the phenomena not new, this urban typology of squalid, overly-dense
communities has flourished over the last decade to over 1 billion people. Today,
almost half of the world‘s urban population are said to be living in slums.
However, Gilbert (2007) informs that ‗slum‘ is nowadays employed to describe ‗bad‘
shelter. The word slum is used at a varying scale in that a house or a large settlement
can be tagged slum provided it is perceived to be substandard and is occupied by the
poor. Nevertheless, Gilbert (2007) further informs that ―every urban area in the world
tend to define slums differently, even though efforts have been made for years to
establish objectives measures with which to demarcate the major problem areas.
Furthermore, the UN-HABITAT report (2003) on ―The Challenge of Slums‖, defines
―slum‖ as a ―household or group of individuals living under the same roof that lack
one or more of the following conditions: access to sale water; access to sanitation;
secure tenure; durability of housing; and sufficient living area.‖ This working
definition, officially adopted at a UN meeting in Nairobi on October 2002, is
―restricted to the physical and legal characteristics of the settlement,‖ and according to
Kim (2008) this definition shies away from the more difficult-to-measure social
dimensions associated with slum. However, in most cases, it is equally related to both
the economic and social circumstances of the individual or community (UN-Habitat,

Human settlement in Nigeria
172
2003). The literature informs that two types of slum exist in Nigerian cities. There are
the traditional slums arising in towns from the decay of existing structures and the
spontaneous slums created by squatters on illegally acquired lands (Agbola, 1998).
The latter pattern represents the majority of the slums existing in the urban areas in
Nigeria. In a study on urban decay in 40 Nigerian cities, Abumere (1987) states that
the cities closely identified with the phenomenon of overcrowding are large cities like
Lagos, Kano, Ibadan, Benin, Onitsha, and these cities are generally deemed to be
ancient (all except Onitsha). This study of almost three decades is more than true as
these cities have become a shadow of themselves with numerous slums springing up
daily as a result of urbanisation caused by population growth. Laurent (2002) further
argues that urban decay connected with overcrowding is almost entirely an urban
problem in Nigeria and is the major cause of the growing slum environment. Laurent
also informs that about 68.2% of the slums in Nigerian cities are found within a radius
of one km from the city centre; of which, if there are no resources for urban renewal,
the city centre, which is the oldest by definition, turns into a slum in time. However,
slums on the outskirts of the city can also be found, normally in the largest Nigerian
cities. In the large cities, such as Enugu, Kano, Ibadan and Lagos, a considerable
proportion of slums occur on the city outskirts, more than five km from the centre.
The reason being that accommodation in many of these cities has been over-priced
beyond what most citizens can afford. Many low-income workers, who cannot afford
the high price, therefore live in low-cost shanties or slums on the outskirts of the city.
The situation has not improved in the major cities with the money that reportedly has
been spent on slum upgrading and eradication in Nigeria (Laurent, 2002).
Slum upgrading approaches differ from city to city. In its simplest form, the approach
that deals with the main deficiencies determined in the slum definition of the UN-
Habitat in Section 2.1.2 is normally adopted in Nigeria. Slum upgrading is a package
that improves the basic services such as clean water supply, sanitation, sewage
disposal, garbage collection, electricity, amongst others, up to a satisfactory standard
(Camilo, 2008). Usually it does not involve the construction of new houses, because it
is assumed that the residents can do this by themselves. Others include legalization
and regularization of property rights or providing security of tenure. Security of tenure
is considered to be one of the essential actions of upgrading since it opens up
possibilities of raising credit for livelihood related activities (UN-HABITAT, 2003).
However, it is also known to be among the most difficult since it requires changes or
flexibility in governmental mechanisms and legislation. At neighbourhood level,
upgrading includes actions such as improvement of footpaths, roads and public
spaces. In some cases actions go beyond the physical aspects and health issues are
addressed by providing clinics and health education programs; school facilities and
training programs are also implemented to attack the lack of basic education and
courses offered to increase income earning opportunities and the general economic
health of the community (Camilo, 2008). Further action includes the removal of
environmental hazards and providing incentives for community management and
maintenance or investment in capacity building. The responsibility of the public sector
is to provide basic infrastructure, while housing is a matter of enabling people to
improve their own conditions (Tannerfeldt & Ljung, 2006). Besides, it has been
confirmed that after the provision of services and infrastructures and guaranteeing
security of tenure, slum dwellers have been motivated to invest up to four times the
amount of funds that the governments invest in the infrastructure improvements of the
area (World Bank, 2000). Nevertheless, it is important to mention once more that the
ways of implementing and applying this approach can vary from city to city and not

Aigbavoa and Thwala
173
always are all these actions put into practice. This is because in a country like South
Africa, slums dwellers are not only provided security of tenure, but also, already
constructed houses are given to them to make a start into the socio-economic
environment. In some other situations in-situ upgrading of the slums are done where
relocation is practically impossible. Also, illegal evictions of slums dwellers were
rampantly used during the Military regime without an alternative solution for the poor.
The Nigerian development agenda concerning slum upgrading is particularly geared
towards achieving the MDGs. Sibeudu (2007) informs that the comprehensive
political, economic and social reforms taking place in Nigeria today emphasis poverty
reduction, slum upgrading, integrated planning and the sustainability principle
(Sibeudu, 2007). But this has only resulted in a little percentage of improvement in the
quality of life for it citizens. The National Framework for poverty reduction strategy,
which is the National Economic Empowerment and Development Strategy (NEEDS),
specifically focuses on poverty reduction, employment generation, wealth creation,
gender mainstreaming, overall social development and value reorientation, without an
agenda to affordable housing and slum upgrading in its formative years. However, in
2007, NEEDS was expanded to cover housing, slum upgrading, social housing,
regional development and other urbanisation issues. Current policy measures in
operation include a revised National Housing Policy, Urban Development Policy and
Environmental Sanitation Policy amongst others to achieve the goals of the MDGs
(Sibeudu, 2007). NEEDS has put in place a modernized land registration and
information system and the establishment of a National Housing Data Bank, as well as
preparation of Strategic Regional Development Plans to correct national disparities.
To date, Nigeria has witnessed a rapid rate of urbanization in the last two decades,
because of the developmental neglect of the rural areas. It is estimated that over 40%
of the Nigerian population live in urban areas. The rapid rate of urbanization has
brought with it significant problems including a shortage of housing, overcrowding,
traffic congestion, environmental degradation, inadequate infrastructure and services,
slum creation, amongst others. In recognition of these problems, the National Rolling
Plans have factored in the new National Housing Policy instruments for implementing
the National Housing Programme that will enable the provision of affordable housing
for the poor. Furthermore, the National Housing Fund an Infrastructural Development
Fund has been put in place to facilitate the attainment of the goals of Sustainable
Human Settlement in the country (UN-Habitat, 2008).
Numerous policies have been adopted by government to improve Urban Management
as discussed above. For instance, the National Urban Development Policy was
formulated in 1992 to provide guidelines for urban development and management. In
addition, a National Construction Policy was promulgated in 1994 to ensure and
enhance the following: the use of indigenous building materials and industries;
adoption of standards and regulatory measures for increased use of energy-efficient
designs; and use of labour intensive construction and maintenance technologies for the
generation of employment (UN-Habitat, 2008).
Other strategies being employed include a mortgage system to facilitate home
ownership among all segments of the population, a National Contributory Pension
Scheme to ensure the availability of long-term savings for residential estate
development and a robust secondary mortgage system. If all these must be realised,
the present administration must complete as efficiently as possible abandoned
programmes by past government and its agencies and target those who can always
benefit from them, which are the poor. As contained in the new National Housing

Human settlement in Nigeria
174
Policy, 2006, government should make available 40% of the National Housing Trust
Fund (NHTF) for low income and rural housing, support and encourage the inclusion
of community Urban Upgrading Programmes and support through Housing co-
operatives and housing association in the provision and maintenance of low income
housing in decent, safe and healthy environment (UN-Habitat, 2008).
PROGRAMMES SUPPORTING SLUM UPGRADING
Nigeria's efforts towards sustainable development since 1986 are marked by policy
formulation and the establishment of agencies for implementation. One of such
‗efforts‘ is the establishment of the Family Support Programme (FSP) initiated by the
then First Lady of the Federal Republic of Nigeria, Her Excellency, Mrs. Maryam
Babaginda. The FSP recognizes that one of the most important needs for the survival
of any family and healthy family living is the provision of decent and affordable
housing, as most low income families in cities do not own houses because they cannot
afford them. In this regard, the FSP sets out, amongst others, the above objectives to
ensure affordable housing for the less privileged in the society.
The Federal Government through the Federal Housing Authority (FHA) started the
National Housing Programme in 1994. The objective was to produce 121,000 housing
units for low, medium, and high income earners. Records show that about 5% of the
target has been achieved as at 2010. Further efforts on direct construction of houses
continue to be made through the National Prototype Housing Programme aimed at
demonstrating the feasibility of constructing functional, cost effective and affordable
housing units. Currently, the Nigerian Urban Renewal Programme is directed at
improving existing slums in the core of cities. The programme has been implemented
in 18 cities across the nation. The Federal Government has also provided through the
National Sites and Services Programme over 15,000 plots at subsidized rates to the
public; and over N250 million have been committed to the programme in the last six
years as reported by the UN-Habitat (2008).
Further to the achievement of the goal of improving urban management, the country is
now participating in the Sustainable Cities Programme (SCP) under the urban
management programme (UMP) of the United Nations Centre for Human Settlement
(UNCHS) / World Bank/United Nations Development Programme (UNDP). Under
the programme, the Sustainable Ibadan Project (SIP) is being implemented. Also,
through this initiative, Local Governments, NGOs, Community Based Organizations,
and private individuals are encouraged to participate and contribute to urban
improvement and management. Presently, the process of replicating the sustainable
city programme in other cities has already begun. Two other cities, Kano and Enugu
have commenced their projectsThe SCP emphasizes a two-way relationship between
development and environment, which promotes better awareness and understanding of
the priority issues to be addressed in urban environment and development, better
considerate of modern urban and environmental management methods, and the most
effective and lasting impact (UN-Habitat, 2008).
The Nigerian Government is currently working on developing future programmes
aimed at improving the human settlement development and management sectors.
These sectors include: poverty alleviation programmes in collaboration with the
World Bank and UNDP; a programme support document for Governance in
collaboration with UNDP; a National strategy for the replication of the Sustainable
City Programme in other Nigerian cities; and replication of the Urban Basic Services
Programme in collaboration with the United Nations Children‘s Fund. The

Aigbavoa and Thwala
175
government intends to concentrate efforts in the near future on: capacity building for
improved management; institutional and policy reforms; social reorientation;
increased participation of NGOs and the private sector; and promotion of appropriate
technologies (UN- Habitat, 2008). These future plans are aimed at achieving a state of
environmentally sound human settlements, free of slum conditions, in which every
disadvantaged and poor Nigerian will have access to adequate and affordable shelter.
FINANCING OF SLUM UPGRADING PROGRAMMES IN
NIGERIA
Slum upgrading in Nigeria is mostly funded by the Federal Government. Slum
upgrading, according to the Nigerian Minister for housing in 2007, is to embark on re-
planning of already existing plans, which have not been properly planned to invariably
improve lives of the slum dwellers across the country. It should be known that slum
upgrading is not just about this alone, because some of the cities centres that are now
in slum condition are planned. But because of the lack of a maintenance culture and
lack of infrastructure and other amenities, they have become slum centres. Although,
the later was the reason while in 2007 the ministry of housing allocated, N500 million
for an intervention fund for three slums locations to be upgraded. The projects
executed in these areas included rehabilitation and upgrading of township roads and
drains including water drainages; rehabilitation and provision of water to household
connections, provision and upgrading of electricity supply in slum neighbourhoods;
household connection and others (UN-Habitat, 2008).
Currently, the Nigeria Urban Basic Services Programme (UBS) is being financed with
a $3 million grant from UNICEF with a matching grant from the Federal Government.
The targeted communities to benefit from the programme were identified in the cities
of Lagos and Ibadan, which have some of the oldest slums in the country. Through
financial assistance from the World Bank (US$ 180 million), the Infrastructure
Development Fund has been able to finance urban development projects in 15 States
of the Federation. The initial loan from the World Bank was matched with local funds.
The projects carried out covers storm drainage, sanitation, urban road rehabilitation,
water and solid waste management, market development, water rehabilitation, motor
part development, river channelization, and street lighting according a report of UN-
Habitat (2008).
Under the various programmes for the upgrading and eradication of informal
settlements, the government in collaboration with agencies such as the World Bank,
UNDP, the United Nations Environment Programme (UNEP), the International
Labour Organisation (ILO), UNICEF, and UNCHS have sponsored foreign and local
training programmes to acquaint operators of this sector with contemporary ideas,
strategies, and tools for human resources development and a better approach to slum
upgrading in the selected sites. Also, technical assistance for human resource
development has been received to enhance the management capacity of agencies
responsible for urban development.
SUCCESS ACHIEVED TO DATE COMPARED WITH THE
SUPPORT RECEIVED
Further to the foregoing, the Nigeria government in collaboration with other
international agencies have made a lot of commitment to the upgrading of slum
condition in the country. This commitment thus gives a ray of hope to the slum
dwellers which is seen as a worthy commitment to changing the slum condition

Human settlement in Nigeria
176
plaguing the urban areas. These thus contradict the World Bank research findings that
African countries do not see housing and slum upgrading as a funding priority (Shea,
2008). But when a critical review of what is achieved to date is compared with the
investment/support, one can conclude that the success achieved is not commensurate
with the support received. Although a significant impact has not really been made in
reality that can adequately compensate for the support received, however, we can still
say that the urban poor‘s right to adequate housing and other problem issues that are
associated with slum conditions are being given attention. However, it should be noted
that one major obstacle to the short comings of the success received to date is a lack of
transparency and corruption in the part of the policy implementers and the country‘s
law makers.
This is because, if the financial assistance from the World Bank (such as - US$ 180
million) and other agencies, said to have been used for urban development projects in
15 States can be adequately accounted for, the majority of the slum dwellers would
have had a roof over their heads, free supply of drinkable water, good sanitary system
amongst others even though it is not up to the standard that can called ―adequate in
terms of the quality received‖. Also, there should be an integrated approach to
informal settlements upgrading, and also the project should build capacity in order to
improve the lives of slum dwellers. Because even though the sponsored trainings have
indeed foster a capacity building within those that were trained, in the acquisition of
contemporary ideas, strategies, and tools for human resources development and giving
of a better approach to slum upgrading in the selected sites; there should be the
involvement of volunteers within the community to be upgraded so that they can
contribute meaningfully and give suggestions based on the pressing need of the other
community members. Also, technical assistance for human resource development
should not only be to those agencies responsible for urban development, but also to
the locals; because for the slum upgrading process to be sustainable, the locals must
have a first oversight of the development so that they can be responsible to their
communities when the agencies are gone from the slum upgrading sites. Moreover, in
making a significant contribution in the lives of the urban poor, economic
empowerment should be sought, because in this lies the true and only way out of slum
conditions, because when the slums of today are upgraded without the socio-economic
empowerment of the poor, the slums being upgraded today will again become slums
to be upgrade tomorrow.
LESSONS LEARNT TO DATE ON NIGERIA SLUM UPGRADING
EFFORT
From the reviewed literature, the lessons learnt to date from the Nigeria slum
upgrading include:
1. the success of slum upgrading depend on ensuring full support and engagement
of local actors and the beneficiaries, which the new housing policy have fully
recognised;
2. the Government initiative towards upgrading of slum is more of a borrowed
initiative from the MDGs, and until the Nigeria government set its own goals
and develop its own approach that will align with the Cities Without Slums
goals and others, the quick reality of Nigeria cities without slum will not be
achieved;
3. also, slum dwellers confuse slum upgrading to mean construction of housing,
and this myth is hard to erase from their minds;
Aigbavoa and Thwala
177
4. the buy-in of the slum dwellers into the project has been difficult because no
one wants to work for free, however, the government should encourage the
locals to be involved so that they can be empowered for economic
opportunities;
5. Government must promote alternative strategies for housing construction, such
as provision of service sites with basic infrastructure before making them
available for sale to individuals who need them.
CONCLUSIONS AND RECOMMENDATIONS
The study revealed that the Nigerian government has embarked on the provision of
housing for its citizens with a revised Housing Policy Framework to fight the current
slum condition associated with the city capitals in the country. However, the problem
with management and implementation of housing policy by the agencies given the
responsibility has made these laudable policies ineffective. It should be appreciated
that it is the operational effectiveness of these public agencies that will help in the
achievement of the revised objectives of the National Housing policies. The present
housing difficulty in Nigeria results from the absence of effective administrative
machinery to mobilize and organise the country‘s natural resources, human, industrial,
amongst others; for housing and urban development. Thus, the problem of poor co-
ordination and ineffectiveness of some public housing agencies in Nigeria is in most
cases responsible for the failure of certain laudable housing policies and programmes.
However, to date, there is no known government housing subsidy programme in place
to help provide houses for the low income group. Therefore, the following
recommendations are therefore made:
the government must shift attention from direct housing construction to that of
providing empowering environment for the sector. This is because individuals
and private agencies are known to be more effective in housing construction.
Therefore, given the same amount of money that is reported to have been
spent, individuals and private agencies are likely to build more and better
houses than the government or quasi-government agencies, especially in a
country like Nigeria where there is a high level of corruption;
also, Nigeria being a politically diverse nation, the government need to master
the necessary political will and make more concerted efforts to address and
solve for the majority of its citizens living in slum conditions, the twin
problem of shelter and better living conditions.
REFERENCES
Abumere, S. (1987) Urbanisation and Urban Design in Nigeria. IN Onibokun, A. C. &
OLOKESUSI, ET AL (Eds.) Urban Renewal In Nigeria.
Ademiluyi, I. A. (2010) Public housing delivery strategies in Nigeria: a historical perspective
of policies and programmes Journal of Sustainable Development in Africa, 12, 153-
161.
Agbola, T. (1998) The Housing of Nigerian: A review of policy development and
implementation. Research Report No.14.
Ajanlekoko, J. S. (2001) Sustainable Housing Development in Nigeria - The financial and
infrastructural Implication. International Conference on Spatial Information for
Sustainable Development. Nairobi, Kenya.
Angel, S. (2000) Housing Policy Matters, Oxford University Press.

Human settlement in Nigeria
178
Bret, T. J. D. (2002) The Human Right to Adequate Housing: Tool for promoting and
Protecting Individual and Community Health. Am J Public Health. American Journal
of Public Health, 92, 712–715. .
Camilo, A. C. A. (2008) Learning from Slum Upgrading and Participation. A case study of
participatory slum upgrading in the emergence of new governance in the city of
Medellín–Colombia. KTH, Department of Urban Planning and Environment Division
of Environmental Strategies Research fms. Kungliga Tekniska Högskolan.
Federal Republic of Nigeria. (2006) National Housing Policy. Chebychev Ventures Ltd.
Ferguson, B. (2001) Process, Policy, and Public-Private Partnerships in Housing in
Developing Countries: What Can the United States Learn?, London.
Gbolagade, M. O. (2005) An Appraisal of Maintenance of Privately Owned and Publicly
Owned Multi-Tenanted Estate in Lagos Metropolis. (An Unpublished Work of the
Department of Urban and Regional Planning). Ibadan, Nigeria, University of Ibadan.
Gilbert, A. (2007) The return of the Slum: Does Language Matter? International Journal of
urban and Regional Research. Volume 31.4, pp. 697-713
Jolaoso, et al. (2008) Self-help Contribution: a Viable Source of Financing Low-income
Housing. The 3rd Built Environment conference. Cape Town, South Africa.
Kim, L. (2008) The kijijikit: a strategy for slum upgrading in Nairobi. Water loo, Ontario:
Canada, University of Water loo
Laurent, F. (2002) Urban Slums Reports: The case of Ibadan, Nigeria. Institut Francais de
Recherche en Afrique (IFRA). University of Ibadan, Oyo State, Nigeria.
Mthembi-Mahanyele, S. (2002) Keynote address to the Round Table on Sustainable African
Cities. WSSD: Crowne Plaza.
Novick, R. E. (1990) The Poor die young. Housing and Health in The Third World cities.
London: Earth scan Publication Ltd.
Nubi, O. T. (2008) Affordable Housing Delivery in Nigeria. The South Africa Foundation
International conference and exhibition. Cape Town, October, pp. 1-8
Onibokun, A. G. (1983) Housing Needs and Responses: A planner‘s view. Journal of the
Nigerian Institute of Town Planners, 11.
Onibokun, P. (1990) Urban Housing in Nigeria, Ibadan: NISER.
Salau, A. T. (1990) The Environmental context of urban housing-public services and
infrastructural facilities in Nigerian urban centres. IN P., O. (Ed.) Urban Housing in
Nigeria. Ibadan: NISER.
Shu'aibu, M. U. (2007) Housing policy implementation problems in Nigeria. Daily Triumph
newspaper. Nigeria.
Sibeudu, A. (2007) Planning Sustainable Urban Growth in Nigeria: Challenges and Strategies.
Planning Sustainable Urban Growth and Sustainable Architecture. ECOSOC
Chambers, United Nations Headquarters, New York.
Tannerfeldt, G. & Ljung, P. (2006) More Urban Less Poor - An introduction to Urban
Development and Management, London, UK: Earthscan Publications Ltd.
United Nations Centre for Human Settlements. (2009) Habitat Backgrounder: Facts and
Figures. Available at: ww2.unhabitat.org/istanbul+5/back11.doc. [Accessed on: 02
March 2009].
United Nations Human Settlements Programme (UN-HABITAT). (2003) The Challenge of
Slums: Global Report on Human Settlements. London, United Kingdom: Earthscan.

Aigbavoa and Thwala
179
United Nations Human Settlements Programme (UN-HABITAT). (2006/2007) State of the
World‘s Cities: The Millennium Development Goals and Urban Sustainability.
London, United Kingdom: Earthscan.
United Nations Human Settlements Programme (2008) Un-habitat and the Kenya slum
upgrading programme Strategy document. May 2008 HS: 1010/08E.
Van VLIET, W. (1998) The Encyclopedia of Housing, Sage Publications.
World Bank. (2000) Cities Without Slums - Moving Slum Upgrading to Scale. Urban Notes -
Upgrading Experiences (2).


Dadzie, J. and Coles, D. (2011) Assessing the impact of the National Building Regulation, 1996,
L.I.1630 in Ghana In: Laryea, S., Leiringer, R. and Hughes, W. (Eds) Procs West Africa Built
Environment Research (WABER) Conference, 19-21 July 2011, Accra, Ghana, 181-181.
181
ASSESSING THE IMPACT OF THE NATIONAL
BUILDING REGULATION, 1996, L.I.1630 IN GHANA
John Dadzie1 and David Coles
2
1Kumasi Polytechnic, Ghana
2University College of London (UCL), UK
The development of the National Building Regulation was based on the ideas and
objectives of a new national policy. It is a complicated document with far reaching
consequences. The Regulation has been in existence for well over ten years now yet,
it is within this same period that the nation (Ghana) has witnessed high level of
collapse of structures, flooding and fire outbreaks. This research paper, therefore,
looks at the impact of the National Building Regulation ever since its passage into law
and what can be done to reverse the current trend. Pertinent areas such as; location of
buildings, structural stability, structural fire precaution and obstructions and hazards
in means of escape as stipulated in the Regulation were considered. After analysing
data and testing of scientific hypothesis, the results establish that the National
Building Regulation has not made the needed impact due to poor adherence. The
results further establish that poor construction practices leading to collapse of
structures, fire outbreaks and flooding are as a result of non-adherence to the National
Building Regulation.
Keywords: flooding, Ghana, National Building Regulation.
2


Omisore, O.E. (2011) Assessment of patronage of Natural History Museum, Obafemi Awolowo
University, Ile-Ife, Nigeria In: Laryea, S., Leiringer, R. and Hughes, W. (Eds) Procs West Africa Built
Environment Research (WABER) Conference, 19-21 July 2011, Accra, Ghana, 183-192.
183
ASSESSMENT OF PATRONAGE OF NATURAL
HISTORY MUSEUM, OBAFEMI AWOLOWO
UNIVERSITY, ILE-IFE, NIGERIA
Emmanuel Olufemi Omisore1
Department of Urban and Regional Planning, Obafemi Awolowo University, Ile-Ife, Nigeria
This study examined the extent to which tourism sites on Obafemi Awolowo
University Campus particularly Natural History Museum have attracted patronage and
its contribution to the development of the built environment of the University
Campus. Data for this study were sourced through primary and secondary sources.
From the physical survey, tourist sites were identified on the Campus and these
formed the sample frame of the eight study. However, a detailed survey was carried
out on the Natural History Museum which formed the sample size. The survey was
carried out through physical survey and questionnaire administration in order to
assess its patronage pattern over a period of twelve weeks. 320 questionnaires were
administered to collect the primary data from tourists that visited the Natural History
Museum during the working days only. From the questionnaire administered the
purpose of patronage, frequency of visit and time spent at the museum were
determined through data analysis. Analysis showed that 25.6% patrons came to the
museum for sightseeing, 24.4% for personal relaxation and 35.4% visit for
educational and research purposes. The secondary data obtained from the register of
attendance showed a decline from a total number of 13,747 patrons in 1998 to 8,444
in 2005. It was observed that the exploitation of the identified tourism potentials on
the University campus would attract more patrons, even of varying age, educational
and occupational distributions for the overall development of the Campus. The study
suggested ways by which the potentials of tourism could be achieved through proper
exploitation, investment and management to enhance the development of the
University community and her built environment.
Keywords: environment, Ile-Ife, museum, tourism, tourist site, tourist.
INTRODUCTION
The built environment of Obafemi Awolowo University campus is endowed with
several man-made and natural sites with tourism potential. These tourist sites are
places of significant events. They are areas or places containing properties and
monuments commemorating diverse socio cultural- events (Omisore and Akande,
2009). Access sites reveal natural and artificial structures of significance and provide
insight into how past generations lived, worked and worshiped. In addition, the level
of patronage of these sites depends on accessibility and the ability of facilities on these
sites to meet the taste of the tourist. Accessibility is the ease with which an activity or
a service can be reached or used (Social Exclusion Unit, 2003). Today, tourism is one
of the fast growing industries in the world particularly in terms of its social and
economic benefits (UNESCO, 2005 and Foan and Franco, 2008). One of the most
valuable characteristics of the tourism industry is that while it has grown in number, it

Omisore
184
has also grown in variety of destinations. There has been a continued geographical
spread of tourism to all parts of the world. This may be the reason why many
countries, especially developing countries, have shifted to the development of tourism
as a viable engine for their socio-economic development (FRN, 2006).
As a human activity, tourism deals with the movement of people in search of holiday
or business (United Nation Economic and Social Council, 2005). It is a driver of
economy at the local, national and international levels. It is a rapidly growing
phenomenon and has become one of the largest industries in the world (Shah and
Gupta, 2000, Kreag, 2001, UNESCO, 2005). The impact of tourism is extremely
varied. On one hand, it plays an important and certainly positive role in the socio-
economic and political development in destination countries by, (for instance),
offering new employment opportunities. In addition, it may contribute to a broader
cultural understanding by creating awareness, respecting the diversity of cultures and
ways of life (United Nations Commission on Sustainable Development, 1999, United
Nations, 2003).
In another perspective, tourism contributes, to a greater degree than most activities, in
the provision of encouragement of the wide range of infrastructural services - airports,
air navigation, roads, railheads and ports, as well as basic infrastructural services
required by hotels, restaurants, shops, and recreation facilities (for instance
telecommunications and utilities). As such, it can be said that tourism is able to
contribute to development, which is economically, ecologically and socially
sustainable. This is because it has less impact on natural resources and the
environment than most other industries. It is based on enjoyment and appreciation of
local culture, built heritage, and natural environment. The industry has a direct and
powerful motivation to protect these assets; it can play a positive part in increasing
consumer commitment to sustainable development principles through its unparalleled
consumer distribution channels; and it provides an economic incentive to conserve
natural environment and habitats which might otherwise be allocated to more
environmentally damaging land uses, thereby, helping to maintain bio-diversity
(United Nations Commission on Sustainable Development}, 1999, UNESCO, 2005).
The impact of patronage of tourists‘ site on the built environment in Nigerian towns
and cities whether for tourism or any other purposes need to be critically examined.
This paper focused on the examination of the extent to which the patronage of the
Natural History Museum located within the built environment of Obafemi Awolowo
University has contributed to the development of the University Campus.
LITERATURE REVIEW
Francis Perroux postulated growth pole theory in 1955. He argued that a growth pole
is a place of passage of forces. It attracts people and objects to itself and repulses
them. He further claims that it is a center from which centrifugal and centripetal forces
operates. In the context of spatial development, a regional growth pole according to
Hermansen (1981) is a set of expanding industries located in an urban area and
including further development of economic and social activities throughout its zone of
influence.
Kuklinski (1972) extended the theory of growth pole to include, more
comprehensively the geographical dimension. He however based his observation and
consequent recognition of the facts that development does not appear everywhere all
at once. It appears at point of development pole with variable intensities: it spreads

Economic potential of tourism
185
along diverse channels and has varying terminal effects for the whole of the economy.
Perroux‘s interests were economic activities, that is, industries and commercial
enterprises were used as his main element of attraction for creating the pole. The
concern which has lead to rather ready acceptance of the growth pole as a basis for
policy making are the problems generated by the rapid metropolitan growth. Over
concentration of economic activities and social services in one or few large
metropolitan centers has stimulated effort to decentralize industries and government
employment in relation to country population and natural resources location for even
economic development. In contribution to industrial theory, Myrdal (1957) believes
that a growth pole result in a circular and cumulative causation. He states that once a
particular region has the virtue of the location of a large industry, new increment of
activities and growth will concentrate in the region because of the derived
advantage.Once growth has begun in a place, spatial flow of labour, capital and
commodities develop spontaneously to support it. There are trickledown effects or
spread even to other parts of the region with respect to this development. A backwash
effect is also set in the surrounding region since the region loses their younger, more
skilled and able bodied workers to the growth centres. Fredmann (1966) in the theory
and strategy of development discussed the need for concentration of the development
and impulse in some centers. They believed that in the long run development will
trickle down from these growth centers into the hinterland as well as the periphery.
Tourism sites are referred to as development impulses of growth poles from which
development can trickle down into other parts of the host environment. Once growth
has begun in a place of tourism site, spatial flow of labour, capital and commodities
develop spontaneously to support it. This study postulates that the development of the
existing tourism sites has potentials to stimulate socio-economic development of the
host communities with significant multiplier effects. It is on his theoretical concept
that this study is based
THE STUDY AREA
Obafemi Awolowo University is situated in Nigeria as a Federal government-owned
and operated Nigerian University. It situated in the South Western part of Nigeria and
lies between Latitude 7o15‘N, 7
o31‘N and Longitude 4
o43‘E, 4
o45‘E at a distance of
288 and 671 kilometres from Lagos and Abuja respectively. See Figure 1. The
Campus is situated in Osun State precisely within the Ife-Central Local Government
Area. (See Figure 2 and 3).
It is situated in a tropical zone and therefore, tropical temperature and rainfall prevail
there. In the dry season, the temperature can be as high as 29oC (90
oF) and in raining
season, the temperature can be as low as 23oC (70
oF). The University formed the
northern part of the ancient city of Ile-Ife, and lies between the tropical rain forest
belts of Nigeria. Its vegetation is characterised by high evergreen forest. The
University was founded in 1962 as the University of Ife by the regional government of
Western Nigeria led by late chief Samuel Ladoke Akintola and was renamed Obafemi
Awolowo University on May 12, 1987 in honour of Chief Obafemi Awolowo (1909–
1987), the first Nigerian premier of the Western Region of Nigeria.
The University is endowed with beautiful architecture and an eye-catching landscape
built on about 5,000 acres (20 km2) out of a total of 11,560 acres of the land owned by
the University. (See Figure 4). It is however by no means "Africa's most beautiful
campus" as students and staff are always wont to claim. Some of these endowments
include: Natural History Museum, Opa Dam, Zoological Garden, Botanical Garden,

Omisore
186
Hills, Bat Colony, Sculptural Park and Architectural Buildings such as Oduduwa Hall,
the Spider House, and Senate Building among others. These features (natural and
manmade) could contribute to the local economic development of the University‘s
Built Environment. Pictures of some of these features are shown below. However, in
this paper, emphasis and analysis will be on Natural History Museum.
Natural History Museum
The Natural History Museum was established in 1971 as a sub-unit under the
Department of Biological Sciences. In 1990, the Department of Archeology in the
University was merged with the Museum, thus expanding the scope of activities to
include Archeology and Cultural Anthropology (Faborode, 2011). The Museum was
housed temporarily on the top floor in one of the buildings of the Faculty of
Agriculture for more than 30 years.
The roles of the Natural History Museum in the life of a nation with particular
reference to the Museum at Obafemi Awolowo University, Ile-Ife have been
published (Ige, 2010). Other objectives of setting up the Museum include
To conduct research into the vast natural and cultural history of Nigeria;
To serve as a repository of natural and cultural objects in Nigeria;

Economic potential of tourism
187
To create scientific awareness on natural and cultural resources of Nigeria through
annotated exhibitions for public enlightenment in display of galleries;
To prepare database on natural history and cultural resources in Nigeria to facilitate an
information retrieval system on them for use by the public and the scientific
community as a basis for sustainable development
To provide identification services on natural history and cultural objectives to user
groups especially pest control workers in Archaeology, Agriculture, Veterinary and
Human medicine.
According to Ige (2011), the Museum is currently organized into six scientific
sections comprising of Botany, Entomology, Zoology, Earth Sciences, Paleontology
and Archaeology/Anthropology. A hole unit of the museum is devoted to Illustration,
Graphics, Taxidermy and Publication.
METHOD
Data for this study were collected through primary and secondary sources. The
primary source of data includes both physical survey and questionnaire
administration. The physical survey involved the reconnaissance of the University
Campus to identify potential tourism sites. An inventory of the study area revealed
some potential tourist sites, which formed the sample frame and these are represented
in the Table 1 below.
TABLE 1: Tourism Sites in Obafemi Awolowo University, Ile-Ife
S/N TOURISM SITES
1 Zoological Garden
2 Botanical Garden
3 Opa Dam
4 Natural History Museum
5 Aladura Mountain or Messiah Hills
6 Bat Colony
7 Architectural Buildings(e.g. Spider House, Architecture Department, Senate Building,
Heziekiah Oluwasanmi Library, Music Department and so on.
8 Sculptural Park
Source: Author‘s fieldwork (2010)
Data for this study were collected through field surveys using a propulsive method of
sampling over a period of 12 weeks. The questions in the questionnaire sought
information from patrons of Natural History Museum on such variables as age, sex,
marital status, education, place of origin, occupation, family size, car ownership,
religious affiliation, purpose of patronage, mode of patronage, gate fees, frequency of
patronage, duration or hours of patronage and quality of services given at this site.
Secondary sources include record of attendance, Dissertation, Theses and Journals.
The study revealed that most of these sites had no record except Natural History
Museum. This informed the selection of National History Museum as the sample size.
Data analysis was carried out using simple frequencies and cross-tabulation of
variables.
DATA ANALYSIS
This study was conducted using the natural history museum as one of the tourism sites
on the campus. A survey was carried out through questionnaire administration in order

Omisore
188
to assess its patronage over a period of twelve weeks (Monday to Friday). The
questionnaire were administered on 320 patrons who were selected propulsively.
Analysis of the socio-economic characteristics of the 320 respondents revealed that
most of the respondents (75.3%) were male while the remaining (24.7%) are female.
The age distribution of the respondents also revealed that majority of the respondents
were less than 20 years of age (39.4%) and between 20 and 30 years (35.0%). This
confirmed the information from the attendants in the museum that most of the patrons
of the museum were students of the university and others from primary and secondary
schools from within and outside the University community.
Likewise, the educational qualification of the respondents showed that some of them
had secondary education (25.9%) and higher education (57.2%) respectively. The
occupational distribution of respondents revealed that majority were students (65.6%)
while others were civil servants (9.37%), traders (18.7%) and company or private
workers (6.3%). All these indicate that the respondents were mainly students within
the University environment and those that were coming for excursion on the campus.
Therefore, with these categories of patrons to museum, it could be deduced that the
patrons may be more satisfied to have variety in having different areas of interest to
visit. It can then be said that the utilization of the identified tourism potentials on the
University campus would attract more patrons, even of varying age, educational and
occupational classes.
TABLE 2: Purpose of the Patronage of the Museum
Purpose Frequency Percentage
Sightseeing 82 25.6
Personal Relaxation 78 24.4
Religious/Spiritual 8 2.5
Picnic 22 6.8
Educational/Research 113 35.4
Convalescence 17 5.3
TOTAL 320 100.0
Source: Author‘s Survey, 2010
Table 2 above revealed that, patrons come to the museum for various purposes. The
table showed that patrons come to the museum mainly for sightseeing (25.6%),
personal relaxation (24.4%) and educational and research purposes (35.4%). It could
be said from this analysis that people visit mainly for recreation and learning (85.4%).
Therefore, the availability of the tourism potentials on the University campus, if
maximized could enhance learning and improve recreational activities within the
campus.
TABLE 3: Frequency of Visit to Tourist Centre
Visiting Period Frequency Percentage
Weekly 51 15.9
Monthly 76 23.8
Occasionally 193 60.3
TOTAL 320 100.0
Source: Author‘s Survey, 2010
Table 3 above gave insight that most people visit the museum occasionally (60.3%)
and other patrons come weekly or monthly. The reason that can be adduced for this
was that the weekly and monthly regular patrons might be University students that
patronize the museum for academic purposes. Nevertheless, the occasional patrons to
the museum were students from other educational institutions which include

Economic potential of tourism
189
secondary and primary schools that are coming for excursion, sightseeing and
relaxation. It could then be said that the occasional visits to the museum and the
purpose of patronage (sightseeing and relaxation) indicate that the museums have
tourism potential that could be maximized.
TABLE 4: Time Spent at the Museum
Time Frequency Percentage
Less than 1 hour 189 59.1
1 – 3 hours 131 40.9
Whole day - -
More than a day - -
Total 320 100.0
Source: Author‘s Survey, 2010
Table 4 revealed that 189 patrons (59.1%) spend less than an hour while 131 patrons
(40.9%) spend one to three hours in the museum. However, no respondents spend a
day or more in the museum. This might be because of the nature of operation of the
museum that does not allow visits after working hours. This is an indication that the
museum was having less economic impact as it was established in the literature that
such short trips have less economic impact. Analysis of the respondents revealed that
they spend between 1-3 hours while 59.1% spent less than one hour.
TABLE 5: Patronage to the Museum (1998 – 2006)*
Months 1998 1999 2000 2001 2002
2004 2005 2006
January 914 1171 1341 1467 1089 - 175 347
February 919 1365 1060 1069 1203 - 568 612
March 769 834 - 1057 2283 - 646 330
April 964 526 - 819 1844 - 775 491
May 1631 574 119 394 902 479 813 904
June 757 1320 172 973 660 816 1216 1026
July 637 1089 823 660 1027 517 933 -
August 1181 1552 1616 1448 1125 726 1057 -
September 1962 1150 1479 1267 731 799 603 -
October 1535 635 575 1637 520 440 456 -
November 1428 752 1291 1803 1310 328 410 -
December 1050 1809 1543 1352 843 510 792 -
TOTAL 13747 12777 10037 13946 13537 4615 8444 3710
* Data for some months (2000, 2004 and 2006) and year 2003 are not available.
Source: Natural History Museum, OAU, Ile-Ife, (2010)
From Table 5 above, it can be deduced that there was a downward trend in the rate of
patronage of the museum. The decline from a total number of 13, 747 patrons in 1998
to 8,444 in 2005 was an indication that the patronage of the museum might not have
effective economic impact on the economic development of the University and Ife
communities. This might be because the museum was primarily established for
education and research purposes. However, it can be financially sustained and better
managed if there is a focus on its tourism potential, which could generate revenue to
the local economy while the primary focus of education and research are also
sustained.
The above not withstanding, the Director of the museum revealed during interview
that visitors to the museum were charged ^5.00 as entry fee. This was the amount
charged across the board since the inception of operation of the museum regardless
of age, gender or social status.

Omisore
190
However, the fee has been increased to ^50.00 since the completion and opening of
the new ultra modern architectural complex in March 2011.
Table 6: Computed Gate Fees (1998 -2006)
Months 1998(^) 1999 2000 2001 2002
2004 2005 2006
January 4570 5855 6705 7335 5445 875 1735
February 4595 6825 5300 5345 6015 2840 3060
March 3845 4170 - 5285 11415 3230 1650
April 4820 2630 - 4025 9220 3875 2455
May 8155 2870 595 1970 4510 2395 4065 4520
June 3785 6600 860 4865 3300 4080 6080 5130
July 3185 5445 4115 3300 5135 2585 4665
August 5905 7760 8080 7240 5625 3630 5285
September 9810 5750 7375 6335 3655 3995 3015
October 7675 3175 2875 8185 2600 2200 2050
November 7140 3760 6455 9015 6550 1640 2050
December 5250 9045 7715 6760 4215 2550 3960
TOTAL 68,735 63,885 50,095 69,730 67,685 23,075 42,220 18,550
Source: Author‘s Fieldwork (2010)
The amount of money that had been collected as gate fees at ^5 per person are since
1998 on yearly basis are calculated and shown on table 6.The table showed that the
months of August to November of every year had more revenue than other periods.
This period seem to coincide with the beginning of session when students are less
busy. It is also the period when fresh students come on campus.
SUMMARY OF FINDINGS, CONCLUSION AND
RECOMMENDATIONS
Summary of Findings
The paper revealed that the University has many natural resources that could be
developed for tourism purposes. The study reveals that many of these potentials are
not optimally utilized. The study conducted on a tourism facility on the campus (the
Natural History Museum) revealed that its use is not maximized. Analysis of the
socio-economic characteristics of the 320 respondents revealed that most of the
respondents (75.3%) were male while the remaining (24.7%) were female. Further
analysis showed that patrons come to the museum mainly for sightseeing personal
relaxation and educational research purposes with 25.6%, 24.4% and 35.4%
respectively. The summary of frequency of visit showed that 60.3% people visit the
museum occasionally and other patrons come weekly or monthly and that 189 patrons
(59.1%) spend less than an hour while 131 patrons (40.9%) spend one to three hours
in the museum. Findings also revealed that the museum would have been more
functional if there had been a better focus on its tourism potentials (including its
ability to generate revenue). This has made the patronage of the museum to be
characterized by a downward trend leading to lesser income and thereby sapping the
University revenue rather than generating income to improve the internally generated
revenue of the University. There is substantial evidence to show that the small amount
of gate fee collected had generated substantial sum over years. This money could be
used to improve the services provided at the museum also make the organization self
sustaining. This paper has also revealed that the University and Ile-Ife communities
can benefit immensely if all the identified tourism potentials are developed and
maximized.

Economic potential of tourism
191
CONCLUSION
Tourism is widely considered to be one of the sectors that provide the built
environment opportunity to meet economic targets by generating revenue and
promoting socio-economic development. In addition, it is evident that a well-
developed tourist sites will boost the volume of patronage and consequently, the
socio-economic developments of the host environment. Directing tourism growth
toward local needs, interests, and limits can greatly enhance the value of tourism to
the community and help create a sustainable built environment. Obafemi Awolowo
University have the skills and resources for successful tourism development. Creating
a local tourism development for international and national patronage is not a daunting
task, but making tourism really fit in the community requires work.
RECOMMENDATIONS
*The university should have a policy on the utilization of the tourism sites to be self-
sustaining by ensuring their continuous and effective maintenance.
*Partnership with private investors should be encouraged in order to allow external
influx of money into the development and maintenance of these tourism sites.
*The University management should create awareness of the existence of these
tourism sites on the University campus.
*There should be an upward review of the entrance fees to the Natural History
Museum so as to ensure fund generation thereby improving the internally generated
revenue of the University.
*The management of the university should as a matter of urgency address the
development of the other tourist sites within the campus. This will create such
multiplier effects in the areas of creating employment, boosting the internally
generated revenue of the University and promoting the global image of the University
and the city of Ile-Ife.
REFERENCES
Faborode, M.O. (2011) Speech Delivered by the Vice Chancellor,Obafemi Awolowo
University, Ile-Ife at the Opening Ceremony of the New Building of the National
History Museum, Ile-Ife.
Federal Republic of Nigeria (FRN) (2006) Nigeria Tourism Development Master Plan.
Institutional Capacity Strengthening to the Tourism Sector in Nigeria. Final Report
Executive Summary, January 2006
Friedmann, J. (1966). Regional Development Policy. Case Study of Venezuela. Cambridge
Mass. M.I.T. Press.
Foan, L. and Franco, R. (2008) Measuring the Local Economic Impact of Tourism. In Local
Tourism in Guatemala, Honduras, and Nicaragua. Washington D. C.: The SEEP
Network
Hermansen, T.(1981). Development Poles and Development Centres in National and Regional
Development. Element of theoretical framework in UNRISD Concepts and Theories
of Growth Poles and Growth Centers.
Ige, Akin. (2011) Speech by the Director of National History Museum during the
Commissioning of the New Building at OAU, Ile-ife.
Kreag. G. (2001). The Impacts of Tourism. University of Minnesota Publication

Omisore
192
Kuklinshink, A. (1972). Growth Poles and Growth Centres in Regional Planning Morton,
New York. Pp3
Myerscough, J. (1988). The Economic Importance of the Arts in Britain. London: Policy
Studies Institute.
Myrad, P.G (1957). Economic Theory and Underdeveloped Regions, Methuen and Co. Ltd,
London, pp 66-67
Omisore, E.O. and Akande, C.G. (2009). Accessibility Constraints of Patronage of Tourist
Sites in Ondo and Ekiti, States, Nigeria. Ethiopian Journal of Environmental Studies
and Management Vol.2 No.1.
Shah, K. and Gupta, V, (2000) Tourism, the Poor and other Stakeholders: Asian Experience.
London: ODI Fair Trade in Tourism Paper.
Social Exclusion Unit Report (2003): Office of the Deputy Prime Minister, Eland House,
London. www.socialexclusion.gov.uk
UNESCO (2005). Major issues in tourism development in the Asian and pacific Region:
enhancing the role of tourism in socio-economic Development and poverty reduction.
Bali, Indonesia.
(UNCSD {United Nations Commission on Sustainable Development}, 1999) Global
Importance of Tourism. Commission on Sustainable Development Seventh Session
19- 30 April 1999, New York.

Nyame-Tawiah, D., Koranteng, C. and Woyome, A.M. (2011) Bioclimatic and design strategies
analysis towards the improvement of comfort in semi-detached houses in Ghana In: Laryea, S.,
Leiringer, R. and Hughes, W. (Eds) Procs West Africa Built Environment Research (WABER)
Conference, 19-21 July 2011, Accra, Ghana, 193-202.
193
BIOCLIMATIC AND DESIGN STRATEGIES ANALYSIS
TOWARDS THE IMPROVEMENT OF COMFORT IN
SEMI-DETACHED HOUSES IN GHANA
David Nyame-Tawiah1, Christian Koranteng
2 and Adeline Mawupemor
Woyome3
1,3Research Centre for Building Performance and Design, Kumasi, Ghana
2Department of Architecture, Kwame Nkrumah University of Science and Technology, Kumasi, Ghana
A 10 month period of monitoring temperature and relative humidity values in semi-
detached houses on the campus of the Kwame Nkrumah University of Science and
Technology in Kumasi was studied. The thermal conditions prevailing in the spaces
were analysed using recommended design strategies to achieve comfort, as well as the
Bioclimatic Chart, modified for warm countries. The main purpose was to find out
which of the sustainable design strategies (thermal mass, night ventilation, comfort
ventilation, evaporative cooling, etc) and air velocity would have a commensurate
effect on thermal comfort in Ghanaian semi-detached houses. The results showed that
the most effective design strategy would be comfort ventilation. Further, the plots on
the Bioclimatic Charts resulted in the use of an air velocity of 0.5m.s-1 to attain
comfort. This outcome implied that designers ought to enforce passive design
recommendations in the orientation, placing of building elements and the use of
efficient systems.
Keywords: bioclimatic, psychrometric, thermal comfort, ventilation.
INTRODUCTION
Thermal comfort is generally defined as a state of mind which displays satisfaction
with the thermal environment. The main factors are temperature, humidity, air-
movement and radiation. Over the years, researchers have attempted to provide a
range of acceptable comfort indices which are normally referred to as the comfort
zone. Previous studies have in-part concentrated on some of the factors of comfort (for
instance, temperature in relation to activity, etc). According to Szokolay (2004),
Olgyay introduced a chart in 1963 (the Bioclimatic Chart) with temperature and
relative humidity on its axes. The chart has an aerofoil comfort zone in the middle,
with the possibility of extension by air-movement and by radiation at high
temperatures and low temperatures (Fig. 1).
The effect of 0.5m.s-1
air-movement on thermal comfort has been reported by Gut and
Ackerknect (1993) to have a cooling effect of 1 to 1.7 °C at a corresponding ambient
temperature of 25 to 30°C.

Nyame-Tawiah, Koranteng and Woyome
194
The most recent comfort indices used are the effective temperature and its
standardised versions. These indices take activity and clothing into consideration
(thus, at higher activity level, clothing is reduced). Further, slopes bordering
recommended comfort zones on psychrometric charts (Fig. 2) are characterised by
temperature tolerance (at higher humidities, temperature acceptance is reduced
(Szokolay, 2004)).
Fig.1: Olgyay’s Bioclimatic Chart (Szokolay, 2004)
Fig.2: Comfort zone with recommended design strategies by Givoni and Murray
(Lechner, 2001)
For tropical countries, a temperature range of 22 to 29°C as the comfort zone has been
suggested by international and local researchers (Olgyay, 1963; Koenigsberger et al.,
1974; Ferstl, 2005; and Koranteng and Mahdavi, 2010).
Studies on design strategies on climatic zones, conditions and recommendations have
been cited by Lechner (2001). Zones of design strategies to be implemented have been
plotted on psychrometric charts (Fig. 2). The main zones recommended are comfort
ventilation, the use of thermal mass, night ventilation and evaporative cooling.
The positive potential of thermal mass (depending on outdoor environmental
conditions) and natural ventilation have been the focus of recent studies (Koranteng
and Mahdavi, 2010 and, Mahdavi and Orehounig, 2009). The studies which were
based on building performance simulations concluded that thermal mass and night
ventilation could improve the thermal conditions of indoor spaces. This approach is
however only efficient in regions with a high diurnal temperature difference of more
than 10°C (Szokolay, 2004). With thermal mass, the building envelope and floors are

Bioclimatic and design strategies
195
used to store cool air during periods when the temperature outdoors is lower than
indoors. The stored cool air is then released into the internal space whenever there is a
temperature imbalance. Night ventilation is the use of outdoor air to cool building
fabrics in the night whereas comfort ventilation can be used during the day. Comfort
ventilation depends on air-movement and has been found to be appreciable at wind
speeds of 0.2 to 1.0m.s-1
(Szokolay, 2004). Furthermore, comfort ventilation assists
the evaporative cooling potential of the human skin.
Ghana is characterised by high temperatures and humid conditions. These conditions,
in part, contribute to thermal discomfort in semi-detached houses. Most of the time,
the outdoor air velocity is low and this is coupled with low diurnal ranges culminating
in the inefficient use of thermal mass and comfort ventilation. Furthermore,
sustainable design principles of orientation, shading, window sizes and positioning,
efficient building materials, etc, are not exploited. Neither are scientific methods and
low power consuming equipment (for instance, fans are capable of improving the
thermal sensation of a space by 2-3°C (Hyde, 2000)) used to support design
recommendations towards indoor comfort. Against the background of prevailing
characteristics of the climate and practices in Ghanaian construction, it is imperative
to find out which design strategies and air velocities work efficiently in Ghanaian
houses. The solutions would help contribute to the few studies on thermal comfort in
Ghana and narrow down the existing knowledge gap.
This paper analyses the thermal performance of semi-detached houses in warm and
humid Ghana. The study is based on the bioclimatic chart modified for warm
countries (see Szokolay, 2004) and design strategies recommended by Givoni and
Murray in Lechner (2001).
RESEARCH METHOD
The study uses recommended charts and design strategies (see Szokolay, 2004 and
Lechner, 2001) to analyse the thermal performance of semi-detached houses in
Kumasi, capital of the Ashanti Region in Ghana. The twelve buildings under the study
are situated on the campus of the Kwame Nkrumah University of Science and
Technology (KNUST) and are called the ―Four Star Estate‖ housing (Fig. 3). The
thermal performance of the 4-star rated buildings is worth studying, since they are the
only star-rated residential facilities on the campus of KNUST and are representatives
of semi-detached dwellings in the region.
Fig.3: View of a semi-detached building, KNUST
Each detached unit has an area of ca. 90m² and contains a gracious entrance with the
living area and kitchen oriented towards the north. Two bedrooms and a bathroom are
situated at the rear (southern orientation) of the house, which are separated by a
corridor to the northern oriented spaces. All the active spaces are cross ventilated and
the corridors have windows on the eastern and western sides. The form aspect ratio of

Nyame-Tawiah, Koranteng and Woyome
196
1:1.80 per block is ideal for rectangular buildings with north-south orientations
(Koranteng and Abaitey, 2010).
To analyse the thermal performance of the buildings, indoor sensors that measured the
temperature and relative humidity values were mounted in the spaces (living area,
kitchen, corridor and bedrooms). The monitored variables were limited to
temperature and humidity because financial constraints prevented us from mounting
sensors capable of observing occupancy patterns, light switching on and off activities,
frequency of equipment usage, etc. The outdoor environmental conditions were also
monitored. The observation period was 10 months, from September 2008 until June
2009. However, the data for the months of November and December was lost due to a
malfunction of the loggers. The data loggers are capable of measuring temperature
and relative humidity values from -20 to 70°C and from 5 to 95% with an error of ±
0.4 oC and ± 3% respectively.
To a large extent, the data gathered was processed with MS Excel, because of its high
compatibility with a number of other applications. Other software applications used in
the study were Greenline and Hoboware pro. Greenline was used to launch and
download the files from the data loggers. The downloaded temperature and relative
humidity values were screened in Hoboware pro software, after which the data points
were exported to an MS Excel file. In MS Excel, the text files were imported,
screened, and built together in monthly tables. Since the data was recorded in minute
intervals, formulae sheets were generated to produce mean hourly values, and the
output values were graphed in charts and analysed. Two charts were used for the
graphs: a psychrometric chart with recommended design strategies and a bioclimatic
chart which shows that different air-movement values should be employed to attain
thermal comfort.
RESULTS
The mean monthly values tabulated and plotted in the charts show points of minimum
and maximum temperature in relation to the prevailing relative humidity values. The
points were joined with lines which indicate the monthly thermal behaviour of the
respective spaces. Fig. 4 shows the mean monthly outdoor temperature and relative
humidity values in relation to the comfort zone and the recommended design
strategies. The mean outdoor values plotted in the modified bioclimatic chart for
warm countries are illustrated in Fig. 5. The thermal behaviour prevailing in the
bedroom is demonstrated in Fig. 6 and Fig. 7. Further, Figs. 8, 10 and 12 show the
mean temperature and relative humidity values of the corridor, kitchen and living
areas in relation to the comfort zone and design strategies. Demonstrations of the
thermal conditions on the bioclimatic chart of the corridor, kitchen and living areas are
shown in Figs. 9, 11 and 13.

Bioclimatic and design strategies
197
Fig.4: Mean monthly outdoor temperature and relative humidity values in
relation to the comfort zone and design strategies
Fig.5: Mean monthly outdoor temperature and relative humidity values in
relation to the comfort zone and air-movement
Fig.6: Mean monthly bedroom temperature and relative humidity values in
relation to the comfort zone and design strategies

Nyame-Tawiah, Koranteng and Woyome
198
Fig.7: Mean monthly bedroom temperature and relative humidity values in
relation to the comfort zone and air-movement
Fig.8: Mean monthly corridor temperature and relative humidity values in
relation to the comfort zone and design strategies
Fig.9: Mean monthly corridor temperature and relative humidity values in
relation to the comfort zone and air-movement

Bioclimatic and design strategies
199
Fig.10: Mean monthly kitchen temperature and relative humidity values in
relation to the comfort zone and design strategies
Fig.11: Mean monthly kitchen temperature and relative humidity values in
relation to the comfort zone and air-movement
Fig.12: Mean monthly living room temperature and relative humidity values in
relation to the comfort zone and design strategies

Nyame-Tawiah, Koranteng and Woyome
200
Fig.13: Mean monthly living room temperature and relative humidity values in
relation to the comfort zone and air-movement
DISCUSSION
The mean outdoor temperature and relative humidity values plotted on the design
strategies chart show that all monthly values are outside the comfort zone (Fig. 4).
Furthermore, the design strategy to be employed in attaining thermal satisfaction is
comfort ventilation. Thermal mass with night ventilation, high thermal mass and
evaporative cooling characterize the month of January. Monthly points outside the
comfort ventilation zone imply the use of conventional air-conditioning to achieve
comfort. According to Fig. 5, the month of January is comfortable whilst during all
other months, air-movement of about 0.5m.s-1 would be required for thermal comfort.
The thermal performance of the bedrooms oriented towards the south shows
uncomfortable conditions. All the months are outside the general comfort
recommendations (Fig. 6). Comfort ventilation and high thermal mass could be used
as a design strategy for the month of January. However, the application of thermal
mass as a design strategy would not be economical for the other months of the year.
The only strategy that could prove efficient is comfort ventilation. In Fig. 7, the
bioclimatic chart modified for warm countries shows most of the month of January to
be comfortable. An extension of the comfort zone to 0.4m.s-1 air-movement would
result in all months within the zone. The reason for the performance of the southern
oriented spaces could be the inadequate overhang of the building in shading the
building envelope. Even though the windows have been recessed and the spaces cross
ventilated with an orientation towards 45° east of the prevailing wind direction, the
effect of direct and reflected solar radiation could have contributed to the performance
of the spaces (Lauber, 2005 and Heerwagen, 2004).
The thermal situation of the corridor was similar to that of the bedroom spaces. The
plotted values in Fig. 8 show representations outside the general comfort zone. High
thermal mass could improve the thermal performance of the space in January
(Koranteng, 2010). However, the most effective approach towards thermal relief is
comfort ventilation. An air velocity of 0.4m.s-1 would guarantee thermal comfort
(Fig. 9).
The northern oriented kitchen space had temperature values of 28 to 34 °C and
relative humidity values between 60 and 80% (Fig. 10). The relative humidity values
fall within the recommended range for comfort (Ferstl, 2005). Conversely, most of the
Bioclimatic and design strategies
201
temperature values are above the maximum recommended value of 29 °C (Koranteng
and Mahdavi, 2010). The frequent addition of latent and sensible heat from cooking in
the kitchen space makes the room vulnerable to poor thermal performance. This is the
main reason why cooking areas have to be placed in prevailing wind directions and if
possible, separated from living areas. To attain comfort, the installation and use of
fans (Hyde, 2000) with a velocity of 0.5m.s-1 would contribute to improving the
performance of the space (Fig. 11). Furthermore, a comfortable and clean indoor
environment can be achieved by the adoption of an effective ventilation system, both
in terms of providing thermal comfort and removing contaminated air (Alamdari,
1994).
In Figs. 12 and 13, comfort ventilation and an air velocity of 0.4m.s-1 could provide
comfort in the living room. Even though the space is oriented towards the cool
northern side, it has poor indoor thermal conditions. The possible reasons for the
behaviour of the space are the bedrooms and corridor spaces blocking air from the
prevailing wind direction, direct and reflected solar radiation and conductive sensible
loads from the attic space of the roof (Koranteng, 2010). The pressure difference
created by temperature variations makes the size and position of windows in naturally
ventilated buildings an important criterion in sustainable and passive building designs
(Walker, 2010). Fans ought to be used in the building, since their effect would be a
thermal sensation reduction of air temperature values of 2 – 3°C (Hyde, 2000). Late
afternoon discomfort could be alleviated by using dehumidifiers; however, their
energy consumption needs to be considered. The most imperative strategy would be
the use of sustainable design principles of orientation, shading, ventilation, planting,
insulation and efficient building materials (Dubois, 2008). In addition, buildings
should be able to respond to changes in climate by rejection of solar heat, and have the
thermal integrity to maintain internal comfort, despite the influence of climatic forces
acting on the building envelope (Salmon, 1999).
CONCLUSION
To effectively study the thermal performance of semi-detached houses towards the
improvement of comfort, staff bungalows at KNUST were thermally monitored over a
period of 10 months. The main objective was to find out which sustainable design
strategies and air velocities work efficiently in Ghanaian houses. The thermal values
plotted on comfort and design strategies graphs showed conditions of discomfort in
the building. These were due to the mean room temperature of above 30°C and
relative humidity values of above 80% represented outside the comfort zone
boundaries in the charts employed. The most effective design strategy to attain
thermal satisfaction was found to be comfort ventilation. Further, an air velocity of
0.5m.s-1 was capable of achieving comfort in the buildings. The use of sustainable
design principles of orientation, shading, and efficient building elements can
contribute to thermal comfort sensation in houses and as such, these measures have to
be employed by designers.
REFERENCES
Alamdari, F. (1994) ―Applications of CFD in the Built Environment‖, Microclimate Centre,
BSRIA, Bracknell, England.
Dubois, P. (2008) Shaping Buildings for the Humid Tropics, (available at
www.earthbagbuilding.com/pdf/shapingbuildings1.pdf).

Nyame-Tawiah, Koranteng and Woyome
202
Ferstl, K. (2005) ―Fundamentals of Climatically Appropriate Building and Relevant Design
Principles‖, In: Tropical Architecture by Lauber W., First Edition, Prestel Verlag,
Munich, Germany.
Gut, P. and Ackerknecht, D. (1993) ―Climate Responsive Building‖, First Edition, SKAT –
Swiss Centre for Development and Cooperation in Technology and Management,
Switzerland.
Heerwagen, D. (2004) Passive and Active Environmental Controls: Informing the Schematic
Designing of Buildings, First Edition, McGraw Hill, New York, USA.
Hyde, R. (2000) Climate Responsive Design, First Edition, E and FN Spon, United Kingdom.
Koenigsberger, O. H., Ingersoll, T. G., Mayhew A. and Szokolay S.V. (1974). Manual of
Tropical Housing and Building: part one, Climatic Design, First Edition, Longman
Inc., New York, USA.
Koranteng, C. (2010) ―The Energy Performance of Office Buildings in Ghana‖, Journal of
Science and Technology, Ghana.
Koranteng, C. and Abaitey, G. E. (2010) ―The Effects of Form and Orientation on Energy
Performance of Residential Buildings in Ghana‖, Journal of Science and Technology,
Ghana.
Koranteng, C. and Mahdavi, A. (2010) ―An Inquiry into the Thermal Performance of Five
Office Buildings in Ghana‖, 10th Rehva World Congress, Sustainable Energy Use in
Buildings, CLIMA 2010, Antalya, Turkey, May 9 – 12, 2010.
Lauber, W. (2005) Tropical Architecture, First Edition, Prestel Verlag, Munich.
Lechner, N. (2001) Heating, Cooling, Lighting: Design Methods for Architects, Second
Edition, John Wiley and Sons, Inc., New York, USA.
Mahdavi, A. and Orehounig, K. (2009) ―Building Energy Use Via Intelligent Passive
Cooling‖, 6te Internationale Energiewirtschaft, TU Wien, IEWT 2009.
Olgyay, V. (1963) Design with Climate: Bioclimatic Approach to Architectural Regionalism,
First Edition, Princeton University Press, New Jersey, USA.
Salmon, C. (1999) Architectural Design for Tropical Regions, First Edition, John Wiley and
Sons, Inc., New York.
Szokolay, S. (2004) Introduction to Architectural Science: The Basis of Sustainable Design,
First Edition, Architectural Press, Oxford, UK.
Walker, A. (2010) Natural Ventilation, (available at
www.wbdg.org/resources/naturalventilation.php).

Laryea (2011) Built environment education and research in West Africa In: Laryea, S., Leiringer, R.
and Hughes, W. (Eds) Procs West Africa Built Environment Research (WABER) Conference, 19-21
July 2011, Accra, Ghana, 203-214.
203
BUILT ENVIRONMENT EDUCATION AND RESEARCH
IN WEST AFRICA
Samuel Laryea1
School of Construction Management and Engineering, University of Reading, P.O. Box 219, Reading,
RG6 6AW, UK
Built environment programmes in West African universities; and research
contributions from West Africa in six leading international journals and proceedings
of the WABER conference are explored. At least 20 universities in the region offer
degree programmes in Architecture (86% out of 23 universities); Building (57%);
Civil Engineering (67%); Estate Management (52%); Quantity Surveying (52%);
Surveying and Geoinformatics (55%); Urban and Regional Planning (67%). The
lecturer-student ratio on programmes is around 1:25 compared to the 1:10 benchmark
for excellence. Academics who teach on the programmes are clearly research active
with some having published papers in leading international journals. There is,
however, plenty of scope for improvement particularly at the highest international
level. Out of more than 5000 papers published in six leading international peer-
reviewed journals since each of them was established, only 23 of the papers have
come from West Africa. The 23 papers are published by 28 academics based in 13
universities. Although some academics may publish their work in the plethora of
journals that have proliferated in recent years, new generation researchers are
encouraged to publish in more established journals. The analyses of 187 publications
in the WABER conference proceedings revealed 18 research-active universities.
Factors like quality of teaching, research and lecturer-student ratio, etc count in the
ranking of universities. The findings lay bare some of the areas that should be
addressed to improve the landscape of higher education in West Africa.
Keywords: built environment, education, research, university, West Africa.
INTRODUCTION
The aim of the paper is to explore the built environment programmes offered in West
African universities; and research contributions from West Africa at an international
and regional level. The specific objectives are:
To identify major universities in West Africa (WA) that offer programmes and
research contributions in the built environment;
To examine the range of the built environment programmes offered in different
universities and the nature of the programmes; and
To explore research contributions from West Africa published in leading
international peer-reviewed journals and proceedings of the West Africa Built
Environment Research (WABER) Conference (2009-11).
The rationale of the paper is not to provide a ranking of schools in the region; the
purpose is merely to offer some insights on universities in the region that are playing a

Education and research
204
leading role in the provision of academic programmes and research contributions in
the built environment.
METHOD
Three main tasks were necessary. The first objective involved searching the websites
of Education Ministries of all 16 WA countries to obtain a list of accredited
universities. This was followed with a detailed searching of the websites of
universities to identify the ones that offer built environment programmes such as
architecture, building, engineering, quantity surveying, urban and regional planning,
etc. Author addresses found in research publications in journals and database of the
WABER conference also helped to identify some of the built environment
departments. The second objective was achieved through analyses of data from
websites of universities and firsthand information from academics. The papers by
Vorster (2011), Abudayyeh et al. (2000) and Oglesby (1990) provided some of the
theoretical context for construction education in universities. The third objective
involved analysing research publications of academics teaching on the built
environment programmes. This involved analyses at both international and regional
level. The online databases of six leading built environment-related journals were
searched to identify papers originating from WA. The journals chosen were based on
a paper by Chau (1997) on the ranking of construction management journals.
Bibliometric information available in Journal Citation Reports; Scopus; Journal
Impact Factors; Thomson Reuters Web of Knowledge; and journal ratings of the
Excellence in Research for Australia initiative also gave an indication of leading
journals in the field. 187 publications in the proceedings of the WABER conference
were also examined and analysed to trace the institutions and countries of authors. By
bringing together all of this data for the first time, it has been possible to obtain some
insights into the higher education landscape in WA the built environment programmes
in universities, and the research contributions of academics in WA universities.
COUNTRIES AND UNIVERSITIES IN WEST AFRICA
The 16 countries in WA are developing countries that are pushing for socio-economic
development (UN, 2010). Their average GDP is $1,397 (IMF, 2010).
Table 1: Universities in West African countries
Country Population
(million)
Year of
Independence
Official
language
Number of
universities
Benin 9 1960 French 3
Burkina Faso 16 1960 French 1
Cameroon 19 1960 (France) 1961
(Britain)
French and
English 13
Cape Verde 0.5 1975 Portuguese 10
Côte d‘Ivoire 21 1960 French 6
Gambia 2 1965 English 1
Ghana 24 1957 English 59
Guinea 10 1958 French 6
Guinea-Bissau 1.6 1973 Portuguese 4
Liberia 4 1847 English 9
Mali 15 1960 French 10
Mauritania 3.5 1960 Arabic 9
Niger 15.5 1960 French 1
Nigeria 152 1960 English 195
Senegal 14 1960 French 6
Sierra Leone 6.5 1961 English 2
Togo 7 1960 French 1
Total 320.6 336

Laryea
205
There are at least 336 universities across WA for a total population of 320.6 million
people (see Table 1). From its establishment in 1962, Ahmadu Bello University based
in Zaria, Nigeria is the largest university in Sub-Saharan Africa. The University of
Monrovia, opened as Liberia College in 1862, is the oldest degree-awarding
institution in WA. The universities in WA offer a wide range of degree programmes
in the arts, education, engineering, medicine, social sciences, law, physical sciences,
built environment, etc. The interest of this paper lies in built environment
programmes. As a simple way to define ‗built environment‘, it encompasses buildings
and infrastructure, in their planning, design, management, operation, maintenance and
disposal stages (Hughes, 2010). The analysis of universities from this point forward
focuses mainly on universities in Ghana and Nigeria. The two countries have the
largest number of universities (76%) in the region (Table 1). However, less than 50
percent are public universities funded by the state. The majority of universities are
private-owned ‗smaller‘ institutions with most affiliated to public universities.
BUILT ENVIRONMENT PROGRAMMES IN UNIVERSITIES
Tables 2 and 4 show some universities in West Africa that offer undergraduate and
postgraduate programmes relating to the built environment.
Table 2: Built environment undergraduate programmes in some West African universities
University Country Yea
r es
tab
lish
ed
Arc
hit
ectu
re /
Des
ign
Bu
ildin
g /
Bu
ild
ing
Tec
hn
olo
gy
Civ
il /
En
v. E
ng
inee
rin
g
Est
ate
/lan
d M
ana
gem
ent
Qu
an
tity
Su
rvey
ing
/
Co
nst
ruct
ion E
cono
mic
s
Urb
an
and
Reg
ion
al
Pla
nn
ing
Abubakar Tafawa Balewa University Nigeria 1980
Ahmadu Bello University Nigeria 1962
Anambra State University Nigeria 2000
Covenant University Nigeria 2002
Enugu State Uni. of Science and Tech. Nigeria 1979
Federal University of Tech., Akure Nigeria 1981
Federal University of Tech., Minna Nigeria 1982
Federal University of Tech., Owerri Nigeria 1980
Federal University of Technology, Yola Nigeria 1983
Kwame Nkrumah University of Science
and Technology, Kumasi
Ghana 1961
Nnamdi Azikiwe University Nigeria 1991
Obafemi Awolowo University Nigeria 1962
Olabisi Onabanjo University Nigeria 1982
Osun State University Nigeria 2006
Rivers State Uni. of Science and Tech. Nigeria 1979
University of Benin Nigeria 1970
University of Ibadan Nigeria 1948
University of Ilorin Nigeria 1975
University of Jos Nigeria 1975
University of Lagos Nigeria 1962
University of Nigeria, Enugu Nigeria 1960
University of Nigeria, Nsukka Nigeria 1960
University of Uyo Nigeria 1991
86% 57% 67% 52% 52% 67%
Notes: Programmes may not have the exact titles in universities. Other programmes include Project
Management, Real Estate, Surveying, etc. The data here is a combination of information taken from university
websites and firsthand information obtained from built environment academics in the region.

Education and research
206
Undergraduate programmes
Table 2 shows some universities in WA and their built environment programmes. BSc
programmes include Architecture, Building, Civil Engineering, Development
Planning, Estate Management, Geoinformatics, Land Economy, Planning, Quantity
Surveying and Construction Economics, Real Estate, Surveying and Urban and
Regional Planning. Some universities also offer a combination of technical and
vocational education programmes. The duration of BSc programmes in Ghana is four
years. However, the duration of programmes in Nigeria is five years. For
architecture, the duration tends to be for four years in the first instance plus one or two
additional years for the Post Graduate diploma or MSc in Architecture. Much of the
programme contents examined reflects little change over the years, but educational
programmes should develop based on research into the phenomena we observe
(Hughes, 2010), current trends and future directions. An approximation of lecturer-
student ratios on built environment programmes in some universities is presented in
Tables 3-7. The lecturer-student ratio gives a measure of the staffing level; this is
often a criterion considered when ranking institutions. In the UK, staff-student ratio
in institutions is calculated by the Higher Education Statistics Agency (HESA). A
ratio of 1:10 is often considered as the benchmark for excellence.
Table 3: Built environment programmes at Obafemi Awolowo University
Programmes /Departments No. of Lecturers No. of Students Lecturer/Student ratio
Architecture 20 235 1:12
Building 16 333 1:21
Estate Management 13 538 1:41
Quantity Surveying 09 272 1:30
Urban and Regional Planning 13 323 1:25
Total 71 1701
Table 4: Built environment programmes at Federal University of Technology, Minna
Programmes /Departments No. of Lecturers No. of Students Lecturer/Student ratio
Architecture 25 401 1:16
Building 14 383 1:27
Estate Management 20 660 1:33
Quantity Surveying 16 479 1:29
Surveying and Geoinformatics 11 320 1:29
Urban and Regional Planning 24 585 1:24
Total 110 2828
Table 5: Built environment programmes at Kwame Nkrumah University of Science and Technology
Programmes /Departments No. of Lecturers No. of Students Lecturer/Student ratio
Architecture 15 281 1:19
Building Technology 17 474 1:28
Land economy 11 457 1:20
Planning 17 528 1:31
Total 60 1740
Table 6: Built environment programmes at Enugu State University of Science and Technology
Programmes /Departments No. of Lecturers No. of Students Lecturer/Student ratio
Architecture 14 326 1:23
Building technology 7 411 1:59
Estate Management 13 428 1:33
Quantity Surveying 6 198 1:33
Surveying and Geoinformatics 7 143 1:20
Urban and Regional Planning 8 184 1:23
Total 55 1690

Laryea
207
Table 7: Built environment programmes at Federal University of Technology, Akure
Programmes /Departments No. of Lecturers No. of Students Lecturer/Student ratio
Architecture 21 454 1:22
Estate Management 13 476 1:37
Industrial Design 11 324 1:29
Quantity Surveying 16 469 1:29
Surveying and Geoinformatics 2 13 1:7
Urban and Regional Planning 16 427 1:27
Total 79 2163
The analyses in Tables 3-7 show that the average lecturer-student ratio on built
environment programmes in selected WA universities is around 1:25. A lower
lecturer-student ratio is often better in tertiary education context. A lecturer-student
ratio of 1:25 may seem reasonable. However, a clear need for improvement becomes
evident when the 1:25 statistic is compared to that of institutions where academics
achieve prolific research publications. At the School of Construction Management
and Engineering at University of Reading, for example, the lecturer-student ratio is
1:14. Improvements in lecturer-student ratio can enable staff and students to engage
more effectively; reduce students‘ demand on staff time; and enhance time spent by
staff on teaching preparation, personal development and research work if appropriate
support is available. The findings by Aregbeyen (2010) on students‘ perceptions of
effective teaching and effective lecturer characteristics in Nigeria should be addressed.
Generally, many lecturers are not ‗trained teachers‘ per se, although most have a PhD
or equivalent qualification. To improve quality of teaching on programmes, the
concept of teaching training for lecturers can be introduced by higher education
councils and universities. Thus will provide opportunity for lecturers to acquire and
develop teaching skills and techniques. In the US, training requirements for lecturers
teaching civil engineering in universities are explored by Quadrato et al. (2005). In
the UK, a postgraduate teaching qualification accredited by the Higher Education
Academy (HEA) is almost compulsory for new university lecturers.
Postgraduate programmes
Most universities in Table 2 offer MSc and PhD programmes. The postgraduate (PG)
programmes offered in some universities are shown in Table 8.
Table 8: Built environment postgraduate programmes in some WA universities
University MSc/MPhil programmes PhD programmes
Ahmadu Bello
University, Nigeria
Building Services, Construction Management,
Construction Technology, Building, Facilities
Management, Landscape Architecture, Urban
Design
Building Services,
Construction Management,
Construction Tech., Building,
Facilities Management
Kwame Nkrumah
University of Science
and Technology, Ghana
Architecture, Construction Management,
Development Planning and Management,
Development Policy and Planning, Land Economy
Architecture, Development
Studies; Planning, Building
Technology
Obafemi Awolowo
University, Nigeria
Architecture, Building, Civil Engineering, Estate
Management, Quantity Surveying, Urban and
Regional Planning
Architecture, Building, Civil
Engineering, Estate
Management, Planning
University of Lagos,
Nigeria
Environmental Design, Landscape Architecture,
Architecture, Construction Management,
Construction Technology, Project Management,
Estate Management, Urban and Regional Planning,
Urban Design, Environmental Management,
Environmental Design, Building Services,
Facilities Management
Architecture, Building, Estate
Management, Urban And
Regional Planning
The duration of MSc programmes is officially two years and PhD is three years. Table 8 gives an idea of the
range of academic programmes and staff expertise available at the postgraduate level.

Education and research
208
RESEARCH CONTRIBUTION OF UNIVERSITIES IN LEADING
JOURNALS AND WABER CONFERENCE PROCEEDINGS
Table 9: Research contribution from West Africa in six leading international journals
Author(s) institution Journal Year Research focus
Kwame Nkrumah University of Science and
Technology, Kumasi, Department of Building
Technology, Ghana
IJPM 2011 Effect of integration on project
delivery team effectiveness
University of Benin, Faculty of Engineering, Benin
City, Nigeria
JME 2009 Unethical practices in Nigerian firms
Kwame Nkrumah University of Science and
Technology, Kumasi, Centre for Settlements
Studies, Ghana
ECAM 2009 Project management competencies
Ahmadu Bello University, Department of Quantity
Surveying, Nigeria
ECAM 2009 Finance for healthcare facilities
Federal University of Technology, Akure,
Department of Quantity Surveying, Nigeria
Obafemi Awolowo University, Department of
Quantity Surveying, Nigeria
CME 2006 Time-cost model
Kwame Nkrumah University of Science and
Technology, Kumasi, Department of Building
Technology, Ghana
CME 2005 Strategic planning by construction
firms in Ghana
Osun State College of Technology, Department of
Building, Nigeria
Obafemi Awolowo University, Department of
Building, Nigeria
CME 2004 Non-financial incentives
University of Lagos, Department of Building,
Nigeria
IJPM 2002 Project leadership, team composition,
performance
Obafemi Awolowo University, Department of
Quantity Surveying, Nigeria
IJPM 2002 Effect of delay on project delivery
University of Lagos, Department of Building,
Nigeria
JME 2002 Project leadership skills
Federal University of Technology, Owerri,
Department of Project Management
Technology, Nigeria
JCEM 2001 Methodology for determining price
variation in project execution
Abubakar Tafawa Balewa University, Engineering
and Quantity Surveying programme, Nigeria
JCEM 2001 Time-overrun factors in Nigeria
Ahmadu Bello University, Department of Civil
Engineering, Zaria, Nigeria
BRI 1997 Solid soilcrete blocks for low-cost
buildings
University of Benin, Department of Civil
Engineering, Nigeria
JCEM 1995 Causes of high costs of construction in
Nigeria
University of Benin, Department of Civil
Engineering, Nigeria
CME 1995 Business environment of construction
Abubakar Tafawa Balewa University, Department
of Civil Engineering., Nigeria
JCEM 1993 Construction cost factors in Nigeria
Obafemi Awolowo University, Faculty of Env.
Design and Management, Nigeria
CME 1992 Cost information management
University of Jos, Department of Building, Nigeria CME 1991 Evaluation and selection of projects
University of Ilorin, Department of Management
Sciences, Nigeria
JCEM 1990 New approach to construction
management
Obafemi Awolowo University, Department of
Building, Nigeria
CME 1989 Production outputs in building trades
Obafemi Awolowo University, Department of
Building, Nigeria
CME 1989 Operative productivity
University of Benin, Department of Civil
Engineering, Nigeria
CME 1987 Contract arrangements
University of lfe, Building Department, Nigeria BRI 1985 Pipe-Type Solar Water Heater
Notes: BRI = Building Research and Information; CME = Construction Management and Economics; ECAM =
Engineering, Construction and Architectural Management; IJPM = International Journal of Project Management;
JCEM = Journal of Construction Engineering and Management; JME = Journal of Management in Engineering.
23 papers in all from West Africa. The criterion for including a paper is the author(s) affiliation. The full citation
for the papers can be found in the list of references. Frequency: 1980-1990 (4); 1990-2000 (7); 2000-present (12).

Laryea
209
The third objective of the study was to explore the research contribution of built
environment academics teaching on the programmes from an international and
regional perspective. At an international level, the journals examined for papers from
West Africa are: Building Research and Information; Construction Management and
Economics; Engineering, Construction and Architectural Management; International
Journal of Project Management; Journal of Construction Engineering and
Management; and Journal of Management in Engineering (see Tables 9 and 10).
Table 10: Frequency of research publications from Ghana and Nigeria
Journal
Contributions
from Ghana
Contributions
from Nigeria
Building Research and Information (1973-date) 0 2
Construction Management and Economics (1983-date) 1 8
Engineering, Construction and Architectural Management (1994-date) 1 1
International Journal of Project Management (1983-date) 1 2
Journal of Construction Engineering and Management* (1957-date) 0 5
Journal of Management in Engineering (1985-date) 0 2
Proceedings of the West Africa Built Environment Research
(WABER) Conference (2009-date)
62 127
Total 65 147
*The Journal of Construction Engineering and Management has been published since the late 19th
century i.e. for 137 years under different titles (see Pietroforte and Stefani, 2004: 441)
The basis for the journal selection is explained in the introductory section of the paper.
This was based primarily on a journal paper by Chau (1997) on the ranking of
construction management journals; bibliometric information on journals; and journal
ratings in research quality assessment frameworks. All data was collected through a
rigorous search of online databases of the six journals. The author address was a
primary factor used to identify the location and institution of the paper author(s).
Table 11: Frequency of research publications from institutions
Institution
Publications
in Journals
Publications in proceedings of
the WABER conference
Abubakar Tafawa Balewa University, Nigeria 2 2009 (1)
Ahmadu Bello University, Nigeria 2 2009 (5); 2010 (17); 2011 (14)
Anambra State University, Nigeria - 2011 (1)
Covenant University, Nigeria - 2009 (5); 2010 (1); 2011 (3)
Federal University of Technology, Akure, Nigeria 1 2010 (7); 2011 (18)
Federal University of Technology, Minna, Nigeria - 2009 (1); 2010 (4); 2011 (8)
Federal University of Technology, Owerri, Nigeria 1 -
Federal University of Technology, Yola, Nigeria 1 2011 (1)
Kwame Nkrumah University of Science and
Technology, Kumasi, Ghana
3 2009 (2); 2010 (9); 2011 (5)
Obafemi Awolowo University, Nigeria 7 2010 (4); 2011 (7)
Olabisi Onabanjo University, Nigeria - 2011 (1)
Osun State College of Technology, Nigeria 1 -
Osun State University, Nigeria - 2010 (1)
Rivers State University of Technology - 2011 (2)
University of Benin, Nigeria 4 2010 (3)
University of Ilorin, Nigeria 1 -
University of Jos, Nigeria 1 2009 (3); 2011 (2)
University of Lagos, Nigeria 2 2009 (7); 2010 (8); 2011 (17)
University of Nigeria, Enugu - 2011 (1)
University of Uyo - 2011 (1)
Total 25* 2009 (25); 2010 (57); 2011 (92)
Notes: *Papers with authors from multiple universities were credited to each institution

Education and research
210
Table 9 shows an audit of papers of WA origin in the six leading international journals
since each of them was established (see Table 11). From a regional perspective,
publications in the proceedings of the WABER Conference (i.e. 2009-2011) were
examined and analysed. This provided additional insights into the research
contributions of built environment academics in WA. The data in Table 5 shows that
the 23 papers in leading journals are published by 28 academics based in 13 West
African universities in a period of 25 years (1985-2011). The data in Table 11 shows
that Obafemi Awolowo University plays a leading role in terms of research
contributions at an international level although not in the last five years. Some
academics at Kwame Nkrumah University of Science and Technology, Kumasi,
Ghana have made strong contributions in recent years. There has also been a strong
contribution from some academics at University of Benin, Nigeria.
It should be emphasised that the construction management or built environment field
is primarily a field of application (Hughes, 1999). The ARCOM book edited by
Langford and Hughes (2009) gives an international overview of the development of
the construction management discipline. Built environment researchers tend to use
theories from mainstream academic disciplines (such as economics, mathematics, law,
management, organisational science, geography, engineering, physics, chemistry, etc.)
to analyse and interpret their observations and phenomena of what happens in
construction. An even better publishing achievement will be to publish some of our
research papers in leading journals of mainstream disciplines. Construction may be
different from other industries because of the way a set of factors interact
simultaneously to have influence on projects (as explained in a textbook on economic
theory and the construction industry by Hillebrandt, 2000). However, the underlying
scientific, economic, management, organisational theories governing construction
work is not too different from theories governing work in other industries. Publishing
in leading built environment journals can be a reasonable starting point. However,
built environment researchers should also aspire to publish in mainstream journals.
Current themes like sustainability, innovation, digital practices, etc. should provide an
increased opportunity to contribute towards mainstream thinking and theory.
DISCUSSION OF FINDINGS
Four main points are discussed in connection with the research objectives and
findings. First, the data on development of tertiary education institutions in WA is
interesting. As demonstrated in Table 2, most universities in WA were established by
the state in the post-independence era. From the start of the colonial period in 1850 to
1948 when the University of Ghana was founded as the University College of the
Gold Coast, no higher education institution was established in West Africa in almost
400 years of colonial rule. This situation created a serious educational and
development backwardness for people in the region. Between 1957 when Ghana
became the first Sub-Saharan Africa country to gain independence, and now, more
than 336 universities have been established in WA in the last 50 years alone. Most
universities were traditionally established and funded by the state. Nowadays, the
private sector is playing an increasingly greater role in the provision of access to
higher education. Lagos City Polytechnic, established in 1990, is the first private
tertiary education institution in Nigeria. In Ghana, the Central University College,
established in 1998, is the first private tertiary education institution. Since the
establishment of these pioneering institutions, several private tertiary institutions have
proliferated in Ghana, Nigeria and other WA countries, and a significant number of

Laryea
211
them are owned by religious establishments. It is, however, important to mention that
some of the new universities owned by the private sector are competing well with the
public universities established long before them.
Second, there are several universities in WA that offer programmes and research
contributions in the built environment (see Table 2). The dominant built environment
programme areas are Architecture, Building, Civil Engineering, Estate Management,
Land Management, Quantity Surveying, Surveying and Geoinformatics, and Urban
and Regional Planning. With time, academic staff expertise and increasing
specialising of practice in the construction sector, new and specialised undergraduate
and postgraduate programmes are likely to emerge alongside the traditional degree
programmes. A paper on construction education by Oglesby (1990) discusses some of
the possible approaches for expanding university programme offerings in built
environment studies. Universities like Ahmadu Bello University (Nigeria); Federal
University of Technology, Akure (Nigeria); Kwame Nkrumah University of Science
and Technology, Kumasi (Ghana); Obafemi Awolowo University (Nigeria);
University of Benin (Nigeria) and University of Lagos (Nigeria) are the ones playing a
leading role in the region when it comes to the provision of academic programmes and
research contributions in the built environment. Unsurprisingly most of these
universities are ranked among the top 100 universities in Africa
(http://www.4icu.org/). On programme quality and relevance, it is important to
update built environment programmes from time to time in line with changing
national and global needs and trends (see paper by Abudayyeh et al., 2000 which
explores a wide array of issues on construction engineering and management
undergraduate education). In the area of quantity surveying for example, a book by
Cartlidge (2002) shows new aspects of quantity surveying practice arising from
industry changes and new procurement methods in the UK.
Third, the data shows that built environment academics in WA are clearly research
active. The dominant broad focus of the journal papers from West Africa has been on
cost, time, project teams, contract arrangements, business environment of projects,
productivity, incentives and business practices in firms (see Table 9). The frequency
of publication of papers from WA in the six journals has proved to be increasing (see
Table 9): 1980-1990 (4); 1990-2000 (7); 2000-present (12). However, this is a
relatively small fraction compared to more than 5000 papers published in the six
journals since each of them was established. Further details of regions where most
journal papers originate from can be seen in a review paper by Abudayyeh et al.
(2004). To increase research activity and contributions in journals and conferences
will require greater collaboration with industry for research funding and access to
data. Tables 10 and 11 show the frequency of publication of 212 papers from Ghana
and Nigeria in journals (11%) and proceedings of the WABER conference (89%). For
journal publications, the ratio of contributions from Ghana and Nigeria is 1:7. In
interpreting the result, it is imperative to take the 1:7 population ratio of the countries
into account including the 1:4 ratio of number of universities (see Table 1).
Fourth, the overall research statistics in Tables 10 and 11 shows a low level of high
quality research output from the region. This conclusion has been earlier
demonstrated in analyses of construction management research publications in papers
by Abudayyeh et al. (2004); Pietroforte and Stefani (2004) and Pietroforte and
Aboulezz (2005). Although academics in West African institutions may publish their
work in the plethora of other journals that have proliferated in recent years, it would
clearly be worthy for them to direct some of their high quality research output for

Education and research
212
publication in the more established journals as this can enhance their research profile.
As articulated in a keynote paper by Hughes (2005) on the publication process for
refereed journal papers, ―The most important feature of an academic CV is the list of
publications. It is not just the quantity that matters, but where they are published.‖ It
is fair to suggest that bibliometric information freely available in Journal Citation
Reports; Scopus; Journal Impact Factors; Thomson Reuters Web of Knowledge; etc.
should give researchers an indication of leading journals in the field and the best
places to publish high quality work. Research quality counts in the ranking of
universities and the academic environment in a university. Universities should
support their academics to develop their research profile and output. Academics
should also make a conscious effort to do and publish their research work in the best
outlets. In institutions and environments where researchers may not have direct
access or subscription to the literature in leading journals, collaborations with
colleagues elsewhere can provide a useful means for overcoming the challenge.
CONCLUSIONS
The aim of the paper was to explore the built environment programmes offered in
universities in West Africa; and some of the research contributions of academics
teaching on the programmes. Academic programmes in 20+ universities were
explored. The major programmes are Architecture, Building, Civil Engineering,
Estate Management, Quantity Surveying, Surveying and Geoinformatics, and Urban
and Regional Planning. Academics teaching on the programmes are clearly research
active with some having published in leading international journals. However, the
publication statistics of papers from West Africa shows that there is plenty of scope
for improvement especially at the highest international level. Although some
academics may publish their work in the plethora of journals that have proliferated, it
would be worthy to publish high quality research output in more established journals.
The analyses of 187 publications in the proceedings of the WABER conference, 2009-
11, revealed 18 research-active universities.
The interpretation of the results flowing from this work requires careful consideration
of its limitations. First, the analysis of research papers in journals was limited to six
leading international journals. Another point is that the six journals examined here
may not cover all areas of the built environment. There are a plethora of other
journals that also provide an outlet for the dissemination of built environment research
findings. Second, the conference papers examined and analysed were based on only
papers published in the proceedings of WABER conference (2009-11). There may be
other conferences that West African academics attend and get their papers published
in the proceedings. Third, apart from information that was obtained directly from
built environment academics in the region, some of the information examined in this
paper was taken from the official websites of universities where there is a risk that
some of the information might not have been updated to cover current information on
programmes. Regardless of the study limitations, the need to refresh and improve
built environment academic programmes in tune with current and future national and
international trends and standards is clear. Participation in forums like the WABER
conference can help. The WABER conference provides an ideal opportunity for built
environment researchers in West Africa to interact, develop their research profile and
disseminate their research work. The conference also provides an opportunity for
researchers to develop new knowledge and collaborations with colleagues based
elsewhere. Through these objectives, the WABER conference serves a major vehicle
for developing built environment education and research in West Africa.

Laryea
213
REFERENCES
Abejide, O. S. (1997) Solid soilcrete blocks for low-cost buildings: a Nigerian case study,
Building Research and Information, 25(2), 115-119
Abudayyeh, O., Dibert-DeYoung, A., and Jaselskis, E. (2004) Analysis of trends in
construction research: 1985:2002, Journal of Construction Engineering and
Management, 130(3), 433–439.
Abudayyeh, O., Russell, J., Johnston, D. and Rowings, J. (2000) Construction engineering and
management undergraduate education, Journal of construction engineering and
management, 126(3), 169-175
Ahadzie, D.K., D.G. Proverbs, P.O. Olomolaiye, N.A. Ankrah, (2009) Competencies required
by project managers for housing construction in Ghana: Implications for CPD agenda,
Engineering, Construction and Architectural Management, 16(4), 353-375
Aibinu A. A. and Jagboro, G. O. (2002) The effects of construction delays on project delivery
in Nigerian construction industry, International Journal of Project Management,
20(8), 593-599
Akintoye, A.S., Ajewoleb, O. Olomolaiye, P.O. (1992) Construction cost information
management in Nigeria, Construction Management and Economics, 10(2), 107-116
Akpan, E. O. P. and Igwe, O. (2001) Methodology for determining price variation in project
execution, Journal of Construction Engineering and Management, 127(5)367-373
Alutu, O. E. and M. L. Udhawuve (2009) Unethical Practices in Nigerian Engineering
Industries: Complications for Project Management, Journal of Management in
Engineering, 25(1), 40-44
Anaman, K. A. and Osei-Amponsah C. (2007), Analysis of the causality links between the
growth of the construction industry and the growth of the macro-economy in Ghana,
Construction Management and Economics, 25(9), 951-961
Aniekwu, A. (1995) The business environment of the construction industry in Nigeria,
Construction Management and Economics, 13(6), 445-455
Aniekwu, A.N. and Okpala, D.C. (1987) The effect of systemic factors on contract services in
Nigeria, Construction Management and Economics, 6(2), 171-182
Aregbeyen, O. (2010) Students perceptions of effective teaching and effective lecturer
characteristics at the University of Ibadan, Nigeria, Pakistan Journal of Social
Sciences, 7(2), 62-69
Cartlidge, D. (2002) New aspects of Quantity Surveying practice, Oxford: Butterworth-
Heinemann
Chau, W. K. (1997) The ranking of construction management journals, Construction
Management and Economics, 15(4), 387-398
Dansoh, A. (2005) Strategic planning practice of construction firms in Ghana, Construction
Management and Economics, 23(2), 163-168
Elinwa, A.U.E. and Joshua, M. (2001) Time-overrun factors in Nigerian construction industry,
Journal of Construction Engineering and Management, 127(5), 419-426
Elinwa, A. U. and Buba, S. A. (1995) Construction cost factors in Nigeria, Journal of
Construction Engineering and Management, 121(3), 330
Elinwa, A. U. and Buba, S. A. (1993) Construction cost factors in Nigeria, Journal of
Construction Engineering and Management, 119(4) 698-713
Fernie, S. and Leiringer, R. (2009) The construction management field: a bit of a dig. In
proceedings of 5th Nordic Conference on Construction Economics and Organisation,
vol. 1, Reykjavik, Iceland, June 10-12. pp. 110-120
Hillebrandt, P.M. (2000) Economic theory and the construction industry, 3ed. London:
Macmillan
Hughes, W.P. (2010) Built environment education, research and practice: Integrating diverse
interests to make an impact In: Laryea, S., Leiringer, R. and Hughes, W. (Eds) Procs
West Africa Built Environment Research (WABER) Conference, 27-28 July 2010,
Accra, Ghana, 1-8

Education and research
214
Hughes, W. (2005) Keynote paper to The 2nd Scottish Conference for Postgraduate
Researchers of the Built and Natural Environment (PRoBE), Glasgow Caledonian
University, UK, 16-17 November 2005
Hughes, W.P. (1999) Construction research: a field of application. Australian Institute of
Building Papers, 9, 51-58
Ibrahim, A.D., Price, A.D.F. and Dainty, A.R.J. (2009) Evaluation of key practices under the
Local Improvement Finance Trust (LIFT) initiative for UK healthcare facilities,
Engineering, Construction and Architectural Management, 16(5), 504-518
International Monetary Fund (2010) World GDP (PPP) and Country population, World
Economic Outlook Database-October 2010, Accessed on 23 April 2011
Kalu, T.C.U. (1990) New approach to construction management, Journal of Construction
Engineering and Management, 116(3), 494-514
Kennedy, D. (1997) Academic Duty, Boston: Harvard University Press
Langford, D. and Hughes, W. (2009) (Eds) Building a discipline: The story of construction
management, Reading: Association of Researchers in Construction Management
Laryea, S., Leiringer, R. and Hughes, W. (Eds) (2010) Proceedings of the West Africa Built
Environment Research (WABER) Conference, 27-28 July 2010, Accra, Ghana. pp.
670 ISBN 978-0-9566060-0-6
Ngoka, N. I. (1985) A Simple Pipe-Type Solar Water Heater, Building Research and
Information, 13: 3, 166-169
Odia, L.O. and Omofonmwan S.I (2007) Educational system in Nigeria problems and
prospects, Journal of Social Sciences, 14(1): 81-86
Odusami K. T. (2002) Perceptions of Construction Professionals Concerning Important Skills
of Effective Project Leaders, Journal of Management in Engineering, 18(2) 61-68
Odusami, K.T., Iyagba, R.R.O. and Omirin, M.M. (2002) The relationship between project
leadership, team composition and construction project performance in Nigeria,
International Journal of Project Management, 21(7), 519-527
Oglesby, C.H. (1990) Dilemmas facing construction education and research in 1990s, Journal
of Construction Engineering and Management, 116(1), 4-17
Ogunsemi, D. R. and Jagboro, G.O. (2006) Time-cost model for building projects in Nigeria,
Construction Management and Economics, 24(3), 253-258
Okpala, D. C. (1991) Evaluation and selection of construction projects in Nigeria,
Construction Management and Economics, 9(1), 51-61
Okpala, D.C. and Aniekwu, A. N. (1988) Causes of high costs of construction in Nigeria,
Journal of Construction Engineering and Management, 114(2), 233-245
Olabosipo I. Fagbenlea, O.I., Aderemi Y. A., Adesanya, D.A. (2004) The impact of non-
financial incentives on bricklayers‘ productivity in Nigeria, Construction
Management and Economics, 22(9), 899 - 911
Olomolaiye, P. O. and Ogunlana, S. O. (1989) An evaluation of production outputs in key
building trades in Nigeria, Construction Management and Economics, 7(1), 75-86
Olomolaiye, P. O. and Ogunlana, S. O. (1989) A system for monitoring and improving
construction operative productivity in Nigeria, Construction Management and
Economics, 7(2), 175-186
Pietroforte, R., and Stefani, T. P. (2004) ASCE Journal of Construction Engineering and
Management: Review of the years 1983–2000, Journal of Construction Engineering
and Management, 130(3), 440-448
Pietroforte, Roberto and Aboulezz, Mohamed (2005) ASCE Journal of Management in
Engineering: Review of the years 1985-2002, Journal of Management in Engineering.
21(3), 125-130
Quadrato, C., Welch, R.W., and Albert, B.C. (2005) Training Faculty to teach Civil
Engineering, Journal of Professional Issues in Engineering Education and Practice,
131, 111-117
Vorster, M.C. (2011) Teaching and learning: The critical balance in effective education,
Journal of Const. Eng. and Mgt., doi:10.1061/(ASCE)CO.1943-7862.0000295.

Boadu, M.A., Eshun, J. and Opoku-Ware, E. (2011) Capacity-building in contract administration: key
to effective utilization of District Assembly Common Fund of infrastructural development In: Laryea,
S., Leiringer, R. and Hughes, W. (Eds) Procs West Africa Built Environment Research (WABER)
Conference, 19-21 July 2011, Accra, Ghana, 215-215.
215
CAPACITY-BUILDING IN CONTRACT
ADMINISTRATION: KEY TO EFFECTIVE
UTILIZATION OF DISTRICT ASSEMBLY COMMON
FUND OF INFRASTRUCTURAL DEVELOPMENT
Michael A. Boadu1, Joseph Eshun
2 and Emmanuel Opoku-Ware
3 1,2
Human Resource Office, Takoradi Polytechnic, P. O. Box 256, Takoradi, Ghana 3Sunyani Polytechnic, Sunyani, Ghana
The aim of the study is to examine the utilization of District Assembly Common Fund
(DACF) under the capacity- building in contract administration to infrastructural
developments. A capacity-building course in contract administration was organized
for the staff of the Tender Boards of twelve District Assemblies in the Brong-Ahafo
Region of Ghana. A self-reported instrument was used to measure participants‘
knowledge on contract administration. Sixty-nine per cent of the participant agreed
that they had never attended any training in contract administration and 31per cent
had no knowledge about contract administration. However, 99 per cent participants
agreed that capacity building would help them to overcome the deficiencies in the
administration of infrastructural projects in their District Assemblies. It is
recommended that training seminars and workshops should be organized for all
relevant contract administration staff in District Assemblies as a matter of government
policy.
Keywords: contract administration, District Assembly, District Assembly Common
Fund, Tender Board.
2
3

Danso, F.O., Badu, E. and Ahadzie, D.K. (2011) Casual workers preference of occupational health and
safety items on building construction sites in Ghana; a Kumasi study In: Laryea, S., Leiringer, R. and
Hughes, W. (Eds) Procs West Africa Built Environment Research (WABER) Conference, 19-21 July
2011, Accra, Ghana, 217-227.
217
CASUAL WORKERS PREFERENCE OF
OCCUPATIONAL HEALTH AND SAFETY ITEMS ON
BUILDING CONSTRUCTION SITES IN GHANA; A
KUMASI STUDY
Frederick Owusu Danso1, Edward Badu
2 and Divine Kwaku Ahadzie
3
1Department of Building Technology, Takoradi Polytechnic, Takoradi, Ghana
2College of Architecture and Planning, Kwame Nkrumah University of Science and Technology,
Kumasi, Ghana
3Centres for Settlements Studies, Nkrumah University of Science and Technology, Kumasi, Ghana
The Ghanaian construction industry noted as a provider of employment and as a
driver of economic growth is fraught with occupational health and safety issues.
Employers of casual workers provide them substandard welfare facilities and safety
materials. This paper aimed at the establishment of preference of casual workers to
the provision of substandard welfare facilities and safety materials. Observations
followed by a questionnaire survey were used to elicit from casual workers on their
preference for occupational health and safety items involving their engagement. The
items were grouped under two major thematic areas, namely welfare facilities and
safety items, and the casual workers were asked to indicate their preference on 5-
point rating scale. The findings reveal that, the casual workers preference for welfare
facilities were in the order of safe drinking water (ranked 1st), suitable
accommodation for resting (ranked 2nd
), sanitary facilities (ranked 3rd
), first-aid
equipment (ranked 4th
) and water for washing (ranked 5th
), while for safety items the
following emerged; safety boots (ranked 1st), safety signs (ranked 2
nd), hard hats or
helmet (ranked 3rd
), training in safety (ranked 4th
) and safety glasses (ranked 5th
). One
sample statistics supported the findings suggesting that the findings could have wider
relevance in Ghana. Given that casual workers now account for about 70-90% of the
construction labour workforce in Ghana. The findings have implications for both
contractors‘ safety management strategies and also policy direction in future safety
guidelines for improving health and safety practices on Ghanaian construction sites.
Keywords: casual worker, occupational health and safety.
INTRODUCTION
The construction industry plays an important role in any economy and its activities are
also vital to the achievement of the socio-economic development goals of providing
shelter, infrastructure and employment (Anaman and Osei Amponsah, 2007). In
Ghana, just like many other developing countries the construction industry is playing
a vital role in achieving socio-economic development goals, providing shelter,
infrastructure and employment, and above all contributing significantly to the GDP of
the country. For instance, since 2003 to 2008, the industry has consistently provided

Danso, Badu and Ahadzie
218
an average GDP growth of 6.1% to the economy (ISSER 2005, Anaman and Osei
Amponsah, 2007, IYF 2009, IMF 2009, DI 2009).
It is worth noting one of the main agenda of the Millennium Development Goals
(MDGs) and The Ghana Poverty Reduction Strategy II (GPRSII), is to address human
development issues of which, Cotton et al (2005) noted that the agenda is achievable
by the provision of infrastructure for services and employment through the
construction industry if health and safety on construction sites are improved to
promote and sustain efficiency.
However, despite this strategic importance of the Ghanaian construction industry, it is
fraught with occupational health and safety (OHS) issues. For example, it was
reported that the construction industry, recorded 902 accident cases comprising 56
fatalities in 2000 and 846 non-fatal accidents (Danso, 2005). In that same report,
Kumasi (the regional capital of Ashanti Region) alone recorded 124 construction
fatalities from 1999 to 2004. In attempting to find the causes of this breach in
Occupational Health and Safety issues, a number of factors are discussed and
researched, among them the rise and the increasing use of casual labour on
construction sites in Ghana.
Danso (2010) asserted the occupational health and safety issues of casual workers in
the Ghanaian construction industry have been compromised in that 60% of Ghanaian
contractors provide substandard welfare facilities and safety materials on construction
sites. It is contended that with the increasing use of casual workers in many
developing countries such as Ghana, there is the need for their perceptions of OHS to
be fully understood towards building a collaborative framework for addressing the
shortcomings arising from occupational health and safety issues. Thus the perceptions
of casual workers on what should constitute the important Occupational Health and
Safety items on site are sought and presented.
The paper starts by first putting into perspective the significant contribution that the
Ghanaian Construction Industry is making to the economy in recent times. This is then
followed by the situation of casual workers in the Ghanaian construction industry,
making references to other developing countries. The next, is the discussions of the
data collected and its analysis, having considered the framework that governs
casualisation. The subsequent section discusses the findings of the study. The
conclusion and recommendations follow after this section. Acknowledgement and the
list of references are detailed at the end of the paper.
THE SIGNIFICANCE OF THE GHANAIAN BUILDING
CONSTRUCTION INDUSTRY
As stated earlier on in the introduction, the construction industry plays an important
role in the economy of Ghana (Anaman and Osei Amponsah 2007). Indeed, the
interdependence between the construction sector and the Ghanaian economic has been
addressed by various writers and in all cases, there is evidence indicating a direct link
of the potential between investment in construction and economic growth (Anaman
and Osei Amponsah, 2007; ISSER, 2005, IYF 2009, IMF 2009, DI 2009). Indeed in
2003 to 2008, the Ghanaian construction industry has consistently provided an
average GDP growth of 6.1% to economy (see for instance Figure 1).

Occupational health and safety
219
Figure 1: Contributions Construction Industry to GDP
Source: Anaman and Osei Amponsah, 2007; ISSER, 2005, IYF 2009, IMF 2009, DI 2009
Figure 1 indicates that, the construction industry in Ghana, as at 2003 had a GDP
growth of 5.8% and experienced a constant GDP growth of about 5.8 % from 2004 to
2005. This remarkable consistent growth increased to 6.2 % in 2006. In 2007, it had
picked up again from 6.2 % and peaked at 7.3% in 2008.Following the emergence of
Ghana as an oil producing country, it is projected that the construction industry will
grow stronger at an unprecedented rate of 13% (ISSER, 2008). It should be noted that
concomitant with this projected growth is the increasing use of casualization with its
attendant occupational health and safety challenges.
CASUAL WORKERS AND THE GHANAIAN CONSTRUCTION
INDUSTRY
Rasell et al (1997) in their view defined casual work as a non-traditional employment
in the absence of regular full-time work and it is characterised by non continuing
work. Some writers have concluded that the services of these workers are temporal.
They are required when the need arises, and are laid off when the assigned task (the
task period is usually short) is over (Sheehan et al 2006; Brooks, 1985; Carter, 1990:
Creighton el al, 1994; Dawkings et al, 1990). Buchanan (2004) defined casual worker
as an individual who is hired on temporal basis, often for one day at a time. Mitullah
et al (2003) further defined a causal worker to include all construction workers who
are employed on a casual or temporal basis without any proper form of contract. Thus
individual workers, either working alone or in groups, who undertake temporal work
without any contract, are known as casual workers, labourers, temporary workers or
day labourers.
Indeed, the fragmented nature of the construction industry, its transient nature and
especially the fluctuating nature of jobs execution makes it unattractive for contractors
to keep a lot of permanent workers, making construction firms rely enormously on the
use of casual workers (Africa Development, 2007). The extent of employment of
casual workers in the construction industry in developing countries has been
documented by some researchers, and there is evidence to show that the practice has
grown in recent years. For example in Sri Lanka, workers on building sites revealed
82% of the skilled workforce and 93% of the unskilled workforce were employed as
5.2 5.8 5.8 6.2 6.37.3
6.16.6 7
8.2
10.311
0
2
4
6
8
10
12
14
16
18
20
2003 2004 2005 2006 2007 2008
A Graph of GDP Growth
GDP Growth Rate Sector Growth Rate
Sector Growth
GDP Growth Rate

Danso, Badu and Ahadzie
220
casual workers (Jayawardane et al, 1998). Vaid (1999) also indicated that, an
estimated 73% of construction workers in India were recruited on casual basis. Again,
the proportion of casuals in Malaysia increased slightly from 71% in 1983 to 74% in
1998 (Abdul- Aziz, 2001). The trend is not different in Philippines, where
construction companies continue to downsize their regular workforce. It is estimated
that 85% of the 1.35 million wage and salaried workers in the construction industry in
January 2000, were casual workers or project-based employees (Yuson, 2001).
Mitullah et al, (2003) also indicated that there is a high level of casualization on all the
construction sites in Tanzania. At least 70% of workers on each site were found to be
employed on casual basis and on some sites the number is as high as 96%. In India,
Wells (2007) reported that casual workers in the construction workforce increased in
10 years between 1983 and 1993. Wells (2007) further reported Mexico and Republic
of Korea have about 64% and 77 % of casual workers on construction sites. In that
same report Wells (2007) indicated, 90% of construction workforce in Egypt are hired
on casual basis.
These characteristics of the industry are indeed very typical of the Ghanaian situation
as well, with over 90% being artisans and also given that casual workers account for
about 70-90% of the construction labour workforce in Ghana. However as noted by
the International Labour Organisation (2001), the increasing use of casualisation
(while it appears irresistible due to the unique nature of the industry) also has led to
debilitating effect upon occupational health and safety issues.
DRIVERS OF CASUALISATION
As indicated, the ILO (2001) has indicated that, casualisation in the construction
industry has led to debilitating effect upon occupational health and safety issues
especially in developing countries. This led some writers to research in that area and
that indeed in almost all cases, there were pieces of evidence indicating that the health
and safety of casual workers had been compromised. For example, a base study
conducted in Tanzania by Mitullah et al (2003) revealed that about 70% of casual
workers were not provided with welfare related facilities and safety materials at most
of the project sites resulting in accidents and sometimes fatal on construction sites.
Writing in the same vein other writers such as Wachira (2003) and Buchanan (2004)
also dealt with the situation of casual workers on construction sites to assert why
contractors want to still engage casual workers on site and provide substandard safety
materials and poor welfare facilities, and why casual workers want to continue to
work in such unsafe conditions. Factors such as the ready availability of casual
workers, casual workers being cheaper to employ, and as a means of saving on labour
among others, are all plausible in the case of employers. Socio-economic conditions of
the casual workers themselves have been suggested by some writers as one of the
reasons why casual workers want to continue work in such unsafe conditions. For
example during the ethnographical study by Buchanan (2004), the author found casual
workers were unwilling to leave dangerous work situations because they recognised
the turnover of workers and hence, worried that they would be replaced if they
complained about safety hazards on construction site. Other writers are of the view
that the lower level of education and the quest of casual workers to meet their basic
needs such as food and shelter, among others, have contributed to their inability to
refuse to work in unsafe conditions.
In view of the significant role casualisation plays in the construction industry, it is
important to understand casual workers perception of Occupational Health and Safety

Occupational health and safety
221
(OHS) issues to building a collaborative framework for addressing the defects
emanating from these issues, which will further help to achieve some of the agenda of
the Millennium Development Goals (MDGs) and The Ghana Poverty Reduction
Strategy II (GPRSII).
THEORETICAL FRAMEWORK
As demonstrated, pieces of evidence indicate that indeed there has been a significant
growth of casual workers in the construction industry. However, the ILO (2001) has
indicated that the increasing number and the practice of casualisation have led to a
debilitating effect upon occupational health and safety issues on construction sites. For
example, in India, the on-site accommodation provided for casual workers is
rudimentary, comprising simple shacks with no running water or decent sanitation,
and poor ventilation (Vaid, 1999). The same can be said about Malaysia where it has
been estimated that 82% of casual workers live on sites in buildings of poor quality,
and this was their second major grievance after social security (Abdul-Aziz, 2001).
Even China as an emerging developed nation, the trend is not different. The bulk of
casual workers on construction sites, lack proper places to have their meals and they
are often found eating outdoors, exposed to dust in the air, without dining tables or
seats (Lu and Fox, 2001). Additionally, Jeemol et al (2002) indicated that casual
workers have a problem of meeting their basic needs such as food and shelter. A base
study conducted in Tanzania by ILO, (2005) revealed that casual workers were not
provided with welfare facilities in most of the projects.
The Construction Industry is often seen as a driver of economic growth especially in
the developing countries such as Ghana (Anaman et al, 2007). From 2001 to 2005, the
annual economic growth rates of Ghana, has been between 5 to 6% (Anaman et al,
2007) and recently the Government of Ghana (GOG) has set a target of annual
economic growth rate of 8% and above. This means that for the Government of Ghana
(GOG) to achieve her target and beyond, one of the key sectors to consider is the
construction sector. However, it appears that the policy makers in Ghana have
different view about the industry. Anaman et al (2007) confirm that policy makers
have not promoted this industry towards engendering the much needed growth of the
economy. In Ghana, the main occupational health and safety policy frameworks are
as listed below:
National labour Act 651 of 2003;
Factories, Offices and shop Act of 1970;
Building Regulation; and
Workmen compensation Act 1987
These documents obviously do provide some legal framework on casual labour
practices in the Ghanaian construction industry. However indication from the
blueprints available suggests some lack of understanding or inconsistencies on the real
issues confronting casual workers in the construction industry. Moreover recent
developments and challenges following the increasing use of casual labour have not
been properly investigated to reflect modern occupational challenges.
Here, the ILO framework, the Ghanaian National labour Act 651 of 2003 in
conjunction with the factory, offices and shop Act of 1970 was adopted as the main
basis for theoretical framework (refer Fig 4.1).

Danso, Badu and Ahadzie
222
Figure 4.1: A framework of OHS provisions for casual workers
Within the legislation and policies in fig 4.1 lies the National Labour Act 651 of 2003
and Factories, Offices and shop Act of 1970 and the requirement of the law in the
context of OHS is projected to form OHS issue (see fig 4.1). Section 73 under the
legislation and policies in fig 4.1, deals with the right of employers to employ casual
workers, whereas sections 74 and 78 deal with the conditions of employment of the
casual worker, and the interpretation or the meaning of casual worker respectively.
Section 118 of Act 651of 2003 explains how employers should manage the
occupational health and safety of casual workers and the environment within which
they work. From the legislation and policies, contractors are allowed to hire casual
workers for short periods on terms that suit the operations of their firms. However
contractors are to operate within the definition of engagement of a casual worker.
Once the contractor employs a casual worker, by legislation, a verbal contractual
relationship is established, where the casual worker have rights to minimum
remuneration for each day worked, overtime and medical facilities. Further
opportunity is provided by the legislation for the casual to access full remuneration
when he or she attends work, for example whether the weather prevents him or her
from carrying on his or her normal work. The legislation and policies further place the
responsibility of provision of welfare facilities and safety materials for the casual
worker on the main contractor on site. Portions of the Factories, Offices and shop Act
of 1970 only re-echoes the health and safety provisions in sections 118 to 119 of the
National labour Act 651. Portions of these legislation and policies were also adopted
from blue print of the ILO Code of Practice on Health and Safety on Construction
sites 1992. This legislation and policies as explained in the framework, becomes the
base line for measuring what the Ghanaian contractor provides for the casual worker
and what the casual worker receive from the contractor with regards to occupational
health and safety measures. Indeed the framework seeks to confirm the provision of
and receipt of standardised welfare and safety items
DATA COLLECTION AND ANALYSIS
Observations followed by a questionnaire survey of preference of casual workers for
occupational health and safety items were carried out in Kumasi. The choice of
Kumasi was based on the fact Kumasi is the second largest city in Ghana and has
some of the highest concentration of construction activities in Ghana. Furthermore
informal activities are very intense because of the largely traditional nature of the city
(KPMG, 2008).

Occupational health and safety
223
The questionnaire used a five-point Likert-type scale to measure a range of preference
of welfare and safety items of opinions from ―most preferred‖ to ―least preferred‖ to
determine the preference of welfare and safety items. The significant agreement or
otherwise with the notion being tested was determined by adopting the mid-point
value of the index (i.e. 3point or neutral) as the hypothesized mean (Coakes and Steed,
2001). This means that any result significantly different from this uncommitted or
unsure value was assumed to be either most preferred or least preferred of welfare and
safety items to the notion being tested (Pullin and Haidar, 2003).
Indications from Erbil et al (2010) are that purposive sampling allows the researchers
to select the individual who have good knowledge on the subject in discussion. Here
casual workers are known to be directly involved with the actual construction works
and they know the problems they encounter with management in terms of provisions
of welfare facilities and safety materials.
Using purposive sampling technique, 100 questionnaires were distributed to casual
workers. Seventy-three were retrieved. Twenty three out of the seventy-three were not
properly completed and were therefore discarded. This brought the responses
effectively to fifty, representing a response rate of 50%. This response rate is
considered adequate as, according to Oladapo (2005), Newman & Idrus (2002) and
Ellhag and Boussabaine (1999), a response rate of 30% to 40.50% is good enough in
construction studies. It is worth noting, those casual workers who could not read or
write at the time of responding to the questionnaires were guided by the researcher to
make their contributions.
Indications from Naoum, (2008) cited Creswell, (1994) is that any inquiry into a
social or human problem which is based on a theory composed of variable, measured
with number and analysed with statistical procedures is a quantitative research. Here
the quantitative approach was used for basis of triangulating the results with previous
findings, which were all based on quantitative analysis
ONE SAMPLE STATISTIC MEANS OF PREFERENCE
One sample statistics of preference was carried out to determine whether casual
workers prefer the provision of substandard safety materials and welfare facilities or
otherwise. While, the mean ranking establishes the preference of some of these issues,
it also provides a clearer picture of the concerns raised by casual workers. The ranking
of these variables (welfare facilities and safety issues), are determined by putting
together the sample size, the sample mean, the standard deviations and the standard
error of each of these variables of the welfare facilities and safety materials.
The sample mean, makes inferences about the population based on sample
information (Saunders et al, 2007). Standard deviation according to Ahadzie (2007) is
the statistical tool that measures the dispersion around the sample mean. High values
of standard deviation (relative to the sample mean) suggest that the values of standard
deviation are widely spread out from the sample mean. This means that that there is a
lot of variability between means of the sample. Low values of standard deviations on
the other hand, suggest that the values of standard deviation are more tightly clustered
around the sample mean. This is an indication that most sample means are similar to
the population mean and so the sample is likely to be an accurate reflection of the
population (Ahadzie, 2007). The standard error indicates how tightly the sample mean
are distributed around the population mean (Bbabbie, 2001). From this, the standard
error appears to behave like standard deviation. To this, a number of researchers such

Danso, Badu and Ahadzie
224
as Bbabbie (2001), Ahadzie (2007) often referred the standard error as the standard
deviation.
These characteristics of the above statistical tools, helped in ranking the variables of
welfare facilities and safety issues. It is important to note that while ranking the
variables of welfare facilities and safety materials using one sample statistic means of
preference, when two or more variables have the same mean, the one with the lowest
standard deviation is assigned the highest ranking. To this end, table 3 below shows
the summary of results of ranking of welfare facilities and safety materials using one
sample statistic means of preference on building construction sites.
Table 3: Summary of one sample statistic showing rankings of OHS issues from casual workers
N Mean Standard
deviation
Standard
error
Ranking
Welfare facilities
Safe drinking water 50 4.5686 1.00509 0.082 1st
Suitable accommodation to rest 50 4.1373 1.00039 0.127 2nd
Sanitary facilities (toilets, showers,
changing rooms)
50 4.1373 1.13172 0.125 3rd
First-aid equipment 50 4.1373 1.42856 0.122 4th
Water for washing and cooking 50 4.0196 1.06752 0.138 5th
Catering service 50 3.8824 1.32132 0.136 6th
Means of heating food 50 3.6667 1.21106 0.118 7th
Accommodation to change and store
clothing
50 3.5686 1.17055 0.144 8th
Safety Materials
Safety boots 50 4.3725 1.01903 0.135 1st
Safety signs 50 4.1176 1.05161 0.106 2nd
Hard hats or helmet 50 4.0196 1.06752 0.130 3rd
Training in safety 50 4.0196 1.20814 0.128 4th
Safety glasses, goggles, and face shields 50 3.9412 1.12092 0.140 5th
Appointment of safety officer on site 50 3.9412 1.34777 0.143 6th
Rain gear 50 3.6078 1.32783 0.199 7th
Knee pads 50 3.1176 4.62881 0.095 8th
Gloves 50 3.0000 1.56205 0.100 9th
Hearing protection 50 2.8627 1.53648 0.177 10th
Safety nets 50 2.3333 1.46515 0.222 11th
Flashlights 50 2.2745 1.47076 0.268 12th
Ladder Scaffold platforms 50 2.2353 1.39411 0.292 13th
Hoisting equipment 50 2.0000 1.41421 0291 14th
FINDINGS
Welfare facilities
The following observations were made from table 3. Casual workers ranked safe
drinking water first (1st) as the most preferred welfare facility for addressing the health
and safety issues concerning them, while suitable accommodation to rest, sanitary
facilities, first-aid equipment and water for washing were ranked as second (2nd
),third
(3rd
), fourth (4th
) and fifth (5th
) respectively as preferred facilities.
These welfare facilities are preferred by casual workers because it was observed that
sanitary facilities such as toilets and urinals were virtually nonexistent and thereby
casual workers have to depend on nearby bushes. With first aid kits, some sites have
them alright, but they do not contain drugs or clinical items. Further, there is no
arrangement for catering services for casual workers. Food is sold by women vendors
who come around and there is no proper place for dining; they have their meals is
outdoors, exposed to dust and without dining tables or seats in an unhygienic

Occupational health and safety
225
environment. Drinking water is not provided to casual workers at some construction
sites. They have to carry their drinking water from home, otherwise they have to
request or buy from these women sellers. Sites that are provided with water are stored
in unhygienic concrete or poly tanks and this is usually infested by spirogyra and other
organisms. All these and others have created poor and dangerous conditions for casual
workers to work unsafely. To be able to work effectively and efficiently means that
certain basic human needs are needed, and clearly the casual workers have
demonstrated that by indicating that safe drinking water, sanitary facilities, suitable
accommodation to rest, first-aid equipment and water for washing are the most
preferable welfare facility for addressing the health and safety issues concerning
them. It appears the choices of casual workers confirm Abraham Maslow‘s hierarchy
of human needs at the Physiological stage.
Safety materials
Casual workers also ranked safety boots first (1st) as the most preferred safety material
for addressing the health and safety issues concerning them, while safety signs, hard
hats or helmet , training in safety and safety glasses were ranked as second (2nd
), third
(3rd
), fourth (4th
) and fifth (5th
) respectively as preferred safety materials. The
preference of safety boots, safety signs, hard hats or helmet, training in safety norms
and safety glasses on sites, are the unknowingly thought of casual workers on
proactive measures on construction sites. Proactive measures, in the context of
Occupational Health and Safety (OHS) issues, on construction sites means taking
steps necessary to prevent accidents and control of loss and damage of materials on
construction sites. To react proactively, casual workers are of the view that wearing of
safety boots and helmet coupled with training in safety norms is the best option and
this is an indication to the fact that they are directly involved in the actual construction
work.
CONCLUSION AND RECOMMENDATIONS
As earlier indicated, the Ghanaian construction industry is fraught with occupational
health and safety issues. This study has shown that casual workers who constitute
about 70-90% of the construction labour workforce in Ghana, have their occupational
health and safety issues compromised, and if given the opportunity they would have
preferred safe drinking water, sanitary facilities, suitable accommodation to rest, first-
aid equipment and water for washing for addressing their welfare issues on
construction site. Additionally safety boots, safety signs, hard hats or helmet, training
in safety, and safety glasses were their first choice of safety materials for addressing
their provision of safety materials. This outcome of casual workers preferences was
based on one sample statistic, which apart from the fact that it determined the
preferences of items, it also provided a clearer picture of the concerns raised by the
casual workers. In the light of this and given the results obtained from the studies, it is
recommended that contractors, consultants of construction sector and construction
clients should allocate more resources to improve the preferred welfare facilities and
safety materials on site. Government ministries, agencies and department of labour
should liaise with the Ministry of Water Resources, Works and Housing and in
conjunction with the Association of Civil Engineering and Building Contractors,
produce a comprehensive policy document to cover standardised preferred welfare
facilities and safety materials on site in order to build a more sustainable construction
industry in Ghana.

Danso, Badu and Ahadzie
226
ACKNOWLEDGEMENTS
The authors are grateful to Mr. Augustine Owusu Danso for his enormous
contribution.
REFERENCES
Ahadzie, D.K. (2007), Model for Predicting the Performance Of Project Managers At The
Construction Phase Of Mass House Building Projects,
http://wlv.openrepository.com/wlv/bitstream/2436/15393/2/Ahadzie_PhD%20t
hesis.pdf, Accessed on 12th November 2009
Anaman, K. A. & Osei-Amponsah C.,(2007), Analysis Of Causality Links Between The
Growth Of The Construction Industry And Growth Of The Macro-Economy In
Ghana, Construction Management & Economics, Vol 25, pp. 951-961.
Buchanan, S. (2004), Day Labor And Occupational Health: Time To Take A Closer Look,
Baywood, Publishing Co. Inc., USA, pp 253 – 260.
Cotton A.P., Sohail, M. & Scott, R.E. (2005), Towards improved labour standards for
construction of minor works in low income countries, Engineering, Construction and
Architectural Management, Vol. 12 No. 6, pp. 617-632
Danso, F. O. (2005), Improving Safety on Building Construction Site on KNUST Campus in
Kumasi Ghana, Unpublished BSc Thesis, Faculty of Architecture and Building
Technology, KNUST, Kumasi, Ghana
Danso, F.O. (2010), Occupational Health and Safety Issues Involving Casual Workers on
Building Construction Sites In Ghana, A Kumasi Study, Unpublished BSc Thesis,
Faculty Of Architecture And Building Technology, KNUST, Kumasi, Ghana
Earl Babbie. (2001), The practice of social Research, Eve Howard, United States of America
Erbil, Y. & Akıncıtürk, N. (2010), An Exploratory Study Of Innovation Diffusion In
Architecture Firms, Scientific Research And Essays, Vol. 5(11), Pp. 1392-1401
ILO. (2005a), Prevention: A Global Strategy. Promoting Safety and Health at Work The ILO
Report For World Day For Safety And Health At Work International Labour
Organisation, Geneva, Switzerland. Accessed On 15th September 2009 from
Http://Www.Ilo.Org.Pk/Informationfiles/Prevention%20A%20Global%20Strategy.Pd
f
ILO. (2005b), Global Estimates Of Fatal Work Related Diseases And Occupational Accidents,
World Bank Regions. International Labour Organisation, Geneva. Programme On
Safety And Health At Work And Environment (Safework), Accessed On 15th
September 2009 From;
Http://Www.Ilo.Org/Public/English/Protection/Safework/Accidis/Globest_2005/Index
.Htm
ILO. (2007), The Decent Work Agenda In Africa: 2007-2015. In: Eleventh African Regional
Meeting, Held At Addis Ababa, Ethiopia. Report Of The Director General–
International
Jayawardane, A.K.W. & Gunawardena, N.D. (1998), Construction Workers In Developing
Countries: A Case Study Of Sri Lanka, Construction Management And Economics,
London, E & FN Spon, Vol.16, Pp. 521-530.
Kheni, N.A. Dainty, A, R. & Gibb A. (2008), Health and Safety Management in Developing
Countries: A Study of Construction SMES in Ghana, Construction Management and
Economics, Vol. 26, pp. 1159-1169
KPMG (2008), Potential Opportunity for Investors Kumasi, Ghana, pp. 1-15.
Occupational health and safety
227
Lopes, J. (1998), The Construction Industry And Macroeconomy In Sub-Saharan Africa Post
1970, Construction Management And Economics, Vol 16, pp 637-649.
Mitullah, W. V. And Wachira, I. N. (2003), Informal Labour In The Construction Industry In
Kenya: A Case Study Of Nairob, Sectoral Activities Programme Working Paper 204,
International Labour Organisation, Geneva.
Naoum, S. (2008), dissertation Research and writing for Construction Student, Oxford:
Butterworth-Heinemann.
National Labour ACT 651 (2003), Section 74 – 118.
Neuman W., (2007), Social Research: Quantitative and Qualitative Approaches, Pearson
Education, Inc., USA.
Oladapo, A. A. (2005), An Investigation Into The Use Of Ict In The Nigerian Construction
Industry, from
Http://Www.Itcon.Org/Data/Works/Att/2007_18.Content.02391.Pdf, Assessed
On 30 November 2009
Resell, E. & Applebaum, E. (1997), Nonstand Work Arrangement: A Challenge For Worker
And Labour Unions, Social Policy, Vol. 28 No 2 Pp31-6.
Vaid, K.N. (1999), The Construction Industry In Nepal - The Challenges Of Manpower
Development, National Institute Of Construction Management And Research
(NICMAR), Walchand Center, Mumbai
Wells, J. (2007), Informality In The Construction Sector In Developing Countries,
Construction Management And Economics, Vol. 25, Pp 87-93.


Babalola, J.A. and Idehen, A.F. (2011) Causes of variations on building projects in Nigeria In: Laryea,
S., Leiringer, R. and Hughes, W. (Eds) Procs West Africa Built Environment Research (WABER)
Conference, 19-21 July 2011, Accra, Ghana, 229-236.
229
CAUSES OF VARIATIONS ON BUILDING PROJECTS
IN NIGERIA
J.A. Babalola1 and A.F. Idehen
Department of Building, University of Lagos, Akoka, Yaba, Lagos, Nigeria
Variations are inevitable reality of every construction project. Variations in
construction projects can cause substantial adjustment to the construction project
duration, cost and quality. The aim of this study is to examine causes and possible
control measures of variations in the Nigerian construction industry. Data on recently
completed projects were collected from clients, consultants and contractors in the
construction industry in Nigeria. A total number of seventy five (75) questionnaires
were distributed out of which sixty five (65) were returned for analysis. The data
collected were analyzed using descriptive statistics. Change of plan or scope of work
by owner, change of specification by owner, unforeseen problems, change in
economic conditions and differing site conditions were identified as the major causes
of variations. While involvement of professionals at initial stages of project, clear and
thorough project brief, thorough detailing of design, team effort by the owner,
consultant and contractor, also comprehensive site investigation are major possible
control measures of variations in the Nigerian construction industry. In conclusion, to
minimize variations, client and consultants must be actively involved in the planning
stage of construction project and the collaborative effort of the construction
professionals should be encouraged with site investigation carried out during the pre-
contract stage.
Keywords: cost overrun, Nigeria, time overrun, variations.
INTRODUCTION
Construction projects are complex endeavours majorly because they involve many
human and non human factors and variables (Arain and Pheng, 2007). Construction
projects are unique, one off task that last for a defined period. Another important fact
about project is that no two projects are entirely the same. Furthermore, a project
involves different stages ranging from initial stage, feasibility analysis, design stage,
procurement, construction, turnover to the disposal of the facility. Thus, the need to
make changes in a construction project is a matter of practical reality. Even the most
thoughtfully planned project may necessitate changes due to the above factors and
more (O‘Brien, 1998).
The problem of delays in construction is a global phenomenon as pointed out by
various researchers (Sambasivan and Soon, 2006; Arain and Pheng, 2006;
Mohammed, 2001) and variations constitute one of the major causes of construction
delays. Thus, variations in construction projects are a global phenomenon. Variations
are inevitable in any construction project because needs of the owner may change in
the course of design or construction, market conditions may impose changes to the
project, and technological developments may alter the design and the choice of the

Babalola and Idehen
230
engineers. The engineer‘s view of the design may bring about changes to improve or
optimize the design and hence the operations of the project (Arain and Pheng, 2006).
Variations affect project cost, time, and quality of projects in so many ways. Variation
can lead to contractual disputes, compromised quality of construction products and
frustration of all parties involved in the construction project (Akinsola, 1996). Change
orders could be disruptive, beneficial or neutral (Motawa et al; 2007). Early
identification and analysis of potential causes of variations and there consequential
effect on a project can enhance the management of projects. In O‘Brien (1998) clear
and thorough project brief is an important control for variations in construction
projects, as it helps in clarifying the objectives to all participants. According to
Mokhtar et.al. (2000) clarification of variation order procedures is an integral part of
effective management of variation orders.
However, some of the studies carried out on the causes of variations were outside
Nigeria. The few in Nigeria did not do much justice on the possible control measures
of variations on construction projects. The significant importance of this study will be
to have a clearer understanding of the causes and to assist the project team to make
more informed decisions, to minimize the effects of unavoidable variations and to
prepare adequately for unforeseen and or unaffordable variations.
LITERATURE REVIEW
Various researchers have described variations in various ways but generally,
variations refer to change in the requirement of the original contract signed by the
parties, or a ―variance from what was originally stated in the contract documents
(Kassim and Boong, 2002; Ssegawa et al, 2002; Ibrahim, 2006). It is a common
saying that the only constant thing in life is change. The same applies to construction
projects, there is hardly any construction project void of alterations, omissions,
substitutions and the like. In the construction industry, these changes are referred to as
―variations‖ and they are initiated by a written instruction issued by the architect who
stands as the client‘s representatives, these instructions are known as ―variation order‖
or ―change order‖.
Major variations include increase and decrease in the quantity of work, modification
of the quality of materials to be used, change in the dimensions of any parts of the
work, omissions, changes which cause limitation to site access, working space or
hours, removal from sites of materials or for inspection of any work covered up and
replacement of any person employed in connection with the contract (Ssegawa et al,
2002). To Arain and Pheng (2008) causes of variations can be grouped under the
following headings:
Owner related variations, e. g change of plans or scope by owner, change of
schedule by owner, owner‘s financial problems and inadequate project
objectives etc.
Consultant related variations, e. g change in design by consultants, errors and
omissions in design, conflicts between contract documents, inadequate scope
of work for contractor etc.
Contractor related variations, e. g lack of contractor‘s involvement in design,
unavailability of equipment, unavailability of skills and contractor‘s financial
difficulties etc.
Other variations, e. g weather condition, safety considerations, change in
government regulations and change in economic conditions etc.

Causes of variations
231
However, on the way forward opinions of some researchers were reviewed on the
possible control measures of variations. To the Construction Industry Institute (1994)
contract documents are the main source of information for any project.
Comprehensive and balanced variation clauses would help in improving co-ordination
and communication quality. According to Arain et al. (2004) involvement of the
professionals in design may assist in developing better designs by accommodating
their creative and practical ideas. This practice would assist in developing a
comprehensive design with minimum discrepancies (O‘Brien, 1998). Clarity of
variation order procedures would help in reducing the processing time and other
mishandling issues (Ibbs et .al 2001). To Chan and Yeong (1995) and Fisk (1997) a
structured and thorough prequalification system for awarding projects would act as a
filter to select only the capable parties for project bids. However, the lack of such pre-
qualification system may allow incapable parties to bid. This may eventually lead to
numerous problems in the later stages of a construction project.
RESEARCH METHOD
The population of this study includes building projects in Lagos State. The samples
selected for this study includes some selected new building projects in the Lagos
State area of Nigeria.
A sample size of seventy five (75) construction projects in Lagos State was selected
using non-probabilistic sampling technique. Both primary data and secondary data
were used in carrying out the research study. The sources of primary data were
structured questionnaires administered to consultants, contractors and clients on new
building projects. The questionnaire contained questions aimed at answering the
research questions. The 5 points Likert rating scale was adopted to elicit information
from the respondents. The ratings used are as follows: for agreement ratings 5 –
strongly agree, 4 – agree, 3 – uncertain, 2-disagree and 1 – strongly disagree. In
addition personal interviews and in–depth discussions with the professionals
concerned were carried out.
In analyzing the data, the mean item scores of the variables were calculated using the
formula below;
MIS = 5 - ∑(f x s) (1 < MIS < 5)
N
Where MIS is the mean item scores, f is the frequency of responses to each rating (1-
5), s is the score given to each variables by the respondents (ranging from 1 to 5), and
N is the total number of responses concerning that variable. SPSS was used to arrived
at the analysis of the data by coding and data entry. The information collated from the
respondents were presented in tables. These table were interpreted according to
information obtained and conclusions and recommendations were deduced from the
results of the analysis.
DATA ANALYSES AND RESULTS
This section of work presents the result and the analysis of the data obtained from the
questionnaires distributed.

Babalola and Idehen
232
Table 1: Respondents characteristics
Characteristics of Respondents Frequency Percentage Cumulative
Client
Professionals: Quantity surveyor
Architect
Services Engineer
Structural Engineer
Contractors
1
26
21
3
8
8
1.50
38.80
31.30
4.50
11.90
11.90
1.50
40.30
71.60
76.10
88.10
100.00
1 -5 years
Years of 6 – 10 years
experience 11-15 years
16 – 20 years
Over 20 years
35
19
8
3
2
52.20
28.40
11.90
4.50
3.0
52.20
80.60
92.50
97.00
100.00
Qualification: Ordinary Diploma ND
Higher National
Diploma HND
B.SC
PGD/M.SC
1
7
28
31
1.50
10.40
41.80
46.30
1.5
11.90
53.70
100
Table 1 shown that the respondents have adequate understanding of the professional
practice and the activities of the construction industry and that the questionnaires are
representative of the activities in the construction industry.
Table 2 Causes of Variation
Causes MIS Standard
deviation
Rank
Change in plan or scope by owner 4.57 0.722 1
Change in specification by owner 4.31 0.925 2
Unforeseen problems 3.97 1.114 3
Change in economic conditions 3.75 1.210 4
Differing site conditions 3.63 1.139 5
Change in design by consultant 3.52 1.352 6
Rigid nature of owner/owner‘s interference 3.49 1.341 7
Owner‘s financial difficulties 3.49 1.295 8
Change in government regulations 3.49 1.341 9
Lack of communication 3.45 1.105 10
Poor procurement process 3.45 1.222 11
Lack of strategic planning 3.45 1.363 12
Weather conditions 3.37 1.166 13
Errors and omissions in design 3.36 1.484 14
Inadequate working drawings details 3.25 1.429 15
Contractor‘s lack of judgement and experience 3.24 1.338 16
Inadequate shop drawing details 3.24 1.349 17
Lack of co-ordination 3.12 1.285 18
Socio-cultural factors 3.10 1.061 19
Conflicts between contract documents 3.10 1.316 20
Design complexity 3.10 1.304 21
Non compliance of design with government regulation 3.03 1.21 22
Lack of specialized contraction manager 3.03 1.359 23
Shortage of skilled manpower 3.00 2.780 24
Unfamiliarity with local conditions 2.93 1.235 25
Fast track construction 2.90 1.116 26
Lack of contractors involvement in design 2.90 1.220 27
Technology change 2.84 1.423 28
Contractor‘s mismanagement of funds 2.70 1.423 29
Consultant‘s lack of judgement and experience 2.73 1.309 30
Unavailability of equipment 2.73 1.098 31.

Causes of variations
233
Table 3: Possible control measures for variations
Control measures Mean Standard
deviation
Rank
Involvement of professionals at initial sages of project. 4.63 0.850 1
Clear and thorough project brief 4.58 0.838 2
Thorough detailing of design 4.52 0.804 3
Team effort by owner, consultant and contractor. 4.49 0.894 4
Comprehensive site investigation 4.30 0.954 5
Continuous coordination and direct communication. 4.28 0.982 6
Value engineering at conceptual phase 4.25 1.106 7
Knowledge base of previous similar projects 4.24 0.923 8
Prompt approval procedures 4.22 0.867 9
Owner‘s involvement at planning and design phase 4.22 1.204 10
Use of collected and organized project data complied by owner,
consultant and contractor.
4.19 0.973 11
Ability to negotiate variation 4.13 1.028 12
Clarity of variation order procedures 4.10 1.017 13
Control the potential for variation orders to arise through
contractual clauses.
4.09 0.965 14
Review of contract documents 4.09 1.203 15
Comprehensive documentation of variation order 3.94 1.179 16
Variation order scope 3.84 1.175 17
A structured pre-qualification system for awarding project 3.69 1.117 18
Involvement of contractor at planning and scheduling process. 3.66 1.262 19
Project manager from an independent firm to manage the project. 3.63 1.253 20
Valuation of indirect effects 3.54 1.283 21
Freezing design 3.42 1.519 22
Reduce contingency sum 2.67 1.223 23
Table 2 shown causes of variation and there ranking. Table 3 shows the possible
control measures for variations on the construction projects the analysis was based on
the perceptions of the respondents.
DISCUSSION OF FINDINGS
Table 2 indicates the thirty-one various causes of variations in the construction
projects. These causes were ranked according to there level of importance. The most
important causes of variations in the building projects that was ranked first on the list
was change in plan or scope by owner and followed by change in specification by
owner. It was revealed through the interviews with the professionals that the owners
found it difficult to make quick decision of their needs. Project must be adequately
conceived before commencement. Unforeseen problems ranked third and when this
occurred adequate steps must be taken to avoid reworks and delays in the project
completion. Change in the economic conditions causes variation. From the findings
of Fisk (1997) economic conditions is one of the influential factors that may affects a
construction project. This may affect the project adversely, depending on the timing of
the occurrence of the variations. Another causes of variations that ranked fifth was
differing site conditions. This type of variation can be avoided if adequate site test was
carried out at the initial stage of the project.
Change in design by consultant ranked sixth. This is one of opinion given in the work
of Ibrahim (2006).Adequate planning at early stage will eliminate this problem.

Babalola and Idehen
234
Owner financial difficulties ranked eight . It was gathered from the interview
conducted that most project did not cash flow projection at the beginning. Therefore
cash flow forecast must be prepared at the early stage to solve any financial problem
that may arise. Another causes of variations that was indicated is change in
government policies and lack of communication between the building team. This may
be due to unstable in government policies. Poor procurement process ranked eleventh.
The interview conducted revealed that must of the projects were not properly
conceived before implementation. Other causes of variations are lack of strategic
planning, weather conditions, errors and omission in design, inadequate working
drawings details contractor‘s lack of judgement and experience, inadequate shop
drawings details and lack of co-ordination etc.
Table3 indicates the twenty-three possible control measures for variations of the
construction projects. These possible control measures were ranked according to there
level of importance. The most important possible control measure of variations is by
involvement of professionals at initial stages of project. This was highly supported by
the respondents. This will make the professionals to agree on some issues that may
later cause variations. Clear and thorough project brief ranked second. According to
O‘Brien (1998), clear and thorough project brief will help in clarifying the project
objectives to all the participants. Thorough detailing ranked third, this will assist in
identifying the errors and omissions in design at an early stage supported by O‘Brien
(1998).
Team effort by owner, consultant and contractor ranked forth while comprehensive
co-ordination with proper communication ranked sixth. Value engineering at
conceptual phase and knowledge base of previous similar projects ranked seventh and
eight respectively. Prompt approval procedures ranked ninth by the respondents.
Owner‘s involvement at planning and design phase. The respondents were also in
support of the fact that owners must be involved during the planning and design
phase. Use of collected and organized project data complied by owner, consultant and
contractor ranged eleventh while ability to negotiate variation ranked twelfth. Clarity
of variation order procedures was also ranked thirteenth, clarity of variation order
procedures is an integral part of effective management of variation orders, and this
will help in reducing the processing time and other mishandling issues (Mokhtar et al,
2007). Control the potential for variation orders that may arise through contractual
clauses and the review of contract documents ranked fourteenth and fifteenth
respectively. Other possible control measures are comprehensive documentation of
variation order, variation order scope, a structured pre-qualification system for
awarding project, involvement of contractor at planning and scheduling process,
project manager from an independent firm to manage the project, valuation of indirect
effects, freezing design and finally reduce contingency sum.
CONCLUSION
This study presented the professionals‘ views of the causes and controls for variations
orders for some building projects in Lagos State as a case study. Through the
questionnaire survey and interviews with the professionals who were involved new
building projects, causes and effective controls of variations for these projects were
identified. From a comprehensive tabulation of 31 causes of variations and with there
mean item scores, causes of variations were ranked according to there significance.
The most important causes were change in specification by the owners, unforeseen
problems, change in economic conditions and differing site conditions. Also from the

Causes of variations
235
findings of the study, the professionals can control project variations by involving the
professionals at the early stage of project, by having clear and thorough project brief,
thorough detailing of design and ensuring team effort by owner, consultant and
contractor during the preliminary stage of a project. This study will benefit the
professionals involved with office and residential buildings in Nigeria. .
RECOMMENDATION
In light of the findings of this study, the following recommendations are suggested.
The client should be actively involved in the initial stages of the project. This would
ensure that the clients objectives are clearly spelt out and invariably variations caused
by change in plan or scope would be greatly reduced. The consultants should ensure
that the client‘s project brief is thorough. This may reduce variations caused by errors
and omissions. It may also reduce the tendency of rework and demolition during the
construction phase. The collaborative effort of the construction professionals should
be encouraged. Regular site meetings and clear mode of communication cannot be
over emphasized especially in reducing the effects of variations caused by unforeseen
circumstances. Site investigation should be thoroughly done and taken seriously to
reduce variations caused by differing site conditions.
REFERENCES
Akinsola, A.O. (1996). Neural Networks, Model for Predicting Building Projects‘
Contingency Allowance. Proceeding of Association of Research in Construction
Management, ARCOM 96, 11 – 13 September, Sheffield Hallam University, England,
507 – 516.
Arain, F.M. and Pheng, L.S. (2005). The Potential Effects of Variation Orders on Institutional
Building Projects, Facilities, 23 (11/12) 496 – 510.
Arain, F.M. and Pheng, L.S. (2006). Leveraging on Information Technology for Effective
Management of Variations in Education Building Projects: A KBDSS Approach,
Centre for Education in the Built Environment, Working paper 10, pp. 1 – 18.
Arain, F.M. and Pheng, L.S. (2007). Modelling for Management of Variations in Building
projects. Engineering Construction and Architecture Management, 14 (5), 420 – 433.
Arain, F.M. and Pheng, L.S. (2008). Causes of Discrepancies Between Design and
Construction Architectural Science Review. 47 (3), 237 – 249.
Assat, S.A. and AL – Hejji, S. (2006). Causes of Delay in Large Construction projects.
International Journal of Project Management 24 (4), 349 – 57.
Cameron, I. Duff, R. and Hare, B. (2004). Integrated Gateways: Planning out Health and
Safety Risk. Research Report 263, Glasgow Caledonian University, UK.
Construction Industry Institute (1994) Project Change Management Special Publication 43-1,
Construction Industry Institute, University of Texas at Austin, Texas.
Chan, A.P.C. and Yeong, C.M. (1995). A Comparison of Strategies for Reducing variations.
Construction management and Economics. 13(6), 476-473.
Fisk, E.R. (1997) Construction Project Administration 5th Edition. New Jersey: Prentice Hall.
Hanna,A.S.P.E., Calmic,R., Peterson, P.A. and Nordheim,E.V.,(2002).Quantitative Definition
of Projects impacted by change Orders. Journal of Construction Engineering and
Management, 128(1),57-64.
Hassainien,Amr. A.G and El Nemr, N.(2007).Management of change order claims in the
Egyptian industrial construction sector. Journal of Financial Management of Property
and Constuction.12(1),45-60

Babalola and Idehen
236
Hao, Q, Shen, W., Neelamkavil, J and Thomas, R., (2008) Change Management in
Construction Projects. Proceedings of the CIB W78 25th
International Conference on
Information Technology: Improving the Management of Construction Projects
through IT Adaptation, Santiago, Chile, July 15- 17, 387 – 396.
Ibrahim,N.H.B.,(2006). Variation Orders in University Technology Malaysia Construction
Projects. M.Sc Thesis University of Technology,Malaysia.
Ibbs, C.W.; Wong, C.K.; and Kuak, Y.H. (2001) Project Change Management System.
Journal of Management in Engineering ASCE, 17 (3), 159 – 165.
Kassim, M.A. and Loong, L.J. (2002). A Study on Variations in Sewage Construction Projects
Journal Teknologi, 37 (B), 13 – 26.
Mohammed, A. A.(2001).Analysis and Management of Change Order for combined sewer
over flow construction projects. Dissertation , Wayne State University.
M otawa, I.A., Anumba, C.J., Lee, S., Peria – Morak, F. (2007) An Integrated System for
Change Management in Construction. Automation in Construction, 16 (3), 368 – 377
O‘Brien, J.J. (1998). Construction Change Orders. New York; McGraw Hill.
Sambasivan, M. and Soon, Y.W. (2006). Causes and Effects of Delays on Malaysian
Construction Industry, International Journal of Project Management, 25, 577 – 526.
Ssegawa, J.K., Mfolwe, K.M. Makuke, B., Kutua, B. (2002). Construction Variations: A
Scourge or a necessity? Proceedings of the First International Conference of CIB
W107, 11 – 13 November, Cape Town, South Africa.

Ameyaw, C., Mensah, S. and Osei-Tutu, E. (2011) Challenges facing the smooth implementation of
Ghana‘s Public Procurement Law, 2003, Act 663 In: Laryea, S., Leiringer, R. and Hughes, W. (Eds)
Procs West Africa Built Environment Research (WABER) Conference, 19-21 July 2011, Accra, Ghana,
237-247.
237
CHALLENGES FACING THE SMOOTH
IMPLEMENTATION OF GHANA’S PUBLIC
PROCUREMENT LAW, 2003, ACT 663
Collins Ameyaw1, Sarfo Mensah
2 and Ernest Osei-Tutu
3
1,2Department of Building Technology, Kumasi Polytechnic, Kumasi, Ghana
3Building and Road Research Institute, Kumasi, Ghana
The Public Procurement Act (Act 663) is an ACT passed in 2003 to regulate public
procurement in Ghana. The purpose of this law was to promote fairness, transparency
and ensure that public procurement is carried out in non-discriminatory manner. The
adoption of the Act has been faced with several challenges since its introduction in
2003. The aim of this study was to identify various bottlenecks hampering the smooth
implementation of the law and attempt to suggest possible remedies for identified
challenges. The study adopted multiple research approach; which include; review of
relevant literature, interview and questionnaire survey of 49 District Assemblies and
Metropolitan and Municipal Assemblies in the Ashanti and Brong Ahafo Regions of
Ghana. The study identified; inadequate funding, political interference, poor
dissemination of procurement information, low capacity of procurement managers
were identified as the major challenges to the smooth implementation of the public
procurement law in Ghana. The ability of procurement officials to ensure strict
conformance with the law without political interference, would ensure that the objects
of the Law are achieved.
Keywords: Ghana, public procurement, Public Procurement Authority, Public
Procurement Act.
INTRODUCTION
This paper outlines the events leading to the public procurement reforms in Ghana and
discusses challenges that confront the smooth implementation of the law. Some
pragmatic ways, which if adopted, could improve the effectiveness of the law and
reduce the operational challenges have been suggested. Substantial evidence in
literature suggest that procurement problems relating to Ghana are similar to the
situations in many African and some Asian countries. (Aniekwu and Okpala, 1988;
Kumaraswamy, 1994; Rwelamila et. al. 1999). Due to this procurement reforms have
been taken place in these countries. The challenges observed and the remedial steps
suggested are therefore of wider importance to many developing economies.
The Government, in consultation with its development partners identified public
procurement system as an area that required urgent attention in view of the
widespread perception of corrupt practices and inefficiencies, and to build trust in the
procurement system. As 50%-70% of the national budgets (after personal
emoluments) is procurement related (World Bank, 2003), an efficient public
3

Ameyaw, Mensah and Osei-Tutu
238
procurement system will ensure value for money in government expenditure, which is
essential in a country facing enormous developmental challenges.
In view of this, the government of Ghana in 1996 launched the Public Financial
Management Reform Programme (PUFMARP). The purpose of this programme was
to improve financial management in Ghana. PUFMARP indentified weaknesses in the
procurement system. Some of these weaknesses included: lack of comprehensive
public procurement policy; lack of central body with technical expertise; absence of
clearly defined roles and responsibilities for procurement entities; absence of
comprehensive legal regime to safeguard public procurement; lack of rules and
regulations to guide, direct, train and monitor public procurement. The programme
also identified that there was lack of rules and regulations to guide, direct, train and
monitor public procurement; there was also no independent appeals process to address
complaints from tenderers. These findings led to the establishment of Public
Procurement Oversight Group in 1999. The aim of this group was to steer the design
of a comprehensive public procurement reform programme which led to the drafting
of a public procurement bill in September 2002 and passed into law on 31 December
2003. The Public Procurement Act, 2003, is a comprehensive legislation designed to
eliminate the shortcomings and organizational weaknesses which were inherent in
public procurement in Ghana.
The object of this paper was to identify the specific challenges, in the case of Ghana,
that militate against the smooth implementation of the law and to proffer solutions to
address such issues that confront the success of the law. Further this exploratory study
aims at promoting discussion and reflection on steps needed to promote procurement
reforms .Thus the implementation of the law may be enhanced, rather than being used
as a panacea to the numerous bottlenecks hampering the success of the procurement
law.
LITERATURE REVIEW
The challenges to the institutionalization of national laws are pervasive in developing
countries, Ghana not being an exception. The National Public Procurement Authority
of Sierra Leone, in its 2005 report, outlined several challenges bedeviling the
operations of the Authority. Some of them included: inadequate funding; deficient
staff strength and organizational and logistical limitations. The report recommended
among other things, that the law would achieve its object if there is a concerted effort
by all stakeholders, backed by very firm political will and adequate budgetary support,
to streamline and improve public procurement procedures in Sierra Leone (NPPA
Annual Report, 2005). Annual Reports of PPA, since its establishment, have always
cited inadequate funding as the leading factor that raises barriers to smooth operations
of the Authority. Lack of adequate office accommodation was specifically reported in
2008 and 2007 annual reports (PPA Annual Report, 2007 and 2008).
Political will is the demonstrated credible intent of political actors (elected or
appointed leaders, civil society watchdogs, stakeholder groups, etc.) to attack
perceived causes or effects of corruption at a systemic level (Sahr, 1999). Asek,
(2006) described political will as the desire and determination of political actors to
introduce as well as embark on reforms that will bring significant and persistent
changes in the society. However, those who wield power, the moral courage or
capacity to exercise that power to ensure the needed change. Historically, successful
reform programmes around the globe indicate that the paramount success factor is
strong political will demonstrated by a commitment from the leadership at all levels of

Public procurement
239
government (Sahr, 1999). Kosack (2008) argued strongly that success chalked in
several countries around the world in areas of access to basic education was due to
political will of the leaders in those countries and their commitment to increasing
access to education. New rules and campaign gimmicks adopted by politicians alone
are not enough for procurement reforms (Philip, 2002). The principal challenge in
assessing political will is the need to distinguish between reform approaches that are
intentionally superficial and designed only to bolster the image of political leaders and
substantive efforts that are based on strategies to create change (Sahr, 1999).
However, political commitment is a necessary condition for procurement reforms to
curb corruption. Without political will and commitment by the leadership of the
country, grand corruption is perpetuated at an alarming rate with petty corruption
becoming endemic and more difficult to stop (Philip, 2002). There are tangible
indications of political will by some stakeholders at the lower level to effect change,
but this cannot be achieved if those at the apex of the pyramid lean back (Szeftel,
1998). However, the battle against corruption should begin with a strong political will
and explicit commitment to eradicate all its manifestations (Osei-Tutu et al, 2009).
Reform efforts are oftentimes unsuccessful due to the combined influence of
inadequate strategies, political resistance, failure to sustain long-term reform efforts
and the lack of knowledge about appropriate tools to establish systemic change
(World Bank, 1994). Kagwe (2005) indicated that the perceptions among Kenyans
about corruption in public service have unfortunately gone higher despite all the laws
passed to fight against this menace. This was attributed to several factors including:
loopholes in the legislative provisions of the public procurement and conflict of
interest (Kagwe, 2005).
It is worth noting that studies have shown that corruption is pervasive in developing
countries because of weak institutional infrastructures and the lack of effective
monitoring mechanisms (Lengwiler and Wolfstetter, 2006). Public procurement has
been perceived as an area of waste and corruption (Thai, 2005). If the procurement
laws and regulations are not enforced to the letter, the issue of corruption will
continue to cover headlines in both the print and electronic media.
Wilson (2004) argued that in a situation where there is huge system loopholes coupled
with laxity in legal and administrative system, compounded by non-transparency and
extensive discretionary powers at the hands of politicians, there will be a required
effort to ensure strict enforcement of laws to achieve the purpose for which the laws
were enacted. Studies in Uganda, Tanzania and Kenya have revealed that corruption
in public procurement has mainly been through hidden violation of the laid down
procurement rules (Transparency International, 2009). Lengwiler and Wolfstetter
(2006) stated that corruption is persistent in developing countries due to weak
institutional systems and lack of effective monitoring mechanisms. Low detection of
breaches of the law (Kanaga, 1999); weak enforcement of rules (Larmour, 2006); and
regulations will also strengthen the hands of wrongdoers to misapply the law with
impunity
Another key challenge facing many governments is combating widespread corruption
in the procurement process (Jones, 2007). Ghana remains one of the most corrupt
nations in the world judging from the annual Corruption Perceptions Index (CPI)
released by Transparency International in 2010. Corruption is said to be present in all
societies (Sahr, 1999). Lengwiler and Wolfstetter (2006) revealed that the quantum of
money exchanging hands through corruption in public procurement is estimated
between $390-400 billion per annum in the world. It is also estimated that corruption

Ameyaw, Mensah and Osei-Tutu
240
in Sub-Saharan Africa is about 70 per cent of public contracts and these corruptions
results in about 20-30 per cent rise in contracts sum. Cost of corruption in Africa is
estimated around $148 billion a year (Mawenya, 2008). Corruption occurs
throughout the procurement process and project cycle; with the root causes being
attributed to the actions and inactions of project participants such as political officers,
public servants, clients, consultants, contractors and suppliers (Osei-Tutu et al., 2009).
There is no evidence that the passage of the law and its implementation has so far
made any significant impact in curbing the incidence of corruption in public
procurement in Ghana. According to the 2010 annual Corruption Perceptions Indices
(CPI) released by Transparency International, Ghana ranked as the 62nd
most corrupt
country respectively out of a worldwide survey. Corruptions and bribes are
widespread in government contracts (www.transparency.org; accessed, 2010). With
only 4.1 CPI score, corruption in Ghana is still a huge impediment to effective
resource utilization and efficient service delivery. There is therefore no concrete
evidence that Ghana has made serious gains through the enactment of corruption
targeted legislations though their impact cannot be discounted completely.
Schiele and McCue (2006) described the public procurement implementation
challenges as environmental factors. These include; market condition, legal
environment, political environment, organizational and socio-economic environmental
factors. It was further established that, regardless of the effort by the central
government and its related agencies to overcome implementation challenges and the
acknowledgement that the procurement department is capable of adding value to the
organization, a large number of the internal customers act on their own and frequently
bypass the procuring department.
The Country Procurement Assessment Report of Ghana in 2003 revealed that most
staff members of Ministries, Departments and Agencies (MDAs) and District
Assemblies (DAs) responsible for procurement were not procurement-proficient, even
though they have been trained. The report contended that, application of the PPA and
the Standard Tender and Contract Documents will not be successful without broad
training and ―refresher‖ programs and encouragement of officials in charge of
procurement. Forgor (2007), outlined among other things, lack of proper training for
the managers of the procurement process as another challenge that confronts
procurement reforms. This supports the assertion that poor dissemination of
procurement law is one of the major challenges facing the smooth implementation of
public procurement laws Azeem (2003).
Political interference with the procurement process is also a big challenge to the
implementation process and public procurement reforms. A good number of
politicians think that they have the right to intervene in the procurement procedures
thereby leading to capricious procurement decisions (World Bank, 2004).
The lack of career development path and low salaries of procurement personnel also
militates against procurement reforms implementation (World Bank, 2003). Poor
records keeping (World Bank, 2003b), delays in payment of contractors and suppliers
have also been cited as some of the crucial factors that challenges the procurement
reforms implementation (Azeem, 2007).
Low level or absence of capacity building for service providers has been identified as
one of the factors inhibiting successful public procurement reforms. Many bidders are
limited in various capacity issues including: lack of basic knowledge in the law,
inadequate capacity to appreciate the standard tender documents, poor access to tender

Public procurement
241
information and insufficient technical and managerial skills to be competitive in the
tendering process (ODPP Annual Report, 2007). The office of the Director of Public
procurement of Malawi, in its 2006/2007 Annual report outlined the following factors,
among others, impeding the operation of the procurement law in Malawi: shortage of
qualified personnel, lack of adequate financial resources, lack of adequate office
space, non-compliance with some provisions of the law, poor records management by
entities and overpricing of goods, works and services by bidders.
RESEARCH METHOD
The research methods adopted for this study consisted of a multiple research approach
which includes; review of pertinent literature, exploratory interview, survey
questionnaires and review of procurement documents (evaluation reports) of
procurement entities surveyed. The literature review helped to position the study
within its theoretical context whilst the preliminary exploratory interview helped to
elicit relevant information from the respondents, to complement the main
questionnaire survey. The collection of data from the field was done through activities
such as conducting interviews, administering of questionnaires and reviewing of
respondents‘ procurement processes conducted in 2008. The data collected were then
analyzed using descriptive statistics.
The research was limited to Metropolitan, Municipal and District Assemblies
(MMDAs) in the Ashanti and Brong Ahafo Regions of Ghana. The questionnaires
were personally administered; with the help of some procurement consultants. A total
of 49 questionnaires were administered and retrieved (27 from Ashanti and 22 Brong
Ahafo). All the Forty-nine (49) questionnaires were retrieved from the respondents
representing a response rate of 100 percent and that was used for the analysis. The
high response rate of 100 percent achieved was as a results of the several follow ups
done by the researchers and the high interest demonstrated by respondents in the
subject matter of the study.
RESULTS AND DISCUSSION
In the public procurement Law the default method for all contracts is open
competitive bidding, except otherwise provided for in the Act (Section 35). Restricted
tendering and Sole sourcing are justifiable only on the grounds of providing greater
economy and efficiency and subject to the approval of the Authority (Sections 38
and 40).
Table 1 - Contracts and the Procurement Methods Adopted
Procurement method Procurement category
Total Goods Works Services
National Competitive Bidding NCB 8 113 5 126
Price Quotation (PQ) 128 47 13 188
Sole Sourcing (SS) 68 17 12 95
Unkown 1 2 0 3
No. of Approval for SS from PPA 0 0 0 0
TOTAL 205 177 30 412
From table 1, a review of 205 goods contracts revealed that 33% were procured via
Sole Sourcing (SS), 62% Price Quotation (PQ) and 5% National Competitive Bidding
(NCB). From the survey (table 1) 23% and 46% of respondents had engaged in Sole
Sourcing and Price Quotation respectively. However, there was also no evidence of
approval from the PPA allowing for the usage of the sole sourcing. Further interview

Ameyaw, Mensah and Osei-Tutu
242
to establish why Sole Sourcing and Price Quotation seems to be the option for goods
procurement revealed that lack of funds and the uncooperativeness of goods suppliers
had been behind the high inclination towards Sole Sourcing without approval. Some
respondents indicated that suppliers mostly refuse to respond to invitation to submit
quotation with the reason that they have failed to win the previous bids. It was also
observe from interview that procurement officials in public entities play on the
ignorance of the PPA to create emergency situation when in fact it could be avoided.
This is done to allow for the award of project to their preferred tenderers at a very
high cost to the state. Procurement of consultancy services also recorded 40% of sole
sourcing, 43% Price Quotation and 17% National competitive bidding. Results from
works procurement showed a very high patronage of NCB and PQ. An encouraging
64% proportion was NCB whilst 27% PQ and 9% sole sourcing.
Table 2 - Bidders per Contract Package and Average Rate of Responsiveness
No. of Bidders/Contract Package (SS) (1) 2 3 4 5 > 5 TOTAL
No. of Bids 95 17 230 25 9 6 382
No. of Bidders per Lot 95 34 690 100 45 41 1005
No. of Responsive Bidders 95 29 621 74 33 32 884
Average Responsiveness 1 1.7 2.7 2.96 3.7 5.3 2.3
Average No. of Bidders per Lot 1.00 2.00 3.00 4.00 5.00 6.83 2.63
It has become a common practice to find only one bidder being allowed to purchase
about three (3) or four (4) tender documents, using different companies‘ particulars to
process the bid for submission. This scenario is an illusion of the existence of
competition; in reality, the client responsible for the procurement would know the
winner of the bid even before tender evaluation is commenced. The results of the
survey in table 2, revealed that, out of 382 contracts, a total of 1005 bidders competed
representing an average 2.6 bidders per contract and 2.3 bidders responsive. The
percentage recorded for the 2 or 3 minimum bidders per contract package was
relatively higher i.e. 65%; few of the contracts (10%) had number of bidders being
above four (4) and 23% being sole sourcing. This is observed to be a calculated
attempt by some entities to limit competitiveness level by refusing to open up for
more competitors in a given bid. Section 49 (1) provides that tender documents should
be supplied to all prospective bidders who may want to submit a bid on any contract.
It is not uncommon to hear contractors and suppliers complain about some deliberate
efforts by some entities, especially at the local government level e.g. Metropolitan,
Municipal and District Assemblies, to refuse to supply them with tender documents.
This collaborates Crown Agents (1998) and Westring (1997) observation that there
are many instances of a single contractor buying and pricing all the bidding
documents, and the contractor/supplier, processing the documents under different
contracting proposals. The average rate of responsiveness for all the contracts
surveyed was 2.3 bidders per lot.
The Ghana Public Procurement Law, 2003, Act 663 Part III- stipulates procedures for
the sizing of tender packages, soliciting and evaluating tenders and for contract award.
Section 21 (5) states, ―A procurement entity shall not divide a procurement order into
parts or lower the value of a procurement order to avoid the application of the
procedures for public procurement in this Act‖. Unfortunately, it has been observed
from the survey that some entities engage in what is known as ―breaking of bulk‖
especially in goods procurement, to allow for the use of price quotation (see table 1).

Public procurement
243
Procurement staff/entities, in circumventing the law, misapply the Section 21 (5)
under the pretense of lack of funds and therefore procure goods in bits; thus splitting
the contract to give way for the usage of price quotation procurement method which
can easily be manipulated to favor their preferred tenderers.
Political interference with the procurement system stands as one of the most
significant challenges to the success of the procurement reforms (World Bank, 2004).
In Ghana, the public procurement authority is directly under the Ministry of Finance
and Economic Planning with the Minister of Finance playing supervisory role over the
Authority. This situation could have been an empowering circumstance for a
committed government of the day to ensure that the law is functional and the
Authority is given all the support it requires. However, this power is sometimes
wrongly used to interfere in the procurement process. The handing over of state power
to a newly elected government often leads to the replacement of the Technical Head of
the PPA. This state of affairs would clearly disable the newly appointed Technical
Head of the PPA to enforce the law. This was viewed as a challenge by interviewers
in ensuring a smooth implementation of the law and thereby rendering the PPA
impotent. OECD/OCDE (2003) argued that good governance is a fundamental
building block of a just and economically efficient public procurement system.
Procurement officers may be involved in malpractices, such as misusing the power of
invitation by only inviting preferred firms, favouring certain firms at the short-listing
stage, to design tender documents in favour of particular firms or release confidential
information. While some procurement officers can, in their own interest, choose to
violate procurement rules, they work in most cases under the influence of powerful
politicians (OECD/OCDE, 2003).
The Ghana Public Procurement Authority (PPA) is a wholly sub-vented organization
receiving periodic release from government for its operations. Other sources of
funding include internal generation and assistance from development partners. Under
section 3 of the law, the Authority‘s duties include: provide policy and regulatory
oversight; provide training and capacity building for procurement officials; hear
appeals and complaints; and, assist local industries to become competitive and
efficient suppliers to the public sector. The Authority, in an effort to fulfill its‘
mandate, initiated a capacity building of procurement officials in the application of the
law in 2007. However a discussion with some staff of the PPA cited inadequate
funding as a major problem militating against the fulfillment of their mandate and
thereby leading to the halting of a step which was applauded by all and up to date,
many stakeholders remain untrained in the application of the Law and this is actually
contributing to the over exploitation of the law. An interview with local government
staff responsible for procurement surveyed indicated that, a good number of them
were privileged to be part of the first procurement training programme. Unfornately,
this did not reflect much on the application of the law. For example, when asked
whether they communicate results of tenders to unsuccessful bidders as require by
section 65 (9), 87% answered in the negative whilst only 13% answered in the
affirmative. Another activity which was hardly hit by the lack of funding phenomena
is the annual assessment of procurement activities of procurement entities throughout
the country. The number of entities assessed each year was on the increase year by
year. In 2007, 90 entities were assessed in Ashanti and Brong Ahafo regions and
increased to 150 entities in 2008. Due to financial difficulties the exercise did not take
place in 2009. An interview with some staff at the Kumasi offices of PPA again cited
funding as an impediment to the implementation of the law. It was revealed that only

Ameyaw, Mensah and Osei-Tutu
244
150 entities were assessed nationwide in 2010. The auditing of procurement activities
is the barometer by which the PPA measures the level of compliance with the law.
The result of this annual assessment actually shapes policies in public procurement in
Ghana and aid in the combat against corruption which is perceived to be pervasive in
public procurement (www.transparency.org).
Low capacity of procurement staff has been identifies as one of the paramount factors
that inhibits the successful implementation of procurement reforms. The survey results
revealed that only 5% of the 49 entities had procurement staff with qualification in
procurement and 95% lacked procurement qualification. This finding collaborates
ODPP Annual Report, (2007) which suggest that low capacity of procurement staff is
hampering procurement reforms in developing countries.
Poor dissemination of procurement information from the policy makers to the
implementers is a sure way of undermining the successful procurement reforms. The
survey results on whether there has been any communication between the entities
surveyed and the PPA, 45% had no formal correspondence with the custodians of the
law whilst 55% have had some communication with the PPA. If there is a constant
flow of information from PPA to the entities and vice versa, it informs the PPA of the
lapses in the implementation process and helps to shape policy directions. It also helps
the entities to build their capacity in the law and to seek assistance of any kind from
the PPA especially in the area of capacity development and clarification of any section
of the law.
Several studies indicate that Procurement Reforms and Mainstreaming (PRM) has
been a valuable instrument for implementing pro-social equity policies and have
historically been used by governments to encourage more equitable social benefit
(Westring, 1997; Larmour, 2006; Cavill and Sohail, 2005). These suggest that any
step to commit more resources in ensuring a smooth implementation of the
procurement reforms would lead to improvement in reduction in corruption in the
public procurement system which will also have a direct and considerable impact on
the overall economic situation of the country, thus, resulting in budgetary savings and
efficiency in public expenditures (Mawenya, 2008, 2007).
CONCLUSION
The common procurement methods being practice are the National Competitive
Bidding, Price Quotation and the Sole Sourcing methods. All contracts executed under
the sole sourcing methods did not have the needed approval for the Public
procurement Authority. Lack of funds and the uncooperativeness of goods suppliers
had been behind the high inclination towards using the method without approval.
It is observed and confirmed from this study that there is a calculated attempt by some
entities to limit competitiveness level by refusing to open up for more competitors in a
given bid.
The under listed are among factors that present themselves as major challenges facing
the smooth implementation of the public procurement law in Ghana: lack of
enforcement, lack of political will, inadequate funding, corruption, lack of capacity,
loopholes in legislative provisions, lack of due diligence by the procurement authority
and over exploitation of sole sourcing provision of the law. It is significant to note
that, this study, along with other publications, have revealed that, the mere passage of
the law, though important, is not the solution to the problems that necessitated the
enactment of the law.

Public procurement
245
Further, there is an over exploitation of some inherent loopholes in the procurement
law which needs to be plugged. The vulnerability of the head of the public
procurement authority when there is a change of government also weakens
acceleration of effective monitoring.
In a developing country like Ghana, public procurement reforms and implementation
usually encounter some of the challenges discussed in this paper. The most important
point is how the problems are tackled in order to find antidote. Procurement reform is
a continuous process and there would certainly be many challenges along the way.
Setting up the legal framework and the regulatory institution are the first and possibly
the easiest steps in the reform process. Insisting on compliance with the act and
curbing corruption from public procurement are the more difficult steps that may take
relatively longer duration to achieve.
It is further suggested that there is a need to insulate the head of the organization from
political interference and removal from office. There is clearly the need to resource
the body mandated to oversee to the implementation and enforcement of the law.
Building the capacity of procurement officers in various public institutions in the
application of the law would also go a long way to reduce the incidence of
misapplication of the law. More importantly, proper operationalization, such as
procurement officials ensuring strict conformance with the law without wrong
political interference, would ensure that the objects of transparency, fairness, non-
discrimination in competition are realized. Ultimately, this will lead to the much-
desired value for money, which is the aim of every procurement process.
REFERENCE
Anvuur, A. and Kumaraswamy, M.M. (2006) Taking Forward Public Procurement Reforms
in Ghana , CIB W107 Construction in Developing Economies International
Symposium, ―Construction in Developing Economies: New Issues and
Challenges‖, 18-20 January 2006, Santiago, Chile, CD Rom 9 pages
Aniekwu, A N and Okpala, D C (1988) The effect of systemic factors in contract services
in Nigeria. Construction Management and Economics, 6, 171-182.
Azeem V. (2007) “Impact of the Public Procurement Act, 2003 (Act 663) in Ghana
Integrity Initiative‟s Perspective. Paper Presented at a Special Forum on
Improving Efficiency and transparency in Public Procurement through
Information Dissemination.
Cavill, S. and Sohail, M. (2005), ―Improving public urban services
through increased accountability‖, Journal of Professional Issues in
Engineering Education and Practice, American Society of Civil Engineers,
Vol. 131 No. 4, pp. 263-73.
Crown Agents (1998) The World Bank Procurement Audit in Ghana. Value for
Money Audit Report for Ghana, Crown Agents for Overseas Governments
and Administrations Ltd, UK.
Forgor E. S. (2007) Proposed amendments to make procurement flexible: the
practical experiences of District Chief Executives with respect to the
implementation of the Public Procurement Law, Decentralization Agenda,3rd
March 2007, pp 1-3.
Jones, S. David (2007), Public Procurement in Southeast Asia: Challenge and Reform.
Journal of Public Procurement, Volume 7, Issue 1, 3-33

Ameyaw, Mensah and Osei-Tutu
246
Kanaga, W.S. (1999), ―Corporations must act ethically‖, Economic Reform Today,
No. 1, Center for International Private Enterprise, Washington, DC, available
at: www.cipe.org/publications /ert/e31/e31_1.pdf
Kagwe (2005), Kenyan Leaders Corrupt? No Way!, available on
www.africanexecutive.com
Kumaraswamy, M. M. (1994) Growth strategies for less developed construction
industries. In: Skitmore, R M and Betts, M (Eds.), 10th Annual ARCOM
Conference, September 14-16, Loughborough University. Association of
Researchers in Construction Management, Vol. 1, 154-163.
Kosack, S. (2008), Directing foreign aid for basic education : Taking account of
political w ill
Larmour, P. (2006), ―Administrative theory, interpersonal relations and anti corruption
practice in Papua New Guinea‖, Policy and Governance discussion paper
presented to Workshop on Collaborative Relations, Personal Aims and the Work
of Organizations, National Research Institute, Boroko, available at:
www.crawford.anu.edu.au/degrees/pogo/discussion_.
Lengwiler, Y. and Wolfstetter, E. (2006), ―Corruption in procurement auctions‖,
Governance and the Efficiency of Economic Systems, Discussions Paper
No. 90, January, available at:www.sfbtr15.de/dipa/90.pdf
Mawenya, A.S. (2007), ―Corruption in public procurement in Sub-Saharan Africa and
how to prevent and combat it‖, paper presented at the Anti-Corruption
Southern Africa Conference, February.
Mawenya, A.S. (2008), ―Preventing corruption in Africa‖, occasional paper,
SAIIA, Johannesburg.
NPPA Annual Report (2005), National Public Procurement Authority Annual Report
2005. Sierra Leone.
ODPP Annual Report (2007), Office of the Director of Public Procurement Annual
Report, 2007, Malawi
Osei-Tutu, E, Badu, E, and Owusu-Manu, D. (2009), Exploring Corruption Practices
in Public Procurement of Infrastructural Projects in Ghana, International
Journal of Managing Projects in Business Vol. 3 No. 2, 2010 pp. 236-256.
Emerald Group Publishing Limited
OECD/OCED (2003), Public Procurement: Lessons From Kenya, Tanzania And
Uganda, Research programme on: The Integration of Developing Countries
into the World Trading System by Walter O. and Paul Kamau, Working Paper
No. 208, pp. 16-42
Palaneeswaran, E, Kumaraswamy, M M and Zhang, X Q (2001) Reforging
construction supply chains: a source selection perspective. European Journal of
Purchasing and Supply Management, 8(1), 7- 12.
Philip, M. (2002), ―Conceptualizing political corruption‖, in Heidenheimer, A.J. and
Johnston, M. (Eds), Political Corruption – Concepts and Contexts, 3rd
ed., Transaction Publishers, London.
Rwelamila, P D, Talukhaba, A A and Ngowi, A B (1999) Tracing the African Project
Failure Syndrome: the significance of 'ubuntu'. Engineering, Construction and
Architectural Management, 6(4), 335-346.

Public procurement
247
Sahr J. Kpundeh, (1999), Integrity improvement initiatives in developing countries,
pp. 91
Schiele, J.J. and McCue, C.P. (2006), ―Professional service acquisition in public
sector procurement‖, International Journal of Operations and Production
Management, Vol. 26 No. 3, pp. 300-325
Stephen N. Asek (2006), Political Will and Sustainable Development. Available on:
http://www.tigweb.org/youth-media/panorama/article.html?
Szeftel, M. (1998), ―Misunderstanding African politics: corruption and the governance
agenda‖, Review of African Political Economy, Vol. 25 No. 76, pp. 221-
40Tom
Thai K. V. (2005), Challenges in Public Procurement, pp. 2 Transparency
International (2009), The East African Bribery Index. Available on:
http://www.tikenya.org/documents/EABIReport09.pdf. Accessed in 2011.
Westring, G. (1997), Ghana Public Procurement Reform, an Audit Report Prepared
for the World Bank, Advokatfirman Cederquist KB, Stockholm.
World Bank (1994) Adjustment in Africa: Reforms, Results, and the Road Ahead. A
World Bank Policy Research Report. New York: Oxford University Press.
World Bank (2003a), ―Ghana 2003 Country Procurement Assessment Report”,
Washington, DC: Ghana Country Department, The World Bank.
World Bank (2003b), “Economic Report on Ghana”, Washington, DC: Ghana
Country Department, The World Bank.
World Bank (2004), “Uganda Country Procurement Assessment Report” Vol. II Main
Findings and Recommendations. Operational Quality and Knowledge
services, African Region.


Olubunmi, G.S. and Abiodun, G.S. (2011) Clay exploration, aesthetics and environmental
sustainability: a case study of Akure and Ado-Ekiti, Nigeria In: Laryea, S., Leiringer, R. and Hughes,
W. (Eds) Procs West Africa Built Environment Research (WABER) Conference, 19-21 July 2011,
Accra, Ghana, 249-249.
249
CLAY EXPLORATION, AESTHETICS AND
ENVIRONMENTAL SUSTAINABILITY: A CASE STUDY
OF AKURE AND ADO-EKITI, NIGERIA
Ganiyu Sulayman Olubunmi1and Ganiyu Sikiru Abiodun
2
1Department of Fine and Applied Arts, Adeyemi College of Education, Ondo, Nigeria
2Department of Architecture, Federal University of Technology, Akure, Nigeria
Clay, known by so many names, is one of the oldest building materials that are
ubiquitous. Ancient as it is, clay, due to its physical as well as chemical properties,
can be further explored for the aesthetics and sustainability of the built environment
most importantly in the tropics where the temperature is dynamic. This paper
therefore aimed at identifying the various uses to which clay can be put and a number
of applications of clay either in its original form or as a processed and finished
product for aesthetic or/and utility value especially as it relates to the built
environment. To achieve this aim, relevant literature were reviewed to expose the
varieties of clay and its environmental compatibility, the various procedures and
techniques for transforming clay and the various end-uses to which clay could be put
with particular emphasis on the built environment. A survey was also conducted
through the administration of questionnaires in Akure and Ado-Ekiti (both in the
South/Western Nigeria) to find out the extent to which clay is used either as aesthetic
material or for the sustainability of the built environment. Based on the analysis and
discussion of the results of the survey, the paper recommended the encouragement of
the continuous use of clay for its environmental sustainability and aesthetic values in
the built environment. Clay was also recommended for use based on its ability to
assist in ameliorating some of the negative effects of climatic changes.
Keywords: Ado-Ekiti, Akure, clay, laterite, sustainability, aesthetics.


Kolo, B.A., Yunusa, B.Y. and Dzikwi, A.A. (2011) Client-architect behaviours towards cost advice in
Nigeria: Quantity Surveyors‘ perspective In: Laryea, S., Leiringer, R. and Hughes, W. (Eds) Procs
West Africa Built Environment Research (WABER) Conference, 19-21 July 2011, Accra, Ghana, 251-
260.
251
CLIENT-ARCHITECT BEHAVIOURS TOWARDS COST
ADVICE IN NIGERIA: QUANTITY SURVEYORS’
PERSPECTIVE
Baba Adama Kolo1, Badiru Y. Yunusa
2 and Anita A. Dzikwi
3
1,3Department of Quantity Surveying, Ahmadu Bello University, Zaria, Nigeria
2Department of Architecture, Ahmadu Bello University, Zaria, Nigeria
Cost advice (CA) during early stage of building projects is an imperative to achieving
value for money, but receives little consideration in the Nigerian Construction
Industry (NCI). Construction clients and architects are foremost beneficiaries of this
function and contributor majorly to its success or failure. Problems related to the „cost
advice‟ function significantly contribute to some of the inefficiencies and non-
performances crippling NCI. This paper investigates „behaviours‟ of clients and
architects as they relate to the „cost advice‟ function of quantity surveying (QS)
practice. Data were gathered from 248 projects sought from quantity surveying firms.
Descriptive statistics, correlation analysis and test of significance were carried out.
Based on these outcomes regression analysis was employed to establish the impact of
the behaviours to the outcome of „cost advice‟ function. Behaviours relative to
engaging QS and provision of design information were found to be „slightly less than
normal‟ while services required from the QS comes with some challenges. Based on
the strength of the impact of these behaviours on CA outcomes, it is suggested that
certain behaviours must be tightly monitored and improved upon to ensure success of
the CA services offered by the QS during early stage of building projects.
Keywords: client-architect behaviour, cost advice, quantity surveyor.
INTRODUCTION
Boundaries of cost advice function within the construction industry globally is
assuming unprecedented highs owing to what Cartlidge (2006) referred to as the
‗catalyst for change‘. This is towards achieving and improving value for money for
public sector procurement in particular (Kelly, Morledge & Wilkinson, 2002).This
catalyst influences procurement culture worldwide bringing with it adaptive measures
for the evolving nature of the traditional cost advice function of quantity surveyors
(Ashworth and Hogg, 2007). Liu and Fellows (2008) reviewed several culture-based
literature and assert that‘ behaviour is an important manifestation of culture‘.
In line with global trends, the Federal Government of Nigeria (FGN) stipulate that all
public procurement must follow the path of value for money in its procedures and
practices as contained in the Public Procurement Act (PPA) 2007 (FRN, 2007; ICRC,
2009). And as such, evidence exists of calls for the NCI to adopt Value Management
(VM) (Omole, 2000; Ajator, 2004; Oke & Ogunsemi, 2009; APDC, 2010) which is a

Kolo, Yunusa and Dzikwi
252
widely accepted methodology for achieving value for money (Kelly, Male, & Graham,
2004). This call for an integrative approach by the FGN will have significant
implications for the CA services required by the NCI. For example VM methodology
requires excellent working relationships that promote integrated team work. However,
this is at dissonance with inherent practice in NCI (Kolo and Ibrahim, 2010). Again,
for an integrative approach, Ashworth (2004) demonstrate that the eventual outcome
of the CA function is a reflection of individual circumstance, nature of design and
information available etc, which are termed as behavioural variables (BVs) within the
context of this study and discussed in the next section.
The challenge posits by these inherencies of the NCI will impact on the theoretical
and methodological considerations (e.g. purpose, applications, reactions etc) of the
cost advice function which the QS offers in the NCI. Despite this, researches on CA in
NCI have exclusively focused on factors affecting accuracy (see for example Odusami
and Onukwube, 2008) and accuracy level (e.g. Oladokum et al., 2009). Therefore
gaps exist in literature on behaviours and the CA function of the QS in NCI. A study
of human behaviour is a domain of sociology, dealing specifically about social nature
of the problems within a system. This study situates itself within this context. In
construction, problems of social nature in recent times have been the focus of
researches (Hughes, 2009, 2010; Leiringer, 2010). And the solutions to these social
problems will bring about the needed change in service delivery of the industry
(Hughes, 2010). Hence this paper contributes to this field of study. To do that, it
investigates client-architect behaviours towards cost advice function of QS in the NCI
by first discussing cost advice in Nigeria, bringing out ‗expected behaviours‘ of both
the clients and architects for successful CA services from the QS. Thereafter, the way
the research was conducted is described in detail followed by the results of the
investigations. Lastly, ways aimed at addressing the implications of the findings are
suggested to establish a base for advancing researches in this aspect in the NCI.
COST ADVICE AND THE NIGERIAN CONSTRUCTION
INDUSTRY
The Construction Industry is made up of complex nexuses of relationships and
interactions in order to meet up the requirement of its clients, thus requiring highly
specialised services. Therefore, it is necessary for clients to employ a range of
different professional advisers to advice on funding, design, cost, construction, letting
etc (Ashworth, 2008). In Nigeria, QSs are the professionals recognised by law to
provide CA during the life cycle of construction projects (Adetola, 2001). And over
the years the QS profession has been experiencing phenomena changes in her
approach to providing CA. Akintoye (2001) highlights these changing pattern from a
global perspective and characterised the challenges posed by these changes within the
NCI as focusing more on client‘s satisfaction. Adetola (2001) further stated that the
re-directioning of the QS practise in Nigeria is more of ‗value and wealth generation
through cost and financial engineering‘ rather than preparation of bills of quantities
and financial statements.
Adetola‘s assertions tends to locate the significance of the QS within the early parts of
construction projects which essencially is the strategic stage (Cartlidge, 2006). This is
in line with global practice, thus: ‗the (cost) advice is particularly crucial at the early
stages of project inception. It is at this time major decisions, often affecting the size
and quality of the works are determined‘ (Ashworth, 2004). However, in spite of the
changing nature of the QS profession within the NCI, certain challenges do exist.

Attitudes towards cost advice
253
Adebola (2001) informed that though QSs were duly recognised by law in 1990 it has
largely been excluded from projects in the engineering subsector of the NCI . For
instance heavy engineering, civil engineering, petroleum, oil and gas installations, and
power installations. Adetola (2001) also noted that government, which is the major
client of the NCI have been quite unfair to the QS in that services rendered are either
partially reimbursed or totally not reimbursed. Some of the reasons advanced for the
non involvement of the QS in these areas include ignorance by the public sector of
benefits derivable from the services of the QS and corruptive tendencies (Adebola,
2001; Aje & Awodele, 2006).
CLIENT – ARCHITECT BEHAVIOURAL ISSUES
Behaviour is defined as ‗the way in which somebody behave‘ and behave is ‗to act in
a particular way that expresses general character, state of mind, or response to a
situation or other people‘ or ‗to perform in or react to particular conditions or
circumstances‘ (Encarta, 2010). This section contextualises the particular ways clients
and architects act and characterise their response towards the CA function of the QS.
The objective of the design process is the satisfaction of client‘s requirement, which is
obtained when the ‗best‘ design solution has been discovered within the constraints
imposed by or on the project (Ferry, Brandon, & Ferry, 1999). In order to keep within
these constraints, some compromises are necessary and it is the duty of the QS to
provide information of the implications of these compromises to aid design decisions.
This point to the aspect of how clients act in engaging QS on projects. Late
engagements of QS have been reported in Nigeria (Anago, 2001; Oladapo, 2006).
To achieve value for money at the design stage, Ferry, Brandon, & Ferry (1999)
advice that such responsibility particularly cost planning - a process of CA, should not
be solely placed on the shoulders of the QS. But that the architect must cooperate and
contribute to the process. This gives an instance of behaviour of the architect in terms
of collaborating with the QS towards the success of the CA function. Ashworth (2004)
brings out the behavoural repercussion of this instance thus: ‗a designer who is either
unable to or unwilling to provide quantitatlve and qualitative information must
therefore expect that the cost advice will, by necessity, be vague‘. Within the NCI,
there are calls to improve upon the relationships that exist between members of the
design and construction teams for the purpose of achiecing project success (Adetola,
2001; Akingbohungbe, 2006; Kolo & Ibrahim, 2010).
From the aforementioned, a study of behaviours of client-designer towards cost advice
at early stages of projects can be viewed from three aspects: engagement of firms,
design information and client-designer responsiveness in terms of provision of
requisite information and reaction to the advice. The concept of behaviour within
literature is inferred from the established practices i.e. ‗the way client – architect are
‗expected to act‘ in terms of engagement of QS and their subsequent reaction to the
CA provided. The theories of these practices have been exhaustively explained and
conceptualised (see Ferry, Brandon & Ferry, 1999; Ashworth, 2004; Cartilidge, 2006).
For lack of space and need for brevity, we have merely outline the behaviours and
their attributes. For the purpose of this study three aspects relative to CA are evident –
engagement, design information and response. Engagement involves the stages at
which QS are brought into the project e.g. at inception, design, information production
etc; and form, which relates to who brings the QS in, for instance the client or
architect. Design information focuses on establishing the following behaviours, the
sufficiency of information contained in the brief, frequency and sufficiency of design

Kolo, Yunusa and Dzikwi
254
information given by the architect. Finally, the third aspect, response measures
behaviours in terms of the type of cost advice requires e.g. cost limit, cost plan, BOQ;
time allowed for the CA function; and both the client and architect response to the CA
e.g. accepting or rejecting the CA. The paper further assumes that where behaviours
are consistent with practice as established in literature, they are termed as ‗normal‘
and as ‗abnormal‘ otherwise. This is clearly in line with Graham‘s (1995) assertion
cited in Liu and Fellows (2008) that ‗moral reasoning is one of the possible
explanations in determining what constitutes good behaviour‘.
RESEARCH METHOD
Research Approach
There however can be two aspects to the study of behaviours – identifying and/or
establishing behaviours and explaining the behaviour. This study focuses on
identifying behaviours of clients and designers towards cost advice function of the
QS. A number of methods seem adequate for studies of this nature namely: survey
research, observation research and the case study method (Moser and Kalton, 2001).
The type of data required for a study, which entails the investigation of QS practice to
establish behaviours necessitates the adoption of methods that would produce a wide
coverage of data collected on a variable-by-case-data basis (DeVaus, 1991). This
involved gathering responses based on the same data structure set from as many cases
as possible. The survey research method was chosen for this study, been a much
appropriate method for studies of this nature as suggested by DeVaus (1991). This
was also used by Liu and Fellows (2008) in a related study on behaviours of QS in
Hong Kong.
Survey Sample
The target population for the survey research are QS in the NCI. In establishing the
sample from the identified population of a survey research, De Vaus (1991) identified
two types of samples: probability and non-probability samples He advised that the
probability samples are preferred "because they are more likely to produce
representative samples and enable estimates of the sample's accuracy". Hence, the
choice of the probability sample type for the purpose of this study. In deciding on the
sample size that would be representative of the population De Vaus' advised that "....
the size of the population from which we draw the sample is largely irrelevant for the
accuracy of the sample. It is the absolute size of the sample that is important." This
was adhered to for the purpose of this work and the parameters in De Vaus‘s sample
size model provided further guide in deciding on the sample size. Based on the model,
an initial sample size of 150 was drawn.
Survey techniques/Methods
Basically, data can be collected by observation, in-depth interview, document
analysis, questionnaire amongst other known survey methods. The questionnaire
technique has been found to be apt descriptive researches and was adopted for this
study. Of the three methods of administration identified by De Vaus viz: face-to-face,
telephone and mail, the mail was adopted. This is due to the unsurpassed 'plus'
inherent in and enjoyed by this method - ability of handling long questionnaire and
complex questions, identification of non-response items, efficient response rate in
terms of general and specialized samples amongst others (Frankfort-Nachmias and
Nachmias 2009).

Attitudes towards cost advice
255
The questionnaire ‗set‘ consists of close ended question types divided into two main
sections - General Information about Respondent/Firm and basic description of
projects for which information were provided; and Client/Architect Based
Information. The questionnaire was designed to elicit factual information from the
respondents which were easily gleaned from project files. On completion of a pilot, a
total of 150 sets of questionnaires were distributed to selected QS firm in Nigeria. A
return rate of 65.3% was considered high for a research of this nature as researches in
similar areas with lower response rates have been reported. Of the returned
questionnaire, 41.32% of them i.e. 62 were usable for the purpose of achieving the
goals of the study. However, since respondents were requested to provide project
specific information for up to nine (9) current projects, information for at least four (4)
projects were given in each of the usable questionnaires. Hence, project-based data
were provided for 248 projects which formed the basis for analysis in this study. The
units of measurement for each of the behaviours identified in the previous section are
shown in Table 1.
RESULTS
Cost-related Behaviours of Clients and Architects
The success of any cost advice depends on the inputs and reactions of both clients and
members of the design team – in this case, architects (Ashworth, 2004). Table 1 shows
the general characteristics of project surveyed in this study in terms of building types,
client types and project status. It further shows the BV investigate for which the most
common occurrence statistics i.e. mode (Frankfort-Nachmias and Nachmias 2009) has
been adopted in this study as an indication of the existence of a behaviour.
Table 1 – Frequency Distribution of Client/Architect Cost-related Behaviour Variables (n = 248)
Variables % Variables % Variables % Variables %
Building type Client type Project status Clients brief
1 - Commercial 27.4 1 – Public 54.8 0 - Didn't Say 0.4 1 - Not sufficient 21.0
2 - Educational 10.9 2 – Private 25.4 1 – Abandon 12.9 2 – Sufficient 62.5
3 - Industrial 13.7 3 - Institutional 19.4 2 – Completed 58.5 3 - Very sufficient 16.5
4 - Residential 47.6 4 – Others 0.4 3 – Others 28.2
5 – Others 0.4
Engage Stage Engage Form Cost Advice Time Allowed
0 - Didn't Say 4.8 1 - Client 59.7 1 - Cost limit 12.9 0 - Didn't Say 49.2
1 - Inception 49.2 2 – Architect 32.7 2 – Prel cost plan 11.3 1 - Not sufficient 25.8
2 - Outline proposal 25.8 3 – Others 7.7 3 - Final cost plan 0.4 2 – Sufficient 16.1
3 - Design stage 2.0 4 – BOQ 23.4 3 - Very sufficient 8.9
4 - Productn inform 18.1 5 – None 4.8
6 - All of the above 47.2
Freq of Des Info Arc Design info Arc Response Client Response
1 - Less frequent 14.5 1 - Not sufficient 17.7 0 - Didn't Say 6.9 0 - Didn't Say 10.9
2 - Frequent 37.9 2 – Sufficient 48 1 - Design to CA 70.2 1 - Design to CA 66.1
3 - Very frequent 47.6 3 - Very sufficient 34.3 2 - Unwillingly 10.9 2 - CA as academic 8.9
3 - Design not to 12.1 3 - Indifferent to CA 14.1
The data set best describes public residential buildings which were completed at the
time of collecting the data. From a general viewpoint, the client brief provided at the
start of construction project is ‗sufficient‘ for the purpose of cost advice during design
stages. Though a fair number of QS are engaged at the ‗inception stage‘ of projects,
some of them are ‗not engaged by the client‘ with more than half of them ‗not
providing all the services required‘ at the pre-tender stage. This goes against the
principle of continuity wherein lies the gains of cost control (Seeley, 1996). A major
mismatch however exist between the stage of engagement and cost advice produces
where in more than 80% of QS are ‗engaged before production information stage‘ and
up to a quarter of them ‗were asked to prepare BOQs‘. This will definitely affect the

Kolo, Yunusa and Dzikwi
256
accuracy of the BOQ since at this stage design information will not be sufficient for
the purpose of BOQ (Ashworth, 1999; Ferry et al., 1999).
In terms of the time given for the purpose of CA function, Clients still ‗do not give
sufficient time‘ for the cost advice function of the QS as only 25% of the respondents
believe that the time allowed is either sufficient or very sufficient. However this
particular variable had a relatively high response of ‗didn‘t say‘ (46%) and hence will
distort the patterning of the client‘s behaviour in terms of time allocation to the QS in
Nigeria. But this notwithstanding, the finding further supports the rush-style behaviour
of project implementation in Nigeria. Though design information given by architects
are believed to be ‗sufficient‘ and are ‗provided very frequently‘, efforts should
however be upped by architects to improve upon the sufficiency of design information
they provide. In spite of the lack of a coordinated cost control mechanism exhibited by
clients, they do ‗ensure that designs are kept within the limits of the cost advice‘
provide by the QS while architects also endeavour to ‗design within the cost advice‘.
Modelling Client/Architect Behaviour and Outcome of the CA Function
1. Behaviour – Outcome Relationships
Behaviour and character, aside individualising an entity, further dictates to a very
large extent its responses to external stimuli i.e. the resultant outcome of the
interaction. As identified earlier the client-architect behaviour will determine cost
advice function in terms of project status, the cost advice eventually provided, and
both the client and architect reactions to it. Table 2 below shows the existence of
significant relationships between behaviours and the aforementioned outcomes based
on correlation analysis tested at 99% confidence level.
Table 2 - Correlation between Behaviour/character and CA Outcomes (Showing only those
which are significant at 99%)
Character/Behaviour Project
status
Cost advice
provided
Clients
Response
Architect
response
Building type - - 0.267 -0.469
Client type 0.326 0.170 -0.391 -
Stage of Engagement 0.485 - 0.162 0.187
Form of Engagement - 0.198 -0.240 -0.150
clients brief 0.214 - - 0.609
Time allowed - -0.531 - 0.303
Architect's design info 0.186 0.199 0.182 -
Frequency of Design Info 0.609 0.363 - -
Table 2 reveal that project status do have positive relationships with client type, stage
of engagement, client brief, sufficiency of design information, and frequency of the
design information. Frequency of design information has the greatest degree of
relationship with project status having a correlation coefficient of 0.609 while
sufficiency of design information has the lowest at 0.186. Cost advice provided is
positively related with client type, form of engagement, architect design information
and frequency of design information but negatively related to time allowed for CA
function. The reverse relationship suggest that more time is given for simpler CA
functions like establishing cost limit and preparing cost plans than that given when
preparing BOQ and where all CA services are required. Client response positively
correlates with building type, stage of engagement and architect design information
while it negatively related to client type and form of engagement. The strengths of the
relationships in this outcome variable are weak ranging from 0.162 to 0.391.

Attitudes towards cost advice
257
This finding is not surprising, it is expected that client response to the CA should not
be dependent on project particulars and behaviours. But the existence of significant
relationships is indicative of an unhealthy trend in the NCI especially for public
projects given the requirements of the PPA currently in use. The PPA 2007 requires
that projects must strictly comply with budget provision. Architect‘s response is
negatively related to building type and form of engagement while it is positively
related to stage of engagement, client brief and time allowed. Its highest degree of
relationship is with client brief having a correlation coefficient of 0.609 and building
type -0.469. Expectedly, this should be the case particularly with that of client‘s brief
because as the brief becomes less sufficient on cost-related information, such
deficiencies will lead to the architect disregarding the essence of CA provided there
from.
2. Impact of Client-Architect Behaviour
The coefficient of correlation established in the previous section identified those BVs
that significantly correlate with the various CA outcomes i.e. project status, cost
advice provided, client‘s and architect‘s responses. This section establishes the
impact of the associative BVs with each of these CA outcomes. Regression analysis
is employed in establishing these impacts, which is a robust technique for establishing
influences and impact but poor at determining causality (Mohammed, 2007).
The outcome of the analysis performed is shown on Table 3, displaying the
standardised coefficients of β values for each of the BVs and their respective p-values.
The p-value of the ANOVA statistic i.e. 0.000 indicates that the established impacts of
the BVs are statistically significant to the various responses variables i.e. the CA
outcomes. The r2 is indicative of the extent to which the BVs explained the variations
of impact in the responses variables (RVs). The statistics as shown in Table 3 reveals
that the BVs explained 82 – 96% of the impact variations in the RVs.
Table 3 – Impact of Client-Architect Behaviour on CA Outcome
Variables β Sig. Variables Β Sig.
Project Status Cost Advice
Client type 0.162 0.000 Client type 0.497 0.000
Stage of Engagement 0.160 0.000 Form of Engagement 0.193 0.000
client's brief 0.196 0.000 Time allowed -0.359 0.000
Architect's design info 0.001 0.990 Architect's design info 0.442 0.000
Freq of providing DI 0.508 0.000 Freq of providing DI 0.073 0.423
ANOVA 0.000 ANOVA 0.000
r2 0.963 r2 0.938
Client's Response Architect's Response
Building type 0.369 0.000 Building type -0.384 0.000
Client type -0.341 0.000 Stage of Engagement 0.423 0.000
Stage of Engagement 0.330 0.000 Form of Engagement -0.016 0.715
Form of Engagement -0.221 0.002 Clients brief 0.773 0.000
Architect's design info 0.771 0.000 Time allowed 0.180 0.000
ANOVA 0.000 ANOVA 0.000
r2 0.820 r2 0.899
A major influence on project status is the ‗frequency with which the architect provides
design information‘ to the QS by exacting a 0.508 positive change to the project status
per unit change relative to the other four influences. In essence then, this is a variable
whose behaviour amongst architects should be closely monitored for CA success at
the very early stages of building project. Though the other project status related

Kolo, Yunusa and Dzikwi
258
variables do have minimal impact (their impact are statistically significant except for
the sufficiency of the design information provided by the architect) on project status,
they should also be closely monitored for effectiveness of CA function. The
infinitesimal impact of ‗sufficiency of design information‘ should not be surprising
because at early stages of building projects the paucity of design information is widely
recognised in the NCI.
Three BVs highly impacts on the cost advice provided by QS in the NCI, namely:
client type (0.497), time allowed (-0.359) and sufficiency of design information
provided by the architect (0.442). The inverse impact of time allowed implies that for
a unit increase in the time allowed for instance say from ‗not sufficient‘ to ‗sufficient‘,
the nature of the cost advice will tend to change from say ‗BOQ production to final
cost plan‘ or from ‗final cost plan to the mere establishment of cost limit‘. Two
variables do not potentially impact on the cost advice provided namely form of
engagement (0.193) and frequency with which design information are provided by the
architect (0.073). Though the former does not exhibit any statistical significance in its
impact but latter should nonetheless be closely considered during early stages of
projects alongside the other three variables.
Clients have been known to either do nothing or ensure that designs are in consonance
with the CA provided; sufficiency of architect‘s design information is found to have
the greatest impact (0.771) on client‘s response compared to the others. The others
fairly impact both negatively and positively. For instance, client type exacts a -0.341
impact which means that as client type changes from ‗public‘ to ‗private‘, client
response is decreased by a value of 0.341. This may mean moving from say seeing the
‗CA as an academic exercise‘ to ‗ensuring that designs are within the CA‘. In the case
of architect‘s response to the CA, client‘s brief has the greatest impact (0.773)
followed by stage of engagement of the QS. The negative impact of building type on
architect‘s response implies that as building type change from commercial to
education, architect‘s response is more likely to change from not designing to CA to
unwillingly designing to CA.
CONCLUSIONS
Despite the urgency in call for researches on CA in the CI, brought about by the wake
of the ‗catalyst for change‘ in the construction industry and further worsen by the
challenges facing QS in the NCI, attention has only been focused on issues that deal
with accuracy. Evidences do exist in literature that the success of the quantity
surveyor‘s CA function is largely dependent on the behaviours of clients and
designers particularly during early stages of construction projects. This is against the
popular thinking of considering the factors as oppose to the reasons for this factors
which is the direction of this study. On a general level, client-architect behaviours
towards CA in the NCI can be described as ‗slightly less than normal‘ because in
more cases the behaviour are less than that expected i.e. normal, compared to those in
which they were exceptional i.e. above normal. In fact none of the behaviours attained
this status. Instances in which behaviour can be described as ‗normal‘ includes: client
provides QS with briefs that are sufficient in information. Their behaviour towards
engagement is that they engage QS early by that the engagement is done by clients
themselves. However in some instances, abnormal behaviours were evident. For
instance despite the fact that clients do engage QS early enough in projects, they
required them to prepare BOQs. Some other abnormalities include insufficient time
given for the purpose of CA and the near insufficiency of design information provided

Attitudes towards cost advice
259
by the architect. Hence, there is need for improvements in these behaviours by clients
and architects for effectiveness in the CA function. The reason for this is further
corroborated by the existence of significant relationships and the impact these
behaviours do have on the CA related outcomes. Another way at leveraging the
challenges pose by the existence and influences of these behaviours is the re-
consideration of the CA tools and methods adopted during the design stage. This
however calls for researches that will relate methodological issues to behavioural
concepts by expanding Liu and Fellows‘ (2008) research to study clients and designer
and localising their research instrument to fit the NCI.
REFERENCES
Adebola, O. (2001). Quantity Surveying and National Development: The Public Sector
Perspective. In G. O. Moneke, Quantity Surveying and Total Cost Management:
Context, Issues, and National Development (pp. 134 - 150). Abuja: Nigerian Institute
of Quantity Surveyors.
Adetola, F. O. (2001). Quantity Surveying and National Development: The Private Sector
Perspective. In G. O. Moneke, Quantity Surveying and Total Cost Management:
Context, Issues and National Development (pp. 110 - 133). Nigerian Institute of
Quantity Surveyors.
Aibinu, A. A., & Jagboro, G. O. (2002). The Effect of Construction Delays on Project
Delivery in Nigerian Construction Industry. International Journal of Project
Management , 20, 593-599.
Ajator, U. (2004). Value Management and Buildability Assessment as Indispensable Tool for
Efficient, Cost-Effective Building Production. The Quantity Surveyor , 48, 2 - 9.
Aje, I. O., & Awodele, O. A. (2006). A Study of Ethical Values of Quantity Surveyors in
Nigeria. In D. R. Ogunsemi (Ed.), Ethical Issues and the Challenges in Construction
Professionals' Service Delivery (pp. 14 - 31). Akure: NIQS Ondo State Chapter.
Akingbohungbe, D. O. (2006). Development, Building Industry: The Context and Challenges
for National. In D. R. Ogunsemi (Ed.), Ethical Issues and the Challenges in
Construction Professionals' Service Delivery (pp. 32 - 42). Akure: NIQS Ondo State
Chapter.
Akintoye, A. (2001). Quantity Surveying: An Art or Science? A Researcher's Perspective. In
G. O. Moneke (Ed.), Quantity Surveying and Total Cost Management: Context, issues
and National Development. Nigerin Institute of Quantity Surveyors.
Anago, I. T. (2001). The Role of the Quantity Surveyor in National Development. In G.
Moneke (Ed.), Quantity Surveying and Total Cost Management: Context, Issues and
National Development (pp. 1 - 18). Abuja: Nigerian Institute of Quantity Surveyors.
Ashworth, A. (2004). Cost Studies of Buildings (4th Edition ed.). Oxford: Pearson Prentice
Hall.
Ashworth, A. (2008). Pre-contract Studies: Development economics, tendering and
estimating. London: Blackwell Publishing.
Ashworth, A. and Hogg, K. (2007) Willis‘s Practice and Procedure for Quantity Surveyors,
12th Edition, Blackwell Publishing, UK.
Cartlidge, D. (2006) New Aspects of Quantity Surveying Practice, 2nd
Edition. Butterworth-
Heinemann, Oxford.
Federal Republic of Nigeria. (2007). The Due Process Handbook. The Public Procurement
Act . Nigeria.

Kolo, Yunusa and Dzikwi
260
Ferry, D. J., Brandon, P. S., & Ferry, J. D. (1999). Cost Planning of Building, 7th Edition.
Oxford: Blackwell Science.
Frankfort-Nachmias, C. and Nachmias, D. (2009) Research methods in the social sciences, 5th
Edition. Hodder Education Ltd.
Hughes, W. (2010) Built environment education, research and practice: Integrating diverse
interests to make an impact. In: Laryea, S., Leiringer, R. and Hughes, W. (Eds).
Proceedings of the West Africa Built Environment Research (WABER) Conference, pp
1- 8.
ICRC. (2009). Transitional Arrangement for Implementing Public Private Partnership.
Abuja: Infrastructure Concession Regulatory Commission.
Kelly, J., Male, S., & Graham, D. (2004). Value Management of Construction Projects.
London: Blackwell Science Limited.
Kelly, J., Morledge, R., & Wilkinson, S. (2002). Best Value in Construction. In J. Kelly, R.
Morledge, S. Wilkinson, J. Kelly, R. Morledge, & S. Wilkinson (Eds.), Best Value in
Construction (pp. 1 - 11). Oxford, UK: Blackwell Science in conjunction with RICS
Foundation.
Kolo, B.A. and Ibrahim, A.D. (2010) Value management: How adoptable is it in the Nigerian
construction industry? In: Laryea, S., Leiringer, R. and Hughes, W. (Eds).
Proceedings of the West Africa Built Environment Research (WABER) Conference.,
pp653-663.
Leiringer, R. (2010) Handmaidens and Ivory Towers: The role and responsibility of
construction management researchers as agents of change. In: Laryea, S., Leiringer,
R. and Hughes, W. (Eds). Proceedings of the West Africa Built Environment Research
(WABER) Conference, pp 27- 29.
Liu, A. M. M., and Fellows, R. (2008) Behaviours of quantity surveyors as organisational
citizens. Construction Management and Economics, 26 (10 – 12) 1271 – 1282.
Mohammed, R. E. (2007). An Exploratory System Dynamics Model to Investigate the
Relationships between Errors that Occur in Construction Documents in Saudi Arabia
and their Possible Causes. PhD Thesis, Heriot-Watt University, School of Built
Environment.
Moser, C. and Kalton, G. (2001) Survey methods in social investigation. Aldershot: Ashgate.
Oke, A., & Ogunsemi, D. (2009). Competencies of Quantity Surveyors as Value Managers in
a Developing Economy. COBRA 2009 The Construction and Building Research
Conference of the Royal Institute of Chartered Surveoys (pp. 23-38). Cape Town:
Royal Institute of Chartered Surveyors.
Okuwoga, A. A. (1998). Cost-time Performance of Public Sector Housing Projects in Nigeria.
Habitat International , 22 (4), 389-385.
Omole, A. O. (2000). Quality of Professional Service and Ethics. The Quantity Surveyor , 33,
2-7.
Appiagyei, N.B. and Dansoh, A. (2011) Constraints in real estate development finance in Ghana In:
Laryea, S., Leiringer, R. and Hughes, W. (Eds) Procs West Africa Built Environment Research
(WABER) Conference, 19-21 July 2011, Accra, Ghana, 261-271.
261
CONSTRAINTS IN REAL ESTATE DEVELOPMENT
FINANCE IN GHANA
Nkyi Benjamin Appiagyei1 and Ayirebi Dansoh
2 Department of Building Technology, Kwame Nkrumah University of Science and Technology, Kumasi,
Ghana
Corporate Real estate finance in Ghana is fraught with problems emanating from
infrastructural inadequacies with a preponderance of equity finance. Property owners
use their own equity, barter arrangements and remittances from abroad to finance
substantial volumes of their investment. Poor access to debt finance relates to
demand-side problems, particularly a lack of information about available sources,
rather than a lack of available credit. The financial market, however, is critical to the
development of the real estate industry. The aim of the research is to identify and
analyze the nature and the causes of financial market constraints in corporate real
estate development in Ghana. A questionnaire survey and interviews were conducted
to ascertain from corporate real estate developers and financial institutions
(commercial banks, development, merchant banks) the underlying causes of
difficulties in real estate finance. Financial constraints are identified under demand
and supply of debt and equity finance as well as information and knowledge
constraints.
Keywords: corporate real estate, debt, equity, financial constraint.
INTRODUCTION
The major financial lending institutions which supply funding to corporate real estate
developers are banks. Apart from this source, all others are under developed in
developing countries. Owing to the small size of corporate real estate developers, they
are confronted with challenges in accessing finance from banks. They are usually
required to meet strict loan requirements. Lack of material security or collateral has
been found as the most serious bottleneck in receiving financial assistance from
financial institutions, (Binks and Vale, 1990). But there are other sources of
difficulties in the access of finance by corporate real estate firms in developing
countries. Regardless of the immense role that real estate plays in the economy of
every nation, and in spite of the ingenuity of the emerging lending industry, there are
inherent difficulties impeding the financing of the corporate real estate industry. The
aim of this study is to identify and analyze the nature and the causes of financial
market constraints in corporate real estate development.
Financial constraint defines the difference between the demand and supply of external
finance by lending institutions over a given period and measures the need for external
funds by corporate real estate firms. Though the banks contribute to the difficulty of
the corporate real estate firms‘ access to finance, the firms themselves also contribute
to these difficulties.

Appiagyei and Dansoh
262
DEMAND FACTORS
Real estate finance is seen as remaining in a primitive state compared to the rapid
development of the banking industry (Jaffee and Russel, 1996). This has resulted in a
clear segregation between the real estate sector and the financial market in Ghana.
Access to finance for real estate development is influenced by the characteristics of
the corporate real estate institutions such as age, size (number of employees, turnover,
profitability, net worth, etc) and legal status. Relative to developed countries,
corporate real estate developers in Ghana are small in size. According to Ofei, (2001),
most small and medium sized firms in Ghana felt constrained in their access to credit.
Some corporate real estate developers are reluctant to surrender equity to outsiders
because of the perceived loss of independence, control and freedom of action, dilution
of earnings and the cost involved (Mason and Harrison, 1999).
In addition, some developers are also reluctant to seek external equity because they
are often unfamiliar with the investors, with their protocol and criteria and often the
implications of an external equity investment (Binks and Vale, 1990). Many corporate
real estate developers are inhibited in accessing funding due to lack of information
and awareness. Lack of knowledge or imperfect information is the main reason why
small and medium scale industries (SMIs) failed to approach appropriate funding
bodies (Bannock and Partners, 1991; Harvey, 1992). However, Confederation of
British Industry, CBI (1993) pointed out that the root of the problem often lies with
the owner managers themselves. This is because, they tend to react late to information
and they do not approach the appropriate persons for advice until a funding crisis
occurs. Poor financing planning is also found to be one of the challenges of corporate
real estate developers (Hankinson, 1997). Most researchers agree that financial
planning in businesses is a key to survival (Bates, 1991). Unfortunately, while many
corporate real estate managers are aware of the benefits of financial planning, they fail
to pay reasonable attention to these activities and they only plan when they are already
faced with a need for funds.
Since short term loans are the most available forms of finance in Ghana, it becomes a
challenge for corporate developers who acquire loans to pay back within the agreed
period due to their inability so sell their products in the short term. Real estate
investment periods take a longer time for recuperation, particularly when viewed from
the land acquisition and development stage, through the construction to leasing or
eventual sale of the property. The World Bank estimates that registering formal
ownership/lease over a piece of unencumbered land in Ghana is the third longest
registration process in the world (World Bank, 2004). Corruption and land disputes,
especially involving public lands in urbanizing areas, have been experienced by
significant majorities (CDD Report, 2000). Corporate real estate developers in Ghana
are expected to have a personal contribution in a form of a deposit (between 20% and
30%), pay the interest on the loan and the principal in the form of monthly or annual
repayments. Given the loan-to value ratio (between 70% and 80%) and the low level
of returns in the country, it makes it difficult for most of the corporate real estate
developers to qualify (Boamah, 2002, and Asare, 2004). Finally, the assessment of the
credit worthiness of corporate real estate developers is made difficult as many
potential borrowers have only a limited association with banks with the use of credit
for transaction being uncommon.

Real estate development finance
263
SUPPLY FACTORS
Banks are the basic financial lending institutions that make up the supply sources of
finance. In the course of business transaction, the unwillingness on the part of
suppliers of finance to supply it on the terms and conditions required by corporate real
estate developers leads to the difficulties in obtaining finance.
Most financial institutions believe that it is risky and administratively expensive to
lend to small firms, including real estate developers, (Berger and Black, 2011) and
even if these firms do get external finance, they are usually required to pay a higher
rate of interest and offer a higher level of security and collateral (Economist, 1994). It
is believed that, as firms grow in size, they may enjoy less expensive financial options
since ―the prospective lenders have a greater degree of trust in large firms, and
accordingly a lower perception of risk‖ (Menkhoff, Neuberger, and Suwanaporn,
2005).
Many researchers conclude that the access to credit by small firms is restricted
primarily because of stringent lending conditions imposed by financial institutions.
Loans from banks in the initial years are difficult, as younger firms are less likely to
command bank loans since they have no established track records (Binks, 1990).
The cost of lending to small corporate real estate developers are bound to be high
because of the small amounts involved in each loan and consequently greater returns
are expected by lending institutions (Binks, Ennew and Reed, 1990; Confederation of
British Industry, 1993). The documentation, supervision and collection are also often
more expensive than when loans are made to larger firms.
Also small firms suffer a number of genuine disabilities, by comparison with larger
firms, in seeking finance from external sources; most of these disabilities reflect the
higher costs of lending in small amounts or the higher risk of lending to small
borrowers. They do not result from imperfections in the supply of finance and, indeed,
the ability and readiness of the financial institutions to exploit every new legitimate
demand for funds is one of the greatest strengths of the financial systems (Beitel,
Schiereck and Wahrenburg 2004, Cybo-Ottone and Murgia 2000),
Basically, it is a high-risk proposition to lend finance to small real estate firms, (Hall,
1989). In contrast, the degree of risk involved in lending to large firms ―is assumed to
be lower than that involved in the case of small firms, as large firms have a more
sophisticated management, permit greater access to their financial reporting, and are
well known in the financial world‖, (Petersen, M. and Rajan, R. (2002).
Financial institutions are also unwilling to lend because of the high failure rates of
small firms (Smallbone, 1990). The ―financial characteristic which distinguishes small
firms from large is their relatively high probability of failure‖, (Black, 2011).
Research has shown that the mortality rate of small firms was high among younger
firms. In the United Kingdom, the mortality rate of new firms can be as high as
33percent within two years of starting and 60 percent within five years (Pettit and
Singer1985). In the United States, the mortality rate of small firms is 70 percent and
most of these failures occur in the first year of operation, (Bain, 1990). This
characteristic of small firms makes it difficult for financial institutions to advance
credit to them.
Government assistance is one of the important sources of external finance for
corporate real estate development. It is the responsibility of the government to strive

Appiagyei and Dansoh
264
to create the economic conditions necessary for stability to enable any form of
housing finance market to thrive (Karley, 2002).
The Ghana government in 1990 established the Home Finance Company (HFC) with
the objective to provide the service and raise funds for real estate finance. On its
inception it was owned equally by the Government of Ghana, Merchant Bank (Ghana)
and the Social Security and National Insurance Trust (SSNIT) (HFC, 2008). The
assumption behind this approach was that the government, representing society, can
be more risk tolerant as compared to banks, which have the object of maximising risk
adjusted profit. The HFC provides funding to prospective home owners but does not
fund the operations of corporate real estate developers. The Government of Ghana
intervention has helped to establish the Ghana Real Estate Developers Association
(GREDA) as an initiative for public and private sector participation in housing
investment and delivery. GREDA draws together representatives of Government
departments, property professional bodies, brokers and major developers to co-
ordinate public policy and the private sector.
However in Ghana corporate real estate developers access finance for development at
the same inter-bank loan rate with no form of discount. Since the collapse of the Bank
for Housing and construction in the mid 1990s which aimed to develop formal debt
finance systems for the construction sector, Ghana has not benefited from any special
construction bank to ease the financial constraints facing the developers.
RESEARCH METHOD
Data for the research was drawn from personal delivery of questionnaire survey to
identify the nature and causes of financial market constraints in real estate
development in Ghana. The items relating to financial variables leading to the
perceived existence of financial difficulties were extracted from a review of literature
and preliminary interviews with senior managers of banking and real estate companies
on debt and equity constraints as well as information inadequacy in the financial
market environment.
The questionnaire was pilot-tested on 6 companies selected from the list of Ghana
Real Estate Developers Association (GREDA) members with offices in Accra, Ghana.
A random selection form this list is expected to give a sample with characteristics
similar to the population. This sample gave a Cronbach‘s alpha of 0.72. Nunnaly
(1978) has indicated 0.7 to be an acceptable reliability coefficient and therefore the
0.72 suggests a good reliability result.
A major observation from the pilot test was the difficulty in identifying respondents
with adequate information on the companies‘ financial management record and
decision making process. In response, initial checks were made through telephone - to
identify individuals for the survey. A total of 69 questionnaires were sent to GREDA
members in good standing and financial institutions (commercial, development,
merchant banks). Realising the need to obtain a high response rate, the total design
methodology suggested by Dillman (1978) was followed, and 38 responses (yielding a
55% response rate) were received. An estimate of non-response bias was calculated by
testing the differences in the means of 3 variables in the two groups which indicated
no significant differences.
Respondents described their current positions as managers, financial manager,
managing director, chief accountant and CEO. Their functions involved sales of
houses, debt contracting, advance payment negotiation, inviting negotiating equity and
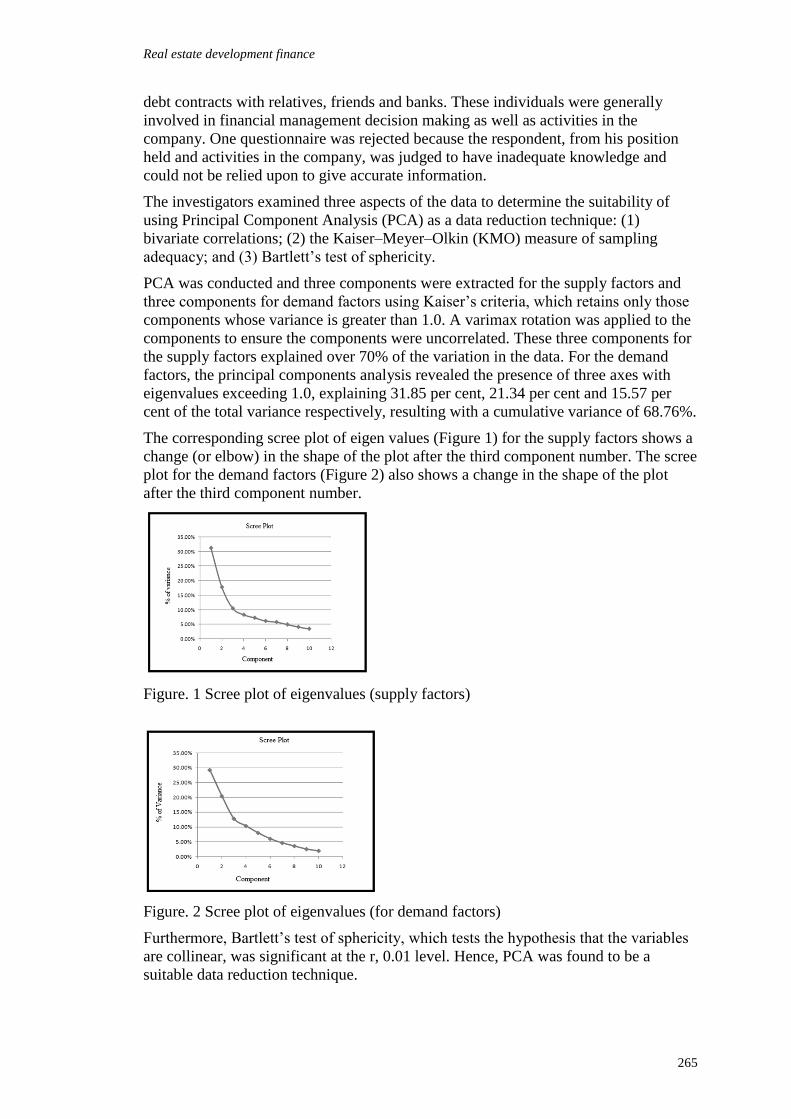
Real estate development finance
265
debt contracts with relatives, friends and banks. These individuals were generally
involved in financial management decision making as well as activities in the
company. One questionnaire was rejected because the respondent, from his position
held and activities in the company, was judged to have inadequate knowledge and
could not be relied upon to give accurate information.
The investigators examined three aspects of the data to determine the suitability of
using Principal Component Analysis (PCA) as a data reduction technique: (1)
bivariate correlations; (2) the Kaiser–Meyer–Olkin (KMO) measure of sampling
adequacy; and (3) Bartlett‘s test of sphericity.
PCA was conducted and three components were extracted for the supply factors and
three components for demand factors using Kaiser‘s criteria, which retains only those
components whose variance is greater than 1.0. A varimax rotation was applied to the
components to ensure the components were uncorrelated. These three components for
the supply factors explained over 70% of the variation in the data. For the demand
factors, the principal components analysis revealed the presence of three axes with
eigenvalues exceeding 1.0, explaining 31.85 per cent, 21.34 per cent and 15.57 per
cent of the total variance respectively, resulting with a cumulative variance of 68.76%.
The corresponding scree plot of eigen values (Figure 1) for the supply factors shows a
change (or elbow) in the shape of the plot after the third component number. The scree
plot for the demand factors (Figure 2) also shows a change in the shape of the plot
after the third component number.
Figure. 1 Scree plot of eigenvalues (supply factors)
Figure. 2 Scree plot of eigenvalues (for demand factors)
Furthermore, Bartlett‘s test of sphericity, which tests the hypothesis that the variables
are collinear, was significant at the r, 0.01 level. Hence, PCA was found to be a
suitable data reduction technique.

Appiagyei and Dansoh
266
RESULTS AND ANALYSIS
Constraints in real estate capital acquisition
Initial results are presented in 2 sections. Firstly, the results and analysis of data on the
difficulties in the acquisition of external finance for real estate development is
presented. The second part presents the initial result of the causes of financial
difficulty under both demand and supply.
One of the obstacles for the growth of firms is the limited access smaller firms have to
credit. The respondents were asked to identify if there is a difficulty in the lending
system with regard to financing their operations. The majority (79.2%) of them were
found to have difficulties with the financial lending system while (20.8 percent) have
no financial acquisition difficulties. This confirms studies which show that, most
small and medium sized firms felt constrained in their access to credit. (Ofei, 2001;
see also Gokel and Akoena, 2002) reported that, a good majority of the firms in
Ghana, 62%, felt fully constrained in accessing funds while 19% felt partially
constrained. Only 12 percent felt unconstrained in accessing funds. This means a good
majority of firms (81 percent) felt somewhat constrained in having access to funding.
Tenure of Financial Difficulty
The study adopted a definition for short, medium and long-term finance following
responses from interviews with GREDA members and financial institutions (leasing
and commercial banks, development, merchant and building societies) in Ghana.
Short-term finance in this study has a repayment period of less than one-year,
medium-term has between one and three (1-3) years repayment period with long-term
finance extending over three years. Firms were asked as to the type of finance tenure
they had most difficulty accessing.
Respondents were further asked to indicate the severity of financial difficulties on a
scale of 1-5, where one (1) is ‗not severe and five (5) is ‗very severe. They were to
provide multiple responses to all three options. A severity index was developed by
calculating weighted averages of the responses (table 4.3.3). The most severe
difficulties occur with long term financing (I = 4.90), medium term (2.98) and short
term (2.04).
Table 1 Severity of difficulty associated with loan by tenure
Financial difficulty tenure index
Short Term Difficulty (Less than 1 year) 2.04
Medium term difficulty (1-3 years) 2.98
Long term difficulty (more than 3 years) 4.90
There is inadequate credit for medium and long-term investments therefore most
credit in Ghana is short-term. Further responses from the financial institutions
(commercial banks, development, merchant and building societies) in the survey
indicate that a number of factors constrain the availability of longer-term credit, the
most important being the term structure of deposits. As a result of the short-term
structure of deposits, banks are limited in their ability to make long-term loans.
Generally, the lack of long term deposit instruments and the existence of secondary
markets for loans, severely limit the long term lending capabilities of the lending
system. As a result, the money deposit finance institutions are unable to provide
needed long-term credit.
Causes of Financial Difficulty

Real estate development finance
267
Literature review and preliminary studies suggested some possible factors that could
be hindering the acquisition of finance for real estate development. Factors identified
as the cause of financial difficulty were grouped under two main headings of supply
and demand factors.
Supply Factors
Principal Component Analysis was performed on these factors yielding three
components that were extracted using Kaizer‘s criteria which retains only those
components whose variance is greater than one. The result of the component analysis
is as shown in the table below.
Table 2 Rotated Component matrix of factor analysis of financial supply difficulty factors
Supply Factors PC1 PC2 PC3
Lack of adequate lending policies -0.277 0.803 -0.484
High Lending Cost -0.099 0.472 0.755
Stringent lending conditions 0.036 -0.515 0.701
Absence of co-operating banking institutions -0.052 0.883 0.231
Failure to establish a legal framework 0.904 -0.057 -0.326
Limited capacity of banks 0.892 -0.305 0.145
Too rapid expansion of real estate firms 0.133 0.034 0.601
Lack of perceived viability of proposal 0.943 0.015 -0.675
Lack of credit history -0.121 0.959 0.077
When the firm has exceeded the limit of its borrowing 0.862 -0.402 0.106
From Table 2, the first principal component (PC1) identified four major factors. A
closer look at these factors suggests that they may be inherent in restrictive monetary
policies of lending institutions. Monetary policy has been strictly limited by
macroeconomic stabilization agreements made with the IMF and World Bank in
conjunction with IMF loans, the HIPC (Heavily Indebted Poor Country) initiative and
the PRSP (Poverty Reduction Strategy Paper) process.
Under the standard financial programming methods implemented by the IMF, target
ceilings are set for central bank monetary and credit expansion and floors are
established on net foreign reserves (Barth and Hemphill 2000) for good descriptions
of these programmes). The original motivation for these restrictions were to ensure the
ability of program countries to reduce their foreign debt and remain solvent, including
protecting the ability of the IMF to get repaid. Recently, other goals, such as reducing
inflation, increasing foreign exchange reserves and ―creating room for private
investment,‖ for that matter, real estate development, have been emphasized. The
main targets are Net Domestic Assets ceilings (NDA), which are sometimes called
domestic credit ceilings, directly limit the amount of credit that the Bank of Ghana can
create, and Net International Reserve floors (NIR), which require monetary and fiscal
policy to operate so to preserve a minimum level of international reserves.
The second principal component (PC2) resulted in three factors. It is reasonable to
suggest that these factors may be inherent in one principal factor, mainly financial and
legal policy of lending institutions.
Respondents complain that Ghana has an inadequate legal system for collateralised
lending and an extremely difficult land ownership and titling environment, which
together constitute a major problem for mortgage lending. Consequently, only a
limited number of banks extend mortgage bonds to borrowers. Also some real estate
developers lack the ―track record‖ and reputation to make them attract funding from

Appiagyei and Dansoh
268
financiers. Due to the inadequate legal system, it becomes difficult for banks or
lending institutions to enforce repayment by defaulted borrowers.
The Bank of Ghana is responsible for formulation of all financial policies binding the
operations of financial institutions. With no specialised legal institutions to enforce
contracts effectively and in the absence of bankruptcy laws and procedures, banks'
attitude to contract enforcement is rather subtle. The first line of action is often to
persuade delinquent borrowers to resume their payments. The majority of bankers in
the survey indicated that delinquency and default was generally not wilful, but
resulted from poor returns on investments, particularly due to bad management of
projects. Banks have occasionally been forced to re-finance projects in the hope that
these will revive distressed borrowers. Banks suffer severe losses as results of the
unavailability of adequate information to enable them arrange special loan contracts
for borrowers who have not wilfully defaulted.
From Table 2, the third principal component (PC3) identified three factors. A close
look at these factors suggests that they may be inherent in risk aversion transaction
conditions of lending institutions. Transaction costs of lending, refers to the cost of
administering credit and the cost of the risk of default. These are the costs involved in
establishing and conducting financial relationships. Difficulties arising from
transaction conditions are caused by the asymmetric distribution and costly acquisition
of information. Consequently, economic transactions are conducted in highly
uncertain and risky environments, which engender eminently more volatile returns to
investment. Often, lenders have little information about the expected success of
projects. This raises their risk perception and increases their reluctance to advance the
financing requested of them.
In many developing countries, even with relatively well developed general banking
systems financial institutions may not be prepared to take on the risks involved in
developing a broadly based formal housing finance system without support.
Government intervention is therefore seen as necessary to jump start a formal
mortgage system
Financiers demand collateral or security so that in default of the debt, the funds can be
recovered. Because some real estate firms lack assets to provide as collateral, and lack
the ―track record‖ necessary to establish their reputation, the financiers tend to put in
place stringent lending conditions by charging higher interest rates, processing fees
and insurance costs to all borrowers to cover the cost of additional monitoring
requirements as well as the likelihood of bad debts and default on outstanding
commitments. If banking institutions were co-ordinated in such a way to share the cost
of funding to real estate developers, the risk involved in financing would not be so
great as to warrant excessively high lending conditions.
Demand Factors
Demand factors associated with raising real estate finance are the internal constraints
that the developers face in accessing finance from lending institutions. Seven factors
were identified.
Nearly 89.58 % of real estate firms are unable to provide suitable collateral so as to
enable them demand financial aid. Real estate firms graded this inability of providing
acceptable collateral highest importance (code 5). Lack of personal financial
contribution is an important factor restraining real estate firms from demanding
financial aid.
Real estate development finance
269
In order to clearly interpret the eigenvalues loadings, these principal components were
further subjected to factor rotation using the varimax with Kaiser normalization
method (Kaiser, 1970, 1974).
Table 3 Component matrix of factor analysis of demand difficulty factors associated with raising funding
for real estate firms.
Demand Factors PC1 PC2 PC3
Lack of adequate financial control 0.798 0.245 -0.05
Absence of forward planning 0.790 0.055 -0.088
Deficiencies in the financial and managerial skill 0.476 0.681 -0.466
Real estate firms inability to repay loan on time -0.341 0.851 0.054
Inability of real estate firms to provide acceptable collateral 0.066 0.635 -0.088
Inability of real estate firms to provide a viable business plan 0.693 -0.244 0.490
Lack of internal financial contribution 0.034 -0.464 0.925
The seven factors have been summarized into three components explaining the
demand difficulty factors associated with raising funding for real estate developers.
The first principal component (PC1) consists of three factors which can be grouped as
resource planning of corporate real estate developers. . The preparation of business
plan is the most important step in expanding existing business or launching new
ventures. The business plan is the principal tool for raising finance. From an investor‘s
viewpoint, a major consideration in deciding whether or not to supply capital is the
quality of the business plan presented by the potential borrower. Firms‘ seeking to
attract funding need to formulate a coherent business strategy, analysing the market
opportunity and competitive advantages of its products, together with a clear
implementation plan, bearing part of the risks of the business in order to induce
investors in their assessment for offer of funding.
The deficiencies in the financial and managerial skill and competence of the real
estate developers were found to be a factor. This deficiency results in a
mismanagement of the finance of these firms thereby making it difficult for loans to
be repaid on time. This makes it difficult for banking and financial institutions to
advance loans to real estate developers.
The second principal component (PC2) consists of three factors. These factors are
inherent in the credit rating position of corporate real estate developers.
The findings is consistent with the notion that collateral and personal guarantees also
affect the incentives of creditors, as they will either substitute for or complement
information production by financial intermediaries (Manove, Padilla, and Pagano,
2001; Rajan and Winton, Boot 2000; Longhofer and Santos, 2000). The presence of
collateral and personal guarantees may also depend on the length and intimacy of the
relationship between creditors and borrowers (Boot, 2000).
From Table 3, the third principal component (PC3) mainly, Lack of personal financial
contribution is however, associated with financial strength of corporate real estate
developers.
In order to enhance the lender‘s incentive to monitor, loan contracts must be
structured in a way that makes the lender‘s payoff sensitive to the borrower‘s financial
health. Rajan and Winton (1995) argue that collateral and personal contributions may
serve as a contractual device to increase the lender‘s monitoring incentive, because
collateral is likely to be effective only if its value can be monitored. Moreover, the use
of collateral as an incentive will be more extensive when the value of such collateral

Appiagyei and Dansoh
270
depreciates rapidly according to business conditions (e.g., accounts receivable and
inventories), than when the value of collateral is relatively stable (e.g., real estate).
Internal and external sources of finance under perfect capital markets should be
perfectly substitutable (Modigliani and Miller, 1958), so that the availability of
internal funds should not affect investment decisions. It is reasonable to suggest that
real estate developers need to generate enough cash flow to offset any funding they
receive.
CONCLUSIONS
The study identified the factors that contributed to the difficulties in accessing finance
for real estate development in terms of demand and supply. These factors were
informed by the literature review. Upon analysis of these factors, it was realized that
as much as banking and lending institutions contributed to the financial difficulties,
the real estate developers themselves also contributed to their difficulty in accessing
finance in other forms.
The deficiencies in the financial and managerial skill and competence of corporate
real estate developers were found to be a factor. This deficiency results in a
mismanagement of finance of these developers thereby making it difficult for loans to
be repaid on time. In this regard, it becomes difficult for banking and financial
institutions to advance loans to real estate developers. At times, banking and financial
institutions would expect borrowers to provide counter-part funding to projects they
are financing. This strategy is used by the financial institutions as part of a risk sharing
strategy. The inability of real estate developers to provide this form of internal
contribution also affects their success in acquiring finance.
On the side of the supply which is mainly made up of the Banks and other financial
institutions, the interim result showed that, some of the difficulties of real estate
finance could be attributed to them. Some of these factors were correlated under the
following headings; restrictive monetary policy, financial and legal policy and risk
aversion transaction conditions.
REFERENCES
Asare. E. L, (2004), Residential Mortgage Market in Ghana: Nature and Implications,
Unpublished MPhil Thesis, Department of Land Economy, University of Cambridge
UK
Bannock, G and Partners Ltd. 1991. Venture capital and the equity gap. A study
commissioned by National Westminster Bank Barth, Richard and William Hemphill,
2000. Financial Programming and Policy: The Case of Turkey. Washington, D.C.:
IMF Institute, IMF.
Bates, T. 1991, Comercial bank financing of white and black-owned small business start-ups,
Quarterly Review of Economics and Business. 31 (1). Spring: pp. 64-80.
Beitel, P., Schiereck, D. and Wahrenburg, M. (2004), ―Explaining the M&A success in
European bank mergers and acquisitions‖, European Financial Management, Vol. 10,
pp. 109-40.
Berger, A. N., and Black, L. K., 2011, Banking and Finance 35 (724-735)
Binks, M. R. Ennew C. T. and Reed G. V. (1990) Finance Gaps and Small Firms, Paper
presented to Royal Economics Society Annual Conference. Royal Economics Society,
Binks M and Vale P, Entrepreneurship and Economic Change 1990. McGraw-Hill Book
Binks, M., Ennew, C. and Reed, G. (1988), Small Businesses and Banks: A Two Nation
Perspective, Forum of Private Business, Knutsford.
Boamah, N (2002), The Impact of Liberalisation on Residential Property Financing in Ghana,
Unpublished MPhil Thesis Department of Land Economy, University of Cambridge

Real estate development finance
271
Bolton Report (1971). Report of the Committee of Inquiry on Small Firms, Buckley, R. M.
(1996), Housing finance in Developing Countries, Macmillan Press Ltd
Boot, Arnoud W. A. (2000). ―Relationship Banking: What Do We Know?‖ Journal of
Financial Intermediation 9, 7-25
Booth, Laurence, Aivazian, Varouj, Demirgüc-Kunt, Asli, and Vojislav Maksimovic (2001):
Capital Structures in Developing Countries. The Journal of Finance, Vol. 56, pp. 87 -
130.
Centre for Democratic Development, CDD-Ghana Research Paper 4, August 2000,
Corruption and other constraints on the Land Market and Land Administration in Ghana: A
Preliminary Investigation,
Confederation of British Industry, 1993. Finance for growth
Cybo-Ottone, A. and Murgia, M. (2000), ―Mergers and shareholder wealth in European
banking‖, Journal of Banking and Finance, Vol. 24, pp. 831-59.
Gockel, Augustine F. and Sesi K. Akoena. 2002. ―Financial Intermediation for the Poor:
Credit Demand By Micro, Small and Medium Scale Enterprises in Ghana. A Further
Assignment for Financial Sector Policy?‖. Geneva: ILO. IFLIP Research Paper 02-6.
Hankinson, A. Bartlett, D. and Ducheneaut, D. (1997). The key factors in the small profiles of
small medium enterprise owner-managers that influence business performance,
International Journal of Entrepreneurial Behaviour and research, Vol. 3 (4) pp 168-
175.
Harvey, D. 1992. Small business, big banks. Certified Accountant, October, 26-27,
Management Autumn pp.47-60. Management Science 30.10 pp1161-1183
Jaffee, D. and Russel, T. (1996). ‗Imperfect Information, Uncertainty, and Credit Rationing‘,
Quarterly Journal of Economics, Vol. 90, pp. 651-66.
Karley, N. K (2002), ―Alternative Options to Mortgages in Ghana‖ in Housing Finance
International 2 Vol. 17
Longhofer, Stanley D. and João A. C. Santos. (2000). ―The Importance of Bank Seniority for
Relationship Lending.‖ Journal of Financial Intermediation 9, 57-89
Manove, Michael and A. Jorge Padilla. (2001). ―Collateral versus Project Screening: A Model
of Lazy Banks.‖ RAND Journal of Economics 32, 726-744
Mason, C. M. and Harrison R. T. (1999), "Informal Venture Capital and the Financing of
Emergent Growth Businesses." The Blackwell Handbook of Entrepreneurship.
(eds)Menkhoff, L, Neuberger, D, and Suwanaporn, C, 2004, Journal of Banking and
Finance 30 (1-21)
Miller D. and Friesen P.H. (1984) ―A lower individual study of the corporate life cycle‖
Modigliani, F. and Miller, M. (1958), ―The Cost of Capital, Corporation Finance, and the
Theory of Investment,‖ American Economic Review 48, 261-297. Nottingham
Ofei, Kwadwo Ansah. 2001. ―Terms and Access to Credit: Perceptions of SME/Entrepreneurs
in Ghana‖. University of Ghana, Legon.
Pettit, R. and Singer R. (1985) "Small Business Finance: A Research Agenda." Financial
Rahaman, M. M, 2011, Access to financing and firm growth, Journal of Banking and Finance
35 (709-723)
Petersen, M. and Rajan, R. (2002). Does Distance Still Matter? The Revolution in Small
Business Lending. Journal of Finance 57(6): 2533-2570.
Rajan, Raghuram and Andrew Winton. (1995). ―Covenants and Collateral as Incentives to
Monitor.‖ Journal of Finance 50, 1113-1146
World Bank, Doing Business in 2005, London, 2004.


Alabi, F.O. (2011) Construction participants‘ perspective on multi-criteria selection practice in Lagos
State, Nigeria In: Laryea, S., Leiringer, R. and Hughes, W. (Eds) Procs West Africa Built Environment
Research (WABER) Conference, 19-21 July 2011, Accra, Ghana, 273-279.
273
CONSTRUCTION PARTICIPANTS’ PERSPECTIVE ON
MULTI-CRITERIA SELECTION PRACTICE IN LAGOS
STATE, NIGERIA
Folasade Omoyemi Alabi1
Quantity Surveying Department, Yaba College of Technology, Yaba, Lagos, Nigeria
The awards of contract to qualified contractor contribute to its successful delivery,
which is a desirable goal of every construction participant. However, in Nigeria the
award of contract has been perceived as lacking transparency which makes the
adoption of multi-criteria selection practice in contractors‘ selection a viable option.
This study investigates the perception of the construction participants on the use of
multi-criteria selection practice. The research method involves the review of
literatures and administration of structured questionnaires to construction participants
using a purposive sampling technique. The data were analyzed using descriptive
analysis while mean items score was used to present responses obtained on a modified
Likert scale instrument. The study revealed that most organizations viewed
prequalification as a standard procedure for the execution of construction projects. In
addition, the decision criteria and evaluation of contractors are considered to be based
on the size, type and complexity of projects while both clients and contractors are
found to benefit from multi-criteria selection practice. The study recommends that
prequalification of contractors must be done periodically for developing a standing
list of contractors.
Keywords: contractor selection, multi-criteria selection, Nigeria.
INTRODUTION
In trying to select the most suitable and qualified contractor for the contract, the task
facing a construction client is a multiple criteria decision making process, in which a
large number of criteria need to be evaluated (Sonmez, Yang and Holt, 2001 citing
Hatush and Skitmore, 1998; Martin 2008). Jennings and Holt, (1998) define multi-
criteria selection practice as a selection based on evaluation of tender submissions
against criteria predetermined by client and considered important by advisor in terms
of achieving successful project completion. Using a multi criteria approach for
evaluating contractors with respects to their economic and technological aspects,
quality standards, past performance and other characteristics assist in solving the
problem of poor performance by contractors (Odusami, 1998).
Earlier studies (Drew and Skitmore, 1993; Odusami, 1998; Onwusonye, 2006) note
that prequalification seeks to ensure that invitation to bid are extended only to those
who have adequate capabilities and structures taking into cognizance the contractor
experience in relation to past performance on similar contracts, capabilities with
regard to personnel, equipment and construction facilities, financial position and other
associated structure. Moreover, prequalification is employed to screen out those

Alabi
274
contractors having low capabilities; the remaining bidders are then evaluated for
further consideration (Topcu, 2004).
Sadly this area has been neglected in the Nigerian construction industry and in most
cases; prequalification of contractors has always been based on whom you know and
not whether the contractor can perform (Odusami, 1998). In support of this view,
Onwusonye (2006) adds that the award of contracts in Nigeria has been perceived as
lacking transparency, inflated contract cost and process that were closed discretionary
and well designed conduct for abuse of public power. This led to poor performance of
contractors especially on government sponsored projects. Consequently the Nigerian
government established what is called ―due process‖ in order to introduce
transparency in construction procurement system. Under due process, contactors are
initially prequalified before being allowed to tender with the aim of ensuring that
qualified contractors are selected and the minimum project cost is achieved
(Mafimidiwo, 2009). However, in the private sector, the multi-criteria selection
practices are influenced by the clients‘ organization policies and consultants‘ advice.
To date, much construction procurement research has investigated aspects of
tendering strategies (Mafimidiwo, 2009), prequalification and selection of contractor
from the clients and consultants view points (Odusami, 1998; Ng and Skitmore, 1999;
Plebankiewicz, 2010), and from the viewpoint of contractors (Jennings and Holt,
1998). Therefore, taking a cue from past studies (Drew and Skitmore, 1993; Holt,
Olomolaiye, and Harris, (1995); Jennings and Holt 1998); this study intend to
investigate the construction participants‘ views on the use of multi criteria selection
practice in Lagos state, Nigeria
LITERATURE REVIEW
Farooq (2005) observes that the overall objectives of the project unite a diverse
collection of project participants who are involved in the award and execution of
contracts in the construction industry. Most of the clients recognized the role of the
construction practitioners in the overall success and final cost of the project. Thus,
construction owners have developed many different ways of selecting contractors who
will be responsible for the execution of the project. These different ways of selecting
contractors according to Farooq (2005) have been based on several factors ranging
from the circumstances of the prospective owners to the extent of advice or guidance
supplied by the project consultants.
Banaitiene and Banaitis (2006) note that the selection of an appropriate contractor is
the most critical for project success, as the decision may result in the success or failure
of the entire project. The objective of prequalifying contractors as noted by Drew and
Skitmore (1993) is to obtain an optimal level of competition that is, obtaining the
lowest bid at a minimum cost of bidding. This requires engaging the minimum
number of contractors to obtain a genuine competitive bid. Plebankiewicz (2010) adds
that the aim of prequalification is often not only contractor competence evaluation, but
also limitation of potential contractors. In such case it is necessary not only to judge
whether the contractor fulfils basic criteria, but also to what degree they are fulfilled.
Holt, et al (1995) posit that prequalification of contractor provides some degree of
confidence in the client that the firms selected will meet project needs. Such
confidence however, is a function of the integrity of the prequalification regime.
Banaitiene and Banaitis (2006 citing Palaneeswaran and Kumaraswamy 2001) point
out that contractor prequalification is generally preferred by clients to minimize risks

Contractor selection
275
and failures and to enhance the performance levels of selected contractors by means of
established minimal capacities below which contractor will not be considered.
Drew and Skitmore, (1993) identified potential problems faced by clients using
prequalification criteria, which includes: inflated development costs; difficulties in
developing quantifiable criteria and formalizing the decision making process to make
objective and sound decisions; and the possibility of higher contract prices when
reducing the numbers of contractors. Potential problems for contractors include the
possibility of unfair exclusion from the bidding process, and the expenditure of
resources on promotion and public relations to secure an opportunity to participate in
the bidding process.
Holt et al (1995) identify four main areas of deficiency in contractor selection as lack
of a universal approach to contractor selection; long term confidence attributed to the
results of prequalification; dependency on tender sum in tender evaluation/final
selection methods; and an over reliance on subjective analysis. Banaitiene and
Banaitis (2006) also identify three prime causes of inadequate contractors‘ selection
thus: inappropriate criteria; inappropriate significance attributed to the criteria;
inappropriate methodology applied for the contractor evaluation and selection task.
Consequently, improper contractor prequalification and selection practice has been
identified as a major contributor to abandoned projects and to the construction
industry inefficiency.
However, Ng and Skitmore (1999) posit that multi-criteria selection practice will
improve chances of contract award and that both clients and contractors benefit from
it. For clients, it will aids in distinguishing unwilling and inexperience contractors
from willing and experience contractors. For contractors, it will minimize the number
of unqualified contractors who might enter unrealistic tenders, provide a direct
opportunity to decline without fear of future disqualification, and protect contractors
from being awarded contracts they are not capable of performing. Also, due to
reducing the number of bidders, the probability of each tenderer winning the contract
is increased.
RESEARCH METHOD AND DESIGN
To achieve the study objective, a literature review on multi-criteria selection practice
was carried out, supported with self administered questionnaires which are similar to
the approach used in related studies (Odusami, 1998; Mafimidiwo, 2009). The study
population comprises of construction participants operating in Lagos metropolis being
a major commercial city in Nigeria. The categories of organizations identified as
having experiences in the use of multi-criteria selection practice are Private and Public
clients, Architectural, Quantity Surveying, Civil/Structural engineering and
Building/Service engineering firms. The sampling technique adopted for the study is
purposive because of the fuzzy nature of the data on construction participants in
Nigeria. Data analysis was done by using descriptive statistics while mean item scores
was used to present responses obtained on a modified Likert scale instrument.
DATA COLLECTION
The questionnaire comprises of two parts. Section A sought to get information about
the organization of the respondent, respondent discipline, and the category of project
the respondent organization undertakes. Section B sought information about the type
of projects where multi-criteria selection practice is used; and reasons for
prequalification of contractors, among others. In addition, the respondents were

Alabi
276
requested to rank in the order of importance the prequalification objectives and the
decision rules in contractors‘ selection among others.
RESULT AND DISCUSSION OF FINDINGS
A total of fifty-five questionnaires were administered and forty-five (82%) were
retrieved and analyzed. According to figure 1, the highest responses (16) came from
public authority while the lowest (7) was from private clients. The contracting and
consulting organizations recorded 12 and 10 responses respectively.
Figure 1: Type of Respondent Organization
Table 1 identifies the types of projects on which prequalification of contractors are
carried out. Building works ranked the highest with 44.44% followed by
Building/Civil Engineering works (40%) while civil engineering works and
Civil/Building maintenance work recorded 13.33% and 4.44% respectively. This is
expected as the most common form of construction project is building works when
compared with others.
Table 1: Projects where multi-criteria selection practice is used
Types of work Frequency Percentage
Building work 20 44.44
Building /Civil Engineering works 18 40
Civil Engineering work 6 13.33
Civil /Building Maintenance 2 4.44
Others 2 4.44
Notes: Very Strong = 5, Strong = 4, Moderate = 3, Low = 2, Very low = 1
On reasons for prequalification by firms as indicated in table 2, the majority of the
respondents (57.77%) viewed it as a standard procedure for the execution of
construction project while the need to comply with due process was given by 22.22%
of the respondents. Other reasons are indicated in their order below. These findings
support Holt et al. (1995) position that no matter how construction is procured, a
method of contractor selection must still be employed.
Table 2: Reasons why organizations prequalify
Reasons Frequency Percentage
Standard procedure 26 57.77
Comply with due process 10 22.22
Ensure most suitable contractor is employed 7 15.56
Public accountability 3 6.67
Client‘s demand 2 4.44
Wide usage 1 2.22
Notes: Very Strong = 5, Strong = 4, Moderate = 3, Low = 2, Very low = 1
167
1210
0 5 10 15 20
Public authority
Contracting
Frequency
Type of Respondent Organization

Contractor selection
277
According to table 3, the predominant prequalification criteria and decision rules used
in selecting contractors for construction projects are determined by the size, nature
and type of projects according to the majority (84.44%) of the respondents. In-house
guidelines of the client‘s organization (8.89%), client‘s requirements/strategies
(6.67%) and individual‘s experience (6.67%) are not significant factors. This view
support Banaitiene and Banaitis (2006) conclusion that evaluation criteria for bids of
contractors must be selected considering the size and complexity of a construction
project.
Table 3: Determinant of prequalification criteria and decision rules used for projects
Decision criteria Frequency Percent
age
According to the size, nature and type of project 38 1
According to in - house guidelines of the clients 4 2
According to clients requirements / strategies 3 3
According to individual‘s experience 3 4
Notes: Very Strong = 5, Strong = 4, Moderate = 3, Low = 2, Very low = 1
As shown in table 4 all the listed client prequalification objectives are highly rated by
the respondents. This finding supports the view that prequalification objectives aim at
ensuring projects success hinged on quality, cost and time performance (Drew and
Skitmore, 1993; Banaitiene and Banaitis, 2006).
Table 4: Prequalification objectives
Mean item score Rank
Quality 4.76 1
Value for money 4.69 2
Time 4.31 3
Safety 4.17 4
Cost 4.16 5
Risk 3.62 6
Notes: Very Strong = 5, Strong = 4, Moderate = 3, Low = 2, Very low = 1
The levels of importance of twelve decision criteria for prequalification of contractors
were ranked very highly by respondents as shown in table 5. Performance was ranked
1st, followed by financial stability, reputation, and others respectively. This finding
supports past studies (Jennings and Holt 1998; Ng and Skitmore, 1999;
Plebankiewicz, 2010).
Table 5: Level of importance of decision criteria
Decision criteria Mean item score Rank
Performance 4.67 1
Financial stability 4.38 2
Reputation 4.51 3
Standard of quality 4.49 4
Integrity 4.36 5
Health & safety 4.22 6
Resources 4.13 7
Management capability 4.00 8
Quality assurance & control 3.78 9
Working capital 3.73 10
Current workload 3.67 11
Level of technology 3.60 12
Notes: Very Strong = 5, Strong = 4, Moderate = 3, Low = 2, Very low = 1

Alabi
278
The prime causes of inadequate contractor selection are indicated in table 6. Long
term confidence on the result of prequalification was ranked highest followed by
others as shown below. Holt et al (1995) and Jennings and Holt (1998) studies
corroborate these findings where lack of cyclic review of prequalification criteria was
said to exist among others.
Table 6: Causes of inadequate contractor selection
Mean item score Rank
Long term confidence on the result of prequalification 4.17 1
Inappropriate criteria selection 4.07 2
Dependency on tender sum in tender evaluation 4.02 3
Inappropriate significance attributed to the criteria 3.84 4
Notes: Very Strong = 5, Strong = 4, Moderate = 3, Low = 2, Very low = 1
According to table 7 the majority of the respondents (88.89%) are of the view that
both the clients and contractors benefit from multi-criteria selection practice while a
very small minority (8.89%) believed that it is only the clients that benefit from multi-
criteria selection practice. This outcome is supported by earlier study by Drew and
Skitmore (1993) where it was observed that both the clients and the contractors
benefits from prequalification exercise.
Table 7: Who benefits from multi-criteria selection?
Frequency Percentage
Client 4 8.89
Contractor 1 2.22
Both 40 88.89
Neither - -
Total 45 100
CONCLUSION
The selection of an appropriate contractor is considered to be very critical to project
success which informed the adoption of multi-criteria selection practice in contractor
selection. The study takes a cue from other related studies and discovered that most
organizations in Nigeria viewed prequalification as a standard procedure for the
execution of construction projects coupled with the need to comply with ―due
process‖. The predominant prequalification determinant in selecting contractors was
found to be based on the size, nature and type of projects while the prequalification
objectives such as quality, value for money, time and safety were highly rated by the
respondents indicating their importance in ensuring projects success. The respondents
agreed with literatures on the importance of performance, financial stability,
reputation, among others as decision criteria for prequalification of contractors and
also established that both clients and contractors benefit from multi-criteria selection
practice.
The study further identified the prime causes of inadequate selection of contractor as
long term confidence in the results of prequalification and inappropriate criteria
among others. Therefore, the study recommends that while using multi-criteria
selection practice, contractors‘ qualification must be evaluated by determining and
defining appropriate evaluation criteria and the prequalification of contractors must be
done periodically for developing a standing list of contractors.

Contractor selection
279
REFERENCES
Banaitiene, N & Banaitis, A 2006, ‗Analysis of criteria for contractors‘ qualification‘
Technological and Economic Development of Economy, vol.12, no.4, pp.276-282.
Drew, DS & Skitmore, MR 1993, ‗Prequalification and competitiveness‘ International
Journal of Management Science, vol.21, no.3, pp.363-376.
Farooq, A 2005, ‗Efficacy of contractor prequalification models‘ Thesis proposal submitted to
the Department of Construction Engineering and Management,
King Fahd University of petroleum and Minerals.
Hatsush, Z & Skitmore, M 1998, ‗Contractor selection using multicriteria utility theory:
an additive model‘ Building and Environment, vol.33, pp.1283-1300
Holt, GD, Olomolaiye, PO, & Harris, FC 1995, ‗A review of contractor selection practice in
the U.K construction industry‘ Building and Environment, vol.4, no.30, pp.553-561.
Jennings, P & Holt, GD 1998, ‗Prequalification and multi-criteria selection: a measure of
contractors` opinion‘ Construction Management and Economic, vol.16, pp.651-660.
Mafimidiwo, BA 2009, ‗A review of tendering strategies for project procurement in the
Nigerian formal and informal sectors‘ The Yaba Journal of Environmental Research,
vol.1, no.2, pp.140-154.
Martin, B 2008, Estimating and tendering for construction work, 4th edn, Butterworth-
Heinemann Publications, Oxford,
Ng, ST & Skitmore, RM 1999, ‗Client and consultant perspectives of prequalification criteria‘
Building and Environment, vol.34, pp.607-621.
Odusami, KT 1998, ‗Prequalification and selection of contractor‘ Journal of construction
in Nigeria, vol.13, no.1, pp.23-28; 30-32.
Onwusonye, SIJ 2006, Tendering, estimating and contracting arrangement in building project
(principle and practice). Intercontinental Education Books and Plublishers, Owerri.
Palaneeswaran, EA & Kumaraswamy, M 2001, ‗Recent advances and proposed improvements
in contractor prequalification methodologies‘ Building and Environment, vol.36,
pp.73-87
Plebankiewicz, E 2010, ‗Construction contractor prequalification from polish clients‘
perspective‘ Journal of Civil Engineering and Management, vol.16, no.1, pp.57-64.
Sonmez, M Yang, JB & Holt, GD 2001, ‗Addressing the contractor selection problem using
an evidential approach‘ Engineering, Construction and Architectural Management,
vol. 8, no.3, pp.198-210.
Topcu, YI 2004, ‗A decision model proposal for construction contractor selection in Turkey‘
Building and Environment, vol.39, pp.469-481.


Mshelgaru, I.H. and Abdulazeez, A.D. (2011) Cost implications of biodegradation of Khaya
grandifoliola (dry land mahogany) by aspergillus spp in residential buildings In: Laryea, S., Leiringer,
R. and Hughes, W. (Eds) Procs West Africa Built Environment Research (WABER) Conference, 19-21
July 2011, Accra, Ghana, 281-289.
281
COST IMPLICATIONS OF BIODEGRADATION OF
KHAYA GRANDIFOLIOLA (DRY LAND MAHOGANY)
BY ASPERGILLUS SPP IN RESIDENTIAL BUILDINGS
I. H. Mshelgaru1 and A. D. Abdulazeez
Department of Building, Ahmadu Bello University, Zaria, Nigeria
Degradation of timbers in building due to microorganisms was reported to cause
enormous economic loses and species of Aspergillus are among the major
contributors to the degradation of timbers in Nigeria. This research aimed at
evaluating cost of implications of the biodegradations of Khaya grandifoliola by
Aspergillus in residential buildings empirically. Decayed Khaya grandifoliola
samples were collected on residential buildings to extract, cultivate and identify the
Aspergillus spp present. The cultivation went through serial dilutions and inoculations
on sabouraud dextrose agar in petri dishes for 72 hours at 30oC. The species were
identified through visual and microscopic observations. Percentage rate of
degradation were determined under controlled laboratory conditions by inoculating
known weights of Khaya grandifoliola with the Aspergillus spp and incubating in a
minimal medium for 24 weeks at 30oC. Weight loses and spore counts were recorded
at 4 weeks intervals. A pattern of the degradation was forecasted for 24 months. an
accumulative weight lost of 16% for this period was obtained. Methods and costs of
repair and replacement of the decayed portions were investigated. Residential
Buildings constructed of Khaya grandifoliola will experience considerable high cost
of maintenance if conditions favourable to the Aspergillus spp.
Keywords: Aspergillus, biodegradation, cost, Khaya grandifoliola, residential
building.
BACKGROUND
Mahogany is a type of timber commonly used as structural and non structural
constructions of buildings in the dry land region of the savanna. The specific species
is known as Khaya grandifoliola. Mshelgaru (2010) indicated that Khaya
grandifoliola is from the family of Meliaceae and is locally known in the Nigerian
timber market as ‗madachi‘, ‗oganwo‘, ‗ono‘ and ‗dalchi‘. Its timber is reddish,
becoming very dark with age, fairly hard, and is distinguished from other timbers in
the region by the close network of the thick circum-medulary lines of the parenchyma
which is visible to the naked eye (Usher and Ocloo, 1979 and Erickson, et al; 2005).
Khaya grandifoliola is known for its durability, high strength-to-weight ratio and
many positive structural and aesthetic properties that earn it its popularity. But like
any other timber Khaya grandifoliola provides specialised ecological niches in which
many organisms are evolved in using it as food (Lappalainen, et al; 2001; The Hidden
Forest, 2011).

Mshelgaru and Abdulazeez
282
The microorganisms that deteriorate timbers are generally from the phyla of
basidiomycetes and ascomycetes where Aspergillus hails (Pe´rez, et al; 2002). These
families are kwon to cause the most serious damage in timber structures around the
world. Decays in timber are categorized into soft-rot, white-rot, and brown rot (Usher
and Ocloo, 1979). This classification is based on the macroscopic characteristics of
the advanced stages of the decays. Among the white-rot fungi are the Aspergillus spp
which specialized in destroying hardwoods (Morris, 1998). Fungi have varying ability
to reduce the strength of timbers. Smulski (1996) showed that the white-rot or the
brown- rot fungi can affect several strength and mechanical properties of timber much
before significant weight loss is reached. This gradual reduction in strength is as a
result of the break down of the lignocellulose, lignin and cellulose of the cell walls.
Aspergillus spp can utilize Khaya grandifoliola for food because of their ability to
produce a large number of enzymes. They were reported to have the abilities to
destroy various types of timbers in buildings (Lappalainen et al; 2001; Mshelgaru and
Olonitola 2010). Morris (1998) and Highley and Flournoy (1994) cited Aspergillus
clavatus, A. flavus, A. parasiticus, A. fumigatus, A. niger, A. oryzae, A. terreus, A.
ustus, and A. versicolor as some of the ubiquitous species among the 200 species of
Aspergillus identified world wide (The Hidden Forest, 2011). Aspergillus spp are
saprophytic filamentous organisms that are capable of enzymatically degrade complex
cellulosic structures of timber, into simple digestible products for food (The Hidden
Forest, 2011). The cellulose, hemicellulose, and lignin make up about 45% of the dry
weight of the timber and the hemicellulose potion makes 25–30% of total weight of a
dried timber. Beesely (1987) and Lappalainen et al (2001) explained that the fine,
threadlike strands called mycelia of the Aspergillus grow and spread throughout the
microscopic cell walls to excrete the enzymes that digest the cell walls. The rate and
extent at which this occurs depend on the duration of the condition favorable for the
growth (Malloch, 1997).
The activities of fungi on timber do not only affect functional properties but also
affect social status and cause economic losses of buildings. It was reported (Morris,
1998) that in 1945 timber structures in the coastal region of British Columbia
experienced a much preventable loss as a result of decay by fungi , particularly in
and around residential buildings. Beesely (1987) has estimated the annual costs of
timber damage in the United States to be two billion dollars a year and that this
number grows every year. Morris (1998) also reported an estimated yearly cost of
4000 million Euros spent on maintenance of fungi damage buildings components in
Finland However, the economic advantages of the same fungi are also huge,
especially in industry and health (Albinas and Bronius, 2007).
MATERIALS AND METHODS
Sample Collections
Bulk samples of ten grammes were aseptically collected on deteriorated timber
components on residential buildings that had shown visible signs of deteriorations.
Information on age and designations of buildings were also gathered to determine the
condition of the component and to know how the deteriorations observed developed.
Cultivation of Microorganisms
Sabouraud Dextrose Agar (SDA) were used as the culture media and were prepared
according to manufacturers‘ specifications of glucose 40.0g, peptone 10.0g ,
streptomycin 0.01%, agar 15.0g, and distilled water 1000ml. This was poured into

Biodegradation
283
20ml petri dishes and sterilized at 121oC for 15 minutes and then allowed to solidify.
A stock of one gramme of decayed sample collected from residential buildings was
dissolved in 10 millilitre of peptone water. These were thoroughly shaken to dislodge
the fungi spores that may be present. From this, dilutions, of 0.5 millimeters of the
second and fourth series were inoculated on to the petri dishes already labeled. The
inoculums were then spread over the entire surface using a sterile glass rod spreader.
The SDA plates were incubated at 30oC for 72 hours, after which developed colonies
were identified and isolated and then counted with the aid of magnifying electronic
counter.
IDENTIFICATIONS AND ISOLATION OF ASPERGILLUS SPP
Visual observations with the aid of dissection microscope and light microscopes were
the main techniques used to identify the fungi. Microscopic observations were
conducted. During this observation attentions were paid to distinguishing
characteristic such as growth morphology, presence and forms of conidia, septa,
conidiophore, appendage, hyphae, texture, catenation, and colour features which
distinctly differentiate one species or genera from another. The information obtained
were referred to relevant fungi dichotomous and picture keys from text books
(Barnett, 1993) and online (Malloch, 1997; Kleagerb, 2011; The Hidden Forest, 2011)
sources for inferences for the identifications.
Determining Biodegradability of Khaya grandifoliola by Aspergillus spp
To determine the biodegradability sound Khaya grandifoliola, known weight of sterile
samples of the Khaya grandifoliola were inoculated with Aspergillus spp in a minimal
medium and incubated for 24 week at 30oC. The temperature and moisture supply
were controlled and maintained throughout the period of the study. Cumulative
percentage lost of weight due to the biodegradation process was recorded at every 4
weeks interval.
RESULTS AND DISCUSSION
Prevalence of Aspergillus spp on Khaya grandifoliola
The prevalence of Aspergillus spp on decayed samples of Khaya grandifoliola is
shown in fig 1. The determination of prevalence was conventionally based on
cultivation methods from a serial dilution (Smulski, 1996). High prevalence of
Aspergillus spp on samples of Khaya grandifoliola is an indication of involvements of
the organisms in the biodegradation (Erickson, et al; 2005). The high prevalence
(samples H1-H15) and the repeated encounter of the same species on the Khaya
grandifoliola were indications of dependence on this species of timbers for food for
survival.
Although the experiments conducted suggested that not all of the Aspergillus spp
available could break down the Khaya grandifoliola cell tissues; Highley and
Flournoy (1994) reported that fungi are the major biodegradants of timbers
(Mshelgaru and Olonitola 2010). Similar studies (Pe´rez, et al; 2002) were reported to
have linked these genera and confirmed its saprophytic characteristics on timber
species.
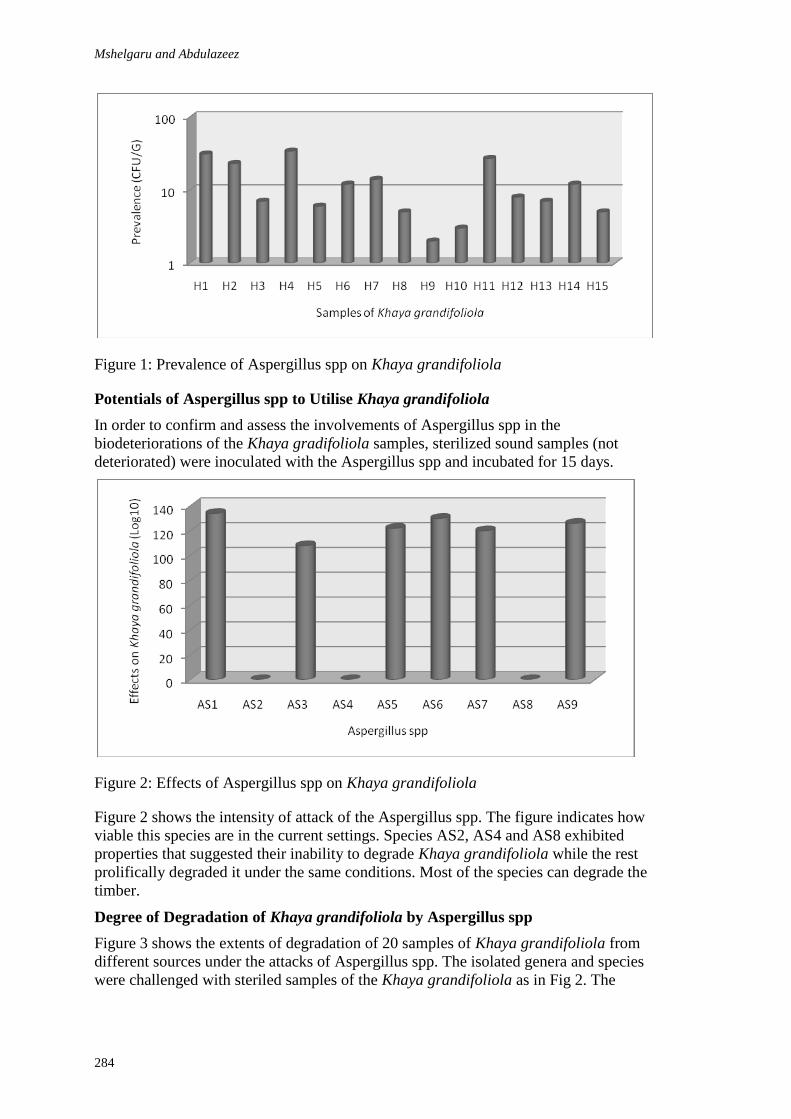
Mshelgaru and Abdulazeez
284
Figure 1: Prevalence of Aspergillus spp on Khaya grandifoliola
Potentials of Aspergillus spp to Utilise Khaya grandifoliola
In order to confirm and assess the involvements of Aspergillus spp in the
biodeteriorations of the Khaya gradifoliola samples, sterilized sound samples (not
deteriorated) were inoculated with the Aspergillus spp and incubated for 15 days.
Figure 2: Effects of Aspergillus spp on Khaya grandifoliola
Figure 2 shows the intensity of attack of the Aspergillus spp. The figure indicates how
viable this species are in the current settings. Species AS2, AS4 and AS8 exhibited
properties that suggested their inability to degrade Khaya grandifoliola while the rest
prolifically degraded it under the same conditions. Most of the species can degrade the
timber.
Degree of Degradation of Khaya grandifoliola by Aspergillus spp
Figure 3 shows the extents of degradation of 20 samples of Khaya grandifoliola from
different sources under the attacks of Aspergillus spp. The isolated genera and species
were challenged with steriled samples of the Khaya grandifoliola as in Fig 2. The

Biodegradation
285
natural characteristic of the Khaya grandifoliola were displayed under the influence of
various species of Aspergillus.
Figure 3: Extents of degradation of Khaya grandifoliola Aspergillus spp
The degradation is higher in samples S12 and S10 compared to S11 and S17. The
differences result from natural resistance and degrading characteristics of the
organism. The studies conducted by Usher and Ocloo, (1979) adopted this method to
categorise some West African timbers according to their natural resistances.
Biodegradation Pattern of Khaya grandifoliola due to Aspergillus spp
1. Degradations of Khaya grandifoliola by Aspergillus spp Under Laboratory
Conditions
Table 1: Percentage lost of weight of Khaya grandifoliola attacked by Aspergillus spp
Time Sample Mass Loss (%) Average Percentage Mass loss
12th
Week K1a 0.24
0.246 K2a 0.25
K3a 0.27
K4a 0.23
16th
Week K5b 0.64
0.648 K6b 0.67
K7b 0.65
K8b 0.63
18th
Week K9c 1.68
1.653 K10c 1.66
K11c 1.65
K12c 1.62
24th
Week K13d 2.42
2.482 K14d 2.31
K15d 2.67
K16d 2.53
Table 1 shows cumulative percentage lost of weight of Khaya grandifoliola for the
period of 24 weeks. Lost of weight for four and eighth week were inconsistent and
insignificant. The experiment measured the growth activities of Aspergillus spp at a
controlled laboratory conditions, moisture, oxygen, thermal loads and other activating

Mshelgaru and Abdulazeez
286
factors were at 100%. An empirical damage function of the timber and the timber-
decaying fungi was developed.
Usually, when microorganisms are moved from favourable conditions, to harsh
conditions; they tend to either cease to grow permanently or retard until they are able
to produce appropriate enzymes capable of digesting the new environment to source
for food to survive (Highley and Flournoy, 1994). The slow down disrupts process of
biodegradation and kills wanted fungi. This could have been the cause of the
inconsistency recorded at the earlier stage of the experiment. To reduce the negative
effect of this phenomenon, a small quantity of yeast extracts was added to the minimal
medium to guaranty survival of days. But since the aim of the experiment was to study
the activities and the behavour of healthy organisms; the radical shift in metabolic
activities was prevented by incorporating KH2PO4 and K2HPO4 into the media
(Smulski, 1996) to serve as a buffer.
The results obtained employing 16 samples were progressive and consistent. Perhaps,
because the period of the experiment fail short of when growth of the fungi will retard
as a result of physiologically abnormality. These organisms degrade cellulose by
secreting enzymes that convert the cellulose into compounds that they absorb. This
attack depletes the cellulose content of the wood and leaves a residue rich in lignin.
Lappalainen et al (2001) described characteristic of such degraded timber as dark in
color, loses of strengths, and become soft, punky, and cross-checked, or fibrillated.
2. Forecasted Degradations of Khaya grandifoliola
Figure 4 presents the forecasted trend line of the degradation of the Khaya
grandifoliola for a period of 24 months. 16% lost was forecasted for this period.
Erickson et al (2005) reported 66% lost of weight at an advanced stage of
biodeterioration.
Figure 4: Trend of degradation of Khaya grandifoliola by Aspergillus spp
As degradation progresses, the metabolic activities of the growing organisms
population may eventually change the nature of the environment to a point where it
will become highly unfavourable and the population will become physiologically
abnormal or dies or inhibit further growth (Erickson, et al; 2005), even when the

Biodegradation
287
activation factor were still available. This may be brought about by, a drastic change
in the hydrogen ion concentration (pH) being either acidic or basic, or by the
accumulation of toxic organic metabolites, or by the depletion of oxygen (Smulski,
1996). A condition similar to the laboratory condition can be attained in service when
water activity (Aw) Levels is > 0.90, RH value at 90% (The Hidden Forest, 2011),
oxygen level in the air is at 20%, and atmospheric temperature is 30°C. (Lappalainen
et al; 2001).
DISCUSSION
When timber lost its values it needs refurbishment (Richardson, 1995) in order to
restore its functionality. The deteriorations due to Aspergillus results to high cost of
maintenance that can inflate the life-cycle cost of buildings (Worldsworth, 2001;
Forest and wood products research and Development Corporation, 2001). This will
eventually render the entire building uneconomical to maintain. On degradation, the
Khaya grandifoliola does not only loss physical mechanical, acoustic and insulation
properties but also loss desirable colours, increased fire hazards; (Highley and
Flournoy, 1994 ) and pollute with missions of volatile organic compounds, toxins and
odour; becomes more nutritional to insects, causes sick building syndrome and
allergens (Pe´rez, et al; 2002; Mshelgaru and Olonitola 2010). The subsequent effects
of all, boarder on the comfort and well being of the building occupants and
environmental impacts, which can be interpreted to money.
To remediate partially decayed non structural timber components, cleaning and
reinforcement with a sound member may suffice; but for a structural member a
complete replace of the deteriorated member may be necessary. The elements of cost
related works in remediating deteriorated Khaya grandifoliola may include the
followings;
1. In-place treatment
Clean-up of small area (fewer than 3 patches and each parch smaller than a square
meter) of fungi problem can be removed by the maintenance staff at less cost (The
Hidden Forest, 2011). But cleaning-up a moderate and a large contaminations, a
consultant firm must be consulted. Treating an infected, but serviceable timber can be
done not only to kill the active fungi (Aspergillus), but also to guard against future
infections epoxy (Beesely, 1987), in which case the services of the consultant firm is
also required.
2. Remediation of decayed potions
In some instances replacement of rotted timber may not be better option than repair
and this may include restoration of the lost properties (Albinas and Bronius, 2007). In
repairs for conservation, for example, the goal is to preserve as much of the original
part as possible. After a successful repair, it is a good option to the restored
component can be stabilized with. Epoxies are useful for consolidating rotted timbers,
restoring lost portions of molding's and carvings, and for strengthening weakened
structural members (Worldsworth, 2001).
3. Replacing decayed components
This operation comprises the costs of removal, material and construction or
installation. It starts with removing the deteriorated and damaged components as
indicated on the plan design, to be replaced with a new one. The Hidden Forest (2011)
stresses that to achieve good replacement, understanding of the cause of infection and

Mshelgaru and Abdulazeez
288
the philosophy of the biodegradation is necessary prerequisite. Removal is done as
much as practicable and economical until sound timber reached, especially with
beams, columns, and other critical members whose load-carrying ability may be
compromised as result of the deterioration. This is because difficult-to-detect incipient
decay can extend well beyond visibly rotted areas. Even though, Lappalainen et al
(2001) and the Hidden Forest (2011) pointed out that there's no known way of
accurately determining residual strength of decayed timber in place; Erickson et al
(2005) suggested strength-to-weight ratio values, velocity of ultrasonic and other
visual means can good guides. The cost of the Khaya grandifoliola is relatively
expensive due to scarsity. Mshelgaru (2010) recorded differences of 30% in the the
market prices of ‗fairly used‘ and brand new ones.
CONCLUSION
This study of biodeterorations of Khaya grandifoliola by Aspergillus spp suggested
that most of the spp available on the residential buildings had the ability to degrade
and the damage they caused was enormous. The procedure used in this study
(incubation) is associated with limitation of not being able to capture the presence of
some species that could be equally significant in the deterioration (The Hidden Forest,
2011) due to domination by privilege species, if any. Another limitation is the use of
‗colony counting‘ to determine the prevalence instead of the preferred ‗spore counting
technique, which has better accuracy.
A lost of weight of about 16% in 24 months was forecasted based on the experiment
in the laboratory under controlled conditions. The conditions for the deteriorations in
the buildings that will warrant such an optimum deterioration can hardly be met under
a normal situation (Mshelgaru and Olonitola 2010). Therefore, it is not likely that the
rate of deterioration can be as high as 16% in two years. But where it is coincidently
possible, the implication will be frequent maintenance work to keep residential
buildings that have Khaya grandifoliola components functioning as required.
REFERENCES
Albinas L. Bronius J. (2007) Microbiological Destruction of Constructional and Decoration
Materials of Buildings. Materials Science (Medžiagotyra). vol.13, no. 1. pp 70-73.
Barnett, H. L. (1993) Illustrated Genera of Imperfect Fungi. Second edition, Burgess
Publishing Company. West Virginia, Morgantown, West Virginia.
Beesely, J. (1987), wood deterioration in buildings: a guide to the indication and treatment of
wood deteriogens, technical bulletin 7.1 Australian Council of National Trusts,
Melbourne.
Dinwoodie, J. M. (2000) Timber: Its Nature and Behaviour. Second edition, published by E &
FN Spon. 11, New Fetter lane, London.
Erickson, K. E. L. Blanchette R. A. and Ander P. (2005) Microbial and Enzymatic
Degradation of Wood and Wood Components. Springer-Verlag. Berlin, New York P.
407
Forest and wood products research and Development Corporation, (2001), Environmental
Friendly Housing Timber- Principles. first edition, Australia.
Highley, T. L. and Flournoy D. (1994) Decomposition of Cellulose by Brown-rot fungi.
International biodeterioration and biodegradation, vol.11, p. 191-221.
Kleagerb, L. (2011), Dichotomous Keys. www.thermes.mbl.edu./biological Bulletin
accessed on 1/04/2011

Biodegradation
289
Lappalainen S. Kahkonen E. Loikanen E. Palomaki E. Lindroos O. Reijula K. (2001)
Evaluation Priorities for Repairing in Moisture damaged School Buildings in Finland.
Journal of Build Environment. Vol. 36, No. 981-986.
Malloch, D. (1997) An Introductory Guide to the Study of Mould (fungi). Mould: isolation,
cultivation, identification. Department of Botany University of Toronto Canada.
Morris, P. I. (1998) Understanding Biodeterioration of Wood in Structures. Forintek Canada
Corporation Specialist Inc. Shutsbury, Massachusetts, USA.
Mshelgaru I. H. (2010) Biodeterioration of Timbers in Building and Building Performance:
sustainability implications under the Nigerian Microclimates. Lambert Academic
Publishing AG & Co. KG. Germany.
Mshelgaru I. H. and O. S. Olonitola, (2010) Health and Safety Conditions of Building
Maintenance sites in Nigeria: evaluating the post occupancy contaminations of timber
buildings by microorganisms. Academic Journals- African Journal of Environmental
Science and Technology.
Pe´rez, J. Mun˜oz-Dorado, T. de la Rubia, J. Martı´nez (2002) Biodegradation and Biological
Treatments of Cellulose, Hemicellulose and Lignin: An overview. International
Microbiology, volume 5: pages 53–63
Richardson, B. A. (1995) Remedial Treatment of Buildings. Second edition. Butterworth-
Heinemann limited oxford.
Seeley, I. H. (1987) Building Maintenance. Second edition. Published by Macmillan press
limited London
Smulski, S. (1996) Wood-Destroying Fungi in Residential Construction. Wood Science
Specialist Inc. Shutsbury, Massachusetts, USA.
The Hidden Forest (2011) Fungi Classification, Fungi Identification Guide, What Fungi do
www.hiddenforest.co.nz accessed 20/02/2011
Usher, M. B. and Ocloo, J. K. (1979) Natural Resistance of 85 West African Hardwood
Timbers to attack by Termites and Microorganisms. Bulletin of Tropical Pest.
Number 19.
Worldsworth, P. (2001), Lee‘s Building Maintenance Management, Fourth edition.Blackwell
Science and the Estate of Reginald Lee.


Imbeah, K.A. and Dansoh, A. (2011) Critical success factors for the implementation of Total Quality
Management (TQM) in real estate development in Ghana In: Laryea, S., Leiringer, R. and Hughes, W.
(Eds) Procs West Africa Built Environment Research (WABER) Conference, 19-21 July 2011, Accra,
Ghana, 291-303.
291
CRITICAL SUCCESS FACTORS FOR THE
IMPLEMENTATION OF TOTAL QUALITY
MANAGEMENT (TQM) IN REAL ESTATE
DEVELOPMENT IN GHANA
Kobina Afoah Imbeah1 and Ayirebi Dansoh
2
1Project Manager, State Housing Company Limited, Kumasi, Ghana
2Department of Building Technology, Kwame Nkrumah University of science and Technology, Kumasi,
Ghana
Research in recent times has come up with accounts of successful and unsuccessful
efforts at implementing TQM, with growing interest in identifying elements of
management that account for successful implementation of TQM. Most current
studies focus on superior quality companies in advanced industrial environments,
leaving companies in the developing economies largely unstudied. This paper
identifies the critical factors contributing to the successful implementation of TQM in
real estate firms in Ghana. A survey of 62 real estate development companies
registered with the Ghana Real Estate Developers Association (GREDA) was
conducted to establish managers perception of factors required for a successful
implementation of TQM.. Eleven factors were identified, viz: Top management
commitment and leadership, Employee welfare and commitment, Employee training
and development, Customer focus, Planning, process control and process evaluation,
Supplier management, Continuous Improvement, Team Work, Information analysis
and evaluation. These are factors to be given attention to minimize difficulties related
to the implementation of total quality management and ensure the successful
implementation of total quality management in this industry.
Keywords: Total Quality Management, critical success factor, real estate, Ghana.
INTRODUCTION
Global competition has increased as countries increasingly embrace the free market
model and open up their borders for external investments and trading (Lee, 2002). To
stay competitive, companies have to focus their business strategies on strategic
advantages through the enhancement of business excellence and performance. Quality
management provides an effective approach to achieving this goal. Companies are
striving to adopt and implement different quality management systems like ISO or
BS-based quality and Total Quality Management (TQM).
Total Quality Management is a quality management system which pursues excellence
in customer satisfaction through continuous improvement of products and processes
by the total involvement and dedication of everyone involved in the process or the
product (Chase et al., 2001; McAdam et al., 2002). When applied effectively, TQM
enables a company to improve long-term relationships, create a harmonious team

Imbeah and Dansoh
292
spirit, enhance professionalism and skills in all spheres of the construction sector,
encourage open addressing of problems and help to achieve the intended project
objectives and benefits (Low and Peh, 1996).The construction industry has generally
lagged behind other industries in implementing reform through total quality
management principles (Metri, 2005).Also, most studies examining the
implementation of TQM have been based on advanced industrial environments, and
the subject of these investigations has largely been big companies with advanced
management systems. Sila and Ebrahimpour (2002) reviewed 347 published articles
on TQM from 1989 to 2000 and observed that the majority of these studies were
conducted in USA, U.K and Australia. This suggests that the operating environment
of companies as well as their corporate background and traditions have a role to play
in the successful implementation of TQM. Real estate development companies in
Ghana generally undertake Mass Housing Building Projects and account for up to
about 60% of all building projects (Zawdie et al, 2000). The term Mass House
Building Projects (MHBPs) is used in the construction industry to describe mass
production techniques of housing development projects (Ashley,1980), and is defined
as ―the design and construction of speculative standardized residential house unit
usually in the same location and executed within the same project scheme (Ahadzie et
al 2007). Unlike many one –off projects undertaken by general construction firms, the
responsibility for the management of the design and construction of these projects lie
within a single real estate development organisation.
The peculiarities of management in small and medium companies, the characteristics
of developing economy environments and the management demands of real estate
development necessitate investigation of factors influencing the implementation of
TQM in the real estate industry in Ghana. This paper identifies the critical factors
contributing to the successful implementation of TQM in real estate firms in Ghana.
The paper is structured by first describing Total quality management with its
importance to firms‘ productivity and results. The next, is critical success factors
identified in other frameworks and quality awards. Discussions of the data collected
and its analysis. The subsequent section discusses the findings of the study. The
conclusion and recommendations follow after this section. Finally, list of references
are detailed at the end of the paper.
TOTAL QUALITY MANAGEMENT
Companies in the construction industry provide infrastructure for the economy and
constitute an important backbone of many economies, yet they face problems of
instability, low productivity, poor quality and lack of standards (Metri, 2005) in the
face of high fragmentation in the industry. Total Quality management provides an
effective approach to prevent or reduce these problems and provide higher quality
services and products. Its management and control processes are designed to focus on
the entire organisation and all of the employees in providing products or services that
satisfy the customers (Talha, 2004).ISO defined it as the management approach of an
organization, which concentrates on quality, based on the participation of its members
which aims at long-term success through satisfaction and benefits to all members of
the organization and society (ISO 8402, 1994). Zhang et al.,(2000) defined TQM as a
management philosophy for continuously improving overall business performance
based on leadership, supplier quality management, vision and plan statement,
evaluation, process control and improvement, product design, quality system
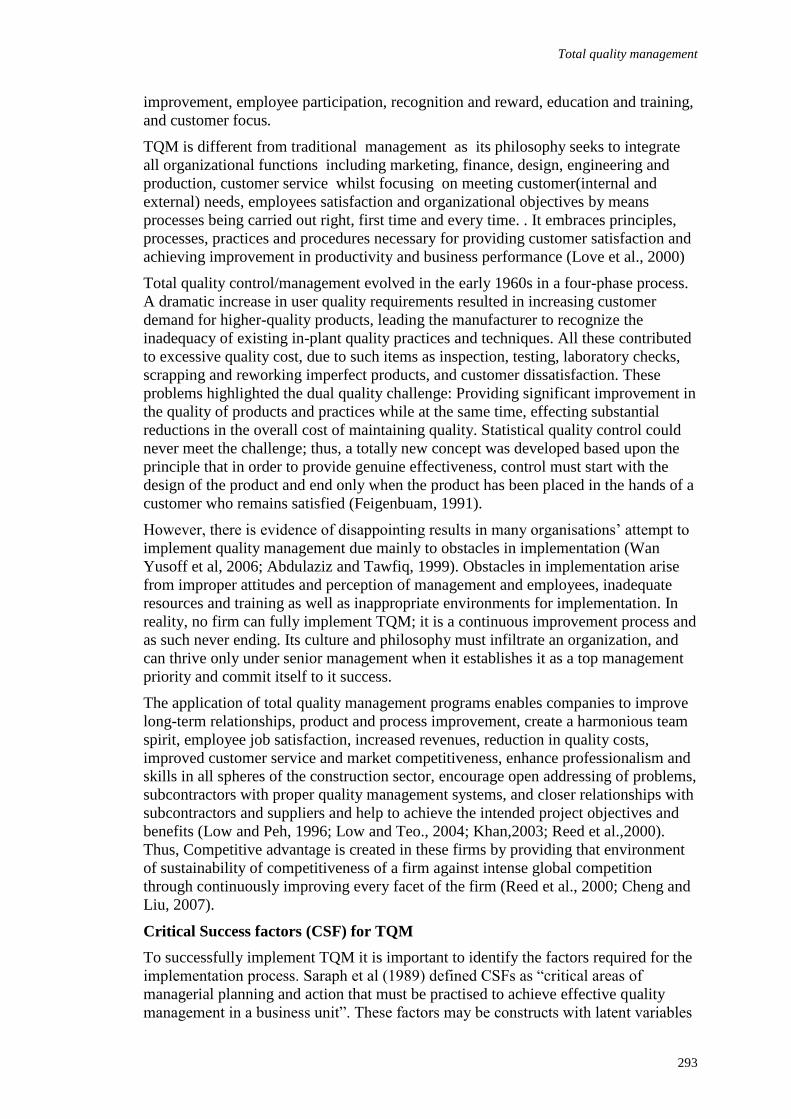
Total quality management
293
improvement, employee participation, recognition and reward, education and training,
and customer focus.
TQM is different from traditional management as its philosophy seeks to integrate
all organizational functions including marketing, finance, design, engineering and
production, customer service whilst focusing on meeting customer(internal and
external) needs, employees satisfaction and organizational objectives by means
processes being carried out right, first time and every time. . It embraces principles,
processes, practices and procedures necessary for providing customer satisfaction and
achieving improvement in productivity and business performance (Love et al., 2000)
Total quality control/management evolved in the early 1960s in a four-phase process.
A dramatic increase in user quality requirements resulted in increasing customer
demand for higher-quality products, leading the manufacturer to recognize the
inadequacy of existing in-plant quality practices and techniques. All these contributed
to excessive quality cost, due to such items as inspection, testing, laboratory checks,
scrapping and reworking imperfect products, and customer dissatisfaction. These
problems highlighted the dual quality challenge: Providing significant improvement in
the quality of products and practices while at the same time, effecting substantial
reductions in the overall cost of maintaining quality. Statistical quality control could
never meet the challenge; thus, a totally new concept was developed based upon the
principle that in order to provide genuine effectiveness, control must start with the
design of the product and end only when the product has been placed in the hands of a
customer who remains satisfied (Feigenbuam, 1991).
However, there is evidence of disappointing results in many organisations‘ attempt to
implement quality management due mainly to obstacles in implementation (Wan
Yusoff et al, 2006; Abdulaziz and Tawfiq, 1999). Obstacles in implementation arise
from improper attitudes and perception of management and employees, inadequate
resources and training as well as inappropriate environments for implementation. In
reality, no firm can fully implement TQM; it is a continuous improvement process and
as such never ending. Its culture and philosophy must infiltrate an organization, and
can thrive only under senior management when it establishes it as a top management
priority and commit itself to it success.
The application of total quality management programs enables companies to improve
long-term relationships, product and process improvement, create a harmonious team
spirit, employee job satisfaction, increased revenues, reduction in quality costs,
improved customer service and market competitiveness, enhance professionalism and
skills in all spheres of the construction sector, encourage open addressing of problems,
subcontractors with proper quality management systems, and closer relationships with
subcontractors and suppliers and help to achieve the intended project objectives and
benefits (Low and Peh, 1996; Low and Teo., 2004; Khan,2003; Reed et al.,2000).
Thus, Competitive advantage is created in these firms by providing that environment
of sustainability of competitiveness of a firm against intense global competition
through continuously improving every facet of the firm (Reed et al., 2000; Cheng and
Liu, 2007).
Critical Success factors (CSF) for TQM
To successfully implement TQM it is important to identify the factors required for the
implementation process. Saraph et al (1989) defined CSFs as ―critical areas of
managerial planning and action that must be practised to achieve effective quality
management in a business unit‖. These factors may be constructs with latent variables

Imbeah and Dansoh
294
which cannot be measured directly, but can still be assessed indirectly from their
manifestation. Saraph et al. (1989) in a pioneering study developed a quality
management instrument, identifying eight (8) critical success factors of TQM: Role of
divisional top management and quality policy, Role of quality department, Training,
Product/service design, Supplier quality management, Process management/operating,
Quality data and reporting and Employee relations. Their study had considerable
influence on later studies, and subsequent research has resulted in the development of
different frameworks and constructs based on varying perceptions and objectives
(Zhang, 2000).Although these frameworks or models have different TQM approaches,
they all lay emphasis on leadership, strategic planning, customer and market focus,
human resources focus, process management, continuous improvement, supplier
management and business results in one way or the other. (Ritchie and Dale, 2000;
Conca et al 2003).
Constructs or elements of critical success factors identified in frameworks for TQM
point to two categories of factors; soft and hard dimensions of TQM (Kanji., 1995;
Powel., 1995; Dow et al.,1999; Oakland., 2000). ―Hard‖ components of TQM
concentrate on the tools and techniques, systems and the supplementary measurement
and control of the work process, ensuring conformance to performance standards and
the reduction of variability whereas ―soft‖ components relate to areas behavioural
concerns such as increasing customer orientation, employee management,
organizational and quality culture. These dimensions are interrelated and are together
are very important for the successful implementation of TQM.
A great deal of research has been conducted in the field of TQM and its
implementation. The study by Sila and Ebrahimpour (2002) reviewing 347 articles on
TQM from 1989 to 2000, identified seventy–six studies that employed factor analysis
to extract factors for successful implementation of TQM. Out of these, they compiled
twenty five TQM constructs which are widely used by researchers to measure TQM
implementation. Their study revealed eight common cores of the factors viz: customer
focus and satisfaction, employee training, leadership and top management
commitment, teamwork, employee involvement, continuous improvement and
innovation, and quality information and performance.
Literature also reveals that different countries have adopted similar TQM factors as
criteria for quality awards under different titles (Metri, 2005). However, the criteria
for all these quality awards are derived from three basic frameworks: the Malcolm
Baldrige National Quality Award (MBNQA), the European Quality Award (EQA)
now called European Foundation for Quality Management (EFQM) Excellence Award
and the Deming Prize.
RESEARCH METHOD
Sampling
The study drew its sample from real estate development companies registered with the
Ghana real estate development association (GREDA). Membership of the association
currently, stands at 353. 96.2% are operating in the capital city Accra, 2.6% in
Kumasi and 1.2 in the other regions. However, the study was limited to Accra and
Kumasi due to the insignificant membership in the other regional cities. 103 structured
questionnaires were sent to quality managers to elicit their perceived importance of
the nine construct adopted for this study. Each construct had a number of items which
were to be measured on a five point Likert scale of 1-5 where, 1=not significant, and

Total quality management
295
5=exceedingly significant. A total of 67 were returned, of which 5 were invalid,
giving an effective response rate of 60.2%.The questionnaires were in two Sections.
Section one seeks personal information on respondents and company characteristics
and Section two, aimed at identifying factors critical for successful TQM
implementation.
TQM Construct Development and Measure
In developing and validating measures for TQM construct, the method by Conca et al
(2004) was chosen for the study. This method was developed by psychologists and it
has been widely accepted in the development of an instrument for measuring variables
in social sciences Conca et al., (2004).
Table 1.
Construct
no.
TQM construct Critical success factors
identified in literature
No. of items
for
questionnaire
Sources of items for
questionnaire
1 Top management
commitment and
leadership
Top management
commitment and
leadership
7 Saraph et al(1989)
Kaynak,H(2003)
Baidoun et al (2003)
Aspinwall et al (2005)
ISO:9001:2000
2 Human resource
management
Employee relations
Employee involvements
Education and Training
Recognition and Reward
12 Kaynak(2003)
Baidoun et al(2003)
Seraph et al(1989)
Conca et al(2004)
ISO:9001:2000
3 Customer
management
Customer management 7 Baidoun et al (2003)
Conca et al(2004)
Rao et al(1999)
4 Supplier quality
management
Supplier quality
management
7 Conca et al(2004)
Kaynak(2003)
ISO:9001:2000
5 Process
management
Process management
Product/service design
6 Baidoun et al(2003)
Conca et al(2004)
ISO:9001:2000
6 Information
Analysis and
Evaluation
Information and
Analysis
Evaluation
6
Conca et al(2004)
Kaynak(2003)
ISO:9001:2000
7 Planning Planning
Vision and Plan
Statement
Communication
8 Conca et al. (2004)
Seraph et al (1989)
ISO:9001:2000
8 Continuous
Improvement
Continuous
Improvement
Benchmarking
Statistical process
control
8 Conca et al (2004)
Baidoun et al(2003)
ISO:9001:2000
9 Teamwork Teamwork
Role of the Quality
Department
Learning
4 Flynn et al(1994)
For this paper, the method was pursued in three stages namely,
Literature review to identify critical factors ( Table 1)
Developing the measuring construct by selecting initial quality items (Table 1).
Data analysis. This includes Reliability, detailed item analysis and construct
validity measurement (see results).
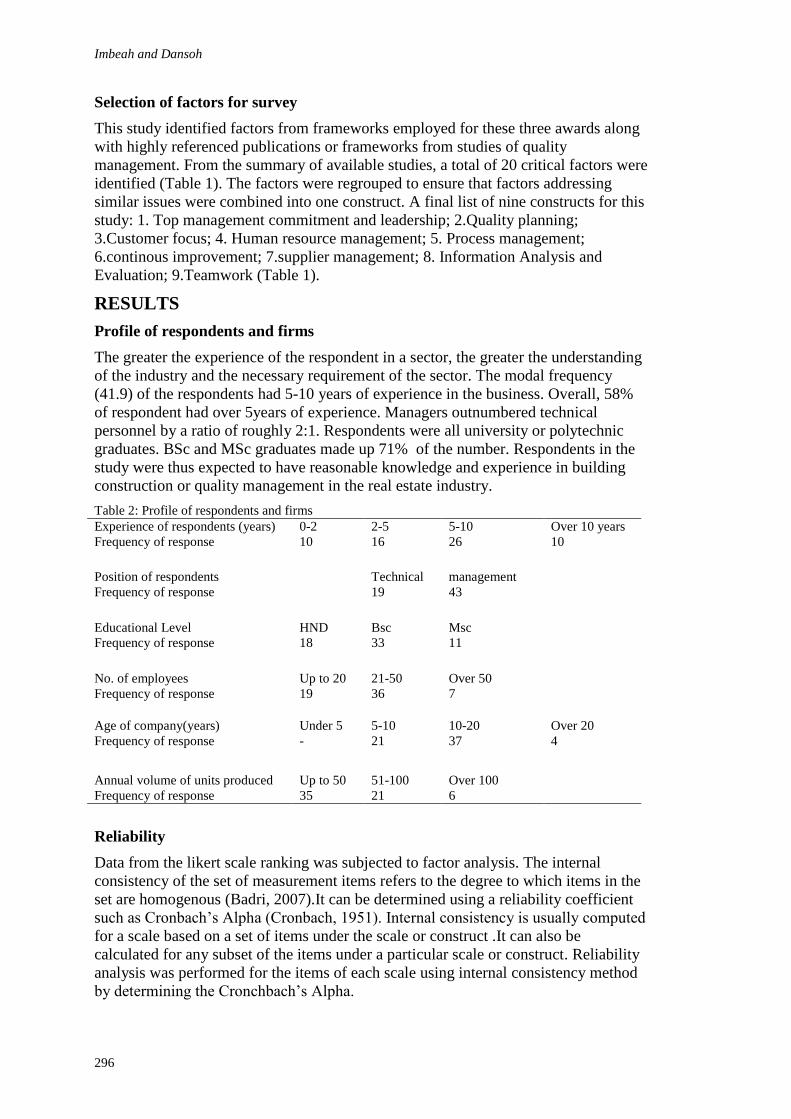
Imbeah and Dansoh
296
Selection of factors for survey
This study identified factors from frameworks employed for these three awards along
with highly referenced publications or frameworks from studies of quality
management. From the summary of available studies, a total of 20 critical factors were
identified (Table 1). The factors were regrouped to ensure that factors addressing
similar issues were combined into one construct. A final list of nine constructs for this
study: 1. Top management commitment and leadership; 2.Quality planning;
3.Customer focus; 4. Human resource management; 5. Process management;
6.continous improvement; 7.supplier management; 8. Information Analysis and
Evaluation; 9.Teamwork (Table 1).
RESULTS
Profile of respondents and firms
The greater the experience of the respondent in a sector, the greater the understanding
of the industry and the necessary requirement of the sector. The modal frequency
(41.9) of the respondents had 5-10 years of experience in the business. Overall, 58%
of respondent had over 5years of experience. Managers outnumbered technical
personnel by a ratio of roughly 2:1. Respondents were all university or polytechnic
graduates. BSc and MSc graduates made up 71% of the number. Respondents in the
study were thus expected to have reasonable knowledge and experience in building
construction or quality management in the real estate industry.
Table 2: Profile of respondents and firms
Experience of respondents (years)
Frequency of response
0-2 2-5 5-10 Over 10 years
10 16 26 10
Position of respondents
Frequency of response
Technical management
19 43
Educational Level
Frequency of response
HND Bsc Msc
18 33 11
No. of employees
Frequency of response
Up to 20 21-50 Over 50
19 36 7
Age of company(years)
Frequency of response
Under 5 5-10 10-20 Over 20
- 21 37 4
Annual volume of units produced
Frequency of response
Up to 50 51-100 Over 100
35 21 6
Reliability
Data from the likert scale ranking was subjected to factor analysis. The internal
consistency of the set of measurement items refers to the degree to which items in the
set are homogenous (Badri, 2007).It can be determined using a reliability coefficient
such as Cronbach‘s Alpha (Cronbach, 1951). Internal consistency is usually computed
for a scale based on a set of items under the scale or construct .It can also be
calculated for any subset of the items under a particular scale or construct. Reliability
analysis was performed for the items of each scale using internal consistency method
by determining the Cronchbach‘s Alpha.

Total quality management
297
Table.3 shows the construct/scale and the original items under each construct/scale
and the items dropped from the original scale to achieve higher reliability coefficient.
Item 7 from the top management and leadership construct is dropped during the
reliability analysis. The reliability for each constructs was again recalculated after
performing detailed item analysis and some items eliminated.
Table 3 Internal consistency of Critical Success Factors
Construct(Scales) Initial
items
Number
of Items
Items
Deleted by
number
Alpha
Before
deletion
Cronchbach‘s
Alpha
After deletion
Top management commitment and
leadership
1-7 7 1 0.755 0.799
Human Resources Management 1-12 12 none 0.812 0.877
Customer Focus 1-7 7 none 0.830 0.879
Planning 1-8 8 none 0.846 0.901
Process Management 1-6 6 none 0.873 0.873
Supply management 1-7 7 none 0.843 0.907
Continuous improvement 1-8 8 none 0.927 0.955
teamwork 1-4 4 none 0.811 0.811
Information analysis and
Evaluation
1-6 6 none 0.852 0.852
The minimum advisable level is 0.7(Nunnally.1978; Nunnally and Bernstein.,
1994;Seraph et al.,1989) for a new instrument. From the table, reliability coefficient
ranges from 0.799 to 0.955 which is greater than the recommended 0.7. The rating are
within the set limit even though they are slightly lower than some of the works cited.
In Zhang (2000) for instance the coefficient ranges from between 0.84-0.92; Seraph et
al., (1989) between0.71- 0.94 and higher than Conca et al.,(2004)which ranges from
0.52-0.82.
Item analysis
A detailed item analysis evaluates the assignment of items to the scales in an
instrument. This is done by correlating each item with each scale. The corrected item-
total correlation (i.e., the correlation of each item with the sum of all other items)
(Hair et al., 1998; Malhotra and Grover, 1998; Torkzadeh and Dhillon, 2002) are used
to determine if an item belongs to the scale as assigned, or is part of another scale, or
should be eliminated. If an item does not correlate highly with any of the scales, it is
eliminated (Nunnally, 1978). The value of that item to scale correlations should be
greater than 0.5. Those lower than 0.50 do not share enough variance with the rest of
the items in that scale. For that reason, item(s) should be deleted from the scale
(Zhang, 2000; Conca et al., 2004).
Seraph et al (1989), Zhang et al (2000.) and Conca et al (2004) used this method to
evaluate the assignment of items to scale in developing their instrument for measuring
the critical factors of quality management.
Table 4 shows the correlation matrix for the nine scales or measures of the constructs.
Most of the items had high correlations with the scales to which they were assigned
relative to all the other scales, except items; 4, 7, 9, 11 of Human resources construct;
item 3 of customer focus construct; item 7 of planning construct; items 4and 7 of
supply management and item 2 of continuous improvement construct which has
correlation less than 0.5 with the scale they were assigned to and as such they were
eliminated accordingly. The rest were judged to be appropriately assigned to their
scale.

Imbeah and Dansoh
298
Table 4. Detailed Item Analysis (Item to Scale Correlation)
Constructs/Scale Item numbers
1 2 3 4 5 6 7 8 9 10 11 12
Top management
commitment and
leadership
.751 .624 .562 .652 .620 .595 -- -- -- -- -- --
Human Resources
Management
.589 .581 .565 .169 .570 .655 .407 .574 .161 .585 .269 .665
Customer Focus .742 .698 .119 .538 .690 .716 .718 -- -- -- -- --
Planning .597 .796 .832 .706 .617 .793 .363 .562 -- -- -- --
Process Management .687 .721 .534 .714 .635 .768 -- -- -- -- -- --
Supply management .784 .754 .791 .321 .678 .778 .170 -- -- -- -- --
Continuous
improvement
.886 .212 .905 .859 .735 .700 .871 .878 -- -- -- --
Teamwork .526 .741 .550 .724 -- -- -- -- -- -- -- --
Information analysis
and Evaluation
.762 .590 .733 .616 .634 .533 -- -- -- -- -- --
Note: Item number in this table is the same as the question number in the instrument;
The symbol ―--‖ means not available
Validity
The validity of a measure refers to the extent to which it measures what is intended to
be measured (Nunnally, 1978). A measure has content validity if there is general
agreement among the subjects and researches and that the instrument has
measurement items that cover all aspects of the variable being measured (Badri,
2007). Content validity is judged by the researchers subjectively. An initial
questionnaire was sent to three experts on the subject (an academician well versed in
quality management studies, a project manager in a real estate firm, and a quality
management consultant) to check the comprehensiveness of the items under each
construct. The feedback from these experts was used to improve the content as well as
ease understanding to eliminate ambiguity and duplication of test. The final
questionnaire had 65 initial quality items for evaluation.
A measure has construct validity if it measures the theoretical construct that it was
designed to measure. This analysis is done using SPSS.16.0 to perform factor analysis
(Principal component) for each construct. In performing factor analysis each measure
was assumed to be a separate construct. In this analysis (shown in tables 5,6, 7 ) each
factor must be one dimensional that is to say, all items in each scale should load on to
one factor. When items in a scale or construct load on more than one factor, the
rotated (varimax) solution was examined. All items with loadings less than 0.5 in each
scale are eliminated.
Kaiser-Meyer-Olkin (KMO) measure is performed to check the degree of inter-
correlation among the items and the appropriateness of factor analysis. Kim and
Mueller (1978) suggested that KMOs in the range of range of 0.5-0.6 are considered
poor, those in the range of 0.6-0.7 are average, those in the range of 0.7-0.8 are
considered good, 0.8-0.9 are great and values greater than 0.9 are superb. From Table
5 most of the KMO values obtained are greater than 0.7 which indicates that the data
is adequate and appropriate for factor analysis

Total quality management
299
Measures of TQM
It can be observed from Table 5 that seven (7) factors or construct had one factor
component except human resources management and process management. This
means that, items in the seven construct or measure formed or load unto a single factor
out of the Nine (9) measures.
Table 5 Summary of the factor matrix for each measure
Constructs/factors KMO Item loadings
Range
Eigen value Percentage of
variance
explained
Top management
commitment and leadership
0.730 0.680-0.771 3.056 50.927
Customer Focus 0.777 0.657-0.832 3.796 63.270
Planning 0.651 0.702-0.900 4.529 64.695
Supply Management 0.877 0.814-0.892 3.655 73.091
Continuous Improvement 0.864 0.760-0.939 5.508 78.685
Teamwork 0.698 0.703-0.893 2.297 64.923
Information analysis and
Evaluation
0.795 0.685-0.852 3.511 58.510
The other two constructs in which the items did not load unto one factor are Human
resource management and Process management. This result was obtained according to
the rule of Eigen values being greater than one, which are listed in tables 6 and 7 with
its rotated and unrotated factor matrix.
Process Management
In the case of Process Management construct, two factors emerged as shown in Table
6. Items number 1, 3 and 5 which are process flow chart, testing and reviewing for
specification and clarity of instruction respectively can be described as ―Process
control‖ constituting a factor separate from the remainder of process management
items. The remaining items 2, 4, 6 formed another factor that can be interpreted as
―Process evaluation‖.
Table 6 Factor matrix process management
Un-rotated Rotated (Varimax)
Factor 1 Factor 2 Factor 1 Factor 2
1 .783 .498 .276 .886
2 .830 -.398 .890 .232
3 .653 .107 .430 .503
4 .830 -.451 .925 .192
5 .734 .586 .183 .921
6 .862 -.216 .797 .392
Human Resources Management
For human resource management, Table 7 lists the un-rotated and rotated factor
matrix (Varimax) for its construct. From the table it is clear that items 1, 2, 3, and 10
constituted a factor which can be deduced as the ―employee welfare and
commitment factor‖ whilst the other items (5, 6, 8, and 12) in this construct also
constituted another factor which can be described as ―employee training and
development factor‖.
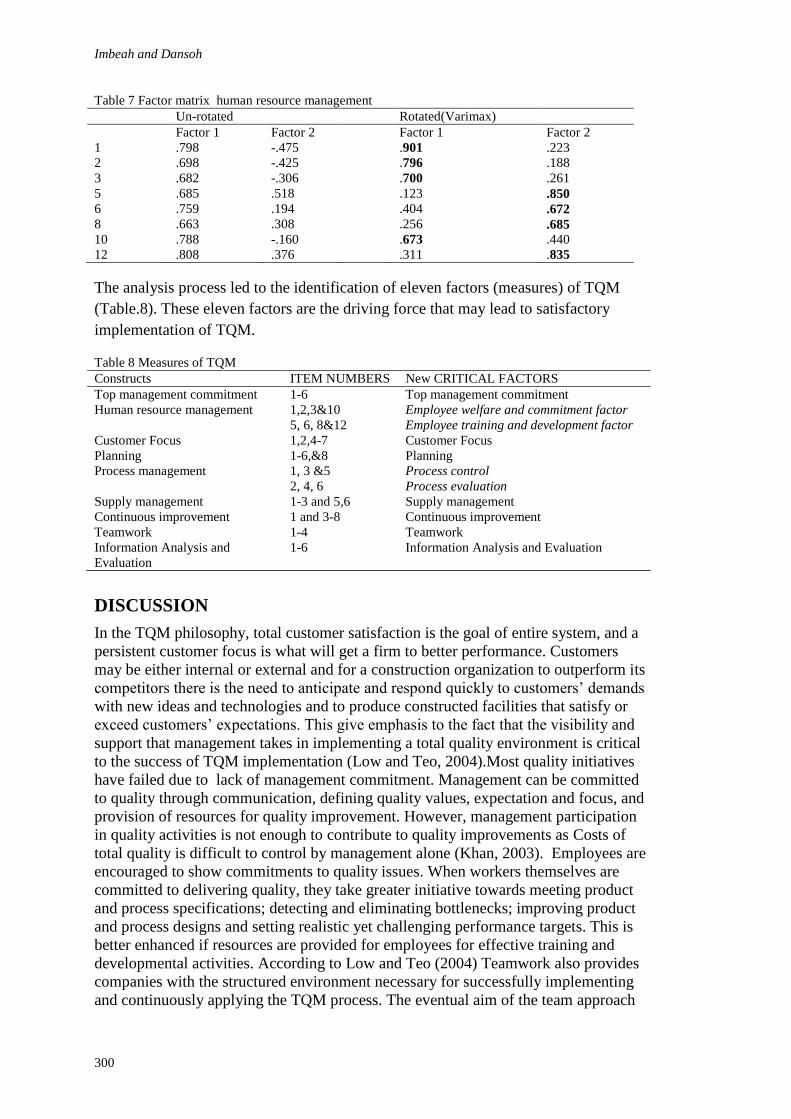
Imbeah and Dansoh
300
Table 7 Factor matrix human resource management
Un-rotated Rotated(Varimax)
Factor 1 Factor 2 Factor 1 Factor 2
1 .798 -.475 .901 .223
2 .698 -.425 .796 .188
3 .682 -.306 .700 .261
5 .685 .518 .123 .850
6 .759 .194 .404 .672
8 .663 .308 .256 .685
10 .788 -.160 .673 .440
12 .808 .376 .311 .835
The analysis process led to the identification of eleven factors (measures) of TQM
(Table.8). These eleven factors are the driving force that may lead to satisfactory
implementation of TQM.
Table 8 Measures of TQM
Constructs ITEM NUMBERS New CRITICAL FACTORS
Top management commitment 1-6 Top management commitment
Human resource management 1,2,3&10 Employee welfare and commitment factor
5, 6, 8&12 Employee training and development factor
Customer Focus 1,2,4-7 Customer Focus
Planning 1-6,&8 Planning
Process management 1, 3 &5 Process control
2, 4, 6 Process evaluation
Supply management 1-3 and 5,6 Supply management
Continuous improvement 1 and 3-8 Continuous improvement
Teamwork 1-4 Teamwork
Information Analysis and
Evaluation
1-6 Information Analysis and Evaluation
DISCUSSION
In the TQM philosophy, total customer satisfaction is the goal of entire system, and a
persistent customer focus is what will get a firm to better performance. Customers
may be either internal or external and for a construction organization to outperform its
competitors there is the need to anticipate and respond quickly to customers‘ demands
with new ideas and technologies and to produce constructed facilities that satisfy or
exceed customers‘ expectations. This give emphasis to the fact that the visibility and
support that management takes in implementing a total quality environment is critical
to the success of TQM implementation (Low and Teo, 2004).Most quality initiatives
have failed due to lack of management commitment. Management can be committed
to quality through communication, defining quality values, expectation and focus, and
provision of resources for quality improvement. However, management participation
in quality activities is not enough to contribute to quality improvements as Costs of
total quality is difficult to control by management alone (Khan, 2003). Employees are
encouraged to show commitments to quality issues. When workers themselves are
committed to delivering quality, they take greater initiative towards meeting product
and process specifications; detecting and eliminating bottlenecks; improving product
and process designs and setting realistic yet challenging performance targets. This is
better enhanced if resources are provided for employees for effective training and
developmental activities. According to Low and Teo (2004) Teamwork also provides
companies with the structured environment necessary for successfully implementing
and continuously applying the TQM process. The eventual aim of the team approach

Total quality management
301
is to get everyone, including contractors, designers, vendors, subcontractors, and
owners involved with the TQM process.
CONCLUSION AND RECOMMENDATION
This study intended to identify the management areas that should be given attention
for a successful quality management in Real estate companies. Eleven critical success
factors of quality management were identified.viz, Top management commitment and
leadership, Employee welfare and commitment, Employee training and development,
Customer focus, Planning, process control and process evaluation, Supplier
management, Continuous Improvement, Team Work, Information analysis and
evaluation. It is believed that attention to these factors will minimize difficulties
related to the implementation of Total quality management and will enhance best
performance in companies implementing Total quality management.
REFERENCES
Abdulaziz A.B., and Tawfiq, H.A., (1999), ―ISO 9000 quality standards in construction‖,
Journal of Management in Engineering, pp 41-45
Ahadzie, D.K., Proverbs, D.G., and Olomolaiye, P. (2007), ―Critical Success Criteria for Mass
House Building Projects In Developing Countries‖, International Journal of Project
Management‖ Vol. 19, No. 7 26, pp. 675-687
Ashley, D.B. (1980), ―Simulation of Repetitive –Unit Construction‖, Journal of Construction
Division, Proceedings of ASCE, Vol. 106, Co. 2, pp. 185-198
Badri,M.A., (2007), ―Dimensions Of Industrial Location factors: Review And Exploration‖
Journal Of Buisness And Public Affairs, Vol., 1, No.2 pp 1-27
Baidoun, S. and Zairi M. A. (2003), ―Proposed Model of TQM Implementation in the
Palestinian Context‖, TQM and Business Excellence, 14(10), 1193–1211
Black, S.A., and Porter, L.J., (1996), ―Identification of The Critical Factors Of TQM‖,
Decision Sciences pp., 27, 1–21
Chase, R.B., and Aquilano, N.J., and Jacobs, F.R., (2001), ―Operations Management for
Competitive Advantage‖, 9th Edition, McGraw-Hill, Boston, MA
Conca,F,J.,Llopis,J.&Tari,.JJ (2003),‖Development of a measure to assess quality
management in certified firms‖ Journal of Operational Reasearch,Vol.156,No2004,pp
683-697
Cronbach, L. J., (1951), ―Coefficient alpha and the internal structure of tests‖, Psychometrika,
16, pp., 297-334
Dale, B.G., (1999), ―Managing Quality‖, Blackwell Publishers, Oxford.
Dow,D ., Samson,D . and Ford, S. (1999), ―Exploding The Myth: Do All Quality
Management Practices Contribute To Superior Quality Performance‖, Production and
Operations Management,8, pp., 1–27
Feigenbaum, A.V., (1991), ―Total Quality Control‖, McGraw-Hill, New York
Flynn,B . B.,Schroeder, R. G. and Sakakibara,S, (1994), ―A Framework For Quality
Management Research And Associated Instrument‖, Journal of Operations
Management,Vol., 11., pp . 339–366
Hair, J.F., Anderson, R.E., Tatham, R.L., and Black, W.C., (1995), ―Multivariate Data
Analysis with Reading‖, Prentice-Hall, Englewood Cliffs, NJ
ISO 8402 (1994),‖Quality Management and Quality Assurance –Vocabulary‖ International
Organisation for Standardization
Kanji, G. K., (1995), ―Quality and Statistical Concepts, In Total Quality Management:
Proceedings of the first world congress (Ed: Kanji, G. K.), London: Chapman and Hill

Imbeah and Dansoh
302
Kaynak, H., (2003), ―The Relationship between Total Quality Management Practices and
Their Effects on Firm Performance‖, Journal of Operations Management, Vol., 21
No., 4, pp., 405-435.
Khan,H.J (2003) "Impact of total quality management on productivity", The TQM Magazine,
Vol. 15 ,No. 6, pp.374 - 380
Lee, P. M. (2002), ―Sustaining Business Excellence through A Framework of Best Practices
In TQM‖, The TQM Magazine, Vol. 14, No. 3, pp 142-149
Love, P. E. D., Li, H., Irani, Z., and Holt, G. D. (2000), ―Rethinking Total Quality
Management: Toward A Framework For Facilitating Learning And Change In
Construction Organizations‖, The TQM Magazine, Vol. 12, No. 2, pp 107–116
Low, S. P. and Teo, J.A. (2004) ―Implementing Total Quality Management in Construction
Firms‖, Journal of Management in Engineering, Vol. 20, No. 1, pp 8-15
Low, S. P., and Peh, K. W. (1996), ―A Framework for Implementing Total Quality
Management in Construction‖ The TQM Magazine, Vol. 8, No. 5, pp 39– 46
Malhotra, M.K. and Grover, V. (1998), ―An Assessment of Survey Research in POM‖, From
Constructs To Theory, Journal of Operations Management, Vol., 16, pp., 407-425
McAdam, R. and Kelly, M., (2002), ―A Business Excellence Approach To Generic
Benchmarking In Smes, Benchmarking‖ An International Journal, 9(1), 7-27
Metri, B.A., (2005), ―TQM Critical Success Factors for Construction Firms‖, Management
Economics, Vol.10, No 2, pp.61-72
Nunnally, J.C., (1978), ―Psychometric Theory‖, Seconded. Mc- Graw-Hill, New York.
Oakland, J., (2000), ―Total quality management – Text with cases‖, 2nd edition, Butterworth-
Heinemann
Powell, T.C., (1995), ―Total Quality Management as Competitive Advantage: A Review and
Empirical Study‖, Strategic Management Journal, Vol. 16, pp 15–37
Reed, R., Lemak, D.J., Montgomery, J.C., (1996), Beyond Process: TQM Content and Firm
Performance, Academy of Management Review 21, pp 173–202
Saraph, J.V., Benson, G.P., and Schroeder, R.G., (1989), ―An Instrument for Measuring the
Critical Factors of Quality Management‖, Decision Sciences Vol. 20, pp 810–829
Sila, I. and Ebrahimpour, M. (2002), ―An Investigation Of The Total Quality Management
Survey Based Research Published Between 1989 And 2000‖. International Journal of
Quality and Reliability Management, Vol. 19, No. 7, pp 902-970.
Talha,M.(2004) ―Total Quality Management(TQM):An Overview‖, Journal of the Bottom
Line: Managing Library Finances, Vol.17, No.1,pp.15-19
Torkzadeh, G. and Dhillon, G., (2002), ―Measuring Factors that Influence the Success of
Internet Success‖ Information Systems Research, Vol., 13 No., 2, pp., 187-204 Vol.
15 ,No. 6, pp.374 - 380
Wan Yusoff, W.M., Abdul Ghani and K., Norizan, M., (2006), ―Quality Management in
Contracting Quality Management In Building And Construction‖, Proceedings of
Eureka Conference, Hamar/Lillehammer, June, pp 61-64
Yusof, S.M. and E. Aspinwall, (1999), ―Critical Success Factors for Total Quality
Management Implementation in Small and Medium Enterprises‖, Total Quality
Management, Vol. 10, No.4&5, pp 803-809
Zawdie, G. and Langford, D.A. (2000), ―The State Of Construction And Infrastructure In Sub
Saharan Africa And Strategies For A Sustainable Way Forward‖, Proceedings of the
2nd
International Conference in Developing Countries: Challenges Facing The
Construction Industry In Developing Countries, pp 15–17, Accessed on 31/03/10 at
http://www.odsf.co.za/cdcproc/1stproceedings.html

Total quality management
303
Zhang, Z. Waszink, A. and Wijngaard, J., (2000), ―An Instrument For Measuring TQM
Implementation For Chinese Manufacturing Companies‖, International Journal of
Quality and Reliability, Vol. 17, no. 7, pp. 730-755
Zhang, Z., (2000), ―Developing A Model Of Quality Management Methods And Evaluation
Their Effects On Business Performance‖, Total Quality Management, Vol. 11, No. 1,
pp. 129-137.

Owusu, K. and Owusu-Ansah, N.B. (2011) Designs and construction of buildings in Ghana: The
disability factor In: Laryea, S., Leiringer, R. and Hughes, W. (Eds) Procs West Africa Built
Environment Research (WABER) Conference, 19-21 July 2011, Accra, Ghana, 305-313.
305
DESIGNS AND CONSTRUCTION OF BUILDINGS IN
GHANA: THE DISABILITY FACTOR
Kwaku Owusu1 and Nana Buabeng Owusu-Ansah
2
1Building Department, Sunyani Polytechnic
2Development Unit, Methodist University College
It is estimated that 10% of Ghana's population suffer from some form of disability.
The blind, deaf and physically disabled people are the most visible. Despite the
magnitude of the disability percentage of the population, most designers and
constructors in Ghana fail to factor the disabled people. It is against this background
that many saw the passage of the Disability Bill into law in June 2006 by
Parliament as the turning point for the disabled people regarding design
and construction of buildings in Ghana. This study examines the extent to
which the disability is factored in designs and construction of buildings in Ghana. To
achieve the study objectives, a comprehensive literature search and survey was
carried out in the Accra metropolis among property owners and People Living with
Disability (PWD). Interviews were also conducted using an interview guide for Estate
Developers, Architects and Engineers as well as officials from the Law Enforcing
Agency (Accra Metropolitan Assembly & Town and Country Planning) to solicit their
views. The results suggested that though the disability law has been passed almost all
estate developers or construction companies are not seriously factoring disabled
people in their construction designs. The study concluded that, massive education
should be embarked upon by all stake holders in educating the general public,
professionals and clients about the importance of the disability law and the need to
make buildings disabled friendly.
Keywords: design, Disability Law, disabled friendly, inclusive design.
INTRODUCTION
Ghana has gone through a lot of transformation in terms of General Building
Construction such as residential, commercial and institutional buildings before and
after independence (1957) from the British. Since this era, Accra and Kumasi, the
capital and second capital cities respectively, have especially witnessed a change from
low-rise to mid-rise buildings in both public and private sector. Yet a cursory look at
development of buildings in Ghana, obviously, shows that with this transformation,
the design and construction of most of these buildings did very little to consider the
disabled in the Ghanaian society despite the fact that they form 10% which is a
major/recognisable constituent of the country‘s population. (UNICEF, 2000)
Many private and public buildings like residential flats/apartments, shopping centers,
office buildings medical clinics and hospitals, schools and universities, recreational
centers and athletic stadia, government buildings and houses of worship are without
mechanisms like ramps, lifts, and escalators etc. which make these buildings not
disabled friendly. What makes the situation worse is the fact that designers and
2

Owusu and Owusu-Ansah
306
constructors tend to forget the axiom that ‗every human being will one day become a
disabled either through accident or old age‘. Over the years, due to cultural beliefs
about disabilities, attitudes towards persons with disabilities which often include
shame, prejudice, and exclusion from the community looked entrenched. Culturally,
people with disabilities are often isolated, discriminated against and considered
inferior while a section of the society consider them as a cursed group; others subject
them to various abuses that commutatively make them bitter against society in Ghana.
Design and construction of buildings in most cases have not given consideration in
making public buildings easily accessible to the disabled people in Ghana. This act of
discrimination has continually deprived disabled persons, their fundamental human
rights in the field of planning and resources allocation, (Wellington, 1992). It is
against this background that some pressure groups advocated for the passage of the
Disability Bill into law in June 2006. The purpose of the Disability Act, 2006 (Act
715) is to fight and protect the rights of people who are living with disability. For
professional and stakeholders in the building industry; the Act stipulates in Section 60
that ―The owner or occupier of an existing building to which the public has access
shall within ten years of the commencement of this Act make the building accessible to
and available for use by a person with disability‖ (AllAfrica.com, 2009). The
implications are that new buildings and old/existing buildings being refurbished must
comply with the Act.
Since 1981, expert knowledge about the needs of disabled people in buildings has
been incorporated into the Ghana Building Standards which is now complemented by
the availability of home improvement grants for disabled people, and the requirements
of the Building Regulations. ([email protected] 2009). There
are so many legislations concerning the disabled factor in the whole world. Among
them include : the Disability Discrimination Act 1995, the Disability (Employment
Regulations 1996) and the Workplace (Health, Safety and Welfare) Regulations
1992.these legislations must be considered by those designing buildings as well as
those employing staff who work within them and people using them. The Disability
Discrimination Act 1995 has been introduced to prevent discrimination against
disabled people. According to the Act, by October 2004, providers of goods and
services must have taken into consideration all disabled people gaining entry into the
building and using it. This legislation is covered under civil law and is not controlled
by the Local Authority, although all public buildings including those where the public
have access must comply with the Act. All people providing service to the public are
affected by this legislation. It is for this reason that when designing buildings or
carrying out alterations or refurbishment the design must make provision for all
sections of society; i.e. access for all (Internet content rating association, 2006).
The foregoing clearly indicates that before the People Living with Disability Act
(PWDA), there have been other efforts aimed at ensuring that building facilities are
disabled friendly. The aim of the paper is to investigate/find out whether disabled
people are properly or adequately factored in the design and construction of buildings
in Ghana after the introduction of PWDA. To attain the needed results the following
objectives were devised:
Identify whether architects and engineers consider the disability factor in
public and domestic buildings after the passage of the disability law in Ghana.
Identify some of the problems people living with disability go through in
domestic and public buildings (i.e. washrooms, offices, etc)
Inclusive design
307
To determine the degree at which building owners refurbish their buildings to
be disabled friendly and to ascertain whether the disability laws are being
enforced in the modern buildings
SIGNIFICANCE OF THE STUDY
Though the disability law has been passed, a scan of buildings just around indicates
that some estate developers or construction companies are not factoring disabled
people in their construction. This attitude frowns on the Disability Act and other
legislation on disabled people. Again, it discriminates against disabled people and put
them at a disadvantage despite the fact that it is essential for people with disabilities to
live independently in their communities. Housing must be accessible and supportive to
help people with disabilities to live independent and self directed lives. (disability.gov,
2009) This has raised the question whether the introduction of the disability law can
help solve the discrimination the disabled people go through in the design and
construction of buildings in Ghana (Thus at the designing and construction stage of
domestic and public / commercial buildings).
According to Kent (2003), owners of some historic buildings in UK are compelled by
law to carry out alterations to make their buildings accessible to disabled. This is how
serious elsewhere, the laws are looked at in terms of implementation. The Disability
Discrimination Act makes it mandatory to put up structures that are disabled friendly
and must not discriminate against them. According to the scan what is happening
around is quite different from what the Act says. In most cases where attention has
been given, the provision of the PWDA has been misconstrued by some building
industry players to mean provision of ramps to ground floors.
Again, it is conservatively estimated that in Ghana, about 10% of the population are
known to be Persons with disability. It must however be noted that quite a number of
people with disability are for cultural reasons not disclosed. It is even estimated that
the undisclosed number might even be the same as disclosed (UNICEF, 2000). This
information connotes that the number of persons with disability in Ghana is more than
the 10% (that is more than 2.3million). Due to the high rate of undisclosed disability
in the rural areas as a result of predominance of cultural norms, disability in Ghana by
record has a higher urban incidence, with the national capital region (Greater Accra)
dominating (Annor, 2002). Therefore it is in the interest of all Ghanaians to champion
the course of disables because the chances of becoming a disable are greater than
anticipated.
RESEARCH METHOD
Research questions
The major research questions for this study are as follow:
What extent has the introduction of the disability law changed the designs and
construction of buildings to suit disabled people?
Are building owners refurbishing their buildings to make them disabled
friendly?
What problems do disabled people go through in traditional, domestic and
public buildings in the country?
Sampling, Procedure, Size and Justification
Owusu and Owusu-Ansah
308
The research adopted triangulation approach in the process of collecting and analyzing
data. The triangulation approach in this research consists of three methods of data
collection and analysis: survey questionnaires, semi structured interview and
observation. This is due to the fact that different approaches lead to greater validity
and reliability than a single methodological approach according to Denzin (1970),
Dixon et al. (1988) and Yin (1994). The questionnaires were designed to explore the
perceptions surrounding the effectiveness of the disability factor in public/commercial
and domestic buildings, to ascertain whether the disability laws are enforced in the
modern buildings in the country and to identify some of the problems disabled
people go through in domestic and public buildings (i.e. wheelchair ramps & handrails
elevators, washrooms, walkway contours, audio signals, Braille signage etc). The
semi-structured face-to-face interview was designed to qualitatively analyze
respondents free format comments on the main subject. Under the observations, the
researcher observed residential and public/commercial buildings in Accra (New, old
buildings and refurbishment as well as Tower buildings, etc). Also, architectural and
structural designs for certain structures were observed and analyzed (Public
buildings, designs by both architects and Engineers of estate developers, etc).
The target population consists of disabled people, architects and engineers, estate
developers, law enforcing agencies as well as property owners in the Accra
metropolis. This is because Accra is the place where almost all the commercial
activities in Ghana take place and it is also the head of Ghana federation of the
disabled. Disability in Ghana by record has a higher urban incidence, with even the
national capital region (Greater Accra) dominating (Annor, 2002).
In all, 30 disabled persons responded to the questionnaire. 15 property owners: 6
architects and engineers, 4 officials from estate developing companies and 2 officials
from law enforcing agencies (i.e. Town and Country Planning and Accra Metropolitan
Authority. Supporting opinions were obtained from experts who are knowledgeable in
this field.
A non probability sampling was used because of the difficulty in establishing the
sample frame especially for the disabled at this early stage of this research due to its
practicality. (Saunders et al, 2007). Under the non probability sampling, convenience
sampling was used because the sample frame of both the interviewees and the
respondents were not known. Purposive sampling was used for the Law enforcing
agencies because of their expertise in that area. Accidental sampling was used for the
rest. A survey was carried out in the Accra Metropolis among disables, architects and
engineers, estate developers as well as property owners in the Accra metropolis. A
questionnaire survey was administered among a sample of 30 disabled people and 15
property owners. Interviews were also conducted. Among those interviewed were 2
officials from the law enforcing agencies (thus Accra metropolitan Assembly and
Town & Country Planning), 10 officials from Estate Developing Companies,
Architects and Engineers.
The researcher adopted a survey strategy because according to Saunders et al. (2007),
surveys are popular as they allow the collection of a large amount of data from a
sizeable population in a highly economical way. Using a survey strategy gives you
more control over the research process and when sampling is used, it is possible to
generate findings that are representative of the whole population at a lower cost than
collecting the data for the whole population (Saunders et al, 2007). Stroh (2000) stated
that a questionnaire is used to explore a large number of people‘s views. The

Inclusive design
309
interviews were conducted in a semi-structure format that allows respondents to
express their own viewpoints (Flick, 2002).
RESULTS AND DISCUSSIONS
Data Analysis of People living with Disability
The data gathered from questionnaires sent to people living with Disability (disabled)
and property owners were analyzed, as well as semi- structured interview for
professionals. Observation aspects were used occasionally to confirm or otherwise.
These presentations were as follows:
Figure 1: Age of respondents of People living with Disability
The age distribution of respondents of people living with disability as shown in Fig. 1;
clearly indicates that there is no age variation or limit of becoming a disabled and
therefore everybody is a potential disable. With above 45years registering almost 38%

Owusu and Owusu-Ansah
310
as the highest and 26-35years closely followed with 20.69%. 18-25years and 36-
45years representing 17.24% and 13.79% respectively also had a substantial
percentages confirming the above assertion.
Table: 1
Question Responden
t
Percentage
(%)
Responden
t
Percentag
e (%)
Total
a. Are you aware of the passage of
the disability bill? Yes 100 No None 100%
b. Have changes been made after
the passage of the bill (property
owners)?
Yes None No 100 100%
c. Do you consider the disables
before the passage of the bill? Yes 90 No 10 100%
d. Do you consider the disables
after the passage of the bill
(builders)?
Sometimes 17.24 No 82.76 100%
e. Is there reduction of plights of
disable after the passage of the bill? Yes 100 No None 100%
f. Was your department involved in
the drafting of the bill? Yes None No 100 100%
g. Do you insist on disabled
friendly designs before approval for
both new and refurbish buildings?
Sometimes 100 No None 100%
h. What is the way forward? Education 100
Rejection
(drawings) None 100%
(Source: field data- Reponses of officials from estate developing companies, law enforcing agencies
officials, architects and engineers)
Figure 2: Number of years respondents have been living with disability.
The fig. 2 above explains the number of years respondents have lived with their
disability. 31.03% have lived as disabled people between 10-20 years, those who have
lived with it 20 years and over, represent 24.14%. Only 17.24% of the respondents
were born with it. This shows that majority of the disabled were not born with it and
that as one pass through life experiences he/she can become a disable even if not
through mishap, age would definitely render him/her disable. Thus old age can render
someone a disable.
Fig 3: Type of disability of respondents
Among those who responded to the questions were physically challenged (52.07%),
old age (17.24%). Hard hearing (10.34%) and visually impaired (10.34%). This
indicates that there are different types of disability and therefore builders, estate
developers as well as engineers and architects have to take into consideration the
above disabilities and make provisions for each of them in their designs and
construction of buildings.
Figure: 4 Disability aids considered in your building
The result shown in fig. 4 indicates that majority of the property owners who
responded to the questions do not consider any of the disability aids, this represents
53.85%. However, 46.15% of respondents pointed out that, they consider only wheel
chairs and clutches in their building. This also discriminates against other disabled
people like visually impaired and hard to hear people from using public buildings.
This indicates that even the few of them who consider disabled people, think about
only the physically challenged people.
Figure 5: Disabled friendly property

Inclusive design
311
The results as shown on figure 5, confirm the fact that, the property owners do not
make room in their buildings for people living with disability. Thus their properties
are not disabled friendly. Even though 30.77% of the respondents disagreed with this
assertion, 59.23% of the respondents agreed. This shows that property owners do not
build to suit disabled people but rather healthy people. They always forget that
everybody can become a potential disable in his or her life time especially old age.
Table 1a: Awareness of the passage of the disability bill (Property Owners)
All the property owners who responded to the questions admitted that they are aware
of the passage of the disability bill. This shows that all the property owners who do
not build to suit people living with disability or consider them do so, not out of
ignorance but negligence and must be sanctioned.
Table 1b: Changes made to property after the passage of the bill (Property Owners)
All the respondents indicated that none of the property owners have made any form of
changes in their buildings after the passage of the bill representing 100%. This
confirms the assertion of the people living with disability that they are not considered
by property owners.
Table 1c: Consideration of disabled people before the passage of the bill (Architects,
Engineers and Estate developers)
90% of the interviewees drawn from architects, estate developers and engineers did
admit that they considered disabled people before the passage of the bill while 10% of
the interviewees did not consider disables. However, a close observation and
interviews conducted shows that only few building in Ghana were built to suit
disabled before the passage of the bill.
Table 1d: Consideration of disabled people by builders/designers after the passage of
the bill (Disabled)
82.76% of the respondents were of the view that they are not considered by designers/
builders after the passage of the bill while 17.24% said they are sometimes considered
after the passage of the bill. This means that the law enforcing agencies and the
designers/ builders are not doing their work well and therefore have to improve upon
it.
Table 1e: Reduction of plights after the passage of the bill (Architects, Engineers and
Estate developers)
Though all the interviewees admitted the passage of the bill will reduce the plight of
the disabled people, most of the buildings in the country are not disability friendly.
This is because refurbishment and building to suit disables brings about extra cost and
for that matter factoring disables in all designs/buildings, needs government
intervention in terms of persuasive agenda and also taking the lead by making all
government buildings disabled friendly.
Table1f: Involvement of law enforcement agencies/departments in drafting the bill
100% of the respondents admitted that their departments did not take part in the
drafting of the bill. Though in further discussion, they admitted having a responsibility
of making sure that all designs and buildings conform to the Disability Act, there were
some sort blame game between the two enforcing agencies used, thereby creating
some sort of laxity in the enforcement of the law.

Owusu and Owusu-Ansah
312
Table 1g: Insistence on disabled friendly designs before approval for both new and
refurbished buildings
All the law enforcement agencies respondents (that is 100%) admitted that though the
law has been passed, most of the designs that come to them for approval do not
conform to the disability standards and attributed this to lack of compliance and
ignorance of the Act. They were of the view that the ten year compliance period is not
helping because some people take advantage of that clause. Also worrisome is the lack
of legislative instrument to back the Act for stronger enforcement powers. However,
they try to impress upon property owners to include disable facilities.
Table 1h: On the way forward
All the respondents (that is 100%) were of the view that Seminars and fora on
disabled friendly buildings must be organized regularly for professionals in the
building industry especially those at the enforcing end. Also education of the general
public on the Disability Act and who can be disable. This clearly demonstrates the
level of ignorance especially the general public.
CONCLUSIONS
The disabled people in Ghana; be it physical, visual, hearing impairment, etc account
for a recognisable size of the population and deserve the right to access and use
buildings comfortably. This is long overdue because before the passage of the
Disability Bill into law in June 2006, there were enough local and international
conventions which made it mandatory for building professionals and clients to ensure
that the disabled people were factored in the design and construction of buildings.
Therefore, the only way to stop the springing up of buildings that are not disabled
friendly is for the government, professional institutions within the building industry
fraternity in particular and civil society, to embarked on vigorous sensitisation or
education drive for all stakeholders on the need to adhere to the dictates of the Act.
This would ensure that industry players do not hide under the canopy of the 10year
grace period (i.e. ten year compliance period) in the Act and create a mess which
would be very difficult and expensive to reverse at the tenth (10th
) year. Again, not
until the government and civil society push for the passage of Legislative Instrument
to back the implementation and enforcement of the PWDA by parliament, it would be
very difficult for the enforcing agencies to insist on the introduction of facilities that
make buildings disabled friendly in residential, commercial and institutional
buildings to ensure compliance
REFERENCES
A Comprehensive and Practical Guide for Students, Oxford: Oxford University Press.
Akufo-Addo N. (2009). Pay serious attention to disability issues. Available:
http://news.myjoyonline.com/news/200911/37625.asp (2009-11-10)
Annor, J. (2002) Implementing government policy for supporting technology use by
Persons with Disability, People to People International
Denzin, N. K. (1970). The Research Act: A Theoretical Introduction to Sociological Methods.
Chicago: Aldine
Disability Culture Human Rights retrieved from www.issues .takingitglobal.org
Disability Statistics DRC website (2003) available:
http://www.drcgb.org/Newsroom/Key_DRC_facts_and_glossary/Number_of_disable
d_people_in.aspx (2009-11-20)

Inclusive design
313
Disability Statistics United Nations website (2003)
http://www.un.org/disabilities/convention/facts.shtml(2009-11-20)
Disability Statistics United States Census Bureau website (2003) available:
http://www.census.gov/hhes/www/disability/sipp/disab02/awd02.html (2009-11-20)
Dixon, B. R., Bouma, G. D. and Atkinson, G. B. J. (1988). A Handbook of Social Science
Research:
Flick, U. (2002). An Introduction to Qualitative Research. London: Sage Publications ltd.
Frain J. P., Carr P. H.(1996) Is the Typical Modern House Designed for Future Adaptation for
Disabled Older People? Darlington Co. Durham, DL36HX
Government of Ghana (2000). National disability policy document, Accra, Government Press.
Handbook for Postgraduate Researchers. London: Sage Publications. Chapter 15.
Hart, C. (2003). Doing a Literature Review: Releasing the Social Science Research
Imagination. London: Sage Publications Ltd.
Liberti-Lansing, M (undated) Building, adapting homes for disabled: Capital District Business
Review. New York
Obeng, M.R. (2009). We owe a duty to people with disability. Faculty of law, KNUST
Kumasi
Poverty report: Ghana‘s toilets are not disability accessible friendly available:
www.allafrica.com (2009-12-10)
Republic of Ghana. Persons with Disability Act (2006) Act 715, Assembly press, Accra.
Sarpong, A. (1978). Ghana in retrospect, Accra, Ghana Publishing Corporation
Saunders, M., Lewis, P. and Thornhill, A. (2007). Research Methods for Business Students
(4th Ed). Prentice hall
Stroh, M. (2000). ‗Qualitative interviewing‘ in Burton, D. (Ed) Research Training for Social
Scientists: Types of Disabilities available
http://web.jhu.edu/disabilities/faculty/types_of_disabilities/adhd.html (2009-11-20)
Types of Disabilities available: http://www.barrierbreak.com (2009-12-02)
UNICEF (2000): The situation of Children in Ghana, Accra. UNICEF www.ssa.gov (2009-
12-10)
United Nations Design Manual for a Barrier Free Environment(2009) Accessibility for the
Disabled, available: www.un.org/esa/socdev/enable(2009-12-27).


Olaniyan, O.A. (2011) Designing out waste on mass housing construction sites in Minna, Niger state
In: Laryea, S., Leiringer, R. and Hughes, W. (Eds) Procs West Africa Built Environment Research
(WABER) Conference, 19-21 July 2011, Accra, Ghana, 315-323.
315
DESIGNING OUT WASTE ON MASS HOUSING
CONSTRUCTION SITES IN MINNA, NIGER STATE
Oluwatoyin Ayodeji Olaniyan1
Department of Architecture, Federal University of Technology, Minna
The need to minimize or eliminate waste in mass housing designs in order to
construct quality houses and meet housing demand in Minna is unavoidably essential.
The nascence of designing out waste; the smearing of design errors that compound
design waste and the unawareness of construction stakeholders are issues in
contention. The aim therefore is to examine construction waste caused by roof design
errors complicated by improper building orientation viz a viz their remedial solutions;
with a view to provide explanations on reducing construction waste on mass housing
sites in Minna. Field investigations of waste routes were conducted. At the same time,
the nature and extent of waste were determined. Changes in roof designs and
introduction of columns in walls were critically enumerated and discussed to explicate
some current and needed strategy for designing out waste in Minna. It found that
waste routes originate from the structural and aesthetical objectives of architectural
design. In addition to building and material complexity, immaterial complexities such
as building orientation can also cause waste. Following from this, designing out waste
is not only interested in reducing waste, but also in reducing environmental impacts
on building and material components. Designing rightly from the onset with simple
plans and building components eliminate the need to repeat work and therefore
designing out waste strategies are better predefined and not post defined.
Keywords: architectural design, construction waste, design waste, mass housing.
INTRODUCTION
Amidst all the needs known to man, housing is the most crucial. Several means have
therefore been devised to make shelter a reality. In the last two decades, the growing
rate of urbanization in Nigeria has accentuated the need for housing quality and
quantity (Ajanlekoko, 2001). Responsively, mass housing construction has intensified
in Nigeria in order to mitigate housing shortage through combined efforts of public
and private domains known as public private partnership (PPP) (Olayiwola et al.
2007).
The successful construction and completion of a house is contingent on a working
architectural design that encompasses at least two of three fundamental objectives,
viz: function, aesthetics and structure. In mass housing construction, architectural
designs play the role of actuators: by which every construction stakeholder is driven,
and acts upon directly or indirectly. Similarly, design links virtually every aspect of
construction mobilization with a multiplied effect on man, material, machine and
money. Concomitantly, fallouts such as loss of building materials are inevitable
thereby resulting in various forms of construction and design waste.

Olaniyan
316
Efforts towards identifying the sources and causes of construction waste in order to
avoid, eliminate or minimize waste and erect quality houses epitomize the concept of
designing out waste. Functional, aesthetical and structural design objectives now run
parallel with waste reduction strategies or still are expected to incorporate waste
reduction strategies. Apparently, waste minimisation through designing out waste is
still in its infancy (Keys et al. 2000). Moreover, design waste is compounded by
design errors and still remains unclear to most construction stakeholders.
BACKGROUND TO THE STUDY
Within the last decade, the M.I.Wushishi and Talba housing estates, comprising five
hundred houses apiece have been constructed through the PPP in Minna, Niger state.
The most prominent feature within these estates is a set of uniform architectural
design prototypes. The Talba housing estate recorded huge building material wastes at
its practical completion stage sequel to a deluge of rainstorms (fig 1). It has been
claimed that the susceptibility of roofs to rainstorm destruction underscores such huge
material wastes; and is caused by design errors inter alia (Jolaoso 2006; Olabintan
2006). Pohjola and Tanskanen (1997) as cited by Pongrácz et al (2004) classified such
waste as things with well-defined purpose, but their performance ceased being
acceptable due to errors in their structure or state.
With these in mind, the prominence of design waste may as well be less obvious in
single housing units but can be quite severe in the case of mass housing construction.
This is because as few designs are distributed over an entire mass housing
construction site, so will a design error no matter how small, be magnified
cumulatively over a wide range of housing units. If this goes unnoticed, it will inhibit
the completion of such enormous projects; reduce its quality; and increase the quantity
of construction waste. Aidonis et al. (2008) estimated that construction waste
constitutes 30-35% of global solid municipal waste stream. It is therefore needful to
highlight design errors that potentially drive construction waste generation in order to
make progress with strategies for designing out waste.
Fig 1: Two and three bedroom prototypes depicting widespread building material losses
resulting in enormous construction waste. Source: Author, 2011
AIM AND OBJECTIVES OF THE STUDY
This study therefore set out to examine construction waste caused by roof design
errors complicated by improper building orientation viz a viz remedial solutions; with

Housing construction
317
a view to provide explanations on reducing construction waste on mass housing sites
in Minna. This will be explicated through the following objectives. First, the overall
design scheme of the Talba housing estate will be assessed. This will be followed by
outlining design waste routes through the nature and extent of material losses on the
site. Lastly, the rehabilitative reconstruction work on the site will be assessed, and
particularly the obvious changes made on roof designs and walls will be enumerated
and discussed.
THEORETICAL FRAMEWORK
Architectural design and material waste can be viewed in different ways; therefore it
is necessary to define architectural design and design waste. In Hillier (2007),
architectural design can be broadly described as a process or an object that emerges
from a creative-predictive design process. He stressed that the creative aspect searches
for design solutions in a normative way: it defines a search-space (for example a
locality) where it adopts formal and spatial properties and incorporates them into a
design proposal. Thus architectural design as an object is a conglomeration of
components and assemblage of various materials (Folorunso and Fadamiro, 2006).
Therefore, architectural design will be considered in this study as a building (walled
roofed structure) that comprises formal and spatial components.
Koskela (1992) as cited by Formoso et al. (1999) describes waste as any inefficiency
that results in the superfluous use of equipment, materials, labour, or capital in the
production of a building: implying that construction waste includes both the incidence
of material losses and the execution of unnecessary work, with general additional cost
but do not add value to the building. Sheeduzzafar and Khan (1984) as cited by
Akinkurolere and Franklin (2005) divided material waste into four categories, viz:
design waste, taking off and ordering waste; supply waste and contract waste. Several
authors (Garas et al.2001; Akinkurolere et al.2005; Ajayi, et al. 2008) refer to design
waste as material losses arising from uncompleted design, design changes, plan errors
and detail errors and such definition is apposite to a study of this nature.
According to Keys et al. (2000), the concept of designing out waste rests on
identifying the source of waste in the construction process which includes: materials
and component complexity, building complexity, lack of co-ordination, fast tracking
and lack of communication. They maintained that the solutions for designing out
waste are characterized by any of four innovative strategies: which must take
cognizance of the waste routes (its origins or concepts); the scheme or detail design
and disciplines involved. Element of these strategies entail long and short term
approaches, viz: use of prefabrication; standard component and realistic sizes;
minimizing temporary works, optimizing design lives; designing for recycling and
disassembly and identification of material products which create waste.
RESEARCH METHOD
This present paper is the outcome of an ongoing study on waste generation on mass
housing construction sites in Minna, Niger state Nigeria. A brief description of the
Talba housing estate highlights the design scheme including its building components.
In order to identify design waste routes on the site, field observations were conducted
to determine the nature and extent of massive loss of building materials and
components accentuated by rainstorm damage. Subsequent rehabilitative works on the
housing units made way for further investigations of the design changes. Together
these constituted primary data and were presented using tables and photographed

Olaniyan
318
pictures. Secondary data which encompass discourse on architectural design,
construction and design waste and rainstorm damage were sourced from cognate
journals and publications. This study is however limited to design waste and only
percentile analysis was carried out on the data so collected.
BRIEF DESCRIPTION OF THE TALBA HOUSING ESTATE
The area under study is a mass housing estate currently under reconstruction and
located along Minna-Bida road of Niger state in Nigeria. It comprises 500 units of 2
and 3 bedroom prototype detached bungalows in a ratio of 3:2 respectively. The
houses marked in red and blue represent 2 bedrooms, while houses marked in green
represent 3 bedrooms (fig 2). Majority of the 2 bedrooms lie along the east-west axis
while the 3 bedroom lie along the north-south axis. The irregular plan shape of the 2
bedroom represent a conglomeration of simple material components and complex
planar shape; while the rectangular shape of the 3 bedroom represent a simpler design
scheme (figs 3 and 4). The walling components were predominantly made of nine and
six inches hollow sandcrete blocks laid in situ; while timber, corrugated aluminium
roofing sheets (.35mm gauge) and asbestos ceilings constitute the roof structure.
The contract was awarded to a private developer, who concentrated on constructing 15
housing units and sub-contracted 485 units to 26 other contractors. Their agreement
elapsed at the practical completion stage. Finishes, fixtures and fittings were sub
contracted out separately and all together the works were executed through direct
labour. The maximum number of building units awarded to other contractors was 50
while the minimum was 2. The highest frequency of building allocation was 20. The
entire site measured approximately 90 hectares and each plot covered approximately
600m2.
Fig 2: Schematic layout plan of the estate, showing distinctions between 2 and 3 bedroom
buildings and their various orientations on site with respect to the north axis. Source: Puzzle
construction

Housing construction
319
Fig 3: Schematic
representation of the 2 bedroom floor plan, roof plan and 3D view. Source: Puzzle
construction
Fig 4: Schematic representation of the 3 bedroom floor plan, roof plan and 3D view. Source:
Puzzle construction
RESEARCH RESULTS
Design Waste Routes
Cases of collapsed walls and exfoliated roof structure typify the bulk of component
wastes. The waste constituents include sandcrete and cement rubbles, wood,
aluminium sheets, nails and asbestos sheets. Following the incidence of rain storms,
the material wastes encompass nearly half of the 2 bedrooms (47%) and 3 bedrooms
(48%) respectively. Out of these, 30% of 2 bedroom and 29% of 3 bedroom recorded
roof component losses.
Table 1: Nature and Extent of Material Waste (Damages) as at July, 2010
S/N Description 2
Bedroom
Percentiles
(%)
3
Bedroom
Percentiles
(%)
1 Completed buildings 278 92.6 191 95.5
2 Affected buildings 133 47 93 48
3 buildings with damaged roofs 86 30 57 29
4 buildings with collapsed walls 47 17 36 19
5 buildings with Collapsed walls and
roofs
53 19.2 42 22.2
6 Uncompleted buildings 22 7.4 9 4.5
Source: Author‘s field work, 2011
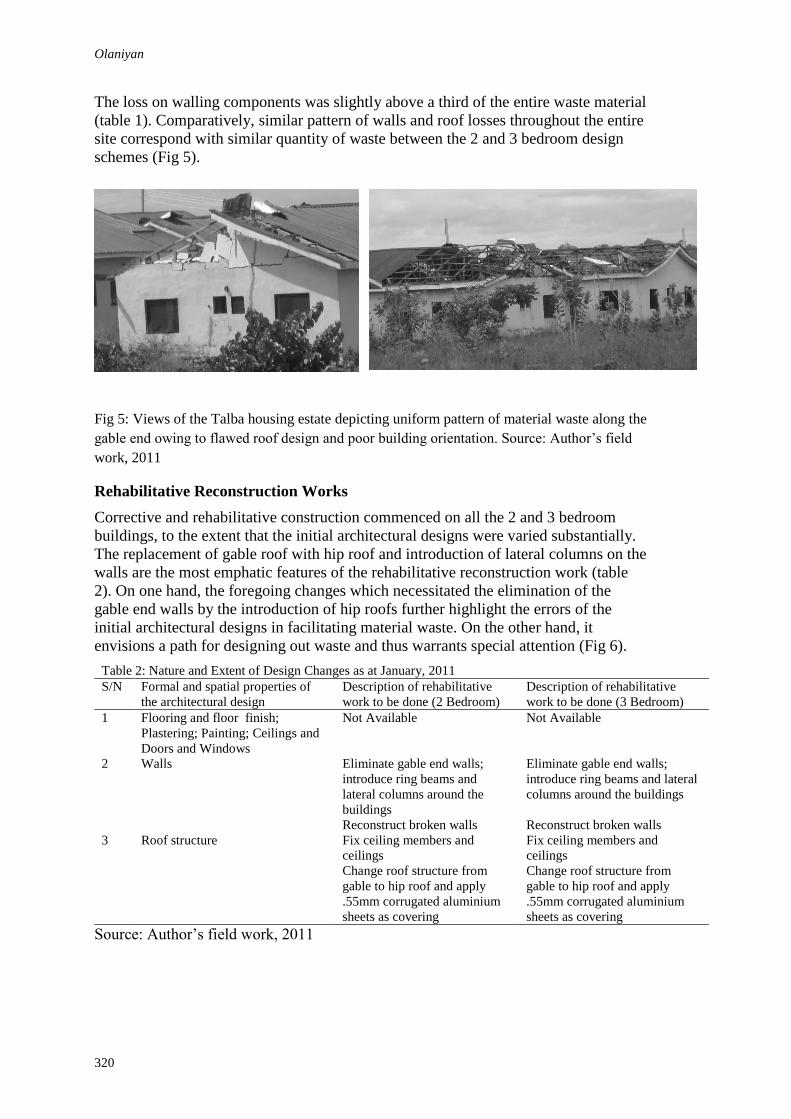
Olaniyan
320
The loss on walling components was slightly above a third of the entire waste material
(table 1). Comparatively, similar pattern of walls and roof losses throughout the entire
site correspond with similar quantity of waste between the 2 and 3 bedroom design
schemes (Fig 5).
Fig 5: Views of the Talba housing estate depicting uniform pattern of material waste along the
gable end owing to flawed roof design and poor building orientation. Source: Author‘s field
work, 2011
Rehabilitative Reconstruction Works
Corrective and rehabilitative construction commenced on all the 2 and 3 bedroom
buildings, to the extent that the initial architectural designs were varied substantially.
The replacement of gable roof with hip roof and introduction of lateral columns on the
walls are the most emphatic features of the rehabilitative reconstruction work (table
2). On one hand, the foregoing changes which necessitated the elimination of the
gable end walls by the introduction of hip roofs further highlight the errors of the
initial architectural designs in facilitating material waste. On the other hand, it
envisions a path for designing out waste and thus warrants special attention (Fig 6).
Table 2: Nature and Extent of Design Changes as at January, 2011
S/N Formal and spatial properties of
the architectural design
Description of rehabilitative
work to be done (2 Bedroom)
Description of rehabilitative
work to be done (3 Bedroom)
1 Flooring and floor finish;
Plastering; Painting; Ceilings and
Doors and Windows
Not Available Not Available
2 Walls Eliminate gable end walls;
introduce ring beams and
lateral columns around the
buildings
Eliminate gable end walls;
introduce ring beams and lateral
columns around the buildings
Reconstruct broken walls Reconstruct broken walls
3 Roof structure
Fix ceiling members and
ceilings
Fix ceiling members and
ceilings
Change roof structure from
gable to hip roof and apply
.55mm corrugated aluminium
sheets as covering
Change roof structure from
gable to hip roof and apply
.55mm corrugated aluminium
sheets as covering
Source: Author‘s field work, 2011

Housing construction
321
Fig 6: Views of the rehabilitative work depicting change in roof design and
introduction of columns within walls. Source: Author‘s field work, 2011
DISCUSSIONS
Designing out waste as the term implies is characterized by either a reduction or an
elimination process: both of waste and waste prone building material components. It is
active against all forms of passive waste inherent in architectural designs. In mass
housing, the complexity of building shape underscores plan errors which constitute a
prime target on the list for elimination and waste minimization. The decision by
architects to super impose simple building elements over complex plans is as much a
mismatch as it is a design error and should be avoided. Complicity with simplicity in
design especially in mass housing is central to material optimization and efficiency in
mobilizing man material machine and money. Apparently, because most mass houses
in Minna are characterized by gable roof structures, the same choice of roof design in
the case in point is normative and at first glance satisfies Hllier‘s (2007) creative
design process. The creativity however required for designing out waste is one that is
technical: penetrating the design process via structural necessities and dovetailing into
the functional and aesthetical objectives. This kind of creativity incorporates short and
long term approaches of minimizing waste in design via. It also reinforces a shift
towards material optimisation.
For instance, a hip roof design reflects a steep digression from the normative roof
design patterns but is consistent with existing roof typologies around the immediate
surroundings of the estate‘s milieu. A proper design that incorporates waste
minimizing strategies reflects an interdependent sensitivity to environmental impacts
such as horizontal wind loads. A hip roof design, if properly constructed minimizes
external area to internal volume and has a greater propensity to minimize the impact
of horizontal wind loads due to its all encompassing slopes. Similarly, wind loads
have maximum impact at 900 inclination to surfaces and lesser impact at angles lesser
than 900. Consider the instance of wind impact on the gabled end of the roof and the
slope of the hip roof (fig 5). The moment of the force in Newton on the gabled end is
F (N); while moment of the force in Newton on the slope is Fcosϴ (N). The former
will have a greater resistance to waste
Olaniyan
322
generation.
Fig 5: Schematic representation of horizontal wind loads on gable roofs and hip roofs respectively
(Author, 2011)
It may be argued that the choice of the gable roofs are cheaper alternatives; not
forgetting that affordability and profitability on investment are objectives of design in
Hillier (2007) and are also consistent with the construction of mass housing through
the PPP. Secondly, it can also be argued that similar estates in Minna used gable roofs
in the past and have recorded successes against the backdrop of design driven waste.
The backlash in these arguments is expressed in the main objective behind introducing
columns to a design of this nature. The introduction of columns and beams are largely
structural and in this context connote a remedial action to an irreversible design error -
poor building orientation. Proper building orientations (that is ensuring that building
lengths of lie along the east west axis), need little or no contraptions for lateral
bracing. The portions of the building walls that received the greatest impact of wind
and as a corollary, the greatest material waste were the gabled end of the roofs.
However, it is less likely to achieve hundred percent successes when orienting
buildings en mass. This further re-echoes the need for designs to possess an
independent propensity to minimize environmental impacts.
CONCLUSIONS
With regards to construction waste generation on mass housing sites, design waste is
first and foremost not to be considered as waste material as much as it is considered an
agent of waste generation. The uniformity and widespread nature of roofing and
walling materials waste in this study lend support to this. Various forms of design
waste are passive and as such further ignorance is not a luxury that can be afforded.
Designing out waste on mass housing construction sites in Minna was however not
premeditated, rather it was learnt the hard way. In fact, it is not in the mobilization of
man material machine and money that waste lies, but in the inability to know and do
the right things from the onset.
Designing rightly from the onset eliminates the need to repeat work and therefore
designing out waste strategies are better predefined and not post defined. This
challenge however is characteristic of the nascence of designing out waste. It was also
found that in addition to building and material complexity, immaterial complexities
such as building orientation can also cause waste generation. Following from this,
designing out waste is not only interested in reducing waste, but also in reducing
environmental impacts on building and material components by minimizing external
surfaces of building components to internal volumes.
While it is important for stake holders in the construction industry to become aware of
design waste, the bulk of design waste and its domino effect starts and ends around the
architect and his attendant design decisions. It is therefore very important for
architects to think hard and deep over and above complex aesthetic decisions or
compromising complexity of building plans with simplicity of material components.
This will hitherto encourage the elimination or avoidance of design changes and plan
errors.
REFERENCES

Housing construction
323
Aidonis, D., Iakovou, E., and Vlachos, D. (2008): Reverse flows optimization for construction
and demolition waste. Paper presented at BALKANTRIB 2008. Sozopol, Bulgaria, 12-
14 June, 2008. pp. 1-5. Viewed 18 May2010
Ajanlekoko, J.S. (2001): Sustainable housing development in nigeria – the financial and
infrastructural implication. Paper presented at the International Conference on
Spatial Information for Sustainable Development, Nairobi, Kenya 2–5th October, 200.
Viewed 13 November 2010, http://
www.fig.net/pub/proceedings/nairobi/ajanlekoko-CMWS1-1.pdf
Ajayi, O. M., Koleoso, Soyingbe, A.A., and Oladiran., O. J. (2008): The practice of waste
management in construction sites in Lagos State, Nigeria. Paper presented at the
construction and building research conference of the Royal Institute of Chartered
Surveyors, held at Dublin Institute of Technology, 4-5th September, 2008, Viewed 15
November 2010
Akinkurolere, O.O., and Franklin, S.O. (2005). Investigation into waste management on
construction sites in south western Nigeria. American Journal of Applied Sciences,
2(5), pp. 980-984
Folorunso and Fadamiro, (2006): Building materials quality and architect‘s specifications in
the Nigerian construction industry: An overview. Archisearch international journal of
architecture and environment. 1(2). pp. 73-80
Formoso, C.T., Isatto, E.L., and Hirota, E.H. (1999): Method for waste Control in the
Building Industry. In: Proceedings of the 7th annual conference of International Group of
Lean Construction, held at University of California, Berkeley, 26-28th July 1999, pp.
325-334
Garas, G.L., Anis, A.R., and Gammal A.E. (2001): Materials Waste in the Egyptian
Construction Industry. Ph.D. thesis, Cairo University, Egypt, Viewed 18 May 2010
Hillier, B. (2007): Space is the machine. London: Space syntax publishers
Jolaoso, B.A. (2006): roof failures in residential buildings in Abeokuta, Nigeria: causes and
remedies. In: Fadamiro, et al. (eds.). Urban environmental sustainability:
interventions and responses. 1st ed. Akure: Shalom Publishers. pp. 128-140
Keys, A., Baldwin, a., and Austin, S. (2000): designing to encourage waste minimization in
the construction industry. Viewed 13 November 2010 http:// www. dspace.iboro.ac.uk
Olabintan, O.D. (2006): Rainstorm damage to buildings in Owoand Akure, Ondo stae; causes
and effects. In: Fadamiro, et al. (eds.). Urban environmental sustainability:
interventions and responses. 1st ed. Akure: Shalom Publishers. pp. 117-127
Olayiwola, L.M., Adeleye, O., and Ogunshakin, L. (2007): Public Housing Delivery in
Nigeria: Problems And Challenges. Paper presented at the XXXIII IAHS world
congress, on Housing, 27-30th September, 2005, Pretoria, South Africa
Pongracz, P., Philips, S.P., and Keiski, R.L. (2004): Evolving the Theory of Waste
Management – Implications to Waste Minimization. Paper presented at Resource Use
Optimization Conference, Oulu. pp. 61-67. Viewed 13 November 2010
http://www.oulu.fi/resopt/wasmin/pongracz5.pdf.


Idiake, J.E. (2011) Diesel (ago) pump price increase and the prices of selected building materials in
Nigeria 1990 – 2009 In: Laryea, S., Leiringer, R. and Hughes, W. (Eds) Procs West Africa Built
Environment Research (WABER) Conference, 19-21 July 2011, Accra, Ghana, 325-333.
325
DIESEL (AGO) PUMP PRICE INCREASE AND THE
PRICES OF SELECTED BUILDING MATERIALS IN
NIGERIA 1990 – 2009
John Ebhohimen Idiake1
Department Of Quantity Surveying, Federal University of Technology Minna, Niger State Nigeria
This paper investigates the effect of increase in diesel pump price on the prices of
selected building materials in Nigeria. The objective is to establish the statistical
relationship existing between diesel price increase and the price of selected basic
building materials. Using a simple interactive polynomial method and working at
95% confidence limit a computation was made of the research variables. The result
showed a significant relationship between the variables tested. Also the result
revealed different degrees of relationships of the variables analyzed. Prices of cement,
blocks and paint had linear, quadratic and cubic relationships respectively with
increase in diesel price. Coefficients of determination of 96.04% for cement, 96.63%
for blocks, 95.76% for iron rod, 94.52% for paints, 90.12% for sharp sand and
96.49% for timber were discovered for these tested variables. The results of the study
indicate that the relationships were either linear or non linear in the tested variables.
This reveals that diesel price increase will cause the price of building materials to rise
at various degrees, thereby exerting an enormous financial pressure on the building
developers as a result of its multiplier effects on haulage and production of building
material. Therefore government fuel price hike policies should be implemented with
caution in order to prevent rise in prices of building materials.
Keywords: building material, diesel price, energy, price hike, road haulage.
INTRODUCTION
Diesel is a refined product obtained from petroleum or crude oil which is a naturally
occurring flammable liquid found in rock formation in the earth. Petroleum consists of
a complex mixture of hydrocarbons of various molecular weights and other organic
compounds (Hyne, 2001). The term ―petroleum‖ was first used in the treatise De
Natural Fossilium published in 1546 by a German Mineralogist. (Wikipaedia, 2009).
In its strictest sense, petroleum includes only Crude oil but in common usage it
includes crude oil and natural gas. Both crude oil and natural gas are predominantly a
mixture of hydrocarbons. The proportion of hydrocarbons in the petroleum mixture is
highly variable between different oilfields and ranges from as much as 97% in weight
in the lighter oils to 50% in the heavier oil and bitumen. The chemical structure of
petroleum is heterogeneous, that is, it is composed of hydrocarbons chains of different
lengths. As a consequence petroleum may be taken to oil refineries for the separation
of the hydrocarbon chemical by distillation and further treatment by other chemical
processes so as to be used for a variety of purposes. The most common distillation
products of petroleum are fuels, which include ethane, diesel fuels (petro diesel), fuel

Idiake
326
oil, gasoline (Petrol), jet fuel, kerosene and liquefied petroleum gas, (Speight, 1999).
The refined oil is moved to the end user through pipelines, by ships and by tanker
trucks.
Petroleum in one form or another has been used since the ancient times, and is still
very important in the economy of many nations. The rise in importance was mostly
due to the invention of the internal combustion engine. More than 4000 years ago
asphalt was used in the construction of walls and towers in Babylon. Great quantities
of it were found around the River Euphrates (Wikipaedia, 2009). Today, about 90% of
vehicular fuel needs are met by petroleum oil. Petroleum‘s worth as a portable, dense
energy source powering the vast majority of vehicles and as the base of many
industrial chemicals makes it one of the world‘s most important commodities. In
Nigeria, petroleum industry is the largest industry and main generator of gross
domestic product in the nation. Since the British discovered oil in the Niger Delta at
Oloibirir in 1956, the oil industry has been marred by political and economic strife
largely due to complexity of multinational corporations. Petroleum production and
export play a dominant role in Nigeria‘s economy and account for 90%of her gross
earning. Nkoro (2005) observed that increase in fuel prices has worsened the
economic crisis in the Nigerian economy. He said that whenever the fuel price
increases the GDP tends to decrease. His analysis showed a negative relationship
between the fuel price increase and GDP.
GASOLINE AND DIESEL USAGE AND PRICING
The usage pricing of gasoline or diesel results from factors such as crude oil prices,
processing and distribution costs, local demand, the strength of local currencies, local
taxation and the unavailability of local sources of diesel (supply). Since the trading of
fuel is globally the trade prices are similar, the price paid by consumer largely reflects
national pricing policy. Some nations such as Europe and Japan impose high taxes on
diesel: other, such Saudi Arabia, Venezuela and Nigeria subsidize the cost (Deutsuhe
2007.)
The Cambridge Energy Research Association reported that 2007 had been the year of
peak gasoline usage in the United States and that record energy price would cause an
enduring shift in energy consumption practices. Despite high demand in the United
States and rising fuel costs, gasoline prices are low in the States when compared with
most other Western countries. (Campoy 2008)
Other nations with subsidies on fuel include Iran, Egypt, Burma, Malaysia, Kuwait,
China, Taiwan, South Korea, Trinidad and Tobago, and Brunei. The purpose of
subsidies is to make transport of people and goods cheaper. This has been viewed to
discourage fuel efficiency. In some of these countries, the soaring cost of crude oil
since 2003 has led to these subsidies being cut, moving inflation from the government
debt to the general populace, something resulting in political unrest. Pricing is a
federal concern in order to ensure supply and demand is kept within limits to the
consumer.
Outcome of diesel price increase on goods and services
The construction industry is a significant and productive sector that plays a vital role
to stimulate growth through its linkage with other industries and professional services.
Favourable energy prices have helped to mitigate the impact of declining volumes on
the operating leverage of the aggregates business. Production costs in the aggregates
business are also sensitive to energy prices both directly and indirectly. Production

Impact of fuel price increases
327
costs directly affect diesel price through consumption and indirectly by the increased
cost of energy related consumables, namely steel, paint and conveyor belts. Changing
diesel costs also affect transportation costs, primarily through fuel surcharges in the
long-hand distribution network. (Raleigh, 2009).
In Malaysia, the negative impact of the recent price increase of fuel was viewed with
concern by the Master Builders Association of Malaysia. Wong (2008) observed that
the increase cost of diesel is affecting the construction contractors very deeply.
Contractors are sandwiched between the need to fulfil their contractual responsibility
to deliver on time at fixed tender price and on the other hand to meeting up with the
rising cost of fuel which has become a tightening noose on the cash flow, financing
and continuous survivability of the construction industry. Furthermore, he noted that
machineries such as Bulldozers, various tower and mobile cranes and off-highway
trucks are insatiable users of fuel and observed that this will definitely cut into
contractors‘ profit margins. Kemp (2008) stated that increasing energy prices
invigorated the surge in bio-fuels, leading to rise in prices for grains and ultimately
boosting demands for natural gas to make fertilizers. Rising gas and energy prices
have filtered back into higher costs for aluminium smelters, steelmakers and shipping
companies.
Wong (2008) pinpointed that due to fuel increases, there has been a rise in cost of
living. According to him transportation of workers has led to extra labour cost. This
has resulted in the escalation of site labour cost in recent times. Contractors have
considered the effect as a major cost item in their estimates. The increase in diesel
price was also observed as having a multiplier effects on other energy sources such as
power and gas used in manufacturing of construction materials, thus leading to
increase in prices of materials. He further noticed that many contractors would be
unable to continue in business if the increase is not kept in check.
Simonson (2008) observed that the American producer price index has gone up 6.5
percent as a result of 24 percent increase in diesel fuel cost. The consequences of this
increase was a 5.5 percent rise in prices of steel reinforcement bars including other
steel sections, and multiple problems on contractors using diesel to power off-road
equipment and construction vehicles and also payment on fuel as result of numerous
inflow and outflow of deliveries at a large job site.
Bureau for Labour Statistics (2008) reported that construction materials cost rose by
6.5 percent in the United States due to high prices of diesel fuel. Simonson (2007)
stated that increase in diesel fuel has affected highway and heavy construction
projects. The effect was noticed in the 2004 producer price index which rose from 5.6
to 14 percent within three years period (2001 to 2004).
PURPOSE OF THE STUDY
The purpose of this study is to examine the relationship existing between increase in
price of diesel from 1990 to 2009, and prices of some selected construction material.
The objectives then will be to measure statistically the relationship existing between
the price of each of these construction materials (cement, 225mm block, Iron rod,
sharp sand, paint and timber) with the pump price increase of diesel over the period of
twenty years. Also the study further seeks to examine or compare previous analysis
(Idiake 2010) carried out on the effect of increase in petrol pump price with that of
current study on diesel so as to build up empirical data for policy makers, budget
planners and others involved in funding and designing infrastructures.

Idiake
328
RESEARCH METHOD
The data used for this study spanned a period of twenty years from 1990-2009, a
period which covered both military and civilian administrations. The data were
collected from two sources, primary and secondary sources. The data for prices of
building materials used in this study were obtained through market survey from
dealers in the building materials; this was also complemented by prices obtained from
Building Material Price Book (2009). The data for diesel pump price were obtained
from secondary sources only provided by CBN and NNPC publications. The data
collected as shown in Table 1 were weighted and subjected to simple statistical
analysis of polynomial modelling with graphical presentation. From these
presentations, discussions and inferences were drawn out for decision making.
Scope of the Research
(i) Factors of production of selected building materials were not considered in this study.
(ii) Variations in production dynamics not taken into account in the analysis of this study.
(iii) Assessment of relationship between variables was simply based on pump price of
diesel and market price of building materials.
Assumptions
The following assumptions were made for this research work;
(i) Inflation was considered to be constant throughout the period under review.
(ii) No significant lag effects existed over the period considered for the research work.
DISCUSSION OF RESULTS OF RESEARCH ANALYSIS
Figure 1 shows the graphical presentation of the relationship between increase in price
of diesel and price of cement. The coefficient of determination for the analysis is
96.04% with corresponding P-value of 0.018 which is lower than 0.05 level of
significance. The R-square value of 0.964 shows that 96.04% variation in the price of
cement is accounted for by the increase in the price of diesel. The relationship
between the variables establishes a cubic or 3rd
degree polynomial model (Eqn.1).
Cement Price = 239.4 + 36.79x – 04793x2 + 0.002605x
3 (1)
0 10 20 30 40 50 60 70 80 90 100
0
200
400
600
800
1000
1200
1400
1600
1800
2000
Price of Diesel
Fig 1 Relationship Between increase in Diesel Price and Price of Cement
Pri
ce o
f C
emen
t
Cubic Model Polynomial 3
PRICEFCEMENT vs. Diesel
fit 11
Pred bnds (fit 11)
SSE: 1.884e+005
R-square: 0.9604
Y = p1*x3 + p2*x2 + p3*x + p4
P value 0.018

Impact of fuel price increases
329
From the equation model, the intercept on Y axis is 239.4 and for every increase of
one unit of diesel there is an increase of about 36.79 in cement price. But it was
observed that for every unit increase in price of diesel raised to the power of two,
there is a decrease of about 0.4793 in cement price. Similarly an increase of about
0.002605 occurred for every unit increase of diesel price raised to the third power.
Figure 2 is showing the relationship between price of 225m block and increase in
price of diesel. The coefficient of determination is 96.63% with a P-value of 0.000
which is less than 0.05 confidence limit set for the study. With R-square of 0.9663, it
means that 96.63% variation in price of 225mm block is accounted for by the increase
in price of diesel. The graphical relationship between the variables tested gives a 3rd
degree polynomial model as stated in equation 2.
Blocks Price = 7.263 + 3.576x – 0.05869x2 + 0.0003291x
3 (2)
The model has an intercept of 7.263 on the Y axis and showed that every increase of
one unit of diesel there is an increase of about 3.57 in 225mm block price. Also it was
noticed that for every unit increase in the price of diesel raised to the second power a
decrease of about 0.05869 was experienced. Similarly an increase of about 0.0003291
was observed for every unit increase of diesel price raised to the third degree.
0 10 20 30 40 50 60 70 80 90 100
0
20
40
60
80
100
120
Price of Diesel
Fig 2 Relationship Between increase in Diesel Price and Price of 225mm Blocks
Pri
ce o
f 2
25
mm
Blo
cks
Cubic Model Polynomial 3
PriceOfBlocks vs. Diesel
fit 12
Pred bnds (fit 12)
R-square: 0.9663
SSE: 681.9
P value 0.000
Y = p1*x3 + p2*x2 + p3*x + p4
0 10 20 30 40 50 60 70 80 90 100
0
2
4
6
8
10
12
14
16
x 104
Price of Diesel
Fig 3 Relationship Between increase in Price of Dieseland Price of Reinforcement Bars
Pri
ce o
f R
ein
forc
emen
t B
ars
Linear Model Polynomial 1
PriceOfIronRods vs. Diesel
fit 13
Pred bnds (fit 13)
R-square: 0.9576
Pvalue 0.000
SSE: 1.634e+009
Y = p1*x + p2

Idiake
330
Figure 3 is the result of the analysis for the relationship between prices of iron rod and
increase in pump price of diesel. The R-square for the analysis is 95.76% which is a
very strong relationship. The P-square is 0.000 which is less than 0.05 level of
significance, which means that the results were highly significant. The R-square result
shows that 95.76% variation in price of iron rod is accounted for by the increase in
price of diesel during the time under review. The variable tested gives a relationship
of linear model with a straight line equation (Equation 3). This suggests that as the
price of diesel changes, there is a corresponding increase in the price of Iron rod.
Iron rod = 1.201 x10⁴+ 1269x (3)
The model has an intercept of 1.201x10⁴
on the Y axis and for every increase of one
unit of diesel there is an increase of about 1269 in the price of iron rod.
Figure 4 shows the result of the relationship between the market price of paint and
increase in pump of diesel. The coefficient of determination from the analysis is
94.2% and has P-value of 0.000 which is less than the allowable level of significance
of 0.05, which depicts that the result is highly significant. The R-square of 0.942
suggest that 94.2% variation in the price of paint is accounted for by the increase in
changes in price of diesel. These variables, prices of paint and diesel, maintain a 3rd
degree polynomial relationship with a model equation (Equation 4)
Paint = 40.44 + 19.79x – 0.354x2 + 0.002029x
3 (4)
From this model the intercept on Y axis is 40.44 and for every increase of one unit of
diesel there is an increase of about 19.79 in the price of paint. But it was noted that for
every unit increase in price of diesel raised to the second degree there is a decrease of
about 0.354 in cement price. Comparably an increase of about 0.002029 was
witnessed for every unit increase of diesel price raised to the third power.
Figure 5 describes the result of the relationship between the market prevailing price of
sharp sand per trip and increase in price of diesel per litre. This relationship has a
coefficient of determination of 90.12% and P-value of 0.025 which is less than 0.05
level of significance. The R-square result of 0.9012 shows that 90.12% variation in the
price of sharp sand is accounted for by the increase in price of diesel. The graphical
relationship in this analysis has a quadratic or 2nd
degree polynomial model, which is
represented in the following mathematical model (Equation 5)
Sharp Sand = 294.6 + 88.39x – 0.1673x2 (5)
0 10 20 30 40 50 60 70 80 90 100
0
100
200
300
400
500
600
700
Price of Diesel
Fig 4 Relationship Between increase in Diesel Price and Price of Paint
Price a
nd P
rice o
f P
ain
t/gallo
n
Cubic Model Polynomial 3
PriceOfPaint vs. Diesel
fit 14
Pred bnds (fit 14)
R-square: 0.942
Pvalue 0.000
SSE: 2.603e+004
Y = p1*x3 + p2*x2 + p3*x + p4
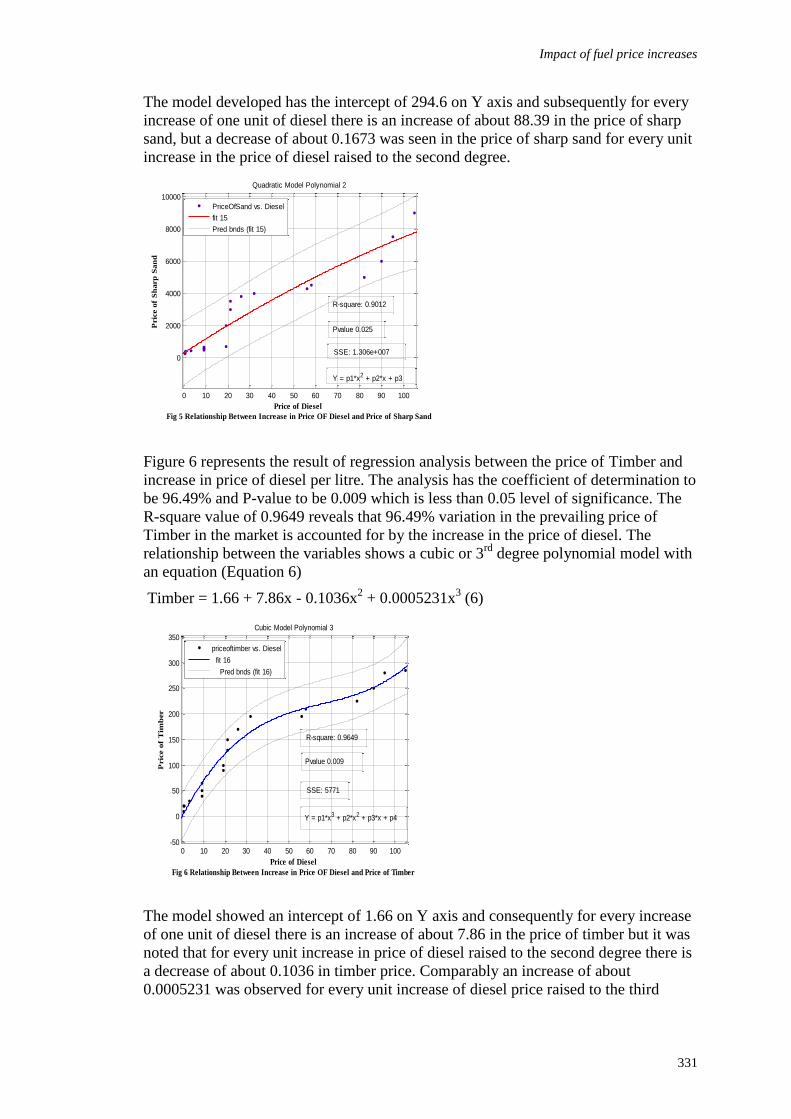
Impact of fuel price increases
331
The model developed has the intercept of 294.6 on Y axis and subsequently for every
increase of one unit of diesel there is an increase of about 88.39 in the price of sharp
sand, but a decrease of about 0.1673 was seen in the price of sharp sand for every unit
increase in the price of diesel raised to the second degree.
Figure 6 represents the result of regression analysis between the price of Timber and
increase in price of diesel per litre. The analysis has the coefficient of determination to
be 96.49% and P-value to be 0.009 which is less than 0.05 level of significance. The
R-square value of 0.9649 reveals that 96.49% variation in the prevailing price of
Timber in the market is accounted for by the increase in the price of diesel. The
relationship between the variables shows a cubic or 3rd
degree polynomial model with
an equation (Equation 6)
Timber = 1.66 + 7.86x - 0.1036x2 + 0.0005231x
3 (6)
The model showed an intercept of 1.66 on Y axis and consequently for every increase
of one unit of diesel there is an increase of about 7.86 in the price of timber but it was
noted that for every unit increase in price of diesel raised to the second degree there is
a decrease of about 0.1036 in timber price. Comparably an increase of about
0.0005231 was observed for every unit increase of diesel price raised to the third
0 10 20 30 40 50 60 70 80 90 100
0
2000
4000
6000
8000
10000
Price of Diesel
Fig 5 Relationship Between Increase in Price OF Diesel and Price of Sharp Sand
Pric
e o
f S
harp
San
d
Quadratic Model Polynomial 2
PriceOfSand vs. Diesel
fit 15
Pred bnds (fit 15)
Y = p1*x2 + p2*x + p3
SSE: 1.306e+007
Pvalue 0.025
R-square: 0.9012
0 10 20 30 40 50 60 70 80 90 100-50
0
50
100
150
200
250
300
350
Price of Diesel
Fig 6 Relationship Between Increase in Price OF Diesel and Price of Timber
Pric
e o
f T
imb
er
Cubic Model Polynomial 3
priceoftimber vs. Diesel
fit 16
Pred bnds (fit 16)
Pvalue 0.009
R-square: 0.9649
SSE: 5771
Y = p1*x3 + p2*x2 + p3*x + p4

Idiake
332
power. Table 1 shows the comparison between the regression analysis results on
increase in petrol pump price and diesel pump price on prices of building materials.
It will be observed that from the previous study (Idiake 2010), about 50% of the
selected building materials tested, such as cement, iron rod and sharp sand, had linear
relationship, while the other 50% are polynomial in nature. In the present study, 15%
of the result showed linear relationship, while the remaining 85% revealed polynomial
model. The reason for this could be linked to the fact that most of the haulage vehicles
are fuelled with diesel. This means that the effects of increase in petroleum products
on prices of building materials could be better captured by the analysis in this study,
rather than the one done in the earlier study (Idiake 2010). Moreover, the predictive
power of the model in the earlier study is between 85.54% and 94.60% but ranges
between 90.12% and 96.63% in this present study, which indicates that the present
study gives a better predictor of the fuel-material price relationship. This is an
improvement to the earlier research done. This also shows that, judging from the
dynamics of market forces, the relationships between the variables tested are highly
indirectly proportional to one another, indicating a multiplier effects.
CONCLUSION
The result of the study revealed that greater proportion of the relationships existing
between the variable tested were non linear in nature except in the relationship
between the price of iron rod and that of diesel which was linear in nature. Also the
analysis showed a high level of significant relationships between the tested variables.
This indicates that the relationships between the variables could be used to predict the
prices of the building materials as it affect construction industry. Therefore it is
suggested that government fuel price hike policies should be implemented with
caution in order to prevent rise in prices of building materials. Secondly, government
should stabilise and regulate prices of petroleum products. Thirdly, professional

Impact of fuel price increases
333
estimators (Building Planners, Quantity Surveyors, Cost Engineers, etc) should note
and consider the predictive power of the model in this study in their preparation of
budgets, estimates and tender bids.
REFERENCES
BLS (2008) Bureau for Labour Statistics. www.bls.gov/ppi Building and Engineering Price
Book (2009) No 6 January 2009, Publisher Cosines Nigeria Limited, Lagos
Campoy . A., (2008) ―Prices Curtail US. Gasoline Use.‖ Wall street Journal. Pp A4
Deetsche Gesellscilaft fur Techinische Zusammennar beit, (2007) International fuel prices
(PDF) htt:ll www. 2007. Palf. Retrieved 10-07-2010.
Hyne , N. J., (2001). Nontechnical Guide to Petroleum, Exploration, Drilling and
Production. Penn Well Corporation. Pp. 1-4.
Idiake, J.E., (2010). The Effect of Increase in Petrol (PMS) Pump Price on the Prices of
Building Construction Materials in Nigeria, 1990-2009. Journal of Environmental
studies, University of Lagos.
Kamp, J., (2009) Easing Cost Pressures on Commodity Producer. Thomson Reuters
Raleigh, N.C., (2009) Martin Marietta Material, Inc. updates 2009 Earnings Expectations
report. www.maritinrietta.com
Nkoro, E., (2005). Increase in Fuel Price: Analysis of its Effects on Nigerian Economy from
Searchwarp.com/swa20448.htm Retrieved 11-09-2009
NNPC, (2000), A report of the special committee on the reviews of petroleum supply and
distribution. NNPC production October.
Simonson, k., (2007). Associated General Contractor of American National Surface
Transportation Policy and Revenue Study Commission Washington, DC.
www.allbusiness.com/economy.../12413775-1.html
Simonson, K., (2008). Steel, Fuel Prices Send Construction Costs Soaring. Associated
Construction Publication. USA.
Speight, J. G., (1999). The Chemistry and Technology of Petroleum. Marcel Dekker. Pp. 21–
216.
Wikipedia, the Free Encyclopaedia (2009) from http://en.wikipedia.org/wiki/main_page
Retrieved 11-09-2009
Wong, P., (2008) Response to Fuel Price Increase and Escalation cost of building material,
presented by the president of Master Builder Association, Malaysia.


Waziri, B.S. and Bala, K. (2011) Drivers for estimating construction costs of institutional building
projects in Nigeria In: Laryea, S., Leiringer, R. and Hughes, W. (Eds) Procs West Africa Built
Environment Research (WABER) Conference, 19-21 July 2011, Accra, Ghana, 335-346.
335
DRIVERS FOR ESTIMATING CONSTRUCTION COSTS
OF INSTITUTIONAL BUILDING PROJECTS IN
NIGERIA
Baba Shehu Waziri1 and Kabir Bala
2
Department of Building Ahmadu Bello University Zaria, Nigeria
Central to cost based competition is the capability to accurately predict the cost of
delivering a project at the early stage. Early cost estimates are important for project
feasibility studies, budget allocation decision and even final project success. The
accuracy and reliability of such estimates largely depend upon the selection and the
use of relevant predictor variables for estimating. This study identifies and proposes
through empirical means the use of relevant cost drivers for accurate and reliable cost
estimating of institutional building projects in Nigeria based on 510 sets of detailed
project data. Relevant cost drivers extracted from related literature were examined
through a field survey. Nine cost drivers were identified by experts. They are the
building height, compactness of the building, expected construction duration, external
wall area, gross external floor area, number of floors, Proportion of opening in
external walls, location and time indices. Backward regression analyses (linear and
semi-log) were employed incorporating these relevant variables to predict
construction costs. The results of the analysis revealed that the transformed regression
model predicted likely construction costs of randomly selected projects with Mean
Absolute Percent Error (MAPE) of 9.76%. The result also showed that the variable
gross external floor area has the greatest explanatory significance with construction
cost.
Keywords: cost drivers, cost estimating, institutional building, regression.
INTRODUCTION
Construction cost is a relevant success factor of building construction projects
(Ogunsemi 2006, Stoy et al., 2007 and Stoy and Schalcher, 2008). Therefore the
estimate for construction cost at the early project stage is essential for many purposes
including the feasibility and budget allocation decisions (Kim et al., 2008a and 2008b;
Cheng et al., 2009a and 2009b). Such early estimates allow owners and planners to
evaluate project feasibility and control cost effectively in detailed project decision
work. Then impact of inaccurate cost estimating on project feasibility as well as
profitability is significant. Overestimated costs results a low feasibility divesting client
to own new projects. On the other hand, an underestimated cost could mislead
planners to a high feasibility, which causes client additional costs in the construction
phase. Thus, underestimated or overestimated cost affects client‘s project requiring a
method to measure as accurate as possible. Due to the limited availability of
information during the early project stage, construction managers usually rely on their
intuition (Cheng et al 2009a and 2009b).

Waziri and Bala
336
Traditionally, cost estimating models have been developed using statistical methods
which are hampered in estimating accurate project costs due to the large number of
significant variables and the interactions thereof (Sonmez and Ontepelli, 2009).
According to Ogunsemi (2006) a vital consideration with any method of estimating is
the accuracy by which anticipated cost can be predicted. Lowe et al., (1996) and
Skitmore (1990) observed that while the levels of accuracy perceived by the early
stage estimators were less than 10%, the accuracy achieved were greater than 20%;
suggesting that estimators have an unrealistically high opinion of the quality of their
estimating ability.
PROBLEM DEFINITION
In today‘s cost conscious project environment, project owners need a way to predict
how their early decision will impact the final cost of projects (Pearce 1997, Sodikov
2005). Ashworth and Skitmore (1983) stated that a vital consideration with any
method of estimating is the accuracy by which anticipated cost is predicted, because
the accuracy level is one of the critical indicators of an effective estimating. The
accuracy level of early estimate is usually small, since the requirements are not always
clearly defined and the estimates extend over a long time period, often several months
between the first cost estimate and the payment of the last bill. Shash and Ibrahim
(2005) and Lowe et al., (2006) have indicated that the levels of accuracy achieved by
using most estimating techniques are lower than desired. Despite the odds, a precise
cost estimate is almost always needed. Ogunsemi (2006) suggested that a difference of
10% between estimate and tender figure is an excellent performance. The study
proposes to improve the accuracy of the cost prediction for institutional Buildings in
Nigeria by looking at the relevant cost drivers for cost estimation. This study is based
on regression model that shows the connection between cost drivers and building
construction cost quantitatively.
STATE OF THE ART
Pearce (1997) used artificial Neural Network (ANN) in identifying potentially
significant relevant cost drivers relating to construction projects. The cost drivers
identified in the study includes floor to floor height, external wall area, exterior
window area, number of floors among others. Bhoka and Ogunlana (1999) developed
an ANN model for predicting the construction cost of building projects at the pre-
design stage. They used the completed project data of 136 properties. The cost drivers
used in their study are; building function, structural system, building height, exterior
finishing, decorating class and site accessibility. The result of the study reveals that on
the overall 42.7% of the sample were underestimated while 57.3% were
overestimated. The underestimate vary from -46.5% to -6.2%. The overestimates vary
from 0.1% to 136.8%. They concluded that there were relatively high errors on few
samples which have extreme building features. Emsley et al., (2002), worked with
regression and neural networks to compare the two methods based on a data pool of
288 properties including residential buildings, up to 41 independent variables were
included in the model. The cost drivers used were grouped into project strategic
variables, site related variables and design related variables. The model has a MAPE
of 17%. Sonmez (2004) used construction year, location index, total building area,
percent health centre, commons area, number of floors and structured parking area as
cost drivers to develop a construction cost models for building projects using
regression and neural network. The cost data of continuing care retirement community
projects were complied for the study. The regression model has a MAPE of 11.7%.

Cost estimating
337
Table 1 Related Studies and their Relevant Cost drivers
Study Data Pool Method Cost Drivers (extract)
Pearce (1997) 46 training Cases Artificial Neural
Network Floor to Floor height
External wall area
Exterior windows
Number of floors
Number of Elevators
Heating Load
Cooling Load
Bhoka and
Ogunlana (1999)
136 Properties Artificial Neural
Network Building Function
Structural system
Building Height
Foundation Index
Decorating Class
Exterior Finishing
Site accessibility
Emsley et al.,
(2002)
288 Properties Artificial Neural
Network and
Regression
Project strategic drivers
Site related variable
Design related variables
Sonmez (2004) 30 Properties
(Institutional )
Artificial Neural
Network and
Regression
Construction year
Total Building area
Number of floors
Percent commons area
Cheng and Wu
(2005)
29 Properties Support Vector
Machine Total floor area
Geology property
Facility class
Decorating class
Lowe et al (2006) 286 Properties Linear regression Project strategic drivers
Site related variable
Design related variables
Stoy and Schalcher
(2007)
290 Properties Regression Median floor height
Ratio of ancillary area
Construction duration
Compactness of Building
Stoy et al (2008) 75 Properties Regression
(Semi-log,
Linear)
Compactness of Building
Number of Elevators
Absolute size
Proportion of Opening
Construction duration
Cheng et al (2009) 28 Properties EFNIM Total floor area
Interior decoration
Site area
Soil condition
Feng et al (2010) 18 training samples Genetic algorithm
and Neural
network
Architecture forms
Number of piles
Doors and windows
Wall and Plane assemble
Cheng and Wu (2005) used Support Vector Machine (SVM) to develop model for
construction conceptual cost estimate. They used both quantitative (total floor area,
floors over ground and floors underground) and qualitative (geology property,
earthquake impact, decoration class and facility class) cost drivers in the study. Lowe
et al., (2006) utilized 19 independent variables in the study using regression analysis

Waziri and Bala
338
to determine optimum model for cost prediction. They used among others, building
function, mechanical installations, internal wall finishing, exterior wall as independent
variables. The study identifies gross internal floor area, building functions,
construction duration, mechanical installation and pilling as the key cost drivers. All
of the models performed similarly with the best model having MAPE of 19.3%.
Sonmez (2008) used a combination of regression and bootstrap techniques to integrate
parametric and probabilistic estimating. The MAPE of the model was calculated to be
12%.
Cheng et al (2009a) and (2009b) provided new mechanisms called the Evolutionary
Fuzzy Neural Inference Model (EFNIM) and the Evolutionary Fuzzy Hybrid Neural
model (EFHNM) for design phase cost estimation of projects in Taiwan. The
mechanisms achieved an overall estimate error of 16.07% and 10.36% respectively.
The main disadvantage of the approaches is that they have very long computing time
due to the use of genetic algorithm. The cost drivers used in the study includes total
floor area, interior decoration, site area, soil condition and seismic zone. Feng et al.,
(2010) presents an optimization method for construction cost estimates. The method is
a hybrid of genetic algorithm and back propagation neural network (GA-BP) which
adopts the algorithm that chooses the optimized dot from the multiply dot in solution
space simultaneously. The GA-BP has a shortcoming. It runs a long time and the error
has not attained a satisfactory degree. The review of related studies supplies a list of
variables (cost drivers) that is further re-examined through a field survey. Table 1
shows extracts of some cost drivers from related literature.
RESEARCH METHOD
The study involved the survey of relevant cost drivers for estimating construction
costs of institutional building projects. From related studies sixteen relevant input
variables were extracted and subjected to further examination through questionnaire
survey and oral interviews. The sample size for the questionnaire survey is made up of
243 professionals drawn from the offices of consultants (82), contractors (76) and
building owners (85) while the expert panel for the interview is made up of 30
professionals (Boyce and Neale, 2006) comprised of 10 quantity surveyors, 7
engineers, 7 Architects and 6 Builders from the offices of consultants, contractors and
building owners respectively. The professionals were mandated to add to the prepared
list or crossing off of cost drivers from the list. From the survey, out of the sixteen
variables, nine variables were identified to be relevant for use in cost prediction of
institutional buildings (Waziri 2010). Regression analysis (back elimination) was used
to further establish the significance of these variables. Linear and semi-log regression
models predicting Cost/M2 and LnCost/M
2 respectively were developed using the
statistical software SPSS 16 for windows, based on 510 institutional Building projects
data initiated and completed between 1999 and 2008 in Nigeria. This applies the
iterative method of analysis (significance level of 5%) which is based on the
fundamental of theoretically causal relationship (Stoy et al., 2008). Two regression
statistic the p value and the coefficient of determination R2 were used for the
determination of the variable to be eliminated. The performances of the models were
tested from two perspectives.
i. The absolute percentage difference between the observed and the predicted costs
is analysed. It is referred to as the Mean absolute Percent error (MAPE) calculated
as

Cost estimating
339
ii. Using a random generator the data of ten properties which are not used for
developing the model but exclusively for testing the performance of the models
were obtained. The construction costs of the properties were predicted on the basis
of the developed models and are then compared to the actual observed data.
RESULTS AND DISCUSSION
The results of the identified input variables from the field survey reflecting relevant
status from weighted values is presented in table 2.
Table 2 Relevant predictor variables
S/No Variable Unit
1 Building Height (X1) M
2 *Compactness of Building (X2) -
3 Construction Duration (X3) Month
4 External Wall Area (X4) M2
5 Gross External floor area (X5) M2
6 Number of Floors (X6) No
7 **Proportion of Opening on External walls (X7) %
8 Location Factor (X8) -
9 Time Index (X9) %
* Compactness of building is defined here as the external wall area divided by the
gross external floor area.
** Proportion of opening on external walls here refers to the area of external doors
and windows divided by external wall area ×100%.
PROPOSED REGRESSION MODEL
In this study parsimonious models were considered. The principle of parsimony is
important because, in practice parsimonious models generally produce better forecasts
(Sonmez 2004). The significance of the identified parameters in the data was
evaluated using the backward elimination regression technique. In the backward
elimination regression, all the independent variables were considered in the initial
regression and the variable that is not contributing to the model is eliminated one at a
time. Two regression statistics significance level (p value) which gives an indication
of the significance of the variable and coefficient of determination (R2) which gives a
measure of the variability explained by the model were used for the determination of
the variable to be eliminated.
Table 2 Summary of the Regression Models
Model Transformation Variables Included R2 R
2 Adj Fvalue Sig.
1 Semi-log X1, X2, X3, X4, X5,
X6, X7
0.940 0.891 25.93 0.00
2 Linear X1, X3, X4, X5,X7 0.808 0.786 45.83 0.00
All the nine variables were included in the first two regression models predicting the
LnCost/M2 and Cost/M
2. The variables that are not contributing to the model were
eliminated one after the other. The semi-log model included seven variables while the
linear model included five variables. The summary of the regression analysis is
presented in table 2.

Waziri and Bala
340
Each of the regression models was tested and the model that produced the best
statistical results in terms of parameter significance is the semi-log model with R2
value of 0.940. The model included seven variables and can be represented with the
following equation
Where;
X1 is building height, X2 is compactness of building, X3 expected construction
duration, X4 external wall area, X5 is gross external floor area, X6 is Number of floors
and X7 is proportion of opening in external walls.
PERFORMANCE OF THE MODELS
a) The first method used in evaluating the performances of the two models is the
absolute difference between the observed and the predicted costs. It is referred to
as the MAPE. The average and maximum errors of the models are also evaluated.
The result is presented in table 3.
Table 3. Errors of the Regression Models
Model Ave Error (%) Max. Error (%) MAPE (%)
Linear -4.72 22.64 12.93
Semi-log -3.62 16.57 10.28
b) Using a random data of ten properties that were not used in the development of the
models. The result of the MAPE, average and maximum error is presented in table
4.
Table 4. Prediction error of randomly selected properties
Model Ave Error (%) Max. Error (%) MAPE (%)
Linear -2.35 24.67 10.17
Semi-log -3.47 21.35 9.76
QUANTIFICATION OF THE CAUSAL RELATIONSHIP
The causal relationships of each independent variable of the proposed model are
described.
i. Gross external floor area (x5)
The gross external floor area measured in 1000m2 is the first variable to be included
in the model. It impacts negatively on the construction cost (Fig. 1). The back-
transformed equation indicates that for each additional 1000m2 of gross external floor
area (the variable‘s unit of measurement), building construction cost per m2 of gross
external floor area dropped by approximately7% [ ]
The construction duration has a positive impact on the construction cost per m2 of
gross external floor area. The construction duration is defined as the duration from
when work begins at the construction site until the work comes to an end. The
regression model shows a positive relationship between duration and construction
cost. This means that building construction cost rises with increasing construction
duration and decrease with a drop in construction duration (Fig. 2).
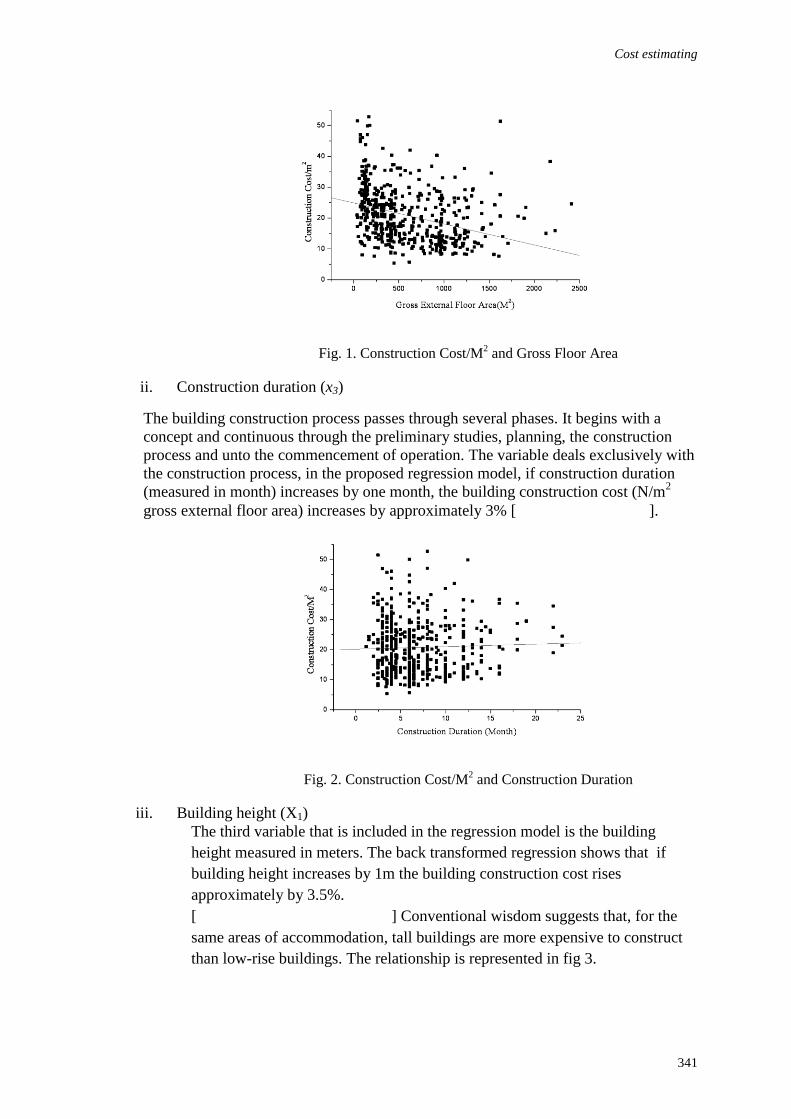
Cost estimating
341
Fig. 1. Construction Cost/M2 and Gross Floor Area
ii. Construction duration (x3)
The building construction process passes through several phases. It begins with a
concept and continuous through the preliminary studies, planning, the construction
process and unto the commencement of operation. The variable deals exclusively with
the construction process, in the proposed regression model, if construction duration
(measured in month) increases by one month, the building construction cost (N/m2
gross external floor area) increases by approximately 3% [ ].
Fig. 2. Construction Cost/M2 and Construction Duration
iii. Building height (X1)
The third variable that is included in the regression model is the building
height measured in meters. The back transformed regression shows that if
building height increases by 1m the building construction cost rises
approximately by 3.5%.
[ ] Conventional wisdom suggests that, for the
same areas of accommodation, tall buildings are more expensive to construct
than low-rise buildings. The relationship is represented in fig 3.

Waziri and Bala
342
Fig. 3. Construction Cost/M2 and Building Height
iv. Proportion of openings in external walls (x7)
Another independent variable of the proposed regression is the proportion of
doors and windows in external wall measured in %. From the back-
transformed regression, it is readable that an increase of 10% in the proportion
of openings makes the building construction cost to rise by approximately 7%.
[ ]. The relationship is also represented in Fig. 4.The
reason for this connection is the high cost of such surfaces. External door and
window areas are generally substantially more complex than the basic external
wall parts.
` Fig. 4. Construction Cost/M2 and Proportion of Opening in External wall
v. Eternal wall area (x4)
Another predictor variable that is included in the proposed model is the external wall
area. The back-transformed regression model indicates that for each additional
1000m2 of external wall area (the variables unit of measurement), building

Cost estimating
343
construction cost per m2 of gross external floor area decreases by approximately 17%.
This relationship is represented in figure 5.
Fig. 5. Construction Cost/M2 and External Wall Area
vi. Compactness of Building (x2)
Another predictor variable that is included in the regression model is the compactness
of the building, (external wall area/gross external floor area). It has a positive impact
on construction cost (Fig. 6).The reason for this impact is particularly found in the
high cost of external walls. With lower compactness of the building the cost of
external walls per m2 gross external floor area rises, largely because more m
2 of
external wall area must be provided. By the model, building construction cost (N/m2
gross external floor area) rise with an increase in units of compactness of building. If
the compactness of building x2 increases by 0.15 units, then building construction
cost/m2 rises approximately by 8.4%
Fig. 6 Construction Cost/M2 and Compactness of Building
vi. Number of Floors (x6)
Number of floor also exhibits a positive cost impact. That means building
construction cost (N/m2gross external floor area) rise with an increase in

Waziri and Bala
344
additional number of floors (Fig. 7). The back-transformed regression
indicates that for each additional number of floors the building construction
cost per floor area will rise by about 6.3%. The regression equation reads
[ ]
Fig. 7 Construction Cost/M2 and Number of Floors
CONCLUSION
The main objective of the study is to identify the relevant cost drivers of institutional
building projects in Nigeria to support early cost estimating. The examination of these
drivers was based on identified relevant cost drivers through literature and field
survey. Seven variables were included in the proposed regression model with R2 value
of 0.867 these are the building height, compactness of the building, expected
construction duration, external wall area, gross external floor area, number of floors,
proportion of opening in external walls. The regression model has a MAPE of
10.38%. The study revealed that the construction cost institutional properties in
Nigeria can be predicted at the early stage using the identified input variables and the
proposed model with high accuracy. Due to the limitation of the data set used for the
study, qualitative drivers were not examined. The model is only limited to be used for
institutional building projects only.
SUGGESTIONS FOR FUTURE RESEARCH
Two areas of future research can stem from this research. First, it is necessary to
extend the database qualitatively. This means that, in addition to the nine variables
used in this research, further cost predictive variables has to be examined which could
be useful for this kind of application. Secondly, it is also recommended to study the
cost variables of other building types such as residential and commercial buildings.
REFERENCES
Bhokha, S. and Ogunlana S.O. (1999). Application of Artificial Neural Network for the
forecast of building cost at the pre-design stage. Seventh East-Asia pacific Conference
on Structural Engineering and Construction. Kochi, University of Kochi Japan. 27-29
August, 1999

Cost estimating
345
Boyce, C and Neale, P. (2006) Conducting In-Depth Interviews: A Guide for Designing and
Conducting In-Depth interviews for Evaluation Input. Pathfinder International Tool
series May 2006.
Cheng M.Y., Tsai, H.C and Hsieh, W.S. (2009). Web-Based Conceptual Cost estimates
forConstruction Projects using Evolutionary Fuzzy Neural Inference Model.
Automation in Construction. 18(2):164-172
Cheng M.Y., Tsai, H.C and Sudjono, E. (2009). Evolutionary Fuzzy Hybrid Neural Network
for Conceptual Cost Estimates in Construction Projects. 26th International Symposium
on Automation and Robotics in Construction (ISARC2009): 512-519.
Cheng, M.Y. and Wu, Y.W. (2005). Construction conceptual cost estimates using support
vector machine. 22nd
international symposium on automation and robotics in
construction. ISRAC 2005, September 11-14, Ferara, Italy.
Emsley M.W, Lowe D.J, Duff A.R, Harding A, Hickson A, (2002). Data Modelling and the
Application of a Neural Network Approach to the Prediction of Total Costs. Journal
of Construction Management and Economics. 20:465-472.
Feng, W.F., Zhu, W. J. and Zhou, Y. G. (2010). The Application of Genetic Algorithm and
Neural Network in Construction Cost Estimation. Proceedings of the Third
International Symposium on Electronic Commerce and Security Workshop (ISEC),
Guangzhou, China. 29-31 July 2010. Pp 151-155
Hinton, P.R. (2004). Statistic Explained. 2nd
edition. Routledge Taylor and Francis group,
London. Pp 375.
Kim, D. Y., Kim, B. and Han, S.N. (2008). Two staged early cost estimation for highway
projects. 25th International Symposium on Automation and Robotics in Construction
(ISARC). June26-29, Held at the Institute of Internet and Intelligent technologies,
Vilnius, Lithuania.
Kim, D.Y., Han, S.H. and Kim, H. (2008). Discriminant analysis of predicting international
construction projects. Journal Construction Engineering and Management.
134(6):398-410
Lowe, D. Emsley, M. and Harding, A. (2006). Predicting Construction Cost Using Multiple
Regression Techniques. Journal of Construction Engineering and Management.
132(7):750-758
Ogunsemi, D. R. (2006). Predicting the Final Cost of Construction in Nigeria. The Quantity
Surveyor 54(4):3-6.
Pearce, A.R. (1997). Cost-Based Risk prediction and Identification of project Cost Drivers
using Artificial Neural Network. Final Report submitted to the Graduate Program,
Georgia Institute of Technology. AFB Tyndall, August, 1997.
Skitmore, R.M. (1990). Developments in Contract price forecasting and building techniques.
“Quantity Surveying Technique‖. New Directions. BSP Professional Books London.
75-120.
Sonmez, R. (2004). Conceptual cost Estimation of building projects with Regression analysis
and neural networks .Canadian Journal of Civil engineering. 31:677-683
Sonmez, R. (2008). Parametric Range estimating of Building cost using Regression model and
Bootstrap. Journal of construction Engineering and Management. 134(12)
Sonmez, R. and Ontepeli, B. (2009). Pre-Design Cost Estimating of Urban Railway Projects
with Parametric Modelling. Journal of Civil Engineering and
Management 5(4):405-409
Stoy,C. Pollalis,S. and Scalcher, H.R (2008). Drivers for cost estimating in early design: case
of residential construction. Journal of Construction Engineering and Management
134 (1):32-39
Stoy, C. and Schalcher, H. R (2007). Residential Building Cost drivers and indicators. Journal
of Construction Engineering and Management. 133(2): 139-145

Waziri and Bala
346
Waziri, B.S. (2010). An artificial Neural Network Model for predicting construction cost of
Institutional building projects. In: Laryea S., Leiringer, R. and Hughes, W. (Eds)
Procs West Africa Built Environment Research (WABER) Conference, 27th-28
th July
2010, Accra, Ghana.

Sackey, E., Tuuli, M.M. and Dainty, A. (2011) Dynamics of empowerment in projects In: Laryea, S.,
Leiringer, R. and Hughes, W. (Eds) Procs West Africa Built Environment Research (WABER)
Conference, 19-21 July 2011, Accra, Ghana, 347-359.
347
DYNAMICS OF EMPOWERMENT IN PROJECTS
Enoch Sackey, Martin M. Tuuli1 and Andy Dainty
Department of Civil and Building Engineering, Loughborough University, Loughborough,
Leicestershire, LE11 3TU, UK
To better understand the implications of empowerment‘s multifaceted nature in a
complex setting such as the project environment, we invoke complexity paradigm as a
theoretical lens that is well positioned to help capture the essence of empowerment.
From this theoretical framework, the true nature of how empowerment can intertwine
with the complex and uncertain project context can be captured and described from
the perspective of the workforce or actors engaged in the creation, execution, and
closure of the project. Three preeminent questions that can aid this line of enquiry
emerge from this review; how can organisations empower employees at different
levels simultaneously within the same project team and still achieve goal
congruence?; how does the changing nature of the project life cycle impact on
employee empowerment experiences?; and what does the multidimensional
perspective on empowerment add to our knowledge of empowerment in
organisations? Empowerment varies depending on the targeted population, the
targeted setting and also fluctuates across time. These perspectives have rarely been
examined simultaneously and no theoretical framework has as yet articulated such an
integrative perspective in any specific setting. The complex and dynamic nature of the
project environment and the project life cycle in particular have significant
implications for understanding how empowerment manifests in projects.
Keywords: empowerment, complexity theory, project life cycle.
INTRODUCTION
A dynamic perspective of empowerment with specific reference to the project
lifecycle is explored in this paper. It presents the multifaceted features of
empowerment including, its contextual embeddedness, its shifting nature across time
and levels and its multiple forms across people. The paper extends the sparse body of
knowledge on the reality of empowerment as experienced by those working within
construction organisations and hence helps explain and clarify trends of empowerment
experiences under conditions of uncertainty and relationship dynamics. Complexity
theory is mobilised as a perspective that can help advance the study of the complex
and dynamic manifestation of empowerment in project. This perspective is
illuminating as it affords sense making of how different actors respond to, and cope
with, the complex nature and dynamic character of project life cycle.
BACKGROUND
Empowerment as a concept exhibits three critical features with implications on how it
is implemented and how it could manifest in organisations but which have received
little attention in previous academic and practitioner discourse. Empowerment takes
on divergent forms across people; is contextually embedded and; shifts across time
Sackey, Tuuli and Dainty
348
(Foster-Fishman et al., 1998; Rappaport, 1984; Zimmerman, 1995). Although most
empowerment researchers acknowledge these features little attention has been given
to the impact they have on our capacity to understand and implement this complex
phenomenon (Cloete et al., 2002; Zimmerman, 1995; Fawcett et al., 1994). There are
therefore some concerns regarding significant lack of knowledge on empowerment in
organisation both at the conceptual level and in practice (Huq, 2010; Logan and
Ganster, 2007; Seibert et al., 2004) and the construction industry is no exemption.
Greasley et al. (2004) argue that, many of the inherent challenges and flexibilities
required of construction companies could be directly or indirectly managed by the
appropriate use of the empowerment concept. The temporary nature of construction
projects however represent a significant element that makes research on the industry
of special interest, so that although others have examined empowerment from vantage
point of employees (Rosenthal et al., 1997), the specific operating environment of
construction warrants further examination of the complex issues surrounding
empowerment.
Theoretical and empirical developments in the field of organisational culture suggest
that any one setting may consist of multiple environmental paradigms (Martin, 1992;
Sackman, 1992), each presenting its own contingencies for member behaviour
(Mayerson and Martin, 1987). The typical nature of construction projects comprising
multi-organisations with numerous highly skilled specialists present varied
environmental and procedural norms that influence employee‘ empowerment
experiences. Central to the empowerment process is a person-environment interaction
(Rappaport, 1981; Zimmerman, 1995), a dynamic interplay between people‘s desires
and contextual opportunities (Foster-Fishman and Kays, 1997). It is not simply the
presence of empowering contextual elements or the presence of motivated, capable
individuals that fosters the empowerment process. Zimmerman (1995) points out that,
it is also the dynamic interplay between person and environment that creates the
infrastructure for empowerment. When individual capabilities meet environmental
demands, when supports and opportunities for control fit with individual desires, then
the empowerment process is likely to succeed (Maton and Salem, 1995). Craig and
Steinhoff (1990) also highlight that ‗individuals or groups that do not perceive that
real power has been delegated are not empowered‘. It is important, therefore to
understand how different contexts impact on the empowerment experiences within
project setting.
While the individual facets of the empowerment features have been well presented in
the literature through the investigation of context-specific questions in understanding
empowerment processes and outcomes such as community organising (Kieffer, 1984),
corporate work settings (Spreitzer, 1995), and human service delivery systems
(Foster-Fishman and Kays, 1997), the range of empowerment experiences within a
particular setting and across time have not been fully explored The linkages of the
multifaceted aspects of empowerment have therefore been implicit at best.
EMPOWERMENT AS A DYNAMIC, CONTEXTUALLY
EMBEDDED AND MULTILEVEL CONSTRUCT
The multifaceted nature of empowerment and the varying needs of people across time
imply that, the desires for pathway towards, and manifestation of empowerment will
vary significantly depending upon the population we target, the setting we examine,
and the point of time we witness (Cloete, et al., 2002; Foster-Fishman et al., 1998).
This perspective has rarely been examined and no theoretical framework has

Empowerment in projects
349
invoked/articulated such a perspective to understanding the meaning of empowerment
in organisations. The features have largely been examined in the management
literature as independent constructs. No studies have yet revealed the multifaceted
nature of empowerment in any specific context. Within the construction industry
context in particular, empowerment research is still piecemeal and fragmented (Tuuli
and Rowlinson, 2007). Here, the multifaceted features of empowerment are
simultaneously examined in order to provide clearer explanation of empowerment‘s
dynamism within a specific context, more precisely, the construction project context.
A clear knowledge of these will enable management to focus efforts in creating the
conditions that enhance, and avoiding those that inhibit the prospect of the desired
manifestation of empowerment.
Contextual Embeddedness of Empowerment Across Space
Employee empowerment, whether it is gaining skills, developing consciousness, or
making decisions, takes place within the structural constraints of institutions and
discursive practices (Rai, Parpart, and Staudt, 2007). Individuals are empowered
through collective action within their organisational context, but that action is enabled
or constrained by the structures and processes that manifest in those organisations
across time. Thus to understand empowerment, closer attention must be paid to the
specific organisational setting in order to capture the broader structures, discourses,
notions, as well as laws and practices inherent in regulating the empowering
experiences within that organisation. Also, empowerment is dynamic, thus, shifting
organisational and environmental demands affect the empowerment experiences of
employees. In the construction context for example, working under tight programme
or a demanding client or significant shift in weather conditions could greatly alter
daily demands and priorities placed upon employees, so that in construction
organisations where time and schedule bring different constraints to the project
process, empowerment is particularly bound to fluctuate over time.
Empowerment also takes on multiple forms across people. Although empowerment
takes place within an organisation, it does so through the perception of individuals
(Lin, 2002). As a result, personal traits such as education, gender, class, and social
backgrounds exert varying degrees of influence on the way in which empowerment is
perceived, thus the range of empowerment experiences within a particular setting
differs across individuals. For example, in their quest to explore the multiple meanings
of empowerment in a service organisation, Foster-Fishman et al. (1998) found that,
the multiple forms empowerment manifest in organisations keeps changing from one
individual to another. One employee for example, emphasised the importance of being
creative, gaining knowledge, receiving respect, and experiencing the fulfilment of
doing a job well while another employee described how having autonomy, trust and
respect, and knowledge were important to feeling empowered.
Dynamics of Empowerment Across Levels
Empowerment programmes often fail as a result of lack of recognition that,
empowerment is continuous variable. Spreitzer (1995) argues that, empowerment is
not a global construct generalisable across different life situations and roles but rather,
specific to the work domain. Indeed, empowerment is not generalisable across
individuals, due to the fact that the understanding of empowerment is influenced by
the individual‘s social-historical context (e.g. race, class, gender, age or ability),
position in the organisation and the particular concerns and interests that result from
his position (Foster-Fishman 1998). For example, empowerment will mean different
Sackey, Tuuli and Dainty
350
things for a site labourer and a project manager on the same project, and the difference
in understanding will reflect their individual and contextualised day to day concerns
and levels of responsibility. Thus, the question that remains to be answered is, how do
organisations empower employees at different levels simultaneously within the same
project team or how does empowerment manifest at different levels of employees
within the same organisation?
Bowen and Lawler (1992) identify three levels of empowerment across people. From
least empowering, ‗controlled oriented‘, to most empowering, or ‗involvement
oriented‘. Empowerment across levels requires individuals to pursue new directions
and to acquire new knowledge and abilities. Individual empowerment involves
increased control in work domains employees deem important. Such control involves
having greater access to resources and or more discretionary choice in the conduct of
one‘s work (Spreitzer, 1995). These changes in power structure may not only
redistribute control but also increase the overall amount of autonomy and influence
exerted, because restructuring requires significant system and individual change.
Thus, empowerment of individuals across hierarchical structures is a gradual and
systematic process in which responsibilities for self-management and decision making
are turned over to employees on as-ready basis (Fox, 1998). This is because, the level
of empowerment that employees belief is appropriate is dependent on their perception
of its use (Greasley et al., 2007). Thus, empowerment level should be appropriate to
employees‘ positions or responsibilities within the team. This suggests that
opportunities made available for employee empowerment must fit the individual‘s
desire for control and influence. The assessment of employee desire for control may
serve as an excellent first step in determining both the feasibility and the nature of an
empowerment initiative.
Indeed, empirical research (e.g., Foster-Fishman 1997) has found that, the levels of
control/power and trust/inclusion in organisations can influence the success of an
empowerment endeavour. When power differences are substantial and are sustained
by the organisational culture, then it is unlikely that a disempowered group will be
empowered. However, when power differences are modest (e.g., between project
managers, site members and site operatives in a project team) and a participatory
organisational culture exists, then employee empowerment becomes more feasible
(e.g., Foster-Fishman, 1997). Flexible organisations are then in a position to
constantly access the needs of the individual employees across levels of
responsibilities and devise strategies to meet those needs.
Dynamics of Empowerment Across Time
Empowerment experiences fluctuate overtime and within the project context, the
project lifecycle provides a convenient basis for examing the dynamics of
empowerment over time. Throughout the lifespan of the construction project, various
changes occur which have the potency to fluctuate employees‘ empowerment
experiences. At the inception stage for example, very little is known about the project
(Wheelwright and Clarke, 1992). As the project progresses and flows through time, it
passes through transitional phases and the character changes (Winch, 1994) and
uncertainty levels diminish with time (Hobday, 1998). As Winch et al., (1998)
describe, ―in the upstream phase the issue is to maximise the exploration of options; in
the intermediate phase, the problem is to choose clearly and decisively, thereby
freezing the project; and in the realisation phase, the objective is to mobilise as
quickly as possible the project due to the heavy financial investment which takes place

Empowerment in projects
351
during this phase‖. The question that emerges therefore is; how does the project life
cycle impact on employees‘ empowerment experiences? The conceptualisation of the
different phases of the construction project process highlights the modulations on the
overall information flow which are screened from one another by key decision points.
It also shows how upstream and downstream activities are mutually dependent and the
different levels are linked and affect one another in a synergistic manner. The project
lifecycle also presents critical milestones for swift decision making and challenging
management tasks and how uncertainty is replaced with certainty as the project
progresses. (Bryman et al., (1988, cited by Dainty et al., 2002) noted that, at certain
times in the course of a project‘s life cycle, the workforce can be under intense
pressure as a result of the need to coordinate key phases often in the face of supply
and weather problems. This is exacerbated when the project is closed to completion
and time is very tight. These transitional, yet, interconnected processes of the project
raise the question of how empowerment manifest across the phases of the project.
In the construction project context, empowerment could be seen as a complex iterative
process which can change, grow, or diminish based on unfolding events throughout
the transitional phases of a project. The multifaceted dynamic nature of empowerment
presented so far is often embedded within complex and dynamic project delivery
arrangements, associated with increasingly demanding and ambiguous objectives due
to environmental, economic and technological pressures on projects. The multiple-
temporary organisation settings and site production nature are naturally uncertain.
Projects are also extremely complex from an organisational and technical point of
view with regards to variability and in the intensity of relationships between human-
environment interactions (Mecca, 1999). The challenge therefore is to enact an
integrative perspective of empowerment that explicitly blends the three empowerment
characteristics to construction organisational change and development within the
context of the complex, dynamic and uncertain operational realities of projects.
Understanding the multifaceted nature of empowerment in project settings demands a
theoretical position which illuminates the complex and interwoven set of perspectives
and constraints which characterise the project environment.
To understand the complexity of empowerment and its manifestations in projects, a
single disciplinary base or a certain perspective alone seems inadequate. A weakness
of previous empowerment studies and the reasons for the unsatisfactory outcomes
from empowerment implementations also appear to be the lack of mobilisation of a
strong and credible theoretical base or lens to inform enquiry and implementation of
empowerment strategies (Tuuli, 2009). In the sections that follow, a complexity
paradigm is invoked as a theoretical lens that is well suited to capturing the essence of
the multifaceted nature of empowerment and how it intertwines with the complex and
transitional phases of the project process. Applying complexity theory as a theoretical
lens could help in gaining a more realistic understanding of how the empowerment
process unfolds in the complex and uncertain project environment.
COMPLEXITY PARADIGM AS A THEORETICAL LENS
The emergence of complexity theory from the natural sciences particularly biology,
computer simulation, mathematics, and physics (Kauffman, 2000; Holland, 1998), has
brought fresh insight into the nature and working of complex systems. Some have
argued that applying this theory to social systems, albeit necessarily in adapted form,
could be equally revealing and useful (Hendrick, 2009). Complexity theory serves as
appropriate metaphors for understanding the nature of complex systems such as

Sackey, Tuuli and Dainty
352
project organisations. It offers a clearer perspective that describes complex systems
and how the agents within the system interact and evolve. It recognises that the world
is composed of both linear and nonlinear dynamics, it does not seek prediction but
understanding of the various elements of the environment and the actors involved
(Yerger, 2006). The appeal of such a theoretical lens for understanding organisation
concepts emerges from the ability to illuminate how order, structure, patterns, and
novelty arise from extremely sophisticated, apparently chaotic systems, and
conversely, how complex behaviour and structure emerges from simple underlying
rules (Cook-davies et al., 2007). Here this theory is used to help us think conceptually
and pragmatically about the functioning of the project environment and how the
features of empowerment presented previously could be efficaciously applied in the
project context.
Within a system, many independent actors interact with each other in many ways. The
systemic interactions can lead to spontaneous self-organisation (Stacey, 2004). The
system could represent nation states, industries, organisations, or even project teams.
Projects are systems and should be addressed systemically (Remington and Pollack,
2007). They exhibit attributes of interactions, perturbation, nonlinearity, emergence,
and sensitivity to initial condition, attributes which are generally useful in describing
systems (Weaver, 2007) and which could well be understood through reference to
complexity theory. Thus it is not out of place in adapting this theme to understanding
empowerment in projects. The actors in the project sense are made up of both
individual team members and any nonhuman actors (objects) required to ensuring the
successful delivery of the project. The ties between the actors may be based on
kinship, power structure, authority, information exchange, expertise services, or
anything else that forms the basis of a relationship within the project.
The multiple nature of empowerment in projects can be likened to the various
independent actors within the project team. Each have their own unique minds –
differenced in identity, character and expertise from one another. As noted by Lopes
(2010), ‗complex system consists of a large number of actors differenced from one
another‘. Thus their needs, expectations and contribution into the broader complex
system vary. One therefore has to have adequate knowledge base of the divergent
forms of needs across these actors before setting out empowerment strategies to meet
those diverse needs. The actors within the system are in constant interactive mode.
The system is always evolving and never in a fixed state (Masterpasqua and Perna,
1997), thus, emergent states are always occurring. This is congruous to the dynamic
reality of empowerment. Human notion is organised not by an internalised stock of
fixed reality as humans are not instinctually provided with a fixed and stable sense of
social order but by the moment to moment creation and re-creation of the social world
in interaction with others (Bartunek et al., 1997). In that instance, individuals attitudes
then become jointly created world of meanings and reality that are shared. Attitudes
are very much the creation of the socially contextualised moment, but at the same time
are on a constant move. Within the system, interactions between the actors (both
humans and objects), which might contain an advice, information, friendship, career
or emotional support, motivation, and cooperation, can lead to very important
emergent states. Emergence is a feature of complex systems. It manifests as the actors
within the system feed through new knowledge as they evolve and change. Stacey
(2003) defines it as a bottom-up process arising when the collective behaviour of
interactive actors result in a system or part of a system adapting and creating new
ordered state.

Empowerment in projects
353
Complex systems are sensitive to initial conditions resulting in an unpredictable
response to any minute initial differences or perturbation, the respond to perturbation
results in self-organisation into emergent forms that cannot be predicted from an
understanding of its constituent parts (Reitsma, 2001). Initial conditions may include
adoption of new technology, unusual weather pattern during construction, or change
in project scope. Small exogenous disturbance to complex systems can cause
unexpectedly large changes (McBride, 2005). This, perhaps to a large extent, explains
why two projects designed to serve a similar purpose or in the same location and size
can never be achieved with the same resources. As an example, the same team
delivering the same project in a different environment with different initial conditions
may achieve radically different levels of performance (Remington and Pollack, 2007).
The famous Lorenz‘s butterfly effect describes the situation where tiny differences in
input can manifest as an overwhelming difference in output (Bloom, 2000). Thus, no
two complex systems can be viewed to be the same because of differences in initial
conditions. This concept is compatible with the contextual embedded nature of
empowerment, thus, any empowerment initiatives designed to suit a particular context
or system might not be effective for a different setting because at any particular point
in time, the empowerment needs will be defined by the system‘s emergent state which
is influenced by initial conditions.
Murphy (1996) noted that, the principle of unpredictable response to initial conditions
defines the very nature of nonlinearity in that, minute change in a system‘s initial
conditions may amplify exponentially as their effects unfolds so that the end result
bears little resemblance to the beginning. Borrowing from the concept of GIGO,
which is the acronym for the almost ancient information technology concept of
garbage-in-garbage-out, the input/initial condition – output/emergence relationship
amongst the actors within a complex system embraces the popular belief in GIGO,
which indicates a strong positive link between input accuracy and overwhelming
output accuracy. As human thoughts create reality, then, if the actors in the system are
fed with discordant and destructive thought, discord and destruction will manifoldly
emerge as the reality. Conversely, if the inner thoughts of the actors are full of
knowledge, beauty, training, etc, that too will be reflected in reality. In this regard, the
actors‘ disposition toward empowerment creates and is created by the pattern of
interactions in which they are routinely involved. Empowerment must therefore not be
treated as an abstract phenomenon, but rather as an experience that is produced in
relationship to other actors in a complex system, so that if for example, the
individuals‘ training needs are met, it will lead to a corresponding contribution back
into the organisation in a more beneficial manner to the organisation.
A complex system holds a large number of actors, differenced from one another but
each of which behaves to the same rules of interaction, sensitive dependence on initial
condition, nonlinearity, and emergence. The combined output of the actors in the
project context as a result of the interaction, is held in a resource bank described here
as project network (Waver, 2007). This combined output is nonlinear because,
complex systems are characterised by the whole being more than the sum of its
constituent parts (Reitsma, 2001). The whole also shows emergent behaviour which
cannot be predicted by studying the elements within the system. These ideas apply in
the natural sciences such as shoals of fish, ant colonies and flock of birds. For
example, the individual bird does not tell us much about the behaviour of the flock.
The concept also applies to human social groups (Weaver, 2007). This network is
encapsulated by the concept of project social network as elaborated below:
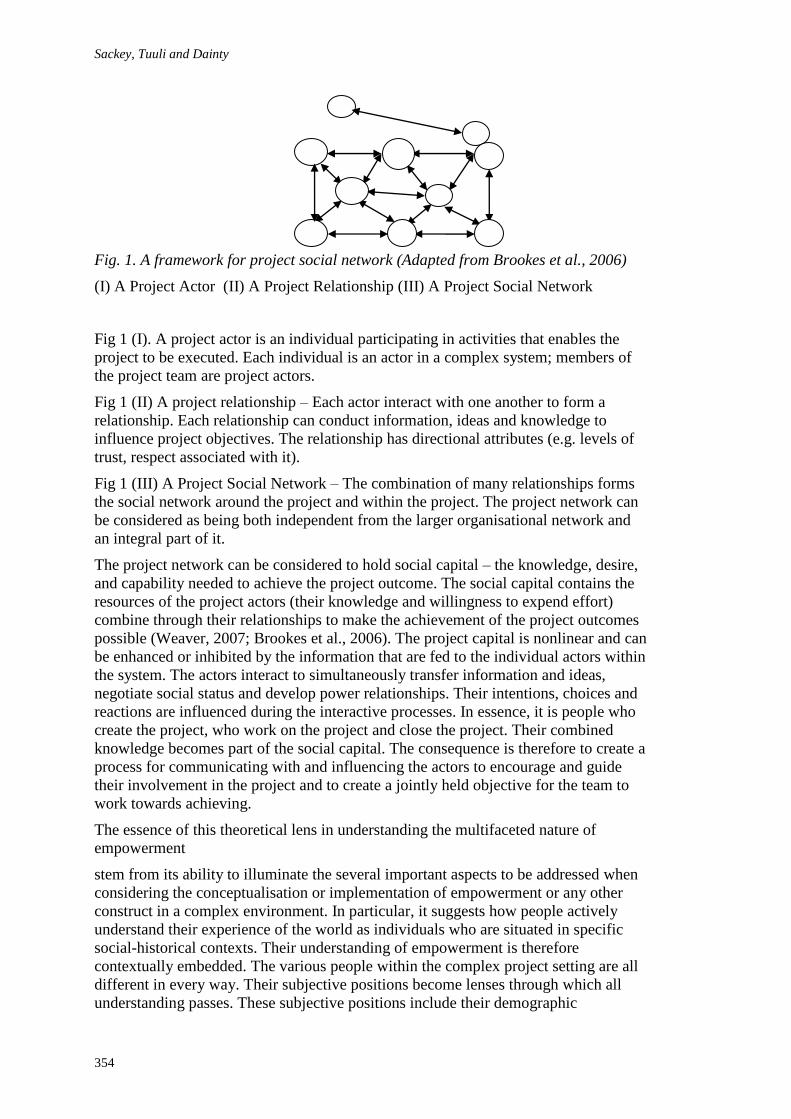
Sackey, Tuuli and Dainty
354
Fig. 1. A framework for project social network (Adapted from Brookes et al., 2006)
(I) A Project Actor (II) A Project Relationship (III) A Project Social Network
Fig 1 (I). A project actor is an individual participating in activities that enables the
project to be executed. Each individual is an actor in a complex system; members of
the project team are project actors.
Fig 1 (II) A project relationship – Each actor interact with one another to form a
relationship. Each relationship can conduct information, ideas and knowledge to
influence project objectives. The relationship has directional attributes (e.g. levels of
trust, respect associated with it).
Fig 1 (III) A Project Social Network – The combination of many relationships forms
the social network around the project and within the project. The project network can
be considered as being both independent from the larger organisational network and
an integral part of it.
The project network can be considered to hold social capital – the knowledge, desire,
and capability needed to achieve the project outcome. The social capital contains the
resources of the project actors (their knowledge and willingness to expend effort)
combine through their relationships to make the achievement of the project outcomes
possible (Weaver, 2007; Brookes et al., 2006). The project capital is nonlinear and can
be enhanced or inhibited by the information that are fed to the individual actors within
the system. The actors interact to simultaneously transfer information and ideas,
negotiate social status and develop power relationships. Their intentions, choices and
reactions are influenced during the interactive processes. In essence, it is people who
create the project, who work on the project and close the project. Their combined
knowledge becomes part of the social capital. The consequence is therefore to create a
process for communicating with and influencing the actors to encourage and guide
their involvement in the project and to create a jointly held objective for the team to
work towards achieving.
The essence of this theoretical lens in understanding the multifaceted nature of
empowerment
stem from its ability to illuminate the several important aspects to be addressed when
considering the conceptualisation or implementation of empowerment or any other
construct in a complex environment. In particular, it suggests how people actively
understand their experience of the world as individuals who are situated in specific
social-historical contexts. Their understanding of empowerment is therefore
contextually embedded. The various people within the complex project setting are all
different in every way. Their subjective positions become lenses through which all
understanding passes. These subjective positions include their demographic

Empowerment in projects
355
characteristics such as race, gender, knowledge, experience, position in the
organisation etc. These characteristics temper with the divergent form empowerment
will manifest across the various actors in the complex system. The continuous
interaction amongst the actors and the ability to feed on and actively integrate new
information from the system causes individuals within the system or the project
setting to spontaneously self-organise and adapt a new emergent form. They
consistently evolve into new form through interaction, learning and adaptation. This
concept is consistence with the dynamic nature of empowerment, as it explains why
empowerment is on a constant shift based on unfolding events in line with the
dynamic state of the project setting as opposed to a fixed state of being. The realities
seen or understood at one point in time may shift within the next setting and across
time. This view was reemphasised by Arthur (1999) when he stated that, complex
systems are ―systems that constantly evolve and unfold over time‖. The collective
output of the individual actors is nonlinear because it cannot be understood by
summing up the individual components, as demonstrated by the framework of the
project social network. Any initiative fed through the actors will manifest
exponentially as the reality unfolds. Thus organisational process should provide broad,
meaningful direction and structure suitable to the interactive nature of the complex
system – retaining adaptability and flexibility by directing actions to favourably alter
the environment rather than trying to control it (Schmitt, 2007). Empowering
individuals or groups that self-organise may be thought to attract certain recurrent
patterns of behaviour (Dooley, Johnston, and Bush, 1995). These recurrent patterns
can represent unpredictable innovation. Kreiner (1992) proposed that, project
organisations should provide a way for project teams to release the creative forces
within themselves rather than to plan; a way to enhance participation rather than to
control. Key words like ―learning‖, ―participation‖, ―renewal‖, and ―innovation‖
ought to become as common in project management terminology as they operate in
complex and uncertain environment.
DISCUSSION
The empowerment concept is very subjective. The wide range of disciplines that apply
it bring differing interpretations to it (Spreitzer and Doneson, 2005; Bartunek and
Spreitzer, 1999). It is thus a multidimensional concept and yet, the common
connotation in most of the definitions appear to be the positive link between employee
participation and job satisfaction, motivation and performance, personal commitment
and corporate achievement. Changes in managerial practices perceived as empowering
should therefore be seen as an antecedent of employees‘ feelings of self efficacy
(Tuuli, 2009). Empowerment influences and reinforces the cognitive state of
employees and eventually affects outcomes, providing justification for continual
reinforcement of organisational practices (Tuuli and Rowlinson, 2007). Although
several management scholars have discussed empowerment in various forms and
currently seen as part of the lexicon of organisational practice, researchers are also
concerned about the lack of publish research finding of its implementation and
consequences in practice at organisational level. Thus empowerment as management
practice is mainly considered as rhetoric rather than reality. Again, empowerment is
considered as a contested construct and subject to different interpretation in different
context.
We argue here that, the lack of clarity in conceptualisation and implementation is
attributable to the lack of or weaknesses in the theoretical lenses invoked previously to
studying and understanding the empowerment concept. The adoption of complexity
Sackey, Tuuli and Dainty
356
theory as a lens to understanding empowerment in the project context suggests inter
alia that, the creation of a successful project outcome will always be an uncertain
journey but the path to success or failure can be influenced by the actions and attitudes
of the actors within the complex system of the project. It is the actors who create the
project, manage the project and ultimately close the project in a complex environment.
The key therefore is how effective the project organisation creates a jointly held
objective for the actors or mobilises the project social network to optimise the social
capital (combined knowledge, expertise, effort etc of the actors in the system through
interaction) needed to creating the project success. Social capital is optimised by
effectively managing the multifaceted dynamics of the actors‘ empowerment needs in
alignment with what is reasonable and feasible for the project to achieve. Managing
the divergent needs of the actors takes place in a dynamic and uncertain environment
and is complex because the actors are actively adapting and spontaneously self-
organising into new forms through the integration of new information.
While most researchers acknowledge the dynamic and multifaceted features of
empowerment, there remain a conspicuous lack of concerted research efforts to
unravel a coherent perspective of the manifestation of empowerment in organisations
and construction project organisation for that matter. While Tuuli (2009) and Greasley
et al. (2007) examined antecedents and consequences of empowerment in project from
a multilevel perspective, and employee perceptions of empowerment respectively,
there is as yet no study empirically examining the dynamic manifestation of
empowerment in projects across time, space and levels. The unique nature of the
project setting and the spontaneous dynamism that manifest across the transitional
processes of a project have the tendency to fluctuate employees empowerment
experiences. Therefore, any effort aimed at capturing this phenomenon in projects is
worthwhile. From the conceptual review above, three focal questions arise that have
not heretofore been addressed in the empowerment literature but warrant further
investigation: 1) How does the combined study of the multiplicity, dynamism and the
context-specific nature of empowerment add to our knowledge of empowerment in
organisations; 2) How does the fluctuation in project life cycle impact empowerment
experiences? 3) How do organisations empower employees at different levels
simultaneously within the same project team and still achieve goal congruence? A
research agenda that cuts across these issues and aimed at capturing the dynamic and
multifaceted perspectives of empowerment through the lens of complexity theory is of
both theoretical and practical importance.
CONCLUSION
Empowerment is an elastic concept that takes on multiple forms across people, is
contextually embedded and shifts over time. A rationale for examining this
multifaceted nature of empowerment across the project life cycle from a complexity
perspective is provided. Each facet provides a different lens for understanding
empowerment in the workplace. The contextually embedded perspective focuses on
the organisational state. The multiple nature drills down to the individual and their
experiences, and the dynamic perspective focuses on the changing state of the
organisation and the fluctuating individual experiences across time. Looking across
these three perspectives, while each one provides different insight on empowerment,
there is apparent complementarrity. The integrative perspective provides the much
needed clarity to understanding empowerment, its implementation, and how it
manifests in organisations. But no theoretical framework has yet invoked this line of
enquiry in defining empowerment in any specific setting. This paper therefore

Empowerment in projects
357
represents a fresh departure from much of the literature on empowerment which take
generalised and unitarised orientations without cognisance to its multiplicity,
dynamism and contextual embeddedness. Future research will seek to empirically
explore this multidimensional phenomenon of empowerment as it manifest through
the transitional stages of projects.
REFERENCES
Arthur, B. W. (1999). Complexity and economy. Science , 284, 107-109.
Bartunek, J. M., Bradbury, H., and Boreth, C. (1997). Attending to difference: A social
interpretivist apprach to empowerment. Organisational Change and Development, 10,
63-103.
Bartunek, J. M., and Spreitzer, G. M. (2006). The interdisciplinary career of a popular
construct used in management: Empowerment in the late 20th century. Journal of
Management Inquiry , 15 (3), 255-273.
Bartunek, J. M., and Spreitzer, G. (1999). The career of a popular construct: A pluralistic
journey of understandings of empowerment. Annual Meeting of the Academy of
Management. Chicago, IL.
Bowen, D. E., and Lawler, E. E. (1992). The empowerment of service workers: What, why,
how and when. Sloan Management Review, Spring 1992, 31.
Brookes, N. J., Morton, S. C., Dainty, A.R.J., Burns, N. D. (2006). Social processes, patterns
and practices and project knowledge management: A theoretical framework and an
empirical investigation. International Journal of Project Management, 474-482.
Bryman, A., Brensen, M., Beardsworth, A., and Keil, T. (1988). Qualitative research and the
study of leadership. Human Relations , 41, 13-30.
Cloete, J. V., Crous, F., and Schepers, M. J. (2002). The construction and Evaluation of a
scale of employee empowerment. SA Journal of Industrial Psychology , 28 (2), 31-36.
Cook-Davies, T., Cicmils, S., Crawford, L. and Richardson, K., 2007. We‘re not in Kansas
anymore, TOTO: Mapping the strange landscape of complexity theory, and its
relationship to project management. Project Management Journal, 38 (3), 50-61.
Craig, J. G., and Steinhoff, D. A. (1990). Empowerment of women in consumer co-ops in
Japan. In J. M. Bold, and L. H. Ketilson, Empowerment through Co-operatives:
Proceedings of the 1990 Meetings of the Canadian Associations for Studies in Co-
operation. Saskatchewan, Canada: The Centre for the Study of Co-operatives.
Dainty, A. R., Bryman, A., and Price, A. D. (2002). Empowerment within the UK
construction sector. Leadership and Organisation Development Journal , 23 (6), 333-
342.
Dooley, K. J., Johnston, T. L., and Bush, D. H. (1995). TQM, chaos and complexity. Human
Systems Management , 14 (4), 1-16.
Fawcett, S. B., White, G. W., Balcazar, F. E., Suarez-Balcazar, Y., Mathews, R. M., Paine-
Andrew, A., et al. (1994). A contextual-behavioural model of empowerment: Case
studies involving people with physical disabilities. American Journal of Community
Psychology , 22, 471-496.
Foster-Fishman, P. G., and Kays, C. B. (1997). The person/environment dynamics of
employee empowerment: An organisational culture analysis. American Journal of
Community Psychology , 25, 345-370.
Foster-Fishman, P. G., Salem, D. A., Chibnall, S., Legler, R., and Yachai, C. (1998).
Empirical support for the critical assumptions of empowerment theory. American
Journal of Community Psychology , 26 (4), 507-536.
Greasley, K., Bryman, A., Dainty, A., Price, A., Naismith, N., and Soetanto, R. (2007).
Understanding empowerment from an employee perspective: What does it mean and
do they want it? Team Performance Management , 14 (1/2), 39-55.
Greasley, K., Bryman, A., Dainty, A., Price, A., Soetanto, R., and King, N. (2004). Employee
perceptions of empowerment. Employees Relations , 27 (4), 354-368.

Sackey, Tuuli and Dainty
358
Hendrick, D. (2009, June). Complexity Theory and conflict transformation. Retrieved March
12, 2011, from Bradford University Web site:
http://www.bradford.ac.uk/acad/confres/papers/pdfs/CCR17.pdf.
Hobday, M. (1998). Product complexity, innovation and industrial organisation. Research
Policy , 26, 689-710.
Holland, J. (1998). Emergence: From chaos to order. Reading, Mass.: Addison-Wesley.
Huq, R. (2010). Employee empowerment: The rhetoric and the reality. London: Triarchy
Press Ltd.
Kauffman, S. A. (2000). Investigations. USA: Oxford University Press.
Kieffer, C. H. (1984). Citizen empowerment: A developmental perspective. In J. Rappaport,
C. Swift, and R. Hess, Studies in empowerment: Steps toward understanding and
action (pp. 9-35). New York: The Haworth Press.
Kreiner, K. (1992). The postmodern epoch of organisation theory. International Studies of
Management and Organisation , 22 (2), 37-52.
Leach, D. J., Wall, T. D., and Jackson, P. R. (2003). The effect of empowerment on job
knowledge: An empirical test involving operators of complex technology. Journal of
Occupation and Organisational Psychology , 76, 27-52.
Levy, D. L. (1994). Chaos theory and strategy: Theory, application, and managerial
implication. Strategic Management Journal , 15, 167-178.
Lin, C. Y. (2002). Empowerment in the service industry: An empirical study in Taiwan. The
Journal of Psychology , 136 (5), 555-560.
Logan, M. S., and Ganster, D. C. (2007). The effects of empowerment on attitudes and
performance: The role of social support and empowerment beliefs. Journal of
Management Studies , 44 (8), 1-28.
Martin, J. (1992). Cultures in organisations: Three perspectives. New York: Oxford
University Press.
Masterpasqua, F., and Perna, P. A. (1997). The psychological meaning of chaos: Translating
theory into practice. American Psychological Association, 225-252.
Maton, K., and Salem, D. (1995). Organisational characteristics of empowering community
setting: A multiple case study approach. American Journal of Community Psychology
, 23 (5), 631-656.
Mayerson, D., and Martin, J. (1987). Cultural change: An integration of three different views.
Journal of Management Studies , 24, 623-647.
McBride, N. (2005). Chaos theory as a model for interpreting information systems in
organisations. Information Systems Journal, 15, 233-254.
Lopes, E. (2010). A grounded theory of decision-making under uncertainty and complexity.
Saarbrűcken, Germany, VDM Verlag.
Rai, M. S., Parpart, J., and Staudt, K. (2007). (Re)defining empowerment, measuring survival.
UK: University of Warwick.
Rappaport, J. (1981). In praise of paradox: A social policy of empowerment over prevention.
American Journal of Community Psychology , 9, 1-25.
Rappaport, J. (1984). Studies in empowerment: Introduction to the issues. Prevention in
Human Services , 3, 1-7.
Reitsma, F. (2001). A response to simplifying complexity: Critical review. Elsevier Science
Ltd.
Remington, K., and Pollack, J. (2007). Tools for complex projects. Gower Publishing,
Aldershot, England.
Rosenthal, P., Hill, S., and Peccei, R. (1997). Checking out service: Evaluating excellence,
HRM, and TQM in retailing. Work, Employment and Society , 11 (3), 481-503.
Sackman, S. A. (1992). Culture and subcultures: An analysis of organisational knowledge.
Administrative Science Quarterly , 37, 140-161.

Empowerment in projects
359
Schmitt, J. F. (2007). Command and (out of) control: The military implications of complexity
theory. In D. S. Alberts, and T. J. Czerwinski, Complexity,Global Politics and
National Security (pp. 219-246). Washington, DC: National Defense University.
Seibert, S. E., Silver, S. R., and Randolph, W. A. (2004). Taking empowerment to the next
level: A multi-level model of empowerment, performance, and satisfaction. Academy
of Management Journal , 47 (3), 332-349.
Spreitzer, G. M. (1995). Psychological empowerment in the workplace: Dimensions,
measurement, and validation. Academy of Management Journal , 38, 1442-1465.
Spreitzer, G. M., and Doneson, D. (2005). "Musing on the past and future of employee
empowerment", in Cummings, T. (Ed.) . CA: Sage, Thousand Oaks.
Stacey, R. (2003). Complexity and creativity in organisations. San Francisco, CA: Berrek-
Koehler.
Tuuli, M. M. (2009). Empowerment and control dynamics in project teams: A multilevel
examination of the antecedents and job performance consequences. The University of
Hong Kong, Ph. D. Thesis.
Tuuli, M. M., and Rowlinson, S. (2007). Empowering project teams: Towards an integrative
conceptualisation of empowerment. Fourth International Conference on Construction
in the 21st Century (CITC-IV) "Accelerating Innovation in Engineering, Management
and Technology", (pp. 240-247). Gold Coast, Australia.
Weaver, P. (2007). A simple view of complexity in project management. WPM Week,
Singapore, 1-13.
Wheelwright, S. C., and Clarke, K. B. (1992). Revolutionising product development: Quantum
leaps in speed, efficiency and quality. New York: Free Press.
Winch, G. (1994). Managing production: Engineering change and stability. Oxford:
Clarendon Press.
Winch, G., Usmani, A., and Edkins, A. (1998). Towards total project quality: A gap analysis
approach. Construction Management Economics , 16 (2), 193-207.
Yerger, H. R. (2006, February). Strategic theory for the 21st century: The little book on big
strategy. Retrieved March 12, 2011, from Strategic Studies Institutes Web site:
http://www.strategicstudiesinstitute.army.mil/pdffiles/pub641.pdf.
Zimmerman, M. A. (1995). Psychological empowerment: Issues and illustrations. American
Journal of Community Psychology , 23, 581-600.


Adukpo, E., Oteng-Seifah, S., Manu, P. (2011) Effect of oil coating on steel bar on the strength of
reinforced concrete In: Laryea, S., Leiringer, R. and Hughes, W. (Eds) Procs West Africa Built
Environment Research (WABER) Conference, 19-21 July 2011, Accra, Ghana, 361-369.
361
EFFECT OF OIL COATING ON STEEL BAR ON THE
STRENGTH OF REINFORCED CONCRETE
Emmanuel Adukpo1, Samuel Oteng-Seifah
2 and Patrick Manu
3
1Black Star Advisors, Ghana
2Department of Building Technology, Kwame Nkrumah University of Science and Technology, Ghana
3School of Technology, University of Wolverhampton, Wolverhampton, WV11LY, UK
The strength of steel-reinforced concrete greatly depends on the adequacy of the bond
between concrete and steel reinforcement and this can be impaired by the surface
condition of reinforcing steel. Oil on the surface of steel reinforcement has been
mentioned to potentially have an adverse effect on steel-concrete bonding action and
consequently structural performance, but this effect remains to be buttressed
empirically. This study thus considered the effect of the surface condition of
deformed mild steel bar on the bond strength and the flexural strength of steel-
reinforced concrete, with the surface condition being engine oil coating. Bond and
flexural test involving concrete embedded with steel bars coated with engine oil and
un-coated steel bars (i.e. bars not coated with engine oil) revealed that engine oil
coating considerably reduces the bond and flexural strength of reinforced concrete.
Steel reinforcement during storage and installation should thus be protected from
contamination by oiling agents.
Keywords: bond, oil-coated rebar, reinforced concrete.
INTRODUCTION
Concrete is a composite material consisting of fine aggregate, coarse aggregate and a
binding material, usually cement, and water, with or without admixtures (Marsh,
1997; Chudley et. al, 2008). It is a universal construction material that plays a key role
in modern construction as a structural material. The ease with which, while plastic, it
can be deposited and made to fill forms or moulds of almost any shape is one key
factor that makes concrete a widely used construction material, the other key factor
being its compressive strength when fully cured. Concrete however is weak in tension
and fails under tensile stresses unless reinforced in the zones of tension by some
materials of high tensile strength such as steel (Chudley et. al, 2008) or fibre
reinforced polymer (cf. Emmons et. al., 1998; Schöck Bauteile GmbH, 2006; and
Durham et. al., 2009). The performance of steel-reinforced concrete element is greatly
influenced by the bond between the steel and the concrete (Turban, 1995; Bamforth,
2004), and this bond can be impaired by the surface condition of steel reinforcement.
Corrosion, for instance results in loose scales on the steel surface giving rise to a weak
bond and consequently reduced performance for steel-reinforced concrete (cf. Adupko
et al., 2010). Apart from corrosion, grease and oil have also been mentioned as having
the potential to reduce the bonding action between concrete and steel reinforcement

Adukpo, Oteng-Seifah and Manu
362
and thus potentially resulting in reduced in-service performance of reinforced concrete
elements (Turban, 1995). Unlike the effect of corrosion which has extensively been
researched (cf. Everett and Treadaway, 1980; Quillin, 2001; and Cheng et al., 2005),
the effect of oil coating on steel bar on the performance of steel reinforced concrete
remains to be empirically examined. Given that oiling agents such as engine oil are
commonplace on construction sites (due to the use of construction equipment,
machinery, etc) and as such serve as potential sources of contamination of steel bars, it
is important to empirically examine the effect of oil coating on steel bar on the
performance of steel reinforced concrete. This study was thus undertaken with the aim
of investigating empirically the effect of engine oil coating on steel bar on the bond
and the flexural strength of steel-reinforced concrete. The next section discusses the
importance of steel-to-concrete bonding to the strength of reinforced concrete to
provide the theoretical underpinning of the research. This is followed by the research
methodology, the results and its discussion and then concluding remarks.
SIGNIFICANCE OF STEEL-CONCRETE BONDING TO THE
PERFORMANCE OF REINFORCED CONCRETE
Concrete, although strong in resisting compression, is weak in resisting tension and
hence the need to reinforce concrete in the zone of tension by some reinforcing
material (Mosley and Bungey, 1995). Conventionally steel has been used as the
reinforcing material due to the high tensile capacity of steel and also due to the
proximity of the coefficient of thermal expansion of steel (i.e.10 x10-6
per 0C) and
concrete (i.e. 7-12 x10-6
per 0C) (Mosley and Bungey, 1995).
Good bonding between reinforcing steel and concrete is essential for the transfer of
tensile stress and hence essential for the performance of reinforced concrete elements
(Bamforth, 2004). If this bond is inadequate the reinforcing bars will just ‗slip‘ out of
the concrete and there will not be a composite action of the two materials resulting in
under-performance of the steel-reinforced concrete (Mosley and Bungey, 1995). Bond
strength is the measure of the effectiveness of the grip/anchorage between steel and
concrete or the stress at which a very small slip occurs (McGregor, 1997) and this is
widely noted to be influenced by the surface condition of steel bars and hence the
need to protect the surface of steel bar from contamination (cf. Turban, 1995; Lu and
Chung, 1998; and Chudley and Greeno, 2008).
Several surface conditions, notably corrosion has been well researched in terms of its
adverse effect on the bonding action between concrete and steel and consequently the
performance of steel reinforced concrete elements (cf. BRE, 2000; Quillin, 2001;
Sergi and Dunster, 2004; and Adupko et al., 2010). Oil coating has similarly been
mentioned as having the capability to impair steel-concrete bonding action and hence
the performance of concrete elements (Turban, 1997). Unlike the effect of corrosion
which has extensively been researched, this however remains to be empirically
verified. Drawing therefore on the widely acknowledged phenomenon of surface
treatment/condition of steel bar influencing steel-concrete bonding, and steel-concrete
bonding also influencing the performance of steel-reinforced concrete, the following
hypothesis were put forth to investigate the effect of engine oil coating on the bond
and the flexural strength of steel-reinforced concrete:
H1: there will be significant difference in the concrete-to-steel bond strength of engine
oil coated steel bar and uncoated steel bar.
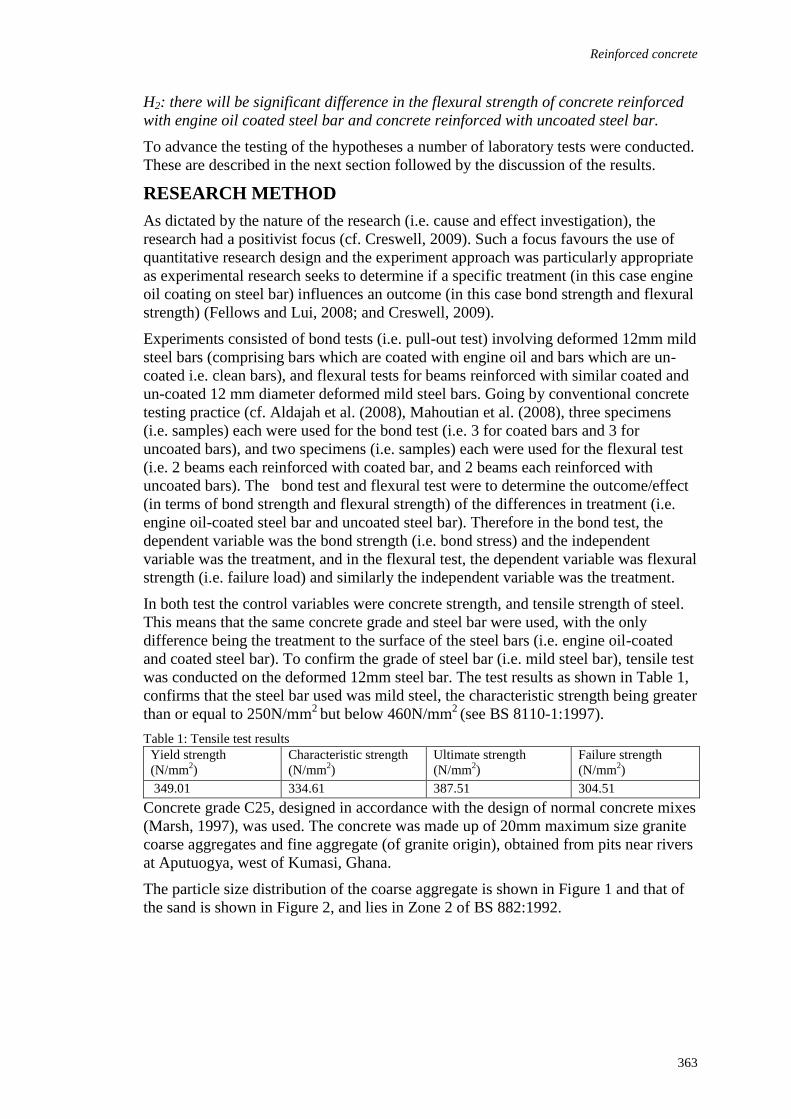
Reinforced concrete
363
H2: there will be significant difference in the flexural strength of concrete reinforced
with engine oil coated steel bar and concrete reinforced with uncoated steel bar.
To advance the testing of the hypotheses a number of laboratory tests were conducted.
These are described in the next section followed by the discussion of the results.
RESEARCH METHOD
As dictated by the nature of the research (i.e. cause and effect investigation), the
research had a positivist focus (cf. Creswell, 2009). Such a focus favours the use of
quantitative research design and the experiment approach was particularly appropriate
as experimental research seeks to determine if a specific treatment (in this case engine
oil coating on steel bar) influences an outcome (in this case bond strength and flexural
strength) (Fellows and Lui, 2008; and Creswell, 2009).
Experiments consisted of bond tests (i.e. pull-out test) involving deformed 12mm mild
steel bars (comprising bars which are coated with engine oil and bars which are un-
coated i.e. clean bars), and flexural tests for beams reinforced with similar coated and
un-coated 12 mm diameter deformed mild steel bars. Going by conventional concrete
testing practice (cf. Aldajah et al. (2008), Mahoutian et al. (2008), three specimens
(i.e. samples) each were used for the bond test (i.e. 3 for coated bars and 3 for
uncoated bars), and two specimens (i.e. samples) each were used for the flexural test
(i.e. 2 beams each reinforced with coated bar, and 2 beams each reinforced with
uncoated bars). The bond test and flexural test were to determine the outcome/effect
(in terms of bond strength and flexural strength) of the differences in treatment (i.e.
engine oil-coated steel bar and uncoated steel bar). Therefore in the bond test, the
dependent variable was the bond strength (i.e. bond stress) and the independent
variable was the treatment, and in the flexural test, the dependent variable was flexural
strength (i.e. failure load) and similarly the independent variable was the treatment.
In both test the control variables were concrete strength, and tensile strength of steel.
This means that the same concrete grade and steel bar were used, with the only
difference being the treatment to the surface of the steel bars (i.e. engine oil-coated
and coated steel bar). To confirm the grade of steel bar (i.e. mild steel bar), tensile test
was conducted on the deformed 12mm steel bar. The test results as shown in Table 1,
confirms that the steel bar used was mild steel, the characteristic strength being greater
than or equal to 250N/mm2
but below 460N/mm2 (see BS 8110-1:1997).
Table 1: Tensile test results
Yield strength
(N/mm2)
Characteristic strength
(N/mm2)
Ultimate strength
(N/mm2)
Failure strength
(N/mm2)
349.01 334.61 387.51 304.51
Concrete grade C25, designed in accordance with the design of normal concrete mixes
(Marsh, 1997), was used. The concrete was made up of 20mm maximum size granite
coarse aggregates and fine aggregate (of granite origin), obtained from pits near rivers
at Aputuogya, west of Kumasi, Ghana.
The particle size distribution of the coarse aggregate is shown in Figure 1 and that of
the sand is shown in Figure 2, and lies in Zone 2 of BS 882:1992.

Adukpo, Oteng-Seifah and Manu
364
Figure 1: Particle size distribution for coarse aggregate
Figure 2: Particle size distribution for fine aggregate
The sand was shown by tests to have very low silt/clay content and a total
sulphate/chloride content of less than 2%. Both fine and coarse aggregate were clean
and were expected to produce dense concrete of good strength, when mixed with
portable water and Ordinary Portland Cement (OPC).
Bond Strength Test (Pull-out Test)
Six (6) specimens of steel bar, each 555mm long, were cut from a standard piece of
deformed 12mm mild steel bar, and three out of the six specimens were uniformly
coated with engine oil over a length of 150mm (i.e. the bond length). Both the coated
and un-coated pieces were each centrally embedded in a 150mm concrete cube (as
shown in Figure 3). This thus resulted in 3 pull-out cubes, each with an embedded
12mm coated steel bar, and another 3 pull-out cubes, each with an embedded uncoated
12mm steel bar. The cubes were cured in water for 28 days. After curing, the pull-out
cubes were each mounted in the electronic tension test machine and strained to failure;
the failure load (i.e. pull-out load) being recorded. Three (3) 100mm concrete cube
specimens were prepared from the concrete batch that was used for the pull-out

Reinforced concrete
365
concrete cubes and were cured in water for 28 days, and subsequently tested to
confirm the grade of concrete (i.e. C25).
Figure 3: Bond test specimen (i.e. Pull-out cube)
Flexural Test
150x150x1600mm concrete beams were used; two (2) beams each embedded with
two deformed 12mm steel bars uniformly coated with engine oil (i.e. beams C), and
another two (2) beams each embedded with two (2) un-coated deformed 12mm steel
bars (i.e. beams UC). The 12mm bars were used as bottom reinforcement (i.e. tension
reinforcement). Two (2) 10mm mild steel bars and 6mm mild steel bars were used for
top reinforcement and stirrups respectively as shown in Figure 4. The beams were
cured in water for 28 days and then tested using third-point loading arrangement
(shown in Figure 5) with a dial gauge placed at mid-span to record the deflections as
loading took place. The third-point loading arrangement was adopted because it
ensures a uniform maximum bending moment in the middle third zone, unaffected by
changes in shear. As loading was increased the formation and location of cracks were
noted and at failure, the failure load recorded and the widest crack measured by means
of a vernier calliper. Three (3) 100mm concrete cube specimens were prepared from
the concrete batch that was used for the beams and were cured in water for 28 days,
and subsequently tested to confirm the grade of concrete (i.e. C25).
Analysis
To assist with the hypothesis testing, the ―Data Analysis‖ tool in Microsoft Excel was
used. As the sample size for the bond test (i.e. 3 pull-out cubes for coated and 3 pull-
out cubes for uncoated bar) and the sample size for flexural test (i.e. 2 beams for
coated and 2 beams for uncoated) are small (i.e. less than 30) and also the hypothesis
testing concerns group comparison (i.e. differences in treatment), t-test (two-sample
equal variance) was used in the hypothesis testing (cf. Middleton, 1997; and Fellows
and Lui, 2008; and Creswell, 2009). For hypothesis H1, the null hypothesis of equal
mean bond strength for the 2 treatments/groups (i.e. coated and uncoated bar) was
thus tested using two tail t-test, and for H2 the null hypothesis of equal mean failure
load for the 2 treatments/groups were also tested using two tail t-test.
150 concrete
cube
12 mm ø bar-
coated/un-coated

Adukpo, Oteng-Seifah and Manu
366
RESULTS AND DISCUSSION
Compressive Test
As indicated in Table 2, the mean compressive strength of the concrete used for the
pull-out concrete cubes (i.e. batch P) was 32.8 N/mm2
and the mean compressive
strength of the concrete used for the beams (i.e. batch B) was 34.40 N/mm2. Both
concrete batches therefore achieved the designed concrete grade C25 at 28 days as
their characteristic strengths are greater than or equal to 25N/mm2
Table 2: Compressive strength test results of 100mm concrete cubes
100mm
Concrete
Cubes
Density
(kg/m3)
Failure
Load
(KN)
Compressive
Strength
(N/mm2)
Mean Compressive
Strength
(N/mm2)
s (Standard
deviation)
(N/mm2)
fc
Characteristic
Strength
(N/mm2)
P1 2531 345 34.5
32.8 2.12 29.29 P 2 2776 334 33.4
P 3 2454 304 30.4
B 1 2529 320 32.0
34.4 2.16 30.85 B 2 2580 350 35.0
B 3 2548 362 36.2
Bond Test
The mean bond strength of the oil-coated 12mm diameter bar and the un-coated
12mm diameter bar were 5.63 N/mm2 and 8.26 N/mm
2 respectively as shown in Table
3. The result of the two tail t-test for the null hypothesis of equal mean bond strength

Reinforced concrete
367
at 5% level of significance is also shown in Table 3. The computed t Stat is greater
than the t Critical two-tail and so the null hypothesis is rejected. The engine oil
coating therefore had an adverse effect on the bonding action between the concrete
and steel reinforcement. The engine oil coating acting as a layer of ‗film‘ on the
surface of the steel bar impaired the gripping/anchorage of the steel bar within the
concrete and thus giving rise to the weakened bond between the concrete and the steel.
This result therefore offers empirical support for Turban‘s (1997) assertion regarding
the effect of oil coating on steel bar on bond strength and again it reinforces the need
to keep the surface of reinforcing steel bars from materials that could impair concrete-
to-steel bonding action (Turban, 1997).
Table 3: t-Test: Two-Sample for Bond Test
Uncoated bar Coated bar
Mean 8.26 5.63
Variance 0.0307 0.1323
Observations 3 3
Pooled Variance 0.0815
Hypothesized Mean Difference 0
df 4
t Stat 11.28294766
P(T<=t) one-tail 0.000175802
t Critical one-tail 2.131846782
P(T<=t) two-tail 0.000351604
t Critical two-tail 2.776445105
Flexural Test
Figure 6: Load-deflection response for reinforced concrete beams
As expected, the deflection of the soffit of the beams increased with increase in
applied load as indicated in Figure 6. For the same amount of applied load, the oil-
coated steel-reinforced concrete beams (C) attained higher values of deflection than
the un-coated steel-reinforced concrete beams (UC). Beam C failed at a mean load of
35KN with a mean central deflection of 9.88mm while beam UC failed at a mean load
of 52KN with a mean central deflection of 20.87mm. Comparing the load-deflection

Adukpo, Oteng-Seifah and Manu
368
plots in Figure 6, it is evident that beam UC performed considerably better in resisting
bending than beam C. This is buttressed by the results of the two tail t-test for the null
hypothesis of equal mean failure load at 5% level of significance as shown in Table 4.
The computed t Stat is greater than the t Critical two-tail and so the null hypothesis is
rejected. The engine oil coating therefore had an adverse effect on the flexural
capacity of the concrete beam.
Table 4: t-Test: Two-Sample for Flexural Test
Uncoated bar Coated bar
Mean 52 35
Variance 0 2
Observations 2 2
Pooled Variance 1
Hypothesized Mean Difference 0
df 2
t Stat 17
P(T<=t) one-tail 0.001721176
t Critical one-tail 2.91998558
P(T<=t) two-tail 0.003442351
t Critical two-tail 4.30265273
Again the adverse effect of the oil coating on flexural strength is confirmed by the
load at which first crack occurred. Whereas Beams C developed the first crack at
8KN, beams UC developed the first crack at 20KN.
Linking the findings of the bond test to the flexural test, the research findings (taken
together) provide empirical support for Turban‘s (1997) report. Also the findings align
with the extant literature in terms of the effect of surface condition of steel bar on
steel-concrete bonding and the effect of steel-concrete bonding on the performance of
reinforced concrete element (cf. Lu and Chung, 1998, BRE, 2000; Quillin, 2001; Sergi
and Dunster, 2004; and Adupko et al., 2010).
CONCLUSIONS AND RECOMMENDATION
The effect of the surface condition of steel reinforcement on the bond and the flexural
strength of steel-reinforced concrete have been investigated in terms of engine oil
coating on the surface of steel reinforcement, and from the analysis of the test results,
the following conclusions can be drawn from the study:
6. Engine oil on the surface of steel reinforcement reduces the bond between
concrete and steel reinforcement.
7. Engine oil on the surface of steel reinforcement reduces the flexural capacity
of steel-reinforced concrete and this reduction stems from the reduction in the
bond between concrete and steel reinforcement due to the oil coating on the
surface of steel reinforcement.
It is thus recommended from this study and the foregoing conclusions that surfaces of
steel reinforcement bars should thus be stored away from on-site oiling agents such as
engine oil and in instances where steel surfaces are ‗contaminated‘ by oiling agents,
they should be cleaned prior to their installation or the placing of concrete. Also,
during cutting, bending (especially where this is done mechanically), and handling of
steel reinforcement, steel fixers should ensure that steel surfaces are not contaminated
by engine oil.

Reinforced concrete
369
REFERENCES
Adukpo, E., Oteng-Seifah, S., Manu, P. and Solomon-Ayeh, K. (2010) The effect of corrosion
on the strength of steel reinforcement and reinforced concrete. In: Barrett, P.,
Amaratunga, D., Haigh, R. and Keraminiyage, K. (eds.) Proceedings of CIB 2010
World Congress, 10-13 May 2010, Salford, CIB.
Aldajah, S., Biddah, A., and Alomari, A. (2008) Experimental and FEM study of the flexural
behaviour of CFRP-strengthened concrete structures. In: Dhir, R. K., Newlands, M.
D., McCarthy, M. J. and Paine, K. A. (eds.), International Conference: Harnessing
Fibres for Concrete Construction, 10th July 2008, University of Dundee, UK. HIS
BRE Press.
Bamforth, P. B. (2004) Enhancing reinforced concrete durability: Guidance on selecting
measures for minimising the risk of corrosion of reinforcement in concrete. Concrete
Society Technical Report No. 61. Concrete Society.
BRE (2000) Corrosion of steel in concrete: Protection and remediation. Digest 444 Part 3.
Watford: BRE.
BSI (1992) Specification for aggregate from natural sources for concrete - BS 882:1992,
London: BSI.
BSI (1997) Structural use of concrete- BS 8110- 1:1997, London: BSI.
Cheng, A., Huang, R., Wu, J.K., and Chen, C.H. (2005) Effect of rebar coating on corrosion
resistance and bond strength of reinforced concrete. Construction and Building
Materials, 19(5), 404-412.
Chudley, R. and Greeno, R. (2008) Building construction handbook, 7 edn, Oxford: Elsevier
Creswell, J. W. (2009) Research design: Qualitative, quantitative, and mixed method
approaches, 3rd
Edition, California: Sage Publications.
Durham, S. A., Heymsfield, E., and Jones, J. X. (2009) Retrofitting precast bridge beams with
carbon fiber-reinforced polymer strip for shear capacity. Journal of Performance of
Constructed Facilities, 23 (4), 219-226.
Emmons, P. H., Baysburd, A. M., and Thomas, J. (1998) Strengthening concrete structures-
Part II. Concrete International, 20(4), 56-60.
Everett, L. H. and Treadaway, K. W. J. (1980) Deterioration due to corrosion in reinforced
concrete, BRE Information Paper IP 12/80, Watford: BRE.
Fellows, R. and Lui, A. (2008) Research methods for construction, 3rd Edition, West Sussex:
Blackwell Publishing Ltd.
Sergi, G. and Dunster, A. (2004) Corrosion of steel in concrete: A review of the effect of
humidity. Digest 491. Watford: BRE.
Lu, W., Fu, X. and Chung, D. (1998) Effects of water-cement ratio, curing age, silica fume,
polymer admixtures, steel surface treatments, and corrosion on bond between concrete
and steel reinforcing bars. ACI Materials Journal, 95(6), 725-734.
Mahoutian, M., Libre, N. A., Emdadi, A., and Shekarchi, M. (2008) Effects of fibres on the
physical properties of lightweight aggregate concrete. In: Dhir, R. K., Newlands, M.
D., McCarthy, M. J. and Paine, K. A (eds.), International Conference: Harnessing
Fibres for Concrete Construction, 10th July 2008, University of Dundee, UK. HIS
BRE Press.
MacGregor, J. (1997) Reinforced concrete mechanics and design, 3rd
Ed.. Prentice-Hall.
Marsh, B. K. (1997) Design of normal concrete, 2nd
Edition. Watford: BRE.
Mosley, W. H. and Bungey, J. H. (1995) Reinforced concrete design, 4th edition. Hong Kong:
Macmillan Press Ltd.
Quillin, K. (2001) Modelling degradation processes affecting concrete. Watford: BRE.
Schöck Bauteile GmbH (2006) Technical information schöck combar: reinforcement made of
glass fiber reinforced polymer, Baden-Baden: Schöck Bauteile GmbH.
Tubman, J. (1995) Steel reinforcement - A handbook for young construction professionals,
London: Construction Industry Research and Information Association.

Babafemi, J.A. and Olawuyi, J.B. (2011) Effect of replacement of sand with granite fines on the
compressive and tensile strengths of palm kernel shell concrete In: Laryea, S., Leiringer, R. and
Hughes, W. (Eds) Procs West Africa Built Environment Research (WABER) Conference, 19-21 July
2011, Accra, Ghana, 371-378.
371
EFFECT OF REPLACEMENT OF SAND WITH
GRANITE FINES ON THE COMPRESSIVE AND
TENSILE STRENGTHS OF PALM KERNEL SHELL
CONCRETE
John Adewumi Babafemi 1 and James Babatunde Olawuyi
2
1Department of Building, Obafemi Awolowo University, Ile-Ife, Nigeria
2Department of Building, Federal University of Technology, Minna, Nigeria
Lately, research works are being focussed on using renewable agricultural waste
resources as construction materials. This is to ensure sustainability and to reduce cost
of construction. Palm kernel shell concrete (PKSC) is concrete containing cement,
sand and palm kernel shells wholly or partially as a coarse aggregate. This paper
therefore presents results of an experimental laboratory investigation carried on PKSC
by incorporating varying percentages of granite fines to replace sand in steps of 20%
to study its effect on the compressive and tensile strength of PKSC. A mix proportion
of 1:1.77:0.77 was used with a w/c = 0.50. Calcium Chloride (CaCl2) was added as an
accelerator. Results of 28-day strength test using 100 mm cubes and 150 × 300 mm
cylinders revealed that the compressive and tensile splitting strengths increased with
curing age and with increase in the percent granite fines content. Maximum
compressive and tensile splitting strengths were obtained for PKSC containing 100%
granite fines. Tensile strength obtained fall within the range of values (1.24-1.90
N/mm2) given for grade 30 concrete.
Keywords: renewable resources; palm kernel shell; compressive strength; water
absorption; palm kernel shell concrete.
INTRODUCTION
One of the major challenges facing the construction industry is the growing concern
over resource depletion, hence, the need to source and utilize renewable materials. A
renewable resource like the palm kernel shell (PKS) is usually not used in the
construction industry but dumped as an agricultural waste. However, researches have
shown that it could be used as a replacement (total or partial) for coarse aggregate in
concrete (Okafor, 1988; Okpala, 1990; Mannan and Ganapathy, 2002; Mannan and
Ganapathy, 2004; Teo et al. 2005; Teo et al. 2006a, b, c, d; Ramasamy et al. 2008).
These researches were necessitated as a result of the growing increase in the cost of
building materials, the need to utilize materials seemingly regarded as agricultural
waste and most importantly, the need for sustainable construction. PKS is available in
Nigeria in large quantity as waste from agricultural industries, particularly in Southern
Nigeria. Exploiting this waste material not only maximises the use of the oil palm, but

Babafemi and Olawuyi
372
also helps preserve the natural resources and maintain ecological balance (Teo et al.
2006a).
Concrete made with PKS is a lightweight concrete. Past researches on PKSC have
shown that its compressive strength is in the range of 15-25 N/mm2 (Abdullah, 1984;
Okafor, 1996, Basri et al. 1999; Ata et al. 2006). The strength of PKSC has been
reported to be influenced by the aggregate-cement matrix bond (FIP Manual, 1983).
The aggregate-cement bond is also generally reported to be influenced by the cement,
water, sand and aggregate contents, shape, roughness and stiffness of the aggregate.
Alengaram et al. (2008) reported that the failure of PKSC is also governed by the
strength of the PKS. However, PKS usually have smooth concave and convex surfaces
which produce a poorly compacted concrete and this will ultimately result in bond
failure between PKS and cement matrix. To achieve PKSC of improved strength, the
bond between the mortar and PKS has to be improved. Alengaram et al. (2008) had
considered improvement of the bond of concrete by considering the influence of sand
content on the mechanical properties of concrete. With all mixes super-plasticized and
the addition of 10% Silica fume and 5% fly ash, Alengaram et al. (2008) reported that
the increase in sand content has positive influence on the mechanical properties of
PKSC by an increase in the density and compressive strength. Osunade (2002) had
reported an increase in the compressive strength and a decrease in the tensile strength
of laterized concrete with the replacement of sand with granite fines. Since sand
content is a factor that influences the compressive and tensile strengths and also the
bond properties of concrete, this study therefore studied and reported the influence of
replacement of sand with granite fines on the workability, compressive and tensile
strengths of PKSC. In this study, 2.0 % Calcium Chloride (CaCl2) by weight of
cement was used as an accelerator.
MATERIALS AND EXPERIMENTAL PROCEDURE
Material Procurement and Preparation
The basic components of palm kernel shell concrete are cement, sand, gravel or
granite and palm kernel shell as total or partial replacement of the coarse aggregate. In
this study, total replacement of the coarse aggregate was adopted while granite fines
(GF) replaced sand at steps of 20% up to 100%. The sand and PKS used were
purchased in Ile–Ife, Nigeria. The palm kernel shells (14 mm maximum aggregate
size) obtained from a local mill along Ede road, Nigeria, was already in the cracked
form, the fibrous outer parts of the nut already removed. The shells were kept
outdoors under a shed for three months. This enabled the oil coating to be removed by
natural weathering, which is one of the methods recommended for pre-treatment
(Salam, 1982; Mohd Noor et al. 1990; Okafor et al. 1996 and Mindess et al.2003)
among others. It was washed and dried again before use. Thereafter, it was graded in
accordance with the British Standard methods of sampling, testing and sieve test of
lightweight aggregates for concrete. The cement was obtained from the open market
in Ile-Ife and was that produced by the West African Portland Cement Company
(WAPCO) since their products are believed to conform to the requirements of BS EN
197-1 (2000) for Ordinary Portland Cement. The range of sizes of the fine aggregate
used were those that passed through the 5 mm BS Sieve. The granite fine was
obtained from a quarry along Ondo Road, Ile-Ife. Table1 presents some physical
properties of the constituent materials. Water used for the mixing was clean water
obtained from the tap.
Concrete Mixture and Testing
Concrete
373
It has been reported by Mannan and Ganapathy (2001) that the mix design of
lightweight concrete using palm kernel shell as aggregate differs widely from the
procedure of mix proportioning for conventional concrete with crushed stone
aggregate. This study therefore adopted the acceptable trial mix design for palm
kernel shell concrete reported in the work of Mannan and Ganapathy (2001). A mix
proportion of 1:1.77:0.77 (cement: sand/GF: PKS) with 2.0% CaCl2 by weight of
cement was used. The sand content in the mix was replaced with granite fines in
gradation of 0%, 20% 40%, 60%, 80% and 100%. A water/cement ratio of 0.50 was
used throughout the research.
Due to the high water absorbing nature of palm kernel shells, they were immersed in
water for 1 hour (pre-soaking) before use. The absorption capacity of the shells was
found to be in the range of 10-15%. Cubical specimen of 100 mm and cylindrical
specimen of 150 × 300 mm were used to determine the compressive and the splitting
tensile strengths of the PKSC. A total of 108 PKSC specimens, 54 apiece, were cast
and tested for compressive and splitting tensile strengths respectively. Each specimen
was made by filling each mould in three layers and then compacted manually by
evenly distributing 25 strokes of a steel rod of 25 mm diameter across the cross-
section of the mould as stipulated by the requirements of BS EN 12390–2:2000. The
cast specimens were covered with polythene bags to prevent evaporation until
demoulding after 24 hours of casting, thereafter the specimens were transferred into a
water bath maintained at 27± 50C in the curing room. The compressive and tensile
strengths were determined after 7, 21 and 28 days of curing.
Strength characteristics of the cube and cylindrical specimens were tested using the
ELE 2000KN Compression Testing Machine. Three replicates of each specimen at the
requisite curing age of 7, 21 and 28 days were brought out of the curing tank and
allowed to rest for 2 hours and then crushed. The average values of the maximum
loads at which each group of three specimens failed was found and then the
compressive and tensile strengths were determined. This was in accordance with BS
EN 12390-3 (2002). The cylindrical specimens were compressed along two
diametrically opposed generators lying horizontal. To prevent multiple cracking and
crushing at the point of loading, two thin plywood strips (25 mm thick) were placed
between the loading platen and the specimen to distribute the load while a special
appliance fabricated was used to hold the cylindrical prisms in place to avoid tilting or
rolling under load. The induced stress caused the specimen to fail by splitting into two
halves across the loading plane. These tests were carried out in accordance to the
provision of BS EN 12390 – 6:2000.
DISCUSSION OF RESULTS
Workability
The result of the slump tests are shown in Figure 1. From Figure 1, it was observed
that the slump values for each replacement level of sand with granite fines (20-100%)
increased at a decreasing rate above the slump value with the mix without granite
fines (control). The peak slump value, 148 mm, was obtained at 40% granite fines
content. The results obtained showed that the slump increased when percentage of
granite fines in the mix increased up to 40% and thereafter (60-100%), the slump
value decreased. However, the result showed concretes of high workability, that is,
above 50 mm. Neville (1995) stated that concrete having slump between 25 and 50
mm can be used for mass concrete foundations without vibration or lightly reinforced
concrete sections with vibration. Accordingly, concrete having slump between 50 and

Babafemi and Olawuyi
374
100 mm can be used for manually compacted flat slabs using crushed granite and also
for normal reinforced concrete manually compacted and heavily reinforced sections
with vibration. It can therefore be implied that, PKSC of mix proportion 1:1.77:0.77,
containing 2.0% CaCl2 as accelerator, with the shells at saturated surface dry (SSD)
condition and a water-cement ratio of 0.5 with or without granite fines can be used for
mass concrete foundations without vibration or lightly reinforced sections with
vibration.
Figure 1: Variation of slump with granite fines content
Water Absorption Capacity
The water absorption capacity of the PKS was 9.03% (see Table1). This result is
within the range of absorption capacity of lightweight aggregates which has been put
at 5-20% (PCA, 1979). When compared with other aggregates used in this research as
shown in Table 1, PKS has high water absorption. If used in the production of
concrete, it would obviously absorb much of the water meant for mixing thereby
requiring a high water/cement ratio to make it workable. It is because of this high
water absorption characteristic of PKS that pre-soaking of the shells is necessary
before use in concrete.
Density of Concrete
The demoulded density of concrete produced in all cases of replacement (Table 2)
ranges within 1900-1950 Kg/m3. It was observed that the replacement level of the
sand with GF did not impact greatly upon the density of concrete produced, though
the higher the GF content, the higher the density and the higher the density, the higher
the strength characteristics of PKSC. This density range falls within that of
lightweight aggregate concrete (Newman, 1993; Shetty, 2002; Teo et al. 2006b).
0
50
100
150
200
0 20 40 60 80 100
Slu
mp
(mm
)
Granite fines content (%)
Table 1: Physical and mechanical properties of PKS, Granite fines and Sand
Properties PKS Granite fines Sand
Maximum size 14 4.75 5.00
Specific gravity 1.58 2.4 2.55
Water absorption 9.03 3.85 3.75
Coefficient of uniformity 1.77 2.60 2.50
Coefficient of curvature 1.00 0.82 0.75
Density (g/cm2) 1.22 2.63 2.57

Concrete
375
Compressive Strength of PKS Concrete
The results showed that the compressive strength of PKSC increased with increase in
the granite fines content (see Fig.2). Maximum compressive strength of 14.73 N/mm2
was obtained at 28 days when the sand was completely replaced with granite fines.
This indicated that palm kernel shell concrete performs better in compressive strength
when sand is completely replaced by granite fines. The compressive strength also
increased with increase in curing age from 7 to 28 days like normal concrete.
However, compressive strength at 28-day test was only slightly higher than for 21
days at the various replacement levels of sand with granite fines. Neville (1995)
posited that the knowledge of the strength-time relation is of importance when a
structure is to be put into use, which is, subjected to full loading, at a later age. This is
similar with the results obtained when granite dust was partially substituted for sand in
laterized concrete (Osunade, 2002). It could be deduced that granite fines enhanced
better bond between the mortar and palm kernel shell than when sand is used.
Table 2: Summary of Demoulded Density, Compressive and Splitting Tensile Strengths of
PKSC containing Granite Fines (GF)
% GF
content
Demoulded Density
(Kg/m3)
Compressive Strength
(N/mm2)
Tensile Strength
(N/mm2)
7
Days
14
Days
28
Days
7
Days
14
Days
28
Days
0 1900 10.90 12.47 12.63 1.24 1.42 1.63
20 1912 11.17 13.13 13.33 1.26 1.48 1.74
40 1925 11.47 13.43 13.60 1.37 1.62 1.78
60 1932 11.77 13.70 13.83 1.49 1.69 1.81
80 1942 12.03 14.07 14.33 1.54 1.77 1.86
100 1950 12.33 14.33 14.73 1.56 1.82 1.90
Figure 2: Variation of compressive strength with % granite fines
From the statistical analysis of the compressive strength results, Table 3, the analysis
of variance (ANOVA) output showed that the independent factors; GF content and
curing age and their interaction had significant effect on the compressive strength of
PKS concrete at p ≤ 0.05.
Tensile strength of PKS concrete
From Table 2 and Fig. 3, it was observed that the tensile splitting strength of the PKS
concrete increased as the percentage of granite dust increased from 20% to 100%. A
similar pattern of performance of compressive strength was observed for the tensile
0
5
10
15
20
0% 20% 40% 60% 80% 100%
Co
mp
ress
ive
str
en
gth
(N
/mm
2
% replacement of sand with granite fine
7
21
Curing age

Babafemi and Olawuyi
376
splitting strength. Total replacement of sand with granite fines (100%) at 28 days gave
the optimum tensile splitting strength of 1.90 N/mm2. Tensile strength obtained fall
within the range of values (1.24-1.90 N/mm2) given for grade 30 concrete. The tensile
splitting strength also increased with curing ages from 7 to 28 days. Neville (1995)
posited that although concrete is not usually designed to resist direct tension, the
knowledge of tensile strength is of value to estimating the load under which cracking
will develop.
Table 3: ANOVA Output
Source Dependent
Variable
Type III Sum
of Squares
df Mean
Square
F Sig.
Model Compressive Str. 9137.800a 18 507.656 4.154E4 .000
Tensile Str. 142.115b 18 7.895 1.254E4 .000
GF Compressive Str. 18.933 5 3.787 309.806 .000
Tensile Str. .753 5 .151 239.145 .000
Curing age Compressive Str. 49.517 2 24.759 2.026E3 .000
Tensile Str. 1.290 2 .645 1.024E3 .000
GF * Curing age Compressive Str. .461 10 .046 3.770 .002
Tensile Str. .049 10 .005 7.827 .000
Error Compressive Str. .440 36 .012
Tensile Str. .023 36 .001
Total Compressive Str. 9138.240 54
Tensile Str. 142.138 54
a. R Squared = 1.000 (Adjusted R Squared = 1.000)
b. R Squared = 1.000 (Adjusted R Squared = 1.000)
Table 1 showed that granite content and curing ages and their interactions also have
significant effect on the tensile splitting strength of PKS concrete at 95% confidence
level.
Figure 3: Variation of tensile strength with % granite fines
CONCLUSIONS
Based on the results of this research, the following conclusions can be drawn;
1. Optimum slump of concrete with PKS was obtained at 40% replacement level of
granite fines with sand.
2. PKSC of mix proportion 1:1.77:0.77, containing 2.0% CaCl2 as accelerator, with
the shells at saturated surface dry (SSD) condition and a water-cement ratio of 0.5
0
0.5
1
1.5
2
0% 20% 40% 60% 80% 100%
Ten
sile
str
en
gth
(N
/mm
2
% replacement of sand with granite fine
7
21
Curing age

Concrete
377
with or without granite fines can be used for mass concrete foundations without
vibration or lightly reinforced sections with vibration.
3. The density of PKSC is not greatly influenced by the replacement of sand with
granite dust at whatever percent replacement level. At all percent replacement
level, PKSC was still found to be lightweight.
4. Compressive and tensile strengths of the concrete increased with increase in
percentage of granite fines in the mix and with the curing age.
5. The 28-day compressive and tensile strengths of PKSC were 14.70 N/mm2 and
1.90 N/mm2 respectively at 100% granite fines contents.
6. The replacement of sand with granite fines (GF) in PKSC better enhanced the
bond between the mortar and the coarse aggregate.
REFERENCES
Abdullah, A.A. (1984); ―Basic Strength Properties of Lightweight Concrete Using
Agricultural Wastes as Aggregates‖, Proceedings of International Conference on
Low-cost Housing for Developing Countries, Roorkee, India.
Alengaram, U.J., Jumaat, M.Z. and Mahmud, H. (2008); ―Influence of Cementitious Materials
and Aggregate Content on Compressive Strength of Palm Kernel Shell Concrete‖,
Journal of Applied Science, 8: 3207-3213.
Ata, O., Olanipekun, E.A. and Olusola, K.O. (2006); ―A Comparative Study of Concrete
Properties Using Coconut Shell and Palm Kernel Shell as Coarse Aggregates‖,
Building and Environment, 41: 297-301.
Basri, H.B., Mannan, M.A. and Zain, M.F.M. (1999); ―Concrete Using Oil Palm Shells as
Aggregate‖, Cement Concrete Research, 29(4): 619-622.
British Standard Institution (1985); Methods for Making Tests Cubes from Fresh Concrete,
BS 1881: Part 108, British Standards Institution, London.
British Standard Institution (2000); Cement Composition, Specifications and Conformity
Criteria for Common Cement, BS EN 197-1, British Standards Institution, London.
British Standard Institution (2000); Testing of Fresh Concrete, BS EN 12350-Part 2: Slump
test, British Standards Institution, London.
British Standard Institution (2002); Testing Hardened Concrete, BS EN 12390-Part 3:
Compressive Strength Test Specimens, British Standards Institution, London.
British Standard Institution (2000); Testing Hardened Concrete, BS EN 12390-Part-6: Tensile
Splitting Strength Test Specimens, British Standards Institution, London.
FIP Manual, (1983); FIP Manual of Lightweight Aggregate Concrete, (2 ed.), London, Surrey
University Press.
Mannan, M.A. and Ganapathy, C. (2001); ―Mix Design for Oil Palm Shell Concrete‖, Cement
and Concrete Research, Vol.31, pp. 1323-1325.
Mannan, M.A. and Ganapathy, C. (2002); ―Engineering Properties of Concrete with Oil Palm
Shell as Coarse Aggregate‖, Construction and Building Materials, Vol.16, pp. 29-34.
Mannan, M.A. and Ganapathy, C. (2004); ―Concrete from an Agricultural Waste – Oil Palm
Shell (OPS)‖, Building and Environment, Vol.39, pp. 441- 448.
Mindess, S., Young, J., and Darwin, D. (2003); Concrete, (2nd
ed.), Pearson Education, Inc.,
Upper Saddle River, NJ. Ch.13, Response of Concrete to Stress, pp. 303-361.
Mohd Noor, M.J., Juosh, A. and Ghazali, A.H. (1990); ―Management and Utilisation of Oil
Palm Wastes - A Review‖, Regional Information Centre on the Management and
Utilisation of Wastes, Universiti Putra Malaysia.

Babafemi and Olawuyi
378
Newman, J. B. (1993); ―Properties of Structural Lightweight Aggregate Concrete‖, (In: Clarke
JL, ed.), Structural Lightweight Aggregate Concrete, Blackie Academic &
Professional; pp. 19–44.
Neville, A.M. (1995); Properties of Concrete, 3rd
edition, Addison Wesley, England, Longman
Limited,.
Okafor, F.O. 1988. ―Palm kernel shell as a lightweight aggregate for concrete‖ Cement and
Concrete Research 18, pp. 901-910.
Okafor, F.O., Eze-Uzomaka, O.J. and Eguniwe, N. (1996); ―The Structural Properties and
Optimum Mix Proportions of Palmnut Fibre-Reinforced Mortar Composite‖, Cement
and Concrete Research, 26, pp. 1045-55.
Okpala, D.C. (1990); ―Palm Kernel Shell as A Lightweight Aggregate In Concrete‖, Building
and Environment, 25(4): 291-296.
Osunade, J.A. (2002); ―Effect of Replacement of Lateritic Soils with Granite Fines on the
Compressive and Tensile Strengths of Laterized Concrete‖, Building and
Environment, 37: 491-496.
Portland Cement Association (1979); ―Design and Control of Concrete Mixtures‖, Illonios:
Shokie.
Ramasamy, P., Asrah, H., Mannan, M.A., Teo, D.C.L. & Neglo K. (2008); ―Performance of
Oil Palm Shell (OPS) and OPS Concrete under Aggressive Conditions‖,
Proceedings of the 2nd Engineering Conference (EnCon), 18-19 December, Kuching,
Sarawak, Malaysia, pp. 93-98.
Salam, S.A. (1982); ―Lightweight Concrete Made from Palm Oil Shell Aggregates and Rice
Husk‖, Proceedings of a Regional Seminar, Universiti Putra Malaysia, pp 177-96.
Shetty, M.S. (2002); Concrete Technology: Theory and Practice, S.Chand and Company Ltd,
Ram Nagar, New Delhi.
Teo, D. C. L., Mannan, M. A., Kurian, V. J. (2006a); ―Structural Concrete Using Oil Palm
Shell (OPS) as Lightweight Aggregate‖, Turkish Journal of Engineering and
Environmental Science, 30: 251- 257.
Teo, D.C.L., Mannan, M.A., and Kurian, J.V. (2006b); ―Behaviour of Reinforced Lightweight
Concrete Beams Made with Oil Palm Shell‖, Journal of Advanced Concrete
Technology, Vol. 4, No.3, 1 -10.
Teo, D.C.L., Mannan, M.A., and Kurian, J.V. (2006c); ―Structural Behaivour of Singly
Reinforced OPS Beams‖, Proceedings of the 6th Asia-Pacific Structural Engineering
and Construction Conference (APSEC), 5th – 6
th September, Kuala Lumpur, Malaysia.
Teo, D.C.L., Mannan, M.A., Kurian, J.V., Ganapathy, C. (2006d); ―Lightweight Concrete
Made from Oil Palm Shell (OPS): Structural Bond and Durability Properties‖,
Building and Environment, doi: 10.1016/j.build env.2006.06.013.
Teo, D.C.L., Mannan, M.A. and Kurian, V.J. (2005); ―Utilization of Solid Waste Oil
Palm Shell (OPS) in Concrete Production‖, Proceedings of the International
Conference on Natural Resources and Environmental Management, Kuching,
Sarawak, Malaysia, pp. 135-140.

Abalaka et al. (2011) Effects of Nigerian rice husk ash produced using a charcoal fired incinerator on
properties of cement mortar and concrete: Preliminary results In: Laryea, S., Leiringer, R. and Hughes,
W. (Eds) Procs West Africa Built Environment Research (WABER) Conference, 19-21 July 2011,
Accra, Ghana, 379-389.
379
EFFECTS OF NIGERIAN RICE HUSK ASH PRODUCED
USING A CHARCOAL FIRED INCINERATOR ON
PROPERTIES OF CEMENT MORTAR AND
CONCRETE: PRELIMINARY RESULTS
A.E. Abalaka1, O. G.
Okoli
2, M.M. Garba
3 and I.K. Zubairu
4
1Building Department, Federal University of Technology, Minna, Nigeria
2,3,4Building Department, Ahmadu Bello University, Zaria, Nigeria
The effects of Nigerian rice husk ash (NRHA) produced in a prototype charcoal fired
incinerator and milled to a specific surface of 235m2/kg, on properties of cement
mortar and strength properties of concrete are presented in this work. Effects of
NRHA on properties of cement mortar were investigated at 0-40% replacement levels
at 5% intervals by weight of ordinary Portland cement (OPC). The results indicate
that standard consistence water content increases linearly with the NRHA content
increases. There were remarkable increases in initial and final setting times of the
cement mortar that peaked at 10% NRHA replacement; above 10% content,
continuous decrease in initial and final setting times were observed. There is no
recorded unsoundness in the cement paste at the replacement levels investigated. The
effects of the NRHA on concrete strength at different hydration periods and
water/binder (w/b) ratio show that compressive strength gains are dependent on w/b
ratio.
Keywords: compressive strength, concrete, rice husk ash.
INTRODUCTION
Rice husk ash (RHA) belongs to a class of materials known as pozzolan. A pozzolan
may be defined as a siliceous or siliceous and aluminous material which in itself
possesses little or no cementitious value but will, in finely divided form and in the
presence of moisture, chemically react with calcium hydroxide at ordinary
temperature to form stable insoluble compounds possessing cementitious properties
(Neville, 2006; Lea, 1988).
The use of RHA in concrete could enhance known properties of concrete (Givi et al.,
2010; Kartini et al., 2010; Reddy and Alvarez, 2006). Ganesan et al. (2008) and Nehdi
et al. (2003b) have reported tensile strength increases in concrete resulting from
cement replacement with RHA in concrete. RHA contains mainly reactive amorphous
silica that reacts with calcium hydroxide liberated by cement hydration in concrete to
produce dense calcium silicate hydrates (CSH) that is mainly responsible for
improved concrete performance (Giannotti de Silva et al., 2008; Reddy and Alvarez
2006; Rodriguez de Sensale, 2006; Zhang and Malhotra, 1996).
2
3
4

Abalaka, Okoli, Garba and Zubairu
380
RHA with high amorphous silica content could be considered as highly reactive (r-
RHA). The action of RHA in concrete has two components; the chemical reaction in
the lime liberated as a result of cement hydration that forms dense CSH gel and the
mechanical filler effect of the fine RHA particles (Bui et al., 2005). These two
components when combined together in concrete enhance its strength properties
significantly.
Research results have shown that country of origin of rice husk, chemical pretreatment
of rice husk and methods of incineration all affect the reactivity of RHA in concrete
(Feng et al., 2004; Nehdi 2003a; Rodriguez de Sensale 2006; Salas et al., 2009).
The works of Qijun et al. (1999) and Feng et al.(2004) shows that amorphous silica in
RHA reacts with Ca2+
and OH- ions, and calcium hydroxide librated by hydrating
cement to form more CSH gel and less portlandite that leads to compressive strength
increase in concrete containing RHA compared to concrete without RHA.
The particle size of the RHA also plays a role in compressive strength increase in
concrete (Bui et al., 2005). Most research results on the effects of RHA in concrete are
based on RHA specific surface that is usually higher than that of OPC. The specific
surface of the RHA used for this study is approximately half of the specific surface of
OPC and the aims of this study are: to determine the effects of the RHA in concrete by
testing the effects of the RHA on properties of cement mortar at standard consistence.
Though these tests are not carried out on concrete directly the results in concrete are
by inference; e.g. a mineral admixture that causes unsoundness in cement mortar
would cause concrete expansion that can lead to subsequent deterioration. Secondly to
determine the effects of the RHA with low surface area achieved by using a
commercial mill rather than a laboratory mill in concrete and to determine the
optimum replacement level of OPC with the RHA in concrete, by testing concrete
cube specimens at different ages and water/binder ratio.
MATERIALS
The RHA used for this study was produced using a charcoal fired incinerator from rice
husk sourced from a local rice mill in Minna town. Minna is a small sized state capital
in Niger state; a major rice producing area in the middle belt region of Nigeria.
After production, the RHA was ground using a commercial mill. Though the level of
fine particle sizes that could be attained by the commercial mill used is lower than
laboratory mills, it was chosen for its affordability and accessibility and to determine
the extent of cement replacement with the RHA produced. Compared to laboratory
mills, commercial mills have larger outputs but produce lower specific surface
milling. The use of commercial mills considerably lowers the cost of RHA milling.
A laser diffraction particle size analyzer was used to determine the particle size
distribution of the raw and milled RHA. Fifty percent of the raw RHA have particles
≤303.192µm and ninety percent have particle size ≤1014.298µm. Particle sizes range
from 200-600µm. When ground using a commercial mill, the ground RHA specific
surface area improves to 235m2/kg, fifty percent of the RHA have particles
≤46.451µm. Particle sizes range from 30-100µm. The particle size distribution of the
ground RHA is shown in figure 1. Ground NRHA was used for all the tests presented
in this work.
In determining the composition of the NRHA, samples were subjected to X-ray
diffraction (XRD) and energy dispersive X-ray spectroscopy (EDS) methods of

Cement mortar and concrete
381
analysis. The results of the analysis of the RHA as shown in table 1. The OPC used is
a local commercial brand.
The sand used is natural river bed quartzite with specific gravity of 2.73; the coarse
aggregate is crushed granite of 20mm maximum size with specific gravity of 2.63.
The fine and coarse aggregates particle size distributions are given in table 2; the sand
used is zone 2 type by BS 882: 1973 classification.
The concrete mix proportions are given in table 3. The concrete used for this work
could be considered as high strength concrete (HSC). HSC have compressive strength
higher than 50 N/mm2 (fcu ≥50N/mm2) according to ACI Committee 363 (1998).
Table 1. Composition of RHA. Specific
surface
Loss of ignition (LOI)
Amorphous
(opal-
SiO2nH2O)
Crystalline
(cristobalite
SiO2)
Quartz
(SiO2)
Langbeinite
KBaFe2(PO4)3)
Fairchild
(K2Ca(CO3))
and
Phosphates
in trace
amounts
800oC
(6 min.)
1050oC
(2 hrs)
235m2/kg 0.77% 3.88% 90% 1% 6% 2% 1%
Figure 1. Particle size distribution of ground RHA.
Table 2. Particle size distribution of aggregates as percentage by weight passing sieve sizes.
Sieve size (mm)
20 10 5 2.36 1.18 0.600 0.300 0.150
Fine
aggregates
- - 96.5 94 68.60 37.40 13.80 4
Coarse
aggregates
95.0 40.62 0.80 - - - - -
Table 3. Concrete mix proportions.
Cement content Sand Coarse aggregates Free w/c ratio
425kg/m3 446kg/m
3
1,419kg/m3 0.35-0.55
METHOD
The standard consistence of the OPC and the effects of NRHA (r-RHA) on cement
paste of standard consistence, initial and final setting time were measured using the
Vicat apparatus using procedures complying with BS 4550: part 3 specifications. The

Abalaka, Okoli, Garba and Zubairu
382
immersion in cold and boiling water method complying with BS 4550: Part 3: Section
3.7: 1978 specifications were used in measuring soundness; vernier caliper was used
to measure the separation of the Le Chatelier apparatus.
The concrete was mixed in a drum mixer for 3minutes and the cubes were cast in
100mm steel moulds and manually compacted in two layers. After 24hrs in the
moulds, the cubes were removed from the moulds and cured in water at 21oC; at the
end of curing days the cubes were removed from water and excess surface water
wiped off and crushed.
The concrete cylinders were cast in 150 mm×300mm steel moulds and de-moulded
after 24hrs and cured in water at 21oC; the cylinders were tested at 28 days. Three
samples were cast for each parameter investigated. No water reducing admixture was
used for the concrete mixes reported in this work.
The split tensile and compressive strength test of the cylinders and cubes were done
using ELE ADR 3000 digital compression machine. The cubes were crushed at a
loading rate of 3.00kN/s and the cylinders were split at a loading rate of 2.10kN/s.
Concrete cubes containing 0% NRHA are used as control for all the ages tested.
RESULTS AND DISCUSSION
Microstructure of RHA
The results of the BSE imaging in plates 1 and 2 show the cellular structure of the
siliceous particles for the raw and ground RHA. The large surface area of the milled
RHA can be seen in plate 2. The effects of the large surface area of the RHA will
reflect in some of the properties of cement mortar investigated. The EDS spectra
presented in plate 3 show the peak intensities of some elements in the ground RHA.
Plate1. Microstructure of raw NRHA(×250).

Cement mortar and concrete
383
Plate 2. Microstructure of the ground NRHA (×1000).
Plate 3. EDS spectra of ground NRHA.
Effects of NRHA on cement mortar
Effects of NRHA on standard consistence water of cement paste are shown in figure
2. The figure shows that the water required to achieve the same standard consistence
of cement paste increases linearly with RHA increase. This is attributable to the large
surface area of the ground RHA seen in plate 3. As more RHA is added to the cement
paste, the water absorption by the RHA particles increases. When the percentage
change in water content is plotted against the RHA content in terms of binder (cement
and RHA), cement and r-RHA weights as shown in figure 3 the change in water
content is most pronounced when expressed in terms of RHA weight, and it peaks at
5% RHA content.
Figure 4 shows the effect of RHA on soundness of cement paste of standard
consistence. The maximum expansion of the Le-Chartelier apparatus recorded was
1.9mm at 30% RHA content. In terms of the meaning of unsoundness of cement paste
as required by BS 4550: Part3: Section 3.7:1978 standard, this value is less than the
maximum of 10mm. The use of RHA is therefore not expected to lead to unsoundness
in cement paste.

Abalaka, Okoli, Garba and Zubairu
384
Figure 2. Effect of NRHA on standard consistence water content.
Figure 3. Effect of water in cement paste as a function of binder materials
Figure 4. Effect of NRHA on soundness of cement paste

Cement mortar and concrete
385
Figure 5. Effect of NRHA on setting times of cement paste.
Figure 5 shows the effects of NRHA on setting times of cement paste. Initial and final
setting times increase peaks at 10% NRHA content followed by a steady decline.
NRHA content from 15% is expected to lead to reduction in initial and final setting
time of cement. The increased acceleration of cement setting can been attributed to
the rapid consumption of Ca(OH)2 formed at early stages of hydration due to the
reactive RHA. Reactive RHA in cement has been reported to cause acceleration of
early hydration of C3S and production of more calcium hydroxide (Feng et al., 2004).
Effects of NRHA on high strength concrete
The results of compressive strength tests at 3, 7, 14, 21, 28 and 90 days on concrete
cubes and split tensile strength tests at 28 days on cylinders at different water/binder
(w/b) ratios are shown in tables 4a-e. The results represent average of three samples.
Effects of NRHA in concrete at w/b = 0.35
Table 4a shows the effect of RHA on compressive strength of HSC at w/b ratio of
0.35 at 3, 7, 14, 21, 28 and 90 days. The compressive strength of all the cubes fall
below the control cubes for all the days tested. The compressive strength loss at 90
days compared to control cubes is 24.04%. Increase in split tensile strength from
3.709 N/mm2 to 3.812 N/mm2 (2.78%) at 28 days was recorded. Since RHA particles
with large surface area absorb water, at this w/b ratio available water for cement
hydration would be inadequate for full strength development; un-hydrated cement has
been associated with low w/c concrete mixes that are usually common with HSC
(Taylor, 1997). This replacement level produces the highest demand for water
absorption in cement paste from figure 3. As less water is available for hydration, the
amount of Ca(OH)2 (a byproduct of cement hydration) that is available to react with
RHA is less, this would account for the loss in strength recorded at this low w/b ratio.
Effects of NRHA in concrete at w/b = 0.40
Table 4b shows the effect of RHA in concrete at w/b of 0.40. At this w/b ratio, more
water becomes available for hydration and more Ca(OH)2 become available for
0
50
100
150
200
250
300
350
0 5 10 15 20 25 30 35 40
Sett
ing
tim
e (
min
ute
s)
RHA content as % replacement in cement paste
Initial setting time
Final setting time

Abalaka, Okoli, Garba and Zubairu
386
reaction with RHA with resultant increase in compressive strength and split tensile
strength at 5% RHA content. At 5% RHA content the increase in compressive strength
over control cubes was recorded for all ages. The data also shows that the RHA used
can lead to 3 days early strength development in concrete. Compressive strength
increase at 90 days is 11.16% above control cubes.
The compressive and split tensile strength of control cubes in table 4b are less than
those in table 4a as expected because of higher w/b ratio. The exception is higher split
tensile strength that is higher than that at lower w/b ratio shown in table 4a. Split
tensile strength increase at 5% RHA replacement was 15.31% higher than control.
Effects of NRHA in concrete at w/b = 0.45
From the results in table 4c, there is progressive loss of compressive strength of
concrete as the w/b increased to this level compared to compressive strength in tables
4a and b. The maximum compressive strength increase at 90 days is unchanged at 5%
RHA replacement and represents compressive strength increase of 5.30% over control
cubes. Appreciable compressive strength gain started at 28 days at 10% RHA
replacement.
Split tensile strength increase of 3.53% over control was recorded at 5% RHA
replacement.
Table 4a. Effects of NRHA on strength properties of HSC
Fre
e w
/b =
0.3
5
RHA
replacement
as %
Average compressive strength (N/mm2)
Tensile
strength
(N/mm2)
3days 7 days 14 days 21 days 28 days
90 days 28 days
0 44.40 45.51 52.13 54.24 55.63 65.11 3.709
5 27.38 37.13 39.54 40.23 46.50 49.46 3.812
Table 4b. Effects of RHA on strength properties of HSC
Fre
e w
/b =
0.4
0
RHA
replacement
as %
Average compressive strength (N/mm2) Tensile
strength
(N/mm2)
3 days 7 days 14 days 21 days 28 days 90 days
28 days
0 29.28 35.35 41.71 42.78 47.93 56.14 3.553
5 35.78 42.85 45.29 51.21 52.81 63.19 4.097
10 33.71 38.20 44.28 44.24 49.87 53.44 3.669
Table 4c. Effects of RHA on strength properties of HSC
Fre
e w
/b =
0.4
5
RHA
replacement
as %
Average compressive strength (N/mm2) Tensile
strength
(N/mm2)
3 days 7 days 14 days 21 days 28 days 90 days
28 days
0 30.18 30.16 37.73 40.59 40.71 50.04 3.517 5 30.60 31.52 37.92 41.95 45.11 52.69 3.641 10 26.91 30.71 37.05 39.29 44.83 49.07 3.230 15 21.70 27.15 31.06 36.48 42.84 44.15 3.228

Cement mortar and concrete
387
Table 4d. Effects of RHA on strength properties of HSC
Fre
e w
/b =
0.5
0
RHA
replacement
as %
Average compressive strength (N/mm2) Tensile
strength
(N/mm2)
3 days 7 days 14 days 21days 28 days 90 days
28 days
0 23.36 26.47 34.93 33.61 37.57 39.33 2.618
5 24.90 27.62 33.60 34.68 38.80 45.18 3.476
10 25.17 30.53 30.01 35.86 44.90 44.00 3.389
15 25.19 31.06 37.11 36.22 41.33 39.89 3.694
20 19.91 26.02 29.83 37.90 32.81 36.68 3.294
Table 4e. Effects of RHA on strength properties of HSC
Fre
e w
/b =
0.5
5
RHA
replacement
as %
Average compressive strength (N/mm2) Tensile
strength
(N/mm2)
3 days 7 days 14 days 21 days 28 days 90 days
28 days
0 21.24 25.75 31.47 30.71 34.86 45.70 3.297
5 21.34 27.28 32.94 34.82 37.72 46.44 3.212
10 19.09 29.57 29.05 34.13 35.53 38.75 2.834
15 18.96 24.53 29.19 34.40 34.13 37.75 3.483
20 18.07 24.06 28.33 32.73 32.84 35.81 3.182
25 17.01 21.07 26.29 30.60 29.38 33.45 3.176
Effects of NRHA in concrete at w/b = 0.50
From the strength values shown in table 4d, increase in w/b ratio to 0.50 resulted in
increases in compressive strength at RHA content of 5% at 90 days, this increase is
14.87% over control cubes; the maximum split tensile strength occurs also at this
RHA content. The compressive strength increase recorded at this w/b ratio is the
maximum recorded in this work. Though compressive strength increase over control
cubes is recorded at 10% and 15% RHA replacement at 90 days, the maximum
increase is at 5%. At 10% RHA replacement the compressive strength increase above
control cubes recorded was 11.87% at 90 days, while at 15% RHA replacement
compressive strength increase of 1.42% over control was recorded. At 15% RHA
replacement, tensile strength increase over control was 41.10% at 28 days.
Effects of NRHA in concrete at w/b = 0.55
At w/b ratio of 0.55, the maximum compressive strength increase recorded was at 5%
RHA replacement representing strength increase of 1.62% over control at 90 days.
Decline in split tensile strength at 28 days was recorded at 5% and 10% RHA content
compared to control; it increased at 15% RHA replacement and then declined from
20-25% RHA replacement.
From the results presented in this work, a maximum compressive strength increase of
14.87% over control was recorded in HSC used for this work at 5% RHA replacement
at a w/b ratio of 0.50 at 90 days. Split tensile strength increases were recorded in
concrete cylinders with RHA.
Even though the specific surface of the NRHA used for this study is low, it has none
the less shown that cement replacement with RHA in concrete up to 15% at w/b of
0.50 is feasible. Though appropriate fineness of RHA could be important in
compressive strength development, this work has shown that the NRHA used for this
research produced by a charcoal fired incinerator is reactive in concrete and can
improve compressive and tensile strength of HSC.
Abalaka, Okoli, Garba and Zubairu
388
CONCLUSION
The results presented in this work shows that the NRHA produced in a charcoal fired
incinerator at a specific surface of 235m2/kg is reactive in cement mortar and in the
concrete mix used for this study. In cement mortar the NRHA has been shown to
effect water demand; higher replacement content would lead to higher water required
to achieve the same slump in concrete. Furthermore, replacement content from 15%
and above is expected to result in reduction in initial and final setting time of cement.
The results also show that in the range of replacement content used for this study,
NRHA does not cause any unsoundness in cement mortar and is therefore not
expected to cause expansion in concrete.
The maximum compressive strength increase recorded occurs in concrete at 5% RHA
replacement at w/b of 0.50. However, the RHA replacement can be increased to 15%
at this w/b ratio without strength reduction. The results have also shown improved
tensile strength of concrete containing RHA. The strength increase recorded in this
work is mainly due to the pozzolanic reaction of the amorphous silica with Ca(OH)2.
Grinding the RHA to higher fineness should increase the filler effect of the RHA in
concrete and subsequent increase in the replacement level in concrete. Though the
OPC used is finer than the RHA, the results show that a commercial mill could be
used to produce RHA that is reactive in concrete. This is particularly relevant
considering the fact that laboratory mills usually have small milling capacity and are
relatively more expensive.
The measurement of durability related properties like coefficient of water
permeability, water absorption and sorptivity on these range of mix proportions are
ongoing. Work on concrete mix of a lower grade to determine the effect of the RHA
on normal strength concrete is currently in progress.
REFERENCES
ACI Committee 363. (1988). State-of-art report on high-strength concrete. (ACI 363.R-
92/97). In: Manual of concrete practice ACI; 55p
Bui, D.D., Hu, J., Stroeven, P., (2005). Particle size effect on the strength of rice husk ash
blended gap graded Portland cement concrete. Cement and concrete composites,
27,357-366.
Feng Q, Yamamichi H., Shoya M., Sugita S. (2004). Study on the pozzolanic properties of
rice husk ash by hydrochloric acid pretreatment. Cement and concrete research, 34,
521-526.
Ganesan, K,Rajagopal K, Thangavel K. (2008). Rice husk ash blended cement: assessment of
optimal level of replacement for strength and permeability properties of concrete.
Construction and building materials, 22, 1675-1683.
Givi, A. N., Rashid, S.A., Aziz F. N. A., and Salleh M. A. M. (2010). Contribution of rice
husk ash to the properties of mortar and concrete: A review. Journal of American
science. -accessed 17 June 2010. Available at http://www.americanscience.org
Kartini, K. Mahmud, H.B. and Hamidah, M.S. (2010). Absorption and permeability
performance of Selangor rice husk ash blended grade 30 concrete. Journal of
engineering science and technology. School of engineering, Taylor‘s university
college,5:1. -accessed 18 June 2010. Available from http://jestec.taylors.edu.my
Lea, F.M. (1988). The chemistry of cement and concrete, third edition. Arnold. London.
Nehdi M, Duquette J, El Damatty A. (2003a). Performance of rice husk ash produced using a
new technology as a mineral admixture in concrete, Cement and Concrete
Research,33, 1203–1210.

Cement mortar and concrete
389
Nehdi M, El Damatty A, Rahimi R. (2003b).Investigation on lap-joint behaviour of GFRP
plates bonded to silica fume and rice husk ash concrete. International journal of
adhesion and adhesives, 23, 323-333.
Neville A.M. (2006). Properties of concrete, fourth edition, Dorling Kindersley (India)Pvt ltd,
Patparganj, Delhi, India.
Qijun, Y., Sawayama, K., Sugita, S., Shoya, M., Isojima, Y., (1999). The reaction between
rice husk ash and Ca(OH)2 solution and the nature of its product. Cement and
concrete research, 29,37-43.
Reddy D.V. and Alvarez, M. (2006). Marine durability characteristics of rice hush ash
modified reinforced concrete. Fourth LACCEI international Latin American and
Caribbean conference for engineering and technology (LACCET‘2006). Breaking
frontiers and barriers in engineering: education, research and practice. 21-23 June,
Mayaguez, Puerto Rico. -accessed 18 June 2010. Available at
http://laccei.eng.fau.edu/
Rodriguez de Sensale, G., (2006). Strength development of concrete with rice-husk ash.
Cement and concrete composites, 28, 158-160.
Salas A, Delvasto S, Mejía de Gutierrez R, Lange D. (2009). Comparison of two processes for
treating rice husk ash for use in high performance concrete. Cement and concrete
research.,39, 773-778.
Taylor H.F.W. (1997). Cement chemistry. 2nd ed. London: Thomas Telford.


Essah, E.A. (2011) Energy generation and consumption in Ghana In: Laryea, S., Leiringer, R. and
Hughes, W. (Eds) Procs West Africa Built Environment Research (WABER) Conference, 19-21 July
2011, Accra, Ghana, 391-401.
391
ENERGY GENERATION AND CONSUMPTION IN
GHANA
Emmanuel A. Essah1
School of Construction Management and Engineering, University of Reading, Reading, RG6 6AW, UK
Electricity consumption in Ghana is estimated to be increasing by 10% per annum due
to the demand from the growing population. However, current sources of production
(hydro and thermal facilities) generate only 66% of the current demand. Considering
current trends, it is difficult to substantiate these basic facts, because of the lack of
information. As a result, research into the existing sources of generating electricity,
electricity consumption and prospective projects has been performed. This was
achieved using three key techniques; review of literature, empirical studies and
modelling. The results presented suggest that, current annual installed capacity of
energy generation (i.e. 1960 MW) must be increased to 9,405.59 MW, assuming 85%
plant availability. This is then capable to coop with the growing demand and it would
give access to the entire population as well as support commercial and industrial
activities for the growth of the economy. The prospect of performing this research is
with the expectation to present an academic research agenda for further exploration
into the subject area, without which the growth of the country would be stagnant.
Keywords: energy, electricity generation, electricity consumption, Ghana.
INTRODUCTION
In today‘s world, the role of energy generation and consumption cannot be over
emphasised. Energy consumption enhances productivity, economical growth, global
networking as well as its adverse effects on climatic; climatic change. The need for
additional installed capacity of energy source to meet the potential of a country has
continued to be at the forefront of growing economies of many countries. However,
these concepts and principles are yet to be fully harnessed in Ghana.
Electricity consumption in Ghana is estimated to be increasing by 10% per annum due
to the demand from the growing population. However, current baseline production
sources generate only 66% of the current demand. From this, an estimated 65% is
used in the industrial and service sectors while the residential sector accounts for
about 47% of total electricity consumed in the country. Though this does not add up
(certainly there must be justified reason), this is what has been presented in the Energy
Sector Strategy and Development Plan, 2010 (www.ghanaoilwatch.org). this lack of
parity prompts research to enable the validation of available data.
Current data draws on the fact that electricity generation is primarily obtained from
hydropower sources at Akosombo and Kpong Dam located in the Eastern Region of
Ghana and another two thermal power plants using light crude oil at Aboadze near
Second-Takoradi in the Western Region of Ghana (Gand, 2009). Additional
infrastructure has been constructed to boost the capacity, bringing Ghana‘s installed

Essah
392
capacity to 1960MW (i.e. 2009 figures) (www.ghanaoilwatch.org). Ghana‘s energy
strategy and development plan by 2015 (www.ghanaoilwatch.org) predicts baseline
production to rise to 80%, however it is not clear what percentage of the nation would
have access to electricity. To achieve this increase, the sector raises the following
challenges for additional energy generation sources:
Developing infrastructure for the production and supply of adequate energy
services to meet national requirements and for export.
Developing the requisite infrastructure to ensure universal access as well as the
efficient and reliable supply of energy services.
Ensuring that energy is produced and supplied in a form that has no adverse
health, safety and environmental impact.
These are interesting projections but current trends and statistics indicates that this
may be farfetched within the 2015 targets set by the nation. This paper reviews
existing data and develops detailed analysis that challenges for potential infrastructure
development to meet growing energy demands. It also draws on the expectation to
present an academic research agenda that is yet to be critically explored.
PROJECT RATIONALE
There is enormous potential for Ghana to address the ―pressures‖ of its energy
demand by investigating ways in which similar or other technologies could be viably
adopted to supplement and provide energy to meet the needs of the growing
population. However, without detailed research and commitment to implement its
findings, this potential would not be realised The fact that there are variations in data
regarding the current percentage of the population that has access to electricity raises
concerns and debate regarding the authenticity of data available to the public. Depending on the source from which information is obtained, values of those who
have access are quoted between 50-70% (www.ghanaoilwatch.org;
http://www.modernghana.com). From this, it is estimated that the access to electricity
in the urban areas is 70 % and that to rural areas is approximately 30%
(http://www.modernghana.com). These figures are yet to be substantiated with facts
backed by research.
Undoubtedly, it is clear from the constant “blackouts” that the current national grid
lacks security because of the unpredictable variation in energy sources
(www.ghanaoilwatch.org) or insufficient wholesale electricity supply (excluding
indirect cost) eventually costing the nation between $320 million and $924 million
annually or 2 - 6% of Gross Domestic Product (GDP) (www.adomonline.com). As a
result, the current energy strategy policy of the country (2010) identifies the need for
research to develop additional strategies to improve and modernise transmission and,
distribution infrastructure. This is aimed at developing a non-congested transmission
system by 2015 (www.ghanaoilwatch.org).
STUDY APPROACH
To understand the lapses in data presented and the challenges that face the Energy
Sector, this paper present research that was performed using three effective stages:
Stage 1: Understanding the potential of the current grid infrastructure and its
capability to meet the growing demands: a literature survey.

Energy generation and consumption
393
Stage 2: Empirical studies to investigate the countries energy requirements, installed
capacity and energy consumption.
Stage 3: Modelling a photovoltaic system with grid integration as a possible source
of energy generation.
Based on these stages, several recommendations are made with a view to initiate a
rigorous research engagement into the subject area by leading researchers and
academic institutions in Ghana.
IMPACT OF GROWTH: URBAN AND RURAL
Ghana‘s 2010 census reported a population of 24.3 million people out of which an
estimated 29% of the population are identified to live in rural areas
(http://unstats.un.org; Yanga and Di Sirio, 2011). Even though rural electrification has
grown substantially (GRIDCo, 2010a), it goes without saying that the urban
population consumes the most. Over the last decade, Ghana experienced annual
growth in peak electricity demand of about 1.4%, from a baseline of 1,258 MW in
2000 to 1,960 MW in 2009, with a corresponding cumulative growth in energy
demand of 3.3% annually from 7,539 GWh in 2000 to 10,116 GWh in 2010
(projected) (GRIDCo, 2010a).The growth rates have been driven largely by three
trends (GRIDCo, 2010a):
Economic growth: Ghana‘s GDP grew at an average of 5.5% per annum between
2000 and 2009.
Rapid urbanization: Ghana‘s urban population share increased from 44% to 52%
between 2000 and 2010.
VALCO’s demand curtailment: VALCO‘s operations have been interrupted
several times over the last 10 years due to the unpredictable nature of the grid
distribution.
Figure 1. Peak Demand and Energy Consumption for key Urban areas; 2000-2009
(Source:GRIDCo,2010a)

Essah
394
Significantly, Ghana‘s three largest cities; Accra, Tema, and Kumasi, have been the
key drivers in increased urban electricity usage, because of the impact of urbanisation.
The total peak electricity demand for these cities rose from 48% in 2000 to 52% in
2009 with a corresponding steady growth of electricity consumption at just over 50%.
The most significant growth was in Tema, where peak demand grew more than 106%
over the 10 year period and energy consumption grew more than 159% (see Figure 1)
(GRIDCo, 2010a; GRIDCo, 2010b).
To sustain this growth, significant development of additional infrastructure is
required. Unless this is developed, the existing infrastructure would not be able to
sustain and/or coop with the prospective demand, as a result the need for research and
investment in this area.
EXISTING INFRASTRUCTURE
Statistics of electricity generation in Ghana as illustrated in Tables 1 and 2 shows the
possible potential of electricity generation even though percentage availability varies
significantly. Since 2007, five additional generation plants have been commissioned to
boost the capacity of the existing structure. As stated earlier, despite this development,
only between 50-70% of the population have access to electricity
(www.ghanaoilwatch.org; http://www.modernghana.com). This is rather low, since
the growth of any country depends on the availability and affordability of electricity to
the entire population.
To meet the growing consumption rates, the projected yearly energy consumption is
estimated by GRIDCo (2010) to be 10,305 GWh. It is anticipated that with the current
construction of additional infrastructure (i.e. to be completed by 2014), hydro would
contribute 6,360 GWh, with the remaining 3,945 GWh generated from thermal plants.
This implies running almost five thermal plants continuously throughout the year.
Hence, with the current low levels of units' availability (Table 1), a supply deficit of
close to 1000 GWh is likely to be experienced (GRIDCo, 2010a).
Table 1: Electricity generated by plant (GWh)
Plant
Hydro Thermal
Total AKOS KPO Total TAPCO TICO TT1 TRPP ERPP KRPP MRPP Total
2000 5557 1052 6610 345 268 - - - - - 613 7223
2001 5524 1085 6609 740 510 - - - - - 1251 7859
2002 4178 858 5036 874 1363 - - - - - 2237 7273
2003 3210 675 3885 1328 668 - - - - - 1997 5882
2004 4404 876 5281 536 222 - - - - - 758 6039
2005 4718 911 5629 831 328 - - - - - 1159 6788
2006 4690 929 5619 1416 1395 - - - - - 2810 8429
2007 3104 623 3727 1521 1417 - 162 80 33 38 3251 6978
2008 5254 941 6196 874 1063 - 85 45 16 46 2128 8323
2009 5842 1035 6877 453 1040 570 - - - 18 2081 8958
%
availability 98.97 99.01 - 27.71 90.5 98.25 - - - 76 - -
Where AKOS = Akosombo Hydro Power Plant
ERPP = Emergency Reserve Power Plant MRPP = Mines Reserve
Power Plant TRPP = Tema Reserve Power Plant KRPP = Kumasi Reserve Power Plant
KPO = Kpone Hydro Power Plant
TT1 = Tema Thermal 1 Plant
TICO = Aboadze Tico Thermal Power Plant TAPCO = Takoradi Thermal Power Plant
Source: Energy Statistics (http://new.energycom.gov.gh )

Energy generation and consumption
395
From Table 3, there is a steady growth in electricity consumption by the residential
sector while a corresponding decline is observed from the industrial sector. This is
only possible because of the reduced activity of VALCO while the construction of
residential properties connected to the grid is on the increase. Within the scheme of
events, electricity exports are also on the increase (Table 3).
Table 2: Grid Electricity available for domestic sales (GWh)
Year Electricity Generated (GWh) Generation
and
Substation
use
Transmission
Loses
Export Available
for
Domestic
sale
Hydro Thermal Import Total
2000 6610 613 864 8087 23 229 392 7835
2001 6608 1251 462 8321 32 259 302 8030
2002 5036 2260 1146 8442 45 368 612 8029
2003 3885 2015 940 6840 45 333 604 6462
2004 5281 758 878 6917 31 205 665 6681
2005 5629 1159 815 7603 42 249 639 7312
2006 5619 2810 629 9058 51 318 754 8689
2007 3727 3251 435 7413 47 230 246 7136
2008 6196 2128 275 8599 51 303 538 8245
2009 6877 2081 198 9156 25 339 752 8792
Source: http://new.energycom.gov.gh
To date, electricity exports have provided an important source of foreign exchange
earnings for the country. Ghana exports power to the neighbouring countries including
Togo, Benin, and Burkina Faso. It must be noted that when necessary, Ghana also
imports power from La Cote D‘Ivoire. Becoming a major exporter of electricity is a
major objective to achieve the vision of the energy sector. In addition, the opportunity
exists for Ghana to expand its electricity exports under the West African Power Pool
(WAPP) Project (www.ghanaoilwatch.org). This is significant as it promotes
investment in the sector.
Table 3: Electricity Consumption by Sector (GWh)*
*data does not include commercial and technical losses (Source: VRA, GRIDCo)
ESTIMATED ELECTRICITY CONSUMPTION
Ideally, based on the population of a country, the basic energy needs of each
individual must be met through the installed capacity of the generated sources. This
forms the basic requirements of all developed countries; in fact, it must form the basis
of any country that seeks development. From this analogue, this section develops
simple equations to analyse the actual demand and deficit of electricity supply
Sector Industrial Non Residential Residential Total
2000 4306 536 1494 6336
2001 4335 579 1612 6526
2002 3900 602 1671 6173
2003 2205 620 1727 4552
2004 2085 661 1782 4528
2005 2543 698 1915 5156
2006 3593 791 2129 6513
2007 2697 803 2095 5594
2008 2966 928 2269 6163
2009 2943 878 2408 6229

Essah
396
required to meet the needs of the current population of Ghana. Assuming all the
electricity consumption requirements of Ghana are met,
Basic Equations
These equations are developed to assess the consumption of household appliances,
assuming every individual has access to a range of basic appliances as would be in
any home.
dayhoursquantityWARdayWhCPD onsWa /)()/( (1)
1000)/(
yeartheofDaysCPDyearkWhCPA onswa
onswnn (2)
Where DaPwCons = Power Consumption/day; Wh/day
AnnPwCons = Annual Power Consumption; kWh/year
AR = Appliance Ratings; W
Note:
These equations do not take into account losses due to inefficient appliances and or transmission losses.
From the carbon independent review of UK, annual average electricity consumption is
4,800 kWh per 4 person household. A smaller than average household (2 person
household) is taken arbitrarily to be 3,000 kWh, and a larger than average household
(5+ person household) accounts for about 7,000 kWh (www.carbonindependent.org).
Since similar statistics is not available through the statistics division of Ghana, a
simple empirical study was carried out to estimate average energy consumption of a
household (4 persons).
The study collates data within a domestic (residential) sector (Table 4) and non
residential sector (using a virtual commercial office) as a case study (Table 5). Tables
4 and 5 were developed using Equations 1 and 2. From the study (Table 4) it was
estimated that an average household of 4 persons consumes at least 1795.1 kWh/year
of electricity. This is approximately 1/4th
the limits consumed in UK. It must be noted
that most of the data used to generate the results in Table 4 were based on updates
from general review appliances reported by Energy Foundation, Ghana (www.
ghanaef.org) in comparison with the researcher‘s current domestic appliances and
other relevant sites. Generally, comparing the yearly household (residential) values of
2408 GWh in 2009 (Table 3) the country requires additional electricity generation
plants that would contribute to ~ 4.5 times more than the current annual average; 2408
GWh. This would then agree with the estimated residential electricity consumption of
10,771 GWh (Table 4).
The total energy required (estimated in Table 4 and 5) for the domestic and
commercial sector is 94,036.1 GWh. From Table 3, the industrial sector requires an
additional 35% (on average) of the residential sector. This implies that to address the
electricity consumption required by the population and for economic growth, the
annual total energy required is 97,805.76 GWh. This is ~ 11 times more than the
current available electricity for domestic sale (Table 2) and ~ 9.5 times more than the
projected electricity consumption estimated at 10,305 GWh.

Energy generation and consumption
397
Table 4: Estimated energy consumption for a domestic residence
Appliances Rating Quantity Hours Power
(W) (per day) (kWh/year)
Hi-Fi radio 20 1 2 14.6
Mobile Phone(Charging 3 times/ week)* - 1 3 0.7
Television (14 inch) 60 1 3 65.7
Computer with LCD screen 150 1 2 109.5
Ceiling Fan (max speed) 45 1 0.5 8.2
Telephone ** 3.6 1 24 6.3
Refrig./freezer(22 cf***) 1200 1 - 292.0
Electric Stove 5500 1 - 876.0
Kettle 1200 1 0.2 73.1
Microwave 1000 1 0.2 73.0
Blender 700 1 0.1 25.6
Lights:
11W compact fluorescent 11 3 2 24.1
Incandescent 40 4 3 175.2
Iron 1000 1 0.14 51.1
Total 1795.1
Total Demand ( assume 4 person household of population) GWh 10,770.5
* Mobile Phone Charger (http://www.willsmith.org/climatechange/domestic.html)
** Charges a DC researchable battery (6v 600mA)
*** cf - cubic foot (www.PVSyst.com)
Table 5: Estimated energy consumption for a Commercial Offices (non residential)
Appliances Rating Quantity Hours Power
(W) (per day) (kWh/year)
LCD Monitors(in Common areas) 90 3 6 591.3
Desk top computer (per Staff) 200 1 8 584.0
Telephone** 3.6 1 24 6.3
Refrig./freezer(22 cf***) 1200 1 - 292.0
Air Conditioning (efficient)**** 1200 1 - 894.0
Toaster 800 1 0.15 43.8
Kettle 2200 1 0.15 120.5
microwave 700 1 0.25 63.9
Multifunctional printers - copiers 4500 1 24 2365.2
Lights:
25W compact fluorescent 28 20 4 817.6
Fluorescent Lamps++ 40 60 3 2628.0
Utility (security…) 500 6 0.08 87.6
Vacuum Cleaner 780 3 0.21 179.4
Total 8673.5
Total Demand***** GWh 83,265.5
**** http://www.sust-it.net/energy_saving.php?id=75#nogo
***** assuming only 35% of the population work in commercial buildings based on facts
from (www.theodora.com)
To investigate the amount required to generate 97,805.76 GWh of electricity by plant,
an empirical calculation based on the assumption that the required average

Essah
398
transmission losses (TLosses), export and substation (Sbs) usage (Table 2) are known
and accounted for.
Assuming 100% annual plant efficiency and yearly losses (Table 2),
then for the estimated available supply for domestic sale (DS)
GWhSbsExportTLossesGWhValueEstimatedGWhDSforavailableyElectricit )()()(
GWh
GWh
86.932,96
)39550284(76.805,97 (3)
Therefore from the estimated demand assuming 85% plant efficiency (based on
current efficiencies Table 1), the required plant power is
= 9,405.59 MW (4)
That is if )(76.8)(1 producedpowerGWhpowerplantMW
Considering the fact that to date Ghana has an installed capacity of 1960 MW
(www.ghanaoilwatch.org), based on the estimated values in Equation 4, there is a
deficit of 6320.59 MW of plant power that is required to be installed (this does not
include a possible 20% generation loss).
PROSPECTIVE INFRASTRUCTURE
There are several projects (Table 5) that are being built to meet the possible demand
and strategic goal set out by the government to increase the existing facility to 5000
MW by 2015 (www.ghanaoilwatch.org). However, this is ~ 53 % less than the
estimated capacity that is required to be installed, to enable every individual function
and attain a substantial level of electricity usage.
Table 5: Summary of potential projects to meet the 2015 targets
Name of Project Unit Type
Installed Capacity
(MW)
Time
Frame
Investment
Cost $/kW*
Bui Hydropower 400 2013 1660
Hemang Hydropower 60 - 1860
Juale Hydropower 93 - 3300
Pwalugu Hydropower 50 - 3600
Tema Thermal Power Gas Turbine** 120 2010 -
Takoradi Thermal Power Gas Turbine*** 132 2013 -
Kpone Thermal Power Gas Turbine*** 220 2011 -
Wind Power Projects Renewable 50 2014 -
Total (MW) 1125
Deficit (MW) 6320.59
* Karlsson,2006 (http://esa.un.org/un-energy/pdf/Ghana.pdf)
** Essandoh-Yeddu, 2010 (http://new.energycom.gov.gh)
*** Energy Sector strategy plan (www.ghanaoilwatch.org)
Amongst all these projects, the potential of photovoltaic systems is yet to be explored.
In this light it is envisaged that solar energy systems, will increase the national energy
mix to ensure production and use. With an estimated 1.0MW of existing Photovoltaic
(PV) installation (i.e. mainly standalone systems for rural electrification) supplying
approximately 0.01% of the total electricity supply (http://www.areed.org), the
potential of the sun through PV systems is still not harnessed.

Energy generation and consumption
399
Ghana, like all other countries in the sub-Saharan region, is blessed with year round
intense and abundant sunshine with daily solar irradiation of between 4-6 kWh/m2.
While integrated photovoltaic (PV) technology is not new, the uptake of the
technology has been slow and patchy. This can be attributed to a whole range of
economical and technical reasons (Essah, 2010).
Using version 5.3 of PVSyst: a modelling software (www.PVSyst.com), the potential
of using building integration photovoltaic (BIPV) technology to offset the deficit has
been investigated, a summary of which is illustrated in Table 6. In this study only two
types of PV technology was considered because of their relatively high efficiencies
(ƞ ). These technologies are:
Polycrystalline Modules (ƞ = 12 - 15%)
Monocrystalline Modules (ƞ = 16 - 19%)
Table 6: Summary of possible electricity generation using photovoltaic modules
PARAMETERS POLYCRYSTALLINE
MODULES
MONOCRYSTALLINE
MODULES
Installed Capacity (MW) 5 10 5 10
Annual Energy Output (GWh) 6.72 13.55 6.72 13.55
Percentage of Demand (Eq. 3); % 0.007 0.014 0.007 0.014
Area required (m2) 47,619 95,238 41,667 83,333
Percentage of Ghana‘s total area (%) 2.00 * 10 -5
3.99 * 10 -5
1.75 * 10 -5
3.49* 10 -5
Cost on Investment ($) 41,100,378 81,466,248 40,053,320 79,367,932
From this study (Table 6), the potential of using PV to offset the demand for
electricity generation sounds promising but comes with its own difficulties. Most of
these short comings are the cost intensity and the vast land required (in this case roof
space). For the percentage that would be offset, it is not currently viable, however
with future reduction in PV module cost, this technology has a huge potential for the
future. Payback time of the systems above was estimated at 20 years.
CONCLUSIONS
This paper has explored significant areas of energy generation and consumption. It is
envisaged that the findings would stimulate debate and research in this field. The
following deductions and suggestions are made:
From the estimates in Tables 3-5, the values of 50 -70% access to electricity
consumption seems rather overstated. From this study, values presented indicate that it
is rather < 30% and not as documented.
Though there are plans to increase the installed capacity, access to electricity would
still be less than 40% of the population even though values quoted are above 70%.
Despite the abundance of yearly solar irradiance levels at present, the cost
implications, payback periods and vast use of land, does not make the uptake of BIPV
systems a viable source of generation and supplying electricity to the country.
It is rather interesting that one of the challenges proposed by the Energy Strategy
Plans is “Ensuring that energy is produced and supplied in a form that has no adverse
health, safety and environmental impact”. The constant generation of power, by
thermal plants (that uses light crude oil for fuel) defeats this purpose as it contributes
significantly to CO2 emissions, and hence global warming.
It is evident that there is very little or no research, in this area hence the variation in
information that has been made available through the net amongst others.

Essah
400
Suggestions
It would be beneficial if such statistics are made available to the public to ensure
wider knowledge of the field.
Ideally data for domestic homes across that country must be made available. Possible
investigation into the energy consumption of typical houses with 2, 4, 6 person
household, throughout all regions.
Similar research and data collection for commercial buildings, educational
establishments must also be considered.
Possible development of a carbon footprint for the country can be investigated.
The results presented in this research paper enhance the understanding of varying
parameters associated with energy generation and consumption in Ghana. This study is
designed to develop an essence of recognising the lack of information in this field to the
general public and the need to research and invest in the subject area.
REFERENCES
Electrical Power in Ghana - Overview
Available at: http://www.mbendi.com/indy/powr/af/gh/p0005.htm
[Cited: May 2011]
Energy Foundation: Cost of Using Appliances
Available at: http://www.ghanaef.org/energyinghana/costofusingappliances.htm
[Cited: May 2011]
Energy Statistics (2000 – 2009)
Available at: http://new.energycom.gov.gh/downloads/statistics2000-2009.pdf
[Cited: May 2011]
Erratic electricity costs Ghana 924 million dollars (source Daily Graphic)
Available at:
http://adomonline.com/index.php?option=com_content&view=article&id=530:erratic
-electricity-costs-ghana-924-million-dollars
[Cited: May 2011]
Essah, E.A. (2010) Building integration photovoltaic module with reference to Ghana: using
triple junction amorphous silicon. Proceedings of the West Africa Built Environment
Research (WABER) Conference, 27-28 July 2010, Accra, Ghana, 203-214.
Essandoh-Yeddu, J.K., (2010). Energy Commission, Ghana. 2010 Energy (Supply And
Demand) Outlook for Ghana
Available at: http://new.energycom.gov.gh/downloads/2010Energy_Outlook.pdf
[Cited: January 2011]
Gand, E.K. (2009), Country profile for Ghana
Available at: http://www.setatwork.eu/downloads/SETatWork_Ghana_Profile_0910.pdf
[Cited: May 2011]
Ghana Overview
Available at: http://www.areed.org/country/ghana/ghana.pdf)
[Cited: November 2010]
Ghana People 2011
Source: 2011 CIA World Factbook and Other Sources
Available at: http://www.theodora.com/wfbcurrent/ghana/ghana_people.html
[Cited: November 2010]
Ghana wholesale power reliability assessment 2010 (GRIDCo), Final Report, March 2010b
Available at:
http://www.gridcogh.com/site/downloads/27a623e256c7d94a7dce43d5ef82d3e3Grid
CoReportFinal.pdf
[Cited: May 2011]

Energy generation and consumption
401
Home energy source
Available at: http://www.carbonindependent.org/sources_home_energy.htm
[Cited: May 2011]
Karlsson.M., (2006). Assessing Policy Options For Increasing the Use Of Renewable Energy
for Sustainable Development: Modelling Energy Scenarios for Ghana (A UN-Energy
Demonstration Study)
Available at: http://esa.un.org/un-energy/pdf/Ghana.pdf
[Cited: January 2011]
Ministry of Energy, National Energy Policy (2010), Republic of Ghana
Available at:
http://www.ghanaoilwatch.org/images/laws/national_energy_policy.pdf
[Cited: January 2011]
Ministry of Energy. Energy Sector Strategy and Development Plan, Republic Of
Ghana
Available at: http://www.ghanaoilwatch.org/images/laws/energy_strategy.pdf
[Cited: January 2011]
PVsyst: Software for Photovoltaic Systems
Available at: www.PVsyst.com
[Cited: January 2011]
2010 Electricity Supply Plan, Ghana Grid Company Limited (GRIDCo), 2010a
Available at:
http://www.gridcogh.com/site/downloads/a22932efb1446463338be7d7f793dc6d2010
-Electricity-Supply-Plan.pdf
[Cited: May 2011]
2010 Population and Housing Census. Provisional Results Ghana Statistical Service
(February, 2011)
Available at:
http://unstats.un.org/unsd/demographic/sources/census/2010_PHC/Ghana/Provisional
_results.pdf
[Cited: January 2011]
VRA to increase electricity supply
Available at: http://www.modernghana.com/news/326464/1/vra-to-increase-electricity-
supply.html
[Cited: May 2011]
Yanga.T and Di Sirio. P.(2011). Draft Country Programme Ghana 200247 (2012–2016
Available at: http://one.wfp.org/eb/docs/2011/wfp234689~1.pdf
[Cited: May 2011].


Yalley, P.P., Poku, G.O. and Adjarko, H. (2011) Enhancing the image of transport terminals in Ghana
In: Laryea, S., Leiringer, R. and Hughes, W. (Eds) Procs West Africa Built Environment Research
(WABER) Conference, 19-21 July 2011, Accra, Ghana, 403-412.
403
ENHANCING THE IMAGE OF TRANSPORT
TERMINALS IN GHANA
Peter P. Yalley1, Gloria Osei Poku
2 and Harold Adjarko
3
1School of Engineering, Department of Civil Engineering, Takoradi Polytechnic, Takoradi, Ghana
2,3School of Engineering, Department of Building Technology, Takoradi Polytechnic, Takoradi, Ghana
A study was conducted with the aim of exploring and understanding intra-city
transport terminals and their impacts on users. The research specifically studied the
Old Tafo Lorry Park in Kumasi, Kaneshie Station in Accra, and Anaji trotro Lorry
Park in Takoradi, examined their location and management problems and level of
congestion. A literature review focused on exploring transport terminals, interviews,
questionnaires and personal observations were used in the study. The study
discovered that the terminals at Old Tafo and Kaneshie in Kumasi and Accra
respectively are sited next to markets, where various economic activities including
vibrant buying and selling occur, while, the Anaji trotro terminal in Takoradi is
found within residential areas located in streets, clearly suggesting that no
consideration was given to the development of public transport terminals. Seventy
four percent of the respondents described the facilities at the terminal as poor yet they
are of the view that the location of the terminals be maintained due to their proximity
to markets. The large number of vehicles that use the terminals in the morning and
evening peak hours result in congestion at the terminals. The study concluded that the
vehicular-pedestrian conflicts at the terminals could be controlled if adequate
infrastructure and services are provided at the terminals. The study increased
awareness of the managers of the terminals on the need to provide security at the
terminals, comfort to patrons and to reduce vehicular and pedestrian conflict.
Keywords: commuters, Ghana, intra-city, terminals, transport.
INTRODUCTION
Road transport is Ghana‘s main means of travelling, accounting for about 45% of the
nation‘s socio-economic growth (Agyemfra, 2003). Majority of daily commuters in
Ghana do not have personal vehicles. Available statistics indicates that only 35% of
road users use private cars, the other 65% travel on foot or make use of public
transport (mass transit system) to meet their travelling requirements (MRT 2006b).
Urbanik (2007) defines public transport as ―transportation service that is available to
the general public and carries passengers to common destinations for a fee‖. Public
transport systems require spaces to operate. The spaces allow people and vehicles to
assemble and disperse. These spaces are known as terminals. A transport terminal is a
facility or location where freight and passengers assemble and disperse on a journey.
It is any point of interchange involving some mode of transport (Rodrigue et al.,
2006). The main functions of all terminals are to provide spaces for convergence and
dispersal; however, the mode of movement and the type of cargo handled there define

Yalley, Poku and Adjarko
404
the differences. The focus of this study is on road transport and intra-city movement
of people from bus terminals. These bus terminals in Ghana are known as lorry parks,
lorry stations or simply ‗stations‘. A lorry park is a bus terminal involving different
kinds of vehicles including taxicabs, minibuses (known locally as ‗trotro‘) and Metro
Mass Transit (MMT) buses.
In Ghana, most settlements are developed without the necessary provisions of certain
social services like public transport terminals. In cases where such provisions are
made, developers violate Town and Country Planning regulations in that, the
terminals may be sited without compliance to regulations. Many of these sites are no
longer suitable for use as terminals because of the changing trends in road
construction and population growth. Prospective users are repelled by the problems of
location, lack of facilities, poor management and unsafe working environment. They
therefore resort boarding vehicles at unauthorised places along the length of the roads.
(This is often referred to as ‗hit-and-run‘ or in the local Twi dialect as “waa-waa”)
The aim of this study is to explore and understand intra-city transport terminals and
their impact on users. The research will specifically study the Old Tafo Lorry Park in
Kumasi, Kaneshie Station in Accra, and Anaji trotro Lorry Park in Takoradi,
examining their location, facilities and security issues. Old Tafo transport terminal is
located outside Kumasi central business area and is a satellite station that serves a
large number of commuters from Mampong and surrounding communities and
therefore needs the attention of the local authorities on the need to upgrade the place.
Kaneshie station which is the satellite station for travellers from the Western and
Central Regions of Ghana also serve a large concentration of people and aid in
commercial activities that take place at the terminal‘s market area. This station also
needs the attention of the local authorities to be upgraded for smooth running of the
market. Stations located on roads are common in the Sekondi-Takoradi Metropolis
and Anaji Trotro Station is one them. Anaji Trotro station was selected because
among the stations located on the road it is the station with most commuters and has
no room for expansion hence increasing the awareness of the need to relocate the
station is important. The study intends to find out the level of congestion, based on
traffic generated on a daily basis at the terminals. The research would examine as well
the infrastructure and services provided at these stations and asses how adequate or
otherwise they are. Safety of passengers and how security issues are handled at the
stations would also be examined.
Finally, the study will propose solutions to the identified problems with the aim of
enhancing the image of the road transport terminals in the study areas and how best
the solutions can be adjusted and applied to other intra-city terminals in Ghana.
ROAD TRANSPORTATION
Road transport is the principal mode of transport in Ghana for both freight and
passengers; be it public or private transport systems, carting on the average 98% of
people and 95% of goods (MRT, 2006a). Other modes such as rail, air and water are
also in use albeit at a lower scale. Ghana therefore has a large road network linking
major cities and towns as well as small villages in hinterlands. The planning,
construction and maintenance of roads and road infrastructure is handled by the
Ministry of Transportation through three main branch departments. These are the
Ghana Highway Authority (GHA), the Department of Urban Roads (DUR) and the
Department of Feeder Roads (DFR) (MRT, 2006c). Improving urban public transport
systems and developing road infrastructure will result in increased mobility and access
Transport terminals
405
to employment, markets, as well as job opportunities, and this is important for both
the populace and the image of the nation.
PUBLIC TRANSPORT IN GHANA
Private car ownership was not very common in Ghana in times past. The history of
public transport in Ghana dates back to 1927 when the first public bus company, the
Omnibus Services Authority (OSA) started. It was government owned and contributed
a lot to the society until its decline in the 1980‘s. This caused the privately owned
public transport industry to boom. The assets of OSA were put into divestiture in
1995. In 1961, the Government of Ghana introduced a bus company, the Government
Transport, to link people in the country. The company‘s name changed to State
Transport Corporation (STC) in 1966. The company was diversified in 2000 and
finally privatised. It is now known as Intercity STC with Social Security and National
Insurance Trust (SSNIT) as its main shareholder (MMT 2006a). Present day public
transport systems operating on intra-city basis are taxis (shared taxis), minibuses
(trotro) and metro mass transit buses (MMT 2006b). Taxis have a seating capacity of
four passengers and trotro range in size from 12 to 30 seats (Kwakye et al., 1997).
These vehicles offer a range of services such as chartering, point-to-point (dropping)
and fixed route sharing or joining. The vehicles are not metered, but fares for normal
journeys are fixed (Grieco et al., 1996). This strategic change in the transport sector
has increased the number of lorry stations, which has made accessibility to transport
terminal easier than before. However, facilities at these terminals do not merit the
status of a modern transport terminal. This calls for the need to upgrade most
terminals especially in the cities to a befitting status.
LOCATION OF TERMINALS AND LEVEL OF TRAFFIC
CONGESTION
Transport terminals are defined by their spatial as well as a functional character. By
virtue of where they are found, their functions are specific going a long way to
influence the environment in which they are located. The major factor influencing the
location of a transport terminal is that it must serve a large concentration of population
and/or industrial activities which forms the terminal‘s market area (Rodrigue et al.,
2006). It also serves as a focal point for clusters of other specialized services including
brisk trading.
Traffic congestion (known colloquially as traffic jam) refers to the situation where
long queues of vehicles result in slower speeds of vehicles and longer travel times
(Strickland and Berman, 1995). In Ghana, the legal seating capacity of taxis is four
passengers while trotro range in size from twelve (12) to thirty (30) seats (Kwakye et
al., 1997). Multiplying these figures with the number of available vehicles and taking
into consideration other people who come to the terminals for other activities give an
idea of the number of people who can be at a particular terminal at a given time.
The various activities that go on and thus draw people to a terminal include boarding
and disembarking from the following types of vehicles – Metro Mass Transit (MMT)
buses, minibuses (trotro), taxis and private cars, and carrying of goods and luggage
either personally or with the assistance of porters to or from vehicles. Other activities
performed are queuing to purchase tickets, if needed; waiting in sheltered areas and
lounges if vehicles are not ready for departure or expected ones have not yet arrived
and trading; i.e. buying and selling of food, snacks and newspapers. Vehicles in queue
awaiting passengers during off-peak hours and interaction between members of the
Yalley, Poku and Adjarko
406
community as they move around also take place at terminals. These activities cause
terminals to become crowded with people and congested with vehicles.
Some notable negative effects congestion can have on the facility are delays in the
movement of people and goods. This is the result of vehicles not being able to enter or
exit the terminal, leaving passengers stranded. The few people who manage to get
vehicles to board within the terminal go through a whole lot of delays and frustrations
before they are able to embark on their journeys. Llittering and filth creation is
another result of overcrowding of terminals as are chaos and high crime rate such as
pick pocketing. Congestion is therefore not a good phenomenon and as such should be
discouraged.
FACILITIES PROVIDED AT TERMINALS
Considerations are to be made when facilities especially infrastructure are being
provided for terminals. This is because, aside the need for facilities and services to be
able to cater for current traffic, future projections and trends are equally important.
Facilities that are provided in terminals include lanes for arrival and departure,
parking areas for the vehicles, areas for cargo-vehicle interchange – handling, storing
and processing of the cargo. Other facilities are traffic control facilities, administration
units, operations, maintenance, safety and security areas; parking areas for the
personnel of the terminal, customers and visitors as well as vehicle servicing areas.
The facilities at terminals are to aid in achieving the main function of a terminal which
is to handle and cart freight and people. They can be sub-grouped under headings such
as shelter, logistics and technology.
THE SAFETY AND SECURITY IN TERMINALS
A major concern when managing terminals is about safety and security of the people
and goods that are handled there on daily basis. Rodrigue et al., (2006) identified
crowd control and safety issues as the priority matters bothering managers of railway
terminals and airports due to the dense numbers of passengers there. They advanced a
proposition that accesses to terminals be well monitored and controlled while
movement of passengers is channelled along pathways that provide safe access to and
from platforms and gates (Rodrigue et al., 2006). Safety and security of goods and
passengers in road transport terminals is also of major importance. In places where
dark alleyways and obscure corners abound, crime rate is higher and safety of users
can be compromised.
After the September 11th
, 2001, terrorists‘ attacks in the US, new and improved
systems of monitoring airports have been put in place. They include restricted
accesses to airports and freight terminals, presence of more security personnel and
fortifying cockpits of aeroplanes. Extensive screening of passengers both manually
and with electronic gadgets as well as rigorous inspection of their luggage are some of
the means employed at ensuring safety in airports (Nolan, 2007). These same systems
if incorporated into road transport terminals will go a long way in helping with the
safety and security of the users. In addition to monitoring systems, planning
arrangements done in such a way as to minimise obscure and dark areas are necessary
to ensure safe and secure terminals.
Worker safety and theft are also of primary concern at terminals. There arises the need
to put in stricter measures to ensure that terminal workers are safe and secure while on
duty. However, these stricter safety measures have their negative consequences. Cost
of installing high-tech security devices and paying of more security personnel are

Transport terminals
407
some problems managers of terminals have to deal with. In addition, when tighter
security measures are employed, it becomes an inconvenience, which delays the
movement of people and goods (Rodrigue et al., 2006).
RESEARCH METHOD
Both primary and secondary sources of data collection were used in this study. The
primary sources used were interviews, questionnaires and personal observations.
Literature review of publications, books, journals and magazines from libraries and
the internet were used as a secondary source of information.
Interviews and Questionnaires
A study of this nature required the collection and analysis of quantitative data. This
survey was carried out using self-administered questionnaires that had open-ended and
closed questions. The population involved in this survey (i.e. the stakeholders in the
transport terminal) is heterogeneous – different people from different backgrounds
with different purposes. Due to the busy nature of the terminals and the nature of the
population, the stratified random sampling method was used in selecting the people to
be interviewed and to be served with questionnaires. The sample size was 500 people
drawn from the population in Accra, Kumasi and Takoradi. The population was
divided into three subgroups. These are:
Patrons of the terminal. This category includes the administrative body working at the
terminal, drivers, conductors, passengers, vendors, porters, shop owners as well as
hawkers (Group A).
Managers of terminals in the cities and statutory bodies managing the three cities, that
is, Accra, Kumasi and Sekondi-Takoradi Metropolitan Assemblies, Town and Country
Planning Department and the Department of Urban Roads, in the three regions (Group
B).
The management of Greater Accra, Ashanti and Western Regional Secretariats of the
Ghana Private Road Transport Union (GPRTU) as an agency operating vehicles that
make use of transport terminals in the region (Group C).
The interviews that took place at the Kaneshie Station in Accra, Old Tafo Lorry Park
in Kumasi and Anaji trotro station in Takoradi were done over a period of two
months. Between December 2010 and February 2011, the terminals were visited daily
for the first two weeks. This was reduced to once a week for the rest of the period.
Personal Observation and Photographs
Extensive personal observations of the situation on ground at various terminals were
undertaken as a data source for this project. The observation focused on the general
layout of the structures in relation to other facilities around, the activities that go on at
the terminal, circulation patterns of humans and vehicles, fabric, structure and
aesthetics of any building, safety and security as well as ground treatment. Relevant
pictures of the terminals and daily activities that go on there were taken and used as a
source of information.
Traffic Density
Traffic density (both human and vehicular) was measured during the study months
through traffic counts at regular intervals during peak and off-peak hours to determine
congestion levels and their impact on the activities at the terminals. Traffic counts
were taken between the hours of 6:00 a.m. and 10:00 a.m. for morning peak densities
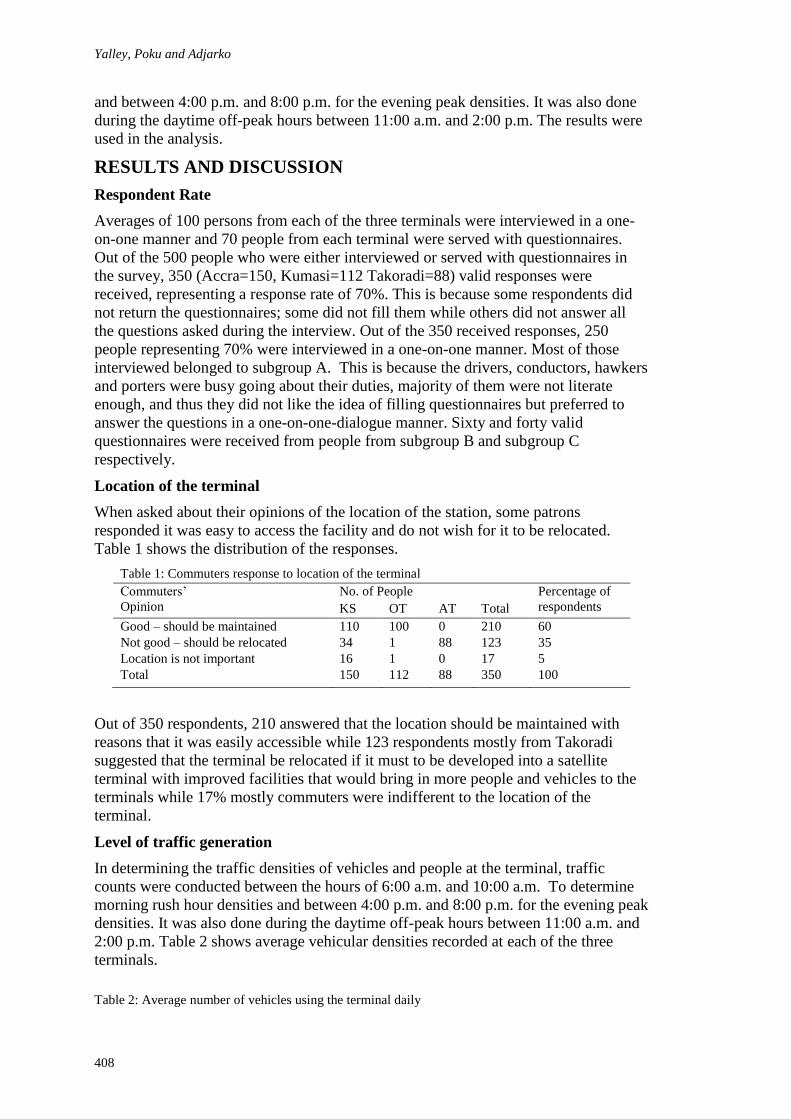
Yalley, Poku and Adjarko
408
and between 4:00 p.m. and 8:00 p.m. for the evening peak densities. It was also done
during the daytime off-peak hours between 11:00 a.m. and 2:00 p.m. The results were
used in the analysis.
RESULTS AND DISCUSSION
Respondent Rate
Averages of 100 persons from each of the three terminals were interviewed in a one-
on-one manner and 70 people from each terminal were served with questionnaires.
Out of the 500 people who were either interviewed or served with questionnaires in
the survey, 350 (Accra=150, Kumasi=112 Takoradi=88) valid responses were
received, representing a response rate of 70%. This is because some respondents did
not return the questionnaires; some did not fill them while others did not answer all
the questions asked during the interview. Out of the 350 received responses, 250
people representing 70% were interviewed in a one-on-one manner. Most of those
interviewed belonged to subgroup A. This is because the drivers, conductors, hawkers
and porters were busy going about their duties, majority of them were not literate
enough, and thus they did not like the idea of filling questionnaires but preferred to
answer the questions in a one-on-one-dialogue manner. Sixty and forty valid
questionnaires were received from people from subgroup B and subgroup C
respectively.
Location of the terminal
When asked about their opinions of the location of the station, some patrons
responded it was easy to access the facility and do not wish for it to be relocated.
Table 1 shows the distribution of the responses.
Table 1: Commuters response to location of the terminal
Commuters‘
Opinion
No. of People Percentage of
respondents KS OT AT Total
Good – should be maintained 110 100 0 210 60
Not good – should be relocated 34 1 88 123 35
Location is not important 16 1 0 17 5
Total 150 112 88 350 100
Out of 350 respondents, 210 answered that the location should be maintained with
reasons that it was easily accessible while 123 respondents mostly from Takoradi
suggested that the terminal be relocated if it must to be developed into a satellite
terminal with improved facilities that would bring in more people and vehicles to the
terminals while 17% mostly commuters were indifferent to the location of the
terminal.
Level of traffic generation
In determining the traffic densities of vehicles and people at the terminal, traffic
counts were conducted between the hours of 6:00 a.m. and 10:00 a.m. To determine
morning rush hour densities and between 4:00 p.m. and 8:00 p.m. for the evening peak
densities. It was also done during the daytime off-peak hours between 11:00 a.m. and
2:00 p.m. Table 2 shows average vehicular densities recorded at each of the three
terminals.
Table 2: Average number of vehicles using the terminal daily

Transport terminals
409
Type of
vehicle
Morning
(6:00 a.m. – 10:00 a.m.)
Afternoon
(11:00 a.m. – 2:00 p.m.)
Evening
(4:00 p.m. – 8:00 p.m.)
KS OT AT Av KS OT AT Av KS OT AT Av
Mini
buses
(trotro)
110 52 38 67 71 28 24 41 113 65 55 78
Taxis 38 26 11 25 26 20 17 21 36 31 26 31
Private
cars
14 11 5 10 12 10 8 10 10 8 3 7
Total 162 89 54 103 109 58 49 72 155 99 84 116
KS- Keneshe, OT- Old Tafo, AT-Anaji Trotro
AVERAGE NUMBER OF PEOPLE USING THE
TRANSPORT TERMINALS
0
1000
2000
3000
4000
KS-ACCRA OT-KUMASI AT-TAKORADITERMINALS
NU
MB
ER
OF
PE
OP
LE
Morning
Peak hours Calm hours Evening
Peak hours
Figure 1 Number of people using the terminals
An average of 103 vehicles use the lorry parks between morning hours of 6:00 a.m. and 10:00 a.m. Out
of these vehicles 25 were taxis, 65 were buses and 10 were private vehicles. The private vehicles
consist of all non-commercial saloon vehicles that use the terminal. The capacities of each vehicle (i.e.
maximum) are 4 for saloon cars – taxis and private cars, an average of 20 for minibuses. It was
determined that the average total number of people that use the terminals were 10412, 3322 and 2620
for Kaneshie, Old Tafo and Anaji trotro respectively as indicated in Figure 1and Table 3 . The
following formula was used to determine the average number of people who use the terminals: Number
of Vehicle type multiplied by Capacity
Facilities at the terminal
All the people interviewed complained about lack of shelter especially during the
rainy season when using the terminal is most inconvenient. Two hundred and ninety
four out of the 350 respondents laid emphasis on the deplorable state of the inadequate
facilities available. The facilities available were described as bad by 74% of the
people interviewed while 18% described the facilities at the terminal as average.
It was also discovered that some passengers wait for sometime before having access to
vehicles, especially in the evenings. Again, it was observed that there were few snack
bars and local restaurants at the terminals. Facilities like waiting room for passage,
common room for drivers were not available at case study terminals. Basic services in
Table 3: Number of people using the terminals
KS OT AT Average
Morning peak hour 3776 1186 824 1928
afternoon 2672 680 580 1310
Evening peak hour 3964 1456 1216 2212
Total vehicle 10412 3322 2620 5450

Yalley, Poku and Adjarko
410
the form of electricity and regular water supply were found to be inadequate at the
terminals. Also there were few refuse disposal bins. As could be seen in Figure 2
ground treatment was very poor. Table 4 display the responses patrons to the terminal
gave about the facilities provided.
[Please note that Figures have been omitted from the proceedings and can be obtained
directly from the authors]
Table 4: Commuters response to facilities provided at the terminal
Facilities
provided
No. of People % of
respondents KS OT AT TOTAL
Very bad 101 70 88 259 74.0
Bad 49 14 0 63 18.0
Average 0 28 0 28 8.0
Good 0 0 0 0 0.0
Very good 0 0 0 0 0.0
Total 150 112 88 80 100
Preferred Means of Public Transport
From 250 commuters randomly selected and interviewed from the station, 200 of
them representing 80% use public transport as their daily means of travel. Of the
remaining 50, it is either they do not travel every day or because they own private cars
and prefer to travel in them.
A list of the three kinds of public transport systems, namely taxi, minibus (trotro) and
Metro Mass Transit (MMT) bus were presented to commuters to indicate their
preferences and reasons (Table 5). Of the respondents, 85 use taxis daily because that
was the only means of public transport to the areas they were going. Given a choice,
55% (representing 137 people) preferred minibuses since they considered taxis as
expensive. Only 28 of the commuters preferred to board MMT buses because they felt
safer travelling aboard bigger vehicles.
DISCUSSION
The findings from the research calls for the need to address the short falls relating to
location, facilities, as well as safety and security issues at the transport terminals in
the study areas and in Ghana as a whole.
Location of the terminal
In this study, it was clear that, 60% of the respondents preferred that the locations of
Old Tafo and Kaneshie transport terminals be maintained at their present locations
but with improved facilities. The preference of the locations by majority of the
respondents might be due to the fact that these terminals are located at vantage points
and this makes them able to serve a large concentration of population, which is in line
Table 5: Commuters public transport preference
Type of vehicle No. of People % of commuters
Taxis 85 34
Minibuses 137 55
MMT buses 80 11
Total 250 100

Transport terminals
411
with the submission of Rodrigue et al. (2006). Kaneshie and Old Tafo terminals with
upgraded facilities would serve as a focal point for clusters of other specialized
services including brisk trading. A modern satellite transport terminals at the current
location, would also help patrons to and from the Kaneshie and Old Tafo markets
have easy means of transportation for themselves as well as their goods.
On the contrary, almost all the respondents from Takoradi were of the view that Anaji
Trotro and other stations in Takoradi which are located on the road should be
relocated. Relocation of the Anaji and other stations in the Sekondi Takoradi
Metropolis would ease traffic congestion on roads used as lorry station and also
minimize vehicular pedestrian conflict.
Facilities provided at the terminal
Information from literature revealed that standard terminal should have basic
infrastructures like, ticket booths, arrival and offloading bays, and vehicle boarding
bays. Others are sheltered waiting areas for passengers (both open and enclosed) and
washrooms. None of the above mentioned facilities were found at any of the terminals
under study. There was also inadequate lighting system and poor sanitary facilities at
these terminals.
Inadequate lighting, absence of sheltered waiting areas for passengers and rest rooms
for drivers at the terminals, compel passengers to stand in the open (sun or rain) or in
the dark in the evenings while waiting to board a vehicle. These expose passengers to
all forms of harm, such as pick pocketing, snatching of mobile phones, hand bags, etc.
To prevent these vices there must be the need to provide facilities such as waiting
room where passengers, could rest while waiting for Lorries to their various
destinations.
The authors observed in all the three terminals that drivers rest in their lorries, while
waiting for their turn to load, which in effect make drivers restless and look tired.
Provision of rest room for drivers would reduce the incident of accidents due to
tiredness on our roads, since driving tired can cause accident.
Again it was observed that there were inadequate waste disposal bins at these
terminals. This makes users of the terminals indiscriminately litter waste and create
filth on the untreated ground, making it difficult for cleaner to tidy up the place,
since sweeping is always accompany with dust causing dust pollution..
The Safety and Security at the terminal
From the study, it was observed that there were no safety and security facilities
provided. Because, the terminals are close to markets, there is movement of people
between the markets and the terminals during the day. This evokes a sense of security
in users during the day. This then implies that, in the late evenings and night, criminal
activities at the terminals are increased, since there are less or no activities at the
market during those times, hence less people moving between the markets and the
terminals making the dark terminals insecure. Maximum security at night is of
paramount importance. This could be achieved by providing security lights around the
terminals at Kaneshie and Old Tafo, while streetlights are to be provided around the
terminal periphery for full night lighting at the Anaji Trotro station. Besides secondary
security systems such as closed circuit cameras and televisions (CCTV) monitoring
activities all over the facility and alarm systems should be employed. Fire hydrants are
to be located at vantage points of the terminals for easy access by fire engines, since
none was found there.

Yalley, Poku and Adjarko
412
CONCLUSIONS
This study explored intra-city transport terminals and their impact on users in Accra,
Kumasi and Takoradi, using Kaneshie, Old Tafo and Anaji Trotro terminals as case
study areas. From the findings and their implications it can be concluded that
Poor lorry park location of Anaji trotro affects optimum use of public transport
systems, as people do not wish to patronise badly located terminals.
Lack of facilities like security light, engineered waiting areas, washrooms, fire
hydrants and inadequate waste disposal bins at the terminals, expose users to robbery
especially during the night and insanitary conditions.
The practical implication of this research was that awareness of the managers of the
terminals was increase on the need to provide security at the terminals, comfort to
patrons and to reduce vehicular and pedestrian conflict. The study recommends that
Anaji and other stations in the Sekondi-Takoradi Metropolis be relocation to ease
traffic congestion on roads used as lorry parks and also to minimize vehicular
pedestrian conflict. Also enough lightening, waiting rooms for passengers, rest rooms
for drivers and proper sanitary facilities must be provided at the terminals to enhance
the image of the terminals under this study.
REFERENCES
Agyemfra, D. D. (2003). Transport Terminal - Kronom, Kumasi. Unpublished Postgraduate
Design Thesis, KNUST, Kumasi.
Grieco, M., Apt, N., Dankwa, Y. and Turner, J., (1996). At Christmas and on rainy days:
transport, travel and the female traders of Accra. Avebury, Aldersh
Kwakye, E. A., Fouracre, P. R. and Ofosu-Dorte, D., (1997). Developing Strategiesto Meet
the Transport Needs of the Urban Poor in Ghana, PA3330/98 World Transport Policy
and Practice, Vol. 3, No 1.
Metro Mass Transit Limited, Ghana (2006a). The Establishment of
MMThttp://metromass.com/establish_mmt..htm [Accessed 2006, December 19]
Metro Mass Transit Limited, Ghana (2006b). Background Information
http://metromass.com/back_fies_journalists.htm [accessed 2006, December 19]
Ministry of Roads and Transport, Ghana (2006a). Road Transport Services and Safety,
http:www.mrt.gov.gh/images/log02. [Accessed 2006, December 21]
Ministry of Roads and Transport, Ghana (2006b). Public Transport in Ghana
http:www.metromass.com/pub_trans_gh.htm [Accessed 2006, December 21]
Ministry of Roads and Transport, Ghana (2006c). Departments and Agencies
http://www.mrt.gov.gh/lists.asp?page_Id=73&expandable=2 [Accessed 2006,
December 19]
Nolan, Michael S. "Airport." Microsoft® Student 2008 [DVD]. Redmond, WA: Microsoft
Corporation, 2007.

Mac-Barango, D.O. and Kakulu, I.I. (2011) Establishing a maintenance cost profile of residential
buildings In: Laryea, S., Leiringer, R. and Hughes, W. (Eds) Procs West Africa Built Environment
Research (WABER) Conference, 19-21 July 2011, Accra, Ghana, 413-425.
413
ESTABLISHING A MAINTENANCE COST PROFILE OF
RESIDENTIAL BUILDINGS
D. O. Mac-Barango1 and I. I. Kakulu
Quantity Surveying Dept, Rivers State University of Science & Technology, Port – Harcourt (Nigeria)
Regular maintenance ensures restoration of building components. It is a sinequanon
to longevity of building fabrics. The work attempts to establish a maintenance cost
profile. It appraises the existing relationship between maintenance cost and the
variables of gross floor area, the age of building, population densities of residential
buildings in Warri Metropolis (an oil rich city in the Niger Delta region of Nigeria).
The work obtains data for the variables through primary source. It uses the statistical
tool of regression in the analysis of data. It concludes that the variables of floor area,
population, population density do not significantly impact on maintenance cost.
Whilst the variable of age, impact significantly on maintenance cost. It recommends
that in planning of maintenance schedule cognizance should be given to age of
building; the frequency should increase as the age increases.
Keywords: maintenance, maintenance cost variable, maintenance management.
BACKGROUND
Buildings have a substantial life in the order of 40 to 80 years. The lives of existing
buildings are difficult to assess as all properties have from the date of their erection,
been the subject of varying amounts and standards of maintenance, besides being
constructed to different standards. Physical life is often much greater but they may be
demolished before the end of this period to permit a more profitable use of the site.
(Seeley 1976b). Holmes and Droop (1982): have established that the cost of
maintenance increases with age, revealing further that costs are shown to increase
significantly during the first 20 years and then assume a slow-growth pattern. It
would seem reasonable to suggest that maintenance costs continue to rise for the
economic life of the dwelling. It will be appreciated that any (strictly hypothetical)
building entirely composed of elements which are supposed to need repairing or
replacing only every sixty years will not require much attention for the first twenty or
thirty years, but after sixty years the annual repair bill will be substantial. Specific
dwelling types, have different maintenance cost. There is little evidence to support
the view that size of dwelling should be taken into account in the maintenance
equation. It was assumed social status of estates would affect maintenance costs, those
areas or estates enjoying a good reputation would require less maintenance than those
estates which were less desirable. The assumption was wrong. Infact the area with
the highest reputation, had the highest maintenance cost per dwelling and areas which
were less desirable had lower maintenance costs. Slater (1982a), opines that costs are
generally of a ―random‖ nature and do not appear to significantly influenced by the
size of the hospital, in terms of number of bed, volume of floor area. The unit cost of

Mac-Barango and Kakulu
414
hospitals performing the same medical functions, did not relate to size, no detectable
pattern could be seen. The total maintenance cost related to the number of beds (and
therefore patients) the examination of maintenance cots per bed did not reveal any
clear pattern, except that correlation between costs and bed numbers appeared to
improve slightly when smaller hospitals were ignored. The pattern is certainly too
vague to enable predictions to be made. It was apparent that no pattern existed
between maintenance costs (per unit) and size. Whilst the age of a building can be a
factor in determining maintenance expenditure, it will also depend on the standard of
maintenance which the building has received over the years. Disparities exist between
actual costs of maintenance, when compared with the previously estimated costs of
maintenance. It was observed that in 14 cases, out of the 18, the estimates were
greater than the actual amounts spent sometimes by over 300%. The effectiveness of
maintenance spending was decreasing, because of the disparities.
The research establishes a maintenance cost profile with a view of being used as a
management tool that addresses maintenance problems associated with residential
buildings. It investigates existing relationships between maintenance cost and the
variables of size (gross floor area), population, age and population densities of the
buildings making inferences from the outcomes of relationship and using these
outcome of analysis between variables to inform and predict future relationships. It
also digests the concept of maintenance and management of residential buildings.
The boundary and limits of the study are as follows:
(i) Location – Warri Metropolis (in the Niger Delta region of Nigeria). (ii) Building
Types – Two floors (Duplexes) and Bungalows. (iii) Parameter Coverage –
Demographic variables, affecting cost of maintenance in residential buildings.
Location: Warri metropolis in the oil rich Niger Delta region of Nigeria. Nigeria lies
between latitude 5031‘N and 5
045‘E of Nigeria.
(http.www.travemath.com/city/warri). It lies latitudes 50300 and 5
0350N and
longitudes 50290 and 5
0480E within the Niger Delta region
(http:www.springlink.com). The activities of multi-national oil companies have
enhanced economic activities and increased the inflow of population, this has
increased the demand housing stock and its maintenance.
This research will assist designers and builders appreciate problems associated with
maintenance and its applicability in subsequent designs, subsequently improve the
environmental scenario of the city on the long run. Also, assist in budget control and
management of maintenance. Warri is an oil rich city with rapid increase in
population, the demand for housing stock has also increased. Maintenance enhances
the longevity of building fabrics and cost data profile, in turn enhances maintenance
management.
The outcome of research findings are hinged on the premises that data given by the
Landlords and tenants are true reflections of expenditure incurred, the models are
developed from these raw data. Economic, climatic and other variables that influence
building maintenance, do not impact on the outcome of results. The study attempts to
provide answers to the followings: (i) Has the lack of maintenance cost data and
profile, necessitated the rapid deterioration and decadence of buildings. (ii) Are there
problems of maintenance and lack of maintenance culture Warri metropolis. (iii) What
underlying factors are responsible for maintenance problems. (iv) What relationships
exist between the various independent and dependent variables. (v) How does the

Maintenenace cost of residential buildings
415
demographic variables of age of building, seize of building, population and population
density influence maintenance cost. (vi) Are there existing cost data, maintenance cost
profile. (vii) How can a maintenance cost profile be built. The study Hypothesis that a
linear model exists between the variables of maintenance cost and the demographic
variables of total floor area, age, population of occupants and the population densities
of occupants of the sampled housing stock.
THE ESSENCE OF MAINTENANCE
Maintaining a building is to retain the value of the investment; to maintain the
building in a condition in which it continues to satisfactory fulfill its function and to
present a good appearance to the public. (Seeley 1983a). Maintenance is a
combination of any actions carried out to retain an item in, or restore it to an
acceptable condition. Retailing implies work carried out in anticipation of failure and
restoring which implies work carried out after failure. (Igwe, 1989a). According to
Oguike (1997), opines that building maintenance services include maintenance,
structure and fabric maintenance, services maintenance, finishes maintenance,
external area maintenance, security, telecommunications, energy maintenance,
environmental survey and health and safety.
Total neglect of maintenance inputs significantly influences the state of disrepair of
infrastructural facilities and the built environment. There is also inadequate funding
set aside for maintenance works. Natural resources are depleted because of the
frequent use of building materials for new construction, which ordinarily would have
being reserved and conserved. New buildings are always springing up along side with
some existing old almost dilapidated and yet inhabited ones. Some have stayed over
100 years. The craze is always to build new houses and caring little for the existing
ones. The governments of the Federation have spend billions of Naira providing
housing estates that are very poorly maintained. (Onwuka, 1989a). According to
Onwuka (1989b), no matter how well a building or construction project is executed by
a good contractor, it must require constant routine checks to maintain it properly. A
close examination of the life span of some building components will reveal the need
for proper maintenance of the building as the life span of some components expires.
There is a need for proper maintenance of building and replacement of some worn out
components. Ashworth (1988), observes that the expenditure of money in time and
materials on building maintenance is extensive, and growing due to the necessity of
having to maintain an ever-increasing stock of older properties. The petroleum trust
fund (PTF), is a classical example of an interventionist body set up in the mid-nineties
(1994-1998) to address problems of maintenance neglect. Most projects executed
indicated that maintenance and rehabilitation costs were twice as high as their initial
cost of construction, the infrastructure were and have been neglected for large span of
periods, due mainly to backlog of outstanding rehabilitation and maintenance.
(Ahmad 1997). Maintenance related work, account for less than 20% of the total
work load of the construction industry in Nigeria. The neglect has manifested in the
sorry state of most infrastructure in both public and private sectors. Findings of the
outcome of (20) twenty organizations indicate the absence of a maintenance culture,
policies and practices. Most glaring was the absence of any planned maintenance
system. (Ikupolati, et-al 2004).
Maintenance seek to preserve a building in its initial state so that it continues to serve
its purpose as an essential component in the life cycle of a building. Building work
will be a discredit to the designer, if its usefulness and convenience is permitted to fall

Mac-Barango and Kakulu
416
below accepted standard. Accepted standard recognizes three categories which serve
to illustrate some of the complexities of maintenance. Functional performance,
quality and reliability which relate to user needs. Structural, electrical, fire and other
safety aspects for which maintenance personnel are generally responsible. The
preservation of the asset and its amenities, in which the owner has the primary
interest. (Seeley 1983b).
Types of Maintenance: Seeley (1976b), categories maintenance into three,
components, servicing, rectification and replacement. Servicing is essentially a
cleaning operation undertaken at regular intervals of varying frequency and is
sometimes termed day to day maintenance. Rectification work usually occurs fairly
early in the life of the building and arises from shortcomings in design, inherent faults
in or unsuitability of components, damage of goods in transit or installation and
incorrect assembly. Repayment is inevitable because service conditions cause
materials to decay at different rates. Much replacement works seems not so much
from physical breakdown of the materials or element as from deterioration of
appearance. Maintenance can also embrace renovations which consist of work done
to restore a structure, service and equipment by a major overhaul to the original design
and specification, or to improve on the original design. This may include limited
additions and extensions to the original building. BS 3811, breaks maintenance work
into there classes. Planned preventive running maintenance work which can be done
while the facility is in service. Planned preventive or corrective shut down
maintenance work which can only be done when the facility is, or is taken, out of
service. Planned corrective breakdown maintenance. Work which is carried out after
a failure, but for which advance provision has been made in the form of spares,
materials, labour and equipment. (Seeley 1983d). Igwe (1989b) has opined hat a
building will definitely need regular maintenance to ensure a useful and economical
life. It is therefore essential that planned approach be adopted for this work and that
maintenance planning should start at the design stage of any building project and
should continues throughout the life of that building, all buildings start to deteriorate
from the moment they are completed and from that time they begin to need
maintenance in order to keep them in good condition. The adequacy of the building
design and the suitability of material specified, the standard of workmanship in initial
construction determine the extent to which the designer has anticipated future
maintenance needs.
MAINTENANCE COST VARIABLES (TECHNICAL)
Maintenance work is generated by a whole range of factors, including weathering,
corrosion, dirt, structural and thermal movement, wear, low initial expenditure,
passage of time, incorrect specification, inferior design, poor detailing and damage by
users. Some of the major maintenance problems stem from the use of new materials
and techniques, workmanship, the intensity of exposure and the efficiency of
maintenance organization. (Seeley 1983c). Generally, the more adaptable the design,
the longer the period of use of the building resulting in higher total maintenance costs
but lower new construction costs. A direct relationship exists between the design of a
building and its eventual overall cost. In this regard the economics of maintenance
demands that a proper balance be struck between first costs and subsequent
maintenance and running costs. Okechukwu, (1988a), postulates that the use to which
these facilities are put also determines the frequency and extent of maintenance
required. Quite often these facilities are stretched beyond designed limits The
design‘s team ability to take into account the continuing technical and economic

Maintenenace cost of residential buildings
417
consequences of design decisions and how these influence future operating cost is
required. The availability of replacement parts for building components, machinery
and equipment when they have reached the inevitable end of their useful life, is
important. It does not make sense, from maintenance point of view, to incorporate in
a building design items that cannot be easily replaced due to scarcity of vital parts.
(Igwe 1989b).
Mosaku (1990), has observed a basis for rational specification writing and opines that
materials and components specification for building requires careful consideration and
informed judgment if premature decay of our building stock as well as a reduction in
maintenance costs are to be accomplished. It is obviously not going to be possible to
write specification that will eradicate maintenance problem. Mosaku and Kuroshi
(2002), have concluded that systematic analysis, in-depth study and creative thinking
that border on the factors of climatic conditions, design considerations, social and
ergonomic implication, can influence and affects the scale of maintenance.
DEMOGRAPHIC VARIABLES INFLUENCING MAINTENANCE
COST (AGE)
There is some relationship generally between maintenance costs and the age of a
building. Evidence collected showed an increasing maintenance cost trend with age.
The cycle of redecoration depends upon many factors such as user requirements, the
type of finish exposure, etc. During the early years of a building‘s life, no costs will
be allocated to these elements of costs-in-use. (Ashworth 1988b).
Some Other Variables influencing maintenance cost (Economic and
Environmental):
Okechukwu (1988b), has opined that weather affects will still take its toll on facilities.
Wind, sun etc, will definitely manifest themselves on the components of finishing‘s.
Deterioration due to age, whether induced by pollution of time will still remain an
issue to contend with.
MAINTENANCE MANAGEMENT
Planning, budgeting and controlling the cost of maintenance work are essential
operations if buildings are to be maintained effectively within available funds. Budget
limits will be established after inspection, critical analyses and estimates that provide
the essential supporting data, aimed at controlling the use of resources in order to
achieve objectives of programmes of maintenance. Analysis of maintenance cost
information services gives details of the type, owner/occupier, location, age,
accommodation, dimensions, construction, budget procedure and maintenance
organization relating to the particular building. (Seeley 1976c). In a similar vein,
Holme and Droop (1982b) have contended and stated that it is by no means a simple
matter to estimate accurately the capital cost of new construction but the estimating of
capital cost is a much more predictable business than estimating maintenance
expenditure. The equation becomes complex and it is extremely difficult to predict
what influence each variable is likely to have from year to year.
The running of an efficient and effective maintenance management programme
borders on management information service system, that derives its basis from
building records of defects, faults replacement preventive as well as on refurbishment
and renovation works. Visa viz maintenance cost records for budgetary planning,
management control and design cost control. A good maintenance management

Mac-Barango and Kakulu
418
system derive its basis from a good planned maintenance system that involves a frame
of activities; details of jobs to be executed, their frequencies, a master book of
maintenance statement that is reviewed periodically, to reach the optimum total cost,
through a preventive maintenance policy. The number of breakdowns and the
frequency of preventive maintenance are inversely related, whilst with a repair only
maintenance policy number of breakdowns remains stationary for a while, then began
to increase. The ―optimal policy‖, is the policy with a specified among of preventive
maintenance that results in the minimum total cost of maintenance, plus downtime.
The attainment of this state, involves several iterations between maintenance and cost.
It becomes critical to determine the level of preventive maintenance that ensures the
total minimum. This makes imperative budgetary control that integrates cost data and
analysis that identify areas of excessive costs and to investigate the reason why.
(Shields et-al 1975a). The above assertions relate particularly to a preventive
maintenance system for machinery maintenance, the approach can however be
adopted, when dealing with structural maintenance for building works.
Okechukwu (1988c), has postulated and avers that if we want to enjoy these facilities
and services then we must be ready to tackle the challenges of preservation by
cultivating the right attitude towards maintenance and repairs. The availability of
funds and staff resources dictate the volume of maintenance and repair work that
could be undertaken at any given period. While we can conveniently boast of
adequate staff resources in the industry we cannot do the same for funds. Igwe
(1989d), has stressed that it is maintenance It is the responsibility of the owner/user to
provide realistic maintenance budget for the regular servicing of his building. The
designer can assist him in routine maintenance by providing a maintenance manual on
completion of construction works.
RESEARCH METHOD
The research conducts field survey, using questionnaire in the form of a checklist that
outlines parameters of interest. The dependent variable, maintenance cost, data are
obtained through primary source. The data for the independent variables are also
obtained, by taking physical measurement of the buildings for the parameters.
literature; include journals, magazines, periodicals, newspapers and internet browsing.
A sample population of 30 buildings, duplexes and bungalows were obtained. The
selection for the parameters of gross floor area, whilst data for the variables of age,
population of occupants and its derivate, population densities are obtained through
interactive interviews. The selection of buildings were done randomly in clusters
within some estates. The mean values of the raw data (the demographic parameters)
is used for the analysis of data. The unit cost of maintenance (cost per m2), is used in
the analysis of data; this allows for commonality of raw data values for maintenance
cost obtained from duplexes or bungalow buildings. Also as a further check to the
reliability of the data and the outcome of research findings, the ages of building within
the same age brackets are grouped together to ascertain how varying building age
segments impact on maintenance cost.
The study uses the statistical tool of regression analysis, to determine the relationship
between variables. The equation is put as Y = abx, where a and b are the regression
co-efficient (parameters). The co-efficient of determination R2 is employed to
determine the extent of the relationship existing between the maintenance cost and the
demographic parameters. Graphs and Charts are used for the descriptive analysis of
data. Statistical computer package, (SPSS), is used for the data analysis. The level of

Maintenenace cost of residential buildings
419
significance, between variables is put at 5%. The decision rule to accept the Null
hypothesis is determine by the outcome of the Fcal, Ftab and P values of the statistic
calculated. Hypothesis Testing; the following hypotheses are set and tested. Null
Hypothesis: (Ho), there is no significant relationship between two or more parameters
(when Ho equals zero); we reject the null hypothesis. Alternative Hypothesis (Hi),
there is significant relationship between two or more parameters. (When Hi, is not
equal to zero, we accept the alternative hypothesis (i.e. Ho: U = O, Hi: U = 0). The
validity of the outcome of the hypothesis is restricted to some bounds, that is limited
and scope within which results hold. From the outcome of research findings, the
dependent variables of (total floor area, population of occupants, the population
density and ages of the buildings), are used to predict the independent variable of
maintenance cost; for the sampled buildings.
PRESENTATION, ANALYSIS AND DISCUSSION OF RESULTS
Segment investigates the existing relationships between the parameters of
maintenance cost and the demographic variables.
Summary of Correlation Analysis between Parameters:
Anal No
Variables Type of
Model
Observations Inferences
X Y Regression Equation R2 Fcal Ftab Pvalue Strength of
Relationship Rmk
Action
on hyp
1
TF
A
MC
Linear MC = 46920.06 + 253.79 TFA
12.2% 3.891 4.17 0.058 Very Weak NS Accept Ho
2
TF
A
MC
M2
Linear MCM2 = 555.58 – 0.433TFA
2.40% 0.701 4.17 0.409 Very Weak NS Accept Ho
3
Ag
e
MC
Linear MC = 20336.64 +
10035.49 Age 73.8% 78.852 4.17 0.000 Strong SS
Reject
Ho
4
Ag
e
MC
M2
Linear MCM2 = 189.43 + 27.13 Age
37.2% 16.565 4.17 0.000 Weak SS Reject Ho
5
Po
pn
MC
Linear MC = 100889.3 +
1383.84 Popn 1.30% 0.363 4.17 0.552 Very Weak NS
Accept
Ho
6
Po
pn
MC
M2
Linear MCM2 = 480.81 – 4.23
Popn 0.80% 0.233 4.17 0.633 Very Weak NS
Accept
Ho
7
Po
pn
Den
sity
MC
Linear MC = 135041.5 –
577699 Popn Density
3.00% 0.880 4.17 0.356 Very Weak NS Accept
Ho
8
Po
pn
Den
sity
MC
M2
Linear MCM2 = 476.155 –
929.23 Popn Density
0.50% 0.153 4.17 0.699 Very Weak NS Accept
Ho
S/No. Details of Analysis Statistics of ANOVA Remarks
1
Ranges of floor areas of blog Average Maintenance
Cost (N)
Ftab Fcal P value
a
b
c d
(150 – 190)m2
(191 – 255)m2
(256 – 332.5)m2
(333 – 400)m2
78,750
105,714
141,250 130,000
2.975 2.122 0.122 NS
2.
a b
c
d
Age Brackets
(2 – 5) yrs (6 – 9) yrs
(10 – 13) yrs
(14 – 18) yrs
63,000 75,000
138,571
178,571
2.975 16.362 0.000 SS
3.
a
b c
d
Population of Occupants
(2 – 5) persons
(6 – 9) persons (10 – 13) persons
(14 – 18) persons
(107,500)
(110,000) (115,714)
(122,857)
2.975 0.098 0.960 NS
4. a
b
c
Population densities (persons per m2)
– 0.03)
– 0.05) – 0.07)
(114,667)
(125,000)
(88,000)
3.354 0.707 0.502 SS

Mac-Barango and Kakulu
420
Analysis of Variance of Building Maintenance Cost for the Parameters of (i) Floor
Area (ii) Age (iii) Population (iv) Population densities. The set of transpositions of
the initial linear models to exponential format (square roots), did not result to any
significant departure from the initial linear analysis. The P values and the significance
showed the same trend.
Descriptive Analysis of Data: The descriptive charts show the pattern and trends
between variables. Fig. 1: It indicates that building have floor areas between 256-352
square metres recorded the highest maintenance cost. Floor areas between (333-400)
square meters, though highest recorded lower maintenance values than those having
(256 – 352 square meters).
Fig. 2: Variations in cost of maintenance based on ages of buildings being maintained. The charts show
progressive increases in cost of maintenance according to the age brackets of the building. Building
that have lower age brackets show lower maintenance costs.
Fig. 3: Variations in cost of maintenance based on population of occupants of buildings being
maintained. The charts show progressive increases in maintenance cost according to number of
occupants in buildings.
Fig. 4: Variations in cost of maintenance based on population densities of occupants of buildings. The
chart did not exhibit any systematic trend. Building having 0.01 – 0.03 persons per square meters
recorded the lowest, whilst buildings having population densities of 0.06 – 0.07 person per square
Fig. 2
Fig. 1

Maintenenace cost of residential buildings
421
metres recorded the least. Densities of between 0.04-0.05 per square metres recorded the highest
maintenance cost.
DISCUSSIONS OF RESULTS:
Research findings establish as follows: (1) Total floor area, has a weak positive
relationship with maintenance cost. The model is of the form MC = 46920.06 +
253.79TFA, R2 value = 12.12%, Fcal = 3.891, Ftab = 4.17. The statistics of the
analysis between the parameters of the mean values of the maintenance cost and the
floor areas of buildings showed that both variables increase in the same direction, (a
positive relationship). The correlation between the variables is a weak one,
acceptance establishing an R2 value of 12%. The outcome of the statistics Fcal, Ftab
and P values led to the acceptance of the Null hypothesis. There is no significant
relationship between the variables of maintenance cost and the total floor areas of
buildings. (2) The ages of building however establish a strong positive relationship
with maintenance cost. The model is of the form MC = 20336.64 + 10035.49 Age, R2
value = 73.8%, Fcal = 78.852, Ftab = 4.17. The statistics of the analysis between the
parameters of maintenance cost and Age showed that both variables increase in the
same directions (a positive relationship). The correlation between variables is a strong
one, with an R2 value of 73.8%. The outcome of the statistics, Fcal, Ftab and P values
led to the rejection of the Null hypothesis. There is a significant relationship between
the variables of maintenance cost and the ages of the tested buildings. (3) Also,
population of occupants, has a weak positive relationship with maintenance cost. The
model is of the form MC = 100889.3 + 1383.84 population, R2 value = 1.3%, Fcal =
0.363, Ftab = 4.17. The statistics of the analysis between maintenance cost and the
population of building occupants showed that both variables increase in the same
directions, (a positive relationship). The correlation between the variables is a weak
one, with an R2 value of 1.3%. The outcome of the statistics, Fcal, Ftab and P values
led to the acceptance of the Null hypothesis. There is no significant relationship
between the variables of maintenance and population. (4) Population densities of the
buildings have weak negative relationship with maintenance cost. The model is of the
form MC = 135041.5 – 577699 population density, R2 value = 3.0%, Fcal = 0.888,
Ftab = 4.17. The statistics of the analysis between maintenance cost and the
population densities showed that both variables increase in the same direction, (a
positive relationship). The correlation between the variables is a weak one,
establishing an R2 value of 3.0%. The outcome of the Fcal, Ftab and P values
statistics led to the acceptance of the Null hypothesis. There is no significant
relationship between the variables of maintenance cost and the population densities.
Discussion of Research Findings (ANOVA)
Fig. 4

Mac-Barango and Kakulu
422
The ANOVA for maintenance cost of buildings having different ranges of total floor
area. Observation: The observations of the floor areas range between (150-190), (191-
225), (256-332.50) and (333-400)m2. Interpretation: The null hypothesis is not
rejected. The result is summarized as follows. There is no significant difference in
the mean values of the maintenance cost of buildings for different floor area ranges.
(2) The ANOVA for maintenance cost of buildings having different ranges of age
brackets. Observations: The age brackets of building (2-5), (6-9), (10-13) and (14-18)
years old. The statics: Fcal = 16.362, Ftab = 2.975, P = 0.000. Interpretation: The
null hypothesis is rejected. The result is summarized as follows: There is significant
difference in the mean values of maintenance cost for building having different age
brackets. (3) The ANOVA for maintenance cost of buildings having different ranges
of population of occupants. Observations: The observations of the population of
occupants range between (2-5), (6-9), (10-13) and (16-18) persons. The statistics Fcal
= 0.098, Ftab = 2.975, P = 0.960. Interpretations: The null hypothesis is not rejected.
The result is summarized as follows. There is no significant different in the ranges of
population of occupants. (4) The ANOVA for maintenance cost of buildings having
different ranges of population densities. Observations: The ranges of population
densities (0.01 – 0.03) (0.04 – 0.05) (0.06 – 0.07) per m2. The statistics, Fcal = 0.707,
Ftab = 3.354, P = 0.502. Interpretation: The Null hypothesis is not rejected. The
result is summarized as follows. There is no significant difference in the mean values
of maintenance cost for buildings having different ranges of population densities.
Implications of Research Findings: (Correlation Analysis)
Analysis No. 1: Total floor area and maintenance cost. The positive relationship
between the variables, indicate that increases in the total floor areas, might necessitate
a corresponding increase in maintenance cost, however the impact of the total floor
area on the cost maintenance is negligible. Analysis No. 2: Age of building and
maintenance cost. The positive relationship between the variables is indicative that
increases in the age of building would necessitate a corresponding increase in
maintenance cost. Variations in the age of buildings can be used to predict the
outcome of maintenance cost. The trend of the descriptive chart between these
variables, further supports the outcome. Analysis No. 3: Population of Occupants and
maintenance cost. Increases in the population of occupants might necessitate a
corresponding increase in maintenance cost, however the impact of occupants
population on maintenance cost is negligible, having R2 values less than 2%.
Variations, in the maintenance cost of buildings cannot be safely attributable to
population changes. Such variations in maintenance cost would be explainable by
other factors – the frequency of usage by the occupants and some other technical
variables (Quality of construction and supervision, etc). Analysis No. 4: Population
densities of occupants and maintenance cost. Decreases in the dependent variables
(population densities) would necessitate a corresponding increase in maintenance cost.
However, the influence of population densities of buildings on maintenance would be
negligible, establishing an R2 value that is not greater than 3%. Maintenance cost,
cannot be adequately predicated from population densities. The outcome of this result
is in tandem with that of occupants‘ population, after all population density is a
derivate of occupants population. The outcome of the descriptive analysis, (between
maintenance cost and population densities – a non systemic trend further explains the
outcome of the inferential statistic between the variables).
Implications of Research Finding (ANOVA):

Maintenenace cost of residential buildings
423
The implication of the outcome of the ANOVA test for different ranges of floor areas
show that maintenance costs of building do not increase in same proportion to
increase in floor areas. The result has shown that for the ranges of floor areas studied,
there were no differences in their maintenance cost.
The ANOVA test for maintenance cost of different age brackets of building shows
that each age bracket has a different maintenance cost. Therefore for age bracket
studied, each had a different maintenance cost.
The ANOVA test for maintenance cost of different buildings with the occupancy rates
did not establish differences in maintenance cost for the different population ranges of
occupants.
The ANOVA test for maintenance cost of different ranges of population densities did
not establish differences, in the categories of population densities (0.01 - 0.03) (0.04 –
0.05) (0.06 – 0.07) per m2.
CONCLUSION
Periodic maintenance of buildings, enhances longevity, it restores the building fabric
and adds value to property. A computerized cost information service facilitates an
efficient and effective maintenance management. A computerized management
information system on maintenance captions all variables influencing maintenance
cost and establish inter relationships between them. Research findings establish that
the impact of total floor area, the population of occupants and population densities of
occupants on maintenance cost are negligible. The predictability of maintenance cost
from these variables can not be ascertained. The variable of age, however impacts
significantly on maintenance costs; the variable can be used adequately to predict
maintenance cost. Corollary to the above conclusion are that (i) maintenance cost for
buildings will not change for floor area between (150 – 400) sq.m (ii) maintenance
cost for buildings constantly change for building, within the bracket (2 – 18) yrs (iii)
maintenance cost will not be influenced by occupancy population within the range (2
– 18) persons (iv) it will not also be influenced by population densities within the
range (0.01 – 0.07) per m2. Changes in maintenance costs, within the stated
categorization are likely to be explainable by other factors outside the tested variables
which influence the maintenance cost.
Recommendation: Residential building owners should make maintenance an integral
part of the construction process even at the initial design stage of construction. This
sandwiched with quality supervision and right choice of material reduces the
frequencies of maintenance during the life cycle of the buildings. The frequencies of
maintenance, even when all other variables are taken care should be stepped up as the
ages of buildings increase. Maintenance cost profile compilation and management
should be imbibed by all stakeholders in the real estate business. Further research
works to study the impact of economic and climatic variables on maintenance cost,
maintenance cost profile for commercial and institutionalized buildings..
REFERENCES
Ahmad, S. (1997): Facility management: The Petroleum (special) Trust Fund Approach to
National Rehabilitation of infrastructure. Paper presented on the occasion of the 2-
Day National Seminar on Facilities Management and Maintenance programme.
Organized by the Nigerian Institute of Quantity Surveyors, Lagos. P(2 and 3).

Mac-Barango and Kakulu
424
Ashworth, A. (1988a): ―Cost studies of Buildings‖ Longman Group UK limited. London
p(229)
Ashworth, A. (1988b): ―Cost studies of Buildings‖ Longman Group UK limited. London
p(229-230)
Holmes, R and Droop, C (1982a): Factors affecting maintenance costs in Local Authority
Housing. In (Ed) Brandon P. S. ―Building Cost Techniques. New Directions pp (399-
408)
Holmes, R and Droop, C (1982b): Factors affecting maintenance costs in Local Authority
Housing. In (Ed) Brandon P. S. ―Building Cost Techniques. New Directions pp (418-
419)
Igwe, J. M. (1989a): The designer‘s Role in Building maintenance management. Paper in
―Lagos Q. S. Digest‖ Journal of the Nigerian Institute of Quantity Surveyors. Vol.
3:1:5
Igwe, J. M. (1989b): The designer‘s Role in Building maintenance management. Paper in
―Lagos Q. S. Digest‖ Journal of the Nigerian Institute of Quantity Surveyors. Vol.
3:1:5-7.
Igwe, J. M. (1989c): The designer‘s Role in Building maintenance management. Paper in
―Lagos Q. S. Digest‖ Journal of the Nigerian Institute of Quantity Surveyors. Vol.
3:1:6.
Igwe, J. M. (1989d): The designer‘s Role in Building maintenance management. Paper in
―Lagos Q. S. Digest‖ Journal of the Nigerian Institute of Quantity Surveyors. Vol.
3:1:7.
Ikupolati, A. O., Apochi J. O. and Ene G. U. (2004): Maintenance organization and practice of
selected public organizations in Kaduna State. Paper in ―Nigerian Journal of
Construction Technology and Management. University of Jos, Nigeria. Vol. 2:1:36
Mosaku, T. O. (1990): Specification of Building components as a means of reducing
maintenance costs. Paper in ―the Nigerian Quantity Surveyors‖ Journal of the NIQS,
Lagos. Nigeria pp (13-14)
Mosaku, T. O. (2002): Evaluating performance specification factor in Building maintenance
cost minimization. Paper in ―Nigerian journal of Construction Technology and
Management Department of Building. University of Jos. Vol. 4:1:117.
Oguike, L. M. (1997): Facilities management in Nigerian Economy: - Emergent Business
Opportunities for Nigerian professionals. Paper on Seminar ―Evolving a maintenance
culture in Nigeria. The Role of facilities management‖. Organized by the NIQS,
Lagos. Nigeria p(6)
Okechukwu, C (1988a): Maintenance and repairs in the construction industry – A sadly
neglected line. Paper in ―Lagos Q. S. Digest‖ Journal of the Nigerian Institute of
Quantity Surveyors. Lagos Nigeria. Vol. 2:3:9.
Okechukwu, C (1988b): Maintenance and repairs in the construction industry – A sadly
neglected line. Paper in ―Lagos Q. S. Digest‖ Journal of the Nigerian Institute of
Quantity Surveyors. Lagos Nigeria. Vol. 2:3:11.
Okechukwu, C (1988c): Maintenance and repairs in the construction industry – A sadly
neglected line. Paper in ―Lagos Q. S. Digest‖ Journal of the Nigerian Institute of
Quantity Surveyors. Lagos Nigeria. Vol. 2:3:11-23.
Onwuka, E. E. (1989a). Maintenance in Building and Construction Works: Paper in ―Lagos
Q. S. Digest‖ Journal of the Nigerian Institute of Quantity Surveyors. Lagos chapter.
Vol. 3:1:3.
Onwuka, E. E. (1989b). Maintenance in Building and Construction Works: Paper in ―Lagos
Q. S. Digest‖ Journal of the Nigerian Institute of Quantity Surveyors. Lagos chapter.
Vol. 3:1:3.
Seeley, I. H. (1976a): Building Maintenance. Macmillan. London & Basingstoke. Pp(10-11)
Seeley, I. H. (1976b): Building Maintenance. Macmillan. London & Basingstoke. P(8-9)
Seeley, I. H. (1976c): Building Maintenance. Macmillan. London & Basingstoke. Pp(214,
232)

Maintenenace cost of residential buildings
425
Seeley, I. H. (1983a): Building Economics third edition. Macmillan publishers Ltd. London &
Basingstoke. P(209)
Seeley, I. H. (1983b): Building Economics third edition. Macmillan publishers Ltd. London &
Basingstoke. Pp(209-210)
Seeley, I. H. (1983c): Building Economics third edition. Macmillan publishers Ltd. London &
Basingstoke. Pp(210).
Seeley, I. H. (1983d): Building Economics third edition. Macmillan publishers Ltd. London &
Basingstoke. Pp(209).
Shields, S, Sparshott, K. J. and Cameron, E.A (1975a): Ship maintenance a Quantitative
Approach. Marine Media Management Ltd. London pp(22, 25, 26, 31, 32, 47 and 48)
Slater, K (1982a): An Investigation into hospital maintenance expenditure in the North West
Regional Health Authority. In (Ed) Brandon, P.S. ―Building Cost Techniques new
directions‖ pp(411-417)
The Spatial distribution of particular matter (pm 10) in Warri metropolis, Nigeria.
Warri, Nigeria, Latitude/Longitude: Accessed from http:www.travelmath.com/city/warri on
23rd
March, 2011.
APPENDICES

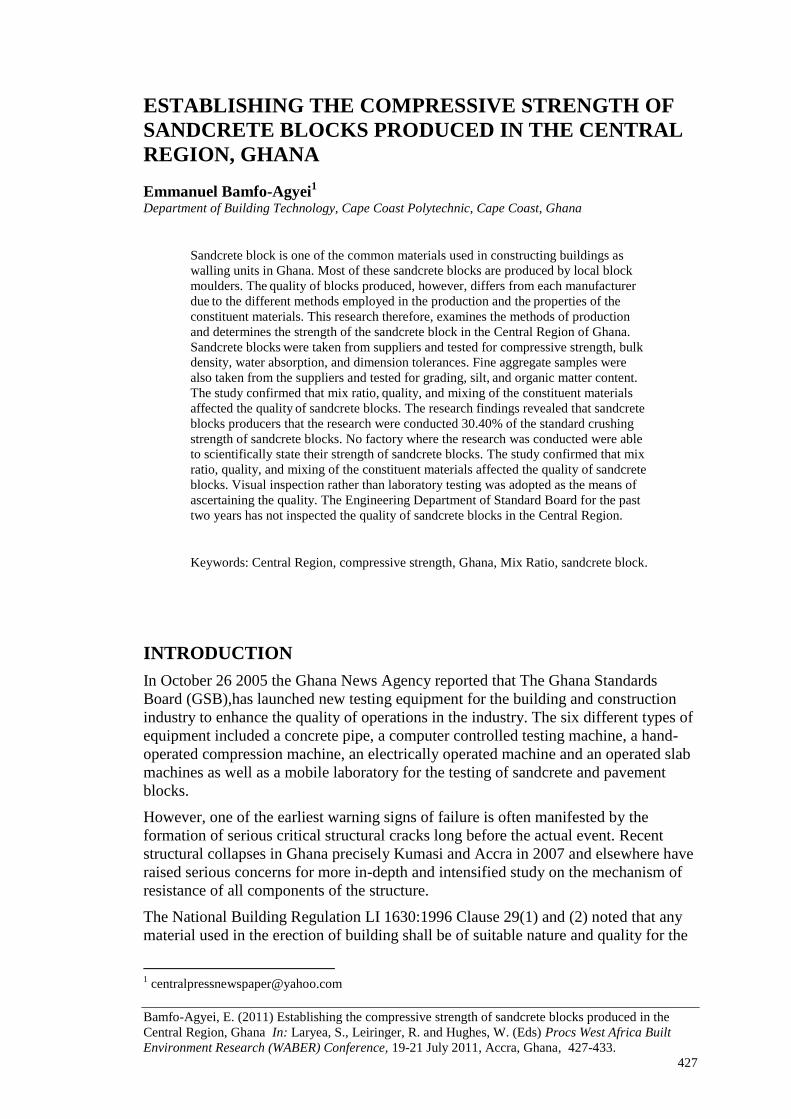
Bamfo-Agyei, E. (2011) Establishing the compressive strength of sandcrete blocks produced in the
Central Region, Ghana In: Laryea, S., Leiringer, R. and Hughes, W. (Eds) Procs West Africa Built
Environment Research (WABER) Conference, 19-21 July 2011, Accra, Ghana, 427-433.
427
ESTABLISHING THE COMPRESSIVE STRENGTH OF
SANDCRETE BLOCKS PRODUCED IN THE CENTRAL
REGION, GHANA
Emmanuel Bamfo-Agyei1
Department of Building Technology, Cape Coast Polytechnic, Cape Coast, Ghana
Sandcrete block is one of the common materials used in constructing buildings as
walling units in Ghana. Most of these sandcrete blocks are produced by local block
moulders. The quality of blocks produced, however, differs from each manufacturer
due to the different methods employed in the production and the
properties of the
constituent materials. This research therefore, examines the methods of production
and determines the strength of the sandcrete block in the Central Region of Ghana.
Sandcrete blocks were taken from suppliers and tested for compressive strength, bulk
density, water absorption, and dimension tolerances. Fine aggregate samples were
also taken from the suppliers and tested for grading, silt, and organic matter content.
The study confirmed that mix ratio, quality, and mixing of the constituent materials
affected the quality of sandcrete blocks. The research findings revealed that sandcrete
blocks producers that the research were conducted 30.40% of the standard crushing
strength of sandcrete blocks. No factory where the research was conducted were able
to scientifically state their strength of sandcrete blocks. The study confirmed that mix
ratio, quality, and mixing of the constituent materials affected the quality of sandcrete
blocks. Visual inspection rather than laboratory testing was adopted as the means of
ascertaining the quality. The Engineering Department of Standard Board for the past
two years has not inspected the quality of sandcrete blocks in the Central Region.
Keywords: Central Region, compressive strength, Ghana, Mix Ratio, sandcrete block.
INTRODUCTION
In October 26 2005 the Ghana News Agency reported that The Ghana Standards
Board (GSB),has launched new testing equipment for the building and construction
industry to enhance the quality of operations in the industry. The six different types of
equipment included a concrete pipe, a computer controlled testing machine, a hand-
operated compression machine, an electrically operated machine and an operated slab
machines as well as a mobile laboratory for the testing of sandcrete and pavement
blocks.
However, one of the earliest warning signs of failure is often manifested by the
formation of serious critical structural cracks long before the actual event. Recent
structural collapses in Ghana precisely Kumasi and Accra in 2007 and elsewhere have
raised serious concerns for more in-depth and intensified study on the mechanism of
resistance of all components of the structure.
The National Building Regulation LI 1630:1996 Clause 29(1) and (2) noted that any
material used in the erection of building shall be of suitable nature and quality for the

Bamfo-Agyei
428
purposes and conditions in which they are to be used. Section (2) stated that the use of
any material should conform to an approved Ghana Standard Code of Practice.
At present, nearly 90% of buildings in Ghana are constructed with sandcrete blocks,
i.e blocks made from sand, water and cement. This is highly undesirable because
sandcrete blocks possess an intrinsic low compressive strength making them
susceptible to any tragedy such as seismic activity (Andam, 2005). Past Research
conducted showed dismal results for production of sandcrete blocks, which exhibited
compressive strengths far below the standardized strengths for construction of houses.
RESEARCH OBJECTIVES
The main objective of this research is to investigate and establish the strength of the
sandcrete block in the Central Region of Ghana. To compare the research findings to
the standard crushing strength of sandcrete block and to establish the frequency of
blocks inspection and test by the Ghana standard board
CLASSIFICATION OF BLOCKS
According to Obande (1989), building blocks are classified according to specified
properties. The manufacturer usually has good varieties to choose from depending on
the requirements of the user. There are three grades of building blocks; these are dense
aggregates blocks, which are suitable for general use in load-bearing external walls
including works below ground level damp proof course. Lightweight aggregates
block, which are used for load-bearing internal walls, including use below ground
level damp proof course and inner leaf of cavity and composite walls; and lightweight
aggregates blocks, which are used for non-load, bearing partitions. The following
information‘s will serve as a guide in determining the grade of a block. For first grade,
blocks are those with not less than 1500kg/m density and a minimum average
compressive strength of 2.8N/mm.
MATERIALS USED IN THE MANUFATURE OF SANDCRETE
BLOCKS
There are three main materials used in the manufacture of blocks. These are: Sand;
Cement; and Water.
Sand
Sand makes up about 80 percent of the mix. It is therefore necessary to ensure that
good quality sand is used. It must be free from humus and vegetable matter, clean
angular and coarse-grained. River sand is used extensively in preference to other
sources of and, particularly the type of sand that is obtained on the ground surface
along roadsides or form drains. The reason for this is that sand obtained from river is
river is already washed and, therefore, contains less silt and other impurities than sand
collected from drains, which may need washing before use.
Cement
The important thing about cement is to keep it dry. This can be achieved by storing in
a shed (or a silo, for loose cement). Storing cement in the open, it needs to be arranged
on a platform raised at least 100mm above ground. It is then covered with tarpaulin or
other waterproof material. Any cover used must overlap properly to keep out
rainwater.

Sandcrete blocks
429
Water
Water used for blocks making must be clean and free from deleterious matter. Pipe
borne water is the best, but water from streams, rivers, lakes, and wells may be used.
Water containing too many suspended solids must not be used, but can be left in a
tank or suitable container for the solids to settle to the bottom. Chudley and Greeno
(1997). A significant factor influencing this increase in the number of such production
centres is the introduction of different rapidly assembled machines and other manually
operated frameworks for the production of masonry units. The predominant three are:
1. Hand ramming compaction moulds.
2. Manual tamping compaction frame.
3. Motorised vibration machine.
All three employ both horizontal and vertical orientations in production. A quick
survey of any of these block-making centres will show that anyone of these does not
employ all three forms of production. For a particular type of compaction method used
by any such centre, use is normally made of only one orientation for the production of
block units. Different centres make use of different compaction methods with different
orientations during production.
This research assesses the three main local methods of sandcrete block manufacture
and its effect on strength when the blocks are produced in either the horizontal flat or
the vertical straight positions. Differences in bulk density, water absorption capacities
and compressive strength of block samples produced from each of the compaction
methods are compared. The differences in properties between the different
compaction methods and for similar orientations will also be considered.
Blocks and block type considered
A block is a masonry unit, which by usage in its normal function exceeds the actual
dimensions specified for a brick that is 337.5 x 225 x 112.5 mm. By specification, it is
also required that the height of the block does not exceed the length or six times the
thickness to avoid confusion with slabs or panels. There are basically two types of
blocks; the lightweight and the dense weight block. Lightweight blocks are made
either with lightweight aggregate or with aerated concrete. Such lightweight
aggregates are products of industrial plants [3].
Dense blocks are made from dense aggregates specified by BS 882 [4]. They include
natural sand and crushed stone or rock. Dense blocks may be hollow, cellular or solid
[5,6]. The solid type of the dense blocks is considered in this study. A unit of
sandcrete block is made from a mixture of hard durable and clean sand, cement and
water. Well-graded sand falling within the BS (2) grading zone is used. The mix
proportion is 1:6 parts of cement to sand by BS 2028
Plants and Equipment
These are available in various makes and sizes. Some of these machines are operated
manually. Either others are electrically or diesel operated. In addition, some of the
block moulding machines only mould one block at a time, whereas others mould two
or more blocks at a time are Petres and coronet multi-block and rosechomester
machine.
Manually Operated Block Moulding Machine
This machine is popularly known as ‗Manpower‘. Here the mould is filled with
mixture and the mixture achieves compaction with a flat weighted mould cover made

Bamfo-Agyei
430
of metal. The strength of the levels blocks will depend on the force with which the
cover is brought down on the mixture. Good blocks can be made from this machine.
Power Machines
These machines depend on electrical power for their operation. A high degree of
compaction can be achieved, so that block of very high strength can be made. They
cannot be used where there is no electrical power supply. Since they are not portable,
they are always permanently installed.
THE COMPRESSIVE STRENGTH OF BLOCKS
BS 6073 required average crushing strength for ten blocks not less than 75mm thick
not less than 2.8N/mm and the strength for any individual block to be not less than 80
percent of the average. Typical products have minimum crushing strength of;
Table 2.1 The Crushing Strength of Sandcrete blocks
Block type Concrete density kg/m3
Strength N/mm2
Dense aggregate 1500-2100 2.8-3.5
Lightweight aggregates 700-1500 2.8-10.5
Autoclaved aerated 400-900 2.8-7.5
Adopted from Alan Everett (1994)
METHOD
The compressive strength of the block was determined for mixed proportion of, 1:8 ,
at the age of 28 days. Other related tests included sieve analysis of sand used and
determination of densities. All the experimental works were carried out in accordance
with BS 5628(1978) and 1377-2(1990). Nine block factories were randomly visited
and and a total of 18 sandcrete blocks were tested in this research. Samples of soils
used for production were also collected. The blocks were weighed and tested for
compressive strength using the compressiontesting machine in accordance to BS
2028. Sieve analysis test was carried out on the soil samples to ascertain their
suitability for block making in accordance to BS 1377.
RESULTS AND DISCUSSION
Table 2: Crushing strength of the factory blocks tested District Factory Weight in air
(kg)
Weight in
water (g)
Peak load
(kg)
Strength of
block n/mm2
AAK A1
(150*215mm)
25.12 14.19 29.20 0.91
A2
(150*215mm)
24.76 13.95 21.90 0.68
A3
(100*215mm)
21.63 13.25 14.30 0.67
CAPE COAST C1 (150*215mm) 28.38 16.12 36.3 1.13
C2 (150*215mm) 26.80 15.02 44.10 1.37
KEEA K1
(150*215mm)
25.06 12.52 27.8 1.29
K2
(100*215mm)
24.94 11.99 24.08 1.12
MFANTSIMAN M1
(150*215mm)
26.51 15.06 6.45 0.20
M2
(150*215mm)
26.75 14.77 9.35 0.29
The Strength Sandcrete Block Produced In Central Region is given below
CALCULATION OF CRUSHING STRENGTH OF SANDCRETE BLOCK

Sandcrete blocks
431
For Cape Coast, block factory
Peak load/ Area of the sandcrete block that went through the test
36300/ (150*215) = 1.13N/mm2
COMPARING THE RESEARCH FINDINGS TO THE STANDARD
CRUSHING STRENGTH OF SANDCRETE BLOCK
Fig 1: The Crushing Strength of sandcrete block produced in Central Region, Ghana
At Abura Asebu Kwamankess District (AAK) the block factory recorded 0.91N/mm2 instead of
2.8N/mm2; Cape Coast metropolis two blocks were tested from the same factory and recorded different
strength 1.13N/mm2 and 1.37N/mm
2 respectively representing less than 50% of the standard crushing
strength; at Komenda Edina Eguafo Abrem (KEEA) 1.29N/mm2 and 1.12N/mm
2 were recorded and the
standard crushing strength of 2.8N/mm2 was not achieved; Mfantsiman municipality recorded the least
crushing strength of sandcrete block 0.20N/mm2 and 0.29N/mm
2 respectively representing 7% . Some
of the supervisors of the sandcrete block factories that the research was conducted indicated that they
lack equipment to determine the strength of the blocks produced, they measure the strength based on
visual test or how long the block can absorb the water determines the strength. While others noted that
if they are to achieve the standard then the selling cost of blocks would be very expensive making it
difficult for their clients to patronise their goods.
PLATE 1 A block factory at Mfantsiman PLATE 2 A-sandcrete block just produced.

Bamfo-Agyei
432
PLATE 3 Submerge the block in water to measure PLATE 4 Crushing test of one the
weight in water. sandcrete blocks.
ESTABLISHING THE FREQUENCY OF BLOCKS INSPECTION
AND TEST BY THE GHANA STANDARD BOARD
The research revealed that the Engineering Department of Standard Board in Ghana is
responsible for the inspection of the quality of sandcrete blocks. Meanwhile the last
time block factories were inspected in the region was 2008, the inspection was
suppose to be every year. While at some factories, they said officials of Standard
Board have not carried out any inspection for the past five years. Some of the block
producers revealed that if they are to achieve the strength of 2.8N/mm2 then the
selling price of one block would be very expensive and the clients would not patronise
their products. A block producer said they mould the block with strength that is
2.8N/mm2 for inspection by the Ghana Standard board but do not produce that same
strength for the public.
CONCLUSION
The research finding revealed that sandcrete blocks producers in the Central Region,
Ghana achieved on the average 30.40% of the standard crushing strength of sandcrete
blocks. No factory where the research was conducted was able to scientifically state
their strength of sandcrete blocks due to lack of crushing test equipment. On the basis
of the noted poor quality control, recommendations appropriate for improving the
strength and effectiveness of sandcrete blocks production in Central Region are
made. The Engineering Department of Standard Board in Ghana for the past two years
has not inspected the quality of sandcrete blocks in the Central Region of Ghana.
ACKNOWLEDGEMENTS
The author is grateful to Mr. Eric Ewere and Freebody Mensah of the Civil
Laboratory and to the staff of Building Technology laboratory.
The author is also grateful to Mr. Stephen Agyefi Mensah, Benjamin Ankomah and
workers of the block factories where the research were conducted in Central Region.
REFERENCES
Abdullahi, M. 2005. “Compressive Strength of Sandcrete Blocks‖. AU J.T. 9(2): 126-132

Sandcrete blocks
433
Andam, K.A. (2002a) Compressive Strength of Commercial Sandcrete Blocks. Proceedings of
the 4th International Conference on Structural Engineering Analysis and Modelling
(SEAM 4); University of Science and Technology, Kumasi, Ghana, Vol. 1, p. 282.
Andam, K.A. (2002b) Enhancing the Compressive Strength of Concrete Blocks with Single
and Mixed Coarse Aggregates. Proceedings of the 5th International Conference on
Structural Engineering Analysis and Modelling (SEAM 5); University of Science and
Technology, Kumasi, Ghana, Vol. 1, pp. 75–78.
Baiden, B.K.; and Tuuli, M.M. 2004. ―Impact of quality control practices in sandcrete
block production‖. Journal of Architectural Engineering, 10, 53 (2004);
doi:10.1061/(ASCE)1076-0431(2004)10:2(53) (8 pages).
Barry, R. 1969. The Construction of Building. Vol.1. pp 54-55 & 94. Crosby Lockwood,
London, England.
British Standard Institution. (1978) Structural Use of Masonry. Part 1. Unreinforced Masonry.
London: BSI. BS 5628.
BS 8110 British Standard Institution. (1997) Structural Use of Concrete. London: BSI.
BS 1377-2 British Standard Institution. (1990) Methods of Test for Soils for Civil
Engineering Purposes. Classification Tests. London: BSI.
BS 5628 British Standard Institution. (1978) Specification for Precast Concrete. London: BSI.
Chudley, R. And Greeno,R. 1997, Building Construction Handbook: (5th edition) Butterworth-
Heinemann Publisher London.
Hodge, J.C. 1971. Brick work. 3rd ed. Edward Arnold, London, England.
Obande, M.O. 1989, Block laying and Concreting: (2nd
edition) Longman Publisher Singapore
Publishers Ltd.
Wenapere ,A.D. and Ephraim M.E. Journal of Building Appraisal (2009) 4, 301–309.
doi:10.1057/jba.2009.8.


Dahiru, A. and Bustani, S.A. (2011) Evaluating the benefits of BOT infrastructure projects in Nigeria
In: Laryea, S., Leiringer, R. and Hughes, W. (Eds) Procs West Africa Built Environment Research
(WABER) Conference, 19-21 July 2011, Accra, Ghana, 435-441.
435
EVALUATING THE BENEFITS OF BOT
INFRASTRUCTURE PROJECTS IN NIGERIA
Alhassan Dahiru1 and S. A. Bustani
2
Department of Building, Ahmadu Bello University, Zaria, Nigeria
Build Operate Transfer (BOT) in project management is particularly relevant in most
of the developing countries of the African region including Nigeria. Most African
countries required extensive infrastructure to meet the economic development
challenges. Therefore, BOT stands as a tool for bridging the critical infrastructure gap
without utilizing the public sector funds. However, BOT is a relatively new
experience in most developing countries of the African region and Nigeria in
particular where the experience of the public sector has not always been positive.
Many studies shown that majority of BOT projects offered in Nigeria were failed at
the procurement stage due to the high costs of procurement process among others.
Although the federal government had taken various steps by establishing a PPP Unit
called Infrastructure Concession Regulatory Commission (ICRC) towards realizing
the possible benefits attributable to the BOT projects in the country. This paper is aim
at investigating the factors influencing the high costs of BOT procurement process
and the possible benefits of BOT projects based on the respondents‘ agreement. The
survey findings will serve as a way of encouraging both the public and the private
sector participation in the development of BOT projects for sustainable infrastructure
development in the country. Using questionnaire survey, the opinions of respondents
such as clients, consultants, developers, lenders, and users group were assessed.
Reliability index was employed to measure the attribute of each factor. One-way
analyses of variance (ANOVA) were also performed to test whether the mean values
on each benefit were equal for all groups of respondents. The survey has empirically
identified and ranked ten factors influencing the high costs of BOT procurement
process. Twenty benefits of BOT projects were identified based on the respondents‘
agreement. Therefore the overall benefits will give the public sector leverage in
facilitating infrastructure development within the shortest possible time scale.
Keyword: BOT, procurement, infrastructure, Nigeria.
INTRODUCTION
Build-Operate-Transfer (BOT) has emerged as one of the major Public-Private-
Partnership (PPP) approaches for delivering public infrastructure projects that attract
high capital outlay. The concept is particularly relevant in most of the developing
countries of the African region and Nigeria in particular where the government
requires adequate finances to bridge the critical infrastructure gap and improve
investment. If properly formulated and managed, BOT projects can provide a number
of benefits to both the public and the private sector. However, the experience of the
public sector with BOT projects has not always been positive. Many BOT offered
projects were failed at the procurement stage due to the high costs of procurement
process (Wigwe, 2008). Majority of BOT projects offered from 2003 – 2009 were

Dahiru and Bustani
436
failed at the procurement stage due to lack of adequate knowledge and technical skills
from the public sector experience in BOT contract transaction (Ibrahim, 2007; Dahiru
and Bustani, 2010).
Despite numerous negative experiences by the public sector, the federal government
of Nigeria has continued to view BOT as one of the key strategies for delivering
public infrastructure projects. Therefore, understanding and enhancing the benefits of
BOT projects continue to be a matter of significance and importance. Many
researchers have conducted studies on appropriate selection of concessionaires and
critical success factors for BOT projects. This paper intends to determine the factors
influencing the high costs of BOT procurement process and the benefits of BOT
projects for the purpose of future BOT infrastructure development in the country.
THE BENEFITS OF BOT IMPLEMENTATION IN
INFRASTRUCTURE DEVELOPMENT
UNIDO (1996) has defined BOT approach as an integrative procurement model
designed to provide unique opportunity for financing public infrastructure facilities
and boost the economic growth of the country without utilization of government
finances. Nkado (2010) urged that BOT offers significant attractive opportunities to
foreign investors, which in turn can generate substantial foreign exchange for
economic growth and sustainable development. This innovative procurement
approach promotes technology transfer as well as a variety of other benefits such as
effective utilization of resources (World Bank, 2007; Levy, 1996). The worldwide
experience has shown that if BOT projects are properly formulated and managed, can
provide a variety of benefits to the government. Such benefits include: alleviating the
financial burden on the public sector due to rising infrastructure development costs;
allowing risks to be transferred from the public to the private sector; and increasing
the value for money spent for infrastructure services by providing more efficient,
lower cost, and reliable services (Kwak etal, 2009; Tiong, 1990; Nkado, 2010; and
Adetola, 2010).
However, despite the broad benefits attributable to BOT projects, Wigwe (2008)
concludes that BOT is relatively new concept that are not well understood in many
African countries and Nigeria in particular. In addition, Ezeh (2008) opined that both
the public and the private sectors still lack appropriate knowledge and skills to
implement such long-term project financing. Furthermore, competition in BOT
projects is limited due to the high costs of procurement process and projects are highly
likely to be delayed by political debates, public opposition, and complex negotiation
processes ( Ibrahim, 2007; Nwankwo, 2008; and Weng etal, 2005). Similarly, BOT
projects may cost more since the private sector cannot barrow capital to finance
projects as cheaply as the public sector. This can result in to a monopoly situation and
higher costs to the public users for using the infrastructure services (Yari, 2010;
Henley, 2004; and Gupta, 2008).
RESEARCH METHOD
This section presents the procedures which were followed in achieving the aim of the
study. Data used in the study were initially sourced from the pilot survey and a
structured questionnaire was designed based on the data obtained from the survey and
administered to major BOT stakeholders in the six geopolitical zones in the federation
including FCT Abuja. Six states and the FCT were identified in the study as having
projects that were contractually signed under the BOT approach. Therefore, the

BOT projects in Nigeria
437
selected states include: Lagos, representing South-West; Enugu, representing South-
East; Port-Harcourt, representing South-South; Kano, representing North-West;
Bauchi, representing North-East; Plateau, representing North-Central and Abuja, the
Federal Capital Territory.
The Pilot Survey
Pilot survey was initially conducted on the forty eight BOT projects offered across the
country with the aim to secure the relevant data suitable for the analyses. These
projects were initiated and planned to be completed within the range of the period
2003 – 2009 with different concession periods ranging from 15 to 35 years.
Furthermore, oral interviews were conducted with the projects‘ participants such as
concessionaires, investors and lenders who were directly involved in to the projects.
Factors influencing the high costs of BOT procurement process and the top 20
benefits of BOT projects were obtained from an oral interview with view to ascertain
the significance and importance of BOT projects to the national development.
The Structured Questionnaire
A structured questionnaire was designed to consist of all the identified factors and the
top 20 benefits obtained from the pilot survey which were sent out asking the
respondents to rate them based on their importance on a 1 – 5 scale. The purpose was
to seek the respondents‘ agreement on the importance of the factors. The respondents
were categorized in to clients, the consultants, the developers, the lenders, and the end
users.
Survey Responses and Characteristics of Respondents
The distribution and details of responses from the administered questionnaire shown
that in all the survey, 220 questionnaires were returned out of the 260 distributed, of
which 47 were for clients, 42 consultants, 41 developers, 44 lenders, and 46 end users.
This represents 85% effective response rate. The clients include federal and state
government ministries, departments or agencies responsible for the provision of public
infrastructures. Consultants include professional within the construction industry.
Developers are simply referred to as the project promoters or concessionaires. Lenders
include financial institutions such as commercial banks and insurance corporations.
End users on the other hand include community group who were also categorized as
users group.
Techniques for Data Analyses
The responses that were received from the survey participants were tabulated and
analyzed individually. Reliability index was employed to measure the factors
influencing the high costs of BOT procurement process while on the other hand, One-
way Analysis of Variance (ANOVA) was used to test whether all groups of
respondents have the same mean. F significant indicates whether the mean values
between groups of respondents are the same. Lower probability value indicates that
there is difference of agreement between the respondents, suggesting that there is
difference of opinion between groups. A probability value (significance level = P)
below 0.05 suggests a high degree of difference of opinion between groups of
respondents on a specific factor.
RESEARCH RESULTS AND ANALYSES
The factors influencing the high costs of BOT procurement process were identified
and ranked as shown in Table 1. The factors were initially obtained from the survey

Dahiru and Bustani
438
interview on 48 BOT projects and later included in to the questionnaire survey to seek
the respondents‘ agreement on the factors. Result of the analysis shows that the
relative inexperience of public officials in handling BOT projects was ranked the 1st
most reliable attribute with computed RI value of 2.29. The complex contractual and
financial structure of BOT projects was ranked 2nd
most reliable attribute with
computed RI value of 2.24. It is also shown that the lack of appropriate legislation to
allow private sector participation in public infrastructure projects was identified and
ranked the 3rd
most reliable attribute with computed RI value of 2.22. Similarly, the
lack of standardized project agreements and standardized bidding documents was
ranked the 4th
most reliable attribute with computed RI value of 2.19. Furthermore, the
lack of clear criteria for evaluating BOT bids was ranked the 5th
most reliable attribute
with computed RI value of 2.14. It is also observed that the lack of independently
commissioned feasibility studies to confirm that the project is viable and help the
government solicit realistic project proposal was also identified and ranked the 5th
most reliable attribute with the same computed RI value of 2.14.
Table 1 Weighted average (RI) on factors influencing high costs of BOT procurement process
Influential factors
Clients Consult. Develop. Lend. End. Reliability Index
of the weighted
average of all
responses (ARI)
Ranks
Ordered
R RI RI RI RI RI
1 The complex contractual and
financial structure of BOT projects
2 The relative inexperience of the
parties and of government officials in
the development of BOT projects
3 The lack of a clearly defined project
framework
4 The lack of appropriate legislation
to allow private sector participation
in public infrastructure projects
5 The lack of clear criteria for
evaluating BOT bids
6 The lack of independently
commissioned feasibility studies to
confirm that the project is viable and
help the government solicit realistic
project proposals
7 The lack of standardized project
agreements and standardized bidding
documents
8 The lack of established methods of
pre-qualifying bidders in order to
limit the number of bidders and thus
reduce the high bidding risk
9 The lack of a clearly established
procurement procedure and schedule
10 Prolong & uncertain negotiations
with preferred bidders before final
acceptance of a tender
2.23
2.28
1.85
2.30
2.02
2.09
2.02
2.02
1.98
1.98
2.21
2.38
2.00
2.17
2.24
2.12
2.17
2.10
2.33
1.91
2.24
2.27
2.22
2.24
2.17
2.27
2.22
2.10
2.10
2.27
2.16
2.25
2.27
2.23
2.23
2.11
2.18
2.05
2.11
2.02
2.35
2.28
2.04
2.17
2.04
2.13
2.35
2.11
2.00
2.04
2.24
2.29
2.08
2.22
2.14
2.14
2.19
2.08
2.10
2.04
2
1
7
3
5
5
4
7
6
8
Meanwhile, the lack of a clearly established procurement procedure and schedule was
ranked the 6th
most reliable attribute with computed RI value of 2.10. The result has
also discovered that the lack of a clearly defined project framework coupled with the
lack of established method of pre-qualifying bidders in order to limit the number of
bidders and thus reduce the high bidding risk became the 7th
most reliable attribute
with computed RI value of 2.08. Finally, the prolong and uncertain negotiations with
preferred bidder(s) before final acceptance or closing of a tender was identified and
ranked the 8th
most reliable attribute with computed RI value of 2.04.

BOT projects in Nigeria
439
The above analysis has clearly shown that respondents were in full support of the
constraint factors as found responsible to the high costs of BOT procurement process
in Nigeria. The factors were ranked accordingly based on the level of attribute to each
factor. Therefore, the findings will assist in minimizing the costs of procurement
process which will significantly improve the implementation of BOT projects
especially at the procurement stage of development.
Table 2 Profile of responses on the benefits attributable to BOT projects in Nigeria
Benefits of BOT projects
Clients
Consu
ltants
Deve
loper
s
Lende
rs
Users
grou
p
____ANOVA__
___
F Stat. Sign.
level
Better value for money 4.61 4.38 4.74 4.71 4.72 3.30 0.13
Reduced cost 4.47 3.92 4.67 4.70 4.71 3.03 0.12
Effective utilization of
resources
4.45 4.19 4.58 4.57 4.52 3.49 0.14
Sharing of resources 4.17 3.89 4.41 4.14 3.88 2.58 0.10
Risks sharing 4.05 3.87 4.18 3.39 4.17 2.93 0.11
Increased user satisfaction 4.01 4.00 4.15 3.39 3.74 2.98 0.11
Improved time-scale 3.98 3.94 3.87 4.12 3.67 2.45 0.10
Improved return on
resources
3.94 3.88 4.02 4.04 3.78 2.51 0.10
Effective service delivery 3.86 3.82 3.98 3.89 3.79 3.31 0.13
Reduced risk exposure 3.85 3.62 3.96 3.94 3.76 2.38 0.09
Improved administration 3.83 3.64 3.97 3.91 3.86 1.83 0.07
Transfer of technology 3.78 3.58 3.84 3.95 3.63 2.74 0.10
Offered investment
opportunities
3.75 3.64 3.93 3.64 3.62 2.93 0.11
Enhanced mutual reward 3.69 3.38 3.97 3.67 3.64 2.03 0.07
Reduced public capital
investment
3.68 3.61 3.74 3.71 3.32 3.14 0.12
Generate economic growth 3.66 3.65 3.64 3.76 3.30 3.11 0.12
Environmental protection 3.63 3.74 3.84 3.72 3.57 1.91 0.07
Reduced poverty level 3.62 3.94 3.64 3.78 3.56 2.61 0.10
Reduced corruption 3.71 3.74 3.76 3.82 3.62 2.53 0.10
Accountability and
transparency
3.79 3.81 3.83 3.78 3.68 2.46 0.10
The second phase of the study had identified the top 20 benefits of BOT projects
obtained from the survey interview. Table 2 presents the results of the analyses and
the survey was sent out asking the respondents to rate the benefits on a 1 - 5 scale with
view to find out whether they were indeed benefits. Therefore, the results are
interpreted as follows: Better value for money with F- value of 3.30 and P – value of
0.13 stands as strong indication that all groups of respondents have positively agreed
on the importance of the factor as a benefit attributable to BOT projects. Reduced cost
has F – value of 3.03 and P – value of 0.12 while, effective utilization of resources is
highly significance as all groups of respondents have rated the factor very high with F-
value of 3.49 and P – value of 0.14. Sharing of resources (F- value of 2.58 and P –
value of 0.10), risk sharing (F – value of 2.93 and P- value of 0.11), increase user
satisfaction (F – value 2.98 and P value of 0.11), improved time scale (F – value of
2.45 and P – value of 0.10), improved return on resources (F – value of 2.51 and P –
value of 0.10), effective service delivery (F- value of 3.31 and P – value of 0.13),
reduce risk exposure (F value of 2.38 and P value of 0.09), improved administration

Dahiru and Bustani
440
(F – value of 1.83 and P – value of 0.07), transfer of technology (F - value of 2.74 and
P - value of 0.10), offers significant attractive opportunities (F - value of 2.93 and P -
value of 0.11), enhanced mutual reward (F - value of 2.03 and P - value of 0.07),
reduced public capital investment (F - value of 3.14 with corresponding P - value of
0.12), generate economic growth (F - value of 3.11 and P - value of 0.12),
environmental Protection (F - value of 1.92 and P - value of 0.07), reduced poverty
level (F - value of 2.61 and P - value of 0.10), reduced corruption (F - value of2.53
and P -value of 0.10), accountability and transparency (F - value of 2.46 and P - value
of 0.10) as important benefits attributable to BOT projects in Nigeria.
The above survey findings revealed that respondents were in full agreement of the
factors found to be the main benefits of BOT projects in Nigeria. This means to say
that if BOT projects are properly formulated and well managed accordingly, the
country will significantly benefits from infrastructure development to the attainment
of the national economic growth in the short run.
DISCUSSION OF MAIN FINDINGS
The study has empirically evaluated the positive correlation between the respondents‘
agreement on the constraint factors influencing the high costs of BOT procurement
process and the benefits of BOT projects. This has clearly shown what actors involved
in BOT projects in Nigeria believe to be the main benefits of BOT. The survey
indicates that If BOT projects are properly formulated and managed, the system will
provide efficient and effective routes to utilize private sector funds, technology
innovation, management skills and operational efficiencies in public infrastructure
development. This will in turn provides efficient and effective infrastructure facilities
that will alleviate the financial burden on the public sector due to rising infrastructure
development costs; allowing risks to be transferred from the public to the private
sector; and increasing the value for money spent for infrastructure services by
providing more efficient, lower cost, and reliable services. Therefore, the system has
the potentials of providing availability of public needed infrastructure in Nigeria
which will substantially improve economic growth and development expansion in the
near future.
CONCLUSION
The study had conducted a pilot survey on 48 BOT projects and identified the factors
influencing the high costs of BOT procurement process and the top 20 benefits of
BOT. A questionnaire survey was then sent out asking the respondents to rate the
factors and the benefits on a 1–5 scale and found that they were indeed benefits.
Therefore based on these findings, a conclusion has been drawn that if BOT projects
are properly set up and managed they have the potential to contribute to economic and
societal growth in Nigeria.
REFERENCES
Adetola, F.O. (2010). An over view of Public-Private-Partnership and concession in the
delivery of public services and infrastructures. A paper presented at the NIQS Abuja
chapter on infrastructure concession held at merit house, Abuja.
Dahiru, A. & Bustani S.A. (2010). Appraisal of factors influencing the implementation of
BOT infrastructure projects in Nigeria. Proceedings of the West Africa Built
Environment Research (WABER) Conference, Accra, Ghana. pp - 189.

BOT projects in Nigeria
441
Ezeh, E M. (2008). Procurement strategy/value for money for Public-Private-Partnership
projects. A paper presented by the Bureau of public procurement during the Nigeria
Infrastructure Summit, Abuja.
Gidado, Kassim (2010). A model for PFI implementation in the Sub-Saharan Africa-Nigeria
as a case study. A paper presented at the third international world of construction
project management conference held in Coventry University, UK
Gupta, S. (2008). Risk sharing under Publi-Private-Partnership. Speech delivered by the
senior advisor, Fiscal Affairs Department, IMF during the Nigeria Infrastructure
Summit, Transcorp Hilton Hotel, Abuja.
Ibrahim A.D. (2007). Contractual and tendering arrangements for Build-Operate-Transfer
(BOT) projects. Journal of the Nigerian Institute of Quantity Surveying, Vol. 55, No.
2, pp 17-21.
Kwak,Y. H.; Ying, Y.C. and William, C.I. (2009). Towards a ComprehensiveUnderstanding
of Public-Private-Partnerships for Infrastructure Development, California
Management Review, vol. 15, No. 2
NEPAD (2001). A New Global Partnership; Implementation for the New Partnership for
Africa‘s Development. Infrastructure and regional integration. A paper presented at
International Conference by African Leaders, Abuja, Nigeria
Nigeria‘s Economic Reforms (2007). Nigeria‘s Economic Reforms: Progress and Challenges
Global Economy and Development Program, The Brookings Institution, Washington
DC.
Nkado, R. (2010). Public-Private-Partnership Approach to infrastructure development in
Nigeria: Nature and features of railway construction. A paper presented at the
international workshop organized by the NIQS on PPP approach to infrastructure
development held in Abuja.
Nwankwo, A. (2008). PPP prospects in key infrastructure: roads and rails. A paper presented
by the senior vice president, Parsons Brincherhoff PB at the Nigeria Infrastructure
Summit, Abuja.
Tiong, R.L.K., (1990). Comparative study of BOT projects. Journal of management in
Engineering, USA, vol.6, No.1, pp 107-122.
UNIDO (1996).UNIDO BOT Guidelines: Guidelines for infrastructure development through
Build-Operate-Transfer (BOT) projects. UNIDO publication, Vienna, Austria,
ID/SER.O/22.
Weng, T.C. et al (2005). ―Interface management for China‘s BOT projects‖. Journal of
Construction Engineering and Management, pp 645-655, ASCE.
Wigwe, J. S. (2008). Concessions in Nigeria: The reality. A book published in Nigeria by
Victor Company Limited.
World Bank Group (2007). Private Participation in infrastructure Projects Database, Mailstop,
Washington, D.C. 20433.


Ayarkwa, J., Agyekum, K. and Adinyira, E. (2011) Exploring waste minimization measures in the
Ghanaian construction industry In: Laryea, S., Leiringer, R. and Hughes, W. (Eds) Procs West Africa
Built Environment Research (WABER) Conference, 19-21 July 2011, Accra, Ghana, 443-452.
443
EXPLORING WASTE MINIMIZATION MEASURES IN
THE GHANAIAN CONSTRUCTION INDUSTRY
J. Ayarkwa1, K. Agyekum
2 and E. Adinyira
3
College of Architecture and Planning, Kwame Nkrumah University of Science and Technology Kumasi,
Ghana
The chronic problems of construction include low productivity, low quality, poor co-
ordination and high costs. High product cost is also associated with poor quality,
inefficiency and high waste generation. Various studies in the construction industry
have developed best practices that are not only capable of improving organization‘s
profit but also assist in producing systematic work processes which encourage the
optimal use of resources. A structured questionnaire survey was conducted to provide
empirical evidence on levels of significant contribution of waste minimization
measures to waste reduction, and levels of practice of same measures using weighted
average and coefficient of variation criteria. Purchasing raw materials that are just
sufficient, using materials before expiry dates, and using more efficient construction
equipment are perceived by construction professionals as three of twenty-six
measures which most significantly contribute to waste minimization, and also the
three most practiced waste minimization measures in Ghana. Encouraging re-use of
waste materials, use of low waste technology and recycling of waste materials on site
are, however, considered as the three least significant measures contributing to waste
minimization and also least practiced. Among various suggested recommendations,
the construction industry is encouraged to sort and re-use waste materials, and adopt
environmentally friendly and low waste technologies on site. This paper presents
measures which significantly contribute to materials waste minimization on
construction sites in Ghana.
Keywords: Ghana, waste, waste minimization.
INTRODUCTION
The construction industry plays a vital role in meeting the needs of society and
enhancing quality of life (Shen and Tam, 2002; Tse, 2001). However, the
responsibility of ensuring that construction activities and products are consistent with
environmental policies needs to be defined, and good environmental practices
improved (Environmental Protection Department, 2002; Shen et al., 2002).
Environmental protection has recently become an important issue all over the world.
Compared with other industries, construction generates fairly large amount of
pollutants, including solid waste, noise, dust and water (Ball, 2002; Morledge and
Jackson, 2001). Since construction has a major and direct influence on many other
industries by means of both purchasing the inputs from other industries and providing
products to almost all other industries, eliminating or reducing waste could yield great
cost savings to society (Polat and Ballard, 2004). The construction industry has been

Ayarkwa, Agyekum and Adinyira
444
encouraged to re-use built assets, minimize waste, recycle materials, minimize energy
in construction and use of buildings, use environmental management systems to
reduce pollution, enhance bio-diversity, conserve water, respect people and their local
environment, measure performance and set targets for the environment and
sustainability (Ofori et al., 2000). It is, however, regrettable that although stakeholders
are now questioning the traditional routes of waste disposal in favour of sustainable
waste management strategies, the majority of construction companies have placed
waste reduction at the bottom of their agenda because of complexities over re-use and
recycling.
CONSTRUCTION WASTE
Construction waste has caused serious environmental problems in many large cities
(Begum et al., 2006; Chen et al., 2002; Teo and Loosemore, 2001). Polat and Ballard
(2004) defined waste simply as ―that which can be eliminated without reducing
customer value‖. Waste in construction is also defined as ―the difference between the
value of those materials delivered and accepted on site and those used properly as
specified and accurately measured in the work, after deducting cost saving of
substituted materials and those transferred elsewhere‖ (Polat and Ballard, 2004; Pheng
and Tan, 1998).
According to Formoso et al. (1999), waste can be classified as unavoidable waste (or
natural waste), in which the investment necessary for its reduction is higher than the
economic benefit, and avoidable waste in which the cost of waste is higher than the
cost to prevent it. The percentage of unavoidable waste depends on the technological
development level of the company (Polat and Ballard, 2004; Formoso et al., 1999;
Womack and Jones, 1996). Waste can be categorized according to its source- the stage
in which the root causes of waste occurs. Bossink and Brouwers (1996) identified the
main sources of waste in construction as design, procurement, material handling,
operation and residual. Sources of waste are also identified from the processing
preceding construction such as materials manufacturing, design, material supply, and
planning, as well as from the construction stage (Formoso et al., 1999). According to
Ofori and Ekanayake (2000), construction waste can be divided into three major
categories: material, labour and machinery waste. The current study, however, focuses
on material wastage since most of the raw materials from which construction inputs
are derived come from non-renewable resources and once wasted, becomes very
difficult to replace them (Ofori and Ekanayake, 2000). Garas et al. (2001) categorized
material wastes by activity, to include over-ordering, overproduction, wrong handling,
wrong storage, manufacturing defects and theft or vandalism.
The Environmental Protection Agency of USA (2000) defines waste minimization as
―any method that reduces the volume or toxicity of a waste that requires disposal‖.
Poon et al. (2004) also define waste minimization as ―any technique, process or
activity which avoids, eliminates or reduces waste at its source or allows re-use or
recycling of the waste. In the opinion of Begum et al. (2006), waste minimization
includes source reduction and recycling. The same authors defined source reduction as
any activity that reduces or eliminates the generation of waste at source, usually
within a process, and recycling as the recovery and/or re-use of what would otherwise
be a waste material. Different measures for minimizing materials waste have been
discussed (Begum et al., 2006; Faniran and Caban, 1998). Coffey (1999) pointed out
that solid construction waste management is generally seen as a low priority when
financial constraints are present and suggested that considerable waste reduction can

Waste minimization
445
be achieved if waste management is implemented as part of project management
functions. Polat and Ballard (2004) emphasized that reduction is the best and most
efficient method for minimizing the generation of waste and eliminating many of the
waste disposal problems.
Ayarkwa and Adinyira ( n.d.) reports of a wide variation in wastage rates of between
5% and 27% of total materials purchased for construction projects in Ghana. As
construction is a locomotive sector of the national economy, waste in the construction
industry affects the overall national economy. It is important therefore to explore
measures contributing to construction material waste minimization and assess the
level of practice of such measures by the construction industry since cost reduction
arising from minimization of materials waste is of direct benefit to all stakeholders.
This paper reports on a study conducted to assess the levels of contribution of some
waste minimization measures to waste reduction, and the levels of practice of such
measures in the Ghanaian construction industry.
RESEARCH METHOD
Twenty-six (26) waste minimization measures which have been extensively studied
were extracted from the literature (Begum et al., 2006; Shen et al., 2002; Shen and
Tam, 2002; Poon et al., 2001; Ho, 2001; Faniran and Caban, 1998; Peng and Scorpio,
1997; Sherman, 1996). These measures were pre-tested in a multiple pilot study using
interviews and questionnaire involving ten selected experienced construction
practitioners to evaluate their applicability to the current study. In the view of some
interviewees, waste is an inevitable by-product of construction, and waste reduction
activities will not be able to eliminate the generation of waste completely. Most of
them demonstrated in depth understanding and knowledge of the 26 waste
minimization measures extracted from the literature for the study. They agreed with
the applicability of the selected measures to the current study and suggested
modification and rewording of a few of the measures.
A structured questionnaire survey employing both closed and open-ended questions
was conducted. The survey targeted site managers of construction organizations, and
architects and quantity surveyors of registered firms in the Ashanti and Greater Accra
regions of Ghana. The questionnaire was divided into three sections. The first part
sought information about the respondents‘ profile, the second part assessed
respondents‘ perception on how the measures identified from literature and pre-tested
in the pilot study contribute to materials waste minimization, and the final part
assessed the level of practice of the measures identified.
Building construction organizations operating within Ghana register with the Ministry
of Water Resource, Works and Housing (MWRWH) in four categories: class D, K, E
and G, based on the nature of work the organizations engage in - building, civil
engineering, electrical and plumbing works respectively. There are four financial sub-
classifications within these categories - Class 1, 2, 3 and 4 - which set the limitations
for companies in respect of their asset, plant and labour holdings, and the nature and
size of the projects they can undertake. Class 1 has the highest resource base,
decreasing through classes 2 and 3, to class 4 having the least resource base
(MWRWH, 2011). Site managers of D1 and D2 building construction organizations
who are registered with the MWRWH as well as senior architects of architectural
firms fully registered with the Architects Registration Council of Ghana (ARCG) and
senior quantity surveyors of firms fully registered with the Ghana Institution of

Ayarkwa, Agyekum and Adinyira
446
Surveyors (GhIS) were involved in the study. D1/D2 firms were the focus of the
study mainly because such firms have the capacity to employ most the waste
minimization measures identified from the literature and confirmed through the
interviews as applicable to the Ghanaian construction industry. According to the
MWRWH (2011), there are 519 D1 and D2 building contractors in the Ashanti and
Greater Accra Regions of Ghana. Records of the ARCG (2010) indicate that there are
114 fully registered architectural firms in the two regions, whilst the GhIS (2010) also
had 60 fully registered quantity surveying firms.
A sample size of 226 site managers of D1 and D2 construction organizations was
determined using the following formula recommended for such studies by Israel
(1992):
n=
where n is the sample size, N is the population size and e is the desired level of
precision (±5%). The questionnaire was administered through a face-to-face session
which ensured that 188 out of the 226 site managers were completed, representing a
response rate of 83%. Questionnaires were distributed to all the 174 architectural and
quantity surveying firms fully registered with their respective professional bodies. Out
of this, 123 were completed, resulting in a response rate of 71%.
The waste minimization measures identified from the literature and confirmed by pre-
testing were considered to have different levels of contribution to waste minimization.
The study therefore used the following weighted average model (Begum et al., 2006)
to examine the relative levels of significant contribution of the waste minimization
measures as perceived by the construction professionals:
Where ASSi is the average significant score of the waste minimization measure i, Xj
the waste minimization score assigned (on a Likert scale of 1 to 5). Nij = the number
of respondents who assigned the score Xj for the measure i and N is the total number
of respondents. For each waste minimization measure, the respondents were asked to
score the level of contribution to waste minimization on the Likert scale of 1 to 5
where 1= ‗very low‘, 2= ‗low‘, 3= ‘Medium‘, 4= ‗High‘ and 5= ‗Very high‘. The
respondents were further asked to score each measures according to the level of
practice in their organization on a scale of 1 to 5 where 1= ‗Not practiced at all‘, 2=
‗Not practiced‘, 3= ‗Practiced‘, 4= ‗Frequently practiced‘ and 5= ‗Most frequently
practiced‘. The weighted average model (used to calculate ASS above) was used to
calculate the average practiced score (APS) of the waste minimization measure i. To
rank the levels of significant contribution of the minimization measures, the study
employed the combined value of the weighted average and coefficient of variation.
The coefficient of variation, measured as minimization index value (MIV), was
calculated using the following model (Begum et al., 2006):

Waste minimization
447
where MIVi is the coefficient of variation of the waste minimization measure i, ASSi is
the average significant score of the waste minimization measure i and is the
standard deviation of the average significance score for the measure i. The same
model was used to calculate the practiced index value (PIV) for the ranking of the
level of practice of the minimization measures. According to Begum et al. (2006),
although the ASS and APS are weighted average measures and could be used to rank
all the waste minimization measures, they do not consider the degree of variation
between individual responses. Since a smaller variation between individual responses
give better quality to the weighted average value, when two factors carry the same or
very close weighted values, the factor carrying the smaller variation is given a higher
ranking. Thus, the effective assessment of ranking attributes should consider both the
weighted average and the coefficient of variation measured by the minimization and
practice index values.
RESULTS AND DISCUSSION
Company profile
The average years of experience of the firms surveyed in the construction market are
between 10 and 20 years. This implies that all the firms have significant experience in
the building industry. With regards to the average number of permanent and
temporary employees, none of the firms contacted was willing to disclose. The main
reason given was that it is confidential. The respondents, however, indicated that they
had enough employees and could recruit additional employees when necessary.
Architects constituted 58% and quantity surveyors constituted 42% of the consultant.
For the contractors, project managers constituted 68% and site engineers constituted
32%. Forty percent of the contractor-respondents and 50% of the consultant-
respondents had bachelors‘ degree, and 36% of the contractors and 34% of consultants
had Higher National Diploma (HND) certificates. The study further showed that 15%
of consultants and 8% of the contractors had Master‘s degree. Nine percent of the
contractors and 1% of the consultants had doctorate degree. The results also showed
that majority of the firms (58% of contractors and 60% of consultants) had both public
and private sector clients. Seven percent of contractors and 15% of consultants had
public sector clients and 35% of contractors and 25% of consultants had private sector
clients.
Levels of contribution of the waste minimization measures
Table 1 shows a summary of average significant scores (ASS), minimization index
values (MIVs) and rankings of the levels of significance contribution of the
minimization measures on the basis of MIV. The waste minimization measure 24
(WMM 24) is ranked the first measure that most significantly contributes to waste
minimization, indicating that ‗purchasing raw materials that are just sufficient for a
project‘ very highly contributes to waste minimization. WMM 1 is ranked the 26th,
indicating that ‗recycling of some waste materials on site‘ has the least significant
contribution to waste minimization. The other measures evaluated have ASS ranging
between 4.88 and 3.73. Thus, apart from ‗recycling of some waste materials on site‘
(WMM 1), ‗using of low waste technology‘ (WMM 12) and ‗encouraging re-use of
waste materials in projects‘ (WMM 16), all the other measures evaluated by the
construction professionals have medium to high contribution to waste minimization in
Ghana. The ranking profile (Fig. 1) shows empirical evidence of the levels of

Ayarkwa, Agyekum and Adinyira
448
significant contribution of the various measures to waste minimization in the
implementation of waste management.
Table 1: Summary of Average Significant Scores, Minimization Index Values and their Rankings
Waste minimization measures (WMM) Average
significant
score (ASS)
Standard
deviation
(δ)
Minimizatio
n index value
(MIV)
Rank of
minimization
index value (RMIV)
Purchasing raw materials that are just sufficient (WMM 24) 4.96 0.286 34.685 1
Using materials before expiry dates (WMM 25) 4.88 0.461 21.171 2
Use of more efficient construction equipment (WMM 5) 4.42 0.605 14.612 3
Good coordination between store and construction personnel to avoid over ordering (WMM 4) 4.46 0.689 12.946 4
Adoption of proper site management techniques (WMM 21) 4.37 0.727 12.022 5
Training of construction personnel (WMM3) 4.36 0.797 10.941 6
Accurate and good specifications of materials to avoid wrong ordering (WMM 26) 4.17 0.765 10.910 7
Proper storage of materials on site (WMM 7) 4.35 0.82 10.610 8 Checking materials supplied for right quantities and volumes
(WMM 13 4.32 0.817 10.575 9
Employment of skilled workmen (WMM 14) 4.22 0.813 10.380 10
Minimizing design changes (WMM 23) 4.15 0.876 9.475 11 Change of attitude of workers towards the handling of
materials (WMM 11) 4.12 0.893 9.227 12 Accurate measurement of materials during batching (WMM
15) 4.16 0.942 8.832 13
Mixing, transporting and placing concrete at the appropriate time (WMM 19) 4.21 0.978 8.609 14
Access to latest information about types of materials on the
market (WMM 22) 4.07 0.948 8.586 15
Vigilance of supervisors (WMM 6) 4.13 0.982 8.411 16
Weekly programming of works (WMM 18) 4.10 0.896 8.384 17
Careful handling of tools and equipment on site (WMM 17) 4.07 1.032 7.888 18 Good construction management practices (WMM 2) 4.24 1.098 7.723 19
Adherence to standardized dimensions (WMM 10) 4.18 1.103 7.579 20 Waste management officer or personnel employed to handle
waste issues (WMM20) 4.01 1.068 7.509 21
Just in time operations (WMM 8) 3.99 1.187 6.723 22
Early and prompt scheduling of deliveries (WMM 9) 4.01 1.203 6.667 23
Encourage re-use of waste materials in projects (16) 3.76 1.197 6.282 24
Use of low waste technology (WMM 12) 3.73 1.339 5.571 25
Recycling of some waste materials on site (WMM 1) 2.65 1.524 3.478 26
Empirical evidence of the levels of practice of the waste minimization measures
Table 2 gives a summary of average practiced scores (APS), practiced index values
(PIVs) and rankings of the level of practice of the various measures on the basis of
PIVs. WMM-25 is ranked the first measure highly practiced by the respondents to
minimize waste indicating that ‗using materials before expiry dates‘ is most frequently
practiced to minimize waste in Ghana. WMM-1 is ranked the 26th, indicating that
‗recycling of some waste materials on site‘ is the least practiced measure to minimize
waste in Ghana. The other measures evaluated have APS ranging between 4.10 and
3.64. Thus, apart from ‗recycling of some waste materials on site‘ (WMM 1), ‗using
of low waste technology‘(WMM 12) and ‗encouraging re-use of waste materials in
projects‘ (WMM 16), all the other measures evaluated by the construction
professionals are either practiced or frequently practiced to minimize waste in Ghana.
The ranking profile (Fig. 2) shows empirical evidence of the levels of practice of the
various measures to minimize waste in construction projects.

Waste minimization
449
Fig. 1 Ranking profile of the levels of significant contribution of waste minimization measures
The empirical evidence presented in Tables 1 and 2 and Figures 1 and 2 shows that the
ranking of the various waste minimization measures by the weighted average criteria
(i.e. the ASS and the APS) give the same results as that by the coefficient of variation
criteria (i.e. the MIV and the PIV). Thus, both criteria are effective for assessing the
relative levels of significance contribution and relative levels of practice of the various
measures in the implementing of construction waste management.
Fig. 2 Ranking profile of the levels of practice of waste minimization measures
The study has shown that the measures that are highly practiced by construction
organizations (i.e. ‗purchasing raw materials that are just sufficient‘ (WMM 25),
‗using materials before expiry dates‘ (WMM 24) and ‗use of more efficient
construction equipment‘ (WMM 5), are those that directly result in cost savings to the
organization, and the least practiced measures (i.e. ‗encouraging re-use of waste
materials in projects‘ (WMM 16), ‗using of low waste technology‘ (WMM 12) and
‗recycling of some waste materials on sites‘ ( WMM 1) are those that require
investment or further processing of materials to obtain value. Thus, the results show
little awareness among construction professionals on the importance of waste
minimization. This corroborates with the findings of Teo and Loosemore (2001) and
Lingard et al. (2000) on waste minimization in Australia. In Australia, waste
management was reported as a low project priority amongst construction workers.
Waste sorting and recycling although widely publicized by government bodies in
Australia, were still not used on most sites at the time. Applying environmentally
friendly technology on site and using low waste technology are considered less
attractive environmental management measure to construction organizations in Ghana,
confirming findings of Begum et al. (2006) and Shen and Tam (2002). Such measures

Ayarkwa, Agyekum and Adinyira
450
were seen as adding to their production cost hence defeating their perceived views of
waste minimization as a cost saving technique.
Table 2 Level of practice of waste minimization measures among professionals
Waste minimization measures (WMM) Average
Practiced score
(APS)
Standard
deviation (δ)
Practiced
index value
(PIV)
Rank of
Practiced index value
(PIV)
Using materials before expiry dates (WMM 25) 4.83 0.575 16.800 1
Use of more efficient construction equipment (WMM 5) 4.18 0.693 12.063 2
Purchasing raw materials that are just sufficient (WMM 24) 4.68 0.821 11.400 3
Adoption of proper site management techniques (WMM 21) 3.92 0.848 9.245 4
Good coordination between store and construction personnel to
avoid over ordering (WMM 4)
4.09 0.834 9.808 5
Minimizing design changes (WMM 23) 4.10 0.896 9.152 6
Training of construction personnel (WMM 3) 4.07 0.913 8.916 7
Proper storage of materials on site (WMM 7) 4.02 0.905 8.884 8
Employment of skilled workmen (WMM 14) 3.99 0.900 8.867 9
Accurate and good specifications of materials to avoid wrong ordering (WMM 26)
3.71 0.905 8.200 10
Checking materials supplied for right quantities and volumes
(WMM 13)
3.95 0.989 7.988 11
Change of attitudes of workers towards the handling of materials
(WMM 11)
3.83 0.978 7.832 12
Vigilance of supervisors (WMM 6) 3.95 1.030 7.670 13
Access to latest information about types of materials on the market
(WMM 22)
3.83 1.025 7.473 14
Accurate measurement of materials during batching (WMM 15) 3.88 1.071 7.246 15
Weekly programming of works (WMM 18) 3.64 1.017 7.158 16
Good construction management practices (WMM 2) 3.96 1.113 7.116 17
Mixing, transporting and placing concrete at the appropriate time (WMM 19)
3.88 1.092 7.106 18
Adherence to standardized dimensions (WMM 10) 3.97 1.131 7.020 19
Waste management officer or personnel employed to handle waste
issues (WMM 20)
3.73 1.134 6.578 20
Early and prompt scheduling of deliveries (WMM9) 3.76 1.169 6.433 21
Just in time operations (WMM 8) 3.67 1.143 6.422 22
Careful handling of tools and equipment on site (WMM 17) 3.69 1.154 6.395 23
Encourage re-use of waste materials in projects (WMM16) 3.42 1.203 5.686 24
Use of low waste technology (WMM 12) 3.53 1.312 5.381 25
Recycling of some waste materials on site (WMM 1) 2.55 1.422 3.586 26
CONCLUSION AND RECOMMENDATIONS
The study has provided empirical evidence on the levels of contribution and the levels
of practice of waste minimization measures in the Ghanaian construction industry. It
has shown that purchasing raw materials that are just sufficient, using materials before
expiry dates and use of more efficient construction equipment are perceived as the
three measures that most significantly contribute to waste minimization and also the
most practiced waste minimization measures. Encouraging re-use of waste materials
in projects, using low waste technology and recycling of some waste materials on sites
are, however, perceived as the least significant factors that contribute to waste
minimization and the least practiced measures simply because such measures are seen
as adding to their production cost instead of reducing cost. These findings will assist
in the formulation of appropriate policy interventions to address the construction
waste management problem in the Ghanaian construction industry. The findings will
also help firms to improve the quality of construction in Ghana.
In order to assist the construction industry to minimize materials wastage, the authors
recommend that government should enact laws and establish policies that engender

Waste minimization
451
positive attitudes towards waste minimization at all levels in a construction project.
Also the construction industry in Ghana should collaborate with relevant government
agencies to develop appropriate guidelines for preparing waste management plans for
the construction industry. The construction industry should also adopt low waste and
environmentally friendly technologies on site, and government should provide
incentives to the construction industry to encourage the reduction, recycling and re-
use of construction waste. Construction organizations should also provide waste
reduction training to site staff to raise their environmental awareness and improve
working procedures to reduce waste generation in construction projects.
REFERENCES
Architects Registration Council of Ghana (2010) List of fully registered architectural firms in
Ghana, available at http://www.archghana.org.
Ayarkwa, J. and Adinyira, E. (n.d.) Construction material waste in Ghana: Sources, causes
and minimization. Submitted for publication in the Journal of Construction: South
Africa ISSN 1994-7402.
Ball, J. (2002) ―Can ISO 14000 and eco-labeling turn the construction industry green?‖
Building and Environment, 37:4, 421-428.
Begum, R.A., Siwar, C., Pereira, J.J. and Jaafar, A.H. (2006) ―Implementation of waste
management and minimization in the Malaysian construction industry‖. Conservation
and Recycling, 51, 190-202.
Bossink, B. A. G. and Brouwers, H. J. H. (1996) Construction waste: quantification and
source evaluation. Journal of Construction Eng. and Management, 122:1, 55- 60
Chen, Z., Li, H. and Wong, T.C. (2002) ―An application of bar-code system for reducing
construction wastes‖. Automation in Construction, 11, 521-533.
Coffey, M. (1999) ―Cost-effective systems for solid waste management‖. Waterlines, 17:3, 23
Environmental Protection Agency of USA (2000) Solid Waste and Emergency Response.
EPA-530-F-00-001. United States.
Environmental Protection Department (2002) Hong Kong Environment 2002, Hong Kong
Government.
Faniran, O. O. and Caban, G. (1998) ―Minimizing waste on construction project sites‖
Engineering, Construction and Architectural Management, 5:2, 182–8.
Formoso, C. T., Isatto, E. L., and Hirota, E. H. (1999) Method for Waste Control in the
Building Industry. Procs IGLC-7, University of California, Berkeley, CA, USA.
Garas, G.L., Anis, A.R. and El Gammal, A. (2001) Materials Waste in the Egyptian
Construction Industry. Proceedings IGLC-9, Singapore.
Ghana Institution of Surveyors, GHIS (2010). List of fully registered quantity surveyors in
Ghana. Available at http://www.ghisonline.org.
Ho, O.S.T. (2001) Construction waste management - a contractor‘s perspective, The Hong
Kong Institute of Builders. Hong Kong.
Israel, G.D. (1992) Sampling the Evidence of Extension Program Impact. Programme
Evaluation and Organizational Development, IFAS, University of Florida. PEOD-5
management system operating in a large Australian contracting organisation:
implications for company policy implementation‖. Construction Management and
Economics, 18:4, 383–93.
Morledge, R. and Jackson, F. (2001) ―Reducing environmental pollution caused by
construction plant‖. Environmental Management and Health, 12:2, 191-206.
Ministry of Water Resource, Works and Housing, MWRWH (2011) List of registered
building contractors in Ghana, available at http.//ghana-net.com/ Ministry of Water
Resources_Works_and Housing_Ghana.aspx
Ofori, G. and Ekanayake, L.L. (2000) Construction material waste source evaluation. In:
Proceedings of the Second Southern African Conference on Sustainable Development
in the Built Environment, Pretoria, 35-1, 35–6.

Ayarkwa, Agyekum and Adinyira
452
Ofori, G., Briffet, C., Gang, G. and Ranasinghe, M. (2000) ―Impact of ISO 14000 on
construction companies in Singapore‖. Construction Management and Economics, 18,
935-947.
Peng, C.L., and Scorpio, D.E. (1997) ―Strategies for successful construction and demolition
waste recycling operations‖. Construction Management and Economics, 15, 49-58.
Pheng, L. S. and Tan, S. K. L. (1998) ―How 'Just-in-Time' Wastages can be Quantified: Case
Study of a Private Condominium Project‖. Construction Management and Economics,
16, 621-635.
Polat, G. and Ballard, G. (2004) Waste in Turkish Construction- Need for Lean Construction
Techniques. Proceedings of the 12th Annual Conference of the International Group for
Lean Construction IGLC-12, August, Denmark. 488-501.
Poon, C. S., Yu, A. T. W. and Jaillon, L. (2004) ―Reducing Building Waste at Construction
Sites in Hong Kong‖. Journal of Construction Management and Economics, 22, 461–
470.
Poon, C.S., Yu, A.T.W. and Ng, L.H. (2001) ―On-site sorting of construction and demolition
waste in Hong Kong‖. Resources, Construction and Recycling, 32:1, 157-172.
Shen, L. Y. and Tam, W. Y. V. (2002) ―Implementation of environmental management in the
Hong Kong construction industry‖. International Journal of Project Management, 20:7,
535-543.
Shen, L. Y., Tam, W. Y. V., Chan, C. W. S. and Kong, S. Y. J. (2002) ―An
examination on the waste management practice in the local construction site‖. Hong
Kong Surveyor, 13:1, 39-48.
Sherman,R.L. (1996) Managing Construction and Demolition Debris: A Guide for Builders,
Developers and Contractors. Published by: North Carolina Cooperative Extension
Service. Publication Number: AG-473-19.
Teo, M.M.M. and Loosemore, M. (2001) ―A theory of waste behavior in the construction
Industry‖. Journal of Construction Management and Economics, 19:7, 741–51.
Tse, Y. C. R. (2001) ―The implementation of EMS in construction firms: case study in Hong
Kong‖. Journal of Environmental Assessment Policy and Management, 3:2, 177-194.
Womack, J. P. and Jones, D. T. (1996) Lean Thinking: Banish Waste and Create Wealth in
Your Corporation. Simon and Schuster, New York, N.Y., USA.

Dada, J.O. (2011) Factors affecting women enrolment in construction education in Nigeria In: Laryea,
S., Leiringer, R. and Hughes, W. (Eds) Procs West Africa Built Environment Research (WABER)
Conference, 19-21 July 2011, Accra, Ghana, 453-464.
453
FACTORS AFFECTING WOMEN ENROLMENT IN
CONSTRUCTION EDUCATION IN NIGERIA
Joshua O. Dada1
Department of Quantity Surveying, Obafemi Awolowo University, Ile-Ife, Nigeria
The Millennium Development Goals (MDGs), as reflected in the agenda of many
African countries, have advocated for the empowerment of women in all aspects of
the economy for them to be economically self reliance and active participant in
decision making. While construction industry was found to be a major player in the
economy of any nation, in Nigeria and indeed a review around the world indicates
that all parts of this industry are male dominated. This paper reports on a study carried
out on assessing factors affecting women enrolment in construction education in
Nigeria. Structure questionnaires were used to collect data from targeted students,
within and outside construction related disciplines, of Obafemi Awolowo University,
Ile-Ife, Nigeria. The result indicates that respondents placed importance on the fact
that women were not at the fore front and their impact or participation not been felt in
construction sector. The issue of gender discrimination was also revealed as one of
the problems confronting the very few women in the sector. The paper also presents
charts showing the trend of women enrolment in construction as compare to those of
men over a ten year period. The charts show that women enrolment over the years is
extremely low. The paper concludes on the need to make concerted effort in the
enhancement of women enrolment and eventual participation in construction.
Keywords: construction education, enrolment, Nigeria, women.
INTRODUCTION
The issue of the role of women in the management of the world economy cannot be
overemphasized. Globally, the construction industry contribute about 1/3 of gross
capital formation and is an important vehicle for economic development through built
environment assets such as houses, roads, utility networks, schools and clinics
(Kenny, 2007). The construction industry has been male dominated for years, and on
many jobsites women construction workers are not welcome. Inequalities along
gender lines have been one of the main factors driving the establishment of women-
focused and, more recently, gender focused programme. The earliest and most
pronounced recognition of the gender disparities in development was the
announcement by the international community of International Women‘s Year in 1975
and its later extension into a women‘s decade (Wamukonya, 2002). Clancy and Dutta,
(2005) observed that gender mainstreaming has gained prominence since Platform for
Action from the 4th
International Conference on Women in 1995 called on
governments to mainstream gender perspective in all policies and programme to
ensure equalities of outcome for men and women.
All over the World, there is the issue of elimination of all forms of discrimination
against women; discrimination against women violates the principles of equality of

Dada
454
rights and respect for human dignity. Particularly there is emphasis on women‘s right
to non discrimination on education, employment and social activities, yet most women
in Nigerian and indeed in African countries are subjected to discrimination based on
gender and often suffer from neglect and abuse by men. Despite the fact that it is
obvious that women are lagging behind in construction participation in Nigeria, the
factors responsible for this have not been investigated and it was this lack of
information that led to the research described in this paper. The paper also presents
trend of women enrolment in construction as compare to those of men over a ten year
period.
AN OVERVIEW OF SOCIO-ECONOMIC CHARLENGES
CONFRONTING WOMEN
At the outset of the United Nation decade for women in 1975, it was noted that
women constitute about 50 percent of the world‘s population. But unfortunately
despite this population, they own only 1 percent of the world‘s wealth (Akande,
1996). In 1970, when Occupational Safety and Health Administration (OSHA) was
enacted, women made up less than 1 percent of workers in the construction trades and
in 1995 that percentage had only grown to 2.3 percent (US Department, 1996).
Women play multiple roles as economic producer, as managers of households, as
producer of services, as workers providing the household with all its necessities, as
producers of children and in caring for their community. The Women Commission for
Refugee and Women and Children (2006) pay particular attention to the problem
women in refugee camps are facing. Millions of women and girls venture out from
their camps into danger, risking rape, assault, abduction, theft, exploitation or even
murder, in order to collect firewood to cook for their families. Moreover, there has
been erroneous assumption for women in that men are involved in productive work
outside the house while the women takes overall responsibility for reproductive and
domestic work. Wickham (2001) remarked that even though women may be in the
labour force, they are not achieving their full economic potential.
A REVIEW OF NIGERIAN WOMEN EDUCATION AND
TRAINING IN CONSTRUCTION
The issue of education cannot be overemphasized in the development of any nation. It
is generally accepted that it is through education that we can develop our human
resources. Studies have shown that while in primary school, close to 60 percent of the
enrolment is female; the proportion drops to about 32 percent in secondary schools
and to about 12 percent in the universities. Williams (2006) established the fact that
many females do not take their study seriously and many come out with very bad
results. Likewise more boys are enrolled in school than girls due to cultural beliefs.
From this premise she suggested that female students should take their academic work
seriously as that is the only way through which they can disengage themselves from
the shackles of cultural subjugation.
World figure for literacy, higher education in scientific and technical courses shows
that women are lagging far behind men. Female enrolment ratios in higher education
in developing countries are typically only half the male ratio. In Sub- Saharan Africa,
women‘s enrolment rates for tertiary education are only a third of those of men. Even
in industrialized countries women are poorly represented in scientific and technical
study. As a result, there are few women Engineers, Architects, Builders, Planners, etc.
(Ademororti, 1994). Research has shown that women suffer disadvantage in built

Women enronment in construction education
455
environment that is planned chiefly by men and primarily for men and so changes
need to be made. Mogbo (1999) belated the neglect of role of women in construction
practices and education in Nigeria in the National construction Policy and Vision
2010.
RESEARCH APPROACH AND METHOD
The overall research project has been approached through the multiple methods of
literature review and questionnaire survey. A case study approach, using a university,
was adopted for the study. Edwin et al (2002) admitted that universities have a role to
play in the training of competent professionals. Roesset and Yan (2000) also believed
that universities with research capacities have a role to play that is ―to assume a more
active role in the formulation of rational continuing education programmes that will
provide a solid opportunity for lifelong learning, rather than providing only a handful
of short-course offering without any linking or continuity among them‖. It was on this
premise that the paper is focusing university as the training ground for construction
professionals. The data for the study has been collected from two different groups of
students from Obafemi Awolowo University, Ile-Ife Nigeria. The first group belongs
to female students outside construction related disciplines and for this, a total of 200
students were randomly selected from various disciplines. The selected students cut
across the 13 faculties of the institution. The second group comprises female students
from construction related disciplines - architecture, civil engineering, building
technology, quantity surveying, estate management, mechanical engineering and
electrical and electronic engineering. For this a total of 50 out of the 109 female
students were randomly selected. Measurement of perception of respondents on
factors affecting women enrolment (response from group 1) and difficulties faced by
female students in construction (response from group 2) was approached on relative
importance index basis. The respondents were asked to rate, on a five-point Likert
scale, the significance of the factors, where 1 = not significant, and 5 = highly
significant. The numerical scores assigned by respondents were transformed to
Relative Importance Index (RII).
For the purpose of comparing female enrolment as against their male counterparts,
secondary data on students‘ enrolment in the various construction related disciplines
of the institution from 1995 - 2006 were collected from the administrative officers of
the respective disciplines. These were used to generate the charts showing the trend
for the period. It is to be noted that 2000 and 2004 academic year was cancelled at
Obafemi Awolowo University.
RESULTS AND DISCUSSION
Respondent profile
A total of 250 questionnaires were administered, 200 to group 1 and 50 to group 2. A
total of 156 respondents replied (118 for group 1 and 38 for group 2), achieving a
response rate of 62%. The disciplines of the respondents are shown in Table 1 and 2.
Of the 156 respondents who participated in the survey, 24.4% were from construction
related disciplines while 75.6% were from disciplines outside construction related
field. This justifies the essence of capturing the views of respondent outside
construction related fields. In order to be sure that respondents has adequate
understanding of construction and its operation (especially for those outside
construction related fields); the term construction was defined and its activities
highlighted in the questionnaire. Table 3 shows the level of understanding of the

Dada
456
respondents about construction and its operations. On the basis of this it is inferred
that the respondents has knowledge of construction and the data obtained from them
can be relied on.
Table 1: Discipline of respondents (Group 1)
Discipline of respondent No.
Sociology and Anthropology 5
Management and Accounting 9
Economics 6
Computer Sc. and Engineering 3
Medicine 9
Biochemistry 4
Geography 4
Physiotherapy 3
Agricultural Engineering 4
Law 8
English Language 7
Education Foundation and Counseling 2
Religious Studies 2
Dramatic Art 2
Nursing Science 3
Medical Rehabilitation 3
Political Science 5
Zoology 4
Crop Production 2
International Relation 4
Local Government 3
Microbiology 5
Mathematics 3
Pharmacy 6
Animal Science 5
Agricultural Economics 4
Total 118
Table 2: Discipline of respondents (Group 2)
Discipline of respondent No.
Architecture 6
Building Technology 2
Civil Engineering 4
Electrical and Electronics Engineering 9
Estate Management 7
Mechanical Engineering 5
Quantity Surveying 5
Total 38
Table 3: Level of Understating of respondents about Construction
Level of Understanding No. Percentage
Adequate knowledge 43 27
Average knowledge 66 42
Fair knowledge 26 17
Faint knowledge 12 8
No knowledge 9 6
Total 156 100

Women enronment in construction education
457
FACTORS AFFECTING WOMEN ENROLMENT IN
CONSTRUCTION
From the review of literature carried out, factors affecting women education and
eventual participation in construction were identified. Employing the identified
factors, the respondents were asked to indicate the importance they place on each on a
five-point Likert scale, the significance of the factors, where 1 = not significant, and 5
= highly significant. Their response is shown in Table 4.
Lack of female role model to emulate
The study revealed the issue of lack of female role model to emulate as the highest
rating factor affecting women enrolment in construction education. This revelation is
not surprising as previous researchers have established it that less than 5 percent of
Nigerian women are managers. Awe (1991) revealed that out of the 50 companies
quoted in Nigeria, none of the blue chips bosses is a woman. In the same vein, while
about 55 percent of the workers in the Nigerian public service, GL 1-6 are women,
only about 9 percent of workers on GL 15-17, are women (Clark, 1992). The issue of
role model and mentorship is very important in any human endeavour. If we have
more women architect, engineer, quantity surveyors, builders, etc, in top position of
their respective fields, it will serves as an impetus and morale booster for increase in
women enrolment in construction fields of study. In this regard all forms of
discrimination against women to get to the highest position in construction field
(either in private or public sector) should be avoided. This is in line with Ferguson and
Dunphy's (1991) suggestion that qualified women should be made more visible in
organisations by promoting them to positions of real power. Recently in Nigeria,
female activist under the aegis of Gender and Affirmative Action (GAA) and the 100
women Group Platform, have urged President Goodluck Jonathan to fulfill his
campaign pledge of allocating 35% of his new cabinet position to women. This is to
ensure adequate representation of women in appointive position in line with the
National Gender Policy – the 35% Affirmative Action of the Beijing Conference and
other International instruments, which Nigeria is signatory to.
Job opportunity
Low job opportunity was observed as the second highest rating factors affecting
women enrolment in construction education. This calls for a serious concern as the
pattern is similar all over the world. Of the 105,567 persons formally employed in
Zimbabwe‘s construction sector in 1999, only 6.3% were women (CSO, 2002). In the
Czech Republic, 2.7% of entrepreneurs in the construction sector were women and
4.5% of influential positions in the construction business were held by women
(Putnova, 2007). The Singapore Labour Force Survey reported that women constitute
42% of the local labour force, but only 15% of the construction industry's local labour
force are female (Ling and Leow, 2008). In North America, women constitute about
10% of the construction participants (Sigcau, 2004) and in South Africa about 8% of
construction sector managers are women (Mjoli-Mncube, 2005). This trend is also
observed in other countries, whereby the construction workforce remains
overwhelming male (Dainty et al., 2001). It has been found that equipping women
with construction related skills as well as giving them confidence to champion their
development, ensures that women engage in self – build housing projects which not
only ensure that women are adequately shelter, but also that they earn an income from
such skills. This works on the premise that getting women to participate in the

Dada
458
construction industry empowers them to harness their development and thus reducing
vulnerability amongst women.
Table 4: Index of importance placed on factors affecting female enrolment in construction.
Factor *Mean Score Rank
It is tasking and difficult 2.85 4
Lack of awareness right from
secondary/high school 2.31 7
Perception of construction
not suitable or meant for female 3.11 3
No female role model to emulate 4.08 1
Low job opportunity for female 3.72 2
Difficulty in coping couple
with family responsibilities 2.46 5
Poor background in science
and technical subjects 2.21 8
Religious factor 1.32 9
Female prefers social
sciences and art discipline 2.39 6
* Mean score calculated from five-point Likert scale, where 1= not significant, and 5 = highly significant.
Construction not meant for women
Another important factor is the perception that construction is not suitable for women
and invariably meant for men. This finding is in agreement with Loosemore and
Galea‘s (2008) study which viewed construction industry as a male dominated and
threatening environment, with an ingrained culture characterised by masculinity,
conflict and crisis. In line with this finding, Powel et al (2005) highlighted the
problems associated with the integration of women into construction despite their
education status in the field. This they called the problem of transition from higher
education to the workplace. Powell et al‘s research also indicated that women starts to
develop strategies for coping within a male dominated workforce, although the coping
mechanism have not been able to challenge the existing culture and structure of the
construction sector.
In an attempt to ameliorate this problem, Bagilhole (1997) made a case for increasing
the number of women in construction sector. Also, there has been a call for more
gender-balanced construction organization. Etzkowitz et al (2000) have also argued
that women face a series of gender related barriers to success in scientific carriers
despite recent advances. Arising from all these myriads of problems confronting
women, there have been calls for increase in women participation in construction and
numerous initiatives have been suggested from many quarters. Mogbo (1999)
suggested the review of the Nigerian National Construction Policy to make special
provisions for women to be adequately involved in policy formulation and
implementation as well as participation in construction services which had always
been practically reserved for men. Women in the next millennium should cease to be
―hewer of woods‖, ―drawers of water‖ and ―sellers of food‖ on construction sites.

Women enronment in construction education
459
They should be appointed construction site managers, project supervisors etc.
Education and training programmes will have to create special quota for women as an
encouragement in order to achieve these objectives.
Another major constraint on the participation of women in the labour force of
construction sector related to labour-protection laws which imposes statutory
restrictions on the conditions of women employment, though this is meant to be
reviewed periodically in the light of scientific and technological knowledge but this is
largely ignored in many countries. As a result, many protections –related occupation
in the formal construction sector remain an exclusive preserve of men. Mutandwar et
al (2008) in their opinion has advocated for the need to explore strategies that can
reduce gender burden that arises due to the conflicts between social and economic
activities. They also suggested the need for re-orientation of the national housing
policies so as to explicitly incorporate the specific needs of women in the construction
industry.
Construction subjects regarded to be difficulty and tasking
Akande (1996) challenged the Nigerian womenfolk in that their deprivation is not in
men who have the right to preserve the status quo of the exclusive ―men‘s club‖.
Rather, it is that of women, who in spite of their culturally disadvantaged position and
deprivation, still create more loopholes for exploitation. In view of this, the onus rests
on women to take their destiny in their hand by rising up to the challenge.
Difficulty in coping coupled with family responsibilities
One of the factors militating against women in realisation of their full economic
potential is the difficulties in coping with their career and family responsibilities.
Wickham (2001) remarked that even though women may be in the labour force, they
are not achieving their full economic potential because their specific needs and
characteristics are often overlooked. The challenge of striking a balance between
household chores and economic activities has been observed and as such there is need
to develop a career programme that will allow women to combine work and family
life more effectively. This is in consistent with Tigges and Green‘s (1994)
recommendation, which advocated for real progress in closing the gender gap by
developing program which will reduce their ―double burden‖ of family and market
work. This can be in form of introducing flexible practices, childcare arrangements
and career-break schemes. Lee and Choo (2001) suggested various ways of
implementing flexible work schedules. For example, employees can work an eight-
hour day by choosing their preferred time. But, they must be in the office during
specified ''core'' hours. They can also be given options to complete a 40-hour week in
four 10-hour workdays.
Preference for other disciplines
The other factor rated high is that women preferred discipline such as social sciences
and arts. Again this reflects the true picture of the situation in Nigerian education
enrolment. Typical analysis of student enrolment in different discipline shows that we
have more female in art and social sciences. Compared to other sectors, construction
sector experiences negative/low growth rates. With unfavourable growth rates, career
opportunities and prospects in the construction industry are bleak. Consequently, it
will lose valuable human assets to other sectors.

Dada
460
Poor background in science and Technical subjects
Lane (1997), co-author of ‗The Rising Tide‘ report on women in Science, Engineering
and Technology (SET), commented, ―Engineering…. is a subject where women are
currently catastrophically underrepresented‖. Studies have shown, however, that
women are not driven away from technology because of lack of ability but rather
because of ―an atmosphere dominant masculinity (Sagebiel, 2003). Lack of
appropriate training of women in technical skill was noted as a major constraint that
limits women participation in construction activities. This is corroborated by Mjoli-
Mncube (2005) who indicated that the dearth of technical skill have been a major
hindrance in effective participation of women in South African‘s booming
construction industry. Technical training is therefore a strategy that could be used to
improve women involvement in construction. Other factors, affecting the enrolment
of women into construction are lack of awareness and religion factor factors. These
factors were, however rated low. This means that women should rise up to the
challenge confronting them rather than hiding under the issue of religion and lack of
awareness.
DIFICULTIES FACED BY WOMEN ENROLED IN
CONSTRUCTION
Respondents were asked to indicate the seriousness of 4 difficulties (identified from
the literature) faced by female students who are in construction related discipline.
Table 5 revealed degree of seriousness of the difficulties. The main problem here is on
gender discrimination. This correlates with the submission by Dainty et al (2000) that
sex discrimination and anti-women attitudes are still prevalent on worksites, despite
the fact that sex discrimination is illegal. Several studies have shown that female
construction workers suffer from gender and sexual harassment, a factor associated
with low job satisfaction as well as psychological and physiological health symptoms
and workplace injuries. The issue of gender discrimination should be totally
eradicated or discouraged in the system. As was suggested by Mogbo (1999), there
should be an enabling law giving equal chance to both male and female in the
National Construction Policy. The decline in female enrolment in construction and
eventual participation may be attributable to policies not favourable to them.
Table 5: Index of importance placed on difficulties faced by female enrolled in construction
Factor * Mean Score Rank
It is tasking and strenuous 4.56 3
Gender discrimination 6.84 1
Intimidation by male counterpart 4.90 2
Poor performance 2.14 4
* Mean score calculated from five-point Likert scale, where 1= not serious at all, and 5 = very serious.
Another factor is the intimidation by male counterpart. This may be due to the fact
that men are the majority. These are good factor to be addressed in the promotion and
enhancement of women participation in construction. We can also see from the table
that the issue of tasking/difficulty of construction subjects and performance were rated
low. This means that the female students can cope very well with construction
subjects. If they can do well in sciences, social sciences, arts and humanities; they can
as well perform very well in construction or engineering if they are given equal
chance. The view that construction is tasking and strenuous was rated low. Women
should not use this as an excuse for not coming into construction. The popular adage
that ―what a man can do, a woman can do, even better‖ should be seen as a challenge

Women enronment in construction education
461
by women folk. In the same vein, the issue of poor performance is a mere excuse and
should not stop women from participating in construction.
TREND OF WOMEN ENROLMENT IN CONSTRUCTION
A comparison between women and men enrolment was conducted for a 10 year
period. From figure 1, it is clearly indicated that women are lagging far behind men in
enrolment in construction. This is reflected in all the construction related disciplines
considered as the charts are of the same pattern. Transposing the chart to a line graph
gives the trend analysis in figure 2. From this the trends are brought to a clearer
picture. In all, except in two occasions that we have women enrolment up to 50% of
that of men, it can be observed that the percentages, as compare to those of men,
remain below 30% on the average. This shows that women are grossly under enrolled
when it comes to construction education. From this it is clearly indicated that
something must be done to arrest this ugly trend so as to boost the participation of
women in construction.
Figure 1: Women enrolment in construction related disciplines as compared to men

Dada
462
Figure 2: Trends in women enrolment in construction related disciplines
CONCLUSIONS AND RECOMMENDATIONS
This paper assessed women enrolment in construction education in Nigeria. It
identified the factors affecting their enrolment and examined the trend over a 10 year
period. The findings of the study indicates that the fact that women were not at the
fore front and their impact or participation not been felt in construction sector is a
major factor affecting women enrolment in construction education. This is attributable
to the negative perception by the society towards women participation in construction
works. The study findings also showed the issue of gender discrimination as one of
the problems confronting the very few women in construction. The trend analysis
shows that women enrolment over the years is extremely low in comparison with that
of men. The research findings points to the need to revise the Nigerian National
Construction Policy in such a way that women are given special consideration due to
their peculiar nature. The issue of gender discrimination against women should be
completely eradicated. The paper concludes on the need to make concerted effort in
the enhancement of women enrolment and eventual participation in construction.
REFERENCES
Ademoroti, G. (1994). Technological Participation of Women in the Construction Industry.
Builder‟s Magazine, Vol. ix, No. 3, October/December, 2-9.
Akande, J. (1996). Women in the Management of the Nigeria Economy. Management in
Nigeria (Journal of the Nigerian Institute of Management), Vol. 32, No. 1, January
/March, 15-18.

Women enronment in construction education
463
Awe, B. (1991). The role of the Nigerian Women in Management in the 90‘s. Management in
Nigeria (Journal of the Nigerian Institute of Management), Vol. 27, No. 1,
November/December, 8.
Bagilhole, B. (1997). Equal Opportunity and Social Policy: Issues of gender, race and
disability. London: Longman.
Clancy, J. and Dutta, S. (2005). Women and productive uses of energy: some light on
shadowy area. Paper presented at UNDP meeting on productive of renewable Energy,
Bangkok, Thailand, 9-11 May.
Clark, E. (1992). Breaking Gender Management Monopolies. Management in Nigeria
(Journal of the Nigerian Institute of Management), Vol. 28, No. 4,
October/December, 10.
Central Statistics Office (CSO). (2002). Men and Women in Zimbabwe, Harare, Zimbabwe.
Dainty, A.R.J, Bagihole, B.M. and Neale, R.H. (2001). Male and female perspectives on
equality measures for the UK construction sector, Women in Mnagement Review,
Vol. 16, No. 6, 297-304.
Edwin, H.W., Chan, M.W., Scott, D. and Chan, A.T.S. (2002). Educating the 21st construction
professionals. Journal of professional issues in engineering education and practice,
January, 44 -51.
Etzkowitz, H., Kemelgor, C. and Uzi, B. (2000). Athena Unbound: The advancement of
women in science and technology. Cambridge: Cambridge University Press.
Ferguson, T. and Dunphy, J. (1991). Answers to the Mommy Track. New Jersey: New Horizon
Press.
Kenny, C. (2007). Construction, Corruption and Developing Countries. World Bank Policy
Research Working Paper 4271, June.
Lane, N. (1997). Women in Science, Engineering and Technology: The rising tide report and
beyond. In: Maynard, M. (Ed.) Science and the construction of women. London: UCL
Press.
Ling, F.Y.Y. and Leow, L. (2008). Enabling Knowledge Flow: Retaining Graduate Women in
the Singapore Construction Industry. Journal of Construction in Developing
Countries, Vol. 13, No. 2, 65-81.
Lee, J. and Choo, S.L. (2001). Work-family conflict of women entrepreneurs in
Singapore. Women in Management Review, 16(5): 204–221
Loosemore, M. and Galea, N. (2008). Genderlect and conflict in the Australian
construction industry. Construction Management and Economics, 26: 125–135.
Mjoli-Mncube, N. (2005). Opportunities for women in housing. Paper presented at “Creating
sustainable human settlements, in KwaZulu Natal Conference, Durban, South Africa,
March.
Mogbo, T.C. (1999). Education and Training of Nigerian Construction Professionals (1991-
2010). The Quantity Surveyor. (Journal of the Nigerian Institute of Quantity
Surveyors), Vol. 26, January/March, 5-14.
Mutandwa, E., Sigauke, N. and Muganiwa, C.P. (2008). Urban Women‘s Participation in the
Construction Industry: An Analysis of Experience form Zimbabwe. Journal of
International Women‟s Studies, Vol. 9 (3), May, 256-268.
Powell, A.D., Dainty, A.R.J., Bagilhole, B.M. and Neale, R.H. (2005). Coping in
Construction: Female Students‘ Perspective. Proceedings of 21st Annual conference
of ARCOM, Vol. 1, 7-9 September, London, 34-42.

Dada
464
Putnova, A. (2007). Czech women‘s entrepreneurship. Electronic Journal of Business Ethics,
Vol. 12, No. 2, Business and organization Ethics Network.
Roesset, J.M and Yao, T.P. (2000). Roles of civil engineering faculty. Journal of Professional
Issues in Engineering Education and Practice, 126(1), 8-15.
Sagebiel, F. (2003). New Initiatives in Science Technology and Mathematics Education at the
Formal Level: Masculinity cultures in engineering departments in institution of higher
education and perspectives for social change. Proceedings of GASAT 11 Conference,
6-11 July.
Sigcau, S. (2004). Messages from the Minister: 2004 Annual Report of South Africa‘s women
in construction, Dezinamite Printers, Pretoria for the Development Bank of South
Africa, Halfway House, Midrand.
Tigges, L.M. and Green, G.P. (1994). Does small business offer opportunities for women in
rural areas? Department of Agricultural Economics, Community Economics,
University of Wisconsin-Madison, No. 266, USA.
U.S. Department of Labour, Bureau of Labour Statistics (Employment and Earnings). (1996).
Washington.
Wamukonya, N. (2002). A critical look at gender and energy mainstreaming in Africa. Paper
presented at the “gender perspectives in sustainable development”, side event
organized by UNDESA/DAW and WEDO at Prp Com III, April.
Wickham, P.A. (2001). Strategic entrepreneurship: A decision making approach to new
venture creation in management. London: Pearson Education Limited.
Williams, S. (2006). A legacy of Women Empowerment. Gender Equity Initiative Bulletin (Bi
–Annual publication of Centre for Gender and Social Policy Studies, Obafemi
Awolowo University, Ile Ife, Nigeria), Vol. 4, No. 1 September, 3-4.
Women Commission for Refugee and Women and Children (2006). Beyond Firewood: Fuel
Alternatives and Protection Strategies for Displaced Women and Girls. New York.

Stanley, A.M. and Orobowale, O. (2011) Factors influencing land accessibility for housing
development in Abuja, Nigeria In: Laryea, S., Leiringer, R. and Hughes, W. (Eds) Procs West Africa
Built Environment Research (WABER) Conference, 19-21 July 2011, Accra, Ghana, 465-471.
465
FACTORS INFLUENCING LAND ACCESSIBILITY FOR
HOUSING DEVELOPMENT IN ABUJA, NIGERIA
Andrew Mhya Stanley1 and O. Orobowale
Department of Building, Ahmadu Bello University, Zaria, Nigeria
Housing has been rated the second most important need for human development. Its
accessibility has continued to pose serious challenges to policy makers and
stakeholders in most developing countries. It was identified that land availability has
been a factor militating against housing development in Nigeria. This study was
conducted to assess the factors associated with land accessibility for housing
development in the Federal Capital City (FCC) Abuja-Nigeria. The method adopted
for this study included; use of questionnaire, collate records from land administrators
and articulation of literature from books, journals, internet etc. Results obtained
shows that 63.64% of the respondents applied for land in the FCC and 61.9% were
denied. This was due to non-compliance (100%) with mode of application. Other
factors included; financial constraints (75%), bank high interest rate (66.67%), apathy
(33.33%), cumbersome application process, revoked due to delay in development of
allocated land (50%) etc. It was concluded that 2/3 (two third) of the applications
were denied, accessing loan from financial institution by the applicants for
development is difficult, there is cumbersome application process etc. It was
recommended that; land application for housing development should be encouraged
and applicants given equal chances, government should encourage more active
participation of the private sector in housing delivery, prolong procedure of land
accessibility should be reduce, financial institutions should relax the stiff conditions
laid down to obtain fund without high interest and collateral.
Keywords: Abuja, housing, land accessibility, Nigeria.
INTRODUCTION
Housing has been universally accepted as important component of overall human
development. It is rated second to food on human scale of preferences (Nubi, 2008).
Inspite of its importance, its provision has continued to pose problems to policy
makers and stakeholders. These problems are common in most Sub-Saharan African
(SSA) countries where over 40% of the populace lives below the international poverty
level of less than $1 a day (Groves, 2004). Groves (2004) attributed these to factors
such as poor policy formulation, difficulties in accessing funds from the financial
institutions and poverty level. Other factors included unavailability of land, rural-
urban migration which account for over 65% urban population growth, inefficient
mortgage system/financial intermediation process and ineffective land administration
system.
In an effort to tackle these problems, several administrations in Nigeria have
introduced different housing programmes and created institutional frameworks, but
continued unabated. Records from 1979 to date showed that investment in the housing

Ampadu-Asiamah and Agyei
466
sector by the public sector was 1.0 to 9.0% of the total annual budgets (Federal Office
of Statistics, 1998). This figure is far below what is in operation (15%) in most
developing countries (Ughamadu, 1991). There is therefore need for both the public
and private sectors to create conducive environment to tackle the problems in Nigeria.
Land availability and ineffective land administration have been identified as the major
factors militating against housing development in Nigeria despite the existence of the
land use act over the past 30 years (Iseh, 2004). These problems have also been
identified by previous researches (Olayiwola, 2000; Omirin, 1997; Onakerhoraye,
1984; Olaore, 1981; Mabogunje,1968). Abiodun (1997) observed that the major actors
(public and private sectors) in housing delivery are also faced with the constraint to
access land in Nigeria, mostly due to land bureaucracy. The complexity of land tenure
system in the country has actually affected the development of housing in most urban
cities. For instance, the customary law and cultural attachments to land conflicts with
the land use act under the control of state governor and minister of the FCT. This has
influenced difficulty to access land for urban housing development.
Abuja by virtue of its location and other important factors was made the federal
capital city of Nigeria to solve problems which became impracticable in the then
federal capital city Lagos. Government parastatals, private bodies, schools, businesses,
NGOs etc flocked into the city from different parts of the country for greener pastures.
This influenced the demand for housing in all parts of the city. The government in its
effort to tackle this problem created the Federal Capital Development Authority
(FCDA) which has been in existence for over a decade, solely responsible with the
design, planning and implementation of the master plan, provision of infrastructural
facilities, residential accommodation, provision of available plots of land for
development etc. This paper assesses some of the factors affecting land accessibility
and housing development in Abuja with a view to highlight the factors responsible
and proffer solutions.
RESEARCH METHOD
The method adopted in this study included the use of primary and secondary sources
for data collection. The primary source included use of questionnaire, oral interview
and records from land administrators. Secondary source included articulation of
literature from books, journals, internet etc. Fourty (40) questionnaires were carefully
designed and administrated to respondents randomly to seek how they possessed and
developed land for residential purposes in Abuja. The questionnaire was divided into
two (2) parts. The first part seeks the respondents‘ profile, while the second part seeks
to know if the respondents have ever applied for land in the Abuja, how many applied
for, how many approvals were made, how it was developed, if not approved, what are
the reasons etc. Also, interview was conducted with land officials in the FCT to seek
modalities on land administration and criteria use for selection. Data generated were
analysed using simple statistical tools such as mean, percentages etc and presented in
tabular form.
RESULTS AND DISCUSSION
A total of fourty (40) questionnaires were administered to respondents, out of which
thirty three (33) representing 82.5% were returned, while seven (7) representing
17.5% were not returned.

Land accessibility
467
1. Respondents‟ Profile Table 1: Respondents‘ Age Bracket
Age bracket Frequency
(N)
Percentage
(%)
18-25 - 0
26-35 8 24
36-above 25 76
Total 33 100
Table 1 show that 8 out of 33 respondents were between ages 26-35 which represent
24% while 25 were between ages 36 and above representing 76% with the highest
responses. This particular age group is more than 2/3 of the total respondents. It is
believed that at this age group most are married and are regarded as more responsible
in the society because they have families to care for. This may be the reason why most
of the respondents applied for land as shown in Figure 2.
Figure 1 show the educational qualification of the respondents where 6% have SSCE,
15% OND/NCE, while the larger respondents (48%) have HND/BSc. Others not
specified had 36%. These imply that most of the respondents are knowledgeable and
the level of their education gives them the opportunity to know how to apply for land
and the mode of application as shown in Figure 2. It could also be the reasons why the
FCT land administrator receives an average of two hundred and fifty (250)
applications per month as shown in Table 6.
2. Application for Land and Approval
0
5
10
15
20
25
30
35
40
45
50
First Sch.
Leav.
Cert.
SSCE OND/NCEHND/BSc Others
Pe
rce
nta
ge (
%)
Educational Qualification
Fig. 1: Educational Qualification of Respondents
0
10
20
30
40
50
60
70
Yes No
Pe
rcen
tage
(%
)
Fig. 2: Number of Respondents Applied for Land in FCT

Ampadu-Asiamah and Agyei
468
Figure 2 shows that 21 respondents applied for land in the FCT which represent
63.64%, while 36.36% representing 12 respondents did not applied.
Table 2: Reasons for Not Applying
Reason(s) Frequency
(N)
Percentage
(%)
Lack of fund 4 33.33
Ignorance 3 25
Apathy 5 41.67
Total 12 100
Table 2 shows that 33.33% of the respondents did not applied for land in FCT due to
lack of fund, 25% were due to ignorant of the process, while 41.67% with the highest
frequency were due to apathy. Majority of the respondents do not apply for residential
land because they are not just interested in going through the rigorous application
process. Some are ignorant, while some due to financial reasons. Those who have
apathy for application of land feel so because they don‘t have time to go through the
process.
Figure 3 shows that 13 out of the 21 respondents who applied for land in the FCT
representing 61.91% were denied, while 8 representing 38.09% were approved. These
imply that the number of respondents who did not get approval for land in FCT out
weighs those who got. The reason why those who did not get approvals might be
because the applications do not comply with the requirements as shown in Table 6.
This could also be the reason why land development is low as shown in Table 3.
100% of the applications received by the administrator were through paper mode,
none use the online process. This is in conformity with the responses from the land
administrators shown in Table 6.
Table 3: Land Developed at the Stipulated Period
Developed Frequency
(N)
Percentage
(%)
Yes 4 50
No 4 50
Total 8 100
Table 3 shows that 4 out of 8 respondents who got land approval developed their
lands, while the remaining 50% respondents have not developed same. This could be
attributed to lack of fund for most successful applicants who are savings before
embarking on the development.
Yes
No
Fig. 3: Approval for Land Application

Land accessibility
469
Figure 4 shows that 75% of the respondents have not developed the land allotted to
them due to financial constraints, while 25% represents those who could not develop
due to delay in building approval. These imply that the respondents could not save
from their income and they do not have access to loan facility from financial
institutions as shown in Table 4. This is the major reason why housing delivery is low
in the urban centres.
Table 4: Application for Funds from Financial Institution for Land Development
Applied Frequency
(N)
Percentage
(%)
Yes 1 25
No 3 75
Total 4 100
Table 4 shows that 1 respondent representing 25% applied for fund from financial
institution for the land development while 75% represents those who did not apply for
fund from financial institution. Majority do not apply for fund from financial
institution due to high interest rate and use of collateral for the application as shown in
Table 5.
Table 5: Reasons for Not Applying for Fund
Reason(s) Frequency
(N)
Percentage
(%)
High interest rate 2 66.67
Lack of collateral - 0
Apathy 1 33.33
Total 3 100
Table 5 shows that 2 respondents did not apply for financial assistance because of
high interest which represents 66.67%, while 33.33% were due to apathy. This may
also be responsible for low development of residential lands shown in Figure 4.
3. Process and Mode of Land Application in the FCT
Interview conducted with land officials in the FCT were collated and the results are
presented in Table 6.
CONCLUSIONS
Based on the limited findings, the following conclusions were made:
0
10
20
30
40
50
60
70
80
Lack of Fund Delay in
Building
Approval
Revocation of
Land
O thers
Fig. 4: Reasons for Non Development
Reason(s)
Pe
rcen
tage
(%
)

Ampadu-Asiamah and Agyei
470
- Despite the existence of Act for over 30 years there are problems of land speculation
and racketing in the FCT.
- Over 2/3 (two third) of the applicants who apply for residential land in FCT do not
get approval because of non meeting up with the requirement stipulated by the
administrators.
- There is rise in the number of undeveloped residential land due to lack of fund.
- Accessing loan from financial institution by the applicants is difficult due to high
interest rates and use of collateral.
- The process of accessing residential land is characterized by a long procedure which
takes quite a number of years and this discouraged the applicants to abandon the
process.
Table 6: Process of Land Administration
Format Process
Process of getting residential land *filling of application forms
*attachment of bank draft for the application fee on the
form
*submission of filled forms with the requirements.
Tools/Method for land application Paper Application
Source of application form Forms are collected from office of Abuja Geographical
Information System or download from their website.
Time taken to process an application No fixed time schedule for processing an application of
land. The application moves from submission point to
the next office for treatment.
No of applications received in a month On the average 250 applications per month.
Rationales for Land Approval The rationales for land approval are based on payment of
application fees, attachment of all necessary documents
and provision of necessary information.
Rationales for Disapproval of Application No application is disapprove if the requirements are met.
The following recommendations were drawn:
- Government should provide a measure that can curb or eradicate completely the
menace of land speculation and racketing.
- All applicants for residential land should be given equal chances which should be
devoid of favouritism and nepotism.
- Government should encourage more active participation of the private sector in
housing delivery.
- The prolong procedure of land accessibility should be streamlined and reduced to a
more convenient and reasonable way.
- Financial institutions should relax the stiff conditions laid down to obtain fund so
that applicants can have access to such without high interest and collateral.
REFERENCES
Abiodun, A. (1997): Land Accessibility in Nigeria. Pamphlet on Housing Issues.
Akujuru, V. (2004): Land Administration and Infrastructure Management for Urban
Development. Paper Presentation at the Nigerian Institution of Estate Surveyors
Annual Conference 1st April, pp 1-8.
Agbola T. and Olatubara C (2003): Private Sector Driven Housing Delivery in Nigeria: Issues,
Constraints, Challenges and Prospects. Paper Presented At National Workshop by the
Department of Estate Management, University of Lagos.

Land accessibility
471
Babade T. (2002): Access to Urban Land in Nigeria – An Analysis of the Activities of Lagos
State Land Use and Allocation Committee. Paper Presented at 1st National Workshop
by Estate Management Department, University of Lagos.
Babatunde J. (2003): Housing the Masses in Democratic Nigeria: Issues, Constraints, and
Prospects. Paper Presented at CPD Seminar Organized By NIESV, Niger State
Branch.
Babatunde J. (2004): Land Administration and Effective Housing Delivery Paper Presentation
at The Nigerian Institution of Estate Surveyors Annual Conference 2nd
April. Pp 50-
58.
Digest (2009): Land Administration in the FCT Under the Administration of Mall. Nasir El-
Rufai – NIESV. Pg. 10.
Ebie, F. (2007): Land Rights and Secure Tenure as the Basis for Economics Empowerment
and Housing Delivery Paper Presented at the Stakeholders Forum on Land Reform 6th
-7th November. pp. 1-14.
Groves, L. (2004): Sustainable Housing Delivery-Survey of The National Housing Stock for
Effective Planning. Paper Presented at National Conference of Chief Architects of the
Federation 12th-17
th July. Pp. 71-72.
Iseh, F. (2004): Land Accessibility in Nigeria – The Contribution of Lagos State Land and
Infrastructural Policies. Paper Presented at the National Workshop on Private Sector
Driven Housing Delivery Organization 1st April. Pp. 25-26.
Mabogunje, A. L. (1968): Urbanization in Nigeria. In: Olayiwola, L.M., Adeleye, O.A. and
Oduwaye, A.O. (2005): Correlates of Land Value Determinants in Lagos Metropolis,
Nigeria. J. Hum. Ecol., Vo. 17, No. 3. Pp. 183-189.
Mabogunje S. (2002): Land Management. Paper Presented at National Conference on Land
Management and Taxation by Estate Management Department, University of Lagos.
Olaore, G.O. (1981): Values of Land and Rentage of Shelter in Nigeria Urban Areas: A Case
Study of Kaduna, In: Olayiwola, L.M., Adeleye, O.A. and Oduwaye, A.O. (2005):
Correlates of Land Value Determinants in Lagos Metropolis, Nigeria. J. Hum. Ecol.,
Vo. 17, No. 3. Pp. 183-189.
Olawoye C. (1974): Title to Land in Nigeria Ibadan, Evans Publisher.
Olayiwola, L.M. (2000): Techniques for Planning Sustainable Development for Towns and
Cities in Nigeria. In: Olayiwola, L.M., Adeleye, O.A. and Oduwaye, A.O. (2005):
Correlates of Land Value Determinants in Lagos Metropolis, Nigeria. J. Hum. Ecol.,
Vo. 17, No. 3. Pp. 183-189.
Omirin, M.M. (1997): Land Accessibility and Low Income House Building Activity in
Metropolitan Lagos. In: Olayiwola, L.M., Adeleye, O.A. and Oduwaye, A.O. (2005):
Correlates of Land Value Determinants in Lagos Metropolis, Nigeria. J. Hum. Ecol.,
Vo. 17, No. 3. Pp. 183-189.
Omirin M. (2002): Issues on Land Accessibility in Nigeria. Paper Presented at a National
Conference of Land Management and Taxation on 25th – 26
th April. pp. 12-17.
Onokerhoraye, A.G. (1984): An Introduction to the History of Geographic Thought. In:
Olayiwola, L.M., Adeleye, O.A. and Oduwaye, A.O. (2005): Correlates of Land
Value Determinants in Lagos Metropolis, Nigeria. J. Hum. Ecol., Vo. 17, No. 3. Pp.
183-189.
Onokwai, T. (2004): Sustainable Housing Delivery -Paper Presented at the National
Conference of Chief Architects of the Federation Held at Uyo, Akwa - Ibom State
12th-17
th July, page 2.National Housing Policy Draft, 2004 National Urban
Development Policy, 2004.
Nubi, T.O. (2008): Affordable Housing Delivery in Nigeria - Developing Communities. The
Southern African Housing Foundation, International Conference and Exhibition, Cape
Town, South Africa. October 12th – 15
th.
Ughamadu, F. (1991): Investment in Human Settlements. Business Times. March 4. pp. 24.


Ampadu-Asiamah, A.D. and Adjei, E.A. (2011) Factors influencing the extensive use of glass on
facades of office buildings in Accra, Ghana In: Laryea, S., Leiringer, R. and Hughes, W. (Eds) Procs
West Africa Built Environment Research (WABER) Conference, 19-21 July 2011, Accra, Ghana, 473-
485.
473
FACTORS INFLUENCING THE EXTENSIVE USE OF
GLASS ON FACADES OF OFFICE BUILDINGS IN
ACCRA, GHANA
Adwoa Difie Ampadu-Asiamah1 and Emmanuel Akoi-Gyebi Adjei
2
Building Technology Department, Accra Polytechnic, Ghana
Sustainability has become a much discussed topic globally. It affects various aspects
of our lives i. e. environmentally, socially and economically. Many parameters have
been drawn to pursue sustainability in all aspects of human life. Sustainable
construction is one aspect where these parameters have been set to enable
stakeholders in the construction industries all over the world to be mindful of the way
and manner construction is undertaken, in order to minimise the misuse of natural
resources and pollution of the environment. Climatic forces have been an important
factor ever since man first constructed shelter. The nature of buildings in Ghana
which is in a tropical climatic region was initially dictated by the climatic conditions
thus they were tailored to make the most use of the climatic elements to give comfort
to occupants without compromising the environment. However with the advent of
modern methods of construction, construction materials and mechanical aids like air-
conditioning, extractor fans and artificial lighting, these climatic conditions have been
relegated to the background, whilst building styles in other climatic regions have been
copied. Glass is now being used extensively on facades of buildings, especially office
buildings. The increasing use of glass on façades of office buildings in Accra (the
capital city of Ghana) raises a few questions in relation to sustainable construction. In
order to answer these questions there is the need to find out why the increased
extensive use of glass in buildings.
Keywords: glass façade, sustainable construction, tropical building
INTRODUCTION
Ghana is located in a tropical climatic region where the weather is warm and humid
most part of the year. The traditional style of buildings in Ghana made use of natural
climatic elements to provide comfort for occupants; features like openness, courtyards
to facilitate ventilation and provision of natural lighting, sun shading devices to
control ingress of the sun and provide thermal comfort were used to achieve this.
Quite recently, these features have been substituted with closed up buildings, made up
of glass facades, which seem to ignore the climatic elements present.
This paper has through literature review established requirements for sustainable
construction and based on these have found out from stakeholders in the construction
industry in Ghana the factors that are considered when designing and constructing
office buildings in Accra. Occupants of some office buildings in Accra were also
asked to give their opinions on the comfortability of these buildings.
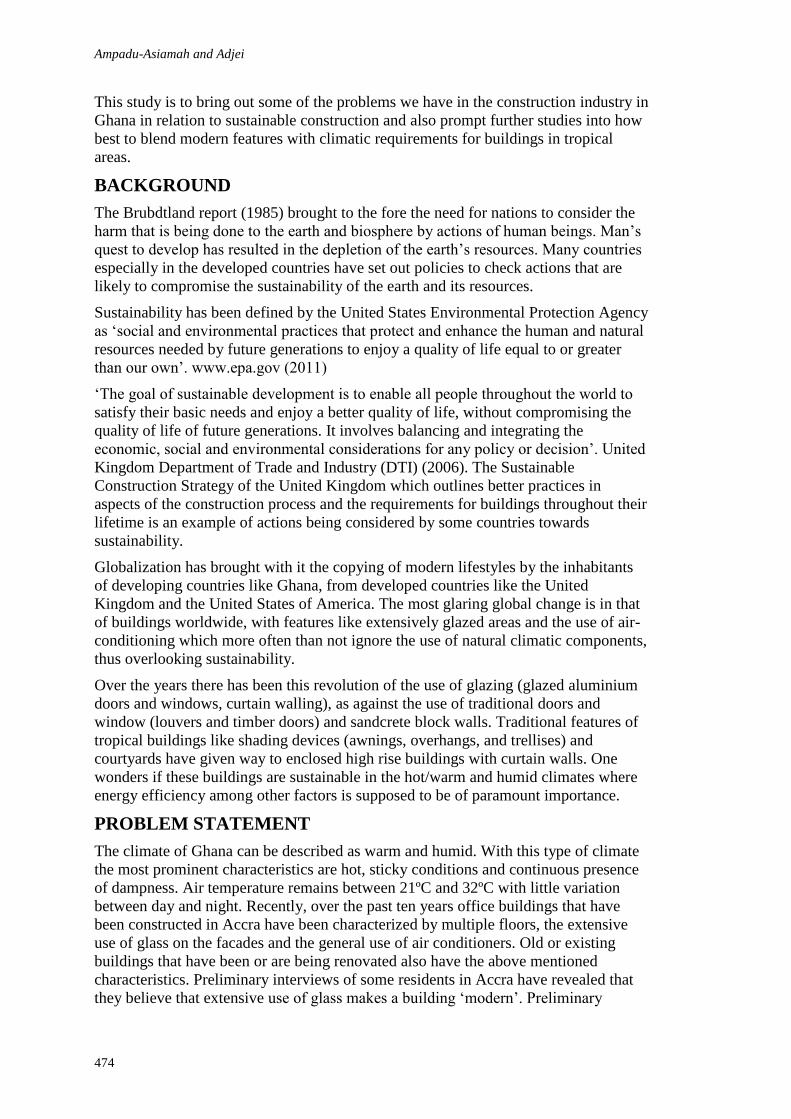
Ampadu-Asiamah and Adjei
474
This study is to bring out some of the problems we have in the construction industry in
Ghana in relation to sustainable construction and also prompt further studies into how
best to blend modern features with climatic requirements for buildings in tropical
areas.
BACKGROUND
The Brubdtland report (1985) brought to the fore the need for nations to consider the
harm that is being done to the earth and biosphere by actions of human beings. Man‘s
quest to develop has resulted in the depletion of the earth‘s resources. Many countries
especially in the developed countries have set out policies to check actions that are
likely to compromise the sustainability of the earth and its resources.
Sustainability has been defined by the United States Environmental Protection Agency
as ‗social and environmental practices that protect and enhance the human and natural
resources needed by future generations to enjoy a quality of life equal to or greater
than our own‘. www.epa.gov (2011)
‗The goal of sustainable development is to enable all people throughout the world to
satisfy their basic needs and enjoy a better quality of life, without compromising the
quality of life of future generations. It involves balancing and integrating the
economic, social and environmental considerations for any policy or decision‘. United
Kingdom Department of Trade and Industry (DTI) (2006). The Sustainable
Construction Strategy of the United Kingdom which outlines better practices in
aspects of the construction process and the requirements for buildings throughout their
lifetime is an example of actions being considered by some countries towards
sustainability.
Globalization has brought with it the copying of modern lifestyles by the inhabitants
of developing countries like Ghana, from developed countries like the United
Kingdom and the United States of America. The most glaring global change is in that
of buildings worldwide, with features like extensively glazed areas and the use of air-
conditioning which more often than not ignore the use of natural climatic components,
thus overlooking sustainability.
Over the years there has been this revolution of the use of glazing (glazed aluminium
doors and windows, curtain walling), as against the use of traditional doors and
window (louvers and timber doors) and sandcrete block walls. Traditional features of
tropical buildings like shading devices (awnings, overhangs, and trellises) and
courtyards have given way to enclosed high rise buildings with curtain walls. One
wonders if these buildings are sustainable in the hot/warm and humid climates where
energy efficiency among other factors is supposed to be of paramount importance.
PROBLEM STATEMENT
The climate of Ghana can be described as warm and humid. With this type of climate
the most prominent characteristics are hot, sticky conditions and continuous presence
of dampness. Air temperature remains between 21ºC and 32ºC with little variation
between day and night. Recently, over the past ten years office buildings that have
been constructed in Accra have been characterized by multiple floors, the extensive
use of glass on the facades and the general use of air conditioners. Old or existing
buildings that have been or are being renovated also have the above mentioned
characteristics. Preliminary interviews of some residents in Accra have revealed that
they believe that extensive use of glass makes a building ‗modern‘. Preliminary

Glass
475
interviews with stakeholders in the construction industry agree with the residents in
that these types of features are what clients request for, thus that is what they provide.
The question however is, do these features (glass walls, etc.) correspond with
sustainability of buildings in the warm humid climate?
Ghana has been having problems with the reduction in water levels in the Akosombo
dam (a hydro-electric dam and the principal source of electrical energy) to the extent
that the supply of electricity is sometimes rationed. The use of air conditioners and
artificial lighting (during daytime) in homes and offices has become a necessity due to
the manner in which our buildings are constructed. The need for mechanical
ventilation has resulted in an increase in energy consumption. Even though some of
these office buildings have the kind of features that are needed to be incorporated into
buildings in tropical areas in order for them to be comfortable, (like sun shading
devices, the orientation of buildings to take advantage of air movement, etc.), there
are others that have ignored or abandoned these features for ‗the modern look‘. Is it
not possible to combine the use of glass with these tried and tested features for
sustainable tropical buildings in order for the office buildings that are being
constructed to make maximum use of elements like natural ventilation and natural
lighting? This paper seeks to find answers to some of these questions.
HYPOTHESIS
Glass is used extensively on facades of office buildings in Ghana mainly for aesthetic
reasons and not for reasons of sustainability.
This research aims at finding out the reasons behind the extensive use of glass on the
facades of office buildings in Accra and whether considerations are given to
sustainability when these buildings are being designed and constructed. It also seeks
to establish whether the use of such buildings is effective without mechanical
ventilation and artificial lighting.
LITERATURE REVIEW
Sustainability has been researched into and written about by many authors and
researchers. They all agree that it is about living presently in a way that even though
the needs of human being are being met, care is being taken so as not to compromise
or damage the ability of future generations to meet their own needs.
What is Sustainable construction?
Sustainable construction involves the provision of built developments that are efficient
and affordable, socially acceptable and less damaging to the environment.
‗Sustainable construction not only refers to the buildings and spaces themselves but
also the processes or activities used to construct them. It also includes the
infrastructural elements such as waste management, transportation, and utility
transmission systems put in place to serve this building space‘. Presley and Meade.
(2010)
According to the United Kingdom Department of Trade and Industry (DTI) (2006),
there are three key strands involved in Sustainable construction:
Environmental responsibility
Social awareness
Economic profitability
Sustainable Construction includes the following actions:
Ampadu-Asiamah and Adjei
476
Minimising pollution during construction Halliday, (2008), DTI (2006)
Preserving and enhancing biodiversity Halliday. (2008), DTI (2006)
Conserving resources - ‗There should be the conscious efforts not to consume a
disproportionate amount of resources during construction and also not to cause
unnecessary waste of energy, water or materials due to poor design, inefficiency, or
less than ideal construction processes.‘ Halliday (2008), DTI (2006)
Respecting people (Communities) and local environment Halliday (2008), DTI (2006)
Creating healthy environments Halliday (2008), DTI (2006)
Managing the process through the identification of appropriate targets, tools and
benchmarks, and management of its delivery. Halliday (2008), DTI (2006)
Sustainability of the Building Envelope
‗In the life time of an average building most energy is consumed mostly during the
period when the building is in use. That is, when energy is being used for heating,
cooling, lighting, cooking, ventilation and so on. Typically more than 80% of the total
energy consumption takes place during the use of buildings and less than 20% during
construction of the same‘. United Nations Environment Programme (UNEP) (2007)
Since buildings, especially office buildings are noted to be major electricity or energy
consumers, it is important that stakeholders in the construction industry, especially
architects, take a look at the planning and designing of buildings (especially office
buildings) in Ghana in order to make the most of the climate and environment thereby
producing environmentally friendly buildings.
Below are some sustainability requirements relating to the design and construction of
the building envelope.
It is essential to consider the local climatic conditions (temperature, moisture, wind) in
order to know the materials for construction of the building envelope, the amount of
and effectiveness of glazing used specific to each orientation, and the overall energy
performance of the building. Bolin (2009)
Designing to make maximum use of natural light whilst being aware of its limitations.
Bolin (2009), Smith (2006)
Using Effective Solar Shading Devices especially exterior shading devices such as
overhangs, vertical fins and light shelves as energy efficiency measures. Bolin (2009)
Integrating photovoltaic panels as part of the building envelope system or solar
shading system as a way of generating on-site, renewable energy. Bolin (2009)
Providing windows that afford building occupants views outside but do not negatively
impact the visual and acoustic comfort of the work environment. Bolin (2009)
Components of the building envelope should adequately address issues of thermal
comfort at the building perimeter, particularly thermal and solar performance of
glazing or fenestration. Bolin (2009), Smith (2006)
The potential for natural ventilation in the context of an overall climate control
strategy must be exploited while minimising energy use and maximising comfort.
Where appropriate, the use of operable windows for natural ventilation and occupant
control must be considered. Bolin (2009), Smith (2006)
Glass
477
Sustainable Construction in the Tropics
Climatic forces have been an important factor ever since man first constructed shelter.
Throughout architectural history, local builders have used great resourcefulness in
providing the most comfortable internal conditions possible within the constraints and
requirements of the local climates. Jones (1998)
Countries in the tropics have a long history of sustainable buildings in their vernacular
architecture. The hot and dry regions for instance, developed over centuries,
appropriate materials, a perfect balance of shading and day lighting, natural
ventilation and heat storage to suit their climatic conditions. In the hot and humid
regions natural ventilation and shading systems were perfectly adapted to the local
climate as well. Laar and Grimme (2002).
‗However a lot have changed with the introduction of airconditioners, extractors,
artificial lighting, etc. Design and construction of buildings have become independent
from the prevailing climatic conditions. Aesthetics has become the main aim for the
design of buildings, overshadowing sustainability‘. Laar and Grimme (2002). Viet
(2008) also observed that ‗generally, architects (in Hanoi, Vietnam) are not concerned
about climatic issues caused by the use of glass, because they believe these issues can
be solved by technology, but rather design according to client‘s (who see the use of
glass in buildings as modern) request‘.
Sustainable construction in the tropics is no different from sustainable construction in
other climatic conditions. The actions listed in the previous sections that are needed to
be undertaken to achieve sustainable construction are the same. The problem lies in
the fact that while buildings in temperate regions are being improved to meet
requirements on sustainability by using appropriate materials and methods, buildings
in the tropics are being changed to imitate those in the temperate regions regardless of
whether the changes are sustainable or not.
Description of Ghana’s climate
As stated already Ghana happens to fall within the warm humid type of climate which
has hot sticky conditions and the continual presence of dampness. Details of Ghana‘s
climate are found below.
‗The climate of Ghana is tropical but relatively mild for the latitude. Average
temperatures range between 21° and 32° C (70–90° F), with relative humidity between
50% and 80%. Rainfall ranges from 83 to 220 cm (33–87 in) a year.‘
(http://www.nationsencyclopedia.com/Africa/Ghana-CLIMATE.html, 2004)
‗In most areas, temperatures are highest in March and lowest in August. Variation
between day and night temperatures is relatively small, but greater in the north,
especially in January. No temperature lower than 10° C (50° F) has ever been
recorded in Ghana.‘ (http://www.nationsencyclopedia.com/Africa/Ghana-
CLIMATE.html 2004)
Requirements for Buildings in Warm Humid Climates
The requirements for buildings built in this climatic region has been discussed by
many writers over the years and they all agree to the fact that buildings in this region
like all other buildings elsewhere are supposed to provide comfort, be functional, and
environmentally friendly or sustainable.

Ampadu-Asiamah and Adjei
478
According to Koenisberger et al., (1980), buildings have to be opened up to breezes
and orientated to catch available air movement in order for heat to be removed from
the occupants‘ body into the environment. Other features that were suggested by
Koenisberger et al. (1980) are shading devices to reduce radiation from the sky.
According to Jones (1998), some of the important considerations for building in
tropical regions are ‗natural ventilation, mechanical ventilation, night ventilation,
artificial cooling, free cooling, light weight construction, daylighting and solar
shading/control‘.
Another writer, Stagno (2001) also suggests that in order to achieve an acceptable
level of habitability and comfort in buildings in the tropics, consideration must be
given to variables like ‗the problems of excess rainwater disposal, air-cooling,
decreasing relative humidity levels and reduction of excessive glare from the sun‘ and
existing environmental factors.
According to Bay and Ong (2006), ‗shading devices with verandas, sun breaks, and
appropriate openings, are always more efficient and cheaper than any glass technology
for climatic control in subtropical regions‘.
Reasons for using Glass in Buildings
The introduction of glass in buildings was brought about due to certain needs that
designers, occupants and owners had to meet. Some of these are the need to make
buildings lighter, the need to have high amount of natural daylighting in order to
reduce electricity consumption through the use of artificial lighting, the need to create
views, blending interior and exterior views, the need to control the solar and thermal
heat in interiors thus maintaining temperatures at comfort levels, the need for
designers and architects to have least restriction in capturing desired shapes and forms
and the need to control noise. http/in.saint-gobain-glass.com (2011)
In order to be able to satisfy the above stated needs however, different types of glass
with different characteristics and properties are required; failure to match the correct
type of glass with the specific needs may result in the creation of problems in the
building. For example, according to Bay and Ong (2006), ‗ many designers are eager
to find innovative glass technologies, such as reflective glass, double skin glass, and
low –E glass, to cut down the cooling load of glass skin but still cannot change the
basic material performance that bigger solar heat gain comes from bigger glass
opening‘. This means that the use of glass should be determined by the climate as
against the properties of the glass; and should not be used in spite of the climatic
conditions or the requirement for sustainability in a region.
RESEARCH DESIGN AND METHOD
This section gives details of the methods and procedure of this study. The
methodology used in this study is survey questionnaire which can be categorised as
quantitative research. Quantitative approaches are more specific and result oriented
and it involves the collection of numerical data in order to explain, predict, and/or
control phenomena of interest (Mojaheed, 2005).
Survey
Literature research was undertaken to identify variables considered in the sustainable
design and construction of buildings. The sources of the research were published
professional journals, academic works, internet search and other relevant literature. A
survey was then conducted among stakeholders in the construction industry made up

Glass
479
of professionals in the construction industry and occupants of office buildings in
Accra.
Design of Questionnaire
Structured questionnaires were formulated for the professionals in the construction
industry and occupants of office buildings in Accra. Basically the questionnaire for
the consultants was made up of three parts and consisted of open and closed questions.
The first part was made up of questions that enabled one to be familiar with the
respondent. They included questions that sought to know the respondent‘s profession,
contact number and email address. It also had questions which sought to know
whether respondents have been involved in the construction or refurbishment of office
buildings and details of the projects. They also had to indicate whether they used glass
extensively and the reasons for that.
The next section of the questionnaire asked respondents to rate seven hypothetical
factors (which were put in a likert scale format) that are likely to influence the
extensive use of glass on facades of office buildings in Accra; thus they rated ‗Very
Common‘, ‗Common‘, ‗Averagely Common‘, ‗Not Common‘ and ‗Do Not Know‘.
The factors were, namely, aesthetics, to achieve modern looks, to regulate indoor
temperatures, to keep away dust from the offices, to control solar ingress, to create
access to external view and to control draft/wind movement indoors.
Respondents were also asked to rate five hypothetical variables that should be
considered in sustainable tropical buildings according to the amount of consideration
applied. These variables are ‗natural ventilation‘, ‗thermal comfort‘, ‗natural lighting‘,
‗sun shading devices‘, ‗orientation of building‘. The final section asked the respondent
to give other variables they considered during design and construction and were also
to indicate which among the stakeholders usually suggests the use of glass. The
questionnaire for the occupants sought to know the type of buildings they had their
businesses in and how they feel generally in the building. This set of questions sought
to find out the effect of glass facades on the interior space. A purposive sampling
method was used to select the class of construction companies for the questionnaires
administration. The targeted buildings were situated in and around the central business
district of Accra.
Administering of Questionnaires
A total of 65 questionnaires were administered to occupants of which 49 responses
were obtained representing 75.38% response rate. A total of 25 questionnaires were
sent out to professionals and clients. A response rate of 13 presenting 52% was
received.
Data Analysis Tools
Two analytical tools were used in analysing the responses from the survey. These are
statistics importance index and Kappa statistic for multiple raters.
Importance index facilitates the identification of tactical approaches to increasing
productivity. The nearer the value of importance index of the identified factor is to
unity (1), the more significant it as a factor for using glass extensively on buildings. A
ranking of importance indices were undertaken to ascertain the most frequent factors.
Importance index (I.I.) = 5n1 +4n2 + 3n3 +2n4 + n5
5(n1 +n2 +n3 +n4 +n5)

Ampadu-Asiamah and Adjei
480
Where: n1 –number of respondent answered ‗strongly significant‘
n2 –number of respondent answered ‗significant‘
n3 –number of respondent answered ‗average‘
n4 –number of respondent answered ‗not significant‘
n5 –number of respondent answered ‗strongly not significant‘ Kadir et. al. (2005)
Kappa statistic for multiple raters
Kappa statistics for multiple raters using categorical classifications was employed
to test the level of agreement for respondents. This analytical tool is used to test the
consistency of values and is employed when there are more than two raters and or
subjects. The determination of is demonstrated as follows.
The overall kappa value for occurrence = j j j
j j
Where: j = category of rating, k = number of category, j = overall proportion of ratings
j = overall proportion of non-ratings, j = kappa value per category, = overall
kappa value
The break down to find the overall kappa value for occurrence is as follows
m = ij (1)
= i i = n x (2)
n
j= i (3)
n x
j = 1- ij (m-xij) (4)
nm(m-1) j j
Where j = 1- j
m = number of different raters, xij = number of ratings on a subject,
i = subject, n = number of subjects, j = category of rating, k = number of category
= mean number of ratings per subject, j = overall proportion of ratings,
j = overall proportion of non-ratings, j = kappa value per category, = overall kappa value
Green (1996) explained that a perfect agreement will exist when =1.00. Also, a high
degree of agreement beyond chance is said to occur when kappa value is 0.75
1.00. This means that there is no divergence in response from respondents. In
addition when 0.40 < 0.75, a fair or good agreement is said to exist which gives
the indication that there could be the possibility of divergence in opinions but not
much. Finally when < 0.40, there is said to be the existence of low agreement
beyond chance.
SURVEY FINDINGS
Response from Professionals
A total of 13 questionnaires were received comprising 6 Quantity surveyors, 2
Engineer and 5 Architects representing 46%, 15% and 39% respectively of which
43% work in the government sector and 57% in the private sector.
The research revealed that 72% of respondents have been involved in the design and
construction of office buildings whereas 43% have been involved in re-design and
refurbishments within the last 10yrs. The office buildings under development within

Glass
481
this period have about 30-70% of walls made up predominantly of glass. Some of the
glass used for the buildings are reflective glass, translucent glass, and laminated glass.
The buildings described by the respondents were storey buildings having between
three and thirteen floors.
From the respondent‘s perspective, out of ten office buildings to be built in Accra in
future, there is the probability of having between 5 and 9 buildings having facades
made extensively from glass. This brings out the need for sensitization on sustainable
construction among the stakeholders in the construction industry in Ghana to be able
to have economical and environmentally friendly buildings.
It was found out from the response that most of the time the use of glass is suggested
by either the client or the architect for the following reasons:
To achieve lightness of structure,
To achieve flexibility in composition,
To show formality, and financial status of client,
Because it is the order of the day.
These were reasons that were supplied by the respondents in addition to those
provided in the questionnaire for rating (table 1).
From the response of the professionals, they all agreed that the factors that influence
the extensive use of glass on facades of office buildings in Accra (table 1), was rated
as follows
1. Aesthetics
2. To control draft / wind movement indoors
3. To keep away dust from the office
4. To control solar ingress
5. To regulate indoor temperature
6. To create access to external view
7. To achieve modern looks
From the above it can be deduced that aesthetics is the main factor that influences the
extensive use of glass on facades of office buildings.
The variables listed in table 2 are suggested variables that must be considered to
achieve sustainability in a building. The ratings of the professionals indicate that all
Table 1: professionals‘ rating of the probable factors that influence the extensive use of glass on
facades of office buildings in Accra, where 1-very common, 2- common, 3-averagely common, 4-
not common and 5-do not know
PROBABLE FACTORS Respondents on
Significance
Importance
Index (I.I.)
Rank
(I.I)
1 2 3 4 5
Aesthetics 12 0 0 0 0 1.000 1
To achieve modern looks 10 2 1 0 0 0.262 7
To regulate indoor temperature 1 3 5 2 0 0.545 5
To keep away dust from the office 0 5 4 2 1 0.583 3
To control solar ingress 2 2 3 5 0 0.583 3
To create access to external view 5 3 3 1 0 0.400 6
To control draft / wind movement indoors 0 2 8 2 0 0.600 2

Ampadu-Asiamah and Adjei
482
the variables are considered however, natural ventilation emerged as the most
considered variable this is followed by the other variables as follows:
Sun shading device, Natural lighting, Orientation of building, and Thermal comfort.
Table 2: professionals‘ rating of variables to be considered in sustainable tropical buildings, where
1-highly considered, 2-considered, 3- averagely, 4-least considered and 5-not considered
VARIABLES Respondents on Significance Importance
Index (I.I.)
Rank
(I.I)
1 2 3 4 5
Natural ventilation 6 2 4 1 0 0.800 1
Thermal comfort 6 2 3 1 0 0.383 5
Natural lighting 6 3 4 2 0 0.427 3
Sun shading device 4 3 3 2 1 0.492 2
Orientation of building 5 3 4 1 0 0.415 4
Response from Occupants
Table 3: answers to questions from occupants of office buildings.
Occupants in public buildings 88.89 11.11 0.00
Buildings with facade predominately of glass 69.39 30.61 0.00
Favourable working condition without artificial lighting during
the day42.00 56.00 2.00
Staying in the office without artificial ventilation 22.00 76.00 2.00
Windows openable? 61.70 36.17 2.13
Effective working with open windows 41.18 55.88 2.94
Opening of blinds whiles in office 35.42 52.08 12.50
Having a good view when looking outside your window 78.79 12.12 9.09
Effect on the ingress of the sun when windows are open 33.33 60.00 6.67
Satisfaction with indoor condition of the office 83.67 8.16 8.16
Yes ( %) Partially (%)No (%)
From the response of the occupants (table 3), it was revealed that:
88.89% of respondent were accommodated in public buildings.
69.39% of respondents were reported to have the office buildings
predominantly of glass facade.
56.00% revealed unfavourable working condition without artificial lighting
during the day. This gives indication that the light intensity in the rooms or
offices is reduced due to the inadequate natural lighting.
76% cannot work or stay in the office building without mechanical or artificial
ventilation, even though 61.70% had windows that can be opened.
55.88% occupants do not have favourable working conditions although
majority indicated that the windows can be opened
35.42% do not open their blinds when in the office, despite the fact that
78.79% have good external view.
33.33% are affected by the ingress of the sun when windows are opened.
83.67% are satisfied with indoor conditions due to air conditioning and nice
internal arrangements.

Glass
483
Concordance of response
As has been explained above, Kappa statistics for multiple raters using categorical
classifications was employed to test the level of agreement among respondents.
The agreement among responses on factors that influence the extensive use of glass in
office buildings can be tested by reference Table 1 as follows:
The overall kappa value for occurrence = = j j j
j j
From table 1
j j j = 0.854 and
j j = 0.857
= 0.854 = 0.996 ≈ 1.00
0.857
From the results obtained, it can clearly be seen that there is a perfect level of
agreement beyond chance in responses related to factors influencing the extensive use
of glass in office buildings. This means that there existed no divergence in opinions on
factors given, an indication that it pertains throughout the understudied area.
Table 2, dealt with the variables that are usually considered in designing. The level of
agreement to the response received is given below:
The overall kappa value for occurrence = j j j
j j
From table 2
j j j = 0.795 and
j j = 0.796
= 0.796 = 0.997 ≈ 1.00
0.799
From the results obtained, it can be interpreted that there exists a perfect level of
agreement with respect to ratings of the variables considered in designing office
buildings. This means that all the variables are taken into consideration in designing
so as to make the office buildings user friendly.
DISCUSSION OF FINDINGS
One aim of sustainable construction is to create buildings with comfortable indoor
environment through the use of appropriate materials, without compromising on our
natural environment. From the literature review conducted, some writers on the use of
glass in tropical regions observed that aesthetics is the main reason for the use of glass
in buildings, Laar and Grimme (2002), and that architects do not really think about the
problems that the use of glass brings because they think the problems will be taken
care of mechanically. Viet (2008). From the research conducted there it has been
found out that glass is extensively used on facades of office buildings in Accra and the
use is mainly for aesthetic reasons and that there is the heavy reliance on mechanical
aids to solve the problems like ventilation and natural lighting.
According to the professionals‘ response the factors that determine the extensive use
of glass on facades of office buildings in Accra are aesthetics, to control draft / wind
movement indoors, to keep away dust from the office, to control solar ingress, to
regulate indoor temperature, to create access to external view and to achieve modern
looks. Other reasons were, to achieve lightness of structure, to achieve flexibility in
composition and to show formality, and financial status of client. Comparing with the

Ampadu-Asiamah and Adjei
484
reasons for the use of glass in buildings identified in the literature review (the need to
make buildings lighter, the need to have high amount of natural daylighting in order to
reduce electricity consumption through the use of artificial lighting, the need to create
views, blending interior and exterior views, the need to control the solar and thermal
heat in interiors thus maintaining temperatures at comfort levels, the need for
designers and architects to have least restriction in capturing desired shapes and forms
and the need to control noise. http/in.saint-gobain-glass.com (2011)), one realizes that
the research findings is in agreement with what was identified in the literature review.
However there is the need to take a second look at these reasons and find out if they
are effectively implemented in terms of sustainable construction since the occupants
response tell a different story.
CONCLUSION AND RECOMMENDATIONS`
Even though the use of glass is seen as the order of the day, its use must be done with
consideration to the adverse effect it is likely to produce on the Ghanaian economy,
society and environment. The increase in energy demand for example, can be reduced
effectively by considering and implementing the identified requirements to sustainable
construction. In as much as the use of glass is desirable for a number of reasons
(especially aesthetics), there is the need to thoroughly investigate ways of
incorporating the use of glass without compromising the natural environment and to
provide natural comfort to inhabitants. It is important for professionals in the
Ghanaian construction industry to pay more attention to what constitutes sustainable
construction and takes steps towards achieving it.
REFERENCE
Bay, Joo-Hwa and Ong, Boon Lay, Tropical sustainable architecture: Social and
environmental dimensions. 2006 Elsevier
Bolin, Rob (2009) Sustainability of the Building Envelope. National Institute of Building
Sciences, www.wbdg.org/design/envelope, accessed 6th March, 2011
Brent Richard, Dennis Gilbert (2006) New Glass in Architecture. Laurence King Publishing,
London
Department of Trade and Industry (2006) www.dti.gov.uk accessed from www.bis.gov.uk
www.epa.gov/waste/education/quest/gloss1a.htm
Green A. M. (1996) Kappa Statistics of Multiple Raters Using Categorical Classification
Halliday Sandy (2008) Sustainable Construction. Butterworth-Heinemann, Oxford
Kadir, M. R. A.et. al. (2005) Factors affecting construction labour productivity for Malaysian
Residential Project, Structural Survey Vol. 1, Pp 42-54
Koenisberger O. H, Ingersoll T. G, Mayhew A, Szokolay S. V. (1980) Manual of Tropical
Housing and Building. Longman Group Limited, London
Laar Michael and Grimme F. W. (2002) Sustainable Buildings in the Tropics RIO 02 - World
Climate and Energy Event, January 6-11, 2002
Lloyd, Jones David, (1998) Architecture and the Environment – Bioclimatic Building Design.
Laurence King Publishing. London
Mojaheed Shahrivar (2005), A project improvement system for effective management of
construction projects, PHD Dissertation (unpublished)
Presley Adrien and Meade Laura (2010) Benchmarking for Sustainability: an Application to
the sustainable construction industry. Benchmarking: an international Journal, Vol.17
No. 3 2010 pp 435-451 Emerald Group Publishing Limited.
Viet Trinh Hong (2009) Roles of everyday lifestyle in the city‘s built environment: the use of
glass in Hanoi‘s new shop-houses:, Universitas 21 International Graduate Research
Conference: Sustainable Cities for the Future Melbourne and Brisbane. Nov 29 – Dec
5, 2009

Glass
485
Smith,Peter F.(2006) Architecture in a climate of change – A guide to sustainable design,
second edition. Architectural Press, Oxford
SOSA G. MARIA EUGENIA (2007), Facades design strategies in a warm-humid climate to
reduce thermal loads in Venezuelan buildings, Revista de la Facultad de Ingenier a
Universidad Central de Venezuela Rev. Fac. Ing. UCV vol.22 no.4 Caracas 2007
(http://www.nationsencyclopedia.com/Africa/Ghana-climate.html 2004)
(http://www.ghanaweb.com/GhanaHomePage/geography/climate.php, 2011)
UNEP,2007 Buildings Can Play a Key Role in Combating Climate Change.
http://www.unep.org/Documents.Multilingual/Default.asp?DocumentID=502&Article
ID=5545&l=en
Stagno Bruno (2001) designing and building in the tropics
(www.brunostagno.info/.../Designing%20and%20Building%20in%20the%20Tropics.
doc -) 4th April, 2011
Smith, Peter F. (2006) Architecture in a climate of Change- A guide to sustainable Design
second edition. Architectural Press, Oxford
http/in.saint-gobain-glass.com (2011) Role of Glass in Green Architecture, in.saint-gobain-
glass.com/upload/files/glass-in-green-architecture.pdf. Accessed 6th March 2011.


Olagunju, O., Oloke, D., Hammond, F. and Costello, P. (2011) Framework analysis of technology and
design of sustainable affordable housing in Nigeria In: Laryea, S., Leiringer, R. and Hughes, W. (Eds)
Procs West Africa Built Environment Research (WABER) Conference, 19-21 July 2011, Accra, Ghana,
487-499.
487
FRAMEWORK ANALYSIS OF TECHNOLOGY AND
DESIGN OF SUSTAINABLE AFFORDABLE HOUSING
IN NIGERIA
Olatunji Olagunju1, David Oloke, Felix Hammond and Pat Costello
School of Technology, University of Wolverhampton, Technology Center MI building City campus
North Wulfruna street Wolverhampton WV1 1LY United Kingdom
Architectural firms have a crucial part to play in the design of sustainable homes as
majority of the decisions that drive the production of affordable housing and affect the
buildings energy performance are made by architects, at the design phase. With
advancement in technology and engineering, designers can evaluate the energy
performance of a building at the early stage of designing building process The code
for sustainable homes was derived from a study organized by the government to aid
the improvement and standards of new homes in the UK. Can this be utilized in
Nigeria? For sustainable construction practices, designers should look at materials
that were traditionally used by locals. With a huge housing shortfall in Nigeria and the
government policy seemingly defective and unable to cope with demand due to
budgetary constraints and other competing needs. The market economy approach
along with flexible, efficient economic instruments are key factors to enable the
construction industry to positively respond to sustainable development in terms of
resource efficiencies and environmental protection in a developing economy. This
research would aim to discuss the above and consider some possible solutions.
Keywords: affordable housing, environment, housing policy, sustainability.
INTRODUCTION
This paper will appraise issues surrounding the design and technological aspects in the
provision of sustainable affordable housing units for a growing Nigerian population.
It is hoped this will highlight some points for success. Key questions arise such as:
With technology can we design and build close to zero carbon homes and equally
provide affordable housing? Is it fair to expect the same standards for affordable
housing in a developing country like Nigeria as one would ask for in UK a developed
country?
The aim of the research would be to try to answer the above proposed questions
including 'Is affordable housing in a developing country like Nigeria sustainable or is
there a price to pay?'
In the pursuit of the aim of this research the study would also seek to achieve the
following objectives: (1) Conduct a literature review; (2)Collect data that are relevant
to the research questions; (3)Analyse same and finally (4)develop a framework model
or toolkit that can aid the design and technological implementation of sustainable
housing in Nigeria.

Olagunju, Oloke, Hammond and Costello
488
Zero carbon buildings in bulk can be cost effective if properly designed and all supply
chain parties are on board and committed. At present zero carbon homes are presumed
to cost more on the onset than the standard homes built as materials used are still
being further researched. (Obertelli 2010)(Marburger 2010) Although we are recently
informed that zero carbon in the UK is not exactly zero anymore but close. (King
2011) However, if research and development continues and the policies are geared
towards encouraging and ensuring green homes delivery, then the manufacturers
would have no choice but to adhere. Affordability in housing definition will be
dependent on income of buyers and the level of need.
With housing as such a high priority in Nigeria there is a struggle to balance this
delivery with saving the environment. It is generally understood that there is the need
to have zero carbon homes whilst also looking at various ways of providing the homes
using materials that would be kind to the environment.
A key challenge of the introduction of any housing standards (both in grant funded
housing or in the open market) is that they are implemented in a cost effective way in
order to ensure their volumetric success (Barefoot and Gilles, 2009). Nigeria is a
country with a large population of over 155 million people (CIA Fact book 2011)
spread across a diverse micro climate of equatorial in south, tropical in the center and
arid in the north. Its presently the 8th
largest country in the world, the most populous
in Africa with a multicultural and varied group of people of more than 250 ethnic
groups. One of the main dilemma the country is facing is the provision of affordable
housing. As more and more Nigerians make towns and cities their homes, the
resulting social, economic, environmental and political challenges need to be urgently
addressed (Raji, 2008) Home prices and rents have grown ahead of inflation and the
composition of homes for sale and rent on the market has been inexorably shifting
towards very expensive homes (Nubi 2008)
DESIGN CONSIDERATIONS
The Nigerian designers and architectural firms have a great part to play as
architectural firms can aid the development of a green tomorrow. As 80% OF
THE SUSTAINABLE DESIGN DECISIONS that affect a
building's energy performance are made by architects, at the design phase. With
gradual advancement in technology and engineering, Architectural firms can evaluate
the energy performance of a building at the early stage of designing a building process
(Brown, 2007)
This unique position is echoed internationally as in a study undertaken on the future
for architects by the Royal Institute of British Architects (RIBA) in 2010, architects
were quoted as saying that they expect to be crucial to decision making and initiating
the design of buildings for the future. As architecture is an art in which habitable
spaces are created and a relationship between man and his environment is forged, it
has logically become a discipline that at times embraces environmentally friendly
strategies (Marmol and Radziner, 2008) it however should always embrace
environmental strategies as its paramount to satisfying the design brief and the client.
Ethics in architecture are essential, if the objective is to increase environmental
awareness and create a sustainable world. (Chueca, 2009) The designers will
invariably be a voice for the protection of the earth and its resources.
Nigeria being a country with a unique population of people that spans various
climatic, cultural and geographic zones, therefore the housing requirement varies

Affordable housing design
489
across these zones. Preferably the design that would be required for the arid northern
states will be quite different from the design and building materials for the swampy
riverine humid regions. The primary function of all buildings is to adapt to the
prevailing climate and provide an internal and external environment that is
comfortable and conducive to the occupants. However, in this era of climate change
and global warming, providing comfort for the occupants of a building is quite
challenging and very fundamental. (Akande,2010)
Prior to commencement of any development, the designers training gives
understanding that adaptation to local conditions means that a site must be studied
with respect to nature, climate and community structure, as well as human activities.
In order to achieve harmony with nature and for people, the conditions of the site must
be used as the point of departure for planning. Existing development is made use of
and environmentally adapted. (Bokalders and Block, 2010)
HOUSING ISSUES AND AFFORDABILITY
The low income of the average Nigerian makes home ownership challenging. A third
of the nation in the lower income bracket can't get on the housing ladder. A fifth earn
less than £30.00 per month (Oluwaluyi, 2008) with Lagos being one of the worst in
the country. Land prices are highest in Lagos and unaffordable to a good proportion.
There are no jobs and the population is rising. Waiting lists are long for rental
apartments, and landlords charge a premium with tenants paying almost half their
salaries on rent. (Daramola S and Aina, 2004)
Affordability is generally accepted as a household paying no more than 30% income
for their housing, and the populace are considered cost burdened otherwise, as
difficulties can arise in paying for other things like food, clothing, transport and
medical care. (US dept of housing and urban devt. 2011)
The Minister of State Works and Housing and Urban Development in 2009, Mrs.
Grace Ekpiwhere, was quoted as saying that Nigeria had an estimated 16 million
housing shortfall. (This day, 2009) Also a claim that housing production would catch
up by government and the private sector partnering to build at a rate of 400,000 new
units per year seems untenable and unjustifiable. Building pace has been nowhere near
that and present indications don't show any improvement on how the policy would
bring that about. Acquiring mortgage debt is an insidious problem in Nigeria because
of the imbalance of cost of building to an individuals earning power. Since the
majority of the methods required in constructing a house are monopolised. As it were,
these companies can fix the prices for the bricks, blocks and cement needed for
construction (Nnanna, 2010)
The Nigerian building and construction industry last year contributed 1.98% to the
GDP the highest contributor at 18% was the wholesale and retail arm closely followed
by the oil and gas industry at 16% contributions (The Nigerian bureau of statistics).
There is therefore the need for higher contribution from the housing sector and a need
to make it a more sustainable process.
Present governments in developing countries like Nigeria do not take on this
responsibility adequately to provide social housing. For example the Lagos state
property development corporation (LSDPC) is an organisation in Lagos which has
become a government enterprise that‘s solely profit driven. They have adopted a
policy to only build in areas that would generate the highest returns. The organisation
commenced as a government parastatal and is now an autonomous organisation.

Olagunju, Oloke, Hammond and Costello
490
Nigeria has a long unenviable history of civil-military political cycles, the state seems
to be perpetually in crisis. The country's several democratization attempts and the
interchange with military rule, most of which often come with great promises, have
failed with the result that both forms of government are now largely doubted by
majority of the ordinary citizens. (Yagboyaju, 2010)
KEY INFLUENCES ON TECHNOLOGY AND DESIGN
Adaptation to nature: The local geography, geology, hydrology, flora and fauna, as
well as micro climate should be studied. The results from this study would be the basis
for building and layout. Adapting buildings to the local climate saves energy.
Adapting to natural surroundings is positive for biological diversity and land based
industries. As mentioned previously Nigeria is spread across micro climates that
would have different impact on the various building materials available.
Social structure: Development of a sustainable society. Infrastructure and buildings
should be planned so that transport needs are minimized. To achieve this, a
multifunctional community connected by a well developed public transit system is
required. The requirement is usually for the local government to provide the primary
services like main roads, it would be beneficial if pedestrian walkways and bicycle
paths are better incorporated in the designs as this is not the norm in many present
developer schemes in Nigeria. Pedestrian and bicycle traffic should serve as a starting
point for planning. Towns, communities and rural settlements must be integrated into
a network structure.
Existing Buildings – Environmental adaptation of existing buildings, is required as
they make up a good proportion of the total building stock. To achieve sustainable
development, existing buildings must also be more healthy and resource efficient,
better adapted to ecological cycles, to local conditions and the rest of the community.
A huge effort is needed for this type of conversion, as the norm is for existing
buildings on big developer sites tend to be demolished. However when local buildings
utilizing local materials are remaining on site, it could be ideal to analyze the previous
usage and see if this can be incorporated into the new development.
People: Building with people as the starting point. The goal should be to build a
humane society with room for everyone. Safety, comfort and beauty make us feel
good. Sometimes we need to be alone and sometimes with others. There should be
opportunities at different levels to participate in community development. How can
segregation and fear be avoided, and how do we make towns and communities
flourish. (Bokalders and Block, 2010)
A holistic approach is adopted in this paper as a means of ensuring a useful outcome
that recommends techniques that are deliverable at a reasonable cost both financially
and environmentally. Architects should be at the forefront of this as they would be
immediately involved from inception. The planning design and specification of the
housing units will determine the materials to be used and the procurement methods to
be utilized.
Housing delivery systems have been classified as developmentally-orientated or
conventionally-orientated. It has been claimed that a developmentally-orientated
approach to building procurement would encompass the parameters of community
empowerment and participation in design, job creation via the development process,
and economically and environmentally-sustainable procurement (Taylor and Norval
1995). However especially in upcoming developments in Nigeria, new building

Affordable housing design
491
procurement systems display an increasing awareness of sustainability, but
concentrate on economic and social sustainability, as opposed to environmental
sustainability. (Dalgliesh, et al, 1997)
To commence in the local areas requires initiatives at the neighbourhood level
supported by changes in the enabling environment. Changes such as housing finance
policies and mechanisms that channel resources to the informal private sector for the
provision of housing and access to land for low-income housing by individuals and
small-scale developers and private entrepreneurs. (Ogu and Ogbuozobe, 2001)
Planning and building regulations, and building materials to facilitate the production
of new low-cost and low-income housing units
Population increase and city condition led to an expedite demand for new buildings,
and concentrated stance on the importance of local building materials and techniques.
In many parts of the world, such materials and techniques are widely used and help
meet the growing demand for low-cost housing. Methods of improving such materials
and technologies and for combining them in new ways are constantly being
developed. (Gentileschi, 1999) However, the production of indigenous building
materials requires that technologies are tested, tried, and above all, widely known at
the local level. In some cases, it is dissemination of technological innovations is
limited by the inability of local institutions to translate research findings to
commercial scale operations and to self-help builders. Although the pace of research
is slow, the Nigerian Building and Road Research Institute (NBRRI) is expected to be
at the forefront of this exercise as is the case with the British Research Establishment
(BRE) is in the UK and US Green building council (USGBC) in the USA .
Government Policies
The Nigerian government policies for housing development in the past have not been
helpful to majority of developers. What is needed therefore are policies that are in
tune with local realities, and are flexible and responsive to change. This is best
achieved with home-grown policies. (Nubi and Oyalowo 2010) Turning enabling
policy into effective practice requires far-reaching changes, involving a complex
combination of development actors who bring their own perspectives on participation
to bear on attempts to close the gap between principles and reality, and between the
potential for action and the concrete activities (Cornwall, 2002).
One of the major problems facing private developers in Nigeria was the lack of
finance to embark on meaningful housing delivery services amongst others. It is
recommended that government housing policy need to be proactive, most especially in
respect of addressing delay in getting registration on lands. The government should
also focus its attention on the problem of poor infrastructural facilities; this is believed
is necessary for more developments to take place in the real property market in
Nigeria. (Gbadeyan 2011) Also with the uncertainty surrounding land ownership,
efficient land markets and sustainable land use policies are indispensable and there is
need to change the Land Use Decree to a more housing friendly legislation.
(Ajanlekoko, 2001) Its also claimed that government efforts should be directed on
social housing, this its said will force the three tiers of government to develop housing
for disabled, elderly, single mothers and poor people who can't meet their own
housing needs (Arigbola 2006) Its predicted Nigeria has the largest expected
contribution from population growth over the next 40 years, which will significantly
increase its working age population contributing to GDP growth. (Hawksworth and
Tiwari, 2011)

Olagunju, Oloke, Hammond and Costello
492
Nigerian Building technology and Nigerian Building and Road Research Institute -
NBRRI
The NBRRI a parastatal under the aegis of the Nigerian Federal Ministry of Science
and Technology established in 1978. They have a mission to improve the quality of
life of Nigerians in the area of affordable housing and increased economic
empowerment through integrated research and development in building, road and
engineering materials sector.
Their key mandates are (1). Research into local building and construction materials to
determine the most effective and economic methods of their utilization and (2).
Architectural design of buildings to suit the Nigerian climatic conditions with respect
to lighting, ventilation, thermal comfort and humidity. (NBRRI website)
Some achievements have been made by NBRRI to date. These include producing
brick making machines for cement stabilized bricks and blocks, fibre concrete roofing
tiles and a few other machinery. However, there is the need for further proactive
research to create more sustainable materials for the building industry and actually
achieve their mission.
RESEARCHING EMERGING TECHNIQUES IN
CONSTRUCTION DELIVERY
Government needs to create a research unit of expert consultants who will help and
advise, making sure that developers and house builders maximize the potential of
sustainable materials and off-site for each individual project by adopting and adapting
the techniques and materials best suited to their own specific area requirements:
Fast delivery, creating large volumes of housing units quickly and easily
On time to meet critical target dates, such as new owners/tenants and terms
Exact repeatability every time, to house-builder/developers own particular
specification
Minimizing disruption on active sites, with fewer build processes, contractors and
deliveries
Viability allows better funding options, with various commercial arrangements and
specialist funders
Research indicates that off-site can play a significant part in delivering sustainable
construction. Technology and design by the architects should be emphasised and
government policies should be geared towards helping off-site system manufacturers
and the clients who specify them to promote and exploit the environmental benefits of
off-site techniques. (Goss, 2010)
The growing demands on the construction industry to improve its environmental
performance make it essential to integrate environmental and sustainability
requirements into building design at the earliest possible stage.
Available building materials
The supply of low-cost but durable building materials is almost universally recognised
as a major obstacle to improved housing conditions in developing countries, whether
in urban or rural areas. There is a growing interest in the use of building materials that
can be produced entirely from local resources, using simple small-scale production
technologies to provide durable building materials at a cost that is affordable by the

Affordable housing design
493
majority of potential builders. New building technologies that rely on locally available
materials are likely to have the most significant impact. (Okwo and Soboyejo, 2006)
Despite the potential contributions of indigenous materials to the construction sector
and national economies, and despite the opportunities that exist to promote these
materials in several countries, the successful development of these materials has been
restricted to a few countries only. The transfer of technologies between countries and
establishment of a framework to identify and receive requisite technologies can
overcome this limitation. This was highlighted by the Habitat Agenda, which stated
that ―International organizations have an important role to play in disseminating and
facilitating access to information on technologies available for transfer‖ (paragraph
205, UN Habitat)
The way materials are organised, shaped and connected or configured is fundamental
to attaining structural quality and durability of dwellings. Most functions of materials
are tied to the physical safety and integrity of the building while some other functions
are equally tied to operational and aesthetic aspects.
Cost comparison of available walling materials in Makurdi metropolis for example in
Nigeria showed that the use of laterite bricks made from 45% sand and 5% cement
resulted in a saving of 30 - 47% when compared with the use of sandcrete blocks
while the use of fired clay bricks resulted in a savings of 19% per square meter of
wall. The study therefore recommends the use of laterite bricks in Makurdi and other
locations because it is more economical and environmental friendly than fired clay
bricks. (Agbede, and Manasseh, 2008)
Also research is being done into using cement-fibres composite panels made of
cement reinforced with palm kernel shaft, a by-product of oil palm for cost-efficient
and low-cost building panels for walls and ceilings. Data from the field survey on 10
buildings shows that cement-bonded composite panels are comparatively cheaper,
sound-proof, durable, lighter-weight and environmentally friendly than the
conventional sandcrete blocks and asbestos ceiling board.(Adedeji and Ajayi, 2008)
Achieving cost efficiency by accelerated sustainable building can be by using for
example Interlocking bricks. It‘s crucial to accelerate the construction process as the
traditional method can be laborious and slow. Efforts are being made to increase
productivity through using different types of interlocking blocks (Adedeji, 2005)
In the rural areas of Nigeria, local materials are usually the most common, used
because of the cost and time savings. One example of sustainable construction
materials is adobe. In West Asia, North Africa, West Africa, South America, South-
western and North America, and Spain adobe is used to construct all kinds of
buildings. Not only is there almost no energy consumed in transportation, but the
material is found everywhere. Many people simply use the adobe found right on the
land where they are building. You will of course need a frame for support, but the
adobe mixture is very strong and the home is somewhat naturally insulated because of
the thickness of the walls and the density of the adobe itself. Once the home is built,
the occupants will find lowered electric bills and less energy consumption than their
neighbours who may not have used sustainable building materials, or indeed may not
have Sustainable Homes (http://www.sustainablebuildingmaterials.net/)
RESEARCH METHODS
For the analysis and Interpretation of this research the quantitative and also qualitative
methods have been chosen.

Olagunju, Oloke, Hammond and Costello
494
The quantitative research approach offers results in precise measurements and tends to
be good for confirmation and deduction. Determining the relationship between one
and the other is usually achievable. It‘s found to be good for knowing how many or
how much, as some data is in the form of numbers and statistics. Quantitative research
is objective and seeks precise measurements and analysis of target concepts. It‘s been
employed for the user‘s surveys and questionnaires as it‘s more efficient and able to
test hypothesis.
Qualitative – As this is usually recommended during the earlier phases of the research
project, (Neill, J 2007) the design would emerge as the study unfolds. The data is in
the form of words, pictures or objects. Qualitative research is subjective and
individual‘s interpretation of events is important, e.g. uses participant observations
and in depth interviews. This has commenced and is proceeding well. The qualitative
method is also richer though time consuming, but less able to be generalized. The case
study type of qualitative was also selected. Creswell (1998) defines the case study as
an exportation of a bounded system or a case (multiple cases) over time through
detailed in depth data collection involving multiple sources of information rich in
context. Some consider ―the case‖ as an object of study (e.g. Stake, 1995) while others
consider it a methodology (e.g. Merrian 1998) According to Creswell, the bounded
system is bounded by time and place and it is the case being studied.
The Code for Sustainable Home
Launched by the Government in 2007 the Code for Sustainable Homes replaces
EcoHomes as the National standard to be used in the design and construction of new-
build residential properties in England. The code is a set of sustainable design
principles covering performance in 9 key areas: 1.) Energy and CO2 emissions, 2.)
Water, 3.) Materials, 4.) Surface water run-off, 5.) Waste, 6.) Pollution, 7.) Health and
well-being, 8.) Management, 9.) Ecology. The code uses a rating system of 1-6 stars
and involves a Design Stage Report and a Post Construction Report which is
submitted to the Building Research Establishment to provide a final code certificate.
Formal code assessment of new-build dwellings can only be carried out by a suitably
qualified licensed and registered, Code Assessor. Developers wishing to lead the field
in sustainable development will want to have their developments assessed under the
code as soon as possible in the project life cycle to achieve as high a code as possible.
(Department for communities and local government, 2007)
These codes need to be adopted by the developing countries like Nigeria and even
though they are beginning to realise the importance of sustainable development its
been difficult to get out of the starting blocks due to other more pressing issues like
rapid development of slums, transportation and ensuring reduction of building
collapses prevalent in the country as an outcome of poor adherence to existing policies
and codes. There is therefore a need to police the builders further and also to weed out
corrupt practices amongst the officials, as a result of slack supervision and
unprofessional conduct at different levels.
The code focuses on how these problems highlighted can be tackled right from the
onset in the design aspect before the building gets to the construction phase. Analysis
of existing regulations indicates that developing countries need to ensure that these
requirements are adhered to as long time development can only be sustained if the
design and materials are coordinated adequately with the right supervision for an
efficient delivery. Inefficiency is the bedrock of failure in trying to create a guideline.
Affordable housing design
495
Adequate design will improve production taking cognizance of locality and culture.
There is waste generated in energy, in developing countries inadequate power supply,
an influx of individually generated power from home owners. The desire to create a
thermal environment that would satisfy the human body condition has created the
need for air conditioners in every room in the house, this is obviously not viable for
affordable housing. Good design and usage of materials would eliminate this and
make the house more affordable to run and maintain. Shared water supply source
would negate the need for each home to have a borehole and a shared filtered ground
source would supply a maximum number of householders creating a good economy of
scale in delivery. A mix of climate appropriate design will make the delivery better
and reduce running costs of buildings. Solar orientation of buildings to allow good
cross ventilation. Reduction in water usage, rainwater harvesting techniques and good
sanitation are some of the all-important infrastructure and service requirements.
Toolkit
A toolkit is being proposed and its likely to be developed in three parts namely (a) the
principles will be highlighted, (b) the process will be shown and finally (c) case
studies will be used to highlight the practical resource aspects. Its meant to help
interpret the findings based on the information gathered using the 9 key areas of the
sustainable code. This would be used as the key resource to draw conclusions on the
way forward. It will serve to aid the users namely government planners and decision
makers, house builders and home owners to make decisions. The toolkit can be
defined as something focused around conscious, repeatable methods for gathering raw
research from multiple sources in specific contexts and transforming it into real
insight and information. (Beecher, 2008) It‘s proposed that the toolkit will have a
sustainability and affordability checklist as well as a menu of potential performance
indicators.
This would be a systematic analysis of the prevailing surrounding situation to come to
the most appropriate technological sustainable design for any proposed project. The
toolkit as said will aim to look at the 9 key areas of the sustainable code focusing on
design and technology of the materials as well as other factors surrounding creating
affordable housing in a sustainable way. Energy and CO2 emissions is one of the
bigger issues for sustainability and good designs can be created for the varied
Nigerian climate by combining energy efficient construction with passive heating and
cooling to achieve a sustainable society. Future buildings must be energy efficient,
and energy conservation measures must be adopted in existing buildings.
The adaptation to Natural surroundings and the people in the area is also significant to
forming a seamless relationship with all parties involved in the development.
In the UK the code for sustainable Homes and the ever tightening building regulations
have had a big impact on house builders and ensured changed building practices.
Likewise legislation needs to drive the move towards sustainability in the built
environment in Nigeria.
The government needs to give incentives to consumers reducing their cost and to
producers making it more viable to produce. As research meliorates the range of
innovative materials and solutions for house builders to choose from also improves
and helps to satisfy discerning consumers.
By 2020 45% of global construction is projected will be in emerging markets like
Nigeria. Over the next decade infrastructure construction is expected to grow by 128%

Olagunju, Oloke, Hammond and Costello
496
in emerging markets compared with 18% projected growth in developed
markets.(RICS 2010) While 70% of the global population will live in urban areas by
2050 (World fact book 2010) Affordable housing is therefore a key issue to target to
avoid urban slums.
FIGURE 1
CONCLUSION
High building costs, environmental and social issues in the different micro climates in
Nigeria are predominant. (FIGURE 1) There is a need for greater interaction and
communication between policy, research and practice. The Government needs to be
more proactive to create an enabling environment for improving the building codes
and its proper implementation. This can be done by participating with the research and
private sectors to create a sustainability code suitable for Nigeria that would highlight
the beneficial aspects of the materials used in terms of energy efficiency and reduced
costs.
Hence there is a need to have a revised building regulation that would ensure delivery
of buildings by utilising materials that would be environmentally friendly and
sustainable on the long term. Proper training of the local built environment
professionals is cardinal as there is evidence of a dearth of knowledge of sustainability
and zero carbon developments across the board. The degree of research that's being
done by for example the NBRRI is still inferior. The professionals need to share
knowledge and gather relevant data for improved shared research.
To facilitate this objective, there needs to be a comprehensive review of the energy
policies in force today, going on to how the low carbon buildings can be made a
Affordable housing design
497
reality with the relevant interventions in design and innovative materials and how the
value and cost savings from operational performance would make these affordable
housing buildings a viable proposition. As we have noted from the UK the focus is to
have all new builds achieving near zero carbon by 2016, the provision of affordable
housing is ongoing and hence the designers and developers have to be more creative
and resourceful in the specification of materials and on site installation process in
order to accomplish this.
As this research progresses, it is envisaged that appropriate outcomes and processes
that would assist the designers and policy makers in drawing up a sufficient energy
code enabling the specification of the right/available local materials to ensure
sustainable affordable build in different microclimates all over Nigeria would emerge.
REFERENCES
Akande, O K and Adebamowo, M (2010)– Indoor thermal comfort for residential buildings in
hot-dry climate of Nigeria proceedings of conference:adapting to change, new
thinking on comfort – Cumberland Lodge Windsor UK 9-11 April 2010 Network for
comfort and Energy use in buildings.
Adedeji, Y.M.D AND B. AJAYI, (2008) Cost effective composite building panels for walls
and ceilings in Nigeria, Department of Architecture, Federal University of
Technology, Akure, Nigeria and Department of Forestry and Wood Technology,
Federal University of Technology, Akure, Nigeria
Adedeji, Y.M.D (2005) -Sustainable Low-Cost Housing Technology in cities: Accelerated
Construction Initiatives Option – Journal of Land Use and Development Studies Vol.
1, No. 1, 2005
Agbede, I O and Manasseh, J (2008) - Use of Cement-Sand Admixture in Laterite Brick
Production for Low Cost Housing- dept. of civil engineering Univ. of Agriculture,
Makurdi, Benue state, Nigeria
Ajanlekoko, J S- FNIQS – Sustainable housing development in Nigeria - The financial and
infrastructural Implication – international conference for spatial information for
sustainable development in Nairobi, Kenya - October 2001
Aribigbola, A (2008) Housing Policy Formulation in Developing Countries: Evidence of
Program Implementation from Akure Ondo State Nigeria. Dept of Geography and
planning sciences, Adekunle Ajasin University Ondo State
Barefoot and Gilles, 2009 – Specialist Architectural practice in East London
Beecher, Fred (2008) Sr. User Experience Consultant Evantage Consulting (Interaction design
association- IxDA)
Bokalders, V and Block, M (2010) The whole building handbook – How to design healthy,
efficient and sustainable buildings. Earthscan and RIBA publishing
Brown, G - (2007) the Editor and mentor of Architectural Evangelist, A BIM consultant and
3D expert
Chueca, P- 2009, Today's City Houses - Architectural design, Links International Press
Cornwall, Andrea (2002). Beneficiary, Consumer, Citizen: Perspectives on Participation for
Poverty Reduction, Swedish International Development Agency
Dalgliesh, C D, Bowen, P A and Hill, R C (1997) Environmental sustainability in the delivery
of affordable housing in South Africa. Engineering, Construction and Architectural
Management, 4(1), 23-39.

Olagunju, Oloke, Hammond and Costello
498
Daramola, S A and Aina O 2004 - Planning policies and affordable housing in Nigeria – An
analysis of Abuja Master Plan Scheme and the re-validation of Certificate of
Occupancy.
Gbadeyan, RA, 2011 Private sectors contributions to the development of the Nigerian
Housing Market. Institute of public administration and management (ipam),
Department of business Administration, University of Sierra Leone, Tower Hill,
Freetown, Sierra Leone
Gentileschi,L,M 1999- Changing attitudes to traditional houses / Sardinia Island -Italy.
http://www.csiwisepractices.org/?read=22 assessed 12/01/2011
Hawksworth, J and Tiwari, A 2011- The world in 2050, The accelerating shift of global
economic power: challenges and opportunities, PWC economics practice London
Iweka, A and Adebayo A – Improving housing durability in deprived settlements of Lagos
Megacity through ingenious use of sustainable indigenous materials.
Kabir, B and Bustani S A (2008), A review of housing delivery efforts in Nigeria, department
of building, faculty of environmental design, Ahmadu Bello University- Zaria Nigeria
King, P (2011)- article on 230311 (UKGBCwebsite) Executive of the UK green building
council assessed 05042011
Marmol, L and Radziner, R (2008) Between architecture and construction, Princeton
architectural press (1st edition 15 May 2008)
Marburger, L, 2010 – High performance home building guide for Habitat for humanity
affiliates.-Federation of American Scientists (FAS) guide accessed on the 4th April
2011 (http://www.fas.org/programs/energy/btech/advanced%20technologies/Habitat
%20high%20performance%20guide.pdf) pg. 5
Nnanna, J.V (2010) Housing Crisis: A theoretical study of the home building industry in
Nigeria. Graduate college of Business administration Argosy University Dallas,
Texas USA
Nubi, T and Oyalowo B, 2010 – Housing Finance between social needs and economic
realities: The dilemma of policy transfer under Neo-Liberalism.
Nubi O T 2008 - Affordable housing delivery in Nigeria. The South African foundation
International conference and exhibition Cape town, October 2008, pp 1 -18
Obertelli, J – (2010) – Green homes will constrain affordable housing: Article in
www.insidehousing.co.uk of 11th January 2010 assessed 03/02/2011
Ogu, Vincent I. and Joseph E. Ogbuozobe (2001). ―Housing policy in Nigeria: towards
enablement of private housing development‖, Habitat International, vol. 25, issue 4,
December 2001.
Okwo, A and Soboyejo, W O (2006) – An alternative holistic approach to affordable
housing:Homes of foam. Perspectives on global development and technology Vol.
5 Issues 1-2 pgs 1-30
Oluwaluyi, Abiodun- 2008 International Housing Conference Nigerian Institution of Estate
Surveyors and valuers, Lagos state Branch 2008.
The Central Intelligence Agency: The world fact book, 2010
This day newspaper, 2009 Article titled 'Country has 16 million housing shortfall – Minister
24/06/2009 http://allafrica.com/stories/200906240453.html assessed 02102010
Raji, O.2008-Public and private developers as agents in urban housing delivery in sub-saharan
Africa. The situation in Lagos State, Humanity of social sciences journal, Vol 3, No.
2: pp 143-150.

Affordable housing design
499
RIBA , 2010 -The Future for architects (a report by the Royal Institute of British Architects)
www.buildingfutures.org.uk assessed 03022011
RICS 2010 global construction forecast http://www.sustainablebuildingmaterials.net/ assessed
in 2/03/2011
United Nations Economic and social council, 2004 -Creating an enabling environment for
successful poverty, reduction initiatives --Subcommittee on Poverty Reduction
Practices First session 30 June-2 July 2004 Bangkok
UN Habitat, 2008-Chapter three of UN Habitat annual report for 2008
US dept of housing and urban development. 2011, community planning and development -
Article on 'who needs affordable housing?'
http://www.hud.gov/offices/cpd/affordablehousing/assessed 15/04/2011
Yagboyaju, D,A (2010) The state and governance crisis in Nigeria, College press Ibadan,
Nigeria.


Shika, A.S. and Dardau, A.A. (2011) Framework for performance-based post-occupancy evaluation of
educational institution buildings in Nigeria In: Laryea, S., Leiringer, R. and Hughes, W. (Eds) Procs
West Africa Built Environment Research (WABER) Conference, 19-21 July 2011, Accra, Ghana, 501-
508.
501
FRAMEWORK FOR PERFORMANCE-BASED POST-
OCCUPANCY EVALUATION OF EDUCATIONAL
INSTITUTION BUILDINGS IN NIGERIA
Aliyu Suleiman Shika1 and Abubakar Abdulazeez Dardau
Department of Building, Faculty of Environmental Design, Ahmadu Bello University, Zaria
Performance-based criteria for post-occupancy evaluation (POE) for individual
buildings are based typically on the stated design intent and criteria contained in or
inferred from a functional program. Assessment of performance of buildings of
institutions delivering higher educational services has become a matter of particular
interest to governments seeking to increase the effectiveness of educational provision
and maximize value for money. This paper presents the characteristics of important
aspects of a performance evaluation approach related to higher education properties,
with the aim of developing a general guideline for the POE practice specifically for
institutional buildings in Nigeria. The main objectives are firstly, to review and
analyse the government and institutional building performance, secondly, to
determine the occupants‘ satisfaction level, thirdly, to determine the correlation
between building performance and occupants‘ satisfaction level. It will evaluate
specific aspects of planning and detailed design as well as match performance against
design expectations within the ambits of budget for capital project in terms of
function, accessibility, purpose, economy, aesthetics, experiences and environmental
quality in institution of higher learning in Nigeria. Data required for the study will be
mainly numerical and direct observations at the scene of occurrence.
Keywords: accessibility, economy, performance evaluation, post-occupancy
evaluation.
INTRODUCTION
There is a growing concern for organizations to structure their built asset to enhance
the performance of their primary processes or core businesses. Building performance
evaluation provides this platform as it is now assuming a prominent place in the
strategic plans of most business concerns (Then, 2003) in (Okolie, 2009). Barrett and
Baldry, (2003) opines that building evaluations are broadly divided into; user-based
systems and expert-based systems. The user-based system uses a building‘s occupants
to evaluate the suitability of a building for their particular needs and hence is also
known as post-occupancy evaluation (POE). The expert-based evaluation relies on
experts‘ assessments and typically covers far more areas, such as provision for
information technology, organizational growth, energy efficiency and changes in work
style. Accordingly, the building performance evaluation seeks to assess the extent to
which a building after construction, occupation and use meets its conception and
design purpose (Ornstein and Ono, 2009; Obiegbu, 2004).
Shika and Dardau
502
Facility performance evaluation allows an organization to establish its position
through the careful and consistent evaluation of facility performance; it stimulates
action through identifying what is to be done, who is required to act and in what
manner (Barrett and Baldry, 2003).
This suggests that the objective of performance evaluation is not limited to optimizing
the running costs of buildings; though that is important, but encompasses other
strategic management issues in an organization. For construction organizations, it
encompasses the design and management of space and related assets for people and
processes in such a way as to support the achievement of organizational mission and
goals (Amaratunga and Baldry, 2002). As external and internal factors place more
demands upon facilities in an organization, resources must be suitably combined for
efficiency and cost. Performance evaluation explicitly focuses attention on feedback
loops and this influences behaviour. For educational institutions, this feedback loop
influences the overall project design for improved performance and flexibility.
Facility performance provides a mechanism to learn from the past and evaluates
contemporary future trends in the use of facilities (Cots, 1992; Lackney, 2001). It is
therefore believed that the collection, interpretation and analysis of information about
performance of buildings provide the key to better planning and design for the future.
LITERATURE REVIEW
Building Performance Evaluation Concept
To lay a theoretical foundation /framework for this study, a review of related
literature is necessary. This frame-work, according to Bak (2004) is vital for guiding
the research, ensuring coherence and establishing the boundaries of the study. The role
of building performance evaluation in facilitating organizational performance is
widely acknowledged. Amaratunga and Baldry (2002) stated that performance
evaluation is a key factor in ensuring the successful implementation of organizational
strategy. They maintain that it does not only play a vital role but also provides
standards for establishing comparisons. Omirin (2005) in her contribution states that it
is a very important tool for strategic studies, budget preparation, and organizational
change.
In simple terms, performance has been defined in BS 5240 as the behavior of a
product in use. It can be used in this context to describe the physical performance
characteristics of a building as a whole and of its parts (Cliff and Buttler, 1995). It
therefore relates to a building‘s ability to contribute to fulfilling the functions of its
intended use. To make it clearer, it involves the inspection of a building between one
and five years after its completion, and assessing whether and to what extent it has
met its design goals for resource consumption and occupant satisfaction. The primary
purpose of Building Performance Evaluation is to improve design practice. The
methodology includes reviews of design documentation, interviews with operators and
occupants, site inspection, analysis of utility data and occupant satisfaction surveys.
Finally feedback is provided to the design team. Generally, Barrett and Baldry (2003)
report that building performance evaluation can serve two broad purposes, namely;
Improves current situations; and Aid in the design of future buildings (briefing).
Douglas (1996) outlines specific areas where evaluation of buildings can be useful.
These include:
Property portfolio review, acquisition and disposal; Highlighting the areas a building
is lacking in performance; Helping in prioritizing maintenance or remodeling works;

Post occupancy evaluation
503
Providing identification of performance or early warning signs of obsolescence in
buildings; and Assisting in achieving value for money from building assets through
achievements as well failures.
Baird (1996) maintains that the benefits of evaluation include: Better matching of
demand and supply; improved productivity within the workplace; Minimization of
occupancy costs; Increased user satisfaction; Certainty of management and design
decision making; and higher returns on investment in buildings and people. It is
obvious from the above, that building performance evaluation should be considered a
potential success factor by the facilities manager. Building performance is important
in both inter and intra building sense. Douglas (1996) distinguishes between inter and
intra building evaluation by stating that inter building evaluation takes place when one
building is compared against another building. Douglas (1996) further states that this
is important where clients or occupiers are undertaking a comparative analysis of
various properties for acquisition or portfolio assessment purposes. On the other hand,
intra building evaluation takes place when the building is assessed on its own without
direct reference to other properties. The goal here, according to Douglas (1996) is to
ascertain how well the building is serving the needs of the occupier or identify any
major deficiencies in its overall performance. It is in the later sense that this research
is anchored which is in tandem with the definition of building performance evaluation
earlier adopted for this study.
The Facilities Management Functions in Building Performance
From the standpoint of commercial property, facilities management means the
coordination of management functions which concentrate on the interface between the
physical work-place and people. But from the non-commercial property standpoint,
the functions concentrate on the interface between the physical use-place and people
(Hakkinen and Nuutinen, 2007). The premise of this view, according to the authors, is
that facilities management has a role to play in supporting organizational effectiveness
in a non-commercial context and buildings in educational institutions are no
exceptions. Whatever the definition is, the consensus among authors is that facility
management is not only about buildings, but also about the people that occupy the
spaces within the buildings, the processes they are supporting within known
constraints of available resources and the prevailing corporate culture (Then, 2003).
Given the significance of buildings, it will be difficult to argue that they do not have a
role to play in sustaining the core business in an organization. If this role is to be fully
understood, Lavy and Bilbo (2009) submit that facilities maintenance managers must
have some way of determining the extent to which buildings under their control affect
the performance of business in an organization. This further suggests that a facilities
manager needs adequate knowledge of building performance evaluation or building
diagnostics. Building diagnostics is the systematic study and evaluation of building
performance. It is sometimes used to describe facility performance evaluation
activities (Preiser, 2005). Douglas (1996) argues that building diagnostics is very
relevant to facility management and as part of facility performance evaluation; it
should be considered as a potential success factor to the organization. Douglas (1996)
concludes that whether or not it is a critical success factor depends on the
circumstances and needs of the organization. However, the methodology for this study
is not clear and must therefore be interpreted with caution.
In his work titled ―post occupancy evaluation; how to make our buildings work better‖
Preiser (1995) opines that performance evaluation of buildings is a toolkit for facility
managers. Preiser (1995) submits that the technique can be used for trouble shooting

Shika and Dardau
504
at the early planning and pre-design phases of a project. Thus, it can supply valuable
advice on building performance aspects of specialized systems and materials as well
as shed light on maintenance and operating costs. The other areas the tool can be
useful to facilities managers include problem identification of performance issues in
occupied facilities, intra-agency feed forward of design and guidance criteria to
improve future facility performance and documentation of data for litigation purposes.
This is because when facilities malfunction, the facilities manager is the first person to
know.
PROBLEM IDENTIFICATION
According to Preiser et al (1988), hundreds of POEs have been conducted on a variety
of building types over the last 25years. Some solutions included increasing
involvement of the organization being studied, better presentation of results, and
better targeting of information to appropriate decision makers (Zimring, 1988). Preiser
(1995) stated that historically, building performance was evaluated in an informal
manner, and the lessons learned were applied in the next building cycle of a similar
facility type. Because of relatively slow change in the evolution of building types in
the past, knowledge about their performance was passed on from generation to
generation of building specialists. Therefore, building performance criteria are an
expression and translation of client goals and objectives, functions and activities, and
environmental conditions that are required in relation to evaluation of building
performance using POE application.
Currently, one of the challenges facing Nigerian universities is the massive expansion
in higher education participation and the explosion in yearly students‘ in-take. As a
result of this, space requirements of classrooms, lecture theatres, hostels, laboratories
and workshops are hardly met in over 70% of tertiary institutions (Obaka, 2008;
Okebukola, 2002). Okebukola (2002) noted that facilities are overstretched, thus
presenting a recipe for rapid decay in the face of dwindling funds for maintenance.
There is no doubt however that the above scenario imposes severe constraints on the
institutions to effectively deliver their educational objectives and user value. These
call for strategic and proactive facilities management skills.
RESEARCH AIM AND OBJECTIVES
The aim of this research is to undertake Post Occupancy Evaluation of some selected
educational institution buildings in Nigeria, with the view to identify the key
performance-based indicators for best practice. In this regard, the following specific
objectives were highlighted for the study.
a) To appraise the nature and type of building facilities in the study area.
b) To assess the existing tools and approaches to performance evaluation of buildings.
c) To obtain the correlation between performance of the buildings and occupant‘s
satisfaction level
RESEARCH APPROACH
The proposed guideline to this study is illustrated in Figure 1. This guideline consists
of a systematic sequence of six (6) steps involving identification of building
parameters; evaluation of objectives; selection of planning approach; conducting of
the POE inspection; application of findings and actions in response to feedbacks. The
steps fall within three (3) phases namely, the initial phase; process phase, and

Post occupancy evaluation
505
recommendation phase, illustrated in Figure 2. Each phase illustrates issues or
activities that need to be addressed in the POE. This guideline provides an initial
framework to facilitate the application of POE in the selected facilities.
Figure 1. The performance concept in the building delivery process
(Source: Preiser, 1995)
ANALYSIS AND FINDINGS
Based on the POE guideline, a POE inspection survey will be conducted in the
selected facilities. The analysis of this research will be divided into three (3) sections.
The first section will features comparative analysis on building performance review in
the pursuit of determining the score of performance either under poor, medium or
good performance. The second section will feature the presentation of result which
will consists of analysis on the survey findings pertaining to the satisfaction level of
the surveyed building occupants in terms of building elements, services and

Shika and Dardau
506
environment. Survey questionnaire sets will be distributed and the respondents will
consist of the building occupants in the education institution concerned. Answers
obtained from the questionnaires will be used to provide specific findings to the study
and to provide recommendations. The final section will feature the correlation analysis
between building performance scores and the building occupants‘ satisfaction score.
The survey under Section B of the questionnaire will be designed to determine the
satisfaction level of the building occupants on the 19 parameters as stated earlier
based on a likert scale from 1 to 5:
―1‖ - Very Unsatisfied
―2‖ - Unsatisfied
―3‖ - Medium Satisfied
―4‖ - Satisfied
―5‖ - Very Satisfied
The final section of the analysis involves finding the correlation coefficient of the
building occupants‘ satisfaction in relation to the building performance. The
correlation analysis will be carried out using Kendall‘s tau correlation, using the
statistical software program SPSS (Statistical Packages for the Social Sciences,
version 12.00). The hypotheses will then be statistically tested with a two-tailed alpha
level of 0.05. This will be done to see whether building performance correlates with
the level of building occupants‘. High correlation between building performance and
building occupants‘ satisfaction indicates that the proposed guideline is effective and
relevant to be used to evaluate performance of institutional buildings in Nigeria.
CONCLUSION
POE provides a valuable approach in analyzing the performance of institutional
buildings, application of POE is relevant, effective and able to determine occupants‘
satisfaction level as well as provide recommendation to improve building
performance. The approach has a great potential in analyzing building performance as
it uses a strategic approach to achieve the best quality in building services, whereby
the assessment integrates the building occupants‘ behaviour, perception and opinion
as the building users.
Inevitably, POE is a useful tool for building asset and facilities management; as long
as the approach employed to collect feedback from users is effectively integrated
towards sustainability of government and public buildings. POE also seems to have a
natural place in strategic planning of building management and can be developed
under public sector. The key to this application is by allocating the needs of POE in
building design and planning phase. The research also noted through literature search
that, much ideas and solution are developed to achieve buildings‘ sustainability and
this can create an opportunity for wider application of POE, especially to government
and public buildings. POE is able to mitigate emergence of defective problems as the
process comprise a strategic assessment to building current performance.
More importantly, design of the buildings should also consider parameters that will
determine the good respectable performance of the buildings in line with high
satisfaction and comfort to the building occupants as the users of the buildings.
The research has also outlined the important considerations and recommendations
towards improving the performance of the institutional buildings.

Post occupancy evaluation
507
REFERENCES
Amaratunga, D. and Baldry, D. (2002). Performance measurement in management and its
relationships with management theory and motivation Facilities. 20(10); 327-336.
ASTM (American Society for Testing and Materials). 2000. ASTM Standards on
Whole Building Functionality and Serviceability. West Conshohocken, Pa.ASTM.
Bak, N. (2004). Completing your thesis: A practical guide. Pretoria, Van Schaik.
Baird, G. (1996). Building evaluation techniques. New York, McGraw-Hill.
Barrett, P. and Baldry, D. (2003). Facilities management. Towards best practice.
Oxford. Blackwell publishing.
Cotts, D. and Lee, M. (1992). The facilities management hand book. Newyork.
Amaloen; A division of American Management Association.
Cliff, M. and Butler, R. (1995). The Performance and Cost-in-use of Buildings: A New
Approach, BRE Report. Building Research Establishment. Garston.
Douglas, J. (1996). Building Performance and its relevance to facilities management.
Facilities, 4(3/4); 3-32.
Hakkinen, T. and Nuutinen, M. (2007). Setting Sustainable Solutions for Office
Buildings. Facilities, 25(11/12) 437-451.
Lackney, J. (2000). Awarding Innovative Educational Design. The School
Construction News and Design Share Awards 2000 Program.
Lackney, J. (2001). Post-Occupancy Evaluation in the Practice of Educational
Design; Paper presented at the Environmental Design Research Association.
Scotland. July, 5th 2001. Pp. 2-18.
Lavy, S. and Bilbo, D. (2009). Facilities Maintenance Practices in large public Schools.
Facilities. 27(1-2); 5-20.
Ornstein, S. and Ono, R. (2009). Performance Evaluation of a Psychiatric Facility in
Sao Paulo. Facility. 27(3-4); 152-167.
Obiegbu, M. E. (2004). Overview of total Performance concept of buildings: Focusing
on Quality, Safety, and Durability. Paper presented at the 34th Annual
Conference of the Nigerian Institute of Building. Abeokuta. 2004.
Obaka, D. (2008). Current Challenges for Nigerian Students: Tertiary Education in
Nigeria [Online]. Available from: www.gieva.org; www.ece.org. (Viewed
29th December, 2010).
Okolie, K, C. (2009). Building Performance Evaluation in Educational Institution: A
Case Study of Universities in South East Nigeria. RICS COBRA Research
Conference, University of Cape Town, 10-11 September 2009: 1598-1625
Omirin, M.M. (2005). Principles of Facilities Management. Paper presented at the
international conference organized by the Nigerian Institute of Building.
Nasarawa. April, 20-22.
Ornstein, S. (1997). ―Post-Occupancy Evaluation Performed in Elementary and High
Schools.Greater Sao Paulo, Brazil: The Occupants and the Quality of the
School Environment‖, Environment and Behaviour. 29(2): 236-263.
Okebukola, P. (2002). The State of University Education in Nigeria. Abuja: National
Universities Commission.
Preiser, W. F. (1995). Post-Occupancy Evaluation; How to make buildings work

Shika and Dardau
508
better. Facilities.13(11); 19-28.
Preiser, W. F. (2005). Building Performance Assessment; From Post-Occupancy
Evaluation to Building Performance Evaluation. Architectural Science
Review. 48(2); 20-25.
Preiser, P. and Vischer, J. (Eds) (2005). Assessing Building Performance. Oxford:
Elsevier.
Preiser, W.F.E., Rabinowits, H.Z. and White, E.T. (1988). Post Occupancy
Evaluation. New York: Van Nostrand Reinhold Company CRS Sirrine
Houston, TX
Then, D. S. (2003). Strategic Management; In: Best, R., Langston, C. and De
Valence,G. (Eds), Work place strategies and facilities management; Building
in value, Butterworth, London.
Watson, C. (2003). Review of building quality using post occupancy evaluation.
Journal of programme Education Building. Vol. 35, pp. 1-5
Zimring, C. (1988). Post-occupancy evaluation and implicit theories of organizational
decision-making. The Proceedings of the 19th Annual Conference of the
Environmental Design Research Association. Pomona, CA., pp.277-280.
Adebola, A.M. (2011) Gender issues in land: implications for housing development in Nigeria In:
Laryea, S., Leiringer, R. and Hughes, W. (Eds) Procs West Africa Built Environment Research
(WABER) Conference, 19-21 July 2011, Accra, Ghana, 509-516.
509
GENDER ISSUES IN LAND: IMPLICATIONS FOR
HOUSING DEVELOPMENT IN NIGERIA
Ajayi Mary Adebola1
Department of Estate Management, Federal University of Technology, Akure, Nigeria
The basis of all development or construction is land and access to this gift of nature in
most traditional African societies has been restricted from the female gender through
the customary laws guiding its use and ownership. The factors of cultural attitude of
male dominance, lack of inheritance rights, low education and income levels of the
female gender have been found to reduce their participation in housing development.
The aim of the study is to investigate how males and females secure access to land
and housing in four selected ethnic groups in southern Nigeria with a view to
ascertaining the existence of gender discrimination in access to landed property.
Methodology includes administration of close-ended questionnaires to 1,518
indigenous homeowners across Akure, Benin City, Owerri and Calabar using cluster
sampling, stratified and systematic random sampling techniques. Data analysis
includes the use of Discriminant Function Analysis, Hypothesis Test for Difference in
Proportion and Phi Correlation. Findings reveal that there is a significant relationship
between gender and inheritance rights and that this has implications on housing
development. Recommendations are made on promoting female participation in
housing production and legal backing for women to ensure security of tenure in real
estate development.
Keywords: gender, housing development, inheritance, land, southern Nigeria.
INTRODUCTION Rights to land in Africa stem from many different sources, such as first settlement,
conquest, allocation by government, long occupation or market transaction. In some
cases these rights are transferable to heirs or can be sold (Toulmin, 2006). Down
through the ages, land is handed down to the next generation as an asset and so
inheritance is the surest and cheapest way through which any member of a family or
clan could access land. Unfortunately, the customary laws of property inheritance in
various communities in Africa and Nigeria in particular are mostly discriminatory
against the property rights of women. As a result, in most of Africa, women do not
have right to land. In many societies, women‘s claim to land within the customary
systems is usually realized through men, as daughters, sisters but especially as wives.
Such rights are known as secondary rights since they are of uncertain duration, are not
well-defined and are subject to change based on maintaining good relations between
parties (Kironde, 2006).
The Nigerian government promulgated the Land Use Act No 6 of 1978, drafted into
cap 202 of the laws of the Federation of Nigeria in 1990 in order to ensure that land is
within the reach of all citizens irrespective of gender or ethnicity and prevent
fragmentation of rural lands arising from the application of the traditional principle of
Adebola
510
inheritance (Aluko and Amidu, 2006). Even though the Act would have ensured
equality of men and women in land allocation and management in the country, it is an
open secret that land still continues to change hands outside government regulatory
mechanism, in accordance to native law and customs of the people. This has,
therefore, hindered the hope of promoting equality of access to land to men and
women under the Act since the customary land tenure system discriminates, in land
matters, against women.
Mullins (2008) attests that there is a direct link between a country's attitude toward
women and its progress socially and economically. Having secured property rights
and easy access to land reduces the poverty level of a lot of women and boosts the
economy of the nation as a whole. Meinzen-Dick (2001) reveals that secured property
rights empowered women by increasing the agricultural productivity, securing access
to services, providing incentives and ability to invest, raising the status of women,
providing greater security and improving bargaining power. Women‘s equal property
rights are important because they are fundamental to women‘s economic security,
social and legal status and sometimes survival. This paper hopes to investigate how
males and females secure access to land and housing in selected ethnic groups in
southern Nigeria with a view to ascertaining the existence of gender discrimination in
access to land and housing.
EMPIRICAL STUDIES ON WOMEN’S TRADITIONAL ACCESS
TO LAND IN AFRICA
According to Kevane and Gray (1996), the various means through which women
secure land rights in Africa include through marriage, kinship, Islamic inheritance
laws and through local norms that are not gender bias. Customary laws in many
African societies enjoin a husband to provide his wife with land. In Sudan-Sahelian
West Africa, where land is under extensive agricultural production, women gain land
chiefly through marriage while single women rarely have rights in land. However,
these rights are lost upon divorce, widowhood and relocation. For instance among the
Tiv in Nigeria, women land right depend on either residence or marriage. A wife has
right to a plot large enough to support her and her dependants. If not given a plot of
land after marriage, she can leave and re-demand her bride wealth (Bohannan and
Bohannan, 1968).
Women also have land rights through their kinship status as among the Hausas in
Niger and Nigeria where women especially non-Muslim gain access to land through
the ‗Gandu‘ system. In this case, a woman is given a plot from the general family
holdings which she holds for her life time and then it reverts to the corporate group for
re-allocation to other lineage members. Her right to alienate the land is limited and
only by permission from the family (Starns, 1974). This kind of right is limited and
restricted, just like most land rights of women. In Akan society in Ghana, where
matrilineal system of inheritance operates, both men and women can own property.
Duncan and Brant (2004) conducted a gender study in the Volta Region of Ghana on
access to and control over land and found that ninety-six percent of women
respondents indicated that both men and women had access to lineage, stool or clan
land. However, access rights of men and women were less equal than initially
presumed as women‘s rights were generally ―secondary‘‘ rights. As a result, women
feared that they could be the first to lose their access rights due to growing population
pressures, agricultural intensification and commercialization. The study also revealed
the strong impact of marriage on especially women‘s access rights to land among the

Gender issues in housing development
511
patrilineal communities studied. Women generally gained (secondary) access rights to
their husbands‘ land through marriage, but lost their access rights to their own lineage
land at the same time. A similar study was conducted by Owusu (2008) on land tenure
dynamics in Volta and Central Regions of Ghana to determine the effect of gender and
access to land on livelihood of males and females. Although gender did not have
statistically significant effect, having access to land turned out to be the main
determining variable for livelihood. This shows the importance of access to land.
Furthermore, the areas of sub-Saharan African where women have historically had the
strongest right occur where they inherit land according to the precept of Islamic law.
Here, women have right to land that allow them to alienate or allocate them. Upon the
death of a father, a daughter can inherit a share of her father‘s property equal to one
half of her brother‘s. Also, husbands and wife inherit each other‘s property; a woman
receives one-eighth of her husband‘s property while a husband can receive on quarter
of his wife‘s property. Barnett (1977) reveals how women in Eastern Sudan regained
access to land through Islamic inheritance laws in Gezira irrigation scheme. Land was
confiscated from both men and women but only redistributed to men in form of semi-
permanent tenancies. Over time, women regained their land rights through the Islamic
inheritance law.
Although, women‘s land rights are usually restricted in most societies, there are a
number of areas where women have strong land rights. Keller et al (1990) reveals that
women in Central Africa have clear private rights to land and could pass their land
rights to heirs. Also, Grundfest (1985) writes that the land belongs to women in
Lemba of Zaire and they have a say in everything relating to land. Another example of
areas where women have strong land rights is among the Akure people, a part of the
Yoruba ethnic group in south-western Nigeria where females especially the first
female inherit land and houses from their parents (Ajayi, 2004).
GENDER ISSUES IN HOUSING DEVELOPMENT
Sokomba (1987) differentiates the importance of housing between the genders. To the
male, a house is an asset for future generation and a place to relax after a day‘s job.
The female however sees the house as a place to undertake her traditional roles and a
means of survival in a hard world. Differentiating the significance of housing between
the genders, it was observed that the urban woman rates housing highly because it
provides a base for household formation, income generation, workplace, networking,
security and urban identity. The house has a use value for women and their life
revolve more or less around it.
Despite the importance of housing to the female gender, a lot of factors have
constrained women‘s involvement in housing development. First on the list is the
cultural attitude that housing construction is a man‘s affair. In a survey carried out in
Ibadan by Agbola in 1998, a lot of married women show disinterest in the land
acquisition and housing construction process. Illiteracy and poverty were further
discovered by Okewole (1997) and Opoko (1997) as constraints to female
participation in housing development. Studies across Africa reveal that the population
of female decreases as one moves up the educational ladder (Anker, 1986; Mamman,
1996; Ajayi, 2000 etc). Another factor inhibiting women in housing development is
the lack of property inheritance rights. In many cultures in Nigeria and most of Africa,
female children are not usually allowed to inherit land because they will be married
out of the family. Ajayi (2004) however revealed that lack of property rights was not a
factor affecting women‘s involvement in housing supply in Akure as the inheritance

Adebola
512
system was favourable to the female gender. As such, about 20% of the existing stock
in Akure belonged to women.
RESEARCH METHOD
A set of close-ended questionnaires was the basic instrument for eliciting data for this
research. The target population includes all adult males and females who are
residential property owners and indigenes of the selected ethnic groups. Southern
Nigeria comprises of many ethnic groups out of which four groups were selected
namely Yoruba, Bini, Igbo and Efik and represented by Akure, Benin City, Owerri
and Calabar towns respectively. Each town was stratified into two, that is, the core
and the periphery with the aim of reaching the indigenes who are predominantly at the
core. Stratified and systematic random sampling techniques were employed to reach
male and female home owners, in selected streets in the core of the town till the
sample size of 381, 381, 376 and 380 respectively was reached making a total of 1518
respondents. Data analysis includes the use of Discriminant Function Analysis while
the Hypothesis Test of Difference of Proportion and Phi Correlation were used to test
the two hypotheses postulated for the study.
DATA ANALYSIS AND DISCUSSION OF RESULTS
Table 2: Cross tabulation of Gender and Socio-economic Characteristics of Respondents Response Frequency Percentage
Marital status Male Female Total
Single 180 (17.1) 83(18.1) 263 17.3 Married 734(69.5) 231(50.0) 965 63.6
Divorced 55(5.2) 21(4.6) 76 5.0
Separated 34(3.2) 34(7.4) 68 4.5 Widowed 53(5.0) 92(19.9) 145 9.6
Total 1056 (100.0) 461(99.7) 1517 99.9
Missing 0(0.0) 1(0.3) 1 .1 Total 1056 (100.0) 462(100.0) 1518 100.0
Religion
Christianity 889(84.2) 396(85.7) 1285 8.7 Islamic 69(6.5) 48(10.4) 117 7.7
Traditional 88(8.3) 13(2.8) 101 6.7
Others 0(0.0) 0(0.0) 0 0 Total 1046(99.0) 457(98.9) 1503 99.0
Missing 10(1.0) 5(1.1) 15 1.0
Total 1056 (100.0) 462(100.0) 1518 100.0 Educational status
No formal education 111(10.5) 69(14.9) 180 11.9
Primary 68(6.4) 56(12.1) 124 8.2 Secondary 298(28.2) 78(16.9) 376 24.8
Tertiary 545(51.6) 250(54.1) 795 52.4
Total 1022(96.7) 453(98) 1475 97.2 Missing 34(3.3) 9(2) 43 2.8
Total 1056 (100.0) 462(100.0) 1518 100.0
Monthly Income (N)2 10,000 and below 166(15.7) 83(18.0) 249 16.4
11-20,000 186(17.6) 123(26.6) 309 20.4
21-50,000 238(22.5) 91(19.7) 329 21.7 51-80,000 248(23.5) 24(5.2) 272 17.9
Above 80,000 104(9.9) 56(12.1) 160 10.5
Total 942(89.2) 377(81.6) 1319 86.9 Missing 114(10.8) 85(18.4) 199 13.1
Total 1056(100.0) 462(100.0) 1518 100.0
Source: Field Survey, July 2010
The data got can be grouped into two namely the socio-economic variables of
respondents (which are gender, marital status, religion, educational status and monthly
2 US$1 equals approximately 160 Naira, as at March 2011.

Gender issues in housing development
513
income) and data on the means of gaining access to land and housing in the four
towns. Table 2 shows that the highest percentages of respondents in both male and
female genders are married. Christianity is the predominant religion in the study area
while about half of the respondents have tertiary education which shows that literacy
rate is high in the study area among both males and females. The table also reveals
that the income range with the highest percentage of respondents is N21- 50,000 while
the least percentage of respondents earn above N80,000.
Table 3: Distribution of Respondents by Means of Gaining Access to Land and Housing
Response Frequency Percentage
Male Female Total
Purchase 479(45.4) 238(51.5) 717 47.2
Inheritance 525(49.7) 183(39.6) 708 46.6
Gift 16(1.5) 22(4.8) 38 2.5
Government allocation 22(2.1) 8(1.7) 30 2.0
Others 1(0.1) 4(0.9) 5 0.3
Total 1043(98.8) 45598.5) 1498 98.7
Missing 13(1.2) 7(1.5) 20 1.3
Total 1056(100.0) 462(100.0) 1518 100.0
Source: Field Survey, July 2010
Table 3 reveals that 47.2% of respondents got access to land and housing through
purchase which is closely followed by those who got through inheritance (46.6%).
Males got access majorly through inheritance (49.7%) while females account for
39.6%. This shows that the more males than females inherited their houses. With
limited access through inheritance, females are better represented in gaining access
through purchase, that is, 51.5% as against 45.4% for males.
Table 4: Distribution of Access to Land and Housing through Inheritance
Location Male Female Total
Akure 83(56.1) 65(43.9) 148 (100.0)
Benin City 156 (83.4) 31(16.6) 187(100.0)
Owerri 158(85.4) 27(14.6) 185(100.0)
Calabar 128(68.1) 60(31.9) 188(100.0)
Total 525 183 708(100.0)
Source: Field survey, July 2010.
Sequel to Table 3, the 708 respondents who gained access to land and housing through
inheritance were further presented in Table 4 through cross tabulation based on gender
and location. The table reveals that in all the towns, greater number of males than
females had access to land though inheritance. This shows that access to land through
inheritance operates in all the selected towns with the same trend of being more
favourable to the male gender although to different degrees. Access to land and
housing through inheritance is greater for women in Akure (43.9%) as against 14.6%
in Owerri.
Data Analysis
Discriminant Function Analysis was used to establish the variables with the greatest
effect on access to land and housing ownership among the two groups of those who
have property inheritance right and those who do not. The variables related to how
access to land and housing can be got through inheritance include gender, education,
income, ethnicity, marital status and religion. Mathematically, the model is given as:
d=b0+b1x1+b2x2+b3x3+b4x4+b5x5+b6x6

Adebola
514
A total of 1518 homeowners were sampled out of which 1277 were used for the
analysis because 241 have at least one missing discriminating variable. This number
was divided into two groups (Group 1 and 2) according to their cultural right to
property inheritance. These were selected and used for the classification purpose.
Table 5: Eigenvalues
Function Eigen values % of Variance Cumulative % Canonical
Correlation
1 .048(a) 100.0 100.0 .214
a First 1 canonical discriminant functions were used in the analysis.
Table 5 shows the efficacy of the Discriminant function. The canonical correlation of
0.214 is good while the value of Wilk‘s Lamda (0.954) as shown in the next table
indicates the discriminatory ability of the function.
Table 6: Wilks' Lambda
Test of Function(s) Wilks' Lambda Chi-square Df Sig.
1 .954 59.735 6 .000
In addition, the small significant value of Chi-square statistics indicates that the
Discriminant Function did better than chance at separating between the groups of
those who have right to inherit land and those who do not.
Table 7: Tests of Equality of Group Means
Wilks' Lambda F df1 df2 Sig.
Monthly Income 1.000 .151 1 1275 .698
Educational
Status
.999 1.257 1 1275 .262
Religion .999 1.134 1 1275 .287
Marital Status 1.000 .041 1 1275 .839
Gender .957 56.826 1 1275 .000
Ethnicity 1.000 .198 1 1275 .657
This table provides an insight into the relative contribution of each of the variables. It
shows that gender is the best discriminatory variable among the six variables in
discriminating between the two groups based on cultural right of inheritance. Also, the
percentage of cases that were correctly classified in group 1 is 74.4% while in group 2
is 65% indicating a high degree of accuracy in the model. The percentage of grouped
cases correctly classified is 73.4%.
Two hypotheses were postulated for the study and tested. The first hypothesis (H01:
There is no significant difference in housing ownership through inheritance between
the male and female genders in southern Nigeria) was tested by using the Hypothesis
Test for Difference between Proportions. The formula is given as:
z =
where p1 = proportion of success in sample one (number of males having residential
property through inheritance in the study area)
p2 = proportion of success in sample two (number of females having residential
property through inheritance in the study area)
1 = 1- 1
2 = 1- 2

Gender issues in housing development
515
n1 = size of sample one (total number of male respondents)
n2 = size of sample two (total number of female respondents).
The decision rule is to reject H01 and accept the alternate hypothesis if z is greater than
1.96 at 5% level of significance. The observed value of z is 3.8151 which is in the
rejection region and thus H0 is rejected in favour of the alternate hypothesis. This
means that the difference in the proportion of males and females who secured housing
ownership through inheritance in southern Nigeria is significant.
The second hypothesis (H02: There is no significant relationship between gender and
property inheritance rights in southern Nigeria) was tested using the Phi Correlation.
Using gender and cultural right to inherit property as the variables for Hypothesis 2,
then the phi correlation coefficient is derived as:
Φ =0.1895
χ2
=1518(0.1895) = 54.51
The critical value of a chi-square (χ2) for one degree of freedom at 5 percent level of
significance is 3.84. If χ2
is larger than 3.84 at 0.05 level of significance, then phi
coefficient is significant and falls on the zero range on the correlation line. Therefore,
the null hypothesis that there is no significant relationship between gender and
property inheritance rights in southern Nigeria is rejected. This means that there is
significant relationship between gender and property inheritance rights.
CONCLUSION AND RECOMMENDATIONS
This study has revealed that there is significant relationship between gender and
property inheritance in southern Nigeria and that gender is a strong discriminating
factor in inheritance. There is variation in the levels of access of women to land
through inheritance in the towns of southern Nigeria. In Owerri and Benin City, there
is greater level of bias in customary laws against access of women to land and housing
through inheritance, while in Akure and Calabar, customary inheritance laws are not
rigidly against women‘s and this has impact on housing development by the female
gender. A higher percentage of female home owners secure access to land and housing
through purchase while inheritance was the means through which a greater percentage
of males do. This study has thus shown that where women‘s access to land and
housing are not constrained through discriminatory inheritance laws, they are more
involved in housing development. Through public awareness campaigns by
government and NGOs, discrimination against women in access to land and housing
through inheritance can be discouraged in order to promote female participation in
housing production. Legal literacy and backing should also be given to women to
ensure security of their tenure in real estate development.
REFERENCES
Ajayi, M.A. (2004). Women‘s involvement in housing supply in Akure, Nigeria, M.Tech
dissertation, Department of Estate Management, Federal University of Technology,
Akure.
Ajayi, M.A. & Olotuah, A.O. (2005). Violation of women‘s property rights within the family.
Agenda No. 66, Gender-Based Violence Trilogy 1 (1), 58-63.
Ajayi, M.O. (2000). Appraising gender participation in housing production and management.
Effective housing in 21st century Nigeria, (pp 215-219) Ibadan: AKT. Ventures Ltd.
Aluko, B.T. & Amidu, A. (2006). Women and land right reforms in Nigeria, paper presented
at the 5th FIG regional conference, Ghana.
Adebola
516
Barnett, T. (1977). The Gezira scheme: an illusion of development. London: Frank Cass.
Bohanan, P. and Bohannan, L. (1968). Tiv economics. London: Longman.
Duncan B.A and Brants, C. (2004). Access to and control over land from a gender perspective
a study conducted in the Volta Region of Ghana. Commissioned by the SNV
Netherlands Development Organisation, Ghana Office and the Gender and
Development Unit of the Food and Agriculture Organization of the United Nations,
Regional Office for Africa, Accra, Ghana: SNV/FAO.
Grundfest, S.B. (1985). The ‗wild,‘ the ‗lazy‘ and the ‗matriarchal‘: nutrition and cultural
survival in the Zairian Copperbelt. Working Paper 96, Office of Women in
International Development, Michigan State University. Kariuki, C. (2006). The role of women in rural land management and the impact of
HIV/AIDS. Paper presented at Africa Region CASLE Conference on Promoting
Sustainable Land Management in Africa, Bagamoyo, Tanzania, 14-16, March.
Kevane, M. & Gray, L. (1996). Land tenure status of African women. Background
Paper for Project on Gender and Property Rights in Africa. The World Bank. Kironde, L. (2006). Good governance as a fundamental framework to deal with problems of
access to land, land delivery and land conflicts in Africa. Paper presented at Africa
Region CASLE Conference on Promoting Sustainable Land Management in Africa,
Bagamoyo, Tanzania, 14-16, March.
Meizen-Dick, R.S. (2001). Property rights for empowering low-income women.
Retrieved on May 4, 2005 from http://www.ifpri.org/2020conference
Mullin, J. (2008). Gender discrimination: why is still so bad? Retrieved on August 26, 2008
from http://childreninneed.org/magazine/gender.html Okewole, A.I. (1997). Women‘s access to and control of housing accommodation in urban
centres of the South Western zone of Nigeria: an assessment. Proceedings from The
House in Nigeria. Obafemi Awolowo University, Ile-Ife, Nigeria.
Opoko, A.P. (1997). In search of adequate housing: a gender-aware approach. Proceedings
from The House in Nigeria. Obafemi Awolowo University, Ile-Ife, Nigeria.
Owusu, G.A. (2008). Gender, land tenure dynamics and livelihood: a comparison of Central
and Volta Regions of Ghana using Logistic Regression Analysis. Studies in Gender
and Development in Africa, 1, 34- 57. Sokomba, M.J. (1987). The role of women in rural housing and development in Nigeria being
a paper delivered at a National Seminar on Rural Housing Development, Abuja.
Starns, W. (1974). Land tenure among the rural Hausa. Wisconsin: Land Tenure Centre
Publications.
Toulmin, C. (2006). Securing land and property rights in sub-Saharan Africa: the role of local
institutions. Global Competitiveness Report ‟05-‟06. Switzerland: World Economic
Forum.

Okedele, O. and Adejumo, T. (2011) Geosophic perspective in Yoruba urbanism In: Laryea, S.,
Leiringer, R. and Hughes, W. (Eds) Procs West Africa Built Environment Research (WABER)
Conference, 19-21 July 2011, Accra, Ghana, 517-527.
517
GEOSOPHIC PERSPECTIVE IN YORUBA URBANISM
Olaniyi Okedele1 and Tunji Adejumo
2
1Department of Architecture, Faculty of Environmental Sciences, University of Lagos, Akoka, Lagos,
Nigeria 2Department of Urban and Regional Planning, Faculty of Environmental Sciences, University of Lagos,
Akoka, Lagos, Nigeria
Geosophic consideration is important in achieving sustainable design for nations
outside the western hemisphere. Such design is underpinned by the philosophy of
mimesis. The research explored geosophy to understand the mimetic design principles
in Yoruba urbanism. It adopted qualitative methodology. Data gathered through
scoped literature and two hour each interview of seven Ifa educational system sages
were analyzed using grounded theory to conceptualised Yoruba city design intents.
Four categories of conceptual framework including ―cosmological world view‖,
―harmonic ideal‖, ―seat of power‖ and ―nodal symbol‖ were found to influence urban
design in the study area. While ―cosmological world view‖ emerged as the core
category the remaining three constitute sub categories. The core hypothesis which
stemmed from theory generation is that Yoruba urbanism is influenced by her
cosmological world view. The cosmological world view is based on 16 sided
polygonal cosmic urban forms with a square inset that corresponds to the cardinal
points. Sustainable design in Yoruba cities must explore the prime position of
architectural numerology that operates on ―4‖, ―16‖ in ‗sense of place‘ determination.
This is in addition to the accommodation of bio-mimicry of the ecosystems and their
living communities within the bioregion that naturally exhibit identified
characteristics.
Keywords: cosmological world view, geosophy, geomantic planning, mimesis.
INTRODUCTION
Sustainable design had been the concern of built environment professionals since the
advent of postmodernism. Post modernism preaches a systemic approach to design
with climate and biophysical variables to create human habitats in harmony with
nature. Simulating ecological process in designing of human settlement is what Ryn
and Cowan (1999) referred to as ecological design. Such design followed the
principles of bio mimicry. Bio mimicry examines models, systems, process and
elements in nature with goal of imitating or acquiring information to solve human
problems. Form, process and ecosystem are the three levels of mimicry in design with
nature. Nature in this instance is viewed on a bioregional platform where daily
relationship of man with his immediate environment is paramount (Nicholls 2004). As
examined by Downton (2002) bioregionalism is having ―a sense of place‖. This
principle seeks a localized design solution. It emphasize that man and earth are
intrinsically related and the sustainability of the earth depend on man‘s consciousness
of his ecosystem which consequently determines the way he interact with the
Okedele and Adejumo
518
environment (Berg, 2001). Hence bioregionalism demands that sustainable design
must be built on ―sense of place‖.
The concept of ‗place‘ addresses man‘s relationship to his environment especially
how such landscape is used over a period of time to create a site specific identity.
Such identity emanates from the fusion of spiritual, social and traditional meanings a
‗place‘ generates to the inhabitants. Verhagen (2008) citing Rifkin (1983) observed
that ―Every age has its own unique view of nature, its own interpretation of what the
world is all about. Knowing a civilization‘s concept of nature is tantamount to
knowing how a civilization thinks and acts.‖ That is, world view varies with local
people‘s perception of what is called nature at point in time. Lefferts (2007) referring
to Buckminster Fuller research works submitted that nature and the universe uses a
particular set of energetic relationships that influence the way naturally designed
systems are sustainable. If nature mimics the cosmos for sustainability then imitating
nature in design works will meet the needs of man for generations. Understanding
this cosmic world view is what Lefferts (2007) called cosmometry, which he defined
as ‗the study of the fundamental patterns, structures, processes and principles that are
at the foundation of reality and the application of this knowledge towards the design
of sustainable and healthy living systems‖. The knowledge manifests in commercial,
social, culture, and belief system developed in partnership with contextual landscape.
That is why Arbab (2000) made case for the creation of alternative development
strategy that seeks to apply spiritual principles to the transformation of physical, social
and economic structures. This is borne out of conviction that scientific perceptions in
sustainability constitute an inquiry into matter and nature of external world while
religion is an inquiry into consciousness, spiritual and the nature of unseen world
(Kapur 2000). At the centre of such alternative strategy is Geosophy- the sum total
wisdom man developed in living at a particular place in the biosphere. This paper
examines geosophy to understand the mimetic design principles in Yoruba urbanism.
Such principles will find relevance in people driven sustainable architectural design;
effective land use planning that accommodates human dimensions in decision making;
identifying and building on distinctive local cultural resources for city branding – a
marketing tool for successful cultural, conference, anthropological and ecological
tourism industry.
STUDY AREA
Yoruba nation lies between longitudes 10 25
/E and 6
0 45
/E; Latitudes 5
0 55
/N and 9
0
10/N above the equator. In Nigeria, Yoruba nation inhabit the south western
geopolitical region (Figure 1). It is fully made up of five federating units of Nigeria
including Lagos, Ogun, Oyo, Osun and Ondo states. Parts of Kwara, Kogi and Edo
states are inclusive. According to NPC (1991) the total population of Yoruba speaking
states in Nigeria was 25,000,000. All classic Yoruba cities share the same form
(Obateru, 2006). There seemed to be a distinct traditional school of planning with
unwritten urban design manual.
MIMETIC ART THEORY AND DESIGN FORM
Mimetic theory is a world view art concept that emanates from the philosophy of
universe. Universe is traditionally on three levels namely the natural world, human
society, and the non material world. Mimetic theory of art simply states that art is
essentially an imitation of nature.

Yoruba urbanism
519
Figure 1. Map of Nigeria showing the 36 States
AS noted by Sorbom (1992), theory of mimesis as documented in ancient texts is not
exactly a theory of art in a modern sense; it is rather a theory of pictorial apprehension
and representation. The theory of mimesis was based on the relationship between
‗mimemata‘ and real things. For example, a house is a real thing whereas a
perspective drawing or an architectural model of the same house is a mimema
(Sorbom 1992). That is, the painting is a thing that looks like a house but is not a
house. Thus ‗mimema‘ as a thing becomes a vehicle for ‗man-made dreams produced
for those who are awake‘, as Plato suggestively formulated it (Lane 2007). Neither the
dream nor the mimema is a real thing. The real thing then exists in an immaterial
realm. Hagen (2006) observed that Plato theorized forms are tetrahedron (4 sides), the
hexahedron or cube (6 sides), the octahedron (8 sides), the dodecahedron (12 sides)
and the icosahedron (20 sides).
Plato postulates a metaphysics in which the four elements of Greek science - earth, air,
fire, and water are associated with four of the five solids. Many parts of the human
existence are metaphysical including thoughts, feelings, memories, dreams, and ideas.
Generating metaphysical experience demands interaction between the human mind
and the material world. For the designers, this experience is achieved through the
interaction between the human mind and the physical elements of the environment.
What the designer does is to manipulate any effect that an intended object has on man.
In the case of the built environment, the architect tampers with the effect of the object
whose original form is domicile in the intangible realm of ideas. Thus design at any
level is the imitation of ideal forms in the intangible realm. That is why Russell (1961)
testified that platonic forms are perfect templates that exist in an immaterial world.
These forms, Plato said, are the ultimate reference points for all objects we observe in
the physical world. They are more real than the physical objects in this material world
(Lane 2007). These complex platonic forms have recently been discovered to be
planetary grid that served as geosophical planning model for Neolithic man.
Geosophical planning is a world view design and planning techniques operating on
ancient philosophy relating and living on earth. All geomantic planning does is to
relate human design with cosmic design forms so as to harmoniously access intangible
attributes entrenched in radiant earth energy.

Okedele and Adejumo
520
Oriental nations, including Japan and China, had long acknowledged the place of earth
energy in sustainable spatial configuration of cities and other urban components.
Bring et al (1981) research works on the foundation of garden design and urban
planning in Japan is a relevant case study. Spatial consideration in Japanese
environmental design is traced to the concept of Chinese ―harmonic ideal‖. The goal
of Chinese environmental planning is to achieve harmony with nature, that is,
harmony of forces within and between physical and immaterial environments (Bring
et al, 1981). This translates into Chinese art principles where man is positioned to
harness the positive heavenly energies in his quest to survive on earth.
While Feng Shui is Buddhism influenced on Taoist art of placement in China and
Oriental nations, environmental design and planning is culturally done in India
through Vastu Shastra. Vastu Shastra is the traditional Indian architecture and design
system (Raman, 2004). It is a Hindu system of philosophy based on the belief that
human life can be improved by rearranging the spaces or design elements where we
live and work to benefit from cosmic influences (Ananth, 1999). The Hindu
philosophy that drives vastu shastra emphasized that successful human existence on
planet earth depends on how man is able to harness the gifts in nature. Ancient
Chinese Feng shui geomantic planning recognizes earth energy as dragon lines that
influence oriental human settlements. Vastu shastra is ancient India‘s planning
philosophy that allows creative access to ‗bioforce‘. Hermetic philosophy elucidates
planetary grid as planning tool for neolithic man. Greek esoteric traditions and
philosophers including Plato and Pythagoras attested to position of grid lines and
nodes in creative design that attracts man. There seems to be consensuses that
planetary grid and its biophysical ingredients possess intangible attributes that are
culturally interpreted to attract man over the ages. Aboriginal perceptions and
relationship to the earth influence the physical form of created settlements within the
contextual bioregional landscape. This corroborates Obateru (2006) submission that
physical composition and configuration of aboriginal towns is a reflection of the
communal philosophical perception of planet earth. At the core of this community
doctrine is earth creation. This is geosophy – the philosophy of man‘s relationship to
the bioregion. This paper examined the root of Yoruba indigenous sustainable design
principles. The study recognized Rapoport (1988) model for reading meaning in built
environment. His three level model is made up of high level meaning; middle level
meaning; and low level meaning. Rapoport (1988) high-level meaning describes
cosmological and supernatural symbolism that was embedded in buildings and urban
platting reflecting the culture and the philosophical system of local people.
RESEARCH METHOD
This research is interpretive in nature. It adopted qualitative methodological approach.
Qualitative research is exploratory and descriptive in form with characteristic ongoing
data collection and inductive analysis. Grounded theory was the adopted method to
theorize Yoruba city design intents. Black (2009) refers to grounded theory as a
research method of comparative data analysis, applied in an inductive research
process. Data collection spans a variety of empirical materials including scoped
reviewed literature on the phenomenon, interviews and personal observation. Extant
literatures, journals and conferences are research submissions that can be subjected to
qualitative analytical process (Jabareen, 2009; Kamba, 2009). The use of literature
review as secondary data is hinged on the fact that the authors undertook some
measure of research before writing. The research process is in two stages namely pre
study and data gathering and analysis (Figure 1).

Yoruba urbanism
521
Figure 2, Research Process
Data gathering and analysis is also in two phases. The first phase of textual data
gathering and analysis were from reviewed literature on Yoruba traditional urban
design documented in various research works and books on Yoruba nation building.
Seven scoped secondary textual sources made up of five books and two articles were
used. Each scoped literature was subjected to open coding to derive incidents, codes,
concepts and categories on the phenomenon. The open coding proceeded in parallel,
treating each extant literature as confirmation or further development of results from
earlier one. The second group of textual data was semi structured interviews of seven
sages in Ifa educational system to obtain first hand information on Yoruba urban
design and planning system.
This second phase is directed by emerging concepts, involving a more strategic
selection of 7 informants knowledgeable in traditional Yoruba Ifa educational system.
All conducted interviews were interspersed with transcription and selective coding
which allowed for the confirmation of scoped literature findings or further
generation of codes, memos, concepts and categories. A very important milestone
in grounded theory methodology is taking decision on when to stop data gathering and
analysis
RESULTS
The open coding of all the 7 scoped literature produced 20 different concepts, which
were organized, following a process of axial coding, into 4 categories. The selective
coding phase of Ifa sages transcribed interviews led to the emergence of 18 concepts.
The concepts were organized, following a process of selective coding into four
categories namely ―Numerology‖, ―City Building Strategy‖, ―Symbolic Linkage‖ and
―Geomancy‖.

Okedele and Adejumo
522
Codes, memos, concepts and the categories derived from scoped literature and Ifa
sages interview were properly synthesised for similarities and differences with the
intention of changing, modifying or detecting new categories. Five categories
emanated from the synthesis namely ―Cosmological World View‖, ―Harmonic Ideal‖,
―Seat of Power‖, ―Nodal Symbol‖ and ―City building Strategy‖ (Table 1).
Table 1 Scoped Literatures and Ifa Sages Categories Synthesis
S/N Scoped Literature Ifa Sages Interview Remark New Category
1 Eco Form Numerology Changed Cosmological World View
2 Environmental harmony Geosophy Combined Harmonic Ideal
3 Seat of Power Retained Seat of Power
4 Nodal Symbol Symbolic Linkage Combined Nodal Symbol
5 City building Strategy New City building Strategy
Grounded Theory Synthesis (2010)
Conceptual Frameworks for Understanding Mimetic Design in Yoruba
Urbanism
Identifying design intents in the configuration of these cities looked at the grounded
theory analysis and synthesis of scoped extant literature and Ifa Sages interview to
derive four categories including cosmological world view, harmonic ideal, seat of
power, nodal symbol.
Category 1: Yoruba Cosmological World View
The initial scoped literature analysis core category was Eco Form composed of the
cosmology and mimesis concepts. While cosmology refers to mythology and Yoruba
aboriginal city foundation, mimesis highlights the principle of mimicking heavenly
divinities in this material realm to arrive at 16 radial forms with prominent 4 cardinal
points. In the Ifa sages interview analysis similar category evolved as ‗Numerology‘
with additional use of ‗16‘ and ‗4‘ in divination system. There are 16 major ‗Ifa
Odus‘. There are 16 major deities including Ifa that also has 16 disciples. Divination
in Yoruba land is done by 16 cowries or 4 halves of Cola nitida seed (Ologundudu,
2008). The recurrence of ‗16‘ and ‗4‘ is a Yoruba cultural adherence to Hermetic
principle which states that, "As above, so below; as below, so above.‖ That is
whatever is below is like unto that which is above‘. In the Yoruba understanding of
heaven (intangible realm) there are ―16 deities‖ (orisas) on the beck and call of
Supreme God (Olodumare). On the earth (material realm) there are also 16 chiefs
(Oloye) answerable to the king (Oba). Everything in Yoruba world view runs on ‗16‘
and its divisible indices of ‗4‘.
Category 2 Harmonic Ideal.
Geomancy divinely relates human design with cosmic design forms so as to
harmoniously access intangible attributes entrenched in radiant earth energy. This is
achieved by locating most auspicious position on the landscape. Ifa sages interview
confirmed such locations through divinations to be followed by sacrifices at the
inception of Yoruba city building that often commence from the panoramic palace
landscape. Textual analysis of scoped literature identified hilly landscape as the
preferential site planning criteria for the city core made up of the palace and the
adjoining king‘s market.
Category 3: Nodal Symbol.
Religion is at the centre of aboriginal city planning. Nodal Symbol category is a group
of concepts highlighting the place of animist religious belief system in Yoruba city

Yoruba urbanism
523
planning. Ifa geomantic planning identifies the city core as major city dome where
earth energy is assessed. Most of the national Yoruba deities are located within the
palace and adjoining land uses accepting sacrifices through their priests under the
leadership of the King. The city core is therefore a Yoruba city mindscape composed
of local and external images of the city. It carries the economic, social, festive,
religious and recreational image of the city.
Category 4: The Seat of Power
The Seat of Power category from scoped literature revealed the social, economic and
political institutional frame work of the town. The King administered the city state
from the palace city core through the quarter chiefs to compound heads (Oloriebi).
The political structure is also an imitation of the cosmic Olodumare (supreme God)
and the 16 divinities. The ―King‖ is the political leader as well as chief priest of the
city. The quarter chief (Oloye) assumes the same role on quarter basis while the ‗Olori
ebi‘ control the compound and family deity. The King‘s palace is therefore the vista of
Yoruba city. All physical objects radiates to him. This is not unconnected with his
position as the spiritual head of the kingdom receiving positive bio force from the
major city dome.
Yoruba Mimetic Urban Design Theoretical Framework
The core category that emerged from synthesized categories is Cosmological World
View while the sub-categories include Harmonic Ideal, Seat of Power, Nodal Symbol
and City Building Strategy. The category network is represented as Figure 2. The core
hypotheses which stemmed from the theory generation process are:
Hypotheses 1: Yoruba Urbanism is influenced by Her Yoruba Cosmological
World View
Hypothesis 2: There is a relationship between Yoruba Cosmological World
View and Harmonic Ideal.
Hypothesis 3: There is a relationship between Yoruba Cosmological World
View and Seat of Power.
Hypothesis 4: There is a relationship between Yoruba Cosmological World
View and Nodal Symbol.
Figure 2.0 Category Frameworks for Yoruba Urbanism

Okedele and Adejumo
524
The influence of cosmological world view on Yoruba urbanism manifested in the four
properties that constitute the major category namely cosmic urban form, urban
numerology, principal deities and governance. Cosmic urban referred to the 16 sided
polygons influenced by the 16 divinities in Ifa earth creation. In addition to cosmic
form is the square that corresponds to the cardinal points often attached to primordial
deities. The same 16 and 4 constitute numerology in Yoruba daily living and art
works. The political governance with the king at the centre of affairs and 16 chiefs
ruling over quarters is rooted in the cosmic personalities that recreate the earth after
the flood in Yoruba world view.
Yoruba cosmological world view had a direct cause on achieving environmental
harmony. The belief system identified domes on earth (Igbo Odu) where extra
terrestrial energy flows from celestial world. Such energy points must be
geomantically located to enhance successful living on earth. Three properties of
―harmonic ideal‖ are geomantic planning, earth energy and panoramic landscape.
Major energy points in the city are geomantically chosen as the city core made up of
the palace and king‘s market. Such locations correspond to panoramic landscapes.
The grand nodal space in the city corresponds with king‘s market within the city core.
Other nodal points are the road intersections belief to be minor energy points.
Yoruba cosmological world view also had a direct cause on ―Nodal symbol‖. The
nodal points, the city core and the inter sections are treated as outdoor temples with
shrines for periodic propitiation according to the polytheist nature belief. The last
category, ‗seat of power‘ is influenced by the cosmological world view. Political,
religious system and the personification of the city by the king are the properties of
this category. The political structure is a reflection of the heavenly contingent that
created earth. While mythological frame work identified the supreme position of self
existing God ‗Olodumare‘ and 16 divinities in heaven, a copy of this administrative
model was instituted on city scale. In retrospect, the theoretical framework for Yoruba
cities fit perfectly into Rapoport (1988) high-level meaning‘‘ sacred architecture‘.
Citing the works of Eliade (1959), Smith (2007) identified four basic beliefs about
cosmological significance including principle of heavens on earth; the cosmos are set
in four cardinal points so planning works on earth should do likewise; there is an axial
linkage between heaven and earth; and that the art of divination is needed to locate
and sanctify sacred space on earth.
CONCLUSIONS
Traditional Yoruba urbanism is a geosophic perspective of cosmic statement as
expressed in the Ifa mythology of earth creation. Beckley (1980) classified urban
designers in two categories namely self- conscious and un-self- conscious. The latter
is intuitive in nature and is capable of affecting urban form. Self-conscious group are
professionals who rely upon sets of principles to create city forms that are liveable.
Principles employed by the self-conscious group actually evolved from the unwritten
knowledge and wisdom the intuitive group developed in living harmoniously in a
defined geographical setting. MacLean (1997) noted that organic architecture, green
architecture or sustainable architecture respond to issues of the heart, spirit, mind and
body. By responding to these four qualities, organic architecture embraces and fuses
together two fundamental concepts namely sustainability and geomantic site planning
which is divination art of locating positive earth energy empowered from the cosmos.
On this note sustainable design in Yoruba cities must explore the following:

Yoruba urbanism
525
Imitating 16 sided polygonal cosmic form with possible insertions of square
that define the cardinal points.
Accommodate the prime position of architectural numerology that operates on
―4‖, ―16‖ and theirs multiples in ‗sense of place‘ determination.
Bio-mimicry of biotic communities within the bioregion that naturally exhibit
identified numerology. Phenomenological interpretation of bio mimicry
foundation of form, ecosystem and process illuminates designs that respond to
sustainability on local scale.
The prime position of traditional institutional frame work and the religious
apparatus rooted in nature.
Consideration for local knowledge on how man relates to earth especially
reliance on landscape indicators to understand site planning with necessary bio
force in the absence of geomantic knowledge.
The cosmic 16 sided polygonal form imitated in Yoruba city lay out is meant to give
symbolic meaning to the sum total way of living. This was physically achieved
through the location of the palace in the most holy city core, location of central open
space called King‘s market as twin core land use and incorporation of sacred forms in
different quarters of the city.
REFERENCES
Ananth, S. (1999). The Penguin Guide to Vaastu: The Classical Indian Science of
Architecture and Design
Arbab, F. (2000) Promoting a Discourse on Science, Religion and Development. In The Lab,
The Temple and The Market: Reflections at the Intersection of Science, Religion and
Development. Edited by Sharon Harper. International Development Research Center,
Kumacricum Press. Bloomfield, CT 06002. Pp149-210
Awolalu, A. O. (1979), Yoruba Beliefs and Sacrificial Rites
Berg, P. (2001) The post Environmentalist Directions of Bioregionalism. Being a lecture at
University of Montana Missoula. Planet Drum Foundation. P.O.Box 31251, San
Francisco. CA 94131. U.S.A.
Black, (2009). Methodology -. Introducing a Constructivist Grounded Theory Method. In
BLOOD MONEY: A Grounded Theory of Corporate Citizenship. University of
Waikato. Myanmar .Burma. Pp 81-100
Bring, M. and Wayembergh J. (1981) Japanese Gardens: Design and Meaning. McGraw-Hill
Book Company. New York.
Brolin B.C. (1976). The Failure of Modern Architecture. Cassel and Macmillian Publishing
Limited 35, Red Lion Square. London WC1R4SG Pp70.
Corbin, J. and Strauss, A. (1990). Grounded Theory Research: Procedures, Canons, and
Evaluative. In Journal of Qualitative Sociology, Vol. 13, No.1
Cowan, S. and Sim Van Der Ryn. (1996). Ecological Design. Island Press. Washington DC.
U.S.A.
Downton, P. F. (2002). The Ecopolis Development Principles. The Urban Ecology Australia.
Newsletter #43. Adelaide; Australia.
Fadipe N.A. (1962). The Sociology of the Yoruba. Ibadan University Press. : USA
Fatunbi A.F. (2004) Odu and Ifa Concept of History: The African Perspective. Part IV. Awo
Study Center.
Gasson, S. (2001). Rigor in Grounded Theory Research: An Interpretive Perspective on
Generating Theory from Qualitative Field Studies. Drexel University, USA.
Retrieved from www.library.drexel.edu on 5th of March 2008
Giles, D.C. (2002) Advanced Research Methods in Psychology. Hove: Routledge

Okedele and Adejumo
526
Hagens B. (2006). The Divine Feminine in Geometric Consciousness. Anthropology of
Consciousness Journal of American Anthropological Association Vol. 17, Issue 1, Pp.
1-34.
Handel M (1993) John K. Wright and Human Nature in Geography. In America Geographical
Society of New York. New York
Jabareen, Y. (2009) Building a Conceptual Framework: Philosophy, Definitions, and
Procedure. In International Journal of Qualitative Methods. University of Alberta.
Canada. Vol. 8, No 14. Retrieved from http://creativecommons.org/licenses/by/2.0 on
10/9/2010
Kakulu, I. , Byrne, P. and Viitanen, K. (2009) Phenomenological Research in Compulsory
Land Acquisition and Compensation.FIG Working Week 2009 - Surveyors Key Role in
Accelerated Development Eilat, Israel.
Kamba,M.A.(2009). Harmonizing the Use of Research Terminologies: An Explanation and
Clarification of Meanings of Some Research Concepts. In The African Symposium:
An On Line Journal of African Educational Research Network. Vol.9, No 2. Pp 99-
110
Krapf-Askari E. (1965). Yoruba Towns and Cities: An Inquiry into the Nature of Urban Social
Phenomena. Oxford.
Lane, M. (2007). Plato: The Republic. Translated by Desmond Lee. Penguin Books Limited,
80 Strand, LondonWC2RORI, England.
Lefferts,M.(2007). Cosmometry: Embracing a New Paradigm of Understanding and Design.
Retrieved from http://www.cosmometry.net/pdf on 5/12/ 2010
MacLean, H.P. (1997). Organic Architecture: Sustainability and Geomancy As One Timeless
Architecture. Boston. Retrieved from http:// Timearch.com. on 6/9/2010
Michl, J. (1995). Form Folow What? The Modernist Notion of Function as a Carte blanche. In
1:50-Magazine of the Faculty of Architecture and Town Planning. Technion Israel
Institute of Technology, Haifa. Israel.
Michl,J. (2009) E. H. Gombrich‘s Adoption of the Formula Form Follows Function: A Case
of Mistaken Identity? In Human affairs Vol. 19, Pp274–288.
Munoz, L. (2005). The Geography of Traditional Yoruba City. In Globalization, Culture and
the Nigerian Built Environment. Faculty of Environmental Design and Management.
Obafemi Awolowo University. Ile Ife Vol. I Pp 31-39.
Newman, H (2008) Earth Grids - The Secret Patterns of Gaia's Sacred Sites. Wooden Books:
Retrieved from http://www.woodenbooks.com/ on 9/8/2009
Nicholls, R. (2004). Bioregionalism: A context for Sustainable Patterns of Living. Urban
Ecology, Australia. Adelaide. Australia
Obateru, O.(2006) The Yoruba City in History: 11th Century to the Present. Penthouse
Publications (Nig.)30 Ilaro Street, Old Bodija Estate, Ibadan
Okedele,O.S. (1981) The Design of ―A Residential Planned Unit of a New Community‖ for
Oyo, Nigeria. A Dissertation Submitted to the School of Engineering and Architecture
of the Catholic University of America in Partial fulfillment of the Requirement for the
Degree of Master of Architecture. Washington D.C.
Ologundudu, D. (2008). The Cradle of Yoruba Culture. Center for Spoken Words/Institute of
Yoruba Culture.
Raman P (2004) Vastu Shastra: Ancient Indian Architecture. In What‘s Happening -Tri Cities
Voice Newspaper. Fremont, Union City, Newark Califonia.
Rapoport, A. (1988). Levels of Meaning in the Built Environment. In Cross-Cultural
Perspectives in Non Verbal Communication, ed. Fernando Poyatos (Toronto: C. J.
Hogrefe,), 317-36;

Yoruba urbanism
527
Russell B. (1965). The History of Western Philosophy: And its Connection with Political and
Social Circumstances from the Earlier Times to the Present Day. George Allen and
Unwin Limited. London p125- 163
Shannak R.O and Aldhmour,F.M, (2009). Grounded Theory as a Methodology for Theory
Generation in Information Systems Research. In European Journal of Economics,
Finance and Administrative Sciences. Issue 15. Retrieved from
http://www.eurojournals.com on 10/12/2010
Smith, M. E. (2007). Form and Meaning in the Earliest Cities: A New Approach to Ancient
Urban Planning. In Journal of Planning History, Vol. 6, No. 1, 3-47
Sörbom, G. (1992) ‗The theory of imitation is not a theory of art. Some stages in a conceptual
tradition‘, in Jeanette Emt and Goran Hermeren, (eds), Understanding the Arts.
Contemporary Scandinavian Aesthetics, Lund University Press, pp. 217–35
Verhagen , F.C. (2008).Worldviews and Metaphors in The Human-Nature
Relationship: An Ecolinguistic Exploration Through the Ages. In the journal
of Language and Ecology vol. 2 no. 3.

Boakye, A.N., Akomah, B.B. and Coles, D. (2011) Health and safety in the Ghanaian construction
industry: Towards the establishment of roles and responsibilities of key stakeholders In: Laryea, S.,
Leiringer, R. and Hughes, W. (Eds) Procs West Africa Built Environment Research (WABER)
Conference, 19-21 July 2011, Accra, Ghana, 529-539.
529
HEALTH AND SAFETY IN THE GHANAIAN
CONSTRUCTION INDUSTRY: TOWARDS THE
ESTABLISHMENT OF ROLES AND RESPONSIBILITIES
OF KEY STAKEHOLDERS
A. Nimo Boakye1, B. B. Akomah
2 and David Coles
3
1Department of Building Technology, Sunyani Polytechnic, P. O. Box 206, Sunyani, Ghana
2Department of Building Technology, Cape Coast Polytechnic, P. O. Box AD 50, Cape Coast, Ghana
3Faculty of Built Environment, Han University, The Netherlands
Efforts aimed at addressing the health and safety issues in the Ghanaian construction
industry are not encouraging. This is because in the local contracts, the criteria for
determining the competency of contractors and the subsequent evaluation of tender
lays little or no emphasis on health and safety issues. It is true with other similar
documents. This shows that from the outset of the construction project less attention
is given to health and safety. The paper appraises the roles and responsibilities of key
stakeholders on health and safety in the Ghanaian construction industry - in
comparison with UK model – as a means of establishing best practice. The study
focused on professionals in the Ghanaian construction industry. Primary data were
obtained through structured questionnaire and informal interviews. The secondary
data were also obtained through desk top study. The data were analysed using both
qualitative and quantitative data analysis method. The study revealed that,
management commitment to health and safety seems to be at the lowest side. It also
came to light that UK construction industry is doing more to improve health and
safety of construction workers than their Ghanaian counterparts. However it was
conceded by the majority of the respondents that future adaptation of Construction
(Design and Management) Regulations 2007 (CDM 2007) to suit local conditions by
emphasising much on how roles and responsibilities concerning health and safety of
duty holders are spelt out. It is recommended that health and safety should be made
part of the criteria to select suitable contractor through tendering.
Key words: CDM 2007, health and safety, tender.
INTRODUCTION
The construction industry plays an essential role in the socio-economic development
of a country (Khan, 2008). Notwithstanding it is positive impact on the economy of
most countries in the world, it is characterized by poor safety record (Rawlinson,
2004). The poor state of the industry is partly due to the irresponsible manner in which
some of the stakeholders or the players within the industry take issues concerning
health and safety. It‘s also emphasized that the physical nature of the construction
process, the attitude of the people involved in the production process is normally
influenced by their cultural believes, the production environment. The culture of the
industry itself, coupled with other factors, contribute immensely to the poor health and
2
3

Boakye, Akomah and Coles
530
safety state of the industry (Loosemore et al. 2003; Petrovic – Lazarevic and
Djordevic, 2002).
The global report given by (ILO / WHO, 2005) indicates that about 17 percent of all
total workplace accidents occur in the construction sector. This is a very significant
number which requires good measures by the stakeholders in the industry to reduce
the extent of accident and to make the industry more attractive to job seekers.
The research conducted by (Boakye et al. 2010) indicated that not all construction
accidents are reported by the National Labour Department. Notwithstanding the poor
coverage and reporting systems facing the industry, the research further presented the
following records to show the trend of accidents in the construction industry of Ghana.
The report said in 2004 the number of accidents reported was 8 and it rose to 28 in
2009 (250%).
Boakye, Akomah and Coles
Table1: Recorded construction accidents 2004-2009
Year Number of accidents Index
2004 8 100
2005 21 262.5
2006 29 362.5
2007 20 250
2008 30 375
2009 28 350
Source: National Labour Department, 2010 in Boakye et al, 2010.
Figure 3: Trend of construction industry accidents
The trend of the accident statistics above indicates that construction related accidents
are on the increase in the Ghanaian construction industry, though some laws and
regulations are in place. The problem is whether the extent at which the laws and
regulations spelt out the roles and responsibilities are enough and more so whether the
stakeholders go by their health and safety responsibilities expected from them.
Against the background that the research seeks to examine health and safety practice
in the Ghanaian construction industry and how best it could be improved using the UK
model.
VARIOUS INTERVENTIONS TO IMPROVE HEALTH AND
SAFETY AND THE INVOLVEMENT OF STAKEHOLDERS
The factory, offices and shops Act (FOSA) 1970, (Act 328), Workmen‘s
Compensation Law 1987, (Act 187) and Labour Act, 2003 (Act 651) are the main
legislative instruments enacted by the government of Ghana to impose health and
safety standards in the workplace(Adei and Kunfaa, 2007) . Other Acts such as
Environmental Protection Agency Act, (Act 490) and Safety Commission Act (Act
0
5
10
15
20
25
30
2004 2005
2006 2007
2008 2009

Health and safety
531
567) and Mines Regulations (1970) also have some provisions related to health and
safety on construction sites. However, these safety and health legislation have not
been regularly revised to bring them up to date with the prevailing socio-economic
conditions in the country (Kheni et al, 2008).
The Labour Act, 2008 (Act 651) as well as the Factories, Offices and Shop Act
(FOSA) 1970 (Act 328) spells out the responsibilities of health and safety to the
employers and employees in the industry. The employers are required to ensure that
their employees work under satisfactory, safe and healthy conditions, provide and
maintain workplace plant and system of work that are safe and without risks to health,
personal protective equipment (PPE‘s) among others. While the workers are also
required to use all the safety appliances, fire-fighting equipment and personal
protection equipment provided by the employer in compliance with the employer‘s
instructions.
Health and Safety and Procurement of Construction Works
Currently, the common procedure for awarding construction contracts in the
developing countries is open competitive tender with tenders evaluated mainly on the
basis of price. Therefore the winning tender could be the one which does not provide
safety equipment, welfare facilities and safe working environment (ICE). Lubega
(2002) cited in Awodele and Ayoola (2005) stated that cost, time, quality and safety
have been identified as important characteristics of every project. However, Ghanaian
construction industry lays emphasis on the first three aspects at the expense of safety,
even in the determination of contractors‘ competency through tendering things that
would have improve health and safety conditions such as contractor‘s health and
safety plans, contractor‘s safety records and other similar information is not given
much attention.
Sometimes the consultants allow the contractors to charge some fees for safety and
welfare facilities, but as to whether they check for compliance by the contractor is
another matter. Kheni et al, (2008) stated that the consultant‘s involvement in safety
and welfare facilities within SME‘s often follows the dictates of the client and funding
bodies. The report further stated that, consultant‘s involvement in health and safety
issues is far better on projects funded by international donor agencies and clients who
aspire to implement health and safety standard that meet ILO guideline on
construction health and safety.
Current Health and Safety Situation in Ghana
Kheni et al, (2008) conducted a study which critically examines health and safety
management of developing countries conducted by researchers such as ―Suazo and
Jaselskis, 1993 ; Koehn et al. 1995 ; Peckitt et al. 2002; Small Wood, 2002‖ and
found ample evidence of lapses in the management of safety and health at
construction sites. The paper stated that the construction industry of Ghana shares in
many of these features of safety and health management in the construction industry
of developing countries. Touching on the safety culture of the industry, the paper
stated in its conclusion that the national culture of Ghana has influenced on workers
attitudes and behaviour at the workplace and even recommended a further research on
the impact culture has on health and safety in the construction industry. Hughes and
Ferret (2008) discusses the effect of health and safety culture of an organisation and
stated that management should be at the forefront to have effective health and safety
culture through the formulation of health and safety policy statement outlining short
term and long term health and safety objectives and be highly committed to the

Boakye, Akomah and Coles
532
implementation of health and safety policy. All managers, supervisors and members
of the governing body (e.g. directors) should received training in health and safety and
be made familiar during training session with the health and safety target of the
organisations. Commenting on the factors affecting health and safety culture, Hughes
and Ferret (2008) stated that, the most important factor affecting the culture is the
commitment to health and safety from the top of organisation. The above information
shows how management leadership and commitment promote health and safety
culture in an organisation.
Parties Responsible for Construction Health and Safety
The main parties responsible for construction health and safety in Ghana are the
clients (i.e. Public Sector clients, corporate clients and individual clients) main
contractors, regulatory agencies and Employees.(Laryea and Mensah, 2010). The
above stakeholder‘s responsibilities on construction health and safety stem on the Acts
such as factories, Offices and shop Act (1970) Labour Act, 203 and Workmen‘s
Compensation Law 1987 (Adei and Kunfaa, 2007; Laryea and Mensah, 2010).
The Health and Safety Situation in the UK Construction Industry
As part of an effort to improve health and safety of construction industry of the UK
and to reduce injuries and related problems resulting from accidents, the government
has focused on revising legislations. Taking Construction (Design and Management)
Regulations 1994 (CDM 94) for example after it came into force in 1995, the
regulations have been amended a number of times by regulations such as the
management of health and safety at work regulations 1999, the construction (health,
safety and welfare) regulations 1996 and the construction (design and management)
(amendment) regulations 2000. These successive amendments came as a result of
health and safety commission commitment to maintain the health and safety of
construction workers and the general public. (Hackett et al, 2007). The current
legislation as revised was the Construction (Design and Management) Regulations
1994 (CDM 1994) which came into force in March 1995. The construction (Design
and Management) Regulations 2007(CDM 2007) and its approved code of practice
came to replace CDM 1994. This new regulations seeks to involve and place duties on
all the stakeholders in the industry including clients, designers (Architects and
Engineers) contractors (principal contractors, sub-contractors and suppliers), users of
the building or the facility and the CDM Co-ordinator in case of (notifiable project – a
notifiable project is one where the construction work is likely to take more than 30
days or involve more than 500 person days).
Pre-Construction Information – It is the client‘s duty under the new regulations to
provide the pre-production information. This information should reach designers and
contractors who may be bidding for the work. The pre-production information covers
project-specific health and safety information needed to identify hazards and risks
associated with the design and construction work.
Construction Phase Health and Safety Plan - The regulations require the principal
contractor to produce a construction phase health and safety plan outlining the key
arrangements to ensure that the work is carried out safely. Clients need to ensure that
adequate plan is in place before allowing work to start on site. In addition, the
principal contractor is required to work with contractors to identify the hazards and
assess the risks related to their work, including the risks they may create for others.

Health and safety
533
Health and Safety File - The CDM Co-ordinator also under the regulation is required
to prepare Health and Safety file for (notifiable projects – a notifiable project is one
where the construction work is likely to take more than 30 days or involve more than
500 person days) only. The file should contain information needed to allow future
construction work including cleaning, maintenance, alterations, refurbishment and
demolition to be carried out safely. Information in the file should alert those carrying
out such work to risks and should help them to decide how to work safely.
Responsibilities of other duty holders as given by CDM 2007 and ACoP are too
detailed to be considered in this paper.
The introduction of the new health and safety regulations including Corporate
Manslaughter and Corporate Homicide Act (Act 2008) which implicates the whole
organization in the case of the death of an employee on a construction site might
contribute to the reduction of accident rates in the UK. According to Johnson (2010)
there were 41 fatal injuries of the whole UK construction industry in 2009/10 (2 per
100,000) and represents a reduction of 37% which compared against the average 3.2
per 100,000 for the previous five years.
Assessment and Evaluation of Contractor’s Competency
Assessment of contractor‘s competency and tender evaluation processes are key
operations in contract procurement and it enables the client to trust the selected
contractor to execute the project satisfactorily. It is a period at which the client makes
an important decision and it is an event for the project success (Alarcon and Mourgues
2002; Holt et al. 1995) cited in Ajayi (2010). The correct choice of the competent
contractor is a function of either client consultant or the project manager
(Kumarasway, 1996) cited in Ajayi (2010). In determining the competency of
organization (including principal contractor, contractors etc) CDM 2007 emphasised
that the company‘s organization and arrangements for health and safety are to be
assessed to determine whether the company provisions are competent and sufficient to
enable them carry out the work safely and without risk to health.
Rating Health and Safety Equally To Traditional Cost, Time and Quality
One of the recommendations made by Kheni (2008) as cited in Laryea and Mensah
(2010) suggested that one of the mechanisms to improve health and safety in the
construction industry of Ghana is to tighten health and safety requirements using
contractual frame works. Lubga (2002) also rated safety high and therefore added it to
cost, time and quality and consider them as the important characteristics of project.
Traditional tendering criterion are most often designed to meet the client‘s primary
project objective of cost, time and quality which Hackett et al. (2007) termed it as
―The Eternal Triangle‖. But looking at the emphasis place on health and safety and
effort being made by Health and Safety Executive (HSE) and the International Labour
Organisation (ILO) couple with ineffective management of health and safety at
construction sites in developing countries including Ghana (Kheni et al, 2008), it
would be ideal to consider health and safety as important as cost, time and quality of
project so that it could be incorporated into tender evaluation criteria for the selection
of suitable contractors for the award of construction contracts.
The diagram below illustrates the shifting from traditional Golden triangle to proposed
Golden Square (Sayeed, 2006).

Boakye, Akomah and Coles
534
Fig. 1.0 Shifting from Golden Triangle to Golden Square
Source: Sayeed 2006 – University College of London.
MAIN OBJECTIVES
To identify the state of health and safety practices in the Ghanaian Construction
Industry.
To identify areas of improvement by comparing it with the best practices in the
UK.
RESEARCH QUESTIONS
The above objectives were answered through the following research questions:
What is the state of the health and safety practice in the construction industry of
Ghana and the UK?
How can the current Ghanaian Health and Safety issues or practices be improved
based on the best practices from the UK?
RESEARCH METHOD
Structured questionnaire were administered to professionals in the industry who were
the target group for the research. The questionnaire was personally handed to the
respondents and that open the chance of informal interviews during the interactions.
Thirty-five (35) professionals working on behalf of clients and contractors were
conveniently selected for the research. Architects, quantity surveyors and structural
engineers were mostly the respondents. They were drawn from six consultancy firms
of which three were public owned consultancy firms and the other three private owned
firms. Five (5) Personnel serving in the capacity as Site Engineer/Project manager for
five constructing firms were also contacted. In addition, ten practising lecturers from
four tertiary institutions were also involved in the research. Out of the thirty-five
questionnaire distributed, twenty-nine (29) were received given the response level of
83%. The obtained data were analysed using both quantitative and qualitative data
analysis approach.
DATA PRESENTATION, ANALYSIS AND DISCUSSION OF
RESULTS
The table 1 – 7 present the data obtained from the field survey. The questions are
analysed and discussed making reference to the table concerned.

Health and safety
535
Source: Researcher field survey, 2010.
Table 3: Current safety culture in Ghanaian construction industry
Source: Researcher field survey, 2010
Table 4: Rating health and safety high and its impact on Ghanaian construction industry
Question /statement
Response in percentage (%)
Strongly
agree
Agree Disagree Strongly
disagree
Rating health and safety high and its impact
on Ghanaian Construction Industry
41
45
7
-
Incorporating health and safety issues in
assessing Contractors‘ Competency
66
34
-
-
Source: Researcher field survey, 2010
Table 5: Knowledge of CDM 2007 regs and its possible impact to Ghanaian construction industry
Question /statement
Response in percentage (%)
Heard about
it
Never heard of
it
Not quite sure
Knowledge about Construction (Design and
Management) Regulation 2007 (CDM, 2007)
59
34
7
Source: Researcher field survey, 2010.
Table 6: First learnt / heard about CDM 2007 Regulations
Question /statement
Response in percentage (%)
College/
university
At seminar/
conference
Internet Other
source
Where (CDM 2007 Regulations) first
learnt/heard about.
45
10
7
-
Source: Researcher field survey, 2010
Table 7: Impact of CDM 2007 Regulations on Ghanaian construction industry
Question /statement Response in percentage (%)
Yes Not sure / somehow
Do you agree that adoption of CDM 2007
regulation and modify to suit local conditions
can improve health and safety?
90 10
Source: Researcher field survey, 2010
Table 2: State of Health and Safety in the Ghanaian Construction Industry
Question /statement
Response in percentage (%)
Strongly
agree
Agree Disagree Strongly
disagree
Adequacy of the current laws and regulations 61 37 - -
Leadership commitment on health and safety
and the influence on their workers
59 39 2 -
Leadership commitment and promotion of
culture and safety in organisation
53 37 - 9
Question /statement
Response in percentage (%)
Satisfactory Not
satisfactory
Either satisfactory
Current safety culture in Ghanaian
Construction Industry 7 86 7
Boakye, Akomah and Coles
536
Adequacy of the current laws and regulations
It could be read from the table 2 that, the large number of respondents of 59% stated
that the extent to which current laws and regulations spells out health and safety duties
on the stakeholders in the construction industry are not enough. Three percent (3%) of
the respondents did not answer that question. However, 38% agreed that the extent to
which the current laws and regulations spells out duties on the stakeholders are
enough.
Leadership commitment and promotion of culture and safety in organisation
Fifty-five (55%) of the respondents strongly agreed that leadership commitment can
promote safety culture in an organisation. Supported by additional 38% of the
respondents who also stated that, they agreed to the statement. Only a fraction of the
respondents representing 7% stated what is contrary to what 93% (total of strongly
agree and agreed) respondents said. Refer to table 2.
Leadership commitment on health and safety and the influence on their workers
Fifty-two (52%) of the respondents strongly agree that leadership commitment on
health and safety can influence the worker‘s attitude to health and safety; 34% only
agreed while 10% disagreed to the statement.
Respondents assessment on current safety culture in Ghanaian Construction
Industry
Respondents were given the opportunity to comment how satisfactory or other wise of
safety culture in the Ghanaian construction industry. Majority of the respondents, 86%
confirmed that current health and safety culture was not satisfactory. Seven percent
(7%) stated that it was satisfactory. The remaining 7% stated that they were not sure
of the situation. See table 3 for detailed responses.
The response to the above questions indicate that management commitment to health
and safety is not the best in the Ghanaian construction industry and not reflecting what
Hughes and Ferret (2008) suggested as discussed in the literature. They were with the
view that management should be at the forefront in ensuring positive health and safety
culture through formulation of safety policy and be committed to the implementation
of the policy. Some of the respondents were in managerial position, their response
indicate that they are not effectively injecting health and safety culture into the
Ghanaian construction industry.
Rating health and safety high and its impact on Ghanaian Construction Industry
Almost all the respondents were in an agreement with the statement that rating health
and safety as equal to conventional cost, time and quality of projects will improve
health and safety conditions in the Ghanaian construction industry as could be seen
from table 4. Forty-five (45%) closer to the half of the respondents strongly agree to
the statement, while 41% confirmed that they agree to the statement. With regard to
the disagreement to the statement, 7% said they disagree and the remaining 7% also
stated that they are not sure whether such equal rating of health and safety to the
conventional project objectives would improve health and safety condition as by the
statement. It is confirmed by the majority of the respondents that incorporating health
and safety into criteria for contractor selection through tendering with equal rating of
health and safety to conventional cost, time and quality as a primary client‘s project

Health and safety
537
objective would be in the right direction as proposed by Sayeed (2006) discussed in
the literature.
Incorporating health and safety issues in assessing Contractors’ Competency
Assessment of contractor‘s competency and the tender evaluation processes are key
operations in contract procurement as the selection of qualified contract will give the
client assurance that the selected contractor can achieve the project objective (El-
Sawalhi et al. 2007 cited in Ajayi, 2010) one of the effective ways the proposed
concept would deal with health and safety is to incorporate them in the criteria for
determining the competences of the potential contractors. The respondents gave
overwhelming support as 66% strongly agreed to the statement while the remaining
34% confirmed that they also agreed to the statement.
Knowledge about Construction (Design and Management) Regulation 2007
(CDM, 2007)
Prior to the questions at this section, a proposal for the possible adoption of CDM
2007 Regulations was put forward and in order for the respondents to get fair idea or
knowledge of the Model, a brief description of how the model works was given as the
preamble to the questions related to the model.
The first question enquired about the knowledge of the current regulations of the
respondents since it changes or differs from CDM 94. The respondents were asked
whether they have heard about Construction (Design and Management) Regulations
2007, and these were the percentage responses as indicated from the table. Quite a
number of respondents (59%) have heard about the CDM 2007 Regulations. On the
other hand 34% confirmed that they have not heard about it, while 7% stated that they
were not sure.
Where first learnt/heard about CDM 2007 Regulations.
This question was also a follow up question to the preceding question enquiring the
knowledge of respondents on the CDM 2007 and these were the responses as shown
in table 6 (j).
Quite appreciable number of respondents, 45% has heard about CDM 2007
Regulations at College/University or other similar institution. Forty percent (40%) did
not answer the question at all. It could be noted that, it is the same percentage of
respondents who stated earlier that they have not heard about the new regulations,
therefore their staying away from the question is not surprising. However, 10% stated
that they had heard about the new regulations at a seminar or conference they
attended. The remaining 7% were part of the respondents who initially stated that they
had heard about the regulations, but through the internet.
Respondents’ opinion about how CDM Regulations -2007 will impact Ghanaian
Construction Industry
The question in table 7 was one of the key questions of the study and various
responses came out from the respondents. From the table, it is clear that the majority
of the respondents 90% support the proposal put forward, while 10% stated that they
are not sure whether its adoption will help improve health and safety situations. The
overwhelming support of the majority of the respondents regarding possible future
adoption of CDM 2007 model indicates that the brief explanation to how the model
works to the question giving in the preamble was able to communicate well to the
respondents despite the fact that quite number of the respondents had not heard about
the new CDM regulations.

Boakye, Akomah and Coles
538
CONCLUSION AND RECOMMENDATION
It can be concluded that in terms of promulgation and enactment of laws and
regulations to control accident rate and improve health and safety condition in the
construction industry, UK is doing more than their counterpart in Ghana. The
literature showed the successive revision or amendment even to the CDM 94 before
CDM 2007 came into being. Corporate Homicide Act 2008 which implicates the
whole organization in the case of the death of an employee on a construction sites is
another evidence of the effort being made by the UK government to bring sanity into
the construction industry. Possible future adoption of CDM 2007 regulations in Ghana
received massive support from the respondents. This includes making health and
safety part of tender evaluation and contractor selection criteria with equal rating to
cost, time and quality of project. This will factor health and safety issues from the
outset of the project. It also came to light that management commitment to health and
safety in Ghanaian construction industry is not encouraging and the industry safety
culture is at the lower side since less emphasis is made on health and safety issue
when determining the competency of a contractor and the subsequent evaluation of
tenders.
The paper suggests that the professional bodies within the industry should acquaint
themselves with how the CDM 2007 model works and permission from the UK
government, adopt it. This will require some adaptations to suit local conditions by
dwelling much on how the roles and responsibilities concerning health and safety of
stakeholders in the industry are spelt out.
The paper also suggests that government of Ghana should task the organisations like
the Department of Factory Inspectorate (DFI) and the professional bodies preferably
Ghana Institution of Surveyors, Ghana Institute of Architect, Chartered Institute of
Builders and others to develop health and safety Code of Practice to supplement the
current safety laws and regulations so that roles and responsibilities of each
stakeholder would be clearly spelt out. After the Code of Practice has been developed,
the stakeholders would then be required to serve as watchdog for effective
implementation/usage of the code.
Lastly, the paper suggests that further research should be carried out to identify the
strategies and modalities that could be put in place such that health and safety become
integral part of the criteria used to select suitable contractor through tendering.
REFERENCES
Adei, D and Kanfaa, E. Y. (2007), ―Occupational Health and Safety Policy in the Operation of
the Wood Processing Industry in Kumasi, Ghana‖. Journal of Science and
Technology volume 27, Number 2 August, 2007, 171.
Ajayi, O.M (2010) Multi – Criteria Decision Model for Contractor Selection in Construction
Project in Nigeria. Proceeding of West Africa Built Environment Research (WABER)
Conference, 27 – 28 July, 2010, Ghana. 423 – 433.
Akomah B. B., Boakye A. N. and Fugar F.D.K (2010), Safety on Ghanaian Construction
Sites: The Role of the Employer and the Employee. Proceeding of West Africa Built
Environment Research (WABER) Conference, 27 – 28 July, 2010, Ghana, 477 – 487.
Awodele, O. A and Ayoola, M.C. (2005). An Assessment of Safety Programmes on
Construction site. Journal of Land Use and Development Studies. Vol.1No1, 2005.

Health and safety
539
Boakye A. N., Akomah B. B. and Fugar F.D.K (2010), Ensuring the Health and Safety of
Ghanaian Construction Workers By Decentralised Government Agencies: An
Exploratory Study Proceeding of West Africa Built Environment Research (WABER)
Conference, 27 – 28 July, 2010, Ghana. 295 – 304
Global Workplace Deaths Vastly under Reported (ILO), (http://www.ilo.org/global/about-
the-
ilo/press-and-media-centre/press-releases/WMCS-00516/Lang-en/index.ht). (Assessed
on 5th December 2010).
Ghana Economy. (http:www.traveldocs.com/gh/economy.htm). (Accessed on 4th Dec 2010).
Hackett, M., Robinson, I. and Statham, G. (Ed.), (2007). The Aquah Group Guide to
Procurement, Tendering and contract Administration. Blackwell publishing Ltd, HSC,
Managing Health and Safety in Construction, Construction (Design and Management)
Regulations 2007. Approved Code of Practice. HSE Books.
Housing Deficit in Ghana Hits, 1 million (Public Agenda September 2009)
(http://www.traveldocs.com/gh/economy.htm.) .
(http://kppbumediacomms.com/HousingDeficitGhanaArts1million.asx).
(Assessed on 4th December, 2010)
Hughes, P. and Ferret, E (2008) Introduction to Health and Safety in Construction, 3rd
Edition.
Butterworth - Heinemann, UK
ICE, Promoting Construction Health and Safety through Procurement: A Briefing Note for
Developing Countries. Engineer Against Poverty Briefing Note.
(http://engineeragainstpoverty.org_db_/documents/EAP-ICE_HS_Briefing -
Note- pdf). (Accessed on 3rd
December 2010).
ILO/WHO (2005), Number of work related Accidents and Illness continues to Increase, Joint
Press Release. (http://www.ILO.org/global/about-the- ilo/ press-and-media-
entre/press-release/WCMS_00516/Lang-en/index.ht). (Assessed 3rd
Dec 2010)
Johnson M. (2010), Why doesn‘t a drop in Accidents Statistics Result in Lower Employers
Liability. (http:www.jltgroup.com/jlt-limited /blogs/construction/2010/08/why-
doesn‘t-a-drop-in-accident-statistics result). (Accessed on 5th December 2010)
Khan R. I. (2008), Role of Construction Sector in Economic Growth: Empirical Evidence
from Pakistan Economy Conference Paper, Karachi, Pakistan.
Kheni, N. A., Gibb, A. G. F. and Dainty, A. R. J., (2008), Institutional and Economic
Challenges To Health and Safety Management within SMEs in developing countries:
A Case Study of Ghana. (www.irbdirekt.de/claten/konda/CIB10336.pdf).
(Accessed on 16th July, 2010).
Laryea, S and Mensah, S (2010) Health and Safety on Construction sites in Ghana. RICS
International Conference, Paris. (http://reading.academia.edu/Sam
Laryea/313582/Health_and_Safety_on_construction_site). (Accessed on 10th May,
2010).
Petrovic – Lazarevic, S and Djordjevic, Z. (2002). ―Influence of Social Protection Program on
Senior Management styles in the Serbian Construction Industry‖. Manadzment u
novom okruzeju (Management in New Environment), Fakulet Organizacionih nauka
(Faculty of Org. Science), Belgrade, Serbia, pp. 576.
Rowlinson, S. (2004) Construction Safety Management Systems. London: Spon Press.
Sayeed, S. (2006) The Shift from The Golden Triangle to The Golden Square. Dissertation for
Bsc. (Hons) in Project Management for Construction. University College of London,
London: The Bartlett.


Kwofie, T.E., Adinyira, E. and Botchway, E. (2011) Historical overview of housing provision in pre
and post independence Ghana In: Laryea, S., Leiringer, R. and Hughes, W. (Eds) Procs West Africa
Built Environment Research (WABER) Conference, 19-21 July 2011, Accra, Ghana, 541-557.
541
HISTORICAL OVERVIEW OF HOUSING PROVISION
IN PRE AND POST INDEPENDENCE GHANA
T. E. Kwofie1 E. Adinyira
2 and E. Botchway
3
1,3Department of Architecture, Kwame Nkrumah University of Science and Technology, Kumasi Ghana
2 Department of Building Technology, Kwame Nkrumah University of Science and Technology, Kumasi
Ghana
Housing undoubtedly remains one of the essential needs of man among food and
clothing from creation. Meeting this essential need has witnessed different
interventions that span several centuries from individuals, community self help,
corporate organisations, NGO‘s to governments. From the Palaeolithic era
interventions have taken the forms of caves, make shift tents, nomadic artefacts,
traditional mud houses, wooden houses etc. These efforts to meet the housing needs
have been greatly influenced by nature of requirement, ethnicity, geographical
location, colonial impact and national policy direction. In Ghana, the rate of housing
delivery has been erratic and often fallen short of the demand. This has culminated
into several developmental problems such as high unaffordable rent, development of
slumps and ghettos and huge housing deficits that will take sustained efforts over long
periods to correct. In Ghana, diverse efforts have been expounded by many key
players before and after independence to provide this need of man. Until recently,
housing provision was the responsibility of the government and few individuals who
could afford. A critical analysis of the situation from pre independence to date posits
interesting features- (1. In 2005, Ghana had an estimated 5.4 million slum dwellers, 2.
Current statistics rate Ghana‘s housing deficit over one million as against an annual
estimated delivery of 37,000 and 3. Besides less than 15% of the population can
afford house ownership by mortgage and less than 8% without mortgage) -which give
a solid background for future national policy direction on housing provision.
Historically, housing provision in Ghana has evolved through several paradigm and
fragmented unsustained interventions due to several factors. This paper presents a
historical overview of housing provision in Ghana. It attempts to systematically bring
to bare the challenges of housing delivery by reviewing past and present housing
schemes and also collect the views of various key actors through semi-structured
interviews
Keywords: Ghana, housing, mortgage.
INTRODUCTION
Housing the low to moderate or average majority of the population of developing
countries remains one of the greatest socio-economic challenges which several
efforts/interventions in the form of housing projects schemes have been evolved to
address [Fergusson, 2008]. Despite the universally acknowledged importance of
housing for the physical and social well-being of mankind, its provision, affordability
and accessibility remains a seemly insurmountable problem for the nations in Sub-

Kwofie, Adinyira and Botchway.
542
Saharan Africa [Werna, 1998]. A full supply of proper decent housing for the
low/average-income people is still an unresolved issue in many notable cities
throughout the world [Werna, 1998].
Housing is one of the three basic needs of mankind, a pre-requisite to survival of man
[Onibokun, 1983; UN, 1992] and remains the most in short supply or deprived to
demand in many countries in the world. It remains the essential element of the
physical survival of mankind and contributes to the attainment of physical and moral
health of a nation and stimulates the social stability, work efficiency and the
development of the individual. It is also one of the best indicators of a person‘s
standard of living and of his place in society [Adeniyi, 1974]. In-spite of the
fundamental role of housing in the life of an individual, society or nation and in-spite
of the United Nation‘s realization of the need to globally attain adequate
shelter/housing for all, the housing situation in the world is at a crisis level and
remains one of the global problems. It is a grave and a rising challenge facing urban,
peri-urban and rural residents, particularly in most developing economies [Ademiluyi,
2009]. The situation seems worst than thought given the current trends in population
dynamism in major cities in the world especially in developing countries. According
to the United Nations Population Fund, the world‘s population passed 6.1 billion in
2001 and is expected to reach between 7.9 and 10.9 billion by 2050 and with this over
90% of this growth during the next two decades is forecast to occur in developing
countries [Wilkipedia, 2009].Currently, one-sixth of the world's population – one
billion people – live in urban slums in emerging countries. In addition, virtually all
net growth of 2.6 billion in world population between now and 2050 is projected to
occur in these cities [Fergusson, 2008].
The ever mounting crisis in the housing sector in the world is evident in the fact that
there is absolute housing unit shortage, growing emergence and proliferation of slum
and squatter settlements, rising cost of housing rent and growing inability of the
average citizens to own their own houses or procure decent accommodation of their
taste in the housing market [Ademiluyi, 2009].It is estimated that the number of
people considered to be homeless are estimated to be in excess of 100 million in the
world [UNCHS, 1999]. In cities such as Mumbai, Lagos, Accra, Abidjan Shanghai,
Mexico City, Moscow, an estimated 40 to 50% of their population live in slums,
dilapidated chawls and on pavements [Yuen, 2007]. Figure 1 below gives an
indication of the situation of housing shortage in the various part of the world.
38%
41.50%
2.50%
4% 14%
ASIA
SUB-SAHARAN AFRICA
USA
EUROPE
OTHER DEVELOPING COUNTRIES
Figure 1: Distribution of Housing Shortages in the World.
In Ghana, Housing situation is said to be at a crisis level [Ghana National Housing
Policy and Action Plan, 1987-1990]. In a 2006 Housing Conference in Accra, it was
revealed by the then president, J.A. Kuffour that Ghana‘s population was at 20
Housing provision in Ghana
543
million and was set to increase by 50% by 2025 with a growth rate of 2.7-3%.
Ghana‘s urban centres are at bursting seams from rural-urban drifts and bear the brunt
of rapid urbanisation. It is estimated that Ghana‘s urban population will be about 52%
of the national total growth and central to this rapid urban growth are serious housing
shortages and poor sanitation [UN-HABITAT, 2006].In 2005, as a result of acute
shortage of housing and poor conditions of housing, sub-Saharan Africa had 199
million slum dwellers constituting 20% of the worlds total slum population and had
the highest urban growth rate of 4.58% and the high annual slum growth rate of
4.53%. Ghana in the same year had 5.4 million slum dwellers and is anticipated to
reach 7.1 million by 2020. The worse hit cities are Accra, Kumasi and Sekondi-
Takoradi [UN-HABITAT, 2006].
Provision of affordable housing for the mass of the population has remained a major
challenge for many countries. Several interventions have been seen as the way to
remedy the ever growing demands which far outstrip the supply creating an acute
shortage leading to creation of slums, insanitary conditions and overcrowding
especially in the major cities of the world. This paper attempts to recount or offer a
historical overview of Ghana‘s housing situation. It presents a historical overview of
housing delivery in Ghana from pre to post independence era and reveals the
emerging developments in the Ghanaian housing industry. Information for the paper
was gathered through an extensive and exhaustive assessment of various housing
reports, a review of published literature on Ghana‘s housing situation and also through
semi-structured interviews with various stakeholders like the Ministry of Water
Resources Works and Housing (MWRWH), Centre for Scientific and Industrial
Research/ Building and Road Research Institute (CSIR/BRRI), Ghana Statistical
Services (GSS), Real Estate Developers, and Building Professionals.
HISTORY OF PUBLIC HOUSING IN GHANA
Ghana‘s housing delivery and access to decent accommodation in any part of the
country is at crisis level [Agyemang, 2001]. Provision of housing in Ghana has
witnessed fragmented and unsustained effort from individuals, private developers and
the government. This situation has contributed to the huge housing deficit we
encounter today. The shortage of housing continues to be one of the most critical
socio-economic challenges facing the country [Ghana National Development Plan
2008]. Statistics show that, the country‘s housing deficit is projected to be around 1.2
million house-units as against an annual purported delivery of 37,000 house units
which is dominated by individual self house projects [Amoa-Mensah, 2008].
The 2000 Population and Housing Census reports that there were 2,181,975 houses
countrywide even though a total of 3,877,418 dwelling units were recorded. This
implies that about 1,695,443 ‗houses‘ are unconventional houses. Records show
uneven distribution of houses across the country as indicated in Table 1and Figure 2
with an arithmetic increase in housing provision as against a geometric rate increase in
the population.

Kwofie, Adinyira and Botchway.
544
Figure 2: Distribution of Housing in Ghana
Source: Bank of Ghana Report, 2007

Housing provision in Ghana
545
Table 3: Housing Deficit Growth
YEAR DEFICIT DELIVERY % OF DELIVERY NEED
1980‘s 250,000 70,000 22% 133,000
1998 300,000 30,000 25% 140,000
2000 700,000 25,000-30,000 21% 199,000
2008 1,000,000 37,000 22% 150,000
2010 1,200,000 199,000 23% 300,000
Source: Authors compilation from several literatures
The purported delivery of 37,000 units in 2008 as indicated on Table 3 is very much
inconsistent. For this period ( 2001-2008), only 5092 houses were initiated by
government and remain incomplete after five years of pre contract planning [ISSER,
2007]. This also include projections of ‗self-build houses‘ which in reality can take
several years to complete through lock up capital process [Ahadzie et al, 2010].
Anecdotal evidence suggests that it takes between 5-15 years for an individual
household to build a house [Bank of Ghana, 2007].
Ghana‘s public housing constituted about 10% of the total housing stock by 1982 as
against over 80% from private individuals. The relative absence of a well developed
real estate market/industry accounted for about 3-8% of the housing stock delivered
then [Barnes, 1982].From the late 1980s to 2010, no single unit of housing has been
added by the government from purely public housing provision as many initiated
schemes within this periods remain incomplete. In 2006, from the annual purported
delivery requirement of 199,000 the annual contribution of delivery from Ghana Real
Estate Developers Association‘s (GREDA) peaked at 2,500 units, (less than 8%) with
the informal sector (private individuals) which has formed the bulk of the contribution
to be about 90%. From the past three decades, contribution from the public sector has
been non existence as seen in the numerous uncompleted government housing projects
[Akuffo, 2006].This is coupled by the fact that only 8% of Ghanaians can afford to
buy house without a mortgage and 15% can access mortgages [BRRI, 2006; City
Properties, 2010]. The private sector has been bashed for making their housing units
targeted at the rich and prominent persons of the society at the neglected of the
average and the poor. The Building and Road Research Institute (BRRI), established
in 2004 that out of the total housing supply of 40,000, supply from the private
individuals amounted to 38,200 (95.5%) [Akuffo, 2006; BRRI, 2006]. The GREDA‘s
accumulated contribution accounts for less than 5% of the total housing stock.
Table 4: Estimated Housing Stock and Deficit
Source: 1960, 1970 and 2000 Population Census and projected calculations

Kwofie, Adinyira and Botchway.
546
Given the estimated and projected delivery and deficit in Table 4, as against the actual
delivery, it should be of great concern to demand immediate action from all parties
since housing promotes economic growth through the expansion of the construction
industry and contributes to reducing poverty by increasing the demand for low-skilled
labour [Bank of Ghana, 2007].
GHANA’S PUBLIC HOUSING POLICIES OVER THE YEARS
The foregoing reviews suggest a continuous effort by private individuals and the real
estate sectors over and above that of the public sector. Ghana‘s serious housing deficit
is a problem which spawned and fuelled by host of factors notably, ever increasing
cost of building materials, rapid population growth, urbanization, deterioration of
fabric of existing structures, absence of clear sustainable delivery policy framework
and poor managerial system. It is however not for lack of effort on the part of
successive governments to address the problem of shortages. Verifiable records
confirm concerted efforts have been made by all governments, even before and after
independence towards the provision of affordable social/public housing in Ghana
[Daily graphic, 2011].
IMPLEMENTATION
Pre-independence witnessed the direct involvement of government in public housing.
The emphasis on developing the housing industry gained prominence in Ghana
probably from the late 50s to the early 60s as it attained independence from colonial
rule [Bank of Ghana, 2007]. It is worth noting as stated by [Ayeh, 2009; Agyemang,
2001] that all housing schemes initiated by various governments from pre to post
independence era were unsuccessful due to a host of factors. The history of housing
delivery in Ghana is a de-facto, a tale of failed economic policies [Akuffo, 2006].
The housing interventions during the pre-independence era took the form of provision
of staff bungalows for the senior public officer of the colonial governments in many
parts of the country especially in regional capitals, towns and mining areas through
direct funding by the colonial government [Agyemang, 2001]. It must be noted that
literature on housing provision during pre-independence era is scanty and its statistics
are almost unavailable but the notable ones give account of housing schemes initiated
by major companies in the then Gold Coast to provide accommodation for their
expatriates, senior officers and junior worker. It is worth noting that this housing was
mainly provided for the working class. No consideration was made for the average,
poor and non working class until1920s and after the occurrence of the 1939
earthquake in Ghana[Agyemang, 2001; Ayeh, 2009]. Ghana‘s Public housing
constituted about 10% of the total housing stock by 1982 as against over 80% from
private individuals. The relative absence of a well developed real estate
market/industry accounted for about 3-8% of the housing stock delivered then
[Barnes, 1982].
Gordon Guggisberg (9th
October 1919-24th
April 1927)
The Gold Coast government‘s first recorded direct involvement in native housing was
in 1920s when Dispossessed Person‘s Housing Scheme was introduced to provide
housing for the natives dispossessed as a result of government development programs.
Under the scheme, which begun in 1923, affected persons were advanced with
building material loans to commence their own houses. By 1933, 118 loans involving
a total of £9,280 had been approved and given. The scheme was discontinued in 1933
because it was perceived by the government to be very expensive. This was during

Housing provision in Ghana
547
Governor G. Guggisberg‘s reign [Agyemang, 2001]. From this time onwards, little
attention was paid to housing until the 1939 earthquake.
The 22nd
June, 1939 earthquake in the now capital city of Ghana, called for the direct
intervention of the then government in the provision of affordable housing for the
affected population. The government provided funding to build 1000 two (2) -
bedroom unit houses at Osu, Mamprobi, Chorkor, North-West Korle Gonno, ,
Kaneshie and Abbosey-Okai. By 1955, 1250 units were completed and they exist up
to date occupied by civil and public servants and the Armed Forces. The rental units
were subsidized and tenants given the opportunity to acquire them through hire-
purchase [BRRI, 1970].
Alan Burns (29th
June 1942-2nd
August 1947)
The Alan Burns government also introduced a four (4) year Development Plan in
1943 of which housing was a top priority. The plan sought to implement the
construction of inexpensive but well built houses‘ with as much local material content
as possible on a budget of £0.8 million [Agyemang, 2001].
In 1946, two (2) housing schemes under the government‘ plan and policies were
published. Scheme A was under the direction of Department of Social Welfare. Under
this scheme 3, 2, and 1 bedroom dwellings were to be constructed and rented to all
people at economic cost. Only labourers were required to pay non economic rents.
The Scheme B was termed Town and Council Housing to be concentrated in Accra,
Kumasi and Sekondi-Takoradi. Under this scheme, a person could apply for financial
assistance to build within the Municipal on his own design or pro-forma building plan
from the Department of Social Welfare which both the plan and contractor must be
approved by the Town Council.
Kwame Nkrumah (6th
March 1957-24th
February, 1966)
In the post independence era, several interventions were undertaken but considered
unsuccessful by experts and stakeholders. Under the reign of Dr. Kwame Nkrumah,
the first president of Ghana, three (3) Development plans were formulated aimed at
the provision of adequate housing. The first was the five year plan from 1951-1956.
This plan saw the establishment of the Tema Development Corporation (TDC) and the
State Housing Corporation (SHC) [Bank of Ghana, 2007; Benjamin, 2007;
Agyemang, 2001]. The main objective of the TDC was to provide affordable housing
for the low income workers of the newly created Tema. The activities of TDC led to
the creation of the Communities of Tema, i.e. Communities 1 to 8 etc contributing
over 2255 units. The Schockbeton Housing scheme was also established targeted to
provide 168 houses in Accra, Kumasi, and Sekondi-Takoradi. This scheme under the
consultancy of a Dutch firm introduced pre cast members perceived to be cheaper but
became more expensive than estimated and hence the whole scheme was abandoned.
The Roof Loan Scheme which sought to grant loans and assistance to public sector
workers under the recommendation of the United Nation also made contribution to the
a total housing units. However, due to its inefficiencies, only 2517 units out of the
proposed 6700 from the 2million pound fund were realized [Nelson and Ayeh, 2009].
The SHC was also established to provide housing for the workers in the civil and
public service class and also provide long term housing finance. Their activities were
expanded to all the nine (9) regions in the country. Their activities were monitored
under the Ministry of Works and Housing with direct funding of their projects from
the central governments and in 1995, it was converted into a limited liability company
and operated as a commercial enterprise. Their schemes operated with the flexibility

Kwofie, Adinyira and Botchway.
548
of workers owning their home through years of gradual monthly payment from salary
deduction [Gyabah, 2009; Agyemang, 2001].
The second Development Plan which was instituted to continue provision of housing
was from 1959-1964. This was to support the UN commission‘s recommendations and
initiated programmes to put up housing units. It sought to continue and expand the
‗Roof Loan‘ scheme which focused on assistance from employers to employees
through housing loans and self-help housing sites and services [Ayeh, 2011]. The
shortfall of this plan was that there was no needs assessment and as a result, there was
no indication of projected targets and outputs in the development plan [Gyabah, 2009;
Agyemang, 2001]. Nkrumah‘s vision on housing was to house particularly those in
urban areas where shortage was at its peak due to uncontrolled urbanisation. He was
not able to see to the end of this plan and was kicked out in a coup d‘tact in 1966.
Joseph Ankrah (24th
February, 1966-3rd
April 1969)
The National Liberation Council (NLC) which booted out the Nkrumah government
in 1966 implemented a two (2) year Development plan. The NLC‘s plan through the
TDC and the SHC was to produce2,000 housing units annually. Only a total of 1000
units were realized. Out of this only 2.7% were one room. By location, 63.6% were in
Accra, 9% in Kumasi, 7.5 in Sekondi-Takoradi and 11.3% inCape Coast. The main
objective of this scheme was to ensure that housing was generated by the productive
sectors of the economy through rational and balanced approach [BRRI, 1970; Ayeh,
2011]. It also targeted clearance and slowing down of the growth of slums in urban
areas.
Kofi Busia (1st October 1969-13
th January 1972)
The Busia administration showed commitment to alleviating the housing crisis
confronting the nation especially in the major cities by introducing a one year
development plan. The one year Development plan (1970-1971) of the second
republic under Busia proceeded the seven year Development Plan. The main objective
of this plan was aimed at a house occupancy rate of 10 persons per house as against a
housing need estimated at 26,000 units per year. This plan failed to specify the
housing units with their associated cost involved. His scheme added just 25% (764-
SHC, 1012-TDC=1776) of the targeted 8,000 units mainly due to lack of funds [S-
Ayeh, 2011; K-Agyemang, 2001].
I. K. Acheampong (13th
January 1972-9th
October 1975)
The National Redemption Council under I. K. Acheampong took over government in
1972 and established the National Low Cost Housing Committee under the auspices
of the Ministry of Works and Housing. This plan received a capital injection of 10
million cedis ($9,803,921.77, $1=¢1.02, 1970) to construct low cost housing for low-
income households in urban areas across the ten regions. It had an annual projected
delivery of 2,300 units [BRRI, 1972; Ayeh, 2011]. The scheme by June, 1975 had
realized 5,466 units at a cost of 47,602,678 cedis. It was however abandoned in 1976
because of its failure to serve the targeted population due to its high cost [Nelson and
Ayeh, 2009]. The original estimates indicated a cost of 2,000-4,000 cedis depending
on the size. Upon completion of 5,466 units average per unit stood at 10,000 cedis
($9,803.92). Further, 6,000 units cost a total sum of 62.6 million cedis, thus increasing
the average cost to over 12,000 cedis. The government acknowledging its limitation
with funding sought to encourage the private sector to complement her effort [K-
Agyemang, 2001].

Housing provision in Ghana
549
Hilla Liman (24th
September 1979-31st December 1981)
The Liman government also recognized the enormity of the housing problems and
thus contributed to the building of 1990 rental units through SHC and 228 by the TDC
[Nelson and Ayeh, 2009; Benjamin, 2007]. The 1970s, however, brought a period of
very poor economic performance for Ghana. There was the energy crisis, rising cost
of oil, excessive high rise in imported building materials, decline in external funding
etc. This extended recession brought the construction industry to a halt. It was against
this background that the Liman government sought to invest in the development of the
use of local materials leading through the establishment of the Tile and Brick factory
[Nelson &Ayeh, 2009; Benjamin, 2007; Gyabah, 2009; Agyemang, 2001].
Jerry J. Rawlings 4th
June 1979-24th
September 1979, 31st December, 1981-7
th
January, 1993, 7th
January, 1993-7th
January, 2001)
The PNDC/NDC era under J. J. Rawlings saw the implementation of many schemes in
an attempt to solve the housing problems. These were the National Shelter Strategy
(NSS), Ghana Vision 2020 and the Structural Adjustment Programme (SAP) and
Economic Recovery Programme (SAP/ERP).
The National Shelter Strategy was initiated in 1986 by forming a National Housing
Policy Committee by the Ministry of Works and Housing (MOWH) to examine the
housing situation in the country. This was to establish a government policy and action
plan that seeks to provide adequate and decent housing unit in order to improve the
quality of life of people in the urban areas. The main focus of the committee was on
the constraints of housing delivery either than any other contributing factor to the
sector. It focused on housing finance, land, physical planning, infrastructure, building
materials, management effort towards delivery. This policy and plan covered the
period 1987 to 1990. This was coined from the MOWH‘s need to enhance its planning
capacity to implement housing policies. The focus of the policy was to create an
enabling environment and framework to enhance housing provision rather than the
full participation of the government to deliver housing [Bank of Ghana, 2007;
Agyemang, 2001]. It sought to promote use of local materials, improve rural housing
strategy, improve monitoring, managing and coordination of shelter programmes,
improve land acquisition and increase access to finance and participation of women in
the sector.
The Ghana Vision 2020 scheme had the First Medium-Term Development plan from
1997-2000 target the provision of low-income housing as reported by [Bank of Ghana,
2007 ; MOWH, 2001]. It sought to bring housing within the purview of the poor to
improve their living conditions. The plan introduced a new facility under the Social
Security scheme which permitted contributors to withdraw part of their contributions
to purchase a house. Unfortunately, due to lack of funds, private sector participation
and political will, none of the housing strategies under this plan were implemented
[Bank of Ghana, 2007].
When the financial crisis had peaked in the 1980s. Ghana signed onto the infamous
Structural Adjustment Programmes (SAP) of the World Bank and the IMF in order to
secure much needed cash flows for the housing construction industry. This required
the country‘s participation in trade liberalization initiatives which opened its market to
imported building materials and necessitated the loosening of rent controls [Benjamin,
2007]. This brought in its wake high inflation translating into high cost of building,
high cost of construction, high rent and loosening the government‘s grip on the
housing market. This increased the creation of slums and ghettoes in many cities and
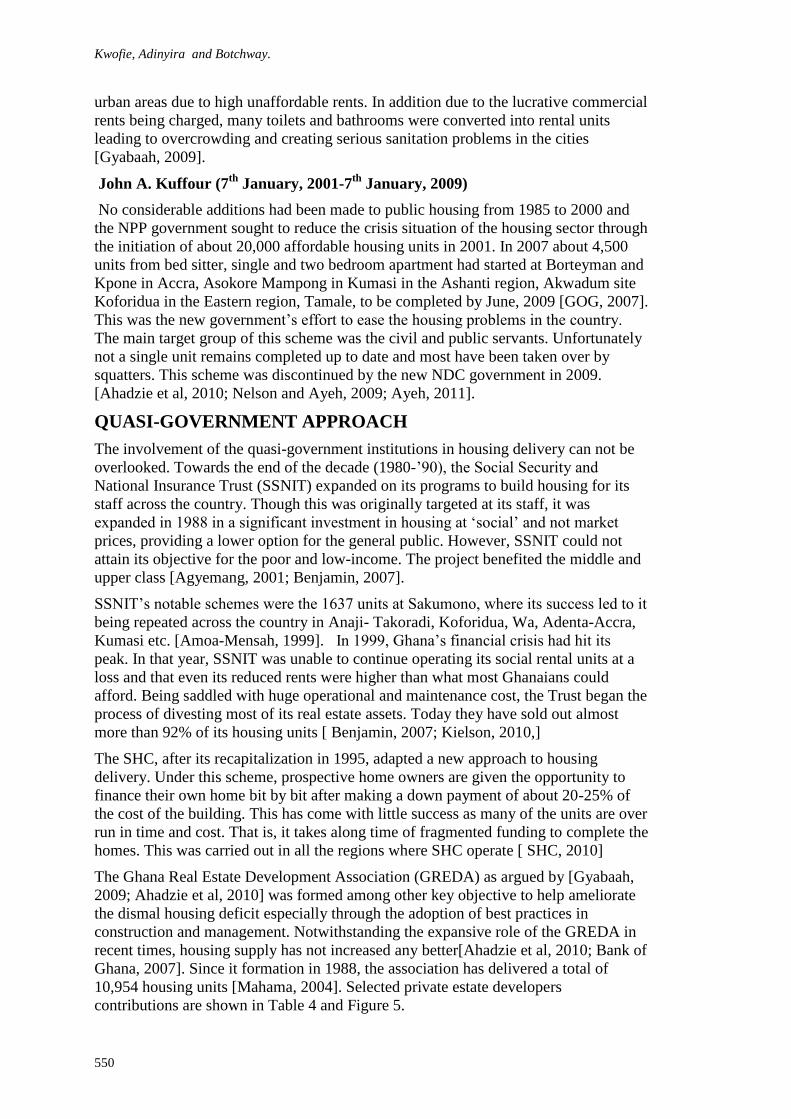
Kwofie, Adinyira and Botchway.
550
urban areas due to high unaffordable rents. In addition due to the lucrative commercial
rents being charged, many toilets and bathrooms were converted into rental units
leading to overcrowding and creating serious sanitation problems in the cities
[Gyabaah, 2009].
John A. Kuffour (7th
January, 2001-7th
January, 2009)
No considerable additions had been made to public housing from 1985 to 2000 and
the NPP government sought to reduce the crisis situation of the housing sector through
the initiation of about 20,000 affordable housing units in 2001. In 2007 about 4,500
units from bed sitter, single and two bedroom apartment had started at Borteyman and
Kpone in Accra, Asokore Mampong in Kumasi in the Ashanti region, Akwadum site
Koforidua in the Eastern region, Tamale, to be completed by June, 2009 [GOG, 2007].
This was the new government‘s effort to ease the housing problems in the country.
The main target group of this scheme was the civil and public servants. Unfortunately
not a single unit remains completed up to date and most have been taken over by
squatters. This scheme was discontinued by the new NDC government in 2009.
[Ahadzie et al, 2010; Nelson and Ayeh, 2009; Ayeh, 2011].
QUASI-GOVERNMENT APPROACH
The involvement of the quasi-government institutions in housing delivery can not be
overlooked. Towards the end of the decade (1980-‘90), the Social Security and
National Insurance Trust (SSNIT) expanded on its programs to build housing for its
staff across the country. Though this was originally targeted at its staff, it was
expanded in 1988 in a significant investment in housing at ‗social‘ and not market
prices, providing a lower option for the general public. However, SSNIT could not
attain its objective for the poor and low-income. The project benefited the middle and
upper class [Agyemang, 2001; Benjamin, 2007].
SSNIT‘s notable schemes were the 1637 units at Sakumono, where its success led to it
being repeated across the country in Anaji- Takoradi, Koforidua, Wa, Adenta-Accra,
Kumasi etc. [Amoa-Mensah, 1999]. In 1999, Ghana‘s financial crisis had hit its
peak. In that year, SSNIT was unable to continue operating its social rental units at a
loss and that even its reduced rents were higher than what most Ghanaians could
afford. Being saddled with huge operational and maintenance cost, the Trust began the
process of divesting most of its real estate assets. Today they have sold out almost
more than 92% of its housing units [ Benjamin, 2007; Kielson, 2010,]
The SHC, after its recapitalization in 1995, adapted a new approach to housing
delivery. Under this scheme, prospective home owners are given the opportunity to
finance their own home bit by bit after making a down payment of about 20-25% of
the cost of the building. This has come with little success as many of the units are over
run in time and cost. That is, it takes along time of fragmented funding to complete the
homes. This was carried out in all the regions where SHC operate [ SHC, 2010]
The Ghana Real Estate Development Association (GREDA) as argued by [Gyabaah,
2009; Ahadzie et al, 2010] was formed among other key objective to help ameliorate
the dismal housing deficit especially through the adoption of best practices in
construction and management. Notwithstanding the expansive role of the GREDA in
recent times, housing supply has not increased any better[Ahadzie et al, 2010; Bank of
Ghana, 2007]. Since it formation in 1988, the association has delivered a total of
10,954 housing units [Mahama, 2004]. Selected private estate developers
contributions are shown in Table 4 and Figure 5.

Housing provision in Ghana
551
Table 4: Housing Units Provided by Selected Real Estate Developers
Figure 5: Shares of Houses Built by Selected Real Estate Developers (2000-2006)
The delivery from formal Real Estate Developers (GREDA) annually at its peak
averaged 2,500 units constituting less than 10% of the total annual delivery. This is a
drop in the ocean, compared to the annual housing requirement of 199,000 units
[Akuffo, 2006]. Actual delivery is purported to be between 25,000 to 30,000 units and
is mostly through informal efforts. The BRRI, established in 2004 that out of the
total housing supply of 40,000, supply from the private individuals amounted to
38,200 (95.5%) [Akuffo, 2006; BRRI, 2006]. The GREDA scheme allows prospective
homeowners to own their home through mortgage or outright purchase. In spite of so
many available information through research to make the sector sensitive to the
average income and the poor in society, no achievement has been recorded in this
direction. This is coupled by the fact that only 8% of Ghanaians can afford to buy a
house without a mortgage and 15% can access mortgage [BRRI, 2006; City
Properties, 2010]. This sector has been bashed for making their housing units targeted
at the rich and prominent persons of the society at the neglected of the average and the
poor. Arguments have been leveled for them to adopt more innovative and cost saving
approach to make their schemes affordable [ Dapaah, 2006; Abongo and Mahama,
2009].
The forgoing discussions and findings reveal that the housing industry in Ghana is
inundated/plagued with an army of challenges with the notable ones being:

Kwofie, Adinyira and Botchway.
552
absence of clearly defined national housing policy,
managerial inefficiencies,
high cost of building materials,
lack of access to sustainable capital/finance,
land acquisition/litigation, and
Lack of control and Regulatory Policy framework for rent [Bank of Ghana, 2007;
Ahadzie et al, 2010; Akuffo, 2006 ; Benjamin, 2007].
HOUSING FINANCE
Housing finance remains the greatest and highest challenge to the smooth delivery of
schemes the world over. Housing is usually the largest expenditure item in a family
budget either as rent, personal building initiatives or mortgage financing. High
housing cost can strain a family budget, constrain available resources for other
household needs such as utilities, education, health care, transportation, savings for
retirement and emergencies [Bank of Ghana, 2007]. Finding a reliable and sustainable
constant source of finance for housing either for individuals, private real estate
developers (GREDA), central government, NGOs and quasi-government institution
has remained the greatest challenge from pre-independence era.
Access to decent affordable house/home is the biggest challenge facing a greater
proportion of the population. The situation is worse in the major cities. A typical
Ghanaian household is faced with three choices in the acquisition of shelter. These are
by rent, self built and mortgage.
Financing by any of these means has not come easy and at great cost and sacrifice.
Individual ‗Self Built‘ housing finance comes through:
Self accumulated income
Remittances from relatives and friends
Access to home loans from non banking institution (SHC, FGBSL, SSNIT etc)
Access to credit from Banks.
Unstable economy and evolving impact of world economy downturn and
unfavourable economic policies set to have negative impact on these sources of
income reducing ability to save as against other competing needs, high cost of
borrowing, high cost of building materials and inability to sustain home loan fund
schemes such as FGBS, BHC, SSNIT. This is evident in the long years taken for
individuals to complete their homes [Bank of Ghana, 2007; Agyemang, 2001]
Government from pre and post independence era undertook direct injection of capital
to fund building projects as well as offer home loans at low interest to workers to
build their homes. When SHC and TDC were formed in 1955, they enjoyed a
sustained funding for building projects aimed at providing houses for the workers in
the cities and other urban centres. This chalked a considerable impact until the mid
1970s when Government could no longer sustain his effort due to the oil crisis and
economic decline, coupled with the offer of fixed rate long-term loans to borrowers.
With these the SHC and TDC‘s impact on housing delivery declined. The TDC and
SHC under went a recapitalisation in 1995 and has since not been able to get back
again as a force[ Akuffo, 2006; Bank of Ghana, 2007].
The First Ghana Building Society (FGBS) was also established in 1956 under an
ordinance as a typical building society to lend affordable loans to members from a
pooled savings for prospective home ownership. The economic downturn of the 1970s

Housing provision in Ghana
553
with its associated high inflation levels, over valued currency, poor and reduced
savings of members caused a severe shortfall in its funding and eventual collapse. The
FGBS offered loans and its interest rates were way lower than the prevailing
commercial bank rates. It become unattractive to borrowers and main funding from
the government dried up under the SAP. Several attempts to resuscitate it have not
materialised. Between 1980 and 1988, it granted 549 original and 418 supplementary
loans. The total loans in 1988 did not exceed 500,000 cedis ($181,818- $1=¢2.75
cedis, 1980). The BHC was established with a core function of providing funds for
the housing and construction sector. Unfortunately, it could not maintain it focus on
housing but rather shifted to commercial banking and unfortunately liquidated in
2000. In 1990, only 17% of its total portfolio of three billion cedis ($9,316,770.19,
$1=¢322, 1990) was spent on housing. In its 14 year operation, BHC granted only 363
residential mortgage loans [Agyemang, 2001]. Governments‘ effort in funding housing
through state agencies culminates in the table below.
Table 6: Various Government Funding Support to Housing Schemes in Ghana
S/No. GOV‘T AMOUNT REMARKS
1 G Guggisberg £9,280 Benefitted only high
rank people
2 Alan Burns £0.8million Rising prices of
materials
3 Kwame Nkrumah £2.5 million-TDC
£2.0 million- SHC
£1,600 loans scheme
£500,000
£216,000 Mortgage loans
£50,000-Research into LM
£20million- Coup detact
£24.5million private sector
Rising prices of
materials and labour
4 E. A. Ankra £20million- Coup detact
£24.5million private sector
Continue from
Nkrumah
5 I. K. Acheampong ¢47,602,678
¢15,000,000
¢62,000,000
Rising prices of
materials
6 Liman Rising prices of
materials
7 J. J. Rawlings Through Quasi-Gov‘t Inst.
SSNIT, SHC, TDC, HFC
Rising prices of
materials
8 J.A. Kuffour GH¢270,000,000 Incomplete
9 J. E. A. Mills $10 billion Proposed STX
* Busia and Liman no recorded capital injection
Source: Author‘s compilation from several literatures
Corporate Housing Financing
The corporate financial institutions have made immense contribution towards housing
provision in Ghana but these efforts have not come cheap but at a cost often
unaffordable by greater percentage of Ghanaian. Up to the early 1980s, all commercial
banks in the country (BBG, SCBG, GCB etc) did not provide any mortgage loans
towards housing. It was from 1986, that the GCB through its newly established
mortgage department, started granting mortgage loans at as high as 35-38% interest
rate [Akuffo, 2006; Agyemang, 2001].
Given the deprivation of the housing sector in the early 1990s couple with rising cost
of borrowing and building, the ruling government with the intervention of the World
Bank (IDA) established the Home Finance Company (HFC) in 1991 with the sole

Kwofie, Adinyira and Botchway.
554
mandate of creating a sustainable housing Finance System. It initial capital was
provided by SSNIT and the IDA and was enlisted on the Ghana Stock Exchange in
1995 to raise funds and others from bonds issued. It granted a 15-20 year mortgage at
a rate of 35-45%.
Figure 6: Mortgage Performance by HFC
Source: World Bank/IMF Housing Conference Report
The highest annual origination was in 1994. On the average the company did 350
mortgages per annum. The mortgage business has been slow since 1999 when the
local currency -the cedi depreciated by 90%. House prices almost doubled thereby
worsening the affordability situation. The significant reduction in originations over
the past 5 years was an indication that the company‘s role as a private specialised
mortgage lender needed to be reviewed. Recent economic performance however,
gives hope that the mortgage business will pick up again. It is worth noting that in
November, 2003, HFC could not go on with its mandate and as such converted to a
commercial bank [Akuffo, 2006; Agyemang, 2001].
BUILDING MATERIAL INDUSTRY
Before Ghana‘s contact with the European and influence of capitalism, building in
Ghana was predominantly locally based materials in the form of Thatch, Mud, Wood,
Earth and Bricks.
The paradigm changed when formal trading started under colonisation in the 1870s.
The trading allowed for the introduction of foreign building materials in the Gold
Coast which were later perceived to be better and ‗elites‘ above the cheaper local
materials[Agyemang, 2001]. As Ghana advanced in age, with trading activities
growing above expectation and coupled with certain government policies, the
situation grew worse and foreign materials were at all cost preferred above all local
materials. This development choked certain housing programmes introduced by
certain colonial and successive governments. For example the rising cost of imported
materials such as cement, roofing sheets etc had to redirect the housing scheme of
1920 by the Guggisberg regime. This trend went on and successive governments did
little to control or curtail it. What is witnessed today in the building material industry
is an inheritance from the colonial to early independence Ghana [Agyemang, 2001;
Akuffo, 2006].
In the rural Ghana, the local materials constitute about 95% of housing stock whilst
foreign materials form about 98% of urban housing stock [Atiemo, 2009]. In recent
times greater percentage of the national expenditure is on importation of foreign
building materials at the expense of cheap local materials. It is estimated that 70% of

Housing provision in Ghana
555
all building materials in Ghana are imported and more than 180, million dollars are
spent on importation of clinker and gypsum [Ayittey, 2009]. It is also recorded that
the construction industry utilizes more than 90% of the cement and residential
construction account for 75% [Atiemo, 2009]. Table 5 shows the relative composition
of building material usage in Ghana.
Table 7: Extent of usage of various building materials for housing in Ghana
Section Material Percentage Usage
Floor Cement/concrete 72
Earth 23.8
Terrazzo 1.4
Timber/wood 1
Stone 0.6
PVC 0.4
Ceramic/Marble 0.3
Roof Timber/wood >97.0
Carcass
Roof Cover Metal sheets 60.3
Thatch/Palm leaf 18.6
Slate/Asbestos 12.9
Cement/Concrete 2.4
Bamboo 2.1
Timber/wood 0.9
Roofing tiles 0.5
This worsening development led to several interventions to remedy the situation but
little has been attained. For example the establishment of Department of Rural
Housing (DRH), CSIR/BRRI, KNUST, Brick and Tile Factory- Liman era etc. all in
an attempt to reduce the component of foreign material in the construction industry
and promote the locally made materials through appropriate locally dominated
technology and methodology, skill and know-how, research and manufacturing.
Unfortunately little success has been recorded [Nelson and Ayeh, 2009].
The main set back of the Affordable Housing Scheme in 2006 was rising cost of
materials and high inflation against planned budget. Cement for example rose from
GH¢3.20-$4.5 (2001) to GH¢8-$6.9(2008) and about GH¢10- GH¢14 ($7.6-$10.8) in
2009[Atiemo, 2009]. Cement and it related products alone constitute about 60% of
total cost of construction and the average increase in the price of cement between
2005 and 2008 was 140% [Boadi et al, 2009]. From Table 6, it is anticipated that with
so many indicators in the world, market/economy beyond our control, the several calls
for extensive use of local materials should be encouraged. The local building material
industry should be developed and entrenched so as to harness it related benefits.
From 1984-1998, through the IMF and the World Bank‘s ERP and SAPs, worsening
inflation and devaluation of the cedi resulted in prices of building materials increasing
by 5,000-20,000% [K-Agyemang, 2001]. From the above table it is clear that the cedi
in a period of 15 years (1983-1998) was devalued over 80,000%. With this in mind
one is tempted to ask if the STX housing project will at all be successful.
There is the readily available local materials such as clay, wood, limestone, thatch,
bauxite waste, bamboo etc and as such further studies should be conducted into

Kwofie, Adinyira and Botchway.
556
develop them further to boost the industry as being suggested in many government
policies. Extensive studies by BRRI, DRH and Geological Survey indicate that these
materials are comparable to cement product and are cheaper in cost [Atiemo, 2009;
Boadi et al, 2009].
Table 8:Inflation and Exchange Rates for the Period 1991 – 2008
Year Rate of Exchange Remarks
Inflation (ER)$ -¢
(IR) (%) (Average)
1983 2.75
1986 90
1990 322
1991 25.00 370.00
1992 27.00 450.00
1993 52.00 790.00
1994 24.18 1000.00
1995 41.35 1290.00
1996 59.38 1688.00
1997 34.41 2115.00
1998 37.00 2350.00
1999 20.80 2706.00 IR at the end of
2000 was 51% and the
2000 40.50 5300.00 ER ¢7000.00
IR was 41.9% in March
2001 27.10 7170.00 and 21.3% in December
2002 14.92 7870
2003 26.71 8820
2004 12.74 9360
2005 15.08 9550
2006 10.96 9555
2007 10.69 GH0.9397
(9397)
2008 17.30 GH1.1521
(11,521) As at October
Sources: Quarterly Digest of Statistics (Sept. 1998) of the
Statistical Services, BRRI (2000) and ISSER (1998), Ghana
Statistical Service (2008)
CONCLUSION AND RECOMMENDATIONS FOR FUTURE
PUBLIC HOUSING POLICIES
In conclusion, it is worth noting, that governments, elected officials and stakeholders
who create policies have to look beyond the coming elections, fulfilling political
manifesto, scoring points in the form news paper headlines. For this reason, affordable
housing delivery is most effective when the commitment is along-term policy bedrock
so solid its support is bipartisan and non-partisan‘. We ought to learn from the success
stories of Singapore and the United Kingdom.
In order to chalk notable success on any future housing policy meant to arrest our ever
widening housing deficit, we will have to change our perception towards the use of
local materials, Adopt sound efficient and sustainable cost effective architectural
design and constructional methodology. Also we will have to set up non political

Housing provision in Ghana
557
National Housing Authority with the mandate to implement policies devoid of
political interferences, develop an effective Housing Policy in line with all acclaimed
recommendations from experts, and equip research institutions to develop good
acceptable local material industry. Last but not the least we will have to create a
National Housing Fund and help develop the capacities of building professionals and
workmen in the local material technology.
ACKNOWLEDGEMENT
I want to extend a heart of gratitude to the following personalities for their
contribution and assistance towards this piece. Deputy Director of Housing-
MWRWH, Arc. Yemofio FGIA, Isaac Afranie, Arc. S. O. Afram, Department of
Architecture-KNUST
REFERENCE
Fergusson, B. (2008) A Value Chain Framework For Affordable Housing In Emerging
Countries, Global Urban Development Magazine, Vol. 4, pp 1-5
Ankrah M.N. A(2009) The IDEM Social Housing and Anti-Poverty Strategies pp 6-8
UN-HABITAT (2006) Innovative Financing for Affordable Housing, www.unhabitat.org
(accessed, 20th August, 2010)
Ghana Statistical Service Report, (GLSS) 2008
Ghana National Development plan 2008
Mr, Abongo, General News, www.ghanaweb.com (accessed 23rd
August, 2010)
Home Finance Company report, 2001
Amoa-Mensah, K. Housing in Ghana: A Search for Sustainable Options as the Way Forward
for Enhanced Output- Year 2003 and Beyond, A paper presented at the International
Building Exhibition Seminar, Accra 27th-28 August
Ahadzie, D. K., (2008) Management Practices in Ghanaian House Building Industry
(unpublished), pp 1-4, 7-9.
Benjamin C. (2007) A Brief History of Housing in Ghana, www.the statesmanonline.com
(accessed 20th August, 2010)
K. Konadu-Agyemang (2001), The Political Economy of Housing ans Urban Development in
Africa- Ghana‘s Experience from Colonial Times to 1998. Praegers Publishers,
Westport, UK
Institute of Statistical and Social Economic Research, ISSER, 2007, pp 23-31
SSNIT Magazine, 2006, pp 8 and 11
City Properties, August, 2010 pp 13 and 25
Interview with Ankrah M. N. A. –CEO, State Housing Company (SHC) on 8th September,
2010
Mr. Alban Bagbin, Ministry signs MOU for Affordable Housing, www.accra-mail.com
(accessed 20th August, 2010)
Interview with Mr. Kielson , Regional Estate Officer, SSNIT-Koforidua on 8th February, 2011
K. Nsiah- Gyabaah, Urban Housing Challenge and Prospects for Meeting the Housing Needs
of the Urban Poor in Ghana. Proceedings at the 2009 National Housing Conference,
pp 15-21, 24
D-Nelson, S-Ayeh, Provision of Affordable Housing in Ghana; the Realities. Proceedings at
the 2009 National Housing Conference, pp 36-37
O-Tutu, A-Kumi, An Evaluation of Housing Cost Trends in Ghana for the Period 1991-2008.
Proceedings at the 2009 National Housing Conference, pp 166-170
Interview with S. Kielson-Regional Estate Manager of SSNIT, Koforidua
Wikipedia, Affordable Housing, 2009 pg1-8. www.wikipedia.com (accessed, January, 2011)
Wikipedia, Public Housing, 2009 pg 1-3. www.wikipedia.com(accessed, January, 2011).


Folaranmi, A.O. (2011) House owners‘ participation in mass housing provision in Niger State Nigeria:
a need for change from speculative to specific housing In: Laryea, S., Leiringer, R. and Hughes, W.
(Eds) Procs West Africa Built Environment Research (WABER) Conference, 19-21 July 2011, Accra,
Ghana, 559-569.
559
HOUSE OWNERS’ PARTICIPATION IN MASS
HOUSING PROVISION IN NIGER STATE NIGERIA: A
NEED FOR CHANGE FROM SPECULATIVE TO
SPECIFIC HOUSING
Adedayo Olatunde Folaranmi1
Department of Architecture, Federal University of Technology, Minna, Niger State, Nigeria
Urbanisation in Nigeria has brought about an increase in population and housing
demand in the urban areas. In order to meet the demand for housing, State
governments in Nigeria have adopted mass housing provision. The mass housing
schemes adopted have and are speculative in nature. In Niger state Nigeria, mass
housing provision between the years 2007-2010 has been through public private
partnership. The houses built had the end-users involved at the sales stage of the
process. The aim of the research is to show that the house owners in mass housing
estates in Niger state would like to participate in the design of their future houses. In
carrying out this research two housing estates were selected and a questionnaire was
administered to selected households. The respondents were required to respond to
questions with regards to what aspects of housing unit design they considered
important participating in. An analysis of the data generated showed that majority of
the house owners would like to have houses that meet their specific requirement. The
research concludes that for any house to meet the requirements of each house owner
there is a need for a conscious shift towards specific housing design in mass housing.
Keywords: design, house-owner, mass housing.
INTRODUCTION
A trip around many cities in Nigeria particularly the state capitals will reveal the high
rate of housing construction that is taking place, either at the individual level or at the
mass housing level. The aim of mass housing is the production of large quantity of
houses, an examination of the housing estates already being occupied will show some
degree of changes on the houses within the estates. In many cities in Nigeria increase
in human population has led to an increase in the demand for more housing units for
the populace. In response to this demand many state governments and private
developers see mass housing provision as the solution to the problem. According to
Ademiluyi and Raji (2008), there is an unimaginable high demand for housing in the
urban centres and it cited inability of government to provide house for its populace as
the reason for the high demand. While this assertion might be right, it failed to
examine if the houses already provided got to the target people or even met the needs
and aspiration of the people. Often times many housing providers be it the Federal
government, State government or the private developer usually generalise the masses
that require houses and assume their needs to be the same thereby providing same type

Folaranmi
560
of house for all. In many cases where housing provision is discussed and the
prospective house owner mentioned, it is often in terms of how they can afford it and
not what they would want [see Dung-Gwom and Mallo (2009), Ajanlekoko (2001),
Aribigbola (2008), Anugwom (2001)]. It is the need to produce as many possible
housing units that has led many developers and designers to focus on quantity and
quality of materials and not the need of the end-users. In the discussion of post
constructional changes in housing estates in Minna, Adedayo (2010a) showed that the
generalisation and provision of same house type is no longer the trend in mass
housing.
TRANSFORMATION IN HOUSING ESTATES
Transformation in housing estates is a way by which house owners try to adapt the
houses provided for them to meet their needs and aspiration and it is this
transformation that results in post constructional changes on housing units. According
to Tipple and Ameen (1999) the belief that transformation in housing estates provided
by governments was developing slums was not correct as it was able to show that the
transformations in selected housing estates in four countries were initiated to meet the
needs of the house owners. It identified the need for additional space by the house
owners as one of the major factors driving transformation in many housing estates.
Natakun and O‘Brien (2008) described transformation in housing as self-help
modification and it said that it was a common trend in many developing countries. An
examination of the researches carried out on housing transformation revealed two
common issues which are:
i. Majority of the transformation are done on government provided housing
estates.
ii. Transformations are carried out more in developing countries.
In the study conducted in Niger state by Adedayo (2010a) and shown in plates 1 to
plate 4, the major characteristics of location and type of houses identified by Natakun
& O‘Brien (2008) and Tipple & Ameen (1999) are satisfied. The major reason that
could be adjudged for this trend is that data about the prospective owners were either
inadequate or not sought for. The sad story is that while majority of these government
houses where transformations have occurred were built before the year 2000, the
principle in practise as of 2011 is still the same with no attempt at change. Private
developers who are now the driving force in mass housing provision also continue
with the same principle of excluding the prospective owner and hence laying the
foundation for housing transformation. In order to avoid the problems that occur when
post-construction changes take place there is a need for the shift as proposed in the
title of the paper.
MASS HOUSING DEVELOPMENT IN NIGER STATE
Mass housing development in Niger state like many other states in Nigeria has
become what is referred to as dividends of democracy by many politicians. The
location of these mass housing schemes in many states is common and is usually in
the state capital. In Niger state the two mass housing scheme that were developed by
the state government are in Minna the state capital and they are;
i. Gen. M.I. Wushishi housing estate
ii. Talba housing estate.

Housing provision
561
While the Gen. M.I. Wushishi estate has been completed and occupied the Talba
estate is still under construction, despite both projects taking off in 2007. In 2011
these estates have now become a campaign tool for the government and not a social
service that is expected of a government to its people. As a social service mass
housing should be geared towards reduction of housing shortage as is the case in many
countries. [ see Ademuluyi and Raji (2008), Onder (2007) & Eger (2007)].
Figure1: Roof, Window changes & Fence 123 Qtrs. Minna
Source: Adedayo (2010a)
Figure 2: Elevation Modification & Fence 123 Qtrs. Minna
Source: Adedayo (2010a)
Figure 3: Constructed fence at Tunga Low cost Minna Figure 4: Constructed gate house at Tunga Low cost
Minna Source: Adedayo (2010a) Source: Adedayo (2010a)
The provision of mass housing through the Public Private Partnership (PPP) in Minna
focussed more on the government and the private sector leaving out the prospective
house owner. The adoption of the method of construction of staff quarters has ensured
that the prospective house owners are left out. The principle behind the staff quarters

Folaranmi
562
approach is mass production which is purely speculative in nature as practiced in
Niger state. If the housing developers had carried out case studies on existing housing
estates they would have discovered that speculative design approach as practiced in
mass housing development in Niger state might not be considered suitable from the
end-users point.
SPECULATIVE MASS HOUSING PRINCIPLE
A case where there is no data in terms of prospective house owners backing the
development of a mass housing scheme as is often the case in Niger state, Nigeria then
this estate could be referred to as speculative mass housing. According to Larson,
Intille, Mcleish, Beaudin and Williams (2004), a standard generic house produced by
a speculative developer is considered as the choice of almost everyone that cannot
afford to engage an architect. It goes to show that the mass housing schemes built
without anyone particular in mind is referred to as speculative. It is based on the
assumption that someone will need it and the designs are often generic in nature. This
is what is visible and common to virtually majority if not all the mass housing
schemes in Nigeria with special reference to Niger state.
Tipple (1994) referred to speculative housing as when a speculative builder, is
constructing housing ahead of demand which it said was absent in sub-Saharan Africa.
The key thing worth observing from the statement is that speculative housing should
be ahead of demand and not behind as practiced in Niger state. Speculative housing
works on the principle of mass production which is in turn centred around higher
quantity of a product within a given limited resources of time and cost. According to
Noguchi (2005) speculative housing is an established production process in housing.
This view while it shows why mass housing is the way it is in many countries it runs
against the views of Tipple (1994) and Larson et al (2004) which suggests it should be
used for future demand. It can be assumed that since it is widely known and accepted
that Nigeria is yet to meet the housing demand for its people, then it can be concluded
that there is no need for speculative housing yet. The problem of speculative mass
housing is that it allows for middle men and government agents to use their authority
to acquire a large number of the housing units and either resell it to people at higher
profits or give it out for rental purpose. This nullifies the aim of the project by the
housing provider. In cases where the housing unit actually reaches the end-user,
modification becomes an inevitable result because the house was generic and the
house owner is not generic. The net effect of getting the house to meet the needs and
aspirations of the house owner is increased cost of the building which could have been
avoided. The fact that there is already a high demand for housing units in urban areas
means the information about prospective house owners can be obtained and not
assumed. In order to achieve this aim of meeting the needs of the end users in mass
housing there is the need for the proposed principle of specific housing.
SPECIFIC HOUSING AND PROCESS
Specific housing could be viewed and explained to mean the direct opposite of
speculative housing. It is a broad housing principle that seeks to ensure that houses are
tailor made for the particular prospective owner. There are several concepts that could
be employed ranging from mass customization to grow house concept to participatory
design. The sole aim in specific housing is that prospective house owners should be
given the opportunity to have a say in their future houses. In attempting to provide
specific housing, the briefing stage in mass housing in Niger state needs to be re-
examined to include the end-user. This is the basic aim and starting point of any given

Housing provision
563
design process which is the accumulation of data. Jarvinen and Koshinen (2001)
stated that architecture unlike other industrial design is not shifting towards
collaborative approach that seeks to involve the end-users at the early stage of the
process. This is the case in mass housing provision in Niger state as of 2011 where the
house owner is brought into the process at the sales stage. There is therefore the need
to get the house owner involved at the start of the mass housing process so as to begin
collaborative design process. According to Barrow, Kumar and Arayedh (2007) the
quest for workable solutions in mass housing by architects dates back to the 1920s and
it is still ongoing. A reason that could be adjudge for not finding a solution that works
for all is because in many cases house owners have been treated as groups or regions
rather than specific individuals. The process proposed for achieving specific housing
principle in mass housing is shown in figure 1.0.
Figure 5.0 Proposed Specific Housing Process Source: Author (2011)
The proposed process in figure 1.0 shows the stage at which the prospective house
owner should be involved. It can be observed that the collation of the data precedes
the brief development by the architect and in essence ensures that the brief is focussed
on the house owner. It can also be observed that the approval for the design is by both
the house owner and the developer, thereby ensuring that the desires of the house
owner are met and that the designs also falls within the overall plan of the housing
developer. The process ends with the construction of the house which is expected to
be specific since the house owner would have given his approval.
RESEARCH METHOD
The research is part of a PhD study on housing customization by the author and the
paper discusses part of the findings of the trial test conducted in Minna, Niger state.
The main question the researcher seeks to answer is which aspect of housing unit
design is the house owner interested in participating in. The choice of a questionnaire
survey was to allow for respondents to freely participate in the research and to ensure
that the data generated are focussed and can be analysed. The questionnaire is better
suited for this research as most respondents were not willing to spend time with the
research assistant to document their answers for security purposes. The limitation with
this method is the streamlining of answers; however this suits the research when
compared with the interview method also an interview survey in Niger state would be
time consuming because some house owners would require interpreters to speak their
native language. The trial test covered two selected housing estates in Minna namely;
i. 123 quarters Minna, Niger state
ii. Bosso lowcost estate Minna, Niger state
The civil servants occupying government estates were chosen as respondents, the
choice of the respondents was based on the focus on the middle income earners and

Folaranmi
564
the public service people by the state government in terms of mass housing provision.
The respondents chosen are people already living in government built housing estates
over a period of time and hence would have been able to give personal opinion about
the house based on experience.
The research lasted a period of five weeks from the date the first copy of questionnaire
was administered to a respondent. Thirty households were randomly selected in each
of the estates and the questionnaire was administered by trained final year students of
the Department of Architecture, Federal University of Technology Minna who served
as research assistants. Respondents were allowed to fill the questionnaire at their
leisure time and were collected by the students after they had finished filling it,
pictures of some of the houses were taken in cases where some of the changes were
visible from the outside. Due to concerns for security and some cultural beliefs some
respondents refused to allow the research assistants to enter into their premises to
observe the house and possibly take pictures. Questionnaire and observation
techniques served as the major source of data collection for the research.
The data collected was collated and entered into a computer system by the author, the
data was analysed using the cross tabulation in the SPSS software. The unit of
analysis is based on household each number represents a household which is
represented by the house owner. The results were produced in tables and selected few
are chosen for discussion.
DISCUSSION OF RESULTS
This section examines a few aspect of housing unit design where the participation of
the house owner could be a key in providing specific housing. The results would aid in
determining the aspects that are considered important to the house owners.
Fig.6.0 Participation in Type of Fence And Gate Source: Adedayo (2010b)
This is one aspect of design that many architects and housing developers in mass
housing schemes leave out and assume that the provision of an overall fence around
the estate will serve them. The respondents however feel different as shown in figure
6.0 where it can be observed that 89% and 94% of the respondents in Bosso lowcost
estate and 123 quarters respectfully considered a personal fence and gate important.
The nature of the fence and gate is usually an expression of the identity of the house
owners which is a reflection specific housing. This is an expression of housing
transformation as supported by Tipple, & Ameen, (1999) when it showed how house
owners carried out changes on their houses along the fence.

Housing provision
565
Fig.7.0 Participation in Space Sizes Source: Adedayo (2010b)
The size of spaces in the house is usually determined by the architect or the housing
developer in the mass housing scheme and in many cases it is assumed that a given
size would serve everyone. The size of space should be determined by the total
number of possible occupants and this can only be achieved if the family size is
known and not assumed. Figure 7.0 showed that participation in the determination of
sizes of space is quite important because 97% of the respondents in Bosso lowcost
estate and 123 quarters considered this option as being either important or very
important. This shows a way of ensuring that housing units in the estate consider the
socio-cultural values of the occupants as identified by Ajanlekoko, (2001) when it
stated that housing designs should not be the same all through the country.
Fig.8.0 Participation in Number of Spaces Source: Adedayo (2010b)
When a generic design is provided it is assumed that the spaces provided in terms of
number is adequate, however the house extension and conversion of space for other
uses contradicts such assumptions. On the issue of the number of spaces to be
provided in the design of their houses 90% of the respondents in Bosso lowcost estate
and 93% of the respondents in 123 quarters as shown in figure 8.0 considered
participation in this option as being important. The reason for such interest could be
that the family sizes of household differ, likewise their cultural affiliations as
discussed by Ajanlekoko, (2001).
A trip to any of the mass housing estates in Niger state will reveal that the finishes are
the same with little variance in terms of the colour of the material used, it is often a
case of see one seen all. This trend of making all the finishes the same simply assumes
that the aspirations of the prospective owners are the same which is not the case. The

Folaranmi
566
result regarding this option in figure 9.0 shows that 83% and 90% of the respondents
in Bosso lowcost estate and 123 quarters respectfully considered the option as quite
important. The resultant effect when they are not considered in this option is changes
on wall and floor finishes in an attempt to create a form of identity.
Fig.9.0 Participation in Interior Finishes Source: Adedayo (2010b)
Fig.10.0 Participation in Exterior Finishes Source: Adedayo (2010b)
The case of external finishes is not too different from that of the internal finishes and
in many of the housing units examined, the external finishes was done to reflect some
form identity by the house owners. The response to this option by respondents as
shown in figure 10.0 showed that 83% of the respondents in Bosso lowcost estate and
86% of the respondents in 123 quarters considered the option as either important or
very important. The choices of the external finishes usually ranged from the type of
roofing material to the colour of paint on the walls. The interesting thing about the
finishes is that it is based on what the house owner considers as beautiful which is
usually relative.
The surrounding of a building has to do with the landscaping of the plot and in many
mass housing schemes this aspect of the design and construction is often left bare for
the house owner. Majority of the house owners usually provide mass concrete on the
plot and in some cases they provide some flowers or shrubs. An examination of the
final work on the building surrounding usually shows a poorly executed attempt at
beauty. This need to have a beautiful surrounding could probably be the reason why
the respondents as shown in figure 11.0 consider participation in this option equally
important.
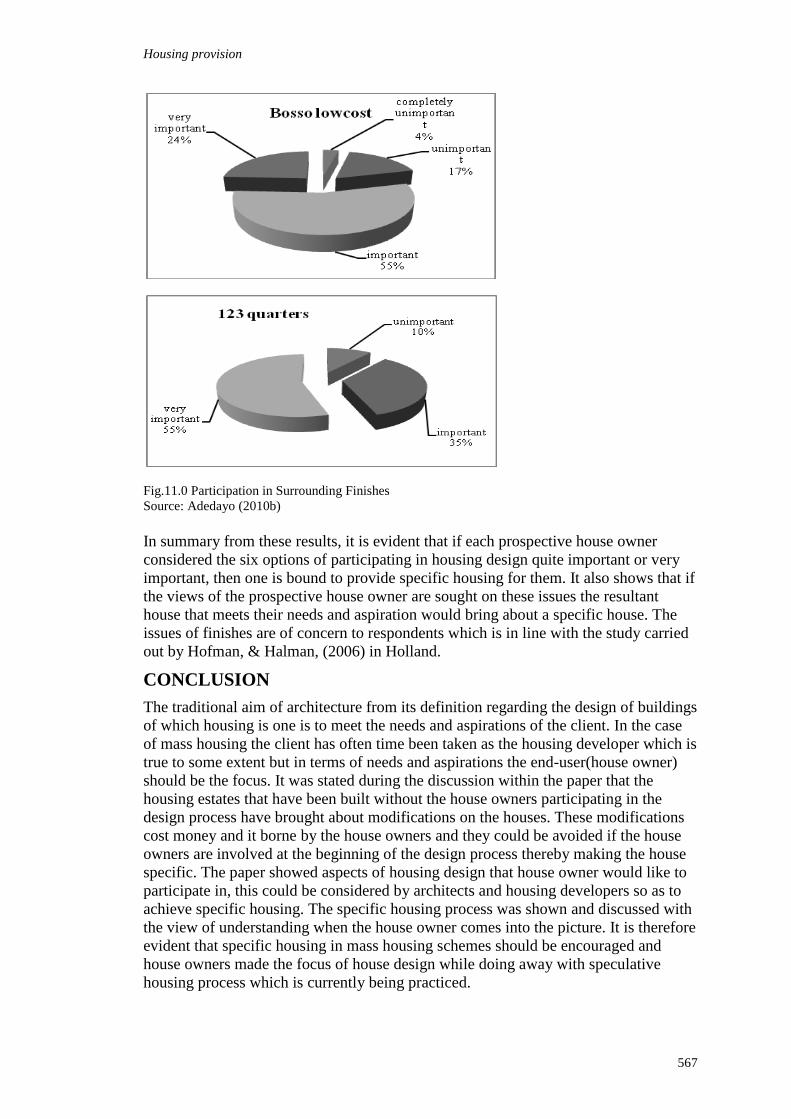
Housing provision
567
Fig.11.0 Participation in Surrounding Finishes
Source: Adedayo (2010b)
In summary from these results, it is evident that if each prospective house owner
considered the six options of participating in housing design quite important or very
important, then one is bound to provide specific housing for them. It also shows that if
the views of the prospective house owner are sought on these issues the resultant
house that meets their needs and aspiration would bring about a specific house. The
issues of finishes are of concern to respondents which is in line with the study carried
out by Hofman, & Halman, (2006) in Holland.
CONCLUSION
The traditional aim of architecture from its definition regarding the design of buildings
of which housing is one is to meet the needs and aspirations of the client. In the case
of mass housing the client has often time been taken as the housing developer which is
true to some extent but in terms of needs and aspirations the end-user(house owner)
should be the focus. It was stated during the discussion within the paper that the
housing estates that have been built without the house owners participating in the
design process have brought about modifications on the houses. These modifications
cost money and it borne by the house owners and they could be avoided if the house
owners are involved at the beginning of the design process thereby making the house
specific. The paper showed aspects of housing design that house owner would like to
participate in, this could be considered by architects and housing developers so as to
achieve specific housing. The specific housing process was shown and discussed with
the view of understanding when the house owner comes into the picture. It is therefore
evident that specific housing in mass housing schemes should be encouraged and
house owners made the focus of house design while doing away with speculative
housing process which is currently being practiced.

Folaranmi
568
REFERENCE
Adedayo, O.F. (2010a). Post-constructional changes in housing units in mass housing estates
in Niger State: A case for housing customization. A paper presented at Architects
Colloquium 2010 held at Shehu Musa Yar‘adua Centre Abuja, Nigeria,
21st-22
nd April 2010
Adedayo, O.F. (2010b). Customization of Housing Units on Mass Housing Estates on
Nigeria: A Case Study of Kwara State. An unpublished PhD research proposal
submitted to the Department of Architecture Federal University of Technology
Minna, Niger State.
Ademiluyi, A.I. & Raji, B.A. (2008). Public and Private Developers as Agents in Urban
Housing Delivery in Sub-Saharan Africa: The Situation in Lagos State. Humanity &
Social Sciences Journal, 3(2), 143-150.
Ajanlekoko, J.S. (2001). Sustainable Housing Development in Nigeria – The Financial and
Infrastructural Implication International Conference on Spatial Information for
Sustainable Development Nairobi, Kenya. 2–5 October 2001.
Anugwom, E.E. (2001). Privatization of workers‘ housing provision: the National Housing
Fund (NHF) Scheme in Nigeria. An article Centre Africain de Formation et de
Recherche Administratives pour le Developpement. Retrieved from
http://www.unpan1.un.org/intradoc/groups/public/documents/CAFRAD/UNPAN0176
96.pdf on 24th February 2009, 21:35pm.
Aribigbola, A. (2008), Housing Policy Formulation in Developing Countries: Evidence of
Programme Impliementation from Akure, Ondo State, Nigeria. Journal of Human
Ecology, 23(2), 125-134.
Barrow, L. Kumar, S. & Al Arayedh, S. (2007). Emerging Technology- Dilemma and
Opportunities in Housing. Retrieved from
http://www.shilpikumar.com/CAADRIA_2007.pdf on 14th February 2010, 13:24pm
Dung-Gwom, J.Y.and Mallo, D.M. (2009), An Appraisal of the Challenges of Accessing
Credit for Home Acquisition by Low Income Earners in Nigeria. Retrieved from
http://www.gla.ac.uk/media/media_129707_en.pdf on 2nd
March 2011
Eger, A.O. (2007). Evolutionary Product Development in Working-Class Housing.
Lemma Publishers. Den Haag. Retrieved From
http://www.evolutionaryproductdevelopment.org/2008%2008%2026%20Evolutionar
y%20Product%20Development%20in%20Working-Class%20Housing.pdf on 13th
November 2009, 4:21pm
Hofman, E. & Halman, J.I.M. (2006). Variation in housing design: Identifying
Customerpreferences.351-368. Retrieved from
http:/www.irddirekt.de/daten/iconda/CIB8977.pdf on 24th November 2009, 2:43 pm.
Jarvinen, J. & Koskinen, L. (2001), Industrial Design as a Culturally Reflexive Activity in
Manufacturing, University of Art and Design, Helsinki. Retrieved From
http://webmail.faac.unesp.br/~paula/Paula/industrial_design.pdf
on 14th January 2010, 2:28 pm.
Larson, K. Intille, S. Mcleish, T.J. Beaudin, J. & Williams R.E. (2004). Open Source
Building: Reinventing Places of Living. Retrieved from
http://www.media.mit.edu/~intille/papers-files/LarsonETAL04.pdf
on 30th July 2010 12:08pm
Natakun, B. & O‘Brien, D. (2008). Extending the house / Extending the dream:
Modifications to Government-built Housing in Bangkok Metropolitan Region.
Journal of Architectural/Planning Research and Studies, 6(1), 1-18.
Noguchi, M. (2005), Japanese Manufacturers‘ ‗Cost-Performance‘ Marketing Strategy for the
Delivery of Solar Photovoltaic Homes. Proceedings ISES 2005, Solar World
Congress, Aug. 6-12, 2005, Orlando, USA.
Onder, D.E. (2007). A Criteria for Increasing Quality in Housing Area: User
Participation. ENHR 2007 International Conference ‗Sustainable Urban Areas‘
Rotterdam, 5th – 28
th June.

Housing provision
569
Tipple, A.G. (1994), The Need for New Urban Housing in Sub-Saharan Africa: Problem
or Opportunity. African Affairs, 93(373), 587-608. Retrieved from
http://www.jstor.org/stable/723668 on 31st October 2010, 10:03am
Tipple, A.G. & Ameen, M.S. (1999). User initiated extension activity in Bangladesh:
―building slums‖ or area improvement? Environment and Urbanization,
11(1), 165-183.


Akortsu, W. (2011) How should health and safety be measured as a tender evaluation criterion in the
Ghanaian construction industry? In: Laryea, S., Leiringer, R. and Hughes, W. (Eds) Procs West Africa
Built Environment Research (WABER) Conference, 19-21 July 2011, Accra, Ghana, 571-583.
571
HOW SHOULD HEALTH AND SAFETY BE MEASURED
AS A TENDER EVALUATION CRITERION IN THE
GHANAIAN CONSTRUCTION INDUSTRY?
Wise Akortsu1
School of Applied Science and Technology, Wa Polytechnic, Box 553, Wa, Upper West Region, Ghana
Occupational health and safety is said to be relevant to all branches of industry,
business and commerce including traditional industries, information technology
companies, universities, leisure facilities and offices. Furthermore, construction
methods, procurement systems and project management systems keep changing,
making it imperative to place more emphasis on the management of health and safety
issues. The parties bidding for the award of contracts must also demonstrate their
competence in the area of health and safety management. This research investigated
the current tender evaluation and contractor selection criteria in use in Ghana.
Consideration was given to the evolution of the traditional time, cost and quality
triangle into the time, cost, quality, and health and safety square. A model was
therefore proposed for the assessment of the health and safety competence of
contractors. The findings revealed that price is the major determining factor and that
health and safety have not been considered in the criteria for contractor selection.
However, the proposal for the adoption of the Golden Square received an enormous
level of acceptance, with many of the respondents describing it as a brilliant idea and
‗long overdue‘.
Key words: health and safety, golden triangle, golden square, tender evaluation.
INTRODUCTION
In the face of changing construction methods, procurement systems, contract
administration and project management systems, health and safety (H and S) issues
have become a very significant aspect of the total project arrangements. This is an
addition to the traditional approach of tendering, procuring, construction, supervision
and commissioning. To do a good assessment of the health and safety implications of
a project, relevant and detailed information on the project must be provided for
particularly those bidding for the work, and for the development of the construction
phase health and safety plan.
Though the construction industry in Ghana has been growing at a very fast pace over
years, there seems to be a neglect of issues like health, safety and welfare when
contractors are being recommended for the award of contracts. The primary tender
evaluation criteria currently used in Ghana for the award of contracts is the traditional
time, cost and quality (i.e. the golden triangle). With these, the award criterion is
dependent on either the least price or the most economically advantageous. This
culture of the least price tender could be the major cause of many health and safety
issues in construction. This is because clients will be looking for the least price tender

Akortsu
572
without proper regard to the health and safety of workers and others. However, the
Government of Ghana has taken steps to promote a good health and safety culture in
the construction industry. In this regard, the Labour Act 2003, Act 651 was enacted, in
2003, and it states, among others, that “it is the duty of an employer to ensure that
every worker employed by him or her works under satisfactory, safe and healthy
conditions”. The Act of Parliament further states in Section 118 (5) that “an
employer who, without reasonable excuse, fails to discharge any of the obligations
under subsection (1) or (2) commits an offence and is liable on summary conviction to
a fine not exceeding 1000 penalty units or to imprisonment for a term not exceeding
three years or to both”.
A model was proposed for the assessment of the health and safety competence of
contractors (health and safety key areas and scoring matrix).
TENDERING AND CONTRACTOR SELECTION IN GHANA
Invitation and Submission of Bids
Under of the Public Procurement Act (PPA) of Ghana (Act 663, 2003), National
Competitive Tendering (NCT) procedures are employed if only domestic suppliers or
contractors are desired to submit tenders and International Competitive Tendering
(ICT) is to be used where open competitive tendering is employed.
Bids are usually delivered to the premises of the relevant procurement entity, which in
most cases is the address provided in the notice of invitation. Acceptance of bids close
at the time and date specified in the bidding document and in the notice of invitation.
Members of the relevant Tender Committee, the consultants and interested bidders or
their representatives attend the tender opening. A record of bid prices as read out and
endorsed at the opening is taken, a sample of which is shown in Table 1.
Table 1: Record of Bid Prices at Tender Opening as Read Out and Endorsed
ITEM CONTRACTOR BID PRICES (GH¢) REMARKS
1 Contractor A 49,910.69 Complete
2 Contractor B 50,332.04 Complete
3 Contractor C 50,973.39 No Labour, IRS, SSNIT and
MWH
(Source: Author‘s Fieldwork Study, 2009)
Key
Labour = Labour Clearance Certificate
IRS = Internal Revenue Service Tax Clearance Certificate
SSNIT = Social Security Clearance Certificate
MWH = Ministry of Water Resources, Works and Housing Registration Certificate
Bid Evaluation
The evaluation of bids received is normally carried out in three stages. These are
preliminary examination, detailed examination and post-qualification evaluation.
Preliminary Examination
This is carried out to identify and reject bids that are incomplete, invalid or
substantially non-responsive to the bid document and therefore would not be
considered further. Under this section of the evaluation of tenders or bids, the
following parameters are checked:

Tender evaluation
573
Verification: Here, bids are scrutinised to establish whether they were signed by
the appropriate authority within the firm (i.e. a Director or any other person given
the Power of Attorney). Bids are also checked for the submission of Tax Clearance
Certificate, Labour Clearance Certificate, Ministry of Water Resources, Works
and Housing (MWH) Registration Certificate, District Assembly Registration
Certificate/Renewal Receipt and Social Security Clearance Certificate.
Eligibility: Bidders are checked to determine whether they are from eligible
countries as per the instructions to bidders and whether they provide documentary
information of their registration. In this case, a Certificate of
Incorporation/Registration is looked out for.
Bid Security: The PPA requires that all tenders are provided with tender or bid
securities. Every Invitation for Tender (IFT), therefore captures this and specifies
an amount or sum of Bid Security, or Bid Bond to be provided by all tenderers.
This is therefore checked to ensure that all bidders provide the facility adequately.
Bid Security Declarations are also accepted as an alternative.
Completeness of Bid: In terms of the completeness of bids, tenders received are to
ensure that they submit complete bidding documents and that all the items of the
Bill of Quantities (BoQ) provided in the bidding document are wholly priced.
Substantial Responsiveness: Bids that meet the above requirements are
determined to be substantially responsive and are taken through detailed
examination.
It must be noted that all these parameters discussed are set out in the bidding or tender
documents.
Detailed Examination
Only bids that survive the preliminary examination are considered for further
evaluation. There are two stages involved, the correction of arithmetic errors and
evaluation and comparison of bids.
Correction of Arithmetic Errors: The priced BoQs of the responsive bids are
checked for arithmetic errors in extensions, summations, transfers and summaries.
Errors detected are corrected in accordance with the bid guidelines provided by the
Board of the PPA. A notice is sent to the affected bidder(s), giving details of the
errors and the adjusted figure(s) which they have to either accept or decline.
Evaluation and Comparison of Bids: The evaluated (corrected or discounted) bid
prices are determined by subtracting provisional sums, discounts offered and
contingencies in the summary of the BoQs. The evaluated bid prices of the
responsive bids are then ranked in ascending order.
Post-Qualification Evaluation
This is usually done in cases where pre-qualification is not done prior to bidding.
However, the norm in most consultancy firms is to take all responsive bidders that
accept corrections (if any) through the post-qualification exercise. The choice of the
route depends on the procurement entity. The exercise applies the following checks, as
set out in the bidding documents:
Experience in Similar Works: The experience of bidders, as Prime Contractor or
Main Contractor, in works of similar nature and complexity are assessed. A
minimum threshold established in the bidding document is used.
Akortsu
574
Personnel Capability: The experience and qualification of key personnel (e.g.
Quantity Surveyors, Site Supervisors and Site Managers) in the firm is also
assessed. Minimum thresholds established earlier are used.
Financial Capability: Bidders are required to submit certified Financial
Statements and these are assessed to ascertain whether they have adequate
financial capabilities to execute the contract. This coupled with undertakings or
declarations from companies‘ bankers also indicate the adequacy of the lines of
credit available to the bidders.
Equipment Holding: Thresholds established are used to check the appropriateness
of the equipment provided in documentary evidence by the contractors for the
specified financial classes.
History of Litigation: Bidders are also required to provide evidence of non-
involvement in litigation, or the history and details of any such litigation.
Annual Turnover: Qualified bidders must meet the minimum annual turnover
thresholds specified for the particular financial class.
Methodology/Works Programme: After the contract has been won it is important
for the work to be completed on time and to the required standard (quality) and
within budget, therefore bidders are required to provide method statements and
programmes of work, which are compared with the Master Programme.
Contractor Selection
A successful bidder must meet all the minimum qualifying criteria stated in the
bidding document and discussed earlier under bid evaluation. “The lowest evaluated
tender is selected and recommended for the award of the contract.” (PPA, 2003) In
other words, the responsive bidder who satisfied the Post-Qualification Evaluation
requirements and offered the least evaluated bid price is the first to be considered for
the award of the contract.
THE GOLDEN TRIANGLE
The evaluation criteria discussed above can be broadly grouped into three main
categories. These are Time (work to be completed on time, using works programmes),
Cost (the project to be completed on budget by using a priced BoQs, cost estimates,
etc.) and Quality (performance, where experience and personnel qualifications are
used). The importance of each of these criteria is discussed briefly below.
Time
The Master Programme helps to determine the time frame for all aspects of the project
(i.e. the design, tender and construction stages). In practice, the actual progress of
works should be better than, or in the least meet the planned progress. Situations like
lack or unavailability of funds or a delay in securing a building permit may lead to a
late start of the project. On the part of the contractor, continual late completion can
damage the company‘s reputation and may also affect subsequent projects. Time lost
may be reclaimed by re-scheduling and re-sequencing of subsequent activities, but this
is usually accompanied by comprising performance standards, or costs.
Cost
It is a general view that all companies in every industry exist first and foremost for the
sole purpose of making money or profit and the construction industry is not left out.
Everyone (including the client, the contractor and suppliers) therefore wants to make
money, because success is measured by profit. Projects should therefore be completed
within the authorised budget to ensure the desired profit is not reduced and that the

Tender evaluation
575
return on capital expected is attained. It is very important to control costs and
therefore cost control must be appreciated by all as an essential part of the project
delivery.
Quality
Quality can sometimes be referred to as performance and is very difficult to measure,
mainly because quality related to defaults can only be seen later on. It also means that
the final product must be able to perform its functions efficiently, reliably and safely.
The product should also be appealing to the client and meet all relevant legislation and
building standards. In addition, quality can refer to the quality of the materials used,
the quality of the workmanship or the quality of the design and specifications.
CONTRACTOR SELECTION REQUIREMENTS IN THE UK
Osei-Tutu (1999) recognises that the organisation and management of construction
and construction related activities vary from country to country and that these have
also developed from traditions and conventions laid down in the various countries
over long periods of time. Ghana, however, has a peculiar link with her colonial
masters, the United Kingdom (UK), hence construction practices in the country have
been dominated by this relationship. Moreover, the colonial legacy left the nation with
a very small number of indigenes who were professionally qualified, especially in the
field technology. For example, at the time of independence “there were five (5)
architects, three (3) land economy surveyors, no quantity surveyor, etc.” (Owusu
Addo, 1989 as reported in Osei-Tutu, 1999). Also, Kyei (2009) identifies that the
procurement methods/systems in use in Ghana indicate a tilt towards those of the UK
due to the colonial relationship discussed earlier. Furthermore, consultants,
construction industry professionals, contractors and clients in Ghana have a vast
knowledge of the various procurement systems in use. Based on these, the UK has
been chosen to be a kind of benchmark.
Tendering in the UK
This is done in accordance with the UK‘s Public Contracts Regulations (2006).
Sayeed (2006) stated that “the expression of interest received from prospective
companies is reviewed by the client”. The experience of the contractors who
submitted tenders is considered and a tender shortlist (which is to, as much as
possible, comprise of both new contractors and previously appointed ones) of between
three and six potential companies is produced. However, it is made clear that the
submission of an expression of interest does not guarantee automatic invitation to
tender but all expressions received must be considered in drawing up the tender
shortlist. Notices are given out to contractors short listed and they have to confirm
whether or not they still desire to tender. Formal invitation to tender is then sent out to
them, including the requirements and the specifications of the project.
Tenders received are opened and signed to acknowledge receipt, after which copies
are sent out to the tender board for evaluation. According to Sayeed (2006), the
following (all of which are supposed to be clearly identified in the contractors‘
tenders) are used to evaluate the proposals:
“Relevant experience
Suitability of their working arrangements
Suitability of their proposed schedule and their likelihood to meet them
The cost and value for money” (Sayeed, 2006)

Akortsu
576
The proposals are evaluated by the tender board judges by completing an evaluation
matrix to make sure that the assessment of the proposals has been carried out in a
consistent manner, using fair methods. A typical evaluation matrix is shown in Table
2. The assessment is usually in the following areas and the successful tenderer is
notified in writing:
“Suitable and complete documentation as specified in the invitation to tender
document
Adherence to the specifications
Best value for money, in terms price and quality”, (Sayeed, 2006). Table 2: A Typical Evaluation Matrix
Criteria
Assessment Team
A (PM) B (aPM) C (Arch.) D (Eng.) E (QS)
Health and Safety 4 5 2 3 3
Design 3 3 5 4 3
(Source: Adapted from Coles, 2009)
Key
PM ` = Project Manger
aPM = Assistant Project Manager
Arch. = Architect
Eng. = Engineer
QS = Quantity Surveyor
Key to the marks awarded in Table 2
0 = No information was submitted
1 = A poor response – severe difficulties in most areas of service delivery, overall
2 = A poor response – difficulties in some areas of service delivery
3 = A fair response – the basic requirements were met
4 = A very good response – exceeding the minimum requirements, in most areas
5 = An outstanding and complete response – exceeding requirements, in all areas
(Source: Adapted from Hannah and DeZoysa, 2005, as presented in Sayeed, 2006)
The following provides an example of how the UK‘s Public Contracts Regulations
(2006) could be operated. (It should however be noted that this is not in the
Regulations, itself, but is just an example of how the Regulations could be applied,
and which could survive a Freedom of Information legal challenge). The weightings
that are usually applied in quality/price criteria, according to Coles (2009), are:
50% weighting for Price and
50% weighting for Quality issues
The quality issues usually comprise (but not limited to) the following:
“Technical merit of design proposal
Aesthetic and functional characteristics
Quality management
The management of health safety and welfare throughout the project
Project programmes and the time required for project completion”, Coles (2009).
In addition to the assessment areas above, tenderers are to produce documentary
evidence of their promotion and management of health and safety, throughout their

Tender evaluation
577
organisations. Contractors are to produce health and safety plans to support their
proposals. The UK‘s Construction Design and Management Regulations (the CDM
Regs, 2007) in Appendix 4 provides the key areas for the assessment of the health
competence of contractors.
From Table 2, it is advised that to arrive at the final mark for a particular criterion it is
important to argue out any major differences rather than averaging the marks awarded
by the assessment panel as this may hide some problems or shortcomings. The agreed
final mark is weighted with the criteria weighting and the quality criteria marks are
added up to obtain total quality criteria weighting percentage. Price is kept separate
and “the price weighting percentage is determined by the pecking order of the
competitive tender prices submitted, the lowest being given the highest percentage”,
Coles (2009).
The Successful Tender
According to Sayeed (2006), the method used in the selection of the contractor must
be simple and transparent, to make it easier to explain why a particular contractor was
unsuccessful. Sayeed (2006) further stated that in the selection of the best contractor
(successful tender) “the decision maker has a duty to use reasonable skill, care and
judgement” and provided the following list of key factors which should be considered:
Experience Record: This can be represented by:-
(1) The number of years of working in construction
(2) The number of years of working on similar projects
(3) Past experience in working in similar geographical conditions
(4) Past experience in working in similar weather conditions
Past Performance Record: This helps in analysing how the contractor has
achieved the desired objectives in:-
(1) Previous projects
(2) Cost
(3) Quality of work
(4) On time
(5) Safety
(6) The client‘s ultimate satisfaction
(7) Previous relationships with subcontractors, suppliers and insurance companies
Financial Stability of the Contractor: This can be represented by the
contractor‘s:-
(1) Credit history
(2) Quality of financial statements
(3) Liquidity ratios
THE GOLDEN SQUARE
As mentioned earlier, clients traditionally place much emphasis on time, cost and
quality issues in the award of contracts to contractors. However, time, cost, quality
and health and safety are all interlinked. Therefore, the importance of the management
of health and safety has to be discussed, linking it to time, cost and quality.
Furthermore, the CDM Regs 2007 in Appendix 4 provide key areas for the assessment
of the health and safety competence of contractors, justifying the need to incorporate
H and S into the award criteria.
Health and Safety with Time

Akortsu
578
―Poor health and safety can result in a loss of productive work time while the remains
and debris following an accident are being removed, and the restoration of the
damaged part of the building is being undertaken.‖ (Davies and Tomasin, 1996, cited
by Sayeed, 2006). This may lead to a reduced work rate until such a time that the
normal work rate of the employees is regained and their morale restored.
Health and Safety with Cost
As discussed earlier, the emphasis is on the least price, neglecting H and S issues in
the evaluation of tenders by clients. However, poor H and S procedures, more often
than not, lead to more costs to the company. “Employees may suffer through loss of
income and employers may have to endure increased insurance premiums and the
economy suffers due to loss of production” (Griffith and Howarth, 2001, cited in
Sayeed, 2006). The affected company may also incur legal costs since it may be liable
for prosecution costs. In addition, the contractor may also be liable to pay Liquidated
and Ascertained Damages (LAD) to the client for failing to complete the project on
time due to an accident. “Accidents and deaths represent atrocious tragedies and
result in the worst cost of all, human life” (Sayeed, 2006).
Health and Safety with Quality
Sayeed (2006) suggested that the quality of the remainder of the building will be
questioned should a part collapse, leading to an accident and/or death on site. “Health
and safety should therefore be developed alongside, or be a part of a quality system”
(Griffith and Howarth, 2001 and Lavender, 1996, cited in Sayeed, 2006). This is due
to the fact that health and safety is inherent in all quality assurance procedures,
according to Sayeed (2006). If an accident occurred, it could be as a result of quality
standards not being adhered to and this could affect the reputation and public opinion
of the company.
RESEARCH METHOD
This paper is an adaptation of part of the research conducted in partial fulfilment of
the requirements for the award of a Master in Construction Project Management at the
HAN University of Applied Sciences, Netherlands on the topic: ‗Should Health and
Safety be Tender Evaluation Criterion in the Ghanaian Construction Industry?‘ The
researcher adopted a structured questionnaire in the study. This was based on the
principle that the questionnaire allows the respondents to answer the questions when it
is most convenient for them. The key issues arising from the literature review were
converted into questions (i.e. the field work questionnaire). Northern Ghana
(comprising the three northern regions, i.e. the Northern, Upper East and Upper West
Regions) was chosen as the location of the research sample due to their proximity and
ease of obtaining relevant information. A total of 65 questionnaires were administered
(the distribution list is presented in Table 3), out of which 45 were returned. Statistical
tools of tables, percentages, charts and graphs were employed for the data analysis.
The results were presented (i.e. in summary), analysed, and discussed.
The consultants‘ category constitutes professionals who provide technical and
professional services in the building industry such as drawings/designs, supervisions
and general contract administration and management services. The kind and class of
contraction firms chosen were those in the D1/K1 and D2/K2 categories (financial
classes) because they have the capacity and requisite structure (responded to by their
quantity surveyors and engineers). Respondents from the clients‘ category were

Tender evaluation
579
chosen from professionals working in Tertiary Educational Institutions, District
Assemblies/Ministries, Private organisations and individuals.
Table 3: The Distribution of Administered Questionnaires
Category Number
Administered
Number Returned Percentage
Returned
Consultants 25 21 84.0%
Clients 27 16 59.3%
Contractors 13 8 61.5%
Total 65 45 69.2%
(Source: Author‘s fieldwork study, 2009)
HEALTH AND SAFETY MEASUREMENT
The following key areas have been adapted and proposed for use in the assessment of
the competence of prospective contractors in terms of health and safety in Ghana
(each assigned a weighting of 25%, placing on them equal levels of importance):
Policy: - The company‘s health and safety policy
The company‘s historic health and safety track record
Training: - The type of training that is available to new employees.
Do employees go through regular training?
Does training equip employees to recognise dangerous situations early?
Are all employees are aware of basic yet important first aid?
Health and Safety Awareness: -
Do employees have adequate Certification in construction? If not, are they being
encouraged to study to get them?
Are workers being encouraged to wear protective safety equipment?
Is there enough equipment available to those who need it?
Preventing Exposure to Health Hazards: -
Are there procedures in place to control workers‘ exposure to health hazards?
Is there a systematic surveillance of workers‘ health?
In this regard, it is suggested that the golden triangle should evolve into the golden
square, to give H and S a proper place in the assessment of the best contractor for the
job. Therefore, the following weightings are adapted and suggested for the criteria:
25% weighting for health and safety
25% weighting for tender price
50% weighting for time and quality issues
In this case, the four key areas of H&S (25%) are to be scored as shown in Table 4.
Table 4: The Proposed Scoring Matrix for H and S (25%), being used in an example
Health and Safety Criteria Weighting Company
A B C
Policy 25% 5 5 5
Training 25% 5 3 4
Health and Safety Awareness 25% 3 3 3
Preventing Exposure to health hazards 25% 3 3 4
Total marks out of 100% 80% 70% 80%
Health and Safety Weighting out of 25% 20% 17.5% 20%
(Source: Adapted from Sayeed, 2006)

Akortsu
580
The tender with the largest total combined score (Table 5) is then recommended for
the award of the contract. In other words, when the scores for the H and S weighting,
the Price weighting and the Time and Quality weighting are summed, the contractor
that obtains the best total score wins. However, minimum thresholds are to be set for
the criteria above and also the total combined score. However, it is also suggested that
there should be a minimum ideal percentage, below which contractors should not be
appointed.
Table 5: A Typical Scoring Matrix for the Final Score (Combining the Weightings for H and S, Price
and Time and Quality issues), being used in an example
Company H and S Score
(Out of 25%)
Price
Price Score
(Out of 25%)
Time and
Quality Score
(Out of 50%)
Total Combined
Score (Out of
100%)
A 20% 1.2m 20% 39.5% 79.5%
B 17.5% 1.0m 25% 35.5% 78%
C 20% 1.1m 22.5% 36.5% 79%
(Source: Adapted from Sayeed, 2006)
RESEARCH RESULTS
All the respondents agreed to the fact that the main criteria in place, currently, for the
evaluation of tenders can be broadly grouped under cost (i.e. tender price) and time
and quality issues (i.e. completion time, experience in similar works, qualification and
experience of key personnel, among others). In addition to this, 80% of the
respondents (Figure 1) replied yes to price as the major determining factor for
selecting contractors in Ghana. The respondents are professionals working with
consultant, client, or contractor organisations or firms; hence this can be accepted as
the current practice in the industry. Figure 2 shows the distribution of the respondents.
Furthermore, a great number of the respondents (34 out of 45) answered no to health
and safety issues ever being considered (used) as a key criterion in contractor
selection. As mentioned earlier, the current selection criteria (the golden triangle)
place much emphasis on time, cost and quality, neglecting health and safety issues.
This response affirms the position of the researcher further, on the neglect of H and S
issues when contracts are being awarded to contractors in the construction industry in
Ghana. However, 76% of the respondents believed that the incorporation of health and

Tender evaluation
581
safety issues in the award criteria will ensure that health and safety issues will be
properly considered at the contractor selection stage.
Furthermore, 82% of the professionals believed that the H and S provisions contained
in the Labour Act of 2003 are not being adhered to in the construction industry. But,
42 of the professionals who responded thought that the inclusion of health and safety
issues in the award criteria will address this.
(Source: Author‘s fieldwork study, 2009)
On the four H and S key areas proposed by the researcher, 40 of the respondents
(representing 89%) believed that the list was adequate for the assessment of the health
and safety competence of contractors at the tender stage, whist 5 (representing 11%)
disagreed. Some of those who said no suggested that issues like ‗remedy and
compensation‘ need to be captured. Also, 39 out of 45 of the respondents thought that
the equal evaluation of the four key areas was sufficient, should health and safety
issues be included as a tender evaluation criterion. Interestingly, all the respondents
who thought that the weightings were not adequate were all from the category of
consultants. They therefore provided alternatives, which are presented in Table 7.
Table 8: Alternative Weightings for Health and Safety Criteria
Health and Safety Criteria
Weighting (%)
A4 A9 A10 A11 A19 A20
Policy 20 20 25 25 15 50
Training 25 20 45 25 30 15
Health and Safety Awareness 30 30 15 30 25 15
Preventing Exposure to Health Hazards 25 30 15 20 30 20
Total Marks 100 100 100 100 100 100
(Source: Author‘s fieldwork study, 2009)
The contractor with the largest combined score for the weightings suggested in the
golden square criteria is to be selected and recommended for the award of the
contract. In this regard, 35 out of the 45 respondents agreed that the weightings were
adequate, whereas the remaining 10 felt it was not sufficient. Also, 91% of the
respondents (Figure 3) thought that the weightings to be applied in the evaluation of
the time and quality issues within the assessment process was adequate. However, the
professionals (again, all from the consultants‘ category) that did not agree to the
weightings that were assigned to the time and quality issues went ahead and provided
alternative ways for scoring time and quality issues.

Akortsu
582
In assessing each selection criterion marks have to be awarded. All 45 respondents
(100%) replied yes, implying that the suggested key for determining the marks to be
awarded was perfectly alright. This means that if health and safety is incorporated, in
order to ensure transparency in the evaluation of tenders, the above key to the marks
awarded could come in handy. 37 of the respondents (representing 82%) also believed
that the incorporation of health and safety issues into the contractor selection criteria
will work in Ghana (Figure 4). Lastly, respondents were asked to provide some
comments on the adoption and use of this criteria for selecting contractors. Many of
the respondents said this was a laudable and brilliant idea. Others also said that it was
long overdue. However, many stressed the need for a statutory/regulatory body to take
charge. Majority praised it as a good criteria which must be embraced whole-
heartedly.
CONCLUSIONS
Based on the literature review and the analysis of the survey results, the findings of
the study are summarised as follows. Price is indeed the major determining factor in
the criteria for selecting contractors employed in Ghana. Health and safety issues have
also not been considered as a key selection criterion for contractors. Also, the
enforcement of the health and safety provisions contained in the Labour Act, 2003
(Act 651) of Ghana is lacking in the construction industry. However, the golden
square has received a widespread acceptance and most of the respondents look
forward to its adoption and use in the Ghanaian construction industry. It is very likely
to get clients and contractors to accept the proposed assessment process. They are also
ready to accept the additional responsibilities to be placed on them by the
consideration of health and safety issues. Also, the inclusion of health and safety will
help in the enforcement of the health and safety provision within the Labour Act of
Ghana. Furthermore, the current award criteria in Ghana can be broadly grouped into
time, cost and quality issues. Also, much emphasis is placed on time, cost and quality,
neglecting the important role played by health and safety.
REFERENCES
Coles, D. (2009) Lecture Notes on Project Evaluation and Development. HAN University.
Coles, D. (2008) Lecture Notes on The Management of Health, Safety and Welfare in the
Construction Industry. HAN University.
Hughes, P. and Ferret, E. (2008) Introduction to health and safety in construction (3rd
Edition).
Oxford: Butterworth Heinemann.
HSC. (2007) Managing Health and Safety in Construction, (Construction Design and
Management Regulations 2007). London: HSE Books.
Kyei, A. K. (2009). Procurement Systems and Project Success in the Ghanaian Construction
Industry. MSc Thesis, Department of Building Technology, Kwame Nkrumah
University of Science and Technology-Kumasi.

Tender evaluation
583
Osei-Tutu, E. (1999). Construction Procurement Decision in Ghana. MSc Thesis, Department
of Building Technology, Kwame Nkrumah University of Science and Technology-
Kumasi.
Sayeed, S. (2006). The Golden Square. Dissertation for BSc. (Hons) in Project Management
for Construction, University College of London. London: The Bartlett.
The Labour Act of Ghana, 2003, Act 651 (the LA, 2003).
The Public Procurement Act of Ghana, 2003, Act 663 (the PPA, 2003).


Lade, O., Oloke, D., Booth, C., Fullen, M. and Proverbs, D. (2011) Hydrological performance of
rainwater harvesting system in the residential sector: A literature review of modelling techniques In:
Laryea, S., Leiringer, R. and Hughes, W. (Eds) Procs West Africa Built Environment Research
(WABER) Conference, 19-21 July 2011, Accra, Ghana, 585-592.
585
HYDROLOGICAL PERFORMANCE OF RAINWATER
HARVESTING SYSTEM IN THE RESIDENTIAL
SECTOR: A LITERATURE REVIEW OF MODELLING
TECHNIQUES
Omolara Lade1, David Oloke
2, Collin Booth
3, Michael Fullen
4 and David
Proverbs5
1,2,3,4School of Technology, University of Wolverhampton, West Midlands, City Campus, WV1 1LY, UK
5Faculty of Environment and Technology, University of the West of England, Frenchay Campus,
Bristol BS 16 1 QY, UK
There is a growing interest in reducing water consumption and the associated water
wastages in every sector of the economy. The residential sector is a substantial
consumer of water in every country and therefore constitutes a focus of water
consumption efforts. Since the water consumption characteristics of the residential
sector are complex and inter-related, comprehensive models are needed to assess the
environmental engineering and socio-economic impacts of adopting rainwater
harvesting (RWH) as a sustainable system suitable for residential applications in
developing countries. This research seeks to develop a RWH decision support system
(DSS) to assist decision makers and stake holders by indicating the suitability of
RWH in any selected part of developing nations in general and Nigeria in particular.
A review of the various modelling techniques used for assessing the performance of
RWH systems in the residential sector (i.e. in terms of their water saving reliability) is
thus presented. Numerous approaches are identified: these ranges from the relatively
simple, ―rule-of-thumb‘ approach to the more complex, statistical methods and
sophisticated computer programs. The literature reviewed revealed, there are few
RWHS models and there seems to be insufficient attention to Decision Support Tools
(DST) for integrated urban water management. A GIS-based DST will be developed
for evaluating rainwater by the combine use of RainCycle© model and mass balance-
transfer model.
Keywords: modelling, rainwater system, water consumption, rainwater harvesting,
residential sector.
INTRODUCTION
Reduction of water consumption and the associated water wastages in the residential
sector is on a rapid increase. The residential sector is a substantial consumer of water
in every country and therefore constitutes a focus of water consumption efforts. Since
the water consumption characteristics of the residential sector are complex and inter-
related, comprehensive models are needed to assess the environmental engineering
and socio-economic impacts of adopting RWH as a sustainable system suitable for
residential applications in developing countries.
3
4

Lade, Oloke, Booth, Fullen and Proverbs
586
Water is one of the most precious natural resources that are indispensable for human
beings and economic growth. Water consumption pattern can vary from house to
house, depending on the occupants of the house, social and cultural condition as well
as the type of water consuming appliances installed in the houses. Fig. 1 reveals 15-
20% of in-house water demand is used for purposes requiring drinking water quality
(including water used for drinking, cooking and cleaning dishes).
Fig.1. Water consumption share of different micro-components of the household in
the industrialised world (Source: Memon and Butler, 2006)
This paper thus presents a review of the various modelling techniques used for
assessingthe performance of RWH systems in the residential sector (i.e. in terms of
their water saving reliability). Numerous approaches are identified: these ranges from
the relatively simple, ―rule-of-thumb‘ approach to the more complex, statistical
methods and sophisticated computer programs. Some techniques consider only a
single building whilst others seek to investigate the impacts of wider implementation,
such as at the development or catchment scale (Liu et al., 2005; Sakellari et al., 2005;
Sekar and Ranhir, 2006), often with the aid of geographical information system (GIS),
(Prakash and Abrol 2005). Some methodologies focus on assessment of system
sustainability (Parkinson et al., 2001; Vleuten-Balkema, 2003; Anderson, 2005;
Sakellari et al., 2005) while others on hydrological performance with the inclusion of
additional elements such as economic/financial measures (Coombes et al., 2002;
2003b; Liaw and Tsai, 2004; Ghisi and Oliveira, 2007).
The literature revealed that few models exist on RWH system. These include:
RainCycle©: which is an Excel-based mass balance model using YAS (Yield after
storage) algorithms and whole life costing approaches.
RSR: is a RWH tank- sizing procedure for storm water retention to reduce flood
magnitudes. The city of Seoul is used as a case study.
RCSM: is a behavioural, continuous simulation, including detailed analysis of time-
interval variation and yield both before and after spills.
REWAPUT: is a reservoir model and uses rainfall-intensity-duration-frequency
relationships and triangular distribution.
DRHM: is a mass balance with stochastic elements for demand profiling. The model
simulates quantity, quality and costs.
The purpose of the study is to appraise the various RWH models available, assess
their performance in the residential sector in terms of water saving reliability and
evaluate the potential for their sustainable application in Nigeria and adoption.
Kitchen Sink 15%
Outside Supply 4%
Shower 5%

Rainwater harvesting
587
Objectives
The main objective of this paper is to review the various RWH models available
nationally and internationally and evaluate the potential for their sustainable
application in Nigeria and also the potential of their uptake/adoption. It is envisaged
that the work will develop a RWH decision support system (DSS) to assist decision
makers and stake holders by indicating the suitability of RWH in any selected part of
Nigeria.
Research Questions
What are the different types of modelling concepts available?
What are the key components to be included in a comprehensive model?
Which methods are available for modelling the behaviour of rainwater storage
tanks?
Which methods are available for predicting the future of non-potable water
demand? how do we account for the impacts of environment and socio-
economic factors?
Study Area
Lagos lies in the south-western Nigeria (6027
1N, 3
024
1E) and was selected due to her
susceptibility to sea intrusion and prevalent industrial wastes resulting in groundwater
pollution. These scenarios have made both groundwater and surface water resources to
be expensive. Incidentally, rainfalls are usually torrential especially during the wet
season leading to severe floods. Hence, tapping of rainwater will help alleviate this
problem as well as providing potable water for the hugely populated city of Lagos.
The city has an annual precipitation of about 2,000mm.
HYDROLOGIC MODELLING IN WATER RESOURCES
MANAGEMENT
Water resource is crucial for human development and survival. However, with
increasing demand there is an envisaged risk of scarcity of the resource (De Fraiture et
al, 2001), there is therefore a necessity of finding alternative solutions to withdrawal
rates (Handia et al, 2003)and reduction of unnecessary demand (Mulwafu et al, 2003).
Modelling approaches provide management choices, used in addressing
environmental problems that concerns resources, both as representation of the
complex system and as a tool for decision support and management.
Gaur et al., 2011 developed a method for evaluating groundwater by the combined use
of numerical model and spatial model using GIS. The groundwater model has been
performed using MODFLOW based GMS 4.0. The groundwater model was used to
generate future scenarios, for the duration of 10years (July 2006-June 2016) by
increasing the discharge of wells and incorporating the recharge structures in the
watershed on the sub-basin of the Banganga River, India. The study reveals the area
falling in the potential zones can produce good amount of groundwater while the
overall stress on the watershed can be reduced using the wells of these zones. The
results concluded the construction of the structures reduces the overall decline of the
groundwater level.
Global warming is considered a major threat to the natural environment. Ozaki et al.,
(2008) established a model for displaying water temperature and applied it to a small

Lade, Oloke, Booth, Fullen and Proverbs
588
river basin at Yamanakatanigara river located in South west Japan. The mesh and
multi-layer runoff model was applied to a stream and the behaviour of heat transfer
was modelled in the water runoff model. The model was verified by measuring daily
changes of streamflow and river water temperature, and the calculation with the model
was conducted using meteorological data and compared to measured data. The model
outputs agreed well with measured values and it showed that water temperature could
be a good indicator for evaluating the performance of river hydrological models.
Water availability in semi-arid and dry Mediterranean regions can be improved
through water harvesting and water shed management. Makhamreh Zeyad (2011)
identified and optimized the potential water-harvesting sites in Jordan based on the
characterization of surface landscape conditions using DEM and remote sensing
techniques. A mathematical model was established in order to characterize the surface
landscape conditions, by establishing a relationship between soil colour and soil
surface property to derived indicators of landscape conditions from remote sensing
data, combined with DEM and GIS hydrological analysis tool for optimizing
delineation and selection of the water harvesting sites. This approach considers both
physical and current landscape conditions. The landscape properties, the effect of built
up areas and human construction objects (i.e. the effect of man made changes) on the
surface drainage network and direction of water flow were considered while the
traditional water shed management approaches considers only the physical landscape
characteristics without considering the actual landscape conditions
A promising and successful water harvesting technology to ensure water and food
security in semi-arid region like Kenya is the use of sand-storage dams. A
measurement campaign of hydrological processes in the surrounding of a single dam
in the Kitui district in Kenya reveals groundwater levels increase quickly after
precipitation while there is recession of groundwater levels during the dry season
following the rains. Quilis et al., (2009) developed a groundwater model for a single
sand-storage dam. The model shows high sensitivity of parameters like thick and
hydraulic conductor of the shallow aquifer on the riverbanks and thickness of the sand
layer in the riverbed. A second model for a series of dams was also developed, which
indicated that the inter-dam distance is an important parameter. The model results
confirm that sand-storage dams can affect increase water availability throughout the
dry season.
REVIEW OF EXISTING COMPUTER BASED MODEL IN RWH
The principle of mass-balance transfer was used by many researchers (Dixon 1999,
Fewkes (1999); Fewkes & Butler (1999); Fewkes & warm 2001; Day (2002);
Racticliffe (20002); Cobley (2004) and Roebuck 2006), as computer based assessment
methods for RWH (Figure 2).
Figure 2: Typical mass-balance transfer model (Source: Roebuck and Ashley 2006)
Excel spreadsheets are used by many models and it contains algorithm replicating the
processes shown in Fig. 2. Also review is the best practice methods for RWH in UK.
The most relevant information was found in the Construction Industry Research &
Information Association (CIRIA) best practice manuals (Leggett et al, 2001a; Leggett
Rainfall
Generation Water used
Temperature
of water in
storage
structure
Production of runoff
from Catchment
surface

Rainwater harvesting
589
et al, 2001b; Shaffer et al., 2004). The literature review shows that although some
variations exist between individual models there is a widespread use of the mass-
balance transfer principle when predicting hydraulic performance.
Table 1: Selection of existing computer based hydraulic models for RWH
Reference Description
Ward et al (2008) Ward designed RWH systems in two district new-building developed in UK and
was evaluated as a state -of-the art model than the two simpler methods. The
results showed that the design methods based on the simplified AR/D (used by
RWHS suppliers) and the EA approach generated tank sizes substantially larger
than the state –of –the –art yield after spill (YAS) continuous simulation.
Roebuck et al. (2006) Roebuck developed the RainCycle© model, which is based on the YAS model,
as described by Jenkins et al., (1978). This is an accepted and widely used
computer-based modelling tool to investigate the hydraulic and whole life cost
performance of RWHS of a UK school. The results revealed that both water and
monetary savings are possible in the long term. Although, the results were less
favour, RWH was revealed as a viable way of reducing reliance on mains water
and also capable of saving money in a long term. However, it has been revealed
that the methodology used for the prediction of future performance by many
RWHS supplier is inadequate in both scope and detail, leading to overestimating
both the demand that can be met by harvested rainwater and level of financial
savings.
Cobley (2004) Describes a simple method for estimating the largest storage requirement based
on the consumption rates and occupancy of a building. Similar in many aspects
to the numerous basic models available from the Internet.
Day (2002); Ratcliffe
(2002)
Rainwater harvesting project led by Telford and Wrekin Council, UK.
Monitoring of domestic rainwater harvesting (DRWH) system water usage and
water quality was conducted. Water consumption data was used to build a model
of the system.
Fewkes (1999); Fewkes and
Butler (1999); Fewkes and
Warm (2001)
Fewkes developed a number of models based on the YAS method described by
Jenkins et al (1978). Fewkes and Warm (2001) describe a method of modelling
RWH systems at eleven different locations in the UK. Recorded daily rainfall
statistics and a daily time step were used to predict water saving efficiencies.
Dixon (1999)
Model of DRWH system for predicting water quality and water saving
efficiency. Also includes some stochastic elements for creating water demand
profiles and a basic whole life costing element.
Jenkins et al (1978)
An early behavioural model identifying two fundamental algorithms that
describe the operation of a rainwater storage structure: Yield After Storage
(YAS) and Yield Before Storage (YBS). Jenkins et al used the YAS algorithm
and a monthly time interval to investigate the performance of rainwater storage
in North America.
Note: all the models described in table 1 are based on mass-balance transfer algorithms
A flow diagram is presented in Fig. 3 that shows the steps involved in the creation of a
simulation model (after James 1984).
THE RAINCYCLE© RAINWATER HARVESTING MODELLING
TOOL
Overview of main features
The following list highlights the main features of the modelling tool:
Daily simulation of proposed design for up to 100 years of operation
Compares the whole life costing (WLC) of a RWH system with that of an
equivalent mains-only system
Takes explicit account of all associated costs, including capital (to-build),
operating/maintenance and decommissioning costs

Lade, Oloke, Booth, Fullen and Proverbs
590
Multiple values allowed on 11 key parameters which enable performance
under a range of conditions to be investigated. Sensitivity analysis and Monte
Carlo simulation also available.
Main results are output as: long-term savings, average yearly savings, pay-
back period and percentage of demand met by harvested water.
Uses standard accounting techniques to calculate the Net Present Value (NPV)
Figure 3 Diagrammatic representation of model development after James (1984)
CONCLUSION
The literature reviewed revealed, there are few RWHS models and there seems to be
insufficient attention to Decision Support Tools (DST) for integrated urban water
management. To integrate RWH into the development and management of water
resources in Nigeria, there is a need to develop tools and methodologies that will not
only assist planners with the identification of areas suitable for RWH but also quantify
the associated hydrological impacts of its wide spread adoption.
A GIS-based DST will be developed for evaluating rainwater by the combine use of
RainCycle© model and mass balance-transfer model. The RWH model will help
justify location of potential zones for RWH and give more realistic appraisal for their
use. Modelling of Economic assessment would also be performed to include relevant
environmental and social costs as this largely underscores the failure or success of
RWH systems. In order to achieve the objectives of these research, it was decided that
the RainCycle© RWH modeling tool be adopted since this method is widely accepted
and used.
REFERENCES
Anderson, J.M. 2005. Blueprint for a Greener City: Growth Need not Cost the Earth. Water,
Science and Technology, volume 52, no.9, pp.61-67.
Coombes, P.J. 2002. Rainwater Tanks Revisited: New Opportunities for Urban Water
Cycle Management. PhD thesis. Newcastle University, New South Wales,
Australia.
Coombes, P. & Kuczera, G. 2003. Analysis of the Performance of Rainwater Tanks in
Australian Capital Cities. The Institute of Engineers, Australia 28th
International Hydrology and Water Resources Symposium. Wollongong, New
South Wales.

Rainwater harvesting
591
Cobley, J.C. 2004. SUDS: The Consultants Specification. Proc. of 25th meeting of the
Standing Conference on Stormwater Source Control: Quantity and Quality.
Coventry University, Friday 20th February 2004.
Day M. 2002. The Millennium Green Development Rainwater Project. Proc. of
Standing Conference on Stormwater Source Control Quantity and Quality.
13th
February 2002, Coventry University UK, Vol. 22.
De Fraiture C., Molden, D., Amarasinghe, U., Makin, I., 2001. PODIUM: Projecting
Water Supply and Demand for Food Production in 2025, Physics and
Chemistry of the Earth 26, pp. 869-876.
Dixon A. 1999. Simulation of Domestic Water Re-use Systems: Greywater and
Rainwater in Combination. Department of Civil and Environmental
Engineering PhD Thesis. Imperial College of Science, Technology and
Medicine, London, UK.
Fewkes, A.1999. Modelling the Performance of Rainwater Collection Systems:
Towards a Generalized Approach. Urban Water, vol.1, pp. 323-333.
Fewkes, A. & Butler, D. 2000. Simulating the Performance of Rainwater Collection
Systems in the UK. Building Services Engineering Research and Technology,
Vol.2, pp. 257-263.
Fewkes, A. & Warm, P. 2001. A Method of Modelling the Performance of Rainwater
Collection Systems in the UK. Building Services Enineering Research &
Technology, Vol.2, pp.257-265.
Ghisi, E. & Oliveira, S.M. 2007. Potential for Potable Water Savings by Combining
the Use of Rainwater and Greywater in Houses in Southern Brazil. Building
and Environment, Vol. 42 (2007), pp.1731-1742.
Gaur, S., Chahar, B.R., Graillot Didier 2011. Combined Use of Groundwater
Modelling and Potential Zone Analysis for Management of Groundwater.
International Journal of Applied Earth Observation and Geoinformation 13,
pp.127-139.
Handia, L., Tembo, J.M., Mwiindwa, C., 2003. Potential of Rainwater Harvesting in
Urban Zambia, Physics and Chemistry of the Earth 28, pp. 893-896.
James, A. 1984. An Introduction to Water Quality Modelling. John Wiley & Sons,
Chichester.
Jenkins, D., Pearson, F., Moore, E., Sun, J.K. & Valentine, R. 1978: Feasibility of
Rainwater Collection Systems in California. Contribution No. 173, Californian
Water Resources Centre, University of California USA. Leggett D. J., Brown R., Brewer D., Stanfield G and Holliday E 2001a. Rainwater and
Greywater Use in Buildings: Best Practice Guidance. CIRIA Report C539.
Construction Information & Research Information Association, London, UK.
Leggett D., Brown R., Stanfield G., Brewer D. and Holliday E. 2001b. Rainwater and
Greywater Use in Buildings: Decision-making for Water Conservation. CIRIA report
PR080. Construction Information & Research Information Association, London, UK.
Liu, S., Butler, D., Makropoulos, C. & Memon, F. 2005. An Excel-Matlab Based
Decision Making Framework and its Application in Urban Water
Management. CWWI2005. Exeter, UK, pp. 21-26.
Liaw, C. & Tsai, Y. 2004. Optimum Storage Volume of Rooftop Rainwater Harvesting
Systems for Domestic Use. Journal of the American Water Resources
Association, August 2000, Vol. 40, no. 4, pp. 901-912.
Makhameh, Z., 2011. Using Remote Sensing Approach and Surface Landscape
Conditions for Optimization of Watershed Management in Mediterranean
Regions. Physics and Chemistry of the Earth 36, pp. 213-220.

Lade, Oloke, Booth, Fullen and Proverbs
592
Memon, F.A. & Butler D. 2006. Water Consumption Trends and Demand Forecasting
Techniques. In: Water Demand Management, IWA Publishing, London.
Mulwafu, W., Chipeta, C., Chavula, G., Ferguson, A., Nkhoma, B.G., Chilima, G. ,
2003. Water Demand Management in Malawi: Problems and Prospects for its
Promotion, Physics and Chemistry of the Earth 28, pp. 787-796.
Ozaki N., Fukushima, T., Kojiri, T. 2008. Simulation of the Effects of the Alteration of
the River Basin Land Use on River Water Temperatur using the Multi-Layer
Mesh-typed Runoff Model. Ecological Modelling 215, pp. 159-169.
Parkinson, J., Schutze, M. & Butler, D. 2001. Modelling the Impact of Source Control
Strategies on the Sustainability of the Urban Wastewater System. Proc. of 1st
Nat. Conf. on Sustainable Drainage. 18th-19th June 2001, Coventry
University, UK, pp. 255-267.
Prakash, S. & Abrol, Y.P. 2005. The Possible Integration Of A GIS Based
Metholodology with the Existing Community Rainwater Harvesting Plan of
Hauz Khas Apartment, New Delhi (India). Proc. of 12th International
Rainwater Catchment Systems Conference, New Delhi, India, November
2005.
Quilis, R.O., Hoogmoed, M., Ersten, M., Foppen, J.W., Hut, R., Arjen de Vries 2009:
Measurement and Modelling Hydrologic Processes of Sand-storage Dams on
Different Spatial Scales. Physics and Chemistry of the Earth 34, pp. 289-298.
Ratcliffe, J. 2002. Telford Rainwater Harvesting Project. Proc. of Standing
Conference on Stormwater Source Control Quantity and Quality. 13th
February 2002, Coventry University, UK, Vol.22.
Roebuck, R. M. & Ashley, R. M. 2006. Predicting the Hydraulic and Life-cycle Cost
Performance of Rainwater Harvesting Systems Using a Computer Based
Modelling Tool. In: Delectic, A. and Fletcher, T. (eds): Proc. of the 7th
International Conference on Urban Drainage and 4th International Conference
on Water Sensitive Urban Design, Melbourne, Australia, 2-7 April 2006, Vol.
2, pp. 699-706.
Sakellari, I., Makropoulos, C., Butler, D. & Memon, F.A. 2005. Modelling
Sustainable Urban Water Management Options. Proc. of the Institution of
Civil Engineers. Engineering Sustainability 158, September 2005, Issue ES3,
pp143-153.
Shaffer, P., Elliott, C., Reed, J., Holmes, J. & Ward, M. 2004. Model Agreements for
Sustainable Water Management Systems: Model Agreements for Rainwater
and Greywater Use Systems. CIRIA report C626, London.
Sekar, I. & Randhir, T.O. 2006. Spatial Assessment of Conjunctive Water Harvesting
Potential in Watershed Systems. Journal of Hydrology, 9(24), pp. 1-14.
Vleuten-Balkema, A.J. 2003. Sustainable Wastewater Treatment: Developing a
Methodology and Selecting Promising Systems. PhD thesis, Eindhoven
Technical University.
Ward, S., Memon, F.A., Butler, D., 2008. Rainwater Harvesting: Model-based Design
Evaluation. Proc. of the 11th
International Conference on Urban Drainage,
Edinburgh, Scotland, UK.

Agumba, J.N., Thwala, W. and Haupt, T. (2011) Identification of health and safety performance
improvement measuring indicators: A literature review In: Laryea, S., Leiringer, R. and Hughes, W.
(Eds) Procs West Africa Built Environment Research (WABER) Conference, 19-21 July 2011, Accra,
Ghana, 593-606.
593
IDENTIFICATION OF HEALTH AND SAFETY
PERFORMANCE IMPROVEMENT MEASURING
INDICATORS: A LITERATURE REVIEW
Justus N. Agumba1, Wellington Thwala
2 and Theo Haupt
3
Department of Construction Management and Quantity Surveying, University of Johannesburg, South
Africa
Improvement to small and medium construction enterprises (SMEs) safety standards
could inevitably be helped by continuous monitoring and review of their health and
safety (H&S) performance. To achieve this objective safety performance
improvement model is a prerequisite. Although various methods of health and safety
performance improvement have been proposed, a more comprehensive health and
safety performance improvement model is advocated which takes into account factors
pertinent to SMEs projects. Studies have indicated there is no consensus of health and
safety performance measuring indicators to be used in monitoring health and safety
performance. This paper tries to fill this gap that is so contentious in the field of
health and safety in the construction industry. An extensive literature review on health
and safety literature identified 64 potential indicators that influence H&S
performance, which may be incorporated in the health and safety SMEs questionnaire
survey, after the Delphi survey. The measuring, indicators identified were leading
indicators, categorized in 10 core elements depicting the health and safety culture
characteristic i.e. management commitment, employees involvement and occupational
health and safety management system i.e. what the organization does. These core
elements and leading indicators will also depict the health and safety management of
an organization.
Keywords: health and safety, literature review, measuring indicator, performance
improvement.
INTRODUCTION
Improvement to small and medium construction enterprises (SMEs) safety standards
could inevitably be helped by continuous monitoring and review of their H&S
performance. According to Azimah et al., (2009) they indicated that legislation is
inadequate to address those problems in managing H&S in the workplace. This is due
to the ―people‖ element having a tendency in engaging in unsafe or safe behavior
according to their interpretation and the unsafe behavior that can lead to accidents.
Mitchison and Papadakis (1999) demonstrated that effective safety management
improves level of safety in an organization and thus can be seen to decrease damages
and harms from incidents (cited from Bottani et al., 2009). Mearns et al., (2003),
indicated that safety management refers to the tangible practices, responsibility and
performance related to safety. They further indicated the association between safety
Agumba,Thwala and Haupt
594
management, safety climate and safety culture. They noted that safety climate is
perceived as the precise indicator of overall safety culture while safety management
practices display the safety culture of top management and as a result, good safety
management practices are reflected in enhanced safety climate of all employees. For
these reasons Azimah et al., (2009) for example, management in organizations will
assist to resolve OHS problems successfully and is also a means to legal compliance.
Unfortunately Fernandez Muniaz, et al., (2007) indicated in there study that there is no
consensus of what elements and measuring indicators constitutes the health and safety
management system.
This paper therefore describes research work that is in progress, the ultimate goal of
this research is to identify proactive H&S elements and indicators that will be used to
monitor the H&S performance of SMEs at project level in South Africa in order to
reduce incidents and accidents such as injuries, illness and fatalities in their projects.
CHALLENGES FACING SMALL AND MEDIUM
CONTRACTORS
Contractors can be distinguished from each other by various variables such as the
amount of annual turnover, capacity, capability and their fixed assets. In South Africa
the National Small Business Act amended in 2003 defines small contractors as those
with a total annual turnover of between R3m and R6m, full time paid employees
between 20 and 50 and a total gross asset value (fixed property) of between 0.5m and
R1m, whereas medium contractors are defined as having a total annual turnover of
between R6m and R26m, total full time paid employees between 50 and 200 and have
a total gross asset value (fixed property) of between R1m and R5m (National Small
Business Act, 2004). This definition will be adapted for this study.
The White Paper on Creating an Enabling Environment for the Construction Industry,
describes the South African SMEs as largely underdeveloped and lacking the
managerial and technical skills and sophistication enjoyed by larger well established
contractors [Department of Public Works (DPW), 1999]. Dlungwana et al., (2003)
asserts that SMEs are left on the periphery of the mainstream economy and do not
participate fully in the economies of developing countries as large contractors
dominate. They further indicate that conditions in developing countries such as lack of
resources for training contractors, poor procurement systems, lack of management
capacity and lack of available resources to equip managers to operate their business
enterprise effectively, some of these factors have been supported in previous study of
Agumba, et al., (2005), lack of awareness of what specific H&S legislation is relevant
to SMEs (Vickers et al., 2003) is also a challenge. These challenges faced by SMEs
are viewed as exacerbating the current state of poor H&S performance in SMEs,
globally and in South Africa.
HEALTH AND SAFETY STATUS IN SOUTH AFRICA
CONSTRUCTION INDUSTRY
Traditionally, cost, time and quality have constituted the parameters within which
projects have been managed. However, there is a paradigm shift to the inclusion of
H&S as a project performance measure by petro-chemical organizations (Smallwood,
2005). Based on the aforementioned challenges on construction SMEs, occupational
accidents and diseases impose an enormous cost on South Africa. The Department of
Labour (DoL), (2007) indicated that construction accidents account for 4% of the
global gross domestic product (GDP). Occupational accidents and diseases in South

Health and safety performance
595
Africa account for approximately 3.5% of its GDP, which, translates to about R30
billion (about $4.2 billion). There are other aspects apart from the financial and
economic impacts which cannot be measured in any accurate and tangible terms,
namely the strain of the loss of a family member, particularly if the worker was the
only family bread winner. According to the National Occupational Health and Safety
Policy (2003) the absence of a consistent national reporting system means that there is
no set of figures that reflects accurately the full extent of occupational accidents and
diseases these has been supported by the Construction Industry Development Board,
(CIDB, 2008) report. The statistics presented in this review does not separate the
statistics into the size of organization. The most complete accident figures are
compiled by the Compensation Commissioner. Construction H&S statistics provided
by the DoL as cited in CIDB, (2008) report covering the period 2004/2005 to 2007/08
show a sharp rise in accidents up to 2007/08; to around 160 fatalities and around 400
non-fatal accidents (i.e. temporary or permanent disablement).
Despite isolated reports of improvement in (2003), there is very limited commitment
to comply with basic requirements, let alone promote a culture of H&S. Employers
view, H&S as a cost in the system. Small contractors can barely maintain tools and
regard safety equipment as luxury items. Even where protective clothing and
equipment are provided, workers often avoid their use, including the use of safety
goggles and masks when working with grinders and asbestos. Aside from the direct
compensation and medical costs associated with accidents the costs to the economy
are immense and include rework, lost time, damage to plant and equipment,
disruption, productivity loss and loss of skills to the economy (CIDB, 2004).
The continuing poor H&S performance of the construction industry in the form of
fatalities, injuries, and diseases, the number of large-scale construction accidents, and
the general non-participation by key project stakeholders such as clients and
designers, provided the catalyst for promulgation of consolidated construction H&S
legislation in the form of the Construction Regulations (Smallwood and Haupt, 2005).
Compliance with this construction legislation, codes and standards such as the
Construction Regulations (2003) in South Africa, present significant challenges
involving cost, compliance, design and implementation capacity, clients such as the
Department of Public Works (DPW) and consultants agree that implementation would
require raised understanding on the implications and importance of H&S in the
construction industry (CIDB, 2004).
Walters (2001) (cited in HSE, 2007) indicated that SMEs have shown to experience
proportionately more accidents than large enterprises. It has also been indicated in
various research projects that models for measuring H&S performance for large
contractors will not be applicable to SMEs, this is a challenge as this is what is
currently taking place. This can be reflected in a study conducted by Lin et al., (2001)
in Australia. These authors concluded there is need to improve OHS within small
enterprises. Based on the aforementioned challenges and poor H&S performance
facing construction SMEs this study therefore aims to identify potential core elements
and leading indicators that will be essential in influencing H&S performance at project
level of SMEs. This will be achieved through extensive literature review.
MEASUREMENT OF CONSTRUCTION HEALTH AND SAFETY
PERFORMANCE
Health and safety performance can be used by owners to compare H&S performance
of different organizations to assess which organization has a better H&S record. It also

Agumba,Thwala and Haupt
596
allows comparison of H&S performance between projects and can also be used by
organizations internally to maintain line accountability for H&S and pin point
problem areas for improvement. Health and safety performance can be broadly
classified into two groups which are lagging indicators like accident rates and leading
indicators like measurement of H&S climate (Flin et al., 2000).
Teo and Fang (2006) research indicated that players in the construction industry are
aware that historic and statistical data do not accurately reflect H&S performance. The
results of their research have shown the importance of leading indicators over lagging
indicators to measure construction organizations expected H&S performance. In view
of Teo and Fang (2006) this research project through extensive literature review will
determine the main H&S elements and the leading indicators that will influence H&S
performance improvement in construction SMEs projects.
LITERATURE REVIEW
The Occupational Health and Safety Act (OS&H Act) 1993, mandates that the
employer is the responsibility of the employee and reconfirmed in Construction
Regulation 2003. The contractors commonly take, the lead role on a project, and are
often the sole party, in addressing worker health and safety. Toole, (2000) studied the
responsibility of contractors, subcontractors and designers involved in a project. The
study revealed that there was not uniform agreement on the site safety responsibility
that should be assumed by each of these groups. Most of the respondents placed
responsibility for safety with the contractor. This indicates that the contractor needs to
be able to manage health and safety in his projects. It is therefore essential to identify
elements and leading indicators to assist SMEs in managing H&S.
Levitt and parker (1976) studied the role of top management in construction firm in
reducing construction injuries. Some of the findings of the study are that: companies
whose top managers, talked about safety when they visited jobsites had lower
Experience Modification Rating (EMR‘s) than companies in which safety was not
mentioned during these events, they also found that companies with formal orientation
programs had lower EMR‘s compared to companies with no orientation programs.
Cooper (1998) indicated the importance of communication in influencing H&S
performance improvement and categorized them into formal and informal verbal and
written communication. Kheni et al., (2006) further indicated the need for verbal
communication as good measure for safety management practice. Sawacha et al.,
(1999) established that the most important first level factors to improve H&S
performance under organization safety policy are: management talk about safety,
provision of safety booklets, provision of safety equipment, assuring a tidy site,
appointing safety representatives and training of operatives on safety. Jaselskis et al.,
(1996) indicated to achieve better construction safety performance at company level
the related factors/elements are; upper management support, time devoted to safety
issues for company safety coordinator, number of informal safety inspections, made
by the company coordinator, meetings with field safety representatives and craft
workers, length and detail of company safety program, safety training for new
foremen and safety coordinators, the authors also indicated that at project level, the
factors/elements that are important for achieving better safety performance; increased
project manager experience level, more supportive upper management attitude
towards safety, reduced project team turnover, increased time devoted to safety
representative, more formal meetings with supervisors and specialty contractors, more
informal safety meetings with supervisors, a greater number of informal site safety

Health and safety performance
597
meetings with supervisors, a greater number of informal site safety inspections,
reduced craft worker penalties, and increased budget allocation to safety awards.
Toellner, (2001) established leading indicators that are essential in improving safety
performance viz. safety walkthrough by management, barricading a given place, tool
box talk meeting and housekeeping. Jannadai et al., (2002) revealed that management
involvement, personal protective equipment, and emergency planning and preparation
were considered to be extremely important factors in influencing safety performance
as they revealed the greatest impact. The authors had identified 20 main
factors/elements and 135 sub-factors/indicators that affect health and safety
performance from literature review. They developed a questionnaire to find the impact
these health and safety factors and sub-factors have on H&S performance. They
revealed 20 important main factors/elements and 85 important sub-factors/indicators
from the contractors, this survey conducted on large contractors dealing with large
volume of industrial construction. The factors and sub-factors were logically filtered
to conform to the required elements and indicators.
In a study contacted by Fernandez Muniaz et al., (2007) they developed a positive
safety culture model that consisted of management commitment, employee
involvement and safety management system (SMS). The SMS included safety policy,
incentives, training, communication, planning, and control, there model was generic to
cover more than one industry of different sizes, their result indicated improvement
when these elements are used and especially when managers and employees are
involved. Aksorn et al., (2008) in a validated study indicated that the critical safety
factors identified if emphasized on a project can contribute to a marked improvement
of safety performance. They identified 16 factors/elements included management
support, appropriate safety education and training, teamwork, clear and realistic goals
these can be termed as policies, effective enforcement scheme, personnel attitude,
program evaluation, personal motivation, delegation of authority and responsibility,
appropriate supervision, safety equipment acquisition and maintenance, good
communication, sufficient resources allocation, positive group norms and personnel
competency. The factors were later categorized into four major dimensions namely;
worker involvement, safety prevention and control system, safety arrangement and
management commitment, Aksorn et al., (2008) study focused on validating these
factors on large contractors, it is therefore crucial for this factors to be in cooperated in
these present study matrix for small and medium contractors to find if these elements
are appropriate to be implemented on there projects and if they are able to influence
performance improvement.
In a recent study by Rajendran et al., (2009) they developed a sustainable construction
safety rating system using a Delphi method of which literature and an expert panel
was used in identifying the essential elements to be used by the project team which
included; contractors, designers, owners and subcontractors. The authors identified 50
elements considered essential by experts. These elements were validated on real
projects, the results indicated that 26 elements were considered to be mandatory to be
used by all the four project team members while 24 were considered to be elective i.e.
not mandatory. These elements were categorized into 14 categories i.e.; project team
selection, safety and health professionals, safety commitment, safety planning,
training and education, safety resources, drug and alcohol program, accident
investigation and reporting, employee involvement, safety inspection, safety
accountability and performance measurement, industrial hygiene practices. The

Agumba,Thwala and Haupt
598
authors indicated a variance of the elements with total recordable injury rate (TRIR).
Based on this extensive literature synthesis research the result is tabulated in Table 1.
RESEARCH METHOD
A systematic literature review was conducted on relevant journal papers, conference
papers, books and government regulations on H&S from 1976 to 2009, based on
topics of health and safety (H&S) performance measurement, H&S culture tools
developed, H&S climate tools developed, OHS management and H&S performance
improvement. The elements and indicators identified from the literature were
identified from the empirical studies of peer reviewed journal papers and conference
papers. A matrix result Table 1 was developed to capture the elements and the
measuring leading indicators of H&S.
A wealth of literature on construction H&S has accumulated over the past 35 years
from 1976 to date when Levitt and Parker (1976) studied the role of top management
of a construction firm in reducing construction injuries. Detailed review and analysis
of all studies was not within the scope of this document. Only specific studies
pertinent are extracted and reported in this section. The researchers used their best
judgment to interpret the elements and leading indicators to the best of their
understanding to accurately extract them. The main elements selected occurred in two
empirical studies. This proposed cutoff is in line with Shannon et al., (1997).
This paper covers the first phase of a three phase PhD research project by identifying
the potential H&S elements and leading indicators that are potential in influencing
H&S performance improvement, the results of the literature review will be used to
develop a three round Delphi survey questionnaire for validation in the second phase
of this research project in order to attain consensus of the main elements and leading
indicators identified.
RESULTS
Core elements and leading indicators synthesized from the literature review
Table 1: Core elements and leading indicators identified
Core elements Leading indicators/Positive performance
indicators Source(s)
Appointment of
H&S staff, Sawacha
et al., (1999);
Vredenburgh,
(2002)
Employing at least one qualified manager with
H&S training to oversee H&S [on multiple
projects]
Findley et al., (2004) and
researchers addition italics
At least one staff member with H&S training is
employed on each project Ng. et al., (2005)
Employing at least one H&S representative on
each project Sawacha et al., (1999)
Rajendran, et al., (2009)
Formal and informal
written
Communication
Cooper, (1998);
HSE, (2008)
Provision of written information about H&S
procedures HSE, (2008); Fernandez-Muniz
et al., (2007)
Provision of written information about the correct
way to perform tasks HSE, (2008); Fernandez-Muniz
et al., (2007)
Written circular/brochure that informs workers
about the risks associated with their work Sawacha et al., (1999)
Fernandez-Muniz et al., (2007)
Written circular/brochure that inform workers
about the preventive measures to reduce risk Sawacha et al., (1999)
Fernandez-Muniz et al., (2007)

Health and safety performance
599
The literature review aims to answer the following main research questions:
What are the main health and safety performance elements to be implemented to
improve H&S at project level?
What are the main leading indicators for health and safety performance
improvement to be implemented to improve H&S at project level?
The main objectives of this research project are:
To identify the health and safety performance elements which will lead to H&S
performance improvement in SMEs project; and
To identify the health and safety performance improvement leading indicators,
which will lead to H&S performance improvement in SMEs projects;
Continued Table 1: Core elements and leading indicators identified
Core elements Leading indicators/Positive performance
indicators Source(s)
Formal and informal
verbal communication
Cooper, (1998);
HSE, (2008)
Provide clear verbal instructions to both literate
and illiterate employees about H&S Fernandez-Muniz et al., (2007)
H&S information verbally communicated to
workers before changes are made to the way
their work activities are executed
HSE, (2008); Kheni et al.,
(2006) Fernandez-Muniz et al.,
(2007)
Organize regular meetings to verbally inform
workers about the risks associated with their
work
Fernandez-Muniz et al., (2007)
Organize regular meetings to verbally inform
workers about the preventive H&S measures of
risky work
Fernandez-Muniz et al., (2007)
H&S resources
Abudayyeh et al.,
(2006); Rajendran et
al., (2009)
Provision of personal protective equipment
(PPE) Kheni et al., (2006) Rajendran
et al., (2009)
Training in H&S through attending
seminars/workshops Fernandez-Muniz et al., (2007)
Material schedule data sheets provided for all
hazardous materials on site Lingard et al., (2005)
Employing technically skilled employees with
H&S training Rajendran et al., (2009)
Adequate information brochures given on H&S Sawacha et al., (1999)
Fernandez-Muniz et al., (2007)
Provision of a budget for H&S Liska et al., (1993); Kheni et
al. (2006)
Provision of correct tools, equipment and plant
to execute construction Teo et al., (2005); Rajendran et
al., (2009)
Provision of good welfare facilities such as
showers, canteens, toilets Kheni et al., (2006) Rajendran
et al., (2009)
Project
supervision/inspection
Fang et al., (2004);
Rajendran et al.,
(2009)
Proper supervision by staff trained in H&S Fang et al., (2004)
Identification of hazards by at least (one staff
member trained in H&S) Mitchell, (2000); Jannadi et
al., (2002)
Results of inspections discussed at H&S
meetings Mitchell, (2000);
H&S inspections done at least daily Jaselskis et al., (1996); Jannadi
et al., (2002);
Local authorities and H&S enforcement
agencies visit sites for inspection Aksorn, et al., (2008);

Agumba,Thwala and Haupt
600
Ad hoc informal H&S inspections of work place Jaselskis et al., (1996); Lin et
al., (2001)
Regular H&S audits of projects Mitchell, (2000); Trewthewy,
(2003)
Continued Table 1: Core elements and leading indicators identified
Core elements Leading indicators/Positive performance
indicators Source(s)
Project planning
of H&S Sawacha
et al., (1999); Mitchell, (2000);
Teo et. al.,
(2005); Rajendran
et al., (2009)
Ergonomics is considered when deciding the
method of construction Shikdar et al., (2003); Rajendran et
al., (2009)
Reengineering is considered to reduce hazards Vredenburgh.,(2002) Mitchell,
(2000);
When head office decides on the method of
construction H&S is included in decision
making process
Vredenburgh., (2002)
Each project has a site-specific H&S plan Fernandez-Muniz et al., (2007);
Rajendran et al., (2009)
Layout of the site considers H&S aspects Mitchell, (2000); Rajendran et al.,
(2009)
Use hazard identification procedures Trewthewy, (2003); Teo et al.,
(2005)
Use of risk assessment procedures Trewthewy, (2003)
Constructability of project is reviewed Coble et al., (2000); Sawacha et al.,
(1999)
Scheduling for H&S Mitchell, (2000); Rajendran et al.,
(2009)
Training in H&S Sawacha et al.,
(1999); Kheni et
al., (2006);
Fernandez-
Muniz et al.,
(2007)
Workers undergo induction on H&S before
commencing work on a particular site Trewthewy, (2003); Fernandez-
Muniz et al., (2007)
Workers trained in proper care and use of
personal protective equipment Sawacha et al., (1999) Shannon, et
al., (1997); Fernandez-Muniz et al.,
(2007)
Workers are regularly trained in H&S Shannon, et al., (1997); Ng, et al.,
(2005); Rajendran et al., (2009)
Instruction manuals or safe work procedures are
used to aid in preventive action Sawacha et al., (1999) Fernandez-
Muniz et al., (2007)
Workers are given time off for training Findley et al., (2004); Fernandez-
Muniz et al., (2007)
Worker/employee
involvement in
H&S Aksorn et
al., (2008);
Fernandez-
Muniz et al.,
2007)
Workers are involved in production of H&S
policy Fernandez-Muniz et al., (2007)
Workers provide written suggestions on H&S Kheni et al., (2006)
Workers kept informed of provisions of H&S
plan Fernandez-Muniz et al., (2007);
Workers are involved in H&S inspections Jaselskis et al., (1996)
Workers are consulted when the H&S plan is Fernandez-Muniz et al., (2007);

Health and safety performance
601
compiled
Workers are involved in development of H&S
rules and safe work procedures Fernandez-Muniz et al., (2007)
Workers have the explicit right to refuse to
work in potentially unsafe, unhealthy conditions Sawacha et al., (1999) Rajendran et
al., (2009);
Continued Table 1: Core elements and leading indicators identified
Core elements Leading indicators/Positive performance
indicators Source(s)
Upper management
commitment in H&S
Levitt et al., (1976);
Abudayyeh et al.,
(2004); Aksorn, et
al., (2008)
Managers encourage and support worker
participation, commitment and involvement in
H&S activities
Abudayyeh et al., (2004);
Fernandez-Muniz et al., (2007)
Managers encourage and support training of
employees in H&S Abudayyeh et al., (2004);
Fernandez-Muniz et al., (2007)
Managers communicate regularly with workers
about H&S Abudayyeh et al., (2004);
Fernandez-Muniz et al., (2007)
Managers actively monitor the H&S performance
of their projects and workers Toellner (2001); Abudayyeh et
al., (2004);
Managers take responsibility for H&S Shannon et al., (1996) Trethewy
(2003); Teo et al., (2005)
Managers actively and visibly lead in H&S matters Aksorn et. al., (2008);
Fernandez-Muniz et al., (2007)
Managers regularly visit workplaces to check work
conditions or communicate with workers about
H&S
Findley et al., (2004); Toellner
et. al., (2009)
Managers encourage and arrange meetings with
employees & other managers to discuss H&S
matters
Findley et al., (2004);
Fernandez-Muniz et al., (2007)
Managers conduct toolbox talks themselves Toellner (2009);
Managers ensure that the H&S budget is adequate Abudayyeh et al., (2004);
Jaselskis et al., (1996)
Managers recognize and reward outstanding H&S
performance of workers Teo et al., (2005)
H&S policy Shannon
et al., (1997); Ng et
al., (2005);
Fernandez-Muniz et
al., 2007)
Proper implementation of safety management
system Teo et al., (2005)
Company has H&S policy Ng et al., (2005); Teo et al.,
(2005)
Written in-house H&S rules and regulations for all
workers reflecting management concern for safety,
principles of action and objectives of achievement
Teo, et al., (2006); Fernandez-
Muniz et al., (2007)
The firm coordinates its H&S policies with other
human resource policies to ensure the well-being
of workers
Fernandez-Muniz et al., (2007)
DISCUSSION
Table 1 indicates the results of the synthesized literature. The authors did not include
drugs and alcohol testing as an element because Findley et al., (2004) found that small
contractors do not undertake drug and alcohol testing despite being indicated as being
essential by large contractors, a study conducted by Rajendran et al., (2009) indicated
that this element was elective and not mandatory. Few of the indicators were not
obtained from empirical research paper such as the material schedule data sheet.

Agumba,Thwala and Haupt
602
In order to abate the high rise of poor performance of H&S, majority of studies have
indicated that upper management commitment in H&S should be in place, according
to (Levitt et al., 1976; Abudayyeh et al., 2004; Aksorn, et al., 2008). Various authors
have also indicated the need to portray management commitment in an organization,
they indicated that behavior and attitude has to be evident to influence employee H&S
attitude and behavior. Upper management commitment is measured using eleven
indicators, adapted from the scales developed by Abudayyeh et al., (2004), Fernandez-
Muniz et al., (2007), Toellner (2001), Shannon et al., (1996), Trethewy (2003), Teo et
al., (2005), Aksorn et al., (2008), Findley et al., (2004). The indicators are indicated in
Table 1.
Upper management and employee involvement go hand in hand, according to
Fernandez-Muniaz et al., (2007). In various projects as stated previously it‘s about the
people doing the work and these are the employees. Employee involvement and
empowerment is an important element as per the literature review and for employees
to reflect that they are empowered and involved are measured by seven indicators
derived from the scales of OHSA, (1993), Fernandez-Muniz et al., (2007), Kheni et
al., (2006), Sawacha et al., (1999), Rajendran et al., (2009). The indicators are
tabulated in Table 1.
In order for SMEs to improve on H&S performance upper management and
employees need to adhere to proper implementation of safety management system
(SMS) elements, hence reflecting a better H&S culture. The literature review has
identified the following essentials elements and there indicators;
Appointment of H&S staff has been indicated by Sawacha et al., (1999) and
Vredenburgh, (2002) to be an important element to influence H&S performance. The
need to employ quality H&S staff has been advocated (Findley et al., 2004). Three
indicators measure this element, adapted from the scales developed by Findley et al.,
(2004), Ng. et al., (2005), Sawacha et al., (1999), Rajendran, et al., (2009).
Formal and informal written communication refers to the transfer of information to
employees about the possible risks in the workplace and the correct way to combat
them. This is done in writing. This element will be measured by four indicators i.e.
provision of written information about H&S procedures, provision of written
information about the correct way to perform tasks, written circular/brochure that
informs workers about the risks associated with their work and written
circular/brochure that inform workers about the preventive measures to reduce risk.
The adapted scales references are indicated in Table 1.
Formal and informal verbal communication refers to the transfer of information to
employees about the possible risks in the workplace and the correct way to combat
them. This can either be formal or informal verbal communication. Four indicators
measure this element they are; providing clear verbal instructions to both literate and
illiterate employees about H&S, H&S information verbally communicated to workers
before changes are made to the way their work activities are executed, organizing
regular meetings to verbally inform workers about the risks associated with their work
and organizing regular meetings to verbally inform workers about the preventive H&S
measures of risky work. The adapted scales references are indicated in Table 1.
H&S resources are important in a project they enable the outcome of the project to be
achieved. In this review Abudayyeh et al., (2006) and Rajendran et al., (2009) have
indicated the importance of H&S resources. This element will be measured using
eight indicators, the scales adapted from; Mitchell., (2000), Jannadi et al., (2002),
Health and safety performance
603
Fang et al. (2004), Jaselskis et al., (1996), Aksorn, et al., (2008), Lin et al., (2001) and
Trewthewy, (2003) These indicators are indicated in Table 1.
Project planning of H&S captures the existence of procedures to evaluate risks and
establish necessary health and safety measures to avoid accidents and includes
organized planning in case of emergencies (Fernandez-Muniaz et al., 2007). This
element will be measured using nine indicators and the scale are adapted from studies
of; Shikdar et al, (2003) Vredenburgh., (2002), Mitchell, (2000), Trewthewy, (2003),
Teo et al., (2005), Coble et al., (2000), Sawacha et al., (1999), Fernandez-Muniaz et
al., (2007) and Rajendran et al., (2009). These indicators are indicated in Table 1.
Project supervision is an internal concept H&S performance improvement, it captures
the existence of mechanisms to verify the extent to which goals have been fulfilled, as
well as compliance with internal norms or work procedures (Fernandez-Muniaz et al.,
2007). It has also been advocated in the Construction Regulation (2003). This
construct will be measured by the indicators adpted from, Fang et al., (2004),
Mitchell, (2000), Jannadi et al., (2002), Jaselskis et al., (1996), Aksorn, et al., (2008),
Lin et al., (2001) and Trewthewy, (2003). These indicators are indicated in Table 1.
Training in H&S is fundamental to any organization and especially in H&S as
asserted by (Sawacha et al., 1999; Kheni et al., 2006; Fernandez-Muniz et al., 2007).
Five indicators will measure this element as depicted from the scales of Trewthewy,
(2003) and Fernandez-Muniz et al., (2007). These indicators are indicated in Table 1.
There is consistency in studies reviewed of the importance of H&S policy, according
to Ng et al., (2005) and Fernandez-Muniz et al., (2007) they assert that employers
should formulate safety policies this is also a requirement in the OS&H Act in South
Africa. The indicators to measure policy are: Proper implementation of safety
management system; company has H&S policy, written in-house H&S rules and
regulations for all workers reflecting management concern for safety, principles of
action and objectives of achievement and the firm coordinates its H&S policies with
other human resource policies to ensure the well-being of workers
CONCLUSIONS
The identified elements and measuring indicators were upper management
commitment with 11 measuring indicators, worker/employee involvement with seven
measuring indicators, appointment of H&S staff with three measuring indicators,
formal and informal written communication, with four measuring indicators, formal
and informal verbal communication, with four measuring indicators, project planning
of H&S, with nine measuring indicators, H&S resources, with eight measuring
indicators, H&S policy, with four measuring indicators, training in H&S, with seven
measuring indicators and project supervision, with seven measuring indicators. These
elements and leading indicators can be formulated to be a framework for measuring
health and safety culture or management.
There were problems in synthesizing the data such as the different sets of elements
and indicators obtained had different terms but meant the same thing e.g. allocation of
resources and H&S resources, the interpretation was purely on how the researchers
understood the terms used. Further the range of industries included varied from study
to study. The essence of this literature review was to help in populating relevant H&S
elements and indicators to be formulated for Delphi questionnaire survey.

Agumba,Thwala and Haupt
604
FUTURE STUDY
The main elements and the measuring performance improvement indicators identified
is the first phase of a PhD study to develop a health and safety performance
improvement model at project level of SMEs. The second phase is to use a three round
Delphi method to validate the identified leading indicators.
REFERENCES
Abudayyeh, O., Fredericks K.T., Butt, E.S. and Shaar, A. (2006) ―An Investigation of
Management‘s Commitment to Construction Safety‖. International Journal of Project
Management, 24,167-174.
Agumba, J.N., Adegoke, I.O., and Otieno, F.A.O. (2005) ―Evaluating Project Management
Techniques in Small and Medium Enterprises Delivering Infrastructure in South
Africa Construction Industry‖. Proceedings of 3rd
Postgraduate Conference 2005,
Construction Industry Development, Eskom Convention Center, Midrand,
Johannesburg, South Africa, 9th-11
th October, pp. 52-65.
Aksorn, T. and Hadisukumo, B.H.W., (2008) ―Critical success factors influencing safety
performance program in Thai construction projects‖. Safety Science, 4, 707-727.
Azimah, N., Abdullah C., Spickett T.J., Rumchev, B.K. and Dhaliwal S.S. (2009) ―Assessing
Employees Perception on Health and Safety Management in Public Hospitals‖.
International review of research papers, 5:3,54-72.
Bottani, E., Monica, L., and Vignali, G., (2009) ―Safety management systems: performance
differences between adopters and non-adopters‖. Safety Science, 47,155-162.
Cadieux, J., Roy, M. and Desmarais, L. (2006) ―Preliminary Validation of a New Measure of
Occupational Health and Safety‖. Journal of Safety Research, 37, 413-419.
Coble, R.J. and Haupt, T.C. (2000) Potential Contribution of Construction Foremen in
Designing for Safety, Designing for Safety and Health Conference, CIB Working
Commission W99 and European Construction Institute London.
Cooper, D. (1998) Improving Safety Culture: A Practical Guide, Published by John Wiley &
Sons Ltd.
Construction Industry Development Board, (2004) SA Construction Industry Status Report,
synthesis review on the South African construction industry and its development,
discussion document, April, Pretoria, South Africa.
Construction Industry Development Board (2008) Construction Health and Safety in South
Africa, Status and Recommendations.
Department of Labour, (2007) Minister of Labour Mdladlana speech of safety and health at
work commemoration, Republic of South Africa.
Department of Public Works, (1999) White paper on ―Creating an Enabling Environment for
Reconstruction Growth and Development in the Construction Industry‖, Republic of
South Africa. (http://www.info.gov.za/whitepaper/1999/environment.htm) last viewed
on the 28/05/2010.
Dlungwana D.W. and Rwelamila P.D. (2003) ―The role of performance assessment tools in
improving contractor performance in developing countries‖ CSIR Boutek: Pretoria.
Fernandez-muniz, B., Montes-Peon M.J. and Vazquez-Ordas, J.C. (2007) ―Safety culture:
Analysis of the causal relationships between its key dimensions‖. Journal of Safety
Research, 38, 627-641.
Findley, M., Smith, S., Tyler K., Petty G. and Enoch K. (2004) ―Injury and cost control safety
program elements in construction. Which ones best prevent injuries and control
related workers‘ compensation costs?‖. Professional Safety 14-21.
Flin, R. Mearns, K., O‘Connor, P. and Bryden, R. (2000) ―Measuring health and safety
climate: identifying the common features‖. Safety Science, 34, 177-192.

Health and safety performance
605
Health and Safety Executive (2007) Health and safety in the small to medium-sized enterprise,
Psychological opportunities for intervention, Heriot Watt University.
Health and Safety Executive (2008) Successful health and safety, published by HSE books.
Kew, Richmond, Surrey, TW9 4DU.
Kheni, A.N. Gibb, G.A. and Dainty, A. (2006) ―Health and Safety Management Practices of
Small and Medium Sized Construction Business‖. Proceedings of CIB W99
International Conference on Global Unity for Safety and Health in Construction pp91-
101, 27th-
30th June, Bejing China.
Jannadai, A.O. and Bu-Khamsin, S.M. (2002) ―Safety Factors Considered by Industrial
Contractors in Saudi Arabia‖. Building and Environment, 37, 537-547.
Jaselskis, E.J., Anderson S.D. and Russell, J.S. (1996) ―Strategies for Achieving Excellence in
Construction Safety Performance‖. Journal of Construction Engineering and
Management, 122:1, 61-70.
Levitt, R.E. and Parker, H.W. (1976) ―Reducing construction accidents - top management‘s
role‖. Journal of construction division ASCE, 102:3, 465-478.
Lin, J. and Mills, A. (2001) ―Measuring the occupational health and safety performance of
construction companies in Australia‖. Facilities, 19: ¾,131-138.
Lingard, H. and Rowlison S. (2005) Occupational Health and Safety in Construction Project
Management, Spon Press 2 Park Square, Milton Park Abington, Oxon OX 14 4rn
Mearns K., Whitaker, M.S. and Flin, R. (2003) ―Safety Climate, Safety Management Practice
and Safety Performance in Offshore Environments‖. Safety Science, 41,641-680.
Mitchell, R., (2000) ―Development of PPIs to monitor OHS performance in Australian
construction industry‖, Journal Occupational Health and Safety Australia-NZ, 16: 4,
325-331.
National Small Business Act, (2004) Number 29 of 2004 Republic of South Africa.
(http://www.seda.org.za/print.asp?subID=573) last viewed on the 18/04/2010.
National Occupational Health and Safety Policy (2003).
Ng, T.S., Cheng, P.K. and Skitmore, R.M. (2005) ―A framework for evaluating the safety
performance of construction contractors‖ Built and Environment, 40, 1347-1355.
Occupational Health and Safety Act, (1993) Republic of South Africa Government Gazette
vol. 337, Cape Town July 1993.
Occupational Health and Safety Act, (1993) Draft amendment to the Construction Regulation
2003, www.polity.org.za accessed 13/09/2010.
O‘Toole, M. (2002) ―The relationship employees‘ perceptions of safety and organizational
culture‖. Journal of Safety Research, 33, 231-243.
Rajendran, S. and Gambatese, A.J. (2009) Development and initial validation of sustainable
construction safety and health rating system; Journal of Construction Engineering and
Management, 135: 10, 1067-1075.
Sawacha, E., Naoum, S. and Fong, D. (1999) ―Factors affecting safety performance on
construction sites‖. International Journal of Project Management, 17:5,309-315.
Shannon, H.S., Mayr, J. and Haines, T. (1997) ―Overview of the relationship between
organizational and workplace factors and injury rates‖, Safety Science, 26:3, 201-217.
Shikdar, A., and Sawqed, M.N., (2003) ―Worker productivity and occupational health and
safety issues in selected industries‖. Computers and Industrial Engineering, 45: 4,
563-572.
Smallwood, J. and Haupt, T. (2005) ―The need for construction health and safety (H&S) and
the Construction Regulations: Engineers‘ perceptions‖. Journal of the South African
Institution of Civil Engineering, 47: 2, 2-8 paper 581.

Agumba,Thwala and Haupt
606
Smallwood, (2005) ―Health and safety in housing‖. Proceeding of the XXXIII IAHS, World
Congress in Housing, Transforming Housing Environments through Design
September 27-30, Pretoria South Africa.
Teo A.L. and Fang, D.P. (2006) ―Measurement of Health and Safety Climate in Construction
Industry; Studies in Singapore and Hong Kong‖. Proceedings of CIB W99
International Conference on Global Unity for Safety and Health in Construction
pp157-164, 27th-
30th June, Bejing China.
Teo, A. L. E., Ling Y.Y.F. and Chong W.F.A. (2005) ―Framework for project managers to
manage construction safety‖. International Journal of Project Management, 23, 329-
341.
Toellner, J. (2001) ―Improving safety and health performance: Identifying and measuring
leading indicators‖. Professional Safety, 46: 9, 42-47.
Trethewy, W.R. (2001) Improved OHS management of contractors in the construction
industry, Sydney, School of Safety Science University of New South Wales.
Trethewy, W.R. (2003) ―OHS performance improved indicators for construction contractors‖.
Journal of Construction Research, 4: 1, 17-27.
Vickers, I., Baldock, R., Smallbone, D., Philips, J., and Ekanem, I. (2003) ―Cultural
influences on health and safety attitudes and behavior in small businesses‖. (Contract
Research Report No. 150): HSE.
Vredenburgh G.H. (2002) ―Organizational Safety: Which Management Practices are most
effective in Reducing Employee Injury Rates?‖ Journal of Safety Research, 33, 259-
276.

Fakere, A.A. and Aluko, O.O. (2011) Impact of improper solid waste disposal on urban housing in
Akure, Nigeria In: Laryea, S., Leiringer, R. and Hughes, W. (Eds) Procs West Africa Built
Environment Research (WABER) Conference, 19-21 July 2011, Accra, Ghana, 607-616.
607
IMPACT OF IMPROPER SOLID WASTE DISPOSAL ON
URBAN HOUSING IN AKURE, NIGERIA
Alexander A. Fakere1
and Olaniyi O. Aluko2
Department of Architecture, Federal University of Technology, Akure, Nigeria
Solid wastes are solid or semisolid materials resulting from human and animal
activities that are useless, unwanted, or hazardous. Poor consciousness of the
inhabitants on the environment and inadequate information on hazards that can result
from wastes has also contributed to disease breakouts and deterioration of the built
environment. This paper seeks to assess the significance of the dangers posed by
indiscriminate disposal of solid waste on the built environment by examining its
impacts on the inhabitants of the building structures with particular reference to
selected neighbourhoods in Akure, Ondo State, Nigeria. The study summarizes and
interprets findings from empirical survey of some residential buildings randomly
selected within the study area through the use of questionnaire, direct observations,
housing demographic and facility survey to elicit relevant data relating to social,
economic and environmental variables. Data obtained were collated and presented in
the single factor descriptive analysis while health records were obtained from the few
available health institutions. Findings show that health of individuals cannot be
considered in isolation without considering the building and the environment in which
they live. The paper recommends public enlightenment, environmental and health
education, enforcement of environmental and waste disposal protection laws and re-
introduction of old sanitary inspectors with corresponding policy statements.
Keywords: building structure, solid waste, urban housing.
INTRODUCTION
Waste is concomitant with virtually all human activities. Encarta Dictionary, 2008
describes it as remains, byproducts, unwanted or unusable materials or household
garbage. Huang, (2008) described solid wastes as solid or semisolid materials
resulting from human and animal activities that are useless, unwanted, or hazardous.
Ogedengbe and Oyedele (2006) defined waste as any unwanted materials intentionally
thrown away for disposal. Waste is inseparable from life because as long as man is
alive, he stores, uses and disposes off materials and the complexities of waste which
modern civilization produce is directly related to the living standards, socio-economic
and cultural attributes of that particular environment. (Hoornweg, 1999). Hoornweg,
(1999) also asserted the following:
i. Solid waste streams should be characterized by their sources, type of waste
produced as well as generation rate and composition.
ii. Waste can be classified in terms of state; solid, liquid, or gaseous states.
Fakere and Aluko
608
iii. There are eight major classifications of solid waste generation; residential,
industrial, commercial, institutional, constructional and demolition, municipal
services, process and agriculture.
As countries become richer and more urbanized, their waste composition changes
(Freeman III, 1979 and Lietman, 1995). A study carried out by Ogedengbe and
Oyedele, (2006) showed that the rate of change in municipal solid waste quantities
and composition in developing and developed countries is unprecedented. It further
opined that generally the greater the economic prosperity and the higher percentage of
urban population, the greater the amount of solid waste generated and as lifestyles
rapidly change, the related conveniences and products-mobile phones, electronics,
polyvinyl chloride plastics (PVC plastics), disposable diapers pose special waste
disposal challenges. Even more problematic is the fact that in most low and middle
income countries, development of waste management systems woefully lags behind
the realities of a quickly changing waste streams. In addition, it observed that newly
mobilized consumers and their market-survey suppliers rarely consider the potential
waste management problems that go hand in hand with changing lifestyles.
Waste management in any city is of paramount importance due to the risk posed to
human beings and to the environment. Encarta Dictionary, 2008 describes it as the
activities that deal with waste before and after it is produced, including its
minimization, transfer, storage, separation, recovery, recycling, and final disposal.
Knowledge of the sources of waste and type in an area is required in order to design
and operate appropriate solid waste management systems (Gumbo 1996, Famuyigbo
1998). Waste management is a labour and capital-intensive function that often
consumes 20 to 50 percent of municipal operating budget (Oyinlola, 1998 and
Thomas, 2000).
Residential waste, which is the major type of waste concerned in this paper, has a
direct bearing on housing standard of an urban area. It is different from other types of
waste because it is directly related to households. The contents of household wastes
are majorly food materials. Others are papers, broken furniture, plastic materials,
disposable diapers, worn-out fabrics, etc. Most household wastes are biodegradable,
hence attract organisms, insects and rodents that can transmit diseases to humans and
this spreads very fast when in close proximity to residences. (Ogedengbe and Oyedele,
2006). When residents dump wastes behind their houses, as is the case with some
residents in the study area, the organisms concomitant with such refuse can act as
agent of degradation. This will make the residential environment to be of poor quality,
hence, the buildings will require renovation or maintenance more frequently. The
quality of man‘s environment is an integral contributor to the overall quality of
families and individuals quality of life (Adedeji, 2005). It is expected that when the
environmental sanitation standards of a city improves, there will be an upliftment in
the living condition and health security for the inhabitants as well as improvement in
the quality and aesthetics of the environment at large. Although trends of solid waste
have been examined, much has not been done in the area of housing quality. This
paper therefore attempts to examine the effects of waste disposal on the housing and
health condition of urban dwellers in Nigeria with a particular reference to the study
area.

Waste disposal
609
PREVIOUS STUDIES ON URBAN HOUSING QUALITY AND
WASTE MANAGEMENT
Domeniq (1995) studied the trend of waste in Austria and laws guiding the
management of waste. He examined the Austrian Federal Environmental Agency and
elaborated on the generation of waste, treatment and the utilization of such wastes
generated and the goals, which could be achieved in years to come. Oreyomi (1998)
maintained that improper disposal of solid waste poses serious danger to the handlers
and the people living around the wastes as disposal sites carry along rodents, insects
and other vermin, which could transmit diseases such as typhoid fever, dysentery,
diarrhea, cholera, yaws, onchocerciasis, salmonellas, and other diseases. Also
Hoornweg (1999), examined the trend of waste produced in Asia and used his study to
make a forecast of waste that would probably be produced in the year 2025. He
emphasized that waste is inseparable from life because as long as man is alive, he
stores up, uses, and disposes off materials and the complexity of waste which modern
civilization produced is directly related to the living standard, socio-economic and
cultural attributes of that particular environment. In pursuit of expansion,
multinational corporations with global marketing programs, no doubt have changed
and increased the overall waste stream.
According to Akinola and Salami (2001), waste disposal is one of the important
aspects of urban management crises in Nigeria. The study noticed that management of
solid waste generated within the urban centers has become one of the most intractable
problems of development. In the last two decades, there has been a phenomenal
increase in the volume and range of waste generated in many developing countries of
the world, Nigeria inclusive. The rapidly growing metropolis in developing countries
has been identified as one of the major factors responsible for solid waste problems.
For quite some time, the management of solid waste has been the responsibility of
public authorities, which has not produced, expected results. The central problem of
such public agencies is that their basic approach is not managerial and business-like
but administrative and bureaucratic; this explains the need to adopt the privatization
approach to solid waste management. Akinola and Salami (2001) are of the view that
private sector participation in waste management would be more effective in waste
management and that the local government should review its strategy by withdrawal
of poor operators from the services, set monitoring team, get rid of cart pushers and
make trucks and other equipment available to the operators at subsidized rate.
Akaninyere and Atser (2001) examined the typology, characteristics and future trends
of solid waste and asserted that the major components of waste are degradable
materials (food remnants, paper, and rags) and non-biodegradable plastics, tins,
metals, bottles, glass, and bones. Food remnants contributes substantially more than
other components, this could be explained by the fact that most activities which affect
the environment stem from the need for food; its production, processing and
preparation. Moreover, the high proportion of food remnants could be viewed from
the fact that this component of waste embraces all forms of food waste from both
domestic and commercial sources.
Ogedengbe and Oyedele (2006) studied the effects of waste management on property
values in Ibadan and found a relationship between the closeness of dump sites and the
value of rental properties in the area. The study discovered that the rental values
placed on such properties were reduced as a result of the presence waste dumps. It

Fakere and Aluko
610
then became palpable that most of the landlords lived in other parts of the town and
rented out their apartments in the area.
A study carried out by Olotuah, (2006) in Oba-Ile, Nigeria shows that frequency of
collection refuse is a predictor variable for housing quality. The study also discovered
that the quality of housing in the study area would improve significantly with an
increase in the collection of refuse.
URBAN HOUSING QUALITY
Housing quality is a matter of great concern, especially in less developed countries.
The magnitude of the housing needs of the populace in these countries rises
phenomenally by the day. This is on account of rapid growth and urbanization
occurring there, and the lack of a commensurate increase in housing stock (Lewin,
1981). Housing quality is often evaluated in terms of the quality of design, building
materials, standard of construction, and the provision and performance of public
amenities. A study carried out by Olotuah (2006) affirmed that 75% of the dwelling
units in urban centres in Nigeria are substandard and the dwellings are sited in slums.
The inadequacy of the quality of most urban housing stems mainly from the poor
physical state of the buildings. They are often unsafe and insecure and do not provide
adequate shelter from the element of weather. The environment in which the buildings
are located is squalid in most cases, and this generally leads to slum conditions.
When waste disposal sites are in close proximity to residential structures, such
environment is adversely affected as organisms that thrive in such dirty places are also
agents of disease outbreak. Therefore, the aim of shelter as a place where people live
and play in a hygienic manner is defeated when the stench from the nearby dump sites
is a constant occurrence. In addition, these dump sites can contaminate ground water
which in turn affects the purity of the water fetched from wells, hence, if residents of a
city are devoid of access to portable water, it will take its turn on their health.
RESEARCH METHOD
The research design follows a multistage description framework covering survey,
analysis and interpretation. Primary data for the research were obtained in a field
survey conducted in the study areas of Oke Aro and Isolo both in Akure, Nigeria. The
research instrument used is a well structured questionnaire to elicit required
information relating to socioeconomic and environmental conditions of the
households as well as the characteristics of the dwellings in which the people live. A
sampling frame of 1041 was considered and a sample size of 300 cases representing
30% spread over the study area through random sampling in order to ensure that it
was fully representative of the population of the audience of the study. Secondary data
include; records obtained from available health institutions within the area, analogue
base maps of the study area, population data, household data and direct observation of
the buildings and the environment. The neighbourhoods were sampled through the
base maps by the use of stratified sampling method. The analysis focused on the
physical conditions as well as the general environmental conditions of the dwelling
units.
RESEARCH FINDINGS
Analysis of data in table 1 below shows the home ownership status of the respondents
in both areas. It reveals that an average of 69% of the respondents rented the

Waste disposal
611
apartments they live while 30.5% of them are landlords in Isolo and Oke Aro
respectively.
Table 1: Respondents home ownership type
Item Isolo Area (%) Oke Aro Area (%) Average (%)
Owner occupier
Rented apartment
44.0
56.0
17.0
83.0
30.5
69.5
Total 100% 100% 100%
Source: Field Survey, 2011
The analysis of the average monthly income of household heads in table 2 shows that
14.39% of the household heads earn below N7, 500.00 monthly, 58.16% earn between
N7, 500.00 and N25, 000.00, 13.34% earn between N25, 000.00 and N40, 000.00
while 9.55% earn N40, 000.00 monthly and above. Also the analysis of average
monthly income of the household heads reveals that more than 50% of the people earn
less than N25, 000per month. This is in fact a testimony that the low-income group
and the less privileged in the society occupy the two communities.
Table 2: percentage of average monthly income of head of households
Income level ISOLO (%) Oke Aro Area (%) Average (%)
Below N7, 500 18.0 14.5 16.25
N7, 500-N25, 000 56.0 58.5 57.25
N25, 000-N40, 000 14.0 12.5 13.25
N40, 000- above 12.0 14.5 13.25
Total 100% 100% 100
Source: Field Survey 2011
Analysis in table 3 shows the proximity of the dump sites to the residences. An
average of 58% of the respondents in Isolo and Oke Aro areas respectively responded
that the dumps sites in the area are within 50 meters from their residences, yet,
majority of them dump their refuse in the surrounding of their buildings. This reveals
the level of their ignorance on the dangers posed by improper disposal of wastes.
Table 3: Distance of residences to dump sites
Isolo Area (%) Oke Aro Area (%) Average (%)
Below 50m
51m – 100m
Above 100m
56.0
33.0
11.0
61.0
22.0
17.0
58.5
27.5
14.0
Total 100 100 100
Source: Field Survey, 2011
The analysis of the state of buildings in table 4 shows that 12.4% is in sound state,
20.2% requires minor repairs while 67.4% needs major repairs. Findings show that
most of the buildings in the two neighborhoods are in very poor state as only about
12.4% of them are in sound condition. A greater proportion of the buildings require
minor or major repairs to bring them to good quality. The state of repairs of the
buildings takes into consideration the soundness of the roofs, walls, floors and
foundations. The soundness of wall and floor means there is absence of cracks,
surface wear, tearing or peeling off of surface plaster and paints. Socio-economic
characteristics of the inhabitants of the buildings such as household size, income
classification significantly contribute to the poor state of repair of the buildings.
The state of refuse disposal as revealed in table 5 is generally absurd which emanates
from the laissez-faire approach of the people towards indiscriminate dumping of
refuse and delay in evacuation by the waste management authority. Refuse dumps

Fakere and Aluko
612
littered the environment which were an eyesore. 68.5% dispose their refuse
indiscriminately out of which 41.2% dump theirs in open spaces. Such constitute
breeding grounds for rodents, flies, mosquitoes, snake and harbour for other
dangerous animals as well as hindering the free flow of run-off.
Table 4: State of buildings in the two neighbourhoods
State Isolo (%) Oke Aro Area (%) Average (%)
Sound 13.6 11.2 12.4
Require minor repair 21.9 18.5 20.2
Require major repairs 64.5 70.3 67.4
Total 100% 100% 100%
Source: Field Survey 2011
11.7% burnt theirs within the residential environment thereby causing air pollution,
while 19.8% dispose theirs in controlled tipping. However, interview conducted with
the waste management board revealed that they do not visit some of those streets due
to bad roads that hinder access to such streets and the insufficient number of waste
disposal vehicles.
Table 5: Methods of Refuse Disposal Isolo Area (%) Oke Aro Area (%) Average (%)
Free Range – Road side / Drainages 26.7 27.9 27.3
Open Spaces 43.2 39.2 41.2
Controlled Tipping 20.5 19.1 19.8
Incinerating / Burning 11.5 11.9 11.7
Total 100 100 100
Source: Field Survey, 2011
Table 6 shows the underlying reasons for improper refuse disposal in the study area.
Majority of the respondents dumped their waste as a result of closeness of dump site
to their residences. This shows that they are ignorant of environmental and health
impacts of such actions. An average of 19% responded that they do so because the
waste management authority does not visit their streets to collect their refuse.
Table 6: Reasons for dumping refuse indiscriminately
Isolo Area (%) Oke Aro Area (%) Average (%)
Proximity to residence
No affordable alternative
No response
The waste management authority does
not come to my street
45.0
20.0
15.0
20.0
48.0
21.0
13.0
18.0
46.5
20.5
14.0
19.0
Total 100 100 100
Source: Field Survey, 2011
Table 7 shows the main sources of water supply in the area. An average of 83%
sourced their water from hand-dug well, most of which are located in unkempt
environment without covers and rings, while an average of 17% get theirs through the
boreholes sunk within the area. This prevailing situation does not guarantee quality
water supply in the area as the water sources are not treated before use; hence, the
people stand a greater risk of contacting serious water borne diseases.
In table 8, it is observed that an average of 58.5% of the respondents maintained that
dump sites are within 50 meters from their wells/boreholes, while an average of
27.5% in responded that the dump sites are between 51 meters to 100 meters from the

Waste disposal
613
wells/boreholes. This shows that the ground water is at a risk of being polluted, hence,
the risk of being infected by water borne diseases.
Table 7: Sources of water supply
Isolo Area (%) Oke Aro Area (%) Average (%)
Well
Borehole
Public mains
78.0
22.0
Nil
88.0
12.0
Nil
83.0
17.0
Nil
Total 100 100 100
Source: Field Survey, 2011
Table 8: Proximity of wells/boreholes to dump sites
Isolo Area (%) Oke Aro Area (%) Average (%)
Below 50m
51m – 100m
Above 100m
56.0
33.0
11.0
61.0
22.0
17.0
58.5
27.5
14.0
Total 100 100 100
Source: Field Survey, 2011
HEALTH HAZARDS AND THEIR CAUSATIVE FACTORS
The most prevalent disease and the ecological problem identified in the area, as shown
in Figure 1 is malaria fever, accounting for 29.6%. Others in their order of magnitudes
include typhoid fever, measles, diarrhoea, cholera, dysentery and some communicable
diseases prevalent in the tropics. Their identified causative factors include inadequate
sanitary services (57.4%), poor water supply (14.8%), unkempt environment (14.8%),
overcrowding (12.2%) and poor drainage system (0.9%). Other health issue
investigated involved the availability of health institution within the neighbourhood.
About 73.9% indicated non-availability of any within their reach. They are either
located farther away from their dwellings or completely absent. Only 26.1% are sure
of having at least a chemist store or a mini health clinic within their neighbourhood,
thus, low level health care and environmental education.
Source: Field Survey, 2011
Fig. 1: Environmental Related Problems and Diseases in the study area.
20.4
9.1
23.5
29.6
11.6
6.1
0
5
10
15
20
25
30
35
Measles Cholera Typhoid Fever
Malaria Fever
Diarrhoea Dysentery
Variables
%

Fakere and Aluko
614
RECOMMENDATIONS AND POLICY GUIDELINES
Based on the major findings in this research, it has become imperative to put up some
recommendations that are necessary to improve the environmental and health
conditions of the people. The first thing that needs urgent attention is in the area of
public enlightenment and environmental and health education. Residents of these
areas should be educated on the effect of improper dumping of refuse. Without
grassroots environmental education and enlightenment, enforcement of environmental
sanitation and waste disposal laws has a very little prospect of success. There is
therefore a need to educate the people about the danger of living in disheveled
environment, particularly in the study area. This appears to be a possible solution as a
preventive measure against the prevailing environmental hazards in the country, as
education promotes health. Also, the existing laws and regulations guiding
environmental sanitation and health should be reviewed and enforced with stiffer
actions in order to make them more effective. Meanwhile, the reintroduction of the
old sanitary inspectors, locally called ‗wole-wole‘ would be of help to sustain this
idea. Also, more attention should be given to waste disposal management through
adequate funding. Likewise, poverty has been identified as the major underlying cause
of poor environmental and good health because the poor are incapable of paying for
the required amenities for healthy living. As a result, the ongoing national policy on
sustainable minimum wage should be extended to all and sundry. Governments should
be alive to their responsibilities of making basic amenities that would enable families
and individuals have access and maintain good healthy environment.
Plate 1: A water body polluted with waste in the study area
Source: Field Survey, 2011
Plate2: One of the wells not suitable for drinking as a result of waste pollution
Source: Field Survey, 2011
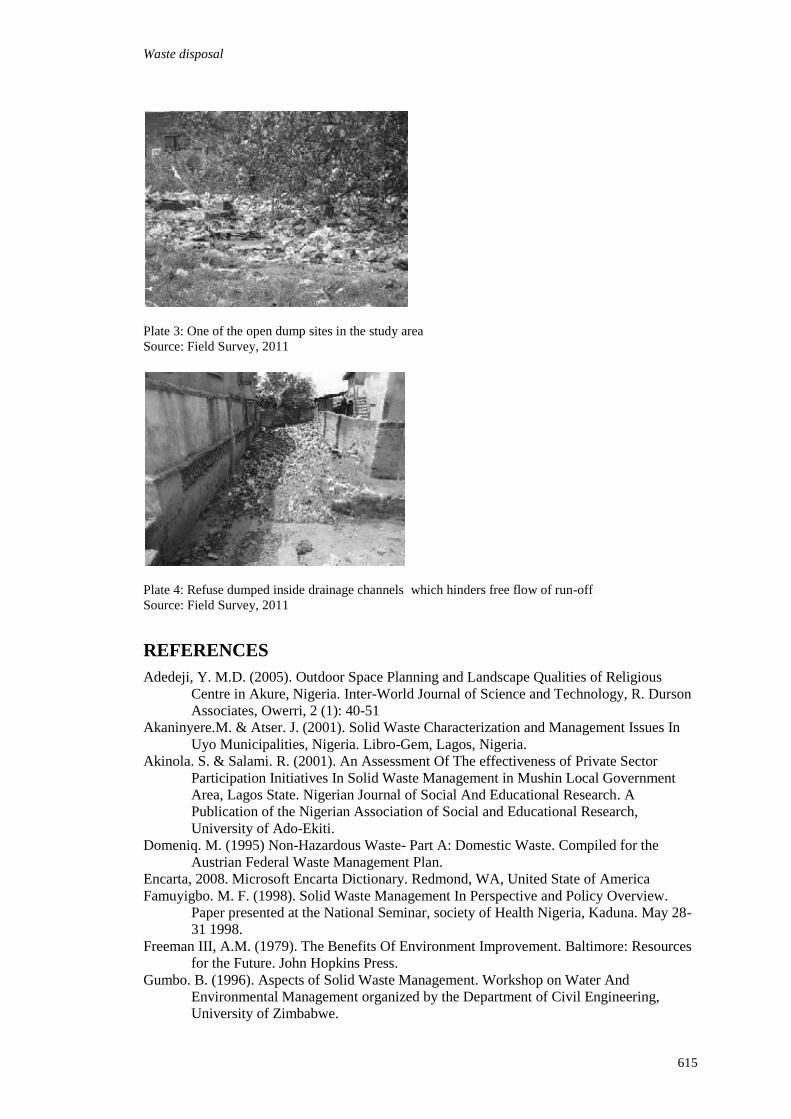
Waste disposal
615
Plate 3: One of the open dump sites in the study area
Source: Field Survey, 2011
Plate 4: Refuse dumped inside drainage channels which hinders free flow of run-off
Source: Field Survey, 2011
REFERENCES
Adedeji, Y. M.D. (2005). Outdoor Space Planning and Landscape Qualities of Religious
Centre in Akure, Nigeria. Inter-World Journal of Science and Technology, R. Durson
Associates, Owerri, 2 (1): 40-51
Akaninyere.M. & Atser. J. (2001). Solid Waste Characterization and Management Issues In
Uyo Municipalities, Nigeria. Libro-Gem, Lagos, Nigeria.
Akinola. S. & Salami. R. (2001). An Assessment Of The effectiveness of Private Sector
Participation Initiatives In Solid Waste Management in Mushin Local Government
Area, Lagos State. Nigerian Journal of Social And Educational Research. A
Publication of the Nigerian Association of Social and Educational Research,
University of Ado-Ekiti.
Domeniq. M. (1995) Non-Hazardous Waste- Part A: Domestic Waste. Compiled for the
Austrian Federal Waste Management Plan.
Encarta, 2008. Microsoft Encarta Dictionary. Redmond, WA, United State of America
Famuyigbo. M. F. (1998). Solid Waste Management In Perspective and Policy Overview.
Paper presented at the National Seminar, society of Health Nigeria, Kaduna. May 28-
31 1998.
Freeman III, A.M. (1979). The Benefits Of Environment Improvement. Baltimore: Resources
for the Future. John Hopkins Press.
Gumbo. B. (1996). Aspects of Solid Waste Management. Workshop on Water And
Environmental Management organized by the Department of Civil Engineering,
University of Zimbabwe.

Fakere and Aluko
616
Hoornweg D. (1999). What a waste: Solid Waste Management in Asia. The International
Bank for Reconstruction and Development for The World Bank.
Huang, J. Y. C. (2008). Solid Waste Disposal. Microsoft Encarta, 2009 (DVD). Redmond,
WA. Microsoft Corporation.
Lewin, A. (1981) Housing Co-Operatives in Developing Countries. International Technology
Publication Ltd.
Lietman. J. (1995). Urban Environmental Issues. The Agricultural and Forestry Systems
Division (AGRAF) The World Bank.
Ogedengbe, P. S & Oyedele, J. B. (2006). Effect of waste management on Property values in
Ibadan, Nigeria. Journal of land use and development studies, Vol 2, No 1.
Olotuah, A. O. (2006). Housing quality in suburban areas: An empirical study of Oba–Ile,
Nigeria. Dimensi Teknik Arsitektur Vol. 34, no. 2. 133-137
Oreyomi. M.K. (1998). Selective Topic On Environmental Health Technology. Term paper
presented to the Department of Environmental Health And Epidemiology UNIFE.
Unpublished.
Oyinlola. A. K. (1998). Waste reuse and Recycling. A paper presented at the Petroleum
(Special) Trust Fund Stakeholders Technical workshop, Abuja.
Thomas. L. (2000). Brief History of Solid Waste Management. Written for The California
Department of Health Services.

Ayarkwa, J., Adinyira, E. and Agyekum, K. (2011) Industrial training in Ghana: perceptions of the
undergraduate construction student In: Laryea, S., Leiringer, R. and Hughes, W. (Eds) Procs West
Africa Built Environment Research (WABER) Conference, 19-21 July 2011, Accra, Ghana, 617-627.
617
INDUSTRIAL TRAINING IN GHANA: PERCEPTIONS
OF THE UNDERGRADUATE CONSTRUCTION
STUDENT
J. Ayarkwa1, E. Adinyira
2 and K. Agyekum
3
College of Architecture and Planning, Kwame Nkrumah University of Science and Technology Kumasi,
Ghana
The recent oil discovery and processing in Ghana is expected to result in growth of
infrastructural development and increased chances of construction graduates to secure
jobs. Universities hold the responsibility of producing graduates with sufficient
background and excellent qualification to meet the expectations of the construction
industry. Although universities‘ curricula have provisions for industrial training (IT),
such programmes have not made the expected impact and need quick redress. This
paper assesses the perceptions of undergraduate construction students of the College
of Architecture and Planning of the Kwame Nkrumah University of Science and
Technology (KNUST), Kumasi, Ghana, on IT, and identifies challenges and possible
measures to overcome such challenges. A structured questionnaire survey of 185 final
year Building Technology and Architecture students was conducted. Data obtained
were analyzed based on mean scores of factors evaluated and also t-test to assess the
significance of the differences between students‘ performance before and after
undertaking IT. Students are of the view that IT exposes them to real work
environment and increase their job prospects among others. Students‘ satisfaction
level with their performance on personal attitude, communication and work attitude
significantly improved after undergoing IT. They are, however, not satisfied with
their departments‘ involvement, particularly, with regards to placement and
monitoring. Stressful placement processes and financial strain on students are some of
the challenges identified. Educational institutions are to collaborate with industry to
secure suitable placement for all students and to monitor IT activities in order to
enhance the effectiveness of training programmes.
Keywords: construction undergraduate, Ghana, industrial training.
INTRODUCTION
Rapid growth of infrastructural development in Ghana recently has increased job
opportunities for many construction graduates. Until recently construction students
have readily been accepted into the Ghanaian construction industry, however, with the
increasing number of graduates produced every year, the industry now has to choose
graduates with sufficient background and excellent qualification. The universities
hold the responsibility of producing graduates who meet the expectation of the
construction industry. As an assurance that the performance of construction students is
up to the required standards, preparation and exposure of students to industrial
training (IT) is necessary in any professional education training programme (Osman et
Undergraduate industrial training
618
al., 2008). IT is one of the essential curriculum requirements of any technical
institution (Bansal et al., 2010; Pillai and Yusoff, 2007). According to Nambudiripad
(2003), students graduating from universities are like uncut diamonds and look useless
like trifles, but when given proper training they dazzle forth in all their glory.
Bansal et al. (2010) assert that although Universities‘ curricula have provision for IT
and various training schemes are in force, especially for professional courses, some IT
programmes have not made the considerable impact expected and need quick redress.
It has become a competitive endeavour for students, and placement is akin to job
placements, making it stressful to students (Bansal et al., 2010; Pillai and Yusoff,
2007). If students are to meet the skills requirements of an ever-changing labour
market, adequate resources need to be invested in appropriate forms of work
experience and in building up transferable skills (Mihail, 2006).
To confirm the importance of IT in Ghana, Duodo (2006) noted that, there have been
on-going discussions with Ghana Employers Association and Association of Ghana
Industries to formalize industrial training programmes. The Students Work Experience
program prepares students for the labour market. It has become an innovative
phenomenon in human resource development and training in Ghana. IT is, thus, an
important strategy to expose students to real work life situation and to equip them with
the necessary skills so that they would be job ready when they graduate.
Although IT plays an important role in preparing qualified future professional
manpower, little research has been done to address issues which seek to improve the
effectiveness of IT programmes, especially, for construction students in Ghana. This
study therefore assesses the perceptions of undergraduate students from the
Department of Building Technology and the Department of Architecture of the
Kwame Nkrumah University of Science and Technology (KNUST) on IT
programmes. It also identifies challenges to IT and possible measures to enhance its
effectiveness.
THE VALUE AND OBJECTIVES OF INDUSTRIAL TRAINING
The value and objectives of IT are well documented in past research (Rahman et al.,
2009; Osman et al., 2008; Connor and Shaw, 2008; Pillai and Yusoff, 2007; Mihail,
2006; Teoh, 2006; Wasonga and Murphy, 2006; Callanan and Benzing, 2004; Fallows
and Steven, 2000). Rahman et al. (2009) and Osman et al. (2008) urged graduates to
prepare themselves and improve their personal attitude, work attitude, communication,
leadership and other soft skills before they graduate. Fallows and Steven (2000) stated
that employers need graduates to contribute immediately on starting work, and
graduates need to develop their skills in short time towards the competence level set
by the employer. IT is reported to improve job opportunities for students since it
allows them to refine their job skills and work values, focus on their career choices,
directly access job sources, and impress potential employers (Mihail, 2006; Callanan
and Benzing, 2004). It is a positive developmental experience for university students
to improve their ability to secure career-oriented positions (Callanan and Benzing,
2004), leadership skills (Wasonga and Murphy, 2006), specialist knowledge,
information technology, time management, and teamwork (Mihail, 2006). IT also
helps to develop the student‘s communication skills that include daily interaction
within the working environment and technical writing (Connor and Shaw, 2008;
Mihail, 2006). Work experience is reported by Garavan and Murphy (2001) to provide
credible means for softening the reality shock of transitioning from the world of
academics to the world of work.
Ayarkwa, Adinyira and Agyekum
619
The objectives of IT are to expose the students to construction practice specific to
their field of specialization, to the nature of the industry selected, and to expose the
students to their responsibilities in the construction profession (Rahman et al., 2009).
It provides opportunities for undergraduates to apply what they have learnt at the
university, provides on-the-job training and real-life job experience, making them
more employment ready (Rahman et al., 2009; Pillai and Yusoff, 2007). IT also makes
students more aware of the needs and expectations of the industry and shape graduates
who are ―energetic and action-oriented‖ (Rahman et al., 2009; Pillai and Yusoff,
2007).
THE ROLE OF UNIVERSITIES IN INDUSTRIAL TRAINING
IT is an extremely valuable component of university education, especially for
professional courses (Bansal et al., 2010; Pillai and Yusoff, 2007). Academic
institutions organize and promote the placement of students in private enterprises and
other organizations to foster work experience so that students will attain the necessary
skills to supplement their theoretical training (Mihail, 2006). While students are still in
the university, IT helps them develop a core of global market skills such as
communication and time management skills, better self-confidence and better self-
motivation, that are now considered requirements (Gill and Lashine, 2003). Students
undertaking IT are supervised by their university lecturers as well as industry
supervisors, and students have to prepare and submit written reports on their IT
experience (Pillai and Yusoff, 2007). Connor and Shaw (2008) emphasized the need
for higher educational institutions to continue to strengthen its links with industry and
commerce, not only to give graduates the skills which employers value but also to
make sure that students are aware of what is happening in the labour market and what
employers are seeking.
In analyzing the role of the university in IT, Mihail (2006) stated that modern
knowledge economy requires a leap in graduates‘ skills, and educational institutions
are expected to implement innovative reforms to provide their students with skills
needed by ―high performance‖ firms. The importance of making the most of
communication opportunities between training institutions and employers cannot be
underestimated. The flow of supply and demand information between training
institutions and employers and the integration of that information into training
programs are at the crux of providing strong support to a country‘s industrial
workforce needs (Chileshie and Haupt, 2006). Currently, there are growing concerns
about the perceived mismatch between industry needs and demand and skills of the
graduates produced by higher education institutions (Haupt, 2003). Haupt (2003)
states that there is a gap between what employers appear to want and what higher
education provides.
RESEARCH METHOD
The study involved a comprehensive review of published works and electronic
presentations on IT and a questionnaire survey of undergraduate construction student.
The survey instrument employed was structured questionnaire that avoided
interviewer bias, guiding and cues that could impact the validity and reliability of the
data collection (Roberts, 2007). The questionnaire was administered to all 185 final
year Bachelor of Science Building Technology and Architecture students of the
KNUST. The study assumed that final year students had undertaken industrial training
at least once and would have a higher level of experience with industrial training and
could provide objective and accurate industrial training perspectives.

Undergraduate industrial training
620
Closed questions were mainly used in the survey since it is considered likely to reduce
bias in the question and answer processes (Roberts, 2007). However, open-ended
questions were used where respondents were asked to suggest areas of improvement
and possible solutions to challenges to IT. The questionnaire comprised of three main
sections as follows.
Section one focused primarily on
the profile of the respondents;
their experience with IT;
reasons for not undertaking IT; and
issues on placement for IT.
Section two assessed
factors motivating students to undertake IT;
students‘ perceptions on benefits of IT;
students‘ perceptions on performance before, during and after IT; and
IT monitoring system.
Section three focused on
challenges of IT and measures to overcome such challenges.
For evaluation of factors motivating students to undertake IT, respondents were asked
to score the factors on a Likert scale of 1 to 5, where score ‗1‘ = strongly disagree,
score ‗2‘ = disagree, score ‗3‘ = neutral, score ‗4‘ = agree, and score ‗5‘ = strongly
agree. For evaluation of respondents‘ perception before, during and after undergoing
IT, they were asked to score their satisfaction levels on the Likert scale of 1 to 5,
where score ‗1‘ = most unsatisfactory, score ‗2‘ = unsatisfactory, score ‗3‘ = neutral,
score ‗4‘ = satisfactory, and score ‗5‘ = most satisfactory. From the various scores it
was possible to rank the factors according to their mean scores. The one sample t-test
was used to determine whether students‘ satisfaction with their performance on each
attribute in three categories (personal attitude, communication and work attitude)
increased after IT. To maximize the response rate, face-to-face questioning approach
was used to administer the questionnaire. Out of the total of 185 questionnaires
administered to all final year students of the Departments of Building Technology and
Architecture, 125 were retrieved and used in the analysis, giving a response rate of
68%, considered sufficient for the study (Moser and Kalton, 1993).
RESULTS AND DISCUSSION
Respondent’s Profile
Sixty-five percent (65%) of the respondents to the survey are from the Department of
Building Technology and 35% are from the Department of Architecture (Fig. 1).
About 85% of the respondents have undertaken industrial training at least once and
about 15% have not at all undertaken industrial training (Fig. 2). The most common
reasons for not undertaking industrial training include, ‗industrial training is not
compulsory‘, ‗no remuneration‘ and ‗application for placement is stressful‘.

Ayarkwa, Adinyira and Agyekum
621
Fig. 1 Percentage of respondents by Department
Fig. 2 Percentage by Experience on industrial training
Placement for industrial training
Figure 3 shows that about 91% of the respondents have worked as trainees either in a
consultancy or in a construction organization or both. These organizations are directly
in the respondents‘ chosen fields of specialization. However, 4% of the respondents
had worked in either the environmental agency or the banking sector, and 3% and 1%
of the respondents had worked in the transportation and energy sectors respectively.
Figure 4 shows the method by which respondents received their placement for training
in the industry. Forty-two percent (42%) of respondents received placement through
their relatives and 38% through their friends. Fourteen percent (14%) of the
respondents, however, received placement through their own efforts and only 5%
received placement through their respective teaching departments. This result
suggests very little involvement of the teaching departments in the placement of
prospective trainees.
Fig. 3 Percentage by type of industry
Fig. 4 Percentage by placement methods

Undergraduate industrial training
622
Figure 5 shows that the major contribution of the teaching departments has been the
area of issuance of introductory letters to prospective trainees (94%). Issuance of
introductory letters only does not contribute much to students‘ chances of obtaining
placement for their IT. This is corroborated by the fact that 60% of the respondents
indicate their dissatisfaction with the current placement method (Fig. 6).
Mihail (2006) stated that academic institutions should actively organize and promote
the placement of students in private enterprises and other organizations to foster work
experience so that students will attain the necessary skills to supplement their
theoretical training. Gill and Lashine (2003) also emphasized that while students are
still in the university, it should be the responsibility of the university to organize IT
since it can help students develop a core of global market skills such as
communication, time management, better self-confidence, and better self-motivation
that are now considered requirements for employment.
Fig. 6 Students‘ perceptions on the current method of placement
Motivation factors for industrial training
Factors that motivate respondents to undertake IT include ‗exposure to real working
environment‘ and ‗increase job prospects‘ (Table 1). Mean scores of all the motivating
factors evaluated except ‗meeting requirements of the Department‘ are significantly
greater than the neutral score of 3.00 (p=0.05) when the t-test was applied. Thus, the
respondents agree that ‗exposure to real work environment‘ and ‗increase in job
prospects‘ are the first and second major factors motivating them to undertake IT.
Other motivating factors include ‗provision of knowledge and guidance in choosing
job after graduation‘, ‗confidence in terms of job qualification‘, and ‗improvement of
communication skills‘. The respondents, however, disagree that ‗meeting the
requirements of the department‘ is a motivating factor to undertake IT, suggesting that
IT is not enforced by any of the two departments studied. Rahman et al. (2009)
emphasize the importance of IT to professional education by stating that it is now a
compulsory course for every student in the Civil and Structural Engineering
Department in the Universiti Kebangsaan Malaysia (UKM). Bansal et al. (2010) and
Pillai and Yusoff (2007) stressing the importance of IT to construction education,
assert that universities‘ curricula have provision for IT, especially for professional
programmes. To confirm the importance of IT in Ghana, Duodo (2006) noted that

Ayarkwa, Adinyira and Agyekum
623
there have been on-going discussions with Ghana Employers Association and
Association of Ghana Industries to formalize IT programmes.
Table 1 Factors that motivates students to undergo industrial training
Motivating Factor Mean Std.
Dev.
Rank
To be exposed to real working environment 4.39 0.610 1
To increase job prospects 4.00 0.663 2
To provide knowledge and guidance in choosing job after
graduation
3.92 0.759 3
To increase confidence in terms of job qualification 3.69 0.879 4
To improve communication skills 3.62 0.936 5
To meet requirements of the department *2.32 1.157 6
*The t-test indicates that the mean score is not significantly greater than 3.00 (p=0.05)
Perceptions on benefits of industrial training
About 95% of the respondents are of the perception that completion of IT can increase
their job prospects, 93% also perceive that IT can provide more confidence in terms of
job qualification, and 90% perceive that IT could provide more knowledge and
guidance in their job selection after graduation (Fig.7). Eighty-three percent (83%) of
the respondents also perceive that it provides a platform for the industry to evaluate
their future employees. Thus, majority of students are of the perception that IT is
beneficial and allows for the acquisition of job relevant skills. Improved
communication skills through daily interaction with the working environment, and
improved leadership skills are attributes industrial training can help improve in order
to provide more confidence in terms of job qualification (Connor and Shaw, 2008;
Mihail, 2006). The results are in line with findings from the literature. Callanan and
Benzing (2004) found that IT improves the individual‘s career decision-making, and
Rahman et al. (2009) and Osman et al. (2008) also found that IT serves as a platform
for developing the students‘ communication skills.
Perceptions on performance before and after industrial training
Means scores of students‘ satisfaction with their performance on each of the 17
attributes in the three categories (personal attitude, communication and work attitude)
before and after undertaking IT are presented in Table 2. The differences between
mean scores (i.e. mean score gaps) of students‘ satisfaction with their performance on
each of the 17 attributes before and after undertaking IT are also presented in Table 2.
The one sample t-test at 5% significance level showed that there are significant
differences between mean scores of all attribute before and after undertaking IT.
Students‘ satisfaction with their performance on each attribute in the three categories
increased after the IT. This indicates that the respondents perceive their personal

Undergraduate industrial training
624
attitude, work attitude and communication skills to have satisfactorily improved
through IT. On personal attitude, the mean score gap shows that students‘ self-
confidence is perceived to have most significantly improved after the IT. With regards
to communication, oral communication skills most significantly improved, whilst their
subject knowledge also significantly improved after undertaking IT.
The results are consistent with the findings of Rahman et al. (2009) and Osman et al.
(2008) which acknowledged the fact that students personal attitude, communication,
work attitude, and leadership skills improved after undergoing IT. Rahman et al.
(2009) further admonish students to prepare themselves and improve their skills
before they graduate. Connor and Shaw (2008) conceding to students‘ poor
communication skills also emphasized that IT helps to develop students‘
communication skills that include daily interaction within the working environment
and technical writing. Other studies also view IT as a positive developmental
experience for university students to improve their leadership skills (Wasonga and
Murphy, 2006), knowledge in information technology, time management,
communication skills and teamwork (Mihail, 2006). Rahman et al. (2009) stated that
employers provide the students with hands-on-the-job experience which accelerate the
trainee‘s progress and hands-on knowledge.
Table 2 Mean scores, standard deviations and mean score gaps of students‘ satisfaction
Aspect Attribute
Before training After training Mean
ScoreGa
p (B-A) Mean score
(A)
Std.
Dev
Mean score
(B)
Std.
Dev
Personal attitude
Self confidence 1.70 0.752 4.27 0.502 2.57
Self esteem 1.92 0.759 4.36 0.566 2.44
Curiosity 2.33 0.697 4.63 0.484 2.30
Punctuality 2.27 0.713 4.48 0.494 2.21
Self and time
management 2.26
0.754 4.38 0.488 2.12
Communication
Oral communication 1.76 0.843 4.47 0.502 2.71
Written communication 1.88 0.837 4.55 0.500 2.67
Discussion skills 1.99 0.805 4.57 0.498 2.57
Work attitude
Subject knowledge 2.34 0.684 4.72 0.451 2.38
Adaptable with
environment 2.27 0.728 4.54 0.502 2.27
Problem solving skills 2.32 0.694 4.58 0.513 2.26
Leadership 2.25 0.721 4.52 0.523 2.25
Teamwork 2.24 0.732 4.49 0.524 2.25
Ability to work
independently 2.23
0.697 4.46 0.496 2.23
Ability to work under
pressure 2.21
0.749 4.39 0.501 2.18
The one sample t-test (p=0.05) showed that there is a significant difference between mean scores of
each attribute before and after undertaking IT
Perceptions on performance during industrial training
Respondents were asked to evaluate their performance during IT on 20 performance
criteria. Mean scores of all the performance criteria, except three- ‗ability to
communicate with the public‘, ‗negotiation skills‘ and ‗independence‘ were found to
be significantly greater than the neutral score of 3.00 (p=0.05) when the t-test was
applied (Table 3). Thus, the respondents are of the view that they are satisfied with
their ability to apply knowledge gained from the classroom to the world of work,
interact well within the work environment, and carry out instructions satisfactorily.
The respondents also regarded their performance on other 14 performance criteria as

Ayarkwa, Adinyira and Agyekum
625
satisfactory (Table 3). They were, however, not satisfied with their ability to
communicate with the public, their negotiation skills and their independence.
Table 3 Respondent‘s performance during industrial training
Performance Criteria Mean Std. D Rank
Ability to apply knowledge 3.98 0.838 1
Ability to interact well 3.86 0.944 2
Ability to carry out instructions satisfactorily 3.84 0.929 3
Adequate background knowledge 3.80 0.833 4
Professionalism and work ethics 3.78 0.959 5
Ability to function as a team player 3.70 1.066 6
Listening skill 3.68 1.119 7
Ability to extract information 3.66 0.986 8
Disciplined and motivated 3.65 1.053 9
Ability to function as a leader 3.64 1.001 10
Lifelong learning 3.60 1.053 11
Ability to express ideas (oral) 3.57 1.020 12
Social and multi-racial awareness 3.51 1.114 13
Ability to make decision 3.48 0.908 14
Environmental awareness 3.45 0.965 15
Ability to express ideas (written) 3.39 1.099 16
Non-Verbal skill 3.30 0.946 17
Ability to communicate with public *3.27 1.070 18
Negotiation skill *3.25 0.979 19
Independence *3.10 1.070 20
*The t-test showed that the mean score of the performance criteria is not significantly greater than 3.00
(p=0.05)
Perceptions on monitoring of industrial training
The results presented in Figure 8 showed that majority (53%) of the respondents do
not submit any IT report to their departments. The remaining 47% who submit reports
claim that they are not obliged to do so, indicating lack of serious monitoring system
to ensure that students undertake IT. Thus, although students are expected to benefit
from IT, the absence of an effective monitoring system may affect their seriousness
with the training. For IT to achieve the desired impact, training monitoring systems
had to be quite effective (Bansal et al., 2010). Effective monitoring provides
confidence in the students that the teaching department is at their back to extend
helping hand to tackle various bottlenecks that come their way during industrial
training (Bansal et al., 2010). Monitoring also helps to check non-serious students by
putting them on the right track.
Challenges of industrial training
About thirty-four percent (34%) of the respondents consider the current method of
placement to be stressful. Some challenges students encountered during IT were
identified to include ‗improper supervision‘, ‗no remuneration‘, and ‗unprofessional

Undergraduate industrial training
626
or mundane tasks‘ (Fig. 9). The stressful nature of placement procedure for IT is in
line with findings of Pillai and Yusoff (2007).
On possible measures to overcome the above challenges, the respondents are of the
opinion that their teaching departments should contact the appropriate training
organization to arrange for placement for all students to undergo industrial training.
They also suggested that in addition to providing lists of organizations in good
standing for students to choose from, their departments should liaise with training
organizations to ensure that IT is well structured and beneficial to them. They further
suggested the introduction of strict and effective monitoring systems to enforce IT and
provide confidence in the students.
CONCLUSION AND RECOMMENDATIONS
The student-respondents agree that ―exposure to real working environment‖ and
―increase in job prospects‖ are among the major factors motivating them to undertake
industrial training. Industrial training provides benefits such as job prospects, more
confidence in terms of job qualification, and more knowledge and guidance in job
selection after graduation. It also significantly improves the students performance on
personal attitude, work attitude and communication skills, and that their self-
confidence, oral communication skills and subject knowledge are significantly
improved after training. The students are of the view that they are satisfied with their
ability to apply knowledge gained from the classroom to the world of work, interact
well within the work environment, and carry out instructions satisfactorily during IT.
The results, however, have shown that the major contribution of teaching departments
to industrial training has been the issuance of introductory letters to prospective
trainees, and most of the student-respondents are dissatisfied with the current
placement method. There is also no serious monitoring system in place to ensure that
students undertake industrial training.
Stressful placement procedure, lack of proper supervision and financial strain on
students are some of the perceived challenges to industrial training and on the basis of
these, it is recommended that: educational institutions establish industrial training
liaison offices to facilitate, manage and monitor the procedures involved in the
placement of industrial trainees. Also educational institutions should make industrial
training compulsory and training reports should be assessed and graded as part of
students‘ overall marks. Educational institutions should institute effective monitoring
systems for industrial training such as site visits, in order to enhance the effectiveness
of industrial training. There is the need to have educational institutions foster linkages
with industry and bridge the gap between the academia and the employer, in this case
Fig. 9 Challenges encountered by students
Percentage (%)

Ayarkwa, Adinyira and Agyekum
627
the Ghana Employers Association, in order to ensure that industrial training is well
structured and beneficial to students and also the training organization.
REFERENCES
Bansal,V.K., Grover, S., and Ashok, K. (2010) ―Feedback on students industrial training for
enhancing engineering education quality: a survey based analysis‖, International
Journal of Engineering Science and Technology, 2:9, 4807- 4816.
Callanan, G. and Benzing, C. (2004) ―Assessing the role of internships in the career-oriented
employment of graduating college student‖, Education & Training, 46: 2, 82-89.
Chileshie N. and Haupt. T. C. (2006) ―Industry and Academia; Perceptions of Construction
Management Education. The Case of South Africa‖. Available online,
http://www.cebe.heacademy.ac.uk/news/events/beecon2006/pdf/p14-Nicholas
Chileshe.pdf. [Accessed 18th April 2009]
Connor, H. and Shaw, S. (2008) ―Graduate Training and Development: Current trends and
Issues‖, Education & Training, 50:5, 357-365.
Duodu A. (2006) ―TVET in Ghana, A core study-Technical and vocational education division,
Ghana education service ministry of education and sports‖, Accra, Ghana.
Fallows, S. and Steven, C. (2000) ―Integrating Key Skills in Higher Education‖, London,
United Kingdom.
Garavan, T.N. and Murphy, C. (2001) ―The co-operative education process and organizational
socialization: a qualitative study of students perceptions of its effectiveness‖.
Education & Training, 43: 281-302.
Gill, A. and Lashine, S. (2003) ―Business education: a strategic market-oriented focus‖, The
International Journal of Education Management, 17:5, 188-94.
Haupt, T.C. (2003) ―Student Attitudes towards Cooperative Construction Education
Degree Level Skills for Construction and Surveying Students Experiences‖. The Australian
Journal of Construction Economics and Building, 3:1, 31-42.
Mihail, D.M., (2006) ―Internships at Greece Universities: An exploratory study‖, Journal of
Workplace Learning, 18:1, 28-41.
Moser, C. A and Kalton, G. (1993), Survey Methods in Social Investigation, 2nd ed.,
Dortworth, Aldershot, England.
Nambudiripad, K. B. M. (2003) ―On Designing a Curriculum for Undergraduate
Engineering Degree‖. The Indian Journal of Technical Education, 26:3, 18-28.
Osman, S.A., Omar, M.Z., Kofli, N.T., Mat, K., Darus, Z.M. and Rahman, M. N.A. (2008)
―The importance of Industrial Training: Students‘ Perception in Civil Engineering
Sector‖. Proceedings of the 7th WSEAS International Conference on Education and
Educational Technology (EDU‘08), pp. 121-125
Pillai, S. and Yussof, M. (2007) ―The Student Industrial Training Programme: Issues and
Challenges‖. World Association of Corporate Education, WACE2007.
Rahman, M.N.A., Omar, M.Z., Kofli, N.T., Mat, K., Osman, S.A. and Darus, Z.M. (2009)
―Assessment of Engineering Students Perception After Industrial Training
Placement‖, European Journal of Social Sciences, 8:3, 420-431.
Roberts, C. (2007) ―Mixing modes of data collection in surveys: A methodological review‖,
ESRC National Centre for Research Methods, Briefing Paper.
Teoh, S. (2006) ―Industry Explores Internship Issues‖. In The Star Online, http:/star-
techcnetral/tehc/story.
Wasonga, T.A. and Murphy, J.F., (2006). ―Learning from tacit knowledge: the impact of the
internship‖, International Journal of Educational Management, 20:2, 153-163.


Idoro, G.I. and Bamidele, E.O. (2011) Influence of channels of recruitment on performance of
construction workers in Nigeria In: Laryea, S., Leiringer, R. and Hughes, W. (Eds) Procs West Africa
Built Environment Research (WABER) Conference, 19-21 July 2011, Accra, Ghana, 629-639.
629
INFLUENCE OF CHANNELS OF RECRUITMENT ON
PERFORMANCE OF CONSTRUCTION WORKERS IN
NIGERIA
Godwin Iroroakpo Idoro1 and Ebenezer Olutide Bamidele
2
1 Department of Building, University of Lagos, Akoka, Lagos, Nigeria
2 Federal Polytechnic, Ilaro, Ogun State, Nigeria
The productivity of construction workers which has been discovered to be a major
problem and the possible contribution of the channel adopted for recruiting workers to
it necessitates the adoption of appropriate channel of recruitment. This study
investigates the use and influence of existing channels of recruitment on workers
performance in the Nigerian construction industry. The objectives are to evaluate the
extents of use of selected channels of recruitment and their influence on construction
workers‘ length of service and performance. A field survey of 532 construction
workers selected from construction companies in Nigeria by purposive sampling was
conducted. For the field survey, 10 channels of recruitment were selected and data
were collected on respondents‘ characteristics, the channels adopted for recruiting the
respondents and the immediate supervisors‘ assessment of their performance. The
data were collected using structured questionnaires and analysed using percentage,
mean item score and chi-square test. The study discovers that some channels adopted
in recruiting construction workers are more used than others however; their use does
not contribute to the length of service and performance of construction workers. The
study suggests that construction firms should neglect the possible length of time that
prospective workers will serve them and their performance but rather consider the
convenience, cost, possibility of reaching prospective applicants and other related
factors in choosing the channel to adopt in recruiting their prospective workers.
Keywords: employee recruitment, Nigeria, workers‘ characteristics, workers‘ length
of service, workers‘ performance
INTRODUCTION
Construction labour occupies a very significant position and it is often regarded as the
most important of all the resources employed in the process of construction project
development. Gberevbie (2010) asserted that human resource is seen as one of the
most crucial factors in every firm without which the goals of an organisation are as
good as dead. This assertion stems from the fact that it is the active resource that
employs, activates and mobilises other resources to work therefore the productivity of
other resources depends upon that of construction labour. Apart from this,
Guhathakurta and Yates (1993) maintained that the execution of construction projects
is mainly labour intensive. This assertion tends to imply that labour is the most
significant input in the construction of projects. In support of this assertion, several
studies have discovered that labour cost constitute the highest proportion of project
const. Ersoz (1999) discovered that labour cost makes up a large proportion of the

Idoro and Bamidele
630
total cost of a construction project. Guhathakurta and Yates (1993) put labour cost at
between 30 to 50% of project cost while Ng et al., (2004) and Kazaz et al., (2008)
maintained that the percentage of labour cost in the total cost of a project could be up
to 40%. This finding tends to indicate that any saving in labour cost will translate to
considerable saving in project cost.
Labour cost is a product of productivity therefore any attempt to achieve savings in
labour cost will involve improvement in labour productivity. Hanna et al., (2008)
maintained that when productivity is increased, labour cost is reduced in the same
proportion. Yates (1993), Assaf et al., (1995), Kaming et al., (1998) and Chan and
Kumaraswamy (2002) in separate studies discovered that the productivity of
construction labour especially in developing countries is poor. The findings of these
studies tend to emphasise the need for measures that will bring about improvement in
the productivity of construction labour.
One of the factors that can contribute to poor performance of construction labour is
the channel used to recruit them. Cascio (2003), Heneman and Judge (2003) and
Gberevbie (2008) in separate studies discovered that one of the fundamental
challenges facing organisations in the area of performance is their inability to put in
place strategies capable of recruiting competent employees and retaining them to
achieve organisational goals. Gberevbie (2010) opined that for an organisation to
realise its goals, appropriate strategies for employee recruitment and retention are
sine-qua-non for enhanced performance. This assertion is particularly true with
construction labour whose productivity is known to be very poor. The industry is
characterised by migrant workers and for this reason, several channels ranging from
informal to formal approaches are often adopted to recruit workers. Whereas, studies
have examined several factors that contribute to the poor productivity of construction
workers, the contribution of the several approaches adopted to recruit workers has
been neglected.
Ofoegbu (1985) and McOliver (2005) in separate studies established a relationship
between the strategy of employee recruitment and performance. The relationship is an
indication that the qualification and indeed the productivity of workers recruited will
vary from one channel to another. It is therefore incumbent on contracting
organisations to adopt the most appropriate channels to recruit their workers in order
to recruit the most qualified, skilful and productive ones. In the light of this
understanding, this study attempts to fill the gap in literature on the contribution of the
channels adopted in recruiting construction workers to their productivity. The study
examines the influence of channels of recruitment adopted in the Nigerian
construction industry on the performance of construction workers. The objectives are
to evaluate the extent of use of selected channels of recruitment and determine its
relationship with the length of service and performance of workers in the industry.
The achievement of these objectives will assist stakeholders especially construction
firms in several ways. The evaluation of the extent of use of existing channels of
recruitment will make practitioners as well as academics to know the common
channels of recruitment adopted in the industry. The evaluation of the relationship
between recruitment channels and the length of service and the performance of
workers recruited by them will assist the stakeholders to know the contribution of the
various channels of recruitment they adopt to the productivity of their workers.

Channels of recruitment
631
RECRUITMENT CHANNELS AND PROJECT PERFORMANCE
Studies have it that workers‘ performance has a relationship with the channel by
which they were recruited. Banjoko (2003) described employee recruitment as the
process of reaching out, searching for and attracting, a large supply of people or a
large pool of interested applicants from which an organisation can choose those it
considers competent or most qualified for a job. Adebayo (2001), Ejiofor and Mbachu
(2001) and Olowu and Adamolekun (2005) maintained that the human resource is the
most valuable asset in any organisation and it is fundamental to the achievement of the
organisational goals. Ofoegbu (1985) and McOliver (2005) in separate studies
established a relationship between the strategy of employee recruitment and
performance in an organisation and identified the problems in employee recruitment
as basis for poor performance of public sector workers in Nigeria.
Project performance remains a prominent issue in project delivery all over the world.
Ling (2004) stated that the performance of a project is multifaceted and may include
unit cost, construction and delivery speeds and the level of clients‘ satisfaction. Pinto
and Slevin (1998) classified project performance parameters into (1) internal factors
which are project variables namely: schedule, cost and quality and (2) external factors
which are concerned with stakeholders‘ satisfaction with the performance of a project
and the perceived impact on organisation‘s effectiveness. Schedule, time, cost and
quality are quantifiable, measurable and controllable as such they do not vary in
assessment therefore; internal factors are regarded as objective performance
parameters. However, project stakeholders are many and their satisfaction often varies
from one stakeholder to another, therefore external factors are regarded as subjective
performance parameters. Ling et al. (2004) also identified two categories of indicators
of project success namely: product success which consists of measures of achievement
of quality standards and process success which is made up of variables that measure
the achievement of time and cost. Idoro (2008) however considered three parameters
namely: time, cost and quality as the most prominent in research studies. Josephson
and Lindstrom (2007) maintained that project goal which considers clients‘ goals, is
measured from several perspectives but the main aim is to stimulate clients to identify
and clearly present their goals and to stimulate all managers involved to inform and
remind all individuals of the goals. Hatush and Skitmore (1997) maintained that
success in a project is generally operationalized into time, cost and quality. Michell et
al. (2007) remarked that the primary concern of construction clients is that their
projects are completed within budget, on time and at the required level of quality. On
the basis of the above assertions, time and cost overruns are selected in this study as
parameters for measuring project performance. The third parameter (quality) which is
commonly used when defining project objectives and setting targets and deadlines is
not a common objective parameter in research studies because as Vincent and Joel
(1995) put it: stakeholders see the goal of quality management as customer
satisfaction.
HYPOTHESES OF THE STUDY
Two research hypotheses were postulated in the attempt to achieve the objectives of
the study. The first hypothesis states that the channel of recruitment is not
significantly related with the length of service of construction workers. The hypothesis
is intended to establish the contribution of the channels of recruiting construction
workers to the length of their service with their employers. The construction industry
is known for several forms of employment contracts such as casual, contract, part-time

Idoro and Bamidele
632
and permanent because construction work is a temporary endeavour and migrant in
nature. The test of the hypothesis is intended to determine whether or not some
channels of recruitment are appropriate for prospective workers offered particular
contracts of employment and whether or not the channels by which workers are
recruited contribute to staff turnover in the construction firms.
The second hypothesis states that the channel of recruitment is not significantly
related with the performance of construction workers. The test of this hypothesis is
intended to establish whether or not the channel adopted in recruiting construction
workers contribute to their performance on the job. The issue of performance is
synonymous with productivity which has been established in previous studies as a
major problem in the construction industry especially those of developing countries
like Nigeria. The result of the hypothesis will therefore indirectly establish whether or
not the channels by which construction workers are recruited contribute to their poor
productivity.
RESEARCH METHOD
The study adopted a questionnaire survey design approach because the data required
for the study could easily be obtained from the respondents of the study by
questionnaires. In the approach, a field survey involving a sample of 532 construction
workers was conducted in 2009. The sample was drawn from the population of
workers employed in construction firms in Nigeria. To obtain the study population,
the difficulty encountered in obtaining reliable data of construction workers in Nigeria
prompted a preliminary survey. The preliminary survey which was conducted in early
2009 was meant for two purposes namely: to obtain respondents views on the
channels of recruitment used by them and to obtain the number of workers employed
on their sites to serve as the study population frame. From the preliminary survey, 75
on-going projects were identified in which a total of 1125 workers were employed.
The workers employed (1125) in the projects identified were adopted as the
population of the study. Contractors‘ site supervisors who were either engineers or
builders were adopted as respondents.
The variables selected to achieve the objectives of the study were classified into two
categories namely: channel of recruitment and construction workers‘ characteristics.
Selected respondents were interviewed during the pilot study and from the interview
conducted, ten channels of recruitment namely: walk-in/casual job seekers, referral,
advertisement, state employment agency, training programmes, private employment
agency, professional search firm, professional body, educational institutions and
military operations were identified and used as the variables of channel of recruitment.
construction workers‘ length of service and performance were selected as construction
workers‘ characteristics. Based on the assertion by Ofoegbu (1985) and McOliver
(2005), the length of service and performance of construction workers can be said to
be related to the channels adopted in recruiting them.
The respondents were requested to indicate the channel adopted in recruiting the
workers employed on the sites, their age, sex, marital status, educational qualification,
position and the number of years served in the firm and the respondents‘ assessment
of his performance. Ten channels of recruitment stated in the variables of the study
were listed for respondents to indicate the one adopted to recruit each worker. The
length of service of construction workers was measured using six ranks namely: 1-5
years, 6-10 years, 11-15 years, 16-20 years, 21-25 years and above 25 years.

Channels of recruitment
633
However, no respondent indicated 1-5 years therefore, the rank was omitted and only
the remaining five ranks were used for the study.
For the measurement of the performance of construction workers, the inclusion of all
cadres of workers and the large size of the study sample did not permit the use of
work study to collect data on the productivity of the study sample therefore a
subjective assessment of their performance by their immediate supervisors was
adopted. Their performance was measured using five ranks namely: poor, fair,
moderate, high and very high. The ranks were assigned scores of 1, 2, 3, 4 and 5
respectively. The age of construction workers was classified into four categories
namely: 20-30 years, 31-40 years, 41-50 years and 51-60 years. The sex of
construction workers is either male or female while their marital status was
categorised as single, married or divorced. Their educational qualifications were
classified into four categories namely: West African School Certificate (WASC) or
National Examination Certificate (NECO) for secondary school certificates, City and
Guilds (C&G) and National Diploma (ND) for technical school certificates, Higher
National Diploma (HND) and University Degree (B.Sc.) for degree and equivalent
and Masters of Science (M.Sc.) and above for Post-graduate degree. The position
occupied by construction workers on site was classified into six categories namely:
manager, supervisor, foreman, artisan, clerical staff and general labour.
The data were collected with the aid of structured questionnaires. The instrument was
administered on the respondents in late 2009. From the population frame of 1125, 532
questionnaires were selected for the study by purposive sampling. In the sampling, at
least five most fully completed questionnaires were selected from each project. Data
collected were analysed using percentage and the hypothesis was tested with Chi-
square test.
RESULTS
The results of the analysis of data collected are presented as follows:
Characteristics of the Respondents of the Study
The characteristics of the respondents of the study were investigated. The descriptive
results are presented in Table 1 Table 1 Descriptive result of the characteristics of the respondents of the study Characteristic N % Characteristic N %
Age
20-30 years
31-40 years
41-50 years
51-60 years
Total
Sex
Male
Female
Total
Educational qualification
WAEC/NECO
C&G/ND
HND/B.Sc.
M.Sc. and above
Total
140
184
134
74
532
483
49
532
102
99
226
105
532
26.3
34.6
25.2
13.9
100.0
90.3
9.2
100.0
19.2
18.6
4.5
19.7
100.0
Marital status
Single
Married
Divorced
Total
Length of service
5-10 years
11-15 years
16-20 years
21-25 years
Above 25 years
Total
Employment position Manager
Supervisor
Clerical officer
Foreman
Artisan
General labour/security
Total
228
303
1
532
337
94
53
33
15
535
64
123
58
42
197
46
530
42.9
57.0
0.2
100.0
63.3
17.7
10.0
6.2
2.8
100.0
12.1
23.2
10.9
7.9
37.2
8.7
100.0
N=Number of respondents

Idoro and Bamidele
634
The results in Table 1 indicate that the respondents are adults within working age
group (20 – 60 years). The results of the sex of the respondents reveal that both male
and female construction workers are covered by the study although male workers
constitute the majority. The results of the respondents‘ educational qualifications
reveal that the respondents possess different qualifications ranging from secondary
school certificates to degree. The analysis of the marital status of the respondents
shows that the majority of the respondents are either single or married. The analysis of
the length of service of the respondents shows that the length of service of the
majority of the respondents is 5-10 years. The analysis of the employment position of
the respondents shows that several cadres of construction workers are covered by the
study however, artisan constituted the highest percentage among the different cadres
of construction workers covered by the study.
Levels of Use of Selected Channels of Recruitment
One of the objectives of the study is to evaluate the levels of use of channels of
recruitment in the construction industry. To achieve this objective, ten channels of
recruitment stated in the variables of the study were selected. Respondents were
requested to indicate the channel of recruitment adopted during their employment. The
percentages of respondents employed by each of the channels were analysed. The
results of their ranks are presented in Table 2.
Table 2 Ranks of the levels of use of selected channels of recruitment
Channel of recruitment N % Rank
Advertisement
Referral
State employment agency
Walk-in/casual job seekers
Training programmes
Private employment agency
Professional search firm
Professional body
Military operations
Educational institutions
181
116
81
57
26
20
17
16
11
7
34.0
21.8
15.2
10.7
4.9
3.8
3.2
3.0
2.1
1.3
1
2
3
4
5
6
7
8
9
10
N=Number of respondents
The results in Table 2 show that advertisement is the most used channel of recruitment
followed by referral. State employment agency, walk-in/casual job seekers, training
programmes, private employment agency and professional search firms. Professional
bodies, military operations and educational institutions are the least used channels of
recruiting the respondents.
Difference in the Levels of Use of Selected Channels of Recruitment
From the ranks of the extent of use of the selected channels of recruitment among the
study sample in Table 2, the study has shown that the use of the channels for
recruiting construction workers differs from one channel to another. The study
attempted to investigate further the result by determining whether or not the difference
is significant. The first hypothesis of the study was postulated for this purpose. The
hypothesis states that the difference in the use of selected channels adopted to recruit
construction workers is not significant. The hypothesis was tested using the Chi-
square test with p≤0.05. The rule for the acceptance or rejection of the hypothesis is
that when the p-value>0.05, the test fails to reject the hypothesis but when the p-
value≤0.05, the hypothesis is rejected. The results are presented in Table 3.

Channels of recruitment
635
.Table 3 Results of Chi-square test of difference in the use of selected channels for recruiting
construction workers
Variables differentiated N 2x -value Df p-value Decision
Extents of use of 10 selected
channels of recruitment
532 554.805 9 0.001 Reject
N=Number of respondents, Df=Degree of freedom
The result of the test of the hypothesis in Table 3 reveals that the hypothesis is
rejected. The result indicates that the difference in the extent of use of the ten selected
channels of recruitment is significant. This result confirms that the levels of use of the
channels of recruitment are significantly different.
Length of Service of Construction Workers Recruited by selected Channels of
Recruitment
One of the objectives of the study is to investigate the contribution of the channels of
recruiting construction workers to workers‘ turnover in construction firms. This
investigation involves the analysis of the length of service of respondents recruited by
the ten selected channels of recruitment. Data were collected on the number of years
that respondents have served in their respective organisations and the channel adopted
in recruiting them. The number of years of service which otherwise implies length of
service was classified into five groups namely: 6-10 years, 11-15 years, 16-20 years,
21-25 years and above 25 years. The first hypothesis of the study was postulated for
the purpose of the investigation. The percentage of respondents in each of the five
groups of length of service that were recruited by each of the ten channels of
recruitment was analysed. The results of their ranks are presented in Table 3.
Table 5 Percentages of construction workers with selected length of service recruited by selected
channels of recruitment
Recruitment channel 5-10 yrs
N %
11-15 yrs
N %
16-20 yrs
N %
21-25 yrs
N %
26-30 yrs
N %
Total
N %
Casual job seekers
Referral
Advertisement
State employment
agency
Private employment
agency
Professional search
firms
Educational institutions
Professional bodies
Military operations
Training programmes
Total
28 8.3
72 21.4
123 36.5
54 16.0
16 4.7
9 2.7
7 2.1
7 2.1
8 2.4
13 3.9
337 100
12 12.8
27 28.7
24 25.5
15 16.0
2 2.1
4 4.3
0 0.0
4 4.3
0 0.0
6 6.4
94 100
9 17.0
8 15.1
19 35.8
7 13.2
1 1.9
3 5.7
0 0.0
1 1.9
1 1.9
4 7.5
53 100
5 15.2
7 21.2
9 27.3
3 9.1
0 0.0
1 3.0
0 0.0
4 12.1
2 6.1
2 6.1
33 100
3 20.0
2 13.3
6 40.0
2 13.2
1 6.7
0 0.0
0 0.0
0 0.0
0 0.0
1 6.7
15 100
57 10.7
116 21.8
181 34.0
81 15.2
20 3.8
17 3.2
7 1.3
16 3.0
11 2.1
26 4.9
532 100
N=Number of respondents, Yrs=years
Table 5 shows that workers recruited by casual, referral, advertisement, state
employment agency and training programmes have length of service ranging from 5-
30 years. Workers recruited through private employment agencies and professional
bodies have length of service ranging from 5-20 years and 26-30 years whereas
workers recruited through professional search firms have length of service that ranges
from 5-25 years. Workers recruited from military operations have length of service
that ranges from 5-10years and 21-25 years while only workers with 5-10 years length
of service were recruited from educational institutions. The results indicate that both
short-serving and long-serving construction workers were recruited by casual, referral,

Idoro and Bamidele
636
advertisement, state employment agency, training programmes, private employment
agencies, professional bodies professional search and military operations whereas only
short-serving or new workers are employment from educational institutions.
Relationship between Channel of recruitment and Length of Service of
Construction Workers
The results in Table 5 have revealed that the percentages of the respondents of the
study recruited by each channel differ according to their length of service. The
question posed by these results is ‗Does the channel of recruitment influence their
length of service? The study attempted to answer the question by postulating the
second hypothesis of the study. The hypothesis states that the channel of recruitment
is not significantly related with the length of service of construction workers. The
respondents recruited by each of the ten channels of recruitment and their length of
service in their respective organisations analysed above were used for the test. The
hypothesis was tested using the chi-square test with p≤0.05. The rule for the
acceptance or rejection of the hypothesis is that when the p-value>0.05, the test fails
to reject the hypothesis but when the p-value≤0.05, the hypothesis is rejected. The
results are presented in Table 6.
Table 3 Results of Chi-square test of relationship between channels of recruitment and the length of
service and performance of construction workers
Parameters compared N 2x -value Df p-value Decision
Channel of recruitment
Length of service of workers
Assessment of performance of workers
532
503
42.146
43.486
36
36
0.222
0.183
Accept
Accept
N=Number of respondents, Df=Degree of freedom
The result of the test of the hypothesis in Table 3 shows that the test fails to reject the
hypothesis. The result indicates that the channel by which the respondents were
recruited has no significant relationship with their length of service.
Performance of Construction Workers Recruited by selected Channels of
Recruitment
The study also investigated the contribution of the channels of recruiting construction
workers to their performance. This investigation involves the analysis of the
performance of the study sample recruited by each channel of recruitment. As
described in the research methods, the Mean Item Score (MIS) of the immediate
supervisors‘ assessment of the performance of the workers recruited by each channel
was analysed. The results of their ranks are presented in Table 6.
Table 6 Ranks of supervisors‘ assessment of the performance of workers recruited by selected channels
of recruitment
Recruitment channel 1 2 3 4 5 N Score MIS Rank
Educational institutions
Advertisement
Professional body
Military operations
Private employment agency
Training programmes
State employment agency
Walk-in/casual job seekers
Professional search firms
Referral
0
0
0
0
0
0
1
3
0
1
0
12
0
0
2
0
5
2
3
9
1
63
2
3
3
7
21
12
3
43
4
76
10
6
10
15
41
26
8
50
2
25
2
1
3
1
11
5
2
9
7
176
14
10
18
23
79
48
16
112
29
632
56
38
68
86
293
172
57
393
0.83
0.81
0.80
0.76
0.76
0.75
0.74
0.72
0.71
0.70
1
2
3
4
4
6
7
8
9
10
N=Number of respondents, 1=poor, 2=fair, 3=moderate, 4=high, 5=very high,
MIS=Mean Item Score

Channels of recruitment
637
Table 6 shows that the immediate supervisors‘ assessment of the performance of
workers recruited by educational institutions is the highest while those of workers
recruited by advertisement and professional bodies are second and third highest
respectively. The performance of workers recruited from military operations and
private employment agency are fourth highest while those of respondents recruited
through training programmes and state employment agencies are sixth and seventh
highest respectively. The performance of workers recruited by casual method is eighth
highest while those of workers recruited by professional search firms and referral are
the lowest.
Relationship between Channels of recruitment and Construction Workers’
Performance
Table 6 reveals that the immediate supervisors‘ assessments of the performances of
respondents recruited by the ten selected channels of recruitment differ. The question
posed by this result is ‗Does the channel of recruiting construction workers influence
their performance? The study attempted to answer the question by testing the third
research hypothesis. The hypothesis states that the channel of recruitment is not
significantly related with the performance of construction workers. Workers recruited
by each of the ten channels of recruitment and their immediate supervisors‘
assessment of their performance analysed above were used for the test. The hypothesis
was tested using the Chi-square test with p≤0.05. The rule for the acceptance or
rejection of the hypothesis is that when the p-value>0.05, the test fails to reject the
hypothesis but when the p-value≤0.05, the hypothesis is rejected. The results are
presented in Table 3. The result of the test of the hypothesis in Table 3 shows that the
test fails to reject the hypothesis. The result indicates that the channel by which the
respondents were recruited has no significant relationship with their performance or
productivity.
DISCUSSION OF FINDINGS
The analysis of the characteristics of the respondents has shown that the respondents
consist of construction workers who possessed both secondary and technical schools
certificates, Polytechnic diplomas and University degrees. Similarly, the respondents
consist of managerial and supervisory staff and labour. This result indicates that the
study sample consists of all categories of construction workers both junior and senior
staff and both management, supervisory and technical staff. This result implies that
the channels of recruitment and the performance of workers investigated in the study
cover all categories of construction workers.
The test of the first research hypothesis has established that some channels of
recruitment are more adopted in recruiting construction workers than others. The
analysis of the extent of use of the channels of recruitment above shows that
advertisement is the most used channel while referral is the second most used. State
employment agency is discovered to be the third while casual job-seeker is the fourth
most used. Military operations and educational institutions are discovered to be the
least used channels of recruitment.
The test of the second research hypothesis has shown that the use of the selected
channels of recruitment has no significant relationship with the length of service and
performance of the workers sampled. The result of no significant relationship between
channels of recruitment and the length of service of the respondents is an indication
that the number of years that workers serve their organisations is not influenced by the

Idoro and Bamidele
638
channel through which they were recruited. In other words, the channel through which
construction workers are recruited does not have influence on the number of years that
the workers will serve their organisations. This result tends to imply that the channels
of recruitment have no influence on workers‘ turnover. The result of no significant
relationship between the use of the channels of recruitment and the performance of the
respondents is an indication that the channels by which construction workers are
employed have no influence on their performance. This result tends to imply that the
channel of recruiting both management and supervisory staff and labour in the
construction industry does not contribute to the performance of the workers. This
result contradicts the assertion made in previous studies (Ejiofor and Mbachu, 1983;
Ofoegbu, 1985; Adebayo, 2001; McOliver, 2005; Olowu and Adamolekun, 2005) that
the strategy of employee recruitment and their performance are related. The
contradiction may be due to the fact that not all the workers can be recruited through
the same channel. In other words, the channels are appropriate for recruiting specific
workers.
CONCLUSION
The study has established that the extent of use of the existing channels for recruiting
construction workers differs. This result implies that some are more favoured than
others. Further investigation has revealed that the use of any of the channels of
recruitment does not contribute to the length of service of construction workers and
their performance on the job. This result does not reveal any justification for
construction firms to favour one channel of recruitment more than another. The
conclusion from the results is that construction firms could adopt any channel to
recruit any category of worker and that such would not have any negative effect on the
productivity and length of service of the worker. Based on this conclusion, it is
suggested that construction firms should neglect the possible length of time that
prospective workers will serve them and their productivity but rather consider the
convenience, cost, possibility of reaching prospective applicants and other related
factors in choosing the channel to adopt in recruiting their prospective workers.
REFERENCES
Adebayo, A (2001). Principles and Practice of Public Administration in Nigeria. 2nd edition.
Ibadan. Spectrum Books Limited.
Assaf, S A, Al-KHALIL, M and Al-Hazmi, M (1995). Causes of Delay in Large Building
Construction Projects. Journal of Management in Engineering, 1, 45-50
Banjoko, S A (2003). Human Resource Management: An Expository Approach. 1st edition.
Ibadan. Pumack Nigeria Limited.
Cascio, W F (2003). Managing Human Resources: Productivity, Quality of Work life and
Profits. 6th edition. Boston. McGraw-Hill, Irwin.
Chan, D W M and Kumaraswamy, M M (2002). Compressing Construction Durations:
Lessons leaned from Hong Kong Building Projects. International Journal of Project
Management, 20, 23-35
Ejiofor, P N O and Mbachu, A U (2001). Imperatives of Human Resource Practices in the
New Millennium. Journal of Management Science, 5, 1-10
Ersoz, Y Y (1999).Neural Network Model for Estimating Construction Productivity. Journal
of Construction Engineering and Management, May/June,
Gberevbie, D E (2008). Staff Recruitment, Retention Strategies and Performance of Selected
Public and Private Organisations in Nigeria. PhD Thesis, Covenant University, Ota,
Nigeria.

Channels of recruitment
639
Gberevbie, D E (2010). Strategies for Employee Recruitment, Retention and Performance:
Dimension of the Federal CIVIL Service of Nigeria. African Journal of Business
Management, 4(8), 1447-1456
Guhathakurta, S and Yates, J (1993). International Labour Productivity. Cost Engineering,
35(1), 15-25
Hanna, A S, Chang, C, Sullivan, K T and Lackney, J A (2008). Impact of Shift Work on
Labour Productivity for Labour Productivity for Labour Intensive Contractor. Journal
of Construction Engineering and Management, 138(3), 197-204
Hatush, Z and Skitmore, M (1997). Evaluating Contractor Prequalification Data Selection
Criteria and Project Success Factors. Construction Management and Economics, 15:
129-147
Heneman, H G and Judge, T A (2003). Staffing Organisation. 4th edition. Boston. McGraw-
Hill, Irwin.
Idoro, G I (2008). Effect of Mechanisation on Project Performance in the Nigerian
Construction Industry. Proceedings of RICS Construction and Building Research
Conference (COBRA 2008), Dublin Institute of Technology, Dublin, UK, 4-5
September, 2008
Josephson, P E and Lindstrom, J (2007). Measuring Performance in Construction Projects.
Proceeding of the CIB World Building Conference on Construction for Development
Cape Town, South Africa, 14 – 18 May 2007: pp 383-394
Kaming, P F,Holt, G D, Kometa, S T and Olomolaiye, P O (1998). Severity Diagnosis of
Productivity Problems-A Reliability Analysis. International Journal of Project
Management, 16(2), 107-113.
Kazaz, A, Manisali, E and Serdar, U(2008). Effect of Motivational Factors on Construction
Workforce Productivity in Turkey. Journal of Civil Engineering and Management,
14(2), 95-106
Ling, F Y Y (2004). Key Determinants of Performance of DBB Projects in Singapore.
Building Research and Information, 32(2): 128-139
Ling, F. Y. Y.; Chan, S. L.; Chong, E. and El, P. 2004. Predicting Performance of Design-
Build and Design-Bid-Build Projects. Journal of Construction Engineering and
Management ASCE. 130(1): 10-20
McOliver, F O (2005). Management in Nigeria: Philosophy and Practice. International Journal
of Communication Human Studies, 2, 1-8
Michell, K; Bowen, P; Cattell, K; Edward, P and Pearl, R (2007). Stakeholder Perceptions of
Contractor Time, Cost and Quality Management on Building Project.Proceeding of
the CIB World Building Conference on Construction for Development, Cape Town,
South Africa, 14 – 18 May 2007: pp 231-240
Ng, S T, Skitmore, R M, Lam, K C and Poon, A W C (2004). De-motivating Factors
influencing the Productivity of Civil Engineering Projects. International Journal of
Project Management, 22, 139-146
Olowu, D and Adamolekun, L (2005). Human Resources Management, in L. Adamolekun
(eds) Public Administration in Africa: Main Issues and Selected Country Studies.
Ibadan. Spectrum Books.
Ofoegbu, R (1985). Personnel Recruitment and Management, in H. N. Nwosu (eds) Problems
of Nigerian Administration. Enugu. Fourth Dimension Publishing Co.Limited.
Pinto J K and Slevin, D P (1998). Project Success: Definitions and Management Techniques.
Project Management Journal, 19(1): 67-71
Vincent, K O and Joel, E R (1995). Principles of Total Quality. Kogan Page, London
Yates, J (1993). Construction Decision Support System for Delay Analysis. Journal of
Construction Engineering and Management, 119, 226-244.


Idoro, G.I. (2011) Influence of construction site OHS facilities on OHS performance in Nigeria In:
Laryea, S., Leiringer, R. and Hughes, W. (Eds) Procs West Africa Built Environment Research
(WABER) Conference, 19-21 July 2011, Accra, Ghana, 641-650.
641
INFLUENCE OF CONSTRUCTION SITE OHS
FACILITIES ON OHS PERFORMANCE IN NIGERIA
Godwin Irororakpo Idoro1
Department of Building, University of Lagos, Akoka, Yaba, Lagos, Nigeria
As part of the effort to improve the poor Occupational Health and Safety (OHS)
condition of the Nigerian construction industry, this study investigates the OHS
condition of construction sites in Nigeria. In the study, construction site OHS
condition is defined by OHS facilities provided. The objectives are to evaluate
contractors‘ perception of the adequacy of selected OHS facilities and its influence on
OHS performance on construction sites. To achieve the objectives, a questionnaire
survey approach involving a field survey of 86 construction projects selected by
stratified random sampling was adopted. Data were collected from the heads of the
project sites on the adequacy of 12 selected facilities required on construction sites,
the characteristics and number of construction workers employed, accidents and
injuries recorded on sites in 2008 using structured questionnaires and analysed using
Relative Provision Index (RPI) and chi-square test. The results indicate that
contractors perceive the adequacy of OHS facilities provided on sites to be moderate
and their adequacy has significant influence on OHS performance. It is concluded that
the OHS facilities provided on project sites contribute to improvement in OHS
performance. It is suggested that construction firms should commit adequate
resources and effort to the provision if OHS facilities on their project sites and put in
place appropriate provisions in their OHS policy and structures that will ensure
adequate provision of the facilities.
Keywords: construction site, contractor, Nigeria, OHS performance, OHS facility.
INTRODUCTION
Studies have discovered that construction is one of the most hazardous industries in
every economy (HSE, 1993; Short, 1998; Eurostat, 2001; Whitelaw, 2001; Hare and
Cameron, 2010). In UK, HSE (1993) discovered that the construction industry
recorded the highest accident, injury and non-injury to injury/accident rates on site.
CBPP (2002) reported that the UK construction industry is responsible for more than
70 deaths, thousands of disabling accidents and thousands of people that suffered ill-
health. The European Agency for Safety and Safety at Work reported that about 13
workers per 100,000 lose their lives in UK construction as against 5 per 100,000 all
sector average (Eurostat, 2001). HSC (2001 & 2003) reported a fatal injury rate of 0.8
per 100,000 workers which put the number of injured workers in UK at 225 in
2002/03. It also reported a non-fatal injury rate of 614.1 per 100,000 workers in
2002/03. HSE (2009) report shows that over 2,800 people died from injuries received
from construction work in the last 25 years. Figures published by the body showed
that the industry in UK exceeded the all-industry average rates on musculosketal
disorders, occupational dermatitis, mesothelioma, asbestos and diffuse pleural

Idoro
642
thickening and work related hear loss. Hare and Cameron (2010) reported that 72 fatal
accidents occurred in Britain‘s construction industry in 2007/08 while 53 fatal
accidents were recorded in 2008/09.
The OHS performances of the construction industries of other European countries are
not in any way different from what prevails in UK. Eurostat (2001 & 2002) reported
that in 1998/99, the construction industries across European Union recorded the
highest number (1,330) of fatal accidents and discovered that they constituted one of
the high-risk industries in terms of workers absence from work due to injury. It also
discovered that the rate of injury in the construction industries of European Union was
8,008 per 100,000 workers.
In Nigeria, there is a dearth of records on OHS performance of the construction
industry. In a sample of the number of accidents recorded by 20 selected reputable
contractors across Nigeria in 2006, Idoro (2007) discovered that the Accident per
Contractor Rate (ACR) of indigenous contractors was 1-16 with a mean of 11 while
that of expatriate contractors was 2-14 with a mean of 8. The study also discovered the
Injury per Contractor Rate (ICR) of indigenous contractors to be 2-8 with a mean of 5
while that of expatriate contractors was 1-10 with a mean of 4. The study equally
discovered the Injury per Accident Rate (IAR) of indigenous contractors to be 0.19-
3.0 with a mean of 0.77 while that of multinational contractors was 0.13-4.0 with a
mean of 0.94. The high ACR, ICR and IAR of the two categories of Nigerian
contractors indicate that the Nigerian construction industry is certainly one of the most
hazardous.
Studies have investigated the problem of high accident and injury rates in the
construction industry and measures that can reduce them. The parameters mentioned
above and similar others such as lost time injury frequency rate which are traditional
measures of safety performance do actually report performance. However, researchers
have argued that they do not proffer solution to the problem and therefore described
them as Negative Performance Indicators (NPIs) or lag factors (Dingsdag et al.,
2008). In the effort to develop measures that can bring about improvement in the OHS
performance of the construction industry, the use of NPIs or lag factors was criticised
because of their inability to improve performance. In their place, Positive Performance
Indicators (PPIs) or lead factors which centre on safety culture were advocated
(Dingsdag et al., 2006a & b; 2008). Several indicators have been developed for PPIs
as discussed in the literatures reviewed below however, it is observed that all the
indicators of safety culture so far developed for PPIs (psychological, conditional and
behavioural) neglected the project environment. This omission by implication is an
indication that the project environment is not part of the safety culture of construction
projects and it does not contribute to safety performance. The multi-causal nature of
construction accidents as opined by Reason (1997) and HSE (2006) has made
researchers to examine numerous factors associated with construction in the search for
the solution to poor OHS. Jaselskris et al., (1996) measured organisational factors
affecting safety performance at company and project levels and discovered that safety
manuals, programmes, meetings or inspections, training for foremen and safety
personnel, coordinator‘s time spent on safety, alcohol and drug testing programmes
contributed to variation in safety performance. Sawacha et al., (1999) examined seven
groups of factors namely: historical, economical, psychological, technical, procedural,
organisational and environmental factors and discovered that the age and experience
of operatives, payment of hazard and productivity bonus, care for personal safety,
knowledge of OHS act, management attitudes and involvement, training on safety,
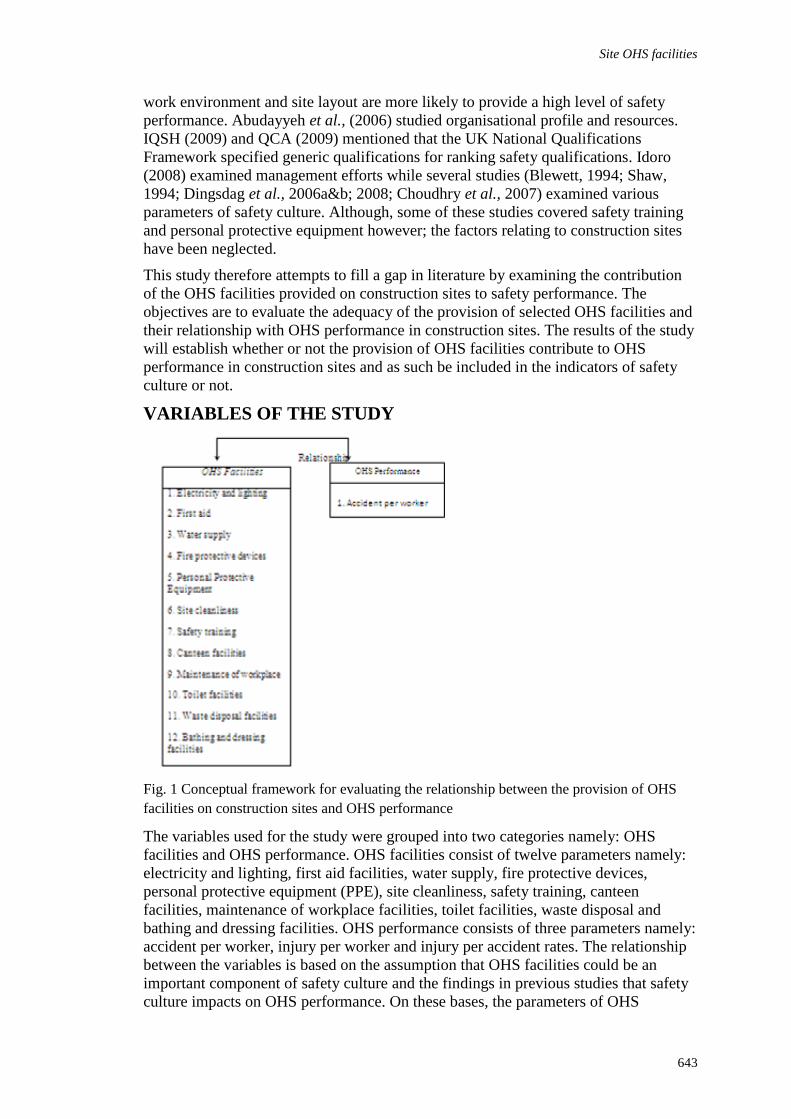
Site OHS facilities
643
work environment and site layout are more likely to provide a high level of safety
performance. Abudayyeh et al., (2006) studied organisational profile and resources.
IQSH (2009) and QCA (2009) mentioned that the UK National Qualifications
Framework specified generic qualifications for ranking safety qualifications. Idoro
(2008) examined management efforts while several studies (Blewett, 1994; Shaw,
1994; Dingsdag et al., 2006a&b; 2008; Choudhry et al., 2007) examined various
parameters of safety culture. Although, some of these studies covered safety training
and personal protective equipment however; the factors relating to construction sites
have been neglected.
This study therefore attempts to fill a gap in literature by examining the contribution
of the OHS facilities provided on construction sites to safety performance. The
objectives are to evaluate the adequacy of the provision of selected OHS facilities and
their relationship with OHS performance in construction sites. The results of the study
will establish whether or not the provision of OHS facilities contribute to OHS
performance in construction sites and as such be included in the indicators of safety
culture or not.
VARIABLES OF THE STUDY
Fig. 1 Conceptual framework for evaluating the relationship between the provision of OHS
facilities on construction sites and OHS performance
The variables used for the study were grouped into two categories namely: OHS
facilities and OHS performance. OHS facilities consist of twelve parameters namely:
electricity and lighting, first aid facilities, water supply, fire protective devices,
personal protective equipment (PPE), site cleanliness, safety training, canteen
facilities, maintenance of workplace facilities, toilet facilities, waste disposal and
bathing and dressing facilities. OHS performance consists of three parameters namely:
accident per worker, injury per worker and injury per accident rates. The relationship
between the variables is based on the assumption that OHS facilities could be an
important component of safety culture and the findings in previous studies that safety
culture impacts on OHS performance. On these bases, the parameters of OHS
Idoro
644
facilities are considered to have influence on the parameters of OHS performance.
This theory on which the study is based forms the conceptual framework for the study
which is presented in Fig. 1.
HYPOTHESIS OF THE STUDY
To achieve the objective of determining the relationship between the provision of
OHS facilities on sites and OHS performance, a research hypothesis was postulated.
The hypothesis states that the adequacy of provision of selected OHS facilities on
construction sites has no significant relationship with OHS performance. The result of
the hypothesis will establish whether or not the provision of OHS facilities contributes
to OHS performance on site.
OCCUPATIONAL HEALTH AND SAFETY PERFORMANCE
The inability of NPIs to improve OHS performance has generally been accepted as a
strong weakness in previous studies and in their place, PPIs have been strongly
advocated. Since the mid 90‘s when PPIs were advocated, several studies have been
conducted and conferences were held to develop appropriate and acceptable
parameters for measuring OHS performance using lead factors. National Occupational
Health and Safety Commission (NOHSC) of Australia organised workshops to
determine the viability of PPIs as alternative to NPIs but could not produce any
acceptable standards for their measurement (Blewett, 1994; Shaw, 1994; Dingsdag et
al., 2008). Another attempt made in 1999 by NOHSC through a tri-partite working
group of industry, government and unions to develop a set of broad PPIs for
measuring OHS performance across industry led to the development of 24
performance indicators. In two separate studies, Dingsdag et al., (2006a & b)
developed a matrix of safety cultural competencies based on safe behaviours and
Safety Management Tasks (SMTs) for the Australian construction industry. Three
main dimensions of safety culture namely: psychological, conditional and behavioural
formed the thrust of the effort to develop performance indicators for PPIs (Choudhry
et al., 2007).
Dingsdag et al., (2008) presented a summary of researches on safety culture in which
several indicators so far proposed as measures of safety culture were listed. It is
discovered that all the proposed indicators of PPIs have several shortcomings such as
difficulty of measurability of safety performance, lack of validated evidence that the
positive safety actions they generate actually impact on safety performance, lack of
uniformity and standardisation in the application of PPIs, lack of acceptable measures
of PPIs in the construction industry and lack of reference and use of PPIs in the
provisions of existing safety regulations (Dingsdag et al., 2008).
RESEARCH METHODS
A questionnaire survey research design approach was adopted in the study. The
approach involves the use of structured questionnaires which was considered as the
most appropriate tool to reach the population of the study especially when data
required for the study can be obtained by the instrument. In the approach, a field
survey of a sample of 86 projects was conducted. To obtain the sample, a preliminary
survey of projects completed in 2008/09 in Nigeria was conducted in 2009 because of
lack of reliable data on them. From the survey, a list of 120 projects was prepared and
adopted as the study population frame. The heads of the project sites among

Site OHS facilities
645
contractors‘ site staff who were either engineers or builders constituted the
respondents of the study.
Data collected consist of the characteristics of the construction firms sampled using
four parameters namely: contractor type, business type, scope of operation and site
OHS manager. Contractor type consists of indigenous and expatriate. Contractor
business type consists of building, civil engineering and building/civil engineering.
Contractor scope of operation consists of local (within one State in Nigeria), regional
(within a geo-political zone consisting of six states), national (within two or more geo-
political zones) and multinational (within two or more countries). Site OHS manager
consists of safety coordinator/officer and site manager. Respondents were requested to
indicate the type of firm or OHS manager applicable in their projects. Data were also
collected on the adequacy of the provision of twelve CSF listed in the variables of the
study. This was measured using five ranks namely: poor, low, moderate, high and
very high. The ranks were scored as 1, 2, 3, 4 and 5 respectively. Data were also
collected on the average number of workers engaged on the project sites in 2008 and
the number of accidents and injuries recorded.
The data were collected with the aid of structured questionnaires administered on the
respondents of the study. From the population frame, 86 projects executed by
indigenous and expatriate construction firms were selected by stratified random
sampling to form the study sample. The sampling option was adopted to ensure good
representation of the two categories of contractors. The data collected were used to
derive the parameters of OHS performance namely: accident per worker, injury per
worker and injury per accident rates. The data were analysed using percentage,
Relative Provision Index (RPI) and Chi-square test. RPI which is the same as Relative
Importance Index (RII) was selected in order to obtain the mean index or score of the
level of provision of the selected facilities and rank them. Chi-square test was selected
for the test of the relationship between site facilities and OHS performance because
the extent of provision of site facilities was measured in ordinal scale.
RESULTS
The results of the analysis of data collected are presented as follows:
Characteristics of Contracting Organisations used in the Study
The characteristics of the construction firms sampled were analysed and presented in Table 1.
Table 1. Characteristics of contracting organisations sampled
Characteristic N % Characteristic N %
Contractor type
Indigenous
Expatriate
Total
Contractor business type
Building
Civil engineering
Building/civil engineering
Total
70
16
86
44
6
36
86
81.4
18.6
100
51.2
7.0
41.9
100
Contractor scope of operation
Local
Regional
National
Multinational
Total
Site OHS manager
Safety manager
Site manager
Total
9
10
40
26
84
44
24
68
9.5
11.9
47.6
31.0
100
64.7
35.3
100
N=Number of respondents
Table 1 shows that the percentage of indigenous firms sampled is 81.4 while that of
expatriate firms is 18.6. The result shows that the percentage of indigenous firms used
for the study is higher than that of expatriate firms. This result is borne out of the
results in previous studies that indigenous construction firms considerably

Idoro
646
outnumbered their expatriate counterparts (Edmond, 1979; Ogunpola, 1984; Olateju,
1991). Table 1 also shows that the percentage of the firms sampled that are engaged in
building construction is 51.2, the percentage of firms engaged in the construction of
civil engineering projects is 7 while that of firms engaged in the construction of both
building and civil engineering projects is 41.9. This result shows that both building
and civil engineering construction firms were covered in the study. The scope of
operation of the contractors sampled shows that the percentage of local contractors is
9.5, that of regional and national contractors are 11.9 and 47.6 respectively while that
of multinational contractors is 31. This result shows that the four categories of
contractors that represent small, medium and large contractors are covered in the
study. The analysis of the person responsible for OHS on site shows that the
percentage of project sites with safety manager/coordinator is 64.7 while that of sites
where the site manager is responsible for OHS is 35.3 This result shows that in the
majority of the projects sampled, a safety manager/coordinator was engaged while in
the minority of the projects, a safety manager/coordinator was not engaged rather the
site manager was responsible for OHS management.
Adequacy of the Provision of Selected OHS Facilities on Construction Sites
Table 2 Ranks of Relative Provision Index (RPI) of selected OHS facilities on construction sites
Facilities N 1 2 3 4 5 TS RPI Rank
Electricity and lighting
First aid facilities
Water supply
Fire protective devices
Personal protective equipment
Site cleanliness
Safety training
Canteen facilities
Maintenance of workplace facilities
Toilet facilities
Waste disposal
Bathing and dressing facilities
86
86
86
86
86
86
86
86
86
86
86
86
2
2
0
0
2
0
6
0
2
2
0
6
4
4
8
6
2
4
4
6
8
12
8
22
14
14
12
16
14
26
22
28
20
22
34
18
24
30
32
30
40
30
24
36
40
34
32
32
42
36
34
34
28
26
30
16
16
16
10
8
358
352
350
350
348
336
326
320
318
308
296
272
4.16
4.09
4.07
4.07
4.05
3.91
3.79
3.72
3.70
3.58
3.52
3.16
1
2
3
3
5
6
7
8
9
10
11
12
N=Number of respondents; 1=Poor; 2=Fair; 3=Moderate; 4=Good; 5=Very good;
TS=Total Score; RPI=Relative Provision Index
The OHS facilities provided on the project sites sampled were investigated to
determine their adequacy. Respondents were requested to indicate the adequacy of
provision of twelve selected facilities using five ranks as described in the research
methods. The Relative Provision Index (RPI) which is similar to Relative Importance
Index (RII) was used for the analysis of the data as explained in the research methods.
The RPI of each facility was calculated and ranked. The results are presented in Table
2. The results in Table 2 indicate that the provision of electricity and lighting which is
regarded by the respondents as good is the most adequate facility provided on site.
This is followed by the provision of first aid facilities, water supply, fire protective
devices and PPE which are also considered as good by the respondents. The provision
of safety training, canteen, toilet, waste disposal and bathing and dressing facilities
and cleanliness of site are regarded as average.
Relationship between Provision of Selected OHS Facilities and OHS
Performance
In the attempt to establish whether or not the selected OHS facilities contribute to
OHS performance, a research hypothesis was postulated. The hypothesis states that
the adequacy of provision of selected OHS facilities on construction sites has no

Site OHS facilities
647
significant relationship with OHS performance. The respondents‘ assessment of the
adequacy of provision of the selected facilities and three parameters of OHS
performance namely: accident per worker rate, injury per worker rate and injury per
accident rate which were derived as explained in the research methods were used for
the test of the hypothesis. The hypothesis was tested using Chi-square test at p≤0.05.
The rule for accepting or rejecting the hypothesis is that when the p-value>0.5, the
hypothesis is accepted but when the p-value≤0.05, the hypothesis is rejected. The
results are presented in Table 3.
Table 3 Results of Chi-square test of relationship between the adequacy of provision of OHS facilities and OHS
performance on construction sites
Variables compared N 2x value Df p-value Decision
Provision of toilet facilities on site
Accident per worker rate
Injury per worker rate
Injury per accident rate
Provision of canteen facilities on site
Accident per worker rate
Injury per worker rate
Injury per accident rate
Supply of portable water on site
Accident per worker rate
Injury per worker rate
Injury per accident rate
Provision of first aid facilities on site
Accident per worker rate
Injury per worker rate
Injury per accident rate
Site cleanliness
Accident per worker rate
Injury per worker rate
Injury per accident rate
Waste disposal from site
Accident per worker rate
Injury per worker rate
Injury per accident rate
Supply of PPE to workers on site
Accident per worker rate
Injury per worker rate
Injury per accident rate
Safety training for workers on site
Accident per worker rate
Injury per worker rate
Injury per accident rate
Provision of fire protective devices on site
Accident per worker rate
Injury per worker rate
Injury per accident rate
Maintenance of workplace facilities
Accident per worker rate
Injury per worker rate
Injury per accident rate
Provision of bathing & dressing facilities on site
Accident per worker rate
Injury per worker rate
Injury per accident rate
Provision of electricity and lighting on site
Accident per worker rate
Injury per worker rate
Injury per accident rate
32
42
28
32
42
28
32
42
28
32
42
28
32
42
28
30
40
26
32
42
2
80.762
119.875
84.000
74.133
126.000
84.000
66.222
126.000
84.000
86.095
121.275
56.000
70.133
120.750
84.000
45.357
120.000
52.000
27.733
37.760
28.000
93.943
162.667
112.000
62.667
121.091
84.000
86.667
168.000
112.000
122.514
168.000
112.000
65.067
119.250
84.000
36
57
39
36
57
39
36
57
39
36
57
26
36
57
39
22
54
24
12
19
13
48
76
52
36
57
39
48
76
52
48
76
52
36
57
39
0.001
0.001
0.001
0.001
0.001
0.001
0.002
0.001
0.001
0.001
0.001
0.001
0.001
0.001
0.001
0.002
0.001
0.001
0.006
0.006
0.009
0.001
0.001
0.001
0.004
0.001
0.001
0.001
0.001
0.001
0.001
0.001
0.001
0.002
0.001
0.001
Reject
Reject
Reject
Reject
Reject
Reject
Reject
Reject
Reject
Reject
Reject
Reject
Reject
Reject
Reject
Reject
Reject
Reject
Reject
Reject
Reject
Reject
Reject
Reject
Reject
Reject
Reject
Reject
Reject
Reject
Reject
Reject
Reject
Reject
Reject
Reject
N=Number of respondents; Df=Degree of freedom
Idoro
648
Table 3 shows that the adequacy of provision of toilet facilities on site is significantly
related to accident per worker rate, injury per worker rate and injury per accident rate.
Similarly, the adequacy of provision of canteen facilities on site is significantly related
to accident per worker rate, injury per worker rate and injury per accident rate. The
adequacy of supply of portable water on site is significantly related to accident per
worker rate, injury per worker rate and injury per accident rate. Also, the adequacy of
provision of first aid facilities on site is significantly related to accident per worker
rate, injury per worker rate and injury per accident rate.
Table 3 shows that the adequacy of cleanliness of site is significantly related to
accident per worker rate, injury per worker rate and injury per accident rate while the
adequacy of disposal of waste from site is significantly related to accident per worker
rate, injury per worker rate and injury per accident rate. The test of the hypothesis also
shows that the adequacy of provision of PPE is related to accident per worker rate,
injury per worker rate and injury per accident rate while the adequacy of provision of
safety training is related to accident per worker rate, injury per worker rate and injury
per accident rate. The adequacy of provision of fire detective devices on site is
discovered to be significantly related to accident per worker rate, injury per worker
rate and injury per accident rate. The result of the test also shows that the adequacy of
maintenance of workplace facilities is significantly related to accident per worker rate,
injury per worker rate and injury per accident rate while the adequacy of provision of
bathing and dressing facilities on site is significantly related to accident per worker
rate, injury per worker rate and injury per accident rate. In the same vein, the
adequacy of provision of electricity and lighting on site is significantly related to
accident per worker rate, injury per worker rate and injury per accident rate. The
results of the test of the hypothesis above indicate that the adequacy of provision of
the twelve selected facilities has significant influence on the three parameters of OHS
performance.
DISCUSSION OF FINDINGS
The results of the analysis of the characteristics of the respondents have indicated that
the majority of the contractors sampled are indigenous firms. These results indicate
that the results of the study are mostly applicable to projects executed by indigenous
contractors. The results of the ranking of the adequacy of provision of the selected
OHS facilities show that the RPIs vary from one facility to another with the provision
of electricity and lighting being the most adequate while the provision of bathing and
dressing facilities on site is the least adequate. These results tend to indicate that the
contracting firms who are majorly indigenous contractors provide some facilities more
than others on site. This result implies that the priority accorded the facilities and the
resources committed to their provision by the contracting firms vary from one facility
to another.
The attempt to establish the contribution of the provision of the facilities and perhaps
the reason why some are more provided than others led to the test of the relationship
between their provision and OHS performance. The results of the test above show that
the adequacy of the provision of all the facilities has significant influence on OHS
performance. The implication of this result is that the adequacy of the provision of any
of the facilities will contribute to improved OHS performance on site. In other words,
inadequate provision of the facilities will contribute to increase in the number of
accidents and injuries to workers on site while adequate provision of the facilities can
contribute to reduction in the number of accidents and injuries to workers on site.

Site OHS facilities
649
CONCLUSION
The results of the study have shown that the adequacy of the provision of some
facilities is good while that of others is average. From these results, it can be
concluded that some facilities are provided more than others and that there is room for
improvement in the provision of all the facilities. The results of the relationship
between the provision of the facilities and OHS performance have further indicated
that the provision of each of the facilities on site can contribute to improvement in
OHS performance on construction sites. This result is an indication that the provision
of any of the facilities is as important as the provision of others. In other words,
Nigerian contractors need to give equal consideration and commit equal resources and
effort to the provision of all the facilities. The result equally indicates the need for
construction firms to ensure improvement in the provision of the facilities. Such an
improvement as established by study can reduce accident and injury rates on site.
Based on the results of the study, it is suggested that contracting firms should commit
adequate resources to the provision of OHS facilities in every project site. They
should put in place appropriate provisions in their OHS policy and structures to ensure
that the facilities are adequately provided whenever they mobilise workers to a site.
REFERENCES
Abudayyeh, O, Fredericks, T K, Butt, S and Shaar, A (2006) An investigation of
Management‘s Commitment to Construction Safety. International Journal of Project
Management, 24(2), 167-174
Blewett, V (1994). Beyond Lost Time Injuries, Positive Performance Indicators for OHS.
Summary Paper Positive Performance Indicators Beyond Lost Time Injuries, Part 1 –
Issues. Worksafe Australia, National Occupational Health and Safety Commission,
Canbarra, pp 1-55
CBPP (2002) Construction Best Practice Programme. http://www.cbpp.org.uk. Cited
February, 2002
Choudhry, R, Fang, D P and Mohamed, S (2007). The Nature of Safety Culture: A Study of
the state-of-the-art. Safety Science, 45, 993-1012
Dingsdan, D P, Biggs, H C and Sheahan, V L (2006a). The Carrot and the Stick: Driving
Safety Culture in the Construction Industry, in K. Brown, K. Hampson and P.
Brandon (eds.), Clients‟ Driving Innovation: Moving Ideas into Practice. Cooperative
Research Centre for Construction Innovation, Icon Net Pty Limited, Brisbane, pp214-
223
Dingsdan, D P, Biggs, H C, Sheahan, V L and Cipolla, D J (2006b). A Construction
SafetyCompetency Framework: Improving OH&S Performance by Creating and
Maintaining a Safety Culture. Cooperative Research Centre for Construction
Innovation, Icon Net Pty Limited, Brisbane
Dingsdan, D P, Biggs, H C and Cipolla, D (2008). Safety Effectiveness Indicators (SEIs):
Measuring Construction Industry Safety Performance. Proceedings of the 3rd
International Conference of the Cooperative Research Centre (CRC) for Construction
Innovation – Clients‟ Driving Innovation, Benefitting from Innovation. Gold Coast,
Australia.
Edmonds, G A (1979): Macro firms; Construction Firms for the Computer Age. Journal of
Construction Engineering and Management 109 (1). 13-24.
Eurostat (2001) European Social Statistics: Accidents at Work and Work related health
problems (1994-2000). Eurostat, European Communities

Idoro
650
Eurostat (2002) European Social Statistics: Accidents at Work and Work related health
problems (1994-2000). Eurostat, European Communities
Hare, B and Cameron, (2010) Site Manager Training and Safety Performance. Proceedings of
CIB 2010 World Congress on Building a Better World, 10th-13
th May 2010, Salford.
UK
HSC (2001) Health and Safety Statistics 2000/01, National Statistics. Health & Safety
Commission
HSC (2003) Health and Safety Statistics 2002/03, National Statistics. Health & Safety
Commission
HSE (1993) Health and Safety Executive. http://www.hse.gov.uk Cited February 2002
HSE (2002) Health and Safety Executive. http://www.hse.gov.uk Cited February 2002
HSE (2006) An Analysis of the Significant Causes of Fatal and major Injuries in Scotland.
Research Report 443. Health and Safety Executive, London
HSE (2009) HSE Statistics. http://www.hse.gov.uk/statistics. Cited September 2009
Idoro, G I (2007) A comparative Evaluation of Health and Safety Performance of
Indigenous and Multinational Construction Firms in Nigeria. Construction Research Journal,
1(1), 65-75
Idoro, G I (2008) Health and Safety Management Efforts as Correlates of Health and Safety
Performance in the Nigerian Construction Industry. Journal of Civil Engineering
Management, 14(4), 277-288
IQSH (2009) IQSH Membership Structure. Institution for Occupational Safety and Health.
http://www.iqsh.co.uk/index.ofm?go=membership structure. Cited September
2009
Jaselskris, E, Anderson, S and Russell, J (1996) Strategies for achieving Excellence in
Construction Safety Performance. Journal of Construction Engineering and
Management, 122(1), 61-70
Ogunpola, A (1984): The Structure of Building Costs and Implication for Economic
Development. Proceedings of the Annual Conference of Nigerian Economic Society.
Nigerian Economic Society, University of Ibadan, Ibadan, Nigeria. pp 28.
Olateju, B (1991): Enhancing the Contract Management Capabilities of the Indigenous
Contractor: Effective Contract Management in the Construction Industry. The
Nigerian Institute of Building, Lagos, Nigeria. pp.132-142
QCA (2009) Qualifications can cross Boundaries. http://www.qca.org.uk. September 2009
Reason, J (1997) Managing the Risks of Organisational Accidents. Ashgate Publisher,
Aldershot
Shaw, A (1994). OHS Performance Indicators for Benchmarking: Positive Performance
Indicators beyond Lost Time Injuries, Part 1 – Issues. Worksafe Australia, National
Occupational Health and Safety Commission, Australia, pp 15-27
Short, B (1998) Health and Safety in the Construction Industry, positive prognosis or bitter
pill. http//www.hse.gov.uk/indg 341. Accessed March 16 2006.
Whitelaw, J (2001) Safety: What do you think? New Civil Engineer, January, 11, 22-24.

Wilson, J. and Idoro, G. (2011) Influence of IT use at pre-contract stage of construction projects in
Akwa Ibom State Nigeria In: Laryea, S., Leiringer, R. and Hughes, W. (Eds) Procs West Africa Built
Environment Research (WABER) Conference, 19-21 July 2011, Accra, Ghana, 651-661.
651
INFLUENCE OF IT USE AT PRE-CONTRACT STAGE
OF CONSTRUCTION PROJECTS IN AKWA IBOM
STATE NIGERIA
Jimmy Wilson1 and Godwin Idoro
2
1Department of Building, University of Uyo, Uyo, Nigeria
2Department of Building, University of Lagos, Akoka, Nigeria
The growth of the construction industry is increasingly predicated on technology
driven investments in Information Technology (IT). This study evaluates the extent of
use of IT at pre-contract stage of construction projects in Akwa Ibom State. The
objectives are to determine the factors that affect the use of IT at pre-contract stage,
the extent of use of IT at pre-contract stage of construction projects and its influence
on project performance. A questionnaire survey design approach involving a field
survey of a sample of forty projects was conducted. Data were collected from project
leaders of the projects sampled using structured questionnaires and analysed with
Mean Item Score and Chi Square. The results indicate that high cost of IT hardware
and software, lack of management commitment, low level of computer literacy of
project leaders and size of firm rank high in effect on the use of IT. It also reveals that
the extent of use of IT at pre-contract stage does not contribute to project
performance. Greater use of IT at pre-contract stage is suggested as a tool for
improving project performance while local production of IT hardware and software,
greater management commitment and computer training programmes are suggested as
measures of increasing the extent of use of IT at pre-contract stage.
Keywords: information technology, Nigeria, pre-contract stage, project performance.
INTRODUCTION
Every construction process requires heavy exchange of data and information between
project participants on a daily basis. Construction industries usually use Information
Technology (IT) in order to overcome problems and achieve improvements in
construction process. The average annual growth rate of IT investment in the
construction industry is increasing every year and this now constitutes a significant
part of the total project cost. (Issa et al., 2007). Information Technology (IT) is seen as
a mechanism that enables fundamental change to be effected in the construction
industry. However, firms in the construction industry are slowly responding and
adapting to developments in information and communication technologies (Alshawi et
al., 2003). O'Connor and Yang (2003) opined that the success of a project is related to
the level of IT use. The duo approached the issue of IT by means of statistical
methods and discovered that there is a statistically significant correlation between the
use of IT and projects being successful. In Nigeria, Oladapo (2007) argued that the
level of use of IT in the construction industry is low and one of the reasons is
attributed to the project leaders‘ attitudes toward the use of IT in their organisations.

Wilson and Idoro
652
The focus area of this study are on the level of use of IT at pre-contract stage, the
factors that affect IT adoption, the use of IT in construction projects in Akwa Ibom
State and its influence on project performance. IT has been an effective tool adopted
in other industries to enhance work processes and achieve digital-based
documentation and communication, resulting in a real-time connection among work
stakeholders and suppliers (Fischer and Kunz, 2004). The use of IT reduces task
fragmentation and improves coordination and collaboration, resulting in better
communication practices among team members of the construction project (Stewart et
al., 2002). The implementation and use of IT is not a straightforward process because
many issues need to be considered at the earlier stages when IT is to be adopted.
Previous study conducted by O‘Connor et al., (2003) focused on the use of IT
throughout the different phases of a project. The focus of the study is restricted to the
pre-contract stage because it is the stage when major documentation on a project is
done. The significance of this study comes from the fact that IT has an important role
to play in the speed, cost and quality of project documentation which should translate
to improved project performance. In order for this to be achieved, there is the need for
greater awareness of the benefits that IT brings to construction. This understanding
prompts this study. The objectives are to evaluate the impact of selected factors on IT
usage, the extent of IT usage at the pre-contract stage of oil and gas projects and its
influence on project performance in Akwa Ibom State of Nigeria. The results will
assist oil and gas companies, construction organisations and project leaders to promote
the use of IT in the delivery of construction projects in Akwa Ibom State Nigeria.
USE OF IT AND ORGANISATIONAL PERFORMANCE
Information technology strategy can positively influence competitive and
organisational performance (Hampson and Tatum 1997). Johnson and Clayton (1998)
contended that information technology can improve productivity of teams and
management procedures. Back and Moreau (2000) suggested that improving internal
information exchange and integrating project-based information across organizational
boundaries may result in project cost and schedule reductions. Thomas et al., (2001)
evaluated the impacts of design/information technologies by connecting their use to
project performance in terms of cost growth, schedule growth, and safety success.
Whyte et al., (2002) explored processes by which emerging technologies can be
introduced into construction organizations. Goodrum and Haas (2002) investigated the
impact of different types of equipment technologies on construction productivity. De
Lapp et al. (2004) examined the impacts of computer-aided design (CAD) on design
realization. Tse and Choy (2005) carried out an in-depth interview for studying the
scope of use of information technology (IT) in Hong Kong‘s construction industry.
Lee et al., (2005) examined the relative impacts of selected practices on project cost
and schedule. Peansupap and Walker (2005) addressed the critical issue of how best to
adopt and diffuse information technology (IT) into organizations. A review of the
literature suggests that the use of technology as a means to enhance project
performance has been widely supported. Generally, many researchers have suggested
that technology provides significant benefits to construction projects. The literature
review provides a background for developing an understanding of the issues related to
the adoption and use of technology, factors influencing the adoption of technology,
and the benefits to be derived from information technology. This research adds to the
literature by providing important results on the comparisons of information
technology utilisation at project phases.
IT use at pre-contract stage
653
BENEFITS OF THE USE OF IT IN CONSTRUCTION PROJECTS
IT has been an effective tool adopted in other industries to enhance work processes
and achieve digital-based documentation and communication, resulting in a real-time
connection among work stakeholders and suppliers (Fischer and Kunz, 2004). The
potential benefits to be derived from using IT in construction processes can be
examined from construction strategy and operational views (Love et al 2004, Stewart
2008); therefore the benefits of IT could be tangible and direct or intangible and
indirect, depending on their nature and scope (Suwardy et al., 2003, Love et al.,
2004). Moreover, the benefits of using IT in the construction industry should be
apparent in such business success criteria as increased work efficiency, effectiveness
and performance of the construction projects (Alshawi et al., 2003). However,
implementing IT in construction companies does not always have economic
justification and does not usually provide all the benefits initially envisaged at the
expected time (Andresen et al., 2000, Alshawi et al., 2003). The use of IT reduces
task fragmentation and improves coordination and collaboration, resulting in better
communication practices among team members of the construction project (Stewart et
al., 2002). The strategic IT benefits for construction companies do not occur unless
dramatic changes take place, because the technology only enables, and benefits don‘t
come about automatically (Alshawi et al., 2003, Norton, 1995). A specific style of
management may realize IT benefits in a short time frame. Other benefits require
more time for maturity, therefore, there is a time gap between the initial investment
and revenues (Peppard et al., 2007). Some benefits have direct and tangible effects on
productivity, while others have intangible results in terms of effectiveness and
performance (Andresen et al, 2000).
BARRIERS TO THE USE OF IT IN CONSTRUCTION PROJECTS
Many of the barriers to the use of IT are attributable to the high cost of investment and
the nature of the construction industry (Marsh & Finch 1998, Marsh & Flanagan
2000). A common barrier is the limited investment in IT by firms in the construction
industry. (Marosszeky et al. 2000) identified causes of low levels of adopting IT. In
their study, they found out that limited skills and vision in strategic IT use at
organisational level; Perceptions of financial risk and lack of precedent clear benefits
of IT investment were the reasons of low level of IT adoption. Another barrier to IT
adoption is technical constraints. Problems in this area can be grouped into immaturity
of technology, limited quality of technology, and non-standardisation. Stewart and
Mohamed (2002) identified barriers to IT implementation in developing countries.
The result his study concluded that high cost of IT; Quality and quantity of IT
infrastructure; System incompatibility; Lack of IT skill and supports IT were the
barriers to IT implementation in developing countries. IT adoption involves both
technical and social issues and requires an understanding of IT management in order
to ensure that full benefit is gained from IT investment. Construction organisations
that derive benefits from IT investment will only get partial benefits if only a few
people actually adopt and use it and even within organisations where many users
adopt IT, they will find it difficult to communicate or transfer electronic information
with colleagues who avoid using IT (Stewart et al., 2004)

Wilson and Idoro
654
VARIABLES AND CONCEPTUAL FRAMEWORK FOR THE
STUDY
Three variable groups namely: IT factors, IT usage and project performance were used
in the study. IT factors consist of sixteen factors that affect the extent of use of IT in
project delivery process. IT usage variable group consists of eleven project delivery
processes. Two parameters of project performance namely: time-overrun and cost-
overrun were selected.
Relevant literature was reviewed in order to select the variables and develop a
research framework. The role of the organisational characteristics such as size, firm
business type, was considered as vital factor in the use of IT in construction project.
Several researchers have discussed this variable from different perspectives; from the
adoption of microcomputers, use of PCs, to studying end-user satisfaction. The
demographic variables are the most widely studied factors. The variables include
computer literacy, commitment of management to IT investment, experience on IT,
educational qualification and IT awareness of management staff. Montazemi (1988)
discovered that the level of management‘s computer literacy correlates with their
participation in the systems development process. Fear of virus attack, non compatible
software, need to continually upgrade, constituted technological factors according to
Oladapo (2007). According to O‘Connor (2001), there are a total of 68 work functions
that make a project. For the purpose of this work, 11 work functions which make up
the pre-contract process as modified from Kim (1996) are studied. Pre-contract work
function include: design, tender/bid analysis, budgeting /financing, project
communication, engineering analysis, estimating and accounting, project data storage
, documentation and reporting, risk assessment, scheduling and tracking and project
scope definition. The benefits of IT usage in these work functions from the studies
reviewed above (Suwandy et al., 2003; Alshawi et al., 2003; Love et al., 2004) are
manifested in project performance. The framework for the study was developed from
the understanding that IT usage is related to project performance. The framework is
presented in Fig. 1.
Fig. 1 Conceptual Framework for evaluating the relationship between IT usage and project
performance
RESEARCH METHOD
A questionnaire survey design approach was adopted for the study. In the approach, a
field study of forty oil and gas construction projects was conducted. The projects were
a sample of oil and gas projects located in Akwa Ibom State of Nigeria. To obtain the
sample, a pilot study was conducted in late 2010 to identify recently completed oil and
gas projects within the study area. From the survey, 76 projects were identified and
Organisational
characteristic
Project
characteristic
Management
characteristic
Technological
characteristic
IT Usage Project Performance
H0
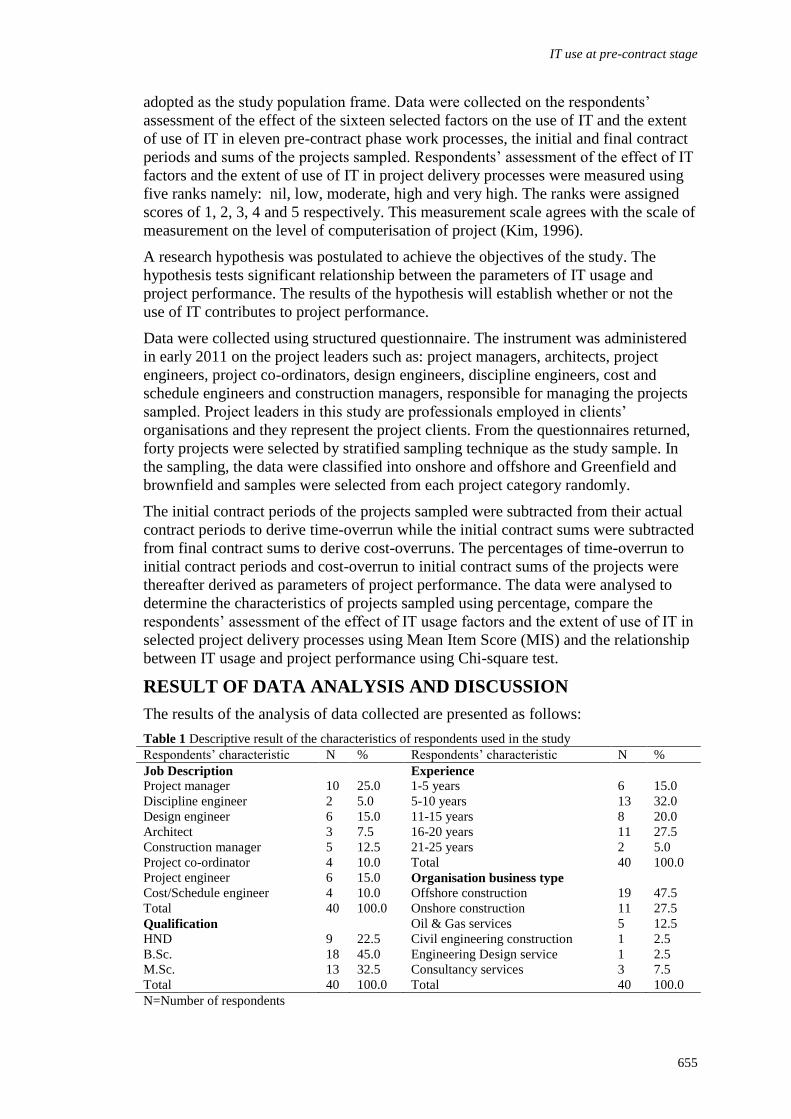
IT use at pre-contract stage
655
adopted as the study population frame. Data were collected on the respondents‘
assessment of the effect of the sixteen selected factors on the use of IT and the extent
of use of IT in eleven pre-contract phase work processes, the initial and final contract
periods and sums of the projects sampled. Respondents‘ assessment of the effect of IT
factors and the extent of use of IT in project delivery processes were measured using
five ranks namely: nil, low, moderate, high and very high. The ranks were assigned
scores of 1, 2, 3, 4 and 5 respectively. This measurement scale agrees with the scale of
measurement on the level of computerisation of project (Kim, 1996).
A research hypothesis was postulated to achieve the objectives of the study. The
hypothesis tests significant relationship between the parameters of IT usage and
project performance. The results of the hypothesis will establish whether or not the
use of IT contributes to project performance.
Data were collected using structured questionnaire. The instrument was administered
in early 2011 on the project leaders such as: project managers, architects, project
engineers, project co-ordinators, design engineers, discipline engineers, cost and
schedule engineers and construction managers, responsible for managing the projects
sampled. Project leaders in this study are professionals employed in clients‘
organisations and they represent the project clients. From the questionnaires returned,
forty projects were selected by stratified sampling technique as the study sample. In
the sampling, the data were classified into onshore and offshore and Greenfield and
brownfield and samples were selected from each project category randomly.
The initial contract periods of the projects sampled were subtracted from their actual
contract periods to derive time-overrun while the initial contract sums were subtracted
from final contract sums to derive cost-overruns. The percentages of time-overrun to
initial contract periods and cost-overrun to initial contract sums of the projects were
thereafter derived as parameters of project performance. The data were analysed to
determine the characteristics of projects sampled using percentage, compare the
respondents‘ assessment of the effect of IT usage factors and the extent of use of IT in
selected project delivery processes using Mean Item Score (MIS) and the relationship
between IT usage and project performance using Chi-square test.
RESULT OF DATA ANALYSIS AND DISCUSSION
The results of the analysis of data collected are presented as follows:
Table 1 Descriptive result of the characteristics of respondents used in the study
Respondents‘ characteristic N % Respondents‘ characteristic N %
Job Description
Project manager
Discipline engineer
Design engineer
Architect
Construction manager
Project co-ordinator
Project engineer
Cost/Schedule engineer
Total
Qualification
HND
B.Sc.
M.Sc.
Total
10
2
6
3
5
4
6
4
40
9
18
13
40
25.0
5.0
15.0
7.5
12.5
10.0
15.0
10.0
100.0
22.5
45.0
32.5
100.0
Experience
1-5 years
5-10 years
11-15 years
16-20 years
21-25 years
Total
Organisation business type
Offshore construction
Onshore construction
Oil & Gas services
Civil engineering construction
Engineering Design service
Consultancy services
Total
6
13
8
11
2
40
19
11
5
1
1
3
40
15.0
32.0
20.0
27.5
5.0
100.0
47.5
27.5
12.5
2.5
2.5
7.5
100.0
N=Number of respondents

Wilson and Idoro
656
Characteristics of Respondents of the Study
Four characteristics namely: Respondents‘ job description, qualification, experience
and organisation business type were investigated. The percentages of the respondents‘
sampled in each of the sub-variables of respondents‘ characteristics are analysed and
presented in Table 1. Table 1shows that the eight disciplines that serve as project
leaders in oil and gas construction projects were covered in the study. Result on
respondents‘ qualification shows that the respondents of the study possessed
qualifications required for management position. On experience, this result shows that
project leaders with both short and long experience were covered in the study.
Characteristics of Projects Sampled
Five project characteristics namely: project type, category, location, duration and cost
were investigated. The percentages of the projects sampled in each of the sub-
variables of project characteristics are presented in Table 2.
Table 2 Descriptive result of the characteristics of projects used in the study
Project characteristic N % Project characteristic N %
Project location
Onshore
Offshore
Total
Project category
Greenfield
Brownfield
Total
Project duration
1-6 months
7-12 months
Above 12 months
Total
16
24
40
17
23
40
11
18
11
40
40.0
60.0
100.0
42.5
57.5
100.0
27.5
45.0
27.5
100.0
Project type
Civil construction
Fabrication
Installation
Building construction
Well work/servicing
Pipeline
Total
Project budget
$1-25 million
$26-50 million
$51-100 million
Above $100 million
Total
7
16
9
2
2
4
40
19
8
8
5
40
17.5
40.0
22.5
5.0
5.0
10.0
100.0
47.5
20.0
20.0
12.5
100
N=Number of projects
Table 2 shows that both onshore and offshore projects were used in the study although
offshore projects constituted the majority. Results of project category also indicate
that both greenfield and brownfield projects were sampled but the latter constituted
the majority.
Factors affecting the Use of Information Technology in Construction Project
Delivery
Sixteen factors stated in the variables of the study were investigated to evaluate their
effects on IT usage in project delivery. Respondents were requested to indicate their
assessment of the effect of the factors on the use of IT in the delivery process of their
projects. The respondents‘ assessment was measured as described in the research
methods. The Mean Item Score (MIS) of their assessment was analysed and ranked.
The results are presented in Table.3.
Table 3 reveals that the cost of IT, size of firm, project leaders‘ computer literacy
level and firms‘ business type are the top four constraints to the use of IT in project
delivery. Computer components are known to be import-oriented in Nigeria and this
has made their cost to be very high. This result tends to imply that the import-oriented
nature of IT in Nigeria has the highest impact on the use of IT in project delivery. On
the size of firm, a firm can be large or small depending on its workforce and
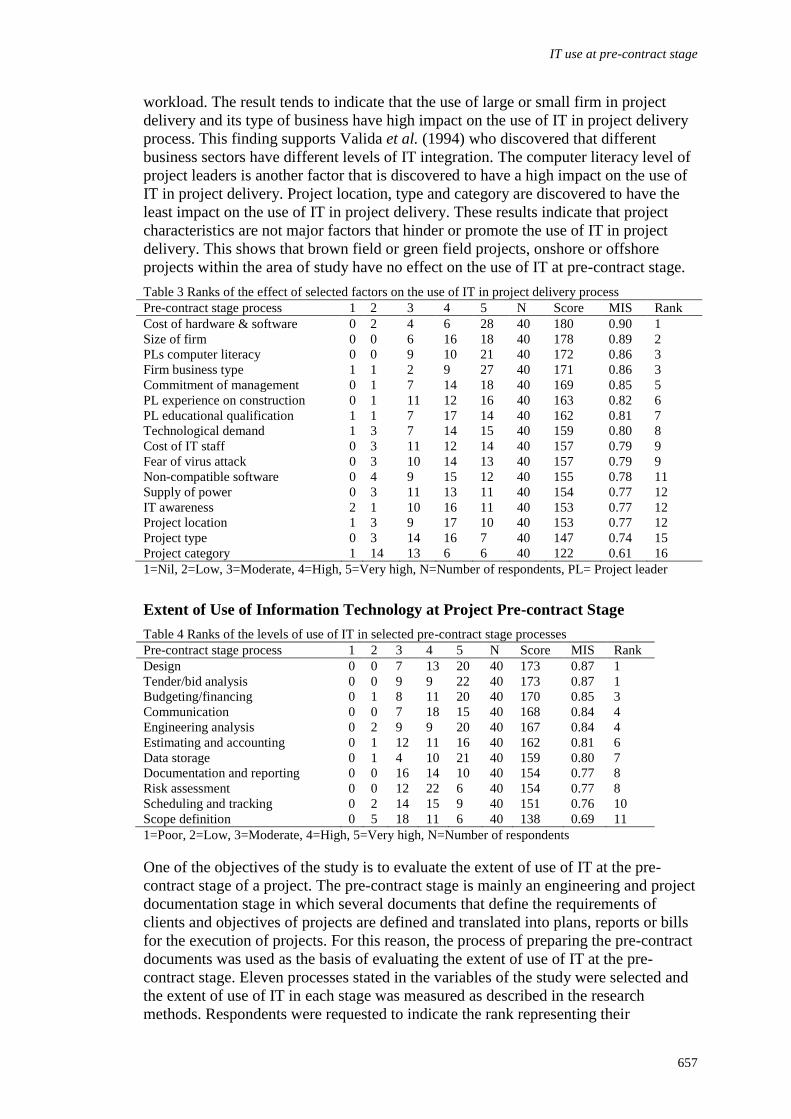
IT use at pre-contract stage
657
workload. The result tends to indicate that the use of large or small firm in project
delivery and its type of business have high impact on the use of IT in project delivery
process. This finding supports Valida et al. (1994) who discovered that different
business sectors have different levels of IT integration. The computer literacy level of
project leaders is another factor that is discovered to have a high impact on the use of
IT in project delivery. Project location, type and category are discovered to have the
least impact on the use of IT in project delivery. These results indicate that project
characteristics are not major factors that hinder or promote the use of IT in project
delivery. This shows that brown field or green field projects, onshore or offshore
projects within the area of study have no effect on the use of IT at pre-contract stage.
Table 3 Ranks of the effect of selected factors on the use of IT in project delivery process
Pre-contract stage process 1 2 3 4 5 N Score MIS Rank
Cost of hardware & software
Size of firm
PLs computer literacy
Firm business type
Commitment of management
PL experience on construction
PL educational qualification
Technological demand
Cost of IT staff
Fear of virus attack
Non-compatible software
Supply of power
IT awareness
Project location
Project type
Project category
0
0
0
1
0
0
1
1
0
0
0
0
2
1
0
1
2
0
0
1
1
1
1
3
3
3
4
3
1
3
3
14
4
6
9
2
7
11
7
7
11
10
9
11
10
9
14
13
6
16
10
9
14
12
17
14
12
14
15
13
16
17
16
6
28
18
21
27
18
16
14
15
14
13
12
11
11
10
7
6
40
40
40
40
40
40
40
40
40
40
40
40
40
40
40
40
180
178
172
171
169
163
162
159
157
157
155
154
153
153
147
122
0.90
0.89
0.86
0.86
0.85
0.82
0.81
0.80
0.79
0.79
0.78
0.77
0.77
0.77
0.74
0.61
1
2
3
3
5
6
7
8
9
9
11
12
12
12
15
16
1=Nil, 2=Low, 3=Moderate, 4=High, 5=Very high, N=Number of respondents, PL= Project leader
Extent of Use of Information Technology at Project Pre-contract Stage
Table 4 Ranks of the levels of use of IT in selected pre-contract stage processes
Pre-contract stage process 1 2 3 4 5 N Score MIS Rank
Design
Tender/bid analysis
Budgeting/financing
Communication
Engineering analysis
Estimating and accounting
Data storage
Documentation and reporting
Risk assessment
Scheduling and tracking
Scope definition
0
0
0
0
0
0
0
0
0
0
0
0
0
1
0
2
1
1
0
0
2
5
7
9
8
7
9
12
4
16
12
14
18
13
9
11
18
9
11
10
14
22
15
11
20
22
20
15
20
16
21
10
6
9
6
40
40
40
40
40
40
40
40
40
40
40
173
173
170
168
167
162
159
154
154
151
138
0.87
0.87
0.85
0.84
0.84
0.81
0.80
0.77
0.77
0.76
0.69
1
1
3
4
4
6
7
8
8
10
11
1=Poor, 2=Low, 3=Moderate, 4=High, 5=Very high, N=Number of respondents
One of the objectives of the study is to evaluate the extent of use of IT at the pre-
contract stage of a project. The pre-contract stage is mainly an engineering and project
documentation stage in which several documents that define the requirements of
clients and objectives of projects are defined and translated into plans, reports or bills
for the execution of projects. For this reason, the process of preparing the pre-contract
documents was used as the basis of evaluating the extent of use of IT at the pre-
contract stage. Eleven processes stated in the variables of the study were selected and
the extent of use of IT in each stage was measured as described in the research
methods. Respondents were requested to indicate the rank representing their

Wilson and Idoro
658
assessment of the extent of IT use in carrying out each process. The MIS of the
respondents‘ assessment was analysed and ranked. The results are presented in Table
4.
Table 4 shows that the extent of use of IT in carrying out the selected pre-contract
processes differs from process to process. The results shows that the use of IT at pre-
contract stage is high ranging from MIS of 0.69 to 0.87. Design and tender analysis
processes are discovered to have the highest IT usage. This shows that IT is used
extensively for design and tender analysis. Communication and engineering analysis
are also discovered to rank high in the use of IT. The use of IT for project
budgeting/financing is also discovered to rank high. In line with the earlier result
which shows that the cost and availability of hardware and software has the highest
impact on IT usage, these results tend to indicate that software for project design,
tender analysis, communication and engineering analysis are readily available and
applied. The reverse is the case of risk analysis, project scheduling and tracking and
scope definition which are discovered to rank lower than other processes in the use of
IT at pre-contact.
Relationship between the Use of Information Technology and Project Outcome
To achieve the objective of evaluating the influence of the use of IT on project
performance, eleven project delivery processes and two parameters of project
performance namely: time-overrun and cost-overrun stated above were used.
Table 5 Results of Chi-square test of relationship between the use of IT and project outcome
Variables correlated N 2x value Df p-value Decision
Project time-overrun
Design
Tender/bid analysis
Budgeting/financing
Communication
Engineering analysis
Estimating and accounting
Data storage
Documentation and reporting
Risk assessment
Scheduling and tracking
Scope objective definition
Project cost-overrun
Design
Tender/bid analysis
Budgeting/financing
Communication
Engineering analysis
Estimating and accounting
Data storage
Documentation and reporting
Risk assessment
Scheduling and tracking
Scope objective definition
40
40
40
40
40
40
40
40
40
40
40
40
40
40
40
40
40
40
40
40
40
40
45.416
55.640
93.962
59.212
81.111
85.221
64.413
57.137
55.025
79.762
82.744
80.000
80.000
120.000
80.000
120.000
120.000
120.000
80.000
80.000
120.000
120.000
50
50
75
50
75
75
75
50
50
75
75
78
78
117
78
117
117
117
78
78
117
117
0.658
0.271
0.068
0.175
0.295
0.197
0.803
0.227
0.290
0.332
0.253
0.416
0.416
0.406
0.416
0.406
0.406
0.406
0.416
0.416
0.406
0.406
Accept
Accept
Accept
Accept
Accept
Accept
Accept
Accept
Accept
Accept
Accept
Accept
Accept
Accept
Accept
Accept
Accept
Accept
Accept
Accept
Accept
Accept
N=Number of respondents, Df=Degree of freedom
A research hypothesis was postulated for this objective. The hypothesis states that the
use of IT at pre-contract stage has no significant relationship with project
performance. The hypothesis was tested using the Chi-Square test at p≤0.05. The rule
for the rejection or non-rejection of the hypothesis is that when the p-value > 0.05, the

IT use at pre-contract stage
659
test fails to reject the hypothesis but when the p-value ≤ 0.05, the hypothesis is
rejected. The results of the test of the hypothesis are presented in Table 5.
Table 5 shows that the p-values for the test of relationship between project time-
overrun, project cost overrun and the use of IT are greater than the critical p-value
(0.05). The results of the test fail to reject the hypothesis. These results indicate that
the use of IT at pre-contract stage have no significant relationship with project
performance. The results indicate that the use of IT for carrying out project delivery
processes at the pre-contract stage does not contribute to project performance. This
result tend to imply that increased utilisation of IT at pre-contract stage does not
contribute to the long delay and high cost-overrun of projects which have been the
bane of the construction industry in Nigeria and it does not serve as a solution. This
finding does not support the result of the study conducted by O‘Connor et al., (2003)
which discovered that information technology usage throughout all project phases
contributes to cost and schedule success of a project. Also, it does not agree with the
findings in O‘Connor and Yang (2003) study that, for US projects, the levels of
information technology usage in project work functions are positively associated with
the projects‘ levels of cost success. The reason for this may not be unconnected with
the fact that the parameters of project performance used in the study do not include the
time and cost expended at the pre-contract stage. This may also be due to the
limitation in the scope of the study to IT use at pre-contract stage. Other reasons could
be variation in perception of project success and ways to execute work functions
between the project phases. This result tends to imply that increased utilisation of IT
at pre-contract stage does not contribute to the long delay and high cost-overrun of
projects which have been the bane of the construction industry in Nigeria and it does
not serve as a solution. It also tends to indicate that the benefits of IT usage will
manifest better in the delivery speed and cost of pre-contract processes than post-
contract processes.
CONCLUSION
The purpose of this study is to investigate the extent to which information
technologies are used in pre-contract processes in Akwa Ibom State Nigeria and its
contribution to project performance. This was accomplished by carrying out a survey
of 40 completed oil and gas projects located in Akwa Ibom State in 2011. The
conclusion from the findings of the study is that first, high cost of IT has the highest
impact on its use in project delivery. The problem can be traced to the high cost of
importing IT components. The problem calls for support from all stakeholders
including the Nigerian government to ensure high level of IT literacy among project
participants, subsidised IT components and development of local and affordable
software.
Second, information technology usage at pre-contract stage is high but it does not
contribute to project performance. Generally, the findings indicate that oil and gas
construction projects in Akwa Ibom State employ relatively high level of technology
usage but this does not statistically produce significant correlation with the levels of
cost and schedule successes. The availability of specialized software coupled with
limited work scope may help explain the high information technology levels
associated with this phase. The findings of the study provide direction for decision
making on information technology investment and are helpful to managers in deciding
whether to apply technologies to certain work functions.

Wilson and Idoro
660
The findings of the study do not in any way imply that IT usage does not contribute to
project performance. IT innovation has an important role to play at both strategic and
operational levels in project delivery. At a business strategy level, IT could be used to
establish a corporate differentiation strategy as well as a cost reduction strategy. At an
operational level, IT can be used to help improve project information exchange,
communication and document sharing during the construction project life cycle. In
addition, it can also enhance the process of construction procurement. These benefits
should provide one of the primary drivers for IT use and adoption in the construction
industry. However, the results do indicate that the benefits of IT usage will manifest
mainly on the performance of the process or function for which it is used. This
understanding suggests the need for an investigation of the use of IT on the
performance of pre-contract stage process.
REFERENCES
Alshawi, M. and Ingirige, B. (2002) Web-based project management: A report on web-
enabled project management, School of Construction and Property Management,
University of Salford, UK.
Alshawi, M. and Ingirige, B. (2003), 'Web-enabled project management: An emerging
paradigm in construction', Automation in Construction, vol. 12, no. 4, pp. 349- 64.
Andersen, T., and Segars, A. (2002). The impact of IT on decision structure and firm
performance: evidence from the textile and apparel industry. Information and
Management, 39, 85-100.
Andresen J., Baldwin A., Betts M., Carter C., Hamilton A., Stokes E. and Thorpe T. (2000). A
Framework for Measuring IT Innovation Benefits, Journal of Information Technology
in Construction (ITcon), 5, 57-72.
Back, W. E., and Moreau, K. A. (2000). Cost and schedule impacts of information
management on EPC process. Journal of Management. Engineering, 16(2),59–70.
De Lapp, J. A., Ford, D. N., Bryant, J. A., and Horlen, J. (2004). Impacts of CAD on design
realization. Engineering, Construction and Architectural Management, 11(4), 284–
291.
Fischer M. and Kunz J. (2004). The scope and role of information technology in construction.
CIFE Technical Report 156, Civil and Environmental Engineering Dept., Stanford
University, Palo Alto, pp 17-28.
Hampson, K., and Tatum, C. (1997). Technology strategy and competitive performance in
bridge construction. Journal of Construction Engineering and Management, 123(2),
153-161.
Issa, RR.A.; Flood, L.; Caglasin, G. (2007). A survey of e-business implementation in the US
construction industry. Electron Journal Information Technology Construction. 8, 115-
120.
Johnson, R. E., and Clayton, M. J. (1998). The impact of information technology in design
and construction: The owner‘s perspective.‖Autom. Constr., 8(1), 3–14.
Kim, C. (1996). An evaluation of the impact of integration and computerization on
construction projects. PhD Thesis., Worcester Polytechnic Institute, Worcester, MA.
Lee, S., Thomas, S. R., and Tucker, R. L. (2005). ―The relative impacts of selected practices
on project cost and schedule.‖ Constr. Manage. Econom., 23(5), 545–553.
Love P. E. D., Irani, Z. and Edwards D. J. (2004). Industry-centric benchmarking of
information technology benefits, costs and risks for small-to-medium sized enterprises
in construction, Journal Automation in Construction, 13(4), 507–524.
Norton D. P. (1995). Managing benefits from information technology, Information
Management & Computer Security, 3(5), 29-35. ITcon 16 (2011),Karrem, pg. 492

IT use at pre-contract stage
661
Marosszeky, M., Sauer, C., Johnson, K., Karim, K. and Yetton, P. (2000). Information
Technology in the building and construction industry: The Australian Experience,
Proceedings of INCITE 2000 conference, implementing IT to obtain a competitive
advantage in the 21st century, Hong Kong Polytechnic University, Hong Kong, 78-
92.
Marsh, L. and Finch, E. (1998), 'Attitudes towards auto-id technologies within the UK
construction industry.' Construction Management & Economics, 16(4), 383-8.319
Marsh, L. and Flanagan, R. (2000), 'Measuring the costs and benefits of information
technology in construction', Engineering, Construction and Architectural
Management, 7(4), 423-35.
Montazemi, A. R., (1988) ―Factors Affecting Information Satisfaction in the Context of the
Small Business Environment‖, MIS Quarterly 12(2), 239-256.
O´Connor, J. T. and Yang, L. R.(2003). Impact of integration and automation technology
success measures. 4th Joint Symposium on IT in Civil Engineering, ASCE, Reston,
Va.
Oladapo A. (2007). An investigation into the use of ICT in the Nigerian construction industry.
Journal of Information Technology in Construction (ITcon), 12(18), 261-277.
Olugbode, Mojisola.; Richards, Rhodri, Biss, Tom.(2007).The role of information technology
in achieving the organisation's strategic development goals: a case study Information
Systems, 32, 641-648.
Peansupap, V, and Walker, D. (2005). Factors affecting ICT diffusion: A case study of
three large Australian construction contractors. Engineering, Construction and,
Architectural Management., 12(1), 21-37. Peppard J., Ward J. and Daniel E. (2007). Managing the Realization of Business Benefits
from IT Investments, MIS Quarterly Executive, 6(1), 1-11.
Thomas, S. R., Macken, C. L., and Lee, S. H. (2001). ―Impacts of design/ information
technology on building and industrial projects.‖ BMM2001-10, Construction Industry
Institute (CII), Austin, Tex.
Tse, R. Y., and Choy, L. (2005). ―Is IT training in construction industry useful?‖ Journal
of Construction Research., 6(1), 1–13. Stewart R. A. (2003). Lifecycle Management of Information Technology (IT) Projects in
Construction, PhD Thesis, Griffith University, Gold Coast.
Stewart R. A., Mohamed S. and Daet R. (2002). Strategic Implementation of IT/IS Projects in
construction: a case study, Journal of Construction Automation, 11(6), 681- 694.
Stewart R. A. (2008). A framework for the life cycle management of information technology
projects: ProjectIT, International Journal of Project Management, 26, 203-212.
Suwardy T., Ratnatunga J., Sohal A. S. and Speight G. (2003). IT projects: evaluation,
outcomes and impediments, Benchmarking: An International Journal, 10(4), 325-342.
Svidt K. and Christiansson P. (2006). Experiences from implementation of ICT for resource
management in small construction companies, World Conference on IT in Design and
Construction, INCITE/ITCSED, New Delhi, Vol. 1, 285-295
Valida, A. C., Leng, A. C., Kasiran, M. K., Hashim, S and Suradi, Z., (1994) ― A Survey of
Information Technology Utilization Among Business Organizations in Malaysia‖,
Proceedings of International Conference on IT, KL: Malaysia.
Webb, R. M., Smallwood, J., and Haupt, T. C. (2004). ―The potential of 4D CAD as a tool for
construction management. Journal of Construction Research, 5(1), 43–60.
Whyte, J., Bouchlaghem, D., and Thorpe, T. (2002). IT implementation in the
construction organization. Engineering, Construction and, Architectural.
Management., 9(5–6),371–377.

Sam-Amobi, C. (2011) Innovative approaches to sustainable built environments in Nigeria In: Laryea,
S., Leiringer, R. and Hughes, W. (Eds) Procs West Africa Built Environment Research (WABER)
Conference, 19-21 July 2011, Accra, Ghana, 663-673.
663
INNOVATIVE APPROACHES TO SUSTAINABLE BUILT
ENVIRONMENTS IN NIGERIA
Chinwe Sam-Amobi1
Department of Architecture, University of Nigeria, Enugu Campus, Enugu, Nigeria
Sustainability as far as the environment is concerned, is not new. It is seen as a means
of reducing environmental degradation, enhancing environmental protection, and
environmental costs (such as energy consumption). Sustainability concepts also
encompass the basic principles of having a healthy lifestyle. This work reviews the
concept of sustainability as it relates to buildings and the built environment by
examining the basic principles and indicators of sustainable buildings, with a view to
determining innovative approaches to attaining sustainability in buildings in Nigeria.
Keywords: innovative approach, Nigeria, sustainable buildings, sustainability.
INTRODUCTION
With rising human population and the desire of all humanity for a comfortable,
healthy lifestyle, the Earth is experiencing increasing stress to the physical, chemical,
and biological systems that sustain life on our planet. Consequently, the greatest
challenge facing humanity is to attain harmony with the global environment and to
provide a sustainable future for the diversity of life on Earth. According to Levin
(1997) the contribution of buildings to the total environmental burden ranges between
12–42% for the eight major environmental stressor categories: use of raw materials
(30%), energy (42%), water (25%) and land (12%), and pollution emission such as
atmospheric emissions (40%), water effluents (20%), solid waste (25%) and other
releases (13%).
The role of environmental sustainability therefore has increased strongly during the
past decade. There is a worldwide awareness of the large role of built environment, for
example in U.S., the built environment accounts for 40 % of total energy consumption
and over 38 % of total carbon dioxide emissions, (Schleich, et al 2009). Consequently,
the built environment has an important role in climate change and in delivering a
sustainable energy economy. Energy consumption in the housing sector, work and
leisure places, lighting, heating, cooling and water heating is higher than in transport
or even industrial sectors. As this consumption grows,it leds to a proportionate
increase in CO2 emission into the environment, (Mickaityte,et al 2008).
The World Commission on Environment and Development was one of the first who
adopted the simple definition for sustainability to the mainstream international
political agenda. The WCED (1987) defines sustainable development as:
“…development that meets the needs of the present without compromising the ability
of future generations to meet their own needs”. The definition contains within it, two
key concepts: 1) the concept of 'needs', in particular the essential needs of the world's

Sam-Amobi
664
poor, to which overriding priority should be given; and 2) the idea of limitations
imposed by the state of technology and social organization on the environment's
ability to meet present and future needs.
Building sustainably is a balancing act between planning and research. By taking the
time to research and plan ahead of time, the building can be built with the Earth in
mind. While upfront costs can be higher, sustainable buildings save money in lower
energy, water, and clean-up costs. The core concepts of the sustainable development
of buildings are straightforward and allow for variety in visual design and application.
Sustainable buildings have existed since the historic past. They are built using such
traditions and know-how of generations that take into consideration such opportunities
as the characteristic properties of the wind, sun, currents of air, vegetation, water
surfaces, and natural sources of light. They are made of natural materials known for a
long time in ways based on tradition and experience, (Lányi 2007). Most countries in
the tropics have a long history of sustainable buildings, vernacular architecture, with
the hot and dry regions with hot days and cold nights developed over centuries, a
perfect balance of shading and daylighting, natural ventilation and heat storage. In the
hot and humid regions natural ventilation and shading systems were perfectly adapted
to the local climate, (Laar et al 2002). For buildings therefore to be sustainable they
should be able to minimize the consumption of natural resources and the release of
harmful emissions through the building system. In addition, sustainable buildings
should be able to create the desired building performance that corresponds to the user
needs and requirements stated by the owner.( Häkkinen, 2007). This paper reviews the
concept of sustainability as it relates to buildings and the built environment, by
examining the basic principles and indicators of sustainable buildings, with a view to
determining approaches to attaining sustainability in the built environment in Nigeria.
INDICATORS OF SUSTAINABLE BUILDINGS
The United Nations Conference on Environment and Development in 1992 recognized
the important role that indicators could play in helping countries make informed
decisions concerning sustainable development. Sustainability is a laudable goal, but
difficult to define and to implement because of the complexity of interlinked human
and natural systems, and the uncertainty inherent in such complex systems. Resilience
shows promise as a relevant and measurable attribute of sustainability, which itself
defies measurement. Identification and assessment of conditions that are desirable, as
well as those that are undesirable, are necessary in order to determine both the degree
of progress toward sustainability and the removal of impediments to such progress.
Indicators therefore are ideal means by which progress towards sustainable
development can be measured. However, most indicator initiatives throughout the
world have been aimed at state-of-the-environmental reporting, with relatively few
aimed at developing sectoral indicators.
Indicators perform many functions. They can lead to better decisions and more
effective actions by simplifying, clarifying, and making aggregated information
available to policy makers. They can help incorporate physical and social science
knowledge into decision-making, and they can help measure and calibrate progress
toward sustainable development goals. Indicators can provide an early warning to
prevent economic, social and environmental setbacks. They are also useful tools to
communicate ideas, thoughts and values. Indicators are supposed to be simple figures
or other signs, with help of which the information on a complicated phenomenon like
environmental pressure is simplified in a more easily understandable format. This is

Sustainable built environments
665
how the information is easier to explain also for those who are not experts or who
need the information quickly. It may be defined as a quantitative model and a form of
information that makes a certain phenomenon perceptible that is not immediately
detectable. Indicators therefore provide a simpler and more readily understandable
form of information than complex statistics or complex phenomena. The three main
functions of indicators are: quantification, simplification, and communication. .(
Häkkinen, 2007)
Agenda 21, chapter 40 states that ―Indicators of sustainable development need to be
developed to provide solid bases for decision making at all levels, and to contribute to
a self-regulating sustainability of integrated environmental and development systems.‖
Sustainability indicators are primarily needed, because complicated ecological, social,
cultural and economical phenomena need to be considered in decision making at all
levels. "Sustainable development is a continuous, guided process of societal change at
the global, regional and local levels, aimed at providing every opportunity to present
future generations to live a good life", (Rorarius 2007). In general, sustainable
development comprises three operational dimensions: an eco-economic, a societal and
a cultural dimension. The four dimensions of sustainability that must be aspired are
shown below:
Figure 1: The four dimensions of sustainability (Source: Rorarius 2007)
The mutual dependence of the economic, ecological, social and cultural dimension of
sustainable development, extends beyond the current generation and the long-term
nature of policies. However it rests on a global, national and local consistency
between various policy sectors; strong scientific foundation and an approach based on
the assessment of risks and probabilities; and strengthening of human resources by
offering better prerequisites for sustainable choices and equal opportunities for
individuals to attain self-fulfillment and influence society.
The question of how bad or good a building is in relation to 'sustainability' is an
important one and predicates on decisions of how much we need to improve the nature
or performance of a building in order to make it really sustainable. In the years
between 1980 and now Nigeria joined the rest of the world in the design and
construction of mansions such as the one below in fig 1 otherwise called
"mcmansions", generally characterized by shoddy construction, steep roofs of
complex design, theatrical entrances, lack of stylistic integrity and backsides which
are notably less fussy than their fronts. They appealed to people who value perceived
social status over actual, physical, economic or historic value. These buildings dot the
entire Nigerian urban areas and are high energy users, needing constant air-
conditioning, artificial lighting, and high maintenance costs.

Sam-Amobi
666
Fig 1: A mcmansion under construction.
APPROACHES TO SUSTAINABILTY IN THE NIGERIA BUILT
ENVIRONMENT
Urban areas are centres of arts, culture, education, entertainment and technological
innovations, which come with far reaching economic, socio-spatial and health
implications Sustainable development as applied to urban areas is the ability of the
urban areas and their regions to continue to function at levels of desired quality of life
by communities without limiting the options available to the present and future
generations and resulting to adverse impacts within and outside their boundaries
(Daramola, et al 2010).
The design, construction, and maintenance of buildings have a tremendous impact on
the environment and natural resources. All around the world, a huge amount of
buildings are being constructed and the challenge is to build them smart with a
minimal usage of non-renewable energy, minimal production of pollution, and
minimal cost of energy. Other important issues include increasing the comfort, health,
and safety of the people who live and work in them. According to the chaotic theory
of sustainable building there are three principles which are an example of natural
levels of order that can exist in architectural projects. The principles indicate that we
need strategies, not symbols, to create sustainable design and design innovation. An
important factor is that they can be applied in many ways, with a variety of
architectural expressions. They can be relevant at a master-planning level or the
design of a single building (Wheatley 2009). Either way this should lead to
sustainability in the built environment. Sustainable buildings should be seen as a
comprehensive process which is able to understand user needs and requirements, to
create design options that fulfill these requirements while minimizing environmental
impacts and life cycle costs, (Häkkinen, 2007).
The three major benefits associated with sustainable building and construction are
environmental, economic, health and community benefits. Environmental benefits
include improved air and water quality, reduced energy and water consumption and
reduced waste disposal. Economic benefits include reduced operational costs, reduced
maintenance costs and increased revenue (sale price or rent). Health and community
benefits include enhanced occupant comfort and health, (Häkkinen, 2007). In a

Sustainable built environments
667
country like Nigeria the community benefits will also include designs that take into
consideration the various traditions and culture of the people such as polygamy,
extended family system, street trading, and communal land ownership.
Creating a sustainable built environment in the developing world requires a different
approach to that taken by the developed world, the following sustainability indicators
if properly applied can lead to sustainable built environments in Nigeria.
Land use planning
In Nigeria, there is still strong adherent to the conventional land use planning
approach. Most major cities including Lagos, Kaduna, Port Harcourt, Onitsha, Enugu,
Aba, Yenogoa, Asaba have been developing with the conventional land use approach.
This has generated diverse urban problems manifesting in the form of deterioration of
cities into slums, pollution, congestion, unsanitary condition and epidemics. Nigeria
cities are reputed to be the dirtiest, most unsanitary, least aesthetically pleasing and
dangerously unsafe for living . They are characterized by non-functioning
infrastructure facilities, most poorly governed, intensively dotted with illegal
structures while physical growth and development of the cities had not been properly
managed or controlled (Aribigbola, 2008). Thus people in urban areas wallow not
only in abject poverty, but they also do not live in planned urban areas, which are
―orderly safe, convenient and healthy living environment‘ that is promised as the
gains of land use planning.
Fig 2: A chaotic transit route with trading going on alongside vehicular and pedestrian
movement.
In Nigerian millions of naira is spent producing masterplans for both institutional and
urban development. However there is very little awareness of the existence of these
plans by the people and great apathy on the part of government in adhering to or
implementing them. In Nigeria land use planning and control tools are either not
available or weakly implemented. Land use activities are disjointed and uncoordinated
with several organizations and agencies ( example in Enugu where there exists the
Capital Development Authority, the Local Government Planning Authorities, the
Enugu State Waste Management Agency and the Ministry of Environment). Figure 2
below shows the confusion found in most of our cities, where there is no distinction

Sam-Amobi
668
between vehicular movement, pedestrian movement and street trading. This leads to
the chaos seen in the picture below.
With a little more efficiency in planning it could be easy to separate pedestrian and
vehicular circulation as this will lead to a more efficient and orderly city as shown
below in Fig 3. Innovative approaches to achieve sustainability in the built
environment in Nigeria will require new planning strategies such as;
1. Community participation to encourage a feeling of ownership; promote public
awareness; and encourage community involvement;
2. Involvement of all stakeholders from the initial stages of planning process to
implementation and maintenance;
3. By providing sustainable approaches that address long-term concerns and energy
efficient urban development,
4. Encouraging greater diversity within the built environment, avoiding urban sprawl
and redeveloping urban wasteland
Energy
More than 90 per cent of our time is spent in buildings i.e. either in the office or at
home. Energy used in buildings (residential and commercial) accounts for a
significant percentage of a country‘s total energy consumption. This percentage
depends greatly on the degree of electrification, the level of urbanization, the amount
of building area per capita, the prevailing climate, as well as national and local
policies to promote efficiency. The energy efficiency of a building therefore is the
extent to which the energy consumption per square meter of floor area of the building
measures up to established energy consumption benchmarks for that particular type of
building under defined climatic conditions.
Fig 3: A well designed tree lined pedestrian walkway.
In Nigeria where electricity supply is poor, intermittent and power rationing is
frequent, there is a large demand for alternative energy sources such as diesel or
renewable energy-based backup/stand-by power generation from end-users. Reducing

Sustainable built environments
669
power and energy requirements in buildings reduces the capital outlay required and
the running costs of these stand-by systems.
The main benefit from measures to improve energy efficiency in buildings in Nigeria
will be to lower energy costs. Energy efficiency measures are meant to reduce the
amount of energy consumed while maintaining or improving the quality of services
provided in the building. Adopting energy efficiency strategies in Nigeria will involve
a retraining of Architects. Among the benefits likely to arise from energy efficiency
investments in buildings in Nigeria are: reducing energy use for cooling, reduced
electricity use for lighting, lower maintenance requirements and improved comfort.
Building Energy efficiency strategies for Nigeria must include integration of
(a) natural lighting (day lighting) strategies in building designs there by reducing the
incidence of daytime artificial lighting use.
(b) natural ventilation by efficient use of window openings (size and type), location of
openings on the facade. Currently the use of sliding windows cuts air flow into
interior spaces by half while the use of louvres achieves almost 100% air flow into
interior spaces. These louvres could be made to be more aesthetic and less boring by
producing them in various sizes and shades. Casement windows though quite aesthetic
are clumsy and not very durable while in use. They also allow for almost 100% air
flow into the buildings but unlike louvres require constant maintenance of the
controls.
(c) proper ventilation will reduce the use of air conditioning and thereby reduce costs.
(d) introduction of renewable energy sources such as solar energy, and bio mass will
reduce reliance on electricity supply from the national grid, while improving the
environmental quality of Nigerian built environment.
Water
Water is essential for life and every day domestic activities. Agriculture and industry
depend on reliable clean water supplies. Household water use is influenced by the
weather, type of dwelling, the number of water saving devices and house hold size.
Minimizing the water usage during production, maintenance, and other phases of the
building operation is a major goal of sustainability. Reducing water consumption and
protecting water quality are key objectives in sustainable building. To the maximum
extent feasible, facilities should increase their dependence on water that is collected,
used, purified, and reused on-site. The protection and conservation of water
throughout the life of a building may be accomplished by designing from inception
water conservation systems.
A good example of a sustainable building system for Nigeria will be one that has a
well designed rainwater harvesting system. This will require efficient strategies for
harnessing abundant rain water, on the average a normal heavy rainfall that lasts for
about two hours fills up a 500l ( five hundred liter) tank, with the make-shift water
harvesters installed in buildings, as can be seen in fig 4 below. The rainwater is
collected and stored either in underground concrete tanks or in over head tanks. When
needed, it is then pumped out for use. A water treatment plant could be installed.
Many urban centers in Nigeria lack portable water and residents are sometimes forced
to resort to unsafe water sources, such as run-offs, seasonal contaminated streams and
shallow wells. In towns like Enugu were the coal deposits make it impossible for
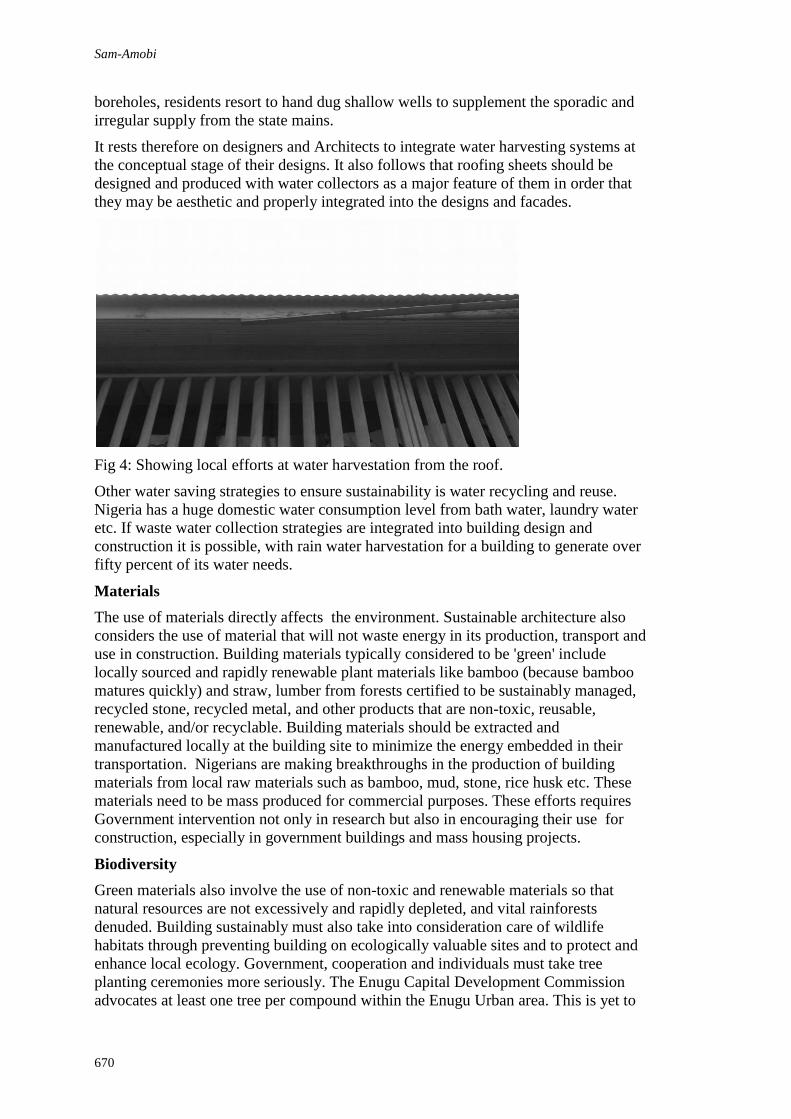
Sam-Amobi
670
boreholes, residents resort to hand dug shallow wells to supplement the sporadic and
irregular supply from the state mains.
It rests therefore on designers and Architects to integrate water harvesting systems at
the conceptual stage of their designs. It also follows that roofing sheets should be
designed and produced with water collectors as a major feature of them in order that
they may be aesthetic and properly integrated into the designs and facades.
Fig 4: Showing local efforts at water harvestation from the roof.
Other water saving strategies to ensure sustainability is water recycling and reuse.
Nigeria has a huge domestic water consumption level from bath water, laundry water
etc. If waste water collection strategies are integrated into building design and
construction it is possible, with rain water harvestation for a building to generate over
fifty percent of its water needs.
Materials
The use of materials directly affects the environment. Sustainable architecture also
considers the use of material that will not waste energy in its production, transport and
use in construction. Building materials typically considered to be 'green' include
locally sourced and rapidly renewable plant materials like bamboo (because bamboo
matures quickly) and straw, lumber from forests certified to be sustainably managed,
recycled stone, recycled metal, and other products that are non-toxic, reusable,
renewable, and/or recyclable. Building materials should be extracted and
manufactured locally at the building site to minimize the energy embedded in their
transportation. Nigerians are making breakthroughs in the production of building
materials from local raw materials such as bamboo, mud, stone, rice husk etc. These
materials need to be mass produced for commercial purposes. These efforts requires
Government intervention not only in research but also in encouraging their use for
construction, especially in government buildings and mass housing projects.
Biodiversity
Green materials also involve the use of non-toxic and renewable materials so that
natural resources are not excessively and rapidly depleted, and vital rainforests
denuded. Building sustainably must also take into consideration care of wildlife
habitats through preventing building on ecologically valuable sites and to protect and
enhance local ecology. Government, cooperation and individuals must take tree
planting ceremonies more seriously. The Enugu Capital Development Commission
advocates at least one tree per compound within the Enugu Urban area. This is yet to

Sustainable built environments
671
be implemented. This strategy if properly articulated and implemented would change
the urban space and image of the city and could also be applied to other major cities in
Nigeria which are bare and lack luster.
Social
Most cities in Nigeria have a diverse population; gender, age, ethnicity, religion,
income, wealth and ability. In some cases, this reflects ethnic or religious differences.
The way most Nigerian cities are planned or developed, both historically and
currently, have failed to take into account the needs of many of these diverse groups,
because the groups lack the influence to bring their interests to prominence and
therefore to affect policy and planning decisions. A cursory look at most Nigerian
cities reveals that ethnic ties and identities are reinforced because most city-dwellers
are to some extent within their own ethnic network, which serves as a partial barrier
between them and the wider social system. The sharp cultural differences among
many groups further hamper the development of an inter-ethnic sense of community.
This may be responsible for the killing and unrest in some parts of the country. This
could also be attributed to incompatible modes of community life. For the built
environment to be sustainable residents of the city must feel safe and secure. this
shows that attainment of sustainability in Nigeria can only be possible with
intervention of government in provision of appropriate and effective security to city
dwellers.
Economic
Good design, in the context of sustainability is economical, and calls for designing
buildings which are easy to use, easy to convert for other uses, safe to use for both
children and the elderly. It can also have an influence on energy usage, repair and
maintenance, and inevitably, on the property‘s value. Energy efficiency in the
Nigerian built environment will be most economical to residents because of cost
savings from alternative power generation, better health due less exposure to pollution
( fume and gases, water, etc).
The physical well-being of the occupants is the primary concern of this principle. Its
area of concern is the general atmosphere within a building. For example, stale air is
not healthy to breathe for long periods of time and good design can prevent this
problem. The use of hazardous building materials are also avoided by this principle.
DISCUSSION
With respect to matters of the environment, the Nigerian people are becoming more
aware of the fact that the land, water, coastlines, air and other natural resources in the
towns and cities are being rapidly polluted and degraded, creating in the process loss
of valuable resources. However, low level of involvement of the people, absence of
effective advocacy and inappropriate programmes of development compound the
problems. To make progress in the area of sustainable development in Nigeria, there
must be conscious changes. What is required is a new approach that will respect the
climate and culture of each region and therefore create an ecological and cultural
sustainability in the built environment. There are a lot of solutions that may be
implemented in order to achieve a much better sustainability. In some areas, research
and development work has to be done; improvement in the formation of future
architects and engineers, beginning with interdisciplinary projects at the faculties;
prototypes and pilot projects for research and development as well as for proving to
investors and planners that these new ideas really work. This is definitely a

Sam-Amobi
672
government duty as appropriate policy is very crucial. The government must set up
appropriate drivers (political, environmental and economical) leading to sustainable
management systems by;
(a) building industry capacities through training
(b) developing work in sustainable building technologies
(c) government taking the lead by giving incentives to private sector to improve
existing building stock by retrofitting to improve energy efficiency
(d) energy profiling of building types and raising awareness on the benefits of
sustainable buildings
(e) developing and imposing minimum standards especially for new construction by
introducing energy codes, energy rating and certification.
(f) the implementation of sustainable building practices in a multi-cultural society
with different cultural practices and aspirations, and different ways of using the built
environment
(g) An integrated approach to sustainable development by encouraging and enabling
collaboration between the different built environment professions, the professions and
other professions such as environmentalists, sociologists, anthropologists, and the
professions and the different layers of government (federal, state and local), as well as
community involvement and public/private partnerships.
CONCLUSION
The country is currently undergoing fundamental political, social and economic
reforms aimed at stabilizing the economy and placing the nation on the path of
sustainable development.
Sustainable development policies in Nigeria must incline toward longer-term, broad-
spectrum interventions, touching upon the driving forces operating in human society.
This would mean tackling inequities, poverty, and population growth and thereby
contributing, for example, to the control of land degradation and deforestation,
biodiversity loss, soil erosion, food insecurity, and decline in water quality. (Corvalán,
et al 1999).
The concept of Sustainable architecture is not new. It has been resorted to before as a
means of reducing building operating costs (such as energy consumption and
maintenance), and its precepts also encompass the basic principles of having a healthy
lifestyle. The former reduces the building‘s negative impact on the environment, while
the latter ensures that the occupants‘ well-being (which may not only be limited to
physical well-being) is also taken care of.
Sustainable architecture can therefore become a significant part of the path to a
sustainable future in Nigeria because a sustainable building serves the needs of the
people who inhabit it. It supports and nurtures their health, satisfaction, productivity,
and spirit. It requires the careful application of the acknowledged strategies of
sustainable architecture - non-toxic construction; the use of durable, natural resource
efficient materials; reliance on the sun for day lighting; renewable energy sources; and
recycling of wastes into nutrients.
Employment of integrated design principles: optimization of energy efficiency and use
of renewable energy; protection and conservation of water; enhancement of indoor
environmental quality, and reduction of environmental impacts of materials, will lead
Nigeria to achieving sustainability.

Sustainable built environments
673
REFERENCES
Aribigbola, A. (2008) Imroving Urban Land Use Planning And Management In Nigeria: The
Case Of AkureTheoretical and Empirical Researches in Urban Management, Year 3,
Number 9, 2008 Cercetari practice si teoretice în Managementul Urban, Anul 3, Nr. 9,
2008 ISSN: 1842-5712
Corvalán, C.F., Kjellström,T., Smith, K.R., (2009). Health, Environment and Sustainable
Development. Identifying Links and Indicators to Promote Action Epidemiology
September 1999, Vol. 10 No. 5 656-660
Daramola, A., & Ibem, E.O., (2010) Urban Environmental Problems in Nigeria: Implications
for Sustainable Development. Journal of Sustainable Development in Africa (Volume
12, No.1, 2010) ISSN: 1520-5509
Dizdaroglu, D., Yigitcanlar, T., & Dawes, L. (2010). "Assessing The Sustainability Of
Urban Ecosystems: An Innovative Approach". 1 4 T H International Planning
History Society Conference .http://web.itu.edu.tr/~csuygar/iphs2010/abs/ID228.pdf
Ghosh S., (2007) Sustainable Approach to Healthy Buildings Indoor Proceedings of Clima
2007 WellBeing Indoors
Häkkinen, T., (2007) Draft of New Work Item Proposal - Sustainability in building
construction Sustainability indicators - Part 1 Buildings. http://www.rpd-
hesr.com/uploads/custompages/ISO
059SC17_N0236_Draft_of_New_Work_Item_Proposal_-_Susta.pdf (assessed July,
2010)
Laar, M., Grimme, F.W. (2002) Sustainable Buildings in the TropicsRIO 02 - World Climate
& Energy Event, January 6-11, 2002 163.
http://www.rio02.com/proceedings/pdf/159_Grimme.pdf (assessed September, 12,
2010)
Lányi, E., (2007) The basic principles of sustainable architecture.
http://www.pp.bme.hu/ar/2007_2/pdf/ar2007_2_06.pdf (assessed July, 2009)
Leitner, T., Schiffleitner, A., Lipp, B., (2010) Assessment and Simulation Methods for Green
Building Planning http://www.corp.at/archive/CORP2010_261.pdf
Levin, H. (1997). Systematic evaluation and assessment of building environmental
performance (ASEABEP). Proc. Second International Conference on Buildings and
the Environment, CSTB and CIB, 2, Paris, June, 3–10.
Mickaityte, A., Zavadskas, E.K., Kaklauskas A., Tupenaite L.I. (2008). The concept model of
sustainable buildings refurbishment/koncepcinis darnaus visuomeniniu pastatu
atnaujinimo modelis.(Report) International Journal of Strategic Property Management
- March, 2008
Rorarius, J., (2007 ). Existing Assessment Tools and Indicators: Building up Sustainability
Assessment (Some Perspectives and Future Applications for Finland)
Schleich, H., Lindholm, A., Heidi Falkenbach, H. (2009)Environmental sustainability–drivers
for the real estate investor http://www.eres2009.com/papers/1A_Schleich.pdf
Wheatley, D., (2009) A Chaotic Theory Of Sustainable Building Principles
http://www.woodsbagot.com/en/Documents/Public_Research/090318_Donna_wheatl
ey_chaos_paper.pdf (assessed September, 12, 2010).


Ashiboe-Mensah, N.A., Akuffo, F. and Fugar, F. (2011) Investigating the perceptions of architects in
the Ghanaian building industry with regard to photovoltaic energy technology In: Laryea, S., Leiringer,
R. and Hughes, W. (Eds) Procs West Africa Built Environment Research (WABER) Conference, 19-21
July 2011, Accra, Ghana, 675-682.
675
INVESTIGATING THE PERCEPTIONS OF
ARCHITECTS IN THE GHANAIAN BUILDING
INDUSTRY WITH REGARD TO PHOTOVOLTAIC
ENERGY TECHNOLOGY
Naa Adjeley Ashiboe-Mensah1, Fred Akuffo
2 and Frank Fugar
3
1,3Department of Building Technology, Kwame Nkrumah University of Science and Technology,
Kumasi, Ghana
2 Department of Mechanical Engineering, Kwame Nkrumah University of Science and Technology,
Kumasi, Ghana
Photovoltaic energy conversion is widely considered one of the promising renewable
energy technologies with the potential to contribute significantly to a sustainable
energy supply and which may help to mitigate green house emissions. However the
availability of physical and technical potential of the technology does not guarantee
adoption. Rather a number of factors including how the technology and its attributes
are perceived by potential adopters influence the adoption decision. This study
therefore investigates the perceptions of photovoltaics by architects in the Ghanaian
building industry. It involved a survey of architects within the Ghana Institution of
Architects. Results of the study showed a generally positive perception regarding
photovoltaics except with a number of items such as initial cost of the technology.
The few negative perceptions may however account for the low levels of actual
photovoltaic adoption in the Ghanaian building industry.
Keywords: energy, Ghana, innovation diffusion, photovoltaic.
INTRODUCTION
According to (Alsema and Nieulaar, 2000) ―photovoltaic (PV) energy conversion is
widely considered one of the promising renewable energy technologies which has the
potential to contribute significantly to a sustainable energy supply and which may help
to mitigate green house emissions‖ (Jackson and Oliver, 2000) (Johansson et al.,
2004). In Ghana where there is a need to decrease demand on the national grid and
also increase the renewable component of the nation‘s energy mix, photovoltaics (a
type of solar technology that generates electricity using sunlight) seem like a plausible
means of achieving both goals simultaneously especially by incorporating them in
new buildings in urban areas.
PHOTOVOLTAIC ADOPTION AND DIFFUSION
Literature, relating to Ghana and the world, shows that there is a significant difference
in the actual levels of investment in photovoltaic energy technology and the possible
levels of investment given the physical and technical potentials (Bawakyillennuo,

Ashiboe-Mensah, Akuffo and Fugar
676
2007). This problem of adoption and use of photovoltaics have been attributed to a
number of barriers including misplaced incentives, distortionary fiscal and regulatory
policies, unpriced cost such as air pollution, unpriced goods such as education,
training and technological advances, and insufficient and imperfect information
(Brown, 2001) (Golove and Eto, 1996) (Painuly and Fenhann, 2002). Consequently
the aim has been to identify these barriers and eliminate them in order to promote
adoption.
Whereas this traditional approach has been to identify related barriers and eliminate
them, an alternate approach to compliment the traditional approach forms the basis of
this paper. This perspective seeks to understand the factors that may potentially
influence individuals‘ adoption of photovoltaics by focusing on how the theoretical
understanding of the diffusion of innovations as presented by Rogers (2003) can be
used to evaluate the factors that influence PV adoption and diffusion in the Ghanaian
building industry.
Formal inquiries into energy efficient and renewable energy technologies such as
photovoltaics tend to isolate diffusion and adoption factors without integrating them
into a broader theoretical framework except in a few cases (Bawakyillennuo, 2007).
Investigations hence become difficult to compare owing to differences in concepts
used to describe similar phenomenon. Although photovoltaic adoption and diffusion
has widespread interest owing to their environmental, national security and
macroeconomic repercussions; they are essentially like other products and services
which also face obstacles that hinder their adoption. As such they can be investigated
using the vast array of concepts and theories; grouped under the umbrella of
innovation diffusion; specially established to study how and why new products,
practices and ideas spread.
PURPOSE
This paper is part of a larger research to investigate the factors that may influence
photovoltaic adoption in the Ghanaian building industry and involves clients,
architects and electrical engineers. The paper however only reports on the initial
results of a cross-sectional survey that investigates the perceptions of architects about
photovoltaics.
The diffusion of innovation theory (Rogers, 2003) and a framework by Hartmann et
al. (2006) together provide a majority of the relevant variables that influence the
adoption of innovations. However this study evaluates the factors that relate to
perceived innovation attributes as these have been noted to account for 49-87 percent
of variance in the rate of adoption of innovations. (Rogers, 2003) (Ostlund, 1974)
(Dearing, 2007). Five standard attributes have been defined by Rogers (2003) and
include:
1. The relative advantage of the innovation
2. Its compatibility with the potential adopters‘ current way of doing things and
with social norms
3. The complexity of the innovation
4. Trialability, the ease with which the innovation can be tested by potential
adopter
5. Observability, the ease with which the innovation can be evaluated after trial
These attributes formed the basis of the items that are rated in the questionnaire.

Photovoltaic energy technology
677
RESEARCH DESIGN AND METHOD
In diffusion research4 two major research approaches are applicable- Variance
research and Process research depending on the aim of the research (Gopalakrishnan
and Damanpour 1994, Subramanian and Nilakanta, 1996). Whereas variance research
involves data gathering and analysis that consists of determining the covariance
(correlations) among a set of variables, process research seeks to determine the
sequence of a set of events over time (Rogers, 2003). For example variance research
may be employed to investigate the key variables that influence innovation
adoption/diffusion and process research maybe used to investigate the process an
individual goes through in coming to a decision to adopt an innovation. Consequently
variance research involves quantitative methods which measure variables by assigning
numerical values to behaviour and process research involves qualitative methods.
The study employed a survey method of research to the research aim outlined above.
The choice of the survey method hence the variance approach in this research was
informed by the aim of the study. The survey was a cross-sectional one with data
collected at one point in time rather than over time and involved the use of a
structured self administered questionnaire.
The population of the study comprised of architects within the Ghanaian building
industry with the sample frame of the architects selected based on the list of members
as provided by Ghana Institute of Architects. The list was made up of 586 architects
out of whom 314 had valid email addresses.
Questionnaire design
The design of the research questionnaire was carried out in four steps: informal
interviews, literature review, informal and formal questionnaire pre-tests. The initial
step conducted in the research and which informed the questionnaire design was the
informal interview of building professionals and researchers, employees at the Ghana
Energy Foundation and Energy Commission. These interviews brought to light the
issues surrounding energy generation and use in Ghana and hence helped identify the
research problem to be investigated and the major issue the questionnaire was to
tackle. Clearly identifying the research problem guided and focused the literature
review. The interviews also made sure that the problem identified was directly
relevant to the Ghanaian context.
A review of literature for other related surveys and interviews was then conducted so
as to determine the format of the survey instrument and how questions were
paraphrased and generated. The literature review also provided the theoretical
framework of the research and most of the relevant variables include in the
instrument. Supporting the empirical inquiry with a theoretical framework as was
done provided a majority of the factors to be evaluated. Also it made it easier to
identify new information that may extend the boundaries of the selected framework.
Furthermore the framework also presented the methodological options available for
the study and provided a reference point around which the discussion of the results
and findings are centred.
A draft of the questionnaire was then developed and an informal pre-test conducted to
determine whether the questions were easily and consistently understood by asking
4 Diffusion research deals with the study of how and why innovations(an idea, practice or object that is
perceived as new by an individual or other adoption unit) are adopted and spread

Ashiboe-Mensah, Akuffo and Fugar
678
the individuals to say in their own words what they thought the questions meant.
Finally a final formal pre-test involving ten individuals working as professionals and
researchers in the building industry and clients was done. Although respondents
included only architects, the pre-test had respondents drawn from a range of
individuals within the Ghanaian building industry in addition to architects in order to
obtain comprehensive comments and input. This culminated in the final questionnaire
used in data collection.
Sample size
Sample size was calculated using the following formulae:
= = 96
n = sample size
Z = the z-score from a normal distribution table at 95% confidence interval (1.96)
p = the proportion of the population that expresses the same opinion. 0.05 is
selected since this value of ‗p‘ gives the highest sample size
E = standard error which is assumed to be 0.1 for the study
This sample size of 96 was however the total for the larger study of architects (70),
clients (16) and electrical engineers (10). Although only 70 architects were required
to respond, 314 architects (all those with valid email addresses on the GIA list) were
contacted with the questionnaires to cater for low response rates.
Data collection
Actual data collection was carried out using dual methods. The initial distribution of
the questionnaires was done via email and then a second phase involved the
distribution of hard copies of the questionnaire. Respondents were first sent an
introductory email informing them of the impending survey and explaining the
purpose of the survey. Subsequently, a second email containing a hyperlink to access
the survey was sent followed by two reminder emails a week apart. Respondents who
failed to respond to the questionnaire were then contacted by telephone with a final
reminder. Some respondents expressed a preference for printed copies of the
questionnaire and were therefore furnished with them.
FINDINGS
The findings reported in this paper are based on thirty-nine5 responses obtained from
the survey out of the total of 314 questionnaires sent out.
Knowledge of PV
The first question sort to find out how many architects knew about photovoltaics. Out
of the 38 responses obtained 32(84%) knew about PV and 6(16%) did not. One person
did not respond to this question. Only respondents that knew about photovoltaics (32)
went on to answer the follow up questions.
5 As at the time the paper was written only 39 responses had been received, but it is expected that more
will respond subsequently.

Photovoltaic energy technology
679
Communication channels
In this question respondents were asked to indicate where they first heard about
photovoltaics.
Table 2 Source information on Photovoltaics
COMMUNICATION CHANNEL FREQUENCY
University/research institute 6
Worldwide web/internet 5
Peers/friends 5
Don't remember 4
Trade show/building exhibition 4
Manufacturer's brochure 1
Consultants and fellow building participants 1
Journal/technical publication 1
Secondary school 1
Client 0
Sales and supplier representatives 2
Seminar/conference 1
Advertisement (television, newspapers, radio etc.) 1
Non-response 1
Total 39
Level of adoption
This question investigated the number of architects who had actually adopted the
technology. [Table 2]
Table 3 Photovoltaic adoption by architects
TYPE OF ADOPTION DECISION RESPONSES
been part of a project in which photovoltaics were adopted (adoption) 6
currently on a project in which photovoltaics are to be installed (adoption) 3
been part of a project in which photovoltaics were proposed but not installed
(rejection)
8
never been part of a project in which photovoltaics have been adopted (non-
adoption)
14
been part of a project in which photovoltaics were adopted but later
discontinued (discontinuance)
1
Non-response 1
Total 33
Decision-making
This aspect of the questionnaire had two questions that found out about building
participants involved in the decision to adopt photovoltaics and the one that made the
final decision. Out of the 33 responses 19 who had been involved in some decision-
making process regarding photovoltaics went on to answer this question.
Perceived innovation attributes
This question sought to investigate the perceptions of architects on the attributes of
photovoltaics by rating a number of items. A summary of statistics of the results is
presented in tables 5 and 6.

Ashiboe-Mensah, Akuffo and Fugar
680
DISCUSSION
Prior to making a decision to adopt or reject an innovation such as photovoltaics, there
must be the knowledge of the existence of the innovations (Rogers, 2003). Data
collected reveals a majority of the architects have been exposed to the existence of
photovoltaics however the question does not explore the type of knowledge they have.
Table 4 Item codes for attributes and definition6
ITEM ID ATTRIBUTES
1 Impact of photovoltaics on profitability
2 Certainty of its future performance
3 Labour savings derived from the use of photovoltaics
4 Waste reduction potential of photovoltaics
5 Ability to recover the cost of photovoltaics
6 Reduction in build time
7 Compatibility with preferred construction practices
8 Ease of continuing use of photovoltaics
9 Impact of photovoltaics on image/status
10 Initial cost of the photovoltaics
11 Ease in first use of photovoltaics
12 The risk of failure associated with using photovoltaics
13 Continuing cost of photovoltaics (Cost-in-use/running cost)
14
Quality compared with alternatives (diesel generators, electricity from the grid
i.e. ECG etc)
15 Compatibility with construction codes and standards
16 Greenhouse gases/CO2 reduction potential of photovoltaics
17 Ability to see the photovoltaics in use in other projects
18 Noise reduction potential of photovoltaics
19 Cost savings derived from the use of photovoltaics
20 Visual/aesthetic impact of photovoltaics
21 Ability to try the photovoltaics prior to actual adoption
22 Material savings derived from the use of photovoltaics
23 Impact of photovoltaics on safety
Knowledge does not however guarantee adoption; rather the attitude towards an
innovation frequently intervenes between knowledge and the decision functions in the
innovation decision process. From the study, the architects generally have a
favourable attitude or perception of photovoltaics i.e. 50% and above of respondents
rate majority of the items as good, very good or excellent (% Rating ≥ good). [Table 5
and table 6]. However some attributes have negative perceptions: Labour savings
6 This table to be used with Table 5 and 6 to define the meaning of the Row headings 1-23 and the
attributes they represent

Photovoltaic energy technology
681
derived from the use of photovoltaics, reduction in build-time, initial cost of
photovoltaics, ease in first use of photovoltaics, the risk of failure associated with
using photovoltaics, ability to see the photovoltaics in use in other projects, ability to
try the photovoltaics prior to actual adoption and material savings derived from the
use of photovoltaics. Of the above the initial cost of photovoltaics had an extremely
negative rating i.e. 73% of the respondents rated it as fair or poor [Table 5].
The study also investigated the building participants involved in decision to adopt
photovoltaics. Clients and architect were detected to wield a greater influence in the
innovation decision than other building participants. [Table 3]
CONCLUSIONS
The use of the theory of diffusion of innovation in investigating the adoption of
photovoltaics is limited and those that pertain to the Ghanaian building industry are
absent. This paper therefore is part of a larger study which extends the use of the
theory applying it to a new context.
The theory of diffusion of innovation is extensive in its propositions and concepts
hence fitting it within a single research study presents a challenge. This study focuses

Ashiboe-Mensah, Akuffo and Fugar
682
on just a portion and so there remains need for further research in this area within the
context of the Ghanaian building industry. The current study only investigates the
perceptions of architects but the perceptions of other building project participants, for
example the building client, are relevant hence more studies are needed in this regard.
Although the study shows a high level of knowledge and generally positive
perceptions regarding photovoltaics, a number of attributes reveal negative
perceptions and actual adoption of the technology is low (6 respondents have been
part of projects in which they have been adopted [Table 2]). Consequently if the
preferred end of policy makers to increase adoption is to be realised perceptions must
be positively influenced. Where perceptions represent an objective assessment of
performance of the photovoltaics, efforts should be aimed at improving the technology
and introducing policies that minimise negative effects of adoption. Alternatively in
cases where perceptions are contrary to the objective assessments, further education is
required to alter such false perceptions.
REFERENCES
Alsema, E. A. and Nieuwlaar, E., 2000, Energy viability of photovoltaic systems. Energy
Policy, Vol.28, Issue 14, 999-1010.
Bawakyillennuo, S. 2007. Rural electrification in Ghana: Issues of photovoltaic energy
technology utilisation. Ph.D. diss., The University of Hull, Hull.
Brown, M.A., 2001, Market failures and barriers as a basis for clean energy policies, Energy
policy Vol.29, Issue 14, 1197-1207
Dearing, J.W. 2007. Measurement of Innovation attributes. [Online]. Available on:
http://www.research-
practice.org/tools/measures/Innovation%20attributes%20measurement.pdf [Accessed:
19/10/2010]
Golove, W. and Eto, J. 1996 Market barriers to energy efficiency: a critical appraisal of the
rational for public policies to promote energy efficiency. Berkeley
Gopalakrishnan, S. and Damanpour, F. 1994. Patterns of generation and adoption of
innovation in organisations: contingency models of innovation attributes, Journal of
Engineering and Technology Management Vol. 11 No. 2 95-116
Hartmann, A., Dewulf, G. and Reymen, I. 2006 Understanding the innovation adoption
process of construction clients. Clients driving innovation: Moving ideas into practice
12-14 March 2006
Jackson, T. and Oliver, M. 2000. The viability of photovoltaics. Energy Policy, Vol. 28, Issue
14, pp. 983-988.
Johansson, T.B., McCormick, K., Neij, L. and Turkenburg, W. 2004. The Potential of
renewable energy. Paper presented at the International conference for renewable
energies. Bonn.
Ostlund L.E. 1974, Perceived innovation attributes as predictors of innovativeness. The
journal of consumer research Vol. 1 No. 2 23-29
Painuly, J.P. and Fenhann, J.V. 2002. Implementation of renewable energy technologies –
Opportunities and barriers. Denmark: UNEP Collaborating Centre on Energy and
Environment.
Rogers, E.M. 2003. Diffusion of innovations (Fifth edition).New York: The Free Press.
Subramanian, A. and Nilakanta, S. 1996. Organisational innovativeness: exploring the
relationship between organisational determinants of innovativeness, types of
innovations and measures of organisational performance. Omega Vol. 24, No.6, 631-
647.

Chindo, P.G. and Adogbo, K.J. (2011) Investigation into the use of total quality management in
Nigerian construction industry: A case study of large and medium size firms In: Laryea, S., Leiringer,
R. and Hughes, W. (Eds) Procs West Africa Built Environment Research (WABER) Conference, 19-21
July 2011, Accra, Ghana, 683-690.
683
INVESTIGATION INTO THE USE OF TOTAL QUALITY
MANAGEMENT IN NIGERIAN CONSTRUCTION
INDUSTRY: A CASE STUDY OF LARGE AND MEDIUM
SIZE FIRMS
Peter Gangas Chindo1 and Kulomri Jipato Adogbo
2
Department of Quantity Surveying, Ahmadu Bello University, Zaria, Nigeria
Previous researches indicate that Total Quality Management (TQM) has been in use
since the 1980s. In Nigeria, studies have shown little usage of TQM despite its
potential benefits to the industry. This study therefore aims at investigating the use of
TQM in Nigerian construction industry. The study was carried out using structured
questionnaire to collect data from stake holders in the construction industry. The data
were analysed and the mean and standard deviations were determined and formed the
basis for discussion. The results indicate that most contracting organisations in
Nigeria are yet to fully adopt TQM in their operations. The findings suggests that
principal factors which prevent contracting organisations from adopting TQM is the
perception that it takes a long time to yield the desired benefits, and that TQM
involves unnecessary extra cost. It was recommended that government being the
major client of the construction industry should come up with an award for excellence
for quality construction to deserving organisations and a penalty for organisations
which refuse to adopt TQM. This will serve as an incentive for conformity to
standards in various areas of the industry and deterrent to defaulters.
Keywords: Total Quality Management, Nigeria.
INTRODUCTION
Total Quality Management (TQM) is a concept which developed over time from the
basic principles of management having as its main objective the improvement of every
part of an organisation. It‘s basically about doing the right things at the right time in
the first instance (Ramachandran, 2010). TQM features focus on the customers‘
satisfaction, continuous improvement in terms of service delivery and measurement of
quality (Emison, 2004). TQM requires a thorough understanding by all members in an
organisation, of the needs and desires of the clients in order to meet these needs in the
most efficient and cost effective way possible. The elements of TQM as identified by
Ramachandran (2010) include customer (the ultimate user who wants a quality
product at a reasonable price); leadership (vision, commitment and leadership
exhibited by top management); recognition and rewards (recognising employees‘
outstanding performance); education and training (to upgrade the knowledge of the
employees); feedback mechanism (customers‘ feedback is analysed and corrective
steps taken); and team work (employees work as a united team to achieve common
goal). Koh and Low (2010) identified the following eight elements: top management

Chindo and Adogbo
684
leadership, customer management, people management, supplier management, quality
information management, process management, organisational learning and continual
improvement. The factors identified in Ramachandran (2010) and Koh and Low
(2010) were listed by Metri (2005) in what he calls critical success factors (CSFs) for
the implementation TQM by construction organisations.
The study into quality management may be viewed from the point of view of the
several theories underlying the subject area, the quality management processes
involved and the role of various professionals in quality management (Anon, 1999).
This paper considers the professionals involved in the construction industry and seeks
to establish their perception on the use of TQM by their organisations. There is an
increasing interest in the human resource issues surrounding quality thus requiring
organisations to reassess or redesign their quality management programmes. Sanni
and Windapo (2008) observe that today quality has moved beyond manufacturing
into...construction. Kiwus and Williams (2001) and Al-Momani (2007) have observed
that TQM techniques can be applied to improve construction processes.
Haupt and Whiteman (2003) opined that the construction industry has been slow to
embrace the concept stating that contractors will only use those aspects that would
improve their competitive advantage and improve their financial performance. This
notwithstanding, it is helpful to look into the adoption of the concept of TQM by
contractors in order to determine extent of use and to ascertain benefits derived by
them. There is need for a proposed radical change in the industry practice that will
improve the quality of the construction processes and level of clients‘ satisfaction. The
image of most contractors has been dented over the last eight (8) years (FOS, 2004),
as a result of their inability to meet up with their clients‘ requirements which led to a
decrease in the level of clients‘ satisfaction. Information on news and print media have
been reporting cases of abandoned projects, total collapse of buildings at the
construction stages, decrease in profit margins, low quality of construction works,
poor performance by contractors, increase in overhead charges and formal litigation.
Above all, there is greater difficulty in selecting a high quality oriented contractor for
a project. Therefore, it has become pertinent for contracting organizations to establish
a quality management system that will help to bring projects to a satisfactory
completion within time, cost limitations and maintaining quality standards, with
greater improvement in quality of construction, construction processes, and the level
of clients‘ satisfaction.
Against this backdrop, the study aims to investigate the use of Total quality
management among construction firms in Nigeria. This research covers the use of
total quality management among large and medium size construction firms located
within the Kaduna and Abuja metropolis. According to Uduak (2006), the
construction firms in Nigeria can be classified as follows:
1. Large firms: firms whose annual turnover range from 500 million naira and above
and have over fifty workers on its pay roll. They undertake erecting of a wide
range of building from housing estate to offices, hospitals and factories, these
firms occupy less than three percent of the contracting firms in Nigeria, they
undertake both national and regional works.
2. Medium sized firms; those who have annual turnover between 100-500 million
naira and have between 20 to 50 people in its pay roll. The regional firms
undertake regional work such as real estate schemes and others and they constitute
about twenty three percent of total contracting firms in Nigeria.

Total quality management
685
3. Small sized firms: those whose annual less than 10 million naira to 100 million
naira and have less than 20 people on its pay roll. They undertake small works,
industry minor repairs and maintenance works and they are almost seventy four
percent of contracting firms in Nigeria.
TOTAL QUALITY MANAGEMENT IN CONSTRUCTION
Several studies have looked into the adoption of TQM in construction and the general
observation is that the construction industry is slow in adopting TQM concept despite
its identified potential benefits. According to Haupt and Whiteman (2003), this is one
reason why construction remains behind where it should be on the implementation of
TQM. Agha (2011) opines that the reason for the late arrival of the construction
industry to TQM approach is that construction professionals are not familiar with its
principles and techniques. However, Boaden and Dale (1992) note that the relative
immaturity of the construction industry in adopting TQM may be an advantage if
companies learn from the mistakes and the best practices of other organisations.
Ramachandran (2010) observed that the construction industry is more complex
compared to other industry and that the use of TQM approach can be useful in
analysing and remedying defects as soon as they occur. Miller (1993) notes that the
emphasis of TQM is placed on prevention of the causes of defects rather than on
correction, thus providing a means for achieving quality in the construction process.
Pheng and Teo (2004) investigated how TQM can be applied more actively in the
construction industry in Japan. They noted that TQM can be embraced in the
construction industry to help raise quality and productivity and concluded that for
successful implementation of TQM, organisations needed to develop a culture change
and a change in status quo. It is easier to teach new employees about TQM strategy
than to try to teach old employees who are set in their ways.
McIntyre and Kirschenman (2000) surveyed the acceptance of TQM in upper
Midwestern United States and they found that majority of their respondents (72.5%)
employed TQM practices and benefits articulated include higher customer satisfaction
and improved schedule performance. They recommended an increased effort to be put
in the education and training requirements regarding the implementation and
application areas of TQM and a more systematic approach to the collection and
analysis of data concerning the overall TQM process. According to a survey by Koh
and Low (2010), they found that of eight identified elements of TQM, customer
management, process management and top management leadership were implemented
at a higher level by construction companies.
Agha (2011) studied the suitable applications of TQM in different phases of
construction projects and concludes that though the industry is late in adopting TQM
it is a suitable tool for improving business quality, increasing customer satisfaction
and saving time. Sannni and Windapo (2008) evaluated contractor‘s quality control
practices on construction sites in Nigeria and they found that over 80% of contractors
did comply with some form of quality control plan and recommended that contractors
be evaluated based their compliance or otherwise with quality plans.
TQM philosophy is applicable on various platforms in the construction industry from
the office management to site operations, whether pre-construction phase or during
construction as a necessary avenue for securing customer satisfaction and improving
productivity while enhancing organisations‘ profitability.

Chindo and Adogbo
686
Benefits of TQM
The potential benefits offered by TQM techniques are varied and the consensus from
various studies is that it has been successfully applied in other industries and can be
very beneficial in the construction industry. Hassin et al (2007) studied TQM
implementation in the electrical generation industry and found that its adoption will be
of pre-eminent importance to the industry in Libya. In considering application of
TQM to environmental construction Kiwus and Williams (2001) conclude that TQM
techniques may reduce the frequency and severity of schedule overruns. Other
benefits for implementing TQM include: higher customer satisfaction, reduction in
construction costs, improved employee job satisfaction, improved schedule
performance, improved relationships with subcontractors, reduced rework, improved
safety, higher productivity, lower employee turnover, speeding up construction work,
improved methods of working, better control over the construction process, gaining
competitive advantage, increase profitability, decreasing waste and rework, better
coordination of activities and more customer focused (Hassin et al, 2006; Love et al,
2000; McIntyre and Kirschenman, 2000; Al-Momani, 2007; Khadour and Darkwa,
2008; Chini and Valdez, 2003; Love et al, 2004).
Obstacles to implementing TQM programme
The implementation of TQM in construction has been the subject of arguments the
main ones being that diversity of construction products. Quality is sometimes a
subjective construct based on the customers‘ perceived needs and degree of
satisfaction. Secondly, the construction industry is considered unstable where several
organisations suffer collapse within short intervals. Since TQM is a long-term
endeavour some of these firms may not want to engage in an effort that may not
provide any yield till after several years. Thirdly, it is the misconception of the cost of
quality. Contractors often perceive TQM as an extra cost which they may not be
willing to incur. Tutesigensi and Pleim (2008) identified reasons for lack of
implementation of quality plans by small and medium construction firms and these
include: lack of knowledge, perception that customers may not need such plans and
lack of resources. The construction industry was found to lag behind manufacturing
and other industries in its implementation of quality plans.
Gunning and McCallion (2007) enumerated ten obstacles to TQM as seen by
contracting firms and they include: lack of commitment from management, lack of
communications in organisations, cultural attitudes and lack of training. Organisations
would need to devise strategy to bring all parties on board of their quality policies and
plans so there can be better participation and cooperation on all levels. Two aspects
addressed in literature is the need for a radical culture change and the commitment of
top management in the implementation of TQM.
Hassin et al (2007) recommend that training and education are key factors in the
implementation of TQM. Other factors include customer satisfaction, employee
participation and quality policy. Love et al (2000) made a case for a cultural and
behavioural shift in the mind-set of practitioners, academics and professional
institutions if the construction industry is to improve its performance and
competitiveness. This view was reiterated by Ramachandran (2010) and Mahmood
and Mohammed (2008) stating that the implementation of TQM requires a culture
change and change in management behaviour.

Total quality management
687
RESEARCH METHOD
The data for this study were obtained through a questionnaire survey of selected
contracting organisations in the Federal Capital Territory (Abuja) and Kaduna
metropolis. The opinions of Architects, Quantity Surveyors, Builders, Engineers and
Project Managers were sampled with respect to their involvement in the building
construction works. A simple random sample was adopted the objective of the
sampling being to provide a practical means of enabling data collection process to be
carried out while ensuring that sample provides good representation of the population
(Osuala, 1987; Fellows and Liu, 1997). Seventy (70) questionnaires were distributed
and 59 were successfully retrieved.
Various methods are open for research surveys, such as review of existing literature,
field study which comprises of the administering of structured questionnaires,
interviews, observations, e.t.c. (Fellow and Liu, 1997). For the purpose of this
research, the use of structured questionnaire were considered the best method of
obtaining the data as it provide adequate and a better means of collecting and
gathering data and subsequent analyzing the data.
The questionnaire was designed to attain its objectives of this study. To facilitate easy
response and analysis, the structured questionnaire were divided into two (2) sections
A and B, section A contained the general information about the respondent, section B
contained information about the use of and implementation of TQM in the Nigerian
Construction Industry. There are three main methods of administering questionnaire:
face to face, by mail and via telephone. Various factors are considered before
selecting the method to be adopted. These factors include the response rates, the
sample quality and control over who answers the questionnaire. The face-to-face
method was adopted for the survey. Questionnaire duly filled by respondents were
collected immediately in order to facilitate gathering of the data.
DATA ANALYSIS AND DISCUSSION
The data obtained from the questionnaire survey were analysed using tables, figures,
charts percentages, simple means. A total of seventy (70) questionnaires were
administered out of which fifty-nine (59) where retrieved representing eighty-four
percent (84%) and eleven (16%) were not returned. Table 1 shows the distribution of
respondents‘ organisation:
Table 1: Nature of the organisation
Organisation Frequency Percentage (%)
Construction firms 13 22 Limited liability company 40 68
Public liability company 6 10
Total 59 100
The majority of respondents (68%) were employed in limited liability companies
while 22% were with construction organisations and 10% with public liability
company. Of the construction firms surveyed, 68% engaged in both civil engineering
and construction; Twenty (20%) engaged in building works only while only 12% were
exclusively involved in civil engineering construction. The age of organisations
ranged from over twenty years (34%), between 16-20 years (36%). Thirty percent of
the respondents‘ organisations had existed for less than 15 years and at least 86% of
the organisations have over twenty employees on their payroll.

Chindo and Adogbo
688
Fifty-two percent (52%) of the respondents have between 10 -15 years work
experience, 14% have over 15 years experience while 34% have less than 10 years
experience in construction. At least 83% of the respondents were at middle and senior
level management cadre.
The major clients for whom the respondents‘ organisations have worked for include
the government (at local, state and federal levels) (75%); corporate bodies (22%) and
private individuals (3%). The high proportion of clients from the government implies
that government is the major client of construction and should be conscious of quality
requirements. The respondents were required to indicate their perception of the focus
of TQM and results showed that there were varying opinions as shown in Table 2.
Table 2: Focus of Total quality management (TQM)
TQM Focus Frequency Percentage
Continuous improvement 15 25%
Customer satisfaction 19 32
Preventing non-conformance 11 19
Employee involvement 14 24
Total 59 100
Adoption of TQM
A majority of the respondents (69%) (Table 3) responded that they do not adopt TQM
in their organisation while 31% indicated that they do have an articulated TQM
policy.
Table 3: Adoption of Total quality management (TQM)
Option Frequency Percentage (%) Yes 18 31 No 41 69 Total 59 100
TQM is a new concept in Nigeria construction industry and this may explain why
though there is some level of familiarity with it, it is yet to be widely adopted.
Furthermore the factors that impede the implementation of TQM were investigated
and these include: the extra cost and time required and lack of adequate training.
Some of the reasons cited for lack of implementation also include lack of commitment
to change and poor cultural attitude. It was the recommendation of 97% of the
respondents that an extensive enlightenment campaign on the importance of TQM in
construction will be required to further encourage its use. The response obtained from
both building and civil engineering contracting organisations suggest the same view is
shared on the use of TQM to help improve the quality of their construction and
enhance project delivery within the cost and time limits.
The clients‘ goal is to have a finished product with minimal time and cost overruns
therefore the measurement of quality will not just be an inspection at the end of the
work but an essential part of each phase of construction. The implication for the
contractors is that they need to put in place a system which will ensure that they meet
or exceed their customers‘ requirements.
CONCLUSION
The circumstances which warrant the adoption of TQM in the Nigerian construction
industry were identified, this is sequel to the fact that price is no longer the

Total quality management
689
determining factor. TQM is a new concept in Nigeria construction industry and
though there is some level of familiarity with it, it is yet to be widely adopted. The key
factor impeding its implementation is the extra cost and time required. One of the
reasons is the perception that TQM takes a long time to yield the desired benefits.
RECOMMENDATIONS
Contracting organisations are advised to implement TQM at the project level because
it has been identified as a performance enabler. The TQM philosophy of continuous
improvement, prevention of defects, conformance to specified standards, employee
involvement and performance appraisal should be incorporated into the organisation
as a whole and there should be commitment from the top management regarding the
implementation of TQM.
Prospective building owners should insist on assessing the quality performance of
contractors before awarding a contract, this will motivate contractors to improve and
document their quality management procedure in order to be competitive and maintain
a continuous flow of business. Quality and not lowest competitive bid should be a
major criterion in the selection of contractors.
The government being the major client of the construction industry should come up
with an award for excellence for quality construction to deserving organisations. This
will serve as an incentive for conforming to quality standards in various areas of the
construction industry.
REFERENCES
Agha, A.S. (2011) Total quality management in construction industry (available at
http://faculty.kfupm.edu.sa/CEM/bushait/cem515/term-
papers/TQMinconstructionindustry.pdf
Al-Momani, A. (2007) Total quality management in construction: a case study of Jordan. In:
Hughes, W (Ed) Procs of the Inaugural Construction Management and Economics
„Past, Present and Future‟ Conference, 16th -18
th July 2007 University of Reading,
UK, 741-752
Anon (1999) Engineering News Record (ENR) 242 18: 30.
Boaden, R. and Dale, B. (1992) ―Total quality management in the construction industry: a
preliminary analysis‖. International Journal of Technology Management, 7: 4/5: 244-
253.
Chini, A.R. and Valdez, H.E. (2003) ―ISO 9000 and the U.S construction industry‖.
Journal of Management in Engineering, 16: 2: 69-76.
Emison, G.A. (2004) ―Pragmatism, adaptation, and total quality management: philosophy and
science in the service of managing continuous improvement‖. Journal of Management
in Engineering, 20: 2: 56-61
Fellows, R.F. and Liu, A. (1997) Research Methods for Construction. Blackwell Science Ltd.
Oxford
Gunning, J.G. and McCallion, E.M. (2007) TQM in large Northern Ireland contracting
organisations. In: Boyd, D (Ed) Procs 23rd
Annual ARCOM Conference, 3-5 Septeber
2007, Belfast, UK, Association of Researchers in Construction Management, 577-586
Hassin, E., Tookey, J.E. and Vidalakis, C.(2007) Sustainable development and TQM
implementation in Libya: A study of the electrical generation industry. In: Egbu, C.O.
and Tong, M.K.L. (Eds) Procs of the 3rd
Scottish Conference for Postgraduate
Researchers of the Built and Natural Environment (PRoBE), 20-22 November 2007,
Glasgow Caledonian University, 203-215

Chindo and Adogbo
690
Haupt, T.C. and Whiteman, D.E. (2003) ―Deploying total quality management on construction
sites: inhibiting factors‖ The International Journal of Construction Management, 3: 2:
51-68
Khadour, L. and Darkwa, J. (2008) ―TQEM in the UK construction industry: some key
findings from a survey‖. In: Dainty, A (Ed) Procs 24th Annual ARCOM Conference,
1-3 September 2008, Cardiff, UK, Association of Researchers in Construction
Management, 239-246.
Kiwus, C.H. and Williams, T.P. (2001) ―Application of TQM to environmental construction‖.
Journal of Management in Engineering, 17: 3: 176-184.
Koh, T.Y. and Low, S.P. (2010) ―Empiricist framework for TQM implementation in
construction companies‖. Journal of Management in Engineering, 26: 3: 133-143
Love, P.E.D., Edwards, D.J. and Sohal, A. (2004) ―Total quality management in
Australian Contracting organisations: pre-conditions for successful
implementation‖. Engineering, Construction and Architectural Management,
11: 3: 189-198.
Love, P.E.D., Li, H., Irani, Z. And Faniran, O. (2000) ―Total quality management and
the learning organization: a dialogue for change in construction‖. Construction
Management and Economics 18: 321-331
Mahmood and Mohammed (2008) ―A conceptual framework for the development of
quality culture in the construction industry‖ In: Dainty, A (Ed) Procs 24th
Annual ARCOM Conference, 1-3 September 2008, Cardiff, UK, Association of
Researchers in Construction Management, 247-256.
Metri, B.A. (2005) ―TQM Critical success factors for construction firms‖.
Management, 10: 2: 61-72.
McIntyre, C.and Kirschenman, M. (2000) ―Survey of TQM in construction industry in
upper Midwest‖. Journal of Management in Engineering, 16: 5: 67-70.
Miller, C.C. (1993) Total quality management in construction. An unpublished
Master‘s thesis, available at http://handle.dtic.mil/100.2/ADA268922
Osuala, E.C. (1987) Introduction to Research Methodology. Africana-FEP Publishers
Ltd. Onitsha, Nigeria, pp105-117
Pheng, L.S. and Teo, J.A. (2004) ―Implementing total quality management in construction
firms‖ Journal of Management in Engineering, 20: 1: 8-15
Ramachandran, V. (2010) Total quality management in construction. Edwards, G. (Ed)
available at http://www.brighthub.com/office/project-management/articles/86518
Sanni, A.A. and Windapo, A.O. (2008) Evaluation of contractor‘s quality control practices on
construction sites in Nigeria. In: Dainty, A (Ed) Procs 24th Annual ARCOM
Conference, 1-3 September 2008, Cardiff, UK, Association of Researchers in
Construction Management, 257-265.
Tutesigensi, A. and Pleim, V. (2008) Why small and medium construction enterprises do not
employ six sigma. In: Dainty, A (Ed) Procs 24th Annual ARCOM Conference, 1-3
September 2008, Cardiff, UK, Association of Researchers in Construction
Management, 267-276 .
Dadu, D.W. (2011) Jos plateau volcanic deposits as sustainable cementitious materials for partial
replacement of Portland cement in concrete mixtures In: Laryea, S., Leiringer, R. and Hughes, W.
(Eds) Procs West Africa Built Environment Research (WABER) Conference, 19-21 July 2011, Accra,
Ghana, 691-701.
691
JOS PLATEAU VOLCANIC DEPOSITS AS
SUSTAINABLE CEMENTITIOUS MATERIALS FOR
PARTIAL REPLACEMENT OF PORTLAND CEMENT IN
CONCRETE MIXTURES
Danjuma W. Dadu1
Department of Building, Faculty of Environmental Design, Ahmadu Bello University, Zaria, Nigeria
The costs of concrete mixtures are high in Nigeria. This is due to soaring prices of
Portland cement (PC) in the country. There is a need therefore to reduce the PC
contents in the concrete mixtures by its partial replacements with Sustainable
Cementitious Materials of volcanogenic origins (natural pozzolanas). These materials
are environment friendly (no CO2 emissions) and are economical as little or no energy
inputs are required prior to their applications. The compressive strengths tests of
concretes with 15% partial replacements of the PC with the pozzolan indicated that
the Portland Pozzolana Cement concrete mixtures gave Pozzolanic Activity Index
varying from 90 to 99%. The Moisture Contents of 90 % of the samples tested were
0.10 to 2.30% by weight. It is thus, concluded that the Jos Plateau volcanic deposits
possessed Pozzolanic Characteristics and are thus potential cementitious materials for
partial replacements of the PC in concrete mixtures.
Key words: Jos, natural pozzolanas, partial replacements, pozzolanic activity,
sustainable cementitious material.
INTRODUCTION
Concrete is the most commonly used construction materials for housing and other
physical infrastructures worldwide. This is due to its outstanding strength, durability,
availability of the raw materials and its ease to produce to any and forms and at
cheaper costs than other building materials. Thus, Concrete is a material of preference
in housing other construction activities. The essential constituent for the production of
this material is cement. A growing economy such as Nigerian needs enormous amount
of cement as a building material for its housing and other infrastructural
developments. Oluwakiyesi (2011) stated that Nigeria requires about 224 million tons
of cement for its estimated housing deficits of between 16 and 18 million housing
units. But there is a shortage of cement as a building material in the country. This is as
a result of a wide gap that exists between production capacity of the Local Cement
manufacturing firms and the high demand of the commodity, such that Nigeria
imports about 60% of its cement demands to meet up these shortfalls (Fiakpa, 2008).
Consequently the costs of concretes and other cement products are high. These
cements deficits can be palliated by the utilisation of Jos Plateau Volcanic Deposits
for partial replacements of the ordinary Portland cement in concrete mixes. It has been
established by Dadu et al (2010) that the chemical characteristics of the Jos Plateau

Dadu
692
Volcanic Deposits indicated that the materials are potential pozzolans with good
Pozzolanic Reactivity; the sum of the oxides of silica, aluminium and iron are over
76% by weight in all the materials samples reported; the report also showed that the
materials were free from carbon and alkalis; the sulphur and calcium contents are
found to be low, with values of 2% and 0.28% respectively. The Jos Plateau Volcanic
Deposits thus, offer a ray of opportunities in the reductions of the cement contents in
the concretes mixtures. The current investigations provided the levels of partial
replacements of the materials with the OPC in concrete mixes.
Volcanic deposits as potential pozzolans.
The distinctive characteristic of the natural pozzolana stands from its occurrence from
nature with varies from the Ordinary Portland cement (OPC) production. In Portland
cement production, Neville (1996) stated that calcinations of lime stones (CaCO3)
create a reactive mixture of tri-calcium silicate (3CaO.SiO2), di-calcium silicate
(2CaO.SiO2) and tri-calcium aluminates (3CaO.Al2O3) and tetra-calcium
aluminoferrites (4CaO.Al2O3Fe2O3) is produced. Gypsum (CaSO4.2HO) is then added
to the product for the preservation of the cement. But with the Volcanic Pozzolans, the
raw ingredients reactivity occurs naturally from the molten earth eruptions. Thus,
properties of each volcanic deposit consequently depends on the nature and type of
eruptions; the chemistry therefore, differs from deposit to deposit containing mainly
the oxides of silica (SiO2), alumina (Al2O3) and iron (Fe2O3) and other elements and
alkalis in varying degrees. It is the siliceous elements in Pozzolanas react with
Ca(OH)2 to produce highly cementitious calcium silicate hydrates that yield high
strength and reduces permeability resulting in the production of durable concretes.
The pozzolanicity of the volcanic material according to Neville (1998) is the degree of
the chemical reactions of the materials with calcium hydroxide (from cement
hydration) at ordinary temperature to form cementitious compounds. In the cement
hydration, it is the tri-calcium silicate and the di-calcium silicate that take part in the
chemical reaction producing calcium silicate, water and calcium hydroxides
{CaO.SiO2.H2O and Ca(OH)2} presented thus; CaO.SiO2 – 2CaO.SiO2+H2O
=>CaO.SiO2.H2O+Ca(OH)2.When the pozzolan is added to the hydrating cement a
gel of a Cementitious substance of Calcium-Silicate- Pozzolana + Ca(OH)2 + H2O =>
C-S-H (a strong gel).This reaction is referred to as the Pozzolanic Reaction of the
pozzolan (Neuwald, 2004).The reaction continues to produce additional C-S-H. This
continuous reactivity of the OPC with the pozzolan is termed the Pozzolanic Activity
of the pozzolana (Zhanng et al., 1996). This pozzolanic reactivity of the Natural
Pozzolanas has accounted for the continued existence of ancient structures to date.
Shetty (1982) reported the Wharf of Caligula for instance was constructed with
volcanic ash from Mt Vesuvius in Pozzuoli over 2000 thousand years ago.
STUDY AREA
Wright (1989) asserted that the Jos Plateau is a major Volcanic Region in Nigeria
presented by basaltic lava flows and cones formations. The major areas of the
volcanism in Nigeria are Jos, Biu and Longuda Plateax. The approximately
quantities of the volcanic deposits for Jos and Biu are 4.3 and 1.25 billion cubic
metres respectively; while the deposits of Longuda Plateau stand at about 75 million
cubic metres of the volcanogenic materials (Lekmang, 2006).Thus, the volcanic
deposits in Nigeria are in large quantities, but the high volume of the volcanic deposits
of the Jos Plateau makes it favourable Study Area for the evaluation of the
characteristics of Natural Pozzolans in Nigeria.

Sustainable cementitious materials
693
The Jos plateau volcanic deposits as sustainable cementitious materials
The concept of this study is the utilisation of the Jos Plateau Volcanic Pozzolans as
sustainable cementitious materials for the provision of affordable mass housing for the
citizenry. The use of Natural Pozzolans in the industrialized world may not be cost
effective due to the costs inherent in mining and abundant industrial wastes by
products‘ pozzolans, such as fly ash and slags. But in developing communities
especially Nigeria (with historic volcanism), the use of volcanic deposits is variable;
the pre-requisite to their application are reliable tests methods that would ascertain its
suitability for use in concrete. The volcanic deposits do not require complex mining
procedures; they are excavated just like laterite in these developing communities and
are accordingly free or obtained at little cost. This situation will invariably reduce
cement-making costs and lead to the provision of affordable housing.
Primarily, the sustainability components of the application of the volcanic pozzolans
as cementitious materials will lead to poverty reductions. This is because the
utilisation of the natural pozzolans will generate local employments (in the mining and
processing of the pozzolans to cementitious values) where the deposits of volcanic
materials occur. Secondly, Ronald et al (2007) averred that the byproducts of Portland
cement production are carbon dioxide and other environmental pollutants. The
European Commission (2001) affirmed further that for every ton of Portland cement
produce (during lime stone calcinations); about 1 ton of CO2 is released into the
atmosphere. Wilson and Ding (2007), in appraising environmental effects of OPC
production avowed that the manufacture of OPC is responsible for more than 8% of
all greenhouse gasses release by human activities world over. The direct correlation
therefore between Portland cement production and carbon dioxide emissions is that; a
reduction in the cement contents in our concretes mixes by its substitution with natural
pozzolans in the construction activities would in tandem reduce CO2 emissions
(greenhouse gasses) into the atmosphere. Besides the environmental friendly and
poverty alleviation potentials, the application of the natural pozzolans in partial
replacements of the OPC in concrete will produce cheaper cementitious materials and
thus lower construction costs, particularly in a less developed community such as
Nigeria. For instance, the energy consumption in calcinations of the raw materials for
the OPC production is about 1 barrel of fuel or ¼ ton of coal 1 ton of cement.
European Commission (2001) asserted that this is about 50% of the total cost of
producing 1 ton of Portland cement. Thus, the applications of Jos plateau volcanic
deposits in concrete mixes and other cement products as sustainable cementitious
materials are intended to lower construction costs, alleviate poverty and provide
affordable housing to the citizenry as important goals of sustainable developments in
Nigeria.
BENEFITS OF NATURAL POZZOLANS AS CEMENTITIOUS
MATERIALS
Pozzolanas are cement of antiquities. Detwiler et al (1996) averred that making of
hydraulic binders using these cements date back to 10th century BC. The word
pozzolana, according to meaning Powder from Puteoli according to Jackson et al
(2003), were a direct reference to the unconsolidated pyroclastic (ash) deposits of
Campi flegrei and Vesuvius volcanic fields were the Romans first discovered the
unique characteristics of the pozzolans. But today, American Society for Testing and
Material (ASTM) C 618 (2005), defined pozzolans as a siliceous or siliceous and
aluminous material, which ordinary possesses little or no cementitious values but

Dadu
694
when, in finely divided form and in the presence of moisture, chemically react with
calcium hydroxide at ordinary temperatures to form compounds possessing
cementitious properties. Kurtis (2002) classified the pozzolans into Natural and
Artificial. The Artificial Pozzolanas are residues of waste products of Industrial
Manufacturing Processes, which includes fly ash, activated or artificially burnt clays,
slags, silica fume and ashes from agricultural industrial residues; among these are rice
husk ash, sugar cane straw ash and ground nut shell ash .The Natural pozzolans are
made up of the volcanic ash, pumicite, volcanic tuffs, diatomaceous earths, volcanic
glass, lava, opaline chert and shales resulting from rapid cooling of lavas ejected
during volcanic eruptions. The Natural pozzolans have economic benefits as they are
cheaper to process (with low technological inputs and capital out lay) and requiring no
burning of any sort prior to their applications. The volcanic deposits would thus not
only argument the local cement productions, but also reduce the cost of cement in the
country.
STUDY OBJECTIVES
The aim of this study is to investigate the pozzolanic characteristics of Jos Plateau
Volcanic Deposits as potential pozzolans for innovative, sustainable and
environmentally friendly cementitious materials for partial replacement of the
Ordinary Portland Cement (OPC) in concrete mixes. Therefore, to achieve the
objectives of the study, the investigations are to determine the levels of partial
replacements of the OPC with the volcanic materials in the production of Portland
Pozzolana Cement Concretes.
SCOPE OF STUDY
The scope of this study is to evaluate the level of partial replacement of OPC with the
volcanic rocks from Jos Plateau in concrete mixtures. The collections of the samples
were limited to outstanding volcanic land marks and materials exposed as results of
physical activities such soil erosion, mining and road construction exploits in the
area of the study. The materials were collected from 20 locations; JP1 (Mista Ali) JP2
(Kaskadi), JP3 (Miango). JP4 (Gwafan), JP5 (Furaka), JP6 (Lobel), JP7 (Fobur), JP8
(Vwang), JP9 (Kwi), JP10 (Kombun), JP11 (Kafi Abu), JP12 (Kuben), JP13
(Danwal), JP14 (Bang), JP15 (Kuba), JP16 (Niyes), JP17 (Wunat), JP18 (Kerang),
JP19 (Larpia) and JP20 (Mile 8).
RESEARCH LIMITATIONS
The purpose of the investigations is to evaluate the pozzolanic activity of the Jos
Plateau volcanic Deposits as potential pozzolans for replacements of OPC in our
concrete mixes for low cost housing construction. Consequently, tests of physical
characteristics such as soundness, setting time and pozzolanic activity index with
lime of the Portland pozzolana cement concretes were not within the time frame and
the objectives of this study. Long term deleterious activities that manifest after years
of construction (Neville and Brooks, 2008) such as tests on resistance to sulpate
attack, resistance to freezing and thawing and alkalis-aggregate reactions tests were
not studied under the present work.
RESEARCH METHOD
Determination of the compressive strength
1. Materials and samples preparations.

Sustainable cementitious materials
695
The volcanic deposits‘ samples were ground manually to powder with an agate mortar
and the sieving were carried out in accordance with the ASTM C 136 (2006) Method
of sieve Analysis until all material passed 90µm (sieve no 170). According to Neville
(1998), this fineness is necessary because the rate of hydration depends on the
fineness of the cement particles and for rapid development of strengths in concretes.
Shetty (2006) explained further that finer cement offers greater surface area for
hydration, hence faster strength developments.
Locally available Ordinary Portland cements; the ‗Dangote‘ brands were obtained
from Zaria Building Materials Market. But preceding the utilisation of the cement, the
determination of the Oxides Composition, LOI and the MC of the cement were
investigated. The results (Table) showed excess of CaO -79.45% by weight as against
ASTM C 150 Limits of 60-67%; very low value of SiO2 - 8.56 as against ASTM C
150 limits of 17-25; and a high LOI of 8.8%,ASTM C 150 limits are 1-3% by weight
of the cement.
Table 1. Chemical composition of ‗Dangote‘ cement.
component Content % ASTM C 150(2004) Limits
CaO 79.46 60-67
SiO2 8.56 17-25
Al2O3, 1.7 3-8
Fe2O3 3.95 0.5-6.0
MgO 0.03 0.1-4.0
SO3 1.62 1-3
MnO 0.02 -
SrO 0.74 -
Alkalis 0.21 0.2-1.3
LOI 8.8 1-3
MC 0.3 -
The crushed stones sands met the specifications of ASTM C33 (2002).The sands were
quartzite river sands; and the crushed granite stones were obtained from a Local
Quarry. Tap water was used for the production and the curing of the concrete cubes.
2. Compressive strengths portland pozzolana cement.
The concrete cubes were prepared in 150mm steel moulds and tested in accordance to
ASTM C 109 / 109M (2001) techniques. The Portland cement was replaced with 5%,
10%, 15%, 20% and 30% of the volcanic materials in the concrete mixtures. The
water/cement ratio of 0.55 was used for all the mixes. This is in line with Neville
(1998) recommendation that in partial replace concrete test, water/cement ratio of
0.60, 0.55 or 0.45 be applied for the concrete mixtures. The control cubes specimens
were treated identically to the test specimens and compressive strengths of all the
cubes were measured at 7, 14 and 28 days.
THE POZZOLANIC ACTIVITY INDEX WITH PORTLAND
CEMENT
American Society for Testing and Material C 311(2000) recommended that the
strength activity index be used to determine if a mineral admixture is in an acceptable
level of strength development when in addition with hydraulic cement. The
Pozzolanic Activity Index (PAIC) with Portland cement as explained by Neville and

Dadu
696
Books (2008) is the ratio of compressive strength of the mixture with a specific
replacement of cement by the pozzolana to the strength of
the mix without replacement. ASTM C 618 (2005) provides the determination as
PAIC = 100.
Where A = average compressive strengths of test mix cubes (N/mm2).
B = average compressive strengths of control mix cubes (N/mm2).
These were established by the evaluation of the strength of the concrete with zero
pozzolan and with the specific replacements at 28 days for all the samples
investigated.
RESULTS AND DISCUSION
1. Control cubes
The control cubes tests (Table 2.) indicated that the compressive strengths at 7, 14 and
28 days were 20.18 N/mm2, 23.93N/mm
2 and 26.0N/mm
2 respectively.
Table 2. Control cubes compressive strengths (N/mm2)
Day 7 14 28
Compressive
Strength(N/mm2)
20.18(N/mm2) 23.93(N/mm
2) 26.0(N/mm
2)
2. Compressive strengths portland pozzolana cement.
The Compressive strengths results (Table 3) showed that portland pozzolana cement
concretes with 5%, 10% and15% of the volcanic materials partially replacing the
OPC in the concrete mixtures certified the minimum recommendation of ASTM C
618(2005) that compressive strengths of PPC concrete should be at least 75% of the
control cubes compressive strengths at 28 days crushing. For 20% replacements, 90%
of the samples tested also met this recommendation.

Sustainable cementitious materials
697
3. Compressive strength of Average Samples Tested N/mm2
.
The average compressive strength N/mm2
(Figure 1) of the Jos Natural Pozzolana
volcanic rock samples of 5, 10, 15, 20 and 30% replacements of OPC with the
volcanic rocks materials at 28 days for the 20 samples investigated were evaluated as
27.97, 25.61, 23.86, 21.14 and 17.19 N/mm2 respectively.
Figure 1. Average Compressive strength N/mm2
of the Jos Natural Pozzolana
4. The Pozzolanic Activity Index with Portland cement (PAI-C) at 28 days.
The results (Figure 2) of the Pozzolanic Activity Index with Portland cement (PAI-C)
with volcanic materials and the compressive strengths of the control specimens
measured at 28 days. The activity index vary from 92 (JP5) to 116 (JP3, JP4 and JP7).
The average index (105) of the 5% replacement is also presented.
Figure 2. Pozzolanic Activity Index with Portland cement at 28 days.
Figure 3 is the PAIC with 10% replacement of the OPC with volcanic materials and
the compressive strengths measured at 28 days. The activity index vary from 87(JP9)
to 108 (JP1). The average index is 96.
0
5
10
15
20
25
30
0% 5% 10% 15% 20% 30%
Co
mp
ress
ive
stre
ngth
N/m
m2
Average replacements of volcanic materials
7 Days
`14 Days2
28 Days
0
20
40
60
80
100
120
140
JP1
JP2
JP3
JP4
JP5
JP6
JP7
JP8
JP9
JP1
0
JP1
1
JP1
2
JP1
3
JP1
4
JP1
5
JP1
6
JP1
7
JP1
8
JP1
9
JP2
0
Ave
rageP
AI w
ith
PC
(5%
) @
28
day
s
Volcanic Rocks Samples

Dadu
698
Figure 3 Pozzolanic Activity Index with Portland cement at 28 days.
Replacement of 15% of the OPC with volcanic materials and the compressive
strengths measured at 28 days showed that the PAI-C (Figure 4) vary from 70 (JP15)
to 98 (Samples JP1 and JP17) with an average of 90.
Figure 4 Pozzolanic Activity Index with Portland cement at 28 days.
The results(Figure 5) indicated that the PAIC with 20% replacement of the OPC with
volcanic materials and the compressive strengths measured at 28 days provided
activity index varying from 65 (JP5) to 91(JP1). The average index was 81for the
20% replacements.
Figure 5 Pozzolanic Activity Index with Portland cement at 28 days.
The results (Figure 6) indicated that the PAI-C with 30% replacement of the OPC with
volcanic materials only 4 samples {JP1 (75), JP7 (83), JP10 (77), JP14 (79)}
representing 20% had its activity index within the recommended value of 75.
020406080
100120
JP1
JP2
JP3
JP4
JP5
JP6
JP7
JP8
JP9
JP1
0
JP1
1
JP1
2
JP1
3
JP1
4
JP1
5
JP1
6
JP1
7
JP1
8
JP1
9
JP2
0
Ave
ra…
PA
I wit
h P
C(1
0%
) @
2
8 d
ays
Volcanic Rocks Samples…
020406080
100120
JP1
JP2
JP3
JP4
JP5
JP6
JP7
JP8
JP9
JP1
0
JP1
1
JP1
2
JP1
3
JP1
4
JP1
5
JP1
6
JP1
7
JP1
8
JP1
9
JP2
0
Ave
rageP
AI w
ith
PC
(15
%)
@
28
day
s
Volcanic Rocks Samples
0
20
40
60
80
100
JP 1
JP 2
JP3
JP4
JP5
JP6
JP7
JP8
JP9
JP1
0
JP1
1
JP1
2
JP1
3
JP1
4
JP1
5
JP1
6
JP1
7
JP1
8
JP1
9
JP2
0
Ave
…
PA
I wit
h P
C(2
0%
) @
28
day
s
Volcanic Rocks Samples

Sustainable cementitious materials
699
Figure 6 Pozzolanic Activity Index with Portland cement at 28 days
The results of Figures 2 to 6 showed that PAI with Portland cement at 5, 10, 15 and
20% replacements, with Portland cement is within the ASTM C 595(2006)
specification of minimum of 75% at 28 days; this is the basis for a pozzolan to be
utilised for pozzolan to use Portland Pozzolana Cement in concrete production. This
according to ACI (2000) report, are indicators of the reactivity of the pozzolan. But
with 30% partial replacements only samples JP1 (75%), JP7 (83%), JP10 (77) and
JP14 (79%) representing 20% of the samples investigated met the Pozzolanic Activity
Index specification of ASTM C 595(2006).
CONCLUSION
The results of the compressive tests showed that the pozzolan can partially replace up
to 20% of Ordinary Portland Cement in the concrete production which is within the
limits of ASTM C 618 (2005). ASTM C 595 (2005) classified the Portland Pozzolana
Cement Concrete as type IP (cement for general concrete construction) and type P (for
use when high strengths at early ages are not a requirement). ASTM C 595 (2005)
however limits the pozzolana content in the concrete to between 15-40 % by weight. It
is thus concluded, that the Jos Plateau Volcanic Deposits can utilised in partial
replacement of Ordinary Portland Cement up to 20% as innovative, sustainable and
environmentally friendly cementitious materials for partial replacement of the
Ordinary Portland Cement (OPC) in concrete mixes; this will invariably reduce
cement-making costs, leading to the provision of affordable housing.
RECOMMENDATIONS
The establishment of Blending Plants for the production of Portland Pozzolan
Cements is recommended; since there are economic benefits of the utilisation of
volcanic deposits as cementitious materials in providing cheaper housing. It is further
recommended that the studies be carried out on physical characteristics such as
soundness, setting time and pozzolanic activity index with lime of the Portland
pozzolana cement concretes were also not carried out within the time frame and the
objectives of the study.
REFERENCES
American Concrete Institute (2000).Use of Raw or Processed Natural Pozzolanas in Concrete.
Committee Report R232, American Concrete Institute, Farmington Hills, Michigan,
0102030405060708090
JP 1
JP2
JP 3
JP 4
JP5
JP6
JP7
JP8
JP9
JP1
0
JP1
1
JP1
2
JP1
3
JP1
4
JP1
5
JP1
6
JP1
7
JP1
8
JP1
9
JP2
0
Ave
rage
PA
I wit
h P
C(3
0%
) @
28
day
s
Volcanic Rocks Samples

Dadu
700
United States of America, pp. 1-10.
American Society for Testing and Material. (2004). Standard Test Method for Density, Relative
Density (Specific Gravity), and Absorption of Coarse Aggregate. American Society for
Testing and Material, West Conshohocken, Pa., No. C127
American Society for Testing and Material. (2000), Standard Specification for Portland cement
concrete. American Society for Testing and Material, West Conshohocken, Pa.,No.C 150.
American Society for Testing and Material (2003). Standard Specification for Concrete Aggregates.
American Society for Testing and Material, West Conshohocken, Pa., No‘s 33
American Society for Testing and Material. (2006).Standard Test Method for Sieve Analysis of Fine
and Coarse Aggregates. American Society for Testing and Material, West Conshohocken, Pa.,
No. C 136.
ASTM-(a) C 311(2005a): Standard Test Methods for Sampling and Testing Fly Ash or Natural
Pozzolans for Use in Portland-Cement Concrete. American Society for Testing and Material,
West Conshohocken, Pa., No.C311
American Society for Testing and Material. (2005), Standard Specification for Blended
Hydraulic Cements. American Society for Testing and Material, West Conshohocken,
Pa., No. C 595.
American Society for Testing and Material. (2005), Specification for Fly Ash and Raw or
Calcined Natural Pozzolana or Use in as a Mineral Admixture in Portland cement
Concrete. American Society for Testing and Material, West Conshohocken, Pa.,
No C 618.
American Society for Testing and Material (2001) Standard Test Method for Compressive
Strength of Hydraulic Cement Mortars (Using 2-in. or 50-mm Cube Specimens),
American Society for Testing and Material, West Conshohocken, Pa., No. C 109/C 109M.
Dadu, D. W. Garba, M. M. Zubairu, I. K. Bustani, S. A. (2010). Investigations into The
Pozzolanic Activities of Volcanic Deposits from the Jos Plateau: Interim Report on
Chemical Characteristics. In: Laryea, S. S., Leiringer, R. and Hughes, W. (Eds).Procs
West Africa Built Environment Research (WABER) Conference, 27-28 July 2010, Accra.
Ghana. pp. 395-402.
Detwiler, R. J., Bhatty J.I. and Bhattacharja S. (1996). Supplementary Cementing Materials
for Use in Blended Cements. In; Research and Development Bulletin, Portland
cement Association, Skokie, Illinois.
European Commission (2001). Pollution Control on Best Available Techniques in the Cement
and Lime Manufacturing Industries. In European Commission Report, pp. 10-14,
Seville, Spain.
Fiakpa, L. (2008). The Cement Barrier Crumbles. Thisday Sunday, Jan 20. 3, pp 28-29.
Jackson, M., Sagnotti, L., Solheid. (2003) Pozzolana Cement. Institute of Rock Magnetic
Quarterly. Minneapolis, 13.3:2-10.
Kurtis, K. (2002), Supplementary Cementitious Materials. In: Pres to Precast Concrete
Association, 2003, PCA CD2038.
Lekmang. I. C. (2006). Geochemical Study of the Basaltic Volcanism within the Jos Plateau
Younger Granite Province North Central Nigeria. In; Pres to the Department of Geology
and Mining, Faculty of Natural Science, University of Jos, 2006.
Neuwald, A.D. (2004).Supplementary Cementitious Material. Part 2; Pozzolanic Supplementary
Cementitious Material, In; Manufactured Concrete Magazine, app. -17.
Retrieved.www.precast.org/publicatios/mc/2005-janfeb/scm-part2.htm on 2 June, 2007.
Neville, A. M. (1998). Properties of Concrete 3rd Edition. A Pitman International London,
pp. 118-162.
Neville, A. M. and Books J. J. (2008). Concrete Technology, Pearson education Ltd., India

Sustainable cementitious materials
701
Branch, New Delhi, Revised Edition, pp. 8-38.
Oluwakeyesi, T. (20011).NIGERIAN Cement Industry; Unbundling Potentials. In; Pres to
Vetiva Capital Management Limited, 2010.
Ronald A. H., Thomas, D. E., Jr., and Christian, W.A. S. (2007). Natural Pozzolans for Sustainable
Development: Mapping Poverty in the Philippine. In: Report to National Science
Foundation.
Shetty, M. S. (2006). Concrete Technology; Theory and Practice, S Chad and Company, New
Delhi, India, pp. 124– 238.
Wilson, John, W and Ding, Y. C. (2007).A Compressive Report on Pozzolanic Admixtures; The
Cement Industry, Market and Economic Trends and Major Companies Operating In The Far
East, with reference to Pagan Island; In Report to The Secretary, Department of Public,
Lands, Commonwealth of Northern Mariana Island.
Wright, J. B. (1989). Volcanic Rocks in Nigeria. In: Kogbe, C. A. (Ed), Geology of Nigeria.
2nd
Edition, Rock View (Nigeria) Limited, Jos. pp. 125– 175.
Zhanng, C., Aigin, W., Mingshu, T. and Xiaoyu, L. (1996). Filling Role of Pozzolanic
Material, Cement and Concrete Research, 26: 943 – 947.


Onukwube, H. (2011) Leader influences on training effectiveness of construction professionals: The
case of Nigeria In: Laryea, S., Leiringer, R. and Hughes, W. (Eds) Procs West Africa Built
Environment Research (WABER) Conference, 19-21 July 2011, Accra, Ghana, 703-713.
703
LEADER INFLUENCES ON TRAINING
EFFECTIVENESS OF CONSTRUCTION
PROFESSIONALS: THE CASE OF NIGERIA
Henry Onukwube1
Department of Building, University of Lagos, Lagos, Nigeria
Training can be defined as the systematic acquisition of skills, concepts or attributes
that result in improved performance in another environment. Training effectiveness is
a function of trainee characteristics, training design and contextual factors. The
purpose of this study is to examine the extent to which leaders influence skill transfer,
maintenance and generalisation. Using a survey research, 160 construction
professionals that have attended continuous professional development (CPD)
programmes of their respective professional bodies were asked to respond to the
structured questionnaires. The data generated were subjected to both inferential and
descriptive statistics. The findings in this study indicates that LMX, training
motivation and outcome expectancy are positively related to training effectiveness
The practical contributions of this study are twofold: The first has to do with
leadership. The professional who has a good relationship with his or supervisor stands
a much better chance of benefitting from the training. Secondly, Leaders can directly
influence their employees‘ training motivation and this has a positive impact on how
they transfer new skills, maintain them over time and how they use them in other
domains of their jobs.
Keywords: construction professionals, leadership, Nigeria, training.
INTRODUCTION
A performance improvement intervention that is used almost universally in
organizations is training. Training is defined as a planned learning experience
designed to bring about permanent change in an individual's knowledge, attitudes, or
skills (Noe, 1986).As organizations strive to enhance performance through their
human capital, workplace learning professionals and trainers are increasingly expected
to deliver results. Formal learning interventions in the contemporary workplace are
designed and delivered with the expectation of improving organizational and
employee performance. Ensuring that skills acquired during training are used in the
workplace, or transferred to the job, remains of critical importance for researchers and
practitioners. In recent years, investments in training activities have increased all over
the world (Velada et al. 2007). However, unsettling questions continue to be raised
about the return on this investment. The exact amount of transfer varies from author to
author, some indicate that only 10% of all training-related expenditures actually result
in the transfer of recently acquired skills and knowledge back to the job (Fitzpatrick
2001).According to Burke and Baldwin (1999), there is much evidence suggesting
that a considerable part of organizations‘ investment in training does not result in
optimal transfer. To improve job performance, the skills and behaviours learned and

Onukwube
704
practiced during training have to be transferred to the workplace, maintained over
time, and generalized across contexts (Holton and Baldwin, 2003). This ―transfer
problem‖ presents a big challenge for organizations, given that training is considered
to be a primary leverage point by which organizations influence their corporate
performance (Kozlowski et al. 2000). As transfer of training remains an important
issue for researchers and practitioners (Holton and Baldwin, 2003), it becomes
essential to investigate relationships that include central, but less frequently studied
training effectiveness predictors. Researchers have called for studies on training
effectiveness, in an effort to include both individual and organizational contextual
factors as antecedents of transfer of training (Colquitt et al., 2000; Quinones, 1997).
For example, although work environment aspects are important for training transfer
(e.g. Burke and Hutchins, 2007), they are not sufficiently examined in existing
literature. It has also been suggested that future studies look at the role of motivation
in the relationship between contextual factors and learning, and other training
outcomes (e.g. training transfer, maintenance and generalization). For example,
Tracey et al. (2001) discuss the importance of future research examining the impact of
training motivation on different effectiveness criteria, and similar research needs were
suggested in other studies (Cheng and Ho, 2001;Tracey et al., 2001). Specifically,
whereas acknowledging that individual characteristics are related to training
motivation and training outcomes, Colquitt and colleagues (2000) maintain that
researchers tend to ignore situational aspects. Therefore, there are calls for studies
where the social context is connected with training motivation and transfer (Colquitt et
al., 2000), and specifically for connecting leader–member exchange (LMX) and
training dimensions. The aim of this study is to examine how leader member
relationship (LMX) impact training effectiveness. More specifically, training
effectiveness outcomes include transfer of training, training maintenance and training
generalization. Transfer of training is defined as ‗the degree to which trainees
effectively apply the knowledge, skills, and attitudes gained in a training context to
the job‘ (Baldwin and Ford, 1988).Training maintenance is defined as the
reproduction of trained skills in a new setting, and training generalization refers to the
adaptation of trained skills to a more complex task situation (Ford et al., 1998).
THE RELATIONSHIP BETWEEN A LEADER AND A
FOLLOWER
Leader member exchange (LMX) theory posits that leaders and members engage in a
role development process during which differentiated role definitions develop
between a leader and an individual employee (Graen and Cashman, 1975). Whereas
low-quality relationships involve rudimentary exchanges that typify the basic
employment contract, high-quality relationships are characterized by mutual trust,
respect, and loyalty between leader and employee. Based on the concepts of social
exchange (Blau, 1964) and reciprocity (Gouldner, 1960), LMX theory posits that the
exchange relationship creates a feeling of obligation in members to reciprocate high-
quality relationships (Graen and Uhl-Bien, 1995). As such, high-LMX employees are
sometimes referred to as ‗trusted assistants‘ who are committed to the leader and who
enhance their leader‘s effectiveness (Liden, Sparrowe, &Wayne, 1997). Research has
demonstrated that LMX is related to important employee and organizational outcomes
such as job performance, organizational citizenship behaviour, job satisfaction,
organizational commitment, retention, and openness to organizational change (e.g.,
Hofmann, Morgeson, and Gerras, 2003; van Dam, Oreg, and Schyns, 2008). It is
generally expected that high-LMX employees engage in more learning activities

Training of construction professionals
705
than do low-LMX employees (e.g., Driver, 2002; Maurer et al., 2002; Paparoidamis,
2005). Although researchers proposed that supervisor support is positively related to
training transfer (e.g. van der Klink et al., 2001; Velada et al., 2007), there are no
empirical studies examining the relationship between a leader and a follower. This
relationship is frequently referred to as LMX (e.g. Gerstner and Day, 1997; Murphy
and Ensher, 1999). Built into these exchange relationships is the fact that leaders form
different relationships with each follower, making it possible that at any given time, a
leader will have many different exchange relationships with various subordinates
(Gerstner and Day, 1997; Wang et al., 2005) and discretionary behaviours, or
behaviours that go beyond formal task requirements (Ilies et al.,2007). In addition,
LMX has been linked to many different organizational outcomes and has been found
to have a positive relationship with job satisfaction (Murphy and Ensher, 1999),
organizational commitment (Gerstner and Day, 1997) and a negative relationship with
turnover (Gerstner and Day, 1997). As related to training, Velada and coauthors
(2007) recently investigated whether aspects of the work environment (performance
feedback and supervisor support) predicted the transfer of training. Specifically,
performance feedback from the supervisor that was received after training had a
significant correlation with skill transfer. In their study, performance feedback was
defined as an indication from management about how well an employee is performing
on the job. Feedback concerning the newly acquired knowledge and skills, and how
these relate to job performance, increases the probability of its transfer to the
workplace (Velada et al., 2007). Although positively related to training transfer, the
other component of the work context – supervisor support – did not predict skill
transfer. This is a finding that is consistent with several other studies examining
support coming from a vertical source e.g. Chiaburu and Marinova, 2005; vander
Klink et al., 2001). These inconsistent results of supervisor support on training
transfer may be because support dimensions are proximal and specific to training
transfer aspects. For example, supervisors engage in discussions with the employees
(Lim and Johnson, 2002) and provide feedback (Velada et al., 2007). Unfortunately,
more distal aspects and diffuse support aspects, such as the relationship of the
employee with one‘s direct leader (or LMX) and its influence on training
effectiveness, have received little empirical attention. The current study focuses on
filling this gap and examining how LMX impact training effectiveness.
PROCESSES LEADING TO TRAINING EFFECTIVENESS
The current study focuses on training motivation and outcome expectancy as
individual factors having an effect on training outcomes. For example, there are
particular training characteristics that are essential preconditions for learning, such as
training motivation (Goldstein and Ford, 2002), the first individual factor investigated
in the present study. Training motivation refers to the ‗intensity and persistence of
efforts that trainees apply in learning-oriented improvement activities before, during,
and after training‘ (Burke and Hutchins, 2007). There is evidence suggesting that there
are differences in the amount of training motivation among different trainees, and that
it relates to the success of the trainees in the subsequent training program (Goldstein
and Ford, 2002). For example, Scaduto et al; (2008) investigated both individual and
contextual predictors of training transfer, maintenance and generalization. Their
findings suggest that training motivation is directly related to all components of
training effectiveness (positive correlation with training transfer, maintenance and
generalization). Furthermore, high-quality leader–member relationships have a
positive influence on employees‘ levels of empowerment, which are described by

Onukwube
706
Kang and Stewart (2007) as a motivating factor and supported empirically in other
studies (Liden et al., 2000).In addition, because LMX relationships are based on social
exchanges, there is a perceived commitment on the part of subordinates to reciprocate
high-quality relationships (Hofmann et al., 2003). One way in which subordinates can
reciprocate these relationships is by engaging in discretionary behaviours.
Reciprocation is not limited to these behaviours, and employees can also engage in
such behaviours as paying attention to skill application in a work setting. More
importantly, employees will be motivated to maintain the skills in time (training
maintenance), and will go the extra mile and generalize these skills to new situations
(training generalization).
The second individual factor of interest influencing training effectiveness is outcome
expectancy. According to Stone and Henry (2003), outcome expectancy is defined as
‗the consequence of an act and not the act itself‘. Concretely, the central idea of
expectancy theories is that the influence on an individual to take on a specific
behaviour is a function of: (1) his or her expectations that the behaviour will result in a
specific outcome; and (2) the sum of the valences (or values) that he or she gains from
the outcome. In a training context, in most cases, learners who are motivated have two
beliefs: (1) making an effort during training will result in learning; and (2) the material
they learn will be useful for achieving valued outcomes back on the job (Brown and
Ford, 2002).There is both theoretical and empirical support for the importance of this
second belief, which is related to Vroom‘s (1964) expectancy theory (Brown and
Ford, 2002). This theory suggests that the motivating force behind specific choices
originates mainly from perceptions of the utility or value of that choice (Brown and
Ford, 2002). According to Vroom‘s theory (1964) an individual is more likely to
pursue choices, and make an effort, when he or she believes the result will be valued
outcomes. Empirical support for the importance of utility perceptions demonstrated a
high correlation between beliefs in the value of training and specific motivation to do
well in training (Alliger et al., 1997) Leaders, through their complex relationships
with followers, can have an influence on follower expectancies, in that they provide
formal rewards for task performance and for discretionary behaviours (by having a
choice on positioning specific employees in the in- or out-group through high or low
LMX relationships). Therefore, a good relationship between the leader and the
follower would include communication about what behaviours are tied to good – and
bad – performance. If the organization has done a good job of aligning the training
outcomes with necessary employee performance, then the benefits of training transfer
would be apparent to the employee, subsequently adding to their outcome expectancy
regarding the training. Put another way, if the leader and follower agree (through a
good LMX relationship) on what is important from a performance standpoint, and if
they see the training as contributing to this desired performance, then employee
outcome expectancy would increase because training is a path to the performance
desired by the leader (and the organization).
Therefore, based on the previous discussion, the following hypotheses are proposed:
Hoa: LMX will not be positively related to (a) training transfer, (b) training
maintenance, and (c) training generalization.
H1a: LMX will be positively related to (a) training transfer, (b) training maintenance,
and (c) training generalization.
Hob: Training motivation not will be positively related to (a) training transfer,(b)
training maintenance, and (c) training generalization.
Training of construction professionals
707
H1b: Training motivation will be positively related to (a) training transfer,(b) training
maintenance, and (c) training generalization.
Hoc: Training motivation will not mediate the relationship between LMX and training
outcomes (transfer, maintenance, generalization).
H1c: Training motivation will mediate the relationship between LMX and training
outcomes (transfer, maintenance, generalization).
Hod: Outcome expectancy will not mediate the relationship between LMX and training
outcomes (transfer, maintenance, generalization).
H1d: Outcome expectancy will mediate the relationship between LMX and training
outcomes (transfer, maintenance, generalization).
RESEARCH METHOD
The study embraces both quantitative and qualitative methods of data collection.
Relevant information is sourced from construction professionals (Architects, Builders,
Quantity Surveyors and Civil Engineers) who have participated in various continuous
professional development programmes organised by their respective professional
bodies. Respondents were asked to indicate their judgement on identified leader
member exchange factors, training transfer factors, training maintenance factors,
training generalisation factors, training motivation factors and outcome expectancy
factors. A 5-point scale was used to assess the importance of these factors. Section A
addresses questions on name and type of organisation, years of construction industry
experience. For each factor, an important index was determined. Questions on section
B to G are quantitative in nature. Section B comprises twenty four questions on leader
member relationship, section C comprises fifteen questions on training transfer,
Sections D, E, F and G comprise two, three, ten and three questions respectively on
maintenance, generalisation, motivation and outcome expectancy. The population
upon which the respondents were stratified comprises government establishment (120
respondents), contracting organisations (100 respondents) and consultancy firms (100
respondents) Using stratified random sampling technique; a total number of 160
respondents were selected for study from each group. One out of every two in the
sample frame was selected.
Measures
In this study previously published scales was used to collect data relevant for the
study. All measures were assessed using a 5-point Likert-type scale (1-strongly
disagree; 2-disagree; 3-neither agree nor disagree; 4-agree; and 5-strongly agree).
Cronbach‘s alpha is the most widely used criteria to measure the reliability of items
for each construct.Leader–Member Exchange (LMX): This construct was measured
with the LMX7 designed by Graen et al. (1982). It consisted of seven items; ‗I always
know how satisfied my supervisor is with what I do‘, α = 0.85. Training motivation
was measured using a scale developed by Noe and Schmitt (1986) (15 items, ‗I try to
learn as much as I can from training programs ‘, α = 0.79). The training outcome
expectancy was based on a scale developed by Stone and Henry (2003) and adapted
for organizational outcomes (eight items, ‗Working with the techniques from this
course will result in obtaining better work outcomes‘, and ‗Knowing and applying
skills learned in class will help advance my career‘, α = 0.89).Training outcomes were
measured by training transfer (seven items, Xiao, 1996, ‗I can accomplish the job
tasks better by using new knowledge acquired from the training course‘, α = 0.83),
training maintenance (seven items, Gist et al., 1991, ‗I have monitored my progress in

Onukwube
708
the use/review of the skills‘, α = 0.86) and training generalization (two items, Tesluk
et al., 1995, ‗I make use of the acquired skills only in situations similar to those
presented during the training program‘ [reverse-scored], α = 0.78) Statistical packages
for social sciences (SPSS) were used for the processing of data in this study.
RESULTS
Data collected from Section A of the research instrument shows that 44(27.5%) of the
respondents are Architects, 39(24.4%) are Quantity Surveyors, 37(23.1%) are Civil
Engineers while the remaining 40 (25.0%) are Builders. Majority of the respondents
68 (42.5%) had more than 25 years construction industry experience, while 42
(26.25%) had experience ranging between (15- 20) years. Others are 30 (18.75%) for
industry experience ranging between (10-14) years while the last group recorded 20
(22.5%) for industry experience of (5-9) years. The implication of this result is that
most of the respondents had enough knowledge and experience to make useful
contribution to this area of research.
Relationship between LMX and Performance Outcomes
Means, standard deviations and correlations are presented in Table 2.Hypothesis 1,
predicted direct positive relationships between LMX and the three performance
outcomes. As expected, LMX was positively related to transfer (r = 0.303, p < 0.05),
maintenance (r = 0.253, p < 0.05) and generalization (r = 0.302, p < 0.05) of training
skills. Hypothesis 2 predicted a direct positive relationship between training
motivation and the three performance outcomes.
Table 2: Means, standard deviations, correlations, and reliabilities
Variable Mean SD 1 2 3 4 5 6
1. Leader-member
exchange
3.04 0.84 (0.91)
2. Training motivation 3.49 0.40 0.358** (0.83)
3. Outcome expectancy 3.70 0.70 0.271* 0.423** (0.93)
4. Training transfer 3.49 0.67 0.303* 0.466** 0.531** (0.87)
5. Training maintenance 3.7 0.65 0.253* 0.446** 0.455** 0.433** (0.92)
6. Training
generalization
3.86 0.77 0.302* 0.237* 0.342** 0.330** 0.338** (0.81)
*p<0.05; n=160, ** P < 0.01, D = standard deviation.
As expected, training motivation was positively related to transfer (r = 0.466, p <
0.05), maintenance (r = 0.446, p < 0.05) and generalization (r = 0.237, p < 0.05) of
Table 1: Demograghic Profile of Respondents
Professional Groups Frequency Cum. Freq. Percentage Cumulative Percentage
Architects 44 44 27.5% 27.5%
Quantity Surveyors 39 83 24.4% 49.9%
Civil Engineers
Builders
37
40
120
160
23.1%
25.0%
75.0%
100.0%
Total 160
Industry Experience
(5-9) years 20 20 12.5% 12.5%
(10-14) years
(15-20) years
More than 25 years
30
42
68
50
92
160
18.75%
26.25%
42.5%
31.25%
57.50%
100.0%
Total 160

Training of construction professionals
709
training skills. Therefore, Hypotheses 1 and 2 were supported. Additionally, outcome
expectancy was positively related to transfer (r = 0.531, p < 0.05), maintenance (r =
0.455, p < 0.05) and generalization (r = 0.342, p < 0.05). Lastly, as shown in Table 1,
LMX was positively correlated to both training motivation (r = 0.358, p < 0.05) and
outcome expectancy (r = 0.271, p < 0.05).
Regression results
Hypothesis 1 was also supported from the regression analysis. As shown in Table 3,
LMX is positively related to transfer ( = 0.358, p < 0.05), maintenance ( = 0.303,
p < 0.05) and generalization ( = 0.253, p < 0.05).
Hypotheses 3 and 4 predicted a mediating effect of training motivation and outcome
expectancy, respectively. According to extant literature, the following relationships
must be investigated in order to demonstrate mediation. First, the relationship between
the predictor (LMX) and the outcome variables (transfer, maintenance and
generalization) must be significant. As shown in Table 3, LMX was positively related
to these outcomes. Second, the predictor must be related to the mediators. As shown
in table 2, LMX was positively correlated to both training motivation and outcome
expectancy. Third, the path between the mediators and the criteria must be tested, and
the positive relationships between the training motivation and the transfer outcomes
are supported (see Table 3, all correlation coefficients higher than 0.40, p<0.05). For
Hypothesis 3, the effect of the LMX on the outcome variables, controlling for training
motivation should decrease (for partial mediation), or become non-significant (for full
mediation). After entering training motivation into the equation, the relationship
between LMX and transfer ( = 0.00, non significant [ns]), maintenance ( = 0.00,
ns) and generalization ( = 0.00, ns), became non significant; hence, the mediating
test was meaningful for all three of the outcome variables, supporting Hypothesis 3.
Training motivation fully mediated the relationship between LMX and transfer ( =
0.423, p < 0.05), maintenance ( = 0.531, p < 0.05) and generalization ( = 0.455, p <
0.05).
Table3: Direct and mediated regressions for training transfer, maintenance, and generalization
Predictors Outcome variables
Training
transfer
Training
maintenance
Training
generalization
Step 1
( )
Step 2
( )
Step 1
( )
Step 2
( )
Step 1
( )
Step 2
( )
Distal variable
Leader-member
exchange
mediators
0.358* 0.00 0.303* 0.00 0.253* 0.00
Training
motivation
0.423* 0.531* 0.455*
Outcome
expectancy
0.237* 0.283* 0.305*
R2 0.128* 0.179* 0.092* 0.282* 0.064* 0.207*
R2 0.056* 0.168* 0.109* 0.271* 0.338* 0.196*
F 10.02* 14.84* 6.89* 26.70* 4.64* 17.79*
F 4.04* 8.33* 8.78*
Hypothesis 4 predicted a mediating effect of outcome expectancy. The same
procedure used for the previous hypothesis was used to test this hypothesis .In
addition to the relationship between LMX and the criteria (demonstrated above, for

Onukwube
710
Hypothesis 3), as shown in Table 2, LMX was positively related to outcome
expectancy. The path between the mediator and the criterion must be tested using
LMX and outcome expectancy as predictors of the outcome variables. After entering
outcome expectancy into the equation, the relationship between LMX and transfer
became, again, non significant (with standardized coefficients close to zero); hence,
the mediating test was meaningful for all three outcome variables. There was support
for Hypothesis 4, and outcome expectancy fully mediated the relationship between
LMX and transfer ( = 0.237, p < 0.05), maintenance ( = 0.283, p < 0.05) and
generalization ( = 0.305, p < 0.05)
CONCLUSIONS
Theoretical and practical study contributions
The purpose of this study was to examine how leader member relationship (LMX)
impact training effectiveness (training transfer, training maintenance and training
generalization) This study focus on this particular aspect of the work environment to
compensate for the scarcity of research in this area (Burke and Hutchins, 2007) and
attempt to contribute both theoretically and practically to the training effectiveness
and leadership research domains. In this study, empirical test was used to test the
relationship among the study variables. The findings in this study suggests that leader
member relationship was positively related to training effectiveness (Training transfer,
maintenance and generalization).This results is supportive of previous research
findings of (Scaduto et al, 2008; Chiaburu and Tekleab, 2005;Colquitt and others,
2000; Ilies et al, 2007 and Kozlowski et al; 2000).Knowing where one stands with the
leader, having the certainty that the leader will use his or her power to help the
employee solve work issues and, more generally, having an effective work
relationship with one‘s leader (all aspects of LMX as evaluated in this study), are
beneficial for training transfer. The results of the study also indicate that training
motivation was positively related to training transfer, maintenance and generalization.
This agrees with the findings of Scaduto et al., (2008). The study also found out that
outcome expectancy was positively related to training transfer, maintenance and
generalization. This result is consistent with the findings of (Stone and Henry, 2003;
Brown and Ford, 2002). According to them, outcome expectancy influences training
effectiveness. The central idea of expectancy theories is that the influence on an
individual to undergo training is a function of his or her expectations that the training
will result in a specific outcome and this will correspond to the sum of valences he or
she expects to gain from such training. The study further discovered that training
motivation fully mediated the relationship between LMX and training effectiveness
and outcome expectancy mediated the relationship between LMX and training
effectiveness.As suggested in prior theories, but captured to a limited extent in
empirical work in a training setting, leaders are powerful motivating forces and can
manage the outcome expectancies of their followers (e.g. Scaduto and others,
2008).The findings demonstrate the importance of leader–follower relationships.
Showing processes through which the leader influences employees‘ training
effectiveness, especially in managing the performance–outcome link (conceptualized
as outcome expectancy) is important. The practical contributions of this study are
twofold. The first has to do with leadership. The existence of direct relationships
between LMX and training effectiveness has implications for the individual (in terms
of training material learned and performed on the job) and for the organization.
Therefore, less than ideal relationships and exchanges between employees and their
leaders can stall training transfer and related outcomes (maintenance, generalization).

Training of construction professionals
711
This point to the fact that the effectiveness of training programs and interventions
extends beyond the individual participating in the training, the particular type of
training and the intervention design features. The individual who has a good
relationship with his or her supervisor (which enhances communication of
organizationally relevant and important information) stands a much better chance of
benefiting from the training, which will lead to positive outcomes, both for the
individual and the organization. The second aspect is related to training motivation
and outcome expectancy as intervening processes. Leaders can directly influence their
employees ‘training motivation and this has a positive impact on how they transfer
new skills, maintain them over time and how they use them in other domains of their
jobs. Of importance here is the fact that employees do not enter, remain and exit the
training situation in a neutral state. The entire experience is influenced by their
perception of the relationship with the direct leader, and this can both enhance, and
hinder in the case of a negative LMX relationship, their motivation. Leaders are also a
source for trainees‘ outcome expectancies, and this study shows the need to actively
manage information in this particular domain. Practically, leaders can (and should)
inform their followers on how their performance during training is related to outcomes
of interest to the employees. In conclusion, this study has advanced knowledge of
training effectiveness and leader influence on training transfer.
FUTURE RESEARCH DIRECTIONS
This study suggests a number of directions for future research. One area that needs
more attention is on the reasons for the low rates of organizations that incorporate
training activities to improve transfer before, during, and after training. While many
studies have attempted to improve transfer through various interventions, relatively
few have sought to understand why it remains a problem. In this regard, more research
is needed on both transfer generalization and maintenance.
REFERENCES
Alliger, G. M., Tannenbaum, S. I., Bennett,W., Traver, H. and Shotland, A. (1997) ―A meta-
analysis of the relations among training criteria‖, Personnel Psychology, 50, pp 341–
58.
Baldwin, T. T. and Ford, J. K. (1988) ―Transfer of training: a review and directions for future
research‖, Personnel Psychology, 41, pp 63–103.
Blau, P. M. (1964) Exchange and power in social life. Wiley, New York.
Brown, K. G. and Ford, J. K. (2002) ―Using Computer Technology in Training: Building An
Infrastructure for Active Learning‖, in K. Kraiger (ed.), Creating, Implementing, and
Managing Effective Training and Development San Francisco, CA: Jossey-Bass, pp
192–233.
Burke, L. A. and Baldwin, T. T. (1999) ―Workforce training transfer: a study of the effect of
relapse prevention training and transfer‖, Human Resource Management, 38, 227–43.
Burke, L. A. and Hutchins, H. M. (2007) ―Training transfer: an integrative literature review‖,
Human Resource Development Review, 6, pp 263–96.
Cheng, E. W. L. and Ho, D. C. K. (2001), ―A review of transfer of training studies in the past
decade‖, Personnel Review, 30, pp 102–18.
Chiaburu, D. S. and Tekleab, A. G. (2005) ―Individual and contextual influences on Multiple
dimensions of training effectiveness‖, Journal of European Industrial Training, 29, pp
604–26.
Colquitt, J. A., LePine, J. A. and Noe, R. A. (2000) ―Toward an integrative theory of Training
motivation: a meta-analytic path analysis of 20 years of research‖, Journal of Applied
Psychology, 85, pp 679–707.

Onukwube
712
Driver, M. (2002) ―Learning and leadership in organizations: Toward complementary
communities of practice,‖ Management Learning, 33, pp 99–126.
Fitzpatrick, R. (2001) ―The strange case of the transfer of training estimate,‖ Industrial-
Organizational Psychologist, 39(2), pp 18–19.
Ford, J. K., Smith, E. M., Gully, S. M. and Salas, E. (1998) ―Relationships of Goal
orientation, meta cognitive activity, and practice strategies with learning outcomes
and transfer‖, Journal of Applied Psychology, 83, pp 218–32.
Gerstner, C. R. and Day, D. V. (1997) ―Meta-analytic review of leader-member exchange
theory: correlates and construct issues‖, Journal of Applied Psychology, 82, pp 827–
44.
Goldstein, I. L. and Ford, J. K. (2002) Training in Organizations: Needs, Development, and
Evaluation, 4th ed., Wadsworth Group, Belmont, CA.
Gouldner, A.W. (1960) ―The norm of reciprocity: A preliminary statement,‖ American
Sociological Review, 25, pp 161–177.
Graen, G., and Cashman, J. F. (1975) ―A role-making model of leadership in organizations:A
development approach.‖ In J. G. Hunt and L. L. Larson (Eds.), Leadership frontiers
Kent, OH: Kent State University Press, 1 (1), pp 143–165
Graen, G. B. and Uhl-Bien, M. (1995) ―Relationship-based approach to leadership:
development of leader-member exchange (LMX) theory of leadership over 25 years:
applying a multi-level multi-domain perspective‖, Leadership Quarterly, 6, pp 219–
47.
Hofmann, D. A., Morgeson, F. P. and Gerras, S. J. (2003) ‗Climate as a moderator of the
relationship between leader-member exchange and content specific citizenship:
safety climate as an exemplar‘, Journal of Applied Psychology, 88, pp 170–8.
Holton, E. F., III and Baldwin, T. T. (2003) Improving Learning Transfer Systems in
Organizations, Josey-Bass and Pfeiffer, San Francisco.
Ilies, R., Nahrgang, J. D. and Morgeson, F. P. (2007) ―Leader-member exchange and
citizenship behaviours: a meta-analysis‖, Journal of Applied Psychology,92, pp 269–
77.
Kang, D. and Stewart, J. (2007) ―Leader-member exchange (LMX) theory of leadership and
HRD: development of units of theory and laws of interaction‖, Leadership and
Organization Development Journal, 28, pp 531–51.
Kozlowski, S. W. J., Brown, K. G., Weissbein, D. A., Cannon-Bowers, J. A., and Salas, E.
(2000). ―A multilevel approach to training effectiveness‖. In K. J.Klein and S. W. J.
Kozlowski (Eds.), Multi level theory, research, and methods in organizations:
Foundations, extensions, and new directions Jossey-Bass, San Francisco, CA,
pp.157–210.
Liden, R. C., Wayne, S. J. and Sparrowe, R. T. (2000), ―An examination of the mediating role
of psychological empowerment on the relations between the job, interpersonal
relationships, and work outcomes‖, Journal of Applied Psychology, 85, pp 407–16.
Liden, R. C., Sparrowe, R. T., and Wayne, S. J. (1997). ―Leader–member exchange theory:
The past and potential for the future‖. Research in Personnel and Human Resources
Management, 15, pp 47–119.
Lim, D. H. and Johnson, S. D. (2002) ―Trainee perception of factors that influence learning
transfer‖, International Journal of Training and Development, 6, pp 36–48.
Murphy, S. E. and Ensher, E. A. (1999) ―The effects of leader and Subordinate characteristics
in the development of leader-member exchange quality‖, Journal of Applied Social
Psychology, 29, pp 1371–94.
Maurer, T. J., Pierce, H. R., and Shore, L. M. (2002) ―Perceived beneficiary of employee
development activity: A three-dimensional social exchange model.‖ Academy of
Management Review, 27, pp 432–444.
Noe, R. A. and Schmitt, N. (1986) ―The influence of trainee attitudes on training
effectiveness: test of a model‖, Personnel Psychology, 39, pp 497–523.
Paparoidamis, N. G. (2005) ―Learning orientation and leadership quality: Their impact on
salespersons‘ performance.‖ Management Decision, 43, pp 1054–1063.

Training of construction professionals
713
Quinones, M. A. (1997) ―Contextual influences on training effectiveness‖, in M. A. Quinones
and A. Ehrenstein (eds), Training for a Rapidly Changing Workforce: Application of
Psychological Research American Psychological Association, Washington, DC, pp.
177–201.
Tracey, J. B., Hinkin, T. R., Tannenbaum, S. and Mathieu, J. E. (2001) ―The influence of
individual characteristics and thework environment on varying levels of training
outcomes‖, Human Resource Development Quarterly, 12, pp 5–23.
Van Dam, K., Oreg, S., and Schyns, B. (2008) ―Daily work contexts and resistance to
organizational change: The role of leader–member exchange, development climate,
and change process characteristics.‖ Applied Psychology: An International Review,
57, pp 313–334.
Van der Klink, M., Gielen, E. and Nauta, C. (2001) ―Supervisory support as amajor
condition toenhance transfer‖, International Journal of Training and Development, 5,
pp 52–63.
Velada, R., Caetano, A., Michel, J. W., Lyons, B. D. and Kavanagh, M. J. (2007) ―The effects
of training design, individual characteristics and work environment on transfer of
training‖, International Journal of Training and Development, 11, pp 282–94.
Vroom, V. H. (1964) Work and Motivation, Wiley, New York.
Wang, H., Law, K. S., Hackett, R. D., Wang, D. and Chen, Z. X. (2005) Leader-member
exchange as a mediator of the relationship between transformational leadership and
followers, performance and organizational citizenship behaviour‖, Academy of
ManagementJournal, 48, pp 420–32.
Scaduto, A; Linday,D and Chiaburu, D.S (2008) ―Leader Influences ontraining effectiveness:
Motivation and Outcome expectation processes‖ International Journal of Training and
Development, 12(3), pp 158-170
Stone, R. W. and Henry, J. W. (2003) ―The role of computer self-efficacy and outcome
expectancy in influencing the computer end user‘s organizational commitment‖,
Journal of End User Computing, 15, pp 38–53.


Dimoriaku, I. and Obiozo, I. (2011) Malaika Children‘s Village, Mkuranga, Tanzania: A case study of
sustainable construction in Africa In: Laryea, S., Leiringer, R. and Hughes, W. (Eds) Procs West
Africa Built Environment Research (WABER) Conference, 19-21 July 2011, Accra, Ghana, 715-724.
715
MALAIKA CHILDREN’S VILLAGE, MKURANGA,
TANZANIA: A CASE STUDY OF SUSTAINABLE
CONSTRUCTION IN AFRICA
Ifeyinwa Dimoriaku1 and Rita Obiozo
2
1Corner Stone Architects, New York, USA
2Department of Architecture, Enugu State University of Science and Technology, Enugu, Enugu State,
Nigeria
Sustainable construction should not be seen as something that is exclusive to
expensive projects, as it has the potential to be applied to any development. Even
switching of small aspects of a development to more sustainable materials or designs
is a step forward. Malaika Children‘s village, Mkuranga, in Tanzania represents a
case study of effective sustainable practices by planning, design, construction, and
maintenance as well as theme formation and concept. The village is a Hydraform
sustainable construction demonstration, designed in 2008 to accommodate 320 AIDS
orphans and offer them a normal life with a unique living concept based on family
houses. It is an excellent example of current sustainable construction practice that
showcases the problem as well as the solutions employed. In highlighting the case of
sustainable construction with this very successful project - still in progress - this paper
offers tangible evidence of the construction industry‘s adoption of more sustainable
practices in Africa for more provocative cost efficient results!
Keywords: compressed earth blocks, efficient water system, phased construction,
sustainable construction, Tanzania.
INTRODUCTION
The American Institute of Architects defines sustainability as the ability of society to
continue functioning into the future without being forced into decline through
exhaustion or overloading of the key resources on which that system depends
(Mendler and Odell, 2000). Sustainable Design in buildings and construction requires
a holistic view of land, infrastructure and buildings in order to use material, energy
and water resources efficiently, improve the health of ecosystems and address health
issues relating to the indoor environment. Sustainable design can lead to a variety of
economic benefits – energy, water and materials savings as well as reduced
maintenance and other operational costs (Mendler and Odell, 2000).
This paper will start by highlighting the issues that designers should consider in order
to ensure a sustainable building project. The Malaika Children‘s Village project will
then be examined in detail in order to draw attention to the design considerations
which make it a good case study of sustainable construction.
SUSTAINABLE DESIGN

Dimoriaku and Obiozo
716
The following are ten issues designers should consider as part of a sustainable design
approach:-
1. Select And Develop Sites To Promote Livable Communities:
Seek out opportunities to redevelop existing sites, structures and infrastructure.
Develop links to public transit and strategies to develop pedestrian friendly, mixed-use
communities. Provide areas of dedicated open space and green ways.
2. Develop Flexible Designs to Enhance Building Longevity:
Consider future needs and design to accommodate them. Design for ease of
expansion.
3. Use Natural Strategies to Protect and Restore Water Resources:
Design the site to limit disruption to existing vegetated areas and use natural storm
water treatment systems to purify runoff and promote groundwater recharge.
4. Improve Energy Efficiency while Ensuring Thermal Comfort:
Improve the building envelope and develop passive solar strategies to improve
comfort and reduce energy demand. Coordinate daylighting with high – efficiency
electric lighting.
5. Reduce Environmental Impacts Related to Energy Use:
Explore opportunities to reduce reliance on fossil fuels and use cleaner sources of
power.
6. Promote Occupant Health and Well – being in the Indoor Environment:
Enhance the indoor environment by providing a connection to nature and daylight.
Use natural ventilation.
7. Conserve Water and Consider Water Reuse Systems:
Conserve water with the use of low flow plumbing fixtures and water efficient
appliances. Consider collection of rainwater, reuse of gray water for nonpotable uses
and construction of wetlands for biological wastewater treatment.
8. Use Environmentally Preferable Building Materials
Evaluate the environmental impact, resource efficiency and performance of proposed
building materials over their full life cycle. Seek out non-toxic materials from,
renewable, sustainably acquired resources that minimize waste and pollution from
manufacturing, installation and maintenance.
9. Use Appropriate Plant Material
Use plant material native to the region‘s climate, soils and water availability to ensure
survival while reducing maintenance and irrigation requirements.
10. Plan for Recycling During Construction, Demolition and Occupancy
Provide collection bins for recyclable materials at the point of use on each floor and
an area for materials collection at the loading dock. Where appropriate, consider

Sustainable construction
717
vertical chutes to make collection easier. Require contractors to develop a construction
waste management plan prior to construction (Mendler and Odell, 2010).
MALAIKA CHILDREN’S VILLAGE
It has been a long standing dream of Jamilla, the founder of Malaika Kids Network to
establish a safe ―home‖ environment for the street children in Tanzania (Coneboy,
2010). Malaika Kids is an international network of charities which raises fund for and
builds homes for orphans with the support of volunteers and companies [Malaika Kids
UK (2011). Our approach]. In the past six years AIDS has spread rapidly in
Tanzania. The most tragic consequence of the AIDS epidemic is the enormous
increase in the number of street children who are in need of a caring home
environment, regular meals and a proper education.
The Malaika children‘s village has been designed to accommodate 320 children. The
aim is to offer the children a normal life with a unique living concept based on family
houses. The children‘s village hopes to help the children grow up into young
independent adults with a future to look forward to (Coneboy, 2010).
The project was actualized with the support of the government - which provided land
for the project - and local companies – which donated services and equipment for the
project [Malaika Kids UK (2011). Support from the district commissioner in
Mkuranga]. Building started under the supervision of architect Kees Dwarhuis in
2008. The first cluster of homes and a school room have been built (Coneboy, 2010).
DESCRIPTION OF THE VILLAGE
The smallest unit in the village is the family house. Each family house accommodates
ten children: five boys and five girls. Each house consists of two dormitory buildings
(one for the boys and one for the girls - so that the boys and girls can sleep separately)
and a living room. In the living room there is space reserved for the carer to sleep.
Figure 4: Aerial View of a Cluster. Figure 5: A Shower Block.
Source: Malaika Kids UK website. Source: Malaika Kids UK website.
The family houses are built in clusters (see Figure 1). A cluster consists of four family
houses, a central meeting room and a shower block. The family houses are to be built
around the central meeting room, where there is a communal dining facility. Each
‗family‘ eats together at their own table. There is also sufficient space to organize
communal activities. The meeting room also has a kitchen. It has been proposed that
the meals will also be cooked here until the village has grown to its full size. Then,

Dimoriaku and Obiozo
718
there will be a central kitchen where the food can be picked up, so that it only needs to
be warmed up in the cluster
Each cluster has been designed to have one shower block (see Figure 2) with toilets,
showers and a space for doing the washing. That is the only place in the cluster where
there is running water. By placing the shower blocks on the edge of the village, the
village can easily be supplied with water via one ring main. All parts of a cluster and
their linking walkways are covered and therefore always easy to reach, even in the
rainy season.
A nice detail is that the clusters have been linked with attractive covered walkways
where the residents of the various clusters can easily meet each other. By linking the
clusters, a courtyard is formed between the dormitory buildings of two clusters. Such
a courtyard offers a secure space where the smallest children can play peacefully and
safely. In the middle of the village there is space for sports fields. The children can
play football there – by far the most popular sport in Africa – and other sports and
games. It is also part of the plan to build classrooms at the entrance of the village,
where the children can go to school. There are also plans for a computer building to
give the village children extra opportunities to develop [Malaika Kids UK (2011). The
building of the village].
CHOICE OF BUILDING MATERIAL
The buildings, the surrounding walls of the village and the walls of the structures
within the village were constructed with Hydraform blocks (Sarah Coneboy, 2010).
Hydraform blocks are special building blocks that have been designed to have a
profile which allows them to be stacked on top of each other without using mortar.
This system was specially developed by a South African company ―Hydraform‖ for
the African market in order to build simply but well at low cost. The advantages are
that the Hydraform blocks can be manufactured on site - earth from the site can be
used to make the blocks (See pics. 1 and 2). Moreover, the blocks are thick, the
thickness of the blocks helps to keep the buildings cool [Malaika Kids UK (2011).
Building has begun!].
Pic 1: Making Hydraform blocks on the building Pic 2: The Hydraform blocks ready for the first
site with a special machine. building.
Source: Malaika Kids UK website. Source: Malaika Kids UK website.
EFFICIENT USE OF WATER
In order to supply the village with water it was proposed that three wells would be
drilled and water pumped up from approximately 30 metres deep. At each well, a
water tower and two storage tanks of 10.000 litres would be placed. The aim is to give

Sustainable construction
719
the village a total storage capacity of 60.000 litres. A conscious choice has been made
for three wells with separate storage capacity in order to always have clean water,
even during maintenance or some calamity. With an expected usage of approximately
12.000 litres per day when the village is fully occupied, there would still be sufficient
water for five days even if not all tanks were in use. The storage tanks would be
connected to a ring main which would provide the village and all the shower blocks
(and a number of other buildings) with water. By placing the wells, water towers and
storage tanks at the top of the village, there would be sufficient water pressure in the
shower blocks.
Each cluster of 4 family houses has a communal shower block, with showers, toilets,
and facilities to wash and dry clothes. The eight shower blocks are all on the edge of
the village, supplied with running water, and are the only places in the village where
there is clean water. This creates a relatively efficient and effective water system
which is easy to install and maintain [Malaika Kids UK (2011). Clean water].
In addition, rain water is collected and drained away as much as possible. This is
achieved by collecting the rain water from the roofs in guttering and the water on the
ground via a system of drainage channels. The rain water is collected and drained
away as much as possible. This is achieved by collecting the rain water from the roofs
in guttering (see Figure 3 and Pic 5 on p. 9) and the water on the ground via a system
of drainage channels (see Figure 4). This is to ensure that there is no damage to
buildings or the land during the rainy season. Where the buildings are not connected
to each other, they are linked by covered walkways, so that the children‘s village can
also function well during the rainy season. These centrally located walkways would be
built above the central drain (see Figure 4).
The treatment of waste water has also been well planned. The shower and washing
water would be used to flush the toilets. The flushed waste water would be collected
in two consecutive septic tanks and then cleaned further by a soak away. When the
cleaned water eventually disappears into the land, it will no longer be polluted, so that
the wells 80 metres further up will not be contaminated [Malaika Kids UK (2011).
Treating waste water responsibly].
Figure 6: Rainwater Collection by the Means Figure 7: Section Showing the Central of Shared
Gutters. Drains in the Foundation of Covered Walkways
Source: Malaika Kids UK website. Source: Malaika Kids UK website.

Dimoriaku and Obiozo
720
OPTIMAL USE OF SITE CHARACTERISTICS
The land, where the children‘s village building is sited is in Mkuranga, an hour‘s
journey south of the capital of Tanzania (Dar-es-Salaam). It is an 18 hectare piece of
land with major differences in elevation: from the middle the land goes up 14 metres
high on the one side and on the other side 8 metres. That may appear difficult, but
actually offers many advantages.
On the village map (see Figure 5), it can be seen that the plan consists of three strips of land: two strips
each with four living clusters and in between a strip of land with sport and playing fields. Each stretch
is approximately 250 metres long and 60 metres wide and would be levelled during the preparation of
the land for building. Due to the slope of the land, each strip of land is two metres lower than the
previous strip, whereby a slope of 45º brings you from one strip to the next. This means that on one side
of the playing fields, there would be a natural stand for the children when a game is being played. Also
by placing the water sources and storage tanks at the top of the village, the shower blocks will
automatically have sufficient water pressure. The drainage of rain water will also be made easier by the
differences in height. This allows for optimal use of the natural characteristics of the land [Malaika
Kids UK (2011). Made to measure for the terrain].
Figure 8: Village Map Showing the Location of the Master plan on the Land.
Source: Malaika Kids UK website.
PHASED CONSTRUCTION
The village was designed to have a modular formation (see Figure 6). The building
elements were repeated and the facilities were designed cleverly so that the village
could be built and maintained with much less funds. With this type of design it is
possible to build one cluster at a time, so that a quick start can be made with building
and populating the village - more can be added as more funds become available and as
more children need a place [Malaika Kids UK (2011). The Master Plan in Short ].
The construction of the village was planned in phases. The first four phases are as
follows (see Figure 7):-

Sustainable construction
721
Phase 1 – Preparation of the land for building (laying out of adjacent horizontal
terraces of land); Construction of the first cluster, on the highest strip (this cluster
consists of four family houses with eight dormitories, a central hall with kitchen and a
shower block) and putting in place the infrastructure and 500 metres of fencing.
Figure 6: The Master Plan of the Village in 3D.
Source: Malaika Kids UK website.
Phase 2 – Drilling of a well, construction of a water tower, the placing of two storage
tanks and the construction of the first part of the main water pipes.
Phase 3- Construction of two school buildings and an office.
Phase 4 – Construction of a second cluster (like the first cluster this will consist of
four family houses, a central hall with kitchen and a shower block).This cluster will be
connected to the main water pipes [Malaika Kids UK (2011). The first building
phases].
Figure 7: The First Four Construction Phases.
Source: Malaika Kids UK website.

Dimoriaku and Obiozo
722
PROGRESS MADE SO FAR IN THE CONSTRUCTION
Four family houses and a shower block are ready for use (see Pics 3, 4 and 5).
Pic 3: The Family Houses Showing the Pic 4: The Completed Shower Block Courtyard.
Source: Malaika Kids UK website. Source: Malaika Kids UK website.
Pic 5: The Completed Shower Block (Guttering Pic 6: Roofing of the School Buildings.
of the Shower Block also connects to Neighbouring
Buildings) Source: Malaika Kids UK website.
The school buildings have also been completed (see Pic 6).The Central Dining Room
(see Pic 7) was the last building of the first cluster to be constructed. It is located in
the middle of the cluster and is supposed to form the focus of all activities of the four
"families" living around this building. As it has no walls the building is really open –
actually a roof on pillars [Malaika Kids UK (2011).Great progress in Mkuranga].
Pic 7: Kids Playing on a Swing with the Completed Central Dining Room in the background.
Source: Malaika Kids UK website.

Sustainable construction
723
The first well has been drilled (see Pic 8) [Malaika Kids UK (2011). The first well has
been drilled] and the first water tower is also ready (see Pic 9) [Malaika Kids UK
(2011). The first water tower is ready! ]. In July 2010, the first phase of the village
was opened. Four family houses, a school and several general buildings are now
operational. Preparations for the construction of the second phase are on their way
[Malaika Kids UK (2011). The building in phases].
Pic 8: Cement Lined Well with Lid (Ready for
Placement of the Water Pump Pic 9: The Finished Water Tower.
Source: Malaika Kids UK website. Source: Malaika Kids UK website.
CONCLUSION
The Malaika Children‘s Village project is a good case study of sustainable
construction. The choice of Hydraform blocks as a building material in this project is
in line with the design recommendations for a sustainable construction project.
Hydraform blocks are environmentally preferable because they are sustainably
acquired, easy to install and easy to maintain. Moreover, since Hydraform blocks keep
buildings cool, this means that their use results in energy savings.
Conservation of water is an important aspect of sustainable construction. It can be
seen that the acquisition and use of water in this project has been properly planned so
that the natural water resources are properly harnessed, used and reused. The site of
the village has been developed in such a manner that it is user friendly -
accommodating recreational activities while maintaining the natural characteristics of
the land i.e. its sloppy nature. The modular formation of buildings and the design of
building elements and facilities have enabled phased construction of the buildings in
the village thereby making it easy to expand gradually as the need arises.
In 2002, a document ―Agenda 21 for sustainable construction in developing countries‖
was published by the International Council for Research and Innovation in Building
and Construction (CIB) in conjunction with United Nations Environment Programme
- International Environmental Technology Centre (UNEP-IETC). (CSIR Research
Space, 2010). The Agenda recommended active involvement of government, industry,
non-governmental organizations, professionals and clients in order to ensure that
sustainable construction is adopted by developing countries (AKANI, 2001). The case
study cited in this article shows an example of a project in a developing country where

Dimoriaku and Obiozo
724
government, industry, non-governmental organizations, professionals and clients have
cooperated to realize a sustainable design project.
REFERENCES
AKANI, (2001). ―Agenda 21 for sustainable construction in developing countries.‖ Akani
newsletter. November 2002 issue. (available at
http://www.buildnet.co.za/akani/2002/nov/01.html).
CSIR Research Space, (2010). ―Agenda 21 For Sustainable Construction In Developing
Countries: A Discussion Document‖ (available at
http://researchspace.csir.co.za/dspace/handle/10204/3511)
Malaika kids uk (2011). Building has begun! (available at http://www.malaika-
kids.org.uk/resources/amgate_7158_103_tich_r943780299266/)
Malaika Kids UK (2011). Clean water. (available at http://www.malaika-
kids.org.uk/resources/AMGATE_7158_103_TICH_R646301355052/)
Malaika kids uk (2011). Great progress in mkuranga (available at http://www.malaika-
kids.org.uk/resources/amgate_7158_103_tich_r1505441915878/
Malaika kids uk (2011). Made to measure for the terrain. (available at http://www.malaika-
kids.org.uk/resources/amgate_7158_103_tich_r6451087842911/)
Malaika Kids UK (2011). Our approach. (available at http://www.malaika-
kids.org.uk/resources/AMGATE_7158_103_TICH_R23390541888/
Malaika Kids UK (2011). Support from the district commissioner in Mkuranga (available at
http://www.malaika-
kids.org.uk/resources/AMGATE_7158_103_TICH_R587852652979/
Malaika Kids UK (2011). The building in phases. (available at http://www.malaika-
kids.org.uk/resources/AMGATE_7158_103_TICH_R650341719139/)
Malaika Kids UK (2011). The building of the village. (available at http://www.malaika-
kids.org.uk/resources/AMGATE_7158_103_TICH_R6441168036956/
Malaika Kids UK (2011). The first building phases. (available at http://www.malaika-
kids.org.uk/resources/AMGATE_7158_103_TICH_R649324258751/
Malaika Kids UK (2011). The first water tower is ready! (available at http://www.malaika-
kids.org.uk/resources/AMGATE_7158_103_TICH_R861467215209/
Malaika Kids UK (2011). The first well has been drilled (available at http://www.malaika-
kids.org.uk/resources/AMGATE_7158_103_TICH_R8601249908842/
Malaika Kids UK (2011). The Master Plan in Short. (available at http://www.malaika-
kids.org.uk/resources/AMGATE_7158_103_TICH_R642392614480/)
Malaika Kids UK (2011). Treating waste water responsibly. (available at http://www.malaika-
kids.org.uk/resources/AMGATE_7158_103_TICH_R647591410104/)
Mendler, S.F. and Odell, W. (2000). ―The HOK Guidebook to Sustainable Design.‖ John
Wiley & Sons, New York. P.1-5.
Coneboy, S. (2010). “ Malaika Children's Home.” (available at
http://www.hydraform.com/PressReleases/ArticleDetail.asp?PublicationID=42.

Onukwube, H. (2011) Management of building construction disputes in Nigeria In: Laryea, S.,
Leiringer, R. and Hughes, W. (Eds) Procs West Africa Built Environment Research (WABER)
Conference, 19-21 July 2011, Accra, Ghana, 725-734.
725
MANAGEMENT OF BUILDING CONSTRUCTION
DISPUTES IN NIGERIA
Henry Onukwube1
Department of Building, University of Lagos, Akoka, Yaba, Lagos, Nigeria
The relationships between the stakeholders in most building construction end up in
disputes. Efforts have been made over the years to avoid or improve on the
management of dispute without much success. The aim of this study is to identify the
most preferred dispute resolution method in the area of study. This study adopted
descriptive survey research and the focus is on medium and large construction firms
in Lagos state. The respondents for the study were (architects, builders, quantity
surveyors, civil engineers, project managers, mechanical and electrical
engineers).Data collected was mainly primary data with some elements of information
obtained from secondary data through literature review. The random sampling
technique was used to select the respondents for the study. The data collected were
analysed using descriptive and inferential statistics. The result of data analysis
indicates that the most preferred method is arbitration, this closely followed by
negotiation, conciliation There is need to popularise these methods through Seminars,
workshops and conferences by various stakeholders involved in the administration of
building projects.
Keywords: dispute resolution, Nigeria.
INTRODUCTION
According to Dike (2005), it is a known fact that construction related disputes account
for a high percentage of abandoned projects in Nigeria as well as contentious matters
in our law court. The process of adjudication in court has over the time resulted in
difficulties to the litigants in getting access to justice. The courts are also
overburdened and facilities are inadequate, especially in Nigeria, to attend to matters
with the deserved urgency. Formalism, legalism and excessive cost among other
things have led to the quest for alternatives to the traditional court system (Onyeador,
2006). The Nigerian construction industry has managed to develop and adopt many
unique methods to resolve disputes that occur in projects. However, the justification
for implementing these methods has been primarily upon contractual requirements,
government regulations, court order or basic reactionary instinct but not on measured
utility(Onyeador,2006). Despite being an industry keenly focused on quantitative
results, many researchers in the field argue that parties involved in a dispute fail to
analyse the actual utility associated with each dispute resolution method in a particular
situation. Selecting a dispute resolution process is the first step to resolve a dispute
and this is an important decision because of the resource implications (Kersuliene, et
al., 2010). Determination of rational method for dispute resolution is an issue of
special relevance. This is so because of a few reasons: first of all, resolution of
disputes requires complex legal, technological, engineering, economic, etc.

Onukwube
726
knowledge; secondly, disputes frequently stop development of business projects;
thirdly, for disputant parties it is very important that their disputes have a minimum
impact on their amicable business relations in future. Problems of rational dispute
resolution generally are large and complex, involving many interested parties, often
with sharply differing beliefs and values. It is an extremely important decision of the
parties involved to justify the choice of any selected method. Researchers like
(Bingham 2002; Chan and Suen 2005; Koolwijk 2006; Gebken and Gibson 2006;
Gabuthy et al. 2008; Ma et al. 2008) have shown continuous interest in Alternative
dispute resolution. Problems of rational dispute resolution generally are large and
complex, involving many interested parties, often with sharply differing beliefs and
values. It is an extremely important decision of the disputant to justify the choice to
find a rational option. There are quite many researchers dedicated to dispute resolution
by applying mathematical methods. Cheung and Yiu (2007) mathematically described
mediation process in construction. Kronaveter and Shamir (2007) proposed a solution
model for long-lasting conflicts over international waters. Rauschmayer and Wittmer
(2006) stated, that the combination of deliberative and analytical methods has a high
potential for the resolution of environmental conflicts. However, selecting methods
and tools for a specific case often remains indistinct. They described the resolving
environmental conflicts by combining participation and multi-criteria analysis. Chan
et al. (2006) presented a dispute resolution selection model based on the analytical
hierarchy process and multi-attribute utility technique (MAUT).Goltsman et al. (2009)
compared three common dispute resolution processes – negotiation, mediation, and
arbitration. Dispute resolution has raised fresh questions about both decision-making
in selecting the most suitable dispute resolution option (Wang 2009). Disputes can be
more complex when shared interpretations cannot be assumed. In spite of this, there is
a lack of scientific research that could substantiate decisions of parties when selecting
the most rational way of dispute resolution (Wang, 2009) This study is set up to
address the following questions: (a) Are there any significant difference in the
importance attached to the key selection factors that affect the decision in the selection
of dispute resolution methods? (b) Can the use of a dispute resolution model help us in
selecting the most appropriate dispute resolution method?
RESEARCH PROBLEM
The problem in question is on how to select the most appropriate resolution method
that can address the nature of the dispute and the disputing parties‘ needs. The
industry‘s approach in the selection of dispute resolution method has been heavily
criticized, where too much reliance is placed on intuitive judgments rather than on
rational approach. Decisions of such may have created biases, due to personal
preferences and experiences (Gold 1991; Cheung and Suen2002). Given the industry‘s
reliance on the subjective approach to dispute resolution selection, there is a need for a
more systematic approach (Gold 1991; Miller 1995). Previous studies (Chan 2002;
Gold 1991; Cheung and Suen 2002) suggested that research may play an important
role in refining the knowledge of dispute resolution, particularly in the development of
a systematic dispute resolution model. Hence the aim of this paper is to advance the
knowledge of dispute resolution by developing a dispute resolution model for the built
environment.
Management of construction disputes
727
DEFINITION OF CONCEPTS USED IN THE STUDY
Negotiation
Negotiation provides a method for guiding parties through a process that focuses
discussion more on understanding and meaning and less on blaming, control, or who
gets authority over what.
Mediation
Mediation is a flexible process conducted confidentially in which a neutral person
actively assists parties in working towards negotiated agreements of a dispute or
difference, with the parties in the ultimate control of the decision to settle and the
terms of resolution.
Conciliation
This is a dispute resolution method in which the disputant parties appoints a
conciliator. The conciliator is usually given power to evaluate the relative strengths of
the case, issue a binding opinion, if the parties agree to that ahead of time.
MINI Trial
This is a settlement process in which the parties present summaries‘ versions of their
respective cases to a panel of officials who represent each party (plus a neutral
official) and who have authority to settle the dispute. After the parties have presented
their best case, the panel convenes and tries to settle the matter.
Arbitration
Arbitration is a binding, non judicial, and private means of settling disputes based on
an explicit agreement by the parties involved in a transaction. Such an agreement is
typically embodied in the terms of a contract between the parties.
Litigation
This is the process of taking of taking a case through court. In litigation, there is a
plaintiff (one who brings the charge) and a defendant (one against whom the charge is
brought).
THE KEY SELECTION FA CTORS
Factors used in selecting the most appropriate resolution methods are varying. A
number of relevant studies have been conducted. Goldberg and his research team
(1992) stressed the procedural aspects of dispute resolution in selecting a successful
dispute resolution forum. They included willingness of the disputants, control by third
party, degree of formality, nature of proceeding, enforceability, and confidentiality. It
was also suggested that such factors as time, cost, preservation of business, binding
decision, control by parties, flexibility, and confidentiality are important too. David
(1988) came to the point of view that the parties‘ relationship is the key to successful
joint ventures, and therefore critical selection factors should include impartiality,
parties‘ control, continuing parties‘ relationships, and confidentiality. Taking into
account of the above-mentioned studies together with the works of Brown and
Marriott (1999), Cheung (1999), Kersuliene et al. (2010) and Chan et al (2006),
fifteen selection factors were identified and used for this study.

Onukwube
728
IDENTIFYING DISPUTE RESOLUTION METHODS
Dispute resolution methods commonly used for typical construction projects include
negotiation, mediation, concialiation, mini- trial, arbitration, dispute resolution
adviser, adjudication, expert determination and litigation. In recent years, alternative
dispute resolution (ADR) has gained favour over litigation for its low cost and speedy
resolution, Woolf (1996). Having considered the works of Kersuliene et al (2010) and
Chan et al (2006), the following dispute resolution methods (negotiation, mediation,
concialiation, mini- trial, arbitration and litigation) were selected and used for this
study. In each particular case, analysis of negative and positive features of various
dispute resolution methods allows evaluating the perspective of judicial litigation and
application of other dispute resolution methods.
RESEARCH METHOD
Through literature review, a list of potential key selection factors and a list of
commonly used dispute resolution methods were compiled. The lists were verified and
refined with interview discussions with a small group of dispute resolution experts
from institute of construction industry arbitrators‘. Having identified the selection
factors and the most commonly used dispute resolution methods, an interview survey
was then conducted to collect the utility factors (U factors), which was important for
the development of the Model. A total of 40 respondents who are members of
construction industry arbitrators were selected and interviewed for this study. The
selection of the experts was based on the following criteria:
Practitioners who have over five year‘s experiences in handling disputes within the
built environment and practitioners who exhibit a good understanding of the
alternative dispute resolution and litigation processes. The final selected experts
included project architects, engineers, builders, quantity surveyors, services engineers,
project managers and others comprising mainly of lawyers, figure 1 shows the
distribution of the respondents. Structured questionnaire were also used to collect data
from the respondents. The sample frame for the study comprises construction
professionals who are registered members of construction industry arbitrators. Using
stratified random sampling the various members of construction industry arbitrators
were selected. Each of the professionals selected have being involved in settling
construction disputes and are well experienced in dispute resolution .The differences
in the number of various professionals that participated is due to their population in
the sample frame. The data collected were analysed using statistical package for social
sciences (SPSS).
Questionnaire on Multi-Attribute Decision Making (MADM) for Dispute
Resolution
Statements were made on (a) the object of the dispute (b) the goals of the disputant
parties and(c) attributes and feasible ways of dispute resolution and using a 5- point
likert scale of 1 for strongly disagree and 5 for strongly agree the respondents were
asked to tick the options based on the extent to which they agree or disagree with the
statements.
Reliability and Validity
Cronbach‘s alpha is the most widely used criteria to measure the reliability of items
for each construct. α for (MADM) questionnaire =0.93. Confirmatory factor analysis

Management of construction disputes
729
shows that all factor loadings and path coefficients are statistically significant. The t
values are above the required value of 1.96, all factor loadings are above (0.60).These
high and significant factor loadings indicate good convergence validity.
RESULTS
Figure 1 shows that Architects constitute the largest majority of the respondents 14
(35%), others are: Civil engineers 7(17%), Quantity Surveyors 6(15%), Services
Engineers 6(15%) Builders 3(8%), others 3(7%) and Project managers (1) 3%.The
distribution of the sample population represents professionals with vast experience in
dispute resolution hence their contributions is presumed to be very useful in achieving
the objective of this study.
Figure 1: Respondents used for the Study
DATA COLLECTION OF UTILITY FACTORS
An interview exercise was carried out to collect the utility factors (U factors), which
was an essential input for the development of dispute resolution model. A total of 40
practitioners in the field were interviewed. The aim of the interview survey was to
collect and formulate a set of mean utility scores for the selection factors. It was
anticipated that the mean U factors obtained would reflect the common view of the
practioners. The interview survey started with a general introduction to the practioners
of the research study, purpose, the use of multi purpose utility technique, and the
instructions about completing the questionnaire. The respondents were then asked to
insert the utility scores against the identified selection factors for each dispute
resolution method. The scale range of utility scores adopted was from a scoreboard of
10–110. The reason for adopting the scale range was to avoid any possible occurrence
of a zero value in the outcome. After the briefing, the respondents were given enough
time to fill in the scores, while the interviewer would stand by to answer any queries.
Because of their unique features, the degree of relevance/usefulness of the dispute
resolution methods against each individual selection factor is expected to be different.
Findings on the Utility Factors
Expedition of Dispute Resolution
First place is taken by negotiation (90.5), followed by arbitration (80.5) and
Conciliation (80.5), mediation (70.5), litigation (30.25) and mini-trial (20).The survey
results are consistent with the unique features of negotiation in that negotiation seeks
to achieve a win- win situation for the disputant parties and this facilitates early
settlement of such disputes.

Onukwube
730
Price of Dispute Resolution
Price represents the total amount spent by the parties in reaching settlement. Extant
literature in this area of study documents that litigation is more expensive than other
methods of settling disputes. The result of this study confirms that, in that litigation
with utility score of (80.5) is the first and the most expensive of all the methods listed
in the survey.
Possibility of Appeal
First place is taken by litigation (90.5), followed by mini-trial (80.5) arbitration (60.5),
mediation (60.25) and conciliation (60.25).The survey results are consistent with the
unique features of litigation. This result is consistent with practice in that the courts
are structured in such a way for the aggrieved party to appeal.
Confidentiality
First place is taken by conciliation, mini-trial and arbitration with (60.5) utility score
each. This is followed by negotiation (50.5), mediation (50.25) and finally litigation
(20). The survey results are consistent with the unique features of conciliation, mini-
trial and arbitration that parties to a dispute are not allowed to disclose any
information or materials to the public unless with formal consent of the parties
(Brown and Marriott 1999). Hence, they are more preferable when parties want to
keep their disputes away from high profile coverage.
Authority of the Person solving the Dispute
First place is taken by litigation (90.5), followed by mini-trial (80.5) negotiation
(80.5).The first position given to litigation is consistent with practice in that judges are
vested with much authority when dispensing justice.
Preservation of Business Relationships
Maintaining a continuing business relationship is vital to effective business
management. A good business relationship is established on the basis of trust,
common interests, and mutual respect. The survey results show that first place is taken
by negotiation (70.5) followed by mediation and conciliation (60.5)The results are
reasonably accurate, as part of their functions, these methods are designed to sustain a
continuing strategic relationship. Negotiation always try to satisfy the aspirations of
the parties by coming up with a ―win-win‖ settlement.
Addressing Power Imbalance
First place is taken by mini- trial (80.5), followed by arbitration and litigation (70.5)
This result is not supportive of the work done by Chan et al (2006).In their study
mediation is the most influencing method for this factor.
Third Party Control on the Process
First place is taken by mini-trial (90.5) followed by arbitration and negotiation
(80.50), conciliation (70.50), mediation (60.5) and litigation (40.25)Some of the
results are consistent with the current practice while some are not. In litigation, the
contents and the pace of hearing are virtually controlled by the court and this implies
that litigation supposed to take the first place but the result is contrary. Even though
arbitration is less formal and the arbitrator is an impartial, facilitative third party, the
arbitration process remains highly regulated by rules and the arbitrator directs the
hearing process.

Management of construction disputes
731
Enforceability
First place is taken by litigation, mini-trial and negotiation (90.5) followed by
conciliation (80.50), Arbitration (70.5) and mediation (60.25) Some of the results are
consistent with the current practice while some are not. The result is supportive of the
study done by Chan et al(2006),although the researcher is of the opinion that
arbitration should be more enforceable than negotiation and conciliation.
Establishing Relative Importance Index for Identified Factors
Table 1: Summary of the mean item score for selection criteria
Selection criteria Coding Mean item score Ranking
Expedition of dispute resolution (SF 1) 0.90 1
Price of dispute resolution (SF 2) 0.90 1
Authority of the person solving the dispute (SF 3) 0.90 1
Enforceability (SF 4) 0.90 1
Possibility to appeal (SF 5) 0.80 5
Parties ability to control (SF 6) 0.80 5
Remedies (SF 7) 0.80 5
Type of contract (SF 8) 0.80 5
Addressing power imbalance (SF 9) 0.70 9
Third party control in the process (SF 10) 0.60 10
Relationship between parties (SF 11) 0.60 10
Preservation of business relationship (SF 12) 0.50 12
Degree of formality (SF 13) 0.50 12
Confidentiality (SF 14) 0.40 14
Flexibility (SF 15) 0.30 15
Where SF = selection factor.
Given the myriad of utility factors used in this study, it is essential that the relative
importance of each factor be determined. The challenge, of course is to identify the
relative importance of the utility factors as this will be used in the derivation of
dispute resolution model. Relative importance index (RII) was first published by
Mayer et al (1997).It allows for a relative quantification of the importance of
identified factors. Mean item score is used for the quantification of the importance of
these factors.
Mean Response Analysis / Mean Item Score
This method of analysis had been employed by many construction management
researchers: (Akintoye, 1997), (Odeyinka, 2000), to mention a few. The Mean Item
Score (MIS) is determined as follows: Mean Item Score
Where n1 = number of respondents who answered ‗not important‘
n2 = number of respondents who answered ‗somewhat important‘
n3 = number of respondents who answered ‗of little importance‘
n4 = number of respondents who answered ‗important‘
n5= number of respondents who answered ‗very important‘
Four of the identified factors, expedition of dispute resolution, price of dispute
resolution, authority of the person solving the dispute, enforceability with mean item
score of (0.90) were highly ranked by the respondents. Equally ranked are possibility
to appeal, parties ability to control, remedies and type of contract with M.I.S (0.80).
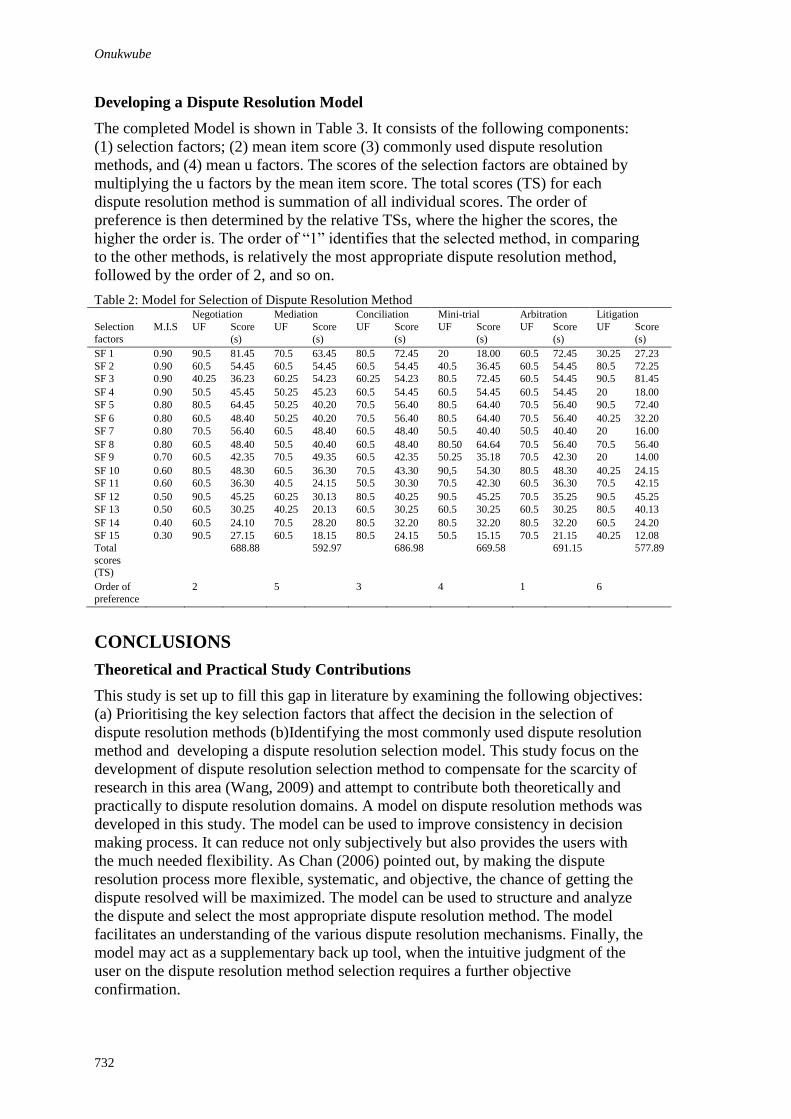
Onukwube
732
Developing a Dispute Resolution Model
The completed Model is shown in Table 3. It consists of the following components:
(1) selection factors; (2) mean item score (3) commonly used dispute resolution
methods, and (4) mean u factors. The scores of the selection factors are obtained by
multiplying the u factors by the mean item score. The total scores (TS) for each
dispute resolution method is summation of all individual scores. The order of
preference is then determined by the relative TSs, where the higher the scores, the
higher the order is. The order of ―1‖ identifies that the selected method, in comparing
to the other methods, is relatively the most appropriate dispute resolution method,
followed by the order of 2, and so on.
Table 2: Model for Selection of Dispute Resolution Method Negotiation Mediation Conciliation Mini-trial Arbitration Litigation
Selection
factors
M.I.S UF Score
(s)
UF Score
(s)
UF Score
(s)
UF Score
(s)
UF Score
(s)
UF Score
(s)
SF 1 0.90 90.5 81.45 70.5 63.45 80.5 72.45 20 18.00 60.5 72.45 30.25 27.23
SF 2 0.90 60.5 54.45 60.5 54.45 60.5 54.45 40.5 36.45 60.5 54.45 80.5 72.25
SF 3 0.90 40.25 36.23 60.25 54.23 60.25 54.23 80.5 72.45 60.5 54.45 90.5 81.45
SF 4 0.90 50.5 45.45 50.25 45.23 60.5 54.45 60.5 54.45 60.5 54.45 20 18.00
SF 5 0.80 80.5 64.45 50.25 40.20 70.5 56.40 80.5 64.40 70.5 56.40 90.5 72.40
SF 6 0.80 60.5 48.40 50.25 40.20 70.5 56.40 80.5 64.40 70.5 56.40 40.25 32.20
SF 7 0.80 70.5 56.40 60.5 48.40 60.5 48.40 50.5 40.40 50.5 40.40 20 16.00
SF 8 0.80 60.5 48.40 50.5 40.40 60.5 48.40 80.50 64.64 70.5 56.40 70.5 56.40
SF 9 0.70 60.5 42.35 70.5 49.35 60.5 42.35 50.25 35.18 70.5 42.30 20 14.00
SF 10 0.60 80.5 48.30 60.5 36.30 70.5 43.30 90,5 54.30 80.5 48.30 40.25 24.15
SF 11 0.60 60.5 36.30 40.5 24.15 50.5 30.30 70.5 42.30 60.5 36.30 70.5 42.15
SF 12 0.50 90.5 45.25 60.25 30.13 80.5 40.25 90.5 45.25 70.5 35.25 90.5 45.25
SF 13 0.50 60.5 30.25 40.25 20.13 60.5 30.25 60.5 30.25 60.5 30.25 80.5 40.13
SF 14 0.40 60.5 24.10 70.5 28.20 80.5 32.20 80.5 32.20 80.5 32.20 60.5 24.20
SF 15 0.30 90.5 27.15 60.5 18.15 80.5 24.15 50.5 15.15 70.5 21.15 40.25 12.08
Total
scores (TS)
688.88 592.97 686.98 669.58 691.15 577.89
Order of
preference
2 5 3 4 1 6
CONCLUSIONS
Theoretical and Practical Study Contributions
This study is set up to fill this gap in literature by examining the following objectives:
(a) Prioritising the key selection factors that affect the decision in the selection of
dispute resolution methods (b)Identifying the most commonly used dispute resolution
method and developing a dispute resolution selection model. This study focus on the
development of dispute resolution selection method to compensate for the scarcity of
research in this area (Wang, 2009) and attempt to contribute both theoretically and
practically to dispute resolution domains. A model on dispute resolution methods was
developed in this study. The model can be used to improve consistency in decision
making process. It can reduce not only subjectively but also provides the users with
the much needed flexibility. As Chan (2006) pointed out, by making the dispute
resolution process more flexible, systematic, and objective, the chance of getting the
dispute resolved will be maximized. The model can be used to structure and analyze
the dispute and select the most appropriate dispute resolution method. The model
facilitates an understanding of the various dispute resolution mechanisms. Finally, the
model may act as a supplementary back up tool, when the intuitive judgment of the
user on the dispute resolution method selection requires a further objective
confirmation.

Management of construction disputes
733
Future Research Directions
In the multi-attribute decision making (MADM) context, the evaluation of each
alternative provide the basis for comparison of the alternatives and consequently
facilitate the selection. There may be need to develop a similar model using Analytic
hierarchy process(AHP).
REFERENCES
Akintoye, A.S. and Macleod, M.J. (1997) ―Risk Analysis and Management in Construction.
International Journal of Project Management. 15, (1) 31-38.
Bingham, L. B. (2002) ―The next step: research on how dispute system design affects
function‖, Negotiation Journal 18(4),375–379.
Brown, H., and Marriott, A. (1999) ―ADR: Principles and practice‖, 2nd
Ed., London, Sweet
and Maxwell.
Chan, E.; Suen, H. C. H.; Chan, C. K. L. (2006) ―MAUT-based dispute resolution selection
model prototype for international construction projects‖, ASCE, Journal of
Construction Engineering and Management – Part I: Taxonomies of dispute sources,
mediator tactics and mediation outcomes‖, Building and Environment 42(2): 752–
761.
Cheung, S. O. (1999)―Critical factors affecting the use of alternativedispute resolution
processes in construction.‖ Int. J. Proj. Management17(3), 189–94.
David, J. (1988) ―Dispute resolution for lawyers-overview of range of Dispute resolution
processes,‖ The Univ. of Sydney, Faculty of Law Continuing Legal Education,
Sydney, Australia.
Dike ,E (2005) Arbitration practice and procedure in the settlement of Domestic Commercial
Disputes in Nigeria. Macmillian Publishers, Lagos, Nigeria.
Gabuthy, Y; Jacquemet, N.; Marchand, N. (2008) ―Does resorting to online dispute resolution
promote agreements? Experimental evidence‖, Economic Review 52: 259–282.
Gebken, R. J.; Gibson, G. E. (2006) ―Quantification of costs for dispute resolution procedures
in the construction industry‖, Journal of Professional Issues in Engineering
Education and Practice 132(3),264–271.
Goldberg, S. B., Sander, F. E. A., and Roger, N. H. (1992) ―Dispute resolution negotiation,
mediation, and other processes, Little, Brown and Company, Boston, Mass.
Goltsman, M.; Hörner, J.; Pavlov, G.; Squintani, F. (2009) ―Mediation, arbitration and
negotiation‖, Journal of Economic Theory 144(4), 1397–1420.
Koolwijk, J. S. J. (2006) ―Alternative dispute resolution methods used in alliance contracts‖,
Journal of Professional Issues in Engineering Education and Practice 132(1), 44–47.
Kronaveter, L.; Shamir, U. (2007) ―Negotiation support system for resolution of disputes over
international water resources‖, in A. Castelletti, R. Soncini-Sessa, Topics on System
Analysis and Integrated Water Resources Management. Elsevier Ltd., 189–205.
Kersuliene,V;Zavadskas,E.K andTurskis,Z (2010) ―Selection of Rational Dispute Resolution
Method‖,Journal of Business Economics and Management, 11(2), 243-258.
Ma, J.; Hipel, K. W.; De, M.; Cai, J. (2008) ―Trans boundary water policies: Assessment
comparison and Enhancement‖, Water Resources Management 22(8): 1069–1087.
Odeyinka, H. A. (2000) ―An Evaluation of the use of Insurance in Managing Construction
Risks‖. Construction Management and Economics. 18 (1) 512-524.
Onyeador, S.O. (2006) Alternative Disputes Resolution Construction. The case of the Niger
Delta. Proceedings of Biennal Conference and General meeting of Nigeria Institute
of Quantity Surveyors,15-16th September, Ibadan, Nigeria.
Rauschmayer, F.; Wittmer, H. (2006) ―Evaluating deliberative and analytical methods for the
resolution of environmental conflicts‖, Land Use Policy 23(1), 108–122.

Onukwube
734
Wang, F. F. (2009) ―Online Dispute Resolution” Technology Management and
Legal Practice from an International Perspective. Chandos, Oxford.
Woolf, M. R. (1996) Access to justice: The final report to the Lord Chancellor on the civil
justice system in England and Wales, HMSO, London.

Manu et al. (2011) Managing the adverse health and safety influence of subcontracting: findings of a
qualitative inquiry In: Laryea, S., Leiringer, R. and Hughes, W. (Eds) Procs West Africa Built
Environment Research (WABER) Conference, 19-21 July 2011, Accra, Ghana, 735-744.
735
MANAGING THE ADVERSE HEALTH AND SAFETY
INFLUENCE OF SUBCONTRACTING: FINDINGS OF A
QUALITATIVE INQUIRY
Patrick Manu1, Nii Ankrah
2, David Proverbs
3, Subashini Suresh
4, and
Emmanuel Adukpo5
1, 2, 4 School of Technology, University of Wolverhampton, Wolverhampton, WV11LY, UK
3 Faculty of Environment and Technology, University of the West of England, Bristol, BS16 1QY, UK
5 Black Star Advisors, Ghana
Despite the economic benefits of subcontracting, it is widely known to be one of the
factors influencing adverse health and safety (H&S) outcomes on projects. Given the
increasing complexity of construction technologies which inevitably means that
specialisation in construction will grow, it is expected that there will be even more
subcontracting in the future, and hence the need for measures to address the adverse
H&S influence of subcontracting. In the UK, beyond the legal health and safety
requirements which offer some opportunity for mitigating the H&S impact of
subcontracting, there is limited insight as to how main contractors manage this
adverse impact in terms of their in-house H&S practices. Using semi-structured
interviews with key management personnel of 6 UK contractors, the research
question, ―how do main contractors manage the adverse H&S influence of
subcontracting, in terms of their in-house H&S practices?‖ was investigated. The
inquiry revealed that beyond the legal requirements, two strategic measures adopted
by the investigated contractors are: restricting the layers/tiers of subcontracting on
projects; and having a regular chain of subcontractors. These measures are aimed at
addressing the communication, teamwork, competence, and safety culture issues that
are associated with workforce fragmentation introduced by subcontracting. Given that
the adverse H&S influence of subcontracting is an international phenomenon, these
findings provide a learning opportunity for all construction contractors within and
outside UK, particularly the large and medium contractors who often sublet work
packages.
Keywords: health and safety, interview, procurement, subcontracting.
INTRODUCTION
As indicated by International Labour Organisation (ILO) (2001) subcontracting grew
significantly over the 1970s and 1980s and it continues to be practised in several
countries. Evidently, and despite its economic benefits, subcontracting has adverse
occupational health and safety consequences in construction as well as other
industries. This adverse H&S influence has long persisted (cf. Mayhew and Quinlan,
1997, Yung, 2009) and it is anticipated that given increasing specialisation in the
construction industry the adverse impact of subcontracting could worsen with an

Manu et al.
736
increase in subcontracting. This creates the need for measures which have far reaching
mitigation effect on the adverse H&S influence of subcontracting.
In the UK, the most influential driver of H&S improvement is the legal framework
within which specific regulations, particularly the Construction Design and
Management Regulations 2007 (CDM 2007), offer some mitigation against the factors
responsible for the adverse H&S influence of subcontracting (Manu et al., 2011).
Arguably, in striving for H&S excellence as captured by headlines such as ―One death
is too many‖ (of Donaghy, 2009), the mitigation offered by the regulations is
insufficient as the adverse H&S influence of subcontracting continues to persist. Aside
the regulatory requirements, there is however limited insight as to the measures
implemented by main contractors (i.e. the employers of subcontractors) to address the
adverse H&S influence of subcontracting. Seeking to shed light on this grey area, with
the wider aim of providing learning opportunity for contractors, particularly those who
often sublet work packages, this research embarked on an inquiry into how main
contractors manage the adverse H&S influence of subcontracting. In the sections that
follow, a review of H&S literature highlighting the adverse H&S influence of
subcontracting in construction is presented. With this background, the research
methodology adopted for the study is presented. The findings that emerged from the
data collection and analysis are subsequently presented and discussed. Concluding
remarks are finally provided.
SUBCONTRACTING AND ITS OCCUPATIONAL H&S
OUTCOMES IN THE CONSTRUCTION INDUSTRY
In several countries including the UK, over the last three decades, the traditional mode
of long term employment relation between an employer and employee has been
supplemented by a variety of employment forms such as self employment,
casual/temporary, part-time and contract/subcontract employment (ILO, 2001;
Mayhew and Quinlan, 2001; LFS, 2004). The growth in these forms of employment
have been driven by a mixture of economic priorities, technological and regulatory
shifts, and increased product market uncertainty (Bielenski et al., 1999; and Chiang,
2009). Subcontracting has for some time been an integral part of the construction
industry (cf. Stinchcombe, 1959; Eccles, 1981; and Lai, 2000), where it typically
involves the subletting of the execution of a section(s) of a project to a contractor(s)
who in most cases is a specialist.
In the UK over 90% of construction companies are micro to small organisations and
majority of them obtain work as subcontractors, therefore forming an important group
in the supply chain in the UK construction sector (Kheni et al., 2005; UK Office for
National Statistics (ONS), 2008). Earlier research also estimates that 80% of
construction work undertaken by UK main contractors is subcontracted (Saad and
Jones, 1998 cited in Thorpe et al. (2003) and Kheni et al. (2005) and this further
shows the importance of subcontractors.
Subcontracting is typically a payment-by-results system where payment is based on
the amount of work completed rather than the period of time spent on the worksite.
Thus returns are enhanced by the completion of tasks in the shortest possible time,
leading to subcontractors pushing themselves hard, working excessive hours, or
cutting corners in regard to safety where it impedes production (Mayhew et al., 1997).
Pressures to complete a job quickly may be increased where intense competition
amongst subcontractors drives down the price of services performed. Work
intensification results as the subcontractor‘s profit must be derived from working

Health and safety
737
harder and longer resulting in occupational health and safety (OHS) outcomes such as
fatigue, stress, burn-out and failure or delays in seeking treatment for work-related
injuries (Mayhew et al., 1997).
In countries such as Spain, Malaysia, Philippine, Poland, Hong Kong and China,
subcontracting has been associated with adverse H&S outcomes in the construction
industry (Byrne and Van der Meer, 2001; ILO, 2001; Wong and So, 2002; Yung,
2009). Similarly in the UK construction industry subcontracting has persistently been
found to have adverse H&S consequences (Mayhew and Quinlan, 1997; UK Health
and Safety Laboratory (HSL),1999; Loughborough University and UMIST, 2003;
Ankrah, 2007; and Donaghy, 2009) clearly emphasising the need for concerted efforts
to address the adverse H&S effects of subcontracting.
As noted by Bomel Limited (2007) in the context of the UK construction industry,
H&S legislation is the most influential environmental influence on H&S, and in that
regard the Construction Design and Management Regulations 2007 (CDM 2007) has
particularly been noted as offering some mitigation against the adverse H&S influence
of subcontracting (Manu et al., 2011). Despite the usefulness of such regulations, the
reporting of the adverse influence of subcontracting persists (cf. Ankrah, 2007;
Donaghy 2009). Arguably, this signals that the mitigation offered by the regulatory
measures is not enough. In the spirit of striving for H&S excellence, the identification
of other measures/practices that are effective in mitigating the adverse H&S influence
of subcontracting is thus warranted. Indeed the identification of such
measures/practices will provide useful organisational learning opportunities among
contractors who often sublet work packages. To this end, this research sought to
investigate how main contractors manage the adverse H&S impact of subcontracting,
with a particular focus on their in-house H&S measures/practices.
As such an investigation will require an appropriate research method, the next section
presents the research methodology adopted for the investigation.
RESEARCH METHOD
Given the exploratory and interpretive focus of the research i.e. how principal
contractors manage the adverse H&S impact of subcontracting, a qualitative inquiry
was deemed appropriate. As indicated by Fellows and Lui (2008) qualitative inquiries
are suitable for obtaining meaning and as such are appropriate for answering questions
relating to ―why‖ and ―how‖.
As micro to small* contractors usually obtain work as subcontractors it was considered
appropriate to target medium* to large contractors who are more likely to operate as
main contractors on projects. Using the UK Kompass directory and also using
contacts in industry, invitation was sent to 54 medium to large UK contractors. H&S
is a very sensitive issue in the UK due to the legalities surrounding it and for that
matter obtaining participation in H&S research is difficult (cf. Gibb et al., 2002).
Given this terrain, in order to obtain participation, using the contacts in industry and
contacts in H&S research was deemed very appropriate and eventually proved to be
very useful. From the invitations, the participation of 6 medium to large contractors
was obtained, 5 of whom are among the top 20 UK contractors. Semi-structured
interviews (using an interview guide) were held with key personnel in management
* Micro enterprise has annual turn-over ≤ 2 million Euros. Small enterprise has annual turn-over ≤ 10 million Euros. Medium-
sized enterprise has annual turn-over ≤ 50 million Euros. Larger company has annual turn-over > 50 million Euros.

Manu et al.
738
roles (i.e. company director, project manager, construction manager, site manager, and
health and safety manager) within the companies to capture the measures/practices
they implement to mitigate the adverse H&S influence of subcontracting. The
interviewees were asked a series of questions relating to their H&S management
system, their perspectives on the H&S implications of subcontracting, and the
measures they implement.
The interviews were audio-taped and averagely they took an hour. For the analysis of
the interviews, the recorded interviews were transcribed. The transcripts were
analysed systematically through iterative re-reading and coding of the transcripts
which enabled the attainment of a profound understanding of each interviewee‘s view
point and hence the extraction of issues relating to how the contractors manage the
adverse H&S influence of subcontracting (cf. Choudhry and Fang, 2008; and
Creswell, 2009).
FINDINGS
Table 1 provides a brief profile of the 6 contractors showing their size and their extent
of use of subcontractors.
Table 1: Profile of construction companies Contractor Size (based on annual turn over) Extent of subcontracting on projects
A Large *High
B Large *High
C Large *High
D Large *High
E Medium *High
F Large *High
* All construction works on projects are subletted
All the contractors use subcontractors for the physical execution of the entire works
they do but provide the site management personnel to manage the operations of the
subcontractors. Depending on the scope of a project, the site management personnel
could include project manager/director, site manager, construction manager, quantity
surveyor, and health and safety manager. There was a general acknowledgement by
the contractors that subcontracting has adverse H&S implications. For instance the
interviewee for Contractor B (a H&S manager) commented that, “One of the big
challenges for the industry is the subcontract culture… it is not unheard of for a team
to turn up on site and they don‟t even know who we are because they‟ve been
contracted by somebody who has been contracted by somebody…So there is
communication issue straight away.” Despite its adverse effects, it was noted by one
interviewee (as quoted below) that perhaps, the industry can not do without it because
it is not economically viable to have directly employed labour.
“If everybody worked for us it would be much easier to control but commercially
that is probably not a viable way to work these days and that‟s why everybody has
gone to subcontracting.”(H&S Manager)
Subcontracting was identified with a number of H&S issues/factors responsible for its
adverse H&S influence. These are communication problems, competence issues
especially in multi-layer subcontracting, interest of subcontractors in making their
profit with less commitment to H&S, and unfamiliarity of subcontractors with the
H&S practices of the main contractor. As a means of addressing these H&S issues, the
contractors implement H&S measures/practices as part of their overall H&S
management system. These measures consist of those which stem from regulatory
requirements, in particular the CDM 2007 and those measures which are the

Health and safety
739
contractors‘ own in-house measures/practices. From the interviews, the identified
measures which stem from regulatory requirements are: conducting H&S training and
induction for the subcontractor workers (CDM 2007 Regulation 22(2)(a)(b));
consultation with the subcontractor workers/representatives on health, safety and
welfare matters (CDM 2007 Regulation 24(b)); undertaking competence assessment
for subcontractors (CDM 2007 Regulation 4(1)(a)); and ensuring the preparation of
risk assessment by subcontractors for their works (CDM 2007 Regulation 4(b)(1) and
19(2) which have their roots in the Management of Health and Safety at Work
Regulations 1999 Regulation 3(1)). When appointing subcontractors to work on
projects, all the contractors ensure that subcontractors (as organisations and their
operatives) have the needed competence for carrying out the works. Among the
criteria used by the contractors for ensuring competence are experience, qualification,
and industry certification. Also before their subcontractors commence the execution of
works on site, the contractors require that the subcontractors provide risk assessments
(and method statements based on the risk assessments) which they vet and agree with
the subcontractors.
Another regulatory requirement adhered to by the contractors is the provision of H&S
induction and training for subcontractors. These are to provide the subcontractors with
information about site risks, precautions and rules. As a way of consulting with
subcontractor workers on health, safety and welfare matters, all the contractors hold
regular meetings with subcontractors to discuss H&S. The frequency of the meetings
ranged from being daily to monthly.
In addition to the above regulatory measures, all the contractors also implement some
in-house measures/practices to further enhance their management of the adverse H&S
influence of subcontracting. Two key measures/practices implemented by the
contractors are:
8. Restricting the layers/tiers of subcontracting on projects.
“Sub-sub-sub-contracting is not good. When that happens the people down there
become distant from the main contractor and you don‟t know who they are. So we
don‟t allow subcontractors to sublet without our permission.” (Site Manager)
9. Keeping a regular chain of subcontractors.
“We have a supply chain management process in place… Hopefully, if they (i.e.
the subcontractors) are working with us regularly, they will know our processes,
procedures, and what we want them to do.” (H&S Manager)
The contractors try to restrict the layers of subcontracting by not allowing their
subcontractors to further sublet works. This is to prevent multi-layer/tier
subcontracting of which one interviewee mentioned that even clients are not very
pleased with. Where it is not possible to restrict the levels of subcontracting for some
reasons, the contractors do a competence check on the other layers of sub-contractors
to also ascertain their suitability for the works. To illustrate, the interviewee for
Contractor D (a H&S manager) gave an example of an on-going large project where
their Mechanical and Electrical (M&E) subcontractor (i.e. the 1st tier subcontractor)
will sublet the fire alarm installation to another subcontractor (i.e. the 2nd
tier
subcontractor). With this arrangement the interviewee mentioned that the M&E
subcontractor will have to inform them that they will be subletting the fire installation
so that in addition to the competence check that will be undertaken by the M&E
subcontractor they will also check the competence of the fire alarm subcontractor.

Manu et al.
740
Keeping a regular chain of subcontractors also emerged as being a very useful
measure not only in terms of H&S but also in terms of ensuring quality. This is
because, by the contractors using the same subcontractors, the subcontractors tend to
get used to the contractors‘ H&S practices, processes, procedures, and requirements.
Also the assurance of repeat business helps to enhance the subcontractors‘
commitment to quality and H&S.
“The subcontractors obviously get a repeat business with us. They ensure that the
quality of their work is good because they want regular business. Because H&S is
important to us, they make sure that when we ask for tool box talks fortnightly,
they do it.”
DISCUSSION
The sole use of subcontractors for the physical execution of works (i.e. no directly
employed operative) by the investigated contractors means that a considerable portion
of the value of works undertaken by the contractors goes to subcontractors. Contractor
A for instance estimates that about 70% of the money they spend as a business goes to
subcontractors and suppliers. Subcontractors are therefore an important part of the
contractors‘ supply chain, and in the wider picture they also are an important part of
the construction industry‘s supply chain.
The unanimous recognition by the contractors that subcontracting has adverse H&S
consequences once again echoes the finding of earlier studies (cf. Ankrah 2007,
Chiang, 2009, Loughborough University, 2009). The commercial justification for the
practice of subcontracting as mentioned by one interviewee aligns with the reported
drivers/reasons for subcontracting (cf. Hunter et al., 1993; Bielenski et al., 1993, 1999;
and Chiang, 2009). The practice of subcontracting for its economic benefits suggests
the inevitability of subcontracting in construction. This also suggests that a reasonable
approach for dealing with its adverse H&S influence will not be to stop subcontracting
entirely but rather to implement measures that will tackle the H&S issues/factors
responsible for its adverse H&S influence.
The H&S issues that were identified as being responsible for the adverse H&S
influence of subcontracting are consistent with earlier reports (cf. Hsieh (1998),
Loughborough University and UMIST (2003), Ankrah (2007)). Loughborough
University and UMIST (2003) for instance indicated that subcontracting introduces
communication and teamwork problems and Hsieh (1998) also noted that
subcontracting has the tendency to divide the construction organization into ―islands‖
or self-centered decision-making units with conflicting interests. As noted by Manu et
al. (2011) any effort aimed at addressing the adverse influence of subcontracting must
be geared towards addressing these issues.
As expected, the contractors implement measures required by the CDM 2007 which
offer some mitigation against the H&S issues responsible for the adverse H&S
influence of subcontracting. In addition to the legal requirements adhered to by the
contractors, the in-house measures implemented by the contractors also provide
mitigation against the H&S issues introduced by subcontracting. By restricting the
levels/tiers of subcontracting, the contractors are able to minimise fragmentation of
the workforce and by so doing are able to manage better, competence,
communication, commitment, teamwork, as well as supervision. That also helps to
ensure clarity of on-site working relationships. As noted in several reports (cf. Wong
and So, 2002; Loughborough University, 2009; and Tam et al., 2010) and again
highlighted in this study by one of the interviewees (that, ―it is not unheard of for a
Health and safety
741
team to turn up on site and they don‟t even know who we are because they‟ve been
contracted by somebody who has been contracted by somebody”), multi-layer
subcontracting is common place within the construction industry and addressing it has
been challenging given its economic benefits. In Hong Kong for instance, there have
been past debates concerning the legal restriction of the layers of subcontracting in
construction. Whereas Linehan (2000, cited in Wong and So, 2002) argued for
legislation to restrict multi-layer subcontracting on the basis of ensuring better safety
performance, So (2000, cited in Wong and So, 2002) argued against such legislative
restriction on the basis of avoiding an interference with the market value of
subcontracting. Although there is no such legislation in UK which restricts multi-layer
subcontracting, it appears from the evidence gathered that some contractors have
found it necessary and useful to impose such restrictions by themselves, and in
situations where they are unable or unwilling to, they take further steps to manage the
inherent H&S problem of fragmentation of the workforce.
As previously mentioned, the benefits of using the same chain of subcontractors goes
even beyond H&S. Using a regular chain of subcontractors helps to build trust, it
helps in quality assurance, and it also gives assurance of repeat business (cf. Entec UK
Ltd, 2000). Touching on the H&S benefits, using the same subcontractors enables the
contractors to minimise workforce fragmentation in terms of the H&S practices and
H&S commitment of the workforce. Entec UK Ltd (2000) reported that companies
who work constantly with the same set of contractors/sub-contractors tend to have
better health and safety performance. Contractor A for instance mentioned that they
have very close long-term working relationship with their supply chain organisations
and by that they (i.e. their supply chain organisations) know their values, they know
their people, and they know their H&S requirements very well. Overall, working with
a regular chain of subcontractors enables the contractors to minimise differences in
safety culture within the workforce.
USEFULNESS OF FINDINGS
As noted by the interviewee for Contractor A (a director), the sharing of knowledge
on H&S practices is useful in promoting a safe construction industry. In view of that,
Contractor A shares videos of their H&S excellence programme with their peer
contractors and as well as their clients to provide the opportunity for inter-
organisational benchmarking and learning. Clearly, the measures/controls identified
from the interviews particularly those in-house measures/practices provide inter-
organisational learning opportunity for contractors. Other medium and large UK
contractors could thus adopt or carefully adapt these measures into their organisations
to mitigate the adverse H&S influence of subcontracting.
In the broader picture, given that the adverse impact of subcontracting is a global
construction issue (cf. ILO, 2001) both the regulatory measures and the in-house
measures also provide similar learning opportunity for contractors in other countries.
In other countries, contractors who often sublet work packages could thus similarly
make efforts to restrict the layers of subcontracting on sites and also keep to a regular
chain of subcontractors in order for their values and H&S practices to be assimilated
by their subcontractors. For countries which do not have similar H&S regulatory
requirements as the UK, the CDM 2007 requirements which offer some mitigation
against the adverse impact of subcontracting (cf. Manu et al., 2011) also provide
learning opportunities for the contractors and as well as the government authorities (in
terms of policy) in those countries. Such regulatory measures could be adopted by the

Manu et al.
742
contractors as their own in-house measures or could be considered by the appropriate
government authorities for inclusion in their H&S legislation.
CONCLUSIONS
The adverse H&S influence of subcontracting continues to persist in the UK
construction industry and in the construction industry of other countries and this
undeniably creates the need for redressing this adverse influence. In the UK, efforts
towards doing this are seen in regulatory requirements, notably the CDM 2007, which
offers some mitigation against the adverse H&S influence of subcontracting. Aiming
to shed light on measures implemented by contractors other than the regulatory
requirements, 6 medium to large contractors were investigated to capture how they
manage the H&S influence of subcontracting. As expected the investigation revealed
the compliance of the contractors with regulatory measures which offer some
mitigation against the adverse H&S influence of subcontracting. Beyond these, it also
emerged that the contractors have their in-house H&S measures which they
implement to complement the regulatory measures. In the spirit of inter-organisational
benchmarking and learning, these in-house measures provide learning opportunity for
other medium to large UK contractors who often sublet work packages. Stretching
beyond the UK context, both the regulatory measures and in-house measures provide
learning opportunity for the contractors and government authorities of other countries.
It is anticipated that through the carefully adoption or adaptation of these measures the
construction industry as a whole could make useful strides in tackling the adverse
H&S influence of subcontracting.
REFERENCES
Ankrah, N. A. (2007) An investigation into the impact of culture on construction project
performance. PhD Thesis. School of Engineering and the Built Environment,
University of Wolverhampton.
Bielenski, H. (1999) New patterns of employment in Europe. In: Ferrie, J., Marmot, M.,
Griffiths, J. & Ziglio, E. (Eds.) Labour Market Changes and Job Insecurity: A
challenge for Social Welfare and Health Promotion. Denmark, WHO.
Bomel Limited (2007) Improving the effectiveness of the Construction (Design and
Management) Regulations 1994. Research Report :538. HSE.
Byrne, J. and Van Der Meer, M. (2001) The construction industry in Spain: Flexibilisation
and other corporatist illusions. International Conference on Structural Change in the
Building Industry‘s Labour Market, Working Relations and Challenges in the Coming
Years. Institut Arbeit und Technik, Gelsenkirchen, Germany.
Chiang, Y. (2009) Subcontracting and its ramifications: A survey of the building industry in
Hong Kong. International Journal of Project Management, 27(1), pp. 80-88.
Choudhry, R.M and Fang, D. (2008) Why operatives engage in unsafe work behaviour:
investigating factors on construction sites. Safety Science 46(4), pp. 566–584.
Creswell, J. W. (2009) Research design: Qualitative, quantitative, and mixed method
approaches, 3rd
Edition. California: Sage Publications.
Donaghy, R. (2009) One death is too many - Inquiry into the underlying causes of
construction fatal accidents: Report to the secretary of state for work and pensions.
The Stationery Office, UK.
Eccles, R. G. (1981) Bureaucratic and craft administration revisited: the impact of market
structure on the nature of the construction firm. Administrative Science Quarterly, 26,
pp. 449–69.
Health and safety
743
Entec UK Ltd. (2000) Construction health and safety for the new millennium. Contract
Research Report 313/2000. HSE.
Fellows, R. and Lui, A. (2008) Research methods for construction, 3rd
Edition. West Sussex:
Blackwell Publishing Ltd.
Gibb, A.G., Haslam, R.A., Gyi, D.E., Hide, S., Hastings, S. and Duff, R. (2002) ConCA-
Preliminary Results from a Study of Accident Causality. In: Rowlinson, S. (Ed.)
Triennial Conference CIB W099, May 2002, University of Hong Kong, Hong Kong.
Loughborough University and UMIST (2003) Causal factors in construction accidents. HSE
Research Report 156, HSE.
HSE (2009) HSE construction intelligence report. HSE.
Hsieh, T.-Y. (1998) Impact of subcontracting on site productivity: Lessons learned in Taiwan,
Journal of Construction Engineering & Management, 124(2), pp. 91-100.
HSL (1999) The impact of procurement and contracting practices on health and safety - A
review of literature. Report: RAS/99/02. HSL.
Hughes, P. and Ferrett, E. (2008) Introduction to health and safety in construction, 3rd
Edition. Oxford: Elsevier Ltd.
ILO (2001) The construction industry in the twenty-first century: Its image, employment
prospects and skill requirements. Geneva, ILO.
Kheni, N. A., Dainty, A. R. J. and Gibb, A. G. F. (2005) Health and safety management
practices of small subcontractors. In: Khosrowshashi, F. (Ed.) 21st Annual ARCOM
Conference, University of London, Association of Researchers in Construction
Management.
Lai, L. W. C. (2000) The Coasian market–firm dichotomy and subcontracting in the
construction industry. Construction Management and Economics, 18(3), pp. 355–62.
LFS (2004) Number of people self-employed; United Kingdom; 1985 to 2003. Office for
National Statistics.
Linehan, A. J. (2000) Subcontracting in the Construction Industry, A speech presented in
Safety and Health Conference in Hong Kong, 22-23 March 2000.
Loughborough University (2009) Phase 2 Report: Health and safety in the construction
industry: Underlying causes of construction fatal accidents –External research, HSE.
Loughborough University and UMIST (2003) Causal factors in construction accidents. HSE
Research Report 156, HSE.
Manu, P., Ankrah, N., Proverbs, D. and Suresh, S. (2011) The adverse health and safety
influence of subcontracting. Proceedings of the Institution of Civil Engineering -
Management, Procurement and Law, Special Issue on Health and Safety, doi:
10.1680/mpal.10.00008.
Maurno, D. (1992) Working with Contractors. Record, 69, pp.3-10.
Mayhew, C. and Quinlan, M. (1997) Subcontracting and occupational health and safety in the
residential building industry. Industrial Relations Journal, 28(3), pp.192-205.
Mayhew, C. and Quinlan, M. (2001) Effects of changing patterns of employment on reporting
occupational injuries and making worker' compensation claims. Safety Science
Monitor, 5(1), Article 1.
Mayhew, C., Quinlan, M. & Ferris, R. (1997) The effects of subcontracting/outsourcing on
occupational health and safety: Survey evidence from four Australian industries.
Safety Science, 25(1-3), pp. 163-178.

Manu et al.
744
ONS (2008) Construction Statistic Annual: 2008 Edition. ONS.
Saad, M. and Jones, M. (1998) Unlocking specialist potential. Reading Construction Forum.
So, K. C. (2000) The Multi-layers subcontracting system. An article of interview from the
Hong Kong newspaper of Hong Kong Economic Post, 12 May 2000.
Stinchcombe, A. L. (1959) Bureaucratic and craft administration of production: a comparative
study. Administrative Science Quarterly, 4, pp. 168–87.
Tam, V. W. Y., Shen, L. and Kong, J. S. Y. (2010) Impacts of multi-layer chain
subcontracting on project management performance. International Journal of Project
Management, 28(6), pp. 593-600.
Thorpe, A., Dainty, A. R. J. & Hatfield, H. (2003) The reality of being preferred: Specialist
subcontractor perspectives on restricted tender list membership. Journal of
construction procurement, 9, pp. 47-55.
Wong, F. & So, L. (2002) Restriction of the Multi-Layers Subcontracting Practice in Hong
Kong - Is it an Effective Tool to Improve Safety Performance of the Construction
Industry? In: Rowlinson, S. (Ed.) Triennial Conference CIB W099, May 2002,
University of Hong Kong, Hong Kong.
Yung, P. (2009) Institutional arrangements and construction safety in China: an empirical
examination. Construction Management and Economics, 27(5), pp. 439 - 450.

Micah, V.K.B. and Ankra, O. (2011) Merging architectural and sculptural forms in the building
industry In: Laryea, S., Leiringer, R. and Hughes, W. (Eds) Procs West Africa Built Environment
Research (WABER) Conference, 19-21 July 2011, Accra, Ghana, 745-745.
745
MERGING ARCHITECTURAL AND SCULPTURAL
FORMS IN THE BUILDING INDUSTRY
Victor Kweku Bondzie Micah1 and Owusu-Ansah Ankra
School of Applied Arts, Department of sculpture, Takoradi polytechnic, P.O. Box 256, Takoradi, Ghana
Long before time sculpture, painting and architecture were treated as inter related
area, and was evidential in the books that were published before the 1960‘s on these
areas of study. Over the years, however, authors and practitioners of these disciplines
have tried frantically to separate this seriously interrelated subject matter by not
involving each other in practice, in trying to do so have negatively affected the
buildings that are put up. Most architects are refusing to see their creations as art
pieces, and or should incorporate art works. Some in their desperate quest in
satisfying their cliental demands refuse to see artist near their creations, as is
perceived as that the artist work will distort their design. This paper seeks to establish
the relationship between sculptural and architectural forms as bed fellow. In so doing
comparative analysis will be made of architectural forms with sculptural forms
incorporated in it and those with no sculptural forms included. Also, this will bring to
bare the importance of consulting with sculptors before designing, in the design
process, and finally in the execution stages of the architectural forms. The above, are
classical examples of sculptural and architectural forms merged. The fusion concept
are rendered in Fiber glass, Cement, Auto body filler, Terracotta and other materials
based on cliental demands. The merger which most has termed ―Archisculpture‖
should be sustained by both professionals to create aesthetics in our homes,
employment, and psychologically therapeutic, ease tension and accommodate human
kind with our creations.

Mining in urban environments
746

Adeyinka et al. (2011) Mining activities in Nigeria urban environment: Impetus for community
development or environmental deterioration? In: Laryea, S., Leiringer, R. and Hughes, W. (Eds) Procs
West Africa Built Environment Research (WABER) Conference, 19-21 July 2011, Accra, Ghana, 747-
760.
747
MINING ACTIVITIES IN NIGERIA URBAN
ENVIRONMENT: IMPETUS FOR COMMUNITY
DEVELOPMENT OR ENVIRONMENTAL
DETERIORATION?
Samson A. Adeyinka1, Albert Ayorinde Abegunde
2, Nathaniel Adeoye
3, S.A.
Adeyemi4
1Department of Urban and Regional Planning, Obafemi Awolowo University, Ile-Ife, Nigeria
3Department of Geography, Obafemi Awolowo University, Ile-Ife, Nigeria
Mining as part of human activities on land is an expanding industry that can provide
sustainable economic, environmental and social benefits to communities and regions
where it is taking place. Nonetheless, the extraction process often times have adverse
effects on their immediate physical environment. This paper examines residents‘
perception of the effects of mining activities on their environment. Data needs were
collected through the administration of structured questionnaires in a systematic
random manner on 10% (554 respondents) of the households in Ijero Local
Government Area of Ekiti State, Nigeria. A total of 21 variables were analysed to
determine the Resident Tolerance Index (RTI) value for residents on each of the
variables. The study reveals that the RTI was found to be between ‗not tolerable‘ and
‗not at all tolerable. The paper further noted that only three variables such as ‗high
influx of people‘, ‗increase in sales and services‘, and ‗improved economic condition‘
with RTI values above 3.0(just tolerable) were the accrued benefits to the residents
while the remaining 17 variables with RTI values of less than 3.0 were considered to
have adverse effects on the environment. In conclusion, the paper recommended that
government should ensure that mining activities are controlled by enforcing
appropriate legislations on the miners and at the same time provide adequate
infrastructural facilities like potable water and electricity to enhance economic
development in the area and ensure a sustainable community development.
Keywords: environmental degradation, residents, socio-economic, sustainable
development.
INTRODUCTION
In the world of geography, endowment in mineral resources is seen as an impetus
towards development. This is because, over history, communities that have unique
natural and man-made resources are at early advantage of attaining social and
economic development above their counterparts that are less privileged (Fuentes and
Mies, 2008). For instance, the discovery of gold brought sudden development to
Lawis Ponds and Summer Hills Creek areas of Victoria in Australia; long before
nineteen century (Evans, 1988). Mining of jasper also transformed the awkward
regions of Erie Creek and Isintok in Calgari, Alberta, Canada to prosperous
2 [email protected], [email protected]
3
4

Adeyinka et al.
748
settlements (Jasper Mining Corporation Annual Report, 2006; 2009). Arising from
these, exploration of mineral resources in any African community is expected to raise
the hope of such ―privileged‖ area from underdevelopment to a desired zone.
In the contrary, mining opportunities have formed the source of community
degradation and conflicts; housing shortage and environmental problems; loss of
cultural heritage and economic value among others (Abegunde, Olayiwola and
Adedokun, 2007). According to Aigbedion and Iyayi (2007), the three stages of
mineral development notably; exploration, mining and processing have caused
different types of environmental damages. In Nigeria, large scale oil extraction and
production have led to adverse environmental impact on the soil, forest and water of
Niger Delta communities and have ultimately affected peasant agriculture in the area
(Dayo, 1999). This is why Ikoni (2000) and Abegunde et al (2007) concluded in their
works that despite the economic benefits associated with mining, more often than not,
it is accompanied with adverse effects on the physical environment.
In furtherance of earlier studies on both negative and beneficial effects of mining
activities on both human and physical environments, this study is based on perception
of residents on the merits and demerits of mining activities on their environment. It
attempted to first understand the socio-economic characteristics of these residents; as
directly or indirectly influenced by mineral exploration and evaluated the influence of
mining activities on their present and future community development. Along this line,
the study probed the opinions of residents on the best way mining activities should be
carried out in their vicinity to promote socio-economic and physical development of
their communities. Specifically, the study focused on a typical homogenous region of
a Africa (Ijero local Government Area) to draw the attention of their policy makers
and researchers on the voice of the people on the empirical contribution of mining
activities to community development in post millennium era.
Mining Industry in Nigeria
According to National Environmental Study/Action Team (NEST) (1991), mining
started many centuries before the arrival of Europeans and of Arabs who preceded
them. It was carried out by traditional methods with locally available technology.
Gold, clay, iron ore, tin, salt and soda were among the most important minerals
worked. The minerals were used in the body adornment, for fabrication of weapons,
tools and vessels, for building construction, in the diet and so on. Thus mining
occupied a highly respected position in the traditional economies of large part of
Nigeria and contributed greatly to intra-tribal and inter-tribal commerce as well as
conflict.
Following the arrival of British in the last century, the number and variety of minerals
mined in Nigeria increased and truly commercial-scale mining commenced. Among
the many other mineral which occur in Nigeria are petroleum, natural gas, coal,
limestone, lead, zinc, sand, feldspar, diamond, sapphire, gemstone, tantalite, marble,
columbite, zircon and uranium.
Specifically, organized mining in Nigeria as documented by Online Encyclopedia
began in 1903 when the Mineral Survey of the Northern Protectorate was created by
the British Colonial Government. A year later, the mineral Survey of the Southern
protectorate was founded. Coal was first discovered in Enugu in 1909, and the Ogbete
mine had opened and began regularly extracting coal by 1916. By 1920, coal
production had reached 180, 122 long tons (201, 737 short tons). Nigeria‘s peak coal

Mining in urban environments
749
production was in the late 1950s and 1960 production was at 565, 681 long tons (633,
563 short tons) (http//www.enwikipedia.org/wikli/minig_in_nigeria-53k).
Bitumen was first discovered in 1900 and its exploration started in 1905. Bitumen
deposits are found in Lagos State, Ogun State, Ondo State and Edo State. Gold
production began in 1913 and peaked in the 1930s. The Nigeria Mining Corporation
(NMC) was formed in the early 1980s to explore for gold. Lack of funds and the lure
of easier profits from oil production led to its failure. Columbite and tantalite are used
to produce elements like nobium and tantalum. Columbite and tantalite are
collectively known as coltan in Africa. In Nigeria, the pegmatite deposits of coltan are
often the sources of several precious and semiprecious stones such as beryl,
aquamarine and tourmaline. These pegmatite are found in Nassarawa State near Jos as
well several areas in Southeast and Southwest Nigeria
(http//www.enwikipedia.org/wiki/mining_in_nigeria-53k).
The mining of minerals in Nigeria accounts for only 0.3% of its GDP, due to the
influence of its vast oil resources. The domestic mining industry is underdeveloped,
leading to Nigeria having to import minerals that it could produce domestically, such
as salt or iron ore. Rights to ownership of mineral resources is held by the Nigerian
government, which grants titles to organizations to explore, mine, and sell mineral
resources.
Organized mining began in 1903 when the Mineral Survey of the Northern
Protectorates was created by the British colonial government. A year later, the Mineral
Survey of the Southern Protectorates was founded. By the 1940s, Nigeria was a major
producer of tin, columbite, and coal. The discovery of oil in 1956 hurt the mineral
extraction industries, as government and industry both began to focus on this new
resource. The Nigerian Civil War in the late 1960s led many expatriate mining experts
to leave the country.
Coal was first discovered in Enugu in 1909, and the Ogbete Mine had opened and
begun regularly extracting coal by 1916. By 1920, coal production had reached
180,122 long tons (183,012 t). Nigeria's peak coal production was in the late 1950s,
and by 1960 production was at 565,681 long tons (574,758 t). The Nigerian Civil War
caused many mines to be abandoned. After the war ended in the early 1970s, coal
production was never able to recover. Attempts to mechanize the industry in the 1970s
and 1980s were ultimately unsuccessful, and actually hindered production due to
problems with implementation and maintenance.
The Nigerian government is currently trying to privatize the Nigerian Coal
Corporation and sells off its assets. While the domestic market for coal has been
negatively affected by the move to diesel and gas-powered engines by organizations
that were previously major coal consumers, the low-sulfur coal mined in Nigeria is
desirable by international customers in Italy and the United Kingdom, who have
imported Nigerian coal. Recent financial problems have caused a near shutdown of
the NCC's coal mining operations, and the corporation has responded by attempting to
sell off some of its assets while it waits for the government to complete privatization
activities.
The discovery of oil in 1956 halt the mineral extraction industries as government and
industries both began to focus on these new resources (NEST. 1991:43). This fact is
corroborated by Lawal (undated) who observed that, despite the mineral potential
Nigeria possesses (proven reserves in 33 types of minerals in over 400 locations);
solid mineral exportation constitutes a mere 1% to its GDP. This extremely low share

Adeyinka et al.
750
is mainly due to Nigeria‘s dependence on oil but also largely due to the under
developed mining sector, primarily resulting from inadequate and inefficient policies
for mineral exploration development.
On ecological effect of mining, environmental officials with the government of
Plateau State believe that 1,100 tin and columbite mines, abandoned after the mining
boom of the 1960s, now pose serious health risks to as many as 2 million people
living in the area. Radioactive mine tailings were reported to be a danger to local
people living around mining fields in Jos, Barikin-Ladi, Bukur, Bassa and Riyom
districts.
Mining Activities and their Effects on the Built Environment
The effect of mining activities has generated a surge of interest among
environmentalists in recent years. Such scholars include Aigbedion and Iyayi (2007),
Lungu and Shikwe (2006), Aghalimo (2000), Akabzaa and Darimani (2001),
Organization for Economic Cooperation and Development (OECD,2002) among
others.
According to OECD (2002), cited in Danielson and Lagos (2001), although the
mining industry occupies a relatively small parts of the land surface, it does have
significant and often irreversible impacts. By its nature, mining has a permanent
environmental impact in that a non-renewable natural resource is exhausted. On the
other hand, the physical non-renewable resource may be deemed sustainable if there is
an effective conversion of the natural capital, represented by the resource, to social
capital that would allow for long-term livelihoods. This assumes that the resilience of
the natural environment is not compromised, undermining social and economic
sustainability (Ali and Fairchealaigh, 2007).
Aghalimo (2000) studied the petroleum exploitation in Nigeria and observed that, the
impacts of oil exploitation on the mineral producing communities are in three folds.
Firstly, it leads to environmental pollution, secondly, it destroys the ecosystem and the
ways of life of the people and thirdly, oil producing communities are generally
undeveloped.
In the same vein, Aghalimo (2000), worked on the petroleum and environmental
degradation in Nigeria. The study also indicates that, the increased proliferation of oil
producing areas have left a number of imprints on both the physical and cultural
landscape. They noted that the attitude demonstrated by petroleum prospecting
companies portrayed a disregard for environmental welfare, forgetting that their
activities are highly unfriendly with the environment. Thus petroleum deposits in the
area constitute much of a liability to the immediate environment as the nature of
relationship between the petroleum prospectors and the environment is tenuous. The
effect of these unguided modes of environmental interactions is that man‘s presence
and future are heavily threatened.
Aigbedion and Iyayi, (2007),observed that the three stages of mineral development
viz: exploration, mining and processing, have caused different types of environmental
damages, which include ecological disturbance, destruction of natural flora and fauna,
pollution of air, land, water, instability of soil and rock masses, landscape degradation
and radiation hazards. The environmental damage has in turn resulted in waste of
arable land as well as economic crop and trees.
In a study conducted in Sub-Saharan countries by OECD (2002), it was established
that environmental concern often times be subordinated to decisions by traditionally
Mining in urban environments
751
powerful ministries such as finance and industry. There are historical reasons for this,
in particular the priority given to economic development in government policy. In the
past this may have been at the expense of the environment. In Ghana for instance, the
cost of environmental degradation to the economy in 1988 was estimated to be $189
million of which at least $17 million was as a result of mining activities. This is
equivalent to 4.00 percent of GDP, whilst GDP growth was 5.00 percent. This growth
occurred entirely at the expense of the country‘s natural resources base, and is
unsustainable (OECD, 2002).
Oyedika and Nwosu (2008) argued that the uncontrolled mining activities and illegal
mining in developing countries have left a lot of environmental hazards and enormous
amount of waste and different types of pollutants in the environment. Mining
activities, apart from the fact that they have deleterious effects on the environment,
they are capable of endangering the lives of people living around the mines and
sometimes constitute health risk. For instance, Onyedika and Nwosu (2008:418),
observed that in mineralized areas of Ishiagu in Ebonyi state of Nigeria, one of the
major sources of lead and associated cadmium to the environment arise from lead and
zinc mining activities by industrial and local miners. However, high level of heavy
metal in the soil could indicate similar concentration in plant by accumulation at
concentration causing serious health risk to human health when consumed. In the
same vein, the dust arising from mining operation in Tarkwa Area in Ghana, as
observed by Akabzaa and Darimani (2001:56), has a high silica content which has
been responsible for silicosis tuberculosis in the area. The same dust is deposited on
the vegetation, making it unpalatable for both human and live stock consumption.
Other environmental related diseases identified in the area include, vector borne
diseases such as malaria, chistomiasis and onchocerciasis, skin diseases due to high
level of cyanide reaching downstream from mine run-off, eye diseases, mental cases,
and accidents resulting from galamseys activities. Sexually transmitted diseases
(STDs) have also assumed an increased trend in the Wasa West District. Reported
cases of syphilis and HIV have been on the increase in the area since 1992. For
instance, reported cases of HIV rose from 6 in 1992 to 100 in 1996 (Akabzaa and
Darimani, 2001:62).
Air and water pollution pose major problems as far as physical environmental impact
of copper mining is concerned in Zambia (OECD, 2002). For instance, hyperlink air
pollution include dust from waste dumps and tailings, which have contributed to
increased bronchial disease and from CO2, NOx and SOx emissions from smelter
stacks such as lead and cadmium poisoning near Kabwe. Water pollution is also a
problem with some rivers having copper levels of 80 times more than the accepted
level in the early 1990s.
As documented by NEST (1991:38), two women that were illegal gold miners were
buried alive in Niger state, and died instantly when the hole they entered in search of
gold caved in, while their fellow gold digger who was in the hole with them, however
escaped with multiple injuries. In a similar story in Jos 1982, between September and
December according to NEST (1991:39), two children were reported drowned in
ponds in the Jos environs when playing around the ponds abandoned by the miners.
Miners as well have sometimes died in explosions or suffocation. In 2002, at least 48
workers were killed when a compressor used to pump clean air failed (Punch, 2008 pg
80).
Mining operation normally upset the equilibrium in geological environment, which
may trigger off certain geological hazards such as landslide, subsidence, flooding,

Adeyinka et al.
752
erosion and tremors together with their secondary effects (Aigbedion and Iyayi,
2007:36). The December 2004 tsunami which took Sri Lanka by surprise was the
natural disaster ever experienced in Sri Lanka killing 35,322 people, losing 150,000
livelihoods, damaging unprecedented number of houses, infrastructure, schools,
tourist hotels, and other commercial buildings. A country report published in 1992 by
the Federal Environmental Protection Agency (FEPA) indicated that Nigeria possess
more than 5,000 recorded species of plant, 22,090 species of animals including insects
and 889 species of birds, and 1,489 species of micro organisms. It is estimated that
0.4% of the plant species are threatened and 8.5% endangered, while 0.14% of the
animals and insects threatened and 0.22% endangered. The decrease in the population
of the nation‘s biodiversity can be attributed to activities of man in the environment
which include mining of minerals (Nigeria National Biodiversity and Action Plan,
undated). Scarification of land often results due to existence of numerous pits some of
which have been abandoned and are more than 10 metres deep and 50 metres wide.
Many of them contain permanent water bodies which are veritable breeding places for
mosquitoes that cause malaria and yellow fever. All of them constitute permanent
physical danger for both human beings and livestock (OECD, 2002; NEST, 1991).
In their investigation on the impact of mining investment in Ghana, Akabzaa and
Darimani (2001:47) observed that the principal elements of the environment land,
water, air have been severely impacted by mining operations. The continued viability
of these elements to support the well being and development of rural population in
Tarkwa Area is currently in doubt. The large-scale mining activities, generally has
continued to reduce the vegetation of the area to level that are destructive to biological
diversity. Currently, surface mining concession has taken over 70% of the total land
area of Tarkwa. It is estimated that at the close of mining, a company would use 40-
60%.
METHOD OF STUDY
Primary data for this study were collected through field observation and
administration of structured questionnaire. The focus was on the household heads who
were residents‘ in the mining areas of Ijero Local Government, Ekiti State, Nigeria.
Information obtained from them focused on their socio-economic background and also
sought to identify residents‘ purposes of coming to the study area. Others are the
residents‘ length of stay, distances from their homes to mining sites, their perceived
effects of mining operations on the physical environment and means to sustainable
community development in the study area. Reconnaissance survey revealed that there
were five thousand, five hundred and forty (5,540) residential buildings in the study
area out of which five hundred and fifty four houses, representing 10% of the total
were randomly sampled. The study also noted that these houses were all numbered
and located along streets, making them accessible during questionnaire administration.
Fifty two copies of the questionnaire were either not properly filled or attended to,
thus were rejected. This study was based on the remaining five hundred and two
copies that were counted worthy of being analysed.
The random selection was done by writing numbers one to ten in each separate sheet
of paper, each rolled and thoroughly mixed together in a carton, after which one of the
rolled papers was picked. At the point of selection, number one was randomly picked.
In other words, in each street, the first house was randomly selected followed by the
selection of every tenth building along the line of movement. In the course of
selecting the household heads, either female or male family head that was available in

Mining in urban environments
753
each family was selected. Where the two were on ground, the latter was given
consideration. This is because, males were saddled with responsibilities of the
households in African communities above their female counterparts. Where there
were more than one household in a building, the oldest, in term of time of stay in the
community was chosen for questionnaire administration.
ANALYISIS AND DISCUSSION
Socio-economic Characteristics of Residents in the Mining Environment of the
Study Area
Information on the socio-economic characteristics of the people in Table 1 revealed
that about two-third of them were males (58.,2%), married (64.3%) and came to reside
in the study area in less than eleven years to the time of this study. In the same vein,
about half of them were young adults (51.3%), within the age range of 21-40 years;
having tertiary education (46.8%), earning below N10,000 (equivalent of 65 Dollars)
per month (51.3%). Their high level of literacy, and short time of residency in the
study area and early adulthood period of their age as at the time of this study are clear
indications that most of them (64.6%) possibly came to seek for employment in the
mining environment. This could be why more than half of them (53.0%) chose to live
very close to the mining sites.
Table 1: Socio-economic Characteristics of Residents in the Study Area
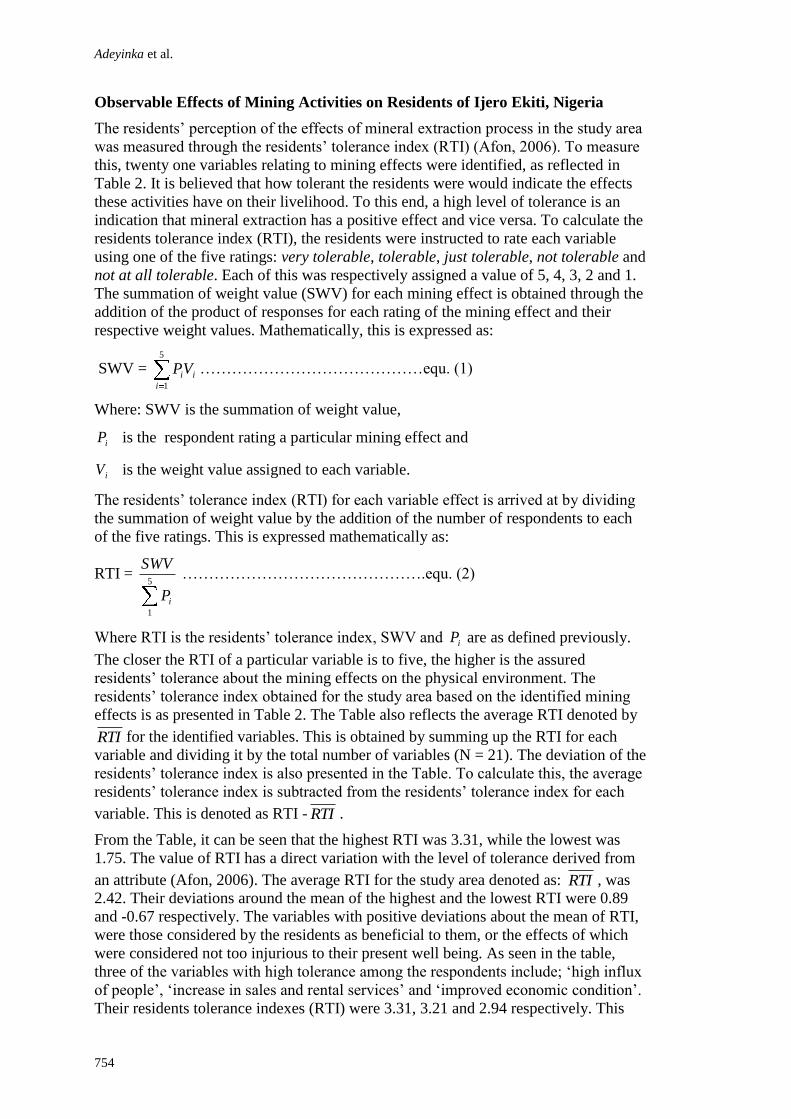
Adeyinka et al.
754
Observable Effects of Mining Activities on Residents of Ijero Ekiti, Nigeria
The residents‘ perception of the effects of mineral extraction process in the study area
was measured through the residents‘ tolerance index (RTI) (Afon, 2006). To measure
this, twenty one variables relating to mining effects were identified, as reflected in
Table 2. It is believed that how tolerant the residents were would indicate the effects
these activities have on their livelihood. To this end, a high level of tolerance is an
indication that mineral extraction has a positive effect and vice versa. To calculate the
residents tolerance index (RTI), the residents were instructed to rate each variable
using one of the five ratings: very tolerable, tolerable, just tolerable, not tolerable and
not at all tolerable. Each of this was respectively assigned a value of 5, 4, 3, 2 and 1.
The summation of weight value (SWV) for each mining effect is obtained through the
addition of the product of responses for each rating of the mining effect and their
respective weight values. Mathematically, this is expressed as:
SWV = 5
1i
iiVP ……………………………………equ. (1)
Where: SWV is the summation of weight value,
iP is the respondent rating a particular mining effect and
iV is the weight value assigned to each variable.
The residents‘ tolerance index (RTI) for each variable effect is arrived at by dividing
the summation of weight value by the addition of the number of respondents to each
of the five ratings. This is expressed mathematically as:
RTI = 5
1
iP
SWV ……………………………………….equ. (2)
Where RTI is the residents‘ tolerance index, SWV and iP are as defined previously.
The closer the RTI of a particular variable is to five, the higher is the assured
residents‘ tolerance about the mining effects on the physical environment. The
residents‘ tolerance index obtained for the study area based on the identified mining
effects is as presented in Table 2. The Table also reflects the average RTI denoted by
RTI for the identified variables. This is obtained by summing up the RTI for each
variable and dividing it by the total number of variables (N = 21). The deviation of the
residents‘ tolerance index is also presented in the Table. To calculate this, the average
residents‘ tolerance index is subtracted from the residents‘ tolerance index for each
variable. This is denoted as RTI - RTI .
From the Table, it can be seen that the highest RTI was 3.31, while the lowest was
1.75. The value of RTI has a direct variation with the level of tolerance derived from
an attribute (Afon, 2006). The average RTI for the study area denoted as: RTI , was
2.42. Their deviations around the mean of the highest and the lowest RTI were 0.89
and -0.67 respectively. The variables with positive deviations about the mean of RTI,
were those considered by the residents as beneficial to them, or the effects of which
were considered not too injurious to their present well being. As seen in the table,
three of the variables with high tolerance among the respondents include; ‗high influx
of people‘, ‗increase in sales and rental services‘ and ‗improved economic condition‘.
Their residents tolerance indexes (RTI) were 3.31, 3.21 and 2.94 respectively. This

Mining in urban environments
755
means that mining activities in the study area is capable of generating meaningful
economic benefits to host communities, and by this promoting community economic
development. That is why their deviations around mean are positive and significant
(between 0.7221 and 0.2704).
Other variables which have positive deviation in Table 2 are overstretched of the
available infrastructures, earth shake, earth movement during blasting, cracks on
building due to blasting and landslide. The Table shows that residents seemed not to
have significantly noticed the negative effects of these variables nor were they
presently affected by them. This could be why their ratings were above half of 5.
Despite the positive deviation of these variables around the mean of RTI, the
residents‘ tolerance index on these variable fell between just tolerable and not
tolerable. The implication of this is that though these variables are presently less
hazardous to the people, they can still pose serious threats to their‘ lives in the nearest
future. This raises the question about the ultimate goal of mining activities in some
developing nations; whether they are towards community development or degradation.
This is because some of these effects may not be pronounced at present as hazardous,
but may constitute serious threats to residents and the built environment in the future.
This finding corroborates Aigbedion and Iyayi (2007), that mining operation may
trigger off certain geological hazards such as landslide, earth shake, earth movement,
flooding erosion and tremors as secondary effects.
The variables with negative deviation around the mean of RTI, were the variables that
the residents showed low level of tolerance for; or considered affecting the physical
environment of their area negatively. These are negative effects that are physically
visible and directly felt by residents. Such variables include: dust in air, illegal
mining, loss of farmland, land dispute, blocking of drains, erosion due to mining
excavation, smokes, increase in crime rate, fumes, loss of domestic animals in the
mine, communal clash, siltation, run off to streams. Their deviations around the mean
of RTI were -0.07, -0.08, -0.08, -0.17, -0.18, -0.19, -0.22, -0.23, -0.32, -0.46, -0.5, -
0.60 and -0.67 respectively. The residents‘ tolerance index (RTI) on some of these
variables fell between just tolerable and not tolerable, while others were between not
tolerable and not at all tolerable. This implies low level of tolerance by the residents.
For instance, contaminated stream sources which the residents use for domestic
purposes could cause water borne diseases (see Plate1). Similarly, loss of farmland (
see Plate 2), loss of domestic animals in the mine, land dispute and communal clash
may result in serious social problem capable of destroying peaceful coexistence of
people in the area in future. Physical observations in the mining area showed that their
land is exposed to soil erosion (Plate 3) and opened up their farmland to degradation
through dug-out holes, polluted their water, artificial lakes (Plate 4) and are changing
the ecological nature of the soil through digging and extraction respectively. This
could be why the computed RTI variance in Table 2 was 0.1845, with a standard
deviation of 0.43 and co-efficient of variance of 17.77%. From this computation, it
could be inferred that the scattering of responses around the mean of RTI was low. In
essence, the level of tolerance expressed by the residents on the mining effects in the
study area was close and not too far from each other.
Computation of RTI Values in Table 4.11
Column 1: Serial number
Column 2: Identified mining effects
Column 3: Number of Individual respondents rating each mining effect with 5 (very tolerable)
Column 4: Number of individual respondents rating each mining effect with 4 (tolerable)

Adeyinka et al.
756
Column 5: Number individual respondents rating each mining effect with 3 (just tolerable)
Column 6: Number of individual respondents rating each mining with 2 (not tolerable).
Column 7: Number of individual respondents rating each mining effect with 1 (not at all
tolerable).
Column 8: Addition of the product of individual respondents rating a particular effect
and their respective weight values. For instance, SWV for high influx of
people = (136 x 5) + (73 x 4) + (73 x 3) + (89 x 2 ) + (61 x 1) = 1430.
Column 9: Resident‘s tolerance index equals summation of weight value (SWV) divided by the
addition of individual respondents rating each effect of mining. For instance RTI for high influx of
people = 1430/ (136 + 73 + 73 + 89 + 61) = 31.3432
1430
Column 10: The deviation equals to mean of residents‘ tolerance index for all the 21 mining
effects subtracted from resident‘s tolerance index value for each mining effect. e.g 42.221
87.50,
Deviation (RTI - )RTI = 3.31 – 2.42 = 0.89
Column 11: Square of values in column 10; for instance (.89)2 = 0.7221
Residents’ Perception of Means of carrying out Mining Activities towards
Community Development in Ijero Ekiti, Nigeria
The residents‘ tolerance index (RTI) method adopted earlier in this research work is
also employed in the computation of the residents‘ agreement index (RAI) used to
measure the level of agreement of respondents to the suggested means of carrying out
mining activities in the study area to attain sustainable community development. To
do this, the residents were instructed to rate the five suggested measures using any one
of the five ratings: very much agree, agree, just agree, not agree and not at all agree.
Each of this was also assigned a value of 5, 4, 3, 2, and 1. The closer the residents‘
level of agreement on each variable to 5, the better is the adequacy of suggested
measure.
As revealed in Table 3, the highest residents‘ agreement index was 4.30, while the
lowest was 3.73 and the average residents‘ agreement index ( RAI ) was 4.06. The
variables with positive deviation about the mean of RAI were the measures the
residents considered important for reducing the effects of mining activities and at the
same time improving their living condition. The variables represented the measures
through which the physical effects of mining activities could be reduced to a barest
minimum and as well beneficial to the host communities. These variables were:
―mining companies should be involved in the provision of infrastructural facilities‖,
―mining activity should be carried out, and using modern equipment‖ and ―mining
activity should be done under close monitoring‖. Their deviations around the mean of
RAI were: 0.24, 0.17 and 0.01 respectively. The residents‘ level of agreement on these
variables was high. For instance, the provision of infrastructural facilities by the
mining companies (RAI= 4.30) would help in reducing the overstretching of the
available infrastructure due to excessive population attracted by mining activities.
Furthermore, the use of modern equipments (RAI= 4.22) will to a large extent reduce
the adverse effects of mineral extractions on the physical environment and at the same
time increase efficiency of the mining operators.
The variables with negative deviation around the mean of RAI were; appropriate
mining legislation should be put in place and properly implemented (-0.11) and
community should participate in the mineral extraction process (-0.33). However, the
negative deviation around the mean of RAI on these variables does not necessarily
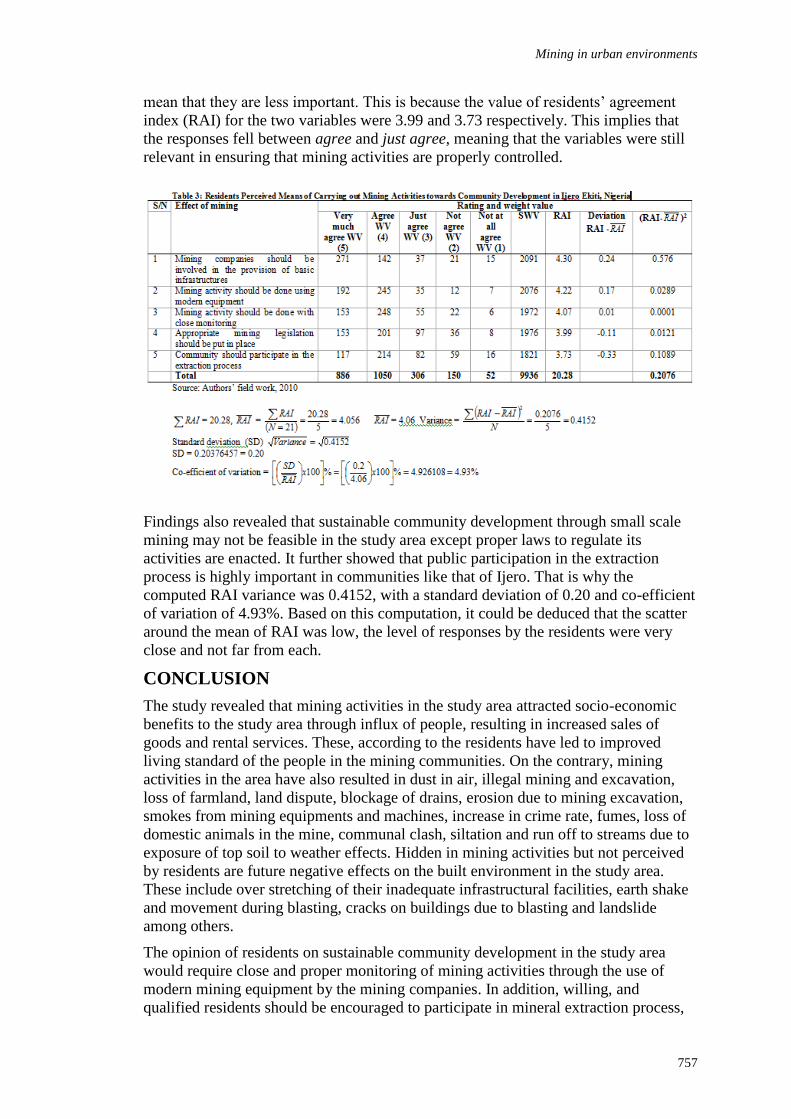
Mining in urban environments
757
mean that they are less important. This is because the value of residents‘ agreement
index (RAI) for the two variables were 3.99 and 3.73 respectively. This implies that
the responses fell between agree and just agree, meaning that the variables were still
relevant in ensuring that mining activities are properly controlled.
Findings also revealed that sustainable community development through small scale
mining may not be feasible in the study area except proper laws to regulate its
activities are enacted. It further showed that public participation in the extraction
process is highly important in communities like that of Ijero. That is why the
computed RAI variance was 0.4152, with a standard deviation of 0.20 and co-efficient
of variation of 4.93%. Based on this computation, it could be deduced that the scatter
around the mean of RAI was low, the level of responses by the residents were very
close and not far from each.
CONCLUSION
The study revealed that mining activities in the study area attracted socio-economic
benefits to the study area through influx of people, resulting in increased sales of
goods and rental services. These, according to the residents have led to improved
living standard of the people in the mining communities. On the contrary, mining
activities in the area have also resulted in dust in air, illegal mining and excavation,
loss of farmland, land dispute, blockage of drains, erosion due to mining excavation,
smokes from mining equipments and machines, increase in crime rate, fumes, loss of
domestic animals in the mine, communal clash, siltation and run off to streams due to
exposure of top soil to weather effects. Hidden in mining activities but not perceived
by residents are future negative effects on the built environment in the study area.
These include over stretching of their inadequate infrastructural facilities, earth shake
and movement during blasting, cracks on buildings due to blasting and landslide
among others.
The opinion of residents on sustainable community development in the study area
would require close and proper monitoring of mining activities through the use of
modern mining equipment by the mining companies. In addition, willing, and
qualified residents should be encouraged to participate in mineral extraction process,

Adeyinka et al.
758
and by this become stakeholders in minerals extracted in their communities. The study
concludes that there is the need to critically assess the benefits and effects of mining
activities before they allowed in the built environment. Moreover, there is the need to
legislate public oriented laws on mining activities in African nations to protect
residents. Companies that are allowed to carry out mining operations should
reciprocate by providing basic infrastructural facilities in the host communities. It is
opined that preparation of a comprehensive impact assessment by professionals in
environmental sciences before mining operations would forestall unforeseen adverse
effects of mining activities in the mining environment.
REFERENCES
Abegunde, Albert; Olayiwola, Lasun and Adedokun, Oladejo (2007): ―An Analysis of
Environmental Effects of Indusrtial Pollution of oilf firms activities on on-shore water
bodies in Warri Region, Nigeria”. Ife Planning Journal. Department of Urban and
Regional Planning, Obafemi Awolwo University, Ile Ife, Nigeria.
Afon A.O. (2006): ―The use of Residents‘ Satisfaction Index in Selective Rehabilitation of
Urban Core Residential Areas in Developing Countries‖. International Review for
Environmental Strategies, vol.6, no1, pp. 137-152.
Aghalimo, S.O. (2000): ―Petroleum Exploitation and Environmental Degradation in Nigeria‖.
In Jimoh and ifabiyi (editors), Contemporary Issues in Environmental Studies. Pg.
141-146.
Aigbedion, I. and Iyayi, S.E. (2007): ―Environmental Effects of Mineral Exploitation In
Nigeria‖. International Journal of Physical Science vol. 2 (2) pp 033-038 February,
2007 (http://www.academic journals.org/IJPS).
Akabzaa, T. and Darimani, A. (2001): ―Impact of Mining Sector Investment in Ghana: A
study of Tarkwa Mining Region‖. A draft report prepared by Thomas, A and Abdulai,
D. for SAPRI January 20, 2001.
Ali, S.H. and Farcheallaigh, C.O. (2007): ―Extractive Industries, Environmental Performance
and Corporate Social Responsibilit‖y: Greenleaf Publishing Limited:
(http:/www.greenerpublisher.com/gmi52).
Dayo, F.B. (1999): ―Nigerian Case Study. UNIDO Project‖. Systems Associates Limited,
Lagos, Nigeria.
Evans, Joe (1988): ―The First Payable Goldfield Found in Australia (OPHIR)‖ Gold Gem and
Treasure, January 1988. http://users.tpg.com.au/dtdan/ophir.htm.
Federal Environmental Protection Agwency (FEPA) (1992): ―Environment and Development;
Implementing World Bank Policy.‖ Development Community, Volume 17.
Washington D.C.
Fuentes, J.R. and Mies, V. (2008): ―Development paths, natural resources and dynamic
comparative advantages‖, Global Development Network Library (GDN).
http//www.gdn.org
Hooge, Lois (2000) ―Mining‘s impact on community development in south Africa: the
Kwagga programme‖. Paper prepared for the Workshop on Growth and
Diversification in Mineral Economies. Organised by the United Nations Conference
on Trade and Development (UNCTAD), Cape Town: 7 to 9 November.
Ikono, U.D. (2000): ―Environmental crises in Nigeria and the oil Multi-national
Companies‖. Social responsibility for sustainable development of Nigier Delta Area.
Department of Public and Private Law, Faculty of Law, Benue State University,
Makurdi, Nigiera.

Mining in urban environments
759
Jasper Mining Incorporation (2009): ―Jasper Mining Incorporation 2006 Annual Report,
Management‘s Discussion and Analysis― (Form 51-102F1). December 31.
Jasper Mining Incorporation (2006): ―Jasper Mining Incorporation Annual Report‖.
National Environmental Action/Study Team, (1991): Nigerian Threatened Environment: A
National Profile. Intec Printers Limited, Ibadan.
Lungu, J. and Shikwe, A. (2006): ―Cooperative Social Responsibility Practices in Small Scale
Mining on the Copper Belt‖: A Baseline Study Sponsored by ZCTU, CCJDP and
DECOP with the financial support from the Netherlands Institute for Southern Africa
April – August 2006.
Organization for Economic Cooperation and Development, (2002): ―Environmental Impacts
of Foreign Direct Investment in the Mining Sector in Sub-Saharan Africa‖.
Conference on Foreign Direct Investment and the Environment, Lesson to be Learned
from the Mining Sector: Prepared by Colin Noy Boocock. 7-8 February, OECD
Headquarters, 2 rue Andre Pascal, 75775 CEDEX 16, Paris, France.
Onyedika, G.O. and Nwosu, G.U (2008): ―Lead, Zinc and Cadmium in Root Crops from
Mineralized Galena-sphalerite Mining Areas and Environment‖. Pakistan Journal of
Nutrition 7 (3): 418-420, 2008. (http//:www.Pjbs.Org/pjnonline/fin915.pdf-lead zinc
& cadmium).
Punch News paper (March 31st, 2008): Hope Faded for 65 Miners. Pg 80.
Wikipedia (2010): ―Australian gold rushes‖, Wikipedia, the free encyclopedia.
http://en.wikipedia.org/wiki/Australian_gold_rushes

Adeyinka et al.
760
APPENDIX
Plate 1: Contaminated dammed stream used for domestic purposes in the study area.
Plate 2: A piece of land exposed to soil erosion in Ijero Ekiti, Nigeria.
Plate 3: An artificial lake created by mining operation in Ijero Ekiti.

Musa, H., Ibrahim, Y.M. and Ibrahim, A.D. (2011) On the accuracy of cost estimates: Identifying flaws
in bills of quantities for building projects in Nigeria In: Laryea, S., Leiringer, R. and Hughes, W. (Eds)
Procs West Africa Built Environment Research (WABER) Conference, 19-21 July 2011, Accra, Ghana,
761-769.
761
ON THE ACCURACY OF COST ESTIMATES:
IDENTIFYING FLAWS IN BILLS OF QUANTITIES FOR
BUILDING PROJECTS IN NIGERIA
Haruna Musa1, Yahaya Makarfi Ibrahim and Ahmed Doko Ibrahim
Department of Quantity Surveying, Ahmadu Bello University, Zaria, Nigeria
Previous researches indicate that accurate cost estimates play significant roles in
construction project decisions. The accurate cost estimates by quantity surveyors are
crucial elements in the success of construction project processes. However, the
reliability of bills of quantities as forms of cost estimates has been questioned by
researchers. This study therefore aims at identifying flaws in the preparation of
accurate cost estimates in bills of quantities prepared in Nigeria. The study was
carried out by the use of a document analysis approach to analyse bills of quantities
for seventeen building projects. The results indicate that there is the presence of
inaccuracies inherent in bills of quantities for building projects in Nigeria. The
findings suggest that accurate cost estimates in the Nigerian construction industry will
ensure the survival of business and individuals in the industry. It was recommended
that consultant quantity surveyors should explore and use computers to aid them in
using various estimating techniques at their disposal for better service delivery.
Keywords: accuracy, bills of quantities, building project, cost estimate, Nigeria.
INTRODUCTION
The subject of cost estimating in construction projects is a topic of debate or
discussion among quantity surveyors, cost engineers, estimators and other
stakeholders in the construction industry. Cost estimating is crucial to construction
contract tendering, providing a basis for establishing the likely cost of resource
elements of the tender price for construction work (Akintoye, 2000). According to
Holroyd (2000) the cost we estimate must be as accurate as possible. He further
asserts that business and individual survival in an organization depends on this
accuracy. In his submission, Geddes (1996) is of the opinion that sound estimating is
produced from a combination of experience and recorded cost data of similar works
carried out over time.
Cost estimating, according to Akintoye (2000) as cited in Kwakye (1994) can be
described as the technical process or function undertaken to assess and predict the
total cost of executing an item or items of work in a given time using all available
project information and resources. The Code of Estimating Practice produced by the
Chartered Institute of Building (CIOB, 1997 P. xiii) defines estimating as ‗the
technical process of predicting costs of construction‘. According to Holroyd (2000),
the estimating of cost follows the same process, whichever industry or environment
we work in and wherever it is. He also added that the cost we estimate must be as

Musa et al.
762
accurate as possible since business and individual survival depends on this accuracy.
Carr (1989), as cited in Akintoye and Fitzgerald (2000), identified a serious lack of
generally accepted estimating guidelines, despite the availability of literature on the
format, procedures and principles involved in cost estimating. This we believe is due
to a lot of factors like complexity of the project, size of the project, unknown soil
conditions, time allowed to prepare the cost estimate, unknown utility location,
location of the project, experience of the estimator and other unknowns that are
beyond the control of the estimator (at a particular time). These factors and unknowns
are notorious to projects and can cause project cost overruns if not detected early and
handled well. A cost estimate is made up of many elements that may not be
completely defined at the time it is prepared. It assists in the making of financial
decisions on a proposed project at a given time or period. In other words, an estimate
is key or central to establishing the basis for key project decisions, for establishing the
benchmark on which project success will be measured and for communicating
financial status of a project at any point in time. Hence it must be prepared using the
best information at the appropriate time and accurately.
The bill of quantities is the document that lists items of a proposed project in trade or
work order with the quantities of each of the items shown (Smith, 1996). According to
Geddes (1996) and Smith (1996), the bill of quantities with other tender documents is
given to each tenderer of a proposed project to serve as a basis of fair competition. It
is the summation of all priced items in the bills of quantities and other un-quantified
items in the other attached tender documents that determine estimated costs of
proposed projects as offered by each tenderer.
PREVIOUS STUDIES ON PRE-TENDER COST ESTIMATES
Review of the practice of cost estimates
There appears to be scarce literature relating to the practice of cost estimating
(Akintoye and Fitzgerald, 2000). One of the shortcomings of cost estimating currently
being practiced is the evidence shown by estimators in avoiding the real problems of
their trades (uncertainty of estimates) by presenting socially acceptable forecasts
(Skitmore and Wilcox, 1994) as cited by Akintoye (2000). This infers that cost
estimating, an important element in tendering, has not been given much attention by
estimators. The question of accuracy of the rates build up for past and proposed
projects by the estimators with this mind set is raised. It is important to note that cost
estimating is a fundamental part of the construction industry of any nation. The
success or failure of a project is in great part dependent on the accuracy of the cost
estimate prepared by the client‘s consultant, the contractor or liaison of the client‘s
consultant and the contractor‘s representative. It is in no doubt that accurate cost
estimates optimize good contracting. Therefore, inaccurate cost estimating is a serious
construction industry problem. According to Adrian (1982), estimating is the nuts and
bolts of the construction industry.
Adrian (1982) clarifies that it is not realistic to expect a construction estimate to be
one hundred percent accurate because of, in part, the uncertainties of future events. He
further asserts that no procedure, or mathematical technique, or policy employed by
the estimator is without its flaws or is able to guarantee perfect estimates. Skitmore
(1990) while commenting on research in the UK opine that despite a substantial
research, very little progress has been made to establish a suitably reliable mechanism
for generating item rates. According to Geddes (1996) a work on estimating must be
sound and at the same time comprehensive, so that both the experienced and
Accuracy of cost estimates
763
inexperienced estimator may not only also have every confidence in the matter it
contains, but also have available data from which to estimate the cost of all those
items of work most likely to be met with. Most times estimators do not have at their
disposals appropriate drawings to work with in the preparation of their cost estimates.
Estimators must have clear and complete drawings based on clear clients‘ briefs in
addition to having current information of even the minutest details that will assist
them in preparing detailed cost estimates at the onset.
Studies on accuracy levels of pre-tender cost estimates
Odusanmi and Onukwube (2008) emphasized that the accuracy of quantity surveyors
pre-tender cost estimates vary from country to country at different levels. Findings of
researchers (Morrison, 1984; McCaffer, 1976; Jupp and McMillan, 1981; Ashworth
and Skitmore, 1982; Cheong, 1991; Gunner and Skitmore, 1999) as cited in Odusanmi
and Onukwube (2008) show that pre-tender estimates are observed to be either
underestimated or overestimated as low as 5% and as high as 33.9% respectively in
different countries where their researches were carried out. Laryea (2010) in a
research conducted in Ghana concluded that clients in that country should add an
allowance of 40% of the cost estimates prepared by consultant quantity surveyors as a
contingency for errors and inaccuracies in their preparations. In the same research, it
was found that contractors‘ calculated estimates were more reliable and accurate than
consultants‘ calculated estimates. This therefore suggests that consultants should
prepare estimates as if they are quoting for a job so that they can prepare and calculate
detailed estimates with whatever data is available. Beeston (1983) also agrees that
consultants should move towards contractors‘ methods of estimating as a way of
improving clients‘ estimators‘ performance.
Factors that affect the accuracy of pre-tender cost estimates
Akintoye (2000) identified the main factors influencing cost estimating practice as the
complexity of the project, scale and scope of construction, site constraints, client‘s
financial position, buildability and location of the project. Consultant quantity
surveyors must visit and assess the site for the proposed project in order to have on
record the features on site to assist them in determining a lot of cost-related issues
with regards to the project. Skitmore (1990) cited the work of Skitmore and Tan
(1988) in which they introduced five types of factors namely (1) the type of project,
(2) the information used, (3) the technique used, (4) the estimator himself, and (5) the
feedback system that affect the quality of estimates generally. There are assertions by
Adrian (1982) that the degree of accuracy varies with the amount of effort and time
taken to prepare a cost estimate and the degree of details in contract document
preparation.
Dysert (2006) also identified factors influencing accuracy of cost estimates as quality
of reference cost estimating data, the quality of assumptions used in preparing the
estimate, the state of new technology in the project, the experience and skill level of
the estimator, the specific estimating techniques employed the desired use of the
estimate, as well as extraneous market conditions. In addition, other factors that affect
estimate accuracy are the project team‘s capability to adjust the estimate for changes
in scope as the project develops. From review of some past contributions of
researchers globally in general and in Nigeria in particular, it is pertinent that there is
little literature on factors affecting accuracy of pre-tender cost estimates in and no any
detailed explanation on record for the inaccurate cost estimate as well Nigeria, hence
the need for this study.

Musa et al.
764
RESEARCH METHOD
The data for the study were obtained through bills of quantities collected from seven
selected consultant quantity surveying firms in the Federal Capital Territory (Abuja),
Kaduna metropolis and Zaria town of Kaduna State. A total of seventeen bills of
quantities were used for the study. We had difficulties in getting documents for some
of the completed projects released to us for this study.
A document analysis approach was employed to analyze the bills of quantities. There
are various methods open for research surveys as opined by Fellow and Liu (1997),
but we chose the document analysis approach to find out if the pricing of the items in
the bills of quantities (BOQs) conform to the provisions made in the 6th
edition of the
Standard Method of Measurement (1979), used in preparing the BOQs. Another
reason for using the document analysis approach is that this study is a preliminary one
that will be broadened in the very near future.
CASE STUDIES
Seventeen projects in Nigeria between 2005 and 2010 were examined and analyzed
(see Tables 1 to 6). In the first group of nine projects in Tables 1 to 3 (Csd 01-Csd 09),
the clients engaged designers and consultant quantity surveyors who prepared and
priced the bills of quantities. It should be noted that the group comprises multi-storey
buildings and none is more than three-storey high. The projects in this group were
initiated by stakeholders from the public sector with varying types of jobs in terms of
usage.
In the second group of eight projects in Tables 4 to 6 (Csd 10-Csd 17), the clients too
engaged designers and consultant quantity surveyors who prepared and priced the bills
of quantities. Buildings in this group are also multi-storey and none is more than
three-storey high. Projects in this group were initiated by the private sector.
All the bills of quantities prepared were format of the 6th
edition of the Standard
Method of Measurement (1979) popularly known and called the SMM 6.
Analysis of the priced bills of quantities
Tables 1 to 3 examine and analyze consultant-priced projects for the public sector
between Year 2005 and 2010. The pricing patterns of some elements of the projects
under consideration were shown.
Csd 01-Csd03: the jobs were yet to start but are about to be awarded. For Csd04-
Csd09, some of the jobs are ongoing with about 95% completion while some have
been completed. These jobs were awarded on a Fixed Contract basis with varying
completion periods. As a result of the problems we had with getting most of the
documents, we resorted to analyzing some vital elements of each job namely (1)
excavation and earthwork, (2) concrete work (in substructure and superstructure), and
(3) concrete work (with formwork section) as shown. Excavation in trench not
exceeding 2m deep. (B.) Excavation in trench exceeding 2m deep. (C.) Excavation
in pit not exceeding 2m deep. (D.) Excavation in pit exceeding 2m deep.
The rates used in Table 1 by the consultant-priced projects for the public sector
projects clearly show that the rates were not built or used in accordance with the
provisions in the SMM 6 (1979). This is evident when the Legend for Table 1 is
considered. A check indicates that excavation works for different items and at
different depths was indicated. But, the rates used did not take into consideration the

Accuracy of cost estimates
765
positions and the depths specified in the BOQs. This is equally true for rates used for
items in Table 2 and Table 3. This inappropriate pricing of items, it is believed, affects
the accuracy of the cost estimates for the items concerned.
Table 1: Case studies of consultants-priced projects in the public sector in Nigeria
Element - Excavation and Earthwork
Case Study Type of
job
A B C D
Csd 01 Hostel blk 350.00 400.00 450.00 NA
Csd 02
Lecture
hall 1,200.00 1,200.00 1,200.00 NA
Csd 03 Hostel blk 100.00 250.00 310.00 NA
Csd 04 Hostel blk 450.00 550.00 600.00 NA
Csd 05 Hostel blk 450.00 550.00 600.00 NA
Csd 06
Offices
educ 350.00 NA 420.00 NA
Csd 07
Exhibtn
hall 500.00 422.50 900.00 NA
Csd 08 Hostel blk 650.00 NA 700.00 NA
Csd 09 Res qtrs NA NA 1,000.00 NA
Notes: Rates are in Nigerian Naira per m3. NA= Not applicable. See Legend
below for other information on alphabetical letters in table
Legend: For Table 1.
(A.) Excavation in trench not exceeding 2m deep. (B.) Excavation in trench exceeding 2m deep. (C.)
Excavation in pit not exceeding 2m deep. (D.) Excavation in pit exceeding 2m deep.
Table 2: Case studies of consultants-priced projects in the public sector in Nigeria
Element - Concrete Work (substructure and superstructure)
Case
Study
Type of job E F G H J K L
Csd 01 Hostel blk 14,000.00 15,000.00 15,000.00 15,000.00 15,000.00 15,000.00 15,000.00
Csd 02
Lecture
hall 22,500.00 24,500.00 24,500.00 24,500.00 24,500.00 24,500.00 24,500.00
Csd 03 Hostel blk 15,600.00 18,700.00 18,700.00 18,700.00 18,700.00 18,700.00 18,700.00
Csd 04 Hostel blk 10,500.00 14,500.00 14,500.00 14,500.00 14,500.00 14,500.00 14,500.00
Csd 05 Hostel blk 15,600.00 18,700.00 18,700.00 18,700.00 18,700.00 18,700.00 18,700.00
Csd 06
Offices
educ 18,500.00 22,500.00 22,500.00 22,500.00 22,500.00 22,500.00 22,500.00
Csd 07
Exhibtn
Hall 18,500.00 20,000.00 20,000.00 20,000.00 20,000.00 20,000.00 20,000.00
Csd 08 Hostel blk 26,000.00 28,850.00 28,850.00 28,850.00 28,850.00 28,850.00 28,850.00
Csd 09 Res qtrs 36,000.00 36,000.00 36,000.00 36,000.00 36,000.00 36,000.00 36,000.00
Notes: Rates are in Nigerian Naira per m3. NA= Not applicable. See Legend below for other information on
alphabetical letters in table
Legend: For Table 2.
(E.) Plain in-situ concrete in foundation. (F.) Reinforced in-situ concrete in column bases. (G.)
Reinforced in-situ concrete in columns in foundation. (H.) Reinforced in-situ concrete in beams. (J.)
Reinforced in-situ concrete in suspended floor slab. (K.) Reinforced in-situ concrete in landing at
staircases. (L.) Reinforced in-situ concrete in waist at staircases.
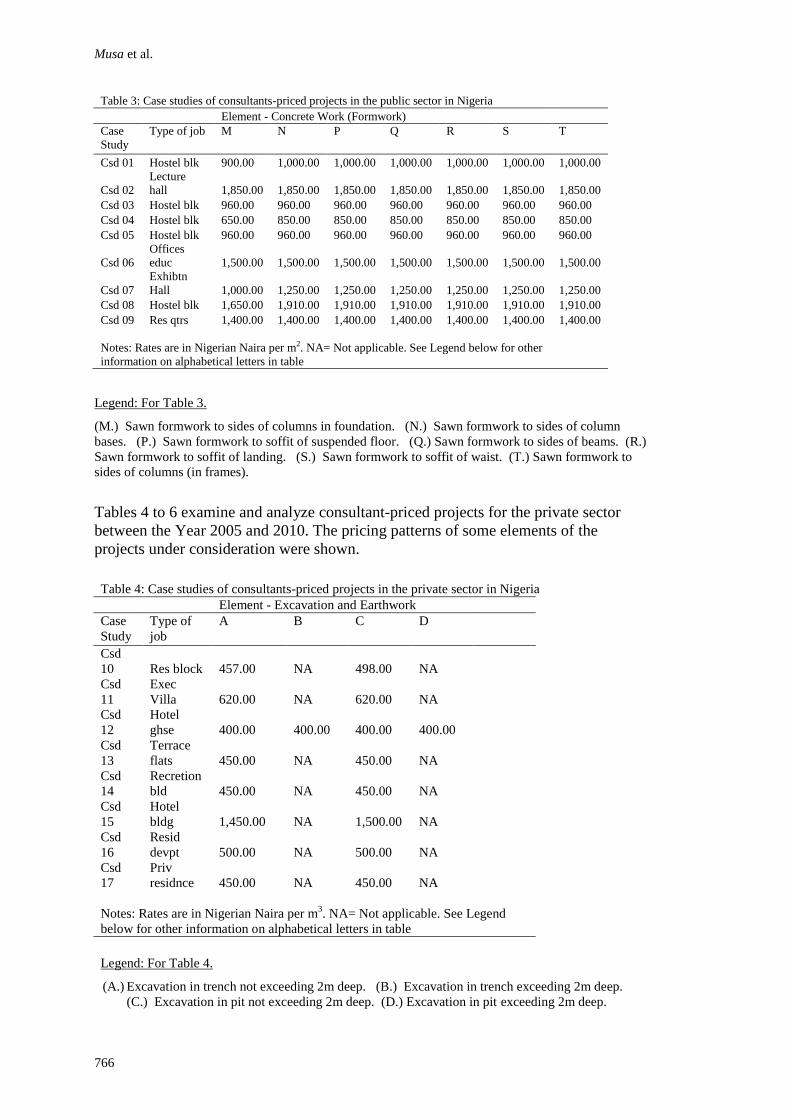
Musa et al.
766
Table 3: Case studies of consultants-priced projects in the public sector in Nigeria
Element - Concrete Work (Formwork)
Case
Study
Type of job M N P Q R S T
Csd 01 Hostel blk 900.00 1,000.00 1,000.00 1,000.00 1,000.00 1,000.00 1,000.00
Csd 02
Lecture
hall 1,850.00 1,850.00 1,850.00 1,850.00 1,850.00 1,850.00 1,850.00
Csd 03 Hostel blk 960.00 960.00 960.00 960.00 960.00 960.00 960.00
Csd 04 Hostel blk 650.00 850.00 850.00 850.00 850.00 850.00 850.00
Csd 05 Hostel blk 960.00 960.00 960.00 960.00 960.00 960.00 960.00
Csd 06
Offices
educ 1,500.00 1,500.00 1,500.00 1,500.00 1,500.00 1,500.00 1,500.00
Csd 07
Exhibtn
Hall 1,000.00 1,250.00 1,250.00 1,250.00 1,250.00 1,250.00 1,250.00
Csd 08 Hostel blk 1,650.00 1,910.00 1,910.00 1,910.00 1,910.00 1,910.00 1,910.00
Csd 09 Res qtrs 1,400.00 1,400.00 1,400.00 1,400.00 1,400.00 1,400.00 1,400.00
Notes: Rates are in Nigerian Naira per m2. NA= Not applicable. See Legend below for other
information on alphabetical letters in table
Legend: For Table 3.
(M.) Sawn formwork to sides of columns in foundation. (N.) Sawn formwork to sides of column
bases. (P.) Sawn formwork to soffit of suspended floor. (Q.) Sawn formwork to sides of beams. (R.)
Sawn formwork to soffit of landing. (S.) Sawn formwork to soffit of waist. (T.) Sawn formwork to
sides of columns (in frames).
Tables 4 to 6 examine and analyze consultant-priced projects for the private sector
between the Year 2005 and 2010. The pricing patterns of some elements of the
projects under consideration were shown.
Table 4: Case studies of consultants-priced projects in the private sector in Nigeria
Element - Excavation and Earthwork
Case
Study
Type of
job
A B C D
Csd
10 Res block 457.00 NA 498.00 NA
Csd
11
Exec
Villa 620.00 NA 620.00 NA
Csd
12
Hotel
ghse 400.00 400.00 400.00 400.00
Csd
13
Terrace
flats 450.00 NA 450.00 NA
Csd
14
Recretion
bld 450.00 NA 450.00 NA
Csd
15
Hotel
bldg 1,450.00 NA 1,500.00 NA
Csd
16
Resid
devpt 500.00 NA 500.00 NA
Csd
17
Priv
residnce 450.00 NA 450.00 NA
Notes: Rates are in Nigerian Naira per m3. NA= Not applicable. See Legend
below for other information on alphabetical letters in table
Legend: For Table 4.
(A.) Excavation in trench not exceeding 2m deep. (B.) Excavation in trench exceeding 2m deep.
(C.) Excavation in pit not exceeding 2m deep. (D.) Excavation in pit exceeding 2m deep.

Accuracy of cost estimates
767
Csd 10-Csd17: the jobs have been completed but we could not have access to the
project files to carry out in-depth analyses on the management of the jobs. Hence,
we examined the jobs in the same way we did Csd01-Csd09. From the rates used in
Table 4 by the consultant-priced projects for the private sector projects it is also
clear that the rates were not built or used in accordance with the provisions in the
SMM 6 used by the consultant quantity surveyors in preparing the BOQs. This is
also true for Table 5 and Table 6. There are therefore doubts that the rates used in
the BOQs were built or developed as accurately as possible; the cost estimates
arrived at may not represent fair and reasonable costs to the clients.
Table 5: Case studies of consultants-priced projects in the private sector in Nigeria
Element - Concrete Work (substructure and superstructure)
Case Study
Type of job E F G H J K L
Csd 10 Res block 14,750.00 15,970.00 15,970.00 15,970.00 15,970.00 15,970.00 15,970.00
Csd 11 Exec Villa 19,500.00 19,500.00 19,500.00 19,500.00 19,500.00 19,500.00 19,500.00
Csd 12 Hotel ghse 20,500.00 20,500.00 20,500.00 20,500.00 20,500.00 20,500.00 20,500.00
Csd 13 Terrace flats 25,900.00 25,900.00 25,900.00 25,900.00 25,900.00 25,900.00 25,900.00
Csd 14 Recretion bld 25,900.00 25,900.00 25,900.00 25,900.00 25,900.00 25,900.00 25,900.00
Csd 15 Hotel bldg 23,000.00 24,500.00 24,500.00 24,500.00 24,500.00 24,500.00 24,500.00
Csd 16 Resid devpt 17,000.00 17,000.00 17,000.00 17,000.00 17,000.00 17,000.00 17,000.00
Csd 17 Priv residnce 15,000.00 25,900.00 25,900.00 25,900.00 25,900.00 25,900.00 25,900.00
Notes: Rates are in Nigerian Naira per m3. NA= Not applicable. See Legend below for other information on alphabetical letters in table
Legend: For Table 5.
(E.) Plain in-situ concrete in foundation. (F.) Reinforced in-situ concrete in column bases. (G.)
Reinforced in-situ concrete in columns in foundation. (H.) Reinforced in-situ concrete in beams. (J.)
Reinforced in-situ concrete in suspended floor slab. (K.) Reinforced in-situ concrete in landing at
staircases. (L.) Reinforced in-situ concrete in waist at staircases.
Table 6: Case studies of consultants-priced projects in the private sector in Nigeria
Element - Concrete Work (Formwork)
Case Study Type of job M N P Q R S T
Csd 10 Res block 480.00 480.00 480.00 480.00 480.00 480.00 480.00
Csd 11 Exec Villa 1,800.00 1,800.00 1,800.00 1,800.00 1,800.00 1,800.00 1,800.00
Csd 12 Hotel ghse 950.00 950.00 950.00 950.00 950.00 950.00 950.00
Csd 13 Terrace flats 1,210.00 1,210.00 1,210.00 1,210.00 1,210.00 1,210.00 1,210.00
Csd 14 Recretion bld 1,210.00 1,210.00 1,210.00 1,210.00 1,210.00 1,210.00 1,210.00
Csd 15 Hotel bldg 2,500.00 2,500.00 2,500.00 2,500.00 2,500.00 2,500.00 2,500.00
Csd 16 Resid devpt 750.00 750.00 750.00 750.00 750.00 750.00 750.00
Csd 17 Priv residnce 1,210.00 1,210.00 1,210.00 1,210.00 1,210.00 1,210.00 0.00
Notes: Rates are in Nigerian Naira per m2. NA= Not applicable. See Legend below for other information on alphabetical
letters in table
Legend: For Table 6.
(M.) Sawn formwork to sides of columns in foundation. (N.) Sawn formwork to sides of column
bases. (P.) Sawn formwork to soffit of suspended floor. (Q.) Sawn formwork to sides of beams. (R.)
Sawn formwork to soffit of landing. (S.) Sawn formwork to soffit of waist. (T.) Sawn formwork to
sides of columns (in frames).

Musa et al.
768
DISCUSSION
The main point of the analyses here is to present a preliminary impression of how
projects estimated by consultants turn out in terms of cost estimated. From the
analyses in Tables 1-6, the rates in the bills of quantities for the same items at
different locations and levels are priced the same. This is not in conformity with some
provisions of the SMM 6 format of which the bills of quantities considered for this
study were based on (refer to sections D.11, F.3, F.4, F.9, F.13, F.15 and T.). This
therefore, raises questions on the accuracy of the cost estimates arrived at by the
consultant quantity surveyors for the projects considered.
There is no comparison of analyses and results from the estimated total cost of the
proposed projects and the final contract sums of the projects studied. This was partly
due to the fact that access to some documents of the completed projects was not
gained. The non-adherence to the provisions of the SMM 6 in building or developing
prices used in the BOQs prepared by the consulting quantity surveyors is a serious
issue. Cost estimates for the various projects handled or being handled by the
consultant quantity surveyors do not represent fair and reasonable cost to the various
clients they rendered services to.
CONCLUSION
The situations which require the adoption of techniques to prepare accurate cost
estimates in the Nigerian construction industry were identified, this is as a result of
one of the findings that survival of business and individuals in the industry are hinged
on accurate cost estimates of projects. There is the need for the consultant quantity
surveyors to obtain sufficient quality and timely cost information to enable them build
up their rates for future projects. In addition, all costs which prudent and experienced
contractors will expect to incur should be captured in their cost estimates.
RECOMMENDATIONS
Consulting quantity surveyors are advised to explore and use various estimating
techniques at their disposal for better service delivery.
Consulting quantity surveyors are advised to explore and use computers to assist them
in using various statistical tools in preparing their cost estimates for all projects. The
computers will also assist them in building and organizing data bank for their use on
projects at different stages.
There should be adherence to provisions made in the Standard Methods of
Measurement of the existing editions in use by consulting quantity surveyors in the
preparation of BOQs.
Prospective project owners should insist on assessing the quality of output of
consultants on projects they intend to engage in handling their projects.
REFERENCES
Adrian, J.J. (1981) CM: The Construction Management Process. Rexton Publishing Co. Inc.
Virginia.
Adrian, J.J. (1982) Construction Estimating: an accounting and productivity approach. Rexton
Publishing Co. Inc. Virginia.
Akintoye, A. (2000) ―Analysis of factors influencing project cost estimating practice‖,
Construction Management and Economics, 18:2:, 77-89.

Accuracy of cost estimates
769
Akintoye, A. and Fitzgerald, E. (2000) ―A survey of current cost estimating practices‖,
Construction Management and Economics, 18:2:, 161-172.
Beeston, D.T. (1983) Statistical methods for building price data. E. and F.N Spon, London.
CIOB (1997) Code of estimating practice, 6ed. The Chartered Institute of Building, London
Press.
Dysert, L.R. (2006) ―Is accuracy an oxymoron?". AACE International Transaction 2006.
EST01: 1-01.5.
Fellows, R.F. and Liu, A. (1997) Research Methods for Construction. Blackwell Science Ltd,
Oxford.
Geddes, S. (1996) Estimating for building and civil engineering works, 9ed. Butterworth,
London.
Holroyd, T.M. (2000) Principles of estimating. Thomas Telford Ltd, London.
Laryea, S. (2000) "Contractor project estimates vs. consultant project estimates in Ghana. In:
The Construction, Building and Real Estate Research Conference of the Royal
Institution of Chartered Surveyors, 2-3 September 2010, Dauphine Université, Paris.
Available at http://centaur.reading.ac.uk/16290/
Odunsami, K.T. and Onukwube, H.N. (2008) "Factors affecting the accuracy of pre-tender
cost estimate in Nigeria. In: The Construction, Building and Real Estate Research
Conference of the Royal Institution of Chartered Surveyors. Held at Dubling Institute
of Technology, 4-5 September 2008.
RICS, and NFBTE. (1979) Standard Method of Measurement of Building Works, 6ed. The
Royal Institution of Chartered Surveyors, London.
Skitmore, M. (1990) ―Which estimating technique?‖. In Procs 11th International Cost
Engineering Congress and 6th Association Francais des Ingenieurs et Techniciens,
D‘estimation de Planification de Projects Annual meeting, pp B.1.1-B.1.7. Paris,
France.
Smith, R. C (1986) Estimating and tendering for building work, Longman: London.


Ansah, S.K. (2011) Partnering: an alternative contractual arrangement for construction project delivery
in Ghana In: Laryea, S., Leiringer, R. and Hughes, W. (Eds) Procs West Africa Built Environment
Research (WABER) Conference, 19-21 July 2011, Accra, Ghana, 771-781.
771
PARTNERING: AN ALTERNATIVE CONTRACTUAL
ARRANGEMENT FOR CONSTRUCTION PROJECT
DELIVERY IN GHANA
Samuel K. Ansah1
Department of Building Technology, Cape Coast Polytechnic, Cape Coast, Ghana
Understandably, clients in both the public and the private sectors in Ghanaian
construction industry have become increasingly dissatisfied. What they see is
unpredictability and under-performance. What they receive is too often of poor
quality, late and over priced. More often contractors enter the construction project
focusing on achieving their objectives and maximising their profit margins, with no
regard for the impacts on others. This mindset leads to conflict, litigation and often a
disastrous project. In the pursuit of performance excellence, there is a need for
partnering. This paper therefore, attempting to explain the need for partnering as an
alternative approach to construction project delivery. The paper presents a review of
partnering projects in general. Through a postal and e-mailed questionnaire survey,
opinions of various parties in Ghanaian construction industry – clients, sub-contractor
and contactors were sought regarding construction project delivery and level of use of
partnering. This paper also explains the importance and benefits arising from
partnering implementation as reviewed by the other researchers and concluded that,
partnering is one of the most innovative developments in delivering a project
efficiently and reducing disputes. It provides a sound basis for a ‗win – win‘ climate
and synergistic teamwork. By changing to a ‘win – win‘ style the parties can reap
benefits of cost saving, profit sharing, quality enhancement and time management.
Keywords: client, under-performance, partnering, win-win.
INTRODUCTION
Historically, the construction industry has used procurement methods and contractual
arrangements (traditional approach) that have beset the industry with several
problems, such as lack of co-operation, limited trust, ineffective communications
(Chan et al. 2004). These procurement methods and contractual arrangements have
encouraged clients and contractors to see themselves as adversaries and that have
reinforced any differences in values, goals and orientations that exist within the
construction project team (Latham, 1994). In fact, the traditional construction
relationship among the parties in Ghanaian construction industry has lacked any
degree of objective alignment, and provides for no improvement in work processes.
Parties enter the project focused on achieving their objective and maximises their
profit margins, with no regard for the impacts on others. This mindset leads to
conflict, litigation, difficult in resolving claims, project delay, and cost overruns and
often a disastrous project. The characteristics of such a competitive environment
includes objectives which lack commonality, success coming at the expense of others
(a win or lose mentality), and a short-term focus.

Ansah
772
Understandably, clients in construction industry have become increasingly
dissatisfied. What they see is unpredictability and under-performance. What they
receive is too often of poor quality, late and overpriced. In Ghana, both public and
private sector clients of the construction industry continue to complain about the
industry‘s performance and its seeming inability to deliver projects on time, within
budget and to expected quality standards. Major clients are dissatisfied with
consultants‘ performance in co-ordinating teams, in design and innovation, in
providing a speedy and reliable service and providing value for money. Nicco-Annan
(2006) carried out a limited survey of the construction of a few office buildings in
Accra which have been commissioned by a well-known non-bank financial institution
and found that:
Costs of executed projects far exceeded the original costs, not taking inflation
into account.
Completion dates of executed projects also far exceeded the original
completion dates.
The question is, ―why is the construction industry under-performing?‖ The Egan‘s UK
Report (Rethinking Construction) saw construction as: ―a series of sequential and
largely separate operations undertaken by individual designers, contractors and
suppliers who have no stake in the long term success of the product and no
commitment to it.‖
In the pursuit of performance excellence in the Ghanaian construction industries, there
is a need for an effective management technique. Many new procurement and
management techniques have gained popularity to help solve these problems (Sanders,
1994). Partnering is one of such technique that tries to create an effective project
management process between two or more organisations (Sanders and Moore, 1992).
It aims to generate an organisational environment of trust, open communication, and
employee involvement. According to Thompson and Sanders (1998), partnering helps
to advance the collaboration and enhance the competence of construction parties. It is
an innovative concept to the construction organisations, which traditionally rely
heavily on contracting to bind the parties together.
Partnering as an approach to manage construction projects is regarded as an important
management tool to improve quality and programme, to reduce confrontations
between parties, thus enabling an open and non-adversarial contracting environment.
This research therefore, attempting to explain the need for partnering as an alternative
approach to effective construction project delivery. The paper also assesses the
performance of construction projects and level of use of partnering in Ghanaian
construction industry. The paper further discusses the importance and benefits arising
from partnering implementation.
LITERATURE REVIEW
What Is Partnering
Numerous definitions of partnering have been derived from past studies. Among
them, the definition developed by the Construction Industry Institute (CII) in the
United States is the most widely cited. The CII defined partnering as ―a long-term
commitment between two or more organizations for the purpose of achieving specific
business objectives by maximizing the effectiveness of each participant resources.
This requires changing traditional relationships to a shared culture without regard to
organizational boundaries. The relationship is based on trust, dedication to common

Partnering
773
goals and an understanding of each other‘s individual expectations and values (CII,
1991).
The above definition depict partnering as a generic term and emphasis that the
relationship will cause all to seek win-win solutions, place value in long-term and
emphasis that the relationships and encourage trust and openness to be the norms and
that an environment for profit exists. It is also a view that neither partner should
benefit from exploitation of the others needs, concerns and objectives and is interested
in helping its partner achieve them. It creates a team environment to accomplish a set
of goals in much the same way that a sports team works together to achieve its goals.
But perhaps the definition that provides explicit meaning, which is adopted for this
paper, is that by the Reading Construction Forum, in trusting the team (Bennett and
Jayes, 1995); Partnering is a managerial approach used by two or more organisations
to achieve specific business objectives by maximising the effectiveness of each
participant‘s resources. The approach is based on mutual objectives, an agreed
method of problem resolution, and an active search for continuous measurable
improvements. This definition focus on the key elements that feature prominently in
partnering, irrespective of the form it takes.
Objectives of Partnering
In construction, the concept of partnering is described as a generic term of
management approach to align project goals (Bayliss, 2002). The goal for partnering
is to improve relationships among contracting parties, either in single project
partnership or in long-term strategic alliances. Partnering provides benefits to the
contract-parties, including cost effectiveness, work efficiency, opportunities for
innovation, equitable risk sharing, and less confrontation (Black C, et al. 1999).
Partnering is not a contract but an attempt to establish non-adversarial working
relationships among project participants through mutual commitment and open
communication. It is also serves to create an environment that fosters cooperation and
team work (Stevens, 1993).
Genesis of Partnering In Construction Industry
Partnering has been widely advocated for the Construction industry to rectify the
adversarial contractual relationships that have jeopardised the success of many
projects. Features of partnering relationships have been seen in various industries for
many years. The partnering style of relationships with contractors was a feature of
some construction projects in Britain early in the Industrial Revolution (Barnes,
2000). As applied today, it originates in the philosophies of the Japanese influenced
automobile industry. The defence, aerospace and construction industries have
followed. Its essence is alignment of values and working practices by all members of
the supply chain in order to meet the customer‘s real needs and objectives (Green,
1999). Continuous improvement has been an important objective, with emphasis not
only on cost but also on quality, lead time, customer service, and health and safety at
work. Contrary to current perceptions, construction partnering, although not
necessarily in its present form or using that particular name, has existed within the UK
construction industry since at least the early 1990‘s, when Marks and Spencer and
Bovis began a long-standing relationship which has lasted to the present time and is
based upon mutual trust and respect as well as the resulting commercial benefits
enjoyed by both parties (Masterman, 2004).
In the USA, it was in the late 1980‘s that growth of claims and litigation on
construction contracts led public agencies to begin to use the technique that led to a

Ansah
774
promising increase in the controlling of cost and time growth on numerous major
projects (Bennett and Jayes, 1998). Many States and central governmental
organisations are now committed to the use of partnering, and it is understood that the
growth of the use of the method in the private sector has increased significantly in the
recent past and continues to expand. In Australia, formalised partnering emerged at
the beginning of the 1990‘s, partially, it is believed (Uher,2000) as a result of central
and state governmental initiatives which put forward a new strategy to improve
production in the construction industry, which included a commitment to partnering.
The Process of Partnering
The key to partnering is that it starts at the outset of a project. The process is formally
established in ‗workshop (or ‗kick-off‘) sessions between the partnering members so
that everyone has a clear understanding of what the process is and agrees to use it. As
in any collaborative venture, all parties have to get together pre-construction and
invest time into agreeing and understanding the objectives, form and operation of a
partnering agreement (Wearne and Wright, 1998). The essential stages of the project
partnering process are:
Decision stage: the desire of all of the main members of the project team to
become involved in the partnering process is essential; this desire will often
stem from relationships that have been formed during past associations when
organisational cultures have been found to be compatible. If this has not been
the case, and examination of each of the main participants‘ organisations and
personnel to establish compatibility, or the lack of it, is essential before any
commitment is entered into. Once all of the parties are convinced that they
wish to participate in the partnering process, a decision to use partnering on the
project under consideration can be made and the next stage of the process can
be commenced.
Establishment of working practices – during this stage, a series of mutual
objectives for the project are identified and agreed and the way in which
problems are to be solved during the duration of the project is established.
These activities are carried out by means of a workshop, which needs to be
held immediately the decision has been taken to use the partnering process and
should be attended by all of the main parties involved in the project. This event
is critical to the sources of the project as it will determine how the project team
will implement the project together and engender mutual understanding among
the participants. This initial workshop is likely to be of 1 or 2 day‘s duration
as it will be dealing with a considerable amount of detail in order to reach
agreement on a list of mutual objectives, identify improvement targets, design
the problem resolution process and deal with any matters specific to the
project. The final major task of the workshop is to formulate a partnering
charter, a document with no legal standing, which incorporates in simple
language the agreed mutual objectives, a summary of the problem resolution
process and the basic philosophy and aims of the partnership. Once this
document had been signed off by all of the parties, it is exhibited in the offices
of all the participating organisations and in all site offices, canteens, notice
boards etc. At the end of the workshop, arrangements are made for future
follow-up and induction workshops.
Implementing partnering practices – the execution of the practices agreed
during the second stage of the partnering process is carried out in parallel with,

Partnering
775
but physically separate from, the everyday management of the project by
means of the follow-up workshops.
These workshops will take place at intervals and will be of a duration determined by
the project team; they will also deal with any problems that have arisen during the
implementation of the project, review progress that has been made in achieving the
agreed mutual objectives and take whatever action is necessary to ensure that the
previously agreed continuous improvements are being made. Sub workshops,
sometimes referred to as action teams, and are used to deal with matters which are not
capable of being dealt with during the comparatively short duration of the normal
workshops.
On the appointment of new key members of the project team, whether they are
consultants, subcontractors or suppliers, induction workshops are held in order to
familiarise the new corner with project partnering and to obtain their agreement to
partnering charter. Over the often lengthy implementation period of many major
projects, these workshops should enable project teams to establish the trust and
understanding which is so necessary to improving working relationships and
enhancing performance to the benefit of all of the participants. Figure 1 illustrates the
project partnering process.
Performance of Partnering Projects in Terms of Cost, Time and Quality Cost
Reduction
According to Uher (2000), a research carried out by the New South Wales Department
of public works and services, which compared costs on the individually partnered
projects with non-partnered public projects, reported a possible 2-3 percent reduction
in cost when using project partnering. A research reported by Westminster University
also suggested savings of 60 percent when practising strategic partnering. This
research was based upon the case study of the McDonalds construction programme for
their standard, fast food restaurants and reflects not only the use of strategic partnering
Ansah
776
but also the use of modular buildings and the repetitions nature of the projects and
should therefore be viewed in this context (Barlow et.al. 1997). Other case studies of
partnering in Australia, although not providing specific examples of cost savings,
confirm that the use of the method results in a lower risk of cost overruns.
In the USA, a quantitative study of 400 public projects half of which were performed
using project partnering, carried out by the Texas Department of Transportation found
that whereas the partnered projects incurred more change orders (variations) than non-
partnered projects, the average cost was approximately one-half of that expended on
non-partnered projects. The partnered projects had slightly less cost growth than non-
partnered projects, and for the majority of the partnered projects no costs were
incurred from claims or disputes. Because of the nature of the research, no attempt
was made to identify any cost savings that may have resulted from these benefits
(Grasberg, et al. 1999).
The University of Reading‘s Report on partnering maintained that cost savings of 2-10
percent were achieved on the project partnering schemes that were examined and that
savings of up to 30 percent could realistically be achieved when strategic partnering
is used (Reading Construction Forum. 1995). Bennett and Jayes, report on second-
generation partnering, i.e. long-term/strategic partnering, maintained that where cost
reduction was the focus of the exercise savings of up to 40 percent were obtained
(Bennett and Jayes, 1998).
Time Saving
The 1995 Reading Construction Forum report on partnering maintained that the
benefits derived from partnering included reduced design times, quicker
commencement on site and shorter construction periods. A 27 percent reduction in
construction times achieved on five projects carried out by the Arizona Department of
Transport is given as an example. As overview of the performance of partnering in
the Australian construction industry (Uher, 2000) is more circumspect in its findings,
which in essence, simply confirmed that there was a lower risk of time overruns on
partnered projects. An analysis of partnered project performance carried out on 400
projects in the State of Texas in the USA was more positive, establishing that time
growth was negative on all of the 200 partnered projects, which resulted in them being
completed, on average, some 4-7 percent earlier than originally planned. Bennett and
Jayes (1998) maintained that when using second-generation/strategic partnering and
provided that the firms involved carry out the correct management actions, savings in
time of more than 50 per cent are achievable.
Quality Improvement
According to the Reading Construction Forum‘s (1995) report on partnering, much of
the literature examined for the report suggested that the primary focus of partnering
should be quality. Some of the case studies investigated showed a reduction in the
number of defects identified, together with a related decline in the amount of remedial
work needed. Three of the five clients studied in the Westminster University report
(Barlow et. al, 1997), claimed to have achieved improvements in construction quality.
The Australian experience (Uher, 2000), although lacking in definitive data with
regard to quality, confirmed in general terms that the use of project partnering resulted
in an improvement in quality standards.

Partnering
777
RESEARCH METHOD
Most of the content of this research is based on a review of relevant materials from
textbooks, professional journals, conference papers, refereed publication and research
reports to explain the objectives of partnering, genesis of partnering and its
implementation process in the construction industry. Opinions of various parties in
Ghanaian construction industry – clients, sub-contractors and contactors were sought
regarding construction project delivery, performance and level of use of partnering in
Ghanaian construction industry. The paper also sought the importance and benefits of
partnering implementation from previous researchers.
Questionnaires were distributed to a random sample of one hundred and eighty (180)
contractors, sub-contractors and clients in Accra and Cape Coast all in Ghana. The
questionnaires were posted with self addressed envelop and the same time e-mailed to
the respondents. This was to ensure that the targeted persons received the
questionnaire. These methods of communication have led to the return of one hundred
and sixty-four (164) completed questionnaires. Table1shows the breakdown of sent
and returned questionnaire and the respondents types as well .Data collected was
analysed using descriptive statistics, thus frequencies and percentages.
Table 1: Sent/Returned Questionnaire
Respondent
type
Number of
questionnaire
sent
Percentage
sent (%)
Number of
questionnaire
return
Percentage
return (%)
Number of
questionnaire
not return
Percentage
of
questionnaire
not return
Main
Contractors
95 52.78 87 48.33 8 4.44
Sub-
Contractors
65 36.11 62 34.44 3 1.67
Client
Consultants
20 11.11 15 8.33 5 2.78
Total 180 100 164 91.11 16 8.89
RESULTS AND DISCUSSION
Table 2 shows a summary of finding of research conducted by the researcher on some
of the Partnered and Non-partnered projects carried out in Ghana, specifically Accra
and Cape Coast between 2009 and 2010. Findings of the survey were analysed by
using descriptive statistics to provide a better understanding of the issues of project
delivery and partnering in the Ghanaian construction industry. The results of this
study were generated from all the responses received. In totality 164 out of 180
questionnaires were received. The 164 returned questionnaires consisted of eighty-
seven (87) respondents from main contractors, sixty-two (62) from sub-contractors
and fifteen (15) from clients.
The survey indicated that 8% of the projects undertaken by the participants‘
organisations were Partnered projects and 92% of the projects Non-partnered. The
participants‘ firms were small to large (D4 through D1) size companies which meant
that the survey was cut-across all organisations irrespective of the size. With regard to
the level of use of the partnering in Ghanaian construction industry, the result
indicates that only 8% of the participants‘ organizations implemented partnering for
their projects. When compared cost on partnered projects with non-partnered project,
it was realized that partnered projects incurred lower cost risks between 2-5%.
Partnered projects also recorded no risk of time overruns. On the other hand all the

Ansah
778
non-partnered projects under studied suffered major deficiencies such as cost and time
overruns. Table 2 gives more details and other related issues concerning partnering
and non-partnering projects performance.
It was also realized that 92% of the projects which formed the non-partnered projects
have been delivered based on the traditional procurement system with open
competitive tendering where clients appointed consultants to act on their behalf in
order to produce designs and supervise site works. The adversarial relationship
between clients and construction constructors inherited in this procurement system is
one of the major barriers to the success of the construction industry. One thing we
should note is that in a traditional procurement system, particularly with open
competitive tendering, cut-throat tendering is actively encouraged, mainly by the
client and usually upon advice from the client‘s consultant. Contractors would be
forced to bid at low margins, hoping to make up for loses through client changes. The
system is adversarial, based on a closed book approach in which client, consultant and
contractor often play a game of hide and seek with one another, hoping to ―catch each
other out‖. This is the main reason for the atrocious prevalence of claims within the
industry and situations when the out-turn or final cost of projects far exceed the tender
price, leaving extremely bitter clients who feel ripped off by unscrupulous contractors.
In contrast to the traditional procurement approach in which the parties appear pitched
against each other, partnering seeks a team approach in which the parties work
together to improve performance through agreeing mutual objective, devising a way
for resolving any disputes and committing themselves to continuous improvement,
measuring progress and sharing gains. Sir John Egan‘s report, ―Rethinking
construction,‖ recommended that ―the industry must replace competitive tendering
with long-term relationships based on clear measurement of performance and
sustained improvements in quality and efficiency.‖
Table 2: Summary of findings of performance of Non-partnered and Partnered project carried out at Accra and Cape Coast
between 2009/2010
Cost overruns For non-partnered projects, cost of construction projects under studied overruns of between
25%-43%, not taking inflation into account.
For partnered projects, cost overruns between 2 – 5 %.
Time overruns For non-partnered projects, time overruns of between 9-21 months.
For partnered projects, no time overruns recorded.
Project delivery
satisfaction
96% of the respondents‘ claim clients were not satisfied with the projects delivered by their
contractors in terms of cost, time and quality for non-partnered project.
For partnered projects, all the clients were satisfied with project delivered.
Claims Issues For non-partnered projects, 73% of the projects under studied had claims issues.
For partnered projects, no claims issues were recorded.
Disputes Issues For non-partnered projects, 54% of the projects under studied had disputes cases.
For partnered projects, no disputes cases were recorded.
Working Relationships For non-partnered projects, 73% of the respondents claim project participants were unhappy
with the working relationship with the other parties.
For partnered projects, all the respondents claim project participants were happy with the
working relationship with the other parties.
Project delivered with
inclusion of partnering
8% of the participant organisations included partnering in their project.
Project delivered on
traditional procurement
system
92% of the completed project under studied, have been delivered based on the traditional
procurement system with open competitive tendering where clients appointed consultants to
act on their behalf.
Previous studies (Cowan et al. 1992; Moore et al. 1992) also suggested that project
partnering could well be applied to construction projects and can provide improved
time and cost benefits to both clients and contractors. It can therefore be concluded

Partnering
779
that the process of partnering is, therefore, a clear attempt to overcome some of the
actual and perceived shortfalls in traditional methods of procurement.
Benefits arising From Partnering Implementation
Partnering relationships offer advantages and opportunities specific to the individual
members of the project team. The benefits of partnering include:
Benefits for client: Effective utilisation of personnel resources may be the most
important benefit to the owner, in terms of both staffing requirements and
available expertise. The client may also benefit from increased flexibility and
responsiveness in terms of added skills and resources available from other parties,
from the presence of a diversity of talent not usually found in a single company,
which will improve on delivery, and from reduced costs associated with contractor
or consultant selection, contract administration, mobilisation, and the learning
curve associated with beginning a project with a new contractor or consultant.
Other benefits to the client will be the reduced dependence on legal counsel, the
development of a team for future projects and more control over possible cost
overruns.
Benefits for design team: Partnering provides the design team with the
opportunity to refine and develop new skills in a controlled and low risk way.
This occurs because new methods or approaches may be required to meet owner
project requirements. Through partnering, the design team will benefit from the
involvement of contractors during budgeting, development of the team for future
projects and optimal use of the design team‘s time.
Benefit for contractor: The contractor may benefit from increased opportunity
for value-engineering involvement to provide value for money, faster decision-
making processes, and more effective time and cost control. Other benefits to the
contractor will include formation of teams for future projects, increased
opportunity for financially successful projects, reduced dependence on legal
counsel and the possibility of faster payments.
Benefits for the manufacturers and suppliers: As with the other team members,
the benefits that manufacturers and supplier stand to gain through partnering
include approval of their products recommendation, a voice in the design intent,
involvement in the coordination with other project trades and the possibility of
repeat business. Other benefits are a better chance for quality in product
installation and increased opportunity for financially successful projects.
CONCLUSION
This paper attempted to explain partnering as an alternative contractual arrangement
for successful project delivery in the Ghanaian construction industry. With the
identification of the specific issues and problems, such as cost overruns, time
overruns, fragmented nature and adversarial relations, in the Ghanaian construction
industry, a partnering is highly recommended. Partnering arrangement can replace the
potentially adversarial atmosphere and foster a team approach to achieve common
goals. Industry world-wide studies have suggested the use of partnering as a way to
promote co-operative contracting. Construction companies and clients in Ghana can
use partnering to improve their competitiveness, to improve product quality and to
keep pace with changing customer requirements. Partnering is one of the most
innovative developments in delivering a project efficiently and reducing disputes. It
provides a sound basis for a ‗win – win‘ climate and synergistic teamwork. By

Ansah
780
changing to a ‘win – win‘ style the parties can reap benefits of cost saving, profit
sharing, quality enhancement and time management.
REFERENCES
Barlow, J., Cohen, M., Jashapara, A and Simpson, Y. (1997), Towards Positive Partnering,
the Policy Press, Bristol
Barnes, N. M. L. (2000), Civil Engineering Management in the Industrial Revolution.
Proceedings of the Institution of Civil Engineers 138, 135 – 144.
Bayliss, R. F. (2002). Partnering on MTR Corporation Ltd‘s Tseung Kwan O Extension.
Hong Kong Inst. Eng. Trans; 9 (1), 1 – 6
Bennett, J. and Jayes, S. (1995). Trusting the Team: The Best Practice Guide to Partnering in
Construction. Centre for Strategic Studies in Construction, University of Reading,
Reading.
Bennett J, and Jayes, S. (1998). The Seven Pillars of Partnering: A guide to Second
Generation Partnering, Centre for Strategic Studies in Construction, University of
Reading, Reading.
Black, C; Akintoye, A; and Fitzgerald E. (2000). An Analysis of Success Factor and Benefits
of Partnering in Construction. International Journal of Project Management, 18 (6):
423 – 434.
Chan, A. P. C; Chan, D. W. M; Chiag, Y. H.; Tang, B. S.; Chan, E. H. W. and Ho, K. S. K.
(2004). Exploring Critical Success Factors for partnering in Construction Projects.
Journal of Construction Engineering and Management 130 (2) 188 – 198.
Construction Industry Institute (1991). In Search of Partnering Excellence, CII Special
Publication, Construction Institute, Austin, Tx.
Cowan, C., Gray, C., and Larson, E. (1992), ―Project Partnering‖. Project Management
Journal, 22(4), 5-12.
Grasberg, D. D.; Dillon, W. D.; Reynolds, L. and Boyd, J. (1999) Qualitative Analysis of
Partnered Project Performance; ASCE Journal of Construction Engineering and
Management 125 (5), 161 – 166).
Green, S. D. (1999). Partnering: The Propaganda of Corporatism. In: Ogunlana S. O (Ed),
Profitable Partnering in Construction Procurement, Proceedings of CIB Symposium,
pp. 3 – 14. E and FN Spon, London.
Latham, M. (1994). Constructing the Team, H M S O, London.
Masterman, J. W. E. (2004). Introduction to Building Procurement systems. Second Edition.
Spon. Press.
Moore, C., Mosley, D., and Slagle, M. (1992). Partnering Guidelines for win-win project
management. Project Management Journal, 22(1), 18-21.
Nicco – Annan, J. (2006) Partnering in Construction. The Quantity Surveyor. Official
Magazine of Quantity Surveying Division of the Ghana Institute of Surveyors. Issue
I., pp 14 – 19.
Reading Construction forum (1995). Trusting the Team. The Best Practice Guide to
Partnering in Construction, Reading: Centre for Strategic Studies in Construction.
Sanders, S. R. (1994). Partnering on the Wangaratta Bypass. Australian project Management
Journal, 12, 21 – 25.
Sanders, S. R., and Moore, M. M. (1992). Perceptions on Partnering in the Public Sector.
Australian Project Management Journal, 22 (4), 13 – 19.

Partnering
781
Stevens, D. (1993). Partnering and Value Management. The Building Economist, the
Australian Institute of Quantity Surveyors.
Thompson, P. J. and Sanders S. R. (1998). Partnering Continuum, Journal of Management in
Engineering, 14(15), 73 – 78.
Uher, T. E. (2000). Partnering Performance in Australia, Journal of Construction
Procurement 5 (2), 163 – 176.
Wearne, S. H. and Wright, D. (1998). Organizational Risks of Joint Ventures, Consortia
and Alliance Partnerships. International Journal of Project and Business Risk
Management, 2 (1), 45 -57.


Mensah, S., Dansoh, A. and Amoah, P. (2011) Performance of building projects funded by public
organizations: Potentially influencing management practices In: Laryea, S., Leiringer, R. and Hughes,
W. (Eds) Procs West Africa Built Environment Research (WABER) Conference, 19-21 July 2011,
Accra, Ghana, 783-793.
783
PERFORMANCE OF BUILDING PROJECTS FUNDED
BY PUBLIC ORGANIZATIONS: POTENTIALLY
INFLUENCING MANAGEMENT PRACTICES
Sarfo Mensah1, Ayirebi Dansoh2 and Peter Amoah3
1Department of Building Technology, Kumasi Polytechnic, Kumasi, Ghana
2,3Department of Building Technology, KNUST, Kumasi, Ghana
There is a strong association between project performance and project management
practices. Satisfactory performance is a reflection of optimal practices. Management
practices may however differ from organization to organization. The aim of this
research is to determine whether there are differences in the performance of building
projects funded by selected public organizations. The study was pursued in two
stages: (1) determination of the performance of projects managed by the organizations
and (2) identifying potential project management practices that could explain
differences in the performance of the projects. Building projects of three funding
organizations were selected for the Study. A structured questionnaire was used to
collect information for measuring the performance of projects executed from year
2005 to 2009. Pair-wise analysis was used to test for differences between the
performances of projects using independent t-test. Significant differences were
observed in the time and cost performances of projects managed by the different
organizations. Semi-structured interviews were conducted for identification of
practices used in the management of the building projects. The time and quality
performances of one organization was better than the other two organizations. This
organization‘s practice of establishing a budget for particular project and making
payments from that budget at defined stages could explain the differences in the
performances.
Keywords: Ghana, project finance, project management practice, project
performance, public organization.
INTRODUCTION
Project performance is influenced by several factors (Blismas et al., 2004). In Ghana,
projects funded by public organizations have had reported performance problems
related to: irregular release of funds for construction projects by the Client (Baiden-
Amissah, 1999); delayed payment by client and inadequate contract information and
performance appraisal (Amoah-Mensah, 2005). Generally, construction projects are
completed in longer times and at higher-than-budgeted costs due to: poor planning at
the pre-design phase of the building procurement process (Best and Valence, 1999);
and improper appraisal of contractor‘s past performance information (Kashiwagi and
Parmar, 2004; Xiao and Proverbs, 2003)

Project performance
784
However, most of these influencing factors seem to emanate from practices engaged
in by project managers and other project-related bodies. Therefore, the relationship
between project performance and project management practices is of great
significance. Sharma and Gadenne, (2002) asserts that there is strong association
between practices and performance. (Loader, 2002) also confirms performance of
projects funded by government organizations suffer from the practices of: Frequent
lateness on approvals of application for funding; infrastructure cost not fully estimated
and so underfunded; and giving tight time scales for preparation of bids.
The relative effect on performance is what makes a practice optimal (Ramabadron et
al., 1997). Thus quality of manner in which individual project management activities
are carried out would determine the eventual performance of a project. Identifying the
influencing tendencies of the daily practices would therefore help managers to pursue
actions to optimize the performances of projects.
It has been argued that since professional practice within the construction industry is
required to follow laid down guidelines and ethics, management practices may not
necessarily vary from organization to organization and that the purpose of adopting a
particular practice may therefore be due to peculiar environmental and social demands
of the project at hand. However, practices could vary from organization to
organization since, in striving for the best results, practices may progressively be
refined till their effect on the performance becomes optimal.
This study was undertaken to determine the performance of projects managed by the
organizations. This was meant to be a measure of the effectiveness of their project
management practices. It further attempts to identify management practices that could
explain the differences in performance. Three public organizations in Ghana whose
key activities involve the funding and management of construction projects were
selected for the study. The organizations differ from each other in funding sources,
scope of operations and peculiar organizational goals. However, the mission of
executing building projects is common to them. The organizations are designated as
PMO1, PMO2 and PMO3 in the Study. The main objectives and project management
activities of the organizations are given in Table 1.
Table 1 Objectives and Project Activities of PMOs
Organization Objective Common observed Project
management -related activities
1 PMO1 Supplement the provision of
educational facilities at all levels
Scheduling release of project funds
Advancing of Mobilization fund
Interim valuation of works by
consultant
Honouring of Payment Certificates
2 PMO2 Develop housing schemes,
improve educational and primary
health care facilities, and manage
environmental sanitation.
3 PMO3 Reduce rural and urban poverty.
The day-to-day ways of carrying out the project management related activities for the
purpose of achieving set project targets (Das et al., 2000) are referred to as project
management practices in this study. The organizations manage building projects
through their project management departments which engage the services of
consultants. Data on building projects funded by the organizations were used for the
study.

Mensah, Dansoh and Amoah
785
LITERATURE REVIEW
Project Performance Measurement
Project performance has been considered to be tied to project success and this is also
tied to project objectives (Chan and Chan, 2004). Sadeh et al. (2000) measured project
success based on dimensions including Meeting Design Goals, Benefit to End Users,
Benefit to the developing organization, etc. These project success criteria do not
consider time, cost and quality, the most common of building project objectives.
Shenhar et al. (1997) proposed that project success is divided into dimensions
including Project Efficiency, Impact on Customer, Business success, etc. The
measurement of these dimensions appears to be on subjective basis. Chan and Chan
(2004) developed a consolidated framework encompassing broad range of values for
measuring project success. The framework includes Cost, Environmental
performance, Quality, etc. The frame work is too broad and may not make the
performance measurement handy for everyday use. Three basic objectives of
Construction projects -time, cost and quality- are adopted as dimensions for
measurement of project performance in this study. Measuring success on these
objectives is expected to yield more effective results since project participants are
more familiar with these basic widely known and widely understood project
objectives (Phua and Rowlinson, 2004.) The overall project performance is
determined from performance metrics based on the outcome of basic project
objectives: Time, Cost and Quality performance. The choice of KPI‘s is based on
guidelines advocated by Collin (2002);
Only a limited, manageable number of KPI‘s is maintainable for regular use.
Having too many (and too complex) KPIs can be time and resource-consuming.
Data Collection must be made as simple as possible.
For performance measurement to be effective, the measurement or indicators must
be accepted, understood and owned across the organization.
Metrics adopted for measurement of project performance include: Time variation (for
measurement of time performance) and Percent Net Variation (for measurement of
cost performance) as employed by Chan and Chan (2004) (originally used by Naoum
,1994). The Time Variation indicator has the ability to take care of percentage
increase or decrease in the estimated project days/weeks whiles discounting the effect
of extension of time. The Percent Net Variation indicator also has the ability to give
indication of cost overrun or under-run. Moreover, the benefit of using these Key
Performance Indicators (KPIs) is the facilitation of the measurement of project and
organizational performance throughout the construction industry. In contrast to the
objective ways of measuring cost and time, quality performance measurement has
mostly been subjective. This study employs consultant and clients‘ satisfaction for
quality performance measurement.
General factors influencing project performance
There are several factors that can affect thesuccess of a project. The nature and source
of funds and payments scheduling engaged by a given organization could determine
performance level (Loader, 2002). Bryde (2003) in his investigation into the
formalization of project management activities cited the structuring of the project
among four broad areas that define the success of projects. The experience of the
client with project management process has a lot to do with the kind of decisions that

Project performance
786
are taken during the lifetime of the project. Some of the decisions made by the project
client include insisting on design changes irrespective of the stage of a project. A lack
of adequate experience on the part of the client is likely to lead to ignoring the cost
implications of such decisions, especially at the latter stages of the project. It is not
only the client‘s decisions that are relevant to project success; the decisions of other
parties too are important. The designer‘s experience is among the major factors that
affect cost and time overruns (Naoum, 1994).
The effectiveness of client‘s representative team, effectiveness of construction
management team, and the scope of works are broad factors that affect construction
time performance (Walker, 1995). Cost performance may also be affected by
variations and modifications during the construction period (Chan and Chan, 2004).
The extent to which projects are monitored, the experience of project consultants,
quality and past performance record of contractors (Kashiwagi and Parmar, 2004) and
the number of variation orders issued affect quality. The competent coordination of all
these factors is relevant to achieving satisfactory quality performance.
MANAGEMEN PRACTICES THAT INFLUENCE PROJECT
PERFORMANCE
Project management practices are very important to performance level that could be
attained in project management. (Gowan and Mathieu, 2005; El-Mashaleh, and
Minchin Jr, 2006). Since ―it is the performance that makes a practice optimum‖, an
accurate measurement of project performance is required for a determination of
optimum practices (Bryde‘s, 2003). Loader (2002) observed that the presence of tight
timescales for preparation of bids is usually an attribute within certain client
organizations that have bodies entrusted with coordination of project funding. This
situation usually occurs when funds need to be tapped from their sources within a time
limit. Pressure therefore mounts on project consultants to subsequently prepare bids
for quick submission. Such schedules place limitations on the preparation of bids
resulting in a reduction in the quality of documents. The consequent result is of
unforeseen variations retarding the project‘s progress. The industry is characterized by
repeated delays, cost overruns and collapse of buildings. In the light of these,
Kashiwagi and Parmar (2004) suggested that past performance information should
stand as a key indicator for predicting future performance in the construction industry.
The problem of poor project performance is attributed to a number of factors
(Mansfield et al., 1994). Best and Valence (1999) contend that the problem of
construction projects frequently taking longer and costing more than originally
anticipated is often due to poor planning at the pre-design phase of the building
procurement process. Xiao and Proverbs (2003) observed that contractor performance
is critical to the success of any construction project as it is contractors who convert
designs into practical reality. Project managers have been called upon to be critical
about the contractor selection process since it is important to project success. The
selection of project consultants is of equal importance.
The ability of managers to have managerial control may be a key element in achieving
project success. A high level of administrative ability in the project team could lead to
reduced time overruns, which in turn leads to increased satisfaction of client. Also
project organizational structure may have some influence on the project performance
from inception to completion. Weaknesses in management structure lead to poor
project performance regardless of organizational facilitators such as senior
management commitment and leadership style (Cooper, 1998). Jawaharnesan and

Mensah, Dansoh and Amoah
787
Price (1997) studied project management best practices in the UK construction
industry and found that ―preparing and organizing‖ and ―developing project
definition‖ were among the highest ranked tasks
Best Practices in Project Management
As practices vary from organization to organization or from project team to project
team the question of best practice subsequently arises. Ramabadron et al. (1997)
describes best practices in project management as optimum ways of performing works
to achieve higher performance. In determining whether certain practices are best or
not, their effect on project outcome should be evaluated. There is a strong association
between quality management practices and performance (Sharma and Gadenne,
2002). Quality management practices differed from industry to industry and from
organization to organization. These practices are carried out for the purpose of
successfully managing projects. In a research conducted into the organizational
learning practices in project management environment, it was concluded that project
organizations should focus on building knowledge because increased knowledge is
associated with increased project performance (Kotnour, 2000). Thus, taking
feedbacks from projects and learning from experiences have a significant influence on
project performance (Loo, 2003). The identification and pursuit of best practices
within a particular project management organization enhances successful project
management.
RESEARCH METHOD
First, the performances of substantially completed similar projects executed by the
organizations were measured with data on projects that fall within predefined criteria.
The conditions were set to minimize the impact on performance that could emanate
from the following extraneous as indicated in Table 2. Purposive sampling was
therefore required to obtain the projects. Thus, from each organization, Thirty-three
(33) projects, which could meet the predefined conditions, were randomly sampled for
the performance measurement .Respondents were also notified of the conditions in
order to guide them the selection of projects for which data were to be provided.
Table 2 – Conditions used project sampling and
Conditions providing basis for project selection Extraneous influence expected to be minimized
Project‘s original contract sum should not be less
than USD 10,000.00
Effect of project financial size
Projects completed from year 2005 to year 2009 Effect of price fluctuations associated with
different economic seasons
Project executed under the traditional
procurement method
Effect of type of procurement method
Project type should be entirely new works. Effect of nature of works being undertaken in
project
Project should be education-related were required
from respondents.
Effect of building end-use
Data on 24, 22 and 20 of PMO1, PMO2 and PMO3 projects falling within the
predefined conditions were obtained. Three criteria - time, cost and quality objectives
- were adopted for measuring the project performance and performance indices were
computed for them. Indices for time and cost performances were developed as (tables
2(a) and 2(b)) using data of planned and actual time and cost values. Quality
performance was measured subjectively by ranking satisfaction with quality of
completed projects as shown in table 2(c).

Project performance
788
Table 2 (a) Time Performance (Y1) Index
Project
Completion Status
Achieved Completed behind schedule
Completed
on schedule Completed ahead of schedule
Index 0.5 and
below 0.6 0.7 0.8 0.9 1.0 1.1 1.2 1.3 1.4
1.5 and
above
Time performance index =
Planned Contract
Period
Actual Construction
Period
Table 2 (b) Cost Performance (Y2) Index
Project
Cost Status
Achieved
Completed above initial estimated
cost
Completed
As
estimated
Completed below initial estimated
cost
Index 0.5 and
below 0.6 0.7 0.8 0.9 1.0 1.1 1.2 1.3 1.4
1.5 and
above
Cost Performance Index =
Initial Project
Cost
Final Project
Cost
Table 2 (c) Quality Performance (Y3) Index
Project
Quality Status
Achieved Below expectation by about:
As
expecte
d
Above expectation by about:
Margin 50% and
below 40% 30% 20% 10%
10
%
20
%
30
%
40
%
50% and
above
Index
0.5 and
below 0.6 0.7 0.8 0.9 1.0 1.1 1.2 1.3 1.4
1.5 and
above
A computed index of less than 1.0 indicates underperformance or below trend whilst
1.0 or above is according to the expected performance or above expected performance
respectively. The results of the performance measurement are as given in Tables 3(i) –
(iii)
To test the significance of differences in the measured performances three null
hypotheses were formulated. These are:
Hypothesis #1
Performance of the building projects funded by ‗PMO1‘ organization does not differ
significantly from performance of the projects funded by the ‗PMO2‖ organization.
(i. e. Ho ; μ1 - μ2 = 0)
Hypothesis #2
Performance of the building projects funded by ‗PMO1‘ organization does not differ
significantly from performance of the projects funded by the ‗PMO3‖ organization.
(i. e. Ho ; μ1 - μ3 = 0)
Hypothesis #3
Performance of the building projects funded by ‗PMO2‘ organization does not differ
significantly from performance of the projects funded by the ‗PMO3‖ organization.
(i. e. Ho; μ2 - μ3 = 0)
Independent t-test statistical method was adopted for the test. The t- tests were
conducted 2-tailed at α-significance level of 0.05. Comparison of the performances
was done by Pair-wise analysis. Tables 4 to 6 give results of the test.
The practices engaged in by the organizations to carry out selected project
management activities were also identified through the administration of semi-
structured questionnaire and interviews as well as documentary analysis. This was to

Mensah, Dansoh and Amoah
789
enable us observe the existence of differences in practices from organization to
organization and to be able to explain any performance differences.
DISCUSSION
Measured Project Performance
Tables 3(i) – 3(iii) show the results of the measured performance of the building
projects obtained under each organization.
Table 3 (i) Measured time performances of projects
Time
Performance
Index
No. of Projects obtained under: Percent (%) Classification
PMO1 PMO2 PMO
3
Total
0.5 13 3 16 24.2
Completed behind schedule
0.6 7 12 19 28.8
0.7 4 8 12 18.2
0.8 2 7 9 13.6
0.9 2 2 3.0
1.0 2 1 5 8 12.1 Completed on schedule
Total 24 22 20 66 100.0
Mean Index 0.60 0.65 0.81
Table 3 (ii) Measured cost performance of projects
Cost Performance
Index
No. of Projects obtained under: Percent
(%)
Classification
PMO1 PMO2 PMO3 Total
0.6 5 5 7.6
Completed above initial
budget
0.7 14 14 21.2
0.8 2 2 3.0
0.9 12 6 18 27.3
1.0 3 10 9 22 33.3 Completed as budgeted
1.1 5 5 7.6 Completed below initial
budget
Total 24 22 20 66 100.0
Mean Index 0.73 0.95 1.00
Table 3 (iii) Measured quality performances of projects
Quality
Performance Index
No. of Projects obtained
under:
Percent (%) Classification
PMO1 PMO2 PMO3 Total
0.9 10 10 15.2 Below expectation
1.0 10 17 2 29 43.9 As expected
1.1 4 5 5 14 21.2
Above expectation 1.2 10 10 15.2
1.5 3 3 4.5
Total 24 22 20 66 100.0
Mean Index 1.10 1.02 1.05
The mean indices indicate of the level of the measured performances of projects
within each organization. From tables 3(i) and 3(ii) the time and cost performances of
PMO3 projects are better than the other two organizations. Also the time and cost
performances of PMO2 projects are better than that of PMO1 projects. Table 3(iii)
however shows that the quality performance of projects funded by PMO1 is better

Project performance
790
than that of projects funded by the other two organizations whilst the quality
performance of PMO3 projects is better than that of PMO2 projects. The significance
or otherwise of theses performance differences are have been determined in Tables 4 -
6
Table 4 Independent Samples T-Test with Time performance as Test Variable
Grouping
Variable t-test for Equality of Means
Conclusion Decision
tα/2,m + n –
2 T Df
Sig. (2-
tailed)
‗PMO1‘ and
‗PMO2‘
Organizations
2.021 -1.294 44 0.202322
Fail to
Reject Null
Hypothesis
Time Performance
difference NOT
SIGNIFICANT
‗PMO1‘ and
‗PMO3‘
Organizations
2.021 -5.101 42 0.000008 Reject Null
Hypothesis
Time Performance
difference SIGNIFICANT
‗PMO2‘ and
‗PMO3‘
Organizations
2.021 -4.117 40 0.000187 Reject Null
Hypothesis
Time Performance
difference SIGNIFICANT
The test results in table 4 imply that, following from table 3(i), the time performances
of the PMO3 projects are significantly better the other two organizations.
Table 5 Independent Samples t-test with Cost performance as Test Variable
Grouping
Variable t-test for Equality of Means
Conclusion Decision
tα/2,m + n – 2 T Df
Sig. (2-
tailed)
PMO1 and
PMO2
Organizations
2.021 -8.04176808 44 3.5138E-10
Reject Null
Hypothesis
Cost
Performance
difference
SIGNIFICANT
PMO1 and
PMO3
Organizations
2.021 -8.76774276 42 4.8821E-11 Reject Null
Hypothesis
Cost
Performance
difference
SIGNIFICANT
PMO2 and
PMO3
Organizations
2.021 -2.504 40 0.016455 Reject Null
Hypothesis
Cost
Performance
difference
SIGNIFICANT
In Table 5, differences in cost performance of all organizations are significant. Thus
the cost performance of PMO3 projects is significantly better than the other two and
that of PMO2 significantly better than that of PMO1. The only significant difference
in quality performance occurs between PMO1 and PMO2 projects. Following from
table 3(iii) the quality performance of PMO1 projects are significantly better than
PMO2 projects but not significantly better than PMO3 projects.

Mensah, Dansoh and Amoah
791
Table 6 Independent Samples t-test with Quality performance as Test Variable
Grouping
Variable t-test for Equality of Means
Conclusion Decision
tα/2,m + n – 2 T Df
Sig. (2-
tailed)
‗PMO1‘ and
‗PMO2
‗Organizations
2.021 3.555 44 0.001 Reject Null
Hypothesis
Quality
Performance
difference
SIGNIFICANT
‗PMO1‘ and
‗PMO3‘
Organizations
2.021 1.044 42 0.302
Fail to
Reject Null
Hypothesis
Quality
Performance
difference NOT
SIGNIFICANT
‗PMO2‘ and
‗PMO3‘
Organizations
2.021 -0.592 40 0.557
Fail to
Reject Null
Hypothesis
Quality
Performance
difference NOT
SIGNIFICANT
Potential Practices that could explain Performance Differences
Management practices vary from organization to organization and the performance of
the outcomes is what makes a practice optimum (Bryde, 2003). The cause of variation
in the PM practices may not be due only to the kind of organization but also the type
and purpose of project and most importantly the level of performance desired.
(Sharma and Gadenne, 2002). Project performance could differ from organization to
organization since different practices could yield different success levels. For instance,
PMO3 normally establishes a budget for a particular project from which all payments
on the project are made whilst PMO2 make payments on more than one project from a
quarterly budget, which is not also usually released on time. According to Choudhurry
and Phatak (2004), delayed progress payment is a major cause of construction time
overrun. Thus, the nature and source of funds and payments scheduling engaged by a
given organization could determine performance level. PMO3 engages in the practice
of establishing a budget for a particular project from which payments to builders are
made as and when funds are required for the project. On the other hand the other two
organizations make payments as and when periodic funds, which are not determined
for a given project, are released. With regards to advancing mobilization fund all
PMOs do this in different ways PMO1 client rarely advances mobilization fund to
contractors. It is a usual practice for PMO2 client to advance mobilization fund to
contractors. On the other hand PMO3 client adopts these two practices and
implements one or the other based on certain determined circumstances surrounding a
given project. Concerning how valuation of works is carried out, contractors on PMO1
projects usually initiate valuation of works for subsequent vetting and approval of
consultant. However, within the PMO2 most consultants carry out an entire interim
valuation for a contractor after mere request is made irrespective of pre-defined work
stage. Most consultants within the PMO3 practice same but not until the work reaches
a pre-defined stage. In the process of honouring payment certificates, the client‘s
organization appoints a team, which cross-checks and endorses claims before
contractor receives payment. In the PMO1 and PMO3 these teams are integrated into
the organization. Contractors report that this process does not cause delays hence,
payment is prompt and they are usually motivated to execute satisfactory work.

Project performance
792
CONCLUSION
The measured time performances indicate that averagely, the projects studied were
completed behind schedule. Also the determined cost performances indicate that
PMO1 and PMO2 projects were completed above initial budget with PMO3 projects
being completed as initially budgeted. However, the measured quality performances
indicate that averagely, quality levels achieved for the projects studied were not below
expectation. The time and cost performances of PMO3 projects are significantly better
than the other two organizations. Also the time and cost performances of PMO2
projects are better than that of PMO1 projects. All the organizations show significant
difference in cost performance levels of their projects. The only significant difference
in quality performance determined occurred between PMO1 and PMO2. These
indicate that different practices could have great impact on project performance. The
organizations have different ways of carrying out the project management related
activities of: Scheduling release of funds for payments; Advancing mobilization fund;
Valuation of work done for payments; and Honouring of payment certificates, hence
practices generally differed from organization to organization. Due to the strong
association between performance and practices, (Sharma and Gadenne, 2002), the
difference in the management practices could account for the differences in
performances of the projects.
REFERENCES
Amoa-Mensah, K. (2005) Government Development and Poverty Reduction Challenges to the
Quantity Surveyor as a Built Environment Professional: An Overview The Quantity
Surveyor, Issue 3
Baiden-Amissah, P. D. (1999), An Evaluation of the Delivery Performance of
ConstructionProjects Funded by the District Assemblies‘ Common Fund (A case
Study of 4 Districtsin Ashanti Region), Unpublished M Sc. Thesis submitted to the
Department of Building Technology, KNUST
Best, R. and Valence, G. (1999) ―Building in Value – pre-design issues‖, Arnold: London.
Blismas, N G, Sher, W D, Thorpe, A and Baldwin, A N (2004) Factors influencing project
delivery within construction client‘s multi-project environments. Engineering,
Construction and Architectural Management, 11 (2), 113 -125.
Bryde, D. J. (2003) Project Management Concepts, Methods and Application. International
Journal of operations and Production Management, 23 (7), 775-793
Bubashit A. A. and Almohawis, S. A. (1994) Evaluating the general conditions of a
construction contract. International Journal of Project Management, 12 (3), 133-5
Chan, A. P. C. and Chan, A. P. L. (2004) Key Performance Indicators for measuring
construction success. Benchmarking: An International Journal, 11(2), 203-221
Choudhury, I. and Phatak, O. (2003) Correlates of Time overrun in Commercial Construction.
ASCE Proceedings of the 40th Annual Conference: Texas A&M University
Collin, J. (2002), ―Measuring the Success of Building Projects – improved project delivery
initiatives‖, July 2002.
Cooper, R. (1998), ―Benchmarking new product performance: results of the best practices
study‖, European Management Journal, Vol. 16, pp. 1-17
Das, A, Handfield, R B, Calantone, R J and Ghosh, S (2000) A contingent view of
qualitymanagement – the impact of international competition. Decision Sciences, 13
(3), 649-90
El-Mashaleh, M, O‘Brien, W J, and Minchin Jr., R E (2006) Firm performance and
information technology utilization in the construction industry. Journal of
Construction Engineering and Management, 132 (5), 499 – 507.

Mensah, Dansoh and Amoah
793
Gowan Jr, J A, and Mathieu, R G, (2005) The importance of management practices in IS
project performance. The Journal of Enterprise Information Management Systems,
18(3), 235 – 255
Jawaharnesan, L. and Price, A.D.F. (1997) Assessment of the role of the client‘s
representative for quality improvement. Total Quality Management, Vol. 8, pp. 375-
89.
Kashiwagi, T. and Parmar, D. (2004) Past Performance Information in the Construction
Industry. ASC Proceedings of the 40th Annual Conference, Brigham Young
University - Provo, Utah April 8 -10, 2004.
Kotnour, T. (2000) Organizational Learning practices in the project management
environment. International Journal of Quality and Reliability Management, 17 (4/5),
393-406
Loader, K. (2002) What price competition? The management of competitive funding in UK
Local Government‖, The International Journal of Public Sector Management, 15
(7), 565-577
Loo R. (2003) A multi-level causal model for best practices in project management.
Benchmarking: An International Journal 10 (1), 29-36
Mansfield, N.R., Ugwu, O.O. and Doran, T. (1994) Causes of delay and cost overruns in
Nigerian construction projects. International Journal of Project Management, 12(4)
254 – 260.
Naoum, S. G. (1994) Critical Analysis of time and cost of management and traditional
contracts. Journal of Construction Engineering and Management, 120(3), 687 – 705.
Parfitt, M. K. and Sanvido, V. E. (1993) Checklist of Critical Success factors for Building
Projects. Journal of Management in Engineering, 9(3), 243-249
Phua, F. T. T. and Rowlinson, S. (2004) How important is cooperation to construction project
success? A grounded empirical quantification. Engineering, Construction and
Architectural Management, 11(1), 45–54.
Ramabadron, R., Dean, J.W. Jr. and Evans, J.R. (1997) Benchmarking and project
management: a review and organizational model. Benchmarking for Quality
Management and Technology, 4, 47-58.
Sadeh, A, Dvir, D, and Shenhar, A (2000) The role of contract type in the success of R and D
defence projects under increasing uncertainty. Project Management Journal, 31 (3),
14-21.
Serpell, A. and Alarcon, L.F. (1998) Construction process improvement methodology for
construction projects. International Journal of Project Management, 16(4), 215-221.
Sharma, B and Gadenne, D (2002) "An inter-industry comparison of quality
managementpractices and performance", Managing Service Quality, Vol. 12 Iss: 6,
pp.394 – 404
Shenhar, A J, Levy, O, and Dvir, D (1997) Mapping the dimension of project success. Project
Management Journal, 28 (2), 5-13.
Walker, D. H. T. (1995) An investigation into construction time performance. Construction
Management and Economics, 13, 263 – 274.
Xiao, H and Proverbs, D (2003) Factors influencing contractor performance: an international
investigation. Engineering, Construction and Architectural Management, 10 (5), 322
– 332.


Babatunde, A.A., Adeniran, A. and Olurotimi, K. (2011) Post occupancy evaluation of public office
buildings in Minna urban: A case study of some selected government proprieties In: Laryea, S.,
Leiringer, R. and Hughes, W. (Eds) Procs West Africa Built Environment Research (WABER)
Conference, 19-21 July 2011, Accra, Ghana, 795-803.
795
POST OCCUPANCY EVALUATION OF PUBLIC OFFICE
BUILDINGS IN MINNA URBAN: A CASE STUDY OF
SOME SELECTED GOVERNMENT PROPRIETIES
Ayoola A. Babatunde1, Ayo Adeniran
2 and Kemiki Olurotimi
3
1,3Department of Estate Management, Federal University of Technology, Minna, Nigeria
2 Department of Estate Management Federal Polytechnic, Ado Ekiti, Nigeria
Since humans spend more than 90% of their lives inside constructed environments
and reasonable percentage of their active time in productive activities in such
environments like offices, it is fundamental to know how office environments support
workers productivity and how best they are satisfied with these environments. Post
Occupancy Evaluation therefore has long been recognised as a method of measuring
the performance of a building in use as well as provide information for upgrading or
improving existing facilities. It is against this backgound that the research examines
post occupancy evaluation of public buildings in Minna, Nigeria. The primary method
of data collection was an extensive questionnaire combined with physical observation
of office environments. The research reveals that there is no significant relationship
between quality of office environment and workers productivity. Notwithstanding,
there is need for the involvement of workers at design decisions that affect their
offices for there to be an enabling environment and perfect job satisfaction by
workers.
Keywords: office environment, post occupancy evaluation, workers‘ productivity.
INTRODUCTION
A building has a significant role in the life of man as it is one of man‘s basic
necessities of life after food in the ranking of his greatest wants. Buildings are notable
for the extent to which they are really open to the outside air, a system that could be
described to as natural ventilation, but with technological developments, buildings are
often sealed tightly with people spending most of their time indoors with some
estimates being that humans spend more than 90% of their lives inside constructed
environments.(Iyagba, 2005). It follows that if humans spend most of their lives inside
buildings, then it is fundermental to note how well buildings match users‘ needs, and
identify ways to improve building design, performance and fitness for purpose.
Post Occupancy Evaluation(POE) is importantly to ensure that buildings are
responsive to the changing needs of the occupiers. In a business environment with
constant change and routine evaluation in most areas of activity, Post Occupancy
Evaluation highlights the importance of design to organisations' marketing, operations
and other interests. Evolving laws, market trends and information technology changes
the activities of people and therefore the requirements of designs. Evolution of

Babatunde, Adeniran and Olurotimi
796
environmental ideals for changing ways of life and values is dependent on design
practices clearly identifying these changes. Post Occupancy Evaluation provides the
dialogue with building users about their ways of life, their values and their
environmental ideals.(Watson, 1996).
Formal Post Occupancy Evaluation has its origin in the UK.(Preiser et al, 1988). POE
in the 1960s and 1970s involved in individual case studies of public and student
housing sector (Vischer,2002; Zimring, Rashid & Kampschroer,2000) in Britain,
France, Canada and United States. It then extended to other facilities such as army
barracks, hospitals, prisons, courthouses and hospital. By seeing the logical step and
beneficiary results from POE, it was later applied to commercial real estate and office
buildings by the mid of 1980s. Information from POE has been used by the public
agencies in support of the design criteria.(Khalil and Husin, 2009). Its development
however in most developing countries is yet to be pronounced. But its potentials in
countries like Nigeria, South Africa and Ghana to name a few with large population
and urban settlements that require facilities to satisfy their commercial, residential,
industrial and recreation needs should be canvassed.
Ironically, POE has suffered almost 40 years of continued neglect in Uk where it
originated from.(Carthey, 2006 citing Cooper, 2001). However, in the last decade,
there has been renewed interest in POE fuelled by the emergence of facilities
management as a major discipline in the procurement and management of buildings
(Carthey, 2006 in Preiser, 1995; Baird, 1996; Cooper, 2001; Stanley, 2001). This
research work therefore sets out to investigate the effect of some selected public
building office environment on the workers satisfaction and suggest essential feedback
to inform existing or future actions in building designs.
PROBLEM STATEMENT
Without Post Occupancy Evaluation, the sustainability of buildings in occupation may
only be assumed rather than measured. With increased emphasis on sustainable design
technologies; comfort and functionality may be compromised which in turn may
hinder steps toward sustainability.(Ayoola and Davies, 2006).
Khalil and Husin (2009) were also of the opinion that in our persent-day, peoples‘
concern is about sustainable environment wherein building occupants seek to obtain
comfort and efficiency in their office. They emphasized that occupants‘ demand is to
have priority in terms of comfortability to use and utilize the facilities and services as
it must be fit for purpose of user.
Therefore, in measuring building performance, there are three main elements that
should concern the evaluator as identified by Wolfgang et al (1988) in Zubairu (2010).
Technical elements which is concern with health, safety, stability and security aspects
of building performance; Functional elements which has to do with occupants‘ ability
to operate efficiently and effectively; as well as Behavioural elements which bothers
on psychological and social aspects of user satisfaction and general well-being.
Workers ability to operate efficiently and effectively forms the major research
problem to which this work tends to provide solution.
In an attempt to analyse the main problems of job satisfaction by workers in Minna
from the purview of office environment; the pertinent issues are- are the existing
facilities? What is the adequacy of space? What is the situation of supporting
Infrastructure in public buildings? These are the research problems to which this work
tends to provide solutions.

Post occupancy evaluation
797
RESEARCH HYPOTHESIS
The hypothesis for this research is a Non-directional two tail hypothesis as stated
below;
Ho – There is no significant relationship between the level of workers satisfaction and
their working environment
H1 - There is significant relationship between the level of workers satisfaction and
their working environment
THEORETICAL FRAMEWORK
Post Occupancy Evaluation Defined and Similar Studies
There are a number of meanings of Post Occupancy Evaluation(POE), all generally in
agreement with, and built around the key subject of the simple statement (Preiser et
al., 1988) that ―post-occupancy evaluation (POE) is the process of evaluating
buildings in a systematic and rigorous manner after they have been built and occupied
for some time‖. (Carthey, 2006). Vischer (2001) in Carthey (2006) also defines POE
as any and all pursuits that stem from a concern in learning how a building functions
once it is built, including if and how well it has met expectations.
POE has been defined by Zimring and Reizenstein (1980) in Khalil and Husin (2009)
as examination of the effectiveness for human users of occupied design environment.
Khalil and Husin (2009) added that Post Occupancy Evaluation (POE) is one of
strategic implementation of analysis on building sustainability after occupancy.
Post Occupancy Evaluation(POE) from the purview of this research work is the
systematic evaluation of public buildings or facilities‘ assumed to occur some time
after their occupation.
Khalil and Husin (2009) were of the opinion that POE are typically performed within
4 to 24 months following occupancy of a new or renovated facility and are performed
only once for an individual building. However, Watson (2003) in his opinion states
that POE can be conducted at any time in the life of a building and it is not necessary
to say that it should be conducted in between any time frame.
A POE study conducted by Ayoola and Davies in 2006. Findings revealed that there is
statistically significant difference in the area of space required and the area of space
available to staff in the Minna NTA complex. The study suggested amongst others
that allocation of workplace to the staff should primarily follow the nature of their
jobs and assignment and not to be based on positions and ranks. This work though is
empirical has only taken into consideration space requirement as a variable of work
environments for workers.
Another study conducted by Khalil and Husin (2009) at the golden triangle area in
Kuala Lumpur is purposely to determine occupants‘ satisfaction and perception level
in their office building in terms of indoor environment using level of cleanliness,
visual comfort, thermal comfort, air movement and noise pollution. The study has
shown that majority (much decreased - 40%; decreased – 47%) of the respondents
indicated that their work productivity is affected due to poor indoor environments.
Improved cooling system, better visual comfort(day lightings) and indoor air
movement and ventilation were suggested as ways to mitigate the problems associated
with indoor environment in office buildings. This work, however has not been able to
show statistically the relationship between work productivity and indoor environment
of the occupants.
Babatunde, Adeniran and Olurotimi
798
Types Of Post Occupancy Evaluation(POE)
Van Wagenberg (1989) in Zubairu (2010), identifies four (4) types of POE to include:
(a) Historical Evaluation: This is the most common type of POE. Here the aim is to
evaluate the building in retrospect by asking such questions as does the building
serve its users effectively? The evaluator has to reconstruct the objectives of the
original designers and then determine whether the building actually fulfills these
objectives.
(b) Comparative Evaluation: Here two buildings are compared, one changed by some
specific action and the other unchanged. Several measures after the change are
taken simultaneously in the two buildings which were similar before the change.
The differences in the effects are postulated to result from the change.
(c) Longitudinal Evaluation: This is comparative in time. In this type of evaluation,
the expected consequences on the building are clearly stated before a change is
made and they are used as a yardstick to take baseline measures. After baseline
measurement, an action is taken and the effects measured again. Then the
outcomes of before and after the action are compared.
(d) Quasi-experimental Evaluation: Measures in a control situation as well as in the
experimental situation are taken before and after the intervention by the evaluator.
True effects show up in differences of outcome before and after the action as well
as in the difference in outcome of the experimental situation and the control
situation after the action.
Levels of post occupancy evaluation
The types of POE that Preiser (1989) discusses in much of his work as emphasized by
Carthey (2006) in Zubairu (2010) and Office Accomodation Management Framework
(2009) have been developed to useful in a range of applications ranging from the
investigation of a specific building, through to use for evaluation of an overall
program. The types of POE outlined may be summarised as three main approaches:
• Indicative (wide ranging application) – This provides an indication of major failures
and successes of a building‘s performance. This type of POE is usually covered within
a short time varying from several hours to one or two days.
• Investigative (more detailed approach) – Often an investigative POE is conducted
when an indicative POE has identified issues that require further investigation. An
investigative POE is more time-consuming, more complicated and requires more
resources than an indicative POE. The major steps in conducting an investigative
POE are identical to those in an indicative POE, however the level of effort is higher.
Much more time is spent on the site and more sophisticated data collection techniques
are used.
• Diagnostic (extremely detailed and focussed study) – This is a comprehensive and
in-depth investigation conducted with a very high level of effort. It generally employs
a multi-method strategy including questionnaires, surveys, observations, interviews
and physical measurements. The diagnostic POE may take from several months to one
year or longer to complete. Its results and recommendations are long-term oriented
aiming to improve not only a particular facility, but also the state of the art in a given
building type.

Post occupancy evaluation
799
Functions of post occupancy evaluation
Zimring et al (2010) citing DGS (2003) stated that the goals of the Post Occupancy
Evaluation include;
To better understand the impact of early design delivery decisions on long-
term efficiency and effectiveness of buildings, and
To better understand the impact of building delivery processes and decisions
on customer response both initially and over the life cycle of the building.
Baird et al (1996) in Carthey (2006), notes the benefits of evaluation, which suggest a
range of purposes for carrying out a POE which include;
Better matching of demand and supply
Improved productivity within the workplace
Minimization of occupancy costs
Increased user satisfaction
Certainty of management and design decision making
Higher returns on investment in buildings and people.
Carthey (2006) emphasized that most critics appear to be in general accord that Post
Occupancy Evaluation is an integral component of the building procurement process,
(Marans, 1984; RIBA, 1991; Shepley, 1997; Duffy, 1998; 2001; MARU, 2001;
Zimmerman and Martin, 2001; Preiser, 2002) and that evaluation of buildings in-use
must provide essential feedback to inform future actions.
Carthey (2006) citing Vischer (2001, p.23) notes that POE may be conducted for a
range of purposes and reasons. She considers the main reasons for conducting them
that include initiation as ―research (Marans and Sprecklemayer, 1981), as case studies
of specific situations, (Brill et al., 1985) and to meet an institutional need for useful
feedback on building and building-related activities (Farbstein and Kantrowitz, 1989).
For some public agencies ... POE is a mechanism for linking feedback on newly built
buildings with pre-design decision-making; the goal is to make improvements in
public building design, construction, and delivery.‖
RESEARCH METHOD AND DATA COLLECTION
Majority of the public (government) buildings in Minna are situated within Chanchaga
local government area. Five (5) federal government buildings, Seven (7) state
government buildings and Two (2) local government, giving a total of 14 out of 24
public buildings have been selected for this research work via simple random
sampling technique. This work examines the functional elements of building
performance which is concerned with occupants‘ ability to operate efficiently and
effectively within their office workplace.
The data for this research is mainly primary in nature. A total of 400 questionnaires
were retrieved from the 510 administered questionnaires on the workers across the 14
public buildings. Data as diverse as the level of workers satisfaction, state/condition of
working facilities, availability of clinic, sources of electricity and the allocation of
work place were extracted from this four hundred (400) workers in the fourteen (14)
government owned parastatals and agencies in Minna, Niger State. A descriptive
statistics of the variables for this research is as shown in Table 1.

Babatunde, Adeniran and Olurotimi
800
Table 1: Summary of Descriptive Statistics of the Variables Public Buildings Level of
satisfaction Space Allocation
State of working
facilities
Source of water
Supply
Source of electricity
Availability of Clinics
Niger State Water Board 4.50 0.00 3.60 1 1 1
National Library of Nigeria, Minna 4.50 6.00 3.60 0 1 0
Niger state judiciary 7.75 10.00 5.80 1 1 1
Niger state development company 3.75 4.00 2.40 1 1 0
Federal road safety, Minna 7.50 0.00 6.00 1 1 0
Niger state Housing corporation 3.75 0.00 3.00 0 1 1
Magistrate Court, Minna 9.00 0.00 7.20 1 1 1
National Drug Law Enforcement Agency, Minna 3.75 0.00 3.00 1 1 0
Niger State Transport Authority 7.75 10.67 6.20 1 1 1
Chanchaga Local Government Secetariat 12.00 16.00 9.60 0 1 1
Niger State Library, Minna 3.25 4.00 2.60 0 1 1
Federal government secretariat 20.00 0.00 5.40 1 1 0
Nigerian Postal Services, Minna 8.00 7.00 6.60 0 1 1
Zonal Directorate for Education 4.50 6.00 3.60 0 1 0
*Source of electricity equals to 1 if from PHCN,otherwise 0
Source of water supply equals to 1 if from Niger state water board, otherwise 0
Availability of clinics equals 1 if nearby, otherwise 0
Variables such as the level of satisfaction, space allocation and state of working
facilities were derived from workers perception and composite ranking of the
variables to arrive at their mean values. Conversely, variables such as source of
electricity, water supply and availability of clinics take a dichotomous form. In this
research, simple backward multiple regression model is employed to determine the
relationship between the level of workers satisfaction and working environment using
space allocation, state of working facilities, source of water supply and availability of
clinics as proxies.The results of the research is presented in the subsequent section.
FINDINGS/ANALYSIS
Working Facilities
Computer, Intercom and Internet constitute the major working facilities available
across the sampled public buildings. 55.75% of the respondents rated availability of
computer high, and on the other hand internet facility earned a low score of 19.75%.
From the responses also, it is clear that the score for the adequacy of working facilities
across the sampled public buildings by workers were dwindling with 9.5% as
excellent, 24.75% very good, 32% good, 21.25% fair and 12.25% poor. As to how
best the working facilities enhance performance of workers, 37.25% of the workers
said their productivity had improved by the use of working facilities, 48% indicated
that their productivity is fairly enhanced and 14.75% perceived a no effect of the
working facilities.
Source of Water Supply
The need for water in office buildings is very fundamental. 58.25% of the workers
said water board is the source of their water supply, 27.5% for water Vendor (Mai-
ruwa), while both private borehole and well as sources of water accounted for 14.25%.
This shows an average effort of government agency responsible for water supply in
areas where the selected public buildings are situated.Rather disheartening to find out
that reasonable percentage of the workers still depend on water vendors, private bore
hole and well for sources of water instead of public mains
Post occupancy evaluation
801
Source of Electricity
Power Holding Company of Nigeria(PHCN) and genators are the main sources of
electricity across the 14 public buildings sampled. 89.75% of the workers said that
PHCN is their source of power, while 10.25% indicated that it was generator. 64.5%
of the workers rated electricity from PHCN to be highly frequent as they have
electricity everyday. 28.75% rated the frequency to be several days a week, 5.5%
rated the frequency to be once a week while 1.25% were highly dissatisfied with the
level of electricity supply by PHCN as this percentage hardly have electricity. It has
been observed that the state of electricity in the country as a whole is receiving
attention.
Availability of Social Infrastructure
The availability of clinics around the sampled public buildings is our pre-occupation
here. 43.25% of the workers said clinics are available in close proximity while 56.75%
said clinics are not available nearby. In essence, workers that fall in the latter category
in cases of feverish systoms will have to leave their offices and in most cases go afar
to take care of themselves.
Space allocation
Space management ensures that the quantity and quality of space in a building or
buildings meet up to an established standard, so that it is supportive to the changing
demands of the organisation through time in a cost effective way. The main issue that
often arise with space allocation are the needs of flexibility and adaptability for
different users. In this research, 41.25% of the workers rated space allocation to be
adequate, 34% said it is inadequate and 24.75% were indecisive.
Level of satisfaction with office environment
19% of workers are highly satisfied with the office environment and 18.75% of
workers dissatisfied. 28.75% of the workers sampled are satisfied with their office
environment while 33.5% are fairly satisfied.
Relationship between level of workers satisfaction and their work environment
Tables 2 and 3 give the summary of the regression model and ANOVA indicate that P
– value of 0.240 is greater than 0.05 level of significance, thus we reject the null
hypothesis and accept the alternative hypothesis which states that there is no
significant relationship between the level of workers satisfaction and their working
environment. Although, the four variables as seen in model 1 of regression model
summary table account for 42.6% of the level of satisfaction among workers in the
public buildings, these four variables are not significant predictors since P-value of
0.240 as shown in both the regression model summary table and ANOVA table is
greater than 0.05 level significance. The unexplained factors can be attributed to other
factors.
DISCUSSION
Effective facilities management at work place, specifically public buildings in Minna
has been established as non significant in workers‘ satisfaction. This is contrary to the
work of Khalil and Husin (2009) at the golden triangle area in Kuala Lumpur, where
majority of the respondents indicated that their work productivity is affected due to
poor indoor environments. Similar to general theory of better working facilities
leading to high productivity, source of water supply and space allocation in this
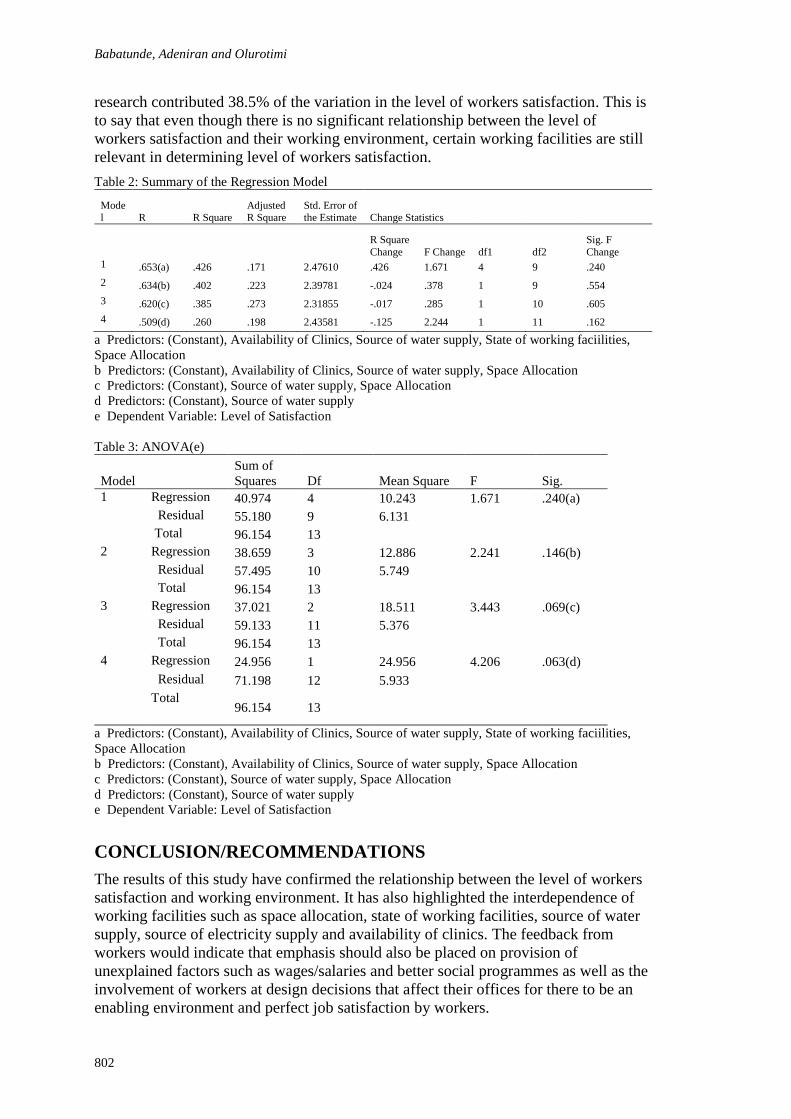
Babatunde, Adeniran and Olurotimi
802
research contributed 38.5% of the variation in the level of workers satisfaction. This is
to say that even though there is no significant relationship between the level of
workers satisfaction and their working environment, certain working facilities are still
relevant in determining level of workers satisfaction.
Table 2: Summary of the Regression Model
Model R R Square
Adjusted R Square
Std. Error of the Estimate Change Statistics
R Square
Change F Change df1 df2
Sig. F
Change 1 .653(a) .426 .171 2.47610 .426 1.671 4 9 .240
2 .634(b) .402 .223 2.39781 -.024 .378 1 9 .554
3 .620(c) .385 .273 2.31855 -.017 .285 1 10 .605
4 .509(d) .260 .198 2.43581 -.125 2.244 1 11 .162
a Predictors: (Constant), Availability of Clinics, Source of water supply, State of working faciilities,
Space Allocation
b Predictors: (Constant), Availability of Clinics, Source of water supply, Space Allocation
c Predictors: (Constant), Source of water supply, Space Allocation
d Predictors: (Constant), Source of water supply
e Dependent Variable: Level of Satisfaction
Table 3: ANOVA(e)
Model
Sum of
Squares Df Mean Square F Sig.
1 Regression 40.974 4 10.243 1.671 .240(a)
Residual 55.180 9 6.131
Total 96.154 13
2 Regression 38.659 3 12.886 2.241 .146(b)
Residual 57.495 10 5.749
Total 96.154 13
3 Regression 37.021 2 18.511 3.443 .069(c)
Residual 59.133 11 5.376
Total 96.154 13
4 Regression 24.956 1 24.956 4.206 .063(d)
Residual 71.198 12 5.933
Total 96.154 13
a Predictors: (Constant), Availability of Clinics, Source of water supply, State of working faciilities,
Space Allocation
b Predictors: (Constant), Availability of Clinics, Source of water supply, Space Allocation
c Predictors: (Constant), Source of water supply, Space Allocation
d Predictors: (Constant), Source of water supply
e Dependent Variable: Level of Satisfaction
CONCLUSION/RECOMMENDATIONS
The results of this study have confirmed the relationship between the level of workers
satisfaction and working environment. It has also highlighted the interdependence of
working facilities such as space allocation, state of working facilities, source of water
supply, source of electricity supply and availability of clinics. The feedback from
workers would indicate that emphasis should also be placed on provision of
unexplained factors such as wages/salaries and better social programmes as well as the
involvement of workers at design decisions that affect their offices for there to be an
enabling environment and perfect job satisfaction by workers.

Post occupancy evaluation
803
If source of water supply and space allocation which contributed 38.5% of the
variation in the level of workers satisfaction coupled with other factors such as
wages/salaries as well as better social programmes are adequately addressed, it is
likely that the level of workers satisfaction would increase. Building owners (local,
state and federal governments) as a result of the findings of this research should know
that attention needs to be directed at future upgrade of internet and water supply so as
to ensure that these facilities are adequate and the reasonable expectations of workers
are met. The attention the power sector is receiving in the country at the moment is a
right step in the right direction. However, efforts should be intensified by the federal
government so that adequate power supply in all the states of the federation will be a
dream come through. Managers of government public buildings are encouraged to
discuss office etiquette on a frequent basis at team meetings. As building designers
have building users opinion in an appropriate format, they can reduce guesses about
what is important to occupants and the building owners will be able to adjust their
practices to suit new buildings.
REFERENCES
Ayoola, A.B and Davies, O.T (2006). Post Occupancy Evaluation of the Nigerian Television
Authority, Minna, Niger State. Unpublished Thesis submitted to the Department of
Esta Management, Federal University of Technology, Minna.
Carthey, J (2006). Post Occupancy Evaluation: Development of a standardised Methodology
for Australian Health Projects, The International Journal of Construction
Management Department of General Services (2003). Facility Performance
Evaluation, State of California.
Khalil, N and Husin, H.N (2009). Post Occupancy Evaluation Towards Indoor
EnvironmentImprovement in Malaysia‘s Office Buildings. Journal of Sustainable
Development, Vol.2, No.1
Office Accomodation Management Framework (2009). Undertaking a Post Occupancy
Review of Office Accomodation Projects.
Preiser W.F.E., Rabinowitz H.R. and White E.T.(1988). Post Occupation Evaluation,Van
Nostrand Reinhold Company, New York.
Prieser, W.F.E (1999). Post Occupancy Evaluation – Conceptual Basics, Benefits and Uses.
Van Nostrand Reinhold Press, New York.
Watson, C.G (1996). Evolving Environmental Ideas; Changing Ways of Life, Values and
Design Practices. A Paper for IAPS 14 Conference in Stockholm on July, 30.
Zimring, C; Rashid, M & Kampschroer, K (2010). Facility Performance Evaluation.
http://www.wbdg.org/ccb/ ; http://www.wbdg.org/index.php
Zubairu, (2010). Introduction to Facilities Management, Lecture notes for M.Tech Students,
Federal University of Technology, Minna, Niger State, Nigeria.


Bolaji, S. (2011) Public private partnership (PPP) in housing delivery in Niger State: Case for low and
medium income earners In: Laryea, S., Leiringer, R. and Hughes, W. (Eds) Procs West Africa Built
Environment Research (WABER) Conference, 19-21 July 2011, Accra, Ghana, 805-805.
805
PUBLIC PRIVATE PARTNERSHIP (PPP) IN HOUSING
DELIVERY IN NIGER STATE: CASE FOR LOW AND
MEDIUM INCOME EARNERS
Suleiman Bolaji1
Quantity Surveying Department, Federal University of Technology, Minna, Nigeria
The problem of providing adequate and qualitative housing for Nigerians, especially
the low and medium income groups has been the concern of both the government
[public housing developers] and many individuals [private developers] since
independence. However, not until recent times, when the world attention is drawn to
the practicability of a symbiotic relationship between government policies, plans and
programmes and private pragmatic project implementation approach that the PPP
became a topical issue. Government of Niger State through its agencies, Niger State
Housing Corporation, Niger State Ministry of Housing and Environment etc. has in
the past provided houses for the civil servants and general public, but not in sufficient
quantities. The paper examines how the low and middle income civil servants fare in
the provision of PPP housing in Minna, Niger state capital. A total of three hundred
(300) questionnaires were administered to workers of different grade levels in the
Federal, State, Local government ministries and parastatals, including police and
para-military agencies in Minna. Data obtained were analysed using relative
frequency distributions. The result reveals that PPP could be a viable method of mass
housing delivery, with modification for peculiarities of the low and middle income
earners and that primary mortgage institutions are yet to perform their expected role
of providing housing loans to the majority of the civil servants in the state.
Keywords: developer, housing, mortgage, Public Private Partnership, Nigeria.


Taiwo, A.A. and Adegun, O.B. (2011) Public-private participation in housing in Nigeria and the case
for community participation In: Laryea, S., Leiringer, R. and Hughes, W. (Eds) Procs West Africa
Built Environment Research (WABER) Conference, 19-21 July 2011, Accra, Ghana, 807-815.
807
PUBLIC-PRIVATE PARTICIPATION IN HOUSING IN
NIGERIA AND THE CASE FOR COMMUNITY
PARTICIPATION
Abraham A. Taiwo1 and Olumuyiwa B. Adegun
2
Department of Architecture, Federal University of Technology, PMB 704 Akure, Nigeria
Collaboration between the public and private sector towards mass delivery of low-
income housing is a relatively new policy initiative in Nigeria. This initiative of
partnership has been widely embraced and employed in a number of housing schemes
across the country in the recent past. Three of such schemes which represented
partnership between state government and private developer and the federal
government and private developer were chosen as case studies. They are, Sunshine
Gardens and HOB Estate, both in Akure and the Doma road Estate in Lafia. The
absence of community/beneficiaries‘ participation in the schemes was discovered
from the study. This absence impinged on the overall performance of these shelter
projects. A case was therefore made for community/beneficiaries‘ participation
throughout the stages of the public-private partnership for low-income housing. The
advantages of this third partner should be exploited to improve success on the present
and future housing schemes.
Keywords: community participation, housing, public-private partnership.
INTRODUCTION
Nigeria is experiencing a high rate of urbanisation. The swelling populace in the
rapidly extending cities do not have adequate supply to basic infrastructural facilities
especially decent housing. To tackle this deficit, successive governments have evolved
various policy approaches to deliver mass and affordable housing for the different
class of citizens especially the low-income group. A notable feature in the recent past
in terms of delivery mechanism is Public-Private Partnership (PPP). PPP originally
entails the provision of public assets and services through collaboration between the
government and private sector. Grimsey and Lewis (2005) opined that PPP generally
fill the space between traditionally procured government projects and full
privatisation. The application of PPP in various sectors of the economy is becoming
increasingly popular in Nigeria as well as other developing economies. For housing,
PPP has been embraced widely and employed in a number of low-income housing
schemes across Nigeria.
Granted that this paradigm of partnership is on course and growing, what kind of
arrangement is obtainable on these projects? How do these arrangements include the
participation of all necessary stakeholders so as to achieve the goal of delivering
adequate, appropriate and affordable houses? This paper delves into the place of

Taiwo and Adegun
808
community/beneficiaries‘ participation in PPP arrangement for low-income housing in
Nigeria.
PRIVATE SECTOR PARTICIPATION IN HOUSING IN NIGERIA
The private sector‘s participation in housing in Nigeria comprises both the formal and
informal segments. Small-scale private landlords in rental housing dominate the
informal sector supply of urban housing as noted by Ikejiofor (1997). The greater part
of houses produced by this sector are non-conventional, they do not comply with
established procedures and are frequently contravening existing legislation, (Olotuah
2005). The formal segment of the private sector constitutes corporate institutions who
are involved in direct large scale production and delivery of housing units. The
collaborative effort between this sector and the government is generally believed to be
beneficial as Li and Akintoye (2003), Austin (2008) among others noted that it
enhances government capacity to develop integrated solutions, facilitates creative and
innovative approaches thus reducing cost and time spent to implement project,
transfers certain risk to the private project partner, attracts larger productivity and
more sophisticated bidders to projects while providing avenue to access better skills,
expertise and technology.
As a Policy Initiative
Private sector participation has been a highlight in Nigeria‘s housing policy
documents. A shift in policy initiative came in response to propositions by various
scholars and stakeholders. Government‘s earlier direct provider approach have been
criticised in terms of meeting the need of target groups, transparency in project
implementation, scale of production achieved (Keivani and Werna, 2001), financial
constraints, affordability and cost recovery. A new housing policy evolved in 2002
from the document produced by a Presidential Committee on Housing and Urban
Development. The extant policy had the primary goal of ensuring that all Nigerians
own or have access to decent, safe and affordable housing accommodation. The
features of the policy influenced the establishment of certain institutional apparatus
such as the Federal Ministry of Housing and Urban Development (FMHUD),
restructuring of the Federal Mortgage Bank of Nigeria (FMBN), review of critical
laws relevant to housing and so on.
A novel policy feature which is in the direction of serious private sector involvement
was the formation of Business Development Department in the Federal Ministry of
Housing and the establishment of the Real Estate Development Association of Nigeria
(REDAN). The former is the division that deals with partnership issues while the latter
is umbrella body of the various individual players(developers) in private sector
housing development. State governments across the country also evolved institutional
frameworks to facilitate partnership with the private sector.
Public-Private Partnership Model
The model of PPP in housing in Nigeria is largely similar to what obtains in Malaysia,
(Abdul-Aziz and Kassim, 2011), Australia (Thomas, 2009) South Korea (Choe, 2002)
and India (Awil and Abdul-Aziz, 2006, Segpunta, 2005). Its emergence can be traced
to the broader Nigeria National Privatisation Policy and shift towards structural
adjustment in the national economy.
Asegiemhe (2007) identified the following operational modes and development
process of PPP in housing through his study of Lagos State Property Development
Company (LSDPC): a) conception or demand for the project b) site identification c)

Housing
809
preliminary development appraisal- feasibility and liability analysis d) development
programme e) appointment of professional team f) contract award g) actual
construction h) completion and disposal of the project and i) profit sharing.
The private developer is expected to perform all development task- design, finance
and construct the housing units. The public sector, that is, government agency would
normally contribute the land, provide counterpart funding, and determine the housing
type and selling price. Abdul-Aziz and Kassim (2011) outlined the role of public
agencies in this form of partnership. They include that of ‗regulator‘ (Leung and Hiu,
2005), ‗enabler‘ by providing enabling environment for the private developer
(Segpunta, 2005), ‗moderator‘ by balancing market incentives with community
interests, ‗facilitator‘ by assisting in project completion and reducing developers risk
(Lynch, Brown and Baker, 1999). These are unlike the erstwhile previous ‗provider‘
role whereby the government involves itself in direct construction and production of
houses (Ogu and Ogbuozobe, 2001). The variety of the roles identified in the former is
a function of the level of involvement of the government and other stakeholders
especially the beneficiaries. The touted value of community participation makes any
arrangement that involves the community of beneficiaries in part or entire project
process noteworthy.
COMMUNITY PARTICIPATION IN HOUSING
The idea of community participation has been so widely expressed (Davidson et al
2007) that it may not seem to mean anything clearly distinct anymore. The term
‗Community‘ has been used to refer to a neighbourhood, a slum, a group of local
NGOs, a group of militant leaders, the residents of a small town, a workers‘ union, a
group of women, etc. It however depicts a group of people that can benefit from any
development project and in this context the terms beneficiaries‘ participation and
community participation are used to mean the same thing.
A ‗ladder of community participation‘ defines a continuum of approaches for how
organisations seek community involvement in housing projects. This ladder was
originally proposed by Arnstein (1969) and was later modified to fit the context in
developing countries by Choguill (1996). (Davidson et al 2007) adapted it from these
two authors as shown in Figure 1 below. The ladder depicts that approaches at the top
of the ladder empower people in important decision-making roles or offer
collaboration with communities, thus promoting community control over the project.
On the bottom end of the ladder, beneficiaries may be consulted about their needs and
wants (with no assurance that these will be taken into account), merely informed about
the shape the housing project will take or even manipulated into taking part in the
project. As Choguill (1996) and Arnstein (1969) argue, these cannot really be
classified as ‗participation‘ because the users will have little or no control over
decision-making (Davidson et al 2007).
It is largely accepted that stakeholder participation brings important benefits for
construction projects (Chinyio and Olomolaiye, 2010; Friedman and Miles, 2006;
Walker et al., 2008). As observed in some African cities (Uduku, 1994), the support of
the urban populace is necessary for the development and provision of many aspects or
infrastructure services. One possible way of achieving this is through some form of
stakeholder partnership, Ogu (2000); and one major stakeholder in a housing project
are the beneficiaries.

Taiwo and Adegun
810
Figure 1. Ladder of Community Participation adapted from Arnstein (1969) and Choguill
(1996) by Davidson et al., (2007).
RESEARCH METHOD
The method adopted follows the case study methodology. This approach involves
careful and complete observation of the concerning unit in minute details and then
from the case data generalisations and inference are drawn (Kothari, 2004). Three case
studies which represented partnership between state government and private developer
and the federal government and private developer were chosen. They are Sunshine
Gardens and HOB Estate, both in Akure, Ondo State. The third one is Doma road
Estate in Lafia, Nassarawa State. The research involved a longitudinal collection of
data from March 2006 to February 2011. The non-chronological sequences of
activities involved are:
Visits to low-cost housing projects delivered through PPP. Study and collection of
drawings indicating building design and site layout, project report, notes and picture.
Non-participant observation also took place which allowed the researchers learn
directly from their own experience of the setting.
Visits to offices (out of site) of the project partners. The offices included that of the
Federal Ministry of Housing and Urban Development (FMHUD), Ondo State
Development and property Company (OSDPC) and other representative of the public
and private sector. Collection of data through interview and taking of notes.
Unstructured interviews and informal meetings were held with personnel involved in
the project. This cut across public servants who are representing government interest,
officers/representative of private developers, contractors and professionals involved in
the scheme.
Search for all publications (advertorial, articles, website, and press releases) that relate
to any one of the projects studied.
Interactions with some individuals who fall within the beneficiaries/target group of the
housing units developed. This yielded information that helped to ascertain the needs,
expectation and involvement during the different phases of the projects
Condensation of research results and analytical generalisations as opined by Yin
(2003).
Following the case study research method proposed by Proverbs and Gemeson (2008),
triangulation method was used to ascertain the integrity of the information collected.
Information on the project discussed in case study 3 was derived from Ahmed et al
(2010) having utilised similar methods to the ones stated above.
Housing
811
Case Study 1- HOB Housing Estate, Akure, Ondo State
Sometime in August 2005, the Federal government of Nigeria signed MOU with
private developers for the construction of housing units across the country.
Development of the above estate was undertaken by the real estate arm of HOB
Nigeria Ltd in partnership wit Federal Ministry of Housing and Urban Development
under the Partnership and Business development programme. HOB is a private
company involved in human and infrastructural development, educational
advancement, telecommunication, automobiles and housing development. It is a
registered member of the Real estate developers association of Nigeria REDAN. The
official handing over of the project site by the honourable minister took place on 15
December, 2005 at Igbatoro road Akure. Funding for the scheme it is learnt was from
institution lenders with particular reference to the Federal Mortgage bank of Nigeria.
The housing scheme was targeted at the low-income group especially the public
servants in the Akure Metropolis. The estate is located directly behind the Federal
Secretariat Complex and adjacent to the Nigeria Police State headquarters as well;
thus making that area to hold the largest concentration of offices of federal public
servants in the state. There are three mode of acquiring any of the dwelling unit. The
first is outright payment, then instalment payment within one year and payment
through Mortgage finance. Contributors to the National Housing Fund through
accredited Primary Mortgage Institution PMI can make installmental payment that
span twenty-five years.
New Dimension Consultants, an architectural firm undertook the design for the estate
in 2005. The 29.9 hectares of land was designed in 110 blocks and 314 units of 2-
bedroom semidetached, 3-bedroom detached and 3-bedroom semi-detached dwelling.
Other supporting facilities include school, religious centre, petrol station,
administrative building, recreation spaces etc. A scheme is only on its first phase
which has seen the construction and delivery of only 3-bedroom detached units.
Different building contractors were engaged by the developer to handle construction
of the units in this phase. Taiwo and Adegun (2010) reported that less than seventy
units of this have actually been delivered in the scheme while others are under
construction though no construction work was seen to going on as at the time of their
study. Some of those delivered have already been sold, allocated and occupied.
Case Study 2- Sunshine Gardens, Oba Ile, Akure, Ondo State
The Ondo Sate Government through the Ministry of Lands and Housing entered into a
strategic partnership wit Locke Homes Ltd, a Lagos-based real estate company in
2009 to develop low-cost housing scheme for the Akure urban populace. The housing
estate is located on a land earlier earmarked for housing development which is also
beside the existing Oba-ile housing estate. PMG Nig. Ltd undertook architectural
design and site layout for the estate in three typologies to a total of 405 dwelling units.
Other facilities proposed are sport centre, police post, shopping mall and other
communal facilities.
This phase of the scheme was developed in the three typologies - namely Liberty,
Diamond, and Starlet. Liberty is 3-bedroom detached dwelling unit with all the rooms
en-suite. Diamond is also a three bedroom detached dwelling unit wit only the Master
Bedroom en-suite. Starlet is a two bedroom semi detached dwelling unit. There are
three mode of payment for any of the unit. The first is outright payment, then
instalment payment within one year (10% initial payment, 30% for provisional
allocation, and the rest 60%). Payment is also possible through Mortgage finance; that
Taiwo and Adegun
812
is the National Housing Fund. Other payments include a 5% of the selling price as
agency fee and 5% also as VAT.
Case Study 3- 500 Unit Estate, Lafia, Nasarawa State
On inception in October, 2007 the Administration of Governor Aliyu Akwe Doma
signed a Memorandum of Understanding (MoU) with CHIPA Nig. Ltd. for the
construction of 500 housing units in Lafia, the Nasarawa State Capital through PPP.
Chipa Nig. Ltd. was selected out of the numerous bidders due to their track record in
similar projects and a strong company profile. The housing scheme was developed in
200 blocks of 3-bedroom detached bungalow and 150 blocks of 2-bedrrom
semidetached units. This makes a total of 500 dwelling units. The scheme was
targeted at civil servants in the State capital.
The agreement provides that Government will shoulder the following as its
contribution to the joint venture: (i) Land with secured tenure, (ii) Access road, Water
Supply, Electricity Supply (off and on the site). The State Government secured a 58–
hectare piece of land along Doma road, in Lafia for the development. Having paid
compensations to the land owners, the land was cleared and handed over to the
developer for the commencement of construction. The Certificate of Occupancy (C of
O) was also issued the developer to facilitate mortgage transactions. The C of O is
under lease tenure of 99 years to be sub-divided among beneficiaries on completion of
the housing estate. The remuneration to Government and other parties in the joint
venture shall be based on pro-rata of contribution to the total project cost. The State
Government signed a contract with a construction company to provide the earlier
mentioned infrastructural services for the estate.
The mortgage arrangement will involve the sourcing of NHF loan from the federal
Mortgage Bank of Nigeria (FMBN) through a PMI at an interest rate of 6% on behalf
of interested civil Servants. The loan would be utilized by the allottee to purchase the
houses from the developers. The developer is to secure the facility for the Civil
Servants in consultation with the office of the Head of Service and an accredited
Primary Mortgage Institution to ensure effective mortgage transaction. The
developer‘s designs and specifications were harmonized with similar designs earlier
prepared by Ministry of Works, Housing and Transport to arrive at costs for the 3-
Bedroom and 2-Bedroom semi-detached houses.
Absence of Beneficiaries’ Input
The study indicated that the organizational structure in the projects excludes the
participation of the beneficiary group at the various stages: management, financing,
design, construction and assembly of components. It was only an affair between the
government ministry/parastatal in charge of housing and the private organization
(developer). The Nigeria Labour Congress (NLC) was to stand in for civil servants in
the MOU signed for case 3. This community of government workers was however
denied participation in the scheme intended for them.
The architectural design and layout of the units did not take adequate cognizance to
the ‗incremental‘3 characteristic of low-cost housing; a factor which can be addressed
with timely and appropriate beneficiaries‘ participation. There is no permission for
external alteration on any of the buildings after they are purchased. Provision for
3 The incremental factor refers to the evolutionary process (horizontal and vertical expansion of the
units) in response to the problem of inadequate space, household dynamics and growth, exploration of
economic possibilities.

Housing
813
physical development to accommodate household growth and dynamics is limited to
the erection of another structure behind the existing building in the little setback
provided at the rear of each building. This is averse to the nature of low-cost housing
in a developing economy, it impedes the achievement of self-help initiative and
citizen empowerment and does not adduce towards sustainable development.
The entire housing schemes studied are relatively new and the housing units delivered
have been barely occupied, the place of community participation at the post-
occupancy stages was therefore not looked into. These housing schemes delivered
through PPP are devoid of meaningful participation from the beneficiary groups. The
same situation applies to majority of the housing scheme delivered through PPP across
the states in the country; though the cases discussed above have not been proved to be
truly representational. The finding corroborates Taiwo and Adegun (2010) position
that although progressive strides are discernable in terms of addition to the existing
housing stock, the present arrangement of PPP needs to be fine-tuned to improve
affordability, project execution among other issues.
Case for Community Participation
On PPP in housing Segpunta (2005) opined that the government will have to pave the
way for a constructive expansion of partnership to include community participation
without stifling producer productivity and competitiveness. This will, however require
the balancing of market incentives with community interests. Alongside policies,
capacity building efforts will be needed to increase awareness and change attitudes to
the formation of what Jain (2003) called Public–Private–Peoples Partnerships. The
fact is that low-income housing development will require a careful ―articulation of
multiple participants‖ (after Lizarralde, 2011) – private, public and communal.
A South African example was noted by Lizarralde (2011) where in order to respond to
the difficulties of integrating beneficiaries in the development of subsidized housing,
the program adopted a participatory approach called People Housing Process (PHP).
Contrary to developer-driven approaches, in PHP housing projects, community based
organizations which might take the form of Community Development Co-operatives
(McEwan, 2003), lead the process of housing procurement with the support of
Community Support Organizations (CSO), which are often NGOs involved in
development and community empowerment.
CONCLUSION
PPP has been embraced and employed as a means of delivering housing to the low-
income group in Nigeria. The discussions made and cases studied have shown this.
Through this arrangement additions have been made to the existing housing stock
across the nation‘s urban centres. The arrangement has however excluded any
meaningful participation of the beneficiaries in the implementation of these shelter
projects.
It has also become clear that there is need to restructure these partnerships to
incorporate beneficiaries input as exemplified in community participation.
Community participation in PPP however would not be an end in itself but a means to
an end, which is, providing mass, decent and affordable houses. There is no single
model for participation that would fit into the different kind of schemes taking place in
the country; since there are varying participants and contexts. Further study would
then be helpful to determine what kind of participation, at what stage, what kind of

Taiwo and Adegun
814
input among other variables would help to achieve better housing projects for the low-
income group.
ACKNOWLEDGEMENT
The authors are grateful to Dr. Gonzalo Lizarralde of IF Research group, University of
Montreal, QC, Canada for making available useful materials for this research.
REFERENCES
Abdul-Aziz, A. R. and John Kassim, P. S. (2011). Objectives, success and failure factors of
housing public–private partnerships in Malaysia. Habitat International. 35(1) pp 150-
157.
Ahmed, M. B., Moohammad, Y. A., and Abubakar, S. U. (2010). Assessing housing delivery
in Nasarawa State through the Public–Private Partnership: Focus on 500 housing units
in Lafia, Nasarawa State. Paper presented at 1st International Conference, Schl. Of
Environmental Tech. Federal University of Technology. Akure. Nigeria. Oct. 23-26.
Arnstein, S. R. (1969). A ladder of citizen participation. Journal of American institute of
Planners, 35(4).
Asegiemhe, I. A. (2007). A study of Public-private partnership in housing delivery in Lagos
State. Unpublished B. Tech. Project. Department of Estate Management. Federal
University of Technology. Akure.
Austin P. M. (2008). Public-private partnership for funding affordable housing development
in New Zealand. Waitakere City Council Report p 5
Awil, A.-U., and Abdul-Aziz, A. R. (2006). Internationalization of Malaysian housing
developers: Case studies from India, South Africa, Cambodia and Australia. Paper
presented at the international real estate research symposium (IRERS), Kuala
Lumpur, 11–13 April.
Chinyio, E., and Olomolaiye, P. (2010). Introducing Stakeholder Management. Construction
Stakeholder Management, 1.
Choe, S.C. (2002). The promise and pitfalls of public–private partnerships in Korea,
International Social Science Journal 54 (172), pp. 253–260.
Choguill, M. B. G. (1996). A ladder of community participation for underdeveloped countries.
Habitat International, 20(3), 431-444.
Davidson, C. H., Johnson, C., Lizarralde, G., Dikmen, N. and Sliwinski, A. (2007). Truths and
Myths about community participation in post-disaster housing projects. Habitat
International. 31. 100-115.
Friedman, A. and Miles, S. (2006). Stakeholders: Theory and Practice. Oxford University
Press.
Grimsey, D. and Lewis, M. K. (2005). Are Public Private Partnerships value for money?
Evaluating alternative approaches and comparing academic and practitioner views.
Accounting Forum 25, 345-378.
Ikejiofor U. (1997). The private sector and urban housing production in Nigeria: A study of
small-scale landlords in Abuja. Habitat International. 21 (4) 409-425.
Jain, A. K. (2003). Actioning new partnerships for Indian Cities. Cities 20(5), 353-359.
Keivani, R., and Werna, E. (2001). Refocusing the housing debate in developing countries
from a pluralistic perspective. Habitat International, 25(2), 191–208.
Kothari, C. R. (2004). Research Methodology. New Age Intl. Publishers. p. 7

Housing
815
Leung, B.Y.P. and Hui, E.C.M.(2005). Evaluation approach on public–private partnership
(PPP) urban redevelopments, Intl. Journal of Strategic Property Management 9(1), 1–
16.
Li B. and Akintoye A. (2003). An Overview of Public Private Partnership. Akintola Akintoye,
Mathias Beck and Cliff Hardcastle (eds) Public Private Partnership: Managing Risk
and Opportunities. ISBN 0-632-06465-X), 1-30.
Lizarralde, G. (2011). Stakeholder Participation and incremental housing in subsidised
housing projects in Colombia and South Africa. Habitat International, 35(2). 175-
187.
Lynch, J., Brown, M. and Baker, L. (1999). Public–private partnerships in transitional land
and housing markets: case studies from Bulgaria and Russia. In: G. Payne, Editor,
Making common ground: Public–private partnerships in land for housing,
Intermediate Technology Publications, London, pp. 168–192.
McEwan, C. (2003). Bringing government to the people: women, local governance and
community participation in South Africa. Geoforum, 34, 469-481
Ogu, V. I. (2000). Stakeholders‘ partnership approach to infrastructure provision and
management in developing world cities: lessons from the Sustainable Ibadan project.
Habitat International, 24, 517-533.
Ogu, V. I. and Ogbuozobe, J. E. (2001). Housing Policy in Nigeria: Towards enablement of
private housing development. Habitat International 25, 473–492.
Olotuah O.A. (2005). Sustainable Urban Housing Provision In Nigeria: A Critical Assessment
of Development Options. Proceedings of the Africa Union of Architects Congress,
23-28 May, Abuja, Nigeria, pp. 64-74.
Proverbs, D. and Gameson, R. (2008). Case Study Research. In A. Kinght and L. Ruddock
(Eds.) Advanced Research Methods in the built environment pp. 99-121.
Sengupta, U. (2005). Government intervention and public-private partnerships in housing
delivery in Kolkata, Habitat International 30 (3), pp. 448–461.
Taiwo, A. A. and Adegun, O. B. (2010). Contribution and Challenges of private Sector‘s
involvement in housing in Nigeria: Case study of Akure. Journal of Housing and
Built Environment. (in the press).
Thomas, H. (2009). The local press and urban renewal: a South Wales case study,
International Journal of Urban and Regional Research 18(2) pp. 315–333.
Uduku, O. (1994). Promoting community based appropriate approaches to social
infrastructure provision in urban areas in Nigeria. Environment and Urbanisation,
16(2), 57-78.
Walker, D., Bourne, L., and Rowlinson, S. (2008). Stakeholders and the supply chain. In:
Procurement systems‟cross industry project management perspective (pp. 70-100).
Yin, R. K. (2003). Case Study: Design and Methods. Sage.


Obiozo, R. (2011) Regeneration of biophilic architectural concepts and psychosocial values in building
design In: Laryea, S., Leiringer, R. and Hughes, W. (Eds) Procs West Africa Built Environment
Research (WABER) Conference, 19-21 July 2011, Accra, Ghana, 817-817.
817
REGENERATION OF BIOPHILIC ARCHITECTURAL
CONCEPTS AND PSYCHOSOCIAL VALUES IN
BUILDING DESIGN
Rita Obiozo1
Department of Architecture, Enugu State University of Science and Technology, Enugu, Enugu State
Nigeria
On reflecting on the various settings and experiences of our lives today, we should be
able to find some fairly close matches between characteristics we like that would have
improved our chances of survival. In our course we perceive that the natural
contiguous keeps us healthy and in turn probably promotes physical performance as
well. Occupants of built environment do not want to work, play, eat or sleep in a
functional building. They want to be inspired, invigorated, comforted and reassured
by their surroundings. We want spaces that will make them more appropriate and
comfortable. In sum buildings that celebrate the local microclimate, topology,
vegetation, hydrology and material resource. Biophilic Architecture offers an exciting
opportunity to achieve environmental, moral and economic benefits. It is an
investigation into nature based designs that merge the interior with the exterior; a
natural blend between landscape architecture and interior design. Green architecture -
an ecostyle that identifies with the characteristic manner of nature referred to as
biophilia. It is an investigation into the psycho-evolutionary framework of the origin
of shelter. Why is it that some environments heal us while others do not?
Conclusively, it will involve breaking up the nature of architectural design of the
workspace involving identification of key elements that increase optimal productivity
of the occupants of our buildings. The ultimately resulting is a more effective built
environment that has both physiological and psychological impact, determining that
the design of human communities affect human health and productivity.
Keywords: biophilia, green architecture, therapeutic garden, living building,
psychosocial.


Lawal, L.A.T. (2011) Reinventing prototype buildings: The significance of prefabrication in mass
housing construction In: Laryea, S., Leiringer, R. and Hughes, W. (Eds) Procs West Africa Built
Environment Research (WABER) Conference, 19-21 July 2011, Accra, Ghana, 819-825.
819
REINVENTING PROTOTYPE BUILDINGS: THE
SIGNIFICANCE OF PREFABRICATION IN MASS
HOUSING CONSTRUCTION
Lateef A.T. Lawal1
Department of Architecture, Federal University of Technology PMB 65 Minna, Nigeria
Increasingly, high quality housing remains a problem of the housing industry.
Compared to the feat recorded by electronic and automotive industries, most
prototype mass housing generally reveal a great deal of variability in the end
products. which differs greatly from the original model. The variability is manifested
in building components such as walls, floors and finishes, which compromise both
quality and uniformity. Prefabrication is considered as a better approach to the
production of mass housing. .A number of visits was made to mass housing
construction sites in Minna, capital of Niger State, Nigeria to assess discrepancies of
work in the prototype buildings. A model prefab system was highlighted and other
applications of innovative methods and techniques especially at the Massachusset
Institute of Technology (MIT) House_n Research Consortium on open source
buildings were discussed. The approach can engender high quality construction,
increase standardisation of repetive work and reduce time spent on construction.
Keywords: mass housing, prefabrication, prototype, quality.
INTRODUCTION
In an age where increasingly, it is difficult to have high-quality houses, a need thus
arise to explore innovative and unconventional method of housing construction (Singh
et al, 1999). There is immense housing shortage that is yet to be constructed globally.
Yet, many existing mass housing stocks generally fall short of quality in their
erection. According to Singh et al (1999), the world is in short supply of about 200
million dwellings. In Nigeria, the housing stock to be constructed is estimated to be
about 16 million (Federal Housing Authority, 2011). Peterside (2005) notes that an
average of 1 million housing units will need to be constructed annually to replenish
decaying housing stock and to meet rising demand. In effect, this constitutes a
gigantic task to be accomplished considering that only about 10,000 housing units are
constructed on an annual basis (Adejumo, 2008). The seeming failure of delivering
adequate quality housing coupled with the housing shortages requires that new
housing construction for the future needs to adopt innovative method and enlightened
production management that will detach from the conventional method of production
of mass housing.
It is frequently observed that mass housing construction predominantly has a deluge of
prototype buildings. Their designs are tailored in manners that reflect simplicity and
flexibility. This is important for the simple reason of mass-producing for different
owners.

Lawal
820
Fig 1: Prototype buildings in Minna showing variations of building components.
Source: Author Field work, 2011
The aim thus, is to have economies of scale for mass production and save time in
construction. Ironically, this is often not the case since a great deal of prototype
buildings shows marked variability among the building components such as walls,
columns, roofs and finishes: these do not only affect quality but also compromise
uniformity among individual building prototype. (For instance, see Figure 1).
This is primarily due to lack of standardisation in the production method as compared
to feat recorded in electronic and automotive industries. Incidentally, mass housing
construction is still fragmented, resistant to change, labour intensive, inefficient,
unresponsive, and slow to embrace new technologies of construction. According to
MIT white paper on Open Source Building Alliance (OSBA), the industry is way
behind other industries in the adoption of new process and technology innovations. It
is thus imperative to examine how prefabrication can help to bring about efficient
erection method that promotes high quality production of mass housing in Nigeria‘s
construction industry.
OBJECTIVES
The objectives of this paper are to bring to fore the concept of prefabrication
technology that is fast and cost-effective for the production of mass housing in
Nigeria. This could further reduce wastages, guarantees accuracy, standardisation, and
robust production.
RESEARCH METHOD
The research reported in this paper involves series of visits to mass housing
construction sites in Minna, capital of Niger State, Nigeria. Primarily, on the spot
physical observations were made involving random survey of the housing units. This
paper focused on the elements of physical variability recorded in the housing units
such as walls, floors, columns and beams variability. The paper also relies on a

Prototype buildings
821
literature research covering the Open Building Approach at Massachusset Institute of
Technology (MIT) House_n Research Consortium for mass housing.
THE CONCEPT OF PREFABRICATION FOR MASS HOUSING
Prefabrication is a method employed for the manufacture of components such as
panels or in modules that can be disassembled and transported to site for purposes of
construction. Prefabrication‘s root lies in ancient Egypt as an ingenious method by
which boat makers of that era attempted to standardise their craft (McQuaid, 2003).
Nevertheless, experimentation by architects and engineers in prefabricated housing
systems only began in the late nineteen century and gained momentum after Henry
Ford‘s mass production of the Model T in the early twentieth century (McQuaid,
2003; Batchelor, 1994). McQuaid (2003) describe prefabrication as the manufacturing
and assembly of standardised parts prior to construction; these parts are later
transported and assembled at a specific site. Thus, a prefabricated construction is ―a
quick and clean method of construction in which components or groups of
components are made under workshop conditions and transported to site for
installation. (Jokiniemi and Davies, 2008).
As pointed out by Phillipson (2001), prefabrication, whether full volumetric
application or based at component level, need only affect the construction process and
not the end-product. The use of prefabrication offers an alternative way to procuring a
building, which comes with opportunities and benefits due to change in the
construction process. The benefits of using prefabrication include may thus be
summarized as follows:
1. Higher quality products for clients;
2. Improved productivity and profitability for contractors;
3. Environmental benefits associated with its use.
However, the quality of construction works by the builders perhaps has not yielded
much in terms of expected quality output. This explains a need for prefabrication in
which standardisation plays a significant role in mass housing construction. The
experience from automotive and electronics industries could be apposite because
buildings are also products that people (customers) would buy, rent and expect
optimum users‘ satisfaction
OVERVIEW OF PREFABRICATION IN MASS HOUSING IN
NIGERIA
There have been a limited number of mass housing construction sites involving the
application of prefabrication. Among the few ones, is the Dolphin Estate in Lagos
where precast panels were employed for the construction of the dwelling units (Alade,
2010). Similarly, Olusanya (2003) proposed the first documented prefabricated
housing impliedly in the form of interlocking masonry, comprising of 60-unit housing
experimented in 1991 at the University of Lagos. The system features a prototype
design that represents a ―marriage of architecture design, materials and technology‖
where the product and the process was made as an integral whole.. This effort,
although very minimal has developed into an urban housing prototype with public
patronage in an industrial scale where a 60-unit housing estate for Home Ownership
Scheme of Lagos State Government Staff Housing Board, in Alausa was constructed (
Olusanya, 2003). Thus, it offers a strategic approach to housing delivery in Nigeria
(Adedeji and Ajayi, 2008). Recently too, a move has been initiated by a firm known as
Structuracasa International LLC.construction firm into the Nigerian housing industry

Lawal
822
with a new building technology aimed to mass-produce housing at reduced cost and
increased speed. The technology known as modular system rested on the use of
prefabricated aluminum frames for mass housing. (http://www.structuracasa.com)
Already, this effort has culminated in the signing of memoranda between the firm and
some state governments in Nigeria.. Notably, this system of mass housing has been
successfully applied in Mexico, Brazil and elsewhere.The acceptability of this
innovation is gaining momentum in India and presents a different approach to modern
construction especially for mass housing in Nigeria. Above all, the implementation of
prefabrication in Nigeria‘s construction industry has been very minimal with generally
few construction industries showing interest in the use of prefabrication and
standardisation techniques aim at improving productivity. There is therefore a need to
move towards leaner construction.
A MODEL PREFAB SYSTEM APPLIED TO CONSTRUCTION
Since the system is firstly developed to tackle much-accustomed problems of quality
and standardisation in mass housing construction, therefore it should present a unique
set of approaches that aim at providing lasting solution. Singh et al (1999), argued that
for a mass housing to be attractive, three parameters have to be present; first is the
architectural flexibility; second manufacturing flexibility and third is the erection
flexibility. These are vital for an agile production. Further, architectural flexibility is
essential so that each dwelling unit can be of different design to address monotony
typical of mass housing.
Singh et al (1999) detailed a prefabricated modular housing, which has a fully
embedded cam-nut/cam-screw for the joining of concrete components. The approach
allows for easy repetition of work tasks for shell erection that can be undertaken using
a single crew. The prefabricated system in question has the architectural
characteristics of one and two bedroom units or modules arranged on seven storeys.
The layout can be used to develop larger units as there is in-built architectural
flexibility. The modules can be placed in different locations to cater for various needs.
The modules are also standardized to allow for efficient manufacture (Figure 2).
Further in the model, provision of the mechanical joint such as cam-nut/cam-screw for
the assembly of walls, floors and columns helps to increase the speed and quality of
construction as compared to day-to-day conventional methods. This proves
advantageous because there is ease of assembly of component parts that also
minimises labour use. The cam-nut/cam-screw was adopted mainly because of its
better performance and faster assembly benefit over other methods (Singh, 1998).
The structural characteristics of the system are an all panel system comprising of wall
and floor panels, or slabs. The panel consists of 6‖thick structural section, a 1.5‖ thick
insulation section and a 2.5‖thick facade section. The panels are joined with
mechanical joints along the panel‘s vertical and horizontal edges. The mechanical
joints clamp the panels together with sufficient force to allow them to work together
as a monolithic element. A gasket is placed between each panel and between the
panels and the floor slabs to ensure a weather tight seal.

Prototype buildings
823
General Plan Layout After Singh, et al, (1999)
The floor system consists of solid precast floor slabs, designed as one-way slabs.
These slabs lie on top of the wall panels and are held in place by passing the cam-
screw of the lower wall panel through the floor slab and into the upper wall panel.
CURRENT PREFABRICATION APLLICATIONS IN MASS
HOUSING
Recent development in the housing industry suggests new future for the production of
mass housing. The applications of prefabrication technology are generally yielding
results, notably in the UK and in the United States of America where innovative way
of delivering high quality houses has begun. Currently in the UK construction
industry, prefabrication is being applied to a wide variety of forms and applications
ranging from the simple prefabricated site hut, which has been a long established
application, up to volumetric units that can be delivered to site to integrate into the
structure of the building (Phillipson,2003). Considerably, the types of prefabrication
approaches that can be used include: Volumetric systems; Partial modularization of
components; and Prefabrication of elements of the construction. Modularisation or
modular design has been described as vital to prefabrication. Modular design refers to

Lawal
824
construction using standardised units or standardised dimensions. Again, modular
buildings do not have to be built using prefabrication techniques, but they are usually
involved (Phillipson, ibid)
Further, work by the Massachusset Institute of Technology MIT House_n Research
Consortium known as the open prototype initiative that developed series of four
prototypical homes also lends weight to the argument for agile production method in
mass housing construction. In the work, they aim to test ‗a new model for the design,
fabrication, and assembly of highly responsive places of living‘. The first prototype
referred as ‗open 1‘ has been completed since 2006 at the Crotched Mountain Brain
Rehabilitation Center. The project successfully implemented the following:
a. Design and construction employed a library of virtual components that could
be combined to form unique structures, with data flowing directly to
automated prefabrication processes.
b. The floor, wall and roof systems - complete with power, data, piping,
ductwork, and finishes - were prebuilt in a factory.
c. The building consisted of distinct, disentangled and accessible layers that
allowed for both efficient assembly and for change over time.
The finished shell, interior fit-out, and mechanical, electrical, and plumbing systems
were completed in approximately 30 days.
Dey (2006) opines that open building could be a revolutionary approach to mass
housing with the house separated into layers; and each layer has its own life span that
determines its need for alteration or maintenance. Importantly, houses need to be
viewed as parts that come together during construction and it is only logical to have
such parts changed or replaced with much ease if they required so at any stage or life
of the building. Thus, this is only possible having a method that integrates enlightened
production techniques that combines a tripartite of architectural flexibility,
manufacturing flexibility and erection flexibility (Sngh et al, 2003). This is very key
to prefabrication.
CONCLUSIONS
In an ever-changing world where everything is all about improvements over what had
been done in the past, the housing industry is resistance and unresponsive to change.
The introduction of prefabrication for the production of mass housing in Nigeria is
however, important in bringing about high quality housing units. It would also
engender standardisation and uniformity, which generally is lacking in the
conventional approach. Essentially, too, there is a need for the prototype design of
mass housing to incorporate architectural flexibility, which assures product variety.
The concept of prototype ignores variability to a large extent and should be so for
prototype construction. Above all, the Nigeria‘s housing industry needs to embrace
prefabrication for better production agility, reduction of wastage and time saving
during construction.
REFERENCES
Adedeji, Y.M.D. & Ajayi, B. (2008) ―Cost-effective Composite Building Panel for Walls and
Ceilings in Nigerian‖ 11th International In-organic Bonded Fiber Composites IIBCC
Proceeding, November, 5-7 2008 Madrid- Spain. Pp 151-159
Adejumo, A.A (2008) ―Some Thoughts on Affordable and Social Housing in Nigeria‖

Prototype buildings
825
Alade, B. (2010) Paper presentation on ―Affordable Mass Housing Delivery: Possibilities
within Nigerian Context‖ 5th Nigerian Real Estate Fair; Eko Hotel Conference Hall,
Victoria Island Lagos, 12th October 2010
Batchelor, R. (1994). Henry Ford: Mass Production, Modernism and Design
Dey, A (2006) ‗Reinventing the House‘ Fine HomeBuilding Houses October/November pp
5863
Jokiniemi and Davies (2008) Dictionary of Architecture and Building Construction,
Architectural Press, UK pp 292
McQuaid, M (2003) Shigeru Ban Phaidon Press Limited, London. pp 152-181
Peterside, C S, 2005. ―Ameliorating Housing Deficit in Nigeria ...The Role of Primary and
Secondary Mortgage Institutions and the Capital Market‖. Available online at
www.nigeriaworld.com 20 July 2005.
Phillipson, M. (2003) ―Defining the Sustainability of Prefabrication and Modular Process in
Construction‖ Current Practice and Potential Uses of Prefabrication BRE
Environment Division Bucknalls Lane; Garston ,Watford ,WD25 9XX
http://projects.bre.co.uk/prefabrication/prefabrication.pdf
Singh, A., Barnes, R, and Yousefpour, A. ―High-Turnaround and Flexibility in Design and
Construction of Mass Housing‖ Proceeding IGLC-7 University of California,
Berkeley, CA, USA. 26-28 July 1999, Pp 181-194.


Karley, N.K. (2011) Remittances to Ghana: Benefits to the housing sector and impact of financial crisis
In: Laryea, S., Leiringer, R. and Hughes, W. (Eds) Procs West Africa Built Environment Research
(WABER) Conference, 19-21 July 2011, Accra, Ghana, 827-840.
827
REMITTANCES TO GHANA: BENEFITS TO THE
HOUSING SECTOR AND IMPACT OF FINANCIAL
CRISIS
Noah Kofi Karley1
School of the Built Environment, Heriot Watt University, Edinburgh, EH14 4AS, UK
The role of inflow of overseas remittances towards the development of housing sector
in Ghana, and the impact of recent financial crisis on the development process is
investigated. This is achieved through a review and analysis of information gathered
through national and international statistical sources and targeted household and
institutional interviews. As a prelude to the analysis the study assessed the importance
of remittance as large and growing part of the economic underpinning of developing
countries. It then assesses whether remittances have a particular relationship with
housing. The research provided an estimate of the nature, level and uses of
remittances and the different cyclical characters of other flows. It reveals that the
successful real estate market development across Ghana during the past decade
benefited from a buoyant national economy, improved financial systems and family
remittances. However, the picture changed especially during 2008 attributed mainly
to the global financial crisis and economic downturn. The reverberating problems of
unemployment and high levels of bankruptcies in the advanced countries were felt but
not as pronounced as they were in the major industrialised economies. The
discussions concluded by posing a much broader question in relation to other
developing countries about how remittances could be mobilised towards the
development of the housing sector.
Key words: financial crisis, Ghana, housing sector, migrant remittance.
INTRODUCTION
The Ghanaian economy, like other developing countries depends highly on external
financial support. In particular, family remittances play a big part in the economy. The
World Bank estimates that total recorded flows of remittances to developing countries
reached US$167 billion in 2005 (World Bank 2006). Officially recorded remittance
flows to developing countries reached US$316 billion in 2009 down 6 per cent from
US$336 billion in 2008. With improved prospects for the global economy, remittance
flows to developing countries were expected to increase by 6.2 per cent in 2010 and
7.1 per cent in 2011 (World Bank 2010). These are staggering sums that dwarfs other
financial sources, such as official development assistance, bank lending and private
investment into developing countries, suggesting that remittances make a powerful
contribution to reducing vulnerability at least at the household and local community
levels. However, the reverberating problems of unemployment and high levels of
bankruptcies in the advanced countries owing to the global financial crisis cannot be
overemphasised. One area that could suffer the direct consequences of high levels of
Karley
828
unemployment, mortgage foreclosure and banking crisis is inward remittances into
these countries.
Despite the importance of remittances as outlined above, and their likely impact on
welfare (including housing), this relationship has not been sufficiently investigated in
Ghana. Thus, the primary aim of this study is to try to fill the knowledge gap by
specifically examining how remittance flows can help to improve the housing and
home ownership aspiration of households in Ghana. To fulfil this aim the primary
objective is to understand the nature, motivation and level of migrant remittances to
Ghana and how these are remitted. The secondary objective is to ascertain whether the
recent financial crisis had any impact on remittances and thus the housing industry in
Ghana. The argument for the secondary objective is that households that receive
remittances are able to withstand economic shocks since these inflows serve as a form
of ―insurance‖ against income shortfalls.
As a prelude to the analysis, a systematic literature review is carried out comprising an
update of academic literature on understanding, motivation as well as impact of
remittances. This is followed by analysis of official statistics on remittances flows and
channels by which they are remitted. Analysis of household data and institutional
interviews is then undertaken. Finally, the impact of recent financial crisis on
remittances is assessed and conclusions drawn.
STUDY APPROACH
In order to understand the contributions of remittances to the housing sector in Ghana
this research investigates several questions: What are remittances? How are
remittances distributed? What channels are used to remit these funds? How are
remittances spent? Finally, what are the policy implications on housing sector
development of how the money is remitted and used, and effects of the recent
financial crisis? In the process of answering these questions this study employed a
variety of methods, predominantly desk-based. First, a systematic literature review is
carried out comprising an update of academic literature and official statistics on
remittances flows. A review and analysis of official statistical information about
remittances to Ghana is undertaken. An important source is statistics held by the Bank
of Ghana on inward remittances.
For diversity, it is deemed valuable to undertake a number of interviews with residents
in the UK to ascertain motivation, use and impact of migrant remittances. The
interviews explored experiences with remittances and impact of the recent global
financial crisis on remittance flow and thus contribution to the housing industry.
Discussions with stakeholder institutions such as developer companies, banks were
also undertaken.
STUDY CONTEXT: A LITERATURE REVIEW
There has been much successful real estate market development across Ghana during
the past decade as many urban areas benefited from buoyant national economy,
improved financial systems, high level of Foreign Direct Investment (FDI) and family
remittances from Ghanaians living and working abroad (BoG 2008). Analysts and
observers (Asare and Whitehead, 2006; Karley, 2009) agree that the real estate
industry has experienced tremendous growth over the past decade. Figures for the past
five years and particularly 2007 showed impressive residential property development
and activities (Karley 2008), benefiting from, among others migrant remittances from
Migrant remittances
829
abroad. Karley (2008) estimated that 65 per cent of the clients of private residential
property developers in Ghana are Ghanaians living and working abroad.
But the picture has been changing especially after the last quarter of 2007 attributable
to the global credit crunch and economic downturn. For example, evidence shows that
the construction orders of NTHC Properties, one of the main private residential
property developers in Ghana declined by about 15 per cent in 2008 after a constant
growth for 5 years (NTHC Properties 2009) although this has started to show signs of
growth again from 2010. The Ghana Real Estate Developers Association (GREDA
2009) also indicated that 2009 and beyond have been tough for its members as they
experienced unfulfilled stage payments for houses completed.
Understanding remittances and motivation for them
The term ‗remittances‘ can be seen from different perspectives. In simple terms it
refers to the money that migrant workers send back to their communities or home
countries of origin. Addison (2005) views remittances as financial flows into
households that do not require a quid pro quo in economic value. Although they can
also be sent in kind, the term ‗remittances‘ is usually limited and referred to monetary
and other cash transfers transmitted by migrant workers to their families and
communities back home. While the motive behind remittances may not be for a direct
compensation in return, literature on remittances confirms elements of quid pro quo
behind transfers although these may not be immediate or binding. The literature on
remittances give several and diverse explanations to motivation for it. These
motivations are summarised by Solimano (2003) as (1) altruism motive, (2) self-
interest motive, (3) implicit family contract I: Loan repayment and (4) Implicit family
contract II: Co-insurance.
The altruistic and self-interest models explained the remittances process from the
individual perspective. The altruism motive also referred to as livelihoods school of
thought considers remitting as an obligation to the household. It argues that
remittances are sent out of affection and responsibility towards the family and sending
remittances yields a satisfaction to the migrant out of a concern for the welfare of
family (Stark 1991). The Self-Interest Motive assumes that the migrant is mainly
motivated by an economic and financial self-interest. The argument is that the aim of
a successful migrant is to save as much money as possible while they are in a foreign
country in order to be able to invest back in their home country by buying property,
land, financial asserts, and so on.
The literature has also considered the discussion on the remittance process from the
family perspective rather than the individual. According to the implicit family contract
I (Loan repayment) model. The family invests in sponsoring a family member to
travel abroad for study or directly for greener pastures with the hope that when they
have settled well and start earning the migrant will be able to pay back to the family
by remitting. The implicit family contract II (Co-insurance) theory argues that
remittances occur largely because migration forms part of a strategy for ‗livelihood
diversification‘. The migrant can help to support his family in bad time at home and
they in turn can help the migrant in bad times in the foreign country. Migration
becomes a co-insurance strategy with remittances playing the role of an insurance
claim.

Karley
830
Impact of remittance flow
There has been a growing literature examining how migrant workers‘ remittances can
affect households. Among these studies, some have documented how migrants have
contributed to economic and social development in their country of origin. Evidence
suggests that remittances from abroad are crucial to the survival of communities in
many developing countries. Russell et al. (1990) concluded that after satisfying
subsistence needs, migrant remittances are used for investment purposes such as
education, livestock, farming, and small scale enterprise. Taylor (1996) has also
argued that remittances have multiplier effects that work to increase national income.
In a study on Senegal, Diatta and Mbow (1999) found that remittances were a
substantial source of revenue for families with migrant members and were also used to
promote development in migrants‘ home communities.
Study by Koc and Onan (2001) examined the impact of remittances on the standard of
living of families of emigrants in Turkey and found that remittances have a positive
effect on household welfare. Migrant remittances also serve as a source of income for
savings and investment, as confirmed by Taylor (1996), and thereby lead to growth
and development of an economy. This is corroborated in a study on Mali by Findley
and Sow (1998), who report that remittances not only covered basic food and cash
needs but also allowed people to pay for irrigation in agriculture. Analysis of
household surveys shows that remittances have been associated with significant
declines in poverty (headcounts) in several low income countries, including Uganda
(11 per cent), Bangladesh (6 per cent) and Ghana (5 per cent). Unlike development
assistance transfers which mostly pay for the expensive lifestyles of NGO executives,
migrant remittances go directly to family members. They tend to increase at difficult
times – during an economic downturn when other private capital flows tend to
decrease.
With respect to Ghana, dated back to the late 1960s, Caldwell (1969) investigated the
uses of remittances from internal migration in Ghana and found that migrants spent
remittances to pay for schooling and wages of farm labourers, and to develop small
businesses. Also, a survey conducted by the Sussex Centre for Migration Research in
Ghana, particularly in the Ashanti Region in March 2003, identifies three main uses of
the remittances. First, remittances are used to satisfy individual needs such as
smoothing consumption needs, organizing funerals and meeting other pressing social
needs. The second motive is to support social projects in migrants‘ originating
communities. The third motive, less common but perhaps the most important for the
promotion of economic development, is for productive investments. Under this third
category, the most common objective is for migrants to invest in businesses of their
relatives in their home country. A recent study on remittances of Ghanaian emigrants
in Sydney, Australia (Obeng-Odoom 2010) also shows that by saving about a third of
their incomes, emigrants are able to build houses in their home country Ghana within
3-6 years.
The Bank of Ghana (BoG) also highlighted the significant contributions to national
development by remittances from the over one million Ghanaians living and working
abroad. In the early 1980s during the period of economic downturn in Ghana,
remittances helped the Ghanaian economy greatly, influencing economic policies
positively and straightening the economic fundamentals in the economic structural
adjustment programme (Acquah 2007). In conclusion, the empirical literature
suggests that remittances make a powerful contribution to reducing vulnerability at
least at the household and local community levels.

Migrant remittances
831
DISTRIBUTION OF REMITTANCES
Remittances by migrants have become an important source of income and foreign
exchange for many developing countries. Remittance flow globally currently exceeds
US$300 billion, which is greater than the value of official development assistance
(ODA). Remittances to developing countries amount to some US$335 billion (Sub
Sahara Africa, US$21.6 billion) in 2010 (World Bank 2010). Outlook for remittances
flows for 2009-11 indicates a similar trend but quite a big jump in the amounts
involved as shown in Table 1.
Table 1: Outlook for remittances flows for 2008-11
US$ billion 2008 2009 2010f 2011*
Developing countries 335.8 315.7 335.4 359.1
East Asia and Pacific 86.1 85.7 94.1 102.7
Europe and Central Asia 57.5 45.6 48.1 51.7
Latin America and Caribbean 64.4 56.5 559.8 64.5
Middle-East and North Africa 34.8 32 33.1 34.5
South Asia 71.7 75.2 78.7 82.8
Sub-Saharan Africa 21.3 20.7 21.6 22.9
Growth rate (%)
Developing countries 15.90% -6.20% 6.20% 7.10%
East Asia and Pacific 20.70% -0.40% 9.80% 9.20%
Europe and Central Asia 13.30% -20.70% 5.40% 7.60%
Latin America and Caribbean 2.10% -12.30% 5.70% 7.90%
Middle-East and North Africa 9.80% -8.10% 3.60% 4.00%
South Asia 32.60% 4.90% 4.70% 5.20%
Sub-Saharan Africa 14.10% -2.70% 4.40% 5.80%
Source: World Bank Migration and Remittances team and Global Development Finance database
(2010), *Estimated.
The distribution of remittances to the top recipient developing countries in terms of
the share of remittances in GDP in 2008 (Figure 1, expressed in 2008 terms) shows
that in these economies remittances exceeded a quarter of the GDP. Data on
remittance flows to Sub-Sahara Africa are sparse, but these flows appear to have
declined only modestly in 2009. Arguable this provides a lifeline to the poor in
developing countries.
Volume of remittances to Ghana
The importance of remittances as a source of foreign exchange is widely
acknowledged in Ghana but there is less agreement on the volume of remittance flows
coming into the country. According to the BOPs data portrayed in Figure 2a, total
transfers to the Ghanaian economy ranged between US$400 million in 1990 and
US$935 million in 2001. Of the total transfers, private unrequited transfers increased
from US$201.9 million to almost US$718 million in 2001. Over the years private
unrequited transfer has gained significant importance in total unrequited transfers. In
Figure 1a, while private unrequited transfer jumped up strongly between 2002 and
2005 (from US$1.1 billion to US$3.8 billion), official transfer rather followed a
relatively sluggish upward trend during the same period. Recent estimates in Figure
1b show a strong increase in private transfer in 2006 from US$4.7 billion to US$9.68
billion in 2010, which represents 27.8 per cent increase over those for the
corresponding period in 2009.
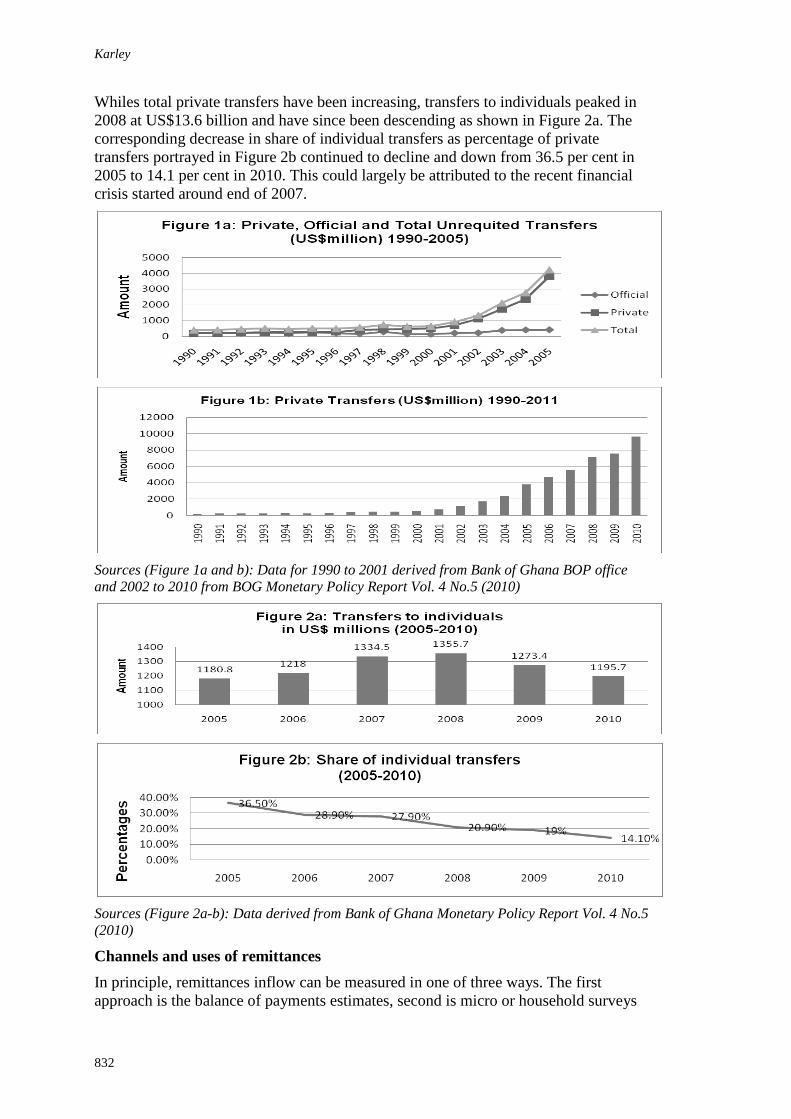
Karley
832
Whiles total private transfers have been increasing, transfers to individuals peaked in
2008 at US$13.6 billion and have since been descending as shown in Figure 2a. The
corresponding decrease in share of individual transfers as percentage of private
transfers portrayed in Figure 2b continued to decline and down from 36.5 per cent in
2005 to 14.1 per cent in 2010. This could largely be attributed to the recent financial
crisis started around end of 2007.
Sources (Figure 1a and b): Data for 1990 to 2001 derived from Bank of Ghana BOP office
and 2002 to 2010 from BOG Monetary Policy Report Vol. 4 No.5 (2010)
Sources (Figure 2a-b): Data derived from Bank of Ghana Monetary Policy Report Vol. 4 No.5
(2010)
Channels and uses of remittances
In principle, remittances inflow can be measured in one of three ways. The first
approach is the balance of payments estimates, second is micro or household surveys

Migrant remittances
833
of recipients of such flows, and the third method is through banks or financial
institutions in origin countries. Recorded Transfers to Ghana were shown earlier.
However, none of these data sets take into account informal remittance flows, which
are likely to be substantial. The fact that remittances are transmitted through different
channels makes it difficult to capture the full amount in the balance of payment
statistics of the recipient country, which tends to underestimate the actual flow of
remittances. This problem makes it difficult to come up with strong conclusions on the
role remittances play in the economy.
It has not been possible to obtain official data on amount of informal remittances and
their uses. So in order to establish how these funds are transmitted and used, data
based on interviews, personal observation and other records are explored. In all, 200
Ghanaian migrants based in different regions in the UK were identified through Ghana
High Commission and local church sources. They were asked to complete
questionnaire and followed with telephone interviews with 10 selected from the
sample. Eighty responses or 40 per cent of questionnaire were returned completed,
among which 5 respondents indicated they never remitted funds back home since
arriving in the UK. The respondents were grouped into two main job categories.
Those employed in jobs perceived as skilled are referred to ‗professionals‘ in this
study; and those unskilled referred to ‗others‘. The discussions are based on analysis
of findings from the 75 responses received. The questionnaire also sought estimates of
income levels, proportions remitted regularly, purpose of remitting, and overall
remittance experiences.
Methods of migrant remittances
Migrants remit funds formally through bank transfers and formal money operators
such as Western Union and Moneygram. Informal remittances tend to be most
significant in countries with relatively undeveloped banking sectors and where trade
and exchange-rate restrictions encourage parallel markets and foreign exchange rates.
Foreign exchange bureaus
Exchange-rate fluctuations and economic uncertainty allow foreign exchange bureaus
(usually referred to as forex) to undercut the official exchange rate and benefit from
devaluations in the cedi (the Ghana currency) relative to hard currencies. Their
competitive rates mean forex bureaus are commonly used for foreign exchange
transactions and anecdotal evidence suggests they may also be key players in informal
remittance systems in Ghana. They offer better exchange rates than the banks, a main
reason for migrants‘ aversion to banks and use of informal channels. Informal
transfers are often made from so-called ―ethnic stores‖ in the migrant‘s country of
residence and the money is received at unregulated agencies or forex bureaus in
Ghana.
The Figure 3 shows the distribution of respondents by method they use in transferring
remittances into Ghana. It also shows distribution of respondents by the type of work
they do and how they transmit remittances. All four methods identified are used by
migrants in varying degrees. Money transfer operators and cash are extensively used
by all types of migrants.
Money transfer operators
This includes both formal and informal operators. There is a wide variety of informal
money transfer operators used by Ghanaian migrants to send remittances. The
remittance sending operators, working principally from developed countries, are as

Karley
834
much a part of informal remittance systems as their receiving counterparts in Ghana.
Migrants often prefer to use the transfer services offered by Ghanaian-owned shops or
small businesses in their country of residence than banks or ―formal‖ money transfer
operators such as Western Union and Moneygram.
Source: Derived from UK-Ghanaian residents survey (2011)
Courier services and cash-in-hand transfers
Money and in-kind transfers are carried by hand to Ghana by returning or visiting
migrants and by couriers who offer direct money transfer services as a business.
Indications are that Africans in general send a greater proportion of remittances
through hand-carrying of cash or kind than other migrant groups (Blackwell and
Seddon 2004). This may also be true for Ghanaian migrants, as shown by this
research, 95 per cent of respondents use this method. The physical transportation of
remittances to Ghana includes money transferred in cash or travellers cheques and
goods, usually consumer durables, brought into the country by migrants for their
families to use or sell to other people. In 2006 the government announced a proposal
to tax part of migrant‘s remittances to pay for physical and social infrastructure
associated with housing development and other type of capital projects used by
Ghanaian migrants. This triggered a huge debate and encouraged cash-in-hand
transfers. These transfers are very difficult to trace and do not enter official estimates
of remittance volumes for Ghana.
Research by Tiemoko (2004) suggests that migrants who remit less frequently are
more likely to use informal channels. Migrants who send remittances tend do so on a
regular basis, but less-skilled migrants were generally found to send remittances more
often than élites, and were more likely to remit through formal channels.
How are remittances spent?
The findings on the use of remittances are discussed under two main themes viz.,
‗productive investment‘ and ‗consumptive investment‘. Here, ‗productive investment‘
refers to investment in activities that increase the household‘s capacity to earn money,
this include agricultural production, and the establishment of small businesses.
‗Consumptive investment‘ refers to goods and services that more immediately
improve the wellbeing of the household members, this include house building, house
purchase, purchase of consumer goods and the payment of health and education
expenses. On average most respondents said a third of their incomes are remitted on
regular basis for the allocated purposes.
When asked to indicate their use-preferences, it is observed that a small proportion of
respondents (14.7 per cent) indicated productive investment as a primary choice,

Migrant remittances
835
while a vast majority (85.3 per cent) is used for consumptive investment such as house
building (41.3 per cent) (see Figure 4). This observation is in line with trends in other
developing countries as revealed by de Brauw and Rozelle (2003).
Source: Derived from UK-Ghanaian residents survey (2011)
Agricultural investment
In comparison with other areas of remittance usage, agriculture benefits relatively
little from remittances. Out of the total of 75 respondents, only three or 4 per cent
indicated agricultural as the primary reason and only 2 respondents indicated it as a
secondary reason for sending money home (see Figure 5). The low rate of return to
productive capital investment in agricultural in general perhaps discourages
investment in such activities. Also, agriculture is often small-scale labour intensive
family farming which does not generate need for sophisticated machinery.
Source: Derived from UK-Ghanaian residents survey (2011)
Business creation
According to the survey, business creation was indicated as primary reason for
remittances by 11 per cent and secondary reason by 16 per cent of respondents.
Although returned migrants who create businesses may not be large in numbers, the
fact that some of them are entrepreneurial and have international experience means
that their impact on the local economy may be greater than their numbers alone
suggest.
House building and house purchase
In common with the families of most migrants the world over (see Lipton 1980; and
Mills 1997) a large proportions of remittances to Ghana are used for house building
and purchase combined. According to the interviews portrayed in Figure 5, 54
respondents or 72 per cent chose house building and house purchase as the primary
reasons for remittances, and 51 respondents or 68 per cent chose it as secondary
reason. Activities here include using remittances for house repairs, buying plots,

Karley
836
housing construction, outright purchase and/or mortgage repayment. Improvements in
accommodation are by no means valuable in enhancing family wellbeing.
In a society such as Ghana where prestige and respect is commanded by material
wealth, it is nearly impossible for one to be respected if one does not have a house to
show. Thus, using savings and earnings from overseas to build a house is essential for
migrants to feel respected in their communities. Building a large house is therefore not
simply an ostentatious display by migrant households; it is also a prerequisite for
meeting the basic human needs of self-respect and full integration into the society.
It is interesting to note that along with the inflow of cash into the economy and the
boom in house construction remittances have acted as catalyst in the emergence of
real estate development companies in Ghana. For instance a previous study by Karley
(2008) shows that around 65 per cent of customers of major real estate development
companies in Ghana are Ghanaians who live overseas and make payments through
remittances. In addition, small construction teams in urban areas have emerged and
engaged in construction of houses on incremental basis, that is, as and when funds
become available presumably including those from remittances.
This observation is consistent with assertion by some respondents who indicated that
they approach construction of their dream homes gradually through regularly sending
money back home to Ghana. Obeng-Odoom (2010) suggested that by this approach
some Ghanaian residents in Sydney, Australia were able to build houses in Ghana
within 3 to 6 years period. Whiles this has become a common and appreciable way to
achieve the housing aspiration of most migrants; the downside is the emergence of
urban sprawling as most have not been able to complete the houses as originally
planned. Uncompleted houses are occupied by squatters and turned into slums (own
observation).
Consumer goods, health and education
Ten respondents or about 13 per cent chose consumer goods, health and education
combined as their primary and secondary reasons for sending money home. In terms
of consumer goods remittances help family members back home to pay for everyday
items such as soap, matches and clothes as well as contributions toward social events
like marriage and funeral ceremonies. As alluded to earlier, instead of cash some
remittances are sent in the form of durable modern consumer goods such as cars,
Television sets, and other electronics and household effects. According to
respondents, health and education expenses place a strain on household budgets and
cannot be covered with income obtained through agriculture alone. So they send
money to pay for medicines and other health services for children, parents, and other
relatives, as well as paying school fees for children, siblings and other relatives. We
now turn to discuss impact of the financial crisis on remittances and housing
development process.
The impact of recent financial crisis
Essentially a financial crisis termed ‗credit crunch‘ is a sudden cut in the availability
of credit or loans, including mortgages, credit cards and interbank lending as banks
worry about a lack of liquidity. In situations where lenders don‘t want to lend,
borrowers unable to borrow, builders unable to build and buyers unable to buy,
economic activities could come to a standstill. This is a simple explanation of very
complex set of issues which have been worsening and changing shape since the later

Migrant remittances
837
part of 2007. The credit crunch affected firms and families in various ways as
discussed presently.
Reduced income and spending on real estate
In many advanced countries the squeeze on consumer as a consequence of the credit
crunch, continue to ripple out into the wider economy with expected growth
substantially lower than initial forecasts. In any period of economic squeeze,
especially with regard to credit, the likely effect is that the economy could run into
recession as it occurred in the US, the UK and other European countries during the
crisis; low consumption led to low street sales and low business profits, which in turn
led to redundancies and unemployment. With unemployment comes, reduced
household incomes, which affects household spending, including family remittances.
Figure 6 shows the total number of respondent‘s remittances before, during and after
the credit crunch. All the seventy five respondents indicated they have remitted
similar proportions before the crisis but this decreased by 13 per cent to 65
respondents during the crisis and increased slightly by only 3 per cent to 67
respondents after the crisis. This observation is somehow consistent with earlier
analysis portrayed in Figures 2a and 2b where the official statistics from Bank of
Ghana showed shares of individual transfers to Ghana during and after the crisis are
lower than before the crisis.
However, the proportion of respondents by type of work (portrayed in Figure 7)
remitting before, during (77.5 per cent) and after the crisis (95 per cent) for
professionals are lower than those in ‗other‘ group. As earlier alluded to, interviews
with NTHC Properties shows a similar trend - reduction in their housing construction
orders by 15 per cent during the crisis period, and improved after 2010. This has far
reaching implications for long term efforts to promote residential property
development where remittances constitute a significant income to families for
consumption and for that matter housing development.
Source: Derived from UK-Ghanaian residents survey (2011)

Karley
838
Source: Derived from UK-Ghanaian residents survey (2011)
Declining investment
Borrowers, both retail and corporate are being squeezed by the global financial crisis,
which spread as Banks suffered growing losses on mark downs on mortgage backed
securities. Before the crisis it was much easier and cheaper in the UK and other
advanced economies to obtain bank loans secured or unsecured on homes. These loans
could be used for many purposes including financing property purchases abroad. But
this has changed due to the decline in the housing market.
Declining housing affordability
Due to the global financial crisis, housing markets have assumed extreme levels of
unaffordability as mortgage interest rates have risen and consumers burdened with
huge debts. For example, in the UK consumers are burdened with more than £1.5
trillion of debt of which £1.2 trillion is mortgage debt (Parkinson et al 2009).
Borrowers now face a much more draconian lending regime which hits all borrowers
across the board and not just the subprime. This coupled with expensive mortgages
and high deposits means most people (including those with intentions to send
remittances to families or invest in properties abroad) are unable to afford properties
home let alone remit or invest in properties abroad.
Reduced real estate development activities
Several changes have taken place in construction sector that affected the tenure and
availability of jobs, purchases of land and completion of building schemes. Media
reports show completed houses remain unsold even after price fell by 10 per cent in
certain parts of the UK. In the UK, it is estimated that 200 small-scale house builders
failed since late 2007; more than 20,000 newly built private homes lied empty; and
about 110,000 builders and craftspeople lost their jobs during the crisis period
(Parkinson 2009).
It could be argued that Ghana may be spared the direct effect of the global economic
downturn outlined above. However, the same cannot be said of the indirect impact of
the downturn. The argument goes as follows: Ghana‘s economy depends on
commodities such as gold, cocoa, bauxite and others whose prices are relatively
strong, compared to other periods of economic downturn, like that of the late 1990s.
Because of the nature of Ghana‘s economic integration into the global system –
including migrantion - if the global economic malaise continues, rising
unemployment, low incomes and cutback on expenditure are likely to affect items
such as remittances.
CONCLUDING REMARKS
There is a growing interest in the role of remittances in the Ghanaian economy. This
interest has been heightened by the recent increase in the flow of remittances to
Ghana. This investigation shows that migrant remittances are useful sources of income
to many Ghanaians, particularly in times of economic shock. The importance of
migrant remittances is evidenced by the proliferation of money transfer institutions in
the country (both formal and informal) and the rapid growth in the volume of such
remittances.
The survey shows that a significant proportion of remittances to Ghana are spent on
consumptive investment activities, particularly house building and house purchases.
The idea to introduce remittance tax may be laudable. But the economic feasibility of
Migrant remittances
839
its intended policy is doubtful. First, this policy could serve as a disincentive to remit
and consequently could derail the housing development process. Secondly, it is
susceptible to failure because as the individual always try to maximise their utility and
will therefore find alternative ways to remit home without using the official channels.
It is therefore economically expedient, and politically wise for policies to direct more
remittances through the formal channel instead of a policy that will divert remittances
flow away from formal channels to the informal channel.
The recent financial crisis had considerable impact on urban economies, and impacted
on the volume of remittances. Given the strong motivation to remit as in case of
Ghana, migrants are less affected especially where they are engaged in ‗other‘ jobs
(by definition not professionals). This should also be seen as very important sources of
remittances especially during economic downturn.
Finally, official sources of information on destination and use of household
remittances are important in estimating the impact of remittances on housing sector.
But it has not been possible to obtain such information. These are some of the
difficulties that characterise most developing countries. However, remittances are
perceived as useful and formidable sources of achieving the housing aspiration of the
populace of many growing urban households and the Ghana case provides useful
lessons. Nevertheless, challenges and opportunities facing housing systems in various
countries can be distinctive and thus policy initiatives to address them may not
necessarily be directly transferable from one economy to another.
REFERENCES
Ahmed, I. (2000) ―Remittances and their economic impact in post-war Somaliland (2000)‖.
Disasters, 24(4): 380–9.
Acquah, P. (2007) Governor of the Bank of Ghana on Remittances, Daily Graphic, 27 July.
Asare, E and Whitehead, C. (2006) Formal mortgage markets in Ghana:
Nature and implications, RICS Research Paper Series, Vol. 6 Number 13, October, Bank of
Ghana (BoG) (2008) Statistical Bulletin, February 2008, Accra.
Blackwell, M. and Seddon, D. (2004) Informal Remittances from the UK: Values, Flows and
Mechanisms. A Report to DFID by the Overseas Development Group, Norwich,
March 2004.
Caldwell, J.C. 1969. African Rural-Urban Migration: The Movement to Ghana‟s Towns.
Canberra: Australian National University Press.
de Brauw, A. and Rozelle, S. (2003) ‗Migration and household investment in rural China‘,
Department of Economics working paper, Williams College, USA, 29 December.
Diatta, M.A. and N. Mbow. 1999. ―Releasing the development potential of return migration:
The case of Senegal‖. International Migration, 37(1): 243–66.
Findley, S. and S. Sow. 1998. ―From season to season: Agriculture, poverty, and migration in
the Senegal River Valley, Mali‖. In R. Appleyard, ed., Emigration Dynamics in
Developing Countries: Sub-Saharan Africa, pp. 69-144. London: Ashgate Publishing
Ltd.
Ghana Real Estate Developers Association (GREDA, 2009) Discussions with President of
GREDA, January 2009.
Karley, N.K. (2002) ‗Alternative Options to Mortgages in Ghana‘, Housing Finance
International, Vol. XVII /No.2: 26-30, December.
Karley, N.K. (2007) ―An Overview and the Prospects of the Ghana Real Estate Market‖,
Report submitted to the RICS Education Trust.
Karley, N.K. (2008) "Ghana Residential Property Delivery Constraints and Affordability
Analysis", Housing Finance International Journal Vol XXII No. 4, June 2008 pp 22-
29.

Karley
840
Karley, N.K. (2009) ―An Overview and the Prospects of the Ghana Real Estate Market‖,
Royal Institution of Chartered Surveyors Research RICS Research Paper Series,
(Forthcoming).
Koc, I. and I. Onan. (2001) ―The impact of remittances of international migrants on the
standard of Living of the Left-Behind Families in Turkey‖.‖Conference Proceedings,
XXIV International Union for the Scientific Study of Population (IUSSP) General
Conference, Salvador, Brazil, 18–24 April.
Lipton, M. (1980) ‗Migration from rural areas in poor countries: The impact on rural
productivity and income distribution‘ World Development, 8 (1): 1 – 24.
Mills, M.B. (1997) ‗Contesting the margins of modernity: women, migration and consumption
in Thailand‘ American Ethnologist, 24(1): 37-61.
NTHC Properties (2009) Discussions with Managing Director NTHC Properties, January
2009.
Obeng-Odoom, F. (2010) Urban Real Estate in Ghana: A study of Housing-related
Remittances from Australia, Housing Studies, Vol. 25, Issue 3: 357-373.
Parkinson, M., M. Ball and T. Key (2009) ‗The Credit Crunch and Regeneration: Impact and
implications‘, Independent Report to the Department of Communities and Local
Government.
Russell S.S., K. Jacobsen and W.D. Stanley. (1990) International Migration and Development
in Sub-Saharan Africa, Volume 2, Country Analyses. World Bank Discussion Papers
No.102. The World Bank, Washington, D.C.
Solimano, A. (2003) Remittances by Emigrants: Issues and Evidence. WIDER Discussion
Paper No. 2003/89. WIDER/UNU, Helsinki, Finland.
Solimano, A. (2003) Workers Remittances to the Andean Region: Mechanisms, Costs and
Development Impact Mimeo ECLAC.
Stark, O. (1991) The Migration of Labour. Cambridge, Basil Blackwell. Sussex Centre for
Migration Research in Ghana, ‗Research Report on the use of Remittances‘, Ashanti
Region, March 2003.
Taylor, J.E. (1996) ―International migration and national development‖. Population Index,
62(2): 181–212.
Tiemoko, R. (2004) Understanding the Opportunities for and Challenges to Migrants‟
Investment in Côte d‟Ivoire and Ghana. Africa Regional Sexuality Resource Centre,
Lagos.
World Bank (2006) Regular Economic Report on Africa, January 2006, Washington DC.
World Bank (2010) ‗Outlook for Remittance Flows 2010-11‘ Migration and Development
Brief Development Prospects Group, World Bank April 23.

Okolo, N., Okpala, C., Ezeji, K. and Okolie, A. (2011) Revitalization of Nigerian urban centres through
effective use of open public spaces: a case study of Onitsha metropolis In: Laryea, S., Leiringer, R. and
Hughes, W. (Eds) Procs West Africa Built Environment Research (WABER) Conference, 19-21 July
2011, Accra, Ghana, 841-841.
841
REVITALIZATION OF NIGERIAN URBAN CENTRES
THROUGH EFFECTIVE USE OF OPEN PUBLIC
SPACES: A CASE STUDY OF ONITSHA METROPOLIS
Ndidi Okolo1, Chukwura Okpala, Kelechi Ezeji, Anthony Okolie
Department of Architecture, Anambra State University, Uli, Anambra state, Nigeria
Urban centres in Nigeria have largely experienced congestion due to the pressure of
urban expansion, consequent upon uncontrolled population increase and growth.
Urban Public spaces as part of urban structure and function constitute areas of
physical, social and cultural interaction among urban dwellers. Open public spaces
could be natural, communal or designated through government planning and policies.
They exist as nodes of connectivity, spaciousness, balance and aesthetics in urban
areas. Proper functioning of these spaces should be emphasized in the planning and
realization of development schemes in urban areas. This would enhance the
revitalization of existing urban centres and create a sense of order and efficiency
within the urban fabric. Field work studies have been carried out on open public
spaces in Onitsha and presented in this research. This paper examines the case of
Onitsha and makes suggestions on revitalization of urban centres through proper
utilization of these open public spaces.
Keywords: open public space, Onitsha, urban centre.


Ishaya, D.A. and Dabo, D. (2011) Security measures adopted by estate surveyors shopping malls in
Kaduna, Nigeria In: Laryea, S., Leiringer, R. and Hughes, W. (Eds) Procs West Africa Built
Environment Research (WABER) Conference, 19-21 July 2011, Accra, Ghana, 843-843.
843
SECURITY MEASURES ADOPTED BY ESTATE
SURVEYORS SHOPPING MALLS IN KADUNA,
NIGERIA
David Ayock Ishaya1 and Daniel Dabo
2
1Department of Estate Management, College of Built Environment, H.A. Federal Polytechnic, Kazaure,
Jigawa State, Nigeria 2 Department of Quantity Surveying, College of Environmental Studies, Kaduna Polytechnic, Kaduna
State,Nigeria
Agency surveyors have not been able to address the importance of security in
shopping malls, as it affects life of customers, tenants and the shopping mall in
developing countries. The provision of or availability of security guards in shopping
mall attracts shoppers and visitors(window shoppers).This study focus on the security
measures put in place by estate surveyors in shopping malls,5 shopping malls were
selected for the study base on their location, size and shoppers patronage, using a
combination of semi-structured questionnaire and personal interviews targeted at the
tenants and managing surveyors, data was collected on the number of guards,
measures adopted, equipments being use, size of the shops, rental values, previous
security breach, fire incidence if any. Simple descriptive statistics was use in
analyzing the data, the results show that the number of security guards and the work
hours varies in the shopping malls, the measures adopted was reasonable however the
equipment use were not in consonance with global trends also the number of security
provided was not base on the size of the shopping malls and the number of shoppers,
which contrasts to previous findings. The outcome of this research can help investors
and security agencies curb security breach in shopping malls.
Keywords: agency surveyor, security, shoppers, shopping mall, tenant.
2

Adiaba et al. (2011) Sources of deficient information regime in urban real estate markets in Sub-
Saharan African countries In: Laryea, S., Leiringer, R. and Hughes, W. (Eds) Procs West Africa Built
Environment Research (WABER) Conference, 19-21 July 2011, Accra, Ghana, 845-859.
845
SOURCES OF DEFICIENT INFORMATION REGIME IN
URBAN REAL ESTATE MARKETS IN SUB-SAHARAN
AFRICAN COUNTRIES
Stanislaus Adiaba1, Felix Hammond
2, David Proverbs
3, Jessica Lamond
4, and
Colin Booth5
1, 2, 4, 5 School of Technology, University of Wolverhampton, Wolverhampton, WV11LY, UK
3 Faculty of Environment and Technology, University of the West of England, Bristol, BS16 1QY, UK
Generally, land registration systems of developed countries produce sufficient and
reliable real estate market information compared to that of developing countries
including Sub-Saharan African countries. The purpose of this paper therefore is to
show, on the basis of critical review of focal literature, how the adoption of defective
and inefficient approaches to land registration by land registries in Sub-Saharan
Africa have undermined the supply of adequate and reliable urban real estate market
information compared to their counterparts in developed countries. On the basis of a
framework developed from land registration principles in literature, the paper
systematically reviews literature to trace the sources of the deficient information
regime in Sub-Saharan African land registries. The findings suggest that
notwithstanding legal, social, political, and resource constraints and challenges in
various countries, defective land registration approaches adopted and being used by
most land registries are the primary sources of information asymmetry in Sub-Saharan
African urban real estate markets. The findings of the paper have policy implications
for land administrators, governments and their international development partners to
adopt the appropriate policy approach otherwise, the colossal sums of money being
pumped into current land administration reforms in Sub-Saharan Africa and other
developing countries could go to waste. The paper brings to focus the problem of
land information asymmetry and how the adoption of inappropriate and blunt land
registration approaches have contributed to the deficient information regime in Sub-
Saharan Africa real estate markets.
Keywords: information asymmetry, land registration, systematic registration, sporadic
registration, real estate market, Sub-Saharan Africa.
INTRODUCTION
This paper is an encapsulation of theoretical review of literature on land information
systems and its scope is limited to generic principles underpinnings land registration
systems. The paper shows how land registration systems contribute to land
information asymmetry in Sub-Saharan African urban real estate markets. The paper
is part of a doctoral study, which implicates land information asymmetry as the major
cause of real estate market failures in many Sub-Saharan African (SSA) countries.
The paper therefore through an extensive review of literature traces the sources and

Adiaba et al.
846
causes of the deficient information regime characteristic of land registries in SSA.
The paper also contributes to knowledge in this regard for policy consideration. The
paper starts with a background to the study and the method for tracing the sources of
the information problem. It then discusses the conceptual basis of information
asymmetry and land registration. A thorough discussion of land registration systems
follows guided by a framework then findings and finally conclusion of the paper.
BACKGROUND TO THE STUDY
The symptoms of market failures caused by information asymmetry are rife in many
Sub-Saharan African (SSA) urban real estate markets. Literature substantially report
on the symptoms of information asymmetry such as high transaction costs,
opportunistic market behaviours and corruption, high overpricing of properties,
market uncertainties, dishonesty, and multiple sales of land all evident by increasingly
recorded land cases over ownership disputes (Hammond and Antwi, 2010; Ghana
LAP Report, 2009 and 2010; Toulmin, 2008; World Bank, 2011; Abdulai, et al.,
2007; Mooya and Cloete, 2007; Hammond, 2006 and 2008; Gouth and Yankson,
2000; Kironde, 2000). The predominance of transactions in informal real estate
markets as a prima facie case of government intervention and formal real estate
market failures in many SSA and developing countries have also been significantly
reported (Colin, 2009; Rakodi, 2006; Antwi, 2000; Kironde, 2000; Gouth and
Yankson, 2000; de Soto, 2000; Fourie, 1998).
Real estate markets are information intensive and depend on the supply of certified
information which according to experts in the field must be reliable, accurate,
relevant, up-to-date, complete and intelligible (Feenan and Dixon, 1992; Hammond,
2006 ). To meet these requirements, governments over many years have established
and mandated land registries or courts depending on the country (Pas, 2002; Dale and
McLaughlin, 1998; Larsson, 1991) to among other functions supply land information
as a public good (Deininger, 2003; Palmer, 1998 and Masser, 1998) and to broadly
distribute the benefits associated with the information to the entire society (Hammond,
2008). In effect these registries exist to reduce transaction costs by coordinating and
disseminating relevant market information. Registries that are discharging their
mandate fully and with the appropriate methods have 100% registration coverage.
Contrarily, registries that have also adopted blunt approaches that do not coordinate
and disseminate information effectively and efficiently are characterised by deficient
information regimes. Undoubtedly, the tendency for land registries to deviate from
performing their mandates once established has been much anticipated (Stanfield and
Lynct, 2009). It is therefore not surprising that land registration and other related land
reforms have been high on the development agenda of most governments in
developing countries including Africa and their international development partners
over decades now (see Sikor and Muller, 2008). Ghana‘s Land Administration Project
(LAP) since 2003 is an example in SSA. It can be argued that the trend of most of
these reforms may still deviate from the solution to the market problem. Most of the
reforms are aimed at addressing the symptoms of the market problem by advocating
for conversion from deeds registration to title registration and touting land registration
as guaranteeing security of title instead of as a means of gathering and supplying
information. These deviations once they are detected needs to be corrected because
the social cost can be high.
In Sub-Saharan African (SSA), the current information supply regime falls short of
the real estate market requirements. It has been reported that the most typical feature

Real estate markets
847
of urban land market for instance is paucity of information (Kironde, 2000, p.26).
This is because land registries as suppliers of the relevant market information are
characterised by deficient information regimes. For example, de Vries (2004) citing
Fourie (2001) posits that less than 1% of the total land area is administered under
formal land registration system in Sub-Saharan Africa. Similarly, Alden Wily (2003,
p. 32) cites Augustinus (2003) that ‗less than one percent of the total land area in Sub-
Saharan Africa is covered by any kind of cadastral survey and entitlement‘. Toulmin
(2008) re-emphasises the point that only between 2 to 3% of land ownership have
been registered for land markets in West Africa region of SSA. The source and causes
of the low registration coverage is not yet fully understood meanwhile various reforms
are being implemented to address the secondary problems of the market. This paper
therefore through a systematic literature review, traces the sources and causes of the
deficient information regime and contributes to knowledge in this regard for policy
consideration. The approach adopted in reviewing literature is explained below.
METHOD AND FRAMEWORK FOR LITERATURE REVIEW
The paper adopts a historical comparison approach in reviewing focal literature. This
approach provides deeper understanding of the origin and developmental stages of
land information systems. The past is reviewed with reference to relevant colonial
masters of Sub-Saharan African countries such as Belgium, Britain, Denmark, The
Netherlands, France (Dale, 2000; Feder and Noronha, 1987). The present is also
reviewed with reference to four Sub-Saharan African countries namely Ghana,
Namibia, South Africa and Tanzania (see Table 1). The historical comparison
approach is found appropriate in line with Tings et al (1999) Worldwide Comparison
of Cadastral Trends. The approach is also in line with de Soto‘s (2000) argument that
the industrialised countries past is the present for many developing countries and
admonishes developing countries to learn from the lessons of history. The historical
comparison approach in land information systems studies and related fields has been
used by Bogaerts (1998), Ting et al. (1999), Torhonen (2004) and Enemark (2009).
Additional information was gathered through international land administration
systems inventories/surveys such as the Cadastral Template (Steudler et al, 2004 and
Rajabifard et al, 2007), Inventory of Land Administration Systems in Europe and
North America (Manthorpe, 2005) and Ting et al. (1999) Western Humankind – Land
Relationship framework from the tribal period to the present. This was done to gain
more insight and information on the historical comparison. The cadastral template
according to Steudler et al.(2004) is an initial step to gather generic information about
cadastral and land administration systems about countries that subscribe to it (see
www.cadastraltemplate.org). The significant role of the template in land
administration is well acknowledged in literature (Williamson and Ting, 2001;
Enemark, 2005 and Enemrk, 2009). The study also, extensively used peer reviewed
literature on land information systems and information gathered was used to
corroborate and fill gaps in the above mentioned interventional inventory and survey
sources.
LAND INFORMATION ASYMMETRY
Land information is very vital for investment decision making and in an ordered
society no improvement or transaction in land can be made by a self-serving
individual without first and foremost acquiring rights to the land. In Ghana for
example, such rights can be obtained either from the state on state lands or from
customary landowners as private landowners. The focus of this paper is mainly on
Adiaba et al.
848
how information on these rights particularly on private ownership is coordinated and
disseminated through land information systems on condition that these rights have
been well defined (see further Abdulai, 2010). In formal real estate markets, self
serving individuals would normally not acquire these rights to the land until
ownership of the land is ascertained. Formal ownership, however, can only be
ascertained from formal sources on condition that the subject land is already surveyed
and registered in the official public records (Simpson, 1976; Larsson, 1991). The
official public records which are kept in various land registries in different countries
may have sufficient or insufficient land information depending on the extent
landowners or prospective land owners‘ part-take in the land registration process.
When the official records are characterised by deficient information regimes and
cannot adequately supply the required information to users, this results in information
asymmetry between parties transacting in the market. This occurs because some
market participants are information rich whereas others are information poor hence
disproportionate possession of market information among market participants which
adversely affects markets transactions and performance.
Generally, the consequences of the information asymmetry on market participants and
performance are costly information (Stigler, 1961; Grossman and Stiglitz, 1980), high
transaction cost (Coase, 1960; North, 1992), inferior quality goods, dishonesty and
market uncertainties (Akerlof, 1970), opportunism and exploitation (Williamson, 1981
and 86), constrained trade volume (Feder and Feeney, 1991), adverse effects on
transacting parties and society in general (Clarkson et al., 2007) and property price
distortion and efficiency loss in use of property (Hammond, 2006). To this effect,
Palmer (1998) posits that land registries acting as information systems reduce
information asymmetry. It also leads to uncertainties in market transactions (Bedard,
1986; Poe et al., 1992). In Sub-Saharan African real estate markets, the effects of
information asymmetry have been variously reported rather as the problems of the
market. These include conflicting and unrecorded ownership claims, multiple sale of
the same parcel of land, cost from insecurity of property rights, high transaction costs,
lack of information on availability of land and general reliance on communication by
word of mouth, considerable possibility of fraud and lengthy negotiations, no general
framework for setting prices (Mooya and Cloete, 2007; Omirin and Antwi, 2004;
Fekade, 2000; Kironde, 2000; Antwi and Adams, 2003; Antwi, 2002; de Soto, 2000;
Gough and Yankson, 2000). These authors have discussed the symptoms of
information asymmetry extensively in SSA real estate markets so this paper will not
reinvent the wheel but rather focuses on the root cause of the market problem.
In the real world situation, it is not uncommon for self serving individuals who want
to acquire lands to make some preliminary investigation about the land or property
from the land registries regarding ownership and encumbrances. Firstly, land
registries as information repositories and secondly, land registration as component of
land information systems according to Palmer (1998) jointly play a vital role in
ensuring certainty when it comes to property transactions. Thus land registries in
acting as information systems reduce asymmetry of information between the parties in
a transaction. Palmer (1998) further argues that a registration system offers security
when it provides sufficient and accurate information prior to registration and
protection of rights after registration. A registration system however, provides
security on condition that the information is current but information can be current
only provided people use the registration system (Palmer, 1998). Several factors may
contribute to the currency of information and also minimise information asymmetries

Real estate markets
849
but this paper investigates the source of the problem in real estate markets particularly
in SSA.
LAND REGISTRATION
Land registration is a component of land administration. Land administration
according to the UN Economic Commission for Europe (UN-ECE, 1996) Guidelines
on Land Administration is ''the process of determining, recording and disseminating
information about tenure, value and use of land when implementing land management
policies. It is considered to include land registration, cadastral surveying and mapping,
fiscal and multi-purpose cadastres and land information systems.'' (see Dale and
Mclaughlin,1999; Willimson 2001; Bogaerts et al. 2002; Steudler, 2004; Steudler et
al., 2004; Bandeira et al., 2010). Land administration functions according to Dale
and McLaughlin (1999) can be divided into four components namely juridical
component which deals with land ownership; fiscal component deals with land values;
regulatory component dealing with land use and finally land information management
component which is integral to all the three other components. The juridical, fiscal
and regulatory components are traditionally organised around three sets of agencies
and each responsible for surveying and mapping, land valuation and land registration
(Dale and McLaughlin, 1999). In effect, data processing into information and
information management are integral part of all the functions of the three agencies
hence the need to trace the land information asymmetry from the point of land
information systems.
Land Information System (LIS)
There are several definitions for LIS (see Larsson, 1991) but Dale and McLaughlin
(1989) provide a summary that land information systems operation include the
acquisition and assembly of data; their processing, storage and maintenance; and their
retrieval, analysis and dissemination (see also Bandeira et al. 2010; Quinter, 2004;
Bedard, 1986). The data may be stored in a manual or digital form although the trend
now is that land related records are being computerised for ease of storage and
retrieval. Irrespective of the mode of storage, the usefulness of the system depends on
how often it is updated, its accuracy, completeness, accessibility, comprehensiveness,
understandable and the extent to which the system has been designed for the benefit of
the user rather for the producer of the information (Dale and McLaughlin, 1989).
Bedard (1986) asserts that a land information system achieves its goal if it helps to
build, verify or improve the users' knowledge of the world without the need for him to
directly observe everything. Lemmen and Oosterom (2001) emphasize that the
requirements of the modern user of land information systems are faster procedure for
land transfer, good access to information, guaranteed and reliable information, faster
distribution channels, value for money and fitness for use and tailor made
product/information. How this is achieved, however, depends largely on the land
registration system which is a component of a country‘s land information system and
how it works. Tracing the source of land information asymmetries from first
principles is thus imperative.
Historical Overview of Land Information Systems
An understanding of the historical context of land registration systems is very crucial
in providing insight to challenges facing registration systems and land information
systems in various countries in Sub-Saharan Africa and hoe these challenges can be
addressed. The need for land records which subsequently transformed into land

Adiaba et al.
850
registration systems evolved from society's relationship with land. Larsson (1991) for
example offers two basic historical reasons for land records. These are firstly, the
need for the state to know all land units for taxation or other fees and dues and
secondly, the need for prospective buyers of land to get publicity for their acquisition
of land. According to Dowson and Sheppard (1956) and Larsson (1991) the earliest
evidence of official land records for purposes of taxation and other services to the
state based on survey of lands dates as far back as 3000 BC in ancient Egypt where
such records were kept in the royal registry. These records were arrangements for
collection of taxes levied by the Pharaohs and Kings on the farmers. Dale and
McLaughlin (1989) further corroborate these facts that information systems have been
in existence since society adopted sedimentary agriculture as evidenced by the
Babylonians when they occupied the lands between the Tigris and the Euphrates and
the Egyptians cultivated the fertile Nile regions. As a result of these settlements in the
region, the need for land management arose and this in turn led to the development of
rudimentary land information systems.
Larsson (1991) mentions similar patterns of land information systems development in
ancient Rome during the 3rd
Century, in China around 700 AD based on crop yields,
in South India around 1000 AD and the famous Domesday Book ordered by William
the Conqueror in 1086 (see Plucknett, 2001). With the Doomsday Survey, the whole
of England was surveyed within a short time. Similarly, King Gustav of Sweden in
1540 ordered a survey of all taxable farms. The records were intermittently revised
and updated and trials were made to include land surveying. The quality of taxation
was enhanced by the addition of map information (Larsson, 1991). Napoleon I
however, brought real breakthrough when he instituted the French Cadastre in 1807
which also became a model for European countries (Steudler, 2004; Larsson, 1991).
The Frecnh breakthrough has seen significant improvements till date. According to
Dale and McLaughlin (1989) the recent examples of LIS include topographical and
geographical mapping programmes, valuation and forest inventory surveys, land title
survey and land registration systems. The changes are rather in degree and not in
principle as what is new are the quantity of data handled, the speed at which data can
be processed, and ways in which data can be manipulated, analysed and disseminated
as land information. Additionally, the information is produced as a result of land
registration functions carried out by government agencies and courts in various
countries (Dale and McLaughlin, 1989). Germany according to Enemark (2005) was
the first European country to take important steps to introduce registration of title
based on cadastral survey as a practice which started in the mid Nineteenth Century
and by 1900 it extended to cover the whole of Germany.
The role of Land registration systems
Successful land markets require efficient and up-to-date land registration systems
which provide sufficient relevant market information to enable market transactions
take place on fairly balanced information among participants in the market. Several
benefits are mentioned in literature as benefits of land registration but Ward (2003)
cited in Mooya and Cloete (2008) provides some positive outcomes of complete land
and property registration in line with conventional wisdom to include;
a) bringing people into market where they can benefit from free sale at full
market price;
b) providing security against eviction (legal security of ownership and land
rights;

Real estate markets
851
c) raising land value;
d) incorporating residents into the property-owning democracy and citizenry; and
e) providing the incentives to stimulate and invest in home improvements.
Farvacque and McAuslan (1992) contribute that registration and land markets have
strong linkages and assert that land registration facilitates the transfer process and
subsequently ensure the transparency of the transactions and further provides records
for land market operations. Toulmin (2008) concurs that among other perceived
benefits land registration provides government with information on land ownership
and plot sizes as well as foundation for a property tax system. Ghyoot (1998)
contributes that it helps in keeping inventory of national resources.
Dale (1997) posits that a functioning land registration system provides a safe and
certain foundation for the acquisition, enjoyment and disposal of rights in land which
some person or a group of persons is entitled to. Land registration system must create
security not for only landowners and their partners, but also national and international
investors, money lenders for traders and dealers as well as governments. Dale (1997)
acknowledges further that land registration is increasingly becoming an instrument of
national land policy and mechanism to support economic development.
Studies in Sub-Saharan Africa show that the benefits of land registration are not
automatic because it may have some adverse effects. For instance Bassett et al. (2007)
cited in Toulmin (2008) report that in Cote d'Ivoire the process of formalizing land
rights led to increased conflict and contributed to the current state of the civil war.
What this may imply is that land formalization should be introduced and implemented
with careful empirical studies as well as cost and benefit analysis. It is important to
mention that there are various and current initiatives towards land registration and
titling across Sub-Saharan Africa with the aim of promoting investment, reducing
poverty and encouraging natural resource management (Toulmin, 2008). In spite of
these initiatives many land registration systems are still not functioning well because
they are complex, expensive and slow to implement (Deininger, 2003; Toulmin,
2008). All these can be attributed to the fact that the methods being used are
inefficient. There are other land registration options that can be used to improve the
system.
Types of Land Registration Systems
Globally, there are basically two types of land registration systems namely the Deeds
Registration System and the Title Registration System. (Abdulai and Hammond,
2010; Enemark et al 2009; Rajabifard et al, 2007; Enemark 2005; Larsson,1991;
Palmer,1998; Zevenbergen, 2002; Bittner and Frank, 2002; Karikari et al, 2003,
Torhonen, 2004; Enemark, 2009). The key differences between the two land
registration systems relate to the extent of state involvement, cultural development and
judicial setting of each country. The cultural and juridical aspect according to
Enemark et al. (2005) depend on whether a country is based on Roman Law (deeds
system) or Germanic or Common Anglo-Law (title system) as well as the country's
colonial history. The Deeds system evolved from Roman culture whiles the Title
system originated from German culture.
Both Deed and Title systems fundamentally operate under similar principles as they
are different solutions to a common problem of determining the legal rights to a parcel
of land (Bittner and Frank, 2002). The key difference between the two systems is that
under the Deeds System, only the transaction is recorded and provides a register of

Adiaba et al.
852
owners and focuses on ''who owns what'' whereas under the Title System, the title
itself is recorded, secured and focuses on ''what is owned by whom'' (Enemark et el,
2005). Deeds registration system focuses on the recording of legal facts (transactions
that has taken place) whereas the Title registration system focuses on the recording of
legal consequences (of transactions) and the content of the register are guaranteed by
the state. Title System is common in Central European countries for example
Germany, Austria, Switzerland whereas the Deeds System is common in Latin
cultures in Europe for example France, Spain and Italy, and also in South America,
parts of Asia and Africa and in most parts of the United States of America (Enemark,
2005). Palmer (1998) remarks that both title and deeds systems ''require similar
quality of information in order to function well'' consequently it is better to introduce
administrative reforms that will improve quality of information rather than to attempt
to transform from deeds to title system.
The Title Registration System however has three variants based on the German
System (Enemark, 2005; Enemark et al. 2005). These variants are peculiarly and
found in (i) the United Kingdom, (ii) the Eastern European and Nordic countries and,
(iii) the Torrens System which is a special version of title registration developed by
Sir Robert Torrens and introduced in Australia in the mid 1800s. The system is
practised in Australia, New Zealand, Western states of Canada and in some Asian for
example Malaysia, and African countries (Enemark, 2005 and Enemark et al, 2005).
The Torrens system was developed in response to the needs of securing land rights of
a newly emerging nation-state with vast tracts of unidentified land. It was a legal
change in response to society's needs in Australia. It was revolutionary due to its
ability to deliver certainty in land ownership as well as cheaper and speedier land
registration (Ting et al, 1999).
Christensen (2004) cites Birrell et al. (2001) and points out that the Torrens System of
registration possess five qualities namely certainty, integrity of title, reliability,
simplicity and ease of use and economy. It is further argued that the fundamental
principle of an indefeasible title guaranteed by the state stems from the fact of the
quality of certainty and integrity of title (Whalan, 1982 cited in Christensen, 2004). It
therefore follows that once the title is registered for an owner, absolute security of that
title is guaranteed to the registered owner. According to Rouff (1952) cited Hanstad
(1997) by Sir Tobert Torrens believed that a land register must show the actual state
of ownership rather than provide evidence of ownership. Furthermore, Rouff (1952
and 1957) cited in Enemark et al. (2005) mention three basic principles of the Torrens
System namely the Mirror Principle, Curtain Principle and the Insurance principle.
By the Mirror Principle, title mirrors all relevant interests in the land and by the
Curtain Principle, title creates a barrier or curtain ensuring that interest off the register
need not be searched. Going by the Insurance Principle the state guarantees registered
interests in land Christensen (2004).
Principles of land registration systems
According to Steudler et al. (2004) there are three generic principles that govern land
registration system in almost every country. These principles are;
a) the type of registration system;
b) registration of land ownership; and
c) approach to establishment of the registration records (see also Cadastral
Template, 2003).

Real estate markets
853
Based on the above-mentioned registration principles and review of literature the
study developed a framework to show the set registration of registration principles that
leads to low registration coverage and contributes to deficient information regimes at
land registries and information asymmetry in SSA real estate markets (see discussion
on approach to establishment of registration that follows from Fig. 1).
Registration system Registration law Approach to registration
Fig. 1 Framework of Land Registration principles
Principle of Land Registration System
The type of registration system in a country whether based on deed or title system or a
variant do not matter much in contributing to information asymmetry. This is because
the fundamental principles underpinning both systems are similar but are different
solutions to a common problem of determining the legal rights to a parcel of land
(Bittner and Frank, 2002). Earlier, Palmer (1998) remarked that both title and deeds
systems require similar quality of information in order to function well. Zevenbergen
(2002) after a comparative study of four countries including Ghana's land registration
system observes that the flaws in the country's Deeds System in terms of technical,
organizational and legal aspects should have been corrected rather than introduce
Land Title Registration Law of 1986.
There are evidences of countries that have adopted either Deeds or Title Systems and
have 100% coverage of registered. Examples of countries operating the Deeds
System with such feat are Belgium and the Nerthelands (Cadastral Template, 2003)
and countries operating Title System with 100% registration are Germany, Denmark,
Sweden, Swizerland, and Korea (Cadastral Template, 2003). On the contrary there
are countries that operate either one or both systems but have incomplete coverage.
Examples of Deeds System with incomplete coverage are South Africa with 70%
urban land registered, Namibia with 60% urban land registered, India 99% and
Mexico with 61% urban land registered (Cadastral Template, 2003). Examples of
countries operating Title System and their coverage of registered urban lands are

Adiaba et al.
854
Malaysia 98%, Japan 72%, Tanzania 10% and Portugal with 17,000,0000 parcels out
of which 2,055,000 parcels are registered.
It could be deduced from the discussions so far that the extent of coverage of land
registration probably influences the sufficiency of information in the records of the
registry. The deduction also follows that with registries with 100% registration
coverage have sufficient information base and capable of supplying information in an
accurate and reliable manner. In line with this Palmer (1998) notes that registration
systems offer security if only it provides sufficient information and accurate
information as well as protection of rights after registration. The discussion proceeds
to the next registration principle which provides slippery ground for information
symmetry in Sub-Sahara Africa.
Principle of Registration of Land Ownership
The second cadastral principle pertains to whether registration of land ownership is by
law compulsory or optional (Steudler, et al., 2004) or voluntary Torhonen, 2004;
Larsson 1991). This principle is incentive based in the sense that individuals would
like to comply if only the benefits of registration exceeds the costs of no registration.
Thus compulsory or optional land registration may depend on a country's social,
economic, legal and political environment. For example Bedard (1986) explains that
the users of land information systems (LIS) information sometimes in the first place
have the choice among LIS to obtain data and secondly, they may themselves observe
the reality. The choice of the users among these two options depends on several
factors such as time, cost, task requirements to obtain the information and quality of
the information offered by the land information system. A land information system
like a communication process therefore relies on the feedbacks from its users to
continuously modify its functions according to internal and external demands and
problems (Bedard, 1986). It is imperative that when the system is fraught with
problems and unattractive, potential users may avoid the system and this will
contribute to low registration coverage.
In any case, the registration law must be grounded on the culture and land tenure
practices of the country for it to gain acceptance by the citizens and their knowledge
of the registration laws. Mitchell et al. (2008), Feeder and Nishio (1999) point out
that one of the factors that may lead to adverse social impact of land registration is the
degree of understanding of the landholders of the processes and benefits of land
registration. Germany for example has two operational land registration principles
based on which the land register enjoys the ''public faith''. The principles are; (a)
changes of rights to land do not take effect before being registered in the land register
(b) until otherwise proven, the correctness of all titles on the register is assumed. The
laws have been also decentralised and tailored to meet the needs of the various states
needs (Steudler et al., 2004 and Cadastral Template, 2003). Conversely, as part of the
colonial legacy in Sub-Saharan Africa, Nkuruziza (2008) citing a UNCHS (1999)
source indicates that state rules and procedures of land access/use have been variously
described as inappropriate, alien, expensive and cumbersome. It is imperative that
this state of affairs may not offer the required incentives for compulsory registration
let alone optional registration.
Principle of Approach for Establishment of Registration Records
The third registration principle is the approach for establishment of the registration
records. This principle provides as to whether land owners are required to register
lands systematically or sporadically or both. Registration is said to be sporadic when

Real estate markets
855
it is performed upon demand by the individual land holder (Feeder and Nishio, 1999).
This review argues further that the approach to land registration may be a major
contributory factor to the deficient information regime in land registries and
information asymmetry in Sub-Saharan African real estate markets. This stems from
the point that four out of the five countries reviewed from the sub-continent appear to
have taken the sporadic approach to land registration which extant literature suggests
that does not provide incentive for voluntary land registration and has been a failure in
past registration practices in some developed economies in most developing countries
(Torhonen, 2004; Bogaerts and Zevenbergen, 2001; Hanstad, 1997; Larsson, 1991;
Dale and McLaughlin, 1988).
Table1: Selected Land Registration Systems in Sub-Saharan African Countries
Country Registration System Registration Law Approach to Registration
Ghana Deeds Optional Sporadic
Namibia Deeds Optional Sporadic
South Africa Deeds Optional Sporadic
Tanzania Title Optional Sporadic
Source: Based on Cadastral Template (2003) and Literature
Larsson (1991) notes objections to the sporadic approach to registration and cautions
that;
a) sporadic approach to registration of titles takes a long time to complete the
register;
b) registration costs per unit of land are high; and suggests that
c) systematic registration provides an overview of all the existing parcels and
titles within an area.
Feeder and Nishio (1999) concur with Larsson (1991) and espouse that the level of
corruption and the degree of understanding by landowners of the benefits of the land
registration process are two major factors that may cause adverse social impacts of the
approach to registration. It is further argued that the potential for the adverse social
impacts is larger when registration and titling are sporadic and when the cost incurred
by the individual for registration is high (Mitchell et al, 2008). This principle it
appears in Sub-Saharan African countries have been largely ignored from the colonial
era till the present day. The practices so far have been optional registration of title and
the approach has been sporadic (see Table 1 and Framework shown). Instances when
the approach has been systematic have not yielded the desired impact. Zevenbergen
(2002) comments on Ghana's land title registration which is systematic to have
progress slowly since 1986 and further says in practice most first registration has
taken the form of more or less sporadic registration. Thus the sporadic concept or
principle of registration never works anywhere and may not help SSA countries to
achieve full coverage. Unfortunately this is the prevailing method in most developing
countries (Torhonen, 2004; Bogaerts and Zevenbergen, 2001; Hanstad, 1997; Larsson,
1991; Dale and McLaughlin, 1988). Figure 2 below shows a graphical example
between SSA and western European countries.

Adiaba et al.
856
16 6 7 8 10
100 100 100 100 100
0
20
40
60
80
100
120
REGISTRATION COVERAGE (%)
REGISTRATION COVERAGE (%)
Figure 2: Land registration coverage in selected Sub-Saharan African and Western European
Countries
Sources: ( Miceli and Kieyah, 2003: McAuslan, 2003; Bruce and Knox, 2009; Hammond,
2006; World Bank, 2005 and 2011; Steudler et al. 2004; www.cadastraltemplate.org )
One may be tempted to argue that 100% registration coverage is associated with the
number of years of land registration implementation and for that matter SSA countries
need more time to achieve full registration coverage. The French national cadastre
which started in 1807 and was completed in 1850 however teaches us a lesson that its
utility diminished within a short time due to lack of updating the records and cadastral
plans and this spread around Europe. As a result of this precedence, countries such as
Germany which became the first country to introduce land registration based on
cadastral surveys and the Netherlands and Denmark completed their cadastre within a
short period (Larsson, 1999). These were done in far less than 50years.
CONCLUSION
The study concludes that the source of the deficient information regime and
information asymmetries in SSA urban real estate markets is largely due to the
optional sporadic land registration approach adopted. This approach has never
achieved full registration coverage in any country. Hence Sporadic Approach to
registration must gradually be phased out as piecemeal gathering of data does not
provide comprehensive information in the land registry. The study suggests that the
information problem can be fundamentally addressed through policy reforms that
from best practice indicate that an initial full-scale registration of a country should be
the appropriate approach towards addressing the deficient information problem.
Alternatively, a supply-led approach to compulsory systematic land registration area
by area can be adopted rather than a compulsory systematic approach which in
practice operates through a demand led approach. The demand led approach causes
no significant difference between systematic and sporadic registration. Finally, land
registration must be seen as a land information tool as such efforts and resources
aimed at addressing real estate market problems should rather be geared towards
recognising and addressing the information problem.
REFERENCES
Abdulai, R., Hammond, F. N. (2010) ‗‗Landed property market information management and
access to finance‘‘. Property Management. :28:4, 228-244.
Akerlof, G. (1970) ‗‗The Market for ‗Lemons‘: Quality Uncertainty and the Market
Mechanism‘‘. Quarterly Journal of Economics,:84, 488-500.

Real estate markets
857
Alden Wily, L. (2003) ‗‗Governance and Land Relations: A Review of Decentralisation of
Land Administration and Management in Africa‘‘. International Institute for
Environmental Development. London
Antwi, A. (2002). ‗‗A study of informal urban land transactions in Accra‘‘. Ghana. Our
Common Estate.
Augustinus, C. (2003) ‗‗Comparative Analysis of Land Registration Systems: African
Review With special reference to Mozambique, Uganda, Namibia, South Africa‘‘.
Prepared for the World Bank.
Bandeira, P., Sumpsi, J. M., & Falconi, C. (2010) ‗‗Evaluating land administration systems: a
comparative method with an application of Peru and Honduras‘‘. Land Use Policy 27,
351-363.
Barnes, G. (2003) ‗Lessons learned: an evaluation of land administration initiatives in Latin
America over the past two decades‘, Land Use Policy , 20, pp 367-374.
Bedard, Y. (1986) ‗‗A Study Of The Nature Of Data Using A Communication-Based
Concept Framework Of Land Information Systems‘‘. The Canadian Surveyor, 40,
449-460.
Bogaerts, T. (1997) ‗‗A Comparative Overview of the Evolution of Land Information Systems
In Central Europe, Computers, Environment and Urban Systems‘‘. 21: 2,109-131.
Bouquet, E. (2009) ‗‗State-Led Land and Local Institutional Change: Land Titles, Land
Markets and Tenure Security in Mexican Communities‘‘. World Development,:37:8,
Bruce, J. W. and Knox, Anna (2009). ‗‗Structures and Stratagems: Making Decentralization
of Authority over Land in Africa Cost-Effective‘‘. World Development, 38 (8), 1360 -
1369,
Cadastral Template (2003) ‗‗A Worldwide Comparison of Cadastral Systems. Established
under UN mandate by Resolution 4 of the 16th UNRCC-AP in Okinawa Japan in July,
2003. available at www.cadastraltemplate.org
Chatterton, W. A. (1980) ‗‗Land Information Systems for the Twenty-First Century. Real
Property‘‘. Probate and Trust Journal, 15, 890-900.
Christensen, S. (2004) ‗‗Electronic Land Dealings in Canada, New Zealand and the United
Kingdom: Lessons for Australia‘‘. E Law – Murdoch University Elecpronic Journal
of Law. 11:4
Clarkson, G., Jacobsen, T. E., Batcheller, A. L. (2007) ‗‗Information asymmetry and
information sharing‘‘. Government Information Quarterly, 24, 827-839.
Coase, R. (1961) The problem of social cost. Journal of Law and Economics, Vol. 3 pp. 1-44
Dale, P. (1997) ‗‗Land Tenure Issues in Economic Development‘‘. Urban Studies, 34 (10),
621-1633.
Dale, P. (2000). The importance of land administration in the development of land markets-A
global perspective. Land Markets and Consolidation in Central Europe, TU Delft-
UDMS.
Dale, P. and McLaughlin, J. D. (1989) ‗‗Land Information Management. An Introduction
with Special Reference to Cadastral Problems in Third World Countries‘‘. Clarendon
Press. Oxford.
Dale, P. and McLaughlin, J. (1999) ‗‗Land Administration‘‘. Oxford University Press Inc.
Oxford, New York.
de Soto, H. (2000) ‗‗The Mystery of Capital: Why Capitalism Triumphs in the West and Fails
Everywhere Else‘‘. Bantam Press, Black Swan Edition, London.
de Vries, W. T. (2004) ‗‗How progressive land titling could foster new surveying practice and
land information systems – based on case studies in Namibia. Computers,
environment and Urban Systems,:28, 531-544
Deininger, K. (2003) ‗‗Land Policies for Growth and Poverty Reduction‘‘. World Bank and
and Oxford University Press, Washington DC.
Deininger, K. And Feder, G (2009) ‗‗Land Registration, Governance, and Development:
Evidence and Implications for Policy‘, The World Bank Research Observer, 24: 2,
233-266.

Adiaba et al.
858
Enemark, S. (2005) ‗‗A Cadastral Tale‘‘. Week on Geomatics 2005, Bogota, Colombia, 8 –
13August, 2005.
Enemark, S. (2009) ‗‗ Land Administration Systems‘‘. Map World Forum, Hyderabad, India,
10-13 February, 2009.
Enemark, S., Williamson, I. and Wallace, J. (2005) ‗‗Building Modern Land Administration
Systems in Developed Economies‘‘. Spatial Science, 50:2, 51-68.
Farvacque, C. and McAuslan, P. (1992) ‗‗Reforming Urban Land Policies and Institution in
Developing Countries‘‘. Urban Management Program Policy Paper No. 5
Feder, G. and Feeny, D. (1991) ‗‗Land Tenure and Property Rights: Theory and Implications
for Development Policy‘‘. World Bank Economic Review, 15:1, 135-153
Feder, G. and Nishio, A. (1999) ‗‗The benefits of land registration and titling: economic and
social perspectives‘‘. Land Use Policy.:15:1, 25-43.
Feder, G. and Noronha, R. (1987) ‗‗Land Rights Systems and Agricultural Developmnet in
Sub-Saharan Africa‘‘. World Bank Research Observer, 2: 2, 143-169.
Fekade, W. (2000) ‗‗Deficits of formal urban management and informal responses under rapid
urban growth, an international perspective‘‘. Habitat International, 24(2), 127-50.
Feenan, R. and Dixon, T J. (1992) ‗‗Information and Technology Applications in Commercial
Property. London:Macmillan.
Fourie, C. (1998) ‗‗The role of local land administrators: an African perspective‘‘. Land Use
Policy, 25(1), 55-66.
Fourie, C. (2001) ‗‗Capacity building for sub-Saharan Africa: Towards a more relevant
approach‘‘. Paper presented at the workshop on capacity building in land
administration for the developing world, ITC, Enschede 13-15 November
2000.
Gough, K.V. and Yankson, P.W.K. (2000) ‗‗Land markets in African cities: The case of puri-
urban Accra, Ghana‘‘. Urban Studies 37(13), 2485-2500.
Ghyoot, V., (1998) ‗‗Public Sector Policy in The Property Industry: A Framework For
Analysis‘‘. Urban Forum, 9(2), 255-257.
Grossman, S. J., Stiglitz, J. E. (1980) ‗‗On the Impossibility of Informationally Efficient
Markets‘‘. The American Economic Review: 70: 3:, 393-408
Hammond, F. N. (2006) ‗‗The Social Cost of Real Estate Market Information Gaps in
Ghana‘‘. Urban Policy Research, 24: 3, 391-408.
Hammond, F. N. (2008) ‗‗Marginal Benefits of Land Policies in Ghana‘‘. Journal of Property
Research,:25:4, 343-362.
Hammond, F. N. and Antwi, Y. A. (2010), Economic Analysis of Sub-Saharan Africa Real
Estate Policies, Palgrave Macmillan, Basingstoke and New York.
Hanstad, T. (1997) ‗‗Designing Land Registration Systems for Developing Countries‘‘.
American University International Law Review.:13:3, 649-702.
Karikari, I., Stillwell, J. and Carver, S. (2003) ‗‗Land Administration and GIS: The Case of
Ghana‘‘. Progress in Development Studies 3: 3, 223-242
Kironde, J. M. L. (2000) ‗‗Understanding land markets in African urban areas: the case of Dar
el Salaam, Tanzania‘‘. Habitat International 24: 2, 151-165.
Larsson, G. (1991) ‗‗Land Registration and Cadastral Systems: Tools for land information
management‘‘. Longman Scientific and Technical. Longman Group UK Ltd,
England.
Lemmen, C., van Oosterom, P. (2001) ‗‗Cadastral Systems‘‘. Computers, Environment and
Urban Systems, 25:4-5:, 319-324.
Manthorpe, J. (2005) ‗‗Inventory of Land Administration Systems in Europe and North
America‘‘. HM Land Registry, London. Available at
http://www.unece.org/env/wpla/welcome.html
McAuslan, P. (2003) ‗‗Bringing the law back: essays in land, law and development‘‘. Ashgate
Publishing Ltd. Aldershot, England.
Mitchell , D., Clarke, M. and Baxter, J. (2008) ‗‗Evaluating land administration projects in
developing countries‘‘. Land Use Policy 5, 464 - 473.

Real estate markets
859
Mooya, M. ., Cloete, C. E. (2007) ‗‗Informal Urban Property Markets and Poverty
Alleviation: A Conceptual Framework‘‘. Urban Studies,:44:1, 147-165
Nkurunziza, E., (2008) ‗‗Understanding informal urban land access processes from a legal
pluralistic perspective: The case of Kampala, Uganda‘‘. Habitat International 32:
109-120
North, D. C. (1992) ‗‗Institutions and Economic Theory. American Economis‘‘. 36:1:, 1-4
Palmer, D. (1998) ‗‗Security, risk and registration‘‘. Land Use Policy, 15:1: 83-94
Pas, J. (2002) ‗‗The Commercialization of Government Information and the Proposal for a
Directive COM (2002) 207 by the European Commission‘‘. E Law – Murdoch
University Electronic Journal of Law, 9: 4.
Olsson, O. (2009) ‗‗On the democratic legacy of colonialism‘‘. Journal of Comparative
Economics 37, 534-551
Plucknett, T. F. T. (2007) ‗‗A concise history of the Common Law‘‘. Firth Edition, the
Lawbook Exchange Ltd. Union , New Jersey.
Poe, L. G., Bishop, R. C., & Cochrane, J. A. (1992) ‗‗Benefit-Cost Principles for Land
Information Systems‘‘. URISA Journal.
Quintero, J. R., (2004) ‗‗Land Information Systems‘‘. International Encyclopedia of the
Social & Behavioral Sciences, 1-6.
Rajabifard, A., Williamson, I., Steudler, D., Binns, A. and King, M. (2007) ‗‗Assessing the
worldwide comparison of cadastral systems‘‘. Land Use Policy, 24, 275-288.
Stanfield, D. J., and Licht, J. (2009) ‗‗Modernizing the Register of Deeds in Dane County,
Wisconsin‘‘. Journal of Urban and Regional Information Systems Association, 21:1:,
31-42.
Steudler, D. Rajabifard , A. & Williamson, I. P. (2004) ‗‗Evaluation of Land Administration
Systems‘‘. Land Use Policy 21: 371-380.
Steudler, D., Williamson, I. P., Rajabifard, A. and Enemark, S. (2004) ‗‗The Cadastral
Template Project‘‘. FIG Working Week 2004, Athens , Greece, May 22-27, 2004.
Stigler, G. J. (1961) ‗‗The Economics of Information. Journal of political Economy‘‘.:69:3,
213 - 225
Ting, I ., Williamson, I.P., Grant, D. and Parker, J.R. (1999) ‗‗Understanding the Evolution of
Land Administration Systems in Some Common Law Countries‘‘. Survey Review.
Toulmin, C. (2008) ‗‗Securing land and property rights in sub-Saharan Africa: The role of
local institutions‘‘. Land Use Policy 26, 10-19.
Torhonen, M. (2004) ‗‗Sustainable land tenure and land registration in developing countries,
including a historical comparison with an industrialised country‘‘. Computers,
Environment and Urban Systems, 28:5, 545-586.
Woodman, G. R. (1987), ‗Land Registration Without Prejudice: The Ghana Land Title
Registration Law, 1986‘, Journal of African Law, 31, pp 119-135.
Williamson, I.P. (2001) ‗‗Land Administration ''best practices'' providing infrastructure for
land policy implementation‘‘. Land Use Policy 18: 297-307.
Williamson, I., Ting, L. (2001) ‗‗Land administration and cadastral trends – a framework for
re-engineering‘‘. Computers, Environment and Urban Systems, Volume 25: 4-5:, 339-
Williamson, E. O. (1981) ‗‗Contract analysis: the transaction cost approach‘‘ in :P. Burrows
& C. G. Veljanovski (Eds) The Economic Approach to Law (London:Butterworths).
Williamson, E. O. (1986) ‗‗Markets or government: framework and implications, Economics
as a Process-Essay in the New Institutional Economics‟‟. 171-202 ( Cambridge:
Cambridge University Press).
World Bank (2005) ‗‗Doing Business in 2005. Removing obstacles to Growth‘‘. Washington
DC: World Bank.
World Bank (2011) ‗‗Doing Business in 2011‘‘ Washington DC: World Bank.
Zevenbergen, J. (2002) ‗‗Systems of Land Registration-Aspects and Effects‘‘. PhD Thesis
Published by Nertherlands Geodetic Commission, delft, The Nertherlands.


Aluko, O. (2011) Spatial scales and measurement of housing values in Nigeria: the case of metropolitan
Lagos In: Laryea, S., Leiringer, R. and Hughes, W. (Eds) Procs West Africa Built Environment
Research (WABER) Conference, 19-21 July 2011, Accra, Ghana, 861-869.
861
SPATIAL SCALES AND MEASUREMENT OF HOUSING
VALUES IN NIGERIA: THE CASE OF METROPOLITAN
LAGOS
Ola Aluko1
Department of Urban and Regional Planning, University of Lagos, Lagos, Nigeria
This research paper tries to answer the questions that can heterogeneous zones be
grouped to produce spatial markets? And are the submarkets produced meaningful
geographically? The study shows that the use of small geographical scale helped to
identify similar zones and neighbourhoods that have the same housing values and
socio-economic characteristics. This is unlike some of the previous studies that
combined wider areas together and so failed to identify spatial submarkets. Four
different geographical scales were examined to determine the level of disaggregation
of data, and the highest level of disaggregative data occurs where cities are divided
into small areas by zones. This study utilized both secondary and primary sources of
data. The study is based on data collected from sixteen Local Government Areas
consisting of 53 residential zones in metropolitan Lagos. Out of the total number of
135,820 properties, a size of about 1% (1,500) was randomly selected. The hypothesis
was tested using a combination of analysis of variance, multiple regression model,
expansion method and the non hierarchical technique of grouping. The variations in
house values by zones are more distinct than house values for communities and local
governments that bear the same name. The grouping of the zones with similar house
values also helps to identify housing submarkets that exist in the study area. The
submarkets have variations in housing values that conform with the socio-economic
characteristics of the households.
Keywords: housing value, Lagos, Nigeria
INTRODUCTION
The fact that there is spatial disparity in the distribution and quality of public services
and infrastructural facilities means there is locational variation within the sub-areas of
the Lagos metropolis (Aluko, 2008, 2003). For a city is in reality a very heterogenous
entity. This paper therefore shows how house values vary by area and the role of
changes in spatial scale in the understanding of housing values. Spatial scales are
geographical terms which also mean geographical scale. It relates to space, position,
shape or changes that take place within the environment. The hypothesis being tested
is that the use of distinct spatial scales within cities for investigation affects the
measurement and interpretation of housing values. That is distinct spatial scales of
investigation within the cities yield different measures of housing values through the
use of neighbourhood, location and physical attributes of houses to determine house
values. This is to argue that rental values could vary significantly between large and
heterogeneous neighbourhoods and more defined near homogeneous areas of
investigation (Aluko, 2008, 2000). Thus, the choice of an appropriate scale is

Aluko
862
necessary for correct interpretation of the nature and pattern of variation. This paper
examines these variations across different definitions of sub-area units for
investigation and relates this to issue of defining housing markets spatially.
STUDY AREA
Metropolitan Lagos developed from a narrow low-lying Island situated on latitude 6°
27' North and longitude 3° 28' East along the West African coast (Ayeni, 1979). The
original settlement on the site on which Lagos grew was first inhabited by fishermen
and farmers and was called Eko. This settlement was christened in 1492 as Lago de
Kuramo by the Portuguese who used it only as a harbour in their attempts at finding a
route to the far east (Ayeni, 1979). Lagos comprises the former 70 square kilometres
of the Federal Territory of Lagos which was composed of the geographically formed
Islands of Eko (Lagos Island), Ikoyi, Victoria Island, Iddo-Otto, Ijora and Apapa
(Aluko, 2000). The central and most developed of this Island chain is Lagos Island. It
also incorporates the municipal settlements of Ebute-Metta, Yaba, Surulere Tin-Can
Island (Mekuwen) and the Eti-Osa areas all of which cover 85.53 square kilometres
from these initial !settlements, development has proceeded northward to the mainland
up to about latitude 6° 40' North (Aluko, 2000). Lagos, however, remains the most
populous state in Nigeria and is still the country's commercial capital.
METHOD
This study utilized both secondary and primary sources of data. Primary information
was collected from both direct interviews and personal observations. The main
primary information was obtained from responses to questionnaires administered by
the author and trained assistants. The study is based on data collected from sixteen
Local Government Areas consisting of 53 residential zones in metropolitan Lagos.
Out of the total number of 135,820 properties, a size of about 1% (1,500) was
randomly selected. The hypothesis was tested using a combination of analysis of
variance, multiple regression model, expansion method and the non hierarchical
technique of grouping. This is necessary in order to show that using proper spatial
scale in the delineation of zones and wards, distinct spatial pattern exist within the
cities' various housing attributes.
On how the spatial scale of areas of investigation within the cities affects the
measurement of housing values, the non hierarchical technique of grouping was used
to identify the similar clusters of zones. The factor scores of the housing values
subjected to non hierarchical technique of grouping on zonal basis identified four
clusters of groupings (as four sub-groups). The cluster analysis invariably followed
the socio-economic groupings that high and upper middle income households
segregate themselves from low income households. This is not a matter of physical
denial but of the fact that most high and upper middle income households have strong
economic power for legally perpetuating neighbourhood socio-economic segregation.
The choice of the study area, Metropolitan Lagos, is based on many factors. First, the
housing markets are very well developed in Lagos. Consequently, it is possible to
identify and analyze variations. Secondly, comprehensive data is available on property
values in the state. The data are expected to be useful in the explanation of the
variations of housing attributes over space.
CONCEPTUAL FRAMEWORK
The conceptual framework focuses on housing at both micro and macro levels. The
micro is the household, while the macro is spatial and relates to areas within the city.

Housing values
863
There are urban micro-economic and macro-economic theories that provide
conceptual issues for the study. The first include the trade-off models and their more
recent reformulations, the hedonic model and the expansion method. While the second
involves the urban spatial structure and the ecological approach to urban land values.
Expansion method is a sequential approach that uses the multiple regression models to
evaluate specific contribution of housing attributes on house prices (Can, 1991;
Follain and Can, 1982; Richardson and Cain, 1974). It also helps to examine the
effects of these housing attributes on house values. The expansion method outlines a
routine for creating or modifying models made of a sequence of clearly identified
logical steps (Can, 1991; Dublin and Sung, 1990; Cronin and Rasmusson, 1980). The
expansion method can be considered as a special case of systematically varying
coefficients in a regression model (Sheffer, 1990; Ndulo, 1985; Andrew, 1987; Ayeni,
1979). The heterogeneity in the phenomenon under study is reflected in parameter
values that differ for each observation. In the terminology of the expansion method,
the original simple homogeneous specification is called the initial model, whereas the
complex heterogeneous formulation is called the terminal model (Megbolugbe, 1991,
1986; Downs, 1979).
SPATIAL SCALE AND PATTERN OF HOUSING ATTRIBUTES
Housing values or rental values within a city are either aggregated or disaggregated
over households in order to examine their variations (Aluko, 2008, 2003).
Consequently, the geographical scale or spatial scale used always determines the level
of the disaggregation of data (Aluko, 2008, 2003). In this section, variation over four
different scales will be examined. The description of the different levels of
geographical scale or spatial scale is presented in figure 1. The first level is when a
city is studied as a whole and this is the highest level of aggregative data. Another
level of scale is when analysis is performed on the basis of local governments that
exists within the metropolitan area. Although most cities in Nigeria have few local
governments, the study area (metropolitan Lagos) has 16 local governments. The level
of data at second scale is also still aggregative. The third level of scale is the analysis
of the city on basis of communities that exist therein. This is when the city is either
studied on neighborhoods basis or when one uses specific areas as explained in the
multiple nuclei model. The data at this level may or may not be disaggregated
depending on the size of the zones. The example of such neighbourhoods as related to
the study area are: Ikeja, Mushin, Ketu, Oshodi, Apapa-Ajegunle, Surulere, Yaba,
Ojota, Ikoyi and so on.
The fourth level of geographical scale or spatial scale is when the city is divided into
zones, wards, enumeration areas or other small units. The highest level of
disaggregative data occur where cities are divided into small areas for better
examination of the households characteristics and distinct analysis of submarkets. For
the collection of valuation data, the estate agents identified 53 zones in metropolitan
Lagos. The zones were sufficiently homogeneous to constitute distinct spatial markets.
The zones and the description of the areas are presented in table 1. In the next section,
we shall evaluate variation in house values at the three levels for comparative
purposes. However, the greatest emphasis will be on the fourth scale which is the
zonal level because of the need to evaluate the extent to which the units at this level
are distinct.

Aluko
864
Variation of Housing Values by Local Governments, Communities and Zones
The local government areas in metropolitan Lagos are Agege, Ifako ljaye, Eti-Osa,
Ikeja, Alimoso, Lagos Island, Apapa, Lagos Mainland, Mushin, Somolu, Kosofe,
Surulere, Amuwo- Odofin and Oshodi Isolo. Mean annual housing rental values for
each of the local government areas are shown in table 2. Clearly there are 3 or 4 types
of groups from the table. The first group which comprise of Eti-Osa/Ibeju-Lekki local
government is a very distinct local government, with mean annual house rental values
of N1,860,000. There was no other local government that has any value as high as this
figure. The second group consists of Ikeja and Alimosho local governments with
annual house rental values of between N300,000 and N720,000. The third type of
group contained local governments with annual house rental values that range
between N100,000 and N250,000. The local governments in this group are Lagos
Island, Lagos Mainland Somolu and Surulere. The fourth identified group of mean
annual house rental values was also very distinct with low figures, they were extremes
of the first group. They are below N100,000 and they consist of Agege, Mushin and
Oshodi local governments.
Table 2: Housing Values by Local Governments
Local Governments Annual House Rental Values
(Means) (N)
No. of Properties
Agege/Ifako-Ijaye 60,658 15,170
Eti-Osa/Ibeju-Lekki 1,860,000 6,471
Ikeja 710,250 13,176
Alimosho 300,000 4,052
Lagos Island/Apapa 180,650 8,046
Lagos Mainland/Ajeromi 150,850 15,070
Mushin 80,400 17,003
Somolu/Kosofe 170,200 27,966
Surulere/Amuwo-Odofin 150,700 18,568
Oshodi/Isolo 80,500 10,298
Sources: Lagos State Valuation Office; Field Work, 2010
Exchange rate: US Dollar 1$=150 N Nigerian Naira
It is suffix to clarify that most of the properties in low income areas are between 1-2
rooms per household. That is, most of the households rent or occupy 1-2 rooms and
the mean annual rental values are between N48,000-72,000 ($320-480). Most of the
properties in medium income area are flats and the mean annual rental values are
between N120,000-360,000 ($800-2,400). While in high income areas the common
properties are flats, bungalows and duplexes and the mean annual rental values are
N500,000- N1million ($3,333=6,667). The average exchange rate of Nigeria currency
(Naira) to United States Dollar ($) is $1= N150. There are twenty five communities
defined on geographic units within which certain social relationships exist (see Table
3 and Figure 1). Table 3 shows the variations in the housing rental values by
communities. The house values by communities in table 3 could also be grouped into
four. The first group are the communities with annual house rental values less than
N220,000 ($1,467). They consist of communities like Mushin, Ketu, Oshodi, Ojota,
Eko, Agege, Oyingbo, Aguda, Ojodu, Ipaja, Alagbado and Abule Ijesa. The second
group of communities are those with annual house rental values between N220,000
and N400,000 ($1,467-2,667). The communities with these values are Apapa, Isolo,
Sogunle, Ijesa Tedo, Somolu, Alausa and Gbagada. The communities within the third
group are Surulere, Yaba and llupeju and they have annual house rental values
between N401,000 and N900,000 ($1,467-6,000). The fourth type of communities are
those, with annual house rental values above N900,000 (>$6,000). The communities

Housing values
865
in these group are Ikeja, Ikoyi and Victoria Island and they have the highest annual
house rental values.
There are two reasons that make the house values by local governments in table 2
different from house values by communities in table 3. The first one is that mean
house values by local governments are lower than house values for communities that
bear the same name, and this is because of the more aggregative data of the local
government.
The second thing that distinguish table 2 from table 3 is that the number of properties
in the local governments are more than the properties in the communities. This is
because the areas covered by the communities are smaller than the areas covered by
the local governments. This account for the reason why house values in the
communities are more than the house values in the local governments because the
properties are fewer and the mean values are disaggregated. Therefore, the
geographical scale on community basis is better than that of the local government.
Table 4 shows the variation in house values by zones. The zonal values could be
grouped into four. The first zonal group are zones with house monthly rental values
below N10,000. The zones consist of Oyingbo, Iponri, Abule Ijesa, Ajegunle, Oju
Elegba, Ketu, Isolo, Mushin, Oshodi, Alagbado, Ipaja and Oniwaya. The second type
of zonal group are the zones with house monthly rental values between N10,000 and
N25,000. The zones in the second group are Oba's Palace, Yaba, Ijora, Masha, Aguda,
Igbobi, Ogba, ltire and Ajao Estate. The house monthly rental values between
N25,000 and N49,000 are those that form the third group and the areas in this group
are Marina, Awolowo Way, Agidingbi, Alausa, Adeniyi Jones and Sogunle. The
fourth zonal group consists of zones with house monthly rental values above N50,000
and they include Alagbon, Ikoyi, Falomo, Eleke Crescent, Victoria Annex, Thomas
Okoya, Ikeja G.R.A., Allen Avenue and Opebi. The variations in house rental values
by zones are more distinct than house values by communities and local governments
because the areas covered are very small. The house rental values in Ikeja by zones is
N106,000, the rental values by communities in Ikeja is N90,000 and the values by
local government in Ikeja is N71,250. That is, the house rental values in the zone are
more than the house rental values in the communities and local governments because
the number of houses covered in the zones are fewer and the data are most
disaggregated. The grouping of the ones with similar house values also help to
identify the housing submarkets that exists in the metropolitan Lagos.
The variation in housing values in table 4 could also be due to differences in socio-
economic characteristics of the households. As some areas have very high values
while others very low values. Areas like Ikoyi, V.I. and Ikeja G.R.A. which are high
income areas could not be compared with Suru1ere, Yaba and llupeju which are
medium income areas, and also Mushin, Oshodi and Oyingbo which are low income
areas. The characteristics of the households in these zones are related to their housing
values. This necessitated the grouping of the zones with similar housing values by non
hierarchical grouping technique in the next section.
Spatial Dimension of Housing Submarkets
There is evidence that the variations over space are better studied by the zones defined
by the estate values. The pattern is not too clear and there are questions to be
answered in this section. The questions are: can the zones be grouped to produce
spatial markets? Are these submarkets meaningful geographically? In order to answer
the questions, there is need to group the zones on the basis of house values and their
Aluko
866
attributes. We used the non hierarchical techniques of grouping. Multivariate grouping
techniques are based on the use of orthogonal dimension of variables. Consequently,
we used factor analysis to produce these dimensions from the set of variables. The
variables are shown in table 5. Therefore, we first examined the factor scores of the
house values and later discussed the non hierarchical techniques of grouping. The
results of the grouping of clusters provided better explanation to issue of housing
submarkets in metropolitan Lagos.
The spatial variation of housing values in metropolitan Lagos involves the groups of
variables of the attribute matrix (35 in all) described in table 5 were subjected to a
factor analysis from which emerged three dimensions. The three dimensions explained
a total of 62.4 percent of the variance contained in the original variables. The first
dimension, which dominates the housing values of metropolitan Lagos accounts for 46
percent of this explained variance while the other two components explain 16.6 and
16.4 percent‘s respectively (see Table 6). The factor loadings show the extent, to
which each variable belongs to or is mostly associated with the factor, while the factor
scores show the performances of the cases on the factors.
The first component is characterized by high positive loadings on the neighbourhood
and structural variables and rather low positive loadings on locational attributes. The
high positive loadings are on number of kitchen, toilet and bathroom facilities;
maintenance of the building; good appearance of the neighbourhood; number of
parking facilities; the noise level and number of waste disposal system in the
neighbourhood (see Table 5). The interpretation of this factor is facilitated by the
pattern of scores shown in table 7. It is a structural neighbourhood dimension. This
dimension of housing values divides the city into three important socio-economic
groups; the high income, the middle income and the low income. The high income is
made up of Ikoyi Park, Alagbon, Falomo Bar Beach, Eleke Crescent, Maroko,
Maryland, Ajao Estate, Allen Avenue, Opebl, Ikeja GRA and Adekunle Fajuyi Street.
These zones have factor scores ranging between 1.0 and 1.5. The middle, income
group, on the other hand, is made up of zones with scores between 0.5 and 0.9 and
includes Yaba, Ijesha Tedo, Igbobi, Awolowo Way, Ogba Estate and Ilupeju. While
the low income group is made up of Oyingbo, Abule Ijesha, Itire Road, Isolo, Mushin,
Oshodi and Oniwaya. These latter zones have low positive and high negative scores -
0.6 to 0.4.
The second component loads on socio-economic variables with high positive loadings
on such variables as number of rooms, income number of persons in the household
and education (see Table 8). The socio-economic variables examined include age of
the household heads, education, occupation, number of rooms occupied by household,
number of persons in the household, length of stay in the house, type of buildings,
income, and house tenure. Consequently, it may be said that this dimension is socio-
economic. The pattern of scores in table 7 which include quality areas like Igbobi,
Mainland, Ajao Estate, Thomas Okoya, Opebi and Ikoyi Park shows that the zones are
made up of high and medium residential areas.
While the first two components identify both the housing attributes and the socio-
economic variables of the city, the third dimension identifies the infrastructural
facilities provided in the neighbourhoods. This component, accounting for only 16.4
percent of the variance, loads highly on, the condition of the road, drainage, provision
of water, electricity, and recreational facilities. This dimension therefore may be
described as the infrastructural facilities of urban housing of' metropolitan Lagos. The
pattern of scores shows that areas such as Idi Araba Road, Olusosun, Aguda-Ogba,

Housing values
867
Ijora, Iponri, Oyingbo and Oba‘s Palace have high scores and they are high density
areas.
The analysis of the spatial variation of metropolitan Lagos could be described in terms
of three major dimensions of neighbuorhood/ structural attributes, the socio-economic
variables and the infrastructural facilities of variation. While they do not show any
discernible spatial variation in terms of being either concentric, sectoral or found in
nucleations, they undoubtedly outline the historic development of the city.
The results of the factor analysis conform with some findings in other parts of the
world. Most of the developed and developing countries have traits of this delimitation
in their metropolitan areas (Aluko, 2008; Cohen, 1990; Phipps, 1987; Freeman, 1979;
Lakshmanan et al, 1978; Mayes, 1979; Ayeni, 1979; Nellis and Longbotton, 1981;
Stutz and Kartman, 1982). In United States of America, the process of urban
development produced high quality neighbourhoods and community environments for
nearly all high income households and middle income households in US metropolitan
areas (Downs, 1981). It has also provided reasonably good quality environments of
many moderate income house and some low income households. Other works on
Singapore, Japan, Korea and Hong Kong confirmed the indicators of housing and
neighbourhood (Mills, 1972). The most important point to note is that the behaviour
or condition of many urban areas of the world is influenced by locally prevailing
culture more than the similarities of objective situations among places - such as
overcrowding, poverty and high density.
Spatial Variation in Housing Submarkets
In order to identify similar clusters of zones, the factor scores of the housing values
were subjected to non hierarchical techniques of grouping on zonal basis. Four
clusters of groupings were identified as four sub-groups. The cluster analysis
coincidentally followed the socio-economic groupings where high and upper middle
income households segregate themselves from low income households (see Table 8).
Most high and upper middle income households have strong economic power for
legally perpetuating neighbourhood socio-economic segregation. We understand the
fact that the different models of residential location believe or explain the spatial
pattern of residents according to their income group segregation. The non hierarchical
grouping technique is the most effective in cluster analysis because it makes
groupings to be optimal and dissimilar cases are not grouped together.
CONCLUSION
This study has shown that the use of small geographical or spatial scale helped to
identify similar zones and neighbourhoods that have the same housing values and
socio-economic characteristics. This is unlike some of the previous studies that
combined wider areas together and failed to identify spatial submarkets. Four different
geographical scales were examined to determine the level of disaggregation of data,
and the highest level of disaggregative data occurs where cities are divided into small
areas by zones. The variations in house values by zones are more distinct than house
values for communities and local governments that bear the same name. This is
because the areas covered are very small and the number of properties covered are
fewer than the· properties in the communities and local governments. The grouping of
the zones with similar house values also helps to identify housing submarkets that
exist in the study area. The submarkets have variations in housing values that conform
with the socio-economic characteristics of the households. Some areas have very high

Aluko
868
values while others very low values. The analysis revealed that spatial variation of
metropolitan Lagos could be described in terms of 3 major dimensions of
neighbourhood structural attributes, socio-economic variables and the infrastructural
facilities.
The classification and identification of spatial areas will help planners, estate
surveyors and valuers, government policy makers and other allied professionals in
housing to make valuable and quality decisions in the location of amenities/ facilities,
ratings of properties and collection of tenement rates, and for proper planning. Areas
that need urgent attention because they are inhabited by low income earners will be
reconsidered and provided with basic facilities while areas with high income earners
could be properly organised to contribute to the provision of essential amenities/
services in their neighbourhoods especially in security services (police stations/ posts).
REFERENCES
Aluko, Ola (2008) Housing and Urban Development in Nigeria, Kins Publishers, Nigeria.
Aluko, Ola (2003) Housing Values and Determinants of Housing Submarkets in Nigeria,
Journal of the Nigerian Institute of Town Planners, Vol. XVI, October, pp. 55-68.
Aluko, Ola (2000) The Effects of Relative Units of Housing on House Prices in Metropolitan
Lagos, Lagos Journal of Environmental Studies, vol. 2 No.1 Oct. pp.85-94.
Andrew, C.L. (1987) The Role a/Rental Housing in Developing Countries. Urban
Development Discussion Paper UDD-I04. Washington, DC: The World Bank.
Ayeni, Bola (1979) Concepts and Techniques in Urban Analysis, Croom Helm, London.
Can, A., (1991) Spatial Variation in the Propensity to move of Household, Sistemi Urban, No.
1, pp. 107-27.
Cohen, M.A. (1990) Macroeconomic Adjustment and the City, Butterworth and Co. Ltd.,
London.
Cronin, F.J., and Rasmussen, D.W. (1980) Renter Choice in Detroit. 'Report No. 1375-2,
Washington, DC: The Urban Institute.
Downs, A. (1979) The Future of Rental Housing in America, Washington, DC: The Brooking
Institution.
Dublin, R.A. and Sung, C. (1990) Specification of Hedonic Regressions: Non-nested test on
Measures of Neighbourhood Quality, Journal of Urban Economics, Vol. 27, 1990,
pp.97- 110.
Follain, J. and Can A. (1982) Housing Crowding in Developing Countries and Willingness to
Pay for Additional Space. The Case of Korea, Journal of Development Economics,
vol. 11, pp. 249-272.
Freeman , A. M. III (1979) The Hedonic Price Approaches Measuring Demand for
Neighbourhood Characteristics, in Marshall, A. (ed.) Principles of Economics, pp.
191-217.
Lakshmanan, T.R., et al. (1978) Housing Consumption and Level of Development: A Cross
National Comparison, Economic Geography, Vol. 54. Pp. 222-233.
Mayes, D. (1979) The Property Boom, Oxford: Martin Robertson.
Megbolugbe, I. F., (1986) Econometric Analysis of Housing Trait Prices in a Third World
City, Journal of Regional Science, Vol. 26, pp. 533-547.
Megbolugbe, I. F., (1991) Hedonic Indices and Housing Programme Benefits, Urban
Studies,Vol. 28, No. 5, pp. 773-781.
Mills, Edwin, (1972) Urban Economics, Scott, Foreman.
Ndulo, M. (1985) The Determinants of Urban Housing Value: The Evidence from Zambia,
Malaysia Journal of Tropical Geography, Vol. 12, pp. 31-36.
Nellis, J.G. and Longbottom, J.A. (1981) An Empirical Analysis of the Determinants of
House Prices in the U.K., Urban Studies, Vol. 13, pp. 9-21.
Phipps, A.G. (1987) Household‘s Utilities and Hedonic Prices for Inner-City Homes,
Environment and Planning A, Vol. 19, pp. 59-80.

Housing values
869
Richardson, H. W. and Cain A. (1974) Determinants of Urban House Prices, Urban Studies,
Vol. 11, pp. 189-199.
Sheffer, D. (1990) The Demand for Housing and Permanent Income in Indonesia, Urban
Studies, Vol. 27, pp. 259-272.
Stutz, F.P. and Kartman, A. E. (1982) Housing Affordability and Spatial Price Variations in
the Unites States, Economic Geography, Vol. 53, pp. 221-235.


Jatau, J. and Westcott, A. (2011) Sustainable construction in Nigeria: methods of delivering sustainable
construction in the Nigerian construction industry In: Laryea, S., Leiringer, R. and Hughes, W. (Eds)
Procs West Africa Built Environment Research (WABER) Conference, 19-21 July 2011, Accra, Ghana,
871-882.
871
SUSTAINABLE CONSTRUCTION IN NIGERIA:
METHODS OF DELIVERING SUSTAINABLE
CONSTRUCTION IN THE NIGERIAN CONSTRUCTION
INDUSTRY
James Jatau1 and Anthony Westcott
School of Built and Natural Environment University of the West of England Bristol, BS16 1QY, UK
Various worldwide Summits have been held regarding sustainable development such
as the United Nations Earth Summit held at Rio de Janeiro in 1992 which gave rise to
the adoption of the Agenda 21 by governments, however, since the Rio de Janeiro
Summit in June 1992, many countries have embarked on various environmental
reform agenda to attain the sustainability mark. The issue of sustainable development
is very challenging in developing countries especially when the priority concerns are
poverty alleviation, institutional strengthening and socio-cultural issues to sustain
harmony and peaceful co-existence. The purpose of this research was to determine the
most suitable approach towards achieving Sustainable Construction in the Nigerian
Construction industry as a developing country. After careful analysis of the problems
at hand, with the use of questionnaires to survey the journey so far in sustainable
construction in Nigeria, this document analyses various approaches towards achieving
sustainable construction all of which cover key sustainability issues from waste
management to noise reduction in construction processes.
Keywords: developing country, sustainable construction, Nigeria.
INTRODUCTION
Sustainable construction is a small part of the general topic of Sustainable
development which is a key theme in today‘s world. The issue of sustainable
development is very challenging in developing countries especially when the priority
concerns are poverty alleviation, institutional strengthening and socio-cultural issues
to sustain harmony and peaceful co-existence. Sustainability as divided into economic
development, social growth and environmental protection are usually addressed at
macro levels with broad based goals without being translated into micro project
specific levels which makes it difficult to address due to lack of in-depth
understanding and detailed planning (Ugwu and Haupt, 2005).
After looking at sustainable development on a large scale, it can therefore be narrowed
to the idea of sustainable construction as a progressive path to achieving sustainable
development. Just as there have been various definitions of sustainable development
so also are there varying definitions of sustainable construction. Charles Kibert (2008)
in defining sustainability in construction said the terms high performance, green and
sustainability are often used interchangeably. However, he proceeded to defining
sustainable construction as that which most comprehensively addresses the ecological,

Jatau and Westcott
872
social and economic issues of a building in the context of its community. Nikolas
Kohler (2003) stated that governments are coming up with new policies towards the
creation of ‗green‘ or environmentally progressive buildings which will however fail
due to the narrowness in defining the term. In order for this to succeed, the transfer
and acceptance of technologies and skills have to be grounded on a firm
understanding of regional cultures. Thus, understanding the concept of sustainable
construction and how it can be applied to various countries especially developing
countries.
In a bid to narrow down the concept of sustainable development which are broadly
classified into economic development, renewable resources and social growth,
Carillion in a presentation have further classified these concepts into social progress,
economic growth and prosperity, protection of the environment and prudent use of
natural resources. These concepts comprise of the following:
Protection of Environment: this category consists of land impacts, biodiversity,
water pollution and atmospheric impact.
Prudent Uses of Natural Resources: this category consists of resource use,
supply chain, design and waste.
Economic Growth and Prosperity: this category consists of shareholder
benefit, customer benefit, cost and risk and community investment.
Social Progress: this category consists of Health and safety, Employee interest,
learning and development and community involvement.
These will be the major factors which need to be considered when developing a
sustainable construction strategy especially in developing countries where poverty
alleviation, employment creation, capacity building and creating peaceful coexistence.
The need for this research was developed from the author‘s interest in sustainable
construction in developing countries in a bid to contribute to the development and
awareness of this field in these countries with particular interest to the Nigerian
construction industry. From research and practice, the author has found the need to
contribute to this cause and help create a more efficient and dynamic construction
society which may stir up a chain of further knowledge and how to consolidate the
four major sustainability factors with the current challenges faced by developing
countries.
SUSTAINABILITY AND THE CONSTRUCTION INDUSTRY
Office of Government Commerce defined sustainable construction as the achievement
of a better quality of life through the efficient use of resources, which realise
continued social progress while maintaining stable economic growth and caring for
the environment. There have been other definitions of sustainable development such
Dr Gro Harlem (1987) who defined sustainable development as ―the development that
meets the needs of the present without compromising the ability of future generations
to meet their own needs‖.
According to the publication in 1999 titled ―A Better Quality of Life: A Strategy for
Sustainable Development for the UK‖. The United Kingdom government clearly
stated its commitment to sustainable development by identifying four main aims
which are:
Social Progress, which is aimed at recognising the needs of everyone
Effective protection of the environment
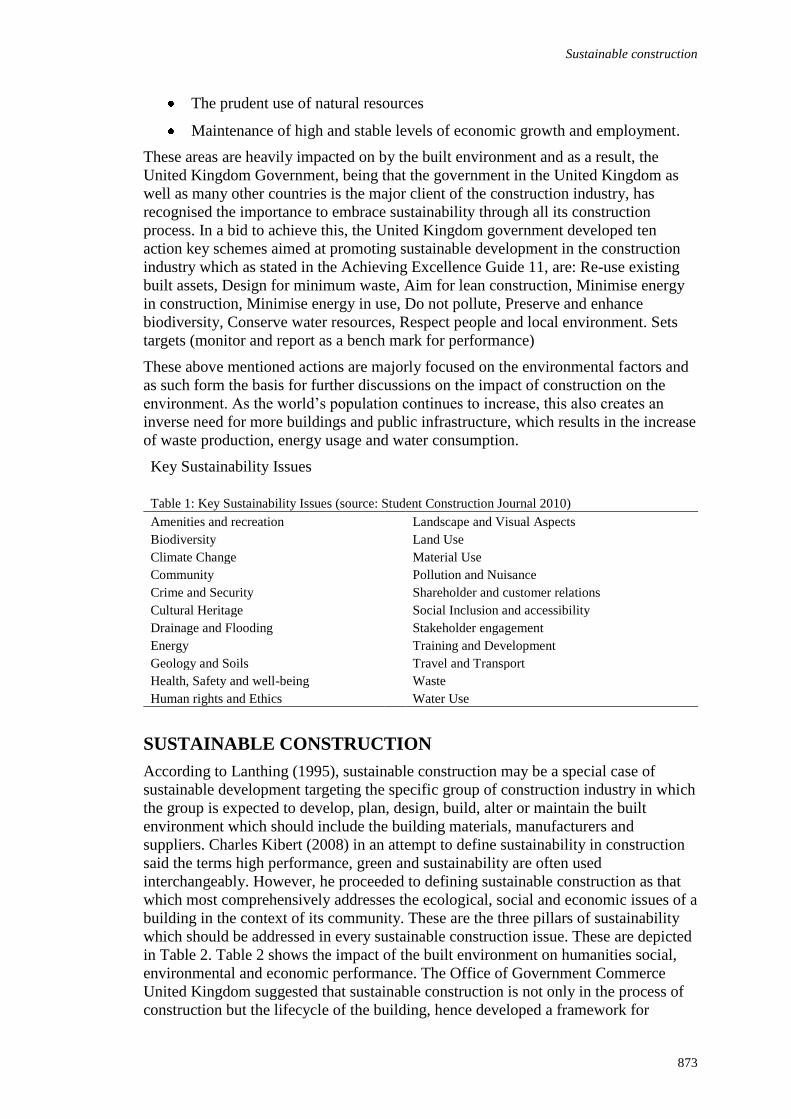
Sustainable construction
873
The prudent use of natural resources
Maintenance of high and stable levels of economic growth and employment.
These areas are heavily impacted on by the built environment and as a result, the
United Kingdom Government, being that the government in the United Kingdom as
well as many other countries is the major client of the construction industry, has
recognised the importance to embrace sustainability through all its construction
process. In a bid to achieve this, the United Kingdom government developed ten
action key schemes aimed at promoting sustainable development in the construction
industry which as stated in the Achieving Excellence Guide 11, are: Re-use existing
built assets, Design for minimum waste, Aim for lean construction, Minimise energy
in construction, Minimise energy in use, Do not pollute, Preserve and enhance
biodiversity, Conserve water resources, Respect people and local environment. Sets
targets (monitor and report as a bench mark for performance)
These above mentioned actions are majorly focused on the environmental factors and
as such form the basis for further discussions on the impact of construction on the
environment. As the world‘s population continues to increase, this also creates an
inverse need for more buildings and public infrastructure, which results in the increase
of waste production, energy usage and water consumption.
Key Sustainability Issues
Table 1: Key Sustainability Issues (source: Student Construction Journal 2010)
Amenities and recreation Landscape and Visual Aspects
Biodiversity Land Use
Climate Change Material Use
Community Pollution and Nuisance
Crime and Security Shareholder and customer relations
Cultural Heritage Social Inclusion and accessibility
Drainage and Flooding Stakeholder engagement
Energy Training and Development
Geology and Soils Travel and Transport
Health, Safety and well-being Waste
Human rights and Ethics Water Use
SUSTAINABLE CONSTRUCTION
According to Lanthing (1995), sustainable construction may be a special case of
sustainable development targeting the specific group of construction industry in which
the group is expected to develop, plan, design, build, alter or maintain the built
environment which should include the building materials, manufacturers and
suppliers. Charles Kibert (2008) in an attempt to define sustainability in construction
said the terms high performance, green and sustainability are often used
interchangeably. However, he proceeded to defining sustainable construction as that
which most comprehensively addresses the ecological, social and economic issues of a
building in the context of its community. These are the three pillars of sustainability
which should be addressed in every sustainable construction issue. These are depicted
in Table 2. Table 2 shows the impact of the built environment on humanities social,
environmental and economic performance. The Office of Government Commerce
United Kingdom suggested that sustainable construction is not only in the process of
construction but the lifecycle of the building, hence developed a framework for

Jatau and Westcott
874
sustainable construction procurement using the lifecycle approach which balances the
three pillars of sustainability.
SUSTAINABLE CONSTRUCTION IN AFRICA
Sustainable construction has not received adequate attention in Africa as a developing
continent even though it has been recognised as an important aspect of sustainable
development. There exists a gap in consolidating theory and practice especially in
African countries and this constitutes a conflict of understanding and implementation
(Adebayo, 2002). Taylor et al (1994) suggested that the ideology of norms and
systems which have emerged as a result of certain experiences by developed countries
have been thought to readily be adoptable by developing countries. He further argued
that this ideological way of thinking typified the stage of economic growth which
involved hypothesis of the emergence of nations as universal ignoring national
circumstances, value systems or current priorities. According to Adebayo (2002) it has
been proven inappropriate where the principles of the developed world have been
applied developing countries without modification to suit the current prioritised needs.
Considering the various problems facing Africa as a developing continent, Adebayo
(2002), suggested that for sustainable construction to take place there has to be an
understanding of the political, economic, social and developmental issues of a place
making it clear that sustainable construction is an integral part of sustainable
development.
According to a research carried out by the International Council for Research and
Innovation in Building and Construction (2001), which covered Africa, Asia and Latin
America commenting on different regional understandings of sustainable construction,
the issues and challenges facing the regions, the impact of the construction industry on
the economy, the environment and society in the regions, the barriers of sustainable
construction, the strengths and opportunities presented by cultures and traditional
practices of the region and suggested actions for the research community,
governments and the construction industry. The issues identified included the
following:
The need for a new model of development, Urbanisation and rural i.e. the
consolidation of urban growth with the reciprocal affect on rural areas and
development, Sustainability in housing which concerns both formal and informal
housing provision as well as regulation of policies that provide housing, Education:
the need for adequate information on sustainable construction, Innovation in building
materials and methods, Gender equity: a consideration of discrimination where
women are seen as second-class citizens should be given a n opportunity to improve in
order to make the construction site more female friendly, Financing and procurement
and Governance and management.
Table 2: Key impacts of construction (Source: ARCOM 2009)
Social Environmental Economic
Provides basic shelter Accounts for half of all energy
use
Employs 110 million people
Provides Cultural spaces Responsible for 40% of
resource use
Accounts for 70% of all man-
made wealth
Creates the basis for social and
manufacturing capital
Responsible for land use Between 8 and 10% of GDP

Sustainable construction
875
Government policies in areas of housing, economics, environment and spatial
planning are often attributed to factor affecting sustainable construction. These have in
most cases directly affected the construction industry and related developmental
issues. These policies are concerned with alleviation of poverty employment creation,
capacity building and quality of environment amongst many others. The construction
industry cannot exist as a single entity without being impacted on and impacting on
economic, social, environmental, technical and policy issues Adebayo (2002). The
definition of sustainable construction in the African context can best be adopted from
the Amsterdam Treaty‘s (1997). This definition sees sustainable construction as the
determination to promote economic and social progress of their peoples. The Nigerian
government due to urbanisation and population growth provided housing among other
national needs and have geared the housing policies towards the delivery of low cost
housing on a large scale down to state government levels with each state having
similar policies and delivering core housing and walk-up flats. The government also
developed satellite towns, and government employee high-rise apartments such as
those found in Gwarinpa Abuja and Suleja Nigeria. The complexity of housing
policies in developing countries varies to an extent which may be due to different
emerging needs. It may be said that the Nigerian Housing policies are not as complex
as the South African housing polices. This may be due to politics, ethnicity and the
South African need to the critical issue of equality regardless of race, ethnicity or
gender. These constitute part of the issues of sustainable construction in developing
countries.
NEED FOR THE STUDY
Due to the global outcry for a sustainable existence, despite the challenges faced in
developing countries such as Nigeria, these countries should not be left out and
contribute greatly to achieving a sustainable environment through sustainable
construction, as the first though which comes to mind when considering development
is the construction of infrastructure and basic facilities.
AIMS AND OBJECTIVES
The aim of this research is to find out the “most suitable method or approach towards
achieving sustainable construction in developing countries primarily Nigeria?” and
how these suitable methods can be adopted by Nigeria as a developing country to
attain sustainable construction and possible ways in which they could be adopted in to
the system considering ethical approaches. Because there are various approaches
towards achieving sustainable construction, thus, the term ‗most suitable‘ which may
meet the basics of best value as emphasised by Egan (2002) who suggested that the
best way to achieve best value is to replace the idea of lowest price tendering with
integrated teams of professional involved in delivering improvement, productivity,
safety and customer satisfaction. This may be likened to aspects of sustainable
construction. However, to support the central research question, the following
objective was put forward. What may be the most suitable approach towards
achieving sustainable construction in Nigeria?
The aims and objectives are to be achieved by a study of the Nigerian construction
industry and the methods they have put in place to achieving sustainable construction.
This is intended to be carried out with the use of ethical questionnaires to source
information.

Jatau and Westcott
876
RESEARCH METHOD
The research was carried out with the use of interviews of three (3) construction
professionals in the Nigerian construction industry as a pilot test to analyse the
validity questions to be asked in the questionnaire which was the major source of
collecting the data. The questionnaire was designed as an online based questionnaire
to ease time and travelling convenience and was structured to meet the various
construction disciplines in Nigeria from Main Contractors, Architects, Structural
Engineers, Quantity Surveyors and Sub Contractors.
Gillham (2000) advices that questionnaire is a very easy, quick and cheap method of
data gathering. On the other hand, he argues that a good project cannot be based on
poorly collected data and that questionnaires are only efficient if used in conjunction
with other methods. This view is strengthened further by Kumar (2005) who states
that responses to questions may be affected by other people since it is possible to
consult others. He also provides a valid point that additional information cannot be
supplemented with the questionnaires whereas it is possible to obtain such information
during interviews. Although, questionnaires may reach a large geographical area and
ensure anonymity (Kumar, 2005) non-returns and lack of honesty of questionnaires
are the common problems which are difficult to overcome (Goddard and Melville,
2004). The Questionnaires were sent to some of the major construction companies in
Nigeria at the moment such as Julius Berger Nigeria Plc, Dantata & Sawoe Const. Co.
Nig. Ltd, Setraco Nigeria Ltd, RCC Nigeria Ltd, Costain West Africa Plc, PW Nigeria
Ltd and Government bodies such as Federal Capital Development Authority (FCDA)
which is the main construction client in Abuja, Nigeria. This questionnaire was also
sent to research staff in various universities in Nigeria who carry out construction
based research for the Nigerian Government in various aspects from procurement to
design. These researchers that participated in this survey where from Ahmadu Bello
University, Zaria, Nigeria and the Federal University of Technology, Minna, Nigeria.
Following the literature review the design of the questionnaire was carried out and it
was primarily based on the research objectives and literature review findings. The
author also used his own knowledge about sustainability and decisions with the co-
author and colleagues back in Nigeria and in the United Kingdom to develop the
questionnaire even more. The main purpose of the questionnaire was to obtain as
much of the real data as possible to draw the initial picture of methods which have
been adopted by various construction companies in Nigeria towards attaining
sustainable construction and analyse these various methods and select viable methods.
The questionnaire was designed online and was sent to various participants via email.
The problem that eventually became apparent was getting the appropriate questions to
fit into the context of the Nigerian construction industry. However, with careful
selection from review of literature a few open ended questionnaire was prepared in
order to maintain the focus of the research.
Also some of the feedback received from respondent was that some of them needed
clarification as to understanding the concept of sustainability in construction. This was
the need for a test survey using a draft questionnaire. However, this was addressed and
was clarified in the introduction of the final questionnaire. The major difficulty of
getting a questionnaire was acquiring the relevant email addresses as it is of
importance that the questionnaire was sent to key management personnel in order to
get valid responses. Hence 50 respondents were contacted about 76% (38) of the
targeted respondents replied and about 24% (12) did not respond to the questionnaire.

Sustainable construction
877
FINDINGS AND DISCUSSION
Based on the Chartered Institute of Architects (CIAT), which requires every
construction professional to have a sustainability policy it was deduced from the
respondents thirty-six percent (36%) of the respondents had company sustainability
policies and sixty-four percent (64%) of the respondents did not have company
policies covering sustainability. Further to this was a follow up question mainly for
respondents who had company sustainability policies. This question was to find out
what aspects of sustainability these policies covered amongst choice areas of waste
management, reducing water consumption, reducing energy consumption, Local
employment, use of local materials, safe and healthy working environment, Noise
reduction and the minimisation of nuisance/nuisance of construction on local
community which were based on the sustainability policy issues as described by the
CIAT. The feedback to this response however, is as shown in Figure 1 below.
Figure 1: Issues Covered by Sustainability Policy
Based on the sustainable construction issues considered so far by the author in this
research which are waste management, reduction of water consumption, reduction of
energy consumption, local employment, use of local materials for construction, safe &
healthy working environment, noise reduction and the management of the impact/
nuisance of construction activities on the local community, the respondents were
asked to rank in order of importance based on company experience and how they
considered these issues while working on construction projects on a scale of ―Not at
all important‖, ―quite important‖, ―important‖, ―very important‖ and ―extremely
important‖. The feedback from the respondents may be seen as depicted in Figure 2
below.

Jatau and Westcott
878
Figure 2: Level of importance of sustainable issues to construction work
Based on Figure 2 above, it may be derived that about four percent (4%) of the
respondents considered the issue of waste management not important, about twenty
percent (20%) of the respondents considered waste management to be quite important,
about twenty-eight percent (28%) of the respondents considered waste management to
be important, about twenty-four percent (24%) of the respondents considered waste
management to be a very important issue during construction and about another
twenty-four percent (24%) considered waste management to be a very important issue
during construction. It may also be deduced that on the issue of reduction in water
consumption, about four percent (4%) of the respondents considered this issue to be
not important, about eight percent (8%) of the respondents considered the reduction in
water consumption to be a quite important issue in construction, about thirty-two
percent (32%) of the respondents considered reduction in water consumption to be an
important issue in construction, about forty percent (40%) of the respondents
considered reduction in water consumption during construction to be a very important
issue and about sixteen percent (16%) of the respondents considered reduction in
water consumption during construction to be a very important issue. The issue of
reduction in energy consumption was considered by about four percent (4%) of the
respondents to not be an important issue during construction, about eight percent (8%)
of the respondents considered reduction in energy consumption to be quite an
important issue during construction, about twenty percent (20%) of the respondents
considered reduction in energy consumption to be an important issue during
construction, about forty-four percent (44%) of the respondents considered the issue
of reduction in energy consumption during construction to be a very important issue
and about twenty-four percent (24%) of the respondents considered reduction in
energy consumption during construction to be an extremely important issue as seen in
Figure 2 above. The issue of local employment was considered by about four percent
(4%) of the respondents to be quite an important issue during construction, about
twenty-four percent (24%) of the respondents considered local employment as an
important issue during construction, about forty percent (40%) of the respondents
referred to the issue of local employment as a very important factor during
construction and about thirty-two percent (32%) of the respondents considered local
employment to be an extremely important issue during construction as depicted in

Sustainable construction
879
Figure 2 above. When considering the issue on the use of local material for
construction, about twelve percent (12%) of the respondents considered this to be
quite an important issue, about another twelve percent (12%) of the respondents
considered the use of local materials to be an important issue during construction
projects, about forty-eight percent (48%) of the respondents considered the use of
local materials in construction to be a very important issue and about twenty-eight
percent (28%) of the respondents considered the use of local material in construction
projects to be an extremely important issue during construction as derived from Figure
2 above. Health and safety is one of the important factors mostly considered during
construction, however, about eight percent (8%) of the respondents considered the
issue of delivering a safe and healthy working environment to be a quite important
issue during construction, about sixteen percent (16%) of the respondents considered a
safe and healthy work environment during construction to be an important issue, about
another sixteen percent (16%) of the respondents considered safety and health in the
work area during construction to be a very important issue and about sixty percent
(60%) of the respondents considered the ability to provide a safe and healthy work
environment during construction to be an extremely important issue as extracted from
Figure 2 above. It may be seen also from Figure 2 above that when considering the
issue of noise reduction, about twelve percent (12%) of the respondents considered
this to be not at all an important issue, about twenty-eight percent (28%) of the
respondents considered noise reduction to be quite an important issue during
construction, about sixteen percent (16%) of the respondents considered the issue of
noise reduction to be an important issue, about thirty-two percent (32%) of the
respondents considered noise reduction to be a very important issue to be addressed
during construction and about twelve percent (12%) of the respondents considered
noise reduction t be an extremely important issue during the construction process.
Considering the issue of the management of the impact / nuisance created by
construction on the local community, about eight percent (8%) of the respondents
considered this issue as not at all important, about twenty percent (20%) of the
respondents considered minimisation of the impact/ nuisance on the local community
to be an important issue during construction, about twenty-eight percent (28%) of the
respondents considered this issue to be very important during construction projects
and about twenty-four percent (24%) of the respondents considered management to
minimise the impact / nuisance of construction activities on the local community
during construction to be an extremely important issue as may be seen in Figure 2
above. It may be inferred from the above analysis that the most considered issue by
the respondents to be extremely important during construction is that of providing a
safe and healthy work environment during construction projects.
A list of options was given which were derived from the outcome of the research by
Plessis et al (2001) and the respondents were required to select three options which
they deemed fit to achieve this goal. This result may be seen in Table 3 below which
gives further a clearer depiction of the outcome.
From Table 3 it may be seen as depicted that about fifteen percent (14.7%) of the
respondents suggest the introduction of sustainability into university syllabus for
construction disciplines, about seventeen percent (16.8%) of the respondents suggest
innovation in the area of building material which may act as alternatives to regular
construction materials, about seven percent (7.4%) of respondents suggest that
modernising traditional methods of construction may be a suitable method of
delivering sustainable construction, about six percent (6.3%) of the respondents

Jatau and Westcott
880
suggest that patronage of local suppliers and manufacturers will be a suitable method
of delivering sustainable construction, about seventeen percent (16.8%) of the
respondents suggest that stricter enforcement of government policies could deliver
sustainable construction, about eleven percent (10.5%) of the respondents suggest that
higher standards of planning and building regulations could be a method of delivering
sustainable construction, about six percent (6.3%) of the respondents suggest that
higher taxation rates on inefficient buildings may be a suitable approach to achieving
sustainable construction, about another seven percent (6.3%) of the respondents
suggest that the provision of incentives, grants or tax allowances to encourage
renewable energy sources can be a method of attaining sustainable construction, about
eleven percent (10.5%) of the respondents suggest that the establishment of a new
procurement route which support sustainability will be a method of achieving
sustainable construction and about four percent (4.2%) of the respondents suggest that
an improvement in supply chain management may be a method of delivering
sustainable construction to the Nigerian construction Industry.
Table 3: Methods of delivering Sustainable Construction
Option Percentage
Introducing Sustainability into university syllabus for construction
disciplines 14.7%
Innovation in building materials (finding alternatives to regular
construction materials 16.8%
Modernising traditional methods of construction 7.4%
Patronising local suppliers and manufacturers 6.3%
Stricter enforcement of government policies 16.8%
Higher standards of planning and building regulations 10.5%
Higher taxation/business rates on inefficient buildings 6.3%
Incentives/grants/tax allowances to encourage renewable energy
sources 6.3%
Establish New procurement route which support sustainability 10.5%
Improve supply chain Management 4.2%
CONCLUSION AND RECOMMENDATION
The following were the conclusions derived from the research;
From the results obtained in this research the following methods seemed to be the
most suitable methods of delivering sustainable construction in the Nigerian
construction industry were selected because they had the highest percentage from
respondents of about seventeen percent (16.8%) each, the next suggested method
which had about fifteen percent (14.7%) and the last two considered by the author to
have about eleven percent (10.5%) of responses and these methods are as follows
respectively;
Innovation in building materials (by finding alternatives to the regular
construction materials
Stricter enforcement of government policies targeted to the construction
industry
Introducing Sustainability into universities for construction disciplines
Introducing higher standards of building and planning regulations and
The establishment of a new procurement route which support sustainability
The following were the recommendations asserted to the research findings;

Sustainable construction
881
With the issues being raised throughout this research document a series of
recommendations have been suggested. These recommendations are as
follows:
The government should endeavour to introduce with stricter penalties for
defaulters of the policies instituted by legislation to curb the level of
indiscipline in the construction industry.
Governing bodies such as the Nigerian University Commission (NUC) should
endeavour to re-evaluate the syllabus of Nigerian universities in construction
disciplines in order to introduce sustainability at an early stage to those who
will afterwards be a part of the construction industry in order to help in
innovation and ideas on the development of sustainable construction in the
Nigerian construction Industry.
Professional bodies like the Nigerian Institute of Quantity Surveyors (NIQS),
Nigerian Institute of Builder (NIOB) and the like should create sustainable
construction policies that will put members in check penalising members if
they fail to meet these standards.
Higher standards of building regulations may be introduced by local housing
authorities such as the Federal Housing Authority (FHA), Kaduna State Urban
and Planning Development Authority (KASUPDA) and the likes should
implement higher and achievable standards which must be met before approval
of any construction may be granted.
The procurement route used in Nigeria have still remained the same over the
years with no development over the years, however, it may be worth the try to
develop and introduce new procurement methods which encourage and
promote sustainable construction in all aspects from water conservation,
energy conservation, employment, waste management and noise reduction.
It may be worth considering that the use of local traditional materials in the
construction on buildings may be a good alternative to modern construction
materials providing better accessibility and availability of construction
materials.
The Nigerian government should not neglect the development of rural areas as
constant rural-urban migration causes unavailability to resources and hence
constitutes a nuisance to the society. Provision of adequate construction
infrastructure in rural areas will reduce the effect of the rural-urban migration.
Construction companies should endeavour to have their staff trained and
educated on sustainable construction.
Construction companies should endeavour to have Key performance indicators
which measure company policies against meeting sustainability roles.
REFERENCES
Adebayo .A (2002) Sustainable Construction in Africa: Agenda 21 for Sustainable
Construction in Developing Countries. Africa Position Paper.
Association of Researchers for Construction Management (ARCOM) Sustainability in the
Built Environment. Doctoral Research workshop. Rolle Building 201 & 202,
University of Plymouth, 16 November 2009
BREEAM (Building Research Establishment Environmental Assessment Method).
www.products.bre.co.uk/breeam/index.html. Accessed on 20th June 2010.
Carillion (2007) Sustainability at the University of the West of England. A presentation at the
University of the West of England. University resources.

Jatau and Westcott
882
Chartered Institute of Builders (CIOB). http://www.ciob.org.uk
Chartered Institute of Architects (CIAT) Sustainability Policy. Available at
http://www.ciat.org.uk/en/the_institute/Regulations/Institute_policies/sustaina
bility_policy.cfm sourced on October 25th 2010.
Dania, A. et al (2010). Sustainable Construction Education: Assessing the Adequacy of Built
Environment Professionals Training. WABER Accra, Ghana 2010
Du Plessis .C. (2005). Action for Sustainability: Preparing an African Plan for Sustainable
Building and Construction. Building Research & Information, 33(5) 1-11
Du Plessis .C. (2002), Agenda 21 For Sustainable Construction in Developing Countries. CIB
Information Bulletin Nr.2/01
Egan. J (1998). Rethinking Construction. UK Government, DETR
Goddard, W and Melville, S (2004). Research Methodology: An introduction. Juta and
Company
Kumar, R. (2005). Research Methodology: a step-by-step guide for beginners. SAGE
Latham, M (1994). Constructing the Team. Constructing Excellence
Lanthing, R (1995) Sustainable Development and the future of Construction. CIB W82
Office of Government Commerce (OGC), Achieving Excellence Guide 11: Sustainability
Crown copyright 2007
Royal institute of Chartered Surveyors (RICS). Student Construction Journal 2010.
Ugwu, O. & Haupt, T (2007). Key Performance Indicators and assessment methods for
infrastructure sustainability – A South African Construction Industry Perspective.
Published Article Building and Environment 42 (2007) p665 – 680.
United Nations Conference on Environment and Development (UNCED), Agenda 21, 1992.
United Nation. Report of the world summit on sustainable development, Johannesburg, South
Africa, 26 August – 4 September 2002, United Nations, New York, 2002. pp173.

Nwokoro, I. and Onukwube, H. (2011) ―Sustainable‖ or ―green‖ construction in Lagos, Nigeria:
principles, attributes and framework In: Laryea, S., Leiringer, R. and Hughes, W. (Eds) Procs West
Africa Built Environment Research (WABER) Conference, 19-21 July 2011, Accra, Ghana, 883-895.
883
“SUSTAINABLE” OR “GREEN” CONSTRUCTION IN
LAGOS, NIGERIA: PRINCIPLES, ATTRIBUTES AND
FRAMEWORK
Immaculata Nwokoro1 and Henry Onukwube
2
1Department of Urban and Regional Planning, University of Lagos, Lagos, Nigeria
2Department of Building, University of Lagos, Lagos, Nigeria
The concept of sustainable development is used as a basis for enhancing
understanding of sustainable construction. Principles of sustainable construction cover
four attributes: social, economic, biophysical and technical. The research examined
these concepts, principles and attributes in understanding sustainable and green
construction as well as current practices and challenges of sustainable construction in
Lagos, Nigeria. The research embraced both quantitative and qualitative methods of
data collection. The sample frame is the total number of built industry registered and
practising professionals in Lagos. A total number of 85 respondents were randomly
selected for study from each group. A 5-point likert scale was used to assess
respondents‘ judgement on the identified social, economic, bio-physical and technical
indicators. Focus group discussions (FGDs) were also conducted with all the above
professional groups to corroborate the primary information. For a wider coverage,
three different construction sites are selected to reflect income neighbourhoods-Lekki
(high income), Yaba (medium income) and Bariga (low income). Data Collected were
analysed using the mean item score. A multi- stage framework which required the
application of environmental assessment and environment management systems for
construction projects was utilised. Research findings indicate that the most important
factors considered for sustainable construction with their mean item scores are quality
of working conditions (0.852) strengthening and enforcement of relevant law and
regulations(0.872), encouraging construction waste management(0.819) and design
for flexibility and adaptability. Results from the FGDs indicate that the current
practice on sustainable construction does not take into consideration
integrated design process, acoustic and visual comfort in the planning and
construction of sustainable projects. The research, therefore, concludes that
government should improve existing laws to enhance quality of working life,
education, training as well as knowledge management for all stakeholders in
sustainable construction.
Keywords: green construction, Nigeria, sustainable construction.
INTRODUCTION
Sustainable construction has emerged as a guiding paradigm to create a new kind of
built environment: one that meets the needs of humans in the present without limiting
the ability of future generations to meet their own needs (Ofori, 2001).The creation,
operation and disposal of the built environment dominate humanity‘s impact on the
natural world (Kibert et al, 2000).The construction industry is the largest destroyer of
the natural environment (Woolley, 2000). It is a major consumer of non-renewable

Nwokoro and Onukwube
884
resources, produces substantial waste, pollutes air and water, and contributes to land
dereliction (Wallbaum and Buerkin, 2003).The construction industry‘s overall impact
on people and society cannot be overestimated. By providing housing and
infrastructure, the industry makes a vital contribution to the social and economic
development of every country (Wallbaum and Buerkin, 2003). Sustainable
development is a development that meets the needs of the present without
compromising the ability of future generations to meet their own needs (United
Nations, 1987). A primary goal of sustainability is to reduce humanity‘s
environmental or ecological footprint on the planet. Sustainable development has
given rise to green buildings. Most green building practices fall into seven basic
categories: energy saving, land saving, storm water runoff-reducing, material
conservation and pollution reduction (ECO Northwest, 2001).A green building uses an
average of 30% less energy than conventional building (Economist, 2004) Material
waste generated during construction is reduced or recycled. Materials are re used.
Energy efficiency is improved, perhaps by relying on the use of natural light and
ventilation or solar power. Less water is used, or rainwater harvesting system is
installed to ensure wiser use. Measures taken to make buildings and construction more
sustainable rely increasingly on life cycle approaches.
Construction is a major and primary sector of Nigerian economy and its consideration
of the issues of sustainability covers a huge spectrum of the sector (Nwafor, 2006).
Thus, the role buildings play is fundamental to the realisation of sustainable
development. Public awareness of environmental issues has increased significantly in
Nigeria. Property owners and clients are seeking commercial buildings that meet
acceptable environmental and health levels. Unfortunately, there is lack of
institutional structures promoting green buildings; awareness on the part of clients,
tenants, professionals in the built environment and other stake holders; professional
capacity to incorporate green building issues and opportunities and; financial
resources to undertake green building construction and upgrades. The aim of this
paper therefore is to examine the principles, attributes, current practices and
challenges of sustainable construction in Lagos, Nigeria. This study addressed the
following research questions-(a) what importance is attached to attributes of
sustainable construction in Lagos? (b) What are the current practices and challenges
facing sustainable construction in Lagos? (c) How can the proposed framework
address the challenges of sustainable construction in the study area?
LITERATURE REVIEW AND CONCEPTUAL ISSUES
To advance the understanding of sustainable construction, this study examines four
attributes of sustainability, social, economic, biophysical and technical.
Social Attributes and Principles
According to Hill and Bowen (1997) the social attributes of green construction calls
specifically for addressing poverty and inequality. The basic principle of social
sustainability is to improve the quality of human life by ensuring secure and adequate
consumption of basic needs, which are food, clothing, shelter, health, and beyond that
by ensuring comfort, identity and choice. The first step towards achieving this goal is
poverty alleviation. Social sustainability attributes include: Improve quality of human
life, including poverty alleviation, make provision for social determination and
cultural diversity in development planning, protect and promote health through a
healthy and safe working environment, implement skills training and capacity
enhancement of disadvantaged workforce, seek fair distribution of the social costs of
Sustainable construction
885
construction, seek equitable distribution of the social benefits of distribution, and seek
intergenerational equity.
Economic Attributes and Principles
According to Sultan (2005),economic sustainability attributes include: Labour –
intensive construction policies (promotion of employment by mandating minimum
crew size and supervisors and use of less machinery in construction projects,
associated with import reduction of machines, spares and foreign exchange savings.
Energy – Efficiency policies in Design and Construction (Mandating the use of low
embodied energy materials such as granite, minimizing high energy materials such as
cement and steel. Energy reduction in buildings via insulation, day lighting, optimize
material use and minimize site waste).Credit and Policies to selected projects,
strategies for sustaining the continuity of affordable infrastructure projects
(infrastructure projects can help enhance the process of industrialization by raising
productivity and reducing production cost).Strengthening the law and regulations in
construction and land affairs Pricing policies (maintain the monetary and fiscal
discipline required to promote price control) and improve administration effectiveness
and reduce bureaucratic procedures. Choose environmentally responsible suppliers
and contractors. Ensure financial affordability for intended beneficiaries, and maintain
sustained and efficient use of resources and materials, sustained employment
opportunities through formal construction, material production and distribution,
maintenance during the economic life span of buildings.
Bio physical Attributes and Principles:
This is founded on the second part of the definition of sustainability proposed by
IUCN (1991). The IUCN stated that sustainability requires the improvement of the
quality of human life within the carrying capacity of supporting ecosystems. Bio
physical sustainable attributes include: Project design facilities that reflect
consciousness of the fragility of the ecology in which it is situated and the awareness
of its impact upon it; The use of renewable building materials from sustainable
sources and designs that take into consideration existing cultural patterns and
behaviours, materials and techniques; Prevention of pollution from construction
activity and preserving sites in their natural state and water use reduction and
conservation and rainwater collection and; Reduction of energy use and on-site
renewable energy and encourage construction waste management(Wolley,2000)
Technical Attributes and Principles:
The technical attribute of sustainability has been used in this paper to group a number
of concepts, including concepts that relate to the performance, quality and service of a
building. The emphasis on the application of these principles should be on
implementing a process which seeks to achieve consensus among interested parties on
which principles are more and which are less important. Sustainable technical
attributes include: Design for flexibility, adaptability and durability of exposed
building parts. Pursue quality in creating the built environment and use serviceability
to promote sustainable construction as well as revitalize existing urban infrastructure.
(Hill and Bowen, 1997; Sultan, 2005; Wolley, 2000)
Process-oriented principles of sustainable construction
In this paper the essence of process oriented principles is to articulate ways of
achieving - social, economic, biophysical and technical indicators of sustainable

Nwokoro and Onukwube
886
construction. The concept is to emphasize that the following stages is essential in
sustainable construction. That is, undertake prior assessments of proposed activities
and involve all stakeholders on the project in due time. Promote interdisciplinary
collaborations and recognize the complexity and multiplicity of objectives inherent in
the concept of sustainability. Utilize a life cycle framework, which recognizes the
need to consider all of the principles of sustainable construction at each and every
stage in planning, assessment, design, construction, operation and decommissioning of
projects. Comply with relevant legislation and regulations and manage activities
through the setting of targets, monitoring, evaluation, feedback and self-regulation of
progress (Gardner, 1989), in a process that is iterative and adaptive in nature.
Current Practices and Challenges of Sustainable Construction in Lagos
Energy Efficiency
According to Santoli and Matteo (2003), the energy performance of a building must
be calculated using standards that indicate the insulation of the buildings, the
characteristics of technical systems and installed equipment, the position and
orientation of the building in relation to other climatic aspects, exposure, its own
capacity for renewable energy sources and other factors, such as indoor environmental
quality, that could influence the energy requirements of the building.
Integrated Design
Reed and Gordon (2000), emphasised that the integrated design process encompasses
cross-disciplinary team work enabling the improved integration of building,
community, natural and economic systems and therefore is a key to sustainable
design. There is considerable agreement among those in the field of sustainable design
that cross-disciplinary team work early in the design process is essential to achieve the
successful integration of building, community, natural and economic systems. Without
the process of integration, systems are over designed and commonly function in
conflict with one another. In this concept, the client takes a more active role than
usual, the architect becomes the team leader rather than the sole form-giver, and the
structural, mechanical, and electrical engineers take on active roles at early design
stages. The team includes an energy specialist (simulator) and hopefully, a bio-
climatic engineer, depending on the nature of the project, a series of additional
consultants can be added.
Indoor Air Quality
The quality of indoor air depends on the concentration of pollutants at a particular
moment in time. The perceived air quality is also dependent on the air temperature
and the relative humidity which, in turn are linked. Health problems from inferior air
quality include lung cancer, sick building syndrome(SBS),symptoms‘ and discomfort
problems like bad smells and experience of dry air (Bornehag, et al.,2004)
Thermal Comfort
Creating thermal comfort for man is a primary purpose of the heating and air
conditioning industry and this had a radical influence on the whole building industry.
Comfort is not a product which is provided for building occupants, it is a goal which
they achieve provided they are able to exert the necessary control over their
environment (Shove et al., 2008). The control they exert over the environment will
partly be decided by the building they occupy and its services and may be subject to
constraints (Cole et al., 2008). The aim of the building must be to allow occupants to

Sustainable construction
887
achieve their comfort goal. People adapt more readily to thermal environments with
which they are familiar. The building should therefore be designed to provide a
thermal environment that is within the range customary for the particular type of
accommodation, according to climate, season and cultural context.
Visual comfort
Visual comfort is brought about by having good lighting which is adequate both in
quality and quantity. The source of light may either be natural or artificial or a
combination of both. In any case, windows have distinct advantages. Today there are
still many new buildings that do not fully utilize the benefits derived from using
natural light. Efficient day lighting considers heat gain, glare, different light levels,
uniformity and solar penetration. The three basic rules of good day lighting are: avoid
direct sunlight on heavy viewing tasks to prevent glare; let natural light in through
skylights and good-sized windows that give deeper penetration and better distribution;
and, filter daylight and bounce it off surrounding surfaces with the use of vegetation,
curtains, sunscreens and shades. When locating buildings in a particular site, correct
spacing together with proper orientation must be maintained to enhance natural
lighting. Adequate window openings must be maintained to ensure that building
interiors get enough natural lighting (Ochoa and Capeluto, 2009)
Site Suitability
Site suitability enquiry is essential as this ensures that the site can legally and
physically accommodate the type and size of project being envisaged. When selecting
sites for developmental purposes avoid sites in noise areas and ensure compatibility
with existing facilities. Determine what else is planned for the site in the future
(Nwafor, 2006)
Acoustic Comfort
Sleeping disturbances are commonly reported as an important problem related to
traffic noise (Griefahn and Spreng, 2004).Apart from secondary stress effects from
sleeping disturbances, there are studies that suggest an association between residential
road traffic noise exposure and hypertension(Bluhm et al.,2007)
Spatial Comfort
This is a concept that is used to express building layouts that are designed to maximise
the space use and improve accessibility within the buildings such that the occupants
derive comfort from such arrangements (Hiller and Hanson, 1984).
Building Integrity
The crippling costs of corruption in the practice of sustainable construction can be
reduced significantly through the application of proven principles and mechanisms
such as building integrity. The basic approach is to stipulate actions that are corrupt
both morally and ethically and expected punishment attached to such actions. If
individuals recognise their actions are illegal, and that they may be discovered and
imprisoned, this deters corruption (Lucas and Rubel, 2004)
Environmental Laws and Regulations on construction in Nigeria
The Federal Government of Nigeria has promulgated various laws and Regulations to
safeguard the Nigerian environment. The prevailing laws within the built environment
include: Federal Environmental Protection Agency Act of 1988 (FEPA Act),National
Policy on the Environment (NPE) 1989 and Environmental Impact Assessment Act of
Nwokoro and Onukwube
888
1992 (EIA Act).The Federal Ministry of Environment (FME) administers and
enforces environmental laws in Nigeria.. The Federal Ministry of Environment has
published several guidelines for the administration of the FEPA and EIA Acts and
procedures for evaluating environmental impact assessment reports (EIA Reports).
The approach of regulatory agencies is the prevention of environmental damages, the
regulation of potentially harmful activities and the punishment of wilful harmful
damage whenever this occurs. The environmental agencies also adopt the approach of
engaging individuals and communities at risk of potential environmental damage in
dialogue. The EIA approval process adopted by the FME involves a system of public
hearings during the EIA evaluation process and interested members of the public are
invited to such hearings. Lagos State Environmental Protection Agency (LASEPA),
also takes the same approach. Unfortunately, the major challenge confronting FEPA is
how to translate the laudable provisions of the Act into an effective tool for managing
the environment. This is because most Nigerian legislations crumble at the
implementation stage
A framework for the attainment of sustainable construction
The essence of this framework is to suggest how sustainable construction can be
achieved. We are of the opinion that Environmental impact Assessment (EIA) should
be carried out during the planning and design stages of projects, provided that the
traditional EIA is expanded to include assessment of all four `indicators‘ of
sustainable construction and is undertaken in accordance with the process-oriented
principles of sustainable construction, and enforcement by FEPA, NPE and LASEPA
for each project, during construction, operation and, where appropriate, even
decommissioning. The framework and its components are summarized in Figure 1 and
discussed below. In this paper, a broad meaning is given to the term `environment‘, to
include the physical, biological, social and economic indicators that affect the
individuals and groups within the developmental area. `Environmental impact
Assessment‘ could include assessment of all four `indicators‘ of sustainable
construction.
There is need to set up a sustainability policy. Such a policy would set the desired
level of environmental performance. Construction organizations could adopt a general
environmental policy which could inform policies for specific projects. At the level of
individual construction projects, environmental policy would emanate from company
policy, if available; relevant legal requirements, and the EIA for the project, which
would identify those principles of sustainable construction deemed relevant to the
project through consultation with interested parties at an early stage in the EIA. The
second key requirement is to provide an organizational structure and to determine the
responsibilities, authority, lines of communication and the resources needed to
implement the EMS. An EMS would need to determine the required interactions
between the various contractors, consultants and clients involved in the project.
Similarly, lines of communication should link the organizations involved, and should
also provide a connection with a range of interested and affected parties external to the
construction process.
The third key requirement is to develop an environmental management programme
(EMP) that stipulates environmental objectives and targets to be met and work
instructions and controls to be applied in order to achieve compliance with the
environmental policy. At project level, the EMP would contain operational procedures

Sustainable construction
889
for controlling various activities, which would include: work instructions for
determining the manner of conducting an activity; inspection procedures to ensure that
mitigating measures are applied; procedures for dealing with accidents and
emergencies; and, procedures for the measurement of performance indicators. In
construction, where the primary goals of the contractor and the environmental
management team may be different, the EMP may need to rely on penalties and
bonuses to ensure compliance with standards. The fourth key requirement is to
undertake periodic audits of the environmental performance of the construction team
and the effectiveness of the Environmental Management System.
Figure 1: Framework for Sustainable Construction
RESEARCH METHOD
The study embraces both quantitative and qualitative methods of data collection.
Relevant information is sourced from professionals in the construction industry,
contractors, developers and clients. Using a structured questionnaire information on
how social, economic, bio physical and technical indicators facilitate sustainable

Nwokoro and Onukwube
890
construction are elicited. Respondents were asked to indicate their judgement on
identified social, economic, bio-physical and technical indicators. A 5-point scale was
used to assess the importance of these factors. Section A addresses questions on name
and type of organisation, years of construction industry experience. For each factor, an
important index was determined. Questions on section B to F are quantitative in
nature. Section B comprises nine questions on social attribute of sustainable
construction while section C comprises twelve questions on economic attribute of
sustainable construction. Sections D, E and F comprise eight, six and six questions on
bio physical, technical and process-oriented principles of sustainable construction
respectively. The sample frame is the total number of registered professionals in the
built industry in Lagos. A total number of 85 respondents were randomly selected for
study from each group. In addition two construction sites each were randomly selected
and visited in 3 different income class neighbourhoods, thus, Lekki (high income),
Yaba (medium income) and Bariga (low income).
Focus group discussions (FGDs) were also conducted with all the above groups to
corroborate the primary information. This involved a meeting of ten (10) stakeholders
drawn from professionals of the built industry in each of the three selected
neighbourhoods. These groups were also gender and age sensitive to achieve diverse
information. The work of Sultan (2005) was identified and used for the quantitative
aspect of the study because of the similarity of data in both researches. The response
format designed by Sultan (2005) was altered. In this study instead of using a 3-point
likert scale used by Sultan, a 5-point likert scale was used to achieve operationality of
variables. Cronbach‘s alpha is a measure of internal reliability. This is bound by 0 and
1, with measures closer to 1 representing strong reliability for the items in the research
instrument. Data Collected are analysed with using mean item score. The
sustainability instrument in this study recorded a Cronbach‘s alpha value of 0.91 and
the data collected was analysed using statistical packages for social sciences (SPSS).
RESULTS AND DISCUSSION
Data collected from Section A of the research instrument shows that 24(28%) of the
respondents are consultants, 21(25%) are developers, 20 (23.5%) are contractors while
the remaining 20 (23.5%) are clients. Majority of the respondents 35 (41%) had more
than 25 years construction industry experience, while 28 (33%) had experience
ranging between (15- 20) years. Others are 13 (15%) for industry experience ranging
between (10-14) years while the last group recorded 10 (11%) for industry experience
of (5-9) years. The implication of this result is that most of the respondents had
enough knowledge and experience to make useful contribution to this area of research.
The information elicited from the respondents were discussed along the lines of the
different attributes of sustainability thus; social, economic, bio physical, technical and
process oriented. This is further supported by the responses from the FGDs conducted
in three different income residential areas. The ranking of these various indicators
corresponds with the respondents need in order of importance.
(Mean item score = 0.852) as an important social factor in achieving green
construction. This means that the respondents expect improved working conditions,
fringe benefits and social amenities‘ that will facilitate better standard of living. This
finding supports the contribution of Hill and Bowen (1997) in their study on principles
of sustainable construction. The finding of Sultan (2005) in this area of study is also in
agreement with this result. Education and training, and knowledge management are
ranked 2nd
and 3rd
respectively. This is a major factor in the developed countries

Sustainable construction
891
where sustainable construction has been achieved. Respondents agreed that
implementing skills training and capacity enhancement will help the disadvantaged
workers. This will also create awareness about the benefits of green construction.
Table 1 reveals that most respondents rated quality of working conditions very high
Table 1: Relative index of social indicators in ―sustainable‖ construction
Social Indicators Mean Item Score
Quality of working conditions 0.852 1
Education and training 0.845 2
Knowledge management 0.833 3
Impact on employment 0.795 4
Health and safety 0.762 5
Innovative potential 0.760 6
Social characteristics and cultural diversity in
development planning
0.718 7
Societal product benefit 0.694 8
Societal dialogue 0.663 9
Other social factors that were ranked high by respondents are impact on employment,
health and safety and innovative potential. Currently the rate of employment is high
and this contradicts the purpose of social sustainability. These factors are important
factors that must be taken into consideration in planning for social sustainability.
For the economic indicators for sustainable construction, strengthening the law and
regulations in construction ranked highest with a mean item score of 0.872 as shown
in table 2. This includes sorting out all legal rights for investors and tenures via legal
agencies to ensure the well conduct of the industry activities in a sustainable and
efficient manner. The respondents also feel strongly about getting strategies for
sustaining the continuity of affordable infrastructure projects and sustained and
efficient use of resources and materials as these indicators ranked 2nd
and 3rd
respectively.
Table 2: Relative Index of Economic Indicators in ―Sustainable‖ Construction
Economic Indicators Mean Item
Score
Ranking
Strengthening the law and regulations in construction 0.872 1
Strategies for sustaining the continuity of affordable infrastructure
projects.
0.833 2
Sustained and efficient use of resources and materials 0.828 3
Choose environmentally responsible suppliers and contractors 0.826 4
Local material protection policy 0.816 5
Energy – Efficiency policies in Design and Construction 0.798 6
Pricing policies 0.793 7
Improve administration effectiveness and reduce bureaucratic
procedures
0.788 8
Ensure financial affordability for intended beneficiaries 0.767 9
Sustained employment opportunities 0.760 10
Credit and Policies to select projects 0.760 11
Labour – intensive construction policies 0.734 12
The ranking of certain bio physical factors that enhance sustainability in construction
is highlighted in table 3. Respondents strongly agree that waste management in
construction should be encouraged. This indicator is ranked first (mean item score =
0.819). This is a major challenge in most Nigerian construction sites and also
corroborated by the FGDs across income areas. The inability to manage construction
waste leads to air pollution and other health hazards. This construction waste problem

Nwokoro and Onukwube
892
manifested seriously at all construction sites visited. Another very important bio
physical indicator for sustainable construction is the use of renewable building
materials from sustainable sources. This will reduce the cost of maintenance due to the
durability of materials used. The issue of renewability is considered as a key factor by
the respondents as promotion of the use of rapidly – renewable materials also rank
high. Table 3 shows other details of relative index of bio physical indicators in
sustainable construction. All the indicators based on their respective (MIS) are very
important and important factors, hence their consideration in sustainable construction
is very essential, this agrees with the observation of (Wooley, 2000) that these factors
will facilitate the attainment of sustainable construction.
Table 3: Relative Index of Bio physical Indicators in ―Sustainable‖ Construction
Bio Physical Indicators Mean Item
Score
Ranking
Encourage construction waste management 0.819 1
Renewable building materials 0.816 2
Project design facilities 0.814 3
Promote the use of rapidly – renewable materials 0.805 4
Prevention of pollution from construction activity 0.795 5
Designs that takes into consideration existing cultural patterns and
behaviours
0.791 6
Reduction of energy use 0.741 7
Water use reduction and conservation and rainwater collection. 0.704 8
Both results from questionnaire information and FGDs revealed that the most
important technical indicator for sustainable construction is Design for flexibility and
adaptability (item mean score = 0.875) as shown in table 4. Design for durability of
exposed building parts and ensuring quality in creating the built environment are other
two highly ranked indicators. Table 4 further indicates that the other factors were not
considered necessary for green construction. To achieve this in Nigeria, the
technological base has to be enhanced. Participants at the FGDs also showed concern
at the low level of infrastructural and technological base which affect the quality of
building materials and design.
Table 4: Relative Index of Technical Indicators in ―Sustainable‖ Construction
Technical Indicators Mean Item
Score
Ranking
Design for flexibility and adaptability 0.875 1
Design for durability of exposed building parts 0.828 2
Pursue quality in creating the built environment 0.814 3
Use serviceability to promote sustainable construction 0.784 4
Construct durability of exposed building parts 0.778 5
Revitalize existing urban infrastructure. 0.764 6
Focus Group Discussions on Current Practices/Challenges of Sustainable
Construction.
Participants at the FGDs are of the opinion that the current practice on sustainable
construction does not take into consideration integrated design process, acoustic and
visual comfort in the planning and construction of sustainable projects. However,
some participants are of the opinion that they apply the principles of site suitability,
spatial comfort and building integrity in the sustainable projects that they were
involved.

Sustainable construction
893
CONCLUSIONS
This research demonstrates how sustainability can be viewed in the context of
Nigeria. It points to the importance of process in any efforts at sustainable
construction. Sustainable construction requires a process that looks at sustainability
comprehensively, exploring each of its component dimensions to discern its fit and
relevance to a given context.
The prioritization of social needs clearly shows that to achieve social sustainability
in Nigeria, emphasis is on quality of working life, education and training as well
as knowledge management.
The ranking of economic indicators of sustainable construction in Nigeria
indicates that strengthening of existing laws, efficient use of resources,
appointment of environmentally responsible contractors and local material
protection are essential factors necessary for attainment of economic sustainability
in construction.
The application of efficient waste management system, the use of renewable
construction materials and effective use of project design facilities will facilitate
the attainment of biophysical sustainability in Nigeria
Design for flexibility, durability, adaptability and quality are essential factors
necessary for the attainment of technical sustainability in construction.
Compliance with relevant legislation and regulations, ability to carry out
preliminary assessment of purposes and activities as well as utilize a life cycle
framework and manage activities through the setting of targets are essential factors
necessary for attainment of sustainable construction.
Emphasis should also be placed on integrated design process, site suitability,
acoustic, visual, spatial and thermal comforts as well as building integrity in the
practice of sustainable construction.
A multi- stage framework for sustainable construction is proposed which requires
application of Environmental impact assessment (EIA) and implementation of
Environmental Management Systems (EMS) for all stake holders involved in
sustainable construction.
RECOMMENDATIONS
In the light of research findings and conclusions, the following recommendations are
made in order to motivate the application of sustainable construction in Nigeria.
Government should improve existing laws in this area of research paradigm so as
to improve quality of working life, education, training as well as knowledge
management for all stakeholders in sustainable construction.
A clause should be introduced in the conditions of contract that will address
environmental issues of sustainable construction as this will facilitate the
appointment of environmentally responsible contractors and suppliers.
Seminars, workshops and lectures should be organised for all stakeholders in
sustainable construction to address issues on efficient waste management,
environmental management systems, and design for flexibility, durability,
adaptability and the use of renewable construction materials.
PRACTICAL IMPLICATIONS
This study also expands the current literature on sustainable construction by carrying
out a comprehensive overview of social, economic, biophysical and technical

Nwokoro and Onukwube
894
indicators associated with sustainable construction as well as the current practice and
challenges facing sustainable construction (Hill and Bowen, 1997; Wolley, 2000;
Sultan, 2005). Most research in this area of study has been qualitative in nature. This
study has gone a step further by adding quantitative dimension to identified social,
economic, biophysical and technical indicators. This prioritizing will guide policy
thrust in the area of sustainable construction. Another major contribution of this study
is the modified multi- stage framework developed for stakeholders in sustainable
construction. From a practical perspective, this study‘s results have implications for
stakeholders in sustainable construction. First, our findings suggest that effective
enforcement of existing laws on the environment will definitely encourage the
practice of sustainable construction. Further the results shows that improvement on
quality of working life, education and training of stakeholders will facilitate rapid
growth in application of principles of sustainable construction. This agrees with the
opinion of Hill and Bowen (1997).
REFERENCES
Bluhm, G. L., Berglind, N., Nordling, E. and Rosenlund, M. (2007). Road Traffic Noise and
Hypertension. OccupationalEnvironmental Medicine, 64,122-126.
Bornehag, C.G., Blomquist, G., Gyntelberg, F., Ja¨rvholm, B.,Malmberg, P., Nordvall, L.,
Nielsen, A., Pershagen, G. and Sundell, J. (2001). Dampness in Buildings and Health.
Nordic Interdisciplinary Review of the Scientific Evidence on Associations between
Exposure to ‗Dampness in Building and Health Effects (NORDDAMP). Indoor Air,
11(2), 72–86.
Bourdeau, L. (2000) ―Sustainable Construction: A Framework and International Agenda for
Change.‖ Publication No. 260, Int. Council for Research and Innovation In Building and
Construction CIB.
Cole, R.J., Robinson, J., Brown, Z. and O‘shea, M. (2008) Re-contextualizing the notion of
comfort. Building Research & Information, 36(4), 232–336.
ECONorthwest (2001). Green Building: Saving Money and the Environment Opportunities for
Louisiana. ECONorthwest, Eugene, Oregon: October 2001.
Gardner, J.E. (1989) Decision Making For Sustainable Development: Selected Approaches to
Environmental Assessment and Management. Environmental Impact Assessment
Review, 9(4), 337- 66.
Griefahn, B. and Spreng, M. (2004) Disturbed Sleep Patterns and Limitation of Noise.
Noise and Health, 6(22), 27–33.
Hill, R.C and Bowen, P.A (1997) Sustainable Construction, Principles and Framework for
Attainment, Construction Management And Economics, 15, 223-239
Hillier, B. and Hanson, J. (1984). The social logic of space. Cambridge: Cambridge University
Press.
International Union for the Conservation of Nature and Natural Resources (IUCN) (1991) World
Conservation Strategy. Gland, Switzerland.
Kibert, C, Sendzimir, J, and Guy, G. B. (2000) ―Defining an Ecology of Construction.‖
Construction Ecology: Nature as the basis for Green Buildings, Ed. Kibert, Sendzimer,
and Guy. New York: Spon Press, Pp 7-28.
Lucas, G and Rubel, W (20004) The Moral Foundations of Leadership, Boston, MA: Pearson
Education, Pp 116.
Nwafor, J.C (2006) Environmental Impact Assessment for Sustainable Development. Enugu:
Eldermark Publishers.
Ochoa, C.E and Capeluto, I.G (2009) Advice Tool for Early Design Stages of Intelligent Facades
Basedon Energy and Visual Comfort Approach, Energy Build, 480-488.

Sustainable construction
895
Ofori, G (2000) Challenges of Construction Industries in Developing Countries: Lessons from
various Countries. Proceedings of The 2nd
International Conference of the UB TG29 On
Construction In Developing Countries Challenges facing The Construction Industry in
Developing Countries 15-17 November 2000, Gabarone, Botswana, Pp1-3
Reed, G.R and Gordon, E.B (2000) Integrated Design and Building Processes, Building Research
and Information, 28(5), Pp 325-337.
Santoli, L. D and Matteo, U.D (2003) Building Energy and Environment Performance system,
Building Systems,24(2), Pp 61-68.
Shove, E., Chappells, H., Lutzenhiser, L. and Hackett, B. (2008) Comfort in a lower Carbon
Society. Building Research &Information, 36(4), 307–311.
Sultan, M K (2005) The Construction Industry In Yemen : Towards Economic Sustainability. A
Thesis Submitted in Partial fulfilment of the requirement for Doctor of Philosophy.
United Nations, (1987)"Report of the World Commission on Environment and Development."
General Assembly Resolution 42/187, 11 December 1987‖
Wallbaum, H, And Buerkin, C (2003). Concepts and Instruments for a Sustainable Sector.
Industry and Environment: Sustainable Building and Construction. United Nations
Environment Programme 26( 2-3): 53-57.
Woolley, T (2000). Green Building: Establishing Principles. Ethics and the Built Environment,
Ed. Warwick Fox. Rutledge, London: Pp 44-56.


Oluigbo, S.N. ( (2011) Sustainable tourism architecture: user evaluation of Argungu fishing village In:
Laryea, S., Leiringer, R. and Hughes, W. (Eds) Procs West Africa Built Environment Research
(WABER) Conference, 19-21 July 2011, Accra, Ghana 897-904.
897
SUSTAINABLE TOURISM ARCHITECTURE: USER
EVALUATION OF ARGUNGU FISHING VILLAGE
Stephen Nwabunwanne Oluigbo1
Department of Architecture, Ahmadu Bello University, Zaria, Nigeria
Architectural design for sustainable tourism facilities demands the creation of spaces
which will attract and satisfy the market, based on solutions which preserve,
reinforce, or project destinations' natural and cultural attributes. In order to determine
the extent to which this was reflected in the design of Argungu fishing village, Kebbi
state, Nigeria, visual survey was conducted. This was followed by user perception
survey through on-site questionnaires administration. Obtained data were subject to
descriptive analysis and non-parametric tests. Findings from the questionnaire survey
include: Perception of low level of response to the market; moderate level of response
to local culture; and, high response to the natural environment. Results also show
positive attitude towards the combination of indigenous and modern architecture in
the design. The study concludes that the design of Argungu fishing village reflected
considerable attempts at sustaining the natural and cultural environment. However,
there is need for more attention to user needs and preferences in order to enhance
patronage and economic sustainability.
Keywords: culture, fishing, market, natural environment, sustainable tourism.
INTRODUCTION
One of the key physical features of tourism development is the construction of
facilities. These facilities are an important part of the tourist experience at destinations
and their adequacy is often central to visitor attraction and satisfaction (Mill and
Morrison, 1985; Moscardo, 2001). They contribute in shaping tourism landscapes by
influencing the type and number of tourists in a particular location as well as their
spatial activity patterns (Middleton and Hawkins,1998). They are one of the most
visible features of tourism destinations with the potential to alter the characteristics of
their location if designed insensitively (Marin and Jafari, 2002). Their fixed nature and
large footprint makes them the most likely sectors to be blamed by destination
authorities and communities for any perceived environmental or social degradation
(Weaver, 2006). In line with this, the World Tourism Organisation (WTO) (2005)
emphasized the importance of appropriate architectural design of tourism facilities and
the place of architecture in shaping and enhancing the image of tourist destinations or
destroying it altogether.
Two key stakeholders in sustainable tourism facilities development are the tourists
and members of the host community. These two also constitute the users. Robinson
and Picard (2006) noted that tourists and member of the host community had a stake
in sustainable tourism development. Therefore, their input is essential in sustainable
tourism facilities design. While the benefit of the tourists was largely linked to

Oluigbo
898
recreational experience, host communities have a direct stake in tourism in ensuring
that developments do not degrade their environment or erode local culture. Studies
have also identified significant difference between tourists and the local community in
perception of tourism facilities developments (Mcnicol, 1996; Jones et al. 2000; Yung
et al, 2003). Others have noted that what some considered as progress may be viewed
by others as detrimental to the environment (Kaltenborn 1998; Cheng et al. 2003;
Cresswell, 2004; Rowena, 2005). These factors need to be put into consideration for
the sustainable tourism facilities design.
This paper applied user perception and evaluation in order to determine the extent to
which the architectural design of Argungu fishing village reflected consideration for
sustainable design. The objectives of the paper are:
(i) To conduct a review of sustainable tourism facilities design requirements with
reference to the three pillars of sustainability;
(ii) To survey the perception of users on the reflections of sustainable design in
Argungu fishing village; and,
(iii) To determine whether there are significant differences between key user
groups (tourists and the local population) on the importance attached to various
aspects of sustainability in the design of tourism facilities.
SUSTAINABLE TOURISM FACILITIES DESIGN
Designing for sustainability firstly requires the identification of the entities that
needed sustaining and what their requisite state should be (Gibberd, 2003). This study
looks at the design of sustainable tourism facilities through the three pillars - the
environment, culture, and economy.
The Market as Basis of Economic Sustainability
One of the keys to economic sustainability of tourism facilities is the ability to attract
tourists, increase their expenditure, while providing them with quality services and
satisfying experiences (Ritchie and Crouch, 2003 Al-Masroori, 2006 op cit). In order
to achieve this, tourism facilities design should be based on study of market trends,
needs, expectations and preferences of tourists, and the type of facilities which would
best satisfy them. This will aid the design of facilities based on the characteristics of the
destination (Michael, 1986; Western Australia Tourism Commission (WATC), 1990;
Southern Australia Tourism Commission (SATC), 2007; http:// www.rainforest-
alliance.org). SATC (2007) listed the following as the basic questions to ask in the
study of the existing market for the purpose of development as: How many visitors
come to the region, town, area, or specific sites? Where do they come from –
international, specific region, local? What do they seek – desires and preferences?
Who are they – origin, demography, psychographic and behavioural segmentation?
Where do they stay – accommodation preferences?
Sustaining the Natural Environment
Environmental conscious tourism facilities design entails optimal use of
environmental resources (SATC, 2007). To achieve this, controls should be applied in
tourism facilities design in order to minimise adverse impacts on the natural
environment, maintain and promote the image of the facility, optimize the experience,
and enhance the attraction (WATC, 1990). At the destinations, design should
minimize any form of environmental degradation or pollution. It should also aim at
maintaining the visual quality of the setting (SATC, 2007). This demands that design

Sustainable tourism architecture
899
be based on ecological factors of the location such as solar energy, soil, water supply,
humidity, wind, topography, and altitude, and the use of sites natural attributes as
primary experience and design determinant (Denver Service Centre, 2009). At the
global level, the major issues are the minimization of greenhouse gas emission and
conservation of non-renewable energy (SATC, 2007). Design with natural
characteristics of tourism destinations reduces capital and operating costs by relying
on the site‘s natural features thus downsizing mechanical systems through smart and
efficient energy systems (WATC, 1990; Sustainable Sitting, 2007; Denver Service
Centre, 2009). Tourists are also responding to good design. According to a 1996 study
by the Travel Industry Association of America, some 43 million Americans are
willing to pay an 8.5% premium to stay in what they perceive to be an
environmentally sensitive property (Sustainable Sitting, 2007).
Sustaining Local Culture
Sustainable tourism facilities design should promote the identity and sense of place of
the host community rather than overshadowing it. In line with this, Huffadine (2000)
recommended the assimilation of local customs and heritage with the function of
tourism facilities. Similarly, SATC (2000) called for the reflection of community
values in tourism developments and recommended that architectural style, landscape
design, and construction materials of new developments should reflect the cultural
heritage of the locality or region. This can be achieved through the use of the cultural
attributes of sites as primary experience and design determinant (Denver Service
Centre, 2009). Design should also encourage the use of local knowledge, skills and
traditions, and promote tourist activities and behaviours which are respectful of
cultural activities, sites and values (Williams, 2007; SATC, 2007). While focusing on
local built environment, submissions from the international conference on Built
Environments for Sustainable Tourism (BEST) held at Muscat, Sultanate of Oman
held in 2005 showed that modern tourism facilities were not necessarily antagonistic
to sense of place (WTO, 2005). Memorandum of the conference stated that modern
components can blend successfully with traditional built environments.
ARGUNGU FISHING VILLAGE
Argungu Fishing Village is the venue of the annual Argungu fishing and cultural
festival which is one of the most popular cultural tourism attractions in Nigeria. It is
located in the Sudan Savannah grassland zone of Nigeria and lies in the Sokoto river
basin at an altitude of about 225 metres above sea level and covers an area of about
276 hectares (Adamu, 1982; http://argungufishingfestival.gov.ng/index.php).
Argungu has been a strong centre of administration, right from its establishment at the
beginning of the nineteenth century, to date (Adamu, 1982). The dominant ethnic
group at the destination is the Hausa with a small minority of the inhabitants from
other groups. (http://argungufishingfestival.gov.ng/index.php).
Place responsive design for this destination is clearly reflected in the traditional
architecture (Hausa architecture). Features of this include: Use of courtyard in design;
massive mud walls of high thermal capacity with an eight hour time lag; small size
openings; longer sides of buildings facing the north and south; use of trees for
shading; flat, domed or thatched roof; pinnacles; arches; decoration of door and
window surrounds; general abstract wall decorations; entrance room (azure) and inner
courtyards, among others (Evans, 1980; Denyer, 1982; Moughtin, 1985; Sa‘ad, 1985;
Dmochowski, 1990; Ogunsote, 1991).

Oluigbo
900
Four categories of buildings are distinguishable from the visual survey of Argungu
fishing village. These are: the fully traditional buildings represented by Gidan D. O.
(former District officer's residence); combination of modern and traditional styles
represented by the round huts; fully modern with no distinguishing characteristics,
represented by the lodges; and, symbolic buildings, represented by the "fish house"
(Nigerian Tourism Development Corporations' station) (see Plates I to IV).
These multiple and apparently contradictory architectural characteristics could
however be explained by the history and evolution of the village which shows that
each of these categories of buildings was constructed at different periods starting from
the colonial era to the present age.
Plate I and II: Gidan D.O. showing fully traditional Hausa architectural
characteristics; group of ‗round huts‘ in the landscape showing resemblance to a
village setting. Source: field survey 2010.
Plate III and IV: Front view of one of the lodges showing reflection of modern
architectural characteristics; ‗fish‘ house showing fish-like building form. Source:
field survey 2010.
METHODOLOGY (EVALUATION)
The study adopted visual survey and user perception in the evaluation of architectural
design of Argungu fishing village with reference to the three pillars of sustainability -
economy, environment, and culture. The users include tourists and members of the
host community. Site/user survey method was adopted. This approach has the
advantage of high response rate and medium cost (Veal, 2006). 392 questionnaires
were administered through systematic random sampling. This was based on a
combination of respondent and interviewer completed methods through stationary

Sustainable tourism architecture
901
interviewers distributed around the survey site. The questions were placed on a five
point Likert scale. The scale consists of a set of items of equal value and a set of
response categories constructed around a continuum of important/not important and
low/high. The study also tested a null hypothesis: Ho1 - There is no significant
difference between residents and visitors on importance of destination's resources to
sustainable tourism facilities design. Analysis was based on descriptive account,
descriptive statistics and non-parametric tests. These involved the use of Statistical
Package for Social Science (SPSS).
RESULT
Design with the Market
With regards to the market, the survey sought to ascertain the level of importance
attached to seven facilities and users' rating of provision of such facilities at Argungu
fishing village. The facilities are: High quality accommodation facilities; outdoor
relaxation spaces; sports facilities; performance spaces; shopping facilities; outlets for
food and drinks; and, conference facilities. The result shows that the most important
facility was outdoor relaxation spaces with a score of 4.60 on a five point Likert scale,
while the provision of such facilities obtained a score of 2.09 on the same scale. The
facility scored low on all aspects except for the provision of performance spaces. (see
Table 1).
Table 1: User needs and its reflection in Argungu fishing village
Facility Importance Reflection
High quality accommodation facilities 4.52 2.09
Outdoor relaxation spaces 4.60 2.29
Sports facilities 4.00 2.09
Performance spaces 4.10 3.64
Shopping facilities 2.52 2.05
Outlets for food and drinks 4.51 2.04
Conference facilities 3.50 1.15
Sustaining the Natural Environment
Five resources were investigated with respect to the sustenance of the natural
environment. These are: Respect for topography; preservation of vegetation; natural
lighting; natural ventilation; and, use of renewable energy. The result shows high
correlation between the level of importance attached to the destination's natural
environment and the reflection of this. Argungu fishing village however scored low in
the use of renewable energy (see Table 2).
Table 2: Natural resources and its reflection in Argungu fishing village
Natural resource Importance Reflection
Respect for topography 3.78 3.04
Preservation of vegetation 3.82 3.60
Natural lighting 4.82 3.50
Natural ventilation 4.89 3.65
Use of renewable energy 2.85 1.00
Sustaining Local Culture
Survey result shows that: 241 respondents representing 61.5% were pleased with the
combination of indigenous and modern (western) architecture in the design; 117
respondents representing 29.8% believed it should have been based on indigenous
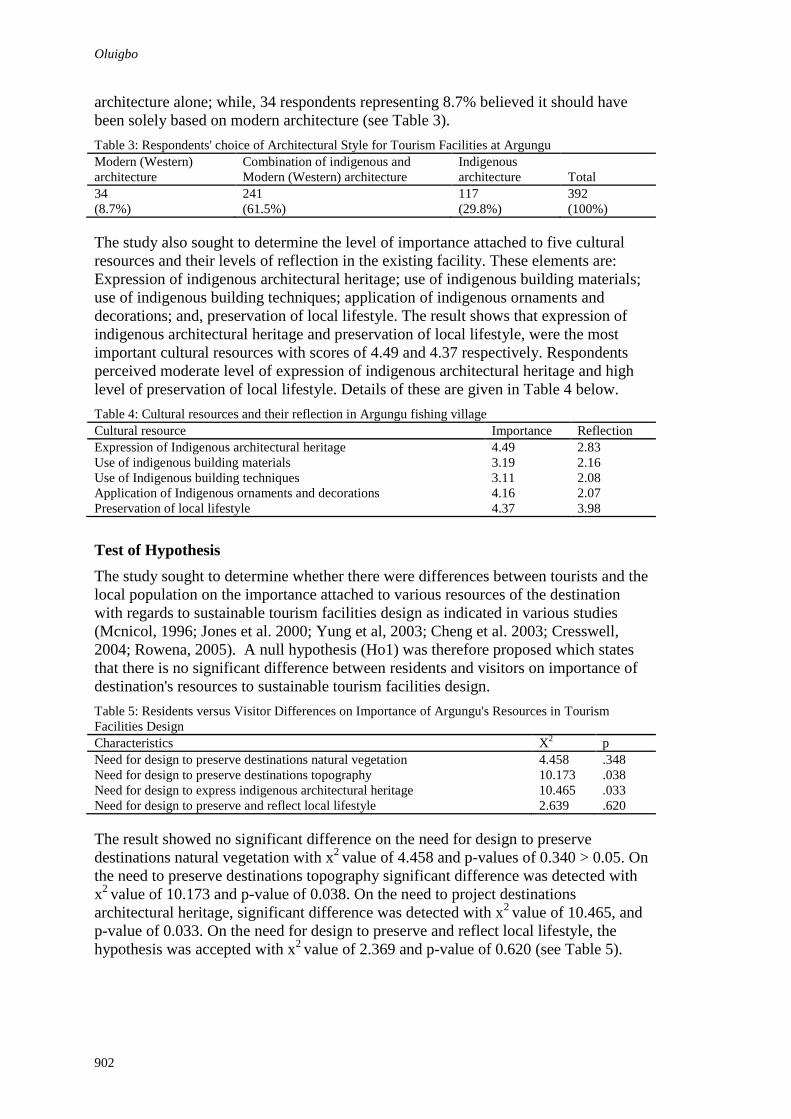
Oluigbo
902
architecture alone; while, 34 respondents representing 8.7% believed it should have
been solely based on modern architecture (see Table 3).
Table 3: Respondents' choice of Architectural Style for Tourism Facilities at Argungu
Modern (Western)
architecture
Combination of indigenous and
Modern (Western) architecture
Indigenous
architecture
Total
34
(8.7%)
241
(61.5%)
117
(29.8%)
392
(100%)
The study also sought to determine the level of importance attached to five cultural
resources and their levels of reflection in the existing facility. These elements are:
Expression of indigenous architectural heritage; use of indigenous building materials;
use of indigenous building techniques; application of indigenous ornaments and
decorations; and, preservation of local lifestyle. The result shows that expression of
indigenous architectural heritage and preservation of local lifestyle, were the most
important cultural resources with scores of 4.49 and 4.37 respectively. Respondents
perceived moderate level of expression of indigenous architectural heritage and high
level of preservation of local lifestyle. Details of these are given in Table 4 below.
Table 4: Cultural resources and their reflection in Argungu fishing village
Cultural resource Importance Reflection
Expression of Indigenous architectural heritage 4.49 2.83
Use of indigenous building materials 3.19 2.16
Use of Indigenous building techniques 3.11 2.08
Application of Indigenous ornaments and decorations 4.16 2.07
Preservation of local lifestyle 4.37 3.98
Test of Hypothesis
The study sought to determine whether there were differences between tourists and the
local population on the importance attached to various resources of the destination
with regards to sustainable tourism facilities design as indicated in various studies
(Mcnicol, 1996; Jones et al. 2000; Yung et al, 2003; Cheng et al. 2003; Cresswell,
2004; Rowena, 2005). A null hypothesis (Ho1) was therefore proposed which states
that there is no significant difference between residents and visitors on importance of
destination's resources to sustainable tourism facilities design.
Table 5: Residents versus Visitor Differences on Importance of Argungu's Resources in Tourism
Facilities Design
Characteristics X2
p
Need for design to preserve destinations natural vegetation 4.458 .348
Need for design to preserve destinations topography 10.173 .038
Need for design to express indigenous architectural heritage 10.465 .033
Need for design to preserve and reflect local lifestyle 2.639 .620
The result showed no significant difference on the need for design to preserve
destinations natural vegetation with x2
value of 4.458 and p-values of 0.340 > 0.05. On
the need to preserve destinations topography significant difference was detected with
x2
value of 10.173 and p-value of 0.038. On the need to project destinations
architectural heritage, significant difference was detected with x2
value of 10.465, and
p-value of 0.033. On the need for design to preserve and reflect local lifestyle, the
hypothesis was accepted with x2
value of 2.369 and p-value of 0.620 (see Table 5).

Sustainable tourism architecture
903
CONCLUSIONS
This paper applied user perception and evaluation to determine the extent to which the
architectural design of Argungu fishing village reflected consideration for sustainable
design. The result shows moderate level of correlation between the importance
attached to local cultural characteristics and their reflection in design; and, fairly high
level of correlation between importance attached to the destination's natural
environment and its reflection in design. However, while previous studies have
buttressed the need for tourism facilities design to be based on user needs and
preferences in order to enhance economic sustainability (WATC, 1990; Ritchie and
Crouch, 2003 Al-Masroori, 2006 op cit; SATC, 2007; www.rainforest-alliance.org),
there was a low level of correlation between facilities demanded by users and that
which was available at the fishing village. Majority of respondents believed that
tourism facilities should be based on a combination of indigenous and modern
architectural styles. This confirms WTO's (2005) findings that modern architecture
was not antagonistic to sense of place and that local vernacular architecture could be
reinterpreted through contemporary lenses for tourism facilities design. Test of
hypothesis confirmed the existence of differences in perception between tourists and
hosts as indicated in previous studies (Mcnicol, 1996; Jones et al. 2000; Yung et al,
2003; Cheng et al. 2003; Cresswell, 2004; Rowena, 2005).
Based on these findings the study recommends the following:
(i) Provision of additional outdoor spaces and improvements of quality of
accommodation facilities in order to satisfy the market;
(ii) Renewable energy should be explored since some amount of importance was
attached to it by the users;
(iii) Design should combine modern architecture with local character to enhance
attraction since modern architecture was not antagonistic to the host community;
(iv) Differences in perception between tourists and the host community should be
harmonised to ensure sustainability.
REFERENCES
Adamu, M. B. (1982). Argungu fishing festival: Its impact on town‘s development, Unpublished
M.Sc. thesis, Ahmadu Bello University, Zaria.
Al-Masroori, R. S. (2006). Destination competitiveness: Interrelationship between
destination planning and development strategies and stakeholders‘ support in enhancing Oman‘s
tourism industry. Unpublished Doctoral thesis, Department of Business and Asian
Studies, Griffith University, Australia.
Cheng, A. S., Kruger, L. E., and Daniels, S .E. (2003). ―Place‖ as an integrating concept in
natural resource politics: Propositions for a social science research agenda. Society and
Natural Resources. 16: 87–104.
Cresswell, T. (2004). Place: A short introduction. Malden Ma: Blackwell Publishing.
Denver Service Centre (2009). Guiding principles of sustainable design. Retrieved May 4, 2009
from http://www.nps.gov/dsc/d_publications/d_1_gpsd.htm.
Denyer, S. (1982). African traditional architecture. London: Heinemann.
Dmochowski, Z. R. (1990). An introduction to Nigerian traditional architecture, Volume one:
Northern Nigeria. London/Lagos: Ethnographica/ National Commission for
Museum and Monumnts.
Gibberd, J. (2003). Integrating sustainable development into briefing and design processes of
buildings in developing countries: An assessment tool. Unpublished PhD thesis,
Department of Architecture, University of Pretoria.

Oluigbo
904
Government of the Federal Republic of Nigeria, United Nations World Tourism Organisation,
United Nations Development Program and Tourism Development International
(2006). Nigeria tourism master plan: Institutional capacity strengthening to the tourism
sector in Nigeria. NIR/03/002.
Huffadine, M. (2000). Resort Design: Planning, Architecture, and Interiors. New York: Mcgraw-
Hill.
Jones, C. D., Patterson, M. E., Hammitt, W. E. (2000). Evaluating the construct validity of sense
of belonging as a measure of landscape perception. Journal of Leisure Research. 32(4):
383–395.
Kaltenborn, B. P. (1998). Effects of sense of place on responses to environmental impact: A
case study among residents in an Arctic community. Applied Geography. 18(2): 169–
189.
Marin, C. and Jafari, J. (2002). Sustainable hotels for sustainable destinations. Annals of Tourism
Research, 29, 266–8.
Middleton, V. and Hawkins, R. (1998). Sustainable Tourism: A Marketing Perspective,
Butterworth: Heinemann.
Mcnicol, B. J. (1996). Views of residents, developers, and government planners about tourism
and tourism resort developments in Canmore, Alberta. Unpublished PhD thesis,
University of Calgary, Alberta, Canada.
Michael, I. O. (1986). Tourism in relation to hotel industry. Nigerian trade journal 5(2), 30.
Mill, R. C., and Morrison, A. M. (1985). The tourism system: An introductory text. New Jersey:
Prentice- Hall.
Moscardo, G. (2001). Visitor evaluations of built tourist facilities: Pontoons on the Great Barrier
Reef. The Journal of Tourism Studies, 12(1), 28-38.
Moughtin, J. C. (1985). Hausa architecture. London: Ethnographica Limited.
Ogunsote, O. O. (1991) Introduction to building climatology. Zaria: Ahmadu Bello University
Press.
Robinson, M. and Picard, D. (2006). Tourism, Culture and Sustainable Development.Paris:
UNESCO.
Rowena, B. (2005 October 17- 21). Peripheral vision: Implications of spatial contextualization
for communities surrounding heritage sites. Proceedings of the ICOMOS 15th General
Assembly and Scientific Symposium on ―Monuments and sites in their setting:
Conserving cultural heritage in changing townscapes and landscapes‖. Xi‘an, China.
Saad, H. T. (1985). The role of individual creativity in traditional African art: The gwani amongst
master builders of Hausa-land. Nigeria magazine, Vol. 53, No 4, pp. 3- 16.
South Australian Tourism Commission (2007). Design guidelines for sustainable tourism
development. Sydney: SATC.
Sustainable Siting (2007). The sustainable siting, design and construction of tourism facilities.
Retrieved December 10, 2007 from http://www.ih-
ra.com/marketplace/docs/3environmental-teaching.pdf.
Veal, A. J. (2006). Research Methods or Leisure and Tourism. Third Edition. London: Prentice
Hall.
Weaver, D. (2006). Sustainable tourism: Theory and practice. Amsterdam: Elsevier Butterworth
Heinemann.
Western Australian Tourism Commission (2000). Designing tourism naturally – A review of
world best practices in wilderness lodges and safari camps. WATC
Williams, D. E. (2007). Sustainable design: Ecology, architecture, and planning. New Jersey:
John Wiley and Sons, Inc.
World Tourism Organisation (2005, February 5-8). Final report of the international conference of
Built environment for Sustainable Tourism (BEST) held in Muscat, Sultanate of Oman.
Yung, L., Freimund, W. A., Belsky, J .M. (2003). The politics of place: Understanding meaning,
common ground, and political difference on the Rocky Mountain Front. Forest Science.
49(6): 855–866.

Boadu, M.A. and Opoku-Ware, E. ( (2011) The context of human resource in the Ghanaian public
sector In: Laryea, S., Leiringer, R. and Hughes, W. (Eds) Procs West Africa Built Environment
Research (WABER) Conference, 19-21 July 2011, Accra, Ghana, 905-905.
905
THE CONTEXT OF HUMAN RESOURCE IN THE
GHANAIAN PUBLIC SECTOR
Michael Adusei Boadu1 and Emmanuel Opoku-Ware
2
1Human Resource Office, Takoradi Polytechnic, P. O. Box 256, Takoradi, Ghana
2Sunyani Polytechnic, Sunyani, Ghana
This paper examines the context of human resource management in the Ghanaian
public sector to the effective management of employees in an organization in which
they work. For one thing, such an understanding could provide managers with the
opportunity to cater to the needs of their employees, for another, this could provide
clues on which effective strategies towards the improvement of the work environment
cold be based. For a country such as Ghana where it is generally acknowledged that
employee productivity is abysmally low, knowledge about the milieu in which
employees work as well as fact ors influencing their behaviour, are certainly critical
to effective human resource management.
Key words: employee, Ghana, human resource management, productivity, public
sector.
2


Ayeni, D.A., Ebohon, O.J. and Taki, A.H. ( (2011) The likely effect of sustainable landscape on the
quality of life through tourism: focus on Nigeria In: Laryea, S., Leiringer, R. and Hughes, W. (Eds)
Procs West Africa Built Environment Research (WABER) Conference, 19-21 July 2011, Accra, Ghana,
907-918.
907
THE LIKELY EFFECT OF SUSTAINABLE LANDSCAPE
ON THE QUALITY OF LIFE THROUGH TOURISM:
FOCUS ON NIGERIA
Dorcas A. Ayeni1, O.J. Ebohon and A.H. Taki
De Montfort University, School of Architecture, Developing World Built and Natural Research Unit.
United Kingdom
Increase in leisure time, improved rising standard of living and concerns for healthy
life style has geared people into taking part in tourism activities and landscape, play a
very important role in the choice of the tourist destination. The desire of every tourist
is to enjoy beautiful landscapes either natural or human-made which come in a variety
of forms. A well landscaped attraction with nature, wildlife, water and other elements
help people enjoy the environment, fresh air, engage in physical exercise, reduce
anxiety and feel relaxed thereby adding to the quality of life. This paper sheds light on
the need for proper development of tourist potentials in Nigeria through landscaping
in order to improve on the quality of life of its people and tourists in general. It
reviews literature in landscaping and examines the role it plays on the quality of life.
It also analysed data collected from field survey in Nigeria using the descriptive
summary measures and concludes that landscaping has the potential to contribute to
the human wellbeing if considered, and should feature in the development of the
Nigerian tourists‘ attractions.
Keywords: landscaping, Nigeria, quality of life, sustainability, tourism.
INTRODUCTION
Tourism is becoming one of the main focus for economic revitalization globally and
especially in developing countries where attention is being directed, to serve as
avenue for economic diversification. It benefits not only the country as a whole as
noted by Bankole and Odularu (2006), but also local areas in tourist destinations.
Tourism also affords the opportunities for diversity of landscapes. In view of this,
Abraham, Sommerhalder and Abel (2010) argued that landscapes have the potential to
promote mental wellbeing, physical wellbeing and social wellbeing; as such tourism
presents an avenue for leisure activities which eventually improves well-being and
quality of life.
As noted by Jim and Chen (2009), people are willing to pay a premium for attractive
environment. Similarly, VanDerZanden and Cook (2010) argued that aesthetic
appearance is the criterion by which most people judge a landscape, in addition, there
is a premium on neat and tidy looking landscapes; hence the need for the Nigerian
tourism industry to enhance tourists‘ attractions through landscaping to maximise the
benefits from tourism. The environment is an important asset to tourism development,
for this reason, Inskeep (1987) noted that tourism and the environment are interrelated

Ayeni, Ebohon and Taki
908
and planning tourism environmentally is essential, as such whatever setting a tourist
destination presents, be it heritage, coastal, natural, urban, or rural, it must be
conducive and exciting. In view of Butler (1991), tourism is dependent upon the
environment, however, the prevailing lack of knowledge, responsibility and long term
planning has resulted in development which is neither environmentally nor culturally
sensitive. This is particularly the case with Nigerian tourism where effective training
and education are not provided in order to create the professionalism the industry
needs towards efficient service delivery (Ebohon, Ayeni and Taki, 2009).
Nigeria is highly blessed with natural resources (Jiboku and Jiboku, 2010)
unfortunately, has failed to capitalise on them for effective and sustainable
development, even with the glaring fact that the tourism sector has the potentials to
generate significant foreign exchange earnings, employment and investment towards
economic development (Adora, 2010). Thus, as revealed in the World Tourism
Organisation yearbook of Tourism Statistics (2008) Nigeria is still far behind in the
lists of the world top earners in terms of tourists‘ arrivals and receipts as compared to
developed countries; where destinations are constantly monitored and changes
effected from time to time in order to be up to date with new developments. In this
regard, Figueira (2001) suggested that to enhance positive effects of tourism, the
authorities should be involved in tourism planning and development.
As averred by Butler (1991), tourists‘ destination areas evolve and change over time,
responding to and being altered by changes in tourism. Furthermore, the environment
is not static and need responsible and proactive planning and management for it to be
sustainable. Sustainable tourism development can only be ascribed to the Nigerian
tourism sector if many of the tourists‘ attractions are given facelift and made
welcoming. We advance the argument that introducing landscape elements is the
most effective ways to transform tourist sites in Nigeria and made attractive to local
and international tourists.
THEORETICAL FRAMEWORK
The definition of sustainable development by the Brundtland commission WCED
(1987) as ‗‗development that meets the needs of the present without compromising the
ability of the future generations to meet their own needs‘‘ is widely acknowledged.
This definition addresses the need of the present and that of the future. As noted by
VanDerZanden and Cook (2010), if resources are over used or misused, there will be
fewer resources for the future generation to draw on. Indeed, sustainable development
is about maintaining balance between human needs to improve wellbeing and at the
same time preserving natural resources and the ecosystems; thereby ensuring the
integrity of the natural environment. Hence, as noted by Ercan (2011), sustainability is
about meeting human needs without having to compromise the ability of the natural
resources to replenish itself, hence its carrying capacity.
In the field of tourism, sustainable tourism as defined by the World Tourism
Organisation refers to tourism that leads to the management of all resources in such a
way that economic, social and aesthetics needs can be fulfilled while maintaining
cultural integrity, essential ecological process, biological diversity and life support
systems. Also, applying the Brundtland report definition, Swarbrooke (1999) argues
that, tourism which meets the need of tourists, the tourism industry, and host
communities today without compromising the ability of future generation to meet
their own need is sustainable tourism. Thus, sustainable tourism is tourism
development which avoids damage to the environment, economy and cultures of the

Sustainable tourism architecture
909
locations where it takes place and coordinated such that its activities does not destroy
nature. Nohl (2009), consider that sustainability can only be achieved if economy,
ecology and culture processes take place without destroying natural resources and at
the same time provide employment and welcome generally opportunities towards
effective social development (Tzanopoulos et al, 2011).
Tourism is a tool which can aid development as well as enhance the quality of life of
visitors and the host community. As such, if poorly planned as noted by AMSET
(2007), it can be a destroyer to the special quality which is so central to sustainable
development. The reason why tourists visit attractions is due to the attractiveness of
the tourism product. These tourism products includes common goods such as the
quality of the landscape, wildlife, historic and cultural attributes of the area as well as
leisure and recreation facilities used by both tourists and local
residents(Supplementary Planning Guidance, 2004). On the other hand, Liu, Ko and
Ko (2011) defines attraction as things to see, activities to do and experiences to be
remembered. Therefore, tourism can improve the quality of life in an area by
increasing the number of attractions, recreational opportunities and services.
Furthermore, it offers residents‘ opportunities to meet interesting people, make
friendships, learn about the world and expose themselves to new perspectives (Kreag,
2001). It can therefore be argued that the overall level of wellbeing and fulfilment that
people enjoy from a combination of their social, economic and community
environment help improve their physical and material conditions (Morais and
Camanho, 2011).
Landscape refers to the combination of natural and cultural, physical and symbolic
elements and features on land that is the product of interaction between natural and
human activity (Supplementary Planning Guidance, 2004). Furthermore, it is
increasingly seen as a valued resource both in terms of its contribution to quality of
life, tourism and leisure industry (Supplementary Planning Guidance, 2004), in this
regard; more sustainable approaches are needed for planning and managing
landscapes worldwide (Leitao and Ahern, 2002) and should support those ecological
processes required for the landscape to deliver biodiversity services for the present
and future generations (Opdam, Steingrover and Rooij, 2006). Enhancing the
environment will leave a legacy for the future generations. As stated by the Scottish
Natural Heritage (2003), the quality of the environment is important for functional,
aesthetics, scientific and economic reasons; ensuring that the environment remain
useful; that is, there is tranquillity and recreational opportunities, important places are
safe guarded for study as well as support jobs and at the same time act as key resource
for tourism.
Dejean-pons and Chaboisseau (2000) noted that landscape is an important part of the
quality of life for people everywhere and a key element of individual and social
wellbeing. Emphasizing on the meaning of quality of life, Pacione (2003) argued that
it is not necessarily a simple function of material wealth but refers either to the
conditions of the environment in which people live or the same attribute of people
themselves. Thus giving the definition of landscape as earlier defined, landscape is
more than a view as argued by CPRE (2010), its character make an area unique and
directly affects the quality of life; Its features are important influences on visitor
experiences (white, 2006).
As noted by Nohl (2011), an improvement of landscape aesthetics will have much to
do with sustainable development of landscapes, thus, sustainability is an all embracing
principle for developing and managing nature and resources. Ling and Dale (2011)

Ayeni, Ebohon and Taki
910
argued that, interaction with nature is as vital for community as is social intercourse;
without landscape and cultural diversity, both ecological and human systems will
stagnate and eventually collapse or fail. Creating and managing sustainable landscapes
as highlighted by Dodson (2010) encourages people to spend more time outside and
exercise as well as families spending more time playing together in safe public parks.
Furthermore, trees help insulate and shade buildings. In addition, Landscaping
elements help provide relief from heat, Creates community cohesion and encourage
friendliness.
In the works of Selman (2008); Backhaus (2008) and Gailing (2005), five dimensions
were reflected in the debate of Sustainable landscape and summarized as
environmental sustainability having sufficient size and quantity and maintaining
healthy and viable population; economic sustainability expressed as the maintenance
of attractive scenery to support tourism and recreation; social sustainability addressing
the participation and inclusivity of decision making and access; political sustainability
reflecting the effective governance structure for both private and public domain; and
aesthetic sustainability, addressing visual amenity and healthy functioning of
underlying system. Thus landscape play important role of visual appeal and are the
results of the interaction of people with their environment, therefore it should be
developed in a sustainable way.
Sustainable landscape is landscape which contributes to human wellbeing, protects
and enhances the ecosystem (flora and fauna) by constantly maintaining and
improving on what currently exists, thereby giving the future a better place to live.
This can be achieved as stated by Bousselot, Badetscher and Roll (2005) by using the
various principles and techniques of landscaping which includes having attractive
environment that is in balance with the local climate and requires minimum inputs of
fertilizer, pesticides and water. In addition, it should be functional, cost effective,
visually pleasing, environmentally friendly and of appropriate design.
SUSTAINABLE LANDSCAPE AND THE QUALITY OF LIFE
Landscape as noted by Selman (2006) provides an avenue in which the balance of
economic, environmental and society commonly described in sustainable development
may be pursued. In tourism, environmental quality can act as a major attraction or an
impediment (Jafari, 2003); furthermore, a tourism facility or destination which strives
to build and maintain an attractive, functional and secure environment of high quality
can anticipate increase in patronage. Thus a well planned tourist destination will not
only improve the individual life but also will increase patronage; as stated by Shah,
Kale and Patki (2002), a well planned and maintained gardens develops man‘s
aesthetic awareness and help people to ponder the values of life. Similarly, Andereck
and Jurowski (2006) said quality tourism experiences depend on a receptive host
population and an attractive natural environment.
Similarly, Buchanan (2000) averred that, a well designed landscape will enhance the
quality of life; also, Thompson et al (2007) stated that the quality of the landscape in
which we lead our lives makes a difference to the quality of the lived experience. As
such quality of life refers to the degree of well-being felt by an individual or group of
people and relates to both physical (health, diet, pair and diseases) and psychological
(worry, stress and pleasure) aspects of life. It is also defined by Felce and Perry
(1999) as the satisfaction of an individual‘s values, goals and needs through the
actualisation of their abilities or life style. In the words of Benson and Roe (2007),
quality of life is used to define a broadest of indicators that describe the environment,

Sustainable tourism architecture
911
opportunities and services available to those living in a given area and has significant
overlap with environment quality, people‘s day to day lives in an attractive and
accessible landscape. It can therefore be said to be an individual‘s wellbeing and
personal satisfaction.
Indeed, it can be argued that knowing the needs of people and putting them into
consideration at the design stage of the urban environment is very important; as this
would allow the creation of attractive and accessible environment that may enhance
their experience and quality of life. Landscaping the environment where man lives
contribute to the health and well-being of the individual, this is particularly true in
places where there is the availability of open parks with various landscape elements
and the opportunity of visiting such places and also around the garden within the
home environment. Finding time out of the busy schedule will help release or reduce
stress and help the individual keep fit and at alert.
A direct contact with nature and planting around the garden and the environment with
a pleasing landscape design help people to relax, also, having to watch nature of
different variety and colour also give a regenerative effect. Further arguing on the
effects nature has on the quality of life, Thompson et al (2007) stated that access to
green space and nature is a key contributor to quality of life and patterns of healthy
living; in addition, various forms of contact with nature are known to produce
restorative benefits, as such there is the need to understand what qualities of landscape
are relevant for different people‘s health, wellbeing and quality of life. A Well
landscaped set up with nature, wildlife, water and other elements help people enjoy
attractive surrounding, fresh air, and physical exercise, reduce anxiety and feel
relaxed. Other forms of benefits include psychological-stress reduction, physiological-
physical health. As noted by SEEDA(2005) research shows that nature, open spaces
and countryside, bring health benefit such as lowering blood pressure significantly;
similarly, Morris (2003) stated that visual contact with nature was beneficial to the
emotional, psychological health of a city dweller and has a restorative effect on the
individual.
Furthermore there are five keys as summarised from the works of Morris (2003) to
which exposure to natural environment is beneficial to human health are as listed
below
a. ―Enhancing personal and social communication skills‖ Recreating in landscape
garden help encourage social interaction, meeting people and help foster a more
socially beneficial society.
b. ―Increases physical health‖. Walking and outdoor sports improves people physical
health and mental well-being.
c. ―Enhances mental and spiritual health‖ Exercise can help improve psychological
and spiritual health, carrying this out in a natural and well landscaped environment,
and increased life-span, greater well-being and increased ability to function better at
work and home. The aesthetics of natural and green landscapes can have an important
impact upon mental health.
d. ―Enhances spiritual, sensory and aesthetics awareness‖ Outdoor recreation helps to
free the mind; listening to water running in the pond or fountain, the wind rustling in

Ayeni, Ebohon and Taki
912
the trees, smell from the damps soil and heat of the sun, encourage natural relaxation
and bring a feeling of physical and mental well-being
e. ―Ability to assert personal control and increased sensitivity to one‘s own well-
being‖ Elderly people allow physical activity to become a memory rather than a
regular exercise. Participating in regular outdoor physical activities can contribute
significantly to quality of life.
Similarly, Ulrich (1979) stressed that individuals feel significantly better after
exposure to nature scenes. Also Klett 2004 stated that landscaping that includes trees,
shrubs, lawns, gardens and flowers improve our quality of life. It enhances and helps
the environment by cleaning the air, controlling erosion and providing shelter to
wildlife. In addition to nature is the man made elements which also contribute to the
quality of life through visually pleasing environment.
Human beings require context with each other and social interactions, one way in
which this can be achieved is by Mixing with people in an open and well landscaped
environment; this often help in the physical well-being of the individual. As argued
by Fitz and LaGory (2008), social ties promote and encourage good health practices
by providing health assistance in various form, Furthermore, landscape is one external
factor that helps to decide people‘s preference of where to live or work. Similarly,
Skarback (2007) states that, a substantial recreational and landscape development has
become a decisive factor in people‘s choice of where to live and work. Sustainable
planning is very important when it comes to the quality of life and living, it does not
only help phase out stress as mentioned but also gives a better quality of life and
provide attractive environments where people want to live in.
Summarily, it can be said that the benefits and well-being through landscaping are
innumerable and the impact on quality of life is overwhelming.
RESEARCH METHOD
This research combined literature review through the use of books, journal articles and
internet websites as the secondary source of data collection and quantitative method
using the questionnaire survey approach as the primary source of data collection. The
literature review provided an overview of tourism, landscaping and the quality of life
while the questionnaire survey was used to elicit information from respondents on the
likely impact of landscaping on quality of life through tourism.
The quantitative approach was adopted in this research in order to gather enough
evidence from a large sample size and ensures that results are statistically robust and
can be generalised to all the tourism attractions in Nigeria. As emphasized by Nykiel,
2007; Vanderstoep and Johnston, 2009) results from quantitative approach are
statistically reliable, and findings will more accurately reflect the overall population
from which the sample was drawn.
Nigeria is divided into six recognised geo-political zones (Ikein et al, 2008), three
from the north, that is, North east, Northwest and North central and three from the
South made up of South south, Southwest and Southeast. Adopting the probability
sampling technique, the simple random sampling which gave equal chance of being
picked and free from sampling bias was used to select two zones , the North central
made up of Kogi state and the Federal capital and the southwest made up of Ekiti and
Ondo states. The tourists‘ attractions from these zones constitute heterogeneous tourist
attractions from which a generalisation can be made. Furthermore, in order to achieve
a widespread sample from the population, the stratified random sampling was also

Sustainable tourism architecture
913
used in selecting respondents from across the tourism industry made up of staff of the
Nigerian Tourism Board, hotels and travel agents, Government employees, that is,
Public Servants, local and state, individuals and tourists.
Closed ended questionnaire was designed such that respondents‘ opinions were
measured on a Likert scale of 4 points, Where 4 denotes strongly agree and 1 denotes
strongly disagree. A sample size of two hundred was adopted for each of the state
selected and administered as follows: staff of the Nigerian Tourism Board 25(12.5%),
hotels and travel agents 25(12.5%), Government employees 25(12.5%), individuals
25(12.5%), and tourists 100(50%) and fifty copies in an academic institution, making
a total of eight hundred and fifty. This was chosen because a sample size must be of
adequate size, not too small and not too large, but big enough that the effect will be of
scientific and statistical significant (Lenth, 2001; Kothari, 2007) furthermore, the
larger the sample, the better and gives greater reliability, however a minimum number
should be thirty (Cohen et al, 2007). The questionnaires were administered by trained
enumerators and at the end of twelve weeks, a total of seven hundred and forty five
copies of filled questionnaires were returned, representing eighty seven percent of
response rate. Data was analysed using the Statistical Packages for Social Sciences
(SPSS).
RESULTS AND DISCUSSION
Descriptive statistics was used to conduct an assessment of all variables, expressing
results in simple percentages and using the central tendency of standard deviation.
The survey found males (63.4 percent) numbered more than females (36.6 percent).
The mode is 1 and shows clearly that more male respondents took part than female
respondents and are more interested in tourism activities. Most of the participants
were within the age bracket of 20-50 years (83.7 percent) while participants above 50
years of age were 10.7 percent and a balance of 5.6 percent did not respond.
Furthermore, majority of respondents 49.3 percent were government employees and
implies that they have regular source of income while 22.1 percent were unemployed.
Those who are self employed accounted for 17.4 percent. Also, the private sector
employees accounted for 11.0 percent and 0.1 percent did not express any view.
Most participants were also well educated (65.8 percent had tertiary education) and
are able to answer the questions and a total of 12.6 and 12.2 percent hold secondary
and primary school certificate respectively while 8.9 percent had no formal education
and needed a form of assistance of interpreting and filling the questionnaires and 0.5
percent did not respond.
Also, a total of 58.9 percent were married and indicates that the married show more
interest than the singles which accounted for 39.1 percent. About 1.6 percent was
widowed while 0.4 percent accounted for participants that did not respond.
The range of income level to ascertain whether it is of significance or not showed that
about 41.1 percent earn above N100, 000 (N = the Nigeria Naira) and are able to
afford some forms of holiday. Further broken down into 48.7 percent earn between
N1 – N100,000 monthly, 25.1 percent earn between N100,001 – N500,000 monthly.
A total of 16.0 percent earn above N500, 000 monthly while 10.2 percent did not
respond.
In a bid to ascertain if respondents attitude will change towards holidaying as a result
of landscaping, respondents were asked to rate their responses from strongly agree to
strongly disagree. As revealed from the literature, attractive tourism products gear

Ayeni, Ebohon and Taki
914
people into making the choice of whether to visit a tourist attraction or not. Results
obtained as revealed in Table 1, show that 46.6 percent agree that people‘s attitude to
tourism will change towards holidaying if landscaping is used in the Nigerian tourist
attractions. About 38.8 percent strongly agree to this notion, while 7.9 percent
disagree, 1.1 percent strongly disagrees and 5.6 percent did not respond. This implies
that a total of 85.40 percent are in support that landscaping will change people‘s
attitude towards tourism and are likely to visit. The mean is 3.12 and the standard
deviation is 1.002.
Table 1: Attitude towards holidaying
Frequency Percent Valid Percent Cumulative
Percent
No response 42 5.6 5.6 5.6
Strongly disagree 8 1.1 1.1 6.7
Disagree 59 7.9 7.9 14.6
Agree 347 46.6 46.6 61.2
Strongly Agree 286 38.8 38.8 100.0
Total 745 100.0 100.0
From the literature, aesthetics appearance is important and most people are willing to
pay for good looking attractions. As such, respondents were asked if they agree or
disagree to this. Table 2 reveals that lack of good landscaping affects people‘s attitude
towards tourism. 44.6 percent agree that the lack of good landscaping explains their
negative attitude towards tourism and 32.1 percent strongly agree. Also 16.5 disagree
while 1.1 percent strongly disagrees and 5.8 percent did not respond, giving a total of
76.7 percent that are in support. The mean is 2.96 and standard deviation is 1.024
Table 2: lack of good Landscaping as Negative attitude to Tourism
Frequency Percent Valid Percent Cumulative
Percent
No response 43 5.8 5.8 5.8
Strongly disagree 8 1.1 1.1 6.8
Disagree 123 16.5 16.5 23.4
Agree 332 44.6 44.6 67.9
Strongly Agree 239 32.1 32.1 100.0
Total 745 100.0 100.0
Landscaping apart from being seen as contributing to the quality of life also help the
tourism industry to thrive. In this regard, respondents were asked to rate their response
on agree or disagree that landscaping is a key element to emerging tourism market. As
revealed in Table 3, respondents‘ opinion show that 56.9 percent agree, 30.3 percent
strongly agree implying a total of 87.2 percent. Also, 6.2 percent disagree, while .9
percent strongly disagrees and 5.6 percent did not respond. The mean is 3.05 and the
standard deviation is .953.
Table 3: Landscaping is a key Element towards emerging Tourism Market
Frequency Percent Valid Percent Cumulative Percent
No response 42 5.6 5.6 5.6
Strongly disagree 7 .9 .9 6.6
Disagree 46 6.2 6.2 12.8
Agree 424 56.9 56.9 69.7
Strongly Agree 226 30.3 30.3 100.0
Total 745 100.0 100.0
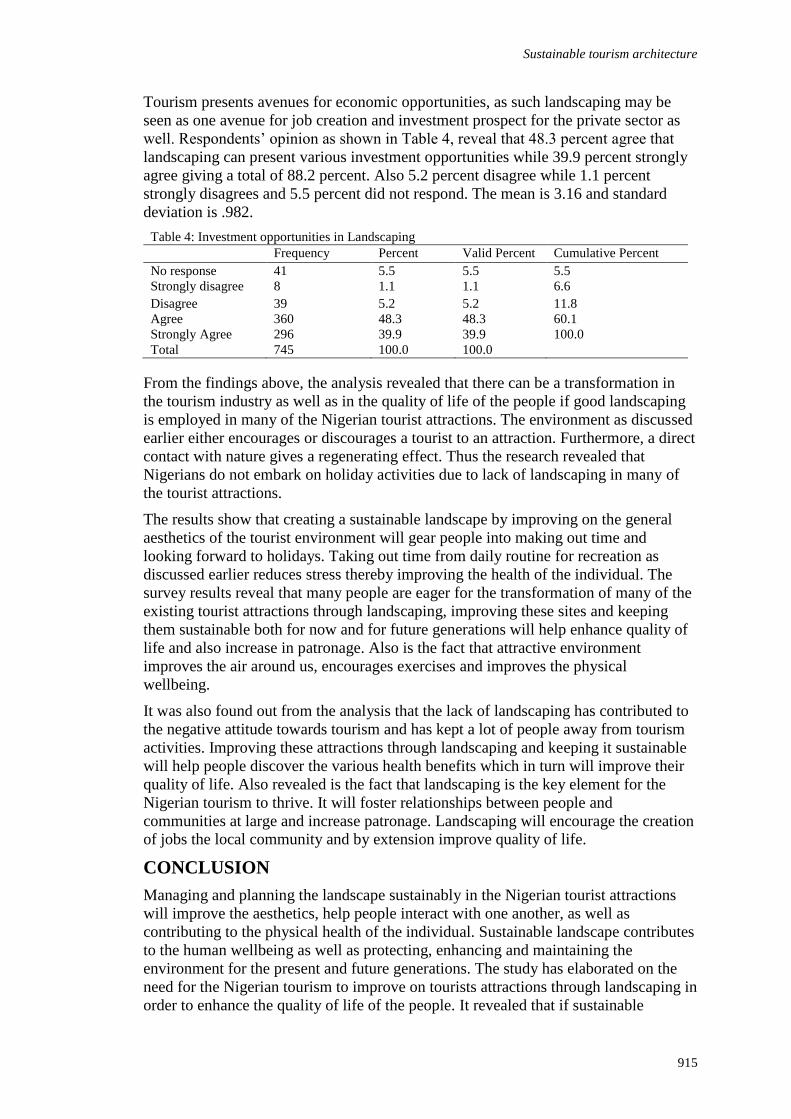
Sustainable tourism architecture
915
Tourism presents avenues for economic opportunities, as such landscaping may be
seen as one avenue for job creation and investment prospect for the private sector as
well. Respondents‘ opinion as shown in Table 4, reveal that 48.3 percent agree that
landscaping can present various investment opportunities while 39.9 percent strongly
agree giving a total of 88.2 percent. Also 5.2 percent disagree while 1.1 percent
strongly disagrees and 5.5 percent did not respond. The mean is 3.16 and standard
deviation is .982.
Table 4: Investment opportunities in Landscaping
Frequency Percent Valid Percent Cumulative Percent
No response 41 5.5 5.5 5.5
Strongly disagree 8 1.1 1.1 6.6
Disagree 39 5.2 5.2 11.8
Agree 360 48.3 48.3 60.1
Strongly Agree 296 39.9 39.9 100.0
Total 745 100.0 100.0
From the findings above, the analysis revealed that there can be a transformation in
the tourism industry as well as in the quality of life of the people if good landscaping
is employed in many of the Nigerian tourist attractions. The environment as discussed
earlier either encourages or discourages a tourist to an attraction. Furthermore, a direct
contact with nature gives a regenerating effect. Thus the research revealed that
Nigerians do not embark on holiday activities due to lack of landscaping in many of
the tourist attractions.
The results show that creating a sustainable landscape by improving on the general
aesthetics of the tourist environment will gear people into making out time and
looking forward to holidays. Taking out time from daily routine for recreation as
discussed earlier reduces stress thereby improving the health of the individual. The
survey results reveal that many people are eager for the transformation of many of the
existing tourist attractions through landscaping, improving these sites and keeping
them sustainable both for now and for future generations will help enhance quality of
life and also increase in patronage. Also is the fact that attractive environment
improves the air around us, encourages exercises and improves the physical
wellbeing.
It was also found out from the analysis that the lack of landscaping has contributed to
the negative attitude towards tourism and has kept a lot of people away from tourism
activities. Improving these attractions through landscaping and keeping it sustainable
will help people discover the various health benefits which in turn will improve their
quality of life. Also revealed is the fact that landscaping is the key element for the
Nigerian tourism to thrive. It will foster relationships between people and
communities at large and increase patronage. Landscaping will encourage the creation
of jobs the local community and by extension improve quality of life.
CONCLUSION
Managing and planning the landscape sustainably in the Nigerian tourist attractions
will improve the aesthetics, help people interact with one another, as well as
contributing to the physical health of the individual. Sustainable landscape contributes
to the human wellbeing as well as protecting, enhancing and maintaining the
environment for the present and future generations. The study has elaborated on the
need for the Nigerian tourism to improve on tourists attractions through landscaping in
order to enhance the quality of life of the people. It revealed that if sustainable

Ayeni, Ebohon and Taki
916
landscape is embarked upon, the attitude of Nigerians towards domestic tourism will
change positively.
REFERENCES
Abraham, A., Sommerhalder, K., and Abel, T. (2010). Landscapes and wellbeing: a Scoping
Study on the Health Promoting Impact of Outdoor Environments. International
Journal of Public Health, 4(1), 59-69.
Adora, C. U. (2010). Managing Tourism in Nigeria: The Security Option. Management
Science and Engineering, 4(1), 14-25.
AMSET. (2007). Report of the Tourism Sustainability Group. Action for More Sustainable
European Tourism. Available on
http://ec.europa.eu/enterprise/newsroom/cf/_getdocument.cfm?doc_id=237 Accessed
on 8/2/11
Andereck, K., and Jurowski, C. (2006). Tourism and Quality of life. In J. Gayle and P. N.
Norma (Eds.), Quality Tourism Experience. Oxford: Butterworth-Heinemann.
Backhaus, N. (2008). Sustainable Development in Contested Landscapes: A landscape Model
for Participation Processes. Available from
http://iasc2008.glos.ac.uk/conference%20papers/papers/B/Backhaus_102702.pdf. .
Accessed on 15/2/11
Bankole, A. S., and Odularu, G. O. (2006). Achieving the Millennium Development Goals:
Issues and Options for the Nigeria's Tourism Industry. PASOS. Revista de Turismo y
Patrimonio Cultural, 4(3), 429-436
Benson, J. F., and Roe, M. H. (2007). Landscape and Sustainability. Abingdon, Oxon:
Routledge.
Bousselot, J., Badeertscher, K., and Roll, M. (2005). Sustainable Landscaping. Colorado:
Colorado State University
Buchanan, R. (2000). Taylor's Master Guide to Landscaping New York: Houghton Mifflin
Harcourt.
Butler, R. W. (1991). Tourism, Environment and Sustainable Development. Environmental
Conservation, 18, 201-209.
Cohen, L., Marion, L., Morrison, K., and Morrison, K. R. B. (2007). Research Methods in
Education. Abigdon.Oxon: Routledge.
CPRE. (2010). Landscape Character Assessment. CPRE FYLDE District Group. Available
from http://www.cprelanlanshire.org.uk/articles/CPRElandscapecharacterassessment-
medlar-with-wesham. Accessed on 1/5/2011.
Dejean-pons, M., and Chaboisseau, F. (2000). Spatial and Landscape Division. Paper
presented at the European Landscape Convention.
Dudson, R. (2010). The What and Why of Sustainable Landscape: An International
Sustainability Council Project promoting sustainable landscapes.
Ebohon, O. J., Ayeni, D. A., and Taki, A. H. (2009). The Need to Explore Sustainable
Tourism for Developmental Growth in Nigeria, Glasgow
Ercan, M. A. (2011). Challenges and Conflicts in achieving Sustainable Communities in
Historic Neighbourhood of Istanbul. Habitat International, 35(2), 295-306.
Felce, D., and Perry, J. (1999). Quality of Life: Its Definition and Measurements. Research in
Developmental Disabilities, 16(1), 51-74.

Sustainable tourism architecture
917
Figueira, A. P. (2001). The Role of Planning in Local and Regional Tourism Development.
Paper presented at the Escola Superior Technologia e Gestao/ IPBeja xxvii Reunion
deEstudios, Regionates Madrid (Espanna) November, 2001.
Gailing, L. (2008). Land Use and Water Management in Sustainable Network Society Paper
for ERSA Congress. 23-27 August 2008: Vrije Universiteit Amsterdam.
Ikein, A. A., Alamieseigha, D. S. P., and Azaiki, S. S. (2008). Oil, Democracy and the
Promise of True Federalism. Maryland: University Press of America.
Inskeep, E. (1987). Environmental Planning for Tourism. Annals of Tourism Research, 14(1),
118-135.
Jafari, J. (2003). Encyclopaedia of Tourism. Abingdon, Oxon: Routledge.
Jiboku, J. O., and Jiboku, P. A. (2010). Harnessing Tourism Potentials in Nigeria for National
Development. Research in National Development, 8(1).
Jim, C. Y., and Chen, W. Y. (2009). Value of Scenic Views: Hedonic Assessment of Private
Housing in Hong Kong. Landscape and Urban Planning, 91(4), 226-234.
Kothari, C. R. (2007). Research Methodology: Methods and Techniques. New Delhi: New
Age International Ltd.
Kreag, G. (2001). The Impacts of Tourism. Minnesota: Sea Grant.
Leitao, A. B. (Ahern, J). Applying Landscape Ecological Concepts and Metrics in Sustainable
Landscape Planning. Landscape and Urban Planning, 59(2), 65-93.
Lenth, R. V. (2001). Some Practical Guidelines for Effective Sample Size Determination.
American Statistician, 55(3), 187-193.
Ling, C., and Dale, A. (2011). Nature, Place and Creative Class: Three Canadian Case
Studies. Landscape and Urban Planning, 99(3-4), 239-247.
Liu, Y. L., Ko, P. F., and Ko, P. F. (2011). A visitor Focused Study of Tourism Attraction in
Taiwan: Empirical Evidences from Outbound Chinese Tourists. Hospitality
Management and Tourism, 2(2), 22-33.
Morais, P., and Camanho, A. S. (2011). Evaluation of Performance of European Cities with
the Aim to promote Quality of Life. Omega, 39(4), 398-409.
Nohl, W. (2011). Sustainable Landscape use and Aesthetics Perception- Preliminary
reflections on Future Landscape. Landscape and Urban Planning, 54(1-4), 223-237.
Nykiel, R. A. (2007). Handbook of Marketing Research Methodologies for Hospitality
Research. New York: The Haworth Hospitality and Tourism Press.
Opdam, P., Steingrover, E., and Rooij, S. (2006). Ecological Networks: A Spatial Concept for
Multi-actor Planning of Sustainable Landscape. Landscape and Urban Planning,
75(3-4), 322-332.
Pacione, M. (2003). Urban Environmental Quality and Human Wellbeing: a Social
Geographical Perspective. Landscape and Urban Planning, 65, 19-30.
Scottish Natural Heritage. (2003). Sustainable Development and the Natural Heritage.
Available on http://www.snh.org.uk. Accessed on 6/2/11.
Selman, P. (2006). Planning at the Landscape Scale. Abigdon, Oxon: Routledge.
Selman, P. (2008). What do we mean by Sustainable Landscapes? E-Journal of Sustainable
Solutions. 4 (2) http://sspp.proquest.com. [Electronic Version],
Shah, M. G., Kale, C. M., and Patki, S. Y. (2002). Building Drawing: With an Integrated
Approach to the Built Environment. New Delhi: Tata-McGraw-Hill Publishing
Company Limited.

Ayeni, Ebohon and Taki
918
Supplementary Planning Guidance. (2004). Landscape. Available on
http://www.npt.gov.uk/PDF/Landscape.pdf. Accessed on 5/2/11.
Swarbrooke, J. (1999). Sustainable Tourism Management. Wallington, Oxon, UK: CABI
Publishing.
Thompson, C. W., Sugiyama, T., Bell, S., Milligton, C., Southwell, K., Roe, J., et al. (2007).
Landscape Quality and Quality of Life. Available from
http://www.openspace.eca.ac.uk accessed on 5/1/11.
Tzanopoulos, J., Kallimanis, A. S., Bella, I., Labrianidis, L., Sgardelis, S., and Pantis, J. D.
(2011). Agricultural Decline and Sustainable Development on Mountain areas in
Greece: Sustainability Assessment of Future Scenario. Land use Policy, 28(3), 585-
593.
Vanderstoep, S. W., and Johnston, D. D. (2009). Research Methods for Everyday Life:
Blending Qualitative and Quantitative Approaches: John Wiley and Sons.
VanDerZanden, A. M., and Cook, T. W. (2010). Sustainable Landscape Management New
Jersey: John Wiley and Sons.
White, D. D. (2006). Visitor Experiences and Transportation Systems in Yosemite National
Park Arizona School of Community Resources and Development, Arizona State
University
World Commission of Environment and Development (WCED, 1987).Our Common Future
Oxford: Oxford University Press.
World Tourism Organisation Tourism Statistics. (2008). Economy Statistic: Tourist Arrivals.
Available from
http://www.nationmaster.com/graph/eco_tou_arr_economy_touristarrivals. Accessed
on 2/5/22011.

Oppong-Danquah, A., Painting, N., Adeyeye, K. and Gidado, K. (2011) The problem of non-
completion of infrastructure projects in Ghana In: Laryea, S., Leiringer, R. and Hughes, W. (Eds)
Procs West Africa Built Environment Research (WABER) Conference, 19-21 July 2011, Accra, Ghana,
919-927.
919
THE PROBLEM OF NON-COMPLETION OF
INFRASTRUCTURE PROJECTS IN GHANA
Andrew Oppong-Danquah1, Noel Painting
2, Kemi Adeyeye
3and Kassim Gidado
4
1 Estate Management Unit of the Ministry of Health and the Ghana Health Service, Ghana
2 Schools of Environment and Technology, University of Brighton, Cockcroft Building, Lewes Road,
Brighton, BN2 4GJ, UK
Many developing countries have identified the need to improve infrastructure as a key
component in meeting their developmental needs. Projects are started with enthusiasm
but often do not end in success being under funded, not completed or completed very
late – or sometimes remain abandoned for many years. The aim of this study is to
identify the causes of failure to satisfactorily delivery infrastructure projects in with
particular focus on Ghana. The research concentrates on Ghana because, since
showing commitment to parliamentary democracy in 1992, members of parliament
and the District Assemblies have all targeted infrastructure provision but often
without clear direction in coordinating and synchronizing developments leading to
duplication of effort and a waste of resources. This paper includes an identification of
practitioners‘ views regarding the constraints faced and major problems leading to
incomplete infrastructure projects. These findings can be used to develop a model
which together with effective project planning can be implemented successfully
within the constraints faced by Ghana and to a large extent the other countries in West
Africa.
Keywords: Ghana, health infrastructure, project non-completion, project planning.
INTRODUCTION
An example of failure in West African infrastructure investments is in the public
health sector in Ghana where the issue of uncompleted projects represents wasted
time, investment and opportunity.
In an attempt to match the health needs with growth of population governments have
felt the need to initiate more health projects such as hospitals, clinics, health centres,
and health training institutions such as those for nurses. They have however failed in
their commitment of ensuring success many of such projects.
According to the Estate Management Unit of the Ghana Health Service (EMU/GHS
Report 2004) the Upper West Region, which is the smallest in terms of population and
the most deprived, had, at the time of our survey, at least five major public health
infrastructural projects mostly at the operational stage which still remain substantially
incomplete notwithstanding that construction started in 1999.

Oppong-Danquah, Painting, Adeyeye and Gidado
920
Gaining a more complete understanding of the causes of these problems and reasons
for projects‘ failure have long been a focus for both academic researchers and
practitioners (Pinto and Mantel, 1990).
The issue of uncompleted public health infrastructural projects in Ghana has varied
causes including finance and other procurement problems and has therefore attracted
the attention of local, national and international stakeholders in the health sector.
International institutions such as the World Bank, the African Development Bank and
other Donor Agencies have either provided funding or technical support for health
infrastructural development in the developing world. The provision of appropriate
guidelines for use of funds and the rules of procedure for effective procurement of
projects in these countries have also been provided by the governments of these
countries and the Banks/Donors for the borrowers or the beneficiary countries in an
effort to ensure that projects initiated get completed with enough funding and
planning. These guidelines are also intended to ensure that funds earmarked for the
project are well spent and that corruption or corrupt practices are either eradicated in
the process or at least reduced to their barest minimum in the development of projects
and yet in spite of these controls and guidance problems remain. Three case studies
were looked at to determine causes of non-completion (projects in the Upper West
Region of Ghana). These causes were used to develop the questionnaire.
CASE STUDY 1- REHABILITATION AND EXPANSION OF
KOFORIDUA CENTRAL HOSPITAL
The agreement for the rehabilitation and expansion of the Koforidua Central Hospital,
a Regional Hospital and therefore a referral hospital, was signed on the 27th
of
September, 1999 between the Ministry of Health (MOH), Ghana and Spain
(IBADESA).
A Turnkey project with a contract sum of $ 30,000.000.00 (Thirty Million US Dollars)
was to be financed through a concessional loan from Spanish Government and an
export credit on OECD Conditions. Before details of the scope of works were agreed
by the parties, the contract sum was reduced to $ 12,000,000 (Amendment No.1 dated
24th
, January 1997). The site was handed over to IBADESA in September, 1998. The
project involved rehabilitation of and new construction of parts of the hospital,
principally the In-Patient Departments and some ancillary services, as well as medical
equipment for those departments.
The budgeted cost of $ 12,000,000 consisted of two components: Construction -$ 6.74
million and Equipment 5.26 million. There were complaints from the end users about
the design which overlooked or did not provide for sluice room, office for nurses,
changing rooms, rest rooms for night officers apart from doctors at some units among
others. Though some blocks were rehabilitated and handed over, signs of roof
leakages, rotten wooden frames, unserviceable louver frames, defaced and broken
wall tiles and seepage of water at the newly constructed mortuary floor are apparent.
Complaints have also been made about the poor quality of equipment supplied and
installed.
CASE STUDY 2 - CONSTRUCTION OF MATERNITY BLOCK
FOR NAMDOM HOSPITAL
The contract was awarded as a Government of Ghana (GoG) Project to a local
contractor in June 1999 with the initial contract sum of ¢ 489,621,480.00 or about US
$55,000 for completion in September 2000. Consultancy services were to be provided

Non-completion of projects
921
by a government owned firm. The user clients were involved from the inception stage
and were part of the discussion on the design, facilities and a number of rooms
required. The Regional Tender Board also discussed and reviewed the draft drawings
and thence awarded the project to the contractor and copied the Regional Health
Directorate.
Work started late and by the end 1999, the contractor could only work to the lintel
level. A certificate needed to be raised before the end of the year as it is in the case of
GOG Projects to ensure payment to the contractor. The first certificate was front
loaded for fear of the funds going to back to the government chest. This was detected
by the Ministry of Finance and considered inappropriate and a team was dispatched to
the region to inspect the project. The team recommended that a certificate to the tune
of works done as at the time totalling ¢84,939,804.90 currently about US $9,000 was
be raised to replace the first one. Payment to the second certificate was effected in
2002.
Due to the change in government in 2000, the works did not progress until 2004 when
a total amount of ¢600,000,000 was raised under Donor Funded Projects, but because
the year was drawing to a close, nothing was done as a new procurement process had
to be followed as a result of the change in the funding source. Local political
observers attribute the situation to the political standing of the contractor who was
initially a staunch member of the previous government but had to ‗cross carpet‘ to join
the current government. The project was re-awarded to the same contractor in the
early part of 2005 and under the 2005 Capital Investment Plan of the MOH/GHS. The
contractor resumed work on site.
CASE STUDY 3 - CONSTRUCTION OF WA DISTRICT HEALTH
MANAGEMENT TEAM (DHMT) OFFICE COMPLEX
In 1999, a committee comprising the Regional Director of Health Services, the
Regional Estate Manager and all functional unit heads in the district discussed the
type and what was required of the project with three consultancy firms. Draft
drawings were provided by the firms for vetting by the committee and finally accepted
by the user clients (MOH) and the Regional Tender Board.
Firms were then asked to cost the project. The DHMT was to cost 1.3 billion cedis and
completed in 9 months (September 1999 – June 2000).
The issues arising from these projects can be summarised as follows:
Table 1: Common problems in uncompleted projects
Problem(s) in projects Koforidua
Hospital
Nandom
Maternity
Block
Wa DHMT
Office
Political Interference Yes Yes
Erratic Flow of Funds Yes Yes Yes
Land disputes Yes
Project not completed within budget Yes Yes Yes
Apathy on the part of contractors/consultants Yes
Over size (floor area) project Yes
Project not meeting technical specification Yes
Project not completed on time Yes Yes Yes
Note: With the exception of ―land issues‖ all of these reasons were identified by Baker, Murphy and
Fisher (1989) in ‗Factors Affecting Project Success‟.

Oppong-Danquah, Painting, Adeyeye and Gidado
922
With the Regional Tender Board as the steering body, the selective method of
tendering was used. The DHMT block was awarded as a GOG Project to a local
contractor. The site however was encumbered by two structures- a drinking bar and a
communication centre. The removal of the structures took 2 months and the contractor
finally mobilized to site in November 1999 as a result not much work was done before
the end of the year, besides the foundation floor.
The first certificate of ¢53,386,046.10 which was raised before the end of the year was
not paid until 2002. Changes in the political situation in Ghana in the year 2000
affected the project as the contractor was believed to be aligned with the previous
government. The project remained at the same stage and has been on the Regional
Capital Investment Plan for years with no further approval.
The questionnaire was piloted (to targeted health managers in Ghana). This was
adapted based on feedback on key issues and adapted questionnaire targeted to
respondents from the Ghana Heath Service (GHS) and Ministry of Health (MOH) -
officials with construction backgrounds as well as professionals in the construction
sector from both private and public institutions with a reasonable number of years of
practical experience. The questionnaire was circulated to forty potential respondents
were and twenty returned; a completion rate of 50%.
Figure 1. the number of respondents and their various professions
Twenty professionals responded of which 12 came from the GHS/MOH whilst the rest
came from other public/private organizations involved in the construction of health
projects. (15 of the respondents came from the public sector whilst 5 came from
private consortia and contracting companies).
Figure 2. Respondents‘ years of experience
Experience of respondents in construction related workplace
0 1 2 3 4 5 6 7 8
0-5 Years 5-10 Years 10-20 Years 20+ Years Years of Experience of Respondents
Nu
mb
er o
f re
spo
nd
ents
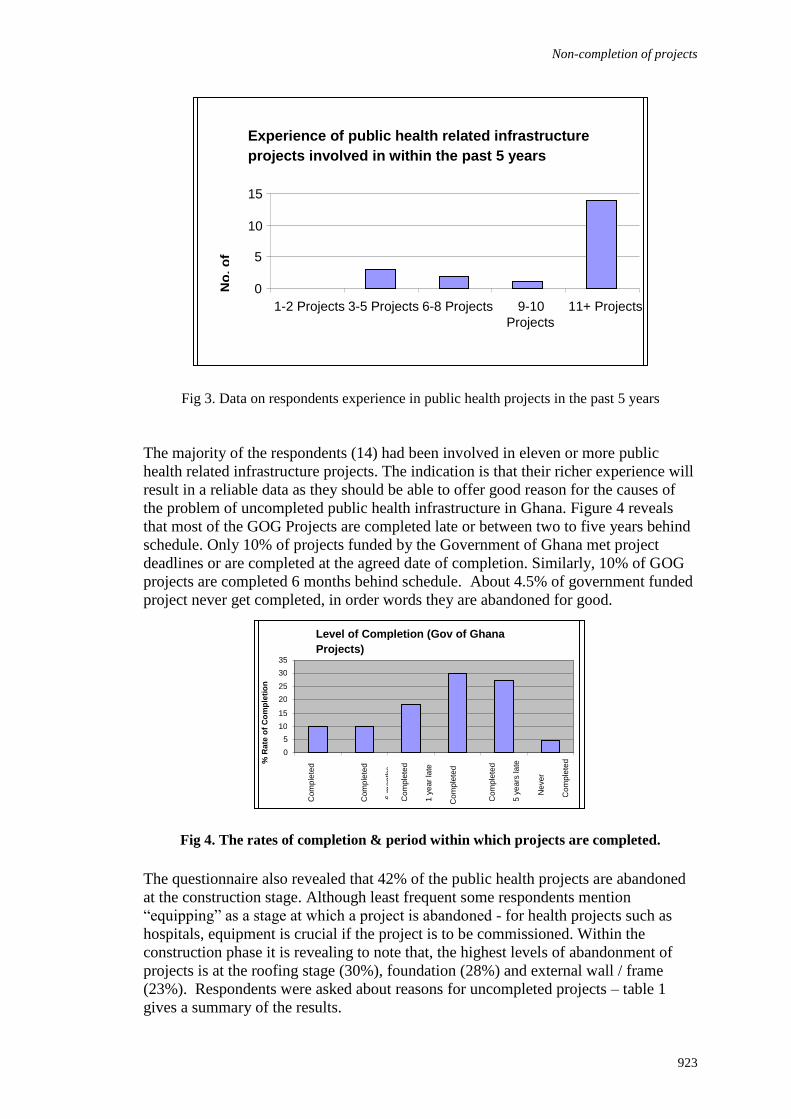
Non-completion of projects
923
Fig 3. Data on respondents experience in public health projects in the past 5 years
The majority of the respondents (14) had been involved in eleven or more public
health related infrastructure projects. The indication is that their richer experience will
result in a reliable data as they should be able to offer good reason for the causes of
the problem of uncompleted public health infrastructure in Ghana. Figure 4 reveals
that most of the GOG Projects are completed late or between two to five years behind
schedule. Only 10% of projects funded by the Government of Ghana met project
deadlines or are completed at the agreed date of completion. Similarly, 10% of GOG
projects are completed 6 months behind schedule. About 4.5% of government funded
project never get completed, in order words they are abandoned for good.
Fig 4. The rates of completion & period within which projects are completed.
The questionnaire also revealed that 42% of the public health projects are abandoned
at the construction stage. Although least frequent some respondents mention
―equipping‖ as a stage at which a project is abandoned - for health projects such as
hospitals, equipment is crucial if the project is to be commissioned. Within the
construction phase it is revealing to note that, the highest levels of abandonment of
projects is at the roofing stage (30%), foundation (28%) and external wall / frame
(23%). Respondents were asked about reasons for uncompleted projects – table 1
gives a summary of the results.
Level of Completion (Gov of Ghana
Projects)
0
5
10
15
20
25
30
35
Com
ple
ted
On
tim
e
Com
ple
ted
6 m
on
ths
Com
ple
ted
1 y
ea
r la
te
Com
ple
ted
2 y
ea
rs la
te
Com
ple
ted
5 y
ea
rs la
te
Neve
r
Com
ple
ted
% R
ate
of
Co
mp
leti
on
Experience of public health related infrastructure
projects involved in within the past 5 years
0
5
10
15
1-2 Projects 3-5 Projects 6-8 Projects 9-10 Projects
11+ Projects
N
o. o
f
Resp
on
den
ts

Oppong-Danquah, Painting, Adeyeye and Gidado
924
Table 1. Reasons for uncompleted projects
Reasons for uncompleted
projects
Never Sometimes Frequently V
Frequently
Always TOTAL Don't
know
SCORE
0 1 2 3 4
Poor brief by client 2 8 8 2
Poor site investigation 3 8 8 1
Complex design 3 6 6 1
Land disputes 3 9 2 1 16 1
Cash flow 5 3 7 5 52
Unsuitable procurement method 4 8 1 10
Conflicts among parties 3 8 8
Termination of contract 3 9 1 11
Political interference 2 10 2 1 17 2
Poor performance by contractors 12 3 2 24
Technical commissioning 3 7 7
Poor monitoring and supervision 1 10 2 4 26
Other-Delayed payment of
interim claims
3 9
The most pronounced causes are cash flow, poor monitoring and supervision, poor
performance by contractors, political interference and land disputes. As expected cash
flow problems occur mostly during construction in the form of delayed payment of
interim claims and erratic flow among others as suggested by some respondents.
The majority of respondents are involved in donor sponsored projects. It is noteworthy
that 38% of Ghana‘s public health infrastructures are donor funded. The Government
of Ghana provides a further 27%, Loans and Grants 19%, District Assembly 10% and
Community Initiated Projects 8% however, the total government contribution could be
substantial if the Local Government (District Assembly) is considered as part of it.
Most of Community Initiated Projects in Ghana eventually become government
funded. These projects are generally poorly planned and the enthusiasm of the
community wanes as a result of apathy on the part of people or the prominent citizens
who normally are the project funders.
Seventy to eighty percent of Donor Funded projects were considered successful with a
considerable number of respondents thinking that they record 90% success.
Mission/NGO Funders also record high rate of success (Very Frequently) like the
Donors with four of the respondents thinking as much as 90% success rate is
attainable. The high rate of success can perhaps be attributed to implementation of
rules and procedures by these funders. The effective implementation of sponsors‘
checks seems to be far higher than in the case of Government Funded projects which
recorded a rate of only 50%.
The opinion of the respondents is that there had been involvement of staff and end
user(s) participation in the post evaluation of completed projects. However, the
majority of the respondents answered ―Sometimes‖ which is not a firm answer and an
indication of the fact that it is not a routine or something consistent with health
projects. The preferred answer to make the situation on the ground more certain and
firm would have been ―Yes‖. Credit may be given to the Estate Management Unit for
the awareness created for staff in project management and contract administration as
indicated in the Procedure Manuals for Capital Projects Investments.
Performance of the local contractors was generally not good. In meeting project
deadlines or completion dates, they were rated as poor. Staff accommodation was
identified as the part most often abandoned indicating that it was not been a priority of
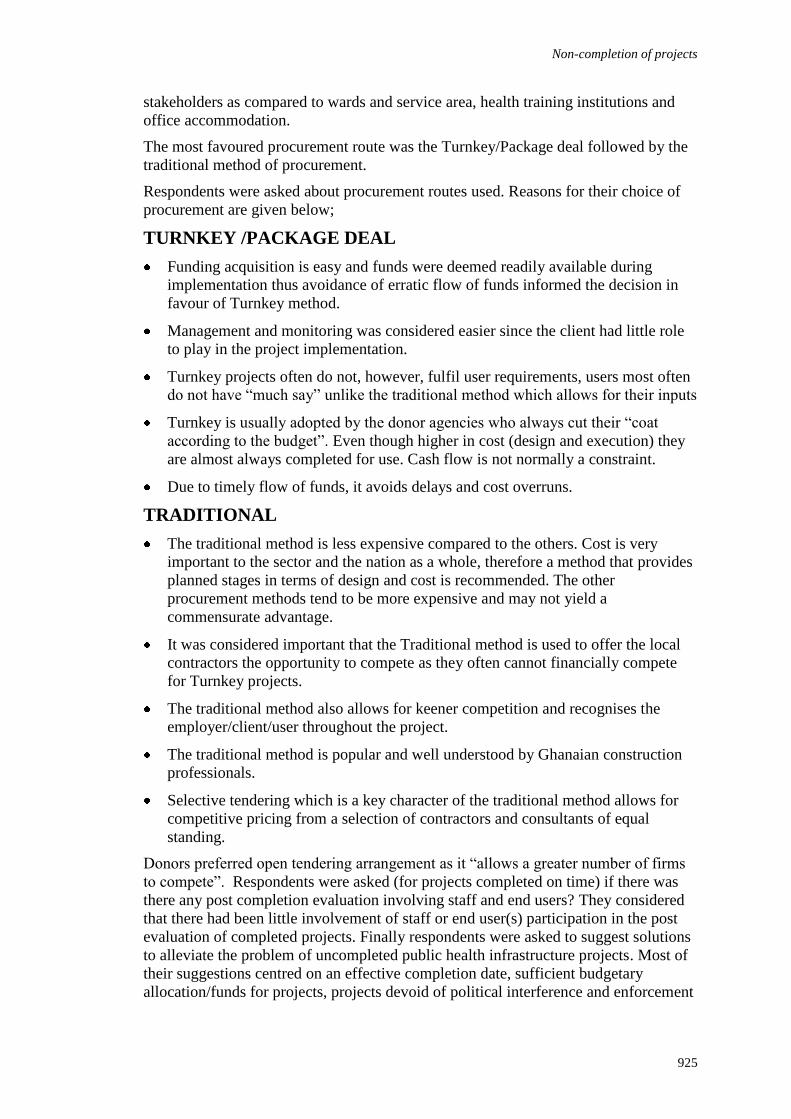
Non-completion of projects
925
stakeholders as compared to wards and service area, health training institutions and
office accommodation.
The most favoured procurement route was the Turnkey/Package deal followed by the
traditional method of procurement.
Respondents were asked about procurement routes used. Reasons for their choice of
procurement are given below;
TURNKEY /PACKAGE DEAL
Funding acquisition is easy and funds were deemed readily available during
implementation thus avoidance of erratic flow of funds informed the decision in
favour of Turnkey method.
Management and monitoring was considered easier since the client had little role
to play in the project implementation.
Turnkey projects often do not, however, fulfil user requirements, users most often
do not have ―much say‖ unlike the traditional method which allows for their inputs
Turnkey is usually adopted by the donor agencies who always cut their ―coat
according to the budget‖. Even though higher in cost (design and execution) they
are almost always completed for use. Cash flow is not normally a constraint.
Due to timely flow of funds, it avoids delays and cost overruns.
TRADITIONAL
The traditional method is less expensive compared to the others. Cost is very
important to the sector and the nation as a whole, therefore a method that provides
planned stages in terms of design and cost is recommended. The other
procurement methods tend to be more expensive and may not yield a
commensurate advantage.
It was considered important that the Traditional method is used to offer the local
contractors the opportunity to compete as they often cannot financially compete
for Turnkey projects.
The traditional method also allows for keener competition and recognises the
employer/client/user throughout the project.
The traditional method is popular and well understood by Ghanaian construction
professionals.
Selective tendering which is a key character of the traditional method allows for
competitive pricing from a selection of contractors and consultants of equal
standing.
Donors preferred open tendering arrangement as it ―allows a greater number of firms
to compete‖. Respondents were asked (for projects completed on time) if there was
there any post completion evaluation involving staff and end users? They considered
that there had been little involvement of staff or end user(s) participation in the post
evaluation of completed projects. Finally respondents were asked to suggest solutions
to alleviate the problem of uncompleted public health infrastructure projects. Most of
their suggestions centred on an effective completion date, sufficient budgetary
allocation/funds for projects, projects devoid of political interference and enforcement

Oppong-Danquah, Painting, Adeyeye and Gidado
926
of contractual obligations among others. Their proposals can be summarized under
broad headings as follows:
PROJECT INITIATION/ PLANNING
proper needs assessment. Appropriate and acceptable design
government to synchronize all development projects and allocate money to
complete few selected projects at a time. District Assemblies to be brought in the
picture for effective coordination of development projects among stakeholders
from inception of projects through to implementation and completion.
adequate consensus building with all stakeholders
scope of works should be clearly defined at the inception stage
Improved budgeting system and encourage long range planning.
ensure a robust project delivery strategy is in place.
phasing out projects with insufficient budget provision
until on-going projects are completed no new ones should be started.
in situations where the planning period overlaps with the execution period, the
necessary adjustments must be made. It must however be ensured that the
unrealistic completion times are not fixed for contracts.
all major projects with a life span of more than two years be reviewed every year,
with a report published providing details of progress for further action.
FUNDING
100% Funding must be acquired /secured or assured before projects start and
advance payments to contractors must be guaranteed by their Bankers.
accurate cost of projects required for realistic budgets.
SELECTION OF CONTRACTORS/CONSULTANTS
only proven contractors and consultants to be engaged, (not on the basis of
political affiliation)
Supervision of works by consultants must be on site and payment of supervision
fees must be based on work done on site by the contractor
Retention of contract sum to be applied and damages for delays must also be
applied (contract terms must be enforced when parties default).
In specialized areas, award of contract should be on the basis of contractor‘s
speciality in the area concerned.
Selective tendering for bigger jobs and open tendering for smaller jobs
PROJECT SUPERVISION/EVALUATION
minimal interference from user clients
effective monitoring of consultants and contractors by user agency as well as
effective supervision by managing consultants.
project approval teams at the national level should visit the regions before the
approval of project estimates

Non-completion of projects
927
management of projects should be lodged at the Regional Health Directorate to
facilitate processing and payment to contractors for work done.
The analyses of the results show the following among others; reasons for
uncompleted public health infrastructure projects, preferred choice of
procurement, and suggestions to improve the situation.
CONCLUSION
Five major reasons for non-completion were identified by practitioners in the
construction of public health infrastructure projects in Ghana:-
1. Cash flow problems
2. Poor monitoring and supervision
3. Poor performance by contractors
4. Political Interference
5. Land disputes.
Efforts to improve the situation should include focusing on the whole project and note
changes as they occur; keeping sight of project objectives throughout the
procurement; ensuring good leadership and accountability ensuring effective
communication and interaction with service providers and other stakeholders and
finally a good understanding of the implications of providers' plans for
implementation.
REFERENCES
Baker B.N., Murphy D.C., Fisher D.(1989) ‗ Factors Affecting Projects Success‘ in
Cleland D.J. & King W.D. Ed. Project Management Handbook. New York.
Van Nostrand 1988: 902-919.
Eastern Regional Health Administration(Regional Report 1999),
EMU/GHS (2004), Estate Management Unit, Upper West – Draft Annual Report,
Ghana
Pinto J.K. & Mantel S.J. (1990) The Causes of Project Failure. IEEE Transactions on
Engineering Management 1990: EM – 37 (4): 269-76.


Nkrumah, J., Koranteng, C. and Safo-Kantanka, K. (2011) The thermal performance of an educational
office building in Ghana In: Laryea, S., Leiringer, R. and Hughes, W. (Eds) Procs West Africa Built
Environment Research (WABER) Conference, 19-21 July 2011, Accra, Ghana, 929-938.
929
THE THERMAL PERFORMANCE OF AN
EDUCATIONAL OFFICE BUILDING IN GHANA
Jimmy Nkrumah1, Christian Koranteng
2 and Kojo Safo-Kantanka
3
1, 3 Development Office, Kwame Nkrumah University of Science and Technology, Kumasi, Ghana
2Department of Architecture, Kwame Nkrumah University of Science and Technology, Kumasi, Ghana
The thermal performance of an educational office building which exhibits sustainable
design principles of passive architecture (emphasis on the use of natural ventilation)
was studied. The building has individual cell and open-plan office spaces with
different orientation and ventilation possibilities (cross, one-sided and borrowed
ventilation). Data loggers were installed to monitor the environmental conditions
existing in the building during the rainy season. The evaluated data showed that the
indoor temperatures were comfortable (mean of 25°C), the relative humidity values
were mostly high (80 - 85%) and the dew point temperature (22°C) was found to be
close to the recommended minimum comfort temperature. Moreover, the enclosed
corridor space was found to be warmer than the adjacent office spaces during the day
time. The use of cool night air as a passive cooling strategy is recommended.
Preference for office types with ventilation possibilities could not be statistically
recommended since all the evaluated thermal values showed insignificant deviations.
Keywords: environment, Ghana, natural ventilation, relative humidity, thermal
performance.
INTRODUCTION
A building which is able to provide comfort and satisfaction to its occupants with
minimum use of energy is said to be efficient. The prime aim of current research has
centred on energy efficiency, user behaviour and thermal comfort (Szokolay, 2004).
The human body has a constant temperature of about 37°C and through the processes
of physiological and behavioural strategies, tolerance to a range of thermal conditions
is improved (Taylor, 2006). A variation of the body temperature by less than or more
than 2°C leads to either hypothermia (35°C) or hyperthermia (39°C) with the
possibility of death at a reduction of about 10°C or an elevation of 5°C (Bessoudo,
2008). In Ghana, where outdoor temperatures can reach as high as 37°C, designers
must make sure that buildings are comfortable, especially in naturally ventilated types,
where the indoor and outdoor temperatures tend to balance each other. With the
adoption of sustainable design recommendations for passive architecture, a good
indoor thermal condition and air quality can be achieved (Alamdari, 1994). Generally,
naturally ventilated and mixed-mode thermal control buildings have a high user
acceptance and use less energy, but their effectiveness depends on prevailing outdoor
conditions (wind velocity and temperature). In favorable climates, the application of
3

Nkrumah, Koranteng and Safo-Kantanka
930
natural ventilation has led to a low total energy use of 10 – 30% when compared to
air-conditioned buildings (Walker, 2010).
Ghana is characterized by a favorable climate during the rainy season (June –
September). During this period, the mean outdoor temperature is about 26°C but
relative humidity values are rather high (above 80%). Generally, for thermal comfort
in spaces, an acceptable range of temperature and relative humidity values needs to be
achieved. Ferstl (2005) suggests 22 – 26°C and 30 - 80% relative humidity values.
The standard of building biology testing methods (SBM, 2008) suggests 30 to 70%
relative humidity to be comfortable. Koranteng and Mahdavi (2010) advocate 23 –
29°C for 90% acceptability based on calculations of a long term study on thermal
comfort and an approach after Szokolay (2004). Further, a relative humidity of 30 –
80% is recommended. Fischer et al. (2008) suggest a range of 50 – 70% of relative
humidity to be comfortable. The danger of higher humidities in Ghana is the
condensation on and in building materials which serves as a source of germs and
odour. Generally, the growth of mould is accelerated when humidity increases
(Fischer et al., 2008). According to Klein and Schlenger (2008), high humidities
restrict evaporation from the skin and in respiration, and thus kerb the dissipation
mechanism as experienced in Ghana, especially during the rainy season where
humidity values of above 90% are recorded.
The human perception with regard to air velocity has been summarized by Szokolay
(2004). An air velocity of less than 0.1 m.s-1
is perceived as stuffy, 0.1 – 0.2 m.s-1
as
unnoticed, 0.2 – 0.5 m.s-1
as pleasant, 0.5 – 1.0 m.s-1
as awareness, 1 – 1.5 m.s-1
as
draughty and over 1.5 m.s-1
as annoying. The influence of high air velocities in humid
conditions can be welcoming since it plays an important role in the evaporative
cooling potential of the skin. Moreover, sustainable design principles of orientation,
building form, window sizes, air change rates and shading cannot be over-emphasised,
especially in naturally ventilated buildings.
The present paper investigates the temperature, dew point and relative humidity values
in an educational office building during the moderate period (rainy season) of the year
in Ghana. Here, lessons on preference, based on the thermal conditions of the different
office spaces (individual cell, open-plan) and on the ventilation possibilities (cross,
one-sided and borrowed) are the focus of the study. Indoor sensors were used to
record the thermal conditions and an evaluation exercise was conducted afterwards.
RESEARCH METHOD
To effectively study the thermal performance of naturally ventilated office buildings
during the rainy season, the thermal conditions existing in an educational office
building with characteristics of sustainable design principles were observed. The
chosen building is the newly constructed studio (architectural students drawing spaces
and offices) block of the College of Architecture and Planning, KNUST, Kumasi,
capital of the Ashanti Region in Ghana. It is representative of low-rise educational
buildings being constructed in Ghana (see Fig. 1 and 2). Moreover, aspects of
sustainable design principles (which are often neglected) of orientation, form,
ventilation and shading have been employed, which makes the building worthy of
studying.
The naturally ventilated building with an area of 2500m² is oriented towards the north,
has three floors and a sub basement. The offices are mostly of a single occupancy type
with few open plan and multiple occupancy spaces on the third and fourth floors. The

Thermal performance
931
ground floor and sub basement are used by students as studio spaces. The windows
have been recessed on the main facades whereas only few are located on the east and
west sides, serving the utility spaces. The corridor type of arrangement of the single
cell offices means that the corridor needs artificial lighting and cross ventilation
cannot be fully utilised (see Fig. 3). High level louvre blade windows are used on both
sides of the office walls to support privacy and comfort.
Fig.1: View of the building at CAP, KNUST
Fig.2: Schematic floor plan of the building with monitored spaces
The window to wall ratio on the main facade is 0.40 and the rectangular building form
has an aspect ratio of 1:3.20.
Indoor temperature, relative humidity and dew point sensors (hobos) were installed in
a number of offices (single and open plan, see Fig. 2). Further, outdoor data loggers
with a cover protecting them from rain were used to record the external environmental
conditions (temperature, relative humidity and dew point). Since the building is
naturally ventilated, the need to monitor the prevailing outdoor conditions was
paramount. The data was recorded every 10 minutes during the rainy season (July to
September).
Fig.3: Corridor showing high level windows of the building
Table 1 shows the accuracy of the sensors. The measured data were analysed in spread
sheets and the various mean monthly values evaluated and graphed.
Table 1: Accuracy of the hobo sensors
Sensor Range Error
Air temperature -20 to 70 oC ± 0.4
oC
Relative humidity 5 to 95 % ± 3%
Furthermore, to evaluate the window to wall ratios, air velocities and volumetric flow
rates, recommended values and equations were used. Equation 1 shows the calculation

Nkrumah, Koranteng and Safo-Kantanka
932
of the air change rates (ACH) with minimum recommendations of 30m³/h. person and
50m³/h. person for individual cell and open-plan office spaces (Klein and Schlenger,
2008). The estimation of the air velocities for cross ventilated spaces was based on
Proeglhof (2004), (Equation 2). The assessment of the room depth for naturally
ventilated buildings (for one-sided ventilation, Equation 3 and for cross ventilated
spaces, Equation 4) was based on Klein and Schlenger (2008). Recommendation on
the form aspect ratio (rectangular buildings to be 1:1.75) was based on previous work
of Koranteng and Abaitey (2010). Finally, a general value for window to wall ratio
(0.5) for appreciable ventilation was applied. The employed equations are general
recommendations without correction factors for the Ghanaian context. There is the
need for research in Ghana to proof the relevance and effectiveness of architectural
design recommendations.
ACH = Ų/V [h-1
] Equation 1
Where ACH is number of air change rates, Ų is volumetric air flow rate [m³/h. person] and V is volume
of space in m³.
V = (ACH + 3.43)/63.1 [ms.-1
] Equation 2
Where V is air velocity and ACH is air change rate.
D = 2.50. h [m]
D = 5.0. h [m]
Equation 3 (one-sided ventilation)
Equation 4 (cross ventilation)
Here, D implies the room depth and h is the floor height.
The air change rates, air velocities in the spaces, assessment of room depth and form
aspect ratios of the buildings were tabulated and compared with the design
recommendations.
RESULTS
The mean monthly hourly values recorded from the offices, namely, individual cells
oriented towards the north and south (named north or south), the corridor, the open-
plan (named open) spaces and the outdoor values are illustrated.
Fig. 4 shows the mean monthly hourly temperature values during the working hours
(8-17 hours) and Fig. 5 illustrates the mean monthly temperature values for the
evening and night time. The mean monthly hourly relative humidity values during and
after the working time is demonstrated in Fig. 6 and 7. Furthermore, Fig. 8 and 9 show
the dew point values (mean monthly) during the working hours and for the evening
and night time. The mean monthly thermal values (temperature, relative humidity and
dew point) for the individual cell offices oriented towards the north are illustrated in
Fig. 10. The same thermal values for the corridor, individual cells oriented towards the
south, and the open-plan offices are shown in Fig. 11, 12 and 13. Table 2 shows the
results of the evaluation of air flow rates and window area per office space.
Fig.4: Mean monthly hourly temperature values during the working hours of individual cells (north and
south orientation) and open-plan offices
Tem
pe
ratu
re
[°C
]
Time [hour]
232425262728
8 - 9 9 -10
10 -11
11 -12
12 -13
13 -14
14 -15
15 -16
16 -17
Outdoor
North
Corridor

Thermal performance
933
Fig.5: Mean monthly hourly temperature values during the evening and night hours of individual cells
(north and south orientation) and open-plan offices
Fig.6: Mean monthly hourly relative humidity values during the working hours of individual cells
(north and south orientation) and open-plan offices
Fig.7: Mean monthly hourly relative humidity values during the evening and night hours of individual
cells (north and south orientation) and open-plan offices
Fig.8: Mean monthly hourly dew point values during the working hours of individual cells (north and
south orientation) and open-plan offices
Fig.9: Mean monthly hourly dew point values during the evening and night hours of individual cells
(north and south orientation) and open-plan offices

Nkrumah, Koranteng and Safo-Kantanka
934
Fig.10: Mean monthly hourly thermal values of an individual cell office oriented towards the north (T:
Temperature, DP: Dew point and RH: Relative humidity)
Fig.11: Mean monthly hourly thermal values of the corridor
(T: Temperature, DP: Dew point and RH: Relative humidity)
Fig.12: Mean monthly hourly thermal values of an individual cell office oriented towards the south (T:
Temperature, DP: Dew point and RH: Relative humidity)
Fig.13: Mean monthly hourly thermal values of the open-plan office
(T: Temperature, DP: Dew point and RH: Relative humidity)
Table 2: Output data on air flow rates and window area
Parameter Individual cell office
(area = 5 m²)
Open-plan office
(area = 80 m²)
Air change rate, ACH [h-1
] 2.40 2.50
Air velocity, V [m.s-1
] 0.10 0.10
Air velocity, V (pleasant) [m.s-1
] 0.50 0.50
Air change rate, ACH (pleasant) [h-1
] 0.4 4
Volumetric air flow rate, Ų [m³.h. person-1
] 30.0 50.0
Occupancy 1.00 10.0
Window area, north façade [m²] 2.20 8.00
Window area per façade required [m²] 2.75 10.0
Window area, corridor-walls [m²] 1.10 8.00
The building depth of 12.50m and depth of individual cell offices (2.50m) fulfils the
recommended values for cross and one-sided ventilation buildings (Equations 3 and

Thermal performance
935
4). However, the aspect ratio of 1:3.20 is more than the recommended value of 1:1.75
for rectangular buildings (Koranteng and Abaitey, 2010).
DISCUSSION
The outdoor mean monthly hourly temperature value rises from 24°C in the morning
to a peak of about 28°C during the working hours (Fig. 4). At 8 in the morning, all the
temperature values of the monitored spaces are nearly the same (24°C). As the
outdoor temperature rises with increasing solar radiation, the indoor temperature also
increases. The individual office cells show a slightly higher temperature (northern and
southern oriented) than the open-plan space (Fig. 2) but with a standard deviation of
0.07. Here, preference of office and ventilation type over each other cannot be
recommended. The maximum indoor temperature of about 27°C could be said to be
comfortable for all the spaces (Koranteng and Mahdavi (2010, studies based on
Fanger‘s percentage of dissatisfied persons)). Interestingly, the corridor shows a lower
temperature value between the hours of 10 am and 5 pm. The cool air at the enclosed
corridor resulted from the low air change rates. This characteristic has also been
observed in compact buildings by Lechner (2001). The advantage in compact building
forms is that they gain less heat during the day but loose less heat at night. To make
good use of the cool air in the corridor, workspace could be located away from the
external facades. However, corridors could be noisy and impair concentration of
workers in office buildings.
In Fig. 5, a fall in all the temperature values (evening and night hours) is
demonstrated. The outdoor temperature reduces, reaching the corridor levels around
midnight and continues to fall to about 23.5°C. At this level, the outdoor air is cooler
than that of the corridor (ca. 1°C temperature difference), northern and open office
spaces, but slightly warmer than the individual cell offices oriented towards the south.
The high temperature in the southern individual cells could be linked to the exposed
external walls, absorbing much solar radiation during the day. The standard deviation
of the cool to the warm offices is low (0.02) and the prevailing indoor temperatures
are all in the recommended thermal comfort range. The cooler outdoor air from 2 am
onwards has a passive cooling potential when effectively used. This could be
combined with thermal mass to improve the thermal performance and energy use of
buildings (Mahdavi and Orehounig (2009) and Koranteng (2010)).
The plotted relative humidity values during the working hours (8 am to 5 pm) showed
lower outdoor values than the indoor spaces (Fig. 6). During the mornings, the relative
humidity difference was about 2%, which increased to about 7% at 3 pm. High values
(above 70%) are recorded for the corridor, followed by the open-plan and the
individual cells (southern and northern) but with a difference of less than 3%.
Moreover, the values exceed 80% from 8 am to 12 noon. These values raise severe
concerns, since high humidity levels result in inefficient evaporative cooling of the
skin which leads to discomfort. In addition, odours and ill-health symptoms are part of
the concern with high humidity values (SBM, 2008). However, values of 70 to 80%
fall within the recommendations on relative humidity (Ferstl (2005), and Koranteng
and Mahdavi (2010)). Furthermore, monitoring of high humidity values above 75% is
recommended, since latent loads of occupants could result in an increase in relative
humidity (58 – 85 g.h-1
per person at temperatures of 24 to 28°C), (Fischer et al.
(2008)).
The demonstration of the relative humidity values during the evening and night hours
(Fig. 7) raises extreme concern. The degree of the concern (humidity and temperature
Nkrumah, Koranteng and Safo-Kantanka
936
discomfort) is based on the standard of building biology (SBM, 2008). After 19 hours,
the recorded relative humidity data exceed the boundary of the recommendation value
of 80%. From midnight to 9 am, values of 85 to 88% were recorded (mean corridor
value of 84%). The most important factor accompanying high relative humidity values
is the dew point temperature. Moisture will be visible when indoor temperature falls
below the dew point. In Fig. 8, the highest dew point temperature was recorded in the
individual cell office towards the south, which was followed by the open-plan space
and the individual cell towards the north, and the corridor space. The standard
deviation ranges from 0.05 to 0.08 which illustrates the closeness of the values.
Besides, the mean dew point temperature of 21.4°C is just below the minimum
recommended temperature for comfort (23°C) (Koranteng and Mahdavi (2010). The
pattern of the dew point temperature was similar during the evening and the night
hours (Fig. 9). A mean temperature value of 21.5°C and a standard deviation of 0.20
to 0.21was recorded.
This clearly shows the difficulty involved (moisture control) in designing healthy and
efficient buildings in warm and humid environments. Further, at a temperature range
of 0 to 50°C, an accelerated growth rate of 15 to 30% of fungal spores (weekly growth
rate of 10³ - 106 of spores/m³ air) has been observed (Fischer et al., 2008). The
proliferation of microorganisms in buildings affects indoor air quality, creates
hazardous health conditions for the occupants and contributes to the deterioration of
building components (Morse, 2009).
In Fig. 10 – 13, the thermal conditions in the spaces have been demonstrated. The
mean temperature (24.7 to 24.9°C), relative humidity (81.5 to 82.2%) and dew point
(21.5 to 21.6°C) values calculated showed insignificant differences and therefore no
preference of office space and ventilation type over the other was given. The
maximum temperature values recorded ranged from 25.9 to 26.8°C. Also, the
maximum relative humidity values ranged from 85 to 88%. The dew point
temperature had a peak of 21.9°C. The maximum temperatures were recorded at 3 pm,
this time of day also showed the minimum relative humidity values (Fig. 10 – 13).
The main concern are definitely the high relative humidity levels and the dew points
leading to problems associated with mould. Persistent moisture leads to rot, corrosion,
and other forms of deterioration. Also, the reduction of thermal resistance and a
decrease in the strength and or stiffness of materials have been observed. Furthermore,
insect infestation through invisible mites, cockroaches and ants are a result of
moisture related issues (Morse, 2009).
The evaluation of the air flow rates (Table 2) showed that due to the high relative
humidity values, a high air change rate would be needed to achieve a pleasant (air
velocity of 0.5 m.s-1
) indoor climate. Whilst the window area required per office space
was 0.55 m² and 2 m² less on the main facades for the individual cell and open-plan
office spaces, that of the corridor would need to be increased by 1.65 m² (individual
cell offices), (Table 2). A minimum window to wall ratio of 0.5 is recommended in
passive designs to assist in the effective use of natural ventilation, which would help
to avoid mildew.
To control and avoid mildew, the use of non-porous building materials and sustainable
design principles are recommended. The installation and use of fans would help to
promote evaporative cooling of the skin and should be a priority in all office
buildings, especially in naturally ventilated types, since the effect would be thermal
sensation reduction of air temperature values of 2 – 3°C (Hyde, 2000).

Thermal performance
937
CONCLUSION
To effectively study the building performance of naturally ventilated office buildings
during the rainy season, the thermal environment prevailing in an educational office
building with attributes of sustainable design was monitored. The results pertaining to
the different office types, ventilation possibilities and orientation showed that whilst
the temperature values (mean of ca. 25°C) were in the recommended comfort range,
the relative humidity levels were rather high (above 80%). The associated dew point
temperatures were also high (very close to the minimum comfort temperature of
23°C). The danger is the growth of mildew, damage to building construction and
health problems. Further, the thermal conditions could not justify one office type over
the other since the recorded values showed minor deviations. However, the corridor
space was found to be cooler during the day time hours but warmer at night. The
consequent use of sustainable building design principles could lead to a better thermal
environment.
REFERENCES
Alamdari, F. (1994) ―Applications of CFD in the Built Environment‖ Microclimate Centre,
BSRIA, Bracknell, England.
Bessoudo, M. (2008) Building Facades and Thermal Comfort: The Impact of Climate, Solar
Radiation, and Glazing on the Indoor Thermal Environment, Verlag Dr. Mueller,
U.K.2
Ferstl, K. (2005) Fundamentals of Climatically Appropriate Building and Relevant Design
Principles, In: Tropical Architecture by Lauber W., First Edition, Prestel Verlag,
Munich, Germany.
Fischer, H., Freymuth, H., Haeupl, P., Homann, M., Jeninsch, R., Richter, E., and Stoehrer,
M. (2008) Theory of Building Physics, Vieweg and Taubner Verlag, Germany.
Hyde, R. (2000) Climate Responsive Design, First Edition, E & FN Spon, United Kingdom.
Klein, O. and Schlenger, J. (2008) Basics: Room Conditioning, Birkhaeuser Verlag, Berlin.
Koranteng, C. and Abaitey, G. E. (2010) ―The Effects of Form and Orientation on Energy
Performance of Residential Buildings in Ghana‖, Journal of Science and Technology,
Ghana.
Koranteng, C. (2010) ―The Energy Performance of Office Buildings in Ghana‖, Journal of
Science and Technology, Ghana.
Koranteng, C. and Mahdavi, A. (2010) ―An inquiry into the thermal performance of five
office buildings in Ghana‖, 10th Rehva World Congress, Sustainable Energy Use in
Buildings, CLIMA 2010, Antalya, Turkey, May 9 – 12, 2010.
Lechner, N. (2001) Heating, Cooling, Lighting: Design Methods for Architects, Second
Edition, John Wiley & Sons, Inc., New York, USA.
Mahdavi, A. and Orehounig, K. (2009) ―Building Energy Use via Intelligent Passive
Cooling‖, 6te Internationale Energiewirtschaft, TU Wien, IEWT 2009.
Morse, R. (2009) Indoor Air Quality and Mold Prevention of the Building Envelope,
(available at www.wbdg.org/resources/env_iaq.php).
Pröglhof, C. (2004). „Aspekte der natürlichen Fensterlüftung – eine Fallstudie‖, Department
of Building Physics and Building Ecology, TU Wien.
Standard of Building Biology Testing Methods (SBM) (2008) Evaluation Guidelines,
(available at www.baubiologie.ca).

Nkrumah, Koranteng and Safo-Kantanka
938
Szokolay, S. (2004) Introduction to Architectural Science: The Basis of Sustainable Design,
First Edition, Architectural Press, Oxford, UK.
Taylor, N. (2006) ―Challenges to Temperature Regulation When Working in Hot
Environments‖, Industrial Health 2006, 44: 331 - 344.
Walker, A. (2010) Natural Ventilation, (available
www.wbdg.org/resources/naturalventilation.php).

Baffour Awuah et al ( (2011) Urban land use planning in Ghana: a policy input discussion In: Laryea,
S., Leiringer, R. and Hughes, W. (Eds) Procs West Africa Built Environment Research (WABER)
Conference, 19-21 July 2011, Accra, Ghana, 939-952.
939
URBAN LAND USE PLANNING IN GHANA: A POLICY
INPUT DISCUSSION
Kwasi Gyau Baffour Awuah1, Felix Hammond
2, Colin Booth
3 and Jessica
Lamond4
School of Technology, University of Wolverhampton, Wolverhampton, WV1 1LY, UK
While the weakness of extant urban land use planning system in Ghana is not in doubt
it is uncertain whether current planning reforms could address the fundamental issues
that underpin the ailing planning system. This work as part of an ongoing study on
evaluation of the economic justification of sub-Saharan Africa urban land use
planning systems interrogates the planning regime in Ghana and the outlined reform
package through a critique of the relevant literature. The primary aim is to provide
input into current efforts in the country to devise effective and efficient urban land use
planning model. The work establishes that while some of the causes of the problem
such as high cost of compliance of planning regulations and inadequate knowledge of
relevance of planning and its regulations appear obvious, their magnitude and
conceptual explanations of the problem remain unresolved. To achieve a befitting
planning model, conceptual understanding of the problem and knowledge of the
magnitude of the causes such as planning regulation compliance cost are imperative.
The work, therefore, outlines a conceptual explanation to the problem based on
insights of the human action theory and identifies that the planning regime appears to
lack incentives. Consequently, it is concluded that a quantitative cost and benefits of
the extant planning regime is vital to the success of the planning reforms.
Keywords: Ghana, human action, urban land use planning system.
INTRODUCTION
The significance of urban land use planning (ULUP) as a central tool for addressing
development imperatives such as rapid urbanisation, climate change and resource
depletion in the world today is widely recognised (cf. Watson, 2009; Seto and
Shephard, 2009). Despite this recognition, scepticism has been expressed over
planning regimes particularly those of the developing world regarding their capability
to deal with these imperatives and promote socio-economic development due to their
underlying weakness (Payne and Majale, 2004; Kironde, 2006; UN-Habitat, 2009).
In Ghana the urban land use planning system in operation has come under severe
criticism regarding its weakness and ineffectiveness (Government of Ghana, 2007;
GIA, 2009). This weakness of the planning regime is manifested in the country‘s
deplorable urban environment which is characterised by massive disregard of planning
laws, co-location of first class settlements and shanties, traffic congestion and poor
infrastructure among others. Hammond (2006), for example, estimates that 80% of

Baffour Awuah et al.
940
developments in Ghana are not covered by requisite building permits. Findings from
surveys of government residential areas in Accra by Ghana‘s Lands Commission in
2006 also established that unauthorised land use conversions in prime areas like East
Legon, Airport West and Achimota Forest residential areas were 20%, 24% and 20%
respectively (cf. Baffour Awuah, 2007, 2010).
Following the emergence of land policy and development, and resource access and
management in development dialogue among governments and the donor community
(Toulmin et al., 2002; Hammond and Adarkwa, 2010), Government of Ghana in 2003
embarked on land tenure reforms (cf. Larbi et al., 2004). As part of this land tenure
reform known as the Land Administration Project (LAP), a Land Use Planning and
Management Project (LUMP) was initiated in 2007 to also revise the planning regime
in the country. The envisaged outcome of the revision which is currently ongoing is to
devise an appropriate planning model to support meaningful socio-economic
development of the country (Government of Ghana, 2007, 2009). However, it appears
doubtful whether the urban land use planning and management reform package will
address the fundamental issues that confront the extant planning regime. This work,
therefore, as part of ongoing study on evaluation of economic justification of sub
Saharan Africa urban land use planning systems (SSA-ULUPS) interrogates through a
critique of the relevant literature the extant planning regime and the reform package.
The primary aim is to contribute to the design of an appropriate planning model for
Ghana in its quest for socio-economic development. It is argued that the ongoing
reforms must be guided by conceptual understanding of the problem that confronts the
existing planning regime to ensure the desired outcome. The work is thus organised in
six sections. Section one gives an introduction to the work and how it has been
organised and approached. Sections two to four critique the relevant literature on the
country‘s planning regime. Section two examines evolution and nature of ULUP
overtime and to date in the country while Section three details the manifestations of
the extant planning regime and causes of its weakness. In Section four the work
critiques the on-going planning reform package to rescue the ailing planning regime.
Based on critique of the literature, Section five devises a conceptual view/framework
based on insights from the human action theory to analyse and provide a conceptual
understanding of the state of the planning regime dwelling on developers/property
owners as unit of analysis and factors such as knowledge of planning regulations and
its costs and benefits for the analysis. To the foregoing, the work then draws a
conclusion in Section six.
EVOLUTION AND NATURE OF ULUP IN GHANA
The nature and practice of urban land use planning in Ghana have evolved overtime to
their current status. Prior to the advent of colonialism, there existed some form of
planning which was used to manage settlements by traditional authorities (Domfeh,
2001). Findings from archaeological and others studies, for example, show that
settlement planning among the Akans, the largest tribe in Ghana dates back to 3, 500
years or more ago (Meyerowitz, 1951; Wilks, 1959; Effah-Gyamfi,1975; Farrar,
1996; see further Baffour Awuah et al., 2010).
The nature of planning during this period, though it may have differed among the
various communities, was such that it was undertaken by traditional leaders on behalf
of their people as political and spiritual leaders. However, this was undertaken in
consultation with community members and in recognition of their socio-economic
needs. Barbot (1732), describing the seventeenth century coastal Akan settlements

Urban land use planning
941
disclosed that developments were in the form of many crooked and irregular lanes,
which ended up at a wide open space at the centres of the settlements. The open
spaces were used as market places. The developments which comprised of sub-
divided dense compounds and occupied by related lineages were also clustered with
small lanes and streets in between them. The rationale for such spatial configuration
was to protect the inhabitants from external aggression and ensure expeditious
organisation against such aggressions. Besides, the open spaces which were at the
centres of the settlements were used as market places and meeting grounds for
deliberation on community issues. This ensured equal commuting distance among
community members. Related spatial configuration also pertained among the Bonos
and Asantes of the Akan tribe (cf. Meyerowitz, 1951; Wilks, 1959; Effah-Gyamfi,
1975; Farrar, 1996).
It has been argued particularly by evolutionary land tenure theorists that this system of
settlement management regime would have evolved into an appropriate design
capable of dealing with the ongoing development imperatives (cf. Hammond, 2006;
Hammond and Adarkwa, 2010). However, this perceived evolutionary arrangement
did not materialise due to colonial intervention. Therefore, following colonialism at
the turn of the nineteenth century, planning arrangement based on Western European
requirements was cobbled onto the country by Western Europeans in particular the
British (cf. Afrane, 1993; Gambrah, 1994; Konadu-Agyemang, 1998).
This new planning arrangement begun as a limited colonial government activity
devoted to the passage of legislations, preparation of planning schemes and building
of infrastructure (Afrane, 1993; Domfeh, 2001; Baffour Awuah et al., 2010). Perhaps
the first of such legislations is the Towns Ordinance (1892) which is described as the
genesis of formal planning in Ghana (Gambrah, 1994). Subsequently, in the 1900s and
1920s a number of regulations on creation of good sanitary conditions, prevention of
diseases, minimum plot sizes and alignment and regulation of streets and so on were
enacted (Konadu Agyemang, 1998). The Town Planning Ordinance (1925), for
instance, was passed and health boards established to ensure healthy environments
(Gambrah, 1994; Domfeh, 2001). Similarly, records at Ghana‘s Town and Country
Planning Department indicate that in 1920 and 1927 during Governor Gordon
Guggisberg‘s era some planning schemes were prepared and implemented in the two
largest cities in Ghana; Accra and Kumasi.
Similar to other sub-Saharan African countries, and unlike planning that predated
colonialism, the motive of the colonial planning apparatus was to secure the health of
colonial administrators and promote the rationale for colonialism of exploiting the
resources of Africa (Konadu-Agyemang, 1998; Njoh, 2009; Baffour Awuah et al.,
2010). This was reinforced with the enactment of the Town and Country Planning
Ordinance No. 13 of (1945) which was based on the UK Town and Country Planning
Act ( 1932) (Amissah, 1979) and considered planning for the first time as a
comprehensive activity of the colonial government (Afrane, 1993; Acquaah-Harrison,
2003). This Ordinance provided for the creation of town and country planning boards
with the responsibility among others to secure the orderly and progressive
development of land. However, Ordinance No.13 was replaced by Cap 84 in 1954
which was also amended in 1959 resulting in the taking on of the functions of the
planning board by the minister responsible for town and country planning. Earlier in
1944, the Town and country Planning Department was set up for preparation of draft
planning schemes and report. Consequently, the Department became the secretariat of

Baffour Awuah et al.
942
the planning board and subsequently the minister responsible for town and country
planning albeit not provided for in the Ordinance (Domfeh, 2001).
The ethos of the Town and Country Planning Ordinance No.13 (1945) and its
subsequent amendments is that it prescribed rational comprehensive approach to
ULUP and the use of master plans (Afrane, 1993; Gambrah, 1994). Underlying this
planning philosophy is the land use segregation concept which sets out four cardinal
principles. These are: unifunctional land use focusing on specialisation in land use;
discreet zoning indicating legal manifestation of unifunctional land use; regulation
prescribing regulatory process for desirable developments; and consensus, signifying
that government actions are in the interest of communities (Afrane, 1993; Lai, 1994;
Baffour Awuah et al., 2010).
The dictates of the 1945 Planning Ordinance and as illustrated by Figure 1, therefore,
were such that upon declaration of any area as a statutory planning area all
developments were to cease pending the preparation and approval of a planning
scheme. Further to that proposed projects were screened to ensure that they met the
necessary requirements for grant of building permits to commence developments and
then certificate of occupancy upon completion of projects. Given its rationale for
Declaration of statutory Planning
Area (Community)
Zoning
(broad classification
of a community)
Sub-division plan
Others
Sub-division Plan
Industrial
Sub-division Plan
Commercial
Sub-division Plan
Residential
Approval of Sub-division
Plan
Development Application/
Building Permit
Others EIA Designs Proof of Title
Approval of Permits &
Commencement of development
Completion of development &
issuance of certificate of occupancy
Inspection to
maintain standard of
construction
Development control
Inspection of statutory
Planning area
Figure 1 simplified version of the ULUP Model under 1945 planning Ordinance

Urban land use planning
943
planning, the colonial government on the basis of the foregoing pursued racial and
spatial segregation especially in the area of residential accommodation. Example of
such segregation was the occupation of large bungalows with luxurious compound on
large tracts of lands in Cantonments and Airport and Ridge Residential Areas whilst
the indigenes lived in deplorable areas like James Town and Chorkor (Konadu-
Agyemang, 1998; see further Baffour Awuah et al., 2010).
After independence and following global criticism of rational comprehensive
approach to planning in the 1960s, attempts were made to change the orientation of
planning to incorporate social and economic issues albeit with little success (Acquaah-
Harrison, 2003). However, in 1993 after a long period of central government control,
planning was decentralised pursuant to the promulgation of a number of legislations.
These include: Local Government Act (1993) Act 462; National Development
Planning Commission Act, (1994) Act 479; and National Development Planning
(Systems) Act (1994) Act 480. Under this arrangement the Town and Country
Planning Department hitherto a central government line agency which had regional
and district branches throughout the country has also been decentralised in accordance
with provisions of the Civil Service Law (PNDCL 327). This means that the former
regional and district branches of the Department have become establishments of the
regional and district coordinating councils respectively and the
metropolitan/municipal/district assemblies planning authorities (Government of
Ghana, 1996).
That said, the current planning arrangement did not abolish Cap 84 and Act 462 which
made the assemblies planning authorities did come with a legislative instrument to
guide ULUP practice. Consequently, though the assemblies are planning authorities,
current ULUP practice follow the dictates of Cap 84 and supported by related
legislations such as the National Building Regulations (1996) LI 1630 (cf. Herrle and
Nkum and Associates, 2001; Domfe, 2001; LUMP, 2009). This planning arrangement
has, however, come under severe criticisms for its adverse manifestations on the
country‘s urban environment.
ULUP MANIFESTATIONS AND CAUSES
Generally, the aim of the extant ULUP regime in Ghana is to ensure orderly and
progressive development of lands in urban areas, preserve amenities and promote
environmental control among others (Konadu-Agyemang, 1998). However, several
studies and reports have criticised the planning regime as being weak, ineffective and
serving as a platform for public officials to undertake corrupt practices (Government
of Ghana, 2007). The location of Nima, a shanty settlement which is only separated by
a road from Roman Ridge and Airport Residential Areas, prime government
residential areas in Accra is an epitome of the problem. Indeed the draft report on the
strategic plan of Accra Vol. I (1991) aptly outline Accra‘s urban terrain as
characterised by high traffic congestion especially in the central areas, poor housing
and infrastructure conditions, urban sprawl with disregard for planning laws.
Afrane (1993) in a study on integration of housing and economic activities in four
low- income settlements in Kumasi, the second largest city in Ghana established
among other findings that property owners and residents would like to integrate
housing and economic activities. However, most of the integration was carried out
without regard to planning regulations. In a study on spatial and urban fragmentation
in Accra, Larbi (1996) also established that 76% of developments on customary lands
in Accra are unauthorised. However, Asabere (1981) in his study on determinants of

Baffour Awuah et al.
944
land values in an African city: case of Accra found out that government zoning
increases land values in Accra. That said, more recent studies (cf. Hammond, 2006;
Baffour Awuah, 2007, 2010; Government of Ghana, 2009) have established adverse
effects of the extant planning regime in Ghana on the country‘s urban environment.
Baffour Awuah (2007) in a study on socio-economic impact of unauthorised land use
conversions in state residential areas in Accra: case study of Ofankor Sector One
Residential established that 48% of plots of land studied had their uses converted
without requisite authorisation from the concerned planning authority. The study also
revealed that this state of affairs had serious economic consequences for Ghana‘s
Lands Commission with respect to ground rent revenue. In fact the study identified
that the Commission lost ground rent revenue in 2006 which was estimated at 52% of
ground rent charged in the same year for the area due to the phenomenon. In addition,
the study established from the records of the Commission that unauthorised land use
conversions in prime state residential areas such as East Legon, Airport West and
Achimota Forest residential areas in 2006 were estimated at 20%, 24% and 20%
respectively. Again, the recent human settlement and land use policy and planning
study on Ghana (see Government of Ghana, 2009) reiterated the foregoing adverse
manifestations and in particular sprawl, of the country‘s planning regime in virtually
all the major urban centres.
Several causes are identified in the literature as responsible for the weak and
ineffective ULUP regime in Ghana. Firstly, it has been argued that the planning
regime continues to respond to colonial demands. Indeed the underpinning laws of the
planning regime which is a relic of colonialism are outmoded, complex and their
requirements restrictive taking into account the socio-economic realities in the country
(Afrane, 1993; Baffour Awuah et al., 2010). For example, Cap 84 and LI 1630 specify
stringent procedure and requirements for applying development and building permits,
type of construction and construction materials allowable which are in the main based
on British standards. These requirements for building permit include architectural
designs, proof of title to land and environmental impact assessment report among
others. Quite apart from that these planning laws are couched in such a technical
language that they are difficult to be understood by even the uninitiated educated
elites let alone majority of the people who are not well informed of planning policies
and are also excluded from participating in the planning process (Afrane, 1993; Herrle
and Nkum and Associates, 2001; see further UN-Habitat, 2009). This thus creates a
platform for developers to disregard planning laws resulting in unauthorised
developments and shanty settlements. In fact Baffour Awuah (2007, 2010) in his study
on unauthorised land use conversions in Ofankor Sector One, for example, established
that property owners who lacked knowledge of planning laws and their requirements
are seven times more likely to convert their approved land uses without authorisation.
To the above point are the bureaucratic delays associated with the procedures for
making formal planned urban lands available for development and of granting
development rights. It is, for example, estimated that it takes a period of two years for
a building permit to be granted (Farvacque and McAuslan, 1992) and in extreme cases
six years (Kassanga, 1991). In a workshop organised in Kumasi, Ghana for Ghanaian
professional planners and planning researcher by Peter Herrle and Nkum and
Associates, participants pointed out that ULUP in Ghana is limited to re-zoning.
Besides, planning processes are associated with delays and that majority of the built
up areas in the country are not covered by approved planning scheme due to lack of
base maps (cf. Herrle and Nkum and Associates, 2001). Further to this, is the huge

Urban land use planning
945
cost involved in enforcing and complying with planning and urban development
regulations. Findings from relevant studies indicate that huge cost in terms of time,
monetary resources for meeting planning law requirements and making extra out of
pocket payments to sort out planning documentation, and planning administration
running cost are incurred for the purpose of complying and enforcing planning laws
(Farvacque and McAuslan, 1992; Government of Ghana, 2007, 2009; UN-Habitat,
2009; GIA, 2009; see further Baffour Awuah et al., 2010).
In addition, planning institutions in Ghana are said to be weak, fragmented, under
resourced and manipulated by politicians (LUMP, 2009). Indeed, the Town and
Country Planning Department, the main professional ULUP agency has had a very
chequered history and in a period of ten years (1999-2009) the Department was
moved eight times between different ministries (LUMP, 2009). It is also observed
that in 1995 there were two hundred and fifty professional planners in the country and
only sixty-two were engaged by the then one hundred and ten
metropolitan/municipal/district assemblies, the planning authorities. This means that
forty-eight of the planning authorities were without planners. Even so, most of these
planners had no varied training in areas like sociology, land economics and political
economy among others to bring on board emerging planning models (Acquaah-
Harrisson, 2003). To this point is the blurring nature of where the planning mandate
actually resides due to the concurrent operation of Cap 84 and Act 462. Compounding
the problem is the tripartite issue of rapid urbanisation, rise of the informal sector and
urban poverty. This has resulted in inordinate demand for urban land and land based
developments with the effect that planning continuous chase of developments has
exacerbated and hence the deplorable urban environments (cf. Obeng-Odoom, 2010).
REFORM PACKAGE
Over the last decade land policy and development and resource access and
management began to emerge in development dialogue among governments and the
donor community (cf. Toulmin et al., 2002; Larbi et al., 2004). In Ghana this
culminated into the development of a land policy (in 1999). Subsequently, a 25-year
land tenure reform programme that began with the Land Administration Project (LAP)
which seeks to put in place an effective and efficient land administration system for
socio-economic development got under way in 2003 (Larbi et al., 2004; Government
of Ghana, 2007, 2009). As part of the Land Administration Project, a sub-project,
Land Use Planning and Management (LUPMP) commenced in 2007.
The aim of LUPMP is to develop a coherent, streamlined and sustainable land use
planning and management system which is decentralised and based on consultative
and participatory approaches to effectively manage human settlement developments.
Flowing from this aim are seven objectives namely:
1. To develop and test models and processes of land use planning and development
controls in partnership and with the active participation of communities and
customary land owners;
2. To develop and test simplified and operational procedures of the inter-linkage
between land tenure clarification and land use management at the local level as an
integral part of the development management process and land administration
system;
3. To develop and draft a coherent and modernised legal framework for town and
country planning including model guidelines and regulations;
Baffour Awuah et al.
946
4. To prepare and implement institutional reform and strengthening including
capacity building;
5. To implement an information system including integration of new and existing
data (maps and other data) to support integrated planning at all levels
6. To develop an information/public awareness campaign strategies and materials to
support the implementation of the reformed planning system; and
7. To support implementation of land use planning and development controls in
Greater Accra Region and selected pilot areas in other regions (cf. Government of
Ghana, 2007, 2009).
The outlined objectives were earmarked to be achieved through four main activities.
These are: development and testing of decentralised land use models in selected high
priority areas; policy studies and reform of legal and institutional framework for land
use planning and management; implementation of information system for land use
planning and management; and implementation of planning at the regional, district
and local levels (Government of Ghana, 2009). The main policy study which is to
underpin a reformed planning regime was completed in 2009. This was complimented
by five discussion papers; a report on land use planning and management in Ghana‘s
regions and selected settlements, review of town and country planning and other
connected legislations, institutional review of agencies and bodies involved in
planning, and a report on the extant planning system (Government of Ghana, 2009).
Whilst findings from the study and the discussion papers confirmed the manifestation
of weakness of the planning regime and also identified the causes as discussed in the
preceding section, they failed to provide a conceptual explanation of the planning
problem in the country, a necessary input for far reaching policy formulation. Besides,
like existing studies relative to the planning regime these policy studies were largely
qualitative. For example, the main policy study dwelt significantly on descriptive
administrative reports on land use planning and management in Ghana‘s regions and
selected settlements. In fact the entire planning reform package though worthy and
long overdue, according to its terms of reference, it is supposed to be based only on
the problems identified by Ghana‘s Land Policy (1999) (cf. Government of Ghana,
2009: p.4), a policy whose basis appears not to be supported by in-depth research.
Consequently, the extent and magnitude of compliance cost of planning regulation
described as high and one of the causes of the ineffective planning regime, for
example, is not known. This raises the question as to: how high is the cost of
compliance of planning regulation? What is the acceptable cost of compliance of
planning regulation to ensure adherence?
To guide policy formulation regarding devising an effective and efficient planning
model for Ghana, a conceptual understanding of the underlying problem of the
planning regime is imperative. A discussion of a proposed conceptual view of the
problem is thus set forth in the next section.
INPUT FOR REFORM – CONCEPTUAL VIEW OF ULUP
PROBLEM
Since the 1980s, there has been proliferation of planning theories dwelling on theories
from political economy and other social science disciplines (Allmendinger, 2002).
From the economics standpoint, the planning question has in the main been examined
from the neo-classical, welfare and in recent times public choice economics (Adams et

Urban land use planning
947
al., 2005). However, these theories have been formulated based on developed
economies experiences (Watson, 2002) and in the case of the economic theories have
resulted in disagreement over outcomes from relevant studies (Adams et al., 2005).
Consequently, in providing conceptual explanation of Ghana‘s planning regime
problem it is imperative that the underlying theory takes into account the socio-
economic conditions of the people and the institutions that prosecute the planning
agenda in Ghana. Such a suitable theory is the human action theory.
Human action theory emerged from a branch of political economy (Mises, 1949)
currently known as Austrian Economics and became an integrated theory following
the work of Mises (1949) despite its long period of existence. The theory constitutes
the central axiom of Austrian Economics (Bratland, 2000) and has also been used in
several fields such as legal theorising (Kinsella and Tinsley, 2004) and political ethics
(cf. Hoppe, 1989). The theory as applied to urban land use planning in Ghana is
illustrated by Figure 2.
The theory posits that every human being acts, and acts instinctively in a cheapest way
possible to achieve their ends (Mises, 1949; Rothbard, 2004). For example, a person
who wants to construct a house will do so using the cheapest means possible.
Therefore, from the theory economic propositions should focus on individuals and not
groups, as groups such as organisations and companies, do not have independent
existence of their own and act through individuals (Mises, 1949; Rothbard, 2004).
Thus human action is a purposive behaviour of using means to achieve ends; the
substitution of a more satisfactory state of affairs for a less satisfactory one (Mises,
1949; Kinsella and Tinsley, 2004).
From Figure 2, developers/property owners expect to have good living environment
and suitable arrangement of land uses to ensure health, safety, amenity and
convenience; the rationale for planning (Adams, 2008; Gurran et al., 2008). These
expectations are, however, manifested in property values appreciation. Therefore, for
developers/property owners, property values appreciation constitutes ends known as
benefits (cf. Fischel, 1990; Lai et al., 2007) and urban land use planning means also
known as cost (cf. Mises, 1949). However, planning is undertaken through adhering to
the requirements of planning regulations such as undertaking of zoning and
preparation of sub-division schemes, building of infrastructure, acquisition of
development permits among others (cf. Cheshire and Sheppard, 2004; Lai, 2005).
Human action in this context, therefore, refers to compliance of planning regulations
and occurs within ends and means framework (cf. Baird, 1998).
The theory further states that individuals act on the basis of incentives, that which
impels human beings to act. This is intuitively conceived as the positive difference
between the values of ends of action and means or resources used up in action (cf.
Mises, 1949; Baird, 1998). Therefore, as depicted in Figure 2, for compliance of
planning regulation to be worthwhile property values appreciation must be more than
the value or resources used up in meeting planning requirements or cost of compliance
of regulation.
What is noteworthy is that human beings speculate and makes speculation critical in
the determination of existence of incentives (Mises, 1949; Rothbard, 2004). Thus in
Figure 2, developers/property owners in arriving at whether or not planning provides
incentives speculate either by perception or actual calculation. However, means in
actual sense exist in the universe as elements and it is only when human beings are

Baffour Awuah et al.
948
able to discover relevant relationship between them and the achievement of their ends
that they become means (Mises, 1949; Rothbard, 2004).
Consequently, developers/property owners must first of all have knowledge as of the
relevance of planning or compliance to planning regulation prior to speculating its
costs and benefits. From the foregoing, human action is contingent on incentives
determined by speculation of the values of ends and means of or resources used up in
action subsequent to conception of means to ends. Therefore, for compliance of
planning regulation, planning regimes must provide incentives signifying that
developers/property owners should for a start conceive the relevance of planning to
their end of property values appreciation and then, on the basis of their speculation
come to a conclusion that benefits of compliance outweighs the costs. This implies
that where there is lack of conception of relevance of planning to appreciation of
property values, there will be lack of incentives and then lack of compliance with
planning regulation. Similarly, where there is lack of resources or means even though
conceived, there will be lack of incentives and hence lack of compliance (Baffour
Awuah et al., 2011).
Figure 2 Source: Baffour Awuah et al. (2011)
The logic of the framework as depicted by Figure 2, therefore, is that where a
planning regime provides incentives developers/property owners will comply with
planning regulations which will result in orderly developments with infrastructure
among others and vice-versa (Baffour Awuah et al., 2011).
However, from the earlier literature review it is evident that the relevance of
planning, and knowledge and requirements of planning regulation are not known by
Incentive/disincentive
Action
Compliance/non compliance
Net benefits and costs
(+/-)
Benefits
Appreciation in property values
Cost
Direct cost Opportunity cost
Means
Relevance of planning and Planning and Urban development laws
Zoning and preparation and approval of sub division schemes
Development/building permission
Infrastructure etc
Expectation
Health
Safety
Convenience
Economy
Amenity
Aesthetics
Good living environment
Suitable arrangement of land uses
Outcome of Planning System
Authorised/unauthorised developments
Perceived Actual

Urban land use planning
949
majority of the people due to prevention of the public from participation in the
planning process and the technical language by which planning legislations are
couched (Herrle and Nkum and Associates, 2001). Besides, whilst the majority of the
people particularly those of the low income bracket want to put their space into
compatible multiple uses as, for example, integrating housing and economic activities
(Afrane, 1993; Baffour Awuah, 2007, 2010) the planning regime continues to operate
a strict land use segregation concept with huge cost for developers in terms of meeting
compliance requirements (Government of Ghana, 2007, 2010). Compounding the
situation has been the growing levels of poverty meaning the majority of the people
simply do not have the resources to meet the planning regulation requirements. Given
this situation and from the standpoint of human action theory, compliance of planning
regulation under the Ghanaian ULUP regime will be low as it appears to lack
incentives and hence the country‘s deplorable urban environment. Consequently, any
policy to address the problems of the extant planning regime must of necessity be
guided by quantitative determination of cost and benefits imposed by the regime.
CONCLUSION
This work set out to examine ULUP in Ghana through a critique of the extant
literature. The primary aim was to contribute to ongoing planning reform efforts
aimed at devising an effective and efficient ULUP model for the socio-economic
development of the country. The literature critique established that although planning
existed prior to colonialism, with the advent of colonialism the colonial master (the
British) cobbled their colonial planning apparatus onto the country and up to date the
country‘s planning regime continues to respond that colonial demands. This has
resulted in lack of knowledge of relevance of planning and planning regulations
among majority of the people, high cost of compliance of planning regulation
compounded by weak planning institutions, poverty, urbanisation etc. and rendered
the planning regime weak and ineffective manifested in deplorable urban
environments. However, relevant studies to date have been silent on conceptual
explanation of the underlying problem of the extant planning regime and the extent
and magnitude of the causes such as high compliance cost of planning regulation.
Using insights from the human action theory, the work outlines a conceptual
explanation of the underlying problem of the planning regime and identifies that the
planning regime appears to lack incentives. The work, therefore, concludes that
determination of quantitative costs and benefits of the extant planning regime is vital
to the success of the planning reforms.
REFERENCES
Accra Planning and Development Programme, United Nations Development Programme and
United Nations Centre for Human Settlements (1991) ―Strategic Plan for Greater Accra
Metropolitan Area, Vols. I. Ministry of Local Government, Accra-Ghana.
Acquaah-Harrison, R. (2003) ―The Restructuring of the Town and Country Planning
Department‖. Paper presented at a Town and Country Planning Department Seminar
held at Little Acre Hotel, Aburi, Ghana from February 12 – 13, 2003.
Adams, D. (2008) ―Mapping out the regulatory environment and its interaction with land and
property markets‖. Energy Policy, 36, 4570 – 4574.
Adams, D., Watkins, C. and White, M. (2005) ―Examining public policy and property markets‘,
in Adams, D., Watkins, C. and White, M. (Eds) Planning, Public Policy and Property
Markets‖. Oxford, Blackwell Publishing Ltd, 3-9.

Baffour Awuah et al.
950
Afrane, S.K. (1993) ―The Integration of Housing and Economic Activities: a Case study of Low
Income Settlements in Kumasi, Ghana‖. PhD Thesis, University of British Columbia,
Canada.
Allmendinger P. (2002) ―Towards a Post-Positivist Typology of Planning Theory‖. Planning
Theory 1:1, 77-99.
Amissah, S.B. (1979) ―Guidelines for the Formulation of Land Policies and Title Registration in
Ghana: A Documentation‖. Kumasi Land Administration Research Centre, University of
Science and Technology.
Asabere P. K. (1981) ―The Determinants of Land Values in an African City: The Case of Accra,
Ghana‖. Land Economics, 57:3, 385-397.
Baffour Awuah, K.G. (2007) ―The Socio-Economic Impact of Unauthorized Land Use
Conversions in State Residential Areas of Accra: A Case Study of Ofankor Sector One
Residential Area, Accra‖. MA Thesis, ISSER- University of Ghana, Ghana.
Baffour Awuah, K.G. (2010) ―Land Use Planning In Ghana – Recent Salient Findings from a
State Residential Area‖. The Journal of Business and Estate Management Research, 2:1,
18-35.
Baffour Awuah, K.G., Hammond, F., Bloch, R., Proverbs, D., Booth, C., Lamond, J. (2010) ―Sub
Saharan Urban Land Use Planning Systems: The Need For An Economic Appraisal‖.
Paper presented at RICS-COBRA Conference held at Dauphine University- Paris,
France from September 2 -3, 2010.
Baffour Awuah, K.G., Hammond, F., Booth, C., Lamond, J. (2011) ―Improving the performance
of the Construction Industry: The Urban Land Use Planning Factor‖. Paper submitted at
the ARCOM and LCI, UK Doctoral Workshop held at the School of the Built and
Natural Environment, University of Northumbria, UK on March 2, 2011.
Baird, C.W. (1998) ―Profit and Loss, in Boettke, J. (Ed.) The Elgar Companion to Austrian
Economics‖. Cheltenham, Edward Elgar Publishing Inc.
Barbot, J. (1732) ―A description of the Coasts of North and South Guinea‖. London, Churchill‘s
Collection of Voyages and Travels.
Bratland, J. (2000) ―Human Action and Socially Optimal Conservation: A Mises Inquiry into the
Hotelling Principle‖. The Quarterly Journal of Austrian Economics, 3, 3-26.
Cheshire P. and Sheppard, S. (2004) ―Land markets and land market regulation: progress towards
understanding‖. Regional Science and Urban Economics, 34, 619-637.
Cotula, L., Toulmin, C. and Hesse, C. (2004) ―Land Tenure and Administration in Africa:
Lessons of Experience and Emerging issues‖. London, International Institute for
Environment and Development.
Domfeh, S. N. (2001) ―Town and Country Planning in Brief, Ghana‖. (Unpublished).
Effah-Gyamfi, K. (1975) ―Traditional History of the Bono State: An Archaeological Approach‖.
Legon, Institute of African Studies, University of Ghana, Legon.
Farrar, T. (1996) ―Building Technology and Settlement Planning in West Africa Civilization:
Precolonial Akan Cities‖. Cambridge, Edwin Mellen Press.
Farvacque, C. and McAuslan, P. (1992) ―Urban Management Programme: Reforming urban land
policies and institutions in developing countries‖. The International Bank for
Reconstruction and Development (World Bank), Washington DC, USA.
Fischel, W.A. (1990) Introduction: Four Maxims for Research on Land-Use Controls, Land
Economics, 66:3, 229- 236.

Urban land use planning
951
Gambrah, A. (1994) ―Regulation of Housing and Services for the Urban Poor: A case study of
Accra, Ghana‖. MSc Thesis, University of British Columbia, Canada
Ghana Institute of Architects (GIA) (2009) ―Addressing the adverse impact of non-enforcement
of building and development controls in Ghana: Summary of findings of research‖. GIA
(Unpublished).
Government of Ghana (2007) ―Draft Inception Report on Land Use Planning and Management
Project‖. Accra, Land Administration Project, Ministry of Lands, Forestry and Mines.
Government of Ghana (2009) ―Human settlements and land use policy and planning in Ghana: A
policy study‖. Land Use Planning and Management Project, Town and Country Planning
Department, Ghana
Gurran, N., Ruming, K., Randolph, B. and Quintal, D. (2008) ―Planning, government charges,
and the costs of land and housing‖. AHURI Positioning Paper No. 109, Australian
Housing and Urban Research Institute, UNSW – UWS Research Centre, Sydney
Research Centre.
Hammond, F.N. (2006) ―The Economic Impacts of Sub-Saharan Africa Urban Real Estate
Policies‖. PhD Thesis, University of Wolverhampton, UK.
Hammond, F.N. and Antwi, Y.A. (2010) ―Analysis of sub-Saharan Africa Real Estate Policies‖.
London, Palgrave Macmillan.
Herrle, P. and Nkum and Associates (2001) ―Towards a Concept for Participatory Urban
Planning in District Towns, Final Report for Promotion of District Capitals II submitted
to Programme Co-ordination Office PRODICAP II‖. Accra, GTZ and Ministry of Local
Government and Rural Development, Ghana.
Hoppe, H. (1989) ―The Theory of Socialism and Capitalism‖. Boston, Kluwer Academic
Publishers.
Kasanga, K.R. (1991) ―Institutional/Lagal Regimes and Urban Land Management: A case study
of Ghana‖. Kumasi, Land administration Research Centre, University of Science and
Technology, Ghana.
Kironde J.M.L. (2006) ―The regulatory framework, unplanned development and urban poverty:
Findings from Dar es Salaam, Tanzania‖. Land Use Policy, 23, 460 – 472.
Kinsella, N.S. and Tinsley, P. (2004) ―Causation and Aggression‖. The Quarterly Journal of
Austrian Economics, 7:4, 97-112
Konadu-Agyemang (1998) ―The Political Economy of Housing and Urban Development in
Africa: Ghana‘s Experience from Colonial Times to 1998‖. Westport, Praeger
Publishers.
Land Use Planning and Management Project (LUMP) (2009) ―Town and Country Planning
Authority‖. LUMP-Dialogue, 2:1, 1-9.
Lai, W.L. (1994) ―The economics of land – use – zoning‖. Town Planning Review, 65: 1, 77-98.
Lai, W. L., Yung, P., Li, R. Y., and Ho, D. C. (2007) ―The private supply of and public demand
for planning conditions in the absence of direct statutory enforcement measures‖.
Planning Practice and Research, 22:4, 535-557.
Larbi, W. O., Antwi, A., Olomolaiye, P. (2004) ―Compulsory land acquisition in Ghana – Policy
and praxis‖. Land Use Policy, 21, 115 – 127.
Larbi, W.O. (1996) ―Spatial planning and urban fragmentation in Accra‖. Third World Planning
Review, 18, 193-215.
Meyerowitz, E.L.R. (1951) ―The Sacred State of the Akan‖. London, Farber and Farber.

Baffour Awuah et al.
952
Mises, L.V. (1949) ―Human Action: A Treatise on Economics‖. Scholar‘s Edition. Auburn, Ala.:
Ludwig von Mises Institute.
Njoh A.J. (2009) ―Urban Planning as a tool of power and social control in colonial Africa‖.
Planning Perspectives, 24: 3, 301 – 317.
Obeng-Odoom, F. (2010) ―An urban twist to politics in Ghana‖. Habitat International. 34, 392 –
399.
Payne, G. and Majale, M. (2004) ―The Urban Housing Manual: Making Regulatory Frameworks
Work for the poor‖. London, Earthscan.
Rothbard, M.N. (2004) ―Man, Economy and State‖. Scholar‘s edition, Alabama, Ludwig Von
Mises Institute.
Seto, K. C. and Shepherd, J. M. (2009) ―Global land use trends and climate impacts‖. Current
Opinion in Environment Sustainability, 1, 89-95.
UN-Habitat (2009) ―Planning Sustainable Cities: Policy Directions. Global Report on Human
Settlements, Abridged (Edn.)‖. London, Earthscan.
Watson, V. (2002) ―The Usefulness of Normative Planning Theories in the context of Sub –
Saharan Africa‖. Planning Theory, 1:1, 27-52.
Watson V. (2009a) ―The Planned City Sweeps the poor away: Urban Planning and 21st century
urbanization‖. Progress in Planning, 72, 151-193.
Wilks, I. (1959) ―Akwamu (1650 – 1750). Rise and Fall of a West African Empire‖. Legon,
Institute of African Studies, University of Ghana, Legon.

Oloto, E. and Adebayo, K. ( (2011) Urbanisation and the marketplace in West African countries:
Impact on the health and safety of children of female traders In: Laryea, S., Leiringer, R. and Hughes,
W. (Eds) Procs West Africa Built Environment Research (WABER) Conference, 19-21 July 2011,
Accra, Ghana, 953-962.
953
URBANISATION AND THE MARKETPLACE IN WEST
AFRICAN COUNTRIES: IMPACT ON THE HEALTH
AND SAFETY OF CHILDREN OF FEMALE TRADERS
Enitan Oloto1 and Kayode Adebayo
2
Department of Architecture, University of Lagos, Akoka, Lagos State, Nigeria
Female traders work in the informal sector, a large segment of the economy about
which there is limited information. As such, their enormous contribution to the
economy has yet to be fully recognized by economists, urban planners, and
policymakers. As Urbanization continues, both the volume of demand and the number
of female traders and street vendors are expected to grow. Economic reforms and
downsizing in the public and private sectors over the years have driven many new
entrants into this competitive market, affecting women greatly and causing downward
pressure on earnings. Majority of these women have their children accompany them
to the marketplace, exposing them to health and safety hazards. These pressures
explain the need for women to be provided with facilities such as the on-site childcare
centre which will assist them in taking care of their children on site while at work.
The purpose of this research is to see how Urbanisation has affected the health and
safety of children in the marketplace and ultimately the positive effect of introducing
childcare facilities in marketplaces. It has actually been observed that public toilets
have been the predominant features springing up in market places recently, but
another important facility, salient and of major importance are the on-site childcare
facilities.
Keywords: female traders, marketplace, on-site childcare facility, urbanisation.
INTRODUCTION
In regard to future trends, it is estimated 93% of urban growth will occur in Asia and
Africa, and to a lesser extent in Latin America and the Caribbean. By 2050 over 6
billion people, two thirds of humanity, will be living in towns and cities. (Webster‘s
online dictionary, 2011). What is historically unprecedented is the absolute rate of
urban growth in Africa—averaging almost 5 percent per year1, implying close to a
doubling of the urban population in 15 years. On average the population of the Africa
Region is now one-third urbanized, higher than South Asia‘s 28 percent. Africa is
approaching a demographic inflection point as the numbers of new urban residents are
projected to rise sharply by over 300 million between 2000-2030—more than twice
the rural population increments. (Kessides, 2005, p.x). By 2025, it is estimated that
58.9% of West Africans will be living in urban areas. (Aniah, .n.d., p.265).
While it is clear that West African countries are experiencing unprecedented rates of
urbanization, debate over the causes and effects of urbanization in the region remains
heated and often rancorous. African urbanization is taking place in a context of severe

Oloto and Adebayo
954
constraints that did not face other country groups in other periods--such as full
exposure to pressures of global competition; very limited outlets for external
migration; and depredation of the productive workforce and of family security.
(Kessides, et al.,2005, p.ix). The study reported in this research is concerned not with
the causes, but rather the effects, of urbanization in the region. Particularly, the study
was designed to explore the impact of urbanization within the informal sector in West
African countries.
Economic reforms and downsizing in the public and private sectors has brought new
influx into the informal sector of most West African countries resulting in a daily
influx of women into the informal sector of trading. The challenges of urbanisation
have made more women venture out to look for alternative means of providing for
their family, while juggling between household chores and trading in the marketplace,
and trying to raise their children. Over 80% of these women bring their children
between the ages of 6-36 months to their workplace (the market).Women have
developed strategies that allow them to be productive while coping with the demands
of childbearing and child care. These include dependence on traditional support
systems, such as choosing flexible working time, and obtaining the help of surrogate
mothers, including older siblings. Sometimes, these other caretakers are unable to
properly look after young children, thus leaving especially infants vulnerable to poor
diet and infections. Another strategy is to take the child to work. (Ene-Obong,
Uwaegbute, Iroegbu, and Amazigo, 1998, p.173) Many informal jobs like trading, are
not only ―flexible, precarious and insecure,‖ but are also hazardous and take place in
settings which are both unhealthy and unsafe. Such work environments can include
waste dumps, informal market areas, roadsides and homes, all of which can expose the
workers who work in them to environmental disease, traffic accidents, fire hazards,
crime and assault, weather related discomfort, and musculo-skeletal injuries. (Alfers,
n.d., p.4.)
A large proportion of lower socioeconomic status women in West African countries
are petty traders, with many selling their products in markets with poor environmental
conditions. Therefore, the children who often accompany their mothers to the market
are constantly at the risk of inadequate immunization and constantly exposed to health
hazards like child diarrhoea, through contaminated food and water, which is an
important cause of morbidity and mortality in this environment. It was observed after
conducting a survey of the market women in Balogun market in Lagos state, that on
average, women trades are 27 years old and have up to three children under the age of
four.
For the purpose of this research, reports will be limited to three West African
countries-Nigeria, Ghana, and Liberia. Comparison to other francophone
neighbouring counties will be researched in the near future. There is however, very
little empirical evidence showing the direct impact of urbanisation on the health and
safety of the market women and its indirect effect on children that accompany their
mothers in the informal sector urban enterprises within West African countries. The
research will contribute to the existing documented researches on this agenda and will
alert policy makers and planners in West African countries to the problems and coping
mechanism which undermines the business performance of female traders in the
informal economy and the health and safety risk of children who accompany them to
the market. It identifies briefly, some of the major institutional obstacles which
currently limit the ability of most West African countries to institute effective health
and safety mechanisms in markets and other trading areas in the region. The research

Urbanisation and market places
955
thus makes only tentative suggestions about possible ways forward in terms of
interventions to address the current situation.
The introduction of on-site childcare facilities in every market locations will be a
catalyst for rapid alienation of challenges faced by female traders who bring their
children to the marketplace. The research proceeds in the following order. Initially, it
examines the theoretical and intuitive link between urbanization and marketplace, and
then the Profile of the 3 selected West African markets will be discussed. Next, it
discusses the data and methodological issues of the study. A subsequent section
presents the study results .The research ends with concluding remarks and articulated
future intentions.
THEORETICAL FRAMEWORKS AND CONCEPTUAL TOOLS
The rapid inflow of people from rural settlements to urban cities and the Urbanisation
affects the growth of markets within the informal sector. This can be seen as more
people migrate daily into the West African urban cities for better opportunities. Even
the economic meltdown has witnessed the gradual transition of people from the formal
sector of the economy to the informal sector. The informal sector in Africa is
dominated by trade-related activities. According to Verick (nd.), this sector is
characterised by a high proportion of women.
Skinner (2005) who argued that trends in petty trading over time are integrally linked
to urbanisation, migration and economic development processes. In their research,
George, Gordon, Mark and Rogelio (2008) argued convincingly that urbanisation is
the most important issue of the twenty-first century – even more important than
economic growth, poverty, and the environment. In their study they agreed that
Urbanisation is critical for economic growth, for reduction of poverty, for stabilisation
of population growth, and for long-term sustainability. George et al. (2008) also
mentioned that informal activities in many developing countries accounts for as much
as two-thirds of urban employment, providing a main source of employment and
income for poor urban women who predominantly engage in trading in the market
place. According to Verick (nd.), the informal sector has not only persisted but
actually grown in many developing countries, particularly in Africa where it
dominates the economy both in terms of output and employment. We can see from
George et al. (2008) and Verick (nd.), that more women fend for their families and
contribute to the economic growth of West African countries. One can only deduce
from these literatures that more attention should be given to the well being of the
female traders who according to Chen, (2008) make up 60% of women‘s labour force
participation in West Africa. It is therefore apparent that the need to provide policies
and facilities that will focus on this group. For instance, in the paper “The role of the
market woman in the Nigerian Economy” (par.2), women, including girls, make up 49
percent of Nigeria‘s population (2006) and constitute 37.14 percent of Nigerians in
gainful employment (3). The paper also mentioned that with only 7 percent presence
in the industrial work force and 26 percent in the service sector, it is apparent that
women are highly concentrated in the informal sector of the economy and for most of
them, life revolves around the family, the farm and the market place. In the case of
Ghana, Tsikata (2007) stated that a distinct characteristic of the informal economy in
Ghana and everywhere in sub-Saharan Africa is the predominant location of women‘s
productive activities. He went on to state that the numerical composition of the
informal sector in Ghana is predominantly female and its official characteristics, the
nature of many enterprises and its labor relations are all associated with the features of

Oloto and Adebayo
956
women‘s work. Tsikata (2007) also observed that though the expansion of the
informal economy has created new work opportunities for women in Ghana, women
have become entrenched in the survivalist sections of the informal economy making a
living in conditions which do not conform to the ILO standards for decent work. Thus
it can be argued that women‘s special relationship with the informal is not a happy
one. Chen, (2008) argued that compared to other regions of the world, Africa is
known for its large numbers of women street vendors and market traders. Verick (nd)
observed that because many African countries either don‘t collect data on the informal
sector or they use different definitions, it was difficult to make strict comparisons
within and between countries. Nonetheless, Verick (nd) stated that the gross national
income (GNI), which ranges from under 30 percent in South Africa, the continent‘s
largest economy, to almost 60 percent in Nigeria,and with an average of 42.3 percent
in sub-Saharan Africa (SSA), indicates the size of the informal economy. According
to Skinner, (2008) in most African countries, other than North African countries,
women represent at least half, if not more, of the total number of traders However, the
empirical findings and documentations on the apparent dominance of the informal
trade by women have not been used as a factor to encourage these women. If true,
then this is evidence that female traders are been neglected and not enough is being
done on their conditions at work. Alfers (nd.) in her paper ―Occupational Health and
Safety for Informal Workers in Ghana -A case study of market and street traders in
Accra‖, stated that female market and street traders were exposed to a number of
health and safety hazards – with fire, and diseases related to poor environmental
health ranking prominently. It was also discovered that it is at the level of local
government where the institutions exist which are most likely to be able to provide
protection against these risks. Unfortunately, despite the potential of these institutions
to provide preventive social health protection to traders, it was found that they have
been largely unable to fulfil this role.
In the same paper, Alfer (n. d.) argued that despite the abundance of health and safety
risks in the large and growing informal economy, little attention has been paid to the
subject of occupational health and safety in the literature on risk and social protection.
She also stated that although there is a wealth of information on both informal and
formal health protection mechanisms in Africa, the focus tends to be on protection that
is curative rather than preventive in nature and that while such curative protection is of
course important.
Ene-Obong,Uwaegbute, Iroegbu and Amazigbo (1998) focused on the salient but
integral part of the market-the children. According to Ene-Obong et al. (1998) the
market environment, with its prevailing unsanitary conditions and overcrowding could
be dangerous for the child. In addition, women engaging in buying and selling may
not be able to give close attention or supervision to their children. They further went
to say that depending on the number of hours spent in the market, infant foods may be
poorly prepared, obtained, or handled. All these were potential hazards to children in
the market. Oladokun, Lawoyin and Adedokun (2009) did not fail to mention that
traders who form a large percentage of the female work force in Nigeria and spend
long hours at work, put their children at risk of inadequate immunization. They
observed that the immunization coverage rate among children of female traders was
low and that routine immunization sites should be made available in the markets.
These immunization activities could be carried out in childcare centres built within the
markets for easy access. Also in the research, ―Women and Children Getting by in
Urban, Accra‖, compiled by the International Food Policy Research Institute [IFPRI],

Urbanisation and market places
957
(n.d.), many young children of the traders in Accra, were not adequately nourished.
About 18 percent were stunted in grow and about 15 percent were underweight for
their age. According to Ene-Obong et al (1998), taking a child to the market could be
seen as advantageous in the sense that it gives mothers the opportunity to continue to
breastfeed and look after the child while at work. Though this argument is acceptable,
until certain parameters are put into place, the children will still be exposed to
unfavourable conditions regarding to safety and health. The hygienic conditions of
most markets are appalling and certain facilities need to be put in place to validate
their argument. (IFPRI), (n.d.), also argued that malnutrition of the children of market
women in Accra appeared to be more closely associated with the quality of care than
with the extent of poverty or food insecurity. In order to avoid an epidemic
catastrophe, it is of paramount importance that more preventive than curative
measures should be adopted regarding the sanitary and safety conditions of our
markets. Markets will continue to expand and grow, as urbanisation persists and
women will continue to dominate this sector of the economy. Verick (nd.), Skinner
(2005), George et al. (2008) and Chen, (2008) all clearly agree that not only does
urbanisation have a dynamic impact on the growth rate of markets in West African
cities, but that one major characteristics of trading is the predominate presence of
women in this informal sector of the economy. Though Ene-Obong et al. (1998) and
Oladokun‘s et al. (2009) focus were on the needs and challenges of the children
exposed to health hazards and poor environmental sanitation, little research has been
made on the health and safety of children who make up a salient part of the market.
This was reflected by non-existence of on-site childcare centres, in almost all the
major markets in Nigeria, Ghana and Liberia. Childcare centres were alien features of
markets in theses three researched countries.
MARKETS AND THEIR FEATURES
Markets in Nigeria
The most common features of Nigerian markets are lock- up shops (permanent
structures), make-shift structures made of wood and old zinc roofing sheets
(temporary structures) or simply tables made of wood arrangement disorderly in open
areas with no superstructures. In markets like Idumota in Lagos State, The distinct
feature about this market is that it is made up of very many multiple storey buildings
some measuring 5 or even more floors. Most of the shops are actually apartment
rooms converted into shops. (Onwueme, 2009).Figure 1 and 2 show pictures of lock-
up stores and open stalls in Balogun Market.
Fig.1 A woman with her children at Balogun Market Fig.2 Open shed market at Balogun

Oloto and Adebayo
958
Markets in Ghana Fig. 3 Makola Market
Open-air markets are an integral part of society in Ghana.
Accra‘s markets are the centre of the city‘s economic
activity; it is here where most people buy their basic
goods. The majority of traders are women who source
and carry their own goods to the market at great expense
and effort. Makola market is a whole neighbourhood
packed full of stalls, multi-storey shops shown in figure
3, and winding streets predominately with women selling
wares .
Markets in Liberia
Market places occur either in enclosed or covered structures or in open space. Market
structures are of several types. Some are roofed buildings with concrete floors and
walls, while others lack walls. Market areas often lack concrete floors and are poorly
drained. Many of the market structures were damaged during the war and have
required major renovation. Urban daily markets often operate in unsanitary,
unhealthy, and congested conditions. (Republic of Liberia: Liberia Market Review
[LMR], 2007, p.xi). Based on the report compiled by ―Liberian Markets and
Marketers Survey‖, (2007, p.12), Over one-thirds (36.4 percent) of marketers
surveyed have their children accompanying them to the market. Marketers‘
justification for taking their children along with them to marketplaces included: the
lack of someone to care for them at home (54 percent), the need for helping hands in
selling (37 percent), and the need to take care of the very young ones who are either
still breastfeeding or require primary parental care (2.2 percent). Over 50 percent of
the women who bring their children to the market use them to sell. Approximately
18.8 percent of the children, however, spend the day playing (with friends).
Surprisingly, only 0.2 percent of the market women enrol their children into day care
programs. (Liberian Markets and Marketers Survey, 2007, p.18). Only two (2)
markets, the Nancy Doe Market in Monrovia and the Logan Town Market, have
learning and child development services for market women. (Liberian Markets and
Marketers Survey, 2007, p.18).
Fig.3 Multi-storey Nancy Doe Market Fig.4 Example of open shed market
RESEARCH METHOD
The research was not designed to produce statistically representative results but to
provide a description of the conditions of markets in three selected West African
Countries, (Nigeria, Ghana, and Liberia) based on qualitative analysis. Generally, data

Urbanisation and market places
959
were scarce and not readily available for theses three countries, although the Liberian
government made efforts to compile information on the female market women,
despite their challenges of lose of data due to the civil war. Recent relevant literature
on Liberian markets and the marketing system is scanty.
However, the findings of this research were obtained through a data collection
methodology that combined a sample survey among marketers with desk study, direct
observation, focus group discussions, and key informant interviews. The main data
sources included the marketers, the Market‘s Association leaders, and local
community leaders of Balogun market in Nigeria .Reviews of available literature were
used for this research from articles, journals, books and the websites. Key informants
interviews were held at local level within selected markets in Lagos, Nigeria. In total,
100 interviews were conducted. The review was conducted in 2 markets (Balogun and
Oyingbo market). Given logistic and time constraints, markets were selected based on
their frequency (daily, weekly), geographic location (urban) and the type of market
(wholesale, retail or combined). A structured questionnaire was designed to collect
primary data. Given the time constraint and the expected output, the questions were
designed to collect mostly qualitative information. Information was gathered using a
mix of methodologies including observations, interviews with individual traders, and
focus group discussions with the market women.
The principal research methodology challenge was the lack of literature and data on
the informal sector in West Africa. Data were often fragmented and based upon
estimates. There were no current, reliable production data available. Statistical
information quoted by international institutions was often based on regional averages
rather than empirical local data. There was very little data on the Nigerian Market
women. Literatures focused more on the structure of the market system and the
demolition of illegal markets than the working conditions of the female trader and
effects on their children. The findings however suggest that female traders are
burdened with the responsibilities of child care which limits the extent of their trading
and equally leaving the children victims to health and safety hazards.
CONCLUSIONS
Recognizing the fact that the informal economy is here to stay and that market women
are permanent players in the economy is an important step that needs to be taken in
reformulating policy. (Cohen, Bhatt and Horn, 2000, p.11). That women who took
their children to the market would rather leave them at home if they had caretakers
suggests that having their children with them imposes some constraints on their
market activities and, therefore, affects the quality of care they can offer to their
children. There is, therefore, a need to empower these women in the areas of quality
child-care practices. The establishment of health posts in markets would be used for
the promotion of appropriate infant-feeding practices, growth monitoring, distribution
of oral rehydration solution and cater for other special needs of the children of market
women. (Ene-Obong et al., 1998).
The results of this study show that women's participation in the economy, in these
informal working conditions, is not accompanied by domestic and social support that
would permit the delegation of other responsibilities, such as the care of the young.
The manner in which these women resolve such problems implies a high probability
that the child will be with its mother. These children cannot be overlooked not only
because they are highly susceptible to diseases and accidents but because they form an
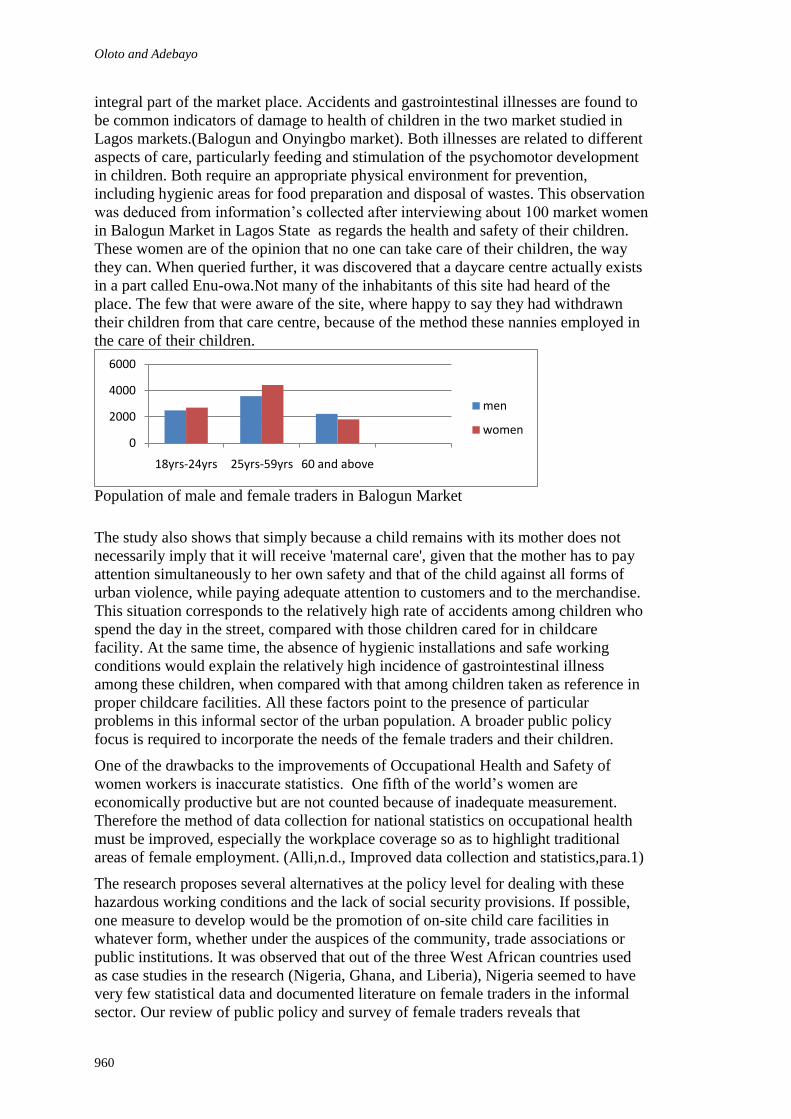
Oloto and Adebayo
960
integral part of the market place. Accidents and gastrointestinal illnesses are found to
be common indicators of damage to health of children in the two market studied in
Lagos markets.(Balogun and Onyingbo market). Both illnesses are related to different
aspects of care, particularly feeding and stimulation of the psychomotor development
in children. Both require an appropriate physical environment for prevention,
including hygienic areas for food preparation and disposal of wastes. This observation
was deduced from information‘s collected after interviewing about 100 market women
in Balogun Market in Lagos State as regards the health and safety of their children.
These women are of the opinion that no one can take care of their children, the way
they can. When queried further, it was discovered that a daycare centre actually exists
in a part called Enu-owa.Not many of the inhabitants of this site had heard of the
place. The few that were aware of the site, where happy to say they had withdrawn
their children from that care centre, because of the method these nannies employed in
the care of their children.
Population of male and female traders in Balogun Market
The study also shows that simply because a child remains with its mother does not
necessarily imply that it will receive 'maternal care', given that the mother has to pay
attention simultaneously to her own safety and that of the child against all forms of
urban violence, while paying adequate attention to customers and to the merchandise.
This situation corresponds to the relatively high rate of accidents among children who
spend the day in the street, compared with those children cared for in childcare
facility. At the same time, the absence of hygienic installations and safe working
conditions would explain the relatively high incidence of gastrointestinal illness
among these children, when compared with that among children taken as reference in
proper childcare facilities. All these factors point to the presence of particular
problems in this informal sector of the urban population. A broader public policy
focus is required to incorporate the needs of the female traders and their children.
One of the drawbacks to the improvements of Occupational Health and Safety of
women workers is inaccurate statistics. One fifth of the world‘s women are
economically productive but are not counted because of inadequate measurement.
Therefore the method of data collection for national statistics on occupational health
must be improved, especially the workplace coverage so as to highlight traditional
areas of female employment. (Alli,n.d., Improved data collection and statistics,para.1)
The research proposes several alternatives at the policy level for dealing with these
hazardous working conditions and the lack of social security provisions. If possible,
one measure to develop would be the promotion of on-site child care facilities in
whatever form, whether under the auspices of the community, trade associations or
public institutions. It was observed that out of the three West African countries used
as case studies in the research (Nigeria, Ghana, and Liberia), Nigeria seemed to have
very few statistical data and documented literature on female traders in the informal
sector. Our review of public policy and survey of female traders reveals that
0
2000
4000
6000
18yrs-24yrs 25yrs-59yrs 60 and above
men
women

Urbanisation and market places
961
predominant concerns in Nigeria are tax collection, elimination of unfair competition
and, in relation to health, protection of consumer health rather than the improvement
of the environment to becoming family-friendly and safe for children of the market
women.
Specific policy recommendations suggested by our findings are: A childcare centre for
vendors' children at the workplace; Maximum reduction of children's exposure to
environmental pollution by caring for them in enclosed areas; Health education of
female vendors, concerning development, nutrition, hygiene and safety. Municipal
authorities must initiate a new and comprehensive program for the development of
markets and marketers. These must include standardized market infrastructural
development and changes, the provision of basic infrastructural services needed onsite
by female marketers. It must also include support for child development that would
help children accompanying their parents to the markets daily.
The research concludes that the formation of strong female traders associations,
education training and more enforcement of municipal by-laws and policy that will
encourage the introduction of childcare facilities like childcare centres and health
posts, will alienate some of the challenges affecting the women who unavoidably must
bring their children to the marketplace.
ACKNOWLEDGEMENTS
The authors are grateful to the market women and market association leaders of
Balogun and Oyingbo market, all in Lagos State, Nigeria, who gave us access to
interview them at a short notice despite their tight and busy schedule.
REFRENCES
Alfers, L. (n.d.) Occupational Health and Safety for Informal Workers in Ghana: A case study of
market and street traders in Accra.
Alli, B.O. (n.d.).Women at the workplace Occupational Health and Gender Focal point,
Retrieved March 16, 2011 miosh.net/articles/Occupational%20Health/Women2.doc
Aniah, E.J., (n.d.) Urbanisation and Development in West Africa: Challenges and Policy
Implications, LWATI: A Journal of Contemporary Research, 3, 265-283.
Chen, M., (2008) Women and Employment in Africa: A framework for action.
Chirisa, I. (2008) Population Growth and Rapid Urbanization in Africa: Implications for
Sustainability, Journal of Sustainable Development in Africa, 10:2, 361-394.
Cohen, M., Bhatt, M. and Horn, P. (2000) Women Street Vendors: The Road to Recognition.
Seeds, 20, 1.
Ene-Obong,H.N., Uwaegbute, A.C., Iroegbu, C.U. and Amazigo, U.V. (1998) The Effect of
Two Child-care Practices of Market Women on Diarrhoea Prevalence, Feeding Patterns
and Nutritional Status of Children Aged 0-24 Months, Journal Diarrhoeal Diseases
Research, 16:3,173-179
George, M., Gordon, M., Mark, M., and Rogelio, F. (2008) Urbanization, Poverty and
Environment in the 21st Century, The New Global Frontier [Review by W.D. Thwala]
19:7, 386.
Ghana,accra,transport and trade for market women -2006 present, Retrieved March 19, 2011
from www.transaid.org/.../ghana,-accra,-transport-and-trade-for-market-women,-2006---
present.
International Food Policy Research Institute [IFPRI], (n.d.), Women and Children Getting by in
Urban Accra. Retrieved March 16, 2011 from
www.ifpri.org/sites/default/files/publications/accra.pdf
Kessides, C.,(2005), The Urban Transition in Sub-Saharan Africa: Implications for Economic
Growth and Poverty Reduction ,Africa Region Working Paper,97,ix-x.

Oloto and Adebayo
962
Ministry of Trade and Industry website, http://www.moti.gov.gh/en/business-
opportunities/model-markets-for-districts-assemblies.php
Oladokun, R.E. , Lawoyin, T.O. and Adedokun, B.O. (2009) Immunization status and its
determinants among children of female traders in Ibadan, South-Western Nigeria. Afr J
Med Med Sci.,.38:1,9-15. Retrieved March 16, 2011 from
www.ncbi.nlm.nih.gov/pubmed/19722422
Onwueme, P., (2009), Retrieved March 19, 201http://EzineArticles.com/?expert=Paul_Onwueme
Republic of Liberia: Liberia Market Review (LMR), (2007)
Skinner, C. (2008) Street Trade in Africa: A Review, School of Development Studies Working
Paper, 20.
Songsore, J. (n.d.). The Urban Transition in Ghana: Urbanization, National Development and
Poverty Reduction.
Subah –Belleh Associates, (2007) Liberian Markets and Marketers‘ Survey.
The Role of the Market Woman in the Nigerian Economy, (n.d.). Retrieved March 16, 2011 from
http://www.gadanigeria.org/THE%20MARKET%20WOMAN%20AND%20THE%20
NIGERIAN%20ECONOMY.pdf
Tsikata, D. (2007) Women and the Informal Economy: A Special Relationship? Retrieved May
8, 2011 from http://www.egnghana.org
Verick,S. (n.d.). The Impact of Globalization on the Informal Sector in Africa. Wahhaj, Z. (2003 September) Women in Ghana, The Executive Times, Retrieved March 16,
2011 from users.ox.ac.uk/~qehs0657/WomenGhana.pdf
Webster‘s Online Dictionary, Retrieved March 16, 2011 from http://www.websters-online
dictionary.org/definitions/Urbanization.

963
INDEX OF AUTHORS
A Abalaka, A E, 379
Abdulazeez, A D, 281
Abegunde, A A, 747
Abiodun, G S, 249
Adeayo, K, 953
Adedeji, Y M D, 59, 79
Adegbehingbe, V O, 37, 93
Adejumo, T, 517
Adeniran, A, 795
Adeoye, N, 747
Adeyemi, S A, 747
Adeyeye, K, 919
Adeyinka, S A, 747
Adiaba, S, 845
Adinyira, E, 443, 541, 617
Adjarko, H, 403
Adjei, A-G E, 473
Adogbo, K J, 683
Adukpo, E, 361, 735
Agumba, J, 593
Agyekum, K, 443, 617
Ahadzie, D K, 119, 217
Ai Lin, E T, 3
Aigbavboa, C, 167
Ajayi, B, 79
Akintayo, O, 105
Akomah, B B, 529
Akortsu, W, 571
Akuffo, F, 675
Alabi, F O, 273
Aluko, O, 861
Aluko, O O, 607
Ameyaw, C, 237
Amoah, P, 783
Ampadu-Asiamah, A D, 473
Ankra, O, 745
Ankrah, N, 735
Ansah, S K, 771
Appiagyei, N B, 261
Arum, C, 79
Ashiboe-Mensah, N A, 675
Awuah, K G B, 939
Ayarkwa, J, 119, 443, 617
Ayeni, D A, 907
B Babafemi, J A, 371
Babalola, J A, 229
Babatunde, A A, 795
Badu, E, 119, 217
Baffour-Awuah, E, 143
Bala, K, 335
Bamfo-Agyei, E, 427
Bamidele, E O, 629
Boadu, M A, 905
Boadu. M A, 215
Boakye, A N, 529
Bolaji, S, 805
Booth, C, 585, 845, 939
Botchway, E, 541
Bustani, S A, 435
C Chindo, P G, 683
Coles, D, 181, 529
Costello, P, 487
D Dabo, D, 843
Dada, J O, 453
Dadu, D W, 691
Dadzie, J, 181
Dahiru, A, 435
Dainty, A, 347
Danso, F O, 217
Dansoh, A, 261, 291, 783
Dardau, A A, 501
Dimoriaku, I, 715
Dzikwi, A A, 251
E Ebohon, O J, 907
Eshun, J, 215
Essah, E A, 391
Ezeji, K, 841
F Fakere, A A, 607
Folaranmi, A O, 559
Fugar, F, 675
Fullen, M, 585
G Ganiyu, S A, 45, 59
Garba, M M, 379
Gidado, K, 919
Gyadu-Asiedu, W, 23
H Hammond, F, 487, 845, 939
Harty, C, 19
Haupt, T, 593
Hughes, W, 1
I Ibrahim, A D, 761
Ibrahim, Y M, 761
Idehen, A F, 229
Idiake, J E, 325
Idoro, G, 651
Idoro, G I, 629, 641
Imbeah, K A, 291
Ishaya, D A, 843
J Jatau, J, 871
K Kakulu, I I, 413
Karley, N K, 827
Kolo, B A, 251
Index of authors
964
Koranteng, C, 193, 929
Kwaw, P, 131
Kwofie, T E, 541
L Lade, O, 585
Lamond, J, 845, 939
Laryea, S, 203
Lawal, L A T, 819
Leiringer, R, 17
M Mac-Barango, D O, 413
Madawaki, M N, 69
Manu, P, 361, 735
Mensah, S, 237, 783
Micah, V K B, 745
Mshelgaru, I H, 281
Musa, H, 761
N Nkrumah, J, 929
Nwokoro, I, 883
Nyame-Tawiah, D, 193
O Obiozo, R, 715
Ofori, G, 3
Ogunleye, B M, 91
Ogunsote, O O, 45
Okedele, O, 517
Okoli, O G, 379
Okolie, A, 841
Okolo, N, 841
Okpala, C, 841
Olagunju, O, 487
Olaniyan, O A, 315
Olawuyi, J B, 371
Oloke, D, 487, 585
Oloto, E, 953
Olubunmi, G S, 249
Oluigbo, S N, 897
Olurotimi, K, 795
Olusola, B S, 105
Omisore, O.E., 183
Onajite, J G, 105
Onukwube, H, 725, 883
Opintan-Baah, E, 131
Opoku-Ware E, 215
Opoku-Ware, E, 905
Oppong-Danquah, A, 919
Orgen, N K, 119
Orobowale, O, 465
Osei-Poku, G, 131
Osei-Tutu, E, 237
Otchere, P K, 143
Oteng-Seifah, S, 361
Owusu, K, 305
Owusu-Ansah, N B, 305
P Painting, N, 919
Poku, G O, 403
Proverbs, D, 585, 735, 845
S Sackey, E, 347
Safo-Kantanka, K, 929
Sam-Amobi, C, 663
Shika, A S, 501
Stanley, A M, 465
Suresh, S, 735
T Taki, A H, 907
Thwala, W, 167, 593
Tjandra, I T, 3
Tuuli, M M, 347
V Vroom, C B, 143
W Waziri, B S, 335
Westcott, A, 871
Wilson, J, 651
Woyome, A M, 193
Y Yalley, P P, 131, 403
Yunusa, B Y, 251
Z Zubairu, I K, 379

965
INDEX OF KEYWORDS
A Abuja, 465
accessibility, 501
accuracy, 761
acoustics, 45
adjudication, 143
Ado-Ekiti, 249
aesthetics, 249
affordability, 69
affordable, 79
affordable housing, 487
agency surveyor, 843
Akure, 91, 249
architectural design, 315
Aspergillus, 281
award, 143
B bills of quantities, 761
bioclimatic, 193
biodegradation, 281
biophilia, 817
bond, 361
BOT, 435
Botswana Factories Act, 47
budgetary allocation, 105
building code, 45
building material, 325
building panels, 79
building project, 761
building structure, 607
built environment, 203
C casual worker, 217
CDM 2007, 529
Central Region, 427
change, 3
city, 91
clay, 249
client, 23, 771
client-architect behaviour, 251
community participation, 807
commuters, 403
complexity theory, 347
composite, 79
compressed earth blocks, 715
compressive strength, 371, 379, 427
concrete, 379
construction contract, 143
construction dispute, 143
construction education, 453
construction industry development, 3
construction professionals, 703
construction site, 641
construction undergraduate, 617
construction waste, 315
consultant, 23
contextual constraints, 3
contractor selection, 273
core neighbourhood, 91
corporate real estate, 261
cosmological world view, 517
cost, 281
cost advice, 251
cost drivers, 335
cost estimate, 761
cost estimating, 335
cost overrun, 229
critical success factor, 291
culture, 897
D debt, 261
demographic variable, 153
design, 305, 559
design waste, 315
developing country, 871
diesel price, 325
Disability Law, 305
disabled friendly, 305
dispute resolution, 725
E economic variable, 153
economy, 501
education, 203
efficient water system, 715
electricity consumption, 391
electricity generation, 391
employee, 905
employee recruitment, 629
empowerment, 347
energy, 325, 391, 675
engineering/design service delivery, 119
enrolment, 453
environment, 183, 487, 929
Environment, 131
environmental degradation, 747
environmental pollution, 59
Environmental Protection Act, 131
Environmental Protection Agency, 131
equity, 261
F female traders, 953
financial constraint, 261
financial crisis, 827
fishing, 897
flooding, 181
G gender, 509
geomantic planning, 517
geosophy, 517
Ghana, 23, 131, 181, 237, 291, 391, 403, 427,
443, 541, 617, 675, 783, 827, 905, 919, 929,
939
Index of keywords
966
glass façade, 473
golden square, 571
golden triangle, 571
Government policy, 167
green architecture, 817
green construction, 883
gross annual income, 69
H health and safety, 529, 571, 593, 735
Health and safety, 47
health infrastructure, 919
house-owner, 559
housing, 79, 91, 167, 465, 541, 807
housing development, 509
housing policy, 487
housing sector, 827
housing value, 861
human action, 939
human resource management, 905
I Ile-Ife, 183
inclusive design, 305
industrial training, 617
information asymmetry, 845
information technology, 651
infrastructure, 105, 435
inheritance, 509
innovation diffusion, 675
innovative approach, 663
institutional building, 335
integrated approach, 119
international research collaboration, 3
interview, 735
intra-city, 403
J Jos, 691
K Khaya grandifoliola, 281
L Lagos, 861
land, 509
land accessibility, 465
land registration, 845
landscaping, 907
laterite, 249
leadership, 703
literature review, 593
living building, 817
M maintenance, 413
maintenance cost variable, 413
maintenance management, 413
market, 897
marketplace, 953
mass housing, 315, 559, 819
measuring indicator, 593
migrant remittance, 827
mimesis, 517
Mix Ratio, 427
modelling, 585
mortgage, 541
mortgage loan, 69
multi-criteria selection, 273
museum, 183
N naira value, 69
National Building Regulation, 181
natural environment, 897
natural pozzolanas, 691
natural ventilation, 929
Nigeria, 59, 79, 167, 229, 273, 435, 453, 465,
629, 641, 651, 663, 683, 703, 725, 761, 861,
871, 883, 907
noise, 45, 59
O Oba-Ile housing estate, 59
occupational health and safety, 217
office environment, 795
OHS facility, 641
OHS performance, 641
oil-coated rebar, 361
Onitsha, 841
on-site childcare facility, 953
open public space, 841
P palm kernel shell concrete, 371
partial replacements, 691
partnering, 771
performance, 23
performance evaluation, 501
performance improvement, 593
phased construction, 715
photovoltaic, 675
pollution, 45
post occupancy evaluation, 795
post-occupancy evaluation, 501
pozzolanic activity, 691
pre-contract stage, 651
prefabrication, 819
price hike, 325
price of cement, 153
procurement, 435, 735
productivity, 905
project execution, 105
project finance, 783
project life cycle, 347
project management practice, 783
project non-completion, 919
project performance, 651, 783
project planning, 919
prototype, 819
psychosocial, 817
psychrometric, 193
public organization, 783
public procurement, 237
Public Procurement Act, 237
Public Procurement Authority, 237
public sector, 905
public-private partnership, 807

Index of keywords
967
Q quality, 819
quality of life, 907
quantity surveyor, 251
R rainwater harvesting, 585
rainwater system, 585
real estate, 291
real estate market, 845
regression, 335
reinforced concrete, 361
relationship management, 119
relative humidity, 929
renewable resources, 371
research, 203
residential building, 281
residential sector, 585
residents, 747
rice husk ash, 379
road haulage, 325
S sandcrete block, 427
Sekondi-Takoradi, 131
slum, 167
slum upgrading, 167
socio-economic, 747
solid waste, 607
southern Nigeria, 509
sporadic registration, 845
subcontracting, 735
Sub-Saharan Africa, 845
supply chain relationship, 119
sustainability, 249, 487, 663, 907
sustainable buildings, 663
sustainable cementitious material, 691
sustainable construction, 473, 715, 871, 883
sustainable development, 747
sustainable tourism, 897
systematic registration, 845
T Tanzania, 715
tender, 529
tender evaluation, 571
terminals, 403
therapeutic garden, 817
thermal comfort, 193
thermal performance, 929
time overrun, 229
Total Quality Management, 291, 683
tourism, 183, 907
tourist, 183
tourist site, 183
training, 703
transport, 403
transportation, 153
tropical building, 473
U under-performance, 771
university, 203
urban centre, 841
urban housing, 607
urban land use planning system, 939
urbanisation, 45, 91, 953
V variations, 229
ventilation, 193
W waste, 443
waste minimization, 443
water absorption, 371
water consumption, 585
West Africa, 203
win-win, 771
women, 453
workers‘ characteristics, 629
workers‘ length of service, 629
workers‘ performance, 629
workers‘ productivity, 795
Workmen‘s Compensation Act, 47