Changes in PYY and gastric emptying across the ... - CentAUR
27
Changes in PYY and gastric emptying across the phases of the menstrual cycle and the influence of the ovarian hormones Article Accepted Version Creative Commons: Attribution-Noncommercial-No Derivative Works 4.0 Campolier, M., Thondre, S. P., Clegg, M., Shafat, A., McIntosh, A. and Lightowler, H. (2016) Changes in PYY and gastric emptying across the phases of the menstrual cycle and the influence of the ovarian hormones. Appetite, 107. pp. 106- 115. ISSN 0195-6663 doi: https://doi.org/10.1016/j.appet.2016.07.027 Available at http://centaur.reading.ac.uk/80392/ It is advisable to refer to the publisher’s version if you intend to cite from the work. See Guidance on citing . To link to this article DOI: http://dx.doi.org/10.1016/j.appet.2016.07.027 Publisher: Elsevier All outputs in CentAUR are protected by Intellectual Property Rights law, including copyright law. Copyright and IPR is retained by the creators or other
-
Upload
khangminh22 -
Category
Documents
-
view
1 -
download
0
Transcript of Changes in PYY and gastric emptying across the ... - CentAUR

Changes in PYY and gastric emptying across the phases of the menstrual cycle and the influence of the ovarian hormones
Article
Accepted Version
Creative Commons: Attribution-Noncommercial-No Derivative Works 4.0
Campolier, M., Thondre, S. P., Clegg, M., Shafat, A., McIntosh, A. and Lightowler, H. (2016) Changes in PYY and gastric emptying across the phases of the menstrual cycle and the influence of the ovarian hormones. Appetite, 107. pp. 106-115. ISSN 0195-6663 doi: https://doi.org/10.1016/j.appet.2016.07.027 Available at http://centaur.reading.ac.uk/80392/
It is advisable to refer to the publisher’s version if you intend to cite from the work. See Guidance on citing .
To link to this article DOI: http://dx.doi.org/10.1016/j.appet.2016.07.027
Publisher: Elsevier
All outputs in CentAUR are protected by Intellectual Property Rights law, including copyright law. Copyright and IPR is retained by the creators or other

copyright holders. Terms and conditions for use of this material are defined in the End User Agreement .
www.reading.ac.uk/centaur
CentAUR
Central Archive at the University of Reading
Reading’s research outputs online

1
Title: Changes in PYY and gastric emptying across the phases of the menstrual cycle and the 1
influence of the ovarian hormones 2
3
Authors Names: 4
Marta Campolier1, Sangeetha PariyarathThondre2, Miriam Clegg3, Amir Shafat4, Ali Mcintosh5, 5
Helen Lightowler6 (corresponding author) 6
Authors’ Address and e-mail addresses: 1-3, 5-6 Functional Food Centre, Department of Sport and 7
Health Sciences, Oxford Brookes University; 4 Physiology, School of Medicine, National University of 8
Ireland, Galway, Ireland. 9
10
1 [email protected] 11
2 [email protected] 12
3 [email protected] 13
4 [email protected] 14
5 [email protected] 15
6 [email protected] 16
2
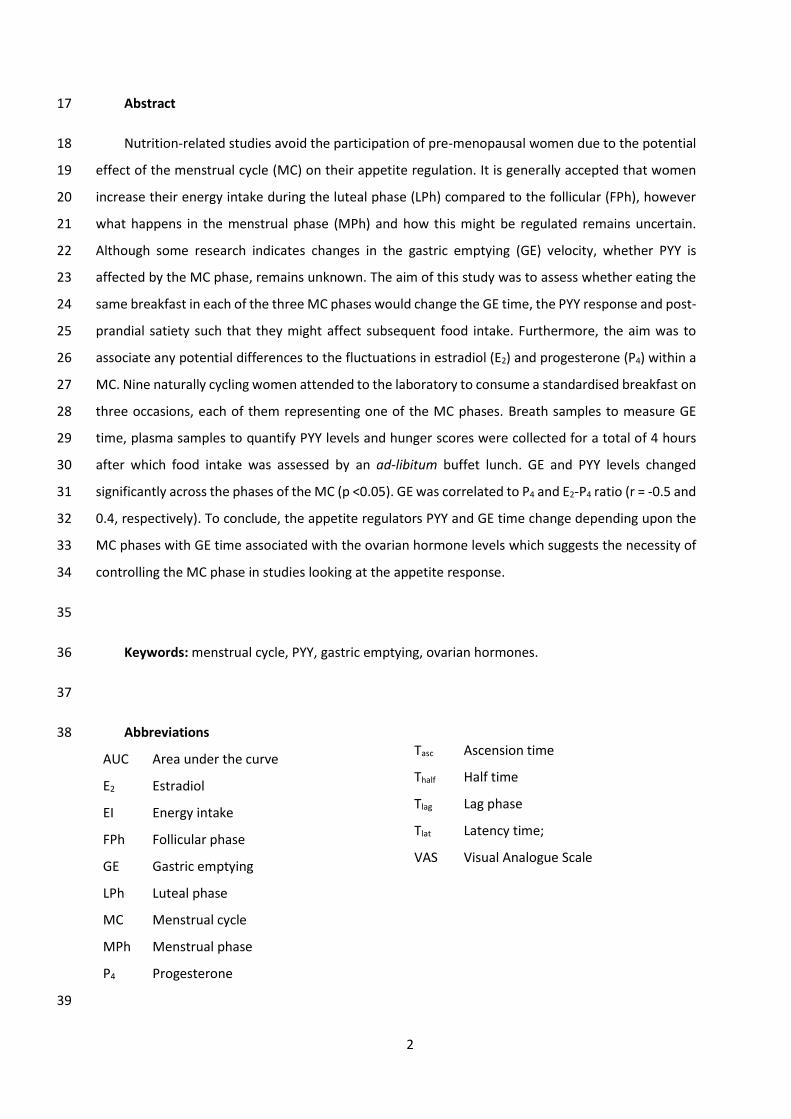
Abstract 17
Nutrition-related studies avoid the participation of pre-menopausal women due to the potential 18
effect of the menstrual cycle (MC) on their appetite regulation. It is generally accepted that women 19
increase their energy intake during the luteal phase (LPh) compared to the follicular (FPh), however 20
what happens in the menstrual phase (MPh) and how this might be regulated remains uncertain. 21
Although some research indicates changes in the gastric emptying (GE) velocity, whether PYY is 22
affected by the MC phase, remains unknown. The aim of this study was to assess whether eating the 23
same breakfast in each of the three MC phases would change the GE time, the PYY response and post-24
prandial satiety such that they might affect subsequent food intake. Furthermore, the aim was to 25
associate any potential differences to the fluctuations in estradiol (E2) and progesterone (P4) within a 26
MC. Nine naturally cycling women attended to the laboratory to consume a standardised breakfast on 27
three occasions, each of them representing one of the MC phases. Breath samples to measure GE 28
time, plasma samples to quantify PYY levels and hunger scores were collected for a total of 4 hours 29
after which food intake was assessed by an ad-libitum buffet lunch. GE and PYY levels changed 30
significantly across the phases of the MC (p <0.05). GE was correlated to P4 and E2-P4 ratio (r = -0.5 and 31
0.4, respectively). To conclude, the appetite regulators PYY and GE time change depending upon the 32
MC phases with GE time associated with the ovarian hormone levels which suggests the necessity of 33
controlling the MC phase in studies looking at the appetite response. 34
35
Keywords: menstrual cycle, PYY, gastric emptying, ovarian hormones. 36
37
Abbreviations 38
AUC Area under the curve
E2 Estradiol
EI Energy intake
FPh Follicular phase
GE Gastric emptying
LPh Luteal phase
MC Menstrual cycle
MPh Menstrual phase
P4 Progesterone
39
Tasc Ascension time
Thalf Half time
Tlag Lag phase
Tlat Latency time;
VAS Visual Analogue Scale
3
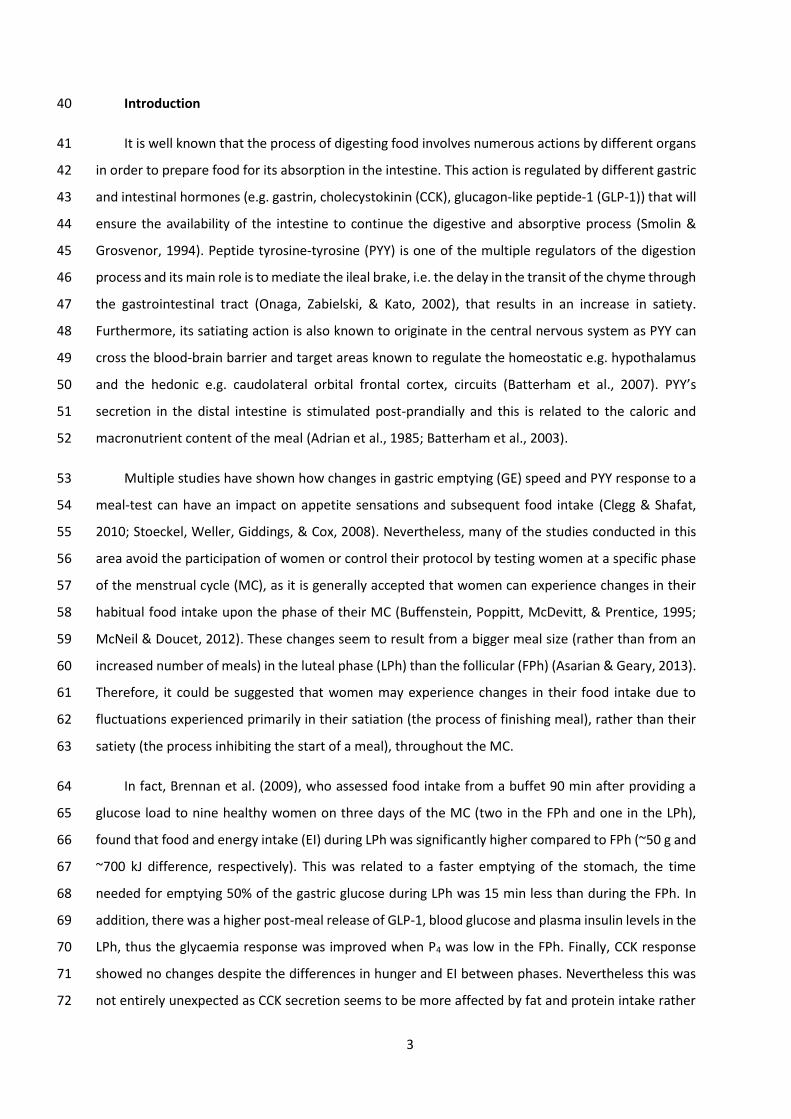
Introduction 40
It is well known that the process of digesting food involves numerous actions by different organs 41
in order to prepare food for its absorption in the intestine. This action is regulated by different gastric 42
and intestinal hormones (e.g. gastrin, cholecystokinin (CCK), glucagon-like peptide-1 (GLP-1)) that will 43
ensure the availability of the intestine to continue the digestive and absorptive process (Smolin & 44
Grosvenor, 1994). Peptide tyrosine-tyrosine (PYY) is one of the multiple regulators of the digestion 45
process and its main role is to mediate the ileal brake, i.e. the delay in the transit of the chyme through 46
the gastrointestinal tract (Onaga, Zabielski, & Kato, 2002), that results in an increase in satiety. 47
Furthermore, its satiating action is also known to originate in the central nervous system as PYY can 48
cross the blood-brain barrier and target areas known to regulate the homeostatic e.g. hypothalamus 49
and the hedonic e.g. caudolateral orbital frontal cortex, circuits (Batterham et al., 2007). PYY’s 50
secretion in the distal intestine is stimulated post-prandially and this is related to the caloric and 51
macronutrient content of the meal (Adrian et al., 1985; Batterham et al., 2003). 52
Multiple studies have shown how changes in gastric emptying (GE) speed and PYY response to a 53
meal-test can have an impact on appetite sensations and subsequent food intake (Clegg & Shafat, 54
2010; Stoeckel, Weller, Giddings, & Cox, 2008). Nevertheless, many of the studies conducted in this 55
area avoid the participation of women or control their protocol by testing women at a specific phase 56
of the menstrual cycle (MC), as it is generally accepted that women can experience changes in their 57
habitual food intake upon the phase of their MC (Buffenstein, Poppitt, McDevitt, & Prentice, 1995; 58
McNeil & Doucet, 2012). These changes seem to result from a bigger meal size (rather than from an 59
increased number of meals) in the luteal phase (LPh) than the follicular (FPh) (Asarian & Geary, 2013). 60
Therefore, it could be suggested that women may experience changes in their food intake due to 61
fluctuations experienced primarily in their satiation (the process of finishing meal), rather than their 62
satiety (the process inhibiting the start of a meal), throughout the MC. 63
In fact, Brennan et al. (2009), who assessed food intake from a buffet 90 min after providing a 64
glucose load to nine healthy women on three days of the MC (two in the FPh and one in the LPh), 65
found that food and energy intake (EI) during LPh was significantly higher compared to FPh (~50 g and 66
~700 kJ difference, respectively). This was related to a faster emptying of the stomach, the time 67
needed for emptying 50% of the gastric glucose during LPh was 15 min less than during the FPh. In 68
addition, there was a higher post-meal release of GLP-1, blood glucose and plasma insulin levels in the 69
LPh, thus the glycaemia response was improved when P4 was low in the FPh. Finally, CCK response 70
showed no changes despite the differences in hunger and EI between phases. Nevertheless this was 71
not entirely unexpected as CCK secretion seems to be more affected by fat and protein intake rather 72

4
than glucose (Liddle, Goldfine, Rosen, Taplitz, & Williams, 1985). Whether modifications in the 73
appetite responses are maintained with a full breakfast and whether there would be any differences 74
during the menstrual phase (MPh) has not been previously studied. The latter seems of importance 75
as both ovarian hormones, estradiol (E2) and progesterone (P4), are found at very low concentrations, 76
in contrast to the other two phases. Having a better understanding of women’s appetite physiology 77
seems imperative in light of the global higher obesity prevalence in women than men (WHO, 2015). 78
The objective of the present study was to assess whether eating the same breakfast in each of 79
the three MC phases would change the GE time, PYY response and satiety feelings of the meal to 80
ultimately have an impact on the food intake of a buffet lunch served four hours later. Furthermore, 81
the aim was to associate any potential differences to the naturally occurring fluctuations in E2 and P4 82
of the MC. We finally aimed to investigate whether food intake recorded during three days for each 83
MC phase changed significantly. 84
85
Material and methods 86
Participants 87
Participants were recruited by posters placed in Oxford Brookes University facilities e.g. library, 88
sport centre, student accommodation, and also in local libraries or gyms, as well as on social media. 89
Moreover, the study was advertised in the Oxford Brookes University Research Activity Group, on the 90
Functional Food Centre website and in the volunteers section of a local website. 91
The inclusion criteria comprised of women between 18-40 y with regular MC for the last three 92
months that lasted between 25 and 35 days and excluded those who were taking hormonal 93
contraceptives, were pregnant, lactating or had any metabolic/genetic diseases or taking any 94
medications known to interfere with their metabolism. In addition, participants who had an 95
allergy/intolerance to any of the foods given in the study, did not consume breakfast and lunch 96
habitually or were attempting to lose weight were also excluded. Finally, smokers and participants 97
with a disease (e.g. Gilbert's syndrome) or taking medication known to interfere with appetite (e.g. 98
codeine) or those who showed to be restrictive eaters were also excluded. The latter was assessed by 99
the combination of two adapted restrictive eating questionnaires: the Dutch Eating Behaviour 100
Questionnaire (DEBQ) (van Strien, Frijters, Bergers, & Defares, 1986) and the Three-factor eating 101
questionnaire – restraint eating (TFEQ FI) (Stunkard & Messick, 1985). Participants with a TFEQ score 102
of >10 and a DEBQ >2.5 were considered restrictive eaters and were excluded from participating in 103
the study. 104
5
Ethical approval for the study was obtained from the University Research Ethics Committee at 105
Oxford Brookes University. All participants gave written informed consent prior to commencing the 106
study. 107
108
Protocol 109
Once the participant agreed to participate in the study, she was given a fertility monitor (Clear 110
Blue Advanced Fertility Monitor, Clearblue) to assist in the scheduling of visits to the laboratory based 111
on the three different MC phases i.e. MPh, FPh and LPh. The three chosen days were aimed to display 112
a very distinguishable profile in the ovarian hormones: MPh, E2 and P4 at low concentrations; FPh, E2 113
at high concentrations while P4 remains low; and LPh, E2 and P4 at high concentrations. The MPh visit 114
was scheduled as soon as the participant notified the start of a new MC (i.e. day 1) and this was 115
performed within 4 days of starting the MC. From day 6 of the MC, participants tested their morning 116
urine using the fertility monitor to measure their oestrone-3-glucuronide (E3G) and luteinising 117
hormone (LH) levels. When participants obtained the ‘high’ reading (i.e. E3G levels were increased) 118
they notified the researcher who scheduled the next testing session based on the cycle day of the high 119
reading, the MC length history of the participant and the fact that it usually takes approximately five 120
days to reach to ‘peak’ after a ‘high’ reading (Howards et al., 2009), in order to test the participant at 121
very high levels of E2. Once the ‘peak’ reading (i.e. LH levels were high) appeared, the last session was 122
scheduled to test when P4 was at its highest values (in the mid-luteal phase) based on the peak day 123
and the usual MC length of the participant. When participants did not reach ‘peak’ they were asked 124
to postpone their LPh testing session until the next cycle to ensure that the P4 levels were high enough 125
to produce any potential effects on the parameters studied (i.e. PYY response, GE time, appetite 126
feelings and food intake). 127
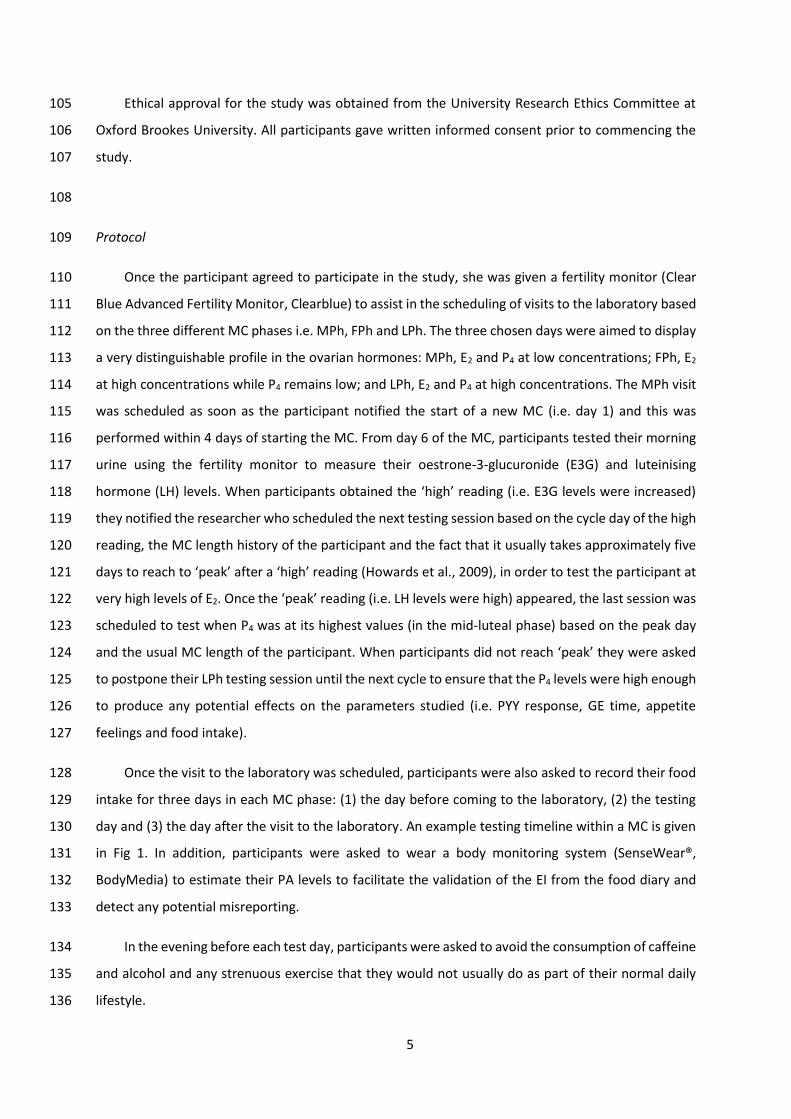
Once the visit to the laboratory was scheduled, participants were also asked to record their food 128
intake for three days in each MC phase: (1) the day before coming to the laboratory, (2) the testing 129
day and (3) the day after the visit to the laboratory. An example testing timeline within a MC is given 130
in Fig 1. In addition, participants were asked to wear a body monitoring system (SenseWear®, 131
BodyMedia) to estimate their PA levels to facilitate the validation of the EI from the food diary and 132
detect any potential misreporting. 133
In the evening before each test day, participants were asked to avoid the consumption of caffeine 134
and alcohol and any strenuous exercise that they would not usually do as part of their normal daily 135
lifestyle. 136
6
137
138
Fig 1. Example experiment timeline during a MC. 139
During the visits to the laboratory, participants were requested to arrive between 7:00-9:30h to 140
have their body composition assessed by electrical bioimpedance, Tanita Body Composition Analyzer 141
BC-418MA (Tanita Ltd, West Drayton, UK) and then a cannula (BD Venflon Pro Safety 20GA, Becton 142
Dickinson Induction Therapy, Singapore) was inserted into a vein of the anti-cubital fosse of the arm 143
to obtain the baseline blood sample (t = 0). The cannula was kept patent by flushing 0.9% sodium 144
chloride into the system with a needle-free syringe after collecting each sample. Immediately after, 145
participants filled in the visual analogue scale (VAS) for appetite sensations and the first breath sample 146
for the measurement of GE was collected. Then the participant consumed the standardised breakfast 147
labelled with 13C octanoic acid; the breakfast consisted of scrambled eggs on toast, pineapple and a 148
drink of their choice (water, coffee or tea with/out milk and sugar). The breakfast was standardised 149
amongst participants and provided 375-395 kcal of which 35%, 38% and 23% were in the form of fat, 150
carbohydrate and protein, respectively. The energy provided by the breakfast accounted for 17-18 % 151
of the total daily energy requirements for an average woman (19-44 years) with median physical 152
activity level of 1.63 i.e. 2103-2175 kcal/d (SACN 2011). Participants were asked to finish their 153
breakfast within 15min. As soon as they finished their breakfast, the first post-ingestion breath 154

7
sample, blood sample and satiety scores were collected. Subsequent breath samples were taken every 155
15 min until 240 min. Subsequent blood samples and satiety scores were taken every 15 min until t = 156
60 min thereafter every 30 min until t = 240 min (Fig 2). 157
158
Fig 2. Timeline of events during each of the testing days in the laboratory. 159
Immediately after the last blood sample, the cannula was removed and the participant was 160
offered an ad-libitum lunch buffet composed by a variety of dishes/foods. The selected foods were 161
chosen with the aim to satisfy all tastes and possible conditions (e.g. lactose intolerance, vegetarian 162
diets, etc.) thus food intake was not restrained by choice or quantity (Table 1). Participants were 163
invited to eat until comfortably full within 30 min. 164
Table 1. Foods available in buffet lunch with nutritional composition per portion provided. 165
Food Serving Energy Fat
(g) Carbs
(g) Fibre
(g) Prot
(g) Salt (g) units g (kJ) (kcal)
Hummus 50 664 161 14 4 2 4 1
Apples Gala 1 135 304 71 0 16 2 1 0
Banana 1 158 636 150 0 36 4 2 0
Clementines 2 226 398 95 0 20 3 2 0
Carrots 70 123 30 0 6 2 0 0
Celery sticks 80 32 8 0 1 1 0 0
Tomatoes 18 142 119 28 0 4 1 1 0
Potato Salad * 270 1858 448 35 28 3 4 1
Tuna & Sweetcorn Pasta 295 2295 549 25 59 3 20 1
Moroccan Couscous 245 2112 502 16 75 11 9 0
Bright Salad 83 93 22 0 3 2 1 0
Cheese, Babybel 4 95 1207 291 23 0 0 21 2
Low-fat Yoghurt 1 120 406 96 1 19 0 3 0
Sausages 8 66 779 187 14 7 1 9 1
Chicken Nuggets 5 77 770 185 10 14 1 10 0
Cheese & Tomato Pizza 1 160 1934 459 12 68 2 18 1
Bread sticks 19 331 78 1 14 1 2 0
Crisps, ready salted 1 bag 24 527 126 8 12 1 1 0

8
KitKat 4 fingers 45 958 229 11 29 1 3 0
Orange Juice 500 985 230 0 54 0 5 1
Water 500 0 0 0 0 0 0 0
Egg Mayonnaise Sandwich * 139 1202 287 13 26 5 14 1
Chicken Sweetcorn Sandwich* 139 1199 287 12 29 5 14 1
TOTAL (non-vegan buffet) 3594 17974 4291 184 494 51 142 11
Bean & Mint Salad ϒ 215 1288 310 13 26 14 15 2
Soya Fruit Yoghurt ϒ 1 129 396 94 3 12 2 5 0
Vegetable Spring Rolls ϒ 6 115 1173 281 14 33 3 6 0
Peanut Butter Sandwich ϒ 113 1477 355 20 23 7 17 0
Beetroot, Mint hummus Sandwich ϒ 109 755 180 5 23 6 7 1
TOTAL (vegan buffet) 2914 11413 2721 95 361 62 78 6
Nutritional composition of the foods was based on manufacturer’s information. Carbs, carbohydrates; Prot, 166 protein. * Item removed in the vegan buffet. ϒ Item included in the vegan buffet only. 167
168
Measurements 169
Gastric emptying Breath samples were collected by blowing into a small glass tube (Labco 170
Exetainer, Labco Limited, UK) through a straw while having the nose blocked with a nose-clip. 171
Participants blew into the tube while removing the straw to immediately cap the tube which was then 172
stored at room temperature for analysis. Breath samples were analysed using an isotope ratio mass 173
spectrometer (ABCA, Sercon Ltd, Chesire UK) to quantify the excess amount of labelled oxidised 174
octanoic acid (i.e. 13CO2) above baseline for each time point, as previously described elsewhere (Clegg 175
& Shafat, 2010). This was expressed as the percentage of dose recovered per hour and this was fitted 176
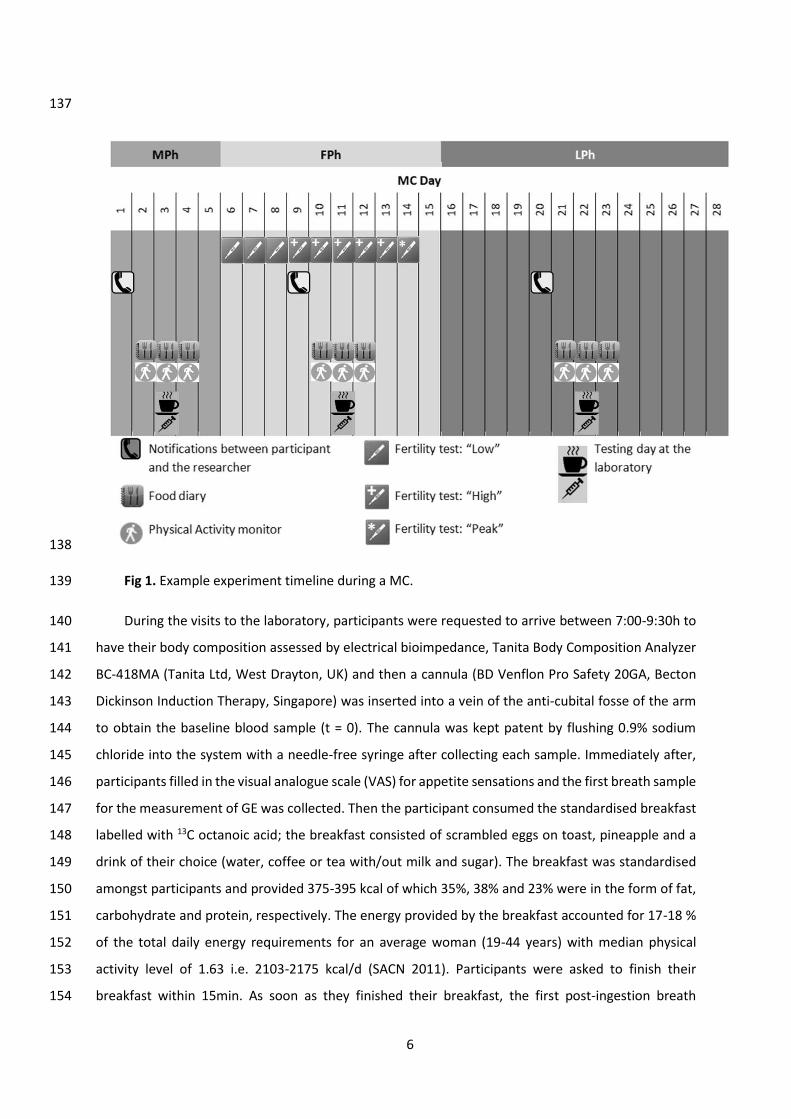
into a non-linear regression model (Ghoos et al., 1993). From this model several parameters were 177
measured. Lag phase (Tlag) and half time (Thalf) were calculated using the formulae derived by Ghoos 178
et al. (1993). Tlag is the time taken to maximal rate of 13CO2 excretion (Jackson, Bluck, & Coward, 2004) 179
and is equivalent to the time of the inflection point (Schommartz, Ziegler, & Schadewaldt, 1998). Thalf 180
is the time it takes 50% of the 13C dose to be excreted (Jackson et al., 2004). Latency phase (Tlat) 181
(Schommartz et al., 1998) is the point of intersection of the tangent at the inflection point of the 13CO2-182
excretion curve representing an initial delay in the excretion curve. Ascension time (Tasc) (Schommartz 183
et al., 1998) is the time course between the Tlat and Thalf, representing a period of high 13CO2-excretion 184
rates (Fig. 3). 185
9
186
Fig 3. GE time points (Clegg & Shafat, 2010) 187
PYY and E2 and P4 levels. Blood samples were collected with K2E-EDTA tubes (BD Vacutainer, 188
Becton Dickinson, UK). A 4 ml blood sample was withdrawn from the cannula for every time point, 189
except for the baseline when 8 ml were collected to measure the ovarian hormones. After collection, 190
blood samples were kept in ice until they were centrifuged at 4°C for 10 minutes at 4000 rpm (MC-6, 191
Sarstedt Ltd, Leicester, UK) to extract the plasma. These were then frozen at -80°C in different aliquots 192
until analysis. E2 and P4 levels were measured by an ElectroChemiLuminescense immunoassay (ECLIA) 193
with a Cobas e411 semi-automated analyser (Roche diagnostics Burgess Hill, UK) and total PYY 194
concentrations were assessed with a direct sandwich enzyme-linked-immunosorbent assay (ELISA) kit 195
(EMD Millipore). Samples of the same participant in the three phases of the MC were analysed within 196
the same ELISA plate. Averaged intra-duplicates coefficient of variance (CV) for the total PYY ELISA 197
assay was 6.3 ± 1.4 %. Averaged inter-plate CV for the quality controls of the PYY ELISA assay was 13.3 198
± 4.1 %. 199
Appetite sensations. Feelings of satiety were assessed by four questions (1) ‘How hungry do you 200
feel?,’ (2) ‘How full do you feel?’, (3) ‘How strong is your desire to eat?’ and (4) ‘How much food do 201
you think you can eat?’ in which participants had to rate their appetite sensations with the VAS, 202
namely, by putting a mark in a 100 mm line per each question, where 0 = (1) ‘not hungry at all’, (2) 203
‘extremely full’; (3) ‘not strong at all’ and (4) ‘nothing at all’ and 100 = (1) ‘extremely hungry’, (2) ‘not 204
at all full’; (3) ‘extremely strong’ and (4) ‘a large amount’. The distance between the origin (score = 0) 205
and the mark was used to measure the participant’s score. 206
Ad libitum food intake. The researcher weighed out all the foods before and after the participant 207
had lunch and then food intake was analysed using an excel spreadsheet designed from the 208
10
manufacture’s food information provided in the food label. Ad-libitum food intake assessment 209
included the measurement of energy, carbohydrate, protein, sugar, fat, saturated fat, fibre and 210
sodium. 211
Food intake from food diaries. For three days of each MC phase participants were asked to weigh 212
out and record all the foods and beverages consumed with as much detail as possible (e.g. brand, 213
cooking process). If participants could not weigh out a meal, they were asked to provide portion sizes 214
by using household measures (e.g. cups) and/or by taking pictures of the foods eaten. The selected 215
days of each phase included one of the visits to the laboratory (on day 2 of the 3-days), therefore 216
participants had to only record anything consumed after leaving the testing facilities on the test day. 217
Food intake recorded was measured by the use of a nutrition analyses software program (Nutritics 218
V3.74 Professional Edition) and intakes of energy, carbohydrate, sugar, protein, fat, saturated fat, fibre 219
and sodium were determined per day and per phase of the MC for each participant. 220
Physical activity. Participants were requested to wear the body monitoring system on the upper 221
right arm (triceps muscle) throughout the day (24 hours) except during activities in which the skin is 222
in contact with water (e.g. showering) as the equipment instructions advise (Body Media, 2006). Data 223
was downloaded and analysed as total daily energy expenditure (kcal/d) using the BodyMedia 224
software once individual characteristics (i.e. date of birth, height, weight, sex) were entered into the 225
system. Averaged daily energy expenditure across the same nine days as the food diaries were 226
recorded. This was then compared to the energy intake estimated from the food diaries. 227
228
Calculations and statistical analyses 229
PYY peak was defined as the highest PYY concentrations achieved post-baseline. Concentrations 230
of PYY were used to calculate the total area under the curve (AUC) using the trapezoidal method at 231
min 60, 120, 180, 210 and 240 from baseline (before breakfast). 232
Each appetite sensation question was analysed separately by calculating the derived AUC from 233
the scores of all the time points. AUC was calculated using the trapezoidal method at min 60, 120, 180, 234
210 and 240 from baseline. The employment of VAS has been validated in many studies and the use 235
of total AUCs with baseline levels as covariates has been recommended over individual time scores or 236
incremental AUCs within participants (Blundell et al., 2010). 237
One-way repeated measures ANOVA or Friedman test was used to test differences across the 238
phases of the MC for PYY AUCs, ovarian hormone levels, GE parameters and food intake across the 239

11
phases of the MC. When significant differences were found, a Bonferroni post-hoc pairwise 240
comparison or a Wilcoxon signed-rank test was performed, according to the normality of the data. A 241
2-way repeated measures ANOVA with time and MC phase as factors was used to analyse the change 242
in PYY levels from baseline within subjects as an assessment of the post-prandial changes across the 243
MC. AUC for VAS was analysed with another 2-way repeated measures ANOVA that included the 244
baseline scores as covariates in the analyses. 245
Associations between EI and PYY, GE and appetite feelings as well as between ovarian hormones 246
and the appetite markers (i.e. EI and PYY, GE and appetite feelings) were analysed by Pearson’s or 247
Spearman’s correlation, according to the normality of the data. 248
A sample size of nine women was based on the only other study that has looked at appetite 249
hormones responses in the MC (Brennan et al., 2009). 250
251
Results 252
Participants characteristics 253
Fifteen women signed the consent form of which three had to be excluded because of violating 254
the inclusion criteria (i.e. irregular MC and suspicion of suffering Gilbert’s syndrome). Of the twelve 255
women who started the study, two withdrew due to personal reasons and another who completed 256
the study had to be excluded because of unconfirmed ovulation and unavailability to reschedule the 257
LPh testing day. Thus the following results are based on a population of nine NC women (Table 2). 258
Table 2. Participants’ characteristics at baseline 259
Mean ± SD
Age (years) 31 ± 6
Height (m) 1.67 ± 0.09
Body weight (kg) 63.4 ± 12.8
BMI (kg/m2) 22.6 ± 2.7
Fat Mass Percentage (%) 29.0 ± 7.4
Fat Mass (kg) 19.1 ± 7.8
Fat Free Mass (kg) 44.4 ± 6.3
Waist-to-hip ratio 0.77 ± 0.07
260
MC characteristics and ovarian hormones 261
12
Average MC length was 29 ± 3 days. Of the nine participants included, four had a “peak” reading 262
i.e. ovulation was confirmed by the fertility monitor, within their first MC, while three participants 263
only ovulated on the second MC. Averaged “peak” reading happened on day 14 ± 3 of the MC. The 264
two remaining participants were asked to attend to the laboratory when it was expected to be their 265
mid-LPh despite not having had a peak reading in the fertility monitor. Nevertheless, plasma P4 levels 266
indicated that these participants had ovulated as P4 concentrations were > 15.9 nmol/L which is 267
considered high enough to have ovulated (Piers et al., 1995). Moreover, one of these two participants 268
had a positive LH peak in her personal fertility monitor, thus participants were kept in the study as 269
they seemed to have ovulated despite not having been detected by the fertility monitor used in the 270
study. 271
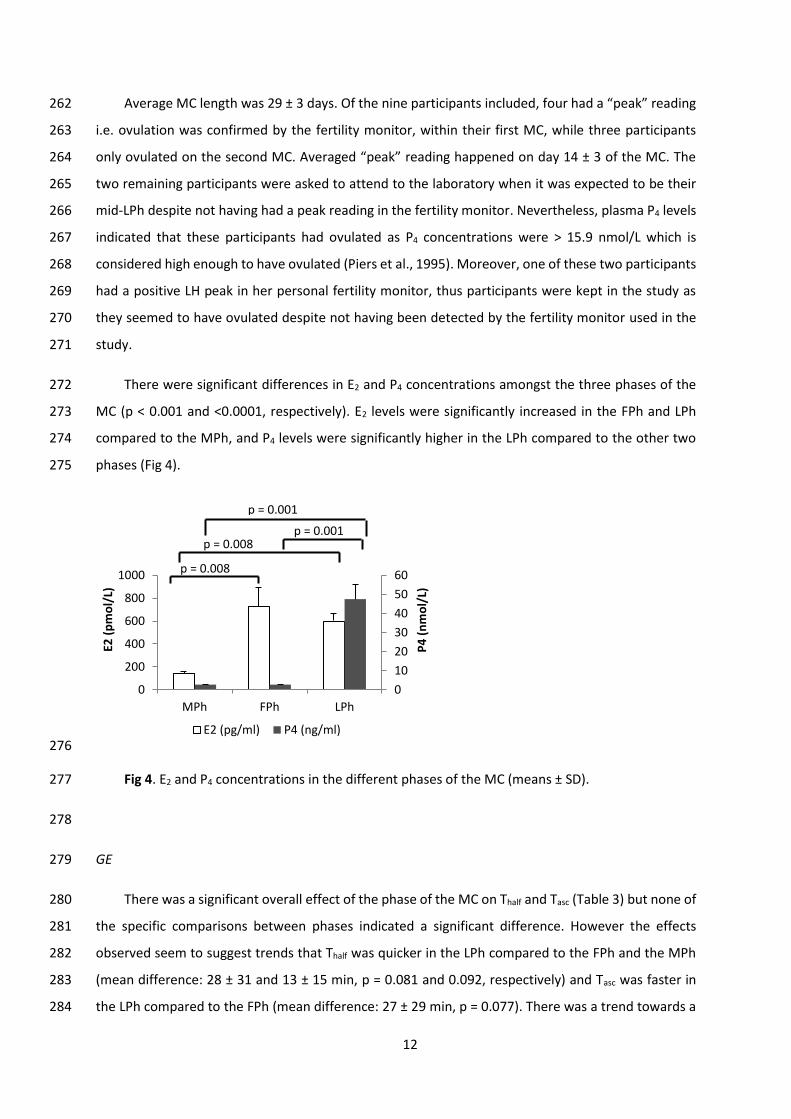
There were significant differences in E2 and P4 concentrations amongst the three phases of the 272
MC (p < 0.001 and <0.0001, respectively). E2 levels were significantly increased in the FPh and LPh 273
compared to the MPh, and P4 levels were significantly higher in the LPh compared to the other two 274
phases (Fig 4). 275
276
Fig 4. E2 and P4 concentrations in the different phases of the MC (means ± SD). 277
278
GE 279
There was a significant overall effect of the phase of the MC on Thalf and Tasc (Table 3) but none of 280
the specific comparisons between phases indicated a significant difference. However the effects 281
observed seem to suggest trends that Thalf was quicker in the LPh compared to the FPh and the MPh 282
(mean difference: 28 ± 31 and 13 ± 15 min, p = 0.081 and 0.092, respectively) and Tasc was faster in 283
the LPh compared to the FPh (mean difference: 27 ± 29 min, p = 0.077). There was a trend towards a 284
0
10
20
30
40
50
60
0
200
400
600
800
1000
MPh FPh LPh
P4
(n
mo
l/L)
E2 (
pm
ol/
L)
E2 (pg/ml) P4 (ng/ml)
p = 0.001
p = 0.001
p = 0.008
p = 0.008

13
difference in Tlag across the phases of the MC (p = 0.072). No differences were found in Tlat across the 285
phases of the MC. 286
Table 3. GE parameters shown in minutes for MPh, FPh and LPh. 287
GE parameter (min) MPh FPh LPh p
Thalf 101 ± 23 116 ± 46 88 ± 22 0.015
Tlag 48 ± 8 51 ± 14 43 ± 12 0.072
Tlat 52 ± 7 53 ± 12 48 ± 13 0.264
Tasc 128 ± 23 143 ± 41 116 ± 13 0.011
Thalf, half time; Tlag, lag phase; Tlat, latency time; Tasc, ascension time. Mean ± SD 288
289
Total PYY 290
Due to blood collection issues, a total of four samples (1%) could not be obtained. These were 291
the 150-240 min samples of one participant’s FPh, therefore, comparisons from min 150 onwards are 292
only from 8 participants. 293
PYY levels were significantly different at baseline across the phases of the MC (p = 0.004), being 294
significantly lower in the LPh compared to the MPh (14.97 ± 10.11 vs 22.81 ± 11.89 pmol/L) (p = 0.008), 295
but not to the FPh (16.22 ± 7.08 pmol/L, p = 0.079). PYY peak was lower in the LPh compared to the 296
MPh and FPh (29.20 ± 12.38 vs.33.35 ± 11.83 and 32.94 ± 12.00 pmol/L, respectively) but it was not 297
significantly different (p = 0.264). 298
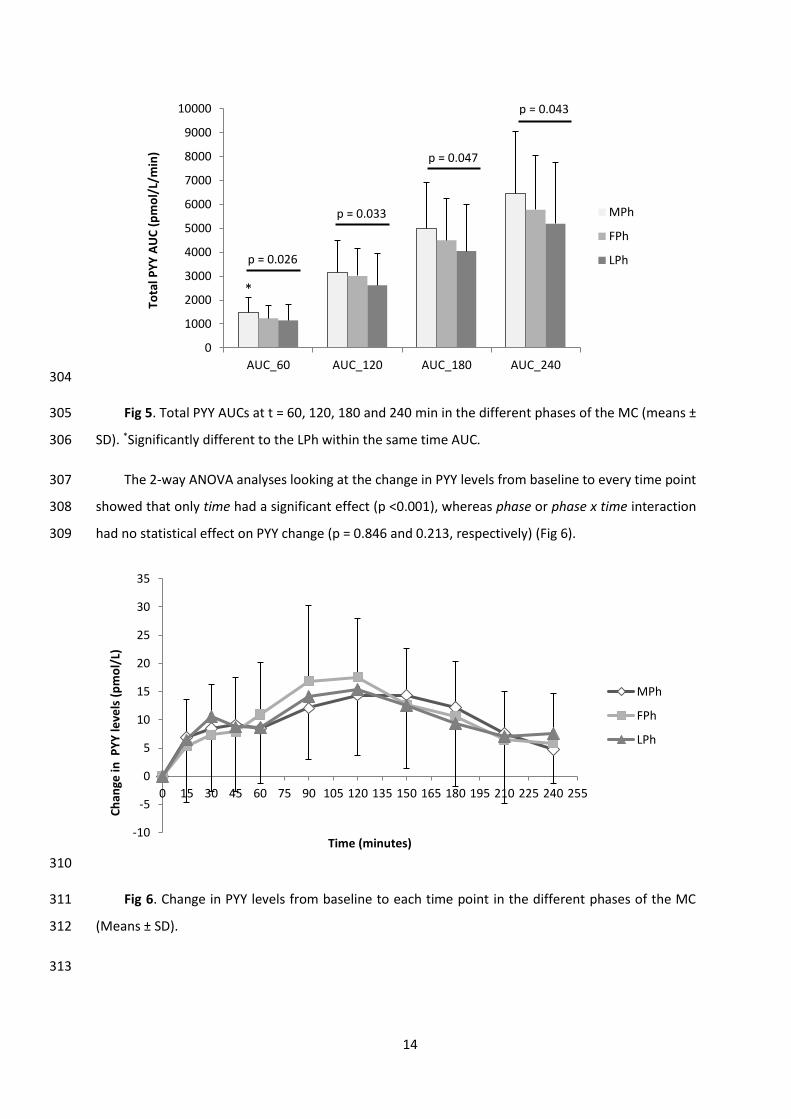
There was a significant overall effect on PYY AUC at t = 60, 120, 180 and 240 min, but only at t = 299
60 min there was a significant difference between specific phases, i.e. LPh vs. MPh (1157 ± 678 vs.1471 300
± 650 pmol/ml/min) (p = 0.021) (Fig 5). However the effects observed seem to mainly reflect that the 301
PYY AUCs at t = 120, 180 and 240 min were smaller in the LPh compared to the MPh (p = 0.066, 0.129 302
and 0.113, respectively). 303
14
304
Fig 5. Total PYY AUCs at t = 60, 120, 180 and 240 min in the different phases of the MC (means ± 305
SD). *Significantly different to the LPh within the same time AUC. 306
The 2-way ANOVA analyses looking at the change in PYY levels from baseline to every time point 307
showed that only time had a significant effect (p <0.001), whereas phase or phase x time interaction 308
had no statistical effect on PYY change (p = 0.846 and 0.213, respectively) (Fig 6). 309
310
Fig 6. Change in PYY levels from baseline to each time point in the different phases of the MC 311
(Means ± SD). 312
313
-10
-5
0
5
10
15
20
25
30
35
0 15 30 45 60 75 90 105 120 135 150 165 180 195 210 225 240 255
Ch
ange
in P
YY
leve
ls (
pm
ol/
L)
Time (minutes)
MPh
FPh
LPh
0
1000
2000
3000
4000
5000
6000
7000
8000
9000
10000
AUC_60 AUC_120 AUC_180 AUC_240
Tota
l PY
Y A
UC
(p
mo
l/L/
min
)
MPh
FPh
LPhp = 0.026
p = 0.043
p = 0.047
p = 0.033
*

15
Satiety ratings 314
There were no significant differences in AUC for any of the four satiety questions when analysing 315
them in a two-way-ANOVA (time x phase) with the baseline measurements as covariates. AUC at the 316
end of the 4 hours test for “how hungry do you feel”; “how full do you feel?” “how strong is your desire 317
to eat” and “how much food do you think you can eat?” were 6932 ± 2961, 7404 ± 2010 and 7802 ± 318
2080 mm/min; 8924 ± 3153, 10358 ± 4261 and 10340 ± 3638 mm/min; 7039 ± 3147, 7479 ± 2108 and 319
8268 ± 2388 mm/min for MPh, FPh and LPh, respectively (Fig 7). 320
Fig 7. Appetite sensations scores (mm) before and after breakfast in the different phases of the 321
MC: (1) ‘How hungry do you feel?’ (A), (2) ‘How full do you feel?’ (B), (3) ‘How strong is your desire to 322
eat?’ (C) and (4) ‘How much food do you think you can eat?’ (D). (Means ± SD) 323
324
325
a
-20
0
20
40
60
80
100
120
0 60 120 180 240
Hu
nge
r (m
m)
Time (minutes)
-20
0
20
40
60
80
100
120
0 60 120 180 240
Fulln
ess
(m
m)
Time (minutes)
-20
0
20
40
60
80
100
120
0 60 120 180 240
De
sire
to
eat
(m
m)
Time (minutes)
MPh FPh
-20
0
20
40
60
80
100
120
0 60 120 180 240
Foo
d y
ou
can
eat
(m
m)
Time (minutes)
LPh
A B
C D
No
t at
all
Extr
eme
No
t at
all
Extr
eme
Extr
eme
N
ot
at a
ll
A la
rge
amo
un
t N
oth
ing
at a
ll

16
Ad-libitum, post-lunch and averaged food intake 326
For this section of the results, a participant’s data was excluded as her eating behaviour and food 327
diary analyses showed a strong indication that she was restricting her EI during the ad-libitum buffet-328
lunch as well as underreporting her food intake in the food diary. 329
During the buffet lunch there were no significant differences in EI, carbohydrate, protein or fat 330
intake between phases of the MC (Table 4). Similarly no differences were observed in food intake once 331
participants left the laboratory. In addition, as an average of the three days in each MC phase, non-332
significant differences were found in food intake. Finally, food intake as an average of the day before 333
and after the laboratory visit, i.e. food intake under free-living conditions, did not change significantly 334
for energy, carbohydrate, fat or protein intake across the MC. 335
Table 4. Food intake during and after the ad libitum lunch and as an average of the three 336
measured days in each MC phase. 337
MPh FPh LPh
Ad libitum lunch
Energy (kcal) 931 ± 193 984 ± 178 956 ± 194
Carbohydrate (g) 113 ± 20 119 ± 20 116 ± 27
Fat (g) 38 ± 11 41 ± 10 39 ± 8
Protein (g) 29 ± 6 30 ± 6 30 ± 7
After Ad libitum lunch
Energy (kcal) 1131 ± 339 1308 ± 660 1192 ± 485
Carbohydrate (g) 134 ± 47 156 ± 93 141 ± 54
Fat (g) 42 ± 14 52 ± 25 56 ± 31
Protein (g) 43 ± 21 39 ± 16 34 ± 18
Average of 3 days
Energy (kcal) 2352 ± 358 2368 ± 604 2443 ± 412
Carbohydrate (g) 271 ± 41 274 ± 70 279 ± 54
Fat (g) 101 ± 21 97 ± 25 106 ± 22
Protein (g) 84 ± 17 77 ± 10 85 ± 15
Free-living conditions
Energy (kcal) 2292 ± 146 2203 ± 598 2386 ± 520
Carbohydrate (g) 264 ± 52 255 ± 64 270 ± 67
Fat (g) 103 ± 26 91 ± 26 103 ± 27
Protein (g) 79 ± 19 70 ± 13 84 ± 20
Means ± SD 338
339

17
Relationships between PYY, GE, appetite feelings and EI 340
There was a significant moderate correlation between peak PYY and Thalf and Tasc (r = 0.396 and 341
0.410, p = 0.041 and 0.034, respectively). Moreover, there was a trend for a moderate correlation of 342
PYY AUC at time 180 and 240 with Thalf and Tasc (r = 0.4 for all, p = 0.08 and 0.07 for Thalf and Tasc 343
correlations, respectively). 344
No significant correlations were found between EI and PYY, GE or appetite feelings. 345
346
Relationships between appetite markers and the ovarian hormones 347
There was a moderate negative correlation between Thalf and Tasc and P4 levels (r = -0.490 and -348
0.426, p= 0.010 and 0.027, respectively). Moreover, Thalf and Tasc were positively correlated to E2:P4 349
ratio (r = 0.437 and 0.407, p= 0.023 and 0.035). 350
There were no correlations between PYY AUCs or peak PYY and the ovarian hormones. Similarly, 351
no correlations between appetite sensations or food intake and the ovarian hormones were found. 352
353
Discussion 354
The aim of this study was to investigate whether appetite responses vary after consuming the 355
same breakfast in the different phases of the MC. This research is of importance in order to extend 356
the current knowledge in appetite regulation in a subset of the adult population who seems to be at 357
a higher risk of developing obesity than men (WHO, 2015). 358
Our results showed that the time to empty half of the breakfast from the stomach to the 359
duodenum (Thalf) was significantly different across the phases of MC, being on average 28 and 13 360
minutes quicker in the LPh compared to the FPh and MPh, respectively. Iit could be suggested that 361
the reduction in the GE time (represented by Thalf) was because of a significantly shorter Tasc and, 362
potentially, a faster Tlag in the LPh compared to the other phases.. In the LPh, high GE rates might have 363
been reached quicker and once attained, these were sustained for a shorter period which resulted in 364
a reduction of the time required to empty the same amount of food from the stomach when compared 365
to the other two phases of the MC. Because Tasc was maintained for less time in the LPh, GE rates 366
achieved during that period had to be of a higher velocity to achieve a shorter Thalf. 367
18
Faster GE during the LPh in comparison to the FPh has previously been described (Brennan et al., 368
2009), however, others have found opposite results (Gill, Murphy, Hooper, Bowes, & Kingma, 1987) 369
or no differences (Horowitz et al., 1985; Monés et al., 1993) between these two phases, thus a definite 370
position in this matter cannot be made with the available evidence. Discrepancies amongst studies 371
might be due to different test meals in terms of calories and nutrient composition (Horowitz et al., 372
1985) and the fact that some women might not have ovulated as this was not tested in all studies 373
(Monés et al., 1993). Furthermore, attention is warranted as our outcome does not only support those 374
who found differences between the LPh and the FPh (Brennan et al., 2009), but also suggests that the 375
GE effect seen in the LPh is large enough to be compared to the MPh, as well. As far as we know, this 376
is the first study to add the MPh as another time point to investigate GE within the MC and our findings 377
suggest that this should be included in future investigations. 378
To our knowledge, this is the first investigation to indicate that fasting and post-prandial PYY 379
levels significantly change amongst the phases of the MC. The results indicate that when participants 380
are fasted in the LPh there are lower PYY levels compared to the MPh. Moreover, the results suggest 381
that PYY response is smaller after the consumption of the same breakfast in the LPh compared to the 382
other MC phases. Nevertheless, the MC effect on the PYY response seems to partly result from the 383
significant differences found at baseline (when fasted) as the statistical significance was lost when 384
looking at the change in PYY levels from baseline. 385
PYY secretion occurs by direct contact depending on the presence of food in the lower intestine 386
(ileum, colon) where the L-cells are located (Fu-Cheng et al., 1995). Its secretion can also start earlier 387
via neural or hormonal mechanisms, by digestive events that occur at upper sections of the 388
gastrointestinal tract, i.e. duodenum and stomach (Fu-Cheng et al., 1995). For instance, there is 389
evidence that gastrin, which is known to stimulate the production of gastric acid, can inhibit the 390
release of PYY as seen in rats (Gomez et al., 1996). Meanwhile, the increase in gastric acid 391
concentrations will trigger the synthesis of PYY as part of the ileal brake of the digestion process, thus 392
creating a feedback loop between the upper and lower gastrointestinal tract. In some (Adamopoulos, 393
Dessypris, Xanthopoulos, & Chryssicopoulos, 1982) but not all (Frick, Bremme, Sjögren, Lindén, & 394
Uvnäs-Moberg, 1990; Uvnäs-Msoberg, Sjögren, Westlin, Anderson, & Stock, 1989) studies, gastrin 395
levels were elevated in the LPh when compared to the FPh which could partly explain the impairment 396
in the PYY release and the consequent unavailability to reduce the GE time in the LPh in our 397
participants. This was supported by the positive correlation found between Thalf and PYY peak and the 398
tendency for a positive correlation with the PYY AUC at t = 180 and 240 min. 399
19
Another potential mechanism that could have contributed to the different PYY responses would 400
be changes in the CCK secretion. CCK release after the infusion of long-chain fatty acids in the 401
duodenum has been shown to up-regulate PYY secretion by CCK-receptor 1 (Degen et al., 2007), thus 402
if CCK secretion is inhibited in the LPh that could in turn impair PYY release. Brennan et al. (2009) 403
found that CCK secretion was maintained across the MC, although this could have been influenced by 404
the fact that participants only ingested a glucose drink and carbohydrates are known to be less 405
effective in stimulating the CCK than fats (Hildebrand et al., 1990), thus there could still be a potential 406
for CCK modulating the changes in PYY secretion across the phases of the MC. 407
One interesting finding of the current study was the significant negative correlation between P4 408
and Thalf. Despite being only a moderate correlation, our results agree with Brennan et al. (2009) and 409
corroborate the idea that the ovarian hormones might have an influence on GE. Furthermore, the fact 410
that the ratio between E2 and P4 is also significantly correlated, suggests that both hormones may 411
modulate the changes in the GE process. Although our results did not indicate a direct association 412
between PYY levels and the ovarian hormones, these may have exerted their influence by other factors 413
involved in the digestive process e.g. GE, other appetite-hormonal secretions. Considering the 414
naturally occurring changes in E2 levels between the MPh and FPh it seemed necessary to investigate 415
three rather than two phases and this was corroborated by the outcome of the study. 416
Although increases in food intake in the ad-libitum lunch were expected in the LPh as seen in 417
previous literature (McNeil & Doucet, 2012), our results did not find significant fluctuations in EI or 418
macronutrient intake across the phases of the MC. This could be due to the fact that the majority of 419
the food intake of the day (while in the laboratory) was already purposely kept constant, thus leaving 420
little room for any changes. Nevertheless, food intake under the free-living conditions, which was 183 421
and 94 kcal/d higher in the LPh compared to the FPh and MPh, respectively, was not significantly 422
different throughout the MC phases, either. Despite not reaching the statistical significance, 423
fluctuations were within the spectrum of +50-100 kcal/d which are recognised to be of enough 424
magnitude to induce the progressive development of obesity (Mozaffarian, Hao, Rimm, Willett, & Hu, 425
2011). 426
The unchanged food intake during the lunch buffet may be expected since there were no 427
significant differences in the appetite sensations post-breakfast, suggesting that food intake was 428
responding to actual appetite perceptions and not to other extrinsic factors. However, direct 429
correlations were not found between food intake and appetite sensations which manifest the 430
difficulty in assessing subjective measurements. 431

20
Although the assessment of food intake in a controlled setting presents important advantages, 432
such as the availability to accurately quantify what is consumed, it also presents several limitations 433
that cannot be ignored. For instance, eating behaviour can be altered due to eating in a non-familiar 434
and unnatural environment, or because of the expectations the participants believe that the 435
researcher might have (Stubbs, Johnstone, O’Reilly, & Poppitt, 1998). Nevertheless, we tried to 436
minimise this effect by providing a sensible variety of foods that the participant could be familiar with. 437
On the other hand, although food diaries can avoid the limitations of the laboratory setting, they can 438
also present different drawbacks such as the misreporting displayed by one of our participants as well 439
as in other studies (de Vries, Zock, Mensink, & Katan, 1994). Therefore, both methods agreed on the 440
idea that there were no significant alterations in food intake throughout the phases of the MC. 441
Inconsistencies with other studies might rely on the limited sample size, although others have proved 442
significant differences with the same number of participants (Dalvit-McPhillips, 1983). Thus, 443
differences between the latter study and ours could partly be due to the dietary assessment 444
techniques employed i.e. dietary interview during 60 days vs. 9 days of food diaries. Finally, although 445
PYY response significantly changed throughout the MC, the magnitude of the change (mean difference 446
in total PYY AUC at min 240 in LPh: 15 and 23% compared to the MPh and FPh, respectively) might not 447
have been substantial enough to elicit modifications in appetite sensations and subsequent food 448
intake. 449
There were limitations to this study. Despite GE time and PYY response showing to be significantly 450
different across the MC, pairwise comparisons could not achieve the statistical significance and that 451
could be due to the small sample size or the inter-individual variation. In fact, if applying a t-test to 452
compare Thalf between the LPh and FPh or MPh, significant differences would have been found; 453
however, with the ANOVA and the Bonferroni correction, the statistical significance was diminished. 454
Nevertheless, we employed the same sample size used by previous studies (Brennan et al., 2009). The 455
current study did not distinguish the two different forms of PYY, i.e. PYY1-36 and PYY3-36. It is well known 456
that with food intake PYY1-36 is cleaved by the dipeptidyl peptidase IV to PYY3-36 and that only the latter 457
form has almost exclusive and high affinity to Y-2 receptors of the ARC. This is of relevance as Y-2 458
receptors are the only subtype of Y-receptors that can induce appetite and body weight suppression 459
by stimulating the activity of the α-MSH through the inhibition of the NPY release (Ballantyne, 2006). 460
Thus, although unlikely, changes in the concentrations of total PYY could respond to alterations in the 461
proportion between the two forms of PYY. Thus it cannot be dismissed that lower PYY response in the 462
LPh was mainly relying on a diminished PYY1-36 secretion and conversion, therefore, inducing minimal 463
changes in food intake. Future studies could improve our findings by measuring the two forms of PYY. 464

21
465
Conclusion 466
To our knowledge this is the first study to investigate GE time and PYY response after consuming 467
the same breakfast three times in the MC in which ovarian hormones, E2 and P4 presented very 468
distinguishable levels. Our results found significant differences in GE time and PYY response that 469
suggest the LPh as the quickest in GE time with the smallest PYY response of the all MC phases.. Finally 470
changes in the GE time could be influenced by the fluctuations in the ovarian hormones. 471
Further research needs to be done to confirm these findings and to have a better understanding 472
of the underlying mechanisms for these changes in GE time and PYY response across the MC as they 473
could potentially direct us to novel dieting strategies in women. Finally, our findings suggest that any 474
functional food studies aimed to change satiation should take into account the likely modifications in 475
the processing of food that women might experience throughout the MC by re-testing their products 476
in the different MC phases to ultimately be able to demonstrate the effects of a dietary intervention 477
in this population. 478
479
Acknowledgments 480
The authors thank the participants for their involvement and cooperation during the study. We 481
also thank Dr Ryan Pink for his assistance with the ELISA assays. 482
483
References 484
Adamopoulos, D. A., Dessypris, A., Xanthopoulos, J., & Chryssicopoulos, E. (1982). Gastrin secretion in 485
the menstrual cycle and pregnancy. Hepato-Gastroenterology, 29(1), 24–6. Retrieved from 486
http://www.ncbi.nlm.nih.gov/pubmed/7095733 487
Adrian, T. E., Ferri, G. L., Bacarese-Hamilton, A. J., Fuessl, H. S., Polak, J. M., & Bloom, S. R. (1985). 488
Human distribution and release of a putative new gut hormone, peptide YY. Gastroenterology, 489
89(5), 1070–1077. 490
Asarian, L., & Geary, N. (2013). Sex differences in the physiology of eating. American Journal of 491
Physiology. Regulatory, Integrative and Comparative Physiology, 305(11), R1215–67. 492
doi:10.1152/ajpregu.00446.2012 493

22
Ballantyne, G. H. (2006). Peptide YY(1-36) and peptide YY(3-36): Part II. Changes after gastrointestinal 494
surgery and bariatric surgery. Obesity Surgery, 16(6), 795–803. 495
doi:10.1381/096089206777346619 496
Batterham, R. L., Cohen, M. A., Ellis, S. M., Le Roux, C. W., Withers, D. J., Frost, G. S., … Bloom, S. R. 497
(2003). Inhibition of food intake in obese subjects by peptide YY3-36. The New England Journal 498
of Medicine, 349(10), 941–8. doi:10.1056/NEJMoa030204 499
Batterham, R. L., ffytche, D. H., Rosenthal, J. M., Zelaya, F. O., Barker, G. J., Withers, D. J., & Williams, 500
S. C. R. (2007). PYY modulation of cortical and hypothalamic brain areas predicts feeding 501
behaviour in humans. Nature, 450(7166), 106–9. doi:10.1038/nature06212 502
Blundell, J., de Graaf, C., Hulshof, T., Jebb, S., Livingstone, B., Lluch, A., … Westerterp, M. (2010). 503
Appetite control: methodological aspects of the evaluation of foods. Obesity Reviews : An Official 504
Journal of the International Association for the Study of Obesity, 11(3), 251–70. 505
doi:10.1111/j.1467-789X.2010.00714.x 506
Body Media. (2006). SenseWear body monitoring system. Instructions For Use. Pittsburgh, USA. 507
Brennan, I. M., Feltrin, K. L., Nair, N. S., Hausken, T., Little, T. J., Gentilcore, D., … Feinle-Bisset, C. 508
(2009). Effects of the phases of the menstrual cycle on gastric emptying, glycemia, plasma GLP-509
1 and insulin, and energy intake in healthy lean women. American Journal of Physiology. 510
Gastrointestinal and Liver Physiology, 297(3), G602–10. doi:10.1152/ajpgi.00051.2009 511
Buffenstein, R., Poppitt, S. D., McDevitt, R. M., & Prentice, A. M. (1995). Food intake and the menstrual 512
cycle: a retrospective analysis, with implications for appetite research. Physiology & Behavior, 513
58(6), 1067–1077. doi:10.1016/0031-9384(95)02003-9 514
Clegg, M., & Shafat, A. (2010). Energy and macronutrient composition of breakfast affect gastric 515
emptying of lunch and subsequent food intake, satiety and satiation. Appetite, 54(3), 517–23. 516
doi:10.1016/j.appet.2010.02.005 517
Dalvit-McPhillips, S. P. (1983). The effect of the human menstrual cycle on nutrient intake. Physiology 518
& Behavior, 31(2), 209–12. Retrieved from http://www.ncbi.nlm.nih.gov/pubmed/6634986 519
de Vries, J., Zock, P., Mensink, R., & Katan, M. (1994). Underestimation of energy intake by 3-d records 520
compared with energy intake to maintain body weight in 269 nonobese adults. Am J Clin Nutr, 521
60(6), 855–860. Retrieved from http://ajcn.nutrition.org/content/60/6/855.short 522
Degen, L., Drewe, J., Piccoli, F., Gräni, K., Oesch, S., Bunea, R., … Beglinger, C. (2007). Effect of CCK-1 523

23
receptor blockade on ghrelin and PYY secretion in men. American Journal of Physiology. 524
Regulatory, Integrative and Comparative Physiology, 292(4), R1391–9. 525
doi:10.1152/ajpregu.00734.2006 526
Frick, G., Bremme, K., Sjögren, C., Lindén, A., & Uvnäs-Moberg, K. (1990). Plasma levels of 527
cholecystokinin and gastrin during the menstrual cycle and pregnancy. Acta Obstetricia et 528
Gynecologica Scandinavica, 69(4), 317–20. Retrieved from 529
http://www.ncbi.nlm.nih.gov/pubmed/2244463 530
Fu-Cheng, X., Anini, Y., Chariot, J., Voisin, T., Galmiche, J. P., & Rozé, C. (1995). Peptide YY release after 531
intraduodenal, intraileal, and intracolonic administration of nutrients in rats. Pflugers Archiv : 532
European Journal of Physiology, 431(1), 66–75. Retrieved from 533
http://www.ncbi.nlm.nih.gov/pubmed/8584419 534
Ghoos, Y. F., Maes, B. D., Geypens, B. J., Mys, G., Hiele, M. I., Rutgeerts, P. J., & Vantrappen, G. (1993). 535
Measurement of gastric emptying rate of solids by means of a carbon-labeled octanoic acid 536
breath test. Gastroenterology, 104(6), 1640–7. Retrieved from 537
http://www.ncbi.nlm.nih.gov/pubmed/8500721 538
Gill, R. C., Murphy, P. D., Hooper, H. R., Bowes, K. L., & Kingma, Y. J. (1987). Effect of the menstrual 539
cycle on gastric emptying. Digestion, 36(3), 168–74. Retrieved from 540
http://www.ncbi.nlm.nih.gov/pubmed/3596076 541
Gomez, G., Padilla, L., Udupi, V., Tarasova, N., Sundler, F., Townsend, C. M., … Greeley, G. H. (1996). 542
Regulation of peptide YY homeostasis by gastric acid and gastrin. Endocrinology, 137(4), 1365–543
9. doi:10.1210/endo.137.4.8625912 544
Hildebrand, P., Beglinger, C., Gyr, K., Jansen, J. B., Rovati, L. C., Zuercher, M., … Stalder, G. A. (1990). 545
Effects of a cholecystokinin receptor antagonist on intestinal phase of pancreatic and biliary 546
responses in man. The Journal of Clinical Investigation, 85(3), 640–6. doi:10.1172/JCI114486 547
Horowitz, M., Maddern, G. J., Chatterton, B. E., Collins, P. J., Petrucco, O. M., Seamark, R., & Shearman, 548
D. J. (1985). The normal menstrual cycle has no effect on gastric emptying. British Journal of 549
Obstetrics and Gynaecology, 92(7), 743–6. Retrieved from 550
http://www.ncbi.nlm.nih.gov/pubmed/4016035 551
Howards, P. P., Schisterman, E. F., Wactawski-Wende, J., Reschke, J. E., Frazer, A. A., & Hovey, K. M. 552
(2009). Timing clinic visits to phases of the menstrual cycle by using a fertility monitor: the 553
BioCycle Study. American Journal of Epidemiology, 169(1), 105–12. doi:10.1093/aje/kwn287 554

24
Jackson, S. J., Bluck, L. J. C., & Coward, W. A. (2004). Use of isotopically labelled octanoic acid to assess 555
the effect of meal size on gastric emptying. Rapid Communications in Mass Spectrometry : RCM, 556
18(10), 1003–7. doi:10.1002/rcm.1440 557
Liddle, R. A., Goldfine, I. D., Rosen, M. S., Taplitz, R. A., & Williams, J. A. (1985). Cholecystokinin 558
bioactivity in human plasma. Molecular forms, responses to feeding, and relationship to 559
gallbladder contraction. The Journal of Clinical Investigation, 75(4), 1144–52. 560
doi:10.1172/JCI111809 561
McNeil, J., & Doucet, É. (2012). Possible factors for altered energy balance across the menstrual cycle: 562
a closer look at the severity of PMS, reward driven behaviors and leptin variations. European 563
Journal of Obstetrics, Gynecology, and Reproductive Biology, 163(1), 5–10. 564
doi:10.1016/j.ejogrb.2012.03.008 565
Monés, J., Carrió, I., Calabuig, R., Estorch, M., Sainz, S., Berná, L., & Vilardell, F. (1993). Influence of the 566
menstrual cycle and of menopause on the gastric emptying rate of solids in female volunteers. 567
European Journal of Nuclear Medicine, 20(7). doi:10.1007/BF00176554 568
Mozaffarian, D., Hao, T., Rimm, E. B., Willett, W. C., & Hu, F. B. (2011). Changes in diet and lifestyle 569
and long-term weight gain in women and men. The New England Journal of Medicine, 364(25), 570
2392–404. doi:10.1056/NEJMoa1014296 571
Onaga, T., Zabielski, R., & Kato, S. (2002). Multiple regulation of peptide YY secretion in the digestive 572
tract. Peptides, 23(2), 279–290. doi:10.1016/S0196-9781(01)00609-X 573
Piers, L. S., Diggavi, S. N., Rijskamp, J., van Raaij, J. M., Shetty, P. S., & Hautvast, J. G. (1995). Resting 574
metabolic rate and thermic effect of a meal in the follicular and luteal phases of the menstrual 575
cycle in well-nourished Indian women. The American Journal of Clinical Nutrition, 61(2), 296–576
302. Retrieved from http://www.ncbi.nlm.nih.gov/pubmed/7840066 577
Schommartz, B., Ziegler, D., & Schadewaldt, P. (1998). Significance of diagnostic parameters in 578
[13C]octanoic acid gastric emptying breath tests. Isotopes in Environmental and Health Studies, 579
34(1-2), 135–43. Retrieved from http://www.ncbi.nlm.nih.gov/pubmed/9854848 580
Smolin, L. A., & Grosvenor, M. B. (1994). Nutrition: science and applications. Retrieved from 581
http://www.cabdirect.org/abstracts/19951400111.html;jsessionid=E778B60969C2FCC06B5CB9582
E6A964DA7C 583
Stoeckel, L. E., Weller, R. E., Giddings, M., & Cox, J. E. (2008). Peptide YY levels are associated with 584

25
appetite suppression in response to long-chain fatty acids. Physiology & Behavior, 93(1-2), 289–585
95. doi:10.1016/j.physbeh.2007.08.018 586
Stubbs, R. J., Johnstone, A. M., O’Reilly, L. M., & Poppitt, S. D. (1998). Methodological issues relating 587
to the measurement of food, energy and nutrient intake in human laboratory-based studies. The 588
Proceedings of the Nutrition Society, 57(3), 357–72. Retrieved from 589
http://www.ncbi.nlm.nih.gov/pubmed/9793992 590
Stunkard, A. J., & Messick, S. (1985). The three-factor eating questionnaire to measure dietary 591
restraint, disinhibition and hunger. Journal of Psychosomatic Research, 29(1), 71–83. 592
doi:10.1016/0022-3999(85)90010-8 593
Uvnäs-Msoberg, K., Sjögren, C., Westlin, L., Anderson, P. O., & Stock, S. (1989). Plasma Levels of 594
Gastrin, Somatostatin, VIP, Insulin and Oxytocin During the Menstrual Cycle in Women (With and 595
Without Oral Contraceptives). Acta Obstetricia et Gynecologica Scandinavica, 68(2), 165–169. 596
doi:10.3109/00016348909009906 597
van Strien, T., Frijters, J. E. R., Bergers, G. P. A., & Defares, P. B. (1986). The Dutch Eating Behavior 598
Questionnaire (DEBQ) for assessment of restrained, emotional, and external eating behavior. 599
International Journal of Eating Disorders, 5(2), 295–315. doi:10.1002/1098-600
108X(198602)5:2<295::AID-EAT2260050209>3.0.CO;2-T 601
WHO. (2015). Obesity and overweight. Retrieved from 602
http://www.who.int/mediacentre/factsheets/fs311/en/ 603
604